UNITED STATES
SECURITIES AND EXCHANGE COMMISSION
Washington, D.C. 20549
FORM N-CSR
CERTIFIED SHAREHOLDER REPORT OF REGISTERED
MANAGEMENT INVESTMENT COMPANIES
Investment Company Act file number 811-21864
WisdomTree Trust
(Exact name of registrant as specified in charter)
380 Madison Avenue, 21st Floor
New York, NY 10017
(Address of principal executive offices) (Zip code)
The Corporation Trust Company
1209 Orange Street Wilmington, DE 19801
(Name and address of agent for service)
Registrant’s telephone number, including area code: (866)-909-9473
Date of fiscal year end: March 31
Date of reporting period: March 31, 2011
Form N-CSR is to be used by management investment companies to file reports with the Commission not later than 10 days after the transmission to stockholders of any report that is required to be transmitted to stockholders under Rule 30e-1 under the Investment Company Act of 1940 (17 CFR 270.30e-1). The Commission may use the information provided on Form N-CSR in its regulatory, disclosure review, inspection, and policymaking roles.
A registrant is required to disclose the information specified by Form N-CSR, and the Commission will make this information public. A registrant is not required to respond to the collection of information contained in Form N-CSR unless the Form displays a currently valid Office of Management and Budget (“OMB”) control number. Please direct comments concerning the accuracy of the information collection burden estimate and any suggestions for reducing the burden to Secretary, Securities and Exchange Commission, 450 Fifth Street, NW, Washington, DC 20549-0609. The OMB has reviewed this collection of information under the clearance requirements of 44 U.S.C. § 3507.
| Item 1. | Report(s) to Stockholders. |
The Trust’s annual report transmitted to shareholders pursuant to Rule 30e-1 under the Investment Company Act of 1940 is as follows:

JOIN YOUR FELLOW WISDOMTREE INVESTORS
Help reduce impact to environment by going paperless
Sign up for eDelivery at www.wisdomtree.com
WisdomTree Trust
Domestic Dividend Funds
Annual Report
March 31, 2011
WisdomTree Total Dividend Fund (DTD)
WisdomTree Equity Income Fund (DHS)
WisdomTree LargeCap Dividend Fund (DLN)
WisdomTree Dividend ex-Financials Fund (DTN)
WisdomTree MidCap Dividend Fund (DON)
WisdomTree SmallCap Dividend Fund (DES)
Table of Contents
“WisdomTree” is a registered mark of WisdomTree Investments, Inc. and is licensed for use by the Trust.
Management’s Discussion of Funds’ Performance (unaudited)
Domestic Dividend Funds
Market Environment Overview
The U.S. equity market, measured by the S&P 500 Index returned 15.65% for the 12-month period ended March 31, 2011 (the “period”). These gains are a continuation of the equity market bounce back after the bear market bottom in March of 2009 and followed gains of nearly 50% for the previous 1-year period. Given the back to back annual gains, on a cumulative basis, the S&P 500 Index now remains just 15% below its October 2007 highs. Considering the painful bear market experienced in 2008 and early 2009, it is clear that the U.S. equity market has experienced a significant recovery.
During the period, investors regained confidence in the safety and soundness of major United States financial institutions. The markets enjoyed strong gains from the lows of March 2009 until May 2010. May 2010 was marked by several detrimental events, specifically the “Flash Crash” and the BP Oil spill. The Flash Crash occurred on May 6, 2010, when the market fell approximately 900 points or 9% in minutes, and then made up much of the losses only minutes later. These events were the first bout of heightened fear and volatility entering the markets since the lows of early 2009. Choppy sideways performance remained in place until late summer 2010, when the Federal Reserve, led by Chairman Benjamin Bernanke, announced it was considering a second round of quantitative easing (“QE2”). Through QE2 the Federal Reserve pledged to initiate a purchase program of medium to long maturity treasury securities in order to lower mortgage and other interest rates levels. QE2 was implemented in November 2010. The Federal Funds target interest rate remained near zero throughout the entire period. Unemployment, one of the most widely watched economic indicators in judging the effectiveness of both monetary and fiscal policy, went from 9.7% in March of 2010 to 8.8% in March of 2011.
Similar to the 12-month period ended March 31, 2010, mid and small cap stocks continued to outperform large cap stocks for the year ended March 31, 2011. Given the accommodative monetary policy of the Federal Reserve, as well as positive earnings reports and an improving economic picture, investors have been willing to take more investment risk. This environment led many investors to prefer small capitalization stocks over large capitalization stocks and more cyclical sectors over defensive sectors.
WisdomTree Funds’ Performance Overview
WisdomTree’s dividend weighted funds are designed to track indexes based on the dividend stream generated by the companies included in the underlying WisdomTree index. The dividend stream is defined as the sum of the dollar value of dividends indicated to be paid by each company. There are two primary factors that drive performance differential of the WisdomTree Funds and indexes versus market cap-weighted benchmarks. The first is aggregate exposure to one or more sectors. The second is stock selection within each sector. Both of these are determined as part of WisdomTree’s rules-based index methodology. These exposures are not subjectively determined. Rather, they are objectively determined at the index rebalancing dates based on the dividend stream.
The following table reflects the WisdomTree Fund performance versus capitalization-weighted benchmark index.
| | | | | | | | | | | | | | | | |
| TICKER | | WISDOMTREE FUND | | 1 YEAR
RETURN | | | CAPITALIZATION-WEIGHTED
BENCHMARK INDEX | | 1 YEAR
RETURN | | | 1 YEAR
RETURN
FUND
VS
INDEX | |
DTN | | WT Dividend ex-Financials Fund | | | 21.68 | % | | Dow Jones U.S. Select Dividend Index | | | 18.03 | % | | | 3.65 | % |
DON | | WT MidCap Dividend Fund | | | 20.60 | % | | S&P MidCap 400 Index | | | 26.95 | % | | | -6.35 | % |
DHS | | WT Equity Income Fund | | | 20.24 | % | | Russell 1000 Value Index | | | 15.15 | % | | | 5.09 | % |
DES | | WT SmallCap Dividend Fund | | | 18.96 | % | | Russell 2000 Index | | | 25.79 | % | | | -6.83 | % |
DTD | | WT Total Dividend Fund | | | 17.37 | % | | Russell 3000 Index | | | 17.41 | % | | | -0.04 | % |
DLN | | WT LargeCap Dividend Fund | | | 16.83 | % | | S&P 500 Index | | | 15.65 | % | | | 1.18 | % |
| | | | |
| WisdomTree Domestic Dividend Funds | | | 1 | |
Management’s Discussion of Funds’ Performance
(unaudited) (concluded)
All 10 sectors represented within the S&P 500 index experienced positive performance over the period. The best performing sector over the period was the Energy sector, spurred on by a jump in oil prices over $100 in early 2011. The other typically cyclical sectors (Industrials, Materials, Consumer Discretionary) also out-performed the broader markets while most of the less cyclical stocks under-performed the broader markets (notably, Health Care, Consumer Staples, and Utilities).
WisdomTree’s fund performance, when measured on a relative basis versus their cap-weighted benchmarks, was the worst in the mid and small cap sectors, where cap-weighted benchmark performance was the strongest. Strong gains in technology stocks, which are not typically dividend payers and tend to be underweighted in WisdomTree’s dividend funds had a negative impact on relative performance. In addition, poor performance from financial sector stocks, which were more heavily represented in these funds than their cap weighted benchmarks, also had a negative impact on performance.
The LargeCap Dividend Fund and the Dividend ex-Financials Fund had better relative performance than their cap-weighted benchmarks. These funds had a relatively smaller portion of their assets invested in the financial sector than their capitalization-weighted benchmarks. Since financials lagged, the WisdomTree funds performed better than their cap-weighted benchmarks which were more heavily exposed to the financial sector.
The views expressed in this report reflect those of WisdomTree Asset Management only through the end of the period of the report as stated on the cover. The portfolio managers’ views are subject to change at any time based on market and other conditions and should not be construed as a recommendation. Past performance is no guarantee of future results.
Fund returns are shown at NAV. Please see Performance Summaries on the subsequent pages for more complete performance information. Please see page 10 for the list of index descriptions.
Fund performance assumes reinvestment of dividends and capital gain distributions. An index is a statistical measure of a specified financial market or sector. An index does not actually hold a portfolio of securities, incur expenses or pay any transaction costs. Therefore index returns do not reflect deductions for fees or expenses and are not available for direct investment. In comparison, the Funds’ performance is negatively impacted by these deductions. Fund returns do not reflect brokerage commissions or taxes on transactions in Fund shares or that a shareholder would pay on Fund distributions. Past performance is no guarantee of future results. For the most recent month end performance information visit www.wisdomtree.com.
| | |
| 2 | | WisdomTree Domestic Dividend Funds |
Performance Summary (unaudited)
WisdomTree Total Dividend Fund (DTD)
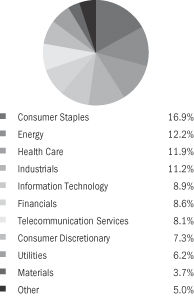
Sector Breakdown† as of 3/31/11‡
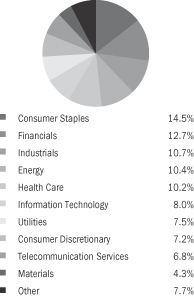
| † | The Fund’s sector breakdown is expressed as a percentage of total investments and may change over time. |
| ‡ | A sector may be comprised of several industries. |
Top Ten Holdings* as of 3/31/11
| | | | |
| |
| Description | | % of Net Assets | |
AT&T, Inc. | | | 4.0% | |
Exxon Mobil Corp. | | | 4.0% | |
Chevron Corp. | | | 2.7% | |
Pfizer, Inc. | | | 2.6% | |
Verizon Communications, Inc. | | | 2.3% | |
General Electric Co. | | | 2.2% | |
Johnson & Johnson | | | 2.1% | |
Procter & Gamble Co. (The) | | | 2.0% | |
Philip Morris International, Inc. | | | 2.0% | |
Microsoft Corp. | | | 1.9% | |
| * | The ten largest holdings are subject to change, and there are no guarantees the Fund will remain invested in any particular company. |
The WisdomTree Total Dividend Fund (the “Fund”) seeks investment results that closely correspond to the price and yield performance, before fees and expenses, of the WisdomTree Dividend Index.
The Fund returned 17.37% at net asset value (“NAV”) for the fiscal year ended March 31, 2011. The Fund’s performance benefited from its favorable stock selection within the Financials sector. Stock selection within the Information Technology sector contributed to a drag on the Fund’s performance.
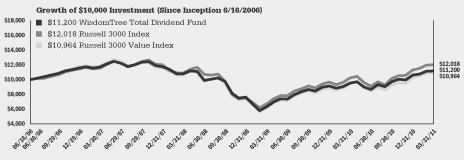
The following performance chart is provided for comparative purposes and represents the period noted. The Fund’s per share NAV is the value of one share of the Fund and is calculated by dividing the value of total assets less total liabilities by the number of shares outstanding. The NAV return is based on the NAV of the Fund and the market return is based on the market price per share of the Fund. The price used to calculate market price returns is the mid-point of the highest bid and lowest offer for Fund shares as of the close of trading on the exchange where Fund shares are listed. NAV and market returns assume that dividends and capital gain distributions have been reinvested in the Fund at NAV and market price, respectively. As with other ETFs, NAV returns and market price returns may differ because of factors such as the supply and demand for Fund shares and investors assessments of the underlying value of a Fund’s portfolio securities.
An index is a statistical measure of a specified financial market or sector. An index does not actually hold a portfolio of securities, incur expenses or pay any transaction costs. Therefore index returns do not reflect deductions for fees or expenses and are not available for direct investment. In comparison, the Fund’s performance is negatively impacted by these deductions. Fund returns do not reflect brokerage commissions or taxes on transactions in Fund shares or that a shareholder would pay on Fund distributions. The annual expense ratio of the Fund is 0.28%.
Performance as of 3/31/11
| | | | | | | | | | | | | | | | | | | | |
| | | Average Annual Total Return | |
| | | Fund
Net Asset Value | | | Fund
Market Price | | | WisdomTree
Dividend Index | | | Russell 3000 Index | | | Russell 3000
Value Index | |
One Year | | | 17.37 | % | | | 18.25 | % | | | 18.32 | % | | | 17.41 | % | | | 15.60 | % |
Three Year | | | 1.30 | % | | | 1.35 | % | | | 1.93 | % | | | 3.42 | % | | | 1.09 | % |
Since Inception1 | | | 2.39 | % | | | 2.38 | % | | | 2.90 | % | | | 3.91 | % | | | 1.94 | % |
| 1 | Total returns are calculated based on the commencement of Fund trading on June 16, 2006. |
Performance quoted represents past performance and past performance does not guarantee future results. Current performance may be higher or lower than the performance quoted. For the most recent month-end performance information visit www.wisdomtree.com. Investment in the Fund poses investment risk including the possible loss of principal. The investment return and principal value of an investment will fluctuate, so that shares, when sold or redeemed, may be worth more or less than their original cost. The returns do not reflect the deduction of taxes that a shareholder would pay on Fund distributions or on the redemption of Fund shares. Total returns for a period less than one year have not been annualized. Index returns do not reflect expenses paid by the Fund.
| | | | |
| WisdomTree Domestic Dividend Funds | | | 3 | |
Performance Summary (unaudited)
WisdomTree Equity Income Fund (DHS)
Sector Breakdown† as of 3/31/11‡
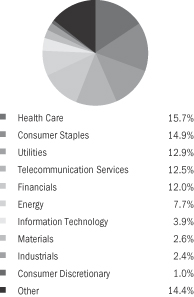
| † | The Fund’s sector breakdown is expressed as a percentage of total investments and may change over time. |
| ‡ | A sector may be comprised of several industries. |
Top Ten Holdings* as of 3/31/11
| | | | |
| |
| Description | | % of Net Assets | |
AT&T, Inc. | | | 7.9% | |
Chevron Corp. | | | 5.4% | |
Pfizer, Inc. | | | 5.2% | |
Verizon Communications, Inc. | | | 4.7% | |
Johnson & Johnson | | | 4.3% | |
Procter & Gamble Co. (The) | | | 4.0% | |
Philip Morris International, Inc. | | | 3.9% | |
Merck & Co., Inc. | | | 3.2% | |
ConocoPhillips | | | 3.0% | |
Intel Corp. | | | 2.9% | |
| * | The ten largest holdings are subject to change, and there are no guarantees the Fund will remain invested in any particular company. |
The WisdomTree Equity Income Fund (the “Fund”) seeks investment results that closely correspond to the price and yield performance, before fees and expenses, of the WisdomTree Equity Income Index.
The Fund returned 20.24% at net asset value (“NAV”) for the fiscal year ended March 31, 2011. The Fund benefited from its relative underweight in the Financials sector and favorable stock selection within the sector. The Fund’s exposure to the Health Care sector and its stock selection within the sector contributed to a drag on Fund performance.
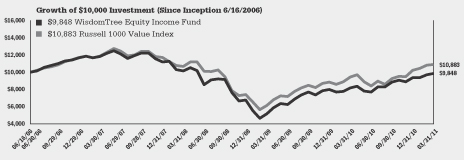
The following performance chart is provided for comparative purposes and represents the period noted. The Fund’s per share NAV is the value of one share of the Fund and is calculated by dividing the value of total assets less total liabilities by the number of shares outstanding. The NAV return is based on the NAV of the Fund and the market return is based on the market price per share of the Fund. The price used to calculate market price returns is the mid-point of the highest bid and lowest offer for Fund shares as of the close of trading on the exchange where Fund shares are listed. NAV and market returns assume that dividends and capital gain distributions have been reinvested in the Fund at NAV and market price, respectively. As with other ETFs, NAV returns and market price returns may differ because of factors such as the supply and demand for Fund shares and investors assessments of the underlying value of a Fund’s portfolio securities.
An index is a statistical measure of a specified financial market or sector. An index does not actually hold a portfolio of securities, incur expenses or pay any transaction costs. Therefore index returns do not reflect deductions for fees or expenses and are not available for direct investment. In comparison, the Fund’s performance is negatively impacted by these deductions. Fund returns do not reflect brokerage commissions or taxes on transactions in Fund shares or that a shareholder would pay on Fund distributions. The annual expense ratio of the Fund is 0.38%.
Performance as of 3/31/11
| | | | | | | | | | | | | | | | |
| | | Average Annual Total Return | |
| | | Fund
Net Asset Value | | | Fund
Market Price | | | WisdomTree
Equity Income
Index | | | Russell 1000
Value Index | |
One Year | | | 20.24 | % | | | 21.62 | % | | | 20.76 | % | | | 15.15 | % |
Three Year | | | -0.99 | % | | | -0.98 | % | | | -0.60 | % | | | 0.60 | % |
Since Inception1 | | | -0.32 | % | | | -0.30 | % | | | -0.05 | % | | | 1.78 | % |
| 1 | Total returns are calculated based on the commencement of Fund trading on June 16, 2006. |
Performance quoted represents past performance and past performance does not guarantee future results. Current performance may be higher or lower than the performance quoted. For the most recent month-end performance information visit www.wisdomtree.com. Investment in the Fund poses investment risk including the possible loss of principal. The investment return and principal value of an investment will fluctuate, so that shares, when sold or redeemed, may be worth more or less than their original cost. The returns do not reflect the deduction of taxes that a shareholder would pay on Fund distributions or on the redemption of Fund shares. Total returns for a period less than one year have not been annualized. Index returns do not reflect expenses paid by the Fund.
| | |
| 4 | | WisdomTree Domestic Dividend Funds |
Performance Summary (unaudited)
WisdomTree LargeCap Dividend Fund (DLN)
Sector Breakdown† as of 3/31/11‡
| † | The Fund’s sector breakdown is expressed as a percentage of total investments and may change over time. |
| ‡ | A sector may be comprised of several industries. |
Top Ten Holdings* as of 3/31/11
| | | | |
| |
| Description | | % of Net Assets | |
AT&T, Inc. | | | 4.7% | |
Exxon Mobil Corp. | | | 4.7% | |
Chevron Corp. | | | 3.2% | |
Pfizer, Inc. | | | 3.1% | |
Verizon Communications, Inc. | | | 2.7% | |
General Electric Co. | | | 2.6% | |
Johnson & Johnson | | | 2.5% | |
Procter & Gamble Co. (The) | | | 2.3% | |
Philip Morris International, Inc. | | | 2.3% | |
Microsoft Corp. | | | 2.2% | |
| * | The ten largest holdings are subject to change, and there are no guarantees the Fund will remain invested in any particular company. |
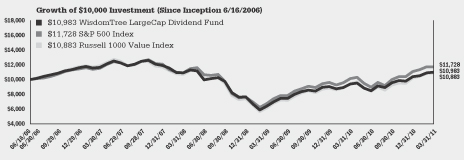
The WisdomTree LargeCap Dividend Fund (the “Fund”) seeks investment results that closely correspond to the price and yield performance, before fees and expenses, of the WisdomTree LargeCap Dividend Index.
The Fund returned 16.83% at net asset value (“NAV”) for the fiscal year ended March 31, 2011. The Fund benefited from its underweight to the Financials sector and favorable stock selection within the sector. The Consumer Discretionary sector, which had and underweight position, contributed to a drag on Fund performance.
The following performance chart is provided for comparative purposes and represents the period noted. The Fund’s per share NAV is the value of one share of the Fund and is calculated by dividing the value of total assets less total liabilities by the number of shares outstanding. The NAV return is based on the NAV of the Fund and the market return is based on the market price per share of the Fund. The price used to calculate market price returns is the mid-point of the highest bid and lowest offer for Fund shares as of the close of trading on the exchange where Fund shares are listed. NAV and market returns assume that dividends and capital gain distributions have been reinvested in the Fund at NAV and market price, respectively. As with other ETFs, NAV returns and market price returns may differ because of factors such as the supply and demand for Fund shares and investors assessments of the underlying value of a Fund’s portfolio securities.
An index is a statistical measure of a specified financial market or sector. An index does not actually hold a portfolio of securities, incur expenses or pay any transaction costs. Therefore index returns do not reflect deductions for fees or expenses and are not available for direct investment. In comparison, the Fund’s performance is negatively impacted by these deductions. Fund returns do not reflect brokerage commissions or taxes on transactions in Fund shares or that a shareholder would pay on Fund distributions. The annual expense ratio of the Fund is 0.28%.
Performance as of 3/31/11
| | | | | | | | | | | | | | | | | | | | |
| | | Average Annual Total Return | |
| | | Fund Net Asset Value | | | Fund
Market Price | | | WisdomTree
LargeCap
Dividend Index | | | S&P 500 Index | | | Russell 1000
Value Index | |
One Year | | | 16.83 | % | | | 17.53 | % | | | 17.16 | % | | | 15.65 | % | | | 15.15 | % |
Three Year | | | 0.19 | % | | | 0.22 | % | | | 0.83 | % | | | 2.35 | % | | | 0.60 | % |
Since Inception1 | | | 1.98 | % | | | 1.93 | % | | | 2.37 | % | | | 3.38 | % | | | 1.78 | % |
| 1 | Total returns are calculated based on the commencement of Fund trading on June 16, 2006. |
Performance quoted represents past performance and past performance does not guarantee future results. Current performance may be higher or lower than the performance quoted. For the most recent month-end performance information visit www.wisdomtree.com. Investment in the Fund poses investment risk including the possible loss of principal. The investment return and principal value of an investment will fluctuate, so that shares, when sold or redeemed, may be worth more or less than their original cost. The returns do not reflect the deduction of taxes that a shareholder would pay on Fund distributions or on the redemption of Fund shares. Total returns for a period less than one year have not been annualized. Index returns do not reflect expenses paid by the Fund.
| | | | |
| WisdomTree Domestic Dividend Funds | | | 5 | |
Performance Summary (unaudited)
WisdomTree Dividend ex-Financials Fund (DTN)
Sector Breakdown† as of 3/31/11‡
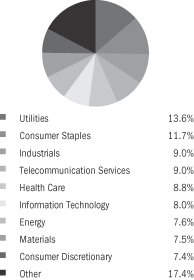
| † | The Fund’s sector breakdown is expressed as a percentage of total investments and may change over time. |
| ‡ | A sector may be comprised of several industries. |
Top Ten Holdings* as of 3/31/11
| | | | |
| |
| Description | | % of Net Assets | |
Frontier Communications Corp. | | | 2.1 | % |
Pitney Bowes, Inc. | | | 2.0 | % |
Reynolds American, Inc. | | | 2.0 | % |
Windstream Corp. | | | 2.0 | % |
Verizon Communications, Inc. | | | 1.9 | % |
Altria Group, Inc. | | | 1.9 | % |
Lorillard, Inc. | | | 1.8 | % |
FirstEnergy Corp. | | | 1.8 | % |
AT&T, Inc. | | | 1.8 | % |
CenturyLink, Inc. | | | 1.7 | % |
| * | The ten largest holdings are subject to change, and there are no guarantees the Fund will remain invested in any particular company. |
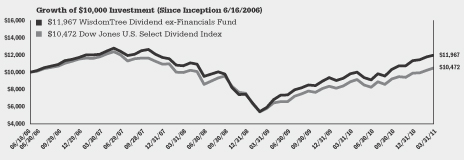
The WisdomTree Dividend ex-Financials Fund (the “Fund”) seeks investment results that closely correspond to the price and yield performance, before fees and expenses, of the WisdomTree Dividend ex-Financials Index. The WisdomTree Dividend ex-Financials Index measures the performance of high dividend-yielding stocks outside the financial sector.
The Fund returned 21.68% at net asset value (“NAV”) for the fiscal year ended March 31, 2011. The Fund’s favorable stock selection within the Consumer Staples sector contributed to the Fund’s positive performance. The Energy sector, which was relatively underweight, contributed to a drag on Fund performance.
The following performance chart is provided for comparative purposes and represents the period noted. The Fund’s per share NAV is the value of one share of the Fund and is calculated by dividing the value of total assets less total liabilities by the number of shares outstanding. The NAV return is based on the NAV of the Fund and the market return is based on the market price per share of the Fund. The price used to calculate market price returns is the mid-point of the highest bid and lowest offer for Fund shares as of the close of trading on the exchange where Fund shares are listed. NAV and market returns assume that dividends and capital gain distributions have been reinvested in the Fund at NAV and market price, respectively. As with other ETFs, NAV returns and market price returns may differ because of factors such as the supply and demand for Fund shares and investors assessments of the underlying value of a Fund’s portfolio securities.
An index is a statistical measure of a specified financial market or sector. An index does not actually hold a portfolio of securities, incur expenses or pay any transaction costs. Therefore index returns do not reflect deductions for fees or expenses and are not available for direct investment. In comparison, the Fund’s performance is negatively impacted by these deductions. Fund returns do not reflect brokerage commissions or taxes on transactions in Fund shares or that a shareholder would pay on Fund distributions. The annual expense ratio of the Fund is 0.38%.
Performance as of 3/31/11
| | | | | | | | | | | | | | | | |
| | | Average Annual Total Return | |
| | | Fund
Net Asset Value | | | Fund
Market Price | | | WisdomTree
Dividend Top 100/
Dividend ex-Financials
Spliced Index1 | | | Dow Jones
U.S. Select
Dividend Index | |
One Year | | | 21.68 | % | | | 22.61 | % | | | 22.25 | % | | | 18.03 | % |
Three Year | | | 3.64 | % | | | 3.70 | % | | | 4.17 | % | | | 1.63 | % |
Since Inception2 | | | 3.82 | % | | | 3.81 | % | | | 4.21 | % | | | 0.97 | % |
| 1 | WisdomTree Dividend Top 100 Index through May 7, 2009; Wisdomtree Dividend ex-Financials Index threrafter. |
| 2 | Total returns are calculated based on the commencement of Fund trading on June 16, 2006. |
Performance quoted represents past performance and past performance does not guarantee future results. Current performance may be higher or lower than the performance quoted. For the most recent month-end performance information visit www.wisdomtree.com. Investment in the Fund poses investment risk including the possible loss of principal. The investment return and principal value of an investment will fluctuate, so that shares, when sold or redeemed, may be worth more or less than their original cost. The returns do not reflect the deduction of taxes that a shareholder would pay on Fund distributions or on the redemption of Fund shares. Total returns for a period less than one year have not been annualized. Index returns do not reflect expenses paid by the Fund.
| | |
| 6 | | WisdomTree Domestic Dividend Funds |
Performance Summary (unaudited)
WisdomTree MidCap Dividend Fund (DON)
Sector Breakdown† as of 3/31/11‡
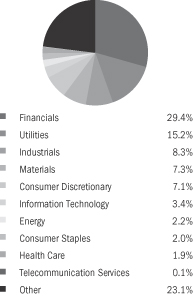
| † | The Fund’s sector breakdown is expressed as a percentage of total investments and may change over time. |
| ‡ | A sector may be comprised of several industries. |
Top Ten Holdings* as of 3/31/11
| | | | |
| |
| Description | | % of Net Assets | |
WisdomTree LargeCap Dividend Fund | | | 1.4 | % |
Plum Creek Timber Co., Inc. | | | 1.2 | % |
Pitney Bowes, Inc. | | | 1.1 | % |
Nationwide Health Properties, Inc. | | | 1.1 | % |
Macerich Co. (The) | | | 1.1 | % |
NiSource, Inc. | | | 1.0 | % |
Ares Capital Corp. | | | 1.0 | % |
Cincinnati Financial Corp. | | | 1.0 | % |
Oneok, Inc. | | | 0.9 | % |
Hudson City Bancorp, Inc. | | | 0.9 | % |
| * | The ten largest holdings are subject to change, and there are no guarantees the Fund will remain invested in any particular company. |
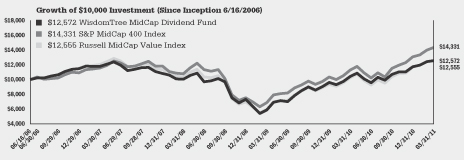
The WisdomTree MidCap Dividend Fund (the “Fund”) seeks investment results that closely correspond to the price and yield performance, before fees and expenses, of the WisdomTree MidCap Dividend Index.
The Fund returned 20.60% at net asset value (“NAV”) for the fiscal year ended March 31, 2011. The Fund benefited from its exposure to the Telecommunication Services sector. The Fund’s relatively overweight position in the Financials sector contributed to a drag on Fund performance.
The following performance chart is provided for comparative purposes and represents the period noted. The Fund’s per share NAV is the value of one share of the Fund and is calculated by dividing the value of total assets less total liabilities by the number of shares outstanding. The NAV return is based on the NAV of the Fund and the market return is based on the market price per share of the Fund. The price used to calculate market price returns is the mid-point of the highest bid and lowest offer for Fund shares as of the close of trading on the exchange where Fund shares are listed. NAV and market returns assume that dividends and capital gain distributions have been reinvested in the Fund at NAV and market price, respectively. As with other ETFs, NAV returns and market price returns may differ because of factors such as the supply and demand for Fund shares and investors assessments of the underlying value of a Fund’s portfolio securities.
An index is a statistical measure of a specified financial market or sector. An index does not actually hold a portfolio of securities, incur expenses or pay any transaction costs. Therefore index returns do not reflect deductions for fees or expenses and are not available for direct investment. In comparison, the Fund’s performance is negatively impacted by these deductions. Fund returns do not reflect brokerage commissions or taxes on transactions in Fund shares or that a shareholder would pay on Fund distributions. The annual expense ratio of the Fund is 0.38%.
Performance as of 3/31/11
| | | | | | | | | | | | | | | | | | | | |
| | | Average Annual Total Return | |
| | | Fund
Net Asset Value | | | Fund
Market Price | | | WisdomTree
MidCap
Dividend Index | | | S&P MidCap
400 Index | | | Russell MidCap
Value Index | |
One Year | | | 20.60 | % | | | 21.37 | % | | | 21.34 | % | | | 26.95 | % | | | 22.26 | % |
Three Year | | | 7.69 | % | | | 7.69 | % | | | 7.99 | % | | | 10.00 | % | | | 6.61 | % |
Since Inception1 | | | 4.90 | % | | | 5.00 | % | | | 4.66 | % | | | 7.80 | % | | | 4.86 | % |
| 1 | Total returns are calculated based on the commencement of Fund trading on June 16, 2006. |
Performance quoted represents past performance and past performance does not guarantee future results. Current performance may be higher or lower than the performance quoted. For the most recent month-end performance information visit www.wisdomtree.com. Investment in the Fund poses investment risk including the possible loss of principal. The investment return and principal value of an investment will fluctuate, so that shares, when sold or redeemed, may be worth more or less than their original cost. The returns do not reflect the deduction of taxes that a shareholder would pay on Fund distributions or on the redemption of Fund shares. Total returns for a period less than one year have not been annualized. Index returns do not reflect expenses paid by the Fund.
| | | | |
| WisdomTree Domestic Dividend Funds | | | 7 | |
Performance Summary (unaudited)
WisdomTree SmallCap Dividend Fund (DES)
Sector Breakdown† as of 3/31/11‡
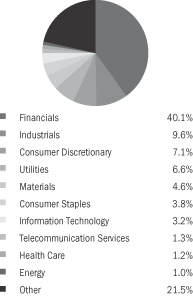
| † | The Fund’s sector breakdown is expressed as a percentage of total investments and may change over time. |
| ‡ | A sector may be comprised of several industries. |
Top Ten Holdings* as of 3/31/11
| | | | |
| |
| Description | | % of Net Assets | |
WisdomTree MidCap Dividend Fund | | | 1.5 | % |
Prospect Capital Corp. | | | 1.2 | % |
Vector Group Ltd. | | | 1.1 | % |
Potlatch Corp. | | | 1.0 | % |
Medical Properties Trust, Inc. | | | 1.0 | % |
Brandywine Realty Trust | | | 0.9 | % |
UIL Holdings Corp. | | | 0.9 | % |
Healthcare Realty Trust, Inc. | | | 0.9 | % |
Solar Capital Ltd. | | | 0.8 | % |
Fifth Street Finance Corp. | | | 0.8 | % |
| * | The ten largest holdings are subject to change, and there are no guarantees the Fund will remain invested in any particular company. |
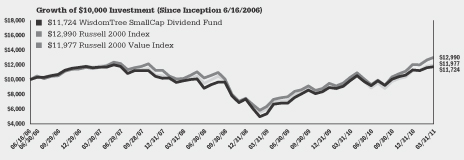
The WisdomTree SmallCap Dividend Fund (the “Fund”) seeks investment results that closely correspond to the price and yield performance, before fees and expenses, of the WisdomTree SmallCap Dividend Index.
The Fund returned 18.96% at net asset value (“NAV”) for the fiscal year ended March 31, 2011. The Fund benefited from its relative underweight to the Health Care sector and its favorable stock selection within the sector. Information Technology, a sector that had a significant underweight during the period, and unfavorable stock selection within the sector contributed to a drag on Fund performance.
The following performance chart is provided for comparative purposes and represents the period noted. The Fund’s per share NAV is the value of one share of the Fund and is calculated by dividing the value of total assets less total liabilities by the number of shares outstanding. The NAV return is based on the NAV of the Fund and the market return is based on the market price per share of the Fund. The price used to calculate market price returns is the mid-point of the highest bid and lowest offer for Fund shares as of the close of trading on the exchange where Fund shares are listed. NAV and market returns assume that dividends and capital gain distributions have been reinvested in the Fund at NAV and market price, respectively. As with other ETFs, NAV returns and market price returns may differ because of factors such as the supply and demand for Fund shares and investors assessments of the underlying value of a Fund’s portfolio securities.
An index is a statistical measure of a specified financial market or sector. An index does not actually hold a portfolio of securities, incur expenses or pay any transaction costs. Therefore index returns do not reflect deductions for fees or expenses and are not available for direct investment. In comparison, the Fund’s performance is negatively impacted by these deductions. Fund returns do not reflect brokerage commissions or taxes on transactions in Fund shares or that a shareholder would pay on Fund distributions. The annual expense ratio of the Fund is 0.38%.
Performance as of 3/31/11
| | | | | | | | | | | | | | | | | | | | |
| | | Average Annual Total Return | |
| | | Fund
Net Asset Value | | | Fund
Market Price | | | WisdomTree
SmallCap
Dividend Index | | | Russell 2000 Index | | | Russell 2000
Value Index | |
One Year | | | 18.96 | % | | | 19.65 | % | | | 19.17 | % | | | 25.79 | % | | | 20.63 | % |
Three Year | | | 6.06 | % | | | 6.03 | % | | | 6.82 | % | | | 8.57 | % | | | 6.76 | % |
Since Inception1 | | | 3.38 | % | | | 3.36 | % | | | 3.42 | % | | | 5.61 | % | | | 3.84 | % |
| 1 | Total returns are calculated based on the commencement of Fund trading on June 16, 2006. |
Performance quoted represents past performance and past performance does not guarantee future results. Current performance may be higher or lower than the performance quoted. For the most recent month-end performance information visit www.wisdomtree.com. Investment in the Fund poses investment risk including the possible loss of principal. The investment return and principal value of an investment will fluctuate, so that shares, when sold or redeemed, may be worth more or less than their original cost. The returns do not reflect the deduction of taxes that a shareholder would pay on Fund distributions or on the redemption of Fund shares. Total returns for a period less than one year have not been annualized. Index returns do not reflect expenses paid by the Fund.
| | |
| 8 | | WisdomTree Domestic Dividend Funds |
| | | | | | | | | | | | | | | | | | | | | | | | | | | | |
| | | | | | Cumulative Returns as of 3/31/11 | |
| | | | | | Total Return NAV (%) | | | Market Price (%) | |
| | | | | | 1-Year | | | 3-Year | | | Since
Inception | | | 1-Year | | | 3-Year | | | Since
Inception | |
WisdomTree Total Dividend Fund | | | DTD | | | | 17.37 | % | | | 3.94 | % | | | 12.00 | % | | | 18.25 | % | | | 4.11 | % | | | 11.94 | % |
Russell 3000 Index | | | | | | | 17.41 | % | | | 10.61 | % | | | 20.18 | % | | | 17.41 | % | | | 10.61 | % | | | 20.18 | % |
Russell 3000 Value Index | | | | | | | 15.60 | % | | | 3.30 | % | | | 9.64 | % | | | 15.60 | % | | | 3.30 | % | | | 9.64 | % |
WisdomTree Dividend Index | | | | | | | 18.32 | % | | | 5.90 | % | | | 14.69 | % | | | 18.32 | % | | | 5.90 | % | | | 14.69 | % |
WisdomTree Equity Income Fund | | | DHS | | | | 20.24 | % | | | -2.94 | % | | | -1.52 | % | | | 21.62 | % | | | -2.90 | % | | | -1.42 | % |
Russell 1000 Value Index | | | | | | | 15.15 | % | | | 1.82 | % | | | 8.83 | % | | | 15.15 | % | | | 1.82 | % | | | 8.83 | % |
WisdomTree Equity Income Index | | | | | | | 20.76 | % | | | -1.79 | % | | | -0.26 | % | | | 20.76 | % | | | -1.79 | % | | | -0.26 | % |
WisdomTree LargeCap Dividend Fund | | | DLN | | | | 16.83 | % | | | 0.57 | % | | | 9.83 | % | | | 17.53 | % | | | 0.65 | % | | | 9.61 | % |
S&P 500 Index | | | | | | | 15.65 | % | | | 7.23 | % | | | 17.28 | % | | | 15.65 | % | | | 7.23 | % | | | 17.28 | % |
Russell 1000 Value Index | | | | | | | 15.15 | % | | | 1.82 | % | | | 8.83 | % | | | 15.15 | % | | | 1.82 | % | | | 8.83 | % |
WisdomTree LargeCap Dividend Index | | | | | | | 17.16 | % | | | 2.52 | % | | | 11.89 | % | | | 17.16 | % | | | 2.52 | % | | | 11.89 | % |
WisdomTree Dividend ex-Financials Fund | | | DTN | | | | 21.68 | % | | | 11.33 | % | | | 19.67 | % | | | 22.61 | % | | | 11.51 | % | | | 19.63 | % |
Dow Jones U.S. Select Dividend Index | | | | | | | 18.03 | % | | | 4.96 | % | | | 4.72 | % | | | 18.03 | % | | | 4.96 | % | | | 4.72 | % |
Spliced WisdomTree Index (1) | | | | | | | 22.25 | % | | | 13.03 | % | | | 21.84 | % | | | 22.25 | % | | | 13.03 | % | | | 21.84 | % |
WisdomTree MidCap Dividend Fund | | | DON | | | | 20.60 | % | | | 24.88 | % | | | 25.72 | % | | | 21.37 | % | | | 24.88 | % | | | 26.30 | % |
S&P MidCap 400 Index | | | | | | | 26.95 | % | | | 33.11 | % | | | 43.31 | % | | | 26.95 | % | | | 33.11 | % | | | 43.31 | % |
Russell MidCap Value Index | | | | | | | 22.26 | % | | | 21.19 | % | | | 25.55 | % | | | 22.26 | % | | | 21.19 | % | | | 25.55 | % |
WisdomTree MidCap Dividend Index | | | | | | | 21.34 | % | | | 25.93 | % | | | 24.41 | % | | | 21.34 | % | | | 25.93 | % | | | 24.41 | % |
WisdomTree SmallCap Dividend Fund | | | DES | | | | 18.96 | % | | | 19.31 | % | | | 17.24 | %�� | | | 19.65 | % | | | 19.20 | % | | | 17.12 | % |
Russell 2000 Index | | | | | | | 25.79 | % | | | 27.96 | % | | | 29.90 | % | | | 25.79 | % | | | 27.96 | % | | | 29.90 | % |
Russell 2000 Value Index | | | | | | | 20.63 | % | | | 21.68 | % | | | 19.77 | % | | | 20.63 | % | | | 21.68 | % | | | 19.77 | % |
WisdomTree SmallCap Dividend Index | | | | | | | 19.17 | % | | | 21.87 | % | | | 17.50 | % | | | 19.17 | % | | | 21.87 | % | | | 17.50 | % |
Performance quoted represents past performance and past performance does not guarantee future results. Current performance may be higher or lower than the performance quoted. For the most recent month end performance information visit www.wisdomtree.com. Investment in the Fund poses investment risk including the possible loss of principal. The investment return and principal value of an investment will fluctuate, so that shares, when sold or redeemed, may be worth more or less than their original cost. The returns do not reflect the deduction of taxes that a shareholder would pay on Fund distributions or on the redemption of Fund shares. Total returns for a period less than one year have not been annualized. Index returns do not reflect expenses paid by the Fund.
Please see page 10 for list of index descriptions.
| | | | |
| WisdomTree Domestic Dividend Funds | | | 9 | |
Description of Terms and Indices (unaudited)
Below are descriptions of each index referenced in this Report:
The WisdomTree Dividend Index defines the dividend-paying portion of the U.S. stock market.
The WisdomTree LargeCap Dividend Index measures the performance of the large-capitalization segment of the U.S. dividend-paying market, selected from the WisdomTree Dividend Index.
The WisdomTree MidCap Dividend Index measures the performance of the mid-capitalization segment of the U.S. dividend-paying market, selected from the WisdomTree Dividend Index.
The WisdomTree SmallCap Dividend Index measures the performance of the small-capitalization segment of the U.S. dividend-paying market, selected from the WisdomTree Dividend Index.
The WisdomTree Equity Income Index measures the performance of companies with high dividend yields, selected from the WisdomTree Dividend Index.
The WisdomTree Dividend ex-Financials Index measures the performance of high dividend-yielding stocks outside the financial sector.
The WisdomTree Dividend Top 100 Index measures the performance of the 100 highest dividend-yielding companies in the WisdomTree LargeCap Dividend Index.
The S&P 500 Index is a capitalization-weighted index of 500 stocks selected by Standard & Poor’s Index Committee, designed to represent the performance of the leading industries in the United States economy.
The S&P Midcap 400 Index is a capitalization-weighted index that measures the performance of the mid-capitalization range of the U.S. stock market, with stocks selected by the Standard & Poor’s Index Committee.
The Russell 2000 Index measures performance of the smallest 2,000 securities in the Russell 3000 Index.
The Russell 3000 Index measures the performance of the 3,000 largest U.S. companies, based on total market capitalization.
The Russell 1000 Value Index is a measure of the large-capitalization value segment of the U.S. equity universe, selecting from the Russell 1000 Index.
The Russell 2000 Value Index is a capitalization weighted index that measures the small-cap value segment of the U.S. equity universe, selecting from the Russell 2000 Index.
The Russell 3000 Value Index is a capitalization weighted index that measures the performance of the value sector of the broad U.S. equity market. The index is a subset of the Russell 3000 Index and consists of those companies or portion of a company, with lower price-to-book ratios and lower forecasted growth within the Russell 3000 Index.
The Russell MidCap Value Index is a capitalization weighted index that measures the midcap value segment of the U.S. equity universe, selecting from the Russell Midcap Index.
The Dow Jones U.S. Select Dividend Index measures the performance of 100 U.S. dividend-paying companies.
WisdomTree Dividend Top 100/Dividend ex-Financials Spliced Index — WisdomTree Dividend Top 100 Index through May 7, 2009; WisdomTree Dividend ex-Financials Index thereafter.
Index performance information assumes the reinvestment of gross dividends and excludes management fees, transaction costs and expenses. You cannot directly invest in an index.
| | |
| 10 | | WisdomTree Domestic Dividend Funds |
Shareholder Expense Examples (unaudited)
As a shareholder of a WisdomTree Fund, you incur two types of costs: (1) transaction costs, including brokerage commissions on purchases and sales of your Fund shares and (2) ongoing costs, including management fees and other Fund expenses. The following example is intended to help you understand your ongoing costs (in dollars and cents) of investing in a Fund and to compare these costs with the ongoing costs of investing in other funds.
The example is based on an investment of $1,000 invested at the beginning of the period and held for the entire period from October 1, 2010 to March 31, 2011.
Actual expenses
The first line under each Fund in the table on the next page provides information about actual account values and actual expenses. You may use the information in this line, together with the amount you invested, to estimate the expenses that you paid over the period. Simply divide your account value by $1,000 (for example, an $8,600 account value divided by $1,000 = 8.6), then multiply the result by the number in the first line for your Fund under the heading entitled “Expenses Paid During Period 10/01/10 to 3/31/11” to estimate the expenses you paid on your account during this period.
Hypothetical example for comparison purposes
The second line under each Fund in the table on the next page provides information about hypothetical account values and hypothetical expenses based on each Fund’s actual expense ratio and an assumed rate of return of 5% per year before expenses, which is not the Fund’s actual return. The hypothetical account values and expenses may not be used to estimate the actual ending account balance or expenses you paid for the period. You may use this information to compare the ongoing costs of investing in your Fund and other funds. To do so, compare this 5% hypothetical example with the 5% hypothetical examples that appear in the shareholder reports of the other funds.
Please note that the expenses shown in the table are meant to highlight your ongoing costs only and do not reflect any transactional costs, such as brokerage commissions paid on purchases and sales of Fund shares. Therefore, the second line under each Fund in the table is useful in comparing ongoing Fund costs only and will not help you determine the relative total costs of owning different funds. In addition, if these transactional costs were included, your costs would have been higher.
| | | | |
| WisdomTree Domestic Dividend Funds | | | 11 | |
Shareholder Expense Examples (unaudited) (concluded)
| | | | | | | | | | | | | | | | |
| | | Beginning
Account Value
10/01/10 | | | Ending
Account Value
3/31/11 | | | Annualized
Expense Ratio
Based on the
Period
10/01/10 to
3/31/11 | | | Expenses Paid
During the
Period†
10/01/10 to
3/31/11 | |
WisdomTree Total Dividend Fund | | | | | | | | | | | | | | | | |
Actual | | $ | 1,000.00 | | | $ | 1,151.85 | | | | 0.28 | % | | $ | 1.50 | |
Hypothetical (5% return before expenses) | | $ | 1,000.00 | | | $ | 1,023.54 | | | | 0.28 | % | | $ | 1.41 | |
WisdomTree Equity Income Fund | | | | | | | | | | | | | | | | |
Actual | | $ | 1,000.00 | | | $ | 1,113.30 | | | | 0.38 | % | | $ | 2.00 | |
Hypothetical (5% return before expenses) | | $ | 1,000.00 | | | $ | 1,023.04 | | | | 0.38 | % | | $ | 1.92 | |
WisdomTree LargeCap Dividend Fund | | | | | | | | | | | | | | | | |
Actual | | $ | 1,000.00 | | | $ | 1,148.15 | | | | 0.28 | % | | $ | 1.50 | |
Hypothetical (5% return before expenses) | | $ | 1,000.00 | | | $ | 1,023.54 | | | | 0.28 | % | | $ | 1.41 | |
WisdomTree Dividend ex-Financials Fund | | | | | | | | | | | | | | | | |
Actual | | $ | 1,000.00 | | | $ | 1,158.52 | | | | 0.38 | % | | $ | 2.04 | |
Hypothetical (5% return before expenses) | | $ | 1,000.00 | | | $ | 1,023.04 | | | | 0.38 | % | | $ | 1.92 | |
WisdomTree MidCap Dividend Fund | | | | | | | | | | | | | | | | |
Actual | | $ | 1,000.00 | | | $ | 1,172.78 | | | | 0.38 | % | | $ | 2.06 | |
Hypothetical (5% return before expenses) | | $ | 1,000.00 | | | $ | 1,023.04 | | | | 0.38 | % | | $ | 1.92 | |
WisdomTree SmallCap Dividend Fund | | | | | | | | | | | | | | | | |
Actual | | $ | 1,000.00 | | | $ | 1,167.08 | | | | 0.38 | % | | $ | 2.05 | |
Hypothetical (5% return before expenses) | | $ | 1,000.00 | | | $ | 1,023.04 | | | | 0.38 | % | | $ | 1.92 | |
| † | Expenses are calculated using each Fund’s annualized expense ratio, multipled by the average account value for the period, multipled by 182/365 (to reflect the one-half year period). |
| | |
| 12 | | WisdomTree Domestic Dividend Funds |
Schedule of Investments
WisdomTree Total Dividend Fund (DTD)
March 31, 2011
| | | | | | | | |
| Investments | | Shares | | | Fair
Value | |
| | | | | | | | |
| COMMON STOCKS – 98.9% | | | | | | | | |
| Advertising – 0.1% | | | | | | | | |
Harte-Hanks, Inc. | | | 1,885 | | | $ | 22,432 | |
Omnicom Group, Inc. | | | 3,134 | | | | 153,754 | |
| | | | | | | | |
| Total Advertising | | | | | | | 176,186 | |
| Aerospace/Defense – 2.6% | | | | | | | | |
Alliant Techsystems, Inc. | | | 164 | | | | 11,590 | |
Boeing Co. (The) | | | 12,562 | | | | 928,709 | |
General Dynamics Corp. | | | 5,859 | | | | 448,565 | |
Goodrich Corp.(a) | | | 1,158 | | | | 99,044 | |
L-3 Communications Holdings, Inc. | | | 1,588 | | | | 124,356 | |
Lockheed Martin Corp. | | | 9,987 | | | | 802,955 | |
Northrop Grumman Corp. | | | 5,684 | | | | 356,443 | |
Raytheon Co. | | | 7,786 | | | | 396,074 | |
Rockwell Collins, Inc. | | | 1,787 | | | | 115,851 | |
United Technologies Corp. | | | 13,003 | | | | 1,100,704 | |
| | | | | | | | |
| Total Aerospace/Defense | | | | | | | 4,384,291 | |
| Agriculture – 4.2% | | | | | | | | |
Altria Group, Inc. | | | 83,612 | | | | 2,176,420 | |
Archer-Daniels-Midland Co. | | | 8,041 | | | | 289,556 | |
Lorillard, Inc. | | | 5,288 | | | | 502,413 | |
Philip Morris International, Inc. | | | 50,941 | | | | 3,343,258 | |
Reynolds American, Inc. | | | 23,182 | | | | 823,657 | |
Universal Corp. | | | 758 | | | | 33,003 | |
Vector Group Ltd.(a) | | | 4,547 | | | | 78,618 | |
| | | | | | | | |
| Total Agriculture | | | | | | | 7,246,925 | |
| Apparel – 0.4% | | | | | | | | |
Cherokee, Inc.(a) | | | 864 | | | | 14,913 | |
Coach, Inc. | | | 1,902 | | | | 98,980 | |
Columbia Sportswear Co.(a) | | | 415 | | | | 24,659 | |
Jones Group, Inc. (The) | | | 1 | | | | 14 | |
NIKE, Inc. Class B | | | 3,593 | | | | 271,990 | |
Polo Ralph Lauren Corp. | | | 87 | | | | 10,757 | |
VF Corp.(a) | | | 2,086 | | | | 205,534 | |
Wolverine World Wide, Inc. | | | 591 | | | | 22,032 | |
| | | | | | | | |
| Total Apparel | | | | | | | 648,879 | |
| Auto Manufacturers – 0.1% | | | | | | | | |
PACCAR, Inc.(a) | | | 2,091 | | | | 109,464 | |
| Auto Parts & Equipment – 0.2% | | | | | | | | |
Cooper Tire & Rubber Co. | | | 1,314 | | | | 33,836 | |
Douglas Dynamics, Inc. | | | 732 | | | | 10,438 | |
Johnson Controls, Inc. | | | 7,502 | | | | 311,858 | |
| | | | | | | | |
| Total Auto Parts & Equipment | | | | | | | 356,132 | |
| Banks – 3.0% | | | | | | | | |
1st Source Corp. | | | 909 | | | | 18,216 | |
Arrow Financial Corp. | | | 717 | | | | 17,739 | |
Associated Banc-Corp.(a) | | | 832 | | | | 12,355 | |
Bancfirst Corp. | | | 409 | | | | 17,456 | |
BancorpSouth, Inc.(a) | | | 2,916 | | | | 45,052 | |
Bank of America Corp. | | | 21,027 | | | | 280,290 | |
Bank of Hawaii Corp. | | | 1,061 | | | | 50,737 | |
| | | | | | | | |
| Investments | | Shares | | | Fair
Value | |
| | | | | | | | |
Bank of New York Mellon Corp. (The) | | | 10,145 | | | $ | 303,031 | |
BB&T Corp.(a) | | | 10,567 | | | | 290,064 | |
BOK Financial Corp.(a) | | | 762 | | | | 39,380 | |
Capital One Financial Corp. | | | 1,569 | | | | 81,525 | |
Cathay General Bancorp | | | 593 | | | | 10,111 | |
Chemical Financial Corp. | | | 777 | | | | 15,486 | |
City Holding Co.(a) | | | 571 | | | | 20,191 | |
Comerica, Inc. | | | 934 | | | | 34,296 | |
Commerce Bancshares, Inc. | | | 1,500 | | | | 60,660 | |
Community Bank System, Inc.(a) | | | 1,049 | | | | 25,459 | |
Community Trust Bancorp, Inc. | | | 692 | | | | 19,148 | |
Cullen/Frost Bankers, Inc.(a) | | | 1,291 | | | | 76,195 | |
CVB Financial Corp. | | | 3,838 | | | | 35,732 | |
Fifth Third Bancorp | | | 1,847 | | | | 25,636 | |
First Busey Corp. | | | 2,096 | | | | 10,648 | |
First Commonwealth Financial Corp. | | | 1,392 | | | | 9,535 | |
First Financial Bancorp | | | 614 | | | | 10,248 | |
First Financial Bankshares, Inc.(a) | | | 411 | | | | 21,113 | |
First Financial Corp.(a) | | | 453 | | | | 15,058 | |
FirstMerit Corp. | | | 2,112 | | | | 36,031 | |
FNB Corp.(a) | | | 4,377 | | | | 46,134 | |
Fulton Financial Corp. | | | 1,129 | | | | 12,543 | |
Glacier Bancorp, Inc.(a) | | | 2,403 | | | | 36,165 | |
Goldman Sachs Group, Inc. (The) | | | 2,851 | | | | 451,798 | |
Hancock Holding Co.(a) | | | 484 | | | | 15,895 | |
Huntington Bancshares, Inc. | | | 4,220 | | | | 28,021 | |
Iberiabank Corp.(a) | | | 533 | | | | 32,049 | |
International Bancshares Corp. | | | 1,286 | | | | 23,585 | |
JPMorgan Chase & Co. | | | 12,501 | | | | 576,296 | |
KeyCorp | | | 3,524 | | | | 31,293 | |
M&T Bank Corp. | | | 2,712 | | | | 239,931 | |
Marshall & Ilsley Corp. | | | 1,679 | | | | 13,415 | |
MB Financial, Inc.(a) | | | 614 | | | | 12,869 | |
Morgan Stanley | | | 7,272 | | | | 198,671 | |
National Penn Bancshares, Inc.(a) | | | 2,269 | | | | 17,562 | |
NBT Bancorp, Inc. | | | 1,039 | | | | 23,679 | |
Northern Trust Corp. | | | 3,348 | | | | 169,911 | |
Old National Bancorp | | | 2,095 | | | | 22,458 | |
Park National Corp. | | | 718 | | | | 47,977 | |
Penns Woods Bancorp, Inc.(a) | | | 319 | | | | 12,419 | |
PNC Financial Services Group, Inc. | | | 2,408 | | | | 151,680 | |
Prosperity Bancshares, Inc. | | | 606 | | | | 25,919 | |
Regions Financial Corp.(a) | | | 6,896 | | | | 50,065 | |
S&T Bancorp, Inc.(a) | | | 643 | | | | 13,869 | |
S.Y. Bancorp, Inc. | | | 765 | | | | 19,247 | |
Sterling Bancshares, Inc. | | | 1,701 | | | | 14,646 | |
Suffolk Bancorp(a) | | | 906 | | | | 19,008 | |
Synovus Financial Corp. | | | 5,036 | | | | 12,086 | |
TCF Financial Corp. | | | 1,009 | | | | 16,003 | |
TrustCo Bank Corp. | | | 2,178 | | | | 12,915 | |
Trustmark Corp.(a) | | | 1,405 | | | | 32,905 | |
U.S. Bancorp | | | 9,880 | | | | 261,128 | |
UMB Financial Corp. | | | 785 | | | | 29,324 | |
Umpqua Holdings Corp. | | | 1,881 | | | | 21,519 | |
See Notes to Financial Statements.
| | | | |
| WisdomTree Domestic Dividend Funds | | | 13 | |
Schedule of Investments (continued)
WisdomTree Total Dividend Fund (DTD)
March 31, 2011
| | | | | | | | |
| Investments | | Shares | | | Fair
Value | |
| | | | | | | | |
United Bankshares, Inc.(a) | | | 1,522 | | | $ | 40,363 | |
Univest Corp. of Pennsylvania | | | 479 | | | | 8,488 | |
Valley National Bancorp(a) | | | 5,505 | | | | 76,850 | |
Washington Trust Bancorp, Inc.(a) | | | 431 | | | | 10,232 | |
Wells Fargo & Co. | | | 23,101 | | | | 732,302 | |
WesBanco, Inc. | | | 826 | | | | 17,106 | |
Westamerica Bancorp. | | | 496 | | | | 25,479 | |
| | | | | | | | |
| Total Banks | | | | | | | 5,185,197 | |
| Beverages – 3.0% | | | | | | | | |
Brown-Forman Corp. Class A | | | 787 | | | | 53,406 | |
Brown-Forman Corp. Class B | | | 1,099 | | | | 75,062 | |
Coca-Cola Co. (The) | | | 41,141 | | | | 2,729,705 | |
Coca-Cola Enterprises, Inc. | | | 4,320 | | | | 117,936 | |
Dr. Pepper Snapple Group, Inc.(a) | | | 3,831 | | | | 142,360 | |
Molson Coors Brewing Co. Class B | | | 2,250 | | | | 105,502 | |
PepsiCo, Inc. | | | 30,416 | | | | 1,959,095 | |
| | | | | | | | |
| Total Beverages | | | | | | | 5,183,066 | |
| Building Materials – 0.1% | | | | | | | | |
Eagle Materials, Inc. | | | 466 | | | | 14,101 | |
Lennox International, Inc. | | | 639 | | | | 33,599 | |
Martin Marietta Materials, Inc. | | | 569 | | | | 51,022 | |
Masco Corp.(a) | | | 5,541 | | | | 77,131 | |
Simpson Manufacturing Co., Inc. | | | 487 | | | | 14,347 | |
| | | | | | | | |
| Total Building Materials | | | | | | | 190,200 | |
| Chemicals – 2.6% | | | | | | | | |
A. Schulman, Inc. | | | 343 | | | | 8,479 | |
Air Products & Chemicals, Inc. | | | 3,036 | | | | 273,786 | |
Airgas, Inc. | | | 964 | | | | 64,029 | |
Albemarle Corp. | | | 758 | | | | 45,306 | |
Arch Chemicals, Inc. | | | 485 | | | | 20,171 | |
Ashland, Inc. | | | 639 | | | | 36,909 | |
Cabot Corp. | | | 1,128 | | | | 52,215 | |
Celanese Corp. Series A | | | 443 | | | | 19,656 | |
CF Industries Holdings, Inc. | | | 77 | | | | 10,533 | |
Cytec Industries, Inc. | | | 1 | | | | 54 | |
Dow Chemical Co. (The) | | | 13,543 | | | | 511,248 | |
E.I. Du Pont de Nemours & Co. | | | 19,887 | | | | 1,093,188 | |
Eastman Chemical Co. | | | 1,098 | | | | 109,053 | |
Ecolab, Inc. | | | 1,948 | | | | 99,387 | |
FMC Corp.(a) | | | 428 | | | | 36,350 | |
Huntsman Corp. | | | 4,498 | | | | 78,175 | |
Innophos Holdings, Inc. | | | 472 | | | | 21,764 | |
International Flavors & Fragrances, Inc. | | | 1,270 | | | | 79,121 | |
Kronos Worldwide, Inc. | | | 766 | | | | 44,773 | |
Lubrizol Corp. | | | 625 | | | | 83,725 | |
Monsanto Co. | | | 6,351 | | | | 458,923 | |
Mosaic Co. (The) | | | 1,035 | | | | 81,506 | |
NewMarket Corp. | | | 94 | | | | 14,873 | |
Olin Corp. | | | 2,737 | | | | 62,732 | |
PPG Industries, Inc. | | | 2,909 | | | | 276,966 | |
Praxair, Inc. | | | 3,910 | | | | 397,256 | |
RPM International, Inc. | | | 3,211 | | | | 76,197 | |
| | | | | | | | |
| Investments | | Shares | | | Fair
Value | |
| | | | | | | | |
Sensient Technologies Corp. | | | 914 | | | $ | 32,758 | |
Sherwin-Williams Co. (The)(a) | | | 1,320 | | | | 110,867 | |
Sigma-Aldrich Corp. | | | 747 | | | | 47,539 | |
Valhi, Inc.(a) | | | 1,743 | | | | 46,155 | |
Valspar Corp. | | | 1,342 | | | | 52,472 | |
Westlake Chemical Corp. | | | 404 | | | | 22,705 | |
| | | | | | | | |
| Total Chemicals | | | | | | | 4,368,871 | |
| Coal – 0.1% | | | | | | | | |
Arch Coal, Inc. | | | 1,595 | | | | 57,484 | |
Consol Energy, Inc. | | | 1,229 | | | | 65,911 | |
Massey Energy Co.(a) | | | 297 | | | | 20,303 | |
Peabody Energy Corp. | | | 1,073 | | | | 77,213 | |
Walter Energy, Inc.(a) | | | 193 | | | | 26,138 | |
| | | | | | | | |
| Total Coal | | | | | | | 247,049 | |
| Commercial Services – 1.3% | | | | | | | | |
ABM Industries, Inc. | | | 964 | | | | 24,476 | |
Advance America, Cash Advance Centers, Inc. | | | 2,098 | | | | 11,119 | |
Automatic Data Processing, Inc.(a) | | | 10,030 | | | | 514,639 | |
Deluxe Corp.(a) | | | 2,112 | | | | 56,052 | |
Equifax, Inc. | | | 1,356 | | | | 52,681 | |
H&R Block, Inc.(a) | | | 8,746 | | | | 146,408 | |
Healthcare Services Group, Inc. | | | 1,931 | | | | 33,947 | |
Hillenbrand, Inc. | | | 1,627 | | | | 34,981 | |
Iron Mountain, Inc. | | | 1,164 | | | | 36,352 | |
Landauer, Inc. | | | 328 | | | | 20,179 | |
Lender Processing Services, Inc. | | | 552 | | | | 17,769 | |
Lincoln Educational Services Corp. | | | 1,000 | | | | 15,890 | |
Manpower, Inc. | | | 858 | | | | 53,951 | |
Mastercard, Inc. Class A | | | 206 | | | | 51,854 | |
McGrath Rentcorp | | | 768 | | | | 20,943 | |
Moody’s Corp. | | | 2,495 | | | | 84,605 | |
Paychex, Inc. | | | 9,330 | | | | 292,589 | |
Pharmaceutical Product Development, Inc. | | | 2,029 | | | | 56,224 | |
R.R. Donnelley & Sons Co. | | | 7,649 | | | | 144,719 | |
Robert Half International, Inc.(a) | | | 1,848 | | | | 56,549 | |
Rollins, Inc. | | | 1,546 | | | | 31,384 | |
SEI Investments Co. | | | 1,032 | | | | 24,644 | |
Service Corp. International | | | 3,980 | | | | 44,019 | |
Strayer Education, Inc.(a) | | | 148 | | | | 19,313 | |
Total System Services, Inc. | | | 2,160 | | | | 38,923 | |
Visa, Inc. Class A | | | 2,439 | | | | 179,559 | |
Weight Watchers International, Inc. | | | 1,054 | | | | 73,885 | |
Western Union Co. (The) | | | 5,154 | | | | 107,049 | |
| | | | | | | | |
| Total Commercial Services | | | | | | | 2,244,703 | |
| Computers – 1.8% | | | | | | | | |
Computer Sciences Corp. | | | 1,100 | | | | 53,603 | |
Diebold, Inc. | | | 1,842 | | | | 65,317 | |
DST Systems, Inc. | | | 319 | | | | 16,850 | |
Hewlett-Packard Co. | | | 11,295 | | | | 462,756 | |
International Business Machines Corp. | | | 14,599 | | | | 2,380,659 | |
Jack Henry & Associates, Inc. | | | 847 | | | | 28,705 | |
| | | | | | | | |
| Total Computers | | | | | | | 3,007,890 | |
See Notes to Financial Statements.
| | |
| 14 | | WisdomTree Domestic Dividend Funds |
Schedule of Investments (continued)
WisdomTree Total Dividend Fund (DTD)
March 31, 2011
| | | | | | | | |
| Investments | | Shares | | | Fair
Value | |
| | | | | | | | |
| Cosmetics/Personal Care – 2.6% | | | | | | | | |
Alberto-Culver Co. | | | 765 | | | $ | 28,511 | |
Avon Products, Inc. | | | 8,194 | | | | 221,566 | |
Colgate-Palmolive Co. | | | 8,138 | | | | 657,225 | |
Estee Lauder Cos., Inc. (The) Class A | | | 885 | | | | 85,279 | |
Procter & Gamble Co. (The) | | | 55,025 | | | | 3,389,540 | |
| | | | | | | | |
| Total Cosmetics/Personal Care | | | | | | | 4,382,121 | |
| Distribution/Wholesale – 0.3% | | | | | | | | |
Fastenal Co.(a) | | | 1,446 | | | | 93,744 | |
Genuine Parts Co. | | | 3,414 | | | | 183,127 | |
Owens & Minor, Inc. | | | 871 | | | | 28,290 | |
Pool Corp.(a) | | | 902 | | | | 21,747 | |
W.W. Grainger, Inc. | | | 757 | | | | 104,224 | |
Watsco, Inc.(a) | | | 656 | | | | 45,730 | |
| | | | | | | | |
| Total Distribution/Wholesale | | | | | | | 476,862 | |
| Diversified Financial Services – 1.5% | | | | | | | | |
American Express Co. | | | 12,340 | | | | 557,768 | |
Ameriprise Financial, Inc. | | | 2,208 | | | | 134,865 | |
BGC Partners, Inc. Class A | | | 3,695 | | | | 34,327 | |
BlackRock, Inc. | | | 1,853 | | | | 372,472 | |
Charles Schwab Corp. (The)(a) | | | 10,727 | | | | 193,408 | |
CME Group, Inc. | | | 610 | | | | 183,945 | |
Discover Financial Services | | | 1,741 | | | | 41,993 | |
Eaton Vance Corp. | | | 1,727 | | | | 55,678 | |
Federated Investors, Inc. Class B(a) | | | 2,386 | | | | 63,825 | |
Franklin Resources, Inc.(a) | | | 1,205 | | | | 150,721 | |
GFI Group, Inc.(a) | | | 4,249 | | | | 21,330 | |
Greenhill & Co., Inc.(a) | | | 375 | | | | 24,671 | |
Jefferies Group, Inc. | | | 1,032 | | | | 25,738 | |
Legg Mason, Inc.(a) | | | 489 | | | | 17,648 | |
NYSE Euronext | | | 7,081 | | | | 249,039 | |
Raymond James Financial, Inc. | | | 1,399 | | | | 53,498 | |
T. Rowe Price Group, Inc. | | | 2,962 | | | | 196,736 | |
TD Ameritrade Holding Corp. | | | 3,676 | | | | 76,718 | |
Waddell & Reed Financial, Inc. Class A | | | 1,551 | | | | 62,986 | |
| | | | | | | | |
| Total Diversified Financial Services | | | | | | | 2,517,366 | |
| Electric – 6.9% | | | | | | | | |
ALLETE, Inc. | | | 1,495 | | | | 58,260 | |
Alliant Energy Corp. | | | 3,368 | | | | 131,116 | |
Ameren Corp. | | | 8,278 | | | | 232,363 | |
American Electric Power Co., Inc. | | | 15,912 | | | | 559,148 | |
Avista Corp. | | | 1,555 | | | | 35,967 | |
Black Hills Corp. | | | 1,440 | | | | 48,154 | |
Central Vermont Public Service Corp. | | | 947 | | | | 22,056 | |
CH Energy Group, Inc. | | | 598 | | | | 30,223 | |
Cleco Corp. | | | 1,518 | | | | 52,052 | |
CMS Energy Corp.(a) | | | 6,757 | | | | 132,707 | |
Consolidated Edison, Inc. | | | 9,077 | | | | 460,385 | |
Constellation Energy Group, Inc. | | | 4,332 | | | | 134,855 | |
Dominion Resources, Inc. | | | 16,691 | | | | 746,088 | |
DPL, Inc. | | | 3,427 | | | | 93,934 | |
DTE Energy Co. | | | 5,287 | | | | 258,851 | |
Duke Energy Corp. | | | 47,742 | | | | 866,517 | |
| | | | | | | | |
| Investments | | Shares | | | Fair
Value | |
| | | | | | | | |
Edison International | | | 7,273 | | | $ | 266,119 | |
Empire District Electric Co. (The) | | | 2,230 | | | | 48,592 | |
Entergy Corp. | | | 5,468 | | | | 367,504 | |
Exelon Corp. | | | 21,970 | | | | 906,043 | |
FirstEnergy Corp.(a) | | | 14,084 | | | | 522,376 | |
Great Plains Energy, Inc. | | | 3,982 | | | | 79,720 | |
Hawaiian Electric Industries, Inc. | | | 3,772 | | | | 93,546 | |
IDACORP, Inc. | | | 1,223 | | | | 46,596 | |
Integrys Energy Group, Inc.(a) | | | 2,912 | | | | 147,085 | |
ITC Holdings Corp. | | | 801 | | | | 55,990 | |
MDU Resources Group, Inc. | | | 3,505 | | | | 80,510 | |
MGE Energy, Inc. | | | 815 | | | | 32,999 | |
NextEra Energy, Inc. | | | 10,579 | | | | 583,114 | |
Northeast Utilities | | | 4,148 | | | | 143,521 | |
NorthWestern Corp. | | | 1,452 | | | | 43,996 | |
NSTAR | | | 2,921 | | | | 135,155 | |
NV Energy, Inc. | | | 5,893 | | | | 87,747 | |
OGE Energy Corp. | | | 2,177 | | | | 110,069 | |
Otter Tail Corp. | | | 1,653 | | | | 37,573 | |
Pepco Holdings, Inc. | | | 8,837 | | | | 164,810 | |
PG&E Corp. | | | 9,703 | | | | 428,678 | |
Pinnacle West Capital Corp. | | | 3,428 | | | | 146,684 | |
PNM Resources, Inc. | | | 2,797 | | | | 41,731 | |
Portland General Electric Co. | | | 2,745 | | | | 65,249 | |
PPL Corp. | | | 17,162 | | | | 434,199 | |
Progress Energy, Inc. | | | 10,531 | | | | 485,900 | |
Public Service Enterprise Group, Inc. | | | 14,249 | | | | 448,986 | |
SCANA Corp.(a) | | | 3,579 | | | | 140,905 | |
Southern Co. | | | 26,445 | | | | 1,007,819 | |
TECO Energy, Inc. | | | 6,928 | | | | 129,969 | |
UIL Holdings Corp. | | | 1,653 | | | | 50,450 | |
Unisource Energy Corp. | | | 1,215 | | | | 43,898 | |
Unitil Corp. | | | 975 | | | | 22,971 | |
Westar Energy, Inc.(a) | | | 3,899 | | | | 103,012 | |
Wisconsin Energy Corp. | | | 4,112 | | | | 125,416 | |
Xcel Energy, Inc. | | | 13,090 | | | | 312,720 | |
| | | | | | | | |
| Total Electric | | | | | | | 11,804,328 | |
| Electrical Components & Equipment – 0.5% | | | | | | | | |
Acuity Brands, Inc. | | | 402 | | | | 23,513 | |
AMETEK, Inc. | | | 720 | | | | 31,586 | |
Emerson Electric Co. | | | 11,754 | | | | 686,786 | |
Hubbell, Inc. Class B | | | 902 | | | | 64,069 | |
Molex, Inc.(a) | | | 1,532 | | | | 38,484 | |
Molex, Inc. Class A | | | 2,595 | | | | 53,691 | |
| | | | | | | | |
| Total Electrical Components & Equipment | | | | | | | 898,129 | |
| Electronics – 0.1% | | | | | | | | |
AVX Corp. | | | 1,787 | | | | 26,644 | |
Brady Corp. Class A | | | 855 | | | | 30,515 | |
Gentex Corp. | | | 1,570 | | | | 47,493 | |
Jabil Circuit, Inc. | | | 3,205 | | | | 65,478 | |
National Instruments Corp. | | | 1,447 | | | | 47,418 | |
PerkinElmer, Inc. | | | 1,205 | | | | 31,655 | |
| | | | | | | | |
| Total Electronics | | | | | | | 249,203 | |
See Notes to Financial Statements.
| | | | |
| WisdomTree Domestic Dividend Funds | | | 15 | |
Schedule of Investments (continued)
WisdomTree Total Dividend Fund (DTD)
March 31, 2011
| | | | | | | | |
| Investments | | Shares | | | Fair
Value | |
| | | | | | | | |
| Engineering & Construction – 0.1% | | | | | | | | |
Fluor Corp. | | | 1,032 | | | $ | 76,017 | |
Granite Construction, Inc.(a) | | | 438 | | | | 12,308 | |
KBR, Inc. | | | 947 | | | | 35,768 | |
| | | | | | | | |
| Total Engineering & Construction | | | | | | | 124,093 | |
| Entertainment – 0.1% | | | | | | | | |
Cinemark Holdings, Inc. | | | 4,007 | | | | 77,535 | |
International Game Technology | | | 2,635 | | | | 42,766 | |
National CineMedia, Inc. | | | 1,669 | | | | 31,160 | |
Regal Entertainment Group Class A(a) | | | 4,291 | | | | 57,929 | |
| | | | | | | | |
| Total Entertainment | | | | | | | 209,390 | |
| Environmental Control – 0.4% | | | | | | | | |
Mine Safety Appliances Co. | | | 847 | | | | 31,059 | |
Nalco Holding Co. | | | 574 | | | | 15,676 | |
Republic Services, Inc. | | | 6,641 | | | | 199,496 | |
U.S. Ecology, Inc. | | | 569 | | | | 9,918 | |
Waste Connections, Inc.(a) | | | 596 | | | | 17,159 | |
Waste Management, Inc. | | | 10,931 | | | | 408,163 | |
| | | | | | | | |
| Total Environmental Control | | | | | | | 681,471 | |
| Food – 2.8% | | | | | | | | |
B&G Foods, Inc. | | | 2,120 | | | | 39,792 | |
Campbell Soup Co.(a) | | | 7,159 | | | | 237,034 | |
ConAgra Foods, Inc. | | | 11,510 | | | | 273,362 | |
Corn Products International, Inc. | | | 708 | | | | 36,689 | |
Flowers Foods, Inc.(a) | | | 1,949 | | | | 53,071 | |
General Mills, Inc. | | | 12,644 | | | | 462,138 | |
H.J. Heinz Co.(a) | | | 7,586 | | | | 370,349 | |
Hershey Co. (The) | | | 3,020 | | | | 164,137 | |
Hormel Foods Corp. | | | 3,618 | | | | 100,725 | |
J.M. Smucker Co. (The) | | | 1,803 | | | | 128,716 | |
Kellogg Co. | | | 7,474 | | | | 403,447 | |
Kraft Foods, Inc. Class A | | | 41,658 | | | | 1,306,395 | |
Kroger Co. (The) | | | 7,983 | | | | 191,353 | |
Lancaster Colony Corp.(a) | | | 605 | | | | 36,663 | |
McCormick & Co., Inc. | | | 2,043 | | | | 97,717 | |
Ruddick Corp. | | | 607 | | | | 23,424 | |
Safeway, Inc. | | | 5,129 | | | | 120,737 | |
Sara Lee Corp.(a) | | | 12,179 | | | | 215,203 | |
Snyders-Lance, Inc. | | | 633 | | | | 12,565 | |
SUPERVALU, Inc.(a) | | | 5,177 | | | | 46,231 | |
Sysco Corp. | | | 13,712 | | | | 379,822 | |
Tyson Foods, Inc. Class A | | | 2,344 | | | | 44,981 | |
Weis Markets, Inc. | | | 655 | | | | 26,501 | |
| | | | | | | | |
| Total Food | | | | | | | 4,771,052 | |
| Forest Products & Paper – 0.2% | | | | | | | | |
International Paper Co. | | | 5,283 | | | | 159,441 | |
MeadWestvaco Corp. | | | 4,141 | | | | 125,596 | |
PH Glatfelter Co. | | | 834 | | | | 11,109 | |
| | | | | | | | |
| Total Forest Products & Paper | | | | | | | 296,146 | |
| Gas – 0.9% | | | | | | | | |
AGL Resources, Inc. | | | 2,154 | | | | 85,815 | |
Atmos Energy Corp. | | | 2,535 | | | | 86,444 | |
| | | | | | | | |
| Investments | | Shares | | | Fair
Value | |
| | | | | | | | |
CenterPoint Energy, Inc. | | | 13,139 | | | $ | 230,721 | |
Chesapeake Utilities Corp. | | | 394 | | | | 16,398 | |
Energen Corp. | | | 620 | | | | 39,134 | |
Laclede Group, Inc. (The) | | | 970 | | | | 36,957 | |
National Fuel Gas Co. | | | 1,316 | | | | 97,384 | |
New Jersey Resources Corp.(a) | | | 836 | | | | 35,906 | |
Nicor, Inc. | | | 1,235 | | | | 66,319 | |
NiSource, Inc. | | | 9,692 | | | | 185,893 | |
Northwest Natural Gas Co. | | | 544 | | | | 25,095 | |
Piedmont Natural Gas Co., Inc.(a) | | | 1,608 | | | | 48,803 | |
Questar Corp. | | | 3,480 | | | | 60,726 | |
Sempra Energy | | | 4,590 | | | | 245,565 | |
South Jersey Industries, Inc.(a) | | | 576 | | | | 32,239 | |
Southern Union Co. | | | 2,222 | | | | 63,594 | |
Southwest Gas Corp. | | | 924 | | | | 36,008 | |
UGI Corp. | | | 2,089 | | | | 68,728 | |
Vectren Corp. | | | 2,745 | | | | 74,664 | |
WGL Holdings, Inc.(a) | | | 1,192 | | | | 46,488 | |
| | | | | | | | |
| Total Gas | | | | | | | 1,582,881 | |
| Hand/Machine Tools – 0.2% | | | | | | | | |
Kennametal, Inc. | | | 970 | | | | 37,830 | |
Lincoln Electric Holdings, Inc. | | | 553 | | | | 41,984 | |
Regal-Beloit Corp. | | | 421 | | | | 31,082 | |
Snap-On, Inc. | | | 946 | | | | 56,817 | |
Stanley Black & Decker, Inc. | | | 2,200 | | | | 168,520 | |
| | | | | | | | |
| Total Hand/Machine Tools | | | | | | | 336,233 | |
| Healthcare-Products – 3.2% | | | | | | | | |
Baxter International, Inc. | | | 8,950 | | | | 481,242 | |
Beckman Coulter, Inc. | | | 402 | | | | 33,394 | |
Becton Dickinson and Co. | | | 2,921 | | | | 232,570 | |
C.R. Bard, Inc.(a) | | | 469 | | | | 46,576 | |
DENTSPLY International, Inc.(a) | | | 576 | | | | 21,306 | |
Hill-Rom Holdings, Inc. | | | 602 | | | | 22,864 | |
Johnson & Johnson | | | 61,557 | | | | 3,647,252 | |
Medtronic, Inc. | | | 17,388 | | | | 684,218 | |
Meridian Bioscience, Inc.(a) | | | 1,308 | | | | 31,379 | |
Patterson Cos., Inc.(a) | | | 931 | | | | 29,969 | |
STERIS Corp. | | | 561 | | | | 19,377 | |
Stryker Corp.(a) | | | 2,776 | | | | 168,781 | |
Techne Corp. | | | 404 | | | | 28,926 | |
Teleflex, Inc. | | | 624 | | | | 36,180 | |
West Pharmaceutical Services, Inc. | | | 351 | | | | 15,714 | |
| | | | | | | | |
| Total Healthcare-Products | | | | | | | 5,499,748 | |
| Healthcare-Services – 0.3% | | | | | | | | |
Aetna, Inc. | | | 503 | | | | 18,827 | |
Lincare Holdings, Inc. | | | 1,771 | | | | 52,528 | |
Quest Diagnostics, Inc. | | | 933 | | | | 53,853 | |
UnitedHealth Group, Inc. | | | 9,916 | | | | 448,203 | |
| | | | | | | | |
| Total Healthcare-Services | | | | | | | 573,411 | |
| Holding Companies-Diversified – 0.0% | | | | | | | | |
Compass Diversified Holdings | | | 2,789 | | | | 41,110 | |
See Notes to Financial Statements.
| | |
| 16 | | WisdomTree Domestic Dividend Funds |
Schedule of Investments (continued)
WisdomTree Total Dividend Fund (DTD)
March 31, 2011
| | | | | | | | |
| Investments | | Shares | | | Fair
Value | |
| | | | | | | | |
| Home Builders – 0.1% | | | | | | | | |
D.R. Horton, Inc. | | | 3,067 | | | $ | 35,731 | |
KB Home(a) | | | 888 | | | | 11,047 | |
Lennar Corp. Class A | | | 1,183 | | | | 21,436 | |
MDC Holdings, Inc. | | | 1,252 | | | | 31,738 | |
Ryland Group, Inc. | | | 634 | | | | 10,081 | |
Thor Industries, Inc.(a) | | | 296 | | | | 9,877 | |
| | | | | | | | |
| Total Home Builders | | | | | | | 119,910 | |
| Home Furnishings – 0.1% | | | | | | | | |
Whirlpool Corp. | | | 1,072 | | | | 91,506 | |
| Household Products/Wares – 0.8% | | | | | | | | |
American Greetings Corp. Class A | | | 406 | | | | 9,582 | |
Avery Dennison Corp. | | | 1,679 | | | | 70,451 | |
Church & Dwight Co., Inc. | | | 592 | | | | 46,969 | |
Clorox Co.(a) | | | 3,097 | | | | 217,007 | |
Fortune Brands, Inc. | | | 1,316 | | | | 81,447 | |
Jarden Corp. | | | 899 | | | | 31,977 | |
Kimberly-Clark Corp. | | | 11,192 | | | | 730,502 | |
Scotts Miracle-Gro Co. (The) Class A(a) | | | 654 | | | | 37,834 | |
Tupperware Brands Corp. | | | 1,018 | | | | 60,785 | |
| | | | | | | | |
| Total Household Products/Wares | | | | | | | 1,286,554 | |
| Housewares – 0.0% | | | | | | | | |
Newell Rubbermaid, Inc. | | | 2,437 | | | | 46,620 | |
Toro Co. (The) | | | 408 | | | | 27,018 | |
| | | | | | | | |
| Total Housewares | | | | | | | 73,638 | |
| Insurance – 2.7% | | | | | | | | |
Allstate Corp. (The) | | | 9,280 | | | | 294,918 | |
American Family Life Assurance Co., Inc. | | | 6,774 | | | | 357,532 | |
American Financial Group, Inc. | | | 1,582 | | | | 55,402 | |
American National Insurance Co. | | | 569 | | | | 45,048 | |
AON Corp. | | | 2,851 | | | | 150,989 | |
Arthur J. Gallagher & Co. | | | 3,187 | | | | 96,917 | |
Assurant, Inc. | | | 1,386 | | | | 53,375 | |
Baldwin & Lyons, Inc. Class B | | | 1,029 | | | | 24,099 | |
Brown & Brown, Inc. | | | 1,813 | | | | 46,775 | |
Chubb Corp. | | | 5,036 | | | | 308,757 | |
Cincinnati Financial Corp.(a) | | | 5,467 | | | | 179,318 | |
Delphi Financial Group, Inc. Class A | | | 320 | | | | 9,827 | |
Donegal Group, Inc. Class A | | | 1,596 | | | | 21,339 | |
Erie Indemnity Co. Class A | | | 1,081 | | | | 76,870 | |
Fidelity National Financial, Inc. Class A | | | 7,256 | | | | 102,527 | |
First American Financial Corp. | | | 829 | | | | 13,679 | |
Hanover Insurance Group, Inc. (The) | | | 616 | | | | 27,874 | |
Harleysville Group, Inc. | | | 963 | | | | 31,904 | |
Hartford Financial Services Group, Inc.(a) | | | 2,369 | | | | 63,797 | |
HCC Insurance Holdings, Inc. | | | 1,711 | | | | 53,571 | |
Horace Mann Educators Corp. | | | 3 | | | | 50 | |
Life Partners Holdings, Inc.(a) | | | 660 | | | | 5,306 | |
Lincoln National Corp.(a) | | | 1,239 | | | | 37,220 | |
Loews Corp. | | | 1,965 | | | | 84,672 | |
Marsh & McLennan Cos., Inc. | | | 11,242 | | | | 335,124 | |
Mercury General Corp. | | | 1,980 | | | | 77,477 | |
| | | | | | | | |
| Investments | | Shares | | | Fair
Value | |
| | | | | | | | |
MetLife, Inc. | | | 10,838 | | | $ | 484,784 | |
Old Republic International Corp. | | | 9,050 | | | | 114,845 | |
Principal Financial Group, Inc. | | | 3,682 | | | | 118,229 | |
Progressive Corp. (The) | | | 3,019 | | | | 63,792 | |
Protective Life Corp. | | | 1,626 | | | | 43,170 | |
Prudential Financial, Inc. | | | 6,285 | | | | 387,030 | |
Reinsurance Group of America, Inc. | | | 348 | | | | 21,847 | |
RLI Corp.(a) | | | 379 | | | | 21,849 | |
Safety Insurance Group, Inc. | | | 569 | | | | 26,237 | |
Selective Insurance Group, Inc. | | | 1,677 | | | | 29,012 | |
StanCorp Financial Group, Inc. | | | 848 | | | | 39,110 | |
State Auto Financial Corp. | | | 1,442 | | | | 26,273 | |
Symetra Financial Corp. | | | 846 | | | | 11,506 | |
Torchmark Corp. | | | 681 | | | | 45,273 | |
Tower Group, Inc.(a) | | | 336 | | | | 8,074 | |
Transatlantic Holdings, Inc.(a) | | | 691 | | | | 33,631 | |
Travelers Cos., Inc. (The) | | | 7,894 | | | | 469,535 | |
Unitrin, Inc. | | | 1,676 | | | | 51,755 | |
Universal Insurance Holdings, Inc. | | | 2,269 | | | | 12,298 | |
Unum Group | | | 3,421 | | | | 89,801 | |
W.R. Berkley Corp. | | | 1,195 | | | | 38,491 | |
| | | | | | | | |
| Total Insurance | | | | | | | 4,690,909 | |
| Internet – 0.1% | | | | | | | | |
Earthlink, Inc. | | | 5,228 | | | | 40,935 | |
Expedia, Inc. | | | 1,626 | | | | 36,845 | |
Nutrisystem, Inc.(a) | | | 3 | | | | 44 | |
United Online, Inc. | | | 3,370 | | | | 21,248 | |
| | | | | | | | |
| Total Internet | | | | | | | 99,072 | |
| Investment Companies – 0.4% | | | | | | | | |
Apollo Investment Corp. | | | 13,050 | | | | 157,383 | |
Ares Capital Corp. | | | 10,291 | | | | 173,918 | |
BlackRock Kelso Capital Corp.(a) | | | 5,727 | | | | 58,015 | |
Fifth Street Finance Corp.(a) | | | 3,600 | | | | 48,060 | |
Gladstone Capital Corp.(a) | | | 2,029 | | | | 22,948 | |
Golub Capital BDC, Inc. | | | 909 | | | | 14,344 | |
Main Street Capital Corp.(a) | | | 1,462 | | | | 26,974 | |
MCG Capital Corp.(a) | | | 3,408 | | | | 22,152 | |
MVC Capital, Inc. | | | 567 | | | | 7,779 | |
NGP Capital Resources Co. | | | 1,152 | | | | 11,105 | |
PennantPark Investment Corp. | | | 3,163 | | | | 37,703 | |
Prospect Capital Corp.(a) | | | 5,998 | | | | 73,236 | |
Solar Capital Ltd. | | | 2,110 | | | | 50,387 | |
TICC Capital Corp. | | | 2,728 | | | | 29,653 | |
Triangle Capital Corp. | | | 622 | | | | 11,233 | |
| | | | | | | | |
| Total Investment Companies | | | | | | | 744,890 | |
| Iron/Steel – 0.3% | | | | | | | | |
AK Steel Holding Corp. | | | 585 | | | | 9,231 | |
Allegheny Technologies, Inc.(a) | | | 1,031 | | | | 69,819 | |
Carpenter Technology Corp. | | | 820 | | | | 35,022 | |
Cliffs Natural Resources, Inc. | | | 560 | | | | 55,037 | |
Nucor Corp.(a) | | | 6,930 | | | | 318,919 | |
Reliance Steel & Aluminum Co. | | | 651 | | | | 37,615 | |
See Notes to Financial Statements.
| | | | |
| WisdomTree Domestic Dividend Funds | | | 17 | |
Schedule of Investments (continued)
WisdomTree Total Dividend Fund (DTD)
March 31, 2011
| | | | | | | | |
| Investments | | Shares | | | Fair
Value | |
| | | | | | | | |
Steel Dynamics, Inc. | | | 2,204 | | | $ | 41,369 | |
United States Steel Corp. | | | 425 | | | | 22,925 | |
| | | | | | | | |
| Total Iron/Steel | | | | | | | 589,937 | |
| Leisure Time – 0.1% | | | | | | | | |
Callaway Golf Co.(a) | | | 1,877 | | | | 12,801 | |
Harley-Davidson, Inc.(a) | | | 1,967 | | | | 83,578 | |
Polaris Industries, Inc. | | | 543 | | | | 47,252 | |
| | | | | | | | |
| Total Leisure Time | | | | | | | 143,631 | |
| Lodging – 0.2% | | | | | | | | |
Ameristar Casinos, Inc. | | | 672 | | | | 11,928 | |
Choice Hotels International, Inc.(a) | | | 952 | | | | 36,985 | |
Marriott International, Inc. Class A(a) | | | 2,159 | | | | 76,817 | |
Starwood Hotels & Resorts Worldwide, Inc. | | | 784 | | | | 45,566 | |
Wyndham Worldwide Corp. | | | 1,724 | | | | 54,841 | |
Wynn Resorts Ltd. | | | 732 | | | | 93,147 | |
| | | | | | | | |
| Total Lodging | | | | | | | 319,284 | |
| Machinery-Construction & Mining – 0.5% | | | | | | | | |
Caterpillar, Inc. | | | 7,860 | | | | 875,211 | |
Joy Global, Inc. | | | 617 | | | | 60,966 | |
| | | | | | | | |
| Total Machinery-Construction & Mining | | | | | | | 936,177 | |
| Machinery-Diversified – 0.6% | | | | | | | | |
Applied Industrial Technologies, Inc. | | | 898 | | | | 29,867 | |
Briggs & Stratton Corp. | | | 493 | | | | 11,166 | |
Cognex Corp. | | | 499 | | | | 14,097 | |
Cummins, Inc. | | | 1,299 | | | | 142,396 | |
Deere & Co. | | | 4,120 | | | | 399,187 | |
Flowserve Corp. | | | 426 | | | | 54,869 | |
Graco, Inc. | | | 1,127 | | | | 51,267 | |
IDEX Corp. | | | 972 | | | | 42,428 | |
Nordson Corp. | | | 275 | | | | 31,642 | |
Rockwell Automation, Inc.(a) | | | 1,885 | | | | 178,415 | |
Roper Industries, Inc. | | | 421 | | | | 36,400 | |
| | | | | | | | |
| Total Machinery-Diversified | | | | | | | 991,734 | |
| Media – 2.1% | | | | | | | | |
Cablevision Systems Corp. Class A | | | 2,618 | | | | 90,609 | |
CBS Corp. Class A | | | 805 | | | | 20,222 | |
CBS Corp. Class B | | | 3,888 | | | | 97,355 | |
Comcast Corp. Class A | | | 23,254 | | | | 574,839 | |
Comcast Corp. Special Class A | | | 8,456 | | | | 196,348 | |
Courier Corp. | | | 1,010 | | | | 14,100 | |
Factset Research Systems, Inc.(a) | | | 361 | | | | 37,808 | |
Gannett Co., Inc. | | | 2,174 | | | | 33,110 | |
John Wiley & Sons, Inc. Class A | | | 479 | | | | 24,352 | |
McGraw-Hill Cos., Inc. (The) | | | 5,344 | | | | 210,554 | |
Meredith Corp.(a) | | | 482 | | | | 16,349 | |
News Corp. Class A | | | 11,939 | | | | 209,649 | |
News Corp. Class B | | | 4,224 | | | | 78,651 | |
PRIMEDIA, Inc. | | | 1,728 | | | | 8,415 | |
Scripps Networks Interactive, Inc. Class A | | | 637 | | | | 31,907 | |
Time Warner Cable, Inc. | | | 5,641 | | | | 402,429 | |
Time Warner, Inc. | | | 19,358 | | | | 691,081 | |
Viacom, Inc. Class A | | | 363 | | | | 19,344 | |
| | | | | | | | |
| Investments | | Shares | | | Fair
Value | |
| | | | | | | | |
Viacom, Inc. Class B | | | 5,427 | | | $ | 252,464 | |
Walt Disney Co. (The) | | | 11,811 | | | | 508,936 | |
Washington Post Co. (The) Class B(a) | | | 121 | | | | 52,945 | |
World Wrestling Entertainment, Inc. Class A | | | 2,181 | | | | 27,415 | |
| | | | | | | | |
| Total Media | | | | | | | 3,598,882 | |
| Metal Fabricate/Hardware – 0.1% | | | | | | | | |
Commercial Metals Co. | | | 2,215 | | | | 38,253 | |
Kaydon Corp. | | | 475 | | | | 18,615 | |
Timken Co. | | | 1,071 | | | | 56,013 | |
Worthington Industries, Inc.(a) | | | 1,494 | | | | 31,255 | |
| | | | | | | | |
| Total Metal Fabricate/Hardware | | | | | | | 144,136 | |
| Mining – 1.1% | | | | | | | | |
Alcoa, Inc.(a) | | | 5,925 | | | | 104,576 | |
AMCOL International Corp. | | | 562 | | | | 20,221 | |
Compass Minerals International, Inc. | | | 433 | | | | 40,499 | |
Freeport-McMoRan Copper & Gold, Inc. | | | 10,824 | | | | 601,273 | |
Kaiser Aluminum Corp. | | | 483 | | | | 23,788 | |
Newmont Mining Corp. | | | 3,030 | | | | 165,377 | |
Royal Gold, Inc. | | | 169 | | | | 8,856 | |
Southern Copper Corp. | | | 20,214 | | | | 814,018 | |
Vulcan Materials Co.(a) | | | 1,804 | | | | 82,262 | |
| | | | | | | | |
| Total Mining | | | | | | | 1,860,870 | |
| Miscellaneous Manufacturing – 4.4% | | | | | | | | |
3M Co. | | | 11,402 | | | | 1,066,087 | |
A.O. Smith Corp. | | | 228 | | | | 10,110 | |
Aptargroup, Inc. | | | 620 | | | | 31,081 | |
Barnes Group, Inc.(a) | | | 897 | | | | 18,729 | |
Brink’s Co. (The) | | | 521 | | | | 17,250 | |
Carlisle Cos., Inc. | | | 842 | | | | 37,511 | |
CLARCOR, Inc. | | | 487 | | | | 21,881 | |
Crane Co. | | | 1,198 | | | | 58,019 | |
Danaher Corp. | | | 846 | | | | 43,907 | |
Donaldson Co., Inc. | | | 609 | | | | 37,326 | |
Dover Corp. | | | 2,410 | | | | 158,433 | |
Eaton Corp. | | | 5,234 | | | | 290,173 | |
General Electric Co. | | | 190,220 | | | | 3,813,911 | |
Harsco Corp. | | | 1,327 | | | | 46,830 | |
Honeywell International, Inc. | | | 12,015 | | | | 717,416 | |
Illinois Tool Works, Inc. | | | 8,381 | | | | 450,227 | |
ITT Corp. | | | 2,251 | | | | 135,173 | |
Koppers Holdings, Inc. | | | 495 | | | | 21,136 | |
Leggett & Platt, Inc. | | | 4,828 | | | | 118,286 | |
NL Industries, Inc. | | | 2,068 | | | | 30,710 | |
Pall Corp. | | | 1,195 | | | | 68,844 | |
Parker Hannifin Corp. | | | 1,488 | | | | 140,884 | |
Pentair, Inc.(a) | | | 1,428 | | | | 53,964 | |
SPX Corp. | | | 573 | | | | 45,490 | |
Textron, Inc.(a) | | | 1,125 | | | | 30,814 | |
Trinity Industries, Inc. | | | 951 | | | | 34,873 | |
| | | | | | | | |
| Total Miscellaneous Manufacturing | | | | | | | 7,499,065 | |
See Notes to Financial Statements.
| | |
| 18 | | WisdomTree Domestic Dividend Funds |
Schedule of Investments (continued)
WisdomTree Total Dividend Fund (DTD)
March 31, 2011
| | | | | | | | |
| Investments | | Shares | | | Fair
Value | |
| | | | | | | | |
| Office Furnishings – 0.0% | | | | | | | | |
HNI Corp. | | | 893 | | | $ | 28,183 | |
Knoll, Inc. | | | 2 | | | | 42 | |
| | | | | | | | |
| Total Office Furnishings | | | | | | | 28,225 | |
| Office/Business Equipment – 0.2% | | | | | | | | |
Pitney Bowes, Inc.(a) | | | 8,178 | | | | 210,093 | |
Xerox Corp. | | | 12,685 | | | | 135,095 | |
| | | | | | | | |
| Total Office/Business Equipment | | | | | | | 345,188 | |
| Oil & Gas – 10.1% | | | | | | | | |
Anadarko Petroleum Corp. | | | 1,910 | | | | 156,467 | |
Apache Corp. | | | 1,302 | | | | 170,458 | |
Chesapeake Energy Corp. | | | 5,338 | | | | 178,930 | |
Chevron Corp. | | | 42,892 | | | | 4,607,888 | |
Cimarex Energy Co. | | | 260 | | | | 29,962 | |
ConocoPhillips | | | 32,364 | | | | 2,584,589 | |
Devon Energy Corp. | | | 2,530 | | | | 232,178 | |
Diamond Offshore Drilling, Inc.(a) | | | 587 | | | | 45,610 | |
EOG Resources, Inc. | | | 998 | | | | 118,273 | |
EQT Corp. | | | 1,707 | | | | 85,179 | |
EXCO Resources, Inc. | | | 827 | | | | 17,086 | |
Exxon Mobil Corp. | | | 80,279 | | | | 6,753,872 | |
Helmerich & Payne, Inc. | | | 262 | | | | 17,997 | |
Hess Corp. | | | 1,243 | | | | 105,916 | |
Holly Corp. | | | 891 | | | | 54,137 | |
Marathon Oil Corp. | | | 13,399 | | | | 714,301 | |
Murphy Oil Corp. | | | 2,044 | | | | 150,071 | |
Noble Energy, Inc. | | | 1,105 | | | | 106,798 | |
Occidental Petroleum Corp. | | | 8,533 | | | | 891,613 | |
Patterson-UTI Energy, Inc.(a) | | | 1,311 | | | | 38,530 | |
Pioneer Natural Resources Co. | | | 2 | | | | 204 | |
Range Resources Corp. | | | 445 | | | | 26,015 | |
Sunoco, Inc. | | | 1,416 | | | | 64,555 | |
Valero Energy Corp. | | | 3,731 | | | | 111,258 | |
| | | | | | | | |
| Total Oil & Gas | | | | | | | 17,261,887 | |
| Oil & Gas Services – 0.4% | | | | | | | | |
Baker Hughes, Inc. | | | 3,171 | | | | 232,846 | |
Halliburton Co. | | | 5,484 | | | | 273,323 | |
National Oilwell Varco, Inc. | | | 2,015 | | | | 159,729 | |
RPC, Inc.(a) | | | 1,332 | | | | 33,726 | |
| | | | | | | | |
| Total Oil & Gas Services | | | | | | | 699,624 | |
| Packaging & Containers – 0.3% | | | | | | | | |
Ball Corp. | | | 894 | | | | 32,050 | |
Bemis Co., Inc. | | | 2,137 | | | | 70,115 | |
Greif, Inc. Class A | | | 361 | | | | 23,613 | |
Greif, Inc. Class B | | | 742 | | | | 45,707 | |
Packaging Corp. of America | | | 1,881 | | | | 54,342 | |
Rock-Tenn Co. Class A(a) | | | 231 | | | | 16,020 | |
Sealed Air Corp. | | | 2,507 | | | | 66,837 | |
Silgan Holdings, Inc. | | | 795 | | | | 30,321 | |
Sonoco Products Co. | | | 2,535 | | | | 91,843 | |
Temple-Inland, Inc. | | | 1,707 | | | | 39,944 | |
| | | | | | | | |
| Total Packaging & Containers | | | | | | | 470,792 | |
| | | | | | | | |
| Investments | | Shares | | | Fair
Value | |
| | | | | | | | |
| Pharmaceuticals – 7.3% | | | | | | | | |
Abbott Laboratories | | | 36,638 | | | $ | 1,797,094 | |
Allergan, Inc. | | | 647 | | | | 45,950 | |
AmerisourceBergen Corp. | | | 2,549 | | | | 100,839 | |
Bristol-Myers Squibb Co. | | | 53,675 | | | | 1,418,630 | |
Cardinal Health, Inc. | | | 4,908 | | | | 201,866 | |
Eli Lilly & Co. | | | 41,661 | | | | 1,465,217 | |
McKesson Corp. | | | 1,643 | | | | 129,879 | |
Mead Johnson Nutrition Co. | | | 1,844 | | | | 106,823 | |
Merck & Co., Inc. | | | 82,971 | | | | 2,738,873 | |
Perrigo Co.(a) | | | 452 | | | | 35,943 | |
Pfizer, Inc. | | | 219,371 | | | | 4,455,425 | |
| | | | | | | | |
| Total Pharmaceuticals | | | | | | | 12,496,539 | |
| Pipelines – 0.5% | | | | | | | | |
El Paso Corp. | | | 1,735 | | | | 31,230 | |
Oneok, Inc.(a) | | | 2,572 | | | | 172,015 | |
Spectra Energy Corp.(a) | | | 17,440 | | | | 474,019 | |
Williams Cos., Inc. (The) | | | 7,915 | | | | 246,790 | |
| | | | | | | | |
| Total Pipelines | | | | | | | 924,054 | |
| Private Equity – 0.0% | | | | | | | | |
Hercules Technology Growth Capital, Inc. | | | 2,621 | | | | 28,831 | |
| REITS – 5.3% | | | | | | | | |
Acadia Realty Trust | | | 1,383 | | | | 26,166 | |
Agree Realty Corp.(a) | | | 991 | | | | 22,248 | |
Alexander’s, Inc. | | | 71 | | | | 28,893 | |
Alexandria Real Estate Equities, Inc. | | | 844 | | | | 65,807 | |
AMB Property Corp. | | | 4,091 | | | | 147,153 | |
American Campus Communities, Inc. | | | 1,794 | | | | 59,202 | |
Apartment Investment & Management Co. Class A(a) | | | 1,468 | | | | 37,390 | |
Associated Estates Realty Corp. | | | 973 | | | | 15,451 | |
AvalonBay Communities, Inc.(a) | | | 1,871 | | | | 224,670 | |
BioMed Realty Trust, Inc.(a) | | | 3,035 | | | | 57,726 | |
Boston Properties, Inc.(a) | | | 2,289 | | | | 217,112 | |
Brandywine Realty Trust(a) | | | 4,630 | | | | 56,208 | |
BRE Properties, Inc. | | | 1,392 | | | | 65,675 | |
Camden Property Trust | | | 1,781 | | | | 101,196 | |
CapLease, Inc. | | | 1,659 | | | | 9,091 | |
CBL & Associates Properties, Inc.(a) | | | 3,999 | | | | 69,663 | |
Cedar Shopping Centers, Inc. | | | 1,739 | | | | 10,486 | |
Chesapeake Lodging Trust | | | 547 | | | | 9,523 | |
Cogdell Spencer, Inc. | | | 4,112 | | | | 24,425 | |
Colonial Properties Trust | | | 2,154 | | | | 41,465 | |
CommonWealth REIT | | | 3,757 | | | | 97,569 | |
Corporate Office Properties Trust SBI MD(a) | | | 2,006 | | | | 72,497 | |
Cousins Properties, Inc. | | | 1,844 | | | | 15,397 | |
DCT Industrial Trust, Inc.(a) | | | 8,780 | | | | 48,729 | |
Digital Realty Trust, Inc.(a) | | | 2,299 | | | | 133,664 | |
Douglas Emmett, Inc.(a) | | | 2,106 | | | | 39,488 | |
Duke Realty Corp. | | | 9,617 | | | | 134,734 | |
DuPont Fabros Technology, Inc.(a) | | | 670 | | | | 16,248 | |
EastGroup Properties, Inc. | | | 1,117 | | | | 49,114 | |
Education Realty Trust, Inc. | | | 2,097 | | | | 16,839 | |
See Notes to Financial Statements.
| | | | |
| WisdomTree Domestic Dividend Funds | | | 19 | |
Schedule of Investments (continued)
WisdomTree Total Dividend Fund (DTD)
March 31, 2011
| | | | | | | | |
| Investments | | Shares | | | Fair
Value | |
| | | | | | | | |
Entertainment Properties Trust | | | 1,883 | | | $ | 88,162 | |
Equity Lifestyle Properties, Inc. | | | 502 | | | | 28,940 | |
Equity One, Inc.(a) | | | 3,201 | | | | 60,083 | |
Equity Residential(a) | | | 5,107 | | | | 288,086 | |
Essex Property Trust, Inc. | | | 787 | | | | 97,588 | |
Extra Space Storage, Inc. | | | 1,763 | | | | 36,512 | |
Federal Realty Investment Trust | | | 1,431 | | | | 116,712 | |
First Potomac Realty Trust | | | 1,803 | | | | 28,397 | |
Franklin Street Properties Corp.(a) | | | 3,145 | | | | 44,250 | |
Getty Realty Corp. | | | 1,323 | | | | 30,270 | |
Gladstone Commercial Corp. | | | 873 | | | | 15,924 | |
Glimcher Realty Trust | | | 3,671 | | | | 33,957 | |
Government Properties Income Trust | | | 1,525 | | | | 40,962 | |
HCP, Inc. | | | 11,267 | | | | 427,470 | |
Health Care REIT, Inc. | | | 5,339 | | | | 279,977 | |
Healthcare Realty Trust, Inc. | | | 2,590 | | | | 58,793 | |
Hersha Hospitality Trust | | | 4,676 | | | | 27,775 | |
Highwoods Properties, Inc.(a) | | | 2,338 | | | | 81,853 | |
Home Properties, Inc.(a) | | | 1,317 | | | | 77,637 | |
Hospitality Properties Trust | | | 6,412 | | | | 148,438 | |
Host Hotels & Resorts, Inc.(a) | | | 662 | | | | 11,658 | |
Inland Real Estate Corp. | | | 4,319 | | | | 41,203 | |
Investors Real Estate Trust(a) | | | 3,669 | | | | 34,855 | |
Kilroy Realty Corp. | | | 1,058 | | | | 41,082 | |
Kimco Realty Corp. | | | 11,817 | | | | 216,724 | |
Kite Realty Group Trust | | | 2,937 | | | | 15,595 | |
LaSalle Hotel Properties | | | 639 | | | | 17,253 | |
Lexington Realty Trust(a) | | | 5,845 | | | | 54,651 | |
Liberty Property Trust(a) | | | 4,246 | | | | 139,693 | |
LTC Properties, Inc. | | | 914 | | | | 25,903 | |
Macerich Co. (The) | | | 4,019 | | | | 199,061 | |
Mack-Cali Realty Corp. | | | 2,942 | | | | 99,734 | |
Medical Properties Trust, Inc.(a) | | | 4,666 | | | | 53,986 | |
Mid-America Apartment Communities, Inc.(a) | | | 890 | | | | 57,138 | |
Mission West Properties, Inc. | | | 3,478 | | | | 22,850 | |
Monmouth Real Estate Investment Corp. Class A | | | 3,348 | | | | 27,487 | |
National Health Investors, Inc. | | | 1,111 | | | | 53,239 | |
National Retail Properties, Inc.(a) | | | 3,440 | | | | 89,887 | |
Nationwide Health Properties, Inc. | | | 4,414 | | | | 187,727 | |
Omega Healthcare Investors, Inc.(a) | | | 4,409 | | | | 98,497 | |
One Liberty Properties, Inc. | | | 562 | | | | 8,475 | |
Parkway Properties, Inc. | | | 985 | | | | 16,745 | |
Pennsylvania Real Estate Investment Trust | | | 2,055 | | | | 29,325 | |
Piedmont Office Realty Trust, Inc. Class A | | | 5,360 | | | | 104,038 | |
Plum Creek Timber Co., Inc.(a) | | | 4,729 | | | | 206,232 | |
Post Properties, Inc. | | | 967 | | | | 37,955 | |
Potlatch Corp.(a) | | | 1,452 | | | | 58,370 | |
ProLogis | | | 12,774 | | | | 204,129 | |
PS Business Parks, Inc. | | | 662 | | | | 38,356 | |
Public Storage(a) | | | 3,544 | | | | 393,065 | |
Ramco-Gershenson Properties Trust | | | 1,045 | | | | 13,094 | |
Rayonier, Inc. | | | 2,340 | | | | 145,805 | |
Realty Income Corp.(a) | | | 3,891 | | | | 135,990 | |
Regency Centers Corp. | | | 2,688 | | | | 116,874 | |
| | | | | | | | |
| Investments | | Shares | | | Fair
Value | |
| | | | | | | | |
Saul Centers, Inc. | | | 533 | | | $ | 23,745 | |
Senior Housing Properties Trust | | | 5,534 | | | | 127,503 | |
Simon Property Group, Inc. | | | 6,332 | | | | 678,537 | |
SL Green Realty Corp. | | | 492 | | | | 36,998 | |
Sovran Self Storage, Inc. | | | 1,178 | | | | 46,590 | |
Sun Communities, Inc. | | | 1,198 | | | | 42,709 | |
Tanger Factory Outlet Centers | | | 1,920 | | | | 50,381 | |
Taubman Centers, Inc. | | | 1,494 | | | | 80,049 | |
UDR, Inc. | | | 4,434 | | | | 108,057 | |
Universal Health Realty Income Trust | | | 761 | | | | 30,843 | |
Urstadt Biddle Properties, Inc. Class A | | | 487 | | | | 9,263 | |
U-Store-It Trust | | | 1 | | | | 11 | |
Ventas, Inc.(a) | | | 4,592 | | | | 249,346 | |
Vornado Realty Trust | | | 3,912 | | | | 342,300 | |
Washington Real Estate Investment Trust | | | 2,285 | | | | 71,041 | |
Weingarten Realty Investors(a) | | | 3,759 | | | | 94,201 | |
Weyerhaeuser Co. | | | 3,563 | | | | 87,650 | |
Winthrop Realty Trust | | | 1,712 | | | | 20,972 | |
| | | | | | | | |
| Total REITS | | | | | | | 9,022,487 | |
| Retail – 5.8% | | | | | | | | |
Abercrombie & Fitch Co. Class A | | | 877 | | | | 51,480 | |
Advance Auto Parts, Inc. | | | 423 | | | | 27,757 | |
American Eagle Outfitters, Inc. | | | 3,095 | | | | 49,180 | |
Best Buy Co., Inc. | | | 4,319 | | | | 124,042 | |
Bob Evans Farms, Inc. | | | 627 | | | | 20,440 | |
Brinker International, Inc. | | | 2,195 | | | | 55,533 | |
Buckle, Inc. (The)(a) | | | 807 | | | | 32,603 | |
Casey’s General Stores, Inc. | | | 204 | | | | 7,956 | |
Cato Corp. (The) Class A | | | 919 | | | | 22,515 | |
Chico’s FAS, Inc. | | | 1,231 | | | | 18,342 | |
Costco Wholesale Corp. | | | 3,415 | | | | 250,388 | |
Cracker Barrel Old Country Store, Inc. | | | 385 | | | | 18,919 | |
CVS Caremark Corp. | | | 9,219 | | | | 316,396 | |
Darden Restaurants, Inc.(a) | | | 2,456 | | | | 120,663 | |
Family Dollar Stores, Inc. | | | 1,190 | | | | 61,071 | |
Foot Locker, Inc. | | | 3,600 | | | | 70,992 | |
Gap, Inc. (The)(a) | | | 7,348 | | | | 166,506 | |
Guess ?, Inc. | | | 905 | | | | 35,612 | |
Home Depot, Inc. | | | 29,575 | | | | 1,096,049 | |
HOT Topic, Inc. | | | 1,453 | | | | 8,282 | |
J.C. Penney Co., Inc. | | | 3,954 | | | | 141,988 | |
Lowe’s Cos., Inc. | | | 15,706 | | | | 415,110 | |
Ltd. Brands, Inc. | | | 4,301 | | | | 141,417 | |
Macy’s, Inc. | | | 2,374 | | | | 57,593 | |
McDonald’s Corp. | | | 21,853 | | | | 1,662,795 | |
MSC Industrial Direct Co. Class A | | | 486 | | | | 33,276 | |
Nordstrom, Inc. | | | 2,694 | | | | 120,907 | |
Nu Skin Enterprises, Inc. Class A(a) | | | 1,041 | | | | 29,929 | |
PetSmart, Inc. | | | 1,171 | | | | 47,952 | |
RadioShack Corp. | | | 1,487 | | | | 22,320 | |
Ross Stores, Inc. | | | 915 | | | | 65,075 | |
Staples, Inc. | | | 7,244 | | | | 140,678 | |
Starbucks Corp. | | | 7,655 | | | | 282,852 | |
See Notes to Financial Statements.
| | |
| 20 | | WisdomTree Domestic Dividend Funds |
Schedule of Investments (continued)
WisdomTree Total Dividend Fund (DTD)
March 31, 2011
| | | | | | | | |
| Investments | | Shares | | | Fair
Value | |
| | | | | | | | |
Target Corp. | | | 7,877 | | | $ | 393,929 | |
Tiffany & Co.(a) | | | 1,273 | | | | 78,213 | |
TJX Cos., Inc. | | | 3,693 | | | | 183,653 | |
Walgreen Co. | | | 11,227 | | | | 450,652 | |
Wal-Mart Stores, Inc. | | | 52,655 | | | | 2,740,693 | |
Wendy’s/Arby’s Group, Inc. Class A | | | 6,578 | | | | 33,087 | |
Williams-Sonoma, Inc. | | | 1,431 | | | | 57,956 | |
Yum! Brands, Inc. | | | 6,288 | | | | 323,077 | |
| | | | | | | | |
| Total Retail | | | | | | | 9,977,878 | |
| Savings & Loans – 0.6% | | | | | | | | |
Astoria Financial Corp. | | | 3,150 | | | | 45,266 | |
Brookline Bancorp, Inc. | | | 1,894 | | | | 19,944 | |
Capitol Federal Financial, Inc. | | | 8,552 | | | | 96,381 | |
Dime Community Bancshares, Inc.(a) | | | 1,318 | | | | 19,454 | |
First Niagara Financial Group, Inc.(a) | | | 5,390 | | | | 73,196 | |
Hudson City Bancorp, Inc. | | | 15,538 | | | | 150,408 | |
New York Community Bancorp, Inc.(a) | | | 15,815 | | | | 272,967 | |
NewAlliance Bancshares, Inc. | | | 1,485 | | | | 22,037 | |
Northwest Bancshares, Inc. | | | 2,711 | | | | 33,996 | |
OceanFirst Financial Corp. | | | 1,414 | | | | 19,725 | |
Oritani Financial Corp. | | | 1,888 | | | | 23,940 | |
People’s United Financial, Inc. | | | 10,630 | | | | 133,725 | |
Provident Financial Services, Inc. | | | 1,665 | | | | 24,642 | |
Roma Financial Corp. | | | 1,400 | | | | 15,498 | |
Washington Federal, Inc. | | | 1,235 | | | | 21,415 | |
| | | | | | | | |
| Total Savings & Loans | | | | | | | 972,594 | |
| Semiconductors – 2.6% | | | | | | | | |
Altera Corp.(a) | | | 1,583 | | | | 69,684 | |
Analog Devices, Inc. | | | 4,735 | | | | 186,464 | |
Applied Materials, Inc. | | | 17,953 | | | | 280,426 | |
Broadcom Corp. Class A* | | | 2,004 | | | | 78,918 | |
Intel Corp. | | | 122,449 | | | | 2,469,796 | |
Intersil Corp. Class A(a) | | | 3,121 | | | | 38,856 | |
KLA-Tencor Corp. | | | 2,594 | | | | 122,878 | |
Linear Technology Corp.(a) | | | 4,182 | | | | 140,641 | |
Maxim Integrated Products, Inc. | | | 6,946 | | | | 177,818 | |
Microchip Technology, Inc.(a) | | | 5,039 | | | | 191,532 | |
National Semiconductor Corp. | | | 4,300 | | | | 61,662 | |
Texas Instruments, Inc. | | | 12,332 | | | | 426,194 | |
Xilinx, Inc.(a) | | | 3,998 | | | | 131,134 | |
| | | | | | | | |
| Total Semiconductors | | | | | | | 4,376,003 | |
| Shipbuilding – 0.0% | | | | | | | | |
Huntington Ingalls Industries, Inc.* | | | 947 | | | | 39,301 | |
| Software – 2.5% | | | | | | | | |
Activision Blizzard, Inc. | | | 9,247 | | | | 101,440 | |
American Software, Inc. Class A | | | 2,037 | | | | 15,033 | |
Broadridge Financial Solutions, Inc. | | | 2,604 | | | | 59,085 | |
CA, Inc. | | | 2,381 | | | | 57,572 | |
Dun & Bradstreet Corp. | | | 474 | | | | 38,034 | |
Fidelity National Information Services, Inc. | | | 1,602 | | | | 52,369 | |
Microsoft Corp. | | | 127,640 | | | | 3,236,950 | |
Oracle Corp. | | | 21,629 | | | | 721,760 | |
| | | | | | | | |
| Investments | | Shares | | | Fair
Value | |
| | | | | | | | |
Quality Systems, Inc.(a) | | | 265 | | | $ | 22,085 | |
| | | | | | | | |
| Total Software | | | | | | | 4,304,328 | |
| Telecommunications – 8.1% | | | | | | | | |
ADTRAN, Inc. | | | 630 | | | | 26,750 | |
Alaska Communications Systems Group, Inc.(a) | | | 2,841 | | | | 30,257 | |
AT&T, Inc. | | | 221,861 | | | | 6,788,946 | |
CenturyLink, Inc.(a) | | | 12,611 | | | | 523,987 | |
Comtech Telecommunications Corp. | | | 493 | | | | 13,400 | |
Consolidated Communications Holdings, Inc. | | | 2,006 | | | | 37,572 | |
Corning, Inc. | | | 11,184 | | | | 230,726 | |
Frontier Communications Corp.(a) | | | 51,808 | | | | 425,862 | |
Harris Corp. | | | 1,802 | | | | 89,379 | |
NTELOS Holdings Corp. | | | 2,218 | | | | 40,833 | |
QUALCOMM, Inc. | | | 16,541 | | | | 906,943 | |
Qwest Communications International, Inc. | | | 49,077 | | | | 335,196 | |
Telephone & Data Systems, Inc. Special Shares | | | 965 | | | | 28,487 | |
Tellabs, Inc. | | | 2,294 | | | | 12,020 | |
Verizon Communications, Inc. | | | 103,679 | | | | 3,995,789 | |
Virgin Media, Inc.(a) | | | 1,459 | | | | 40,546 | |
Windstream Corp. | | | 22,552 | | | | 290,244 | |
| | | | | | | | |
| Total Telecommunications | | | | | | | 13,816,937 | |
| Textiles – 0.0% | | | | | | | | |
Cintas Corp. | | | 1,499 | | | | 45,375 | |
| Toys/Games/Hobbies – 0.2% | | | | | | | | |
Hasbro, Inc.(a) | | | 1,927 | | | | 90,261 | |
Mattel, Inc. | | | 7,880 | | | | 196,448 | |
| | | | | | | | |
| Total Toys/Games/Hobbies | | | | | | | 286,709 | |
| Transportation – 1.6% | | | | | | | | |
Alexander & Baldwin, Inc.(a) | | | 1,095 | | | | 49,987 | |
C.H. Robinson Worldwide, Inc.(a) | | | 1,439 | | | | 106,673 | |
Con-way, Inc. | | | 512 | | | | 20,116 | |
CSX Corp. | | | 4,099 | | | | 322,181 | |
Expeditors International of Washington, Inc. | | | 1,078 | | | | 54,051 | |
FedEx Corp. | | | 1,030 | | | | 96,356 | |
International Shipholding Corp. | | | 790 | | | | 19,671 | |
JB Hunt Transport Services, Inc. | | | 1,132 | | | | 51,415 | |
Knight Transportation, Inc. | | | 437 | | | | 8,412 | |
Norfolk Southern Corp. | | | 5,532 | | | | 383,202 | |
Overseas Shipholding Group, Inc.(a) | | | 829 | | | | 26,644 | |
Ryder System, Inc. | | | 888 | | | | 44,933 | |
Tidewater, Inc.(a) | | | 723 | | | | 43,272 | |
Union Pacific Corp. | | | 5,393 | | | | 530,294 | |
United Parcel Service, Inc. Class B | | | 12,415 | | | | 922,683 | |
| | | | | | | | |
| Total Transportation | | | | | | | 2,679,890 | |
| Trucking & Leasing – 0.0% | | | | | | | | |
GATX Corp. | | | 990 | | | | 38,273 | |
TAL International Group, Inc. | | | 892 | | | | 32,353 | |
| | | | | | | | |
| Total Trucking & Leasing | | | | | | | 70,626 | |
| Water – 0.2% | | | | | | | | |
American States Water Co. | | | 749 | | | | 26,859 | |
American Water Works Co., Inc. | | | 4,003 | | | | 112,284 | |
See Notes to Financial Statements.
| | | | |
| WisdomTree Domestic Dividend Funds | | | 21 | |
Schedule of Investments (concluded)
WisdomTree Total Dividend Fund (DTD)
March 31, 2011
| | | | | | | | |
| Investments | | Shares | | | Fair
Value | |
| | | | | | | | |
Aqua America, Inc. | | | 2,315 | | | $ | 52,991 | |
California Water Service Group | | | 800 | | | | 29,736 | |
Connecticut Water Service, Inc. | | | 666 | | | | 17,549 | |
Middlesex Water Co. | | | 1,065 | | | | 19,372 | |
SJW Corp. | | | 562 | | | | 13,010 | |
| | | | | | | | |
| Total Water | | | | | | | 271,801 | |
TOTAL COMMON STOCKS
(Cost: $145,489,258) | | | | | | | 169,101,661 | |
| EXCHANGE-TRADED FUNDS – 0.8% | | | | | | | | |
WisdomTree Earnings 500 Fund(b) | | | 5,988 | | | | 273,651 | |
WisdomTree Total Earnings Fund(a)(b) | | | 24,537 | | | | 1,158,392 | |
| | | | | | | | |
TOTAL EXCHANGE-TRADED FUNDS
(Cost: $1,225,651) | | | | | | | 1,432,043 | |
| SHORT-TERM INVESTMENT – 0.1% | | | | | | | | |
| MONEY MARKET FUND – 0.1% | | | | | | | | |
Invesco Treasury Fund Private Class, 0.02%(c)
(Cost: $92,891) | | | 92,891 | | | | 92,891 | |
| INVESTMENT OF CASH COLLATERAL FOR SECURITIES LOANED – 7.4% | | | | | | | | |
| MONEY MARKET FUND – 7.4% | | | | | | | | |
Dreyfus Institutional Preferred Money Market Fund, 0.19%(d) (Cost: $12,567,000)(e) | | | 12,567,000 | | | | 12,567,000 | |
TOTAL INVESTMENTS IN SECURITIES – 107.2%
(Cost: $159,374,800) | | | | 183,193,595 | |
Liabilities in Excess of Other Assets – (7.2)% | | | | | | | (12,245,434 | ) |
| | | | | | | | |
| NET ASSETS – 100.0% | | | | | | $ | 170,948,161 | |
| * | Non-income producing security. |
| (a) | Security, or portion thereof, was on loan at March 31, 2011 (See Note 2). |
| (b) | Affiliated companies (See Note 7). |
| (c) | Rate shown represents annualized 7-day yield as of March 31, 2011. |
| (d) | Interest rate shown reflects yield as of March 31, 2011. |
| (e) | At March 31, 2011, the total market value of the Fund’s securities on loan was $12,257,799 and the total market value of the collateral held by the Fund was $12,567,000. |
See Notes to Financial Statements.
| | |
| 22 | | WisdomTree Domestic Dividend Funds |
Schedule of Investments
WisdomTree Equity Income Fund (DHS)
March 31, 2011
| | | | | | | | |
| Investments | | Shares | | | Fair
Value | |
| | | | | | | | |
| COMMON STOCKS – 99.3% | | | | | | | | |
| Aerospace/Defense – 1.4% | | | | | | | | |
Lockheed Martin Corp. | | | 20,843 | | | $ | 1,675,777 | |
Raytheon Co.(a) | | | 16,304 | | | | 829,385 | |
| | | | | | | | |
| Total Aerospace/Defense | | | | | | | 2,505,162 | |
| Agriculture – 8.1% | | | | | | | | |
Altria Group, Inc. | | | 173,629 | | | | 4,519,563 | |
Lorillard, Inc. | | | 11,133 | | | | 1,057,746 | |
Philip Morris International, Inc. | | | 105,837 | | | | 6,946,082 | |
Reynolds American, Inc. | | | 48,004 | | | | 1,705,582 | |
Universal Corp. | | | 1,511 | | | | 65,789 | |
Vector Group Ltd.(a) | | | 8,774 | | | | 151,703 | |
| | | | | | | | |
| Total Agriculture | | | | | | | 14,446,465 | |
| Auto Parts & Equipment – 0.0% | | | | | | | | |
Douglas Dynamics, Inc. | | | 1,184 | | | | 16,884 | |
Superior Industries International, Inc. | | | 1,128 | | | | 28,922 | |
| | | | | | | | |
| Total Auto Parts & Equipment | | | | | | | 45,806 | |
| Banks – 1.1% | | | | | | | | |
1st Source Corp. | | | 1,068 | | | | 21,403 | |
Arrow Financial Corp. | | | 647 | | | | 16,007 | |
BancorpSouth, Inc.(a) | | | 6,418 | | | | 99,158 | |
Bank of Hawaii Corp.(a) | | | 2,555 | | | | 122,180 | |
Bryn Mawr Bank Corp. | | | 439 | | | | 9,030 | |
Capital City Bank Group, Inc.(a) | | | 746 | | | | 9,459 | |
Chemical Financial Corp. | | | 1,351 | | | | 26,925 | |
City Holding Co.(a) | | | 979 | | | | 34,617 | |
Community Bank System, Inc.(a) | | | 1,663 | | | | 40,361 | |
Community Trust Bancorp, Inc. | | | 894 | | | | 24,737 | |
Cullen/Frost Bankers, Inc.(a) | | | 2,544 | | | | 150,147 | |
CVB Financial Corp.(a) | | | 6,732 | | | | 62,675 | |
First Busey Corp. | | | 2,706 | | | | 13,747 | |
First Interstate Bancsystem, Inc. | | | 541 | | | | 7,358 | |
First of Long Island Corp. (The) | | | 308 | | | | 8,547 | |
FirstMerit Corp.(a) | | | 4,477 | | | | 76,378 | |
FNB Corp.(a) | | | 7,769 | | | | 81,885 | |
Glacier Bancorp, Inc.(a) | | | 3,994 | | | | 60,110 | |
Great Southern Bancorp, Inc.(a) | | | 453 | | | | 9,717 | |
M&T Bank Corp. | | | 5,555 | | | | 491,451 | |
NBT Bancorp, Inc. | | | 1,577 | | | | 35,940 | |
Park National Corp.(a) | | | 1,127 | | | | 75,306 | |
Renasant Corp.(a) | | | 1,594 | | | | 27,066 | |
Southside Bancshares, Inc. | | | 566 | | | | 12,112 | |
Sterling Bancorp(a) | | | 1,125 | | | | 11,261 | |
Suffolk Bancorp | | | 379 | | | | 7,951 | |
Tompkins Financial Corp.(a) | | | 541 | | | | 22,479 | |
TrustCo Bank Corp. | | | 4,578 | | | | 27,148 | |
Trustmark Corp.(a) | | | 3,287 | | | | 76,982 | |
United Bankshares, Inc.(a) | | | 2,685 | | | | 71,206 | |
Univest Corp. of Pennsylvania | | | 1,174 | | | | 20,803 | |
Valley National Bancorp(a) | | | 11,540 | | | | 161,098 | |
Washington Trust Bancorp, Inc.(a) | | | 854 | | | | 20,274 | |
WesBanco, Inc. | | | 1,069 | | | | 22,139 | |
| | | | | | | | |
| Total Banks | | | | | | | 1,957,657 | |
| | | | | | | | |
| Investments | | Shares | | | Fair Value | |
| | | | | | | | |
| Chemicals – 1.4% | | | | | | | | |
E.I. Du Pont de Nemours & Co. | | | 41,224 | | | $ | 2,266,083 | |
Olin Corp.(a) | | | 4,261 | | | | 97,662 | |
RPM International, Inc. | | | 6,897 | | | | 163,666 | |
| | | | | | | | |
| Total Chemicals | | | | | | | 2,527,411 | |
| Commercial Services – 1.5% | | | | | | | | |
Advance America, Cash Advance Centers, Inc. | | | 3,880 | | | | 20,564 | |
Automatic Data Processing, Inc. | | | 20,434 | | | | 1,048,469 | |
CPI Corp. | | | 277 | | | | 6,235 | |
Deluxe Corp.(a) | | | 3,325 | | | | 88,246 | |
Electro Rent Corp. | | | 1,509 | | | | 25,925 | |
H&R Block, Inc.(a) | | | 18,560 | | | | 310,694 | |
Healthcare Services Group, Inc. | | | 3,730 | | | | 65,573 | |
Hillenbrand, Inc. | | | 3,186 | | | | 68,499 | |
Landauer, Inc. | | | 471 | | | | 28,976 | |
Lincoln Educational Services Corp. | | | 1,660 | | | | 26,377 | |
McGrath Rentcorp | | | 1,093 | | | | 29,806 | |
Paychex, Inc. | | | 20,135 | | | | 631,434 | |
R.R. Donnelley & Sons Co.(a) | | | 16,563 | | | | 313,372 | |
| | | | | | | | |
| Total Commercial Services | | | | | | | 2,664,170 | |
| Computers – 0.1% | | | | | | | | |
Diebold, Inc. | | | 3,094 | | | | 109,713 | |
| Cosmetics/Personal Care – 4.0% | | | | | | | | |
Procter & Gamble Co. (The) | | | 114,527 | | | | 7,054,863 | |
| Distribution/Wholesale – 0.3% | | | | | | | | |
Genuine Parts Co. | | | 6,978 | | | | 374,300 | |
Watsco, Inc.(a) | | | 1,257 | | | | 87,625 | |
| | | | | | | | |
| Total Distribution/Wholesale | | | | | | | 461,925 | |
| Diversified Financial Services – 0.4% | | | | | | | | |
BGC Partners, Inc. Class A | | | 6,457 | | | | 59,986 | |
Federated Investors, Inc. Class B(a) | | | 5,103 | | | | 136,505 | |
GFI Group, Inc. | | | 7,611 | | | | 38,207 | |
NYSE Euronext | | | 14,489 | | | | 509,578 | |
Westwood Holdings Group, Inc. | | | 378 | | | | 15,215 | |
| | | | | | | | |
| Total Diversified Financial Services | | | | | | | 759,491 | |
| Electric – 13.4% | | | | | | | | |
ALLETE, Inc. | | | 2,366 | | | | 92,203 | |
Alliant Energy Corp. | | | 6,553 | | | | 255,108 | |
Ameren Corp. | | | 17,695 | | | | 496,699 | |
American Electric Power Co., Inc. | | | 33,519 | | | | 1,177,858 | |
Avista Corp. | | | 3,180 | | | | 73,553 | |
Black Hills Corp.(a) | | | 2,540 | | | | 84,938 | |
Central Vermont Public Service Corp. | | | 527 | | | | 12,274 | |
CH Energy Group, Inc. | | | 958 | | | | 48,417 | |
Cleco Corp.(a) | | | 2,696 | | | | 92,446 | |
CMS Energy Corp.(a) | | | 14,314 | | | | 281,127 | |
Consolidated Edison, Inc. | | | 19,180 | | | | 972,810 | |
Constellation Energy Group, Inc. | | | 9,186 | | | | 285,960 | |
Dominion Resources, Inc. | | | 34,547 | | | | 1,544,251 | |
DPL, Inc.(a) | | | 7,432 | | | | 203,711 | |
DTE Energy Co. | | | 11,338 | | | | 555,108 | |
Duke Energy Corp. | | | 100,297 | | | | 1,820,391 | |
See Notes to Financial Statements.
| | | | |
| WisdomTree Domestic Dividend Funds | | | 23 | |
Schedule of Investments (continued)
WisdomTree Equity Income Fund (DHS)
March 31, 2011
| | | | | | | | |
| Investments | | Shares | | | Fair Value | |
| | | | | | | | |
Edison International | | | 14,828 | | | $ | 542,556 | |
Empire District Electric Co. (The) | | | 3,350 | | | | 72,996 | |
Entergy Corp. | | | 11,442 | | | | 769,017 | |
Exelon Corp. | | | 45,815 | | | | 1,889,411 | |
FirstEnergy Corp. | | | 25,078 | | | | 930,143 | |
Great Plains Energy, Inc. | | | 7,979 | | | | 159,740 | |
Hawaiian Electric Industries, Inc. | | | 7,161 | | | | 177,593 | |
IDACORP, Inc. | | | 2,179 | | | | 83,020 | |
Integrys Energy Group, Inc. | | | 5,887 | | | | 297,352 | |
MDU Resources Group, Inc. | | | 7,872 | | | | 180,820 | |
MGE Energy, Inc. | | | 1,125 | | | | 45,551 | |
NextEra Energy, Inc. | | | 22,273 | | | | 1,227,688 | |
Northeast Utilities | | | 7,882 | | | | 272,717 | |
NorthWestern Corp. | | | 2,367 | | | | 71,720 | |
NSTAR | | | 5,780 | | | | 267,441 | |
NV Energy, Inc. | | | 11,153 | | | | 166,068 | |
OGE Energy Corp. | | | 4,329 | | | | 218,874 | |
Otter Tail Corp. | | | 2,798 | | | | 63,598 | |
Pepco Holdings, Inc. | | | 18,197 | | | | 339,374 | |
PG&E Corp. | | | 20,510 | | | | 906,132 | |
Pinnacle West Capital Corp. | | | 7,597 | | | | 325,076 | |
PNM Resources, Inc. | | | 4,729 | | | | 70,557 | |
Portland General Electric Co. | | | 4,860 | | | | 115,522 | |
PPL Corp. | | | 35,889 | | | | 907,992 | |
Progress Energy, Inc. | | | 22,665 | | | | 1,045,763 | |
Public Service Enterprise Group, Inc. | | | 30,111 | | | | 948,798 | |
SCANA Corp.(a) | | | 8,152 | | | | 320,944 | |
Southern Co. | | | 54,886 | | | | 2,091,705 | |
TECO Energy, Inc. | | | 14,130 | | | | 265,079 | |
UIL Holdings Corp.(a) | | | 3,816 | | | | 116,464 | |
Unisource Energy Corp. | | | 1,966 | | | | 71,032 | |
Unitil Corp. | | | 999 | | | | 23,536 | |
Westar Energy, Inc.(a) | | | 7,538 | | | | 199,154 | |
Xcel Energy, Inc. | | | 26,928 | | | | 643,310 | |
| | | | | | | | |
| Total Electric | | | | | | | 23,823,597 | |
| Electrical Components & Equipment – 0.0% | | | | | | | | |
Molex, Inc. Class A | | | 4,101 | | | | 84,850 | |
| Electronics – 0.0% | | | | | | | | |
DDi Corp. | | | 798 | | | | 8,435 | |
| Entertainment – 0.2% | | | | | | | | |
Cinemark Holdings, Inc. | | | 7,390 | | | | 142,997 | |
National CineMedia, Inc. | | | 3,255 | | | | 60,771 | |
Regal Entertainment Group Class A(a) | | | 8,687 | | | | 117,274 | |
| | | | | | | | |
| Total Entertainment | | | | | | | 321,042 | |
| Environmental Control – 0.5% | | | | | | | | |
Mine Safety Appliances Co. | | | 1,561 | | | | 57,242 | |
U.S. Ecology, Inc. | | | 1,218 | | | | 21,230 | |
Waste Management, Inc. | | | 22,541 | | | | 841,681 | |
| | | | | | | | |
| Total Environmental Control | | | | | | | 920,153 | |
| Food – 4.1% | | | | | | | | |
B&G Foods, Inc. | | | 3,280 | | | | 61,566 | |
Campbell Soup Co.(a) | | | 14,917 | | | | 493,902 | |
| | | | | | | | |
| Investments | | Shares | | | Fair Value | |
| | | | | | | | |
ConAgra Foods, Inc. | | | 24,616 | | | $ | 584,630 | |
General Mills, Inc. | | | 26,435 | | | | 966,199 | |
H.J. Heinz Co.(a) | | | 15,649 | | | | 763,984 | |
Ingles Markets, Inc. Class A | | | 824 | | | | 16,323 | |
Kellogg Co. | | | 15,638 | | | | 844,139 | |
Kraft Foods, Inc. Class A | | | 87,221 | | | | 2,735,251 | |
SUPERVALU, Inc.(a) | | | 10,748 | | | | 95,980 | |
Sysco Corp. | | | 28,359 | | | | 785,544 | |
Village Super Market, Inc. Class A | | | 241 | | | | 7,013 | |
| | | | | | | | |
| Total Food | | | | | | | 7,354,531 | |
| Forest Products & Paper – 0.2% | | | | | | | | |
MeadWestvaco Corp. | | | 9,454 | | | | 286,740 | |
| Gas – 1.3% | | | | | | | | |
AGL Resources, Inc.(a) | | | 5,257 | | | | 209,439 | |
Atmos Energy Corp. | | | 5,395 | | | | 183,970 | |
CenterPoint Energy, Inc. | | | 28,273 | | | | 496,474 | |
Chesapeake Utilities Corp. | | | 417 | | | | 17,355 | |
Laclede Group, Inc. (The) | | | 1,532 | | | | 58,369 | |
New Jersey Resources Corp.(a) | | | 1,885 | | | | 80,961 | |
Nicor, Inc. | | | 2,342 | | | | 125,765 | |
NiSource, Inc. | | | 20,424 | | | | 391,732 | |
Northwest Natural Gas Co. | | | 1,478 | | | | 68,180 | |
Piedmont Natural Gas Co., Inc.(a) | | | 3,731 | | | | 113,236 | |
Questar Corp. | | | 7,232 | | | | 126,198 | |
UGI Corp. | | | 4,807 | | | | 158,150 | |
Vectren Corp. | | | 6,044 | | | | 164,397 | |
WGL Holdings, Inc. | | | 2,923 | | | | 113,997 | |
| | | | | | | | |
| Total Gas | | | | | | | 2,308,223 | |
| Healthcare-Products – 4.3% | | | | | | | | |
Johnson & Johnson | | | 128,115 | | | | 7,590,814 | |
Meridian Bioscience, Inc.(a) | | | 1,495 | | | | 35,865 | |
| | | | | | | | |
| Total Healthcare-Products | | | | | | | 7,626,679 | |
| Holding Companies-Diversified – 0.0% | | | | | | | | |
Compass Diversified Holdings | | | 4,937 | | | | 72,771 | |
| Home Builders – 0.0% | | | | | | | | |
MDC Holdings, Inc. | | | 2,364 | | | | 59,927 | |
| Household Products/Wares – 1.1% | | | | | | | | |
Clorox Co.(a) | | | 6,681 | | | | 468,137 | |
Ennis, Inc. | | | 1,559 | | | | 26,550 | |
Kimberly-Clark Corp.(a) | | | 23,529 | | | | 1,535,738 | |
| | | | | | | | |
| Total Household Products/Wares | | | | | | | 2,030,425 | |
| Insurance – 1.3% | | | | | | | | |
American National Insurance Co. | | | 1,252 | | | | 99,121 | |
Arthur J. Gallagher & Co. | | | 6,347 | | | | 193,012 | |
Baldwin & Lyons, Inc. Class B(a) | | | 711 | | | | 16,652 | |
Cincinnati Financial Corp.(a) | | | 11,150 | | | | 365,720 | |
EMC Insurance Group, Inc. | | | 682 | | | | 16,934 | |
Fidelity National Financial, Inc. Class A | | | 15,938 | | | | 225,204 | |
Harleysville Group, Inc. | | | 1,427 | | | | 47,276 | |
Kansas City Life Insurance Co. | | | 437 | | | | 13,975 | |
Life Partners Holdings, Inc.(a) | | | 1,397 | | | | 11,232 | |
See Notes to Financial Statements.
| | |
| 24 | | WisdomTree Domestic Dividend Funds |
Schedule of Investments (continued)
WisdomTree Equity Income Fund (DHS)
March 31, 2011
| | | | | | | | |
| Investments | | Shares | | | Fair Value | |
| | | | | | | | |
Marsh & McLennan Cos., Inc. | | | 23,126 | | | $ | 689,386 | |
Mercury General Corp. | | | 4,167 | | | | 163,055 | |
Old Republic International Corp. | | | 18,206 | | | | 231,034 | |
Safety Insurance Group, Inc. | | | 1,000 | | | | 46,110 | |
State Auto Financial Corp.(a) | | | 2,032 | | | | 37,023 | |
Unitrin, Inc. | | | 2,961 | | | | 91,436 | |
| | | | | | | | |
| Total Insurance | | | | | | | 2,247,170 | |
| Internet – 0.1% | | | | | | | | |
Earthlink, Inc. | | | 11,039 | | | | 86,435 | |
Nutrisystem, Inc.(a) | | | 1,005 | | | | 14,563 | |
United Online, Inc. | | | 7,203 | | | | 45,415 | |
| | | | | | | | |
| Total Internet | | | | | | | 146,413 | |
| Investment Companies – 0.8% | | | | | | | | |
Apollo Investment Corp. | | | 26,880 | | | | 324,173 | |
Ares Capital Corp. | | | 21,858 | | | | 369,400 | |
BlackRock Kelso Capital Corp. | | | 10,644 | | | | 107,824 | |
Fifth Street Finance Corp.(a) | | | 7,950 | | | | 106,132 | |
Gladstone Capital Corp.(a) | | | 1,705 | | | | 19,283 | |
Golub Capital BDC, Inc. | | | 1,509 | | | | 23,812 | |
Main Street Capital Corp.(a) | | | 1,842 | | | | 33,985 | |
MCG Capital Corp.(a) | | | 7,068 | | | | 45,942 | |
MVC Capital, Inc. | | | 1,559 | | | | 21,389 | |
PennantPark Investment Corp. | | | 4,599 | | | | 54,820 | |
Prospect Capital Corp.(a) | | | 13,037 | | | | 159,182 | |
Solar Capital Ltd. | | | 4,387 | | | | 104,762 | |
TICC Capital Corp. | | | 2,724 | | | | 29,610 | |
Triangle Capital Corp. | | | 1,533 | | | | 27,686 | |
| | | | | | | | |
| Total Investment Companies | | | | | | | 1,428,000 | |
| Iron/Steel – 0.4% | | | | | | | | |
Nucor Corp.(a) | | | 14,238 | | | | 655,233 | |
| Media – 0.0% | | | | | | | | |
World Wrestling Entertainment, Inc. Class A(a) | | | 3,778 | | | | 47,489 | |
| Mining – 1.0% | | | | | | | | |
Southern Copper Corp. | | | 42,110 | | | | 1,695,770 | |
| Miscellaneous Manufacturing – 0.2% | | | | | | | | |
Harsco Corp. | | | 2,958 | | | | 104,388 | |
Leggett & Platt, Inc. | | | 9,621 | | | | 235,714 | |
NL Industries, Inc.(a) | | | 2,927 | | | | 43,466 | |
| | | | | | | | |
| Total Miscellaneous Manufacturing | | | | | | | 383,568 | |
| Office Furnishings – 0.0% | | | | | | | | |
HNI Corp. | | | 1,739 | | | | 54,883 | |
| Office/Business Equipment – 0.2% | | | | | | | | |
Pitney Bowes, Inc.(a) | | | 16,713 | | | | 429,357 | |
| Oil & Gas – 8.4% | | | | | | | | |
Chevron Corp. | | | 89,138 | | | | 9,576,095 | |
ConocoPhillips | | | 67,222 | | | | 5,368,349 | |
| | | | | | | | |
| Total Oil & Gas | | | | | | | 14,944,444 | |
| Packaging & Containers – 0.1% | | | | | | | | |
Sonoco Products Co. | | | 4,655 | | | | 168,651 | |
| | | | | | | | |
| Investments | | Shares | | | Fair Value | |
| | | | | | | | |
| Pharmaceuticals – 13.9% | | | | | | | | |
Abbott Laboratories(a) | | | 76,308 | | | $ | 3,742,908 | |
Bristol-Myers Squibb Co. | | | 111,384 | | | | 2,943,879 | |
Eli Lilly & Co. | | | 87,153 | | | | 3,065,171 | |
Merck & Co., Inc. | | | 172,925 | | | | 5,708,254 | |
Pfizer, Inc. | | | 456,277 | | | | 9,266,986 | |
| | | | | | | | |
| Total Pharmaceuticals | | | | | | | 24,727,198 | |
| Pipelines – 0.7% | | | | | | | | |
Oneok, Inc. | | | 5,184 | | | | 346,706 | |
Spectra Energy Corp.(a) | | | 36,003 | | | | 978,561 | |
| | | | | | | | |
| Total Pipelines | | | | | | | 1,325,267 | |
| Private Equity – 0.0% | | | | | | | | |
Hercules Technology Growth Capital, Inc. | | | 3,954 | | | | 43,494 | |
| REITS – 9.2% | | | | | | | | |
Acadia Realty Trust | | | 2,662 | | | | 50,365 | |
Agree Realty Corp.(a) | | | 1,001 | | | | 22,472 | |
AMB Property Corp. | | | 8,453 | | | | 304,054 | |
American Campus Communities, Inc. | | | 3,882 | | | | 128,106 | |
Associated Estates Realty Corp. | | | 2,158 | | | | 34,269 | |
AvalonBay Communities, Inc.(a) | | | 3,834 | | | | 460,387 | |
BioMed Realty Trust, Inc. | | | 6,396 | | | | 121,652 | |
Brandywine Realty Trust(a) | | | 10,058 | | | | 122,104 | |
BRE Properties, Inc. | | | 3,149 | | | | 148,570 | |
Camden Property Trust(a) | | | 3,303 | | | | 187,676 | |
CapLease, Inc. | | | 3,385 | | | | 18,550 | |
CBL & Associates Properties, Inc.(a) | | | 8,403 | | | | 146,380 | |
Cedar Shopping Centers, Inc. | | | 4,377 | | | | 26,393 | |
Chesapeake Lodging Trust | | | 883 | | | | 15,373 | |
Cogdell Spencer, Inc. | | | 4,483 | | | | 26,629 | |
Colonial Properties Trust | | | 3,701 | | | | 71,244 | |
CommonWealth REIT | | | 7,918 | | | | 205,630 | |
Corporate Office Properties Trust SBI MD(a) | | | 4,376 | | | | 158,149 | |
DCT Industrial Trust, Inc.(a) | | | 16,282 | | | | 90,365 | |
Digital Realty Trust, Inc.(a) | | | 4,927 | | | | 286,456 | |
Duke Realty Corp. | | | 21,001 | | | | 294,224 | |
EastGroup Properties, Inc. | | | 1,843 | | | | 81,037 | |
Entertainment Properties Trust(a) | | | 3,642 | | | | 170,518 | |
Equity One, Inc.(a) | | | 7,156 | | | | 134,318 | |
Essex Property Trust, Inc. | | | 1,609 | | | | 199,516 | |
Federal Realty Investment Trust | | | 3,006 | | | | 245,169 | |
First Potomac Realty Trust | | | 3,562 | | | | 56,101 | |
Franklin Street Properties Corp. | | | 6,918 | | | | 97,336 | |
Getty Realty Corp.(a) | | | 2,636 | | | | 60,312 | |
Glimcher Realty Trust | | | 6,169 | | | | 57,063 | |
Government Properties Income Trust | | | 3,288 | | | | 88,316 | |
HCP, Inc. | | | 23,956 | | | | 908,891 | |
Health Care REIT, Inc. | | | 11,584 | | | | 607,465 | |
Healthcare Realty Trust, Inc. | | | 5,244 | | | | 119,039 | |
Hersha Hospitality Trust | | | 6,006 | | | | 35,676 | |
Highwoods Properties, Inc.(a) | | | 5,671 | | | | 198,542 | |
Home Properties, Inc. | | | 2,228 | | | | 131,341 | |
Hospitality Properties Trust | | | 13,559 | | | | 313,891 | |
Inland Real Estate Corp. | | | 8,188 | | | | 78,114 | |
See Notes to Financial Statements.
| | | | |
| WisdomTree Domestic Dividend Funds | | | 25 | |
Schedule of Investments (continued)
WisdomTree Equity Income Fund (DHS)
March 31, 2011
| | | | | | | | |
| Investments | | Shares | | | Fair Value | |
| | | | | | | | |
Investors Real Estate Trust | | | 8,315 | | | $ | 78,992 | |
Kilroy Realty Corp.(a) | | | 2,997 | | | | 116,374 | |
Kimco Realty Corp.(a) | | | 24,092 | | | | 441,847 | |
Kite Realty Group Trust(a) | | | 3,975 | | | | 21,107 | |
Lexington Realty Trust(a) | | | 10,439 | | | | 97,605 | |
Liberty Property Trust(a) | | | 9,739 | | | | 320,413 | |
LTC Properties, Inc. | | | 2,170 | | | | 61,498 | |
Macerich Co. (The) | | | 8,190 | | | | 405,651 | |
Mack-Cali Realty Corp.(a) | | | 6,434 | | | | 218,113 | |
Medical Properties Trust, Inc. | | | 11,494 | | | | 132,986 | |
Mid-America Apartment Communities, Inc.(a) | | | 1,866 | | | | 119,797 | |
Monmouth Real Estate Investment Corp.
Class A(a) | | | 2,755 | | | | 22,619 | |
National Health Investors, Inc. | | | 2,141 | | | | 102,597 | |
National Retail Properties, Inc.(a) | | | 6,801 | | | | 177,710 | |
Nationwide Health Properties, Inc.(a) | | | 9,479 | | | | 403,142 | |
Omega Healthcare Investors, Inc.(a) | | | 9,473 | | | | 211,627 | |
Pennsylvania Real Estate Investment Trust | | | 3,290 | | | | 46,948 | |
Piedmont Office Realty Trust, Inc. Class A(a) | | | 11,145 | | | | 216,324 | |
Plum Creek Timber Co., Inc.(a) | | | 10,252 | | | | 447,090 | |
Potlatch Corp.(a) | | | 3,465 | | | | 139,293 | |
ProLogis | | | 25,960 | | | | 414,841 | |
PS Business Parks, Inc. | | | 1,095 | | | | 63,444 | |
Public Storage(a) | | | 7,420 | | | | 822,952 | |
Ramco-Gershenson Properties Trust | | | 3,106 | | | | 38,918 | |
Rayonier, Inc. | | | 4,672 | | | | 291,112 | |
Realty Income Corp.(a) | | | 8,323 | | | | 290,889 | |
Regency Centers Corp. | | | 5,152 | | | | 224,009 | |
Saul Centers, Inc. | | | 803 | | | | 35,774 | |
Senior Housing Properties Trust(a) | | | 12,516 | | | | 288,369 | |
Simon Property Group, Inc. | | | 13,220 | | | | 1,416,655 | |
Sovran Self Storage, Inc. | | | 1,871 | | | | 73,998 | |
Sun Communities, Inc. | | | 2,071 | | | | 73,831 | |
Tanger Factory Outlet Centers | | | 3,526 | | | | 92,522 | |
Taubman Centers, Inc. | | | 2,731 | | | | 146,327 | |
UDR, Inc. | | | 8,241 | | | | 200,833 | |
Universal Health Realty Income Trust | | | 1,149 | | | | 46,569 | |
Urstadt Biddle Properties, Inc. Class A | | | 1,796 | | | | 34,160 | |
Ventas, Inc.(a) | | | 9,403 | | | | 510,583 | |
Vornado Realty Trust | | | 8,050 | | | | 704,375 | |
Washington Real Estate Investment Trust | | | 5,167 | | | | 160,642 | |
Weingarten Realty Investors(a) | | | 7,404 | | | | 185,544 | |
Winthrop Realty Trust | | | 1,567 | | | | 19,196 | |
| | | | | | | | |
| Total REITS | | | | | | | 16,418,969 | |
| Retail – 0.1% | | | | | | | | |
Foot Locker, Inc. | | | 6,859 | | | | 135,259 | |
HOT Topic, Inc. | | | 2,310 | | | | 13,167 | |
| | | | | | | | |
| Total Retail | | | | | | | 148,426 | |
| Savings & Loans – 1.1% | | | | | | | | |
Astoria Financial Corp. | | | 5,220 | | | | 75,011 | |
Berkshire Hills Bancorp, Inc.(a) | | | 697 | | | | 14,533 | |
Brookline Bancorp, Inc.(a) | | | 2,596 | | | | 27,336 | |
Capitol Federal Financial, Inc. | | | 18,442 | | | | 207,841 | |
| | | | | | | | |
| Investments | | Shares | | | Fair Value | |
| | | | | | | | |
Dime Community Bancshares, Inc. | | | 1,790 | | | $ | 26,420 | |
First Niagara Financial Group, Inc.(a) | | | 12,030 | | | | 163,367 | |
Flushing Financial Corp. | | | 1,593 | | | | 23,736 | |
Hudson City Bancorp, Inc. | | | 34,722 | | | | 336,109 | |
New York Community Bancorp, Inc.(a) | | | 33,240 | | | | 573,722 | |
Northwest Bancshares, Inc. | | | 5,336 | | | | 66,914 | |
OceanFirst Financial Corp. | | | 782 | | | | 10,909 | |
Oritani Financial Corp. | | | 2,146 | | | | 27,211 | |
People’s United Financial, Inc.(a) | | | 22,420 | | | | 282,044 | |
Provident Financial Services, Inc. | | | 2,513 | | | | 37,192 | |
Roma Financial Corp. | | | 1,165 | | | | 12,897 | |
| | | | | | | | |
| Total Savings & Loans | | | | | | | 1,885,242 | |
| Semiconductors – 3.3% | | | | | | | | |
Intel Corp. | | | 254,912 | | | | 5,141,575 | |
Intersil Corp. Class A(a) | | | 5,498 | | | | 68,450 | |
Maxim Integrated Products, Inc. | | | 14,162 | | | | 362,547 | |
Microchip Technology, Inc.(a) | | | 10,263 | | | | 390,097 | |
| | | | | | | | |
| Total Semiconductors | | | | | | | 5,962,669 | |
| Telecommunications – 14.5% | | | | | | | | |
Alaska Communications Systems Group, Inc.(a) | | | 4,710 | | | | 50,161 | |
AT&T, Inc. | | | 461,227 | | | | 14,113,546 | |
CenturyLink, Inc.(a) | | | 26,081 | | | | 1,083,666 | |
Comtech Telecommunications Corp. | | | 1,162 | | | | 31,583 | |
Consolidated Communications Holdings, Inc. | | | 3,414 | | | | 63,944 | |
Frontier Communications Corp.(a) | | | 108,531 | | | | 892,125 | |
IDT Corp. Class B | | | 556 | | | | 14,984 | |
NTELOS Holdings Corp. | | | 3,351 | | | | 61,692 | |
Qwest Communications International, Inc.(a) | | | 101,149 | | | | 690,848 | |
Verizon Communications, Inc.(a) | | | 215,465 | | | | 8,304,021 | |
Windstream Corp.(a) | | | 46,415 | | | | 597,361 | |
| | | | | | | | |
| Total Telecommunications | | | | | | | 25,903,931 | |
| Toys/Games/Hobbies – 0.2% | | | | | | | | |
Mattel, Inc. | | | 16,101 | | | | 401,398 | |
| Transportation – 0.1% | | | | | | | | |
Alexander & Baldwin, Inc.(a) | | | 1,855 | | | | 84,681 | |
Overseas Shipholding Group, Inc.(a) | | | 1,988 | | | | 63,894 | |
| | | | | | | | |
| Total Transportation | | | | | | | 148,575 | |
| Trucking & Leasing – 0.1% | | | | | | | | |
GATX Corp. | | | 2,039 | | | | 78,828 | |
TAL International Group, Inc. | | | 1,904 | | | | 69,058 | |
| | | | | | | | |
| Total Trucking & Leasing | | | | | | | 147,886 | |
| Water – 0.2% | | | | | | | | |
American Water Works Co., Inc. | | | 8,426 | | | | 236,349 | |
California Water Service Group | | | 738 | | | | 27,432 | |
Connecticut Water Service, Inc. | | | 341 | | | | 8,985 | |
Middlesex Water Co. | | | 869 | | | | 15,807 | |
York Water Co. | | | 423 | | | | 7,365 | |
| | | | | | | | |
| Total Water | | | | | | | 295,938 | |
TOTAL COMMON STOCKS
(Cost: $169,927,897) | | | | | | | 177,040,007 | |
See Notes to Financial Statements.
| | |
| 26 | | WisdomTree Domestic Dividend Funds |
Schedule of Investments (concluded)
WisdomTree Equity Income Fund (DHS)
March 31, 2011
| | | | | | | | |
| Investments | | Shares | | | Fair Value | |
| | | | | | | | |
| EXCHANGE-TRADED FUND – 0.4% | | | | | | | | |
WisdomTree Total Dividend Fund (b)
(Cost: $754,901) | | | 16,165 | | | $ | 792,408 | |
| SHORT-TERM INVESTMENT – 0.1% | | | | | | | | |
| MONEY MARKET FUND – 0.1% | | | | | | | | |
| Invesco Treasury Fund Private Class, 0.02%(c) (Cost: $171,947) | | | 171,947 | | | | 171,947 | |
| INVESTMENT OF CASH COLLATERAL FOR SECURITIES LOANED – 16.2% | | | | | | | | |
| MONEY MARKET FUND – 16.2% | | | | | | | | |
Dreyfus Institutional Preferred Money Market Fund, 0.19%(d) (Cost: $28,880,000)(e) | | | 28,880,000 | | | | 28,880,000 | |
TOTAL INVESTMENTS IN SECURITIES – 116.0%
(Cost: $199,734,745) | | | | 206,884,362 | |
Liabilities in Excess of Other Assets – (16.0)% | | | | | | | (28,611,573 | ) |
| | | | | | | | |
| NET ASSETS – 100.0% | | | | | | $ | 178,272,789 | |
| (a) | Security, or portion thereof, was on loan at March 31, 2011 (See Note 2). |
| (b) | Affiliated companies (See Note 7). |
| (c) | Rate shown represents annualized 7–day yield as of March 31, 2011. |
| (d) | Interest rate shown reflects yield as of March 31, 2011. |
| (e) | At March 31, 2011, the total market value of the Fund’s securities on loan was $27,991,295 and the total market value of the collateral held by the Fund was $28,880,000. |
See Notes to Financial Statements.
| | | | |
| WisdomTree Domestic Dividend Funds | | | 27 | |
Schedule of Investments
WisdomTree LargeCap Dividend Fund (DLN)
March 31, 2011
| | | | | | | | |
| Investments | | Shares | | | Fair
Value | |
| | | | | | | | |
| COMMON STOCKS – 99.6% | | | | | | | | |
| Advertising – 0.1% | | | | | | | | |
Omnicom Group, Inc. | | | 13,908 | | | $ | 682,326 | |
| Aerospace/Defense – 3.0% | | | | | | | | |
Boeing Co. (The) | | | 52,985 | | | | 3,917,181 | |
General Dynamics Corp. | | | 24,901 | | | | 1,906,421 | |
Goodrich Corp.(a) | | | 4,696 | | | | 401,649 | |
L-3 Communications Holdings, Inc. | | | 6,961 | | | | 545,116 | |
Lockheed Martin Corp. | | | 41,806 | | | | 3,361,202 | |
Northrop Grumman Corp. | | | 23,678 | | | | 1,484,847 | |
Raytheon Co. | | | 32,726 | | | | 1,664,772 | |
Rockwell Collins, Inc. | | | 7,372 | | | | 477,927 | |
United Technologies Corp. | | | 54,442 | | | | 4,608,515 | |
| | | | | | | | |
| Total Aerospace/Defense | | | | | | | 18,367,630 | |
| Agriculture – 4.9% | | | | | | | | |
Altria Group, Inc. | | | 352,304 | | | | 9,170,473 | |
Archer-Daniels-Midland Co. | | | 34,407 | | | | 1,238,996 | |
Lorillard, Inc. | | | 22,382 | | | | 2,126,514 | |
Philip Morris International, Inc. | | | 214,389 | | | | 14,070,350 | |
Reynolds American, Inc. | | | 97,237 | | | | 3,454,831 | |
| | | | | | | | |
| Total Agriculture | | | | | | | 30,061,164 | |
| Airlines – 0.0% | | | | | | | | |
Southwest Airlines Co. | | | 3,229 | | | | 40,782 | |
| Apparel – 0.4% | | | | | | | | |
Coach, Inc. | | | 8,320 | | | | 432,973 | |
NIKE, Inc. Class B | | | 15,007 | | | | 1,136,030 | |
Polo Ralph Lauren Corp. | | | 741 | | | | 91,624 | |
VF Corp.(a) | | | 8,607 | | | | 848,048 | |
| | | | | | | | |
| Total Apparel | | | | | | | 2,508,675 | |
| Auto Manufacturers – 0.1% | | | | | | | | |
PACCAR, Inc.(a) | | | 8,519 | | | | 445,970 | |
| Auto Parts & Equipment – 0.2% | | | | | | | | |
Johnson Controls, Inc. | | | 31,068 | | | | 1,291,497 | |
| Banks – 2.7% | | | | | | | | |
Bank of America Corp. | | | 88,235 | | | | 1,176,172 | |
Bank of New York Mellon Corp. (The) | | | 41,985 | | | | 1,254,092 | |
BB&T Corp.(a) | | | 43,510 | | | | 1,194,349 | |
Capital One Financial Corp. | | | 6,074 | | | | 315,605 | |
Comerica, Inc. | | | 4,504 | | | | 165,387 | |
Fifth Third Bancorp | | | 6,443 | | | | 89,429 | |
Goldman Sachs Group, Inc. (The) | | | 11,850 | | | | 1,877,869 | |
JPMorgan Chase & Co. | | | 53,116 | | | | 2,448,648 | |
KeyCorp | | | 12,367 | | | | 109,819 | |
M&T Bank Corp. | | | 11,295 | | | | 999,269 | |
Morgan Stanley | | | 31,281 | | | | 854,597 | |
Northern Trust Corp. | | | 13,727 | | | | 696,645 | |
PNC Financial Services Group, Inc. | | | 9,839 | | | | 619,759 | |
Regions Financial Corp.(a) | | | 22,149 | | | | 160,802 | |
State Street Corp. | | | 1,746 | | | | 78,465 | |
SunTrust Banks, Inc. | | | 2,213 | | | | 63,823 | |
U.S. Bancorp | | | 41,157 | | | | 1,087,779 | |
| | | | | | | | |
| Investments | | Shares | | | Fair Value | |
| | | | | | | | |
Wells Fargo & Co. | | | 96,334 | | | $ | 3,053,788 | |
| | | | | | | | |
| Total Banks | | | | | | | 16,246,297 | |
| Beverages – 3.5% | | | | | | | | |
Coca-Cola Co. (The) | | | 172,917 | | | | 11,473,043 | |
Coca-Cola Enterprises, Inc. | | | 17,587 | | | | 480,125 | |
Dr. Pepper Snapple Group, Inc.(a) | | | 16,493 | | | | 612,880 | |
Molson Coors Brewing Co. Class B | | | 9,328 | | | | 437,390 | |
PepsiCo, Inc. | | | 127,637 | | | | 8,221,099 | |
| | | | | | | | |
| Total Beverages | | | | | | | 21,224,537 | |
| Chemicals – 2.4% | | | | | | | | |
Air Products & Chemicals, Inc. | | | 12,897 | | | | 1,163,051 | |
CF Industries Holdings, Inc. | | | 604 | | | | 82,621 | |
Dow Chemical Co. (The) | | | 57,164 | | | | 2,157,941 | |
E.I. Du Pont de Nemours & Co. | | | 84,169 | | | | 4,626,770 | |
Ecolab, Inc. | | | 7,964 | | | | 406,323 | |
Lubrizol Corp. | | | 2,462 | | | | 329,810 | |
Monsanto Co. | | | 26,658 | | | | 1,926,307 | |
Mosaic Co. (The)(a) | | | 3,726 | | | | 293,423 | |
PPG Industries, Inc.(a) | | | 12,208 | | | | 1,162,324 | |
Praxair, Inc. | | | 16,369 | | | | 1,663,090 | |
Sherwin-Williams Co. (The)(a) | | | 5,387 | | | | 452,454 | |
Sigma-Aldrich Corp. | | | 3,278 | | | | 208,612 | |
| | | | | | | | |
| Total Chemicals | | | | | | | 14,472,726 | |
| Coal – 0.1% | | | | | | | | |
Consol Energy, Inc. | | | 5,726 | | | | 307,085 | |
Peabody Energy Corp. | | | 4,177 | | | | 300,577 | |
| | | | | | | | |
| Total Coal | | | | | | | 607,662 | |
| Commercial Services – 0.8% | | | | | | | | |
Automatic Data Processing, Inc. | | | 41,768 | | | | 2,143,116 | |
Mastercard, Inc. Class A | | | 773 | | | | 194,580 | |
Moody’s Corp. | | | 9,886 | | | | 335,234 | |
Paychex, Inc. | | | 40,334 | | | | 1,264,874 | |
Visa, Inc. Class A | | | 10,376 | | | | 763,881 | |
Western Union Co. (The) | | | 22,020 | | | | 457,356 | |
| | | | | | | | |
| Total Commercial Services | | | | | | | 5,159,041 | |
| Computers – 2.0% | | | | | | | | |
Computer Sciences Corp.(a) | | | 4,881 | | | | 237,851 | |
Hewlett-Packard Co. | | | 47,609 | | | | 1,950,541 | |
International Business Machines Corp. | | | 60,962 | | | | 9,941,073 | |
| | | | | | | | |
| Total Computers | | | | | | | 12,129,465 | |
| Cosmetics/Personal Care – 3.0% | | | | | | | | |
Avon Products, Inc. | | | 35,087 | | | | 948,753 | |
Colgate-Palmolive Co. | | | 34,137 | | | | 2,756,904 | |
Estee Lauder Cos., Inc. (The) Class A | | | 3,429 | | | | 330,418 | |
Procter & Gamble Co. (The) | | | 231,177 | | | | 14,240,503 | |
| | | | | | | | |
| Total Cosmetics/Personal Care | | | | | | | 18,276,578 | |
| Distribution/Wholesale – 0.3% | | | | | | | | |
Fastenal Co.(a) | | | 5,824 | | | | 377,570 | |
Genuine Parts Co. | | | 14,127 | | | | 757,772 | |
W.W. Grainger, Inc. | | | 3,054 | | | | 420,475 | |
| | | | | | | | |
| Total Distribution/Wholesale | | | | | | | 1,555,817 | |
See Notes to Financial Statements.
| | |
| 28 | | WisdomTree Domestic Dividend Funds |
Schedule of Investments (continued)
WisdomTree LargeCap Dividend Fund (DLN)
March 31, 2011
| | | | | | | | |
| Investments | | Shares | | | Fair
Value | |
| | | | | | | | |
| Diversified Financial Services – 1.5% | | | | | | | | |
American Express Co. | | | 51,697 | | | $ | 2,336,704 | |
Ameriprise Financial, Inc. | | | 9,088 | | | | 555,095 | |
BlackRock, Inc. | | | 7,599 | | | | 1,527,475 | |
Charles Schwab Corp. (The)(a) | | | 46,338 | | | | 835,474 | |
CME Group, Inc. | | | 2,554 | | | | 770,159 | |
Discover Financial Services | | | 6,384 | | | | 153,982 | |
Franklin Resources, Inc.(a) | | | 4,635 | | | | 579,746 | |
NYSE Euronext | | | 29,163 | | | | 1,025,663 | |
T. Rowe Price Group, Inc. | | | 12,164 | | | | 807,933 | |
TD Ameritrade Holding Corp. | | | 15,955 | | | | 332,981 | |
| | | | | | | | |
| Total Diversified Financial Services | | | | | | | 8,925,212 | |
| Electric – 6.2% | | | | | | | | |
Ameren Corp. | | | 35,795 | | | | 1,004,766 | |
American Electric Power Co., Inc. | | | 67,158 | | | | 2,359,932 | |
Consolidated Edison, Inc.(a) | | | 38,566 | | | | 1,956,068 | |
Dominion Resources, Inc. | | | 69,723 | | | | 3,116,618 | |
DTE Energy Co. | | | 22,547 | | | | 1,103,901 | |
Duke Energy Corp. | | | 201,554 | | | | 3,658,205 | |
Edison International | | | 29,748 | | | | 1,088,479 | |
Entergy Corp. | | | 23,035 | | | | 1,548,182 | |
Exelon Corp. | | | 91,811 | | | | 3,786,286 | |
FirstEnergy Corp. | | | 50,342 | | | | 1,867,185 | |
NextEra Energy, Inc. | | | 44,595 | | | | 2,458,076 | |
PG&E Corp. | | | 41,055 | | | | 1,813,810 | |
PPL Corp. | | | 71,294 | | | | 1,803,738 | |
Progress Energy, Inc. | | | 45,583 | | | | 2,103,200 | |
Public Service Enterprise Group, Inc. | | | 60,270 | | | | 1,899,108 | |
Southern Co. | | | 110,705 | | | | 4,218,968 | |
Wisconsin Energy Corp. | | | 17,653 | | | | 538,416 | |
Xcel Energy, Inc. | | | 54,118 | | | | 1,292,879 | |
| | | | | | | | |
| Total Electric | | | | | | | 37,617,817 | |
| Electrical Components & Equipment – 0.5% | | | | | | | | |
AMETEK, Inc. | | | 2,472 | | | | 108,447 | |
Emerson Electric Co. | | | 49,929 | | | | 2,917,351 | |
| | | | | | | | |
| Total Electrical Components & Equipment | | | | | | | 3,025,798 | |
| Electronics – 0.0% | | | | | | | | |
Amphenol Corp. Class A | | | 582 | | | | 31,655 | |
| Engineering & Construction – 0.1% | | | | | | | | |
Fluor Corp.(a) | | | 4,072 | | | | 299,944 | |
| Environmental Control – 0.4% | | | | | | | | |
Republic Services, Inc. | | | 28,508 | | | | 856,381 | |
Waste Management, Inc. | | | 45,330 | | | | 1,692,622 | |
| | | | | | | | |
| Total Environmental Control | | | | | | | 2,549,003 | |
| Food – 3.0% | | | | | | | | |
Campbell Soup Co.(a) | | | 30,643 | | | | 1,014,590 | |
ConAgra Foods, Inc. | | | 49,164 | | | | 1,167,645 | |
General Mills, Inc. | | | 53,500 | | | | 1,955,425 | |
H.J. Heinz Co.(a) | | | 31,584 | | | | 1,541,931 | |
Hershey Co. (The) | | | 12,377 | | | | 672,690 | |
Hormel Foods Corp. | | | 15,430 | | | | 429,571 | |
J.M. Smucker Co. (The) | | | 8,070 | | | | 576,117 | |
| | | | | | | | |
| Investments | | Shares | | | Fair
Value | |
| | | | | | | | |
Kellogg Co. | | | 31,725 | | | $ | 1,712,516 | |
Kraft Foods, Inc. Class A | | | 175,576 | | | | 5,506,063 | |
Kroger Co. (The) | | | 34,073 | | | | 816,730 | |
Safeway, Inc.(a) | | | 22,970 | | | | 540,714 | |
Sara Lee Corp.(a) | | | 50,802 | | | | 897,671 | |
Sysco Corp. | | | 57,056 | | | | 1,580,451 | |
| | | | | | | | |
| Total Food | | | | | | | 18,412,114 | |
| Forest Products & Paper – 0.1% | | | | | | | | |
International Paper Co. | | | 22,162 | | | | 668,849 | |
| Gas – 0.3% | | | | | | | | |
CenterPoint Energy, Inc. | | | 54,780 | | | | 961,937 | |
Sempra Energy | | | 19,755 | | | | 1,056,892 | |
| | | | | | | | |
| Total Gas | | | | | | | 2,018,829 | |
| Hand/Machine Tools – 0.1% | | | | | | | | |
Stanley Black & Decker, Inc. | | | 9,099 | | | | 696,983 | |
| Healthcare-Products – 3.6% | | | | | | | | |
Baxter International, Inc. | | | 37,791 | | | | 2,032,022 | |
Becton Dickinson and Co. | | | 12,428 | | | | 989,517 | |
C.R. Bard, Inc.(a) | | | 2,067 | | | | 205,274 | |
Johnson & Johnson | | | 259,406 | | | | 15,369,805 | |
Medtronic, Inc. | | | 72,693 | | | | 2,860,470 | |
Stryker Corp.(a) | | | 11,912 | | | | 724,250 | |
| | | | | | | | |
| Total Healthcare-Products | | | | | | | 22,181,338 | |
| Healthcare-Services – 0.4% | | | | | | | | |
Aetna, Inc. | | | 1,531 | | | | 57,305 | |
CIGNA Corp. | | | 768 | | | | 34,007 | |
Quest Diagnostics, Inc. | | | 3,131 | | | | 180,721 | |
UnitedHealth Group, Inc. | | | 42,713 | | | | 1,930,628 | |
| | | | | | | | |
| Total Healthcare-Services | | | | | | | 2,202,661 | |
| Household Products/Wares – 0.7% | | | | | | | | |
Clorox Co.(a) | | | 13,378 | | | | 937,397 | |
Fortune Brands, Inc. | | | 5,357 | | | | 331,545 | |
Kimberly-Clark Corp. | | | 47,120 | | | | 3,075,522 | |
| | | | | | | | |
| Total Household Products/Wares | | | | | | | 4,344,464 | |
| Insurance – 2.2% | | | | | | | | |
Allstate Corp. (The) | | | 38,441 | | | | 1,221,655 | |
American Family Life Assurance Co., Inc. | | | 28,210 | | | | 1,488,924 | |
AON Corp. | | | 11,649 | | | | 616,931 | |
Chubb Corp. | | | 21,169 | | | | 1,297,871 | |
Hartford Financial Services Group, Inc.(a) | | | 8,246 | | | | 222,065 | |
Lincoln National Corp.(a) | | | 5,861 | | | | 176,064 | |
Loews Corp. | | | 7,612 | | | | 328,001 | |
Marsh & McLennan Cos., Inc. | | | 46,779 | | | | 1,394,482 | |
MetLife, Inc.(a) | | | 46,271 | | | | 2,069,702 | |
Principal Financial Group, Inc. | | | 14,988 | | | | 481,265 | |
Progressive Corp. (The) | | | 13,228 | | | | 279,508 | |
Prudential Financial, Inc. | | | 26,273 | | | | 1,617,891 | |
Travelers Cos., Inc. (The) | | | 33,185 | | | | 1,973,844 | |
Unum Group | | | 13,600 | | | | 357,000 | |
| | | | | | | | |
| Total Insurance | | | | | | | 13,525,203 | |
See Notes to Financial Statements.
| | | | |
| WisdomTree Domestic Dividend Funds | | | 29 | |
Schedule of Investments (continued)
WisdomTree LargeCap Dividend Fund (DLN)
March 31, 2011
| | | | | | | | |
| Investments | | Shares | | | Fair
Value | |
| | | | | | | | |
| Internet – 0.0% | | | | | | | | |
Expedia, Inc. | | | 7,034 | | | $ | 159,390 | |
| Iron/Steel – 0.3% | | | | | | | | |
Cliffs Natural Resources, Inc. | | | 2,594 | | | | 254,938 | |
Nucor Corp.(a) | | | 28,550 | | | | 1,313,871 | |
United States Steel Corp. | | | 1,504 | | | | 81,126 | |
| | | | | | | | |
| Total Iron/Steel | | | | | | | 1,649,935 | |
| Leisure Time – 0.1% | | | | | | | | |
Harley-Davidson, Inc.(a) | | | 7,859 | | | | 333,929 | |
| Lodging – 0.1% | | | | | | | | |
Marriott International, Inc. Class A(a) | | | 8,737 | | | | 310,862 | |
Starwood Hotels & Resorts Worldwide, Inc. | | | 2,605 | | | | 151,403 | |
Wynn Resorts Ltd. | | | 3,161 | | | | 402,237 | |
| | | | | | | | |
| Total Lodging | | | | | | | 864,502 | |
| Machinery-Construction & Mining – 0.6% | | | | | | | | |
Caterpillar, Inc. | | | 33,370 | | | | 3,715,750 | |
Joy Global, Inc. | | | 2,445 | | | | 241,590 | |
| | | | | | | | |
| Total Machinery-Construction & Mining | | | | | | | 3,957,340 | |
| Machinery-Diversified – 0.5% | | | | | | | | |
Cummins, Inc. | | | 5,408 | | | | 592,825 | |
Deere & Co. | | | 17,442 | | | | 1,689,955 | |
Rockwell Automation, Inc.(a) | | | 7,750 | | | | 733,538 | |
Roper Industries, Inc.(a) | | | 1,482 | | | | 128,134 | |
| | | | | | | | |
| Total Machinery-Diversified | | | | | | | 3,144,452 | |
| Media – 2.3% | | | | | | | | |
Cablevision Systems Corp. Class A | | | 9,869 | | | | 341,566 | |
CBS Corp. Class B | | | 19,913 | | | | 498,622 | |
Comcast Corp. Class A | | | 98,203 | | | | 2,427,578 | |
Comcast Corp. Special Class A | | | 36,005 | | | | 836,036 | |
McGraw-Hill Cos., Inc. (The) | | | 21,706 | | | | 855,216 | |
News Corp. Class A | | | 51,556 | | | | 905,323 | |
News Corp. Class B | | | 20,212 | | | | 376,348 | |
Scripps Networks Interactive, Inc. Class A | | | 2,478 | | | | 124,123 | |
Time Warner Cable, Inc. | | | 24,194 | | | | 1,726,000 | |
Time Warner, Inc. | | | 82,002 | | | | 2,927,471 | |
Viacom, Inc. Class B | | | 23,788 | | | | 1,106,618 | |
Walt Disney Co. (The) | | | 49,335 | | | | 2,125,845 | |
| | | | | | | | |
| Total Media | | | | | | | 14,250,746 | |
| Metal Fabricate/Hardware – 0.0% | | | | | | | | |
Precision Castparts Corp. | | | 346 | | | | 50,924 | |
| Mining – 1.1% | | | | | | | | |
Alcoa, Inc.(a) | | | 24,082 | | | | 425,047 | |
Freeport-McMoRan Copper & Gold, Inc. | | | 44,884 | | | | 2,493,306 | |
Newmont Mining Corp. | | | 13,025 | | | | 710,905 | |
Southern Copper Corp. | | | 84,032 | | | | 3,383,969 | |
| | | | | | | | |
| Total Mining | | | | | | | 7,013,227 | |
| Miscellaneous Manufacturing – 4.7% | | | | | | | | |
3M Co.(a) | | | 47,819 | | | | 4,471,076 | |
Danaher Corp. | | | 2,743 | | | | 142,362 | |
Dover Corp. | | | 9,928 | | | | 652,667 | |
Eaton Corp. | | | 21,906 | | | | 1,214,469 | |
| | | | | | | | |
| Investments | | Shares | | | Fair
Value | |
| | | | | | | | |
General Electric Co. | | | 800,072 | | | $ | 16,041,444 | |
Honeywell International, Inc. | | | 50,822 | | | | 3,034,582 | |
Illinois Tool Works, Inc. | | | 36,117 | | | | 1,940,205 | |
ITT Corp. | | | 9,899 | | | | 594,435 | |
Parker Hannifin Corp. | | | 6,136 | | | | 580,956 | |
Textron, Inc.(a) | | | 2,745 | | | | 75,185 | |
| | | | | | | | |
| Total Miscellaneous Manufacturing | | | | | | | 28,747,381 | |
| Office/Business Equipment – 0.1% | | | | | | | | |
Xerox Corp. | | | 55,016 | | | | 585,920 | |
| Oil & Gas – 11.7% | | | | | | | | |
Anadarko Petroleum Corp. | | | 7,268 | | | | 595,395 | |
Apache Corp. | | | 5,396 | | | | 706,444 | |
Chesapeake Energy Corp. | | | 22,445 | | | | 752,356 | |
Chevron Corp. | | | 180,404 | | | | 19,380,802 | |
Cimarex Energy Co. | | | 792 | | | | 91,270 | |
ConocoPhillips | | | 136,364 | | | | 10,890,029 | |
Devon Energy Corp. | | | 10,371 | | | | 951,747 | |
Diamond Offshore Drilling, Inc.(a) | | | 2,940 | | | | 228,438 | |
EOG Resources, Inc. | | | 4,732 | | | | 560,789 | |
Exxon Mobil Corp. | | | 337,854 | | | | 28,423,657 | |
Hess Corp. | | | 4,993 | | | | 425,453 | |
Marathon Oil Corp. | | | 55,880 | | | | 2,978,963 | |
Murphy Oil Corp. | | | 8,361 | | | | 613,865 | |
Noble Energy, Inc. | | | 4,239 | | | | 409,699 | |
Occidental Petroleum Corp. | | | 35,659 | | | | 3,726,009 | |
Pioneer Natural Resources Co. | | | 358 | | | | 36,487 | |
QEP Resources, Inc. | | | 990 | | | | 40,135 | |
Range Resources Corp.(a) | | | 1,495 | | | | 87,398 | |
Valero Energy Corp. | | | 17,040 | | | | 508,133 | |
| | | | | | | | |
| Total Oil & Gas | | | | | | | 71,407,069 | |
| Oil & Gas Services – 0.5% | | | | | | | | |
Baker Hughes, Inc. | | | 13,094 | | | | 961,492 | |
Halliburton Co. | | | 22,953 | | | | 1,143,978 | |
National Oilwell Varco, Inc. | | | 8,275 | | | | 655,959 | |
| | | | | | | | |
| Total Oil & Gas Services | | | | | | | 2,761,429 | |
| Pharmaceuticals – 8.6% | | | | | | | | |
Abbott Laboratories | | | 154,840 | | | | 7,594,902 | |
Allergan, Inc. | | | 2,816 | | | | 199,992 | |
AmerisourceBergen Corp. | | | 9,555 | | | | 377,996 | |
Bristol-Myers Squibb Co. | | | 226,559 | | | | 5,987,954 | |
Cardinal Health, Inc. | | | 20,812 | | | | 855,998 | |
Eli Lilly & Co. | | | 175,425 | | | | 6,169,697 | |
McKesson Corp. | | | 7,180 | | | | 567,579 | |
Mead Johnson Nutrition Co. | | | 7,926 | | | | 459,153 | |
Merck & Co., Inc. | | | 348,084 | | | | 11,490,253 | |
Pfizer, Inc. | | | 923,794 | | | | 18,762,256 | |
| | | | | | | | |
| Total Pharmaceuticals | | | | | | | 52,465,780 | |
| Pipelines – 0.5% | | | | | | | | |
El Paso Corp. | | | 6,033 | | | | 108,594 | |
Spectra Energy Corp.(a) | | | 73,221 | | | | 1,990,147 | |
Williams Cos., Inc. (The) | | | 33,993 | | | | 1,059,902 | |
| | | | | | | | |
| Total Pipelines | | | | | | | 3,158,643 | |
See Notes to Financial Statements.
| | |
| 30 | | WisdomTree Domestic Dividend Funds |
Schedule of Investments (continued)
WisdomTree LargeCap Dividend Fund (DLN)
March 31, 2011
| | | | | | | | |
| Investments | | Shares | | | Fair
Value | |
| | | | | | | | |
| REITS – 2.5% | | | | | | | | |
AvalonBay Communities, Inc.(a) | | | 7,781 | | | $ | 934,342 | |
Boston Properties, Inc.(a) | | | 9,451 | | | | 896,427 | |
Equity Residential | | | 21,631 | | | | 1,220,205 | |
HCP, Inc. | | | 48,218 | | | | 1,829,391 | |
Health Care REIT, Inc. | | | 22,815 | | | | 1,196,419 | |
Host Hotels & Resorts, Inc.(a) | | | 4,084 | | | | 71,919 | |
Kimco Realty Corp. | | | 45,345 | | | | 831,627 | |
ProLogis | | | 52,225 | | | | 834,556 | |
Public Storage | | | 14,994 | | | | 1,662,985 | |
Simon Property Group, Inc. | | | 26,689 | | | | 2,859,993 | |
Ventas, Inc.(a) | | | 18,904 | | | | 1,026,487 | |
Vornado Realty Trust | | | 16,267 | | | | 1,423,363 | |
Weyerhaeuser Co. | | | 15,950 | | | | 392,370 | |
| | | | | | | | |
| Total REITS | | | | | | | 15,180,084 | |
| Retail – 6.4% | | | | | | | | |
Best Buy Co., Inc. | | | 18,689 | | | | 536,748 | |
Costco Wholesale Corp. | | | 13,670 | | | | 1,002,284 | |
CVS Caremark Corp. | | | 37,544 | | | | 1,288,510 | |
Darden Restaurants, Inc.(a) | | | 9,286 | | | | 456,221 | |
Family Dollar Stores, Inc. | | | 4,070 | | | | 208,872 | |
Gap, Inc. (The)(a) | | | 32,146 | | | | 728,428 | |
Home Depot, Inc. | | | 124,879 | | | | 4,628,016 | |
J.C. Penney Co., Inc. | | | 16,124 | | | | 579,013 | |
Lowe’s Cos., Inc. | | | 66,595 | | | | 1,760,106 | |
Ltd. Brands, Inc. | | | 18,054 | | | | 593,615 | |
Macy’s, Inc. | | | 9,345 | | | | 226,710 | |
McDonald’s Corp. | | | 92,157 | | | | 7,012,226 | |
Nordstrom, Inc. | | | 11,403 | | | | 511,767 | |
Ross Stores, Inc. | | | 3,215 | | | | 228,651 | |
Staples, Inc. | | | 31,331 | | | | 608,448 | |
Starbucks Corp. | | | 33,358 | | | | 1,232,578 | |
Target Corp. | | | 33,259 | | | | 1,663,283 | |
Tiffany & Co.(a) | | | 5,101 | | | | 313,405 | |
TJX Cos., Inc. | | | 15,198 | | | | 755,797 | |
Walgreen Co. | | | 47,381 | | | | 1,901,873 | |
Wal-Mart Stores, Inc. | | | 221,217 | | | | 11,514,345 | |
Yum! Brands, Inc. | | | 26,212 | | | | 1,346,773 | |
| | | | | | | | |
| Total Retail | | | | | | | 39,097,669 | |
| Savings & Loans – 0.2% | | | | | | | | |
New York Community Bancorp, Inc.(a) | | | 63,445 | | | | 1,095,061 | |
| Semiconductors – 2.8% | | | | | | | | |
Altera Corp.(a) | | | 5,703 | | | | 251,046 | |
Analog Devices, Inc. | | | 19,437 | | | | 765,429 | |
Applied Materials, Inc. | | | 76,464 | | | | 1,194,368 | |
Broadcom Corp. Class A | | | 8,463 | | | | 333,273 | |
Intel Corp. | | | 513,353 | | | | 10,354,330 | |
Linear Technology Corp. | | | 16,553 | | | | 556,677 | |
Maxim Integrated Products, Inc. | | | 28,571 | | | | 731,417 | |
Microchip Technology, Inc.(a) | | | 20,763 | | | | 789,202 | |
Texas Instruments, Inc. | | | 51,927 | | | | 1,794,597 | |
Xilinx, Inc.(a) | | | 16,242 | | | | 532,738 | |
| | | | | | | | |
| Total Semiconductors | | | | | | | 17,303,077 | |
| | | | | | | | |
| Investments | | Shares | | | Fair
Value | |
| | | | | | | | |
| Shipbuilding – 0.0% | | | | | | | | |
Huntington Ingalls Industries, Inc.* | | | 3,946 | | | $ | 163,759 | |
| Software – 2.9% | | | | | | | | |
Activision Blizzard, Inc. | | | 38,585 | | | | 423,278 | |
CA, Inc. | | | 10,088 | | | | 243,928 | |
Fidelity National Information Services, Inc. | | | 6,109 | | | | 199,703 | |
Microsoft Corp. | | | 538,022 | | | | 13,644,238 | |
Oracle Corp. | | | 91,366 | | | | 3,048,883 | |
| | | | | | | | |
| Total Software | | | | | | | 17,560,030 | |
| Telecommunications – 9.3% | | | | | | | | |
AT&T, Inc. | | | 932,322 | | | | 28,529,053 | |
CenturyLink, Inc.(a) | | | 53,122 | | | | 2,207,219 | |
Corning, Inc. | | | 45,893 | | | | 946,773 | |
Frontier Communications Corp. | | | 211,935 | | | | 1,742,106 | |
QUALCOMM, Inc. | | | 68,409 | | | | 3,750,865 | |
Qwest Communications International, Inc. | | | 210,559 | | | | 1,438,118 | |
Verizon Communications, Inc. | | | 435,345 | | | | 16,778,196 | |
Virgin Media, Inc.(a) | | | 5,512 | | | | 153,178 | |
Windstream Corp. | | | 89,011 | | | | 1,145,572 | |
| | | | | | | | |
| Total Telecommunications | | | | | | | 56,691,080 | |
| Toys/Games/Hobbies – 0.2% | | | | | | | | |
Hasbro, Inc.(a) | | | 7,181 | | | | 336,358 | |
Mattel, Inc. | | | 32,563 | | | | 811,796 | |
| | | | | | | | |
| Total Toys/Games/Hobbies | | | | | | | 1,148,154 | |
| Transportation – 1.6% | | | | | | | | |
C.H. Robinson Worldwide, Inc.(a) | | | 5,889 | | | | 436,552 | |
CSX Corp. | | | 16,990 | | | | 1,335,414 | |
Expeditors International of Washington, Inc. | | | 4,286 | | | | 214,900 | |
FedEx Corp. | | | 4,279 | | | | 400,300 | |
Norfolk Southern Corp. | | | 23,065 | | | | 1,597,713 | |
Union Pacific Corp. | | | 22,441 | | | | 2,206,623 | |
United Parcel Service, Inc. Class B | | | 52,285 | | | | 3,885,821 | |
| | | | | | | | |
| Total Transportation | | | | | | | 10,077,323 | |
TOTAL COMMON STOCKS
(Cost: $544,745,326) | | | | | | | 608,436,941 | |
| EXCHANGE-TRADED FUND – 0.2% | | | | | | | | |
WisdomTree Total Dividend Fund (b)
(Cost: $1,043,680) | | | 26,493 | | | | 1,298,687 | |
| SHORT-TERM INVESTMENT – 0.0% | | | | | | | | |
| MONEY MARKET FUND – 0.0% | | | | | | | | |
Invesco Treasury Fund Private Class, 0.02%(c) (Cost: $254,149) | | | 254,149 | | | | 254,149 | |
See Notes to Financial Statements.
| | | | |
| WisdomTree Domestic Dividend Funds | | | 31 | |
Schedule of Investments (concluded)
WisdomTree LargeCap Dividend Fund (DLN)
March 31, 2011
| | | | | | | | |
| Investments | | Shares | | | Fair
Value | |
| | | | | | | | |
| INVESTMENT OF CASH COLLATERAL FOR SECURITIES LOANED – 4.9% | | | | | | | | |
| MONEY MARKET FUND – 4.9% | | | | | | | | |
Dreyfus Institutional Preferred Money Market Fund, 0.19%(d) (Cost: $30,091,000)(e) | | | 30,091,000 | | | $ | 30,091,000 | |
TOTAL INVESTMENTS IN SECURITIES – 104.7%
(Cost: $576,134,155) | | | | 640,080,777 | |
Liabilities in Excess of Other Assets – (4.7)% | | | | | | | (28,987,040 | ) |
| | | | | | | | |
| NET ASSETS – 100.0% | | | | | | $ | 611,093,737 | |
| * | Non-income producing security. |
| (a) | Security, or portion thereof, was on loan at March 31, 2011 (See Note 2). |
| (b) | Affiliated companies (See Note 7). |
| (c) | Rate shown represents annualized 7-day yield as of March 31, 2011. |
| (d) | Interest rate shown reflects yield as of March 31, 2011. |
| (e) | At March 31, 2011, the total market value of the Fund’s securities on loan was $29,388,126 and the total market value of the collateral held by the Fund was $30,091,000. |
See Notes to Financial Statements.
| | |
| 32 | | WisdomTree Domestic Dividend Funds |
Schedule of Investments
WisdomTree Dividend ex-Financials Fund (DTN)
March 31, 2011
| | | | | | | | |
| Investments | | Shares | | | Fair Value | |
| | | | | | | | |
| COMMON STOCKS – 98.5% | | | | | | | | |
| Aerospace/Defense – 4.2% | | | | | | | | |
Boeing Co. (The)(a) | | | 40,489 | | | $ | 2,993,352 | |
Lockheed Martin Corp. | | | 61,225 | | | | 4,922,490 | |
Northrop Grumman Corp. | | | 46,834 | | | | 2,936,960 | |
Raytheon Co. | | | 69,829 | | | | 3,552,201 | |
| | | | | | | | |
| Total Aerospace/Defense | | | | | | | 14,405,003 | |
| Agriculture – 7.2% | | | | | | | | |
Altria Group, Inc. | | | 250,825 | | | | 6,528,975 | |
Lorillard, Inc. | | | 66,727 | | | | 6,339,732 | |
Philip Morris International, Inc. | | | 74,399 | | | | 4,882,807 | |
Reynolds American, Inc. | | | 192,251 | | | | 6,830,678 | |
| | | | | | | | |
| Total Agriculture | | | | | | | 24,582,192 | |
| Apparel – 1.0% | | | | | | | | |
VF Corp.(a) | | | 34,243 | | | | 3,373,963 | |
| Chemicals – 4.1% | | | | | | | | |
Air Products & Chemicals, Inc. | | | 25,106 | | | | 2,264,059 | |
E.I. Du Pont de Nemours & Co. | | | 69,783 | | | | 3,835,972 | |
Eastman Chemical Co. | | | 27,087 | | | | 2,690,281 | |
International Flavors & Fragrances, Inc. | | | 35,745 | | | | 2,226,913 | |
PPG Industries, Inc.(a) | | | 33,930 | | | | 3,230,475 | |
| | | | | | | | |
| Total Chemicals | | | | | | | 14,247,700 | |
| Commercial Services – 2.3% | | | | | | | | |
Automatic Data Processing, Inc. | | | 67,495 | | | | 3,463,169 | |
Paychex, Inc. | | | 138,959 | | | | 4,357,754 | |
| | | | | | | | |
| Total Commercial Services | | | | | | | 7,820,923 | |
| Distribution/Wholesale – 1.0% | | | | | | | | |
Genuine Parts Co. | | | 66,047 | | | | 3,542,761 | |
| Electric – 14.5% | | | | | | | | |
Ameren Corp. | | | 184,512 | | | | 5,179,252 | |
American Electric Power Co., Inc. | | | 140,587 | | | | 4,940,227 | |
Duke Energy Corp. | | | 309,464 | | | | 5,616,772 | |
Exelon Corp. | | | 126,638 | | | | 5,222,551 | |
FirstEnergy Corp.(a) | | | 169,631 | | | | 6,291,614 | |
Pepco Holdings, Inc. | | | 314,007 | | | | 5,856,230 | |
Pinnacle West Capital Corp. | | | 123,157 | | | | 5,269,888 | |
PPL Corp. | | | 211,404 | | | | 5,348,521 | |
Progress Energy, Inc. | | | 127,691 | | | | 5,891,663 | |
| | | | | | | | |
| Total Electric | | | | | | | 49,616,718 | |
| Environmental Control – 1.9% | | | | | | | | |
Republic Services, Inc. | | | 92,203 | | | | 2,769,778 | |
Waste Management, Inc.(a) | | | 98,992 | | | | 3,696,361 | |
| | | | | | | | |
| Total Environmental Control | | | | | | | 6,466,139 | |
| Food – 4.4% | | | | | | | | |
ConAgra Foods, Inc. | | | 186,243 | | | | 4,423,271 | |
H.J. Heinz Co.(a) | | | 73,061 | | | | 3,566,838 | |
Kraft Foods, Inc. Class A | | | 119,836 | | | | 3,758,057 | |
Sysco Corp.(a) | | | 119,645 | | | | 3,314,167 | |
| | | | | | | | |
| Total Food | | | | | | | 15,062,333 | |
| | | | | | | | |
| Investments | | Shares | | | Fair Value | |
| | | | | | | | |
| Forest Products & Paper – 2.0% | | | | | | | | |
International Paper Co. | | | 74,672 | | | $ | 2,253,601 | |
MeadWestvaco Corp. | | | 156,158 | | | | 4,736,272 | |
| | | | | | | | |
| Total Forest Products & Paper | | | | | | | 6,989,873 | |
| Gas – 1.7% | | | | | | | | |
NiSource, Inc. | | | 311,995 | | | | 5,984,064 | |
| Healthcare-Products – 3.1% | | | | | | | | |
Baxter International, Inc. | | | 47,488 | | | | 2,553,430 | |
Becton Dickinson and Co. | | | 24,640 | | | | 1,961,837 | |
Johnson & Johnson | | | 54,202 | | | | 3,211,468 | |
Medtronic, Inc. | | | 71,878 | | | | 2,828,399 | |
| | | | | | | | |
| Total Healthcare-Products | | | | | | | 10,555,134 | |
| Household Products/Wares – 2.4% | | | | | | | | |
Clorox Co.(a) | | | 55,266 | | | | 3,872,488 | |
Kimberly-Clark Corp.(a) | | | 66,610 | | | | 4,347,635 | |
| | | | | | | | |
| Total Household Products/Wares | | | | | | | 8,220,123 | |
| Iron/Steel – 1.1% | | | | | | | | |
Nucor Corp.(a) | | | 85,099 | | | | 3,916,256 | |
| Media – 2.6% | | | | | | | | |
McGraw-Hill Cos., Inc. (The) | | | 73,259 | | | | 2,886,405 | |
Time Warner Cable, Inc. | | | 38,842 | | | | 2,770,988 | |
Time Warner, Inc. | | | 88,943 | | | | 3,175,265 | |
| | | | | | | | |
| Total Media | | | | | | | 8,832,658 | |
| Mining – 1.7% | | | | | | | | |
Southern Copper Corp. | | | 84,774 | | | | 3,413,849 | |
Vulcan Materials Co.(a) | | | 51,802 | | | | 2,362,171 | |
| | | | | | | | |
| Total Mining | | | | | | | 5,776,020 | |
| Miscellaneous Manufacturing – 1.8% | | | | | | | | |
General Electric Co. | | | 167,324 | | | | 3,354,846 | |
Illinois Tool Works, Inc. | | | 54,104 | | | | 2,906,467 | |
| | | | | | | | |
| Total Miscellaneous Manufacturing | | | | | | | 6,261,313 | |
| Office/Business Equipment – 2.0% | | | | | | | | |
Pitney Bowes, Inc.(a) | | | 266,850 | | | | 6,855,377 | |
| Oil & Gas – 6.9% | | | | | | | | |
Chevron Corp. | | | 39,432 | | | | 4,236,180 | |
ConocoPhillips | | | 55,284 | | | | 4,414,980 | |
EQT Corp.(a) | | | 48,286 | | | | 2,409,471 | |
Exxon Mobil Corp. | | | 34,113 | | | | 2,869,927 | |
Marathon Oil Corp. | | | 83,206 | | | | 4,435,712 | |
Murphy Oil Corp. | | | 23,229 | | | | 1,705,473 | |
Occidental Petroleum Corp. | | | 17,817 | | | | 1,861,698 | |
Sunoco, Inc. | | | 36,976 | | | | 1,685,736 | |
| | | | | | | | |
| Total Oil & Gas | | | | | | | 23,619,177 | |
| Pharmaceuticals – 7.4% | | | | | | | | |
Abbott Laboratories(a) | | | 76,044 | | | | 3,729,958 | |
Bristol-Myers Squibb Co. | | | 184,864 | | | | 4,885,955 | |
Cardinal Health, Inc. | | | 57,738 | | | | 2,374,764 | |
Eli Lilly & Co. | | | 160,757 | | | | 5,653,824 | |
Merck & Co., Inc. | | | 116,604 | | | | 3,849,098 | |
See Notes to Financial Statements.
| | | | |
| WisdomTree Domestic Dividend Funds | | | 33 | |
Schedule of Investments (concluded)
WisdomTree Dividend ex-Financials Fund (DTN)
March 31, 2011
| | | | | | | | |
| Investments | | Shares | | | Fair Value | |
| | | | | | | | |
Pfizer, Inc. | | | 250,390 | | | $ | 5,085,421 | |
| | | | | | | | |
| Total Pharmaceuticals | | | | | | | 25,579,020 | |
| Pipelines – 2.2% | | | | | | | | |
Spectra Energy Corp.(a) | | | 168,911 | | | | 4,591,001 | |
Williams Cos., Inc. (The) | | | 90,768 | | | | 2,830,146 | |
| | | | | | | | |
| Total Pipelines | | | | | | | 7,421,147 | |
| Retail – 3.3% | | | | | | | | |
Darden Restaurants, Inc.(a) | | | 51,418 | | | | 2,526,166 | |
Home Depot, Inc.(a) | | | 88,623 | | | | 3,284,368 | |
J.C. Penney Co., Inc. | | | 73,479 | | | | 2,638,631 | |
McDonald’s Corp. | | | 39,896 | | | | 3,035,687 | |
| | | | | | | | |
| Total Retail | | | | | | | 11,484,852 | |
| Semiconductors – 6.6% | | | | | | | | |
Analog Devices, Inc. | | | 65,835 | | | | 2,592,582 | |
Intel Corp. | | | 155,664 | | | | 3,139,743 | |
KLA-Tencor Corp. | | | 67,000 | | | | 3,173,790 | |
Linear Technology Corp.(a) | | | 80,870 | �� | | | 2,719,658 | |
Maxim Integrated Products, Inc. | | | 147,774 | | | | 3,783,015 | |
Microchip Technology, Inc.(a) | | | 117,438 | | | | 4,463,818 | |
Xilinx, Inc.(a) | | | 82,609 | | | | 2,709,575 | |
| | | | | | | | |
| Total Semiconductors | | | | | | | 22,582,181 | |
| Shipbuilding – 0.1% | | | | | | | | |
Huntington Ingalls Industries, Inc.* | | | 7,805 | | | | 323,908 | |
| Software – 0.6% | | | | | | | | |
Microsoft Corp. | | | 87,614 | | | | 2,221,891 | |
| Telecommunications – 10.7% | | | | | | | | |
AT&T, Inc. | | | 202,093 | | | | 6,184,046 | |
CenturyLink, Inc.(a) | | | 144,379 | | | | 5,998,948 | |
Frontier Communications Corp.(a) | | | 858,092 | | | | 7,053,516 | |
Qwest Communications International, Inc. | | | 598,605 | | | | 4,088,472 | |
Verizon Communications, Inc. | | | 171,152 | | | | 6,596,198 | |
Windstream Corp.(a) | | | 524,821 | | | | 6,754,446 | |
| | | | | | | | |
| Total Telecommunications | | | | | | | 36,675,626 | |
| Toys/Games/Hobbies – 0.9% | | | | | | | | |
Mattel, Inc. | | | 125,176 | | | | 3,120,638 | |
| Transportation – 0.8% | | | | | | | | |
United Parcel Service, Inc. Class B(a) | | | 36,664 | | | | 2,724,869 | |
TOTAL COMMON STOCKS (Cost: $307,303,575) | | | | | | | 338,261,859 | |
| EXCHANGE-TRADED FUNDS – 1.3% | | | | | | | | |
WisdomTree LargeCap Dividend Fund(b) | | | 46,431 | | | | 2,243,546 | |
WisdomTree MidCap Dividend Fund(b) | | | 41,796 | | | | 2,256,566 | |
| | | | | | | | |
TOTAL EXCHANGE-TRADED FUNDS (Cost: $3,874,298) | | | | | | | 4,500,112 | |
| SHORT-TERM INVESTMENT – 0.1% | | | | | | | | |
| MONEY MARKET FUND – 0.1% | | | | | | | | |
Invesco Treasury Fund Private Class, 0.02%(c) (Cost: $365,738) | | | 365,738 | | | | 365,738 | |
| | | | | | | | |
| Investments | | Shares | | | Fair Value | |
| | | | | | | | |
| INVESTMENT OF CASH COLLATERAL FOR SECURITIES LOANED – 19.4% | | | | | | | | |
| MONEY MARKET FUND – 19.4% | | | | | | | | |
Dreyfus Institutional Preferred Money Market Fund, 0.19%(d) | | | | | | | | |
| (Cost: $66,577,000)(e) | | | 66,577,000 | | | $ | 66,577,000 | |
TOTAL INVESTMENTS IN SECURITIES – 119.3% (Cost: $378,120,611) | | | | 409,704,709 | |
Liabilities in Excess of Other Assets – (19.3)% | | | | | | | (66,322,918 | ) |
| | | | | | | | |
| NET ASSETS – 100.0% | | | | | | $ | 343,381,791 | |
| * | Non-income producing security. |
| (a) | Security, or portion thereof, was on loan at March 31, 2011 (See Note 2). |
| (b) | Affiliated companies (See Note 7). |
| (c) | Rate shown represents annualized 7-day yield as of March 31, 2011. |
| (d) | Interest rate shown reflects yield as of March 31, 2011. |
| (e) | At March 31, 2011, the total market value of the Fund’s securities on loan was $64,781,496 and the total market value of the collateral held by the Fund was $66,577,000. |
See Notes to Financial Statements.
| | |
| 34 | | WisdomTree Domestic Dividend Funds |
Schedule of Investments
WisdomTree MidCap Dividend Fund (DON)
March 31, 2011
| | | | | | | | |
| Investments | | Shares | | | Fair
Value | |
| | | | | | | | |
| COMMON STOCKS – 98.4% | | | | | | | | |
| Aerospace/Defense – 0.1% | | | | | | | | |
Alliant Techsystems, Inc. | | | 3,068 | | | $ | 216,816 | |
Triumph Group, Inc. | | | 387 | | | | 34,230 | |
| | | | | | | | |
| Total Aerospace/Defense | | | | | | | 251,046 | |
| Apparel – 0.2% | | | | | | | | |
Columbia Sportswear Co.(a) | | | 4,054 | | | | 240,889 | |
Wolverine World Wide, Inc.(a) | | | 6,341 | | | | 236,392 | |
| | | | | | | | |
| Total Apparel | | | | | | | 477,281 | |
| Banks – 2.7% | | | | | | | | |
Associated Banc-Corp. | | | 4,839 | | | | 71,859 | |
Bank of Hawaii Corp.(a) | | | 16,937 | | | | 809,927 | |
BOK Financial Corp.(a) | | | 11,963 | | | | 618,248 | |
CapitalSource, Inc. | | | 16,871 | | | | 118,772 | |
City National Corp. | | | 3,253 | | | | 185,583 | |
Commerce Bancshares, Inc. | | | 18,120 | | | | 732,773 | |
Cullen/Frost Bankers, Inc.(a) | | | 17,085 | | | | 1,008,357 | |
East West Bancorp, Inc.(a) | | | 2,869 | | | | 63,003 | |
First Citizens BancShares, Inc. Class A | | | 524 | | | | 105,104 | |
FirstMerit Corp.(a) | | | 32,882 | | | | 560,967 | |
Fulton Financial Corp. | | | 23,098 | | | | 256,619 | |
Huntington Bancshares, Inc. | | | 42,848 | | | | 284,511 | |
Marshall & Ilsley Corp. | | | 33,409 | | | | 266,938 | |
Synovus Financial Corp.(a) | | | 115,275 | | | | 276,660 | |
TCF Financial Corp.(a) | | | 18,314 | | | | 290,460 | |
Valley National Bancorp(a) | | | 78,716 | | | | 1,098,875 | |
Zions Bancorp. | | | 2,968 | | | | 68,442 | |
| | | | | | | | |
| Total Banks | | | | | | | 6,817,098 | |
| Beverages – 0.7% | | | | | | | | |
Brown-Forman Corp. Class A | | | 9,706 | | | | 658,649 | |
Brown-Forman Corp. Class B | | | 15,258 | | | | 1,042,122 | |
| | | | | | | | |
| Total Beverages | | | | | | | 1,700,771 | |
| Building Materials – 0.8% | | | | | | | | |
Lennox International, Inc. | | | 6,193 | | | | 325,628 | |
Martin Marietta Materials, Inc.(a) | | | 7,125 | | | | 638,899 | |
Masco Corp.(a) | | | 77,036 | | | | 1,072,341 | |
| | | | | | | | |
| Total Building Materials | | | | | | | 2,036,868 | |
| Chemicals – 4.0% | | | | | | | | |
Airgas, Inc. | | | 12,084 | | | | 802,619 | |
Albemarle Corp. | | | 8,660 | | | | 517,608 | |
Ashland, Inc.(a) | | | 8,204 | | | | 473,863 | |
Cabot Corp. | | | 11,468 | | | | 530,854 | |
Celanese Corp. | | | 7,072 | | | | 313,785 | |
Cytec Industries, Inc. | | | 464 | | | | 25,228 | |
Eastman Chemical Co. | | | 14,514 | | | | 1,441,530 | |
FMC Corp.(a) | | | 4,269 | | | | 362,566 | |
Huntsman Corp. | | | 56,538 | | | | 982,630 | |
International Flavors & Fragrances, Inc. | | | 14,391 | | | | 896,559 | |
Kronos Worldwide, Inc. | | | 12,235 | | | | 715,136 | |
NewMarket Corp.(a) | | | 1,828 | | | | 289,226 | |
RPM International, Inc. | | | 46,292 | | | | 1,098,509 | |
| | | | | | | | |
| Investments | | Shares | | | Fair
Value | |
| | | | | | | | |
Sensient Technologies Corp. | | | 9,823 | | | $ | 352,056 | |
Valhi, Inc. | | | 19,081 | | | | 505,265 | |
Valspar Corp. | | | 16,806 | | | | 657,115 | |
Westlake Chemical Corp.(a) | | | 3,843 | | | | 215,977 | |
| | | | | | | | |
| Total Chemicals | | | | | | | 10,180,526 | |
| Coal – 0.5% | | | | | | | | |
Arch Coal, Inc. | | | 18,790 | | | | 677,192 | |
Massey Energy Co.(a) | | | 4,478 | | | | 306,116 | |
Walter Energy, Inc.(a) | | | 2,120 | | | | 287,111 | |
| | | | | | | | |
| Total Coal | | | | | | | 1,270,419 | |
| Commercial Services - 4.6% | | | | | | | | |
DeVry, Inc. | | | 3,430 | | | | 188,890 | |
Equifax, Inc. | | | 20,939 | | | | 813,480 | |
Global Payments, Inc. | | | 1,305 | | | | 63,840 | |
H&R Block, Inc.(a) | | | 130,598 | | | | 2,186,210 | |
Iron Mountain, Inc.(a) | | | 18,181 | | | | 567,793 | |
Lender Processing Services, Inc. | | | 10,976 | | | | 353,317 | |
Manpower, Inc. | | | 8,817 | | | | 554,413 | |
Morningstar, Inc.(a) | | | 1,694 | | | | 98,896 | |
Pharmaceutical Product Development, Inc. | | | 24,561 | | | | 680,585 | |
R.R. Donnelley & Sons Co.(a) | | | 113,349 | | | | 2,144,563 | |
Rent-A-Center, Inc. | | | 4,493 | | | | 156,851 | |
Robert Half International, Inc.(a) | | | 23,131 | | | | 707,809 | |
Rollins, Inc. | | | 16,739 | | | | 339,802 | |
SEI Investments Co. | | | 14,474 | | | | 345,639 | |
Service Corp. International | | | 43,526 | | | | 481,397 | |
Sotheby’s | | | 2,658 | | | | 139,811 | |
Strayer Education, Inc.(a) | | | 3,136 | | | | 409,217 | |
Total System Services, Inc. | | | 32,386 | | | | 583,596 | |
Towers Watson & Co. Class A | | | 2,395 | | | | 132,827 | |
Weight Watchers International, Inc.(a) | | | 12,899 | | | | 904,220 | |
| | | | | | | | |
| Total Commercial Services | | | | | | | 11,853,156 | |
| Computers – 0.6% | | | | | | | | |
Diebold, Inc.(a) | | | 20,758 | | | | 736,079 | |
DST Systems, Inc. | | | 5,529 | | | | 292,042 | |
Jack Henry & Associates, Inc.(a) | | | 10,143 | | | | 343,746 | |
Syntel, Inc.(a) | | | 1,924 | | | | 100,490 | |
| | | | | | | | |
| Total Computers | | | | | | | 1,472,357 | |
| Cosmetics/Personal Care – 0.1% | | | | | | | | |
Alberto-Culver Co. | | | 8,325 | | | | 310,273 | |
| Distribution/Wholesale – 0.4% | | | | | | | | |
Owens & Minor, Inc.(a) | | | 14,149 | | | | 459,560 | |
Watsco, Inc.(a) | | | 8,364 | | | | 583,054 | |
| | | | | | | | |
| Total Distribution/Wholesale | | | | | | | 1,042,614 | |
| Diversified Financial Services – 1.7% | | | | | | | | |
Eaton Vance Corp.(a) | | | 24,952 | | | | 804,452 | |
Federated Investors, Inc. Class B(a) | | | 34,125 | | | | 912,844 | |
Greenhill & Co., Inc.(a) | | | 5,966 | | | | 392,503 | |
Janus Capital Group, Inc. | | | 5,250 | | | | 65,468 | |
Jefferies Group, Inc.(a) | | | 17,575 | | | | 438,320 | |
Legg Mason, Inc.(a) | | | 9,289 | | | | 335,240 | |
See Notes to Financial Statements.
| | | | |
| WisdomTree Domestic Dividend Funds | | | 35 | |
Schedule of Investments (continued)
WisdomTree MidCap Dividend Fund (DON)
March 31, 2011
| | | | | | | | |
| Investments | | Shares | | | Fair
Value | |
| | | | | | | | |
Raymond James Financial, Inc.(a) | | | 18,658 | | | $ | 713,482 | |
Waddell & Reed Financial, Inc. Class A(a) | | | 18,473 | | | | 750,189 | |
| | | | | | | | |
| Total Diversified Financial Services | | | | | | | 4,412,498 | |
| Electric – 12.2% | | | | | | | | |
Alliant Energy Corp. | | | 43,955 | | | | 1,711,168 | |
Cleco Corp.(a) | | | 17,941 | | | | 615,197 | |
CMS Energy Corp.(a) | | | 100,382 | | | | 1,971,503 | |
Constellation Energy Group, Inc.(a) | | | 64,511 | | | | 2,008,227 | |
DPL, Inc.(a) | | | 52,286 | | | | 1,433,159 | |
Great Plains Energy, Inc. | | | 53,402 | | | | 1,069,108 | |
Hawaiian Electric Industries, Inc.(a) | | | 48,051 | | | | 1,191,665 | |
IDACORP, Inc. | | | 14,592 | | | | 555,955 | |
Integrys Energy Group, Inc.(a) | | | 39,426 | | | | 1,991,407 | |
ITC Holdings Corp. | | | 10,166 | | | | 710,603 | |
MDU Resources Group, Inc. | | | 56,740 | | | | 1,303,318 | |
Northeast Utilities | | | 52,793 | | | | 1,826,638 | |
NSTAR | | | 38,738 | | | | 1,792,407 | |
NV Energy, Inc. | | | 74,904 | | | | 1,115,321 | |
OGE Energy Corp. | | | 28,989 | | | | 1,465,684 | |
Pepco Holdings, Inc. | | | 121,931 | | | | 2,274,013 | |
Pinnacle West Capital Corp. | | | 50,964 | | | | 2,180,750 | |
Portland General Electric Co. | | | 32,636 | | | | 775,758 | |
SCANA Corp.(a) | | | 54,692 | | | | 2,153,224 | |
TECO Energy, Inc. | | | 94,731 | | | | 1,777,154 | |
Westar Energy, Inc.(a) | | | 50,639 | | | | 1,337,882 | |
| | | | | | | | |
| Total Electric | | | | | | | 31,260,141 | |
| Electrical Components & Equipment – 0.7% | | | | | | | | |
Acuity Brands, Inc.(a) | | | 3,573 | | | | 208,985 | |
Belden, Inc. | | | 2,256 | | | | 84,713 | |
Hubbell, Inc. Class B | | | 11,480 | | | | 815,424 | |
Molex, Inc.(a) | | | 26,689 | | | | 670,428 | |
| | | | | | | | |
| Total Electrical Components & Equipment | | | | | | | 1,779,550 | |
| Electronics – 1.0% | | | | | | | | |
AVX Corp. | | | 18,521 | | | | 276,148 | |
Gentex Corp.(a) | | | 19,653 | | | | 594,503 | |
Jabil Circuit, Inc.(a) | | | 33,090 | | | | 676,029 | |
National Instruments Corp. | | | 15,055 | | | | 493,352 | |
PerkinElmer, Inc. | | | 11,892 | | | | 312,403 | |
Woodward, Inc. | | | 4,084 | | | | 141,143 | |
| | | | | | | | |
| Total Electronics | | | | | | | 2,493,578 | |
| Engineering & Construction – 0.1% | | | | | | | | |
KBR, Inc. | | | 9,758 | | | | 368,560 | |
| Entertainment – 0.9% | | | | | | | | |
Cinemark Holdings, Inc.(a) | | | 49,602 | | | | 959,799 | |
International Game Technology(a) | | | 40,603 | | | | 658,987 | |
Regal Entertainment Group Class A(a) | | | 58,353 | | | | 787,765 | |
| | | | | | | | |
| Total Entertainment | | | | | | | 2,406,551 | |
| Environmental Control – 0.2% | | | | | | | | |
Nalco Holding Co. | | | 5,669 | | | | 154,820 | |
Waste Connections, Inc.(a) | | | 11,282 | | | | 324,809 | |
| | | | | | | | |
| Total Environmental Control | | | | | | | 479,629 | |
| | | | | | | | |
| Investments | | Shares | | | Fair
Value | |
| | | | | | | | |
| Food – 1.5% | | | | | | | | |
Corn Products International, Inc.(a) | | | 8,425 | | | $ | 436,583 | |
Flowers Foods, Inc.(a) | | | 25,207 | | | | 686,387 | |
McCormick & Co., Inc.(a) | | | 26,461 | | | | 1,265,630 | |
Ruddick Corp.(a) | | | 5,917 | | | | 228,337 | |
Seaboard Corp. | | | 20 | | | | 48,260 | |
SUPERVALU, Inc.(a) | | | 78,338 | | | | 699,558 | |
Tyson Foods, Inc. Class A | | | 26,857 | | | | 515,386 | |
| | | | | | | | |
| Total Food | | | | | | | 3,880,141 | |
| Forest Products & Paper – 0.7% | | | | | | | | |
MeadWestvaco Corp. | | | 62,062 | | | | 1,882,340 | |
| Gas – 5.7% | | | | | | | | |
AGL Resources, Inc.(a) | | | 35,280 | | | | 1,405,555 | |
Atmos Energy Corp. | | | 36,238 | | | | 1,235,716 | |
Energen Corp. | | | 7,369 | | | | 465,131 | |
National Fuel Gas Co. | | | 16,282 | | | | 1,204,868 | |
New Jersey Resources Corp.(a) | | | 12,592 | | | | 540,827 | |
Nicor, Inc. | | | 15,706 | | | | 843,412 | |
NiSource, Inc. | | | 137,040 | | | | 2,628,427 | |
Piedmont Natural Gas Co., Inc.(a) | | | 25,104 | | | | 761,906 | |
Questar Corp. | | | 52,747 | | | | 920,435 | |
South Jersey Industries, Inc.(a) | | | 7,381 | | | | 413,115 | |
Southern Union Co. | | | 28,107 | | | | 804,422 | |
Southwest Gas Corp. | | | 11,894 | | | | 463,509 | |
UGI Corp. | | | 32,184 | | | | 1,058,854 | |
Vectren Corp. | | | 40,552 | | | | 1,103,015 | |
WGL Holdings, Inc.(a) | | | 19,748 | | | | 770,172 | |
| | | | | | | | |
| Total Gas | | | | | | | 14,619,364 | |
| Hand/Machine Tools – 0.7% | | | | | | | | |
Kennametal, Inc. | | | 9,574 | | | | 373,386 | |
Lincoln Electric Holdings, Inc. | | | 6,627 | | | | 503,122 | |
Regal-Beloit Corp. | | | 3,677 | | | | 271,473 | |
Snap-On, Inc. | | | 12,041 | | | | 723,182 | |
| | | | | | | | |
| Total Hand/Machine Tools | | | | | | | 1,871,163 | |
| Healthcare-Products – 1.1% | | | | | | | | |
Beckman Coulter, Inc. | | | 6,773 | | | | 562,633 | |
Cooper Cos., Inc. (The) | | | 451 | | | | 31,322 | |
DENTSPLY International, Inc.(a) | | | 7,457 | | | | 275,835 | |
Hill-Rom Holdings, Inc. | | | 5,921 | | | | 224,880 | |
Patterson Cos., Inc.(a) | | | 15,264 | | | | 491,348 | |
STERIS Corp. | | | 8,673 | | | | 299,565 | |
Techne Corp.(a) | | | 5,583 | | | | 399,743 | |
Teleflex, Inc. | | | 9,081 | | | | 526,516 | |
| | | | | | | | |
| Total Healthcare-Products | | | | | | | 2,811,842 | |
| Healthcare-Services – 0.4% | | | | | | | | |
Lincare Holdings, Inc. | | | 27,335 | | | | 810,756 | |
Universal Health Services, Inc. Class B | | | 3,963 | | | | 195,812 | |
| | | | | | | | |
| Total Healthcare-Services | | | | | | | 1,006,568 | |
| Home Builders – 0.4% | | | | | | | | |
D.R. Horton, Inc. | | | 39,497 | | | | 460,140 | |
Lennar Corp. Class A | | | 13,357 | | | | 242,029 | |
See Notes to Financial Statements.
| | |
| 36 | | WisdomTree Domestic Dividend Funds |
Schedule of Investments (continued)
WisdomTree MidCap Dividend Fund (DON)
March 31, 2011
| | | | | | | | |
| Investments | | Shares | | | Fair
Value | |
| | | | | | | | |
Thor Industries, Inc.(a) | | | 6,205 | | | $ | 207,061 | |
| | | | | | | | |
| Total Home Builders | | | | | | | 909,230 | |
| Home Furnishings – 0.5% | | | | | | | | |
Whirlpool Corp.(a) | | | 13,838 | | | | 1,181,212 | |
| Household Products/Wares – 1.3% | | | | | | | | |
Avery Dennison Corp. | | | 19,294 | | | | 809,576 | |
Church & Dwight Co., Inc. | | | 6,484 | | | | 514,441 | |
Jarden Corp. | | | 8,960 | | | | 318,707 | |
Scotts Miracle-Gro Co. (The) Class A(a) | | | 11,782 | | | | 681,589 | |
Tupperware Brands Corp. | | | 14,947 | | | | 892,485 | |
| | | | | | | | |
| Total Household Products/Wares | | | | | | | 3,216,798 | |
| Housewares – 0.3% | | | | | | | | |
Newell Rubbermaid, Inc. | | | 30,014 | | | | 574,168 | |
Toro Co. (The) | | | 3,404 | | | | 225,413 | |
| | | | | | | | |
| Total Housewares | | | | | | | 799,581 | |
| Insurance – 5.9% | | | | | | | | |
American Financial Group, Inc. | | | 19,996 | | | | 700,260 | |
American National Insurance Co. | | | 9,054 | | | | 716,805 | |
Arthur J. Gallagher & Co. | | | 42,332 | | | | 1,287,316 | |
Assurant, Inc. | | | 16,770 | | | | 645,813 | |
Brown & Brown, Inc. | | | 17,686 | | | | 456,299 | |
Cincinnati Financial Corp.(a) | | | 74,507 | | | | 2,443,830 | |
Erie Indemnity Co. Class A | | | 14,038 | | | | 998,242 | |
Fidelity National Financial, Inc. Class A | | | 109,254 | | | | 1,543,759 | |
Hanover Insurance Group, Inc. (The) | | | 8,654 | | | | 391,593 | |
HCC Insurance Holdings, Inc. | | | 21,365 | | | | 668,938 | |
Mercury General Corp. | | | 27,998 | | | | 1,095,562 | |
Old Republic International Corp. | | | 121,787 | | | | 1,545,477 | |
Primerica, Inc.(a) | | | 1,096 | | | | 27,959 | |
Protective Life Corp. | | | 16,574 | | | | 440,040 | |
Reinsurance Group of America, Inc. | | | 6,044 | | | | 379,442 | |
StanCorp Financial Group, Inc.(a) | | | 7,897 | | | | 364,210 | |
Torchmark Corp.(a) | | | 7,859 | | | | 522,466 | |
Transatlantic Holdings, Inc.(a) | | | 9,477 | | | | 461,246 | |
W.R. Berkley Corp. | | | 13,682 | | | | 440,697 | |
Wesco Financial Corp. | | | 287 | | | | 111,700 | |
| | | | | | | | |
| Total Insurance | | | | | | | 15,241,654 | |
| Investment Companies – 1.9% | | | | | | | | |
Apollo Investment Corp. | | | 182,420 | | | | 2,199,985 | |
Ares Capital Corp. | | | 150,789 | | | | 2,548,334 | |
| | | | | | | | |
| Total Investment Companies | | | | | | | 4,748,319 | |
| Iron/Steel – 0.8% | | | | | | | | |
Allegheny Technologies, Inc.(a) | | | 12,547 | | | | 849,683 | |
Carpenter Technology Corp.(a) | | | 7,241 | | | | 309,263 | |
Reliance Steel & Aluminum Co. | | | 5,622 | | | | 324,839 | |
Steel Dynamics, Inc. | | | 34,803 | | | | 653,252 | |
| | | | | | | | |
| Total Iron/Steel | | | | | | | 2,137,037 | |
| Leisure Time – 0.2% | | | | | | | | |
Polaris Industries, Inc.(a) | | | 6,433 | | | | 559,800 | |
| Lodging – 0.5% | | | | | | | | |
Choice Hotels International, Inc.(a) | | | 10,791 | | | | 419,230 | |
| | | | | | | | |
| Investments | | Shares | | | Fair
Value | |
| | | | | | | | |
Wyndham Worldwide Corp. | | | 26,426 | | | $ | 840,611 | |
| | | | | | | | |
| Total Lodging | | | | | | | 1,259,841 | |
| Machinery-Diversified – 0.8% | | | | | | | | |
Flowserve Corp.(a) | | | 5,195 | | | | 669,116 | |
Gardner Denver, Inc. | | | 1,409 | | | | 109,944 | |
Graco, Inc. | | | 11,284 | | | | 513,309 | |
IDEX Corp.(a) | | | 11,352 | | | | 495,515 | |
Nordson Corp.(a) | | | 3,044 | | | | 350,243 | |
Wabtec Corp. | | | 447 | | | | 30,320 | |
| | | | | | | | |
| Total Machinery-Diversified | | | | | | | 2,168,447 | |
| Media – 0.8% | | | | | | | | |
Factset Research Systems, Inc.(a) | | | 4,326 | | | | 453,062 | |
Gannett Co., Inc. | | | 22,930 | | | | 349,224 | |
John Wiley & Sons, Inc. Class A | | | 6,497 | | | | 330,307 | |
Viacom, Inc. Class A | | | 6,148 | | | | 327,627 | |
Washington Post Co. (The) Class B(a) | | | 1,430 | | | | 625,711 | |
| | | | | | | | |
| Total Media | | | | | | | 2,085,931 | |
| Metal Fabricate/Hardware – 0.5% | | | | | | | | |
Commercial Metals Co. | | | 29,531 | | | | 510,000 | |
Timken Co. | | | 13,379 | | | | 699,722 | |
Valmont Industries, Inc.(a) | | | 1,859 | | | | 194,024 | |
| | | | | | | | |
| Total Metal Fabricate/Hardware | | | | | | | 1,403,746 | |
| Mining – 0.7% | | | | | | | | |
Compass Minerals International, Inc.(a) | | | 5,433 | | | | 508,148 | |
Royal Gold, Inc.(a) | | | 3,992 | | | | 209,181 | |
Vulcan Materials Co.(a) | | | 25,525 | | | | 1,163,940 | |
| | | | | | | | |
| Total Mining | | | | | | | 1,881,269 | |
| Miscellaneous Manufacturing – 2.7% | | | | | | | | |
Actuant Corp. Class A | | | 872 | | | | 25,288 | |
Aptargroup, Inc. | | | 9,485 | | | | 475,483 | |
Carlisle Cos., Inc. | | | 9,401 | | | | 418,815 | |
CLARCOR, Inc. | | | 4,563 | | | | 205,016 | |
Crane Co. | | | 12,370 | | | | 599,079 | |
Donaldson Co., Inc. | | | 6,297 | | | | 385,943 | |
Harsco Corp. | | | 21,914 | | | | 773,345 | |
Leggett & Platt, Inc. | | | 64,586 | | | | 1,582,357 | |
Pall Corp. | | | 13,767 | | | | 793,117 | |
Pentair, Inc.(a) | | | 19,267 | | | | 728,100 | |
SPX Corp.(a) | | | 6,578 | | | | 522,227 | |
Trinity Industries, Inc. | | | 9,632 | | | | 353,205 | |
| | | | | | | | |
| Total Miscellaneous Manufacturing | | | | | | | 6,861,975 | |
| Office/Business Equipment – 1.1% | | | | | | | | |
Pitney Bowes, Inc.(a) | | | 112,191 | | | | 2,882,187 | |
| Oil & Gas – 1.6% | | | | | | | | |
Berry Petroleum Co. Class A | | | 3,294 | | | | 166,182 | |
Cabot Oil & Gas Corp. | | | 3,134 | | | | 166,008 | |
EQT Corp. | | | 27,955 | | | | 1,394,954 | |
EXCO Resources, Inc. | | | 16,082 | | | | 332,254 | |
Helmerich & Payne, Inc. | | | 4,776 | | | | 328,063 | |
Holly Corp.(a) | | | 8,067 | | | | 490,151 | |
Patterson-UTI Energy, Inc.(a) | | | 13,527 | | | | 397,559 | |
See Notes to Financial Statements.
| | | | |
| WisdomTree Domestic Dividend Funds | | | 37 | |
Schedule of Investments (continued)
WisdomTree MidCap Dividend Fund (DON)
March 31, 2011
| | | | | | | | |
| Investments | | Shares | | | Fair
Value | |
| | | | | | | | |
SM Energy Co. | | | 1,093 | | | $ | 81,090 | |
Sunoco, Inc. | | | 17,278 | | | | 787,704 | |
| | | | | | | | |
| Total Oil & Gas | | | | | | | 4,143,965 | |
| Oil & Gas Services – 0.3% | | | | | | | | |
CARBO Ceramics, Inc.(a) | | | 1,703 | | | | 240,327 | |
Lufkin Industries, Inc.(a) | | | 2,258 | | | | 211,055 | |
RPC, Inc.(a) | | | 13,220 | | | | 334,731 | |
| | | | | | | | |
| Total Oil & Gas Services | | | | | | | 786,113 | |
| Packaging & Containers – 2.0% | | | | | | | | |
Ball Corp. | | | 9,619 | | | | 344,841 | |
Bemis Co., Inc. | | | 28,103 | | | | 922,059 | |
Packaging Corp. of America | | | 21,832 | | | | 630,727 | |
Rock-Tenn Co. Class A(a) | | | 5,167 | | | | 358,332 | |
Sealed Air Corp.(a) | | | 30,639 | | | | 816,836 | |
Silgan Holdings, Inc. | | | 8,413 | | | | 320,872 | |
Sonoco Products Co. | | | 31,210 | | | | 1,130,738 | |
Temple-Inland, Inc. | | | 20,288 | | | | 474,739 | |
| | | | | | | | |
| Total Packaging & Containers | | | | | | | 4,999,144 | |
| Pharmaceuticals – 0.2% | | | | | | | | |
Medicis Pharmaceutical Corp. Class A | | | 4,722 | | | | 151,293 | |
Omnicare, Inc.(a) | | | 5,612 | | | | 168,304 | |
Perrigo Co.(a) | | | 3,716 | | | | 295,496 | |
| | | | | | | | |
| Total Pharmaceuticals | | | | | | | 615,093 | |
| Pipelines – 0.9% | | | | | | | | |
Oneok, Inc.(a) | | | 34,791 | | | | 2,326,822 | |
| Real Estate – 0.0% | | | | | | | | |
Jones Lang LaSalle, Inc. | | | 973 | | | | 97,047 | |
| REITS – 22.5% | | | | | | | | |
Alexander’s, Inc.(a) | | | 1,143 | | | | 465,144 | |
Alexandria Real Estate Equities, Inc. | | | 13,301 | | | | 1,037,079 | |
AMB Property Corp.(a) | | | 56,645 | | | | 2,037,521 | |
American Campus Communities, Inc. | | | 27,169 | | | | 896,577 | |
Apartment Investment & Management Co. Class A | | | 17,783 | | | | 452,933 | |
BioMed Realty Trust, Inc.(a) | | | 47,074 | | | | 895,347 | |
BRE Properties, Inc. | | | 21,097 | | | | 995,356 | |
Camden Property Trust(a) | | | 22,153 | | | | 1,258,733 | |
CBL & Associates Properties, Inc.(a) | | | 60,716 | | | | 1,057,673 | |
CommonWealth REIT | | | 55,557 | | | | 1,442,815 | |
Corporate Office Properties Trust SBI MD(a) | | | 30,346 | | | | 1,096,704 | |
Developers Diversified Realty Corp. | | | 14,366 | | | | 201,124 | |
Digital Realty Trust, Inc.(a) | | | 34,281 | | | | 1,993,097 | |
Douglas Emmett, Inc.(a) | | | 28,428 | | | | 533,025 | |
Duke Realty Corp. | | | 144,187 | | | | 2,020,060 | |
Entertainment Properties Trust(a) | | | 24,441 | | | | 1,144,328 | |
Equity Lifestyle Properties, Inc. | | | 6,285 | | | | 362,330 | |
Equity One, Inc.(a) | | | 44,771 | | | | 840,352 | |
Essex Property Trust, Inc. | | | 10,736 | | | | 1,331,264 | |
Federal Realty Investment Trust | | | 20,178 | | | | 1,645,718 | |
Highwoods Properties, Inc.(a) | | | 37,102 | | | | 1,298,941 | |
Home Properties, Inc.(a) | | | 14,948 | | | | 881,185 | |
Hospitality Properties Trust | | | 94,778 | | | | 2,194,111 | |
| | | | | | | | |
| Investments | | Shares | | | Fair
Value | |
| | | | | | | | |
Kilroy Realty Corp.(a) | | | 19,824 | | | $ | 769,766 | |
LaSalle Hotel Properties(a) | | | 11,240 | | | | 303,480 | |
Liberty Property Trust(a) | | | 66,118 | | | | 2,175,282 | |
Macerich Co. (The)(a) | | | 54,740 | | | | 2,711,272 | |
Mack-Cali Realty Corp. | | | 44,099 | | | | 1,494,956 | |
Mid-America Apartment Communities, Inc.(a) | | | 12,491 | | | | 801,922 | |
National Retail Properties, Inc.(a) | | | 45,511 | | | | 1,189,202 | |
Nationwide Health Properties, Inc.(a) | | | 65,005 | | | | 2,764,663 | |
Omega Healthcare Investors, Inc.(a) | | | 65,698 | | | | 1,467,693 | |
Piedmont Office Realty Trust, Inc. Class A(a) | | | 78,809 | | | | 1,529,683 | |
Plum Creek Timber Co., Inc.(a) | | | 69,288 | | | | 3,021,650 | |
Post Properties, Inc. | | | 10,346 | | | | 406,081 | |
Rayonier, Inc. | | | 31,338 | | | | 1,952,671 | |
Realty Income Corp.(a) | | | 55,801 | | | | 1,950,245 | |
Regency Centers Corp. | | | 34,557 | | | | 1,502,538 | |
Senior Housing Properties Trust | | | 84,958 | | | | 1,957,432 | |
SL Green Realty Corp.(a) | | | 4,578 | | | | 344,266 | |
Tanger Factory Outlet Centers | | | 23,656 | | | | 620,733 | |
Taubman Centers, Inc. | | | 18,217 | | | | 976,067 | |
UDR, Inc. | | | 55,236 | | | | 1,346,101 | |
Washington Real Estate Investment Trust(a) | | | 34,655 | | | | 1,077,424 | |
Weingarten Realty Investors(a) | | | 49,744 | | | | 1,246,585 | |
| | | | | | | | |
| Total REITS | | | | | | | 57,691,129 | |
| Retail – 2.8% | | | | | | | | |
Abercrombie & Fitch Co. Class A | | | 10,436 | | | | 612,593 | |
Advance Auto Parts, Inc. | | | 2,823 | | | | 185,245 | |
American Eagle Outfitters, Inc. | | | 51,519 | | | | 818,637 | |
Brinker International, Inc. | | | 23,584 | | | | 596,675 | |
Buckle, Inc. (The)(a) | | | 8,515 | | | | 344,006 | |
Chico’s FAS, Inc. | | | 21,322 | | | | 317,698 | |
Dillard’s, Inc. Class A(a) | | | 2,445 | | | | 98,094 | |
Foot Locker, Inc. | | | 45,098 | | | | 889,333 | |
Guess ?, Inc. | | | 13,945 | | | | 548,736 | |
MSC Industrial Direct Co. Class A | | | 5,686 | | | | 389,321 | |
Nu Skin Enterprises, Inc. Class A(a) | | | 9,136 | | | | 262,660 | |
PetSmart, Inc. | | | 13,756 | | | | 563,308 | |
Phillips-Van Heusen Corp. | | | 1,413 | | | | 91,887 | |
RadioShack Corp. | | | 14,234 | | | | 213,652 | |
Tractor Supply Co. | | | 3,799 | | | | 227,408 | |
Wendy’s/Arby’s Group, Inc. Class A | | | 64,844 | | | | 326,165 | |
Williams-Sonoma, Inc. | | | 17,092 | | | | 692,226 | |
World Fuel Services Corp. | | | 3,049 | | | | 123,820 | |
| | | | | | | | |
| Total Retail | | | | | | | 7,301,464 | |
| Savings & Loans – 2.8% | | | | | | | | |
Capitol Federal Financial, Inc. | | | 127,441 | | | | 1,436,260 | |
First Niagara Financial Group, Inc.(a) | | | 85,760 | | | | 1,164,621 | |
Hudson City Bancorp, Inc. | | | 235,482 | | | | 2,279,466 | |
People’s United Financial, Inc.(a) | | | 156,404 | | | | 1,967,562 | |
Washington Federal, Inc. | | | 13,263 | | | | 229,980 | |
| | | | | | | | |
| Total Savings & Loans | | | | | | | 7,077,889 | |
| Semiconductors – 1.3% | | | | | | | | |
Intersil Corp. Class A(a) | | | 36,712 | | | | 457,064 | |
See Notes to Financial Statements.
| | |
| 38 | | WisdomTree Domestic Dividend Funds |
Schedule of Investments (concluded)
WisdomTree MidCap Dividend Fund (DON)
March 31, 2011
| | | | | | | | |
| Investments | | Shares | | | Fair
Value | |
| | | | | | | | |
KLA-Tencor Corp. | | | 39,185 | | | $ | 1,856,194 | |
National Semiconductor Corp.(a) | | | 65,248 | | | | 935,656 | |
| | | | | | | | |
| Total Semiconductors | | | | | | | 3,248,914 | |
| Software – 0.8% | | | | | | | | |
Broadridge Financial Solutions, Inc. | | | 31,239 | | | | 708,813 | |
Dun & Bradstreet Corp.(a) | | | 7,915 | | | | 635,100 | |
Quality Systems, Inc.(a) | | | 4,744 | | | | 395,365 | |
Solera Holdings, Inc. | | | 3,795 | | | | 193,924 | |
| | | | | | | | |
| Total Software | | | | | | | 1,933,202 | |
| Telecommunications – 0.9% | | | | | | | | |
ADTRAN, Inc. | | | 5,783 | | | | 245,546 | |
Harris Corp. | | | 25,828 | | | | 1,281,069 | |
Plantronics, Inc.(a) | | | 2,258 | | | | 82,688 | |
Telephone & Data Systems, Inc.(a) | | | 5,772 | | | | 194,516 | |
Telephone & Data Systems, Inc. Special Shares | | | 6,478 | | | | 191,231 | |
Tellabs, Inc. | | | 39,381 | | | | 206,356 | |
| | | | | | | | |
| Total Telecommunications | | | | | | | 2,201,406 | |
| Textiles – 0.3% | | | | | | | | |
Cintas Corp.(a) | | | 22,413 | | | | 678,442 | |
| Transportation – 0.9% | | | | | | | | |
Con-way, Inc.(a) | | | 5,714 | | | | 224,503 | |
JB Hunt Transport Services, Inc. | | | 13,813 | | | | 627,387 | |
Knight Transportation, Inc. | | | 9,601 | | | | 184,819 | |
Landstar System, Inc. | | | 2,274 | | | | 103,876 | |
Ryder System, Inc.(a) | | | 10,418 | | | | 527,151 | |
Tidewater, Inc.(a) | | | 9,366 | | | | 560,555 | |
Werner Enterprises, Inc.(a) | | | 5,987 | | | | 158,476 | |
| | | | | | | | |
| Total Transportation | | | | | | | 2,386,767 | |
| Trucking & Leasing – 0.2% | | | | | | | | |
GATX Corp. | | | 13,586 | | | | 525,235 | |
| Water – 0.9% | | | | | | | | |
American Water Works Co., Inc. | | | 56,490 | | | | 1,584,544 | |
Aqua America, Inc. | | | 35,585 | | | | 814,541 | |
| | | | | | | | |
| Total Water | | | | | | | 2,399,085 | |
TOTAL COMMON STOCKS (Cost: $223,433,316) | | | | | | | 252,433,078 | |
| EXCHANGE-TRADED FUND – 1.5% | | | | | | | | |
WisdomTree LargeCap Dividend Fund (b) (Cost: $3,405,574) | | | 76,014 | | | | 3,672,996 | |
| SHORT-TERM INVESTMENT – 0.1% | | | | | | | | |
| MONEY MARKET FUND – 0.1% | | | | | | | | |
Invesco Treasury Fund Private Class, 0.02%(c) (Cost: $280,973) | | | 280,973 | | | | 280,973 | |
| | | | | | | | |
| Investments | | Shares | | | Fair
Value | |
| | | | | | | | |
| INVESTMENT OF CASH COLLATERAL FOR SECURITIES LOANED – 28.1% | | | | | | | | |
| MONEY MARKET FUND – 28.1% | | | | | | | | |
Dreyfus Institutional Preferred Money Market Fund, 0.19%(d) (Cost: $72,151,000)(e) | | | 72,151,000 | | | $ | 72,151,000 | |
TOTAL INVESTMENTS IN SECURITIES – 128.1% (Cost: $299,270,863) | | | | 328,538,047 | |
Liabilities in Excess of Other Assets – (28.1)% | | | | | | | (71,986,171 | ) |
| | | | | | | | |
| NET ASSETS – 100.0% | | | | | | $ | 256,551,876 | |
| * | Non-income producing security. |
| (a) | Security, or portion thereof, was on loan at March 31, 2011 (See Note 2). |
| (b) | Affiliated companies (See Note 7). |
| (c) | Rate shown represents annualized 7-day yield as of March 31, 2011. |
| (d) | Interest rate shown reflects yield as of March 31, 2011. |
| (e) | At March 31, 2011, the total market value of the Fund’s securities on loan was $70,342,995 and the total market value of the collateral held by the Fund was $72,151,000. |
See Notes to Financial Statements.
| | | | |
| WisdomTree Domestic Dividend Funds | | | 39 | |
Schedule of Investments
WisdomTree SmallCap Dividend Fund (DES)
March 31, 2011
| | | | | | | | |
| Investments | | Shares | | | Fair
Value | |
| | | | | | | | |
| COMMON STOCKS – 98.2% | | | | | | | | |
| Advertising – 0.2% | | | | | | | | |
Harte-Hanks, Inc. | | | 36,319 | | | $ | 432,196 | |
Marchex, Inc. Class B | | | 5,643 | | | | 44,410 | |
| | | | | | | | |
| Total Advertising | | | | | | | 476,606 | |
| Aerospace/Defense – 0.5% | | | | | | | | |
Cubic Corp. | | | 2,417 | | | | 138,977 | |
Curtiss-Wright Corp.(a) | | | 10,991 | | | | 386,224 | |
Ducommun, Inc. | | | 3,456 | | | | 82,598 | |
HEICO Corp.(a) | | | 698 | | | | 43,639 | |
HEICO Corp. Class A | | | 1,447 | | | | 65,086 | |
Kaman Corp. | | | 12,259 | | | | 431,517 | |
National Presto Industries, Inc.(a) | | | 1,328 | | | | 149,639 | |
| | | | | | | | |
| Total Aerospace/Defense | | | | | | | 1,297,680 | |
| Agriculture – 1.7% | | | | | | | | |
Andersons, Inc. (The) | | | 4,664 | | | | 227,230 | |
Griffin Land & Nurseries, Inc. | | | 1,635 | | | | 52,614 | |
Limoneira Co.(a) | | | 1,289 | | | | 30,549 | |
Universal Corp. | | | 27,508 | | | | 1,197,699 | |
Vector Group Ltd.(a) | | | 157,642 | | | | 2,725,630 | |
| | | | | | | | |
| Total Agriculture | | | | | | | 4,233,722 | |
| Airlines – 0.1% | | | | | | | | |
Skywest, Inc. | | | 13,152 | | | | 222,532 | |
| Apparel – 0.5% | | | | | | | | |
Cherokee, Inc. | | | 17,596 | | | | 303,707 | |
Jones Group, Inc. (The) | | | 28,173 | | | | 387,379 | |
Oxford Industries, Inc. | | | 7,887 | | | | 269,657 | |
R.G. Barry Corp.(a) | | | 6,423 | | | | 84,077 | |
Weyco Group, Inc. | | | 7,066 | | | | 172,834 | |
| | | | | | | | |
| Total Apparel | | | | | | | 1,217,654 | |
| Auto Parts & Equipment – 0.8% | | | | | | | | |
Cooper Tire & Rubber Co. | | | 27,278 | | | | 702,409 | |
Douglas Dynamics, Inc. | | | 26,038 | | | | 371,302 | |
Miller Industries, Inc. | | | 1,825 | | | | 29,638 | |
Spartan Motors, Inc. | | | 13,446 | | | | 92,240 | |
Standard Motor Products, Inc. | | | 8,374 | | | | 115,812 | |
Superior Industries International, Inc. | | | 20,332 | | | | 521,312 | |
Titan International, Inc.(a) | | �� | 987 | | | | 26,264 | |
| | | | | | | | |
| Total Auto Parts & Equipment | | | | | | | 1,858,977 | |
| Banks – 13.6% | | | | | | | | |
1st Source Corp. | | | 18,978 | | | | 380,319 | |
Alliance Financial Corp.(a) | | | 4,127 | | | | 137,635 | |
American National Bankshares, Inc.(a) | | | 5,821 | | | | 131,031 | |
Ames National Corp.(a) | | | 4,806 | | | | 91,795 | |
Arrow Financial Corp.(a) | | | 9,927 | | | | 245,594 | |
Bancfirst Corp. | | | 9,222 | | | | 393,595 | |
Bancorp Rhode Island, Inc. | | | 2,823 | | | | 87,146 | |
BancorpSouth, Inc.(a) | | | 123,005 | | | | 1,900,427 | |
Bank of Kentucky Financial Corp. | | | 5,559 | | | | 113,959 | |
Bank of Marin Bancorp | | | 2,316 | | | | 86,433 | |
Bank of the Ozarks, Inc.(a) | | | 6,592 | | | | 288,136 | |
Bar Harbor Bankshares(a) | | | 3,506 | | | | 106,933 | |
| | | | | | | | |
| Investments | | Shares | | | Fair
Value | |
| | | | | | | | |
Boston Private Financial Holdings, Inc.(a) | | | 12,997 | | | $ | 91,889 | |
Bridge Bancorp, Inc.(a) | | | 5,945 | | | | 132,990 | |
Bryn Mawr Bank Corp. | | | 9,425 | | | | 193,872 | |
Camden National Corp. | | | 4,868 | | | | 166,680 | |
Capital City Bank Group, Inc.(a) | | | 13,289 | | | | 168,505 | |
Cardinal Financial Corp. | | | 5,144 | | | | 59,979 | |
Cass Information Systems, Inc.(a) | | | 3,970 | | | | 155,981 | |
Cathay General Bancorp | | | 5,206 | | | | 88,762 | |
Centerstate Banks, Inc. | | | 3,700 | | | | 25,900 | |
Chemical Financial Corp.(a) | | | 24,335 | | | | 484,997 | |
Citizens & Northern Corp. | | | 9,102 | | | | 153,005 | |
City Holding Co.(a) | | | 14,320 | | | | 506,355 | |
CNB Financial Corp.(a) | | | 12,939 | | | | 187,745 | |
CoBiz Financial, Inc.(a) | | | 7,592 | | | | 52,764 | |
Columbia Banking System, Inc. | | | 1,849 | | | | 35,445 | |
Community Bank System, Inc.(a) | | | 29,765 | | | | 722,397 | |
Community Trust Bancorp, Inc.(a) | | | 15,903 | | | | 440,036 | |
CVB Financial Corp.(a) | | | 106,367 | | | | 990,277 | |
Enterprise Financial Services Corp. | | | 7,009 | | | | 98,617 | |
Financial Institutions, Inc. | | | 5,578 | | | | 97,615 | |
First Bancorp | | | 8,910 | | | | 118,147 | |
First Bancorp, Inc.(a) | | | 12,285 | | | | 187,346 | |
First Busey Corp. | | | 59,415 | | | | 301,828 | |
First Commonwealth Financial Corp. | | | 15,802 | | | | 108,244 | |
First Community Bancshares, Inc.(a) | | | 11,476 | | | | 162,730 | |
First Financial Bancorp | | | 31,266 | | | | 521,830 | |
First Financial Bankshares, Inc.(a) | | | 14,029 | | | | 720,670 | |
First Financial Corp.(a) | | | 8,563 | | | | 284,634 | |
First Interstate Bancsystem, Inc. | | | 11,438 | | | | 155,557 | |
First Merchants Corp. | | | 3,535 | | | | 29,234 | |
First Midwest Bancorp, Inc. | | | 6,813 | | | | 80,325 | |
First of Long Island Corp. (The) | | | 6,492 | | | | 180,153 | |
FNB Corp.(a) | | | 138,589 | | | | 1,460,728 | |
German American Bancorp, Inc.(a) | | | 8,585 | | | | 147,576 | |
Glacier Bancorp, Inc.(a) | | | 64,063 | | | | 964,148 | |
Great Southern Bancorp, Inc.(a) | | | 9,813 | | | | 210,489 | |
Hancock Holding Co.(a) | | | 24,737 | | | | 812,363 | |
Heartland Financial USA, Inc.(a) | | | 8,995 | | | | 152,915 | |
Home Bancshares, Inc. | | | 6,866 | | | | 156,201 | |
Hudson Valley Holding Corp. | | | 10,705 | | | | 235,510 | |
Iberiabank Corp.(a) | | | 15,876 | | | | 954,624 | |
Independent Bank Corp. | | | 13,987 | | | | 377,789 | |
International Bancshares Corp. | | | 32,424 | | | | 594,656 | |
Lakeland Bancorp, Inc.(a) | | | 13,567 | | | | 140,825 | |
Lakeland Financial Corp. | | | 11,479 | | | | 260,344 | |
MainSource Financial Group, Inc. | | | 2,001 | | | | 20,030 | |
MB Financial, Inc.(a) | | | 3,199 | | | | 67,051 | |
Merchants Bancshares, Inc. | | | 6,045 | | | | 160,072 | |
Midsouth Bancorp, Inc. | | | 4,193 | | | | 60,631 | |
MidWestOne Financial Group, Inc.(a) | | | 2,746 | | | | 40,751 | |
National Bankshares, Inc.(a) | | | 5,410 | | | | 156,349 | |
National Penn Bancshares, Inc.(a) | | | 17,447 | | | | 135,040 | |
NBT Bancorp, Inc. | | | 28,215 | | | | 643,020 | |
Old National Bancorp | | | 52,370 | | | | 561,406 | |
See Notes to Financial Statements.
| | |
| 40 | | WisdomTree Domestic Dividend Funds |
Schedule of Investments (continued)
WisdomTree SmallCap Dividend Fund (DES)
March 31, 2011
| | | | | | | | |
| Investments | | Shares | | | Fair
Value | |
| | | | | | | | |
Pacific Continental Corp. | | | 1,554 | | | $ | 15,835 | |
PacWest Bancorp(a) | | | 1,727 | | | | 37,562 | |
Park National Corp.(a) | | | 19,986 | | | | 1,335,464 | |
Peapack Gladstone Financial Corp. | | | 3,447 | | | | 45,707 | |
Penns Woods Bancorp, Inc.(a) | | | 4,480 | | | | 174,406 | |
Peoples Bancorp, Inc.(a) | | | 6,265 | | | | 75,305 | |
PrivateBancorp, Inc. | | | 5,189 | | | | 79,340 | |
Prosperity Bancshares, Inc. | | | 21,247 | | | | 908,734 | |
Renasant Corp.(a) | | | 24,662 | | | | 418,761 | |
Republic Bancorp, Inc. Class A | | | 11,423 | | | | 222,520 | |
S&T Bancorp, Inc.(a) | | | 18,633 | | | | 401,914 | |
S.Y. Bancorp, Inc.(a) | | | 9,736 | | | | 244,958 | |
Sandy Spring Bancorp, Inc. | | | 1,349 | | | | 24,903 | |
SCBT Financial Corp.(a) | | | 6,984 | | | | 232,428 | |
Sierra Bancorp | | | 7,261 | | | | 81,178 | |
Simmons First National Corp. Class A | | | 11,134 | | | | 301,620 | |
Southside Bancshares, Inc.(a) | | | 12,190 | | | | 260,866 | |
State Bancorp, Inc. | | | 8,839 | | | | 91,837 | |
StellarOne Corp. | | | 6,147 | | | | 87,287 | |
Sterling Bancorp | | | 24,192 | | | | 242,162 | |
Sterling Bancshares, Inc. | | | 24,372 | | | | 209,843 | |
Suffolk Bancorp(a) | | | 8,162 | | | | 171,239 | |
Susquehanna Bancshares, Inc. | | | 13,968 | | | | 130,601 | |
Tompkins Financial Corp.(a) | | | 9,050 | | | | 376,027 | |
Tower Bancorp, Inc. | | | 8,736 | | | | 194,725 | |
TowneBank(a) | | | 12,481 | | | | 195,452 | |
Trico Bancshares(a) | | | 9,420 | | | | 153,640 | |
TrustCo Bank Corp.(a) | | | 81,192 | | | | 481,469 | |
Trustmark Corp.(a) | | | 59,819 | | | | 1,400,961 | |
UMB Financial Corp.(a) | | | 18,965 | | | | 708,438 | |
Umpqua Holdings Corp. | | | 48,978 | | | | 560,308 | |
Union First Market Bankshares Corp. | | | 12,042 | | | | 135,472 | |
United Bankshares, Inc.(a) | | | 47,801 | | | | 1,267,683 | |
Univest Corp. of Pennsylvania | | | 16,591 | | | | 293,993 | |
Washington Banking Co. | | | 5,667 | | | | 79,905 | |
Washington Trust Bancorp, Inc.(a) | | | 15,115 | | | | 358,830 | |
Webster Financial Corp. | | | 4,305 | | | | 92,256 | |
WesBanco, Inc.(a) | | | 19,135 | | | | 396,286 | |
Westamerica Bancorp.(a) | | | 19,183 | | | | 985,431 | |
Whitney Holding Corp. | | | 9,004 | | | | 122,634 | |
Wintrust Financial Corp.(a) | | | 4,376 | | | | 160,818 | |
| | | | | | | | |
| Total Banks | | | | | | | 33,738,828 | |
| Beverages – 0.1% | | | | | | | | |
Coca-Cola Bottling Co. Consolidated | | | 3,075 | | | | 205,533 | |
Farmer Bros Co. | | | 9,959 | | | | 120,703 | |
| | | | | | | | |
| Total Beverages | | | | | | | 326,236 | |
| Building Materials – 0.9% | | | | | | | | |
AAON, Inc.(a) | | | 5,264 | | | | 173,186 | |
Apogee Enterprises, Inc. | | | 18,381 | | | | 242,445 | |
Comfort Systems USA, Inc. | | | 14,911 | | | | 209,798 | |
Eagle Materials, Inc. | | | 16,463 | | | | 498,170 | |
LSI Industries, Inc. | | | 13,127 | | | | 95,040 | |
Quanex Building Products Corp. | | | 8,153 | | | | 160,044 | |
| | | | | | | | |
| Investments | | Shares | | | Fair
Value | |
| | | | | | | | |
Simpson Manufacturing Co., Inc.(a) | | | 16,720 | | | $ | 492,571 | |
Texas Industries, Inc.(a) | | | 4,897 | | | | 221,491 | |
Universal Forest Products, Inc. | | | 5,320 | | | | 194,978 | |
| | | | | | | | |
| Total Building Materials | | | | | | | 2,287,723 | |
| Chemicals – 1.9% | | | | | | | | |
A. Schulman, Inc. | | | 20,599 | | | | 509,207 | |
Aceto Corp. | | | 15,514 | | | | 123,647 | |
American Vanguard Corp.(a) | | | 3,693 | | | | 32,055 | |
Arch Chemicals, Inc.(a) | | | 14,098 | | | | 586,336 | |
Balchem Corp. | | | 2,242 | | | | 84,120 | |
H.B. Fuller Co. | | | 15,822 | | | | 339,857 | |
Hawkins, Inc. | | | 3,425 | | | | 140,699 | |
Innophos Holdings, Inc. | | | 10,348 | | | | 477,146 | |
KMG Chemicals, Inc. | | | 1,719 | | | | 33,796 | |
Minerals Technologies, Inc. | | | 1,416 | | | | 97,024 | |
Olin Corp.(a) | | | 77,257 | | | | 1,770,730 | |
Quaker Chemical Corp. | | | 6,550 | | | | 263,113 | |
Stepan Co.(a) | | | 3,372 | | | | 244,470 | |
Zep, Inc. | | | 4,816 | | | | 83,847 | |
| | | | | | | | |
| Total Chemicals | | | | | | | 4,786,047 | |
| Commercial Services – 4.5% | | | | | | | | |
Aaron’s, Inc.(a) | | | 4,309 | | | | 109,276 | |
ABM Industries, Inc. | | | 26,924 | | | | 683,600 | |
Advance America, Cash Advance Centers, Inc. | | | 73,078 | | | | 387,313 | |
Arbitron, Inc. | | | 6,691 | | | | 267,841 | |
Barrett Business Services, Inc. | | | 5,407 | | | | 86,836 | |
CDI Corp.(a) | | | 12,970 | | | | 191,826 | |
Chemed Corp. | | | 4,976 | | | | 331,451 | |
Collectors Universe, Inc.(a) | | | 18,133 | | | | 256,945 | |
Corporate Executive Board Co. (The) | | | 10,029 | | | | 404,871 | |
CPI Corp.(a) | | | 5,863 | | | | 131,976 | |
Deluxe Corp.(a) | | | 59,227 | | | | 1,571,885 | |
Electro Rent Corp. | | | 22,720 | | | | 390,330 | |
Great Lakes Dredge & Dock Corp. | | | 12,552 | | | | 95,772 | |
Healthcare Services Group, Inc.(a) | | | 62,030 | | | | 1,090,487 | |
Heartland Payment Systems, Inc.(a) | | | 2,371 | | | | 41,564 | |
Heidrick & Struggles International, Inc. | | | 7,735 | | | | 215,265 | |
Hillenbrand, Inc. | | | 58,097 | | | | 1,249,086 | |
Insperity, Inc. | | | 11,503 | | | | 349,461 | |
Intersections, Inc. | | | 26,200 | | | | 324,880 | |
Landauer, Inc. | | | 8,190 | | | | 503,849 | |
Lincoln Educational Services Corp. | | | 36,353 | | | | 577,649 | |
Mac-Gray Corp. | | | 4,444 | | | | 71,682 | |
MAXIMUS, Inc. | | | 3,093 | | | | 251,059 | |
McGrath Rentcorp | | | 19,465 | | | | 530,811 | |
Monro Muffler Brake, Inc. | | | 6,776 | | | | 223,472 | |
Multi-Color Corp. | | | 3,270 | | | | 66,087 | |
National American University Holdings, Inc. | | | 10,271 | | | | 72,821 | |
National Research Corp. | | | 3,832 | | | | 130,058 | |
Resources Connection, Inc. | | | 9,370 | | | | 181,684 | |
Stewart Enterprises, Inc. Class A(a) | | | 42,813 | | | | 327,091 | |
Viad Corp.(a) | | | 3,118 | | | | 74,645 | |
| | | | | | | | |
| Total Commercial Services | | | | | | | 11,191,573 | |
See Notes to Financial Statements.
| | | | |
| WisdomTree Domestic Dividend Funds | | | 41 | |
Schedule of Investments (continued)
WisdomTree SmallCap Dividend Fund (DES)
March 31, 2011
| | | | | | | | |
| Investments | | Shares | | | Fair
Value | |
| | | | | | | | |
| Computers – 0.2% | | | | | | | | |
MTS Systems Corp. | | | 8,355 | | | $ | 380,570 | |
| Cosmetics/Personal Care – 0.1% | | | | | | | | |
Inter Parfums, Inc. | | | 9,961 | | | | 184,378 | |
| Distribution/Wholesale – 0.3% | | | | | | | | |
Houston Wire & Cable Co.(a) | | | 12,412 | | | | 181,464 | |
Pool Corp.(a) | | | 28,147 | | | | 678,624 | |
| | | | | | | | |
| Total Distribution/Wholesale | | | | | | | 860,088 | |
| Diversified Financial Services – 2.0% | | | | | | | | |
Artio Global Investors, Inc. Class A | | | 17,593 | | | | 284,303 | |
Asta Funding, Inc. | | | 3,447 | | | | 29,506 | |
BGC Partners, Inc. Class A(a) | | | 109,511 | | | | 1,017,357 | |
Calamos Asset Management, Inc. Class A | | | 11,278 | | | | 187,102 | |
CBOE Holdings, Inc.(a) | | | 5,650 | | | | 163,680 | |
Cohen & Steers, Inc.(a) | | | 16,564 | | | | 491,620 | |
Duff & Phelps Corp. Class A | | | 10,270 | | | | 164,115 | |
Epoch Holding Corp. | | | 6,240 | | | | 98,467 | |
Evercore Partners, Inc. Class A(a) | | | 10,595 | | | | 363,303 | |
Federal Agricultural Mortgage Corp. Class C(a) | | | 2,664 | | | | 50,909 | |
GAMCO Investors, Inc. Class A | | | 439 | | | | 20,352 | |
GFI Group, Inc.(a) | | | 125,873 | | | | 631,882 | |
JMP Group, Inc. | | | 4,443 | | | | 38,254 | |
KBW, Inc.(a) | | | 6,550 | | | | 171,544 | |
MarketAxess Holdings, Inc. | | | 11,318 | | | | 273,896 | |
Nelnet, Inc. Class A | | | 11,282 | | | | 246,286 | |
Oppenheimer Holdings, Inc. Class A | | | 5,315 | | | | 178,106 | |
Sanders Morris Harris Group, Inc. | | | 20,302 | | | | 162,619 | |
SWS Group, Inc. | | | 8,084 | | | | 49,070 | |
US Global Investors, Inc. Class A | | | 9,860 | | | | 79,965 | |
Westwood Holdings Group, Inc. | | | 6,216 | | | | 250,194 | |
| | | | | | | | |
| Total Diversified Financial Services | | | | | | | 4,952,530 | |
| Electric – 6.4% | | | | | | | | |
ALLETE, Inc. | | | 42,968 | | | | 1,674,463 | |
Avista Corp. | | | 63,374 | | | | 1,465,841 | |
Black Hills Corp.(a) | | | 46,165 | | | | 1,543,758 | |
Central Vermont Public Service Corp. | | | 13,633 | | | | 317,513 | |
CH Energy Group, Inc.(a) | | | 17,072 | | | | 862,819 | |
Empire District Electric Co. (The)(a) | | | 61,046 | | | | 1,330,192 | |
MGE Energy, Inc. | | | 20,035 | | | | 811,217 | |
NorthWestern Corp. | | | 42,844 | | | | 1,298,173 | |
Ormat Technologies, Inc.(a) | | | 7,757 | | | | 196,485 | |
Otter Tail Corp.(a) | | | 46,963 | | | | 1,067,469 | |
PNM Resources, Inc.(a) | | | 86,142 | | | | 1,285,239 | |
UIL Holdings Corp.(a) | | | 72,921 | | | | 2,225,549 | |
Unisource Energy Corp. | | | 39,188 | | | | 1,415,862 | |
Unitil Corp. | | | 15,999 | | | | 376,936 | |
| | | | | | | | |
| Total Electric | | | | | | | 15,871,516 | |
| Electrical Components & Equipment – 0.8% | | | | | | | | |
Encore Wire Corp. | | | 1,852 | | | | 45,078 | |
Graham Corp. | | | 840 | | | | 20,109 | |
Insteel Industries, Inc.(a) | | | 4,114 | | | | 58,172 | |
| | | | | | | | |
| Investments | | Shares | | | Fair
Value | |
| | | | | | | | |
Littelfuse, Inc. | | | 7,038 | | | $ | 401,870 | |
Molex, Inc. Class A | | | 72,171 | | | | 1,493,218 | |
| | | | | | | | |
| Total Electrical Components & Equipment | | | | | | | 2,018,447 | |
| Electronics – 1.2% | | | | | | | | |
American Science & Engineering, Inc. | | | 3,147 | | | | 290,657 | |
Analogic Corp. | | | 2,670 | | | | 150,989 | |
Badger Meter, Inc.(a) | | | 4,662 | | | | 192,121 | |
Bel Fuse, Inc. Class B | | | 2,763 | | | | 60,814 | |
Brady Corp. Class A | | | 26,216 | | | | 935,649 | |
CTS Corp. | | | 9,265 | | | | 100,062 | |
Daktronics, Inc. | | | 6,441 | | | | 69,241 | |
DDi Corp. | | | 16,882 | | | | 178,443 | |
Methode Electronics, Inc. | | | 19,778 | | | | 238,918 | |
Park Electrochemical Corp. | | | 6,849 | | | | 220,880 | |
Pulse Electronics Corp. | | | 23,869 | | | | 144,407 | |
Watts Water Technologies, Inc. Class A | | | 9,086 | | | | 346,994 | |
| | | | | | | | |
| Total Electronics | | | | | | | 2,929,175 | |
| Engineering & Construction – 0.2% | | | | | | | | |
Granite Construction, Inc.(a) | | | 17,153 | | | | 481,999 | |
VSE Corp. | | | 917 | | | | 27,244 | |
| | | | | | | | |
| Total Engineering & Construction | | | | | | | 509,243 | |
| Entertainment – 0.7% | | | | | | | | |
Churchill Downs, Inc. | | | 4,916 | | | | 204,014 | |
International Speedway Corp. Class A | | | 4,282 | | | | 127,604 | |
National CineMedia, Inc. | | | 54,735 | | | | 1,021,902 | |
Speedway Motorsports, Inc. | | | 25,505 | | | | 407,570 | |
| | | | | | | | |
| Total Entertainment | | | | | | | 1,761,090 | |
| Environmental Control – 0.6% | | | | | | | | |
Met-Pro Corp. | | | 8,546 | | | | 101,697 | |
Mine Safety Appliances Co. | | | 28,072 | | | | 1,029,400 | |
U.S. Ecology, Inc. | | | 19,594 | | | | 341,524 | |
| | | | | | | | |
| Total Environmental Control | | | | | | | 1,472,621 | |
| Food – 2.2% | | | | | | | | |
Arden Group, Inc. Class A | | | 962 | | | | 73,410 | |
B&G Foods, Inc. | | | 58,648 | | | | 1,100,823 | |
Calavo Growers, Inc.(a) | | | 8,632 | | | | 188,609 | |
Cal-Maine Foods, Inc.(a) | | | 4,227 | | | | 124,697 | |
Diamond Foods, Inc.(a) | | | 1,832 | | | | 102,226 | |
Imperial Sugar Co. | | | 1,638 | | | | 21,851 | |
Ingles Markets, Inc. Class A | | | 10,466 | | | | 207,331 | |
J&J Snack Foods Corp. | | | 4,374 | | | | 205,884 | |
Lancaster Colony Corp.(a) | | | 16,139 | | | | 978,023 | |
Nash Finch Co. | | | 5,624 | | | | 213,375 | |
Sanderson Farms, Inc.(a) | | | 9,587 | | | | 440,235 | |
Snyders-Lance, Inc. | | | 22,082 | | | | 438,328 | |
Spartan Stores, Inc. | | | 6,442 | | | | 95,277 | |
Tootsie Roll Industries, Inc. | | | 10,666 | | | | 302,488 | |
Village Super Market, Inc. Class A | | | 5,202 | | | | 151,378 | |
Weis Markets, Inc. | | | 19,129 | | | | 773,959 | |
| | | | | | | | |
| Total Food | | | | | | | 5,417,894 | |
See Notes to Financial Statements.
| | |
| 42 | | WisdomTree Domestic Dividend Funds |
Schedule of Investments (continued)
WisdomTree SmallCap Dividend Fund (DES)
March 31, 2011
| | | | | | | | |
| Investments | | Shares | | | Fair
Value | |
| | | | | | | | |
| Forest Products & Paper – 0.5% | | | | | | | | |
Buckeye Technologies, Inc. | | | 7,427 | | | $ | 202,237 | |
Deltic Timber Corp. | | | 1,618 | | | | 108,147 | |
Neenah Paper, Inc. | | | 8,432 | | | | 185,251 | |
PH Glatfelter Co. | | | 32,185 | | | | 428,704 | |
Schweitzer-Mauduit International, Inc. | | | 4,314 | | | | 218,332 | |
Wausau Paper Corp. | | | 17,418 | | | | 133,074 | |
| | | | | | | | |
| Total Forest Products & Paper | | | | | | | 1,275,745 | |
| Gas – 1.0% | | | | | | | | |
Chesapeake Utilities Corp. | | | 7,477 | | | | 311,193 | |
Laclede Group, Inc. (The) | | | 24,301 | | | | 925,868 | |
Northwest Natural Gas Co. | | | 24,720 | | | | 1,140,333 | |
| | | | | | | | |
| Total Gas | | | | | | | 2,377,394 | |
| Hand/Machine Tools – 0.1% | | | | | | | | |
Franklin Electric Co., Inc. | | | 7,562 | | | | 349,364 | |
| Healthcare-Products – 0.7% | | | | | | | | |
Atrion Corp. | | | 475 | | | | 82,873 | |
Cantel Medical Corp. | | | 2,173 | | | | 55,955 | |
Female Health Co. (The) | | | 22,755 | | | | 113,548 | |
Invacare Corp. | | | 1,449 | | | | 45,093 | |
Meridian Bioscience, Inc.(a) | | | 32,160 | | | | 771,518 | |
West Pharmaceutical Services, Inc.(a) | | | 13,503 | | | | 604,529 | |
Young Innovations, Inc. | | | 997 | | | | 31,306 | |
| | | | | | | | |
| Total Healthcare-Products | | | | | | | 1,704,822 | |
| Healthcare-Services – 0.2% | | | | | | | | |
America Service Group, Inc. | | | 3,718 | | | | 95,329 | |
Ensign Group, Inc. (The) | | | 4,532 | | | | 144,707 | |
National Healthcare Corp. | | | 7,991 | | | | 371,502 | |
| | | | | | | | |
| Total Healthcare-Services | | | | | | | 611,538 | |
| Holding Companies-Diversified – 0.6% | | | | | | | | |
Compass Diversified Holdings | | | 88,790 | | | | 1,308,765 | |
Primoris Services Corp. | | | 12,490 | | | | 126,648 | |
Resource America, Inc. Class A | | | 8,455 | | | | 54,112 | |
| | | | | | | | |
| Total Holding Companies-Diversified | | | | | | | 1,489,525 | |
| Home Builders – 0.8% | | | | | | | | |
KB Home(a) | | | 43,831 | | | | 545,258 | |
Lennar Corp. Class B | | | 8,649 | | | | 126,881 | |
MDC Holdings, Inc.(a) | | | 44,016 | | | | 1,115,805 | |
Ryland Group, Inc. | | | 8,073 | | | | 128,361 | |
Skyline Corp. | | | 6,265 | | | | 125,613 | |
| | | | | | | | |
| Total Home Builders | | | | | | | 2,041,918 | |
| Home Furnishings – 0.2% | | | | | | | | |
American Woodmark Corp.(a) | | | 5,418 | | | | 113,128 | |
Ethan Allen Interiors, Inc. | | | 7,376 | | | | 161,534 | |
Flexsteel Industries | | | 2,790 | | | | 42,268 | |
Hooker Furniture Corp. | | | 8,285 | | | | 99,089 | |
Kimball International, Inc. Class B | | | 19,675 | | | | 137,725 | |
| | | | | | | | |
| Total Home Furnishings | | | | | | | 553,744 | |
| Household Products/Wares – 0.7% | | | | | | | | |
American Greetings Corp. Class A | | | 23,366 | | | | 551,438 | |
| | | | | | | | |
| Investments | | Shares | | | Fair
Value | |
| | | | | | | | |
Blyth, Inc. | | | 1,138 | | | $ | 36,974 | |
CSS Industries, Inc. | | | 6,963 | | | | 131,252 | |
Ennis, Inc. | | | 22,033 | | | | 375,222 | |
Oil-Dri Corp. of America | | | 3,678 | | | | 78,341 | |
WD-40 Co. | | | 10,817 | | | | 457,992 | |
| | | | | | | | |
| Total Household Products/Wares | | | | | | | 1,631,219 | |
| Insurance – 4.8% | | | | | | | | |
American Equity Investment Life Holding Co.(a) | | | 11,565 | | | | 151,733 | |
Amtrust Financial Services, Inc.(a) | | | 26,496 | | | | 505,279 | |
Baldwin & Lyons, Inc. Class B(a) | | | 11,914 | | | | 279,026 | |
Delphi Financial Group, Inc. Class A | | | 18,317 | | | | 562,515 | |
Donegal Group, Inc. Class A | | | 14,013 | | | | 187,354 | |
Eastern Insurance Holdings, Inc. | | | 5,183 | | | | 67,379 | |
EMC Insurance Group, Inc. | | | 10,404 | | | | 258,331 | |
Employers Holdings, Inc.(a) | | | 13,928 | | | | 287,752 | |
FBL Financial Group, Inc. Class A | | | 6,394 | | | | 196,424 | |
First American Financial Corp. | | | 41,893 | | | | 691,234 | |
Harleysville Group, Inc.(a) | | | 25,643 | | | | 849,553 | |
Horace Mann Educators Corp. | | | 17,157 | | | | 288,238 | |
Infinity Property & Casualty Corp. | | | 2,852 | | | | 169,665 | |
Kansas City Life Insurance Co.(a) | | | 9,651 | | | | 308,639 | |
Life Partners Holdings, Inc.(a) | | | 22,910 | | | | 184,196 | |
Meadowbrook Insurance Group, Inc. | | | 21,448 | | | | 221,987 | |
National Interstate Corp.(a) | | | 7,256 | | | | 151,288 | |
National Western Life Insurance Co. Class A | | | 178 | | | | 28,881 | |
Presidential Life Corp. | | | 18,550 | | | | 176,781 | |
Radian Group, Inc. | | | 4,147 | | | | 28,241 | |
RLI Corp.(a) | | | 11,339 | | | | 653,693 | |
Safety Insurance Group, Inc. | | | 15,668 | | | | 722,451 | |
SeaBright Holdings, Inc. | | | 11,674 | | | | 119,658 | |
Selective Insurance Group, Inc. | | | 38,053 | | | | 658,317 | |
State Auto Financial Corp. | | | 33,187 | | | | 604,667 | |
Stewart Information Services Corp. | | | 1,943 | | | | 20,363 | |
Symetra Financial Corp. | | | 44,221 | | | | 601,406 | |
Tower Group, Inc.(a) | | | 20,000 | | | | 480,600 | |
United Fire & Casualty Co. | | | 17,515 | | | | 353,978 | |
Unitrin, Inc. | | | 53,418 | | | | 1,649,548 | |
Universal Insurance Holdings, Inc.(a) | | | 79,826 | | | | 432,657 | |
| | | | | | | | |
| Total Insurance | | | | | | | 11,891,834 | |
| Internet – 1.1% | | | | | | | | |
Earthlink, Inc. | | | 188,169 | | | | 1,473,363 | |
Keynote Systems, Inc. | | | 6,044 | | | | 112,116 | |
Nutrisystem, Inc.(a) | | | 21,581 | | | | 312,709 | |
United Online, Inc. | | | 129,130 | | | | 814,165 | |
| | | | | | | | |
| Total Internet | | | | | | | 2,712,353 | |
| Investment Companies – 6.6% | | | | | | | | |
Arlington Asset Investment Corp. Class A | | | 17,810 | | | | 542,136 | |
BlackRock Kelso Capital Corp.(a) | | | 192,020 | | | | 1,945,163 | |
Capital Southwest Corp. | | | 701 | | | | 64,163 | |
Fifth Street Finance Corp.(a) | | | 152,305 | | | | 2,033,272 | |
Gladstone Capital Corp.(a) | | | 37,340 | | | | 422,315 | |
Gladstone Investment Corp. | | | 34,462 | | | | 267,425 | |
See Notes to Financial Statements.
| | | | |
| WisdomTree Domestic Dividend Funds | | | 43 | |
Schedule of Investments (continued)
WisdomTree SmallCap Dividend Fund (DES)
March 31, 2011
| | | | | | | | |
| Investments | | Shares | | | Fair
Value | |
| | | | | | | | |
Golub Capital BDC, Inc. | | | 33,064 | | | $ | 521,750 | |
Kohlberg Capital Corp.(a) | | | 54,991 | | | | 454,226 | |
Main Street Capital Corp.(a) | | | 40,232 | | | | 742,280 | |
MCG Capital Corp.(a) | | | 151,156 | | | | 982,514 | |
Medallion Financial Corp. | | | 31,022 | | | | 272,683 | |
MVC Capital, Inc. | | | 19,522 | | | | 267,842 | |
NGP Capital Resources Co. | | | 39,955 | | | | 385,166 | |
PennantPark Investment Corp. | | | 78,263 | | | | 932,895 | |
Prospect Capital Corp.(a) | | | 242,162 | | | | 2,956,798 | |
Solar Capital Ltd. | | | 86,265 | | | | 2,060,008 | |
THL Credit, Inc. | | | 14,468 | | | | 197,778 | |
TICC Capital Corp. | | | 59,014 | | | | 641,482 | |
Triangle Capital Corp. | | | 33,046 | | | | 596,811 | |
| | | | | | | | |
| Total Investment Companies | | | | | | | 16,286,707 | |
| Iron/Steel – 0.3% | | | | | | | | |
AK Steel Holding Corp. | | | 37,983 | | | | 599,372 | |
Schnitzer Steel Industries, Inc. Class A | | | 631 | | | | 41,021 | |
| | | | | | | | |
| Total Iron/Steel | | | | | | | 640,393 | |
| Leisure Time – 0.1% | | | | | | | | |
Ambassadors Group, Inc.(a) | | | 9,867 | | | | 108,044 | |
Brunswick Corp.(a) | | | 6,182 | | | | 157,208 | |
Callaway Golf Co.(a) | | | 7,967 | | | | 54,335 | |
| | | | | | | | |
| Total Leisure Time | | | | | | | 319,587 | |
| Lodging – 0.3% | | | | | | | | |
Ameristar Casinos, Inc. | | | 36,398 | | | | 646,064 | |
Marcus Corp. | | | 12,354 | | | | 134,659 | |
| | | | | | | | |
| Total Lodging | | | | | | | 780,723 | |
| Machinery-Diversified – 1.6% | | | | | | | | |
Alamo Group, Inc. | | | 2,663 | | | | 73,099 | |
Albany International Corp. Class A | | | 13,878 | | | | 345,562 | |
Applied Industrial Technologies, Inc. | | | 22,538 | | | | 749,614 | |
Briggs & Stratton Corp. | | | 27,677 | | | | 626,884 | |
Cascade Corp. | | | 2,312 | | | | 103,069 | |
Cognex Corp. | | | 10,196 | | | | 288,037 | |
Gorman-Rupp Co. (The) | | | 4,765 | | | | 187,694 | |
Lindsay Corp. | | | 1,556 | | | | 122,955 | |
Manitowoc Co., Inc. (The)(a) | | | 20,842 | | | | 456,023 | |
NACCO Industries, Inc. Class A | | | 3,177 | | | | 351,599 | |
Robbins & Myers, Inc. | | | 3,974 | | | | 182,764 | |
Tennant Co.(a) | | | 8,299 | | | | 348,890 | |
Twin Disc, Inc. | | | 3,072 | | | | 98,980 | |
| | | | | | | | |
| Total Machinery-Diversified | | | | | | | 3,935,170 | |
| Media – 1.2% | | | | | | | | |
CBS Corp. Class A | | | 14,004 | | | | 351,780 | |
Courier Corp. | | | 17,439 | | | | 243,448 | |
Meredith Corp.(a) | | | 23,314 | | | | 790,811 | |
PRIMEDIA, Inc. | | | 59,788 | | | | 291,168 | |
Scholastic Corp. | | | 8,494 | | | | 229,678 | |
Value Line, Inc. | | | 13,234 | | | | 195,863 | |
World Wrestling Entertainment, Inc. Class A(a) | | | 68,795 | | | | 864,753 | |
| | | | | | | | |
| Total Media | | | | | | | 2,967,501 | |
| | | | | | | | |
| Investments | | Shares | | | Fair
Value | |
| | | | | | | | |
| Metal Fabricate/Hardware – 1.3% | | | | | | | | |
Ampco-Pittsburgh Corp. | | | 6,269 | | | $ | 172,899 | |
CIRCOR International, Inc. | | | 1,493 | | | | 70,201 | |
Dynamic Materials Corp. | | | 2,439 | | | | 68,170 | |
Haynes International, Inc.(a) | | | 5,852 | | | | 324,493 | |
Kaydon Corp. | | | 15,913 | | | | 623,631 | |
Lawson Products, Inc. | | | 2,723 | | | | 62,738 | |
Mueller Industries, Inc. | | | 11,447 | | | | 419,189 | |
Mueller Water Products, Inc. Class A(a) | | | 67,467 | | | | 302,252 | |
Olympic Steel, Inc. | | | 705 | | | | 23,131 | |
Sun Hydraulics Corp. | | | 4,309 | | | | 185,718 | |
Worthington Industries, Inc.(a) | | | 41,653 | | | | 871,381 | |
| | | | | | | | |
| Total Metal Fabricate/Hardware | | | | | | | 3,123,803 | |
| Mining – 0.6% | | | | | | | | |
AMCOL International Corp. | | | 18,212 | | | | 655,268 | |
Globe Specialty Metals, Inc. | | | 15,919 | | | | 362,316 | |
Kaiser Aluminum Corp.(a) | | | 9,290 | | | | 457,533 | |
| | | | | | | | |
| Total Mining | | | | | | | 1,475,117 | |
| Miscellaneous Manufacturing – 2.1% | | | | | | | | |
A.O. Smith Corp. | | | 13,121 | | | | 581,785 | |
Ameron International Corp. | | | 3,313 | | | | 231,214 | |
AZZ, Inc. | | | 8,042 | | | | 366,715 | |
Barnes Group, Inc.(a) | | | 21,054 | | | | 439,608 | |
Brink’s Co. (The) | | | 17,105 | | | | 566,347 | |
Chase Corp. | | | 4,776 | | | | 88,165 | |
ESCO Technologies, Inc. | | | 5,582 | | | | 212,953 | |
John Bean Technologies Corp. | | | 9,719 | | | | 186,896 | |
Koppers Holdings, Inc. | | | 13,334 | | | | 569,362 | |
Matthews International Corp. Class A | | | 6,659 | | | | 256,704 | |
Myers Industries, Inc. | | | 21,567 | | | | 214,160 | |
NL Industries, Inc.(a) | | | 51,954 | | | | 771,517 | |
Raven Industries, Inc. | | | 6,030 | | | | 370,363 | |
Standex International Corp. | | | 2,464 | | | | 93,361 | |
Sturm Ruger & Co., Inc.(a) | | | 9,616 | | | | 220,880 | |
Tredegar Corp. | | | 6,533 | | | | 140,982 | |
| | | | | | | | |
| Total Miscellaneous Manufacturing | | | | | | | 5,311,012 | |
| Office Furnishings – 0.7% | | | | | | | | |
Herman Miller, Inc.(a) | | | 5,401 | | | | 148,474 | |
HNI Corp.(a) | | | 30,902 | | | | 975,267 | |
Interface, Inc. Class A | | | 6,827 | | | | 126,231 | |
Knoll, Inc. | | | 6,157 | | | | 129,051 | |
Steelcase, Inc. Class A | | | 33,866 | | | | 385,395 | |
| | | | | | | | |
| Total Office Furnishings | | | | | | | 1,764,418 | |
| Oil & Gas – 0.7% | | | | | | | | |
Alon USA Energy, Inc.(a) | | | 39,606 | | | | 542,602 | |
Delek US Holdings, Inc. | | | 27,516 | | | | 373,117 | |
Houston American Energy Corp.(a) | | | 979 | | | | 15,086 | |
Panhandle Oil and Gas, Inc. Class A | | | 2,221 | | | | 70,295 | |
Penn Virginia Corp.(a) | | | 14,271 | | | | 242,036 | |
W&T Offshore, Inc.(a) | | | 17,309 | | | | 394,472 | |
| | | | | | | | |
| Total Oil & Gas | | | | | | | 1,637,608 | |
See Notes to Financial Statements.
| | |
| 44 | | WisdomTree Domestic Dividend Funds |
Schedule of Investments (continued)
WisdomTree SmallCap Dividend Fund (DES)
March 31, 2011
| | | | | | | | |
| Investments | | Shares | | | Fair
Value | |
| | | | | | | | |
| Oil & Gas Services – 0.0% | | | | | | | | |
Gulf Island Fabrication, Inc. | | | 610 | | | $ | 19,624 | |
| Packaging & Containers – 1.0% | | | | | | | | |
Greif, Inc. Class A(a) | | | 16,723 | | | | 1,093,851 | |
Greif, Inc. Class B | | | 23,185 | | | | 1,428,196 | |
| | | | | | | | |
| Total Packaging & Containers | | | | | | | 2,522,047 | |
| Pipelines – 0.1% | | | | | | | | |
Crosstex Energy, Inc. | | | 36,786 | | | | 366,021 | |
| Private Equity – 0.3% | | | | | | | | |
Hercules Technology Growth Capital, Inc. | | | 70,737 | | | | 778,107 | |
| Real Estate – 0.0% | | | | | | | | |
Consolidated-Tomoka Land Co. | | | 214 | | | | 6,934 | |
| REITS – 18.5% | | | | | | | | |
Acadia Realty Trust | | | 39,746 | | | | 751,994 | |
Agree Realty Corp.(a) | | | 18,404 | | | | 413,170 | |
Associated Estates Realty Corp. | | | 47,199 | | | | 749,520 | |
Brandywine Realty Trust | | | 193,084 | | | | 2,344,040 | |
CapLease, Inc. | | | 56,860 | | | | 311,593 | |
Cedar Shopping Centers, Inc. | | | 95,905 | | | | 578,307 | |
Chatham Lodging Trust | | | 9,001 | | | | 146,266 | |
Chesapeake Lodging Trust | | | 19,475 | | | | 339,060 | |
Cogdell Spencer, Inc. | | | 83,375 | | | | 495,247 | |
Colonial Properties Trust | | | 66,310 | | | | 1,276,467 | |
Cousins Properties, Inc. | | | 38,004 | | | | 317,333 | |
DCT Industrial Trust, Inc.(a) | | | 296,118 | | | | 1,643,455 | |
DuPont Fabros Technology, Inc.(a) | | | 34,030 | | | | 825,228 | |
EastGroup Properties, Inc.(a) | | | 33,491 | | | | 1,472,599 | |
Education Realty Trust, Inc. | | | 39,987 | | | | 321,096 | |
Excel Trust, Inc. | | | 14,405 | | | | 169,835 | |
Extra Space Storage, Inc. | | | 51,266 | | | | 1,061,719 | |
First Potomac Realty Trust | | | 65,076 | | | | 1,024,947 | |
Franklin Street Properties Corp.(a) | | | 114,941 | | | | 1,617,220 | |
Getty Realty Corp.(a) | | | 47,193 | | | | 1,079,776 | |
Gladstone Commercial Corp.(a) | | | 17,144 | | | | 312,707 | |
Glimcher Realty Trust | | | 106,286 | | | | 983,146 | |
Government Properties Income Trust | | | 63,821 | | | | 1,714,232 | |
Healthcare Realty Trust, Inc. | | | 95,079 | | | | 2,158,293 | |
Hersha Hospitality Trust | | | 131,148 | | | | 779,019 | |
Hudson Pacific Properties, Inc. | | | 13,398 | | | | 196,951 | |
Inland Real Estate Corp. | | | 149,053 | | | | 1,421,966 | |
Investors Real Estate Trust(a) | | | 147,860 | | | | 1,404,670 | |
Kite Realty Group Trust(a) | | | 71,478 | | | | 379,548 | |
Lexington Realty Trust(a) | | | 189,428 | | | | 1,771,152 | |
LTC Properties, Inc. | | | 40,760 | | | | 1,155,138 | |
Medical Properties Trust, Inc.(a) | | | 217,219 | | | | 2,513,224 | |
Mission West Properties, Inc. | | | 48,061 | | | | 315,761 | |
Monmouth Real Estate Investment Corp. Class A(a) | | | 59,255 | | | | 486,484 | |
National Health Investors, Inc.(a) | | | 38,874 | | | | 1,862,842 | |
One Liberty Properties, Inc. | | | 20,042 | | | | 302,233 | |
Parkway Properties, Inc. | | | 9,673 | | | | 164,441 | |
Pennsylvania Real Estate Investment Trust | | | 59,057 | | | | 842,743 | |
Potlatch Corp.(a) | | | 62,990 | | | | 2,532,198 | |
| | | | | | | | |
| Investments | | Shares | | | Fair
Value | |
| | | | | | | | |
PS Business Parks, Inc. | | | 20,033 | | | $ | 1,160,712 | |
Ramco-Gershenson Properties Trust | | | 52,202 | | | | 654,091 | |
Retail Opportunity Investments Corp. | | | 25,836 | | | | 282,646 | |
Saul Centers, Inc. | | | 14,414 | | | | 642,144 | |
Sovran Self Storage, Inc. | | | 34,066 | | | | 1,347,310 | |
Sun Communities, Inc.(a) | | | 36,616 | | | | 1,305,360 | |
UMH Properties, Inc.(a) | | | 24,075 | | | | 239,305 | |
Universal Health Realty Income Trust | | | 20,512 | | | | 831,351 | |
Urstadt Biddle Properties, Inc. Class A | | | 26,244 | | | | 499,161 | |
U-Store-It Trust | | | 26,365 | | | | 277,360 | |
Winthrop Realty Trust | | | 33,770 | | | | 413,683 | |
| | | | | | | | |
| Total REITS | | | | | | | 45,888,743 | |
| Retail – 2.6% | | | | | | | | |
bebe Stores, Inc. | | | 35,955 | | | | 210,337 | |
Big 5 Sporting Goods Corp. | | | 7,372 | | | | 87,874 | |
Bob Evans Farms, Inc. | | | 17,509 | | | | 570,793 | |
Brown Shoe Co., Inc.(a) | | | 21,169 | | | | 258,685 | |
Casey’s General Stores, Inc. | | | 12,251 | | | | 477,789 | |
Cash America International, Inc. | | | 2,702 | | | | 124,427 | |
Cato Corp. (The) Class A | | | 17,965 | | | | 440,143 | |
Christopher & Banks Corp. | | | 39,290 | | | | 254,599 | |
Cracker Barrel Old Country Store, Inc. | | | 9,069 | | | | 445,651 | |
Finish Line, Inc. (The) Class A | | | 11,147 | | | | 221,268 | |
Fred’s, Inc. Class A | | | 11,090 | | | | 147,719 | |
Frisch’s Restaurants, Inc. | | | 3,671 | | | | 78,009 | |
Gaiam, Inc. Class A | | | 8,447 | | | | 55,750 | |
Group 1 Automotive, Inc. | | | 5,460 | | | | 233,688 | |
HOT Topic, Inc. | | | 51,442 | | | | 293,219 | |
Lithia Motors, Inc. Class A | | | 8,247 | | | | 120,241 | |
Men’s Wearhouse, Inc. (The)(a) | | | 18,897 | | | | 511,353 | |
PEP Boys-Manny, Moe & Jack | | | 11,522 | | | | 146,445 | |
PetMed Express, Inc.(a) | | | 15,228 | | | | 241,516 | |
PF Chang’s China Bistro, Inc. | | | 9,634 | | | | 444,994 | |
Pricesmart, Inc.(a) | | | 9,826 | | | | 360,025 | |
Regis Corp. | | | 12,373 | | | | 219,497 | |
Sonic Automotive, Inc. Class A(a) | | | 7,466 | | | | 104,599 | |
Stage Stores, Inc. | | | 16,749 | | | | 321,916 | |
Winmark Corp. | | | 293 | | | | 13,516 | |
| | | | | | | | |
| Total Retail | | | | | | | 6,384,053 | |
| Savings & Loans – 3.8% | | | | | | | | |
Abington Bancorp, Inc. | | | 10,193 | | | | 124,661 | |
Astoria Financial Corp.(a) | | | 94,040 | | | | 1,351,355 | |
Bank Mutual Corp.(a) | | | 26,239 | | | | 110,991 | |
BankFinancial Corp. | | | 15,105 | | | | 138,815 | |
Berkshire Hills Bancorp, Inc.(a) | | | 10,531 | | | | 219,571 | |
Brookline Bancorp, Inc.(a) | | | 46,425 | | | | 488,855 | |
Clifton Savings Bancorp, Inc.(a) | | | 15,483 | | | | 183,783 | |
Danvers Bancorp, Inc. | | | 5,089 | | | | 109,006 | |
Dime Community Bancshares, Inc.(a) | | | 32,195 | | | | 475,198 | |
ESB Financial Corp. | | | 7,230 | | | | 106,787 | |
ESSA Bancorp, Inc. | | | 5,585 | | | | 73,722 | |
First Financial Holdings, Inc. | | | 6,935 | | | | 78,435 | |
Flushing Financial Corp. | | | 28,510 | | | | 424,799 | |
See Notes to Financial Statements.
| | | | |
| WisdomTree Domestic Dividend Funds | | | 45 | |
Schedule of Investments (concluded)
WisdomTree SmallCap Dividend Fund (DES)
March 31, 2011
| | | | | | | | |
| Investments | | Shares | | | Fair
Value | |
| | | | | | | | |
Home Federal Bancorp, Inc. | | | 7,013 | | | $ | 82,613 | |
Kearny Financial Corp. | | | 38,896 | | | | 390,127 | |
NewAlliance Bancshares, Inc. | | | 50,114 | | | | 743,692 | |
Northfield Bancorp, Inc. | | | 16,403 | | | | 226,362 | |
Northwest Bancshares, Inc. | | | 97,041 | | | | 1,216,894 | |
OceanFirst Financial Corp. | | | 17,382 | | | | 242,479 | |
Oritani Financial Corp. | | | 47,221 | | | | 598,762 | |
Provident Financial Services, Inc.(a) | | | 45,060 | | | | 666,888 | |
Provident New York Bancorp | | | 21,985 | | | | 226,885 | |
Rockville Financial, Inc. | | | 17,304 | | | | 180,481 | |
Roma Financial Corp. | | | 25,018 | | | | 276,949 | |
Territorial Bancorp, Inc. | | | 4,166 | | | | 82,987 | |
United Financial Bancorp, Inc. | | | 8,471 | | | | 139,856 | |
Viewpoint Financial Group | | | 12,314 | | | | 160,082 | |
Westfield Financial, Inc. | | | 18,535 | | | | 167,927 | |
WSFS Financial Corp. | | | 2,165 | | | | 101,972 | |
| | | | | | | | |
| Total Savings & Loans | | | | | | | 9,390,934 | |
| Semiconductors – 0.2% | | | | | | | | |
Cohu, Inc. | | | 8,745 | | | | 134,323 | |
Micrel, Inc.(a) | | | 16,114 | | | | 217,217 | |
Power Integrations, Inc. | | | 3,405 | | | | 130,514 | |
Richardson Electronics Ltd. | | | 2,647 | | | | 34,887 | |
| | | | | | | | |
| Total Semiconductors | | | | | | | 516,941 | |
| Software – 0.9% | | | | | | | | |
American Software, Inc. Class A | | | 30,725 | | | | 226,751 | |
Blackbaud, Inc. | | | 17,051 | | | | 464,469 | |
Computer Programs & Systems, Inc. | | | 8,019 | | | | 515,461 | |
EPIQ Systems, Inc. | | | 9,108 | | | | 130,791 | |
Fair Isaac Corp. | | | 3,321 | | | | 104,977 | |
Opnet Technologies, Inc. | | | 8,350 | | | | 325,566 | |
Pegasystems, Inc.(a) | | | 3,272 | | | | 124,140 | |
Renaissance Learning, Inc. | | | 18,180 | | | | 213,615 | |
Schawk, Inc. | | | 10,203 | | | | 198,346 | |
| | | | | | | | |
| Total Software | | | | | | | 2,304,116 | |
| Telecommunications – 2.1% | | | | | | | | |
Alaska Communications Systems Group, Inc.(a) | | | 84,328 | | | | 898,093 | |
Atlantic Tele-Network, Inc.(a) | | | 9,346 | | | | 347,578 | |
Black Box Corp. | | | 2,714 | | | | 95,397 | |
Communications Systems, Inc. | | | 8,814 | | | | 136,088 | |
Comtech Telecommunications Corp. | | | 25,426 | | | | 691,079 | |
Consolidated Communications Holdings, Inc. | | | 61,478 | | | | 1,151,483 | |
HickoryTech Corp. | | | 18,813 | | | | 171,010 | |
IDT Corp. Class B | | | 12,371 | | | | 333,398 | |
NTELOS Holdings Corp. | | | 60,345 | | | | 1,110,951 | |
Preformed Line Products Co.(a) | | | 1,970 | | | | 136,265 | |
Shenandoah Telecommunications Co. | | | 9,872 | | | | 178,288 | |
Tessco Technologies, Inc. | | | 4,667 | | | | 53,671 | |
USA Mobility, Inc. | | | 1,165 | | | | 16,881 | |
| | | | | | | | |
| Total Telecommunications | | | | | | | 5,320,182 | |
| | | | | | | | |
| Investments | | Shares | | | Fair
Value | |
| | | | | | | | |
| Textiles – 0.1% | | | | | | | | |
G&K Services, Inc. Class A | | | 5,720 | | | $ | 190,190 | |
UniFirst Corp. | | | 1,096 | | | | 58,099 | |
| | | | | | | | |
| Total Textiles | | | | | | | 248,289 | |
| Transportation – 1.4% | | | | | | | | |
Alexander & Baldwin, Inc.(a) | | | 33,254 | | | | 1,518,045 | |
Arkansas Best Corp. | | | 2,894 | | | | 75,012 | |
Forward Air Corp.(a) | | | 6,848 | | | | 209,754 | |
Heartland Express, Inc.(a) | | | 11,012 | | | | 193,371 | |
International Shipholding Corp. | | | 10,279 | | | | 255,947 | |
Marten Transport Ltd. | | | 1,952 | | | | 43,530 | |
Overseas Shipholding Group, Inc.(a) | | | 37,435 | | | | 1,203,161 | |
| | | | | | | | |
| Total Transportation | | | | | | | 3,498,820 | |
| Trucking & Leasing – 0.6% | | | | | | | | |
TAL International Group, Inc. | | | 39,822 | | | | 1,444,344 | |
| Water – 0.9% | | | | | | | | |
American States Water Co. | | | 13,685 | | | | 490,744 | |
Artesian Resources Corp. Class A(a) | | | 6,570 | | | | 128,049 | |
California Water Service Group | | | 15,894 | | | | 590,780 | |
Connecticut Water Service, Inc. | | | 7,235 | | | | 190,642 | |
Middlesex Water Co. | | | 14,698 | | | | 267,357 | |
Pennichuck Corp. | | | 3,030 | | | | 86,325 | |
SJW Corp. | | | 11,392 | | | | 263,725 | |
York Water Co. | | | 9,151 | | | | 159,319 | |
| | | | | | | | |
| Total Water | | | | | | | 2,176,941 | |
TOTAL COMMON STOCKS
(Cost: $217,349,029) | | | | | | | 243,742,721 | |
| EXCHANGE-TRADED FUND – 1.5% | | | | | | | | |
WisdomTree MidCap Dividend Fund(b)
(Cost: $3,452,991) | | | 70,546 | | | | 3,808,779 | |
| SHORT-TERM INVESTMENT – 0.1% | | | | | | | | |
| MONEY MARKET FUND – 0.1% | | | | | | | | |
Invesco Treasury Fund Private Class, 0.02%(c)
(Cost: $125,334) | | | 125,334 | | | | 125,334 | |
| INVESTMENT OF CASH COLLATERAL FOR SECURITIES LOANED – 25.3% | | | | | | | | |
| MONEY MARKET FUND – 25.3% | | | | | | | | |
Dreyfus Institutional Preferred Money Market Fund, 0.19%(d) (Cost: $62,801,000)(e) | | | 62,801,000 | | | | 62,801,000 | |
TOTAL INVESTMENTS IN SECURITIES – 125.1%
(Cost: $283,728,354) | | | | 310,477,834 | |
Liabilities in Excess of Cash and Other Assets – (25.1)% | | | | (62,306,387 | ) |
| | | | | | | | |
| NET ASSETS – 100.0% | | | | | | $ | 248,171,447 | |
| (a) | Security, or portion thereof, was on loan at March 31, 2011 (See Note 2). |
| (b) | Affiliated companies (See Note 7). |
| (c) | Rate shown represents annualized 7-day yield as of March 31, 2011. |
| (d) | Interest rate shown reflects yield as of March 31, 2011. |
| (e) | At March 31, 2011, the total market value of the Fund’s securities on loan was $60,974,025 and the total market value of the collateral held by the Fund was $62,801,000. |
See Notes to Financial Statements.
| | |
| 46 | | WisdomTree Domestic Dividend Funds |
Statements of Assets and Liabilities
WisdomTree Domestic Dividend Funds
March 31, 2011
| | | | | | | | | | | | | | | | | | | | | | | | |
| | | WisdomTree
Total
Dividend Fund | | | WisdomTree
Equity
Income Fund | | | WisdomTree
LargeCap
Dividend Fund | | | WisdomTree
Dividend
ex-Financials Fund1 | | | WisdomTree
MidCap
Dividend Fund | | | WisdomTree
SmallCap
Dividend Fund | |
ASSETS: | | | | | | | | | | | | | | | | | | | | | | | | |
| | | | | | |
Investments, at cost | | $ | 158,149,149 | | | $ | 198,979,844 | | | $ | 575,090,475 | | | $ | 374,246,313 | | | $ | 295,865,289 | | | $ | 280,275,363 | |
| | | | | | |
Investment in affiliate, at cost (Note 7) | | | 1,225,651 | | | | 754,901 | | | | 1,043,680 | | | | 3,874,298 | | | | 3,405,574 | | | | 3,452,991 | |
Investment in securities, at fair value (including securities on loan)2 | | | 181,761,552 | | | | 206,091,954 | | | | 638,782,090 | | | | 405,204,597 | | | | 324,865,051 | | | | 306,669,055 | |
| | | | | | |
Investment in affiliate, at fair value (Note 7) | | | 1,432,043 | | | | 792,408 | | | | 1,298,687 | | | | 4,500,112 | | | | 3,672,996 | | | | 3,808,779 | |
| | | | | | |
Cash | | | — | | | | — | | | | — | | | | — | | | | — | | | | 132 | |
| | | | | | |
Receivables: | | | | | | | | | | | | | | | | | | | | | | | | |
| | | | | | |
Dividends and interest | | | 361,396 | | | | 473,423 | | | | 1,244,961 | | | | 924,094 | | | | 543,516 | | | | 829,526 | |
Total Assets | | | 183,554,991 | | | | 207,357,785 | | | | 641,325,738 | | | | 410,628,803 | | | | 329,081,563 | | | | 311,307,492 | |
LIABILITIES: | | | | | | | | | | | | | | | | | | | | | | | | |
| | | | | | |
Payables: | | | | | | | | | | | | | | | | | | | | | | | | |
| | | | | | |
Investment securities purchased | | | — | | | | 150,024 | | | | — | | | | 562,298 | | | | 297,482 | | | | 257,821 | |
| | | | | | |
Collateral for securities on loan (Note 2) | | | 12,567,000 | | | | 28,880,000 | | | | 30,091,000 | | | | 66,577,000 | | | | 72,151,000 | | | | 62,801,000 | |
| | | | | | |
Advisory fees (Note 3) | | | 39,202 | | | | 54,332 | | | | 138,786 | | | | 106,447 | | | | 80,255 | | | | 76,321 | |
| | | | | | |
Service fees (Note 2) | | | 628 | | | | 640 | | | | 2,215 | | | | 1,267 | | | | 950 | | | | 903 | |
Total Liabilities | | | 12,606,830 | | | | 29,084,996 | | | | 30,232,001 | | | | 67,247,012 | | | | 72,529,687 | | | | 63,136,045 | |
NET ASSETS | | $ | 170,948,161 | | | $ | 178,272,789 | | | $ | 611,093,737 | | | $ | 343,381,791 | | | $ | 256,551,876 | | | $ | 248,171,447 | |
NET ASSETS: | | | | | | | | | | | | | | | | | | | | | | | | |
| | | | | | |
Paid-in capital | | $ | 177,139,106 | | | $ | 243,004,840 | | | $ | 638,485,102 | | | $ | 393,801,916 | | | $ | 260,526,771 | | | $ | 276,094,427 | |
| | | | | | |
Undistributed net investment income | | | 138,984 | | | | 188,355 | | | | 481,347 | | | | 337,857 | | | | 195,853 | | | | 583,763 | |
| | | | | | |
Accumulated net realized loss on investments | | | (30,148,724 | ) | | | (72,070,023 | ) | | | (91,819,334 | ) | | | (82,342,080 | ) | | | (33,437,932 | ) | | | (55,256,223 | ) |
| | | | | | |
Net unrealized appreciation on investments | | | 23,818,795 | | | | 7,149,617 | | | | 63,946,622 | | | | 31,584,098 | | | | 29,267,184 | | | | 26,749,480 | |
NET ASSETS | | $ | 170,948,161 | | | $ | 178,272,789 | | | $ | 611,093,737 | | | $ | 343,381,791 | | | $ | 256,551,876 | | | $ | 248,171,447 | |
Outstanding beneficial interest shares of $0.001 par value (unlimited number of shares authorized) | | | 3,500,000 | | | | 4,400,000 | | | | 12,650,000 | | | | 6,850,000 | | | | 4,750,000 | | | | 5,100,000 | |
Net asset value per share | | $ | 48.84 | | | $ | 40.52 | | | $ | 48.31 | | | $ | 50.13 | | | $ | 54.01 | | | $ | 48.66 | |
| 1 | This information reflects the investment objective and strategy of the WisdomTree Dividend Top 100 Fund through May 7, 2009 and the investment objective and strategy of the WisdomTree Dividend ex-Financials Fund thereafter. |
| 2 | Market value of securities on loan were as follows: $12,257,799, $27,991,295, $29,388,126, $64,781,496, $70,342,995 and $60,974,025, respectively (Note 2). |
See Notes to Financial Statements.
| | | | |
| WisdomTree Domestic Dividend Funds | | | 47 | |
Statements of Operations
WisdomTree Domestic Dividend Funds
For the Year Ended March 31, 2011
| | | | | | | | | | | | | | | | | | | | | | | | |
| | | WisdomTree
Total
Dividend Fund | | | WisdomTree
Equity
Income Fund | | | WisdomTree
LargeCap
Dividend Fund | | | WisdomTree
Dividend
ex-Financials Fund | | | WisdomTree
MidCap
Dividend Fund | | | WisdomTree
SmallCap
Dividend Fund | |
INVESTMENT INCOME: | | | | | | | | | | | | | | | | | | | | | | | | |
| | | | | | |
Dividends | | $ | 4,841,115 | | | $ | 7,033,066 | | | $ | 15,646,167 | | | $ | 11,588,607 | | | $ | 6,470,147 | | | $ | 8,286,806 | |
| | | | | | |
Dividends from affiliate (Note 7) | | | 20,413 | | | | 25,760 | | | | 57,477 | | | | 86,295 | | | | 52,008 | | | | 49,984 | |
| | | | | | |
Interest | | | 45 | | | | 48 | | | | 154 | | | | 83 | | | | 59 | | | | 65 | |
| | | | | | |
Securities lending income (Note 2) | | | 19,912 | | | | 29,420 | | | | 24,166 | | | | 34,742 | | | | 91,434 | | | | 195,508 | |
Total investment income | | | 4,881,485 | | | | 7,088,294 | | | | 15,727,964 | | | | 11,709,727 | | | | 6,613,648 | | | | 8,532,363 | |
EXPENSES: | | | | | | | | | | | | | | | | | | | | | | | | |
| | | | | | |
Advisory fees (Note 3) | | | 403,944 | | | | 581,824 | | | | 1,325,313 | | | | 1,019,087 | | | | 709,455 | | | | 765,136 | |
| | | | | | |
Service fees (Note 2) | | | 6,348 | | | | 6,737 | | | | 20,826 | | | | 11,800 | | | | 8,215 | | | | 8,859 | |
Total expenses | | | 410,292 | | | | 588,561 | | | | 1,346,139 | | | | 1,030,887 | | | | 717,670 | | | | 773,995 | |
Expenses reimbursements/waivers (Note 3) | | | (2,040 | ) | | | (2,574 | ) | | | (4,416 | ) | | | (8,421 | ) | | | (5,101 | ) | | | (5,155 | ) |
Net expenses | | | 408,252 | | | | 585,987 | | | | 1,341,723 | | | | 1,022,466 | | | | 712,569 | | | | 768,840 | |
Net investment income | | | 4,473,233 | | | | 6,502,307 | | | | 14,386,241 | | | | 10,687,261 | | | | 5,901,079 | | | | 7,763,523 | |
NET REALIZED AND UNREALIZED GAIN ON INVESTMENTS: | | | | | | | | | | | | | | | | | | | | | | | | |
| | | | | | |
Net realized gain (loss) from: | | | | | | | | | | | | | | | | | | | | | | | | |
| | | | | | |
Investment transactions | | | (592,775 | ) | | | (2,069,666 | ) | | | (2,585,986 | ) | | | (412,558 | ) | | | (1,599,086 | ) | | | (1,897,612 | ) |
| | | | | | |
Investment transactions from affiliate (Note 7) | | | 18,355 | | | | 53,423 | | | | 125,030 | | | | 6,082 | | | | 51,260 | | | | 75,524 | |
| | | | | | |
In-kind redemptions | | | 4,350,311 | | | | 16,511,712 | | | | 23,466,917 | | | | 33,406,849 | | | | 14,642,024 | | | | 18,868,999 | |
| | | | | | |
In-kind redemptions from affiliate (Note 7) | | | 236 | | | | 75,949 | | | | 41,359 | | | | 84,211 | | | | 26,743 | | | | 8,254 | |
Net realized gain | | | 3,776,127 | | | | 14,571,418 | | | | 21,047,320 | | | | 33,084,584 | | | | 13,120,941 | | | | 17,055,165 | |
Net change in unrealized appreciation (depreciation) on investments | | | 16,294,181 | | | | 9,399,565 | | | | 47,856,444 | | | | 16,420,742 | | | | 19,534,938 | | | | 9,067,962 | |
Net realized and unrealized gain on investments | | | 20,070,308 | | | | 23,970,983 | | | | 68,903,764 | | | | 49,505,326 | | | | 32,655,879 | | | | 26,123,127 | |
NET INCREASE IN NET ASSETS RESULTING FROM OPERATIONS | | $ | 24,543,541 | | | $ | 30,473,290 | | | $ | 83,290,005 | | | $ | 60,192,587 | | | $ | 38,556,958 | | | $ | 33,886,650 | |
See Notes to Financial Statements.
| | |
| 48 | | WisdomTree Domestic Dividend Funds |
Statements of Changes in Net Assets
WisdomTree Domestic Dividend Funds
| | | | | | | | | | | | | | | | | | | | | | | | |
| | | WisdomTree
Total Dividend Fund | | | WisdomTree
Equity Income Fund | | | WisdomTree
LargeCap Dividend Fund | |
| | | For the
Year Ended
March 31, 2011 | | | For the
Year Ended
March 31, 2010 | | | For the
Year Ended
March 31, 2011 | | | For the
Year Ended
March 31, 2010 | | | For the
Year Ended
March 31, 2011 | | | For the
Year Ended
March 31, 2010 | |
INCREASE (DECREASE) IN NET ASSETS RESULTING FROM OPERATIONS: | | | | | | | | | | | | | | | | | | | | | |
| | | | | | |
Net investment income | | $ | 4,473,233 | | | $ | 3,494,830 | | | $ | 6,502,307 | | | $ | 4,804,949 | | | $ | 14,386,241 | | | $ | 10,830,061 | |
| | | | | | |
Net realized gain (loss) on investments | | | 3,776,127 | | | | (7,707,476 | ) | | | 14,571,418 | | | | (8,284,028 | ) | | | 21,047,320 | | | | (19,976,429 | ) |
| | | | | | |
Net change in unrealized appreciation (depreciation) on investments | | | 16,294,181 | | | | 48,824,215 | | | | 9,399,565 | | | | 59,598,462 | | | | 47,856,444 | | | | 146,328,209 | |
Net increase in net assets resulting from operations | | | 24,543,541 | | | | 44,611,569 | | | | 30,473,290 | | | | 56,119,383 | | | | 83,290,005 | | | | 137,181,841 | |
DIVIDENDS: | | | | | | | | | | | | | | | | | | | | | | | | |
| | | | | | |
Net investment income | | | (4,438,769 | ) | | | (3,446,970 | ) | | | (6,474,781 | ) | | | (4,721,943 | ) | | | (14,235,763 | ) | | | (10,722,974 | ) |
Total dividends | | | (4,438,769 | ) | | | (3,446,970 | ) | | | (6,474,781 | ) | | | (4,721,943 | ) | | | (14,235,763 | ) | | | (10,722,974 | ) |
CAPITAL SHARE TRANSACTIONS: | | | | | | | | | | | | | | | | | | | | | | | | |
| | | | | | |
Net proceeds from sale of shares | | | 33,151,332 | | | | 19,294,993 | | | | 177,074,847 | | | | 46,679,655 | | | | 221,454,446 | | | | 73,698,313 | |
| | | | | | |
Cost of shares redeemed | | | (15,278,459 | ) | | | (12,332,769 | ) | | | (145,707,467 | ) | | | (76,261,688 | ) | | | (92,223,882 | ) | | | (81,483,288 | ) |
Net increase (decrease) in net assets resulting from capital share transactions | | | 17,872,873 | | | | 6,962,224 | | | | 31,367,380 | | | | (29,582,033 | ) | | | 129,230,564 | | | | (7,784,975 | ) |
Net Increase in Net Assets | | | 37,977,645 | | | | 48,126,823 | | | | 55,365,889 | | | | 21,815,407 | | | | 198,284,806 | | | | 118,673,892 | |
NET ASSETS: | | | | | | | | | | | | | | | | | | | | | | | | |
| | | | | | |
Beginning of year | | $ | 132,970,516 | | | $ | 84,843,693 | | | $ | 122,906,900 | | | $ | 101,091,493 | | | $ | 412,808,931 | | | $ | 294,135,039 | |
| | | | | | |
End of year | | $ | 170,948,161 | | | $ | 132,970,516 | | | $ | 178,272,789 | | | $ | 122,906,900 | | | $ | 611,093,737 | | | $ | 412,808,931 | |
Undistributed net investment income included in net assets at end of year | | $ | 138,984 | | | $ | 128,223 | | | $ | 188,355 | | | $ | 223,296 | | | $ | 481,347 | | | $ | 356,417 | |
SHARES CREATED AND REDEEMED: | | | | | | | | | | | | | | | | | | | | | | | | |
| | | | | | |
Shares, outstanding, beginning of year | | | 3,100,000 | | | | 2,900,000 | | | | 3,500,000 | | | | 4,400,000 | | | | 9,700,000 | | | | 9,850,000 | |
| | | | | | |
Shares created | | | 750,000 | | | | 500,000 | | | | 4,750,000 | | | | 1,400,000 | | | | 5,000,000 | | | | 1,900,000 | |
| | | | | | |
Shares redeemed | | | (350,000 | ) | | | (300,000 | ) | | | (3,850,000 | ) | | | (2,300,000 | ) | | | (2,050,000 | ) | | | (2,050,000 | ) |
Shares outstanding, end of year | | | 3,500,000 | | | | 3,100,000 | | | | 4,400,000 | | | | 3,500,000 | | | | 12,650,000 | | | | 9,700,000 | |
See Notes to Financial Statements.
| | | | |
| WisdomTree Domestic Dividend Funds | | | 49 | |
Statements of Changes in Net Assets (concluded)
WisdomTree Domestic Dividend Funds
| | | | | | | | | | | | | | | | | | | | | | | | |
| | | WisdomTree
Dividend ex-Financials Fund | | | WisdomTree
MidCap Dividend Fund | | | WisdomTree
SmallCap Dividend Fund | |
| | | For the
Year Ended
March 31, 2011 | | | For the
Year Ended
March 31, 20101 | | | For the
Year Ended
March 31, 2011 | | | For the
Year Ended
March 31, 2010 | | | For the
Year Ended
March 31, 2011 | | | For the
Year Ended
March 31, 2010 | |
INCREASE (DECREASE) IN NET ASSETS RESULTING FROM OPERATIONS: | | | | | | | | | | | | | | | | | | | | | |
| | | | | | |
Net investment income | | $ | 10,687,261 | | | $ | 6,373,801 | | | $ | 5,901,079 | | | $ | 3,361,295 | | | $ | 7,763,523 | | | $ | 5,035,138 | |
| | | | | | |
Net realized gain (loss) on investments | | | 33,084,584 | | | | (12,082,997 | ) | | | 13,120,941 | | | | 4,691,967 | | | | 17,055,165 | | | | 6,121,768 | |
| | | | | | |
Net change in unrealized appreciation on investments | | | 16,420,742 | | | | 73,563,002 | | | | 19,534,938 | | | | 45,170,197 | | | | 9,067,962 | | | | 53,786,910 | |
Net increase in net assets resulting from operations | | | 60,192,587 | | | | 67,853,806 | | | | 38,556,958 | | | | 53,223,459 | | | | 33,886,650 | | | | 64,943,816 | |
DIVIDENDS: | | | | | | | | | | | | | | | | | | | | | | | | |
| | | | | | |
Net investment income | | | (10,527,617 | ) | | | (6,252,514 | ) | | | (5,778,694 | ) | | | (3,242,404 | ) | | | (7,366,770 | ) | | | (4,954,523 | ) |
Total dividends | | | (10,527,617 | ) | | | (6,252,514 | ) | | | (5,778,694 | ) | | | (3,242,404 | ) | | | (7,366,770 | ) | | | (4,954,523 | ) |
CAPITAL SHARE TRANSACTIONS: | | | | | | | | | | | | | | | | | | | | | | | | |
| | | | | | |
Net proceeds from sale of shares | | | 255,440,000 | | | | 97,666,183 | | | | 169,491,298 | | | | 60,079,949 | | | | 121,807,365 | | | | 71,158,842 | |
| | | | | | |
Cost of shares redeemed | | | (152,000,000 | ) | | | (73,267,291 | ) | | | (67,838,212 | ) | | | (53,595,618 | ) | | | (54,879,905 | ) | | | (49,793,228 | ) |
Net increase in net assets resulting from capital share transactions | | | 103,440,000 | | | | 24,398,892 | | | | 101,653,086 | | | | 6,484,331 | | | | 66,927,460 | | | | 21,365,614 | |
Net Increase in Net Assets | | | 153,104,970 | | | | 86,000,184 | | | | 134,431,350 | | | | 56,465,386 | | | | 93,447,340 | | | | 81,354,907 | |
NET ASSETS: | | | | | | | | | | | | | | | | | | | | | | | | |
| | | | | | |
Beginning of year | | $ | 190,276,821 | | | $ | 104,276,637 | | | $ | 122,120,526 | | | $ | 65,655,140 | | | $ | 154,724,107 | | | $ | 73,369,200 | |
| | | | | | |
End of year | | $ | 343,381,791 | | | $ | 190,276,821 | | | $ | 256,551,876 | | | $ | 122,120,526 | | | $ | 248,171,447 | | | $ | 154,724,107 | |
Undistributed net investment income included in net assets at end of year | | $ | 337,857 | | | $ | 310,225 | | | $ | 195,853 | | | $ | 194,523 | | | $ | 583,763 | | | $ | 269,407 | |
SHARES CREATED AND REDEEMED: | | | | | | | | | | | | | | | | | | | | | | | | |
| | | | | | |
Shares, outstanding, beginning of year | | | 4,450,000 | | | | 3,900,000 | | | | 2,650,000 | | | | 2,450,000 | | | | 3,650,000 | | | | 3,050,000 | |
| | | | | | |
Shares created | | | 5,600,000 | | | | 2,400,000 | | | | 3,500,000 | | | | 1,600,000 | | | | 2,650,000 | | | | 1,950,000 | |
| | | | | | |
Shares redeemed | | | (3,200,000 | ) | | | (1,850,000 | ) | | | (1,400,000 | ) | | | (1,400,000 | ) | | | (1,200,000 | ) | | | (1,350,000 | ) |
Shares outstanding, end of year | | | 6,850,000 | | | | 4,450,000 | | | | 4,750,000 | | | | 2,650,000 | | | | 5,100,000 | | | | 3,650,000 | |
| 1 | This information reflects the investment objective and strategy of the WisdomTree Dividend Top 100 Fund through May 7, 2009 and the investment objective and strategy of the WisdomTree Dividend ex-Financials Fund thereafter. |
See Notes to Financial Statements.
| | |
| 50 | | WisdomTree Domestic Dividend Funds |
Financial Highlights
WisdomTree Domestic Dividend Funds
March 31, 2011
Selected data for a share of beneficial interest outstanding throughout the period is presented below:
| | | | | | | | | | | | | | | | | | | | |
| WisdomTree Total Dividend Fund | | For the
Year Ended
March 31, 2011 | | | For the
Year Ended
March 31, 2010 | | | For the
Year Ended
March 31, 2009 | | | For the
Year Ended
March 31, 2008 | | | For the Period
June 16, 2006*
through
March 31, 2007 | |
Net asset value, beginning of period | | $ | 42.89 | | | $ | 29.26 | | | $ | 51.81 | | | $ | 57.87 | | | $ | 50.32 | |
Investment operations: | | | | | | | | | | | | | | | | | | | | |
Net investment income1 | | | 1.37 | | | | 1.14 | | | | 1.54 | | | | 1.68 | | | | 1.18 | |
Net realized and unrealized gain (loss) | | | 5.92 | | | | 13.61 | | | | (22.56 | ) | | | (6.04 | ) | | | 7.28 | |
Total from investment operations | | | 7.29 | | | | 14.75 | | | | (21.02 | ) | | | (4.36 | ) | | | 8.46 | |
Dividends and distributions to shareholders: | | | | | | | | | | | | | | | | | | | | |
Net investment income | | | (1.34 | ) | | | (1.12 | ) | | | (1.53 | ) | | | (1.68 | ) | | | (0.91 | ) |
Capital gains | | | — | | | | — | | | | — | | | | (0.02 | ) | | | — | |
Total dividends and distributions to shareholders | | | (1.34 | ) | | | (1.12 | ) | | | (1.53 | ) | | | (1.70 | ) | | | (0.91 | ) |
Net asset value, end of period | | $ | 48.84 | | | $ | 42.89 | | | $ | 29.26 | | | $ | 51.81 | | | $ | 57.87 | |
| | | | | |
TOTAL RETURN2 | | | 17.37 | % | | | 50.83 | % | | | (41.29 | )% | | | (7.77 | )% | | | 16.84 | % |
RATIOS/SUPPLEMENTAL DATA: | | | | | | | | | | | | | | | | | | | | |
Net assets, end of period (000’s omitted) | | $ | 170,948 | | | $ | 132,971 | | | $ | 84,844 | | | $ | 88,071 | | | $ | 89,698 | |
Ratios to average net assets4 of: | | | | | | | | | | | | | | | | | | | | |
Expenses, net of expense reimbursements/waivers | | | 0.28 | % | | | 0.28 | % | | | 0.28 | % | | | 0.28 | % | | | 0.28 | %3 |
Expenses, prior to expense reimbursements/waivers | | | 0.28 | % | | | 0.28 | % | | | 0.28 | % | | | 0.28 | % | | | 0.31 | %3 |
Net investment income | | | 3.10 | % | | | 3.01 | % | | | 3.91 | % | | | 2.89 | % | | | 2.76 | %3 |
Portfolio turnover rate5 | | | 6 | % | | | 16 | % | | | 23 | % | | | 10 | % | | | 12 | % |
| | | | | | | | | | | | | | | | | | | | |
| | | | | | |
| WisdomTree Equity Income Fund | | For the
Year Ended
March 31, 2011 | | | For the
Year Ended
March 31, 2010 | | | For the
Year Ended
March 31, 2009 | | | For the
Year Ended
March 31, 2008 | | | For the Period
June 16, 2006* through March 31, 2007 | |
Net asset value, beginning of period | | $ | 35.12 | | | $ | 22.98 | | | $ | 47.81 | | | $ | 57.99 | | | $ | 50.01 | |
Investment operations: | | | | | | | | | | | | | | | | | | | | |
Net investment income1 | | | 1.61 | | | | 1.17 | | | | 1.95 | | | | 2.22 | | | | 1.56 | |
Net realized and unrealized gain (loss) | | | 5.33 | | | | 12.16 | | | | (24.80 | ) | | | (10.19 | ) | | | 7.54 | |
Total from investment operations | | | 6.94 | | | | 13.33 | | | | (22.85 | ) | | | (7.97 | ) | | | 9.10 | |
Dividends to shareholders: | | | | | | | | | | | | | | | | | | | | |
Net investment income | | | (1.54 | ) | | | (1.19 | ) | | | (1.98 | ) | | | (2.21 | ) | | | (1.12 | ) |
Total dividends to shareholders | | | (1.54 | ) | | | (1.19 | ) | | | (1.98 | ) | | | (2.21 | ) | | | (1.12 | ) |
Net asset value, end of period | | $ | 40.52 | | | $ | 35.12 | | | $ | 22.98 | | | $ | 47.81 | | | $ | 57.99 | |
| | | | | |
TOTAL RETURN2 | | | 20.24 | % | | | 58.47 | % | | | (49.06 | )% | | | (14.18 | )% | | | 18.23 | % |
RATIOS/SUPPLEMENTAL DATA: | | | | | | | | | | | | | | | | | | | | |
Net assets, end of period (000’s omitted) | | $ | 178,273 | | | $ | 122,907 | | | $ | 101,091 | | | $ | 138,659 | | | $ | 205,874 | |
Ratios to average net assets4 of: | | | | | | | | | | | | | | | | | | | | |
Expenses, net of expense reimbursements/waivers | | | 0.38 | % | | | 0.38 | % | | | 0.38 | % | | | 0.38 | % | | | 0.38 | %3 |
Expenses, prior to expense reimbursements/waivers | | | 0.38 | % | | | 0.38 | % | | | 0.38 | % | | | 0.38 | % | | | 0.40 | %3 |
Net investment income | | | 4.25 | % | | | 3.72 | % | | | 5.59 | % | | | 3.88 | % | | | 3.68 | %3 |
Portfolio turnover rate5 | | | 8 | % | | | 25 | % | | | 45 | % | | | 19 | % | | | 11 | % |
| * | Commencement of investment operations. |
| 1 | Based on average shares outstanding. |
| 2 | Total return is calculated assuming an initial investment made at the net asset value at the beginning of the period, reinvestment of all dividends and distributions at net asset value during the period and redemption on the last day of the period. Total return calculated for a period of less than one year is not annualized. The total return would have been lower if certain expenses had not been reimbursed/waived by the investment adviser (Note 2). |
| 4 | The ratios to average net assets do not include net investment income (loss) or expenses of affiliated funds in which the Fund invests. |
| 5 | Portfolio turnover rate is not annualized and excludes the value of portfolio securities received or delivered as a result of in-kind creations or redemptions of the Fund’s capital shares. |
See Notes to Financial Statements.
| | | | |
| WisdomTree Domestic Dividend Funds | | | 51 | |
Financial Highlights (continued)
WisdomTree Domestic Dividend Funds
March 31, 2011
Selected data for a share of beneficial interest outstanding throughout the period is presented below:
| | | | | | | | | | | | | | | | | | | | |
| WisdomTree LargeCap Dividend Fund | | For the Year Ended
March 31, 2011 | | | For the Year Ended
March 31, 2010 | | | For the Year Ended
March 31, 2009 | | | For the Year Ended March 31, 2008 | | | For the Period June 16, 2006* through
March 31, 2007 | |
Net asset value, beginning of period | | $ | 42.56 | | | $ | 29.86 | | | $ | 52.71 | | | $ | 57.97 | | | $ | 50.34 | |
Investment operations: | | | | | | | | | | | | | | | | | | | | |
Net investment income1 | | | 1.33 | | | | 1.10 | | | | 1.51 | | | | 1.60 | | | | 1.11 | |
Net realized and unrealized gain (loss) | | | 5.68 | | | | 12.69 | | | | (22.91 | ) | | | (5.21 | ) | | | 7.32 | |
Total from investment operations | | | 7.01 | | | | 13.79 | | | | (21.40 | ) | | | (3.61 | ) | | | 8.43 | |
Dividends to shareholders: | | | | | | | | | | | | | | | | | | | | |
Net investment income | | | (1.26 | ) | | | (1.09 | ) | | | (1.45 | ) | | | (1.65 | ) | | | (0.80 | ) |
Total dividends to shareholders | | | (1.26 | ) | | | (1.09 | ) | | | (1.45 | ) | | | (1.65 | ) | | | (0.80 | ) |
Net asset value, end of period | | $ | 48.31 | | | $ | 42.56 | | | $ | 29.86 | | | $ | 52.71 | | | $ | 57.97 | |
| | | | | |
TOTAL RETURN2 | | | 16.83 | % | | | 46.53 | % | | | (41.25 | )% | | | (6.47 | )% | | | 16.77 | % |
RATIOS/SUPPLEMENTAL DATA: | | | | | | | | | | | | | | | | | | | | |
Net assets, end of period (000’s omitted) | | $ | 611,094 | | | $ | 412,809 | | | $ | 294,135 | | | $ | 308,379 | | | $ | 333,339 | |
Ratios to average net assets4 of: | | | | | | | | | | | | | | | | | | | | |
Expenses, net of expense reimbursements/waivers | | | 0.28 | % | | | 0.28 | % | | | 0.28 | % | | | 0.28 | % | | | 0.28 | %3 |
Expenses, prior to expense reimbursements/waivers | | | 0.28 | % | | | 0.28 | % | | | 0.28 | % | | | 0.28 | % | | | 0.29 | %3 |
Net investment income | | | 3.04 | % | | | 2.89 | % | | | 3.78 | % | | | 2.74 | % | | | 2.65 | %3 |
Portfolio turnover rate5 | | | 5 | % | | | 17 | % | | | 25 | % | | | 8 | % | | | 13 | % |
| | | | | | | | | | | | | | | | | | | | |
| | | | | | |
| WisdomTree Dividend ex-Financials Fund | | For the Year Ended
March 31, 2011 | | | For the Year Ended
March 31, 2010 | | | For the
Year Ended
March 31, 2009 | | | For the
Year Ended
March 31, 2008 | | | For the Period
June 16, 2006*
through March 31, 2007 | |
Net asset value, beginning of period | | $ | 42.76 | | | $ | 26.74 | | | $ | 51.14 | | | $ | 59.69 | | | $ | 50.12 | |
Investment operations: | | | | | | | | | | | | | | | | | | | | |
Net investment income1 | | | 1.81 | | | | 1.60 | | | | 1.81 | | | | 2.10 | | | | 1.40 | |
Net realized and unrealized gain (loss) | | | 7.25 | | | | 16.01 | | | | (24.34 | ) | | | (8.56 | ) | | | 9.09 | |
Total from investment operations | | | 9.06 | | | | 17.61 | | | | (22.53 | ) | | | (6.46 | ) | | | 10.49 | |
Dividends to shareholders: | | | | | | | | | | | | | | | | | | | | |
Net investment income | | | (1.69 | ) | | | (1.59 | ) | | | (1.87 | ) | | | (2.09 | ) | | | (0.92 | ) |
Total dividends to shareholders | | | (1.69 | ) | | | (1.59 | ) | | | (1.87 | ) | | | (2.09 | ) | | | (0.92 | ) |
Net asset value, end of period | | $ | 50.13 | | | $ | 42.76 | | | $ | 26.74 | | | $ | 51.14 | | | $ | 59.69 | |
| | | | | |
TOTAL RETURN2 | | | 21.68 | % | | | 66.66 | % | | | (45.10 | )% | | | (11.15 | )% | | | 20.99 | % |
RATIOS/SUPPLEMENTAL DATA: | | | | | | | | | | | | | | | | | | | | |
Net assets, end of period (000’s omitted) | | $ | 343,382 | | | $ | 190,277 | | | $ | 104,277 | | | $ | 166,205 | | | $ | 188,009 | |
Ratios to average net assets4 of: | | | | | | | | | | | | | | | | | | | | |
Expenses, net of expense reimbursements/waivers | | | 0.38 | % | | | 0.38 | % | | | 0.38 | % | | | 0.38 | % | | | 0.38 | %3 |
Expenses, prior to expense reimbursements/waivers | | | 0.38 | % | | | 0.38 | % | | | 0.38 | % | | | 0.38 | % | | | 0.40 | %3 |
Net investment income | | | 3.99 | % | | | 4.32 | % | | | 4.57 | % | | | 3.57 | % | | | 3.29 | %3 |
Portfolio turnover rate5 | | | 5 | % | | | 57 | % | | | 53 | % | | | 16 | % | | | 21 | % |
| * | Commencement of investment operations. |
| 1 | Based on average shares outstanding. |
| 2 | Total return is calculated assuming an initial investment made at the net asset value at the beginning of the period, reinvestment of all dividends and distributions at net asset value during the period and redemption on the last day of the period. Total return calculated for a period of less than one year is not annualized. The total return would have been lower if certain expenses had not been reimbursed/waived by the investment adviser (Note 2). |
| 4 | The ratios to average net assets do not include net investment income (loss) or expenses of affiliated funds in which the Fund invests. |
| 5 | Portfolio turnover rate is not annualized and excludes the value of portfolio securities received or delivered as a result of in-kind creations or redemptions of the Fund’s capital shares. |
See Notes to Financial Statements.
| | |
| 52 | | WisdomTree Domestic Dividend Funds |
Financial Highlights (concluded)
WisdomTree Domestic Dividend Funds
March 31, 2011
Selected data for a share of beneficial interest outstanding throughout the period is presented below:
| | | | | | | | | | | | | | | | | | | | |
| WisdomTree MidCap Dividend Fund | | For the Year Ended March 31, 2011 | | | For the Year Ended March 31, 2010 | | | For the Year Ended
March 31, 2009 | | | For the Year Ended
March 31, 2008 | | | For the Period June 16, 2006* through March 31, 2007 | |
Net asset value, beginning of period | | $ | 46.08 | | | $ | 26.80 | | | $ | 48.00 | | | $ | 58.02 | | | $ | 50.21 | |
Investment operations: | | | | | | | | | | | | | | | | | | | | |
Net investment income1 | | | 1.53 | | | | 1.29 | | | | 1.63 | | | | 1.88 | | | | 1.45 | |
Net realized and unrealized gain (loss) | | | 7.79 | | | | 19.22 | | | | (21.16 | ) | | | (10.12 | ) | | | 7.41 | |
Total from investment operations | | | 9.32 | | | | 20.51 | | | | (19.53 | ) | | | (8.24 | ) | | | 8.86 | |
Dividends and distribution to shareholders: | | | | | | | | | | | | | | | | | | | | |
Net investment income | | | (1.39 | ) | | | (1.23 | ) | | | (1.67 | ) | | | (1.78 | ) | | | (1.04 | ) |
Capital gains | | | — | | | | — | | | | — | | | | — | | | | (0.01 | ) |
Total dividends and distributions to shareholders | | | (1.39 | ) | | | (1.23 | ) | | | (1.67 | ) | | | (1.78 | ) | | | (1.05 | ) |
Net asset value, end of period | | $ | 54.01 | | | $ | 46.08 | | | $ | 26.80 | | | $ | 48.00 | | | $ | 58.02 | |
| | | | | |
TOTAL RETURN2 | | | 20.60 | % | | | 77.34 | % | | | (41.61 | )% | | | (14.47 | )% | | | 17.71 | % |
RATIOS/SUPPLEMENTAL DATA: | | | | | | | | | | | | | | | | | | | | |
Net assets, end of period (000’s omitted) | | $ | 256,552 | | | $ | 122,121 | | | $ | 65,655 | | | $ | 91,198 | | | $ | 78,333 | |
Ratios to average net assets4 of: | | | | | | | | | | | | | | | | | | | | |
Expenses, net of expense reimbursements/waivers | | | 0.38 | % | | | 0.38 | % | | | 0.38 | % | | | 0.38 | % | | | 0.38 | %3 |
Expenses, prior to expense reimbursements/waivers | | | 0.38 | % | | | 0.38 | % | | | 0.38 | % | | | 0.38 | % | | | 0.43 | %3 |
Net investment income | | | 3.16 | % | | | 3.34 | % | | | 4.31 | % | | | 3.38 | % | | | 3.47 | %3 |
Portfolio turnover rate5 | | | 10 | % | | | 11 | % | | | 43 | % | | | 30 | % | | | 12 | % |
| | | | | | | | | | | | | | | | | | | | |
| | | | | | |
| WisdomTree SmallCap Dividend Fund | | For the Year Ended March 31, 2011 | | | For the Year Ended March 31, 2010 | | | For the Year Ended March 31, 2009 | | | For the Year Ended March 31, 2008 | | | For the Period June 16, 2006* through March 31, 2007 | |
Net asset value, beginning of period | | $ | 42.39 | | | $ | 24.06 | | | $ | 46.31 | | | $ | 57.41 | | | $ | 50.24 | |
Investment operations: | | | | | | | | | | | | | | | | | | | | |
Net investment income1 | | | 1.72 | | | | 1.49 | | | | 1.85 | | | | 2.13 | | | | 1.79 | |
Net realized and unrealized gain (loss) | | | 6.14 | | | | 18.28 | | | | (22.26 | ) | | | (11.10 | ) | | | 6.65 | |
Total from investment operations | | | 7.86 | | | | 19.77 | | | | (20.41 | ) | | | (8.97 | ) | | | 8.44 | |
Dividends to shareholders: | | | | | | | | | | | | | | | | | | | | |
Net investment income | | | (1.59 | ) | | | (1.44 | ) | | | (1.84 | ) | | | (2.13 | ) | | | (1.27 | ) |
Total dividends to shareholders | | | (1.59 | ) | | | (1.44 | ) | | | (1.84 | ) | | | (2.13 | ) | | | (1.27 | ) |
Net asset value, end of period | | $ | 48.66 | | | $ | 42.39 | | | $ | 24.06 | | | $ | 46.31 | | | $ | 57.41 | |
| | | | | |
TOTAL RETURN2 | | | 18.96 | % | | | 83.27 | % | | | (45.27 | )% | | | (15.93 | )% | | | 16.88 | % |
RATIOS/SUPPLEMENTAL DATA: | | | | | | | | | | | | | | | | | | | | |
Net assets, end of period (000’s omitted) | | $ | 248,171 | | | $ | 154,724 | | | $ | 73,369 | | | $ | 81,040 | | | $ | 111,948 | |
Ratios to average net assets4 of: | | | | | | | | | | | | | | | | | | | | |
Expenses, net of expense reimbursements/waivers | | | 0.38 | % | | | 0.38 | % | | | 0.38 | % | | | 0.38 | % | | | 0.38 | %3 |
Expenses, prior to expense reimbursements/waivers | | | 0.38 | % | | | 0.38 | % | | | 0.38 | % | | | 0.38 | % | | | 0.42 | %3 |
Net investment income | | | 3.86 | % | | | 4.21 | % | | | 5.15 | % | | | 3.97 | % | | | 4.25 | %3 |
Portfolio turnover rate5 | | | 11 | % | | | 16 | % | | | 65 | % | | | 34 | % | | | 16 | % |
| * | Commencement of investment operations. |
| 1 | Based on average shares outstanding. |
| 2 | Total return is calculated assuming an initial investment made at the net asset value at the beginning of the period, reinvestment of all dividends and distributions at net asset value during the period and redemption on the last day of the period. Total return calculated for a period of less than one year is not annualized. The total return would have been lower if certain expenses had not been reimbursed/waived by the investment adviser (Note 2). |
| 4 | The ratio to average net assets do not include net investment income (loss) or expenses of affiliated funds in which the Fund invests. |
| 5 | Portfolio turnover rate is not annualized and excludes the value of portfolio securities received or delivered as a result of in-kind creations or redemptions of the Fund’s capital shares. |
See Notes to Financial Statements.
| | | | |
| WisdomTree Domestic Dividend Funds | | | 53 | |
Notes to Financial Statements
March 31, 2011
1. ORGANIZATION
WisdomTree Trust (the “Trust”) is registered under the Investment Company Act of 1940, as amended (the “1940 Act”), as an open-end management investment company. The Trust was established as a Delaware statutory trust pursuant to a Trust Instrument dated December 15, 2005. As of March 31, 2011, the Trust offered 46 investment funds (each a “Fund”, collectively, the “Funds”). The Funds, described herein, commenced operations on June 16, 2006.
These financial statements relate only to the WisdomTree Total Dividend Fund (“Total Dividend Fund”), WisdomTree Equity Income Fund (“Equity Income Fund”), WisdomTree LargeCap Dividend Fund (“LargeCap Dividend Fund”), WisdomTree Dividend ex-Financials Fund (“Dividend ex-Financials Fund”), WisdomTree MidCap Dividend Fund (“MidCap Dividend Fund”) and WisdomTree SmallCap Dividend Fund (“SmallCap Dividend Fund”), together the “Domestic Dividend Funds”.
Each Fund seeks investment returns that closely correspond to the price and yield performance, before fees and expenses, of a particular index (“Index”) developed by WisdomTree Investments, Inc. (“Wisdom Tree Investments”). WisdomTree Investments is the parent company of WisdomTree Asset Management, Inc. (“WTAM”), the investment adviser to each Fund and the Trust. “WisdomTree” is a registered mark of WisdomTree Investments and has been licensed for use by the Trust. Each Fund described herein is considered to be non-diversified.
2. SIGNIFICANT ACCOUNTING POLICIES
The Financial Accounting Standards Board (“FASB”) Accounting Standards Codification (“Codification”) has become the exclusive reference of authoritative U.S. generally accepted accounting principles (“GAAP”) recognized by the FASB to be applied by nongovernmental entities. Rules and interpretive releases of the Securities and Exchange Commission (“SEC”) under authority of federal laws are also sources of authoritative GAAP for SEC registrants.
The following is a summary of significant accounting policies followed by the Funds:
Guarantees — In the normal course of business the Funds may enter into contracts that contain a variety of representations or that provide indemnification for certain liabilities. The Funds’ maximum exposure under these arrangements is unknown, as this would involve future claims that may be made against the Funds that have not yet occurred. However, the Funds have not had prior claims or losses pursuant to these contracts and expect the risk of loss to be remote. Therefore no liabilities have been recorded in connection with these indemnifications.
Use of Estimates — The preparation of financial statements in conformity with GAAP requires management to make certain estimates and assumptions that affect the reported amounts of assets and liabilities and disclosure of contingent assets and liabilities at the date of the financial statements and the reported amounts of increases and decreases in the net assets from operations during the reporting period. Actual results could differ from those estimates.
Investment Valuation — The net asset value (“NAV”) of each Fund’s shares is calculated each day the national securities exchanges are open for trading as of the close of regular trading on the New York Stock Exchange, generally 4:00 p.m. Eastern time. NAV per share is calculated by dividing a Fund’s net assets by the number of Fund shares outstanding. Transactions in Fund shares will be priced at NAV only if you purchase or redeem shares directly from a Fund in creation units, which are typically in blocks of 50,000 shares or more. Fund shares are purchased or sold on a national securities exchange at market prices, which may be higher or lower than NAV. Each Fund may invest in money market funds or affiliated funds, which are valued at NAV.
Securities traded on any recognized U.S. or non-U.S. exchange are valued at the last sale price or official closing price on the exchange or system on which they are principally traded. As indicated, unlisted equity securities are valued at the last quoted sale price or, if no sale price is available, at the mean between the highest bid and lowest ask prices. Securities for which market quotations are not readily available are valued at fair value as determined by management and in accordance with procedures approved by the Board of Trustees. Short-term securities with 60 days or less remaining to maturity are valued using the amortized cost method, which approximates fair value.
In certain instances, such as when reliable market valuations are not readily available or are not deemed to reflect current market values, a Fund’s investments will be valued in accordance with the Fund’s pricing policy and procedures approved by the Board of Trustee. For these purposes, a price based on amortized cost is considered a market valuation. Securities that may be valued using “fair value” pricing may include, but are not limited to, securities for which there are no current market quotations or whose issuer is in default or bankruptcy, securities subject to corporate actions (such as mergers or reorganizations), securities subject to non-U.S. investment limits or currency controls, and securities affected by “significant events”. An example of a significant event is an event occurring after the close of the market in which a security trades but before a Fund’s next NAV calculation time that may materially affect the value of a Fund’s investment (e.g., government action, natural disaster, or significant market fluctuation). Price movements in U.S. market that are deemed to affect the value of the foreign securities, or reflect changes to the value of such securities, also may cause securities to be “fair valued”. When fair value pricing is employed, the prices of securities used by a Fund to calculate its NAV may differ form quoted or published prices for the same securities.
Fair Value Measurement — In accordance with Codification Topic 820 (“ASC 820”), Fair Value Measurements and Disclosures, fair value is defined as the price that each Fund would receive upon selling an investment in an orderly transaction to an independent
| | |
| 54 | | WisdomTree Domestic Dividend Funds |
Notes to Financial Statements (continued)
buyer in the principal or most advantageous market of the investment. ASC 820 established a three-tier hierarchy to maximize the use of observable market data and minimize the use of unobservable inputs and to establish classification of fair value measurements for disclosure purposes. Inputs refer broadly to the assumptions that market participants would use in pricing the asset or liability, including assumptions about risk—for example, the risk inherent in a particular valuation technique used to measure fair value (such as a pricing model) and/or the risk inherent in the inputs to the valuation technique. Inputs may be observable or unobservable. Observable inputs reflect the assumptions market participants would use in pricing the asset or liability. Observable inputs are based on market data obtained from sources independent of the reporting entity. Unobservable inputs reflect the reporting entity’s own assumptions about the assumptions market participants would use in pricing the asset or liability. Unobservable inputs are based on the best information available in the circumstances. The three-tier hierarchy of inputs is summarized in the three broad levels listed below:
Level 1 – quoted prices in active markets for identical securities
Level 2 – other significant observable inputs (including quoted prices for similar securities, interest rates, prepayment speeds, credit risk, etc.)
Level 3 – significant unobservable inputs (including each Fund’s assumptions in determining the fair value of investments)
Investments that use Level 2 or Level 3 inputs may include, but are not limited to: (i) an unlisted security related to corporate actions; (ii) a restricted security (e.g., one that may not be publicly sold without registration under the Securities Act of 1933, as amended); (iii) a security whose trading has been suspended or which has been de-listed from its primary trading exchange; (iv) a security that is thinly traded; (v) a security in default or bankruptcy proceedings for which there is no current market quotation; (vi) a security affected by currency controls or restrictions; and (vii) a security affected by a significant event (e.g., an event that occurs after the close of the markets on which the security is traded but before the time as of which a Fund’s NAV is computed and that may materially affect the value of the Fund’s investments).
The inputs or methodology used for valuation are not necessarily an indication of the risk associated with investing in those investments.
The following is a summary of the inputs used as of March 31, 2011 in valuing the Fund’s assets carried at fair value:
| | | | | | | | | | | | |
| Total Dividend Fund | | Level 1 | | | Level 2 | | | Level 3 | |
Investment in Securities | | | | | | | | | | | | |
Common Stocks* | | $ | 169,101,661 | | | $ | — | | | $ | — | |
Money Market Funds | | | — | | | | 12,659,891 | | | | — | |
Affiliated Funds | | | 1,432,043 | | | | — | | | | — | |
Total | | $ | 170,533,704 | | | $ | 12,659,891 | | | $ | — | |
| | | | | | | | | | | | |
| Equity Income Fund | | Level 1 | | | Level 2 | | | Level 3 | |
Investment in Securities | | | | | | | | | | | | |
Common Stocks* | | $ | 177,040,007 | | | $ | — | | | $ | — | |
Money Market Funds | | | — | | | | 29,051,947 | | | | — | |
Affiliated Funds | | | 792,408 | | | | — | | | | — | |
Total | | $ | 177,832,415 | | | $ | 29,051,947 | | | $ | — | |
| | | | | | | | | | | | |
| LargeCap Dividend Fund | | Level 1 | | | Level 2 | | | Level 3 | |
Investment in Securities | | | | | | | | | | | | |
Common Stocks* | | $ | 608,436,941 | | | $ | — | | | $ | — | |
Money Market Funds | | | — | | | | 30,345,149 | | | | — | |
Affiliated Funds | | | 1,298,687 | | | | — | | | | — | |
Total | | $ | 609,735,628 | | | $ | 30,345,149 | | | $ | — | |
| | | | | | | | | | | | |
| Dividend ex-Financials Fund | | Level 1 | | | Level 2 | | | Level 3 | |
Investment in Securities | | | | | | | | | | | | |
Common Stocks* | | $ | 338,261,859 | | | $ | — | | | $ | — | |
Money Market Funds | | | — | | | | 66,942,738 | | | | — | |
Affiliated Funds | | | 4,500,112 | | | | — | | | | — | |
Total | | $ | 342,761,971 | | | $ | 66,942,738 | | | $ | — | |
| | | | |
| WisdomTree Domestic Dividend Funds | | | 55 | |
Notes to Financial Statements (continued)
| | | | | | | | | | | | |
| MidCap Dividend Fund | | Level 1 | | | Level 2 | | | Level 3 | |
Investment in Securities | | | | | | | | | | | | |
Common Stocks* | | $ | 252,433,078 | | | $ | — | | | $ | — | |
Money Market Funds | | | — | | | | 72,431,973 | | | | — | |
Affiliated Funds | | | 3,672,996 | | | | — | | | | — | |
Total | | $ | 256,106,074 | | | $ | 72,431,973 | | | $ | — | |
| | | | | | | | | | | | |
| SmallCap Dividend Fund | | Level 1 | | | Level 2 | | | Level 3 | |
Investment in Securities | | | | | | | | | | | | |
Common Stocks* | | $ | 243,742,721 | | | $ | — | | | $ | — | |
Money Market Funds | | | — | | | | 62,926,334 | | | | — | |
Affiliated Funds | | | 3,808,779 | | | | — | | | | — | |
Total | | $ | 247,551,500 | | | $ | 62,926,334 | | | $ | — | |
| | * | Please refer to Schedule of Investments for a breakdown of the valuation by industry type. |
In January 2010, FASB issued Accounting Standards Update No. 2010-06 “Improving Disclosures about Fair Value Measurements (“ASU 2010-06”).” ASU 2010-06 requires reporting entities to make new disclosures about amounts and reasons for significant transfers in and out of Level 1 and Level 2 fair value measurements, as well as inputs and valuation techniques used to measure fair value for both recurring and nonrecurring fair value measurements that fall in either Level 2 or Level 3. There were no Level 3 securities during or for the year ended March 31, 2011. ASU 2010-06 will also requires information on purchases and sales, issuances and settlements on a gross basis in the reconciliation of activity in Level 3 fair value measurements. The new and revised disclosures are required to be implemented for fiscal years beginning after December 15, 2009, except for the disclosures surrounding purchases, sales, issuances and settlements on a gross basis in the reconciliation of Level 3 fair value measurements, which are effective for fiscal years beginning after December 15, 2010. Management has implemented the applicable portion of ASU 2010-06 for the fiscal year ended March 31, 2011 and the impact of such adoption is limited to additional disclosure in the financial statements. No transfers between Level 1 or Level 2 fair value measurements occurred during the fiscal year March 31, 2011.
Derivative and Hedging Disclosure — Codification Topic 815 (“ASC 815”), Derivatives and Hedging, requires qualitative disclosures about objectives and strategies for using derivatives, quantitative disclosures about fair value amounts of gains and losses on derivative instruments, and disclosures about credit-risk-related contingent features in derivative agreements. The Funds did not invest in derivative instruments during the fiscal year ended March 31, 2011.
Investment Transactions and Investment Income — Investment transactions are recorded as of the date that the securities are purchased or sold (trade date). Realized gains and losses on sales of portfolio securities are calculated using the identified-cost method. Dividend income is recognized on the ex-dividend date. Interest income is accrued daily. The value of additional securities received as dividend payments is recorded as income and as an increase to the cost basis of such securities.
Expenses/Reimbursements — WTAM has agreed to pay all expenses of the Funds, except for: (i) brokerage expenses and other expenses (such as stamp taxes) connected with the execution of portfolio transactions or in connection with creation and redemption transactions; (ii) legal fees or expenses in connection with any arbitration, litigation or pending or threatened arbitration or litigation, including any settlements in connection therewith; (iii) compensation and expenses of each Independent Trustee; (iv) compensation and expenses of counsel to the Independent Trustees; (v) compensation and expenses of the Trust’s chief compliance officer; (vi) extraordinary expenses; (vii) distribution fees and expenses paid by the Trust under any distribution plan adopted pursuant to Rule 12b-1 under the 1940 Act; and (viii) the advisory fee payable to WTAM.
Pursuant to a separate contractual arrangement, WTAM has arranged for the provision of Chief Compliance Officer (“CCO”) services to the Funds and is liable and responsible for, and administers, payments to the CCO, the Independent Trustees and counsel to the Independent Trustees, in exchange for a service fee paid by each Fund of up to 0.0044% of each Fund’s average daily net assets. Trustees fees, which are included in Service Fees on the Statements of Operations, of $288,600 have been paid on behalf of the Funds of the Trust to the Independent Trustees for the fiscal year ended March 31, 2011.
Security Lending — Each Fund may lend portfolio securities to certain creditworthy borrowers, including the Funds’ securities lending agent. It is the Fund’s policy that, at origination, all loans are secured by collateral of at least 102% of the value of U.S. securities loaned and 105% of the value of foreign securities loaned. Collateral in the form of cash and/or high grade debt obligations, equivalent to at least 100% of the market value of securities is maintained at all times. The collateral can be invested in certain money market mutual funds which also have exposure to the fluctuations of the market. Each Fund receives compensation for lending its securities from interest or dividends earned on the cash or U.S. government securities held as collateral, net of fee
| | |
| 56 | | WisdomTree Domestic Dividend Funds |
Notes to Financial Statements (continued)
rebates paid to the borrower plus reasonable administrative and custody fees. The dividend and interest income earned on the securities loaned is accounted for in the same manner as other dividend and interest income. The borrower pays to the Funds an amount equal to any dividends or interest received on loaned securities. The Funds retain all or a portion of the interest received on investment of cash collateral or receives a fee from the borrower. Lending portfolio securities could result in a loss or delay in recovering each Fund’s securities if the borrower defaults.
The securities lending income earned by the Funds is disclosed on the Statements of Operations on page 48.
Short-Term Investments — Each Fund may invest a portion of its assets in high-quality money market instruments on an ongoing basis to provide liquidity or for other reasons. The instruments in which a Fund may invest include short-term obligations issued by the U.S. Government, negotiable certificates of deposit (“CDs”), fixed time deposits and bankers’ acceptances of U.S. and foreign banks and similar institutions, commercial papers, repurchase agreements and money market funds. CDs are short-term negotiable obligations of commercial banks. Time deposits are non-negotiable deposits maintained in banking institutions for specified periods of time at stated interest rates. Banker’s acceptances are time drafts drawn on commercial banks by borrowers, usually in connection with international transactions.
Tax Information and Dividends and Distributions to Shareholders — It is each Fund’s policy to comply with all requirements of the Internal Revenue Code of 1986, as amended (the “Code”). Each Fund intends to qualify for and to elect treatment as a separate Regulated Investment Company (“RIC”) under Subchapter M of the Code. It is the policy of each Fund to pay out dividends, if any, to investors at least annually. Taxable net realized gains from investment transactions, reduced by capital loss carryforwards, if any, are declared and distributed to shareholders at least annually. The capital loss carryforward amount, if any, is available to offset future net capital gains. The Funds may occasionally be required to make supplemental distributions at some other time during the year. The Trust reserves the right to declare special distributions if, in its reasonable discretion, such action is necessary or advisable to preserve the status of each Fund as a RIC or to avoid imposition of income or excise taxes on undistributed income. Dividends and distributions to shareholders are recorded on the ex-dividend date. The amount of dividends and distributions from net investment income and net realized capital gains are determined in accordance with Federal income tax regulations which may differ from GAAP. These “book/tax” differences are either considered temporary or permanent in nature. To the extent these differences are permanent in nature, such amounts are reclassified within the components of net assets based on their Federal tax basis treatment; temporary differences do not require reclassification. Dividends and distributions, which exceed earnings and profit for tax purposes, are reported as a tax return of capital.
3. ADVISER FEES AND TRANSACTIONS
As an investment adviser, WTAM has overall responsibility for the general management and administration of the Trust. WTAM also provides an investment program for each Fund. WTAM also arranges for sub-advisory, transfer agency, custody, fund administration, and all other non-distribution related services necessary for the Funds to operate. Under the Investment Advisory Agreement for each Fund, also described in Note 2, WTAM agrees to pay all expenses of the Funds, except compensation and expenses of the Independent Trustees, counsel to the Independent Trustees and the Trust’s CCO, interest expenses and taxes, brokerage expenses, and other expenses connected with the execution of portfolio transactions, any distribution fees or expenses, legal fees or expenses and extraordinary expenses.
Pursuant to a separate contractual arrangement, also described in Note 2, WTAM arranges for the provision of CCO services with respect to each Fund and is liable and responsible for, and administers, payments to the CCO, the Independent Trustees and counsel to the Independent Trustees in exchange for a fee of up to 0.0044%. WTAM expects to receive fees from each Fund, based on a percentage of the Fund’s average daily net assets, as shown in the following table.
| | | | |
| Fund | | Advisory Fee Rate | |
Total Dividend Fund | | | 0.28 | % |
Equity Income Fund | | | 0.38 | % |
LargeCap Dividend Fund | | | 0.28 | % |
Dividend ex-Financials Fund | | | 0.38 | % |
MidCap Dividend Fund | | | 0.38 | % |
SmallCap Dividend Fund | | | 0.38 | % |
Each Fund may purchase shares of an affiliated exchange traded fund(s) in secondary market transactions. For the fiscal year ended March 31, 2011 WTAM waived a portion of its advisory fees based on each Fund’ investments in affiliated Funds. The table below indicates the waiver amounts. Please see Note 7 on page 60, for additional information on Other Affiliated Parties and Transactions.
| | | | |
| WisdomTree Domestic Dividend Funds | | | 57 | |
Notes to Financial Statements (continued)
WTAM waived a portion of it’s investment advisory fees with respect to its investments in affiliated funds for the year ended March 31, 2011 as follows:
| | | | |
| Fund | | Advisory Fees Waived | |
Total Dividend Fund | | $ | 2,040 | |
Equity Income Fund | | | 2,574 | |
LargeCap Dividend Fund | | | 4,416 | |
Dividend ex-Financials Fund | | | 8,421 | |
MidCap Dividend Fund | | | 5,101 | |
SmallCap Dividend Fund | | | 5,155 | |
4. CAPITAL SHARE TRANSACTIONS
As of March 31, 2011, there were an unlimited number of $0.001 par value shares of beneficial interest authorized by the Trust. Shares are issued and redeemed by each Fund only in Creation Units or multiples thereof. Except when aggregated in Creation Units, shares of each Fund are not redeemable. Transactions in shares for each Fund are disclosed in detail in the Statements of Changes in Net Assets. The consideration for the purchase of Creation Units of a Fund generally consists of the in-kind contribution of a designated portfolio of equity securities constituting a portfolio sampling representation of the securities included in the relevant Fund’s underlying index and an amount of cash. Investors purchasing and redeeming Creation Units may be charged a purchase transaction fee and a redemption transaction fee to offset transfer and other transaction costs associated with the issuance and redemption of Creation Units.
5. INVESTMENT PORTFOLIO TRANSACTIONS
Purchases and sales of investments (excluding in-kind purchases and redemptions and short-term investments) for the fiscal year ended March 31, 2011 were as follows:
| | | | | | | | |
| Fund | | Purchases | | | Sales | |
Total Dividend Fund | | $ | 15,532,041 | | | $ | 7,943,697 | |
Equity Income Fund | | | 42,876,952 | | | | 12,438,472 | |
LargeCap Dividend Fund | | | 52,791,142 | | | | 22,880,387 | |
Dividend ex-Financials Fund | | | 115,788,714 | | | | 13,139,531 | |
MidCap Dividend Fund | | | 58,086,192 | | | | 17,865,608 | |
SmallCap Dividend Fund | | | 64,529,152 | | | | 22,721,574 | |
For the fiscal year ended March 31, 2011, the cost of in-kind purchases and the proceeds from in-kind redemptions were as follows:
| | | | | | | | |
| Fund | | Purchases | | | Sales | |
Total Dividend Fund | | $ | 23,789,313 | | | $ | 13,230,420 | |
Equity Income Fund | | | 144,698,322 | | | | 143,716,189 | |
LargeCap Dividend Fund | | | 190,708,439 | | | | 90,984,978 | |
Dividend ex-Financials Fund | | | 151,369,237 | | | �� | 150,285,436 | |
MidCap Dividend Fund | | | 128,558,073 | | | | 66,651,208 | |
SmallCap Dividend Fund | | | 78,347,348 | | | | 52,583,843 | |
Gains and losses on in-kind redemptions are not recognized at the Fund level for tax purposes.
6. FEDERAL INCOME TAXES
At March 31, 2011, the cost of investments (including securities on loan) for Federal income tax purposes was as follows:
| | | | | | | | | | | | | | | | |
| Fund | | Tax Cost | | | Gross Unrealized
Appreciation | | | Gross Unrealized
Depreciation | | | Net Unrealized
Appreciation | |
Total Dividend Fund | | $ | 162,193,222 | | | $ | 24,906,990 | | | $ | (3,906,617 | ) | | $ | 21,000,373 | |
Equity Income Fund | | | 201,447,321 | | | | 11,420,238 | | | | (5,983,197 | ) | | | 5,437,041 | |
LargeCap Dividend Fund | | | 584,879,134 | | | | 67,423,425 | | | | (12,221,782 | ) | | | 55,201,643 | |
Dividend ex-Financials Fund | | | 379,443,006 | | | | 34,977,066 | | | | (4,715,363 | ) | | | 30,261,703 | |
MidCap Dividend Fund | | | 301,782,461 | | | | 30,445,715 | | | | (3,690,129 | ) | | | 26,755,586 | |
SmallCap Dividend Fund | | | 287,540,501 | | | | 29,814,869 | | | | (6,877,536 | ) | | | 22,937,333 | |
| | |
| 58 | | WisdomTree Domestic Dividend Funds |
Notes to Financial Statements (continued)
At March 31, 2011, the components of accumulated earnings/loss on a tax-basis were as follows:
| | | | | | | | | | | | | | | | |
| Fund | | Undistributed
Ordinary Income | | | Undistributed
Capital and Other
Losses | | | Net Unrealized
Appreciation | | | Total Accumulated
Losses | |
Total Dividend Fund | | $ | 138,984 | | | $ | (27,330,302 | ) | | $ | 21,000,373 | | | $ | (6,190,945 | ) |
Equity Income Fund | | | 188,355 | | | | (70,357,447 | ) | | | 5,437,041 | | | | (64,732,051 | ) |
LargeCap Dividend Fund | | | 481,347 | | | | (83,074,355 | ) | | | 55,201,643 | | | | (27,391,365 | ) |
Dividend ex-Financials Fund | | | 337,857 | | | | (81,019,685 | ) | | | 30,261,703 | | | | (50,420,125 | ) |
MidCap Dividend Fund | | | 195,853 | | | | (30,926,334 | ) | | | 26,755,586 | | | | (3,974,895 | ) |
SmallCap Dividend Fund | | | 583,763 | | | | (51,444,076 | ) | | | 22,937,333 | | | | (27,922,980 | ) |
The tax character of distributions paid during the years ended March 31, 2011 and March 31, 2010, was as follows:
| | | | | | | | |
| | | Year Ended March 31, 2011 | | | Year Ended March 31, 2010 | |
| Fund | | Distributions Paid from Ordinary Income* | | | Distributions Paid from Ordinary Income* | |
Total Dividend Fund | | $ | 4,438,769 | | | $ | 3,446,970 | |
Equity Income Fund | | | 6,474,781 | | | | 4,721,943 | |
LargeCap Dividend Fund | | | 14,235,763 | | | | 10,722,974 | |
Dividend ex-Financials Fund | | | 10,527,617 | | | | 6,252,514 | |
MidCap Dividend Fund | | | 5,778,694 | | | | 3,242,404 | |
SmallCap Dividend Fund | | | 7,366,770 | | | | 4,954,523 | |
| | * | Includes short-term capital gains. |
At March 31, 2011, for Federal income tax purposes, the Funds have capital loss carryforwards available to offset future capital gains through the years indicated. To the extent that these loss carryforwards are utilized, capital gains so offset will not be distributed to shareholders.
| | | | | | | | | | | | | | | | | | | | | | | | |
| Fund | | Capital Loss
Available
Through 2015 | | | Capital Loss
Available
Through 2016 | | | Capital Loss
Available
Through 2017 | | | Capital Loss
Available
Through 2018 | | | Capital Loss
Available
Through 2019 | | | Capital Loss
Available Total | |
Total Dividend Fund | | $ | — | | | $ | 410,492 | | | $ | 4,674,701 | | | $ | 11,073,078 | | | $ | 10,786,298 | | | $ | 26,944,569 | |
Equity Income Fund | | | 4,934 | | | | 1,261,567 | | | | 9,481,659 | | | | 36,880,803 | | | | 21,181,473 | | | | 68,810,436 | |
LargeCap Dividend Fund | | | 5,452 | | | | 3,165,417 | | | | 12,904,697 | | | | 32,859,591 | | | | 32,903,699 | | | | 81,838,856 | |
Dividend ex-Financials Fund | | | 16,309 | | | | 1,204,674 | | | | 9,972,192 | | | | 68,035,975 | | | | 1,318,159 | | | | 80,547,309 | |
MidCap Dividend Fund | | | — | | | | 517,017 | | | | 7,127,052 | | | | 16,904,294 | | | | 5,568,674 | | | | 30,117,037 | |
SmallCap Dividend Fund | | | 44,705 | | | | 774,464 | | | | 10,100,965 | | | | 32,761,958 | | | | 6,604,794 | | | | 50,286,886 | |
Capital losses incurred after October 31 (“post-October capital losses”) and within the taxable year are deemed to arise on the first business day of each Fund’s next taxable year.
During the year ended March 31, 2011, the following Funds incurred and will elect to defer net post-October losses as follows:
| | | | |
| Fund | | Post-October
Capital Losses | |
Total Dividend Fund | | $ | 385,733 | |
Equity Income Fund | | | 1,547,011 | |
LargeCap Dividend Fund | | | 1,235,499 | |
Dividend ex-Financials Fund | | | 472,376 | |
MidCap Dividend Fund | | | 809,297 | |
SmallCap Dividend Fund | | | 1,157,190 | |
| | | | |
| WisdomTree Domestic Dividend Funds | | | 59 | |
Notes to Financial Statements (continued)
At March 31, 2011, the effect of permanent book/tax reclassifications resulted in increases (decreases) to the components of net assets as follows:
| | | | | | | | | | | | |
| Fund | | Undistributed Net
Investment Loss | | | Accumulated
Net Realized
Loss | | | Paid-in Capital | |
Total Dividend Fund | | $ | (23,703 | ) | | $ | (3,788,801 | ) | | $ | 3,812,504 | |
Equity Income Fund | | | (62,467 | ) | | | (15,089,772 | ) | | | 15,152,239 | |
LargeCap Dividend Fund | | | (25,548 | ) | | | (20,392,771 | ) | | | 20,418,319 | |
Dividend ex-Financials Fund | | | (132,012 | ) | | | (32,113,854 | ) | | | 32,245,866 | |
MidCap Dividend Fund | | | (121,055 | ) | | | (13,453,175 | ) | | | 13,574,230 | |
SmallCap Dividend Fund | | | (82,397 | ) | | | (17,648,544 | ) | | | 17,730,941 | |
These differences are primarily due to redemptions-in-kind, the tax treatment of income earned from investments in partnerships, and non-dividend distributions from underlying investments.
GAAP provides guidance on tax provisions that prescribe a minimum threshold for financial statement recognition of the benefit of a tax position taken or expected to be taken in a tax return. Foreign taxes are provided for based on each Fund’s understanding of the tax rules and rates that exist in the foreign markets in which it invests. Taxes are accrued and applied to net investment income, net realized capital gains and net unrealized appreciation, as applicable, as the income is earned or capital gains are recorded. As of and during the fiscal year ended March 31, 2011, the Funds did not have any liabilities for unrecognized tax benefits. If applicable, the Funds will recognize interest accrued related to unrecognized tax benefits in interest expense and penalties in “Other” expenses on the Statements of Operations. The Funds file tax returns with U.S. Internal Revenue Service, the state of New York, and various states. Generally, each of the tax years in the four year period ended March 31, 2011, remains subject to examination by taxing authorities.
7. OTHER AFFILIATED PARTIES AND TRANSACTIONS
Affiliated holdings are funds which are managed by the Trust or an affiliate of the Trust. Transactions with affiliated companies during the fiscal year ended March 31, 2011 are as follows:
| | | | | | | | | | | | | | | | | | | | |
| Affiliated Fund Name | | Value at
3/31/2010 | | | Purchases/
Additions | | | Sales/ Reductions | | | Value at
3/31/2011 | | | Dividend
Income | |
Total Dividend Fund | | | | | | | | | | | | | | | | | | | | |
LargeCap Dividend Fund | | $ | — | | | $ | 833,400 | | | $ | 824,356 | | | $ | — | | | $ | — | |
WisdomTree Total Earnings Fund | | | — | | | | 1,742,933 | | | | 748,943 | | | | 1,158,392 | | | | 16,838 | |
WisdomTree Earnings 500 Fund | | | — | | | | 3,147,363 | | | | 2,943,336 | | | | 273,651 | | | | 3,575 | |
Total | | $ | — | | | $ | 5,723,696 | | | $ | 4,516,635 | | | $ | 1,432,043 | | | $ | 20,413 | |
Equity Income Fund | | | | | | | | | | | | | | | | | | | | |
Total Dividend Fund | | $ | — | | | $ | 6,332,271 | | | $ | 5,706,743 | | | $ | 792,408 | | | $ | 25,760 | |
LargeCap Dividend Fund | | | | | | | | | | | | | | | | | | | | |
Total Dividend Fund | | $ | — | | | $ | 8,934,995 | | | $ | 7,965,491 | | | $ | 1,298,687 | | | $ | 52,081 | |
WisdomTree Total Earnings Fund | | | — | | | | 2,767,294 | | | | 2,859,507 | | | | — | | | | 5,396 | |
Total | | $ | — | | | $ | 11,702,289 | | | $ | 10,824,998 | | | $ | 1,298,687 | | | $ | 57,477 | |
Dividend ex-Financials Fund | | | | | | | | | | | | | | | | | | | | |
LargeCap Dividend Fund | | $ | — | | | $ | 5,963,784 | | | $ | 4,048,839 | | | $ | 2,243,546 | | | $ | 42,154 | |
MidCap Dividend Fund | | | — | | | | 5,933,411 | | | | 4,064,350 | | | | 2,256,566 | | | | 44,141 | |
Total | | $ | — | | | $ | 11,897,195 | | | $ | 8,113,189 | | | $ | 4,500,112 | | | $ | 86,295 | |
MidCap Dividend Fund | | | | | | | | | | | | | | | | | | | | |
LargeCap Dividend Fund | | $ | — | | | $ | 7,532,095 | | | $ | 4,141,874 | | | $ | 3,672,996 | | | $ | 49,775 | |
SmallCap Dividend Fund | | | — | | | | 125,998 | | | | 126,228 | | | | — | | | | — | |
WisdomTree SmallCap Earnings Fund | | | — | | | | 863,614 | | | | 926,034 | | | | — | | | | 2,233 | |
Total | | $ | — | | | $ | 8,521,707 | | | $ | 5,194,136 | | | $ | 3,672,996 | | | $ | 52,008 | |
SmallCap Dividend Fund | | | | | | | | | | | | | | | | | | | | |
MidCap Dividend Fund | | $ | — | | | $ | 8,874,989 | | | $ | 5,505,776 | | | $ | 3,808,779 | | | $ | 49,984 | |
| | |
| 60 | | WisdomTree Domestic Dividend Funds |
Notes to Financial Statements (concluded)
8. SUBSEQUENT EVENT
Effective June 17, 2011, the Wisdomtree Funds listed in the table below are not covered in this Report but will change their investment objective, strategies and fund names. Certain WisdomTree Funds listed below are not part of this Report but are part of the forty-six funds that comprise the Trust.
| | | | | | |
| Ticker | | Former Fund Name | | New Fund Name | | Primary Change |
DRW | | WisdomTree International Real Estate Fund | | WisdomTree Global ex-U.S. Real Estate Fund | | Broader, global real estate exposure with addition of emerging markets. |
DBU | | WisdomTree International Utilities Sector Fund | | WisdomTree Global ex-U.S. Utility Fund | | Broader, global utilities exposure with addition of emerging markets. |
DBN | | WisdomTree International Basic Materials Sector Fund | | WisdomTree Commodity Country Equity Fund | | More diversified commodity-focused equity strategy; adds emerging markets. |
DKA | | WisdomTree International Energy Sector Fund | | WisdomTree Global Natural Resources Fund | | More diversified energy/natural resources-focused equity strategy; adds emerging markets. |
DND | | WisdomTree Pacific ex-Japan Total Dividend Fund | | WisdomTree Asia Pacific ex- Japan Fund | | Expand portfolio to become a broader Asia-Pacific regional strategy; adds emerging markets. |
DNH | | WisdomTree Pacific ex-Japan Equity Income Fund | | WisdomTree Australia Dividend Fund | | Expand majority Australia portfolio weight to pure Australia dividend strategy. |
DNL | | WisdomTree World ex-U.S. Growth Fund | | WisdomTree Global ex-U.S. Growth Fund | | Name change only. |
The WisdomTree Dreyfus Euro Fund and the WisdomTree Dreyfus New Zealand Dollar Fund will change their investment objective, strategies and fund names as indicated table below, effective on or after June 27, 2011 and August 26, 2011 respectively.
| | | | | | |
| Ticker | | Former Fund Name | | New Fund Name | | Primary Change/Enhancement |
EU | | WisdomTree Dreyfus Euro Fund | | WisdomTree Dreyfus Euro Debt Fund | | Restructured to provide exposure to debt of issuers in the European Union denominated in Euros. Extend duration to achieve intermediate-term European bond strategy. |
BNZ | | WisdomTree Dreyfus New Zealand Dollar Fund | | WisdomTree Dreyfus Australia & New Zealand Debt Fund | | Restructured to provide exposure to Australia & New Zealand debt denominated in their respective currencies. Extend duration to achieve intermediate-term Australia/ New Zealand bond strategy. |
| | | | |
| WisdomTree Domestic Dividend Funds | | | 61 | |
Report of Independent Registered Public Accounting Firm
The Board of Trustees and Shareholders of WisdomTree Trust:
We have audited the accompanying statements of assets and liabilities, including the schedules of investments, of WisdomTree Total Dividend Fund, WisdomTree Equity Income Fund, WisdomTree LargeCap Dividend Fund, WisdomTree Dividend ex-Financials Fund, WisdomTree MidCap Dividend Fund and WisdomTree SmallCap Dividend Fund (six of the investment funds constituting the WisdomTree Trust (the “Trust”)) as of March 31, 2011, and the related statements of operations for the year then ended, the statements of changes in net assets for each of the two years in the period then ended, and the financial highlights for each of the periods indicated therein. These financial statements and financial highlights are the responsibility of the Trust’s management. Our responsibility is to express an opinion on these financial statements and financial highlights based on our audits.
We conducted our audits in accordance with the standards of the Public Company Accounting Oversight Board (United States). Those standards require that we plan and perform the audit to obtain reasonable assurance about whether the financial statements and financial highlights are free of material misstatement. We were not engaged to perform an audit of the Trust’s internal control over financial reporting. Our audits included consideration of internal control over financial reporting as a basis for designing audit procedures that are appropriate in the circumstances, but not for the purpose of expressing an opinion on the effectiveness of the Trust’s internal control over financial reporting. Accordingly, we express no such opinion. An audit also includes examining, on a test basis, evidence supporting the amounts and disclosures in the financial statements and financial highlights, assessing the accounting principles used and significant estimates made by management, and evaluating the overall financial statement presentation. Our procedures included confirmation of securities owned as of March 31, 2011, by correspondence with the custodian and brokers or by other appropriate auditing procedures where replies from brokers were not received. We believe that our audits provide a reasonable basis for our opinion.
In our opinion, the financial statements and financial highlights referred to above present fairly, in all material respects, the financial position of WisdomTree Total Dividend Fund, WisdomTree Equity Income Fund, WisdomTree LargeCap Dividend Fund, WisdomTree Dividend ex-Financials Fund, WisdomTree MidCap Dividend Fund and WisdomTree SmallCap Dividend Fund of WisdomTree Trust at March 31, 2011, the results of their operations for the year then ended, the changes in their net assets for each of the two years in the period then ended, and the financial highlights for each of the indicated periods, in conformity with U.S. generally accepted accounting principles.

New York, New York
May 26, 2011
| | |
| 62 | | WisdomTree Domestic Dividend Funds |
Approval of Investment Advisory and Sub-Advisory Agreement (unaudited)
Approval of Investment Advisory Agreement. The Trust and the Investment Adviser have entered into an investment advisory agreement covering each Fund discussed herein. At a meeting held on March 16, 2011, the Board of Trustees re-approved the Investment Advisory Agreement for each Fund. The Board reviewed and analyzed the factors it deemed relevant, including: (i) the nature, quality and extent of the services to be provided to the Funds by WTAM; (ii) the performance of the Funds; (iii) the costs of services to be provided and the profits to be realized by WTAM from its relationship with the Funds; (iv) the extent to which economies of scale would be realized as the Funds grow; (v) whether the fee levels reflect these economies of scale for the benefit of investors; and (vi) the fees charged by the Investment Adviser for non-registered funds.
The Board also considered the nature and quality of the services to be provided by WTAM to the Funds, recognizing WTAM’s operational capabilities and resources. The Board also noted the extensive responsibilities that WTAM has as investment adviser to the Funds, including the selection of the Funds’ Sub-Adviser and oversight of the Sub-Adviser’s compliance with Fund policies and objectives, oversight of general Fund compliance with federal and state laws, and the implementation of Board directives as they relate to the Funds.
The Board gave substantial consideration to the fees payable under the Advisory Agreement. In this connection, the Board evaluated WTAM’s anticipated costs and profitability in serving as investment adviser to the Funds, including the costs associated with the personnel, systems and equipment necessary to manage the Funds and the costs associated with compensating the Sub-Adviser. The Board also examined the fees to be paid by each Fund in light of fees paid to other investment managers by comparable funds and the method of computing each Fund’s fee. After comparing the fees with those of comparable funds and in light of the quality and extent of services to be provided and the costs anticipated to be incurred by WTAM, the Board concluded that the level of the fees paid to WTAM with respect to each Fund is fair and reasonable. The Board also re-approved the Sub-Advisory Agreement between WTAM and Mellon Capital Management (“MCM”), on behalf of each Fund, using essentially the same criteria it used in connection with the Advisory Agreement. The Board considered MCM’s operational capabilities and resources and MCM’s experience in serving as an adviser to ETFs, noting that MCM currently provides investment advisory and management services to other ETFs. The Board considered the investment performance of the Funds, and the expertise and performance of the MCM personnel. The Board also noted that Bank of New York Mellon Corporation, an affiliate of MCM, serves as the Funds’ administrator, accountant, custodian, transfer agent and securities lending agent and receives compensation for acting in these capacities and is responsible for, among other things, coordinating the Funds’ audits, financial statements and tax returns, managing expenses and budgeting for the Funds, processing trades on behalf of each Fund and custodying Fund assets. As such, the Board concluded that the benefits accruing to MCM and its affiliates by virtue of their relationship to the Trust are reasonable and fair in comparison with the anticipated costs of providing the relevant services. The Board noted that WTAM, not the Funds, pays the fees to MCM under the Sub-Advisory Agreement for each Fund.
Based on these considerations and the overall high quality of the personnel, operations, financial condition, investment advisory capabilities, methodologies, and performance of WTAM and MCM, the Board determined that the re-approval of the Advisory Agreements and the Sub-Advisory Agreements was in the best interests of each Fund. After full consideration of these and other factors, the Board, including a majority of the Independent Trustees, with the assistance of independent counsel, approved the Advisory Agreements and Sub-Advisory Agreements.
| | | | |
| WisdomTree Domestic Dividend Funds | | | 63 | |
Frequency Distribution of Discounts & Premiums (unaudited)
The chart below presents information about differences between the per share net asset value (“NAV”) of each Fund and the market trading price of shares of each Fund. For these purposes, the “market price” is the mid-point of the highest bid and lowest offer for Fund shares as of the close of trading on the exchange where Fund shares are listed. The term “premium” is sometimes used to describe a market price in excess of NAV and the term “discount” is sometimes used to describe a market price below NAV. The chart presents information about the size and frequency of premiums or discounts. As with other exchange traded funds, the market price of Fund shares is typically slightly higher or lower than the Fund’s per share NAV. Factors that contribute to the differences between market price and NAV include the supply and demand for Fund shares and investors’ assessments of the underlying value of a Fund’s portfolio securities.
Differences between the closing times of the U.S. and non-U.S. markets may contribute to differences between the NAV and market price of Funds that invest in non-U.S. securities. Many non-U.S. markets close prior to the close of the U.S. securities exchanges. Developments after the close of such markets as a result of ongoing price discovery may be reflected in a Fund’s market price but not in it’s NAV (or vice versa).
| | | | | | | | | | | | | | | | | | | | |
| | | | | | Market Price Above or Equal to Net Asset Value | | | Market Price Below Net Asset Value | |
| | | Basis Point Differential | | | Number
of Days | | | Percentage of
Total Days | | | Number
of Days | | | Percentage of
Total Days | |
WisdomTree Total Dividend Fund | | | | | | | | | | | | | | | | | | | | |
June 16, 2006 – March 31, 2011 | | | 0 – 24.9 | | | | 587 | | | | 46.29 | % | | | 626 | | | | 49.37 | % |
| | | 25 – 49.9 | | | | 23 | | | | 1.81 | % | | | 12 | | | | 0.95 | % |
| | | 50 – 74.9 | | | | 6 | | | | 0.47 | % | | | 5 | | | | 0.39 | % |
| | | 75 – 99.9 | | | | 3 | | | | 0.24 | % | | | 0 | | | | 0.00 | % |
| | | 100 –124.9 | | | | 1 | | | | 0.08 | % | | | 1 | | | | 0.08 | % |
| | | 125 –174.9 | | | | 1 | | | | 0.08 | % | | | 0 | | | | 0.00 | % |
| | | 175 – 199.9 | | | | 2 | | | | 0.16 | % | | | 0 | | | | 0.00 | % |
| | | 200 – 249.9 | | | | 0 | | | | 0.00 | % | | | 0 | | | | 0.00 | % |
| | | >250 | | | | 1 | | | | 0.08 | % | | | 0 | | | | 0.00 | % |
| | | | Total | | | | 624 | | | | 49.21 | % | | | 644 | | | | 50.79 | % |
WisdomTree Equity Income Fund | | | | | | | | | | | | | | | | | | | | |
June 16, 2006 – March 31, 2011 | | | 0 – 24.9 | | | | 500 | | | | 39.43 | % | | | 702 | | | | 55.36 | % |
| | | 25 – 49.9 | | | | 29 | | | | 2.29 | % | | | 13 | | | | 1.03 | % |
| | | 50 – 74.9 | | | | 5 | | | | 0.39 | % | | | 5 | | | | 0.39 | % |
| | | 75 – 99.9 | | | | 2 | | | | 0.16 | % | | | 1 | | | | 0.08 | % |
| | | 100 – 124.9 | | | | 2 | | | | 0.16 | % | | | 1 | | | | 0.08 | % |
| | | 125 – 174.9 | | | | 3 | | | | 0.23 | % | | | 1 | | | | 0.08 | % |
| | | 175 – 199.9 | | | | 0 | | | | 0.00 | % | | | 0 | | | | 0.00 | % |
| | | 200 – 249.9 | | | | 0 | | | | 0.00 | % | | | 1 | | | | 0.08 | % |
| | | >250 | | | | 2 | | | | 0.16 | % | | | 1 | | | | 0.08 | % |
| | | | Total | | | | 543 | | | | 42.82 | % | | | 725 | | | | 57.18 | % |
WisdomTree LargeCap Dividend Fund | | | | | | | | | | | | | | | | | | | | |
June 16, 2006 – March 31, 2011 | | | 0 – 24.9 | | | | 676 | | | | 53.31 | % | | | 499 | | | | 39.35 | % |
| | | 25 – 49.9 | | | | 42 | | | | 3.31 | % | | | 17 | | | | 1.34 | % |
| | | 50 – 74.9 | | | | 18 | | | | 1.42 | % | | | 2 | | | | 0.16 | % |
| | | 75 – 99.9 | | | | 2 | | | | 0.16 | % | | | 0 | | | | 0.00 | % |
| | | 100 – 124.9 | | | | 2 | | | | 0.16 | % | | | 0 | | | | 0.00 | % |
| | | 125 – 174.9 | | | | 1 | | | | 0.08 | % | | | 1 | | | | 0.08 | % |
| | | 175 – 199.9 | | | | 1 | | | | 0.08 | % | | | 0 | | | | 0.00 | % |
| | | 200 – 249.9 | | | | 0 | | | | 0.00 | % | | | 0 | | | | 0.00 | % |
| | | >250 | | | | 5 | | | | 0.39 | % | | | 2 | | | | 0.16 | % |
| | | | Total | | | | 747 | | | | 58.91 | % | | | 521 | | | | 41.09 | % |
| | |
| 64 | | WisdomTree Domestic Dividend Funds |
Frequency Distribution of Discounts & Premiums (unaudited) (concluded)
| | | | | | | | | | | | | | | | | | | | |
| | | | | | Market Price Above or Equal to Net Asset Value | | | Market Price Below Net Asset Value | |
| | | Basis Point Differential | | | Number
of Days | | | Percentage of
Total Days | | | Number
of Days | | | Percentage of
Total Days | |
WisdomTree Dividend ex-Financials Fund | | | | | | | | | | | | | | | | | | | | |
June 16, 2006 – March 31, 2011 | | | 0 – 24.9 | | | | 602 | | | | 47.46 | % | | | 576 | | | | 45.43 | % |
| | | 25 – 49.9 | | | | 47 | | | | 3.70 | % | | | 18 | | | | 1.41 | % |
| | | 50 – 74.9 | | | | 4 | | | | 0.32 | % | | | 2 | | | | 0.16 | % |
| | | 75 – 99.9 | | | | 3 | | | | 0.24 | % | | | 2 | | | | 0.16 | % |
| | | 100 – 124.9 | | | | 2 | | | | 0.16 | % | | | 1 | | | | 0.08 | % |
| | | 125 – 174.9 | | | | 1 | | | | 0.08 | % | | | 1 | | | | 0.08 | % |
| | | 175 – 199.9 | | | | 1 | | | | 0.08 | % | | | 0 | | | | 0.00 | % |
| | | 200 – 249.9 | | | | 4 | | | | 0.32 | % | | | 1 | | | | 0.08 | % |
| | | >250 | | | | 2 | | | | 0.16 | % | | | 1 | | | | 0.08 | % |
| | | | Total | | | | 666 | | | | 52.52 | % | | | 602 | | | | 47.48 | % |
WisdomTree MidCap Dividend Fund | | | | | | | | | | | | | | | | | | | | |
June 16, 2006 – March 31, 2011 | | | 0 – 24.9 | | | | 668 | | | | 52.67 | % | | | 525 | | | | 41.40 | % |
| | | 25 – 49.9 | | | | 24 | | | | 1.89 | % | | | 18 | | | | 1.41 | % |
| | | 50 – 74.9 | | | | 8 | | | | 0.63 | % | | | 4 | | | | 0.32 | % |
| | | 75 – 99.9 | | | | 2 | | | | 0.16 | % | | | 4 | | | | 0.32 | % |
| | | 100 – 124.9 | | | | 2 | | | | 0.16 | % | | | 3 | | | | 0.24 | % |
| | | 125 – 174.9 | | | | 2 | | | | 0.16 | % | | | 1 | | | | 0.08 | % |
| | | 175 – 199.9 | | | | 2 | | | | 0.16 | % | | | 0 | | | | 0.00 | % |
| | | 200 – 249.9 | | | | 4 | | | | 0.32 | % | | | 0 | | | | 0.00 | % |
| | | >250 | | | | 1 | | | | 0.08 | % | | | 0 | | | | 0.00 | % |
| | | | Total | | | | 713 | | | | 56.23 | % | | | 555 | | | | 43.77 | % |
WisdomTree SmallCap Dividend Fund | | | | | | | | | | | | | | | | | | | | |
June 16, 2006 – March 31, 2011 | | | 0 – 24.9 | | | | 579 | | | | 45.65 | % | | | 542 | | | | 42.74 | % |
| | | 25 – 49.9 | | | | 59 | | | | 4.65 | % | | | 49 | | | | 3.86 | % |
| | | 50 – 74.9 | | | | 12 | | | | 0.95 | % | | | 6 | | | | 0.47 | % |
| | | 75 – 99.9 | | | | 2 | | | | 0.16 | % | | | 2 | | | | 0.16 | % |
| | | 100 – 124.9 | | | | 3 | | | | 0.24 | % | | | 2 | | | | 0.16 | % |
| | | 125 – 174.9 | | | | 3 | | | | 0.24 | % | | | 2 | | | | 0.16 | % |
| | | 175 – 199.9 | | | | 0 | | | | 0.00 | % | | | 0 | | | | 0.00 | % |
| | | 200 – 249.9 | | | | 1 | | | | 0.08 | % | | | 1 | | | | 0.08 | % |
| | | >250 | | | | 3 | | | | 0.24 | % | | | 2 | | | | 0.16 | % |
| | | | Total | | | | 662 | | | | 52.21 | % | | | 606 | | | | 47.79 | % |
| | | | |
| WisdomTree Domestic Dividend Funds | | | 65 | |
Trustee and Officer Information (unaudited)
The Board of Trustees has responsibility for the overall management and operations of the Funds, including general supervision of the duties performed by WisdomTree Asset Management and other service providers. The Board of Trustees elects the officers of the Trust who are responsible for administering the Trust’s day-to-day operations. Each Trustee serves until his or her successor is duly elected or appointed and qualified.
The address of each Trustee and Officer is c/o WisdomTree Asset Management, Inc., 380 Madison Avenue, 21st Floor, New York, NY 10017.
Interested Trustee and Officers
| | | | | | | | | | | | |
Name (year of birth) | | Position | | Term of Office
and Length of
Time Served | | Principal Occupation(s) During the Past 5 Years | | Number of Portfolios
in Fund Complex
Overseen by Trustee/
Officer+ | | | Other Directorships Held by Trustee/
Officer |
Jonathan Steinberg (1964) | | Trustee, President* | | Trustee and Officer since 2005 | | President, WisdomTree Trust since 2005; Chief Executive Officer of WisdomTree Investments, Inc. and Director of WisdomTree Investments, Inc. since 1989. | | | 46 | | | None. |
| | | | | |
Amit Muni (1969) | | Treasurer,* Assistant Secretary* | | Officer since 2008 | | Chief Financial Officer and Assistant Secretary of WisdomTree Investments, Inc. since March 2008; International Securities Exchange Holdings, Inc. (ISE), Controller and Chief Accounting Officer from 2003 to 2008; Instinet Group Inc., Vice President Finance 2000 to 2003 | | | 46 | | | None. |
| | | | | |
Richard Morris (1967) | | Secretary,* Chief Legal Officer* | | Officer since 2005 | | General Counsel of WisdomTree Asset Management since 2009; Chief Compliance Officer of the Trust since 2009; Deputy Counsel of WisdomTree Investments, Inc. since 2005; Senior Counsel at Barclays Global Investors, N.A. from 2002 to 2005; Counsel at Barclays Global Investors, N.A. from 2000 to 2001. | | | 46 | | | None. |
| * | Elected by and serves at the pleasure of the Board of Trustees. |
| | |
| 66 | | WisdomTree Domestic Dividend Funds |
Trustee and Officer Information (unaudited) (concluded)
Independent Trustees
| | | | | | | | | | | | |
Name (year of birth) | | Position | | Term of Office
and Length of
Time Served | | Principal Occupation(s) During the Past 5 Years | | Number of Portfolios
in Fund Complex
Overseen by
Trustee+ | | | Other
Directorships Held by Trustee |
Gregory Barton (1961)* | | Trustee | | Trustee since 2006 | | Executive Vice President of Legal and Business Affairs, General Counsel and Secretary of TheStreet.com, 2009 to present; General Counsel of Martha Stewart Living Omnimedia, Inc. from 2007 to 2008; Executive Vice President of Licensing and Legal Affairs, General Counsel and Secretary of Ziff Davis Media Inc. from 2004 to 2007; Executive Vice President of Legal Affairs, General Counsel and Secretary of Ziff Davis Media Inc. from 2002 to 2004; President from 2001 to 2002, Chief Financial Officer from 2000 to 2002, Vice President of Business Development from 1999 to 2001 and General Counsel and Secretary from 1998 to 2002 of WisdomTree Investments, Inc. | | | 46 | | | Trustee, GLG Investment Series Trust. |
| | | | | |
Toni Massaro (1955)** | | Trustee | | Trustee since 2006 | | Dean Emerita at University of Arizona James E. Rogers College of Law (“Rogers College of Law”) since 2009; Dean at the Rogers College of Law from 1999 to 2009; Regents’ Professor since 2006; Milton O. Riepe Chair in Constitutional Law since 1997; Professor at the Rogers College of Law since 1990. | | | 46 | | | None. |
| | | | | |
Victor Ugolyn (1947) | | Trustee, Chairman of the Board of Trustees | | Trustee since 2006 | | Private Investor - 2005 to Present; President and Chief Executive Officer of William D. Witter, Inc. from 2005 to 2006; Consultant to AXA Enterprise in 2004; Chairman, President and Chief Executive Officer of Enterprise Capital Management (subsidiary of The MONY Group, Inc.) and Enterprise Group of Funds, Chairman of MONY Securities Corporation, and Chairman of the Fund Board of Enterprise Group of Funds 1991 to 2004. | | | 46 | | | Member of the Board of New York Society of Security Analysts; Member of the Board of Governors of Naismith Memorial Basketball Hall of Fame; Member of the Board of Overseers of Stanford University’s Hoover Institution. |
| * | Chair of the Audit Committee. |
| ** | Chair of the Governance and Nominating Committee. |
| | | | |
| WisdomTree Domestic Dividend Funds | | | 67 | |
Supplemental Information (unaudited)
Federal Income Tax Information
The following Federal tax information related to the Funds fiscal year ended March 31, 2011, is provided for information purposes only and should not be used for reporting to federal or state revenue agencies. Federal tax information for the calendar year will be reported on Form 1099-DIV in January 2012.
Certain dividends paid by the Funds may be subject to a maximum tax rate of 15%, as provided by the Jobs and Growth Tax Relief Reconciliation Act of 2003. Of the distributions paid during the fiscal year ended March 31, 2011, the following represents the maximum amount of ordinary income distributions that may be considered qualified dividend income:
| | | | |
| Fund | | Qualified Dividend
Income | |
Total Dividend Fund | | $ | 4,846,746 | |
Equity Income Fund | | | 6,500,368 | |
LargeCap Dividend Fund | | | 16,822,433 | |
Dividend ex-Financials Fund | | | 10,866,199 | |
MidCap Dividend Fund | | | 3,013,140 | |
SmallCap Dividend Fund | | | 4,265,596 | |
The following represents the percentage of dividends paid during the fiscal year ended March 31, 2011 that qualify for the 70% dividends received deduction for corporate shareholders:
| | | | |
| Fund | | Dividends-Received
Deduction | |
Total Dividend Fund | | | 91 | % |
Equity Income Fund | | | 84 | |
LargeCap Dividend Fund | | | 100 | |
Dividend ex-Financials Fund | | | 90 | |
MidCap Dividend Fund | | | 54 | |
SmallCap Dividend Fund | | | 48 | |
| | |
| 68 | | WisdomTree Domestic Dividend Funds |
General Information (unaudited)
Proxy Voting Policies, Procedures and Record
A complete copy of the Proxy Voting Policy may be obtained by calling 866-909-9473; or writing to: WisdomTree Trust, c/o ALPS Distributors, Inc., 1290 Broadway, Suite 1100, Denver, Colorado 80203.
The Trust is required to disclose annually the Funds’ complete proxy voting record on Form N-PX covering the most recent 12-month period ended June 30 and to file Form N-PX with the U.S. Securities and Exchange Commission (“SEC”) no later than August 31 of each year. The current Form N-PX for the Funds is available at no charge upon request by calling 866-909-9473 or through the Trust’s website at www.wisdomtree.com. The Funds’ Form N-PX is also available on the SEC’s website at www.sec.gov.
Shareholder Reports and Quarterly Portfolio Disclosure
The Funds are required to file their complete schedule of portfolio holdings with the SEC for their first and third fiscal quarters on Form N-Q. Copies of the filings are available, without charge, upon request on the SEC’s website at www.sec.gov and are also available by calling the Trust at 1-866-909-WISE. You can also obtain copies of Form N-Q by (i) visiting the SEC’s Public Reference Room in Washington, DC (information on the operation of the Public Reference Room may be obtained by calling 1-800-SEC-0330). (ii) sending your request and a duplicating fee to the SEC’s Public Reference Room, Washington, DC 20549-0102 or (iii) sending your request electronically to publicinfosec.gov.
Information about each Fund’s portfolio holdings is available daily, without charge, at www.wisdomtree.com.
The Fund’s Statement of Additional Information (“SAI”) has additional information about the Funds’ Trustees and Officers and is available without charge upon request. Contact your financial representative for a free prospectus or SAI.
| | | | |
| WisdomTree Domestic Dividend Funds | | | 69 | |
The WisdomTree Family of Funds
The following is a list of WisdomTree Funds being offered, along with their respective ticker symbols as of March 31, 2011:
| | |
WisdomTree Domestic Dividend Funds WisdomTree Total Dividend Fund (DTD) WisdomTree Equity Income Fund (DHS) WisdomTree LargeCap Dividend Fund (DLN) WisdomTree Dividend ex-Financials Fund (DTN) WisdomTree MidCap Dividend Fund (DON) WisdomTree SmallCap Dividend Fund (DES) WisdomTree International Dividend Funds WisdomTree DEFA Fund (DWM) WisdomTree DEFA Equity Income Fund (DTH) WisdomTree Global Equity Income Fund (DEW) WisdomTree Europe SmallCap Dividend Fund (DFE) WisdomTree Japan Hedged Equity Fund (DXJ) WisdomTree World ex-U.S. Growth Fund (DNL) WisdomTree Japan SmallCap Dividend Fund (DFJ) WisdomTree Pacific ex-Japan Total Dividend Fund (DND) WisdomTree Pacific ex-Japan Equity Income Fund (DNH) WisdomTree International LargeCap Dividend Fund (DOL) WisdomTree International Dividend ex-Financials Fund (DOO) WisdomTree International MidCap Dividend Fund (DIM) WisdomTree International SmallCap Dividend Fund (DLS) WisdomTree Emerging Markets Equity Income Fund (DEM) WisdomTree Emerging Markets SmallCap Dividend Fund (DGS) WisdomTree Middle East Dividend Fund (GULF) WisdomTree International Hedged Equity Fund (HEDJ) WisdomTree International Dividend Sector Funds WisdomTree International Basic Materials Sector Fund (DBN) WisdomTree International Energy Sector Fund (DKA) WisdomTree International Utilities Sector Fund (DBU) WisdomTree International Real Estate Fund (DRW) | | WisdomTree Domestic and International Earnings Funds WisdomTree Total Earnings Fund (EXT) WisdomTree Earnings 500 Fund (EPS) WisdomTree MidCap Earnings Fund (EZM) WisdomTree SmallCap Earnings Fund (EES) WisdomTree LargeCap Value Fund (EZY) WisdomTree LargeCap Growth Fund (ROI) WisdomTree India Earnings Fund (EPI) WisdomTree Currency Income Funds WisdomTree Dreyfus Brazilian Real Fund (BZF) WisdomTree Dreyfus Chinese Yuan Fund (CYB) WisdomTree Dreyfus Commodity Currency Fund (CCX) WisdomTree Dreyfus Emerging Currency Fund (CEW) WisdomTree Dreyfus Euro Fund (EU) WisdomTree Dreyfus Indian Rupee Fund (ICN) WisdomTree Dreyfus Japanese Yen Fund (JYF) WisdomTree Dreyfus New Zealand Dollar Fund (BNZ) WisdomTree Dreyfus South African Rand Fund (SZR) WisdomTree Fixed Income Funds WisdomTree Emerging Markets Local Debt Fund (ELD) WisdomTree Asia Local Debt Fund (ALD) WisdomTree Alternative Fund WisdomTree Managed Futures Strategy Fund (WDTI) |
The WisdomTree Funds are exchange traded funds (“ETFs”) registered with the United States Securities and Exchange Commission as series of WisdomTree Trust (“Trust”). WisdomTree Asset Management, Inc., a wholly owned subsidiary of WisdomTree investments, Inc., serves as the investment adviser to the WisdomTree Trust. None of the WisdomTree entities are affiliated with ALPS Distributors, Inc., the Funds’ distributor. WisdomTree Investments, its affiliates and their independent providers are not liable for any informational errors, incompleteness, or delays, or for any actions taken in reliance on information contained herein
Investors should consider the investment objectives, risks, charges and expenses of the Funds carefully before investing. A prospectus, containing this and other information, is available at www.wisdomtree.com, or by calling 1-866-909-WISE (9473). Investors should read the prospectus carefully before investing. There are risks associated with investing, including possible loss of principal. Past performance does not guarantee future results. Indexes are unmanaged and you can not invest directly in an index.
There are risks associated with investing including possible loss of principal. Foreign investing involves special risks, such as risk of loss from currency fluctuation or political or economic uncertainty. Investments in real estate involve additional special risks, such as credit risk, interest rate fluctuations and the effect of varied economic conditions. Funds that focus its investments in one country increase the impact of events and developments associated with the region which can adversely affect performance. Funds focusing on a single sector and/or smaller companies generally experience greater price volatility.
Investments in emerging, offshore or frontier markets are generally less liquid and less efficient than developed markets and are subject to additional risks, such as of adverse governmental regulation and intervention or political developments. Investments in currency involve additional special risks, such as credit risk and interest rate fluctuations. Derivative investments can be volatile and may be less liquid than other securities and more sensitive to the effect of varied economic conditions. As these Funds can have a high concentration in some issuers, the Funds can be adversely impacted by changes affecting such issuers.
Fixed income investments are subject to interest rate risk; their value will normally decline as interest rates rise. In addition when interest rates fall income may decline. Fixed income investments are also subject to credit risk, the risk that the issuer of a bond will fail to pay interest and principal in a timely manner, or that negative perceptions of the issuer’s ability to make such payments will cause the price of that bond to decline. Unlike typical exchange-traded funds, the Currency Funds, Fixed Income Funds and Alternative Funds do not attempt to track or replicate. Thus, the ability of these Funds to achieve their objectives will depend on the effectiveness of the portfolio manager. Please read each Funds prospectus for specific details regarding the Fund’s risk profile.
Transactions in Fund shares will result in brokerage commissions and will generate tax consequences. Shares may be sold through brokerage accounts, but may be redeemed from the Funds only in large amounts of 50,000 shares or more.
380 Madison Avenue, 21st Floor
New York, NY 10017
1.866.909. WISE (9473)
www.wisdomtree.com
JOIN YOUR FELLOW WISDOMTREE INVESTORS
Help reduce impact to environment by going paperless
Sign up for eDelivery at www.wisdomtree.com
WisdomTree Domestic Dividend ETFs
WisdomTree Total Dividend Fund
WisdomTree Equity Income Fund
WisdomTree LargeCap Dividend Fund
WisdomTree Dividend ex-Financials Fund
WisdomTree MidCap Dividend Fund
WisdomTree SmallCap Dividend Fund
WisdomTree Fund shares are distributed by ALPS Distributors, Inc.
WIS003263 (05/2012)

JOIN YOUR FELLOW WISDOMTREE INVESTORS
Help reduce impact to environment by going paperless
Sign up for eDelivery at www.wisdomtree.com
WisdomTree Trust
Domestic and International Earnings Funds
Annual Report
March 31, 2011
WisdomTree Total Earnings Fund (EXT)
WisdomTree Earnings 500 Fund (EPS)
WisdomTree MidCap Earnings Fund (EZM)
WisdomTree SmallCap Earnings Fund (EES)
WisdomTree LargeCap Value Fund (EZY)
WisdomTree LargeCap Growth Fund (ROI)
WisdomTree India Earnings Fund (EPI)
Table of Contents
“WisdomTree” is a registered mark of WisdomTree Investments, Inc. and is licensed for use by the Trust.
Management’s Discussion of Funds’ Performance (unaudited)
Domestic and International Earnings Funds
Market Environment Overview
The U.S. equity market, measured by the S&P 500 Index returned 15.65% for the 12-month period ended March 31, 2011 (the “period”). These gains are a continuation of the equity market bounce back after the bear market bottom in March of 2009 and followed gains of nearly 50% for the previous 1-year period. Given the back to back annual gains, on a cumulative basis, the S&P 500 Index now remains just 15% below its October 2007 highs. Considering the painful bear market experienced in 2008 and early 2009, it is clear that the U.S. equity market has experienced a significant recovery.
During the period, investors regained confidence in the safety and soundness of major United States financial institutions. The markets enjoyed strong gains from the lows of the market in March 2009 until May 2010. May 2010 was marked by several detrimental events, specifically the “Flash Crash” and the BP Oil spill. The Flash Crash occurred on May 6, 2010, when the market fell approximately 900 points or 9% in minutes, and then made up much of the losses only minutes later. These events were the first bout of heightened fear and volatility entering the markets since the lows of early 2009. Choppy sideways performance remained in place until late summer 2010, when the Federal Reserve, led by Chairman Benjamin Bernanke, announced it was considering a second round of quantitative easing (“QE2”). Through QE2 the Federal Reserve pledged to initiate a purchase program of medium to long maturity treasury securities in order to lower mortgage and other interest rates levels. QE2 was implemented in November 2010. The Federal Funds target interest rate remained near zero throughout the entire period. Unemployment, one of the most widely watched economic indicators in judging the effectiveness of both monetary and fiscal policy, went from 9.7% in March of 2010 to 8.8% in March of 2011.
Similar to the 12-month period ended March 31, 2010, mid and small cap stocks continued to outperform large cap stocks for the year ended March 31, 2011. Given the accommodative monetary policy of the Federal Reserve, as well as positive earnings reports and an improving economic picture, investors have been willing to take more investment risk. This environment has led many investors to prefer small capitalization stocks over large capitalization stocks and more cyclical sectors over defensive sectors.
WisdomTree Funds Performance Overview
WisdomTree’s earnings weighted funds are designed to track indexes based on the earnings stream generated by companies included in the underlying WisdomTree index. The earnings stream is defined as the total dollar level of earnings for all companies within each index. There are two primary factors that drive performance differential of the WisdomTree Funds and indexes versus market cap-weighted benchmarks. The first is aggregate exposure to one or more sectors. The second is stock selection within each sector. Both of these are determined as part of WisdomTree’s rules-based index methodology. These exposures are not subjectively determined. Rather, they are objectively determined at the index rebalancing dates based on the dividend stream.
The following table reflects the WisdomTree Fund performance versus capitalization- weighted benchmark index:
| | | | | | | | | | | | | | | | |
| Ticker | | WisdomTree Fund | | 1 Year
Return | | | Capitalization-Weighted
Benchmark Index | | 1 Year
Return | | | 1 Year
Return
Fund
vs
Index | |
EZM | | WT MidCap Earnings Fund | | | 26.15 | % | | S&P MidCap 400 Index | | | 26.95 | % | | | -0.80 | % |
EES | | WT SmallCap Earnings Fund | | | 25.57 | % | | Russell 2000 Index | | | 25.79 | % | | | -0.22 | % |
EZY | | WT LargeCap Value Fund | | | 17.86 | % | | Russell 1000 Value Index | | | 15.15 | % | | | 2.71 | % |
EXT | | WT Total Earnings Fund | | | 15.44 | % | | Russell 3000 Index | | | 17.41 | % | | | -1.97 | % |
EPS | | WT Earnings 500 Fund | | | 13.99 | % | | S&P 500 Index | | | 15.65 | % | | | -1.66 | % |
ROI | | WT LargeCap Growth Fund | | | 13.57 | % | | Russell 1000 Growth Index | | | 18.26 | % | | | -4.69 | % |
EPI | | WT India Earnings Fund | | | 7.59 | % | | MSCI India Index | | | 9.46 | % | | | -1.87 | % |
| | | | |
| WisdomTree Domestic and International Earnings Funds | | | 1 | |
Management’s Discussion of Funds’ Performance (unaudited) (concluded)
All 10 sectors represented within the S&P 500 index experienced positive performance over the period. The best performing sector over the period was the Energy sector, spurred on by a jump in oil prices over $100 in early 2011. The other typically cyclical sectors (Industrials, Materials, Consumer Discretionary) also out-performed the broader markets while most of the less cyclical stocks under-performed the broader markets (notably, Health Care, Consumer Staples, and Utilities).
By including only companies with profits, WisdomTree’s earnings funds tend to have a higher quality bias to their investment portfolios. During the period, the strongest gains tended to be in the more cyclical and speculative stocks. For example, small cap stocks as a group outperformed large cap stocks and cyclical sectors as a group out- performed defensive sectors. As a result, most of the WisdomTree earnings funds under-performed their cap-weighted benchmarks. The one exception was the WisdomTree LargeCap Value Fund, in which performance was aided by positive stock selection in sectors such as Energy and Health Care.
Internationally, India is the only region of the world where WisdomTree sets portfolio weights based on earnings. This is because the tax regulations in India act as a disincentive to dividend payments. During the period, emerging markets continued to lead the global economy and emerging market returns were higher than those in the developed world. India was in the lower half of countries within the MSCI Emerging Markets index on the basis of cumulative equity performance from March 31, 2010 through March 31, 2011. The slowdown in India was largely due to concerns about corruption and inflation that surfaced in late 2010 and early 2011.
The views expressed in this report reflect those of WisdomTree Asset Management only through the end of the period of the report as stated on the cover. The portfolio managers’ views are subject to change at any time based on market and other conditions and should not be construed as a recommendation. Past performance is no guarantee of future results.
Fund returns are shown at NAV. Please see Performance Summaries on the subsequent pages for more complete performance information. Please see page 11 for the list of index descriptions.
Fund performance assumes reinvestment of dividends and capital gain distributions. An index is a statistical measure of a specified financial market or sector. An index does not actually hold a portfolio of securities, incur expenses or pay any transaction costs. Therefore index returns do not reflect deductions for fees or expenses and are not available for direct investment. In comparison, the Funds’ performance is negatively impacted by these deductions. Fund returns do not reflect brokerage commissions or taxes on transactions in Fund shares or that a shareholder would pay on Fund distributions. Past performance is no guarantee of future results. For the most recent month end performance information visit www.wisdomtree.com.
| | |
| 2 | | WisdomTree Domestic and International Earnings Funds |
Performance Summary (unaudited)
WisdomTree Total Earnings Fund (EXT)
Sector Breakdown† as of 3/31/11‡
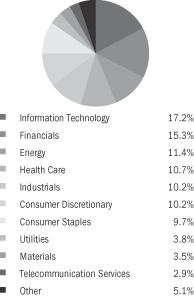
| † | The Fund’s sector breakdown is expressed as a percentage of total investments and may change over time. |
| ‡ | A sector may be comprised of several industries. |
Top Ten Holdings* as of 3/31/11
| | | | |
| |
| Description | | % of Net Assets | |
Exxon Mobil Corp. | | | 3.8% | |
Chevron Corp. | | | 2.4% | |
AT&T, Inc. | | | 2.3% | |
Microsoft Corp. | | | 2.1% | |
JPMorgan Chase & Co. | | | 1.9% | |
Apple, Inc. | | | 1.7% | |
Wal-Mart Stores, Inc. | | | 1.6% | |
International Business Machines Corp. | | | 1.6% | |
General Electric Co. | | | 1.4% | |
Johnson & Johnson | | | 1.3% | |
| * | The ten largest holdings are subject to change, and there are no guarantees the Fund will remain invested in any particular company. |
The WisdomTree Total Earnings Fund (the “Fund”) seeks investment results that correspond to the price and yield performance, before fees and expenses, of the WisdomTree Earnings Index.
The Fund returned 15.44% at net asset value (“NAV”) for the fiscal year ended March 31, 2011. The Fund’s performance benefited from its relatively underweight exposure to the Financials sector, which lagged other sectors, and from favorable stock selection within the sector. The Fund’s stock selection within Information Technology sector contributed to a drag on the Fund’s performance.
The following performance chart is provided for comparative purposes and represents the period noted. The Fund’s per share NAV is the value of one share of the Fund and is calculated by dividing the value of total assets less total liabilities by the number of shares outstanding. The NAV return is based on the NAV of the Fund and the market return is based on the market price per share of the Fund. The price used to calculate market price returns is the mid-point of the highest bid and lowest offer for Fund shares as of the close of trading on the exchange where Fund shares are listed. NAV and market returns assume that dividends and capital gain distributions have been reinvested in the Fund at NAV and market price, respectively. As with other ETFs, NAV returns and market price returns may differ because of factors such as the supply and demand for Fund shares and investors assessments of the underlying value of a Fund’s portfolio securities.
An index is a statistical measure of a specified financial market or sector. An index does not actually hold a portfolio of securities, incur expenses or pay any transaction costs. Therefore index returns do not reflect deductions for fees or expenses and are not available for direct investment. In comparison, the Fund’s performance is negatively impacted by these deductions. Fund returns do not reflect brokerage commissions or taxes on transactions in Fund shares or that a shareholder would pay on Fund distributions. The annual expense ratio of the Fund is 0.28%.
Performance as of 3/31/11
| | | | | | | | | | | | | | | | |
| | | Average Annual Total Return | |
| | | Fund
Net Asset Value | | | Fund
Market Price | | | WisdomTree
Earnings Index | | | Russell 3000 Index | |
One Year | | | 15.44 | % | | | 15.96 | % | | | 15.70 | % | | | 17.41 | % |
Three Year | | | 3.33 | % | | | 3.35 | % | | | 3.60 | % | | | 3.42 | % |
Since Inception1 | | | 0.53 | % | | | 0.54 | % | | | 0.72 | % | | | 0.42 | % |
| 1 | Total returns are calculated based on the commencement of Fund trading on February 23, 2007. |
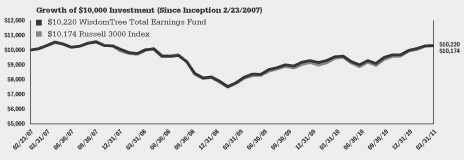
Performance quoted represents past performance and past performance does not guarantee future results. Current performance may be higher or lower than the performance quoted. For the most recent month-end performance information visit www.wisdomtree.com. Investment in the Fund poses investment risk including the possible loss of principal. The investment return and principal value of an investment will fluctuate, so that shares, when sold or redeemed, may be worth more or less than their original cost. The returns do not reflect the deduction of taxes that a shareholder would pay on Fund distributions or on the redemption of Fund shares. Total returns for a period less than one year have not been annualized. Index returns do not reflect expenses paid by the Fund.
| | | | |
| WisdomTree Domestic and International Earnings Funds | | | 3 | |
Performance Summary (unaudited)
WisdomTree Earnings 500 Fund (EPS)
Sector Breakdown† as of 3/31/11‡
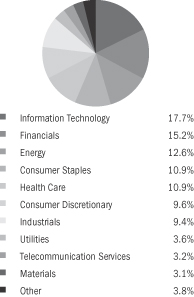
| † | The Fund’s sector breakdown is expressed as a percentage of total investments and may change over time. |
| ‡ | A sector may be comprised of several industries. |
Top Ten Holdings* as of 3/31/11
| | | | |
| |
Description | | % of Net Assets | |
Exxon Mobil Corp. | | | 4.4% | |
Chevron Corp. | | | 2.8% | |
AT&T, Inc. | | | 2.7% | |
Microsoft Corp. | | | 2.4% | |
JPMorgan Chase & Co. | | | 2.2% | |
Apple, Inc. | | | 2.0% | |
Wal-Mart Stores, Inc. | | | 1.9% | |
International Business Machines Corp. | | | 1.9% | |
General Electric Co. | | | 1.6% | |
Johnson & Johnson | | | 1.5% | |
| * | The ten largest holdings are subject to change, and there are no guarantees the Fund will remain invested in any particular company. |
The WisdomTree Earnings 500 Fund (the “Fund”) seeks investment results that correspond to the price and yield performance, before fees and expenses, of the WisdomTree Earnings 500 Index.
The Fund returned 13.99% at net asset value (“NAV”) for the fiscal year ended March 31, 2011. The Fund’s performance benefited from its relative underweight in the Financials sector, which lagged other sectors, and its favorable stock selection within the sector. Stock selection within the Information Technology sector contributed to a drag on Fund performance.
The following performance chart is provided for comparative purposes and represents the period noted. The Fund’s per share NAV is the value of one share of the Fund and is calculated by dividing the value of total assets less total liabilities by the number of shares outstanding. The NAV return is based on the NAV of the Fund and the market return is based on the market price per share of the Fund. The price used to calculate market price returns is the mid-point of the highest bid and lowest offer for Fund shares as of the close of trading on the exchange where Fund shares are listed. NAV and market returns assume that dividends and capital gain distributions have been reinvested in the Fund at NAV and market price, respectively. As with other ETFs, NAV returns and market price returns may differ because of factors such as the supply and demand for Fund shares and investors assessments of the underlying value of a Fund’s portfolio securities.
An index is a statistical measure of a specified financial market or sector. An index does not actually hold a portfolio of securities, incur expenses or pay any transaction costs. Therefore index returns do not reflect deductions for fees or expenses and are not available for direct investment. In comparison, the Fund’s performance is negatively impacted by these deductions. Fund returns do not reflect brokerage commissions or taxes on transactions in Fund shares or that a shareholder would pay on Fund distributions. The annual expense ratio of the Fund is 0.28%.
Performance as of 3/31/11
| | | | | | | | | | | | | | | | |
| | | Average Annual Total Return | |
| | | Fund
Net Asset Value | | | Fund
Market Price | | | WisdomTree
Earnings 500
Index | | | S&P 500 Index | |
One Year | | | 13.99 | % | | | 14.45 | % | | | 14.33 | % | | | 15.65 | % |
Three Year | | | 1.94 | % | | | 1.99 | % | | | 2.23 | % | | | 2.35 | % |
Since Inception1 | | | -0.18 | % | | | -0.18 | % | | | 0.13 | % | | | -0.04 | % |
| 1 | Total returns are calculated based on the commencement of Fund trading on February 23, 2007. |
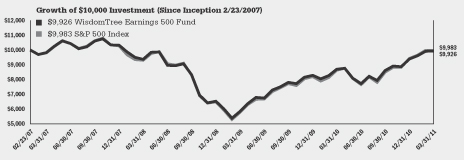
Performance quoted represents past performance and past performance does not guarantee future results. Current performance may be higher or lower than the performance quoted. For the most recent month-end performance information visit www.wisdomtree.com. Investment in the Fund poses investment risk including the possible loss of principal. The investment return and principal value of an investment will fluctuate, so that shares, when sold or redeemed, may be worth more or less than their original cost. The returns do not reflect the deduction of taxes that a shareholder would pay on Fund distributions or on the redemption of Fund shares. Total returns for a period less than one year have not been annualized. Index returns do not reflect expenses paid by the Fund.
| | |
| 4 | | WisdomTree Domestic and International Earnings Funds |
Performance Summary (unaudited)
WisdomTree MidCap Earnings Fund (EZM)
Sector Breakdown† as of 3/31/11‡
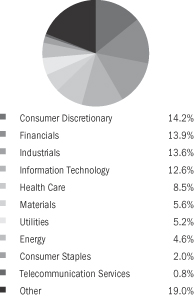
| † | The Fund’s sector breakdown is expressed as a percentage of total investments and may change over time. |
| ‡ | A sector may be comprised of several industries. |
Top Ten Holdings* as of 3/31/11
| | | | |
| |
| Description | | % of Net Assets | |
Owens Corning | | | 1.4% | |
American Capital Ltd. | | | 1.1% | |
Oshkosh Corp. | | | 0.9% | |
Coventry Health Care, Inc. | | | 0.8% | |
EXCO Resources, Inc. | | | 0.8% | |
H&R Block, Inc. | | | 0.8% | |
Ares Capital Corp. | | | 0.7% | |
Assurant, Inc. | | | 0.7% | |
W.R. Berkley Corp. | | | 0.6% | |
American Financial Group, Inc. | | | 0.6% | |
| * | The ten largest holdings are subject to change, and there are no guarantees the Fund will remain invested in any particular company. |
The WisdomTree MidCap Earnings Fund (the “Fund”) seeks investment results that correspond to the price and yield performance, before fees and expenses, of the WisdomTree MidCap Earnings Index.
The Fund returned 26.15% at net asset value (“NAV”) for the fiscal year ended March 31, 2011. The Fund benefited from its underweight in the Financials sector, which underperformed other sectors. This had a positive impact on relative performance. Unfavorable stock selection within the Information Technology sector created a drag on the Fund’s performance.
The following performance chart is provided for comparative purposes and represents the period noted. The Fund’s per share NAV is the value of one share of the Fund and is calculated by dividing the value of total assets less total liabilities by the number of shares outstanding. The NAV return is based on the NAV of the Fund and the market return is based on the market price per share of the Fund. The price used to calculate market price returns is the mid-point of the highest bid and lowest offer for Fund shares as of the close of trading on the exchange where Fund shares are listed. NAV and market returns assume that dividends and capital gain distributions have been reinvested in the Fund at NAV and market price, respectively. As with other ETFs, NAV returns and market price returns may differ because of factors such as the supply and demand for Fund shares and investors assessments of the underlying value of a Fund’s portfolio securities.
An index is a statistical measure of a specified financial market or sector. An index does not actually hold a portfolio of securities, incur expenses or pay any transaction costs. Therefore index returns do not reflect deductions for fees or expenses and are not available for direct investment. In comparison, the Fund’s performance is negatively impacted by these deductions. Fund returns do not reflect brokerage commissions or taxes on transactions in Fund shares or that a shareholder would pay on Fund distributions. The annual expense ratio of the Fund is 0.38%.
Performance as of 3/31/11
| | | | | | | | | | | | | | | | |
| | | Average Annual Total Return | | | | |
| | | Fund
Net Asset Value | | | Fund
Market Price | | | WisdomTree
MidCap Earnings
Index | | | S&P MidCap
400 Index | |
One Year | | | 26.15 | % | | | 26.37 | % | | | 26.71 | % | | | 26.95 | % |
Three Year | | | 13.35 | % | | | 13.32 | % | | | 13.72 | % | | | 10.00 | % |
Since Inception1 | | | 5.45 | % | | | 5.46 | % | | | 5.62 | % | | | 4.81 | % |
| 1 | Total returns are calculated based on the commencement of Fund trading on February 23, 2007. |
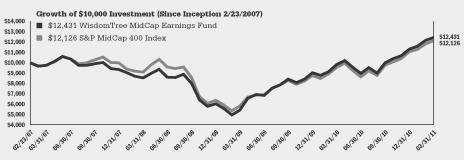
Performance quoted represents past performance and past performance does not guarantee future results. Current performance may be higher or lower than the performance quoted. For the most recent month-end performance information visit www.wisdomtree.com. Investment in the Fund poses investment risk including the possible loss of principal. The investment return and principal value of an investment will fluctuate, so that shares, when sold or redeemed, may be worth more or less than their original cost. The returns do not reflect the deduction of taxes that a shareholder would pay on Fund distributions or on the redemption of Fund shares. Total returns for a period less than one year have not been annualized. Index returns do not reflect expenses paid by the Fund.
| | | | |
| WisdomTree Domestic and International Earnings Funds | | | 5 | |
Performance Summary (unaudited)
WisdomTree SmallCap Earnings Fund (EES)
Sector Breakdown† as of 3/31/11‡
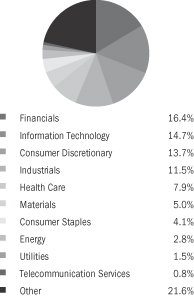
| † | The Fund’s sector breakdown is expressed as a percentage of total investments and may change over time. |
| ‡ | A sector may be comprised of several industries. |
Top Ten Holdings* as of 3/31/11
| | | | |
| |
Description | | % of Net Assets | |
Earthlink, Inc. | | | 0.9% | |
Nelnet, Inc. | | | 0.7% | |
Kulicke & Soffa Industries, Inc. | | | 0.7% | |
Buckeye Technologies, Inc. | | | 0.7% | |
MKS Instruments, Inc. | | | 0.6% | |
WisdomTree MidCap Earnings Fund | | | 0.6% | |
Amedisys, Inc. | | | 0.6% | |
Ariad Pharmaceuticals, Inc. | | | 0.6% | |
GT Solar International, Inc. | | | 0.6% | |
Amtrust Financial Services, Inc. | | | 0.5% | |
| * | The ten largest holdings are subject to change, and there are no guarantees the Fund will remain invested in any particular company. |
The WisdomTree SmallCap Earnings Fund (the “Fund”) seeks investment results that correspond to the price and yield performance, before fees and expenses, of the WisdomTree SmallCap Earnings Index.
The Fund returned 25.57% at net asset value (“NAV”) for the fiscal year ended March 31, 2011. Stock selection in the Financials sector contributed most positively to Fund performance. The Fund’s exposure to the Energy sector, which was relatively underweight, contributed to a drag on Fund performance.
The following performance chart is provided for comparative purposes and represents the period noted. The Fund’s per share NAV is the value of one share of the Fund and is calculated by dividing the value of total assets less total liabilities by the number of shares outstanding. The NAV return is based on the NAV of the Fund and the market return is based on the market price per share of the Fund. The price used to calculate market price returns is the mid-point of the highest bid and lowest offer for Fund shares as of the close of trading on the exchange where Fund shares are listed. NAV and market returns assume that dividends and capital gain distributions have been reinvested in the Fund at NAV and market price, respectively. As with other ETFs, NAV returns and market price returns may differ because of factors such as the supply and demand for Fund shares and investors assessments of the underlying value of a Fund’s portfolio securities.
An index is a statistical measure of a specified financial market or sector. An index does not actually hold a portfolio of securities, incur expenses or pay any transaction costs. Therefore index returns do not reflect deductions for fees or expenses and are not available for direct investment. In comparison, the Fund’s performance is negatively impacted by these deductions. Fund returns do not reflect brokerage commissions or taxes on transactions in Fund shares or that a shareholder would pay on Fund distributions. The annual expense ratio of the Fund is 0.38%.
Performance as of 3/31/11
| | | | | | | | | | | | | | | | |
| | | Average Annual Total Return | |
| | | Fund
Net Asset Value | | | Fund
Market Price | | | WisdomTree
SmallCap
Earnings Index | | | Russell 2000 Index | |
One Year | | | 25.57 | % | | | 25.78 | % | | | 25.90 | % | | | 25.79 | % |
Three Year | | | 13.51 | % | | | 13.55 | % | | | 13.38 | % | | | 8.57 | % |
Since Inception1 | | | 3.52 | % | | | 3.51 | % | | | 3.50 | % | | | 1.90 | % |
| 2 | Total returns are calculated based on the commencement of Fund trading on February 23, 2007. |

Performance quoted represents past performance and past performance does not guarantee future results. Current performance may be higher or lower than the performance quoted. For the most recent month-end performance information visit www.wisdomtree.com. Investment in the Fund poses investment risk including the possible loss of principal. The investment return and principal value of an investment will fluctuate, so that shares, when sold or redeemed, may be worth more or less than their original cost. The returns do not reflect the deduction of taxes that a shareholder would pay on Fund distributions or on the redemption of Fund shares. Total returns for a period less than one year have not been annualized. Index returns do not reflect expenses paid by the Fund.
| | |
| 6 | | WisdomTree Domestic and International Earnings Funds |
Performance Summary (unaudited)
WisdomTree LargeCap Value Fund (EZY)
Sector Breakdown† as of 3/31/11‡
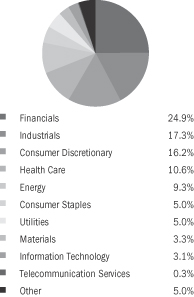
| † | The Fund’s sector breakdown is expressed as a percentage of total investments and may change over time. |
| ‡ | A sector may be comprised of several industries. |
Top Ten Holdings* as of 3/31/11
| | | | |
| |
| Description | | % of Net Assets | |
General Electric Co. | | | 6.6% | |
Goldman Sachs Group, Inc. (The) | | | 6.1% | |
JPMorgan Chase & Co. | | | 5.5% | |
Wells Fargo & Co. | | | 5.0% | |
ConocoPhillips | | | 4.0% | |
UnitedHealth Group, Inc. | | | 3.3% | |
Walt Disney Co. (The) | | | 2.6% | |
Travelers Cos., Inc. (The) | | | 2.4% | |
News Corp. | | | 2.2% | |
CVS Caremark Corp. | | | 2.0% | |
| * | The ten largest holdings are subject to change, and there are no guarantees the Fund will remain invested in any particular company. |
The WisdomTree LargeCap Value Fund (the “Fund”) seeks investment results that correspond to the price and yield performance before fees and expenses, of the WisdomTree LargeCap Value Index. The LargeCap Value Index is a fundamentally weighted index that measures the performance of large-cap value companies. The Index consists of U.S. companies that have positive cumulative earnings over the past four fiscal quarters and that meet WisdomTree’s market capitalization, liquidity, and other requirements as of the Index measurement date.
The Fund returned 17.86% at net asset value (“NAV”) for the fiscal year ended March 31, 2011. Stock selection within the Health Care sector contributed most positively to the Fund’s performance. The Fund’s underweight position to the Telecommunication Services sector and unfavorable stock selection within the sector contributed to a drag on the Fund’s performance.
The following performance chart is provided for comparative purposes and represents the period noted. The Fund’s per share NAV is the value of one share of the Fund and is calculated by dividing the value of total assets less total liabilities by the number of shares outstanding. The NAV return is based on the NAV of the Fund and the market return is based on the market price per share of the Fund. The price used to calculate market price returns is the mid-point of the highest bid and lowest offer for Fund shares as of the close of trading on the exchange where Fund shares are listed. NAV and market returns assume that dividends and capital gain distributions have been reinvested in the Fund at NAV and market price, respectively. As with other ETFs, NAV returns and market price returns may differ because of factors such as the supply and demand for Fund shares and investors assessments of the underlying value of a Fund’s portfolio securities.
An index is a statistical measure of a specified financial market or sector. An index does not actually hold a portfolio of securities, incur expenses or pay any transaction costs. Therefore index returns do not reflect deductions for fees or expenses and are not available for direct investment. In comparison, the Fund’s performance is negatively impacted by these deductions. Fund returns do not reflect brokerage commissions or taxes on transactions in Fund shares or that a shareholder would pay on Fund distributions. The annual expense ratio of the Fund is 0.38%.
Performance as of 3/31/11
| | | | | | | | | | | | | | | | |
| | | Average Annual Total Return | |
| | | Fund
Net Asset Value | | | Fund
Market Price | | | WisdomTree Low P/E
LargeCap Value
Spliced Index1 | | | Russell 1000
Value Index | |
One Year | | | 17.86 | % | | | 18.23 | % | | | 18.52 | % | | | 15.15 | % |
Three Year | | | 1.55 | % | | | 1.56 | % | | | 2.02 | % | | | 0.60 | % |
Since Inception2 | | | -1.66 | % | | | -1.64 | % | | | -1.32 | % | | | -2.42 | % |
| 1 | WisdomTree Low P/E LargeCap Value Index through June 19, 2009; WisdomTree LargeCap Value Index thereafter. |
| 2 | Total returns are calculated based on the commencement of Fund trading on February 23, 2007. |
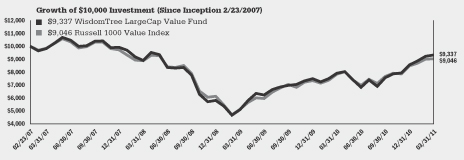
Performance quoted represents past performance and past performance does not guarantee future results. Current performance may be higher or lower than the performance quoted. For the most recent month-end performance information visit www.wisdomtree.com. Investment in the Fund poses investment risk including the possible loss of principal. The investment return and principal value of an investment will fluctuate, so that shares, when sold or redeemed, may be worth more or less than their original cost. The returns do not reflect the deduction of taxes that a shareholder would pay on Fund distributions or on the redemption of Fund shares. Total returns for a period less than one year have not been annualized. Index returns do not reflect expenses paid by the Fund.
| | | | |
| WisdomTree Domestic and International Earnings Funds | | | 7 | |
Performance Summary (unaudited)
WisdomTree LargeCap Growth Fund (ROI)
Sector Breakdown† as of 3/31/11‡
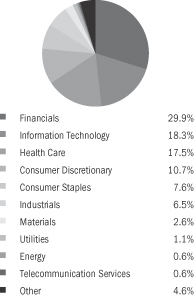
| † | The Fund’s sector breakdown is expressed as a percentage of total investments and may change over time. |
| ‡ | A sector may be comprised of several industries. |
Top Ten Holdings* as of 3/31/11
| | | | |
| |
| Description | | % of Net Assets | |
Apple, Inc. | | | 7.7% | |
Goldman Sachs Group, Inc. (The) | | | 6.1% | |
JPMorgan Chase & Co. | | | 5.4% | |
Wells Fargo & Co. | | | 4.9% | |
Berkshire Hathaway, Inc. | | | 4.8% | |
Google, Inc. | | | 3.8% | |
UnitedHealth Group, Inc. | | | 3.3% | |
Travelers Cos., Inc. (The) | | | 2.4% | |
Bristol-Myers Squibb Co. | | | 2.1% | |
CVS Caremark Corp. | | | 2.0% | |
| * | The ten largest holdings are subject to change, and there are no guarantees the Fund will remain invested in any particular company. |
The WisdomTree LargeCap Growth Fund (the “Fund”) seeks investment results that correspond to the price and yield performance, before fees and expenses, of the WisdomTree LargeCap Growth Index.
The Fund returned 13.57% at net asset value (“NAV”) for the fiscal year ended March 31, 2011. The Fund’s performance benefited from favorable stock selection in the Information Technology sector, which had a significant relative underweight. A significant overweight to the Financials sector, which underperformed other sectors, contributed to a drag on fund performance.
The following performance chart is provided for comparative purposes and represents the period noted. The Fund’s per share NAV is the value of one share of the Fund and is calculated by dividing the value of total assets less total liabilities by the number of shares outstanding. The NAV return is based on the NAV of the Fund and the market return is based on the market price per share of the Fund. The price used to calculate market price returns is the mid-point of the highest bid and lowest offer for Fund shares as of the close of trading on the exchange where Fund shares are listed. NAV and market returns assume that dividends and capital gain distributions have been reinvested in the Fund at NAV and market price, respectively. As with other ETFs, NAV returns and market price returns may differ because of factors such as the supply and demand for Fund shares and investors assessments of the underlying value of a Fund’s portfolio securities.
An index is a statistical measure of a specified financial market or sector. An index does not actually hold a portfolio of securities, incur expenses or pay any transaction costs. Therefore index returns do not reflect deductions for fees or expenses and are not available for direct investment. In comparison, the Fund’s performance is negatively impacted by these deductions. Fund returns do not reflect brokerage commissions or taxes on transactions in Fund shares or that a shareholder would pay on Fund distributions. The annual expense ratio of the Fund is 0.38%.
Performance as of 3/31/11
| | | | | | | | | | | | | | | | |
| | | Average Annual Total Return | |
| | | Fund
Net Asset Value | | | Fund
Market Price | | | WisdomTree
LargeCap
Growth Index | | | Russell
1000
Growth Index | |
One Year | | | 13.57 | % | | | 13.93 | % | | | 14.24 | % | | | 18.26 | % |
Since Inception1 | | | 23.00 | % | | | 23.01 | % | | | 23.70 | % | | | 30.27 | % |
| 1 | Total returns are calculated based on the commencement of Fund trading on December 4, 2008. |
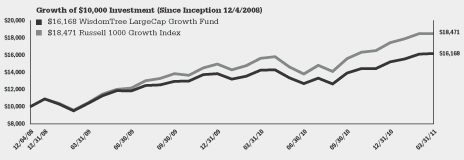
Performance quoted represents past performance and past performance does not guarantee future results. Current performance may be higher or lower than the performance quoted. For the most recent month-end performance information visit www.wisdomtree.com. Investment in the Fund poses investment risk including the possible loss of principal. The investment return and principal value of an investment will fluctuate, so that shares, when sold or redeemed, may be worth more or less than their original cost. The returns do not reflect the deduction of taxes that a shareholder would pay on Fund distributions or on the redemption of Fund shares. Total returns for a period less than one year have not been annualized. Index returns do not reflect expenses paid by the Fund.
| | |
| 8 | | WisdomTree Domestic and International Earnings Funds |
Performance Summary (unaudited)
WisdomTree India Earnings Fund (EPI)
Sector Breakdown† as of 3/31/11‡
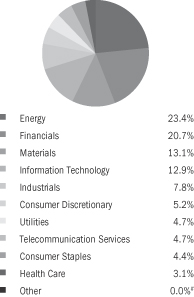
| † | The Fund’s sector breakdown is expressed as a percentage of total investments and may change over time. |
| ‡ | A sector may be comprised of several industries. |
| # | Amount represents less than 0.05%. |
Top Ten Holdings* as of 3/31/11
| | | | |
| |
| Description | | % of Net Assets | |
Reliance Industries Ltd. | | | 14.6% | |
Infosys Technologies Ltd. | | | 6.7% | |
Oil & Natural Gas Corp., Ltd. | | | 4.5% | |
Bharti Airtel Ltd. | | | 3.3% | |
Housing Development Finance Corp. | | | 3.0% | |
ICICI Bank Ltd. | | | 3.0% | |
State Bank of India | | | 2.8% | |
Tata Consultancy Services Ltd. | | | 2.8% | |
Hindalco Industries Ltd. | | | 2.2% | |
HDFC Bank Ltd. | | | 1.9% | |
| * | The ten largest holdings are subject to change, and there are no guarantees the Fund will remain invested in any particular company. |
The WisdomTree India Earnings Fund (the “Fund”) seeks investment results that correspond to the price and yield performance, before fees and expenses, of the WisdomTree India Earnings Index.
The Fund returned 7.59% at net asset value (“NAV”) for the fiscal year ended March 31, 2011. Stock selection in the Financials sector contributed most positively to Fund performance. The Fund’s exposure to the Information Technology sector and its stock selection within the sector contributed to a drag on Fund performance.
The following performance chart is provided for comparative purposes and represents the period noted. The Fund’s per share NAV is the value of one share of the Fund and is calculated by dividing the value of total assets less total liabilities by the number of shares outstanding. The NAV return is based on the NAV of the Fund and the market return is based on the market price per share of the Fund. The price used to calculate market price returns is the mid-point of the highest bid and lowest offer for Fund shares as of the close of trading on the exchange where Fund shares are listed. NAV and market returns assume that dividends and capital gain distributions have been reinvested in the Fund at NAV and market price, respectively. As with other ETFs, NAV returns and market price returns may differ because of factors such as the supply and demand for Fund shares and investors assessments of the underlying value of a Fund’s portfolio securities.
An index is a statistical measure of a specified financial market or sector. An index does not actually hold a portfolio of securities, incur expenses or pay any transaction costs. Therefore index returns do not reflect deductions for fees or expenses and are not available for direct investment. In comparison, the Fund’s performance is negatively impacted by these deductions. Fund returns do not reflect brokerage commissions or taxes on transactions in Fund shares or that a shareholder would pay on Fund distributions. The annual net expense ratio of the Fund is 0.88%. Fund expenses are capped by contract at 0.88%.
Performance as of 3/31/11
| | | | | | | | | | | | | | | | |
| | | Average Annual Total Return | | | | |
| | | Fund
Net Asset Value | | | Fund
Market Price | | | WisdomTree
India Earnings
Index | | | MSCI
India Index | |
One Year | | | 7.59 | % | | | 6.88 | % | | | 8.40 | % | | | 9.46 | % |
Three Year | | | 3.87 | % | | | 3.35 | % | | | 5.33 | % | | | 4.08 | % |
Since Inception1 | | | 0.46 | % | | | 0.11 | % | | | 1.92 | % | | | 0.06 | % |
| 1 | Total returns are calculated based on the commencement of Fund trading on February 22, 2008. |
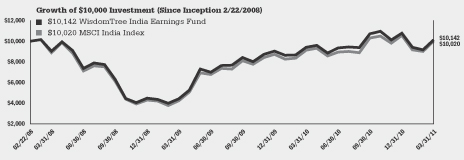
Performance quoted represents past performance and past performance does not guarantee future results. Current performance may be higher or lower than the performance quoted. For the most recent month-end performance information visit www.wisdomtree.com. Investment in the Fund poses investment risk including the possible loss of principal. The investment return and principal value of an investment will fluctuate, so that shares, when sold or redeemed, may be worth more or less than their original cost. The returns do not reflect the deduction of taxes that a shareholder would pay on Fund distributions or on the redemption of Fund shares. Total returns for a period less than one year have not been annualized. Index returns do not reflect expenses paid by the Fund.
| | | | |
| WisdomTree Domestic and International Earnings Funds | | | 9 | |
| | | | | | | | | | | | | | | | | | | | | | | | | | |
| | | | | Cumulative Returns as of 3/31/11 (unaudited) | |
| | | | | Total Return NAV (%) | | | Market Price (%) | |
| | | | | 1-Year | | | 3-Year | | | Since
Inception | | | 1-Year | | | 3-Year | | | Since
Inception | |
WisdomTree Total Earnings Fund | | EXT | | | 15.44 | % | | | 10.34 | % | | | 2.20 | % | | | 15.96 | % | | | 10.40 | % | | | 2.22 | % |
Russell 3000 Index | | | | | 17.41 | % | | | 10.61 | % | | | 1.74 | % | | | 17.41 | % | | | 10.61 | % | | | 1.74 | % |
WT Earnings Index | | | | | 15.70 | % | | | 11.20 | % | | | 3.01 | % | | | 15.70 | % | | | 11.20 | % | | | 3.01 | % |
WisdomTree Earnings 500 Fund | | EPS | | | 13.99 | % | | | 5.94 | % | | | -0.74 | % | | | 14.45 | % | | | 6.09 | % | | | -0.72 | % |
S&P 500 Index | | | | | 15.65 | % | | | 7.23 | % | | | -0.17 | % | | | 15.65 | % | | | 7.23 | % | | | -0.17 | % |
WT Earnings 500 Index | | | | | 14.33 | % | | | 6.83 | % | | | 0.55 | % | | | 14.33 | % | | | 6.83 | % | | | 0.55 | % |
WisdomTree MidCap Earnings Fund | | EZM | | | 26.15 | % | | | 45.64 | % | | | 24.31 | % | | | 26.37 | % | | | 45.52 | % | | | 24.36 | % |
S&P MidCap 400 Index | | | | | 26.95 | % | | | 33.11 | % | | | 21.26 | % | | | 26.95 | % | | | 33.11 | % | | | 21.26 | % |
WT MidCap Earnings Index | | | | | 26.71 | % | | | 47.08 | % | | | 25.14 | % | | | 26.71 | % | | | 47.08 | % | | | 13.72 | % |
WisdomTree SmallCap Earnings Fund | | EES | | | 25.57 | % | | | 46.23 | % | | | 15.25 | % | | | 25.78 | % | | | 46.41 | % | | | 15.19 | % |
Russell 2000 Index | | | | | 25.79 | % | | | 27.96 | % | | | 8.00 | % | | | 25.79 | % | | | 27.96 | % | | | 8.00 | % |
WT SmallCap Earnings Index | | | | | 25.90 | % | | | 45.74 | % | | | 15.17 | % | | | 25.90 | % | | | 45.74 | % | | | 15.17 | % |
WisdomTree LargeCap Value Fund | | EZY | | | 17.86 | % | | | 4.74 | % | | | -6.63 | % | | | 18.23 | % | | | 4.77 | % | | | -6.54 | % |
Russell 1000 Value Index | | | | | 15.15 | % | | | 1.82 | % | | | -9.54 | % | | | 15.15 | % | | | 1.82 | % | | | -9.54 | % |
Spliced WisdomTree Index | | | | | 18.52 | % | | | 6.17 | % | | | -5.31 | % | | | 18.52 | % | | | 6.17 | % | | | -5.31 | % |
WisdomTree LargeCap Growth Fund | | ROI | | | 13.57 | % | | | n/a | | | | 61.68 | % | | | 13.93 | % | | | n/a | | | | 61.71 | % |
Russell 1000 Growth Index | | | | | 18.26 | % | | | n/a | | | | 84.71 | % | | | 18.26 | % | | | n/a | | | | 84.71 | % |
WisdomTree LargeCap Growth Index | | | | | 14.24 | % | | | n/a | | | | 63.80 | % | | | 14.24 | % | | | n/a | | | | 63.80 | % |
WisdomTree India Earnings Fund | | EPI | | | 7.59 | % | | | 12.07 | % | | | 1.42 | % | | | 6.88 | % | | | 10.39 | % | | | 0.34 | % |
MSCI India Index | | | | | 9.46 | % | | | 12.75 | % | | | 0.20 | % | | | 9.46 | % | | | 12.75 | % | | | 0.20 | % |
WT India Earnings Index | | | | | 8.40 | % | | | 16.87 | % | | | 6.07 | % | | | 8.40 | % | | | 16.87 | % | | | 6.07 | % |
Performance quoted represents past performance and past performance does not guarantee future results. Current performance may be higher or lower than the performance quoted. For the most recent month end performance information visit www.wisdomtree.com. Investment in the Fund poses investment risk including the possible loss of principal. The investment return and principal value of an investment will fluctuate, so that shares, when sold or redeemed, may be worth more or less than their original cost. The returns do not reflect the deduction of taxes that a shareholder would pay on Fund distributions or on the redemption of Fund shares. Total returns for a period less than one year have not been annualized. Index returns do not reflect expenses paid by the Fund.
Please see page 11 for the list of index descriptions.
| | |
| 10 | | WisdomTree Domestic and International Earnings Funds |
Description of Terms and Indices (unaudited)
Below are descriptions of each index referenced in this Annual Report:
The WisdomTree Earnings Index measures the performance of earnings-generating companies within the broad U.S. stock market.
The WisdomTree Earnings 500 Index measures the performance of earnings-generating companies within the large-cap segment of the U.S. stock market.
The WisdomTree MidCap Earnings Index measures the performance of earnings-generating companies within the mid-capitalization segment of the U.S. stock market.
The WisdomTree SmallCap Earnings Index measures the performance of earnings-generating companies within the small-capitalization segment of the U.S. stock market.
The WisdomTree LargeCap Value Index is a fundamentally weighted index that measures the stock performance of value companies in the US.
The WisdomTree Low P/E Index measures the performance of companies with the lowest price-to-earnings ratios (P/E ratios) in the WisdomTree Earnings Index.
The WisdomTree LargeCap Growth Index is a fundamentally weighted index that measures the performance of large cap growth companies.
The WisdomTree India Earnings Index is a fundamentally weighted index that measures the performance of companies incorporated and traded in India that are profitable and that are eligible to be purchased by foreign investors as of the index measurement date.
The Russell 3000 Index measures the performance of the 3,000 largest U.S. companies, based on total market capitalization.
The S&P 500 Index is a capitalization-weighted index of 500 stocks selected by Standard & Poor’s Index Committee, designed to represent the performance of the leading industries in the United States economy.
The Russell 1000 Growth Index is a measure of the large-capitalization growth segment of the U.S. equity universe, selecting from the Russell 1000 Index.
The Russell 1000 Value Index is a measure of the large-capitalization value segment of the U.S. equity universe, selecting from the Russell 1000 Index.
The S&P MidCap 400 Index is a capitalization-weighted index that measures the performance of the mid-capitalization range of the U.S. stock market, with stocks selected by the Standard & Poor’s Index Committee.
The Russell 2000 Index measures performance of the smallest 2,000 securities in the Russell 3000 Index.
The MSCI India Index is a free float-adjusted market capitalization index that is designed to measure the performance of stocks in India.
| (1) | Spliced WisdomTree Index — WisdomTree Low P/E Index through June 19, 2009; WisdomTree LargeCap Value Index thereafter. |
Index performance information assumes the reinvestment of gross dividends and excludes management fees, transaction costs and expenses. Performance information for the MSCI India Index assumes reinvestment of net dividends and excludes management fees, transaction costs and expenses. You cannot directly invest in an index.
Neither MSCI nor any other party involved in or related to compiling, computing or creating the MSCI data makes any express or implied warranties or representations with respect to such data (or the results to be obtained by the use thereof), and all such parties hereby expressly disclaim all warranties of originality, accuracy, completeness, merchantability or fitness for a particular purpose with respect to any such data. Without limiting any of the foregoing, in no event shall MSCI, any of its affiliates or any third party involved in or related to compiling, computing or creating the data have any liability for any direct, indirect, special, punitive, consequential or any other damages (including lost profits) even if notified of the possibility of such damages. No further distribution or dissemination of the MSCI data is permitted without MSCI’s express written consent.
| | | | |
| WisdomTree Domestic and International Earnings Funds | | | 11 | |
Shareholder Expense Examples (unaudited)
As a shareholder of a WisdomTree Fund, you incur two types of costs: (1) transaction costs, including brokerage commissions on purchases and sales of your Fund shares and (2) ongoing costs, including management fees and other Fund expenses. The following example is intended to help you understand your ongoing costs (in dollars and cents) of investing in a Fund and to compare these costs with the ongoing costs of investing in other funds.
The example is based on an investment of $1,000 invested at the beginning of the period and held for the entire period from October 1, 2010 to March 31, 2011.
Actual expenses
The first line under each Fund in the table on the next page provides information about actual account values and actual expenses. You may use the information in this line, together with the amount you invested, to estimate the expenses that you paid over the period. Simply divide your account value by $1,000 (for example, an $8,600 account value divided by $1,000 = 8.6), then multiply the result by the number in the first line for your Fund under the heading entitled “Expenses Paid During Period 10/01/10 to 3/31/11” to estimate the expenses you paid on your account during this period.
Hypothetical example for comparison purposes
The second line under each Fund in the table on the next page provides information about hypothetical account values and hypothetical expenses based on each Fund’s actual expense ratio and an assumed rate of return of 5% per year before expenses, which is not the Fund’s actual return. The hypothetical account values and expenses may not be used to estimate the actual ending account balance or expenses you paid for the period. You may use this information to compare the ongoing costs of investing in your Fund and other funds. To do so, compare this 5% hypothetical example with the 5% hypothetical examples that appear in the shareholder reports of the other funds.
Please note that the expenses shown in the table are meant to highlight your ongoing costs only and do not reflect any transactional costs, such as brokerage commissions paid on purchases and sales of Fund shares. Therefore, the second line under each Fund in the table is useful in comparing ongoing Fund costs only and will not help you determine the relative total costs of owning different funds. In addition, if these transactional costs were included, your costs would have been higher.
| | |
| 12 | | WisdomTree Domestic and International Earnings Funds |
Shareholder Expense Examples (unaudited)(concluded)
| | | | | | | | | | | | | | | | |
| | | Beginning Account Value 10/01/10 | | | Ending Account Value 3/31/11 | | | Annualized Expense Ratio Based on the Period 10/01/10 to 3/31/11 | | | Expenses Paid During the Period† 10/01/10 to 3/31/11 | |
WisdomTree Total Earnings Fund | | | | | | | | | | | | | | | | |
Actual | | $ | 1,000.00 | | | $ | 1,164.00 | | | | 0.28 | % | | $ | 1.51 | |
Hypothetical (5% return before expenses) | | $ | 1,000.00 | | | $ | 1,023.54 | | | | 0.28 | % | | $ | 1.41 | |
WisdomTree Earnings 500 Fund | | | | | | | | | | | | | | | | |
Actual | | $ | 1,000.00 | | | $ | 1,154.14 | | | | 0.28 | % | | $ | 1.50 | |
Hypothetical (5% return before expenses) | | $ | 1,000.00 | | | $ | 1,023.54 | | | | 0.28 | % | | $ | 1.41 | |
WisdomTree MidCap Earnings Fund | | | | | | | | | | | | | | | | |
Actual | | $ | 1,000.00 | | | $ | 1,224.97 | | | | 0.38 | % | | $ | 2.13 | |
Hypothetical (5% return before expenses) | | $ | 1,000.00 | | | $ | 1,023.04 | | | | 0.38 | % | | $ | 1.92 | |
WisdomTree SmallCap Earnings Fund | | | | | | | | | | | | | | | | |
Actual | | $ | 1,000.00 | | | $ | 1,224.96 | | | | 0.38 | % | | $ | 2.11 | |
Hypothetical (5% return before expenses) | | $ | 1,000.00 | | | $ | 1,023.04 | | | | 0.38 | % | | $ | 1.92 | |
WisdomTree LargeCap Value Fund | | | | | | | | | | | | | | | | |
Actual | | $ | 1,000.00 | | | $ | 1,233.44 | | | | 0.38 | % | | $ | 2.12 | |
Hypothetical (5% return before expenses) | | $ | 1,000.00 | | | $ | 1,023.04 | | | | 0.38 | % | | $ | 1.92 | |
WisdomTree LargeCap Growth Fund | | | | | | | | | | | | | | | | |
Actual | | $ | 1,000.00 | | | $ | 1,163.50 | | | | 0.38 | % | | $ | 2.05 | |
Hypothetical (5% return before expenses) | | $ | 1,000.00 | | | $ | 1,023.04 | | | | 0.38 | % | | $ | 1.92 | |
WisdomTree India Earnings Fund | | | | | | | | | | | | | | | | |
Actual | | $ | 1,000.00 | | | $ | 946.11 | | | | 0.88 | % | | $ | 4.27 | |
Hypothetical (5% return before expenses) | | $ | 1,000.00 | | | $ | 1,020.54 | | | | 0.88 | % | | $ | 4.43 | |
| † | Expenses are calculated using each Fund’s annualized expense ratio, multipled by the average account value for the period, multipled by 182/365 (to reflect one-half year period). |
| | | | |
| WisdomTree Domestic and International Earnings Funds | | | 13 | |
Schedule of Investments
WisdomTree Total Earnings Fund (EXT)
March 31, 2011
| | | | | | | | |
| Investments | | Shares | | | Fair Value | |
| | | | | | | | |
| COMMON STOCKS – 99.1% | | | | | | | | |
| Aerospace & Defense – 2.9% | | | | | | | | |
AAR Corp.* | | | 270 | | | $ | 7,484 | |
Alliant Techsystems, Inc. | | | 203 | | | | 14,346 | |
BE Aerospace, Inc.* | | | 178 | | | | 6,324 | |
Boeing Co. (The) | | | 2,860 | | | | 211,440 | |
Ceradyne, Inc.* | | | 234 | | | | 10,549 | |
Cubic Corp. | | | 234 | | | | 13,455 | |
Curtiss-Wright Corp.(a) | | | 177 | | | | 6,220 | |
Esterline Technologies Corp.* | | | 136 | | | | 9,618 | |
General Dynamics Corp. | | | 2,119 | | | | 162,231 | |
Goodrich Corp.(a) | | | 390 | | | | 33,357 | |
HEICO Corp.(a) | | | 52 | | | | 3,251 | |
Hexcel Corp.* | | | 641 | | | | 12,621 | |
Honeywell International, Inc. | | | 2,041 | | | | 121,868 | |
Huntington Ingalls Industries, Inc.* | | | 301 | | | | 12,491 | |
ITT Corp. | | | 670 | | | | 40,233 | |
L-3 Communications Holdings, Inc. | | | 818 | | | | 64,058 | |
Lockheed Martin Corp. | | | 2,171 | | | | 174,548 | |
Moog, Inc. Class A* | | | 183 | | | | 8,402 | |
National Presto Industries, Inc. | | | 91 | | | | 10,254 | |
Northrop Grumman Corp. | | | 1,808 | | | | 113,380 | |
Orbital Sciences Corp.* | | | 227 | | | | 4,295 | |
Precision Castparts Corp. | | | 407 | | | | 59,902 | |
Raytheon Co. | | | 2,407 | | | | 122,444 | |
Rockwell Collins, Inc. | | | 520 | | | | 33,712 | |
Spirit Aerosystems Holdings, Inc. Class A*(a) | | | 684 | | | | 17,558 | |
Teledyne Technologies, Inc.* | | | 136 | | | | 7,033 | |
TransDigm Group, Inc.* | | | 104 | | | | 8,718 | |
Triumph Group, Inc. | | | 116 | | | | 10,260 | |
United Technologies Corp. | | | 3,183 | | | | 269,441 | |
| | | | | | | | |
| Total Aerospace & Defense | | | | | | | 1,569,493 | |
| Air Freight & Logistics – 0.5% | | | | | | | | |
Atlas Air Worldwide Holdings, Inc.*(a) | | | 166 | | | | 11,574 | |
C.H. Robinson Worldwide, Inc. | | | 292 | | | | 21,646 | |
Expeditors International of Washington, Inc. | | | 350 | | | | 17,549 | |
FedEx Corp. | | | 539 | | | | 50,423 | |
Forward Air Corp. | | | 111 | | | | 3,400 | |
HUB Group, Inc. Class A* | | | 139 | | | | 5,030 | |
United Parcel Service, Inc. Class B | | | 2,461 | | | | 182,902 | |
| | | | | | | | |
| Total Air Freight & Logistics | | | | | | | 292,524 | |
| Airlines – 0.3% | | | | | | | | |
Alaska Air Group, Inc.* | | | 195 | | | | 12,367 | |
Allegiant Travel Co.(a) | | | 189 | | | | 8,280 | |
Delta Air Lines, Inc.* | | | 3,285 | | | | 32,193 | |
Hawaiian Holdings, Inc.* | | | 1,231 | | | | 7,398 | |
JetBlue Airways Corp.*(a) | | | 1,073 | | | | 6,728 | |
Republic Airways Holdings, Inc.* | | | 454 | | | | 2,919 | |
Skywest, Inc. | | | 342 | | | | 5,786 | |
Southwest Airlines Co. | | | 2,141 | | | | 27,041 | |
United Continental Holdings, Inc.*(a) | | | 835 | | | | 19,197 | |
US Airways Group, Inc.*(a) | | | 2,259 | | | | 19,676 | |
| | | | | | | | |
| Total Airlines | | | | | | | 141,585 | |
| | | | | | | | |
| Investments | | Shares | | | Fair Value | |
| | | | | | | | |
| Auto Components – 0.5% | | | | | | | | |
American Axle & Manufacturing Holdings, Inc.* | | | 720 | | | $ | 9,065 | |
BorgWarner, Inc.*(a) | | | 228 | | | | 18,169 | |
Cooper Tire & Rubber Co. | | | 298 | | | | 7,673 | |
Federal-Mogul Corp.* | | | 473 | | | | 11,778 | |
Gentex Corp. | | | 192 | | | | 5,808 | |
Goodyear Tire & Rubber Co. (The)* | | | 574 | | | | 8,599 | |
Johnson Controls, Inc. | | | 2,258 | | | | 93,865 | |
Lear Corp. | | | 1,010 | | | | 49,359 | |
TRW Automotive Holdings Corp.* | | | 880 | | | | 48,470 | |
| | | | | | | | |
| Total Auto Components | | | | | | | 252,786 | |
| Automobiles – 0.7% | | | | | | | | |
Ford Motor Co.* | | | 24,900 | | | | 371,259 | |
Harley-Davidson, Inc.(a) | | | 318 | | | | 13,512 | |
Thor Industries, Inc. | | | 210 | | | | 7,008 | |
| | | | | | | | |
| Total Automobiles | | | | | | | 391,779 | |
| Beverages – 1.8% | | | | | | | | |
Brown-Forman Corp. Class B | | | 374 | | | | 25,544 | |
Coca-Cola Bottling Co. Consolidated | | | 163 | | | | 10,895 | |
Coca-Cola Co. (The) | | | 7,188 | | | | 476,924 | |
Coca-Cola Enterprises, Inc. | | | 735 | | | | 20,066 | |
Constellation Brands, Inc. Class A* | | | 550 | | | | 11,154 | |
Dr. Pepper Snapple Group, Inc.(a) | | | 879 | | | | 32,664 | |
Hansen Natural Corp.* | | | 271 | | | | 16,322 | |
Molson Coors Brewing Co. Class B | | | 842 | | | | 39,481 | |
PepsiCo, Inc. | | | 5,284 | | | | 340,342 | |
| | | | | | | | |
| Total Beverages | | | | | | | 973,392 | |
| Biotechnology – 1.4% | | | | | | | | |
Alexion Pharmaceuticals, Inc.* | | | 240 | | | | 23,683 | |
Amgen, Inc.* | | | 5,010 | | | | 267,785 | |
Ariad Pharmaceuticals, Inc.* | | | 1,585 | | | | 11,919 | |
Biogen Idec, Inc.* | | | 995 | | | | 73,023 | |
BioMarin Pharmaceutical, Inc.* | | | 494 | | | | 12,414 | |
Celgene Corp.* | | | 987 | | | | 56,782 | |
Cephalon, Inc.*(a) | | | 373 | | | | 28,266 | |
Cubist Pharmaceuticals, Inc.* | | | 288 | | | | 7,269 | |
Emergent Biosolutions, Inc.* | | | 143 | | | | 3,455 | |
Gilead Sciences, Inc.* | | | 5,071 | | | | 215,213 | |
Myriad Genetics, Inc.* | | | 509 | | | | 10,257 | |
PDL BioPharma, Inc. | | | 2,860 | | | | 16,588 | |
Talecris Biotherapeutics Holdings Corp.* | | | 475 | | | | 12,730 | |
| | | | | | | | |
| Total Biotechnology | | | | | | | 739,384 | |
| Building Products – 0.2% | | | | | | | | |
A.O. Smith Corp. | | | 241 | | | | 10,686 | |
Ameron International Corp. | | | 63 | | | | 4,397 | |
Apogee Enterprises, Inc. | | | 340 | | | | 4,485 | |
Owens Corning* | | | 2,087 | | | | 75,111 | |
Simpson Manufacturing Co., Inc. | | | 138 | | | | 4,065 | |
| | | | | | | | |
| Total Building Products | | | | | | | 98,744 | |
| Capital Markets – 3.3% | | | | | | | | |
American Capital Ltd.* | | | 5,932 | | | | 58,727 | |
Ameriprise Financial, Inc. | | | 1,194 | | | | 72,930 | |
See Notes to Financial Statements.
| | |
| 14 | | WisdomTree Domestic and International Earnings Funds |
Schedule of Investments (continued)
WisdomTree Total Earnings Fund (EXT)
March 31, 2011
| | | | | | | | |
| Investments | | Shares | | | Fair Value | |
| | | | | | | | |
Ares Capital Corp. | | | 2,240 | | | $ | 37,856 | |
Artio Global Investors, Inc. Class A | | | 705 | | | | 11,393 | |
Bank of New York Mellon Corp. (The) | | | 5,387 | | | | 160,910 | |
BlackRock Kelso Capital Corp.(a) | | | 533 | | | | 5,399 | |
BlackRock, Inc. | | | 546 | | | | 109,751 | |
Charles Schwab Corp. (The) | | | 2,275 | | | | 41,018 | |
Eaton Vance Corp. | | | 435 | | | | 14,024 | |
Federated Investors, Inc. Class B(a) | | | 481 | | | | 12,867 | |
Financial Engines, Inc.* | | | 338 | | | | 9,315 | |
Franklin Resources, Inc. | | | 773 | | | | 96,687 | |
GAMCO Investors, Inc. Class A | | | 133 | | | | 6,166 | |
GFI Group, Inc.(a) | | | 1,261 | | | | 6,330 | |
Gleacher & Co., Inc.* | | | 1,801 | | | | 3,134 | |
Goldman Sachs Group, Inc. (The) | | | 4,030 | | | | 638,634 | |
Greenhill & Co., Inc.(a) | | | 72 | | | | 4,737 | |
Investment Technology Group, Inc.* | | | 250 | | | | 4,548 | |
Janus Capital Group, Inc. | | | 756 | | | | 9,427 | |
Jefferies Group, Inc.* | | | 497 | | | | 12,395 | |
Knight Capital Group, Inc. Class A*(a) | | | 589 | | | | 7,893 | |
Legg Mason, Inc.(a) | | | 400 | | | | 14,436 | |
Morgan Stanley | | | 5,816 | | | | 158,893 | |
Northern Trust Corp. | | | 797 | | | | 40,448 | |
optionsXpress Holdings, Inc. | | | 372 | | | | 6,811 | |
Prospect Capital Corp.(a) | | | 304 | | | | 3,712 | |
Raymond James Financial, Inc. | | | 548 | | | | 20,956 | |
SEI Investments Co. | | | 520 | | | | 12,418 | |
Solar Capital Ltd. | | | 398 | | | | 9,504 | |
State Street Corp. | | | 2,660 | | | | 119,540 | |
T. Rowe Price Group, Inc. | | | 622 | | | | 41,313 | |
TD Ameritrade Holding Corp. | | | 1,947 | | | | 40,634 | |
Waddell & Reed Financial, Inc. Class A | | | 158 | | | | 6,416 | |
| | | | | | | | |
| Total Capital Markets | | | | | | | 1,799,222 | |
| Chemicals – 2.1% | | | | | | | | |
Air Products & Chemicals, Inc. | | | 693 | | | | 62,495 | |
Airgas, Inc. | | | 211 | | | | 14,015 | |
Albemarle Corp. | | | 271 | | | | 16,198 | |
Arch Chemicals, Inc. | | | 140 | | | | 5,823 | |
Ashland, Inc. | | | 308 | | | | 17,790 | |
Balchem Corp. | | | 87 | | | | 3,264 | |
Cabot Corp. | | | 225 | | | | 10,415 | |
Celanese Corp. | | | 480 | | | | 21,298 | |
CF Industries Holdings, Inc. | | | 94 | | | | 12,858 | |
Cytec Industries, Inc. | | | 112 | | | | 6,089 | |
Dow Chemical Co. (The) | | | 2,608 | | | | 98,452 | |
E.I. Du Pont de Nemours & Co. | | | 3,281 | | | | 180,357 | |
Eastman Chemical Co. | | | 284 | | | | 28,207 | |
Ecolab, Inc. | | | 520 | | | | 26,530 | |
FMC Corp.(a) | | | 272 | | | | 23,101 | |
H.B. Fuller Co. | | | 317 | | | | 6,809 | |
Innophos Holdings, Inc. | | | 55 | | | | 2,536 | |
International Flavors & Fragrances, Inc. | | | 316 | | | | 19,687 | |
Intrepid Potash, Inc.* | | | 46 | | | | 1,602 | |
Koppers Holdings, Inc. | | | 186 | | | | 7,942 | |
| | | | | | | | |
| Investments | | Shares | | | Fair Value | |
| | | | | | | | |
Kraton Performance Polymers, Inc.* | | | 337 | | | $ | 12,890 | |
Lubrizol Corp. | | | 406 | | | | 54,388 | |
Monsanto Co. | | | 1,048 | | | | 75,728 | |
Mosaic Co. (The) | | | 923 | | | | 72,686 | |
Nalco Holding Co. | | | 324 | | | | 8,848 | |
NewMarket Corp. | | | 131 | | | | 20,727 | |
Olin Corp. | | | 430 | | | | 9,856 | |
PPG Industries, Inc. | | | 565 | | | | 53,794 | |
Praxair, Inc. | | | 921 | | | | 93,574 | |
Rockwood Holdings, Inc.* | | | 206 | | | | 10,139 | |
RPM International, Inc. | | | 776 | | | | 18,414 | |
Scotts Miracle-Gro Co. (The) Class A(a) | | | 316 | | | | 18,281 | |
Sensient Technologies Corp. | | | 188 | | | | 6,738 | |
Sherwin-Williams Co. (The) | | | 353 | | | | 29,648 | |
Sigma-Aldrich Corp. | | | 358 | | | | 22,783 | |
Stepan Co. | | | 139 | | | | 10,077 | |
Valspar Corp. | | | 362 | | | | 14,154 | |
W.R. Grace & Co.* | | | 371 | | | | 14,206 | |
Westlake Chemical Corp. | | | 215 | | | | 12,083 | |
| | | | | | | | |
| Total Chemicals | | | | | | | 1,124,482 | |
| Commercial Banks – 2.7% | | | | | | | | |
Bancfirst Corp. | | | 71 | | | | 3,030 | |
BancorpSouth, Inc.(a) | | | 321 | | | | 4,959 | |
Bank of Hawaii Corp. | | | 211 | | | | 10,090 | |
Bank of the Ozarks, Inc. | | | 111 | | | | 4,852 | |
BB&T Corp.(a) | | | 1,911 | | | | 52,457 | |
BOK Financial Corp. | | | 387 | | | | 20,000 | |
Camden National Corp. | | | 279 | | | | 9,553 | |
CIT Group, Inc.* | | | 5,080 | | | | 216,154 | |
City National Corp. | | | 158 | | | | 9,014 | |
Commerce Bancshares, Inc. | | | 460 | | | | 18,602 | |
Community Bank System, Inc.(a) | | | 159 | | | | 3,859 | |
Community Trust Bancorp, Inc. | | | 101 | | | | 2,795 | |
Cullen/Frost Bankers, Inc.(a) | | | 204 | | | | 12,040 | |
CVB Financial Corp. | | | 413 | | | | 3,845 | |
First Citizens BancShares, Inc. Class A | | | 42 | | | | 8,424 | |
First Financial Bancorp | | | 236 | | | | 3,939 | |
First Financial Bankshares, Inc.(a) | | | 86 | | | | 4,418 | |
FirstMerit Corp. | | | 322 | | | | 5,493 | |
FNB Corp.(a) | | | 361 | | | | 3,805 | |
Fulton Financial Corp. | | | 709 | | | | 7,877 | |
Glacier Bancorp, Inc.(a) | | | 247 | | | | 3,717 | |
Hancock Holding Co.(a) | | | 114 | | | | 3,744 | |
Iberiabank Corp.(a) | | | 115 | | | | 6,915 | |
International Bancshares Corp. | | | 438 | | | | 8,033 | |
M&T Bank Corp. | | | 452 | | | | 39,988 | |
NBT Bancorp, Inc. | | | 154 | | | | 3,510 | |
Old National Bancorp | | | 298 | | | | 3,195 | |
Park National Corp. | | | 69 | | | | 4,611 | |
PNC Financial Services Group, Inc. | | | 2,199 | | | | 138,515 | |
Prosperity Bancshares, Inc. | | | 166 | | | | 7,100 | |
Republic Bancorp, Inc. Class A | | | 476 | | | | 9,272 | |
S&T Bancorp, Inc.(a) | | | 117 | | | | 2,524 | |
See Notes to Financial Statements.
| | | | |
| WisdomTree Domestic and International Earnings Funds | | | 15 | |
Schedule of Investments (continued)
WisdomTree Total Earnings Fund (EXT)
March 31, 2011
| | | | | | | | |
| Investments | | Shares | | | Fair Value | |
| | | | | | | | |
Simmons First National Corp. Class A | | | 341 | | | $ | 9,238 | |
Susquehanna Bancshares, Inc. | | | 318 | | | | 2,973 | |
SVB Financial Group* | | | 206 | | | | 11,728 | |
TCF Financial Corp. | | | 635 | | | | 10,071 | |
Tompkins Financial Corp. | | | 241 | | | | 10,014 | |
Trustmark Corp. | | | 248 | | | | 5,808 | |
U.S. Bancorp | | | 6,964 | | | | 184,058 | |
UMB Financial Corp. | | | 116 | | | | 4,333 | |
United Bankshares, Inc.(a) | | | 160 | | | | 4,243 | |
Valley National Bancorp | | | 364 | | | | 5,081 | |
Wells Fargo & Co. | | | 18,124 | | | | 574,531 | |
Westamerica Bancorp. | | | 91 | | | | 4,675 | |
| | | | | | | | |
| Total Commercial Banks | | | | | | | 1,463,083 | |
| Commercial Services & Supplies – 0.6% | | | | | | | | |
ABM Industries, Inc. | | | 208 | | | | 5,281 | |
Avery Dennison Corp. | | | 348 | | | | 14,602 | |
Brink’s Co. (The) | | | 388 | | | | 12,847 | |
Cintas Corp. | | | 550 | | | | 16,648 | |
Clean Harbors, Inc.* | | | 72 | | | | 7,104 | |
Consolidated Graphics, Inc.* | | | 166 | | | | 9,069 | |
Copart, Inc.* | | | 273 | | | | 11,829 | |
Corrections Corp. of America* | | | 419 | | | | 10,224 | |
Covanta Holding Corp. | | | 350 | | | | 5,978 | |
Deluxe Corp.(a) | | | 436 | | | | 11,571 | |
Ennis, Inc. | | | 619 | | | | 10,542 | |
Geo Group, Inc. (The)* | | | 138 | | | | 3,538 | |
Herman Miller, Inc. | | | 66 | | | | 1,814 | |
HNI Corp. | | | 277 | | | | 8,742 | |
Iron Mountain, Inc. | | | 646 | | | | 20,175 | |
Knoll, Inc. | | | 505 | | | | 10,585 | |
M&F Worldwide Corp.* | | | 232 | | | | 5,828 | |
McGrath Rentcorp | | | 74 | | | | 2,018 | |
Mine Safety Appliances Co. | | | 154 | | | | 5,647 | |
Pitney Bowes, Inc.(a) | | | 1,118 | | | | 28,721 | |
Republic Services, Inc. | | | 818 | | | | 24,573 | |
Rollins, Inc. | | | 406 | | | | 8,242 | |
Stericycle, Inc.* | | | 156 | | | | 13,833 | |
SYKES Enterprises, Inc.* | | | 246 | | | | 4,863 | |
Tetra Tech, Inc.*(a) | | | 184 | | | | 4,543 | |
UniFirst Corp. | | | 121 | | | | 6,414 | |
United Stationers, Inc. | | | 163 | | | | 11,581 | |
Waste Connections, Inc.(a) | | | 301 | | | | 8,666 | |
Waste Management, Inc. | | | 1,604 | | | | 59,893 | |
| | | | | | | | |
| Total Commercial Services & Supplies | | | | | | | 345,371 | |
| Communications Equipment – 1.4% | | | | | | | | |
ADTRAN, Inc. | | | 327 | | | | 13,884 | |
Arris Group, Inc.* | | | 503 | | | | 6,408 | |
Black Box Corp. | | | 113 | | | | 3,972 | |
Cisco Systems, Inc. | | | 24,726 | | | | 424,051 | |
Comtech Telecommunications Corp. | | | 109 | | | | 2,963 | |
F5 Networks, Inc.* | | | 75 | | | | 7,693 | |
Harris Corp. | | | 749 | | | | 37,150 | |
InterDigital, Inc.(a) | | | 264 | | | | 12,595 | |
| | | | | | | | |
| Investments | | Shares | | | Fair Value | |
Juniper Networks, Inc.* | | | 827 | | | $ | 34,800 | |
Loral Space & Communications, Inc.* | | | 135 | | | | 10,469 | |
Plantronics, Inc. | | | 175 | | | | 6,409 | |
Polycom, Inc.* | | | 80 | | | | 4,148 | |
QUALCOMM, Inc. | | | 3,861 | | | | 211,699 | |
Tekelec* | | | 292 | | | | 2,371 | |
Tellabs, Inc. | | | 1,675 | | | | 8,777 | |
| | | | | | | | |
| Total Communications Equipment | | | | | | | 787,389 | |
| Computers & Peripherals – 3.7% | | | | | | | | |
Apple, Inc.* | | | 2,716 | | | | 946,390 | |
Dell, Inc.* | | | 9,921 | | | | 143,954 | |
Diebold, Inc. | | | 224 | | | | 7,943 | |
EMC Corp.*(a) | | | 4,664 | | | | 123,829 | |
Hewlett-Packard Co. | | | 13,172 | | | | 539,657 | |
Lexmark International, Inc. Class A* | | | 584 | | | | 21,632 | |
NCR Corp.* | | | 617 | | | | 11,624 | |
NetApp, Inc.* | | | 713 | | | | 34,352 | |
QLogic Corp.* | | | 524 | | | | 9,720 | |
SanDisk Corp.* | | | 1,454 | | | | 67,015 | |
Synaptics, Inc.*(a) | | | 339 | | | | 9,160 | |
Western Digital Corp.* | | | 2,435 | | | | 90,801 | |
| | | | | | | | |
| Total Computers & Peripherals | | | | | | | 2,006,077 | |
| Construction & Engineering – 0.3% | | | | | | | | |
Aecom Technology Corp.* | | | 594 | | | | 16,472 | |
EMCOR Group, Inc.* | | | 80 | | | | 2,478 | |
Fluor Corp. | | | 449 | | | | 33,073 | |
Jacobs Engineering Group, Inc.* | | | 409 | | | | 21,035 | |
KBR, Inc. | | | 769 | | | | 29,045 | |
MasTec, Inc.* | | | 394 | | | | 8,195 | |
Quanta Services, Inc.* | | | 828 | | | | 18,572 | |
Tutor Perini Corp. | | | 332 | | | | 8,087 | |
URS Corp.* | | | 455 | | | | 20,953 | |
| | | | | | | | |
| Total Construction & Engineering | | | | | | | 157,910 | |
| Construction Materials – 0.0% | | | | | | | | |
Martin Marietta Materials, Inc. | | | 91 | | | | 8,160 | |
| Consumer Finance – 1.0% | | | | | | | | |
Advance America, Cash Advance Centers, Inc. | | | 1,510 | | | | 8,003 | |
American Express Co. | | | 4,112 | | | | 185,862 | |
Capital One Financial Corp. | | | 4,080 | | | | 211,997 | |
Cash America International, Inc. | | | 177 | | | | 8,151 | |
Credit Acceptance Corp.* | | | 251 | | | | 17,811 | |
Discover Financial Services | | | 1,191 | | | | 28,727 | |
Dollar Financial Corp.*(a) | | | 476 | | | | 9,877 | |
Ezcorp, Inc. Class A* | | | 205 | | | | 6,435 | |
First Cash Financial Services, Inc.* | | | 97 | | | | 3,744 | |
Nelnet, Inc. Class A | | | 517 | | | | 11,286 | |
SLM Corp.* | | | 4,098 | | | | 62,699 | |
World Acceptance Corp.*(a) | | | 159 | | | | 10,367 | |
| | | | | | | | |
| Total Consumer Finance | | | | | | | 564,959 | |
| Containers & Packaging – 0.4% | | | | | | | | |
Aptargroup, Inc. | | | 205 | | | | 10,277 | |
Ball Corp. | | | 1,010 | | | | 36,208 | |
See Notes to Financial Statements.
| | |
| 16 | | WisdomTree Domestic and International Earnings Funds |
Schedule of Investments (continued)
WisdomTree Total Earnings Fund (EXT)
March 31, 2011
| | | | | | | | |
| Investments | | Shares | | | Fair Value | |
| | | | | | | | |
Bemis Co., Inc. | | | 297 | | | $ | 9,745 | |
Boise, Inc.(a) | | | 1,738 | | | | 15,920 | |
Crown Holdings, Inc.* | | | 670 | | | | 25,849 | |
Greif, Inc. Class A | | | 251 | | | | 16,418 | |
Owens-Illinois, Inc.* | | | 317 | | | | 9,570 | |
Packaging Corp. of America | | | 501 | | | | 14,474 | |
Rock-Tenn Co. Class A(a) | | | 326 | | | | 22,608 | |
Sealed Air Corp. | | | 965 | | | | 25,727 | |
Silgan Holdings, Inc. | | | 249 | | | | 9,497 | |
Sonoco Products Co. | | | 252 | | | | 9,130 | |
Temple-Inland, Inc. | | | 551 | | | | 12,893 | |
| | | | | | | | |
| Total Containers & Packaging | | | | | | | 218,316 | |
| Distributors – 0.1% | | | | | | | | |
Core-Mark Holding Co., Inc.* | | | 71 | | | | 2,346 | |
Genuine Parts Co. | | | 531 | | | | 28,483 | |
LKQ Corp.* | | | 526 | | | | 12,677 | |
Pool Corp. | | | 229 | | | | 5,521 | |
| | | | | | | | |
| Total Distributors | | | | | | | 49,027 | |
| Diversified Consumer Services – 0.5% | | | | | | | | |
Apollo Group, Inc. Class A* | | | 1,341 | | | | 55,933 | |
Bridgepoint Education, Inc.*(a) | | | 427 | | | | 7,302 | |
Career Education Corp.* | | | 806 | | | | 18,312 | |
Corinthian Colleges, Inc.*(a) | | | 3,093 | | | | 13,671 | |
DeVry, Inc. | | | 294 | | | | 16,191 | |
Education Management Corp.*(a) | | | 904 | | | | 18,930 | |
H&R Block, Inc. | | | 2,061 | | | | 34,501 | |
Hillenbrand, Inc. | | | 462 | | | | 9,933 | |
ITT Educational Services, Inc.*(a) | | | 375 | | | | 27,056 | |
Lincoln Educational Services Corp. | | | 443 | | | | 7,039 | |
Matthews International Corp. Class A | | | 112 | | | | 4,318 | |
Pre-Paid Legal Services, Inc.* | | | 88 | | | | 5,808 | |
Regis Corp. | | | 322 | | | | 5,712 | |
Service Corp. International | | | 2,103 | | | | 23,259 | |
Sotheby’s | | | 165 | | | | 8,679 | |
Strayer Education, Inc. | | | 23 | | | | 3,001 | |
Weight Watchers International, Inc. | | | 267 | | | | 18,717 | |
| | | | | | | | |
| Total Diversified Consumer Services | | | | | | | 278,362 | |
| Diversified Financial Services – 2.7% | | | | | | | | |
Bank of America Corp. | | | 13,257 | | | | 176,716 | |
CBOE Holdings, Inc. | | | 387 | | | | 11,211 | |
Citigroup, Inc.* | | | 9,829 | | | | 43,444 | |
CME Group, Inc. | | | 201 | | | | 60,612 | |
Interactive Brokers Group, Inc. Class A | | | 520 | | | | 8,263 | |
IntercontinentalExchange, Inc.* | | | 254 | | | | 31,379 | |
JPMorgan Chase & Co. | | | 21,919 | | | | 1,010,466 | |
Leucadia National Corp. | | | 365 | | | | 13,702 | |
Moody’s Corp. | | | 1,301 | | | | 44,117 | |
MSCI, Inc. Class A* | | | 129 | | | | 4,750 | |
NASDAQ OMX Group, Inc. (The)* | | | 1,264 | | | | 32,662 | |
NYSE Euronext | | | 1,283 | | | | 45,123 | |
Portfolio Recovery Associates, Inc.* | | | 56 | | | | 4,767 | |
| | | | | | | | |
| Total Diversified Financial Services | | | | | | | 1,487,212 | |
| | | | | | | | |
| Investments | | Shares | | | Fair Value | |
| | | | | | | | |
| Diversified Telecommunication Services – 2.8% | | | | | | | | |
AboveNet, Inc. | | | 298 | | | $ | 19,328 | |
AT&T, Inc. | | | 41,585 | | | | 1,272,501 | |
CenturyLink, Inc.(a) | | | 1,313 | | | | 54,555 | |
Cincinnati Bell, Inc.* | | | 1,031 | | | | 2,763 | |
Frontier Communications Corp.(a) | | | 714 | | | | 5,869 | |
Qwest Communications International, Inc. | | | 916 | | | | 6,256 | |
tw telecom, inc.* | | | 953 | | | | 18,298 | |
Verizon Communications, Inc. | | | 3,282 | | | | 126,488 | |
Windstream Corp.(a) | | | 1,343 | | | | 17,285 | |
| | | | | | | | |
| Total Diversified Telecommunication Services | | | | | | | 1,523,343 | |
| Electric Utilities – 2.1% | | | | | | | | |
ALLETE, Inc. | | | 158 | | | | 6,157 | |
American Electric Power Co., Inc. | | | 2,353 | | | | 82,684 | |
Cleco Corp. | | | 491 | | | | 16,836 | |
DPL, Inc. | | | 727 | | | | 19,927 | |
Duke Energy Corp. | | | 5,588 | | | | 101,422 | |
Edison International | | | 2,119 | | | | 77,534 | |
El Paso Electric Co.* | | | 185 | | | | 5,624 | |
Entergy Corp. | | | 1,166 | | | | 78,367 | |
Exelon Corp. | | | 3,915 | | | | 161,455 | |
FirstEnergy Corp. | | | 2,038 | | | | 75,589 | |
Great Plains Energy, Inc. | | | 849 | | | | 16,997 | |
Hawaiian Electric Industries, Inc. | | | 294 | | | | 7,291 | |
IDACORP, Inc. | | | 183 | | | | 6,972 | |
ITC Holdings Corp. | | | 133 | | | | 9,297 | |
MGE Energy, Inc. | | | 115 | | | | 4,656 | |
NextEra Energy, Inc. | | | 2,335 | | | | 128,705 | |
Northeast Utilities | | | 891 | | | | 30,829 | |
NV Energy, Inc. | | | 911 | | | | 13,565 | |
Pepco Holdings, Inc. | | | 733 | | | | 13,670 | |
Pinnacle West Capital Corp. | | | 393 | | | | 16,817 | |
Portland General Electric Co. | | | 252 | | | | 5,990 | |
PPL Corp. | | | 1,815 | | | | 45,920 | |
Progress Energy, Inc. | | | 1,240 | | | | 57,214 | |
Southern Co. | | | 3,254 | | | | 124,010 | |
UIL Holdings Corp. | | | 117 | | | | 3,571 | |
Unisource Energy Corp. | | | 292 | | | | 10,550 | |
Westar Energy, Inc.(a) | | | 419 | | | | 11,070 | |
| | | | | | | | |
| Total Electric Utilities | | | | | | | 1,132,719 | |
| Electrical Equipment – 0.6% | | | | | | | | |
Acuity Brands, Inc. | | | 64 | | | | 3,743 | |
AMETEK, Inc. | | | 558 | | | | 24,480 | |
AZZ, Inc. | | | 45 | | | | 2,052 | |
Brady Corp. Class A | | | 281 | | | | 10,029 | |
Emerson Electric Co. | | | 2,026 | | | | 118,379 | |
EnerSys* | | | 336 | | | | 13,356 | |
General Cable Corp.* | | | 41 | | | | 1,775 | |
GrafTech International Ltd.* | | | 360 | | | | 7,427 | |
Hubbell, Inc. Class B | | | 299 | | | | 21,238 | |
II-VI, Inc.* | | | 202 | | | | 10,050 | |
Powell Industries, Inc.* | | | 273 | | | | 10,767 | |
Regal-Beloit Corp. | | | 188 | | | | 13,880 | |
See Notes to Financial Statements.
| | | | |
| WisdomTree Domestic and International Earnings Funds | | | 17 | |
Schedule of Investments (continued)
WisdomTree Total Earnings Fund (EXT)
March 31, 2011
| | | | | | | | |
| Investments | | Shares | | | Fair Value | |
| | | | | | | | |
Rockwell Automation, Inc.(a) | | | 251 | | | $ | 23,757 | |
Roper Industries, Inc. | | | 297 | | | | 25,679 | |
Thomas & Betts Corp.* | | | 98 | | | | 5,828 | |
Woodward, Inc. | | | 293 | | | | 10,126 | |
| | | | | | | | |
| Total Electrical Equipment | | | | | | | 302,566 | |
Electronic Equipment, Instruments & Components – 1.0% | | | | | | | | |
Amphenol Corp. Class A | | | 599 | | | | 32,580 | |
Anixter International, Inc. | | | 110 | | | | 7,688 | |
Arrow Electronics, Inc.* | | | 722 | | | | 30,237 | |
Avnet, Inc.* | | | 772 | | | | 26,317 | |
AVX Corp. | | | 848 | | | | 12,644 | |
Benchmark Electronics, Inc.* | | | 369 | | | | 7,000 | |
Checkpoint Systems, Inc.*(a) | | | 327 | | | | 7,351 | |
Corning, Inc. | | | 10,801 | | | | 222,825 | |
Dolby Laboratories, Inc. Class A* | | | 262 | | | | 12,893 | |
FLIR Systems, Inc.(a) | | | 686 | | | | 23,742 | |
Ingram Micro, Inc. Class A* | | | 959 | | | | 20,168 | |
Insight Enterprises, Inc.* | | | 476 | | | | 8,106 | |
Jabil Circuit, Inc. | | | 702 | | | | 14,342 | |
Molex, Inc.(a) | | | 458 | | | | 11,505 | |
MTS Systems Corp. | | | 135 | | | | 6,149 | |
Multi-Fineline Electronix, Inc.* | | | 326 | | | | 9,200 | |
National Instruments Corp. | | | 376 | | | | 12,321 | |
Plexus Corp.*(a) | | | 280 | | | | 9,817 | |
Power-One, Inc.*(a) | | | 736 | | | | 6,440 | |
Rofin-Sinar Technologies, Inc.* | | | 184 | | | | 7,268 | |
Sanmina-SCI Corp.* | | | 617 | | | | 6,917 | |
Scansource, Inc.* | | | 204 | | | | 7,750 | |
SYNNEX Corp.* | | | 229 | | | | 7,495 | |
Tech Data Corp.* | | | 322 | | | | 16,377 | |
Trimble Navigation Ltd.* | | | 117 | | | | 5,913 | |
Vishay Intertechnology, Inc.* | | | 1,018 | | | | 18,059 | |
| | | | | | | | |
| Total Electronic Equipment, Instruments & Components | | | | | | | 551,104 | |
| Energy Equipment & Services – 1.2% | | | | | | | | |
Atwood Oceanics, Inc.* | | | 418 | | | | 19,408 | |
Baker Hughes, Inc. | | | 626 | | | | 45,967 | |
Bristow Group, Inc.* | | | 166 | | | | 7,852 | |
Cameron International Corp.* | | | 631 | | | | 36,030 | |
CARBO Ceramics, Inc.(a) | | | 111 | | | | 15,664 | |
Diamond Offshore Drilling, Inc.(a) | | | 938 | | | | 72,883 | |
Dresser-Rand Group, Inc.* | | | 190 | | | | 10,188 | |
Dril-Quip, Inc.* | | | 133 | | | | 10,511 | |
FMC Technologies, Inc.* | | | 264 | | | | 24,943 | |
Gulfmark Offshore, Inc. Class A* | | | 226 | | | | 10,059 | |
Halliburton Co. | | | 2,191 | | | | 109,199 | |
Helmerich & Payne, Inc. | | | 354 | | | | 24,316 | |
Hornbeck Offshore Services, Inc.*(a) | | | 301 | | | | 9,286 | |
Lufkin Industries, Inc.(a) | | | 35 | | | | 3,271 | |
National Oilwell Varco, Inc. | | | 1,606 | | | | 127,308 | |
Oceaneering International, Inc.* | | | 209 | | | | 18,695 | |
Oil States International, Inc.* | | | 156 | | | | 11,878 | |
| | | | | | | | |
| Investments | | Shares | | | Fair Value | |
| | | | | | | | |
Patterson-UTI Energy, Inc.(a) | | | 458 | | | $ | 13,461 | |
Pride International, Inc.* | | | 406 | | | | 17,438 | |
Rowan Cos., Inc.* | | | 523 | | | | 23,106 | |
RPC, Inc.(a) | | | 287 | | | | 7,267 | |
SEACOR Holdings, Inc. | | | 129 | | | | 11,927 | |
Tidewater, Inc.(a) | | | 191 | | | | 11,431 | |
Unit Corp.* | | | 180 | | | | 11,151 | |
Willbros Group, Inc.* | | | 552 | | | | 6,028 | |
| | | | | | | | |
| Total Energy Equipment & Services | | | | | | | 659,267 | |
| Food & Staples Retailing – 2.9% | | | | | | | | |
BJ’s Wholesale Club, Inc.* | | | 200 | | | | 9,764 | |
Casey’s General Stores, Inc. | | | 212 | | | | 8,268 | |
Costco Wholesale Corp. | | | 1,129 | | | | 82,778 | |
CVS Caremark Corp. | | | 6,396 | | | | 219,511 | |
Ingles Markets, Inc. Class A | | | 202 | | | | 4,002 | |
Kroger Co. (The) | | | 2,824 | | | | 67,691 | |
Pantry, Inc. (The)* | | | 70 | | | | 1,038 | |
Pricesmart, Inc. | | | 78 | | | | 2,858 | |
Ruddick Corp. | | | 178 | | | | 6,869 | |
Safeway, Inc. | | | 1,725 | | | | 40,606 | |
Spartan Stores, Inc. | | | 87 | | | | 1,287 | |
Sysco Corp. | | | 2,348 | | | | 65,040 | |
United Natural Foods, Inc.* | | | 159 | | | | 7,126 | |
Walgreen Co. | | | 3,530 | | | | 141,694 | |
Wal-Mart Stores, Inc. | | | 17,138 | | | | 892,033 | |
Whole Foods Market, Inc. | | | 302 | | | | 19,902 | |
| | | | | | | | |
| Total Food & Staples Retailing | | | | | | | 1,570,467 | |
| Food Products – 1.8% | | | | | | | | |
Archer-Daniels-Midland Co. | | | 3,543 | | | | 127,583 | |
Cal-Maine Foods, Inc.(a) | | | 272 | | | | 8,024 | |
Campbell Soup Co.(a) | | | 1,312 | | | | 43,440 | |
Chiquita Brands International, Inc.* | | | 235 | | | | 3,605 | |
ConAgra Foods, Inc. | | | 1,725 | | | | 40,969 | |
Corn Products International, Inc. | | | 215 | | | | 11,141 | |
Darling International, Inc.* | | | 777 | | | | 11,942 | |
Dean Foods Co.* | | | 1,149 | | | | 11,490 | |
Flowers Foods, Inc.(a) | | | 249 | | | | 6,780 | |
General Mills, Inc. | | | 2,361 | | | | 86,295 | |
H.J. Heinz Co. | | | 1,077 | | | | 52,579 | |
Hershey Co. (The) | | | 852 | | | | 46,306 | |
Hormel Foods Corp. | | | 884 | | | | 24,611 | |
J.M. Smucker Co. (The) | | | 543 | | | | 38,765 | |
Kellogg Co. | | | 1,418 | | | | 76,544 | |
Kraft Foods, Inc. Class A | | | 5,101 | | | | 159,967 | |
Lancaster Colony Corp.(a) | | | 119 | | | | 7,211 | |
McCormick & Co., Inc. | | | 444 | | | | 21,237 | |
Mead Johnson Nutrition Co. | | | 419 | | | | 24,273 | |
Pilgrim’s Pride Corp.* | | | 1,090 | | | | 8,404 | |
Ralcorp Holdings, Inc.* | | | 343 | | | | 23,471 | |
Sanderson Farms, Inc. | | | 164 | | | | 7,531 | |
Sara Lee Corp. | | | 1,946 | | | | 34,386 | |
Seneca Foods Corp. Class A*(a) | | | 390 | | | | 11,649 | |
TreeHouse Foods, Inc.* | | | 216 | | | | 12,284 | |
See Notes to Financial Statements.
| | |
| 18 | | WisdomTree Domestic and International Earnings Funds |
Schedule of Investments (continued)
WisdomTree Total Earnings Fund (EXT)
March 31, 2011
| | | | | | | | |
| Investments | | Shares | | | Fair Value | |
| | | | | | | | |
Tyson Foods, Inc. Class A | | | 2,782 | | | $ | 53,387 | |
| | | | | | | | |
| Total Food Products | | | | | | | 953,874 | |
| Gas Utilities – 0.4% | | | | | | | | |
AGL Resources, Inc. | | | 547 | | | | 21,792 | |
Atmos Energy Corp. | | | 385 | | | | 13,129 | |
Energen Corp. | | | 458 | | | | 28,909 | |
Laclede Group, Inc. (The) | | | 90 | | | | 3,429 | |
National Fuel Gas Co. | | | 163 | | | | 12,062 | |
New Jersey Resources Corp. | | | 181 | | | | 7,774 | |
Nicor, Inc. | | | 182 | | | | 9,773 | |
Northwest Natural Gas Co. | | | 98 | | | | 4,521 | |
Oneok, Inc. | | | 526 | | | | 35,179 | |
Piedmont Natural Gas Co., Inc.(a) | | | 225 | | | | 6,829 | |
Questar Corp. | | | 820 | | | | 14,309 | |
South Jersey Industries, Inc. | | | 134 | | | | 7,500 | |
Southwest Gas Corp. | | | 177 | | | | 6,898 | |
UGI Corp. | | | 446 | | | | 14,673 | |
WGL Holdings, Inc. | | | 189 | | | | 7,371 | |
| | | | | | | | |
| Total Gas Utilities | | | | | | | 194,148 | |
| Health Care Equipment & Supplies – 1.7% | | | | | | | | |
Align Technology, Inc.*(a) | | | 507 | | | | 10,383 | |
American Medical Systems Holdings, Inc.* | | | 483 | | | | 10,452 | |
Baxter International, Inc. | | | 1,904 | | | | 102,378 | |
Beckman Coulter, Inc. | | | 179 | | | | 14,869 | |
Becton Dickinson and Co. | | | 860 | | | | 68,473 | |
Boston Scientific Corp.*(a) | | | 4,391 | | | | 31,571 | |
C.R. Bard, Inc.(a) | | | 329 | | | | 32,673 | |
CareFusion Corp.* | | | 289 | | | | 8,150 | |
Conmed Corp.* | | | 138 | | | | 3,627 | |
Cooper Cos., Inc. (The) | | | 235 | | | | 16,321 | |
Cyberonics, Inc.* | | | 99 | | | | 3,149 | |
DENTSPLY International, Inc. | | | 689 | | | | 25,486 | |
Edwards Lifesciences Corp.*(a) | | | 152 | | | | 13,224 | |
Gen-Probe, Inc.* | | | 120 | | | | 7,962 | |
Greatbatch, Inc.* | | | 115 | | | | 3,043 | |
Haemonetics Corp.* | | | 67 | | | | 4,391 | |
Hill-Rom Holdings, Inc. | | | 208 | | | | 7,900 | |
Hospira, Inc.* | | | 428 | | | | 23,626 | |
IDEXX Laboratories, Inc.*(a) | | | 180 | | | | 13,900 | |
Immucor, Inc.* | | | 183 | | | | 3,620 | |
Intuitive Surgical, Inc.* | | | 81 | | | | 27,010 | |
Kinetic Concepts, Inc.* | | | 409 | | | | 22,258 | |
Medtronic, Inc. | | | 4,783 | | | | 188,211 | |
ResMed, Inc.* | | | 347 | | | | 10,410 | |
St. Jude Medical, Inc. | | | 1,253 | | | | 64,229 | |
STERIS Corp. | | | 229 | | | | 7,910 | |
Stryker Corp.(a) | | | 1,429 | | | | 86,883 | |
Teleflex, Inc. | | | 250 | | | | 14,495 | |
Varian Medical Systems, Inc.* | | | 330 | | | | 22,321 | |
West Pharmaceutical Services, Inc. | | | 112 | | | | 5,014 | |
Zimmer Holdings, Inc.* | | | 963 | | | | 58,290 | |
| | | | | | | | |
| Total Health Care Equipment & Supplies | | | | | | | 912,229 | |
| | | | | | | | |
| Investments | | Shares | | | Fair Value | |
| | | | | | | | |
| Health Care Providers & Services – 3.2% | | | | | | | | |
Aetna, Inc. | | | 2,881 | | | $ | 107,836 | |
Amedisys, Inc.*(a) | | | 320 | | | | 11,200 | |
AMERIGROUP Corp.*(a) | | | 453 | | | | 29,105 | |
AmerisourceBergen Corp. | | | 1,183 | | | | 46,800 | |
Amsurg Corp.* | | | 155 | | | | 3,943 | |
Cardinal Health, Inc. | | | 1,351 | | | | 55,567 | |
Catalyst Health Solutions, Inc.* | | | 165 | | | | 9,229 | |
Centene Corp.* | | | 249 | | | | 8,212 | |
Chemed Corp. | | | 113 | | | | 7,527 | |
CIGNA Corp. | | | 1,761 | | | | 77,977 | |
Community Health Systems, Inc.* | | | 611 | | | | 24,434 | |
Coventry Health Care, Inc.* | | | 982 | | | | 31,316 | |
DaVita, Inc.* | | | 385 | | | | 32,921 | |
Emergency Medical Services Corp. Class A* | | | 138 | | | | 8,775 | |
Ensign Group, Inc. (The) | | | 147 | | | | 4,694 | |
Express Scripts, Inc.* | | | 1,291 | | | | 71,793 | |
Five Star Quality Care, Inc.* | | | 1,579 | | | | 12,837 | |
Gentiva Health Services, Inc.* | | | 178 | | | | 4,989 | |
Hanger Orthopedic Group, Inc.* | | | 142 | | | | 3,696 | |
Health Management Associates, Inc. Class A* | | | 1,851 | | | | 20,176 | |
Health Net, Inc.* | | | 461 | | | | 15,075 | |
Healthsouth Corp.* | | | 480 | | | | 11,990 | |
Healthspring, Inc.* | | | 410 | | | | 15,322 | |
Healthways, Inc.*(a) | | | 301 | | | | 4,626 | |
Henry Schein, Inc.* | | | 319 | | | | 22,384 | |
Humana, Inc.* | | | 1,392 | | | | 97,357 | |
Kindred Healthcare, Inc.* | | | 269 | | | | 6,424 | |
Laboratory Corp. of America Holdings*(a) | | | 403 | | | | 37,128 | |
Landauer, Inc. | | | 25 | | | | 1,538 | |
LHC Group, Inc.* | | | 258 | | | | 7,740 | |
LifePoint Hospitals, Inc.* | | | 315 | | | | 12,657 | |
Lincare Holdings, Inc. | | | 549 | | | | 16,283 | |
Magellan Health Services, Inc.* | | | 143 | | | | 7,018 | |
McKesson Corp. | | | 1,082 | | | | 85,532 | |
Medco Health Solutions, Inc.* | | | 1,398 | | | | 78,512 | |
Mednax, Inc.* | | | 204 | | | | 13,588 | |
Molina Healthcare, Inc.* | | | 207 | | | | 8,280 | |
National Healthcare Corp. | | | 46 | | | | 2,139 | |
Omnicare, Inc.(a) | | | 467 | | | | 14,005 | |
Owens & Minor, Inc. | | | 210 | | | | 6,821 | |
Patterson Cos., Inc. | | | 478 | | | | 15,387 | |
PSS World Medical, Inc.* | | | 186 | | | | 5,050 | |
Quest Diagnostics, Inc. | | | 963 | | | | 55,584 | |
Select Medical Holdings Corp.* | | | 1,524 | | | | 12,283 | |
Triple-S Management Corp. Class B* | | | 551 | | | | 11,340 | |
UnitedHealth Group, Inc. | | | 7,894 | | | | 356,809 | |
Universal American Corp.(a) | | | 669 | | | | 15,327 | |
Universal Health Services, Inc. Class B | | | 357 | | | | 17,639 | |
VCA Antech, Inc.*(a) | | | 317 | | | | 7,982 | |
WellPoint, Inc. | | | 2,904 | | | | 202,670 | |
| | | | | | | | |
| Total Health Care Providers & Services | | | | | | | 1,737,517 | |
See Notes to Financial Statements.
| | | | |
| WisdomTree Domestic and International Earnings Funds | | | 19 | |
Schedule of Investments (continued)
WisdomTree Total Earnings Fund (EXT)
March 31, 2011
| | | | | | | | |
| Investments | | Shares | | | Fair Value | |
| | | | | | | | |
| Health Care Technology – 0.0% | | | | | | | | |
Allscripts Healthcare Solutions, Inc.* | | | 304 | | | $ | 6,381 | |
Cerner Corp.*(a) | | | 202 | | | | 22,462 | |
| | | | | | | | |
| Total Health Care Technology | | | | | | | 28,843 | |
| Hotels, Restaurants & Leisure – 1.2% | | | | | | | | |
Ameristar Casinos, Inc. | | | 394 | | | | 6,994 | |
Bally Technologies, Inc.* | | | 254 | | | | 9,614 | |
Bob Evans Farms, Inc. | | | 166 | | | | 5,412 | |
Brinker International, Inc. | | | 643 | | | | 16,268 | |
CEC Entertainment, Inc. | | | 142 | | | | 5,358 | |
Cheesecake Factory (The)* | | | 118 | | | | 3,551 | |
Chipotle Mexican Grill, Inc.* | | | 44 | | | | 11,984 | |
Choice Hotels International, Inc. | | | 185 | | | | 7,187 | |
Cracker Barrel Old Country Store, Inc. | | | 159 | | | | 7,813 | |
Darden Restaurants, Inc.(a) | | | 519 | | | | 25,498 | |
Domino’s Pizza, Inc.* | | | 662 | | | | 12,201 | |
Einstein Noah Restaurant Group, Inc. | | | 438 | | | | 7,131 | |
International Game Technology | | | 709 | | | | 11,507 | |
International Speedway Corp. Class A | | | 204 | | | | 6,079 | |
Interval Leisure Group, Inc.* | | | 208 | | | | 3,401 | |
Jack In The Box, Inc.* | | | 239 | | | | 5,421 | |
Life Time Fitness, Inc.* | | | 126 | | | | 4,701 | |
Marriott International, Inc. Class A | | | 611 | | | | 21,739 | |
McDonald’s Corp. | | | 3,894 | | | | 296,294 | |
Panera Bread Co. Class A* | | | 68 | | | | 8,636 | |
Papa John’s International, Inc.* | | | 384 | | | | 12,161 | |
Sonic Corp.* | | | 271 | | | | 2,453 | |
Speedway Motorsports, Inc. | | | 115 | | | | 1,838 | |
Starbucks Corp. | | | 1,830 | | | | 67,618 | |
Texas Roadhouse, Inc. | | | 201 | | | | 3,415 | |
Vail Resorts, Inc.* | | | 32 | | | | 1,560 | |
WMS Industries, Inc.* | | | 143 | | | | 5,055 | |
Wyndham Worldwide Corp. | | | 801 | | | | 25,480 | |
Yum! Brands, Inc. | | | 1,398 | | | | 71,829 | |
| | | | | | | | |
| Total Hotels, Restaurants & Leisure | | | | | | | 668,198 | |
| Household Durables – 0.4% | | | | | | | | |
American Greetings Corp. Class A | | | 518 | | | | 12,225 | |
Blyth, Inc. | | | 117 | | | | 3,801 | |
D.R. Horton, Inc. | | | 1,455 | | | | 16,951 | |
Fortune Brands, Inc. | | | 418 | | | | 25,870 | |
Jarden Corp. | | | 132 | | | | 4,695 | |
Leggett & Platt, Inc. | | | 419 | | | | 10,266 | |
Lennar Corp. Class A | | | 394 | | | | 7,139 | |
MDC Holdings, Inc. | | | 380 | | | | 9,633 | |
Mohawk Industries, Inc.* | | | 162 | | | | 9,906 | |
Newell Rubbermaid, Inc. | | | 1,302 | | | | 24,907 | |
NVR, Inc.* | | | 26 | | | | 19,656 | |
Stanley Black & Decker, Inc. | | | 112 | | | | 8,579 | |
Tempur-Pedic International, Inc.* | | | 224 | | | | 11,348 | |
Tupperware Brands Corp. | | | 164 | | | | 9,793 | |
Whirlpool Corp. | | | 416 | | | | 35,510 | |
| | | | | | | | |
| Total Household Durables | | | | | | | 210,279 | |
| | | | | | | | |
| Investments | | Shares | | | Fair Value | |
| | | | | | | | |
| Household Products – 1.8% | | | | | | | | |
Central Garden and Pet Co. Class A* | | | 896 | | | $ | 8,252 | |
Church & Dwight Co., Inc. | | | 338 | | | | 26,817 | |
Clorox Co.(a) | | | 561 | | | | 39,309 | |
Colgate-Palmolive Co. | | | 1,679 | | | | 135,596 | |
Energizer Holdings, Inc.* | | | 315 | | | | 22,416 | |
Kimberly-Clark Corp. | | | 1,876 | | | | 122,447 | |
Procter & Gamble Co. (The) | | | 9,864 | | | | 607,622 | |
WD-40 Co. | | | 54 | | | | 2,286 | |
| | | | | | | | |
| Total Household Products | | | | | | | 964,745 | |
| Independent Power Producers & Energy Traders – 0.1% | | | | | |
AES Corp. (The)* | | | 3,208 | | | | 41,704 | |
NRG Energy, Inc.* | | | 1,694 | | | | 36,489 | |
Ormat Technologies, Inc.(a) | | | 114 | | | | 2,887 | |
| | | | | | | | |
| Total Independent Power Producers & Energy Traders | | | | | | | 81,080 | |
| Industrial Conglomerates – 1.9% | | | | | | | | |
3M Co. | | | 2,777 | | | | 259,649 | |
Carlisle Cos., Inc. | | | 118 | | | | 5,257 | |
General Electric Co. | | | 38,132 | | | | 764,547 | |
Seaboard Corp. | | | 5 | | | | 12,065 | |
| | | | | | | | |
| Total Industrial Conglomerates | | | | | | | 1,041,518 | |
| Insurance – 5.2% | | | | | | | | |
Alleghany Corp.* | | | 44 | | | | 14,563 | |
Allstate Corp. (The) | | | 3,456 | | | | 109,832 | |
American Family Life Assurance Co., Inc. | | | 2,903 | | | | 153,220 | |
American Financial Group, Inc. | | | 861 | | | | 30,152 | |
American National Insurance Co. | | | 95 | | | | 7,521 | |
AMERISAFE, Inc.* | | | 162 | | | | 3,582 | |
Amtrust Financial Services, Inc. | | | 646 | | | | 12,319 | |
AON Corp. | | | 817 | | | | 43,268 | |
Arthur J. Gallagher & Co. | | | 272 | | | | 8,272 | |
Assurant, Inc. | | | 892 | | | | 34,351 | |
Berkshire Hathaway, Inc. Class B* | | | 7,602 | | | | 635,755 | |
Brown & Brown, Inc. | | | 424 | | | | 10,939 | |
Chubb Corp. | | | 2,066 | | | | 126,666 | |
Cincinnati Financial Corp.(a) | | | 455 | | | | 14,924 | |
CNA Financial Corp.* | | | 942 | | | | 27,836 | |
CNA Surety Corp.* | | | 332 | | | | 8,386 | |
CNO Financial Group, Inc.* | | | 1,643 | | | | 12,339 | |
Delphi Financial Group, Inc. Class A | | | 401 | | | | 12,315 | |
Employers Holdings, Inc. | | | 371 | | | | 7,665 | |
Erie Indemnity Co. Class A | | | 202 | | | | 14,364 | |
FBL Financial Group, Inc. Class A | | | 482 | | | | 14,807 | |
Fidelity National Financial, Inc. Class A | | | 1,346 | | | | 19,019 | |
First American Financial Corp. | | | 611 | | | | 10,081 | |
FPIC Insurance Group, Inc.* | | | 103 | | | | 3,904 | |
Genworth Financial, Inc. Class A* | | | 2,208 | | | | 29,720 | |
Hanover Insurance Group, Inc. (The) | | | 171 | | | | 7,738 | |
Harleysville Group, Inc. | | | 161 | | | | 5,334 | |
Hartford Financial Services Group, Inc. | | | 3,935 | | | | 105,970 | |
HCC Insurance Holdings, Inc. | | | 677 | | | | 21,197 | |
Horace Mann Educators Corp. | | | 274 | | | | 4,603 | |
See Notes to Financial Statements.
| | |
| 20 | | WisdomTree Domestic and International Earnings Funds |
Schedule of Investments (continued)
WisdomTree Total Earnings Fund (EXT)
March 31, 2011
| | | | | | | | |
| Investments | | Shares | | | Fair Value | |
| | | | | | | | |
Infinity Property & Casualty Corp. | | | 82 | | | $ | 4,878 | |
Lincoln National Corp.(a) | | | 1,844 | | | | 55,394 | |
Loews Corp. | | | 1,819 | | | | 78,381 | |
Markel Corp.* | | | 33 | | | | 13,677 | |
Marsh & McLennan Cos., Inc. | | | 1,073 | | | | 31,986 | |
Mercury General Corp. | | | 184 | | | | 7,200 | |
MetLife, Inc. | | | 4,071 | | | | 182,096 | |
National Western Life Insurance Co. Class A | | | 51 | | | | 8,275 | |
Navigators Group, Inc. (The)* | | | 53 | | | | 2,729 | |
Primerica, Inc.(a) | | | 845 | | | | 21,556 | |
Principal Financial Group, Inc. | | | 1,562 | | | | 50,156 | |
ProAssurance Corp.* | | | 244 | | | | 15,462 | |
Progressive Corp. (The) | | | 3,070 | | | | 64,869 | |
Protective Life Corp. | | | 530 | | | | 14,071 | |
Prudential Financial, Inc. | | | 4,404 | | | | 271,198 | |
Reinsurance Group of America, Inc. | | | 476 | | | | 29,883 | |
RLI Corp.(a) | | | 255 | | | | 14,701 | |
Safety Insurance Group, Inc. | | | 109 | | | | 5,026 | |
Selective Insurance Group, Inc. | | | 141 | | | | 2,439 | |
StanCorp Financial Group, Inc. | | | 305 | | | | 14,067 | |
Symetra Financial Corp. | | | 821 | | | | 11,166 | |
Torchmark Corp. | | | 503 | | | | 33,439 | |
Tower Group, Inc. | | | 165 | | | | 3,965 | |
Transatlantic Holdings, Inc.(a) | | | 451 | | | | 21,950 | |
Travelers Cos., Inc. (The) | | | 3,695 | | | | 219,779 | |
Unitrin, Inc. | | | 417 | | | | 12,877 | |
Universal Insurance Holdings, Inc. | | | 1,254 | | | | 6,797 | |
Unum Group | | | 2,310 | | | | 60,637 | |
W.R. Berkley Corp. | | | 1,165 | | | | 37,525 | |
Wesco Financial Corp. | | | 4 | | | | 1,557 | |
| | | | | | | | |
| Total Insurance | | | | | | | 2,808,378 | |
| Internet & Catalog Retail – 0.3% | | | | | | | | |
Amazon.com, Inc.* | | | 393 | | | | 70,791 | |
Expedia, Inc. | | | 1,076 | | | | 24,382 | |
HSN, Inc.* | | | 113 | | | | 3,619 | |
NetFlix, Inc.*(a) | | | 48 | | | | 11,392 | |
priceline.com, Inc.*(a) | | | 72 | | | | 36,464 | |
| | | | | | | | |
| Total Internet & Catalog Retail | | | | | | | 146,648 | |
| Internet Software & Services – 1.3% | | | | | | | | |
Akamai Technologies, Inc.* | | | 198 | | | | 7,524 | |
Digital River, Inc.*(a) | | | 177 | | | | 6,625 | |
Earthlink, Inc. | | | 2,243 | | | | 17,563 | |
eBay, Inc.* | | | 3,104 | | | | 96,348 | |
Equinix, Inc.* | | | 22 | | | | 2,004 | |
Google, Inc. Class A* | | | 825 | | | | 483,623 | |
j2 Global Communications, Inc.* | | | 156 | | | | 4,604 | |
ValueClick, Inc.* | | | 461 | | | | 6,666 | |
VeriSign, Inc. | | | 265 | | | | 9,596 | |
Yahoo!, Inc.* | | | 3,349 | | | | 55,761 | |
| | | | | | | | |
| Total Internet Software & Services | | | | | | | 690,314 | |
| IT Services – 3.3% | | | | | | | | |
Acxiom Corp.* | | | 181 | | | | 2,597 | |
Alliance Data Systems Corp.*(a) | | | 246 | | | | 21,129 | |
| | | | | | | | |
| Investments | | Shares | | | Fair Value | |
| | | | | | | | |
Automatic Data Processing, Inc. | | | 1,531 | | | $ | 78,556 | |
Broadridge Financial Solutions, Inc. | | | 694 | | | | 15,747 | |
CACI International, Inc. Class A* | | | 116 | | | | 7,113 | |
Cognizant Technology Solutions Corp. Class A* | | | 598 | | | | 48,677 | |
Computer Sciences Corp. | | | 906 | | | | 44,149 | |
Convergys Corp.* | | | 627 | | | | 9,004 | |
CoreLogic, Inc. | | | 142 | | | | 2,627 | |
CSG Systems International, Inc.* | | | 229 | | | | 4,566 | |
DST Systems, Inc. | | | 486 | | | | 25,670 | |
Euronet Worldwide, Inc.* | | | 274 | | | | 5,296 | |
Fidelity National Information Services, Inc. | | | 799 | | | | 26,119 | |
Fiserv, Inc.* | | | 533 | | | | 33,430 | |
Gartner, Inc.* | | | 340 | | | | 14,168 | |
Global Payments, Inc. | | | 258 | | | | 12,621 | |
International Business Machines Corp. | | | 5,370 | | | | 875,686 | |
Jack Henry & Associates, Inc. | | | 294 | | | | 9,964 | |
Lender Processing Services, Inc. | | | 488 | | | | 15,709 | |
Mantech International Corp. Class A* | | | 109 | | | | 4,622 | |
Mastercard, Inc. Class A | | | 438 | | | | 110,253 | |
MAXIMUS, Inc. | | | 109 | | | | 8,848 | |
NeuStar, Inc. Class A* | | | 277 | | | | 7,086 | |
Paychex, Inc. | | | 1,007 | | | | 31,580 | |
SAIC, Inc.* | | | 2,060 | | | | 34,855 | |
Sapient Corp.* | | | 492 | | | | 5,633 | |
SRA International, Inc. Class A* | | | 246 | | | | 6,977 | |
Syntel, Inc. | | | 186 | | | | 9,715 | |
TeleTech Holdings, Inc.* | | | 396 | | | | 7,674 | |
Teradata Corp.* | | | 426 | | | | 21,598 | |
Total System Services, Inc. | | | 1,278 | | | | 23,030 | |
Unisys Corp.* | | | 399 | | | | 12,457 | |
Visa, Inc. Class A | | | 2,307 | | | | 169,841 | |
Western Union Co. (The) | | | 2,964 | | | | 61,562 | |
Wright Express Corp.* | | | 109 | | | | 5,651 | |
| | | | | | | | |
| Total IT Services | | | | | | | 1,774,210 | |
| Leisure Equipment & Products – 0.1% | | | | | | | | |
Hasbro, Inc.(a) | | | 531 | | | | 24,872 | |
Mattel, Inc. | | | 1,464 | | | | 36,498 | |
Polaris Industries, Inc. | | | 101 | | | | 8,789 | |
| | | | | | | | |
| Total Leisure Equipment & Products | | | | | | | 70,159 | |
| Life Sciences Tools & Services – 0.4% | | | | | | | | |
Agilent Technologies, Inc.* | | | 834 | | | | 37,347 | |
Bio-Rad Laboratories, Inc. Class A* | | | 68 | | | | 8,170 | |
Bruker Corp.* | | | 716 | | | | 14,929 | |
Charles River Laboratories International, Inc.*(a) | | | 293 | | | | 11,245 | |
Covance, Inc.*(a) | | | 184 | | | | 10,068 | |
Dionex Corp.* | | | 41 | | | | 4,840 | |
Illumina, Inc.*(a) | | | 156 | | | | 10,931 | |
Life Technologies Corp.* | | | 370 | | | | 19,395 | |
Parexel International Corp.* | | | 345 | | | | 8,591 | |
PerkinElmer, Inc. | | | 459 | | | | 12,058 | |
Pharmaceutical Product Development, Inc. | | | 268 | | | | 7,426 | |
Techne Corp. | | | 203 | | | | 14,535 | |
Thermo Fisher Scientific, Inc.* | | | 1,111 | | | | 61,716 | |
See Notes to Financial Statements.
| | | | |
| WisdomTree Domestic and International Earnings Funds | | | 21 | |
Schedule of Investments (continued)
WisdomTree Total Earnings Fund (EXT)
March 31, 2011
| | | | | | | | |
| Investments | | Shares | | | Fair Value | |
| | | | | | | | |
Waters Corp.* | | | 278 | | | $ | 24,158 | |
| | | | | | | | |
| Total Life Sciences Tools & Services | | | | | | | 245,409 | |
| Machinery – 2.1% | | | | | | | | |
Actuant Corp. Class A | | | 362 | | | | 10,498 | |
AGCO Corp.* | | | 212 | | | | 11,654 | |
Astec Industries, Inc.* | | | 120 | | | | 4,475 | |
Barnes Group, Inc.(a) | | | 407 | | | | 8,498 | |
Bucyrus International, Inc. | | | 184 | | | | 16,827 | |
Caterpillar, Inc. | | | 1,409 | | | | 156,892 | |
Chart Industries, Inc.* | | | 32 | | | | 1,761 | |
CLARCOR, Inc. | | | 159 | | | | 7,144 | |
Crane Co. | | | 163 | | | | 7,894 | |
Cummins, Inc. | | | 513 | | | | 56,235 | |
Danaher Corp. | | | 2,108 | | | | 109,405 | |
Deere & Co. | | | 1,364 | | | | 132,158 | |
Donaldson Co., Inc. | | | 248 | | | | 15,200 | |
Dover Corp. | | | 653 | | | | 42,928 | |
Eaton Corp. | | | 1,140 | | | | 63,202 | |
EnPro Industries, Inc.* | | | 226 | | | | 8,208 | |
ESCO Technologies, Inc. | | | 90 | | | | 3,434 | |
Federal Signal Corp. | | | 391 | | | | 2,545 | |
Flowserve Corp. | | | 202 | | | | 26,018 | |
Gardner Denver, Inc. | | | 98 | | | | 7,647 | |
Graco, Inc. | | | 298 | | | | 13,556 | |
Harsco Corp. | | | 178 | | | | 6,282 | |
IDEX Corp. | | | 339 | | | | 14,797 | |
Illinois Tool Works, Inc. | | | 1,937 | | | | 104,056 | |
John Bean Technologies Corp. | | | 135 | | | | 2,596 | |
Joy Global, Inc. | | | 302 | | | | 29,841 | |
Kaydon Corp. | | | 133 | | | | 5,212 | |
Middleby Corp.* | | | 120 | | | | 11,186 | |
Mueller Industries, Inc. | | | 231 | | | | 8,459 | |
Navistar International Corp.* | | | 265 | | | | 18,373 | |
Nordson Corp. | | | 35 | | | | 4,027 | |
Oshkosh Corp.* | | | 1,343 | | | | 47,515 | |
PACCAR, Inc.(a) | | | 364 | | | | 19,055 | |
Pall Corp. | | | 320 | | | | 18,435 | |
Parker Hannifin Corp. | | | 414 | | | | 39,198 | |
Pentair, Inc. | | | 294 | | | | 11,110 | |
Robbins & Myers, Inc. | | | 250 | | | | 11,498 | |
Snap-On, Inc. | | | 255 | | | | 15,315 | |
SPX Corp. | | | 161 | | | | 12,782 | |
Timken Co. | | | 150 | | | | 7,845 | |
Toro Co. (The) | | | 185 | | | | 12,251 | |
Trinity Industries, Inc. | | | 414 | | | | 15,181 | |
Valmont Industries, Inc. | | | 109 | | | | 11,376 | |
Wabtec Corp. | | | 158 | | | | 10,717 | |
Watts Water Technologies, Inc. Class A | | | 161 | | | | 6,149 | |
| | | | | | | | |
| Total Machinery | | | | | | | 1,149,435 | |
| Marine – 0.1% | | | | | | | | |
Alexander & Baldwin, Inc.(a) | | | 166 | | | | 7,578 | |
International Shipholding Corp. | | | 303 | | | | 7,544 | |
| | | | | | | | |
| Investments | | Shares | | | Fair Value | |
| | | | | | | | |
Kirby Corp.*(a) | | | 251 | | | $ | 14,380 | |
| | | | | | | | |
| Total Marine | | | | | | | 29,502 | |
| Media – 3.1% | | | | | | | | |
Cablevision Systems Corp. Class A | | | 432 | | | | 14,952 | |
CBS Corp. Class B | | | 1,654 | | | | 41,416 | |
Cinemark Holdings, Inc. | | | 514 | | | | 9,946 | |
Comcast Corp. Class A | | | 8,398 | | | | 207,599 | |
DIRECTV Class A* | | | 2,445 | | | | 114,426 | |
Discovery Communications, Inc. Class C* | | | 986 | | | | 34,717 | |
DISH Network Corp. Class A* | | | 3,567 | | | | 86,892 | |
DreamWorks Animation SKG, Inc. Class A*(a) | | | 364 | | | | 10,166 | |
Gannett Co., Inc. | | | 1,938 | | | | 29,516 | |
Harte-Hanks, Inc. | | | 596 | | | | 7,092 | |
Interpublic Group of Cos., Inc. (The) | | | 1,345 | | | | 16,907 | |
John Wiley & Sons, Inc. Class A | | | 202 | | | | 10,270 | |
Madison Square Garden, Inc. Class A* | | | 105 | | | | 2,834 | |
McGraw-Hill Cos., Inc. (The) | | | 1,369 | | | | 53,939 | |
Meredith Corp.(a) | | | 338 | | | | 11,465 | |
Morningstar, Inc.(a) | | | 157 | | | | 9,166 | |
News Corp. Class A | | | 12,979 | | | | 227,911 | |
Omnicom Group, Inc. | | | 1,077 | | | | 52,838 | |
Regal Entertainment Group Class A(a) | | | 363 | | | | 4,900 | |
Scholastic Corp. | | | 211 | | | | 5,705 | |
Scripps Networks Interactive, Inc. Class A | | | 399 | | | | 19,986 | |
Sirius XM Radio, Inc.*(a) | | | 6,782 | | | | 11,258 | |
Time Warner Cable, Inc. | | | 1,178 | | | | 84,038 | |
Time Warner, Inc. | | | 4,593 | | | | 163,970 | |
Viacom, Inc. Class B | | | 2,860 | | | | 133,047 | |
Walt Disney Co. (The) | | | 6,281 | | | | 270,648 | |
Washington Post Co. (The) Class B(a) | | | 48 | | | | 21,003 | |
World Wrestling Entertainment, Inc. Class A(a) | | | 294 | | | | 3,696 | |
| | | | | | | | |
| Total Media | | | | | | | 1,660,303 | |
| Metals & Mining – 1.1% | | | | | | | | |
AK Steel Holding Corp. | | | 605 | | | | 9,547 | |
AMCOL International Corp. | | | 137 | | | | 4,929 | |
Cliffs Natural Resources, Inc. | | | 604 | | | | 59,361 | |
Compass Minerals International, Inc. | | | 100 | | | | 9,353 | |
Freeport-McMoRan Copper & Gold, Inc. | | | 4,124 | | | | 229,088 | |
Newmont Mining Corp. | | | 2,020 | | | | 110,252 | |
Noranda Aluminum Holding Corp.* | | | 595 | | | | 9,550 | |
Nucor Corp.(a) | | | 288 | | | | 13,254 | |
Reliance Steel & Aluminum Co. | | | 249 | | | | 14,387 | |
Southern Copper Corp. | | | 1,870 | | | | 75,305 | |
Steel Dynamics, Inc. | | | 431 | | | | 8,090 | |
Titanium Metals Corp.* | | | 587 | | | | 10,906 | |
Walter Energy, Inc. | | | 178 | | | | 24,107 | |
| | | | | | | | |
| Total Metals & Mining | | | | | | | 578,129 | |
| Multiline Retail – 0.8% | | | | | | | | |
Big Lots, Inc.* | | | 488 | | | | 21,194 | |
Dillard’s, Inc. Class A(a) | | | 245 | | | | 9,829 | |
Dollar General Corp.* | | | 890 | | | | 27,901 | |
Dollar Tree, Inc.* | | | 408 | | | | 22,652 | |
See Notes to Financial Statements.
| | |
| 22 | | WisdomTree Domestic and International Earnings Funds |
Schedule of Investments (continued)
WisdomTree Total Earnings Fund (EXT)
March 31, 2011
| | | | | | | | |
| Investments | | Shares | | | Fair Value | |
| | | | | | | | |
Family Dollar Stores, Inc. | | | 489 | | | $ | 25,095 | |
J.C. Penney Co., Inc. | | | 582 | | | | 20,900 | |
Kohl’s Corp. | | | 1,244 | | | | 65,982 | |
Macy’s, Inc. | | | 1,511 | | | | 36,657 | |
Nordstrom, Inc. | | | 800 | | | | 35,904 | |
Target Corp. | | | 2,968 | | | | 148,430 | |
| | | | | | | | |
| Total Multiline Retail | | | | | | | 414,544 | |
| Multi-Utilities – 1.3% | | | | | | | | |
Alliant Energy Corp. | | | 459 | | | | 17,869 | |
Ameren Corp. | | | 1,307 | | | | 36,687 | |
Avista Corp. | | | 231 | | | | 5,343 | |
CenterPoint Energy, Inc. | | | 1,762 | | | | 30,941 | |
CH Energy Group, Inc. | | | 212 | | | | 10,714 | |
CMS Energy Corp. | | | 1,172 | | | | 23,018 | |
Consolidated Edison, Inc. | | | 1,122 | | | | 56,908 | |
Dominion Resources, Inc. | | | 1,428 | | | | 63,832 | |
DTE Energy Co. | | | 894 | | | | 43,770 | |
Integrys Energy Group, Inc. | | | 223 | | | | 11,264 | |
MDU Resources Group, Inc. | | | 605 | | | | 13,897 | |
NiSource, Inc. | | | 1,027 | | | | 19,698 | |
NorthWestern Corp. | | | 182 | | | | 5,515 | |
NSTAR(a) | | | 550 | | | | 25,448 | |
OGE Energy Corp. | | | 440 | | | | 22,246 | |
PG&E Corp. | | | 1,511 | | | | 66,756 | |
Public Service Enterprise Group, Inc. | | | 3,274 | | | | 103,164 | |
SCANA Corp. | | | 670 | | | | 26,378 | |
Sempra Energy | | | 1,052 | | | | 56,282 | |
TECO Energy, Inc. | | | 690 | | | | 12,944 | |
Vectren Corp. | | | 274 | | | | 7,453 | |
Wisconsin Energy Corp. | | | 552 | | | | 16,836 | |
Xcel Energy, Inc. | | | 2,083 | | | | 49,763 | |
| | | | | | | | |
| Total Multi-Utilities | | | | | | | 726,726 | |
| Office Electronics – 0.1% | | | | | | | | |
Xerox Corp. | | | 3,257 | | | | 34,687 | |
Zebra Technologies Corp. Class A* | | | 293 | | | | 11,497 | |
| | | | | | | | |
| Total Office Electronics | | | | | | | 46,184 | |
| Oil, Gas & Consumable Fuels – 10.7% | | | | | | | | |
Alpha Natural Resources, Inc.*(a) | | | 128 | | | | 7,599 | |
Anadarko Petroleum Corp. | | | 812 | | | | 66,519 | |
Apache Corp. | | | 1,549 | | | | 202,795 | |
Arch Coal, Inc. | | | 393 | | | | 14,164 | |
Bill Barrett Corp.*(a) | | | 235 | | | | 9,379 | |
Cabot Oil & Gas Corp. | | | 143 | | | | 7,575 | |
Chesapeake Energy Corp. | | | 2,559 | | | | 85,778 | |
Chevron Corp. | | | 12,052 | | | | 1,294,746 | |
Cimarex Energy Co. | | | 355 | | | | 40,910 | |
Concho Resources, Inc.* | | | 205 | | | | 21,996 | |
ConocoPhillips | | | 6,529 | | | | 521,406 | |
Consol Energy, Inc. | | | 595 | | | | 31,910 | |
Contango Oil & Gas Co.* | | | 74 | | | | 4,680 | |
Continental Resources, Inc.*(a) | | | 282 | | | | 20,154 | |
CVR Energy, Inc.* | | | 105 | | | | 2,432 | |
| | | | | | | | |
| Investments | | Shares | | | Fair Value | |
| | | | | | | | |
Denbury Resources, Inc.* | | | 640 | | | $ | 15,616 | |
Devon Energy Corp. | | | 2,023 | | | | 185,651 | |
El Paso Corp. | | | 3,913 | | | | 70,434 | |
EOG Resources, Inc. | | | 77 | | | | 9,125 | |
EQT Corp. | | | 182 | | | | 9,082 | |
EXCO Resources, Inc. | | | 1,965 | | | | 40,597 | |
Exxon Mobil Corp. | | | 24,513 | | | | 2,062,279 | |
Forest Oil Corp.* | | | 367 | | | | 13,884 | |
Hess Corp. | | | 1,127 | | | | 96,032 | |
Holly Corp. | | | 78 | | | | 4,739 | |
Marathon Oil Corp. | | | 2,704 | | | | 144,150 | |
Murphy Oil Corp. | | | 799 | | | | 58,663 | |
Newfield Exploration Co.* | | | 494 | | | | 37,549 | |
Noble Energy, Inc. | | | 505 | | | | 48,808 | |
Occidental Petroleum Corp. | | | 2,794 | | | | 291,945 | |
Peabody Energy Corp. | | | 668 | | | | 48,069 | |
Petrohawk Energy Corp.* | | | 1,000 | | | | 24,540 | |
Pioneer Natural Resources Co. | | | 323 | | | | 32,920 | |
Plains Exploration & Production Co.* | | | 254 | | | | 9,202 | |
QEP Resources, Inc. | | | 558 | | | | 22,621 | |
Quicksilver Resources, Inc.* | | | 565 | | | | 8,085 | |
Range Resources Corp. | | | 110 | | | | 6,431 | |
Southern Union Co. | | | 694 | | | | 19,862 | |
Southwestern Energy Co.* | | | 1,074 | | | | 46,150 | |
Spectra Energy Corp. | | | 2,369 | | | | 64,389 | |
Sunoco, Inc. | | | 347 | | | | 15,820 | |
Valero Energy Corp. | | | 1,380 | | | | 41,152 | |
W&T Offshore, Inc.(a) | | | 577 | | | | 13,150 | |
Whiting Petroleum Corp.* | | | 214 | | | | 15,718 | |
World Fuel Services Corp. | | | 482 | | | | 19,574 | |
| | | | | | | | |
| Total Oil, Gas & Consumable Fuels | | | | | | | 5,808,280 | |
| Paper & Forest Products – 0.1% | | | | | | | | |
Buckeye Technologies, Inc. | | | 461 | | | | 12,553 | |
Clearwater Paper Corp.* | | | 77 | | | | 6,268 | |
International Paper Co. | | | 434 | | | | 13,098 | |
KapStone Paper and Packaging Corp.* | | | 387 | | | | 6,645 | |
PH Glatfelter Co. | | | 755 | | | | 10,056 | |
| | | | | �� | | | |
| Total Paper & Forest Products | | | | | | | 48,620 | |
| Personal Products – 0.2% | | | | | | | | |
Alberto-Culver Co. | | | 278 | | | | 10,361 | |
Avon Products, Inc. | | | 1,510 | | | | 40,830 | |
Estee Lauder Cos., Inc. (The) Class A | | | 508 | | | | 48,951 | |
Nu Skin Enterprises, Inc. Class A(a) | | | 276 | | | | 7,935 | |
| | | | | | | | |
| Total Personal Products | | | | | | | 108,077 | |
| Pharmaceuticals – 4.4% | | | | | | | | |
Abbott Laboratories | | | 6,098 | | | | 299,107 | |
Allergan, Inc. | | | 491 | | | | 34,871 | |
Bristol-Myers Squibb Co. | | | 7,506 | | | | 198,383 | |
Eli Lilly & Co. | | | 8,204 | | | | 288,535 | |
Endo Pharmaceuticals Holdings, Inc.* | | | 380 | | | | 14,501 | |
Forest Laboratories, Inc.* | | | 1,179 | | | | 38,082 | |
Impax Laboratories, Inc.* | | | 936 | | | | 23,821 | |
See Notes to Financial Statements.
| | | | |
| WisdomTree Domestic and International Earnings Funds | | | 23 | |
Schedule of Investments (continued)
WisdomTree Total Earnings Fund (EXT)
March 31, 2011
| | | | | | | | |
| Investments | | Shares | | | Fair Value | |
| | | | | | | | |
Johnson & Johnson | | | 12,090 | | | $ | 716,332 | |
Medicis Pharmaceutical Corp. Class A | | | 293 | | | | 9,388 | |
Merck & Co., Inc. | | | 5,178 | | | | 170,926 | |
Mylan, Inc.* | | | 936 | | | | 21,219 | |
Par Pharmaceutical Cos., Inc.* | | | 129 | | | | 4,009 | |
Perrigo Co.(a) | | | 217 | | | | 17,256 | |
Pfizer, Inc. | | | 24,887 | | | | 505,455 | |
Questcor Pharmaceuticals, Inc.*(a) | | | 217 | | | | 3,127 | |
Viropharma, Inc.* | | | 662 | | | | 13,174 | |
Watson Pharmaceuticals, Inc.* | | | 326 | | | | 18,259 | |
| | | | | | | | |
| Total Pharmaceuticals | | | | | | | 2,376,445 | |
| Professional Services – 0.2% | | | | | | | | |
Corporate Executive Board Co. (The) | | | 200 | | | | 8,074 | |
Dun & Bradstreet Corp. | | | 157 | | | | 12,598 | |
Equifax, Inc. | | | 477 | | | | 18,531 | |
FTI Consulting, Inc.* | | | 160 | | | | 6,133 | |
IHS, Inc. Class A* | | | 106 | | | | 9,407 | |
Insperity, Inc. | | | 177 | | | | 5,377 | |
Manpower, Inc. | | | 154 | | | | 9,684 | |
Robert Half International, Inc. | | | 254 | | | | 7,772 | |
Towers Watson & Co. Class A | | | 158 | | | | 8,763 | |
Verisk Analytics, Inc. Class A* | | | 302 | | | | 9,894 | |
| | | | | | | | |
| Total Professional Services | | | | | | | 96,233 | |
| Real Estate Investment Trusts (REITs) – 0.8% | | | | | | | | |
Alexander’s, Inc. | | | 16 | | | | 6,511 | |
Alexandria Real Estate Equities, Inc. | | | 88 | | | | 6,861 | |
AvalonBay Communities, Inc.(a) | | | 84 | | | | 10,087 | |
BioMed Realty Trust, Inc. | | | 341 | | | | 6,486 | |
Boston Properties, Inc.(a) | | | 169 | | | | 16,030 | |
BRE Properties, Inc. | | | 112 | | | | 5,284 | |
CommonWealth REIT* | | | 349 | | | | 9,064 | |
Digital Realty Trust, Inc.(a) | | | 186 | | | | 10,814 | |
Equity Lifestyle Properties, Inc. | | | 182 | | | | 10,492 | |
Equity One, Inc.(a) | | | 234 | | | | 4,392 | |
Essex Property Trust, Inc. | | | 14 | | | | 1,736 | |
Extra Space Storage, Inc. | | | 85 | | | | 1,760 | |
Federal Realty Investment Trust | | | 90 | | | | 7,340 | |
Getty Realty Corp. | | | 394 | | | | 9,015 | |
HCP, Inc. | | | 321 | | | | 12,179 | |
Health Care REIT, Inc. | | | 179 | | | | 9,387 | |
Hospitality Properties Trust | | | 450 | | | | 10,417 | |
Kimco Realty Corp. | | | 411 | | | | 7,538 | |
Liberty Property Trust(a) | | | 248 | | | | 8,159 | |
LTC Properties, Inc. | | | 325 | | | | 9,210 | |
Mack-Cali Realty Corp. | | | 178 | | | | 6,034 | |
National Health Investors, Inc. | | | 135 | | | | 6,469 | |
National Retail Properties, Inc.(a) | | | 315 | | | | 8,231 | |
Nationwide Health Properties, Inc. | | | 225 | | | | 9,569 | |
Omega Healthcare Investors, Inc. | | | 297 | | | | 6,635 | |
Plum Creek Timber Co., Inc.(a) | | | 297 | | | | 12,952 | |
Potlatch Corp. | | | 138 | | | | 5,548 | |
Public Storage | | | 269 | | | | 29,835 | |
Rayonier, Inc. | | | 284 | | | | 17,696 | |
| | | | | | | | |
| Investments | | Shares | | | Fair Value | |
| | | | | | | | |
Realty Income Corp.(a) | | | 206 | | | $ | 7,200 | |
Senior Housing Properties Trust | | | 350 | | | | 8,064 | |
Simon Property Group, Inc. | | | 348 | | | | 37,292 | |
SL Green Realty Corp. | | | 179 | | | | 13,461 | |
Ventas, Inc.(a) | | | 275 | | | | 14,932 | |
Vornado Realty Trust | | | 153 | | | | 13,388 | |
Weingarten Realty Investors(a) | | | 255 | | | | 6,390 | |
Weyerhaeuser Co. | | | 2,491 | | | | 61,279 | |
| | | | | | | | |
| Total Real Estate Investment Trusts (REITs) | | | | | | | 427,737 | |
| Real Estate Management & Development – 0.0% | | | | | | | | |
CB Richard Ellis Group, Inc. Class A* | | | 529 | | | | 14,124 | |
Forest City Enterprises, Inc. Class A*(a) | | | 478 | | | | 9,001 | |
Jones Lang LaSalle, Inc. | | | 59 | | | | 5,885 | |
| | | | | | | | |
| Total Real Estate Management & Development | | | | | | | 29,010 | |
| Road & Rail – 0.8% | | | | | | | | |
Amerco, Inc.* | | | 76 | | | | 7,372 | |
CSX Corp. | | | 1,392 | | | | 109,411 | |
Dollar Thrifty Automotive Group* | | | 162 | | | | 10,810 | |
Genesee & Wyoming, Inc. Class A* | | | 114 | | | | 6,635 | |
Heartland Express, Inc.(a) | | | 226 | | | | 3,969 | |
JB Hunt Transport Services, Inc. | | | 344 | | | | 15,624 | |
Kansas City Southern* | | | 131 | | | | 7,133 | |
Knight Transportation, Inc. | | | 184 | | | | 3,542 | |
Landstar System, Inc. | | | 142 | | | | 6,487 | |
Norfolk Southern Corp. | | | 1,337 | | | | 92,614 | |
Old Dominion Freight Line, Inc.* | | | 241 | | | | 8,457 | |
Union Pacific Corp. | | �� | 1,685 | | | | 165,686 | |
Werner Enterprises, Inc. | | | 188 | | | | 4,976 | |
| | | | | | | | |
| Total Road & Rail | | | | | | | 442,716 | |
| Semiconductors & Semiconductor Equipment – 3.4% | | | | | |
Altera Corp.(a) | | | 1,119 | | | | 49,258 | |
Amkor Technology, Inc.*(a) | | | 2,946 | | | | 19,856 | |
Analog Devices, Inc. | | | 1,193 | | | | 46,980 | |
Applied Materials, Inc. | | | 4,376 | | | | 68,353 | |
Atmel Corp.* | | | 929 | | | | 12,662 | |
Broadcom Corp. Class A* | | | 1,330 | | | | 52,375 | |
Brooks Automation, Inc.* | | | 1,151 | | | | 15,803 | |
Cirrus Logic, Inc.* | | | 602 | | | | 12,660 | |
Cree, Inc.* | | | 136 | | | | 6,278 | |
Cymer, Inc.* | | | 229 | | | | 12,957 | |
Diodes, Inc.* | | | 495 | | | | 16,860 | |
Entegris, Inc.* | | | 1,775 | | | | 15,567 | |
Entropic Communications, Inc.*(a) | | | 509 | | | | 4,301 | |
Fairchild Semiconductor International, Inc.* | | | 538 | | | | 9,792 | |
First Solar, Inc.*(a) | | | 301 | | | | 48,413 | |
GT Solar International, Inc.* | | | 1,603 | | | | 17,088 | |
Hittite Microwave Corp.* | | | 78 | | | | 4,974 | |
Intel Corp. | | | 33,048 | | | | 666,578 | |
International Rectifier Corp.* | | | 266 | | | | 8,794 | |
KLA-Tencor Corp. | | | 548 | | | | 25,959 | |
Kulicke & Soffa Industries, Inc.* | | | 1,411 | | | | 13,193 | |
Lam Research Corp.* | | | 637 | | | | 36,092 | |
See Notes to Financial Statements.
| | |
| 24 | | WisdomTree Domestic and International Earnings Funds |
Schedule of Investments (continued)
WisdomTree Total Earnings Fund (EXT)
March 31, 2011
| | | | | | | | |
| Investments | | Shares | | | Fair Value | |
| | | | | | | | |
Linear Technology Corp.(a) | | | 762 | | | $ | 25,626 | |
LSI Corp.* | | | 1,186 | | | | 8,065 | |
Maxim Integrated Products, Inc. | | | 839 | | | | 21,478 | |
Microchip Technology, Inc.(a) | | | 633 | | | | 24,060 | |
Micron Technology, Inc.* | | | 14,445 | | | | 165,540 | |
MKS Instruments, Inc. | | | 341 | | | | 11,355 | |
National Semiconductor Corp. | | | 1,269 | | | | 18,197 | |
Novellus Systems, Inc.* | | | 459 | | | | 17,043 | |
NVIDIA Corp.* | | | 950 | | | | 17,537 | |
ON Semiconductor Corp.* | | | 2,027 | | | | 20,006 | |
RF Micro Devices, Inc.* | | | 982 | | | | 6,295 | |
Silicon Laboratories, Inc.* | | | 146 | | | | 6,309 | |
Skyworks Solutions, Inc.* | | | 416 | | | | 13,487 | |
Spansion, Inc. Class A* | | | 961 | | | | 17,942 | |
SunPower Corp. Class A*(a) | | | 112 | | | | 1,920 | |
Teradyne, Inc.* | | | 1,613 | | | | 28,728 | |
Tessera Technologies, Inc.* | | | 362 | | | | 6,610 | |
Texas Instruments, Inc. | | | 5,553 | | | | 191,912 | |
TriQuint Semiconductor, Inc.*(a) | | | 653 | | | | 8,430 | |
Varian Semiconductor Equipment Associates, Inc.* | | | 284 | | | | 13,822 | |
Veeco Instruments, Inc.* | | | 275 | | | | 13,981 | |
Xilinx, Inc. | | | 1,589 | | | | 52,119 | |
| | | | | | | | |
| Total Semiconductors & Semiconductor Equipment | | | | | | | 1,855,255 | |
| Software – 3.7% | | | | | | | | |
Activision Blizzard, Inc. | | | 1,857 | | | | 20,371 | |
Adobe Systems, Inc.* | | | 1,147 | | | | 38,035 | |
ANSYS, Inc.* | | | 204 | | | | 11,055 | |
Autodesk, Inc.* | | | 321 | | | | 14,159 | |
BMC Software, Inc.* | | | 584 | | | | 29,048 | |
CA, Inc. | | | 2,000 | | | | 48,360 | |
Cadence Design Systems, Inc.* | | | 1,294 | | | | 12,616 | |
Citrix Systems, Inc.* | | | 346 | | | | 25,417 | |
Compuware Corp.* | | | 1,102 | | | | 12,728 | |
Factset Research Systems, Inc. | | | 156 | | | | 16,338 | |
Fair Isaac Corp. | | | 298 | | | | 9,420 | |
Informatica Corp.* | | | 274 | | | | 14,311 | |
Intuit, Inc.* | | | 692 | | | | 36,745 | |
MICROS Systems, Inc.* | | | 158 | | | | 7,810 | |
Microsoft Corp. | | | 45,182 | | | | 1,145,816 | |
MicroStrategy, Inc. Class A* | | | 98 | | | | 13,179 | |
Oracle Corp. | | | 12,877 | | | | 429,705 | |
Progress Software Corp.* | | | 276 | | | | 8,029 | |
Quest Software, Inc.* | | | 189 | | | | 4,799 | |
Red Hat, Inc.* | | | 122 | | | | 5,538 | |
Rovi Corp.* | | | 124 | | | | 6,653 | |
S1 Corp.* | | | 1,464 | | | | 9,780 | |
Salesforce.com, Inc.* | | | 33 | | | | 4,408 | |
Symantec Corp.* | | | 2,711 | | | | 50,262 | |
Synopsys, Inc.* | | | 530 | | | | 14,654 | |
TeleCommunication Systems, Inc. Class A* | | | 1,033 | | | | 4,256 | |
TIBCO Software, Inc.* | | | 195 | | | | 5,314 | |
Tyler Technologies, Inc.* | | | 71 | | | | 1,683 | |
| | | | | | | | |
| Investments | | Shares | | | Fair Value | |
| | | | | | | | |
VMware, Inc. Class A* | | | 211 | | | $ | 17,205 | |
| | | | | | | | |
| Total Software | | | | | | | 2,017,694 | |
| Specialty Retail – 2.3% | | | | | | | | |
Aaron’s, Inc. | | | 265 | | | | 6,720 | |
Abercrombie & Fitch Co. Class A | | | 136 | | | | 7,983 | |
Advance Auto Parts, Inc. | | | 297 | | | | 19,489 | |
Aeropostale, Inc.* | | | 580 | | | | 14,106 | |
American Eagle Outfitters, Inc. | | | 638 | | | | 10,138 | |
Ascena Retail Group, Inc.* | | | 390 | | | | 12,640 | |
AutoNation, Inc.*(a) | | | 616 | | | | 21,788 | |
AutoZone, Inc.* | | | 181 | | | | 49,514 | |
Bed Bath & Beyond, Inc.* | | | 1,058 | | | | 51,070 | |
Best Buy Co., Inc. | | | 2,531 | | | | 72,690 | |
Buckle, Inc. (The)(a) | | | 248 | | | | 10,019 | |
Cabela’s, Inc.* | | | 174 | | | | 4,352 | |
CarMax, Inc.* | | | 596 | | | | 19,132 | |
Cato Corp. (The) Class A | | | 122 | | | | 2,989 | |
Chico’s FAS, Inc. | | | 669 | | | | 9,968 | |
Childrens Place Retail Stores, Inc. (The)* | | | 155 | | | | 7,724 | |
Collective Brands, Inc.* | | | 317 | | | | 6,841 | |
Dick’s Sporting Goods, Inc.* | | | 457 | | | | 18,271 | |
DSW, Inc. Class A*(a) | | | 189 | | | | 7,552 | |
Express, Inc. | | | 531 | | | | 10,376 | |
Foot Locker, Inc. | | | 458 | | | | 9,032 | |
GameStop Corp. Class A*(a) | | | 1,445 | | | | 32,541 | |
Gap, Inc. (The) | | | 3,840 | | | | 87,014 | |
Group 1 Automotive, Inc. | | | 55 | | | | 2,354 | |
Guess ?, Inc. | | | 415 | | | | 16,330 | |
Home Depot, Inc. | | | 5,664 | | | | 209,908 | |
JOS A Bank Clothiers, Inc.*(a) | | | 180 | | | | 9,158 | |
Lowe’s Cos., Inc. | | | 4,783 | | | | 126,415 | |
Ltd. Brands, Inc. | | | 1,372 | | | | 45,111 | |
Men’s Wearhouse, Inc. (The) | | | 278 | | | | 7,523 | |
O’Reilly Automotive, Inc.* | | | 383 | | | | 22,007 | |
Penske Automotive Group, Inc.* | | | 687 | | | | 13,754 | |
PetSmart, Inc. | | | 463 | | | | 18,960 | |
Pier 1 Imports, Inc.*(a) | | | 657 | | | | 6,669 | |
RadioShack Corp. | | | 870 | | | | 13,059 | |
Rent-A-Center, Inc. | | | 373 | | | | 13,021 | |
Ross Stores, Inc. | | | 526 | | | | 37,409 | |
Sally Beauty Holdings, Inc.* | | | 785 | | | | 10,998 | |
Select Comfort Corp.* | | | 689 | | | | 8,309 | |
Staples, Inc. | | | 2,609 | | | | 50,667 | |
Systemax, Inc.* | | | 364 | | | | 4,921 | |
Tiffany & Co.(a) | | | 304 | | | | 18,678 | |
TJX Cos., Inc. | | | 1,978 | | | | 98,366 | |
Tractor Supply Co. | | | 232 | | | | 13,887 | |
Urban Outfitters, Inc.* | | | 432 | | | | 12,887 | |
Williams-Sonoma, Inc. | | | 306 | | | | 12,393 | |
| | | | | | | | |
| Total Specialty Retail | | | | | | | 1,264,733 | |
| Textiles, Apparel & Luxury Goods – 0.7% | | | | | | | | |
Carter’s, Inc.* | | | 228 | | | | 6,528 | |
Coach, Inc. | | | 837 | | | | 43,558 | |
See Notes to Financial Statements.
| | | | |
| WisdomTree Domestic and International Earnings Funds | | | 25 | |
Schedule of Investments (concluded)
WisdomTree Total Earnings Fund (EXT)
March 31, 2011
| | | | | | | | |
| Investments | | Shares | | | Fair Value | |
| | | | | | | | |
Columbia Sportswear Co.(a) | | | 160 | | | $ | 9,507 | |
Deckers Outdoor Corp.* | | | 195 | | | | 16,799 | |
Fossil, Inc.* | | | 202 | | | | 18,917 | |
Hanesbrands, Inc.* | | | 482 | | | | 13,033 | |
Iconix Brand Group, Inc.* | | | 369 | | | | 7,926 | |
Maidenform Brands, Inc.* | | | 151 | | | | 4,314 | |
NIKE, Inc. Class B | | | 1,360 | | | | 102,952 | |
Polo Ralph Lauren Corp. | | | 302 | | | | 37,342 | |
Skechers U.S.A., Inc. Class A*(a) | | | 472 | | | | 9,695 | |
Timberland Co. (The) Class A* | | | 275 | | | | 11,355 | |
Under Armour, Inc. Class A*(a) | | | 132 | | | | 8,983 | |
VF Corp.(a) | | | 479 | | | | 47,196 | |
Warnaco Group, Inc. (The)* | | | 211 | | | | 12,067 | |
Wolverine World Wide, Inc. | | | 223 | | | | 8,313 | |
| | | | | | | | |
| Total Textiles, Apparel & Luxury Goods | | | | | | | 358,485 | |
| Thrifts & Mortgage Finance – 0.2% | | | | | | | | |
Astoria Financial Corp. | | | 249 | | | | 3,578 | |
Capitol Federal Financial, Inc. | | | 216 | | | | 2,434 | |
Dime Community Bancshares, Inc.(a) | | | 163 | | | | 2,406 | |
First Niagara Financial Group, Inc.(a) | | | 319 | | | | 4,332 | |
Flushing Financial Corp. | | | 223 | | | | 3,323 | |
Hudson City Bancorp, Inc. | | | 3,018 | | | | 29,214 | |
New York Community Bancorp, Inc.(a) | | | 1,921 | | | | 33,156 | |
NewAlliance Bancshares, Inc. | | | 758 | | | | 11,249 | |
Northwest Bancshares, Inc. | | | 392 | | | | 4,916 | |
People’s United Financial, Inc. | | | 541 | | | | 6,806 | |
TFS Financial Corp.(a) | | | 299 | | | | 3,175 | |
Washington Federal, Inc. | | | 211 | | | | 3,659 | |
| | | | | | | | |
| Total Thrifts & Mortgage Finance | | | | | | | 108,248 | |
| Tobacco – 1.7% | | | | | | | | |
Alliance One International, Inc.* | | | 2,012 | | | | 8,088 | |
Altria Group, Inc. | | | 9,297 | | | | 242,001 | |
Lorillard, Inc. | | | 756 | | | | 71,828 | |
Philip Morris International, Inc. | | | 7,365 | | | | 483,365 | |
Reynolds American, Inc. | | | 2,470 | | | | 87,759 | |
Universal Corp. | | | 365 | | | | 15,892 | |
Vector Group Ltd.(a) | | | 317 | | | | 5,481 | |
| | | | | | | | |
| Total Tobacco | | | | | | | 914,414 | |
| Trading Companies & Distributors – 0.2% | | | | | | | | |
Applied Industrial Technologies, Inc. | | | 269 | | | | 8,947 | |
Beacon Roofing Supply, Inc.* | | | 103 | | | | 2,108 | |
Fastenal Co.(a) | | | 367 | | | | 23,793 | |
GATX Corp.(a) | | | 321 | | | | 12,410 | |
Interline Brands, Inc.* | | | 294 | | | | 5,998 | |
MSC Industrial Direct Co. Class A | | | 131 | | | | 8,970 | |
TAL International Group, Inc. | | | 250 | | | | 9,067 | |
W.W. Grainger, Inc. | | | 213 | | | | 29,326 | |
Watsco, Inc. | | | 109 | | | | 7,598 | |
WESCO International, Inc.* | | | 119 | | | | 7,437 | |
| | | | | | | | |
| Total Trading Companies & Distributors | | | | | | | 115,654 | |
| Water Utilities – 0.1% | | | | | | | | |
American States Water Co. | | | 256 | | | | 9,180 | |
| | | | | | | | |
| Investments | | Shares | | | Fair Value | |
| | | | | | | | |
American Water Works Co., Inc. | | | 712 | | | $ | 19,972 | |
Aqua America, Inc. | | | 273 | | | | 6,249 | |
| | | | | | | | |
| Total Water Utilities | | | | | | | 35,401 | |
| Wireless Telecommunication Services – 0.2% | | | | | | | | |
American Tower Corp. Class A* | | | 556 | | | | 28,812 | |
MetroPCS Communications, Inc.* | | | 1,691 | | | | 27,462 | |
NII Holdings, Inc.* | | | 405 | | | | 16,876 | |
Telephone & Data Systems, Inc. | | | 298 | | | | 10,043 | |
United States Cellular Corp.* | | | 192 | | | | 9,886 | |
USA Mobility, Inc. | | | 194 | | | | 2,811 | |
| | | | | | | | |
| Total Wireless Telecommunication Services | | | | | | | 95,890 | |
TOTAL COMMON STOCKS
(Cost: $48,623,005) | | | | | | | 53,723,987 | |
| EXCHANGE-TRADED FUND – 0.7% | | | | | | | | |
WisdomTree LargeCap Growth Fund(b)
(Cost: $381,810) | | | 10,045 | | | | 392,157 | |
| SHORT-TERM INVESTMENT – 0.1% | | | | | | | | |
| MONEY MARKET FUND – 0.1% | | | | | | | | |
| Invesco Treasury Fund Private Class, 0.02%(c) (Cost: $26,624) | | | 26,624 | | | | 26,624 | |
| INVESTMENT OF CASH COLLATERAL FOR SECURITIES LOANED – 4.5% | | | | | | | | |
| MONEY MARKET FUND – 4.5% | | | | | | | | |
Dreyfus Institutional Preferred Money Market Fund, 0.19%(d) | | | | | | | | |
| (Cost: $2,452,000)(e) | | | 2,452,000 | | | | 2,452,000 | |
| TOTAL INVESTMENTS IN SECURITIES – 104.4% (Cost: $51,483,439) | | | | | | | 56,594,768 | |
Liabilities in Excess of Other Assets – (4.4)% | | | | | | | (2,401,585 | ) |
| | | | | | | | |
| NET ASSETS – 100.0% | | | | | | $ | 54,193,183 | |
| * | Non-income producing security. |
| (a) | Security, or portion thereof, was on loan at March 31, 2011 (See Note 2). |
| (b) | Affiliated companies (See Note 7). |
| (c) | Rate shown represents annualized 7-day yield as of March 31, 2011. |
| (d) | Interest rate shown reflects yield as of March 31, 2011. |
| (e) | At March 31, 2011, the total market value of the Fund’s securities on loan was $2,392,238 and the total market value of the collateral held by the Fund was $2,452,000. |
See Notes to Financial Statements.
| | |
| 26 | | WisdomTree Domestic and International Earnings Funds |
Schedule of Investments
WisdomTree Earnings 500 Fund (EPS)
March 31, 2011
| | | | | | | | |
| Investments | | Shares | | | Fair Value | |
| | | | | | | | |
| COMMON STOCKS – 99.3% | | | | | | | | |
| Aerospace & Defense – 3.0% | | | | | | | | |
Boeing Co. (The) | | | 3,867 | | | $ | 285,887 | |
General Dynamics Corp. | | | 2,911 | | | | 222,866 | |
Goodrich Corp.(a) | | | 552 | | | | 47,213 | |
Honeywell International, Inc. | | | 2,812 | | | | 167,905 | |
Huntington Ingalls Industries, Inc.* | | | 405 | | | | 16,807 | |
ITT Corp. | | | 861 | | | | 51,703 | |
L-3 Communications Holdings, Inc. | | | 1,092 | | | | 85,515 | |
Lockheed Martin Corp. | | | 2,930 | | | | 235,572 | |
Northrop Grumman Corp. | | | 2,434 | | | | 152,636 | |
Precision Castparts Corp. | | | 571 | | | | 84,040 | |
Raytheon Co. | | | 3,236 | | | | 164,615 | |
Rockwell Collins, Inc. | | | 740 | | | | 47,974 | |
United Technologies Corp. | | | 4,356 | | | | 368,735 | |
| | | | | | | | |
| Total Aerospace & Defense | | | | | | | 1,931,468 | |
| Air Freight & Logistics – 0.6% | | | | | | | | |
C.H. Robinson Worldwide, Inc.(a) | | | 417 | | | | 30,912 | |
Expeditors International of Washington, Inc. | | | 504 | | | | 25,271 | |
FedEx Corp. | | | 713 | | | | 66,701 | |
United Parcel Service, Inc. Class B | | | 3,320 | | | | 246,742 | |
| | | | | | | | |
| Total Air Freight & Logistics | | | | | | | 369,626 | |
| Airlines – 0.2% | | | | | | | | |
Delta Air Lines, Inc.* | | | 4,313 | | | | 42,268 | |
Southwest Airlines Co. | | | 2,754 | | | | 34,783 | |
United Continental Holdings, Inc.* | | | 1,064 | | | | 24,461 | |
| | | | | | | | |
| Total Airlines | | | | | | | 101,512 | |
| Auto Components – 0.4% | | | | | | | | |
BorgWarner, Inc.*(a) | | | 330 | | | | 26,298 | |
Johnson Controls, Inc. | | | 3,020 | | | | 125,541 | |
Lear Corp.* | | | 1,338 | | | | 65,388 | |
TRW Automotive Holdings Corp.* | | | 1,159 | | | | 63,838 | |
| | | | | | | | |
| Total Auto Components | | | | | | | 281,065 | |
| Automobiles – 0.8% | | | | | | | | |
Ford Motor Co.* | | | 33,766 | | | | 503,451 | |
Harley-Davidson, Inc. | | | 477 | | | | 20,268 | |
| | | | | | | | |
| Total Automobiles | | | | | | | 523,719 | |
| Beverages – 2.1% | | | | | | | | |
Brown-Forman Corp. Class B | | | 538 | | | | 36,745 | |
Coca-Cola Co. (The) | | | 9,809 | | | | 650,827 | |
Coca-Cola Enterprises, Inc. | | | 1,059 | | | | 28,911 | |
Constellation Brands, Inc. Class A* | | | 744 | | | | 15,088 | |
Dr. Pepper Snapple Group, Inc.(a) | | | 1,240 | | | | 46,078 | |
Hansen Natural Corp.* | | | 405 | | | | 24,393 | |
Molson Coors Brewing Co. Class B | | | 1,113 | | | | 52,189 | |
PepsiCo, Inc. | | | 7,214 | | | | 464,654 | |
| | | | | | | | |
| Total Beverages | | | | | | | 1,318,885 | |
| Biotechnology – 1.4% | | | | | | | | |
Alexion Pharmaceuticals, Inc.* | | | 300 | | | | 29,604 | |
Amgen, Inc.* | | | 6,788 | | | | 362,819 | |
Biogen Idec, Inc.* | | | 1,381 | | | | 101,351 | |
| | | | | | | | |
| Investments | | Shares | | | Fair Value | |
| | | | | | | | |
Celgene Corp.* | | | 1,307 | | | $ | 75,192 | |
Cephalon, Inc.*(a) | | | 546 | | | | 41,376 | |
Gilead Sciences, Inc.* | | | 6,845 | | | | 290,502 | |
| | | | | | | | |
| Total Biotechnology | | | | | | | 900,844 | |
| Capital Markets – 3.4% | | | | | | | | |
Affiliated Managers Group, Inc.* | | | 67 | | | | 7,328 | |
Ameriprise Financial, Inc. | | | 1,587 | | | | 96,934 | |
Bank of New York Mellon Corp. (The) | | | 7,378 | | | | 220,381 | |
BlackRock, Inc. | | | 749 | | | | 150,556 | |
Charles Schwab Corp. (The) | | | 3,185 | | | | 57,425 | |
Franklin Resources, Inc. | | | 1,053 | | | | 131,709 | |
Goldman Sachs Group, Inc. (The) | | | 5,500 | | | | 871,585 | |
Jefferies Group, Inc.(a) | | | 623 | | | | 15,538 | |
Legg Mason, Inc.(a) | | | 488 | | | | 17,612 | |
Morgan Stanley | | | 7,966 | | | | 217,631 | |
Northern Trust Corp. | | | 1,112 | | | | 56,434 | |
SEI Investments Co. | | | 827 | | | | 19,749 | |
State Street Corp. | | | 3,653 | | | | 164,166 | |
T. Rowe Price Group, Inc. | | | 836 | | | | 55,527 | |
TD Ameritrade Holding Corp. | | | 2,729 | | | | 56,954 | |
| | | | | | | | |
| Total Capital Markets | | | | | | | 2,139,529 | |
| Chemicals – 2.0% | | | | | | | | |
Air Products & Chemicals, Inc. | | | 918 | | | | 82,785 | |
Airgas, Inc. | | | 324 | | | | 21,520 | |
Albemarle Corp. | | | 408 | | | | 24,386 | |
Celanese Corp. | | | 701 | | | | 31,103 | |
CF Industries Holdings, Inc. | | | 142 | | | | 19,424 | |
Dow Chemical Co. (The) | | | 3,488 | | | | 131,672 | |
E.I. Du Pont de Nemours & Co. | | | 4,425 | | | | 243,242 | |
Eastman Chemical Co. | | | 361 | | | | 35,855 | |
Ecolab, Inc. | | | 826 | | | | 42,143 | |
FMC Corp.(a) | | | 359 | | | | 30,490 | |
International Flavors & Fragrances, Inc. | | | 422 | | | | 26,291 | |
Lubrizol Corp. | | | 534 | | | | 71,535 | |
Monsanto Co. | | | 1,450 | | | | 104,777 | |
Mosaic Co. (The) | | | 1,278 | | | | 100,642 | |
Nalco Holding Co. | | | 400 | | | | 10,924 | |
PPG Industries, Inc. | | | 741 | | | | 70,551 | |
Praxair, Inc. | | | 1,272 | | | | 129,235 | |
Sherwin-Williams Co. (The) | | | 502 | | | | 42,163 | |
Sigma-Aldrich Corp. | | | 514 | | | | 32,711 | |
| | | | | | | | |
| Total Chemicals | | | | | | | 1,251,449 | |
| Commercial Banks – 2.6% | | | | | | | | |
BB&T Corp.(a) | | | 2,530 | | | | 69,449 | |
CIT Group, Inc.* | | | 6,869 | | | | 292,276 | |
M&T Bank Corp. | | | 592 | | | | 52,374 | |
PNC Financial Services Group, Inc. | | | 2,958 | | | | 186,324 | |
U.S. Bancorp | | | 9,399 | | | | 248,416 | |
Wells Fargo & Co. | | | 24,860 | | | | 788,062 | |
| | | | | | | | |
| Total Commercial Banks | | | | | | | 1,636,901 | |
| Commercial Services & Supplies – 0.3% | | | | | | | | |
Avery Dennison Corp. | | | 440 | | | | 18,462 | |
See Notes to Financial Statements.
| | | | |
| WisdomTree Domestic and International Earnings Funds | | | 27 | |
Schedule of Investments (continued)
WisdomTree Earnings 500 Fund (EPS)
March 31, 2011
| | | | | | | | |
| Investments | | Shares | | | Fair Value | |
| | | | | | | | |
Iron Mountain, Inc. | | | 747 | | | $ | 23,329 | |
Pitney Bowes, Inc.(a) | | | 1,203 | | | | 30,905 | |
Republic Services, Inc. | | | 1,145 | | | | 34,396 | |
Stericycle, Inc.* | | | 235 | | | | 20,838 | |
Waste Management, Inc. | | | 2,227 | | | | 83,156 | |
| | | | | | | | |
| Total Commercial Services & Supplies | | | | | | | 211,086 | |
| Communications Equipment – 1.6% | | | | | | | | |
Cisco Systems, Inc. | | | 33,735 | | | | 578,555 | |
F5 Networks, Inc.* | | | 110 | | | | 11,283 | |
Harris Corp. | | | 1,085 | | | | 53,816 | |
Juniper Networks, Inc.* | | | 1,271 | | | | 53,484 | |
QUALCOMM, Inc. | | | 5,276 | | | | 289,283 | |
Riverbed Technology, Inc.* | | | 52 | | | | 1,958 | |
| | | | | | | | |
| Total Communications Equipment | | | | | | | 988,379 | |
| Computers & Peripherals – 4.1% | | | | | | | | |
Apple, Inc.* | | | 3,682 | | | | 1,282,993 | |
Dell, Inc.* | | | 13,305 | | | | 193,055 | |
EMC Corp.*(a) | | | 6,305 | | | | 167,398 | |
Hewlett-Packard Co. | | | 17,972 | | | | 736,313 | |
NetApp, Inc.* | | | 931 | | | | 44,856 | |
SanDisk Corp.* | | | 1,926 | | | | 88,769 | |
Western Digital Corp.* | | | 3,249 | | | | 121,155 | |
| | | | | | | | |
| Total Computers & Peripherals | | | | | | | 2,634,539 | |
| Construction & Engineering – 0.2% | | | | | | | | |
Fluor Corp. | | | 642 | | | | 47,290 | |
Jacobs Engineering Group, Inc.* | | | 608 | | | | 31,269 | |
KBR, Inc. | | | 983 | | | | 37,128 | |
| | | | | | | | |
| Total Construction & Engineering | | | | | | | 115,687 | |
| Consumer Finance – 1.0% | | | | | | | | |
American Express Co. | | | 5,554 | | | | 251,041 | |
Capital One Financial Corp. | | | 5,503 | | | | 285,936 | |
Discover Financial Services | | | 1,514 | | | | 36,517 | |
SLM Corp.* | | | 5,436 | | | | 83,171 | |
| | | | | | | | |
| Total Consumer Finance | | | | | | | 656,665 | |
| Containers & Packaging – 0.1% | | | | | | | | |
Ball Corp. | | | 1,327 | | | | 47,573 | |
Crown Holdings, Inc.* | | | 871 | | | | 33,603 | |
Owens-Illinois, Inc.* | | | 374 | | | | 11,291 | |
| | | | | | | | |
| Total Containers & Packaging | | | | | | | 92,467 | |
| Distributors – 0.1% | | | | | | | | |
Genuine Parts Co. | | | 752 | | | | 40,337 | |
| Diversified Consumer Services – 0.1% | | | | | | | | |
Apollo Group, Inc. Class A* | | | 1,778 | | | | 74,160 | |
| Diversified Financial Services – 3.1% | | | | | | | | |
Bank of America Corp. | | | 18,167 | | | | 242,166 | |
Citigroup, Inc.* | | | 12,932 | | | | 57,159 | |
CME Group, Inc. | | | 270 | | | | 81,419 | |
IntercontinentalExchange, Inc.* | | | 300 | | | | 37,062 | |
JPMorgan Chase & Co. | | | 29,921 | | | | 1,379,358 | |
Leucadia National Corp. | | | 434 | | | | 16,292 | |
Moody’s Corp. | | | 1,597 | | | | 54,154 | |
| | | | | | | | |
| Investments | | Shares | | | Fair Value | |
| | | | | | | | |
MSCI, Inc. Class A* | | | 226 | | | $ | 8,321 | |
NASDAQ OMX Group, Inc. (The)* | | | 1,395 | | | | 36,047 | |
NYSE Euronext | | | 1,674 | | | | 58,875 | |
| | | | | | | | |
| Total Diversified Financial Services | | | | | | | 1,970,853 | |
| Diversified Telecommunication Services – 3.2% | | | | | | | | |
AT&T, Inc. | | | 56,755 | | | | 1,736,703 | |
CenturyLink, Inc.(a) | | | 1,743 | | | | 72,422 | |
Frontier Communications Corp.(a) | | | 1,133 | | | | 9,313 | |
Qwest Communications International, Inc. | | | 1,444 | | | | 9,863 | |
Verizon Communications, Inc. | | | 4,511 | | | | 173,854 | |
Windstream Corp.(a) | | | 1,935 | | | | 24,903 | |
| | | | | | | | |
| Total Diversified Telecommunication Services | | | | | | | 2,027,058 | |
| Electric Utilities – 2.0% | | | | | | | | |
American Electric Power Co., Inc. | | | 2,949 | | | | 103,628 | |
Duke Energy Corp. | | | 7,148 | | | | 129,736 | |
Edison International | | | 2,831 | | | | 103,586 | |
Entergy Corp. | | | 1,557 | | | | 104,646 | |
Exelon Corp. | | | 5,483 | | | | 226,119 | |
FirstEnergy Corp.(a) | | | 1,817 | | | | 67,392 | |
NextEra Energy, Inc. | | | 3,098 | | | | 170,762 | |
Northeast Utilities | | | 976 | | | | 33,770 | |
Pepco Holdings, Inc. | | | 1,223 | | | | 22,809 | |
Pinnacle West Capital Corp. | | | 501 | | | | 21,438 | |
PPL Corp. | | | 2,391 | | | | 60,492 | |
Progress Energy, Inc. | | | 1,720 | | | | 79,361 | |
Southern Co. | | | 4,469 | | | | 170,314 | |
| | | | | | | | |
| Total Electric Utilities | | | | | | | 1,294,053 | |
| Electrical Equipment – 0.4% | | | | | | | | |
AMETEK, Inc. | | | 569 | | | | 24,962 | |
Emerson Electric Co. | | | 2,789 | | | | 162,961 | |
Rockwell Automation, Inc.(a) | | | 421 | | | | 39,848 | |
Roper Industries, Inc. | | | 331 | | | | 28,618 | |
| | | | | | | | |
| Total Electrical Equipment | | | | | | | 256,389 | |
Electronic Equipment, Instruments &
Components – 0.7% | | | | | | | | |
Amphenol Corp. Class A | | | 754 | | | | 41,010 | |
Avnet, Inc.* | | | 1,091 | | | | 37,192 | |
Corning, Inc. | | | 14,566 | | | | 300,497 | |
Dolby Laboratories, Inc. Class A*(a) | | | 378 | | | | 18,601 | |
FLIR Systems, Inc. | | | 851 | | | | 29,453 | |
Trimble Navigation Ltd.* | | | 111 | | | | 5,610 | |
| | | | | | | | |
| Total Electronic Equipment, Instruments & Components | | | | | | | 432,363 | |
| Energy Equipment & Services – 1.0% | | | | | | | | |
Baker Hughes, Inc. | | | 880 | | | | 64,618 | |
Cameron International Corp.* | | | 889 | | | | 50,762 | |
Diamond Offshore Drilling, Inc.(a) | | | 1,301 | | | | 101,088 | |
FMC Technologies, Inc.* | | | 379 | | | | 35,808 | |
Halliburton Co. | | | 3,018 | | | | 150,417 | |
Helmerich & Payne, Inc. | | | 521 | | | | 35,788 | |
National Oilwell Varco, Inc. | | | 2,211 | | | | 175,266 | |
See Notes to Financial Statements.
| | |
| 28 | | WisdomTree Domestic and International Earnings Funds |
Schedule of Investments (continued)
WisdomTree Earnings 500 Fund (EPS)
March 31, 2011
| | | | | | | | |
| Investments | | Shares | | | Fair Value | |
| | | | | | | | |
Pride International, Inc.* | | | 613 | | | $ | 26,328 | |
| | | | | | | | |
| Total Energy Equipment & Services | | | | | | | 640,075 | |
| Food & Staples Retailing – 3.3% | | | | | | | | |
Costco Wholesale Corp. | | | 1,557 | | | | 114,159 | |
CVS Caremark Corp. | | | 8,749 | | | | 300,266 | |
Kroger Co. (The) | | | 3,914 | | | | 93,819 | |
Safeway, Inc. | | | 2,434 | | | | 57,296 | |
Sysco Corp. | | | 3,246 | | | | 89,914 | |
Walgreen Co. | | | 4,752 | | | | 190,745 | |
Wal-Mart Stores, Inc. | | | 23,291 | | | | 1,212,297 | |
Whole Foods Market, Inc. | | | 495 | | | | 32,620 | |
| | | | | | | | |
| Total Food & Staples Retailing | | | | | | | 2,091,116 | |
| Food Products – 1.8% | | | | | | | | |
Archer-Daniels-Midland Co. | | | 4,755 | | | | 171,228 | |
Campbell Soup Co.(a) | | | 1,830 | | | | 60,591 | |
ConAgra Foods, Inc. | | | 2,417 | | | | 57,404 | |
General Mills, Inc. | | | 3,257 | | | | 119,043 | |
Green Mountain Coffee Roasters, Inc.*(a) | | | 122 | | | | 7,882 | |
H.J. Heinz Co. | | | 1,500 | | | | 73,230 | |
Hershey Co. (The) | | | 1,033 | | | | 56,143 | |
Hormel Foods Corp. | | | 1,278 | | | | 35,579 | |
J.M. Smucker Co. (The) | | | 700 | | | | 49,973 | |
Kellogg Co. | | | 1,960 | | | | 105,801 | |
Kraft Foods, Inc. Class A | | | 6,991 | | | | 219,238 | |
McCormick & Co., Inc. | | | 643 | | | | 30,755 | |
Mead Johnson Nutrition Co. | | | 598 | | | | 34,642 | |
Sara Lee Corp.(a) | | | 2,171 | | | | 38,362 | |
Tyson Foods, Inc. Class A | | | 3,684 | | | | 70,696 | |
| | | | | | | | |
| Total Food Products | | | | | | | 1,130,567 | |
| Gas Utilities – 0.1% | | | | | | | | |
National Fuel Gas Co. | | | 273 | | | | 20,202 | |
Oneok, Inc. | | | 556 | | | | 37,185 | |
| | | | | | | | |
| Total Gas Utilities | | | | | | | 57,387 | |
| Health Care Equipment & Supplies – 1.6% | | | | | | | | |
Baxter International, Inc. | | | 2,619 | | | | 140,824 | |
Becton Dickinson and Co. | | | 1,189 | | | | 94,668 | |
Boston Scientific Corp.*(a) | | | 5,682 | | | | 40,853 | |
C.R. Bard, Inc.(a) | | | 465 | | | | 46,179 | |
CareFusion Corp.* | | | 449 | | | | 12,662 | |
DENTSPLY International, Inc. | | | 723 | | | | 26,744 | |
Edwards Lifesciences Corp.*(a) | | | 229 | | | | 19,923 | |
Hospira, Inc.* | | | 609 | | | | 33,617 | |
Intuitive Surgical, Inc.* | | | 102 | | | | 34,013 | |
Medtronic, Inc. | | | 6,259 | | | | 246,292 | |
ResMed, Inc.* | | | 540 | | | | 16,200 | |
St. Jude Medical, Inc. | | | 1,738 | | | | 89,090 | |
Stryker Corp. | | | 1,974 | | | | 120,019 | |
Varian Medical Systems, Inc.* | | | 471 | | | | 31,858 | |
Zimmer Holdings, Inc.* | | | 1,338 | | | | 80,989 | |
| | | | | | | | |
| Total Health Care Equipment & Supplies | | | | | | | 1,033,931 | |
| Health Care Providers & Services – 2.9% | | | | | | | | |
Aetna, Inc. | | | 4,142 | | | | 155,035 | |
| | | | | | | | |
| Investments | | Shares | | | Fair Value | |
| | | | | | | | |
AmerisourceBergen Corp. | | | 1,660 | | | $ | 65,669 | |
Cardinal Health, Inc. | | | 1,880 | | | | 77,324 | |
CIGNA Corp. | | | 2,542 | | | | 112,560 | |
DaVita, Inc.* | | | 549 | | | | 46,945 | |
Express Scripts, Inc.* | | | 1,721 | | | | 95,705 | |
Henry Schein, Inc.* | | | 463 | | | | 32,489 | |
Humana, Inc.* | | | 1,919 | | | | 134,215 | |
Laboratory Corp. of America Holdings* | | | 567 | | | | 52,238 | |
McKesson Corp. | | | 1,501 | | | | 118,654 | |
Medco Health Solutions, Inc.* | | | 1,874 | | | | 105,244 | |
Quest Diagnostics, Inc. | | | 1,191 | | | | 68,744 | |
UnitedHealth Group, Inc. | | | 10,694 | | | | 483,369 | |
WellPoint, Inc. | | | 3,978 | | | | 277,625 | |
| | | | | | | | |
| Total Health Care Providers & Services | | | | | | | 1,825,816 | |
| Health Care Technology – 0.0% | | | | | | | | |
Cerner Corp.*(a) | | | 224 | | | | 24,909 | |
| Hotels, Restaurants & Leisure – 1.2% | | | | | | | | |
Chipotle Mexican Grill, Inc.* | | | 52 | | | | 14,163 | |
Darden Restaurants, Inc.(a) | | | 745 | | | | 36,602 | |
Hyatt Hotels Corp. Class A* | | | 88 | | | | 3,787 | |
International Game Technology | | | 1,081 | | | | 17,545 | |
Las Vegas Sands Corp.* | | | 83 | | | | 3,504 | |
Marriott International, Inc. Class A | | | 782 | | | | 27,824 | |
McDonald’s Corp. | | | 5,324 | | | | 405,103 | |
Starbucks Corp. | | | 2,426 | | | | 89,641 | |
Wyndham Worldwide Corp. | | | 1,021 | | | | 32,478 | |
Wynn Resorts Ltd. | | | 31 | | | | 3,945 | |
Yum! Brands, Inc. | | | 1,935 | | | | 99,420 | |
| | | | | | | | |
| Total Hotels, Restaurants & Leisure | | | | | | | 734,012 | |
| Household Durables – 0.2% | | | | | | | | |
Fortune Brands, Inc. | | | 536 | | | | 33,173 | |
Newell Rubbermaid, Inc. | | | 1,350 | | | | 25,826 | |
Stanley Black & Decker, Inc. | | | 179 | | | | 13,711 | |
Whirlpool Corp. | | | 545 | | | | 46,521 | |
| | | | | | | | |
| Total Household Durables | | | | | | | 119,231 | |
| Household Products – 2.0% | | | | | | | | |
Church & Dwight Co., Inc. | | | 412 | | | | 32,688 | |
Clorox Co.(a) | | | 792 | | | | 55,496 | |
Colgate-Palmolive Co. | | | 2,304 | | | | 186,071 | |
Energizer Holdings, Inc.* | | | 527 | | | | 37,501 | |
Kimberly-Clark Corp. | | | 2,578 | | | | 168,266 | |
Procter & Gamble Co. (The) | | | 13,395 | | | | 825,132 | |
| | | | | | | | |
| Total Household Products | | | | | | | 1,305,154 | |
Independent Power Producers & Energy
Traders – 0.2% | | | | | | | | |
AES Corp. (The)* | | | 4,185 | | | | 54,405 | |
NRG Energy, Inc.* | | | 2,402 | | | | 51,739 | |
| | | | | | | | |
| Total Independent Power Producers & Energy Traders | | | | | | | 106,144 | |
| Industrial Conglomerates – 2.2% | | | | | | | | |
3M Co. | | | 3,761 | | | | 351,653 | |
See Notes to Financial Statements.
| | | | |
| WisdomTree Domestic and International Earnings Funds | | | 29 | |
Schedule of Investments (continued)
WisdomTree Earnings 500 Fund (EPS)
March 31, 2011
| | | | | | | | |
| Investments | | Shares | | | Fair Value | |
| | | | | | | | |
General Electric Co. | | | 51,214 | | | $ | 1,026,841 | |
| | | | | | | | |
| Total Industrial Conglomerates | | | | | | | 1,378,494 | |
| Insurance – 4.9% | | | | | | | | |
Allstate Corp. (The) | | | 4,635 | | | | 147,300 | |
American Family Life Assurance Co., Inc. | | | 3,916 | | | | 206,686 | |
AON Corp. | | | 1,148 | | | | 60,798 | |
Berkshire Hathaway, Inc. Class B* | | | 10,365 | | | | 866,825 | |
Chubb Corp. | | | 2,783 | | | | 170,626 | |
Cincinnati Financial Corp.(a) | | | 686 | | | | 22,501 | |
CNA Financial Corp. | | | 1,349 | | | | 39,863 | |
Genworth Financial, Inc. Class A* | | | 2,870 | | | | 38,630 | |
Hartford Financial Services Group, Inc.(a) | | | 5,278 | | | | 142,136 | |
Lincoln National Corp.(a) | | | 2,436 | | | | 73,177 | |
Loews Corp. | | | 2,420 | | | | 104,278 | |
Marsh & McLennan Cos., Inc. | | | 1,385 | | | | 41,287 | |
MetLife, Inc. | | | 5,572 | | | | 249,236 | |
Principal Financial Group, Inc. | | | 2,170 | | | | 69,679 | |
Progressive Corp. (The) | | | 4,255 | | | | 89,908 | |
Prudential Financial, Inc. | | | 5,933 | | | | 365,354 | |
Torchmark Corp. | | | 714 | | | | 47,467 | |
Travelers Cos., Inc. (The) | | | 4,995 | | | | 297,103 | |
Unum Group | | | 3,223 | | | | 84,604 | |
| | | | | | | | |
| Total Insurance | | | | | | | 3,117,458 | |
| Internet & Catalog Retail – 0.3% | | | | | | | | |
Amazon.com, Inc.* | | | 545 | | | | 98,171 | |
Expedia, Inc. | | | 1,397 | | | | 31,656 | |
NetFlix, Inc.*(a) | | | 73 | | | | 17,325 | |
priceline.com, Inc.*(a) | | | 101 | | | | 51,150 | |
| | | | | | | | |
| Total Internet & Catalog Retail | | | | | | | 198,302 | |
| Internet Software & Services – 1.4% | | | | | | | | |
Akamai Technologies, Inc.* | | | 299 | | | | 11,362 | |
eBay, Inc.* | | | 4,273 | | | | 132,634 | |
Google, Inc. Class A* | | | 1,127 | | | | 660,659 | |
VeriSign, Inc. | | | 411 | | | | 14,882 | |
Yahoo!, Inc.* | | | 4,437 | | | | 73,876 | |
| | | | | | | | |
| Total Internet Software & Services | | | | | | | 893,413 | |
| IT Services – 3.3% | | | | | | | | |
Automatic Data Processing, Inc. | | | 2,117 | | | | 108,623 | |
Cognizant Technology Solutions Corp. Class A* | | | 835 | | | | 67,969 | |
Computer Sciences Corp. | | | 1,272 | | | | 61,984 | |
Fidelity National Information Services, Inc. | | | 885 | | | | 28,931 | |
Fiserv, Inc.* | | | 752 | | | | 47,165 | |
International Business Machines Corp. | | | 7,298 | | | | 1,190,085 | |
Mastercard, Inc. Class A | | | 590 | | | | 148,515 | |
Paychex, Inc. | | | 1,419 | | | | 44,500 | |
SAIC, Inc.* | | | 2,692 | | | | 45,549 | |
Teradata Corp.* | | | 627 | | | | 31,789 | |
Visa, Inc. Class A | | | 3,205 | | | | 235,952 | |
Western Union Co. (The) | | | 4,113 | | | | 85,427 | |
| | | | | | | | |
| Total IT Services | | | | | | | 2,096,489 | |
| Leisure Equipment & Products – 0.1% | | | | | | | | |
Hasbro, Inc.(a) | | | 764 | | | | 35,786 | |
| | | | | | | | |
| Investments | | Shares | | | Fair Value | |
| | | | | | | | |
Mattel, Inc. | | | 2,303 | | | $ | 57,414 | |
| | | | | | | | |
| Total Leisure Equipment & Products | | | | | | | 93,200 | |
| Life Sciences Tools & Services – 0.3% | | | | | | | | |
Agilent Technologies, Inc.* | | | 1,068 | | | | 47,825 | |
Illumina, Inc.*(a) | | | 145 | | | | 10,160 | |
Life Technologies Corp.* | | | 464 | | | | 24,323 | |
Thermo Fisher Scientific, Inc.* | | | 1,540 | | | | 85,547 | |
Waters Corp.* | | | 404 | | | | 35,108 | |
| | | | | | | | |
| Total Life Sciences Tools & Services | | | | | | | 202,963 | |
| Machinery – 1.8% | | | | | | | | |
AGCO Corp.* | | | 333 | | | | 18,305 | |
Bucyrus International, Inc. | | | 272 | | | | 24,874 | |
Caterpillar, Inc. | | | 1,900 | | | | 211,565 | |
Cummins, Inc. | | | 683 | | | | 74,871 | |
Danaher Corp. | | | 2,908 | | | | 150,925 | |
Deere & Co. | | | 1,834 | | | | 177,696 | |
Donaldson Co., Inc. | | | 300 | | | | 18,387 | |
Dover Corp. | | | 920 | | | | 60,481 | |
Eaton Corp. | | | 1,518 | | | | 84,158 | |
Flowserve Corp. | | | 296 | | | | 38,125 | |
Illinois Tool Works, Inc. | | | 2,603 | | | | 139,833 | |
Joy Global, Inc. | | | 433 | | | | 42,785 | |
PACCAR, Inc.(a) | | | 432 | | | | 22,615 | |
Pall Corp. | | | 418 | | | | 24,081 | |
Parker Hannifin Corp. | | | 643 | | | | 60,879 | |
Timken Co. | | | 234 | | | | 12,238 | |
| | | | | | | | |
| Total Machinery | | | | | | | 1,161,818 | |
| Media – 3.3% | | | | | | | | |
Cablevision Systems Corp. Class A | | | 661 | | | | 22,877 | |
CBS Corp. Class B | | | 2,092 | | | | 52,384 | |
Comcast Corp. Class A | | | 11,501 | | | | 284,305 | |
DIRECTV Class A* | | | 3,282 | | | | 153,598 | |
Discovery Communications, Inc. Class C* | | | 1,390 | | | | 48,942 | |
DISH Network Corp. Class A* | | | 4,698 | | | | 114,443 | |
Interpublic Group of Cos., Inc. (The) | | | 1,740 | | | | 21,872 | |
McGraw-Hill Cos., Inc. (The) | | | 1,946 | | | | 76,672 | |
News Corp. Class A | | | 17,524 | | | | 307,721 | |
Omnicom Group, Inc. | | | 1,501 | | | | 73,639 | |
Scripps Networks Interactive, Inc. Class A | | | 581 | | | | 29,102 | |
Sirius XM Radio, Inc.*(a) | | | 7,254 | | | | 12,042 | |
Time Warner Cable, Inc. | | | 1,572 | | | | 112,147 | |
Time Warner, Inc. | | | 6,294 | | | | 224,696 | |
Viacom, Inc. Class B | | | 4,095 | | | | 190,499 | |
Walt Disney Co. (The) | | | 8,498 | | | | 366,179 | |
| | | | | | | | |
| Total Media | | | | | | | 2,091,118 | |
| Metals & Mining – 1.1% | | | | | | | | |
Allegheny Technologies, Inc.(a) | | | 110 | | | | 7,449 | |
Cliffs Natural Resources, Inc. | | | 795 | | | | 78,133 | |
Freeport-McMoRan Copper & Gold, Inc. | | | 5,691 | | | | 316,135 | |
Newmont Mining Corp. | | | 2,715 | | | | 148,185 | |
Nucor Corp.(a) | | | 345 | | | | 15,877 | |
Southern Copper Corp. | | | 2,528 | | | | 101,803 | |
See Notes to Financial Statements.
| | |
| 30 | | WisdomTree Domestic and International Earnings Funds |
Schedule of Investments (continued)
WisdomTree Earnings 500 Fund (EPS)
March 31, 2011
| | | | | | | | |
| Investments | | Shares | | | Fair Value | |
| | | | | | | | |
Walter Energy, Inc. | | | 257 | | | $ | 34,805 | |
| | | | | | | | |
| Total Metals & Mining | | | | | | | 702,387 | |
| Multiline Retail – 0.8% | | | | | | | | |
Dollar General Corp.* | | | 1,142 | | | | 35,802 | |
Dollar Tree, Inc.* | | | 584 | | | | 32,424 | |
Family Dollar Stores, Inc. | | | 629 | | | | 32,280 | |
J.C. Penney Co., Inc. | | | 740 | | | | 26,573 | |
Kohl’s Corp. | | | 1,720 | | | | 91,229 | |
Macy’s, Inc. | | | 1,972 | | | | 47,841 | |
Nordstrom, Inc. | | | 1,137 | | | | 51,028 | |
Sears Holdings Corp.*(a) | | | 72 | | | | 5,951 | |
Target Corp. | | | 4,008 | | | | 200,440 | |
| | | | | | | | |
| Total Multiline Retail | | | | | | | 523,568 | |
| Multi-Utilities – 1.4% | | | | | | | | |
Alliant Energy Corp. | | | 659 | | | | 25,655 | |
Ameren Corp. | | | 1,816 | | | | 50,975 | |
CenterPoint Energy, Inc. | | | 2,182 | | | | 38,316 | |
CMS Energy Corp.(a) | | | 1,390 | | | | 27,300 | |
Consolidated Edison, Inc. | | | 1,487 | | | | 75,421 | |
Dominion Resources, Inc. | | | 1,980 | | | | 88,506 | |
DTE Energy Co. | | | 1,175 | | | | 57,528 | |
NiSource, Inc. | | | 1,815 | | | | 34,812 | |
NSTAR | | | 618 | | | | 28,595 | |
OGE Energy Corp. | | | 610 | | | | 30,841 | |
PG&E Corp. | | | 2,090 | | | | 92,336 | |
Public Service Enterprise Group, Inc. | | | 4,504 | | | | 141,921 | |
SCANA Corp. | | | 785 | | | | 30,905 | |
Sempra Energy | | | 1,463 | | | | 78,270 | |
Wisconsin Energy Corp. | | | 788 | | | | 24,034 | |
Xcel Energy, Inc. | | | 2,812 | | | | 67,179 | |
| | | | | | | | |
| Total Multi-Utilities | | | | | | | 892,594 | |
| Office Electronics – 0.1% | | | | | | | | |
Xerox Corp. | | | 4,513 | | | | 48,063 | |
| Oil, Gas & Consumable Fuels – 12.0% | | | | | | | | |
Alpha Natural Resources, Inc.*(a) | | | 184 | | | | 10,924 | |
Anadarko Petroleum Corp. | | | 1,075 | | | | 88,064 | |
Apache Corp. | | | 2,089 | | | | 273,492 | |
Arch Coal, Inc. | | | 267 | | | | 9,623 | |
Chesapeake Energy Corp. | | | 3,393 | | | | 113,733 | |
Chevron Corp. | | | 16,410 | | | | 1,762,926 | |
Cimarex Energy Co. | | | 498 | | | | 57,390 | |
Concho Resources, Inc.* | | | 248 | | | | 26,610 | |
ConocoPhillips | | | 8,858 | | | | 707,400 | |
Consol Energy, Inc. | | | 846 | | | | 45,371 | |
Continental Resources, Inc.*(a) | | | 349 | | | | 24,943 | |
Denbury Resources, Inc.* | | | 779 | | | | 19,008 | |
Devon Energy Corp. | | | 2,726 | | | | 250,165 | |
El Paso Corp. | | | 5,172 | | | | 93,096 | |
EOG Resources, Inc. | | | 123 | | | | 14,577 | |
EQT Corp. | | | 378 | | | | 18,862 | |
Exxon Mobil Corp. | | | 33,251 | | | | 2,797,407 | |
Hess Corp. | | | 1,505 | | | | 128,241 | |
| | | | | | | | |
| Investments | | Shares | | | Fair Value | |
| | | | | | | | |
Marathon Oil Corp. | | | 3,723 | | | $ | 198,473 | |
Murphy Oil Corp. | | | 1,145 | | | | 84,066 | |
Newfield Exploration Co.* | | | 690 | | | | 52,447 | |
Noble Energy, Inc. | | | 661 | | | | 63,886 | |
Occidental Petroleum Corp. | | | 3,781 | | | | 395,077 | |
Peabody Energy Corp. | | | 939 | | | | 67,570 | |
Petrohawk Energy Corp.* | | | 1,269 | | | | 31,141 | |
Pioneer Natural Resources Co. | | | 414 | | | | 42,195 | |
Plains Exploration & Production Co.* | | | 389 | | | | 14,093 | |
QEP Resources, Inc. | | | 808 | | | | 32,756 | |
Range Resources Corp. | | | 53 | | | | 3,098 | |
Southwestern Energy Co.* | | | 1,404 | | | | 60,330 | |
Spectra Energy Corp. | | | 3,287 | | | | 89,341 | |
Sunoco, Inc. | | | 428 | | | | 19,512 | |
Valero Energy Corp. | | | 1,779 | | | | 53,050 | |
Whiting Petroleum Corp.* | | | 257 | | | | 18,877 | |
| | | | | | | | |
| Total Oil, Gas & Consumable Fuels | | | | | | | 7,667,744 | |
| Paper & Forest Products – 0.0% | | | | | | | | |
International Paper Co. | | | 648 | | | | 19,557 | |
MeadWestvaco Corp. | | | 368 | | | | 11,161 | |
| | | | | | | | |
| Total Paper & Forest Products | | | | | | | 30,718 | |
| Personal Products – 0.2% | | | | | | | | |
Avon Products, Inc. | | | 1,951 | | | | 52,755 | |
Estee Lauder Cos., Inc. (The) Class A | | | 602 | | | | 58,009 | |
| | | | | | | | |
| Total Personal Products | | | | | | | 110,764 | |
| Pharmaceuticals – 5.0% | | | | | | | | |
Abbott Laboratories | | | 8,330 | | | | 408,587 | |
Allergan, Inc. | | | 688 | | | | 48,862 | |
Bristol-Myers Squibb Co. | | | 10,276 | | | | 271,595 | |
Eli Lilly & Co. | | | 11,108 | | | | 390,668 | |
Endo Pharmaceuticals Holdings, Inc.* | | | 481 | | | | 18,355 | |
Forest Laboratories, Inc.* | | | 1,650 | | | | 53,295 | |
Johnson & Johnson | | | 16,482 | | | | 976,558 | |
Merck & Co., Inc. | | | 7,091 | | | | 234,074 | |
Mylan, Inc.* | | | 1,173 | | | | 26,592 | |
Perrigo Co. | | | 320 | | | | 25,446 | |
Pfizer, Inc. | | | 33,961 | | | | 689,748 | |
Watson Pharmaceuticals, Inc.* | | | 475 | | | | 26,605 | |
| | | | | | | | |
| Total Pharmaceuticals | | | | | | | 3,170,385 | |
| Professional Services – 0.1% | | | | | | | | |
Equifax, Inc. | | | 590 | | | | 22,922 | |
IHS, Inc. Class A* | | | 176 | | | | 15,620 | |
Manpower, Inc. | | | 172 | | | | 10,815 | |
Robert Half International, Inc. | | | 291 | | | | 8,905 | |
Verisk Analytics, Inc. Class A* | | | 370 | | | | 12,121 | |
| | | | | | | | |
| Total Professional Services | | | | | | | 70,383 | |
| Real Estate Investment Trusts (REITs) – 0.6% | | | | | | | | |
AvalonBay Communities, Inc. | | | 93 | | | | 11,167 | |
Boston Properties, Inc.(a) | | | 206 | | | | 19,539 | |
Digital Realty Trust, Inc.(a) | | | 104 | | | | 6,047 | |
Federal Realty Investment Trust | | | 194 | | | | 15,823 | |
HCP, Inc. | | | 378 | | | | 14,341 | |
See Notes to Financial Statements.
| | | | |
| WisdomTree Domestic and International Earnings Funds | | | 31 | |
Schedule of Investments (continued)
WisdomTree Earnings 500 Fund (EPS)
March 31, 2011
| | | | | | | | |
| Investments | | Shares | | | Fair Value | |
| | | | | | | | |
Health Care REIT, Inc. | | | 186 | | | $ | 9,754 | |
Kimco Realty Corp. | | | 434 | | | | 7,960 | |
Nationwide Health Properties, Inc. | | | 374 | | | | 15,906 | |
Plum Creek Timber Co., Inc.(a) | | | 445 | | | | 19,406 | |
Public Storage | | | 350 | | | | 38,818 | |
Rayonier, Inc. | | | 431 | | | | 26,856 | |
Simon Property Group, Inc. | | | 467 | | | | 50,044 | |
SL Green Realty Corp. | | | 266 | | | | 20,003 | |
Ventas, Inc. | | | 470 | | | | 25,521 | |
Vornado Realty Trust | | | 185 | | | | 16,188 | |
Weyerhaeuser Co. | | | 3,274 | | | | 80,540 | |
| | | | | | | | |
| Total Real Estate Investment Trusts (REITs) | | | | | | | 377,913 | |
| Real Estate Management & Development – 0.0% | | | | | | | | |
CB Richard Ellis Group, Inc. Class A* | | | 632 | | | | 16,874 | |
| Road & Rail – 0.8% | | | | | | | | |
CSX Corp. | | | 1,919 | | | | 150,833 | |
JB Hunt Transport Services, Inc. | | | 461 | | | | 20,939 | |
Kansas City Southern* | | | 216 | | | | 11,761 | |
Norfolk Southern Corp. | | | 1,843 | | | | 127,665 | |
Union Pacific Corp. | | | 2,309 | | | | 227,044 | |
| | | | | | | | |
| Total Road & Rail | | | | | | | 538,242 | |
Semiconductors & Semiconductor
Equipment – 3.2% | | | | | | | | |
Altera Corp.(a) | | | 1,449 | | | | 63,785 | |
Analog Devices, Inc. | | | 1,551 | | | | 61,078 | |
Applied Materials, Inc. | | | 5,752 | | | | 89,846 | |
Atmel Corp.* | | | 1,085 | | | | 14,789 | |
Broadcom Corp. Class A* | | | 1,748 | | | | 68,836 | |
Cree, Inc.* | | | 207 | | | | 9,555 | |
First Solar, Inc.*(a) | | | 414 | | | | 66,588 | |
Intel Corp. | | | 45,089 | | | | 909,445 | |
KLA-Tencor Corp. | | | 687 | | | | 32,543 | |
Lam Research Corp.* | | | 822 | | | | 46,575 | |
Linear Technology Corp. | | | 997 | | | | 33,529 | |
Maxim Integrated Products, Inc. | | | 1,027 | | | | 26,291 | |
Microchip Technology, Inc.(a) | | | 781 | | | | 29,686 | |
Micron Technology, Inc.* | | | 19,322 | | | | 221,430 | |
NVIDIA Corp.* | | | 1,105 | | | | 20,398 | |
Skyworks Solutions, Inc.* | | | 349 | | | | 11,315 | |
Texas Instruments, Inc. | | | 7,474 | | | | 258,302 | |
Xilinx, Inc. | | | 1,668 | | | | 54,710 | |
| | | | | | | | |
| Total Semiconductors & Semiconductor Equipment | | | | | | | 2,018,701 | |
| Software – 4.0% | | | | | | | | |
Activision Blizzard, Inc. | | | 2,652 | | | | 29,093 | |
Adobe Systems, Inc.* | | | 1,494 | | | | 49,541 | |
ANSYS, Inc.* | | | 296 | | | | 16,040 | |
Autodesk, Inc.* | | | 383 | | | | 16,894 | |
BMC Software, Inc.* | | | 826 | | | | 41,085 | |
CA, Inc. | | | 2,786 | | | | 67,366 | |
Citrix Systems, Inc.* | | | 350 | | | | 25,711 | |
Factset Research Systems, Inc.(a) | | | 154 | | | | 16,128 | |
Intuit, Inc.* | | | 974 | | | | 51,719 | |
| | | | | | | | |
| Investments | | Shares | | | Fair Value | |
| | | | | | | | |
Microsoft Corp. | | | 61,666 | | | $ | 1,563,850 | |
Oracle Corp. | | | 17,579 | | | | 586,611 | |
Red Hat, Inc.* | | | 199 | | | | 9,033 | |
Rovi Corp.* | | | 191 | | | | 10,247 | |
Salesforce.com, Inc.* | | | 56 | | | | 7,481 | |
Symantec Corp.* | | | 3,567 | | | | 66,132 | |
VMware, Inc. Class A* | | | 305 | | | | 24,870 | |
| | | | | | | | |
| Total Software | | | | | | | 2,581,801 | |
| Specialty Retail – 2.0% | | | | | | | | |
Abercrombie & Fitch Co. Class A | | | 157 | | | | 9,216 | |
Advance Auto Parts, Inc.(a) | | | 433 | | | | 28,413 | |
AutoZone, Inc.* | | | 239 | | | | 65,381 | |
Bed Bath & Beyond, Inc.* | | | 1,317 | | | | 63,572 | |
Best Buy Co., Inc. | | | 3,386 | | | | 97,246 | |
CarMax, Inc.* | | | 792 | | | | 25,423 | |
Gap, Inc. (The)(a) | | | 4,849 | | | | 109,878 | |
Guess ?, Inc. | | | 501 | | | | 19,714 | |
Home Depot, Inc. | | | 7,654 | | | | 283,657 | |
Lowe’s Cos., Inc. | | | 6,436 | | | | 170,103 | |
Ltd. Brands, Inc. | | | 1,802 | | | | 59,250 | |
O’Reilly Automotive, Inc.* | | | 547 | | | | 31,431 | |
PetSmart, Inc. | | | 518 | | | | 21,212 | |
Ross Stores, Inc. | | | 748 | | | | 53,198 | |
Staples, Inc. | | | 3,385 | | | | 65,737 | |
Tiffany & Co.(a) | | | 447 | | | | 27,464 | |
TJX Cos., Inc. | | | 2,731 | | | | 135,813 | |
Urban Outfitters, Inc.* | | | 632 | | | | 18,852 | |
| | | | | | | | |
| Total Specialty Retail | | | | | | | 1,285,560 | |
| Textiles, Apparel & Luxury Goods – 0.5% | | | | | | | | |
Coach, Inc. | | | 1,165 | | | | 60,627 | |
Fossil, Inc.* | | | 238 | | | | 22,289 | |
NIKE, Inc. Class B | | | 1,869 | | | | 141,483 | |
Phillips-Van Heusen Corp.(a) | | | 26 | | | | 1,691 | |
Polo Ralph Lauren Corp.(a) | | | 430 | | | | 53,169 | |
VF Corp.(a) | | | 666 | | | | 65,621 | |
| | | | | | | | |
| Total Textiles, Apparel & Luxury Goods | | | | | | | 344,880 | |
| Thrifts & Mortgage Finance – 0.1% | | | | | | | | |
Hudson City Bancorp, Inc. | | | 3,880 | | | | 37,559 | |
New York Community Bancorp, Inc.(a) | | | 2,220 | | | | 38,317 | |
People’s United Financial, Inc. | | | 635 | | | | 7,988 | |
| | | | | | | | |
| Total Thrifts & Mortgage Finance | | | | | | | 83,864 | |
| Tobacco – 1.9% | | | | | | | | |
Altria Group, Inc. | | | 12,718 | | | | 331,050 | |
Lorillard, Inc. | | | 1,050 | | | | 99,760 | |
Philip Morris International, Inc. | | | 9,998 | | | | 656,169 | |
Reynolds American, Inc. | | | 3,412 | | | | 121,228 | |
| | | | | | | | |
| Total Tobacco | | | | | | | 1,208,207 | |
| Trading Companies & Distributors – 0.1% | | | | | | | | |
Fastenal Co.(a) | | | 377 | | | | 24,441 | |
W.W. Grainger, Inc. | | | 305 | | | | 41,992 | |
| | | | | | | | |
| Total Trading Companies & Distributors | | | | | | | 66,433 | |
See Notes to Financial Statements.
| | |
| 32 | | WisdomTree Domestic and International Earnings Funds |
Schedule of Investments (concluded)
WisdomTree Earnings 500 Fund (EPS)
March 31, 2011
| | | | | | | | |
| Investments | | Shares | | | Fair Value | |
| Water Utilities – 0.0% | | | | | | | | |
American Water Works Co., Inc. | | | 940 | | | $ | 26,367 | |
| Wireless Telecommunication Services – 0.1% | | | | | | | | |
American Tower Corp. Class A* | | | 674 | | | | 34,927 | |
MetroPCS Communications, Inc.* | | | 1,305 | | | | 21,193 | |
NII Holdings, Inc.* | | | 594 | | | | 24,752 | |
| | | | | | | | |
| Total Wireless Telecommunication Services | | | | | | | 80,872 | |
TOTAL COMMON STOCKS
(Cost: $61,164,629) | | | | | | | 63,396,951 | |
| EXCHANGE-TRADED FUND – 0.6% | | | | | | | | |
WisdomTree Equity Income Fund(b)
(Cost: $334,044) | | | 8,494 | | | | 344,576 | |
| SHORT-TERM INVESTMENT – 0.0% | | | | | | | | |
| MONEY MARKET FUND – 0.0% | | | | | | | | |
| Invesco Treasury Fund Private Class, 0.02%(c) (Cost: $20,078) | | | 20,078 | | | | 20,078 | |
| INVESTMENT OF CASH COLLATERAL FOR SECURITIES LOANED – 3.3% | | | | | | | | |
| MONEY MARKET FUND – 3.3% | | | | | | | | |
Dreyfus Institutional Preferred Money Market Fund, 0.19%(d) | | | | | | | | |
| (Cost: $2,120,000)(e) | | | 2,120,000 | | | | 2,120,000 | |
| TOTAL INVESTMENTS IN SECURITIES – 103.2% (Cost: $63,638,751) | | | | | | | 65,881,605 | |
Liabilities in Excess of Other Assets – (3.2)% | | | | | | | (2,049,216 | ) |
| | | | | | | | |
| NET ASSETS – 100.0% | | | | | | $ | 63,832,389 | |
| * | Non-income producing security. |
| (a) | Security, or portion thereof, was on loan at March 31, 2011 (See Note 2). |
| (b) | Affiliated companies (See Note 7). |
| (c) | Rate shown represents annualized 7-day yield as of March 31, 2011. |
| (d) | Interest rate shown reflects yield as of March 31, 2011. |
| (e) | At March 31, 2011, the total market value of the Fund’s securities on loan was $2,067,776 and the total market value of the collateral held by the Fund was $2,120,000. |
See Notes to Financial Statements.
| | | | |
| WisdomTree Domestic and International Earnings Funds | | | 33 | |
Schedule of Investments
WisdomTree MidCap Earnings Fund (EZM)
March 31, 2011
| | | | | | | | |
| Investments | | Shares | | | Fair Value | |
| | | | | | | | |
| COMMON STOCKS – 99.4% | | | | | | | | |
| Aerospace & Defense – 1.9% | | | | | | | | |
Alliant Techsystems, Inc. | | | 4,510 | | | $ | 318,722 | |
BE Aerospace, Inc.*(a) | | | 4,888 | | | | 173,671 | |
Cubic Corp. | | | 1,563 | | | | 89,873 | |
Curtiss-Wright Corp.(a) | | | 3,703 | | | | 130,123 | |
DigitalGlobe, Inc.* | | | 711 | | | | 19,929 | |
Esterline Technologies Corp.* | | | 2,204 | | | | 155,867 | |
HEICO Corp.(a) | | | 1,134 | | | | 70,898 | |
Hexcel Corp.* | | | 4,686 | | | | 92,267 | |
Moog, Inc. Class A* | | | 2,906 | | | | 133,414 | |
Spirit Aerosystems Holdings, Inc. Class A*(a) | | | 12,415 | | | | 318,693 | |
Teledyne Technologies, Inc.* | | | 3,028 | | | | 156,578 | |
TransDigm Group, Inc.*(a) | | | 2,284 | | | | 191,468 | |
Triumph Group, Inc. | | | 1,349 | | | | 119,319 | |
| | | | | | | | |
| Total Aerospace & Defense | | | | | | | 1,970,822 | |
| Air Freight & Logistics – 0.2% | | | | | | | | |
Atlas Air Worldwide Holdings, Inc.*(a) | | | 2,892 | | | | 201,630 | |
HUB Group, Inc. Class A* | | | 1,481 | | | | 53,598 | |
| | | | | | | | |
| Total Air Freight & Logistics | | | | | | | 255,228 | |
| Airlines – 0.7% | | | | | | | | |
Alaska Air Group, Inc.* | | | 4,761 | | | | 301,943 | |
JetBlue Airways Corp.* | | | 18,728 | | | | 117,425 | |
US Airways Group, Inc.*(a) | | | 43,316 | | | | 377,282 | |
| | | | | | | | |
| Total Airlines | | | | | | | 796,650 | |
| Auto Components – 0.8% | | | | | | | | |
Cooper Tire & Rubber Co.(a) | | | 6,016 | | | | 154,912 | |
Federal-Mogul Corp.* | | | 9,430 | | | | 234,807 | |
Gentex Corp.(a) | | | 5,559 | | | | 168,160 | |
Goodyear Tire & Rubber Co. (The)* | | | 9,816 | | | | 147,043 | |
Tenneco, Inc.*(a) | | | 2,326 | | | | 98,739 | |
| | | | | | | | |
| Total Auto Components | | | | | | | 803,661 | |
| Automobiles – 0.1% | | | | | | | | |
Thor Industries, Inc.(a) | | | 4,209 | | | | 140,454 | |
| Beverages – 0.1% | | | | | | | | |
Boston Beer Co., Inc. Class A* | | | 618 | | | | 57,239 | |
| Biotechnology – 0.9% | | | | | | | | |
BioMarin Pharmaceutical, Inc.* | | | 10,222 | | | | 256,879 | |
Cubist Pharmaceuticals, Inc.* | | | 5,710 | | | | 144,120 | |
Myriad Genetics, Inc.*(a) | | | 7,683 | | | | 154,812 | |
Talecris Biotherapeutics Holdings Corp.* | | | 8,592 | | | | 230,266 | |
United Therapeutics Corp.* | | | 1,779 | | | | 119,229 | |
| | | | | | | | |
| Total Biotechnology | | | | | | | 905,306 | |
| Building Products – 1.8% | | | | | | | | |
A.O. Smith Corp. | | | 2,870 | | | | 127,256 | |
Armstrong World Industries, Inc. | | | 815 | | | | 37,710 | |
Lennox International, Inc. | | | 2,572 | | | | 135,236 | |
Masco Corp. | | | 1,057 | | | | 14,713 | |
Owens Corning* | | | 42,352 | | | | 1,524,248 | |
Simpson Manufacturing Co., Inc. | | | 1,965 | | | | 57,889 | |
| | | | | | | | |
| Total Building Products | | | | | | | 1,897,052 | |
| | | | | | | | |
| Investments | | Shares | | | Fair Value | |
| | | | | | | | |
| Capital Markets – 3.2% | | | | | | | | |
American Capital Ltd.* | | | 116,466 | | | $ | 1,153,013 | |
Apollo Investment Corp. | | | 5,967 | | | | 71,962 | |
Ares Capital Corp. | | | 45,626 | | | | 771,079 | |
BGC Partners, Inc. Class A | | | 1,310 | | | | 12,170 | |
Eaton Vance Corp.(a) | | | 6,701 | | | | 216,040 | |
Evercore Partners, Inc. Class A | | | 205 | | | | 7,030 | |
Federated Investors, Inc. Class B(a) | | | 7,397 | | | | 197,870 | |
GAMCO Investors, Inc. Class A | | | 1,342 | | | | 62,215 | |
Greenhill & Co., Inc.(a) | | | 766 | | | | 50,395 | |
Janus Capital Group, Inc. | | | 13,497 | | | | 168,308 | |
Knight Capital Group, Inc. Class A*(a) | | | 13,284 | | | | 178,006 | |
Raymond James Financial, Inc.(a) | | | 8,415 | | | | 321,790 | |
Waddell & Reed Financial, Inc. Class A(a) | | | 5,235 | | | | 212,593 | |
| | | | | | | | |
| Total Capital Markets | | | | | | | 3,422,471 | |
| Chemicals – 3.1% | | | | | | | | |
Ashland, Inc. | �� | | 7,176 | | | | 414,486 | |
Cabot Corp. | | | 4,757 | | | | 220,202 | |
Cytec Industries, Inc. | | | 3,236 | | | | 175,941 | |
Huntsman Corp. | | | 1,223 | | | | 21,256 | |
Intrepid Potash, Inc.* | | | 1,287 | | | | 44,813 | |
Minerals Technologies, Inc. | | | 1,160 | | | | 79,483 | |
NewMarket Corp. | | | 1,761 | | | | 278,625 | |
Olin Corp. | | | 3,203 | | | | 73,413 | |
OM Group, Inc.* | | | 2,307 | | | | 84,298 | |
PolyOne Corp. | | | 6,421 | | | | 91,242 | |
Rockwood Holdings, Inc.*(a) | | | 4,363 | | | | 214,747 | |
RPM International, Inc. | | | 9,692 | | | | 229,991 | |
Scotts Miracle-Gro Co. (The) Class A(a) | | | 5,287 | | | | 305,853 | |
Sensient Technologies Corp. | | | 3,572 | | | | 128,021 | |
Solutia, Inc.* | | | 2,041 | | | | 51,841 | |
Valhi, Inc. | | | 1,809 | | | | 47,902 | |
Valspar Corp. | | | 7,510 | | | | 293,641 | |
W.R. Grace & Co.* | | | 7,666 | | | | 293,531 | |
Westlake Chemical Corp.(a) | | | 4,533 | | | | 254,755 | |
| | | | | | | | |
| Total Chemicals | | | | | | | 3,304,041 | |
| Commercial Banks – 3.0% | | | | | | | | |
Bank of Hawaii Corp.(a) | | | 4,937 | | | | 236,087 | |
BOK Financial Corp.(a) | | | 5,478 | | | | 283,103 | |
City National Corp. | | | 2,146 | | | | 122,429 | |
Commerce Bancshares, Inc. | | | 6,450 | | | | 260,838 | |
Cullen/Frost Bankers, Inc.(a) | | | 4,321 | | | | 255,025 | |
East West Bancorp, Inc. | | | 2,204 | | | | 48,400 | |
First Citizens BancShares, Inc. Class A | | | 585 | | | | 117,339 | |
FirstMerit Corp. | | | 5,346 | | | | 91,203 | |
Fulton Financial Corp. | | | 12,969 | | | | 144,086 | |
Hancock Holding Co.(a) | | | 2,379 | | | | 78,126 | |
Iberiabank Corp.(a) | | | 2,321 | | | | 139,562 | |
International Bancshares Corp. | | | 8,660 | | | | 158,824 | |
Investors Bancorp, Inc.*(a) | | | 4,796 | | | | 71,413 | |
Prosperity Bancshares, Inc. | | | 4,078 | | | | 174,416 | |
Signature Bank*(a) | | | 2,400 | | | | 135,360 | |
SVB Financial Group* | | | 2,068 | | | | 117,731 | |
See Notes to Financial Statements.
| | |
| 34 | | WisdomTree Domestic and International Earnings Funds |
Schedule of Investments (continued)
WisdomTree MidCap Earnings Fund (EZM)
March 31, 2011
| | | | | | | | |
| Investments | | Shares | | | Fair Value | |
| | | | | | | | |
TCF Financial Corp.(a) | | | 11,510 | | | $ | 182,549 | |
Trustmark Corp.(a) | | | 4,542 | | | | 106,374 | |
UMB Financial Corp.(a) | | | 2,854 | | | | 106,611 | |
United Bankshares, Inc.(a) | | | 3,273 | | | | 86,800 | |
Valley National Bancorp(a) | | | 10,780 | | | | 150,489 | |
Westamerica Bancorp. | | | 2,132 | | | | 109,521 | |
| | | | | | | | |
| Total Commercial Banks | | | | | | | 3,176,286 | |
| Commercial Services & Supplies – 2.3% | | | | | | | | |
ABM Industries, Inc.(a) | | | 2,951 | | | | 74,926 | |
Brink’s Co. (The) | | | 7,742 | | | | 256,338 | |
Cintas Corp.(a) | | | 9,455 | | | | 286,203 | |
Clean Harbors, Inc.*(a) | | | 1,824 | | | | 179,956 | |
Copart, Inc.* | | | 5,231 | | | | 226,659 | |
Corrections Corp. of America* | | | 7,800 | | | | 190,320 | |
Covanta Holding Corp. | | | 4,931 | | | | 84,221 | |
Deluxe Corp.(a) | | | 8,698 | | | | 230,845 | |
Geo Group, Inc. (The)* | | | 2,781 | | | | 71,305 | |
Herman Miller, Inc.(a) | | | 1,383 | | | | 38,019 | |
Higher One Holdings, Inc.*(a) | | | 1,222 | | | | 17,658 | |
HNI Corp. | | | 933 | | | | 29,445 | |
Kar Auction Services, Inc.* | | | 6,323 | | | | 96,995 | |
R.R. Donnelley & Sons Co.(a) | | | 9,344 | | | | 176,788 | |
Rollins, Inc. | | | 5,608 | | | | 113,842 | |
Tetra Tech, Inc.*(a) | | | 3,749 | | | | 92,563 | |
United Stationers, Inc. | | | 2,034 | | | | 144,516 | |
Waste Connections, Inc.(a) | | | 5,548 | | | | 159,727 | |
| | | | | | | | |
| Total Commercial Services & Supplies | | | | | | | 2,470,326 | |
| Communications Equipment – 1.5% | | | | | | | | |
Acme Packet, Inc.*(a) | | | 899 | | | | 63,793 | |
ADTRAN, Inc. | | | 3,231 | | | | 137,188 | |
Arris Group, Inc.*(a) | | | 10,044 | | | | 127,961 | |
Blue Coat Systems, Inc.* | | | 2,458 | | | | 69,217 | |
Brocade Communications Systems, Inc.*(a) | | | 28,977 | | | | 178,209 | |
Echostar Corp. Class A* | | | 288 | | | | 10,901 | |
Finisar Corp.* | | | 408 | | | | 10,037 | |
InterDigital, Inc.(a) | | | 5,141 | | | | 245,277 | |
Loral Space & Communications, Inc.* | | | 2,317 | | | | 179,683 | |
Netgear, Inc.* | | | 1,764 | | | | 57,224 | |
Plantronics, Inc. | | | 3,315 | | | | 121,395 | |
Polycom, Inc.* | | | 1,682 | | | | 87,212 | |
Tellabs, Inc. | | | 42,256 | | | | 221,422 | |
Viasat, Inc.*(a) | | | 742 | | | | 29,561 | |
| | | | | | | | |
| Total Communications Equipment | | | | | | | 1,539,080 | |
| Computers & Peripherals – 0.8% | | | | | | | | |
Diebold, Inc.(a) | | | 3,918 | | | | 138,932 | |
Lexmark International, Inc. Class A* | | | 10,972 | | | | 406,403 | |
NCR Corp.* | | | 12,454 | | | | 234,633 | |
QLogic Corp.* | | | 5,392 | | | | 100,022 | |
| | | | | | | | |
| Total Computers & Peripherals | | | | | | | 879,990 | |
| Construction & Engineering – 1.1% | | | | | | | | |
Aecom Technology Corp.*(a) | | | 10,490 | | | | 290,888 | |
EMCOR Group, Inc.* | | | 1,808 | | | | 55,994 | |
| | | | | | | | |
| Investments | | Shares | | | Fair Value | |
| | | | | | | | |
MasTec, Inc.* | | | 6,247 | | | $ | 129,937 | |
Quanta Services, Inc.*(a) | | | 10,451 | | | | 234,416 | |
Shaw Group, Inc. (The)* | | | 3,227 | | | | 114,268 | |
URS Corp.* | | | 7,486 | | | | 344,730 | |
| | | | | | | | |
| Total Construction & Engineering | | | | | | | 1,170,233 | |
| Construction Materials – 0.1% | | | | | | | | |
Eagle Materials, Inc. | | | 1,231 | | | | 37,250 | |
Martin Marietta Materials, Inc.(a) | | | 1,142 | | | | 102,403 | |
| | | | | | | | |
| Total Construction Materials | | | | | | | 139,653 | |
| Consumer Finance – 0.3% | | | | | | | | |
Credit Acceptance Corp.* | | | 3,233 | | | | 229,414 | |
Ezcorp, Inc. Class A* | | | 4,470 | | | | 140,313 | |
| | | | | | | | |
| Total Consumer Finance | | | | | | | 369,727 | |
| Containers & Packaging – 2.3% | | | | | | | | |
Aptargroup, Inc. | | | 4,542 | | | | 227,690 | |
Bemis Co., Inc. | | | 6,431 | | | | 211,001 | |
Graphic Packaging Holding Co.* | | | 8,625 | | | | 46,747 | |
Greif, Inc. Class A | | | 3,351 | | | | 219,189 | |
Packaging Corp. of America | | | 10,366 | | | | 299,474 | |
Rock-Tenn Co. Class A(a) | | | 4,883 | | | | 338,636 | |
Sealed Air Corp. | | | 13,448 | | | | 358,524 | |
Silgan Holdings, Inc. | | | 5,201 | | | | 198,366 | |
Sonoco Products Co. | | | 8,247 | | | | 298,789 | |
Temple-Inland, Inc. | | | 8,699 | | | | 203,557 | |
| | | | | | | | |
| Total Containers & Packaging | | | | | | | 2,401,973 | |
| Distributors – 0.2% | | | | | | | | |
LKQ Corp.* | | | 8,882 | | | | 214,056 | |
| Diversified Consumer Services – 3.5% | | | | | | | | |
Career Education Corp.*(a) | | | 15,007 | | | | 340,959 | |
Coinstar, Inc.*(a) | | | 1,188 | | | | 54,553 | |
DeVry, Inc.(a) | | | 8,385 | | | | 461,762 | |
Education Management Corp.*(a) | | | 16,586 | | | | 347,311 | |
H&R Block, Inc.(a) | | | 48,434 | | | | 810,785 | |
Hillenbrand, Inc. | | | 5,679 | | | | 122,098 | |
ITT Educational Services, Inc.*(a) | | | 7,499 | | | | 541,053 | |
Service Corp. International | | | 30,603 | | | | 338,469 | |
Sotheby’s | | | 3,542 | | | | 186,309 | |
Strayer Education, Inc.(a) | | | 1,020 | | | | 133,100 | |
Weight Watchers International, Inc. | | | 5,649 | | | | 395,995 | |
| | | | | | | | |
| Total Diversified Consumer Services | | | | | | | 3,732,394 | |
| Diversified Financial Services – 0.2% | | | | | | | | |
CBOE Holdings, Inc.(a) | | | 5,631 | | | | 163,130 | |
Portfolio Recovery Associates, Inc.* | | | 1,150 | | | | 97,900 | |
| | | | | | | | |
| Total Diversified Financial Services | | | | | | | 261,030 | |
| Diversified Telecommunication Services – 0.7% | | | | | | | | |
AboveNet, Inc. | | | 5,603 | | | | 363,411 | |
tw telecom, inc.*(a) | | | 19,542 | | | | 375,206 | |
| | | | | | | | |
| Total Diversified Telecommunication Services | | | | | | | 738,617 | |
| Electric Utilities – 2.5% | | | | | | | | |
ALLETE, Inc.(a) | | | 2,647 | | | | 103,154 | |
Cleco Corp. | | | 9,777 | | | | 335,253 | |
See Notes to Financial Statements.
| | | | |
| WisdomTree Domestic and International Earnings Funds | | | 35 | |
Schedule of Investments (continued)
WisdomTree MidCap Earnings Fund (EZM)
March 31, 2011
| | | | | | | | |
| Investments | | Shares | | | Fair Value | |
| | | | | | | | |
DPL, Inc. | | | 12,859 | | | $ | 352,465 | |
El Paso Electric Co.* | | | 3,647 | | | | 110,869 | |
Great Plains Energy, Inc. | | | 15,470 | | | | 309,709 | |
Hawaiian Electric Industries, Inc. | | | 5,223 | | | | 129,531 | |
IDACORP, Inc. | | | 4,981 | | | | 189,776 | |
ITC Holdings Corp. | | | 2,808 | | | | 196,279 | |
NV Energy, Inc. | | | 20,724 | | | | 308,580 | |
Portland General Electric Co.(a) | | | 5,541 | | | | 131,710 | |
UIL Holdings Corp. | | | 2,484 | | | | 75,812 | |
Unisource Energy Corp. | | | 4,002 | | | | 144,592 | |
Westar Energy, Inc.(a) | | | 10,745 | | | | 283,883 | |
| | | | | | | | |
| Total Electric Utilities | | | | | | | 2,671,613 | |
| Electrical Equipment – 1.5% | | | | | | | | |
Acuity Brands, Inc. | | | 1,538 | | | | 89,958 | |
American Superconductor Corp.*(a) | | | 1,123 | | | | 27,929 | |
Belden, Inc. | | | 2,470 | | | | 92,748 | |
Brady Corp. Class A(a) | | | 3,195 | | | | 114,030 | |
EnerSys* | | | 3,436 | | | | 136,581 | |
General Cable Corp.*(a) | | | 1,002 | | | | 43,387 | |
GrafTech International Ltd.* | | | 7,957 | | | | 164,153 | |
Hubbell, Inc. Class B | | | 4,276 | | | | 303,724 | |
II-VI, Inc.* | | | 1,392 | | | | 69,252 | |
Regal-Beloit Corp. | | | 2,999 | | | | 221,416 | |
Thomas & Betts Corp.* | | | 3,503 | | | | 208,323 | |
Woodward, Inc. | | | 3,611 | | | | 124,796 | |
| | | | | | | | |
| Total Electrical Equipment | | | | | | | 1,596,297 | |
| Electronic Equipment, Instruments & Components – 2.9% | | | | | | | | |
Anixter International, Inc. | | | 1,848 | | | | 129,157 | |
Arrow Electronics, Inc.* | | | 14,348 | | | | 600,894 | |
AVX Corp. | | | 16,213 | | | | 241,736 | |
Cognex Corp. | | | 1,570 | | | | 44,353 | |
Ingram Micro, Inc. Class A* | | | 20,861 | | | | 438,707 | |
IPG Photonics Corp.* | | | 1,226 | | | | 70,716 | |
Itron, Inc.* | | | 1,994 | | | | 112,541 | |
Jabil Circuit, Inc.(a) | | | 13,840 | | | | 282,751 | |
Molex, Inc.(a) | | | 8,807 | | | | 221,232 | |
National Instruments Corp. | | | 3,611 | | | | 118,332 | |
Plexus Corp.*(a) | | | 3,970 | | | | 139,188 | |
Tech Data Corp.* | | | 5,907 | | | | 300,430 | |
Vishay Intertechnology, Inc.*(a) | | | 20,387 | | | | 361,665 | |
| | | | | | | | |
| Total Electronic Equipment, Instruments & Components | | | | | | | 3,061,702 | |
| Energy Equipment & Services – 2.8% | | | | | | | | |
Atwood Oceanics, Inc.*(a) | | | 8,626 | | | | 400,505 | |
Bristow Group, Inc.*(a) | | | 2,748 | | | | 129,980 | |
CARBO Ceramics, Inc.(a) | | | 867 | | | | 122,351 | |
Dresser-Rand Group, Inc.* | | | 3,991 | | | | 213,998 | |
Dril-Quip, Inc.* | | | 1,799 | | | | 142,175 | |
Lufkin Industries, Inc.(a) | | | 732 | | | | 68,420 | |
Oceaneering International, Inc.* | | | 3,311 | | | | 296,169 | |
Oil States International, Inc.*(a) | | | 3,317 | | | | 252,556 | |
Patterson-UTI Energy, Inc.(a) | | | 2,076 | | | | 61,014 | |
| | | | | | | | |
| Investments | | Shares | | | Fair Value | |
| | | | | | | | |
Rowan Cos., Inc.* | | | 10,669 | | | $ | 471,356 | |
RPC, Inc.(a) | | | 5,813 | | | | 147,185 | |
SEACOR Holdings, Inc. | | | 2,615 | | | | 241,783 | |
Tidewater, Inc.(a) | | | 4,065 | | | | 243,290 | |
Unit Corp.* | | | 3,607 | | | | 223,454 | |
| | | | | | | | |
| Total Energy Equipment & Services | | | | | | | 3,014,236 | |
| Food & Staples Retailing – 0.5% | | | | | | | | |
BJ’s Wholesale Club, Inc.* | | | 3,652 | | | | 178,291 | |
Casey’s General Stores, Inc. | | | 3,245 | | | | 126,555 | |
Ruddick Corp. | | | 3,249 | | | | 125,379 | |
United Natural Foods, Inc.*(a) | | | 2,300 | | | | 103,086 | |
| | | | | | | | |
| Total Food & Staples Retailing | | | | | | | 533,311 | |
| Food Products – 1.5% | | | | | | | | |
Corn Products International, Inc. | | | 4,472 | | | | 231,739 | |
Dean Foods Co.* | | | 25,047 | | | | 250,470 | |
Flowers Foods, Inc.(a) | | | 6,161 | | | | 167,764 | |
Hain Celestial Group, Inc. (The)*(a) | | | 1,496 | | | | 48,291 | |
Lancaster Colony Corp.(a) | | | 2,352 | | | | 142,531 | |
Pilgrim’s Pride Corp.* | | | 19,196 | | | | 148,001 | |
Ralcorp Holdings, Inc.* | | | 4,650 | | | | 318,200 | |
Smithfield Foods, Inc.* | | | 3,564 | | | | 85,750 | |
Tootsie Roll Industries, Inc. | | | 2,898 | | | | 82,187 | |
TreeHouse Foods, Inc.* | | | 1,990 | | | | 113,171 | |
| | | | | | | | |
| Total Food Products | | | | | | | 1,588,104 | |
| Gas Utilities – 2.5% | | | | | | | | |
AGL Resources, Inc. | | | 8,235 | | | | 328,082 | |
Atmos Energy Corp. | | | 7,799 | | | | 265,946 | |
Energen Corp. | | | 7,255 | | | | 457,936 | |
New Jersey Resources Corp.(a) | | | 3,233 | | | | 138,857 | |
Nicor, Inc. | | | 3,786 | | | | 203,308 | |
Northwest Natural Gas Co. | | | 2,044 | | | | 94,290 | |
Piedmont Natural Gas Co., Inc. | | | 4,616 | | | | 140,096 | |
Questar Corp. | | | 20,282 | | | | 353,921 | |
South Jersey Industries, Inc. | | | 1,555 | | | | 87,033 | |
Southwest Gas Corp. | | | 3,643 | | | | 141,968 | |
UGI Corp. | | | 9,217 | | | | 303,239 | |
WGL Holdings, Inc.(a) | | | 2,951 | | | | 115,089 | |
| | | | | | | | |
| Total Gas Utilities | | | | | | | 2,629,765 | |
| Health Care Equipment & Supplies – 2.3% | | | | | | | | |
Align Technology, Inc.*(a) | | | 4,750 | | | | 97,280 | |
American Medical Systems Holdings, Inc.* | | | 4,886 | | | | 105,733 | |
Beckman Coulter, Inc. | | | 3,740 | | | | 310,682 | |
Cooper Cos., Inc. (The) | | | 2,343 | | | | 162,722 | |
Gen-Probe, Inc.*(a) | | | 2,121 | | | | 140,728 | |
Haemonetics Corp.* | | | 1,205 | | | | 78,976 | |
Hill-Rom Holdings, Inc. | | | 3,241 | | | | 123,093 | |
IDEXX Laboratories, Inc.*(a) | | | 2,347 | | | | 181,235 | |
Immucor, Inc.*(a) | | | 5,091 | | | | 100,700 | |
Integra LifeSciences Holdings Corp.* | | | 1,641 | | | | 77,816 | |
Kinetic Concepts, Inc.* | | | 7,365 | | | | 400,803 | |
Masimo Corp. | | | 2,894 | | | | 95,792 | |
Sirona Dental Systems, Inc.*(a) | | | 2,747 | | | | 137,790 | |
See Notes to Financial Statements.
| | |
| 36 | | WisdomTree Domestic and International Earnings Funds |
Schedule of Investments (continued)
WisdomTree MidCap Earnings Fund (EZM)
March 31, 2011
| | | | | | | | |
| Investments | | Shares | | | Fair Value | |
| | | | | | | | |
STERIS Corp.(a) | | | 1,893 | | | $ | 65,384 | |
Teleflex, Inc. | | | 3,288 | | | | 190,638 | |
Thoratec Corp.* | | | 2,527 | | | | 65,525 | |
West Pharmaceutical Services, Inc.(a) | | | 2,373 | | | | 106,239 | |
| | | | | | | | |
| Total Health Care Equipment & Supplies | | | | | | | 2,441,136 | |
| Health Care Providers & Services – 5.4% | | | | | | | | |
Accretive Health, Inc.* | | | 1,073 | | | | 29,786 | |
AMERIGROUP Corp.*(a) | | | 6,236 | | | | 400,663 | |
Catalyst Health Solutions, Inc.* | | | 2,011 | | | | 112,475 | |
Centene Corp.* | | | 4,447 | | | | 146,662 | |
Chemed Corp. | | | 1,541 | | | | 102,646 | |
Community Health Systems, Inc.* | | | 9,436 | | | | 377,346 | |
Coventry Health Care, Inc.* | | | 26,487 | | | | 844,670 | |
Emergency Medical Services Corp. Class A* | | | 2,417 | | | | 153,697 | |
Health Management Associates, Inc. Class A* | | | 19,589 | | | | 213,520 | |
Health Net, Inc.* | | | 5,393 | | | | 176,351 | |
Healthsouth Corp.* | | | 7,340 | | | | 183,353 | |
Healthspring, Inc.* | | | 8,281 | | | | 309,461 | |
HMS Holdings Corp.* | | | 742 | | | | 60,733 | |
LifePoint Hospitals, Inc.*(a) | | | 5,065 | | | | 203,512 | |
Lincare Holdings, Inc. | | | 8,319 | | | | 246,742 | |
Magellan Health Services, Inc.* | | | 3,928 | | | | 192,786 | |
Mednax, Inc.* | | | 3,735 | | | | 248,788 | |
Omnicare, Inc.(a) | | | 9,747 | | | | 292,312 | |
Owens & Minor, Inc.(a) | | | 5,113 | | | | 166,070 | |
Patterson Cos., Inc.(a) | | | 9,131 | | | | 293,927 | |
PSS World Medical, Inc.*(a) | | | 3,747 | | | | 101,731 | |
Universal American Corp.(a) | | | 13,527 | | | | 309,904 | |
Universal Health Services, Inc. Class B | | | 7,355 | | | | 363,411 | |
VCA Antech, Inc.*(a) | | | 5,938 | | | | 149,519 | |
| | | | | | | | |
| Total Health Care Providers & Services | | | | | | | 5,680,065 | |
| Health Care Technology – 0.2% | | | | | | | | |
Allscripts Healthcare Solutions, Inc.* | | | 1,192 | | | | 25,020 | |
athenahealth, Inc.*(a) | | | 326 | | | | 14,712 | |
Emdeon, Inc. Class A*(a) | | | 1,495 | | | | 24,085 | |
MedAssets, Inc.* | | | 1,779 | | | | 27,165 | |
Quality Systems, Inc.(a) | | | 965 | | | | 80,423 | |
| | | | | | | | |
| Total Health Care Technology | | | | | | | 171,405 | |
| Hotels, Restaurants & Leisure – 1.2% | | | | | | | | |
Bally Technologies, Inc.* | | | 3,091 | | | | 116,994 | |
Brinker International, Inc. | | | 6,663 | | | | 168,574 | |
Cheesecake Factory (The)* | | | 2,375 | | | | 71,464 | |
Choice Hotels International, Inc.(a) | | | 3,471 | | | | 134,848 | |
Cracker Barrel Old Country Store, Inc. | | | 2,047 | | | | 100,590 | |
International Speedway Corp. Class A | | | 2,820 | | | | 84,036 | |
Life Time Fitness, Inc.*(a) | | | 2,508 | | | | 93,573 | |
Panera Bread Co. Class A* | | | 1,244 | | | | 157,988 | |
PF Chang’s China Bistro, Inc.(a) | | | 1,148 | | | | 53,026 | |
SIX Flags Entertainment Corp. | | | 1,124 | | | | 80,928 | |
Texas Roadhouse, Inc. | | | 4,004 | | | | 68,028 | |
Vail Resorts, Inc.* | | | 660 | | | | 32,182 | |
WMS Industries, Inc.*(a) | | | 3,130 | | | | 110,646 | |
| | | | | | | | |
| Total Hotels, Restaurants & Leisure | | | | | | | 1,272,877 | |
| | | | | | | | |
| Investments | | Shares | | | Fair Value | |
| | | | | | | | |
| Household Durables – 2.0% | | | | | | | | |
D.R. Horton, Inc. | | | 27,255 | | | $ | 317,521 | |
Harman International Industries, Inc. | | | 2,155 | | | | 100,897 | |
Jarden Corp. | | | 3,620 | | | | 128,763 | |
Leggett & Platt, Inc. | | | 10,043 | | | | 246,054 | |
Lennar Corp. Class A(a) | | | 6,741 | | | | 122,147 | |
MDC Holdings, Inc. | | | 4,283 | | | | 108,574 | |
Mohawk Industries, Inc.*(a) | | | 3,311 | | | | 202,468 | |
NVR, Inc.* | | | 379 | | | | 286,524 | |
Tempur-Pedic International, Inc.* | | | 4,826 | | | | 244,485 | |
Tupperware Brands Corp. | | | 5,882 | | | | 351,214 | |
| | | | | | | | |
| Total Household Durables | | | | | | | 2,108,647 | |
Independent Power Producers & Energy Traders – 0.0% | | | | | | | | |
Ormat Technologies, Inc.(a) | | | 957 | | | | 24,241 | |
| Industrial Conglomerates – 0.5% | | | | | | | | |
Carlisle Cos., Inc. | | | 4,246 | | | | 189,159 | |
Seaboard Corp. | | | 122 | | | | 294,386 | |
| | | | | | | | |
| Total Industrial Conglomerates | | | | | | | 483,545 | |
| Insurance – 7.6% | | | | | | | | |
Alleghany Corp.* | | | 701 | | | | 232,017 | |
American Financial Group, Inc. | | | 17,608 | | | | 616,632 | |
American National Insurance Co. | | | 1,659 | | | | 131,343 | |
Arthur J. Gallagher & Co. | | | 5,535 | | | | 168,319 | |
Assurant, Inc. | | | 17,931 | | | | 690,523 | |
Brown & Brown, Inc. | | | 7,549 | | | | 194,764 | |
CNO Financial Group, Inc.* | | | 29,810 | | | | 223,873 | |
Delphi Financial Group, Inc. Class A | | | 8,118 | | | | 249,304 | |
Erie Indemnity Co. Class A | | | 1,858 | | | | 132,122 | |
Fidelity National Financial, Inc. Class A | | | 27,856 | | | | 393,605 | |
First American Financial Corp. | | | 10,867 | | | | 179,306 | |
Hanover Insurance Group, Inc. (The) | | | 3,395 | | | | 153,624 | |
HCC Insurance Holdings, Inc. | | | 13,971 | | | | 437,432 | |
Markel Corp.*(a) | | | 684 | | | | 283,484 | |
Mercury General Corp.(a) | | | 4,573 | | | | 178,942 | |
Primerica, Inc.(a) | | | 16,835 | | | | 429,461 | |
ProAssurance Corp.* | | | 4,112 | | | | 260,577 | |
Protective Life Corp. | | | 15,361 | | | | 407,835 | |
Reinsurance Group of America, Inc. | | | 9,666 | | | | 606,832 | |
RLI Corp.(a) | | | 2,396 | | | | 138,129 | |
StanCorp Financial Group, Inc. | | | 6,087 | | | | 280,732 | |
Symetra Financial Corp. | | | 14,828 | | | | 201,661 | |
Transatlantic Holdings, Inc.(a) | | | 9,220 | | | | 448,737 | |
Unitrin, Inc. | | | 9,374 | | | | 289,469 | |
W.R. Berkley Corp. | | | 19,426 | | | | 625,711 | |
Wesco Financial Corp. | | | 239 | | | | 93,019 | |
| | | | | | | | |
| Total Insurance | | | | | | | 8,047,453 | |
| Internet & Catalog Retail – 0.1% | | | | | | | | |
HSN, Inc.* | | | 4,005 | | | | 128,280 | |
| Internet Software & Services – 0.5% | | | | | | | | |
Ancestry.com, Inc.* | | | 1,457 | | | | 51,651 | |
Digital River, Inc.*(a) | | | 846 | | | | 31,666 | |
See Notes to Financial Statements.
| | | | |
| WisdomTree Domestic and International Earnings Funds | | | 37 | |
Schedule of Investments (continued)
WisdomTree MidCap Earnings Fund (EZM)
March 31, 2011
| | | | | | | | |
| Investments | | Shares | | | Fair Value | |
| | | | | | | | |
Equinix, Inc.* | | | 605 | | | $ | 55,115 | |
j2 Global Communications, Inc.* | | | 3,129 | | | | 92,337 | |
OpenTable, Inc.*(a) | | | 245 | | | | 26,056 | |
Rackspace Hosting, Inc.*(a) | | | 1,690 | | | | 72,416 | |
ValueClick, Inc.* | | | 5,862 | | | | 84,765 | |
WebMD Health Corp.* | | | 2,398 | | | | 128,101 | |
| | | | | | | | |
| Total Internet Software & Services | | | | | | | 542,107 | |
| IT Services – 3.5% | | | | | | | | |
Acxiom Corp.* | | | 3,666 | | | | 52,607 | |
Alliance Data Systems Corp.*(a) | | | 3,435 | | | | 295,032 | |
Broadridge Financial Solutions, Inc. | | | 11,887 | | | | 269,716 | |
CACI International, Inc. Class A* | | | 2,554 | | | | 156,611 | |
Convergys Corp.* | | | 11,024 | | | | 158,305 | |
CoreLogic, Inc.* | | | 5,898 | | | | 109,113 | |
DST Systems, Inc. | | | 6,782 | | | | 358,225 | |
Gartner, Inc.*(a) | | | 3,137 | | | | 130,719 | |
Global Payments, Inc. | | | 5,552 | | | | 271,604 | |
iGate Corp.(a) | | | 2,862 | | | | 53,720 | |
Jack Henry & Associates, Inc. | | | 5,130 | | | | 173,856 | |
Lender Processing Services, Inc. | | | 12,569 | | | | 404,596 | |
Mantech International Corp. Class A* | | | 3,716 | | | | 157,558 | |
NeuStar, Inc. Class A* | | | 5,261 | | | | 134,576 | |
Sapient Corp.* | | | 9,773 | | | | 111,901 | |
SRA International, Inc. Class A* | | | 4,559 | | | | 129,293 | |
Syntel, Inc. | | | 3,012 | | | | 157,317 | |
TeleTech Holdings, Inc.* | | | 3,619 | | | | 70,136 | |
Total System Services, Inc. | | | 16,820 | | | | 303,097 | |
VeriFone Systems, Inc.* | | | 1,640 | | | | 90,118 | |
Wright Express Corp.* | | | 2,179 | | | | 112,959 | |
| | | | | | | | |
| Total IT Services | | | | | | | 3,701,059 | |
| Leisure Equipment & Products – 0.2% | | | | | | | | |
Eastman Kodak Co.*(a) | | | 6,692 | | | | 21,615 | |
Polaris Industries, Inc.(a) | | | 2,129 | | | | 185,266 | |
| | | | | | | | |
| Total Leisure Equipment & Products | | | | | | | 206,881 | |
| Life Sciences Tools & Services – 1.0% | | | | | | | | |
Bio-Rad Laboratories, Inc. Class A* | | | 1,876 | | | | 225,383 | |
Bruker Corp.* | | | 7,832 | | | | 163,297 | |
Charles River Laboratories International, Inc.*(a) | | | 855 | | | | 32,815 | |
Covance, Inc.*(a) | | | 1,928 | | | | 105,500 | |
Dionex Corp.* | | | 660 | | | | 77,913 | |
PerkinElmer, Inc. | | | 5,171 | | | | 135,842 | |
Pharmaceutical Product Development, Inc. | | | 4,570 | | | | 126,635 | |
Techne Corp. | | | 2,049 | | | | 146,708 | |
| | | | | | | | |
| Total Life Sciences Tools & Services | | | | | | | 1,014,093 | |
| Machinery – 4.2% | | | | | | | | |
Actuant Corp. Class A | | | 3,048 | | | | 88,392 | |
CLARCOR, Inc. | | | 2,672 | | | | 120,053 | |
Crane Co. | | | 4,493 | | | | 217,596 | |
Gardner Denver, Inc. | | | 2,669 | | | | 208,262 | |
Graco, Inc. | | | 3,024 | | | | 137,562 | |
Harsco Corp. | | | 4,031 | | | | 142,254 | |
IDEX Corp.(a) | | | 4,614 | | | | 201,401 | |
| | | | | | | | |
| Investments | | Shares | | | Fair Value | |
| | | | | | | | |
Kaydon Corp. | | | 1,627 | | | $ | 63,762 | |
Kennametal, Inc. | | | 2,965 | | | | 115,635 | |
Lincoln Electric Holdings, Inc. | | | 2,053 | | | | 155,864 | |
Middleby Corp.* | | | 1,036 | | | | 96,576 | |
Mueller Industries, Inc. | | | 2,032 | | | | 74,412 | |
Navistar International Corp.* | | | 5,456 | | | | 378,264 | |
Nordson Corp.(a) | | | 892 | | | | 102,634 | |
Oshkosh Corp.* | | | 28,376 | | | | 1,003,943 | |
Pentair, Inc.(a) | | | 5,991 | | | | 226,400 | |
Sauer-Danfoss, Inc.*(a) | | | 842 | | | | 42,883 | |
Snap-On, Inc. | | | 3,345 | | | | 200,901 | |
SPX Corp.(a) | | | 3,047 | | | | 241,901 | |
Toro Co. (The) | | | 1,788 | | | | 118,401 | |
Trinity Industries, Inc. | | | 3,159 | | | | 115,841 | |
Valmont Industries, Inc. | | | 1,300 | | | | 135,681 | |
Wabtec Corp. | | | 2,782 | | | | 188,703 | |
Watts Water Technologies, Inc. Class A | | | 2,239 | | | | 85,507 | |
| | | | | | | | |
| Total Machinery | | | | | | | 4,462,828 | |
| Marine – 0.3% | | | | | | | | |
Alexander & Baldwin, Inc.(a) | | | 1,804 | | | | 82,352 | |
Kirby Corp.*(a) | | | 3,209 | | | | 183,844 | |
| | | | | | | | |
| Total Marine | | | | | | | 266,196 | |
| Media – 2.1% | | | | | | | | |
Cinemark Holdings, Inc.(a) | | | 10,278 | | | | 198,879 | |
DreamWorks Animation SKG, Inc. Class A*(a) | | | 5,333 | | | | 148,951 | |
Gannett Co., Inc. | | | 39,286 | | | | 598,326 | |
John Wiley & Sons, Inc. Class A | | | 4,346 | | | | 220,951 | |
Madison Square Garden, Inc. Class A* | | | 3,709 | | | | 100,106 | |
Meredith Corp.(a) | | | 3,629 | | | | 123,096 | |
Morningstar, Inc.(a) | | | 1,748 | | | | 102,048 | |
New York Times Co. (The) Class A* | | | 7,313 | | | | 69,254 | |
Regal Entertainment Group Class A(a) | | | 9,154 | | | | 123,579 | |
Valassis Communications, Inc.* | | | 3,067 | | | | 89,372 | |
Washington Post Co. (The) Class B(a) | | | 933 | | | | 408,243 | |
| | | | | | | | |
| Total Media | | | | | | | 2,182,805 | |
| Metals & Mining – 1.3% | | | | | | | | |
AK Steel Holding Corp. | | | 4,968 | | | | 78,395 | |
Allied Nevada Gold Corp.* | | | 2,144 | | | | 76,069 | |
Compass Minerals International, Inc.(a) | | | 2,096 | | | | 196,039 | |
Globe Specialty Metals, Inc. | | | 1,326 | | | | 30,180 | |
Hecla Mining Co.*(a) | | | 8,493 | | | | 77,117 | |
Reliance Steel & Aluminum Co. | | | 6,250 | | | | 361,125 | |
Royal Gold, Inc. | | | 658 | | | | 34,479 | |
Schnitzer Steel Industries, Inc. Class A | | | 1,559 | | | | 101,351 | |
Steel Dynamics, Inc. | | | 11,520 | | | | 216,230 | |
Stillwater Mining Co.* | | | 1,772 | | | | 40,632 | |
Titanium Metals Corp.* | | | 4,524 | | | | 84,056 | |
Worthington Industries, Inc.(a) | | | 5,207 | | | | 108,930 | |
| | | | | | | | |
| Total Metals & Mining | | | | | | | 1,404,603 | |
| Multiline Retail – 0.7% | | | | | | | | |
99 Cents Only Stores*(a) | | | 5,472 | | | | 107,251 | |
Big Lots, Inc.* | | | 9,837 | | | | 427,221 | |
See Notes to Financial Statements.
| | |
| 38 | | WisdomTree Domestic and International Earnings Funds |
Schedule of Investments (continued)
WisdomTree MidCap Earnings Fund (EZM)
March 31, 2011
| | | | | | | | |
| Investments | | Shares | | | Fair Value | |
| | | | | | | | |
Dillard’s, Inc. Class A(a) | | | 4,889 | | �� | $ | 196,147 | |
Saks, Inc.*(a) | | | 1,835 | | | | 20,754 | |
| | | | | | | | |
| Total Multiline Retail | | | | | | | 751,373 | |
| Multi-Utilities – 1.2% | | | | | | | | |
Avista Corp. | | | 5,322 | | | | 123,098 | |
Black Hills Corp.(a) | | | 2,631 | | | | 87,981 | |
Integrys Energy Group, Inc. | | | 4,422 | | | | 223,355 | |
MDU Resources Group, Inc. | | | 14,508 | | | | 333,249 | |
TECO Energy, Inc. | | | 16,865 | | | | 316,387 | |
Vectren Corp. | | | 6,880 | | | | 187,136 | |
| | | | | | | | |
| Total Multi-Utilities | | | | | | | 1,271,206 | |
| Office Electronics – 0.1% | | | | | | | | |
Zebra Technologies Corp. Class A* | | | 2,917 | | | | 114,463 | |
| Oil, Gas & Consumable Fuels – 2.8% | | | | | | | | |
Berry Petroleum Co. Class A | | | 2,894 | | | | 146,002 | |
Bill Barrett Corp.*(a) | | | 3,232 | | | | 128,989 | |
Brigham Exploration Co.* | | | 1,426 | | | | 53,019 | |
Cabot Oil & Gas Corp. | | | 3,072 | | | | 162,724 | |
EXCO Resources, Inc. | | | 39,731 | | | | 820,842 | |
Forest Oil Corp.* | | | 8,687 | | | | 328,629 | |
Holly Corp.(a) | | | 1,590 | | | | 96,608 | |
International Coal Group, Inc.* | | | 1,906 | | | | 21,538 | |
Northern Oil and Gas, Inc.*(a) | | | 385 | | | | 10,280 | |
Quicksilver Resources, Inc.* | | | 9,965 | | | | 142,599 | |
Rosetta Resources, Inc.*(a) | | | 985 | | | | 46,827 | |
SM Energy Co. | | | 1,414 | | | | 104,905 | |
Southern Union Co. | | | 10,545 | | | | 301,798 | |
Swift Energy Co.* | | | 1,601 | | | | 68,331 | |
W&T Offshore, Inc.(a) | | | 11,503 | | | | 262,153 | |
World Fuel Services Corp. | | | 5,423 | | | | 220,228 | |
| | | | | | | | |
| Total Oil, Gas & Consumable Fuels | | | | | | | 2,915,472 | |
| Paper & Forest Products – 0.1% | | | | | | | | |
Schweitzer-Mauduit International, Inc. | | | 1,390 | | | | 70,348 | |
| Personal Products – 0.3% | | | | | | | | |
Alberto-Culver Co. | | | 5,082 | | | | 189,406 | |
Nu Skin Enterprises, Inc. Class A(a) | | | 5,057 | | | | 145,389 | |
| | | | | | | | |
| Total Personal Products | | | | | | | 334,795 | |
| Pharmaceuticals – 0.8% | | | | | | | | |
Impax Laboratories, Inc.* | | | 17,696 | | | | 450,363 | |
Medicis Pharmaceutical Corp. Class A | | | 5,905 | | | | 189,196 | |
Par Pharmaceutical Cos., Inc.* | | | 2,584 | | | | 80,311 | |
Viropharma, Inc.*(a) | | | 7,185 | | | | 142,982 | |
| | | | | | | | |
| Total Pharmaceuticals | | | | | | | 862,852 | |
| Professional Services – 0.5% | | | | | | | | |
Corporate Executive Board Co. (The) | | | 1,598 | | | | 64,512 | |
CoStar Group, Inc.*(a) | | | 328 | | | | 20,559 | |
Dun & Bradstreet Corp.(a) | | | 3,188 | | | | 255,805 | |
FTI Consulting, Inc.*(a) | | | 3,340 | | | | 128,022 | |
Towers Watson & Co. Class A | | | 1,876 | | | | 104,043 | |
| | | | | | | | |
| Total Professional Services | | | | | | | 572,941 | |
| | | | | | | | |
| Investments | | Shares | | | Fair Value | |
| | | | | | | | |
| Real Estate Investment Trusts (REITs) – 1.7% | | | | | | | | |
Alexander’s, Inc. | | | 203 | | | $ | 82,611 | |
Alexandria Real Estate Equities, Inc. | | | 765 | | | | 59,647 | |
American Campus Communities, Inc. | | | 623 | | | | 20,559 | |
BioMed Realty Trust, Inc. | | | 1,022 | | | | 19,438 | |
BRE Properties, Inc. | | | 234 | | | | 11,040 | |
CommonWealth REIT | | | 2,488 | | | | 64,613 | |
Corporate Office Properties Trust SBI MD(a) | | | 660 | | | | 23,852 | |
DuPont Fabros Technology, Inc.(a) | | | 732 | | | | 17,751 | |
EastGroup Properties, Inc.(a) | | | 617 | | | | 27,129 | |
Entertainment Properties Trust(a) | | | 1,826 | | | | 85,493 | |
Equity Lifestyle Properties, Inc. | | | 916 | | | | 52,807 | |
Equity One, Inc.(a) | | | 1,737 | | | | 32,604 | |
Essex Property Trust, Inc. | | | 390 | | | | 48,360 | |
Extra Space Storage, Inc. | | | 1,804 | | | | 37,361 | |
Healthcare Realty Trust, Inc. | | | 730 | | | | 16,571 | |
Highwoods Properties, Inc.(a) | | | 1,066 | | | | 37,321 | |
Home Properties, Inc. | | | 375 | | | | 22,106 | |
Hospitality Properties Trust | | | 6,655 | | | | 154,063 | |
Liberty Property Trust(a) | | | 1,682 | | | | 55,338 | |
Mack-Cali Realty Corp. | | | 1,805 | | | | 61,190 | |
Medical Properties Trust, Inc.(a) | | | 2,077 | | | | 24,031 | |
Mid-America Apartment Communities, Inc.(a) | | | 309 | | | | 19,838 | |
National Health Investors, Inc.(a) | | | 1,810 | | | | 86,735 | |
National Retail Properties, Inc.(a) | | | 1,944 | | | | 50,797 | |
Omega Healthcare Investors, Inc. | | | 3,455 | | | | 77,185 | |
Potlatch Corp.(a) | | | 973 | | | | 39,115 | |
PS Business Parks, Inc. | | | 842 | | | | 48,785 | |
Realty Income Corp.(a) | | | 3,546 | | | | 123,933 | |
Regency Centers Corp. | | | 1,460 | | | | 63,481 | |
Senior Housing Properties Trust | | | 6,867 | | | | 158,216 | |
Tanger Factory Outlet Centers | | | 1,380 | | | | 36,211 | |
Taubman Centers, Inc. | | | 440 | | | | 23,575 | |
Washington Real Estate Investment Trust | | | 1,041 | | | | 32,365 | |
Weingarten Realty Investors(a) | | | 2,040 | | | | 51,122 | |
| | | | | | | | |
| Total Real Estate Investment Trusts (REITs) | | | | | | | 1,765,243 | |
| Real Estate Management & Development – 0.3% | | | | | | | | |
Forest City Enterprises, Inc. Class A*(a) | | | 8,345 | | | | 157,136 | |
Jones Lang LaSalle, Inc. | | | 1,789 | | | | 178,435 | |
| | | | | | | | |
| Total Real Estate Management & Development | | | | | | | 335,571 | |
| Road & Rail – 1.0% | | | | | | | | |
Amerco, Inc.* | | | 1,547 | | | | 150,059 | |
Avis Budget Group, Inc.* | | | 3,518 | | | | 63,007 | |
Con-way, Inc.(a) | | | 185 | | | | 7,269 | |
Dollar Thrifty Automotive Group* | | | 2,079 | | | | 138,732 | |
Genesee & Wyoming, Inc. Class A*(a) | | | 1,777 | | | | 103,421 | |
Heartland Express, Inc.(a) | | | 3,731 | | | | 65,516 | |
Knight Transportation, Inc. | | | 3,655 | | | | 70,359 | |
Landstar System, Inc. | | | 2,566 | | | | 117,215 | |
Old Dominion Freight Line, Inc.* | | | 2,587 | | | | 90,778 | |
Ryder System, Inc. | | | 2,318 | | | | 117,291 | |
Werner Enterprises, Inc.(a) | | | 3,951 | | | | 104,583 | |
| | | | | | | | |
| Total Road & Rail | | | | | | | 1,028,230 | |
See Notes to Financial Statements.
| | | | |
| WisdomTree Domestic and International Earnings Funds | | | 39 | |
Schedule of Investments (continued)
WisdomTree MidCap Earnings Fund (EZM)
March 31, 2011
| | | | | | | | |
| Investments | | Shares | | | Fair Value | |
| | | | | | | | |
Semiconductors & Semiconductor
Equipment – 4.4% | | | | | | | | |
Amkor Technology, Inc.*(a) | | | 45,184 | | | $ | 304,540 | |
Atheros Communications, Inc.* | | | 3,447 | | | | 153,909 | |
Cymer, Inc.*(a) | | | 1,978 | | | | 111,915 | |
Cypress Semiconductor Corp.* | | | 4,797 | | | | 92,966 | |
Diodes, Inc.* | | | 3,007 | | | | 102,418 | |
Fairchild Semiconductor International, Inc.*(a) | | | 10,109 | | | | 183,984 | |
Hittite Microwave Corp.*(a) | | | 1,409 | | | | 89,852 | |
International Rectifier Corp.* | | | 4,990 | | | | 164,969 | |
Intersil Corp. Class A(a) | | | 1,462 | | | | 18,202 | |
LSI Corp.* | | | 22,976 | | | | 156,237 | |
MEMC Electronic Materials, Inc.* | | | 216 | | | | 2,799 | |
Microsemi Corp.* | | | 3,179 | | | | 65,837 | |
National Semiconductor Corp. | | | 23,050 | | | | 330,537 | |
Novellus Systems, Inc.*(a) | | | 8,230 | | | | 305,580 | |
Omnivision Technologies, Inc.*(a) | | | 2,248 | | | | 79,871 | |
ON Semiconductor Corp.* | | | 40,545 | | | | 400,179 | |
PMC – Sierra, Inc.* | | | 13,476 | | | | 101,070 | |
Power Integrations, Inc. | | | 1,623 | | | | 62,210 | |
Rambus, Inc.* | | | 1,031 | | | | 20,414 | |
RF Micro Devices, Inc.*(a) | | | 18,548 | | | | 118,893 | |
Semtech Corp.* | | | 811 | | | | 20,291 | |
Silicon Laboratories, Inc.* | | | 2,726 | | | | 117,790 | |
Spansion, Inc. Class A* | | | 17,610 | | | | 328,779 | |
SunPower Corp. Class A*(a) | | | 2,469 | | | | 42,319 | |
Teradyne, Inc.* | | | 30,046 | | | | 535,119 | |
TriQuint Semiconductor, Inc.*(a) | | | 17,165 | | | | 221,600 | |
Varian Semiconductor Equipment Associates, Inc.* | | | 5,660 | | | | 275,472 | |
Veeco Instruments, Inc.* | | | 5,246 | | | | 266,707 | |
| | | | | | | | |
| Total Semiconductors & Semiconductor Equipment | | | | | | | 4,674,459 | |
| Software – 1.7% | | | | | | | | |
Advent Software, Inc.* | | | 893 | | | | 25,602 | |
Ariba, Inc.*(a) | | | 580 | | | | 19,801 | |
Blackbaud, Inc. | | | 1,349 | | | | 36,747 | |
Blackboard, Inc.*(a) | | | 612 | | | | 22,179 | |
Cadence Design Systems, Inc.* | | | 23,397 | | | | 228,121 | |
CommVault Systems, Inc.* | | | 890 | | | | 35,493 | |
Compuware Corp.*(a) | | | 9,241 | | | | 106,733 | |
Concur Technologies, Inc.*(a) | | | 512 | | | | 28,390 | |
Fortinet, Inc.* | | | 2,748 | | | | 120,912 | |
Informatica Corp.* | | | 2,122 | | | | 110,832 | |
JDA Software Group, Inc.* | | | 764 | | | | 23,119 | |
Lawson Software, Inc.* | | | 2,300 | | | | 27,830 | |
Mentor Graphics Corp.* | | | 1,993 | | | | 29,158 | |
MICROS Systems, Inc.* | | | 3,344 | | | | 165,294 | |
Parametric Technology Corp.* | | | 802 | | | | 18,037 | |
Pegasystems, Inc. | | | 244 | | | | 9,257 | |
Progress Software Corp.* | | | 1,962 | | | | 57,075 | |
Quest Software, Inc.* | | | 4,129 | | | | 104,835 | |
SolarWinds, Inc.* | | | 2,439 | | | | 57,219 | |
Solera Holdings, Inc. | | | 2,234 | | | | 114,157 | |
SS&C Technologies Holdings, Inc.* | | | 1,683 | | | | 34,367 | |
| | | | | | | | |
| Investments | | Shares | | | Fair Value | |
| | | | | | | | |
Synopsys, Inc.* | | | 10,737 | | | $ | 296,878 | |
Taleo Corp. Class A* | | | 163 | | | | 5,811 | |
TIBCO Software, Inc.* | | | 4,419 | | | | 120,418 | |
Ultimate Software Group, Inc.* | | | 108 | | | | 6,345 | |
| | | | | | | | |
| Total Software | | | | | | | 1,804,610 | |
| Specialty Retail – 4.8% | | | | | | | | |
Aaron’s, Inc.(a) | | | 6,792 | | | | 172,245 | |
Aeropostale, Inc.* | | | 13,036 | | | | 317,035 | |
American Eagle Outfitters, Inc. | | | 12,595 | | | | 200,135 | |
Ann, Inc.* | | | 3,083 | | | | 89,746 | |
Ascena Retail Group, Inc.*(a) | | | 7,804 | | | | 252,928 | |
AutoNation, Inc.*(a) | | | 10,400 | | | | 367,848 | |
Buckle, Inc. (The)(a) | | | 4,020 | | | | 162,408 | |
Cabela’s, Inc.* | | | 3,499 | | | | 87,510 | |
Chico’s FAS, Inc. | | | 11,769 | | | | 175,358 | |
Childrens Place Retail Stores, Inc. (The)* | | | 2,104 | | | | 104,842 | |
Collective Brands, Inc.* | | | 6,318 | | | | 136,342 | |
Dick’s Sporting Goods, Inc.* | | | 5,567 | | | | 222,569 | |
DSW, Inc. Class A*(a) | | | 3,320 | | | | 132,667 | |
Express, Inc. | | | 9,407 | | | | 183,813 | |
Foot Locker, Inc. | | | 8,194 | | | | 161,586 | |
GameStop Corp. Class A*(a) | | | 22,261 | | | | 501,318 | |
JOS A Bank Clothiers, Inc.*(a) | | | 2,495 | | | | 126,946 | |
Men’s Wearhouse, Inc. (The)(a) | | | 2,856 | | | | 77,283 | |
OfficeMax, Inc.*(a) | | | 2,962 | | | | 38,328 | |
Penske Automotive Group, Inc.* | | | 7,563 | | | | 151,411 | |
Pier 1 Imports, Inc.*(a) | | | 11,407 | | | | 115,781 | |
RadioShack Corp. | | | 15,390 | | | | 231,004 | |
Rent-A-Center, Inc. | | | 7,562 | | | | 263,989 | |
Sally Beauty Holdings, Inc.*(a) | | | 12,575 | | | | 176,176 | |
Tractor Supply Co. | | | 4,099 | | | | 245,366 | |
Ulta Salon Cosmetics & Fragrance, Inc.*(a) | | | 2,106 | | | | 101,362 | |
Williams-Sonoma, Inc. | | | 6,232 | | | | 252,396 | |
| | | | | | | | |
| Total Specialty Retail | | | | | | | 5,048,392 | |
| Textiles, Apparel & Luxury Goods – 1.7% | | | | | | | | |
Carter’s, Inc.* | | | 5,665 | | | | 162,189 | |
Columbia Sportswear Co. | | | 1,558 | | | | 92,576 | |
CROCS, Inc.* | | | 3,581 | | | | 63,885 | |
Deckers Outdoor Corp.* | | | 2,047 | | | | 176,349 | |
Hanesbrands, Inc.* | | | 8,835 | | | | 238,898 | |
Iconix Brand Group, Inc.* | | | 5,720 | | | | 122,866 | |
Jones Group, Inc. (The) | | | 5,154 | | | | 70,868 | |
Skechers U.S.A., Inc. Class A*(a) | | | 9,415 | | | | 193,384 | |
Steven Madden Ltd.* | | | 2,018 | | | | 94,705 | |
Timberland Co. (The) Class A* | | | 4,173 | | | | 172,303 | |
Under Armour, Inc. Class A*(a) | | | 1,376 | | | | 93,637 | |
Warnaco Group, Inc. (The)* | | | 3,076 | | | | 175,916 | |
Wolverine World Wide, Inc. | | | 3,779 | | | | 140,881 | |
| | | | | | | | |
| Total Textiles, Apparel & Luxury Goods | | | | | | | 1,798,457 | |
| Thrifts & Mortgage Finance – 0.6% | | | | | | | | |
Astoria Financial Corp. | | | 5,271 | | | | 75,744 | |
Capitol Federal Financial, Inc. | | | 7,834 | | | | 88,289 | |
See Notes to Financial Statements.
| | |
| 40 | | WisdomTree Domestic and International Earnings Funds |
Schedule of Investments (concluded)
WisdomTree MidCap Earnings Fund (EZM)
March 31, 2011
| | | | | | | | |
| Investments | | Shares | | | Fair Value | |
First Niagara Financial Group, Inc.(a) | | | 11,298 | | | $ | 153,427 | |
NewAlliance Bancshares, Inc. | | | 5,049 | | | | 74,927 | |
Northwest Bancshares, Inc. | | | 5,044 | | | | 63,252 | |
TFS Financial Corp.(a) | | | 1,943 | | | | 20,635 | |
Washington Federal, Inc. | | | 9,247 | | | | 160,343 | |
| | | | | | | | |
| Total Thrifts & Mortgage Finance | | | | | | | 636,617 | |
| Tobacco – 0.1% | | | | | | | | |
Vector Group Ltd.(a) | | | 3,982 | | | | 68,849 | |
| Trading Companies & Distributors – 0.6% | | | | | | | | |
Applied Industrial Technologies, Inc. | | | 3,010 | | | | 100,113 | |
GATX Corp.(a) | | | 2,454 | | | | 94,872 | |
MSC Industrial Direct Co. Class A | | | 2,865 | | | | 196,166 | |
Watsco, Inc.(a) | | | 1,359 | | | | 94,736 | |
WESCO International, Inc.*(a) | | | 2,471 | | | | 154,437 | |
| | | | | | | | |
| Total Trading Companies & Distributors | | | | | | | 640,324 | |
| Water Utilities – 0.2% | | | | | | | | |
Aqua America, Inc. | | | 6,732 | | | | 154,096 | |
| Wireless Telecommunication Services – 0.4% | | | | | | | | |
Telephone & Data Systems, Inc.(a) | | | 5,398 | | | | 181,912 | |
United States Cellular Corp.* | | | 4,032 | | | | 207,608 | |
| | | | | | | | |
| Total Wireless Telecommunication Services | | | | | | | 389,520 | |
TOTAL COMMON STOCKS
(Cost: $93,411,906) | | | | | | | 105,117,356 | |
| EXCHANGE-TRADED FUND – 0.5% | | | | | | | | |
WisdomTree MidCap Dividend Fund(b)
(Cost: $481,384) | | | 10,322 | | | | 557,285 | |
| SHORT-TERM INVESTMENT – 0.2% | | | | | | | | |
| MONEY MARKET FUND – 0.2% | | | | | | | | |
Invesco Treasury Fund Private Class, 0.02%(c)
(Cost: $158,233) | | | 158,233 | | | | 158,233 | |
| INVESTMENT OF CASH COLLATERAL FOR SECURITIES LOANED – 22.6% | | | | | | | | |
| MONEY MARKET FUND – 22.6% | | | | | | | | |
Dreyfus Institutional Preferred Money Market Fund, 0.19%(d) | | | | | | | | |
| (Cost: $23,904,000)(e) | | | 23,904,000 | | | | 23,904,000 | |
TOTAL INVESTMENTS IN SECURITIES – 122.7%
(Cost: $117,955,523) | | | | | | | 129,736,874 | |
Liabilities in Excess of Other Assets – (22.7)% | | | | | | | (23,991,533 | ) |
| | | | | | | | |
| NET ASSETS – 100.0% | | | | | | $ | 105,745,341 | |
| * | Non-income producing security. |
| (a) | Security, or portion thereof, was on loan at March 31, 2011 (See Note 2). |
| (b) | Affiliated companies (See Note 7). |
| (c) | Rate shown represents annualized 7-day yield as of March 31, 2011. |
| (d) | Interest rate shown reflects yield as of March 31, 2011. |
| (e) | At March 31, 2011, the total market value of the Fund’s securities on loan was $23,243,626 and the total market value of the collateral held by the Fund was $23,904,000. |
See Notes to Financial Statements.
| | | | |
| WisdomTree Domestic and International Earnings Funds | | | 41 | |
Schedule of Investments
WisdomTree SmallCap Earnings Fund (EES)
March 31, 2011
| | | | | | | | |
| Investments | | Shares | | | Fair
Value | |
| | | | | | | | |
| COMMON STOCKS – 99.3% | | | | | | | | |
| Aerospace & Defense – 1.4% | | | | | | | | |
AAR Corp.*(a) | | | 8,497 | | | $ | 235,537 | |
Aerovironment, Inc.* | | | 3,962 | | | | 138,551 | |
American Science & Engineering, Inc. | | | 2,371 | | | | 218,986 | |
Astronics Corp.*(a) | | | 2,187 | | | | 55,047 | |
Ceradyne, Inc.* | | | 5,140 | | | | 231,711 | |
Ducommun, Inc.(a) | | | 4,553 | | | | 108,817 | |
GeoEye, Inc.* | | | 2,167 | | | | 90,104 | |
Global Defense Technology & Systems, Inc.* | | | 996 | | | | 24,123 | |
Kratos Defense & Security Solutions, Inc.* | | | 5,742 | | | | 81,766 | |
Ladish Co., Inc.* | | | 2,667 | | | | 145,751 | |
LMI Aerospace, Inc.*(a) | | | 4,137 | | | | 83,609 | |
National Presto Industries, Inc.(a) | | | 2,392 | | | | 269,531 | |
Orbital Sciences Corp.* | | | 10,033 | | | | 189,824 | |
| | | | | | | | |
| Total Aerospace & Defense | | | | | | | 1,873,357 | |
| Air Freight & Logistics – 0.3% | | | | | | | | |
Air Transport Services Group, Inc.*(a) | | | 25,837 | | | | 218,323 | |
Forward Air Corp.(a) | | | 4,543 | | | | 139,152 | |
Pacer International, Inc.*(a) | | | 9,093 | | | | 47,829 | |
Park-Ohio Holdings Corp.* | | | 2,235 | | | | 46,175 | |
| | | | | | | | |
| Total Air Freight & Logistics | | | | | | | 451,479 | |
| Airlines – 1.4% | | | | | | | | |
AirTran Holdings, Inc.* | | | 36,177 | | | | 269,518 | |
Allegiant Travel Co.(a) | | | 6,528 | | | | 285,992 | |
Hawaiian Holdings, Inc.* | | | 44,329 | | | | 266,417 | |
Pinnacle Airlines Corp.* | | | 15,357 | | | | 88,303 | |
Republic Airways Holdings, Inc.*(a) | | | 80,326 | | | | 516,496 | |
Skywest, Inc. | | | 23,728 | | | | 401,478 | |
| | | | | | | | |
| Total Airlines | | | | | | | 1,828,204 | |
| Auto Components – 1.3% | | | | | | | | |
American Axle & Manufacturing Holdings, Inc.* | | | 29,684 | | | | 373,721 | |
Amerigon, Inc.*(a) | | | 3,356 | | | | 51,246 | |
Dorman Products, Inc.*(a) | | | 5,542 | | | | 233,263 | |
Drew Industries, Inc. | | | 6,091 | | | | 136,012 | |
Exide Technologies* | | | 30,348 | | | | 339,291 | |
Fuel Systems Solutions, Inc.*(a) | | | 9,792 | | | | 295,522 | |
Motorcar Parts of America, Inc.* | | | 4,162 | | | | 58,185 | |
Spartan Motors, Inc. | | | 3,131 | | | | 21,479 | |
Standard Motor Products, Inc. | | | 5,323 | | | | 73,617 | |
Stoneridge, Inc.*(a) | | | 1,795 | | | | 26,243 | |
Superior Industries International, Inc.(a) | | | 6,847 | | | | 175,557 | |
| | | | | | | | |
| Total Auto Components | | | | | | | 1,784,136 | |
| Automobiles – 0.0% | | | | | | | | |
Winnebago Industries, Inc. | | | 612 | | | | 8,182 | |
| Beverages – 0.3% | | | | | | | | |
Coca-Cola Bottling Co. Consolidated | | | 3,035 | | | | 202,859 | |
MGP Ingredients, Inc. | | | 4,207 | | | | 36,685 | |
National Beverage Corp. | | | 13,379 | | | | 183,694 | |
| | | | | | | | |
| Total Beverages | | | | | | | 423,238 | |
| | | | | | | | |
| Investments | | Shares | | | Fair
Value | |
| | | | | | | | |
| Biotechnology – 1.6% | | | | | | | | |
Ariad Pharmaceuticals, Inc.*(a) | | | 109,429 | | | $ | 822,906 | |
Emergent Biosolutions, Inc.* | | | 6,719 | | | | 162,331 | |
Genomic Health, Inc.* | | | 405 | | | | 9,963 | |
GTX, Inc.*(a) | | | 22,020 | | | | 56,592 | |
NABI Biopharmaceuticals* | | | 6,852 | | | | 39,810 | |
Osiris Therapeutics, Inc.*(a) | | | 4,822 | | | | 35,008 | |
PDL BioPharma, Inc. | | | 116,334 | | | | 674,737 | |
Rigel Pharmaceuticals, Inc.*(a) | | | 18,066 | | | | 128,449 | |
Sciclone Pharmaceuticals, Inc.* | | | 23,471 | | | | 94,823 | |
Supergen, Inc.* | | | 18,750 | | | | 58,125 | |
Zalicus, Inc.*(a) | | | 6,420 | | | | 15,536 | |
| | | | | | | | |
| Total Biotechnology | | | | | | | 2,098,280 | |
| Building Products – 0.4% | | | | | | | | |
AAON, Inc.(a) | | | 3,964 | | | | 130,416 | |
Ameron International Corp. | | | 1,576 | | | | 109,989 | |
Apogee Enterprises, Inc. | | | 1,293 | | | | 17,055 | |
Griffon Corp.*(a) | | | 3,933 | | | | 51,640 | |
Insteel Industries, Inc.(a) | | | 573 | | | | 8,102 | |
Quanex Building Products Corp. | �� | | 8,452 | | | | 165,913 | |
Universal Forest Products, Inc.(a) | | | 2,210 | | | | 80,996 | |
| | | | | | | | |
| Total Building Products | | | | | | | 564,111 | |
| Capital Markets – 4.5% | | | | | | | | |
Arlington Asset Investment Corp. Class A | | | 3,694 | | | | 112,445 | |
Artio Global Investors, Inc. Class A | | | 28,613 | | | | 462,386 | |
BlackRock Kelso Capital Corp.(a) | | | 36,105 | | | | 365,744 | |
Calamos Asset Management, Inc. Class A | | | 6,972 | | | | 115,666 | |
Capital Southwest Corp. | | | 3,104 | | | | 284,109 | |
Cohen & Steers, Inc.(a) | | | 8,768 | | | | 260,234 | |
Diamond Hill Investment Group, Inc. | | | 788 | | | | 63,040 | |
Duff & Phelps Corp. Class A | | | 4,318 | | | | 69,002 | |
Epoch Holding Corp. | | | 3,393 | | | | 53,542 | |
Fifth Street Finance Corp.(a) | | | 10,681 | | | | 142,591 | |
Financial Engines, Inc.*(a) | | | 17,304 | | | | 476,898 | |
GFI Group, Inc. | | | 7,602 | | | | 38,162 | |
Gladstone Capital Corp.(a) | | | 6,627 | | | | 74,951 | |
Gladstone Investment Corp. | | | 9,069 | | | | 70,375 | |
Gleacher & Co., Inc.* | | | 4,101 | | | | 7,136 | |
Golub Capital BDC, Inc. | | | 5,490 | | | | 86,632 | |
Harris & Harris Group, Inc.* | | | 3,981 | | | | 21,418 | |
Hercules Technology Growth Capital, Inc. | | | 652 | | | | 7,172 | |
HFF, Inc. Class A* | | | 4,067 | | | | 61,168 | |
International. FCStone, Inc.*(a) | | | 2,908 | | | | 73,921 | |
Internet Capital Group, Inc.* | | | 12,270 | | | | 174,234 | |
Investment Technology Group, Inc.* | | | 5,271 | | | | 95,880 | |
JMP Group, Inc.(a) | | | 5,799 | | | | 49,929 | |
KBW, Inc.(a) | | | 4,501 | | | | 117,881 | |
Main Street Capital Corp.(a) | | | 8,849 | | | | 163,264 | |
MCG Capital Corp.(a) | | | 4,078 | | | | 26,507 | |
Medallion Financial Corp. | | | 891 | | | | 7,832 | |
MVC Capital, Inc. | | | 11,084 | | | | 152,073 | |
Oppenheimer Holdings, Inc. Class A | | | 5,612 | | | | 188,058 | |
optionsXpress Holdings, Inc. | | | 13,901 | | | | 254,527 | |
See Notes to Financial Statements.
| | |
| 42 | | WisdomTree Domestic and International Earnings Funds |
Schedule of Investments (continued)
WisdomTree SmallCap Earnings Fund (EES)
March 31, 2011
| | | | | | | | |
| Investments | | Shares | | | Fair
Value | |
| | | | | | | | |
PennantPark Investment Corp. | | | 15,152 | | | $ | 180,612 | |
Piper Jaffray Cos.* | | | 3,320 | | | | 137,548 | |
Prospect Capital Corp.(a) | | | 35,939 | | | | 438,815 | |
Solar Capital Ltd. | | | 28,785 | | | | 687,386 | |
TICC Capital Corp. | | | 23,797 | | | | 258,673 | |
TradeStation Group, Inc.*(a) | | | 10,684 | | | | 75,002 | |
Triangle Capital Corp.(a) | | | 7,387 | | | | 133,409 | |
US Global Investors, Inc. Class A | | | 2,886 | | | | 23,405 | |
Virtus Investment Partners, Inc.* | | | 231 | | | | 13,611 | |
Westwood Holdings Group, Inc. | | | 1,357 | | | | 54,619 | |
| | | | | | | | |
| Total Capital Markets | | | | | | | 6,079,857 | |
| Chemicals – 2.9% | | | | | | | | |
A. Schulman, Inc.(a) | | | 9,137 | | | | 225,867 | |
Arch Chemicals, Inc. | | | 8,541 | | | | 355,220 | |
Balchem Corp. | | | 4,607 | | | | 172,855 | |
Calgon Carbon Corp.*(a) | | | 13,983 | | | | 222,050 | |
H.B. Fuller Co.(a) | | | 11,861 | | | | 254,774 | |
Hawkins, Inc. | | | 2,755 | | | | 113,175 | |
Innophos Holdings, Inc. | | | 4,405 | | | | 203,115 | |
Innospec, Inc.* | | | 13,612 | | | | 434,767 | |
KMG Chemicals, Inc. | | | 4,549 | | | | 89,433 | |
Koppers Holdings, Inc. | | | 3,703 | | | | 158,118 | |
Kraton Performance Polymers, Inc.* | | | 14,475 | | | | 553,669 | |
Landec Corp.* | | | 4,643 | | | | 30,180 | |
LSB Industries, Inc.* | | | 1,802 | | | | 71,431 | |
NL Industries, Inc.(a) | | | 5,864 | | | | 87,080 | |
Omnova Solutions, Inc.* | | | 11,408 | | | | 89,781 | |
Quaker Chemical Corp. | | | 4,161 | | | | 167,147 | |
Spartech Corp.*(a) | | | 3,894 | | | | 28,232 | |
Stepan Co.(a) | | | 4,180 | | | | 303,050 | |
STR Holdings, Inc.*(a) | | | 10,983 | | | | 210,654 | |
Zagg, Inc.*(a) | | | 3,923 | | | | 29,462 | |
Zep, Inc.(a) | | | 3,278 | | | | 57,070 | |
| | | | | | | | |
| Total Chemicals | | | | | | | 3,857,130 | |
| Commercial Banks – 6.2% | | | | | | | | |
1st Source Corp.(a) | | | 6,921 | | | | 138,697 | |
1st United Bancorp, Inc./Boca Raton* | | | 5,298 | | | | 37,192 | |
Ameris Bancorp*(a) | | | 672 | | | | 6,828 | |
Arrow Financial Corp.(a) | | | 3,954 | | | | 97,822 | |
Bancfirst Corp. | | | 4,944 | | | | 211,010 | |
Bancorp Rhode Island, Inc. | | | 1,411 | | | | 43,558 | |
BancorpSouth, Inc.(a) | | | 1,379 | | | | 21,306 | |
Bank of Marin Bancorp | | | 1,809 | | | | 67,512 | |
Bank of the Ozarks, Inc.(a) | | | 6,860 | | | | 299,851 | |
Bryn Mawr Bank Corp.(a) | | | 1,971 | | | | 40,543 | |
Camden National Corp.(a) | | | 2,892 | | | | 99,022 | |
Cardinal Financial Corp. | | | 7,921 | | | | 92,359 | |
Chemical Financial Corp.(a) | | | 3,526 | | | | 70,273 | |
Citizens & Northern Corp. | | | 5,173 | | | | 86,958 | |
City Holding Co.(a) | | | 5,484 | | | | 193,914 | |
Columbia Banking System, Inc. | | | 3,251 | | | | 62,322 | |
Community Bank System, Inc.(a) | | | 10,941 | | | | 265,538 | |
Community Trust Bancorp, Inc.(a) | | | 5,316 | | | | 147,094 | |
| | | | | | | | |
| Investments | | Shares | | | Fair
Value | |
| | | | | | | | |
CVB Financial Corp.(a) | | | 41,004 | | | $ | 381,747 | |
Danvers Bancorp, Inc. | | | 4,753 | | | | 101,809 | |
Eagle Bancorp, Inc.* | | | 4,410 | | | | 61,960 | |
Enterprise Financial Services Corp. | | | 583 | | | | 8,203 | |
Financial Institutions, Inc. | | | 4,326 | | | | 75,705 | |
First Bancorp | | | 4,754 | | | | 63,038 | |
First Commonwealth Financial Corp.(a) | | | 9,397 | | | | 64,369 | |
First Financial Bancorp(a) | | | 14,536 | | | | 242,606 | |
First Financial Bankshares, Inc.(a) | | | 5,454 | | | | 280,172 | |
First Financial Corp.(a) | | | 3,466 | | | | 115,210 | |
First Interstate Bancsystem, Inc. | | | 12,004 | | | | 163,254 | |
First of Long Island Corp. (The) | | | 2,951 | | | | 81,890 | |
FNB Corp.(a) | | | 28,098 | | | | 296,153 | |
German American Bancorp, Inc.(a) | | | 3,894 | | | | 66,938 | |
Glacier Bancorp, Inc.(a) | | | 13,806 | | | | 207,780 | |
Great Southern Bancorp, Inc.(a) | | | 3,825 | | | | 82,046 | |
Heartland Financial USA, Inc.(a) | | | 4,862 | | | | 82,654 | |
Home Bancshares, Inc.(a) | | | 8,181 | | | | 186,118 | |
Hudson Valley Holding Corp. | | | 699 | | | | 15,378 | |
Independent Bank Corp. | | | 6,991 | | | | 188,827 | |
Lakeland Bancorp, Inc.(a) | | | 5,021 | | | | 52,118 | |
Lakeland Financial Corp. | | | 4,738 | | | | 107,458 | |
MainSource Financial Group, Inc.(a) | | | 5,451 | | | | 54,565 | |
Merchants Bancshares, Inc. | | | 2,980 | | | | 78,910 | |
National Bankshares, Inc.(a) | | | 2,759 | | | | 79,735 | |
National Penn Bancshares, Inc.(a) | | | 3,824 | | | | 29,598 | |
NBT Bancorp, Inc.(a) | | | 11,474 | | | | 261,492 | |
Northfield Bancorp, Inc.(a) | | | 5,134 | | | | 70,849 | |
Old National Bancorp | | | 9,980 | | | | 106,986 | |
OmniAmerican Bancorp, Inc.* | | | 652 | | | | 10,328 | |
Orrstown Financial Services, Inc.(a) | | | 2,643 | | | | 74,004 | |
Pacific Continental Corp.(a) | | | 1,942 | | | | 19,789 | |
Park National Corp.(a) | | | 4,763 | | | | 318,264 | |
Renasant Corp.(a) | | | 1,240 | | | | 21,055 | |
Republic Bancorp, Inc. Class A(a) | | | 13,864 | | | | 270,071 | |
S&T Bancorp, Inc.(a) | | | 8,060 | | | | 173,854 | |
S.Y. Bancorp, Inc.(a) | | | 4,024 | | | | 101,244 | |
Sandy Spring Bancorp, Inc. | | | 1,734 | | | | 32,010 | |
Sierra Bancorp | | | 3,925 | | | | 43,881 | |
Simmons First National Corp. Class A | | | 4,494 | | | | 121,742 | |
Southside Bancshares, Inc.(a) | | | 9,861 | | | | 211,025 | |
Southwest Bancorp, Inc.* | | | 5,240 | | | | 74,356 | |
StellarOne Corp. | | | 2,121 | | | | 30,118 | |
Sterling Bancorp(a) | | | 2,764 | | | | 27,668 | |
Sterling Bancshares, Inc. | | | 1,000 | | | | 8,610 | |
Suffolk Bancorp(a) | | | 3,266 | | | | 68,521 | |
Susquehanna Bancshares, Inc. | | | 5,178 | | | | 48,414 | |
Texas Capital Bancshares, Inc.* | | | 7,728 | | | | 200,851 | |
Tompkins Financial Corp.(a) | | | 4,177 | | | | 173,554 | |
Tower Bancorp, Inc. | | | 1,574 | | | | 35,084 | |
TowneBank(a) | | | 6,166 | | | | 96,560 | |
Trico Bancshares | | | 1,871 | | | | 30,516 | |
Union First Market Bankshares Corp. | | | 5,449 | | | | 61,301 | |
Univest Corp. of Pennsylvania | | | 3,215 | | | | 56,970 | |
See Notes to Financial Statements.
| | | | |
| WisdomTree Domestic and International Earnings Funds | | | 43 | |
Schedule of Investments (continued)
WisdomTree SmallCap Earnings Fund (EES)
March 31, 2011
| | | | | | | | |
| Investments | | Shares | | | Fair
Value | |
| | | | | | | | |
Virginia Commerce Bancorp, Inc.*(a) | | | 13,216 | | | $ | 75,860 | |
Washington Banking Co. | | | 2,764 | | | | 38,972 | |
Washington Trust Bancorp, Inc.(a) | | | 4,861 | | | | 115,400 | |
WesBanco, Inc.(a) | | | 9,008 | | | | 186,556 | |
Wilshire Bancorp, Inc.* | | | 3,688 | | | | 18,071 | |
Wintrust Financial Corp.(a) | | | 216 | | | | 7,938 | |
| | | | | | | | |
| Total Commercial Banks | | | | | | | 8,341,954 | |
| Commercial Services & Supplies – 2.5% | | | | | | | | |
ACCO Brands Corp.*(a) | | | 4,722 | | | | 45,048 | |
American Reprographics Co.*(a) | | | 1,099 | | | | 11,375 | |
APAC Customer Services, Inc.* | | | 43,358 | | | | 260,582 | |
Consolidated Graphics, Inc.* | | | 2,776 | | | | 151,653 | |
Courier Corp. | | | 2,650 | | | | 36,994 | |
EnerNoc, Inc.*(a) | | | 2,999 | | | | 57,311 | |
Ennis, Inc. | | | 12,074 | | | | 205,620 | |
G&K Services, Inc. Class A(a) | | | 4,764 | | | | 158,403 | |
Healthcare Services Group, Inc.(a) | | | 9,789 | | | | 172,091 | |
Innerworkings, Inc.*(a) | | | 6,862 | | | | 50,641 | |
Interface, Inc. Class A(a) | | | 8,400 | | | | 155,316 | |
Kimball International, Inc. Class B(a) | | | 2,447 | | | | 17,129 | |
Knoll, Inc. | | | 6,633 | | | | 139,028 | |
M&F Worldwide Corp.* | | | 26,727 | | | | 671,382 | |
McGrath Rentcorp | | | 5,931 | | | | 161,738 | |
Metalico, Inc.*(a) | | | 5,643 | | | | 35,099 | |
Mine Safety Appliances Co.(a) | | | 4,017 | | | | 147,303 | |
Mobile Mini, Inc.* | | | 4,072 | | | | 97,809 | |
Multi-Color Corp. | | | 3,576 | | | | 72,271 | |
Schawk, Inc.(a) | | | 6,669 | | | | 129,645 | |
Standard Parking Corp.* | | | 3,951 | | | | 70,170 | |
SYKES Enterprises, Inc.*(a) | | | 371 | | | | 7,335 | |
Team, Inc.* | | | 3,537 | | | | 92,882 | |
U.S. Ecology, Inc. | | | 3,167 | | | | 55,201 | |
UniFirst Corp.(a) | | | 6,987 | | | | 370,381 | |
| | | | | | | | |
| Total Commercial Services & Supplies | | | | | | | 3,372,407 | |
| Communications Equipment – 1.2% | | | | | | | | |
Anaren, Inc.* | | | 3,509 | | | | 70,531 | |
Bel Fuse, Inc. Class B(a) | | | 2,738 | | | | 60,263 | |
Black Box Corp. | | | 5,751 | | | | 202,148 | |
Comtech Telecommunications Corp. | | | 12,353 | | | | 335,755 | |
DG FastChannel, Inc.*(a) | | | 6,525 | | | | 210,235 | |
Digi International, Inc.* | | | 3,830 | | | | 40,445 | |
EMS Technologies, Inc.* | | | 237 | | | | 4,658 | |
Emulex Corp.* | | | 6,450 | | | | 68,821 | |
Extreme Networks, Inc.* | | | 10,498 | | | | 36,743 | |
Globecomm Systems, Inc.*(a) | | | 4,366 | | | | 53,833 | |
Harmonic, Inc.* | | | 5,823 | | | | 54,620 | |
KVH Industries, Inc.* | | | 3,428 | | | | 51,831 | |
Oclaro, Inc.*(a) | | | 3,338 | | | | 38,420 | |
Oplink Communications, Inc.*(a) | | | 3,918 | | | | 76,362 | |
Seachange International, Inc.* | | | 4,810 | | | | 45,695 | |
Symmetricom, Inc.*(a) | | | 2,906 | | | | 17,814 | |
Tekelec*(a) | | | 17,272 | | | | 140,249 | |
| | | | | | | | |
| Investments | | Shares | | | Fair
Value | |
| | | | | | | | |
Westell Technologies, Inc. Class A* | | | 24,608 | | | $ | 86,128 | |
| | | | | | | | |
| Total Communications Equipment | | | | | | | 1,594,551 | |
| Computers & Peripherals – 0.7% | | | | | | | | |
Hypercom Corp.* | | | 2,103 | | | | 25,299 | |
Imation Corp.*(a) | | | 1,662 | | | | 18,515 | |
Intevac, Inc.* | | | 9,501 | | | | 118,097 | |
Rimage Corp. | | | 2,518 | | | | 40,666 | |
STEC, Inc.*(a) | | | 10,516 | | | | 211,266 | |
Stratasys, Inc.* | | | 1,245 | | | | 58,515 | |
Super Micro Computer, Inc.*(a) | | | 12,662 | | | | 203,099 | |
Synaptics, Inc.*(a) | | | 10,147 | | | | 274,172 | |
| | | | | | | | |
| Total Computers & Peripherals | | | | | | | 949,629 | |
| Construction & Engineering – 1.3% | | | | | | | | |
Comfort Systems USA, Inc.(a) | | | 7,408 | | | | 104,231 | |
Dycom Industries, Inc.* | | | 1,268 | | | | 21,987 | |
Furmanite Corp.*(a) | | | 1,139 | | | | 9,112 | |
Great Lakes Dredge & Dock Corp. | | | 18,201 | | | | 138,874 | |
Insituform Technologies, Inc. Class A*(a) | | | 9,798 | | | | 262,096 | |
Layne Christensen Co.*(a) | | | 3,503 | | | | 120,853 | |
Michael Baker Corp.*(a) | | | 3,028 | | | | 88,024 | |
MYR Group, Inc.* | | | 4,009 | | | | 95,895 | |
Northwest Pipe Co.* | | | 287 | | | | 6,581 | |
Orion Marine Group, Inc.*(a) | | | 7,276 | | | | 78,144 | |
Primoris Services Corp. | | | 14,520 | | | | 147,233 | |
Sterling Construction Co., Inc.* | | | 3,910 | | | | 66,001 | |
Tutor Perini Corp. | | | 27,631 | | | | 673,091 | |
| | | | | | | | |
| Total Construction & Engineering | | | | | | | 1,812,122 | |
| Consumer Finance – 2.0% | | | | | | | | |
Advance America, Cash Advance Centers, Inc. | | | 37,959 | | | | 201,183 | |
Cash America International, Inc.(a) | | | 15,121 | | | | 696,322 | |
Dollar Financial Corp.*(a) | | | 381 | | | | 7,906 | |
First Cash Financial Services, Inc.* | | | 7,751 | | | | 299,188 | |
Nelnet, Inc. Class A(a) | | | 42,865 | | | | 935,743 | |
World Acceptance Corp.*(a) | | | 8,051 | | | | 524,925 | |
| | | | | | | | |
| Total Consumer Finance | | | | | | | 2,665,267 | |
| Containers & Packaging – 0.5% | | | | | | | | |
Boise, Inc.(a) | | | 65,144 | | | | 596,719 | |
Myers Industries, Inc.(a) | | | 3,136 | | | | 31,141 | |
| | | | | | | | |
| Total Containers & Packaging | | | | | | | 627,860 | |
| Distributors – 0.4% | | | | | | | | |
Audiovox Corp. Class A* | | | 10,936 | | | | 87,488 | |
Core-Mark Holding Co., Inc.*(a) | | | 3,583 | | | | 118,418 | |
Pool Corp. | | | 12,206 | | | | 294,287 | |
Weyco Group, Inc.(a) | | | 2,655 | | | | 64,941 | |
| | | | | | | | |
| Total Distributors | | | | | | | 565,134 | |
| Diversified Consumer Services – 2.9% | | | | | | | | |
American Public Education, Inc.* | | | 4,144 | | | | 167,625 | |
Archipelago Learning, Inc.*(a) | | | 827 | | | | 7,071 | |
Bridgepoint Education, Inc.*(a) | | | 34,340 | | | | 587,214 | |
Capella Education Co.*(a) | | | 4,763 | | | | 237,150 | |
Collectors Universe, Inc. | | | 5,401 | | | | 76,532 | |
See Notes to Financial Statements.
| | |
| 44 | | WisdomTree Domestic and International Earnings Funds |
Schedule of Investments (continued)
WisdomTree SmallCap Earnings Fund (EES)
March 31, 2011
| | | | | | | | |
| Investments | | Shares | | | Fair
Value | |
| | | | | | | | |
Corinthian Colleges, Inc.*(a) | | | 166,134 | | | $ | 734,312 | |
CPI Corp.(a) | | | 2,944 | | | | 66,269 | |
Grand Canyon Education, Inc.*(a) | | | 12,705 | | | | 184,223 | |
K12, Inc.*(a) | | | 3,148 | | | | 106,088 | |
Lincoln Educational Services Corp. | | | 22,397 | | | | 355,888 | |
Mac-Gray Corp. | | | 1,318 | | | | 21,259 | |
Matthews International Corp. Class A(a) | | | 9,462 | | | | 364,760 | |
Pre-Paid Legal Services, Inc.*(a) | | | 4,934 | | | | 325,644 | |
Regis Corp. | | | 22,370 | | | | 396,844 | |
Stewart Enterprises, Inc. Class A(a) | | | 21,726 | | | | 165,987 | |
Universal Technical Institute, Inc.(a) | | | 6,600 | | | | 128,370 | |
| | | | | | | | |
| Total Diversified Consumer Services | | | | | | | 3,925,236 | |
| Diversified Financial Services – 0.4% | | | | | | | | |
Encore Capital Group, Inc.* | | | 10,110 | | | | 239,506 | |
Interactive Brokers Group, Inc. Class A(a) | | | 6,093 | | | | 96,818 | |
Life Partners Holdings, Inc.(a) | | | 10,327 | | | | 83,029 | |
MarketAxess Holdings, Inc.(a) | | | 6,711 | | | | 162,406 | |
| | | | | | | | |
| Total Diversified Financial Services | | | | | | | 581,759 | |
| Diversified Telecommunication Services – 0.7% | | | | | | | | |
Atlantic Tele-Network, Inc.(a) | | | 1,912 | | | | 71,107 | |
Cbeyond, Inc.*(a) | | | 439 | | | | 5,123 | |
Cincinnati Bell, Inc.* | | | 82,564 | | | | 221,271 | |
Consolidated Communications Holdings, Inc. | | | 8,967 | | | | 167,952 | |
General Communication, Inc. Class A* | | | 2,891 | | | | 31,628 | |
Hughes Communications, Inc.*(a) | | | 970 | | | | 57,880 | |
IDT Corp. Class B | | | 2,548 | | | | 68,669 | |
Iridium Communications, Inc.*(a) | | | 3,862 | | | | 30,780 | |
Neutral Tandem, Inc.*(a) | | | 11,965 | | | | 176,484 | |
Premiere Global Services, Inc.* | | | 16,919 | | | | 128,923 | |
| | | | | | | | |
| Total Diversified Telecommunication Services | | | | | | | 959,817 | |
| Electric Utilities – 0.6% | | | | | | | | |
Central Vermont Public Service Corp. | | | 3,987 | | | | 92,857 | |
Empire District Electric Co. (The)(a) | | | 10,682 | | | | 232,761 | |
MGE Energy, Inc.(a) | | | 7,035 | | | | 284,847 | |
Otter Tail Corp.(a) | | | 391 | | | | 8,888 | |
PNM Resources, Inc.(a) | | | 14,502 | | | | 216,370 | |
Unitil Corp. | | | 1,295 | | | | 30,510 | |
| | | | | | | | |
| Total Electric Utilities | | | | | | | 866,233 | |
| Electrical Equipment – 1.2% | | | | | | | | |
Advanced Battery Technologies, Inc.*(a) | | | 50,895 | | | | 98,736 | |
AZZ, Inc. | | | 4,180 | | | | 190,608 | |
Encore Wire Corp. | | | 1,881 | | | | 45,784 | |
Franklin Electric Co., Inc. | | | 4,901 | | | | 226,426 | |
Generac Holdings, Inc.* | | | 15,734 | | | | 319,243 | |
Global Power Equipment Group, Inc.*(a) | | | 7,751 | | | | 213,153 | |
LaBarge, Inc.* | | | 5,338 | | | | 94,483 | |
LSI Industries, Inc. | | | 2,234 | | | | 16,174 | |
Powell Industries, Inc.*(a) | | | 6,094 | | | | 240,347 | |
PowerSecure International, Inc.* | | | 2,577 | | | | 22,162 | |
Ultralife Corp.* | | | 3,697 | | | | 18,707 | |
Vicor Corp. | | | 6,503 | | | | 107,234 | |
| | | | | | | | |
| Total Electrical Equipment | | | | | | | 1,593,057 | |
| | | | | | | | |
| Investments | | Shares | | | Fair
Value | |
| | | | | | | | |
Electronic Equipment, Instruments &
Components – 4.4% | | | | | | | | |
Benchmark Electronics, Inc.*(a) | | | 22,301 | | | $ | 423,050 | |
Brightpoint, Inc.* | | | 20,153 | | | | 218,459 | |
Checkpoint Systems, Inc.*(a) | | | 9,008 | | | | 202,500 | |
Coherent, Inc.* | | | 4,060 | | | | 235,927 | |
CTS Corp.(a) | | | 6,450 | | | | 69,660 | |
DDi Corp. | | | 7,047 | | | | 74,487 | |
DTS, Inc.* | | | 1,416 | | | | 66,028 | |
Electro Rent Corp. | | | 4,846 | | | | 83,254 | |
FARO Technologies, Inc.*(a) | | | 827 | | | | 33,080 | |
Insight Enterprises, Inc.*(a) | | | 23,672 | | | | 403,134 | |
Kemet Corp.* | | | 4,033 | | | | 59,809 | |
Littelfuse, Inc. | | | 7,316 | | | | 417,744 | |
Measurement Specialties, Inc.*(a) | | | 3,524 | | | | 120,027 | |
Mercury Computer Systems, Inc.* | | | 6,622 | | | | 140,121 | |
Methode Electronics, Inc.(a) | | | 6,498 | | | | 78,496 | |
MTS Systems Corp. | | | 3,020 | | | | 137,561 | |
Multi-Fineline Electronix, Inc.*(a) | | | 6,057 | | | | 170,929 | |
Newport Corp.* | | | 7,534 | | | | 134,331 | |
OSI Systems, Inc.* | | | 3,417 | | | | 128,240 | |
Park Electrochemical Corp. | | | 6,221 | | | | 200,627 | |
Power-One, Inc.*(a) | | | 38,088 | | | | 333,270 | |
Radisys Corp.* | | | 727 | | | | 6,296 | |
Richardson Electronics Ltd. | | | 10,715 | | | | 141,224 | |
Rofin-Sinar Technologies, Inc.* | | | 4,479 | | | | 176,920 | |
Rogers Corp.*(a) | | | 4,285 | | | | 193,082 | |
Sanmina-SCI Corp.* | | | 39,317 | | | | 440,744 | |
Scansource, Inc.*(a) | | | 8,180 | | | | 310,758 | |
Spectrum Control, Inc.* | | | 3,779 | | | | 74,371 | |
SYNNEX Corp.*(a) | | | 17,356 | | | | 568,062 | |
Tessco Technologies, Inc. | | | 2,964 | | | | 34,086 | |
TTM Technologies, Inc.* | | | 13,946 | | | | 253,259 | |
Zygo Corp.* | | | 1,482 | | | | 21,667 | |
| | | | | | | | |
| Total Electronic Equipment, Instruments & Components | | | | | | | 5,951,203 | |
| Energy Equipment & Services – 1.0% | | | | | | | | |
Bolt Technology Corp.* | | | 1,796 | | | | 24,318 | |
Gulf Island Fabrication, Inc. | | | 2,670 | | | | 85,894 | |
Gulfmark Offshore, Inc. Class A* | | | 5,483 | | | | 244,048 | |
Hornbeck Offshore Services, Inc.*(a) | | | 10,282 | | | | 317,200 | |
Matrix Service Co.* | | | 2,789 | | | | 38,767 | |
Natural Gas Services Group, Inc.* | | | 1,729 | | | | 30,707 | |
Newpark Resources* | | | 21,219 | | | | 166,781 | |
OYO Geospace Corp.* | | | 410 | | | | 40,418 | |
PHI, Inc.* | | | 2,448 | | | | 54,150 | |
Tetra Technologies, Inc.* | | | 6,302 | | | | 97,051 | |
Willbros Group, Inc.*(a) | | | 20,388 | | | | 222,637 | |
| | | | | | | | |
| Total Energy Equipment & Services | | | | | | | 1,321,971 | |
| Food & Staples Retailing – 1.1% | | | | | | | | |
Andersons, Inc. (The) | | | 7,578 | | | | 369,200 | |
Ingles Markets, Inc. Class A | | | 7,853 | | | | 155,568 | |
Nash Finch Co. | | | 3,225 | | | | 122,357 | |
See Notes to Financial Statements.
| | | | |
| WisdomTree Domestic and International Earnings Funds | | | 45 | |
Schedule of Investments (continued)
WisdomTree SmallCap Earnings Fund (EES)
March 31, 2011
| | | | | | | | |
| Investments | | Shares | | | Fair
Value | |
| | | | | | | | |
Pantry, Inc. (The)* | | | 997 | | | $ | 14,786 | |
Pricesmart, Inc.(a) | | | 6,292 | | | | 230,539 | |
Spartan Stores, Inc. | | | 7,057 | | | | 104,373 | |
Village Super Market, Inc. Class A | | | 3,744 | | | | 108,950 | |
Weis Markets, Inc. | | | 8,588 | | | | 347,470 | |
| | | | | | | | |
| Total Food & Staples Retailing | | | | | | | 1,453,243 | |
| Food Products – 1.7% | | | | | | | | |
B&G Foods, Inc.(a) | | | 7,174 | | | | 134,656 | |
Calavo Growers, Inc.(a) | | | 3,376 | | | | 73,766 | |
Cal-Maine Foods, Inc.(a) | | | 11,096 | | | | 327,332 | |
Chiquita Brands International, Inc.* | | | 9,307 | | | | 142,769 | |
Darling International, Inc.*(a) | | | 17,222 | | | | 264,702 | |
Diamond Foods, Inc.(a) | | | 2,206 | | | | 123,095 | |
J&J Snack Foods Corp. | | | 4,958 | | | | 233,373 | |
John B. Sanfilippo & Son, Inc.* | | | 4,314 | | | | 50,474 | |
Omega Protein Corp.* | | | 5,794 | | | | 78,161 | |
Sanderson Farms, Inc.(a) | | | 13,211 | | | | 606,649 | |
Seneca Foods Corp. Class A*(a) | | | 5,724 | | | | 170,976 | |
Snyders-Lance, Inc. | | | 7,186 | | | | 142,642 | |
| | | | | | | | |
| Total Food Products | | | | | | | 2,348,595 | |
| Gas Utilities – 0.3% | | | | | | | | |
Chesapeake Utilities Corp. | | | 2,972 | | | | 123,694 | |
Laclede Group, Inc. (The) | | | 5,697 | | | | 217,056 | |
| | | | | | | | |
| Total Gas Utilities | | | | | | | 340,750 | |
| Health Care Equipment & Supplies – 2.1% | | | | | | | | |
Abaxis, Inc.* | | | 2,504 | | | | 72,215 | |
Accuray, Inc.*(a) | | | 967 | | | | 8,732 | |
Analogic Corp. | | | 1,500 | | | | 84,825 | |
Angiodynamics, Inc.* | | | 3,901 | | | | 58,983 | |
Arthrocare Corp.* | | | 4,274 | | | | 142,495 | |
Atrion Corp. | | | 584 | | | | 101,890 | |
Cantel Medical Corp.(a) | | | 4,445 | | | | 114,459 | |
Conceptus, Inc.* | | | 1,918 | | | | 27,715 | |
Conmed Corp.* | | | 5,310 | | | | 139,547 | |
CryoLife, Inc.* | | | 4,344 | | | | 26,498 | |
Cyberonics, Inc.* | | | 7,960 | | | | 253,208 | |
DynaVox, Inc. Class A* | | | 8,751 | | | | 48,305 | |
Exactech, Inc.*(a) | | | 2,320 | | | | 40,716 | |
Greatbatch, Inc.* | | | 5,889 | | | | 155,823 | |
ICU Medical, Inc.*(a) | | | 3,833 | | | | 167,809 | |
Invacare Corp.(a) | | | 6,784 | | | | 211,118 | |
IRIS International, Inc.* | | | 2,509 | | | | 22,631 | |
Kensey Nash Corp.*(a) | | | 3,129 | | | | 77,943 | |
Medical Action Industries, Inc.* | | | 6,360 | | | | 53,424 | |
Meridian Bioscience, Inc.(a) | | | 5,445 | | | | 130,626 | |
Merit Medical Systems, Inc.* | | | 5,974 | | | | 117,210 | |
Natus Medical, Inc.*(a) | | | 3,621 | | | | 60,833 | |
Neogen Corp.* | | | 2,311 | | | | 95,629 | |
NuVasive, Inc.*(a) | | | 4,747 | | | | 120,194 | |
Quidel Corp.*(a) | | | 3,462 | | | | 41,405 | |
RTI Biologics, Inc.* | | | 7,789 | | | | 22,277 | |
SonoSite, Inc.* | | | 1,053 | | | | 35,086 | |
| | | | | | | | |
| Investments | | Shares | | | Fair
Value | |
| | | | | | | | |
Symmetry Medical, Inc.* | | | 5,592 | | | $ | 54,802 | |
Synovis Life Technologies, Inc.* | | | 1,406 | | | | 26,967 | |
Vascular Solutions, Inc.* | | | 2,762 | | | | 30,133 | |
Wright Medical Group, Inc.*(a) | | | 3,413 | | | | 58,055 | |
Young Innovations, Inc.(a) | | | 2,359 | | | | 74,073 | |
Zoll Medical Corp.*(a) | | | 2,355 | | | | 105,528 | |
| | | | | | | | |
| Total Health Care Equipment & Supplies | | | | | | | 2,781,154 | |
| Health Care Providers & Services – 5.4% | | | | | | | | |
Air Methods Corp.* | | | 3,229 | | | | 217,150 | |
Allied Healthcare International, Inc.* | | | 20,229 | | | | 51,382 | |
Almost Family, Inc.* | | | 4,397 | | | | 165,503 | |
Amedisys, Inc.*(a) | | | 23,920 | | | | 837,200 | |
America Service Group, Inc. | | | 2,775 | | | | 71,151 | |
American Dental Partners, Inc.* | | | 4,084 | | | | 53,582 | |
Amsurg Corp.*(a) | | | 12,306 | | | | 313,065 | |
Assisted Living Concepts, Inc. Class A*(a) | | | 2,460 | | | | 96,284 | |
Bio-Reference Labs, Inc.*(a) | | | 5,819 | | | | 130,578 | |
Bioscrip, Inc.*(a) | | | 38,511 | | | | 181,387 | |
Capital Senior Living Corp.* | | | 2,054 | | | | 21,813 | |
Chindex International, Inc.*(a) | | | 2,541 | | | | 40,783 | |
Continucare Corp.* | | | 23,197 | | | | 124,104 | |
Corvel Corp.* | | | 3,133 | | | | 166,613 | |
Cross Country Healthcare, Inc.*(a) | | | 2,266 | | | | 17,743 | |
Ensign Group, Inc. (The) | | | 8,206 | | | | 262,018 | |
Five Star Quality Care, Inc.* | | | 13,315 | | | | 108,251 | |
Gentiva Health Services, Inc.*(a) | | | 14,394 | | | | 403,464 | |
Hanger Orthopedic Group, Inc.*(a) | | | 7,682 | | | | 199,962 | |
Healthways, Inc.*(a) | | | 18,188 | | | | 279,550 | |
IPC The Hospitalist Co., Inc.* | | | 3,221 | | | | 146,266 | |
Kindred Healthcare, Inc.*(a) | | | 14,540 | | | | 347,215 | |
Landauer, Inc. | | | 2,003 | | | | 123,224 | |
LHC Group, Inc.* | | | 9,417 | | | | 282,510 | |
Metropolitan Health Networks, Inc.* | | | 26,871 | | | | 127,100 | |
Molina Healthcare, Inc.* | | | 6,273 | | | | 250,920 | |
MWI Veterinary Supply, Inc.*(a) | | | 2,698 | | | | 217,675 | |
National Healthcare Corp.(a) | | | 3,738 | | | | 173,780 | |
PharMerica Corp.* | | | 10,778 | | | | 123,300 | |
Providence Service Corp. (The)* | | | 7,122 | | | | 106,687 | |
RehabCare Group, Inc.* | | | 10,614 | | | | 391,338 | |
Rural/Metro Corp.* | | | 2,249 | | | | 38,323 | |
Select Medical Holdings Corp.* | | | 62,384 | | | | 502,815 | |
Team Health Holdings, Inc.* | | | 10,668 | | | | 186,477 | |
Triple-S Management Corp. Class B*(a) | | | 19,765 | | | | 406,764 | |
U.S. Physical Therapy, Inc. | | | 3,423 | | | | 76,470 | |
| | | | | | | | |
| Total Health Care Providers & Services | | | | | | | 7,242,447 | |
| Health Care Technology – 0.2% | | | | | | | | |
Computer Programs & Systems, Inc. | | | 1,651 | | | | 106,126 | |
Medidata Solutions, Inc.* | | | 2,460 | | | | 62,902 | |
Omnicell, Inc.* | | | 1,974 | | | | 30,084 | |
Transcend Services, Inc.* | | | 2,155 | | | | 51,720 | |
| | | | | | | | |
| Total Health Care Technology | | | | | | | 250,832 | |
See Notes to Financial Statements.
| | |
| 46 | | WisdomTree Domestic and International Earnings Funds |
Schedule of Investments (continued)
WisdomTree SmallCap Earnings Fund (EES)
March 31, 2011
| | | | | | | | |
| Investments | | Shares | | | Fair
Value | |
| | | | | | | | |
| Hotels, Restaurants & Leisure – 2.9% | | | | | | | | |
AFC Enterprises* | | | 7,634 | | | $ | 115,502 | |
Ambassadors Group, Inc. | | | 3,815 | | | | 41,774 | |
Ameristar Casinos, Inc. | | | 4,197 | | | | 74,497 | |
Biglari Holdings, Inc.* | | | 274 | | | | 116,053 | |
BJ’s Restaurants, Inc.*(a) | | | 2,729 | | | | 107,332 | |
Bob Evans Farms, Inc.(a) | | | 8,263 | | | | 269,374 | |
Boyd Gaming Corp.*(a) | | | 7,366 | | | | 69,019 | |
Buffalo Wild Wings, Inc.* | | | 4,072 | | | | 221,639 | |
Caribou Coffee Co., Inc.*(a) | | | 4,027 | | | | 40,955 | |
Carrols Restaurant Group, Inc.* | | | 9,182 | | | | 85,117 | |
CEC Entertainment, Inc.(a) | | | 6,975 | | | | 263,167 | |
Churchill Downs, Inc.(a) | | | 1,870 | | | | 77,605 | |
Denny’s Corp.* | | | 36,405 | | | | 147,804 | |
Domino’s Pizza, Inc.* | | | 27,795 | | | | 512,262 | |
Einstein Noah Restaurant Group, Inc. | | | 4,026 | | | | 65,543 | |
Interval Leisure Group, Inc.* | | | 11,912 | | | | 194,761 | |
Jack In The Box, Inc.*(a) | | | 9,400 | | | | 213,192 | |
Krispy Kreme Doughnuts, Inc.* | | | 3,685 | | | | 25,942 | |
Marcus Corp.(a) | | | 5,750 | | | | 62,675 | |
Monarch Casino & Resort, Inc.* | | | 3,745 | | | | 38,948 | |
Multimedia Games, Inc.* | | | 2,202 | | | | 12,618 | |
Papa John’s International, Inc.*(a) | | | 9,756 | | | | 308,973 | |
Peet’s Coffee & Tea, Inc.*(a) | | | 2,292 | | | | 110,222 | |
Red Robin Gourmet Burgers, Inc.* | | | 1,782 | | | | 47,936 | |
Ruby Tuesday, Inc.* | | | 19,303 | | | | 253,062 | |
Ruth’s Hospitality Group, Inc.*(a) | | | 6,027 | | | | 31,099 | |
Shuffle Master, Inc.* | | | 10,785 | | | | 115,184 | |
Sonic Corp.* | | | 11,194 | | | | 101,306 | |
Speedway Motorsports, Inc. | | | 9,298 | | | | 148,582 | |
| | | | | | | | |
| Total Hotels, Restaurants & Leisure | | | | | | | 3,872,143 | |
| Household Durables – 1.6% | | | | | | | | |
American Greetings Corp. Class A(a) | | | 23,007 | | | | 542,965 | |
Blyth, Inc. | | | 5,102 | | | | 165,764 | |
Hooker Furniture Corp.(a) | | | 2,323 | | | | 27,783 | |
iRobot Corp.*(a) | | | 5,143 | | | | 169,153 | |
KB Home(a) | | | 5,373 | | | | 66,840 | |
Kid Brands, Inc.* | | | 13,621 | | | | 100,114 | |
La-Z-Boy, Inc. Class Z* | | | 15,786 | | | | 150,756 | |
Libbey, Inc.* | | | 20,633 | | | | 340,445 | |
Lifetime Brands, Inc.* | | | 3,906 | | | | 58,590 | |
Meritage Homes Corp.* | | | 11,749 | | | | 283,504 | |
Standard Pacific Corp.*(a) | | | 48,440 | | | | 180,681 | |
Universal Electronics, Inc.* | | | 3,148 | | | | 93,055 | |
| | | | | | | | |
| Total Household Durables | | | | | | | 2,179,650 | |
| Household Products – 0.3% | | | | | | | | |
Central Garden and Pet Co. Class A* | | | 22,837 | | | | 210,329 | |
WD-40 Co. | | | 4,343 | | | | 183,882 | |
| | | | | | | | |
| Total Household Products | | | | | | | 394,211 | |
| Industrial Conglomerates – 0.4% | | | | | | | | |
Raven Industries, Inc.(a) | | | 4,076 | | | | 250,348 | |
Standex International Corp. | | | 3,220 | | | | 122,006 | |
| | | | | | | | |
| Investments | | Shares | | | Fair
Value | |
| | | | | | | | |
Tredegar Corp. | | | 4,842 | | | $ | 104,490 | |
| | | | | | | | |
| Total Industrial Conglomerates | | | | | | | 476,844 | |
| Insurance – 5.1% | | | | | | | | |
American Equity Investment Life Holding Co.(a) | | | 27,408 | | | | 359,593 | |
AMERISAFE, Inc.* | | | 8,606 | | | | 190,279 | |
Amtrust Financial Services, Inc.(a) | | | 38,631 | | | | 736,693 | |
Baldwin & Lyons, Inc. Class B(a) | | | 4,599 | | | | 107,709 | |
Citizens, Inc./Tx* | | | 6,557 | | | | 47,866 | |
CNA Surety Corp.*(a) | | | 26,709 | | | | 674,669 | |
Donegal Group, Inc. Class A(a) | | | 3,577 | | | | 47,825 | |
eHealth, Inc.*(a) | | | 4,501 | | | | 59,863 | |
EMC Insurance Group, Inc. | | | 7,079 | | | | 175,772 | |
Employers Holdings, Inc.(a) | | | 15,640 | | | | 323,122 | |
FBL Financial Group, Inc. Class A(a) | | | 17,108 | | | | 525,558 | |
FPIC Insurance Group, Inc.* | | | 3,741 | | | | 141,784 | |
Hallmark Financial Services, Inc.* | | | 6,456 | | | | 54,101 | |
Harleysville Group, Inc.(a) | | | 9,211 | | | | 305,160 | |
Horace Mann Educators Corp. | | | 18,841 | | | | 316,529 | |
Infinity Property & Casualty Corp. | | | 6,672 | | | | 396,917 | |
Kansas City Life Insurance Co.(a) | | | 3,031 | | | | 96,931 | |
Meadowbrook Insurance Group, Inc.(a) | | | 29,079 | | | | 300,968 | |
National Financial Partners Corp.*(a) | | | 11,367 | | | | 167,663 | |
National Western Life Insurance Co. Class A | | | 1,924 | | | | 312,169 | |
Navigators Group, Inc. (The)*(a) | | | 4,281 | | | | 220,472 | |
Presidential Life Corp.(a) | | | 6,572 | | | | 62,631 | |
Safety Insurance Group, Inc.(a) | | | 5,595 | | | | 257,986 | |
Selective Insurance Group, Inc. | | | 19,696 | | | | 340,741 | |
Tower Group, Inc.(a) | | | 20,246 | | | | 486,511 | |
United Fire & Casualty Co. | | | 8,086 | | | | 163,418 | |
Universal Insurance Holdings, Inc. | | | 9,767 | | | | 52,937 | |
| | | | | | | | |
| Total Insurance | | | | | | | 6,925,867 | |
| Internet & Catalog Retail – 0.3% | | | | | | | | |
Blue Nile, Inc.*(a) | | | 1,171 | | | | 63,222 | |
Gaiam, Inc. Class A | | | 2,383 | | | | 15,728 | |
Nutrisystem, Inc.(a) | | | 7,177 | | | | 103,995 | |
Orbitz Worldwide, Inc.* | | | 1,166 | | | | 4,162 | |
Overstock.com, Inc.*(a) | | | 2,251 | | | | 35,386 | |
PetMed Express, Inc.(a) | | | 6,548 | | | | 103,851 | |
Shutterfly, Inc.*(a) | | | 1,188 | | | | 62,204 | |
| | | | | | | | |
| Total Internet & Catalog Retail | | | | | | | 388,548 | |
| Internet Software & Services – 1.9% | | | | | | | | |
comScore, Inc.*(a) | | | 258 | | | | 7,614 | |
Dice Holdings, Inc.* | | | 6,366 | | | | 96,190 | |
Earthlink, Inc. | | | 155,304 | | | | 1,216,030 | |
Infospace, Inc.* | | | 5,946 | | | | 51,492 | |
Keynote Systems, Inc. | | | 350 | | | | 6,493 | |
Liquidity Services, Inc.* | | | 3,516 | | | | 62,796 | |
LivePerson, Inc.* | | | 4,551 | | | | 57,525 | |
LogMein, Inc.*(a) | | | 1,942 | | | | 81,875 | |
LoopNet, Inc.*(a) | | | 4,796 | | | | 67,863 | |
ModusLink Global Solutions, Inc. | | | 5,628 | | | | 30,729 | |
NIC, Inc. | | | 8,561 | | | | 106,670 | |
See Notes to Financial Statements.
| | | | |
| WisdomTree Domestic and International Earnings Funds | | | 47 | |
Schedule of Investments (continued)
WisdomTree SmallCap Earnings Fund (EES)
March 31, 2011
| | | | | | | | |
| Investments | | Shares | | | Fair
Value | |
| | | | | | | | |
Perficient, Inc.*(a) | | | 2,214 | | | $ | 26,590 | |
QuinStreet, Inc.*(a) | | | 5,372 | | | | 122,106 | |
RightNow Technologies, Inc.* | | | 1,475 | | | | 46,167 | |
Saba Software, Inc.* | | | 1,210 | | | | 11,870 | |
Stamps.com, Inc. | | | 4,483 | | | | 59,848 | |
Travelzoo, Inc.*(a) | | | 1,445 | | | | 96,223 | |
United Online, Inc. | | | 39,089 | | | | 246,456 | |
Web.com Group, Inc.* | | | 7,326 | | | | 106,886 | |
Zix Corp.* | | | 3,944 | | | | 14,514 | |
| | | | | | | | |
| Total Internet Software & Services | | | | | | | 2,515,937 | |
| IT Services – 1.8% | | | | | | | | |
Cardtronics, Inc.* | | | 10,095 | | | | 205,433 | |
Cass Information Systems, Inc.(a) | | | 2,581 | | | | 101,407 | |
Ciber, Inc.*(a) | | | 11,412 | | | | 76,460 | |
Computer Task Group, Inc.* | | | 3,489 | | | | 46,369 | |
CSG Systems International, Inc.* | | | 8,402 | | | | 167,536 | |
Echo Global Logistics, Inc.*(a) | | | 3,520 | | | | 46,218 | |
Euronet Worldwide, Inc.*(a) | | | 8,412 | | | | 162,604 | |
ExlService Holdings, Inc.*(a) | | | 5,650 | | | | 119,497 | |
Forrester Research, Inc.(a) | | | 3,313 | | | | 126,855 | |
Global Cash Access Holdings, Inc.* | | | 43,651 | | | | 142,739 | |
Hackett Group, Inc. (The)* | | | 2,999 | | | | 11,516 | |
Heartland Payment Systems, Inc.(a) | | | 5,817 | | | | 101,972 | |
Lionbridge Technologies, Inc.* | | | 4,225 | | | | 14,492 | |
MAXIMUS, Inc. | | | 4,917 | | | | 399,113 | |
NCI, Inc. Class A* | | | 5,396 | | | | 131,501 | |
PRGX Global, Inc.* | | | 1,553 | | | | 9,427 | |
TNS, Inc.* | | | 1,323 | | | | 20,599 | |
Unisys Corp.* | | | 16,655 | | | | 519,969 | |
Virtusa Corp.* | | | 4,322 | | | | 80,951 | |
| | | | | | | | |
| Total IT Services | | | | | | | 2,484,658 | |
| Leisure Equipment & Products – 0.6% | | | | | | | | |
Arctic Cat, Inc.* | | | 1,946 | | | | 30,260 | |
Jakks Pacific, Inc.*(a) | | | 9,368 | | | | 181,271 | |
Leapfrog Enterprises, Inc. Class A* | | | 6,996 | | | | 30,223 | |
RC2 Corp.* | | | 6,611 | | | | 185,769 | |
Smith & Wesson Holding Corp.*(a) | | | 23,448 | | | | 83,240 | |
Steinway Musical Instruments* | | | 2,351 | | | | 52,216 | |
Sturm Ruger & Co., Inc.(a) | | | 9,201 | | | | 211,347 | |
Summer Infant, Inc.* | | | 4,813 | | | | 38,504 | |
| | | | | | | | |
| Total Leisure Equipment & Products | | | | | | | 812,830 | |
| Life Sciences Tools & Services – 0.4% | | | | | | | | |
Cambrex Corp.* | | | 2,487 | | | | 13,679 | |
eResearch Technology, Inc.*(a) | | | 6,918 | | | | 46,835 | |
Kendle International, Inc.* | | | 3,940 | | | | 42,197 | |
Luminex Corp.*(a) | | | 5,517 | | | | 103,499 | |
Medtox Scientific, Inc. | | | 674 | | | | 11,060 | |
Parexel International Corp.*(a) | | | 13,276 | | | | 330,572 | |
| | | | | | | | |
| Total Life Sciences Tools & Services | | | | | | | 547,842 | |
| Machinery – 3.2% | | | | | | | | |
3d Systems Corp.*(a) | | | 2,368 | | | | 114,966 | |
Alamo Group, Inc. | | | 3,044 | | | | 83,558 | |
| | | | | | | | |
| Investments | | Shares | | | Fair
Value | |
| | | | | | | | |
Albany International Corp. Class A | | | 2,899 | | | $ | 72,185 | |
Altra Holdings, Inc.* | | | 3,993 | | | | 94,315 | |
Ampco-Pittsburgh Corp.(a) | | | 5,260 | | | | 145,071 | |
Astec Industries, Inc.* | | | 3,365 | | | | 125,481 | |
Badger Meter, Inc.(a) | | | 3,059 | | | | 126,061 | |
Barnes Group, Inc.(a) | | | 9,900 | | | | 206,712 | |
Blount International, Inc.* | | | 13,080 | | | | 209,018 | |
Briggs & Stratton Corp. | | | 8,385 | | | | 189,920 | |
Chart Industries, Inc.*(a) | | | 3,257 | | | | 179,265 | |
Colfax Corp.* | | | 3,624 | | | | 83,171 | |
Douglas Dynamics, Inc. | | | 676 | | | | 9,640 | |
Dynamic Materials Corp. | | | 1,109 | | | | 30,996 | |
EnPro Industries, Inc.*(a) | | | 11,220 | | | | 407,510 | |
ESCO Technologies, Inc. | | | 5,720 | | | | 218,218 | |
Federal Signal Corp. | | | 8,135 | | | | 52,959 | |
Force Protection, Inc.* | | | 26,024 | | | | 127,518 | |
Gorman-Rupp Co. (The) | | | 2,799 | | | | 110,253 | |
Graham Corp. | | | 940 | | | | 22,504 | |
Greenbrier Cos., Inc.*(a) | | | 524 | | | | 14,871 | |
John Bean Technologies Corp. | | | 7,806 | | | | 150,109 | |
Kadant, Inc.* | | | 2,110 | | | | 55,261 | |
LB Foster Co. Class A | | | 2,310 | | | | 99,584 | |
Lindsay Corp.(a) | | | 1,819 | | | | 143,737 | |
Met-Pro Corp. | | | 2,348 | | | | 27,941 | |
Miller Industries, Inc.(a) | | | 3,390 | | | | 55,054 | |
NACCO Industries, Inc. Class A | | | 2,734 | | | | 302,572 | |
NN, Inc.* | | | 764 | | | | 13,951 | |
RBC Bearings, Inc.* | | | 4,268 | | | | 163,166 | |
Robbins & Myers, Inc. | | | 5,712 | | | | 262,695 | |
Sun Hydraulics Corp. | | | 2,224 | | | | 95,854 | |
Tennant Co.(a) | | | 3,120 | | | | 131,165 | |
Trimas Corp.* | | | 5,313 | | | | 114,229 | |
Twin Disc, Inc. | | | 377 | | | | 12,147 | |
| | | | | | | | |
| Total Machinery | | | | | | | 4,251,657 | |
| Marine – 0.1% | | | | | | | | |
Horizon Lines, Inc. Class A(a) | | | 1,765 | | | | 1,500 | |
International Shipholding Corp. | | | 3,252 | | | | 80,975 | |
| | | | | | | | |
| Total Marine | | | | | | | 82,475 | |
| Media – 2.0% | | | | | | | | |
Ah Belo Corp. Class A* | | | 1,670 | | | | 13,961 | |
Arbitron, Inc.(a) | | | 5,229 | | | | 209,317 | |
Belo Corp. Class A* | | | 45,421 | | | | 400,159 | |
Entercom Communications Corp. Class A* | | | 28,368 | | | | 312,615 | |
EW Scripps Co. Class A*(a) | | | 5,973 | | | | 59,133 | |
Fisher Communications, Inc.* | | | 328 | | | | 10,194 | |
Harte-Hanks, Inc. | | | 22,392 | | | | 266,465 | |
InterClick, Inc.* | | | 2,884 | | | | 20,332 | |
Journal Communications, Inc. Class A* | | | 24,700 | | | | 148,200 | |
Knology, Inc.* | | | 4,263 | | | | 55,035 | |
LIN TV Corp. Class A* | | | 24,154 | | | | 143,233 | |
Martha Stewart Living Omnimedia Class A*(a) | | | 7,206 | | | | 26,734 | |
McClatchy Co. (The) Class A*(a) | | | 30,920 | | | | 105,128 | |
National CineMedia, Inc.(a) | | | 7,303 | | | | 136,347 | |
See Notes to Financial Statements.
| | |
| 48 | | WisdomTree Domestic and International Earnings Funds |
Schedule of Investments (continued)
WisdomTree SmallCap Earnings Fund (EES)
March 31, 2011
| | | | | | | | |
| Investments | | Shares | | | Fair
Value | |
| | | | | | | | |
Scholastic Corp. | | | 9,013 | | | $ | 243,712 | |
Sinclair Broadcast Group, Inc. Class A | | | 21,574 | | | | 270,538 | |
World Wrestling Entertainment, Inc. Class A(a) | | | 19,619 | | | | 246,611 | |
| | | | | | | | |
| Total Media | | | | | | | 2,667,714 | |
| Metals & Mining – 1.1% | | | | | | | | |
AMCOL International Corp. | | | 8,410 | | | | 302,592 | |
Capital Gold Corp.* | | | 11,275 | | | | 72,498 | |
Horsehead Holding Corp.* | | | 4,013 | | | | 68,422 | |
Kaiser Aluminum Corp.(a) | | | 4,108 | | | | 202,319 | |
Materion Corp.* | | | 3,547 | | | | 144,718 | |
Metals USA Holdings Corp.* | | | 1,234 | | | | 20,200 | |
Noranda Aluminum Holding Corp.* | | | 40,877 | | | | 656,076 | |
Olympic Steel, Inc. | | | 274 | | | | 8,990 | |
Universal Stainless & Alloy* | | | 1,519 | | | | 51,236 | |
| | | | | | | | |
| Total Metals & Mining | | | | | | | 1,527,051 | |
| Multiline Retail – 0.2% | | | | | | | | |
Bon-Ton Stores, Inc. (The)*(a) | | | 6,595 | | | | 102,223 | |
Fred’s, Inc. Class A | | | 9,604 | | | | 127,925 | |
Tuesday Morning Corp.* | | | 10,632 | | | | 52,097 | |
| | | | | | | | |
| Total Multiline Retail | | | | | | | 282,245 | |
| Multi-Utilities – 0.5% | | | | | | | | |
CH Energy Group, Inc.(a) | | | 5,316 | | | | 268,671 | |
NorthWestern Corp. | | | 13,775 | | | | 417,382 | |
| | | | | | | | |
| Total Multi-Utilities | | | | | | | 686,053 | |
| Oil, Gas & Consumable Fuels – 2.5% | | | | | | | | |
Abraxas Petroleum Corp.*(a) | | | 7,919 | | | | 46,326 | |
Approach Resources, Inc.* | | | 1,115 | | | | 37,464 | |
Callon Petroleum Co.* | | | 51,096 | | | | 397,016 | |
Cloud Peak Energy, Inc.* | | | 11,032 | | | | 238,181 | |
Contango Oil & Gas Co.*(a) | | | 4,652 | | | | 294,192 | |
CVR Energy, Inc.* | | | 8,534 | | | | 197,647 | |
FX Energy, Inc.* | | | 3,235 | | | | 27,045 | |
Georesources, Inc.* | | | 4,870 | | | | 152,285 | |
Green Plains Renewable Energy, Inc.*(a) | | | 24,691 | | | | 296,786 | |
Gulfport Energy Corp.*(a) | | | 10,232 | | | | 369,887 | |
Harvest Natural Resources, Inc.*(a) | | | 10,728 | | | | 163,495 | |
Houston American Energy Corp.(a) | | | 633 | | | | 9,754 | |
James River Coal Co.* | | | 10,429 | | | | 252,069 | |
L&L Energy, Inc.*(a) | | | 17,205 | | | | 119,059 | |
Panhandle Oil and Gas, Inc. Class A | | | 1,518 | | | | 48,045 | |
Petroleum Development Corp.*(a) | | | 1,160 | | | | 55,692 | |
REX American Resources Corp.* | | | 3,027 | | | | 48,311 | |
REX Energy Corp.* | | | 2,833 | | | | 33,004 | |
Stone Energy Corp.* | | | 2,753 | | | | 91,868 | |
USEC, Inc.* | | | 4,745 | | | | 20,878 | |
Vaalco Energy, Inc.* | | | 22,152 | | | | 171,899 | |
Venoco, Inc.*(a) | | | 14,835 | | | | 253,530 | |
Warren Resources, Inc.* | | | 21,900 | | | | 111,471 | |
| | | | | | | | |
| Total Oil, Gas & Consumable Fuels | | | | | | | 3,435,904 | |
| Paper & Forest Products – 1.8% | | | | | | | | |
Buckeye Technologies, Inc. | | | 33,230 | | | | 904,853 | |
Clearwater Paper Corp.* | | | 5,148 | | | | 419,047 | |
| | | | | | | | |
| Investments | | Shares | | | Fair
Value | |
| | | | | | | | |
Deltic Timber Corp. | | | 1,223 | | | $ | 81,745 | |
KapStone Paper and Packaging Corp.* | | | 25,844 | | | | 443,742 | |
Neenah Paper, Inc. | | | 5,799 | | | | 127,404 | |
PH Glatfelter Co. | | | 30,439 | | | | 405,448 | |
Wausau Paper Corp. | | | 14,024 | | | | 107,143 | |
| | | | | | | | |
| Total Paper & Forest Products | | | | | | | 2,489,382 | |
| Personal Products – 0.9% | | | | | | | | |
Elizabeth Arden, Inc.* | | | 5,353 | | | | 160,644 | |
Inter Parfums, Inc.(a) | | | 6,915 | | | | 127,997 | |
Medifast, Inc.*(a) | | | 3,194 | | | | 63,081 | |
Nutraceutical International Corp.* | | | 5,260 | | | | 78,795 | |
Prestige Brands Holdings, Inc.*(a) | | | 14,835 | | | | 170,602 | |
Revlon, Inc. Class A* | | | 23,693 | | | | 376,008 | |
Schiff Nutrition International, Inc. | | | 9,433 | | | | 85,935 | |
USANA Health Sciences, Inc.*(a) | | | 4,901 | | | | 169,133 | |
| | | | | | | | |
| Total Personal Products | | | | | | | 1,232,195 | |
| Pharmaceuticals – 0.4% | | | | | | | | |
Cumberland Pharmaceuticals, Inc.*(a) | | | 1,028 | | | | 5,685 | |
Hi-Tech Pharmacal Co., Inc.* | | | 6,372 | | | | 128,268 | |
ISTA Pharmaceuticals, Inc.* | | | 2,417 | | | | 24,484 | |
Jazz Pharmaceuticals, Inc.* | | | 3,556 | | | | 113,259 | |
Obagi Medical Products, Inc.*(a) | | | 4,937 | | | | 62,404 | |
Questcor Pharmaceuticals, Inc.*(a) | | | 12,138 | | | | 174,908 | |
Santarus, Inc.* | | | 12,580 | | | | 43,024 | |
| | | | | | | | |
| Total Pharmaceuticals | | | | | | | 552,032 | |
| Professional Services – 1.4% | | | | | | | | |
Advisory Board Co. (The)*(a) | | | 1,971 | | | | 101,506 | |
Barrett Business Services, Inc. | | | 1,714 | | | | 27,527 | |
CBIZ, Inc.* | | | 23,571 | | | | 169,947 | |
CRA International, Inc.* | | | 863 | | | | 24,880 | |
Dolan Co. (The)*(a) | | | 11,878 | | | | 144,199 | |
Exponent, Inc.* | | | 3,269 | | | | 145,830 | |
GP Strategies Corp.* | | | 4,598 | | | | 62,533 | |
Heidrick & Struggles International, Inc. | | | 1,810 | | | | 50,372 | |
Hill International, Inc.* | | | 12,740 | | | | 67,394 | |
Huron Consulting Group, Inc.*(a) | | | 5,677 | | | | 157,196 | |
ICF International, Inc.* | | | 5,090 | | | | 104,549 | |
Insperity, Inc. | | | 2,047 | | | | 62,188 | |
Kelly Services, Inc. Class A* | | | 739 | | | | 16,044 | |
Kforce, Inc.*(a) | | | 4,980 | | | | 91,134 | |
Korn/Ferry International* | | | 5,814 | | | | 129,478 | |
Mistras Group, Inc.* | | | 4,353 | | | | 74,915 | |
Navigant Consulting, Inc.*(a) | | | 14,903 | | | | 148,881 | |
On Assignment, Inc.*(a) | | | 3,168 | | | | 29,969 | |
SFN Group, Inc.* | | | 3,566 | | | | 50,245 | |
TrueBlue, Inc.*(a) | | | 4,663 | | | | 78,292 | |
VSE Corp. | | | 3,684 | | | | 109,452 | |
| | | | | | | | |
| Total Professional Services | | | | | | | 1,846,531 | |
| Real Estate Investment Trusts (REITs) – 1.1% | | | | | | | | |
Acadia Realty Trust | | | 7,795 | | | | 147,481 | |
Agree Realty Corp.(a) | | | 3,240 | | | | 72,738 | |
Chesapeake Lodging Trust | | | 340 | | | | 5,919 | |
See Notes to Financial Statements.
| | | | |
| WisdomTree Domestic and International Earnings Funds | | | 49 | |
Schedule of Investments (continued)
WisdomTree SmallCap Earnings Fund (EES)
March 31, 2011
| | | | | | | | |
| Investments | | Shares | | | Fair
Value | |
| | | | | | | | |
Franklin Street Properties Corp.(a) | | | 9,299 | | | $ | 130,837 | |
Getty Realty Corp.(a) | | | 7,972 | | | | 182,399 | |
Gladstone Commercial Corp. | | | 245 | | | | 4,469 | |
Government Properties Income Trust | | | 5,232 | | | | 140,532 | |
Inland Real Estate Corp. | | | 1,176 | | | | 11,219 | |
LTC Properties, Inc. | | | 5,031 | | | | 142,579 | |
Mission West Properties, Inc. | | | 3,222 | | | | 21,169 | |
Monmouth Real Estate Investment Corp. Class A(a) | | | 7,734 | | | | 63,496 | |
One Liberty Properties, Inc. | | | 2,625 | | | | 39,585 | |
Saul Centers, Inc. | | | 2,029 | | | | 90,392 | |
Sovran Self Storage, Inc. | | | 3,307 | | | | 130,792 | |
UMH Properties, Inc.(a) | | | 3,295 | | | | 32,752 | |
Universal Health Realty Income Trust | | | 2,355 | | | | 95,448 | |
Urstadt Biddle Properties, Inc. Class A | | | 3,715 | | | | 70,659 | |
Winthrop Realty Trust | | | 2,889 | | | | 35,390 | |
| | | | | | | | |
| Total Real Estate Investment Trusts (REITs) | | | | | | | 1,417,856 | |
| Real Estate Management & Development – 0.0% | | | | | | | | |
Tejon Ranch Co.* | | | 902 | | | | 33,139 | |
| Road & Rail – 0.1% | | | | | | | | |
Celadon Group, Inc.* | | | 2,649 | | | | 43,020 | |
Marten Transport Ltd.(a) | | | 4,385 | | | | 97,785 | |
Quality Distribution, Inc.* | | | 2,220 | | | | 26,307 | |
| | | | | | | | |
| Total Road & Rail | | | | | | | 167,112 | |
Semiconductors & Semiconductor
Equipment – 6.2% | | | | | | | | |
Advanced Energy Industries, Inc.* | | | 13,872 | | | | 226,807 | |
Amtech Systems, Inc.* | | | 1,948 | | | | 49,168 | |
ATMI, Inc.* | | | 7,647 | | | | 144,375 | |
AXT, Inc.* | | | 9,217 | | | | 66,086 | |
Brooks Automation, Inc.* | | | 28,900 | | | | 396,797 | |
Cabot Microelectronics Corp.*(a) | | | 5,849 | | | | 305,610 | |
Ceva, Inc.*(a) | | | 2,043 | | | | 54,609 | |
Cirrus Logic, Inc.*(a) | | | 24,278 | | | | 510,566 | |
Cohu, Inc.(a) | | | 4,736 | | | | 72,745 | |
Conexant Systems, Inc.*(a) | | | 43,570 | | | | 103,697 | |
Entegris, Inc.*(a) | | | 47,767 | | | | 418,917 | |
Entropic Communications, Inc.*(a) | | | 7,384 | | | | 62,395 | |
FEI Co.*(a) | | | 7,734 | | | | 260,790 | |
FSI International, Inc.* | | | 14,348 | | | | 62,844 | |
GSI Technology, Inc.*(a) | | | 9,453 | | | | 85,928 | |
GT Solar International, Inc.*(a) | | | 74,605 | | | | 795,289 | |
Integrated Device Technology, Inc.*(a) | | | 19,579 | | | | 144,297 | |
Integrated Silicon Solution, Inc.* | | | 24,629 | | | | 228,311 | |
IXYS Corp.* | | | 6,875 | | | | 92,331 | |
Kopin Corp.*(a) | | | 9,220 | | | | 42,320 | |
Kulicke & Soffa Industries, Inc.* | | | 97,079 | | | | 907,689 | |
Lattice Semiconductor Corp.* | | | 45,189 | | | | 266,615 | |
LTX-Credence Corp.* | | | 28,112 | | | | 256,663 | |
Maxlinear, Inc. Class A*(a) | | | 2,789 | | | | 22,786 | |
Micrel, Inc.(a) | | | 15,347 | | | | 206,878 | |
Mindspeed Technologies, Inc.*(a) | | | 17,744 | | | | 150,114 | |
MIPS Technologies, Inc.*(a) | | | 6,528 | | | | 68,479 | |
MKS Instruments, Inc.(a) | | | 25,513 | | | | 849,583 | |
| | | | | | | | |
| Investments | | Shares | | | Fair
Value | |
| | | | | | | | |
Monolithic Power Systems, Inc.* | | | 9,484 | | | $ | 134,578 | |
Nanometrics, Inc.* | | | 12,406 | | | | 224,425 | |
NVE Corp.* | | | 1,182 | | | | 66,594 | |
Pericom Semiconductor Corp.*(a) | | | 7,884 | | | | 81,757 | |
Photronics, Inc.* | | | 9,832 | | | | 88,193 | |
PLX Technology, Inc.* | | | 8,976 | | | | 32,762 | |
Rubicon Technology, Inc.*(a) | | | 2,861 | | | | 79,192 | |
Rudolph Technologies, Inc.* | | | 8,041 | | | | 87,969 | |
Standard Microsystems Corp.*(a) | | | 3,596 | | | | 88,677 | |
Supertex, Inc.* | | | 2,204 | | | | 49,105 | |
Tessera Technologies, Inc.* | | | 12,144 | | | | 221,749 | |
Ultra Clean Holdings* | | | 10,520 | | | | 108,777 | |
Ultratech, Inc.* | | | 2,729 | | | | 80,233 | |
Volterra Semiconductor Corp.*(a) | | | 7,746 | | | | 192,333 | |
| | | | | | | | |
| Total Semiconductors & Semiconductor Equipment | | | | | | | 8,389,033 | |
| Software – 2.4% | | | | | | | | |
ACI Worldwide, Inc.* | | | 3,609 | | | | 118,375 | |
Actuate Corp.* | | | 4,347 | | | | 22,604 | |
American Software, Inc. Class A | | | 3,886 | | | | 28,679 | |
Bottomline Technologies, Inc.*(a) | | | 1,214 | | | | 30,520 | |
Deltek, Inc.*(a) | | | 7,194 | | | | 54,674 | |
Digimarc Corp.* | | | 216 | | | | 6,242 | |
Ebix, Inc.*(a) | | | 12,073 | | | | 285,526 | |
EPIQ Systems, Inc. | | | 5,833 | | | | 83,762 | |
ePlus, Inc.* | | | 4,500 | | | | 119,745 | |
Fair Isaac Corp.(a) | | | 13,166 | | | | 416,177 | |
Interactive Intelligence, Inc.*(a) | | | 1,973 | | | | 76,375 | |
Kenexa Corp.*(a) | | | 469 | | | | 12,940 | |
Manhattan Associates, Inc.*(a) | | | 4,387 | | | | 143,543 | |
MicroStrategy, Inc. Class A* | | | 2,531 | | | | 340,369 | |
Monotype Imaging Holdings, Inc.* | | | 7,342 | | | | 106,459 | |
Netscout Systems, Inc.*(a) | | | 6,742 | | | | 184,191 | |
Opnet Technologies, Inc.(a) | | | 1,758 | | | | 68,544 | |
Radiant Systems, Inc.* | | | 3,247 | | | | 57,472 | |
Renaissance Learning, Inc.(a) | | | 8,678 | | | | 101,967 | |
Rosetta Stone, Inc.* | | | 4,785 | | | | 63,210 | |
S1 Corp.* | | | 6,463 | | | | 43,173 | |
Smith Micro Software, Inc.* | | | 2,643 | | | | 24,738 | |
Sourcefire, Inc.*(a) | | | 4,221 | | | | 116,120 | |
SRS Labs, Inc.* | | | 1,568 | | | | 13,391 | |
Synchronoss Technologies, Inc.*(a) | | | 2,310 | | | | 80,273 | |
TeleCommunication Systems, Inc. Class A* | | | 9,489 | | | | 39,095 | |
Telenav, Inc.* | | | 31,530 | | | | 374,261 | |
Tyler Technologies, Inc.* | | | 5,798 | | | | 137,471 | |
VASCO Data Security International, Inc.* | | | 5,455 | | | | 74,897 | |
| | | | | | | | |
| Total Software | | | | | | | 3,224,793 | |
| Specialty Retail – 4.0% | | | | | | | | |
America’s Car-Mart, Inc.*(a) | | | 5,234 | | | | 134,932 | |
Asbury Automotive Group, Inc.* | | | 11,747 | | �� | | 217,202 | |
Big 5 Sporting Goods Corp. | | | 7,827 | | | | 93,298 | |
Brown Shoe Co., Inc.(a) | | | 11,676 | | | | 142,681 | |
Casual Male Retail Group, Inc.* | | | 12,993 | | | | 63,796 | |
See Notes to Financial Statements.
| | |
| 50 | | WisdomTree Domestic and International Earnings Funds |
Schedule of Investments (continued)
WisdomTree SmallCap Earnings Fund (EES)
March 31, 2011
| | | | | | | | |
| Investments | | Shares | | | Fair
Value | |
| | | | | | | | |
Cato Corp. (The) Class A | | | 9,768 | | | $ | 239,316 | |
Christopher & Banks Corp.(a) | | | 3,462 | | | | 22,434 | |
Citi Trends, Inc.*(a) | | | 4,665 | | | | 103,983 | |
Destination Maternity Corp. | | | 4,456 | | | | 102,800 | |
Finish Line, Inc. (The) Class A(a) | | | 17,991 | | | | 357,121 | |
Genesco, Inc.* | | | 6,357 | | | | 255,551 | |
Group 1 Automotive, Inc.(a) | | | 4,393 | | | | 188,020 | |
Haverty Furniture Cos., Inc. | | | 4,422 | | | | 58,636 | |
hhgregg, Inc.*(a) | | | 9,052 | | | | 121,206 | |
Hibbett Sports, Inc.*(a) | | | 6,119 | | | | 219,121 | |
HOT Topic, Inc. | | | 798 | | | | 4,549 | |
Kirkland’s, Inc.* | | | 13,168 | | | | 203,314 | |
Lithia Motors, Inc. Class A(a) | | | 2,646 | | | | 38,579 | |
Lumber Liquidators Holdings, Inc.*(a) | | | 5,741 | | | | 143,468 | |
MarineMax, Inc.* | | | 1,228 | | | | 12,108 | |
Midas, Inc.* | | | 1,825 | | | | 13,998 | |
Monro Muffler Brake, Inc. | | | 5,789 | | | | 190,921 | |
PEP Boys-Manny, Moe & Jack(a) | | | 10,186 | | | | 129,464 | |
Rue21, Inc.*(a) | | | 4,327 | | | | 124,618 | |
Select Comfort Corp.* | | | 34,118 | | | | 411,463 | |
Shoe Carnival, Inc.*(a) | | | 4,229 | | | | 118,623 | |
Sonic Automotive, Inc. Class A(a) | | | 21,817 | | | | 305,656 | |
Stage Stores, Inc. | | | 9,521 | | | | 182,994 | |
Stein Mart, Inc. | | | 16,641 | | | | 168,240 | |
Systemax, Inc.* | | | 18,989 | | | | 256,731 | |
Talbots, Inc.*(a) | | | 1,924 | | | | 11,621 | |
Vitamin Shoppe, Inc.* | | | 3,917 | | | | 132,512 | |
West Marine, Inc.* | | | 9,168 | | | | 95,622 | |
Wet Seal, Inc. (The) Class A* | | | 109,696 | | | | 469,499 | |
Zumiez, Inc.*(a) | | | 1,925 | | | | 50,878 | |
| | | | | | | | |
| Total Specialty Retail | | | | | | | 5,384,955 | |
| Textiles, Apparel & Luxury Goods – 1.1% | | | | | | | | |
Cherokee, Inc. | | | 3,030 | | | | 52,298 | |
Culp, Inc.* | | | 7,238 | | | | 67,169 | |
G-III Apparel Group Ltd.*(a) | | | 6,251 | | | | 234,912 | |
Joe’s Jeans, Inc.*(a) | | | 66,131 | | | | 70,099 | |
Maidenform Brands, Inc.* | | | 8,934 | | | | 255,244 | |
Oxford Industries, Inc.(a) | | | 6,162 | | | | 210,679 | |
Perry Ellis International, Inc.* | | | 4,753 | | | | 130,802 | |
R.G. Barry Corp.(a) | | | 4,207 | | | | 55,070 | |
True Religion Apparel, Inc.* | | | 9,559 | | | | 224,350 | |
Unifi, Inc.* | | | 5,389 | | | | 91,613 | |
Volcom, Inc.(a) | | | 6,406 | | | | 118,703 | |
| | | | | | | | |
| Total Textiles, Apparel & Luxury Goods | | | | | | | 1,510,939 | |
| Thrifts & Mortgage Finance – 1.5% | | | | | | | | |
Abington Bancorp, Inc. | | | 1,396 | | | | 17,073 | |
Bank Mutual Corp.(a) | | | 5,658 | | | | 23,933 | |
Bofi Holding, Inc.* | | | 7,359 | | | | 114,212 | |
Brookline Bancorp, Inc.(a) | | | 11,916 | | | | 125,475 | |
Dime Community Bancshares, Inc.(a) | | | 12,825 | | | | 189,297 | |
ESSA Bancorp, Inc.(a) | | | 1,971 | | | | 26,017 | |
Federal Agricultural Mortgage Corp. Class C(a) | | | 4,542 | | | | 86,798 | |
Flushing Financial Corp. | | | 12,172 | | | | 181,363 | |
| | | | | | | | |
| Investments | | Shares | | | Fair
Value | |
| | | | | | | | |
Kearny Financial Corp. | | | 4,365 | | | $ | 43,781 | |
OceanFirst Financial Corp. | | | 6,364 | | | | 88,778 | |
Ocwen Financial Corp.* | | | 25,152 | | | | 277,175 | |
Oritani Financial Corp. | | | 4,368 | | | | 55,386 | |
Provident Financial Services, Inc.(a) | | | 14,885 | | | | 220,298 | |
Provident New York Bancorp | | | 9,849 | | | | 101,642 | |
Roma Financial Corp. | | | 1,806 | | | | 19,992 | |
Territorial Bancorp, Inc. | | | 2,582 | | | | 51,433 | |
TrustCo Bank Corp.(a) | | | 25,060 | | | | 148,606 | |
United Financial Bancorp, Inc. | | | 3,025 | | | | 49,943 | |
ViewPoint Financial Group | | | 5,825 | | | | 75,725 | |
Westfield Financial, Inc. | | | 2,645 | | | | 23,964 | |
WSFS Financial Corp. | | | 933 | | | | 43,944 | |
| | | | | | | | |
| Total Thrifts & Mortgage Finance | | | | | | | 1,964,835 | |
| Tobacco – 0.8% | | | | | | | | |
Alliance One International, Inc.* | | | 114,460 | | | | 460,129 | |
Universal Corp. | | | 15,408 | | | | 670,865 | |
| | | | | | | | |
| Total Tobacco | | | | | | | 1,130,994 | |
| Trading Companies & Distributors – 0.9% | | | | | | | | |
Aceto Corp. | | | 4,646 | | | | 37,029 | |
Beacon Roofing Supply, Inc.*(a) | | | 9,397 | | | | 192,357 | |
CAI International, Inc.* | | | 6,229 | | | | 161,082 | |
Houston Wire & Cable Co.(a) | | | 3,439 | | | | 50,278 | |
Interline Brands, Inc.*(a) | | | 7,261 | | | | 148,124 | |
Kaman Corp. | | | 5,085 | | | | 178,992 | |
Lawson Products, Inc. | | | 1,001 | | | | 23,063 | |
Rush Enterprises, Inc. Class A*(a) | | | 4,389 | | | | 86,902 | |
TAL International Group, Inc.(a) | | | 6,220 | | | | 225,600 | |
Titan Machinery, Inc.*(a) | | | 3,521 | | | | 88,905 | |
| | | | | | | | |
| Total Trading Companies & Distributors | | | | | | | 1,192,332 | |
| Water Utilities – 0.5% | | | | | | | | |
American States Water Co. | | | 4,405 | | | | 157,963 | |
California Water Service Group | | | 6,021 | | | | 223,800 | |
Connecticut Water Service, Inc. | | | 1,756 | | | | 46,271 | |
Middlesex Water Co. | | | 3,567 | | | | 64,884 | |
SJW Corp.(a) | | | 3,299 | | | | 76,372 | |
York Water Co. | | | 2,790 | | | | 48,574 | |
| | | | | | | | |
| Total Water Utilities | | | | | | | 617,864 | |
| Wireless Telecommunication Services – 0.4% | | | | | | | | |
NTELOS Holdings Corp. | | | 13,107 | | | | 241,300 | |
Shenandoah Telecommunications Co.(a) | | | 4,673 | | | | 84,394 | |
USA Mobility, Inc. | | | 11,176 | | | | 161,940 | |
| | | | | | | | |
| Total Wireless Telecommunication Services | | | | | | | 487,634 | |
TOTAL COMMON STOCKS
(Cost: $119,678,771) | | | | | | | 133,686,450 | |
| EXCHANGE-TRADED FUND – 0.6% | | | | | | | | |
WisdomTree MidCap Earnings Fund(b)
(Cost: $805,992) | | | 14,364 | | | | 843,454 | |
See Notes to Financial Statements.
| | | | |
| WisdomTree Domestic and International Earnings Funds | | | 51 | |
Schedule of Investments (concluded)
WisdomTree SmallCap Earnings Fund (EES)
March 31, 2011
| | | | | | | | |
| Investments | | Shares | | | Fair
Value | |
| | | | | | | | |
| SHORT-TERM INVESTMENT – 0.0% | | | | | | | | |
| MONEY MARKET FUND – 0.0% | | | | | | | | |
Invesco Treasury Fund Private Class, 0.02%(c)
(Cost: $51,041) | | | 51,041 | | | $ | 51,041 | |
| INVESTMENT OF CASH COLLATERAL FOR SECURITIES LOANED – 26.6% | | | | | | | | |
| MONEY MARKET FUND – 26.6% | | | | | | | | |
Dreyfus Institutional Preferred Money Market Fund, 0.19%(d) | | | | | | | | |
| (Cost: $35,836,000)(e) | | | 35,836,000 | | | | 35,836,000 | |
TOTAL INVESTMENTS IN SECURITIES – 126.5%
(Cost: $156,371,804) | | | | | | | 170,416,945 | |
Liabilities in Excess of Other Assets – (26.5)% | | | | | | | (35,745,274 | ) |
| | | | | | | | |
| NET ASSETS – 100.0% | | | | | | $ | 134,671,671 | |
| * | Non-income producing security. |
| (a) | Security, or portion thereof, was on loan at March 31, 2011 (See Note 2). |
| (b) | Affiliated companies (See Note 7). |
| (c) | Rate shown represents annualized 7-day yield as of March 31, 2011. |
| (d) | Interest rate shown reflects yield as of March 31, 2011. |
| (e) | At March 31, 2011, the total market value of the Fund’s securities on loan was $34,713,338 and the total market value of the collateral held by the Fund was $35,836,000. |
See Notes to Financial Statements.
| | |
| 52 | | WisdomTree Domestic and International Earnings Funds |
Schedule of Investments
WisdomTree LargeCap Value Fund (EZY)
March 31, 2011
| | | | | | | | |
| Investments | | Shares | | | Fair Value | |
| | | | | | | | |
| COMMON STOCKS – 98.6% | | | | | | | | |
| Aerospace & Defense – 4.0% | | | | | | | | |
BE Aerospace, Inc.* | | | 839 | | | $ | 29,810 | |
Esterline Technologies Corp.* | | | 308 | | | | 21,782 | |
General Dynamics Corp. | | | 4,745 | | | | 363,277 | |
Goodrich Corp.(a) | | | 1,217 | | | | 104,090 | |
Hexcel Corp.* | | | 653 | | | | 12,857 | |
L-3 Communications Holdings, Inc. | | | 1,436 | | | | 112,453 | |
Moog, Inc. Class A* | | | 377 | | | | 17,308 | |
Raytheon Co. | | | 5,086 | | | | 258,725 | |
Spirit Aerosystems Holdings, Inc. Class A*(a) | | | 1,948 | | | | 50,005 | |
Teledyne Technologies, Inc.* | | | 392 | | | | 20,270 | |
Textron, Inc.(a) | | | 892 | | | | 24,432 | |
Triumph Group, Inc. | | | 188 | | | | 16,629 | |
| | | | | | | | |
| Total Aerospace & Defense | | | | | | | 1,031,638 | |
| Air Freight & Logistics – 0.7% | | | | | | | | |
Atlas Air Worldwide Holdings, Inc.* | | | 182 | | | | 12,689 | |
FedEx Corp. | | | 1,673 | | | | 156,509 | |
| | | | | | | | |
| Total Air Freight & Logistics | | | | | | | 169,198 | |
| Auto Components – 1.0% | | | | | | | | |
Autoliv, Inc. | | | 381 | | | | 28,282 | |
Johnson Controls, Inc. | | | 4,485 | | | | 186,441 | |
TRW Automotive Holdings Corp.* | | | 587 | | | | 32,332 | |
| | | | | | | | |
| Total Auto Components | | | | | | | 247,055 | |
| Automobiles – 0.3% | | | | | | | | |
Harley-Davidson, Inc.(a) | | | 1,811 | | | | 76,949 | |
Thor Industries, Inc.(a) | | | 307 | | | | 10,245 | |
| | | | | | | | |
| Total Automobiles | | | | | | | 87,194 | |
| Beverages – 0.3% | | | | | | | | |
Dr. Pepper Snapple Group, Inc. | | | 2,063 | | | | 76,661 | |
| Building Products – 0.3% | | | | | | | | |
A.O. Smith Corp. | | | 333 | | | | 14,765 | |
Armstrong World Industries, Inc. | | | 497 | | | | 22,996 | |
Masco Corp.(a) | | | 2,039 | | | | 28,383 | |
| | | | | | | | |
| Total Building Products | | | | | | | 66,144 | |
| Capital Markets – 6.7% | | | | | | | | |
Ameriprise Financial, Inc. | | | 2,611 | | | | 159,480 | |
Goldman Sachs Group, Inc. (The) | | | 9,972 | | | | 1,580,263 | |
| | | | | | | | |
| Total Capital Markets | | | | | | | 1,739,743 | |
| Chemicals – 2.3% | | | | | | | | |
Ashland, Inc. | | | 879 | | | | 50,771 | |
Cabot Corp. | | | 300 | | | | 13,887 | |
Cytec Industries, Inc. | | | 272 | | | | 14,789 | |
Dow Chemical Co. (The) | | | 3,046 | | | | 114,986 | |
Eastman Chemical Co. | | | 771 | | | | 76,576 | |
H.B. Fuller Co. | | | 487 | | | | 10,461 | |
Lubrizol Corp. | | | 858 | | | | 114,938 | |
NewMarket Corp. | | | 209 | | | | 33,068 | |
PPG Industries, Inc. | | | 1,167 | | | | 111,110 | |
Rockwood Holdings, Inc.*(a) | | | 343 | | | | 16,882 | |
| | | | | | | | |
| Investments | | Shares | | | Fair Value | |
| | | | | | | | |
RPM International, Inc. | | | 1,237 | | | $ | 29,354 | |
| | | | | | | | |
| Total Chemicals | | | | | | | 586,822 | |
| Commercial Banks – 5.8% | | | | | | | | |
International Bancshares Corp. | | | 773 | | | | 14,177 | |
PNC Financial Services Group, Inc. | | | 3,021 | | | | 190,293 | |
Wells Fargo & Co. | | | 40,382 | | | | 1,280,109 | |
| | | | | | | | |
| Total Commercial Banks | | | | | | | 1,484,579 | |
| Commercial Services & Supplies – 0.9% | | | | | | | | |
ABM Industries, Inc. | | | 540 | | | | 13,711 | |
Avery Dennison Corp. | | | 1,115 | | | | 46,785 | |
Geo Group, Inc. (The)* | | | 557 | | | | 14,282 | |
HNI Corp. | | | 207 | | | | 6,533 | |
R.R. Donnelley & Sons Co. | | | 2,520 | | | | 47,678 | |
Republic Services, Inc. | | | 3,002 | | | | 90,180 | |
United Stationers, Inc. | | | 235 | | | | 16,697 | |
| | | | | | | | |
| Total Commercial Services & Supplies | | | | | | | 235,866 | |
| Communications Equipment – 0.1% | | | | | | | | |
Arris Group, Inc.* | | | 1,013 | | | | 12,906 | |
Plantronics, Inc. | | | 308 | | | | 11,279 | |
| | | | | | | | |
| Total Communications Equipment | | | | | | | 24,185 | |
| Computers & Peripherals – 0.9% | | | | | | | | |
Diebold, Inc. | | | 497 | | | | 17,624 | |
Lexmark International, Inc. Class A* | | | 1,190 | | | | 44,077 | |
NCR Corp.* | | | 1,503 | | | | 28,316 | |
Western Digital Corp.* | | | 3,475 | | | | 129,583 | |
| | | | | | | | |
| Total Computers & Peripherals | | | | | | | 219,600 | |
| Construction & Engineering – 1.2% | | | | | | | | |
EMCOR Group, Inc.* | | | 1,019 | | | | 31,558 | |
Fluor Corp. | | | 2,133 | | | | 157,117 | |
KBR, Inc. | | | 1,914 | | | | 72,292 | |
Tutor Perini Corp. | | | 857 | | | | 20,876 | |
URS Corp.* | | | 656 | | | | 30,209 | |
| | | | | | | | |
| Total Construction & Engineering | | | | | | | 312,052 | |
| Consumer Finance – 0.9% | | | | | | | | |
American Express Co. | | | 2,742 | | | | 123,939 | |
Capital One Financial Corp. | | | 1,768 | | | | 91,865 | |
Cash America International, Inc. | | | 343 | | | | 15,795 | |
| | | | | | | | |
| Total Consumer Finance | | | | | | | 231,599 | |
| Containers & Packaging – 0.8% | | | | | | | | |
Greif, Inc. Class A | | | 592 | | | | 38,723 | |
Owens-Illinois, Inc.* | | | 2,341 | | | | 70,675 | |
Rock-Tenn Co. Class A(a) | | | 787 | | | | 54,578 | |
Sealed Air Corp. | | | 1,766 | | | | 47,082 | |
| | | | | | | | |
| Total Containers & Packaging | | | | | | | 211,058 | |
| Diversified Consumer Services – 0.1% | | | | | | | | |
Regis Corp. | | | 524 | | | | 9,296 | |
Service Corp. International | | | 1,814 | | | | 20,063 | |
| | | | | | | | |
| Total Diversified Consumer Services | | | | | | | 29,359 | |
| Diversified Financial Services – 5.9% | | | | | | | | |
JPMorgan Chase & Co. | | | 30,720 | | | | 1,416,192 | |
See Notes to Financial Statements.
| | | | |
| WisdomTree Domestic and International Earnings Funds | | | 53 | |
Schedule of Investments (continued)
WisdomTree LargeCap Value Fund (EZY)
March 31, 2011
| | | | | | | | |
| Investments | | Shares | | | Fair Value | |
| | | | | | | | |
NYSE Euronext | | | 3,384 | | | $ | 119,015 | |
| | | | | | | | |
| Total Diversified Financial Services | | | | | | | 1,535,207 | |
| Electric Utilities – 1.7% | | | | | | | | |
Edison International | | | 7,849 | | | | 287,195 | |
Hawaiian Electric Industries, Inc. | | | 567 | | | | 14,062 | |
NV Energy, Inc. | | | 2,142 | | | | 31,894 | |
Pepco Holdings, Inc. | | | 1,866 | | | | 34,801 | |
Pinnacle West Capital Corp. | | | 1,363 | | | | 58,323 | |
| | | | | | | | |
| Total Electric Utilities | | | | | | | 426,275 | |
| Electrical Equipment – 0.7% | | | | | | | | |
Acuity Brands, Inc. | | | 299 | | | | 17,489 | |
Belden, Inc. | | | 363 | | | | 13,631 | |
Brady Corp. Class A(a) | | | 379 | | | | 13,527 | |
EnerSys* | | | 404 | | | | 16,059 | |
General Cable Corp.*(a) | | | 548 | | | | 23,728 | |
Hubbell, Inc. Class B | | | 545 | | | | 38,711 | |
Regal-Beloit Corp. | | | 248 | | | | 18,310 | |
Thomas & Betts Corp.* | | | 437 | | | | 25,988 | |
Woodward, Inc. | | | 516 | | | | 17,833 | |
| | | | | | | | |
| Total Electrical Equipment | | | | | | | 185,276 | |
Electronic Equipment, Instruments &
Components – 1.0% | | | | | | | | |
Anixter International, Inc. | | | 343 | | | | 23,972 | |
Arrow Electronics, Inc.* | | | 1,181 | | | | 49,460 | |
Avnet, Inc.* | | | 1,446 | | | | 49,294 | |
Benchmark Electronics, Inc.* | | | 739 | | | | 14,019 | |
Ingram Micro, Inc. Class A* | | | 1,927 | | | | 40,525 | |
Jabil Circuit, Inc. | | | 992 | | | | 20,267 | |
Plexus Corp.* | | | 200 | | | | 7,012 | |
SYNNEX Corp.* | | | 458 | | | | 14,990 | |
Tech Data Corp.* | | | 581 | | | | 29,550 | |
| | | | | | | | |
| Total Electronic Equipment, Instruments & Components | | | | | | | 249,089 | |
| Energy Equipment & Services – 2.7% | | | | | | | | |
Bristow Group, Inc.* | | | 398 | | | | 18,825 | |
Exterran Holdings, Inc.*(a) | | | 546 | | | | 12,957 | |
National Oilwell Varco, Inc. | | | 6,096 | | | | 483,230 | |
Oil States International, Inc.* | | | 476 | | | | 36,243 | |
Rowan Cos., Inc.* | | | 1,788 | | | | 78,994 | |
SEACOR Holdings, Inc. | | | 275 | | | | 25,426 | |
Superior Energy Services, Inc.* | | | 960 | | | | 39,360 | |
| | | | | | | | |
| Total Energy Equipment & Services | | | | | | | 695,035 | |
| Food & Staples Retailing – 2.9% | | | | | | | | |
CVS Caremark Corp. | | | 15,061 | | | | 516,894 | |
Ruddick Corp.(a) | | | 428 | | | | 16,517 | |
Safeway, Inc. | | | 5,002 | | | | 117,747 | |
SUPERVALU, Inc.(a) | | | 5,468 | | | | 48,829 | |
United Natural Foods, Inc.* | | | 317 | | | | 14,208 | |
Whole Foods Market, Inc. | | | 556 | | | | 36,640 | |
| | | | | | | | |
| Total Food & Staples Retailing | | | | | | | 750,835 | |
| | | | | | | | |
| Investments | | Shares | | | Fair Value | |
| | | | | | | | |
| Food Products – 1.9% | | | | | | | | |
ConAgra Foods, Inc. | | | 4,954 | | | $ | 117,657 | |
Corn Products International, Inc. | | | 741 | | | | 38,399 | |
J.M. Smucker Co. (The) | | | 1,326 | | | | 94,663 | |
Sara Lee Corp. | | | 10,606 | | | | 187,408 | |
Tyson Foods, Inc. Class A | | | 2,332 | | | | 44,751 | |
| | | | | | | | |
| Total Food Products | | | | | | | 482,878 | |
| Gas Utilities – 0.4% | | | | | | | | |
Atmos Energy Corp. | | | 1,049 | | | | 35,771 | |
Oneok, Inc. | | | 965 | | | | 64,539 | |
Southwest Gas Corp. | | | 406 | | | | 15,822 | |
| | | | | | | | |
| Total Gas Utilities | | | | | | | 116,132 | |
| Health Care Equipment & Supplies – 0.4% | | | | | | | | |
Hill-Rom Holdings, Inc. | | | 413 | | | | 15,686 | |
Kinetic Concepts, Inc.* | | | 713 | | | | 38,801 | |
Sirona Dental Systems, Inc.* | | | 314 | | | | 15,750 | |
Teleflex, Inc. | | | 368 | | | | 21,337 | |
| | | | | | | | |
| Total Health Care Equipment & Supplies | | | | | | | 91,574 | |
| Health Care Providers & Services – 10.5% | | | | | | | | |
Aetna, Inc. | | | 6,132 | | | | 229,521 | |
Amedisys, Inc.* | | | 319 | | | | 11,165 | |
AMERIGROUP Corp.*(a) | | | 586 | | | | 37,650 | |
AmerisourceBergen Corp. | | | 2,917 | | | | 115,396 | |
Catalyst Health Solutions, Inc.* | | | 209 | | | | 11,689 | |
Centene Corp.* | | | 520 | | | | 17,150 | |
CIGNA Corp. | | | 5,710 | | | | 252,839 | |
Community Health Systems, Inc.* | | | 912 | | | | 36,471 | |
Coventry Health Care, Inc.* | | | 1,869 | | | | 59,602 | |
Emergency Medical Services Corp. Class A* | | | 301 | | | | 19,140 | |
Health Net, Inc.* | | | 2,391 | | | | 78,186 | |
Healthspring, Inc.* | | | 1,202 | | | | 44,919 | |
Humana, Inc.* | | | 3,557 | | | | 248,776 | |
LifePoint Hospitals, Inc.* | | | 545 | | | | 21,898 | |
McKesson Corp. | | | 2,862 | | | | 226,241 | |
Omnicare, Inc.(a) | | | 1,663 | | | | 49,873 | |
Owens & Minor, Inc. | | | 545 | | | | 17,702 | |
Tenet Healthcare Corp.* | | | 4,215 | | | | 31,402 | |
UnitedHealth Group, Inc. | | | 19,066 | | | | 861,783 | |
Universal American Corp.(a) | | | 1,471 | | | | 33,701 | |
Universal Health Services, Inc. Class B | | | 1,121 | | | | 55,389 | |
Wellcare Health Plans, Inc.* | | | 205 | | | | 8,600 | |
WellPoint, Inc. | | | 3,539 | | | | 246,987 | |
| | | | | | | | |
| Total Health Care Providers & Services | | | | | | | 2,716,080 | |
| Hotels, Restaurants & Leisure – 0.8% | | | | | | | | |
Cheesecake Factory (The)* | | | 395 | | | | 11,886 | |
Life Time Fitness, Inc.* | | | 308 | | | | 11,491 | |
MGM Resorts International*(a) | | | 2,629 | | | | 34,571 | |
PF Chang’s China Bistro, Inc. | | | 137 | | | | 6,328 | |
Starwood Hotels & Resorts Worldwide, Inc. | | | 1,193 | | | | 69,337 | |
Wyndham Worldwide Corp. | | | 2,060 | | | | 65,529 | |
| | | | | | | | |
| Total Hotels, Restaurants & Leisure | | | | | | | 199,142 | |
See Notes to Financial Statements.
| | |
| 54 | | WisdomTree Domestic and International Earnings Funds |
Schedule of Investments (continued)
WisdomTree LargeCap Value Fund (EZY)
March 31, 2011
| | | | | | | | |
| Investments | | Shares | | | Fair Value | |
| | | | | | | | |
| Household Durables – 1.1% | | | | | | | | |
Fortune Brands, Inc. | | | 1,309 | | | $ | 81,014 | |
Jarden Corp. | | | 1,046 | | | | 37,206 | |
Newell Rubbermaid, Inc. | | | 3,511 | | | | 67,165 | |
Tupperware Brands Corp. | | | 570 | | | | 34,035 | |
Whirlpool Corp. | | | 821 | | | | 70,081 | |
| | | | | | | | |
| Total Household Durables | | | | | | | 289,501 | |
Independent Power Producers & Energy Traders – 1.1% | | | | | | | | |
AES Corp. (The)* | | | 8,310 | | | | 108,030 | |
Calpine Corp.*(a) | | | 2,800 | | | | 44,436 | |
NRG Energy, Inc.* | | | 5,959 | | | | 128,357 | |
| | | | | | | | |
| Total Independent Power Producers & Energy Traders | | | | | | | 280,823 | |
| Industrial Conglomerates – 6.8% | | | | | | | | |
Carlisle Cos., Inc. | | | 612 | | | | 27,264 | |
General Electric Co. | | | 85,337 | | | | 1,711,007 | |
Seaboard Corp. | | | 8 | | | | 19,304 | |
| | | | | | | | |
| Total Industrial Conglomerates | | | | | | | 1,757,575 | |
| Insurance – 6.3% | | | | | | | | |
American Family Life Assurance Co., Inc. | | | 3,959 | | | | 208,956 | |
American Financial Group, Inc. | | | 2,292 | | | | 80,266 | |
Assurant, Inc. | | | 1,950 | | | | 75,094 | |
Delphi Financial Group, Inc. Class A | | | 521 | | | | 16,000 | |
First American Financial Corp. | | | 964 | | | | 15,906 | |
Hanover Insurance Group, Inc. (The) | | | 514 | | | | 23,259 | |
Lincoln National Corp.(a) | | | 1,914 | | | | 57,497 | |
Loews Corp. | | | 1,927 | | | | 83,034 | |
Principal Financial Group, Inc. | | | 2,984 | | | | 95,816 | |
Reinsurance Group of America, Inc. | | | 1,023 | | | | 64,224 | |
StanCorp Financial Group, Inc. | | | 667 | | | | 30,762 | |
Torchmark Corp. | | | 1,085 | | | | 72,131 | |
Transatlantic Holdings, Inc. | | | 1,326 | | | | 64,536 | |
Travelers Cos., Inc. (The) | | | 10,350 | | | | 615,618 | |
Unum Group | | | 4,857 | | | | 127,496 | |
| Total Insurance | | | | | | | 1,630,595 | |
| Internet & Catalog Retail – 0.2% | | | | | | | | |
Expedia, Inc.(a) | | | 2,394 | | | | 54,248 | |
HSN, Inc.*(a) | | | 317 | | | | 10,154 | |
| | | | | | | | |
| Total Internet & Catalog Retail | | | | | | | 64,402 | |
| IT Services – 0.9% | | | | | | | | |
Acxiom Corp.* | | | 377 | | | | 5,410 | |
CACI International, Inc. Class A*(a) | | | 299 | | | | 18,335 | |
Computer Sciences Corp. | | | 2,424 | | | | 118,121 | |
Convergys Corp.* | | | 2,499 | | | | 35,886 | |
CoreLogic, Inc.* | | | 964 | | | | 17,834 | |
Sapient Corp.* | | | 1,400 | | | | 16,030 | |
SRA International, Inc. Class A* | | | 488 | | | | 13,840 | |
TeleTech Holdings, Inc.* | | | 667 | | | | 12,926 | |
| | | | | | | | |
| Total IT Services | | | | | | | 238,382 | |
| Leisure Equipment & Products – 0.4% | | | | | | | | |
Mattel, Inc. | | | 3,841 | | | | 95,756 | |
| | | | | | | | |
| Investments | | Shares | | | Fair Value | |
| | | | | | | | |
| Life Sciences Tools & Services – 0.0% | | | | | | | | |
Parexel International Corp.* | | | 317 | | | $ | 7,893 | |
| Machinery – 3.0% | | | | | | | | |
Actuant Corp. Class A | | | 459 | | | | 13,311 | |
AGCO Corp.* | | | 551 | | | | 30,288 | |
Barnes Group, Inc. | | | 327 | | | | 6,828 | |
Bucyrus International, Inc. | | | 672 | | | | 61,454 | |
Crane Co. | | | 446 | | | | 21,600 | |
Cummins, Inc. | | | 1,190 | | | | 130,448 | |
Eaton Corp. | | | 1,500 | | | | 83,160 | |
Flowserve Corp. | | | 642 | | | | 82,689 | |
Gardner Denver, Inc. | | | 497 | | | | 38,781 | |
Manitowoc Co., Inc. (The) | | | 1,075 | | | | 23,521 | |
Oshkosh Corp.* | | | 784 | | | | 27,738 | |
Parker Hannifin Corp. | | | 834 | | | | 78,963 | |
Snap-On, Inc. | | | 497 | | | | 29,850 | |
SPX Corp. | | | 698 | | | | 55,414 | |
Timken Co. | | | 586 | | | | 30,648 | |
Trinity Industries, Inc. | | | 1,252 | | | | 45,911 | |
WABCO Holdings, Inc.* | | | 209 | | | | 12,883 | |
Watts Water Technologies, Inc. Class A | | | 284 | | | | 10,846 | |
| | | | | | | | |
| Total Machinery | | | | | | | 784,333 | |
| Media – 8.2% | | | | | | | | |
CBS Corp. Class B | | | 4,714 | | | | 118,039 | |
Cinemark Holdings, Inc. | | | 965 | | | | 18,673 | |
Clear Channel Outdoor Holdings, Inc. Class A* | | | 545 | | | | 7,930 | |
Gannett Co., Inc. | | | 3,934 | | | | 59,915 | |
Interpublic Group of Cos., Inc. (The) | | | 1,981 | | | | 24,901 | |
Meredith Corp.(a) | | | 886 | | | | 30,053 | |
New York Times Co. (The) Class A* | | | 869 | | | | 8,229 | |
News Corp. Class A | | | 32,422 | | | | 569,330 | |
Scholastic Corp. | | | 614 | | | | 16,602 | �� |
Time Warner Cable, Inc. | | | 3,434 | | | | 244,981 | |
Valassis Communications, Inc.* | | | 314 | | | | 9,150 | |
Viacom, Inc. Class B | | | 7,392 | | | | 343,876 | |
Walt Disney Co. (The) | | | 15,351 | | | | 661,475 | |
| | | | | | | | |
| Total Media | | | | | | | 2,113,154 | |
| Metals & Mining – 0.3% | | | | | | | | |
Cliffs Natural Resources, Inc. | | | 394 | | | | 38,722 | |
Reliance Steel & Aluminum Co. | | | 503 | | | | 29,063 | |
Worthington Industries, Inc.(a) | | | 367 | | | | 7,678 | |
| | | | | | | | |
| Total Metals & Mining | | | | | | | 75,463 | |
| Multiline Retail – 2.2% | | | | | | | | |
99 Cents Only Stores* | | | 455 | | | | 8,918 | |
Big Lots, Inc.* | | | 903 | | | | 39,217 | |
J.C. Penney Co., Inc. | | | 1,242 | | | | 44,600 | |
Macy’s, Inc. | | | 4,579 | | | | 111,087 | |
Sears Holdings Corp.*(a) | | | 297 | | | | 24,547 | |
Target Corp. | | | 6,680 | | | | 334,067 | |
| | | | | | | | |
| Total Multiline Retail | | | | | | | 562,436 | |
See Notes to Financial Statements.
| | | | |
| WisdomTree Domestic and International Earnings Funds | | | 55 | |
Schedule of Investments (continued)
WisdomTree LargeCap Value Fund (EZY)
March 31, 2011
| | | | | | | | |
| Investments | | Shares | | | Fair Value | |
| | | | | | | | |
| Multi-Utilities – 2.0% | | | | | | | | |
Alliant Energy Corp. | | | 1,461 | | | $ | 56,877 | |
Ameren Corp. | | | 3,568 | | | | 100,154 | |
Avista Corp. | | | 600 | | | | 13,878 | |
Black Hills Corp. | | | 243 | | | | 8,126 | |
CMS Energy Corp. | | | 1,715 | | | | 33,682 | |
DTE Energy Co. | | | 1,756 | | | | 85,974 | |
Integrys Energy Group, Inc.(a) | | | 785 | | | | 39,650 | |
MDU Resources Group, Inc. | | | 3,379 | | | | 77,616 | |
NiSource, Inc. | | | 2,570 | | | | 49,292 | |
OGE Energy Corp. | | | 994 | | | | 50,257 | |
| | | | | | | | |
| Total Multi-Utilities | | | | | | | 515,506 | |
| Office Electronics – 0.3% | | | | | | | | |
Xerox Corp. | | | 7,866 | | | | 83,773 | |
| Oil, Gas & Consumable Fuels – 6.9% | | | | | | | | |
Alpha Natural Resources, Inc.*(a) | | | 358 | | | | 21,254 | |
Berry Petroleum Co. Class A | | | 342 | | | | 17,254 | |
ConocoPhillips | | | 13,059 | | | | 1,042,892 | |
Marathon Oil Corp. | | | 5,748 | | | | 306,426 | |
Massey Energy Co.(a) | | | 335 | | | | 22,900 | |
Murphy Oil Corp. | | | 1,958 | | | | 143,756 | |
Overseas Shipholding Group, Inc.(a) | | | 335 | | | | 10,767 | |
Patriot Coal Corp.* | | | 937 | | | | 24,203 | |
Sunoco, Inc. | | | 1,613 | | | | 73,537 | |
Williams Cos., Inc. (The) | | | 3,362 | | | | 104,827 | |
World Fuel Services Corp. | | | 639 | | | | 25,950 | |
| | | | | | | | |
| Total Oil, Gas & Consumable Fuels | | | | | | | 1,793,766 | |
| Paper & Forest Products – 0.1% | | | | | | | | |
International Paper Co. | | | 509 | | | | 15,362 | |
| Personal Products – 0.1% | | | | | | | | |
Nu Skin Enterprises, Inc. Class A | | | 461 | | | | 13,254 | |
| Pharmaceuticals – 0.0% | | | | | | | | |
Viropharma, Inc.* | | | 570 | | | | 11,343 | |
| Professional Services – 0.1% | | | | | | | | |
Manpower, Inc. | | | 271 | | | | 17,040 | |
| Real Estate Management & Development – 0.1% | | | | | | | | |
CB Richard Ellis Group, Inc. Class A* | | | 986 | | | | 26,326 | |
Jones Lang LaSalle, Inc. | | | 80 | | | | 7,979 | |
| | | | | | | | |
| Total Real Estate Management & Development | | | | | | | 34,305 | |
| Road & Rail – 0.1% | | | | | | | | |
Avis Budget Group, Inc.* | | | 228 | | | | 4,084 | |
Ryder System, Inc. | | | 427 | | | | 21,606 | |
| | | | | | | | |
| Total Road & Rail | | | | | | | 25,690 | |
Semiconductors & Semiconductor
Equipment – 0.1% | | | | | | | | |
Amkor Technology, Inc.*(a) | | | 2,829 | | | | 19,068 | |
TriQuint Semiconductor, Inc.* | | | 355 | | | | 4,583 | |
| | | | | | | | |
| Total Semiconductors & Semiconductor Equipment | | | | | | | 23,651 | |
| Specialty Retail – 1.8% | | | | | | | | |
Ann, Inc.* | | | 213 | | | | 6,200 | |
| | | | | | | | |
| Investments | | Shares | | | Fair Value | |
| | | | | | | | |
Ascena Retail Group, Inc.* | | | 558 | | | $ | 18,085 | |
AutoNation, Inc.*(a) | | | 1,825 | | | | 64,550 | |
Barnes & Noble, Inc.(a) | | | 986 | | | | 9,061 | |
Cabela’s, Inc.* | | | 951 | | | | 23,785 | |
CarMax, Inc.* | | | 1,444 | | | | 46,352 | |
Chico’s FAS, Inc. | | | 794 | | | | 11,831 | |
Childrens Place Retail Stores, Inc. (The)* | | | 269 | | | | 13,404 | |
Collective Brands, Inc.* | | | 570 | | | | 12,301 | |
Dick’s Sporting Goods, Inc.* | | | 737 | | | | 29,465 | |
DSW, Inc. Class A* | | | 287 | | | | 11,469 | |
Ltd. Brands, Inc. | | | 2,445 | | | | 80,392 | |
Men’s Wearhouse, Inc. (The)(a) | | | 250 | | | | 6,765 | |
OfficeMax, Inc.* | | | 264 | | | | 3,416 | |
Penske Automotive Group, Inc.* | | | 665 | | | | 13,313 | |
RadioShack Corp. | | | 1,360 | | | | 20,414 | |
Rent-A-Center, Inc. | | | 1,065 | | | | 37,179 | |
Tractor Supply Co. | | | 512 | | | | 30,648 | |
Ulta Salon Cosmetics & Fragrance, Inc.* | | | 248 | | | | 11,936 | |
Williams-Sonoma, Inc. | | | 438 | | | | 17,739 | |
| | | | | | | | |
| Total Specialty Retail | | | | | | | 468,305 | |
| Textiles, Apparel & Luxury Goods – 0.7% | | | | | | | | |
Deckers Outdoor Corp.* | | | 373 | | | | 32,134 | |
Fossil, Inc.* | | | 544 | | | | 50,946 | |
Hanesbrands, Inc.* | | | 560 | | | | 15,142 | |
Jones Group, Inc. (The) | | | 724 | | | | 9,955 | |
Phillips-Van Heusen Corp. | | | 427 | | | | 27,768 | |
Skechers U.S.A., Inc. Class A*(a) | | | 213 | | | | 4,375 | |
Timberland Co. (The) Class A* | | | 389 | | | | 16,062 | |
Warnaco Group, Inc. (The)* | | | 330 | | | | 18,873 | |
Wolverine World Wide, Inc.(a) | | | 451 | | | | 16,813 | |
| | | | | | | | |
| Total Textiles, Apparel & Luxury Goods | | | | | | | 192,068 | |
| Tobacco – 0.1% | | | | | | | | |
Universal Corp.(a) | | | 377 | | | | 16,415 | |
| Trading Companies & Distributors – 0.2% | | | | | | | | |
Applied Industrial Technologies, Inc. | | | 357 | | | | 11,874 | |
WESCO International, Inc.* | | | 485 | | | | 30,312 | |
| | | | | | | | |
| Total Trading Companies & Distributors | | | | | | | 42,186 | |
| Wireless Telecommunication Services – 0.3% | | | | | | | | |
NII Holdings, Inc.* | | | 1,367 | | | | 56,963 | |
Telephone & Data Systems, Inc. | | | 953 | | | | 32,116 | |
| | | | | | | | |
| Total Wireless Telecommunication Services | | | | | | | 89,079 | |
TOTAL COMMON STOCKS
(Cost: $21,930,623) | | | | | | | 25,442,332 | |
| EXCHANGE-TRADED FUNDS – 1.2% | | | | | | | | |
WisdomTree LargeCap Dividend Fund(b) | | | 4,600 | | | | 222,272 | |
WisdomTree MidCap Dividend Fund(b) | | | 1,778 | | | | 95,994 | |
| | | | | | | | |
TOTAL EXCHANGE-TRADED FUNDS
(Cost: $295,261) | | | | | | | 318,266 | |
See Notes to Financial Statements.
| | |
| 56 | | WisdomTree Domestic and International Earnings Funds |
Schedule of Investments (concluded)
WisdomTree LargeCap Value Fund (EZY)
March 31, 2011
| | | | | | | | |
| Investments | | Shares | | | Fair Value | |
| | | | | | | | |
| SHORT-TERM INVESTMENT – 0.1% | | | | | | | | |
| MONEY MARKET FUND – 0.1% | | | | | | | | |
Invesco Treasury Fund Private Class, 0.02%(c)
(Cost: $30,185) | | | 30,185 | | | $ | 30,185 | |
| INVESTMENT OF CASH COLLATERAL FOR SECURITIES LOANED – 3.9% | | | | | | | | |
| MONEY MARKET FUND – 3.9% | | | | | | | | |
Dreyfus Institutional Preferred Money Market Fund, 0.19%(d)
| | | | | | | | |
| (Cost: $994,000)(e) | | | 994,000 | | | | 994,000 | |
TOTAL INVESTMENTS IN SECURITIES – 103.8%
(Cost: $23,250,069) | | | | | | | 26,784,783 | |
Liabilities in Excess of Other Assets – (3.8)% | | | | | | | (972,817 | ) |
| | | | | | | | |
| NET ASSETS – 100.0% | | | | | | $ | 25,811,966 | |
| * | Non-income producing security. |
| (a) | Security, or portion thereof, was on loan at March 31, 2011 (See Note 2). |
| (b) | Affiliated companies (See Note 7). |
| (c) | Rate shown represents annualized 7-day yield as of March 31, 2011. |
| (d) | Interest rate shown reflects yield as of March 31, 2011. |
| (e) | At March 31, 2011, the total market value of the Fund’s securities on loan was $970,621 and the total market value of the collateral held by the Fund was $994,000. |
See Notes to Financial Statements.
| | | | |
| WisdomTree Domestic and International Earnings Funds | | | 57 | |
Schedule of Investments
WisdomTree LargeCap Growth Fund (ROI)
March 31, 2011
| | | | | | | | |
| Investments | | Shares | | | Fair Value | |
| | | | | | | | |
| COMMON STOCKS – 98.9% | | | | | | | | |
| Aerospace & Defense – 4.5% | | | | | | | | |
BE Aerospace, Inc.* | | | 938 | | | $ | 33,327 | |
Esterline Technologies Corp.* | | | 294 | | | | 20,792 | |
General Dynamics Corp. | | | 4,640 | | | | 355,238 | |
Lockheed Martin Corp. | | | 5,454 | | | | 438,503 | |
Raytheon Co. | | | 4,981 | | | | 253,383 | |
Spirit Aerosystems Holdings, Inc. Class A*(a) | | | 1,918 | | | | 49,235 | |
| | | | | | | | |
| Total Aerospace & Defense | | | | | | | 1,150,478 | |
| Air Freight & Logistics – 0.0% | | | | | | | | |
Atlas Air Worldwide Holdings, Inc.* | | | 179 | | | | 12,480 | |
| Airlines – 0.0% | | | | | | | | |
Allegiant Travel Co. | | | 185 | | | | 8,105 | |
| Auto Components – 0.1% | | | | | | | | |
TRW Automotive Holdings Corp.* | | | 671 | | | | 36,959 | |
| Beverages – 0.2% | | | | | | | | |
Hansen Natural Corp.* | | | 725 | | | | 43,667 | |
| Biotechnology – 2.3% | | | | | | | | |
Alexion Pharmaceuticals, Inc.* | | | 778 | | | | 76,773 | |
Celgene Corp.* | | | 1,886 | | | | 108,502 | |
Cubist Pharmaceuticals, Inc.* | | | 580 | | | | 14,639 | |
Gilead Sciences, Inc.* | | | 8,737 | | | | 370,798 | |
Onyx Pharmaceuticals, Inc.* | | | 95 | | | | 3,342 | |
United Therapeutics Corp.* | | | 100 | | | | 6,702 | |
| | | | | | | | |
| Total Biotechnology | | | | | | | 580,756 | |
| Building Products – 0.1% | | | | | | | | |
Armstrong World Industries, Inc. | | | 480 | | | | 22,210 | |
| Capital Markets – 7.4% | | | | | | | | |
Ameriprise Financial, Inc. | | | 2,537 | | | | 154,960 | |
BlackRock, Inc. | | | 749 | | | | 150,556 | |
Goldman Sachs Group, Inc. (The) | | | 9,722 | | | | 1,540,646 | |
Greenhill & Co., Inc.(a) | | | 80 | | | | 5,263 | |
Knight Capital Group, Inc. Class A* | | | 1,568 | | | | 21,011 | |
| | | | | | | | |
| Total Capital Markets | | | | | | | 1,872,436 | |
| Chemicals – 1.3% | | | | | | | | |
Ashland, Inc. | | | 831 | | | | 47,999 | |
Celanese Corp. | | | 2,603 | | | | 115,495 | |
Lubrizol Corp. | | | 834 | | | | 111,723 | |
NewMarket Corp. | | | 223 | | | | 35,283 | |
Rockwood Holdings, Inc.*(a) | | | 328 | | | | 16,144 | |
| | | | | | | | |
| Total Chemicals | | | | | | | 326,644 | |
| Commercial Banks – 5.8% | | | | | | | | |
International Bancshares Corp. | | | 784 | | | | 14,379 | |
PNC Financial Services Group, Inc. | | | 2,926 | | | | 184,309 | |
Prosperity Bancshares, Inc. | | | 381 | | | | 16,295 | |
Wells Fargo & Co. | | | 39,379 | | | | 1,248,314 | |
Westamerica Bancorp. | | | 180 | | | | 9,247 | |
| | | | | | | | |
| Total Commercial Banks | | | | | | | 1,472,544 | |
| Commercial Services & Supplies – 0.7% | | | | | | | | |
Brink’s Co. (The) | | | 1,022 | | | | 33,838 | |
| | | | | | | | |
| Investments | | Shares | | | Fair Value | |
| | | | | | | | |
Corrections Corp. of America* | | | 1,307 | | | $ | 31,891 | |
Republic Services, Inc. | | | 2,931 | | | | 88,047 | |
Waste Connections, Inc. | | | 738 | | | | 21,247 | |
| | | | | | | | |
| Total Commercial Services & Supplies | | | | | | | 175,023 | |
| Communications Equipment – 0.3% | | | | | | | | |
Acme Packet, Inc.* | | | 100 | | | | 7,096 | |
Blue Coat Systems, Inc.*(a) | | | 104 | | | | 2,929 | |
Brocade Communications Systems, Inc.* | | | 1,655 | | | | 10,178 | |
F5 Networks, Inc.* | | | 258 | | | | 26,463 | |
InterDigital, Inc.(a) | | | 683 | | | | 32,586 | |
Riverbed Technology, Inc.* | | | 232 | | | | 8,735 | |
| | | | | | | | |
| Total Communications Equipment | | | | | | | 87,987 | |
| Computers & Peripherals – 8.5% | | | | | | | | |
Apple, Inc.* | | | 5,618 | | | | 1,957,592 | |
NetApp, Inc.* | | | 1,321 | | | | 63,646 | |
Western Digital Corp.* | | | 3,379 | | | | 126,003 | |
| | | | | | | | |
| Total Computers & Peripherals | | | | | | | 2,147,241 | |
| Consumer Finance – 0.2% | | | | | | | | |
Cash America International, Inc. | | | 328 | | | | 15,104 | |
Credit Acceptance Corp.* | | | 520 | | | | 36,900 | |
| | | | | | | | |
| Total Consumer Finance | | | | | | | 52,004 | |
| Containers & Packaging – 0.3% | | | | | | | | |
Owens-Illinois, Inc.* | | | 2,234 | | | | 67,444 | |
| Diversified Consumer Services – 0.7% | | | | | | | | |
Apollo Group, Inc. Class A* | | | 1,793 | | | | 74,785 | |
Capella Education Co.*(a) | | | 69 | | | | 3,436 | |
Career Education Corp.* | | | 646 | | | | 14,677 | |
Corinthian Colleges, Inc.*(a) | | | 931 | | | | 4,115 | |
DeVry, Inc. | | | 440 | | | | 24,231 | |
Grand Canyon Education, Inc.* | | | 178 | | | | 2,581 | |
ITT Educational Services, Inc.*(a) | | | 386 | | | | 27,850 | |
Service Corp. International | | | 1,744 | | | | 19,289 | |
Strayer Education, Inc.(a) | | | 65 | | | | 8,482 | |
| | | | | | | | |
| Total Diversified Consumer Services | | | | | | | 179,446 | |
| Diversified Financial Services – 5.7% | | | | | | | | |
IntercontinentalExchange, Inc.* | | | 430 | | | | 53,122 | |
JPMorgan Chase & Co. | | | 29,947 | | | | 1,380,556 | |
MSCI, Inc. Class A* | | | 308 | | | | 11,341 | |
| | | | | | | | |
| Total Diversified Financial Services | | | | | | | 1,445,019 | |
| Diversified Telecommunication Services – 0.2% | | | | | | | | |
AboveNet, Inc. | | | 768 | | | | 49,812 | |
| Electric Utilities – 0.1% | | | | | | | | |
Unisource Energy Corp. | | | 443 | | | | 16,006 | |
| Electrical Equipment – 0.1% | | | | | | | | |
Woodward, Inc. | | | 497 | | | | 17,176 | |
Electronic Equipment, Instruments & Components – 0.2% | | | | | | | | |
Dolby Laboratories, Inc. Class A*(a) | | | 583 | | | | 28,689 | |
Jabil Circuit, Inc. | | | 744 | | | | 15,200 | |
| | | | | | | | |
| Total Electronic Equipment, Instruments & Components | | | | | | | 43,889 | |
See Notes to Financial Statements.
| | |
| 58 | | WisdomTree Domestic and International Earnings Funds |
Schedule of Investments (continued)
WisdomTree LargeCap Growth Fund (ROI)
March 31, 2011
| | | | | | | | |
| Investments | | Shares | | | Fair Value | |
| | | | | | | | |
| Energy Equipment & Services – 0.5% | | | | | | | | |
Atwood Oceanics, Inc.* | | | 961 | | | $ | 44,619 | |
FMC Technologies, Inc.* | | | 768 | | | | 72,561 | |
| | | | | | | | |
| Total Energy Equipment & Services | | | | | | | 117,180 | |
| Food & Staples Retailing – 2.2% | | | | | | | | |
CVS Caremark Corp. | | | 14,700 | | | | 504,504 | |
Whole Foods Market, Inc. | | | 658 | | | | 43,362 | |
| | | | | | | | |
| Total Food & Staples Retailing | | | | | | | 547,866 | |
| Food Products – 3.2% | | | | | | | | |
ConAgra Foods, Inc. | | | 4,815 | | | | 114,356 | |
General Mills, Inc. | | | 7,687 | | | | 280,960 | |
Green Mountain Coffee Roasters, Inc.*(a) | | | 258 | | | | 16,669 | |
Hershey Co. (The) | | | 1,750 | | | | 95,113 | |
Kellogg Co. | | | 3,859 | | | | 208,309 | |
Lancaster Colony Corp. | | | 282 | | | | 17,089 | |
Ralcorp Holdings, Inc.*(a) | | | 594 | | | | 40,647 | |
Tyson Foods, Inc. Class A | | | 2,199 | | | | 42,199 | |
| | | | | | | | |
| Total Food Products | | | | | | | 815,342 | |
| Health Care Equipment & Supplies – 1.3% | | | | | | | | |
Alere, Inc.* | | | 170 | | | | 6,654 | |
American Medical Systems Holdings, Inc.* | | | 424 | | | | 9,175 | |
Edwards Lifesciences Corp.* | | | 457 | | | | 39,759 | |
Hospira, Inc.* | | | 1,414 | | | | 78,054 | |
Intuitive Surgical, Inc.* | | | 100 | | | | 33,346 | |
Kinetic Concepts, Inc.* | | | 835 | | | | 45,441 | |
Masimo Corp. | | | 300 | | | | 9,930 | |
NuVasive, Inc.*(a) | | | 39 | | | | 987 | |
ResMed, Inc.*(a) | | | 866 | | | | 25,980 | |
Sirona Dental Systems, Inc.* | | | 302 | | | | 15,148 | |
Thoratec Corp.* | | | 165 | | | | 4,278 | |
Varian Medical Systems, Inc.* | | | 892 | | | | 60,335 | |
| | | | | | | | |
| Total Health Care Equipment & Supplies | | | | | | | 329,087 | |
| Health Care Providers & Services – 11.4% | | | | | | | | |
Aetna, Inc. | | | 5,960 | | | | 223,083 | |
Amedisys, Inc.* | | | 302 | | | | 10,570 | |
AMERIGROUP Corp.*(a) | | | 582 | | | | 37,394 | |
AmerisourceBergen Corp. | | | 2,867 | | | | 113,419 | |
Catalyst Health Solutions, Inc.* | | | 204 | | | | 11,410 | |
Centene Corp.* | | | 496 | | | | 16,358 | |
CIGNA Corp. | | | 5,505 | | | | 243,760 | |
Community Health Systems, Inc.* | | | 871 | | | | 34,831 | |
Coventry Health Care, Inc.* | | | 1,823 | | | | 58,135 | |
Emergency Medical Services Corp. Class A* | | | 289 | | | | 18,378 | |
Express Scripts, Inc.* | | | 2,859 | | | | 158,989 | |
Healthspring, Inc.* | | | 1,121 | | | | 41,892 | |
HMS Holdings Corp.*(a) | | | 91 | | | | 7,448 | |
Humana, Inc.* | | | 3,451 | | | | 241,363 | |
LifePoint Hospitals, Inc.* | | | 509 | | | | 20,452 | |
Lincare Holdings, Inc. | | | 607 | | | | 18,004 | |
McKesson Corp. | | | 2,755 | | | | 217,783 | |
Medco Health Solutions, Inc.* | | | 3,016 | | | | 169,379 | |
Mednax, Inc.* | | | 508 | | | | 33,838 | |
| | | | | | | | |
| Investments | | Shares | | | Fair Value | |
| | | | | | | | |
PSS World Medical, Inc.* | | | 428 | | | $ | 11,620 | |
Tenet Healthcare Corp.* | | | 4,063 | | | | 30,269 | |
UnitedHealth Group, Inc. | | | 18,600 | | | | 840,719 | |
Universal American Corp.(a) | | | 1,438 | | | | 32,945 | |
Universal Health Services, Inc. Class B | | | 1,089 | | | | 53,807 | |
Wellcare Health Plans, Inc.* | | | 197 | | | | 8,264 | |
WellPoint, Inc. | | | 3,476 | | | | 242,590 | |
| | | | | | | | |
| Total Health Care Providers & Services | | | | | | | 2,896,700 | |
| Health Care Technology – 0.0% | | | | | | | | |
athenahealth, Inc.*(a) | | | 40 | | | | 1,805 | |
Quality Systems, Inc. | | | 106 | | | | 8,834 | |
| | | | | | | | |
| Total Health Care Technology | | | | | | | 10,639 | |
| Hotels, Restaurants & Leisure – 1.6% | | | | | | | | |
Cheesecake Factory (The)* | | | 385 | | | | 11,585 | |
Chipotle Mexican Grill, Inc.* | | | 154 | | | | 41,945 | |
Cracker Barrel Old Country Store, Inc. | | | 209 | | | | 10,270 | |
Life Time Fitness, Inc.*(a) | | | 298 | | | | 11,118 | |
PF Chang’s China Bistro, Inc. | | | 130 | | | | 6,005 | |
Starbucks Corp. | | | 5,103 | | | | 188,556 | |
Starwood Hotels & Resorts Worldwide, Inc. | | | 1,151 | | | | 66,896 | |
WMS Industries, Inc.*(a) | | | 308 | | | | 10,888 | |
Wyndham Worldwide Corp. | | | 1,953 | | | | 62,125 | |
Wynn Resorts Ltd. | | | 49 | | | | 6,235 | |
| | | | | | | | |
| Total Hotels, Restaurants & Leisure | | | | | | | 415,623 | |
| Household Durables – 0.5% | | | | | | | | |
Tempur-Pedic International, Inc.* | | | 380 | | | | 19,251 | |
Tupperware Brands Corp. | | | 595 | | | | 35,527 | |
Whirlpool Corp. | | | 781 | | | | 66,666 | |
| | | | | | | | |
| Total Household Durables | | | | | | | 121,444 | |
| Household Products – 1.3% | | | | | | | | |
Colgate-Palmolive Co. | | | 3,993 | | | | 322,475 | |
Independent Power Producers & Energy Traders – 1.1% | | | | | | | | |
AES Corp. (The)* | | | 8,102 | | | | 105,326 | |
Calpine Corp.*(a) | | | 2,732 | | | | 43,357 | |
NRG Energy, Inc.* | | | 5,759 | | | | 124,048 | |
Ormat Technologies, Inc.(a) | | | 263 | | | | 6,662 | |
| | | | | | | | |
| Total Independent Power Producers & Energy Traders | | | | | | | 279,393 | |
| Insurance – 11.2% | | | | | | | | |
Alleghany Corp.* | | | 137 | | | | 45,344 | |
American Family Life Assurance Co., Inc. | | | 3,820 | | | | 201,620 | |
American Financial Group, Inc. | | | 2,199 | | | | 77,009 | |
Berkshire Hathaway, Inc. Class B* | | | 14,653 | | | | 1,225,431 | |
Delphi Financial Group, Inc. Class A | | | 503 | | | | 15,447 | |
Erie Indemnity Co. Class A | | | 339 | | | | 24,106 | |
First American Financial Corp. | | | 931 | | | | 15,362 | |
Hanover Insurance Group, Inc. (The) | | | 557 | | | | 25,204 | |
Lincoln National Corp.(a) | | | 2,147 | | | | 64,496 | |
Loews Corp. | | | 1,847 | | | | 79,587 | |
Principal Financial Group, Inc. | | | 3,036 | | | | 97,486 | |
See Notes to Financial Statements.
| | | | |
| WisdomTree Domestic and International Earnings Funds | | | 59 | |
Schedule of Investments (continued)
WisdomTree LargeCap Growth Fund (ROI)
March 31, 2011
| | | | | | | | |
| Investments | | Shares | | | Fair Value | |
| | | | | | | | |
ProAssurance Corp.* | | | 557 | | | $ | 35,297 | |
Reinsurance Group of America, Inc. | | | 971 | | | | 60,959 | |
StanCorp Financial Group, Inc. | | | 677 | | | | 31,223 | |
Torchmark Corp. | | | 1,044 | | | | 69,405 | |
Transatlantic Holdings, Inc. | | | 1,269 | | | | 61,762 | |
Travelers Cos., Inc. (The) | | | 10,099 | | | | 600,689 | |
Unum Group | | | 4,727 | | | | 124,084 | |
| | | | | | | | |
| Total Insurance | | | | | | | 2,854,511 | |
| Internet & Catalog Retail – 1.7% | | | | | | | | |
Amazon.com, Inc.* | | | 981 | | | | 176,707 | |
Expedia, Inc. | | | 2,300 | | | | 52,118 | |
HSN, Inc.* | | | 307 | | | | 9,833 | |
NetFlix, Inc.*(a) | | | 193 | | | | 45,805 | |
priceline.com, Inc.* | | | 274 | | | | 138,765 | |
| | | | | | | | |
| Total Internet & Catalog Retail | | | | | | | 423,228 | |
| Internet Software & Services – 5.1% | | | | | | | | |
eBay, Inc.* | | | 7,361 | | | | 228,485 | |
Equinix, Inc.* | | | 95 | | | | 8,655 | |
Google, Inc. Class A* | | | 1,637 | | | | 959,625 | |
MercadoLibre, Inc.* | | | 90 | | | | 7,347 | |
Rackspace Hosting, Inc.*(a) | | | 217 | | | | 9,298 | |
Sohu.com, Inc.*(a) | | | 432 | | | | 38,604 | |
VeriSign, Inc. | | | 1,160 | | | | 42,004 | |
| | | | | | | | |
| Total Internet Software & Services | | | | | | | 1,294,018 | |
| IT Services – 2.9% | | | | | | | | |
Alliance Data Systems Corp.*(a) | | | 364 | | | | 31,264 | |
CACI International, Inc. Class A* | | | 286 | | | | 17,538 | |
Cognizant Technology Solutions Corp. Class A* | | | 1,456 | | | | 118,518 | |
CoreLogic, Inc.* | | | 931 | | | | 17,224 | |
DST Systems, Inc. | | | 589 | | | | 31,111 | |
Lender Processing Services, Inc. | | | 1,147 | | | | 36,922 | |
Mastercard, Inc. Class A | | | 819 | | | | 206,158 | |
MAXIMUS, Inc. | | | 152 | | | | 12,338 | |
Sapient Corp.* | | | 1,351 | | | | 15,469 | |
Syntel, Inc. | | | 457 | | | | 23,869 | |
Visa, Inc. Class A | | | 3,246 | | | | 238,970 | |
| | | | | | | | |
| Total IT Services | | | | | | | 749,381 | |
| Life Sciences Tools & Services – 0.6% | | | | | | | | |
Bruker Corp.* | | | 749 | | | | 15,617 | |
Covance, Inc.*(a) | | | 398 | | | | 21,779 | |
Life Technologies Corp.* | | | 766 | | | | 40,154 | |
Parexel International Corp.* | | | 302 | | | | 7,520 | |
Waters Corp.* | | | 689 | | | | 59,873 | |
| | | | | | | | |
| Total Life Sciences Tools & Services | | | | | | | 144,943 | |
| Machinery – 1.1% | | | | | | | | |
Bucyrus International, Inc. | | | 652 | | | | 59,625 | |
Flowserve Corp. | | | 613 | | | | 78,954 | |
Joy Global, Inc. | | | 997 | | | | 98,513 | |
Manitowoc Co., Inc. (The) | | | 1,029 | | | | 22,515 | |
Oshkosh Corp.* | | | 754 | | | | 26,677 | |
| | | | | | | | |
| Total Machinery | | | | | | | 286,284 | |
| | | | | | | | |
| Investments | | Shares | | | Fair Value | |
| | | | | | | | |
| Media – 1.3% | | | | | | | | |
CBS Corp. Class B | | | 4,645 | | | $ | 116,310 | |
Cinemark Holdings, Inc. | | | 928 | | | | 17,957 | |
CTC Media, Inc. | | | 1,384 | | | | 32,621 | |
Discovery Communications, Inc. Class A* | | | 1,495 | | | | 59,650 | |
DreamWorks Animation SKG, Inc. Class A* | | | 521 | | | | 14,552 | |
Gannett Co., Inc. | | | 3,768 | | | | 57,387 | |
Scholastic Corp. | | | 613 | | | | 16,576 | |
Valassis Communications, Inc.* | | | 302 | | | | 8,800 | |
| | | | | | | | |
| Total Media | | | | | | | 323,853 | |
| Metals & Mining – 1.1% | | | | | | | | |
Compass Minerals International, Inc. | | | 300 | | | | 28,059 | |
Newmont Mining Corp. | | | 3,905 | | | | 213,134 | |
Royal Gold, Inc. | | | 69 | | | | 3,616 | |
Walter Energy, Inc. | | | 237 | | | | 32,097 | |
| | | | | | | | |
| Total Metals & Mining | | | | | | | 276,906 | |
| Multiline Retail – 0.7% | | | | | | | | |
99 Cents Only Stores* | | | 439 | | | | 8,604 | |
Big Lots, Inc.* | | | 674 | | | | 29,272 | |
Dollar Tree, Inc.* | | | 1,156 | | | | 64,181 | |
Nordstrom, Inc. | | | 1,480 | | | | 66,423 | |
| | | | | | | | |
| Total Multiline Retail | | | | | | | 168,480 | |
| Multi-Utilities – 0.0% | | | | | | | | |
Black Hills Corp. | | | 248 | | | | 8,293 | |
| Oil, Gas & Consumable Fuels – 0.2% | | | | | | | | |
Gran Tierra Energy, Inc.* | | | 310 | | | | 2,502 | |
Massey Energy Co. | | | 374 | | | | 25,566 | |
Patriot Coal Corp.* | | | 950 | | | | 24,539 | |
| | | | | | | | |
| Total Oil, Gas & Consumable Fuels | | | | | | | 52,607 | |
| Paper & Forest Products – 0.1% | | | | | | | | |
International Paper Co. | | | 493 | | | | 14,879 | |
| Personal Products – 1.0% | | | | | | | | |
Avon Products, Inc. | | | 3,539 | | | | 95,695 | |
Estee Lauder Cos., Inc. (The) Class A | | | 1,434 | | | | 138,180 | |
Nu Skin Enterprises, Inc. Class A(a) | | | 445 | | | | 12,794 | |
| | | | | | | | |
| Total Personal Products | | | | | | | 246,669 | |
| Pharmaceuticals – 2.5% | | | | | | | | |
Bristol-Myers Squibb Co. | | | 20,261 | | | | 535,499 | |
Endo Pharmaceuticals Holdings, Inc.* | | | 1,191 | | | | 45,449 | |
Medicis Pharmaceutical Corp. Class A | | | 426 | | | | 13,649 | |
Perrigo Co. | | | 522 | | | | 41,509 | |
Viropharma, Inc.* | | | 547 | | | | 10,885 | |
| | | | | | | | |
| Total Pharmaceuticals | | | | | | | 646,991 | |
| Professional Services – 0.1% | | | | | | | | |
IHS, Inc. Class A* | | | 361 | | | | 32,039 | |
| Real Estate Investment Trusts (REITs) – 0.5% | | | | | | | | |
Alexander’s, Inc. | | | 62 | | | | 25,231 | |
Boston Properties, Inc.(a) | | | 482 | | | | 45,718 | |
CommonWealth REIT | | | 41 | | | | 1,065 | |
Corporate Office Properties Trust SBI MD | | | 139 | | | | 5,023 | |
See Notes to Financial Statements.
| | |
| 60 | | WisdomTree Domestic and International Earnings Funds |
Schedule of Investments (concluded)
WisdomTree LargeCap Growth Fund (ROI)
March 31, 2011
| | | | | | | | |
| Investments | | Shares | | | Fair Value | |
| | | | | | | | |
Digital Realty Trust, Inc.(a) | | | 120 | | | $ | 6,977 | |
Equity Lifestyle Properties, Inc. | | | 66 | | | | 3,805 | |
Healthcare Realty Trust, Inc. | | | 173 | | | | 3,927 | |
Potlatch Corp. | | | 310 | | | | 12,462 | |
Senior Housing Properties Trust | | | 698 | | | | 16,082 | |
| | | | | | | | |
| Total Real Estate Investment Trusts (REITs) | | | | | | | 120,290 | |
| Real Estate Management & Development – 0.1% | | | | | | | | |
CB Richard Ellis Group, Inc. Class A*(a) | | | 949 | | | | 25,338 | |
| Road & Rail – 0.0% | | | | | | | | |
Avis Budget Group, Inc.* | | | 220 | | | | 3,940 | |
Semiconductors & Semiconductor
Equipment – 0.7% | | | | | | | | |
Amkor Technology, Inc.*(a) | | | 3,034 | | | | 20,449 | |
Atheros Communications, Inc.* | | | 196 | | | | 8,751 | |
Cree, Inc.*(a) | | | 127 | | | | 5,862 | |
First Solar, Inc.*(a) | | | 728 | | | | 117,092 | |
Power Integrations, Inc. | | | 75 | | | | 2,875 | |
Silicon Laboratories, Inc.* | | | 199 | | | | 8,599 | |
TriQuint Semiconductor, Inc.* | | | 348 | | | | 4,493 | |
| | | | | | | | |
| Total Semiconductors & Semiconductor Equipment | | | | | | | 168,121 | |
| Software – 1.3% | | | | | | | | |
Activision Blizzard, Inc. | | | 7,361 | | | | 80,750 | |
Advent Software, Inc.* | | | 130 | | | | 3,727 | |
ANSYS, Inc.*(a) | | | 402 | | | | 21,784 | |
AsiaInfo-Linkage, Inc.*(a) | | | 194 | | | | 4,200 | |
Blackbaud, Inc. | | | 171 | | | | 4,658 | |
Citrix Systems, Inc.* | | | 691 | | | | 50,761 | |
Concur Technologies, Inc.*(a) | | | 109 | | | | 6,044 | |
Informatica Corp.* | | | 335 | | | | 17,497 | |
MicroStrategy, Inc. Class A* | | | 101 | | | | 13,582 | |
Pegasystems, Inc. | | | 119 | | | | 4,515 | |
Red Hat, Inc.* | | | 438 | | | | 19,881 | |
Rovi Corp.* | | | 160 | | | | 8,584 | |
Salesforce.com, Inc.* | | | 139 | | | | 18,568 | |
TIBCO Software, Inc.* | | | 907 | | | | 24,716 | |
VMware, Inc. Class A* | | | 528 | | | | 43,053 | |
| | | | | | | | |
| Total Software | | | | | | | 322,320 | |
| Specialty Retail – 3.2% | | | | | | | | |
Aeropostale, Inc.* | | | 1,066 | | | | 25,925 | |
Ascena Retail Group, Inc.* | | | 536 | | | | 17,372 | |
Barnes & Noble, Inc.(a) | | | 945 | | | | 8,685 | |
Bed Bath & Beyond, Inc.* | | | 1,620 | | | | 78,197 | |
Cabela’s, Inc.* | | | 1,049 | | | | 26,235 | |
CarMax, Inc.* | | | 1,375 | | | | 44,138 | |
Chico’s FAS, Inc. | | | 764 | | | | 11,384 | |
Childrens Place Retail Stores, Inc. (The)* | | | 262 | | | | 13,055 | |
DSW, Inc. Class A*(a) | | | 281 | | | | 11,229 | |
Guess ?, Inc. | | | 776 | | | | 30,536 | |
Ltd. Brands, Inc. | | | 2,343 | | | | 77,038 | |
OfficeMax, Inc.*(a) | | | 255 | | | | 3,300 | |
O’Reilly Automotive, Inc.* | | | 1,042 | | | | 59,873 | |
PetSmart, Inc. | | | 900 | | | | 36,855 | |
| | | | | | | | |
| Investments | | Shares | | | Fair Value | |
RadioShack Corp. | | | 1,309 | | | $ | 19,648 | |
Ross Stores, Inc. | | | 1,131 | | | | 80,436 | |
TJX Cos., Inc. | | | 3,893 | | | | 193,598 | |
Tractor Supply Co. | | | 485 | | | | 29,032 | |
Ulta Salon Cosmetics & Fragrance, Inc.* | | | 237 | | | | 11,407 | |
Urban Outfitters, Inc.* | | | 789 | | | | 23,536 | |
Williams-Sonoma, Inc. | | | 424 | | | | 17,172 | |
| | | | | | | | |
| Total Specialty Retail | | | | | | | 818,651 | |
| Textiles, Apparel & Luxury Goods – 1.2% | | | | | | | | |
Carter’s, Inc.* | | | 570 | | | | 16,319 | |
Coach, Inc. | | | 2,312 | | | | 120,315 | |
Deckers Outdoor Corp.* | | | 405 | | | | 34,891 | |
Fossil, Inc.* | | | 515 | | | | 48,230 | |
Hanesbrands, Inc.* | | | 541 | | | | 14,629 | |
Jones Group, Inc. (The) | | | 692 | | | | 9,515 | |
Lululemon Athletica, Inc.*(a) | | | 256 | | | | 22,797 | |
Phillips-Van Heusen Corp. | | | 445 | | | | 28,938 | |
Skechers U.S.A., Inc. Class A*(a) | | | 198 | | | | 4,067 | |
Under Armour, Inc. Class A*(a) | | | 191 | | | | 12,998 | |
| | | | | | | | |
| Total Textiles, Apparel & Luxury Goods | | | | | | | 312,699 | |
| Thrifts & Mortgage Finance – 0.0% | | | | | | | | |
Northwest Bancshares, Inc. | | | 531 | | | | 6,659 | |
| Tobacco – 0.1% | | | | | | | | |
Universal Corp. | | | 360 | | | | 15,674 | |
| Wireless Telecommunication Services – 0.4% | | | | | | | | |
American Tower Corp. Class A* | | | 906 | | | | 46,949 | |
NII Holdings, Inc.* | | | 1,294 | | | | 53,921 | |
| | | | | | | | |
| Total Wireless Telecommunication Services | | | | | | | 100,870 | |
TOTAL COMMON STOCKS
(Cost: $21,646,449) | | | | | | | 25,080,719 | |
| EXCHANGE-TRADED FUND – 1.0% | | | | | | | | |
WisdomTree Earnings 500 Fund (a)(b)
(Cost: $221,881) | | | 5,366 | | | | 245,226 | |
| INVESTMENT OF CASH COLLATERAL FOR SECURITIES LOANED – 3.8% | | | | | | | | |
| MONEY MARKET FUND – 3.8% | | | | | | | | |
Dreyfus Institutional Preferred Money Market Fund, 0.19%(c)
| | | | | | | | |
(Cost: $961,000)(d) | | | 961,000 | | | | 961,000 | |
| TOTAL INVESTMENTS IN SECURITIES – 103.7% (Cost: $22,829,330) | | | | | | | 26,286,945 | |
Liabilities in Excess of Cash and Other Assets – (3.7)% | | | | | | | (929,766 | ) |
| | | | | | | | |
| NET ASSETS – 100.0% | | | | | | $ | 25,357,179 | |
| * | Non-income producing security. |
| (a) | Security, or portion thereof, was on loan at March 31, 2011 (See Note 2). |
| (b) | Affiliated companies (See Note 7). |
| (c) | Interest rate shown reflects yield as of March 31, 2011. |
| (d) | At March 31, 2011, the total market value of the Fund’s securities on loan was $937,125 and the total market value of the collateral held by the Fund was $961,000. |
See Notes to Financial Statements.
| | | | |
| WisdomTree Domestic and International Earnings Funds | | | 61 | |
Schedule of Investments
WisdomTree India Earnings Fund (consolidated) (EPI)
March 31, 2011
| | | | | | | | |
| Investments | | Shares | | | Fair Value | |
| | | | | | | | |
| COMMON STOCKS – 100.0% | | | | | | | | |
| Aerospace & Defense – 0.3% | | | | | | | | |
Bharat Electronics Ltd. | | | 125,031 | | | $ | 4,719,468 | |
| Auto Components – 0.6% | | | | | | | | |
Amtek Auto Ltd. | | | 844,068 | | | | 2,851,415 | |
Exide Industries Ltd. | | | 1,232,697 | | | | 3,965,251 | |
Motherson Sumi Systems Ltd. | | | 538,425 | | | | 2,593,423 | |
| | | | | | | | |
| Total Auto Components | | | | | | | 9,410,089 | |
| Automobiles – 3.1% | | | | | | | | |
Bajaj Auto Ltd. | | | 216,254 | | | | 7,095,721 | |
Hero Honda Motors Ltd. | | | 261,005 | | | | 9,302,711 | |
Mahindra & Mahindra Ltd. | | | 1,538,666 | | | | 24,164,249 | |
Maruti Suzuki India Ltd. | | | 181,896 | | | | 5,148,112 | |
| | | | | | | | |
| Total Automobiles | | | | | | | 45,710,793 | |
| Beverages – 0.3% | | | | | | | | |
United Spirits Ltd. | | | 209,306 | | | | 4,809,884 | |
| Building Products – 0.4% | | | | | | | | |
Sintex Industries Ltd. | | | 1,750,510 | | | | 5,962,607 | |
| Capital Markets – 0.2% | | | | | | | | |
India Infoline Ltd. | | | 1,477,501 | | | | 2,456,704 | |
| Chemicals – 0.9% | | | | | | | | |
Asian Paints Ltd. | | | 76,085 | | | | 4,309,351 | |
Gujarat Narmada Valley Fertilizers Co., Ltd. | | | 29 | | | | 62 | |
Sterling Biotech Ltd. | | | 449,549 | | | | 955,147 | |
Tata Chemicals Ltd. | | | 594,903 | | | | 4,562,324 | |
United Phosphorus Ltd. | | | 1,294,443 | | | | 4,338,031 | |
| | | | | | | | |
| Total Chemicals | | | | | | | 14,164,915 | |
| Commercial Banks – 15.7% | | | | | | | | |
Allahabad Bank | | | 1,254,168 | | | | 6,461,377 | |
Andhra Bank | | | 1,382,907 | | | | 4,671,711 | |
Axis Bank Ltd. | | | 718,952 | | | | 22,632,599 | |
Bank of India | | | 1,031,987 | | | | 11,000,225 | |
Canara Bank | | | 1,080,532 | | | | 15,173,969 | |
Central Bank of India | | | 1,030,858 | | | | 3,247,798 | |
Corp. Bank | | | 358,329 | | | | 5,111,984 | |
Federal Bank Ltd. | | | 659,644 | | | | 6,191,142 | |
HDFC Bank Ltd. | | | 548,102 | | | | 28,832,046 | |
ICICI Bank Ltd. | | | 1,761,356 | | | | 44,086,232 | |
IDBI Bank Ltd. | | | 1,683,007 | | | | 5,376,036 | |
Indian Bank | | | 1,154,015 | | | | 6,023,029 | |
Indian Overseas Bank | | | 2,164,612 | | | | 6,979,958 | |
Karnataka Bank Ltd. | | | 1,144,161 | | | | 2,756,814 | |
Oriental Bank of Commerce | | | 715,493 | | | | 6,242,013 | |
State Bank of India | | | 676,365 | | | | 41,940,848 | |
Syndicate Bank | | | 1,843,710 | | | | 5,072,838 | |
Uco Bank | | | 2,347,877 | | | | 5,633,431 | |
Yes Bank Ltd. | | | 882,085 | | | | 6,123,860 | |
| | | | | | | | |
| Total Commercial Banks | | | | | | | 233,557,910 | |
| Construction & Engineering – 2.0% | | | | | | | | |
Era Infra Engineering Ltd. | | | 500,226 | | | | 2,115,543 | |
GMR Infrastructure Ltd.* | | | 1,073,117 | | | | 974,576 | |
| | | | | | | | |
| Investments | | Shares | | | Fair Value | |
| | | | | | | | |
IRB Infrastructure Developers Ltd. | | | 405,288 | | | $ | 1,927,151 | |
Larsen & Toubro Ltd. | | | 524,216 | | | | 19,418,151 | |
Nagarjuna Construction Co. | | | 885,797 | | | | 2,002,205 | |
Voltas Ltd. | | | 656,220 | | | | 2,687,713 | |
| | | | | | | | |
| Total Construction & Engineering | | | | | | | 29,125,339 | |
| Construction Materials – 2.4% | | | | | | | | |
ACC Ltd. | | | 303,811 | | | | 7,320,554 | |
Ambuja Cements Ltd. | | | 4,585,866 | | | | 15,157,678 | |
India Cements Ltd. | | | 1,276,386 | | | | 2,736,237 | |
Shree Cement Ltd. | | | 73,526 | | | | 3,412,995 | |
Ultratech Cement Ltd. | | | 279,416 | | | | 7,089,566 | |
| | | | | | | | |
| Total Construction Materials | | | | | | | 35,717,030 | |
| Consumer Finance – 0.0% | | | | | | | | |
Shriram Transport Finance Co., Ltd. | | | 9,268 | | | | 165,429 | |
| Diversified Consumer Services – 0.2% | | | | | | | | |
Educomp Solutions Ltd. | | | 293,142 | | | | 2,756,896 | |
| Diversified Financial Services – 1.1% | | | | | | | | |
Indiabulls Financial Services Ltd. | | | 751,823 | | | | 2,609,759 | |
Kotak Mahindra Bank Ltd. | | | 680,660 | | | | 6,988,231 | |
Reliance Capital Ltd. | | | 441,780 | | | | 5,776,971 | |
SREI Infrastructure Finance Ltd. | | | 568,282 | | | | 564,523 | |
| | | | | | | | |
| Total Diversified Financial Services | | | | | | | 15,939,484 | |
| Electric Utilities – 1.9% | | | | | | | | |
Power Grid Corp. of India Ltd. | | | 2,129,856 | | | | 4,866,741 | |
Reliance Infrastructure Ltd. | | | 552,949 | | | | 8,554,931 | |
Tata Power Co., Ltd. | | | 448,244 | | | | 13,420,182 | |
Torrent Power Ltd. | | | 369,558 | | | | 2,078,375 | |
| | | | | | | | |
| Total Electric Utilities | | | | | | | 28,920,229 | |
| Electrical Equipment – 1.5% | | | | | | | | |
ABB Ltd. | | | 135,077 | | | | 2,413,485 | |
Bharat Heavy Electricals Ltd. | | | 324,039 | | | | 14,987,757 | |
Crompton Greaves Ltd. | | | 796,051 | | | | 4,868,773 | |
| | | | | | | | |
| Total Electrical Equipment | | | | | | | 22,270,015 | |
| Energy Equipment & Services – 0.2% | | | | | | | | |
Aban Offshore Ltd. | | | 192,391 | | | | 2,658,615 | |
| Food Products – 0.7% | | | | | | | | |
Balrampur Chini Mills Ltd.* | | | 1,300,400 | | | | 2,042,673 | |
Nestle India Ltd. | | | 51,138 | | | | 4,238,910 | |
Tata Global Beverages Ltd. | | | 1,950,897 | | | | 4,276,268 | |
| | | | | | | | |
| Total Food Products | | | | | | | 10,557,851 | |
| Gas Utilities – 1.3% | | | | | | | | |
GAIL India Ltd. | | | 1,625,142 | | | | 16,909,203 | |
Gujarat State Petronet Ltd. | | | 946,132 | | | | 2,100,394 | |
| | | | | | | | |
| Total Gas Utilities | | | | | | | 19,009,597 | |
| Health Care Equipment & Supplies – 0.3% | | | | | | | | |
Opto Circuits India Ltd. | | | 627,199 | | | | 3,874,724 | |
| Household Durables – 0.4% | | | | | | | | |
Videocon Industries Ltd.* | | | 1,357,381 | | | | 5,844,089 | |
See Notes to Financial Statements.
| | |
| 62 | | WisdomTree Domestic and International Earnings Funds |
Schedule of Investments (continued)
WisdomTree India Earnings Fund (consolidated) (EPI)
March 31, 2011
| | | | | | | | |
| Investments | | Shares | | | Fair Value | |
| | | | | | | | |
| Household Products – 1.5% | | | | | | | | |
Hindustan Unilever Ltd. | | | 3,365,389 | | | $ | 21,666,177 | |
Independent Power Producers & Energy Traders – 1.4% | | | | | | | | |
Jaiprakash Power Ventures Ltd.* | | | 353,048 | | | | 333,692 | |
Neyveli Lignite Corp., Ltd. | | | 76,304 | | | | 178,034 | |
NHPC Ltd. | | | 9,480,230 | | | | 5,378,402 | |
NTPC Ltd. | | | 3,609,533 | | | | 15,629,573 | |
| | | | | | | | |
| Total Independent Power Producers & Energy Traders | | | | | | | 21,519,701 | |
| Industrial Conglomerates – 0.8% | | | | | | | | |
Jaiprakash Associates Ltd. | | | 2,893,184 | | | | 6,020,573 | |
Siemens India Ltd. | | | 285,741 | | | | 5,645,299 | |
| | | | | | | | |
| Total Industrial Conglomerates | | | | | | | 11,665,872 | |
| IT Services – 12.6% | | | | | | | | |
HCL Infosystems Ltd. | | | 878,955 | | | | 2,016,304 | |
HCL Technologies Ltd. | | | 902,736 | | | | 9,675,136 | |
Hexaware Technologies Ltd. | | | 2,352,653 | | | | 3,484,533 | |
Infosys Technologies Ltd. | | | 1,367,864 | | | | 99,420,508 | |
Mphasis Ltd. | | | 317,503 | | | | 2,956,455 | |
Patni Computer Systems Ltd. | | | 370,470 | | | | 3,963,061 | |
Rolta India Ltd. | | | 768,466 | | | | 2,389,232 | |
Tata Consultancy Services Ltd. | | | 1,576,990 | | | | 41,865,646 | |
Wipro Ltd. | | | 1,957,582 | | | | 21,079,289 | |
| | | | | | | | |
| Total IT Services | | | | | | | 186,850,164 | |
| Life Sciences Tools & Services – 0.2% | | | | | | | | |
Divi’s Laboratories Ltd. | | | 194,947 | | | | 2,950,543 | |
| Machinery – 2.0% | | | | | | | | |
Ashok Leyland Ltd. | | | 2,831,372 | | | | 3,609,452 | |
Cummins India Ltd. | | | 282,770 | | | | 4,425,276 | |
Tata Motors Ltd. | | | 666,962 | | | | 18,670,300 | |
Thermax Ltd. | | | 185,149 | | | | 2,503,113 | |
| | | | | | | | |
| Total Machinery | | | | | | | 29,208,141 | |
| Marine – 0.3% | | | | | | | | |
Mercator Lines Ltd. | | | 2,394,248 | | | | 2,048,224 | |
Shipping Corp. of India Ltd. | | | 1,214,336 | | | | 2,925,898 | |
| | | | | | | | |
| Total Marine | | | | | | | 4,974,122 | |
| Media – 0.5% | | | | | | | | |
Sun TV Network Ltd. | | | 282,864 | | | | 2,849,572 | |
Zee Entertainment Enterprises Ltd. | | | 1,714,829 | | | | 4,752,839 | |
| | | | | | | | |
| Total Media | | | | | | | 7,602,411 | |
| Metals & Mining – 9.7% | | | | | | | | |
Bhushan Steel Ltd. | | | 542,249 | | | | 5,309,407 | |
Gujarat Mineral Development Corp., Ltd. | | | 1,144,098 | | | | 3,481,424 | |
Hindalco Industries Ltd. | | | 6,878,803 | | | | 32,261,502 | |
Hindustan Zinc Ltd. | | | 1,560,728 | | | | 4,822,700 | |
Jindal Saw Ltd. | | | 776,330 | | | | 3,562,640 | |
Jindal Steel & Power Ltd. | | | 1,666,829 | | | | 26,063,009 | |
JSW Steel Ltd. | | | 481,143 | | | | 9,886,116 | |
National Aluminium Co., Ltd. | | | 978,225 | | | | 2,097,058 | |
NMDC Ltd. | | | 689,204 | | | | 4,396,873 | |
| | | | | | | | |
| Investments | | Shares | | | Fair Value | |
| | | | | | | | |
Sesa Goa Ltd. | | | 2,694,557 | | | $ | 17,604,197 | |
Steel Authority of India Ltd. | | | 4,127,080 | | | | 15,695,768 | |
Sterlite Industries India Ltd. | | | 3,371,559 | | | | 13,132,409 | |
Welspun Corp., Ltd. | | | 1,285,746 | | | | 5,981,119 | |
| | | | | | | | |
| Total Metals & Mining | | | | | | | 144,294,222 | |
| Oil, Gas & Consumable Fuels – 23.2% | | | | | | | | |
Bharat Petroleum Corp., Ltd. | | | 523,375 | | | | 7,180,782 | |
Cairn India Ltd.* | | | 965,586 | | | | 7,598,888 | |
Chennai Petroleum Corp., Ltd. | | | 247,399 | | | | 1,237,688 | |
Essar Oil Ltd.* | | | 1,034,634 | | | | 2,886,164 | |
Essar Shipping Ports & Logistics Ltd.* | | | 519,237 | | | | 1,096,225 | |
Great Eastern Shipping Co., Ltd. (The) | | | 310,378 | | | | 1,831,505 | |
Hindustan Petroleum Corp., Ltd. | | | 676,223 | | | | 5,406,600 | |
Indian Oil Corp., Ltd. | | | 3,169,332 | | | | 23,655,391 | |
Mangalore Refinery & Petrochemicals Ltd. | | | 1,995,405 | | | | 2,886,055 | |
Oil & Natural Gas Corp., Ltd. | | | 10,267,245 | | | | 67,066,902 | |
Oil India Ltd. | | | 73,277 | | | | 2,156,245 | |
Petronet Lng Ltd. | | | 1,993,453 | | | | 5,444,614 | |
Reliance Industries Ltd. | | | 9,222,915 | | | | 216,969,619 | |
| | | | | | | | |
| Total Oil, Gas & Consumable Fuels | | | | | | | 345,416,678 | |
| Personal Products – 0.2% | | | | | | | | |
Dabur India Ltd. | | | 1,630,731 | | | | 3,514,144 | |
| Pharmaceuticals – 2.7% | | | | | | | | |
Aurobindo Pharma Ltd. | | | 594,471 | | | | 2,612,100 | |
Cipla Ltd. | | | 753,839 | | | | 5,437,209 | |
Dr. Reddy’s Laboratories Ltd. | | | 72,574 | | | | 2,667,394 | |
GlaxoSmithKline Pharmaceuticals Ltd. | | | 65,754 | | | | 3,041,758 | |
Glenmark Pharmaceuticals Ltd. | | | 533,109 | | | | 3,391,479 | |
Lupin Ltd. | | | 416,484 | | | | 3,891,200 | |
Piramal Healthcare Ltd. | | | 450,245 | | | | 4,208,143 | |
Sun Pharmaceutical Industries Ltd. | | | 1,482,547 | | | | 14,710,775 | |
| | | | | | | | |
| Total Pharmaceuticals | | | | | | | 39,960,058 | |
Real Estate Management &
Development – 0.8% | | | | | | | | |
Anant Raj Industries Ltd. | | | 139,796 | | | | 262,539 | |
DLF Ltd. | | | 1,672,287 | | | | 10,070,471 | |
Orbit Corp., Ltd. | | | 780,843 | | | | 950,774 | |
| | | | | | | | |
| Total Real Estate Management & Development | | | | | | | 11,283,784 | |
| Road & Rail – 0.2% | | | | | | | | |
Container Corp. of India | | | 116,562 | | | | 3,136,680 | |
| Software – 0.3% | | | | | | | | |
Financial Technologies India Ltd. | | | 91,199 | | | | 1,766,514 | |
Oracle Financial Sevices Software Ltd.* | | | 65,389 | | | | 2,913,069 | |
| | | | | | | | |
| Total Software | | | | | | | 4,679,583 | |
| Textiles, Apparel & Luxury Goods – 0.4% | | | | | | | | |
Alok Industries Ltd. | | | 7,426,240 | | | | 3,688,557 | |
S Kumars Nationwide Ltd.* | | | 1,470,142 | | | | 1,798,324 | |
| | | | | | | | |
| Total Textiles, Apparel & Luxury Goods | | | | | | | 5,486,881 | |
| Thrifts & Mortgage Finance – 3.0% | | | | | | | | |
Housing Development Finance Corp. | | | 2,862,481 | | | | 45,008,895 | |
See Notes to Financial Statements.
| | | | |
| WisdomTree Domestic and International Earnings Funds | | | 63 | |
Schedule of Investments (concluded)
WisdomTree India Earnings Fund (consolidated) (EPI)
March 31, 2011
| | | | | | | | |
| Investments | | Shares | | | Fair Value | |
| | | | | | | | |
| Tobacco – 1.6% | | | | | | | | |
ITC Ltd. | | | 5,900,051 | | | $ | 24,092,371 | |
| Trading Companies & Distributors – 0.4% | | | | | | | | |
Adani Enterprises Ltd. | | | 401,835 | | | | 6,006,124 | |
Wireless Telecommunication
Services – 4.7% | | | | | | | | |
Bharti Airtel Ltd. | | | 6,040,133 | | | | 48,407,749 | |
Idea Cellular Ltd.* | | | 2,371,041 | | | | 3,586,203 | |
Reliance Communications Ltd. | | | 7,549,548 | | | | 18,224,214 | |
| | | | | | | | |
| Total Wireless Telecommunication Services | | | | | | | 70,218,166 | |
TOTAL COMMON STOCKS
(Cost: $1,243,586,815) | | | | | | | 1,487,166,385 | |
| | | Principal Amount | | | | |
| CORPORATE BOND – 0.0% | | | | | | | | |
| Pharmaceuticals – 0.0% | | | | | | | | |
Dr. Reddy’s Laboratories Ltd.
9.25%, 3/24/14** | | | | | | | | |
| (Cost: $49,370) | | $ | 2,213,730 | | | | 49,255 | |
| | | Shares | | | | |
RIGHTS – 0.0% Commercial Banks – 0.0% | | | | | | | | |
Central Bank of India, expiring 4/07/11*
(Cost: $0) | | | 533,820 | | | | 450,087 | |
| TOTAL INVESTMENTS IN SECURITIES – 100.0% | | | | | | | | |
(Cost: $1,243,636,185) | | | | | | | 1,487,665,727 | |
Liabilities in Excess of Cash, Foreign Currency and Other Assets – 0.0% | | | | | | | (576,356 | ) |
| | | | | | | | |
| NET ASSETS – 100.0% | | | | | | $ | 1,487,089,371 | |
| * | Non-income producing security. |
| ** | Rate shown reflects the current yield as of report date. |
See Notes to Financial Statements.
| | |
| 64 | | WisdomTree Domestic and International Earnings Funds |
Statements of Assets and Liabilities
WisdomTree Domestic and International Earnings Funds
March 31, 2011
| | | | | | | | | | | | | | | | | | | | | | | | | | | | |
| | | WisdomTree
Total
Earnings Fund | | | WisdomTree
Earnings
500 Fund | | | WisdomTree
MidCap
Earnings Fund | | | WisdomTree
SmallCap
Earnings Fund | | | WisdomTree
LargeCap
Value Fund | | | WisdomTree
LargeCap
Growth Fund | | | WisdomTree
India
Earnings Fund (consolidated) | |
ASSETS: | | | | | | | | | | | | | | | | | | | | | | | | | | | | |
| | | | | | | |
Investments, at cost | | $ | 51,101,629 | | | $ | 63,304,707 | | | $ | 117,474,139 | | | $ | 155,565,812 | | | $ | 22,954,808 | | | $ | 22,607,449 | | | $ | 1,243,636,185 | |
| | | | | | | |
Investment in affiliate, at cost (Note 7) | | | 381,810 | | | | 334,044 | | | | 481,384 | | | | 805,992 | | | | 295,261 | | | | 221,881 | | | | — | |
| | | | | | | |
Foreign currency, at cost | | | — | | | | — | | | | — | | | | — | | | | — | | | | — | | | | 5,391,429 | |
Investment in securities, at fair value (including securities on loan)1 | | | 56,202,611 | | | | 65,537,029 | | | | 129,179,589 | | | | 169,573,491 | | | | 26,466,517 | | | | 26,041,719 | | | | 1,487,665,727 | |
| | | | | | | |
Investment in affiliate, at fair value (Note 7) | | | 392,157 | | | | 344,576 | | | | 557,285 | | | | 843,454 | | | | 318,266 | | | | 245,226 | | | | — | |
| | | | | | | |
Cash | | | — | | | | — | | | | — | | | | — | | | | — | | | | 27,404 | | | | 12,137 | |
| | | | | | | |
Foreign currency, at fair value | | | — | | | | — | | | | — | | | | — | | | | — | | | | — | | | | 5,395,572 | |
| | | | | | | |
Receivables: | | | | | | | | | | | | | | | | | | | | | | | | | | | | |
| | | | | | | |
Dividends and interest | | | 63,144 | | | | 88,270 | | | | 95,527 | | | | 132,791 | | | | 29,412 | | | | 11,885 | | | | 333,416 | |
| | | | | | | |
Investment securities sold | | | — | | | | — | | | | — | | | | — | | | | — | | | | — | | | | 4,965,165 | |
| | | | | | | |
Capital shares sold | | | — | | | | — | | | | — | | | | — | | | | — | | | | — | | | | 1,689 | |
Total Assets | | | 56,657,912 | | | | 65,969,875 | | | | 129,832,401 | | | | 170,549,736 | | | | 26,814,195 | | | | 26,326,234 | | | | 1,498,373,706 | |
LIABILITIES: | | | | | | | | | | | | | | | | | | | | | | | | | | | | |
| | | | | | | |
Payables: | | | | | | | | | | | | | | | | | | | | | | | | | | | | |
| | | | | | | |
Collateral for securities on loan (Note 2) | | | 2,452,000 | | | | 2,120,000 | | | | 23,904,000 | | | | 35,836,000 | | | | 994,000 | | | | 961,000 | | | | — | |
| | | | | | | |
Investment securities purchased | | | — | | | | — | | | | 147,436 | | | | — | | | | — | | | | — | | | | — | |
| | | | | | | |
Capital shares redeemed | | | — | | | | — | | | | — | | | | — | | | | — | | | | — | | | | 9,845,601 | |
| | | | | | | |
Advisory fees (Note 3) | | | 12,529 | | | | 17,213 | | | | 35,213 | | | | 41,578 | | | | 8,134 | | | | 7,962 | | | | 818,439 | |
| | | | | | | |
Service fees (Note 2) | | | 200 | | | | 273 | | | | 411 | | | | 487 | | | | 95 | | | | 93 | | | | 246,013 | |
| | | | | | | |
Other payable | | | — | | | | — | | | | — | | | | — | | | | — | | | | — | | | | 374,282 | |
Total Liabilities | | | 2,464,729 | | | | 2,137,486 | | | | 24,087,060 | | | | 35,878,065 | | | | 1,002,229 | | | | 969,055 | | | | 11,284,335 | |
NET ASSETS | | $ | 54,193,183 | | | $ | 63,832,389 | | | $ | 105,745,341 | | | $ | 134,671,671 | | | $ | 25,811,966 | | | $ | 25,357,179 | | | $ | 1,487,089,371 | |
NET ASSETS: | | | | | | | | | | | | | | | | | | | | | | | | | | | | |
| | | | | | | |
Paid-in capital | | $ | 55,442,028 | | | $ | 80,706,068 | | | $ | 103,972,253 | | | $ | 130,757,072 | | | $ | 34,855,408 | | | $ | 21,981,370 | | | $ | 1,350,850,321 | |
| | | | | | | |
Undistributed net investment income | | | 24,687 | | | | 35,865 | | | | 15,282 | | | | 39,297 | | | | 11,519 | | | | 11,260 | | | | — | |
| | | | | | | |
Accumulated net realized loss on investments and foreign currency related transactions | | | (6,384,861 | ) | | | (19,152,398 | ) | | | (10,023,545 | ) | | | (10,169,839 | ) | | | (12,589,675 | ) | | | (93,066 | ) | | | (107,791,485 | ) |
| | | | | | | |
Net unrealized appreciation on investments and translation of assets and liabilities denominated in foreign currencies | | | 5,111,329 | | | | 2,242,854 | | | | 11,781,351 | | | | 14,045,141 | | | | 3,534,714 | | | | 3,457,615 | | | | 244,030,535 | |
NET ASSETS | | $ | 54,193,183 | | | $ | 63,832,389 | | | $ | 105,745,341 | | | $ | 134,671,671 | | | $ | 25,811,966 | | | $ | 25,357,179 | | | $ | 1,487,089,371 | |
Outstanding beneficial interest shares of $0.001 par value (unlimited number of shares authorized) | | | 1,150,000 | | | | 1,400,000 | | | | 1,800,000 | | | | 2,450,000 | | | | 600,000 | | | | 650,000 | | | | 59,800,000 | |
Net asset value per share | | $ | 47.12 | | | $ | 45.59 | | | $ | 58.75 | | | $ | 54.97 | | | $ | 43.02 | | | $ | 39.01 | | | $ | 24.87 | |
| 1 | Market value of securities on loan were as follows: $2,392,238, $2,067,776, $23,243,626, $34,713,338, $970,621, $937,125 and $0, respectively (Note 2). |
See Notes to Financial Statements.
| | | | |
| WisdomTree Domestic and International Earnings Funds | | | 65 | |
Statements of Operations
WisdomTree Domestic and International Earnings Funds
For the Year Ended March 31, 2011
| | | | | | | | | | | | | | | | | | | | | | | | | | | | |
| | | WisdomTree
Total
Earnings Fund | | | WisdomTree
Earnings
500 Fund | | | WisdomTree
MidCap
Earnings Fund | | | WisdomTree
SmallCap
Earnings Fund | | | WisdomTree
LargeCap
Value Fund | | | WisdomTree
LargeCap
Growth Fund | | | WisdomTree
India
Earnings Fund (consolidated) | |
INVESTMENT INCOME: | | | | | | | | | | | | | | | | | | | | | | | | | | | | |
| | | | | | | |
Dividends1 | | $ | 1,005,129 | | | $ | 1,491,566 | | | $ | 1,466,823 | | | $ | 1,610,773 | | | $ | 455,991 | | | $ | 223,041 | | | $ | 15,550,181 | |
| | | | | | | |
Dividends from affiliate (Note 7) | | | 8,832 | | | | 10,175 | | | | 15,493 | | | | 16,400 | | | | 4,178 | | | | 3,460 | | | | — | |
| | | | | | | |
Interest | | | 18 | | | | 18 | | | | 25 | | | | 37 | | | | 7 | | | | — | | | | — | |
| | | | | | | |
Securities lending income (Note 2) | | | 6,737 | | | | 6,929 | | | | 54,745 | | | | 172,593 | | | | 4,653 | | | | 2,998 | | | | — | |
Total investment income | | | 1,020,716 | | | | 1,508,688 | | | | 1,537,086 | | | | 1,799,803 | | | | 464,829 | | | | 229,499 | | | | 15,550,181 | |
EXPENSES: | | | | | | | | | | | | | | | | | | | | | | | | | | | | |
| | | | | | | |
Advisory fees (Note 3) | | | 135,697 | | | | 196,116 | | | | 318,354 | | | | 391,109 | | | | 103,400 | | | | 78,147 | | | | 8,469,396 | |
| | | | | | | |
Service fees (Note 2) | | | 2,132 | | | | 3,082 | | | | 3,686 | | | | 4,529 | | | | 1,198 | | | | 905 | | | | 54,802 | |
| | | | | | | |
Custody/Accounting | | | — | | | | — | | | | — | | | | — | | | | — | | | | — | | | | 1,808,304 | |
| | | | | | | |
Printing | | | — | | | | — | | | | — | | | | — | | | | — | | | | — | | | | 203,111 | |
| | | | | | | |
Professional Fees | | | — | | | | — | | | | — | | | | — | | | | — | | | | — | | | | 75,987 | |
| | | | | | | |
Directors | | | — | | | | — | | | | — | | | | — | | | | — | | | | — | | | | 33,691 | |
| | | | | | | |
Insurance | | | — | | | | — | | | | — | | | | — | | | | — | | | | — | | | | 25,162 | |
| | | | | | | |
IOPV Fees2 | | | — | | | | — | | | | — | | | | — | | | | — | | | | — | | | | 54,359 | |
| | | | | | | |
Other | | | — | | | | — | | | | — | | | | — | | | | — | | | | — | | | | 290,385 | |
Total expenses | | | 137,829 | | | | 199,198 | | | | 322,040 | | | | 395,638 | | | | 104,598 | | | | 79,052 | | | | 11,015,197 | |
Expense waiver/reimbursement (Note 3) | | | (533 | ) | | | (478 | ) | | | (1,184 | ) | | | (1,263 | ) | | | (251 | ) | | | (403 | ) | | | — | |
Net expenses | | | 137,296 | | | | 198,720 | | | | 320,856 | | | | 394,375 | | | | 104,347 | | | | 78,649 | | | | 11,015,197 | |
Net investment income | | | 883,420 | | | | 1,309,968 | | | | 1,216,230 | | | | 1,405,428 | | | | 360,482 | | | | 150,850 | | | | 4,534,984 | |
NET REALIZED AND UNREALIZED GAIN (LOSS) ON INVESTMENTS: | | | | | | | | | | | | | | | | | | | | | | | | | | | | |
| | | | | | | |
Net realized gain (loss) from: | | | | | | | | | | | | | | | | | | | | | | | | | | | | |
| | | | | | | |
Investment transactions | | | (855,531 | ) | | | (2,205,434 | ) | | | (707,159 | ) | | | (1,708,438 | ) | | | (270,097 | ) | | | (69,691 | ) | | | (41,048,497 | ) |
| | | | | | | |
Investment transactions from affiliate (Note 7) | | | 60,938 | | | | 31,058 | | | | 11,786 | | | | 57,602 | | | | 1,863 | | | | 3,448 | | | | — | |
| | | | | | | |
In-kind redemptions | | | 1,706,273 | | | | 4,014,313 | | | | 13,151,356 | | | | 15,102,002 | | | | 4,722,463 | | | | 4,123,732 | | | | — | |
| | | | | | | |
In-kind redemptions from affiliate (Note 7) | | | — | | | | 397 | | | | 14,839 | | | | (1,244 | ) | | | 17 | | | | 538 | | | | — | |
| | | | | | | |
Foreign currency related transactions | | | — | | | | — | | | | — | | | | — | | | | — | | | | — | | | | (264,327 | ) |
Net realized gain (loss) | | | 911,680 | | | | 1,840,334 | | | | 12,470,822 | | | | 13,449,922 | | | | 4,454,246 | | | | 4,058,027 | | | | (41,312,824 | ) |
Net change in unrealized appreciation (depreciation) from: | | | | | | | | | | | | | | | | | | | | | | | | | | | | |
| | | | | | | |
Investment transactions | | | 5,488,680 | | | | 4,022,685 | | | | 6,831,357 | | | | 8,550,393 | | | | (1,467,904 | ) | | | (822,362 | ) | | | 90,430,382 | |
| | | | | | | |
Translation of assets and liabilities denominated in foreign currencies | | | — | | | | — | | | | — | | | | — | | | | — | | | | — | | | | 5,555 | |
Net change in unrealized appreciation (depreciation) | | | 5,488,680 | | | | 4,022,685 | | | | 6,831,357 | | | | 8,550,393 | | | | (1,467,904 | ) | | | (822,362 | ) | | | 90,435,937 | |
Net realized and unrealized gain on investments | | | 6,400,360 | | | | 5,863,019 | | | | 19,302,179 | | | | 22,000,315 | | | | 2,986,342 | | | | 3,235,665 | | | | 49,123,113 | |
NET INCREASE IN NET ASSETS RESULTING FROM OPERATIONS | | $ | 7,283,780 | | | $ | 7,172,987 | | | $ | 20,518,409 | | | $ | 23,405,743 | | | $ | 3,346,824 | | | $ | 3,386,515 | | | $ | 53,658,097 | |
| 1 | Net of foreign withholding tax of $0, $0, $0, $0, $0, $0 and $483,665, respectively. |
| 2 | IOPV Fees — Indicative Optimized Portfolio Value — is the real time estimation of net asset value of Fund. |
See Notes to Financial Statements.
| | |
| 66 | | WisdomTree Domestic and International Earnings Funds |
Statements of Changes in Net Assets
WisdomTree Domestic and International Earnings Funds
| | | | | | | | | | | | | | | | | | | | | | | | |
| | | WisdomTree
Total Earnings Fund | | | WisdomTree
Earnings 500 Fund | | | WisdomTree
MidCap Earnings Fund | |
| | | For the
Year Ended
March 31, 2011 | | | For the
Year Ended
March 31, 2010 | | | For the
Year Ended
March 31, 2011 | | | For the
Year Ended
March 31, 2010 | | | For the
Year Ended
March 31, 2011 | | | For the
Year Ended
March 31, 2010 | |
INCREASE (DECREASE) IN NET ASSETS RESULTING FROM OPERATIONS: | | | | | | | | | | | | | | | | | | | | | |
| | | | | | |
Net investment income | | $ | 883,420 | | | $ | 556,841 | | | $ | 1,309,968 | | | $ | 1,076,462 | | | $ | 1,216,230 | | | $ | 457,277 | |
| | | | | | |
Net realized gain (loss) on investments | | | 911,680 | | | | 1,846,674 | | | | 1,840,334 | | | | (5,720,373 | ) | | | 12,470,822 | | | | 2,186,999 | |
| | | | | | |
Net change in unrealized appreciation (depreciation) on investments | | | 5,488,680 | | | | 8,422,771 | | | | 4,022,685 | | | | 26,170,480 | | | | 6,831,357 | | | | 12,621,976 | |
Net increase in net assets resulting from operations | | | 7,283,780 | | | | 10,826,286 | | | | 7,172,987 | | | | 21,526,569 | | | | 20,518,409 | | | | 15,266,252 | |
DIVIDENDS: | | | | | | | | | | | | | | | | | | | | | | | | |
| | | | | | |
Net investment income | | | (879,348 | ) | | | (540,172 | ) | | | (1,308,638 | ) | | | (1,068,776 | ) | | | (1,186,680 | ) | | | (437,001 | ) |
Total dividends | | | (879,348 | ) | | | (540,172 | ) | | | (1,308,638 | ) | | | (1,068,776 | ) | | | (1,186,680 | ) | | | (437,001 | ) |
CAPITAL SHARE TRANSACTIONS: | | | | | | | | | | | | | | | | | | | | | | | | |
| | | | | | |
Net proceeds from sale of shares | | | 8,872,211 | | | | 44,987,988 | | | | 14,930,099 | | | | 22,083,885 | | | | 103,782,212 | | | | 44,315,521 | |
| | | | | | |
Cost of shares redeemed | | | (8,872,443 | ) | | | (23,996,614 | ) | | | (34,384,325 | ) | | | (24,833,003 | ) | | | (71,674,300 | ) | | | (19,245,249 | ) |
Net increase (decrease) in net assets resulting from capital share transactions | | | (232 | ) | | | 20,991,374 | | | | (19,454,226 | ) | | | (2,749,118 | ) | | | 32,107,912 | | | | 25,070,272 | |
Net Increase (Decrease) in Net Assets | | | 6,404,200 | | | | 31,277,488 | | | | (13,589,877 | ) | | | 17,708,675 | | | | 51,439,641 | | | | 39,899,523 | |
NET ASSETS: | | | | | | | | | | | | | | | | | | | | | | | | |
| | | | | | |
Beginning of year | | $ | 47,788,983 | | | $ | 16,511,495 | | | $ | 77,422,266 | | | $ | 59,713,591 | | | $ | 54,305,700 | | | $ | 14,406,177 | |
| | | | | | |
End of year | | $ | 54,193,183 | | | $ | 47,788,983 | | | $ | 63,832,389 | | | $ | 77,422,266 | | | $ | 105,745,341 | | | $ | 54,305,700 | |
Undistributed net investment income included in net assets at end of year | | $ | 24,687 | | | $ | 23,247 | | | $ | 35,865 | | | $ | 37,252 | | | $ | 15,282 | | | $ | 26,152 | |
SHARES CREATED AND REDEEMED: | | | | | | | | | | | | | | | | | | | | | | | | |
| | | | | | |
Shares outstanding, beginning of year | | | 1,150,000 | | | | 600,000 | | | | 1,900,000 | | | | 2,150,000 | | | | 1,150,000 | | | | 550,000 | |
| | | | | | |
Shares created | | | 200,000 | | | | 1,150,000 | | | | 350,000 | | | | 550,000 | | | | 2,050,000 | | | | 1,050,000 | |
| | | | | | |
Shares redeemed | | | (200,000 | ) | | | (600,000 | ) | | | (850,000 | ) | | | (800,000 | ) | | | (1,400,000 | ) | | | (450,000 | ) |
Shares outstanding, end of year | | | 1,150,000 | | | | 1,150,000 | | | | 1,400,000 | | | | 1,900,000 | | | | 1,800,000 | | | | 1,150,000 | |
See Notes to Financial Statements.
| | | | |
| WisdomTree Domestic and International Earnings Funds | | | 67 | |
Statements of Changes in Net Assets (continued)
WisdomTree Domestic and International Earnings Funds
| | | | | | | | | | | | | | | | |
| | | WisdomTree SmallCap Earnings Fund | | | WisdomTree LargeCap Value Fund | |
| | | For the
Year Ended
March 31, 2011 | | | For the
Year Ended
March 31, 2010 | | | For the
Year Ended
March 31, 2011 | | | For the
Year Ended
March 31, 2010 | |
INCREASE (DECREASE) IN NET ASSETS RESULTING FROM OPERATIONS: | | | | | | | | | | | | | |
| | | | |
Net investment income | | $ | 1,405,428 | | | $ | 497,966 | | | $ | 360,482 | | | $ | 557,523 | |
| | | | |
Net realized gain (loss) on investments | | | 13,449,922 | | | | 10,519,529 | | | | 4,454,246 | | | | (1,566,313 | ) |
| | | | |
Net change in unrealized appreciation (depreciation) on investments | | | 8,550,393 | | | | 11,702,550 | | | | (1,467,904 | ) | | | 12,402,272 | |
Net increase in net assets resulting from operations | | | 23,405,743 | | | | 22,720,045 | | | | 3,346,824 | | | | 11,393,482 | |
DIVIDENDS: | | | | | | | | | | | | | | | | |
| | | | |
Net investment income | | | (1,365,764 | ) | | | (411,568 | ) | | | (362,140 | ) | | | (551,890 | ) |
Total dividends | | | (1,365,764 | ) | | | (411,568 | ) | | | (362,140 | ) | | | (551,890 | ) |
CAPITAL SHARE TRANSACTIONS: | | | | | | | | | | | | | | | | |
| | | | |
Net proceeds from sale of shares | | | 76,913,803 | | | | 112,678,960 | | | | 26,563,158 | | | | 3,715,635 | |
| | | | |
Cost of shares redeemed | | | (59,588,233 | ) | | | (53,628,954 | ) | | | (38,899,989 | ) | | | — | |
Net increase (decrease) in net assets resulting from capital share transactions | | | 17,325,570 | | | | 59,050,006 | | | | (12,336,831 | ) | | | 3,715,635 | |
Net Increase (Decrease) in Net Assets | | | 39,365,549 | | | | 81,358,483 | | | | (9,352,147 | ) | | | 14,557,227 | |
NET ASSETS: | | | | | | | | | | | | | | | | |
| | | | |
Beginning of year | | $ | 95,306,122 | | | $ | 13,947,639 | | | $ | 35,164,113 | | | $ | 20,606,886 | |
| | | | |
End of year | | $ | 134,671,671 | | | $ | 95,306,122 | | | $ | 25,811,966 | | | $ | 35,164,113 | |
Undistributed net investment income included in net assets at end of year | | $ | 39,297 | | | $ | 45,160 | | | $ | 11,519 | | | $ | 13,902 | |
SHARES CREATED AND REDEEMED: | | | | | | | | | | | | | | | | |
| | | | |
Shares outstanding, beginning of year | | | 2,150,000 | | | | 600,000 | | | | 950,000 | | | | 850,000 | |
| | | | |
Shares created | | | 1,500,000 | | | | 2,850,000 | | | | 700,000 | | | | 100,000 | |
| | | | |
Shares redeemed | | | (1,200,000 | ) | | | (1,300,000 | ) | | | (1,050,000 | ) | | | — | |
Shares outstanding, end of year | | | 2,450,000 | | | | 2,150,000 | | | | 600,000 | | | | 950,000 | |
See Notes to Financial Statements.
| | |
| 68 | | WisdomTree Domestic and International Earnings Funds |
Statements of Changes in Net Assets (concluded)
WisdomTree Domestic and International Earnings Funds
| | | | | | | | | | | | | | | | |
| | | WisdomTree
LargeCap Growth Fund | | | WisdomTree
India Earnings Fund (consolidated) | |
| | | For the
Year Ended
March 31, 2011 | | | For the
Year Ended
March 31, 2010 | | | For the
Year Ended
March 31, 2011 | | | For the
Year Ended
March 31, 2010 | |
INCREASE (DECREASE) IN NET ASSETS RESULTING FROM OPERATIONS: | | | | | | | | | | | | | |
| | | | |
Net investment income | | $ | 150,850 | | | $ | 283,776 | | | $ | 4,534,984 | | | $ | 980,383 | |
| | | | |
Net realized gain (loss) on investments | | | 4,058,027 | | | | 467,710 | | | | (41,312,824 | ) | | | (6,991,499 | ) |
| | | | |
Net change in unrealized appreciation (depreciation) on investments | | | (822,362 | ) | | | 4,358,046 | | | | 90,435,937 | | | | 265,261,210 | |
Net increase in net assets resulting from operations | | | 3,386,515 | | | | 5,109,532 | | | | 53,658,097 | | | | 259,250,094 | |
DIVIDENDS AND DISTRIBUTIONS: | | | | | | | | | | | | | | | | |
| | | | |
Net investment income | | | (145,072 | ) | | | (278,334 | ) | | | (6,420,668 | ) | | | (1,343,522 | ) |
| | | | |
Capital gains | | | — | | | | (492,811 | ) | | | — | | | | — | |
Total dividends and distributions | | | (145,072 | ) | | | (771,145 | ) | | | (6,420,668 | ) | | | (1,343,522 | ) |
CAPITAL SHARE TRANSACTIONS: | | | | | | | | | | | | | | | | |
| | | | |
Net proceeds from sale of shares | | | 26,159,681 | | | | 9,010,172 | | | | 710,471,987 | | | | 452,328,639 | |
| | | | |
Cost of shares redeemed | | | (26,528,509 | ) | | | (125 | ) | | | (112,152,803 | ) | | | (37,897,695 | ) |
Net increase (decrease) in net assets resulting from capital share transactions | | | (368,828 | ) | | | 9,010,047 | | | | 598,319,184 | | | | 414,430,944 | |
Net Increase in Net Assets | | | 2,872,615 | | | | 13,348,434 | | | | 645,556,613 | | | | 672,337,516 | |
NET ASSETS: | | | | | | | | | | | | | | | | |
| | | | |
Beginning of year | | $ | 22,484,564 | | | $ | 9,136,130 | | | $ | 841,532,758 | | | $ | 169,195,242 | |
| | | | |
End of year | | $ | 25,357,179 | | | $ | 22,484,564 | | | $ | 1,487,089,371 | | | $ | 841,532,758 | |
Undistributed net investment income included in net assets at end of year | | $ | 11,260 | | | $ | 7,197 | | | $ | — | | | $ | 447,862 | |
SHARES CREATED AND REDEEMED: | | | | | | | | | | | | | | | | |
| | | | |
Shares outstanding, beginning of year | | | 650,000 | | | | 350,004 | | | | 36,200,000 | | | | 15,400,000 | |
| | | | |
Shares created | | | 750,000 | | | | 300,000 | | | | 28,400,000 | | | | 22,600,000 | |
| | | | |
Shares redeemed | | | (750,000 | ) | | | (4 | ) | | | (4,800,000 | ) | | | (1,800,000 | ) |
Shares outstanding, end of year | | | 650,000 | | | | 650,000 | | | | 59,800,000 | | | | 36,200,000 | |
See Notes to Financial Statements.
| | | | |
| WisdomTree Domestic and International Earnings Funds | | | 69 | |
Financial Highlights
WisdomTree Domestic and International Earnings Funds
March 31, 2011
Selected data for a share of beneficial interest outstanding throughout the period is presented below:
| | | | | | | | | | | | | | | | | | | | |
| WisdomTree Total Earnings Fund | | For the
Year Ended
March 31, 2011 | | | For the
Year Ended
March 31, 2010 | | | For the
Year Ended
March 31, 2009 | | | For the
Year Ended
March 31, 2008 | | | For the Period
February 23, 2007*
through
March 31, 2007 | |
Net asset value, beginning of period | | $ | 41.56 | | | $ | 27.52 | | | $ | 45.32 | | | $ | 48.99 | | | $ | 49.97 | |
Investment operations: | | | | | | | | | | | | | | | | | | | | |
Net investment income1 | | | 0.77 | | | | 0.70 | | | | 0.87 | | | | 0.85 | | | | 0.11 | |
Net realized and unrealized gain (loss) | | | 5.55 | | | | 14.03 | | | | (17.87 | ) | | | (3.56 | ) | | | (1.00 | ) |
Total from investment operations | | | 6.32 | | | | 14.73 | | | | (17.00 | ) | | | (2.71 | ) | | | (0.89 | ) |
Dividends to shareholders: | | | | | | | | | | | | | | | | | | | | |
Net investment income | | | (0.76 | ) | | | (0.69 | ) | | | (0.80 | ) | | | (0.96 | ) | | | (0.09 | ) |
Total dividends to shareholders | | | (0.76 | ) | | | (0.69 | ) | | | (0.80 | ) | | | (0.96 | ) | | | (0.09 | ) |
Net asset value, end of period | | $ | 47.12 | | | $ | 41.56 | | | $ | 27.52 | | | $ | 45.32 | | | $ | 48.99 | |
| | | | | |
TOTAL RETURN2 | | | 15.44 | % | | | 53.82 | % | | | (37.86 | )% | | | (5.69 | )% | | | (1.79 | )% |
RATIOS/SUPPLEMENTAL DATA: | | | | | | | | | | | | | | | | | | | | |
Net assets, end of period (000’s omitted) | | $ | 54,193 | | | $ | 47,789 | | | $ | 16,511 | | | $ | 15,861 | | | $ | 24,497 | |
Ratios to average net assets4 of: | | | | | | | | | | | | | | | | | | | | |
Expenses, net of expense reimbursements | | | 0.28 | % | | | 0.28 | % | | | 0.28 | % | | | 0.28 | % | | | 0.28 | %3 |
Expenses, prior to expense reimbursements | | | 0.28 | % | | | 0.28 | % | | | 0.28 | % | | | 0.28 | % | | | 0.35 | %3 |
Net investment income | | | 1.82 | % | | | 1.92 | % | | | 2.33 | % | | | 1.76 | % | | | 2.21 | %3 |
Portfolio turnover rate5 | | | 9 | % | | | 16 | % | | | 23 | % | | | 11 | % | | | 1 | % |
| | | | | | | | | | | | | | | | | | | | |
| | | | | | |
| WisdomTree Earnings 500 Fund | | For the
Year Ended
March 31, 2011 | | | For the
Year Ended
March 31, 2010 | | | For the
Year Ended
March 31, 2009 | | | For the
Year Ended
March 31, 2008 | | | For the Period
February 23, 2007*
through
March 31, 2007 | |
Net asset value, beginning of period | | $ | 40.75 | | | $ | 27.77 | | | $ | 45.77 | | | $ | 48.85 | | | $ | 49.77 | |
Investment operations: | | | | | | | | | | | | | | | | | | | | |
Net investment income1 | | | 0.77 | | | | 0.68 | | | | 0.91 | | | | 0.94 | | | | 0.11 | |
Net realized and unrealized gain (loss) | | | 4.84 | | | | 12.98 | | | | (18.07 | ) | | | (3.18 | ) | | | (0.94 | ) |
Total from investment operations | | | 5.61 | | | | 13.66 | | | | (17.16 | ) | | | (2.24 | ) | | | (0.83 | ) |
Dividends to shareholders: | | | | | | | | | | | | | | | | | | | | |
Net investment income | | | (0.77 | ) | | | (0.68 | ) | | | (0.84 | ) | | | (0.84 | ) | | | (0.09 | ) |
Total dividends to shareholders | | | (0.77 | ) | | | (0.68 | ) | | | (0.84 | ) | | | (0.84 | ) | | | (0.09 | ) |
Net asset value, end of period | | $ | 45.59 | | | $ | 40.75 | | | $ | 27.77 | | | $ | 45.77 | | | $ | 48.85 | |
| | | | | |
TOTAL RETURN2 | | | 13.99 | % | | | 49.49 | % | | | (37.83 | )% | | | (4.72 | )% | | | (1.67 | )% |
RATIOS/SUPPLEMENTAL DATA: | | | | | | | | | | | | | | | | | | | | |
Net assets, end of period (000’s omitted) | | $ | 63,832 | | | $ | 77,422 | | | $ | 59,714 | | | $ | 54,927 | | | $ | 19,538 | |
Ratios to average net assets4 of: | | | | | | | | | | | | | | | | | | | | |
Expenses, net of expense reimbursements | | | 0.28 | % | | | 0.28 | % | | | 0.28 | % | | | 0.28 | % | | | 0.28 | %3 |
Expenses, prior to expense reimbursements | | | 0.28 | % | | | 0.28 | % | | | 0.28 | % | | | 0.28 | % | | | 0.37 | %3 |
Net investment income | | | 1.87 | % | | | 1.95 | % | | | 2.49 | % | | | 1.93 | % | | | 2.24 | %3 |
Portfolio turnover rate5 | | | 12 | % | | | 21 | % | | | 21 | % | | | 8 | % | | | 1 | % |
| * | Commencement of investment operations. |
| 1 | Based on average shares outstanding. |
| 2 | Total return is calculated assuming an initial investment made at the net asset value at the beginning of the period, reinvestment of all dividends and distributions at net asset value during the period and redemption on the last day of the period. Total return calculated for a period of less than one year is not annualized. The total return would have been lower if certain expenses had not been reimbursed by the investment adviser (Note 2). |
| 4 | The ratios to average net assets do not include net investment income (loss) or expenses of the affiliated funds in which the Fund invests. |
| 5 | Portfolio turnover rate is not annualized and excludes the value of portfolio securities received or delivered as a result of in-kind creations or redemptions of the Fund’s capital shares. |
See Notes to Financial Statements.
| | |
| 70 | | WisdomTree Domestic and International Earnings Funds |
Financial Highlights (continued)
WisdomTree Domestic and International Earnings Funds
March 31, 2011
Selected data for a share of beneficial interest outstanding throughout the period is presented below:
| | | | | | | | | | | | | | | | | | | | |
| WisdomTree MidCap Earnings Fund | | For the
Year Ended
March 31, 2011 | | | For the
Year Ended
March 31, 2010 | | | For the
Year Ended
March 31, 2009 | | | For the
Year Ended
March 31, 2008 | | | For the Period
February 23, 2007*
through
March 31, 2007 | |
Net asset value, beginning of period | | $ | 47.22 | | | $ | 26.19 | | | $ | 42.08 | | | $ | 48.77 | | | $ | 50.01 | |
Investment operations: | | | | | | | | | | | | | | | | | | | | |
Net investment income1 | | | 0.73 | | | | 0.61 | | | | 0.54 | | | | 0.81 | | | | 0.07 | |
Net realized and unrealized gain (loss) | | | 11.50 | | | | 20.92 | | | | (15.88 | ) | | | (6.90 | ) | | | (1.25 | ) |
Total from investment operations | | | 12.23 | | | | 21.53 | | | | (15.34 | ) | | | (6.09 | ) | | | (1.18 | ) |
Dividends to shareholders: | | | | | | | | | | | | | | | | | | | | |
Net investment income | | | (0.70 | ) | | | (0.50 | ) | | | (0.55 | ) | | | (0.60 | ) | | | (0.06 | ) |
Total dividends to shareholders | | | (0.70 | ) | | | (0.50 | ) | | | (0.55 | ) | | | (0.60 | ) | | | (0.06 | ) |
Net asset value, end of period | | $ | 58.75 | | | $ | 47.22 | | | $ | 26.19 | | | $ | 42.08 | | | $ | 48.77 | |
| | | | | |
TOTAL RETURN2 | | | 26.15 | % | | | 82.49 | % | | | (36.73 | )% | | | (12.57 | )% | | | (2.37 | )% |
RATIOS/SUPPLEMENTAL DATA: | | | | | | | | | | | | | | | | | | | | |
Net assets, end of period (000’s omitted) | | $ | 105,745 | | | $ | 54,306 | | | $ | 14,406 | | | $ | 25,247 | | | $ | 4,877 | |
Ratios to average net assets4 of: | | | | | | | | | | | | | | | | | | | | |
Expenses, net of expense reimbursements | | | 0.38 | % | | | 0.38 | % | | | 0.38 | % | | | 0.38 | % | | | 0.38 | %3 |
Expenses, prior to expense reimbursements | | | 0.38 | % | | | 0.38 | % | | | 0.38 | % | | | 0.38 | % | | | 0.74 | %3 |
Net investment income | | | 1.45 | % | | | 1.54 | % | | | 1.49 | % | | | 1.70 | % | | | 1.47 | %3 |
Portfolio turnover rate5 | | | 18 | % | | | 19 | % | | | 39 | % | | | 45 | % | | | 0 | %6 |
| | | | | | | | | | | | | | | | | | | | |
| | | | | | |
| WisdomTree SmallCap Earnings Fund | | For the
Year Ended
March 31, 2011 | | | For the
Year Ended
March 31, 2010 | | | For the
Year Ended
March 31, 2009 | | | For the
Year Ended
March 31, 2008 | | | For the Period
February 23, 2007*
through
March 31, 2007 | |
Net asset value, beginning of period | | $ | 44.33 | | | $ | 23.25 | | | $ | 38.96 | | | $ | 48.03 | | | $ | 50.03 | |
Investment operations: | | | | | | | | | | | | | | | | | | | | |
Net investment income1 | | | 0.65 | | | | 0.37 | | | | 0.47 | | | | 0.58 | | | | 0.06 | |
Net realized and unrealized gain (loss) | | | 10.60 | | | | 20.96 | | | | (15.64 | ) | | | (9.17 | ) | | | (2.02 | ) |
Total from investment operations | | | 11.25 | | | | 21.33 | | | | (15.17 | ) | | | (8.59 | ) | | | (1.96 | ) |
Dividends to shareholders: | | | | | | | | | | | | | | | | | | | | |
Net investment income | | | (0.61 | ) | | | (0.25 | ) | | | (0.54 | ) | | | (0.48 | ) | | | (0.04 | ) |
Total dividends to shareholders | | | (0.61 | ) | | | (0.25 | ) | | | (0.54 | ) | | | (0.48 | ) | | | (0.04 | ) |
Net asset value, end of period | | $ | 54.97 | | | $ | 44.33 | | | $ | 23.25 | | | $ | 38.96 | | | $ | 48.03 | |
| | | | | |
TOTAL RETURN2 | | | 25.57 | % | | | 91.88 | % | | | (39.31 | )% | | | (17.97 | )% | | | (3.92 | )% |
RATIOS/SUPPLEMENTAL DATA: | | | | | | | | | | | | | | | | | | | | |
Net assets, end of period (000’s omitted) | | $ | 134,672 | | | $ | 95,306 | | | $ | 13,948 | | | $ | 15,585 | | | $ | 9,607 | |
Ratios to average net assets4 of: | | | | | | | | | | | | | | | | | | | | |
Expenses, net of expense reimbursements | | | 0.38 | % | | | 0.38 | % | | | 0.38 | % | | | 0.38 | % | | | 0.38 | %3 |
Expenses, prior to expense reimbursements | | | 0.38 | % | | | 0.38 | % | | | 0.38 | % | | | 0.38 | % | | | 0.58 | %3 |
Net investment income | | | 1.37 | % | | | 0.97 | % | | | 1.49 | % | | | 1.28 | % | | | 1.39 | %3 |
Portfolio turnover rate5 | | | 19 | % | | | 16 | % | | | 51 | % | | | 37 | % | | | 0 | %6 |
| * | Commencement of investment operations. |
| 1 | Based on average shares outstanding. |
| 2 | Total return is calculated assuming an initial investment made at the net asset value at the beginning of the period, reinvestment of all dividends and distributions at net asset value during the period and redemption on the last day of the period. Total return calculated for a period of less than one year is not annualized. The total return would have been lower if certain expenses had not been reimbursed by the investment adviser (Note 2). |
| 4 | The ratios to average net assets do not include net investment income (loss) or expenses of the affiliated funds in which the Fund invests. |
| 5 | Portfolio turnover rate is not annualized and excludes the value of portfolio securities received or delivered as a result of in-kind creations or redemptions of the Fund’s capital shares. |
| 6 | Amount represents less than 1%. |
See Notes to Financial Statements.
| | | | |
| WisdomTree Domestic and International Earnings Funds | | | 71 | |
Financial Highlights (continued)
WisdomTree Domestic and International Earnings Funds
March 31, 2011
Selected data for a share of beneficial interest outstanding throughout the period is presented below:
| | | | | | | | | | | | | | | | | | | | |
| WisdomTree LargeCap Value Fund | | For the
Year Ended
March 31, 2011 | | | For the
Year Ended
March 31, 2010** | | | For the
Year Ended
March 31, 2009 | | | For the
Year Ended
March 31, 2008 | | | For the Period
February 23, 2007*
through
March 31, 2007 | |
Net asset value, beginning of period | | $ | 37.01 | | | $ | 24.24 | | | $ | 43.53 | | | $ | 49.06 | | | $ | 49.99 | |
Investment operations: | | | | | | | | | | | | | | | | | | | | |
Net investment income1 | | | 0.49 | | | | 0.65 | | | | 0.86 | | | | 1.03 | | | | 0.10 | |
Net realized and unrealized gain (loss) | | | 6.04 | | | | 12.75 | | | | (19.33 | ) | | | (5.49 | ) | | | (0.95 | ) |
Total from investment operations | | | 6.53 | | | | 13.40 | | | | (18.47 | ) | | | (4.46 | ) | | | (0.85 | ) |
Dividends to shareholders: | | | | | | | | | | | | | | | | | | | | |
Net investment income | | | (0.52 | ) | | | (0.63 | ) | | | (0.82 | ) | | | (1.07 | ) | | | (0.08 | ) |
Total dividends to shareholders | | | (0.52 | ) | | | (0.63 | ) | | | (0.82 | ) | | | (1.07 | ) | | | (0.08 | ) |
Net asset value, end of period | | $ | 43.02 | | | $ | 37.01 | | | $ | 24.24 | | | $ | 43.53 | | | $ | 49.06 | |
| | | | | |
TOTAL RETURN2 | | | 17.86 | % | | | 55.57 | % | | | (42.87 | )% | | | (9.31 | )% | | | (1.69 | )% |
RATIOS/SUPPLEMENTAL DATA: | | | | | | | | | | | | | | | | | | | | |
Net assets, end of period (000’s omitted) | | $ | 25,812 | | | $ | 35,164 | | | $ | 20,607 | | | $ | 23,940 | | | $ | 24,529 | |
Ratios to average net assets4 of: | | | | | | | | | | | | | | | | | | | | |
Expenses, net of expense reimbursements | | | 0.38 | % | | | 0.38 | % | | | 0.38 | % | | | 0.38 | % | | | 0.38 | %3 |
Expenses, prior to expense reimbursements | | | 0.38 | % | | | 0.38 | % | | | 0.38 | % | | | 0.38 | % | | | 0.45 | %3 |
Net investment income | | | 1.33 | % | | | 2.01 | % | | | 2.60 | % | | | 2.10 | % | | | 1.98 | %3 |
Portfolio turnover rate5 | | | 6 | % | | | 71 | % | | | 54 | % | | | 20 | % | | | 1 | % |
| | | | | | | | | | | | |
| | | | |
| WisdomTree LargeCap Growth Fund | | For the
Year Ended
March 31, 2011 | | | For the
Year Ended
March 31, 2010 | | | For the Period
December 4, 2008*
through
March 31, 2009 | |
Net asset value, beginning of period | | $ | 34.59 | | | $ | 26.10 | | | $ | 25.28 | |
Investment operations: | | | | | | | | | | | | |
Net investment income1 | | | 0.26 | | | | 0.49 | | | | 0.09 | |
Net realized and unrealized gain | | | 4.41 | | | | 9.22 | | | | 0.81 | |
Total from investment operations | | | 4.67 | | | | 9.71 | | | | 0.90 | |
Dividends and distributions to shareholders: | | | | | | | | | | | | |
Net investment income | | | (0.25 | ) | | | (0.46 | ) | | | (0.08 | ) |
Capital gains | | | — | | | | (0.76 | ) | | | — | |
Total dividends and distributions to shareholders | | | (0.25 | ) | | | (1.22 | ) | | | (0.08 | ) |
Net asset value, end of period | | $ | 39.01 | | | $ | 34.59 | | | $ | 26.10 | |
| | | |
TOTAL RETURN2 | | | 13.57 | % | | | 37.46 | % | | | 3.56 | % |
RATIOS/SUPPLEMENTAL DATA: | | | | | | | | | | | | |
Net assets, end of period (000’s omitted) | | $ | 25,357 | | | $ | 22,485 | | | $ | 9,136 | |
Ratios to average net assets4 of: | | | | | | | | | | | | |
Expenses, net of expense reimbursements | | | 0.38 | % | | | 0.38 | % | | | 0.38 | %3 |
Expenses, prior to expense reimbursements | | | 0.38 | % | | | 0.38 | % | | | 0.38 | %3 |
Net investment income | | | 0.73 | % | | | 1.53 | % | | | 1.26 | %3 |
Portfolio turnover rate5 | | | 10 | % | | | 44 | % | | | 1 | % |
| * | Commencement of investment operations. |
| ** | This information reflects the investment objective and strategy of WisdomTree Low P/E Fund through June 19, 2009 and the investment objective and strategy of the WisdomTree LargeCap Value Fund thereafter. |
| 1 | Based on average shares outstanding. |
| 2 | Total return is calculated assuming an initial investment made at the net asset value at the beginning of the period, reinvestment of all dividends and distributions at net asset value during the period and redemption on the last day of the period. Total return calculated for a period of less than one year is not annualized. The total return would have been lower if certain expenses had not been reimbursed by the investment adviser (Note 2). |
| 4 | The ratios to average net assets do not include net investment income (loss) or expenses of the affiliated funds in which the Fund invests. |
| 5 | Portfolio turnover rate is not annualized and excludes the value of portfolio securities received or delivered as a result of in-kind creations or redemptions of the Fund’s capital shares. |
See Notes to Financial Statements.
| | |
| 72 | | WisdomTree Domestic and International Earnings Funds |
Financial Highlights (concluded)
WisdomTree Domestic and International Earnings Funds
March 31, 2011
Selected data for a share of beneficial interest outstanding throughout the period is presented below:
| | | | | | | | | | | | | | | | |
| WisdomTree India Earnings Fund (consolidated) | | For the
Year Ended
March 31, 2011 | | | For the
Year Ended
March 31, 2010 | | | For the
Year Ended
March 31, 2009 | | | For the Period
February 22, 2008*
through
March 31, 2008 | |
Net asset value, beginning of period | | $ | 23.25 | | | $ | 10.99 | | | $ | 22.57 | | | $ | 24.94 | |
Investment operations: | | | | | | | | | | | | | | | | |
Net investment income (loss)1 | | | 0.09 | | | | 0.04 | | | | 0.12 | | | | (0.01 | ) |
Net realized and unrealized gain (loss) | | | 1.67 | | | | 12.27 | | | | (11.60 | ) | | | (2.36 | ) |
Total from investment operations | | | 1.76 | | | | 12.31 | | | | (11.48 | ) | | | (2.37 | ) |
Dividends to shareholders: | | | | | | | | | | | | | | | | |
Net investment income | | | (0.14 | ) | | | (0.05 | ) | | | (0.10 | ) | | | — | |
Total dividends to shareholders | | | (0.14 | ) | | | (0.05 | ) | | | (0.10 | ) | | | — | |
Net asset value, end of period | | $ | 24.87 | | | $ | 23.25 | | | $ | 10.99 | | | $ | 22.57 | |
| | | | |
TOTAL RETURN2 | | | 7.59 | % | | | 112.11 | % | | | (50.89 | )% | | | (9.50 | )% |
RATIOS/SUPPLEMENTAL DATA: | | | | | | | | | | | | | | | | |
Net assets, end of period (000’s omitted) | | $ | 1,487,089 | | | $ | 841,533 | | | $ | 169,195 | | | $ | 162,540 | |
Ratios to average net assets of: | | | | | | | | | | | | | | | | |
Expenses, net of expense reimbursements | | | 0.88 | % | | | 0.88 | % | | | 0.88 | % | | | 0.88 | %3 |
Expenses, prior to expense reimbursements | | | 0.88 | % | | | 0.88 | % | | | 0.92 | % | | | 2.10 | %3 |
Net investment income (loss) | | | 0.36 | % | | | 0.19 | % | | | 0.77 | % | | | (0.41 | )%3 |
Portfolio turnover rate4 | | | 38 | % | | | 33 | % | | | 42 | % | | | 0 | %5 |
| * | Commencement of investment operations. |
| 1 | Based on average shares outstanding. |
| 2 | Total return is calculated assuming an initial investment made at the net asset value at the beginning of the period, reinvestment of all dividends and distributions at net asset value during the period and redemption on the last day of the period. Total return calculated for a period of less than one year is not annualized. The total return would have been lower if certain expenses had not been reimbursed by the investment adviser (Note 2). |
| 4 | Portfolio turnover rate is not annualized and excludes the value of portfolio securities received or delivered as a result of in-kind creations or redemptions of the Fund’s capital shares. |
| 5 | Amount represents less than 1%. |
See Notes to Financial Statements.
| | | | |
| WisdomTree Domestic and International Earnings Funds | | | 73 | |
Notes to Financial Statements
March 31, 2011
1. ORGANIZATION
WisdomTree Trust (the “Trust”) is registered under the Investment Company Act of 1940, as amended (the “1940 Act”), as an open-end management investment company. The Trust was established as a Delaware statutory trust pursuant to a Trust Instrument dated December 15, 2005. As of March 31, 2011, the Trust offered 46 investment funds (each a “Fund”, collectively, the “Funds”). The Funds described herein commenced operations on February 23, 2007, with the exception of the India Earnings Fund and LargeCap Growth Fund which commenced operations on February 22, 2008 and December 4, 2008, respectively.
These financial statements relate only to the WisdomTree Total Earnings Fund (“Total Earnings Fund”), WisdomTree Earnings 500 Fund (“Earnings 500 Fund”), WisdomTree MidCap Earnings Fund (“MidCap Earnings Fund”), WisdomTree SmallCap Earnings Fund (“SmallCap Earnings Fund”), WisdomTree LargeCap Value Fund (“LargeCap Value Fund”), WisdomTree LargeCap Growth Fund (“LargeCap Growth Fund”) and WisdomTree India Earnings Fund (“India Earnings Fund”), together the “Domestic and International Earnings Funds.” The India Earnings Fund makes its investments through the WisdomTree India Investment Portfolio, Inc. (the “Portfolio”), a wholly owned subsidiary organized in the Republic of Mauritius. The Portfolio is advised by WisdomTree Asset Management and is sub-advised by Mellon Capital Management Corporation, Inc. (“MCM”). For India Earnings Fund, the accompanying financial statements reflect the financial position of the Fund and the results of operations on a consolidated basis with the Portfolio. All inter-company accounts and transactions have been eliminated in consolidation. This structure should permit India Earnings Fund to benefit from a tax treaty between India and Mauritius. The Supreme Court of India upheld the validity of this tax treaty in response to a lower court challenge contesting the treaty’s applicability to entities such as India Earnings Fund. No assurance can be given that the terms of the treaty will not be subject to re-negotiation in the future or subject to a different interpretation. Any change in the provision of this treaty or in its applicability to India Earnings Fund could result in the imposition of withholding and other taxes on India Earnings Fund by tax authorities in India. This would reduce the return to the India Earnings Fund on its investments and the return received by India Earnings Fund shareholders. References to investments by India Earnings Fund herein should be understood to refer to investments by the Portfolio.
Each Fund seeks investment returns that closely correspond to the price and yield performance, before fees and expenses, of a particular index (“Index”) developed by WisdomTree Investments, Inc. (“WisdomTree Investments”). WisdomTree Investments is the parent company of WisdomTree Asset Management, Inc. (“WTAM”), the investment adviser to each Fund and the Trust. “WisdomTree” is a registered mark of WisdomTree Investments and has been licensed for use by the Trust. Each Fund described herein is considered to be non-diversified. The securities in each Index are weighted based on earnings or earnings yield.
2. SIGNIFICANT ACCOUNTING POLICIES
The Financial Accounting Standards Board (“FASB”) Accounting Standards Codification (the “Codification”) has become the exclusive reference of authoritative U.S. generally accepted accounting principles (“GAAP”) recognized by the FASB to be applied by nongovernmental entities. Rules and interpretive releases of the U.S. Securities and Exchange Commission (“SEC”) under authority of federal laws are also sources of authoritative GAAP for SEC registrants.
The following is a summary of significant accounting policies followed by the Funds:
Guarantees — In the normal course of business the Funds may enter into contracts that contain a variety of representations or that provide indemnification for certain liabilities. The Funds’ maximum exposure under these arrangements is unknown, as this would involve future claims that may be made against the Funds that have not yet occurred. However, the Funds have not had prior claims or losses pursuant to these contracts and expect the risk of loss to be remote. Therefore, no liabilities have been recorded in connection with these indemnifications.
Use of Estimates — The preparation of financial statements in conformity with GAAP, requires management to make certain estimates and assumptions that affect the reported amounts of assets and liabilities and disclosure of contingent assets and liabilities at the date of the financial statements and the reported amounts of increases and decreases in the net assets from operations during the reporting period. Actual results could differ from those estimates.
Investment Valuation — The net asset value (“NAV”) of each Fund’s shares is calculated each day the national securities exchanges are open for trading as of the close of regular trading on the New York Stock Exchange, generally 4:00 p.m. Eastern time. NAV per share is calculated by dividing a Fund’s net assets by the number of Fund shares outstanding. Transactions in Fund shares will be priced at NAV only if you purchase or redeem shares directly from a Fund in creation units, which are typically in blocks of 50,000 shares or more. Fund shares are purchased or sold on a national securities exchange at market prices, which may be higher or lower than NAV. Each Fund may invest in money market funds or affiliated funds, which are valued at NAV.
Securities traded on any recognized U.S. or non-U.S. exchange are valued at the last sale price or official closing price on the exchange or system on which they are principally traded. Unlisted equity securities are valued at the last quoted sale price or, if no sale price is available, at the mean between the highest bid and lowest ask prices. Securities for which market quotations are not readily available are valued at fair value as determined by management and in accordance with procedures approved by the Board of Trustees. Short-term securities with 60 days or less remaining to maturity are valued using the amortized cost method, which approximates fair value.
| | |
| 74 | | WisdomTree Domestic and International Earnings Funds |
Notes to Financial Statements (continued)
In certain instances, such as when reliable market valuations are not readily available or are not deemed to reflect current market values, a Fund’s investments will be valued in accordance with the Fund’s pricing policy and procedures. Securities that may be valued using “fair value” pricing may include, but are not limited to, securities for which there are no current market quotations or whose issuer is in default or bankruptcy, securities subject to corporate actions (such as mergers or reorganizations), securities subject to non-U.S. investment limits or currency controls, and securities affected by “significant events”. An example of a significant event is an event occurring after the close of the market in which a security trades but before a Fund’s next NAV calculation time that may materially affect the value of a Fund’s investment (e.g., government action, natural disaster, or significant market fluctuation). Price movements in U.S. markets that are deemed to affect the value of foreign securities, or reflect changes to the value of such securities, also may cause securities to be “fair valued.” When fair value pricing is employed, the prices of securities used by a Fund to calculate its NAV may differ from quoted or published prices for the same securities.
Fair Value Measurement — In accordance with Codification Topic 820 (“ASC 820”), Fair Value Measurements and Disclosures, fair value is defined as the price that each Fund would receive upon selling an investment in an orderly transaction to an independent buyer in the principal or most advantageous market of the investment. ASC 820 established a three-tier hierarchy to maximize the use of observable market data and minimize the use of unobservable inputs and to establish classification of fair value measurements for disclosure purposes. Inputs refer broadly to the assumptions that market participants would use in pricing the asset or liability, including assumptions about risk — for example, the risk inherent in a particular valuation technique used to measure fair value (such as a pricing model) and/or the risk inherent in the inputs to the valuation technique. Inputs may be observable or unobservable. Observable inputs reflect the assumptions market participants would use in pricing the asset or liability. Observable inputs are based on market data obtained from sources independent of the reporting entity. Unobservable inputs reflect the reporting entity’s own assumptions about the assumptions market participants would use in pricing the asset or liability. Unobservable inputs are based on the best information available in the circumstances. The three-tier hierarchy of inputs is summarized in the three broad levels listed below:
Level 1 – quoted prices in active markets for identical securities
Level 2 – other significant observable inputs (including quoted prices for similar securities, interest rates, prepayment speeds, credit risk, etc.)
Level 3 – significant unobservable inputs (including each Fund’s assumption in determining the fair value of investments)
Investments that use Level 2 or Level 3 inputs may include, but are not limited to: (i) an unlisted security related to corporate actions; (ii) a restricted security (e.g., one that may not be publicly sold without registration under the Securities Act of 1933, as amended); (iii) a security whose trading has been suspended or which has been de-listed from its primary trading exchange; (iv) a security that is thinly traded; (v) a security in default or bankruptcy proceedings for which there is no current market quotation; (vi) a security affected by currency controls or restrictions; and (vii) a security affected by a significant event (e.g., an event that occurs after the close of the markets on which the security is traded but before the time as of which a Fund’s NAV is computed and that may materially affect the value of the Fund’s investments).
The inputs or methodology used for valuation are not necessarily an indication of the risk associated with investing in those investments.
The following is a summary of the inputs used as of March 31, 2011 in valuing each Fund’s assets carried at fair value:
| | | | | | | | | | | | |
| Total Earnings Fund | | Level 1 | | | Level 2 | | | Level 3 | |
Investments in Securities | | | | | | | | | | | | |
Common Stocks* | | $ | 53,723,987 | | | $ | — | | | $ | — | |
Money Market Funds | | | — | | | | 2,478,624 | | | | — | |
Affiliated Funds | | | 392,157 | | | | — | | | | — | |
Total | | $ | 54,116,144 | | | $ | 2,478,624 | | | $ | — | |
| | | | | | | | | | | | |
| Earnings 500 Fund | | Level 1 | | | Level 2 | | | Level 3 | |
Investments in Securities | | | | | | | | | | | | |
Common Stocks* | | $ | 63,396,951 | | | $ | — | | | $ | — | |
Money Market Funds | | | — | | | | 2,140,078 | | | | — | |
Affiliated Funds | | | 344,576 | | | | — | | | | — | |
Total | | $ | 63,741,527 | | | $ | 2,140,078 | | | $ | — | |
| | | | |
| WisdomTree Domestic and International Earnings Funds | | | 75 | |
Notes to Financial Statements (continued)
| | | | | | | | | | | | |
| MidCap Earnings Fund | | Level 1 | | | Level 2 | | | Level 3 | |
Investments in Securities | | | | | | | | | | | | |
Common Stocks* | | $ | 105,117,356 | | | $ | — | | | $ | — | |
Money Market Funds | | | — | | | | 24,062,233 | | | | — | |
Affiliated Funds | | | 557,285 | | | | — | | | | — | |
Total | | $ | 105,674,641 | | | $ | 24,062,233 | | | $ | — | |
| | | | | | | | | | | | |
| SmallCap Earnings Fund | | Level 1 | | | Level 2 | | | Level 3 | |
Investments in Securities | | | | | | | | | | | | |
Common Stocks* | | $ | 133,686,450 | | | $ | — | | | $ | — | |
Money Market Funds | | | — | | | | 35,887,041 | | | | — | |
Affiliated Funds | | | 843,454 | | | | — | | | | — | |
Total | | $ | 134,529,904 | | | $ | 35,887,041 | | | $ | — | |
| | | | | | | | | | | | |
| LargeCap Value Fund | | Level 1 | | | Level 2 | | | Level 3 | |
Investments in Securities | | | | | | | | | | | | |
Common Stocks* | | $ | 25,442,332 | | | $ | — | | | $ | — | |
Money Market Funds | | | — | | | | 1,024,185 | | | | — | |
Affiliated Funds | | | 318,266 | | | | — | | | | — | |
Total | | $ | 25,760,598 | | | $ | 1,024,185 | | | $ | — | |
| | | | | | | | | | | | |
| LargeCap Growth Fund | | Level 1 | | | Level 2 | | | Level 3 | |
Investments in Securities | | | | | | | | | | | | |
Common Stocks* | | $ | 25,080,719 | | | $ | — | | | $ | — | |
Money Market Funds | | | — | | | | 961,000 | | | | — | |
Affiliated Funds | | | 245,226 | | | | — | | | | — | |
Total | | $ | 25,325,945 | | | $ | 961,000 | | | $ | — | |
| | | | | | | | | | | | |
| India Earnings Fund | | Level 1 | | | Level 2 | | | Level 3 | |
Investments in Securities | | | | | | | | | | | | |
Common Stocks* | | $ | 1,487,166,385 | | | $ | — | | | $ | — | |
Corporate Bond | | | — | | | | 49,255 | | | | — | |
Rights | | | — | | | | 450,087 | | | | — | |
Total | | $ | 1,487,166,385 | | | $ | 499,342 | | | $ | — | |
| * | Please refer to Schedule of Investment for the breakdown of the valuation by industry type. |
In January-2010, FASB issued Accounting Standards Update (“ASU”) No. 2010-06 “Improving Disclosures about Fair Value Measurements (“ASU 2010-06”).” ASU 2010-06 requires reporting entities to make new disclosures about amounts and reasons for significant transfers in and out of Level 1 and Level 2 fair value measurements, as well as inputs and valuation techniques used to measure fair value for both recurring and nonrecurring fair value measurements that fall in either Level 2 or Level 3. There were no Level 3 securities during or the fiscal year ended March 31, 2011. ASU 2010-06 also requires information on purchases and sales, issuances and settlements on a gross basis in the reconciliation of activity in Level 3 fair value measurements. The new and revised disclosures are required to be implemented for fiscal years beginning after December 15, 2009, except for the disclosures surrounding purchases, sales, issuances and settlements on a gross basis in the reconciliation of Level 3 fair value measurements, which are effective for fiscal years beginning after December 15, 2010. Management has implemented the applicable portion ASU 2010-06, for the fiscal year ended March 31, 2011 and the impact of such adoption is limited to additional disclosures in the financial statements. No significant transfers between Level 1 or Level 2 fair value measurements occurred during the fiscal year March 31, 2011.
Derivative and Hedging Disclosure — Codification Topic 815 (“ASC 815”), Derivatives and Hedging, requires qualitative disclosures about objectives and strategies for using derivatives, quantitative disclosures about fair value amounts of gains and losses on derivative instruments, and disclosures about credit-risk-related contingent features in derivative agreements. The Funds did not invest in derivative instruments during the fiscal year ended March 31, 2011.
| | |
| 76 | | WisdomTree Domestic and International Earnings Funds |
Notes to Financial Statements (continued)
Investment Transactions and Investment Income — Investment transactions are recorded as of the date that the securities are purchased or sold (trade date). Realized gains and losses on sales of portfolio securities are calculated using the identified-cost method. Dividend income is recognized on the ex-dividend date, net of any foreign taxes withheld. Interest income including amortization of premiums and discounts, is accrued daily. The value of additional securities received as dividend payments is recorded as income and as an increase to the cost basis of such securities.
Foreign Currency Translation — The accounting records of the Funds are maintained in U.S. dollars. Foreign currencies, as well as investment securities and other assets and liabilities denominated in foreign currencies, are translated into U.S. dollars using exchange rates deemed appropriate by the investment adviser. Realized and unrealized foreign exchange gains or losses on investments are included as a component of net realized and unrealized gain or loss on foreign currency transactions in the Statements of Operations. Certain foreign exchange gains and losses included in realized and unrealized gains or losses are included in, or are a reduction of, ordinary income in accordance with U.S. Federal income tax regulations.
Expenses/Reimbursements — WTAM has agreed to pay all expenses of the Funds (other than the India Earnings Fund), except for: (i) brokerage expenses and other expenses (such as stamp taxes) connected with the execution of portfolio transactions or in connection with creation and redemption transactions; (ii) legal fees or expenses in connection with any arbitration, litigation or pending or threatened arbitration or litigation, including any settlements in connection therewith; (iii) compensation and expenses of each Independent Trustee; (iv) compensation and expenses of counsel to the Independent Trustees; (v) compensation and expenses of the Trust’s chief compliance officer; (vi) extraordinary expenses; (vii) distribution fees and expenses paid by the Trust under any distribution plan adopted pursuant to Rule 12b-1 under the 1940 Act; and (viii) the advisory fee payable to WTAM.
Pursuant to a separate contractual arrangement, WTAM has arranged for the provision of chief compliance officer (“CCO”) services to the Funds, and is liable and responsible for, and administers, payments to the CCO, the Independent Trustees and counsel to the Independent Trustees, in exchange for a service fee paid by each Fund of up to 0.0044% of each Fund’s average daily net assets. Trustees fees, which are included in Service Fees on the Statements of Operations, of $288,600 have been paid on behalf of the Funds of the Trust to the Independent Trustees for the fiscal year ended March 31, 2011. Expenses in excess of 0.0044% were paid by WTAM. WTAM has agreed to limit the total expenses of the India Earnings Fund to 0.88%.
Currency Transactions — India Earnings Fund may enter into foreign currency forward and foreign currency futures contracts to facilitate local securities settlements or to protect against currency exposure in connection with distributions to shareholders. India Earnings Fund does not expect to engage in currency transactions for the purpose of hedging against declines in the value of the Fund’s assets that are denominated in one or more foreign currencies. India Earnings Fund may not enter into such contracts for speculative purposes.
Forward Foreign Currency Transactions — A forward foreign currency contract (“Forward Contract”) involves an obligation to purchase or sell a specific currency at a future date, which may be any fixed number of days from the date of the contract agreed upon by the parties, at a price set at the time of the contract. These contracts are principally traded in the inter-bank market conducted directly between currency traders (usually large, commercial banks) and their customers. A Forward Contract generally has no margin deposit requirement, and no commissions are charged at any stage for trades.
Risks may arise upon entering into Forward Contracts from the potential inability of counterparties to meet the terms of their contracts and from unanticipated movements in the value of foreign currencies relative to the U.S. dollar or each other.
Fluctuations in the value of open Forward Contracts are recorded for book purposes as unrealized gains or losses on Forward Contracts by the Funds. Realized gains and losses on Forward Contracts include net gains or losses recognized by the Funds on contracts which have matured.
There were no Forward Contracts open at or for the year ended March 31, 2011.
Security Lending — Each Fund may lend portfolio securities to certain creditworthy borrowers, including the Funds’ securities lending agent. It is the Fund’s policy that, at origination, all loans are secured by collateral of at least 102% of the value of U.S. securities loaned and 105% of the value of foreign securities loaned. Collateral in the form of cash and/or high grade debt obligations, equivalent to at least 100% of the market value of securities is maintained at all times. The collateral can be invested in certain money market mutual funds which also have exposure to the fluctuations of the market. Each Fund receives compensation for lending its securities from interest or dividends earned on the cash or U.S. government securities held as collateral, net of fee rebates paid to the borrower plus reasonable administrative and custody fees. The dividend and interest income earned on the securities loaned is accounted for in the same manner as other dividend and interest income. The borrower pays to the Funds an amount equal to any dividends or interest received on loaned securities. The Funds retain all or a portion of the interest received on
| | | | |
| WisdomTree Domestic and International Earnings Funds | | | 77 | |
Notes to Financial Statements (continued)
investment of cash collateral or receives a fee from the borrower. Lending portfolio securities could result in a loss or delay in recovering each Fund’s securities if the borrower defaults.
The securities lending income earned by the Funds is disclosed on the Statements of Operations.
Short-Term Investments — Each Fund may invest a portion of its assets in high-quality money market instruments on an ongoing basis to provide liquidity or for other reasons. The instruments in which a Fund may invest include short-term obligations issued by the U.S. Government, negotiable certificates of deposit (“CDs”), fixed time deposits and bankers’ acceptances of U.S. and foreign banks and similar institutions, commercial papers, repurchase agreements and money market funds. CDs are short-term negotiable obligations of commercial banks. Time deposits are non-negotiable deposits maintained in banking institutions for specified periods of time at stated interest rates. Banker’s acceptances are time drafts drawn on commercial banks by borrowers, usually in connection with international transactions.
Tax Information and Dividends and Distributions to Shareholders — It is each Fund’s policy to comply with all requirements of the Internal Revenue Code of 1986, as amended (the “Code”). Each Fund intends to qualify for and to elect treatment as a separate Regulated Investment Company (“RIC”) under Subchapter M of the Code. It is the policy of each Fund to pay out dividends, if any, to investors at least annually. Taxable net realized gains from investment transactions, reduced by capital loss carryforwards, if any, are declared and distributed to shareholders at least annually. The capital loss carryforward amount, if any, is available to offset future net capital gains. The Funds may occasionally be required to make supplemental distributions at some other time during the year. The Trust reserves the right to declare special distributions if, in its reasonable discretion, such action is necessary or advisable to preserve the status of each Fund as a RIC or to avoid imposition of income or excise taxes on undistributed income. Dividends and distributions to shareholders are recorded on the ex-dividend date. The amount of dividends and distributions from net investment income and net realized capital gains are determined in accordance with Federal income tax regulations which may differ from GAAP. These book/tax differences are either considered temporary or permanent in nature. To the extent these differences are permanent in nature, such amounts are reclassified within the components of net assets based on their Federal tax basis treatment; temporary differences do not require reclassification. Dividends and distributions, which exceed earnings and profit for tax purposes, are reported as a tax return of capital. India Earnings Fund has filed an election to treat the Portfolio, as a “pass-through” entity for tax purposes.
3. ADVISER FEES AND TRANSACTIONS
As an investment adviser, WTAM has overall responsibility for the general management and administration of the Trust. WTAM also provides an investment program for each Fund. WTAM also arranges for sub-advisory, transfer agency, custody, fund administration, and all other non-distribution related services necessary for the Funds to operate. Under the Investment Advisory Agreement for each Fund (other than the India Earnings Fund), as also described in Note 2, WTAM agrees to pay all expenses of the Funds, except compensation and expenses of the Independent Trustees, counsel to the Independent Trustees and the Trust’s CCO, interest expenses and taxes, brokerage expenses, and other expenses connected with the execution of portfolio transactions, any distribution fees or expenses, legal fees or expenses and extraordinary expenses. The Investment Advisory Agreement for the India Earnings Fund does not require WTAM to pay any Fund expenses, except sub-advisory fees.
Pursuant to a separate contractual arrangement, as also described in Note 2, WTAM arranges for the provision of CCO services with respect to each Fund (other than the India Earnings Fund), and is liable and responsible for, and administers, payments to the CCO, the Independent Trustees and counsel to the Independent Trustees in exchange for a fee of up to 0.0044%. WTAM has agreed to limit net annual operating expenses for the India Earnings Fund to 0.88%. WTAM expects to receive fees from each Fund, based on a percentage of the Fund’s average daily net assets, as shown in the following table:
| | | | |
| Fund | | Advisory
Fee Rate | |
Total Earnings Fund | | | 0.28 | % |
Earnings 500 Fund | | | 0.28 | % |
MidCap Earnings Fund | | | 0.38 | % |
SmallCap Earnings Fund | | | 0.38 | % |
LargeCap Value Fund | | | 0.38 | % |
LargeCap Growth Fund | | | 0.38 | % |
India Earnings Fund | | | 0.68 | % |
| | |
| 78 | | WisdomTree Domestic and International Earnings Funds |
Notes to Financial Statements (continued)
Each Fund may purchase shares of an affiliated exchange traded fund(s) in secondary market transactions. For the fiscal year ended March 31, 2011, WTAM waived a portion of its advisory fees based on each Fund’s investment in affiliated Funds. The table below indicates the waiver amounts. Please see Note 7 on page 81 for additional information on Other Affiliated Parties and Transactions.
WTAM waived a portion of it’s investment advisory fees with respect to its investments in affiliated funds for the year ended March 31, 2011 as follows:
| | | | |
| Fund | | Advisory Fees
Waived | |
Total Earnings Fund | | $ | 533 | |
Earnings 500 Fund | | | 478 | |
MidCap Earnings Fund | | | 1,184 | |
SmallCap Earnings Fund | | | 1,263 | |
LargeCap Value Fund | | | 251 | |
LargeCap Growth Fund | | | 403 | |
India Earnings Fund | | | — | |
4. CAPITAL SHARE TRANSACTIONS
As of March 31, 2011, there was an unlimited number of $0.001 par value shares of beneficial interest authorized by the Trust. Shares are issued and redeemed by each Fund only in Creation Units or multiples thereof. Except when aggregated in Creation Units, shares of each Fund are not redeemable. Transactions in shares for each Fund are disclosed in detail in the Statements of Changes in Net Assets. The consideration for the purchase of Creation Units of a Fund generally consists of the in-kind contribution of a designated portfolio of equity securities constituting a portfolio sampling representation of the securities included in the relevant Fund’s underlying index and an amount of cash. India Earnings Fund issues and redeems shares on a cash basis only. Investors purchasing and redeeming Creation Units may be charged a purchase transaction fee and a redemption transaction fee to offset transfer and other transaction costs associated with the issuance and redemption of Creation Units.
5. INVESTMENT PORTFOLIO TRANSACTIONS
Purchases and sales of investments (excluding in-kind purchases and redemptions and short-term investments) for the fiscal year ended March 31, 2011 were as follows:
| | | | | | | | |
| Fund | | Purchases | | | Sales | |
Total Earnings Fund | | $ | 12,682,214 | | | $ | 4,274,424 | |
Earnings 500 Fund | | | 16,840,101 | | | | 8,236,791 | |
MidCap Earnings Fund | | | 54,151,495 | | | | 15,366,875 | |
SmallCap Earnings Fund | | | 68,558,061 | | | | 19,962,262 | |
LargeCap Value Fund | | | 26,694,260 | | | | 1,724,024 | |
LargeCap Growth Fund | | | 20,425,080 | | | | 1,952,288 | |
India Earnings Fund | | | 1,073,053,042 | | | | 475,704,016 | |
For the fiscal year ended March 31, 2011, the cost of in-kind purchases and the proceeds from in-kind redemptions were as follows:
| | | | | | | | |
| Fund | | Purchases | | | Redemptions | |
Total Earnings Fund | | $ | — | | | $ | 8,323,286 | |
Earnings 500 Fund | | | 6,310,199 | | | | 34,242,250 | |
MidCap Earnings Fund | | | 63,495,165 | | | | 70,083,922 | |
SmallCap Earnings Fund | | | 27,748,645 | | | | 58,568,294 | |
LargeCap Value Fund | | | — | | | | 37,188,657 | |
LargeCap Growth Fund | | | 6,776,310 | | | | 25,400,674 | |
India Earnings Fund | | | — | | | | — | |
Gains and losses on in-kind redemptions are not recognized at the Fund level for tax purposes.
| | | | |
| WisdomTree Domestic and International Earnings Funds | | | 79 | |
Notes to Financial Statements (continued)
6. FEDERAL INCOME TAXES
At March 31, 2011, the cost of investments (including securities on loan) for Federal income tax purposes was as follows:
| | | | | | | | | | | | | | | | |
| Fund | | Tax Cost | | | Gross Unrealized
Appreciation | | | Gross Unrealized
Depreciation | | | Net Unrealized
Appreciation | |
Total Earnings Fund | | $ | 52,009,579 | | | $ | 6,436,154 | | | $ | (1,850,965 | ) | | $ | 4,585,189 | |
Earnings 500 Fund | | | 63,890,451 | | | | 5,960,999 | | | | (3,969,845 | ) | | | 1,991,154 | |
MidCap Earnings Fund | | | 118,244,524 | | | | 12,680,608 | | | | (1,188,258 | ) | | | 11,492,350 | |
SmallCap Earnings Fund | | | 157,037,208 | | | | 17,728,909 | | | | (4,349,172 | ) | | | 13,379,737 | |
LargeCap Value Fund | | | 23,267,013 | | | | 3,825,863 | | | | (308,093 | ) | | | 3,517,770 | |
LargeCap Growth Fund | | | 22,829,519 | | | | 3,748,252 | | | | (290,826 | ) | | | 3,457,426 | |
India Earnings Fund | | | 1,288,640,947 | | | | 240,356,373 | | | | (41,331,593 | ) | | | 199,024,780 | |
At March 31, 2011, the components of accumulated earning/loss on a tax-basis were as follows:
| | | | | | | | | | | | | | | | | | | | |
| Fund | | Undistributed
Ordinary Income | | | Undistributed
Capital and Other
Losses | | | Net Unrealized
Appreciation | | | Currency
Unrealized
Appreciation | | | Total Accumulated
Earnings/(Losses) | |
Total Earnings Fund | | $ | 24,687 | | | $ | (5,858,721 | ) | | $ | 4,585,189 | | | $ | — | | | $ | (1,248,845 | ) |
Earnings 500 Fund | | | 35,865 | | | | (18,900,698 | ) | | | 1,991,154 | | | | — | | | | (16,873,679 | ) |
MidCap Earnings Fund | | | 15,282 | | | | (9,734,544 | ) | | | 11,492,350 | | | | — | | | | 1,773,088 | |
SmallCap Earnings Fund | | | 39,297 | | | | (9,504,435 | ) | | | 13,379,737 | | | | — | | | | 3,914,599 | |
LargeCap Value Fund | | | 11,519 | | | | (12,572,731 | ) | | | 3,517,770 | | | | — | | | | (9,043,442 | ) |
LargeCap Growth Fund | | | 11,260 | | | | (92,877 | ) | | | 3,457,426 | | | | — | | | | 3,375,809 | |
India Earnings Fund | | | — | | | | (62,786,723 | ) | | | 199,024,780 | | | | 993 | | | | 136,239,050 | |
The tax character of distributions paid during the years ended March 31, 2011 and March 31, 2010, was as follows:
| | | | | | | | | | | | |
| | | Year Ended
March 31, 2011 | | | Year Ended March 31, 2010 | |
| Fund | | Distributions Paid
from Ordinary
Income* | | | Distributions Paid
from Ordinary
Income* | | | Distributions Paid
from Long-Term
Capital Gains | |
Total Earnings Fund | | $ | 879,348 | | | $ | 540,172 | | | $ | — | |
Earnings 500 Fund | | | 1,308,638 | | | | 1,068,776 | | | | | |
MidCap Earnings Fund | | | 1,186,680 | | | | 437,001 | | | | | |
SmallCap Earnings Fund | | | 1,365,764 | | | | 411,568 | | | | | |
LargeCap Value Fund | | | 362,140 | | | | 551,890 | | | | | |
LargeCap Growth Fund | | | 145,072 | | | | 770,937 | | | | 208 | |
India Earnings Fund | | | 6,420,668 | | | | 1,343,522 | | | | | |
| | * | Includes short-term capital gains. |
At March 31, 2011, for Federal income tax purposes, the Funds have capital loss carryforwards available to offset future capital gains through the years indicated. To the extent that these loss carryforwards are utilized, capital gains so offset will not be distributed to shareholders.
| | | | | | | | | | | | | | | | | | | | |
| Fund | | Capital Loss
Available
Through 2016 | | | Capital Loss
Available
Through 2017 | | | Capital Loss
Available
Through 2018 | | | Capital Loss
Available
Through 2019 | | | Capital Loss
Available
Total | |
Total Earnings Fund | | $ | 133,369 | | | $ | 451,951 | | | $ | 3,393,418 | | | $ | 935,380 | | | $ | 4,914,118 | |
Earnings 500 Fund | | | 194,476 | | | | 1,286,040 | | | | 10,811,338 | | | | 4,536,572 | | | | 16,828,426 | |
MidCap Earnings Fund | | | 354,730 | | | | 1,545,771 | | | | 6,328,159 | | | | 346,722 | | | | 8,575,382 | |
SmallCap Earnings Fund | | | 31,705 | | | | 1,465,208 | | | | 4,654,874 | | | | 921,406 | | | | 7,073,193 | |
LargeCap Value Fund | | | 281,843 | | | | 1,085,926 | | | | 10,909,497 | | | | 295,465 | | | | 12,572,731 | |
LargeCap Growth Fund | | | — | | | | — | | | | — | | | | 92,877 | | | | 92,877 | |
India Earnings Fund | | | 1,179 | | | | 20,567,350 | | | | 7,978,486 | | | | 6,294,051 | | | | 34,841,066 | |
Capital losses, currency losses and passive foreign investment company ("PFIC") losses incurred after October 31 (“post-October losses”) within the taxable year are deemed to arise on the first business day of each Fund's next taxable year.
| | |
| 80 | | WisdomTree Domestic and International Earnings Funds |
Notes to Financial Statements (continued)
During the fiscal year ended March 31, 2011, the following Funds incurred and will elect to defer net post-October capital and currency losses as follows:
| | | | | | | | |
| Fund | | Post-October
Capital Losses | | | Post-October
Currency Losses | |
Total Earnings Fund | | $ | 944,603 | | | $ | — | |
Earnings 500 Fund | | | 2,072,272 | | | | — | |
MidCap Earnings Fund | | | 1,159,162 | | | | — | |
SmallCap Earnings Fund | | | 2,431,242 | | | | — | |
LargeCap Value Fund | | | — | | | | — | |
LargeCap Growth Fund | | | — | | | | — | |
India Earnings Fund | | | 27,945,657 | | | | — | |
At March 31, 2011, the effect of permanent “book/tax” reclassifications resulted in increases (decreases) to the components of net assets as follows:
| | | | | | | | | | | | |
| Fund | | Undistributed
Net Investment
Income/(Loss) | | | Accumulated
Net Realized
Gain/(Loss) | | | Paid-in Capital | |
Total Earnings Fund | | $ | (2,632 | ) | | $ | (1,655,886 | ) | | $ | 1,658,518 | |
Earnings 500 Fund | | | (2,717 | ) | | | (3,755,828 | ) | | | 3,758,545 | |
MidCap Earnings Fund | | | (40,420 | ) | | | (12,695,174 | ) | | | 12,735,594 | |
SmallCap Earnings Fund | | | (45,527 | ) | | | (14,928,793 | ) | | | 14,974,320 | |
LargeCap Value Fund | | | (725 | ) | | | (4,515,109 | ) | | | 4,515,834 | |
LargeCap Growth Fund | | | (1,715 | ) | | | (4,110,191 | ) | | | 4,111,906 | |
India Earnings Fund | | | 1,437,822 | | | | 216,847 | | | | (1,654,669 | ) |
The differences are primarily due to redemptions-in-kind, currency gain/loss, Passive Foreign Investment Companies ("PFICs"), the tax treatment of income earned from investments in partnerships, non-deductible expenses, and non-dividend distributions from underlying investments.
GAAP provides guidance on tax provisions that prescribe a minimum threshold for financial statement recognition of the benefit of a tax position taken or expected to be taken in a tax return. Foreign taxes are provided for based on each Fund’s understanding of the tax rules and rates that exist in the foreign markets in which it invests. Taxes are accrued and applied to net investment income, net realized capital gains and net unrealized appreciation, as applicable, as the income is earned or capital gains are recorded. As of and during the fiscal year ended March 31, 2011, the Funds did not have any liabilities for unrecognized tax benefits. If applicable, the Funds will recognize interest accrued related to unrecognized tax benefits in interest expense and penalties in “Other” expenses on the Statements of Operations. The Funds file tax returns with U.S. Internal Revenue Service, the state of New York, and various other states. Generally, each of the tax years in the four year period ended March 31, 2011, remains subject to examination by taxing authorities.
7. OTHER AFFILIATED PARTIES AND TRANSACTIONS
Affiliated holdings are funds which are managed by the Trust or an affiliate of the Trust. Transactions with affiliated companies during the fiscal year ended March 31, 2011 are as follows:
| | | | | | | | | | | | | | | | | | | | |
| Affiliated Fund Name | | Value at
3/31/2010 | | | Purchases/
Additions | | | Sales/
Reductions | | | Value at
3/31/2011 | | | Dividend
Income | |
Total Earnings Fund | | | | | | | | | | | | | | | | | | | | |
WisdomTree LargeCap Dividend Fund | | $ | — | | | $ | 687,644 | | | $ | 750,655 | | | $ | — | | | $ | 8,453 | |
LargeCap Growth Fund | | | — | | | | 542,588 | | | | 158,704 | | | | 392,157 | | | | 379 | |
Total | | $ | — | | | $ | 1,230,232 | | | $ | 909,359 | | | $ | 392,157 | | | $ | 8,832 | |
Earnings 500 Fund | | | | | | | | | | | | | | | | | | | | |
WisdomTree Equity Income Fund | | $ | — | | | $ | 591,457 | | | $ | 256,814 | | | $ | 344,576 | | | $ | 3,734 | |
WisdomTree LargeCap Dividend Fund | | | — | | | | 1,130,649 | | | | 1,162,703 | | | | — | | | | 6,441 | |
Total | | $ | — | | | $ | 1,722,106 | | | $ | 1,419,517 | | | $ | 344,576 | | | $ | 10,175 | |
MidCap Earnings Fund | | | | | | | | | | | | | | | | | | | | |
WisdomTree MidCap Dividend Fund | | $ | — | | | $ | 1,372,254 | | | $ | 917,496 | | | $ | 557,285 | | | $ | 15,493 | |
| | | | |
| WisdomTree Domestic and International Earnings Funds | | | 81 | |
Notes to Financial Statements (concluded)
| | | | | | | | | | | | | | | | | | | | |
| Affiliated Fund Name | | Value at
3/31/2010 | | | Purchases/
Additions | | | Sales/
Reductions | | | Value at
3/31/2011 | | | Dividend
Income | |
SmallCap Earnings Fund | | | | | | | | | | | | | | | | | | | | |
MidCap Earnings Fund | | $ | — | | | $ | 1,115,196 | | | $ | 305,775 | | | $ | 843,454 | | | $ | 1,270 | |
WisdomTree SmallCap Dividend Fund | | | — | | | | 1,281,028 | | | | 1,340,815 | | | | — | | | | 15,130 | |
Total | | $ | — | | | $ | 2,396,224 | | | $ | 1,646,590 | | | $ | 843,454 | | | $ | 16,400 | |
LargeCap Value Fund | | | | | | | | | | | | | | | | | | | | |
WisdomTree LargeCap Dividend Fund | | $ | — | | | $ | 356,452 | | | $ | 150,412 | | | $ | 222,272 | | | $ | 2,908 | |
WisdomTree MidCap Dividend Fund | | | — | | | | 152,626 | | | | 65,285 | | | | 95,994 | | | | 1,270 | |
Total | | $ | — | | | $ | 509,078 | | | $ | 215,697 | | | $ | 318,266 | | | $ | 4,178 | |
LargeCap Growth Fund | | | | | | | | | | | | | | | | | | | | |
Earnings 500 Fund | | $ | — | | | $ | 429,167 | | | $ | 211,272 | | | $ | 245,226 | | | $ | 3,460 | |
8. SUBSEQUENT EVENT
Effective June 17, 2011, the Wisdomtree Funds listed in the table below will change their investment objective, strategies and fund names. Certain WisdomTree Funds listed below are not part of this Report but are part of the forty-six funds that comprise the Trust.
| | | | | | |
| Ticker | | Former Fund Name | | New Fund Name | | Primary Change |
DRW | | WisdomTree International Real Estate Fund | | WisdomTree Global ex-U.S. Real Estate Fund | | Broader, global real estate exposure with addition of emerging markets. |
DBU | | WisdomTree International Utilities Sector Fund | | WisdomTree Global ex-U.S. Utility Fund | | Broader, global utilities exposure with addition of emerging markets. |
DBN | | WisdomTree International Basic Materials Sector Fund | | WisdomTree Commodity Country Equity Fund | | More diversified commodity-focused equity strategy; adds emerging markets. |
DKA | | WisdomTree International Energy Sector Fund | | WisdomTree Global Natural Resources Fund | | More diversified energy/natural resources-focused equity strategy; adds emerging markets. |
DND | | WisdomTree Pacific ex-Japan Total Dividend Fund | | WisdomTree Asia Pacific ex-Japan Fund | | Expand portfolio to become a broader Asia-Pacific regional strategy; adds emerging markets. |
DNH | | WisdomTree Pacific ex-Japan Equity Income Fund | | WisdomTree Australia Dividend Fund | | Expand majority Australia portfolio weight to pure Australia dividend strategy. |
DNL | | WisdomTree World ex-U.S. Growth Fund | | WisdomTree Global ex-U.S. Growth Fund | | Name change only. |
The WisdomTree Dreyfus Euro Fund and the WisdomTree Dreyfus New Zealand Dollar Fund will change their investment objective, strategies and fund names as indicated table below, effective on or after June 27, 2011, and August 26, 2011, respectively.
| | | | | | |
| Ticker | | Former Fund Name | | New Fund Name | | Primary Change/Enhancement |
EU | | WisdomTree Dreyfus Euro Fund | | WisdomTree Dreyfus Euro Debt Fund | | Restructured to provide exposure to debt of issuers in the European Union denominated in Euros. Extend duration to achieve intermediate-term European bond strategy. |
BNZ | | WisdomTree Dreyfus New Zealand Dollar Fund | | WisdomTree Dreyfus Australia & New Zealand Debt Fund | | Restructured to provide exposure to Australia & New Zealand debt denominated in their respective currencies. Extend duration to achieve intermediate-term Australia/ New Zealand bond strategy. |
| | |
| 82 | | WisdomTree Domestic and International Earnings Funds |
Report of Independent Registered Public Accounting Firm
The Board of Trustees and Shareholders of WisdomTree Trust:
We have audited the accompanying statements of assets and liabilities, including the schedules of investments, of WisdomTree Total Earnings Fund, WisdomTree Earnings 500 Fund, WisdomTree MidCap Earnings Fund, WisdomTree SmallCap Earnings Fund, WisdomTree LargeCap Value Fund, WisdomTree LargeCap Growth Fund and WisdomTree India Earnings Fund (seven of the investment funds constituting the WisdomTree Trust (the “Trust”)) as of March 31, 2011, and the related statements of operations, the changes in net assets and the financial highlights for each of the periods indicated therein. These financial statements and financial highlights are the responsibility of the Trust’s management. Our responsibility is to express an opinion on these financial statements and financial highlights based on our audits.
We conducted our audits in accordance with the standards of the Public Company Accounting Oversight Board (United States). Those standards require that we plan and perform the audit to obtain reasonable assurance about whether the financial statements and financial highlights are free of material misstatement. We were not engaged to perform an audit of the Trust’s internal control over financial reporting. Our audits included consideration of internal control over financial reporting as a basis for designing audit procedures that are appropriate in the circumstances, but not for the purpose of expressing an opinion on the effectiveness of the Trust’s internal control over financial reporting. Accordingly, we express no such opinion. An audit also includes examining, on a test basis, evidence supporting the amounts and disclosures in the financial statements and financial highlights, assessing the accounting principles used and significant estimates made by management, and evaluating the overall financial statement presentation. Our procedures included confirmation of securities owned as of March 31, 2011, by correspondence with the custodian and brokers or by other appropriate auditing procedures where replies from brokers were not received. We believe that our audits provide a reasonable basis for our opinion.
In our opinion, the financial statements and financial highlights referred to above present fairly, in all material respects, the financial position of WisdomTree Total Earnings Fund, WisdomTree Earnings 500 Fund, WisdomTree MidCap Earnings Fund, WisdomTree SmallCap Earnings Fund, WisdomTree LargeCap Value Fund, WisdomTree LargeCap Growth Fund, and WisdomTree India Earnings Fund of WisdomTree Trust at March 31, 2011, the results of their operations, the changes in their net assets and the financial highlights for each of the indicated periods, in conformity with U.S. generally accepted accounting principles.

New York, New York
May 26, 2011
| | | | |
| WisdomTree Domestic and International Earnings Funds | | | 83 | |
Approval of Investment Advisory and Sub-Advisory Agreement (unaudited)
Approval of Investment Advisory Agreement. The Trust and the Investment Adviser have entered into an investment advisory agreement covering each Fund discussed herein. At a meeting held on March 16, 2011, the Board of Trustees re-approved the Investment Advisory Agreement for each Fund. The Board reviewed and analyzed the factors it deemed relevant, including: (i) the nature, quality and extent of the services to be provided to the Funds by WTAM; (ii) the performance of the Funds; (iii) the costs of services to be provided and the profits to be realized by WTAM from its relationship with the Funds; (iv) the extent to which economies of scale would be realized as the Funds grow; (v) whether the fee levels reflect these economies of scale for the benefit of investors; and(vi) the fees charged by the Investment Adviser for non-registered funds.
The Board also considered the nature and quality of the services to be provided by WTAM to the Funds, recognizing WTAM’s operational capabilities and resources. The Board also noted the extensive responsibilities that WTAM has as investment adviser to the Funds, including the selection of the Funds’ Sub-Advisers and oversight of the Sub-Advisers’ compliance with Fund policies and objectives, oversight of general Fund compliance with federal and state laws, and the implementation of Board directives as they relate to the Funds.
The Board gave substantial consideration to the fees payable under the Advisory Agreement. In this connection, the Board evaluated WTAM’s anticipated costs and profitability in serving as investment adviser to the Funds, including the costs associated with the personnel, systems and equipment necessary to manage the Funds and the costs associated with compensating the Sub-Adviser. The Board also examined the fees to be paid by each Fund in light of fees paid to other investment managers by comparable funds and the method of computing each Fund’s fee. After comparing the fees with those of comparable funds and in light of the quality and extent of services to be provided and the costs anticipated to be incurred by WTAM, the Board concluded that the level of the fees paid to WTAM with respect to each Fund is fair and reasonable. The Board also re-approved the Sub-Advisory Agreement between WTAM and Mellon Capital Management (“MCM”), on behalf of each Fund, using essentially the same criteria it used in connection with the Advisory Agreement. The Board considered MCM’s operational capabilities and resources and MCM’s experience in serving as an adviser to ETFs, noting that MCM currently provides investment advisory and management services to other ETFs. The Board considered the investment performance of the Funds, and the expertise and performance of the MCM personnel. The Board also noted that Bank of New York Mellon Corporation, an affiliate of MCM, serves as the Funds’ administrator, accountant, custodian, transfer agent and securities lending agent and receives compensation for acting in these capacities and is responsible for, among other things, coordinating the Funds’ audits, financial statements and tax returns, managing expenses and budgeting for the Funds, processing trades on behalf of each Fund and custodying Fund assets. As such, the Board concluded that the benefits accruing to MCM and its affiliates by virtue of their relationship to the Trust are reasonable and fair in comparison with the anticipated costs of providing the relevant services. The Board noted that WTAM, not the Funds, pays the fees to MCM under the Sub-Advisory Agreement for each Fund.
Based on these considerations and the overall high quality of the personnel, operations, financial condition, investment advisory capabilities, methodologies, and performance of WTAM and MCM, the Board determined that the re-approval of the Advisory Agreements and the Sub-Advisory Agreements was in the best interests of each Fund. After full consideration of these and other factors, the Board, including a majority of the Independent Trustees, with the assistance of independent counsel, approved the Advisory Agreements and Sub-Advisory Agreements.
| | |
| 84 | | WisdomTree Domestic and International Earnings Funds |
Frequency Distribution of Discounts & Premiums (unaudited)
The chart below presents information about differences between the per share net asset value (“NAV”) of each Fund and the market trading price of shares of each Fund. For these purposes, the “market price” is the mid-point of the highest bid and lowest offer for Fund shares as of the close of trading on the exchange where Fund shares are listed. The term “premium” is sometimes used to describe a market price in excess of NAV and the term “discount” is sometimes used to describe a market price below NAV. The chart presents information about the size and frequency of premiums or discounts. As with other exchange traded funds, the market price of Fund shares is typically slightly higher or lower than the Fund’s per share NAV. Factors that contribute to the differences between market price and NAV include the supply and demand for Fund shares and investors’ assessments of the underlying value of a Fund’s portfolio securities.
Differences between the closing times of U.S. and non-U.S. markets may contribute to differences between the NAV and market price of Fund shares. Many non-U.S. markets close prior to the close of the U.S. securities exchanges. Developments after the close of such markets as a result of ongoing price discovery may be reflected in a Fund’s market price but not in its NAV (or vice versa).
| | | | | | | | | | | | | | | | | | | | |
| | | | | | Market Price Above or
Equal to Net Asset Value | | | Market Price Below
Net Asset Value | |
| | | Basis Point
Differential | | | Number
of Days | | | Percentage of
Total Days | | | Number
of Days | | | Percentage
of Total Days | |
WisdomTree Total Earnings Fund | | | | | | | | | | | | | | | | | | | | |
February 23, 2007 – March 31, 2011 | | | 0 – 24.9 | | | | 443 | | | | 40.43 | % | | | 587 | | | | 53.56 | % |
| | | 25 – 49.9 | | | | 17 | | | | 1.55 | % | | | 27 | | | | 2.46 | % |
| | | 50 – 74.9 | | | | 3 | | | | 0.27 | % | | | 7 | | | | 0.64 | % |
| | | 75 – 99.9 | | | | 5 | | | | 0.46 | % | | | 0 | | | | 0.00 | % |
| | | 100 – 124.9 | | | | 0 | | | | 0.00 | % | | | 1 | | | | 0.09 | % |
| | | 125 – 174.9 | | | | 0 | | | | 0.00 | % | | | 0 | | | | 0.00 | % |
| | | 175 – 199.9 | | | | 0 | | | | 0.00 | % | | | 0 | | | | 0.00 | % |
| | | 200 – 249.9 | | | | 0 | | | | 0.00 | % | | | 1 | | | | 0.09 | % |
| | | >250 | | | | 4 | | | | 0.36 | % | | | 1 | | | | 0.09 | % |
| | | | Total | | | | 472 | | | | 43.07 | % | | | 624 | | | | 56.93 | % |
WisdomTree Earnings 500 Fund | | | | | | | | | | | | | | | | | | | | |
February 23, 2007 – March 31, 2011 | | | 0 – 24.9 | | | | 415 | | | | 37.87 | % | | | 600 | | | | 54.75 | % |
| | | 25 – 49.9 | | | | 19 | | | | 1.73 | % | | | 38 | | | | 3.47 | % |
| | | 50 – 74.9 | | | | 3 | | | | 0.27 | % | | | 6 | | | | 0.55 | % |
| | | 75 – 99.9 | | | | 5 | | | | 0.46 | % | | | 4 | | | | 0.36 | % |
| | | 100 – 124.9 | | | | 3 | | | | 0.27 | % | | | 0 | | | | 0.00 | % |
| | | 125 – 174.9 | | | | 1 | | | | 0.09 | % | | | 1 | | | | 0.09 | % |
| | | 175 – 199.9 | | | | 0 | | | | 0.00 | % | | | 0 | | | | 0.00 | % |
| | | 200 – 249.9 | | | | 0 | | | | 0.00 | % | | | 0 | | | | 0.00 | % |
| | | >250 | | | | 1 | | | | 0.09 | % | | | 0 | | | | 0.00 | % |
| | | | Total | | | | 447 | | | | 40.78 | % | | | 649 | | | | 59.22 | % |
WisdomTree MidCap Earnings Fund | | | | | | | | | | | | | | | | | | | | |
February 23, 2007 – March 31, 2011 | | | 0 – 24.9 | | | | 552 | | | | 50.37 | % | | | 450 | | | | 41.06 | % |
| | | 25 – 49.9 | | | | 22 | | | | 2.01 | % | | | 38 | | | | 3.47 | % |
| | | 50 – 74.9 | | | | 6 | | | | 0.55 | % | | | 13 | | | | 1.19 | % |
| | | 75 – 99.9 | | | | 4 | | | | 0.36 | % | | | 1 | | | | 0.09 | % |
| | | 100 – 124.9 | | | | 2 | | | | 0.18 | % | | | 3 | | | | 0.27 | % |
| | | 125 – 174.9 | | | | 1 | | | | 0.09 | % | | | 2 | | | | 0.18 | % |
| | | 175 – 199.9 | | | | 0 | | | | 0.00 | % | | | 0 | | | | 0.00 | % |
| | | 200 – 249.9 | | | | 0 | | | | 0.00 | % | | | 1 | | | | 0.09 | % |
| | | >250 | | | | 0 | | | | 0.00 | % | | | 1 | | | | 0.09 | % |
| | | | Total | | | | 587 | | | | 53.56 | % | | | 509 | | | | 46.44 | % |
WisdomTree SmallCap Earnings Fund | | | | | | | | | | | | | | | | | | | | |
February 23, 2007 – March 31, 2011 | | | 0 – 24.9 | | | | 533 | | | | 48.64 | % | | | 295 | | | | 26.92 | % |
| | | 25 – 49.9 | | | | 71 | | | | 6.48 | % | | | 48 | | | | 4.38 | % |
| | | 50 – 74.9 | | | | 13 | | | | 1.19 | % | | | 8 | | | | 0.73 | % |
| | | 75 – 99.9 | | | | 3 | | | | 0.27 | % | | | 1 | | | | 0.09 | % |
| | | 100 – 124.9 | | | | 4 | | | | 0.36 | % | | | 110 | | | | 10.04 | % |
| | | 125 – 174.9 | | | | 1 | | | | 0.09 | % | | | 2 | | | | 0.18 | % |
| | | 175 – 199.9 | | | | 1 | | | | 0.09 | % | | | 1 | | | | 0.09 | % |
| | | 200 – 249.9 | | | | 2 | | | | 0.18 | % | | | 0 | | | | 0.00 | % |
| | | >250 | | | | 2 | | | | 0.18 | % | | | 1 | | | | 0.09 | % |
| | | | Total | | | | 630 | | | | 57.48 | % | | | 466 | | | | 42.52 | % |
| | | | |
| WisdomTree Domestic and International Earnings Funds | | | 85 | |
Frequency Distribution of Discounts & Premiums (unaudited) (concluded)
| | | | | | | | | | | | | | | | | | | | |
| | | | | | Market Price Above or
Equal to Net Asset Value | | | Market Price Below
Net Asset Value | |
| | | Basis Point
Differential | | | Number
of Days | | | Percentage of
Total Days | | | Number
of Days | | | Percentage
of Total Days | |
WisdomTree LargeCap Value Fund | | | | | | | | | | | | | | | | | | | | |
February 23, 2007 – March 31, 2011 | | | 0 – 24.9 | | | | 394 | | | | 35.95 | % | | | 602 | | | | 54.94 | % |
| | | 25 – 49.9 | | | | 18 | | | | 1.64 | % | | | 31 | | | | 2.83 | % |
| | | 50 – 74.9 | | | | 10 | | | | 0.91 | % | | | 7 | | | | 0.64 | % |
| | | 75 – 99.9 | | | | 9 | | | | 0.82 | % | | | 4 | | | | 0.36 | % |
| | | 100 – 124.9 | | | | 5 | | | | 0.46 | % | | | 2 | | | | 0.18 | % |
| | | 125 – 174.9 | | | | 2 | | | | 0.18 | % | | | 2 | | | | 0.18 | % |
| | | 175 – 199.9 | | | | 1 | | | | 0.09 | % | | | 0 | | | | 0.00 | % |
| | | 200 – 249.9 | | | | 2 | | | | 0.18 | % | | | 0 | | | | 0.00 | % |
| | | >250 | | | | 6 | | | | 0.55 | % | | | 1 | | | | 0.09 | % |
| | | | Total | | | | 447 | | | | 40.78 | % | | | 649 | | | | 59.22 | % |
WisdomTree LargeCap Growth Fund | | | | | | | | | | | | | | | | | | | | |
December 4, 2008 – March 31, 2011 | | | 0 – 24.9 | | | | 338 | | | | 52.32 | % | | | 286 | | | | 44.29 | % |
| | | 25 – 49.9 | | | | 9 | | | | 1.39 | % | | | 7 | | | | 1.08 | % |
| | | 50 – 74.9 | | | | 0 | | | | 0.00 | % | | | 1 | | | | 0.15 | % |
| | | 75 – 99.9 | | | | 4 | | | | 0.62 | % | | | 0 | | | | 0.00 | % |
| | | 100 – 124.9 | | | | 0 | | | | 0.00 | % | | | 0 | | | | 0.00 | % |
| | | 125 – 174.9 | | | | 0 | | | | 0.00 | % | | | 1 | | | | 0.15 | % |
| | | 175 – 199.9 | | | | 0 | | | | 0.00 | % | | | 0 | | | | 0.00 | % |
| | | 200 – 249.9 | | | | 0 | | | | 0.00 | % | | | 0 | | | | 0.00 | % |
| | | >250 | | | | 0 | | | | 0.00 | % | | | 0 | | | | 0.00 | % |
| | | | Total | | | | 351 | | | | 54.33 | % | | | 295 | | | | 45.67 | % |
WisdomTree India Earnings Fund | | | | | | | | | | | | | | | | | | | | |
February 22, 2008 – March 31, 2011 | | | 0 – 24.9 | | | | 56 | | | | 6.62 | % | | | 64 | | | | 7.57 | % |
| | | 25 – 49.9 | | | | 74 | | | | 8.76 | % | | | 55 | | | | 6.51 | % |
| | | 50 – 74.9 | | | | 83 | | | | 9.82 | % | | | 43 | | | | 5.09 | % |
| | | 75 – 99.9 | | | | 67 | | | | 7.93 | % | | | 34 | | | | 4.02 | % |
| | | 100 – 124.9 | | | | 66 | | | | 7.81 | % | | | 29 | | | | 3.43 | % |
| | | 125 – 174.9 | | | | 56 | | | | 6.63 | % | | | 38 | | | | 4.50 | % |
| | | 175 – 199.9 | | | | 27 | | | | 3.20 | % | | | 20 | | | | 2.37 | % |
| | | 200 – 249.9 | | | | 32 | | | | 3.79 | % | | | 24 | | | | 2.84 | % |
| | | >250 | | | | 42 | | | | 4.97 | % | | | 35 | | | | 4.14 | % |
| | | | Total | | | | 503 | | | | 59.53 | % | | | 342 | | | | 40.47 | % |
| | |
| 86 | | WisdomTree Domestic and International Earnings Funds |
Trustee and Officer Information (unaudited)
The Board of Trustees has responsibility for the overall management and operations of the Funds, including general supervision of the duties performed by WisdomTree Asset Management and other service providers. The Board of Trustees elects the officers of the Trust who are responsible for administering the Trust’s day-to-day operations. Each Trustee serves until his or her successor is duly elected or appointed and qualified.
The address of each Trustee and Officer is c/o WisdomTree Asset Management, Inc., 380 Madison Avenue, 21st Floor, New York, NY 10017.
Interested Trustee and Officers
| | | | | | | | | | | | |
Name (year of birth) | | Position | | Term of Office
and Length of
Time Served | | Principal Occupation(s) During the Past 5 Years | | Number of Portfolios
in Fund Complex
Overseen by
Trustee/Officer+ | | | Other Directorships Held by
Trustee/Officer |
Jonathan Steinberg (1964) | | Trustee, President* | | Trustee and Officer since 2005 | | President, WisdomTree Trust since 2005; Chief Executive Officer of WisdomTree Investments, Inc. and Director of WisdomTree Investments, Inc. since 1989. | | | 46 | | | None. |
| | | | | |
Amit Muni (1969) | | Treasurer,* Assistant Secretary* | | Officer since 2008 | | Chief Financial Officer and Assistant Secretary of WisdomTree Investments, Inc. since March 2008; International Securities Exchange Holdings, Inc. (ISE), Controller and Chief Accounting Officer from 2003 to 2008; Instinet Group Inc., Vice President Finance 2000 to 2003 | | | 46 | | | None. |
| | | | | |
Richard Morris (1967) | | Secretary,* Chief Legal Officer* | | Officer since 2005 | | General Counsel of WisdomTree Asset Management since 2009; Chief Compliance Officer of the Trust since 2009; Deputy Counsel of WisdomTree Investments, Inc. since 2005; Senior Counsel at Barclays Global Investors, N.A. from 2002 to 2005; Counsel at Barclays Global Investors, N.A. from 2000 to 2001. | | | 46 | | | None. |
| * | Elected by and serves at the pleasure of the Board of Trustees. |
| | | | |
| WisdomTree Domestic and International Earnings Funds | | | 87 | |
Trustee and Officer Information (unaudited) (concluded)
Independent Trustees
| | | | | | | | | | | | |
Name (year of birth) | | Position | | Term of Office
and Length of
Time Served | | Principal Occupation(s) During the Past 5 Years | | Number of Portfolios
in Fund Complex
Overseen by
Trustee+ | | | Other
Directorships Held by Trustee |
Gregory Barton (1961)* | | Trustee | | Trustee since 2006 | | Executive Vice President of Legal and Business Affairs, General Counsel and Secretary of TheStreet.com, 2009 to present; General Counsel of Martha Stewart Living Omnimedia, Inc. from 2007 to 2008; Executive Vice President of Licensing and Legal Affairs, General Counsel and Secretary of Ziff Davis Media Inc. from 2004 to 2007; Executive Vice President of Legal Affairs, General Counsel and Secretary of Ziff Davis Media Inc. from 2002 to 2004; President from 2001 to 2002, Chief Financial Officer from 2000 to 2002, Vice President of Business Development from 1999 to 2001 and General Counsel and Secretary from 1998 to 2002 of WisdomTree Investments, Inc. | | | 46 | | | Trustee, GLG Investment Series Trust. |
| | | | | |
Toni Massaro (1955)** | | Trustee | | Trustee since 2006 | | Dean Emerita at University of Arizona James E. Rogers College of Law (“Rogers College of Law”) since 2009; Dean at the Rogers College of Law from 1999 to 2009; Regents’ Professor since 2006; Milton O. Riepe Chair in Constitutional Law since 1997; Professor at the Rogers College of Law since 1990. | | | 46 | | | None. |
| | | | | |
Victor Ugolyn (1947) | | Trustee, Chairman of the Board of Trustees | | Trustee since 2006 | | Private Investor - 2005 to Present; President and Chief Executive Officer of William D. Witter, Inc. from 2005 to 2006; Consultant to AXA Enterprise in 2004; Chairman, President and Chief Executive Officer of Enterprise Capital Management (subsidiary of The MONY Group, Inc.) and Enterprise Group of Funds, Chairman of MONY Securities Corporation, and Chairman of the Fund Board of Enterprise Group of Funds 1991 to 2004. | | | 46 | | | Member of the Board of New York Society of Security Analysts; Member of the Board of Governors of Naismith Memorial Basketball Hall of Fame; Member of the Board of Overseers of Stanford University’s Hoover Institution. |
| * | Chair of the Audit Committee. |
| ** | Chair of the Governance and Nominating Committee. |
| | |
| 88 | | WisdomTree Domestic and International Earnings Funds |
Supplemental Information (unaudited)
Federal Income Tax Information
The following Federal tax information related to the Funds fiscal year ended March 31, 2011, is provided for information purposes only and should not be used for reporting to federal or state revenue agencies. Federal tax information for the calendar year will be reported to you on Form 1099-DIV in January 2012.
Certain dividends paid by the Funds may be subject to a maximum tax rate of 15%, as provided by the Jobs and Growth Tax Relief Reconciliation Act of 2003. Of the distributions paid during the fiscal year ended March 31, 2011, the following represents the maximum amount of ordinary income distributions that may be considered qualified dividend income:
| | | | |
| Fund | | Qualified Dividend
Income | |
Total Earnings Fund | | $ | 1,089,971 | |
Earnings 500 Fund | | | 1,558,280 | |
MidCap Earnings Fund | | | 1,056,746 | |
SmallCap Earnings Fund | | | 1,219,165 | |
LargeCap Value Fund | | | 485,222 | |
LargeCap Growth Fund | | | 168,477 | |
India Earnings Fund | | | 5,249,186 | |
The following represents the percentage of dividends paid during the fiscal year ended March 31, 2011, that qualify for the 70% dividends received deduction for corporate shareholders:
| | | | |
| Fund | | Dividends-Received
Deduction | |
Total Earnings Fund | | | 100 | % |
Earnings 500 Fund | | | 100 | |
MidCap Earnings Fund | | | 78 | |
SmallCap Earnings Fund | | | 76 | |
LargeCap Value Fund | | | 100 | |
LargeCap Growth Fund | | | 86 | |
India Earnings Fund | | | | |
The Funds intend to elect to pass through to shareholders the credit for taxes paid to foreign countries. The gross foreign source income and foreign taxes paid are as follows:
| | | | | | | | |
| Fund | | Gross Foreign
Income | | | Foreign
Taxes Paid | |
Total Earnings Fund | | $ | — | | | $ | — | |
Earnings 500 Fund | | | — | | | | — | |
MidCap Earnings Fund | | | — | | | | — | |
SmallCap Earnings Fund | | | — | | | | — | |
LargeCap Value Fund | | | — | | | | — | |
LargeCap Growth Fund | | | — | | | | — | |
India Earnings Fund | | | 16,033,846 | | | | 483,187 | |
| | | | |
| WisdomTree Domestic and International Earnings Funds | | | 89 | |
General Information (unaudited)
Proxy Voting Policies, Procedures and Record
A complete copy of the Proxy Voting Policy may be obtained by calling 866-909-9473; or writing to: WisdomTree Trust, c/o ALPS Distributors, Inc., 1290 Broadway, Suite 1100, Denver, Colorado 80203.
The Trust is required to disclose annually the Funds’ complete proxy voting record on Form N-PX covering the most recent 12-month period ended June 30 and to file Form N-PX with the Securities and Exchange Commission (“SEC”) no later than August 31 of each year. The current Form N-PX for the Funds is available at no charge upon request by calling 866-909-9473 or through the Trust’s website at www.wisdomtree.com. The Funds’ Form N-PX is also available on the SEC’s website at www.sec.gov.
Shareholder Reports and Quarterly Portfolio Disclosure
The Funds are required to file their complete schedule of portfolio holdings with the SEC for their first and third fiscal quarters on Form N-Q. Copies of the filings are available, without charge, upon request on the SEC’s website at www.sec.gov and are also available by calling the Trust at 1-866-909-WISE. You can also obtain copies of Form N-Q by (i) visiting the SEC’s Public Reference Room in Washington, DC (information on the operation of the Public Reference Room may be obtained by calling 1-800-SEC-0330); (ii) sending your request and a duplicating fee to the SEC’s Public Reference Room, Washington, DC 20549-0102; or (iii) sending your request electronically to publicinfosec.gov.
Information about each Fund’s portfolio holdings is available daily, without charge, at www.wisdomtree.com.
The Fund’s Statement of Additional Information (“SAI”) has additional information about the Funds’ Trustees and Officers and is available without charge upon request. Contact your financial representative for a free prospectus or SAI.
| | |
| 90 | | WisdomTree Domestic and International Earnings Funds |
The WisdomTree Family of Funds
The following is a list of WisdomTree Funds being offered, along with their respective ticker symbols as of March 31, 2011:
| | |
WisdomTree Domestic Dividend Funds WisdomTree Total Dividend Fund (DTD) WisdomTree Equity Income Fund (DHS) WisdomTree LargeCap Dividend Fund (DLN) WisdomTree Dividend ex-Financials Fund (DTN) WisdomTree MidCap Dividend Fund (DON) WisdomTree SmallCap Dividend Fund (DES) WisdomTree International Dividend Funds WisdomTree DEFA Fund (DWM) WisdomTree DEFA Equity Income Fund (DTH) WisdomTree Global Equity Income Fund (DEW) WisdomTree Europe SmallCap Dividend Fund (DFE) WisdomTree Japan Hedged Equity Fund (DXJ) WisdomTree World ex-U.S. Growth Fund (DNL) WisdomTree Japan SmallCap Dividend Fund (DFJ) WisdomTree Pacific ex-Japan Total Dividend Fund (DND) WisdomTree Pacific ex-Japan Equity Income Fund (DNH) WisdomTree International LargeCap Dividend Fund (DOL) WisdomTree International Dividend ex-Financials Fund (DOO) WisdomTree International MidCap Dividend Fund (DIM) WisdomTree International SmallCap Dividend Fund (DLS) WisdomTree Emerging Markets Equity Income Fund (DEM) WisdomTree Emerging Markets SmallCap Dividend Fund (DGS) WisdomTree Middle East Dividend Fund (GULF) WisdomTree International Hedged Equity Fund (HEDJ) WisdomTree International Dividend Sector Funds WisdomTree International Basic Materials Sector Fund (DBN) WisdomTree International Energy Sector Fund (DKA) WisdomTree International Utilities Sector Fund (DBU) WisdomTree International Real Estate Fund (DRW) | | WisdomTree Domestic and International Earnings Funds WisdomTree Total Earnings Fund (EXT) WisdomTree Earnings 500 Fund (EPS) WisdomTree MidCap Earnings Fund (EZM) WisdomTree SmallCap Earnings Fund (EES) WisdomTree LargeCap Value Fund (EZY) WisdomTree LargeCap Growth Fund (ROI) WisdomTree India Earnings Fund (EPI) WisdomTree Currency Income Funds WisdomTree Dreyfus Brazilian Real Fund (BZF) WisdomTree Dreyfus Chinese Yuan Fund (CYB) WisdomTree Dreyfus Commodity Currency Fund (CCX) WisdomTree Dreyfus Emerging Currency Fund (CEW) WisdomTree Dreyfus Euro Fund (EU) WisdomTree Dreyfus Indian Rupee Fund (ICN) WisdomTree Dreyfus Japanese Yen Fund (JYF) WisdomTree Dreyfus New Zealand Dollar Fund (BNZ) WisdomTree Dreyfus South African Rand Fund (SZR) WisdomTree Fixed Income Funds WisdomTree Emerging Markets Local Debt Fund (ELD) WisdomTree Asia Local Debt Fund (ALD) WisdomTree Alternative Fund WisdomTree Managed Futures Strategy Fund (WDTI) |
The WisdomTree Funds are exchange traded funds (“ETFs”) registered with the United States Securities and Exchange Commission as series of WisdomTree Trust (“Trust”). WisdomTree Asset Management, Inc., a wholly owned subsidiary of WisdomTree investments, Inc., serves as the investment adviser to the WisdomTree Trust. None of the WisdomTree entities are affiliated with ALPS Distributors, Inc., the Funds’ distributor. WisdomTree Investments, its affiliates and their independent providers are not liable for any informational errors, incompleteness, or delays, or for any actions taken in reliance on information contained herein
Investors should consider the investment objectives, risks, charges and expenses of the Funds carefully before investing. A prospectus, containing this and other information, is available at www.wisdomtree.com, or by calling 1-866-909-WISE (9473). Investors should read the prospectus carefully before investing. There are risks associated with investing, including possible loss of principal. Past performance does not guarantee future results. Indexes are unmanaged and you can not invest directly in an index.
There are risks associated with investing including possible loss of principal. Foreign investing involves special risks, such as risk of loss from currency fluctuation or political or economic uncertainty. Investments in real estate involve additional special risks, such as credit risk, interest rate fluctuations and the effect of varied economic conditions. Funds that focus its investments in one country increase the impact of events and developments associated with the region which can adversely affect performance. Funds focusing on a single sector and/or smaller companies generally experience greater price volatility.
Investments in emerging, offshore or frontier markets are generally less liquid and less efficient than developed markets and are subject to additional risks, such as of adverse governmental regulation and intervention or political developments. Investments in currency involve additional special risks, such as credit risk and interest rate fluctuations. Derivative investments can be volatile and may be less liquid than other securities and more sensitive to the effect of varied economic conditions. As these Funds can have a high concentration in some issuers, the Funds can be adversely impacted by changes affecting such issuers.
Fixed income investments are subject to interest rate risk; their value will normally decline as interest rates rise. In addition when interest rates fall income may decline. Fixed income investments are also subject to credit risk, the risk that the issuer of a bond will fail to pay interest and principal in a timely manner, or that negative perceptions of the issuer’s ability to make such payments will cause the price of that bond to decline. Unlike typical exchange-traded funds, the Currency Funds, Fixed Income Funds and Alternative Funds do not attempt to track or replicate. Thus, the ability of these Funds to achieve their objectives will depend on the effectiveness of the portfolio manager. Please read each Funds prospectus for specific details regarding the Fund’s risk profile.
Transactions in Fund shares will result in brokerage commissions and will generate tax consequences. Shares may be sold through brokerage accounts, but may be redeemed from the Funds only in large amounts of 50,000 shares or more.
380 Madison Avenue, 21st Floor
New York, NY 10017
1.866.909.WISE (9473)

JOIN YOUR FELLOW WISDOMTREE INVESTORS
Help reduce impact to environment by going paperless
Sign up for eDelivery at www.wisdomtree.com
WisdomTree Earnings ETFs
WisdomTree Total Earnings Fund
WisdomTree Earnings 500 Fund
WisdomTree MidCap Earnings Fund
WisdomTree SmallCap Earnings Fund
WisdomTree LargeCap Value Fund
WisdomTree LargeCap Growth Fund
WisdomTree India Earnings Fund
WisdomTree Fund shares are distributed by ALPS Distributors, Inc.
WIS003265 (05/2012)

JOIN YOUR FELLOW WISDOMTREE INVESTORS
Help reduce impact to environment by going paperless
Sign up for eDelivery at www.wisdomtree.com
International Dividend and Sector Funds
Annual Report
March 31, 2011
WisdomTree DEFA Fund (DWM)
WisdomTree DEFA Equity Income Fund (DTH)
WisdomTree Global Equity Income Fund (DEW)
WisdomTree Europe SmallCap Dividend Fund (DFE)
WisdomTree Japan Hedged Equity Fund (DXJ)
WisdomTree World ex-U.S. Growth Fund (DNL)
WisdomTree Japan SmallCap Dividend Fund (DFJ)
WisdomTree Pacific ex-Japan Total Dividend Fund (DND)
WisdomTree Pacific ex-Japan Equity Income Fund (DNH)
WisdomTree International LargeCap Dividend Fund (DOL)
WisdomTree International Dividend ex-Financials Fund (DOO)
WisdomTree International MidCap Dividend Fund (DIM)
WisdomTree International SmallCap Dividend Fund (DLS)
WisdomTree Emerging Markets Equity Income Fund (DEM)
WisdomTree Emerging Markets SmallCap Dividend Fund (DGS)
WisdomTree Middle East Dividend Fund (GULF)
WisdomTree International Hedged Equity Fund (HEDJ)
WisdomTree International Basic Materials Sector Fund (DBN)
WisdomTree International Energy Sector Fund (DKA)
WisdomTree International Utilities Sector Fund (DBU)
WisdomTree International Real Estate Fund (DRW)
Table of Contents
“WisdomTree” is a registered mark of WisdomTree Investments, Inc. and is licensed for use by the Trust.
Management’s Discussion of Funds’ Performance
(unaudited)
International Dividend and Sector Funds
Market Environment Overview
The international equity markets, measured by the MSCI EAFE Index, a broad measure of equity performance for the developed world outside the U.S. and Canada, returned 10.42% in the 12-months that ended March, 31, 2011 (the “period). This marks a slowdown from the 12-month period ending March 31, 2010, where the MSCI EAFE Index returned 54.44%. Compared to peak levels reached in 2007, the MSCI EAFE Index is still down on a cumulative basis by nearly 1/3. Emerging Markets, shown through the MSCI Emerging Markets Index, continued to outpace the equity performance of the more developed economies during the period. The MSCI Emerging Markets Index returned 18.46% over the latest 1-year period, which was more than 8 percentage points ahead of the developed markets measured by the MSCI EAFE Index. On a global basis, the economy continues to improve. The expectations of improved earnings for international equities have supported the markets, especially within the emerging market countries.
For the year ended March 31, 2011, much of the performance from developed international equities came from currency gains. Measured in local currency, the MSCI EAFE Index returned just 1.49% over the period. The foreign currency component of the developed world returns added over 9 percentage points to the returns of the MSCI EAFE Index. Gains of currencies measured against the U.S dollar (“USD”) were as follows: Swiss Franc (+14.7%) Australia (+12.6%), Japanese Yen (+12.4%), British pound (+5.6%), and Euro (+4.9%). Strengthening currencies relative to the USD increases the value of non-U.S. investments measured in U.S. dollars and tends to magnify returns experienced by U.S. investors investing abroad. The WisdomTree International Hedged Equity Fund (HEDJ) attempts to eliminate non-U.S. currency exposure. The Fund’s returns were therefore lower than corresponding developed market funds that do not seek to hedge currency exposure.
WisdomTree’s international dividend weighted funds are designed to track indexes based on the dividend stream generated by the companies included in the index. The dividend stream is defined as the sum of all dividends paid over the prior 12-months for each company. There are two primary factors that drive performance differential versus market cap-weighted benchmarks. The first is aggregate exposure to one or more sectors or countries. The second is stock selection within each sector or country. Both of these are determined as part of WisdomTree’s rules-based index methodology. These exposures are not subjectively determined. Rather, they are objectively determined at the index rebalancing dates based on the dividend stream.
| | | | |
| WisdomTree International Dividend and Sector Funds | | | 1 | |
Management’s Discussion of Funds’ Performance
(unaudited) (continued)
WisdomTree Funds’ Performance Overview
The following table reflects the WisdomTree Fund performance versus capitalized weighted benchmark index.
| | | | | | | | | | | | |
| Ticker | | WisdomTree Fund | | 1 Year
Return | | Capitalization-Weighted
Benchmark Index | | 1 Year
Return | | | 1 Year
Return
Fund vs
Index |
DKA | | WT Intl Energy Sector Fund | | 24.74% | | S&P Developed Ex-U.S. BMI Energy Sector Index | | | 21.03% | | | 3.71% |
DGS | | WT EM SmallCap Dividend Fund | | 23.38% | | MSCI Emerging Markets Small Cap Index | | | 17.74% | | | 5.64% |
DFE | | WT Europe SmallCap Dividend Fund | | 21.86% | | MSCI Europe SmallCap Index | | | 23.75% | | | -1.89% |
DEM | | WT EM Equity Income Fund | | 20.75% | | MSCI Emerging Markets Index | | | 18.46% | | | 2.29% |
DRW | | WT Intl Real Estate Fund | | 18.81% | | DJ Global ex-U.S. Select RESI Index | | | 21.14% | | | -2.33% |
DBN | | WT Intl Basic Materials Sector Fund | | 17.31% | | S&P Developed Ex-U.S. BMI Materials Sector Index | | | 25.00% | | | -7.69% |
DLS | | WT Intl SmallCap Dividend Fund | | 16.64% | | MSCI EAFE Small Cap Index | | | 19.94% | | | -3.30% |
DND | | WT Pacific ex-Japan Total Div Fund | | 15.33% | | MSCI Pacific ex-Japan Index | | | 16.53% | | | -1.20% |
DOO | | WT Intl Dividend ex Financials Fund | | 14.93% | | MSCI EAFE Value Index | | | 8.21% | | | 6.72% |
DIM | | WT Intl MidCap Dividend Fund | | 14.38% | | MSCI EAFE Mid Cap Index | | | 15.41% | | | -1.03% |
DNH | | WT Pacific ex-Japan Equity Income Fund | | 14.03% | | MSCI Pacific ex-Japan Value Index | | | 16.63% | | | -2.60% |
DNL | | WT World ex-US Growth Fund | | 13.67% | | MSCI Japan Value/MSCI AC World ex-USA Growth Spliced Index** | | | 14.73% | | | -1.06% |
DEW | | WT Global Equity Income Fund | | 13.12% | | MSCI Europe Value/AC World Spliced Index* | | | 14.08% | | | -0.96% |
DWM | | WT DEFA Fund | | 11.33% | | MSCI EAFE Index | | | 10.42% | | | 0.91% |
DTH | | WT DEFA Equity Income Fund | | 9.74% | | MSCI EAFE Value Index | | | 8.21% | | | 1.53% |
DOL | | WT Intl LargeCap Dividend Fund | | 9.21% | | MSCI EAFE Index | | | 10.42% | | | -1.21% |
GULF | | WT MiddleEast Dividend Fund | | 7.95% | | MSCI Arabian Markets ex Saudi Arabia Index | | | 0.26% | | | 7.69% |
DFJ | | WT Japan SmallCap Dividend Fund | | 6.02% | | MSCI Japan Small Cap Index | | | 8.84% | | | -2.82% |
DBU | | WT Intl Utilities Sector Fund | | 4.27% | | S&P Developed Ex-U.S. BMI Utilities Sector Index | | | 0.75% | | | 3.52% |
HEDJ | | WT Intl Hedged Equity Fund | | 3.27% | | MSCI EAFE Local Currency Index | | | 1.49% | | | 1.78% |
DXJ | | WT Japan Hedged Equity Fund | | -11.25% | | MSCI Japan/Japan Local Currency Spliced Index*** | | | -10.52% | | | -0.73% |
As was the case in the previous economic recovery year, small caps continued to outperform large caps in the international equity markets and this was true across the board for WisdomTree’s small cap regional products. The WisdomTree International Small Cap Dividend Fund (DLS) outperformed the WisdomTree International LargeCap Dividend Fund (DOL) by over 7 percentage points. The second best performing international fund was the WisdomTree Emerging Markets SmallCap Dividend Fund (DGS), which outperformed our larger cap Emerging Markets Equity Income Fund (DEM).
Emerging markets continued to outperform developed markets during the period. The MSCI Emerging Markets Index outperformed the MSCI EAFE Index by about 804 basis points. Investors within both the WisdomTree Emerging Markets Equity Income Fund (DEM) and the WisdomTree Emerging Markets SmallCap Dividend Fund (DGS) were able to experience returns of over 20% for the period.
WisdomTree’s worst performing international fund over the period was the WisdomTree Japan Hedged Equity Fund (DXJ), which was the only international fund with a negative return. The Japanese equity markets lagged the broader international markets. The MSCI Japan Index returned 1.45% during the period, underperforming the MSCI EAFE Index
| | |
| 2 | | WisdomTree International Dividend and Sector Funds |
Management’s Discussion of Funds’ Performance
(unaudited) (concluded)
by nearly 900 basis points. But both of those indexes include exposure to currencies and DXJ hedges exposure to the Japanese yen, which had strong gains in the period. DXJ thus did not benefit from those gains in the yen. A catastrophic earthquake and tsunami also occurred during the last month of this period. This tragic event sent returns down further in March.
Certain international funds were hurt by geopolitical events in their regions. Notably, the WisdomTree Middle East Dividend Fund (GULF) was negatively impacted by regional instability during the first quarter of 2011. The political protests in Egypt, one of the countries included in GULF, shut Egypt’s equity markets for an extended period. It is worth noting that the Fund still returned 7.95% over the period while its market-cap weighted benchmark index, the MSCI Arabian Markets ex Saudi Arabia Index, returned 0.26%.
The turmoil in the Middle East contributed to a spike in oil prices, which was also reflected in WisdomTree’s best performing international fund, the WisdomTree International Energy Sector Fund (DKA). Three of WisdomTree’s four international sector funds outperformed the broad international markets: the International Real Estate Fund, International Basic Materials Fund, and International Energy Fund. Utilities continued to lag. On a macro level, utilities are less cyclical and therefore tend not to perform as strongly during global recoveries as some other sectors. We saw a similar dynamic in last year’s strong equity markets as well.
The views expressed in this report reflect those of WisdomTree Asset Management only through the end of the period of the report as stated on the cover. The portfolio managers’ views are subject to change at any time based on market and other conditions and should not be construed as a recommendation. Past performance is no guarantee of future results.
Fund returns are shown at NAV. Please see Performance Summaries on the subsequent pages for more complete performance information. Please see pages 27-29 for the list of index descriptions.
Fund performance assumes reinvestment of dividends and capital gain distributions. An index is a statistical measure of a specified financial market or sector. An index does not actually hold a portfolio of securities, incur expenses or pay any transaction costs. Therefore index returns do not reflect deductions for fees or expenses and are not available for direct investment. In comparison, the Funds’ performance is negatively impacted by these deductions. Fund returns do not reflect brokerage commissions or taxes on transactions in Fund shares or that a shareholder would pay on Fund distributions. Past performance is no guarantee of future results. For the most recent month end performance information visit www.wisdomtree.com.
| | | | |
| WisdomTree International Dividend and Sector Funds | | | 3 | |
Performance Summary (unaudited)
WisdomTree DEFA Fund (DWM)
Country Breakdown† as of 3/31/11
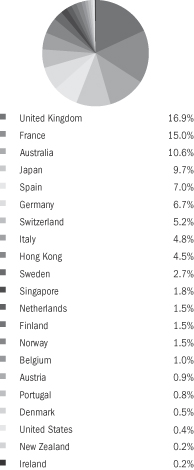
| † | The Fund’s country breakdown is expressed as a percentage of total investments and may change over time; does not include overnight investments in U.S. money market funds or investments of cash collateral for securities loaned. |
Top Ten Holdings* as of 3/31/11
| | | | |
| |
| Description | | % of Net Assets | |
TOTAL S.A. | | | 2.2% | |
Vodafone Group PLC | | | 1.9% | |
Telefonica S.A. | | | 1.7% | |
France Telecom S.A. | | | 1.5% | |
Royal Dutch Shell PLC Class A | | | 1.5% | |
GDF Suez | | | 1.5% | |
Banco Santander S.A. | | | 1.4% | |
HSBC Holdings PLC | | | 1.3% | |
Nestle S.A. | | | 1.3% | |
Enel SpA | | | 1.3% | |
| * | The ten largest holdings are subject to change, and there are no guarantees the Fund will remain invested in any particular company. |
The WisdomTree Dividend Index of Europe, Far East Asia and Australasia (DEFA) Fund (the “Fund”) seeks to track the price and yield performance, before fees and expenses, of the WisdomTree Dividend Index of Europe, Far East Asia and Australasia (WisdomTree DEFA Index). The Fund currently seeks to achieve its investment objective by investing substantially all of its assets directly in the stocks that make up its underlying index.
The Fund returned 11.33% at net asset value (“NAV”) for the fiscal year ended March 31, 2011. The Fund benefited from its underweight in Japan, which underperformed many of its international peers. Stock selection within Germany contributed to the drag on the Fund’s performance.
The following performance chart is provided for comparative purposes and represents the period noted. The Fund’s per share NAV is the value of one share of the Fund and is calculated by dividing the value of total assets less total liabilities by the number of shares outstanding. The NAV return is based on the NAV of the Fund and the market return is based on the market price per share of the Fund. The price used to calculate market price returns is the mid-point of the highest bid and lowest offer for Fund shares as of the close of trading on the exchange where Fund shares are listed. NAV and market returns assume that dividends and capital gain distributions have been reinvested in the Fund at NAV and market price, respectively. As with other ETFs, NAV returns and market price returns may differ because of factors such as the supply and demand for Fund shares and investors assessments of the underlying value of a Fund’s portfolio securities.
An index is a statistical measure of a specified financial market or sector. An index does not actually hold a portfolio of securities, incur expenses or pay any transaction costs. Therefore index returns do not reflect deductions for fees or expenses and are not available for direct investment. In comparison, the Fund’s performance is negatively impacted by these deductions. Fund returns do not reflect brokerage commissions or taxes on transactions in Fund shares or that a shareholder would pay on Fund distributions. The annual expense ratio of the Fund is 0.48%.
Performance as of 3/31/11
| | | | | | | | | | | | | | | | |
| | | Average Annual Total Return | |
| | | Fund
Net Asset Value | | | Fund
Market Price | | | WisdomTree
DEFA Index | | | MSCI EAFE Index | |
One Year | | | 11.33 | % | | | 11.52 | % | | | 11.19 | % | | | 10.42 | % |
Three Year | | | -3.45 | % | | | -3.54 | % | | | -2.83 | % | | | -3.01 | % |
Since Inception1 | | | 3.07 | % | | | 3.12 | % | | | 3.64 | % | | | 2.26 | % |
| 1 | Total returns are calculated based on the commencement of Fund trading on June 16, 2006. |
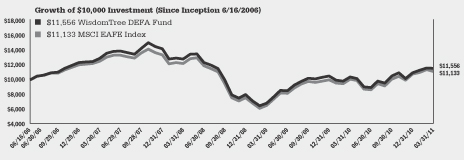
Performance quoted represents past performance and past performance does not guarantee future results. Current performance may be higher or lower than the performance quoted. For the most recent month-end performance information visit www.wisdomtree.com. Investment in the Fund poses investment risk including the possible loss of principal. The Investment return and principal value of an investment will fluctuate, so that shares, when sold or redeemed, may be worth more or less than their original cost. The returns do not reflect the deduction of taxes that a shareholder would pay on Fund distributions or on the redemption of Fund shares. Total returns for a period less than one year have not been annualized. Index returns do not reflect expenses paid by the Fund.
| | |
| 4 | | WisdomTree International Dividend and Sector Funds |
Performance Summary (unaudited)
WisdomTree DEFA Equity Income Fund (DTH)
Country Breakdown† as of 3/31/11
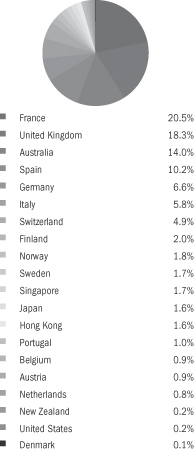
| † | The Fund’s country breakdown is expressed as a percentage of total investments and may change over time; does not include overnight investments in U.S. money market funds or investments of cash collateral for securities loaned. |
Top Ten Holdings* as of 3/31/11
| | | | |
| |
| Description | | % of Net Assets | |
TOTAL S.A. | | | 3.6% | |
Vodafone Group PLC | | | 3.0% | |
Telefonica S.A. | | | 2.7% | |
France Telecom S.A. | | | 2.4% | |
GDF Suez | | | 2.3% | |
Banco Santander S.A. | | | 2.2% | |
HSBC Holdings PLC | | | 2.1% | |
Royal Dutch Shell PLC Class B | | | 2.1% | |
ENI SpA | | | 2.0% | |
Enel SpA | | | 2.0% | |
| * | The ten largest holdings are subject to change, and there are no guarantees the Fund will remain invested in any particular company. |
The WisdomTree DEFA Equity Income Fund (the “Fund”) seeks to track the price and yield performance, before fees and expenses, of the WisdomTree DEFA Equity Income Index.
The Fund returned 9.74% at net asset value (“NAV”) for the fiscal year ended March 31, 2011. The Fund benefited from its underweight position in Japan, and notable positive stock selection within the country. Stock selection within Germany contributed to the drag on the Fund’s performance.
The following performance chart is provided for comparative purposes and represents the period noted. The Fund’s per share NAV is the value of one share of the Fund and is calculated by dividing the value of total assets less total liabilities by the number of shares outstanding. The NAV return is based on the NAV of the Fund and the market return is based on the market price per share of the Fund. The price used to calculate market price returns is the mid-point of the highest bid and lowest offer for Fund shares as of the close of trading on the exchange where Fund shares are listed. NAV and market returns assume that dividends and capital gain distributions have been reinvested in the Fund at NAV and market price, respectively. As with other ETFs. NAV returns and market price returns may differ because of factors such as the supply and demand for Fund shares and investors assessments of the underlying value of a Fund’s portfolio securities.
An index is a statistical measure of a specified financial market or sector. An index does not actually hold a portfolio of securities, incur expenses or pay any transaction costs. Therefore index returns do not reflect deductions for fees or expenses and are not available for direct investment. In comparison, the Fund’s performance is negatively impacted by these deductions. Fund returns do not reflect brokerage commissions or taxes on transactions in Fund shares or that a shareholder would pay on Fund distributions. The annual expense ratio of the Fund is 0.58%.
Performance as of 3/31/11
| | | | | | | | | | | | | | | | |
| | | Average Annual Total Return | |
| | | Fund
Net Asset Value | | | Fund
Market Price | | | WisdomTree
DEFA Equity
Income
Index | | | MSCI EAFE
Value Index | |
One Year | | | 9.74 | % | | | 10.79 | % | | | 10.07 | % | | | 8.21 | % |
Three Year | | | -4.47 | % | | | -4.42 | % | | | -3.95 | % | | | -3.57 | % |
Since Inception1 | | | 1.80 | % | | | 1.79 | % | | | 2.74 | % | | | 1.14 | % |
| 1 | Total returns are calculated based on the commencement of Fund trading on June 16, 2006. |
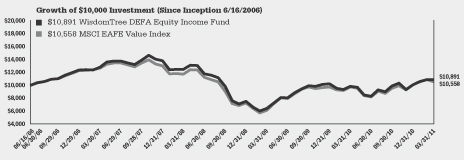
Performance quoted represents past performance and past performance does not guarantee future results. Current performance may be higher or lower than the performance quoted. For the most recent month-end performance information visit www.wisdomtree.com. Investment in the Fund poses investment risk including the possible loss of principal. The investment return and principal value of an investment will fluctuate, so that shares, when sold or redeemed, may be worth more or less than their original cost. The returns do not reflect the deduction of taxes that a shareholder would pay on Fund distributions or on the redemption of Fund shares. Total returns for a period less than one year have not been annualized. Index returns do not reflect expenses paid by the Fund.
| | | | |
| WisdomTree International Dividend and Sector Funds | | | 5 | |
Performance Summary (unaudited)
WisdomTree Global Equity Income Fund (DEW)
Country Breakdown† as of 3/31/11

| † | The Fund’s country breakdown is expressed as a percentage of total investments and may change over time; does not include overnight investments in U.S. money market funds or investments of cash collateral for securities loaned. |
| # | Amount represents less than 0.05%. |
Top Ten Holdings* as of 3/31/11
| | | | |
| |
| Description | | % of Net Assets | |
TOTAL S.A. | | | 2.2% | |
AT&T, Inc. | | | 2.1% | |
Vodafone Group PLC | | | 1.9% | |
Telefonica S.A. | | | 1.7% | |
France Telecom S.A. | | | 1.5% | |
Chevron Corp. | | | 1.4% | |
GDF Suez | | | 1.4% | |
Banco Santander S.A. | | | 1.3% | |
Verizon Communications, Inc. | | | 1.3% | |
HSBC Holdings PLC | | | 1.3% | |
| * | The ten largest holdings are subject to change, and there are no guarantees the Fund will remain invested in any particular company. |
The WisdomTree Global Equity Income Fund (the “Fund”) seeks to track the price and yield performance, before fees and expenses, of the WisdomTree Global Equity Index. The Global Equity Index is a fundamentally weighted index that measures the performance of high dividend-yielding companies in the U.S., developed and emerging markets. The Fund currently seeks to achieve its investment objective by investing substantially all of its assets directly in the stocks that make up its underlying index.
The Fund returned 13.12% at net asset value (“NAV”) for the fiscal year ended March 31, 2011. The Fund benefited from its relative underweight in Japan, which did not perform as well as some its other international peers. This had a positive impact on relative performance. The Fund’s position in the United Kingdom created a drag on performance.
The following performance chart is provided for comparative purposes and represents the period noted. The Fund’s per share NAV is the value of one share of the Fund and is calculated by dividing the value of total assets less total liabilities by the number of shares outstanding. The NAV return is based on the NAV of the Fund and the market return is based on the market price per share of the Fund. The price used to calculate market price returns is the mid-point of the highest bid and lowest offer for Fund shares as of the close of trading on the exchange where Fund shares are listed. NAV and market returns assume that dividends and capital gain distributions have been reinvested in the Fund at NAV and market price, respectively. As with other ETFs, NAV returns and market price returns may differ because of factors such as the supply and demand for Fund shares and investors assessments of the underlying value of a Fund’s portfolio securities.
An index is a statistical measure of a specified financial market or sector. An index does not actually hold a portfolio of securities, incur expenses or pay any transaction costs. Therefore index returns do not reflect deductions for fees or expenses and are not available for direct investment. In comparison, the Fund’s performance is negatively impacted by these deductions. Fund returns do not reflect brokerage commissions or taxes on transactions in Fund shares or that a shareholder would pay on Fund distributions. The annual expense ratio of the Fund is 0.58%.
Performance as of 3/31/11
| | | | | | | | | | | | | | | | |
| | | Average Annual Total Return | |
| | | Fund
Net Asset Value | | | Fund
Market Price | | | WisdomTree
Europe Equity Income/
Global Equity Income
Spliced Index1 | | | MSCI
Europe Value/
AC World Spliced
Index2 | |
One Year | | | 13.12 | % | | | 13.75 | % | | | 13.26 | % | | | 14.08 | % |
Three Year | | | -3.21 | % | | | -3.10 | % | | | -2.94 | % | | | -3.75 | % |
Since Inception3 | | | 2.23 | % | | | 2.22 | % | | | 2.70 | % | | | 1.85 | % |
| 1 | WisdomTree Europe Equity Income Index through June 19, 2009; WisdomTree Global Equity Income Index thereafter. |
| 2 | MSCI Europe Value Index through June 19, 2009; MSCI AC World Index thereafter. |
| 3 | Total returns are calculated based on the commencement of Fund trading on June 16, 2006. |
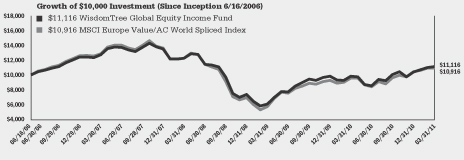
Performance quoted represents past performance and past performance does not guarantee future results. Current performance may be higher or lower than the performance quoted. For the most recent month-end performance information visit www.wisdomtree.com. Investment in the Fund poses investment risk including the possible loss of principal. The investment return and principal value of an investment will fluctuate, so that shares, when sold or redeemed, may be worth more or less than their original cost. The returns do not reflect the deduction of taxes that a shareholder would pay on Fund distributions or on the redemption of Fund shares. Total returns for a period less than one year have not been annualized. Index returns do not reflect expenses paid by the Fund.
| | |
| 6 | | WisdomTree International Dividend and Sector Funds |
Performance Summary (unaudited)
WisdomTree Europe SmallCap Dividend Fund (DFE)
Country Breakdown† as of 3/31/11
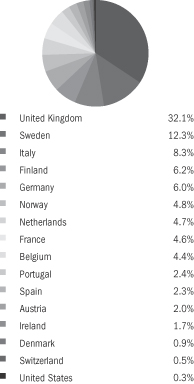
| † | The Fund’s country breakdown is expressed as a percentage of total investments and may change over time; does not include overnight investments in U.S. money market funds or investments of cash collateral for securities loaned. |
Top Ten Holdings* as of 3/31/11
| | | | |
| |
| Description | | % of Net Assets | |
Kungsleden AB | | | 1.5% | |
NCC AB Class B | | | 1.2% | |
Fabege AB | | | 1.2% | |
Banca Generali SpA | | | 1.1% | |
F&C Asset Management PLC | | | 1.0% | |
Go-Ahead Group PLC | | | 0.9% | |
Tessenderlo Chemie N.V. | | | 0.9% | |
Wihlborgs Fastigheter AB | | | 0.9% | |
Tullett Prebon PLC | | | 0.9% | |
Canal Plus | | | 0.9% | |
| * | The ten largest holdings are subject to change, and there are no guarantees the Fund will remain invested in any particular company. |
The WisdomTree Europe SmallCap Dividend Fund (the “Fund”) seeks to track the price and yield performance, before fees and expenses, of the WisdomTree Europe SmallCap Dividend Index.
The Fund returned 21.86% at net asset value (“NAV”) for the fiscal year ended March 31, 2011. The Fund’s investment in the United Kingdom contributed the most positively to Fund performance. The Fund’s position in Portugal contributed to a drag on Fund performance.
The following performance chart is provided for comparative purposes and represents the period noted. The Fund’s per share NAV is the value of one share of the Fund and is calculated by dividing the value of total assets less total liabilities by the number of shares outstanding. The NAV return is based on the NAV of the Fund and the market return is based on the market price per share of the Fund. The price used to calculate market price returns is the mid-point of the highest bid and lowest offer for Fund shares as of the close of trading on the exchange where Fund shares are listed. NAV and market returns assume that dividends and capital gain distributions have been reinvested in the Fund at NAV and market price, respectively. As with other ETFs, NAV returns and market price returns may differ because of factors such as the supply and demand for Fund shares and investors assessments of the underlying value of a Fund’s portfolio securities.
An index is a statistical measure of a specified financial market or sector. An index does not actually hold a portfolio of securities, incur expenses or pay any transaction costs. Therefore index returns do not reflect deductions for fees or expenses and are not available for direct investment. In comparison, the Fund’s performance is negatively impacted by these deductions. Fund returns do not reflect brokerage commissions or taxes on transactions in Fund shares or that a shareholder would pay on Fund distributions. The annual expense ratio of the Fund is 0.58%.
Performance as of 3/31/11
| | | | | | | | | | | | | | | | |
| | | Average Annual Total Return | |
| | | Fund
Net Asset Value | | | Fund
Market Price | | | WisdomTree
Europe
SmallCap
Dividend Index | | | MSCI Europe
SmallCap Index | |
One Year | | | 21.86 | % | | | 22.65 | % | | | 22.71 | % | | | 23.75 | % |
Three Year | | | -2.81 | % | | | -2.75 | % | | | -2.11 | % | | | 0.59 | % |
Since Inception1 | | | 2.93 | % | | | 2.69 | % | | | 3.25 | % | | | 5.77 | % |
| 1 | Total returns are calculated based on the commencement of Fund trading on June 16, 2006. |
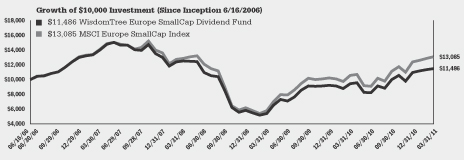
Performance quoted represents past performance and past performance does not guarantee future results. Current performance may be higher or lower than the performance quoted. For the most recent month-end performance information visit www.wisdomtree.com. Investment in the Fund poses investment risk including the possible loss of principal. The investment return and principal value of an investment will fluctuate, so that shares, when sold or redeemed, may be worth more or less than their original cost. The returns do not reflect the deduction of taxes that a shareholder would pay on Fund distributions or on the redemption of Fund shares. Total returns for a period less than one year have not been annualized. Index returns do not reflect expenses paid by the Fund.
| | | | |
| WisdomTree International Dividend and Sector Funds | | | 7 | |
Performance Summary (unaudited)
WisdomTree Japan Hedged Equity Fund (DXJ)
Sector Breakdown† as of 3/31/11‡
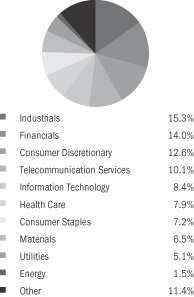
| † | The Fund’s sector breakdown is expressed as a percentage of total investments and may change over time. |
| ‡ | A sector may be comprised of several industries. |
Top Ten Holdings* as of 3/31/11
| | | | |
| |
| Description | | % of Net Assets | |
NTT DoCoMo, Inc. | | | 5.3% | |
Nippon Telegraph & Telephone Corp. | | | 4.2% | |
Toyota Motor Corp. | | | 3.4% | |
Takeda Pharmaceutical Co., Ltd. | | | 3.0% | |
Mitsubishi UFJ Financial Group, Inc. | | | 3.0% | |
Canon, Inc. | | | 2.9% | |
Mizuho Financial Group, Inc. | | | 2.3% | |
Sumitomo Mitsui Financial Group, Inc. | | | 2.2% | |
Honda Motor Co., Ltd. | | | 1.6% | |
Mitsubishi Corp. | | | 1.5% | |
| * | The ten largest holdings are subject to change, and there are no guarantees the Fund will remain invested in any particular company. |
The WisdomTree Japan Hedged Equity Fund (the “Fund”) seeks to track the price and yield performance, before fees and expenses, of the WisdomTree Japan Hedged Equity Index. The Fund is a Japan “total market” fund, and will also seek to hedge against fluctuations between the value of the Japanese yen and the U.S. dollar.
The Fund returned -11.25% at net asset value (“NAV”) for the fiscal year ended March 31, 2011. The Fund benefited from its relatively overweight exposure to the Telecommunication Services sector, which out-performed other sectors in Japan. The Fund’s stock selection in the Industrials sector contributed to a drag on Fund performance.
The following performance chart is provided for comparative purposes and represents the period noted. The Fund’s per share NAV is the value of one share of the Fund and is calculated by dividing the value of total assets less total liabilities by the number of shares outstanding. The NAV return is based on the NAV of the Fund and the market return is based on the market price per share of the Fund. The price used to calculate market price returns is the mid-point of the highest bid and lowest offer for Fund shares as of the close of trading on the exchange where Fund shares are listed. NAV and market returns assume that dividends and capital gain distributions have been reinvested in the Fund at NAV and market price, respectively. As with other ETFs, NAV returns and market price returns may differ because of factors such as the supply and demand for Fund shares and investors assessments of the underlying value of a Fund’s portfolio securities.
An index is a statistical measure of a specified financial market or sector. An index does not actually hold a portfolio of securities, incur expenses or pay any transaction costs. Therefore index returns do not reflect deductions for fees or expenses and are not available for direct investment. In comparison, the Fund’s performance is negatively impacted by these deductions. Fund returns do not reflect brokerage commissions or taxes on transactions in Fund shares or that a shareholder would pay on Fund distributions. The annual expense ratio of the Fund is 0.48%.
Performance as of 3/31/11
| | | | | | | | | | | | | | | | |
| | | Average Annual Total Return | |
| | | Fund
Net Asset Value | | | Fund
Market Price | | | WisdomTree
Japan Dividend/
Japan Hedged
Spliced Index1 | | | MSCI Japan
/Japan
Local Currency
Spliced Index2 | |
One Year | | | -11.25 | % | | | -11.74 | % | | | -11.02 | % | | | -10.52 | % |
Three Year | | | -7.15 | % | | | -7.23 | % | | | -7.30 | % | | | -7.57 | % |
Since Inception3 | | | -5.08 | % | | | -5.05 | % | | | -5.12 | % | | | -5.58 | % |
| 1 | WisdomTree Japan Dividend Index through March 31, 2010; WisdomTree Japan Hedged Equity Index thereafter. |
| 2 | MSCI Japan Index through March 31, 2010; MSCI Japan Local Currency Index thereafter. |
| 3 | Total returns are calculated based on the commencement of Fund trading on June 16, 2006. |
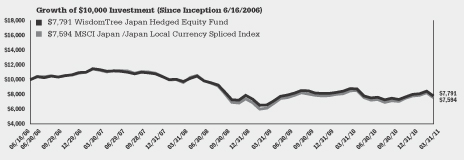
Performance quoted represents past performance and past performance does not guarantee future results. Current performance may be higher or lower than the performance quoted. For the most recent month-end performance information visit www.wisdomtree.com. Investment in the Fund poses investment risk including the possible loss of principal. The investment return and principal value of an investment will fluctuate, so that shares, when sold or redeemed, may be worth more or less than their original cost. The returns do not reflect the deduction of taxes that a shareholder would pay on Fund distributions or on the redemption of Fund shares. Total returns for a period less than one year have not been annualized. Index returns do not reflect expenses paid by the Fund.
| | |
| 8 | | WisdomTree International Dividend and Sector Funds |
Performance Summary (unaudited)
WisdomTree World ex-U.S. Growth Fund (DNL)
Country Breakdown† as of 3/31/11

| † | The Fund’s country breakdown is expressed as a percentage of total investments and may change over time; does not include overnight investments in U.S. money market funds or investments of cash collateral for securities loaned. |
Top Ten Holdings* as of 3/31/11
| | | | |
| Description | | % of Net Assets | |
GlaxoSmithKline PLC | | | 7.4% | |
AstraZeneca PLC | | | 4.5% | |
Siemens AG | | | 3.8% | |
Banco do Brasil S.A. | | | 3.7% | |
Zurich Financial Services AG | | | 3.7% | |
WisdomTree India Earnings Fund | | | 2.4% | |
Muenchener Rueckversicherungs AG | | | 2.4% | |
Criteria Caixacorp S.A. | | | 2.3% | |
Cia de Bebidas das Americas | | | 2.0% | |
Novo Nordisk A/S Class B | | | 1.8% | |
| * | The ten largest holdings are subject to change, and there are no guarantees the Fund will remain invested in any particular company. |
The WisdomTree World ex-U.S. Growth Fund (the “Fund”) seeks to track the price and yield performance, before fees and expenses, of the WisdomTree World ex-U.S. Growth Index. This Index is a fundamentally weighted index that measures the performance of growth companies in the developed and emerging markets outside of the United States.
The Fund returned 13.67% at net asset value (“NAV”) for the fiscal year ended March 31, 2011. The Fund benefited from its exposure to the Financials sector. The Fund’s exposure to the Energy sector contributed to a drag on performance.
The following performance chart is provided for comparative purposes and represents the period noted. The Fund’s per share NAV is the value of one share of the Fund and is calculated by dividing the value of total assets less total liabilities by the number of shares outstanding. The NAV return is based on the NAV of the Fund and the market return is based on the market price per share of the Fund. The price used to calculate market price returns is the mid-point of the highest bid and lowest offer for Fund shares as of the close of trading on the exchange where Fund shares are listed. NAV and market returns assume that dividends and capital gain distributions have been reinvested in the Fund at NAV and market price, respectively. As with other ETFs, NAV returns and market price returns may differ because of factors such as the supply and demand for Fund shares and investors assessments of the underlying value of a Fund’s portfolio securities.
An index is a statistical measure of a specified financial market or sector. An index does not actually hold a portfolio of securities, incur expenses or pay any transaction costs. Therefore index returns do not reflect deductions for fees or expenses and are not available for direct investment. In comparison, the Fund’s performance is negatively impacted by these deductions. Fund returns do not reflect brokerage commissions or taxes on transactions in Fund shares or that a shareholder would pay on Fund distributions. The annual expense ratio of the Fund is 0.58%.
Performance as of 3/31/11
| | | | | | | | | | | | | | | | |
| | | Average Annual Total Return | |
| | | Fund
Net Asset Value | | | Fund
Market Price | | | WisdomTree
Japan Equity Income/
World ex-U.S. Growth
Spliced Index1 | | | MSCI Japan Value/
MSCI AC World
ex-U.S.A. Growth
Spliced Index2 | |
One Year | | | 13.67 | % | | | 14.70 | % | | | 14.62 | % | | | 14.73 | % |
Three Year | | | 6.69 | % | | | 6.89 | % | | | 7.22 | % | | | 8.63 | % |
Since Inception3 | | | 4.44 | % | | | 4.70 | % | | | 4.90 | % | | | 5.44 | % |
| 1 | WisdomTree Japan Equity Income Index through June 19, 2009; WisdomTree World ex-US Growth Index thereafter. |
| 2 | MSCI Japan Value Index through June 19, 2009; MSCI AC World ex-U.S.A. Growth Index thereafter. |
| 3 | Total returns are calculated based on the commencement of Fund trading on June 16, 2006. |
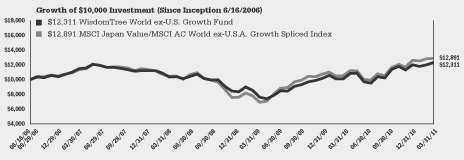
Performance quoted represents past performance and past performance does not guarantee future results. Current performance may be higher or lower than the performance quoted. For the most recent month-end performance information visit www.wisdomtree.com. Investment in the Fund poses investment risk including the possible loss of principal. The investment return and principal value of an investment will fluctuate, so that shares, when sold or redeemed, may be worth more or less than their original cost. The returns do not reflect the deduction of taxes that a shareholder would pay on Fund distributions or on the redemption of Fund shares. Total returns for a period less than one year have not been annualized. Index returns do not reflect expenses paid by the Fund.
| | | | |
| WisdomTree International Dividend and Sector Funds | | | 9 | |
Performance Summary (unaudited)
WisdomTree Japan SmallCap Dividend Fund (DFJ)
Sector Breakdown† as of 3/31/11‡
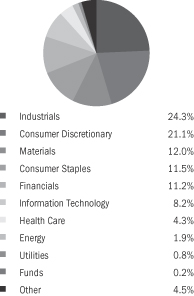
| † | The Fund’s sector breakdown is expressed as a percentage of total investments and may change over time. |
| ‡ | A sector may be comprised of several industries. |
Top Ten Holdings* as of 3/31/11
| | | | |
| |
| Description | | % of Net Assets | |
Century Tokyo Leasing Corp. | | | 0.7% | |
DIC Corp. | | | 0.7% | |
Park24 Co., Ltd. | | | 0.7% | |
KYORIN Holdings, Inc. | | | 0.7% | |
Onward Holdings Co., Ltd. | | | 0.6% | |
Circle K Sunkus Co., Ltd. | | | 0.6% | |
UNY Co., Ltd. | | | 0.6% | |
Kaken Pharmaceutical Co., Ltd. | | | 0.6% | |
Ito En Ltd. | | | 0.6% | |
Hikari Tsushin, Inc. | | | 0.6% | |
| * | The ten largest holdings are subject to change, and there are no guarantees the Fund will remain invested in any particular company. |
The WisdomTree Japan SmallCap Dividend Fund (the “Fund”) seeks to track the price and yield performance, before fees and expenses, of the WisdomTree Japan SmallCap Dividend Index.
The Fund returned 6.02% at net asset value (“NAV”) for the fiscal year ended March 31, 2011. The Fund benefited the most from its exposure to the Industrials sector. The Fund’s exposure to the Financials sector created a drag on Fund performance.
The following performance chart is provided for comparative purposes and represents the period noted. The Fund’s per share NAV is the value of one share of the Fund and is calculated by dividing the value of total assets less total liabilities by the number of shares outstanding. The NAV return is based on the NAV of the Fund and the market return is based on the market price per share of the Fund. The price used to calculate market price returns is the mid-point of the highest bid and lowest offer for Fund shares as of the close of trading on the exchange where Fund shares are listed. NAV and market returns assume that dividends and capital gain distributions have been reinvested in the Fund at NAV and market price, respectively. As with other ETFs, NAV returns and market price returns may differ because of factors such as the supply and demand for Fund shares and investors assessments of the underlying value of a Fund’s portfolio securities.
An index is a statistical measure of a specified financial market or sector. An index does not actually hold a portfolio of securities, incur expenses or pay any transaction costs. Therefore index returns do not reflect deductions for fees or expenses and are not available for direct investment. In comparison, the Fund’s performance is negatively impacted by these deductions. Fund returns do not reflect brokerage commissions or taxes on transactions in Fund shares or that a shareholder would pay on Fund distributions. The annual expense ratio of the Fund is 0.58%.
Performance as of 3/31/11
| | | | | | | | | | | | | | | | |
| | | Average Annual Total Return | |
| | | Fund
Net Asset Value | | | Fund
Market Price | | | WisdomTree Japan
SmallCap Dividend
Index | | | MSCI Japan
SmallCap Index | |
One Year | | | 6.02 | % | | | 5.38 | % | | | 7.52 | % | | | 8.84 | % |
Three Year | | | 0.86 | % | | | 0.63 | % | | | 1.67 | % | | | 0.67 | % |
Since Inception1 | | | -1.97 | % | | | -1.76 | % | | | -1.30 | % | | | -3.06 | % |
| 1 | Total returns are calculated based on the commencement of Fund trading on June 16, 2006. |
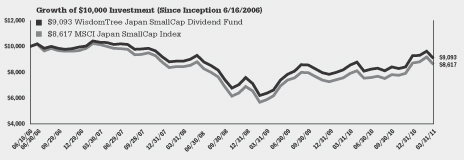
Performance quoted represents past performance and past performance does not guarantee future results. Current performance may be higher or lower than the performance quoted. For the most recent month-end performance information visit www.wisdomtree.com. Investment in the Fund poses investment risk including the possible loss of principal. The Investment return and principal value of an investment will fluctuate, so that shares, when sold or redeemed, may be worth more or less than their original cost. The returns do not reflect the deduction of taxes that a shareholder would pay on Fund distributions or on the redemption of Fund shares. Total returns for a period less than one year have not been annualized. Index returns do not reflect expenses paid by the Fund.
| | |
| 10 | | WisdomTree International Dividend and Sector Funds |
Performance Summary (unaudited)
WisdomTree Pacific ex-Japan Total Dividend Fund (DND)
Country Breakdown† as of 3/31/11
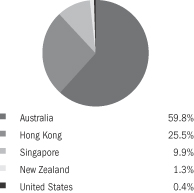
| † | The Fund’s country breakdown is expressed as a percentage of total investments and may change over time; does not include overnight investments in U.S. money market funds or investments of cash collateral for securities loaned. |
Top Ten Holdings* as of 3/31/11
| | | | |
| |
| Description | | % of Net Assets | |
China Mobile Ltd. | | | 6.6% | |
Westpac Banking Corp. | | | 6.0% | |
BHP Billiton Ltd. | | | 5.8% | |
Commonwealth Bank of Australia | | | 5.2% | |
Telstra Corp., Ltd. | | | 4.6% | |
National Australia Bank Ltd. | | | 4.6% | |
Australia & New Zealand Banking Group Ltd. | | | 4.4% | |
CNOOC Ltd. | | | 3.5% | |
Wesfarmers Ltd. | | | 2.5% | |
BOC Hong Kong Holdings Ltd. | | | 1.9% | |
| * | The ten largest holdings are subject to change, and there are no guarantees the Fund will remain invested in any particular company. |
The WisdomTree Pacific ex-Japan Total Dividend Fund (the “Fund”) seeks to track the price and yield performance, before fees and expenses, of the WisdomTree Pacific ex-Japan Dividend Index.
The Fund returned 15.33% at net asset value (“NAV”) for the fiscal year ended March 31, 2011. The Fund’s investment in Singapore contributed the most positively to Fund performance. Stock selection within Australia contributed to the drag on the Fund’s performance.
The following performance chart is provided for comparative purposes and represents the period noted. The Fund’s per share NAV is the value of one share of the Fund and is calculated by dividing the value of total assets less total liabilities by the number of shares outstanding. The NAV return is based on the NAV of the Fund and the market return is based on the market price per share of the Fund. The price used to calculate market price returns is the mid-point of the highest bid and lowest offer for Fund shares as of the close of trading on the exchange where Fund shares are listed. NAV and market returns assume that dividends and capital gain distributions have been reinvested in the Fund at NAV and market price, respectively. As with other ETFs, NAV returns and market price returns may differ because of factors such as the supply and demand for Fund shares and investors assessments of the underlying value of a Fund’s portfolio securities.
An index is a statistical measure of a specified financial market or sector. An index does not actually hold a portfolio of securities, incur expenses or pay any transaction costs. Therefore index returns do not reflect deductions for fees or expenses and are not available for direct investment. In comparison, the Fund’s performance is negatively impacted by these deductions. Fund returns do not reflect brokerage commissions or taxes on transactions in Fund shares or that a shareholder would pay on Fund distributions. The annual expense ratio of the Fund is 0.48%.
Performance as of 3/31/11
| | | | | | | | | | | | | | | | |
| | | Average Annual Total Return | |
| | | Fund
Net Asset Value | | | Fund
Market Price | | | WisdomTree
Pacific ex-Japan
Dividend Index | | | MSCI Pacific
ex-Japan Index | |
One Year | | | 15.33 | % | | | 15.98 | % | | | 16.92 | % | | | 16.53 | % |
Three Year | | | 4.11 | % | | | 4.04 | % | | | 5.38 | % | | | 5.72 | % |
Since Inception1 | | | 11.81 | % | | | 11.89 | % | | | 13.17 | % | | | 11.41 | % |
| 1 | Total returns are calculated based on the commencement of Fund trading on June 16, 2006. |
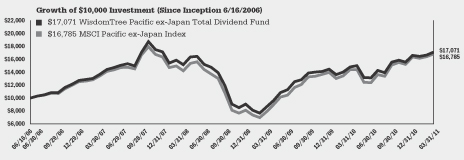
Performance quoted represents past performance and past performance does not guarantee future results. Current performance may be higher or lower than the performance quoted. For the most recent month-end performance information visit www.wisdomtree.com. Investment in the Fund poses investment risk including the possible loss of principal. The investment return and principal value of an Investment will fluctuate, so that shares, when sold or redeemed, may be worth more or less than their original cost. The returns do not reflect the deduction of taxes that a shareholder would pay on Fund distributions or on the redemption of Fund shares. Total returns for a period less than one year have not been annualized. Index returns do not reflect expenses paid by the Fund.
| | | | |
| WisdomTree International Dividend and Sector Funds | | | 11 | |
Performance Summary (unaudited)
WisdomTree Pacific ex-Japan Equity Income Fund (DNH)
Country Breakdown† as of 3/31/11
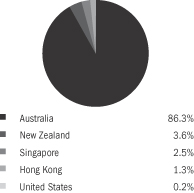
| † | The Fund’s country breakdown is expressed as a percentage of total investments and may change over time; does not include overnight investments in U.S. money market funds or investments of cash collateral for securities loaned. |
Top Ten Holdings* as of 3/31/11
| | | | |
| |
| Description | | % of Net Assets | |
Westpac Banking Corp. | | | 8.8% | |
Commonwealth Bank of Australia | | | 8.2% | |
National Australia Bank Ltd. | | | 7.9% | |
Australia & New Zealand Banking Group Ltd. | | | 7.8% | |
Telstra Corp., Ltd. | | | 7.1% | |
Woolworths Ltd. | | | 4.8% | |
QBE Insurance Group Ltd. | | | 3.6% | |
Coal & Allied Industries Ltd. | | | 2.7% | |
AMP Ltd. | | | 2.1% | |
Foster’s Group Ltd. | | | 2.1% | |
| * | The ten largest holdings are subject to change, and there are no guarantees the Fund will remain invested in any particular company. |
The WisdomTree Pacific ex-Japan Equity Income Fund (the “Fund”) seeks to track the price and yield performance, before fees and expenses, of the WisdomTree Pacific ex-Japan Equity Income Index.
The Fund returned 14.03% at net asset value (“NAV”) for the fiscal year ended March 31, 2011. The Fund’s investment in Singapore contributed the most positively to Fund performance. Stock selection within Australia contributed to the drag on the Fund’s performance.
The following performance chart is provided for comparative purposes and represents the period noted. The Fund’s per share NAV is the value of one share of the Fund and is calculated by dividing the value of total assets less total liabilities by the number of shares outstanding. The NAV return is based on the NAV of the Fund and the market return is based on the market price per share of the Fund. The price used to calculate market price returns is the mid-point of the highest bid and lowest offer for Fund shares as of the close of trading on the exchange where Fund shares are listed. NAV and market returns assume that dividends and capital gain distributions have been reinvested in the Fund at NAV and market price, respectively. As with other ETFS, NAV returns and market price returns may differ because of factors such as the supply and demand for Fund shares and investors assessments of the underlying value of a Fund’s portfolio securities.
An index is a statistical measure of a specified financial market or sector. An index does not actually hold a portfolio of securities, incur expenses or pay any transaction costs. Therefore index returns do not reflect deductions for fees or expenses and are not available for direct investment. In comparison, the Fund’s performance is negatively impacted by these deductions. Fund returns do not reflect brokerage commissions or taxes on transactions in Fund shares or that a shareholder would pay on Fund distributions. The annual expense ratio of the Fund is 0.58%.
Performance as of 3/31/11
| | | | | | | | | | | | | | | | |
| | | Average Annual Total Return | |
| | | Fund
Net Asset Value | | | Fund
Market Price | | | WisdomTree
Pacific ex-Japan
Equity Income Index | | | MSCI Pacific
ex-Japan
Value Index | |
One Year | | | 14.03 | % | | | 15.16 | % | | | 14.59 | % | | | 16.63 | % |
Three Year | | | 7.09 | % | | | 6.85 | % | | | 7.71 | % | | | 6.30 | % |
Since Inception1 | | | 11.49 | % | | | 11.47 | % | | | 12.21 | % | | | 10.01 | % |
| 1 | Total returns are calculated based on the commencement of Fund trading on June 16, 2006. |
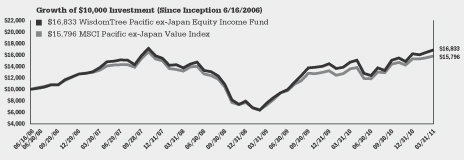
Performance quoted represents past performance and past performance does not guarantee future results. Current performance may be higher or lower than the performance quoted. For the most recent month-end performance information visit www.wisdomtree.com. Investment in the Fund poses investment risk including the possible loss of principal. The investment return and principal value of an investment will fluctuate, so that shares, when sold or redeemed, may be worth more or less than their original cost. The returns do not reflect the deduction of taxes that a shareholder would pay on Fund distributions or on the redemption of Fund shares. Total returns for a period less than one year have not been annualized. Index returns do not reflect expenses paid by the Fund.
| | |
| 12 | | WisdomTree International Dividend and Sector Funds |
Performance Summary (unaudited)
WisdomTree International LargeCap Dividend Fund (DOL)
Country Breakdown† as of 3/31/11
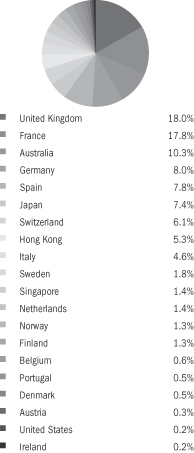
| † | The Fund’s country breakdown is expressed as a percentage of total investments and may change over time; does not include overnight investments in U.S. money market funds or investments of cash collateral for securities loaned. |
Top Ten Holdings* as of 3/31/11
| | | | |
| |
| Description | | % of Net Assets | |
TOTAL S.A. | | | 2.9% | |
Vodafone Group PLC | | | 2.5% | |
Telefonica S.A. | | | 2.3% | |
Royal Dutch Shell PLC Class A | | | 2.1% | |
France Telecom S.A. | | | 2.0% | |
GDF Suez | | | 1.9% | |
Banco Santander S.A. | | | 1.8% | |
Nestle S.A. | | | 1.8% | |
Enel SpA | | | 1.8% | |
ENI SpA | | | 1.8% | |
| * | The ten largest holdings are subject to change, and there are no guarantees the Fund will remain invested in any particular company. |
The WisdomTree International LargeCap Dividend Fund (the “Fund”) seeks to track the price and yield performance, before fees and expenses, of the WisdomTree International LargeCap Dividend Index.
The Fund returned 9.21% at net asset value (“NAV”) for the fiscal year ended March 31, 2011. The Fund benefited from its underweight position in Japan, and notable positive stock selection within the country. Stock selection within the United Kingdom contributed to the drag on the Fund’s performance.
The following performance chart is provided for comparative purposes and represents the period noted. The Fund’s per share NAV is the value of one share of the Fund and is calculated by dividing the value of total assets less total liabilities by the number of shares outstanding. The NAV return is based on the NAV of the Fund and the market return is based on the market price per share of the Fund. The price used to calculate market price returns is the mid-point of the highest bid and lowest offer for Fund shares as of the close of trading on the exchange where Fund shares are listed. NAV and market returns assume that dividends and capital gain distributions have been reinvested in the Fund at NAV and market price, respectively. As with other ETFs, NAV returns and market price returns may differ because of factors such as the supply and demand for Fund shares and investors assessments of the underlying value of a Fund’s portfolio securities.
An index is a statistical measure of a specified financial market or sector. An index does not actually hold a portfolio of securities, incur expenses or pay any transaction costs. Therefore index returns do not reflect deductions for fees or expenses and are not available for direct investment. In comparison, the Fund’s performance is negatively impacted by these deductions. Fund returns do not reflect brokerage commissions or taxes on transactions in Fund shares or that a shareholder would pay on Fund distributions. The annual expense ratio of the Fund is 0.48%.
Performance as of 3/31/11
| | | | | | | | | | | | | | | | |
| | | Average Annual Total Return | |
| | | Fund
Net Asset Value | | | Fund
Market Price | | | WisdomTree
International
LargeCap
Dividend Index | | | MSCI EAFE Index | |
One Year | | | 9.21 | % | | | 9.46 | % | | | 9.81 | % | | | 10.42 | % |
Three Year | | | -3.84 | % | | | -3.90 | % | | | -3.79 | % | | | -3.01 | % |
Since Inception1 | | | 2.61 | % | | | 2.44 | % | | | 3.02 | % | | | 2.26 | % |
| 1 | Total returns are calculated based on the commencement of Fund trading on June 16, 2006. |
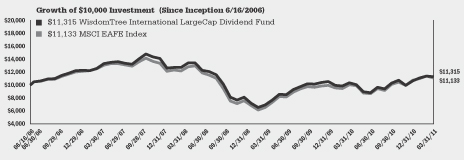
Performance quoted represents past performance and past performance does not guarantee future results. Current performance may be higher or lower than the performance quoted. For the most recent month-end performance information visit www.wisdomtree.com. Investment in the Fund poses investment risk including the possible loss of principal. The investment return and principal value of an investment will fluctuate, so that shares, when sold or redeemed, may be worth more or less than their original cost. The returns do not reflect the deduction of taxes that a shareholder would pay on Fund distributions or on the redemption of Fund shares. Total returns for a period less than one year have not been annualized. Index returns do not reflect expenses paid by the Fund.
| | | | |
| WisdomTree International Dividend and Sector Funds | | | 13 | |
Performance Summary (unaudited)
WisdomTree International Dividend ex-Financials Fund (DOO)
Country Breakdown† as of 3/31/11
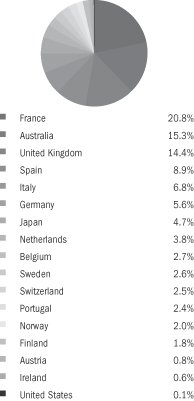
| † | The Fund’s country breakdown is expressed as a percentage of total investments and may change over time; does not include overnight investments in U.S. money market funds or investments of cash collateral for securities loaned. |
Top Ten Holdings* as of 3/31/11
| | | | |
| |
| Description | | % of Net Assets | |
France Telecom S.A. | | | 2.6% | |
Enel SpA | | | 2.5% | |
Telstra Corp., Ltd. | | | 2.4% | |
Vivendi S.A. | | | 2.2% | |
Coal & Allied Industries Ltd. | | | 2.1% | |
Deutsche Telekom AG | | | 1.9% | |
Belgacom S.A. | | | 1.9% | |
National Grid PLC | | | 1.8% | |
GDF Suez | | | 1.8% | |
TOTAL S.A. | | | 1.7% | |
| * | The ten largest holdings are subject to change, and there are no guarantees the Fund will remain invested in any particular company. |
The WisdomTree International Dividend ex-Financials Fund (the “Fund”) seeks to track the price and yield performance, before fees and expenses, of the WisdomTree International Dividend ex-Financials Index.
The Fund returned 14.93% at net asset value (“NAV”) for the fiscal year ended March 31, 2011. The Fund benefited from its relative underweight to Japan, which lagged performance of some of its international peers. This had a positive impact on relative performance. Stock selection within Germany contributed to the drag on the Fund’s performance.
The following performance chart is provided for comparative purposes and represents the period noted. The Fund’s per share NAV is the value of one share of the Fund and is calculated by dividing the value of total assets less total liabilities by the number of shares outstanding. The NAV return is based on the NAV of the Fund and the market return is based on the market price per share of the Fund. The price used to calculate market price returns is the mid-point of the highest bid and lowest offer for Fund shares as of the close of trading on the exchange where Fund shares are listed. NAV and market returns assume that dividends and capital gain distributions have been reinvested in the Fund at NAV and market price, respectively. As with other ETFs, NAV returns and market price returns may differ because of factors such as the supply and demand for Fund shares and investors assessments of the underlying value of a Fund’s portfolio securities.
An index is a statistical measure of a specified financial market or sector. An index does not actually hold a portfolio of securities, incur expenses or pay any transaction costs. Therefore index returns do not reflect deductions for fees or expenses and are not available for direct investment. In comparison, the Fund’s performance is negatively impacted by these deductions. Fund returns do not reflect brokerage commissions or taxes on transactions in Fund shares or that a shareholder would pay on Fund distributions. The annual expense ratio of the Fund is 0.58%.
Performance as of 3/31/11
| | | | | | | | | | | | | | | | |
| | | Average Annual Total Return | |
| | | Fund
Net Asset Value | | | Fund
Market Price | | | WisdomTree International Dividend
Top 100/International
Dividend ex-Financials
Spliced Index1 | | | MSCI EAFE
Value Index | |
One Year | | | 14.93 | % | | | 15.72 | % | | | 15.84 | % | | | 8.21 | % |
Three Year | | | -3.49 | % | | | -3.38 | % | | | -3.19 | % | | | -3.57 | % |
Since Inception2 | | | 3.71 | % | | | 3.58 | % | | | 4.22 | % | | | 1.14 | % |
| 1 | WisdomTree International Dividend Top 100 Index through May 7, 2009; WisdomTree International Dividend ex-Financials Index thereafter. |
| 2 | Total returns are calculated based on the commencement of Fund trading on June 16, 2006. |
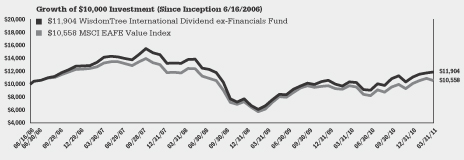
Performance quoted represents past performance and past performance does not guarantee future results. Current performance may be higher or lower than the performance quoted. For the most recent month-end performance information visit www.wisdomtree.com. Investment in the Fund poses investment risk including the possible loss of principal. The investment return and principal value of an investment will fluctuate, so that shares, when sold or redeemed, may be worth more or less than their original cost. The returns do not reflect the deduction of taxes that a shareholder would pay on Fund distributions or on the redemption of Fund shares. Total returns for a period less than one year have not been annualized. Index returns do not reflect expenses paid by the Fund.
| | |
| 14 | | WisdomTree International Dividend and Sector Funds |
Performance Summary (unaudited)
WisdomTree International MidCap Dividend Fund (DIM)
Country Breakdown† as of 3/31/11
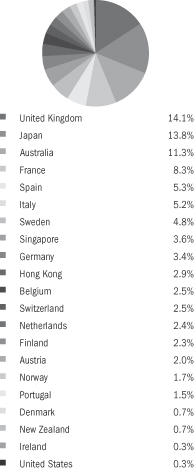
| † | The Fund’s country breakdown is expressed as a percentage of total investments and may change over time; does not include overnight investments in U.S. money market funds or investments of cash collateral for securities loaned. |
Top Ten Holdings* as of 3/31/11
| | | | |
| Description | | % of Net Assets | |
Man Group PLC | | | 1.1% | |
TABCORP Holdings Ltd. | | | 0.8% | |
Coal & Allied Industries Ltd. | | | 0.8% | |
Telecom Italia SpA RSP | | | 0.8% | |
M-6 Metropole Television S.A. | | | 0.7% | |
Mobistar S.A. | | | 0.7% | |
Legal & General Group PLC | | | 0.7% | |
Telekom Austria AG | | | 0.7% | |
Terna Rete Elettrica Nazionale SpA | | | 0.7% | |
Klepierre | | | 0.6% | |
| * | The ten largest holdings are subject to change, and there are no guarantees the Fund will remain invested in any particular company. |
The WisdomTree International MidCap Dividend Fund (the “Fund”) seeks to track the price and yield performance, before fees and expenses, of the WisdomTree International MidCap Dividend Index.
The Fund returned 14.38% at net asset value (“NAV”) for the fiscal year ended March 31, 2011. The Fund’s investment in the United Kingdom contributed the most positively to Fund performance. The Fund’s position in Italy contributed to a drag on Fund performance.
The following performance chart is provided for comparative purposes and represents the period noted. The Fund’s per share NAV is the value of one share of the Fund and is calculated by dividing the value of total assets less total liabilities by the number of shares outstanding. The NAV return is based on the NAV of the Fund and the market return is based on the market price per share of the Fund. The price used to calculate market price returns is the mid-point of the highest bid and lowest offer for Fund shares as of the close of trading on the exchange where Fund shares are listed. NAV and market returns assume that dividends and capital gain distributions have been reinvested in the Fund at NAV and market price, respectively. As with other ETFs, NAV returns and market price returns may differ because of factors such as the supply and demand for Fund shares and investors assessments of the underlying value of a Fund’s portfolio securities.
An index is a statistical measure of a specified financial market or sector. An index does not actually hold a portfolio of securities, incur expenses or pay any transaction costs. Therefore index returns do not reflect deductions for fees or expenses and are not available for direct investment. In comparison, the Fund’s performance is negatively impacted by these deductions. Fund returns do not reflect brokerage commissions or taxes on transactions in Fund shares or that a shareholder would pay on Fund distributions. The annual expense ratio of the Fund is 0.58%.
Performance as of 3/31/11
| | | | | | | | | | | | | | | | |
| | | Average Annual Total Return | |
| | | Fund
Net Asset Value | | | Fund
Market Price | | | WisdomTree
International
MidCap Dividend
Index | | | MSCI EAFE
MidCap Index | |
One Year | | | 14.38 | % | | | 15.01 | % | | | 15.24 | % | | | 15.41 | % |
Three Year | | | -0.74 | % | | | -0.79 | % | | �� | -0.76 | % | | | -2.05 | % |
Since Inception1 | | | 5.02 | % | | | 4.83 | % | | | 5.20 | % | | | 2.57 | % |
| 1 | Total returns are calculated based on the commencement of Fund trading on June 16, 2006. |
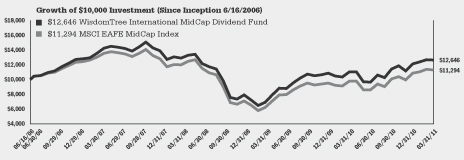
Performance quoted represents past performance and past performance does not guarantee future results. Current performance may be higher or lower than the performance quoted. For the most recent month-end performance information visit www.wisdomtree.com. Investment in the Fund poses investment risk including the possible loss of principal. The investment return and principal value of an investment will fluctuate, so that shares, when sold or redeemed, may be worth more or less than their original cost. The returns do not reflect the deduction of taxes that a shareholder would pay on Fund distributions or on the redemption of Fund shares. Total returns for a period less than one year have not been annualized. Index returns do not reflect expenses paid by the Fund.
| | | | |
| WisdomTree International Dividend and Sector Funds | | | 15 | |
Performance Summary (unaudited)
WisdomTree International SmallCap Dividend Fund (DLS)
Country Breakdown† as of 3/31/11
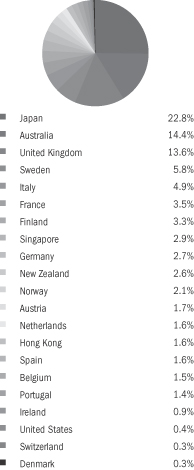
| † | The Fund’s country breakdown is expressed as a percentage of total investments and may change over time; does not include overnight investments in U.S. money market funds or investments of cash collateral for securities loaned. |
Top Ten Holdings* as of 3/31/11
| | | | |
| |
| Description | | % of Net Assets | |
Orion Oyj Class B | | | 0.7% | |
Castellum AB | | | 0.7% | |
Oesterreichische Post AG | | | 0.7% | |
Peab AB | | | 0.6% | |
Rallye S.A. | | | 0.6% | |
Iren SpA | | | 0.6% | |
Spark Infrastructure Group | | | 0.6% | |
Monadelphous Group Ltd. | | | 0.6% | |
Nexity | | | 0.6% | |
Auckland International Airport Ltd. | | | 0.6% | |
| * | The ten largest holdings are subject to change, and there are no guarantees the Fund will remain invested in any particular company. |
The WisdomTree International SmallCap Dividend Fund (the “Fund”) seeks to track the price and yield performance, before fees and expenses, of the WisdomTree International SmallCap Dividend Index.
The Fund returned 16.64% at net asset value (“NAV”) for the fiscal year ended March 31, 2011. The Fund’s investment in the United Kingdom contributed the most positively to Fund performance. The Fund’s investments in Hong Kong contributed to a drag on Fund performance.
The following performance chart is provided for comparative purposes and represents the period noted. The Fund’s per share NAV is the value of one share of the Fund and is calculated by dividing the value of total assets less total liabilities by the number of shares outstanding. The NAV return is based on the NAV of the Fund and the market return is based on the market price per share of the Fund. The price used to calculate market price returns is the mid-point of the highest bid and lowest offer for Fund shares as of the close of trading on the exchange where Fund shares are listed. NAV and market returns assume that dividends and capital gain distributions have been reinvested in the Fund at NAV and market price, respectively. As with other ETFs, NAV returns and market price returns may differ because of factors such as the supply and demand for Fund shares and investors assessments of the underlying value of a Fund’s portfolio securities.
An index is a statistical measure of a specified financial market or sector. An index does not actually hold a portfolio of securities, incur expenses or pay any transaction costs. Therefore index returns do not reflect deductions for fees or expenses and are not available for direct investment. In comparison, the Fund’s performance is negatively impacted by these deductions. Fund returns do not reflect brokerage commissions or taxes on transactions in Fund shares or that a shareholder would pay on Fund distributions. The annual expense ratio of the Fund is 0.58%.
Performance as of 3/31/11
| | | | | | | | | | | | | | | | |
| | | Average Annual Total Return | |
| | | Fund
Net Asset Value | | | Fund
Market Price | | | WisdomTree
International
SmallCap
Dividend Index | | | MSCI EAFE
SmallCap Index | |
One Year | | | 16.64 | % | | | 16.37 | % | | | 17.78 | % | | | 19.94 | % |
Three Year | | | -0.47 | % | | | -0.78 | % | | | 0.50 | % | | | 1.35 | % |
Since Inception1 | | | 4.41 | % | | | 4.23 | % | | | 4.90 | % | | | 3.86 | % |
| 1 | Total returns are calculated based on the commencement of Fund trading on June 16, 2006. |
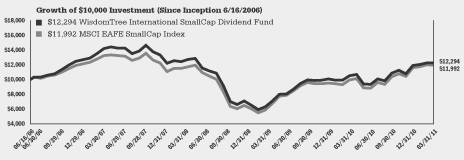
Performance quoted represents past performance and past performance does not guarantee future results. Current performance may be higher or lower than the performance quoted. For the most recent month-end performance information visit www.wisdomtree.com. Investment in the Fund poses investment risk including the possible loss of principal. The investment return and principal value of an investment will fluctuate, so that shares, when sold or redeemed, may be worth more or less than their original cost. The returns do not reflect the deduction of taxes that a shareholder would pay on Fund distributions or on the redemption of Fund shares. Total returns for a period less than one year have not been annualized. Index returns do not reflect expenses paid by the Fund.
| | |
| 16 | | WisdomTree International Dividend and Sector Funds |
Performance Summary (unaudited)
WisdomTree Emerging Markets Equity Income Fund (DEM)
Country Breakdown† as of 3/31/11
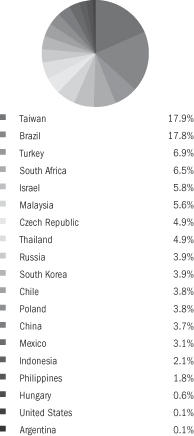
| † | The Fund’s country breakdown is expressed as a percentage of total investments and may change over time; does not include overnight investments in U.S. money market funds or investments of cash collateral for securities loaned. |
Top Ten Holdings* as of 3/31/11
| | | | |
| |
| Description | | % of Net Assets | |
Banco do Brasil S.A. | | | 4.4% | |
Taiwan Semiconductor Manufacturing Co., Ltd. | | | 4.4% | |
Lukoil OAO ADR | | | 2.9% | |
HTC Corp. | | | 2.8% | |
KGHM Polska Miedz S.A. | | | 2.5% | |
CEZ AS | | | 2.5% | |
Bank of China Ltd. Class H | | | 2.4% | |
Cia de Bebidas das Americas | | | 2.3% | |
Turk Telekomunikasyon A.S. | | | 2.2% | |
Chunghwa Telecom Co., Ltd. | | | 2.1% | |
| * | The ten largest holdings are subject to change, and there are no guarantees the Fund will remain invested in any particular company. |
The WisdomTree Emerging Markets Equity Income Fund (the “Fund”) seeks to track the price and yield performance, before fees and expenses, of the WisdomTree Emerging Markets Equity Income Index.
The Fund returned 20.75% for the fiscal year ended March 31, 2011. Stock selection in Brazil contributed most positively to the Fund’s performance. The Fund’s unfavorable stock selection in South Korea created a drag on Fund performance.
The following performance chart is provided for comparative purposes and represents the period noted. The Fund’s per share net asset value (“NAV”) is the value of one share of the Fund and is calculated by dividing the value of total assets less total liabilities by the number of shares outstanding. The NAV return is based on the NAV of the Fund and the market return is based on the market price per share of the Fund. The price used to calculate market price returns is the mid-point of the highest bid and lowest offer for Fund shares as of the close of trading on the exchange where Fund shares are listed. NAV and market returns assume that dividends and capital gain distributions have been reinvested in the Fund at NAV and market price, respectively. As with other ETFs, NAV returns and market price returns may differ because of factors such as the supply and demand for Fund shares and investors assessments of the underlying value of a Fund’s portfolio securities.
An index is a statistical measure of a specified financial market or sector. An index does not actually hold a portfolio of securities, incur expenses or pay any transaction costs. Therefore index returns do not reflect deductions for fees or expenses and are not available for direct investment. In comparison, the Fund’s performance is negatively impacted by these deductions. Fund returns do not reflect brokerage commissions or taxes on transactions in Fund shares or that a shareholder would pay on Fund distributions. The annual expense ratio of the Fund is 0.63%.
Performance as of 3/31/11
| | | | | | | | | | | | | | | | |
| | | Average Annual Total Return | |
| | | Fund
Net Asset Value | | | Fund
Market Price | | | WisdomTree
Emerging
Markets Equity
Income Index | | | MSCI Emerging
Markets Index | |
One Year | | | 20.75 | % | | | 21.37 | % | | | 22.27 | % | | | 18.46 | % |
Three Year | | | 10.11 | % | | | 10.21 | % | | | 11.20 | % | | | 4.32 | % |
Since Inception1 | | | 9.01 | % | | | 8.44 | % | | | 10.03 | % | | | 2.77 | % |
| 1 | Total returns are calculated based on the commencement of Fund trading on July 13, 2007. |
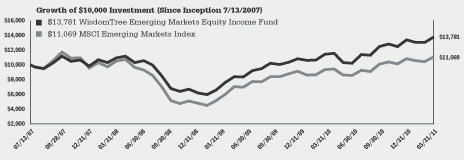
Performance quoted represents past performance and past performance does not guarantee future results. Current performance may be higher or lower than the performance quoted. For the most recent month-end performance information visit www.wisdomtree.com. Investment in the Fund poses investment risk including the possible loss of principal. The investment return and principal value of an investment will fluctuate, so that shares, when sold or redeemed, may be worth more or less than their original cost. The returns do not reflect the deduction of taxes that a shareholder would pay on Fund distributions or on the redemption of Fund shares. Total returns for a period less than one year have not been annualized. Index returns do not reflect expenses paid by the Fund.
| | | | |
| WisdomTree International Dividend and Sector Funds | | | 17 | |
Performance Summary (unaudited)
WisdomTree Emerging Markets SmallCap Dividend Fund (DGS)
Country Breakdown† as of 3/31/11
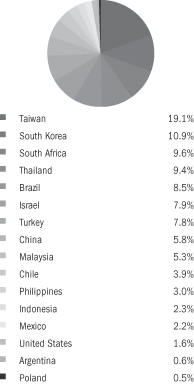
| † | The Fund’s country breakdown is expressed as a percentage of total investments and may change over time; does not include overnight investments in U.S. money market funds or investments of cash collateral for securities loaned. |
Top Ten Holdings* as of 3/31/11
| | | | |
| |
| Description | | % of Net Assets | |
Ford Otomotiv Sanayi A.S. | | | 2.3% | |
Discount Investment Corp. | | | 2.3% | |
AES Tiete S.A. | | | 1.5% | |
CorpBanca S.A. | | | 1.4% | |
Dogan Sirketler Grubu Holdings | | | 1.1% | |
WisdomTree India Earnings Fund | | | 1.1% | |
Oil Refineries Ltd. | | | 1.0% | |
U-Ming Marine Transport Corp. | | | 1.0% | |
Hanwha Chem Corp. | | | 0.8% | |
Foschini Group Ltd. (The) | | | 0.8% | |
| * | The ten largest holdings are subject to change, and there are no guarantees the Fund will remain invested in any particular company. |
The WisdomTree Emerging Markets SmallCap Dividend Fund (the “Fund”) seeks to track the price and yield performance, before fees and expenses, of the WisdomTree Emerging Markets SmallCap Dividend Index.
The Fund returned 23.38% for the fiscal year ended March 31, 2011. The Fund’s investment in Thailand contributed the most positively to Fund performance. The Fund’s position in Argentina contributed to a drag on Fund performance.
The following performance chart is provided for comparative purposes and represents the period noted. The Fund’s per share net asset value (“NAV”) is the value of one share of the Fund and is calculated by dividing the value of total assets less total liabilities by the number of shares outstanding. The NAV return is based on the NAV of the Fund and the market return is based on the market price per share of the Fund. The price used to calculate market price returns is the mid-point of the highest bid and lowest offer for Fund shares as of the close of trading on the exchange where Fund shares are listed. NAV and market returns assume that dividends and capital gain distributions have been reinvested in the Fund at NAV and market price, respectively. As with other ETFs, NAV returns and market price returns may differ because of factors such as the supply and demand for Fund shares and investors assessments of the underlying value of a Fund’s portfolio securities.
An index is a statistical measure of a specified financial market or sector. An index does not actually hold a portfolio of securities, incur expenses or pay any transaction costs. Therefore index returns do not reflect deductions for fees or expenses and are not available for direct investment. In comparison, the Fund’s performance is negatively impacted by these deductions. Fund returns do not reflect brokerage commissions or taxes on transactions in Fund shares or that a shareholder would pay on Fund distributions. The annual expense ratio of the Fund is 0.63%.
Performance as of 3/31/11
| | | | | | | | | | | | | | | | |
| | | Average Annual Total Return | |
| | | Fund
Net Asset Value | | | Fund
Market Price | | | WisdomTree
Emerging
Markets
SmallCap
Dividend Index | | | MSCI Emerging
Markets SmallCap
Index | |
One Year | | | 23.38 | % | | | 23.43 | % | | | 24.68 | % | | | 17.74 | % |
Three Year | | | 10.80 | % | | | 10.57 | % | | | 11.81 | % | | | 8.69 | % |
Since Inception1 | | | 4.49 | % | | | 4.64 | % | | | 5.63 | % | | | 0.73 | % |
| 1 | Total returns are calculated based on the commencement of Fund trading on October 30, 2007. |
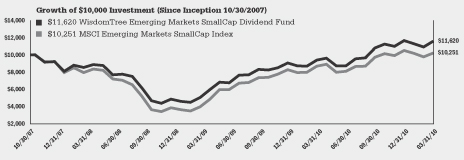
Performance quoted represents past performance and past performance does not guarantee future results. Current performance may be higher or lower than the performance quoted. For the most recent month-end performance information visit www.wisdomtree.com. Investment in the Fund poses investment risk including the possible loss of principal. The investment return and principal value of an investment will fluctuate, so that shares, when sold or redeemed, may be worth more or less than their original cost. The returns do not reflect the deduction of taxes that a shareholder would pay on Fund distributions or on the redemption of Fund shares. Total returns for a period less than one year have not been annualized. Index returns do not reflect expenses paid by the Fund.
| | |
| 18 | | WisdomTree International Dividend and Sector Funds |
Performance Summary (unaudited)
WisdomTree Middle East Dividend Fund (GULF)
Country Breakdown† as of 3/31/11
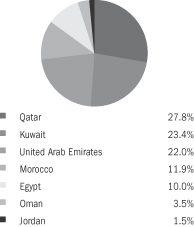
| † | The Fund’s country breakdown is expressed as a percentage of total investments and may change over time; does not include overnight investments in U.S. money market funds or investments of cash collateral for securities loaned. |
Top Ten Holdings* as of 3/31/11
| | | | |
| |
| Description | | % of Net Assets | |
Mobile Telecommunications Co. KSC | | | 15.3% | |
Maroc Telecom | | | 10.1% | |
Industries Qatar QSC | | | 7.6% | |
Qatar Telecom Q-Tel QSC | | | 4.0% | |
Emirates NBD PJSC | | | 4.1% | |
National Bank of Kuwait | | | 3.3% | |
Qatar National Bank S.A.Q | | | 3.2% | |
Qatar Electricity & Water Co. | | | 3.1% | |
Telecom Egypt | | | 2.9% | |
Oman Telecommunications Co. | | | 2.9% | |
| * | The ten largest holdings are subject to change, and there are no guarantees the Fund will remain invested in any particular company. |
The WisdomTree Middle East Dividend Fund (the “Fund”) seeks to track the price and yield performance, before fees and expenses, of the WisdomTree Middle East Dividend Index.
The Fund returned 7.95% at net asset value (“NAV”) for the fiscal year ended March 31, 2011. The Fund benefited from its exposure to Qatar, which had positive performance. The Fund’s position in Oman, created a drag on performance.
The following performance chart is provided for comparative purposes and represents the period noted. The Fund’s per share net asset value (“NAV”) is the value of one share of the Fund and is calculated by dividing the value of total assets less total liabilities by the number of shares outstanding. The NAV return is based on the NAV of the Fund and the market return is based on the market price per share of the Fund. The price used to calculate market price returns is the mid-point of the highest bid and lowest offer for Fund shares as of the close of trading on the exchange where Fund shares are listed. NAV and market returns assume that dividends and capital gain distributions have been reinvested in the Fund at NAV and market price, respectively. As with other ETFs, NAV returns and market price returns may differ because of factors such as the supply and demand for Fund shares and investors assessments of the underlying value of a Fund’s portfolio securities.
An index is a statistical measure of a specified financial market or sector. An index does not actually hold a portfolio of securities, incur expenses or pay any transaction costs. Therefore index returns do not reflect deductions for fees or expenses and are not available for direct investment. In comparison, the Fund’s performance is negatively impacted by these deductions. Fund returns do not reflect brokerage commissions or taxes on transactions in Fund shares or that a shareholder would pay on Fund distributions. The annual net expense ratio of the Fund is 0.88% and the gross expense ratio is 2.17%. The net expense ratio reflects a contractual reimbursement of 1.29%.
Fund expenses are capped by contract at 0.88% through March 31, 2012.
Performance as of 3/31/11
| | | | | | | | | | | | | | | | |
| | | Average Annual Total Return | |
| | | Fund
Net Asset Value | | | Fund
Market Price | | | WisdomTree
Middle East
Dividend Index | | | MSCI Arabian
Markets ex-Saudi
Arabia Index | |
One Year | | | 7.95 | % | | | 7.35 | % | | | 9.47 | % | | | 0.26 | % |
Since Inception1 | | | -11.42 | % | | | -11.22 | % | | | -8.90 | % | | | -16.75 | % |
| 1 | Total returns are calculated based on the commencement of Fund trading on July 16, 2008. |
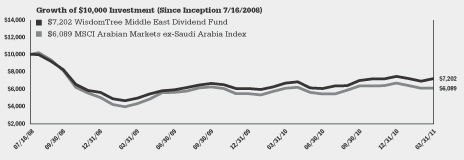
Performance quoted represents past performance and past performance does not guarantee future results. Current performance may be higher or lower than the performance quoted. For the most recent month-end performance information visit www.wisdomtree.com. Investment in the Fund poses investment risk including the possible loss of principal. The investment return and principal value of an investment will fluctuate, so that shares, when sold or redeemed, may be worth more or less than their original cost. The returns do not reflect the deduction of taxes that a shareholder would pay on Fund distributions or on the redemption of Fund shares. Total returns for a period less than one year have not been annualized. Index returns do not reflect expenses paid by the Fund.
| | | | |
| WisdomTree International Dividend and Sector Funds | | | 19 | |
Performance Summary (unaudited)
WisdomTree International Hedged Equity Fund (HEDJ)
Country Breakdown† as of 3/31/11
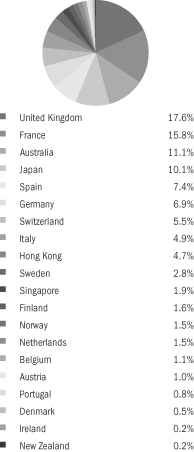
| † | The Fund’s country breakdown is expressed as a percentage of total investments and may change over time; does not include overnight investments in U.S. money market funds or investments of cash collateral for securities loaned. |
Top Ten Holdings* as of 3/31/11
| | | | |
| |
| Description | | % of Net Assets | |
TOTAL S.A. | | | 2.3% | |
Vodafone Group PLC | | | 1.9% | |
Telefonica S.A. | | | 1.8% | |
France Telecom S.A. | | | 1.6% | |
GDF Suez | | | 1.5% | |
Banco Santander S.A. | | | 1.4% | |
Royal Dutch Shell PLC Class A | | | 1.4% | |
Royal Dutch Shell PLC Class B | | | 1.3% | |
HSBC Holdings PLC | | | 1.3% | |
Enel SpA | | | 1.3% | |
| * | The ten largest holdings are subject to change, and there are no guarantees the Fund will remain invested in any particular company. |
The WisdomTree International Hedged Equity Fund (the “Fund”) seeks to track the price and yield performance, before fees and expenses, of the WisdomTree DEFA International Hedged Equity Index.
The Fund returned 3.27% for the fiscal year ended March 31, 2011. The Fund benefited from its favorable stock selection in Japan and its relative underweight the country, which did not perform as well as other international peers. The Fund’s stock selection within the United Kingdom contributed a drag on Fund performance.
The following performance chart is provided for comparative purposes and represents the period noted. The Fund’s per share net asset value (“NAV”) is the value of one share of the Fund and is calculated by dividing the value of total assets less total liabilities by the number of shares outstanding. The NAV return is based on the NAV of the Fund and the market return is based on the market price per share of the Fund. The price used to calculate market price returns is the mid-point of the highest bid and lowest offer for Fund shares as of the close of trading on the exchange where Fund shares are listed. NAV and market returns assume that dividends and capital gain distributions have been reinvested in the Fund at NAV and market price, respectively. As with other ETFs, NAV returns and market price returns may differ because of factors such as the supply and demand for Fund shares and investors assessments of the underlying value of a Fund’s portfolio securities.
An index is a statistical measure of a specified financial market or sector. An index does not actually hold a portfolio of securities, incur expenses or pay any transaction costs. Therefore index returns do not reflect deductions for fees or expenses and are not available for direct investment. In comparison, the Fund’s performance is negatively impacted by these deductions. Fund returns do not reflect brokerage commissions or taxes on transactions in Fund shares or that a shareholder would pay on Fund distributions. The annual net expense ratio of the Fund is 0.58% and the gross expense ratio is 1.65%. The net expense ratio reflects a contractual reimbursement of 1.07%.
Fund expenses are capped by contract at 0.58% through March 31, 2012.
Performance as of 3/31/11
| | | | | | | | | | | | | | | | |
| | | Average Annual Total Return | |
| | | Fund
Net Asset Value | | | Fund
Market Price | | | WisdomTree DEFA
International Hedged
Equity Index | | | MSCI EAFE Local
Currency Index | |
One Year | | | 3.27 | % | | | 3.50 | % | | | 3.71 | % | | | 1.49 | % |
Since Inception1 | | | 4.24 | % | | | 4.80 | % | | | 5.17 | % | | | 4.67 | % |
| 1 | Total returns are calculated based on the commencement of Fund trading on December 31, 2009. |
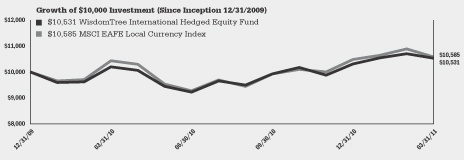
Performance quoted represents past performance and past performance does not guarantee future results. Current performance may be higher or lower than the performance quoted. For the most recent month-end performance information visit www.wisdomtree.com. Investment in the Fund poses investment risk including the possible loss of principal. The investment return and principal value of an investment will fluctuate, so that shares, when sold or redeemed, may be worth more or less than their original cost. The returns do not reflect the deduction of taxes that a shareholder would pay on Fund distributions or on the redemption of Fund shares. Total returns for a period less than one year have not been annualized. Index returns do not reflect expenses paid by the Fund.
| | |
| 20 | | WisdomTree International Dividend and Sector Funds |
Performance Summary (unaudited)
WisdomTree International Basic Materials Sector Fund (DBN)
Country Breakdown† as of 3/31/11
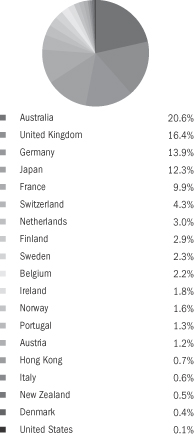
| † | The Fund’s country breakdown is expressed as a percentage of total investments and may change over time; does not include overnight investments in U.S. money market funds or investments of cash collateral for securities loaned. |
Top Ten Holdings* as of 3/31/11
| | | | |
| |
| Description | | % of Net Assets | |
BHP Billiton Ltd. | | | 13.4% | |
BASF SE | | | 9.8% | |
BHP Billiton PLC | | | 6.4% | |
Air Liquide S.A. | | | 3.9% | |
Lafarge S.A. | | | 3.3% | |
Rio Tinto PLC | | | 3.2% | |
Syngenta AG | | | 2.3% | |
Linde AG | | | 1.9% | |
Rio Tinto Ltd. | | | 1.8% | |
CRH PLC | | | 1.8% | |
| * | The ten largest holdings are subject to change, and there are no guarantees the Fund will remain invested in any particular company. |
The WisdomTree International Basic Materials Sector Fund (the “Fund”) seeks to track the price and yield performance, before fees and expenses, of the WisdomTree International Basic Materials Sector Index.
The Fund) returned 17.31% at net asset value (“NAV”) for the fiscal year ended March 31, 2011. The Fund’s investment in Australia contributed the most positively to Fund performance. The Fund’s position in Japan contributed to a drag on Fund performance.
The following performance chart is provided for comparative purposes and represents the period noted. The Fund’s per share NAV is the value of one share of the Fund and is calculated by dividing the value of total assets less total liabilities by the number of shares outstanding. The NAV return is based on the NAV of the Fund and the market return is based on the market price per share of the Fund. The price used to calculate market price returns is the mid-point of the highest bid and lowest offer for Fund shares as of the close of trading on the exchange where Fund shares are listed. NAV and market returns assume that dividends and capital gain distributions have been reinvested in the Fund at NAV and market price, respectively. As with other ETFs, NAV returns and market price returns may differ because of factors such as the supply and demand for Fund shares and investors assessments of the underlying value of a Fund’s portfolio securities.
An index is a statistical measure of a specified financial market or sector. An index does not actually hold a portfolio of securities, incur expenses or pay any transaction costs. Therefore index returns do not reflect deductions for fees or expenses and are not available for direct investment. In comparison, the Fund’s performance is negatively impacted by these deductions. Fund returns do not reflect brokerage commissions or taxes on transactions in Fund shares or that a shareholder would pay on Fund distributions. The annual expense ratio of the Fund is 0.58%.
Performance as of 3/31/11
| | | | | | | | | | | | | | | | |
| | | Average Annual Total Return | |
| | | Fund
Net Asset Value | | | Fund
Market Price | | | WisdomTree
International
Basic Materials
Sector Index | | | S&P
Developed
ex-U.S. BMI
Materials
Sector Index | |
One Year | | | 17.31 | % | | | 18.56 | % | | | 18.25 | % | | | 25.00 | % |
Three Year | | | 1.01 | % | | | 0.86 | % | | | 1.60 | % | | | 3.39 | % |
Since Inception1 | | | 8.96 | % | | | 8.85 | % | | | 9.80 | % | | | 3.39 | % |
| 1 | Total returns are calculated based on the commencement of Fund trading on October 13, 2006. S&P Developed ex-U.S. Sector Index total returns are based on the index’s inception date of April 1, 2008. |
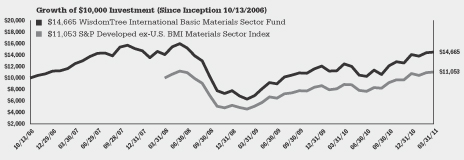
Performance quoted represents past performance and past performance does not guarantee future results. Current performance may be higher or lower than the performance quoted. For the most recent month-end performance information visit www.wisdomtree.com. Investment in the Fund poses investment risk including the possible loss of principal. The investment return and principal value of an investment will fluctuate, so that shares, when sold or redeemed, may be worth more or less than their original cost. The returns do not reflect the deduction of taxes that a shareholder would pay on Fund distributions or on the redemption of Fund shares. Total returns for a period less than one year have not been annualized. Index returns do not reflect expenses paid by the Fund.
| | | | |
| WisdomTree International Dividend and Sector Funds | | | 21 | |
Performance Summary (unaudited)
WisdomTree International Energy Sector Fund (DKA)
Country Breakdown† as of 3/31/11
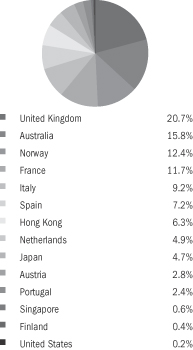
| † | The Fund’s country breakdown is expressed as a percentage of total investments and may change over time; does not include overnight investments in U.S. money market funds or investments of cash collateral for securities loaned. |
Top Ten Holdings* as of 3/31/11
| | | | |
| |
| Description | | % of Net Assets | |
TOTAL S.A. | | | 7.5% | |
Royal Dutch Shell PLC Class B | | | 6.9% | |
Royal Dutch Shell PLC Class A | | | 6.5% | |
CNOOC Ltd. | | | 6.3% | |
ENI SpA | | | 6.3% | |
Statoil ASA | | | 5.8% | |
Repsol YPF S.A. | | | 5.5% | |
BG Group PLC | | | 3.2% | |
Woodside Petroleum Ltd. | | | 3.1% | |
Coal & Allied Industries Ltd. | | | 3.0% | |
| * | The ten largest holdings are subject to change, and there are no guarantees the Fund will remain invested in any particular company. |
The WisdomTree International Energy Sector Fund (the “Fund”) seeks to track the price and yield performance, before fees and expenses, of the WisdomTree International Energy Sector Index.
The Fund returned 24.74% at net asset value (“NAV”) for the fiscal year ended March 31, 2011. The Fund’s investment in the Netherlands contributed the most positively to Fund performance. The Fund’s exposure in the United Kingdom created a drag on Fund performance.
The following performance chart is provided for comparative purposes and represents the period noted. The Fund’s per share NAV is the value of one share of the Fund and is calculated by dividing the value of total assets less total liabilities by the number of shares outstanding. The NAV return is based on the NAV of the Fund and the market return is based on the market price per share of the Fund. The price used to calculate market price returns is the mid-point of the highest bid and lowest offer for Fund shares as of the close of trading on the exchange where Fund shares are listed. NAV and market returns assume that dividends and capital gain distributions have been reinvested in the Fund at NAV and market price, respectively. As with other ETFs, NAV returns and market price returns may differ because of factors such as the supply and demand for Fund shares and investors assessments of the underlying value of a Fund’s portfolio securities.
An index is a statistical measure of a specified financial market or sector. An index does not actually hold a portfolio of securities, incur expenses or pay any transaction costs. Therefore index returns do not reflect deductions for fees or expenses and are not available for direct investment. In comparison, the Fund’s performance is negatively impacted by these deductions. Fund returns do not reflect brokerage commissions or taxes on transactions in Fund shares or that a shareholder would pay on Fund distributions. The annual expense ratio of the Fund is 0.58%.
Performance as of 3/31/11
| | | | | | | | | | | | | | | | |
| | | Average Annual Total Return | |
| | | Fund
Net Asset Value | | | Fund
Market Price | | | WisdomTree
International
Energy
Sector Index | | | S&P
Developed
ex-U.S. BMI
Energy
Sector Index | |
One Year | | | 24.74 | % | | | 25.91 | % | | | 24.02 | % | | | 21.03 | % |
Three Year | | | 2.54 | % | | | 2.75 | % | | | 2.93 | % | | | 4.10 | % |
Since Inception1 | | | 7.47 | % | | | 7.32 | % | | | 7.80 | % | | | 4.10 | % |
| 1 | Total returns are calculated based on the commencement of Fund trading on October 13, 2006. S&P Developed ex-U.S. Sector Index total returns are based on the index’s inception date of April 1, 2008. |
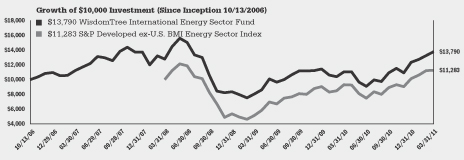
Performance quoted represents past performance and past performance does not guarantee future results. Current performance may be higher or lower than the performance quoted. For the most recent month-end performance information visit www.wisdomtree.com. Investment in the Fund poses investment risk including the possible loss of principal. The investment return and principal value of an investment will fluctuate, so that shares, when sold or redeemed, may be worth more or less than their original cost. The returns do not reflect the deduction of taxes that a shareholder would pay on Fund distributions or on the redemption of Fund shares. Total returns for a period less than one year have not been annualized. Index returns do not reflect expenses paid by the Fund.
| | |
| 22 | | WisdomTree International Dividend and Sector Funds |
Performance Summary (unaudited)
WisdomTree International Utilities Sector Fund (DBU)
Country Breakdown† as of 3/31/11
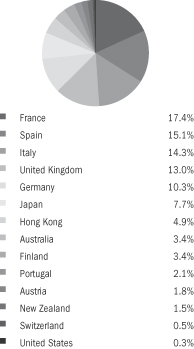
| † | The Fund’s country breakdown is expressed as a percentage of total investments and may change over time; does not include overnight investments in U.S. money market funds or investments of cash collateral for securities loaned. |
Top Ten Holdings* as of 3/31/11
| | | | |
| |
| Description | | % of Net Assets | |
GDF Suez | | | 8.5% | |
Enel SpA | | | 8.4% | |
Iberdrola S.A. | | | 7.3% | |
E.ON AG | | | 5.9% | |
Electricite de France S.A. | | | 5.6% | |
RWE AG | | | 4.9% | |
National Grid PLC | | | 4.0% | |
Fortum Oyj | | | 3.5% | |
Gas Natural SDG S.A. | | | 2.7% | |
Scottish & Southern Energy PLC | | | 2.7% | |
| * | The ten largest holdings are subject to change, and there are no guarantees the Fund will remain invested in any particular company. |
The WisdomTree International Utilities Sector Fund (the “Fund”) seeks to track the price and yield performance, before fees and expenses, of the WisdomTree International Utilities Sector Index.
The Fund returned 4.27% at net asset value (“NAV”) for the fiscal year ended March 31, 2011. The Fund’s investment in the United Kingdom contributed the most positively to Fund performance. The Fund’s position in Germany contributed to a drag on Fund performance.
The following performance chart is provided for comparative purposes and represents the period noted. The Fund’s per share NAV is the value of one share of the Fund and is calculated by dividing the value of total assets less total liabilities by the number of shares outstanding. The NAV return is based on the NAV of the Fund and the market return is based on the market price per share of the Fund. The price used to calculate market price returns is the mid-point of the highest bid and lowest offer for Fund shares as of the close of trading on the exchange where Fund shares are listed. NAV and market returns assume that dividends and capital gain distributions have been reinvested in the Fund at NAV and market price, respectively. As with other ETFs, NAV returns and market price returns may differ because of factors such as the supply and demand for Fund shares and investors assessments of the underlying value of a Fund’s portfolio securities.
An index is a statistical measure of a specified financial market or sector. An index does not actually hold a portfolio of securities, incur expenses or pay any transaction costs. Therefore index returns do not reflect deductions for fees or expenses and are not available for direct investment. In comparison, the Fund’s performance is negatively impacted by these deductions. Fund returns do not reflect brokerage commissions or taxes on transactions in Fund shares or that a shareholder would pay on Fund distributions. The annual expense ratio of the Fund is 0.58%.
Performance as of 3/31/11
| | | | | | | | | | | | | | | | |
| | | Average Annual Total Return | |
| | | Fund
Net Asset Value | | | Fund
Market Price | | | WisdomTree
International
Utilities
Sector Index | | | S&P
Developed
ex-U.S. BMI
Utilities
Sector Index | |
One Year | | | 4.27 | % | | | 4.43 | % | | | 4.17 | % | | | 0.75 | % |
Three Year | | | -8.56 | % | | | -8.59 | % | | | -8.72 | % | | | -8.01 | % |
Since Inception1 | | | 0.26 | % | | | 0.11 | % | | | 0.57 | % | | | -8.01 | % |
| 1 | Total returns are calculated based on the commencement of Fund trading on October 13, 2006. S&P Developed ex-U.S. Sector Index total returns are based on the index’s inception date of April 1, 2008 |
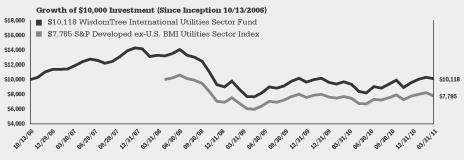
Performance quoted represents past performance and past performance does not guarantee future results. Current performance may be higher or lower than the performance quoted. For the most recent month-end performance information visit www.wisdomtree.com. Investment in the Fund poses investment risk including the possible loss of principal. The investment return and principal value of an investment will fluctuate, so that shares, when sold or redeemed, may be worth more or less than their original cost. The returns do not reflect the deduction of taxes that a shareholder would pay on Fund distributions or on the redemption of Fund shares. Total returns for a period less than one year have not been annualized. Index returns do not reflect expenses paid by the Fund.
| | | | |
| WisdomTree International Dividend and Sector Funds | | | 23 | |
Performance Summary (unaudited)
WisdomTree International Real Estate Fund (DRW)
Country Breakdown† as of 3/31/11
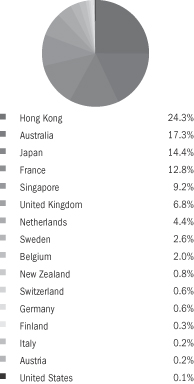
| † | The Fund’s country breakdown is expressed as a percentage of total investments and may change over time; does not include overnight investments in U.S. money market funds or investments of cash collateral for securities loaned. |
Top Ten Holdings* as of 3/31/11
| | | | |
| |
| Description | | % of Net Assets | |
Westfield Group | | | 6.4% | |
Cheung Kong (Holdings) Ltd. | | | 4.6% | |
Sun Hung Kai Properties Ltd. | | | 3.9% | |
Gecina S.A. | | | 3.0% | |
Stockland | | | 2.4% | |
Klepierre | | | 2.4% | |
Wharf Holdings Ltd. | | | 2.1% | |
British Land Co. PLC | | | 2.0% | |
Unibail-Rodamco SE | | | 1.8% | |
Corio N.V. | | | 1.8% | |
| * | The ten largest holdings are subject to change, and there are no guarantees the Fund will remain invested in any particular company. |
The WisdomTree International Real Estate Fund (the “Fund”) seeks to track the price and yield performance, before fees and expenses, of the WisdomTree International Real Estate Index.
The Fund returned 18.81% at net asset value (“NAV”) for the fiscal year ended March 31, 2011. The Fund benefited the most from its investments in Hong Kong, Australia, Japan, and Singapore. Although all countries represented in the Fund had positive performance, Italy, Finland and New Zealand had the least favorable returns.
The following performance chart is provided for comparative purposes and represents the period noted. The Fund’s per share net asset value (“NAV”) is the value of one share of the Fund and is calculated by dividing the value of total assets less total liabilities by the number of shares outstanding. The NAV return is based on the NAV of the Fund and the market return is based on the market price per share of the Fund. The price used to calculate market price returns is the mid-point of the highest bid and lowest offer for Fund shares as of the close of trading on the exchange where Fund shares are listed. NAV and market returns assume that dividends and capital gain distributions have been reinvested in the Fund at NAV and market price, respectively. As with other ETFs, NAV returns and market price returns may differ because of factors such as the supply and demand for Fund shares and investors assessments of the underlying value of a Fund’s portfolio securities.
An index is a statistical measure of a specified financial market or sector. An index does not actually hold a portfolio of securities, incur expenses or pay any transaction costs. Therefore index returns do not reflect deductions for fees or expenses and are not available for direct investment. In comparison, the Fund’s performance is negatively impacted by these deductions. Fund returns do not reflect brokerage commissions or taxes on transactions in Fund shares or that a shareholder would pay on Fund distributions. The annual expense ratio of the Fund is 0.58%.
Performance as of 3/31/11
| | | | | | | | | | | | | | | | |
| | | Average Annual Total Return | |
| | | Fund
Net Asset Value | | | Fund
Market Price | | | WisdomTree
International
Real Estate
Index | | | Dow Jones Global
ex-U.S. Select Real
Estate Securities Index | |
One Year | | | 18.81 | % | | | 19.72 | % | | | 18.88 | % | | | 21.14 | % |
Three Years | | | -4.45 | % | | | -4.83 | % | | | -4.64 | % | | | -3.81 | % |
Since Inception1 | | | -7.79 | % | | | -7.93 | % | | | -7.63 | % | | | -9.15 | % |
| 1 | Total returns are calculated based on the commencement of Fund trading on June 5, 2007. |
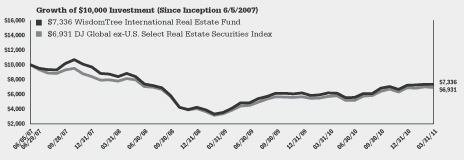
Performance quoted represents past performance and past performance does not guarantee future results. Current performance may be higher or lower than the performance quoted. For the most recent month-end performance information visit www.wisdomtree.com. Investment in the Fund poses investment risk including the possible loss of principal. The investment return and principal value of an investment will fluctuate, so that shares, when sold or redeemed, may be worth more or less than their original cost. The returns do not reflect the deduction of taxes that a shareholder would pay on Fund distributions or on the redemption of Fund shares. Total returns for a period less than one year have not been annualized. Index returns do not reflect expenses paid by the Fund.
| | |
| 24 | | WisdomTree International Dividend and Sector Funds |
| | | | | | | | | | | | | | | | | | | | | | | | | | | | |
| | | | | | Cumulative Returns as of 3/31/11 (unaudited) | |
| | | | | | Total Return NAV (%) | | | Market Price (%) | |
| | | | | | 1-Year | | | 3-Year | | | Since
Inception | | | 1-Year | | | 3-Year | | | Since
Inception | |
WisdomTree DEFA Fund | | | DWM | | | | 11.33 | % | | | -9.98 | % | | | 15.56 | % | | | 11.52 | % | | | -10.24 | % | | | 15.86 | % |
MSCI EAFE Index | | | | | | | 10.42 | % | | | -8.77 | % | | | 11.33 | % | | | 10.42 | % | | | -8.77 | % | | | 11.33 | % |
WisdomTree DEFA Index | | | | | | | 11.19 | % | | | -8.25 | % | | | 18.69 | % | | | 11.19 | % | | | -8.25 | % | | | 18.69 | % |
WisdomTree DEFA Equity Income Fund | | | DTH | | | | 9.74 | % | | | -12.82 | % | | | 8.91 | % | | | 10.79 | % | | | -12.67 | % | | | 8.88 | % |
MSCI EAFE Value Index | | | | | | | 8.21 | % | | | -10.32 | % | | | 5.58 | % | | | 8.21 | % | | | -10.32 | % | | | 5.58 | % |
WisdomTree DEFA Equity Income Index | | | | | | | 10.07 | % | | | -11.38 | % | | | 13.85 | % | | | 10.07 | % | | | -11.38 | % | | | 13.85 | % |
WisdomTree Global Equity Income Fund | | | DEW | | | | 13.12 | % | | | -9.34 | % | | | 11.16 | % | | | 13.75 | % | | | -9.00 | % | | | 11.11 | % |
Spliced Cap-Weighted Index(1) | | | | | | | 14.08 | % | | | -10.85 | % | | | 9.16 | % | | | 14.08 | % | | | -10.85 | % | | | 9.16 | % |
Spliced WisdomTree Index(4) | | | | | | | 13.26 | % | | | -8.57 | % | | | 13.60 | % | | | 13.26 | % | | | -8.57 | % | | | 13.60 | % |
WisdomTree Europe SmallCap Dividend Fund | | | DFE | | | | 21.86 | % | | | -8.20 | % | | | 14.86 | % | | | 22.65 | % | | | -8.03 | % | | | 13.58 | % |
MSCI Europe Small Cap Index | | | | | | | 23.75 | % | | | 1.77 | % | | | 30.85 | % | | | 23.75 | % | | | 1.77 | % | | | 30.85 | % |
WT Europe SmallCap Dividend Index | | | | | | | 22.71 | % | | | -6.20 | % | | | 16.57 | % | | | 22.71 | % | | | -6.20 | % | | | 16.57 | % |
WisdomTree Japan Hedged Equity Fund | | | DXJ | | | | -11.25 | % | | | -19.96 | % | | | -22.09 | % | | | -11.74 | % | | | -20.15 | % | | | -21.99 | % |
Spliced Cap-Weighted Index(3) | | | | | | | -10.52 | % | | | -21.02 | % | | | -24.06 | % | | | -10.52 | % | | | -21.02 | % | | | -24.06 | % |
Spliced WisdomTree Index(7) | | | | | | | -11.02 | % | | | -20.33 | % | | | -22.25 | % | | | -11.02 | % | | | -20.33 | % | | | -22.25 | % |
WisdomTree World ex-U.S. Growth Fund | | | DNL | | | | 13.67 | % | | | 21.44 | % | | | 23.11 | % | | | 14.70 | % | | | 22.11 | % | | | 24.61 | % |
Spliced Cap-Weighted Index(2) | | | | | | | 14.73 | % | | | 28.17 | % | | | 28.91 | % | | | 14.73 | % | | | 28.17 | % | | | 28.91 | % |
Spliced WisdomTree Index(5) | | | | | | | 14.62 | % | | | 23.26 | % | | | 25.74 | % | | | 14.62 | % | | | 23.26 | % | | | 25.74 | % |
WisdomTree Japan SmallCap Dividend Fund | | | DFJ | | | | 6.02 | % | | | 2.60 | % | | | -9.07 | % | | | 5.38 | % | | | 1.90 | % | | | -8.13 | % |
MSCI Japan SmallCap Index | | | | | | | 8.84 | % | | | 2.01 | % | | | -13.83 | % | | | 8.84 | % | | | 2.01 | % | | | -13.83 | % |
WT Japan SmallCap Dividend Index | | | | | | | 7.52 | % | | | 5.10 | % | | | -6.06 | % | | | 7.52 | % | | | 5.10 | % | | | -6.06 | % |
WisdomTree Pacific ex-Japan Total Dividend Fund | | | DND | | | | 15.33 | % | | | 12.84 | % | | | 70.71 | % | | | 15.98 | % | | | 12.62 | % | | | 71.26 | % |
MSCI Pacific ex-Japan Index | | | | | | | 16.53 | % | | | 18.15 | % | | | 67.85 | % | | | 16.53 | % | | | 18.15 | % | | | 67.85 | % |
WT Pacific ex-Japan Dividend Index | | | | | | | 16.92 | % | | | 17.02 | % | | | 80.88 | % | | | 16.92 | % | | | 17.02 | % | | | 80.88 | % |
WisdomTree Pacific ex-Japan Equity Income Fund | | | DNH | | | | 14.03 | % | | | 22.82 | % | | | 68.33 | % | | | 15.16 | % | | | 22.00 | % | | | 68.23 | % |
MSCI Pacific ex-Japan Value Index | | | | | | | 16.63 | % | | | 20.13 | % | | | 57.96 | % | | | 16.63 | % | | | 20.13 | % | | | 57.96 | % |
WT Pacific ex-Japan Equity Income Index | | | | | | | 14.59 | % | | | 24.94 | % | | | 73.65 | % | | | 14.59 | % | | | 24.94 | % | | | 73.65 | % |
WisdomTree International LargeCap Dividend Fund | | | DOL | | | | 9.21 | % | | | -11.08 | % | | | 13.15 | % | | | 9.46 | % | | | -11.26 | % | | | 12.23 | % |
MSCI EAFE Index | | | | | | | 10.42 | % | | | -8.77 | % | | | 11.33 | % | | | 10.42 | % | | | -8.77 | % | | | 11.33 | % |
WisdomTree International LargeCap Dividend Index | | | | | | | 9.81 | % | | | -10.93 | % | | | 15.34 | % | | | 9.81 | % | | | -10.93 | % | | | 15.34 | % |
WisdomTree International Dividend ex-Financials Fund | | | DOO | | | | 14.93 | % | | | -10.11 | % | | | 19.04 | % | | | 15.72 | % | | | -9.79 | % | | | 18.37 | % |
MSCI EAFE Value Index | | | | | | | 8.21 | % | | | -10.32 | % | | | 5.58 | % | | | 8.21 | % | | | -10.32 | % | | | 5.58 | % |
Spliced WisdomTree Index(6) | | | | | | | 15.84 | % | | | -9.27 | % | | | 21.89 | % | | | 15.84 | % | | | -9.27 | % | | | 21.89 | % |
WisdomTree International MidCap Dividend Fund | | | DIM | | | | 14.38 | % | | | -2.21 | % | | | 26.46 | % | | | 15.01 | % | | | -2.36 | % | | | 25.34 | % |
MSCI EAFE Mid Cap Index | | | | | | | 15.41 | % | | | -6.03 | % | | | 12.94 | % | | | 15.41 | % | | | -6.03 | % | | | 12.94 | % |
WisdomTree International MidCap Dividend Index | | | | | | | 15.24 | % | | | -2.27 | % | | | 27.49 | % | | | 15.24 | % | | | -2.27 | % | | | 27.49 | % |
WisdomTree International SmallCap Dividend Fund | | | DLS | | | | 16.64 | % | | | -1.39 | % | | | 22.94 | % | | | 16.37 | % | | | -2.33 | % | | | 21.92 | % |
MSCI EAFE Small Cap Index | | | | | | | 19.94 | % | | | 4.11 | % | | | 19.92 | % | | | 19.94 | % | | | 4.11 | % | | | 19.92 | % |
WisdomTree International SmallCap Dividend Index | | | | | | | 17.78 | % | | | 1.50 | % | | | 25.76 | % | | | 17.78 | % | | | 1.50 | % | | | 25.76 | % |
WisdomTree Emerging Markets Equity Income Fund | | | DEM | | | | 20.75 | % | | | 33.50 | % | | | 37.81 | % | | | 21.37 | % | | | 33.85 | % | | | 35.17 | % |
MSCI Emerging Markets Index | | | | | | | 18.46 | % | | | 13.54 | % | | | 10.69 | % | | | 18.46 | % | | | 13.54 | % | | | 10.69 | % |
WT Emerging Markets Equity Income Index | | | | | | | 22.27 | % | | | 37.52 | % | | | 42.69 | % | | | 22.27 | % | | | 37.52 | % | | | 42.69 | % |
| | | | |
| WisdomTree International Dividend and Sector Funds | | | 25 | |
| | | | | | | | | | | | | | | | | | | | | | | | | | | | |
| | | | | | Cumulative Returns as of 3/31/11 (unaudited) | |
| | | | | | Total Return NAV (%) | | | Market Price (%) | |
| | | | | | 1-Year | | | 3-Year | | | Since
Inception | | | 1-Year | | | 3-Year | | | Since
Inception | |
WisdomTree Emerging Markets SmallCap Dividend Fund | | | DGS | | | | 23.38 | % | | | 36.02 | % | | | 16.20 | % | | | 23.43 | % | | | 35.19 | % | | | 16.77 | % |
MSCI Emerging Markets Small Cap Index | | | | | | | 17.74 | % | | | 28.42 | % | | | 2.51 | % | | | 17.74 | % | | | 28.42 | % | | | 2.51 | % |
WT Emerging Markets SmallCap Dividend Index | | | | | | | 24.68 | % | | | 39.80 | % | | | 20.60 | % | | | 24.68 | % | | | 39.80 | % | | | 20.60 | % |
WisdomTree Middle East Dividend Fund | | | GULF | | | | 7.95 | % | | | n/a | | | | -27.98 | % | | | 7.35 | % | | | n/a | | | | -27.54 | % |
MSCI Arabian Markets ex-Saudi Arabia Index | | | | | | | 0.26 | % | | | n/a | | | | -39.11 | % | | | 0.26 | % | | | n/a | | | | -39.11 | % |
WT Middle East Dividend Index | | | | | | | 9.47 | % | | | n/a | | | | -22.30 | % | | | 9.47 | % | | | n/a | | | | -22.30 | % |
WisdomTree International Hedged Equity Fund | | | HEDJ | | | | 3.27 | % | | | n/a | | | | 5.31 | % | | | 3.50 | % | | | n/a | | | | 6.02 | % |
MSCI EAFE Local Currency Index | | | | | | | 1.49 | % | | | n/a | | | | 5.85 | % | | | 1.49 | % | | | n/a | | | | 5.85 | % |
WisdomTree DEFA International Hedged Equity Index | | | | | | | 3.71 | % | | | n/a | | | | 6.49 | % | | | 3.71 | % | | | n/a | | | | 6.49 | % |
WisdomTree International Basic Materials Sector Fund | | | DBN | | | | 17.31 | % | | | 3.07 | % | | | 46.65 | % | | | 18.56 | % | | | 2.59 | % | | | 46.00 | % |
S&P Developed ex-U.S. BMI Materials Sector Index* | | | | | | | 25.00 | % | | | 10.53 | % | | | 10.53 | % | | | 25.00 | % | | | 10.53 | % | | | 10.53 | % |
WT Int’l Basic Materials Sector Index | | | | | | | 18.25 | % | | | 4.89 | % | | | 51.82 | % | | | 18.25 | % | | | 4.89 | % | | | 51.82 | % |
WisdomTree International Energy Sector Fund | | | DKA | | | | 24.74 | % | | | 7.81 | % | | | 37.90 | % | | | 25.91 | % | | | 8.47 | % | | | 37.06 | % |
S&P Developed ex-U.S. BMI Energy Sector Index* | | | | | | | 21.03 | % | | | 12.82 | % | | | 12.82 | % | | | 21.03 | % | | | 12.82 | % | | | 12.82 | % |
WT International Energy Sector Index | | | | | | | 24.02 | % | | | 9.04 | % | | | 39.85 | % | | | 24.02 | % | | | 9.04 | % | | | 39.85 | % |
WisdomTree International Utilities Sector Fund | | | DBU | | | | 4.27 | % | | | -23.55 | % | | | 1.18 | % | | | 4.43 | % | | | -23.62 | % | | | 0.50 | % |
S&P Developed ex-U.S. BMI Utilities Sector Index* | | | | | | | 0.75 | % | | | -22.15 | % | | | -22.15 | % | | | 0.75 | % | | | -22.15 | % | | | -22.15 | % |
WT International Utilities Sector Index | | | | | | | 4.17 | % | | | -23.94 | % | | | 2.58 | % | | | 4.17 | % | | | -23.94 | % | | | 2.58 | % |
WisdomTree International Real Estate Fund | | | DRW | | | | 18.81 | % | | | -12.77 | % | | | -26.64 | % | | | 19.72 | % | | | -13.80 | % | | | -27.09 | % |
Dow Jones Global ex-U.S. Select Real Estate Securities Index | | | | | | | 21.14 | % | | | -11.00 | % | | | -30.69 | % | | | 21.14 | % | | | -11.00 | % | | | -30.69 | % |
WT Int’l Real Estate Index | | | | | | | 18.88 | % | | | -13.28 | % | | | -26.18 | % | | | 18.88 | % | | | -13.28 | % | | | -26.18 | % |
| * | The inception date of the S&P Developed ex-U.S. Indexes is 4/1/08. |
Performance quoted represents past performance and past performance does not guarantee future results. Current performance may be higher or lower than the performance quoted. For the most recent month end performance information visit www.wisdomtree.com. Investment in the Fund poses investment risk including the possible loss of principal. The investment return and principal value of an investment will fluctuate, so that shares, when sold or redeemed, may be worth more or less than their original cost. The returns do not reflect the deduction of taxes that a shareholder would pay on Fund distributions or on the redemption of Fund shares. Total returns for a period less than one year have not been annualized. Index returns do not reflect expenses paid by the Fund.
Please see pages 27 through 29 for the list of index descriptions.
| | |
| 26 | | WisdomTree International Dividend and Sector Funds |
Description of Indexes (unaudited)
Below are descriptions of each index referenced in this Report:
The WisdomTree Dividend Index of Europe, Far East Asia and Australasia (WisdomTree DEFA) measures the performance of dividend-paying companies in the industrialized world, excluding Canada and the United States.
The WisdomTree DEFA International Hedged Equity Index measures the performance of dividend-paying companies in the industrialized world, excluding Canada and the United States, and is designed to neutralize exposure to fluctuations between the value of the U.S. dollar and non-U.S. currencies reflected in the index. This index is based on the WisdomTree DEFA Index.
The WisdomTree DEFA Equity Income Index measures the performance of companies with high dividend yields selected from the WisdomTree DEFA Index.
The WisdomTree Global Equity Income Index measures the performance of high dividend-paying companies selected from the WisdomTree Dividend Index and the WisdomTree World ex-U.S. Index.
The WisdomTree Europe Equity Income Index measures the performance of companies with high dividend yields selected from the WisdomTree Europe Dividend Index.
The WisdomTree Europe SmallCap Dividend Index measures the performance of the small-capitalization segment of the European dividend-paying market.
The WisdomTree Japan Dividend Index measures the performance of dividend-paying companies incorporated in Japan, listed on the Tokyo Stock Exchange and that meet other requirements necessary to be included in the WisdomTree DEFA Index.
The WisdomTree World ex-U.S. Growth Index measures the stock performance of growth companies selected from developed and emerging markets outside the U.S.
The WisdomTree Japan Equity Income Index measures the performance of companies with high dividend yields selected from the WisdomTree Japan Dividend Index.
The WisdomTree Japan SmallCap Dividend Index measures the performance of dividend-paying small-capitalization companies in Japan.
The WisdomTree Japan Hedged Equity Index is designed to provide exposure to Japanese equity markets while at the same time neutralizing exposure to fluctuations of the Japanese Yen movements relative to the U.S. dollar. This index is based on the WisdomTree Japan Dividend Index.
The WisdomTree Pacific ex-Japan Dividend Index measures the performance of dividend-paying companies incorporated in the Pacific region, excluding Japan.
The WisdomTree Pacific ex-Japan Equity Income Index measures the performance of companies with high dividend yields selected from the WisdomTree Pacific ex-Japan Dividend Index.
The WisdomTree International LargeCap Dividend Index measures the performance of the large-capitalization segment of the dividend-paying market in the industrialized world outside the U.S. and Canada.
The WisdomTree International Dividend ex-Financials Index measures the performance of high dividend-yielding international stocks outside the financial sector.
The WisdomTree International Dividend Top 100 Index measures the performance of the 100 highest dividend-yielding companies in the WisdomTree International LargeCap Dividend Index.
The WisdomTree International MidCap Dividend Index measures the performance of the mid-capitalization segment of the dividend-paying market in the industrialized world outside the U.S. and Canada.
The WisdomTree International SmallCap Dividend Index measures the performance of the small-capitalization segment of the dividend-paying market in the industrialized world outside the U.S. and Canada.
| | | | |
| WisdomTree International Dividend and Sector Funds | | | 27 | |
Description of Terms and Indices (unaudited) (continued)
The WisdomTree Emerging Markets Equity Income Index measures the performance of the highest dividend-yielding stocks selected from the WisdomTree Emerging Markets Dividend Index.
The WisdomTree Emerging Markets SmallCap Dividend Index measures the performance of primarily small-capitalization stocks selected from the WisdomTree Emerging Markets Dividend Index.
The WisdomTree Middle East Dividend Index measures the performance of companies in the Middle East region that pay regular cash dividends on shares of common stock and that meet specified requirements as of the index measurement date.
The WisdomTree International Sector Indexes which encompasses Basic Materials, Energy and Utilities, are derived from the WisdomTree DEFA Index, and measure the performance of dividend-paying companies in developed markets outside the U.S. and Canada, within their specific international sectors.
The WisdomTree International Real Estate Index measures the performance of companies in developed markets outside of the U.S. and Canada that pay regular cash dividends and that WisdomTree Investments classifies as being part of the International Real Estate sector.
The MSCI EAFE Index is a market cap-weighted index composed of companies representative of the developed market structure of 21 developed countries in Europe, Australasia and Japan.
The MSCI EAFE Value Index measures the performance of value stocks in the MSCI EAFE Index.
The MSCI EAFE Mid Cap Index is a free float-adjusted market capitalization index that is designed to measure the performance of mid capitalization equities in the developed markets excluding the US & Canada.
The MSCI EAFE Small Cap Index measures the performance of small-capitalization stocks in the MSCI EAFE Index.
The MSCI Europe Small-Cap Index measures the performance of small-capitalization stocks in the MSCI Europe Index.
The MSCI Europe Value Index measures the performance of value stocks in the MSCI Europe Index.
The MSCI AC World Index measures the performance of the world stock market indexes covered by MSCI.
The MSCI Pacific ex-Japan Index is a subset of the MSCI EAFE Index and measures the performance of stocks in Australia, Hong Kong, Singapore and New Zealand.
The MSCI Pacific ex-Japan Value Index measures the performance of value stocks in the MSCI Pacific ex-Japan Index.
The MSCI Japan Index is a capitalization weighted index that monitors the performance of stocks in Japan.
The MSCI Japan Value Index measures the performance of value stocks in the MSCI Japan Index.
The MSCI AC World ex-USA Growth Index measures the performance of growth stocks in the developed and emerging markets covered by MSCI excluding the U.S.
The MSCI Japan Small Cap Index measures the performance of small cap stocks in the MSCI Japan Index.
The MSCI Japan Local Currency Index is a free float-adjusted market capitalization index that is designed to measure developed market equity performance in Japan and uses the same methodology as its corresponding MSCI Japan Index. The price used for each security in the local currency index is the local price, on the primary exchange on which a security is traded, with no conversion into U.S. dollars.
The MSCI Emerging Markets Index is a free float-adjusted market capitalization index that is designed to measure emerging markets equity performance.
| | |
| 28 | | WisdomTree International Dividend and Sector Funds |
Description of Terms and Indices (unaudited) (concluded)
The MSCI Emerging Markets Small Cap Index is a free float-adjusted market capitalization index that is designed to measure the performance of small capitalization equities in the emerging markets.
The MSCI Arabian Markets ex-Saudi Arabia Index is a free float-adjusted market capitalization index that is designed to measure the performance of stocks in the Gulf Cooperation Council (GCC) countries and the neighboring region: the United Arab Emirates, Kuwait, Qatar, Bahrain, Oman, Egypt, Jordan, and Morocco.
The S&P Developed ex-U.S. BMI Sector Indexes are indexes that track specific sectors of developed global markets outside the United States.
The Dow Jones Global ex-U.S. Select Real Estate Securities Index is designed to provide measures of real estate securities that serve as proxies for direct real estate investing in the international markets and is weighted by float-adjusted market cap.
| 1 | Spliced Cap-Weighted Index — MSCI Europe Value Index through June 19, 2009; MSCI AC World Index thereafter. |
| 2 | Spliced Cap-Weighted Index — MSCI Japan Value Index through June 19, 2009; MSCI AC World ex-USA Growth Index thereafter. |
| 3 | Spliced Cap-Weighted Index — MSCI Japan Value Index through April 1, 2010; MSCI Japan Local Currency Index thereafter. |
| 4 | Spliced WisdomTree Index — WisdomTree Europe Equity Income Index through June 19, 2009; WisdomTree Global Equity Income Index thereafter. |
| 5 | Spliced WisdomTree Index — WisdomTree Japan Equity Income Index through June 19, 2009; WisdomTree World ex-U.S. Growth Index thereafter. |
| 6 | Spliced WisdomTree Index — WisdomTree International Dividend Top 100 Index through May 7, 2009; WisdomTree International Dividend ex-Financials Index thereafter. |
| 7 | Spliced WisdomTree Index — WisdomTree Japan Dividend Index through March 31, 2010; WisdomTree Japan Hedged Equity Index thereafter. |
Index performance information assumes the reinvestment of gross dividends and excludes management fees, transaction costs and expenses. You cannot directly invest in an index.
Neither MSCI nor any other party involved in or related to compiling, computing or creating the MSCI data makes any express or implied warranties or representations with respect to such data (or the results to be obtained by the use thereof), and all such parties hereby expressly disclaim all warranties of originality, accuracy, completeness, merchantability or fitness for a particular purpose with respect to any such data. Without limiting any of the foregoing, in no event shall MSCI, any of its affiliates or any third party involved in or related to compiling, computing or creating the data have any liability for any direct, indirect, special, punitive, consequential or any other damages (including lost profits) even if notified of the possibility of such damages. No further distribution or dissemination of the MSCI data is permitted without MSCI’s express written consent.
| | | | |
| WisdomTree International Dividend and Sector Funds | | | 29 | |
Shareholder Expense Examples (unaudited)
As a shareholder of a WisdomTree Fund, you incur two types of costs: (1) transaction costs, including brokerage commissions on purchases and sales of your Fund shares and (2) ongoing costs, including management fees and other Fund expenses. The following example is intended to help you understand your ongoing costs (in dollars and cents) of investing in a Fund and to compare these costs with the ongoing costs of investing in other funds.
The example is based on an investment of $1,000 invested at the beginning of the period and held for the entire period from October 1, 2010 to March 31, 2011.
Actual expenses
The first line under each Fund in the table on the next page provides information about actual account values and actual expenses. You may use the information in this line, together with the amount you invested, to estimate the expenses that you paid over the period. Simply divide your account value by $1,000 (for example, an $8,600 account value divided by $1,000 = 8.6), then multiply the result by the number in the first line for your Fund under the heading entitled “Expenses Paid During Period 10/01/10 to 3/31/11” to estimate the expenses you paid on your account during this period.
Hypothetical example for comparison purposes
The second line under each Fund in the table on the next page provides information about hypothetical account values and hypothetical expenses based on each Fund’s actual expense ratio and an assumed rate of return of 5% per year before expenses, which is not the Fund’s actual return. The hypothetical account values and expenses may not be used to estimate the actual ending account balance or expenses you paid for the period. You may use this information to compare the ongoing costs of investing in your Fund and other funds. To do so, compare this 5% hypothetical example with the 5% hypothetical examples that appear in the shareholder reports of the other funds.
Please note that the expenses shown in the table are meant to highlight your ongoing costs only and do not reflect any transactional costs, such as brokerage commissions paid on purchases and sales of Fund shares. Therefore, the second line under each Fund in the table is useful in comparing ongoing Fund costs only and will not help you determine the relative total costs of owning different funds. In addition, if these transactional costs were included, your costs would have been higher.
| | |
| 30 | | WisdomTree International Dividend and Sector Funds |
Shareholder Expense Examples (unaudited) (continued)
| | | | | | | | | | | | | | | | |
| | | Beginning
Account Value
10/01/10 | | | Ending
Account Value
3/31/11 | | | Annualized
Expense Ratio
Based on the
Period
10/01/10 to
3/31/11 | | | Expenses Paid
During the
Period†
10/01/10 to
3/31/11 | |
WisdomTree DEFA Fund | | | | | | | | | | | | | | | | |
Actual | | $ | 1,000.00 | | | $ | 1,099.73 | | | | 0.48 | % | | $ | 2.51 | |
Hypothetical (5% return before expenses) | | $ | 1,000.00 | | | $ | 1,022.54 | | | | 0.48 | % | | $ | 2.42 | |
WisdomTree DEFA Equity Income Fund | | | | | | | | | | | | | | | | |
Actual | | $ | 1,000.00 | | | $ | 1,098.01 | | | | 0.58 | % | | $ | 3.03 | |
Hypothetical (5% return before expenses) | | $ | 1,000.00 | | | $ | 1,022.04 | | | | 0.58 | % | | $ | 2.92 | |
WisdomTree Global Equity Income Fund | | | | | | | | | | | | | | | | |
Actual | | $ | 1,000.00 | | | $ | 1,106.46 | | | | 0.58 | % | | $ | 3.05 | |
Hypothetical (5% return before expenses) | | $ | 1,000.00 | | | $ | 1,022.04 | | | | 0.58 | % | | $ | 2.92 | |
WisdomTree Europe SmallCap Dividend Fund | | | | | | | | | | | | | | | | |
Actual | | $ | 1,000.00 | | | $ | 1,146.66 | | | | 0.58 | % | | $ | 3.10 | |
Hypothetical (5% return before expenses) | | $ | 1,000.00 | | | $ | 1,022.04 | | | | 0.58 | % | | $ | 2.92 | |
WisdomTree Japan Hedged Equity Fund | | | | | | | | | | | | | | | | |
Actual | | $ | 1,000.00 | | | $ | 1,038.95 | | | | 0.48 | % | | $ | 2.44 | |
Hypothetical (5% return before expenses) | | $ | 1,000.00 | | | $ | 1,022.54 | | | | 0.48 | % | | $ | 2.42 | |
WisdomTree World ex-U.S. Growth Fund | | | | | | | | | | | | | | | | |
Actual | | $ | 1,000.00 | | | $ | 1,082.27 | | | | 0.57 | % | | $ | 2.96 | |
Hypothetical (5% return before expenses) | | $ | 1,000.00 | | | $ | 1,022.09 | | | | 0.57 | % | | $ | 2.87 | |
WisdomTree Japan SmallCap Dividend Fund | | | | | | | | | | | | | | | | |
Actual | | $ | 1,000.00 | | | $ | 1,079.70 | | | | 0.58 | % | | $ | 3.01 | |
Hypothetical (5% return before expenses) | | $ | 1,000.00 | | | $ | 1,022.04 | | | | 0.58 | % | | $ | 2.92 | |
WisdomTree Pacific ex-Japan Total Dividend Fund | | | | | | | | | | | | | |
Actual | | $ | 1,000.00 | | | $ | 1,097.38 | | | | 0.48 | % | | $ | 2.51 | |
Hypothetical (5% return before expenses) | | $ | 1,000.00 | | | $ | 1,022.52 | | | | 0.48 | % | | $ | 2.42 | |
WisdomTree Pacific ex-Japan Equity Income Fund | | | | | | | | | | | | | |
Actual | | $ | 1,000.00 | | | $ | 1,116.55 | | | | 0.58 | % | | $ | 3.06 | |
Hypothetical (5% return before expenses) | | $ | 1,000.00 | | | $ | 1,022.04 | | | | 0.58 | % | | $ | 2.92 | |
WisdomTree International LargeCap Dividend Fund | | | | | | | | | | | | | |
Actual | | $ | 1,000.00 | | | $ | 1,094.90 | | | | 0.48 | % | | $ | 2.51 | |
Hypothetical (5% return before expenses) | | $ | 1,000.00 | | | $ | 1,022.54 | | | | 0.48 | % | | $ | 2.42 | |
WisdomTree International Dividend ex-Financials Fund | | | | | | | | | | | | | |
Actual | | $ | 1,000.00 | | | $ | 1,097.38 | | | | 0.58 | % | | $ | 3.03 | |
Hypothetical (5% return before expenses) | | $ | 1,000.00 | | | $ | 1,022.04 | | | | 0.58 | % | | $ | 2.92 | |
WisdomTree International MidCap Dividend Fund | | | | | | | | | | | | | |
Actual | | $ | 1,000.00 | | | $ | 1,105.90 | | | | 0.58 | % | | $ | 3.05 | |
Hypothetical (5% return before expenses) | | $ | 1,000.00 | | | $ | 1,022.04 | | | | 0.58 | % | | $ | 2.92 | |
WisdomTree International SmallCap Dividend Fund | | | | | | | | | | | | | |
Actual | | $ | 1,000.00 | | | $ | 1,128.17 | | | | 0.58 | % | | $ | 3.08 | |
Hypothetical (5% return before expenses) | | $ | 1,000.00 | | | $ | 1,022.04 | | | | 0.58 | % | | $ | 2.92 | |
WisdomTree Emerging Markets Equity Income Fund | | | | | | | | | | | | | |
Actual | | $ | 1,000.00 | | | $ | 1,105.10 | | | | 0.63 | % | | $ | 3.31 | |
Hypothetical (5% return before expenses) | | $ | 1,000.00 | | | $ | 1,021.79 | | | | 0.63 | % | | $ | 3.18 | |
WisdomTree Emerging Markets SmallCap Dividend Fund | | | | | | | | | | | | | |
Actual | | $ | 1,000.00 | | | $ | 1,073.20 | | | | 0.63 | % | | $ | 3.26 | |
Hypothetical (5% return before expenses) | | $ | 1,000.00 | | | $ | 1,021.79 | | | | 0.63 | % | | $ | 3.18 | |
WisdomTree Middle East Dividend Fund | | | | | | | | | | | | | | | | |
Actual | | $ | 1,000.00 | | | $ | 1,035.50 | | | | 0.88 | % | | $ | 4.47 | |
Hypothetical (5% return before expenses) | | $ | 1,000.00 | | | $ | 1,020.54 | | | | 0.88 | % | | $ | 4.43 | |
WisdomTree International Hedged Equity Fund | | | | | | | | | | | | | | | | |
Actual | | $ | 1,000.00 | | | $ | 1,061.04 | | | | 0.58 | % | | $ | 2.98 | |
Hypothetical (5% return before expenses) | | $ | 1,000.00 | | | $ | 1,022.04 | | | | 0.58 | % | | $ | 2.92 | |
| | | | |
| WisdomTree International Dividend and Sector Funds | | | 31 | |
Shareholder Expense Examples (unaudited) (concluded)
| | | | | | | | | | | | | | | | |
| | | Beginning
Account Value
10/01/10 | | | Ending
Account Value
3/31/11 | | | Annualized
Expense Ratio
Based on the
Period
10/01/10 to
3/31/11 | | | Expenses Paid
During the
Period†
10/01/10 to
3/31/11 | |
WisdomTree International Basic Materials Sector Fund | | | | | | | | | | | | | |
Actual | | $ | 1,000.00 | | | $ | 1,201.60 | | | | 0.58 | % | | $ | 3.18 | |
Hypothetical (5% return before expenses) | | $ | 1,000.00 | | | $ | 1,022.04 | | | | 0.58 | % | | $ | 2.92 | |
WisdomTree International Energy Sector Fund | | | | | | | | | | | | | | | | |
Actual | | $ | 1,000.00 | | | $ | 1,260.70 | | | | 0.58 | % | | $ | 3.27 | |
Hypothetical (5% return before expenses) | | $ | 1,000.00 | | | $ | 1,022.04 | | | | 0.58 | % | | $ | 2.92 | |
WisdomTree International Utilities Sector Fund | | | | | | | | | | | | | | | | |
Actual | | $ | 1,000.00 | | | $ | 1,080.50 | | | | 0.58 | % | | $ | 3.01 | |
Hypothetical (5% return before expenses) | | $ | 1,000.00 | | | $ | 1,022.04 | | | | 0.58 | % | | $ | 2.92 | |
WisdomTree International Real Estate Fund | | | | | | | | | | | | | | | | |
Actual | | $ | 1,000.00 | | | $ | 1,073.03 | | | | 0.58 | % | | $ | 3.00 | |
Hypothetical (5% return before expenses) | | $ | 1,000.00 | | | $ | 1,022.04 | | | | 0.58 | % | | $ | 2.92 | |
| † | Expenses are calculated using each Fund’s annualized expense ratio, multiplied by the average account value for the period, multiplied by 182/365 (to reflect one-half year period). |
| | |
| 32 | | WisdomTree International Dividend and Sector Funds |
Schedule of Investments
WisdomTree DEFA Fund (DWM)
March 31, 2011
| | | | | | | | |
| Investments | | Shares | | | Fair
Value | |
| | | | | | | | |
| | | | | | | | |
| COMMON STOCKS – 99.0% | | | | | | | | |
| Australia – 11.3% | | | | | | | | |
Adelaide Brighton Ltd. | | | 71,277 | | | $ | 237,350 | |
AGL Energy Ltd. | | | 24,522 | | | | 362,893 | |
Amalgamated Holdings Ltd. | | | 21,271 | | | | 130,884 | |
Amcor Ltd. | | | 53,155 | | | | 388,090 | |
AMP Ltd.(a) | | | 170,335 | | | | 956,505 | |
Australia & New Zealand Banking Group Ltd. | | | 150,456 | | | | 3,704,694 | |
Bank of Queensland Ltd. | | | 18,747 | | | | 192,321 | |
Bendigo and Adelaide Bank Ltd. | | | 27,553 | | | | 271,547 | |
BHP Billiton Ltd. | | | 105,718 | | | | 5,090,323 | |
Billabong International Ltd. | | | 17,029 | | | | 132,960 | |
Brambles Ltd. | | | 59,690 | | | | 437,037 | |
Cabcharge Australia Ltd. | | | 36,934 | | | | 210,838 | |
Caltex Australia Ltd. | | | 14,407 | | | | 232,424 | |
Cardno Ltd. | | | 44,102 | | | | 266,351 | |
carsales.com.au Ltd.(a) | | | 33,454 | | | | 179,210 | |
Coca-Cola Amatil Ltd. | | | 39,276 | | | | 476,847 | |
Cochlear Ltd. | | | 2,749 | | | | 235,930 | |
Commonwealth Bank of Australia | | | 81,979 | | | | 4,442,396 | |
Computershare Ltd. | | | 19,037 | | | | 182,303 | |
Consolidated Media Holdings Ltd. | | | 70,887 | | | | 206,728 | |
Crane Group Ltd. | | | 19,973 | | | | 211,095 | |
Cromwell Property Group | | | 196,588 | | | | 143,327 | |
Crown Ltd. | | | 46,008 | | | | 387,770 | |
CSL Ltd. | | | 13,881 | | | | 512,905 | |
CSR Ltd. | | | 66,990 | | | | 227,231 | |
David Jones Ltd.(a) | | | 59,543 | | | | 292,488 | |
Downer EDI Ltd. | | | 37,857 | | | | 148,378 | |
DUET Group(b) | | | 127,264 | | | | 220,447 | |
Envestra Ltd.(b) | | | 356,466 | | | | 221,183 | |
Fleetwood Corp., Ltd. | | | 18,129 | | | | 227,039 | |
Foster’s Group Ltd. | | | 122,116 | | | | 722,357 | |
Goodman Fielder Ltd. | | | 157,109 | | | | 199,843 | |
GWA International Ltd.(a) | | | 56,696 | | | | 194,072 | |
Harvey Norman Holdings Ltd.(a) | | | 71,739 | | | | 222,567 | |
Insurance Australia Group Ltd. | | | 141,485 | | | | 525,277 | |
Iress Market Technology Ltd. | | | 18,595 | | | | 179,801 | |
Leighton Holdings Ltd.(a) | | | 16,075 | | | | 490,240 | |
Lend Lease Group(b) | | | 37,944 | | | | 355,905 | |
Macquarie Group Ltd. | | | 13,236 | | | | 500,981 | |
Metcash Ltd. | | | 74,190 | | | | 319,170 | |
Monadelphous Group Ltd. | | | 15,085 | | | | 333,843 | |
Myer Holdings Ltd. | | | 53,669 | | | | 178,161 | |
National Australia Bank Ltd. | | | 143,800 | | | | 3,844,172 | |
New Hope Corp., Ltd. | | | 41,066 | | | | 211,493 | |
NIB Holdings Ltd. | | | 132,467 | | | | 194,527 | |
OneSteel Ltd. | | | 59,748 | | | | 150,764 | |
Orica Ltd. | | | 15,539 | | | | 423,757 | |
Origin Energy Ltd. | | | 38,948 | | | | 653,310 | |
Perpetual Ltd. | | | 5,761 | | | | 173,311 | |
Platinum Asset Management Ltd.(a) | | | 43,994 | | | | 218,838 | |
Primary Health Care Ltd. | | | 53,281 | | | | 181,832 | |
QBE Insurance Group Ltd. | | | 62,464 | | | | 1,141,431 | |
| | | | | | | | |
| Investments | | Shares | | | Fair
Value | |
| | | | | | | | |
Rio Tinto Ltd. | | | 5,808 | | | $ | 509,037 | |
Salmat Ltd. | | | 47,702 | | | | 179,565 | |
Santos Ltd. | | | 35,421 | | | | 569,606 | |
Sonic Healthcare Ltd. | | | 27,914 | | | | 345,830 | |
SP AusNet(b) | | | 300,428 | | | | 273,405 | |
Spark Infrastructure Group(c) | | | 238,612 | | | | 276,372 | |
Suncorp Group Ltd. | | | 68,623 | | | | 601,795 | |
TABCORP Holdings Ltd. | | | 75,549 | | | | 585,186 | |
Tatts Group Ltd. | | | 175,000 | | | | 423,484 | |
Telstra Corp., Ltd. | | | 1,345,752 | | | | 3,924,619 | |
| | | | | | | | |
Toll Holdings Ltd. | | | 45,999 | | | | 282,089 | |
Transurban Group(b) | | | 65,813 | | | | 365,485 | |
UGL Ltd. | | | 16,106 | | | | 261,333 | |
Wesfarmers Ltd. | | | 66,654 | | | | 2,190,602 | |
West Australian Newspapers Holdings Ltd. | | | 25,084 | | | | 137,745 | |
Westpac Banking Corp. | | | 201,612 | | | | 5,072,732 | |
Woodside Petroleum Ltd. | | | 23,499 | | | | 1,137,309 | |
Woolworths Ltd. | | | 63,111 | | | | 1,754,356 | |
WorleyParsons Ltd. | | | 13,386 | | | | 428,860 | |
Wotif.com Holdings Ltd.(a) | | | 28,263 | | | | 159,586 | |
| | | | | | | | |
| Total Australia | | | | | | | 51,824,142 | |
| Austria – 0.9% | | | | | | | | |
Andritz AG(a) | | | 2,120 | | | | 197,929 | |
Bank Austria Creditanstalt AG*†(d) | | | 3,774 | | | | — | |
Erste Group Bank AG | | | 8,655 | | | | 437,312 | |
Oesterreichische Post AG(a) | | | 12,034 | | | | 412,420 | |
OMV AG | | | 13,871 | | | | 627,733 | |
Raiffeisen International Bank Holding AG | | | 5,609 | | | | 311,703 | |
Strabag SE | | | 6,625 | | | | 210,877 | |
Telekom Austria AG | | | 37,118 | | | | 543,597 | |
Verbund AG(a) | | | 15,295 | | | | 680,456 | |
Vienna Insurance Group AG Wiener Versicherung Gruppe | | | 5,702 | | | | 326,096 | |
Voestalpine AG | | | 9,950 | | | | 467,797 | |
| | | | | | | | |
| Total Austria | | | | | | | 4,215,920 | |
| Belgium – 1.1% | | | | | | | | |
Ageas | | | 100,908 | | | | 287,113 | |
Anheuser-Busch InBev N.V. | | | 15,104 | | | | 861,543 | |
Bekaert S.A. | | | 2,057 | | | | 234,958 | |
Belgacom S.A. | | | 32,039 | | | | 1,242,828 | |
Delhaize Group S.A. | | | 3,685 | | | | 300,428 | |
Mobistar S.A. | | | 7,957 | | | | 552,394 | |
Solvay S.A. | | | 4,579 | | | | 543,173 | |
Tessenderlo Chemie N.V. | | | 4,604 | | | | 165,233 | |
UCB S.A.(a) | | | 9,010 | | | | 342,603 | |
Umicore S.A. | | | 6,376 | | | | 316,641 | |
| | | | | | | | |
| Total Belgium | | | | | | | 4,846,914 | |
| Denmark – 0.5% | | | | | | | | |
Danisco A/S | | | 2,105 | | | | 266,025 | |
FLSmidth & Co. A/S | | | 2,170 | | | | 185,111 | |
H. Lundbeck A/S(a) | | | 11,748 | | | | 272,788 | |
Novo Nordisk A/S Class B(a) | | | 9,750 | | | | 1,226,613 | |
Novozymes A/S Class B | | | 1,346 | | | | 206,354 | |
See Notes to Financial Statements.
| | | | |
| WisdomTree International Dividend and Sector Funds | | | 33 | |
Schedule of Investments (continued)
WisdomTree DEFA Fund (DWM)
March 31, 2011
| | | | | | | | |
| Investments | | Shares | | | Fair
Value | |
| | | | | | | | |
Tryg A/S(a) | | | 4,403 | | | $ | 259,281 | |
| | | | | | | | |
| Total Denmark | | | | | | | 2,416,172 | |
| Finland – 1.6% | | | | | | | | |
Fortum Oyj(a) | | | 44,789 | | | | 1,522,899 | |
Kone Oyj Class B | | | 9,996 | | | | 575,924 | |
Konecranes Oyj(a) | | | 5,531 | | | | 256,428 | |
Metso Oyj(a) | | | 5,210 | | | | 280,510 | |
Nokia Oyj(a) | | | 183,323 | | | | 1,570,027 | |
Orion Oyj Class B(a) | | | 11,181 | | | | 271,642 | |
Outokumpu Oyj(a) | | | 9,140 | | | | 158,500 | |
Pohjola Bank PLC Class A(a) | | | 17,403 | | | | 237,581 | |
Rautaruukki Oyj(a) | | | 9,476 | | | | 227,530 | |
Sampo Oyj Class A | | | 30,403 | | | | 971,192 | |
Sanoma Oyj(a) | | | 12,022 | | | | 272,455 | |
UPM-Kymmene Oyj*(a) | | | 21,727 | | | | 460,025 | |
Uponor Oyj(a) | | | 9,180 | | | | 156,719 | |
Wartsila Oyj(a) | | | 11,294 | | | | 441,553 | |
| | | | | | | | |
| Total Finland | | | | | | | 7,402,985 | |
| France – 16.0% | | | | | | | | |
Accor S.A. | | | 12,259 | | | | 551,564 | |
Aeroports de Paris | | | 4,438 | | | | 409,368 | |
Air Liquide S.A. | | | 8,712 | | | | 1,159,173 | |
Alstom S.A. | | | 11,430 | | | | 676,793 | |
AXA S.A. | | | 112,325 | | | | 2,350,359 | |
BNP Paribas | | | 41,834 | | | | 3,063,912 | |
Bourbon S.A. | | | 3,612 | | | | 171,201 | |
Bouygues S.A. | | | 20,880 | | | | 1,004,040 | |
Bureau Veritas S.A. | | | 3,857 | | | | 303,340 | |
Canal Plus | | | 26,886 | | | | 213,395 | |
Cap Gemini S.A. | | | 5,269 | | | | 306,455 | |
Carrefour S.A. | | | 25,979 | | | | 1,151,719 | |
Casino Guichard Perrachon S.A. | | | 6,123 | | | | 580,348 | |
CFAO S.A. | | | 5,224 | | | | 196,343 | |
Christian Dior S.A. | | | 5,046 | | | | 711,280 | |
Cie Generale des Etablissements Michelin Class B | | | 3,947 | | | | 333,831 | |
Cie Generale d’Optique Essilor International S.A. | | | 4,538 | | | | 337,449 | |
CNP Assurances | | | 39,008 | | | | 829,237 | |
Compagnie de Saint-Gobain | | | 19,907 | | | | 1,220,542 | |
Credit Agricole S.A. | | | 129,264 | | | | 2,124,218 | |
Danone | | | 21,566 | | | | 1,410,706 | |
Eiffage S.A. | | | 5,214 | | | | 313,652 | |
Electricite de France S.A. | | | 75,785 | | | | 3,142,508 | |
Eutelsat Communications S.A. | | | 9,702 | | | | 388,054 | |
France Telecom S.A. | | | 316,186 | | | | 7,093,940 | |
GDF Suez | | | 165,537 | | | | 6,753,765 | |
Hermes International | | | 910 | | | | 199,777 | |
ICADE | | | 3,857 | | | | 476,630 | |
Imerys S.A. | | | 3,527 | | | | 258,917 | |
Klepierre | | | 14,183 | | | | 576,440 | |
Lafarge S.A. | | | 16,092 | | | | 1,005,133 | |
Lagardere SCA | | | 9,269 | | | | 396,253 | |
Legrand S.A. | | | 10,838 | | | | 451,486 | |
L’Oreal S.A. | | | 13,511 | | | | 1,576,058 | |
| | | | | | | | |
| Investments | | Shares | | | Fair
Value | |
| | | | | | | | |
LVMH Moet Hennessy Louis Vuitton S.A.(a) | | | 10,858 | | | $ | 1,721,139 | |
M-6 Metropole Television S.A. | | | 24,700 | | | | 646,355 | |
Neopost S.A. | | | 3,859 | | | | 338,491 | |
Nexity | | | 6,811 | | | | 338,244 | |
PagesJaunes Groupe(a) | | | 50,941 | | | | 510,876 | |
Pernod-Ricard S.A. | | | 3,167 | | | | 296,174 | |
PPR | | | 5,255 | | | | 806,515 | |
Publicis Groupe S.A. | | | 6,094 | | | | 342,244 | |
Remy Cointreau S.A. | | | 2,631 | | | | 198,406 | |
Safran S.A. | | | 6,395 | | | | 226,334 | |
Sanofi-Aventis S.A. | | | 70,737 | | | | 4,966,443 | |
Schneider Electric S.A. | | | 7,510 | | | | 1,285,287 | |
SCOR SE | | | 16,296 | | | | 444,359 | |
Societe BIC S.A. | | | 1,923 | | | | 171,158 | |
Societe Generale | | | 6,516 | | | | 423,968 | |
Societe Television Francaise 1 | | | 13,872 | | | | 255,029 | |
Sodexo | | | 6,239 | | | | 456,234 | |
Suez Environnement Co. | | | 28,172 | | | | 583,692 | |
Technip S.A. | | | 4,406 | | | | 470,505 | |
TOTAL S.A. | | | 169,018 | | | | 10,302,904 | |
Vallourec S.A. | | | 5,940 | | | | 667,276 | |
Veolia Environnement S.A. | | | 32,663 | | | | 1,016,964 | |
Vinci S.A. | | | 27,171 | | | | 1,700,231 | |
Vivendi S.A. | | | 118,206 | | | | 3,380,084 | |
| | | | | | | | |
| Total France | | | | | | | 73,286,798 | |
| Germany – 7.1% | | | | | | | | |
Allianz SE | | | 19,597 | | | | 2,754,034 | |
BASF SE | | | 32,034 | | | | 2,774,390 | |
Bayer AG | | | 22,610 | | | | 1,753,171 | |
Bayerische Motoren Werke AG | | | 5,692 | | | | 474,554 | |
Beiersdorf AG | | | 4,506 | | | | 275,378 | |
Bilfinger Berger SE | | | 3,089 | | | | 268,495 | |
Celesio AG | | | 7,053 | | | | 173,454 | |
Deutsche Bank AG | | | 12,922 | | | | 760,736 | |
Deutsche Boerse AG | | | 7,674 | | | | 583,169 | |
Deutsche Post AG | | | 55,624 | | | | 1,004,066 | |
Deutsche Telekom AG | | | 324,280 | | | | 5,002,219 | |
E.ON AG | | | 103,995 | | | | 3,180,334 | |
Fielmann AG | | | 1,371 | | | | 129,673 | |
Fraport AG Frankfurt Airport Services Worldwide | | | 4,566 | | | | 335,061 | |
Fresenius Medical Care AG & Co. KGaA | | | 5,127 | | | | 344,797 | |
Hamburger Hafen und Logistik AG | | | 5,474 | | | | 254,990 | |
Hannover Rueckversicherung AG | | | 7,390 | | | | 404,017 | |
Henkel AG & Co. KGaA | | | 5,101 | | | | 266,859 | |
Hochtief AG | | | 2,892 | | | | 311,496 | |
Linde AG | | | 3,816 | | | | 603,534 | |
Merck KGAA(a) | | | 3,764 | | | | 340,146 | |
Metro AG | | | 8,769 | | | | 599,992 | |
Muenchener Rueckversicherungs AG | | | 9,899 | | | | 1,559,291 | |
RWE AG | | | 29,838 | | | | 1,903,111 | |
Salzgitter AG | | | 3,068 | | | | 242,507 | |
SAP AG | | | 14,899 | | | | 913,385 | |
Siemens AG | | | 18,638 | | | | 2,557,901 | |
See Notes to Financial Statements.
| | |
| 34 | | WisdomTree International Dividend and Sector Funds |
Schedule of Investments (continued)
WisdomTree DEFA Fund (DWM)
March 31, 2011
| | | | | | | | |
| Investments | | Shares | | | Fair
Value | |
| | | | | | | | |
Suedzucker AG | | | 10,072 | | | $ | 281,290 | |
Symrise AG | | | 6,750 | | | | 198,188 | |
ThyssenKrupp AG | | | 10,666 | | | | 436,374 | |
United Internet AG Registered Shares | | | 16,695 | | | | 300,887 | |
Volkswagen AG | | | 6,713 | | | | 1,031,711 | |
Wacker Chemie AG | | | 981 | | | | 220,932 | |
Wincor Nixdorf AG | | | 2,680 | | | | 217,276 | |
| | | | | | | | |
| Total Germany | | | | | | | 32,457,418 | |
| Hong Kong – 4.8% | | | | | | | | |
Bank of East Asia Ltd. | | | 58,600 | | | | 248,995 | |
BOC Hong Kong Holdings Ltd. | | | 467,000 | | | | 1,522,004 | |
Cheung Kong (Holdings) Ltd. | | | 61,000 | | | | 994,420 | |
China Merchants Holdings International Co., Ltd. | | | 66,000 | | | | 278,741 | |
China Mobile Ltd. | | | 611,500 | | | | 5,632,920 | |
China Overseas Land & Investment Ltd. | | | 118,000 | | | | 239,999 | |
China Resources Enterprise Ltd. | | | 50,000 | | | | 203,132 | |
China Resources Power Holdings Co., Ltd. | | | 114,000 | | | | 219,552 | |
China Unicom Hong Kong Ltd. | | | 404,000 | | | | 671,065 | |
Citic Pacific Ltd. | | | 115,000 | | | | 319,354 | |
CLP Holdings Ltd. | | | 95,500 | | | | 772,280 | |
CNOOC Ltd. | | | 1,137,300 | | | | 2,865,840 | |
Fushan International Energy Group Ltd. | | | 292,000 | | | | 210,229 | |
Guangdong Investment Ltd. | | | 256,000 | | | | 129,346 | |
Hang Seng Bank Ltd. | | | 87,100 | | | | 1,406,464 | |
Hong Kong & China Gas Co., Ltd. | | | 126,600 | | | | 303,715 | |
Hong Kong Exchanges and Clearing Ltd. | | | 33,700 | | | | 732,213 | |
Hopewell Holdings Ltd. | | | 65,000 | | | | 195,129 | |
Hutchison Whampoa Ltd. | | | 134,000 | | | | 1,586,665 | |
Hysan Development Co., Ltd. | | | 60,000 | | | | 246,844 | |
MTR Corp. | | | 110,000 | | | | 407,292 | |
New World Development Ltd. | | | 120,000 | | | | 211,977 | |
PCCW Ltd. | | | 317,000 | | | | 132,046 | |
Power Assets Holdings Ltd.(a) | | | 88,500 | | | | 591,654 | |
Shanghai Industrial Holdings Ltd. | | | 46,000 | | | | 176,236 | |
Sino Land Co., Ltd. | | | 154,000 | | | | 273,621 | |
Sun Hung Kai Properties Ltd. | | | 53,000 | | | | 839,474 | |
Television Broadcasts Ltd. | | | 35,000 | | | | 205,639 | |
Wharf Holdings Ltd. | | | 72,000 | | | | 496,619 | |
| | | | | | | | |
| Total Hong Kong | | | | | | | 22,113,465 | |
| Ireland – 0.2% | | | | | | | | |
CRH PLC | | | 25,132 | | | | 577,057 | |
DCC PLC | | | 7,780 | | | | 248,082 | |
Kerry Group PLC Class A | | | 7,690 | | | | 286,681 | |
| | | | | | | | |
| Total Ireland | | | | | | | 1,111,820 | |
| Italy – 5.0% | | | | | | | | |
A2A SpA | | | 266,096 | | | | 431,616 | |
Assicurazioni Generali SpA | | | 29,525 | | | | 640,216 | |
Atlantia SpA | | | 29,230 | | | | 670,736 | |
Banca Carige SpA | | | 107,143 | | | | 254,070 | |
Banca Generali SpA | | | 14,177 | | | | 216,074 | |
Banca Popolare di Sondrio S.c.r.l. | | | 25,687 | | | | 218,715 | |
Enel SpA | | | 915,155 | | | | 5,776,602 | |
| | | | | | | | |
| Investments | | Shares | | | Fair
Value | |
| | | | | | | | |
ENI SpA | | | 233,682 | | | $ | 5,746,942 | |
Fiat SpA | | | 24,525 | | | | 222,394 | |
Finmeccanica SpA | | | 26,533 | | | | 334,358 | |
Hera SpA | | | 99,987 | | | | 239,655 | |
Intesa Sanpaolo SpA | | | 380,599 | | | | 1,127,746 | |
Iren SpA | | | 187,156 | | | | 348,989 | |
Lottomatica SpA(a) | | | 13,811 | | | | 249,106 | |
Luxottica Group SpA | | | 8,285 | | | | 270,887 | |
MARR SpA | | | 20,518 | | | | 252,736 | |
Mediaset SpA | | | 56,507 | | | | 359,568 | |
Mediolanum SpA | | | 47,128 | | | | 253,740 | |
Parmalat SpA | | | 115,945 | | | | 388,967 | |
Pirelli & C SpA | | | 23,507 | | | | 206,824 | |
Prysmian SpA | | | 9,094 | | | | 195,386 | |
Saipem SpA | | | 9,774 | | | | 520,274 | |
Snam Rete Gas SpA | | | 195,140 | | | | 1,098,277 | |
Telecom Italia SpA(a) | | | 632,425 | | | | 973,760 | |
Telecom Italia SpA RSP | | | 384,968 | | | | 518,446 | |
Terna Rete Elettrica Nazionale SpA | | | 108,658 | | | | 520,876 | |
UniCredit SpA | | | 278,958 | | | | 690,396 | |
Unione di Banche Italiane SCPA | | | 28,867 | | | | 247,020 | |
Zignago Vetro SpA | | | 23,543 | | | | 176,905 | |
| | | | | | | | |
| Total Italy | | | | | | | 23,151,281 | |
| Japan – 10.3% | | | | | | | | |
Achilles Corp. | | | 100,000 | | | | 149,614 | |
Aeon Co., Ltd.(a) | | | 20,000 | | | | 232,625 | |
Aisin Seiki Co., Ltd. | | | 6,800 | | | | 236,950 | |
Ajinomoto Co., Inc. | | | 25,000 | | | | 261,523 | |
Asahi Glass Co., Ltd. | | | 26,000 | | | | 328,137 | |
Asahi Kasei Corp. | | | 46,000 | | | | 311,366 | |
Astellas Pharma, Inc. | | | 19,600 | | | | 728,378 | |
Bank of Yokohama Ltd. (The) | | | 47,000 | | | | 223,999 | |
Bridgestone Corp. | | | 13,100 | | | | 275,498 | |
Canon, Inc. | | | 33,900 | | | | 1,480,671 | |
Chiba Bank Ltd. (The) | | | 31,000 | | | | 174,300 | |
Chiyoda Co., Ltd. | | | 14,100 | | | | 179,142 | |
Chubu Electric Power Co., Inc. | | | 20,100 | | | | 448,661 | |
Chugai Pharmaceutical Co., Ltd. | | | 13,600 | | | | 234,981 | |
Chugoku Electric Power Co., Inc. (The)(a) | | | 13,300 | | | | 246,807 | |
Circle K Sunkus Co., Ltd. | | | 14,100 | | | | 216,059 | |
Coca-Cola Central Japan Co., Ltd. | | | 14,900 | | | | 203,149 | |
Coca-Cola West Co., Ltd. | | | 12,100 | | | | 231,401 | |
Cosmo Oil Co., Ltd.(a) | | | 68,000 | | | | 212,500 | |
Dai Nippon Printing Co., Ltd. | | | 29,000 | | | | 354,452 | |
Daiichi Sankyo Co., Ltd.(a) | | | 26,600 | | | | 515,439 | |
Daikin Industries Ltd. | | | 5,800 | | | | 174,322 | |
Daito Trust Construction Co., Ltd. | | | 5,200 | | | | 359,508 | |
Daiwa House Industry Co., Ltd. | | | 21,000 | | | | 258,953 | |
Daiwa Securities Group, Inc. | | | 69,000 | | | | 318,026 | |
DCM Japan Holdings Co., Ltd. | | | 23,900 | | | | 146,491 | |
Denso Corp. | | | 13,200 | | | | 439,575 | |
East Japan Railway Co. | | | 6,900 | | | | 385,045 | |
Eisai Co., Ltd.(a) | | | 15,100 | | | | 543,658 | |
See Notes to Financial Statements.
| | | | |
| WisdomTree International Dividend and Sector Funds | | | 35 | |
Schedule of Investments (continued)
WisdomTree DEFA Fund (DWM)
March 31, 2011
| | | | | | | | |
| Investments | | Shares | | | Fair
Value | |
| | | | | | | | |
Ezaki Glico Co., Ltd.(a) | | | 14,000 | | | $ | 163,176 | |
Fanuc Ltd. | | | 1,700 | | | | 258,241 | |
Fast Retailing Co., Ltd. | | | 1,600 | | | | 200,965 | |
FUJIFILM Holdings Corp. | | | 7,400 | | | | 230,000 | |
Fujitsu Ltd. | | | 31,000 | | | | 175,796 | |
Hokuetsu Kishu Paper Co., Ltd. | | | 34,500 | | | | 186,070 | |
Hokuriku Electric Power Co. | | | 10,100 | | | | 229,590 | |
Honda Motor Co., Ltd.(a) | | | 22,000 | | | | 829,513 | |
House Foods Corp.(a) | | | 13,800 | | | | 226,448 | |
Hoya Corp. | | | 15,600 | | | | 357,249 | |
Ito En Ltd. | | | 10,300 | | | | 180,076 | |
ITOCHU Corp. | | | 35,200 | | | | 369,923 | |
Itochu Techno-Solutions Corp. | | | 4,600 | | | | 149,467 | |
Japan Tobacco, Inc. | | | 143 | | | | 518,479 | |
Joyo Bank Ltd. (The) | | | 52,000 | | | | 205,164 | |
JS Group Corp. | | | 10,700 | | | | 278,861 | |
Kajima Corp. | | | 75,000 | | | | 210,847 | |
Kaken Pharmaceutical Co., Ltd. | | | 21,000 | | | | 251,858 | |
Kandenko Co., Ltd. | | | 32,000 | | | | 181,467 | |
Kaneka Corp. | | | 27,000 | | | | 188,622 | |
Kansai Electric Power Co., Inc. (The) | | | 23,800 | | | | 520,051 | |
Kao Corp. | | | 15,700 | | | | 393,068 | |
KDDI Corp. | | | 99 | | | | 615,167 | |
Kirin Holdings Co., Ltd. | | | 23,000 | | | | 303,318 | |
Komatsu Ltd.(a) | | | 12,000 | | | | 409,025 | |
Konami Corp.(a) | | | 10,300 | | | | 191,385 | |
Konica Minolta Holdings, Inc. | | | 15,000 | | | | 126,146 | |
Kubota Corp. | | | 28,000 | | | | 264,865 | |
Kyocera Corp. | | | 3,600 | | | | 366,168 | |
Kyowa Exeo Corp. | | | 16,700 | | | | 167,846 | |
Kyowa Hakko Kirin Co., Ltd. | | | 19,000 | | | | 178,813 | |
Kyushu Electric Power Co., Inc. | | | 15,500 | | | | 303,903 | |
Lawson, Inc. | | | 6,000 | | | | 290,299 | |
Makita Corp. | | | 5,200 | | | | 242,809 | |
Marubeni Corp. | | | 39,000 | | | | 281,865 | |
Marui Group Co., Ltd. | | | 20,500 | | | | 132,825 | |
Maruichi Steel Tube Ltd.(a) | | | 10,300 | | | | 255,387 | |
Max Co., Ltd. | | | 14,000 | | | | 173,480 | |
MEIJI Holdings Co., Ltd. | | | 4,300 | | | | 173,546 | |
Mitsubishi Chemical Holdings Corp. | | | 41,400 | | | | 261,248 | |
Mitsubishi Corp. | | | 26,100 | | | | 727,134 | |
Mitsubishi Estate Co., Ltd. | | | 14,000 | | | | 237,669 | |
Mitsubishi Heavy Industries Ltd. | | | 58,000 | | | | 267,326 | |
Mitsubishi Tanabe Pharma Corp. | | | 16,000 | | | | 260,618 | |
Mitsubishi UFJ Financial Group, Inc. | | | 310,900 | | | | 1,440,463 | |
Mitsui & Co., Ltd. | | | 26,600 | | | | 478,530 | |
Mitsui Fudosan Co., Ltd. | | | 17,000 | | | | 281,624 | |
Mizuho Financial Group, Inc. | | | 689,100 | | | | 1,147,391 | |
Mochida Pharmaceutical Co., Ltd. | | | 21,000 | | | | 249,324 | |
Morinaga & Co., Ltd. | | | 82,000 | | | | 189,961 | |
MS&AD Insurance Group Holdings | | | 12,730 | | | | 290,910 | |
Nichirei Corp. | | | 39,000 | | | | 167,049 | |
Nippon Express Co., Ltd. | | | 48,000 | | | | 184,749 | |
Nippon Flour Mills Co., Ltd. | | | 39,000 | | | | 179,283 | |
| | | | | | | | |
| Investments | | Shares | | | Fair Value | |
| | | | | | | | |
Nippon Kayaku Co., Ltd. | | | 21,000 | | | $ | 191,047 | |
Nippon Paper Group, Inc. | | | 6,900 | | | | 147,524 | |
Nippon Telegraph & Telephone Corp. | | | 46,700 | | | | 2,104,543 | |
Nisshin Seifun Group, Inc. | | | 15,000 | | | | 173,564 | |
Nomura Real Estate Holdings, Inc. | | | 10,900 | | | | 165,841 | |
Nomura Research Institute Ltd. | | | 10,200 | | | | 225,956 | |
NTT DoCoMo, Inc.(a) | | | 1,379 | | | | 2,432,551 | |
OJI Paper Co., Ltd.(a) | | | 41,000 | | | | 195,403 | |
Olympus Corp. | | | 5,800 | | | | 161,935 | |
Oracle Corp. | | | 6,900 | | | | 288,471 | |
Osaka Gas Co., Ltd. | | | 60,000 | | | | 240,348 | |
Otsuka Corp. | | | 2,300 | | | | 148,468 | |
Panasonic Corp. | | | 19,000 | | | | 242,543 | |
Park24 Co., Ltd. | | | 16,300 | | | | 158,516 | |
Ricoh Co., Ltd. | | | 22,000 | | | | 259,073 | |
Sankyo Co., Ltd. | | | 5,300 | | | | 272,738 | |
Secom Co., Ltd. | | | 6,100 | | | | 284,465 | |
Seven & I Holdings Co., Ltd. | | | 22,700 | | | | 581,195 | |
Sharp Corp.(a) | | | 22,000 | | | | 218,991 | |
Shimizu Corp.(a) | | | 39,000 | | | | 174,107 | |
Shin-Etsu Chemical Co., Ltd. | | | 9,100 | | | | 454,012 | |
Shionogi & Co., Ltd. | | | 10,500 | | | | 179,772 | |
Shiseido Co., Ltd.(a) | | | 13,000 | | | | 225,869 | |
Showa Shell Sekiyu K.K. | | | 32,100 | | | | 336,182 | |
Sony Corp. | | | 9,700 | | | | 311,786 | |
Sumitomo Chemical Co., Ltd. | | | 43,000 | | | | 215,311 | |
Sumitomo Corp.(a) | | | 32,400 | | | | 464,812 | |
Sumitomo Electric Industries Ltd. | | | 17,000 | | | | 236,088 | |
Sumitomo Metal Industries Ltd. | | | 142,000 | | | | 318,678 | |
Sumitomo Mitsui Financial Group, Inc. | | | 34,200 | | | | 1,067,099 | |
Sumitomo Mitsui Trust Holdings, Inc. | | | 64,070 | | | | 228,048 | |
Sumitomo Realty & Development Co., Ltd. | | | 9,000 | | | | 180,695 | |
T&D Holdings, Inc. | | | 9,350 | | | | 231,268 | |
Taisei Corp. | | | 67,000 | | | | 165,722 | |
Takeda Pharmaceutical Co., Ltd.(a) | | | 32,000 | | | | 1,498,070 | |
Tohoku Electric Power Co., Inc.(a) | | | 18,100 | | | | 306,835 | |
Tokai Tokyo Financial Holdings, Inc. | | | 44,000 | | | | 150,772 | |
Tokio Marine Holdings, Inc. | | | 15,200 | | | | 407,876 | |
Tokyo Electric Power Co., Inc. (The)(a) | | | 28,200 | | | | 158,557 | |
Tokyo Gas Co., Ltd. | | | 58,000 | | | | 265,927 | |
Tokyu Corp. | | | 49,000 | | | | 203,970 | |
TonenGeneral Sekiyu K.K. | | | 40,000 | | | | 495,656 | |
Toppan Forms Co., Ltd. | | | 19,000 | | | | 165,746 | |
Toppan Printing Co., Ltd.(a) | | | 33,000 | | | | 261,197 | |
Toyoda Gosei Co., Ltd. | | | 5,200 | | | | 108,731 | |
Toyota Auto Body Co., Ltd. | | | 12,000 | | | | 202,124 | |
Toyota Motor Corp. | | | 43,700 | | | | 1,766,349 | |
Trend Micro, Inc. | | | 6,900 | | | | 184,405 | |
USS Co., Ltd. | | | 2,270 | | | | 177,207 | |
Yahoo! Japan Corp. | | | 689 | | | | 247,402 | |
Yamato Holdings Co., Ltd. | | | 14,800 | | | | 230,357 | |
Yamato Kogyo Co., Ltd. | | | 6,000 | | | | 200,531 | |
| | | | | | | | |
| Total Japan | | | | | | | 47,330,620 | |
See Notes to Financial Statements.
| | |
| 36 | | WisdomTree International Dividend and Sector Funds |
Schedule of Investments (continued)
WisdomTree DEFA Fund (DWM)
March 31, 2011
| | | | | | | | |
| Investments | | Shares | | | Fair Value | |
| | | | | | | | |
| Netherlands – 1.6% | | | | | | | | |
Akzo Nobel N.V. | | | 7,198 | | | $ | 495,208 | |
Fugro N.V. CVA | | | 3,705 | | | | 326,928 | |
Heineken Holding N.V. | | | 5,782 | | | | 278,322 | |
Heineken N.V. | | | 8,251 | | | | 451,440 | |
Koninklijke Ahold N.V. | | | 19,351 | | | | 260,001 | |
Koninklijke Boskalis Westminster N.V. | | | 3,762 | | | | 199,212 | |
Koninklijke DSM N.V. | | | 6,450 | | | | 396,837 | |
Koninklijke KPN N.V.(a) | | | 97,243 | | | | 1,658,730 | |
Koninklijke Philips Electronics N.V. | | | 23,398 | | | | 748,918 | |
Reed Elsevier N.V. | | | 29,912 | | | | 385,429 | |
STMicroelectronics N.V.* | | | 22,261 | | | | 276,102 | |
TNT N.V. | | | 9,233 | | | | 237,156 | |
Unilever N.V. CVA | | | 44,923 | | | | 1,410,474 | |
Wolters Kluwer N.V. | | | 12,459 | | | | 291,729 | |
| | | | | | | | |
| Total Netherlands | | | | | | | 7,416,486 | |
| New Zealand – 0.2% | | | | | | | | |
Contact Energy Ltd. | | | 54,462 | | | | 241,768 | |
Telecom Corp. of New Zealand Ltd. | | | 243,328 | | | | 373,053 | |
Vector Ltd. | | | 162,216 | | | | 309,325 | |
Warehouse Group Ltd. (The) | | | 81,781 | | | | 218,948 | |
| | | | | | | | |
| Total New Zealand | | | | | | | 1,143,094 | |
| Norway – 1.6% | | | | | | | | |
Aker ASA | | | 9,147 | | | | 281,929 | |
Aker Solutions ASA | | | 10,921 | | | | 250,926 | |
Copeinca ASA | | | 19,324 | | | | 180,778 | |
DnB NOR ASA | | | 41,277 | | | | 633,137 | |
Fred Olsen Energy ASA | | | 5,830 | | | | 256,102 | |
Marine Harvest ASA | | | 263,022 | | | | 326,653 | |
Norsk Hydro ASA | | | 28,145 | | | | 230,787 | |
Orkla ASA | | | 55,413 | | | | 536,925 | |
Statoil ASA | | | 118,031 | | | | 3,270,963 | |
Telenor ASA | | | 42,218 | | | | 694,507 | |
Veidekke ASA | | | 20,803 | | | | 190,853 | |
Yara International ASA | | | 7,460 | | | | 377,872 | |
| | | | | | | | |
| Total Norway | | | | | | | 7,231,432 | |
| Portugal – 0.9% | | | | | | | | |
Banco Comercial Portugues S.A. Class R(a) | | | 201,570 | | | | 164,764 | |
Banco Espirito Santo S.A. | | | 60,315 | | | | 247,364 | |
Brisa Auto-Estradas de Portugal S.A. | | | 48,012 | | | | 325,203 | |
Cimpor Cimentos de Portugal, SGPS, S.A. | | | 41,539 | | | | 301,460 | |
EDP-Energias de Portugal S.A. | | | 231,945 | | | | 904,513 | |
Galp Energia, SGPS, S.A. Class B | | | 16,302 | | | | 349,441 | |
Jeronimo Martins, SGPS, S.A. | | | 17,488 | | | | 281,675 | |
Novabase, SGPS, S.A. | | | 31,887 | | | | 140,277 | |
Portucel Empresa Produtora de Pasta e Papel S.A. | | | 54,273 | | | | 190,930 | |
Portugal Telecom, SGPS, S.A. | | | 56,295 | | | | 650,610 | |
Sonae | | | 157,195 | | | | 183,814 | |
Zon Multimedia Servicos de Telecomunicacoes
e Multimedia, SGPS, S.A. | | | 38,161 | | | | 200,371 | |
| | | | | | | | |
| Total Portugal | | | | | | | 3,940,422 | |
| | | | | | | | |
| Investments | | Shares | | | Fair
Value | |
| | | | | | | | |
| Singapore – 1.9% | | | | | | | | |
Cityspring Infrastructure Trust | | | 438,000 | | | $ | 189,377 | |
DBS Group Holdings Ltd. | | | 88,000 | | | | 1,022,071 | |
Fraser and Neave Ltd. | | | 52,000 | | | | 247,933 | |
Jardine Cycle & Carriage Ltd. | | | 12,000 | | | | 348,433 | |
Keppel Corp., Ltd. | | | 61,000 | | | | 595,240 | |
Oversea-Chinese Banking Corp., Ltd. | | | 94,000 | | | | 714,415 | |
SembCorp Industries Ltd. | | | 86,000 | | | | 355,462 | |
SembCorp Marine Ltd. | | | 90,000 | | | | 416,977 | |
SIA Engineering Co., Ltd. | | | 76,000 | | | | 244,189 | |
Singapore Exchange Ltd. | | | 52,000 | | | | 323,840 | |
Singapore Post Ltd. | | | 270,000 | | | | 248,473 | |
Singapore Press Holdings Ltd.(a) | | | 149,000 | | | | 465,736 | |
Singapore Technologies Engineering Ltd. | | | 131,000 | | | | 338,802 | |
Singapore Telecommunications Ltd. | | | 570,000 | | | | 1,365,648 | |
StarHub Ltd. | | | 169,000 | | | | 361,999 | |
United Overseas Bank Ltd. | | | 43,000 | | | | 641,333 | |
UOB-Kay Hian Holdings Ltd. | | | 189,000 | | | | 263,895 | |
Venture Corp., Ltd. | | | 29,000 | | | | 221,095 | |
Wilmar International Ltd. | | | 84,000 | | | | 363,856 | |
| | | | | | | | |
| Total Singapore | | | | | | | 8,728,774 | |
| Spain – 7.5% | | | | | | | | |
Abertis Infraestructuras, S.A. | | | 38,836 | | | | 844,869 | |
Acciona S.A. | | | 3,420 | | | | 372,153 | |
ACS Actividades de Construccion y Servicios, S.A. | | | 21,993 | | | | 1,032,436 | |
Antena 3 de Television S.A.(a) | | | 13,492 | | | | 125,601 | |
Banco Bilbao Vizcaya Argentaria S.A.(a) | | | 178,223 | | | | 2,165,216 | |
Banco de Sabadell S.A. | | | 55,745 | | | | 244,206 | |
Banco Espanol de Credito S.A.(a) | | | 52,494 | | | | 475,944 | |
Banco Popular Espanol S.A.(a) | | | 75,827 | | | | 446,350 | |
Banco Santander S.A. | | | 543,810 | | | | 6,321,936 | |
Bankinter, S.A.(a) | | | 35,111 | | | | 241,158 | |
Bolsas y Mercados Espanoles S.A.(a) | | | 10,189 | | | | 310,439 | |
Criteria Caixacorp S.A. | | | 210,160 | | | | 1,484,331 | |
Duro Felguera S.A. | | | 25,346 | | | | 204,661 | |
Ebro Foods S.A.(a)* | | | 12,937 | | | | 304,390 | |
Enagas S.A.(a) | | | 13,877 | | | | 313,510 | |
Endesa S.A. | | | 29,406 | | | | 912,428 | |
Ferrovial S.A. | | | 28,008 | | | | 351,753 | |
Fomento de Construcciones y Contratas S.A.(a) | | | 12,862 | | | | 426,377 | |
Gas Natural SDG S.A. | | | 61,701 | | | | 1,160,606 | |
Gestevision Telecinco S.A.* | | | 11,560 | | | | 132,518 | |
Grifols S.A. | | | 16,001 | | | | 279,296 | |
Iberdrola Renovables S.A. | | | 37,320 | | | | 161,266 | |
Iberdrola S.A. | | | 325,330 | | | | 2,832,843 | |
Inditex S.A. | | | 14,622 | | | | 1,174,869 | |
Indra Sistemas S.A. | | | 12,211 | | | | 245,200 | |
Mapfre S.A. | | | 107,255 | | | | 404,715 | |
Red Electrica Corp. S.A. | | | 6,285 | | | | 357,654 | |
Repsol YPF S.A. | | | 66,431 | | | | 2,279,031 | |
Tecnicas Reunidas S.A.(a) | | | 3,219 | | | | 193,778 | |
Telefonica S.A. | | | 316,582 | | | | 7,936,204 | |
Zardoya Otis S.A.(a) | | | 25,189 | | | | 418,225 | |
| | | | | | | | |
| Total Spain | | | | | | | 34,153,963 | |
See Notes to Financial Statements.
| | | | |
| WisdomTree International Dividend and Sector Funds | | | 37 | |
Schedule of Investments (continued)
WisdomTree DEFA Fund (DWM)
March 31, 2011
| | | | | | | | |
| Investments | | Shares | | | Fair
Value | |
| | | | | | | | |
| Sweden – 2.9% | | | | | | | | |
Alfa Laval AB | | | 15,401 | | | $ | 334,709 | |
Assa Abloy AB Class B | | | 10,404 | | | | 299,335 | |
Atlas Copco AB Class B | | | 33,884 | | | | 819,653 | |
Axfood AB | | | 5,411 | | | | 201,656 | |
Boliden AB | | | 13,081 | | | | 282,007 | |
Castellum AB(a) | | | 13,994 | | | | 203,641 | |
Electrolux AB Series B | | | 8,629 | | | | 222,551 | |
Hennes & Mauritz AB Class B | | | 54,922 | | | | 1,824,813 | |
Kungsleden AB | | | 24,949 | | | | 245,203 | |
Nordea Bank AB(a) | | | 130,822 | | | | 1,432,978 | |
Peab AB | | | 35,813 | | | | 319,333 | |
Ratos AB Class B | | | 9,159 | | | | 361,807 | |
Sandvik AB | | | 14,905 | | | | 281,400 | |
Securitas AB Class B | | | 24,925 | | | | 296,924 | |
Skandinaviska Enskilda Banken AB Class A(a) | | | 52,286 | | | | 466,632 | |
Skanska AB Class B | | | 25,209 | | | | 531,082 | |
SKF AB Class B | | | 13,654 | | | | 397,820 | |
Svenska Cellulosa AB Class B | | | 29,554 | | | | 475,982 | |
Svenska Handelsbanken AB Class A(a) | | | 24,889 | | | | 816,692 | |
Swedish Match AB | | | 10,328 | | | | 343,644 | |
Tele2 AB Class B | | | 15,250 | | | | 352,459 | |
Telefonaktiebolaget LM Ericsson Class B | | | 77,570 | | | | 1,000,919 | |
TeliaSonera AB | | | 188,743 | | | | 1,632,099 | |
| | | | | | | | |
| Total Sweden | | | | | | | 13,143,339 | |
| Switzerland – 5.6% | | | | | | | | |
Adecco S.A. | | | 4,472 | | | | 295,249 | |
Baloise Holding AG | | | 3,573 | | | | 355,406 | |
Cie Financiere Richemont S.A. Class A | | | 5,931 | | | | 343,925 | |
Credit Suisse Group AG | | | 46,691 | | | | 1,991,966 | |
Geberit AG | | | 2,111 | | | | 461,496 | |
Holcim Ltd. | | | 6,391 | | | | 483,421 | |
Kuehne + Nagel International AG | | | 3,012 | | | | 423,066 | |
Nestle S.A. | | | 100,401 | | | | 5,778,120 | |
Novartis AG | | | 90,358 | | | | 4,920,627 | |
Roche Holding AG | | | 28,563 | | | | 4,096,262 | |
Schindler Holding AG Participating Shares | | | 2,789 | | | | 336,564 | |
SGS S.A. | | | 364 | | | | 650,533 | |
Sulzer AG | | | 1,883 | | | | 284,863 | |
Swatch Group AG (The) | | | 3,254 | | | | 259,651 | |
Swiss Reinsurance Co., Ltd. | | | 8,054 | | | | 462,631 | |
Swisscom AG | | | 2,590 | | | | 1,159,321 | |
Syngenta AG | | | 2,181 | | | | 711,623 | |
Zurich Financial Services AG | | | 8,955 | | | | 2,516,621 | |
| | | | | | | | |
| Total Switzerland | | | | | | | 25,531,345 | |
| United Kingdom – 18.0% | | | | | | | | |
Aberdeen Asset Management PLC | | | 87,141 | | | | 294,451 | |
Admiral Group PLC | | | 13,377 | | | | 333,219 | |
AMEC PLC | | | 12,415 | | | | 237,414 | |
Antofagasta PLC | | | 19,121 | | | | 417,146 | |
Ashmore Group PLC | | | 58,022 | | | | 308,223 | |
Associated British Foods PLC | | | 21,607 | | | | 343,578 | |
AstraZeneca PLC | | | 66,823 | | | | 3,066,671 | |
| | | | | | | | |
| Investments | | Shares | | | Fair
Value | |
| | | | | | | | |
Atkins WS PLC | | | 13,791 | | | $ | 154,965 | |
Aviva PLC | | | 198,528 | | | | 1,377,301 | |
BAE Systems PLC | | | 173,896 | | | | 905,647 | |
Balfour Beatty PLC | | | 52,086 | | | | 287,043 | |
Barclays PLC | | | 136,349 | | | | 606,615 | |
Berendsen PLC | | | 31,508 | | | | 242,933 | |
BG Group PLC | | | 39,386 | | | | 979,205 | |
BHP Billiton PLC | | | 60,632 | | | | 2,390,875 | |
Brewin Dolphin Holdings PLC | | | 74,599 | | | | 201,131 | |
British American Tobacco PLC | | | 90,157 | | | | 3,615,818 | |
British Land Co. PLC | | | 53,870 | | | | 477,089 | |
British Sky Broadcasting Group PLC | | | 50,358 | | | | 665,951 | |
BT Group PLC | | | 200,181 | | | | 595,553 | |
Cable & Wireless Communications PLC | | | 492,886 | | | | 359,956 | |
Capita Group PLC (The) | | | 18,735 | | | | 223,132 | |
Carillion PLC | | | 35,742 | | | | 217,712 | |
Centrica PLC | | | 207,185 | | | | 1,080,344 | |
Chaucer Holdings PLC | | | 215,011 | | | | 193,867 | |
Chesnara PLC | | | 50,540 | | | | 199,292 | |
Close Brothers Group PLC | | | 15,321 | | | | 207,522 | |
Compass Group PLC | | | 48,746 | | | | 437,960 | |
Diageo PLC | | | 86,594 | | | | 1,644,849 | |
Electrocomponents PLC | | | 55,451 | | | | 237,590 | |
Eurasian Natural Resources Corp. PLC | | | 12,251 | | | | 183,907 | |
Firstgroup PLC | | | 33,548 | | | | 175,470 | |
Fresnillo PLC | | | 13,829 | | | | 342,040 | |
G4S PLC | | | 52,806 | | | | 216,184 | |
GlaxoSmithKline PLC | | | 266,268 | | | | 5,076,954 | |
Go-Ahead Group PLC | | | 8,896 | | | | 191,082 | |
Greene King PLC | | | 23,102 | | | | 165,789 | |
Hargreaves Lansdown PLC | | | 39,657 | | | | 387,766 | |
Hays PLC | | | 150,245 | | | | 280,091 | |
HMV Group PLC(a) | | | 145,923 | | | | 35,671 | |
Home Retail Group PLC | | | 69,739 | | | | 215,863 | |
HSBC Holdings PLC | | | 584,904 | | | | 6,009,834 | |
ICAP PLC | | | 35,897 | | | | 303,817 | |
IG Group Holdings PLC | | | 22,879 | | | | 167,453 | |
IMI PLC | | | 15,712 | | | | 259,411 | |
Imperial Tobacco Group PLC | | | 39,843 | | | | 1,230,704 | |
Inmarsat PLC | | | 17,078 | | | | 165,346 | |
Intercontinental Hotels Group PLC | | | 9,383 | | | | 192,217 | |
International Power PLC | | | 65,848 | | | | 325,097 | |
Interserve PLC | | | 41,580 | | | | 183,456 | |
Investec PLC | | | 19,622 | | | | 150,251 | |
J. Sainsbury PLC | | | 78,179 | | | | 420,188 | |
Johnson Matthey PLC | | | 8,052 | | | | 240,069 | |
Kier Group PLC | | | 8,957 | | | | 186,649 | |
Kingfisher PLC | | | 71,916 | | | | 283,468 | |
Legal & General Group PLC | | | 296,560 | | | | 547,627 | |
Logica PLC | | | 82,260 | | | | 172,735 | |
London Stock Exchange Group PLC | | | 17,384 | | | | 231,982 | |
Man Group PLC | | | 213,463 | | | | 841,397 | |
Marks & Spencer Group PLC | | | 33,936 | | | | 183,157 | |
Marston’s PLC | | | 86,953 | | | | 132,412 | |
See Notes to Financial Statements.
| | |
| 38 | | WisdomTree International Dividend and Sector Funds |
Schedule of Investments (concluded)
WisdomTree DEFA Fund (DWM)
March 31, 2011
| | | | | | | | |
| Investments | | Shares | | | Fair
Value | |
| | | | | | | | |
Meggitt PLC | | | 34,323 | | | $ | 188,657 | |
Melrose PLC | | | 41,528 | | | | 218,274 | |
N. Brown Group PLC | | | 34,836 | | | | 141,667 | |
National Grid PLC | | | 180,613 | | | | 1,719,710 | |
Next PLC | | | 7,319 | | | | 232,293 | |
Northumbrian Water Group PLC | | | 39,169 | | | | 208,575 | |
Pearson PLC | | | 32,944 | | | | 581,411 | |
Pennon Group PLC | | | 22,052 | | | | 220,926 | |
Premier Farnell PLC | | | 41,541 | | | | 180,654 | |
Provident Financial PLC(a) | | | 16,033 | | | | 246,721 | |
Prudential PLC | | | 91,396 | | | | 1,035,045 | |
Reckitt Benckiser Group PLC | | | 22,944 | | | | 1,177,634 | |
Reed Elsevier PLC | | | 53,060 | | | | 459,283 | |
Rexam PLC | | | 56,314 | | | | 328,036 | |
Rio Tinto PLC | | | 13,347 | | | | 936,868 | |
Robert Wiseman Dairies PLC | | | 19,655 | | | | 108,144 | |
Royal Dutch Shell PLC Class A | | | 191,239 | | | | 6,940,212 | |
Royal Dutch Shell PLC Class B | | | 154,640 | | | | 5,602,090 | |
RSA Insurance Group PLC | | | 219,154 | | | | 461,950 | |
SABMiller PLC | | | 30,756 | | | | 1,088,304 | |
Sage Group PLC (The) | | | 62,383 | | | | 278,091 | |
Scottish & Southern Energy PLC | | | 55,230 | | | | 1,116,375 | |
Segro PLC | | | 44,832 | | | | 231,041 | |
Severn Trent PLC | | | 15,481 | | | | 362,551 | |
Smiths Group PLC | | | 13,733 | | | | 285,513 | |
Stagecoach Group PLC | | | 69,196 | | | | 238,917 | |
Standard Chartered PLC | | | 49,391 | | | | 1,280,199 | |
Standard Life PLC | | | 162,467 | | | | 538,562 | |
Tate & Lyle PLC | | | 32,693 | | | | 302,640 | |
Tesco PLC | | | 252,318 | | | | 1,540,966 | |
Thomas Cook Group PLC | | | 64,861 | | | | 177,371 | |
TUI Travel PLC(a) | | | 66,406 | | | | 241,631 | |
Unilever PLC | | | 40,126 | | | | 1,222,079 | |
United Utilities Group PLC | | | 48,458 | | | | 459,452 | |
Vedanta Resources PLC(a) | | | 5,125 | | | | 195,438 | |
Vodafone Group PLC | | | 3,117,923 | | | | 8,821,246 | |
WH Smith PLC | | | 23,524 | | | | 163,576 | |
Whitbread PLC | | | 7,213 | | | | 190,774 | |
WM Morrison Supermarkets PLC | | | 86,801 | | | | 384,020 | |
Xstrata PLC | | | 14,719 | | | | 343,762 | |
| | | | | | | | |
| Total United Kingdom | | | | | | | 82,251,797 | |
TOTAL COMMON STOCKS
(Cost: $407,189,028) | | | | | | | 453,698,187 | |
| EXCHANGE-TRADED FUND – 0.4% | | | | | | | | |
| United States – 0.4% | | | | | | | | |
WisdomTree International Dividend ex-Financials Fund(a)(e)
| | | | | | | | |
| (Cost: $1,583,764) | | | 36,677 | | | | 1,723,819 | |
| SHORT-TERM INVESTMENT – 0.1% | | | | | | | | |
| MONEY MARKET FUND – 0.1% | | | | | | | | |
Invesco Treasury Fund Private Class, 0.02%(f)
(Cost: $311,791) | | | 311,791 | | | | 311,791 | |
| | | | | | | | |
| Investments | | Shares | | | Fair
Value | |
| | | | | | | | |
| INVESTMENT OF CASH COLLATERAL FOR SECURITIES LOANED – 6.8% | | | | | | | | |
| MONEY MARKET FUND – 6.8% | | | | | | | | |
Dreyfus Institutional Preferred Money Market Fund, 0.19%(g) | | | | | | | | |
| (Cost: $31,277,000)(h) | | | 31,277,000 | | | $ | 31,277,000 | |
TOTAL INVESTMENTS IN SECURITIES – 106.3%
(Cost: $440,361,583) | | | | 487,010,797 | |
Liabilities in Excess of Foreign Currency and Other Assets – (6.3)% | | | | | | | (29,013,766 | ) |
| | | | | | | | |
| NET ASSETS – 100.0% | | | | | | $ | 457,997,031 | |
| RSP | – Risparmio Italian Savings Shares |
| * | Non-income producing security. |
| † | Security is being fair valued by a valuation committee under the direction of the Board of Trustees. The aggregate value of fair valued securities is $0, which represents 0.0% of net assets. |
| (a) | Security, or portion thereof, was on loan at March 31, 2011 (See Note 2). |
| (b) | Stapled Security – A security contractually bound to one or more other securities to form a single saleable unit which cannot be sold separately. |
| (c) | Securities exempt from registration under Rule 144A of the Securities Act of 1933. Such securities are considered liquid, and may be sold in transactions exempt from registration, normally only to dealers in that program or other “accredited investors.” At March 31, 2011, the aggregate value of these securities amounted to $276,372 representing 0.1% of net assets. |
| (d) | Escrow security – additional shares issued as a result of a corporate action. |
| (e) | Affiliated companies (See Note 7). |
| (f) | Rate shown represents annualized 7-day yield as of March 31, 2011. |
| (g) | Interest rate shown reflects yield as of March 31, 2011. |
| (h) | At March 31, 2011, the total market value of the Fund’s securities on loan was $26,710,022 and the total market value of the collateral held by the Fund was $31,277,000. |
See Notes to Financial Statements.
| | | | |
| WisdomTree International Dividend and Sector Funds | | | 39 | |
Schedule of Investments
WisdomTree DEFA Equity Income Fund (DTH)
March 31, 2011
| | | | | | | | |
| Investments | | Shares | | | Fair
Value | |
| | | | | | | | |
| COMMON STOCKS – 99.3% | | | | | | | | |
| Australia – 14.7% | | | | | | | | |
AGL Energy Ltd. | | | 16,173 | | | $ | 239,339 | |
Amcor Ltd. | | | 36,354 | | | | 265,424 | |
AMP Ltd.(a) | | | 67,617 | | | | 379,699 | |
Australia & New Zealand Banking Group Ltd. | | | 70,837 | | | | 1,744,227 | |
Brambles Ltd.(a) | | | 41,798 | | | | 306,036 | |
Coca-Cola Amatil Ltd. | | | 24,942 | | | | 302,819 | |
Commonwealth Bank of Australia | | | 38,151 | | | | 2,067,381 | |
Crown Ltd. | | | 29,115 | | | | 245,391 | |
CSR Ltd. | | | 41,131 | | | | 139,517 | |
David Jones Ltd.(a) | | | 44,052 | | | | 216,393 | |
Foster’s Group Ltd. | | | 70,584 | | | | 417,528 | |
Harvey Norman Holdings Ltd.(a) | | | 59,795 | | | | 185,511 | |
Insurance Australia Group Ltd. | | | 75,894 | | | | 281,764 | |
Leighton Holdings Ltd.(a) | | | 9,217 | | | | 281,092 | |
Lend Lease Group(b) | | | 30,621 | | | | 287,217 | |
Macquarie Group Ltd. | | | 7,660 | | | | 289,930 | |
Metcash Ltd. | | | 53,474 | | | | 230,048 | |
National Australia Bank Ltd. | | | 67,303 | | | | 1,799,196 | |
Orica Ltd. | | | 10,373 | | | | 282,877 | |
Origin Energy Ltd. | | | 24,324 | | | | 408,009 | |
QBE Insurance Group Ltd.(a) | | | 31,801 | | | | 581,113 | |
Santos Ltd. | | | 20,405 | | | | 328,133 | |
Sonic Healthcare Ltd. | | | 17,947 | | | | 222,347 | |
SP AusNet(b) | | | 219,470 | | | | 199,729 | |
Suncorp Group Ltd. | | | 37,415 | | | | 328,114 | |
TABCORP Holdings Ltd. | | | 48,298 | | | | 374,106 | |
Tatts Group Ltd. | | | 119,205 | | | | 288,465 | |
Telstra Corp., Ltd. | | | 626,484 | | | | 1,827,017 | |
Toll Holdings Ltd. | | | 34,211 | | | | 209,799 | |
Transurban Group(b) | | | 44,797 | | | | 248,775 | |
Wesfarmers Ltd. | | | 27,195 | | | | 893,771 | |
Westpac Banking Corp. | | | 93,552 | | | | 2,353,849 | |
Woolworths Ltd. | | | 29,797 | | | | 828,295 | |
WorleyParsons Ltd. | | | 9,009 | | | | 288,630 | |
| | | | | | | | |
| Total Australia | | | | | | | 19,341,541 | |
| Austria – 0.9% | | | | | | | | |
Bank Austria Creditanstalt AG*†(c) | | | 3,058 | | | | — | |
Oesterreichische Post AG | | | 7,233 | | | | 247,884 | |
Telekom Austria AG | | | 18,706 | | | | 273,951 | |
Verbund AG(a) | | | 7,557 | | | | 336,202 | |
Voestalpine AG | | | 7,110 | | | | 334,275 | |
| | | | | | | | |
| Total Austria | | | | | | | 1,192,312 | |
| Belgium – 1.0% | | | | | | | | |
Ageas | | | 48,608 | | | | 138,304 | |
Belgacom S.A. | | | 14,008 | | | | 543,386 | |
Mobistar S.A. | | | 4,118 | | | | 285,881 | |
Solvay S.A. | | | 2,829 | | | | 335,583 | |
| | | | | | | | |
| Total Belgium | | | | | | | 1,303,154 | |
| Denmark – 0.1% | | | | | | | | |
Tryg A/S(a) | | | 2,864 | | | | 168,653 | |
| | | | | | | | |
| Investments | | Shares | | | Fair
Value | |
| | | | | | | | |
| Finland – 2.1% | | | | | | | | |
Fortum Oyj(a) | | | 20,269 | | | $ | 689,179 | |
Kone Oyj Class B | | | 5,430 | | | | 312,852 | |
Nokia Oyj(a) | | | 89,153 | | | | 763,530 | |
Sampo Oyj Class A | | | 14,276 | | | | 456,032 | |
UPM-Kymmene Oyj*(a) | | | 12,574 | | | | 266,229 | |
Wartsila Oyj(a) | | | 6,354 | | | | 248,417 | |
| | | | | | | | |
| Total Finland | | | | | | | 2,736,239 | |
| France – 21.4% | | | | | | | | |
Accor S.A. | | | 6,715 | | | | 302,125 | |
Alstom S.A. | | | 5,507 | | | | 326,080 | |
AXA S.A. | | | 52,409 | | | | 1,096,639 | |
BNP Paribas | | | 19,196 | | | | 1,405,910 | |
Bouygues S.A. | | | 9,979 | | | | 479,852 | |
Carrefour S.A. | | | 12,138 | | | | 538,110 | |
Casino Guichard Perrachon S.A. | | | 2,973 | | | | 281,786 | |
CNP Assurances | | | 13,594 | | | | 288,983 | |
Compagnie de Saint-Gobain | | | 10,240 | | | | 627,837 | |
Credit Agricole S.A. | | | 61,457 | | | | 1,009,934 | |
Danone | | | 10,164 | | | | 664,862 | |
Electricite de France S.A. | | | 34,351 | | | | 1,424,402 | |
Eutelsat Communications S.A. | | | 6,216 | | | | 248,623 | |
France Telecom S.A. | | | 141,838 | | | | 3,182,273 | |
GDF Suez | | | 74,728 | | | | 3,048,837 | |
Klepierre | | | 8,605 | | | | 349,733 | |
Lafarge S.A. | | | 7,920 | | | | 494,697 | |
Lagardere SCA | | | 5,294 | | | | 226,321 | |
Legrand S.A. | | | 6,106 | | | | 254,362 | |
M-6 Metropole Television S.A. | | | 13,582 | | | | 355,417 | |
Neopost S.A. | | | 2,657 | | | | 233,058 | |
PagesJaunes Groupe(a) | | | 22,074 | | | | 221,375 | |
PPR | | | 2,849 | | | | 437,252 | |
Sanofi-Aventis S.A. | | | 31,973 | | | | 2,244,823 | |
Sodexo | | | 3,813 | | | | 278,830 | |
Suez Environnement Co. | | | 13,339 | | | | 276,369 | |
TOTAL S.A. | | | 76,864 | | | | 4,685,433 | |
Vallourec S.A. | | | 3,077 | | | | 345,658 | |
Veolia Environnement S.A. | | | 15,958 | | | | 496,853 | |
Vinci S.A. | | | 13,247 | | | | 828,934 | |
Vivendi S.A. | | | 53,771 | | | | 1,537,574 | |
| | | | | | | | |
| Total France | | | | | | | 28,192,942 | |
| Germany – 6.9% | | | | | | | | |
Allianz SE | | | 9,151 | | | | 1,286,022 | |
BASF SE | | | 15,958 | | | | 1,382,085 | |
Deutsche Boerse AG | | | 4,456 | | | | 338,624 | |
Deutsche Post AG | | | 29,968 | | | | 540,951 | |
Deutsche Telekom AG | | | 146,879 | | | | 2,265,699 | |
E.ON AG | | | 47,877 | | | | 1,464,155 | |
Hannover Rueckversicherung AG | | | 4,098 | | | | 224,041 | |
Muenchener Rueckversicherungs AG | | | 4,624 | | | | 728,373 | |
RWE AG | | | 13,984 | | | | 891,920 | |
| | | | | | | | |
| Total Germany | | | | | | | 9,121,870 | |
See Notes to Financial Statements.
| | |
| 40 | | WisdomTree International Dividend and Sector Funds |
Schedule of Investments (continued)
WisdomTree DEFA Equity Income Fund (DTH)
March 31, 2011
| | | | | | | | |
| Investments | | Shares | | | Fair
Value | |
| | | | | | | | |
| Hong Kong – 1.7% | | | | | | | | |
BOC Hong Kong Holdings Ltd. | | | 229,500 | | | $ | 747,965 | |
CLP Holdings Ltd. | | | 51,024 | | | | 412,616 | |
Hang Seng Bank Ltd. | | | 42,118 | | | | 680,109 | |
Power Assets Holdings Ltd. | | | 51,518 | | | | 344,416 | |
| | | | | | | | |
| Total Hong Kong | | | | | | | 2,185,106 | |
| Italy – 6.1% | | | | | | | | |
A2A SpA | | | 163,492 | | | | 265,189 | |
Atlantia SpA | | | 16,745 | | | | 384,245 | |
Banca Carige SpA | | | 67,796 | | | | 160,766 | |
Enel SpA | | | 421,159 | | | | 2,658,421 | |
ENI SpA | | | 109,139 | | | | 2,684,056 | |
Finmeccanica SpA | | | 16,567 | | | | 208,771 | |
Mediaset SpA | | | 40,838 | | | | 259,862 | |
Parmalat SpA | | | 72,110 | | | | 241,911 | |
Snam Rete Gas SpA | | | 86,014 | | | | 484,100 | |
Telecom Italia SpA RSP | | | 202,765 | | | | 273,069 | |
Terna Rete Elettrica Nazionale SpA | | | 56,402 | | | | 270,375 | |
Unione di Banche Italiane SCPA | | | 17,125 | | | | 146,542 | |
| | | | | | | | |
| Total Italy | | | | | | | 8,037,307 | |
| Japan – 1.7% | | | | | | | | |
Astellas Pharma, Inc. | | | 9,500 | | | | 353,041 | |
Daito Trust Construction Co., Ltd. | | | 3,800 | | | | 262,717 | |
Eisai Co., Ltd.(a) | | | 7,100 | | | | 255,627 | |
Mizuho Financial Group, Inc. | | | 307,100 | | | | 511,339 | |
Oracle Corp. | | | 4,300 | | | | 179,772 | |
Takeda Pharmaceutical Co., Ltd.(a) | | | 13,900 | | | | 650,724 | |
| | | | | | | | |
| Total Japan | | | | | | | 2,213,220 | |
| Netherlands – 0.9% | | | | | | | | |
Koninklijke KPN N.V.(a) | | | 50,235 | | | | 856,888 | |
Reed Elsevier N.V. | | | 21,385 | | | | 275,555 | |
| | | | | | | | |
| Total Netherlands | | | | | | | 1,132,443 | |
| New Zealand – 0.2% | | | | | | | | |
Telecom Corp. of New Zealand Ltd. | | | 153,385 | | | | 235,159 | |
| Norway – 1.9% | | | | | | | | |
Aker ASA | | | 7,329 | | | | 225,895 | |
Fred Olsen Energy ASA | | | 4,404 | | | | 193,460 | |
Marine Harvest ASA | | | 158,002 | | | | 196,226 | |
Orkla ASA | | | 31,226 | | | | 302,565 | |
Statoil ASA | | | 55,709 | | | | 1,543,850 | |
| | | | | | | | |
| Total Norway | | | | | | | 2,461,996 | |
| Portugal – 1.1% | | | | | | | | |
Banco Espirito Santo S.A. | | | 36,849 | | | | 151,125 | |
Brisa Auto-Estradas de Portugal S.A. | | | 33,739 | | | | 228,527 | |
Cimpor Cimentos de Portugal, SGPS, S.A. | | | 30,300 | | | | 219,895 | |
EDP-Energias de Portugal S.A. | | | 115,982 | | | | 452,293 | |
Portugal Telecom, SGPS, S.A. | | | 29,638 | | | | 342,531 | |
| | | | | | | | |
| Total Portugal | | | | | | | 1,394,371 | |
| Singapore – 1.8% | | | | | | | | |
Cityspring Infrastructure Trust | | | 383,000 | | | | 165,597 | |
DBS Group Holdings Ltd. | | | 40,000 | | | | 464,578 | |
| | | | | | | | |
| Investments | | Shares | | | Fair
Value | |
| | | | | | | | |
Keppel Corp., Ltd. | | | 40,000 | | | $ | 390,321 | |
Singapore Press Holdings Ltd. | | | 81,000 | | | | 253,185 | |
Singapore Technologies Engineering Ltd. | | | 90,000 | | | | 232,765 | |
Singapore Telecommunications Ltd. | | | 275,000 | | | | 658,865 | |
StarHub Ltd. | | | 98,000 | | | | 209,917 | |
| | | | | | | | |
| Total Singapore | | | | | | | 2,375,228 | |
| Spain – 10.7% | | | | | | | | |
Abertis Infraestructuras, S.A. | | | 21,045 | | | | 457,830 | |
Acciona S.A. | | | 1,890 | | | | 205,663 | |
ACS Actividades de Construccion y Servicios, S.A. | | | 10,922 | | | | 512,721 | |
Banco Bilbao Vizcaya Argentaria S.A.(a) | | | 82,753 | | | | 1,005,359 | |
Banco Espanol de Credito S.A.(a) | | | 25,965 | | | | 235,415 | |
Banco Popular Espanol S.A.(a) | | | 38,416 | | | | 226,133 | |
Banco Santander S.A. | | | 247,413 | | | | 2,876,242 | |
Bolsas y Mercados Espanoles S.A.(a) | | | 7,589 | | | | 231,222 | |
Criteria Caixacorp S.A. | | | 115,443 | | | | 815,358 | |
Fomento de Construcciones y Contratas S.A.(a) | | | 7,174 | | | | 237,819 | |
Gas Natural SDG S.A. | | | 28,945 | | | | 544,460 | |
Iberdrola S.A. | | | 150,889 | | | | 1,313,881 | |
Indra Sistemas S.A. | | | 9,937 | | | | 199,538 | |
Red Electrica Corp. S.A. | | | 3,370 | | | | 191,773 | |
Repsol YPF S.A. | | | 33,270 | | | | 1,141,385 | |
Telefonica S.A. | | | 142,517 | | | | 3,572,673 | |
Zardoya Otis S.A.(a) | | | 16,015 | | | | 265,905 | |
| | | | | | | | |
| Total Spain | | | | | | | 14,033,377 | |
| Sweden – 1.8% | | | | | | | | |
Nordea Bank AB(a) | | | 61,392 | | | | 672,466 | |
Ratos AB Class B | | | 6,655 | | | | 262,892 | |
Securitas AB Class B | | | 19,944 | | | | 237,587 | |
Skanska AB Class B | | | 12,551 | | | | 264,414 | |
Svenska Cellulosa AB Class B | | | 14,666 | | | | 236,203 | |
TeliaSonera AB | | | 82,797 | | | | 715,962 | |
| | | | | | | | |
| Total Sweden | | | | | | | 2,389,524 | |
| Switzerland – 5.1% | | | | | | | | |
Baloise Holding AG | | | 2,049 | | | | 203,814 | |
Credit Suisse Group AG | | | 22,579 | | | | 963,282 | |
Novartis AG | | | 41,324 | | | | 2,250,381 | |
Roche Holding AG | | | 11,040 | | | | 1,583,263 | |
Swisscom AG | | | 1,198 | | | | 536,242 | |
Zurich Financial Services AG | | | 4,223 | | | | 1,186,788 | |
| | | | | | | | |
| Total Switzerland | | | | | | | 6,723,770 | |
| United Kingdom – 19.2% | | | | | | | | |
Ashmore Group PLC | | | 40,320 | | | | 214,187 | |
AstraZeneca PLC | | | 30,871 | | | | 1,416,746 | |
Aviva PLC | | | 94,721 | | | | 657,133 | |
BAE Systems PLC | | | 91,197 | | | | 474,952 | |
British American Tobacco PLC | | | 42,372 | | | | 1,699,363 | |
British Land Co. PLC | | | 36,128 | | | | 319,960 | |
Cable & Wireless Communications PLC | | | 264,767 | | | | 193,360 | |
Centrica PLC | | | 104,692 | | | | 545,905 | |
Diageo PLC | | | 42,224 | | | | 802,043 | |
GlaxoSmithKline PLC | | | 122,785 | | | | 2,341,152 | |
See Notes to Financial Statements.
| | | | |
| WisdomTree International Dividend and Sector Funds | | | 41 | |
Schedule of Investments (concluded)
WisdomTree DEFA Equity Income Fund (DTH)
March 31, 2011
| | | | | | | | |
| Investments | | Shares | | | Fair
Value | |
| | | | | | | | |
Hays PLC | | | 127,084 | | | $ | 236,914 | |
Home Retail Group PLC | | | 47,744 | | | | 147,782 | |
HSBC Holdings PLC | | | 267,354 | | | | 2,747,037 | |
ICAP PLC | | | 24,098 | | | | 203,955 | |
Imperial Tobacco Group PLC | | | 20,279 | | | | 626,395 | |
International Power PLC | | | 39,766 | | | | 196,328 | |
J. Sainsbury PLC | | | 47,275 | | | | 254,088 | |
Legal & General Group PLC | | | 153,805 | | | | 284,016 | |
Man Group PLC | | | 110,686 | | | | 436,286 | |
National Grid PLC | | | 88,493 | | | | 842,588 | |
Pearson PLC | | | 19,370 | | | | 341,851 | |
Provident Financial PLC(a) | | | 12,216 | | | | 187,984 | |
Prudential PLC | | | 43,484 | | | | 492,449 | |
Reed Elsevier PLC | | | 31,382 | | | | 271,640 | |
Rexam PLC | | | 35,588 | | | | 207,304 | |
Royal Dutch Shell PLC Class B | | | 75,244 | | | | 2,725,839 | |
RSA Insurance Group PLC | | | 124,441 | | | | 262,307 | |
Scottish & Southern Energy PLC | | | 28,175 | | | | 569,507 | |
Severn Trent PLC | | | 8,964 | | | | 209,929 | |
Smiths Group PLC | | | 10,365 | | | | 215,491 | |
Standard Life PLC | | | 84,189 | | | | 279,078 | |
Tate & Lyle PLC | | | 21,497 | | | | 198,998 | |
TUI Travel PLC(a) | | | 44,397 | | | | 161,547 | |
United Utilities Group PLC | | | 28,304 | | | | 268,363 | |
Vodafone Group PLC | | | 1,416,384 | | | | 4,007,242 | |
WM Morrison Supermarkets PLC | | | 52,929 | | | | 234,165 | |
| | | | | | | | |
| Total United Kingdom | | | | | | | 25,273,884 | |
TOTAL COMMON STOCKS
(Cost: $128,996,139) | | | | | | | 130,512,096 | |
| EXCHANGE-TRADED FUND – 0.2% | | | | | | | | |
| United States – 0.2% | | | | | | | | |
WisdomTree International LargeCap Dividend Fund(d) | | | | | | | | |
| (Cost: $189,819) | | | 4,512 | | | | 215,177 | |
| SHORT-TERM INVESTMENT – 0.0% | | | | | | | | |
| MONEY MARKET FUND – 0.0% | | | | | | | | |
Invesco Treasury Fund Private Class, 0.02%(e)
(Cost: $19,414) | | | 19,414 | | | | 19,414 | |
| INVESTMENT OF CASH COLLATERAL FOR SECURITIES LOANED – 5.4% | | | | | | | | |
| MONEY MARKET FUND – 5.4% | | | | | | | | |
Dreyfus Institutional Preferred Money Market Fund, 0.19%(f) | | | | | | | | |
| (Cost: $7,112,000)(g) | | | 7,112,000 | | | | 7,112,000 | |
| TOTAL INVESTMENTS IN SECURITIES – 104.9% (Cost: $136,317,372) | | | | | | | 137,858,687 | |
Liabilities in Excess of Foreign Currency and Other Assets – (4.9)% | | | | | | | (6,404,250 | ) |
| | | | | | | | |
| NET ASSETS – 100.0% | | | | | | $ | 131,454,437 | |
| RSP | – Risparmio Italian Savings Shares |
| * | Non-income producing security. |
| † | Security is being fair valued by a valuation committee under the direction of the Board of Trustees. The aggregate value of fair valued securities is $0, which represents 0.0% of net assets. |
| (a) | Security, or portion thereof, was on loan at March 31, 2011 (See Note 2). |
| (b) | Stapled Security – A security contractually bound to one or more other securities to form a single saleable unit which cannot be sold separately. |
| (c) | Escrow security – additional shares issued as a result of a corporate action. |
| (d) | Affiliated companies (See Note 7). |
| (e) | Rate shown represents annualized 7-day yield as of March 31, 2011. |
| (f) | Interest rate shown reflects yield as of March 31, 2011. |
| (g) | At March 31, 2011, the total market value of the Fund’s securities on loan was $6,718,222 and the total market value of the collateral held by the Fund was $7,112,000. |
See Notes to Financial Statements.
| | |
| 42 | | WisdomTree International Dividend and Sector Funds |
Schedule of Investments
WisdomTree Global Equity Income Fund (DEW)
March 31, 2011
| | | | | | | | |
| Investments | | Shares | | | Fair
Value | |
| | | | | | | | |
| COMMON STOCKS – 99.3% | | | | | | | | |
| Australia – 9.3% | | | | | | | | |
AGL Energy Ltd. | | | 4,189 | | | $ | 61,992 | |
Amcor Ltd. | | | 9,119 | | | | 66,579 | |
AMP Ltd. | | | 29,942 | | | | 168,137 | |
Australia & New Zealand Banking Group Ltd. | | | 25,443 | | | | 626,486 | |
Bendigo and Adelaide Bank Ltd. | | | 4,086 | | | | 40,269 | |
BHP Billiton Ltd. | | | 17,210 | | | | 828,662 | |
Brambles Ltd. | | | 10,165 | | | | 74,426 | |
Coal & Allied Industries Ltd. | | | 376 | | | | 46,482 | |
Coca-Cola Amatil Ltd. | | | 6,747 | | | | 81,915 | |
Commonwealth Bank of Australia | | | 13,837 | | | | 749,819 | |
Crown Ltd. | | | 7,157 | | | | 60,321 | |
CSR Ltd. | | | 10,355 | | | | 35,124 | |
Foster’s Group Ltd. | | | 20,727 | | | | 122,607 | |
Harvey Norman Holdings Ltd.(a) | | | 10,936 | | | | 33,928 | |
Insurance Australia Group Ltd. | | | 21,825 | | | | 81,027 | |
Leighton Holdings Ltd.(a) | | | 2,580 | | | | 78,682 | |
Lend Lease Group(b) | | | 5,854 | | | | 54,909 | |
Macquarie Group Ltd. | | | 2,280 | | | | 86,298 | |
Metcash Ltd. | | | 11,798 | | | | 50,756 | |
National Australia Bank Ltd. | | | 24,211 | | | | 647,227 | |
Orica Ltd. | | | 2,552 | | | | 69,594 | |
Origin Energy Ltd. | | | 6,425 | | | | 107,772 | |
Platinum Asset Management Ltd.(a) | | | 6,517 | | | | 32,417 | |
QBE Insurance Group Ltd.(a) | | | 11,245 | | | | 205,485 | |
Santos Ltd. | | | 5,560 | | | | 89,410 | |
Sonic Healthcare Ltd. | | | 3,996 | | | | 49,507 | |
Suncorp Group Ltd. | | | 11,972 | | | | 104,990 | |
TABCORP Holdings Ltd. | | | 11,832 | | | | 91,648 | |
Tatts Group Ltd. | | | 26,694 | | | | 64,597 | |
Telstra Corp., Ltd. | | | 227,512 | | | | 663,494 | |
Toll Holdings Ltd. | | | 7,122 | | | | 43,676 | |
Transurban Group(b) | | | 10,711 | | | | 59,482 | |
Wesfarmers Ltd. | | | 9,651 | | | | 317,183 | |
Westpac Banking Corp. | | | 33,523 | | | | 843,468 | |
Woodside Petroleum Ltd. | | | 3,852 | | | | 186,430 | |
Woolworths Ltd. | | | 10,543 | | | | 293,074 | |
WorleyParsons Ltd. | | | 2,236 | | | | 71,637 | |
| | | | | | | | |
| Total Australia | | | | | | | 7,289,510 | |
| Austria – 0.5% | | | | | | | | |
OMV AG | | | 1,697 | | | | 76,798 | |
Telekom Austria AG | | | 5,806 | | | | 85,029 | |
Verbund AG(a) | | | 2,375 | | | | 105,661 | |
Vienna Insurance Group AG Wiener Versicherung Gruppe | | | 789 | | | | 45,123 | |
Voestalpine AG | | | 1,461 | | | | 68,689 | |
| | | | | | | | |
| Total Austria | | | | | | | 381,300 | |
| Belgium – 0.6% | | | | | | | | |
Ageas | | | 15,659 | | | | 44,554 | |
Belgacom S.A. | | | 5,016 | | | | 194,576 | |
Mobistar S.A. | | | 1,294 | | | | 89,833 | |
Solvay S.A. | | | 691 | | | | 81,968 | |
| | | | | | | | |
| Investments | | Shares | | | Fair
Value | |
| | | | | | | | |
UCB S.A. | | | 1,313 | | | $ | 49,927 | |
| | | | | | | | |
| Total Belgium | | | | | | | 460,858 | |
| Brazil – 2.3% | | | | | | | | |
Banco do Brasil S.A. | | | 23,600 | | | | 427,244 | |
CCR S.A. | | | 2,700 | | | | 79,120 | |
Cia de Bebidas das Americas | | | 11,800 | | | | 277,818 | |
Cia Energetica de Minas Gerais | | | 3,300 | | | | 49,295 | |
Cia Siderurgica Nacional S.A. | | | 10,100 | | | | 165,462 | |
Cielo S.A. | | | 9,600 | | | | 81,792 | |
CPFL Energia S.A. | | | 4,200 | | | | 120,856 | |
EDP—Energias do Brasil S.A. | | | 1,200 | | | | 29,138 | |
Light S.A. | | | 3,700 | | | | 64,277 | |
Natura Cosmeticos S.A. | | | 2,600 | | | | 73,505 | |
Redecard S.A. | | | 7,000 | | | | 103,058 | |
Souza Cruz S.A. | | | 16,000 | | | | 167,205 | |
Telecomunicacoes de Sao Paulo S.A. | | | 2,900 | | | | 66,619 | |
Tractebel Energia S.A. | | | 4,100 | | | | 69,335 | |
| | | | | | | | |
| Total Brazil | | | | | | | 1,774,724 | |
| Canada – 4.8% | | | | | | | | |
ARC Resources Ltd. | | | 2,440 | | | | 66,095 | |
Bank of Montreal | | | 3,467 | | | | 224,469 | |
Bank of Nova Scotia | | | 5,868 | | | | 358,867 | |
Baytex Energy Corp. | | | 743 | | | | 43,301 | |
BCE, Inc. | | | 6,114 | | | | 221,367 | |
Bonavista Energy Corp.(a) | | | 2,228 | | | | 68,713 | |
Brookfield Properties Corp. | | | 3,200 | | | | 56,450 | |
Canadian Imperial Bank of Commerce | | | 2,800 | | | | 240,637 | |
Canadian Oil Sands Ltd. | | | 3,581 | | | | 120,269 | |
CI Financial Corp. | | | 2,400 | | | | 56,870 | |
Crescent Point Energy Corp.(a) | | | 2,400 | | | | 116,083 | |
Emera, Inc. | | | 800 | | | | 26,062 | |
EnCana Corp. | | | 3,800 | | | | 130,983 | |
Enerplus Corp.(a) | | | 2,608 | | | | 82,335 | |
First Capital Realty, Inc. | | | 2,500 | | | | 41,223 | |
Fortis, Inc. | | | 1,100 | | | | 37,453 | |
Great-West Lifeco, Inc. | | | 3,732 | | | | 103,203 | |
Husky Energy, Inc.(a) | | | 5,770 | | | | 174,746 | |
IGM Financial, Inc. | | | 2,600 | | | | 131,798 | |
Pembina Pipeline Corp. | | | 2,468 | | | | 58,202 | |
Pengrowth Energy Corp. | | | 3,819 | | | | 52,648 | |
Penn West Petroleum Ltd.(a) | | | 5,630 | | | | 155,805 | |
Power Corp. of Canada | | | 900 | | | | 26,581 | |
Power Financial Corp. | | | 3,816 | | | | 123,140 | |
Rogers Communications, Inc. Class B | | | 3,200 | | | | 115,927 | |
Royal Bank of Canada(a) | | | 7,088 | | | | 437,121 | |
Shaw Communications, Inc. Class B | | | 3,100 | | | | 65,139 | |
Sun Life Financial, Inc. | | | 3,604 | | | | 112,890 | |
TransAlta Corp. | | | 2,400 | | | | 50,430 | |
TransCanada Corp. | | | 3,962 | | | | 160,109 | |
Vermilion Energy, Inc.(a) | | | 875 | | | | 45,452 | |
Yellow Media, Inc. | | | 9,056 | | | | 51,296 | |
| | | | | | | | |
| Total Canada | | | | | | | 3,755,664 | |
See Notes to Financial Statements.
| | | | |
| WisdomTree International Dividend and Sector Funds | | | 43 | |
Schedule of Investments (continued)
WisdomTree Global Equity Income Fund (DEW)
March 31, 2011
| | | | | | | | |
| Investments | | Shares | | | Fair
Value | |
| | | | | | | | |
| Chile – 0.5% | | | | | | | | |
AES Gener S.A. | | | 68,014 | | | $ | 36,622 | |
Banco de Chile | | | 784,844 | | | | 107,289 | |
Banco Santander Chile | | | 1,194,923 | | | | 100,003 | |
Empresa Nacional de Electricidad S.A. | | | 41,063 | | | | 75,845 | |
Enersis S.A. | | | 169,953 | | | | 70,585 | |
ENTEL Chile S.A. | | | 2,558 | | | | 42,063 | |
| | | | | | | | |
| Total Chile | | | | | | | 432,407 | |
| China – 0.4% | | | | | | | | |
Bank of China Ltd. Class H | | | 414,000 | | | | 230,467 | |
Guangzhou R&F Properties Co., Ltd. Class H | | | 22,800 | | | | 33,944 | |
Zhejiang Expressway Co., Ltd. Class H | | | 46,000 | | | | 41,871 | |
| | | | | | | | |
| Total China | | | | | | | 306,282 | |
| Czech Republic – 0.7% | | | | | | | | |
CEZ AS | | | 6,450 | | | | 329,788 | |
Komercni Banka AS | | | 191 | | | | 48,222 | |
Telefonica O2 Czech Republic AS | | | 8,438 | | | | 197,480 | |
| | | | | | | | |
| Total Czech Republic | | | | | | | 575,490 | |
| Denmark – 0.0% | | | | | | | | |
Tryg A/S | | | 633 | | | | 37,276 | |
| Finland – 1.2% | | | | | | | | |
Fortum Oyj(a) | | | 7,467 | | | | 253,890 | |
Kone Oyj Class B | | | 1,703 | | | | 98,119 | |
Nokia Oyj(a) | | | 30,009 | | | | 257,005 | |
Pohjola Bank PLC Class A(a) | | | 2,549 | | | | 34,799 | |
Sampo Oyj Class A | | | 5,206 | | | | 166,300 | |
UPM-Kymmene Oyj*(a) | | | 3,424 | | | | 72,496 | |
Wartsila Oyj(a) | | | 1,666 | | | | 65,134 | |
| | | | | | | | |
| Total Finland | | | | | | | 947,743 | |
| France – 13.6% | | | | | | | | |
Accor S.A. | | | 1,926 | | | | 86,656 | |
Aeroports de Paris | | | 620 | | | | 57,190 | |
Air Liquide S.A. | | | 1,433 | | | | 190,667 | |
Alstom S.A. | | | 1,704 | | | | 100,897 | |
AXA S.A. | | | 18,255 | | | | 381,979 | |
BNP Paribas | | | 6,834 | | | | 500,520 | |
Bouygues S.A. | | | 3,214 | | | | 154,549 | |
Carrefour S.A. | | | 4,442 | | | | 196,926 | |
Casino Guichard Perrachon S.A. | | | 976 | | | | 92,507 | |
Ciments Francais S.A. | | | 408 | | | | 41,259 | |
CNP Assurances | | | 6,026 | | | | 128,101 | |
Compagnie de Saint-Gobain | | | 3,392 | | | | 207,971 | |
Credit Agricole S.A. | | | 20,935 | | | | 344,029 | |
Danone | | | 3,691 | | | | 241,441 | |
Eiffage S.A. | | | 757 | | | | 45,538 | |
Electricite de France S.A. | | | 12,600 | | | | 522,473 | |
Eutelsat Communications S.A. | | | 1,505 | | | | 60,196 | |
France Telecom S.A. | | | 52,228 | | | | 1,171,786 | |
GDF Suez | | | 27,176 | | | | 1,108,757 | |
ICADE | | | 589 | | | | 72,786 | |
Klepierre | | | 2,169 | | | | 88,155 | |
| | | | | | | | |
| Investments | | Shares | | | Fair
Value | |
| | | | | | | | |
Lafarge S.A. | | | 2,580 | | | $ | 161,151 | |
Lagardere SCA | | | 1,331 | | | | 56,901 | |
Legrand S.A. | | | 1,880 | | | | 78,316 | |
M-6 Metropole Television S.A. | �� | | 3,641 | | | | 95,278 | |
Neopost S.A. | | | 512 | | | | 44,910 | |
PagesJaunes Groupe(a) | | | 6,186 | | | | 62,038 | |
PPR | | | 836 | | | | 128,306 | |
Sanofi-Aventis S.A. | | | 11,610 | | | | 815,138 | |
Schneider Electric S.A. | | | 1,296 | | | | 221,802 | |
SCOR SE | | | 2,566 | | | | 69,970 | |
Societe Television Francaise 1 | | | 1,856 | | | | 34,121 | |
Sodexo | | | 967 | | | | 70,713 | |
Suez Environnement Co. | | | 4,465 | | | | 92,510 | |
Technip S.A. | | | 707 | | | | 75,499 | |
TOTAL S.A. | | | 27,638 | | | | 1,684,742 | |
Vallourec S.A. | | | 1,007 | | | | 113,122 | |
Veolia Environnement S.A. | | | 5,526 | | | | 172,052 | |
Vinci S.A. | | | 4,612 | | | | 288,597 | |
Vivendi S.A. | | | 18,758 | | | | 536,382 | |
| | | | | | | | |
| Total France | | | | | | | 10,595,931 | |
| Germany – 4.2% | | | | | | | | |
Allianz SE | | | 3,255 | | | | 457,437 | |
BASF SE | | | 5,358 | | | | 464,044 | |
Deutsche Boerse AG | | | 1,285 | | | | 97,651 | |
Deutsche Post AG | | | 9,309 | | | | 168,036 | |
Deutsche Telekom AG | | | 54,240 | | | | 836,685 | |
E.ON AG | | | 17,394 | | | | 531,936 | |
Fielmann AG | | | 362 | | | | 34,239 | |
Hannover Rueckversicherung AG | | | 1,188 | | | | 64,949 | |
Muenchener Rueckversicherungs AG | | | 1,744 | | | | 274,715 | |
RWE AG | | | 5,084 | | | | 324,265 | |
United Internet AG Registered Shares | | | 2,483 | | | | 44,750 | |
| | | | | | | | |
| Total Germany | | | | | | | 3,298,707 | |
| Hong Kong – 2.5% | | | | | | | | |
BOC Hong Kong Holdings Ltd. | | | 76,500 | | | | 249,322 | |
China Mobile Ltd. | | | 102,000 | | | | 939,587 | |
CLP Holdings Ltd. | | | 17,000 | | | | 137,474 | |
Hang Seng Bank Ltd. | | | 13,800 | | | | 222,838 | |
Hopewell Holdings Ltd. | | | 6,000 | | | | 18,012 | |
Hutchison Whampoa Ltd. | | | 27,000 | | | | 319,701 | |
Power Assets Holdings Ltd. | | | 16,000 | | | | 106,966 | |
| | | | | | | | |
| Total Hong Kong | | | | | | | 1,993,900 | |
| Hungary – 0.1% | | | | | | | | |
Magyar Telekom Telecommunications PLC | | | 22,098 | | | | 69,649 | |
| Indonesia – 0.2% | | | | | | | | |
Indo Tambangraya Megah PT | | | 11,500 | | | | 61,016 | |
International Nickel Indonesia Tbk PT | | | 83,500 | | | | 45,790 | |
Telekomunikasi Indonesia Tbk PT | | | 104,000 | | | | 87,786 | |
| | | | | | | | |
| Total Indonesia | | | | | | | 194,592 | |
| Ireland – 0.1% | | | | | | | | |
CRH PLC | | | 4,016 | | | | 92,212 | |
See Notes to Financial Statements.
| | |
| 44 | | WisdomTree International Dividend and Sector Funds |
Schedule of Investments (continued)
WisdomTree Global Equity Income Fund (DEW)
March 31, 2011
| | | | | | | | |
| Investments | | Shares | | | Fair
Value | |
| | | | | | | | |
| Israel – 0.5% | | | | | | | | |
Bezeq Israeli Telecommunication Corp., Ltd. | | | 63,906 | | | $ | 189,880 | |
Israel Chemicals Ltd. | | | 6,997 | | | | 115,432 | |
Partner Communications Co., Ltd. | | | 2,976 | | | | 56,687 | |
| | | | | | | | |
| Total Israel | | | | | | | 361,999 | |
| Italy – 3.8% | | | | | | | | |
A2A SpA | | | 39,793 | | | | 64,545 | |
Atlantia SpA | | | 4,269 | | | | 97,960 | |
Banca Carige SpA | | | 14,484 | | | | 34,346 | |
Enel SpA | | | 150,902 | | | | 952,517 | |
ENI SpA | | | 38,285 | | | | 941,543 | |
Finmeccanica SpA | | | 3,532 | | | | 44,509 | |
Intesa Sanpaolo SpA | | | 57,622 | | | | 170,739 | |
Lottomatica SpA(a) | | | 1,744 | | | | 31,456 | |
Mediaset SpA | | | 8,551 | | | | 54,412 | |
Mediolanum SpA | | | 6,496 | | | | 34,975 | |
Parmalat SpA | | | 17,206 | | | | 57,722 | |
Snam Rete Gas SpA | | | 32,049 | | | | 180,377 | |
Telecom Italia SpA | | | 100,155 | | | | 154,211 | |
Terna Rete Elettrica Nazionale SpA | | | 18,672 | | | | 89,508 | |
Unione di Banche Italiane SCPA | | | 4,189 | | | | 35,846 | |
| | | | | | | | |
| Total Italy | | | | | | | 2,944,666 | |
| Japan – 1.9% | | | | | | | | |
Astellas Pharma, Inc. | | | 3,400 | | | | 126,351 | |
Daiichi Sankyo Co., Ltd. | | | 4,200 | | | | 81,385 | |
Daito Trust Construction Co., Ltd. | | | 700 | | | | 48,395 | |
Eisai Co., Ltd. | | | 2,900 | | | | 104,411 | |
Lawson, Inc. | | | 1,400 | | | | 67,737 | |
Mizuho Financial Group, Inc. | | | 115,400 | | | | 192,148 | |
NTT DoCoMo, Inc. | | | 227 | | | | 400,427 | |
Oracle Corp. | | | 800 | | | | 33,446 | |
Sankyo Co., Ltd. | | | 500 | | | | 25,730 | |
Showa Shell Sekiyu K.K. | | | 4,100 | | | | 42,939 | |
Takeda Pharmaceutical Co., Ltd. | | | 6,000 | | | | 280,888 | |
TonenGeneral Sekiyu K.K. | | | 4,000 | | | | 49,566 | |
| | | | | | | | |
| Total Japan | | | | | | | 1,453,423 | |
| Malaysia – 0.7% | | | | | | | | |
British American Tobacco Malaysia Bhd | | | 3,000 | | | | 47,604 | |
DIGI.Com Bhd | | | 11,500 | | | | 108,593 | |
Petronas Gas Bhd | | | 16,300 | | | | 61,567 | |
PLUS Expressways Bhd | | | 35,400 | | | | 52,362 | |
Public Bank Bhd | | | 26,532 | | | | 114,932 | |
RHB Capital Bhd | | | 16,500 | | | | 46,742 | |
Telekom Malaysia Bhd | | | 38,100 | | | | 50,821 | |
YTL Power International Bhd | | | 59,600 | | | | 45,259 | |
| | | | | | | | |
| Total Malaysia | | | | | | | 527,880 | |
| Mexico – 0.3% | | | | | | | | |
Industrias Penoles S.A.B de CV | | | 2,635 | | | | 96,971 | |
Kimberly-Clark de Mexico S.A.B de C.V. Class A | | | 4,500 | | | | 27,853 | |
Telefonos de Mexico S.A.B de C.V. Class L | | | 120,900 | | | | 110,876 | |
| | | | | | | | |
| Total Mexico | | | | | | | 235,700 | |
| | | | | | | | |
| Investments | | Shares | | | Fair
Value | |
| | | | | | | | |
| Netherlands – 1.0% | | | | | | | | |
Akzo Nobel N.V. | | | 1,003 | | | $ | 69,004 | |
Fugro N.V. CVA | | | 581 | | | | 51,267 | |
Koninklijke DSM N.V. | | | 956 | | | | 58,818 | |
Koninklijke KPN N.V.(a) | | | 16,517 | | | | 281,740 | |
Reed Elsevier N.V. | | | 4,587 | | | | 59,106 | |
Unilever N.V. CVA | | | 7,636 | | | | 239,752 | |
Wolters Kluwer N.V. | | | 1,772 | | | | 41,492 | |
| | | | | | | | |
| Total Netherlands | | | | | | | 801,179 | |
| New Zealand – 0.1% | | | | | | | | |
Telecom Corp. of New Zealand Ltd. | | | 43,022 | | | | 65,958 | |
| Norway – 0.9% | | | | | | | | |
Marine Harvest ASA | | | 43,932 | | | | 54,560 | |
Orkla ASA | | | 9,882 | | | | 95,752 | |
Statoil ASA | | | 20,238 | | | | 560,851 | |
| | | | | | | | |
| Total Norway | | | | | | | 711,163 | |
| Philippines – 0.2% | | | | | | | | |
Globe Telecom, Inc. | | | 3,220 | | | | 66,106 | |
Philippine Long Distance Telephone Co. | | | 1,750 | | | | 93,710 | |
| | | | | | | | |
| Total Philippines | | | | | | | 159,816 | |
| Poland – 0.5% | | | | | | | | |
KGHM Polska Miedz S.A. | | | 3,966 | | | | 251,681 | |
Telekomunikacja Polska S.A. | | | 22,845 | | | | 141,595 | |
| | | | | | | | |
| Total Poland | | | | | | | 393,276 | |
| Portugal – 0.5% | | | | | | | | |
Banco Espirito Santo S.A. | | | 9,915 | | | | 40,663 | |
Brisa Auto-Estradas de Portugal S.A. | | | 7,890 | | | | 53,442 | |
Cimpor Cimentos de Portugal, SGPS, S.A. | | | 6,728 | | | | 48,827 | |
EDP-Energias de Portugal S.A. | | | 36,789 | | | | 143,466 | |
Portugal Telecom, SGPS, S.A. | | | 9,682 | | | | 111,896 | |
| | | | | | | | |
| Total Portugal | | | | | | | 398,294 | |
| Russia – 0.5% | | | | | | | | |
Lukoil OAO ADR | | | 3,919 | | | | 280,796 | |
Tatneft ADR(a) | | | 2,443 | | | | 107,956 | |
| | | | | | | | |
| Total Russia | | | | | | | 388,752 | |
| Singapore – 1.0% | | | | | | | | |
DBS Group Holdings Ltd. | | | 10,000 | | | | 116,144 | |
Keppel Corp., Ltd. | | | 8,000 | | | | 78,064 | |
SembCorp Industries Ltd. | | | 9,000 | | | | 37,200 | |
SembCorp Marine Ltd. | | | 9,000 | | | | 41,698 | |
Singapore Exchange Ltd. | | | 6,000 | | | | 37,366 | |
Singapore Press Holdings Ltd. | | | 24,000 | | | | 75,018 | |
Singapore Technologies Engineering Ltd. | | | 28,000 | | | | 72,416 | |
Singapore Telecommunications Ltd. | | | 102,000 | | | | 244,379 | |
StarHub Ltd. | | | 29,000 | | | | 62,118 | |
| | | | | | | | |
| Total Singapore | | | | | | | 764,403 | |
| South Africa – 0.6% | | | | | | | | |
African Bank Investments Ltd. | | | 9,750 | | | | 54,610 | |
Kumba Iron Ore Ltd. | | | 2,328 | | | | 164,626 | |
Pretoria Portland Cement Co., Ltd. | | | 7,656 | | | | 27,183 | |
See Notes to Financial Statements.
| | | | |
| WisdomTree International Dividend and Sector Funds | | | 45 | |
Schedule of Investments (continued)
WisdomTree Global Equity Income Fund (DEW)
March 31, 2011
| | | | | | | | |
| Investments | | Shares | | | Fair
Value | |
| | | | | | | | |
Sanlam Ltd. | | | 16,853 | | | $ | 68,814 | |
Standard Bank Group Ltd. | | | 9,012 | | | | 138,658 | |
| | | | | | | | |
| Total South Africa | | | | | | | 453,891 | |
| South Korea – 0.3% | | | | | | | | |
Kangwon Land, Inc. | | | 1,960 | | | | 45,473 | |
Korea Exchange Bank | | | 3,930 | | | | 34,644 | |
KT&G Corp. | | | 1,003 | | | | 52,210 | |
LG Uplus Corp. | | | 3,870 | | | | 21,838 | |
SK Telecom Co., Ltd. | | | 474 | | | | 70,650 | |
| | | | | | | | |
| Total South Korea | | | | | | | 224,815 | |
| Spain – 6.5% | | | | | | | | |
Abertis Infraestructuras, S.A. | | | 5,804 | | | | 126,265 | |
Acciona S.A. | | | 515 | | | | 56,041 | |
ACS Actividades de Construccion y Servicios, S.A. | | | 3,671 | | | | 172,331 | |
Banco Bilbao Vizcaya Argentaria S.A.(a) | | | 30,617 | | | | 371,963 | |
Banco de Sabadell S.A. | | | 11,877 | | | | 52,030 | |
Banco Espanol de Credito S.A.(a) | | | 9,982 | | | | 90,503 | |
Banco Popular Espanol S.A.(a) | | | 11,407 | | | | 67,146 | |
Banco Santander S.A. | | | 88,904 | | | | 1,033,533 | |
Bankinter, S.A.(a) | | | 4,549 | | | | 31,245 | |
Criteria Caixacorp S.A. | | | 37,032 | | | | 261,552 | |
Ebro Foods S.A.(a)* | | | 1,733 | | | | 40,775 | |
Enagas S.A.(a) | | | 2,087 | | | | 47,150 | |
Ferrovial S.A. | | | 3,850 | | | | 48,352 | |
Fomento de Construcciones y Contratas S.A. | | | 1,894 | | | | 62,786 | |
Gas Natural SDG S.A. | | | 10,002 | | | | 188,139 | |
Grifols S.A. | | | 1,675 | | | | 29,237 | |
Iberdrola S.A. | | | 54,385 | | | | 473,563 | |
Indra Sistemas S.A. | | | 1,676 | | | | 33,654 | |
Mapfre S.A. | | | 16,225 | | | | 61,223 | |
Red Electrica Corp. S.A. | | | 979 | | | | 55,711 | |
Repsol YPF S.A. | | | 11,078 | | | | 380,050 | |
Telefonica S.A. | | | 52,683 | | | | 1,320,679 | |
Zardoya Otis S.A. | | | 3,665 | | | | 60,852 | |
| | | | | | | | |
| Total Spain | | | | | | | 5,064,780 | |
| Sweden – 1.4% | | | | | | | | |
Hennes & Mauritz AB Class B | | | 9,276 | | | | 308,200 | |
Nordea Bank AB(a) | | | 21,736 | | | | 238,089 | |
Ratos AB Class B | | | 1,282 | | | | 50,643 | |
Skanska AB Class B | | | 3,692 | | | | 77,780 | |
Svenska Cellulosa AB Class B | | | 3,842 | | | | 61,877 | |
Svenska Handelsbanken AB Class A(a) | | | 3,824 | | | | 125,478 | |
TeliaSonera AB | | | 30,927 | | | | 267,432 | |
| | | | | | | | |
| Total Sweden | | | | | | | 1,129,499 | |
| Switzerland – 3.2% | | | | | | | | |
Baloise Holding AG | | | 480 | | | | 47,745 | |
Credit Suisse Group AG | | | 7,621 | | | | 325,133 | |
Geberit AG | | | 281 | | | | 61,431 | |
Novartis AG | | | 14,848 | | | | 808,578 | |
Roche Holding AG | | | 3,986 | | | | 571,638 | |
SGS S.A. | | | 38 | | | | 67,913 | |
Swisscom AG | | | 421 | | | | 188,446 | |
| | | | | | | | |
| | | | | | | | |
| Investments | | Shares | | | Fair
Value | |
| | | | | | | | |
Zurich Financial Services AG | | | 1,463 | | | $ | 411,146 | |
| | | | | | | | |
| Total Switzerland | | | | | | | 2,482,030 | |
| Taiwan – 1.8% | | | | | | | | |
Asia Cement Corp. | | | 32,630 | | | | 36,673 | |
Asustek Computer, Inc. | | | 7,050 | | | | 61,015 | |
Chang Hwa Commercial Bank | | | 31,000 | | | | 24,879 | |
China Steel Corp. | | | 78,815 | | | | 94,209 | |
Chunghwa Telecom Co., Ltd. | | | 62,800 | | | | 195,619 | |
Compal Electronics, Inc. | | | 28,335 | | | | 28,136 | |
Far EasTone Telecommunications Co., Ltd. | | | 35,000 | | | | 52,369 | |
HTC Corp. | | | 6,250 | | | | 244,419 | |
Quanta Computer, Inc. | | | 33,000 | | | | 62,282 | |
Siliconware Precision Industries Co. | | | 27,000 | | | | 33,788 | |
Taiwan Cooperative Bank | | | 47,100 | | | | 36,999 | |
Taiwan Mobile Co., Ltd. | | | 40,000 | | | | 94,129 | |
Taiwan Semiconductor Manufacturing Co., Ltd. | | | 174,000 | | | | 417,744 | |
| | | | | | | | |
| Total Taiwan | | | | | | | 1,382,261 | |
| Thailand – 0.3% | | | | | | | | |
Advanced Info Service PCL | | | 34,800 | | | | 103,554 | |
Charoen Pokphand Foods PCL | | | 57,200 | | | | 48,699 | |
Thai Oil PCL | | | 24,500 | | | | 67,437 | |
| | | | | | | | |
| Total Thailand | | | | | | | 219,690 | |
| Turkey – 0.7% | | | | | | | | |
Ford Otomotiv Sanayi A.S. | | | 9,436 | | | | 90,152 | |
Tupras Turkiye Petrol Rafine | | | 3,210 | | | | 94,396 | |
Turk Telekomunikasyon A.S. | | | 44,361 | | | | 222,976 | |
Turkcell Iletisim Hizmet A.S. | | | 15,254 | | | | 90,308 | |
Turkiye Is Bankasi Class C | | | 25,626 | | | | 81,998 | |
| | | | | | | | |
| Total Turkey | | | | | | | 579,830 | |
| United Kingdom – 12.1% | | | | | | | | |
Admiral Group PLC | | | 2,177 | | | | 54,229 | |
Amlin PLC | | | 5,232 | | | | 32,012 | |
Ashmore Group PLC | | | 8,140 | | | | 43,241 | |
AstraZeneca PLC | | | 11,041 | | | | 506,699 | |
Aviva PLC | | | 30,917 | | | | 214,489 | |
BAE Systems PLC | | | 29,109 | | | | 151,599 | |
British American Tobacco PLC | | | 14,866 | | | | 596,213 | |
British Land Co. PLC | | | 8,421 | | | | 74,579 | |
British Sky Broadcasting Group PLC | | | 8,160 | | | | 107,911 | |
Cable & Wireless Communications PLC | | | 73,322 | | | | 53,547 | |
Centrica PLC | | | 36,317 | | | | 189,371 | |
Diageo PLC | | | 14,457 | | | | 274,610 | |
Firstgroup PLC | | | 4,558 | | | | 23,840 | |
GlaxoSmithKline PLC | | | 43,981 | | | | 838,589 | |
Hargreaves Lansdown PLC | | | 5,337 | | | | 52,185 | |
Hays PLC | | | 19,583 | | | | 36,507 | |
Home Retail Group PLC | | | 8,253 | | | | 25,546 | |
HSBC Holdings PLC | | | 97,369 | | | | 1,000,457 | |
ICAP PLC | | | 5,486 | | | | 46,431 | |
Imperial Tobacco Group PLC | | | 6,799 | | | | 210,013 | |
International Power PLC | | | 10,400 | | | | 51,346 | |
J. Sainsbury PLC | | | 13,814 | | | | 74,246 | |
See Notes to Financial Statements.
| | |
| 46 | | WisdomTree International Dividend and Sector Funds |
Schedule of Investments (continued)
WisdomTree Global Equity Income Fund (DEW)
March 31, 2011
| | | | | | | | |
| Investments | | Shares | | | Fair
Value | |
| | | | | | | | |
Legal & General Group PLC | | | 46,665 | | | $ | 86,172 | |
Man Group PLC | | | 34,199 | | | | 134,801 | |
National Grid PLC | | | 30,936 | | | | 294,558 | |
Next PLC | | | 1,149 | | | | 36,467 | |
Pearson PLC | | | 5,331 | | | | 94,084 | |
Prudential PLC | | | 14,981 | | | | 169,657 | |
Reckitt Benckiser Group PLC | | | 3,441 | | | | 176,614 | |
Reed Elsevier PLC | | | 8,422 | | | | 72,900 | |
Rexam PLC | | | 8,363 | | | | 48,716 | |
Royal Dutch Shell PLC Class B | | | 26,481 | | | | 959,318 | |
RSA Insurance Group PLC | | | 39,525 | | | | 83,314 | |
Sage Group PLC (The) | | | 8,747 | | | | 38,992 | |
Scottish & Southern Energy PLC | | | 9,497 | | | | 191,965 | |
Segro PLC | | | 6,222 | | | | 32,065 | |
Severn Trent PLC | | | 2,373 | | | | 55,574 | |
Smiths Group PLC | | | 2,445 | | | | 50,832 | |
Standard Life PLC | | | 25,590 | | | | 84,828 | |
Tate & Lyle PLC | | | 4,514 | | | | 41,786 | |
Tesco PLC | | | 42,656 | | | | 260,510 | |
Thomas Cook Group PLC | | | 8,542 | | | | 23,359 | |
TUI Travel PLC(a) | | | 9,126 | | | | 33,207 | |
Unilever PLC | | | 6,919 | | | | 210,725 | |
United Utilities Group PLC | | | 7,796 | | | | 73,917 | |
Vodafone Group PLC | | | 513,538 | | | | 1,452,905 | |
WM Morrison Supermarkets PLC | | | 15,870 | | | | 70,211 | |
| | | | | | | | |
| Total United Kingdom | | | | | | | 9,435,137 | |
| United States – 19.5% | | | | | | | | |
Abbott Laboratories | | | 7,299 | | | | 358,016 | |
Alliant Energy Corp. | | | 953 | | | | 37,100 | |
Altria Group, Inc. | | | 20,245 | | | | 526,977 | |
AMB Property Corp. | | | 1,014 | | | | 36,474 | |
Ameren Corp. | | | 1,948 | | | | 54,680 | |
American Electric Power Co., Inc. | | | 3,406 | | | | 119,687 | |
Ares Capital Corp. | | | 2,193 | | | | 37,062 | |
Arthur J. Gallagher & Co. | | | 1,156 | | | | 35,154 | |
AT&T, Inc. | | | 54,462 | | | | 1,666,537 | |
AvalonBay Communities, Inc. | | | 495 | | | | 59,440 | |
Bristol-Myers Squibb Co. | | | 12,505 | | | | 330,507 | |
Capitol Federal Financial, Inc. | | | 2,159 | | | | 24,332 | |
CenterPoint Energy, Inc. | | | 3,386 | | | | 59,458 | |
CenturyLink, Inc. | | | 2,882 | | | | 119,747 | |
Chevron Corp. | | | 10,508 | | | | 1,128,874 | |
Cincinnati Financial Corp.(a) | | | 1,578 | | | | 51,758 | |
ConocoPhillips | | | 7,736 | | | | 617,797 | |
Consolidated Edison, Inc. | | | 2,236 | | | | 113,410 | |
Diamond Offshore Drilling, Inc.(a) | | | 2,484 | | | | 193,007 | |
Dominion Resources, Inc. | | | 3,753 | | | | 167,759 | |
DTE Energy Co. | | | 1,153 | | | | 56,451 | |
Duke Energy Corp. | | | 10,916 | | | | 198,125 | |
Duke Realty Corp. | | | 2,118 | | | | 29,673 | |
E.I. Du Pont de Nemours & Co. | | | 5,782 | | | | 317,837 | |
Edison International | | | 1,816 | | | | 66,447 | |
Eli Lilly & Co. | | | 9,174 | | | | 322,650 | |
Entergy Corp. | | | 1,166 | | | | 78,367 | |
| | | | | | | | |
| Investments | | Shares | | | Fair
Value | |
| | | | | | | | |
Exelon Corp. | | | 4,819 | | | $ | 198,736 | |
Federal Realty Investment Trust | | | 426 | | | | 34,745 | |
FirstEnergy Corp. | | | 2,644 | | | | 98,066 | |
Frontier Communications Corp. | | | 12,448 | | | | 102,323 | |
Genuine Parts Co. | | | 1,017 | | | | 54,552 | |
H&R Block, Inc.(a) | | | 2,047 | | | | 34,267 | |
H.J. Heinz Co. | | | 1,892 | | | | 92,367 | |
HCP, Inc. | | | 2,399 | | | | 91,018 | |
Health Care REIT, Inc. | | | 1,271 | | | | 66,651 | |
Hudson City Bancorp, Inc. | | | 4,089 | | | | 39,581 | |
Integrys Energy Group, Inc. | | | 737 | | | | 37,226 | |
Kimberly-Clark Corp. | | | 2,366 | | | | 154,429 | |
Kraft Foods, Inc. Class A | | | 8,705 | | | | 272,989 | |
Liberty Property Trust(a) | | | 1,184 | | | | 38,954 | |
Lorillard, Inc. | | | 1,319 | | | | 125,318 | |
M&T Bank Corp. | | | 614 | | | | 54,321 | |
Macerich Co. (The) | | | 875 | | | | 43,339 | |
Mack-Cali Realty Corp. | | | 875 | | | | 29,662 | |
Marsh & McLennan Cos., Inc. | | | 2,756 | | | | 82,156 | |
Mattel, Inc. | | | 1,781 | | | | 44,400 | |
Maxim Integrated Products, Inc. | | | 1,697 | | | | 43,443 | |
| | | | | | | | |
McDonald’s Corp. | | | 5,839 | | | | 444,289 | |
MeadWestvaco Corp. | | | 1,164 | | | | 35,304 | |
Merck & Co., Inc. | | | 15,279 | | | | 504,360 | |
Mercury General Corp. | | | 731 | | | | 28,604 | |
Microchip Technology, Inc.(a) | | | 1,230 | | | | 46,752 | |
Nationwide Health Properties, Inc. | | | 915 | | | | 38,915 | |
New York Community Bancorp, Inc. | | | 3,639 | | | | 62,809 | |
NextEra Energy, Inc. | | | 2,193 | | | | 120,878 | |
NiSource, Inc. | | | 2,787 | | | | 53,455 | |
Northeast Utilities | | | 1,166 | | | | 40,344 | |
NSTAR | | | 828 | | | | 38,312 | |
NYSE Euronext | | | 1,751 | | | | 61,583 | |
Old Republic International Corp. | | | 2,286 | | | | 29,009 | |
Oneok, Inc. | | | 732 | | | | 48,956 | |
Paychex, Inc. | | | 2,663 | | | | 83,512 | |
People’s United Financial, Inc. | | | 2,800 | | | | 35,224 | |
Pepco Holdings, Inc. | | | 2,412 | | | | 44,984 | |
Pfizer, Inc. | | | 47,890 | | | | 972,646 | |
PG&E Corp. | | | 2,247 | | | | 99,272 | |
Philip Morris International, Inc. | | | 13,757 | | | | 902,872 | |
Pinnacle West Capital Corp. | | | 1,006 | | | | 43,047 | |
Pitney Bowes, Inc.(a) | | | 1,944 | | | | 49,941 | |
Plum Creek Timber Co., Inc.(a) | | | 1,184 | | | | 51,634 | |
PPL Corp. | | | 2,922 | | | | 73,927 | |
Progress Energy, Inc. | | | 2,614 | | | | 120,610 | |
ProLogis | | | 3,920 | | | | 62,642 | |
Public Service Enterprise Group, Inc. | | | 2,922 | | | | 92,072 | |
Qwest Communications International, Inc. | | | 15,374 | | | | 105,004 | |
R.R. Donnelley & Sons Co. | | | 2,096 | | | | 39,656 | |
Rayonier, Inc. | | | 654 | | | | 40,751 | |
Realty Income Corp. | | | 1,166 | | | | 40,752 | |
Regency Centers Corp. | | | 770 | | | | 33,480 | |
Reynolds American, Inc. | | | 5,769 | | | | 204,973 | |
See Notes to Financial Statements.
| | | | |
| WisdomTree International Dividend and Sector Funds | | | 47 | |
Schedule of Investments (concluded)
WisdomTree Global Equity Income Fund (DEW)
March 31, 2011
| | | | | | | | |
| Investments | | Shares | | | Fair
Value | |
| | | | | | | | |
SCANA Corp. | | | 1,060 | | | $ | 41,732 | |
Senior Housing Properties Trust | | | 1,488 | | | | 34,283 | |
Southern Co. | | | 6,023 | | | | 229,536 | |
Southern Copper Corp. | | | 5,637 | | | | 227,002 | |
Spectra Energy Corp. | | | 4,717 | | | | 128,208 | |
TECO Energy, Inc. | | | 1,888 | | | | 35,419 | |
Ventas, Inc. | | | 1,013 | | | | 55,006 | |
Verizon Communications, Inc. | | | 26,084 | | | | 1,005,277 | |
Waste Management, Inc. | | | 2,627 | | | | 98,092 | |
Windstream Corp. | | | 5,946 | | | | 76,525 | |
Xcel Energy, Inc. | | | 3,304 | | | | 78,933 | |
| | | | | | | | |
| Total United States | | | | | | | 15,206,451 | |
TOTAL COMMON STOCKS
(Cost: $69,389,543) | | | | | | | 77,591,138 | |
| EXCHANGE-TRADED FUNDS – 0.3% | | | | | | | | |
| United States – 0.3% | | | | | | | | |
WisdomTree DEFA Equity Income Fund(a)(c) | | | 3,865 | | | | 170,446 | |
WisdomTree Equity Income Fund(c) | | | 1,395 | | | | 56,591 | |
| | | | | | | | |
TOTAL EXCHANGE-TRADED FUNDS
(Cost: $210,723) | | | | | | | 227,037 | |
| RIGHTS – 0.0% | | | | | | | | |
| Chile – 0.0% | | | | | | | | |
Banco de Chile, expiring 4/29/11*
(Cost: $0) | | | 31,587 | | | | — | |
TOTAL LONG-TERM INVESTMENTS
(Cost: $69,600,266) | | | | | | | 77,818,175 | |
| SHORT-TERM INVESTMENT – 0.0% | | | | | | | | |
| MONEY MARKET FUND – 0.0% | | | | | | | | |
Invesco Treasury Fund Private Class, 0.02%(d)
(Cost: $7,579) | | | 7,579 | | | | 7,579 | |
| INVESTMENT OF CASH COLLATERAL FOR SECURITIES LOANED – 4.7% | | | | | | | | |
| MONEY MARKET FUND – 4.7% | | | | | | | | |
Dreyfus Institutional Preferred Money Market
Fund, 0.19%(e) | | | | | | | | |
| (Cost: $3,655,000)(f) | | | 3,655,000 | | | | 3,655,000 | |
TOTAL INVESTMENTS IN SECURITIES – 104.3%
(Cost: $73,262,845) | | | | | | | 81,480,754 | |
Liabilities in Excess of Cash, Foreign Currency and Other Assets – (4.3)% | | | | | | | (3,333,275 | ) |
| | | | | | | | |
| NET ASSETS – 100.0% | | | | | | $ | 78,147,479 | |
| ADR | – American Depositary Receipt |
| PCL | – Public Company Limited |
| * | Non-income producing security. |
| (a) | Security, or portion thereof, was on loan at March 31, 2011 (See Note 2). |
| (b) | Stapled Security – A security contractually bound to one or more other securities to form a single saleable unit which cannot be sold separately. |
| (c) | Affiliated companies (See Note 7). |
| (d) | Rate shown represents annualized 7-day yield as of March 31, 2011. |
| (e) | Interest rate shown reflects yield as of March 31, 2011. |
| (f) | At March 31, 2011, the total market value of the Fund’s securities on loan was $2,676,982 and the total market value of the collateral held by the Fund was $3,655,000. |
See Notes to Financial Statements.
| | |
| 48 | | WisdomTree International Dividend and Sector Funds |
Schedule of Investments
WisdomTree Europe SmallCap Dividend Fund (DFE)
March 31, 2011
| | | | | | | | |
| Investments | | Shares | | | Fair
Value | |
| | | | | | | | |
| COMMON STOCKS – 99.2% | | | | | | | | |
| Austria – 2.2% | | | | | | | | |
Flughafen Wien AG | | | 3,650 | | | $ | 231,792 | |
Schoeller-Bleckmann Oilfield Equipment AG | | | 1,585 | | | | 156,032 | |
Semperit AG Holding | | | 4,025 | | | | 234,444 | |
| | | | | | | | |
| Total Austria | | | | | | | 622,268 | |
| Belgium – 4.7% | | | | | | | | |
Arseus N.V. | | | 7,492 | | | | 128,114 | |
Cie D’entreprises CFE | | | 2,301 | | | | 190,990 | |
Cie Maritime Belge S.A. | | | 7,652 | | | | 226,409 | |
EVS Broadcast Equipment S.A. | | | 3,776 | | | | 240,598 | |
Nyrstar | | | 8,092 | | | | 116,900 | |
Omega Pharma S.A. | | | 2,837 | | | | 136,743 | |
Recticel S.A. | | | 5,223 | | | | 58,184 | |
Tessenderlo Chemie N.V. | | | 7,456 | | | | 267,589 | |
| | | | | | | | |
| Total Belgium | | | | | | | 1,365,527 | |
| Denmark – 1.0% | | | | | | | | |
Auriga Industries Class B | | | 2,615 | | | | 46,038 | |
East Asiatic Co., Ltd. A/S | | | 2,610 | | | | 79,481 | |
NKT Holding A/S | | | 1,245 | | | | 73,101 | |
Rockwool International A/S Class B | | | 714 | | | | 88,127 | |
| | | | | | | | |
| Total Denmark | | | | | | | 286,747 | |
| Finland – 6.6% | | | | | | | | |
Ahlstrom Oyj | | | 5,646 | | | | 139,253 | |
Alma Media Oyj | | | 15,193 | | | | 175,501 | |
Amer Sports Oyj Class A(a) | | | 8,275 | | | | 106,392 | |
Atria PLC Class A | | | 2,778 | | | | 34,179 | |
Citycon Oyj(a) | | | 33,176 | | | | 152,069 | |
F-Secure Oyj(a) | | | 23,711 | | | | 78,400 | |
HKScan Oyj Class A(a) | | | 5,906 | | | | 55,567 | |
Huhtamaki Oyj*(a) | | | 16,152 | | | | 229,213 | |
Lassila & Tikanoja Oyj(a) | | | 6,221 | | | | 112,118 | |
Oriola-KD Oyj Class B | | | 12,636 | | | | 60,968 | |
Orion Oyj Class A | | | 10,430 | | | | 252,805 | |
PKC Group Oyj | | | 2,685 | | | | 59,555 | |
Poyry Oyj | | | 988 | | | | 15,072 | |
Raisio PLC Class V | | | 18,853 | | | | 70,364 | |
Ramirent Oyj*(a) | | | 7,894 | | | | 129,948 | |
SRV Group PLC | | | 2,872 | | | | 27,511 | |
Tekla Oyj | | | 2,197 | | | | 32,736 | |
Uponor Oyj(a) | | | 10,126 | | | | 172,869 | |
| | | | | | | | |
| Total Finland | | | | | | | 1,904,520 | |
| France – 4.9% | | | | | | | | |
April Group | | | 6,832 | | | | 189,058 | |
Canal Plus | | | 32,591 | | | | 258,676 | |
Faiveley Transport | | | 1,737 | | | | 172,080 | |
Ingenico | | | 3,895 | | | | 174,638 | |
Plastic Omnium S.A. | | | 1,785 | | | | 145,982 | |
Saft Groupe S.A. | | | 2,511 | | | | 106,830 | |
Sechilienne-Sidec | | | 7,414 | | | | 208,372 | |
Sequana | | | 6,199 | | | | 109,083 | |
Stallergenes S.A. | | | 738 | | | | 61,686 | |
| | | | | | | | |
| Total France | | | | | | | 1,426,405 | |
| | | | | | | | |
| Investments | | Shares | | | Fair
Value | |
| | | | | | | | |
| Germany – 6.4% | | | | | | | | |
Bauer AG | | | 2,317 | | | $ | 117,055 | |
BayWa AG | | | 1,917 | | | | 86,904 | |
Bechtle AG | | | 2,151 | | | | 91,040 | |
Carl Zeiss Meditec AG* | | | 5,231 | | | | 110,607 | |
CTS Eventim AG | | | 1,727 | | | | 111,572 | |
Delticom AG | | | 1,631 | | | | 147,784 | |
Deutsche Beteiligungs AG(a) | | | 3,734 | | | | 107,806 | |
Drillisch AG | | | 8,850 | | | | 91,430 | |
Gerry Weber International AG | | | 2,663 | | | | 155,168 | |
H&R WASAG AG | | | 2,514 | | | | 72,833 | |
Indus Holding AG | | | 3,615 | | | | 107,962 | |
Kontron AG(a) | | | 5,376 | | | | 66,831 | |
Medion AG | | | 3,529 | | | | 50,080 | |
MLP AG | | | 13,879 | | | | 128,633 | |
Sixt AG | | | 1,970 | | | | 100,321 | |
Solarworld AG(a) | | | 4,773 | | | | 77,894 | |
Takkt AG | | | 9,095 | | | | 145,200 | |
Wirecard AG | | | 4,970 | | | | 89,255 | |
| | | | | | | | |
| Total Germany | | | | | | | 1,858,375 | |
| Ireland – 1.9% | | | | | | | | |
FBD Holdings PLC | | | 9,233 | | | | 94,994 | |
Fyffes PLC | | | 35,650 | | | | 21,248 | |
Glanbia PLC | | | 24,694 | | | | 148,934 | |
Grafton Group PLC | | | 11,413 | | | | 53,609 | |
Greencore Group PLC | | | 53,173 | | | | 89,040 | |
Total Produce PLC | | | 9,241 | | | | 5,639 | |
United Drug PLC | | | 36,606 | | | | 119,480 | |
| | | | | | | | |
| Total Ireland | | | | | | | 532,944 | |
| Italy – 8.8% | | | | | | | | |
Ascopiave SpA | | | 56,222 | | | | 129,570 | |
Astaldi SpA | | | 11,143 | | | | 92,190 | |
Autostrada Torino-Milano SpA | | | 7,144 | | | | 108,579 | |
Banca Generali SpA | | | 21,057 | | | | 320,933 | |
Banca IFIS SpA | | | 8,523 | | | | 63,196 | |
Banco di Desio e della Brianza SpA | | | 14,765 | | | | 80,376 | |
Brembo SpA | | | 10,656 | | | | 131,561 | |
Buzzi Unicem SpA RSP | | | 2,705 | | | | 22,686 | |
Cairo Communication SpA | | | 21,900 | | | | 98,705 | |
Cementir Holding SpA | | | 5,873 | | | | 17,569 | |
Danieli & C Officine Meccaniche SpA RSP | | | 8,020 | | | | 133,387 | |
De’Longhi SpA | | | 10,782 | | | | 104,275 | |
Fiat SpA RSP | | | 14,554 | | | | 109,051 | |
Fondiaria-Sai SpA RSP | | | 13,863 | | | | 68,541 | |
Immobiliare Grande Distribuzione | | | 58,713 | | | | 129,312 | |
IMMSI SpA | | | 55,079 | | | | 65,422 | |
Italcementi SpA RSP | | | 7,948 | | | | 42,048 | |
Italmobiliare SpA | | | 1,894 | | | | 76,118 | |
Italmobiliare SpA RSP | | | 3,065 | | | | 76,987 | |
Landi Renzo SpA | | | 11,377 | | | | 40,201 | |
Maire Tecnimont SpA | | | 24,628 | | | | 101,494 | |
MARR SpA | | | 13,321 | | | | 164,085 | |
Piaggio & C. SpA(a) | | | 42,931 | | | | 146,825 | |
See Notes to Financial Statements.
| | | | |
| WisdomTree International Dividend and Sector Funds | | | 49 | |
Schedule of Investments (continued)
WisdomTree Europe SmallCap Dividend Fund (DFE)
March 31, 2011
| | | | | | | | |
| Investments | | Shares | | | Fair
Value | |
| | | | | | | | |
Piccolo Credito Valtellinese Scarl | | | 21,617 | | | $ | 103,564 | |
Zignago Vetro SpA | | | 15,164 | | | | 113,944 | |
| | | | | | | | |
| Total Italy | | | | | | | 2,540,619 | |
| Netherlands – 5.0% | | | | | | | | |
Accell Group | | | 1,507 | | | | 78,807 | |
Arcadis N.V. | | | 6,141 | | | | 148,629 | |
Beter Bed Holding N.V. | | | 4,376 | | | | 130,906 | |
BinckBank N.V. | | | 14,407 | | | | 251,269 | |
Brunel International N.V. | | | 2,204 | | | | 103,902 | |
Exact Holding N.V. | | | 6,628 | | | | 210,361 | |
Grontmij CVA | | | 4,132 | | | | 90,301 | |
Koninklijke BAM Groep N.V. | | | 13,075 | | | | 100,919 | |
Koninklijke Ten Cate N.V. | | | 2,519 | | | | 103,399 | |
Mediq N.V. | | | 5,000 | | | | 100,047 | |
TKH Group N.V. | | | 3,764 | | | | 108,512 | |
Unit 4 Agresso N.V. | | | 787 | | | | 26,804 | |
| | | | | | | | |
| Total Netherlands | | | | | | | 1,453,856 | |
| Norway – 5.1% | | | | | | | | |
Atea ASA | | | 11,301 | | | | 127,173 | |
Cermaq ASA* | | | 8,209 | | | | 145,059 | |
Copeinca ASA | | | 23,767 | | | | 222,342 | |
Leroy Seafood Group ASA | | | 7,731 | | | | 237,587 | |
Opera Software ASA | | | 9,838 | | | | 52,287 | |
Salmar ASA | | | 6,348 | | | | 75,739 | |
Sparebank 1 SMN(a) | | | 14,926 | | | | 134,912 | |
Sparebank 1 SR Bank | | | 12,540 | | | | 129,214 | |
Tomra Systems ASA | | | 12,579 | | | | 102,783 | |
Veidekke ASA | | | 26,086 | | | | 239,321 | |
| | | | | | | | |
| Total Norway | | | | | | | 1,466,417 | |
| Portugal – 2.5% | | | | | | | | |
BANIF, SGPS, S.A. | | | 121,313 | | | | 138,757 | |
Martifer, SGPS S.A. | | | 25,308 | | | | 50,280 | |
Mota Engil, SGPS, S.A. | | | 37,455 | | | | 96,737 | |
Novabase, SGPS, S.A. | | | 13,593 | | | | 59,799 | |
REN—Redes Energeticas Nacionais S.A. | | | 62,880 | | | | 223,440 | |
Semapa-Sociedade de Investimento e Gestao | | | 12,974 | | | | 155,392 | |
| | | | | | | | |
| Total Portugal | | | | | | | 724,405 | |
| Spain – 2.3% | | | | | | | | |
Caja de Ahorros del Mediterraneo | | | 14,556 | | | | 128,070 | |
Duro Felguera S.A. | | | 31,157 | | | | 251,582 | |
FAES FARMA S.A. | | | 25,651 | | | | 103,380 | |
Fluidra S.A. | | | 14,886 | | | | 60,628 | |
Laboratorios Farmaceuticos Rovi S.A. | | | 2,829 | | | | 20,635 | |
Pescanova S.A. | | | 2,199 | | | | 89,655 | |
| | | | | | | | |
| Total Spain | | | | | | | 653,950 | |
| Sweden – 13.1% | | | | | | | | |
AarhusKarlshamn AB | | | 3,947 | | | | 112,621 | |
AF AB Class B | | | 3,892 | | | | 77,736 | |
Axis Communications AB | | | 9,944 | | | | 210,438 | |
Bilia AB Class A | | | 2,555 | | | | 63,992 | |
Bjoern Borg AB | | | 7,039 | | | | 75,317 | |
Clas Ohlson AB Class B | | | 7,053 | | | | 114,598 | |
| | | | | | | | |
| Investments | | Shares | | | Fair
Value | |
| | | | | | | | |
Duni AB | | | 6,933 | | | $ | 77,755 | |
Fabege AB(a) | | | 31,353 | | | | 339,205 | |
Hoganas AB Class B | | | 2,259 | | | | 83,973 | |
Husqvarna AB Class A | | | 7,762 | | | | 65,951 | |
Indutrade AB | | | 3,716 | | | | 122,229 | |
Intrum Justitia AB(a) | | | 13,096 | | | | 190,989 | |
JM AB | | | 5,901 | | | | 157,151 | |
KappAhl AB | | | 6,186 | | | | 34,713 | |
Kungsleden AB | | | 43,324 | | | | 425,795 | |
Loomis AB Class B | | | 8,996 | | | | 142,604 | |
Mekonomen AB | | | 4,447 | | | | 169,184 | |
NCC AB Class B | | | 12,209 | | | | 350,106 | |
Nibe Industrier AB Class B | | | 6,285 | | | | 107,848 | |
Niscayah Group AB | | | 26,609 | | | | 51,249 | |
Nolato AB Class B | | | 3,892 | | | | 46,580 | |
Nordnet AB Class B | | | 21,588 | | | | 67,073 | |
ORC Software AB | | | 4,349 | | | | 68,940 | |
Skandinaviska Enskilda Banken AB Class C | | | 9,572 | | | | 85,275 | |
SkiStar AB | | | 5,119 | | | | 88,246 | |
SSAB AB Class B* | | | 4,455 | | | | 61,687 | |
Svenska Handelsbanken AB Class B | | | 4,148 | | | | 134,795 | |
Wihlborgs Fastigheter AB | | | 8,928 | | | | 266,068 | |
| | | | | | | | |
| Total Sweden | | | | | | | 3,792,118 | |
| Switzerland – 0.6% | | | | | | | | |
Kudelski S.A. | | | 1,665 | | | | 30,485 | |
Mobilezone Holding AG | | | 11,005 | | | | 132,322 | |
| | | | | | | | |
| Total Switzerland | | | | | | | 162,807 | |
| United Kingdom – 34.1% | | | | | |
A.G.Barr PLC | | | 3,032 | | | | 59,780 | |
Abcam PLC | | | 8,251 | | | | 49,862 | |
Ashtead Group PLC | | | 40,419 | | | | 128,543 | |
Atkins WS PLC | | | 13,525 | | | | 151,976 | |
BBA Aviation PLC | | | 50,090 | | | | 163,153 | |
Berendsen PLC | | | 29,567 | | | | 227,967 | |
Bodycote PLC | | | 26,680 | | | | 141,558 | |
Brewin Dolphin Holdings PLC | | | 57,204 | | | | 154,231 | |
Carpetright PLC | | | 4,730 | | | | 51,595 | |
Chaucer Holdings PLC | | | 239,350 | | | | 215,812 | |
Chesnara PLC | | | 35,237 | | | | 138,949 | |
Chime Communications PLC | | | 6,751 | | | | 28,893 | |
Cineworld Group PLC | | | 28,131 | | | | 93,567 | |
Collins Stewart PLC | | | 66,792 | | | | 91,005 | |
Computacenter PLC | | | 18,838 | | | | 131,354 | |
Costain Group PLC | | | 12,924 | | | | 49,927 | |
Cranswick PLC | | | 5,579 | | | | 74,270 | |
Dairy Crest Group PLC | | | 21,398 | | | | 123,240 | |
Dechra Pharmaceuticals PLC | | | 8,256 | | | | 66,831 | |
Devro PLC | | | 12,997 | | | | 58,855 | |
Dignity PLC | | | 4,416 | | | | 49,267 | |
Diploma PLC | | | 14,095 | | | | 72,299 | |
Domino Printing Sciences PLC | | | 10,906 | | | | 110,223 | |
Domino’s Pizza UK & IRL PLC | | | 10,698 | | | | 73,378 | |
DS Smith PLC | | | 36,950 | | | | 117,866 | |
See Notes to Financial Statements.
| | |
| 50 | | WisdomTree International Dividend and Sector Funds |
Schedule of Investments (concluded)
WisdomTree Europe SmallCap Dividend Fund (DFE)
March 31, 2011
| | | | | | | | |
| Investments | | Shares | | | Fair
Value | |
| | | | | | | | |
Dunelm Group PLC | | | 14,327 | | | $ | 88,164 | |
eaga PLC(a) | | | 28,371 | | | | 53,663 | |
Elementis PLC | | | 71,340 | | | | 173,933 | |
Euromoney Institutional Investor PLC | | | 9,309 | | | | 104,005 | |
Evolution Group PLC | | | 41,425 | | | | 51,130 | |
F&C Asset Management PLC | | | 226,674 | | | | 275,417 | |
Fenner PLC | | | 19,452 | | | | 112,250 | |
Fiberweb PLC | | | 4,760 | | | | 5,932 | |
Fidessa Group PLC | | | 3,132 | | | | 87,858 | |
Filtrona PLC | | | 25,170 | | | | 122,572 | |
Forth Ports PLC | | | 3,549 | | | | 93,013 | |
Galliford Try PLC | | | 8,544 | | | | 51,359 | |
Game Group PLC | | | 91,411 | | | | 82,788 | |
Genus PLC | | | 4,010 | | | | 60,679 | |
Go-Ahead Group PLC | | | 12,466 | | | | 267,764 | |
Greggs PLC | | | 15,506 | | | | 126,638 | |
Hargreaves Services PLC | | | 4,994 | | | | 74,648 | |
Headlam Group PLC | | | 25,459 | | | | 122,326 | |
Helical Bar PLC | | | 22,643 | | | | 98,288 | |
Hill & Smith Holdings PLC | | | 11,973 | | | | 66,501 | |
HMV Group PLC(a) | | | 205,028 | | | | 50,119 | |
Holidaybreak PLC | | | 10,285 | | | | 52,756 | |
Hunting PLC | | | 15,063 | | | | 187,488 | |
Huntsworth PLC | | | 28,628 | | | | 32,122 | |
Interserve PLC | | | 37,768 | | | | 166,637 | |
ITE Group PLC | | | 34,024 | | | | 132,693 | |
James Fisher & Sons PLC | | | 10,601 | | | | 88,193 | |
JD Wetherspoon PLC | | | 19,859 | | | | 135,131 | |
JKX Oil & Gas PLC | | | 19,518 | | | | 98,552 | |
John Menzies PLC | | | 4,297 | | | | 35,817 | |
Kcom Group PLC | | | 43,990 | | | | 43,366 | |
Keller Group PLC | | | 9,083 | | | | 90,269 | |
Kesa Electricals PLC | | | 90,931 | | | | 175,930 | |
Kier Group PLC | | | 7,138 | | | | 148,744 | |
Laird PLC | | | 79,658 | | | | 176,209 | |
LSL Property Services PLC | | | 15,000 | | | | 58,908 | |
Marston’s PLC | | | 119,694 | | | | 182,270 | |
Mcbride PLC | | | 19,799 | | | | 45,146 | |
Mitie Group PLC | | | 40,108 | | | | 126,332 | |
Moneysupermarket.com Group PLC | | | 86,136 | | | | 118,396 | |
Morgan Crucible Co. PLC | | | 31,566 | | | | 150,126 | |
Morgan Sindall Group PLC | | | 12,060 | | | | 122,176 | |
Mothercare PLC | | | 9,823 | | | | 62,983 | |
N. Brown Group PLC | | | 41,258 | | | | 167,783 | |
Northern Foods PLC | | | 163,223 | | | | 190,342 | |
Novae Group PLC | | | 17,339 | | | | 100,821 | |
Phoenix IT Group Ltd. | | | 6,921 | | | | 22,188 | |
Premier Farnell PLC | | | 47,187 | | | | 205,207 | |
PV Crystalox Solar PLC | | | 98,426 | | | | 86,380 | |
Restaurant Group PLC | | | 40,868 | | | | 196,528 | |
Rightmove PLC | | | 6,825 | | | | 103,931 | |
Robert Wiseman Dairies PLC | | | 14,230 | | | | 78,295 | |
RPC Group PLC | | | 17,554 | | | | 79,068 | |
RPS Group PLC | | | 19,476 | | | | 66,746 | |
Savills PLC | | | 22,853 | | | | 131,180 | |
Senior PLC | | | 31,010 | | | | 75,406 | |
| | | | | | | | |
| Investments | | Shares | | | Fair
Value | |
| | | | | | | | |
Severfield-Rowen PLC | | | 20,128 | | | $ | 85,500 | |
Smiths News PLC | | | 40,996 | | | | 55,364 | |
Speedy Hire PLC | | | 38,096 | | | | 17,556 | |
Spirent Communications PLC | | | 24,624 | | | | 54,273 | |
Sthree PLC | | | 17,374 | | | | 113,989 | |
Synergy Health PLC | | | 6,176 | | | | 81,179 | |
Telecom Plus PLC | | | 14,968 | | | | 109,528 | |
Tullett Prebon PLC | | | 39,621 | | | | 259,948 | |
Umeco PLC | | | 9,584 | | | | 70,899 | |
WH Smith PLC | | | 22,831 | | | | 158,758 | |
Wincanton PLC | | | 32,143 | | | | 59,896 | |
WSP Group PLC | | | 9,968 | | | | 57,961 | |
| | | | | | | | |
| Total United Kingdom | | | | | | | 9,852,418 | |
TOTAL COMMON STOCKS
(Cost: $24,988,621) | | | | | | | 28,643,376 | |
| EXCHANGE-TRADED FUND – 0.3% | | | | | | | | |
| United States – 0.3% | | | | | | | | |
WisdomTree International MidCap Dividend
Fund(b) | | | | | | | | |
| (Cost: $90,852) | | | 1,808 | | | | 97,451 | |
| | |
| | | Principal
Amount | | | | |
| FOREIGN GOVERNMENT OBLIGATION – 0.1% | | | | | |
| Spain – 0.1% | | | | | | | | |
Banco de Sabadell S.A., 7.75%, 11/11/13**
(Cost: $45,058) | | $ | 41,745 | | | | 41,764 | |
| | |
| | | Shares | | | | |
| SHORT-TERM INVESTMENT – 0.0% | | | | | | | | |
| MONEY MARKET FUND – 0.0% | | | | | | | | |
Invesco Treasury Fund Private Class, 0.02%(c)
(Cost: $3,897) | | | 3,897 | | | | 3,897 | |
| INVESTMENT OF CASH COLLATERAL FOR SECURITIES LOANED – 6.7% | | | | | | | | |
| MONEY MARKET FUND – 6.7% | | | | | | | | |
Dreyfus Institutional Preferred Money Market
Fund, 0.19%(d) | | | | | | | | |
| (Cost: $1,932,000)(e) | | | 1,932,000 | | | | 1,932,000 | |
TOTAL INVESTMENTS IN SECURITIES – 106.3%
(Cost: $27,060,428) | | | | | | | 30,718,488 | |
Liabilities in Excess of Foreign Currency and
Other Assets – (6.3)% | | | | | | | (1,829,892 | ) |
| | | | | | | | |
| NET ASSETS – 100.0% | | | | | | $ | 28,888,596 | |
| RSP | – Risparmio Italian Savings Shares |
| * | Non-income producing security. |
| ** | Interest rate shown reflects the discount rate at time of purchase. |
| (a) | Security, or portion thereof, was on loan at March 31, 2011 (See Note 2). |
| (b) | Affiliated companies (See Note 7). |
| (c) | Rate shown represents annualized 7-day yield as of March 31, 2011. |
| (d) | Interest rate shown reflects yield as of March 31, 2011. |
| (e) | At March 31, 2011, the total market value of the Fund’s securities on loan was $1,855,787 and the total market value of the collateral held by the Fund was $1,932,000. |
See Notes to Financial Statements.
| | | | |
| WisdomTree International Dividend and Sector Funds | | | 51 | |
Schedule of Investments
WisdomTree Japan Hedged Equity Fund (DXJ)
March 31, 2011
| | | | | | | | |
| Investments | | Shares | | | Fair
Value | |
| | | | | | | | |
| COMMON STOCKS – 96.9% | | | | | | | | |
| Advertising – 0.1% | | | | | | | | |
Hakuhodo DY Holdings, Inc. | | | 13,308 | | | $ | 704,900 | |
| Agriculture – 1.2% | | | | | | | | |
Japan Tobacco, Inc. | | | 1,609 | | | | 5,833,790 | |
| Apparel – 0.3% | | | | | | | | |
Asics Corp. | | | 16,000 | | | | 214,672 | |
Japan Wool Textile Co., Ltd. (The) | | | 28,000 | | | | 237,162 | |
Onward Holdings Co., Ltd. | | | 40,182 | | | | 299,620 | |
Sanyo Shokai Ltd. | | | 246,000 | | | | 756,877 | |
| | | | | | | | |
| Total Apparel | | | | | | | 1,508,331 | |
| Auto Manufacturers – 5.5% | | | | | | | | |
Daihatsu Motor Co., Ltd. | | | 42,000 | | | | 614,189 | |
Honda Motor Co., Ltd.(a) | | | 211,212 | | | | 7,963,773 | |
Mazda Motor Corp. | | | 267,000 | | | | 589,539 | |
Suzuki Motor Corp. | | | 28,714 | | | | 644,056 | |
Toyota Auto Body Co., Ltd. | | | 29,100 | | | | 490,150 | |
Toyota Motor Corp. | | | 420,000 | | | | 16,976,351 | |
| | | | | | | | |
| Total Auto Manufacturers | | | | | | | 27,278,058 | |
| Auto Parts & Equipment – 2.3% | | | | | | | | |
Aisin Seiki Co., Ltd. | | | 29,608 | | | | 1,031,707 | |
Bridgestone Corp. | | | 80,612 | | | | 1,695,303 | |
Denso Corp. | | | 81,214 | | | | 2,704,520 | |
JTEKT Corp. | | | 52,702 | | | | 688,026 | |
Koito Manufacturing Co., Ltd. | | | 15,000 | | | | 241,252 | |
Stanley Electric Co., Ltd. | | | 28,814 | | | | 478,032 | |
Sumitomo Electric Industries Ltd. | | | 105,800 | | | | 1,469,303 | |
Sumitomo Rubber Industries, Inc. | | | 78,224 | | | | 802,249 | |
Takata Corp. | | | 7,500 | | | | 215,372 | |
Tokai Rika Co., Ltd. | | | 27,202 | | | | 465,401 | |
Toyoda Gosei Co., Ltd. | | | 26,602 | | | | 556,241 | |
Yokohama Rubber Co., Ltd. (The) | | | 217,000 | | | | 1,055,152 | |
| | | | | | | | |
| Total Auto Parts & Equipment | | | | | | | 11,402,558 | |
| Banks – 10.6% | | | | | | | | |
Bank of Yokohama Ltd. (The) | | | 278,018 | | | | 1,325,013 | |
Chiba Bank Ltd. (The) | | | 247,000 | | | | 1,388,779 | |
Daishi Bank Ltd. (The) | | | 253,000 | | | | 839,467 | |
FIDEA Holdings Co., Ltd. | | | 54,200 | | | | 155,642 | |
Fukuoka Financial Group, Inc. | | | 253,504 | | | | 1,058,306 | |
Hokuetsu Bank Ltd. (The) | | | 277,000 | | | | 635,015 | |
Hokuhoku Financial Group, Inc. | | | 286,020 | | | | 559,064 | |
Hyakujushi Bank Ltd. (The) | | | 244,000 | | | | 921,477 | |
Joyo Bank Ltd. (The) | | | 262,018 | | | | 1,033,782 | |
Juroku Bank Ltd. (The) | | | 245,000 | | | | 807,010 | |
Kiyo Holdings, Inc. | | | 513,000 | | | | 718,002 | |
Mitsubishi UFJ Financial Group, Inc. | | | 3,167,534 | | | | 14,675,833 | |
Mizuho Financial Group, Inc.(a) | | | 6,920,775 | | | | 11,523,491 | |
Nishi-Nippon City Bank Ltd. (The) | | | 255,000 | | | | 735,340 | |
Ogaki Kyoritsu Bank Ltd. (The) | | | 250,000 | | | | 820,463 | |
Resona Holdings, Inc. | | | 106,061 | | | | 506,759 | |
Senshu Ikeda Holdings, Inc. | | | 249,516 | | | | 340,194 | |
Shinsei Bank Ltd. | | | 275,000 | | | | 325,169 | |
| | | | | | | | |
| Investments | | Shares | | | Fair
Value | |
| | | | | | | | |
Shizuoka Bank Ltd. (The) | | | 30,008 | | | $ | 249,101 | |
Sumitomo Mitsui Financial Group, Inc. | | | 349,359 | | | | 10,900,608 | |
Sumitomo Mitsui Trust Holdings, Inc. | | | 684,228 | | | | 2,435,416 | |
Suruga Bank Ltd. | | | 14,000 | | | | 124,662 | |
Tokyo Tomin Bank Ltd. (The) | | | 28,800 | | | | 375,290 | |
| | | | | | | | |
| Total Banks | | | | | | | 52,453,883 | |
| Beverages – 1.4% | | | | | | | | |
Asahi Breweries Ltd. | | | 55,614 | | | | 928,018 | |
Coca-Cola Central Japan Co., Ltd. | | | 52,500 | | | | 715,794 | |
Coca-Cola West Co., Ltd. | | | 51,210 | | | | 979,342 | |
Ito En Ltd. | | | 50,800 | | | | 888,142 | |
Kirin Holdings Co., Ltd. | | | 200,008 | | | | 2,637,653 | |
Mikuni Coca-Cola Bottling Co., Ltd. | | | 78,500 | | | | 700,893 | |
Sapporo Holdings Ltd. | | | 17,000 | | | | 63,586 | |
| | | | | | | | |
| Total Beverages | | | | | | | 6,913,428 | |
| Building Materials – 1.5% | | | | | | | | |
Asahi Glass Co., Ltd. | | | 227,018 | | | | 2,865,116 | |
Daikin Industries Ltd. | | | 27,320 | | | | 821,116 | |
JS Group Corp. | | | 78,316 | | | | 2,041,054 | |
Nippon Sheet Glass Co., Ltd. | | | 252,000 | | | | 729,730 | |
Sanwa Holdings Corp.(a) | | | 252,000 | | | | 851,352 | |
Takara Standard Co., Ltd. | | | 19,000 | | | | 153,366 | |
TOTO Ltd. | | | 17,008 | | | | 137,287 | |
| | | | | | | | |
| Total Building Materials | | | | | | | 7,599,021 | |
| Chemicals – 4.3% | | | | | | | | |
Aica Kogyo Co., Ltd. | | | 54,800 | | | | 720,705 | |
Air Water, Inc. | | | 12,000 | | | | 146,670 | |
Asahi Kasei Corp. | | | 270,018 | | | | 1,827,704 | |
DIC Corp. | | | 274,022 | | | | 638,106 | |
Earth Chemical Co., Ltd. | | | 25,400 | | | | 852,898 | |
Hitachi Chemical Co., Ltd. | | | 51,414 | | | | 1,048,999 | |
JSR Corp. | | | 52,214 | | | | 1,051,462 | |
Kaneka Corp. | | | 191,014 | | | | 1,334,425 | |
Mitsubishi Chemical Holdings Corp. | | | 268,118 | | | | 1,691,913 | |
Mitsubishi Gas Chemical Co., Inc. | | | 172,012 | | | | 1,239,034 | |
Nippon Kayaku Co., Ltd. | | | 18,000 | | | | 163,755 | |
Nissan Chemical Industries Ltd. | | | 51,400 | | | | 533,349 | |
Nitto Denko Corp. | | | 26,110 | | | | 1,389,299 | |
Shin-Etsu Chemical Co., Ltd. | | | 80,310 | | | | 4,006,779 | |
Showa Denko K.K. | | | 272,010 | | | | 548,090 | |
Sumitomo Chemical Co., Ltd. | | | 266,010 | | | | 1,331,976 | |
Taiyo Holdings Co., Ltd. | | | 25,700 | | | | 793,822 | |
Taiyo Nippon Sanso Corp. | | | 17,022 | | | | 142,329 | |
Tosoh Corp.(a) | | | 257,000 | | | | 927,160 | |
Toyo Ink SC Holdings Co., Ltd. | | | 27,000 | | | | 138,453 | |
Ube Industries Ltd. | | | 255,020 | | | | 815,399 | |
| | | | | | | | |
| Total Chemicals | | | | | | | 21,342,327 | |
| Commercial Services – 1.9% | | | | | | | | |
Dai Nippon Printing Co., Ltd. | | | 253,004 | | | | 3,092,339 | |
Nomura Co., Ltd. | | | 21,000 | | | | 61,571 | |
Park24 Co., Ltd.(a) | | | 79,022 | | | | 768,481 | |
Secom Co., Ltd. | | | 51,916 | | | | 2,421,035 | |
See Notes to Financial Statements.
| | |
| 52 | | WisdomTree International Dividend and Sector Funds |
Schedule of Investments (continued)
WisdomTree Japan Hedged Equity Fund (DXJ)
March 31, 2011
| | | | | | | | |
| Investments | | Shares | | | Fair
Value | |
| | | | | | | | |
Sohgo Security Services Co., Ltd. | | | 54,502 | | | $ | 595,129 | |
Toppan Forms Co., Ltd. | | | 55,600 | | | | 485,024 | |
Toppan Printing Co., Ltd.(a) | | | 254,002 | | | | 2,010,441 | |
| | | | | | | | |
| Total Commercial Services | | | | | | | 9,434,020 | |
| Computers – 0.9% | | | | | | | | |
Fujitsu Ltd. | | | 257,000 | | | | 1,457,408 | |
Itochu Techno-Solutions Corp. | | | 25,508 | | | | 828,825 | |
NEC Fielding Ltd. | | | 30,100 | | | | 349,012 | |
NS Solutions Corp.(a) | | | 25,800 | | | | 496,513 | |
Otsuka Corp. | | | 1,704 | | | | 109,995 | |
TDK Corp. | | | 20,606 | | | | 1,221,990 | |
| | | | | | | | |
| Total Computers | | | | | | | 4,463,743 | |
| Cosmetics/Personal Care – 1.3% | | | | | | | | |
Fancl Corp.(a) | | | 28,500 | | | | 400,609 | |
Kao Corp. | | | 134,114 | | | | 3,357,705 | |
Lion Corp.(a) | | | 196,000 | | | | 1,000,338 | |
Shiseido Co., Ltd.(a) | | | 106,708 | | | | 1,854,000 | |
| | | | | | | | |
| Total Cosmetics/Personal Care | | | | | | | 6,612,652 | |
| Distribution/Wholesale – 5.2% | | | | | | | | |
Ai Holdings Corp. | | | 132,100 | | | | 541,916 | |
Fuji Electronics Co., Ltd. | | | 17,400 | | | | 267,466 | |
Inaba Denki Sangyo Co., Ltd. | | | 26,300 | | | | 748,890 | |
ITOCHU Corp. | | | 294,216 | | | | 3,091,966 | |
Itochu Enex Co., Ltd. | | | 26,900 | | | | 154,493 | |
Japan Pulp & Paper Co., Ltd. | | | 236,000 | | | | 891,265 | |
Marubeni Corp. | | | 271,000 | | | | 1,958,603 | |
Mitsubishi Corp. | | | 268,200 | | | | 7,471,933 | |
Mitsui & Co., Ltd. | | | 239,318 | | | | 4,305,298 | |
Ryoden Trading Co., Ltd. | | | 19,000 | | | | 125,398 | |
Seika Corp. | | | 216,000 | | | | 591,602 | |
Sinanen Co., Ltd. | | | 147,000 | | | | 677,534 | |
Sumitomo Corp.(a) | | | 268,808 | | | | 3,856,331 | |
Toyota Tsusho Corp. | | | 53,610 | | | | 887,463 | |
| | | | | | | | |
| Total Distribution/Wholesale | | | | | | | 25,570,158 | |
| Diversified Financial Services – 1.0% | | | | | | | | |
Century Tokyo Leasing Corp. | | | 51,400 | | | | 847,157 | |
Daiwa Securities Group, Inc. | | | 530,006 | | | | 2,442,837 | |
Ichiyoshi Securities Co., Ltd. | | | 24,000 | | | | 163,610 | |
Mizuho Securities Co., Ltd.* | | | 267,000 | | | | 711,957 | |
Tokai Tokyo Financial Holdings, Inc. | | | 249,000 | | | | 853,234 | |
| | | | | | | | |
| Total Diversified Financial Services | | | | | | | 5,018,795 | |
| Electric – 4.7% | | | | | | | | |
Chubu Electric Power Co., Inc. | | | 187,916 | | | | 4,194,554 | |
Chugoku Electric Power Co., Inc. (The)(a) | | | 104,212 | | | | 1,933,857 | |
Electric Power Development Co., Ltd. | | | 51,400 | | | | 1,588,885 | |
Hokkaido Electric Power Co., Inc.(a) | | | 55,308 | | | | 1,076,397 | |
Hokuriku Electric Power Co. | | | 55,810 | | | | 1,268,654 | |
Kansai Electric Power Co., Inc. (The) | | | 217,420 | | | | 4,750,816 | |
Kyushu Electric Power Co., Inc. | | | 133,110 | | | | 2,609,842 | |
Shikoku Electric Power Co., Inc.(a) | | | 52,408 | | | | 1,430,976 | |
Tohoku Electric Power Co., Inc.(a) | | | 157,706 | | | | 2,673,467 | |
| | | | | | | | |
| Investments | | Shares | | | Fair
Value | |
| | | | | | | | |
Tokyo Electric Power Co., Inc. (The)(a) | | | 292,314 | | | $ | 1,643,561 | |
| | | | | | | | |
| Total Electric | | | | | | | 23,171,009 | |
| Electrical Components & Equipment – 0.6% | | | | | | | | |
Brother Industries Ltd. | | | 53,604 | | | | 790,349 | |
Casio Computer Co., Ltd.(a) | | | 81,300 | | | | 645,456 | |
Furukawa Electric Co., Ltd. | | | 198,000 | | | | 802,703 | |
Mitsubishi Electric Corp. | | | 35,000 | | | | 414,696 | |
Tatsuta Electric Wire and Cable Co., Ltd.(a) | | | 124,040 | | | | 535,790 | |
| | | | | | | | |
| Total Electrical Components & Equipment | | | | | | | 3,188,994 | |
| Electronics – 2.3% | | | | | | | | |
Eizo Nanao Corp. | | | 25,800 | | | | 613,871 | |
Hirose Electric Co., Ltd. | | | 1,520 | | | | 164,324 | |
Hoya Corp. | | | 132,724 | | | | 3,039,456 | |
Ibiden Co., Ltd. | | | 25,600 | | | | 811,428 | |
Kaga Electronics Co., Ltd. | | | 52,700 | | | | 622,506 | |
Kyocera Corp. | | | 26,804 | | | | 2,726,324 | |
Mitsumi Electric Co., Ltd. | | | 27,300 | | | | 364,637 | |
NEC Corp.* | | | 219,000 | | | | 478,270 | |
NGK Insulators Ltd. | | | 8,012 | | | | 143,748 | |
Nippon Electric Glass Co., Ltd. | | | 19,018 | | | | 270,309 | |
Optex Co., Ltd. | | | 18,500 | | | | 263,839 | |
Ryosan Co., Ltd. | | | 26,400 | | | | 638,340 | |
Shinko Shoji Co., Ltd. | | | 52,702 | | | | 463,559 | |
Yamatake Corp. | | | 27,210 | | | | 669,088 | |
| | | | | | | | |
| Total Electronics | | | | | | | 11,269,699 | |
| Engineering & Construction – 1.2% | | | | | | | | |
COMSYS Holdings Corp.(a) | | | 53,500 | | | | 542,875 | |
JGC Corp. | | | 16,018 | | | | 376,292 | |
Kajima Corp. | | | 286,014 | | | | 804,069 | |
Kandenko Co., Ltd. | | | 18,000 | | | | 102,075 | |
Obayashi Corp. | | | 250,012 | | | | 1,116,125 | |
Shimizu Corp.(a) | | | 260,006 | | | | 1,160,741 | |
Shinko Plantech Co., Ltd. | | | 28,300 | | | | 328,824 | |
Taisei Corp. | | | 285,024 | | | | 704,994 | |
Takasago Thermal Engineering Co., Ltd. | | | 77,300 | | | | 687,381 | |
| | | | | | | | |
| Total Engineering & Construction | | | | | | | 5,823,376 | |
| Entertainment – 0.6% | | | | | | | | |
Avex Group Holdings, Inc. | | | 51,400 | | | | 628,856 | |
Oriental Land Co., Ltd.(a) | | | 3,100 | | | | 247,237 | |
Sankyo Co., Ltd. | | | 29,100 | | | | 1,497,484 | |
Toho Co., Ltd. | | | 51,802 | | | | 745,654 | |
| | | | | | | | |
| Total Entertainment | | | | | | | 3,119,231 | |
| Environmental Control – 0.2% | | | | | | | | |
Kurita Water Industries Ltd. | | | 25,620 | | | | 760,130 | |
| Food – 1.6% | | | | | | | | |
Ajinomoto Co., Inc. | | | 187,002 | | | | 1,956,210 | |
Fujicco Co., Ltd. | | | 12,000 | | | | 148,552 | |
MEIJI Holdings Co., Ltd. | | | 25,400 | | | | 1,025,133 | |
Morinaga & Co., Ltd. | | | 269,000 | | | | 623,166 | |
Nichirei Corp. | | | 207,000 | | | | 886,643 | |
Nippon Suisan Kaisha Ltd.(a) | | | 234,700 | | | | 654,147 | |
See Notes to Financial Statements.
| | | | |
| WisdomTree International Dividend and Sector Funds | | | 53 | |
Schedule of Investments (continued)
WisdomTree Japan Hedged Equity Fund (DXJ)
March 31, 2011
| | | | | | | | |
| Investments | | Shares | | | Fair
Value | |
| | | | | | | | |
Nisshin Seifun Group, Inc. | | | 91,506 | | | $ | 1,058,811 | |
Nissin Foods Holdings Co., Ltd.(a) | | | 26,400 | | | | 933,938 | |
Toyo Suisan Kaisha Ltd. | | | 5,000 | | | | 108,953 | |
Yokohama Reito Co., Ltd. | | | 78,600 | | | | 535,823 | |
| | | | | | | | |
| Total Food | | | | | | | 7,931,376 | |
| Forest Products & Paper – 0.6% | | | | | | | | |
Hokuetsu Kishu Paper Co., Ltd. | | | 126,000 | | | | 679,561 | |
Nippon Paper Group, Inc. | | | 51,706 | | | | 1,105,490 | |
OJI Paper Co., Ltd.(a) | | | 262,022 | | | | 1,248,778 | |
| | | | | | | | |
| Total Forest Products & Paper | | | | | | | 3,033,829 | |
| Gas – 0.9% | | | | | | | | |
Osaka Gas Co., Ltd. | | | 516,014 | | | | 2,067,045 | |
Tokyo Gas Co., Ltd.(a) | | | 522,020 | | | | 2,393,431 | |
| | | | | | | | |
| Total Gas | | | | | | | 4,460,476 | |
| Hand/Machine Tools – 0.4% | | | | | | | | |
Hitachi Koki Co., Ltd. | | | 54,514 | | | | 525,539 | |
Makita Corp. | | | 27,224 | | | | 1,271,198 | |
SMC Corp. | | | 1,320 | | | | 218,036 | |
| | | | | | | | |
| Total Hand/Machine Tools | | | | | | | 2,014,773 | |
| Healthcare-Products – 0.2% | | | | | | | | |
Terumo Corp. | | | 22,102 | | | | 1,169,369 | |
| Home Builders – 0.5% | | | | | | | | |
Daiwa House Industry Co., Ltd. | | | 32,022 | | | | 394,866 | |
Mitsui Home Co., Ltd. | | | 34,000 | | | | 185,425 | |
PanaHome Corp. | | | 30,000 | | | | 195,101 | |
Sekisui Chemical Co., Ltd. | | | 51,008 | | | | 400,654 | |
Sekisui House Ltd. | | | 37,022 | | | | 348,421 | |
Token Corp. | | | 15,858 | | | | 701,250 | |
| | | | | | | | |
| Total Home Builders | | | | | | | 2,225,717 | |
| Home Furnishings – 1.5% | | | | | | | | |
Panasonic Corp. | | | 182,962 | | | | 2,335,591 | |
Sharp Corp.(a) | | | 240,002 | | | | 2,389,016 | |
Sony Corp. | | | 81,108 | | | | 2,607,043 | |
Toa Corp./Hyogo | | | 28,000 | | | | 164,527 | |
| | | | | | | | |
| Total Home Furnishings | | | | | | | 7,496,177 | |
| | | | | | | | |
| Household Products/Wares – 0.1% | | | | | | | | |
Kokuyo Co., Ltd. | | | 79,302 | | | | 608,543 | |
| Insurance – 1.6% | | | | | | | | |
MS&AD Insurance Group Holdings | | | 104,630 | | | | 2,391,038 | |
T&D Holdings, Inc. | | | 67,316 | | | | 1,665,031 | |
Tokio Marine Holdings, Inc. | | | 133,824 | | | | 3,591,030 | |
| | | | | | | | |
| Total Insurance | | | | | | | 7,647,099 | |
| Internet – 0.6% | | | | | | | | |
Dena Co., Ltd. | | | 4,068 | | | | 147,494 | |
Trend Micro, Inc. | | | 52,208 | | | | 1,395,279 | |
Yahoo! Japan Corp.(a) | | | 4,549 | | | | 1,633,425 | |
| | | | | | | | |
| Total Internet | | | | | | | 3,176,198 | |
| Iron/Steel – 1.3% | | | | | | | | |
Aichi Steel Corp. | | | 20,000 | | | | 121,380 | |
Hitachi Metals Ltd. | | | 21,018 | | | | 265,768 | |
| | | | | | | | |
| Investments | | Shares | | | Fair
Value | |
| | | | | | | | |
JFE Holdings, Inc. | | | 27,116 | | | $ | 796,336 | |
Kobe Steel Ltd. | | | 277,000 | | | | 721,911 | |
Kyoei Steel Ltd. | | | 26,400 | | | | 467,606 | |
Nippon Steel Corp. | | | 275,010 | | | | 882,634 | |
Sumitomo Metal Industries Ltd. | | | 1,066,002 | | | | 2,392,331 | |
Yamato Kogyo Co., Ltd. | | | 25,300 | | | | 845,572 | |
| | | | | | | | |
| Total Iron/Steel | | | | | | | 6,493,538 | |
| Leisure Time – 0.5% | | | | | | | | |
Sega Sammy Holdings, Inc. | | | 78,418 | | | | 1,368,152 | |
Yamaha Corp. | | | 77,810 | | | | 885,314 | |
| | | | | | | | |
| Total Leisure Time | | | | | | | 2,253,466 | |
| Machinery-Construction & Mining – 0.6% | | | | | | | | |
Komatsu Ltd.(a) | | | 81,306 | | | | 2,771,349 | |
| Machinery-Diversified – 1.5% | | | | | | | | |
Amada Co., Ltd. | | | 18,014 | | | | 150,841 | |
Chugai Ro Co., Ltd. | | | 19,000 | | | | 84,592 | |
Daifuku Co., Ltd. | | | 105,000 | | | | 765,203 | |
Fanuc Ltd. | | | 5,200 | | | | 789,913 | |
IHI Corp. | | | 266,000 | | | | 651,520 | |
Japan Steel Works Ltd. (The) | | | 12,018 | | | | 94,398 | |
Kawasaki Heavy Industries Ltd.(a) | | | 262,006 | | | | 1,157,025 | |
Kubota Corp. | | | 247,014 | | | | 2,336,619 | |
Max Co., Ltd. | | | 13,000 | | | | 161,088 | |
Mitsubishi Heavy Industries Ltd. | | | 288,016 | | | | 1,327,487 | |
| | | | | | | | |
| Total Machinery-Diversified | | | | | | | 7,518,686 | |
| Media – 0.2% | | | | | | | | |
Nippon Television Network Corp. | | | 5,426 | | | | 774,488 | |
| Metal Fabricate/Hardware – 0.6% | | | | | | | | |
Hanwa Co., Ltd. | | | 194,000 | | | | 861,390 | |
Maruichi Steel Tube Ltd.(a) | | | 26,600 | | | | 659,544 | |
NSK Ltd. | | | 26,000 | | | | 224,928 | |
NTN Corp. | | | 220,012 | | | | 1,059,179 | |
| | | | | | | | |
| Total Metal Fabricate/Hardware | | | | | | | 2,805,041 | |
| Mining – 0.4% | | | | | | | | |
DOWA Holdings Co., Ltd.(a) | | | 221,000 | | | | 1,381,250 | |
Sumitomo Metal Mining Co., Ltd. | | | 38,000 | | | | 656,105 | |
| Total Mining | | | | | | | 2,037,355 | |
| Miscellaneous Manufacturing – 0.9% | | | | | | | | |
Amano Corp. | | | 78,800 | | | | 757,765 | |
FUJIFILM Holdings Corp. | | | 52,104 | | | | 1,619,449 | |
Konica Minolta Holdings, Inc. | | | 119,000 | | | | 1,000,760 | |
Mitsuboshi Belting Co., Ltd. | | | 19,000 | | | | 104,307 | |
Olympus Corp.(a) | | | 27,400 | | | | 765,005 | |
Tamron Co., Ltd. | | | 9,100 | | | | 204,333 | |
| | | | | | | | |
| Total Miscellaneous Manufacturing | | | | | | | 4,451,619 | |
| Office/Business Equipment – 3.3% | | | | | | | | |
Canon, Inc. | | | 323,110 | | | | 14,112,671 | |
Ricoh Co., Ltd. | | | 201,008 | | | | 2,367,083 | |
| | | | | | | | |
| Total Office/Business Equipment | | | | | | | 16,479,754 | |
See Notes to Financial Statements.
| | |
| 54 | | WisdomTree International Dividend and Sector Funds |
Schedule of Investments (continued)
WisdomTree Japan Hedged Equity Fund (DXJ)
March 31, 2011
| | | | | | | | |
| Investments | | Shares | | | Fair
Value | |
| | | | | | | | |
| Oil & Gas – 1.4% | | | | | | | | |
Cosmo Oil Co., Ltd.(a) | | | 279,006 | | | $ | 871,894 | |
Idemitsu Kosan Co., Ltd. | | | 3,320 | | | | 390,164 | |
Showa Shell Sekiyu K.K. | | | 211,322 | | | | 2,213,170 | |
TonenGeneral Sekiyu K.K. | | | 266,004 | | | | 3,296,164 | |
| | | | | | | | |
| Total Oil & Gas | | | | | | | 6,771,392 | |
| Pharmaceuticals – 8.2% | | | | | | | | |
Alfresa Holdings Corp. | | | 3,400 | | | | 131,069 | |
Astellas Pharma, Inc. | | | 184,308 | | | | 6,849,284 | |
Chugai Pharmaceutical Co., Ltd. | | | 106,216 | | | | 1,835,199 | |
Daiichi Sankyo Co., Ltd.(a) | | | 240,508 | | | | 4,660,423 | |
Dainippon Sumitomo Pharma Co., Ltd. | | | 128,318 | | | | 1,199,885 | |
Eisai Co., Ltd.(a) | | | 133,804 | | | | 4,817,461 | |
Hisamitsu Pharmaceutical Co., Inc. | | | 25,604 | | | | 1,036,455 | |
Kaken Pharmaceutical Co., Ltd. | | | 16,000 | | | | 191,892 | |
KYORIN Holdings, Inc. | | | 10,000 | | | | 170,849 | |
Kyowa Hakko Kirin Co., Ltd. | | | 28,022 | | | | 263,720 | |
Medipal Holdings Corp. | | | 57,500 | | | | 510,618 | |
Miraca Holdings, Inc. | | | 24,600 | | | | 945,355 | |
Mitsubishi Tanabe Pharma Corp. | | | 58,608 | | | | 954,643 | |
Shionogi & Co., Ltd. | | | 78,318 | | | | 1,340,893 | |
Suzuken Co., Ltd. | | | 26,200 | | | | 693,567 | |
Takeda Pharmaceutical Co., Ltd.(a) | | | 320,916 | | | | 15,023,577 | |
| | | | | | | | |
| Total Pharmaceuticals | | | | | | | 40,624,890 | |
| Real Estate – 2.2% | | | | | | | | |
Arnest One Corp.(a) | | | 27,200 | | | | 272,394 | |
Daito Trust Construction Co., Ltd. | | | 50,324 | | | | 3,479,205 | |
Mitsubishi Estate Co., Ltd. | | | 54,018 | | | | 917,028 | |
Mitsui Fudosan Co., Ltd. | | | 176,018 | | | | 2,915,935 | |
Nomura Real Estate Holdings, Inc. | | | 55,500 | | | | 844,420 | |
Sumitomo Realty & Development Co., Ltd. | | | 22,012 | | | | 441,940 | |
Tokyo Tatemono Co., Ltd. | | | 220,008 | | | | 825,561 | |
Tokyu Land Corp. | | | 238,002 | | | | 1,039,536 | |
| | | | | | | | |
| Total Real Estate | | | | | | | 10,736,019 | |
| Retail – 4.4% | | | | | | | | |
ABC-Mart, Inc. | | | 4,900 | | | | 178,843 | |
Aeon Co., Ltd.(a) | | | 134,900 | | | | 1,569,059 | |
Chiyoda Co., Ltd.(a) | | | 53,600 | | | | 680,994 | |
Circle K Sunkus Co., Ltd. | | | 52,100 | | | | 798,347 | |
DCM Japan Holdings Co., Ltd. | | | 80,900 | | | | 495,864 | |
EDION Corp.(a) | | | 53,100 | | | | 452,965 | |
FamilyMart Co., Ltd. | | | 26,100 | | | | 984,104 | |
Fast Retailing Co., Ltd. | | | 17,706 | | | | 2,223,932 | |
H2O Retailing Corp. | | | 28,000 | | | | 190,203 | |
Isetan Mitsukoshi Holdings Ltd. | | | 53,102 | | | | 479,891 | |
J Front Retailing Co., Ltd. | | | 42,000 | | | | 175,338 | |
Kasumi Co., Ltd. | | | 124,000 | | | | 670,270 | |
Kyoto Kimono Yuzen Co., Ltd. | | | 51,776 | | | | 577,857 | |
Lawson, Inc. | | | 47,900 | | | | 2,317,556 | |
Marui Group Co., Ltd. | | | 81,818 | | | | 530,119 | |
Paris Miki Holdings, Inc. | | | 54,200 | | | | 556,518 | |
Plenus Co., Ltd. | | | 52,100 | | | | 796,461 | |
Ryohin Keikaku Co., Ltd.(a) | | | 23,200 | | | | 955,936 | |
| | | | | | | | |
| Investments | | Shares | | | Fair
Value | |
| | | | | | | | |
Seven & I Holdings Co., Ltd. | | | 213,108 | | | $ | 5,456,264 | |
Shimamura Co., Ltd. | | | 2,200 | | | | 194,570 | |
Takashimaya Co., Ltd. | | | 22,000 | | | | 140,951 | |
United Arrows Ltd. | | | 11,200 | | | | 147,297 | |
UNY Co., Ltd. | | | 55,116 | | | | 513,387 | |
USS Co., Ltd. | | | 10,622 | | | | 829,203 | |
| | | | | | | | |
| Total Retail | | | | | | | 21,915,929 | |
| Shipbuilding – 0.1% | | | | | | | | |
Mitsui Engineering & Shipbuilding Co., Ltd.(a) | | | 268,020 | | | | 643,533 | |
| Software – 1.2% | | | | | | | | |
IT Holdings Corp. | | | 28,100 | | | | 294,969 | |
Konami Corp.(a) | | | 53,514 | | | | 994,348 | |
NEC Mobiling Ltd. | | | 20,800 | | | | 638,205 | |
Nomura Research Institute Ltd. | | | 54,620 | | | | 1,209,970 | |
Oracle Corp. | | | 52,224 | | | | 2,183,351 | |
Square Enix Holdings Co., Ltd. | | | 26,502 | | | | 461,738 | |
| | | | | | | | |
| Total Software | | | | | | | 5,782,581 | |
| Storage/Warehousing – 0.2% | | | | | | | | |
Sumitomo Warehouse Co., Ltd. (The) | | | 206,000 | | | | 999,180 | |
| Telecommunications – 11.2% | | | | | | | | |
Denki Kogyo Co., Ltd. | | | 22,000 | | | | 119,981 | |
Hikari Tsushin, Inc.(a) | | | 27,500 | | | | 539,515 | |
KDDI Corp. | | | 1,064 | | | | 6,611,487 | |
Nippon Telegraph & Telephone Corp. | | | 456,102 | | | | 20,554,307 | |
NTT DoCoMo, Inc.(a) | | | 14,994 | | | | 26,449,358 | |
Softbank Corp. | | | 25,200 | | | | 1,009,459 | |
| | | | | | | | |
| Total Telecommunications | | | | | | | 55,284,107 | |
| Textiles – 0.6% | | | | | | | | |
Kuraray Co., Ltd. | | | 77,606 | | | | 1,003,784 | |
Toray Industries, Inc. | | | 219,000 | | | | 1,598,637 | |
Toyobo Co., Ltd. | | | 271,000 | | | | 392,374 | |
| | | | | | | | |
| Total Textiles | | | | | | | 2,994,795 | |
| Toys/Games/Hobbies – 0.2% | | | | | | | | |
Namco Bandai Holdings, Inc. | | | 81,406 | | | | 890,869 | |
Sanrio Co., Ltd. | | | 9,700 | | | | 288,144 | |
| | | | | | | | |
| Total Toys/Games/Hobbies | | | | | | | 1,179,013 | |
| Transportation – 2.8% | | | | | | | | |
East Japan Railway Co. | | | 76,012 | | | | 4,241,741 | |
Hankyu Hanshin Holdings, Inc. | | | 253,012 | | | | 1,172,256 | |
Keio Corp. | | | 20,000 | | | | 119,933 | |
Kintetsu Corp.(a) | | | 276,018 | | | | 889,199 | |
Nippon Express Co., Ltd. | | | 273,008 | | | | 1,050,791 | |
Nippon Yusen K.K. | | | 252,014 | | | | 988,231 | |
Nishi-Nippon Railroad Co., Ltd. | | | 253,000 | | | | 1,092,833 | |
Odakyu Electric Railway Co., Ltd. | | | 15,008 | | | | 126,938 | |
Sankyu, Inc. | | | 212,000 | | | | 1,018,050 | |
Tobu Railway Co., Ltd. | | | 238,000 | | | | 976,351 | |
Tokyu Corp. | | | 264,000 | | | | 1,098,938 | |
Yamato Holdings Co., Ltd. | | | 82,322 | | | | 1,281,315 | |
| | | | | | | | |
| Total Transportation | | | | | | | 14,056,576 | |
TOTAL COMMON STOCKS
(Cost: $494,783,195) | | | | | | | 479,804,971 | |
See Notes to Financial Statements.
| | | | |
| WisdomTree International Dividend and Sector Funds | | | 55 | |
Schedule of Investments (concluded)
WisdomTree Japan Hedged Equity Fund (DXJ)
March 31, 2011
| | | | | | | | |
| Investments | | Shares | | | Fair
Value | |
| SHORT-TERM INVESTMENT – 0.0% | | | | | | | | |
| MONEY MARKET FUND – 0.0% | | | | | | | | |
Invesco Treasury Fund Private Class, 0.02%(b) (Cost: $58,523) | | | 58,523 | | | $ | 58,523 | |
| INVESTMENT OF CASH COLLATERAL FOR SECURITIES LOANED – 12.5% | | | | | | | | |
| MONEY MARKET FUND – 12.5% | | | | | | | | |
Dreyfus Institutional Preferred Money Market Fund, 0.19%(c) | | | | | | | | |
| (Cost: $61,960,000)(d) | | | 61,960,000 | | | | 61,960,000 | |
TOTAL INVESTMENTS IN SECURITIES – 109.4%
(Cost: $556,801,718) | | | | 541,823,494 | |
Liabilities in Excess of Cash, Foreign Currency and Other Assets – (9.4)% | | | | | | | (46,842,233 | ) |
| | | | | | | | |
| NET ASSETS – 100.0% | | | | | | $ | 494,981,261 | |
| * | Non-income producing security. |
| (a) | Security, or portion thereof, was on loan at March 31, 2011 (See Note 2). |
| (b) | Rate shown represents annualized 7-day yield as of March 31, 2011. |
| (c) | Interest rate shown reflects yield as of March 31, 2011. |
| (d) | At March 31, 2011, the total market value of the Fund’s securities on loan was $59,182,813 and the total market value of the collateral held by the Fund was $61,960,000. |
See Notes to Financial Statements.
| | |
| 56 | | WisdomTree International Dividend and Sector Funds |
Schedule of Investments
WisdomTree World ex-U.S. Growth Fund (DNL)
March 31, 2011
| | | | | | | | |
| Investments | | Shares | | | Fair Value | |
| | | | | | | | |
| COMMON STOCKS – 96.6% | | | | | | | | |
| Argentina – 0.2% | | | | | | | | |
Telecom Argentina S.A. ADR | | | 3,765 | | | $ | 93,372 | |
| Australia – 2.8% | | | | | | | | |
Cochlear Ltd. | | | 1,957 | | | | 167,958 | |
Leighton Holdings Ltd. | | | 10,991 | | | | 335,193 | |
MacArthur Coal Ltd. | | | 5,722 | | | | 68,642 | |
Origin Energy Ltd. | | | 27,366 | | | | 459,035 | |
Ramsay Health Care Ltd. | | | 8,582 | | | | 169,425 | |
Wesfarmers Ltd. PPS | | | 6,174 | | | | 205,528 | |
| | | | | | | | |
| Total Australia | | | | | | | 1,405,781 | |
| Belgium – 1.3% | | | | | | | | |
Anheuser-Busch InBev N.V. | | | 11,595 | | | | 661,387 | |
| Brazil – 7.9% | | | | | | | | |
Banco do Brasil S.A. | | | 100,900 | | | | 1,826,651 | |
CCR S.A. | | | 11,700 | | | | 342,855 | |
Cia de Bebidas das Americas | | | 41,145 | | | | 968,713 | |
Cyrela Brazil Realty S.A. Empreendimentos e Participacoes | | | 8,200 | | | | 77,879 | |
Lojas Renner S.A. | | | 2,900 | | | | 94,732 | |
M Dias Branco S.A. | | | 2,400 | | | | 56,195 | |
Natura Cosmeticos S.A. | | | 11,400 | | | | 322,290 | |
Porto Seguro S.A. | | | 2,400 | | | | 40,587 | |
Sul America S.A. | | | 13,500 | | | | 169,295 | |
| | | | | | | | |
| Total Brazil | | | | | | | 3,899,197 | |
| Canada – 2.2% | | | | | | | | |
Canadian Imperial Bank of Commerce | | | 10,000 | | | | 859,419 | |
Pembina Pipeline Corp. | | | 10,389 | | | | 245,000 | |
| | | | | | | | |
| Total Canada | | | | | | | 1,104,419 | |
| China – 1.5% | | | | | | | | |
China Life Insurance Co., Ltd. Class H | | | 105,100 | | | | 394,554 | |
China Shenhua Energy Co., Ltd. Class H | | | 42,500 | | | | 200,255 | |
Dongfeng Motor Group Co., Ltd. Class H | | | 75,100 | | | | 127,835 | |
| | | | | | | | |
| Total China | | | | | | | 722,644 | |
| Denmark – 2.1% | | | | | | | | |
FLSmidth & Co. A/S | | | 1,206 | | | | 102,878 | |
Novo Nordisk A/S Class B(a) | | | 7,227 | | | | 909,204 | |
| | | | | | | | |
| Total Denmark | | | | | | | 1,012,082 | |
| Finland – 1.6% | | | | | | | | |
Kone Oyj Class B | | | 6,609 | | | | 380,780 | |
Metso Oyj(a) | | | 3,012 | | | | 162,168 | |
Wartsila Oyj(a) | | | 6,394 | | | | 249,981 | |
| | | | | | | | |
| Total Finland | | | | | | | 792,929 | |
| France – 2.4% | | | | | | | | |
Bureau Veritas S.A. | | | 2,149 | | | | 169,011 | |
Cie Generale d’Optique Essilor International S.A. | | | 3,388 | | | | 251,934 | |
Eutelsat Communications S.A. | | | 7,444 | | | | 297,740 | |
Pernod-Ricard S.A. | | | 2,334 | | | | 218,273 | |
Societe BIC S.A. | | | 1,479 | | | | 131,640 | |
Zodiac Aerospace | | | 1,617 | | | | 117,740 | |
| | | | | | | | |
| Total France | | | | | | | 1,186,338 | |
| | | | | | | | |
| Investments | | Shares | | | Fair Value | |
| | | | | | | | |
| Germany – 7.3% | | | | | | | | |
Fresenius Medical Care AG & Co. KGaA | | | 3,990 | | | $ | 268,332 | |
Henkel AG & Co. KGaA | | | 3,388 | | | | 177,243 | |
Muenchener Rueckversicherungs AG | | | 7,453 | | | | 1,173,997 | |
Siemens AG | | | 13,463 | | | | 1,847,678 | |
Symrise AG | | | 4,217 | | | | 123,816 | |
| | | | | | | | |
| Total Germany | | | | | | | 3,591,066 | |
| Hong Kong – 3.4% | | | | | | | | |
Beijing Enterprises Holdings Ltd. | | | 14,600 | | | | 83,341 | |
China Overseas Land & Investment Ltd. | | | 81,100 | | | | 164,948 | |
China Resources Power Holdings Co., Ltd. | | | 76,800 | | | | 147,909 | |
Fushan International Energy Group Ltd. | | | 180,800 | | | | 130,169 | |
Sino Land Co., Ltd. | | | 104,000 | | | | 184,783 | |
Sun Hung Kai Properties Ltd. | | | 39,000 | | | | 617,727 | |
Wharf Holdings Ltd. | | | 51,000 | | | | 351,771 | |
| | | | | | | | |
| Total Hong Kong | | | | | | | 1,680,648 | |
| Indonesia – 4.0% | | | | | | | | |
Astra International Tbk PT | | | 48,600 | | | | 318,140 | |
Bank Central Asia Tbk PT | | | 291,900 | | | | 232,984 | |
Bank Danamon Indonesia TbK PT | | | 114,800 | | | | 86,356 | |
Bank Mandiri Tbk PT | | | 248,600 | | | | 194,141 | |
Bank Rakyat Indonesia Persero Tbk PT | | | 363,000 | | | | 239,707 | |
Indo Tambangraya Megah PT | | | 41,200 | | | | 218,598 | |
Perusahaan Gas Negara PT | | | 254,400 | | | | 113,943 | |
Semen Gresik Persero TbK PT | | | 125,000 | | | | 130,635 | |
Tambang Batubara Bukit Asam TbK PT | | | 56,900 | | | | 137,226 | |
Unilever Indonesia Tbk PT | | | 114,300 | | | | 200,837 | |
United Tractors TbK PT | | | 47,900 | | | | 119,372 | |
| | | | | | | | |
| Total Indonesia | | | | | | | 1,991,939 | |
| Italy – 1.0% | | | | | | | | |
Mediolanum SpA | | | 28,155 | | | | 151,588 | |
Saipem SpA | | | 6,625 | | | | 352,652 | |
| | | | | | | | |
| Total Italy | | | | | | | 504,240 | |
| Japan – 1.4% | | | | | | | | |
Fast Retailing Co., Ltd. | | | 1,000 | | | | 125,603 | |
Mitsubishi Tanabe Pharma Corp. | | | 11,000 | | | | 179,175 | |
Mitsui & Co., Ltd. | | | 18,000 | | | | 323,817 | |
Yahoo! Japan Corp. | | | 228 | | | | 81,869 | |
| | | | | | | | |
| Total Japan | | | | | | | 710,464 | |
| Malaysia – 0.5% | | | | | | | | |
CIMB Group Holdings Bhd | | | 97,900 | | | | 265,053 | |
| Mexico – 4.5% | | | | | | | | |
America Movil S.A.B de CV Series L | | | 182,600 | | | | 530,444 | |
Coca-Cola Femsa S.A.B de CV Series L | | | 22,700 | | | | 174,798 | |
Embotelladoras Arca S.A.B de C.V. | | | 10,500 | | | | 60,836 | |
Fomento Economico Mexicano S.A.B de CV | | | 29,400 | | | | 172,515 | |
Grupo Mexico S.A.B de CV Series B | | | 78,100 | | | | 292,533 | |
Grupo Modelo S.A.B de CV Series C | | | 66,800 | | | | 401,117 | |
Telmex Internacional S.A.B de CV Class L* | | | 179,600 | | | | 174,362 | |
Wal-Mart de Mexico S.A.B de CV Series V | | | 141,300 | | | | 423,642 | |
| | | | | | | | |
| Total Mexico | | | | | | | 2,230,247 | |
See Notes to Financial Statements.
| | | | |
| WisdomTree International Dividend and Sector Funds | | | 57 | |
Schedule of Investments (continued)
WisdomTree World ex-U.S. Growth Fund (DNL)
March 31, 2011
| | | | | | | | |
| Investments | | Shares | | | Fair Value | |
| | | | | | | | |
| Netherlands – 0.8% | | | | | | | | |
Koninklijke Boskalis Westminster N.V. | | | 2,410 | | | $ | 127,619 | |
Reed Elsevier N.V. | | | 21,982 | | | | 283,247 | |
| | | | | | | | |
| Total Netherlands | | | | | | | 410,866 | |
| Norway – 0.4% | | | | | | | | |
Aker Solutions ASA | | | 7,830 | | | | 179,906 | |
| Poland – 0.6% | | | | | | | | |
Powszechna Kasa Oszczednosci Bank Polski S.A. | | | 19,960 | | | | 307,174 | |
| Portugal – 1.4% | | | | | | | | |
Jeronimo Martins, SGPS, S.A. | | | 14,003 | | | | 225,543 | |
Portugal Telecom, SGPS, S.A. | | | 41,252 | | | | 476,756 | |
| | | | | | | | |
| Total Portugal | | | | | | | 702,299 | |
| Russia – 0.1% | | | | | | | | |
Novorossiysk Commercial Sea Port PJSC,
Reg S GDR | | | 5,873 | | | | 59,259 | |
| Singapore – 2.5% | | | | | | | | |
Great Eastern Holdings Ltd. | | | 7,000 | | | | 84,522 | |
Jardine Cycle & Carriage Ltd. | | | 7,000 | | | | 203,253 | |
Keppel Corp., Ltd. | | | 51,000 | | | | 497,660 | |
SembCorp Marine Ltd. | | | 61,000 | | | | 282,618 | |
Yangzijiang Shipbuilding Holdings Ltd. | | | 100,000 | | | | 143,594 | |
| | | | | | | | |
| Total Singapore | | | | | | | 1,211,647 | |
| South Africa – 3.4% | | | | | | | | |
FirstRand Ltd. | | | 121,497 | | | | 361,285 | |
Kumba Iron Ore Ltd. | | | 9,934 | | | | 702,491 | |
Massmart Holdings Ltd. | | | 8,011 | | | | 166,182 | |
Pick’n Pay Stores Ltd. | | | 6,534 | | | | 44,485 | |
Shoprite Holdings Ltd. | | | 16,618 | | | | 255,117 | |
Truworths International Ltd. | | | 15,206 | | | | 158,596 | |
| | | | | | | | |
| Total South Africa | | | | | | | 1,688,156 | |
| South Korea – 5.6% | | | | | | | | |
Daewoo Shipbuilding & Marine Engineering Co., Ltd. | | | 4,820 | | | | 149,616 | |
Hyundai Heavy Industries Co., Ltd. | | | 904 | | | | 426,885 | |
Hyundai Mobis | | | 603 | | | | 180,029 | |
Hyundai Motor Co. | | | 1,506 | | | | 278,698 | |
LG Chem Ltd. | | | 686 | | | | 287,670 | |
LG Display Co., Ltd. | | | 4,460 | | | | 139,864 | |
LG Electronics, Inc. | | | 2,108 | | | | 201,778 | |
Samsung Electronics Co., Ltd. | | | 1,055 | | | | 896,358 | |
Samsung Engineering Co., Ltd. | | | 754 | | | | 143,658 | |
Woori Finance Holdings Co., Ltd. | | | 4,820 | | | | 63,933 | |
| | | | | | | | |
| Total South Korea | | | | | | | 2,768,489 | |
| Spain – 4.3% | | | | | | | | |
Criteria Caixacorp S.A. | | | 161,993 | | | | 1,144,134 | |
Inditex S.A. | | | 10,776 | | | | 865,846 | |
Tecnicas Reunidas S.A. | | | 1,957 | | | | 117,808 | |
| | | | | | | | |
| Total Spain | | | | | | | 2,127,788 | |
| Sweden – 0.9% | | | | | | | | |
Assa Abloy AB Class B | | | 7,277 | | | | 209,368 | |
Tele2 AB Class B | | | 9,336 | | | | 215,774 | |
| | | | | | | | |
| Total Sweden | | | | | | | 425,142 | |
| | | | | | | | |
| Investments | | Shares | | | Fair Value | |
| | | | | | | | |
| Switzerland – 4.4% | | | | | | | | |
BKW FMB Energie AG | | | 752 | | | $ | 53,388 | |
Schindler Holding AG Participating Shares | | | 2,409 | | | | 290,707 | |
Zurich Financial Services AG | | | 6,474 | | | | 1,819,386 | |
| | | | | | | | |
| Total Switzerland | | | | | | | 2,163,481 | |
| Taiwan – 1.4% | | | | | | | | |
Compal Electronics, Inc. | | | 188,460 | | | | 187,137 | |
Formosa Chemicals & Fibre Corp. | | | 56,000 | | | | 212,334 | |
Mediatek, Inc. | | | 25,025 | | | | 287,639 | |
| | | | | | | | |
| Total Taiwan | | | | | | | 687,110 | |
| Thailand – 1.8% | | | | | | | | |
Banpu PCL | | | 3,850 | | | | 96,998 | |
Charoen Pokphand Foods PCL | | | 292,000 | | | | 248,603 | |
CP ALL PCL | | | 134,100 | | | | 177,352 | |
Kasikornbank PCL | | | 32,200 | | | | 135,209 | |
Siam Cement PCL NVDR | | | 19,100 | | | | 221,660 | |
| | | | | | | | |
| Total Thailand | | | | | | | 879,822 | |
| Turkey – 3.3% | | | | | | | | |
Akbank TAS | | | 44,034 | | | | 213,917 | |
Anadolu EFES Biracilik VE Malt Sanayii A.S. | | | 9,579 | | | | 135,571 | |
Bim Birlesik Magazalar A.S. | | | 3,772 | | | | 127,049 | |
Bsh Ev Aletleri Sanayi VE Ticaret A.S. | | | 754 | | | | 65,688 | |
KOC Holding A.S. | | | 44,113 | | | | 205,157 | |
Migros Ticaret A.S.(a) | | | 6,070 | | | | 136,431 | |
Turkiye Garanti Bankasi A.S. | | | 60,974 | | | | 285,152 | |
Turkiye Halk Bankasi A.S. | | | 17,766 | | | | 137,516 | |
Turkiye Is Bankasi Class C | | | 105,539 | | | | 337,703 | |
| | | | | | | | |
| Total Turkey | | | | | | | 1,644,184 | |
| United Kingdom – 21.6% | | | | | | | | |
Admiral Group PLC | | | 6,770 | | | | 168,640 | |
Amlin PLC | | | 21,622 | | | | 132,293 | |
Associated British Foods PLC | | | 15,960 | | | | 253,784 | |
AstraZeneca PLC | | | 48,705 | | | | 2,235,191 | |
Compass Group PLC | | | 35,563 | | | | 319,517 | |
Fresnillo PLC | | | 9,185 | | | | 227,177 | |
GlaxoSmithKline PLC | | | 191,201 | | | | 3,645,645 | |
Hargreaves Lansdown PLC | | | 18,878 | | | | 184,589 | |
IMI PLC | | | 8,024 | | | | 132,479 | |
Inmarsat PLC | | | 11,602 | | | | 112,329 | |
Investec PLC | | | 12,369 | | | | 94,713 | |
Pearson PLC | | | 24,247 | | | | 427,923 | |
Reckitt Benckiser Group PLC | | | 16,753 | | | | 859,872 | |
Reed Elsevier PLC | | | 38,241 | | | | 331,011 | |
SABMiller PLC | | | 22,626 | | | | 800,623 | |
Sage Group PLC (The) | | | 55,464 | | | | 247,248 | |
Smith & Nephew PLC | | | 12,811 | | | | 144,364 | |
Smiths Group PLC | | | 10,385 | | | | 215,907 | |
Vedanta Resources PLC(a) | | | 3,313 | | | | 126,338 | |
| | | | | | | | |
| Total United Kingdom | | | | | | | 10,659,643 | |
TOTAL COMMON STOCKS
(Cost: $40,545,718) | | | | | | | 47,766,772 | |
See Notes to Financial Statements.
| | |
| 58 | | WisdomTree International Dividend and Sector Funds |
Schedule of Investments (concluded)
WisdomTree World ex-U.S. Growth Fund (DNL)
March 31, 2011
| | | | | | | | |
| Investments | | Shares | | | Fair Value | |
| | | | | | | | |
| EXCHANGE-TRADED FUNDS – 2.6% | | | | | | | | |
| United States – 2.6% | | | | | | | | |
WisdomTree DEFA Fund(a)(b) | | | 1,551 | | | $ | 77,100 | |
WisdomTree Emerging Markets Equity Income Fund(a)(b) | | | 849 | | | | 51,882 | |
WisdomTree India Earnings Fund(b) | | | 47,386 | | | | 1,174,699 | |
TOTAL EXCHANGE-TRADED FUNDS (Cost: $1,223,357) | | | | | | | 1,303,681 | |
| SHORT-TERM INVESTMENT – 0.0% | | | | | | | | |
| MONEY MARKET FUND – 0.0% | | | | | | | | |
Invesco Treasury Fund Private Class, 0.02%(c)
(Cost: $4,260) | | | 4,260 | | | | 4,260 | |
| INVESTMENT OF CASH COLLATERAL FOR SECURITIES LOANED – 1.6% | | | | | | | | |
| MONEY MARKET FUND – 1.6% | | | | | | | | |
Dreyfus Institutional Preferred Money Market Fund, 0.19%(d) | | | | | | | | |
| (Cost: $779,000)(e) | | | 779,000 | | | | 779,000 | |
TOTAL INVESTMENTS IN SECURITIES – 100.8%
(Cost: $42,552,335) | | | | | | | 49,853,713 | |
Liabilities in Excess of Foreign Currency and
Other Assets – (0.8)% | | | | | | | (407,568 | ) |
| | | | | | | | |
| NET ASSETS – 100.0% | | | | | | $ | 49,446,145 | |
| ADR | – American Depositary Receipt |
| GDR | – Global Depositary Receipt |
| NVDR | – Non-Voting Depositary Receipt |
| PCL | – Public Company Limited |
| PPS | – Price Protected Shares |
| * | Non-income producing security. |
| (a) | Security, or portion thereof, was on loan at March 31, 2011 (See Note 2). |
| (b) | Affiliated companies (See Note 7). |
| (c) | Rate shown represents annualized 7-day yield as of March 31, 2011. |
| (d) | Interest rate shown reflects yield as of March 31, 2011. |
| (e) | At March 31, 2011, the total market value of the Fund’s securities on loan was $742,443 and the total market value of the collateral held by the Fund was $779,000. |
See Notes to Financial Statements.
| | | | |
| WisdomTree International Dividend and Sector Funds | | | 59 | |
Schedule of Investments
WisdomTree Japan SmallCap Dividend Fund (DFJ)
March 31, 2011
| | | | | | | | |
| Investments | | Shares | | | Fair
Value | |
| | | | | | | | |
| COMMON STOCKS – 98.5% | | | | | | | | |
| Advertising – 0.5% | | | | | | | | |
Asatsu-DK, Inc. | | | 21,100 | | | $ | 567,215 | |
Moshi Moshi Hotline, Inc. | | | 33,850 | | | | 634,279 | |
| | | | | | | | |
| Total Advertising | | | | | | | 1,201,494 | |
| Agriculture – 0.4% | | | | | | | | |
Hokuto Corp. | | | 41,000 | | | | 927,051 | |
| Apparel – 1.9% | | | | | | | | |
Atsugi Co., Ltd. | | | 348,827 | | | | 437,717 | |
Gunze Ltd. | | | 218,000 | | | | 794,353 | |
Japan Wool Textile Co., Ltd. (The) | | | 112,339 | | | | 951,520 | |
Onward Holdings Co., Ltd. | | | 205,000 | | | | 1,528,596 | |
Sanyo Shokai Ltd. | | | 243,000 | | | | 747,647 | |
| | | | | | | | |
| Total Apparel | | | | | | | 4,459,833 | |
| Auto Manufacturers – 1.3% | | | | | | | | |
Kanto Auto Works Ltd. | | | 50,600 | | | | 354,713 | |
Nissan Shatai Co., Ltd. | | | 101,000 | | | | 754,332 | |
Shinmaywa Industries Ltd. | | | 192,000 | | | | 813,127 | |
Toyota Auto Body Co., Ltd. | | | 62,800 | | | | 1,057,780 | |
| | | | | | | | |
| Total Auto Manufacturers | | | | | | | 2,979,952 | |
| Auto Parts & Equipment – 3.3% | | | | | | | | |
Aisan Industry Co., Ltd. | | | 52,300 | | | | 538,902 | |
Exedy Corp. | | | 30,000 | | | | 904,199 | |
FCC Co., Ltd. | | | 30,800 | | | | 743,243 | |
Keihin Corp. | | | 32,400 | | | | 617,273 | |
Musashi Seimitsu Industry Co., Ltd. | | | 19,200 | | | | 458,224 | |
Nifco, Inc. | | | 32,500 | | | | 781,129 | |
Nissin Kogyo Co., Ltd. | | | 30,000 | | | | 518,340 | |
Riken Corp. | | | 102,000 | | | | 425,820 | |
Sanden Corp. | | | 44,963 | | | | 189,335 | |
Sanoh Industrial Co., Ltd. | | | 18,797 | | | | 156,717 | |
Taiho Kogyo Co., Ltd. | | | 24,100 | | | | 214,888 | |
Toyo Tire & Rubber Co., Ltd. | | | 45,682 | | | | 112,441 | |
TS Tech Co., Ltd. | | | 31,500 | | | | 554,519 | |
Unipres Corp. | | | 21,087 | | | | 422,860 | |
Yokohama Rubber Co., Ltd. (The) | | | 241,084 | | | | 1,172,259 | |
| | | | | | | | |
| Total Auto Parts & Equipment | | | | | | | 7,810,149 | |
| Banks – 9.0% | | | | | | | | |
Akita Bank Ltd. (The) | | | 182,000 | | | | 592,905 | |
Aomori Bank Ltd. (The) | | | 229,000 | | | | 704,573 | |
Awa Bank Ltd. (The) | | | 113,000 | | | | 688,526 | |
Bank of Nagoya Ltd. (The) | | | 164,000 | | | | 530,309 | |
Bank of Saga Ltd. (The) | | | 211,000 | | | | 595,729 | |
Daisan Bank Ltd. (The) | | | 76,602 | | | | 198,714 | |
Daishi Bank Ltd. (The) | | | 336,000 | | | | 1,114,865 | |
Ehime Bank Ltd. (The) | | | 105,144 | | | | 298,128 | |
Eighteenth Bank Ltd. (The) | | | 74,688 | | | | 208,168 | |
FIDEA Holdings Co., Ltd. | | | 139,704 | | | | 401,177 | |
Fukui Bank Ltd. (The) | | | 201,000 | | | | 628,125 | |
Higo Bank Ltd. (The) | | | 115,000 | | | | 643,822 | |
Hokkoku Bank Ltd. (The) | | | 238,000 | | | | 806,926 | |
Hokuetsu Bank Ltd. (The) | | | 461,000 | | | | 1,056,829 | |
| | | | | | | | |
| Investments | | Shares | | | Fair
Value | |
| | | | | | | | |
Hyakugo Bank Ltd. (The) | | | 136,000 | | | $ | 613,707 | |
Hyakujushi Bank Ltd. (The) | | | 191,000 | | | | 721,320 | |
Juroku Bank Ltd. (The) | | | 287,000 | | | | 945,355 | |
Kagoshima Bank Ltd. (The) | | | 100,000 | | | | 679,295 | |
Keiyo Bank Ltd. (The) | | | 192,000 | | | | 963,707 | |
Kiyo Holdings, Inc. | | | 738,000 | | | | 1,032,915 | |
Mie Bank Ltd. (The) | | | 192,000 | | | | 518,919 | |
Miyazaki Bank Ltd. (The) | | | 173,000 | | | | 415,384 | |
Musashino Bank Ltd. (The) | | | 24,500 | | | | 796,959 | |
Ogaki Kyoritsu Bank Ltd. (The) | | | 315,000 | | | | 1,033,784 | |
Oita Bank Ltd. (The) | | | 127,000 | | | | 432,119 | |
San-In Godo Bank Ltd. (The) | | | 28,000 | | | | 209,459 | |
Sapporo Hokuyo Holdings, Inc. | | | 40,148 | | | | 193,764 | |
Shiga Bank Ltd. (The) | | | 113,000 | | | | 595,813 | |
Shikoku Bank Ltd. (The) | | | 135,000 | | | | 415,359 | |
Tochigi Bank Ltd. (The) | | | 106,000 | | | | 470,656 | |
Toho Bank Ltd. (The) | | | 207,000 | | | | 561,957 | |
Tokyo Tomin Bank Ltd. (The) | | | 68,200 | | | | 888,707 | |
Yamagata Bank Ltd. (The) | | | 114,000 | | | | 570,825 | |
Yamanashi Chuo Bank Ltd. (The) | | | 128,000 | | | | 623,938 | |
| | | | | | | | |
| Total Banks | | | | | | | 21,152,738 | |
| Beverages – 1.6% | | | | | | | | |
Coca-Cola Central Japan Co., Ltd. | | | 64,000 | | | | 872,587 | |
Ito En Ltd. | | | 84,700 | | | | 1,480,819 | |
Mikuni Coca-Cola Bottling Co., Ltd. | | | 86,100 | | | | 768,750 | |
Oenon Holdings, Inc. | | | 76,270 | | | | 175,767 | |
Takara Holdings, Inc.(a) | | | 120,000 | | | | 595,077 | |
| | | | | | | | |
| Total Beverages | | | | | | | 3,893,000 | |
| Building Materials – 2.4% | | | | | | | | |
Central Glass Co., Ltd. | | | 127,000 | | | | 513,333 | |
Cleanup Corp. | | | 20,637 | | | | 139,688 | |
Daiken Corp. | | | 167,000 | | | | 620,608 | |
Fujitec Co., Ltd. | | | 88,000 | | | | 468,243 | |
Nichias Corp. | | | 112,000 | | | | 702,703 | |
Sanwa Holdings Corp.(a) | | | 346,000 | | | | 1,168,919 | |
Sumitomo Osaka Cement Co., Ltd. | | | 320,000 | | | | 930,502 | |
Takara Standard Co., Ltd. | | | 136,000 | | | | 1,097,780 | |
| | | | | | | | |
| Total Building Materials | | | | | | | 5,641,776 | |
| Chemicals – 7.7% | | | | | | | | |
ADEKA Corp. | | | 83,200 | | | | 814,131 | |
Aica Kogyo Co., Ltd. | | | 87,000 | | | | 1,144,184 | |
Chugoku Marine Paints Ltd. | | | 27,000 | | | | 227,063 | |
Dainichiseika Color & Chemicals Manufacturing Co., Ltd. | | | 17,618 | | | | 85,029 | |
DIC Corp. | | | 736,000 | | | | 1,713,900 | |
Earth Chemical Co., Ltd. | | | 24,500 | | | | 822,677 | |
Fujimi, Inc. | | | 33,000 | | | | 458,687 | |
Hodogaya Chemical Co., Ltd. | | | 106,228 | | | | 372,977 | |
Lintec Corp. | | | 33,300 | | | | 950,223 | |
Nihon Parkerizing Co., Ltd. | | | 28,000 | | | | 387,500 | |
Nippon Kayaku Co., Ltd. | | | 136,000 | | | | 1,237,259 | |
Nippon Soda Co., Ltd. | | | 130,000 | | | | 538,007 | |
See Notes to Financial Statements.
| | |
| 60 | | WisdomTree International Dividend and Sector Funds |
Schedule of Investments (continued)
WisdomTree Japan SmallCap Dividend Fund (DFJ)
March 31, 2011
| | | | | | | | |
| Investments | | Shares | | | Fair
Value | |
| | | | | | | | |
Nippon Synthetic Chemical Industry Co., Ltd. (The) | | | 27,000 | | | $ | 167,121 | |
NOF Corp. | | | 136,000 | | | | 623,552 | |
Sanyo Chemical Industries Ltd. | | | 111,000 | | | | 952,232 | |
Sumitomo Bakelite Co., Ltd. | | | 194,000 | | | | 1,196,115 | |
Sumitomo Seika Chemicals Co., Ltd. | | | 116,000 | | | | 603,234 | |
T. Hasegawa Co., Ltd. | | | 31,100 | | | | 506,201 | |
Taiyo Holdings Co., Ltd. | | | 40,900 | | | | 1,263,321 | |
Toagosei Co., Ltd. | | | 129,000 | | | | 667,724 | |
Tokai Carbon Co., Ltd. | | | 122,000 | | | | 609,411 | |
Tokyo Ohka Kogyo Co., Ltd. | | | 32,300 | | | | 667,980 | |
Toyo Ink SC Holdings Co., Ltd. | | | 245,000 | | | | 1,256,335 | |
Zeon Corp. | | | 97,000 | | | | 897,671 | |
| | | | | | | | |
| Total Chemicals | | | | | | | 18,162,534 | |
| Commercial Services – 2.3% | | | | | | | | |
Daiseki Co., Ltd. | | | 13,600 | | | | 266,487 | |
Kanamoto Co., Ltd. | | | 22,228 | | | | 169,768 | |
Kyoritsu Maintenance Co., Ltd. | | | 10,525 | | | | 150,484 | |
Nichii Gakkan Co. | | | 43,400 | | | | 342,466 | |
Nissin Corp. | | | 79,556 | | | | 215,016 | |
Nohmi Bosai Ltd. | | | 28,488 | | | | 183,893 | |
Nomura Co., Ltd. | | | 19,533 | | | | 57,270 | |
Park24 Co., Ltd. | | | 171,700 | | | | 1,669,766 | |
Sohgo Security Services Co., Ltd. | | | 89,100 | | | | 972,919 | |
TKC Corp.(a) | | | 24,000 | | | | 490,251 | |
Toppan Forms Co., Ltd. | | | 117,900 | | | | 1,028,495 | |
| | | | | | | | |
| Total Commercial Services | | | | | | | 5,546,815 | |
| Computers – 1.2% | | | | | | | | |
CAC Corp. | | | 22,491 | | | | 187,244 | |
DTS Corp. | | | 41,700 | | | | 415,088 | |
Ines Corp. | | | 48,500 | | | | 341,162 | |
Information Services International-Dentsu Ltd. | | | 20,185 | | | | 141,743 | |
Melco Holdings, Inc. | | | 2,562 | | | | 83,092 | |
NEC Fielding Ltd. | | | 71,700 | | | | 831,367 | |
NS Solutions Corp. | | | 42,400 | | | | 815,975 | |
| | | | | | | | |
| Total Computers | | | | | | | 2,815,671 | |
| Cosmetics/Personal Care – 1.7% | | | | | | | | |
Fancl Corp.(a) | | | 64,400 | | | | 905,237 | |
Kose Corp. | | | 39,700 | | | | 990,105 | |
Lion Corp. | | | 224,000 | | | | 1,143,243 | |
Mandom Corp. | | | 22,400 | | | | 548,378 | |
Pigeon Corp. | | | 12,400 | | | | 389,595 | |
| | | | | | | | |
| Total Cosmetics/Personal Care | | | | | | | 3,976,558 | |
| Distribution/Wholesale – 3.7% | | | | | | | | |
Ai Holdings Corp. | | | 162,100 | | | | 664,986 | |
Daiwabo Holdings Co., Ltd.(a) | | | 74,392 | | | | 154,385 | |
Doshisha Co., Ltd. | | | 3,800 | | | | 75,789 | |
Elematec Corp. | | | 12,123 | | | | 163,385 | |
Fuji Electronics Co., Ltd. | | | 19,284 | | | | 296,426 | |
Hakuto Co., Ltd. | | | 19,683 | | | | 207,327 | |
Inaba Denki Sangyo Co., Ltd. | | | 30,000 | | | | 854,247 | |
Inabata & Co., Ltd. | | | 86,300 | | | | 531,045 | |
| | | | | | | | |
| Investments | | Shares | | | Fair
Value | |
| | | | | | | | |
Itochu Enex Co., Ltd. | | | 154,400 | | | $ | 886,757 | |
Iwatani Corp. | | | 229,000 | | | | 768,123 | |
Japan Pulp & Paper Co., Ltd. | | | 36,000 | | | | 135,956 | |
Matsuda Sangyo Co., Ltd. | | | 24,500 | | | | 373,944 | |
Nagase & Co., Ltd. | | | 86,000 | | | | 1,027,268 | |
Ryoden Trading Co., Ltd. | | | 96,411 | | | | 636,303 | |
San-Ai Oil Co., Ltd. | | | 99,000 | | | | 530,357 | |
Sinanen Co., Ltd. | | | 188,000 | | | | 866,506 | |
Yamazen Corp. | | | 106,200 | | | | 621,465 | |
| | | | | | | | |
| Total Distribution/Wholesale | | | | | | | 8,794,269 | |
| Diversified Financial Services – 1.8% | | | | | | | | |
Century Tokyo Leasing Corp. | | | 106,455 | | | | 1,754,555 | |
Ichiyoshi Securities Co., Ltd. | | | 85,800 | | | | 584,906 | |
Iwai Cosmo Holdings, Inc. | | | 21,245 | | | | 119,964 | |
Okasan Securities Group, Inc. | | | 136,000 | | | | 518,533 | |
Tokai Tokyo Financial Holdings, Inc. | | | 396,000 | | | | 1,356,950 | |
| | | | | | | | |
| Total Diversified Financial Services | | | | | | | 4,334,908 | |
| Electric – 0.2% | | | | | | | | |
Okinawa Electric Power Co., Inc. (The) | | | 10,800 | | | | 495,174 | |
| Electrical Components & Equipment – 1.0% | | | | | | | | |
Hitachi Cable Ltd. | | | 300,000 | | | | 774,614 | |
Nippon Signal Co., Ltd. (The) | | | 62,600 | | | | 478,866 | |
Tatsuta Electric Wire and Cable Co., Ltd. | | | 73,520 | | | | 317,570 | |
Toshiba TEC Corp. | | | 186,386 | | | | 832,080 | |
| | | | | | | | |
| Total Electrical Components & Equipment | | | | | | | 2,403,130 | |
| Electronics – 3.9% | | | | | | | | |
Eizo Nanao Corp. | | | 24,420 | | | | 581,036 | |
Idec Corp. | | | 56,800 | | | | 577,732 | |
Japan Aviation Electronics Industry Ltd. | | | 28,000 | | | | 195,270 | |
Kaga Electronics Co., Ltd. | | | 50,870 | | | | 600,890 | |
Kuroda Electric Co., Ltd. | | | 33,300 | | | | 415,848 | |
Mitsumi Electric Co., Ltd. | | | 51,591 | | | | 689,083 | |
Nichicon Corp. | | | 30,923 | | | | 438,772 | |
Nidec Copal Corp. | | | 34,800 | | | | 421,144 | |
Nissha Printing Co., Ltd.(a) | | | 22,700 | | | | 491,632 | |
Optex Co., Ltd. | | | 18,240 | | | | 260,131 | |
Ryosan Co., Ltd. | | | 42,100 | | | | 1,017,959 | |
Sanshin Electronics Co., Ltd. | | | 55,700 | | | | 471,783 | |
Sanyo Denki Co., Ltd. | | | 11,382 | | | | 90,364 | |
Sato Corp. | | | 50,700 | | | | 672,289 | |
Shinko Shoji Co., Ltd. | | | 32,338 | | | | 284,440 | |
SMK Corp. | | | 76,150 | | | | 354,656 | |
Star Micronics Co., Ltd. | | | 43,188 | | | | 480,446 | |
Toyo Corp. | | | 58,700 | | | | 544,647 | |
Ulvac, Inc. | | | 27,900 | | | | 661,144 | |
| | | | | | | | |
| Total Electronics | | | | | | | 9,249,266 | |
| Engineering & Construction – 6.7% | | | | | | | | |
Airport Facilities Co., Ltd. | | | 107,385 | | | | 466,441 | |
COMSYS Holdings Corp.(a) | | | 117,300 | | | | 1,190,267 | |
Japan Airport Terminal Co., Ltd. | | | 40,900 | | | | 517,665 | |
Kandenko Co., Ltd. | | | 196,000 | | | | 1,111,487 | |
See Notes to Financial Statements.
| | | | |
| WisdomTree International Dividend and Sector Funds | | | 61 | |
Schedule of Investments (continued)
WisdomTree Japan SmallCap Dividend Fund (DFJ)
March 31, 2011
| | | | | | | | |
| Investments | | Shares | | | Fair
Value | |
| | | | | | | | |
Kyowa Exeo Corp. | | | 110,200 | | | $ | 1,107,584 | |
Maeda Corp. | | | 210,000 | | | | 694,257 | |
Maeda Road Construction Co., Ltd. | | | 102,000 | | | | 1,049,783 | |
NEC Networks & System Integration Corp. | | | 42,300 | | | | 539,468 | |
Nippo Corp. | | | 89,000 | | | | 717,326 | |
Nippon Koei Co., Ltd. | | | 26,583 | | | | 96,543 | |
Nippon Road Co., Ltd. (The) | | | 189,000 | | | | 624,831 | |
Nishimatsu Construction Co., Ltd. | | | 410,000 | | | | 652,992 | |
Okumura Corp. | | | 229,000 | | | | 964,298 | |
Sanki Engineering Co., Ltd. | | | 91,000 | | | | 575,338 | |
Shinko Plantech Co., Ltd. | | | 61,400 | | | | 713,419 | |
Taihei Kogyo Co., Ltd. | | | 125,000 | | | | 615,347 | |
Taikisha Ltd. | | | 41,400 | | | | 788,738 | |
Takasago Thermal Engineering Co., Ltd. | | | 108,700 | | | | 966,601 | |
Toda Corp. | | | 301,000 | | | | 1,194,848 | |
Toshiba Plant Systems & Services Corp. | | | 27,000 | | | | 306,552 | |
Toyo Engineering Corp. | | | 198,000 | | | | 764,479 | |
Yurtec Corp. | | | 10,000 | | | | 60,690 | |
| | | | | | | | |
| Total Engineering & Construction | | | | | | | 15,718,954 | |
| Entertainment – 1.1% | | | | | | | | |
Avex Group Holdings, Inc. | | | 65,200 | | | | 797,693 | |
Mars Engineering Corp.(a) | | | 34,800 | | | | 592,877 | |
Toei Co., Ltd. | | | 119,000 | | | | 567,145 | |
Tokyotokeiba Co., Ltd. | | | 409,000 | | | | 532,963 | |
| | | | | | | | |
| Total Entertainment | | | | | | | 2,490,678 | |
| Environmental Control – 0.5% | | | | | | | | |
Asahi Holdings, Inc. | | | 19,200 | | | | 391,969 | |
Hitachi Zosen Corp.(a) | | | 480,000 | | | | 677,606 | |
| | | | | | | | |
| Total Environmental Control | | | | | | | 1,069,575 | |
| Food – 5.1% | | | | | | | | |
Ariake Japan Co., Ltd.(a) | | | 43,400 | | | | 718,446 | |
Ezaki Glico Co., Ltd. | | | 88,000 | | | | 1,025,676 | |
Fuji Oil Co., Ltd. | | | 42,900 | | | | 564,201 | |
House Foods Corp.(a) | | | 40,900 | | | | 671,139 | |
J-Oil Mills, Inc. | | | 206,000 | | | | 579,126 | |
Kato Sangyo Co., Ltd. | | | 34,100 | | | | 590,414 | |
Marudai Food Co., Ltd. | | | 136,000 | | | | 429,923 | |
Maruha Nichiro Holdings, Inc. | | | 410,000 | | | | 603,523 | |
Mitsui Sugar Co., Ltd. | | | 135,000 | | | | 568,473 | |
Morinaga & Co., Ltd. | | | 410,000 | | | | 949,807 | |
Morinaga Milk Industry Co., Ltd. | | | 194,000 | | | | 695,198 | |
Nichirei Corp. | | | 240,000 | | | | 1,027,992 | |
Nippon Beet Sugar Manufacturing Co., Ltd. | | | 225,000 | | | | 504,947 | |
Nippon Flour Mills Co., Ltd. | | | 188,000 | | | | 864,237 | |
Nippon Suisan Kaisha Ltd.(a) | | | 338,600 | | | | 943,733 | |
Nisshin Oillio Group Ltd. (The) | | | 133,000 | | | | 630,659 | |
Starzen Co., Ltd. | | | 28,231 | | | | 82,431 | |
Yokohama Reito Co., Ltd. | | | 99,900 | | | | 681,027 | |
| | | | | | | | |
| Total Food | | | | | | | 12,130,952 | |
| Forest Products & Paper – 1.0% | | | | | | | | |
Chuetsu Pulp & Paper Co., Ltd. | | | 215,000 | | | | 389,117 | |
Daio Paper Corp. | | | 80,000 | | | | 615,830 | |
| | | | | | | | |
| Investments | | Shares | | | Fair
Value | |
| | | | | | | | |
Hokuetsu Kishu Paper Co., Ltd. | | | 174,500 | | | $ | 941,138 | |
Mitsubishi Paper Mills Ltd.* | | | 291,378 | | | | 309,378 | |
| | | | | | | | |
| Total Forest Products & Paper | | | | | | | 2,255,463 | |
| Gas – 0.6% | | | | | | | | |
Saibu Gas Co., Ltd. | | | 430,000 | | | | 1,073,962 | |
Shizuoka Gas Co., Ltd. | | | 55,500 | | | | 346,875 | |
| | | | | | | | |
| Total Gas | | | | | | | 1,420,837 | |
| Hand/Machine Tools – 0.6% | | | | | | | | |
Hitachi Koki Co., Ltd. | | | 118,600 | | | | 1,143,357 | |
Union Tool Co. | | | 13,100 | | | | 311,694 | |
| | | | | | | | |
| Total Hand/Machine Tools | | | | | | | 1,455,051 | |
| Healthcare-Products – 1.2% | | | | | | | | |
Hogy Medical Co., Ltd. | | | 11,700 | | | | 502,558 | |
Nihon Kohden Corp. | | | 30,500 | | | | 666,451 | |
Nipro Corp.(a) | | | 55,800 | | | | 1,108,190 | |
Paramount Bed Co., Ltd. | | | 24,500 | | | | 673,100 | |
| | | | | | | | |
| Total Healthcare-Products | | | | | | | 2,950,299 | |
| Healthcare-Services – 0.1% | | | | | | | | |
BML, Inc. | | | 7,794 | | | | 220,241 | |
| Home Builders – 1.3% | | | | | | | | |
Mitsui Home Co., Ltd. | | | 129,000 | | | | 703,523 | |
PanaHome Corp. | | | 193,000 | | | | 1,255,152 | |
Takamatsu Construction Group Co., Ltd. | | | 8,300 | | | | 134,595 | |
Token Corp. | | | 24,070 | | | | 1,064,389 | |
| | | | | | | | |
| Total Home Builders | | | | | | | 3,157,659 | |
| Home Furnishings – 1.0% | | | | | | | | |
Canon Electronics, Inc. | | | 32,100 | | | | 881,898 | |
Foster Electric Co., Ltd. | | | 13,600 | | | | 312,761 | |
Hoshizaki Electric Co., Ltd. | | | 13,240 | | | | 242,180 | |
Nidec Sankyo Corp. | | | 88,000 | | | | 625,386 | |
Toa Corp./Hyogo | | | 35,673 | | | | 209,613 | |
| | | | | | | | |
| Total Home Furnishings | | | | | | | 2,271,838 | |
| Household Products/Wares – 0.4% | | | | | | | | |
Kokuyo Co., Ltd. | | | 109,000 | | | | 836,438 | |
| Housewares – 0.2% | | | | | | | | |
Noritake Co., Ltd. | | | 128,000 | | | | 546,718 | |
| Internet – 0.2% | | | | | | | | |
CyberAgent, Inc. | | | 81 | | | | 286,354 | |
GMO Internet, Inc. | | | 21,821 | | | | 101,101 | |
| | | | | | | | |
| Total Internet | | | | | | | 387,455 | |
| Iron/Steel – 1.4% | | | | | | | | |
Aichi Steel Corp. | | | 193,881 | | | | 1,176,667 | |
Kyoei Steel Ltd. | | | 44,472 | | | | 787,704 | |
Tokyo Tekko Co., Ltd. | | | 76,944 | | | | 248,805 | |
Yodogawa Steel Works Ltd. | | | 228,000 | | | | 1,061,873 | |
| | | | | | | | |
| Total Iron/Steel | | | | | | | 3,275,049 | |
| Leisure Time – 0.7% | | | | | | | | |
Daikoku Denki Co., Ltd. | | | 20,600 | | | | 248,304 | |
HIS Co., Ltd. | | | 7,914 | | | | 161,469 | |
See Notes to Financial Statements.
| | |
| 62 | | WisdomTree International Dividend and Sector Funds |
Schedule of Investments (continued)
WisdomTree Japan SmallCap Dividend Fund (DFJ)
March 31, 2011
| | | | | | | | |
| Investments | | Shares | | | Fair
Value | |
| | | | | | | | |
Mizuno Corp.(a) | | | 193,000 | | | $ | 824,349 | |
Round One Corp. | | | 84,295 | | | | 396,658 | |
| | | | | | | | |
| Total Leisure Time | | | | | | | 1,630,780 | |
| Lodging – 0.3% | | | | | | | | |
Resorttrust, Inc. | | | 55,360 | | | | 756,124 | |
| Machinery-Construction & Mining – 0.7% | | | | | | | | |
Aichi Corp. | | | 117,100 | | | | 538,310 | |
Modec, Inc.(a) | | | 24,500 | | | | 448,437 | |
Tadano Ltd. | | | 102,000 | | | | 653,499 | |
| | | | | | | | |
| Total Machinery-Construction & Mining | | | | | | | 1,640,246 | |
| Machinery-Diversified – 2.8% | | | | | | | | |
Chugai Ro Co., Ltd. | | | 132,644 | | | | 590,560 | |
Daifuku Co., Ltd. | | | 119,495 | | | | 870,837 | |
Daihen Corp. | | | 106,000 | | | | 446,356 | |
Hisaka Works Ltd. | | | 24,000 | | | | 293,050 | |
Komori Corp. | | | 55,200 | | | | 516,168 | |
Max Co., Ltd. | | | 84,000 | | | | 1,040,878 | |
Miura Co., Ltd. | | | 31,100 | | | | 936,227 | |
Sintokogio Ltd. | | | 39,743 | | | | 417,187 | |
Toshiba Machine Co., Ltd. | | | 96,000 | | | | 521,236 | |
Toyo Kanetsu K.K.(a) | | | 203,103 | | | | 519,520 | |
Tsubakimoto Chain Co. | | | 110,000 | | | | 566,723 | |
| | | | | | | | |
| Total Machinery-Diversified | | | | | | | 6,718,742 | |
| Metal Fabricate/Hardware – 1.5% | | | | | | | | |
Hanwa Co., Ltd. | | | 233,000 | | | | 1,034,556 | |
JFE Shoji Holdings, Inc. | | | 102,000 | | | | 444,281 | |
Kitz Corp. | | | 94,800 | | | | 457,529 | |
Oiles Corp. | | | 30,852 | | | | 594,854 | |
Onoken Co., Ltd. | | | 41,100 | | | | 387,792 | |
Toho Zinc Co., Ltd.(a) | | | 114,000 | | | | 533,687 | |
| | | | | | | | |
| Total Metal Fabricate/Hardware | | | | | | | 3,452,699 | |
| Mining – 0.4% | | | | | | | | |
OSAKA Titanium Technologies Co. | | | 2,061 | | | | 142,738 | |
Pacific Metals Co., Ltd. | | | 106,000 | | | | 786,559 | |
| | | | | | | | |
| Total Mining | | | | | | | 929,297 | |
| Miscellaneous Manufacturing – 2.3% | | | | | | | | |
Amano Corp. | | | 110,300 | | | | 1,060,679 | |
Bando Chemical Industries Ltd. | | | 128,000 | | | | 597,684 | |
JSP Corp. | | | 15,556 | | | | 288,109 | |
KUREHA Corp. | | | 136,000 | | | | 641,602 | |
Mitsuboshi Belting Co., Ltd. | | | 21,525 | | | | 118,169 | |
Morita Holdings Corp. | | | 21,824 | | | | 143,246 | |
Nikkiso Co., Ltd. | | | 27,000 | | | | 228,366 | |
Nippon Valqua Industries Ltd. | | | 74,042 | | | | 209,047 | |
Sekisui Plastics Co., Ltd. | | | 106,000 | | | | 418,219 | |
Shin-Etsu Polymer Co., Ltd. | | | 73,500 | | | | 438,978 | |
Tamron Co., Ltd. | | | 33,297 | | | | 747,656 | |
Tokai Rubber Industries Ltd. | | | 43,500 | | | | 534,828 | |
| | | | | | | | |
| Total Miscellaneous Manufacturing | | | | | | | 5,426,583 | |
| Office Furnishings – 0.2% | | | | | | | | |
Okamura Corp. | | | 99,000 | | | | 559,025 | |
| | | | | | | | |
| Investments | | Shares | | | Fair
Value | |
| | | | | | | | |
| Office/Business Equipment – 0.3% | | | | | | | | |
Riso Kagaku Corp. | | | 11,981 | | | $ | 209,465 | |
Uchida Yoko Co., Ltd. | | | 128,000 | | | | 407,722 | |
| | | | | | | | |
| Total Office/Business Equipment | | | | | | | 617,187 | |
| Oil & Gas – 0.2% | | | | | | | | |
AOC Holdings, Inc.* | | | 74,287 | | | | 500,147 | |
Japan Drilling Co., Ltd. | | | 2,184 | | | | 92,098 | |
| | | | | | | | |
| Total Oil & Gas | | | | | | | 592,245 | |
| Packaging & Containers – 0.7% | | | | | | | | |
Nihon Yamamura Glass Co., Ltd. | | | 180,659 | | | | 512,245 | |
Rengo Co., Ltd. | | | 188,000 | | | | 1,231,709 | |
| | | | | | | | |
| Total Packaging & Containers | | | | | | | 1,743,954 | |
| Pharmaceuticals – 2.9% | | | | | | | | |
Eiken Chemical Co., Ltd. | | | 18,329 | | | | 214,738 | |
Kaken Pharmaceutical Co., Ltd. | | | 124,000 | | | | 1,487,162 | |
KYORIN Holdings, Inc. | | | 97,000 | | | | 1,657,239 | |
Mochida Pharmaceutical Co., Ltd. | | | 118,000 | | | | 1,400,965 | |
Nippon Shinyaku Co., Ltd. | | | 28,000 | | | | 360,473 | |
Sawai Pharmaceutical Co., Ltd. | | | 7,600 | | | | 658,398 | |
Seikagaku Corp. | | | 53,100 | | | | 666,313 | |
Toho Holdings Co., Ltd. | | | 30,000 | | | | 328,306 | |
| | | | | | | | |
| Total Pharmaceuticals | | | | | | | 6,773,594 | |
| Real Estate – 0.8% | | | | | | | | |
Arnest One Corp.(a) | | | 66,300 | | | | 663,960 | |
Goldcrest Co., Ltd. | | | 32,570 | | | | 641,340 | |
Sankei Building Co., Ltd. (The) | | | 64,376 | | | | 382,155 | |
Tokyu Livable, Inc. | | | 23,661 | | | | 208,118 | |
| | | | | | | | |
| Total Real Estate | | | | | | | 1,895,573 | |
| Retail – 10.6% | | | | | | | | |
Alpen Co., Ltd. | | | 34,200 | | | | 591,733 | |
AOKI Holdings, Inc. | | | 45,300 | | | | 740,607 | |
Arcs Co., Ltd. | | | 54,610 | | | | 828,243 | |
ASKUL Corp. | | | 30,400 | | | | 438,321 | |
Belluna Co., Ltd. | | | 88,173 | | | | 563,848 | |
Chiyoda Co., Ltd. | | | 80,700 | | | | 1,025,303 | |
Circle K Sunkus Co., Ltd. | | | 98,200 | | | | 1,504,754 | |
Create SD Holdings Co., Ltd. | | | 10,351 | | | | 241,040 | |
DCM Japan Holdings Co., Ltd. | | | 173,400 | | | | 1,062,828 | |
Doutor Nichires Holdings Co., Ltd. | | | 42,600 | | | | 516,566 | |
EDION Corp.(a) | | | 97,000 | | | | 827,449 | |
Gulliver International Co., Ltd. | | | 4,450 | | | | 171,815 | |
H2O Retailing Corp. | | | 136,000 | | | | 923,842 | |
Heiwado Co., Ltd. | | | 55,500 | | | | 705,134 | |
Izumiya Co., Ltd. | | | 101,000 | | | | 450,893 | |
Joshin Denki Co., Ltd. | | | 26,000 | | | | 251,906 | |
Kappa Create Co., Ltd. | | | 10,987 | | | | 207,862 | |
Kasumi Co., Ltd. | | | 33,079 | | | | 178,805 | |
Keiyo Co., Ltd.(a) | | | 32,420 | | | | 168,202 | |
Komeri Co., Ltd.(a) | | | 31,900 | | | | 814,050 | |
K’s Holdings Corp. | | | 24,520 | | | | 710,039 | |
Kyoto Kimono Yuzen Co., Ltd. | | | 23,845 | | | | 266,127 | |
Matsumotokiyoshi Holdings Co., Ltd. | | | 32,900 | | | | 642,677 | |
See Notes to Financial Statements.
| | | | |
| WisdomTree International Dividend and Sector Funds | | | 63 | |
Schedule of Investments (concluded)
WisdomTree Japan SmallCap Dividend Fund (DFJ)
March 31, 2011
| | | | | | | | |
| Investments | | Shares | | | Fair
Value | |
| | | | | | | | |
Parco Co., Ltd. | | | 77,600 | | | $ | 772,442 | |
Paris Miki Holdings, Inc. | | | 65,255 | | | | 670,029 | |
Plenus Co., Ltd. | | | 63,400 | | | | 969,206 | |
Point, Inc. | | | 17,340 | | | | 728,079 | |
Ryohin Keikaku Co., Ltd.(a) | | | 30,500 | | | | 1,256,727 | |
Shimachu Co., Ltd. | | | 40,900 | | | | 885,805 | |
St. Marc Holdings Co., Ltd. | | | 8,048 | | | | 295,197 | |
Tsuruha Holdings, Inc. | | | 19,200 | | | | 874,517 | |
United Arrows Ltd.(a) | | | 44,600 | | | | 586,559 | |
UNY Co., Ltd. | | | 160,800 | | | | 1,497,799 | |
Valor Co., Ltd. | | | 84,600 | | | | 844,163 | |
WATAMI Co., Ltd.(a) | | | 24,420 | | | | 389,518 | |
Xebio Co., Ltd. | | | 33,800 | | | | 617,029 | |
Zensho Co., Ltd.(a) | | | 66,400 | | | | 660,956 | |
| | | | | | | | |
| Total Retail | | | | | | | 24,880,070 | |
| Semiconductors – 0.2% | | | | | | | | |
Megachips Corp.(a) | | | 25,000 | | | | 447,635 | |
| Shipbuilding – 0.2% | | | | | | | | |
Sasebo Heavy Industries Co., Ltd. | | | 209,000 | | | | 428,692 | |
| Software – 1.9% | | | | | | | | |
Capcom Co., Ltd. | | | 52,500 | | | | 1,007,179 | |
IT Holdings Corp. | | | 78,300 | | | | 821,923 | |
NEC Mobiling Ltd. | | | 12,261 | | | | 376,203 | |
Nihon Unisys Ltd. | | | 62,800 | | | | 413,716 | |
NSD Co., Ltd.(a) | | | 56,700 | | | | 567,821 | |
Sumisho Computer Systems Corp.(a) | | | 52,800 | | | | 739,633 | |
Zenrin Co., Ltd. | | | 52,100 | | | | 556,329 | |
| | | | | | | | |
| Total Software | | | | | | | 4,482,804 | |
| Storage/Warehousing – 0.7% | | | | | | | | |
Mitsui-Soko Co., Ltd. | | | 191,000 | | | | 746,670 | |
Sumitomo Warehouse Co., Ltd. (The) | | | 188,000 | | | | 911,872 | |
| | | | | | | | |
| Total Storage/Warehousing | | | | | | | 1,658,542 | |
| Telecommunications – 0.9% | | | | | | | | |
Denki Kogyo Co., Ltd. | | | 104,000 | | | | 567,182 | |
Hikari Tsushin, Inc.(a) | | | 73,700 | | | | 1,445,900 | |
Hitachi Kokusai Electric, Inc. | | | 28,000 | | | | 222,635 | |
| | | | | | | | |
| Total Telecommunications | | | | | | | 2,235,717 | |
| Textiles – 1.3% | | | | | | | | |
Japan Vilene Co., Ltd. | | | 30,400 | | | | 148,552 | |
Kurabo Industries Ltd. | | | 421,000 | | | | 772,104 | |
Nitto Boseki Co., Ltd.* | | | 199,000 | | | | 468,207 | |
Seiren Co., Ltd. | | | 96,300 | | | | 666,943 | |
Toyobo Co., Ltd. | | | 622,000 | | | | 900,579 | |
| | | | | | | | |
| Total Textiles | | | | | | | 2,956,385 | |
| Toys/Games/Hobbies – 0.6% | | | | | | | | |
Sanrio Co., Ltd. | | | 24,693 | | | | 733,520 | |
Tomy Co., Ltd. | | | 76,200 | | | | 579,223 | |
| | | | | | | | |
| Total Toys/Games/Hobbies | | | | | | | 1,312,743 | |
| Transportation – 3.0% | | | | | | | | |
Fukuyama Transporting Co., Ltd.(a) | | | 201,000 | | | | 979,778 | |
Hitachi Transport System Ltd. | | | 61,400 | | | | 863,808 | |
| | | | | | | | |
| Investments | | Shares | | | Fair
Value | |
| | | | | | | | |
Iino Kaiun Kaisha Ltd. | | | 86,806 | | | $ | 474,458 | |
Kintetsu World Express, Inc. | | | 19,200 | | | | 602,317 | |
Nippon Konpo Unyu Soko Co., Ltd. | | | 79,000 | | | | 885,509 | |
Nishi-Nippon Railroad Co., Ltd. | | | 116,000 | | | | 501,062 | |
Sankyu, Inc. | | | 244,000 | | | | 1,171,718 | |
Seino Holdings Corp. | | | 118,000 | | | | 894,112 | |
Senko Co., Ltd. | | | 194,000 | | | | 629,657 | |
| | | | | | | | |
| Total Transportation | | | | | | | 7,002,419 | |
TOTAL COMMON STOCKS
(Cost: $227,762,129) | | | | | | | 232,172,581 | |
| EXCHANGE-TRADED FUND – 0.2% | | | | | | | | |
WisdomTree Japan Hedged Equity Fund(b)
(Cost: $574,770) | | | 15,521 | | | | 572,259 | |
| SHORT-TERM INVESTMENT – 0.3% | | | | | | | | |
| MONEY MARKET FUND – 0.3% | | | | | | | | |
Invesco Treasury Fund Private Class, 0.02%(c)
(Cost: $688,485) | | | 688,485 | | | | 688,485 | |
| INVESTMENT OF CASH COLLATERAL FOR SECURITIES LOANED – 4.4% | | | | | | | | |
| MONEY MARKET FUND – 4.4% | | | | | | | | |
Dreyfus Institutional Preferred Money Market Fund, 0.19%(d) | | | | | | | | |
| (Cost: $10,303,000)(e) | | | 10,303,000 | | | | 10,303,000 | |
TOTAL INVESTMENTS IN SECURITIES – 103.4%
(Cost: $239,328,384) | | | | 243,736,325 | |
Liabilities in Excess of Foreign Currency and Other Assets – (3.4)% | | | | | | | (8,050,863 | ) |
| | | | | | | | |
| NET ASSETS – 100.0% | | | | | | $ | 235,685,462 | |
| * | Non-income producing security. |
| (a) | Security, or portion thereof, was on loan at March 31, 2011 (See Note 2). |
| (b) | Affiliated companies (See Note 7). |
| (c) | Rate shown represents annualized 7-day yield as of March 31, 2011. |
| (d) | Interest rate shown reflects yield as of March 31, 2011. |
| (e) | At March 31, 2011, the total market value of the Fund’s securities on loan was $9,394,438 and the total market value of the collateral held by the Fund was $10,303,000. |
See Notes to Financial Statements.
| | |
| 64 | | WisdomTree International Dividend and Sector Funds |
Schedule of Investments
WisdomTree Pacific ex-Japan Total Dividend Fund (DND)
March 31, 2011
| | | | | | | | |
| Investments | | Shares | | | Fair
Value | |
| | | | | | | | |
| COMMON STOCKS – 99.3% | | | | | | | | |
| Australia – 61.5% | | | | | | | | |
Adelaide Brighton Ltd. | | | 18,648 | | | $ | 62,097 | |
AGL Energy Ltd. | | | 27,035 | | | | 400,082 | |
Amalgamated Holdings Ltd. | | | 38,138 | | | | 234,670 | |
Amcor Ltd. | | | 62,338 | | | | 455,136 | |
AMP Ltd.(a) | | | 186,331 | | | | 1,046,329 | |
Australia & New Zealand Banking Group Ltd. | | | 159,493 | | | | 3,927,213 | |
Automotive Holdings Group | | | 84,924 | | | | 245,908 | |
Bank of Queensland Ltd. | | | 30,115 | | | | 308,943 | |
Bell Financial Group Ltd. | | | 89,216 | | | | 83,959 | |
Bendigo and Adelaide Bank Ltd. | | | 35,575 | | | | 350,608 | |
BHP Billiton Ltd. | | | 106,956 | | | | 5,149,932 | |
Brambles Ltd. | | | 97,214 | | | | 711,780 | |
Caltex Australia Ltd. | | | 17,864 | | | | 288,195 | |
Coal & Allied Industries Ltd. | | | 6,474 | | | | 800,330 | |
Coca-Cola Amatil Ltd. | | | 37,539 | | | | 455,758 | |
Cochlear Ltd. | | | 3,112 | | | | 267,085 | |
Commonwealth Bank of Australia | | | 84,734 | | | | 4,591,688 | |
Computershare Ltd. | | | 20,397 | | | | 195,326 | |
Consolidated Media Holdings Ltd. | | | 89,778 | | | | 261,820 | |
Cromwell Property Group | | | 331,618 | | | | 241,775 | |
Crown Ltd. | | | 49,331 | | | | 415,777 | |
CSL Ltd. | | | 11,731 | | | | 433,462 | |
CSR Ltd. | | | 75,492 | | | | 256,070 | |
David Jones Ltd.(a) | | | 62,038 | | | | 304,744 | |
DUET Group(b) | | | 185,291 | | | | 320,961 | |
Foster’s Group Ltd. | | | 114,350 | | | | 676,419 | |
Goodman Fielder Ltd. | | | 203,369 | | | | 258,686 | |
GWA International Ltd.(a) | | | 62,676 | | | | 214,542 | |
Harvey Norman Holdings Ltd. | | | 65,718 | | | | 203,887 | |
Insurance Australia Group Ltd. | | | 147,555 | | | | 547,812 | |
Kingsgate Consolidated Ltd. | | | 18,859 | | | | 169,481 | |
Leighton Holdings Ltd.(a) | | | 15,349 | | | | 468,100 | |
Lend Lease Group(b) | | | 44,004 | | | | 412,746 | |
MacArthur Coal Ltd. | | | 19,024 | | | | 228,215 | |
Macquarie Group Ltd. | | | 14,269 | | | | 540,080 | |
MAP Group(b) | | | 115,000 | | | | 361,539 | |
Metcash Ltd. | | | 85,779 | | | | 369,027 | |
Monadelphous Group Ltd. | | | 16,670 | | | | 368,920 | |
Mortgage Choice Ltd. | | | 90,126 | | | | 137,010 | |
National Australia Bank Ltd. | | | 152,566 | | | | 4,078,512 | |
Navitas Ltd. | | | 51,911 | | | | 229,766 | |
New Hope Corp., Ltd. | | | 36,281 | | | | 186,850 | |
OneSteel Ltd. | | | 76,936 | | | | 194,135 | |
Orica Ltd. | | | 16,987 | | | | 463,244 | |
Origin Energy Ltd. | | | 34,219 | | | | 573,986 | |
Orotongroup Ltd. | | | 27,013 | | | | 223,205 | |
Platinum Asset Management Ltd.(a) | | | 63,312 | | | | 314,930 | |
Primary Health Care Ltd. | | | 61,900 | | | | 211,246 | |
QBE Insurance Group Ltd. | | | 65,577 | | | | 1,198,316 | |
Rio Tinto Ltd. | | | 6,477 | | | | 567,671 | |
Santos Ltd. | | | 36,213 | | | | 582,342 | |
Sonic Healthcare Ltd. | | | 28,201 | | | | 349,385 | |
| | | | | | | | |
| Investments | | Shares | | | Fair
Value | |
| | | | | | | | |
SP AusNet(b) | | | 346,676 | | | $ | 315,493 | |
Spark Infrastructure Group(c) | | | 259,129 | | | | 300,136 | |
Specialty Fashion Group Ltd. | | | 109,566 | | | | 118,973 | |
Suncorp Group Ltd. | | | 72,530 | | | | 636,058 | |
TABCORP Holdings Ltd. | | | 78,201 | | | | 605,728 | |
Tatts Group Ltd. | | | 175,499 | | | | 424,692 | |
Telstra Corp., Ltd. | | | 1,401,346 | | | | 4,086,748 | |
TFS Corp., Ltd. | | | 115,982 | | | | 97,154 | |
Toll Holdings Ltd. | | | 54,801 | | | | 336,068 | |
Transurban Group(b) | | | 67,216 | | | | 373,276 | |
UGL Ltd. | | | 16,910 | | | | 274,378 | |
Wesfarmers Ltd. | | | 66,594 | | | | 2,188,630 | |
West Australian Newspapers Holdings Ltd.(a) | | | 32,660 | | | | 179,347 | |
Westpac Banking Corp. | | | 209,492 | | | | 5,270,999 | |
Woodside Petroleum Ltd. | | | 22,505 | | | | 1,089,202 | |
Woolworths Ltd. | | | 58,662 | | | | 1,630,683 | |
WorleyParsons Ltd. | | | 14,314 | | | | 458,591 | |
| | | | | | | | |
| Total Australia | | | | | | | 54,325,856 | |
| Hong Kong – 26.3% | | | | | | | | |
Bank of East Asia Ltd. | | | 79,210 | | | | 336,568 | |
BOC Hong Kong Holdings Ltd. | | | 523,084 | | | | 1,704,788 | |
Cheung Kong (Holdings) Ltd. | | | 67,732 | | | | 1,104,165 | |
China Merchants Holdings International Co., Ltd. | | | 86,194 | | | | 364,027 | |
China Mobile Ltd. | | | 635,832 | | | | 5,857,057 | |
China Overseas Land & Investment Ltd. | | | 140,744 | | | | 286,258 | |
China Resources Enterprise Ltd. | | | 69,675 | | | | 283,064 | |
China Resources Power Holdings Co., Ltd. | | | 128,225 | | | | 246,948 | |
China Unicom Hong Kong Ltd. | | | 431,021 | | | | 715,949 | |
Citic Pacific Ltd. | | | 125,448 | | | | 348,368 | |
CLP Holdings Ltd. | | | 89,479 | | | | 723,590 | |
CNOOC Ltd. | | | 1,212,380 | | | | 3,055,032 | |
Fushan International Energy Group Ltd. | | | 414,042 | | | | 298,094 | |
Hang Seng Bank Ltd. | | | 90,225 | | | | 1,456,926 | |
Hong Kong & China Gas Co., Ltd. | | | 129,895 | | | | 311,620 | |
Hong Kong Exchanges and Clearing Ltd. | | | 41,392 | | | | 899,340 | |
Hutchison Whampoa Ltd. | | | 143,866 | | | | 1,703,486 | |
MTR Corp. | | | 99,545 | | | | 368,581 | |
New World Development Ltd. | | | 164,664 | | | | 290,875 | |
PCCW Ltd. | | | 181,576 | | | | 75,635 | |
Power Assets Holdings Ltd.(a) | | | 88,370 | | | | 590,785 | |
Shanghai Industrial Holdings Ltd. | | | 53,010 | | | | 203,093 | |
Sino Land Co., Ltd. | | | 214,331 | | | | 380,815 | |
SJM Holdings Ltd. | | | 38,432 | | | | 67,296 | |
Sun Hung Kai Properties Ltd. | | | 60,356 | | | | 955,987 | |
Wharf Holdings Ltd. | | | 84,401 | | | | 582,154 | |
| | | | | | | | |
| Total Hong Kong | | | | | | | 23,210,501 | |
| New Zealand – 1.3% | | | | | | | | |
Air New Zealand Ltd. | | | 54,715 | | | | 46,324 | |
Auckland International Airport Ltd. | | | 211,376 | | | | 357,118 | |
Telecom Corp. of New Zealand Ltd. | | | 314,386 | | | | 481,994 | |
Vector Ltd. | | | 160,522 | | | | 306,095 | |
| | | | | | | | |
| Total New Zealand | | | | | | | 1,191,531 | |
See Notes to Financial Statements.
| | | | |
| WisdomTree International Dividend and Sector Funds | | | 65 | |
Schedule of Investments (concluded)
WisdomTree Pacific ex-Japan Total Dividend Fund (DND)
March 31, 2011
| | | | | | | | |
| Investments | | Shares | | | Fair
Value | |
| | | | | | | | |
| Singapore – 10.2% | | | | | | | | |
DBS Group Holdings Ltd. | | | 85,000 | | | $ | 987,227 | |
Fraser and Neave Ltd. | | | 64,223 | | | | 306,212 | |
Jardine Cycle & Carriage Ltd. | | | 12,668 | | | | 367,829 | |
Keppel Corp., Ltd. | | | 76,094 | | | | 742,528 | |
Oversea-Chinese Banking Corp., Ltd. | | | 103,331 | | | | 785,332 | |
SembCorp Industries Ltd. | | | 90,067 | | | | 372,272 | |
SembCorp Marine Ltd.(a) | | | 111,129 | | | | 514,870 | |
SIA Engineering Co., Ltd. | | | 106,389 | | | | 341,829 | |
Singapore Airlines Ltd. | | | 23,864 | | | | 258,992 | |
Singapore Exchange Ltd. | | | 76,945 | | | | 479,189 | |
Singapore Press Holdings Ltd. | | | 128,299 | | | | 401,030 | |
Singapore Technologies Engineering Ltd. | | | 119,875 | | | | 310,030 | |
Singapore Telecommunications Ltd. | | | 576,406 | | | | 1,380,997 | |
StarHub Ltd. | | | 240,910 | | | | 516,031 | |
United Overseas Bank Ltd. | | | 43,000 | | | | 641,333 | |
Venture Corp., Ltd. | | | 37,634 | | | | 286,920 | |
Wilmar International Ltd. | | | 80,441 | | | | 348,439 | |
| | | | | | | | |
| Total Singapore | | | | | | | 9,041,060 | |
TOTAL COMMON STOCKS
(Cost: $77,109,501) | | | | | | | 87,768,948 | |
| EXCHANGE-TRADED FUND – 0.4% | | | | | | | | |
| United States – 0.4% | | | | | | | | |
WisdomTree DEFA Fund(d)
| | | | | | | | |
| (Cost: $321,421) | | | 7,002 | | | | 348,069 | |
| RIGHTS – 0.0% | | | | | | | | |
| Australia – 0.0% | | | | | | | | |
TFS Corp., Ltd.,
expiring 4/05/11* | | | | | | | | |
| (Cost: $0) | | | 5,799 | | | | 60 | |
TOTAL LONG-TERM INVESTMENTS
(Cost: $77,430,922) | | | | | | | 88,117,077 | |
| SHORT-TERM INVESTMENT – 0.0% | | | | | | | | |
| MONEY MARKET FUND – 0.0% | | | | | | | | |
Invesco Treasury Fund Private Class, 0.02%(e)
(Cost: $12,556) | | | 12,556 | | | | 12,556 | |
| INVESTMENT OF CASH COLLATERAL FOR SECURITIES LOANED – 3.1% | | | | | | | | |
| MONEY MARKET FUND – 3.1% | | | | | | | | |
Dreyfus Institutional Preferred Money Market Fund, 0.19% (f) | | | | | | | | |
| (Cost: $2,751,000)(g) | | | 2,751,000 | | | | 2,751,000 | |
TOTAL INVESTMENTS IN SECURITIES – 102.8%
(Cost: $80,194,478) | | | | | | | 90,880,633 | |
Liabilities in Excess of Foreign Currency and Other Assets – (2.8)% | | | | | | | (2,492,845 | ) |
| | | | | | | | |
| NET ASSETS – 100.0% | | | | | | $ | 88,387,788 | |
| * | Non-income producing security. |
| (a) | Security, or portion thereof, was on loan at March 31, 2011 (See Note 2). |
| (b) | Stapled Security – A security contractually bound to one or more other securities to form a single saleable unit which cannot be sold separately. |
| (c) | Securities exempt from registration under Rule 144A of the Securities Act of 1933. Such securities are considered liquid, and may be sold in transactions exempt from registration, normally only to dealers in that program or other “accredited investors.” At March 31, 2011, the aggregate value of these securities amounted to $300,136 representing 0.3% of net assets. |
| (d) | Affiliated companies (See Note 7). |
| (e) | Rate shown represents annualized 7-day yield as of March 31, 2011. |
| (f) | Interest rate shown reflects yield as of March 31, 2011. |
| (g) | At March 31, 2011, the total market value of the Fund’s securities on loan was $2,611,420 and the total market value of the collateral held by the Fund was $2,751,000. |
See Notes to Financial Statements.
| | |
| 66 | | WisdomTree International Dividend and Sector Funds |
Schedule of Investments
WisdomTree Pacific ex-Japan Equity Income Fund (DNH)
March 31, 2011
| | | | | | | | |
| Investments | | Shares | | | Fair Value | |
| | | | | | | | |
| COMMON STOCKS – 99.2% | | | | | | | | |
| Australia – 91.4% | | | | | | | | |
Adelaide Brighton Ltd. | | | 202,351 | | | $ | 673,821 | |
AGL Energy Ltd. | | | 68,123 | | | | 1,008,131 | |
Alesco Corp., Ltd. | | | 4,437 | | | | 14,683 | |
Amalgamated Holdings Ltd. | | | 77,693 | | | | 478,060 | |
AMP Ltd.(a) | | | 306,101 | | | | 1,718,890 | |
Ausdrill Ltd. | | | 63,977 | | | | 251,415 | |
Ausenco Ltd.* | | | 5,909 | | | | 20,471 | |
Austereo Group Ltd. | | | 250,832 | | | | 544,735 | |
Australia & New Zealand Banking Group Ltd. | | | 252,919 | | | | 6,227,651 | |
Automotive Holdings Group | | | 185,862 | | | | 538,186 | |
Bank of Queensland Ltd. | | | 56,524 | | | | 579,866 | |
Bendigo and Adelaide Bank Ltd. | | | 87,549 | | | | 862,834 | |
BT Investment Management Ltd. | | | 74,495 | | | | 211,087 | |
Cabcharge Australia Ltd. | | | 84,192 | | | | 480,610 | |
Cardno Ltd. | | | 8,089 | | | | 48,853 | |
Challenger Infrastructure Fund Class A(b) | | | 292,960 | | | | 360,528 | |
Coal & Allied Industries Ltd. | | | 17,192 | | | | 2,125,314 | |
Commonwealth Bank of Australia | | | 121,719 | | | | 6,595,885 | |
Consolidated Media Holdings Ltd. | | | 195,637 | | | | 570,537 | |
Count Financial Ltd. | | | 146,932 | | | | 186,898 | |
Cromwell Property Group | | | 747,265 | | | | 544,813 | |
Crown Ltd. | | | 123,003 | | | | 1,036,709 | |
CSR Ltd. | | | 181,912 | | | | 617,047 | |
David Jones Ltd.(a) | | | 163,096 | | | | 801,162 | |
DUET Group(b) | | | 349,846 | | | | 606,003 | |
Envestra Ltd.(a)(b) | | | 965,321 | | | | 598,972 | |
Fleetwood Corp., Ltd. | | | 49,116 | | | | 615,107 | |
Foster’s Group Ltd. | | | 289,756 | | | | 1,714,004 | |
Goodman Fielder Ltd. | | | 434,552 | | | | 552,752 | |
GUD Holdings Ltd. | | | 50,404 | | | | 499,360 | |
GWA International Ltd. | | | 148,912 | | | | 509,731 | |
Hastings Diversified Utilities Fund | | | 86,066 | | | | 142,408 | |
Insurance Australia Group Ltd. | | | 361,389 | | | | 1,341,692 | |
Invocare Ltd. | | | 5,481 | | | | 40,131 | |
Iress Market Technology Ltd. | | | 52,024 | | | | 503,036 | |
Lend Lease Group(a)(b) | | | 123,185 | | | | 1,155,443 | |
MAP Group(b) | | | 308,488 | | | | 969,829 | |
McMillan Shakespeare Ltd. | | | 2,666 | | | | 27,019 | |
Metcash Ltd. | | | 188,839 | | | | 812,397 | |
Monadelphous Group Ltd. | | | 41,477 | | | | 917,919 | |
National Australia Bank Ltd. | | | 236,159 | | | | 6,313,184 | |
NIB Holdings Ltd. | | | 99,369 | | | | 145,923 | |
NRW Holdings Ltd. | | | 23,009 | | | | 68,767 | |
Orotongroup Ltd. | | | 2,932 | | | | 24,227 | |
Perpetual Ltd. | | | 23,305 | | | | 701,094 | |
Primary Health Care Ltd. | | | 150,173 | | | | 512,494 | |
QBE Insurance Group Ltd. | | | 156,422 | | | | 2,858,366 | |
Salmat Ltd. | | | 29,216 | | | | 109,978 | |
SMS Management & Technology Ltd. | | | 6,242 | | | | 41,765 | |
Sonic Healthcare Ltd. | | | 75,721 | | | | 938,116 | |
SP AusNet(b) | | | 817,866 | | | | 744,300 | |
Spark Infrastructure Group(c) | | | 526,832 | | | | 610,202 | |
| | | | | | | | |
| Investments | | Shares | | | Fair Value | |
| | | | | | | | |
Suncorp Group Ltd. | | | 179,745 | | | $ | 1,576,290 | |
TABCORP Holdings Ltd. | | | 192,002 | | | | 1,487,205 | |
Tatts Group Ltd. | | | 433,987 | | | | 1,050,210 | |
Telstra Corp., Ltd. | | | 1,963,361 | | | | 5,725,754 | |
Toll Holdings Ltd. | | | 130,581 | | | | 800,789 | |
Transfield Services Infrastructure Fund(b) | | | 19,621 | | | | 16,030 | |
UGL Ltd. | | | 45,612 | | | | 740,092 | |
West Australian Newspapers Holdings Ltd.(a) | | | 69,606 | | | | 382,230 | |
Westpac Banking Corp. | | | 281,218 | | | | 7,075,687 | |
Woolworths Ltd. | | | 137,266 | | | | 3,815,712 | |
| | | | | | | | |
| Total Australia | | | | | | | 73,242,404 | |
| Hong Kong – 1.3% | | | | | | | | |
Henderson Investment Ltd. | | | 1,178,973 | | | | 107,617 | |
PCCW Ltd. | | | 2,379,713 | | | | 991,267 | |
| | | | | | | | |
| Total Hong Kong | | | | | | | 1,098,884 | |
| New Zealand – 3.8% | | | | | | | | |
Air New Zealand Ltd. | | | 524,074 | | | | 443,708 | |
Freightways Ltd. | | | 128,319 | | | | 319,074 | |
Sky City Entertainment Group Ltd. | | | 187,137 | | | | 482,457 | |
Telecom Corp. of New Zealand Ltd. | | | 607,260 | | | | 931,007 | |
Vector Ltd. | | | 258,787 | | | | 493,474 | |
Warehouse Group Ltd. (The) | | | 138,946 | | | | 371,993 | |
| | | | | | | | |
| Total New Zealand | | | | | | | 3,041,713 | |
| Singapore – 2.7% | | | | | | | | |
Cityspring Infrastructure Trust | | | 521,290 | | | | 225,389 | |
Singapore Press Holdings Ltd.(a) | | | 303,311 | | | | 948,073 | |
StarHub Ltd. | | | 453,638 | | | | 971,696 | |
| | | | | | | | |
| Total Singapore | | | | | | | 2,145,158 | |
TOTAL COMMON STOCKS
(Cost: $71,366,822) | | | | | | | 79,528,159 | |
| EXCHANGE-TRADED FUND – 0.2% | | | | | | | | |
| United States – 0.2% | | | | | | | | |
WisdomTree Pacific ex-Japan Total Dividend Fund(d) | | | | | | | | |
| (Cost: $116,124) | | | 2,005 | | | | 136,741 | |
| SHORT-TERM INVESTMENT – 0.0% | | | | | | | | |
| MONEY MARKET FUND – 0.0% | | | | | | | | |
Invesco Treasury Fund Private Class, 0.02%(e) | | | | | | | | |
| (Cost: $23,026) | | | 23,026 | | | | 23,026 | |
INVESTMENT OF CASH COLLATERAL FOR
SECURITIES LOANED – 6.5% | | | | | | | | |
| MONEY MARKET FUND – 6.5% | | | | | | | | |
Dreyfus Institutional Preferred Money Market Fund, 0.19%(f) | | | | | | | | |
| (Cost: $5,162,000)(g) | | | 5,162,000 | | | | 5,162,000 | |
TOTAL INVESTMENTS IN SECURITIES – 105.9%
(Cost: $76,667,972) | | | | | | | 84,849,926 | |
Liabilities in Excess of Foreign Currency and Other Assets – (5.9)% | | | | | | | (4,713,035 | ) |
| | | | | | | | |
| NET ASSETS – 100.0% | | | | | | $ | 80,136,891 | |
See Notes to Financial Statements.
| | | | |
| WisdomTree International Dividend and Sector Funds | | | 67 | |
Schedule of Investments (concluded)
WisdomTree Pacific ex-Japan Equity Income Fund (DNH)
March 31, 2011
| * | Non-income producing security. |
| (a) | Security, or portion thereof, was on loan at March 31, 2011 (See Note 2). |
| (b) | Stapled Security – A security contractually bound to one or more other securities to form a single saleable unit which cannot be sold separately. |
| (c) | Securities exempt from registration under Rule 144A of the Securities Act of 1933. Such securities are considered liquid, and may be sold in transactions exempt from registration, normally only to dealers in that program or other “accredited investors.” At March 31, 2011, the aggregate value of these securities amounted to $610,202 representing 0.8% of net assets. |
| (d) | Affiliated companies (See Note 7). |
| (e) | Rate shown represents annualized 7-day yield as of March 31, 2011. |
| (f) | Interest rate shown reflects yield as of March 31, 2011. |
| (g) | At March 31, 2011, the total market value of the Fund’s securities on loan was $4,403,277 and the total market value of the collateral held by the Fund was $5,162,000. |
See Notes to Financial Statements.
| | |
| 68 | | WisdomTree International Dividend and Sector Funds |
Schedule of Investments
WisdomTree International LargeCap Dividend Fund (DOL)
March 31, 2011
| | | | | | | | |
| Investments | | Shares | | | Fair
Value | |
| | | | | | | | |
| COMMON STOCKS – 99.3% | | | | | | | | |
| Australia – 10.8% | | | | | | | | |
AMP Ltd.(a) | | | 88,390 | | | $ | 496,348 | |
Australia & New Zealand Banking Group Ltd. | | | 75,171 | | | | 1,850,943 | |
BHP Billiton Ltd. | | | 55,637 | | | | 2,678,922 | |
Commonwealth Bank of Australia | | | 39,903 | | | | 2,162,321 | |
Foster’s Group Ltd. | | | 80,023 | | | | 473,363 | |
Leighton Holdings Ltd.(a) | | | 11,320 | | | | 345,227 | |
Macquarie Group Ltd. | | | 8,042 | | | | 304,389 | |
National Australia Bank Ltd. | | | 70,116 | | | | 1,874,395 | |
QBE Insurance Group Ltd. | | | 34,727 | | | | 634,581 | |
Telstra Corp., Ltd. | | | 637,831 | | | | 1,860,108 | |
Wesfarmers Ltd. | | | 33,376 | | | | 1,096,912 | |
Westpac Banking Corp. | | | 96,781 | | | | 2,435,093 | |
Woodside Petroleum Ltd. | | | 13,559 | | | | 656,231 | |
Woolworths Ltd. | | | 32,236 | | | | 896,095 | |
| | | | | | | | |
| Total Australia | | | | | | | 17,764,928 | |
| Austria – 0.3% | | | | | | | | |
Bank Austria Creditanstalt AG*†(b) | | | 1,715 | | | | — | |
Verbund AG(a) | | | 11,161 | | | | 496,539 | |
| | | | | | | | |
| Total Austria | | | | | | | 496,539 | |
| Belgium – 0.7% | | | | | | | | |
Anheuser-Busch InBev N.V. | | | 9,068 | | | | 517,246 | |
Belgacom S.A. | | | 15,432 | | | | 598,624 | |
| | | | | | | | |
| Total Belgium | | | | | | | 1,115,870 | |
| Denmark – 0.5% | | | | | | | | |
Novo Nordisk A/S Class B | | | 6,198 | | | | 779,749 | |
| Finland – 1.4% | | | | | | | | |
Fortum Oyj(a) | | | 25,571 | | | | 869,456 | |
Nokia Oyj(a) | | | 91,289 | | | | 781,823 | |
Sampo Oyj Class A | | | 19,220 | | | | 613,963 | |
| | | | | | | | |
| Total Finland | | | | | | | 2,265,242 | |
| France – 18.7% | | | | | | | | |
Accor S.A. | | | 8,274 | | | | 372,268 | |
Air Liquide S.A. | | | 5,427 | | | | 722,088 | |
AXA S.A. | | | 54,640 | | | | 1,143,322 | |
BNP Paribas | | | 19,619 | | | | 1,436,891 | |
Bouygues S.A. | | | 11,645 | | | | 559,964 | |
Carrefour S.A. | | | 14,598 | | | | 647,169 | |
Christian Dior S.A. | | | 3,617 | | | | 509,849 | |
CNP Assurances | | | 17,327 | | | | 368,339 | |
Compagnie de Saint-Gobain | | | 11,828 | | | | 725,201 | |
Credit Agricole S.A. | | | 60,983 | | | | 1,002,144 | |
Danone | | | 12,103 | | | | 791,699 | |
Electricite de France S.A. | | | 36,455 | | | | 1,511,647 | |
France Telecom S.A. | | | 145,271 | | | | 3,259,296 | |
GDF Suez | | | 77,653 | | | | 3,168,174 | |
Lafarge S.A. | | | 8,751 | | | | 546,602 | |
L’Oreal S.A. | | | 7,415 | | | | 864,960 | |
LVMH Moet Hennessy Louis Vuitton S.A. | | | 6,260 | | | | 992,294 | |
PPR | | | 3,115 | | | | 478,077 | |
Sanofi-Aventis S.A. | | | 32,479 | | | | 2,280,350 | |
| | | | | | | | |
| Investments | | Shares | | | Fair
Value | |
| | | | | | | | |
Schneider Electric S.A. | | | 4,961 | | | $ | 849,043 | |
TOTAL S.A. | | | 79,386 | | | | 4,839,167 | |
Vallourec S.A. | | | 4,212 | | | | 473,159 | |
Veolia Environnement S.A. | | | 18,667 | | | | 581,198 | |
Vinci S.A. | | | 16,357 | | | | 1,023,543 | |
Vivendi S.A. | | | 56,760 | | | | 1,623,044 | |
| | | | | | | | |
| Total France | | | | | | | 30,769,488 | |
| Germany – 8.3% | | | | | | | | |
Allianz SE | | | 10,001 | | | | 1,405,475 | |
BASF SE | | | 17,941 | | | | 1,553,828 | |
Bayer AG | | | 11,414 | | | | 885,037 | |
Deutsche Bank AG | | | 7,339 | | | | 432,057 | |
Deutsche Post AG | | | 34,423 | | | | 621,368 | |
Deutsche Telekom AG | | | 156,097 | | | | 2,407,892 | |
E.ON AG | | | 50,833 | | | | 1,554,555 | |
Metro AG | | | 5,955 | | | | 407,453 | |
Muenchener Rueckversicherungs AG | | | 5,297 | | | | 834,384 | |
RWE AG | | | 15,541 | | | | 991,228 | |
SAP AG | | | 10,229 | | | | 627,090 | |
Siemens AG | | | 10,969 | | | | 1,505,398 | |
Volkswagen AG | | | 3,204 | | | | 492,418 | |
| | | | | | | | |
| Total Germany | | | | | | | 13,718,183 | |
| Hong Kong – 5.6% | | | | | | | | |
BOC Hong Kong Holdings Ltd. | | | 253,000 | | | | 824,554 | |
Cheung Kong (Holdings) Ltd. | | | 47,000 | | | | 766,193 | |
China Mobile Ltd. | | | 287,919 | | | | 2,652,207 | |
China Unicom Hong Kong Ltd. | | | 218,000 | | | | 362,109 | |
CNOOC Ltd. | | | 602,529 | | | | 1,518,291 | |
Hang Seng Bank Ltd. | | | 46,195 | | | | 745,943 | |
Hong Kong Exchanges and Clearing Ltd. | | | 23,500 | | | | 510,594 | |
Hutchison Whampoa Ltd. | | | 95,000 | | | | 1,124,874 | |
Sun Hung Kai Properties Ltd. | | | 42,442 | | | | 672,245 | |
| | | | | | | | |
| Total Hong Kong | | | | | | | 9,177,010 | |
| Ireland – 0.2% | | | | | | | | |
CRH PLC | | | 13,010 | | | | 298,723 | |
| Italy – 4.8% | | | | | | | | |
Enel SpA | | | 457,766 | | | | 2,889,491 | |
ENI SpA | | | 117,105 | | | | 2,879,964 | |
Intesa Sanpaolo SpA | | | 185,935 | | | | 550,940 | |
Snam Rete Gas SpA | | | 125,855 | | | | 708,331 | |
Telecom Italia SpA(a) | | | 338,689 | | | | 521,487 | |
UniCredit SpA | | | 162,250 | | | | 401,554 | |
| | | | | | | | |
| Total Italy | | | | | | | 7,951,767 | |
| Japan – 7.8% | | | | | | | | |
Astellas Pharma, Inc. | | | 13,900 | | | | 516,554 | |
Canon, Inc. | | | 21,300 | | | | 930,333 | |
Daiichi Sankyo Co., Ltd.(a) | | | 20,000 | | | | 387,548 | |
East Japan Railway Co. | | | 7,300 | | | | 407,366 | |
Eisai Co., Ltd.(a) | | | 13,700 | | | | 493,253 | |
Honda Motor Co., Ltd.(a) | | | 15,900 | | | | 599,511 | |
Hoya Corp. | | | 15,800 | | | | 361,829 | |
Kansai Electric Power Co., Inc. (The) | | | 23,500 | | | | 513,495 | |
See Notes to Financial Statements.
| | | | |
| WisdomTree International Dividend and Sector Funds | | | 69 | |
Schedule of Investments (continued)
WisdomTree International LargeCap Dividend Fund (DOL)
March 31, 2011
| | | | | | | | |
| Investments | | Shares | | | Fair
Value | |
| | | | | | | | |
Mitsubishi Corp. | | | 23,700 | | | $ | 660,272 | |
Mitsubishi UFJ Financial Group, Inc. | | | 171,500 | | | | 794,595 | |
Mizuho Financial Group, Inc. | | | 378,698 | | | | 630,554 | |
Nippon Telegraph & Telephone Corp. | | | 23,494 | | | | 1,058,761 | |
NTT DoCoMo, Inc.(a) | | | 794 | | | | 1,400,613 | |
Seven & I Holdings Co., Ltd. | | | 19,900 | | | | 509,505 | |
Shin-Etsu Chemical Co., Ltd. | | | 8,300 | | | | 414,099 | |
Sumitomo Metal Industries Ltd. | | | 177,000 | | | | 397,225 | |
Sumitomo Mitsui Financial Group, Inc. | | | 19,700 | | | | 614,674 | |
Takeda Pharmaceutical Co., Ltd.(a) | | | 19,500 | | | | 912,886 | |
Tokyo Electric Power Co., Inc. (The) | | | 23,600 | | | | 132,693 | |
Toyota Motor Corp. | | | 25,500 | | | | 1,030,707 | |
| | | | | | | | |
| Total Japan | | | | | | | 12,766,473 | |
| Netherlands – 1.4% | | | | | | | | |
Koninklijke KPN N.V.(a) | | | 52,946 | | | | 903,131 | |
Koninklijke Philips Electronics N.V. | | | 18,515 | | | | 592,624 | |
Unilever N.V. CVA | | | 27,215 | | | | 854,485 | |
| | | | | | | | |
| Total Netherlands | | | | | | | 2,350,240 | |
| Norway – 1.4% | | | | | | | | |
Statoil ASA | | | 65,428 | | | | 1,813,190 | |
Telenor ASA | | | 27,586 | | | | 453,803 | |
| | | | | | | | |
| Total Norway | | | | | | | 2,266,993 | |
| Portugal – 0.5% | | | | | | | | |
EDP-Energias de Portugal S.A. | | | 120,608 | | | | 470,333 | |
Portugal Telecom, SGPS, S.A. | | | 32,348 | | | | 373,851 | |
| | | | | | | | |
| Total Portugal | | | | | | | 844,184 | |
| Singapore – 1.5% | | | | | | | | |
DBS Group Holdings Ltd. | | | 55,000 | | | | 638,794 | |
Keppel Corp., Ltd. | | | 65,000 | | | | 634,272 | |
Singapore Telecommunications Ltd. | | | 322,500 | | | | 772,670 | |
United Overseas Bank Ltd. | | | 29,000 | | | | 432,527 | |
| | | | | | | | |
| Total Singapore | | | | | | | 2,478,263 | |
| Spain – 8.2% | | | | | | | | |
ACS Actividades de Construccion y Servicios, S.A. | | | 15,030 | | | | 705,566 | |
Banco Bilbao Vizcaya Argentaria S.A.(a) | | | 87,284 | | | | 1,060,406 | |
Banco Santander S.A. | | | 256,942 | | | | 2,987,019 | |
Criteria Caixacorp S.A. | | | 121,925 | | | | 861,139 | |
Gas Natural SDG S.A. | | | 32,590 | | | | 613,023 | |
Iberdrola S.A. | | | 168,656 | | | | 1,468,589 | |
Inditex S.A. | | | 9,021 | | | | 724,832 | |
Repsol YPF S.A. | | | 37,907 | | | | 1,300,466 | |
Telefonica S.A. | | | 150,772 | | | | 3,779,613 | |
| | | | | | | | |
| Total Spain | | | | | | | 13,500,653 | |
| Sweden – 1.9% | | | | | | | | |
Hennes & Mauritz AB Class B | | | 30,833 | | | | 1,024,443 | |
Nordea Bank AB(a) | | | 70,327 | | | | 770,337 | |
Telefonaktiebolaget LM Ericsson Class B | | | 40,024 | | | | 516,447 | |
TeliaSonera AB | | | 95,803 | | | | 828,428 | |
| | | | | | | | |
| Total Sweden | | | | | | | 3,139,655 | |
| | | | | | | | |
| Investments | | Shares | | | Fair
Value | |
| | | | | | | | |
| Switzerland – 6.4% | | | | | | | | |
Credit Suisse Group AG | | | 24,268 | | | $ | 1,035,339 | |
Nestle S.A. | | | 50,817 | | | | 2,924,540 | |
Novartis AG | | | 43,923 | | | | 2,391,916 | |
Roche Holding AG | | | 14,302 | | | | 2,051,071 | |
Swisscom AG | | | 1,630 | | | | 729,611 | |
Zurich Financial Services AG | | | 4,949 | | | | 1,390,816 | |
| | | | | | | | |
| Total Switzerland | | | | | | | 10,523,293 | |
| United Kingdom – 18.9% | | | | | | | | |
AstraZeneca PLC | | | 31,447 | | | | 1,443,180 | |
Aviva PLC | | | 102,089 | | | | 708,249 | |
BAE Systems PLC | | | 102,615 | | | | 534,417 | |
Barclays PLC | | | 67,417 | | | | 299,937 | |
BG Group PLC | | | 24,042 | | | | 597,726 | |
BHP Billiton PLC | | | 36,644 | | | | 1,444,967 | |
British American Tobacco PLC | | | 45,308 | | | | 1,817,113 | |
British Sky Broadcasting Group PLC | | | 40,130 | | | | 530,692 | |
Centrica PLC | | | 125,096 | | | | 652,300 | |
Diageo PLC | | | 47,926 | | | | 910,352 | |
GlaxoSmithKline PLC | | | 125,211 | | | | 2,387,409 | |
HSBC Holdings PLC | | | 274,801 | | | | 2,823,554 | |
Imperial Tobacco Group PLC | | | 22,143 | | | | 683,971 | |
National Grid PLC | | | 100,059 | | | | 952,714 | |
Prudential PLC | | | 50,795 | | | | 575,245 | |
Reckitt Benckiser Group PLC | | | 12,163 | | | | 624,284 | |
Rio Tinto PLC | | | 8,519 | | | | 597,975 | |
Royal Dutch Shell PLC Class A | | | 93,253 | | | | 3,384,224 | |
Royal Dutch Shell PLC Class B | | | 70,228 | | | | 2,544,126 | |
SABMiller PLC | | | 18,606 | | | | 658,375 | |
Scottish & Southern Energy PLC | | | 31,733 | | | | 641,425 | |
Standard Chartered PLC | | | 26,319 | | | | 682,180 | |
Tesco PLC | | | 134,625 | | | | 822,187 | |
Unilever PLC | | | 22,949 | | | | 698,936 | |
Vodafone Group PLC | | | 1,450,068 | | | | 4,102,541 | |
| | | | | | | | |
| Total United Kingdom | | | | | | | 31,118,079 | |
TOTAL COMMON STOCKS
(Cost: $157,189,084) | | | | | | | 163,325,332 | |
| EXCHANGE-TRADED FUND – 0.2% | | | | | | | | |
| United States – 0.2% | | | | | | | | |
WisdomTree Pacific ex-Japan Total Dividend Fund(c) | | | | | | | | |
| (Cost: $363,196) | | | 5,720 | | | | 390,104 | |
| SHORT-TERM INVESTMENT – 0.0% | | | | | | | | |
| MONEY MARKET FUND – 0.0% | | | | | | | | |
| Invesco Treasury Fund Private Class, 0.02%(d) (Cost: $12,487) | | | 12,487 | | | | 12,487 | |
See Notes to Financial Statements.
| | |
| 70 | | WisdomTree International Dividend and Sector Funds |
Schedule of Investments (concluded)
WisdomTree International LargeCap Dividend Fund (DOL)
March 31, 2011
| | | | | | | | |
| Investments | | Shares | | | Fair
Value | |
| | | | | | | | |
| INVESTMENT OF CASH COLLATERAL FOR SECURITIES LOANED – 5.4% | | | | | | | | |
| MONEY MARKET FUND – 5.4% | | | | | | | | |
Dreyfus Institutional Preferred Money Market Fund, 0.19%(e) | | | | | | | | |
| (Cost: $8,827,000)(f) | | | 8,827,000 | | | $ | 8,827,000 | |
TOTAL INVESTMENTS IN SECURITIES – 104.9%
(Cost: $166,391,767) | | | | | | | 172,554,923 | |
Liabilities in Excess of Foreign Currency and Other Assets – (4.9)% | | | | | | | (8,065,516 | ) |
| | | | | | | | |
| NET ASSETS – 100.0% | | | | | | $ | 164,489,407 | |
| * | Non-income producing security. |
| † | Security is being fair valued by a valuation committee under the direction of the Board of Trustees. The aggregate value of fair valued securities is $0, which represents 0.0% of net assets. |
| (a) | Security, or portion thereof, was on loan at March 31, 2011 (See Note 2). |
| (b) | Escrow security – additional shares issued as a result of a corporate action. |
| (c) | Affiliated companies (See Note 7). |
| (d) | Rate shown represents annualized 7-day yield as of March 31, 2011. |
| (e) | Interest rate shown reflects yield as of March 31, 2011. |
| (f) | At March 31, 2011, the total market value of the Fund’s securities on loan was $7,017,068 and the total market value of the collateral held by the Fund was $8,827,000. |
See Notes to Financial Statements.
| | | | |
| WisdomTree International Dividend and Sector Funds | | | 71 | |
Schedule of Investments
WisdomTree International Dividend ex-Financials Fund (DOO)
March 31, 2011
| | | | | | | | |
| Investments | | Shares | | | Fair
Value | |
| | | | | | | | |
| COMMON STOCKS – 99.4% | | | | | | | | |
| Australia – 15.9% | | | | | | | | |
Amcor Ltd. | | | 206,784 | | | $ | 1,509,750 | |
BHP Billiton Ltd. | | | 27,210 | | | | 1,310,162 | |
Coal & Allied Industries Ltd. | | | 26,028 | | | | 3,217,640 | |
Coca-Cola Amatil Ltd. | | | 138,608 | | | | 1,682,828 | |
Foster’s Group Ltd. | | | 345,403 | | | | 2,043,175 | |
Leighton Holdings Ltd.(a) | | | 47,515 | | | | 1,449,068 | |
Orica Ltd. | | | 46,949 | | | | 1,280,324 | |
Origin Energy Ltd. | | | 88,436 | | | | 1,483,417 | |
Santos Ltd. | | | 101,365 | | | | 1,630,053 | |
Telstra Corp., Ltd. | | | 1,230,081 | | | | 3,587,288 | |
Wesfarmers Ltd. | | | 55,692 | | | | 1,830,333 | |
Woodside Petroleum Ltd. | | | 22,224 | | | | 1,075,602 | |
Woolworths Ltd. | | | 61,133 | | | | 1,699,372 | |
| | | | | | | | |
| Total Australia | | | | | | | 23,799,012 | |
| Austria – 0.8% | | | | | | | | |
OMV AG | | | 28,031 | | | | 1,268,546 | |
| Belgium – 2.8% | | | | | | | | |
Belgacom S.A. | | | 71,551 | | | | 2,775,542 | |
Solvay S.A. | | | 11,966 | | | | 1,419,437 | |
| | | | | | | | |
| Total Belgium | | | | | | | 4,194,979 | |
| Finland – 1.9% | | | | | | | | |
Nokia Oyj(a) | | | 133,195 | | | | 1,140,718 | |
UPM-Kymmene Oyj*(a) | | | 79,089 | | | | 1,674,549 | |
| | | | | | | | |
| Total Finland | | | | | | | 2,815,267 | |
| France – 21.6% | | | | | | | | |
Accor S.A. | | | 28,080 | | | | 1,263,391 | |
Bouygues S.A. | | | 35,993 | | | | 1,730,767 | |
Cap Gemini S.A. | | | 14,639 | | | | 851,431 | |
Carrefour S.A. | | | 24,562 | | | | 1,088,899 | |
Casino Guichard Perrachon S.A. | | | 17,774 | | | | 1,684,650 | |
Dassault Systemes S.A. | | | 5,495 | | | | 422,883 | |
Eutelsat Communications S.A. | | | 28,008 | | | | 1,120,245 | |
France Telecom S.A. | | | 174,011 | | | | 3,904,106 | |
GDF Suez | | | 65,131 | | | | 2,657,288 | |
Lafarge S.A. | | | 25,007 | | | | 1,561,979 | |
PPR | | | 8,768 | | | | 1,345,675 | |
Sanofi-Aventis S.A. | | | 24,598 | | | | 1,727,025 | |
Sodexo | | | 16,327 | | | | 1,193,932 | |
TOTAL S.A. | | | 43,036 | | | | 2,623,364 | |
Vallourec S.A. | | | 14,688 | | | | 1,649,990 | |
Veolia Environnement S.A. | | | 71,001 | | | | 2,210,620 | |
Vinci S.A. | | | 31,429 | | | | 1,966,676 | |
Vivendi S.A. | | | 117,710 | | | | 3,365,901 | |
| | | | | | | | |
| Total France | | | | | | | 32,368,822 | |
| Germany – 5.8% | | | | | | | | |
BASF SE | | | 17,916 | | | | 1,551,663 | |
Bayer AG | | | 13,231 | | | | 1,025,927 | |
Deutsche Post AG | | | 82,888 | | | | 1,496,207 | |
Deutsche Telekom AG | | | 183,484 | | | | 2,830,354 | |
RWE AG | | | 22,230 | | | | 1,417,861 | |
| | | | | | | | |
| Investments | | Shares | | | Fair
Value | |
| | | | | | | | |
SAP AG | | | 7,276 | | | $ | 446,056 | |
| | | | | | | | |
| Total Germany | | | | | | | 8,768,068 | |
| Ireland – 0.6% | | | | | | | | |
CRH PLC | | | 39,047 | | | | 896,560 | |
| Italy – 7.1% | | | | | | | | |
Atlantia SpA | | | 69,348 | | | | 1,591,318 | |
Enel SpA | | | 591,973 | | | | 3,736,626 | |
ENI SpA | | | 85,265 | | | | 2,096,922 | |
Mediaset SpA | | | 172,217 | | | | 1,095,859 | |
Snam Rete Gas SpA | | | 364,788 | | | | 2,053,082 | |
| | | | | | | | |
| Total Italy | | | | | | | 10,573,807 | |
| Japan – 4.8% | | | | | | | | |
Astellas Pharma, Inc. | | | 31,400 | | | | 1,166,892 | |
Canon, Inc. | | | 16,600 | | | | 725,048 | |
Daiichi Sankyo Co., Ltd.(a) | | | 51,500 | | | | 997,937 | |
Eisai Co., Ltd.(a) | | | 36,600 | | | | 1,317,741 | |
Hoya Corp. | | | 30,900 | | | | 707,628 | |
Kyocera Corp. | | | 4,000 | | | | 406,853 | |
NEC Corp.* | | | 99,000 | | | | 216,204 | |
Ricoh Co., Ltd. | | | 42,000 | | | | 494,595 | |
Takeda Pharmaceutical Co., Ltd.(a) | | | 26,400 | | | | 1,235,908 | |
| | | | | | | | |
| Total Japan | | | | | | | 7,268,806 | |
| Netherlands – 3.9% | | | | | | | | |
Koninklijke DSM N.V. | | | 23,479 | | | | 1,444,547 | |
Koninklijke KPN N.V.(a) | | | 137,620 | | | | 2,347,465 | |
Reed Elsevier N.V. | | | 107,531 | | | | 1,385,583 | |
STMicroelectronics N.V.* | | | 56,312 | | | | 698,434 | |
| | | | | | | | |
| Total Netherlands | | | | | | | 5,876,029 | |
| Norway – 2.1% | | | | | | | | |
Orkla ASA | | | 175,870 | | | | 1,704,096 | |
Statoil ASA | | | 52,332 | | | | 1,450,263 | |
| | | | | | | | |
| Total Norway | | | | | | | 3,154,359 | |
| Portugal – 2.5% | | | | | | | | |
EDP-Energias de Portugal S.A. | | | 481,675 | | | | 1,878,381 | |
Portugal Telecom, SGPS, S.A. | | | 158,007 | | | | 1,826,111 | |
| | | | | | | | |
| Total Portugal | | | | | | | 3,704,492 | |
| Spain – 9.3% | | | | | | | | |
Abertis Infraestructuras, S.A. | | | 89,848 | | | | 1,954,625 | |
ACS Actividades de Construccion y Servicios, S.A. | | | 48,994 | | | | 2,299,966 | |
Gas Natural SDG S.A. | | | 123,296 | | | | 2,319,219 | |
Iberdrola S.A. | | | 258,466 | | | | 2,250,618 | |
Repsol YPF S.A. | | | 73,326 | | | | 2,515,576 | |
Telefonica S.A. | | | 101,387 | | | | 2,541,610 | |
| | | | | | | | |
| Total Spain | | | | | | | 13,881,614 | |
| Sweden – 2.7% | | | | | | | | |
Hennes & Mauritz AB Class B | | | 32,100 | | | | 1,066,540 | |
Svenska Cellulosa AB Class B | | | 82,433 | | | | 1,327,626 | |
TeliaSonera AB | | | 189,773 | | | | 1,641,005 | |
| | | | | | | | |
| Total Sweden | | | | | | | 4,035,171 | |
See Notes to Financial Statements.
| | |
| 72 | | WisdomTree International Dividend and Sector Funds |
Schedule of Investments (concluded)
WisdomTree International Dividend ex-Financials Fund (DOO)
March 31, 2011
| | | | | | | | |
| Investments | | Shares | | | Fair
Value | |
| | | | | | | | |
| Switzerland – 2.6% | | | | | | | | |
Novartis AG | | | 20,724 | | | $ | 1,128,567 | |
Roche Holding AG | | | 6,854 | | | | 982,942 | |
Swisscom AG | | | 4,144 | | | | 1,854,914 | |
| | | | | | | | |
| Total Switzerland | | | | | | | 3,966,423 | |
| United Kingdom – 15.0% | | | | | | | | |
AstraZeneca PLC | | | 30,918 | | | | 1,418,902 | |
BAE Systems PLC | | | 298,405 | | | | 1,554,088 | |
British American Tobacco PLC | | | 42,209 | | | | 1,692,825 | |
Diageo PLC | | | 59,645 | | | | 1,132,954 | |
GlaxoSmithKline PLC | | | 85,752 | | | | 1,635,041 | |
Imperial Tobacco Group PLC | | | 41,795 | | | | 1,290,999 | |
J. Sainsbury PLC | | | 248,245 | | | | 1,334,240 | |
National Grid PLC | | | 288,209 | | | | 2,744,188 | |
Pearson PLC | | | 73,694 | | | | 1,300,587 | |
Reed Elsevier PLC | | | 159,966 | | | | 1,384,654 | |
Royal Dutch Shell PLC Class B | | | 65,981 | | | | 2,390,271 | |
Scottish & Southern Energy PLC | | | 110,891 | | | | 2,241,461 | |
Vodafone Group PLC | | | 821,923 | | | | 2,325,389 | |
| | | | | | | | |
| Total United Kingdom | | | | | | | 22,445,599 | |
TOTAL COMMON STOCKS
(Cost: $133,960,370) | | | | | | | 149,017,554 | |
| EXCHANGE-TRADED FUND – 0.1% | | | | | | | | |
| United States – 0.1% | | | | | | | | |
WisdomTree International LargeCap Dividend Fund(b) | | | | | | | | |
| (Cost: $153,377) | | | 3,371 | | | | 160,763 | |
| SHORT-TERM INVESTMENT – 0.0% | | | | | | | | |
| MONEY MARKET FUND – 0.0% | | | | | | | | |
Invesco Treasury Fund Private Class, 0.02%(c)
(Cost: $14,619) | | | 14,619 | | | | 14,619 | |
INVESTMENT OF CASH COLLATERAL FOR
SECURITIES LOANED – 4.5% | | | | | | | | |
| MONEY MARKET FUND – 4.5% | | | | | | | | |
Dreyfus Institutional Preferred Money Market Fund, 0.19%(d) | | | | | | | | |
| (Cost: $6,676,000)(e) | | | 6,676,000 | | | | 6,676,000 | |
TOTAL INVESTMENTS IN SECURITIES – 104.0%
(Cost: $140,804,366) | | | | | | | 155,868,936 | |
Liabilities in Excess of Foreign Currency and Other Assets – (4.0)% | | | | | | | (5,940,009 | ) |
| | | | | | | | |
| NET ASSETS – 100.0% | | | | | | $ | 149,928,927 | |
| * | Non-income producing security. |
| (a) | Security, or portion thereof, was on loan at March 31, 2011 (See Note 2). |
| (b) | Affiliated companies (See Note 7). |
| (c) | Rate shown represents annualized 7-day yield as of March 31, 2011. |
| (d) | Interest rate shown reflects yield as of March 31, 2011. |
| (e) | At March 31, 2011, the total market value of the Fund’s securities on loan was $6,230,881 and the total market value of the collateral held by the Fund was $6,676,000. |
See Notes to Financial Statements.
| | | | |
| WisdomTree International Dividend and Sector Funds | | | 73 | |
Schedule of Investments
WisdomTree International MidCap Dividend Fund (DIM)
March 31, 2011
| | | | | | | | |
| Investments | | Shares | | | Fair
Value | |
| | | | | | | | |
| COMMON STOCKS – 99.1% | | | | | | | | |
| Australia – 12.6% | | | | | | | | |
AGL Energy Ltd. | | | 46,184 | | | $ | 683,462 | |
Alumina Ltd. | | | 39,735 | | | | 101,086 | |
Amcor Ltd. | | | 101,362 | | | | 740,054 | |
Bank of Queensland Ltd. | | | 29,862 | | | | 306,347 | |
Bendigo and Adelaide Bank Ltd. | | | 47,086 | | | | 464,054 | |
Billabong International Ltd. | | | 27,631 | | | | 215,738 | |
Boral Ltd. | | | 42,113 | | | | 217,756 | |
Brambles Ltd.(a) | | | 120,962 | | | | 885,657 | |
Caltex Australia Ltd. | | | 19,442 | | | | 313,653 | |
Coal & Allied Industries Ltd. | | | 9,665 | | | | 1,194,809 | |
Coca-Cola Amatil Ltd. | | | 74,099 | | | | 899,630 | |
Cochlear Ltd. | | | 4,745 | | | | 407,235 | |
Computershare Ltd. | | | 30,730 | | | | 294,277 | |
Crown Ltd. | | | 95,538 | | | | 805,225 | |
CSR Ltd. | | | 120,911 | | | | 410,131 | |
David Jones Ltd.(a) | | | 105,061 | | | | 516,082 | |
Downer EDI Ltd. | | | 57,791 | | | | 226,508 | |
Harvey Norman Holdings Ltd.(a) | | | 131,825 | | | | 408,980 | |
Insurance Australia Group Ltd. | | | 259,980 | | | | 965,201 | |
Lend Lease Group(a)(b) | | | 67,627 | | | | 634,324 | |
MacArthur Coal Ltd. | | | 18,416 | | | | 220,921 | |
MAP Group(b) | | | 102,000 | | | | 320,669 | |
Metcash Ltd. | | | 123,412 | | | | 530,926 | |
New Hope Corp., Ltd. | | | 41,301 | | | | 212,703 | |
OneSteel Ltd. | | | 104,377 | | | | 263,377 | |
Orica Ltd. | | | 30,980 | | | | 844,841 | |
Platinum Asset Management Ltd.(a) | | | 71,732 | | | | 356,814 | |
Ramsay Health Care Ltd. | | | 19,455 | | | | 384,079 | |
Sims Metal Management Ltd. | | | 11,003 | | | | 199,242 | |
Sonic Healthcare Ltd. | | | 52,036 | | | | 644,680 | |
SP AusNet(b) | | | 487,031 | | | | 443,223 | |
TABCORP Holdings Ltd. | | | 154,316 | | | | 1,195,298 | |
Tatts Group Ltd. | | | 345,248 | | | | 835,469 | |
Toll Holdings Ltd. | | | 86,933 | | | | 533,117 | |
Transurban Group(b) | | | 126,619 | | | | 703,164 | |
UGL Ltd. | | | 24,945 | | | | 404,753 | |
WorleyParsons Ltd. | | | 25,188 | | | | 806,972 | |
| | | | | | | | |
| Total Australia | | | | | | | 19,590,457 | |
| Austria – 2.2% | | | | | | | | |
Andritz AG(a) | | | 3,139 | | | | 293,065 | |
Raiffeisen International Bank Holding AG | | | 9,962 | | | | 553,608 | |
Strabag SE | | | 8,695 | | | | 276,765 | |
Telekom Austria AG | | | 70,513 | | | | 1,032,671 | |
Vienna Insurance Group AG Wiener Versicherung Gruppe | | | 9,279 | | | | 530,664 | |
Voestalpine AG | | | 16,873 | | | | 793,280 | |
| | | | | | | | |
| Total Austria | | | | | | | 3,480,053 | |
| Belgium – 2.8% | | | | | | | | |
Ageas | | | 199,277 | | | | 567,002 | |
Bekaert S.A. | | | 2,078 | | | | 237,356 | |
Colruyt S.A. | | | 2,103 | | | | 110,899 | |
| | | | | | | | |
| Investments | | Shares | | | Fair
Value | |
| | | | | | | | |
Delhaize Group S.A. | | | 7,372 | | | $ | 601,019 | |
Mobistar S.A. | | | 15,727 | | | | 1,091,806 | |
Solvay S.A. | | | 5,431 | | | | 644,239 | |
UCB S.A.(a) | | | 15,896 | | | | 604,442 | |
Umicore S.A. | | | 9,678 | | | | 480,623 | |
| | | | | | | | |
| Total Belgium | | | | | | | 4,337,386 | |
| Denmark – 0.8% | | | | | | | | |
FLSmidth & Co. A/S | | | 3,001 | | | | 255,999 | |
H. Lundbeck A/S(a) | | | 14,984 | | | | 347,928 | |
Novozymes A/S Class B | | | 1,709 | | | | 262,005 | |
Tryg A/S(a) | | | 6,880 | | | | 405,145 | |
| | | | | | | | |
| Total Denmark | | | | | | | 1,271,077 | |
| Finland – 2.6% | | | | | | | | |
Metso Oyj(a) | | | 8,608 | | | | 463,460 | |
Neste Oil Oyj(a) | | | 14,736 | | | | 304,268 | |
Nokian Renkaat Oyj | | | 7,900 | | | | 336,663 | |
Outokumpu Oyj(a) | | | 13,614 | | | | 236,086 | |
Pohjola Bank PLC Class A(a) | | | 28,326 | | | | 386,699 | |
Rautaruukki Oyj(a) | | | 12,958 | | | | 311,137 | |
Sanoma Oyj(a) | | | 18,559 | | | | 420,603 | |
UPM-Kymmene Oyj*(a) | | | 40,492 | | | | 857,336 | |
Wartsila Oyj(a) | | | 18,330 | | | | 716,633 | |
| | | | | | | | |
| Total Finland | | | | | | | 4,032,885 | |
| France – 9.2% | | | | | | | | |
Aeroports de Paris | | | 7,154 | | | | 659,896 | |
Arkema S.A. | | | 2,387 | | | | 217,098 | |
Bourbon S.A.(a) | | | 5,164 | | | | 244,763 | |
Bureau Veritas S.A. | | | 5,973 | | | | 469,756 | |
Cap Gemini S.A. | | | 8,657 | | | | 503,507 | |
CFAO S.A. | | | 7,504 | | | | 282,037 | |
Ciments Francais S.A. | | | 3,858 | | | | 390,140 | |
Dassault Systemes S.A. | | | 3,638 | | | | 279,972 | |
Eiffage S.A. | | | 8,216 | | | | 494,239 | |
Eutelsat Communications S.A. | | | 16,634 | | | | 665,316 | |
Havas S.A. | | | 3,841 | | | | 20,653 | |
ICADE | | | 6,055 | | | | 748,248 | |
Imerys S.A. | | | 4,798 | | | | 352,221 | |
Ipsen S.A. | | | 5,286 | | | | 189,897 | |
Klepierre | | | 24,782 | | | | 1,007,215 | |
Lagardere SCA | | | 16,602 | | | | 709,742 | |
Legrand S.A. | | | 19,726 | | | | 821,739 | |
M-6 Metropole Television S.A. | | | 43,244 | | | | 1,131,618 | |
Neopost S.A. | | | 5,847 | | | | 512,867 | |
Nexans S.A. | | | 683 | | | | 65,414 | |
PagesJaunes Groupe(a) | | | 77,245 | | | | 774,673 | |
Remy Cointreau S.A. | | | 4,635 | | | | 349,530 | |
Rhodia S.A. | | | 2,340 | | | | 68,606 | |
Sa des Ciments Vicat | | | 3,375 | | | | 287,416 | |
SCOR SE | | | 26,453 | | | | 721,321 | |
SEB S.A. | | | 2,844 | | | | 280,577 | |
Societe BIC S.A. | | | 3,440 | | | | 306,180 | |
Societe Television Francaise 1 | | | 23,867 | | | | 438,781 | |
Technip S.A. | | | 7,850 | | | | 838,280 | |
See Notes to Financial Statements.
| | |
| 74 | | WisdomTree International Dividend and Sector Funds |
Schedule of Investments (continued)
WisdomTree International MidCap Dividend Fund (DIM)
March 31, 2011
| | | | | | | | |
| Investments | | Shares | | | Fair
Value | |
| | | | | | | | |
Thales S.A. | | | 7,795 | | | $ | 311,337 | |
Zodiac Aerospace | | | 3,622 | | | | 263,732 | |
| | | | | | | | |
| Total France | | | | | | | 14,406,771 | |
| Germany – 3.8% | | | | | | | | |
Aixtron SE NA | | | 458 | | | | 20,080 | |
Bilfinger Berger SE | | | 4,860 | | | | 422,431 | |
Celesio AG | | | 11,422 | | | | 280,901 | |
Fielmann AG | | | 3,732 | | | | 352,984 | |
Fraport AG Frankfurt Airport Services Worldwide | | | 7,022 | | | | 515,286 | |
Gea Group AG | | | 9,442 | | | | 311,396 | |
Hamburger Hafen und Logistik AG | | | 7,907 | | | | 368,324 | |
Hannover Rueckversicherung AG | | | 13,576 | | | | 742,211 | |
Hochtief AG | | | 4,836 | | | | 520,884 | |
Lanxess AG | | | 669 | | | | 50,108 | |
Salzgitter AG | | | 5,082 | | | | 401,701 | |
SMA Solar Technology AG | | | 519 | | | | 65,137 | |
Software AG | | | 99 | | | | 16,423 | |
Suedzucker AG | | | 14,499 | | | | 404,926 | |
Symrise AG | | | 9,798 | | | | 287,681 | |
Tognum AG | | | 1,083 | | | | 39,037 | |
United Internet AG Registered Shares | | | 23,020 | | | | 414,880 | |
Wacker Chemie AG | | | 1,598 | | | | 359,888 | |
Wincor Nixdorf AG | | | 3,967 | | | | 321,617 | |
| | | | | | | | |
| Total Germany | | | | | | | 5,895,895 | |
| Hong Kong – 3.2% | | | | | | | | |
Bank of East Asia Ltd. | | | 105,600 | | | | 448,700 | |
Beijing Enterprises Holdings Ltd. | | | 36,500 | | | | 208,352 | |
China Agri-Industries Holdings Ltd. | | | 20,000 | | | | 22,422 | |
China Merchants Holdings International Co., Ltd. | | | 118,000 | | | | 498,354 | |
Citic Pacific Ltd. | | | 216,000 | | | | 599,830 | |
Fosun International Ltd. | | | 73,000 | | | | 56,030 | |
Fushan International Energy Group Ltd. | | | 520,000 | | | | 374,380 | |
Guangdong Investment Ltd. | | | 414,808 | | | | 209,585 | |
Hopewell Holdings Ltd. | | | 88,662 | | | | 266,162 | |
Hysan Development Co., Ltd. | | | 81,000 | | | | 333,239 | |
New World Development Ltd. | | | 211,482 | | | | 373,578 | |
PCCW Ltd. | | | 1,147,000 | | | | 477,781 | |
Shanghai Industrial Holdings Ltd. | | | 81,000 | | | | 310,329 | |
Sino Land Co., Ltd. | | | 284,000 | | | | 504,600 | |
SJM Holdings Ltd. | | | 30,000 | | | | 52,531 | |
Television Broadcasts Ltd. | | | 57,074 | | | | 335,332 | |
| | | | | | | | |
| Total Hong Kong | | | | | | | 5,071,205 | |
| Ireland – 0.3% | | | | | | | | |
DCC PLC | | | 9,443 | | | | 301,110 | |
Kerry Group PLC Class A | | | 6,544 | | | | 243,959 | |
| | | | | | | | |
| Total Ireland | | | | | | | 545,069 | |
| Italy – 5.8% | | | | | | | | |
A2A SpA | | | 489,218 | | | | 793,527 | |
Banca Carige SpA(a) | | | 165,468 | | | | 392,377 | |
Banca Popolare di Sondrio S.c.r.l.* | | | 29,970 | | | | 255,183 | |
ERG SpA | | | 18,328 | | | | 260,873 | |
Finmeccanica SpA | | | 48,089 | | | | 605,999 | |
| | | | | | | | |
| Investments | | Shares | | | Fair
Value | |
| | | | | | | | |
Hera SpA | | | 136,584 | | | $ | 327,373 | |
Intesa Sanpaolo SpA RSP | | | 110,815 | | | | 293,285 | |
Lottomatica SpA(a) | | | 35,060 | | | | 632,369 | |
Mediaset SpA | | | 118,404 | | | | 753,434 | |
Mediolanum SpA | | | 79,104 | | | | 425,901 | |
Parmalat SpA | | | 208,013 | | | | 697,832 | |
Pirelli & C SpA | | | 39,671 | | | | 349,042 | |
Prysmian SpA | | | 14,318 | | | | 307,625 | |
Societa Iniziative Autostradali e Servizi SpA | | | 21,632 | | | | 253,412 | |
Telecom Italia SpA RSP | | | 874,084 | | | | 1,177,151 | |
Terna Rete Elettrica Nazionale SpA | | | 214,216 | | | | 1,026,891 | |
Unione di Banche Italiane SCPA | | | 54,061 | | | | 462,609 | |
| | | | | | | | |
| Total Italy | | | | | | | 9,014,883 | |
| Japan – 15.3% | | | | | | | | |
Ajinomoto Co., Inc. | | | 39,000 | | | | 407,975 | |
Asahi Kasei Corp. | | | 72,000 | | | | 487,355 | |
Bank of Yokohama Ltd. (The) | | | 70,000 | | | | 333,615 | |
Chiba Bank Ltd. (The) | | | 44,000 | | | | 247,394 | |
Chugoku Electric Power Co., Inc. (The)(a) | | | 20,800 | | | | 385,985 | |
Coca-Cola West Co., Ltd. | | | 12,300 | | | | 235,226 | |
Cosmo Oil Co., Ltd.(a) | | | 90,000 | | | | 281,250 | |
Daihatsu Motor Co., Ltd. | | | 23,000 | | | | 336,342 | |
Dainippon Sumitomo Pharma Co., Ltd. | | | 28,500 | | | | 266,500 | |
Daito Trust Construction Co., Ltd. | | | 9,700 | | | | 670,620 | |
Daiwa House Industry Co., Ltd. | | | 30,000 | | | | 369,932 | |
Daiwa Securities Group, Inc. | | | 129,000 | | | | 594,570 | |
Electric Power Development Co., Ltd. | | | 9,300 | | | | 287,483 | |
FamilyMart Co., Ltd. | | | 6,400 | | | | 241,313 | |
Fukuoka Financial Group, Inc. | | | 49,000 | | | | 204,561 | |
Hitachi Chemical Co., Ltd. | | | 10,900 | | | | 222,393 | |
Hokkaido Electric Power Co., Inc. | | | 13,800 | | | | 268,574 | |
Hokuriku Electric Power Co. | | | 13,900 | | | | 315,970 | |
Joyo Bank Ltd. (The) | | | 54,000 | | | | 213,055 | |
JS Group Corp. | | | 19,100 | | | | 497,780 | |
JSR Corp. | | | 13,400 | | | | 269,843 | |
Kajima Corp. | | | 104,000 | | | | 292,374 | |
Kaneka Corp. | | | 33,000 | | | | 230,538 | |
Kintetsu Corp.(a) | | | 80,000 | | | | 257,722 | |
Kobe Steel Ltd. | | | 122,000 | | | | 317,954 | |
Konami Corp.(a) | | | 13,500 | | | | 250,845 | |
Konica Minolta Holdings, Inc. | | | 30,500 | | | | 256,497 | |
Kuraray Co., Ltd. | | | 18,600 | | | | 240,579 | |
Kyowa Hakko Kirin Co., Ltd. | | | 26,000 | | | | 244,691 | |
Lawson, Inc. | | | 9,100 | | | | 440,287 | |
Makita Corp. | | | 7,200 | | | | 336,197 | |
MEIJI Holdings Co., Ltd. | | | 5,300 | | | | 213,906 | |
Mitsubishi Chemical Holdings Corp. | | | 68,500 | | | | 432,257 | |
Mitsubishi Tanabe Pharma Corp. | | | 25,000 | | | | 407,215 | |
Mizuho Securities Co., Ltd.* | | | 84,000 | | | | 223,986 | |
Namco Bandai Holdings, Inc. | | | 21,700 | | | | 237,475 | |
NGK Insulators Ltd. | | | 14,000 | | | | 251,182 | |
Nippon Electric Glass Co., Ltd. | | | 20,000 | | | | 284,266 | |
Nippon Express Co., Ltd. | | | 69,000 | | | | 265,577 | |
See Notes to Financial Statements.
| | | | |
| WisdomTree International Dividend and Sector Funds | | | 75 | |
Schedule of Investments (continued)
WisdomTree International MidCap Dividend Fund (DIM)
March 31, 2011
| | | | | | | | |
| Investments | | Shares | | | Fair
Value | |
| | | | | | | | |
Nippon Paper Group, Inc. | | | 8,600 | | | $ | 183,871 | |
Nisshin Seifun Group, Inc. | | | 19,000 | | | | 219,848 | |
Nissin Foods Holdings Co., Ltd.(a) | | | 6,700 | | | | 237,022 | |
Nitori Holdings Co., Ltd. | | | 2,350 | | | | 207,270 | |
Nitto Denko Corp. | | | 6,500 | | | | 345,861 | |
Nomura Real Estate Holdings, Inc. | | | 15,500 | | | | 235,829 | |
Nomura Research Institute Ltd. | | | 14,500 | | | | 321,211 | |
Obayashi Corp. | | | 48,000 | | | | 214,286 | |
OJI Paper Co., Ltd.(a) | | | 58,000 | | | | 276,424 | |
Olympus Corp. | | | 9,600 | | | | 268,031 | |
Oracle Corp. | | | 10,868 | | | | 454,363 | |
Oriental Land Co., Ltd.(a) | | | 4,900 | | | | 390,794 | |
Osaka Gas Co., Ltd. | | | 106,000 | | | | 424,614 | |
Sankyo Co., Ltd. | | | 8,100 | | | | 416,825 | |
Sega Sammy Holdings, Inc. | | | 15,500 | | | | 270,427 | |
Sekisui House Ltd. | | | 24,000 | | | | 225,869 | |
Shikoku Electric Power Co., Inc.(a) | | | 11,600 | | | | 316,733 | |
Shimizu Corp.(a) | | | 58,000 | | | | 258,929 | |
Shionogi & Co., Ltd. | | | 17,200 | | | | 294,484 | |
Shiseido Co., Ltd.(a) | | | 21,200 | | | | 368,340 | |
Shizuoka Bank Ltd. (The) | | | 31,000 | | | | 257,336 | |
Showa Shell Sekiyu K.K. | | | 50,700 | | | | 530,980 | |
Stanley Electric Co., Ltd. | | | 13,500 | | | | 223,968 | |
Sumitomo Chemical Co., Ltd. | | | 67,000 | | | | 335,485 | |
Sumitomo Mitsui Trust Holdings, Inc. | | | 62,000 | | | | 220,680 | |
Suzuken Co., Ltd. | | | 6,100 | | | | 161,479 | |
T&D Holdings, Inc. | | | 18,400 | | | | 455,116 | |
Taiyo Nippon Sanso Corp. | | | 22,000 | | | | 183,953 | |
TDK Corp. | | | 5,400 | | | | 320,234 | |
Tokyu Corp. | | | 66,000 | | | | 274,735 | |
TonenGeneral Sekiyu K.K. | | | 65,104 | | | | 806,730 | |
Toppan Printing Co., Ltd.(a) | | | 53,000 | | | | 419,498 | |
Toray Industries, Inc. | | | 48,000 | | | | 350,386 | |
Toyoda Gosei Co., Ltd. | | | 9,700 | | | | 202,825 | |
Toyota Tsusho Corp. | | | 16,000 | | | | 264,865 | |
Trend Micro, Inc. | | | 10,700 | | | | 285,962 | |
Yamato Holdings Co., Ltd. | | | 22,800 | | | | 354,874 | |
| | | | | | | | |
| Total Japan | | | | | | | 23,901,421 | |
| Netherlands – 2.7% | | | | | | | | |
Fugro N.V. CVA | | | 6,183 | | | | 545,586 | |
Koninklijke Boskalis Westminster N.V. | | | 6,596 | | | | 349,283 | |
Koninklijke DSM N.V. | | | 12,701 | | | | 781,430 | |
Koninklijke Vopak N.V. | | | 5,658 | | | | 272,593 | |
Reed Elsevier N.V. | | | 62,539 | | | | 805,842 | |
SBM Offshore N.V. | | | 15,185 | | | | 441,324 | |
STMicroelectronics N.V.* | | | 30,551 | | | | 378,922 | |
Wolters Kluwer N.V. | | | 25,811 | | | | 604,368 | |
| | | | | | | | |
| Total Netherlands | | | | | | | 4,179,348 | |
| New Zealand – 0.8% | | | | | | | | |
Contact Energy Ltd. | | | 60,503 | | | | 268,585 | |
Fletcher Building Ltd. | | | 33,794 | | | | 240,751 | |
Telecom Corp. of New Zealand Ltd. | | | 437,702 | | | | 671,053 | |
| | | | | | | | |
| Total New Zealand | | | | | | | 1,180,389 | |
| | | | | | | | |
| Investments | | Shares | | | Fair
Value | |
| | | | | | | | |
| Norway – 1.8% | | | | | | | | |
Aker Solutions ASA | | | 19,914 | | | $ | 457,553 | |
Fred Olsen Energy ASA | | | 8,545 | | | | 375,367 | |
Marine Harvest ASA | | | 477,599 | | | | 593,140 | |
Norsk Hydro ASA | | | 55,112 | | | | 451,915 | |
Orkla ASA | | | 102,602 | | | | 994,164 | |
| | | | | | | | |
| Total Norway | | | | | | | 2,872,139 | |
| Portugal – 1.6% | | | | | | | | |
Banco Comercial Portugues S.A. Class R(a) | | | 381,359 | | | | 311,724 | |
Banco Espirito Santo S.A.(a) | | | 110,438 | | | | 452,928 | |
Brisa Auto-Estradas de Portugal S.A. | | | 83,450 | | | | 565,237 | |
Cimpor Cimentos de Portugal, SGPS, S.A. | | | 66,804 | | | | 484,815 | |
Jeronimo Martins, SGPS, S.A. | | | 31,959 | | | | 514,757 | |
Sonae | | | 164,977 | | | | 192,914 | |
| | | | | | | | |
| Total Portugal | | | | | | | 2,522,375 | |
| Singapore – 4.0% | | | | | | | | |
ComfortDelgro Corp., Ltd. | | | 172,000 | | | | 212,868 | |
Fraser and Neave Ltd. | | | 91,402 | | | | 435,800 | |
Jardine Cycle & Carriage Ltd. | | | 18,904 | | | | 548,898 | |
Keppel Land Ltd. | | | 66,000 | | | | 235,097 | |
SATS Ltd. | | | 101,000 | | | | 201,119 | |
SembCorp Industries Ltd. | | | 134,000 | | | | 553,860 | |
SembCorp Marine Ltd.(a) | | | 156,360 | | | | 724,429 | |
SIA Engineering Co., Ltd. | | | 85,536 | | | | 274,828 | |
Singapore Exchange Ltd. | | | 96,000 | | | | 597,858 | |
Singapore Press Holdings Ltd. | | | 211,148 | | | | 659,995 | |
Singapore Technologies Engineering Ltd. | | | 241,000 | | | | 623,292 | |
SMRT Corp., Ltd. | | | 116,000 | | | | 173,931 | |
StarHub Ltd. | | | 295,594 | | | | 633,164 | |
Yangzijiang Shipbuilding Holdings Ltd. | | | 218,000 | | | | 313,034 | |
| | | | | | | | |
| Total Singapore | | | | | | | 6,188,173 | |
| Spain – 5.9% | | | | | | | | |
Acciona S.A. | | | 6,547 | | | | 712,422 | |
Banco de Sabadell S.A. | | | 95,508 | | | | 418,398 | |
Banco Espanol de Credito S.A.(a) | | | 92,872 | | | | 842,036 | |
Banco Popular Espanol S.A.(a) | | | 147,614 | | | | 868,919 | |
Bankinter, S.A.(a) | | | 60,303 | | | | 414,188 | |
Bolsas y Mercados Espanoles S.A.(a) | | | 18,319 | | | | 558,145 | |
Ebro Foods S.A.*(a) | | | 21,506 | | | | 506,008 | |
Enagas S.A.(a) | | | 25,789 | | | | 582,627 | |
Ferrovial S.A. | | | 49,680 | | | | 623,933 | |
Fomento de Construcciones y Contratas S.A.(a) | | | 25,096 | | | | 831,937 | |
Gestevision Telecinco S.A.* | | | 1,319 | | | | 15,120 | |
Grifols S.A. | | | 22,028 | | | | 384,497 | |
Grupo Catalana Occidente S.A. | | | 13,943 | | | | 308,274 | |
Indra Sistemas S.A. | | | 18,545 | | | | 372,388 | |
Red Electrica Corp. S.A. | | | 12,499 | | | | 711,267 | |
Tecnicas Reunidas S.A. | | | 5,638 | | | | 339,397 | |
Zardoya Otis S.A. | | | 42,193 | | | | 700,550 | |
| | | | | | | | |
| Total Spain | | | | | | | 9,190,106 | |
| Sweden – 5.3% | | | | | | | | |
Alfa Laval AB | | | 23,442 | | | | 509,463 | |
See Notes to Financial Statements.
| | |
| 76 | | WisdomTree International Dividend and Sector Funds |
Schedule of Investments (continued)
WisdomTree International MidCap Dividend Fund (DIM)
March 31, 2011
| | | | | | | | |
| Investments | | Shares | | | Fair
Value | |
| | | | | | | | |
Assa Abloy AB Class B | | | 16,870 | | | $ | 485,370 | |
Atlas Copco AB Class B | | | 25,209 | | | | 609,805 | |
Boliden AB | | | 21,299 | | | | 459,176 | |
Electrolux AB Series B | | | 15,288 | | | | 394,293 | |
Getinge AB Class B | | | 10,942 | | | | 270,237 | |
Hakon Invest AB | | | 19,525 | | | | 344,482 | |
Kinnevik Investment AB Class B | | | 14,548 | | | | 339,232 | |
Ratos AB Class B | | | 13,844 | | | | 546,878 | |
Scania AB Class B | | | 16,526 | | | | 383,259 | |
Securitas AB Class B | | | 35,086 | | | | 417,969 | |
Skanska AB Class B | | | 42,359 | | | | 892,383 | |
SKF AB Class B | | | 23,516 | | | | 685,156 | |
Svenska Cellulosa AB Class B | | | 45,946 | | | | 739,984 | |
Swedish Match AB | | | 14,832 | | | | 493,507 | |
Tele2 AB Class B | | | 29,283 | | | | 676,790 | |
| | | | | | | | |
Total Sweden | | | | | | | 8,247,984 | |
Switzerland – 2.8% | | | | | | | | |
Baloise Holding AG | | | 6,034 | | | | 600,201 | |
BKW FMB Energie AG | | | 4,430 | | | | 314,509 | |
EFG International AG | | | 1,762 | | | | 26,290 | |
Geberit AG | | | 3,178 | | | | 694,759 | |
Givaudan S.A.* | | | 91 | | | | 91,860 | |
Julius Baer Group Ltd.* | | | 7,542 | | | | 328,605 | |
Partners Group Holding AG | | | 2,214 | | | | 424,964 | |
Schindler Holding AG | | | 2,115 | | | | 256,385 | |
Schindler Holding AG Participating Shares | | | 3,237 | | | | 390,627 | |
Sonova Holding AG | | | 1,775 | | | | 158,806 | |
Sulzer AG | | | 2,449 | | | | 370,489 | |
Swatch Group AG (The) | | | 1,456 | | | | 646,315 | |
| | | | | | | | |
Total Switzerland | | | | | | | 4,303,810 | |
United Kingdom – 15.6% | | | | | | | | |
3i Group PLC | | | 14,116 | | | | 67,633 | |
Aberdeen Asset Management PLC | | | 124,451 | | | | 420,522 | |
Admiral Group PLC | | | 22,202 | | | | 553,048 | |
AMEC PLC | | | 15,279 | | | | 292,183 | |
Amlin PLC | | | 50,769 | | | | 310,628 | |
Ashmore Group PLC | | | 88,881 | | | | 472,151 | |
Balfour Beatty PLC | | | 66,040 | | | | 363,943 | |
British Land Co. PLC | | | 96,834 | | | | 857,591 | |
Bunzl PLC | | | 20,700 | | | | 247,033 | |
Burberry Group PLC | | | 17,496 | | | | 329,251 | |
Cable & Wireless Communications PLC | | | 877,917 | | | | 641,146 | |
Capita Group PLC (The) | | | 33,115 | | | | 394,397 | |
Carillion PLC | | | 37,249 | | | | 226,891 | |
Cobham PLC | | | 58,259 | | | | 214,975 | |
Daily Mail & General Trust N.V. Class A | | | 30,547 | | | | 241,987 | |
Firstgroup PLC | | | 53,676 | | | | 280,748 | |
G4S PLC | | | 88,000 | | | | 360,266 | |
Hargreaves Lansdown PLC | | | 51,652 | | | | 505,053 | |
Hays PLC | | | 221,381 | | | | 412,705 | |
Home Retail Group PLC | | | 118,187 | | | | 365,824 | |
ICAP PLC | | | 64,614 | | | | 546,865 | |
IG Group Holdings PLC | | | 34,875 | | | | 255,253 | |
| | | | | | | | |
| Investments | | Shares | | | Fair
Value | |
| | | | | | | | |
IMI PLC | | | 21,814 | | | $ | 360,157 | |
Inmarsat PLC | | | 31,386 | | | | 303,873 | |
Intercontinental Hotels Group PLC | | | 21,444 | | | | 439,295 | |
International Power PLC | | | 123,106 | | | | 607,785 | |
Investec PLC | | | 32,312 | | | | 247,422 | |
John Wood Group PLC | | | 5,105 | | | | 52,167 | |
Johnson Matthey PLC | | | 12,849 | | | | 383,091 | |
Kingfisher PLC | | | 132,462 | | | | 522,119 | |
Legal & General Group PLC | | | 576,169 | | | | 1,063,952 | |
Logica PLC | | | 106,810 | | | | 224,286 | |
London Stock Exchange Group PLC | | | 27,242 | | | | 363,532 | |
Man Group PLC | | | 430,444 | | | | 1,696,661 | |
Marks & Spencer Group PLC | | | 61,941 | | | | 334,304 | |
Meggitt PLC | | | 44,899 | | | | 246,788 | |
Next PLC | | | 13,554 | | | | 430,182 | |
Northumbrian Water Group PLC | | | 48,276 | | | | 257,070 | |
Pennon Group PLC | | | 30,114 | | | | 301,695 | |
Rexam PLC | | | 93,627 | | | | 545,388 | |
RSA Insurance Group PLC | | | 449,248 | | | | 946,960 | |
Sage Group PLC (The) | | | 84,534 | | | | 376,836 | |
Segro PLC | | | 71,719 | | | | 369,603 | |
Severn Trent PLC | | | 27,346 | | | | 640,419 | |
Smith & Nephew PLC | | | 31,231 | | | | 351,934 | |
Smiths Group PLC | | | 25,876 | | | | 537,969 | |
Stagecoach Group PLC | | | 93,272 | | | | 322,045 | |
Standard Life PLC(a) | | | 303,806 | | | | 1,007,086 | |
Tate & Lyle PLC | | | 52,742 | | | | 488,234 | |
Thomas Cook Group PLC | | | 135,533 | | | | 370,633 | |
TUI Travel PLC(a) | | | 142,263 | | | | 517,652 | |
United Utilities Group PLC | | | 90,415 | | | | 857,265 | |
Whitbread PLC | | | 16,898 | | | | 446,930 | |
William Hill PLC | | | 109,477 | | | | 317,103 | |
| | | | | | | | |
| Total United Kingdom | | | | | | | 24,290,529 | |
TOTAL COMMON STOCKS
(Cost: $142,012,730) | | | | | | | 154,521,955 | |
| EXCHANGE-TRADED FUNDS – 0.3% | | | | | | | | |
| United States – 0.3% | | | | | | | | |
WisdomTree International LargeCap Dividend Fund(a)(c) | | | 5,588 | | | | 266,492 | |
WisdomTree International SmallCap Dividend Fund(a)(c) | | | 5,113 | | | | 271,398 | |
TOTAL EXCHANGE-TRADED FUNDS
(Cost: $464,223) | | | | | | | 537,890 | |
| SHORT-TERM INVESTMENT – 0.1% | | | | | | | | |
| MONEY MARKET FUND – 0.1% | | | | | | | | |
Invesco Treasury Fund Private Class, 0.02%(d)
(Cost: $126,354) | | | 126,354 | | | | 126,354 | |
See Notes to Financial Statements.
| | | | |
| WisdomTree International Dividend and Sector Funds | | | 77 | |
Schedule of Investments (concluded)
WisdomTree International MidCap Dividend Fund (DIM)
March 31, 2011
| | | | | | | | |
| Investments | | Shares | | | Fair
Value | |
| | | | | | | | |
| INVESTMENT OF CASH COLLATERAL FOR SECURITIES LOANED – 11.3% | | | | | | | | |
| MONEY MARKET FUND – 11.3% | | | | | | | | |
Dreyfus Institutional Preferred Money Market Fund, 0.19%(e) | | | | | | | | |
(Cost: $17,619,000)(f) | | | 17,619,000 | | | $ | 17,619,000 | |
TOTAL INVESTMENTS IN SECURITIES –110.8%
(Cost: $160,222,307) | | | | | | | 172,805,199 | |
Liabilities in Excess of Foreign Currency and Other Assets – (10.8)% | | | | | | | (16,799,559 | ) |
| | | | | | | | |
| NET ASSETS – 100.0% | | | | | | $ | 156,005,640 | |
| RSP | – Risparmio Italian Savings Shares |
| * | Non-income producing security. |
| (a) | Security, or portion thereof, was on loan at March 31, 2011 (See Note 2). |
| (b) | Stapled Security – A security contractually bound to one or more other securities to form a single saleable unit which cannot be sold separately. |
| (c) | Affiliated companies (See Note 7). |
| (d) | Rate shown represents annualized 7-day yield as of March 31, 2011. |
| (e) | Interest rate shown reflects yield as of March 31, 2011. |
| (f) | At March 31, 2011, the total market value of the Fund’s securities on loan was $16,418,317 and the total market value of the collateral held by the Fund was $17,619,000. |
See Notes to Financial Statements.
| | |
| 78 | | WisdomTree International Dividend and Sector Funds |
Schedule of Investments
WisdomTree International SmallCap Dividend Fund (DLS)
March 31, 2011
| | | | | | | | |
| Investments | | Shares | | | Fair
Value | |
| | | | | | | | |
| COMMON STOCKS – 98.7% | | | | | | | | |
| Australia – 15.9% | | | | | | | | |
Adelaide Brighton Ltd. | | | 712,986 | | | $ | 2,374,216 | |
Alesco Corp., Ltd. | | | 35,885 | | | | 118,753 | |
Amalgamated Holdings Ltd. | | | 7,133 | | | | 43,891 | |
Ansell Ltd. | | | 44,920 | | | | 628,058 | |
APN News & Media Ltd. | | | 294,298 | | | | 473,261 | |
ARB Corp., Ltd. | | | 88,653 | | | | 757,281 | |
Ausdrill Ltd. | | | 464,322 | | | | 1,824,678 | |
Austal Ltd.(a) | | | 218,156 | | | | 685,842 | |
Austbrokers Holdings Ltd. | | | 142,882 | | | | 945,673 | |
Austereo Group Ltd. | | | 573,889 | | | | 1,246,323 | |
Automotive Holdings Group | | | 432,040 | | | | 1,251,023 | |
Bell Financial Group Ltd. | | | 303,098 | | | | 285,238 | |
Bradken Ltd. | | | 117,288 | | | | 952,153 | |
BT Investment Management Ltd. | | | 260,451 | | | | 738,006 | |
Cabcharge Australia Ltd. | | | 214,496 | | | | 1,224,452 | |
Campbell Brothers Ltd. | | | 37,847 | | | | 1,814,114 | |
Cardno Ltd. | | | 184,441 | | | | 1,113,919 | |
carsales.com.au Ltd.(a) | | | 141,864 | | | | 759,951 | |
Cash Converters International Ltd. | | | 312,623 | | | | 258,639 | |
Challenger Infrastructure Fund Class A(b) | | | 737,541 | | | | 907,646 | |
Coffey International Ltd. | | | 630,022 | | | | 459,334 | |
ConnectEast Group(b) | | | 2,956,699 | | | | 1,391,240 | |
Consolidated Media Holdings Ltd. | | | 822,435 | | | | 2,398,469 | |
Count Financial Ltd. | | | 613,421 | | | | 780,274 | |
Cromwell Property Group | | | 1,615,019 | | | | 1,177,471 | |
DUET Group(b) | | | 1,432,282 | | | | 2,481,000 | |
DWS Advanced Business Solutions Ltd.(a) | | | 478,734 | | | | 715,394 | |
Envestra Ltd.(b) | | | 3,021,220 | | | | 1,874,636 | |
FKP Property Group(b) | | | 999,323 | | | | 878,432 | |
Fleetwood Corp., Ltd. | | | 109,640 | | | | 1,373,082 | |
Flight Centre Ltd. | | | 39,441 | | | | 908,754 | |
Goodman Fielder Ltd. | | | 1,660,047 | | | | 2,111,587 | |
GUD Holdings Ltd. | | | 119,765 | | | | 1,186,530 | |
GWA International Ltd.(a) | | | 419,434 | | | | 1,435,737 | |
Hastie Group Ltd. | | | 502,338 | | | | 480,531 | |
Hastings Diversified Utilities Fund | | | 648,934 | | | | 1,073,752 | |
Hills Holdings Ltd. | | | 306,571 | | | | 485,072 | |
Invocare Ltd. | | | 139,546 | | | | 1,021,725 | |
IOOF Holdings Ltd. | | | 226,061 | | | | 1,694,912 | |
Iress Market Technology Ltd. | | | 116,387 | | | | 1,125,381 | |
JB Hi-Fi Ltd.(a) | | | 70,758 | | | | 1,473,000 | |
Kingsgate Consolidated Ltd. | | | 71,335 | | | | 641,071 | |
Mineral Resources Ltd. | | | 80,707 | | | | 1,041,620 | |
Monadelphous Group Ltd. | | | 126,266 | | | | 2,794,368 | |
Mortgage Choice Ltd. | | | 458,863 | | | | 697,564 | |
Myer Holdings Ltd. | | | 470,476 | | | | 1,561,802 | |
Navitas Ltd.(a) | | | 320,849 | | | | 1,420,129 | |
NIB Holdings Ltd. | | | 769,189 | | | | 1,129,548 | |
NRW Holdings Ltd. | | | 108,691 | | | | 324,844 | |
Peet Ltd.(a) | | | 378,349 | | | | 755,150 | |
Perpetual Ltd.(a) | | | 50,814 | | | | 1,528,659 | |
Primary Health Care Ltd. | | | 574,808 | | | | 1,961,644 | |
| | | | | | | | |
| Investments | | Shares | | | Fair
Value | |
| | | | | | | | |
Prime Infrastructure Group*††(b) | | | 124,997 | | | $ | — | |
Ridley Corp., Ltd. | | | 465,277 | | | | 587,023 | |
SAI Global Ltd. | | | 199,991 | | | | 1,036,171 | |
Salmat Ltd. | | | 123,443 | | | | 464,677 | |
Servcorp Ltd. | | | 334,829 | | | | 1,021,477 | |
SMS Management & Technology Ltd. | | | 121,758 | | | | 814,677 | |
Spark Infrastructure Group(c) | | | 2,413,927 | | | | 2,795,925 | |
Specialty Fashion Group Ltd. | | | 88,797 | | | | 96,421 | |
Spotless Group Ltd. | | | 344,663 | | | | 691,480 | |
STW Communications Group Ltd. | | | 579,252 | | | | 724,830 | |
Super Retail Group Ltd. | | | 123,724 | | | | 899,482 | |
Technology One Ltd. | | | 785,683 | | | | 780,013 | |
Thorn Group Ltd. | | | 107,252 | | | | 242,903 | |
Tower Australia Group Ltd. | | | 259,873 | | | | 1,061,553 | |
TPG Telecom Ltd. | | | 267,986 | | | | 462,820 | |
Transfield Services Infrastructure Fund(b) | | | 1,072,334 | | | | 876,074 | |
Transfield Services Ltd. | | | 351,226 | | | | 1,216,788 | |
Watpac Ltd. | | | 480,534 | | | | 780,202 | |
West Australian Newspapers Holdings Ltd.(a) | | | 219,770 | | | | 1,206,831 | |
Wotif.com Holdings Ltd.(a) | | | 181,952 | | | | 1,027,384 | |
| | | | | | | | |
| Total Australia | | | | | | | 75,572,560 | |
| Austria – 1.9% | | | | | | | | |
bwin Interactive Entertainment AG | | | 15,260 | | | | 573,870 | |
Flughafen Wien AG | | | 24,646 | | | | 1,565,137 | |
Oesterreichische Post AG(a) | | | 95,352 | | | | 3,267,834 | |
Schoeller-Bleckmann Oilfield Equipment AG | | | 17,456 | | | | 1,718,420 | |
Semperit AG Holding | | | 31,547 | | | | 1,837,517 | |
| | | | | | | | |
| Total Austria | | | | | | | 8,962,778 | |
| Belgium – 1.6% | | | | | | | | |
Cie D’entreprises CFE | | | 14,204 | | | | 1,178,977 | |
Cie Maritime Belge S.A. | | | 46,471 | | | | 1,374,995 | |
Cofinimmo | | | 3,207 | | | | 469,896 | |
EVS Broadcast Equipment S.A. | | | 19,303 | | | | 1,229,941 | |
Nyrstar | | | 77,706 | | | | 1,122,575 | |
Omega Pharma S.A. | | | 18,843 | | | | 908,227 | |
Tessenderlo Chemie N.V. | | | 42,640 | | | | 1,530,308 | |
| | | | | | | | |
| Total Belgium | | | | | | | 7,814,919 | |
| Denmark – 0.3% | | | | | | | | |
Auriga Industries Class B | | | 38,397 | | | | 675,991 | |
NKT Holding A/S(a) | | | 13,453 | | | | 789,907 | |
| | | | | | | | |
| Total Denmark | | | | | | | 1,465,898 | |
| Finland – 3.7% | | | | | | | | |
Alma Media Oyj | | | 4,761 | | | | 54,997 | |
Amer Sports Oyj Class A(a) | | | 57,982 | | | | 745,477 | |
Citycon Oyj(a) | | | 360,056 | | | | 1,650,386 | |
F-Secure Oyj(a) | | | 184,364 | | | | 609,600 | |
HKScan Oyj Class A(a) | | | 42,120 | | | | 396,292 | |
Huhtamaki Oyj*(a) | | | 90,416 | | | | 1,283,093 | |
Kemira Oyj(a) | | | 82,801 | | | | 1,338,358 | |
Konecranes Oyj(a) | | | 46,191 | | | | 2,141,507 | |
Lassila & Tikanoja Oyj(a) | | | 45,300 | | | | 816,422 | |
Orion Oyj Class B(a) | | | 143,755 | | | | 3,492,527 | |
Outotec Oyj(a) | | | 21,568 | | | | 1,298,967 | |
Ramirent Oyj*(a) | | | 54,281 | | | | 893,550 | |
See Notes to Financial Statements.
| | | | |
| WisdomTree International Dividend and Sector Funds | | | 79 | |
Schedule of Investments (continued)
WisdomTree International SmallCap Dividend Fund (DLS)
March 31, 2011
| | | | | | | | |
| Investments | | Shares | | | Fair
Value | |
| | | | | | | | |
Stockmann Oyj Abp Class B(a) | | | 23,967 | | | $ | 721,045 | |
Tieto Oyj(a) | | | 46,847 | | | | 857,599 | |
Uponor Oyj(a) | | | 62,710 | | | | 1,070,571 | |
| | | | | | | | |
| Total Finland | | | | | | | 17,370,391 | |
| France – 3.8% | | | | | | | | |
Canal Plus | | | 193,194 | | | | 1,533,386 | |
Etablissements Maurel et Prom | | | 93,155 | | | | 1,797,869 | |
Ingenico | | | 47,968 | | | | 2,150,716 | |
IPSOS | | | 25,482 | | | | 1,249,922 | |
Nexity | | | 56,046 | | | | 2,783,323 | |
Rallye S.A. | | | 65,005 | | | | 2,945,036 | |
Saft Groupe S.A. | | | 21,762 | | | | 925,856 | |
Sechilienne-Sidec | | | 31,331 | | | | 880,566 | |
Sequana | | | 40,121 | | | | 706,003 | |
Societe Immobiliere de Location pour l’Industrie et le Commerce | | | 8,579 | | | | 1,204,054 | |
Teleperformance | | | 51,903 | | | | 1,959,606 | |
| | | | | | | | |
| Total France | | | | | | | 18,136,337 | |
| Germany – 3.0% | | | | | | | | |
Bauer AG | | | 17,817 | | | | 900,114 | |
Bechtle AG | | | 21,219 | | | | 898,087 | |
Carl Zeiss Meditec AG* | | | 36,068 | | | | 762,643 | |
Comdirect Bank AG | | | 111,526 | | | | 1,262,809 | |
CTS Eventim AG | | | 13,885 | | | | 897,034 | |
Douglas Holding AG(a) | | | 14,757 | | | | 806,463 | |
Drillisch AG | | | 84,077 | | | | 868,604 | |
ElringKlinger AG | | | 22,190 | | | | 700,806 | |
Gerry Weber International AG | | | 22,807 | | | | 1,328,924 | |
H&R WASAG AG | | | 25,689 | | | | 744,234 | |
Indus Holding AG | | | 41,140 | | | | 1,228,644 | |
Kontron AG(a) | | | 50,950 | | | | 633,376 | |
MLP AG | | | 76,534 | | | | 709,328 | |
Sixt AG | | | 21,270 | | | | 1,083,162 | |
Solarworld AG(a) | | | 12,353 | | | | 201,597 | |
Vossloh AG | | | 4,275 | | | | 572,631 | |
Wirecard AG | | | 40,122 | | | | 720,539 | |
| | | | | | | | |
| Total Germany | | | | | | | 14,318,995 | |
| Hong Kong – 1.8% | | | | | | | | |
China Merchants China Direct Investments Ltd. | | | 146,000 | | | | 315,343 | |
China Pharmaceutical Group Ltd.(a) | | | 1,352,000 | | | | 801,306 | |
China Power International Development Ltd. | | | 2,872,000 | | | | 612,934 | |
Citic Telecom International Holdings Ltd. | | | 2,053,000 | | | | 654,578 | |
Dah Chong Hong Holdings Ltd. | | | 1,161,000 | | | | 1,303,069 | |
Goldlion Holdings Ltd. | | | 2,052,000 | | | | 873,225 | |
Henderson Investment Ltd. | | | 6,844,000 | | | | 624,725 | |
Shun Tak Holdings Ltd.(a) | | | 1,890,000 | | | | 1,039,983 | |
Sinotrans Shipping Ltd. | | | 1,552,000 | | | | 502,821 | |
Sun Hung Kai & Co., Ltd. | | | 892,189 | | | | 720,340 | |
Tian An China Investment | | | 245,000 | | | | 151,192 | |
Vitasoy International Holdings Ltd. | | | 1,035,364 | | | | 845,255 | |
| | | | | | | | |
| Total Hong Kong | | | | | | | 8,444,771 | |
| | | | | | | | |
| Investments | | Shares | | | Fair
Value | |
| | | | | | | | |
| Ireland – 1.0% | | | | | | | | |
C&C Group PLC | | | 149,734 | | | $ | 673,798 | |
FBD Holdings PLC | | | 13,793 | | | | 141,909 | |
Glanbia PLC | | | 201,368 | | | | 1,214,486 | |
Greencore Group PLC | | | 369,619 | | | | 618,941 | |
Paddy Power PLC | | | 28,755 | | | | 1,260,912 | |
Total Produce PLC | | | 323,060 | | | | 197,135 | |
United Drug PLC | | | 252,822 | | | | 825,193 | |
| | | | | | | | |
| Total Ireland | | | | | | | 4,932,374 | |
| Italy – 5.4% | | | | | | | | |
Ansaldo STS SpA | | | 49,271 | | | | 722,978 | |
Astaldi SpA | | | 96,215 | | | | 796,021 | |
Autostrada Torino-Milano SpA | | | 54,581 | | | | 829,553 | |
Banca Generali SpA | | | 119,601 | | | | 1,822,855 | |
Benetton Group SpA | | | 141,675 | | | | 1,063,560 | |
Brembo SpA | | | 98,404 | | | | 1,214,912 | |
Cairo Communication SpA | | | 247,191 | | | | 1,114,105 | |
Cementir Holding SpA | | | 184,574 | | | | 552,146 | |
De’Longhi SpA | | | 121,166 | | | | 1,171,816 | |
Falck Renewables SpA(a) | | | 118,130 | | | | 270,065 | |
Fiat SpA RSP | | | 95,790 | | | | 717,740 | |
Fondiaria-Sai SpA(a) | | | 83,838 | | | | 697,190 | |
Fondiaria-Sai SpA RSP | | | 59,764 | | | | 295,482 | |
Geox SpA | | | 239,751 | | | | 1,510,624 | |
Immobiliare Grande Distribuzione | | | 674,587 | | | | 1,485,739 | |
IMMSI SpA | | | 574,142 | | | | 681,958 | |
Indesit Co. SpA | | | 35,692 | | | | 423,945 | |
Iren SpA | | | 1,511,322 | | | | 2,818,158 | |
Italcementi SpA | | | 49,202 | | | | 503,770 | |
Maire Tecnimont SpA | | | 170,831 | | | | 704,006 | |
MARR SpA | | | 103,068 | | | | 1,269,570 | |
Piaggio & C. SpA(a) | | | 304,023 | | | | 1,039,768 | |
Piccolo Credito Valtellinese Scarl | | | 29,633 | | | | 141,968 | |
Recordati SpA | | | 167,643 | | | | 1,687,916 | |
Societa Cattolica di Assicurazioni SCRL | | | 20,098 | | | | 544,182 | |
Unipol Gruppo Finanziario SpA | | | 2,476,481 | | | | 1,785,302 | |
| | | | | | | | |
| Total Italy | | | | | | | 25,865,329 | |
| Japan – 25.1% | | | | | | | | |
Achilles Corp. | | | 157,000 | | | | 234,894 | |
ADEKA Corp. | | | 74,200 | | | | 726,064 | |
Aica Kogyo Co., Ltd. | | | 87,300 | | | | 1,148,130 | |
Aichi Steel Corp. | | | 176,000 | | | | 1,068,147 | |
Airport Facilities Co., Ltd. | | | 53,800 | | | | 233,687 | |
Akita Bank Ltd. (The) | | | 146,000 | | | | 475,627 | |
Alpen Co., Ltd. | | | 35,600 | | | | 615,956 | |
Amano Corp. | | | 104,800 | | | | 1,007,790 | |
AOKI Holdings, Inc. | | | 44,000 | | | | 719,353 | |
Ariake Japan Co., Ltd. | | | 5,300 | | | | 87,736 | |
Asahi Holdings, Inc. | | | 28,100 | | | | 573,663 | |
Avex Group Holdings, Inc. | | | 57,800 | | | | 707,157 | |
Bank of Nagoya Ltd. (The) | | | 137,000 | | | | 443,002 | |
Bank of Saga Ltd. (The) | | | 169,000 | | | | 477,148 | |
BML, Inc. | | | 4,000 | | | | 113,031 | |
See Notes to Financial Statements.
| | |
| 80 | | WisdomTree International Dividend and Sector Funds |
Schedule of Investments (continued)
WisdomTree International SmallCap Dividend Fund (DLS)
March 31, 2011
| | | | | | | | |
| Investments | | Shares | | | Fair
Value | |
| | | | | | | | |
Capcom Co., Ltd. | | | 38,600 | | | $ | 740,516 | |
Cawachi Ltd. | | | 4,700 | | | | 90,167 | |
Century Tokyo Leasing Corp. | | | 63,110 | | | | 1,040,158 | |
Chiyoda Co., Ltd. | | | 75,100 | | | | 954,154 | |
Chuetsu Pulp & Paper Co., Ltd. | | | 350,000 | | | | 633,446 | |
Circle K Sunkus Co., Ltd. | | | 86,300 | | | | 1,322,406 | |
Coca-Cola Central Japan Co., Ltd. | | | 40,900 | | | | 557,638 | |
COMSYS Holdings Corp.(a) | | | 93,900 | | | | 952,822 | |
Daifuku Co., Ltd. | | | 132,000 | | | | 961,969 | |
Daio Paper Corp.(a) | | | 76,000 | | | | 585,039 | |
Daishi Bank Ltd. (The) | | | 212,000 | | | | 703,427 | |
DCM Japan Holdings Co., Ltd. | | | 138,100 | | | | 846,462 | |
DIC Corp. | | | 478,000 | | | | 1,113,103 | |
DOWA Holdings Co., Ltd.(a) | | | 190,000 | | | | 1,187,500 | |
EDION Corp.(a) | | | 71,300 | | | | 608,218 | |
Ehime Bank Ltd. (The) | | | 197,000 | | | | 558,579 | |
Ezaki Glico Co., Ltd. | | | 65,000 | | | | 757,601 | |
Fancl Corp.(a) | | | 46,500 | | | | 653,626 | |
Fukui Bank Ltd. (The) | | | 197,000 | | | | 615,625 | |
Fukuyama Transporting Co., Ltd.(a) | | | 163,000 | | | | 794,546 | |
Goldcrest Co., Ltd. | | | 12,420 | | | | 244,564 | |
Gunze Ltd. | | | 206,000 | | | | 750,627 | |
H2O Retailing Corp. | | | 116,000 | | | | 787,983 | |
Hanwa Co., Ltd. | | | 198,000 | | | | 879,151 | |
Higo Bank Ltd. (The) | | | 99,000 | | | | 554,247 | |
Hikari Tsushin, Inc.(a) | | | 46,900 | | | | 920,118 | |
Hitachi Cable Ltd. | | | 227,000 | | | | 586,125 | |
Hitachi Koki Co., Ltd. | | | 84,700 | | | | 816,546 | |
Hokkoku Bank Ltd. (The) | | | 157,000 | | | | 532,300 | |
Hokuetsu Bank Ltd. (The) | | | 353,000 | | | | 809,242 | |
Hokuetsu Kishu Paper Co., Ltd. | | | 161,000 | | | | 868,328 | |
Hokuto Corp. | | | 32,800 | | | | 741,641 | |
House Foods Corp.(a) | | | 52,900 | | | | 868,050 | |
Hyakugo Bank Ltd. (The) | | | 124,000 | | | | 559,556 | |
Hyakujushi Bank Ltd. (The) | | | 173,000 | | | | 653,342 | |
Inaba Denki Sangyo Co., Ltd. | | | 35,800 | | | | 1,019,402 | |
IT Holdings Corp. | | | 54,600 | | | | 573,142 | |
Ito En Ltd. | | | 52,200 | | | | 912,618 | |
Itochu Enex Co., Ltd. | | | 140,200 | | | | 805,203 | |
Iwatani Corp. | | | 239,000 | | | | 801,665 | |
Izumi Co., Ltd. | | | 48,300 | | | | 690,583 | |
Japan Airport Terminal Co., Ltd. | | | 13,200 | | | | 167,070 | |
Japan Pulp & Paper Co., Ltd. | | | 141,000 | | | | 532,493 | |
Japan Vilene Co., Ltd. | | | 59,000 | | | | 288,308 | |
Japan Wool Textile Co., Ltd. (The) | | | 94,000 | | | | 796,187 | |
J-Oil Mills, Inc. | | | 185,000 | | | | 520,089 | |
Joshin Denki Co., Ltd. | | | 13,000 | | | | 125,953 | |
JSP Corp. | | | 13,300 | | | | 246,326 | |
Juroku Bank Ltd. (The) | | | 153,000 | | | | 503,970 | |
Kaga Electronics Co., Ltd. | | | 11,500 | | | | 135,841 | |
Kagome Co., Ltd. | | | 31,000 | | | | 550,579 | |
Kagoshima Bank Ltd. (The) | | | 79,000 | | | | 536,643 | |
Kaken Pharmaceutical Co., Ltd. | | | 123,000 | | | | 1,475,169 | |
Kanamoto Co., Ltd. | | | 31,000 | | | | 236,764 | |
| | | | | | | | |
| Investments | | Shares | | | Fair
Value | |
| | | | | | | | |
Kandenko Co., Ltd. | | | 156,000 | | | $ | 884,653 | |
Kanto Auto Works Ltd. | | | 11,900 | | | | 83,421 | |
Kappa Create Co., Ltd. | | | 7,750 | | | | 146,622 | |
Kasumi Co., Ltd. | | | 46,800 | | | | 252,973 | |
Kato Sangyo Co., Ltd. | | | 6,300 | | | | 109,079 | |
Keihin Corp. | | | 6,800 | | | | 129,551 | |
Keiyo Bank Ltd. (The) | | | 102,000 | | | | 511,969 | |
Keiyo Co., Ltd. | | | 28,300 | | | | 146,827 | |
Kewpie Corp. | | | 80,800 | | | | 978,803 | |
Kiyo Holdings, Inc. | | | 532,800 | | | | 745,714 | |
Kohnan Shoji Co., Ltd. | | | 13,200 | | | | 177,901 | |
Kokuyo Co., Ltd. | | | 91,400 | | | | 701,380 | |
Komeri Co., Ltd. | | | 26,600 | | | | 678,801 | |
Kose Corp. | | | 27,000 | | | | 673,371 | |
K’s Holdings Corp. | | | 5,500 | | | | 159,266 | |
Kurabo Industries Ltd. | | | 430,000 | | | | 788,610 | |
KUREHA Corp. | | | 136,000 | | | | 641,602 | |
Kuroda Electric Co., Ltd. | | | 9,700 | | | | 121,133 | |
Kyoei Steel Ltd. | | | 44,000 | | | | 779,344 | |
Kyokuyo Co., Ltd.(a) | | | 41,000 | | | | 87,066 | |
KYORIN Holdings, Inc. | | | 67,000 | | | | 1,144,691 | |
Kyoritsu Maintenance Co., Ltd. | | | 5,700 | | | | 81,497 | |
Kyosan Electric Manufacturing Co., Ltd. | | | 42,000 | | | | 223,986 | |
Kyowa Exeo Corp. | | | 97,900 | | | | 983,961 | |
Kyudenko Corp. | | | 67,000 | | | | 428,451 | |
Lion Corp. | | | 137,000 | | | | 699,216 | |
Maeda Corp. | | | 55,000 | | | | 181,829 | |
Maeda Road Construction Co., Ltd. | | | 92,000 | | | | 946,863 | |
Mandom Corp. | | | 5,500 | | | | 134,646 | |
Mars Engineering Corp. | | | 22,900 | | | | 390,140 | |
Maruetsu, Inc. (The) | | | 26,000 | | | | 95,680 | |
Maruichi Steel Tube Ltd. | | | 52,700 | | | | 1,306,690 | |
Maruzen Showa Unyu Co., Ltd. | | | 33,000 | | | | 115,866 | |
Max Co., Ltd. | | | 34,000 | | | | 421,308 | |
Mie Bank Ltd. (The) | | | 160,000 | | | | 432,432 | |
Mikuni Coca-Cola Bottling Co., Ltd. | | | 10,800 | | | | 96,429 | |
Mitsuboshi Belting Co., Ltd. | | | 43,000 | | | | 236,064 | |
Mitsumi Electric Co., Ltd. | | | 45,900 | | | | 613,071 | |
Miura Co., Ltd. | | | 31,700 | | | | 954,289 | |
Mizuno Corp.(a) | | | 188,000 | | | | 802,992 | |
Mochida Pharmaceutical Co., Ltd. | | | 92,000 | | | | 1,092,278 | |
Morinaga & Co., Ltd. | | | 328,000 | | | | 759,846 | |
Morinaga Milk Industry Co., Ltd. | | | 181,000 | | | | 648,612 | |
Moshi Moshi Hotline, Inc. | | | 29,300 | | | | 549,021 | |
Musashino Bank Ltd. (The) | | | 25,100 | | | | 816,477 | |
Nagase & Co., Ltd. | | | 79,000 | | | | 943,653 | |
NEC Fielding Ltd. | | | 9,200 | | | | 106,675 | |
Nichirei Corp. | | | 176,000 | | | | 753,861 | |
Nihon Nohyaku Co., Ltd. | | | 19,000 | | | | 87,802 | |
Nihon Yamamura Glass Co., Ltd. | | | 254,000 | | | | 720,198 | |
Nippon Beet Sugar Manufacturing Co., Ltd. | | | 239,000 | | | | 536,366 | |
Nippon Flour Mills Co., Ltd. | | | 128,000 | | | | 588,417 | |
Nippon Kayaku Co., Ltd. | | | 119,000 | | | | 1,082,601 | |
Nippon Shinyaku Co., Ltd. | | | 12,000 | | | | 154,488 | |
See Notes to Financial Statements.
| | | | |
| WisdomTree International Dividend and Sector Funds | | | 81 | |
Schedule of Investments (continued)
WisdomTree International SmallCap Dividend Fund (DLS)
March 31, 2011
| | | | | | | | |
| Investments | | Shares | | | Fair
Value | |
| | | | | | | | |
Nippon Suisan Kaisha Ltd.(a) | | | 176,000 | | | $ | 490,541 | |
Nipro Corp.(a) | | | 40,900 | | | | 812,276 | |
Nishi-Nippon Railroad Co., Ltd. | | | 225,000 | | | | 971,887 | |
Nissha Printing Co., Ltd.(a) | | | 10,200 | | | | 220,910 | |
Nisshin Oillio Group Ltd. (The) | | | 116,000 | | | | 550,048 | |
NOF Corp. | | | 136,000 | | | | 623,552 | |
NS Solutions Corp.(a) | | | 31,300 | | | | 602,359 | |
NSD Co., Ltd.(a) | | | 61,000 | | | | 610,883 | |
Ogaki Kyoritsu Bank Ltd. (The) | | | 199,000 | | | | 653,089 | |
Okasan Securities Group, Inc. | | | 174,000 | | | | 663,417 | |
Okumura Corp. | | | 209,000 | | | | 880,080 | |
Onward Holdings Co., Ltd. | | | 136,000 | | | | 1,014,093 | |
PanaHome Corp. | | | 141,000 | | | | 916,976 | |
Paramount Bed Co., Ltd. | | | 5,400 | | | | 148,357 | |
Parco Co., Ltd. | | | 80,300 | | | | 799,318 | |
Park24 Co., Ltd. | | | 103,000 | | | | 1,001,665 | |
Plenus Co., Ltd. | | | 85,700 | | | | 1,310,110 | |
Point, Inc. | | | 13,270 | | | | 557,186 | |
Rengo Co., Ltd. | | | 143,000 | | | | 936,885 | |
Ryohin Keikaku Co., Ltd.(a) | | | 21,700 | | | | 894,130 | |
Ryosan Co., Ltd. | | | 40,800 | | | | 986,525 | |
Saibu Gas Co., Ltd. | | | 353,000 | | | | 881,648 | |
Saizeriya Co., Ltd. | | | 5,100 | | | | 78,334 | |
Sankei Building Co., Ltd. (The) | | | 29,200 | | | | 173,340 | |
Sankyu, Inc. | | | 174,000 | | | | 835,569 | |
Sanwa Holdings Corp.(a) | | | 287,000 | | | | 969,595 | |
Sanyo Chemical Industries Ltd. | | | 95,000 | | | | 814,973 | |
Sanyo Shokai Ltd. | | | 217,000 | | | | 667,652 | |
Sawai Pharmaceutical Co., Ltd. | | | 1,100 | | | | 95,294 | |
Senshu Ikeda Holdings, Inc. | | | 273,800 | | | | 373,304 | |
Shimachu Co., Ltd. | | | 36,600 | | | | 792,676 | |
Shinko Plantech Co., Ltd. | | | 82,600 | | | | 959,747 | |
Sinanen Co., Ltd. | | | 100,000 | | | | 460,907 | |
Sohgo Security Services Co., Ltd. | | | 81,400 | | | | 888,839 | |
Sugi Holdings Co., Ltd. | | | 4,100 | | | | 95,426 | |
Sumisho Computer Systems Corp.(a) | | | 30,100 | | | | 421,647 | |
Sumitomo Bakelite Co., Ltd. | | | 151,000 | | | | 930,997 | |
Sumitomo Osaka Cement Co., Ltd. | | | 278,000 | | | | 808,374 | |
Sumitomo Warehouse Co., Ltd. (The) | | | 140,000 | | | | 679,054 | |
Sundrug Co., Ltd. | | | 6,800 | | | | 194,204 | |
Taiyo Holdings Co., Ltd. | | | 32,800 | | | | 1,013,127 | |
Takara Holdings, Inc.(a) | | | 73,000 | | | | 362,005 | |
Takara Standard Co., Ltd. | | | 75,000 | | | | 605,393 | |
Takasago Thermal Engineering Co., Ltd. | | | 98,300 | | | | 874,120 | |
Toda Corp. | | | 249,000 | | | | 988,429 | |
Toho Bank Ltd. (The) | | | 162,000 | | | | 439,792 | |
Tokai Tokyo Financial Holdings, Inc. | | | 253,000 | | | | 866,940 | |
Tokyo Tatemono Co., Ltd. | | | 258,000 | | | | 968,123 | |
Tokyo Tomin Bank Ltd. (The) | | | 34,600 | | | | 450,869 | |
Tokyotokeiba Co., Ltd. | | | 590,000 | | | | 768,822 | |
Tokyu Livable, Inc. | | | 33,900 | | | | 298,179 | |
Toppan Forms Co., Ltd. | | | 92,400 | | | | 806,047 | |
Toshiba TEC Corp. | | | 211,000 | | | | 941,964 | |
Tosoh Corp.(a) | | | 302,000 | | | | 1,089,503 | |
| | | | | | | | |
| Investments | | Shares | | | Fair
Value | |
| | | | | | | | |
Towa Pharmaceutical Co., Ltd. | | | 1,800 | | | $ | 91,325 | |
Toyo Ink SC Holdings Co., Ltd. | | | 199,000 | | | | 1,020,451 | |
Toyobo Co., Ltd. | | | 446,000 | | | | 645,753 | |
Toyota Auto Body Co., Ltd. | | | 71,100 | | | | 1,197,582 | |
Tsuruha Holdings, Inc. | | | 3,600 | | | | 163,972 | |
UNY Co., Ltd. | | | 100,500 | | | | 936,125 | |
Valor Co., Ltd. | | | 56,400 | | | | 562,775 | |
Wacoal Holdings Corp. | | | 76,000 | | | | 961,004 | |
WATAMI Co., Ltd.(a) | | | 4,700 | | | | 74,969 | |
Xebio Co., Ltd. | | | 29,300 | | | | 534,881 | |
Yamanashi Chuo Bank Ltd. (The) | | | 121,000 | | | | 589,817 | |
Yodogawa Steel Works Ltd. | | | 198,000 | | | | 922,153 | |
Yokohama Rubber Co., Ltd. (The) | | | 186,000 | | | | 904,416 | |
| | | | | | | | |
| Total Japan | | | | | | | 119,571,097 | |
| Netherlands – 1.8% | | | | | | | | |
Aalberts Industries N.V. | | | 36,314 | | | | 862,923 | |
Arcadis N.V. | | | 42,801 | | | | 1,035,902 | |
BinckBank N.V. | | | 77,453 | | | | 1,350,838 | |
Exact Holding N.V. | | | 36,209 | | | | 1,149,207 | |
Grontmij CVA | | | 39,193 | | | | 856,529 | |
Koninklijke BAM Groep N.V. | | | 84,679 | | | | 653,594 | |
Mediq N.V. | | | 33,011 | | | | 660,527 | |
Sligro Food Group N.V. | | | 28,700 | | | | 969,738 | |
TKH Group N.V. | | | 37,408 | | | | 1,078,436 | |
| | | | | | | | |
| Total Netherlands | | | | | | | 8,617,694 | |
| New Zealand – 2.9% | | | | | | | | |
Air New Zealand Ltd.(a) | | | 983,729 | | | | 832,876 | |
Auckland International Airport Ltd. | | | 1,602,664 | | | | 2,707,686 | |
Fisher & Paykel Healthcare Corp., Ltd. | | | 391,004 | | | | 936,468 | |
Freightways Ltd. | | | 310,138 | | | | 771,178 | |
Infratil Ltd. | | | 552,391 | | | | 804,752 | |
Ryman Healthcare Ltd. | | | 333,213 | | | | 602,355 | |
Sky City Entertainment Group Ltd. | | | 620,313 | | | | 1,599,225 | |
Sky Network Television Ltd. | | | 312,131 | | | | 1,337,997 | |
Tower Ltd. | | | 580,625 | | | | 828,170 | |
Vector Ltd. | | | 1,210,669 | | | | 2,308,594 | |
Warehouse Group Ltd. (The) | | | 423,614 | | | | 1,134,121 | |
| | | | | | | | |
| Total New Zealand | | | | | | | 13,863,422 | |
| Norway – 2.3% | | | | | | | | |
Aker ASA(a) | | | 51,369 | | | | 1,583,299 | |
Atea ASA | | | 112,643 | | | | 1,267,596 | |
Austevoll Seafood ASA | | | 149,424 | | | | 1,161,519 | |
Cermaq ASA* | | | 72,498 | | | | 1,281,092 | |
Copeinca ASA | | | 82,018 | | | | 767,285 | |
Sparebank 1 SMN(a) | | | 115,417 | | | | 1,043,223 | |
Sparebank 1 SR Bank(a) | | | 62,628 | | | | 645,329 | |
Tomra Systems ASA | | | 166,710 | | | | 1,362,190 | |
Veidekke ASA | | | 195,397 | | | | 1,792,633 | |
| | | | | | | | |
| Total Norway | | | | | | | 10,904,166 | |
| Portugal – 1.5% | | | | | | | | |
BANIF, SGPS, S.A. | | | 257,958 | | | | 295,051 | |
Martifer, SGPS S.A.(a) | | | 169,599 | | | | 336,949 | |
See Notes to Financial Statements.
| | |
| 82 | | WisdomTree International Dividend and Sector Funds |
Schedule of Investments (continued)
WisdomTree International SmallCap Dividend Fund (DLS)
March 31, 2011
| | | | | | | | |
| Investments | | Shares | | | Fair
Value | |
| | | | | | | | |
Mota Engil, SGPS, S.A. | | | 211,722 | | | $ | 546,828 | |
Portucel Empresa Produtora de Pasta e Papel S.A. | | | 486,928 | | | | 1,712,988 | |
REN – Redes Energeticas Nacionais S.A. | | | 366,252 | | | | 1,301,449 | |
Semapa-Sociedade de Investimento e Gestao | | | 102,107 | | | | 1,222,956 | |
Zon Multimedia Servicos de Telecomunicacoes e Multimedia, SGPS, S.A.(a) | | | 320,512 | | | | 1,682,903 | |
| | | | | | | | |
| Total Portugal | | | | | | | 7,099,124 | |
| Singapore – 3.2% | | | | | | | | |
Boustead Singapore Ltd. | | | 1,000,000 | | | | 793,336 | |
Cityspring Infrastructure Trust | | | 1,755,649 | | | | 759,087 | |
First Resources Ltd.(a) | | | 481,000 | | | | 503,705 | |
Guocoland Ltd. | | | 648,102 | | | | 1,254,557 | |
Hi-P International Ltd. | | | 1,239,000 | | | | 1,150,044 | |
Ho Bee Investment Ltd. | | | 890,000 | | | | 1,002,618 | |
Hong Leong Asia Ltd. | | | 165,000 | | | | 367,830 | |
Hyflux Ltd.(a) | | | 285,500 | | | | 489,234 | |
K1 Ventures Ltd. | | | 5,321,000 | | | | 654,308 | |
Singapore Post Ltd. | | | 1,755,000 | | | | 1,615,073 | |
Straits Asia Resources Ltd. | | | 692,000 | | | | 1,377,961 | |
United Engineers Ltd. | | | 338,000 | | | | 689,139 | |
UOB-Kay Hian Holdings Ltd. | | | 892,000 | | | | 1,245,474 | |
Venture Corp., Ltd. | | | 285,000 | | | | 2,172,828 | |
Wing Tai Holdings Ltd. | | | 853,000 | | | | 1,035,375 | |
| | | | | | | | |
| Total Singapore | | | | | | | 15,110,569 | |
| Spain – 1.8% | | | | | | | | |
Abengoa S.A.(a) | | | 30,496 | | | | 1,011,380 | |
Almirall S.A. | | | 153,267 | | | | 1,713,909 | |
Antena 3 de Television S.A.(a) | | | 200,354 | | | | 1,865,155 | |
Banco Pastor S.A.(a) | | | 94,916 | | | | 455,944 | |
Duro Felguera S.A. | | | 209,951 | | | | 1,695,287 | |
FAES FARMA S.A. | | | 173,881 | | | | 700,783 | |
Sol Melia S.A. | | | 9,258 | | | | 106,549 | |
Viscofan S.A. | | | 21,037 | | | | 835,901 | |
| | | | | | | | |
| Total Spain | | | | | | | 8,384,908 | |
| Sweden – 6.3% | | | | | | | | |
AarhusKarlshamn AB | | | 22,656 | | | | 646,452 | |
Axfood AB | | | 49,259 | | | | 1,835,773 | |
Axis Communications AB | | | 66,989 | | | | 1,417,639 | |
Castellum AB(a) | | | 229,967 | | | | 3,346,486 | |
Clas Ohlson AB Class B(a) | | | 47,115 | | | | 765,533 | |
Fabege AB(a) | | | 201,545 | | | | 2,180,497 | |
Hoganas AB Class B | | | 19,480 | | | | 724,123 | |
Holmen AB Class B(a) | | | 35,789 | | | | 1,237,899 | |
Husqvarna AB Class A | | | 83,106 | | | | 706,119 | |
Intrum Justitia AB(a) | | | 84,977 | | | | 1,239,282 | |
JM AB | | | 43,616 | | | | 1,161,545 | |
KappAhl AB(a) | | | 57,128 | | | | 320,577 | |
Kungsleden AB | | | 269,048 | | | | 2,644,248 | |
Loomis AB Class B | | | 60,890 | | | | 965,221 | |
Mekonomen AB | | | 33,650 | | | | 1,280,198 | |
NCC AB Class B | | | 74,173 | | | | 2,126,989 | |
Nordnet AB Class B | | | 143,217 | | | | 444,971 | |
| | | | | | | | |
| Investments | | Shares | | | Fair
Value | |
| | | | | | | | |
Peab AB | | | 338,254 | | | $ | 3,016,104 | |
Saab AB Class B | | | 53,247 | | | | 1,161,433 | |
SkiStar AB | | | 27,442 | | | | 473,070 | |
Trelleborg AB Class B | | | 75,278 | | | | 772,660 | |
Wihlborgs Fastigheter AB | | | 58,600 | | | | 1,746,370 | |
| | | | | | | | |
| Total Sweden | | | | | | | 30,213,189 | |
| Switzerland – 0.4% | | | | | | | | |
Kudelski S.A. | | | 21,759 | | | | 398,386 | |
Mobilezone Holding AG | | | 89,828 | | | | 1,080,076 | |
Vontobel Holding AG | | | 7,875 | | | | 305,583 | |
| | | | | | | | |
| Total Switzerland | | | | | | | 1,784,045 | |
| United Kingdom – 15.0% | | | | | | | | |
Ashtead Group PLC | | | 302,651 | | | | 962,506 | |
Atkins WS PLC | | | 79,556 | | | | 893,945 | |
BBA Aviation PLC | | | 368,191 | | | | 1,199,269 | |
Berendsen PLC | | | 171,649 | | | | 1,323,446 | |
Bodycote PLC | | | 210,546 | | | | 1,117,107 | |
Brewin Dolphin Holdings PLC | | | 330,336 | | | | 890,639 | |
Britvic PLC | | | 128,686 | | | | 815,826 | |
Carpetright PLC | | | 34,294 | | | | 374,081 | |
Chaucer Holdings PLC | | | 1,436,452 | | | | 1,295,190 | |
Chemring Group PLC* | | | 53,310 | | | | 590,909 | |
Chesnara PLC | | | 176,966 | | | | 697,822 | |
Cineworld Group PLC | | | 251,522 | | | | 836,592 | |
Close Brothers Group PLC | | | 143,765 | | | | 1,947,286 | |
Collins Stewart PLC | | | 376,077 | | | | 512,408 | |
Computacenter PLC | | | 121,461 | | | | 846,927 | |
Dairy Crest Group PLC | | | 124,025 | | | | 714,309 | |
De La Rue PLC | | | 67,493 | | | | 854,143 | |
Domino Printing Sciences PLC | | | 81,376 | | | | 822,434 | |
DS Smith PLC | | | 288,016 | | | | 918,733 | |
Dunelm Group PLC | | | 102,421 | | | | 630,271 | |
eaga PLC(a) | | | 91,134 | | | | 172,378 | |
Electrocomponents PLC | | | 465,713 | | | | 1,995,433 | |
Elementis PLC | | | 545,160 | | | | 1,329,147 | |
Euromoney Institutional Investor PLC | | | 60,336 | | | | 674,107 | |
Evolution Group PLC | | | 101,065 | | | | 124,742 | |
F&C Asset Management PLC | | | 1,134,772 | | | | 1,378,789 | |
Fenner PLC | | | 61,410 | | | | 354,374 | |
Fidessa Group PLC | | | 20,997 | | | | 589,000 | |
Filtrona PLC | | | 190,618 | | | | 928,264 | |
Forth Ports PLC | | | 25,774 | | | | 675,491 | |
Game Group PLC | | | 515,760 | | | | 467,107 | |
Go-Ahead Group PLC | | | 65,100 | | | | 1,398,317 | |
Greene King PLC | | | 211,396 | | | | 1,517,063 | |
Greggs PLC | | | 71,860 | | | | 586,883 | |
Halfords Group PLC | | | 139,743 | | | | 779,971 | |
Halma PLC | | | 256,235 | | | | 1,439,615 | |
Headlam Group PLC | | | 191,633 | | | | 920,766 | |
Helical Bar PLC | | | 209,873 | | | | 911,014 | |
Hill & Smith Holdings PLC | | | 93,444 | | | | 519,009 | |
HMV Group PLC(a) | | | 1,150,202 | | | | 281,167 | |
Hunting PLC | | | 105,142 | | | | 1,3308,692 | |
See Notes to Financial Statements.
| | | | |
| WisdomTree International Dividend and Sector Funds | | | 83 | |
Schedule of Investments (concluded)
WisdomTree International SmallCap Dividend Fund (DLS)
March 31, 2011
| | | | | | | | |
| Investments | | Shares | | | Fair
Value | |
| | | | | | | | |
Interserve PLC | | | 247,905 | | | $ | 1,093,786 | |
ITE Group PLC | | | 250,348 | | | | 976,351 | |
James Fisher & Sons PLC | | | 13,230 | | | | 110,064 | |
JD Wetherspoon PLC* | | | 124,811 | | | | 849,279 | |
Keller Group PLC | | | 67,671 | | | | 672,534 | |
Kesa Electricals PLC | | | 496,173 | | | | 959,976 | |
Kier Group PLC | | | 49,346 | | | | 1,028,289 | |
Laird PLC | | | 508,507 | | | | 1,124,853 | |
Marston’s PLC | | | 700,546 | | | | 1,066,793 | |
Mcbride PLC | | | 148,181 | | | | 337,882 | |
Melrose PLC | | | 326,047 | | | | 1,713,726 | |
Micro Focus International PLC | | | 72,504 | | | | 367,372 | |
Mitie Group PLC | | | 211,411 | | | | 665,901 | |
Moneysupermarket.com Group PLC | | | 591,353 | | | | 812,832 | |
Morgan Crucible Co. PLC | | | 216,969 | | | | 1,031,894 | |
Morgan Sindall Group PLC | | | 86,274 | | | | 874,011 | |
Mothercare PLC | | | 63,012 | | | | 404,020 | |
N. Brown Group PLC | | | 224,772 | | | | 914,076 | |
Northern Foods PLC | | | 955,598 | | | | 1,114,367 | |
Premier Farnell PLC | | | 304,062 | | | | 1,322,305 | |
Provident Financial PLC(a) | | | 173,895 | | | | 2,675,951 | |
PV Crystalox Solar PLC | | | 678,492 | | | | 595,455 | |
Restaurant Group PLC | | | 268,656 | | | | 1,291,926 | |
Robert Wiseman Dairies PLC | | | 89,301 | | | | 491,345 | |
RPC Group PLC | | | 132,677 | | | | 597,615 | |
RPS Group PLC | | | 140,382 | | | | 481,104 | |
Savills PLC | | | 154,014 | | | | 884,065 | |
Severfield-Rowen PLC | | | 188,648 | | | | 801,342 | |
Smiths News PLC | | | 119,961 | | | | 162,006 | |
Spectris PLC | | | 71,896 | | | | 1,570,798 | |
Spirax-Sarco Engineering PLC | | | 35,506 | | | | 1,103,569 | |
Sthree PLC | | | 130,024 | | | | 853,071 | |
Synergy Health PLC | | | 45,000 | | | | 591,488 | |
Ted Baker PLC | | | 51,036 | | | | 540,752 | |
Telecom Plus PLC | | | 90,566 | | | | 662,714 | |
Tullett Prebon PLC | | | 178,865 | | | | 1,173,510 | |
Ultra Electronics Holdings PLC | | | 27,771 | | | | 766,557 | |
Victrex PLC | | | 32,816 | | | | 710,132 | |
WH Smith PLC | | | 120,293 | | | | 836,469 | |
Wincanton PLC | | | 204,382 | | | | 380,851 | |
| | | | | | | | |
| Total United Kingdom | | | | | | | 71,206,203 | |
TOTAL COMMON STOCKS
(Cost: $401,379,778) | | | | | | | 469,638,769 | |
| EXCHANGE-TRADED FUNDS – 0.4% | | | | | | | | |
| United States – 0.4% | | | | | | | | |
WisdomTree Europe SmallCap Dividend Fund(d) | | | 16,250 | | | | 724,750 | |
WisdomTree Japan SmallCap Dividend Fund(d) | | | 31,960 | | | | 1,376,837 | |
| | | | | | | | |
TOTAL EXCHANGE-TRADED FUNDS
(Cost: $2,034,433) | | | | | | | 2,101,587 | |
| SHORT-TERM INVESTMENT – 0.3% | | | | | | | | |
| MONEY MARKET FUND – 0.3% | | | | | | | | |
Invesco Treasury Fund Private Class, 0.02%(e)
(Cost: $1,323,960) | | | 1,323,960 | | | | 1,3233,960 | |
| | | | | | | | |
| Investments | | Shares | | | Fair
Value | |
| | | | | | | | |
| INVESTMENT OF CASH COLLATERAL FOR SECURITIES LOANED – 10.7% | | | | | | | | |
| MONEY MARKET FUND – 10.7% | | | | | | | | |
Dreyfus Institutional Preferred Money Market Fund, 0.19%(f) | | | | | | | | |
| (Cost: $50,635,000)(g) | | | 50,635,000 | | | $ | 50,635,000 | |
TOTAL INVESTMENTS IN SECURITIES – 110.1%
(Cost: $455,373,171) | | | | 523,699,316 | |
Liabilities in Excess of Foreign Currency and Other Assets – (10.1)% | | | | | | | (47,996,242 | ) |
| | | | | | | | |
| NET ASSETS – 100.0% | | | | | | $ | 475,703,074 | |
| RSP | – Risparmio Italian Savings Shares |
| * | Non-income producing security. |
| ++ | Restricted Security. At March 31, 2011, the value of these securities amounted to $0 and 0.0% if net assets. |
| (a) | Security, or portion thereof, was on loan at March 31, 2011 (See Note 2). |
| (b) | Stapled Security – A security contractually bound to one or more other securities to form a single saleable unit which cannot be sold separately. |
| (c) | Securities exempt from registration under Rule 144A of the Securities Act of 1933. Such securities are considered liquid, and may be sold in transactions exempt from registration, normally only to dealers in that program or other “accredited investors.” At March 31, 2011, the aggregate value of these securities amounted to $2,795,925 representing 0.6% of net assets. |
| (d) | Affiliated companies (See Note 7). |
| (e) | Rate shown represents annualized 7-day yield as of March 31, 2011. |
| (f) | Interest rate shown reflects yield as of March 31, 2011. |
| (g) | At March 31, 2011, the total market value of the Fund’s securities on loan was $48,121,152 and the total market value of the collateral held by the Fund was $50,635,000. |
See Notes to Financial Statements.
| | |
| 84 | | WisdomTree International Dividend and Sector Funds |
Schedule of Investments
WisdomTree Emerging Markets Equity Income Fund (DEM)
March 31, 2011
| | | | | | | | |
| Investments | | Shares | | | Fair
Value | |
| | | | | | | | |
| COMMON STOCKS – 99.4% | | | | | | | | |
| Argentina – 0.1% | | | | | | | | |
Petrobras Argentina S.A. ADR(a) | | | 77,639 | | | $ | 1,715,045 | |
| Brazil – 18.2% | | | | | | | | |
AES Tiete S.A. | | | 462,792 | | | | 6,389,616 | |
Banco do Brasil S.A. | | | 3,224,600 | | | | 58,376,806 | |
Cia de Bebidas das Americas | | | 1,273,800 | | | | 29,990,189 | |
Cia de Saneamento de Minas Gerais-COPASA | | | 130,500 | | | | 2,198,064 | |
Cia Energetica de Minas Gerais | | | 438,805 | | | | 6,554,763 | |
Cia Siderurgica Nacional S.A. | | | 1,359,995 | | | | 22,279,924 | |
Cielo S.A. | | | 1,256,500 | | | | 10,705,449 | |
CPFL Energia S.A. | | | 600,543 | | | | 17,280,724 | |
Cremer S.A. | | | 55,144 | | | | 509,491 | |
Drogasil S.A. | | | 108,600 | | | | 860,522 | |
EDP – Energias do Brasil S.A. | | | 176,900 | | | | 4,295,405 | |
Eternit S.A. | | | 148,500 | | | | 1,019,668 | |
Grendene S.A. | | | 303,997 | | | | 1,814,545 | |
JHSF Participacoes S.A. | | | 652,983 | | | | 1,673,852 | |
Light S.A. | | | 496,839 | | | | 8,631,117 | |
LPS Brasil Consultoria de Imoveis S.A. | | | 60,763 | | | | 1,434,332 | |
Natura Cosmeticos S.A. | | | 298,000 | | | | 8,424,786 | |
Redecard S.A. | | | 929,200 | | | | 13,680,246 | |
Souza Cruz S.A. | | | 2,045,600 | | | | 21,377,102 | |
Sul America S.A. | | | 287,117 | | | | 3,600,545 | |
Tegma Gestao Logistica | | | 82,173 | | | | 1,253,748 | |
Tele Norte Leste Participacoes S.A. | | | 124,900 | | | | 2,855,406 | |
Telecomunicacoes de Sao Paulo S.A. | | | 311,423 | | | | 7,154,066 | |
Tractebel Energia S.A. | | | 554,951 | | | | 9,384,787 | |
| | | | | | | | |
| Total Brazil | | | | | | | 241,745,153 | |
| Chile – 3.9% | | | | | | | | |
AES Gener S.A. | | | 7,566,376 | | | | 4,074,142 | |
Banco de Chile | | | 102,684,420 | | | | 14,037,002 | |
Banco Santander Chile | | | 158,242,434 | | | | 13,243,288 | |
Cia Cervecerias Unidas S.A. | | | 268,440 | | | | 3,162,567 | |
CorpBanca S.A. | | | 345,688,336 | | | | 5,259,455 | |
ENTEL Chile S.A. | | | 318,601 | | | | 5,238,980 | |
Inversiones Aguas Metropolitanas S.A. | | | 1,241,286 | | | | 1,883,366 | |
Parque Arauco S.A. | | | 1,106,875 | | | | 2,448,685 | |
Sociedad Matriz Banco de Chile Class B | | | 5,953,787 | | | | 1,963,265 | |
| | | | | | | | |
| Total Chile | | | | | | | 51,310,750 | |
| China – 3.8% | | | | | | | | |
Anhui Expressway Co. Class H | | | 314,000 | | | | 251,500 | |
Bank of China Ltd. Class H | | | 56,742,000 | | | | 31,587,367 | |
Beijing Capital Land Ltd. Class H* | | | 2,404,000 | | | | 887,028 | |
Chongqing Machinery & Electric Co., Ltd. Class H | | | 2,856,000 | | | | 973,027 | |
Dalian Port PDA Co., Ltd. Class H | | | 5,092,000 | | | | 2,035,962 | |
Great Wall Technology Co., Ltd. Class H | | | 1,071,672 | | | | 531,827 | |
Guangzhou R&F Properties Co., Ltd. Class H(a) | | | 2,626,800 | | | | 3,910,718 | |
Huaneng Power International, Inc. Class H | | | 3,232,000 | | | | 1,890,617 | |
Jiangsu Expressway Co., Ltd. Class H | | | 885,642 | | | | 992,877 | |
| | | | | | | | |
| Investments | | Shares | | | Fair
Value | |
| | | | | | | | |
Shandong Chenming Paper Holdings Ltd. Class H | | | 426,000 | | | $ | 357,090 | |
Sichuan Expressway Co., Ltd. Class H* | | | 2,818,000 | | | | 1,829,588 | |
Weiqiao Textile Co. Class H | | | 1,263,500 | | | | 1,254,046 | |
Xiamen International Port Co., Ltd. Class H | | | 2,370,000 | | | | 484,470 | |
Zhejiang Expressway Co., Ltd. Class H | | | 3,654,715 | | | | 3,326,654 | |
| | | | | | | | |
| Total China | | | | | | | 50,312,771 | |
| Czech Republic – 5.0% | | | | | | | | |
CEZ AS | | | 648,933 | | | | 33,179,866 | |
Komercni Banka AS | | | 41,624 | | | | 10,508,857 | |
Telefonica O2 Czech Republic AS | | | 973,881 | | | | 22,792,427 | |
| | | | | | | | |
| Total Czech Republic | | | | | | | 66,481,150 | |
| Hungary – 0.6% | | | | | | | | |
Magyar Telekom Telecommunications PLC | | | 2,588,282 | | | | 8,157,835 | |
| Indonesia – 2.2% | | | | | | | | |
Elnusa Tbk PT | | | 8,142,418 | | | | 275,856 | |
Indo Tambangraya Megah PT | | | 1,215,303 | | | | 6,448,119 | |
International Nickel Indonesia Tbk PT | | | 11,514,000 | | | | 6,314,022 | |
Medco Energi Internasional Tbk PT | | | 3,171,500 | | | | 1,047,151 | |
Sampoerna Agro PT | | | 1,302,608 | | | | 489,927 | |
Telekomunikasi Indonesia Tbk PT | | | 14,554,000 | | | | 12,285,030 | |
Timah Tbk PT | | | 5,648,653 | | | | 1,800,174 | |
| | | | | | | | |
| Total Indonesia | | | | | | | 28,660,279 | |
| Israel – 5.9% | | | | | | | | |
Alon Holdings Blue Square Israel Ltd. | | | 82,679 | | | | 806,961 | |
Bezeq Israeli Telecommunication Corp., Ltd. | | | 8,752,906 | | | | 26,006,965 | |
Clal Industries and Investments Ltd. | | | 310,729 | | | | 2,342,120 | |
Delek Automotive Systems Ltd. | | | 236,989 | | | | 2,913,492 | |
Delek Group Ltd. | | | 13,438 | | | | 3,644,544 | |
Discount Investment Corp. | | | 453,888 | | | | 9,382,765 | |
Gazit-Globe Ltd. | | | 281,620 | | | | 3,740,285 | |
Israel Chemicals Ltd. | | | 971,736 | | | | 16,031,000 | |
Ituran Location and Control Ltd. | | | 64,103 | | | | 956,940 | |
Migdal Insurance & Financial Holding Ltd. | | | 653,605 | | | | 1,221,287 | |
Oil Refineries Ltd.* | | | 4,085,680 | | | | 3,011,355 | |
Partner Communications Co., Ltd. | | | 357,131 | | | | 6,802,691 | |
Shikun & Binui Ltd. | | | 574,896 | | | | 1,680,015 | |
| | | | | | | | |
| Total Israel | | | | | | | 78,540,420 | |
| Malaysia – 5.8% | | | | | | | | |
Boustead Holdings Bhd | | | 973,689 | | | | 1,883,885 | |
British American Tobacco Malaysia Bhd | | | 300,600 | | | | 4,769,901 | |
DIGI.Com Bhd | | | 1,453,200 | | | | 13,722,334 | |
Lafarge Malayan Cement Bhd | | | 948,300 | | | | 2,316,936 | |
Malaysia Airports Holdings Bhd | | | 1,002,200 | | | | 2,011,845 | |
Media Prima Bhd | | | 817,600 | | | | 693,762 | |
OSK Holdings Bhd | | | 1,250,000 | | | | 742,881 | |
Petronas Dagangan Bhd | | | 938,100 | | | | 5,110,574 | |
Petronas Gas Bhd | | | 1,738,972 | | | | 6,568,333 | |
PLUS Expressways Bhd | | | 5,022,800 | | | | 7,429,515 | |
Public Bank Bhd | | | 3,273,476 | | | | 14,180,109 | |
RHB Capital Bhd | | | 1,763,600 | | | | 4,996,018 | |
Telekom Malaysia Bhd | | | 4,805,855 | | | | 6,410,451 | |
See Notes to Financial Statements.
| | | | |
| WisdomTree International Dividend and Sector Funds | | | 85 | |
Schedule of Investments (continued)
WisdomTree Emerging Markets Equity Income Fund (DEM)
March 31, 2011
| | | | | | | | |
| Investments | | Shares | | | Fair
Value | |
| | | | | | | | |
WCT Bhd | | | 554,400 | | | $ | 556,459 | |
YTL Power International Bhd | | | 6,643,737 | | | | 5,045,182 | |
| | | | | | | | |
| Total Malaysia | | | | | | | 76,438,185 | |
| Mexico – 3.2% | | | | | | | | |
Alsea S.A.B de C.V. | | | 459,806 | | | | 492,349 | |
Bolsa Mexicana de Valores S.A.B de C.V. | | | 579,800 | | | | 1,219,273 | |
Grupo Aeroportuario del Centro Norte S.A.B de C.V. | | | 372,537 | | | | 707,077 | |
Grupo Aeroportuario del Sureste S.A.B de C.V. Class B | | | 255,916 | | | | 1,504,257 | |
Grupo Continental S.A.B de C.V. | | | 804,200 | | | | 2,715,055 | |
Industrias Penoles S.A.B de CV | | | 374,945 | | | | 13,798,392 | |
Kimberly-Clark de Mexico S.A.B de C.V. Class A | | | 845,038 | | | | 5,230,368 | |
Telefonos de Mexico S.A.B de C.V. Class L | | | 17,760,800 | | | | 16,288,222 | |
| | | | | | | | |
| Total Mexico | | | | | | | 41,954,993 | |
| Philippines – 1.9% | | | | | | | | |
Bank of The Philippine Islands | | | 2,732,312 | | | | 3,604,259 | |
Globe Telecom, Inc. | | | 373,088 | | | | 7,659,479 | |
Philippine Long Distance Telephone Co. | | | 224,627 | | | | 12,028,414 | |
Universal Robina Corp. | | | 1,591,100 | | | | 1,239,152 | |
| | | | | | | | |
| Total Philippines | | | | | | | 24,531,304 | |
| Poland – 3.8% | | | | | | | | |
KGHM Polska Miedz S.A. | | | 523,181 | | | | 33,200,879 | |
Telekomunikacja Polska S.A. | | | 2,873,224 | | | | 17,808,404 | |
| | | | | | | | |
| Total Poland | | | | | | | 51,009,283 | |
| Russia – 4.0% | | | | | | | | |
Lukoil OAO ADR | | | 537,104 | | | | 38,483,502 | |
Tatneft ADR(a) | | | 332,300 | | | | 14,684,337 | |
| | | | | | | | |
| Total Russia | | | | | | | 53,167,839 | |
| South Africa – 6.6% | | | | | | | | |
African Bank Investments Ltd. | | | 1,163,382 | | | | 6,516,158 | |
Allied Technologies Ltd. | | | 153,208 | | | | 1,291,948 | |
Astral Foods Ltd. | | | 82,777 | | | | 1,512,395 | |
Aveng Ltd. | | | 411,126 | | | | 2,169,535 | |
AVI Ltd. | | | 353,023 | | | | 1,566,275 | |
City Lodge Hotels Ltd. | | | 91,552 | | | | 912,886 | |
Foschini Group Ltd. (The) | | | 232,610 | | | | 2,913,023 | |
Grindrod Ltd. | | | 427,187 | | | | 937,233 | |
Group Five Ltd. | | | 215,820 | | | | 871,652 | |
Hudaco Industries Ltd. | | | 85,897 | | | | 1,037,583 | |
Kumba Iron Ore Ltd.(a) | | | 285,538 | | | | 20,192,052 | |
Lewis Group Ltd. | | | 141,642 | | | | 1,561,122 | |
MMI Holdings Ltd. | | | 1,145,712 | | | | 2,822,139 | |
Murray & Roberts Holdings Ltd. | | | 327,256 | | | | 1,284,923 | |
Pick’n Pay Holdings Ltd. | | | 576,645 | | | | 1,634,529 | |
Pick’n Pay Stores Ltd.(a) | | | 394,416 | | | | 2,685,281 | |
Pretoria Portland Cement Co., Ltd. | | | 847,613 | | | | 3,009,522 | |
Raubex Group Ltd.(a) | | | 283,008 | | | | 764,100 | |
Reunert Ltd. | | | 254,416 | | | | 2,204,867 | |
Sanlam Ltd. | | | 2,285,562 | | | | 9,332,344 | |
Santam Ltd. | | | 108,575 | | | | 2,043,175 | |
| | | | | | | | |
| Investments | | Shares | | | Fair
Value | |
| | | | | | | | |
Spar Group Ltd. (The) | | | 141,803 | | | $ | 1,992,956 | |
Standard Bank Group Ltd. | | | 1,201,071 | | | | 18,479,519 | |
| | | | | | | | |
| Total South Africa | | | | | | | 87,735,217 | |
| South Korea – 4.0% | | | | | | | | |
Daeduck Electronics Co. | | | 56,410 | | | | 527,100 | |
Daekyo Co., Ltd. | | | 105,737 | | | | 576,423 | |
Daishin Securities Co., Ltd.* | | | 125,740 | | | | 1,690,747 | |
GS Home Shopping, Inc. | | | 7,286 | | | | 905,976 | |
Huchems Fine Chemical Corp. | | | 50,622 | | | | 1,158,314 | |
Jinro Ltd. | | | 62,392 | | | | 2,041,910 | |
Kangwon Land, Inc. | | | 256,490 | | | | 5,950,746 | |
Korea Exchange Bank | | | 631,330 | | | | 5,565,396 | |
KT Corp. ADR(a) | | | 334,568 | | | | 6,534,113 | |
KT&G Corp. | | | 134,382 | | | | 6,995,043 | |
LG Uplus Corp. | | | 558,000 | | | | 3,148,749 | |
SK Telecom Co., Ltd. ADR(a) | | | 873,288 | | | | 16,426,547 | |
SK Telecom Co., Ltd. | | | 5,511 | | | | 821,412 | |
Woongjin Thinkbig Co., Ltd. | | | 32,570 | | | | 498,816 | |
| | | | | | | | |
| Total South Korea | | | | | | | 52,841,292 | |
| Taiwan – 18.3% | | | | | | | | |
AcBel Polytech, Inc. | | | 769,635 | | | | 560,087 | |
Accton Technology Corp. | | | 544,743 | | | | 351,967 | |
Advantech Co., Ltd. | | | 447,964 | | | | 1,386,249 | |
Altek Corp. | | | 382,665 | | | | 524,421 | |
Asia Cement Corp. | | | 3,681,462 | | | | 4,137,599 | |
ASROCK, Inc. | | | 178,988 | | | | 586,147 | |
Asustek Computer, Inc. | | | 524,000 | | | | 4,534,984 | |
AV Tech Corp. | | | 106,000 | | | | 334,151 | |
Avermedia Technologies, Inc. | | | 341,460 | | | | 421,505 | |
Chang Hwa Commercial Bank | | | 5,382,000 | | | | 4,319,290 | |
Cheng Uei Precision Industry Co., Ltd. | | | 558,290 | | | | 1,082,160 | |
China Steel Chemical Corp. | | | 228,520 | | | | 1,220,058 | |
China Steel Corp. | | | 10,684,438 | | | | 12,771,258 | |
Chinese Maritime Transport Ltd. | | | 573,800 | | | | 1,217,592 | |
Chung Hsin Electric & Machinery Manufacturing Corp. | | | 569,873 | | | | 351,732 | |
Chunghwa Telecom Co., Ltd. | | | 8,941,248 | | | | 27,851,608 | |
Compal Communications, Inc. | | | 606,184 | | | | 552,454 | |
CSBC Corp. Taiwan | | | 625,741 | | | | 573,469 | |
CTCI Corp. | | | 842,992 | | | | 960,340 | |
Cyberlink Corp. | | | 173,660 | | | | 533,266 | |
Darfon Electronics Corp. | | | 336,668 | | | | 460,240 | |
Depo Auto Parts Industries Co., Ltd. | | | 209,163 | | | | 511,411 | |
Eternal Chemical Co., Ltd. | | | 999,500 | | | | 1,179,421 | |
Far EasTone Telecommunications Co., Ltd. | | | 4,338,595 | | | | 6,491,700 | |
Farglory Land Development Co., Ltd. | | | 920,000 | | | | 1,961,607 | |
Feng Hsin Iron & Steel Co. | | | 592,922 | | | | 1,052,506 | |
Feng TAY Enterprise Co., Ltd. | | | 549,600 | | | | 575,644 | |
FSP Technology, Inc. | | | 335,355 | | | | 423,093 | |
Gemtek Technology Corp. | | | 359,094 | | | | 412,134 | |
Getac Technology Corp. | | | 603,321 | | | | 322,110 | |
Global Mixed Mode Technology, Inc. | | | 57,000 | | | | 214,187 | |
Great Wall Enterprise Co., Ltd. | | | 446,750 | | | | 477,036 | |
See Notes to Financial Statements.
| | |
| 86 | | WisdomTree International Dividend and Sector Funds |
Schedule of Investments (continued)
WisdomTree Emerging Markets Equity Income Fund (DEM)
March 31, 2011
| | | | | | | | |
| Investments | | Shares | | | Fair
Value | |
| | | | | | | | |
Greatek Electronics, Inc. | | | 709,490 | | | $ | 641,778 | |
Green Energy Technology, Inc. | | | 108,913 | | | | 494,445 | |
Holtek Semiconductor, Inc. | | | 308,454 | | | | 440,027 | |
HTC Corp. | | | 944,350 | | | | 36,930,696 | |
Hua Nan Financial Holdings Co., Ltd. | | | 4,935,020 | | | | 3,692,056 | |
Huaku Development Co., Ltd. | | | 608,880 | | | | 1,706,144 | |
Hung Poo Real Estate Development Corp. | | | 907,385 | | | | 1,075,353 | |
Infortrend Technology, Inc. | | | 537,000 | | | | 684,798 | |
Inventec Appliances Corp. | | | 1,408,224 | | | | 1,115,795 | |
Inventec Co., Ltd. | | | 2,982,701 | | | | 1,521,450 | |
Lite-On Technology Corp. | | | 1,791,512 | | | | 2,205,388 | |
Merida Industry Co., Ltd. | | | 312,646 | | | | 579,437 | |
Merry Electronics Co., Ltd. | | | 270,000 | | | | 422,356 | |
Nan Ya Printed Circuit Board Corp. | | | 625,569 | | | | 1,865,656 | |
Novatek Microelectronics Corp. | | | 559,415 | | | | 1,647,436 | |
Oriental Union Chemical Corp. | | | 587,155 | | | | 826,627 | |
Quanta Computer, Inc. | | | 4,165,990 | | | | 7,862,631 | |
Radiant Opto-Electronics Corp. | | | 300,894 | | | | 723,418 | |
Senao International Co., Ltd. | | | 381,043 | | | | 999,045 | |
Shih Wei Navigation Co., Ltd. | | | 957,901 | | | | 1,263,889 | |
Siliconware Precision Industries Co. | | | 3,080,514 | | | | 3,855,029 | |
Sincere Navigation | | | 844,410 | | | | 921,754 | |
Sonix Technology Co., Ltd. | | | 104,011 | | | | 199,134 | |
Star Comgistic Capital Co., Ltd.* | | | 58,588 | | | | 63,257 | |
Sunrex Technology Corp. | | | 356,856 | | | | 359,204 | |
Taiwan Cement Corp. | | | 2,999,364 | | | | 3,620,880 | |
Taiwan Cogeneration Corp. | | | 935,720 | | | | 644,359 | |
Taiwan Cooperative Bank | | | 5,315,200 | | | | 4,175,305 | |
Taiwan Mobile Co., Ltd. | | | 5,205,000 | | | | 12,248,516 | |
Taiwan Navigation Co., Ltd. | | | 1,002,000 | | | | 1,086,964 | |
Taiwan Secom Co., Ltd. | | | 600,635 | | | | 1,082,538 | |
Taiwan Semiconductor Manufacturing Co., Ltd. | | | 24,160,000 | | | | 58,004,047 | |
Teco Electric and Machinery Co., Ltd. | | | 1,494,624 | | | | 1,047,022 | |
Ton Yi Industrial Corp. | | | 1,470,683 | | | | 800,195 | |
Tsann Kuen Enterprise Co., Ltd. | | | 208,257 | | | | 427,045 | |
TSRC Corp. | | | 738,222 | | | | 1,895,355 | |
Tung Ho Steel Enterprise Corp. | | | 1,005,095 | | | | 1,167,225 | |
U-Ming Marine Transport Corp. | | | 1,691,858 | | | | 3,601,595 | |
Young Fast Optoelectronics Co., Ltd. | | | 102,622 | | | | 753,791 | |
YungShin Global Holding Corp. | | | 310,000 | | | | 421,675 | |
Zinwell Corp. | | | 426,000 | | | | 776,481 | |
| | | | | | | | |
| Total Taiwan | | | | | | | 242,201,222 | |
| Thailand – 5.0% | | | | | | | | |
Advanced Info Service PCL | | | 4,225,890 | | | | 12,574,974 | |
Asian Property Development PCL | | | 5,463,600 | | | | 1,138,062 | |
Bangkok Expressway PCL | | | 1,215,688 | | | | 759,679 | |
BEC World PCL | | | 1,974,969 | | | | 2,203,842 | |
Big C Supercenter PCL | | | 445,900 | | | | 1,168,377 | |
Big C Supercenter PCL NVDR | | | 142,500 | | | | 373,388 | |
Charoen Pokphand Foods PCL | | | 5,496,200 | | | | 4,679,357 | |
Delta Electronics Thai PCL | | | 1,822,900 | | | | 1,612,253 | |
Electricity Generating PCL | | | 661,598 | | | | 2,039,809 | |
| | | | | | | | |
| Investments | | Shares | | | Fair
Value | |
| | | | | | | | |
Esso Thailand PCL | | | 5,443,868 | | | $ | 1,961,916 | |
Glow Energy PCL | | | 1,458,300 | | | | 2,025,082 | |
Hana Microelectronics PCL | | | 949,400 | | | | 753,368 | |
IRPC PCL | | | 15,272,800 | | | | 2,903,574 | |
Kiatnakin Bank PCL | | | 762,078 | | | | 888,188 | |
Land and Houses PCL | | | 8,958,800 | | | | 2,058,643 | |
LPN Development PCL | | | 3,339,100 | | | | 1,170,258 | |
Major Cineplex Group PCL | | | 666,900 | | | | 297,674 | |
MCOT PCL | | | 1,038,100 | | | | 995,368 | |
Precious Shipping PCL | | | 1,893,473 | | | | 1,133,141 | |
Preuksa Real Estate PCL | | | 2,293,700 | | | | 1,395,407 | |
PTT Aromatics & Refining PCL | | | 2,701,000 | | | | 3,326,575 | |
Quality Houses PCL | | | 17,487,000 | | | | 1,306,683 | |
Ratchaburi Electricity Generating Holding PCL | | | 1,688,096 | | | | 2,120,934 | |
Siam City Cement PCL | | | 253,800 | | | | 1,745,426 | |
Siam Makro PCL | | | 269,900 | | | | 1,302,873 | |
Thai Oil PCL | | | 2,234,391 | | | | 6,150,208 | |
Thai Tap Water Supply PCL | | | 5,199,855 | | | | 1,022,951 | |
Thai Union Frozen Products PCL | | | 763,500 | | | | 1,161,217 | |
Thai Vegetable Oil PCL | | | 1,321,442 | | | | 1,168,741 | |
Thanachart Capital PCL | | | 1,186,700 | | | | 1,275,178 | |
Tisco Financial Group PCL | | | 705,581 | | | | 909,825 | |
Total Access Communication PCL | | | 1,569,100 | | | | 2,490,223 | |
| | | | | | | | |
| Total Thailand | | | | | | | 66,113,194 | |
| Turkey – 7.1% | | | | | | | | |
Adana Cimento Sanayii TAS Class A | | | 145,845 | | | | 513,908 | |
Akcansa Cimento A.S.(a) | | | 211,519 | | | | 1,002,895 | |
Anadolu Hayat Emeklilik A.S.(a) | | | 374,775 | | | | 1,238,043 | |
Anadolu Sigorta | | | 859,571 | | | | 662,557 | |
Cimsa Cimento Sanayi ve Tica | | | 212,389 | | | | 1,396,346 | |
Dogan Sirketler Grubu Holdings* | | | 4,828,786 | | | | 3,753,307 | |
Fenerbahce Sportif Hizmetleri Sanayi ve Ticaret A.S. | | | 25,768 | | | | 1,518,857 | |
Ford Otomotiv Sanayi A.S. | | | 1,132,867 | | | | 10,823,453 | |
Hurriyet Gazetecilik A.S. | | | 846,498 | | | | 1,107,573 | |
Mardin Cimento Sanayii ve Ticaret A.S.(a) | | | 266,082 | | | | 1,365,009 | |
Migros Ticaret A.S. | | | 147,722 | | | | 3,320,241 | |
Selcuk Ecza Deposu Ticaret ve Sanayi A.S. | | | 678,802 | | | | 1,086,013 | |
Tofas Turk Otomobil Fabrikasi A.S. | | | 517,705 | | | | 2,924,110 | |
Tupras Turkiye Petrol Rafine(a) | | | 396,412 | | | | 11,657,288 | |
Turk Telekomunikasyon A.S. | | | 5,808,365 | | | | 29,195,137 | |
Turkcell Iletisim Hizmet A.S.(a) | | | 2,029,784 | | | | 12,016,858 | |
Turkiye Is Bankasi Class C(a) | | | 3,289,137 | | | | 10,524,557 | |
| | | | | | | | |
| Total Turkey | | | | | | | 94,106,152 | |
TOTAL COMMON STOCKS
(Cost: $1,122,701,217) | | | | | | | 1,317,022,084 | |
| EXCHANGE-TRADED FUND – 0.1% | | | | | | | | |
| United States – 0.1% | | | | | | | | |
WisdomTree Global Equity Income Fund(a)(b)
(Cost: $1,876,133) | | | 42,292 | | | | 1,907,623 | |
See Notes to Financial Statements.
| | | | |
| WisdomTree International Dividend and Sector Funds | | | 87 | |
Schedule of Investments (concluded)
WisdomTree Emerging Markets Equity Income Fund (DEM)
March 31, 2011
| | | | | | | | |
| Investments | | Shares | | | Fair Value | |
| | | | | | | | |
| RIGHTS – 0.0% | | | | | | | | |
| Chile – 0.0% | | | | | | | | |
Banco de Chile,
expiring 4/29/11* | | | 4,128,228 | | | $ | — | |
Sociedad Matriz Banco de Chile,
expiring 4/29/11* | | | 244,136 | | | | — | |
| | | | | | | | |
TOTAL RIGHTS
(Cost: $50) | | | | | | | — | |
TOTAL LONG-TERM INVESTMENTS
(Cost: $1,124,577,400) | | | | | | | 1,318,929,707 | |
| SHORT-TERM INVESTMENT – 0.1% | | | | | | | | |
| MONEY MARKET FUND – 0.1% | | | | | | | | |
Invesco Treasury Fund Private Class, 0.02%(c) | | | | | |
| (Cost: $1,617,999) | | | 1,617,999 | | | | 1,617,999 | |
| INVESTMENT OF CASH COLLATERAL FOR SECURITIES LOANED – 2.7% | | | | | | | | |
| MONEY MARKET FUND – 2.7% | | | | | | | | |
Dreyfus Institutional Preferred Money Market Fund, 0.19%(d) | | | | | | | | |
| (Cost: $35,295,000)(e) | | | 35,295,000 | | | | 35,295,000 | |
TOTAL INVESTMENTS IN SECURITIES – 102.3% | | | | | |
(Cost: $1,161,490,399) | | | | | | | 1,355,842,706 | |
Liabilities in Excess of Foreign Currency and Other Assets – (2.3)% | | | | | | | (30,586,006 | ) |
| | | | | | | | |
| NET ASSETS – 100.0% | | | | | | $ | 1,325,256,700 | |
| ADR | – American Depositary Receipt |
| NVDR | – Non Voting Depositary Receipt |
| PCL | – Public Company Limited |
| * | Non-income producing security. |
| (a) | Security, or portion thereof, was on loan at March 31, 2011 (See Note 2). |
| (b) | Affiliated companies (See Note 7). |
| (c) | Rate shown represents annualized 7-day yield as of March 31, 2011. |
| (d) | Interest rate shown reflects yield as of March 31, 2011. |
| (e) | At March 31, 2011, the total market value of the Fund’s securities on loan was $23,462,931 and the total market value of the collateral held by the Fund was $35,295,000. |
See Notes to Financial Statements.
| | |
| 88 | | WisdomTree International Dividend and Sector Funds |
Schedule of Investments
WisdomTree Emerging Markets SmallCap Dividend Fund (DGS)
March 31, 2011
| | | | | | | | |
| Investments | | Shares | | | Fair
Value | |
| | | | | | | | |
| COMMON STOCKS – 97.9% | | | | | | | | |
| Argentina – 0.6% | | | | | | | | |
Banco Macro S.A. ADR | | | 71,949 | | | $ | 2,880,118 | |
Cresud SACIF y A ADR | | | 2,244 | | | | 40,616 | |
IRSA Inversiones y Representaciones S.A. ADR | | | 109,795 | | | | 1,521,759 | |
Petrobras Argentina S.A. ADR | | | 41,483 | | | | 916,360 | |
| | | | | | | | |
| Total Argentina | | | | | | | 5,358,853 | |
| Brazil – 8.5% | | | | | | | | |
AES Tiete S.A. | | | 1,008,970 | | | | 13,930,516 | |
B2W Cia Global Do Varejo | | | 52,558 | | | | 723,712 | |
Bematech S.A. | | | 50,854 | | | | 227,893 | |
Brookfield Incorporacoes S.A. | | | 485,672 | | | | 2,519,792 | |
Camargo Correa Desenvolvimento Imobiliario S.A. | | | 235,644 | | | | 941,562 | |
CETIP S.A.-Balcao Organizado de Ativos e Derivativos | | | 365,364 | | | | 5,985,524 | |
Cia de Saneamento de Minas Gerais-COPASA | | | 302,487 | | | | 5,094,909 | |
Cia Hering | | | 135,877 | | | | 2,489,930 | |
Cremer S.A. | | | 27,537 | | | | 254,422 | |
Diagnosticos da America S.A. | | | 199,360 | | | | 2,561,318 | |
Drogasil S.A. | | | 233,859 | | | | 1,853,046 | |
Equatorial Energia S.A. | | | 272,723 | | | | 2,164,349 | |
Estacio Participacoes S.A. | | | 87,235 | | | | 1,435,014 | |
Eternit S.A. | | | 245,860 | | | | 1,688,186 | |
Even Construtora e Incorporadora S.A.* | | | 307,843 | | | | 1,582,030 | |
Grendene S.A. | | | 406,826 | | | | 2,428,327 | |
Iochpe Maxion S.A. | | | 134,848 | | | | 1,788,855 | |
JHSF Participacoes S.A. | | | 1,681,221 | | | | 4,309,631 | |
Kroton Educacional S.A.* | | | 53,961 | | | | 697,587 | |
Localiza Rent A Car S.A. | | | 145,577 | | | | 2,328,516 | |
Lojas Americanas S.A. | | | 217,258 | | | | 1,589,286 | |
LPS Brasil Consultoria de Imoveis S.A. | | | 54,263 | | | | 1,280,897 | |
M Dias Branco S.A. | | | 48,855 | | | | 1,143,929 | |
Marisa Lojas S.A. | | | 89,392 | | | | 1,394,114 | |
Obrascon Huarte Lain Brasil S.A. | | | 102,071 | | | | 3,883,937 | |
Odontoprev S.A. | | | 222,176 | | | | 3,632,938 | |
Positivo Informatica S.A. | | | 154,113 | | | | 753,157 | |
Rossi Residencial S.A. | | | 259,076 | | | | 2,185,045 | |
Santos Brasil Participacoes S.A. | | | 36,193 | | | | 589,144 | |
Sao Martinho S.A. | | | 52,682 | | | | 816,097 | |
Springs Global Participacoes S.A. | | | 279,081 | | | | 832,053 | |
Tegma Gestao Logistica | | | 69,960 | | | | 1,067,409 | |
Totvs S.A. | | | 167,880 | | | | 3,219,829 | |
Valid Solucoes e Servicos de Seguranca em Meios de Pagamento e Identificacao S.A. | | | 155,027 | | | | 1,884,053 | |
| | | | | | | | |
| Total Brazil | | | | | | | 79,277,007 | |
| Chile – 3.9% | | | | | | | | |
Banco de Chile | | | 231,908 | | | | 31,702 | |
CorpBanca S.A. | | | 833,744,340 | | | | 12,684,955 | |
Empresas La Polar S.A. | | | 361,676 | | | | 1,923,303 | |
Inversiones Aguas Metropolitanas S.A. | | | 3,847,472 | | | | 5,837,655 | |
Parque Arauco S.A. | | | 2,409,462 | | | | 5,330,334 | |
| | | | | | | | |
| Investments | | Shares | | | Fair
Value | |
| | | | | | | | |
Sociedad Matriz Banco de Chile Class B | | | 12,310,693 | | | $ | 4,059,458 | |
Sonda S.A. | | | 1,305,864 | | | | 3,214,581 | |
Vina Concha y Toro S.A. | | | 1,529,808 | | | | 3,556,728 | |
| | | | | | | | |
| Total Chile | | | | | | | 36,638,716 | |
| China – 5.9% | | | | | | | | |
Angang Steel Co., Ltd. Class H | | | 168,087 | | | | 230,795 | |
Anhui Expressway Co. Class H | | | 1,302,721 | | | | 1,043,423 | |
BBMG Corp. Class H | | | 688,540 | | | | 1,124,226 | |
Beijing Capital Land Ltd. Class H* | | | 4,900,948 | | | | 1,808,352 | |
Beijing Jingkelong Co., Ltd. Class H | | | 349,636 | | | | 426,583 | |
China National Materials Co., Ltd. Class H | | | 845,456 | | | | 760,869 | |
China Oilfield Services Ltd. Class H | | | 951,549 | | | | 2,153,103 | |
China Shipping Development Co., Ltd. Class H | | | 397,874 | | | | 447,072 | |
Chongqing Machinery & Electric Co., Ltd. Class H | | | 5,551,305 | | | | 1,891,306 | |
CSR Corp., Ltd. Class H | | | 1,248,891 | | | | 1,278,081 | |
Dalian Port PDA Co., Ltd. Class H | | | 11,406,560 | | | | 4,560,747 | |
First Tractor Co., Ltd. Class H | | | 701,762 | | | | 843,572 | |
Great Wall Motor Co., Ltd. Class H | | | 2,405,152 | | | | 4,446,541 | |
Great Wall Technology Co., Ltd. Class H | | | 1,370,726 | | | | 680,235 | |
Guangshen Railway Co., Ltd. Class H(a) | | | 2,691,964 | | | | 1,020,968 | |
Guangzhou Shipyard International Co., Ltd. Class H | | | 46,858 | | | | 94,943 | |
Harbin Power Equipment Co., Ltd. Class H | | | 646,174 | | | | 668,754 | |
Huadian Power International Co. Class H(a) | | | 1,680,649 | | | | 341,393 | |
Huaneng Power International, Inc. Class H(a) | | | 7,915,046 | | | | 4,630,051 | |
Jiangsu Expressway Co., Ltd. Class H | | | 3,117,062 | | | | 3,494,482 | |
Lianhua Supermarket Holdings Co., Ltd. Class H | | | 167,205 | | | | 664,246 | |
Maanshan Iron & Steel Class H | | | 859,584 | | | | 465,255 | |
Shandong Chenming Paper Holdings Ltd. Class H | | | 1,126,447 | | | | 944,233 | |
Shanghai Forte Land Co. Class H(a) | | | 6,487,240 | | | | 2,877,398 | |
Shanghai Jin Jiang International Hotels Group Co., Ltd. Class H(a) | | | 2,372,182 | | | | 512,363 | |
Shenzhen Expressway Co., Ltd. Class H* | | | 1,397,970 | | | | 916,619 | |
Sichuan Expressway Co., Ltd. Class H* | | | 6,863,271 | | | | 4,455,982 | |
Sinopec Shanghai Petrochemical Co., Ltd. Class H | | | 1,288,941 | | | | 606,506 | |
Sinotrans Ltd. Class H | | | 1,715,490 | | | | 416,841 | |
Tong Ren Tang Technologies Co., Ltd. Class H | | | 178,648 | | | | 601,756 | |
Travelsky Technology Ltd. Class H | | | 1,894,137 | | | | 1,848,307 | |
Weichai Power Co., Ltd. Class H | | | 191,371 | | | | 1,162,516 | |
Weiqiao Textile Co. Class H | | | 2,691,532 | | | | 2,671,393 | |
Xiamen International Port Co., Ltd. Class H | | | 3,771,546 | | | | 770,970 | |
Xinjiang Xinxin Mining Industry Co., Ltd. Class H | | | 179,054 | | | | 109,115 | |
Zhuzhou CSR Times Electric Co., Ltd. Class H | | | 693,091 | | | | 2,628,652 | |
ZTE Corp. Class H | | | 223,504 | | | | 1,040,195 | |
| | | | | | | | |
| Total China | | | | | | | 54,637,843 | |
| Indonesia – 2.4% | | | | | | | | |
AKR Corporindo Tbk PT | | | 4,667,341 | | | | 787,940 | |
Aneka Tambang Tbk PT | | | 12,113,325 | | | | 3,199,615 | |
Elnusa Tbk PT | | | 15,191,568 | | | | 514,673 | |
Global Mediacom Tbk PT | | | 6,258,938 | | | | 603,791 | |
See Notes to Financial Statements.
| | | | |
| WisdomTree International Dividend and Sector Funds | | | 89 | |
Schedule of Investments (continued)
WisdomTree Emerging Markets SmallCap Dividend Fund (DGS)
March 31, 2011
| | | | | | | | |
| Investments | | Shares | | | Fair
Value | |
| | | | | | | | |
Jasa Marga PT | | | 9,238,564 | | | $ | 3,607,363 | |
Kalbe Farma Tbk PT | | | 4,080,511 | | | | 1,593,309 | |
Medco Energi Internasional Tbk PT | | | 7,486,714 | | | | 2,471,927 | |
Perusahaan Perkebunan London Sumatra Indonesia Tbk PT | | | 6,010,010 | | | | 1,570,229 | |
Sampoerna Agro PT | | | 2,978,681 | | | | 1,120,319 | |
Summarecon Agung Tbk PT | | | 17,244,022 | | | | 2,297,223 | |
Timah Tbk PT | | | 12,987,162 | | | | 4,138,889 | |
| | | | | | | | |
| Total Indonesia | | | | | | | 21,905,278 | |
| Israel – 8.0% | | | | | | | | |
Alon Holdings Blue Square Israel Ltd. | | | 20,987 | | | | 204,837 | |
Clal Industries and Investments Ltd. | | | 786,199 | | | | 5,925,975 | |
Delek Automotive Systems Ltd. | | | 405,379 | | | | 4,983,642 | |
Discount Investment Corp. | | | 1,010,525 | | | | 20,889,556 | |
Elbit Systems Ltd. | | | 29,158 | | | | 1,626,931 | |
Gazit-Globe Ltd. | | | 517,172 | | | | 6,868,725 | |
Ituran Location and Control Ltd. | | | 18,058 | | | | 269,573 | |
Migdal Insurance & Financial Holding Ltd. | | | 2,582,213 | | | | 4,824,968 | |
Oil Refineries Ltd.* | | | 12,282,217 | | | | 9,052,623 | |
Ormat Industries | | | 350,952 | | | | 2,596,800 | |
Osem Investments Ltd. | | | 147,139 | | | | 2,480,347 | |
Shikun & Binui Ltd. | | | 1,946,336 | | | | 5,687,764 | |
Shufersal Ltd. | | | 766,930 | | | | 4,747,357 | |
Strauss Group Ltd. | | | 228,974 | | | | 3,741,190 | |
| | | | | | | | |
| Total Israel | | | | | | | 73,900,288 | |
| Malaysia – 5.3% | | | | | | | | |
Affin Holdings Bhd | | | 1,568,668 | | | | 1,812,741 | |
Alliance Financial Group Bhd | | | 1,944,738 | | | | 2,035,434 | |
Berjaya Corp. Bhd | | | 1,139,500 | | | | 428,900 | |
Boustead Holdings Bhd | | | 824,451 | | | | 1,595,141 | |
Dialog Group Bhd | | | 2,888,181 | | | | 2,212,325 | |
EON Capital Bhd* | | | 60,975 | | | | 140,924 | |
Gamuda Bhd | | | 3,322,583 | | | | 4,234,476 | |
Genting Plantation Bhd | | | 665,700 | | | | 1,758,349 | |
Hartalega Holdings Bhd | | | 262,596 | | | | 472,521 | |
IGB Corp. Bhd | | | 4,339,777 | | | | 3,094,979 | |
IJM Corp. Bhd | | | 802,700 | | | | 1,698,822 | |
Kulim Malaysia Bhd | | | 2,046,239 | | | | 2,249,765 | |
Lafarge Malayan Cement Bhd | | | 2,473,900 | | | | 6,044,362 | |
Malaysia Airports Holdings Bhd | | | 654,000 | | | | 1,312,858 | |
Media Prima Bhd | | | 647,400 | | | | 549,341 | |
OSK Holdings Bhd | | | 2,707,200 | | | | 1,608,901 | |
Parkson Holdings Bhd | | | 909,678 | | | | 1,711,982 | |
Sapuracrest Petroleum Bhd | | | 1,192,040 | | | | 1,479,842 | |
SP Setia Bhd | | | 2,761,119 | | | | 5,743,310 | |
Tan Chong Motor Holdings Bhd | | | 174,207 | | | | 279,536 | |
Top Glove Corp. Bhd | | | 527,200 | | | | 936,471 | |
UMW Holdings Bhd | | | 2,567,026 | | | | 6,237,990 | |
Wah Seong Corp. Bhd | | | 602,651 | | | | 419,841 | |
WCT Bhd | | | 1,418,800 | | | | 1,424,070 | |
| | | | | | | | |
| Total Malaysia | | | | | | | 49,482,881 | |
| Mexico – 2.3% | | | | | | | | |
Alsea S.A.B de C.V.(a) | | | 1,546,289 | | | | 1,655,730 | |
Bolsa Mexicana de Valores S.A.B de C.V. | | | 1,933,961 | | | | 4,066,966 | |
| | | | | | | | |
| Investments | | Shares | | | Fair
Value | |
| | | | | | | | |
Cia Minera Autlan S.A.B de C.V. Series B* | | | 235,997 | | | $ | 715,488 | |
Compartamos S.A.B de CV* | | | 1,748,889 | | | | 3,147,552 | |
Consorcio ARA S.A.B de C.V. | | | 1,160,162 | | | | 712,237 | |
Grupo Aeroportuario del Centro Norte S.A.B de C.V.(a) | | | 1,062,288 | | | | 2,016,226 | |
Grupo Aeroportuario del Pacifico S.A.B de C.V. Class B | | | 625,574 | | | | 2,670,993 | |
Grupo Aeroportuario del Sureste S.A.B de C.V. Class B | | | 700,132 | | | | 4,115,328 | |
Grupo Continental S.A.B de C.V. | | | 540,444 | | | | 1,824,590 | |
| | | | | | | | |
| Total Mexico | | | | | | | 20,925,110 | |
| Philippines – 3.0% | | | | | | | | |
Aboitiz Equity Ventures, Inc. | | | 6,897,790 | | | | 6,532,239 | |
Banco de Oro Unibank, Inc. | | | 702,809 | | | | 840,456 | |
Energy Development Corp. | | | 25,517,256 | | | | 3,533,611 | |
First Philippine Holdings Corp. | | | 1,155,240 | | | | 1,527,898 | |
International Container Terminal Services, Inc. | | | 806,928 | | | | 775,320 | |
Jollibee Foods Corp. | | | 898,623 | | | | 1,805,528 | |
Manila Water Co., Inc. | | | 3,171,527 | | | | 1,327,072 | |
Megaworld Corp. | | | 19,398,300 | | | | 943,097 | |
Metropolitan Bank & Trust* | | | 1,265,759 | | | | 1,872,390 | |
Philex Mining Corp. | | | 1,401,717 | | | | 483,819 | |
Robinsons Land Corp. | | | 8,194,790 | | | | 2,175,207 | |
Security Bank Corp. | | | 451,569 | | | | 887,531 | |
Universal Robina Corp. | | | 4,278,413 | | | | 3,332,036 | |
Vista Land & Lifescapes, Inc. | | | 23,950,797 | | | | 1,539,694 | |
| | | | | | | | |
| Total Philippines | | | | | | | 27,575,898 | |
| Poland – 0.5% | | | | | | | | |
Asseco Poland S.A. | | | 90,967 | | | | 1,726,694 | |
Eurocash S.A. | | | 70,786 | | | | 777,509 | |
PBG S.A. | | | 1,703 | | | | 112,750 | |
TVN S.A. | | | 367,315 | | | | 2,346,491 | |
| | | | | | | | |
| Total Poland | | | | | | | 4,963,444 | |
| South Africa – 9.7% | | | | | | | | |
Adcock Ingram Holdings Ltd. | | | 189,539 | | | | 1,557,655 | |
Aeci Ltd. | | | 105,099 | | | | 1,292,077 | |
African Oxygen Ltd. | | | 450,211 | | | | 1,198,884 | |
Allied Technologies Ltd. | | | 77,586 | | | | 654,255 | |
Astral Foods Ltd. | | | 158,766 | | | | 2,900,769 | |
Aveng Ltd. | | | 835,704 | | | | 4,410,057 | |
AVI Ltd. | | | 894,695 | | | | 3,969,539 | |
Barloworld Ltd. | | | 249,570 | | | | 2,758,047 | |
Basil Read Holdings Ltd. | | | 303,049 | | | | 513,342 | |
City Lodge Hotels Ltd. | | | 138,888 | | | | 1,384,884 | |
Foschini Group Ltd. (The) | | | 611,374 | | | | 7,656,364 | |
Grindrod Ltd. | | | 996,540 | | | | 2,186,374 | |
Group Five Ltd. | | | 343,721 | | | | 1,388,217 | |
Hudaco Industries Ltd. | | | 16,996 | | | | 205,301 | |
Illovo Sugar Ltd. | | | 759,321 | | | | 3,016,188 | |
Investec Ltd. | | | 754,596 | | | | 5,894,365 | |
JD Group Ltd. | | | 197,207 | | | | 1,412,070 | |
JSE Ltd. | | | 139,505 | | | | 1,444,696 | |
Lewis Group Ltd. | | | 333,985 | | | | 3,681,051 | |
See Notes to Financial Statements.
| | |
| 90 | | WisdomTree International Dividend and Sector Funds |
Schedule of Investments (continued)
WisdomTree Emerging Markets SmallCap Dividend Fund (DGS)
March 31, 2011
| | | | | | | | |
| Investments | | Shares | | | Fair
Value | |
| | | | | | | | |
Medi-Clinic Corp., Ltd. | | | 855,672 | | | $ | 3,671,081 | |
MMI Holdings Ltd. | | | 1,573,637 | | | | 3,876,211 | |
Mondi Ltd. | | | 193,120 | | | | 1,894,216 | |
Mr. Price Group Ltd. | | | 423,547 | | | | 3,837,924 | |
Murray & Roberts Holdings Ltd. | | | 694,723 | | | | 2,727,729 | |
Nampak Ltd. | | | 778,327 | | | | 2,526,314 | |
Northam Platinum Ltd.(a) | | | 202,452 | | | | 1,317,842 | |
Pick’n Pay Holdings Ltd. | | | 1,050,218 | | | | 2,976,896 | |
Raubex Group Ltd.(a) | | | 516,664 | | | | 1,394,953 | |
Reunert Ltd. | | | 487,058 | | | | 4,221,032 | |
Santam Ltd. | | | 231,874 | | | | 4,363,428 | |
Spar Group Ltd. (The) | | | 447,713 | | | | 6,292,337 | |
Tongaat Hulett Ltd. | | | 120,183 | | | | 1,733,372 | |
Wilson Bayly Holmes-Ovcon Ltd. | | | 114,645 | | | | 1,831,756 | |
| | | | | | | | |
| Total South Africa | | | | | | | 90,189,226 | |
| South Korea – 11.0% | | | | | | | | |
BS Financial Group, Inc.* | | | 209,268 | | | | 3,033,284 | |
Bukwang Pharmaceutical Co., Ltd.* | | | 41,659 | | | | 489,905 | |
Cheil Worldwide, Inc. | | | 222,471 | | | | 2,940,726 | |
CJ CheilJedang Corp. | | | 4,873 | | | | 1,021,733 | |
CJ Corp. | | | 29,450 | | | | 1,973,267 | |
Daeduck Electronics Co. | | | 131,287 | | | | 1,226,758 | |
Daegu Bank Ltd. | | | 143,615 | | | | 2,356,598 | |
Daekyo Co., Ltd. | | | 114,596 | | | | 624,718 | |
Daewoong Pharmaceutical Co., Ltd. | | | 5,476 | | | | 222,145 | |
Daishin Securities Co., Ltd.* | | | 213,039 | | | | 2,864,602 | |
Dong-A Pharmaceutical Co., Ltd. Class A | | | 2,782 | | | | 284,046 | |
Dongbu Insurance Co., Ltd.* | | | 55,163 | | | | 2,519,409 | |
Dongbu Steel Co., Ltd. | | | 72,938 | | | | 654,278 | |
Dongkuk Steel Mill Co., Ltd. | | | 89,961 | | | | 3,239,400 | |
Doosan Corp. | | | 20,650 | | | | 2,691,964 | |
Green Cross Corp./South Korea | | | 3,864 | | | | 477,298 | |
GS Home Shopping, Inc. | | | 1,516 | | | | 188,507 | |
Halla Climate Control Corp. | | | 210,190 | | | | 4,014,295 | |
Halla Engineering & Construc | | | 18,979 | | | | 361,604 | |
Handsome Co., Ltd. | | | 61,868 | | | | 1,175,940 | |
Hanjin Heavy Industries & Construction Co., Ltd.* | | | 34,892 | | | | 1,040,128 | |
Hanjin Heavy Industries & Construction Holdings Co., Ltd. | | | 34,150 | | | | 392,260 | |
Hanmi Holdings Co., Ltd.* | | | 1,847 | | | | 57,164 | |
Hanssem Co., Ltd. | | | 58,800 | | | | 742,404 | |
Hanwha Chem Corp. | | | 195,853 | | | | 7,730,922 | |
Hanwha Corp. | | | 76,787 | | | | 3,542,023 | |
Hotel Shilla Co., Ltd. | | | 50,068 | | | | 1,166,176 | |
Huchems Fine Chemical Corp. | | | 58,831 | | | | 1,346,149 | |
Hyosung Corp. | | | 30,570 | | | | 2,452,400 | |
Hyundai Department Store Co., Ltd. | | | 7,999 | | | | 1,035,469 | |
Hyundai Development Co. | | | 63,968 | | | | 1,857,314 | |
Hyundai Hysco | | | 55,447 | | | | 1,609,906 | |
Hyundai Marine & Fire Insurance Co., Ltd.* | | | 93,613 | | | | 2,611,384 | |
Jinro Ltd. | | | 36,806 | | | | 1,204,554 | |
KEPCO Plant Service & Engineering Co., Ltd. | | | 30,722 | | | | 1,083,861 | |
Korean Reinsurance Co.* | | | 146,054 | | | | 1,704,263 | |
KP Chemical Corp. | | | 86,313 | | | | 2,128,417 | |
| | | | | | | | |
| Investments | | Shares | | | Fair
Value | |
| | | | | | | | |
LG Fashion Corp. | | | 47,601 | | | $ | 1,284,461 | |
LG International Corp. | | | 34,865 | | | | 1,344,445 | |
LIG Insurance Co., Ltd.* | | | 60,332 | | | | 1,471,244 | |
LS Corp. | | | 20,571 | | | | 2,062,820 | |
LS Industrial Systems Co., Ltd. | | | 39,333 | | | | 2,904,392 | |
MegaStudy Co., Ltd. | | | 805 | | | | 123,948 | |
Mirae Asset Securities Co., Ltd.* | | | 20,664 | | | | 883,487 | |
Nexen Tire Corp. | | | 84,813 | | | | 1,039,915 | |
Orion Corp./Republic of South Korea | | | 475 | | | | 170,826 | |
Poongsan Corp. | | | 50,238 | | | | 2,118,153 | |
S&T Dynamics Co., Ltd. | | | 47,592 | | | | 767,928 | |
S1 Corp. | | | 61,753 | | | | 3,169,419 | |
Samsung Fine Chemicals Co., Ltd. | | | 24,139 | | | | 1,758,244 | |
Samyang Corp. | | | 6,209 | | | | 364,519 | |
SK Chemicals Co., Ltd. | | | 16,185 | | | | 947,242 | |
SK Networks Co., Ltd. | | | 186,274 | | | | 2,088,673 | |
SKC Co., Ltd. | | | 39,611 | | | | 1,866,893 | |
STX Engine Co., Ltd. | | | 26,376 | | | | 648,009 | |
STX Offshore & Shipbuilding Co., Ltd. | | | 79,708 | | | | 1,754,818 | |
STX Pan Ocean Co., Ltd. | | | 140,356 | | | | 1,266,716 | |
Sungwoo Hitech Co., Ltd. | | | 50,317 | | | | 928,866 | |
Taeyoung Engineering & Construction | | | 97,744 | | | | 458,892 | |
Woongjin Thinkbig Co., Ltd. | | | 55,543 | | | | 850,652 | |
Woori Investment & Securities Co., Ltd.* | | | 271,115 | | | | 4,967,785 | |
Youngone Corp. | | | 61,318 | | | | 581,346 | |
Youngone Holdings Co., Ltd. | | | 21,606 | | | | 647,028 | |
Yuhan Corp. | | | 9,467 | | | | 1,277,283 | |
| | | | | | | | |
| Total South Korea | | | | | | | 101,813,275 | |
| Taiwan – 19.4% | | | | | | | | |
Ability Enterprise Co., Ltd. | | | 730,162 | | | | 1,078,861 | |
AcBel Polytech, Inc. | | | 1,431,599 | | | | 1,041,818 | |
Accton Technology Corp. | | | 1,013,683 | | | | 654,956 | |
ACES Electronic Co., Ltd. | | | 124,925 | | | | 227,279 | |
Advantech Co., Ltd. | | | 1,048,019 | | | | 3,243,151 | |
Alpha Networks, Inc. | | | 711,606 | | | | 590,454 | |
Altek Corp. | | | 933,835 | | | | 1,279,770 | |
Ambassador Hotel (The) | | | 316,977 | | | | 449,490 | |
AmTRAN Technology Co., Ltd. | | | 846,236 | | | | 715,113 | |
Arcadyan Technology Corp. | | | 200,863 | | | | 354,506 | |
ASROCK, Inc. | | | 119,146 | | | | 390,178 | |
AV Tech Corp. | | | 309,296 | | | | 975,014 | |
Avermedia Technologies, Inc. | | | 648,763 | | | | 800,847 | |
BES Engineering Corp. | | | 658,987 | | | | 195,636 | |
Catcher Technology Co., Ltd. | | | 459,919 | | | | 2,275,627 | |
Cheng Uei Precision Industry Co., Ltd. | | | 1,202,345 | | | | 2,330,562 | |
Chicony Electronics Co., Ltd. | | | 1,063,288 | | | | 1,905,541 | |
China Electric Manufacturing Corp. | | | 337,101 | | | | 304,356 | |
China Steel Chemical Corp. | | | 694,232 | | | | 3,706,474 | |
China Synthetic Rubber Corp. | | | 1,172,202 | | | | 1,114,143 | |
Chinese Maritime Transport Ltd. | | | 1,084,218 | | | | 2,300,689 | |
Chin-Poon Industrial Co., Ltd. | | | 177,647 | | | | 144,986 | |
Chroma ATE, Inc. | | | 504,962 | | | | 1,631,319 | |
Chung Hsin Electric & Machinery Manufacturing Corp. | | | 1,005,531 | | | | 620,624 | |
See Notes to Financial Statements.
| | | | |
| WisdomTree International Dividend and Sector Funds | | | 91 | |
Schedule of Investments (continued)
WisdomTree Emerging Markets SmallCap Dividend Fund (DGS)
March 31, 2011
| | | | | | | | |
| Investments | | Shares | | | Fair
Value | |
| | | | | | | | |
Compal Communications, Inc. | | | 1,225,231 | | | $ | 1,116,630 | |
CSBC Corp. Taiwan | | | 1,085,797 | | | | 995,094 | |
CTCI Corp. | | | 1,945,032 | | | | 2,215,788 | |
Cyberlink Corp. | | | 323,929 | | | | 994,705 | |
Darfon Electronics Corp. | | | 469,059 | | | | 641,225 | |
Depo Auto Parts Industries Co., Ltd. | | | 583,157 | | | | 1,425,841 | |
D-Link Corp. | | | 541,163 | | | | 504,238 | |
Dynamic Electronics Co., Ltd. | | | 533,014 | | | | 297,262 | |
Elite Semiconductor Memory Technology, Inc. | | | 141,282 | | | | 215,480 | |
Elitegroup Computer Systems Co., Ltd. | | | 682,414 | | | | 236,704 | |
Eternal Chemical Co., Ltd. | | | 2,213,361 | | | | 2,611,791 | |
Everlight Electronics Co., Ltd. | | | 722,579 | | | | 2,044,397 | |
Far Eastern Department Stores Co., Ltd. | | | 798,496 | | | | 1,261,291 | |
Faraday Technology Corp. | | | 664,360 | | | | 1,011,005 | |
Farglory Land Development Co., Ltd. | | | 2,537,816 | | | | 5,411,085 | |
Feng Hsin Iron & Steel Co. | | | 1,219,950 | | | | 2,165,555 | |
Feng TAY Enterprise Co., Ltd. | | | 842,436 | | | | 882,357 | |
First Steamship Co., Ltd. | | | 200,977 | | | | 445,606 | |
Flytech Technology Co., Ltd. | | | 134,598 | | | | 358,391 | |
Formosa Advanced Technologies Co., Ltd. | | | 317,629 | | | | 395,868 | |
Formosa International Hotels Corp. | | | 45,852 | | | | 781,183 | |
Formosan Rubber Group, Inc. | | | 358,080 | | | | 340,344 | |
FSP Technology, Inc. | | | 354,200 | | | | 446,868 | |
Gemtek Technology Corp. | | | 1,010,778 | | | | 1,160,075 | |
Getac Technology Corp. | | | 1,045,235 | | | | 558,046 | |
Giant Manufacturing Co., Ltd. | | | 411,266 | | | | 1,671,273 | |
Gigabyte Technology Co., Ltd. | | | 1,042,221 | | | | 1,006,549 | |
Global Mixed Mode Technology, Inc. | | | 176,848 | | | | 664,537 | |
Global Unichip Corp. | | | 168,433 | | | | 535,544 | |
Great China Metal Industry | | | 507,694 | | | | 570,598 | |
Great Wall Enterprise Co., Ltd. | | | 1,033,923 | | | | 1,104,014 | |
Greatek Electronics, Inc. | | | 1,203,436 | | | | 1,088,582 | |
Green Energy Technology, Inc. | | | 273,699 | | | | 1,242,542 | |
Hannstar Board Corp. | | | 336,758 | | | | 201,552 | |
Holtek Semiconductor, Inc. | | | 515,482 | | | | 735,364 | |
Holy Stone Enterprise Co., Ltd. | | | 553,636 | | | | 681,537 | |
Hotai Motor Co., Ltd. | | | 513,567 | | | | 1,510,671 | |
Huaku Development Co., Ltd. | | | 1,596,421 | | | | 4,473,334 | |
Hung Poo Real Estate Development Corp. | | | 2,438,248 | | | | 2,889,597 | |
I-Chiun Precision Industry Co., Ltd. | | | 189,086 | | | | 212,192 | |
Infortrend Technology, Inc. | | | 302,000 | | | | 385,119 | |
Inventec Appliances Corp. | | | 2,799,289 | | | | 2,217,994 | |
Inventec Co., Ltd. | | | 7,460,378 | | | | 3,805,474 | |
I-Sheng Electric Wire & Cable Co., Ltd. | | | 234,185 | | | | 349,209 | |
ITE Technology, Inc. | | | 153,481 | | | | 251,309 | |
ITEQ Corp. | | | 375,381 | | | | 597,413 | |
Kindom Construction Co., Ltd. | | | 1,812,045 | | | | 1,306,356 | |
King Slide Works Co., Ltd. | | | 38,948 | | | | 193,373 | |
Kinsus Interconnect Technology Corp. | | | 547,368 | | | | 1,691,998 | |
KYE Systems Corp. | | | 492,316 | | | | 363,296 | |
Largan Precision Co., Ltd. | | | 127,160 | | | | 3,442,074 | |
LCY Chemical Corp. | | | 1,080,556 | | | | 3,108,668 | |
Lien Hwa Industrial Corp. | | | 542,449 | | | | 378,155 | |
LITE-ON IT Corp. | | | 1,427,222 | | | | 1,422,053 | |
| | | | | | | | |
| Investments | | Shares | | | Fair
Value | |
| | | | | | | | |
Macronix International | | | 5,227,722 | | | $ | 3,466,600 | |
Makalot Industrial Co., Ltd. | | | 505,128 | | | | 1,185,242 | |
Merida Industry Co., Ltd. | | | 801,555 | | | | 1,485,547 | |
Merry Electronics Co., Ltd. | | | 613,268 | | | | 959,323 | |
Micro-Star International Co., Ltd. | | | 1,345,420 | | | | 686,287 | |
MIN AIK Technology Co., Ltd. | | | 164,819 | | | | 475,852 | |
Mitac International Corp. | | | 1,055,798 | | | | 454,180 | |
Nantex Industry Co., Ltd. | | | 188,310 | | | | 159,452 | |
National Petroleum Co., Ltd. | | | 529,250 | | | | 676,714 | |
Nien Hsing Textile Co., Ltd. | | | 1,232,948 | | | | 972,724 | |
Novatek Microelectronics Corp. | | | 1,430,417 | | | | 4,212,474 | |
Oriental Union Chemical Corp. | | | 1,730,698 | | | | 2,436,567 | |
Paragon Technologies Co., Ltd. | | | 128,606 | | | | 232,227 | |
Phihong Technology Co., Ltd. | | | 318,363 | | | | 534,818 | |
Pou Chen Corp. | | | 3,107,908 | | | | 2,869,424 | |
Powertech Technology, Inc. | | | 893,890 | | | | 2,799,628 | |
Radiant Opto-Electronics Corp. | | | 823,447 | | | | 1,979,756 | |
Ralink Technology Corp. | | | 153,251 | | | | 489,878 | |
Realtek Semiconductor Corp. | | | 663,442 | | | | 1,191,224 | |
Richtek Technology Corp. | | | 177,127 | | | | 1,225,761 | |
Senao International Co., Ltd. | | | 895,240 | | | | 2,347,202 | |
Shih Wei Navigation Co., Ltd. | | | 1,937,611 | | | | 2,556,554 | |
Shihlin Electric & Engineering Corp. | | | 353,543 | | | | 436,421 | |
Shin Zu Shing Co., Ltd. | | | 196,372 | | | | 519,536 | |
Silitech Technology Corp. | | | 304,284 | | | | 767,785 | |
Sincere Navigation | | | 1,919,687 | | | | 2,095,521 | |
Sonix Technology Co., Ltd. | | | 344,302 | | | | 659,181 | |
Standard Foods Corp. | | | 377,169 | | | | 1,026,083 | |
Star Comgistic Capital Co., Ltd.* | | | 48,400 | | | | 52,257 | |
Sunrex Technology Corp. | | | 364,157 | | | | 366,553 | |
Syncmold Enterprise Corp. | | | 308,680 | | | | 540,595 | |
Taiflex Scientific Co., Ltd. | | | 154,742 | | | | 351,513 | |
Taiwan Cogeneration Corp. | | | 1,407,299 | | | | 969,099 | |
Taiwan Glass Industrial Corp. | | | 544,494 | | | | 688,799 | |
Taiwan HON Chuan Enterprise Co., Ltd. | | | 648,308 | | | | 1,627,026 | |
Taiwan Navigation Co., Ltd. | | | 1,393,000 | | | | 1,511,118 | |
Taiwan Secom Co., Ltd. | | | 1,343,936 | | | | 2,422,206 | |
Teco Electric and Machinery Co., Ltd. | | | 3,305,683 | | | | 2,315,715 | |
Test Research, Inc. | | | 171,965 | | | | 282,451 | |
Test-Rite International Co. | | | 1,006,218 | | | | 771,605 | |
Ton Yi Industrial Corp. | | | 3,489,037 | | | | 1,898,376 | |
Tong Hsing Electronic Industries Ltd. | | | 139,820 | | | | 698,945 | |
Tripod Technology Corp. | | | 377,344 | | | | 1,661,743 | |
Tsann Kuen Enterprise Co., Ltd. | | | 392,894 | | | | 805,656 | |
TSRC Corp. | | | 2,058,928 | | | | 5,286,214 | |
Tung Ho Steel Enterprise Corp. | | | 2,454,559 | | | | 2,850,499 | |
TXC Corp. | | | 531,970 | | | | 987,726 | |
U-Ming Marine Transport Corp. | | | 4,218,681 | | | | 8,980,648 | |
United Integrated Services Co., Ltd. | | | 359,031 | | | | 499,968 | |
Wah Lee Industrial Corp. | | | 327,152 | | | | 645,259 | |
Wistron NeWeb Corp. | | | 284,469 | | | | 946,086 | |
WPG Holdings Co., Ltd. | | | 1,559,894 | | | | 2,625,772 | |
WT Microelectronics Co., Ltd. | | | 186,942 | | | | 285,437 | |
Yageo Corp. | | | 869,432 | | | | 424,272 | |
See Notes to Financial Statements.
| | |
| 92 | | WisdomTree International Dividend and Sector Funds |
Schedule of Investments (continued)
WisdomTree Emerging Markets SmallCap Dividend Fund (DGS)
March 31, 2011
| | | | | | | | |
| Investments | | Shares | | | Fair
Value | |
| | | | | | | | |
Yieh Phui Enterprise Co., Ltd. | | | 1,211,234 | | | $ | 465,439 | |
Young Fast Optoelectronics Co., Ltd. | | | 228,214 | | | | 1,676,304 | |
YungShin Global Holding Corp. | | | 370,015 | | | | 503,310 | |
Yungtay Engineering Co., Ltd. | | | 543,994 | | | | 856,509 | |
Zinwell Corp. | | | 890,317 | | | | 1,622,804 | |
| | | | | | | | |
| Total Taiwan | | | | | | | 179,470,465 | |
| Thailand – 9.5% | | | | | | | | |
Airports of Thailand PCL* | | | 758,072 | | | | 902,317 | |
Asian Property Development PCL | | | 8,734,386 | | | | 1,819,363 | |
Bangkok Dusit Medical Services PCL | | | 1,393,516 | | | | 2,384,343 | |
Bangkok Expressway PCL | | | 3,568,577 | | | | 2,229,992 | |
Bangkok Life Assurance PCL | | | 535,501 | | | | 628,543 | |
BEC World PCL | | | 5,560,606 | | | | 6,205,008 | |
Big C Supercenter PCL | | | 559,139 | | | | 1,465,094 | |
Big C Supercenter PCL NVDR | | | 114,800 | | | | 300,807 | |
Bumrungrad Hospital PCL | | | 918,766 | | | | 1,154,343 | |
Central Pattana PCL | | | 4,677,480 | | | | 4,407,610 | |
Delta Electronics Thai PCL | | | 4,379,409 | | | | 3,873,341 | |
Electricity Generating PCL | | | 1,770,903 | | | | 5,459,967 | |
Esso Thailand PCL | | | 12,234,963 | | | | 4,409,360 | |
Glow Energy PCL | | | 3,587,177 | | | | 4,981,367 | |
Hana Microelectronics PCL | | | 2,558,896 | | | | 2,030,534 | |
Khon Kaen Sugar Industry PCL | | | 1,028,638 | | | | 459,137 | |
Kiatnakin Bank PCL | | | 1,554,610 | | | | 1,811,870 | |
Land and Houses PCL | | | 25,422,963 | | | | 5,841,944 | |
LPN Development PCL | | | 6,730,502 | | | | 2,358,847 | |
Major Cineplex Group PCL | | | 1,453,557 | | | | 648,802 | |
MCOT PCL | | | 2,644,710 | | | | 2,535,844 | |
Minor International PCL | | | 3,277,031 | | | | 1,300,194 | |
Precious Shipping PCL | | | 5,048,698 | | | | 3,021,373 | |
Preuksa Real Estate PCL | | | 5,132,681 | | | | 3,122,544 | |
Quality Houses PCL | | | 35,269,072 | | | | 2,635,414 | |
Ratchaburi Electricity Generating Holding PCL | | | 4,489,689 | | | | 5,640,872 | |
Siam City Cement PCL | | | 95,983 | | | | 660,091 | |
Siam Makro PCL | | | 200,596 | | | | 968,326 | |
Thai Airways International PCL | | | 433,302 | | | | 540,822 | |
Thai Tap Water Supply PCL | | | 15,941,124 | | | | 3,136,045 | |
Thai Union Frozen Products PCL | | | 2,060,359 | | | | 3,133,626 | |
Thai Vegetable Oil PCL | | | 3,146,385 | | | | 2,782,800 | |
Thanachart Capital PCL | | | 3,038,943 | | | | 3,265,520 | |
Thoresen Thai Agencies PCL | | | 323,145 | | | | 200,864 | |
Tisco Financial Group PCL | | | 1,364,407 | | | | 1,759,361 | |
TPI Polene PCL | | | 1,031,489 | | | | 409,253 | |
| | | | | | | | |
| Total Thailand | | | | | | | 88,485,538 | |
| Turkey – 7.9% | | | | | | | | |
Adana Cimento Sanayii TAS Class A | | | 149,992 | | | | 528,521 | |
Akcansa Cimento A.S. | | | 336,949 | | | | 1,597,608 | |
Aksa Akrilik Kimya Sanayii | | | 734,333 | | | | 1,731,368 | |
Albaraka Turk Katilim Bankasi A.S.(a) | | | 1,362,512 | | | | 2,029,846 | |
Anadolu Hayat Emeklilik A.S.(a) | | | 748,590 | | | | 2,472,914 | |
Anadolu Sigorta(a) | | | 1,922,307 | | | | 1,481,715 | |
Asya Katilim Bankasi A.S.(a) | | | 863,013 | | | | 1,682,592 | |
Cimsa Cimento Sanayi ve Tica | | | 362,080 | | | | 2,380,485 | |
| | | | | | | | |
| Investments | | Shares | | | Fair
Value | |
| | | | | | | | |
Dogan Sirketler Grubu Holdings* | | | 13,367,189 | | | $ | 10,390,016 | |
EIS Eczacibasi Ilac ve Sinai ve Finansal Yatirimlar Sanayi ve Ticaret A.S.(a) | | | 1,343,883 | | | | 2,054,321 | |
Fenerbahce Sportif Hizmetleri Sanayi ve Ticaret A.S. | | | 64,524 | | | | 3,803,274 | |
Ford Otomotiv Sanayi A.S. | | | 2,277,376 | | | | 21,758,134 | |
Hurriyet Gazetecilik A.S. | | | 2,347,057 | | | | 3,070,930 | |
Mardin Cimento Sanayii ve Ticaret A.S. | | | 144,017 | | | | 738,812 | |
Sekerbank TAS | | | 2,030,398 | | | | 2,275,214 | |
Selcuk Ecza Deposu Ticaret ve Sanayi A.S. | | | 1,970,664 | | | | 3,152,858 | |
Tekfen Holding A.S. | | | 319,255 | | | | 1,253,156 | |
Tofas Turk Otomobil Fabrikasi A.S.(a) | | | 1,148,634 | | | | 6,487,734 | |
Turcas Petrolculuk A.S.(a) | | | 491,145 | | | | 1,291,608 | |
Ulker Biskuvi Sanayi A.S. | | | 633,909 | | | | 2,307,587 | |
Yazicilar Holding A.S. Class A | | | 99,932 | | | | 873,843 | |
| | | | | | | | |
| Total Turkey | | | | | | | 73,362,536 | |
TOTAL COMMON STOCKS
(Cost: $777,820,834) | | | | | | | 907,986,358 | |
| EXCHANGE-TRADED FUNDS – 1.6% | | | | | | | | |
| United States – 1.6% | | | | | | | | |
WisdomTree Emerging Markets Equity Income Fund(a)(b) | | | 76,279 | | | | 4,661,410 | |
WisdomTree India Earnings Fund(a)(b) | | | 408,361 | | | | 10,123,269 | |
| | | | | | | | |
TOTAL EXCHANGE-TRADED FUNDS
(Cost: $14,244,383) | | | | | | | 14,784,679 | |
| RIGHTS – 0.0% | | | | | | | | |
| Brazil – 0.0% | | | | | | | | |
B2W Cia Global Do Varejo, expiring 4/26/11* | | | 22,043 | | | | 15,176 | |
| Chile – 0.0% | | | | | | | | |
Sociedad Matriz Banco de Chile, expiring 4/29/11* | | | 422,793 | | | | — | |
| Philippines – 0.0% | | | | | | | | |
Robinsons Land Corp., expiring 4/15/11* | | | 4,097,395 | | | | 143,503 | |
TOTAL RIGHTS
(Cost: $0) | | | | | | | 158,679 | |
| WARRANTS – 0.0% | | | | | | | | |
| Malaysia – 0.0% | | | | | | | | |
Kulim Malaysia Bhd, expiring 2/27/16* (Cost: $0) | | | 272,250 | | | | 88,091 | |
TOTAL LONG-TERM INVESTMENTS
(Cost: $792,065,217) | | | | | | | 923,017,807 | |
| SHORT-TERM INVESTMENT – 0.1% | | | | | | | | |
| MONEY MARKET FUND – 0.1% | | | | | | | | |
Invesco Treasury Fund Private Class, 0.02%(c) | | | | | | | | |
| (Cost: $1,179,319) | | | 1,179,319 | | | | 1,179,319 | |
See Notes to Financial Statements.
| | | | |
| WisdomTree International Dividend and Sector Funds | | | 93 | |
Schedule of Investments (concluded)
WisdomTree Emerging Markets SmallCap Dividend Fund (DGS)
March 31, 2011
| | | | | | | | |
| Investments | | Shares | | | Fair
Value | |
| | | | | | | | |
INVESTMENT OF CASH COLLATERAL FOR
SECURITIES LOANED – 1.5% | | | | | | | | |
| MONEY MARKET FUND – 1.5% | | | | | | | | |
Dreyfus Institutional Preferred Money Market Fund, 0.19%(d) | | | | | | | | |
| (Cost: $13,501,000)(e) | | | 13,501,000 | | | $ | 13,501,000 | |
TOTAL INVESTMENTS IN SECURITIES – 101.1%
(Cost: $806,745,536) | | | | 937,698,126 | |
Liabilities in Excess of Foreign Currency and Other Assets – (1.1)% | | | | | | | (10,235,145 | ) |
| | | | | | | | |
| NET ASSETS – 100.0% | | | | | | $ | 927,462,981 | |
| ADR | – American Depositary Receipt |
| NVDR | – Non Voting Depositary Receipt |
| PCL | – Public Company Limited |
| * | Non-income producing security. |
| (a) | Security, or portion thereof, was on loan at March 31, 2011 (See Note 2). |
| (b) | Affiliated companies (See Note 7). |
| (c) | Rate shown represents annualized 7-day yield as of March 31, 2011. |
| (d) | Interest rate shown reflects yield as of March 31, 2011. |
| (e) | At March 31, 2011, the total market value of the Fund’s securities on loan was $12,492,324 and the total market value of the collateral held by the Fund was $13,501,000. |
See Notes to Financial Statements.
| | |
| 94 | | WisdomTree International Dividend and Sector Funds |
Schedule of Investments
WisdomTree Middle East Dividend Fund (GULF)
March 31, 2011
| | | | | | | | |
| Investments | | Shares | | | Fair
Value | |
| | | | | | | | |
| COMMON STOCKS – 98.4% | | | | | | | | |
| Egypt – 9.9% | | | | | | | | |
Commercial International Bank Egypt S.A.E | | | 9,562 | | | $ | 52,387 | |
Eastern Co. | | | 1,190 | | | | 21,042 | |
Egyptian Co. For Mobile Services | | | 13,810 | | | | 365,370 | |
Egyptian Financial Group-Hermes Holding S.A.E | | | 936 | | | | 3,440 | |
Ghabbour Auto | | | 12,135 | | | | 54,816 | |
Maridive & Oil Services S.A.E | | | 20,303 | | | | 67,609 | |
National Societe Generale Bank S.A.E | | | 14,734 | | | | 94,320 | |
Orascom Construction Industries | | | 10,252 | | | | 423,292 | |
Sidi Kerir Petrochemcials Co. | | | 115,235 | | | | 280,377 | |
Telecom Egypt | | | 197,574 | | | | 572,217 | |
| | | | | | | | |
| Total Egypt | | | | | | | 1,934,870 | |
| Jordan – 1.5% | | | | | | | | |
Arab Bank PLC | | | 13,950 | | | | 176,759 | |
Jordan Petroleum Refinery Co. | | | 2,526 | | | | 16,804 | |
Jordan Phosphate Mines | | | 4,809 | | | | 94,689 | |
| | | | | | | | |
| Total Jordan | | | | | | | 288,252 | |
| Kuwait – 23.0% | | | | | | | | |
Gulf Cable & Electrical Industries Co. | | | 10,000 | | | | 56,257 | |
Kuwait Finance House | | | 81,646 | | | | 312,098 | |
Kuwait Portland Cement Co. | | | 10,000 | | | | 57,699 | |
Kuwait Projects Co. Holdings KSC | | | 27,008 | | | | 34,576 | |
Mobile Telecommunications Co. KSC | | | 627,624 | | | | 2,987,607 | |
National Bank of Kuwait | | | 155,017 | | | | 637,286 | |
National Mobile Telecommunication Co. KSC | | | 65,000 | | | | 412,550 | |
| | | | | | | | |
| Total Kuwait | | | | | | | 4,498,073 | |
| Morocco – 11.7% | | | | | | | | |
Attijariwafa Bank | | | 4,727 | | | | 230,884 | |
Douja Promotion Groupe Addoha S.A. | | | 7,372 | | | | 96,128 | |
Maroc Telecom | | | 101,241 | | | | 1,969,726 | |
| | | | | | | | |
| Total Morocco | | | | | | | 2,296,738 | |
| Oman – 3.4% | | | | | | | | |
Oman Telecommunications Co. | | | 195,579 | | | | 558,797 | |
Raysut Cement Co. | | | 25,425 | | | | 71,916 | |
Renaissance Services S.A.O.G | | | 13,201 | | | | 33,740 | |
| | | | | | | | |
| Total Oman | | | | | | | 664,453 | |
| Qatar – 27.3% | | | | | | | | |
Barwa Real Estate Co. | | | 11,833 | | | | 116,500 | |
Commercial Bank of Qatar | | | 19,847 | | | | 419,691 | |
Doha Bank QSC | | | 24,222 | | | | 390,474 | |
Gulf International Services OSC | | | 11,680 | | | | 85,965 | |
Industries Qatar QSC | | | 39,638 | | | | 1,493,514 | |
Qatar Electricity & Water Co. | | | 16,256 | | | | 615,632 | |
Qatar Gas Transport Co. Nakilat | | | 20,475 | | | | 103,294 | |
Qatar Insurance Co. | | | 7,794 | | | | 172,092 | |
Qatar International Islamic Bank | | | 11,536 | | | | 142,564 | |
Qatar Islamic Bank | | | 17,296 | | | | 384,746 | |
Qatar National Bank S.A.Q | | | 16,807 | | | | 633,269 | |
Qatar Telecom Q-Tel QSC | | | 21,216 | | | | 790,655 | |
| | | | | | | | |
| Total Qatar | | | | | | | 5,348,396 | |
| | | | | | | | |
| Investments | | Shares | | | Fair
Value | |
| | | | | | | | |
| United Arab Emirates – 21.6% | | | | | | | | |
Air Arabia | | | 1,255,108 | | | $ | 259,722 | |
Aldar Properties PJSC | | | 142,610 | | | | 59,021 | |
DP World Ltd. | | | 488,280 | | | | 290,527 | |
Drake & Scull International | | | 1,360,005 | | | | 399,925 | |
Dubai Financial Market | | | 800,744 | | | | 285,614 | |
Dubai Investments PJSC | | | 1,411,493 | | | | 324,751 | |
Dubai Islamic Bank PJSC | | | 799,203 | | | | 483,086 | |
Emirates NBD PJSC | | | 875,428 | | | | 788,975 | |
First Gulf Bank PJSC | | | 118,294 | | | | 515,344 | |
Gulf Navigation Holding* | | | 1,475,296 | | | | 136,575 | |
National Bank of Abu Dhabi PJSC | | | 188,133 | | | | 498,929 | |
Tamweel PJSC*† | | | 65,235 | | | | – | |
Waha Capital PJSC | | | 829,137 | | | | 185,121 | |
| | | | | | | | |
| Total United Arab Emirates | | | | | | | 4,227,590 | |
TOTAL INVESTMENTS IN SECURITIES – 98.4%
(Cost: $17,390,252) | | | | | | | 19,258,372 | |
Other Assets in Excess of Foreign Currency and Liabilities – 1.6% | | | | | | | 312,668 | |
| | | | | | | | |
| NET ASSETS – 100.0% | | | | | | $ | 19,571,040 | |
| * | Non-income producing security. |
| † | Security is being fair valued by a valuation committee under the direction of the Board of Trustees. The aggregate value of fair valued securities is $0, which represents 0.0% of net assets. |
See Notes to Financial Statements.
| | | | |
| WisdomTree International Dividend and Sector Funds | | | 95 | |
Schedule of Investments
WisdomTree International Hedged Equity Fund (HEDJ)
March 31, 2011
| | | | | | | | |
| Investments | | Shares | | | Fair
Value | |
| | | | | | | | |
| COMMON STOCKS – 100.3% | | | | | | | | |
| Australia – 11.5% | | | | | | | | |
Adelaide Brighton Ltd. | | | 3,548 | | | $ | 11,815 | |
AGL Energy Ltd. | | | 1,182 | | | | 17,492 | |
Amalgamated Holdings Ltd. | | | 2,191 | | | | 13,482 | |
Amcor Ltd. | | | 2,658 | | | | 19,406 | |
AMP Ltd. | | | 7,576 | | | | 42,543 | |
Australia & New Zealand Banking Group Ltd. | | | 7,167 | | | | 176,474 | |
Bank of Queensland Ltd. | | | 1,192 | | | | 12,228 | |
Bendigo and Adelaide Bank Ltd. | | | 1,229 | | | | 12,112 | |
BHP Billiton Ltd. | | | 5,021 | | | | 241,761 | |
Brambles Ltd. | | | 2,903 | | | | 21,255 | |
Cabcharge Australia Ltd. | | | 1,943 | | | | 11,092 | |
Coal & Allied Industries Ltd. | | | 324 | | | | 40,054 | |
Coca-Cola Amatil Ltd. | | | 2,112 | | | | 25,642 | |
Cochlear Ltd. | | | 146 | | | | 12,530 | |
Commonwealth Bank of Australia | | | 3,829 | | | | 207,491 | |
Consolidated Media Holdings Ltd. | | | 4,550 | | | | 13,269 | |
Crane Group Ltd. | | | 1,004 | | | | 10,611 | |
Cromwell Property Group | | | 17,179 | | | | 12,525 | |
Crown Ltd. | | | 2,678 | | | | 22,571 | |
CSL Ltd. | | | 652 | | | | 24,092 | |
CSR Ltd. | | | 3,479 | | | | 11,801 | |
David Jones Ltd.(a) | | | 2,978 | | | | 14,629 | |
DUET Group(b) | | | 8,206 | | | | 14,214 | |
Envestra Ltd.(b) | | | 23,972 | | | | 14,874 | |
Fleetwood Corp., Ltd. | | | 897 | | | | 11,234 | |
Foster’s Group Ltd. | | | 6,363 | | | | 37,639 | |
Goodman Fielder Ltd. | | | 10,240 | | | | 13,025 | |
GWA International Ltd. | | | 4,029 | | | | 13,791 | |
Harvey Norman Holdings Ltd. | | | 4,431 | | | | 13,747 | |
Insurance Australia Group Ltd. | | | 5,557 | | | | 20,631 | |
Leighton Holdings Ltd. | | | 824 | | | | 25,130 | |
Lend Lease Group(b) | | | 2,239 | | | | 21,001 | |
Macquarie Group Ltd. | | | 672 | | | | 25,435 | |
Metcash Ltd. | | | 3,971 | | | | 17,084 | |
Monadelphous Group Ltd. | | | 755 | | | | 16,709 | |
National Australia Bank Ltd. | | | 6,700 | | | | 179,110 | |
OneSteel Ltd. | | | 4,134 | | | | 10,431 | |
Orica Ltd. | | | 899 | | | | 24,516 | |
Origin Energy Ltd. | | | 1,834 | | | | 30,763 | |
Perpetual Ltd. | | | 353 | | | | 10,619 | |
Platinum Asset Management Ltd. | | | 2,723 | | | | 13,545 | |
Primary Health Care Ltd. | | | 3,398 | | | | 11,596 | |
QBE Insurance Group Ltd. | | | 3,010 | | | | 55,003 | |
Rio Tinto Ltd. | | | 332 | | | | 29,098 | |
Salmat Ltd. | | | 2,060 | | | | 7,754 | |
Santos Ltd. | | | 1,628 | | | | 26,180 | |
Sonic Healthcare Ltd. | | | 1,356 | | | | 16,800 | |
SP AusNet(b) | | | 14,513 | | | | 13,208 | |
Spark Infrastructure Group(c) | | | 11,423 | | | | 13,231 | |
Suncorp Group Ltd. | | | 3,404 | | | | 29,852 | |
TABCORP Holdings Ltd. | | | 3,755 | | | | 29,085 | |
Tatts Group Ltd. | | | 8,808 | | | | 21,315 | |
| | | | | | | | |
| Investments | | Shares | | | Fair
Value | |
| | | | | | | | |
Telstra Corp., Ltd. | | | 62,756 | | | $ | 183,015 | |
Toll Holdings Ltd. | | | 2,153 | | | | 13,203 | |
Transurban Group(b) | | | 2,977 | | | | 16,532 | |
UGL Ltd. | | | 903 | | | | 14,652 | |
Wesfarmers Ltd. | | | 3,120 | | | | 102,540 | |
Westpac Banking Corp. | | | 9,447 | | | | 237,695 | |
Woodside Petroleum Ltd. | | | 985 | | | | 47,672 | |
Woolworths Ltd. | | | 2,803 | | | | 77,918 | |
WorleyParsons Ltd. | | | 617 | | | | 19,767 | |
| | | | | | | | |
| Total Australia | | | | | | | 2,454,489 | |
| Austria – 1.0% | | | | | | | | |
Erste Group Bank AG | | | 409 | | | | 20,666 | |
Oesterreichische Post AG | | | 727 | | | | 24,915 | |
OMV AG | | | 643 | | | | 29,099 | |
Raiffeisen International Bank Holding AG | | | 328 | | | | 18,228 | |
Strabag SE | | | 430 | | | | 13,687 | |
Telekom Austria AG | | | 1,818 | | | | 26,625 | |
Verbund AG(a) | | | 780 | | | | 34,701 | |
Vienna Insurance Group AG Wiener Versicherung Gruppe | | | 341 | | | | 19,502 | |
Voestalpine AG | | | 508 | | | | 23,883 | |
| | | | | | | | |
| Total Austria | | | | | | | 211,306 | |
| Belgium – 1.2% | | | | | | | | |
Ageas | | | 5,454 | | | | 15,518 | |
Anheuser-Busch InBev N.V. | | | 727 | | | | 41,469 | |
Belgacom S.A. | | | 1,276 | | | | 49,498 | |
Cie Maritime Belge S.A. | | | 395 | | | | 11,687 | |
Cofinimmo | | | 130 | | | | 19,048 | |
EVS Broadcast Equipment S.A. | | | 138 | | | | 8,793 | |
Mobistar S.A. | | | 381 | | | | 26,450 | |
Solvay S.A. | | | 267 | | | | 31,672 | |
Tessenderlo Chemie N.V. | | | 412 | | | | 14,786 | |
UCB S.A. | | | 382 | | | | 14,526 | |
Umicore S.A. | | | 289 | | | | 14,352 | |
| | | | | | | | |
| Total Belgium | | | | | | | 247,799 | |
| Denmark – 0.5% | | | | | | | | |
FLSmidth & Co. A/S | | | 77 | | | | 6,568 | |
H. Lundbeck A/S | | | 836 | | | | 19,412 | |
Novo Nordisk A/S Class B | | | 462 | | | | 58,123 | |
Tryg A/S | | | 294 | | | | 17,313 | |
| | | | | | | | |
| Total Denmark | | | | | | | 101,416 | |
| Finland – 1.6% | | | | | | | | |
Fortum Oyj(a) | | | 2,104 | | | | 71,540 | |
Kone Oyj Class B | | | 534 | | | | 30,767 | |
Konecranes Oyj | | | 305 | | | | 14,140 | |
Metso Oyj(a) | | | 269 | | | | 14,483 | |
Nokia Oyj | | | 8,740 | | | | 74,852 | |
Orion Oyj Class B(a) | | | 567 | | | | 13,775 | |
Pohjola Bank PLC Class A | | | 1,083 | | | | 14,785 | |
Sampo Oyj Class A | | | 1,404 | | | | 44,849 | |
Sanoma Oyj | | | 762 | | | | 17,269 | |
UPM-Kymmene Oyj* | | | 1,322 | | | | 27,991 | |
Wartsila Oyj | | | 646 | | | | 25,256 | |
| | | | | | | | |
| Total Finland | | | | | | | 349,707 | |
See Notes to Financial Statements.
| | |
| 96 | | WisdomTree International Dividend and Sector Funds |
Schedule of Investments (continued)
WisdomTree International Hedged Equity Fund (HEDJ)
March 31, 2011
| | | | | | | | |
| Investments | | Shares | | | Fair
Value | |
| | | | | | | | |
| France – 16.3% | | | | | | | | |
Accor S.A. | | | 596 | | | $ | 26,816 | |
Aeroports de Paris | | | 207 | | | | 19,094 | |
Air Liquide S.A. | | | 405 | | | | 53,887 | |
Alstom S.A. | | | 564 | | | | 33,395 | |
AXA S.A. | | | 5,171 | | | | 108,201 | |
BNP Paribas | | | 1,965 | | | | 143,916 | |
Bouygues S.A. | | | 982 | | | | 47,221 | |
Canal Plus | | | 1,481 | | | | 11,755 | |
Cap Gemini S.A. | | | 328 | | | | 19,077 | |
Carrefour S.A. | | | 1,279 | | | | 56,701 | |
Casino Guichard Perrachon S.A. | | | 313 | | | | 29,667 | |
CFAO S.A. | | | 315 | | | | 11,839 | |
Christian Dior S.A. | | | 250 | | | | 35,240 | |
Cie Generale des Etablissements Michelin Class B | | | 178 | | | | 15,055 | |
Cie Generale d’Optique Essilor International S.A. | | | 179 | | | | 13,311 | |
Ciments Francais S.A. | | | 185 | | | | 18,708 | |
CNP Assurances | | | 1,857 | | | | 39,476 | |
Compagnie de Saint-Gobain | | | 993 | | | | 60,883 | |
Credit Agricole S.A. | | | 6,272 | | | | 103,069 | |
Danone | | | 1,015 | | | | 66,395 | |
Eiffage S.A. | | | 252 | | | | 15,159 | |
Electricite de France S.A. | | | 3,480 | | | | 144,302 | |
Eutelsat Communications S.A. | | | 475 | | | | 18,999 | |
France Telecom S.A. | | | 14,859 | | | | 333,376 | |
GDF Suez | | | 7,764 | | | | 316,764 | |
ICADE | | | 177 | | | | 21,873 | |
Klepierre | | | 669 | | | | 27,190 | |
Lafarge S.A. | | | 751 | | | | 46,909 | |
Lagardere SCA | | | 528 | | | | 22,572 | |
Legrand S.A. | | | 644 | | | | 26,827 | |
L’Oreal S.A. | | | 653 | | | | 76,172 | |
LVMH Moet Hennessy Louis Vuitton S.A. | | | 529 | | | | 83,854 | |
M-6 Metropole Television S.A. | | | 1,254 | | | | 32,815 | |
Neopost S.A. | | | 239 | | | | 20,964 | |
Nexity | | | 311 | | | | 15,445 | |
PagesJaunes Groupe | | | 2,316 | | �� | | 23,227 | |
Pernod-Ricard S.A. | | | 134 | | | | 12,531 | |
PPR | | | 254 | | | | 38,983 | |
Publicis Groupe S.A. | | | 375 | | | | 21,060 | |
Rallye S.A. | | | 305 | | | | 13,818 | |
Remy Cointreau S.A. | | | 206 | | | | 15,535 | |
Sanofi-Aventis S.A. | | | 3,321 | | | | 233,167 | |
Schneider Electric S.A. | | | 373 | | | | 63,836 | |
SCOR SE | | | 897 | | | | 24,459 | |
Societe Generale | | | 278 | | | | 18,088 | |
Societe Immobiliere de Location pour l’Industrie et le Commerce | | | 122 | | | | 17,123 | |
Societe Television Francaise 1 | | | 863 | | | | 15,866 | |
Sodexo | | | 302 | | | | 22,084 | |
Suez Environnement Co. | | | 1,385 | | | | 28,696 | |
Technip S.A. | | | 222 | | | | 23,707 | |
TOTAL S.A. | | | 7,940 | | | | 484,002 | |
Vallourec S.A. | | | 340 | | | | 38,194 | |
| | | | | | | | |
| Investments | | Shares | | | Fair
Value | |
| | | | | | | | |
Veolia Environnement S.A. | | | 1,524 | | | $ | 47,450 | |
Vinci S.A. | | | 1,345 | | | | 84,164 | |
Vivendi S.A. | | | 5,598 | | | | 160,074 | |
| | | | | | | | |
| Total France | | | | | | | 3,502,991 | |
| Germany – 7.1% | | | | | | | | |
Allianz SE | | | 953 | | | | 133,928 | |
BASF SE | | | 1,599 | | | | 138,486 | |
Bayer AG | | | 1,097 | | | | 85,061 | |
Bayerische Motoren Werke AG | | | 333 | | | | 27,763 | |
Bilfinger Berger SE | | | 211 | | | | 18,340 | |
Delticom AG | | | 98 | | | | 8,880 | |
Deutsche Bank AG | | | 437 | | | | 25,727 | |
Deutsche Boerse AG | | | 392 | | | | 29,789 | |
Deutsche Post AG | | | 2,813 | | | | 50,777 | |
Deutsche Telekom AG | | | 15,525 | | | | 239,483 | |
E.ON AG | | | 5,051 | | | | 154,468 | |
Fielmann AG | | | 197 | | | | 18,633 | |
Fraport AG Frankfurt Airport Services Worldwide | | | 232 | | | | 17,025 | |
Fresenius Medical Care AG & Co. KGaA | | | 304 | | | | 20,444 | |
Hamburger Hafen und Logistik AG | | | 251 | | | | 11,692 | |
Hannover Rueckversicherung AG | | | 343 | | | | 18,752 | |
Hochtief AG | | | 147 | | | | 15,833 | |
Linde AG | | | 194 | | | | 30,683 | |
Merck KGAA(a) | | | 171 | | | | 15,453 | |
Metro AG | | | 427 | | | | 29,216 | |
Muenchener Rueckversicherungs AG | | | 466 | | | | 73,404 | |
RWE AG | | | 1,399 | | | | 89,230 | |
Salzgitter AG | | | 214 | | | | 16,915 | |
SAP AG | | | 824 | | | | 50,515 | |
Siemens AG | | | 878 | | | | 120,498 | |
ThyssenKrupp AG | | | 603 | | | | 24,670 | |
United Internet AG Registered Shares | | | 823 | | | | 14,833 | |
Volkswagen AG | | | 319 | | | | 49,027 | |
| | | | | | | | |
| Total Germany | | | | | | | 1,529,525 | |
| Hong Kong – 4.8% | | | | | | | | |
Bank of East Asia Ltd. | | | 3,600 | | | | 15,297 | |
BOC Hong Kong Holdings Ltd. | | | 23,000 | | | | 74,959 | |
Cheung Kong (Holdings) Ltd. | | | 3,000 | | | | 48,906 | |
China Merchants Holdings International Co., Ltd. | | | 2,000 | | | | 8,447 | |
China Mobile Ltd. | | | 29,500 | | | | 271,743 | |
China Overseas Land & Investment Ltd. | | | 4,000 | | | | 8,136 | |
China Resources Enterprise Ltd. | | | 2,000 | | | | 8,125 | |
China Resources Power Holdings Co., Ltd. | | | 4,000 | | | | 7,704 | |
China Unicom Hong Kong Ltd. | | | 18,000 | | | | 29,899 | |
Citic Pacific Ltd. | | | 7,000 | | | | 19,439 | |
CLP Holdings Ltd. | | | 4,500 | | | | 36,390 | |
CNOOC Ltd. | | | 55,000 | | | | 138,592 | |
Fushan International Energy Group Ltd. | | | 18,000 | | | | 12,959 | |
Hang Seng Bank Ltd. | | | 4,400 | | | | 71,050 | |
Hong Kong & China Gas Co., Ltd. | | | 7,600 | | | | 18,232 | |
Hong Kong Exchanges and Clearing Ltd. | | | 1,800 | | | | 39,109 | |
Hutchison Whampoa Ltd. | | | 7,000 | | | | 82,886 | |
MTR Corp. | | | 7,000 | | | | 25,919 | |
See Notes to Financial Statements.
| | | | |
| WisdomTree International Dividend and Sector Funds | | | 97 | |
Schedule of Investments (continued)
WisdomTree International Hedged Equity Fund (HEDJ)
March 31, 2011
| | | | | | | | |
| Investments | | Shares | | | Fair
Value | |
| | | | | | | | |
New World Development Ltd. | | | 8,000 | | | $ | 14,132 | |
Power Assets Holdings Ltd. | | | 4,500 | | | | 30,084 | |
Shanghai Industrial Holdings Ltd. | | | 1,000 | | | | 3,831 | |
Sino Land Co., Ltd. | | | 8,000 | | | | 14,214 | |
Sun Hung Kai Properties Ltd. | | | 2,000 | | | | 31,678 | |
Wharf Holdings Ltd. | | | 4,000 | | | | 27,590 | |
| | | | | | | | |
| Total Hong Kong | | | | | | | 1,039,321 | |
| Ireland – 0.2% | | | | | | | | |
CRH PLC | | | 1,403 | | | | 32,215 | |
DCC PLC | | | 538 | | | | 17,155 | |
| | | | | | | | |
| Total Ireland | | | | | | | 49,370 | |
| Italy – 5.0% | | | | | | | | |
A2A SpA | | | 16,165 | | | | 26,220 | |
Assicurazioni Generali SpA | | | 1,544 | | | | 33,480 | |
Atlantia SpA | | | 1,534 | | | | 35,200 | |
Banca Carige SpA | | | 6,731 | | | | 15,961 | |
Banca Popolare di Sondrio S.c.r.l.* | | | 1,364 | | | | 11,614 | |
Enel SpA | | | 44,659 | | | | 281,895 | |
ENI SpA | | | 11,116 | | | | 273,376 | |
Fiat SpA | | | 1,212 | | | | 10,990 | |
Finmeccanica SpA | | | 1,373 | | | | 17,302 | |
Intesa Sanpaolo SpA | | | 19,268 | | | | 57,093 | |
Iren SpA | | | 7,040 | | | | 13,127 | |
Lottomatica SpA | | | 585 | | | | 10,551 | |
Mediaset SpA | | | 2,943 | | | | 18,727 | |
Parmalat SpA | | | 7,903 | | | | 26,513 | |
Pirelli & C SpA | | | 1,676 | | | | 14,746 | |
Prysmian SpA | | | 672 | | | | 14,438 | |
Saipem SpA | | | 562 | | | | 29,916 | |
Snam Rete Gas SpA | | | 9,344 | | | | 52,589 | |
Telecom Italia SpA | | | 39,903 | | | | 61,440 | |
Terna Rete Elettrica Nazionale SpA | | | 6,057 | | | | 29,036 | |
UniCredit SpA | | | 12,597 | | | | 31,176 | |
Unione di Banche Italiane SCPA | | | 1,383 | | | | 11,835 | |
| | | | | | | | |
| Total Italy | | | | | | | 1,077,225 | |
| Japan – 10.5% | | | | | | | | |
Aeon Co., Ltd. | | | 1,200 | | | | 13,957 | |
Airport Facilities Co., Ltd. | | | 1,900 | | | | 8,253 | |
Aisin Seiki Co., Ltd. | | | 500 | | | | 17,423 | |
Ajinomoto Co., Inc. | | | 1,000 | | | | 10,461 | |
Asahi Glass Co., Ltd. | | | 1,000 | | | | 12,621 | |
Asahi Kasei Corp. | | | 2,000 | | | | 13,538 | |
Astellas Pharma, Inc. | | | 1,000 | | | | 37,162 | |
Bank of Yokohama Ltd. (The) | | | 2,000 | | | | 9,532 | |
Bridgestone Corp. | | | 800 | | | | 16,824 | |
CAC Corp. | | | 1,000 | | | | 8,325 | |
Canon, Inc. | | | 1,800 | | | | 78,620 | |
Chiyoda Co., Ltd. | | | 1,000 | | | | 12,705 | |
Chubu Electric Power Co., Inc. | | | 1,200 | | | | 26,786 | |
Chugai Pharmaceutical Co., Ltd. | | | 900 | | | | 15,550 | |
Chugoku Electric Power Co., Inc. (The) | | | 900 | | | | 16,701 | |
Circle K Sunkus Co., Ltd. | | | 900 | | | | 13,791 | |
Coca-Cola West Co., Ltd. | | | 900 | | | | 17,212 | |
| | | | | | | | |
| Investments | | Shares | | | Fair
Value | |
| | | | | | | | |
Cosmo Oil Co., Ltd. | | | 4,000 | | | $ | 12,500 | |
Dai Nippon Printing Co., Ltd. | | | 2,000 | | | | 24,445 | |
Daiichi Sankyo Co., Ltd. | | | 1,400 | | | | 27,128 | |
Daikin Industries Ltd. | | | 200 | | | | 6,011 | |
Daito Trust Construction Co., Ltd. | | | 200 | | | | 13,827 | |
Daiwa House Industry Co., Ltd. | | | 1,000 | | | | 12,331 | |
Daiwa Securities Group, Inc. | | | 2,000 | | | | 9,218 | |
Denso Corp. | | | 700 | | | | 23,311 | |
East Japan Railway Co. | | | 400 | | | | 22,321 | |
Eisai Co., Ltd. | | | 900 | | | | 32,403 | |
Fast Retailing Co., Ltd. | | | 100 | | | | 12,560 | |
FUJIFILM Holdings Corp. | | | 600 | | | | 18,649 | |
Honda Motor Co., Ltd. | | | 1,200 | | | | 45,246 | |
House Foods Corp. | | | 1,000 | | | | 16,409 | |
Hoya Corp. | | | 900 | | | | 20,610 | |
ITOCHU Corp. | | | 2,500 | | | | 26,273 | |
Itochu Techno-Solutions Corp. | | | 200 | | | | 6,498 | |
Japan Tobacco, Inc. | | | 9 | | | | 32,631 | |
JS Group Corp. | | | 900 | | | | 23,456 | |
Kajima Corp.(a) | | | 6,000 | | | | 16,868 | |
Kaken Pharmaceutical Co., Ltd. | | | 1,000 | | | | 11,993 | |
Kandenko Co., Ltd. | | | 3,000 | | | | 17,012 | |
Kansai Electric Power Co., Inc. (The) | | | 1,200 | | | | 26,221 | |
Kao Corp. | | | 900 | | | | 22,533 | |
KDDI Corp. | | | 6 | | | | 37,283 | |
Kirin Holdings Co., Ltd. | | | 1,000 | | | | 13,188 | |
Komatsu Ltd. | | | 600 | | | | 20,451 | |
Konami Corp. | | | 800 | | | | 14,865 | |
Konica Minolta Holdings, Inc. | | | 500 | | | | 4,205 | |
Kubota Corp. | | | 1,000 | | | | 9,459 | |
Kyocera Corp. | | | 200 | | | | 20,343 | |
Kyoto Kimono Yuzen Co., Ltd. | | | 700 | | | | 7,812 | |
Kyushu Electric Power Co., Inc. | | | 900 | | | | 17,646 | |
Lawson, Inc. | | | 300 | | | | 14,515 | |
Marubeni Corp. | | | 2,000 | | | | 14,455 | |
Maruichi Steel Tube Ltd. | | | 800 | | | | 19,836 | |
MEIJI Holdings Co., Ltd. | | | 200 | | | | 8,072 | |
Mitsubishi Chemical Holdings Corp. | | | 2,000 | | | | 12,621 | |
Mitsubishi Corp. | | | 1,600 | | | | 44,575 | |
Mitsubishi Heavy Industries Ltd. | | | 2,000 | | | | 9,218 | |
Mitsubishi Tanabe Pharma Corp. | | | 1,000 | | | | 16,289 | |
Mitsubishi UFJ Financial Group, Inc. | | | 16,000 | | | | 74,131 | |
Mitsui & Co., Ltd. | | | 1,500 | | | | 26,985 | |
Mitsui Fudosan Co., Ltd. | | | 1,000 | | | | 16,566 | |
Mizuho Financial Group, Inc. | | | 29,800 | | | | 49,619 | |
MS&AD Insurance Group Holdings | | | 800 | | | | 18,282 | |
NEC Mobiling Ltd. | | | 300 | | | | 9,205 | |
Nichirei Corp. | | | 2,000 | | | | 8,567 | |
Nippon Express Co., Ltd. | | | 3,000 | | | | 11,547 | |
Nippon Kayaku Co., Ltd. | | | 1,000 | | | | 9,097 | |
Nippon Telegraph & Telephone Corp. | | | 2,200 | | | | 99,143 | |
Nomura Research Institute Ltd. | | | 500 | | | | 11,076 | |
NTT DoCoMo, Inc. | | | 72 | | | | 127,008 | |
OJI Paper Co., Ltd.(a) | | | 2,000 | | | | 9,532 | |
See Notes to Financial Statements.
| | |
| 98 | | WisdomTree International Dividend and Sector Funds |
Schedule of Investments (continued)
WisdomTree International Hedged Equity Fund (HEDJ)
March 31, 2011
| | | | | | | | |
| Investments | | Shares | | | Fair
Value | |
| | | | | | | | |
Oracle Corp. | | | 500 | | | $ | 20,904 | |
Panasonic Corp. | | | 1,400 | | | | 17,872 | |
Park24 Co., Ltd. | | | 1,500 | | | | 14,587 | |
Ricoh Co., Ltd. | | | 1,000 | | | | 11,776 | |
Sankyo Co., Ltd. | | | 200 | | | | 10,292 | |
Secom Co., Ltd.(a) | | | 500 | | | | 23,317 | |
Seven & I Holdings Co., Ltd. | | | 1,200 | | | | 30,724 | |
Sharp Corp. | | | 1,000 | | | | 9,954 | |
Shimizu Corp. | | | 2,000 | | | | 8,928 | |
Shin-Etsu Chemical Co., Ltd. | | | 500 | | | | 24,946 | |
Shiseido Co., Ltd. | | | 800 | | | | 13,900 | |
Showa Shell Sekiyu K.K. | | | 2,300 | | | | 24,088 | |
Sony Corp. | | | 600 | | | | 19,286 | |
Sumitomo Corp. | | | 1,800 | | | | 25,823 | |
Sumitomo Electric Industries Ltd. | | | 1,400 | | | | 19,443 | |
Sumitomo Metal Industries Ltd. | | | 9,000 | | | | 20,198 | |
Sumitomo Mitsui Financial Group, Inc. | | | 1,800 | | | | 56,163 | |
Sumitomo Mitsui Trust Holdings, Inc. | | | 2,980 | | | | 10,607 | |
T&D Holdings, Inc. | | | 100 | | | | 2,473 | |
Taisei Corp. | | | 7,000 | | | | 17,314 | |
Takeda Pharmaceutical Co., Ltd. | | | 1,600 | | | | 74,903 | |
Tohoku Electric Power Co., Inc. | | | 1,000 | | | | 16,952 | |
Tokai Tokyo Financial Holdings, Inc. | | | 2,000 | | | | 6,853 | |
Tokio Marine Holdings, Inc. | | | 900 | | | | 24,151 | |
Tokyo Electric Power Co., Inc. (The) | | | 1,500 | | | | 8,434 | |
Tokyo Tekko Co., Ltd. | | | 3,000 | | | | 9,701 | |
TonenGeneral Sekiyu K.K. | | | 2,000 | | | | 24,783 | |
Toppan Printing Co., Ltd. | | | 2,000 | | | | 15,830 | |
Toyota Motor Corp. | | | 2,100 | | | | 84,882 | |
Trend Micro, Inc. | | | 500 | | | | 13,363 | |
Yahoo! Japan Corp. | | | 39 | | | | 14,004 | |
| | | | | | | | |
| Total Japan | | | | | | | 2,241,957 | |
| Netherlands – 1.6% | | | | | | | | |
Akzo Nobel N.V. | | | 350 | | | | 24,079 | |
CSM | | | 367 | | | | 12,994 | |
Fugro N.V. CVA | | | 216 | | | | 19,060 | |
Heineken N.V. | | | 402 | | | | 21,995 | |
Koninklijke DSM N.V. | | | 400 | | | | 24,610 | |
Koninklijke KPN N.V.(a) | | | 4,337 | | | | 73,979 | |
Koninklijke Philips Electronics N.V.(a) | | | 1,163 | | | | 37,225 | |
Reed Elsevier N.V. | | | 1,515 | | | | 19,521 | |
TNT N.V. | | | 448 | | | | 11,507 | |
Unilever N.V. CVA | | | 2,208 | | | | 69,326 | |
Wolters Kluwer N.V. | | | 787 | | | | 18,428 | |
| | | | | | | | |
| Total Netherlands | | | | | | | 332,724 | |
| New Zealand – 0.2% | | | | | | | | |
Telecom Corp. of New Zealand Ltd. | | | 11,161 | | | | 17,111 | |
TrustPower Ltd. | | | 2,729 | | | | 14,987 | |
Warehouse Group Ltd. (The) | | | 4,441 | | | | 11,890 | |
| | | | | | | | |
| Total New Zealand | | | | | | | 43,988 | |
| Norway – 1.6% | | | | | | | | |
Aker ASA | | | 523 | | | | 16,120 | |
Aker Solutions ASA | | | 771 | | | | 17,715 | |
| | | | | | | | |
| Investments | | Shares | | | Fair
Value | |
| | | | | | | | |
DnB NOR ASA | | | 2,041 | | | $ | 31,306 | |
Fred Olsen Energy ASA | | | 437 | | | | 19,197 | |
Marine Harvest ASA | | | 16,976 | | | | 21,083 | |
Orkla ASA | | | 3,028 | | | | 29,340 | |
Statoil ASA | | | 5,464 | | | | 151,422 | |
Telenor ASA | | | 2,108 | | | | 34,678 | |
Yara International ASA | | | 340 | | | | 17,222 | |
| | | | | | | | |
| Total Norway | | | | | | | 338,083 | |
| Portugal – 0.9% | | | | | | | | |
Banco Comercial Portugues S.A. Class R | | | 11,289 | | | | 9,228 | |
Banco Espirito Santo S.A. | | | 2,919 | | | | 11,971 | |
Brisa Auto-Estradas de Portugal S.A. | | | 2,559 | | | | 17,333 | |
Cimpor Cimentos de Portugal, SGPS, S.A. | | | 2,182 | | | | 15,835 | |
EDP-Energias de Portugal S.A. | | | 11,310 | | | | 44,106 | |
Galp Energia, SGPS, S.A. Class B | | | 1,141 | | | | 24,458 | |
Novabase, SGPS, S.A. | | | 2,651 | | | | 11,662 | |
Portugal Telecom, SGPS, S.A. | | | 3,038 | | | | 35,111 | |
Zon Multimedia Servicos de Telecomunicacoes e Multimedia, SGPS, S.A. | | | 2,848 | | | | 14,954 | |
| | | | | | | | |
| Total Portugal | | | | | | | 184,658 | |
| Singapore – 2.0% | | | | | | | | |
Chip Eng Seng Corp., Ltd. | | | 23,000 | | | | 9,032 | |
Cityspring Infrastructure Trust | | | 34,000 | | | | 14,701 | |
DBS Group Holdings Ltd. | | | 4,000 | | | | 46,458 | |
Fraser and Neave Ltd. | | | 2,000 | | | | 9,536 | |
Keppel Corp., Ltd. | | | 4,000 | | | | 39,032 | |
Oversea-Chinese Banking Corp., Ltd. | | | 5,000 | | | | 38,001 | |
SembCorp Industries Ltd. | | | 6,000 | | | | 24,800 | |
SembCorp Marine Ltd. | | | 4,000 | | | | 18,532 | |
Singapore Exchange Ltd.(a) | | | 2,000 | | | | 12,455 | |
Singapore Press Holdings Ltd. | | | 8,000 | | | | 25,006 | |
Singapore Technologies Engineering Ltd. | | | 9,000 | | | | 23,277 | |
Singapore Telecommunications Ltd. | | | 26,000 | | | | 62,293 | |
StarHub Ltd. | | | 10,000 | | | | 21,420 | |
United Overseas Bank Ltd. | | | 2,000 | | | | 29,829 | |
UOB-Kay Hian Holdings Ltd. | | | 12,000 | | | | 16,755 | |
Venture Corp., Ltd. | | | 2,000 | | | | 15,248 | |
Wilmar International Ltd. | | | 4,000 | | | | 17,326 | |
| | | | | | | | |
| Total Singapore | | | | | | | 423,701 | |
| Spain – 7.6% | | | | | | | | |
Abertis Infraestructuras, S.A. | | | 1,982 | | | | 43,118 | |
Acciona S.A. | | | 203 | | | | 22,090 | |
ACS Actividades de Construccion y Servicios, S.A. | | | 1,066 | | | | 50,042 | |
Antena 3 de Television S.A. | | | 890 | | | | 8,285 | |
Banco Bilbao Vizcaya Argentaria S.A.(a) | | | 8,654 | | | | 105,137 | |
Banco Espanol de Credito S.A. | | | 2,712 | | | | 24,589 | |
Banco Popular Espanol S.A.(a) | | | 3,712 | | | | 21,850 | |
Banco Santander S.A. | | | 25,968 | | | | 301,885 | |
Bankinter, S.A.(a) | | | 1,601 | | | | 10,996 | |
Bolsas y Mercados Espanoles S.A. | | | 526 | | | | 16,026 | |
Criteria Caixacorp S.A. | | | 10,841 | | | | 76,569 | |
Ebro Foods S.A.* | | | 972 | | | | 22,870 | |
Enagas S.A. | | | 926 | | | | 20,920 | |
See Notes to Financial Statements.
| | | | |
| WisdomTree International Dividend and Sector Funds | | | 99 | |
Schedule of Investments (continued)
WisdomTree International Hedged Equity Fund (HEDJ)
March 31, 2011
| | | | | | | | |
| Investments | | Shares | | | Fair
Value | |
| | | | | | | | |
Endesa S.A. | | | 1,452 | | | $ | 45,054 | |
Ferrovial S.A. | | | 1,392 | | | | 17,482 | |
Fomento de Construcciones y Contratas S.A. | | | 678 | | | | 22,476 | |
Gas Natural SDG S.A. | | | 3,111 | | | | 58,518 | |
Grifols S.A. | | | 776 | | | | 13,545 | |
Iberdrola S.A. | | | 15,753 | | | | 137,171 | |
Inditex S.A. | | | 720 | | | | 57,852 | |
Mapfre S.A. | | | 5,044 | | | | 19,033 | |
Red Electrica Corp. S.A. | | | 412 | | | | 23,445 | |
Repsol YPF S.A. | | | 3,336 | | | | 114,447 | |
Telefonica S.A. | | | 15,304 | | | | 383,647 | |
Zardoya Otis S.A. | | | 1,322 | | | | 21,950 | |
| | | | | | | | |
| Total Spain | | | | | | | 1,638,997 | |
| Sweden – 2.9% | | | | | | | | |
Alfa Laval AB | | | 795 | | | | 17,278 | |
Assa Abloy AB Class B | | | 715 | | | | 20,571 | |
Atlas Copco AB Class A | | | 1,717 | | | | 45,671 | |
Electrolux AB Series B | | | 590 | | | | 15,217 | |
Hakon Invest AB | | | 1,006 | | | | 17,749 | |
Hennes & Mauritz AB Class B | | | 2,738 | | | | 90,972 | |
Kungsleden AB | | | 1,662 | | | | 16,334 | |
Nordea Bank AB(a) | | | 6,120 | | | | 67,036 | |
Peab AB | | | 1,986 | | | | 17,709 | |
Ratos AB Class B | | | 508 | | | | 20,067 | |
Skandinaviska Enskilda Banken AB Class A(a) | | | 2,975 | | | | 26,551 | |
Skanska AB Class B | | | 1,407 | | | | 29,642 | |
SKF AB Class B | | | 781 | | | | 22,755 | |
Svenska Cellulosa AB Class B | | | 1,456 | | | | 23,450 | |
Svenska Handelsbanken AB Class A | | | 1,146 | | | | 37,604 | |
Swedish Match AB | | | 536 | | | | 17,834 | |
Tele2 AB Class B | | | 725 | | | | 16,756 | |
Telefonaktiebolaget LM Ericsson Class B | | | 3,911 | | | | 50,465 | |
TeliaSonera AB | | | 8,495 | | | | 73,458 | |
| | | | | | | | |
| Total Sweden | | | | | | | 627,119 | |
| Switzerland – 5.6% | | | | | | | | |
Baloise Holding AG | | | 160 | | | | 15,915 | |
Credit Suisse Group AG | | | 1,754 | | | | 74,830 | |
Geberit AG | | | 115 | | | | 25,141 | |
Holcim Ltd. | | | 301 | | | | 22,768 | |
Kuehne + Nagel International AG | | | 143 | | | | 20,086 | |
Nestle S.A. | | | 4,779 | | | | 275,033 | |
Novartis AG | | | 4,235 | | | | 230,626 | |
Partners Group Holding AG | | | 85 | | | | 16,315 | |
Roche Holding AG | | | 1,365 | | | | 201,255 | |
Schindler Holding AG | | | 160 | | | | 19,396 | |
SGS S.A. | | | 18 | | | | 32,169 | |
Sulzer AG | | | 89 | | | | 13,464 | |
Swatch Group AG (The) | | | 40 | | | | 17,756 | |
Swiss Reinsurance Co., Ltd. | | | 360 | | | | 20,679 | |
Swisscom AG | | | 117 | | | | 52,371 | |
Syngenta AG | | | 103 | | | | 33,607 | |
Vontobel Holding AG | | | 477 | | | | 18,510 | |
Zurich Financial Services AG | | | 418 | | | | 117,470 | |
| | | | | | | | |
| Total Switzerland | | | | | | | 1,207,391 | |
| | | | | | | | |
| Investments | | Shares | | | Fair
Value | |
| | | | | | | | |
| United Kingdom – 18.2% | | | | | | | | |
Admiral Group PLC | | | 727 | | | $ | 18,109 | |
Antofagasta PLC | | | 1,094 | | | | 23,867 | |
Ashmore Group PLC | | | 2,731 | | | | 14,508 | |
Associated British Foods PLC | | | 1,112 | | | | 17,682 | |
AstraZeneca PLC | | | 3,137 | | | | 143,965 | |
Atkins WS PLC | | | 710 | | | | 7,978 | |
Aviva PLC | | | 9,530 | | | | 66,115 | |
BAE Systems PLC | | | 8,461 | | | | 44,065 | |
Barclays PLC | | | 5,751 | | | | 25,586 | |
Berendsen PLC | | | 1,717 | | | | 13,238 | |
BG Group PLC | | | 1,833 | | | | 45,572 | |
BHP Billiton PLC | | | 3,039 | | | | 119,836 | |
British American Tobacco PLC | | | 4,321 | | | | 173,297 | |
British Land Co. PLC | | | 2,595 | | | | 22,982 | |
British Sky Broadcasting Group PLC | | | 2,613 | | | | 34,555 | |
BT Group PLC | | | 9,254 | | | | 27,531 | |
Cable & Wireless Communications PLC | | | 26,854 | | | | 19,612 | |
Centrica PLC | | | 10,612 | | | | 55,335 | |
Chaucer Holdings PLC | | | 14,566 | | | | 13,134 | |
Compass Group PLC | | | 2,472 | | | | 22,210 | |
De La Rue PLC | | | 458 | | | | 5,796 | |
Diageo PLC | | | 4,170 | | | | 79,209 | |
Electrocomponents PLC | | | 4,142 | | | | 17,747 | |
Eurasian Natural Resources Corp. PLC | | | 800 | | | | 12,009 | |
F&C Asset Management PLC | | | 6,751 | | | | 8,203 | |
Firstgroup PLC | | | 2,153 | | | | 11,261 | |
Fresnillo PLC | | | 628 | | | | 15,533 | |
G4S PLC | | | 3,000 | | | | 12,282 | |
Game Group PLC | | | 7,235 | | | | 6,552 | |
GlaxoSmithKline PLC | | | 12,471 | | | | 237,786 | |
Go-Ahead Group PLC | | | 450 | | | | 9,666 | |
Halfords Group PLC | | | 1,473 | | | | 8,221 | |
Hargreaves Lansdown PLC | | | 2,073 | | | | 20,270 | |
Hays PLC | | | 8,401 | | | | 15,661 | |
HMV Group PLC(a) | | | 9,469 | | | | 2,315 | |
Home Retail Group PLC | | | 4,474 | | | | 13,848 | |
HSBC Holdings PLC | | | 27,784 | | | | 285,478 | |
ICAP PLC | | | 2,165 | | | | 18,324 | |
IG Group Holdings PLC | | | 1,551 | | | | 11,352 | |
IMI PLC | | | 867 | | | | 14,314 | |
Imperial Tobacco Group PLC | | | 2,020 | | | | 62,395 | |
Inmarsat PLC | | | 1,132 | | | | 10,960 | |
Intercontinental Hotels Group PLC | | | 513 | | | | 10,509 | |
International Power PLC | | | 3,317 | | | | 16,376 | |
Interserve PLC | | | 1,799 | | | | 7,937 | |
J. Sainsbury PLC | | | 4,474 | | | | 24,046 | |
Johnson Matthey PLC | | | 386 | | | | 11,509 | |
Kingfisher PLC | | | 4,645 | | | | 18,309 | |
Laird PLC | | | 3,213 | | | | 7,107 | |
Legal & General Group PLC | | | 14,160 | | | | 26,148 | |
London Stock Exchange Group PLC | | | 620 | | | | 8,274 | |
Man Group PLC | | | 10,339 | | | | 40,753 | |
National Grid PLC | | | 8,614 | | | | 82,018 | |
See Notes to Financial Statements.
| | |
| 100 | | WisdomTree International Dividend and Sector Funds |
Schedule of Investments (concluded)
WisdomTree International Hedged Equity Fund (HEDJ)
March 31, 2011
| | | | | | | | |
| Investments | | Shares | | | Fair
Value | |
| | | | | | | | |
Next PLC | | | 392 | | | $ | 12,441 | |
Northern Foods PLC | | | 6,716 | | | | 7,832 | |
Pearson PLC | | | 1,700 | | | | 30,002 | |
Premier Farnell PLC | | | 1,734 | | | | 7,541 | |
Provident Financial PLC(a) | | | 897 | | | | 13,803 | |
Prudential PLC | | | 4,292 | | | | 48,606 | |
Reckitt Benckiser Group PLC | | | 1,104 | | | | 56,664 | |
Reed Elsevier PLC | | | 2,767 | | | | 23,951 | |
Rexam PLC | | | 3,574 | | | | 20,819 | |
Rio Tinto PLC | | | 688 | | | | 48,293 | |
Robert Wiseman Dairies PLC | | | 1,447 | | | | 7,962 | |
Royal Dutch Shell PLC Class A | | | 8,316 | | | | 301,794 | |
Royal Dutch Shell PLC Class B | | | 7,977 | | | | 288,980 | |
RSA Insurance Group PLC | | | 12,469 | | | | 26,283 | |
SABMiller PLC | | | 1,492 | | | | 52,795 | |
Sage Group PLC (The) | | | 4,353 | | | | 19,405 | |
Scottish & Southern Energy PLC | | | 2,768 | | | | 55,950 | |
Segro PLC | | | 2,730 | | | | 14,069 | |
Severn Trent PLC | | | 925 | | | | 21,663 | |
Smiths Group PLC | | | 897 | | | | 18,649 | |
Stagecoach Group PLC | | | 3,427 | | | | 11,833 | |
Standard Chartered PLC | | | 2,392 | | | | 62,000 | |
Standard Life PLC | | | 7,883 | | | | 26,131 | |
Tate & Lyle PLC | | | 1,608 | | | | 14,885 | |
Tesco PLC | | | 11,265 | | | | 68,798 | |
Thomas Cook Group PLC | | | 4,203 | | | | 11,494 | |
TUI Travel PLC(a) | | | 3,092 | | | | 11,251 | |
Tullett Prebon PLC | | | 1,330 | | | | 8,726 | |
Unilever PLC | | | 2,048 | | | | 62,374 | |
United Utilities Group PLC | | | 2,621 | | | | 24,851 | |
Vedanta Resources PLC | | | 266 | | | | 10,144 | |
Vodafone Group PLC | | | 147,142 | | | | 416,295 | |
WM Morrison Supermarkets PLC | | | 4,999 | | | | 22,116 | |
Xstrata PLC | | | 886 | | | | 20,692 | |
| | | | | | | | |
| Total United Kingdom | | | | | | | 3,890,437 | |
TOTAL COMMON STOCKS
(Cost: $18,441,868) | | | | | | | 21,492,204 | |
| SHORT-TERM INVESTMENT – 0.1% | | | | | | | | |
| MONEY MARKET FUND – 0.1% | | | | | | | | |
Invesco Treasury Fund Private Class, 0.02%(d)
(Cost: $26,078) | | | 26,078 | | | | 26,078 | |
| INVESTMENT OF CASH COLLATERAL FOR SECURITIES LOANED – 2.8% | | | | | | | | |
| MONEY MARKET FUND – 2.8% | | | | | | | | |
Dreyfus Institutional Preferred Money Market Fund, 0.19%(e) | | | | | | | | |
| (Cost: $589,000)(f) | | | 589,000 | | | | 589,000 | |
| TOTAL INVESTMENTS IN SECURITIES—103.2% (Cost: $19,056,946) | | | | | | | 22,107,282 | |
Liabilities in Excess of Cash, Foreign Currency and Other Assets – (3.2)% | | | | | | | (682,522 | ) |
| | | | | | | | |
| NET ASSETS – 100.0% | | | | | | $ | 21,424,760 | |
| * | Non-income producing security. |
| (a) | Security, or portion thereof, was on loan at March 31, 2011 (See Note 2). |
| (b) | Stapled Security - A security contractually bound to one or more other securities to form a single saleable unit which cannot be sold separately. |
| (c) | Securities exempt from registration under Rule 144A of the Securities Act of 1933. Such securities are considered liquid, and may be sold in transactions exempt from registration, normally only to dealers in that program or other “accredited investors.” At March 31, 2011, the aggregate value of these securities amounted to $13,231 representing 0.1% of net assets. |
| (d) | Rate shown represents annualized 7-day yield as of March 31, 2011. |
| (e) | Interest rate shown reflects yield as of March 31, 2011. |
| (f) | At March 31, 2011, the total market value of the Fund’s securities on loan was $410,924 and the total market value of the collateral held by the Fund was $589,000. |
See Notes to Financial Statements.
| | | | |
| WisdomTree International Dividend and Sector Funds | | | 101 | |
Schedule of Investments
WisdomTree International Basic Materials Sector Fund (DBN)
March 31, 2011
| | | | | | | | |
| Investments | | Shares | | | Fair
Value | |
| | | | | | | | |
| COMMON STOCKS – 99.6% | | | | | | | | |
| Australia – 21.4% | | | | | | | | |
Adelaide Brighton Ltd. | | | 62,679 | | | $ | 208,719 | |
Alumina Ltd. | | | 72,689 | | | | 184,921 | |
Amcor Ltd. | | | 73,045 | | | | 533,309 | |
Ausdrill Ltd. | | | 33,732 | | | | 132,559 | |
BHP Billiton Ltd. | | | 120,178 | | | | 5,786,572 | |
Boral Ltd. | | | 28,272 | | | | 146,187 | |
Brickworks Ltd. | | | 13,279 | | | | 150,920 | |
Incitec Pivot Ltd. | | | 31,623 | | | | 141,604 | |
MacArthur Coal Ltd. | | | 10,016 | | | | 120,153 | |
Newcrest Mining Ltd. | | | 5,295 | | | | 218,047 | |
OneSteel Ltd. | | | 58,410 | | | | 147,388 | |
Orica Ltd. | | | 20,908 | | | | 570,172 | |
Rio Tinto Ltd. | | | 9,088 | | | | 796,510 | |
Sims Metal Management Ltd. | | | 4,607 | | | | 83,423 | |
| | | | | | | | |
| Total Australia | | | | | | | 9,220,484 | |
| Austria – 1.2% | | | | | | | | |
Voestalpine AG | | | 11,023 | | | | 518,244 | |
| Belgium – 2.2% | | | | | | | | |
Solvay S.A. | | | 5,352 | | | | 634,868 | |
Tessenderlo Chemie N.V. | | | 3,272 | | | | 117,429 | |
Umicore S.A. | | | 4,323 | | | | 214,686 | |
| | | | | | | | |
| Total Belgium | | | | | | | 966,983 | |
| Denmark – 0.4% | | | | | | | | |
Novozymes A/S Class B | | | 1,060 | | | | 162,507 | |
| Finland – 3.0% | | | | | | | | |
Ahlstrom Oyj | | | 4,877 | | | | 120,286 | |
Huhtamaki Oyj*(a) | | | 10,709 | | | | 151,971 | |
Kemira Oyj(a) | | | 6,791 | | | | 109,767 | |
Outokumpu Oyj(a) | | | 7,132 | | | | 123,679 | |
Rautaruukki Oyj(a) | | | 7,208 | | | | 173,073 | |
UPM-Kymmene Oyj*(a) | | | 29,619 | | | | 627,122 | |
| | | | | | | | |
| Total Finland | | | | | | | 1,305,898 | |
| France – 10.3% | | | | | | | | |
Air Liquide S.A. | | | 12,769 | | | | 1,698,977 | |
Arkema S.A. | | | 2,426 | | | | 220,645 | |
Ciments Francais S.A. | | | 3,573 | | | | 361,320 | |
Eramet | | | 394 | | | | 145,820 | |
Imerys S.A. | | | 3,255 | | | | 238,950 | |
Lafarge S.A. | | | 23,059 | | | | 1,440,304 | |
Rhodia S.A. | | | 3,508 | | | | 102,850 | |
Sa des Ciments Vicat | | | 2,925 | | | | 249,093 | |
| | | | | | | | |
| Total France | | | | | | | 4,457,959 | |
| Germany – 14.4% | | | | | | | | |
BASF SE | | | 48,878 | | | | 4,233,210 | |
K+S AG | | | 1,393 | | | | 105,304 | |
Lanxess AG | | | 1,642 | | | | 122,986 | |
Linde AG | | | 5,210 | | | | 824,007 | |
Salzgitter AG | | | 2,563 | | | | 202,589 | |
Symrise AG | | | 4,826 | | | | 141,697 | |
| | | | | | | | |
| Investments | | Shares | | | Fair
Value | |
| | | | | | | | |
ThyssenKrupp AG | | | 10,861 | | | $ | 444,352 | |
Wacker Chemie AG | | | 728 | | | | 163,954 | |
| | | | | | | | |
| Total Germany | | | | | | | 6,238,099 | |
| Hong Kong – 0.8% | | | | | | | | |
Fosun International Ltd. | | | 139,500 | | | | 107,071 | |
Fushan International Energy Group Ltd. | | | 316,284 | | | | 227,712 | |
| | | | | | | | |
| Total Hong Kong | | | | | | | 334,783 | |
| Ireland – 1.8% | | | | | | | | |
CRH PLC | | | 34,615 | | | | 794,796 | |
| Italy – 0.6% | | | | | | | | |
Buzzi Unicem SpA | | | 6,206 | | | | 90,535 | |
Italcementi SpA | | | 7,566 | | | | 77,467 | |
Italmobiliare SpA | | | 2,802 | | | | 112,609 | |
| | | | | | | | |
| Total Italy | | | | | | | 280,611 | |
| Japan – 12.8% | | | | | | | | |
Air Water, Inc. | | | 9,000 | | | | 110,002 | |
Asahi Kasei Corp. | | | 41,000 | | | | 277,522 | |
Denki Kagaku Kogyo K.K. | | | 12,000 | | | | 59,363 | |
DIC Corp. | | | 40,000 | | | | 93,147 | |
DOWA Holdings Co., Ltd.(a) | | | 17,266 | | | | 107,912 | |
Hitachi Chemical Co., Ltd. | | | 6,991 | | | | 142,637 | |
Hitachi Metals Ltd. | | | 9,000 | | | | 113,803 | |
Hokuetsu Kishu Paper Co., Ltd. | | | 18,448 | | | | 99,496 | |
JFE Holdings, Inc. | | | 5,928 | | | | 174,092 | |
JSR Corp. | | | 7,244 | | | | 145,876 | |
Kaneka Corp. | | | 22,255 | | | | 155,473 | |
Kobe Steel Ltd. | | | 54,000 | | | | 140,734 | |
Kuraray Co., Ltd. | | | 9,300 | | | | 120,290 | |
Kyoei Steel Ltd. | | | 1,631 | | | | 28,889 | |
Maruichi Steel Tube Ltd.(a) | | | 5,100 | | | | 126,454 | |
Mitsubishi Chemical Holdings Corp. | | | 41,752 | | | | 263,469 | |
Mitsubishi Gas Chemical Co., Inc. | | | 19,169 | | | | 138,078 | |
Nippon Kayaku Co., Ltd. | | | 12,000 | | | | 109,170 | |
Nippon Paper Group, Inc. | | | 8,203 | | | | 175,383 | |
Nippon Steel Corp. | | | 52,000 | | | | 166,892 | |
Nissan Chemical Industries Ltd. | | | 7,132 | | | | 74,005 | |
Nitto Denko Corp. | | | 3,600 | | | | 191,554 | |
OJI Paper Co., Ltd. | | | 40,000 | | | | 190,637 | |
Shin-Etsu Chemical Co., Ltd. | | | 12,644 | | | | 630,827 | |
Showa Denko K.K. | | | 47,298 | | | | 95,304 | |
Sumitomo Chemical Co., Ltd. | | | 41,692 | | | | 208,762 | |
Sumitomo Metal Industries Ltd. | | | 153,000 | | | | 343,364 | |
Sumitomo Metal Mining Co., Ltd. | | | 13,045 | | | | 225,234 | |
Taiyo Holdings Co., Ltd. | | | 2,900 | | | | 89,575 | |
Taiyo Nippon Sanso Corp. | | | 12,936 | | | | 108,164 | |
Tokyo Tekko Co., Ltd. | | | 7,962 | | | | 25,746 | |
Toray Industries, Inc. | | | 25,000 | | | | 182,493 | |
Tosoh Corp. | | | 28,936 | | | | 104,390 | |
Toyo Ink SC Holdings Co., Ltd. | | | 18,700 | | | | 95,892 | |
Ube Industries Ltd. | | | 32,840 | | | | 105,002 | |
Yamato Kogyo Co., Ltd. | | | 3,374 | | | | 112,765 | |
| | | | | | | | |
| Total Japan | | | | | | | 5,532,396 | |
See Notes to Financial Statements.
| | |
| 102 | | WisdomTree International Dividend and Sector Funds |
Schedule of Investments (concluded)
WisdomTree International Basic Materials Sector Fund (DBN)
March 31, 2011
| | | | | | | | |
| Investments | | Shares | | | Fair
Value | |
| | | | | | | | |
| Netherlands – 3.2% | | | | | | | | |
Akzo Nobel N.V. | | | 10,934 | | | $ | 752,237 | |
Koninklijke DSM N.V. | | | 9,953 | | | | 612,359 | |
| | | | | | | | |
| Total Netherlands | | | | | | | 1,364,596 | |
| New Zealand – 0.5% | | | | | | | | |
Fletcher Building Ltd. | | | 30,381 | | | | 216,437 | |
| Norway – 1.7% | | | | | | | | |
Norsk Hydro ASA | | | 27,506 | | | | 225,548 | |
Yara International ASA | | | 9,615 | | | | 487,029 | |
| | | | | | | | |
| Total Norway | | | | | | | 712,577 | |
| Portugal – 1.3% | | | | | | | | |
Cimpor Cimentos de Portugal, SGPS, S.A. | | | 45,701 | | | | 331,665 | |
Portucel Empresa Produtora de Pasta e Papel S.A. | | | 38,651 | | | | 135,972 | |
Semapa-Sociedade de Investimento e Gestao | | | 7,877 | | | | 94,344 | |
| | | | | | | | |
| Total Portugal | | | | | | | 561,981 | |
| Sweden – 2.4% | | | | | | | | |
Boliden AB | | | 13,170 | | | | 283,926 | |
Holmen AB Class B(a) | | | 3,754 | | | | 129,846 | |
Svenska Cellulosa AB Class B | | | 37,690 | | | | 607,017 | |
| | | | | | | | |
| Total Sweden | | | | | | | 1,020,789 | |
| Switzerland – 4.5% | | | | | | | | |
Givaudan S.A. | | | 270 | | | | 272,553 | |
Holcim Ltd. | | | 8,835 | | | | 668,286 | |
Syngenta AG | | | 3,088 | | | | 1,007,562 | |
| | | | | | | | |
| Total Switzerland | | | | | | | 1,948,401 | |
| United Kingdom – 17.1% | | | | | | | | |
Antofagasta PLC | | | 25,278 | | | | 551,469 | |
BHP Billiton PLC | | | 69,818 | | | | 2,753,102 | |
Croda International PLC | | | 5,927 | | | | 159,422 | |
DS Smith PLC | | | 17,149 | | | | 54,703 | |
Elementis PLC | | | 41,039 | | | | 100,057 | |
Eurasian Natural Resources Corp. PLC | | | 15,855 | | | | 238,009 | |
Ferrexpo PLC | | | 14,134 | | | | 97,874 | |
Fresnillo PLC | | | 15,076 | | | | 372,882 | |
Hill & Smith Holdinsgs PLC | | | 5,934 | | | | 32,959 | |
Hochschild Mining PLC | | | 2,656 | | | | 27,439 | |
Johnson Matthey PLC | | | 8,690 | | | | 259,091 | |
Kazakhmys PLC | | | 4,458 | | | | 99,615 | |
Mondi PLC | | | 13,204 | | | | 126,886 | |
Rexam PLC | | | 73,372 | | | | 427,401 | |
Rio Tinto PLC | | | 19,868 | | | | 1,394,598 | |
Vedanta Resources PLC(a) | | | 5,400 | | | | 205,925 | |
Xstrata PLC | | | 19,994 | | | | 466,959 | |
| | | | | | | | |
| Total United Kingdom | | | | | | | 7,368,391 | |
TOTAL COMMON STOCKS
(Cost: $37,470,549) | | | | | | | 43,005,932 | |
| EXCHANGE-TRADED FUND – 0.1% | | | | | | | | |
| United States – 0.1% | | | | | | | | |
WisdomTree DEFA Fund(b)
(Cost: $30,485) | | | 666 | | | | 33,107 | |
| | | | | | | | |
| Investments | | Shares | | | Fair
Value | |
| | | | | | | | |
| SHORT-TERM INVESTMENT – 0.0% | | | | | | | | |
| MONEY MARKET FUND – 0.0% | | | | | | | | |
| Invesco Treasury Fund Private Class, 0.02%(c) (Cost: $3,387) | | | 3,387 | | | $ | 3,387 | |
INVESTMENT OF CASH COLLATERAL FOR
SECURITIES LOANED – 4.1% | | | | | | | | |
| MONEY MARKET FUND – 4.1% | | | | | | | | |
Dreyfus Institutional Preferred Money Market Fund, 0.19%(d) | | | | | | | | |
| (Cost: $1,790,000)(e) | | | 1,790,000 | | | | 1,790,000 | |
| TOTAL INVESTMENTS IN SECURITIES – 103.8% (Cost: $39,294,421) | | | | | | | 44,832,426 | �� |
Liabilities in Excess of Foreign Currency and Other Assets – (3.8)% | | | | | | | (1,660,320 | ) |
| | | | | | | | |
| NET ASSETS – 100.0% | | | | | | $ | 43,172,106 | |
| * | Non-income producing security. |
| (a) | Security, or portion thereof, was on loan at March 31, 2011 (See Note 2). |
| (b) | Affiliated companies (See Note 7). |
| (c) | Rate shown represents annualized 7-day yield as of March 31, 2011. |
| (d) | Interest rate shown reflects yield as of March 31, 2011. |
| (e) | At March 31, 2011, the total market value of the Fund’s securities on loan was $1,703,736 and the total market value of the collateral held by the Fund was $1,790,000. |
See Notes to Financial Statements.
| | | | |
| WisdomTree International Dividend and Sector Funds | | | 103 | |
Schedule of Investments
WisdomTree International Energy Sector Fund (DKA)
March 31, 2011
| | | | | | | | |
| Investments | | Shares | | | Fair
Value | |
| | | | | | | | |
| COMMON STOCKS – 99.6% | | | | | | | | |
| Australia – 15.9% | | | | | | | | |
Beach Energy Ltd. | | | 59,865 | | | $ | 60,052 | |
Caltex Australia Ltd. | | | 10,100 | | | | 162,941 | |
Coal & Allied Industries Ltd. | | | 12,056 | | | | 1,490,390 | |
New Hope Corp., Ltd. | | | 175,011 | | | | 901,318 | |
Origin Energy Ltd. | | | 73,102 | | | | 1,226,206 | |
Santos Ltd. | | | 75,753 | | | | 1,218,186 | |
Whitehaven Coal Ltd. | | | 7,665 | | | | 53,030 | |
Woodside Petroleum Ltd. | | | 31,491 | | | | 1,524,108 | |
WorleyParsons Ltd. | | | 37,359 | | | | 1,196,906 | |
| | | | | | | | |
| Total Australia | | | | | | | 7,833,137 | |
| Austria – 2.8% | | | | | | | | |
OMV AG | | | 28,653 | | | | 1,296,694 | |
Schoeller-Bleckmann Oilfield Equipment AG | | | 691 | | | | 68,024 | |
| | | | | | | | |
| Total Austria | | | | | | | 1,364,718 | |
| Finland – 0.4% | | | | | | | | |
Neste Oil Oyj(a) | | | 9,041 | | | | 186,678 | |
| France – 11.8% | | | | | | | | |
Bourbon S.A.(a) | | | 16,031 | | | | 759,836 | |
Etablissements Maurel et Prom | | | 5,069 | | | | 97,831 | |
Technip S.A. | | | 11,771 | | | | 1,256,993 | |
TOTAL S.A. | | | 60,567 | | | | 3,692,009 | |
| | | | | | | | |
| Total France | | | | | | | 5,806,669 | |
| Hong Kong – 6.3% | | | | | | | | |
CNOOC Ltd. | | | 1,235,618 | | | | 3,113,588 | |
| Italy – 9.2% | | | | | | | | |
ENI SpA | | | 126,357 | | | | 3,107,498 | |
ERG SpA | | | 12,468 | | | | 177,464 | |
Saipem SpA | | | 23,715 | | | | 1,262,360 | |
| | | | | | | | |
| Total Italy | | | | | | | 4,547,322 | |
| Japan – 4.7% | | | | | | | | |
AOC Holdings, Inc.* | | | 600 | | | | 4,039 | |
Cosmo Oil Co., Ltd.(a) | | | 21,000 | | | | 65,625 | |
Idemitsu Kosan Co., Ltd. | | | 400 | | | | 47,008 | |
Itochu Enex Co., Ltd. | | | 5,900 | | | | 33,885 | |
Japan Drilling Co., Ltd. | | | 1,063 | | | | 44,826 | |
Modec, Inc.(a) | | | 200 | | | | 3,661 | |
San-Ai Oil Co., Ltd. | | | 6,000 | | | | 32,143 | |
Shinko Plantech Co., Ltd. | | | 2,000 | | | | 23,238 | |
Showa Shell Sekiyu K.K. | | | 98,000 | | | | 1,026,351 | |
Sinanen Co., Ltd. | | | 8,000 | | | | 36,873 | |
TonenGeneral Sekiyu K.K. | | | 81,250 | | | | 1,006,802 | |
| | | | | | | | |
| Total Japan | | | | | | | 2,324,451 | |
| Netherlands – 4.9% | | | | | | | | |
Fugro N.V. CVA | | | 13,225 | | | | 1,166,969 | |
SBM Offshore N.V. | | | 43,493 | | | | 1,264,045 | |
| | | | | | | | |
| Total Netherlands | | | | | | | 2,431,014 | |
| Norway – 12.5% | | | | | | | | |
Aker ASA | | | 35,694 | | | | 1,100,163 | |
Aker Solutions ASA | | | 48,574 | | | | 1,116,058 | |
Fred Olsen Energy ASA | | | 24,448 | | | | 1,073,958 | |
| | | | | | | | |
| Investments | | Shares | | | Fair
Value | |
| | | | | | | | |
Statoil ASA | | | 103,417 | | | $ | 2,865,969 | |
| | | | | | | | |
| Total Norway | | | | | | | 6,156,148 | |
| Portugal – 2.4% | | | | | | | | |
Galp Energia, SGPS, S.A. Class B | | | 56,139 | | | | 1,203,368 | |
| Singapore – 0.6% | | | | | | | | |
Boustead Singapore Ltd. | | | 77,000 | | | | 61,087 | |
China Aviation Oil Singapore Corp., Ltd. | | | 36,000 | | | | 38,270 | |
Ezra Holdings Ltd. | | | 28,000 | | | | 39,096 | |
Falcon Energy Group Ltd. | | | 100,798 | | | | 27,988 | |
Straits Asia Resources Ltd. | | | 55,000 | | | | 109,520 | |
| | | | | | | | |
| Total Singapore | | | | | | | 275,961 | |
| Spain – 7.3% | | | | | | | | |
Repsol YPF S.A. | | | 78,313 | | | | 2,686,664 | |
Tecnicas Reunidas S.A. | | | 14,700 | | | | 884,914 | |
| | | | | | | | |
| Total Spain | | | | | | | 3,571,578 | |
| United Kingdom – 20.8% | | | | | | | | |
AMEC PLC | | | 53,588 | | | | 1,024,773 | |
BG Group PLC | | | 62,656 | | | | 1,557,737 | |
Hunting PLC | | | 4,681 | | | | 58,264 | |
James Fisher & Sons PLC | | | 4,368 | | | | 36,339 | |
JKX Oil & Gas PLC | | | 4,668 | | | | 23,570 | |
John Wood Group PLC | | | 9,656 | | | | 98,673 | |
Royal Dutch Shell PLC Class A | | | 88,387 | | | | 3,207,633 | |
Royal Dutch Shell PLC Class B | | | 93,559 | | | | 3,389,330 | |
Tullow Oil PLC | | | 36,931 | | | | 857,195 | |
| | | | | | | | |
| Total United Kingdom | | | | | | | 10,253,514 | |
TOTAL COMMON STOCKS
(Cost: $43,772,686) | | | | | | | 49,068,146 | |
| EXCHANGE-TRADED FUND – 0.2% | | | | | | | | |
| United States – 0.2% | | | | | | | | |
WisdomTree DEFA Fund(b)
(Cost: $116,457) | | | 2,451 | | | | 121,839 | |
| SHORT-TERM INVESTMENT – 0.1% | | | | | | | | |
| MONEY MARKET FUND – 0.1% | | | | | | | | |
Invesco Treasury Fund Private Class, 0.02%(c)
(Cost: $55,908) | | | 55,908 | �� | | | 55,908 | |
INVESTMENT OF CASH COLLATERAL FOR
SECURITIES LOANED – 0.7% | | | | | | | | |
| MONEY MARKET FUND – 0.7% | | | | | | | | |
Dreyfus Institutional Preferred Money Market Fund, 0.19%(d) | | | | | | | | |
| (Cost: $347,000)(e) | | | 347,000 | | | | 347,000 | |
TOTAL INVESTMENTS IN SECURITIES – 100.6%
(Cost: $44,292,051) | | | | | | | 49,592,893 | |
Liabilities in Excess of Foreign Currency and Other Assets – (0.6)% | | | | | | | (320,263 | ) |
| | | | | | | | |
| NET ASSETS – 100.0% | | | | | | $ | 49,272,630 | |
| * | Non-income producing security. |
| (a) | Security, or portion thereof, was on loan at March 31, 2011 (See Note 2). |
| (b) | Affiliated companies (See Note 7). |
| (c) | Rate shown represents annualized 7-day yield as of March 31, 2011. |
| (d) | Interest rate shown reflects yield as of March 31, 2011. |
| (e) | At March 31, 2011, the total market value of the Fund’s securities on loan was $330,087 and the total market value of the collateral held by the Fund was $347,000. |
See Notes to Financial Statements.
| | |
| 104 | | WisdomTree International Dividend and Sector Funds |
Schedule of Investments
WisdomTree International Utilities Sector Fund (DBU)
March 31, 2011
| | | | | | | | |
| Investments | | Shares | | | Fair
Value | |
| | | | | | | | |
| COMMON STOCKS – 99.5% | | | | | | | | |
| Australia – 3.6% | | | | | | | | |
AGL Energy Ltd. | | | 24,953 | | | $ | 369,272 | |
Challenger Infrastructure Fund Class A(a) | | | 33,971 | | | | 41,806 | |
DUET Group(a) | | | 133,039 | | | | 230,450 | |
Envestra Ltd.(a) | | | 142,429 | | | | 88,376 | |
Hastings Diversified Utilities Fund | | | 29,551 | | | | 48,896 | |
Prime Infrastructure Group*††(a) | | | 7,592 | | | | – | |
SP AusNet(a) | | | 307,238 | | | | 279,602 | |
Spark Infrastructure Group(b) | | | 239,592 | | | | 277,507 | |
| | | | | | | | |
| Total Australia | | | | | | | 1,335,909 | |
| Austria – 1.9% | | | | | | | | |
EVN AG | | | 5,350 | | | | 100,027 | |
Verbund AG(c) | | | 13,573 | | | | 603,846 | |
| | | | | | | | |
| Total Austria | | | | | | | 703,873 | |
| Finland – 3.5% | | | | | | | | |
Fortum Oyj(c) | | | 38,401 | | | | 1,305,697 | |
| France – 18.2% | | | | | | | | |
Electricite de France S.A. | | | 49,972 | | | | 2,072,144 | |
GDF Suez | | | 78,053 | | | | 3,184,494 | |
Sechilienne-Sidec | | | 2,161 | | | | 60,736 | |
Suez Environnement Co. | | | 26,077 | | | | 540,286 | |
Veolia Environnement S.A. | | | 29,718 | | | | 925,271 | |
| | | | | | | | |
| Total France | | | | | | | 6,782,931 | |
| Germany – 10.8% | | | | | | | | |
E.ON AG | | | 71,486 | | | | 2,186,157 | |
RWE AG | | | 28,729 | | | | 1,832,377 | |
| | | | | | | | |
| Total Germany | | | | | | | 4,018,534 | |
| Hong Kong – 5.1% | | | | | | | | |
China Power International Development Ltd. | | | 150,700 | | | | 32,162 | |
China Resources Power Holdings Co., Ltd. | | | 119,700 | | | | 230,530 | |
CLP Holdings Ltd. | | | 87,322 | | | | 706,147 | |
Guangdong Investment Ltd. | | | 148,000 | | | | 74,778 | |
Hong Kong & China Gas Co., Ltd. | | | 126,996 | | | | 304,665 | |
Power Assets Holdings Ltd. | | | 81,886 | | | | 547,437 | |
| | | | | | | | |
| Total Hong Kong | | | | | | | 1,895,719 | |
| Italy – 14.9% | | | | | | | | |
A2A SpA | | | 269,392 | | | | 436,962 | |
Enel SpA | | | 494,140 | | | | 3,119,089 | |
Hera SpA(c) | | | 105,894 | | | | 253,813 | |
Iren SpA | | | 128,218 | | | | 239,088 | |
Snam Rete Gas SpA | | | 173,750 | | | | 977,891 | |
Terna Rete Elettrica Nazionale SpA | | | 110,621 | | | | 530,286 | |
| | | | | | | | |
| Total Italy | | | | | | | 5,557,129 | |
| Japan – 8.0% | | | | | | | | |
Chubu Electric Power Co., Inc. | | | 18,300 | | | | 408,482 | |
Chugoku Electric Power Co., Inc. (The) | | | 11,500 | | | | 213,405 | |
Electric Power Development Co., Ltd. | | | 6,542 | | | | 202,227 | |
Hokkaido Electric Power Co., Inc. | | | 8,600 | | | | 167,372 | |
Hokuriku Electric Power Co. | | | 8,500 | | | | 193,219 | |
| | | | | | | | |
| Investments | | Shares | | | Fair
Value | |
| | | | | | | | |
Kansai Electric Power Co., Inc. (The) | | | 21,800 | | | $ | 476,349 | |
Kyushu Electric Power Co., Inc. | | | 13,900 | | | | 272,533 | |
Osaka Gas Co., Ltd. | | | 57,000 | | | | 228,330 | |
Shikoku Electric Power Co., Inc. | | | 5,961 | | | | 162,762 | |
Tohoku Electric Power Co., Inc. | | | 15,500 | | | | 262,759 | |
Tokyo Electric Power Co., Inc. (The) | | | 25,800 | | | | 145,063 | |
Tokyo Gas Co., Ltd. | | | 57,000 | | | | 261,342 | |
| | | | | | | | |
| Total Japan | | | | | | | 2,993,843 | |
| New Zealand – 1.6% | | | | | | | | |
Contact Energy Ltd. | | | 50,994 | | | | 226,373 | |
TrustPower Ltd. | | | 20,922 | | | | 114,899 | |
Vector Ltd. | | | 135,152 | | | | 257,718 | |
| | | | | | | | |
| Total New Zealand | | | | | | | 598,990 | |
| Portugal – 2.2% | | | | | | | | |
EDP-Energias de Portugal S.A. | | | 188,688 | | | | 735,824 | |
REN – Redes Energeticas Nacionais S.A. | | | 27,494 | | | | 97,698 | |
| | | | | | | | |
| Total Portugal | | | | | | | 833,522 | |
| Spain – 15.7% | | | | | | | | |
Acciona S.A. | | | 3,496 | | | | 380,423 | |
Enagas S.A. | | | 14,196 | | | | 320,717 | |
Endesa S.A. | | | 26,479 | | | | 821,607 | |
Gas Natural SDG S.A. | | | 53,844 | | | | 1,012,815 | |
Iberdrola Renovables S.A. | | | 61,408 | | | | 265,353 | |
Iberdrola S.A. | | | 311,536 | | | | 2,712,730 | |
Red Electrica Corp. S.A. | | | 6,323 | | | | 359,816 | |
| | | | | | | | |
| Total Spain | | | | | | | 5,873,461 | |
| Switzerland – 0.5% | | | | | | | | |
BKW FMB Energie AG | | | 2,801 | | | | 198,858 | |
| United Kingdom – 13.5% | | | | | | | | |
Centrica PLC | | | 187,551 | | | | 977,965 | |
Drax Group PLC | | | 11,829 | | | | 75,181 | |
International Power PLC | | | 65,115 | | | | 321,478 | |
National Grid PLC | | | 156,925 | | | | 1,494,164 | |
Northumbrian Water Group PLC | | | 37,428 | | | | 199,304 | |
Pennon Group PLC | | | 21,646 | | | | 216,859 | |
Scottish & Southern Energy PLC | | | 48,987 | | | | 990,184 | |
Severn Trent PLC | | | 14,829 | | | | 347,282 | |
United Utilities Group PLC | | | 44,507 | | | | 421,991 | |
| | | | | | | | |
| Total United Kingdom | | | | | | | 5,044,408 | |
TOTAL COMMON STOCKS
(Cost: $48,670,691) | | | | | | | 37,142,874 | |
| EXCHANGE-TRADED FUND – 0.3% | | | | | | | | |
| United States – 0.3% | | | | | | | | |
WisdomTree DEFA Fund(d)
(Cost: $95,500) | | | 2,161 | | | | 107,423 | |
| SHORT-TERM INVESTMENT – 0.1% | | | | | | | | |
| MONEY MARKET FUND – 0.1% | | | | | | | | |
Invesco Treasury Fund Private Class, 0.02%(e)
(Cost: $41,352) | | | 41,352 | | | | 41,352 | |
See Notes to Financial Statements.
| | | | |
| WisdomTree International Dividend and Sector Funds | | | 105 | |
Schedule of Investments (concluded)
WisdomTree International Utilities Sector Fund (DBU)
March 31, 2011
| | | | | | | | |
| Investments | | Shares | | | Fair
Value | |
| | | | | | | | |
| INVESTMENT OF CASH COLLATERAL FOR SECURITIES LOANED – 4.3% | | | | | | | | |
| MONEY MARKET FUND – 4.3% | | | | | | | | |
| Dreyfus Institutional Preferred Money Market Fund, 0.19%(f) | | | | | | | | |
| (Cost: $1,609,000)(g) | | | 1,609,000 | | | $ | 1,609,000 | |
TOTAL INVESTMENTS IN SECURITIES – 104.2%
(Cost: $50,416,543) | | | | | | | 38,900,649 | |
Liabilities in Excess of Foreign Currency and Other Assets – (4.2)% | | | | | | | (1,565,288 | ) |
| | | | | | | | |
| NET ASSETS – 100.0% | | | | | | $ | 37,335,361 | |
| * | Non-income producing security. |
| ++ | Restricted Security. At March 31, 2011, the value of these securities amounted to $0 and 0.0% if net assets. |
| (a) | Stapled Security – A security contractually bound to one or more other securities to form a single saleable unit which cannot be sold separately. |
| (b) | Securities exempt from registration under Rule 144A of the Securities Act of 1933. Such securities are considered liquid, and may be sold in transactions exempt from registration, normally only to dealers in that program or other “accredited investors.” At March 31, 2011, the aggregate value of these securities amounted to $277,507 representing 0.7% of net assets. |
| (c) | Security, or portion thereof, was on loan at March 31, 2011 (See Note 2). |
| (d) | Affiliated companies (See Note 7). |
| (e) | Rate shown represents annualized 7-day yield as of March 31, 2011. |
| (f) | Interest rate shown reflects yield as of March 31, 2011. |
| (g) | At March 31, 2011, the total market value of the Fund’s securities on loan was $1,530,753 and the total market value of the collateral held by the Fund was $1,609,000. |
See Notes to Financial Statements.
| | |
| 106 | | WisdomTree International Dividend and Sector Funds |
Schedule of Investments
WisdomTree International Real Estate Fund (DRW)
March 31, 2011
| | | | | | | | |
| Investments | | Shares | | | Fair
Value | |
| | | | | | | | |
| COMMON STOCKS – 99.6% | | | | | | | | |
| Australia – 17.8% | | | | | | | | |
Abacus Property Group | | | 109,482 | | | $ | 266,069 | |
ALE Property Group | | | 85,453 | | | | 176,742 | |
Ardent Leisure Group | | | 172,886 | | | | 255,670 | |
Aspen Group | | | 340,112 | | | | 160,036 | |
Astro Japan Property Group | | | 71,100 | | | | 216,172 | |
Australand Property Group | | | 205,584 | | | | 650,570 | |
Bunnings Warehouse Property Trust | | | 121,695 | | | | 215,834 | |
CFS Retail Property Trust | | | 758,289 | | | | 1,442,899 | |
Challenger Diversified Property Group | | | 378,159 | | | | 191,626 | |
Charter Hall Office REIT | | | 142,020 | | | | 486,139 | |
Charter Hall Retail REIT | | | 162,126 | | | | 523,107 | |
Commonwealth Property Office Fund | | | 674,918 | | | | 600,251 | |
Cromwell Property Group | | | 464,017 | | | | 338,303 | |
Dexus Property Group | | | 1,677,737 | | | | 1,474,777 | |
Goodman Group | | | 698,327 | | | | 494,690 | |
GPT Group In Specie†*†† | | | 2,305,813 | | | | — | |
ING Office Fund(a) | | | 1,262,210 | | | | 809,295 | |
Lend Lease Group(a) | | | 172,685 | | | | 1,619,740 | |
Mirvac Group | | | 731,321 | | | | 941,588 | |
Peet Ltd. | | | 101,762 | | | | 203,108 | |
Stockland | | | 776,287 | | | | 2,978,377 | |
Westfield Group | | | 810,607 | | | | 7,829,619 | |
| | | | | | | | |
| Total Australia | | | | | | | 21,874,612 | |
| Austria – 0.2% | | | | | | | | |
Conwert Immobilien Invest SE | | | 16,454 | | | | 272,259 | |
| Belgium – 2.1% | | | | | | | | |
Befimmo SCA Sicafi | | | 8,368 | | | | 731,977 | |
Cofinimmo | | | 5,933 | | | | 869,315 | |
Intervest Offices | | | 8,371 | | | | 299,833 | |
Warehouses De Pauw SCA | | | 6,974 | | | | 395,872 | |
Wereldhave Belgium N.V. | | | 2,451 | | | | 256,588 | |
| | | | | | | | |
| Total Belgium | | | | | | | 2,553,585 | |
| Finland – 0.3% | | | | | | | | |
Sponda Oyj(b) | | | 65,115 | | | | 370,543 | |
| France – 13.2% | | | | | | | | |
Anf Immobilier | | | 4,188 | | | | 208,012 | |
Fonciere des Murs | | | 18,603 | | | | 601,381 | |
Fonciere des Regions | | | 16,015 | | | | 1,708,834 | |
Gecina S.A. | | | 26,568 | | | | 3,669,222 | |
ICADE | | | 18,013 | | | | 2,225,960 | |
Klepierre | | | 72,224 | | | | 2,935,402 | |
Mercialys S.A. | | | 29,222 | | | | 1,166,314 | |
Societe de la Tour Eiffel | | | 3,838 | | | | 354,023 | |
Societe Immobiliere de Location pour l’Industrie et le Commerce | | | 7,471 | | | | 1,048,547 | |
Unibail-Rodamco SE | | | 10,356 | | | | 2,246,314 | |
| | | | | | | | |
| Total France | | | | | | | 16,164,009 | |
| Germany – 0.6% | | | | | | | | |
Alstria Office REIT – AG(b) | | | 22,413 | | | | 312,020 | |
Deutsche Euroshop AG | | | 11,386 | | | | 435,454 | |
| | | | | | | | |
| Total Germany | | | | | | | 747,474 | |
| | | | | | | | |
| Investments | | Shares | | | Fair
Value | |
| | | | | | | | |
| Hong Kong – 25.1% | | | | | | | | |
Champion Real Estate Investment Trust(b) | | | 1,746,000 | | | $ | 1,012,376 | |
Cheung Kong (Holdings) Ltd. | | | 344,238 | | | | 5,611,758 | |
China Overseas Land & Investment Ltd. | | | 525,800 | | | | 1,069,419 | |
GZI Real Estate Investment Trust | | | 516,133 | | | | 269,407 | |
Hang Lung Group Ltd. | | | 118,649 | | | | 734,482 | |
Hang Lung Properties Ltd. | | | 478,283 | | | | 2,093,741 | |
Henderson Land Development Co., Ltd. | | | 224,320 | | | | 1,554,453 | |
Hopewell Holdings Ltd. | | | 217,500 | | | | 652,931 | |
Hysan Development Co., Ltd. | | | 165,115 | | | | 679,293 | |
Kowloon Development Co., Ltd. | | | 406,398 | | | | 544,428 | |
Link REIT (The) | | | 486,946 | | | | 1,524,406 | |
New World Development Ltd. | | | 507,125 | | | | 895,824 | |
Regal Real Estate Investment Trust | | | 1,616,000 | | | | 517,323 | |
Shenzhen Investment Ltd. | | | 1,113,900 | | | | 370,909 | |
Silver Grant International | | | 468,900 | | | | 183,263 | |
Sino Land Co., Ltd. | | | 722,305 | | | | 1,283,363 | |
Sino-Ocean Land Holdings Ltd. | | | 447,100 | | | | 277,059 | |
Sun Hung Kai Properties Ltd. | | | 301,871 | | | | 4,781,377 | |
Sunlight Real Estate Investment Trust | | | 981,000 | | | | 310,260 | |
Swire Pacific Ltd. Class A | | | 143,959 | | | | 2,109,913 | |
Swire Pacific Ltd. Class B | | | 545,798 | | | | 1,505,151 | |
Wharf Holdings Ltd. | | | 368,872 | | | | 2,544,288 | |
Wheelock & Co., Ltd. | | | 73,231 | | | | 274,915 | |
| | | | | | | | |
| Total Hong Kong | | | | | | | 30,800,339 | |
| Italy – 0.2% | | | | | | | | |
Beni Stabili SpA | | | 177,464 | | | | 184,724 | |
Beni Stabili SpA | | | 92,712 | | | | 93,413 | |
| | | | | | | | |
| Total Italy | | | | | | | 278,137 | |
| Japan – 14.9% | | | | | | | | |
Aeon Mall Co., Ltd. | | | 11,196 | | | | 241,265 | |
Daito Trust Construction Co., Ltd. | | | 24,400 | | | | 1,686,921 | |
Daiwa House Industry Co., Ltd. | | | 69,000 | | | | 850,845 | |
Daiwa Office Investment Corp.(b) | | | 128 | | | | 445,869 | |
Frontier Real Estate Investment Corp. | | | 60 | | | | 534,266 | |
Fukuoka REIT Co. | | | 51 | | | | 365,516 | |
Japan Excellent, Inc. | | | 75 | | | | 414,002 | |
Japan Logistics Fund, Inc. | | | 29 | | | | 235,135 | |
Japan Prime Realty Investment Corp. | | | 191 | | | | 517,599 | |
Japan Real Estate Investment Corp. | | | 109 | | | | 1,035,026 | |
Japan Retail Fund Investment Corp. | | | 560 | | | | 879,730 | |
Kenedix Realty Investment Corp. | | | 96 | | | | 396,139 | |
MID REIT, Inc. | | | 123 | | | | 350,390 | |
Mitsubishi Estate Co., Ltd. | | | 70,589 | | | | 1,198,344 | |
Mitsui Fudosan Co., Ltd. | | | 77,308 | | | | 1,280,694 | |
Mori Hills REIT Investment Corp. | | | 76 | | | | 233,374 | |
Mori Trust Sogo REIT, Inc. | | | 69 | | | | 676,013 | |
Nippon Accommodations Fund, Inc. | | | 58 | | | | 417,785 | |
Nippon Building Fund, Inc. | | | 152 | | | | 1,485,521 | |
Nomura Real Estate Holdings, Inc. | | | 32,965 | | | | 501,555 | |
Nomura Real Estate Office Fund, Inc. | | | 98 | | | | 665,709 | |
Orix JREIT, Inc. | | | 97 | | | | 534,858 | |
Premier Investment Corp. | | | 77 | | | | 350,253 | |
Sumitomo Real Estate Sales Co., Ltd. | | | 3,816 | | | | 152,861 | |
See Notes to Financial Statements.
| | | | |
| WisdomTree International Dividend and Sector Funds | | | 107 | |
Schedule of Investments (continued)
WisdomTree International Real Estate Fund (DRW)
March 31, 2011
| | | | | | | | |
| Investments | | Shares | | | Fair
Value | |
| | | | | | | | |
Sumitomo Realty & Development Co., Ltd. | | | 23,279 | | | $ | 467,378 | |
Tokyo Tatemono Co., Ltd. | | | 69,751 | | | | 261,735 | |
Tokyu Land Corp. | | | 68,168 | | | | 297,741 | |
Tokyu REIT, Inc. | | | 109 | | | | 675,989 | |
Top REIT, Inc. | | | 64 | | | | 385,714 | |
United Urban Investment Corp.(b) | | | 577 | | | | 731,693 | |
| | | | | | | | |
| Total Japan | | | | | | | 18,269,920 | |
| Netherlands – 4.5% | | | | | | | | |
Corio N.V. | | | 31,833 | | | | 2,229,799 | |
Eurocommercial Properties N.V. | | | 14,461 | | | | 717,435 | |
Nieuwe Steen Investments N.V. | | | 23,455 | | | | 487,625 | |
Vastned Offices/Industrial N.V. | | | 19,388 | | | | 337,866 | |
VastNed Retail N.V. | | | 10,355 | | | | 758,985 | |
Wereldhave N.V. | | | 9,438 | | | | 1,009,332 | |
| | | | | | | | |
| Total Netherlands | | | | | | | 5,541,042 | |
| New Zealand – 0.8% | | | | | | | | |
AMP NZ Office Ltd. | | | 383,367 | | | | 239,779 | |
Argosy Property Trust | | | 285,815 | | | | 159,144 | |
Goodman Property Trust | | | 417,704 | | | | 296,301 | |
Kiwi Income Property Trust | | | 343,190 | | | | 261,768 | |
| | | | | | | | |
| Total New Zealand | | | | | | | 956,992 | |
| Singapore – 9.5% | | | | | | | | |
Allgreen Properties Ltd. | | | 329,000 | | | | 281,888 | |
Ascendas India Trust | | | 330,626 | | | | 250,494 | |
Ascendas Real Estate Investment Trust | | | 519,901 | | | | 841,411 | |
Ascott Residence Trust | | | 194,118 | | | | 184,801 | |
Cambridge Industrial Trust | | | 543,472 | | | | 211,266 | |
CapitaCommercial Trust(b) | | | 817,635 | | | | 901,636 | |
CapitaLand Ltd. | | | 597,589 | | | | 1,564,493 | |
CapitaMall Trust | | | 755,786 | | | | 1,127,233 | |
Capitamalls Asia Ltd. | | | 105,000 | | | | 148,275 | |
CapitaRetail China Trust | | | 243,000 | | | | 240,976 | |
CDL Hospitality Trusts | | | 211,432 | | | | 337,151 | |
City Developments Ltd. | | | 26,103 | | | | 238,561 | |
Fortune Real Estate Investment Trust | | | 527,000 | | | | 260,173 | |
Frasers Centrepoint Trust | | | 192,432 | | | | 232,048 | |
Frasers Commercial Trust | | | 294,614 | | | | 185,814 | |
Guocoland Ltd. | | | 105,000 | | | | 203,253 | |
Keppel Land Ltd. | | | 139,168 | | | | 495,727 | |
K-REIT Asia | | | 341,000 | | | | 348,981 | |
Lippo-Mapletree Indonesia Retail Trust | | | 634,782 | | | | 271,942 | |
Mapletree Logistics Trust | | | 644,187 | | | | 462,506 | |
Parkway Life Real Estate Investment Trust | | | 184,000 | | | | 249,615 | |
Singapore Land Ltd. | | | 70,544 | | | | 390,077 | |
Starhill Global REIT | | | 732,526 | | | | 360,306 | |
Suntec Real Estate Investment Trust | | | 531,828 | | | | 649,754 | |
United Industrial Corp., Ltd. | | | 99,000 | | | | 223,054 | |
UOL Group Ltd. | | | 105,000 | | | | 395,676 | |
Wheelock Properties Singapore Ltd. | | | 182,000 | | | | 272,892 | |
Wing Tai Holdings Ltd. | | | 129,000 | | | | 156,581 | |
Yanlord Land Group Ltd. | | | 105,000 | | | | 125,784 | |
| | | | | | | | |
| Total Singapore | | | | | | | 11,612,368 | |
| | | | | | | | |
| Investments | | Shares | | | Fair
Value | |
| | | | | | | | |
| Sweden – 2.7% | | | | | | | | |
Atrium Ljungberg AB Class B | | | 9,065 | | | $ | 125,017 | |
Castellum AB(b) | | | 46,249 | | | | 673,016 | |
Fabege AB(b) | | | 41,288 | | | | 446,691 | |
Hufvudstaden AB Class A(b) | | | 37,558 | | | | 447,417 | |
Klovern AB | | | 56,882 | | | | 311,082 | |
Kungsleden AB | | | 66,908 | | | | 657,583 | |
Wallenstam AB Class B | | | 9,063 | | | | 281,584 | |
Wihlborgs Fastigheter AB | | | 10,688 | | | | 318,519 | |
| | | | | | | | |
| Total Sweden | | | | | | | 3,260,909 | |
| Switzerland – 0.6% | | | | | | | | |
Allreal Holding AG | | | 2,791 | | | | 433,820 | |
Intershop Holdings | | | 905 | | | | 314,329 | |
| | | | | | | | |
| Total Switzerland | | | | | | | 748,149 | |
| United Kingdom – 7.1% | | | | | | | | |
British Land Co. PLC | | | 274,157 | | | | 2,428,015 | |
Capital Shopping Centres Group PLC | | | 147,773 | | | | 907,222 | |
Daejan Holdings PLC | | | 3,109 | | | | 131,317 | |
Derwent London PLC | | | 13,220 | | | | 348,168 | |
Great Portland Estates PLC | | | 56,595 | | | | 349,994 | |
Hammerson PLC | | | 144,034 | | | | 1,031,799 | |
Land Securities Group PLC | | | 175,449 | | | | 2,062,865 | |
Primary Health Properties PLC | | | 31,372 | | | | 161,424 | |
Savills PLC | | | 32,349 | | | | 185,689 | |
Segro PLC | | | 204,265 | | | | 1,052,676 | |
| | | | | | | | |
| Total United Kingdom | | | | | | | 8,659,169 | |
TOTAL COMMON STOCKS
(Cost: $108,864,502) | | | | | | | 122,109,507 | |
| EXCHANGE-TRADED FUND – 0.1% | | | | | | | | |
| United States – 0.1% | | | | | | | | |
WisdomTree DEFA Fund(c)
(Cost: $160,734) | | | 3,330 | | | | 165,534 | |
| SHORT-TERM INVESTMENT – 0.0% | | | | | | | | |
| MONEY MARKET FUND – 0.0% | | | | | | | | |
Invesco Treasury Fund Private Class, 0.02%(d)
(Cost: $7,135) | | | 7,135 | | | | 7,135 | |
| INVESTMENT OF CASH COLLATERAL FOR SECURITIES LOANED – 3.6% | | | | | | | | |
| MONEY MARKET FUND – 3.6% | | | | | | | | |
Dreyfus Institutional Preferred Money Market Fund, 0.19%(e) | | | | | | | | |
| (Cost: $4,444,000)(f) | | | 4,444,000 | | | | 4,444,000 | |
TOTAL INVESTMENTS IN SECURITIES – 103.3%
(Cost: $113,476,371) | | | | | | | 126,726,176 | |
Liabilities in Excess of Foreign Currency and Other Assets – (3.3)% | | | | | | | (4,055,796 | ) |
| | | | | | | | |
| NET ASSETS – 100.0% | | | | | | $ | 122,670,380 | |
| * | Non-income producing security. |
| † | Security is being fair valued by a valuation committee under the direction of the Board of Trustees. The aggregate value of fair valued securities is $0, which represents 0.0% of net assets. |
| ++ | Restricted Security. At March 31, 2011, the value of these securities amounted to $0 and 0.0% if net assets. |
See Notes to Financial Statements.
| | |
| 108 | | WisdomTree International Dividend and Sector Funds |
Schedule of Investments (concluded)
WisdomTree International Real Estate Fund (DRW)
March 31, 2011
| (a) | Stapled Security - A security contractually bound to one or more other securities to form a single saleable unit which cannot be sold separately. |
| (b) | Security, or portion thereof, was on loan at March 31, 2011 (See Note 2). |
| (c) | Affiliated companies (See Note 7). |
| (d) | Rate shown represents annualized 7-day yield as of March 31, 2011. |
| (e) | Interest rate shown reflects yield as of March 31, 2011. |
| (f) | At March 31, 2011, the total market value of the Fund’s securities on loan was $4,185,406 and the total market value of the collateral held by the Fund was $4,444,000. |
See Notes to Financial Statements.
| | | | |
| WisdomTree International Dividend and Sector Funds | | | 109 | |
Statements of Assets and Liabilities
WisdomTree International Dividend and Sector Funds
March 31, 2011
| | | | | | | | | | | | | | | | | | | | |
| | | WisdomTree DEFA
Fund | | | WisdomTree DEFA
Equity Income
Fund | | | WisdomTree
Global Equity
Income Fund | | | WisdomTree
Europe SmallCap
Dividend Fund | | | WisdomTree
Japan Hedged
Equity Fund | |
ASSETS: | | | | | | | | | | | | | | | | | | | | |
| | | | | |
Investments, at cost | | $ | 438,777,819 | | | $ | 136,127,553 | | | $ | 73,052,122 | | | $ | 26,969,576 | | | $ | 556,801,718 | |
| | | | | |
Investment in affiliate, at cost (Note 7) | | | 1,583,764 | | | | 189,819 | | | | 210,723 | | | | 90,852 | | | | — | |
| | | | | |
Foreign currency, at cost | | | 655,672 | | | | 207,019 | | | | 135,796 | | | | 30,750 | | | | 209,087 | |
Investment in securities, at fair value (including securities on loan) (Note 2)1 | | | 485,286,978 | | | | 137,643,510 | | | | 81,253,717 | | | | 30,621,037 | | | | 541,823,494 | |
| | | | | |
Investment in affiliate, at fair value (Note 7) | | | 1,723,819 | | | | 215,177 | | | | 227,037 | | | | 97,451 | | | | — | |
| | | | | |
Cash | | | — | | | | — | | | | — | | | | — | | | | 172,063 | |
| | | | | |
Foreign currency, at fair value | | | 658,344 | | | | 207,965 | | | | 136,835 | | | | 30,777 | | | | 209,090 | |
| | | | | |
Receivables: | | | | | | | | | | | | | | | | | | | | |
| | | | | |
Dividends and interest | | | 1,693,131 | | | | 459,236 | | | | 257,940 | | | | 81,004 | | | | 6,010,906 | |
| | | | | |
Investment securities sold | | | — | | | | — | | | | 3,956 | | | | 4,708 | | | | — | |
| | | | | |
Unrealized appreciation on foreign forward currency contracts | | | — | | | | — | | | | 215 | | | | — | | | | 8,861,187 | |
| | | | | |
Foreign tax reclaims | | | 507,803 | | | | 104,159 | | | | 27,366 | | | | 16,798 | | | | — | |
Total Assets | | | 489,870,075 | | | | 138,630,047 | | | | 81,907,066 | | | | 30,851,775 | | | | 557,076,740 | |
LIABILITIES: | | | | | | | | | | | | | | | | | | | | |
| | | | | |
Payables: | | | | | | | | | | | | | | | | | | | | |
| | | | | |
Collateral for securities on loan (Note 2) | | | 31,277,000 | | | | 7,112,000 | | | | 3,655,000 | | | | 1,932,000 | | | | 61,960,000 | |
| | | | | |
Investment securities purchased | | | 411,287 | | | | — | | | | 68,139 | | | | 17,080 | | | | — | |
| | | | | |
Advisory fees (Note 3) | | | 180,263 | | | | 63,127 | | | | 36,168 | | | | 13,992 | | | | 130,144 | |
| | | | | |
Service fees (Note 2) | | | 1,687 | | | | 483 | | | | 280 | | | | 107 | | | | 1,193 | |
| | | | | |
Unrealized depreciation on foreign forward currency contracts | | | 2,807 | | | | — | | | | — | | | | — | | | | 4,142 | |
Total Liabilities | | | 31,873,044 | | | | 7,175,610 | | | | 3,759,587 | | | | 1,963,179 | | | | 62,095,479 | |
NET ASSETS | | $ | 457,997,031 | | | $ | 131,454,437 | | | $ | 78,147,479 | | | $ | 28,888,596 | | | $ | 494,981,261 | |
NET ASSETS: | | | | | | | | | | | | | | | | | | | | |
| | | | | |
Paid-in capital | | | $639,303,709 | | | | $205,637,338 | | | | $93,219,733 | | | | $50,773,768 | | | | $520,792,997 | |
| | | | | |
Undistributed net investment income | | | 1,092,255 | | | | 191,867 | | | | 154,543 | | | | 383,628 | | | | 5,918,195 | |
| | | | | |
Accumulated net realized loss on investments and foreign currency related transactions | | | (229,098,396 | ) | | | (75,928,407 | ) | | | (23,449,078 | ) | | | (25,927,661 | ) | | | (25,569,602 | ) |
| | | | | |
Net unrealized appreciation (depreciation) on investments and translation of assets and liabilities denominated in foreign currencies. | | | 46,699,463 | | | | 1,553,639 | | | | 8,222,281 | | | | 3,658,861 | | | | (6,160,329 | ) |
NET ASSETS | | $ | 457,997,031 | | | $ | 131,454,437 | | | $ | 78,147,479 | | | $ | 28,888,596 | | | $ | 494,981,261 | |
Outstanding beneficial interest shares of $0.001 par value (unlimited number of shares authorized) | | | 9,250,000 | | | | 3,000,000 | | | | 1,750,000 | | | | 650,000 | | | | 13,400,000 | |
Net asset value per share | | $ | 49.51 | | | $ | 43.82 | | | $ | 44.66 | | | $ | 44.44 | | | $ | 36.94 | |
| 1 | Market value of securities on loan were as follows: $26,710,022, $6,718,222, $2,676,982, $1,855,787 and $59,182,813, respectively (Note 2). |
See Notes to Financial Statements.
| | |
| 110 | | WisdomTree International Dividend and Sector Funds |
Statements of Assets and Liabilities (continued)
WisdomTree International Dividend and Sector Funds
March 31, 2011
| | | | | | | | | | | | | | | | | | | | |
| | | WisdomTree
World ex-U.S.
Growth Fund | | | WisdomTree
Japan SmallCap
Dividend Fund | | | WisdomTree
Pacific ex-Japan
Total Dividend Fund | | | WisdomTree
Pacific ex-Japan
Equity Income Fund | | | WisdomTree
International
LargeCap
Dividend Fund | |
ASSETS: | | | | | | | | | | | | | | | | | | | | |
| | | | | |
Investments, at cost | | $ | 41,328,978 | | | $ | 238,753,614 | | | $ | 79,873,057 | | | $ | 76,551,848 | | | $ | 166,028,571 | |
| | | | | |
Investment in affiliate, at cost (Note 7) | | | 1,223,357 | | | | 574,770 | | | | 321,421 | | | | 116,124 | | | | 363,196 | |
| | | | | |
Foreign currency, at cost | | | 62,195 | | | | 13,819 | | | | 405,766 | | | | 128,953 | | | | 86,831 | |
Investment in securities, at fair value (including securities on loan) (Note 2)1 | | | 48,550,032 | | | | 243,164,066 | | | | 90,532,564 | | | | 84,713,185 | | | | 172,164,819 | |
| | | | | |
Investment in affiliate, at fair value (Note 7) | | | 1,303,681 | | | | 572,259 | | | | 348,069 | | | | 136,741 | | | | 390,104 | |
| | | | | |
Foreign currency, at fair value | | | 54,298 | | | | 13,819 | | | | 407,104 | | | | 129,103 | | | | 86,955 | |
| | | | | |
Receivables: | | | | | | | | | | | | | | | | | | | | |
| | | | | |
Dividends and interest | | | 229,105 | | | | 2,804,117 | | | | 435,571 | | | | 791,664 | | | | 569,889 | |
| | | | | |
Investment securities sold | | | 324,836 | | | | 790,659 | | | | 6,897 | | | | 729,365 | | | | — | |
| | | | | |
Unrealized appreciation on foreign forward currency contracts | | | — | | | | — | | | | 82 | | | | 15 | | | | — | |
| | | | | |
Foreign tax reclaims | | | 8,918 | | | | — | | | | — | | | | — | | | | 170,237 | |
| | | | | |
Capital shares sold | | | — | | | | 4,240,532 | | | | — | | | | — | | | | — | |
Total Assets | | | 50,470,870 | | | | 251,585,452 | | | | 91,730,287 | | | | 86,500,073 | | | | 173,382,004 | |
LIABILITIES: | | | | | | | | | | | | | | | | | | | | |
| | | | | |
Due to custodian | | | — | | | | 4,032 | | | | — | | | | — | | | | — | |
| | | | | |
Payables: | | | | | | | | | | | | | | | | | | | | |
| | | | | |
Collateral for securities on loan (Note 2) | | | 779,000 | | | | 10,303,000 | | | | 2,751,000 | | | | 5,162,000 | | | | 8,827,000 | |
| | | | | |
Investment securities purchased | | | 222,500 | | | | 5,510,126 | | | | 556,764 | | | | 1,163,515 | | | | — | |
| | | | | |
Advisory fees (Note 3) | | | 23,045 | | | | 82,206 | | | | 34,417 | | | | 37,354 | | | | 64,997 | |
| | | | | |
Service fees (Note 2) | | | 180 | | | | 626 | | | | 318 | | | | 288 | | | | 600 | |
| | | | | |
Unrealized depreciation on foreign forward currency contracts | | | — | | | | — | | | | — | | | | 25 | | | | — | |
Total Liabilities | | | 1,024,725 | | | | 15,899,990 | | | | 3,342,499 | | | | 6,363,182 | | | | 8,892,597 | |
NET ASSETS | | $ | 49,446,145 | | | $ | 235,685,462 | | | $ | 88,387,788 | | | $ | 80,136,891 | | | $ | 164,489,407 | |
NET ASSETS: | | | | | | | | | | | | | | | | | | | | |
| | | | | |
Paid-in capital | | $ | 55,188,780 | | | $ | 249,959,529 | | | $ | 94,104,314 | | | $ | 87,499,218 | | | $ | 201,317,958 | |
| | | | | |
Undistributed net investment income | | | 83,053 | | | | 2,617,816 | | | | 152,356 | | | | 260,728 | | | | 338,266 | |
| | | | | |
Accumulated net realized loss on investments and foreign currency related transactions | | | (13,128,296 | ) | | | (21,281,198 | ) | | | (16,565,023 | ) | | | (15,822,748 | ) | | | (43,347,077 | ) |
| | | | | |
Net unrealized appreciation on investments and translation of assets and liabilities denominated in foreign currencies. | | | 7,302,608 | | | | 4,389,315 | | | | 10,696,141 | | | | 8,199,693 | | | | 6,180,260 | |
NET ASSETS | | $ | 49,446,145 | | | $ | 235,685,462 | | | $ | 88,387,788 | | | $ | 80,136,891 | | | $ | 164,489,407 | |
Outstanding beneficial interest shares of $0.001 par value (unlimited number of shares authorized) | | | 900,000 | | | | 5,450,000 | | | | 1,300,000 | | | | 1,300,000 | | | | 3,450,000 | |
Net asset value per share | | $ | 54.94 | | | $ | 43.25 | | | $ | 67.99 | | | $ | 61.64 | | | $ | 47.68 | |
| 1 | Market value of securities on loan were as follows: $742,443, $9,394,438, $2,611,420, $4,403,277 and $7,017,068, respectively (Note 2). |
See Notes to Financial Statements.
| | | | |
| WisdomTree International Dividend and Sector Funds | | | 111 | |
Statements of Assets and Liabilities (continued)
WisdomTree International Dividend and Sector Funds
March 31, 2011
| | | | | | | | | | | | | | | | | | | | |
| | | WisdomTree
International
Dividend
ex-Financials Fund | | | WisdomTree
International
MidCap
Dividend Fund | | | WisdomTree
International
SmallCap
Dividend Fund | | | WisdomTree
Emerging
Markets Equity
Income Fund | | | WisdomTree
Emerging
Markets
SmallCap
Dividend Fund | |
ASSETS: | | | | | | | | | | | | | | | | | | | | |
| | | | | |
Investments, at cost | | $ | 140,650,989 | | | $ | 159,758,084 | | | $ | 453,338,738 | | | $ | 1,159,614,266 | | | $ | 792,501,153 | |
| | | | | |
Investment in affiliate, at cost (Note 7) | | | 153,377 | | | | 464,223 | | | | 2,034,433 | | | | 1,876,133 | | | | 14,244,383 | |
| | | | | |
Foreign currency, at cost | | | 147,920 | | | | 147,231 | | | | 2,204,259 | | | | 3,821,398 | | | | 4,009,969 | |
Investment in securities, at fair value (including securities on loan) (Note 2)1 | | | 155,708,173 | | | | 172,267,309 | | | | 521,597,729 | | | | 1,353,935,083 | | | | 922,913,447 | |
| | | | | |
Investment in affiliate, at fair value (Note 7) | | | 160,763 | | | | 537,890 | | | | 2,101,587 | | | | 1,907,623 | | | | 14,784,679 | |
| | | | | |
Foreign currency, at fair value | | | 147,914 | | | | 147,537 | | | | 2,187,100 | | | | 3,862,258 | | | | 4,066,717 | |
| | | | | |
Receivables: | | | | | | | | | | | | | | | | | | | | |
| | | | | |
Dividends and interest | | | 401,911 | | | | 651,771 | | | | 3,340,677 | | | | 4,256,286 | | | | 3,705,985 | |
| | | | | |
Investment securities sold | | | — | | | | — | | | | 1,285,703 | | | | 371,861 | | | | 299,576 | |
| | | | | |
Foreign tax reclaims | | | 257,957 | | | | 95,634 | | | | 109,179 | | | | 30,169 | | | | 13,000 | |
| | | | | |
Unrealized appreciation on foreign forward currency contracts | | | — | | | | — | | | | 3,645 | | | | — | | | | 8,035 | |
Total Assets | | | 156,676,718 | | | | 173,700,141 | | | | 530,625,620 | | | | 1,364,363,280 | | | | 945,791,439 | |
LIABILITIES: | | | | | | | | | | | | | | | | | | | | |
| | | | | |
Payables: | | | | | | | | | | | | | | | | | | | | |
| | | | | |
Collateral for securities on loan (Note 2) | | | 6,676,000 | | | | 17,619,000 | | | | 50,635,000 | | | | 35,295,000 | | | | 13,501,000 | |
| | | | | |
Investment securities purchased | | | — | | | | — | | | | 4,052,440 | | | | 3,137,734 | | | | 4,356,047 | |
| | | | | |
Advisory fees (Note 3) | | | 71,244 | | | | 74,924 | | | | 227,553 | | | | 669,160 | | | | 468,088 | |
| | | | | |
Service fees (Note 2) | | | 547 | | | | 577 | | | | 1,741 | | | | 4,686 | | | | 3,323 | |
| | | | | |
Unrealized depreciation on foreign forward currency contracts | | | — | | | | — | | | | 5,812 | | | | — | | | | — | |
Total Liabilities | | | 6,747,791 | | | | 17,694,501 | | | | 54,922,546 | | | | 39,106,580 | | | | 18,328,458 | |
NET ASSETS | | $ | 149,928,927 | | | $ | 156,005,640 | | | $ | 475,703,074 | | | $ | 1,325,256,700 | | | $ | 927,462,981 | |
NET ASSETS: | | | | | | | | | | | | | | | | | | | | |
| | | | | |
Paid-in capital | | $ | 283,500,773 | | | $ | 216,422,796 | | | $ | 623,447,550 | | | $ | 1,174,378,325 | | | $ | 819,408,626 | |
| | | | | |
Undistributed net investment income | | | 154,944 | | | | 529,799 | | | | 3,400,417 | | | | 3,108,011 | | | | 2,762,129 | |
| | | | | |
Accumulated net realized loss on investments and foreign currency related transactions | | | (148,816,501 | ) | | | (73,537,561 | ) | | | (219,451,284 | ) | | | (46,675,626 | ) | | | (25,740,369 | ) |
| | | | | |
Net unrealized appreciation on investments and
translation of assets and liabilities denominated in foreign currencies | | | 15,089,711 | | | | 12,590,606 | | | | 68,306,391 | | | | 194,445,990 | | | | 131,032,595 | |
NET ASSETS | | $ | 149,928,927 | | | $ | 156,005,640 | | | $ | 475,703,074 | | | $ | 1,325,256,700 | | | $ | 927,462,981 | |
Outstanding beneficial interest shares of $0.001 par value (unlimited number of shares authorized) | | | 3,200,000 | | | | 2,900,000 | | | | 8,950,000 | | | | 21,900,000 | | | | 17,400,000 | |
Net asset value per share | | $ | 46.85 | | | $ | 53.80 | | | $ | 53.15 | | | $ | 60.51 | | | $ | 53.30 | |
| 1 | Market value of securities on loan were as follows: $6,230,881, $16,418,317, $48,121,152, $23,462,931 and $12,492,324, respectively (Note 2). |
See Notes to Financial Statements.
| | |
| 112 | | WisdomTree International Dividend and Sector Funds |
Statements of Assets and Liabilities (concluded)
WisdomTree International Dividend and Sector Funds
March 31, 2011
| | | | | | | | | | | | | | | | | | | | | | | | |
| | | WisdomTree
Middle East
Dividend Fund | | | WisdomTree
International
Hedged
Equity Fund | | | WisdomTree
International
Basic Materials
Sector Fund | | | WisdomTree
International
Energy
Sector Fund | | | WisdomTree
International
Utilities
Sector Fund | | | WisdomTree
International
Real
Estate Fund | |
ASSETS: | | | | | | | | | | | | | | | | | | | | | | | | |
| | | | | | |
Investments, at cost | | $ | 17,390,252 | | | $ | 19,056,946 | | | $ | 39,263,936 | | | $ | 44,175,594 | | | $ | 50,321,043 | | | $ | 113,315,637 | |
| | | | | | |
Investment in affiliate, at cost (Note 7) | | | — | | | | — | | | | 30,485 | | | | 116,457 | | | | 95,500 | | | | 160,734 | |
| | | | | | |
Foreign currency, at cost | | | 233,134 | | | | 41,512 | | | | 136,221 | | | | 43,106 | | | | 8,573 | | | | 102,930 | |
Investment in securities, at fair value (including securities on loan) (Note 2)1 | | | 19,258,372 | | | | 22,107,282 | | | | 44,799,319 | | | | 49,471,054 | | | | 38,793,226 | | | | 126,560,642 | |
| | | | | | |
Investment in affiliate, at fair value (Note 7) | | | — | | | | — | | | | 33,107 | | | | 121,839 | | | | 107,423 | | | | 165,534 | |
| | | | | | |
Foreign currency, at fair value | | | 233,144 | | | | 41,800 | | | | 136,501 | | | | 43,307 | | | | 8,802 | | | | 103,378 | |
| | | | | | |
Receivables: | | | | | | | | | | | | | | | | | | | | | | | | |
| | | | | | |
Dividends and interest | | | 179,991 | | | | 79,101 | | | | 121,744 | | | | 40,831 | | | | 73,499 | | | | 381,460 | |
| | | | | | |
Investment securities sold | | | 148,270 | | | | 69,361 | | | | — | | | | — | | | | — | | | | 16,779 | |
| | | | | | |
Foreign tax reclaims | | | — | | | | 20,473 | | | | 35,586 | | | | 15,817 | | | | 14,782 | | | | 36,291 | |
| | | | | | |
Unrealized appreciation on foreign forward currency contracts | | | — | | | | 86,234 | | | | 62 | | | | — | | | | — | | | | 81 | |
Total Assets | | | 19,819,777 | | | | 22,404,251 | | | | 45,126,319 | | | | 49,692,848 | | | | 38,997,732 | | | | 127,264,165 | |
LIABILITIES: | | | | | | | | | | | | | | | | | | | | | | | | |
| | | | | | |
Due to custodian | | | 18,982 | | | | — | | | | — | | | | — | | | | — | | | | — | |
| | | | | | |
Payables: | | | | | | | | | | | | | | | | | | | | | | | | |
| | | | | | |
Collateral for securities on loan (Note 2) | | | — | | | | 589,000 | | | | 1,790,000 | | | | 347,000 | | | | 1,609,000 | | | | 4,444,000 | |
| | | | | | |
Investment securities purchased | | | 215,560 | | | | 43,374 | | | | 143,537 | | | | 50,319 | | | | 35,233 | | | | 90,052 | |
| | | | | | |
Advisory fees (Note 3) | | | 10,908 | | | | 8,459 | | | | 20,516 | | | | 22,725 | | | | 18,000 | | | | 59,279 | |
| | | | | | |
Service fees (Note 2) | | | 71 | | | | 79 | | | | 156 | | | | 174 | | | | 138 | | | | 451 | |
| | | | | | |
Other fees | | | 3,208 | | | | 1,799 | | | | — | | | | — | | | | — | | | | — | |
| | | | | | |
Unrealized depreciation on foreign forward currency contracts | | | 8 | | | | 336,780 | | | | 4 | | | | — | | | | — | | | | 3 | |
Total Liabilities | | | 248,737 | | | | 979,491 | | | | 1,954,213 | | | | 420,218 | | | | 1,662,371 | | | | 4,593,785 | |
NET ASSETS | | $ | 19,571,040 | | | $ | 21,424,760 | | | $ | 43,172,106 | | | $ | 49,272,630 | | | $ | 37,335,361 | | | $ | 122,670,380 | |
NET ASSETS: | | | | | | | | | | | | | | | | | | | | | | | | |
| | | | | | |
Paid-in capital | | $ | 26,093,824 | | | $ | 20,535,218 | | | $ | 55,379,175 | | | $ | 57,382,500 | | | $ | 58,619,237 | | | $ | 171,982,139 | |
| | | | | | |
Undistributed (Distributions in excess of) net investment income | | | 273,070 | | | | 111,910 | | | | 84,988 | | | | 6,966 | | | | 75,147 | | | | (10,265,152 | ) |
| | | | | | |
Accumulated net realized loss on investments and foreign currency related transactions | | | (8,663,649 | ) | | | (2,024,357 | ) | | | (17,833,844 | ) | | | (13,419,969 | ) | | | (9,844,306 | ) | | | (52,295,368 | ) |
| | | | | | |
Net unrealized appreciation (depreciation) on investments and translation of assets and liabilities denominated in foreign currencies | | | 1,867,795 | | | | 2,801,989 | | | | 5,541,787 | | | | 5,303,133 | | | | (11,514,717 | ) | | | 13,248,761 | |
NET ASSETS | | $ | 19,571,040 | | | $ | 21,424,760 | | | $ | 43,172,106 | | | $ | 49,272,630 | | | $ | 37,335,361 | | | $ | 122,670,380 | |
Outstanding beneficial interest shares of $0.001 par value (unlimited number of shares authorized) | | | 1,200,000 | | | | 450,002 | | | | 1,300,000 | | | | 1,650,000 | | | | 1,750,000 | | | | 4,250,000 | |
Net asset value per share | | $ | 16.31 | | | $ | 47.61 | | | $ | 33.21 | | | $ | 29.86 | | | $ | 21.33 | | | $ | 28.86 | |
| 1 | Market value of securities on loan were as follows: $0, $410,924, $1,703,736, $330,087, $1,530,753 and $4,185,406, respectively (Note 2). |
See Notes to Financial Statements.
| | | | |
| WisdomTree International Dividend and Sector Funds | | | 113 | |
Statements of Operations
WisdomTree International Dividend and Sector Funds
For the Year Ended March 31, 2011
| | | | | | | | | | | | | | | | | | | | |
| | | WisdomTree
DEFA Fund | | | WisdomTree
DEFA Equity
Income Fund | | | WisdomTree
Global Equity
Income Fund | | | WisdomTree
Europe SmallCap
Dividend Fund | | | WisdomTree
Japan Hedged
Equity Fund | |
INVESTMENT INCOME: | | | | | | | | | | | | | | | | | | | | |
| | | | | |
Dividends1 | | $ | 16,034,810 | | | $ | 5,866,717 | | | $ | 2,401,472 | | | $ | 899,819 | | | $ | 7,194,325 | |
| | | | | |
Dividends from affiliate (Note 7) | | | 50,041 | | | | 8,454 | | | | 20,974 | | | | 5,291 | | | | 712 | |
| | | | | |
Interest2 | | | 95 | | | | 35 | | | | 2,014 | | | | 2,497 | | | | 40 | |
| | | | | |
Securities lending income (Note 2) | | | 516,928 | | | | 226,295 | | | | 45,256 | | | | 25,343 | | | | 21,687 | |
Total investment income | | | 16,601,874 | | | | 6,101,501 | | | | 2,469,716 | | | | 932,950 | | | | 7,216,764 | |
EXPENSES: | | | | | | | | | | | | | | | | | | | | |
| | | | | |
Advisory fees (Note 3) | | | 2,002,326 | | | | 712,087 | | | | 331,782 | | | | 159,468 | | | | 588,997 | |
| | | | | |
Service fees (Note 2) | | | 18,355 | | | | 5,402 | | | | 2,517 | | | | 1,210 | | | | 5,399 | |
Total expenses | | | 2,020,681 | | | | 717,489 | | | | 334,299 | | | | 160,678 | | | | 594,396 | |
Expenses reimbursements/waivers (Note 3) | | | (4,141 | ) | | | (2,252 | ) | | | (1,234 | ) | | | (799 | ) | | | (97 | ) |
Net expenses | | | 2,016,540 | | | | 715,237 | | | | 333,065 | | | | 159,879 | | | | 594,299 | |
Net investment income | | | 14,585,334 | | | | 5,386,264 | | | | 2,136,651 | | | | 773,071 | | | | 6,622,465 | |
NET REALIZED AND UNREALIZED GAIN (LOSS) ON INVESTMENTS: | | | | | | | | | | | | | | | | | | | | |
| | | | | |
Net realized gain (loss) from: | | | | | | | | | | | | | | | | | | | | |
| | | | | |
Investment transactions | | | (9,480,920 | ) | | | (8,003,481 | ) | | | (839,328 | ) | | | (1,826,928 | ) | | | (8,642,788 | ) |
| | | | | |
Investment transactions from affiliate (Note 7) | | | (109,136 | ) | | | (10,227 | ) | | | 25,938 | | | | 26,422 | | | | (6,010 | ) |
| | | | | |
In-kind redemptions | | | (1,193,019 | ) | | | (65,554 | ) | | | — | | | | 1,061,461 | | | | 904,545 | |
| | | | | |
In-kind redemptions from affiliate (Note 7) | | | 5,199 | | | | (6,367 | ) | | | — | | | | 1,494 | | | | (135 | ) |
| | | | | |
Foreign currency related transactions | | | 12,422 | | | | (55,729 | ) | | | 21,965 | | | | 11,213 | | | | (14,010,034 | ) |
Net realized loss | | | (10,765,454 | ) | | | (8,141,358 | ) | | | (791,425 | ) | | | (726,338 | ) | | | (21,754,422 | ) |
Net change in unrealized appreciation (depreciation) from: | | | | | | | | | | | | | | | | | | | | |
| | | | | |
Investment transactions | | | 38,426,948 | | | | 11,639,564 | | | | 6,560,528 | | | | 5,086,095 | | | | (11,719,122 | ) |
| | | | | |
Translation of assets and liabilities denominated in foreign currencies | | | 35,591 | | | | 10,283 | | | | 2,320 | | | | 3,297 | | | | 8,825,124 | |
Net change in unrealized appreciation (depreciation) | | | 38,462,539 | | | | 11,649,847 | | | | 6,562,848 | | | | 5,089,392 | | | | (2,893,998 | ) |
Net realized and unrealized gain on investments | | | 27,697,085 | | | | 3,508,489 | | | | 5,771,423 | | | | 4,363,054 | | | | (24,648,420 | ) |
NET INCREASE (DECREASE) IN NET ASSETS RESULTING FROM OPERATIONS | | $ | 42,282,419 | | | $ | 8,894,753 | | | $ | 7,908,074 | | | $ | 5,136,125 | | | $ | (18,025,955 | ) |
| 1 | Net of foreign withholding tax of $1,531,695, $569,816, $185,847, $92,330 and $541,520, respectively. |
| 2 | Net of foreign withholding tax of $0, $0, $353, $57 and $0, respectively. |
See Notes to Financial Statements.
| | |
| 114 | | WisdomTree International Dividend and Sector Funds |
Statements of Operations (continued)
WisdomTree International Dividend and Sector Funds
For the Year Ended March 31, 2011
| | | | | | | | | | | | | | | | | | | | |
| | | WisdomTree
World ex-U.S.
Growth Fund | | | WisdomTree
Japan SmallCap
Dividend Fund | | | WisdomTree
Pacific ex-Japan
Total Dividend Fund | | | WisdomTree
Pacific ex-Japan
Equity Income Fund | | | WisdomTree
International
LargeCap
Dividend Fund | |
INVESTMENT INCOME: | | | | | | | | | | | | | | | | | | | | |
| | | | | |
Dividends1 | | $ | 1,123,986 | | | $ | 4,282,234 | | | $ | 3,809,323 | | | $ | 4,664,089 | | | $ | 5,610,602 | |
| | | | | |
Dividends from affiliate (Note 7) | | | 11,999 | | | | 7,888 | | | | 7,343 | | | | 25,258 | | | | 19,612 | |
| | | | | |
Interest | | | 6 | | | | 19 | | | | 16 | | | | 20 | | | | 36 | |
| | | | | |
Securities lending income (Note 2) | | | 16,020 | | | | 61,678 | | | | 13,606 | | | | 25,018 | | | | 186,875 | |
Total investment income | | | 1,152,011 | | | | 4,351,819 | | | | 3,830,288 | | | | 4,714,385 | | | | 5,817,125 | |
EXPENSES: | | | | | | | | | | | | | | | | | | | | |
| | | | | |
Advisory fees (Note 3) | | | 198,100 | | | | 816,555 | | | | 405,416 | | | | 455,481 | | | | 689,801 | |
| | | | | |
Service fees (Note 2) | | | 1,503 | | | | 6,195 | | | | 3,717 | | | | 3,455 | | | | 6,323 | |
Total expenses | | | 199,603 | | | | 822,750 | | | | 409,133 | | | | 458,936 | | | | 696,124 | |
Expenses reimbursements/waivers (Note 3) | | | (5,179 | ) | | | (1,602 | ) | | | (1,209 | ) | | | (2,153 | ) | | | (1,715 | ) |
Net expenses | | | 194,424 | | | | 821,148 | | | | 407,924 | | | | 456,783 | | | | 694,409 | |
Net investment income | | | 957,587 | | | | 3,530,671 | | | | 3,422,364 | | | | 4,257,602 | | | | 5,122,716 | |
NET REALIZED AND UNREALIZED GAIN (LOSS) ON INVESTMENTS: | | | | | | | | | | | | | | | | | | | | |
| | | | | |
Net realized gain (loss) from: | | | | | | | | | | | | | | | | | | | | |
| | | | | |
Investment transactions | | | 131,603 | | | | (4,167,999 | ) | | | (1,761,800 | ) | | | (2,662,804 | ) | | | (8,494,368 | ) |
| | | | | |
Investment transactions from affiliate (Note 7) | | | 8,509 | | | | (43,119 | ) | | | 51,096 | | | | 42,003 | | | | 11,554 | |
| | | | | |
In-kind redemptions | | | — | | | | 3,515,368 | | | | 1,659,049 | | | | 3,337,260 | | | | 632,619 | |
| | | | | |
In-kind redemptions from affiliate (Note 7) | | | — | | | | (1,234 | ) | | | 1,535 | | | | (4,011 | ) | | | (856 | ) |
| | | | | |
Foreign currency related transactions | | | 5,547 | | | | 78,245 | | | | 38,305 | | | | 59,590 | | | | 6,179 | |
Net realized gain (loss) | | | 145,659 | | | | (618,739 | ) | | | (11,815 | ) | | | 772,038 | | | | (7,844,872 | ) |
Net change in unrealized appreciation (depreciation) from: | | | | | | | | | | | | | | | | | | | | |
| | | | | |
Investment transactions | | | 3,255,362 | | | | 8,710,342 | | | | 8,268,020 | | | | 2,225,564 | | | | 14,620,047 | |
| | | | | |
Translation of assets and liabilities denominated in foreign currencies | | | (1,681 | ) | | | (3,223 | ) | | | 5,011 | | | | 5,149 | | | | 12,176 | |
Net change in unrealized appreciation | | | 3,253,681 | | | | 8,707,119 | | | | 8,273,031 | | | | 2,230,713 | | | | 14,632,223 | |
Net realized and unrealized gain on investments | | | 3,399,340 | | | | 8,088,380 | | | | 8,261,216 | | | | 3,002,751 | | | | 6,787,351 | |
NET INCREASE IN NET ASSETS RESULTING FROM OPERATIONS | | $ | 4,356,927 | | | $ | 11,619,051 | | | $ | 11,683,580 | | | $ | 7,260,353 | | | $ | 11,910,067 | |
| 1 | Net of foreign withholding tax of $76,574, $322,323, $64,097, $91,538 and $560,330, respectively. |
See Notes to Financial Statements.
| | | | |
| WisdomTree International Dividend and Sector Funds | | | 115 | |
Statements of Operations (continued)
WisdomTree International Dividend and Sector Funds
For the Year Ended March 31, 2011
| | | | | | | | | | | | | | | | | | | | |
| | | WisdomTree
International
Dividend
ex-Financials Fund | | | WisdomTree
International
MidCap
Dividend Fund | | | WisdomTree
International
SmallCap
Dividend Fund | | | WisdomTree
Emerging
Markets Equity
Income Fund | | | WisdomTree
Emerging
Markets SmallCap
Dividend Fund | |
INVESTMENT INCOME: | | | | | | | | | | | | | | | | | | | | |
| | | | | |
Dividends1 | | $ | 7,063,334 | | | $ | 5,033,233 | | | $ | 15,123,840 | | | $ | 33,785,833 | | | $ | 20,482,082 | |
| | | | | |
Dividends from affiliate (Note 7) | | | 27,837 | | | | 30,810 | | | | 44,768 | | | | 68,652 | | | | 62,539 | |
| | | | | |
Interest | | | 50 | | | | 33 | | | | 101 | | | | 223 | | | | 118 | |
| | | | | |
Securities lending income (Note 2) | | | 252,548 | | | | 161,364 | | | | 403,487 | | | | 67,584 | | | | 177,544 | |
Total investment income | | | 7,343,769 | | | | 5,225,440 | | | | 15,572,196 | | | | 33,922,292 | | | | 20,722,283 | |
EXPENSES: | | | | | | | | | | | | | | | | | | | | |
| | | | | |
Advisory fees (Note 3) | | | 873,335 | | | | 815,042 | | | | 2,526,723 | | | | 5,209,169 | | | | 3,950,955 | |
| | | | | |
Service fees (Note 2) | | | 6,625 | | | | 6,183 | | | | 19,168 | | | | 36,381 | | | | 27,594 | |
Total expenses | | | 879,960 | | | | 821,225 | | | | 2,545,891 | | | | 5,245,550 | | | | 3,978,549 | |
Expenses reimbursements/waivers (Note 3) | | | (4,342 | ) | | | (4,171 | ) | | | (7,090 | ) | | | (9,652 | ) | | | (47,558 | ) |
Net expenses | | | 875,618 | | | | 817,054 | | | | 2,538,801 | | | | 5,235,898 | | | | 3,930,991 | |
Net investment income | | | 6,468,151 | | | | 4,408,386 | | | | 13,033,395 | | | | 28,686,394 | | | | 16,791,292 | |
NET REALIZED AND UNREALIZED GAIN (LOSS)
ON INVESTMENTS: | | | | | | | | | | | | | | | | | | | | |
| | | | | |
Net realized gain (loss) from: | | | | | | | | | | | | | | | | | | | | |
| | | | | |
Investment transactions | | | (553,939 | ) | | | (10,565,107 | ) | | | (3,414,032 | ) | | | (1,364,361 | ) | | | (3,460,668 | ) |
| | | | | |
Investment transactions from affiliate (Note 7) | | | 88,616 | | | | 15,303 | | | | 125,397 | | | | 578,002 | | | | 2,034 | |
| | | | | |
In-kind redemptions | | | 5,947,118 | | | | 1,553,181 | | | | 4,144,077 | | | | 25,086,355 | | | | 24,312,076 | |
| | | | | |
In-kind redemptions from affiliate (Note 7) | | | 11,233 | | | | (2,433 | ) | | | 2,944 | | | | 498 | | | | 106,818 | |
| | | | | |
Foreign currency related transactions | | | (81,318 | ) | | | (116 | ) | | | 223,710 | | | | (273,874 | ) | | | (306,735 | ) |
Net realized gain (loss) | | | 5,411,710 | | | | (8,999,172 | ) | | | 1,082,096 | | | | 24,026,620 | | | | 20,653,525 | |
Net change in unrealized appreciation (depreciation) from: | | | | | | | | | | | | | | | | | | | | |
Investment transactions | | | 6,111,948 | | | | 22,814,081 | | | | 54,673,724 | | | | 108,370,822 | | | | 75,804,953 | |
Translation of assets and liabilities denominated in foreign currencies | | | 13,591 | | | | 9,829 | | | | (2,544 | ) | | | 40,527 | | | | 65,772 | |
Net change in unrealized appreciation | | | 6,125,539 | | | | 22,823,910 | | | | 54,671,180 | | | | 108,411,349 | | | | 75,870,725 | |
Net realized and unrealized gain on investments | | | 11,537,249 | | | | 13,824,738 | | | | 55,753,276 | | | | 132,437,969 | | | | 96,524,250 | |
NET INCREASE IN NET ASSETS RESULTING FROM OPERATIONS | | $ | 18,005,400 | | | $ | 18,233,124 | | | $ | 68,786,671 | | | $ | 161,124,363 | | | $ | 113,315,542 | |
| 1 | Net of foreign withholding tax of $758,078, $447,498, $1,042,726, $4,020,167, and $3,191,704, respectively. |
See Notes to Financial Statements.
| | |
| 116 | | WisdomTree International Dividend and Sector Funds |
Statements of Operations (concluded)
WisdomTree International Dividend and Sector Funds
For the Year Ended March 31, 2011
| | | | | | | | | | | | | | | | | | | | | | | | |
| | | WisdomTree
Middle East
Dividend Fund | | | WisdomTree
International
Hedged
Equity Fund | | | WisdomTree
International
Basic Materials
Sector Fund | | | WisdomTree
International
Energy
Sector Fund | | | WisdomTree
International
Utilities
Sector Fund | | | WisdomTree
International
Real
Estate Fund | |
INVESTMENT INCOME: | | | | | | | | | | | | | | | | | | | | | | | | |
| | | | | | |
Dividends1 | | $ | 866,019 | | | $ | 643,708 | | | $ | 976,798 | | | $ | 1,805,100 | | | $ | 1,755,112 | | | $ | 4,004,056 | |
| | | | | | |
Dividends from affiliate (Note 7) | | | — | | | | 5,416 | | | | 2,674 | | | | 1,523 | | | | 5,082 | | | | 11,366 | |
| | | | | | |
Interest | | | 11 | | | | 4 | | | | 4 | | | | 35 | | | | 8 | | | | 23 | |
| | | | | | |
Securities lending income (Note 2) | | | — | | | | 5,030 | | | | 29,589 | | | | 55,543 | | | | 83,600 | | | | 71,761 | |
Total investment income | | | 866,030 | | | | 654,158 | | | | 1,009,065 | | | | 1,862,201 | | | | 1,843,802 | | | | 4,087,206 | |
EXPENSES: | | | | | | | | | | | | | | | | | | | | | | | | |
| | | | | | |
Advisory fees (Note 3) | | | 112,843 | | | | 85,121 | | | | 239,073 | | | | 310,319 | | | | 222,586 | | | | 584,048 | |
| | | | | | |
Service fees (Note 2) | | | 730 | | | | 780 | | | | 1,813 | | | | 2,354 | | | | 1,688 | | | | 4,431 | |
| | | | | | |
Professional fees | | | 39,104 | | | | 39,007 | | | | — | | | | — | | | | — | | | | — | |
| | | | | | |
Custody/accounting | | | 139,335 | | | | 119,207 | | | | — | | | | — | | | | — | | | | — | |
| | | | | | |
Directors | | | 4,580 | | | | 4,855 | | | | — | | | | — | | | | — | | | | — | |
| | | | | | |
Insurance | | | 3,010 | | | | 3,254 | | | | — | | | | — | | | | — | | | | — | |
| | | | | | |
Printing | | | 12,543 | | | | 13,105 | | | | — | | | | — | | | | — | | | | — | |
| | | | | | |
IOPV fees2 | | | 16,885 | | | | 10,493 | | | | — | | | | — | | | | — | | | | — | |
| | | | | | |
Listing costs | | | 7,018 | | | | 4,823 | | | | — | | | | — | | | | — | | | | — | |
| | | | | | |
Compliance/OOP | | | 9,379 | | | | 8,733 | | | | — | | | | — | | | | — | | | | — | |
| | | | | | |
Pricing | | | 12,997 | | | | 1,273 | | | | — | | | | — | | | | — | | | | — | |
| | | | | | |
Other | | | 1,895 | | | | 2,689 | | | | — | | | | — | | | | — | | | | — | |
Total expenses | | | 360,319 | | | | 293,340 | | | | 240,886 | | | | 312,673 | | | | 224,274 | | | | 588,479 | |
Expenses reimbursements/waivers (Note 3) | | | (213,557 | ) | | | (189,902 | ) | | | (508 | ) | | | (682 | ) | | | (737 | ) | | | (1,048 | ) |
Net expenses | | | 146,762 | | | | 103,438 | | | | 240,378 | | | | 311,991 | | | | 223,537 | | | | 587,431 | |
Net investment income | | | 719,268 | | | | 550,720 | | | | 768,687 | | | | 1,550,210 | | | | 1,620,265 | | | | 3,499,775 | |
NET REALIZED AND UNREALIZED GAIN (LOSS)
ON INVESTMENTS: | | | | | | | | | | | | | | | | | | | | | | | | |
| | | | | | |
Net realized gain (loss) from: | | | | | | | | | | | | | | | | | | | | | | | | |
| | | | | | |
Investment transactions | | | (362,118 | ) | | | (435,209 | ) | | | (3,776,662 | ) | | | (7,184,455 | ) | | | (2,696,395 | ) | | | (9,663,780 | ) |
| | | | | | |
Investment transactions from affiliate (Note 7) | | | — | | | | 40,923 | | | | (3,512 | ) | | | (4,565 | ) | | | (22,034 | ) | | | (54,506 | ) |
| | | | | | |
In-kind redemptions | | | — | | | | — | | | | 2,252,914 | | | | 6,321,308 | | | | (471,048 | ) | | | 234,562 | |
| | | | | | |
In-kind redemptions from affiliate (Note 7) | | | — | | | | — | | | | (107 | ) | | | 4,542 | | | | 2,696 | | | | 496 | |
| | | | | | |
Foreign currency related transactions | | | (17,570 | ) | | | (1,519,196 | ) | | | (19,833 | ) | | | (46,022 | ) | | | 7,835 | | | | (10,938 | ) |
Net realized loss | | | (379,688 | ) | | | (1,913,482 | ) | | | (1,547,200 | ) | | | (909,192 | ) | | | (3,178,946 | ) | | | (9,494,166 | ) |
| | | | | | |
Net change in unrealized appreciation (depreciation) from: | | | | | | | | | | | | | | | | | | | | | | | | |
| | | | | | |
Investment transactions | | | 721,660 | | | | 2,735,939 | | | | 6,538,177 | | | | 12,508,099 | | | | 1,887,975 | | | | 24,157,520 | |
| | | | | | |
Translation of assets and liabilities denominated in foreign currencies | | | (16,966 | ) | | | (248,453 | ) | | | 4,893 | | | | 2,555 | | | | 1,253 | | | | 5,833 | |
Net change in unrealized appreciation | | | 704,694 | | | | 2,487,486 | | | | 6,543,070 | | | | 12,510,654 | | | | 1,889,228 | | | | 24,163,353 | |
Net realized and unrealized gain (loss)
on investments | | | 325,006 | | | | 574,004 | | | | 4,995,870 | | | | 11,601,462 | | | | (1,289,718 | ) | | | 14,669,187 | |
NET INCREASE IN NET ASSETS RESULTING FROM OPERATIONS | | $ | 1,044,274 | | | $ | 1,124,724 | | | $ | 5,764,557 | | | $ | 13,151,672 | | | $ | 330,547 | | | $ | 18,168,962 | |
| 1 | Net of foreign withholding tax of $34,483, $62,836, $90,984, $203,887, $200,612 and $297,610, respectively. |
| 2 | IOPV Fees – Indicative Optimized Portfolio Value – is the real time estimation of net asset value of Fund. |
See Notes to Financial Statements.
| | | | |
| WisdomTree International Dividend and Sector Funds | | | 117 | |
Statements of Changes in Net Assets
WisdomTree International Dividend and Sector Funds
| | | | | | | | | | | | | | | | | | | | | | | | |
| | | WisdomTree
DEFA Fund | | | WisdomTree
DEFA Equity Income Fund | | | WisdomTree
Global Equity Income Fund | |
| | | For the
Year Ended
March 31, 2011 | | | For the
Year Ended
March 31, 2010 | | | For the
Year Ended
March 31, 2011 | | | For the
Year Ended
March 31, 2010 | | | For the
Year Ended
March 31, 2011 | | | For the
Year Ended
March 31, 20101 | |
INCREASE (DECREASE) IN NET ASSETS RESULTING FROM OPERATIONS: | | | | | | | | | | | | | | | | | | | | | |
| | | | | | |
Net investment income | | $ | 14,585,334 | | | $ | 18,404,047 | | | $ | 5,386,264 | | | $ | 5,518,869 | | | $ | 2,136,651 | | | $ | 1,816,059 | |
| | | | | | |
Net realized loss on investments and foreign currency related transactions | | | (10,765,454 | ) | | | (89,192,890 | ) | | | (8,141,358 | ) | | | (21,985,320 | ) | | | (791,425 | ) | | | (6,471,825 | ) |
| | | | | | |
Net change in unrealized appreciation on investments and translation of assets and liabilities denominated in foreign currencies | | | 38,462,539 | | | | 215,788,432 | | | | 11,649,847 | | | | 65,312,283 | | | | 6,562,848 | | | | 16,609,172 | |
Net increase in net assets resulting from operations | | | 42,282,419 | | | | 144,999,589 | | | | 8,894,753 | | | | 48,845,832 | | | | 7,908,074 | | | | 11,953,406 | |
DIVIDENDS: | | | | | | | | | | | | | | | | | | | | | | | | |
| | | | | | |
Net investment income | | | (14,637,890 | ) | | | (19,292,972 | ) | | | (5,400,141 | ) | | | (5,586,535 | ) | | | (2,060,172 | ) | | | (1,835,881 | ) |
Total dividends | | | (14,637,890 | ) | | | (19,292,972 | ) | | | (5,400,141 | ) | | | (5,586,535 | ) | | | (2,060,172 | ) | | | (1,835,881 | ) |
CAPITAL SHARE TRANSACTIONS: | | | | | | | | | | | | | | | | | | | | | | | | |
| | | | | | |
Net proceeds from sale of shares | | | 19,124,551 | | | | 448,192,327 | | | | 2,204,839 | | | | 37,579,579 | | | | 29,257,792 | | | | 53,291,535 | |
| | | | | | |
Cost of shares redeemed | | | (24,677,653 | ) | | | (440,378,667 | ) | | | (16,542,512 | ) | | | (26,664,294 | ) | | | — | | | | (39,154,020 | ) |
Net increase (decrease) in net assets resulting from capital share transactions | | | (5,553,102 | ) | | | 7,813,660 | | | | (14,337,673 | ) | | | 10,915,285 | | | | 29,257,792 | | | | 14,137,515 | |
Net Increase (Decrease) in Net Assets | | | 22,091,427 | | | | 133,520,277 | | | | (10,843,061 | ) | | | 54,174,582 | | | | 35,105,694 | | | | 24,255,040 | |
NET ASSETS: | | | | | | | | | | | | | | | | | | | | | | | | |
| | | | | | |
Beginning of year | | $ | 435,905,604 | | | $ | 302,385,327 | | | $ | 142,297,498 | | | $ | 88,122,916 | | | $ | 43,041,785 | | | $ | 18,786,745 | |
| | | | | | |
End of year | | $ | 457,997,031 | | | $ | 435,905,604 | | | $ | 131,454,437 | | | $ | 142,297,498 | | | $ | 78,147,479 | | | $ | 43,041,785 | |
Undistributed net investment income | | $ | 1,092,255 | | | $ | 1,129,494 | | | $ | 191,867 | | | $ | 260,617 | | | $ | 154,543 | | | $ | 62,883 | |
SHARES CREATED AND REDEEMED: | | | | | | | | | | | | | | | | | | | | | | | | |
| | | | | | |
Shares outstanding, beginning of year | | | 9,450,000 | | | | 9,450,000 | | | | 3,400,000 | | | | 3,100,000 | | | | 1,050,000 | | | | 700,000 | |
| | | | | | |
Shares created | | | 400,000 | | | | 9,950,000 | | | | 50,000 | | | | 950,000 | | | | 700,000 | | | | 1,350,000 | |
| | | | | | |
Shares redeemed | | | (600,000 | ) | | | (9,950,000 | ) | | | (450,000 | ) | | | (650,000 | ) | | | — | | | | (1,000,000 | ) |
Shares outstanding, end of year | | | 9,250,000 | | | | 9,450,000 | | | | 3,000,000 | | | | 3,400,000 | | | | 1,750,000 | | | | 1,050,000 | |
| 1 | This information reflects the investment objective and strategy of the WisdomTree Europe Equity Income Fund through June 19, 2009 and the investment objective and strategy of the WisdomTree Global Equity Income Fund thereafter. |
See Notes to Financial Statements.
| | |
| 118 | | WisdomTree International Dividend and Sector Funds |
Statements of Changes in Net Assets (continued)
WisdomTree International Dividend and Sector Funds
| | | | | | | | | | | | | | | | | | | | | | | | |
| | | WisomTree
Europe SmallCap Dividend Fund | | | WisomTree
Japan Hedged Equity Fund | | | WisomTree
World ex-U.S. Growth Fund | |
| | | For the
Year Ended
March 31, 2011 | | | For the
Year Ended
March 31, 2010 | | | For the
Year Ended
March 31, 2011 | | | For the
Year Ended
March 31, 2010 | | | For the
Year Ended
March 31, 2011 | | | For the
Year Ended
March 31, 20101 | |
INCREASE (DECREASE) IN NET ASSETS RESULTING FROM OPERATIONS: | | | | | | | | | | | | | | | | | | | | | |
| | | | | | |
Net investment income | | $ | 773,071 | | | $ | 721,740 | | | $ | 6,622,465 | | | $ | 1,081,495 | | | $ | 957,587 | | | $ | 546,446 | |
| | | | | | |
Net realized loss on investments and foreign currency related transactions | | | (726,338 | ) | | | (7,165,311 | ) | | | (21,754,422 | ) | | | 838,495 | | | | 145,659 | | | | (6,243,129 | ) |
| | | | | | |
Net change in unrealized appreciation (depreciation) on investments and translation of assets and liabilities denominated in foreign currencies | | | 5,089,392 | | | | 15,921,443 | | | | (2,893,998 | ) | | | 9,618,683 | | | | 3,253,681 | | | | 13,424,864 | |
Net increase (decrease) in net assets resulting from operations | | | 5,136,125 | | | | 9,477,872 | | | | (18,025,955 | ) | | | 11,538,673 | | | | 4,356,927 | | | | 7,728,181 | |
DIVIDENDS: | | | | | | | | | | | | | | | | | | | | | | | | |
| | | | | | |
Net investment income | | | (772,916 | ) | | | (776,003 | ) | | | (1,252,279 | ) | | | (934,315 | ) | | | (917,040 | ) | | | (859,811 | ) |
Total dividends | | | (772,916 | ) | | | (776,003 | ) | | | (1,252,279 | ) | | | (934,315 | ) | | | (917,040 | ) | | | (859,811 | ) |
CAPITAL SHARE TRANSACTIONS: | | | | | | | | | | | | | | | | | | | | | | | | |
| | | | | | |
Net proceeds from sale of shares | | | — | | | | 11,402,548 | | | | 483,187,635 | | | | 101,037,653 | | | | 21,201,069 | | | | 4,767,425 | |
| | | | | | |
Cost of shares redeemed | | | (5,569,277 | ) | | | (3,476,359 | ) | | | (23,678,853 | ) | | | (76,103,751 | ) | | | — | | | | (8,075,928 | ) |
Net increase (decrease) in net assets resulting from capital share transactions | | | (5,569,277 | ) | | | 7,926,189 | | | | 459,508,782 | | | | 24,933,902 | | | | 21,201,069 | | | | (3,308,503 | ) |
Net Increase (Decrease) in Net Assets | | | (1,206,068 | ) | | | 16,628,058 | | | | 440,230,548 | | | | 35,538,260 | | | | 24,640,956 | | | | 3,559,867 | |
NET ASSETS: | | | | | | | | | | | | | | | | | | | | | | | | |
| | | | | | |
Beginning of year | | $ | 30,094,664 | | | $ | 13,466,606 | | | $ | 54,750,713 | | | $ | 19,212,453 | | | $ | 24,805,189 | | | $ | 21,245,322 | |
| | | | | | |
End of year | | $ | 28,888,596 | | | $ | 30,094,664 | | | $ | 494,981,261 | | | $ | 54,750,713 | | | $ | 49,446,145 | | | $ | 24,805,189 | |
Undistributed net investment income | | $ | 383,628 | | | $ | 82,669 | | | $ | 5,918,195 | | | $ | 423,472 | | | $ | 83,053 | | | $ | 36,952 | |
SHARES CREATED AND REDEEMED: | | | | | | | | | | | | | | | | | | | | | | | | |
| | | | | | |
Shares outstanding, beginning of year | | | 800,000 | | | | 600,000 | | | | 1,300,000 | | | | 600,000 | | | | 500,000 | | | | 600,000 | |
| | | | | | |
Shares created | | | — | | | | 300,000 | | | | 12,750,000 | | | | 2,600,000 | | | | 400,000 | | | | 100,000 | |
| | | | | | |
Shares redeemed | | | (150,000 | ) | | | (100,000 | ) | | | (650,000 | ) | | | (1,900,000 | ) | | | — | | | | (200,000 | ) |
Shares outstanding, end of year | | | 650,000 | | | | 800,000 | | | | 13,400,000 | | | | 1,300,000 | | | | 900,000 | | | | 500,000 | |
| 1 | This information reflects the investment objective and strategy of the WisdomTree Japan Equity Income Fund through June 19, 2009 and the investment objective and strategy of the WisdomTree World ex-U.S. Growth Fund thereafter. |
See Notes to Financial Statements.
| | | | |
| WisdomTree International Dividend and Sector Funds | | | 119 | |
Statements of Changes in Net Assets (continued)
WisdomTree International Dividend and Sector Funds
| | | | | | | | | | | | | | | | | | | | | | | | |
| | | WisdomTree
Japan SmallCap Dividend Fund | | | WisdomTree
Pacific ex-Japan Total Dividend Fund | | | WisdomTree
Pacific ex-Japan Equity Income Fund | |
| | | For the
Year Ended
March 31, 2011 | | | For the
Year Ended
March 31, 2010 | | | For the
Year Ended
March 31, 2011 | | | For the
Year Ended
March 31, 2010 | | | For the
Year Ended
March 31, 2011 | | | For the
Year Ended
March 31, 2010 | |
INCREASE (DECREASE) IN NET ASSETS RESULTING FROM OPERATIONS: | | | | | | | | | | | | | | | | | | | | | |
| | | | | | |
Net investment income | | $ | 3,530,671 | | | $ | 1,939,895 | | | $ | 3,422,364 | | | $ | 3,342,344 | | | $ | 4,257,602 | | | $ | 3,509,139 | |
| | | | | | |
Net realized gain (loss) on investments and foreign currency related transactions | | | (618,739 | ) | | | (8,030,183 | ) | | | (11,815 | ) | | | 4,697,421 | | | | 772,038 | | | | 1,991,773 | |
| | | | | | |
Net change in unrealized appreciation on investments and translation of assets and liabilities denominated in foreign currencies | | | 8,707,119 | | | | 28,637,167 | | | | 8,273,031 | | | | 34,487,260 | | | | 2,230,713 | | | | 26,162,337 | |
Net increase (decrease) in net assets resulting from operations | | | 11,619,051 | | | | 22,546,879 | | | | 11,683,580 | | | | 42,527,025 | | | | 7,260,353 | | | | 31,663,249 | |
DIVIDENDS: | | | | | | | | | | | | | | | | | | | | | | | | |
| | | | | | |
Net investment income | | | (2,383,352 | ) | | | (1,520,747 | ) | | | (3,365,676 | ) | | | (3,574,407 | ) | | | (4,176,991 | ) | | | (3,645,372 | ) |
Total dividends | | | (2,383,352 | ) | | | (1,520,747 | ) | | | (3,365,676 | ) | | | (3,574,407 | ) | | | (4,176,991 | ) | | | (3,645,372 | ) |
CAPITAL SHARE TRANSACTIONS: | | | | | | | | | | | | | | | | | | | | | | | | |
| | | | | | |
Net proceeds from sale of shares | | | 121,144,708 | | | | 89,835,686 | | | | — | | | | 79,698,811 | | | | — | | | | 132,484,504 | |
| | | | | | |
Cost of shares redeemed | | | (52,544,856 | ) | | | (19,090,019 | ) | | | (8,963,414 | ) | | | (66,704,221 | ) | | | (40,285,077 | ) | | | (64,722,763 | ) |
Net increase (decrease) in net assets resulting from capital share transactions | | | 68,599,852 | | | | 70,745,667 | | | | (8,963,414 | ) | | | 12,994,590 | | | | (40,285,077 | ) | | | 67,761,741 | |
Net Increase (Decrease) in Net Assets | | | 77,835,551 | | | | 91,771,799 | | | | (645,510 | ) | | | 51,947,208 | | | | (37,201,715 | ) | | | 95,779,618 | |
NET ASSETS: | | | | | | | | | | | | | | | | | | | | | | | | |
| | | | | | |
Beginning of year | | $ | 157,849,911 | | | $ | 66,078,112 | | | $ | 89,033,298 | | | $ | 37,086,090 | | | $ | 117,338,606 | | | $ | 21,558,988 | |
| | | | | | |
End of year | | $ | 235,685,462 | | | $ | 157,849,911 | | | $ | 88,387,788 | | | $ | 89,033,298 | | | $ | 80,136,891 | | | $ | 117,338,606 | |
Undistributed net investment income | | $ | 2,617,816 | | | $ | 1,271,266 | | | $ | 152,356 | | | $ | 50,779 | | | $ | 260,728 | | | $ | 118,893 | |
SHARES CREATED AND REDEEMED: | | | | | | | | | | | | | | | | | | | | | | | | |
| | | | | | |
Shares outstanding, beginning of year | | | 3,800,000 | | | | 2,100,000 | | | | 1,450,000 | | | | 1,000,000 | | | | 2,050,000 | | | | 700,000 | |
| | | | | | |
Shares created | | | 2,950,000 | | | | 2,200,000 | | | | — | | | | 1,600,000 | | | | — | | | | 2,850,000 | |
| | | | | | |
Shares redeemed | | | (1,300,000 | ) | | | (500,000 | ) | | | (150,000 | ) | | | (1,150,000 | ) | | | (750,000 | ) | | | (1,500,000 | ) |
Shares outstanding, end of year | | | 5,450,000 | | | | 3,800,000 | | | | 1,300,000 | | | | 1,450,000 | | | | 1,300,000 | | | | 2,050,000 | |
See Notes to Financial Statements.
| | |
| 120 | | WisdomTree International Dividend and Sector Funds |
Statements of Changes in Net Assets (continued)
WisdomTree International Dividend and Sector Funds
| | | | | | | | | | | | | | | | | | | | | | | | |
| | | WisdomTree
International LargeCap Dividend Fund | | | WisdomTree
International Dividend ex-Financials
Fund | | | WisdomTree
International MidCap Dividend Fund | |
| | | For the
Year Ended
March 31, 2011 | | | For the
Year Ended
March 31, 2010 | | | For the
Year Ended
March 31, 2011 | | | For the
Year Ended
March 31, 2010 | | | For the
Year Ended
March 31, 2011 | | | For the
Year Ended
March 31, 2010 | |
INCREASE (DECREASE) IN NET ASSETS RESULTING FROM OPERATIONS: | | | | | | | | | | | | | | | | | | | | | |
| | | | | | |
Net investment income | | $ | 5,122,716 | | | $ | 4,179,108 | | | $ | 6,468,151 | | | $ | 5,427,797 | | | $ | 4,408,386 | | | $ | 3,506,647 | |
| | | | | | |
Net realized gain (loss) on investments and foreign currency related transactions | | | (7,844,872 | ) | | | (11,590,370 | ) | | | 5,411,710 | | | | (62,895,295 | ) | | | (8,999,172 | ) | | | (30,859,709 | ) |
| | | | | | |
Net change in unrealized appreciation on investments and translation of assets and liabilities denominated in foreign currencies | | | 14,632,223 | | | | 43,894,833 | | | | 6,125,539 | | | | 111,506,461 | | | | 22,823,910 | | | | 75,758,486 | |
Net increase in net assets resulting from operations | | | 11,910,067 | | | | 36,483,571 | | | | 18,005,400 | | | | 54,038,963 | | | | 18,233,124 | | | | 48,405,424 | |
DIVIDENDS: | | | | | | | | | | | | | | | | | | | | | |
| | | | | | |
Net investment income | | | (5,111,213 | ) | | | (4,322,343 | ) | | | (6,504,988 | ) | | | (5,343,066 | ) | | | (4,562,537 | ) | | | (3,633,344 | ) |
Total dividends | | | (5,111,213 | ) | | | (4,322,343 | ) | | | (6,504,988 | ) | | | (5,343,066 | ) | | | (4,562,537 | ) | | | (3,633,344 | ) |
CAPITAL SHARE TRANSACTIONS: | | | | | | | | | | | | | | | | | | | | | |
| | | | | | |
Net proceeds from sale of shares | | | 18,012,609 | | | | 51,077,680 | | | | 20,341,799 | | | | 31,436,210 | | | | 7,564,508 | | | | 24,227,874 | |
| | | | | | |
Cost of shares redeemed | | | (9,946,346 | ) | | | (12,543,062 | ) | | | (46,250,816 | ) | | | (21,099,564 | ) | | | (11,298,397 | ) | | | (11,264,602 | ) |
Net increase (decrease) in net assets resulting from capital share transactions | | | 8,066,263 | | | | 38,534,618 | | | | (25,909,017 | ) | | | 10,336,646 | | | | (3,733,889 | ) | | | 12,963,272 | |
Net Increase (Decrease) in Net Assets | | | 14,865,117 | | | | 70,695,846 | | | | (14,408,605 | ) | | | 59,032,543 | | | | 9,936,698 | | | | 57,735,352 | |
NET ASSETS: | | | | | | | | | | | | | | | | | | | | | | | | |
| | | | | | |
Beginning of year | | $ | 149,624,290 | | | $ | 78,928,444 | | | $ | 164,337,532 | | | $ | 105,304,989 | | | $ | 146,068,942 | | | $ | 88,333,590 | |
| | | | | | |
End of year | | $ | 164,489,407 | | | $ | 149,624,290 | | | $ | 149,928,927 | | | $ | 164,337,532 | | | $ | 156,005,640 | | | $ | 146,068,942 | |
Undistributed net investment income | | $ | 338,266 | | | $ | 318,572 | | | $ | 154,944 | | | $ | 271,354 | | | $ | 529,799 | | | $ | 579,567 | |
SHARES CREATED AND REDEEMED: | | | | | | | | | | | | | | | | | | | | | | | | |
| | | | | | |
Shares outstanding, beginning of year | | | 3,300,000 | | | | 2,500,000 | | | | 3,850,000 | | | | 3,700,000 | | | | 3,000,000 | | | | 2,800,000 | |
| | | | | | |
Shares created | | | 400,000 | | | | 1,100,000 | | | | 450,000 | | | | 750,000 | | | | 150,000 | | | | 500,000 | |
| | | | | | |
Shares redeemed | | | (250,000 | ) | | | (300,000 | ) | | | (1,100,000 | ) | | | (600,000 | ) | | | (250,000 | ) | | | (300,000 | ) |
Shares outstanding, end of year | | | 3,450,000 | | | | 3,300,000 | | | | 3,200,000 | | | | 3,850,000 | | | | 2,900,000 | | | | 3,000,000 | |
See Notes to Financial Statements.
| | | | |
| WisdomTree International Dividend and Sector Funds | | | 121 | |
Statements of Changes in Net Assets (continued)
WisdomTree International Dividend and Sector Funds
| | | | | | | | | | | | | | | | | | | | | | | | |
| | | WisdomTree
International SmallCap
Dividend Fund | | | WisdomTree
Emerging Markets
Equity Income Fund | | | WisdomTree
Emerging Markets
SmallCap Dividend Fund | |
| | | For the
Year Ended
March 31, 2011 | | | For the
Year Ended
March 31, 2010 | | | For the
Year Ended
March 31, 2011 | | | For the
Year Ended
March 31, 2010 | | | For the
Year Ended
March 31, 2011 | | | For the
Year Ended
March 31, 2010 | |
INCREASE (DECREASE) IN NET ASSETS RESULTING FROM OPERATIONS: | | | | | | | | | | | | | | | | | | | | | |
| | | | | | |
Net investment income | | $ | 13,033,395 | | | $ | 10,654,646 | | | $ | 28,686,394 | | | $ | 11,661,187 | | | $ | 16,791,292 | | | $ | 5,004,649 | |
| | | | | | |
Net realized gain (loss) on investments and foreign currency related transactions | | | 1,082,096 | | | | (85,788,287 | ) | | | 24,026,620 | | | | (24,675,941 | ) | | | 20,653,525 | | | | (7,141,320 | ) |
| | | | | | |
Net change in unrealized appreciation on investments and translation of assets and liabilities denominated in foreign currencies | | | 54,671,180 | | | | 240,518,843 | | | | 108,411,349 | | | | 171,241,014 | | | | 75,870,725 | | | | 81,778,689 | |
Net increase in net assets resulting from operations | | | 68,786,671 | | | | 165,385,202 | | | | 161,124,363 | | | | 158,226,260 | | | | 113,315,542 | | | | 79,642,018 | |
DIVIDENDS: | | | | | | | | | | | | | | | | | | | | | |
| | | | | | |
Net investment income | | | (12,889,846 | ) | | | (10,659,948 | ) | | | (27,419,477 | ) | | | (11,953,872 | ) | | | (16,528,911 | ) | | | (5,378,463 | ) |
Total dividends | | | (12,889,846 | ) | | | (10,659,948 | ) | | | (27,419,477 | ) | | | (11,953,872 | ) | | | (16,528,911 | ) | | | (5,378,463 | ) |
CAPITAL SHARE TRANSACTIONS: | | | | | | | | | | | | | | | | | | | | | |
| | | | | | |
Net proceeds from sale of shares | | | 7,115,479 | | | | 53,490,158 | | | | 761,512,984 | | | | 236,686,308 | | | | 603,777,470 | | | | 239,409,467 | |
| | | | | | |
Cost of shares redeemed | | | (17,179,451 | ) | | | (22,651,964 | ) | | | (110,950,763 | ) | | | (19,323,942 | ) | | | (115,855,535 | ) | | | (22,624,786 | ) |
Net increase (decrease) in net assets resulting from capital share transactions | | | (10,063,972 | ) | | | 30,838,194 | | | | 650,562,221 | | | | 217,362,366 | | | | 487,921,935 | | | | 216,784,681 | |
Net Increase in Net Assets | | | 45,832,853 | | | | 185,563,448 | | | | 784,267,107 | | | | 363,634,754 | | | | 584,708,566 | | | | 291,048,236 | |
NET ASSETS: | | | | | | | | | | | | | | | | | | | | | | | | |
| | | | | | |
Beginning of year | | $ | 429,870,221 | | | $ | 244,306,773 | | | $ | 540,989,593 | | | $ | 177,354,839 | | | $ | 342,754,415 | | | $ | 51,706,179 | |
| | | | | | |
End of year | | $ | 475,703,074 | | | $ | 429,870,221 | | | $ | 1,325,256,700 | | | $ | 540,989,593 | | | $ | 927,462,981 | | | $ | 342,754,415 | |
Undistributed net investment income | | $ | 3,400,417 | | | $ | 2,201,624 | | | $ | 3,108,011 | | | $ | 1,702,660 | | | $ | 2,762,129 | | | $ | 1,369,349 | |
SHARES CREATED AND REDEEMED: | | | | | | | | | | | | | | | | | | | | | | | | |
| | | | | | |
Shares outstanding, beginning of year | | | 9,150,000 | | | | 8,400,000 | | | | 10,400,000 | | | | 5,700,000 | | | | 7,700,000 | | | | 2,100,000 | |
| | | | | | |
Shares created | | | 150,000 | | | | 1,250,000 | | | | 13,800,000 | | | | 5,200,000 | | | | 12,300,000 | | | | 6,300,000 | |
| | | | | | |
Shares redeemed | | | (350,000 | ) | | | (500,000 | ) | | | (2,300,000 | ) | | | (500,000 | ) | | | (2,600,000 | ) | | | (700,000 | ) |
Shares outstanding, end of year | | | 8,950,000 | | | | 9,150,000 | | | | 21,900,000 | | | | 10,400,000 | | | | 17,400,000 | | | | 7,700,000 | |
See Notes to Financial Statements.
| | |
| 122 | | WisdomTree International Dividend and Sector Funds |
Statements of Changes in Net Assets (continued)
WisdomTree International Dividend and Sector Funds
| | | | | | | | | | | | | | | | | | | | | | | | |
| | | WisdomTree
Middle East
Dividend Fund | | | WisdomTree
International
Hedged Equity Fund | | | WisdomTree
International Basic
Materials Sector Fund | |
| | | For the
Year Ended
March 31, 2011 | | | For the
Year Ended
March 31, 2010 | | | For the
Year Ended
March 31, 2011 | | | For the Period
December 31, 2009*
through
March 31, 2010 | | | For the
Year Ended
March 31, 2011 | | | For the
Year Ended
March 31, 2010 | |
INCREASE (DECREASE) IN NET ASSETS RESULTING FROM OPERATIONS: | | | | | | | | | | | | | | | | | | | | | |
| | | | | | |
Net investment income | | $ | 719,268 | | | $ | 362,869 | | | $ | 550,720 | | | $ | 38,774 | | | $ | 768,687 | | | $ | 774,008 | |
| | | | | | |
Net realized loss on investments and foreign currency related transactions | | | (379,688 | ) | | | (5,294,529 | ) | | | (1,913,482 | ) | | | (55,698 | ) | | | (1,547,200 | ) | | | (3,919,033 | ) |
| | | | | | |
Net change in unrealized appreciation on investments and translation of assets and liabilities denominated in foreign currencies | | | 704,694 | | | | 7,731,301 | | | | 2,487,486 | | | | 314,503 | | | | 6,543,070 | | | | 23,822,206 | |
Net increase in net assets resulting from operations | | | 1,044,274 | | | | 2,799,641 | | | | 1,124,724 | | | | 297,579 | | | | 5,764,557 | | | | 20,677,181 | |
DIVIDENDS: | | | | | | | | | | | | | | | | | | | | | | | | |
| | | | | | |
Net investment income | | | (520,780 | ) | | | (431,581 | ) | | | (506,947 | ) | | | (25,814 | ) | | | (781,200 | ) | | | (670,355 | ) |
Total dividends | | | (520,780 | ) | | | (431,581 | ) | | | (506,947 | ) | | | (25,814 | ) | | | (781,200 | ) | | | (670,355 | ) |
CAPITAL SHARE TRANSACTIONS: | | | | | | | | | | | | | | | | | | | | | |
| | | | | | |
Net proceeds from sale of shares | | | 6,532,275 | | | | 7,047,766 | | | | 11,261,965 | | | | 9,273,253 | | | | — | | | | 10,926,459 | |
| | | | | | |
Cost of shares redeemed | | | — | | | | (4,179,148 | ) | | | — | | | | — | | | | (10,948,551 | ) | | | (4,255,513 | ) |
Net increase (decrease) in net assets resulting from capital share transactions | | | 6,532,275 | | | | 2,868,618 | | | | 11,261,965 | | | | 9,273,253 | | | | (10,948,551 | ) | | | 6,670,946 | |
Net Increase (Decrease) in Net Assets | | | 7,055,769 | | | | 5,236,678 | | | | 11,879,742 | | | | 9,545,018 | | | | (5,965,194 | ) | | | 26,677,772 | |
NET ASSETS: | | | | | | | | | | | | | | | | | | | | | | | | |
| | | | | | |
Beginning of period | | $ | 12,515,271 | | | $ | 7,278,593 | | | $ | 9,545,018 | | | $ | — | | | $ | 49,137,300 | | | $ | 22,459,528 | |
| | | | | | |
End of period | | $ | 19,571,040 | | | $ | 12,515,271 | | | $ | 21,424,760 | | | $ | 9,545,018 | | | $ | 43,172,106 | | | $ | 49,137,300 | |
Undistributed net investment income | | $ | 273,070 | | | $ | 75,807 | | | $ | 111,910 | | | $ | 165,529 | | | $ | 84,988 | | | $ | 117,334 | |
SHARES CREATED AND REDEEMED: | | | | | | | | | | | | | | | | | | | | | | | | |
| | | | | | |
Shares outstanding, beginning of period | | | 800,000 | | | | 600,004 | | | | 200,002 | | | | — | | | | 1,700,000 | | | | 1,400,000 | |
| | | | | | |
Shares created | | | 400,000 | | | | 500,000 | | | | 250,000 | | | | 200,002 | | | | — | | | | 450,000 | |
| | | | | | |
Shares redeemed | | | — | | | | (300,004 | ) | | | — | | | | — | | | | (400,000 | ) | | | (150,000 | ) |
Shares outstanding, end of period | | | 1,200,000 | | | | 800,000 | | | | 450,002 | | | | 200,002 | | | | 1,300,000 | | | | 1,700,000 | |
| * | Commencement of investment operations. |
See Notes to Financial Statements.
| | | | |
| WisdomTree International Dividend and Sector Funds | | | 123 | |
Statements of Changes in Net Assets (concluded)
WisdomTree International Dividend and Sector Funds
| | | | | | | | | | | | | | | | | | | | | | | | |
| | | WisdomTree
International Energy
Sector Fund | | | WisdomTree
International Utilities
Sector Fund | | | WisdomTree
International Real
Estate Fund | |
| | | For the
Year Ended
March 31, 2011 | | | For the
Year Ended
March 31, 2010 | | | For the
Year Ended
March 31, 2011 | | | For the
Year Ended
March 31, 2010 | | | For the
Year Ended
March 31, 2011 | | | For the
Year Ended
March 31, 2010 | |
INCREASE (DECREASE) IN NET ASSETS RESULTING FROM OPERATIONS: | | | | | | | | | | | | | | | | | | | | | |
| | | | | | |
Net investment income | | $ | 1,550,210 | | | $ | 1,232,979 | | | $ | 1,620,265 | | | $ | 1,529,724 | | | $ | 3,499,775 | | | $ | 2,647,915 | |
| | | | | | |
Net realized loss on investments and foreign currency related transactions | | | (909,192 | ) | | | (3,296,966 | ) | | | (3,178,946 | ) | | | (8,527,942 | ) | | | (9,494,166 | ) | | | (29,156,636 | ) |
| | | | | | |
Net change in unrealized appreciation on investments and translation of assets and liabilities denominated in foreign currencies | | | 12,510,654 | | | | 10,498,224 | | | | 1,889,228 | | | | 12,797,942 | | | | 24,163,353 | | | | 55,854,458 | |
Net increase in net assets resulting from operations | | | 13,151,672 | | | | 8,434,237 | | | | 330,547 | | | | 5,799,724 | | | | 18,168,962 | | | | 29,345,737 | |
DIVIDENDS: | | | | | | | | | | | | | | | | | | | | | |
| | | | | | |
Net investment income | | | (1,511,977 | ) | | | (1,249,410 | ) | | | (1,705,615 | ) | | | (1,445,458 | ) | | | (10,473,002 | ) | | | (7,422,149 | ) |
Total dividends | | | (1,511,977 | ) | | | (1,249,410 | ) | | | (1,705,615 | ) | | | (1,445,458 | ) | | | (10,473,002 | ) | | | (7,422,149 | ) |
CAPITAL SHARE TRANSACTIONS: | | | | | | | | | | | | | | | | | | | | | |
| | | | | | |
Net proceeds from sale of shares | | | 22,597,082 | | | | 17,214,761 | | | | — | | | | 23,269,335 | | | | 31,927,456 | | | | 27,636,033 | |
| | | | | | |
Cost of shares redeemed | | | (30,532,835 | ) | | | (1,163,114 | ) | | | (10,637,587 | ) | | | (6,730,720 | ) | | | (1,228,615 | ) | | | (5,903,444 | ) |
Net increase (decrease) in net assets resulting from capital share transactions | | | (7,935,753 | ) | | | 16,051,647 | | | | (10,637,587 | ) | | | 16,538,615 | | | | 30,698,841 | | | | 21,732,589 | |
Net Increase (Decrease) in Net Assets | | | 3,703,942 | | | | 23,236,474 | | | | (12,012,655 | ) | | | 20,892,881 | | | | 38,394,801 | | | | 43,656,177 | |
NET ASSETS: | | | | | | | | | | | | | | | | | | | | | | | | |
| | | | | | |
Beginning of year | | $ | 45,568,688 | | | $ | 22,332,214 | | | $ | 49,348,016 | | | $ | 28,455,135 | | | $ | 84,275,579 | | | $ | 40,619,402 | |
| | | | | | |
End of year | | $ | 49,272,630 | | | $ | 45,568,688 | | | $ | 37,335,361 | | | $ | 49,348,016 | | | $ | 122,670,380 | | | $ | 84,275,579 | |
Undistributed (Distributions in excess of) net investment income | | $ | 6,966 | | | $ | 14,755 | | | $ | 75,147 | | | $ | 152,662 | | | $ | (10,265,152 | ) | | $ | (4,372,206 | ) |
SHARES CREATED AND REDEEMED: | | | | | | | | | | | | | | | | | | | | | | | | |
| | | | | | |
Shares outstanding, beginning of year | | | 1,850,000 | | | | 1,200,000 | | | | 2,300,000 | | | | 1,600,000 | | | | 3,150,000 | | | | 2,400,000 | |
| | | | | | |
Shares created | | | 950,000 | | | | 700,000 | | | | — | | | | 1,050,000 | | | | 1,150,000 | | | | 1,050,000 | |
| | | | | | |
Shares redeemed | | | (1,150,000 | ) | | | (50,000 | ) | | | (550,000 | ) | | | (350,000 | ) | | | (50,000 | ) | | | (300,000 | ) |
Shares outstanding, end of year | | | 1,650,000 | | | | 1,850,000 | | | | 1,750,000 | | | | 2,300,000 | | | | 4,250,000 | | | | 3,150,000 | |
See Notes to Financial Statements.
| | |
| 124 | | WisdomTree International Dividend and Sector Funds |
Financial Highlights
WisdomTree International Dividend and Sector Funds
March 31, 2011
Selected data for a share of beneficial interest outstanding throughout the period is presented below:
| | | | | | | | | | | | | | | | | | | | |
| WisdomTree DEFA Fund | | For the
Year Ended
March 31, 2011 | | | For the
Year Ended
March 31, 2010 | | | For the
Year Ended
March 31, 2009 | | | For the
Year Ended
March 31, 2008 | | | For the Period
June 16, 2006*
through
March 31, 2007 | |
Net asset value, beginning of period | | $ | 46.13 | | | $ | 32.00 | | | $ | 63.02 | | | $ | 64.15 | | | $ | 49.94 | |
Investment operations: | | | | | | | | | | | | | | | | | | | | |
Net investment income1 | | | 1.58 | | | | 2.00 | | | | 1.89 | | | | 1.70 | | | | 0.86 | |
Net realized and unrealized gain (loss) | | | 3.39 | | | | 14.24 | | | | (31.04 | ) | | | (1.92 | ) | | | 13.58 | |
Total from investment operations | | | 4.97 | | | | 16.24 | | | | (29.15 | ) | | | (0.22 | ) | | | 14.44 | |
Dividends and distributions to shareholders: | | | | | | | | | | | | | | | | | | | | |
Net investment income | | | (1.59 | ) | | | (2.11 | ) | | | (1.87 | ) | | | (0.91 | ) | | | (0.21 | ) |
Capital gains | | | — | | | | — | | | | — | | | | (0.00 | )2 | | | (0.02 | ) |
Total dividends and distributions to shareholders | | | (1.59 | ) | | | (2.11 | ) | | | (1.87 | ) | | | (0.91 | ) | | | (0.23 | ) |
Net asset value, end of period | | $ | 49.51 | | | $ | 46.13 | | | $ | 32.00 | | | $ | 63.02 | | | $ | 64.15 | |
| | | | | |
TOTAL RETURN3 | | | 11.33 | % | | | 51.43 | % | | | (46.61 | )% | | | (0.44 | )% | | | 28.94 | % |
RATIOS/SUPPLEMENTAL DATA: | | | | | | | | | | | | | | | | | | | | |
Net assets, end of period (000’s omitted) | | $ | 457,997 | | | $ | 435,906 | | | $ | 302,385 | | | $ | 425,386 | | | $ | 128,303 | |
Ratio to average net assets4 of: | | | | | | | | | | | | | | | | | | | | |
Expenses, net of expense reimbursements/waivers | | | 0.48 | % | | | 0.19 | %** | | | 0.48 | % | | | 0.48 | % | | | 0.48 | %5 |
Expenses, prior to expense reimbursements/waivers | | | 0.48 | % | | | 0.48 | % | | | 0.48 | % | | | 0.48 | % | | | 0.51 | %5 |
Net investment income | | | 3.50 | % | | | 4.63 | % | | | 4.01 | % | | | 2.54 | % | | | 1.97 | %5 |
Portfolio turnover rate6 | | | 30 | % | | | 97 | % | | | 30 | % | | | 10 | % | | | 11 | % |
| | | | | | | | | | | | | | | | | | | | |
| | | | | | |
WisdomTree DEFA Equity Income
Fund | | For the
Year Ended
March 31, 2011 | | | For the
Year Ended
March 31, 2010 | | | For the
Year Ended
March 31, 2009 | | | For the
Year Ended
March 31, 2008 | | | For the Period
June 16, 2006*
through
March 31, 2007 | |
Net asset value, beginning of period | | $ | 41.85 | | | $ | 28.43 | | | $ | 60.10 | | | $ | 63.62 | | | $ | 49.77 | |
Investment operations: | | | | | | | | | | | | | | | | | | | | |
Net investment income1 | | | 1.75 | | | | 1.56 | | | | 2.45 | | | | 2.20 | | | | 1.19 | |
Net realized and unrealized gain (loss) | | | 2.01 | | | | 13.44 | | | | (31.09 | ) | | | (3.78 | ) | | | 12.94 | |
Total from investment operations | | | 3.76 | | | | 15.00 | | | | (28.64 | ) | | | (1.58 | ) | | | 14.13 | |
Dividends to shareholders: | | | | | | | | | | | | | | | | | | | | |
Net investment income | | | (1.79 | ) | | | (1.58 | ) | | | (3.03 | ) | | | (1.94 | ) | | | (0.28 | ) |
Total dividends to shareholders | | | (1.79 | ) | | | (1.58 | ) | | | (3.03 | ) | | | (1.94 | ) | | | (0.28 | ) |
Net asset value, end of period | | $ | 43.82 | | | $ | 41.85 | | | $ | 28.43 | | | $ | 60.10 | | | $ | 63.62 | |
| | | | | |
TOTAL RETURN3 | | | 9.74 | % | | | 53.57 | % | | | (48.27 | )% | | | (2.72 | )% | | | 28.41 | % |
RATIOS/SUPPLEMENTAL DATA: | | | | | | | | | | | | | | | | | | | | |
Net assets, end of period (000’s omitted) | | $ | 131,454 | | | $ | 142,297 | | | $ | 88,123 | | | $ | 240,408 | | | $ | 184,498 | |
Ratio to average net assets4 of: | | | | | | | | | | | | | | | | | | | | |
Expenses, net of expense reimbursements/waivers | | | 0.58 | % | | | 0.58 | % | | | 0.58 | % | | | 0.58 | % | | | 0.58 | %5 |
Expenses, prior to expense reimbursements/waivers | | | 0.58 | % | | | 0.58 | % | | | 0.58 | % | | | 0.58 | % | | | 0.61 | %5 |
Net investment income | | | 4.39 | % | | | 3.91 | % | | | 5.27 | % | | | 3.32 | % | | | 2.71 | %5 |
Portfolio turnover rate6 | | | 34 | % | | | 36 | % | | | 40 | % | | | 16 | % | | | 19 | % |
| * | Commencement of investment operations. |
| ** | Reflects the Fund’s advisory fees, after waiver, and the fees and expenses of the underlying funds that were paid indirectly by the Fund during the period when the Fund operated as a “fund of funds.” |
| 1 | Based on average shares outstanding. |
| 2 | Amount is less than $0.005. |
| 3 | Total return is calculated assuming an initial investment made at the net asset value at the beginning of the period, reinvestment of all dividends and distributions at net asset value during the period and redemption on the last day of the period. Total return calculated for a period of less than one year is not annualized. The total return would have been lower if certain expenses had not been reimbursed/waived by the investment adviser (Note 2). |
| 4 | The ratios to average net assets do not include net investment income (loss) or expenses of the affiliated funds in which the Fund invests. |
| 6 | Portfolio turnover rate is not annualized and excludes the value of portfolio securities received or delivered as a result of in-kind creations or redemptions of the Fund’s capital shares. |
See Notes to Financial Statements.
| | | | |
| WisdomTree International Dividend and Sector Funds | | | 125 | |
Financial Highlights (continued)
WisdomTree International Dividend and Sector Funds
March 31, 2011
Selected data for a share of beneficial interest outstanding throughout the period is presented below:
| | | | | | | | | | | | | | | | | | | | |
WisdomTree Global Equity Income
Fund | | For the
Year Ended
March 31, 2011 | | | For the
Year Ended
March 31, 20101 | | | For the
Year Ended
March 31, 2009 | | | For the
Year Ended
March 31, 2008 | | | For the Period
June 16, 2006*
through
March 31, 2007 | |
Net asset value, beginning of period | | $ | 40.99 | | | $ | 26.84 | | | $ | 58.90 | | | $ | 63.15 | | | $ | 49.83 | |
Investment operations: | | | | | | | | | | | | | | | | | | | | |
Net investment income2 | | | 1.52 | | | | 2.07 | | | | 2.32 | | | | 2.16 | | | | 1.09 | |
Net realized and unrealized gain (loss) | | | 3.63 | | | | 14.28 | | | | (31.66 | ) | | | (4.38 | ) | | | 12.55 | |
Total from investment operations | | | 5.15 | | | | 16.35 | | | | (29.34 | ) | | | (2.22 | ) | | | 13.64 | |
Dividends and distributions to shareholders: | | | | | | | | | | | | | | | | | | | | |
Net investment income | | | (1.48 | ) | | | (2.20 | ) | | | (2.72 | ) | | | (2.03 | ) | | | (0.32 | ) |
Capital gains | | | — | | | | — | | | | — | | | | (0.00 | )3 | | | — | |
Total dividends and distributions to shareholders | | | (1.48 | ) | | | (2.20 | ) | | | (2.72 | ) | | | (2.03 | ) | | | (0.32 | ) |
Net asset value, end of period | | $ | 44.66 | | | $ | 40.99 | | | $ | 26.84 | | | $ | 58.90 | | | $ | 63.15 | |
| | | | | |
TOTAL RETURN4 | | | 13.12 | % | | | 62.13 | % | | | (50.56 | )% | | | (3.76 | )% | | | 27.39 | % |
RATIOS/SUPPLEMENTAL DATA: | | | | | | | | | | | | | | | | | | | | |
Net assets, end of period (000’s omitted) | | $ | 78,147 | | | $ | 43,042 | | | $ | 18,787 | | | $ | 47,122 | | | $ | 50,520 | |
Ratio to average net assets5 of: | | | | | | | | | | | | | | | | | | | | |
Expenses, net of expense reimbursements/waivers | | | 0.58 | % | | | 0.26 | %** | | | 0.58 | % | | | 0.58 | % | | | 0.58 | %6 |
Expenses, prior to expense reimbursements/waivers | | | 0.58 | % | | | 0.58 | % | | | 0.58 | % | | | 0.58 | % | | | 0.65 | %6 |
Net investment income | | | 3.74 | % | | | 5.49 | % | | | 5.16 | % | | | 3.32 | % | | | 2.44 | %6 |
Portfolio turnover rate7 | | | 35 | % | | | 94 | % | | | 47 | % | | | 21 | % | | | 24 | % |
| | | | | | | | | | | | | | | | | | | | |
| | | | | | |
WisdomTree Europe SmallCap
Dividend Fund | | For the
Year Ended
March 31, 2011 | | | For the
Year Ended
March 31, 2010 | | | For the
Year Ended
March 31, 2009 | | | For the
Year Ended
March 31, 2008 | | | For the Period
June 16, 2006*
through
March 31, 2007 | |
Net asset value, beginning of period | | $ | 37.62 | | | $ | 22.44 | | | $ | 58.47 | | | $ | 70.15 | | | $ | 50.42 | |
Investment operations: | | | | | | | | | | | | | | | | | | | | |
Net investment income2 | | | 1.09 | | | | 0.99 | | | | 2.50 | | | | 2.32 | | | | 1.31 | |
Net realized and unrealized gain (loss) | | | 6.85 | | | | 15.37 | | | | (35.53 | ) | | | (9.78 | ) | | | 18.89 | |
Total from investment operations | | | 7.94 | | | | 16.36 | | | | (33.03 | ) | | | (7.46 | ) | | | 20.20 | |
Dividends to shareholders: | | | | | | | | | | | | | | | | | | | | |
Net investment income | | | (1.12 | ) | | | (1.18 | ) | | | (3.00 | ) | | | (4.22 | ) | | | (0.47 | ) |
Total dividends to shareholders | | | (1.12 | ) | | | (1.18 | ) | | | (3.00 | ) | | | (4.22 | ) | | | (0.47 | ) |
Net asset value, end of period | | $ | 44.44 | | | $ | 37.62 | | | $ | 22.44 | | | $ | 58.47 | | | $ | 70.15 | |
| | | | | |
TOTAL RETURN4 | | | 21.86 | % | | | 74.18 | % | | | (56.75 | )% | | | (10.72 | )% | | | 40.14 | % |
RATIOS/SUPPLEMENTAL DATA: | | | | | | | | | | | | | | | | | | | | |
Net assets, end of period (000’s omitted) | | $ | 28,889 | | | $ | 30,095 | | | $ | 13,467 | | | $ | 46,778 | | | $ | 147,316 | |
Ratio to average net assets5 of: | | | | | | | | | | | | | | | | | | | | |
Expenses, net of expense reimbursements/waivers | | | 0.58 | % | | | 0.58 | % | | | 0.58 | % | | | 0.58 | % | | | 0.58 | %6 |
Expenses, prior to expense reimbursements/waivers | | | 0.58 | % | | | 0.58 | % | | | 0.58 | % | | | 0.58 | % | | | 0.62 | %6 |
Net investment income | | | 2.81 | % | | | 2.92 | % | | | 6.03 | % | | | 3.33 | % | | | 2.99 | %6 |
Portfolio turnover rate7 | | | 60 | % | | | 55 | % | | | 63 | % | | | 22 | % | | | 47 | % |
| * | Commencement of investment operations. |
| ** | Reflects the Fund’s advisory fees, after waiver, and the fees and expenses of the underlying funds that were paid indirectly by the Fund during the period when the Fund operated as a “fund of funds.” |
| 1 | This information reflects the investment objective and strategy of the WisdomTree Europe Equity Income Fund through June 19, 2009 and the investment objective and strategy of the WisdomTree Global Equity Income Fund thereafter. |
| 2 | Based on average shares outstanding. |
| 3 | Amount is less than $0.005. |
| 4 | Total return is calculated assuming an initial investment made at the net asset value at the beginning of the period, reinvestment of all dividends and distributions at net asset value during the period and redemption on the last day of the period. Total return calculated for a period of less than one year is not annualized. The total return would have been lower if certain expenses had not been reimbursed/waived by the investment adviser (Note 2). |
| 5 | The ratios to average net assets do not include net investment income (loss) or expenses of the affiliated funds in which the Fund invests. |
| 7 | Portfolio turnover rate is not annualized and excludes the value of portfolio securities received or delivered as a result of in-kind creations or redemptions of the Fund’s capital shares. |
See Notes to Financial Statements.
| | |
| 126 | | WisdomTree International Dividend and Sector Funds |
Financial Highlights (continued)
WisdomTree International Dividend and Sector Funds
March 31, 2011
Selected data for a share of beneficial interest outstanding throughout the period is presented below:
| | | | | | | | | | | | | | | | | | | | |
| WisdomTree Japan Hedged Equity Fund | | For the
Year Ended
March 31, 2011 | | | For the
Year Ended
March 31, 2010 | | | For the
Year Ended
March 31, 2009 | | | For the
Year Ended
March 31, 2008 | | | For the Period
June 16, 2006*
through
March 31, 2007 | |
Net asset value, beginning of period | | $ | 42.12 | | | $ | 32.02 | | | $ | 48.34 | | | $ | 57.00 | | | $ | 50.32 | |
Investment operations: | | | | | | | | | | | | | | | | | | | | |
Net investment income1 | | | 1.79 | | | | 0.73 | | | | 0.57 | | | | 0.64 | | | | 0.56 | |
Net realized and unrealized gain (loss) | | | (6.52 | ) | | | 9.89 | | | | (16.09 | ) | | | (8.82 | ) | | | 6.33 | |
Total from investment operations | | | (4.73 | ) | | | 10.62 | | | | (15.52 | ) | | | (8.18 | ) | | | 6.89 | |
Dividends to shareholders: | | | | | | | | | | | | | | | | | | | | |
Net investment income | | | (0.45 | ) | | | (0.52 | ) | | | (0.80 | ) | | | (0.48 | ) | | | (0.21 | ) |
Total dividends to shareholders | | | (0.45 | ) | | | (0.52 | ) | | | (0.80 | ) | | | (0.48 | ) | | | (0.21 | ) |
Net asset value, end of period | | $ | 36.94 | | | $ | 42.12 | | | $ | 32.02 | | | $ | 48.34 | | | $ | 57.00 | |
| | | | | |
TOTAL RETURN2 | | | (11.25 | )% | | | 33.33 | % | | | (32.36 | )% | | | (14.39 | )% | | | 13.71 | % |
RATIOS/SUPPLEMENTAL DATA: | | | | | | | | | | | | | | | | | | | | |
Net assets, end of period (000’s omitted) | | $ | 494,981 | | | $ | 54,751 | | | $ | 19,212 | | | $ | 29,004 | | | $ | 51,301 | |
Ratio to average net assets4 of: | | | | | | | | | | | | | | | | | | | | |
Expenses, net of expense reimbursements/waivers | | | 0.48 | % | | | 0.48 | % | | | 0.48 | % | | | 0.48 | % | | | 0.48 | %3 |
Expenses, prior to expense reimbursements/waivers | | | 0.48 | % | | | 0.48 | % | | | 0.48 | % | | | 0.48 | % | | | 0.54 | %3 |
Net investment income | | | 5.40 | % | | | 1.72 | % | | | 1.38 | % | | | 1.17 | % | | | 1.40 | %3 |
Portfolio turnover rate5 | | | 28 | % | | | 13 | % | | | 11 | % | | | 1 | % | | | 6 | % |
| | | | | | | | | | | | | | | | | | | | |
| WisdomTree World ex-U.S. Growth Fund | | For the
Year Ended
March 31, 2011 | | | For the
Year Ended
March 31, 20106 | | | For the
Year Ended
March 31, 2009 | | | For the
Year Ended
March 31, 2008 | | | For the Period
June 16, 2006*
through
March 31, 2007 | |
Net asset value, beginning of period | | $ | 49.61 | | | $ | 35.41 | | | $ | 49.59 | | | $ | 59.42 | | | $ | 50.14 | |
Investment operations: | | | | | | | | | | | | | | | | | | | | |
Net investment income1 | | | 1.41 | | | | 1.11 | | | | 0.75 | | | | 0.65 | | | | 1.18 | |
Net realized and unrealized gain (loss) | | | 5.22 | | | | 14.94 | | | | (13.89 | ) | | | (9.50 | ) | | | 8.44 | |
Total from investment operations | | | 6.63 | | | | 16.05 | | | | (13.14 | ) | | | (8.85 | ) | | | 9.62 | |
Dividends to shareholders: | | | | | | | | | | | | | | | | | | | | |
Net investment income | | | (1.30 | ) | | | (1.85 | ) | | | (1.04 | ) | | | (0.98 | ) | | | (0.34 | ) |
Total dividends to shareholders | | | (1.30 | ) | | | (1.85 | ) | | | (1.04 | ) | | | (0.98 | ) | | | (0.34 | ) |
Net asset value, end of period | | $ | 54.94 | | | $ | 49.61 | | | $ | 35.41 | | | $ | 49.59 | | | $ | 59.42 | |
| | | | | |
TOTAL RETURN2 | | | 13.67 | % | | | 46.04 | % | | | (26.84 | )% | | | (14.96 | )% | | | 19.22 | % |
RATIOS/SUPPLEMENTAL DATA: | | | | | | | | | | | | | | | | | | | | |
Net assets, end of period (000’s omitted) | | $ | 49,446 | | | $ | 24,805 | | | $ | 21,245 | | | $ | 29,754 | | | $ | 95,069 | |
Ratio to average net assets4 of: | | | | | | | | | | | | | | | | | | | | |
Expenses, net of expense reimbursements/waivers | | | 0.57 | %6 | | | 0.58 | %6 | | | 0.58 | % | | | 0.58 | % | | | 0.58 | %3 |
Expenses, prior to expense reimbursements/waivers | | | 0.58 | % | | | 0.58 | % | | | 0.58 | % | | | 0.58 | % | | | 0.64 | %3 |
Net investment income | | | 2.80 | % | | | 2.54 | % | | | 1.70 | % | | | 1.18 | % | | | 3.00 | %3 |
Portfolio turnover rate5 | | | 68 | % | | | 121 | % | | | 47 | % | | | 1 | % | | | 6 | % |
| * | Commencement of investment operations. |
| 1 | Based on average shares outstanding. |
| 2 | Total return is calculated assuming an initial investment made at the net asset value at the beginning of the period, reinvestment of all dividends and distributions at net asset value during the period and redemption on the last day of the period. Total return calculated for a period of less than one year is not annualized. The total return would have been lower if certain expenses had not been reimbursed by the investment adviser (Note 2). |
| 4 | The ratios to average net assets do not include net investment income (loss) or expenses of the affiliated funds in which the Fund invests. |
| 5 | Portfolio turnover rate is not annualized and excludes the value of portfolio securities received or delivered as a result of in-kind creations or redemptions of the Fund’s capital shares. |
| 6 | Reflects the Fund’s advisory fees, after waiver, and the fees and expenses of the India Earnings Fund that were paid indirectly by the Fund . The Fund invests a portion of its assets in the WisdomTree India Earnings Fund in order to achieve exposure to securities in India. |
See Notes to Financial Statements.
| | | | |
| WisdomTree International Dividend and Sector Funds | | | 127 | |
Financial Highlights (continued)
WisdomTree International Dividend and Sector Funds
March 31, 2011
Selected data for a share of beneficial interest outstanding throughout the period is presented below:
| | | | | | | | | | | | | | | | | | | | |
WisdomTree Japan SmallCap
Dividend Fund | | For the
Year Ended
March 31, 2011 | | | For the
Year Ended
March 31, 2010 | | | For the
Year Ended
March 31, 2009 | | | For the
Year Ended
March 31, 2008 | | | For the Period
June 16, 2006*
through
March 31, 2007 | |
Net asset value, beginning of period | | $ | 41.54 | | | $ | 31.47 | | | $ | 44.29 | | | $ | 52.33 | | | $ | 50.69 | |
Investment operations: | | | | | | | | | | | | | | | | | | | | |
Net investment income1 | | | 0.99 | | | | 0.79 | | | | 0.64 | | | | 0.69 | | | | 0.95 | |
Net realized and unrealized gain (loss) | | | 1.47 | | | | 9.96 | | | | (12.97 | ) | | | (8.12 | ) | | | 0.74 | |
Total from investment operations | | | 2.46 | | | | 10.75 | | | | (12.33 | ) | | | (7.43 | ) | | | 1.69 | |
Dividends to shareholders: | | | | | | | | | | | | | | | | | | | | |
Net investment income | | | (0.75 | ) | | | (0.68 | ) | | | (0.49 | ) | | | (0.61 | ) | | | (0.05 | ) |
Total dividends to shareholders | | | (0.75 | ) | | | (0.68 | ) | | | (0.49 | ) | | | (0.61 | ) | | | (0.05 | ) |
Net asset value, end of period | | $ | 43.25 | | | $ | 41.54 | | | $ | 31.47 | | | $ | 44.29 | | | $ | 52.33 | |
| | | | | |
TOTAL RETURN2 | | | 6.02 | % | | | 34.37 | % | | | (27.98 | )% | | | (14.23 | )% | | | 3.34 | % |
RATIOS/SUPPLEMENTAL DATA: | | | | | | | | | | | | | | | | | | | | |
Net assets, end of period (000’s omitted) | | $ | 235,685 | | | $ | 157,850 | | | $ | 66,078 | | | $ | 75,300 | | | $ | 99,419 | |
Ratio to average net assets4 of: | | | | | | | | | | | | | | | | | | | | |
Expenses, net of expense reimbursements/waivers | | | 0.58 | % | | | 0.58 | % | | | 0.58 | % | | | 0.58 | % | | | 0.58 | %3 |
Expenses, prior to expense reimbursements/waivers | | | 0.58 | % | | | 0.58 | % | | | 0.58 | % | | | 0.58 | % | | | 0.64 | %3 |
Net investment income | | | 2.51 | % | | | 2.09 | % | | | 1.68 | % | | | 1.44 | % | | | 2.75 | %3 |
Portfolio turnover rate5 | | | 39 | % | | | 45 | % | | | 16 | % | | | 3 | % | | | 25 | % |
| | | | | | | | | | | | | | | | | | | | |
| | | | | | |
WisdomTree Pacific ex-Japan Total
Dividend Fund | | For the
Year Ended
March 31, 2011 | | | For the
Year Ended
March 31, 2010 | | | For the
Year Ended
March 31, 2009 | | | For the
Year Ended
March 31, 2008 | | | For the Period
June 16, 2006*
through
March 31, 2007 | |
Net asset value, beginning of period | | $ | 61.40 | | | $ | 37.09 | | | $ | 73.00 | | | $ | 67.57 | | | $ | 49.71 | |
Investment operations: | | | | | | | | | | | | | | | | | | | | |
Net investment income1 | | | 2.51 | | | | 1.79 | | | | 2.86 | | | | 2.69 | | | | 1.40 | |
Net realized and unrealized gain (loss) | | | 6.59 | | | | 24.23 | | | | (34.08 | ) | | | 4.61 | | | | 16.85 | |
Total from investment operations | | | 9.10 | | | | 26.02 | | | | (31.22 | ) | | | 7.30 | | | | 18.25 | |
Dividends to shareholders: | | | | | | | | | | | | | | | | | | | | |
Net investment income | | | (2.51 | ) | | | (1.71 | ) | | | (4.69 | ) | | | (1.87 | ) | | | (0.39 | ) |
Total dividends to shareholders | | | (2.51 | ) | | | (1.71 | ) | | | (4.69 | ) | | | (1.87 | ) | | | (0.39 | ) |
Net asset value, end of period | | $ | 67.99 | | | $ | 61.40 | | | $ | 37.09 | | | $ | 73.00 | | | $ | 67.57 | |
| | | | | |
TOTAL RETURN2 | | | 15.33 | % | | | 70.97 | % | | | (42.77 | )% | | | (10.58 | )% | | | 36.80 | % |
RATIOS/SUPPLEMENTAL DATA: | | | | | | | | | | | | | | | | | | | | |
Net assets, end of period (000’s omitted) | | $ | 88,388 | | | $ | 89,033 | | | $ | 37,086 | | | $ | 146,008 | | | $ | 74,329 | |
Ratio to average net assets4 of: | | | | | | | | | | | | | | | | | | | | |
Expenses, net of expense reimbursements/waivers | | | 0.48 | % | | | 0.48 | % | | | 0.48 | % | | | 0.48 | % | | | 0.48 | %3 |
Expenses, prior to expense reimbursements/waivers | | | 0.48 | % | | | 0.48 | % | | | 0.48 | % | | | 0.48 | % | | | 0.54 | %3 |
Net investment income | | | 4.05 | % | | | 3.11 | % | | | 4.76 | % | | | 3.42 | % | | | 3.31 | %3 |
Portfolio turnover rate5 | | | 27 | % | | | 18 | % | | | 31 | % | | | 12 | % | | | 21 | % |
| * | Commencement of investment operations. |
| 1 | Based on average shares outstanding. |
| 2 | Total return is calculated assuming an initial investment made at the net asset value at the beginning of the period, reinvestment of all dividends and distributions at net asset value during the period and redemption on the last day of the period. Total return calculated for a period of less than one year is not annualized. The total return would have been lower if certain expenses had not been reimbursed/waived by the investment adviser (Note 2). |
| 4 | The ratios to average net assets do not include net investment income (loss) or expenses of the affiliated funds in which the Fund invests. |
| 5 | Portfolio turnover rate is not annualized and excludes the value of portfolio securities received or delivered as a result of in-kind creations or redemptions of the Fund’s capital shares. |
See Notes to Financial Statements.
| | |
| 128 | | WisdomTree International Dividend and Sector Funds |
Financial Highlights (continued)
WisdomTree International Dividend and Sector Funds
March 31, 2011
Selected data for a share of beneficial interest outstanding throughout the period is presented below:
| | | | | | | | | | | | | | | | | | | | |
WisdomTree Pacific ex-Japan Equity
Income Fund | | For the
Year Ended
March 31, 2011 | | | For the
Year Ended
March 31, 2010 | | | For the
Year Ended
March 31, 2009 | | | For the
Year Ended
March 31, 2008 | | | For the Period
June 16, 2006*
through
March 31, 2007 | |
Net asset value, beginning of period | | $ | 57.24 | | | $ | 30.80 | | | $ | 63.30 | | | $ | 67.08 | | | $ | 49.02 | |
Investment operations: | | | | | | | | | | | | | | | | | | | | |
Net investment income1 | | | 2.99 | | | | 2.23 | | | | 3.00 | | | | 3.24 | | | | 2.18 | |
Net realized and unrealized gain (loss) | | | 4.62 | | | | 26.27 | | | | (31.22 | ) | | | (3.40 | ) | | | 16.40 | |
Total from investment operations | | | 7.61 | | | | 28.50 | | | | (28.22 | ) | | | (0.16 | ) | | | 18.58 | |
Dividends and distributions to shareholders: | | | | | | | | | | | | | | | | | | | | |
Net investment income | | | (3.21 | ) | | | (2.06 | ) | | | (4.28 | ) | | | (3.48 | ) | | | (0.52 | ) |
Capitals gains | | | — | | | | — | | | | — | | | | (0.14 | ) | | | — | |
Total dividends and distributions to shareholders | | | (3.21 | ) | | | (2.06 | ) | | | (4.28 | ) | | | (3.62 | ) | | | (0.52 | ) |
Net asset value, end of period | | $ | 61.64 | | | $ | 57.24 | | | $ | 30.80 | | | $ | 63.30 | | | $ | 67.08 | |
| | | | | |
TOTAL RETURN2 | | | 14.03 | % | | | 93.79 | % | | | (44.42 | )% | | | (0.69 | )% | | | 38.02 | % |
RATIOS/SUPPLEMENTAL DATA: | | | | | | | | | | | | | | | | | | | | |
Net assets, end of period (000’s omitted) | | $ | 80,137 | | | $ | 117,339 | | | $ | 21,559 | | | $ | 56,966 | | | $ | 87,205 | |
Ratio to average net assets4 of: | | | | | | | | | | | | | | | | | | | | |
Expenses, net of expense reimbursements/waivers | | | 0.58 | % | | | 0.58 | % | | | 0.58 | % | | | 0.58 | % | | | 0.58 | %3 |
Expenses, prior to expense reimbursements/waivers | | | 0.58 | % | | | 0.58 | % | | | 0.58 | % | | | 0.58 | % | | | 0.63 | %3 |
Net investment income | | | 5.42 | % | | | 4.25 | % | | | 6.25 | % | | | 4.42 | % | | | 5.11 | %3 |
Portfolio turnover rate5 | | | 46 | % | | | 25 | % | | | 55 | % | | | 16 | % | | | 7 | % |
| | | | | | | | | | | | | | | | | | | | |
| | | | | | |
WisdomTree International LargeCap
Dividend Fund | | For the
Year Ended
March 31, 2011 | | | For the
Year Ended
March 31, 2010 | | | For the
Year Ended
March 31, 2009 | | | For the
Year Ended
March 31, 2008 | | | For the Period
June 16, 2006*
through
March 31, 2007 | |
Net asset value, beginning of period | | $ | 45.34 | | | $ | 31.57 | | | $ | 61.86 | | | $ | 62.55 | | | $ | 49.86 | |
Investment operations: | | | | | | | | | | | | | | | | | | | | |
Net investment income1 | | | 1.56 | | | | 1.50 | | | | 2.11 | | | | 1.80 | | | | 0.85 | |
Net realized and unrealized gain (loss) | | | 2.37 | | | | 13.91 | | | | (29.98 | ) | | | (1.11 | ) | | | 12.14 | |
Total from investment operations | | | 3.93 | | | | 15.41 | | | | (27.87 | ) | | | 0.69 | | | | 12.99 | |
Dividends to shareholders: | | | | | | | | | | | | | | | | | | | | |
Net investment income | | | (1.59 | ) | | | (1.64 | ) | | | (2.42 | ) | | | (1.38 | ) | | | (0.30 | ) |
Total dividends to shareholders | | | (1.59 | ) | | | (1.64 | ) | | | (2.42 | ) | | | (1.38 | ) | | | (0.30 | ) |
Net asset value, end of period | | $ | 47.68 | | | $ | 45.34 | | | $ | 31.57 | | | $ | 61.86 | | | $ | 62.55 | |
| | | | | |
TOTAL RETURN2 | | | 9.21 | % | | | 49.56 | % | | | (45.57 | )% | | | 0.93 | % | | | 26.08 | % |
RATIOS/SUPPLEMENTAL DATA: | | | | | | | | | | | | | | | | | | | | |
Net assets, end of period (000’s omitted) | | $ | 164,489 | | | $ | 149,624 | | | $ | 78,928 | | | $ | 154,658 | | | $ | 87,569 | |
Ratio to average net assets4 of: | | | | | | | | | | | | | | | | | | | | |
Expenses, net of expense reimbursements/waivers | | | 0.48 | % | | | 0.48 | % | | | 0.48 | % | | | 0.48 | % | | | 0.48 | %3 |
Expenses, prior to expense reimbursements/waivers | | | 0.48 | % | | | 0.48 | % | | | 0.48 | % | | | 0.48 | % | | | 0.52 | %3 |
Net investment income | | | 3.56 | % | | | 3.54 | % | | | 4.38 | % | | | 2.69 | % | | | 1.99 | %3 |
Portfolio turnover rate5 | | | 22 | % | | | 26 | % | | | 30 | % | | | 15 | % | | | 8 | % |
| * | Commencement of investment operations. |
| 1 | Based on average shares outstanding. |
| 2 | Total return is calculated assuming an initial investment made at the net asset value at the beginning of the period, reinvestment of all dividends and distributions at net asset value during the period and redemption on the last day of the period. Total return calculated for a period of less than one year is not annualized. The total return would have been lower if certain expenses had not been reimbursed/waived by the investment adviser (Note 2). |
| 4 | The ratios to average net assets do not include net investment income (loss) or expenses of the affiliated funds in which the Fund invests. |
| 5 | Portfolio turnover rate is not annualized and excludes the value of portfolio securities received or delivered as a result of in-kind creations or redemptions of the Fund’s capital shares. |
See Notes to Financial Statements.
| | | | |
| WisdomTree International Dividend and Sector Funds | | | 129 | |
Financial Highlights (continued)
WisdomTree International Dividend and Sector Funds
March 31, 2011
Selected data for a share of beneficial interest outstanding throughout the period is presented below:
| | | | | | | | | | | | | | | | | | | | |
WisdomTree International Dividend
ex-Financials Fund | | For the
Year Ended
March 31, 2011 | | | For the
Year Ended
March 31, 20101 | | | For the
Year Ended
March 31, 2009 | | | For the
Year Ended
March 31, 2008 | | | For the Period
June 16, 2006*
through
March 31, 2007 | |
Net asset value, beginning of period | | $ | 42.69 | | | $ | 28.46 | | | $ | 64.01 | | | $ | 66.37 | | | $ | 49.77 | |
Investment operations: | | | | | | | | | | | | | | | | | | | | |
Net investment income2 | | | 1.83 | | | | 1.50 | | | | 2.93 | | | | 2.29 | | | | 1.03 | |
Net realized and unrealized gain (loss) | | | 4.21 | | | | 14.24 | | | | (34.43 | ) | | | (2.86 | ) | | | 15.80 | |
Total from investment operations | | | 6.04 | | | | 15.74 | | | | (31.50 | ) | | | (0.57 | ) | | | 16.83 | |
Dividends and distributions to shareholders: | | | | | | | | | | | | | | | | | | | | |
Net investment income | | | (1.88 | ) | | | (1.51 | ) | | | (4.05 | ) | | | (1.79 | ) | | | (0.22 | ) |
Capital gains | | | — | | | | — | | | | — | | | | — | | | | (0.01 | ) |
Total dividends and distributions to shareholders | | | (1.88 | ) | | | (1.51 | ) | | | (4.05 | ) | | | (1.79 | ) | | | (0.23 | ) |
Net asset value, end of period | | $ | 46.85 | | | $ | 42.69 | | | $ | 28.46 | | | $ | 64.01 | | | $ | 66.37 | |
| | | | | |
TOTAL RETURN3 | | | 14.93 | % | | | 56.27 | % | | | (49.95 | )% | | | (1.05 | )% | | | 33.83 | % |
RATIOS/SUPPLEMENTAL DATA: | | | | | | | | | | | | | | | | | | | | |
Net assets, end of period (000’s omitted) | | $ | 149,929 | | | $ | 164,338 | | | $ | 105,305 | | | $ | 390,485 | | | $ | 278,743 | |
Ratio to average net assets5 of: | | | | | | | | | | | | | | | | | | | | |
Expenses, net of expense reimbursements/waivers | | | 0.58 | % | | | 0.58 | % | | | 0.58 | % | | | 0.58 | % | | | 0.58 | %4 |
Expenses, prior to expense reimbursements/waivers | | | 0.58 | % | | | 0.58 | % | | | 0.58 | % | | | 0.58 | % | | | 0.60 | %4 |
Net investment income | | | 4.30 | % | | | 3.81 | % | | | 5.90 | % | | | 3.28 | % | | | 2.30 | %4 |
Portfolio turnover rate6 | | | 52 | % | | | 69 | % | | | 55 | % | | | 24 | % | | | 8 | % |
| | | | | | | | | | | | | | | | | | | | |
| | | | | | |
WisdomTree International MidCap
Dividend Fund | | For the
Year Ended
March 31, 2011 | | | For the
Year Ended
March 31, 2010 | | | For the
Year Ended
March 31, 2009 | | | For the
Year Ended
March 31, 2008 | | | For the Period
June 16, 2006*
through
March 31, 2007 | |
Net asset value, beginning of period | | $ | 48.69 | | | $ | 31.55 | | | $ | 62.60 | | | $ | 67.56 | | | $ | 50.13 | |
Investment operations: | | | | | | | | | | | | | | | | | | | | |
Net investment income2 | | | 1.53 | | | | 1.26 | | | | 1.82 | | | | 1.92 | | | | 1.08 | |
Net realized and unrealized gain (loss) | | | 5.19 | | | | 17.27 | | | | (30.64 | ) | | | (4.95 | ) | | | 16.73 | |
Total from investment operations | | | 6.72 | | | | 18.53 | | | | (28.82 | ) | | | (3.03 | ) | | | 17.81 | |
Dividends and distributions to shareholders: | | | | | | | | | | | | | | | | | | | | |
Net investment income | | | (1.61 | ) | | | (1.39 | ) | | | (2.23 | ) | | | (1.81 | ) | | | (0.38 | ) |
Capital gains | | | — | | | | — | | | | — | | | | (0.12 | ) | | | — | |
Total dividends and distributions to shareholders | | | (1.61 | ) | | | (1.39 | ) | | | (2.23 | ) | | | (1.93 | ) | | | (0.38 | ) |
Net asset value, end of period | | $ | 53.80 | | | $ | 48.69 | | | $ | 31.55 | | | $ | 62.60 | | | $ | 67.56 | |
| | | | | |
TOTAL RETURN3 | | | 14.38 | % | | | 59.59 | % | | | (46.43 | )% | | | (4.61 | )% | | | 35.57 | % |
RATIOS/SUPPLEMENTAL DATA: | | | | | | | | | | | | | | | | | | | | |
Net assets, end of period (000’s omitted) | | $ | 156,006 | | | $ | 146,069 | | | $ | 88,334 | | | $ | 219,104 | | | $ | 168,889 | |
Ratio to average net assets5 of: | | | | | | | | | | | | | | | | | | | | |
Expenses, net of expense reimbursements/waivers | | | 0.58 | % | | | 0.58 | % | | | 0.58 | % | | | 0.58 | % | | | 0.58 | %4 |
Expenses, prior to expense reimbursements/waivers | | | 0.58 | % | | | 0.58 | % | | | 0.58 | % | | | 0.58 | % | | | 0.61 | %4 |
Net investment income | | | 3.14 | % | | | 2.88 | % | | | 3.80 | % | | | 2.76 | % | | | 2.53 | %4 |
Portfolio turnover rate6 | | | 40 | % | | | 49 | % | | | 32 | % | | | 18 | % | | | 44 | % |
| * | Commencement of investment operations. |
| 1 | This information reflects the investment objective and strategy of the WisdomTree International Dividend Top 100 Fund through May 8, 2009 and the investment objective and strategy of the WisdomTree International Dividend ex-Financials Fund thereafter. |
| 2 | Based on average shares outstanding. |
| 3 | Total return is calculated assuming an initial investment made at the net asset value at the beginning of the period, reinvestment of all dividends and distributions at net asset value during the period and redemption on the last day of the period. Total return calculated for a period of less than one year is not annualized. The total return would have been lower if certain expenses had not been reimbursed/waived by the investment adviser (Note 2). |
| 5 | The ratios to average net assets do not include net investment income (loss) or expenses of the affiliated funds in which the Fund invests. |
| 6 | Portfolio turnover rate is not annualized and excludes the value of portfolio securities received or delivered as a result of in-kind creations or redemptions of the Fund’s capital shares. |
See Notes to Financial Statements.
| | |
| 130 | | WisdomTree International Dividend and Sector Funds |
Financial Highlights (continued)
WisdomTree International Dividend and Sector Funds
March 31, 2011
Selected data for a share of beneficial interest outstanding throughout the period is presented below:
| | | | | | | | | | | | | | | | | | | | |
WisdomTree International
SmallCap Dividend Fund | | For the
Year Ended
March 31, 2011 | | | For the
Year Ended
March 31, 2010 | | | For the
Year Ended
March 31, 2009 | | | For the
Year Ended
March 31, 2008 | | | For the Period
June 16, 2006*
through
March 31, 2007 | |
Net asset value, beginning of period | | $ | 46.98 | | | $ | 29.08 | | | $ | 61.11 | | | $ | 67.80 | | | $ | 50.35 | |
Investment operations: | | | | | | | | | | | | | | | | | | | | |
Net investment income1 | | | 1.43 | | | | 1.20 | | | | 1.91 | | | | 1.86 | | | | 1.43 | |
Net realized and unrealized gain (loss) | | | 6.14 | | | | 17.91 | | | | (31.83 | ) | | | (7.08 | ) | | | 16.28 | |
Total from investment operations | | | 7.57 | | | | 19.11 | | | | (29.92 | ) | | | (5.22 | ) | | | 17.71 | |
Dividends and distributions to shareholders: | | | | | | | | | | | | | | | | | | | | |
Net investment income | | | (1.40 | ) | | | (1.21 | ) | | | (2.11 | ) | | | (1.41 | ) | | | (0.26 | ) |
Capital gains | | | — | | | | — | | | | — | | | | (0.06 | ) | | | — | |
Total dividends and distributions to shareholders | | | (1.40 | ) | | | (1.21 | ) | | | (2.11 | ) | | | (1.47 | ) | | | (0.26 | ) |
Net asset value, end of period | | $ | 53.15 | | | $ | 46.98 | | | $ | 29.08 | | | $ | 61.11 | | | $ | 67.80 | |
| | | | | |
TOTAL RETURN2 | | | 16.64 | % | | | 66.50 | % | | | (49.23 | )% | | | (7.79 | )% | | | 35.21 | % |
RATIOS/SUPPLEMENTAL DATA: | | | | | | | | | | | | | | | | | | | | |
Net assets, end of period (000’s omitted) | | $ | 475,703 | | | $ | 429,870 | | | $ | 244,307 | | | $ | 482,761 | | | $ | 298,315 | �� |
Ratio to average net assets4 of: | | | | | | | | | | | | | | | | | | | | |
Expenses, net of expense reimbursements/waivers | | | 0.58 | % | | | 0.58 | % | | | 0.58 | % | | | 0.58 | % | | | 0.58 | %3 |
Expenses, prior to expense reimbursements/waivers | | | 0.58 | % | | | 0.58 | % | | | 0.58 | % | | | 0.58 | % | | | 0.60 | %3 |
Net investment income | | | 2.99 | % | | | 2.87 | % | | | 4.31 | % | | | 2.71 | % | | | 3.33 | %3 |
Portfolio turnover rate5 | | | 55 | % | | | 63 | % | | | 43 | % | | | 17 | % | | | 39 | % |
| | | | | | | | | | | | | | | | |
| | | | | |
WisdomTree Emerging Markets
Equity Income Fund | | For the
Year Ended
March 31, 2011 | | | For the
Year Ended
March 31, 2010 | | | For the
Year Ended
March 31, 2009 | | | For the Period
July 13, 2007*
through
March 31, 2008 | |
Net asset value, beginning of period | | $ | 52.02 | | | $ | 31.11 | | | $ | 51.82 | | | $ | 50.68 | |
Investment operations: | | | | | | | | | | | | | | | | |
Net investment income1 | | | 1.89 | | | | 1.48 | | | | 2.01 | | | | 1.12 | |
Net realized and unrealized gain (loss) | | | 8.55 | | | | 21.00 | | | | (20.76 | ) | | | 0.51 | |
Total from investment operations | | | 10.44 | | | | 22.48 | | | | (18.75 | ) | | | 1.63 | |
Dividends to shareholders: | | | | | | | | | | | | | | | | |
Net investment income | | | (1.95 | ) | | | (1.57 | ) | | | (1.96 | ) | | | (0.49 | ) |
Total dividends to shareholders | | | (1.95 | ) | | | (1.57 | ) | | | (1.96 | ) | | | (0.49 | ) |
Net asset value, end of period | | $ | 60.51 | | | $ | 52.02 | | | $ | 31.11 | | | $ | 51.82 | |
| | | | |
TOTAL RETURN2 | | | 20.75 | % | | | 73.33 | % | | | (36.21 | )% | | | 3.23 | % |
RATIOS/SUPPLEMENTAL DATA: | | | | | | | | | | | | | | | | |
Net assets, end of period (000’s omitted) | | $ | 1,325,257 | | | $ | 540,990 | | | $ | 177,355 | | | $ | 165,813 | |
Ratio to average net assets4 of: | | | | | | | | | | | | | | | | |
Expenses, net of expense reimbursements/waivers | | | 0.63 | % | | | 0.63 | % | | | 0.63 | % | | | 0.63 | %3 |
Expenses, prior to expense reimbursements/waivers | | | 0.63 | % | | | 0.63 | % | | | 0.63 | % | | | 0.63 | %3 |
Net investment income | | | 3.47 | % | | | 3.26 | % | | | 4.96 | % | | | 3.18 | %3 |
Portfolio turnover rate5 | | | 33 | % | | | 44 | % | | | 67 | % | | | 3 | % |
| * | Commencement of investment operations. |
| 1 | Based on average shares outstanding. |
| 2 | Total return is calculated assuming an initial investment made at the net asset value at the beginning of the period, reinvestment of all dividends and distributions at net asset value during the period and redemption on the last day of the period. Total return calculated for a period of less than one year is not annualized. The total return would have been lower if certain expenses had not been reimbursed/waived by the investment adviser (Note 2). |
| 4 | The ratios to average net assets do not include net investment income (loss) or expenses of the affiliated funds in which the Fund invests. |
| 5 | Portfolio turnover rate is not annualized and excludes the value of portfolio securities received or delivered as a result of in-kind creations or redemptions of the Fund’s capital shares. |
See Notes to Financial Statements.
| | | | |
| WisdomTree International Dividend and Sector Funds | | | 131 | |
Financial Highlights (continued)
WisdomTree International Dividend and Sector Funds
March 31, 2011
Selected data for a share of beneficial interest outstanding throughout the period is presented below:
| | | | | | | | | | | | | | | | |
WisdomTree Emerging Markets
SmallCap Dividend Fund | | For the
Year Ended
March 31, 2011 | | | For the
Year Ended
March 31, 2010 | | | For the
Year Ended
March 31, 2009 | | | For the Period
October 30, 2007*
through
March 31, 2008 | |
Net asset value, beginning of period | | $ | 44.51 | | | $ | 24.62 | | | $ | 43.95 | | | $ | 51.50 | |
Investment operations: | | | | | | | | | | | | | | | | |
Net investment income1 | | | 1.32 | | | | 1.02 | | | | 1.56 | | | | 0.37 | |
Net realized and unrealized gain (loss) | | | 8.86 | | | | 20.00 | | | | (19.57 | ) | | | (7.87 | ) |
Total from investment operations | | | 10.18 | | | | 21.02 | | | | (18.01 | ) | | | (7.50 | ) |
Dividends to shareholders: | | | | | | | | | | | | | | | | |
Net investment income | | | (1.39 | ) | | | (1.13 | ) | | | (1.32 | ) | | | (0.05 | ) |
Total dividends to shareholders | | | (1.39 | ) | | | (1.13 | ) | | | (1.32 | ) | | | (0.05 | ) |
Net asset value, end of period | | $ | 53.30 | | | $ | 44.51 | | | $ | 24.62 | | | $ | 43.95 | |
| | | | |
TOTAL RETURN2 | | | 23.38 | % | | | 86.26 | % | | | (40.81 | )% | | | (14.57 | )% |
RATIOS/SUPPLEMENTAL DATA: | | | | | | | | | | | | | | | | |
Net assets, end of period (000’s omitted) | | $ | 927,463 | | | $ | 342,754 | | | $ | 51,706 | | | $ | 52,742 | |
Ratio to average net assets5 of: | | | | | | | | | | | | | | | | |
Expenses, net of expense reimbursements/waivers | | | 0.63 | %4 | | | 0.63 | %4 | | | 0.63 | % | | | 0.63 | %3 |
Expenses, prior to expense reimbursements/waivers | | | 0.63 | % | | | 0.63 | % | | | 0.63 | % | | | 0.63 | %3 |
Net investment income | | | 2.68 | % | | | 2.59 | % | | | 4.98 | % | | | 1.99 | %3 |
Portfolio turnover rate6 | | | 35 | % | | | 38 | % | | | 64 | % | | | 6 | % |
| | | | | | | | | | | | |
| | | | |
| WisdomTree Middle East Dividend Fund | | For the
Year Ended
March 31, 2011 | | | For the
Year Ended
March 31, 2010 | | | For the Period
July 16, 2008*
through
March 31, 2009 | |
Net asset value, beginning of period | | $ | 15.64 | | | $ | 12.13 | | | $ | 24.59 | |
Investment operations: | | | | | | | | | | | | |
Net investment income1 | | | 0.68 | | | | 0.53 | | | | 0.32 | |
Net realized and unrealized gain (loss) | | | 0.49 | | | | 3.68 | | | | (12.78 | ) |
Total from investment operations | | | 1.17 | | | | 4.21 | | | | (12.46 | ) |
Dividends to shareholders: | | | | | | | | | | | | |
Net investment income | | | (0.50 | ) | | | (0.70 | ) | | | — | |
Total dividends to shareholders | | | (0.50 | ) | | | (0.70 | ) | | | — | |
Net asset value, end of period | | $ | 16.31 | | | $ | 15.64 | | | $ | 12.13 | |
| | | |
TOTAL RETURN2 | | | 7.95 | % | | | 35.25 | % | | | (50.67 | )% |
RATIOS/SUPPLEMENTAL DATA: | | | | | | | | | | | | |
Net assets, end of period (000’s omitted) | | $ | 19,571 | | | $ | 12,515 | | | $ | 7,279 | |
Ratio to average net assets of: | | | | | | | | | | | | |
Expenses, net of expense reimbursements/waivers | | | 0.88 | % | | | 0.88 | % | | | 0.88 | %3 |
Expenses, prior to expense reimbursements/waivers | | | 2.17 | % | | | 1.30 | % | | | 1.49 | %3 |
Net investment income | | | 4.33 | % | | | 3.63 | % | | | 2.86 | %3 |
Portfolio turnover rate6 | | | 50 | % | | | 96 | % | | | 26 | % |
| * | Commencement of investment operations. |
| 1 | Based on average shares outstanding. |
| 2 | Total return is calculated assuming an initial investment made at the net asset value at the beginning of the period, reinvestment of all dividends and distributions at net asset value during the period and redemption on the last day of the period. Total return calculated for a period of less than one year is not annualized. The total return would have been lower if certain expenses had not been reimbursed/waived by the investment adviser (Note 2). |
| 4 | Reflects the Fund’s advisory fees, after waiver, and the fees and expenses of the India Earnings Fund that were paid indirectly by the Fund. The Fund invests a portion of its assets in the WisdomTree India Earnings Fund in order to achieve exposure to securities in India. |
| 5 | The ratios to average net assets do not include net investment income (loss) or expenses of the affiliated funds in which the Fund invests. |
| 6 | Portfolio turnover rate is not annualized and excludes the value of portfolio securities received or delivered as a result of in-kind creations or redemptions of the Fund’s capital shares. |
See Notes to Financial Statements.
| | |
| 132 | | WisdomTree International Dividend and Sector Funds |
Financial Highlights (continued)
WisdomTree International Dividend and Sector Funds
March 31, 2011
Selected data for a share of beneficial interest outstanding throughout the period is presented below:
| | | | | | | | |
WisdomTree International Hedged
Equity Fund | | For the
Year Ended
March 31, 2011 | | | For the Period
December 31, 2009*
through
March 31, 2010 | |
Net asset value, beginning of period | | $ | 47.72 | | | $ | 46.92 | |
Investment operations: | | | | | | | | |
Net investment income1 | | | 1.43 | | | | 0.29 | |
Net realized and unrealized gain (loss) | | | (0.02 | ) | | | 0.64 | |
Total from investment operations | | | 1.41 | | | | 0.93 | |
Dividends and distributions to shareholders: | | | | | | | | |
Net investment income | | | (1.52 | ) | | | (0.13 | ) |
Capital gains | | | — | | | | 0.00 | 2 |
Total dividends and distributions to shareholders | | | (1.52 | ) | | | (0.13 | ) |
Net asset value, end of period | | $ | 47.61 | | | $ | 47.72 | |
| | |
TOTAL RETURN3 | | | 3.27 | % | | | 1.98 | % |
RATIOS/SUPPLEMENTAL DATA: | | | | | | | | |
Net assets, end of period (000’s omitted) | | $ | 21,425 | | | $ | 9,545 | |
Ratio to average net assets5 of: | | | | | | | | |
Expenses, net of expense reimbursements/waivers | | | 0.58 | % | | | 0.47 | %**4 |
Expenses, prior to expense reimbursements/waivers | | | 1.65 | % | | | 0.58 | %4 |
Net investment income | | | 3.11 | % | | | 2.53 | %4 |
Portfolio turnover rate6 | | | 38 | % | | | 79 | % |
| | | | | | | | | | | | | | | | | | | | |
| | | | | | |
WisdomTree International Basic
Materials Sector Fund | | For the
Year Ended
March 31, 2011 | | | For the
Year Ended
March 31, 2010 | | | For the
Year Ended
March 31, 2009 | | | For the
Year Ended
March 31, 2008 | | | For the Period
October 13, 2006*
through
March 31, 2007 | |
Net asset value, beginning of period | | $ | 28.90 | | | $ | 16.04 | | | $ | 35.96 | | | $ | 32.03 | | | $ | 25.46 | |
Investment operations: | | | | | | | | | | | | | | | | | | | | |
Net investment income1 | | | 0.53 | | | | 0.47 | | | | 0.65 | | | | 0.61 | | | | 0.25 | |
Net realized and unrealized gain (loss) | | | 4.33 | | | | 12.80 | | | | (19.29 | ) | | | 3.58 | | | | 6.32 | |
Total from investment operations | | | 4.86 | | | | 13.27 | | | | (18.64 | ) | | | 4.19 | | | | 6.57 | |
Dividends and distributions to shareholders: | | | | | | | | | | | | | | | | | | | | |
Net investment income | | | (0.55 | ) | | | (0.41 | ) | | | (1.28 | ) | | | (0.26 | ) | | | — | |
Capital gains | | | — | | | | — | | | | — | | | | 0.00 | 2 | | | — | |
Total dividends and distributions to shareholders | | | (0.55 | ) | | | (0.41 | ) | | | (1.28 | ) | | | (0.26 | ) | | | — | |
Net asset value, end of period | | $ | 33.21 | | | $ | 28.90 | | | $ | 16.04 | | | $ | 35.96 | | | $ | 32.03 | |
| | | | | |
TOTAL RETURN3 | | | 17.31 | % | | | 83.44 | % | | | (52.10 | )% | | | 13.09 | % | | | 25.81 | % |
RATIOS/SUPPLEMENTAL DATA: | | | | | | | | | | | | | | | | | | | | |
Net assets, end of period (000’s omitted) | | $ | 43,172 | | | $ | 49,137 | | | $ | 22,460 | | | $ | 93,507 | | | $ | 6,406 | |
Ratio to average net assets5 of: | | | | | | | | | | | | | | | | | | | | |
Expenses, net of expense reimbursements/waivers | | | 0.58 | % | | | 0.58 | % | | | 0.58 | % | | | 0.58 | % | | | 0.58 | %4 |
Expenses, prior to expense reimbursements/waivers | | | 0.58 | % | | | 0.58 | % | | | 0.58 | % | | | 0.58 | % | | | 0.88 | %4 |
Net investment income | | | 1.86 | % | | | 1.91 | % | | | 2.21 | % | | | 1.62 | % | | | 1.89 | %4 |
Portfolio turnover rate6 | | | 35 | % | | | 25 | % | | | 53 | % | | | 11 | % | | | 0 | %7 |
| * | Commencement of investment operations. |
| ** | Reflects the Fund’s advisory fees, after waiver, and the fees and expenses of the underlying funds that were paid indirectly by the Fund during the period when the Fund operated as a “fund of funds”. |
| 1 | Based on average shares outstanding. |
| 2 | Amount represents less than $0.005. |
| 3 | Total return is calculated assuming an initial investment made at the net asset value at the beginning of the period, reinvestment of all dividends and distributions at net asset value during the period and redemption on the last day of the period. Total return calculated for a period of less than one year is not annualized. The total return would have been lower if certain expenses had not been reimbursed by the investment adviser (Note 2). |
| 5 | The ratios to average net assets do not include net investment income (loss) or expenses of the affiliated funds in which the Fund invests. |
| 6 | Portfolio turnover rate is not annualized and excludes the value of portfolio securities received or delivered as a result of in-kind creations or redemptions of the Fund’s capital shares. |
| 7 | Amount represents less than 1%. |
See Notes to Financial Statements.
| | | | |
| WisdomTree International Dividend and Sector Funds | | | 133 | |
Financial Highlights (continued)
WisdomTree International Dividend and Sector Funds
March 31, 2011
Selected data for a share of beneficial interest outstanding throughout the period is presented below:
| | | | | | | | | | | | | | | | | | | | |
WisdomTree International
Energy Sector Fund | | For the
Year Ended
March 31, 2011 | | | For the
Year Ended
March 31, 2010 | | | For the
Year Ended
March 31, 2009 | | | For the
Year Ended
March 31, 2008 | | | For the Period
October 13, 2006*
through
March 31, 2007 | |
Net asset value, beginning of period | | $ | 24.63 | | | $ | 18.61 | | | $ | 31.98 | | | $ | 28.55 | | | $ | 25.44 | |
Investment operations: | | | | | | | | | | | | | | | | | | | | |
Net investment income1 | | | 0.72 | | | | 0.80 | | | | 1.01 | | | | 0.79 | | | | 0.22 | |
Net realized and unrealized gain (loss) | | | 5.19 | | | | 6.07 | | | | (12.84 | ) | | | 3.18 | | | | 2.92 | |
Total from investment operations | | | 5.91 | | | | 6.87 | | | | (11.83 | ) | | | 3.97 | | | | 3.14 | |
Dividends and distributions to shareholders: | | | | | | | | | | | | | | | | | | | | |
Net investment income | | | (0.68 | ) | | | (0.85 | ) | | | (1.54 | ) | | | (0.53 | ) | | | (0.03 | ) |
Capital gains | | | — | | | | — | | | | — | | | | (0.01 | ) | | | — | |
Total dividends and distributions to shareholders | | | (0.68 | ) | | | (0.85 | ) | | | (1.54 | ) | | | (0.54 | ) | | | (0.03 | ) |
Net asset value, end of period | | $ | 29.86 | | | $ | 24.63 | | | $ | 18.61 | | | $ | 31.98 | | | $ | 28.55 | |
TOTAL RETURN3 | | | 24.74 | % | | | 37.29 | % | | | (37.05 | )% | | | 13.84 | % | | | 12.36 | % |
RATIOS/SUPPLEMENTAL DATA: | | | | | | | | | | | | | | | | | | | | |
Net assets, end of period (000’s omitted) | | $ | 49,273 | | | $ | 45,569 | | | $ | 22,332 | | | $ | 57,562 | | | $ | 22,840 | |
Ratio to average net assets5 of: | | | | | | | | | | | | | | | | | | | | |
Expenses, net of expense reimbursements/waivers | | | 0.58 | % | | | 0.58 | % | | | 0.58 | % | | | 0.58 | % | | | 0.58 | %4 |
Expenses, prior to expense reimbursements/waivers | | | 0.58 | % | | | 0.58 | % | | | 0.58 | % | | | 0.58 | % | | | 0.69 | %4 |
Net investment income | | | 2.90 | % | | | 3.36 | % | | | 3.49 | % | | | 2.43 | % | | | 1.82 | %4 |
Portfolio turnover rate6 | | | 32 | % | | | 16 | % | | | 38 | % | | | 13 | % | | | 1 | % |
| | | | | | | | | | | | | | | | | | | | |
WisdomTree International Utilities
Sector Fund | | For the
Year Ended
March 31, 2011 | | | For the
Year Ended
March 31, 2010 | | | For the
Year Ended
March 31, 2009 | | | For the
Year Ended
March 31, 2008 | | | For the Period
October 13, 2006*
through
March 31, 2007 | |
Net asset value, beginning of period | | $ | 21.46 | | | $ | 17.78 | | | $ | 32.73 | | | $ | 29.71 | | | $ | 24.96 | |
Investment operations: | | | | | | | | | | | | | | | | | | | | |
Net investment income1 | | | 0.84 | | | | 0.87 | | | | 1.25 | | | | 0.55 | | | | 0.18 | |
Net realized and unrealized gain (loss) | | | (0.06 | ) | | | 3.77 | | | | (14.74 | ) | | | 2.75 | | | | 4.61 | |
Total from investment operations | | | 0.78 | | | | 4.64 | | | | (13.49 | ) | | | 3.30 | | | | 4.79 | |
Dividends and distributions to shareholders: | | | | | | | | | | | | | | | | | | | | |
Net investment income | | | (0.91 | ) | | | (0.96 | ) | | | (1.46 | ) | | | (0.28 | ) | | | (0.04 | ) |
Capital gains | | | — | | | | — | | | | — | | | | (0.00 | )2 | | | — | |
Total dividends and distributions to shareholders | | | (0.91 | ) | | | (0.96 | ) | | | (1.46 | ) | | | (0.28 | ) | | | (0.04 | ) |
Net asset value, end of period | | $ | 21.33 | | | $ | 21.46 | | | $ | 17.78 | | | $ | 32.73 | | | $ | 29.71 | |
TOTAL RETURN3 | | | 4.27 | % | | | 26.42 | % | | | (42.00 | )% | | | 11.05 | % | | | 19.18 | % |
RATIOS/SUPPLEMENTAL DATA: | | | | | | | | | | | | | | | | | | | | |
Net assets, end of period (000’s omitted) | | $ | 37,335 | | | $ | 49,348 | | | $ | 28,455 | | | $ | 78,561 | | | $ | 23,768 | |
Ratio to average net assets5 of: | | | | | | | | | | | | | | | | | | | | |
Expenses, net of expense reimbursements/waivers | | | 0.58 | % | | | 0.58 | % | | | 0.58 | % | | | 0.58 | % | | | 0.58 | %4 |
Expenses, prior to expense reimbursements/waivers | | | 0.58 | % | | | 0.58 | % | | | 0.58 | % | | | 0.58 | % | | | 0.68 | %4 |
Net investment income | | | 4.22 | % | | | 4.17 | % | | | 4.53 | % | | | 1.62 | % | | | 1.38 | %4 |
Portfolio turnover rate6 | | | 19 | % | | | 17 | % | | | 50 | % | | | 13 | % | | | 1 | % |
| * | Commencement of investment operations. |
| 1 | Based on average shares outstanding. |
| 2 | Amount represents less than $0.005. |
| 3 | Total return is calculated assuming an initial investment made at the net asset value at the beginning of the period, reinvestment of all dividends and distributions at net asset value during the period and redemption on the last day of the period. Total return calculated for a period of less than one year is not annualized. The total return would have been lower if certain expenses had not been reimbursed by the investment adviser (Note 2). |
| 5 | The ratios to average net assets do not include net investment income (loss) or expenses of the affiliated funds in which the Fund invests. |
| 6 | Portfolio turnover rate is not annualized and excludes the value of portfolio securities received or delivered as a result of in-kind creations or redemptions of the Fund’s capital shares. |
See Notes to Financial Statements.
| | |
| 134 | | WisdomTree International Dividend and Sector Funds |
Financial Highlights (concluded)
WisdomTree International Dividend and Sector Funds
March 31, 2011
Selected data for a share of beneficial interest outstanding throughout the period is presented below:
| | | | | | | | | | | | | | | | |
| WisdomTree International Real Estate Fund | | For the
Year Ended
March 31, 2011 | | | For the
Year Ended
March 31, 2010 | | | For the
Year Ended
March 31, 2009 | | | For the Period
June 5, 2007*
through
March 31, 2008 | |
Net asset value, beginning of period | | $ | 26.75 | | | $ | 16.92 | | | $ | 41.84 | | | $ | 51.89 | |
Investment operations: | | | | | | | | | | | | | | | | |
Net investment income1 | | | 0.96 | | | | 0.96 | | | | 1.35 | | | | 1.22 | |
Net realized and unrealized gain (loss) | | | 3.83 | | | | 11.39 | | | | (25.46 | ) | | | (9.32 | ) |
Total from investment operations | | | 4.79 | | | | 12.35 | | | | (24.11 | ) | | | (8.10 | ) |
Dividends to shareholders: | | | | | | | | | | | | | | | | |
Net investment income | | | (2.68 | ) | | | (2.52 | ) | | | (0.81 | ) | | | (1.95 | ) |
Total dividends to shareholders | | | (2.68 | ) | | | (2.52 | ) | | | (0.81 | ) | | | (1.95 | ) |
Net asset value, end of period | | $ | 28.86 | | | $ | 26.75 | | | $ | 16.92 | | | $ | 41.84 | |
| | | | |
TOTAL RETURN2 | | | 18.81 | % | | | 74.20 | % | | | (57.85 | )% | | | (15.90 | )% |
RATIOS/SUPPLEMENTAL DATA: | | | | | | | | | | | | | | | | |
Net assets, end of period (000’s omitted) | | $ | 122,670 | | | $ | 84,276 | | | $ | 40,619 | | | $ | 112,962 | |
Ratio to average net assets4 of: | | | | | | | | | | | | | | | | |
Expenses, net of expense reimbursements/waivers | | | 0.58 | % | | | 0.58 | % | | | 0.58 | % | | | 0.58 | %3 |
Expenses, prior to expense reimbursements/waivers | | | 0.58 | % | | | 0.58 | % | | | 0.58 | % | | | 0.58 | %3 |
Net investment income | | | 3.48 | % | | | 3.76 | % | | | 4.55 | % | | | 3.17 | %3 |
Portfolio turnover rate5 | | | 18 | % | | | 19 | % | | | 35 | % | | | 15 | % |
| * | Commencement of investment operations. |
| 1 | Based on average shares outstanding. |
| 2 | Total return is calculated assuming an initial investment made at the net asset value at the beginning of the period, reinvestment of all dividends and distributions at net asset value during the period and redemption on the last day of the period. Total return calculated for a period of less than one year is not annualized. The total return would have been lower if certain expenses had not been reimbursed by the investment adviser (Note 2). |
| 4 | The ratios to average net assets do not include net investment income (loss) or expenses of the affiliated funds in which the Fund invests. |
| 5 | Portfolio turnover rate is not annualized and excludes the value of portfolio securities received or delivered as a result of in-kind creations or redemptions of the Fund’s capital shares. |
See Notes to Financial Statements.
| | | | |
| WisdomTree International Dividend and Sector Funds | | | 135 | |
Notes to Financial Statements
March 31, 2011
1. ORGANIZATION
WisdomTree Trust (the “Trust”) is registered under the Investment Company Act of 1940, as amended (the “1940 Act”), as an open-end management investment company. The Trust was established as a Delaware statutory trust pursuant to a Trust Instrument dated December 15, 2005. As of March 31, 2011, the Trust offered 46 investment funds (each a “Fund,” collectively, the “Funds”). The Funds described herein, commenced operations on June 17, 2006, except as follows: The WisdomTree International Basic Materials Sector Fund, WisdomTree International Energy Sector Fund, WisdomTree International Utilities Sector Fund commenced operations on October 13, 2006 and the WisdomTree International Real Estate Fund, WisdomTree Emerging Markets Equity Income Fund, WisdomTree Emerging Markets SmallCap Dividend Fund, WisdomTree Middle East Dividend Fund and WisdomTree International Hedged Equity Fund commenced operations on June 5, 2007, July 13, 2007, October 30, 2007, July 16, 2008 and December 31, 2009, respectively.
These financial statements relate only to the WisdomTree DEFA Fund (“DEFA Fund”), WisdomTree DEFA Equity Income Fund (“DEFA Equity Income Fund”), WisdomTree Global Equity Income Fund, (“Global Equity Income Fund”), WisdomTree Europe SmallCap Dividend Fund (“Europe SmallCap Dividend Fund”), WisdomTree Japan Hedged Equity Fund, (“Japan Hedged Equity Fund”), WisdomTree World ex-U.S. Growth Fund, (“World ex-U.S. Growth Fund”), WisdomTree Japan SmallCap Dividend Fund (“Japan SmallCap Dividend Fund”), WisdomTree Pacific ex-Japan Total Dividend Fund (“Pacific ex-Japan Total Dividend Fund”), WisdomTree Pacific ex-Japan Equity Income Fund (“Pacific ex-Japan Equity Income Fund”), WisdomTree International LargeCap Dividend Fund (“International LargeCap Dividend Fund”), WisdomTree International Dividend ex-Financials Fund, (“International Dividend ex-Financials Fund”), WisdomTree International MidCap Dividend Fund (“International MidCap Dividend Fund”), WisdomTree International SmallCap Dividend Fund (“International SmallCap Dividend Fund”), WisdomTree Emerging Markets Equity Income Fund (“Emerging Markets Equity Income Fund”), WisdomTree Emerging Markets SmallCap Dividend Fund (“Emerging Markets SmallCap Dividend Fund”), WisdomTree Middle East Dividend Fund (“Middle East Dividend Fund”), WisdomTree International Hedged Equity Fund (“International Hedged Equity Fund”), WisdomTree International Basic Materials Sector Fund (“International Basic Materials Sector Fund”), WisdomTree International Energy Sector Fund (“International Energy Sector Fund”), WisdomTree International Utilities Sector Fund (“International Utilities Sector Fund”) and WisdomTree International Real Estate Fund (“International Real Estate Fund”), together the “International Dividend and Sector Funds.”
Each Fund seeks to track the price and yield performance, before fees and expenses, of a particular index (“Index”) developed by WisdomTree Investments, Inc. (“WisdomTree Investments”). WisdomTree Investments is the parent company of WisdomTree Asset Management, Inc. (“WTAM”), the investment adviser to each Fund and the Trust. “WisdomTree” is a registered mark of WisdomTree Investments and has been licensed for use by the Trust. Each Fund described herein is considered to be non-diversified.
2. SIGNIFICANT ACCOUNTING POLICIES
The Financial Accounting Standards Board (“FASB”) Accounting Standards Codification (“Codification”) has become the exclusive reference of authoritative U.S. generally accepted accounting principles (“GAAP”) recognized by the FASB to be applied by nongovernmental entities. Rules and interpretive releases of the Securities and Exchange Commission (“SEC”) under authority of federal laws are also sources of authoritative GAAP for SEC registrants.
The following is a summary of significant accounting policies followed by the Funds:
Guarantees — In the normal course of business the Funds may enter into contracts that contain a variety of representations or that provide indemnification for certain liabilities. The Funds’ maximum exposure under these arrangements is unknown, as this would involve future claims that may be made against the Funds that have not yet occurred. However, the Funds have not had prior claims or losses pursuant to these contracts and expect the risk of loss to be remote. Therefore, no liabilities have been recorded in connection to the indemnifications.
Use of Estimates — The preparation of financial statements in conformity with GAAP, requires management to make certain estimates and assumptions that affect the reported amounts of assets and liabilities and disclosure of contingent assets and liabilities at the date of the financial statements and the reported amounts of increases and decreases in the net assets from operations during the reporting period. Actual results could differ from those estimates.
Investment Valuation — The Net Asset Value (“NAV”) of each Fund’s shares is calculated each day the national securities exchanges are open for trading as of the close of regular trading on the New York Stock Exchange, generally 4:00 p.m. Eastern time. NAV per share is calculated by dividing a Fund’s net assets by the number of Fund shares outstanding. Transactions in Fund shares will be priced at NAV only if you purchase or redeem shares directly from a Fund in creation units which are typically in blocks of 50,000 shares or more. Fund shares purchased or sold on a national securities exchange at market prices, which may be higher or lower than NAV. Each Fund may invest in money market funds or affiliated funds which are valued at NAV.
Securities traded on any recognized U.S. or non-U.S. exchange are valued at the last sale price or official closing price on the exchange or system on which they are principally traded. Events occurring after the close of trading on non-U.S. exchanges may
| | |
| 136 | | WisdomTree International Dividend and Sector Funds |
Notes to Financial Statements (continued)
result in adjustments to the valuation of foreign securities to more accurately reflect their fair value as of the close of regular trading on the New York Stock Exchange. The Fund may rely on an independent fair valuation service in adjusting the valuations of foreign securities. Unlisted equity securities are valued at the last quoted sale price or, if no sale price is available, at the mean between the highest bid and lowest ask prices. Securities for which market quotations are not readily available are valued at fair value as determined by management and in accordance with procedures approved by the Board of Trustees. Short-term securities with 60 days or less remaining to maturity are valued using the amortized cost method, which approximates fair value. Forward foreign currency contracts are valued daily using WM/Reuters closing spot and forward rates as of 4:00 p.m, London time for Europe and the Americas and Tullett Prebon closing spot and forward rates as of 2:00 p.m, Singapore time for Asia.
In certain instances, such as when reliable market valuations are not readily available or are not deemed to reflect current market values, a Fund’s investments will be valued in accordance with the Fund’s pricing policy and procedures. Securities that may be valued using “fair value” pricing may include, but are not limited to, securities for which there are no current market quotations, securities or whose issuer is in default or bankruptcy, securities subject to corporate actions (such as mergers or reorganizations), securities subject to non-U.S. investment limits or currency controls, and securities affected by “significant events”. An example of a significant event is an event occurring after the close of the market in which a security trades but before a Fund’s next NAV calculation time that may materially affect the value of a Fund’s investment (e.g., government action, natural disaster, or significant market fluctuation). Price movements in U.S. markets that are deemed to affect the value of foreign securities, or reflect changes to the value of such securities, also may cause securities to be “fair valued”. When fair value pricing is employed, the prices of securities used by a Fund to calculate its NAV may differ form quoted or published prices for the same securities.
Fair Value Measurement — In accordance with Codification Topic 820 (“ASC 820”), Fair Value Measurements and Disclosures, fair value is defined as the price that each Fund would receive upon selling an investment in an orderly transaction to an independent buyer in the principal or most advantageous market of the investment. ASC 820 established a three-tier hierarchy to maximize the use of observable market data and minimize the use of unobservable inputs and to establish classifications of fair value measurements for disclosure purposes. Inputs refer broadly to the assumptions that market participants would use in pricing the asset or liability, including assumptions about risk – for example, the risk inherent in a particular valuation technique used to measure fair value (such as a pricing model) and/or the risk inherent in the inputs to the valuation technique. Inputs may be observable or unobservable. Observable inputs reflect the assumptions market participants would use in pricing the asset or liability. Observable inputs are based on market data obtained from sources independent of the reporting entity. Unobservable inputs reflect the reporting entity’s own assumptions about the assumptions market participants would use in pricing the asset or liability. Unobservable inputs are based on the best information available in the circumstances. The three-tier hierarchy of inputs is summarized in the three broad levels listed below:
Level 1 – quoted prices in active markets for identical securities
Level 2 – other significant observable inputs (including quoted prices for similar securities, interest rates, prepayment speeds, credit risk, etc.)
Level 3 – significant unobservable inputs (including each Fund’s assumption in determining the fair value of investments)
Investments that use Level 2 or Level 3 inputs may include, but are not limited to: (i) an unlisted security related to corporate actions; (ii) a restricted security (e.g., one that may not be publicly sold without registration under the Securities Act of 1933, as amended); (iii) a security whose trading has been suspended or which has been de-listed from its primary trading exchange; (iv) a security that is thinly traded; (v) a security in default or bankruptcy proceedings for which there is no current market quotation; (vi) a security affected by currency controls or restrictions; and (vii) a security affected by a significant event (e.g., an event that occurs after the close of the markets on which the security is traded but before the time as of which a Fund’s net asset value is computed and that may materially affect the value of the Fund’s investments).
The inputs or methodology used for valuation are not necessarily an indication of the risk associated with investing in those investments.
The following is a summary of the inputs used as of March 31, 2011 in valuing each Fund’s assets carried at fair value:
| | | | | | | | | | | | |
| DEFA Fund | | Level 1 | | | Level 2 | | | Level 3 | |
Investments in Securities | | | | | | | | | | | | |
Common Stocks* | | $ | 453,698,187 | | | $ | — | | | $ | — | |
Money Market Funds | | | — | | | | 31,588,791 | | | | — | |
Affiliated Funds | | | 1,723,819 | | | | — | | | | — | |
Total | | | 455,422,006 | | | | 31,588,791 | | | | — | |
Unrealized Depreciation on Foreign Currency Contracts | | | — | | | | (2,807 | ) | | | — | |
Total – Net | | $ | 455,422,006 | | | $ | 31,585,984 | | | $ | — | |
| | | | |
| WisdomTree International Dividend and Sector Funds | | | 137 | |
Notes to Financial Statements (continued)
| | | | | | | | | | | | |
| DEFA Equity Income Fund | | Level 1 | | | Level 2 | | | Level 3 | |
Investments in Securities | | | | | | | | | | | | |
Common Stocks* | | $ | 130,512,096 | | | $ | — | | | $ | — | |
Money Market Funds | | | — | | | | 7,131,414 | | | | — | |
Affiliated Funds | | | 215,177 | | | | — | | | | — | |
Total | | $ | 130,727,273 | | | $ | 7,131,414 | | | $ | — | |
| | | | | | | | | | | | |
| Global Equity Income Fund | | Level 1 | | | Level 2 | | | Level 3 | |
Investments in Securities | | | | | | | | | | | | |
Common Stocks* | | $ | 77,591,138 | | | $ | — | | | $ | — | |
Money Market Funds | | | — | | | | 3,662,579 | | | | — | |
Affiliated Funds | | | 227,037 | | | | — | | | | — | |
Total | | | 77,818,175 | | | | 3,662,579 | | | | — | |
Unrealized Appreciation on Foreign Currency Contracts | | | — | | | | 215 | | | | — | |
Total - Net | | $ | 77,818,175 | | | $ | 3,662,794 | | | $ | — | |
| | | | | | | | | | | | |
| Europe SmallCap Dividend Fund | | Level 1 | | | Level 2 | | | Level 3 | |
Investments in Securities | | | | | | | | | | | | |
Common Stocks* | | $ | 28,643,376 | | | $ | — | | | $ | — | |
Foreign Corporate Obligations | | | — | | | | 41,764 | | | | — | |
Money Market Funds | | | — | | | | 1,935,897 | | | | — | |
Affiliated Funds | | | 97,451 | | | | — | | | | — | |
Total | | $ | 28,740,827 | | | $ | 1,977,661 | | | $ | — | |
| | | | | | | | | | | | |
| Japan Hedged Equity Fund | | Level 1 | | | Level 2 | | | Level 3 | |
Investments in Securities | | | | | | | | | | | | |
Common Stocks* | | $ | 479,804,971 | | | $ | — | | | $ | — | |
Money Market Funds | | | — | | | | 62,018,523 | | | | — | |
Total | | | 479,804,971 | | | | 62,018,523 | | | | — | |
Unrealized Appreciation on Foreign Currency Contracts | | | — | | | | 8,861,187 | | | | — | |
Unrealized Depreciation on Foreign Currency Contracts | | | — | | | | (4,142 | ) | | | — | |
Total - Net | | $ | 479,804,971 | | | $ | 70,875,568 | | | $ | — | |
| | | | | | | | | | | | |
| World ex-U.S. Growth Fund | | Level 1 | | | Level 2 | | | Level 3 | |
Investments in Securities | | | | | | | | | | | | |
Common Stocks* | | $ | 47,766,772 | | | $ | — | | | $ | — | |
Money Market Funds | | | — | | | | 783,260 | | | | — | |
Affiliated Funds | | | 1,303,681 | | | | — | | | | — | |
Total | | $ | 49,070,453 | | | $ | 783,260 | | | $ | — | |
| | | | | | | | | | | | |
| Japan SmallCap Dividend Fund | | Level 1 | | | Level 2 | | | Level 3 | |
Investments in Securities | | | | | | | | | | | | |
Common Stocks* | | $ | 232,172,581 | | | $ | — | | | $ | — | |
Money Market Funds | | | — | | | | 10,991,485 | | | | — | |
Affiliated Funds | | | 572,259 | | | | — | | | | — | |
Total | | $ | 232,744,840 | | | $ | 10,991,485 | | | $ | — | |
| | |
| 138 | | WisdomTree International Dividend and Sector Funds |
Notes to Financial Statements (continued)
| | | | | | | | | | | | |
| Pacific ex-Japan Total Dividend Fund | | Level 1 | | | Level 2 | | | Level 3 | |
Investments in Securities | | | | | | | | | | | | |
Common Stocks* | | $ | 87,768,948 | | | $ | — | | | $ | — | |
Rights | | | — | | | | 60 | | | | — | |
Money Market Funds | | | — | | | | 2,763,556 | | | | — | |
Affiliated Funds | | | 348,069 | | | | — | | | | — | |
Total | | | 88,117,017 | | | | 2,763,616 | | | | — | |
Unrealized Appreciation on Foreign Currency Contracts | | | — | | | | 82 | | | | — | |
Total - Net | | $ | 88,117,017 | | | $ | 2,763,698 | | | $ | — | |
| | | | | | | | | | | | |
| Pacific ex-Japan Equity Income Fund | | Level 1 | | | Level 2 | | | Level 3 | |
Investments in Securities | | | | | | | | | | | | |
Common Stocks* | | $ | 79,528,159 | | | $ | — | | | $ | — | |
Money Market Funds | | | — | | | | 5,185,026 | | | | — | |
Affiliated Funds | | | 136,741 | | | | — | | | | — | |
Total | | | 79,664,900 | | | | 5,185,026 | | | | — | |
Unrealized Appreciation on Foreign Currency Contracts | | | — | | | | 15 | | | | — | |
Unrealized Depreciation on Foreign Currency Contracts | | | — | | | | (25 | ) | | | — | |
Total - Net | | $ | 79,664,900 | | | $ | 5,185,016 | | | $ | — | |
| | | | | | | | | | | | |
| International LargeCap Dividend Fund | | Level 1 | | | Level 2 | | | Level 3 | |
Investments in Securities | | | | | | | | | | | | |
Common Stocks* | | $ | 163,325,332 | | | $ | — | | | $ | — | |
Money Market Funds | | | — | | | | 8,839,487 | | | | — | |
Affiliated Funds | | | 390,104 | | | | — | | | | — | |
Total | | $ | 163,715,436 | | | $ | 8,839,487 | | | $ | — | |
| | | | | | | | | | | | |
| International Dividend ex-Financials Fund | | Level 1 | | | Level 2 | | | Level 3 | |
Investments in Securities | | | | | | | | | | | | |
Common Stocks* | | $ | 149,017,554 | | | $ | — | | | $ | — | |
Money Market Funds | | | — | | | | 6,690,619 | | | | — | |
Affiliated Funds | | | 160,763 | | | | — | | | | — | |
Total | | $ | 149,178,317 | | | $ | 6,690,619 | | | $ | — | |
| | | | | | | | | | | | |
| International MidCap Dividend Fund | | Level 1 | | | Level 2 | | | Level 3 | |
Investments in Securities | | | | | | | | | | | | |
Common Stocks* | | $ | 154,521,955 | | | $ | — | | | $ | — | |
Money Market Funds | | | — | | | | 17,745,354 | | | | — | |
Affiliated Funds | | | 537,890 | | | | — | | | | — | |
Total | | $ | 155,059,845 | | | $ | 17,745,354 | | | $ | — | |
| | | | | | | | | | | | |
| International SmallCap Dividend Fund | | Level 1 | | | Level 2 | | | Level 3 | |
Investments in Securities | | | | | | | | | | | | |
Common Stock* | | | | | | | | | | | | |
Hastie Group Ltd. | | $ | — | | | $ | 480,531 | | | $ | — | |
All Other Common Stock | | | 469,158,238 | | | | | | | | — | |
Total Common Stock | | | 469,158,238 | | | | 480,531 | | | | — | |
Money Market Funds | | | — | | | | 51,958,960 | | | | — | |
Affiliated Funds | | | 2,101,587 | | | | — | | | | — | |
Total | | | 471,259,825 | | | | 52,439,491 | | | | — | |
Unrealized Appreciation on Foreign Currency Contracts | | | — | | | | 3,645 | | | | — | |
Unrealized Depreciation on Foreign Currency Contracts | | | — | | | | (5,812 | ) | | | — | |
Total - Net | | $ | 471,259,825 | | | $ | 52,437,324 | | | $ | — | |
| | | | |
| WisdomTree International Dividend and Sector Funds | | | 139 | |
Notes to Financial Statements (continued)
| | | | | | | | | | | | |
| Emerging Markets Equity Income Fund | | Level 1 | | | Level 2 | | | Level 3 | |
Investments in Securities | | | | | | | | | | | | |
Common Stocks* | | $ | 1,317,022,084 | | | $ | — | | | $ | — | |
Money Market Funds | | | — | | | | 36,912,999 | | | | — | |
Affiliated Funds | | | 1,907,623 | | | | — | | | | — | |
Total | | $ | 1,318,929,707 | | | $ | 36,912,999 | | | $ | — | |
| | | | |
| Emerging Markets SmallCap Dividend Fund | | Level 1 | | | Level 2 | | | Level 3 | |
Investments in Securities | | | | | | | | | | | | |
Common Stocks* | | $ | 907,986,358 | | | $ | — | | | $ | — | |
Rights | | | 15,176 | | | | 143,503 | | | | — | |
Warrants | | | — | | | | 88,091 | | | | | |
Money Market Funds | | | — | | | | 14,680,319 | | | | — | |
Affiliated Funds | | | 14,784,679 | | | | — | | | | — | |
Total | | | 922,786,213 | | | | 14,911,913 | | | | — | |
Unrealized Appreciation on Foreign Currency Contracts | | | — | | | | 8,035 | | | | — | |
Total - Net | | $ | 922,786,213 | | | $ | 14,919,948 | | | $ | — | |
| | | | |
| Middle East Dividend Fund | | Level 1 | | | Level 2 | | | Level 3 | |
Investments in Securities | | | | | | | | | | | | |
Common Stocks* | | | 19,258,372 | | | | — | | | | — | |
Unrealized Depreciation on Foreign Currency Contracts | | | — | | | | (8 | ) | | | — | |
Total - Net | | $ | 19,258,372 | | | $ | (8 | ) | | $ | — | |
| | | | |
| International Hedged Equity Fund | | Level 1 | | | Level 2 | | | Level 3 | |
Investments in Securities | | | | | | | | | | | | |
Common Stocks* | | $ | 21,492,204 | | | $ | — | | | $ | — | |
Money Market Funds | | | — | | | | 615,078 | | | | — | |
Total | | | 21,492,204 | | | | 615,078 | | | | — | |
Unrealized Appreciation on Foreign Currency Contracts | | | — | | | | 86,234 | | | | — | |
Unrealized Depreciation on Foreign Currency Contracts | | | — | | | | (336,780 | ) | | | — | |
Total - Net | | $ | 21,492,204 | | | $ | 364,532 | | | $ | — | |
| | | | |
| International Basic Materials Sector Fund | | Level 1 | | | Level 2 | | | Level 3 | |
Investments in Securities | | | | | | | | | | | | |
Common Stocks* | | $ | 43,005,932 | | | $ | — | | | $ | — | |
Money Market Funds | | | — | | | | 1,793,387 | | | | — | |
Affiliated Funds | | | 33,107 | | | | — | | | | — | |
Total | | | 43,039,039 | | | | 1,793,387 | | | | — | |
Unrealized Appreciation on Foreign Currency Contracts | | | — | | | | 62 | | | | — | |
Unrealized Depreciation on Foreign Currency Contracts | | | — | | | | (4 | ) | | | — | |
Total - Net | | $ | 43,039,039 | | | $ | 1,793,445 | | | $ | — | |
| | | | |
| International Energy Sector Fund | | Level 1 | | | Level 2 | | | Level 3 | |
Investments in Securities | | | | | | | | | | | | |
Common Stocks* | | $ | 49,068,146 | | | $ | — | | | $ | — | |
Money Market Funds | | | — | | | | 402,908 | | | | — | |
Affiliated Funds | | | 121,839 | | | | — | | | | — | |
Total | | $ | 49,189,985 | | | $ | 402,908 | | | $ | — | |
| | |
| 140 | | WisdomTree International Dividend and Sector Funds |
Notes to Financial Statements (continued)
| | | | | | | | | | | | |
| International Utilities Sector Fund | | Level 1 | | | Level 2 | | | Level 3 | |
Investments in Securities | | | | | | | | | | | | |
Common Stocks* | | $ | 37,142,874 | | | $ | — | | | $ | — | |
Money Market Funds | | | — | | | | 1,650,352 | | | | — | |
Affiliated Funds | | | 107,423 | | | | — | | | | — | |
Total | | $ | 37,250,297 | | | $ | 1,650,352 | | | $ | — | |
| | | | | | | | | | | | |
| International Real Estate Fund | | Level 1 | | | Level 2 | | | Level 3 | |
Investments in Securities | | | | | | | | | | | | |
Common Stocks* | | $ | 122,109,507 | | | $ | — | | | $ | — | |
Money Market Funds | | | — | | | | 4,451,135 | | | | — | |
Affiliated Funds | | | 165,534 | | | | — | | | | — | |
Total | | | 122,275,041 | | | | 4,451,135 | | | | — | |
Unrealized Appreciation on Foreign Currency Contracts | | | — | | | | 81 | | | | — | |
Unrealized Depreciation on Foreign Currency Contracts | | | — | | | | (3 | ) | | | — | |
Total - Net | | $ | 122,275,041 | | | $ | 4,451,213 | | | $ | — | |
| | * | Please refer to Schedule of Investments for a breakdown of the valuation by industry type and country. |
The following is a reconciliation of assets in which significant unobservable inputs (Level 3) were used in determining fair value. All transfers in or out of Level 3 are done using beginning of period method. For the fiscal year ended March 31, 2011, there were no transfers in or out of Level 3.
| | | | |
| Europe SmallCap Dividend Fund | | Common Stocks | |
Balance as of April 1, 2010 | | $ | — | |
Realized gain (loss) | | | (18,252 | ) |
Change in unrealized appreciation (depreciation) | | | 21,216 | |
Net purchases (sales) | | | (2,964 | ) |
Transfers in and/or out of Level 3 | | | — | |
Balance as of March 31, 2011 | | $ | — | |
| | | | |
| International MidCap Dividend Fund | | Common Stocks | |
Balance as of April 1, 2010 | | $ | 1,562 | |
Realized gain (loss) | | | 1,959 | |
Change in unrealized appreciation (depreciation) | | | (497 | ) |
Net purchases (sales) | | | (3,024 | ) |
Transfers in/or out of Level 3 | | | — | |
Balance as of March 31, 2011 | | $ | — | |
| | | | |
| International SmallCap Dividend Fund | | Common Stocks | |
Balance as of April 1, 2010 | | $ | — | |
Realized gain (loss) | | | (173,738 | ) |
Change in unrealized appreciation (depreciation) | | | 200,742 | |
Net purchases (sales) | | | (27,004 | ) |
Transfers in/or out of Level 3 | | | — | |
Balance as of March 31, 2011 | | | — | |
| | | | |
| International Basic Materials Sector Fund | | Common Stocks | |
Balance as of April 1, 2010 | | $ | 1,203 | |
Realized gain (loss) | | | 1,563 | |
Change in unrealized appreciation (depreciation) | | | (438 | ) |
Net purchases (sales) | | | (2,328 | ) |
Transfers in and/or out of Level 3 | | | — | |
Balance as of March 31, 2011 | | $ | — | |
In January 2010, FASB issued Accounting Standards Update No. 2010-06 “Improving Disclosures about Fair Value Measurements (“ASU 2010-06”).” ASU 2010-06 requires reporting entities to make new disclosures about amounts and reasons for significant
| | | | |
| WisdomTree International Dividend and Sector Funds | | | 141 | |
Notes to Financial Statements (continued)
transfers in and out of Level 1 and Level 2 fair value measurements, as well as inputs and valuation techniques used to measure fair value for both recurring and nonrecurring fair value measurements that fall in either Level 2 or Level 3 Funds.
ASU 2010-06 also requires information on purchases and sales, issuances and settlements on a gross basis in the reconciliation of activity in Level 3 fair value measurements. The new and revised disclosures are required to be implemented for fiscal years beginning after December 15, 2009, except for the disclosures surrounding purchases, sales, issuances and settlements on a gross basis in the reconciliation of Level 3 fair value measurements, which are effective for fiscal years beginning after December 15, 2010. Management has implemented the application portion ASU 2010-06 for the fiscal year ended March 31, 2011 and the impact of such adoption is limited to additional disclosure in the financial statements.
No significant transfers between Level 1 or Level 2 fair value measurements occurred during the fiscal year March 31, 2011.
Derivative and Hedging Disclosure — Codification Topic 815 (“ASC 815”), Derivatives and Hedging, requires qualitative disclosures about objectives and strategies for using derivatives, quantitative disclosures about fair value amounts of gains and losses on derivative instruments, and disclosures about credit-risk-related contingent features in derivative agreements. The Funds that have invested in derivatives, specifically foreign currency contracts for the year ended March 31, 2011 which are detailed in the foreign currency contract table herein. The volume of derivatives that is presented is consistent with the derivative activity during the twelve months ended March 31, 2011. There are no credit-risk contingent features on foreign currency contracts and warrants held by the Funds.
The Funds listed below have invested in derivatives, specifically foreign currency contracts and warrants as described on pages 144-146, for the year ended March 31, 2011. The foreign currency contracts and warrants are subject to credit risk. Credit risk is where the financial condition of an issuer of a security or instrument may cause it to default or become unable to pay interest or principal due on the security. The counterparty to a derivative contract might default on its obligations. The effect of such derivative instruments on each Fund’s financial position and financial performance as reflected in the Statement of Assets and Liabilities and Statements of Operations are presented in the summary below.
| | | | | | | | | | | | | | | | |
| | | Asset Derivatives | | | | | | Liability Derivatives | | | | |
| Derivatives not designated as hedging instruments, carried at fair value | | Balance Sheet Location | | | Fair Value | | | Balance Sheet Location | | | Fair Value | |
DEFA Fund | | | | | | | | | | | | | | | | |
Foreign currency contracts | |
| Unrealized appreciation
on forward currency
contracts |
| | $ | — | | |
| Unrealized depreciation
on forward currency
contracts |
| | $ | 2,807 | |
Global Equity Income Fund | | | | | | | | | | | | | | | | |
Foreign currency contracts | |
| Unrealized appreciation
on forward currency
contracts |
| | | 215 | | |
| Unrealized depreciation
on forward currency
contracts |
| | | — | |
Japan Hedged Equity Fund | | | | | | | | | | | | | | | | |
Foreign currency contracts | |
| Unrealized appreciation
on forward currency
contracts |
| | | 8,861,187 | | |
| Unrealized depreciation
on forward currency
contracts |
| | | 4,142 | |
Pacific ex-Japan Total Dividend Fund | | | | | | | | | | | | | | | | |
Foreign currency contracts | |
| Unrealized appreciation
on forward currency
contracts |
| | | 82 | | |
| Unrealized depreciation
on forward currency
contracts |
| | | — | |
Pacific ex-Japan Equity Income Fund | | | | | | | | | | | | | | | | |
Foreign currency contracts | |
| Unrealized appreciation
on forward currency
contracts |
| | | 15 | | |
| Unrealized depreciation
on forward currency
contracts |
| | | 25 | |
International SmallCap Dividend Fund | | | | | | | | | | | | | | | | |
Foreign currency contracts | |
| Unrealized appreciation
on forward currency
contracts |
| | | 3,645 | | |
| Unrealized depreciation
on forward currency
contracts |
| | | 5,812 | |
Emerging Markets SmallCap Dividend Fund | | | | | | | | | | | | | | | | |
Foreign currency contracts | |
| Unrealized appreciation
on forward currency
contracts |
| | | 8,035 | | |
| Unrealized depreciation
on forward currency
contracts |
| | | — | |
Equity Contracts | |
| Investment in
securities |
| | | 88,091 | | | | | | | | — | |
Middle East Dividend Fund | | | | | | | | | | | | | | | | |
Foreign currency contracts | |
| Unrealized appreciation
on forward currency
contracts |
| | | — | | |
| Unrealized depreciation
on forward currency
contracts |
| | | 8 | |
| | |
| 142 | | WisdomTree International Dividend and Sector Funds |
Notes to Financial Statements (continued)
| | | | | | | | | | | | | | | | |
| | | Asset Derivatives | | | | | | Liability Derivatives | | | | |
| Derivatives not designated as hedging instruments, carried at fair value | | Balance Sheet Location | | | Fair Value | | | Balance Sheet Location | | | Fair Value | |
International Hedged Equity Fund | | | | | | | | | | | | | | | | |
Foreign currency contracts | |
| Unrealized appreciation
on forward currency
contracts |
| | $ | 86,234 | | |
| Unrealized depreciation
on forward currency
contracts |
| | $ | 336,780 | |
International Basic Materials Sector Fund | | | | | | | | | | | | | | | | |
Foreign currency contracts | |
| Unrealized appreciation
on forward currency
contracts |
| | | 62 | | |
| Unrealized depreciation
on forward currency
contracts |
| | | 4 | |
International Real Estate Fund | | | | | | | | | | | | | | | | |
Foreign currency contracts | |
| Unrealized appreciation
on forward currency
contracts |
| | | 81 | | |
| Unrealized depreciation
on forward currency
contracts |
| | | 3 | |
| | | | | | | | | | | | |
Derivatives not designated as hedging instruments, carried at fair
value | | Derivative Instruments | | | Amount of Realized
Gain or (Loss) on Derivatives
Recognized in Income | | | Change in Unrealized
Appreciation or (Depreciation) on
Derivatives Recognized in Income | |
DEFA Fund | | | Foreign Currency Contracts | | | $ | 12,422 | | | $ | 35,591 | |
Global Equity Income Fund | | | Foreign Currency Contracts | | | | 21,965 | | | | 2,320 | |
Japan Hedged Equity Fund | | | Foreign Currency Contracts | | | | (14,010,034 | ) | | | 8,825,124 | |
Pacific ex-Japan Total Dividend Fund | | | Foreign Currency Contracts | | | | 38,305 | | | | 5,011 | |
Pacific ex-Japan Equity Income Fund | | | Foreign Currency Contracts | | | | 59,590 | | �� | | 5,149 | |
International SmallCap Dividend Fund | | | Foreign Currency Contracts | | | | 223,710 | | | | (2,544 | ) |
Emerging Markets SmallCap Dividend Fund | | | Foreign Currency Contracts | | | | (306,735 | ) | | | 65,772 | |
Emerging Markets SmallCap Dividend Fund | | | Equity Contracts | | | | — | | | | 88,091 | |
Middle East Dividend Fund | | | Foreign Currency Contracts | | | | (17,570 | ) | | | (16,966 | ) |
International Hedged Equity Fund | | | Foreign Currency Contracts | | | | (1,519,196 | ) | | | (248,453 | ) |
International Basic Materials Sector Fund | | | Foreign Currency Contracts | | | | (19,833 | ) | | | 4,893 | |
International Real Estate Fund | | | Foreign Currency Contracts | | | | (10,938 | ) | | | 5,833 | |
Investment Transactions and Investment Income — Investment transactions are recorded as of the date that the securities are purchased or sold (trade date). Realized gains and losses on sales of portfolio securities are calculated using the identified-cost method. Dividend income is recognized on the ex-dividend date, net of any foreign taxes withheld. Interest income including amortization of premium and discounts, is accrued daily. The value of additional securities received as dividend payments is recorded as income and as an increase to the cost basis of such securities.
Foreign Currency Translation — The accounting records of the Funds are maintained in U.S. dollars. Foreign currencies, as well as investment securities and other assets and liabilities denominated in foreign currencies are translated into U.S. dollars using exchange rates deemed appropriate by the investment adviser. Realized and unrealized foreign exchange gains or losses on investments are included as a component of net realized and unrealized gain or loss on foreign currency transactions in the Statements of Operations. Certain foreign exchange gains and losses included in realized and unrealized gains or losses are included in, or are a reduction of ordinary income in accordance with U.S. Federal income tax regulations.
Expenses/Reimbursements — WTAM has agreed to pay all expenses of the Funds (other than the Middle East Dividend Fund and International Hedged Equity Fund), except for: (i) brokerage expenses and other expenses (such as stamp taxes) connected with the execution of portfolio transactions or in connection with creation and redemption transactions; (ii) legal fees or expenses in connection with any arbitration, litigation or pending or threatened arbitration or litigation, including any settlements in connection therewith; (iii) compensation and expenses of each Independent Trustee; (iv) compensation and expenses of counsel to the Independent Trustees; (v) compensation and expenses of the Trust’s chief compliance officer; (vi) extraordinary expenses; (vii) distribution fees and expenses paid by the Trust under any distribution plan adopted pursuant to Rule 12b-1 under the 1940 Act; and (viii) the advisory fee payable to WTAM.
Pursuant to a separate contractual arrangement, WTAM has arranged for the provision of chief compliance officer (“CCO”) services to the Funds, and is liable and responsible for, and administers, payments to the CCO, the Independent Trustees and counsel to the Independent Trustees, in exchange for a service fee paid by each Fund, of up to 0.0044% of each Fund’s average daily net assets. Trustees fees, which are included in Service Fees on the Statements of Operations, of $288,600 have been paid on behalf of the Funds of the Trust to the Independent Trustees for the year ended March 31, 2011. Expenses in excess of 0.0044% were paid by WTAM. WTAM has agreed to limit the total expenses of the Middle East Dividend Fund to 0.88% and International Hedged Equity Fund to 0.58%.
| | | | |
| WisdomTree International Dividend and Sector Funds | | | 143 | |
Notes to Financial Statements (continued)
Currency Transactions — The Funds may enter into foreign currency forward and foreign currency futures contracts to facilitate local securities settlements or to protect against currency exposure in connection with distributions to shareholders. The Funds, other than Japan Hedged Equity Fund and International Hedged Equity Fund, do not expect to engage in currency transactions for the purpose of hedging against declines in the value of a Fund’s assets that are denominated in one or more foreign currencies. The Funds may not enter into such contracts for speculative purposes.
Forward Foreign Currency Transactions — A forward foreign currency contract (“Forward Contract”) involves an obligation to purchase or sell a specific currency at a future date, which may be any fixed number of days from the date of the contract agreed upon by the parties, at a price set at the time of the contract. These contracts are principally traded in the inter-bank market conducted directly between currency traders (usually large, commercial banks) and their customers. A Forward Contract generally has no margin deposit requirement, and no commissions are charged at any stage for trades.
Risks may arise upon entering into Forward Contracts from the potential inability of counterparties to meet the terms of their contracts and from unanticipated movements in the value of foreign currencies relative to the U.S. dollar or each other.
Fluctuations in the value of open Forward Contracts are recorded for book purposes as unrealized gains or losses on Forward Contracts by the Funds. Realized gains and losses on Forward Contracts include net gains or losses recognized by the Funds on contracts which have matured.
The following foreign currency transactions were open at and for the year ended March 31, 2011:
| | | | | | | | | | | | | | | | | | | | | | |
| Fund Name | | Settlement
Date | | | | | Contracts To
Deliver | | | | | | In
Exchange For | | | Unrealized
Gain (Loss) | |
DEFA Fund | | | | | | | | | | | | | | | | | | | | | | |
| | | 4/01/11 | | | AUD | | | | 316,206 | | | | USD | | | | 324,197 | | | $ | (2,807 | ) |
Global Equity Income Fund | | | | | | | | | | | | | | | | | | | | | | |
| | 4/04/11 | | | AUD | | | | 74,343 | | | | USD | | | | 77,064 | | | $ | 182 | |
| | 4/04/11 | | | CAD | | | | 8,156 | | | | USD | | | | 8,417 | | | | 33 | |
| | | | | | | | | | | | | | | | | | | | | $ | 215 | |
Japan Hedged Equity Fund | | | | | | | | | | | | | | | | | | | | | | |
| | 4/05/11 | | | JPY | | | | 10,310,863,849 | | | | USD | | | | 125,874,257 | | | $ | 1,463,373 | |
| | 4/05/11 | | | JPY | | | | 10,310,863,849 | | | | USD | | | | 125,872,720 | | | | 1,461,837 | |
| | 4/05/11 | | | JPY | | | | 57,363,869 | | | | USD | | | | 700,892 | | | | 8,739 | |
| | 4/05/11 | | | JPY | | | | 2,133,908,045 | | | | USD | | | | 26,013,117 | | | | 265,383 | |
| | 4/05/11 | | | JPY | | | | 325,108,308 | | | | USD | | | | 3,947,549 | | | | 24,792 | |
| | 4/05/11 | | | JPY | | | | 164,781,217 | | | | USD | | | | 2,000,695 | | | | 12,445 | |
| | 4/05/11 | | | JPY | | | | 165,820,813 | | | | USD | | | | 2,021,712 | | | | 20,918 | |
| | 4/05/11 | | | JPY | | | | 163,860,136 | | | | USD | | | | 1,981,740 | | | | 4,603 | |
| | 4/05/11 | | | JPY | | | | 1,319,550,197 | | | | USD | | | | 16,453,962 | | | | 532,270 | |
| | 4/05/11 | | | JPY | | | | 1,953,110,276 | | | | USD | | | | 24,801,841 | | | | 1,235,613 | |
| | 4/05/11 | | | JPY | | | | 85,636,503 | | | | USD | | | | 1,087,195 | | | | 53,905 | |
| | 4/05/11 | | | JPY | | | | 270,270,057 | | | | USD | | | | 3,331,243 | | | | 70,164 | |
| | 4/05/11 | | | JPY | | | | 7,556,588,727 | | | | USD | | | | 93,290,758 | | | | 2,112,959 | |
| | 4/05/11 | | | JPY | | | | 2,528,327,442 | | | | USD | | | | 31,239,026 | | | | 732,227 | |
| | 4/05/11 | | | JPY | | | | 325,576,674 | | | | USD | | | | 4,021,208 | | | | 92,799 | |
| | 4/05/11 | | | JPY | | | | 584,401,098 | | | | USD | | | | 7,203,498 | | | | 152,115 | |
| | 4/05/11 | | | JPY | | | | 3,538,889,655 | | | | USD | | | | 43,306,652 | | | | 606,409 | |
| | 4/05/11 | | | USD | | | | 247,101,330 | | | | JPY | | | | 20,479,511,151 | | | | 4,452 | |
| | 4/05/11 | | | USD | | | | 257,185,547 | | | | JPY | | | | 21,315,409,564 | | | | 6,184 | |
| | 5/09/11 | | | JPY | | | | 20,136,421,597 | | | | USD | | | | 243,000,682 | | | | (3,076 | ) |
| | 5/09/11 | | | JPY | | | | 20,958,316,355 | | | | USD | | | | 252,921,214 | | | | (1,066 | ) |
| | | | | | | | | | | | | | | | | | | | | $ | 8,857,045 | |
Pacific ex-Japan Total Dividend Fund | | | | | | | | | | | | | | | | | | | | | | |
| | 4/01/11 | | | AUD | | | | 6,661 | | | | HKD | | | | 53,649 | | | $ | 9 | |
| | 4/04/11 | | | AUD | | | | 67,764 | | | | SGD | | | | 88,425 | | | | 73 | |
| | | | | | | | | | | | | | | | | | | | | $ | 82 | |
| | |
| 144 | | WisdomTree International Dividend and Sector Funds |
Notes to Financial Statements (continued)
| | | | | | | | | | | | | | | | | | | | | | |
| Fund Name | | Settlement
Date | | | | | Contracts To
Deliver | | | | | | In
Exchange For | | | Unrealized
Gain (Loss) | |
Pacific ex-Japan Equity Income Fund | | | | | | | | | | | | | | | | | | | | | | |
| | 4/01/11 | | | NZD | | | | 30,253 | | | | HKD | | | | 179,607 | | | $ | 15 | |
| | 4/04/11 | | | USD | | | | 80,000 | | | | SGD | | | | 100,808 | | | | (25 | ) |
| | | | | | | | | | | | | | | | | | | | | $ | (10 | ) |
International SmallCap Dividend Fund | | | | | | | | | | | | | | | | | | | | | | |
| | 4/01/11 | | | JPY | | | | 14,258,812 | | | | NZD | | | | 225,000 | | | $ | (423 | ) |
| | 4/01/11 | | | USD | | | | 80,371 | | | | AUD | | | | 78,100 | | | | 396 | |
| | 4/01/11 | | | USD | | | | 314,528 | | | | JPY | | | | 25,920,000 | | | | (1,786 | ) |
| | 4/01/11 | | | USD | | | | 435,333 | | | | NZD | | | | 575,000 | | | | 3,249 | |
| | 4/04/11 | | | JPY | | | | 48,000,000 | | | | USD | | | | 577,201 | | | | (1,950 | ) |
| | 4/05/11 | | | AUD | | | | 984,000 | | | | USD | | | | 1,015,950 | | | | (1,653 | ) |
| | | | | | | | | | | | | | | | | | | | | $ | (2,167 | ) |
Emerging Markets SmallCap Dividend Fund | | | | | | | | | | | | | | | | | | | | | | |
| | 4/01/11 | | | USD | | | | 965,229 | | | | ILS | | | | 3,379,267 | | | $ | 7,698 | |
| | 4/01/11 | | | USD | | | | 231,673 | | | | KRW | | | | 254,376,838 | | | | 222 | |
| | 4/04/11 | | | USD | | | | 148,020 | | | | ILS | | | | 514,519 | | | | 115 | |
| | | | | | | | | | | | | | | | | | | | | $ | 8,035 | |
Middle East Dividend Fund | | | | | | | | | | | | | | | | | | | | | | |
| | 4/04/11 | | | AED | | | | 376,450 | | | | USD | | | | 102,494 | | | $ | (5 | ) |
| | 4/04/11 | | | QAR | | | | 53,000 | | | | USD | | | | 14,552 | | | | (3 | ) |
| | 4/04/11 | | | USD | | | | 16,104 | | | | OMR | | | | 6,200 | | | | — | |
| | | | | | | | | | | | | | | | | | | | | $ | (8 | ) |
International Hedged Equity Fund | | | | | | | | | | | | | | | | | | | | | | |
| | 4/01/11 | | | AUD | | | | 27,016 | | | | USD | | | | 27,699 | | | $ | (240 | ) |
| | 4/05/11 | | | AUD | | | | 2,450,755 | | | | USD | | | | 2,485,161 | | | | (48,976 | ) |
| | 4/05/11 | | | CHF | | | | 1,151,760 | | | | USD | | | | 1,239,522 | | | | (19,447 | ) |
| | 4/05/11 | | | EUR | | | | 6,614,304 | | | | USD | | | | 9,131,814 | | | | (254,447 | ) |
| | 4/05/11 | | | EUR | | | | 50,120 | | | | USD | | | | 69,163 | | | | (1,961 | ) |
| | 4/05/11 | | | GBP | | | | 2,474,523 | | | | USD | | | | 4,023,661 | | | | 57,170 | |
| | 4/05/11 | | | JPY | | | | 202,480,262 | | | | USD | | | | 2,471,876 | | | | 28,793 | |
| | 4/05/11 | | | NOK | | | | 1,818,567 | | | | USD | | | | 324,139 | | | | (4,599 | ) |
| | 4/05/11 | | | SEK | | | | 3,873,918 | | | | USD | | | | 611,002 | | | | (3,068 | ) |
| | 4/05/11 | | | SGD | | | | 546,500 | | | | USD | | | | 430,108 | | | | (3,451 | ) |
| | 4/05/11 | | | USD | | | | 2,534,139 | | | | AUD | | | | 2,450,755 | | | | — | |
| | 4/05/11 | | | USD | | | | 17,057 | | | | CHF | | | | 15,838 | | | | 255 | |
| | 4/05/11 | | | USD | | | | 1,241,657 | | | | CHF | | | | 1,135,922 | | | | — | |
| | 4/05/11 | | | USD | | | | 9,386,273 | | | | EUR | | | | 6,614,304 | | | | (13 | ) |
| | 4/05/11 | | | USD | | | | 71,125 | | | | EUR | | | | 50,120 | | | | — | |
| | 4/05/11 | | | USD | | | | 18,736 | | | | GBP | | | | 11,514 | | | | (280 | ) |
| | 4/05/11 | | | USD | | | | 3,948,033 | | | | GBP | | | | 2,463,009 | | | | — | |
| | 4/05/11 | | | USD | | | | 2,443,083 | | | | JPY | | | | 202,480,262 | | | | — | |
| | 4/05/11 | | | USD | | | | 328,738 | | | | NOK | | | | 1,818,567 | | | | — | |
| | 4/05/11 | | | USD | | | | 614,070 | | | | SEK | | | | 3,873,918 | | | | — | |
| | 4/05/11 | | | USD | | | | 433,558 | | | | SGD | | | | 546,500 | | | | — | |
| | 5/04/11 | | | AUD | | | | 2,430,976 | | | | USD | | | | 2,504,661 | | | | (49 | ) |
| | 5/04/11 | | | CHF | | | | 1,112,560 | | | | USD | | | | 1,216,314 | | | | 16 | |
| | 5/04/11 | | | EUR | | | | 6,550,731 | | | | USD | | | | 9,290,889 | | | | (149 | ) |
| | 5/04/11 | | | NOK | | | | 1,867,825 | | | | USD | | | | 337,123 | | | | (10 | ) |
| | 5/04/11 | | | SEK | | | | 3,988,113 | | | | USD | | | | 631,274 | | | | (10 | ) |
| | 5/05/11 | | | GBP | | | | 2,465,549 | | | | USD | | | | 3,950,719 | | | | (42 | ) |
| | 5/05/11 | | | SGD | | | | 531,826 | | | | USD | | | | 421,922 | | | | (9 | ) |
| | 5/09/11 | | | JPY | | | | 188,260,293 | | | | USD | | | | 2,271,872 | | | | (29 | ) |
| | | | | | | | | | | | | | | | | | | | | $ | (250,546 | ) |
| | | | |
| WisdomTree International Dividend and Sector Funds | | | 145 | |
Notes to Financial Statements (continued)
| | | | | | | | | | | | | | | | | | | | | | |
| Fund Name | | Settlement
Date | | | | | Contracts To
Deliver | | | | | | In
Exchange For | | | Unrealized
Gain (Loss) | |
International Basic Materials Sector Fund | | | | | | | | | | | | | | | | | | | | | | |
| | 4/01/11 | | | AUD | | | | 21,484 | | | | EUR | | | | 15,678 | | | $ | 31 | |
| | 4/04/11 | | | AUD | | | | 8,041 | | | | GBP | | | | 5,185 | | | | (4 | ) |
| | 4/04/11 | | | AUD | | | | 22,077 | | | | JPY | | | | 1,893,502 | | | | 16 | |
| | 4/04/11 | | | AUD | | | | 23,816 | | | | SEK | | | | 155,463 | | | | 15 | |
| | | | | | | | | | | | | | | | | | | | | $ | 58 | |
International Real Estate Fund | | | | | | | | | | | | | | | | | | | | | | |
| | 4/04/11 | | | AUD | | | | 34,094 | | | | USD | | | | 35,231 | | | $ | 63 | |
| | 4/04/11 | | | EUR | | | | 11,220 | | | | USD | | | | 15,931 | | | | 9 | |
| | 4/04/11 | | | HKD | | | | 102,339 | | | | USD | | | | 13,155 | | | | (2 | ) |
| | 4/04/11 | | | NZD | | | | 19,649 | | | | USD | | | | 14,996 | | | | 9 | |
| | 4/04/11 | | | SGD | | | | 16,081 | | | | USD | | | | 12,757 | | | | (1 | ) |
| | | | | | | | | | | | | | | | | | | | | $ | 78 | |
Currency Legend:
| | |
| AED – UAE dirham | | KRW – South Korean won |
| AUD – Australian dollar | | NOK – Norwegian krone |
| CAD – Canadian dollar | | NZD – New Zealand dollar |
| CHF – Swiss franc | | OMR – Omani rial |
| EUR – Euro | | QAR – Qatari rial |
| GBP – British pound | | SEK – Swedish krona |
| HKD – Hong Kong dollar | | SGD – Singapore dollar |
| ILS – Israeli new shekel | | USD – U.S. dollar |
| JPY – Japanese yen | | |
Security Lending — Each Fund may lend portfolio securities to certain creditworthy borrowers, including the Funds’ securities lending agent. It is the Fund’s policy that, at origination, all loans are secured by collateral of at least 102% of the value of U.S. securities loaned and 105% of the value of foreign securities loaned. Collateral in the form of cash and /or high grade debt obligations, equivalent to at least 100% of the market value of securities is maintained at all times. The collateral can be invested in certain money market mutual funds which also have exposure to the fluctuations of the market. Each Fund receives compensation for lending its securities from interest or dividends earned on the cash or U.S. government securities held as collateral, net of fee rebates paid to the borrower plus reasonable administrative and custody fees. The dividend and interest income earned on the securities loaned is accounted for in the same manner as other dividend and interest income. The borrower pays to the Funds an amount equal to any dividends or interest received on loaned securities. The Funds retain all or a portion of the interest received on investment of cash collateral or receives a fee from the borrower. Lending portfolio securities could result in a loss or delay in recovering each Fund’s securities if the borrower defaults.
The securities lending income earned by the Funds is disclosed on the Statements of Operations on page 144.
Short-Term Investments — Each Fund may invest a portion of its assets in high-quality money market instruments on an ongoing basis to provide liquidity or for other reasons. The instruments in which a Fund may invest include short-term obligations issued by the U.S. Government, negotiable certificates of deposit (“CDs”), fixed time deposits and bankers’ acceptances of U.S. and foreign banks and similar institutions, commercial papers, repurchase agreements and money market funds. CDs are short-term negotiable obligations of commercial banks. Time deposits are non-negotiable deposits maintained in banking institutions for specified periods of time at stated interest rates. Banker’s acceptances are time drafts drawn on commercial banks by borrowers, usually in connection with international transactions.
Tax Information and Dividends and Distributions to Shareholders — It is each Fund’s policy to comply with all requirements of the Internal Revenue Code of 1986, as amended (the “Code”). Each Fund intends to qualify for and to elect treatment as a separate Regulated Investment Company (“RIC”) under Subchapter M of the Code. It is the policy of each Fund to pay out dividends, if any, to investors at least annually. Taxable net realized gains from investment transactions, reduced by capital loss carryforwards, if any, are declared and distributed to shareholders at least annually. The capital loss carryforward amount, if any, is available to offset future net capital gains. The Funds may occasionally be required to make supplemental distributions at some other time during the year. The Trust reserves the right to declare special distributions if, in its reasonable discretion, such action is necessary or advisable to preserve the status of each Fund as a RIC or to avoid imposition of income or excise taxes on undistributed income. Dividends and distributions to shareholders are recorded on the ex-dividend date. The amount of dividends and distributions from net investment income and net realized capital gains are determined in accordance with Federal income tax regulations which may differ from GAAP. These book/tax differences are either considered temporary or permanent in nature. To the extent these differences are
| | |
| 146 | | WisdomTree International Dividend and Sector Funds |
Notes to Financial Statements (continued)
permanent in nature, such amounts are reclassified within the components of net assets based on their Federal tax basis treatment; temporary differences do not require reclassification. Dividends and distributions, which exceed earnings and profit for tax purposes, are reported for tax purposes as a tax return of capital to the extent of a shareholder’s tax basis, and thereafter as capital gain.
3. ADVISER FEES AND TRANSACTIONS
As an investment adviser, WTAM has overall responsibility for the general management and administration of the Trust. WTAM also provides an investment program for each Fund. WTAM also arranges for sub-advisory, transfer agency, custody, fund administration, and all other non-distribution related services necessary for the Funds to operate. Under the Investment Advisory Agreement for each Fund, as also described in Note 2, WTAM agrees to pay all expenses of the Funds (other than the Middle East Dividend Fund and the International Hedged Equity Fund), except compensation and expenses of the Independent Trustees, counsel to the Independent Trustees and the Trust’s CCO, interest expenses and taxes, brokerage expenses, and other expenses connected with the execution of portfolio transactions, any distribution fees or expenses, legal fees or expenses and extraordinary expenses. The Investment Advisory Agreements for the Middle East Dividend Fund and International Hedged Equity Fund do not require WTAM to pay any Fund expenses, except sub-advisory fees.
Pursuant to a separate contractual arrangement, as also described in Note 2, WTAM arranges for the provision of CCO services with respect to each Fund, and is liable and responsible for, and administers, payments to the CCO, the Independent Trustees and counsel to the Independent Trustees in exchange for a fee of up to 0.0044%. WTAM has agreed to limit net annual operating expenses for Middle East Dividend Fund to 0.88% and International Hedged Equity Fund to 0.58%. WTAM expects to receive fees from each fund, based on a percentage of the Fund’s average daily net assets as shown in the following table:
| | | | |
| Fund | | Advisory Fee
Rate | |
DEFA Fund | | | 0.48 | % |
DEFA Equity Income Fund | | | 0.58 | % |
Global Equity Income Fund | | | 0.58 | % |
Europe SmallCap Dividend Fund | | | 0.58 | % |
Japan Hedged Equity Fund | | | 0.48 | % |
World ex-U.S. Growth Fund | | | 0.58 | % |
Japan SmallCap Dividend Fund | | | 0.58 | % |
Pacific ex-Japan Total Dividend Fund | | | 0.48 | % |
Pacific ex-Japan Equity Income Fund | | | 0.58 | % |
International LargeCap Dividend Fund | | | 0.48 | % |
International Dividend ex-Financials Fund | | | 0.58 | % |
International MidCap Dividend Fund | | | 0.58 | % |
International SmallCap Dividend Fund | | | 0.58 | % |
Emerging Markets Equity Income Fund | | | 0.63 | % |
Emerging Markets SmallCap Dividend Fund | | | 0.63 | % |
Middle East Dividend Fund | | | 0.68 | % |
International Hedged Equity Fund | | | 0.48 | % |
International Basic Materials Sector Fund | | | 0.58 | % |
International Energy Sector Fund | | | 0.58 | % |
International Utilities Sector Fund | | | 0.58 | % |
International Real Estate Fund | | | 0.58 | % |
Each Fund may purchase shares of an affiliated exchange traded fund(s) in secondary market transactions. For the year ended March 31, 2011, WTAM waived a portion of its advisory fees based on each Fund’s investment in affiliated Funds. For Middle East Dividend Fund and International Hedged Equity Fund, WTAM waived a portion of its advisory fees to comply with expense limits currently in place for these Funds. For Middle East Dividend Fund and International Hedged Equity Fund, WTAM waived a portion of its advisory fees to comply with expense limits in place for these Funds. The table below indicates the waiver amounts. Please see Note 7 on page 152 for additional information on Other Affiliated Parties and Transactions.
| | | | |
| WisdomTree International Dividend and Sector Funds | | | 147 | |
Notes to Financial Statements (continued)
WTAM waived a portion of its investment advisory fees for the year ended March 31, 2011 as follows:
| | | | |
| Fund | | Advisory Fees
Waived | |
DEFA Fund | | $ | 4,141 | |
DEFA Equity Income Fund | | | 2,252 | |
Global Equity Income Fund | | | 1,234 | |
Europe SmallCap Dividend Fund | | | 799 | |
Japan Hedged Equity Fund | | | 97 | |
World ex-U.S. Growth Fund | | | 5,179 | |
Japan SmallCap Dividend Fund | | | 1,602 | |
Pacific ex-Japan Total Dividend Fund | | | 1,209 | |
Pacific ex-Japan Equity Income Fund | | | 2,153 | |
International LargeCap Dividend Fund | | | 1,715 | |
International Dividend ex-Financials Fund | | | 4,342 | |
International MidCap Dividend Fund | | | 4,171 | |
International SmallCap Dividend Fund | | | 7,090 | |
Emerging Markets Equity Income Fund | | | 9,652 | |
Emerging Markets SmallCap Dividend Fund | | | 47,558 | |
Middle East Dividend Fund | | | 213,557 | |
International Hedged Equity Fund | | | 189,902 | |
International Basic Materials Sector Fund | | | 508 | |
International Energy Sector Fund | | | 682 | |
International Utilities Sector Fund | | | 737 | |
International Real Estate Fund | | | 1,048 | |
4. CAPITAL SHARE TRANSACTIONS
As of March 31, 2011, there was an unlimited number of $0.001 par value shares of beneficial interest authorized by the Trust. Shares are issued and redeemed by each Fund only in Creation Units or multiples thereof. Except when aggregated in Creation Units, shares of each Fund are not redeemable. Transactions in shares for each Fund are disclosed in detail in the Statements of Changes in Net Assets. The consideration for the purchase of Creation Units of a Fund generally consist of the in-kind contribution of a designated portfolio of equity securities constituting a portfolio sampling representation of the securities included in the relevant Fund’s underlying index and an amount of cash. Middle East Dividend Fund issues and redeems shares on a cash basis only. Investors purchasing and redeeming Creation Units may be charged a purchase transaction fee and a redemption transaction fee to offset transfer and other transaction costs associated with the issuance and redemption of Creation Units.
5. INVESTMENT PORTFOLIO TRANSACTIONS
Purchases and sales of investments (excluding in-kind purchases and redemptions and short-term investments) for the year ended March 31, 2011 were as follows:
| | | | | | | | |
| Fund | | Purchases | | | Sales | |
DEFA Fund | | $ | 124,274,339 | | | $ | 122,657,310 | |
DEFA Equity Income Fund | | | 41,082,847 | | | | 41,157,052 | |
Global Equity Income Fund | | | 21,900,951 | | | | 19,814,596 | |
Europe SmallCap Dividend Fund | | | 16,670,462 | | | | 16,462,118 | |
Japan Hedged Equity Fund | | | 38,297,689 | | | | 52,578,352 | |
World ex-U.S. Growth Fund | | | 26,482,311 | | | | 23,222,381 | |
Japan SmallCap Dividend Fund | | | 57,354,020 | | | | 57,142,933 | |
Pacific ex-Japan Total Dividend Fund | | | 23,418,590 | | | | 22,605,467 | |
Pacific ex-Japan Equity Income Fund | | | 37,272,662 | | | | 36,329,861 | |
International LargeCap Dividend Fund | | | 32,399,679 | | | | 31,901,766 | |
International Dividend ex-Financials Fund | | | 77,869,151 | | | | 77,142,264 | |
International MidCap Dividend Fund | | | 56,323,917 | | | | 56,430,234 | |
| | |
| 148 | | WisdomTree International Dividend and Sector Funds |
Notes to Financial Statements (continued)
| | | | | | | | |
| Fund | | Purchases | | | Sales | |
International SmallCap Dividend Fund | | $ | 239,582,928 | | | $ | 236,834,803 | |
Emerging Markets Equity Income Fund | | | 715,565,261 | | | | 275,110,908 | |
Emerging Markets SmallCap Dividend Fund | | | 516,442,501 | | | | 219,604,087 | |
Middle East Dividend Fund | | | 14,789,922 | | | | 8,229,403 | |
International Hedged Equity Fund | | | 6,626,154 | | | | 8,008,481 | |
International Basic Materials Sector Fund | | | 14,239,964 | | | | 14,309,228 | |
International Energy Sector Fund | | | 16,869,687 | | | | 16,806,707 | |
International Utilities Sector Fund | | | 7,415,744 | | | | 7,563,277 | |
International Real Estate Fund | | | 17,552,138 | | | | 25,525,541 | |
For the year ended March 31, 2011, the cost of in-kind purchases and the proceeds from in-kind redemptions were as follows:
| | | | | | | | |
| Fund | | Purchases | | | Redemptions | |
DEFA Fund | | $ | 19,100,929 | | | $ | 24,417,106 | |
DEFA Equity Income Fund | | | 2,199,237 | | | | 16,222,881 | |
Global Equity Income Fund | | | 27,323,681 | | | | — | |
Europe SmallCap Dividend Fund | | | — | | | | 5,500,984 | |
Japan Hedged Equity Fund | | | 483,390,690 | | | | 23,853,843 | |
World ex-U.S. Growth Fund | | | 17,824,153 | | | | — | |
Japan SmallCap Dividend Fund | | | 121,174,262 | | | | 52,347,072 | |
Pacific ex-Japan Total Dividend Fund | | | — | | | | 8,903,828 | |
Pacific ex-Japan Equity Income Fund | | | — | | | | 40,056,308 | |
International LargeCap Dividend Fund | | | 17,959,203 | | | | 9,772,659 | |
International Dividend ex-Financials Fund | | | 20,265,766 | | | | 45,902,494 | |
International MidCap Dividend Fund | | | 7,539,308 | | | | 11,175,107 | |
International SmallCap Dividend Fund | | | 7,068,074 | | | | 17,141,401 | |
Emerging Markets Equity Income Fund | | | 303,668,977 | | | | 94,309,413 | |
Emerging Markets SmallCap Dividend Fund | | | 276,914,266 | | | | 87,274,626 | |
Middle East Dividend Fund | | | — | | | | — | |
International Hedged Equity Fund | | | 11,089,477 | | | | — | |
International Basic Materials Sector Fund | | | — | | | | 10,880,307 | |
International Energy Sector Fund | | | 22,496,449 | | | | 30,401,177 | |
International Utilities Sector Fund | | | — | | | | 10,485,609 | |
International Real Estate Fund | | | 33,341,674 | | | | 1,284,984 | |
Gains and losses on in-kind redemptions are not recognized at the Fund level for tax purposes.
6. FEDERAL INCOME TAXES
At March 31, 2011, the cost of investments (including securities on loan) for Federal income tax purposes was as follows:
| | | | | | | | | | | | | | | | |
| Fund | | Tax Cost | | | Gross Unrealized
Appreciation | | | Gross Unrealized
Depreciation | | | Net Unrealized
Appreciation
(Depreciation) | |
DEFA Fund | | $ | 440,610,499 | | | $ | 59,013,740 | | | $ | (12,613,442 | ) | | $ | 46,400,298 | |
DEFA Equity Income Fund | | | 137,415,862 | | | | 13,814,906 | | | | (13,372,081 | ) | | | 442,825 | |
Global Equity Income Fund | | | 73,303,754 | | | | 9,268,547 | | | | (1,091,547 | ) | | | 8,177,000 | |
Europe SmallCap Dividend Fund | | | 27,294,512 | | | | 5,490,593 | | | | (2,066,617 | ) | | | 3,423,976 | |
Japan Hedged Equity Fund | | | 560,188,578 | | | | 6,119,727 | | | | (24,484,811 | ) | | | (18,365,084 | ) |
World ex-U.S. Growth Fund | | | 42,561,906 | | | | 7,657,565 | | | | (365,758 | ) | | | 7,291,807 | |
Japan SmallCap Dividend Fund | | | 240,895,546 | | | | 11,452,812 | | | | (8,612,033 | ) | | | 2,840,779 | |
Pacific ex-Japan Total Dividend Fund | | | 80,714,040 | | | | 14,153,972 | | | | (3,987,379 | ) | | | 10,166,593 | |
Pacific ex-Japan Equity Income Fund | | | 76,929,966 | | | | 10,184,625 | | | | (2,264,665 | ) | | | 7,919,960 | |
International LargeCap Dividend Fund | | | 168,057,520 | | | | 17,022,019 | | | | (12,524,616 | ) | | | 4,497,403 | |
International Dividend ex-Financials Fund | | | 141,167,543 | | | | 20,459,267 | | | | (5,757,874 | ) | | | 14,701,393 | |
| | | | |
| WisdomTree International Dividend and Sector Funds | | | 149 | |
Notes to Financial Statements (continued)
| | | | | | | | | | | | | | | | |
| Fund | | Tax Cost | | | Gross Unrealized
Appreciation | | | Gross Unrealized
Depreciation | | | Net Unrealized
Appreciation
(Depreciation) | |
International MidCap Dividend Fund | | $ | 160,734,579 | | | $ | 22,468,045 | | | $ | (10,397,425 | ) | | $ | 12,070,620 | |
International SmallCap Dividend Fund | | | 458,714,012 | | | | 87,901,883 | | | | (22,916,579 | ) | | | 64,985,304 | |
Emerging Markets Equity Income Fund | | | 1,171,897,880 | | | | 196,926,889 | | | | (12,982,063 | ) | | | 183,944,826 | |
Emerging Markets SmallCap Dividend Fund | | | 813,393,861 | | | | 140,809,515 | | | | (16,505,250 | ) | | | 124,304,265 | |
Middle East Dividend Fund | | | 18,730,764 | | | | 1,794,232 | | | | (1,266,624 | ) | | | 527,608 | |
International Hedged Equity Fund | | | 19,185,139 | | | | 3,166,187 | | | | (244,044 | ) | | | 2,922,143 | |
International Basic Materials Sector Fund | | | 39,492,608 | | | | 8,700,341 | | | | (3,360,523 | ) | | | 5,339,818 | |
International Energy Sector Fund | | | 44,607,411 | | | | 7,313,908 | | | | (2,328,426 | ) | | | 4,985,482 | |
International Utilities Sector Fund | | | 50,564,281 | | | | 1,607,410 | | | | (13,271,042 | ) | | | (11,663,632 | ) |
International Real Estate Fund | | | 131,440,271 | | | | 4,995,156 | | | | (9,709,251 | ) | | | (4,714,095 | ) |
At March 31, 2011, the components of accumulated earnings/loss on a tax-basis were as follows:
| | | | | | | | | | | | | | | | | | | | |
| Fund | | Undistributed
Ordinary Income | | | Undistributed
Capital and Other
Losses | | | Net Unrealized
Appreciation
(Depreciation) | | | Currency
Unrealized
Appreciation
(Depreciation) | | | Total Accumulated
Earnings/(Losses) | |
DEFA Fund | | $ | 1,127,956 | | | $ | (228,885,181 | ) | | $ | 46,400,298 | | | $ | 50,249 | | | $ | (181,306,678 | ) |
DEFA Equity Income Fund | | | 193,426 | | | | (74,831,476 | ) | | | 442,825 | | | | 12,324 | | | | (74,182,901 | ) |
Global Equity Income Fund | | | 154,543 | | | | (23,408,169 | ) | | | 8,177,000 | | | | 4,372 | | | | (15,072,254 | ) |
Europe SmallCap Dividend Fund | | | 383,628 | | | | (25,693,577 | ) | | | 3,423,976 | | | | 801 | | | | (21,885,172 | ) |
Japan Hedged Equity Fund | | | 5,995,250 | | | | (13,402,752 | ) | | | (18,365,084 | ) | | | (39,150 | ) | | | (25,811,736 | ) |
World ex-U.S. Growth Fund | | | 83,053 | | | | (13,118,725 | ) | | | 7,291,807 | | | | 1,230 | | | | (5,742,635 | ) |
Japan SmallCap Dividend Fund | | | 2,987,963 | | | | (20,084,183 | ) | | | 2,840,779 | | | | (18,626 | ) | | | (14,274,067 | ) |
Pacific ex-Japan Total Dividend Fund | | | 179,511 | | | | (16,072,616 | ) | | | 10,166,593 | | | | 9,986 | | | | (5,716,526 | ) |
Pacific ex-Japan Equity Income Fund | | | 327,933 | | | | (15,627,959 | ) | | | 7,919,960 | | | | 17,739 | | | | (7,362,327 | ) |
International LargeCap Dividend Fund | | | 338,266 | | | | (41,681,324 | ) | | | 4,497,403 | | | | 17,104 | | | | (36,828,551 | ) |
International Dividend ex-Financials Fund | | | 154,944 | | | | (148,453,324 | ) | | | 14,701,393 | | | | 25,141 | | | | (133,571,846 | ) |
International MidCap Dividend Fund | | | 531,593 | | | | (73,027,083 | ) | | | 12,070,620 | | | | 7,714 | | | | (60,417,156 | ) |
International SmallCap Dividend Fund | | | 3,882,832 | | | | (216,594,511 | ) | | | 64,985,304 | | | | (18,101 | ) | | | (147,744,476 | ) |
Emerging Markets Equity Income Fund | | | 3,693,067 | | | | (36,853,201 | ) | | | 183,944,826 | | | | 93,683 | | | | 150,878,375 | |
Emerging Markets SmallCap Dividend Fund | | | 3,978,549 | | | | (20,308,464 | ) | | | 124,304,265 | | | | 80,005 | | | | 108,054,355 | |
Middle East Dividend Fund | | | 288,172 | | | | (7,338,239 | ) | | | 527,608 | | | | (325 | ) | | | (6,522,784 | ) |
International Hedged Equity Fund | | | 126,474 | | | | (2,157,575 | ) | | | 2,922,143 | | | | (1,500 | ) | | | 889,542 | |
International Basic Materials Sector Fund | | | 88,792 | | | | (17,639,461 | ) | | | 5,339,818 | | | | 3,782 | | | | (12,207,069 | ) |
International Energy Sector Fund | | | 9,383 | | | | (13,107,026 | ) | | | 4,985,482 | | | | 2,291 | | | | (8,109,870 | ) |
International Utilities Sector Fund | | | 77,625 | | | | (9,699,046 | ) | | | (11,663,632 | ) | | | 1,177 | | | | (21,283,876 | ) |
International Real Estate Fund | | | 2,758,710 | | | | (47,355,330 | ) | | | (4,714,095 | ) | | | (1,044 | ) | | | (49,311,759 | ) |
The tax character of distributions paid during the fiscal year ended March 31, 2011 and March 31, 2010, was as follows:
| | | | | | | | |
| | | Year Ended
March 31, 2011 | | | Year Ended
March 31, 2010 | |
| Fund | | Distributions Paid
from Ordinary
Income* | | | Distributions Paid
from Ordinary
Income* | |
DEFA Fund | | $ | 14,637,890 | | | $ | 19,292,972 | |
DEFA Equity Income Fund | | | 5,400,141 | | | | 5,586,535 | |
Global Equity Income Fund | | | 2,060,172 | | | | 1,835,881 | |
Europe SmallCap Dividend Fund | | | 772,916 | | | | 776,003 | |
Japan Hedged Equity Fund | | | 1,252,279 | | | | 934,315 | |
World ex-U.S. Growth Fund | | | 917,040 | | | | 859,811 | |
Japan SmallCap Dividend Fund | | | 2,383,352 | | | | 1,520,747 | |
Pacific ex-Japan Total Dividend Fund | | | 3,365,676 | | | | 3,574,407 | |
Pacific ex-Japan Equity Income Fund | | | 4,176,991 | | | | 3,645,372 | |
| | |
| 150 | | WisdomTree International Dividend and Sector Funds |
Notes to Financial Statements (continued)
| | | | | | | | |
| | | Year Ended
March 31, 2011 | | | Year Ended
March 31, 2010 | |
| Fund | | Distributions Paid
from Ordinary
Income* | | | Distributions Paid
from Ordinary
Income* | |
International LargeCap Dividend Fund | | $ | 5,111,213 | | | $ | 4,322,343 | |
International Dividend ex-Financials Fund | | | 6,504,988 | | | | 5,343,066 | |
International MidCap Dividend Fund | | | 4,562,537 | | | | 3,633,344 | |
International SmallCap Dividend Fund | | | 12,889,846 | | | | 10,659,948 | |
Emerging Markets Equity Income Fund | | | 27,419,477 | | | | 11,953,872 | |
Emerging Markets SmallCap Dividend Fund | | | 16,528,911 | | | | 5,378,463 | |
Middle East Dividend Fund | | | 520,780 | | | | 431,581 | |
International Hedged Equity Fund | | | 506,947 | | | | 25,814 | |
International Basic Materials Sector Fund | | | 781,200 | | | | 670,355 | |
International Energy Sector Fund | | | 1,511,977 | | | | 1,249,410 | |
International Utilities Sector Fund | | | 1,705,615 | | | | 1,445,458 | |
International Real Estate Fund | | | 10,473,002 | | | | 7,422,149 | |
| | * | Includes short-term capital gains. |
At March 31, 2011, for Federal income tax purposes, the Funds have capital loss carryforwards available to offset future capital gains through the years indicated. To the extent that these loss carryforwards are utilized, capital gains so offset will not be distributed to shareholders.
| | | | | | | | | | | | | | | | | | | | | | | | |
| Fund | | Capital Loss
Available
Through 2015 | | | Capital Loss
Available
Through 2016 | | | Capital Loss
Available
Through 2017 | | | Capital Loss
Available
Through 2018 | | | Capital Loss
Available
Through 2019 | | | Capital Loss
Available Total | |
DEFA Fund | | $ | — | | | $ | 1,113,913 | | | $ | 31,593,366 | | | $ | 187,173,747 | | | $ | 8,855,174 | | | $ | 228,736,200 | |
DEFA Equity Income Fund | | | 3,223 | | | | 1,088,572 | | | | 24,469,991 | | | | 41,582,445 | | | | 7,637,372 | | | | 74,781,603 | |
Global Equity Income Fund | | | — | | | | 251,233 | | | | 6,927,464 | | | | 15,414,669 | | | | 807,956 | | | | 23,401,322 | |
Europe SmallCap Dividend Fund | | | — | | | | 1,116,689 | | | | 6,092,078 | | | | 16,382,086 | | | | 2,102,724 | | | | 25,693,577 | |
Japan Hedged Equity Fund | | | 61,971 | | | | 147,026 | | | | 456,605 | | | | 3,305,242 | | | | 9,431,908 | | | | 13,402,752 | |
World ex-U.S. Growth Fund | | | — | | | | 638,234 | | | | 3,657,374 | | | | 8,823,117 | | | | — | | | | 13,118,725 | |
Japan SmallCap Dividend Fund | | | 6,631 | | | | 450,744 | | | | 2,793,131 | | | | 13,069,045 | | | | 3,661,232 | | | | 19,980,783 | |
Pacific ex-Japan Total Dividend Fund | | | 2,486 | | | | 434,717 | | | | 1,942,155 | | | | 11,545,171 | | | | 2,148,087 | | | | 16,072,616 | |
Pacific ex-Japan Equity Income Fund | | | — | | | | 292,646 | | | | 2,237,436 | | | | 10,402,798 | | | | 2,670,223 | | | | 15,603,103 | |
International LargeCap Dividend Fund | | | 12,856 | | | | 911,666 | | | | 10,714,056 | | | | 21,950,675 | | | | 8,092,071 | | | | 41,681,324 | |
International Dividend ex-Financials Fund | | | — | | | | 1,217,608 | | | | 40,771,676 | | | | 106,422,557 | | | | — | | | | 148,411,841 | |
International MidCap Dividend Fund | | | — | | | | 2,200,353 | | | | 10,045,031 | | | | 49,400,362 | | | | 11,183,904 | | | | 72,829,650 | |
International SmallCap Dividend Fund | | | — | | | | 2,417,649 | | | | 31,684,635 | | | | 176,126,796 | | | | 6,365,431 | | | | 216,594,511 | |
Emerging Markets Equity Income Fund | | | — | | | | 166,963 | | | | 3,240,763 | | | | 32,150,807 | | | | 561,494 | | | | 36,120,027 | |
Emerging Markets SmallCap Dividend Fund | | | — | | | | — | | | | 4,224,150 | | | | 9,367,814 | | | | 4,882,951 | | | | 18,474,915 | |
Middle East Dividend Fund | | | — | | | | — | | | | 41,648 | | | | 6,522,827 | | | | 763,315 | | | | 7,327,790 | |
International Hedged Equity Fund | | | — | | | | — | | | | — | | | | 108,824 | | | | 1,617,839 | | | | 1,726,663 | |
International Basic Materials Sector Fund | | | — | | | | 606,109 | | | | 911,737 | | | | 12,348,688 | | | | 3,769,123 | | | | 17,635,657 | |
International Energy Sector Fund | | | — | | | | 45,822 | | | | 1,245,793 | | | | 4,858,681 | | | | 6,793,018 | | | | 12,943,314 | |
International Utilities Sector Fund | | | — | | | | 13,301 | | | | 1,722,994 | | | | 5,793,876 | | | | 1,986,702 | | | | 9,516,873 | |
International Real Estate Fund | | | — | | | | 261,244 | | | | 12,351,482 | | | | 23,011,711 | | | | 10,538,886 | | | | 46,163,323 | |
World ex-U.S. Growth Fund and International Dividend ex-Financials Fund utilized $146,510 and $29,566 of its capital loss carry forward, respectively which offset net taxable gains realized in the current year ended March 31, 2011.
Capital losses, currency losses and passive foreign investment company ("PFIC") losses incurred after October 31 (“post-October losses”) within the taxable year are deemed to arise on the first business day of each Fund's next taxable year.
| | | | |
| WisdomTree International Dividend and Sector Funds | | | 151 | |
Notes to Financial Statements (continued)
During the fiscal year ended March 31, 2011, the following Funds incurred and will elect to defer net post-October currency and capital losses as follows:
| | | | | | | | |
| Fund | | Post-October
Currency Losses | | | Post-October
Capital Losses | |
DEFA Fund | | $ | 15,083 | | | $ | 133,898 | |
DEFA Equity Income Fund | | | 1,559 | | | | 48,314 | |
Global Equity Income Fund | | | — | | | | 6,847 | |
Europe SmallCap Dividend Fund | | | — | | | | — | |
Japan Hedged Equity Fund | | | — | | | | — | |
World ex-U.S. Growth Fund | | | — | | | | — | |
Japan SmallCap Dividend Fund | | | 7,133 | | | | 96,267 | |
Pacific ex-Japan Total Dividend Fund | | | — | | | | — | |
Pacific ex-Japan Equity Income Fund | | | 6,836 | | | | 18,020 | |
International LargeCap Dividend Fund | | | — | | | | — | |
International Dividend ex-Financials Fund | | | — | | | | 41,483 | |
International MidCap Dividend Fund | | | — | | | | 197,433 | |
International SmallCap Dividend Fund | | | — | | | | — | |
Emerging Markets Equity Income Fund | | | 514,249 | | | | 218,925 | |
Emerging Markets SmallCap Dividend Fund | | | 357,356 | | | | 1,476,193 | |
Middle East Dividend Fund | | | 10,449 | | | | — | |
International Hedged Equity Fund | | | 11,957 | | | | 418,955 | |
International Basic Materials Sector Fund | | | 3,804 | | | | — | |
International Energy Sector Fund | | | 2,417 | | | | 161,295 | |
International Utilities Sector Fund | | | 2,478 | | | | 179,695 | |
International Real Estate Fund | | | — | | | | 1,192,007 | |
At March 31, 2011, the effect of permanent "book/tax" reclassifications resulted in increases (decreases) to the components of net assets as follows:
| | | | | | | | | | | | |
| Fund | | Undistributed Net
Investment
Income/(Loss) | | | Accumulated
Net Realized
Gain/(Loss) | | | Paid-in Capital | |
DEFA Fund | | $ | 15,317 | | | $ | 1,548,084 | | | $ | (1,563,401 | ) |
DEFA Equity Income Fund | | | (54,873 | ) | | | 1,517,323 | | | | (1,462,450 | ) |
Global Equity Income Fund | | | 15,181 | | | | (15,181 | ) | | | — | |
Europe SmallCap Dividend Fund | | | 300,804 | | | | (1,079,680 | ) | | | 778,876 | |
Japan Hedged Equity Fund | | | 124,537 | | | | 882,537 | | | | (1,007,074 | ) |
World ex-U.S. Growth Fund | | | 5,554 | | | | (5,554 | ) | | | — | |
Japan SmallCap Dividend Fund | | | 199,231 | | | | (3,395,801 | ) | | | 3,196,570 | |
Pacific ex-Japan Total Dividend Fund | | | 44,889 | | | | (1,567,120 | ) | | | 1,522,231 | |
Pacific ex-Japan Equity Income Fund | | | 61,224 | | | | (3,302,284 | ) | | | 3,241,060 | |
International LargeCap Dividend Fund | | | 8,191 | | | | (331,441 | ) | | | 323,250 | |
International Dividend ex-Financials Fund | | | (79,573 | ) | | | (5,211,425 | ) | | | 5,290,998 | |
International MidCap Dividend Fund | | | 104,383 | | | | (1,400,652 | ) | | | 1,296,269 | |
International SmallCap Dividend Fund | | | 1,055,244 | | | | (4,648,304 | ) | | | 3,593,060 | |
Emerging Markets Equity Income Fund | | | 138,434 | | | | (24,213,040 | ) | | | 24,074,606 | |
Emerging Markets SmallCap Dividend Fund | | | 1,130,399 | | | | (24,925,441 | ) | | | 23,795,042 | |
Middle East Dividend Fund | | | (1,225 | ) | | | 1,225 | | | | — | |
International Hedged Equity Fund | | | (97,392 | ) | | | 97,392 | | | | — | |
International Basic Materials Sector Fund | | | (19,833 | ) | | | (1,962,742 | ) | | | 1,982,575 | |
International Energy Sector Fund | | | (46,022 | ) | | | (5,276,798 | ) | | | 5,322,820 | |
International Utilities Sector Fund | | | 7,835 | | | | 1,534,517 | | | | (1,542,352 | ) |
International Real Estate Fund | | | 1,080,281 | | | | (767,872 | ) | | | (312,409 | ) |
The differences are primarily due to redemptions-in-kind, currency gain/loss, Passive Foreign Investment Companies ("PFICs"), the tax treatment of income earned from investments in partnerships, non-deductible expenses, and non-dividend distributions from underlying investments.
| | |
| 152 | | WisdomTree International Dividend and Sector Funds |
Notes to Financial Statements (continued)
GAAP provides guidance on tax provisions that prescribe a minimum threshold for financial statement recognition of the benefit of a tax position taken or expected to be taken in a tax return. Foreign taxes are provided for based on each Fund’s understanding of the tax rules and rates that exist in the foreign markets in which it invests. Taxes are accrued and applied to net investment income, net realized capital gains and net unrealized appreciation, as applicable, as the income is earned or capital gains are recorded. As of and during the fiscal year ended March 31, 2011, the Funds did not have any liabilities for unrecognized tax benefits. If applicable, the Funds will recognize interest accrued related to unrecognized tax benefits in interest expense and penalties in “Other” expenses on the Statements of Operations. The Funds file tax returns with the U.S. Internal Revenue Service, the state of New York, and various other states. Generally, each of the tax years in the four year period ended March 31, 2011, remains subject to examination by taxing authorities.
7. OTHER AFFILIATED PARTIES AND TRANSACTIONS
Affiliated holdings are funds which are managed by the Trust or an affiliate of the Trust. Transactions with affiliated companies during the year ended March 31, 2011 are as follows:
| | | | | | | | | | | | | | | | | | | | |
| Affiliated Fund Name | | Value at
3/31/2010 | | | Purchases/
Additions | | | Sales/
Reductions | | | Value at
3/31/2011 | | | Dividend
Income | |
DEFA Fund | | | | | | | | | | | | | | | | | | | | |
International Dividend ex-Financials Fund | | $ | — | | | $ | 12,362,778 | | | $ | 10,709,174 | | | $ | 1,723,819 | | | $ | 50,041 | |
International LargeCap Dividend Fund | | | — | | | | 866,710 | | | | 832,612 | | | | — | | | | — | |
Total | | $ | — | | | $ | 13,229,488 | | | $ | 11,541,786 | | | $ | 1,723,819 | | | $ | 50,041 | |
DEFA Equity Income Fund | | | | | | | | | | | | | | | | | | | | |
International LargeCap Dividend Fund | | $ | — | | | $ | 1,923,081 | | | $ | 1,716,667 | | | $ | 215,177 | | | $ | 8,454 | |
Global Equity Income Fund | | | | | | | | | | | | | | | | | | | | |
DEFA Equity Income Fund | | $ | — | | | $ | 1,418,081 | | | $ | 1,276,009 | | | $ | 170,446 | | | $ | 15,732 | |
Emerging Markets Equity Income Fund | | | — | | | | 42,252 | | | | 40,537 | | | | — | | | | — | |
WisdomeTree Equity Income Fund | | | — | | | | 466,405 | | | | 425,406 | | | | 56,591 | | | | 5,242 | |
Total | | $ | — | | | $ | 1,926,738 | | | $ | 1,741,952 | | | $ | 227,037 | | | $ | 20,974 | |
Europe SmallCap Dividend Fund | | | | | | | | | | | | | | | | | | | | |
International MidCap Dividend Fund | | $ | — | | | $ | 886,936 | | | $ | 828,186 | | | $ | 97,451 | | | $ | 5,291 | |
International SmallCap Dividend Fund | | | — | | | | 121,167 | | | | 116,980 | | | | — | | | | — | |
Total | | $ | — | | | $ | 1,008,103 | | | $ | 945,166 | | | $ | 97,451 | | | $ | 5,291 | |
Japan Hedged Equity Fund | | | | | | | | | | | | | | | | | | | | |
Japan SmallCap Dividend Fund | | $ | — | | | $ | 239,357 | | | $ | 233,213 | | | $ | — | | | $ | 712 | |
World ex-U.S. Growth Fund | | | | | | | | | | | | | | | | | | | | |
DEFA Fund | | $ | — | | | $ | 525,279 | | | $ | 460,118 | | | $ | 77,100 | | | $ | 4,343 | |
Emerging Markets Equity Income Fund | | | — | | | | 350,364 | | | | 313,650 | | | | 51,882 | | | | 3,069 | |
WisdomTree India Earnings Fund | | | 358,979 | | | | 784,923 | | | | — | | | | 1,174,699 | | | | 4,587 | |
Total | | $ | 358,979 | | | $ | 1,660,566 | | | $ | 773,768 | | | $ | 1,303,681 | | | $ | 11,999 | |
Japan SmallCap Dividend Fund | | | | | | | | | | | | | | | | | | | | |
Japan Hedged Equity Fund | | $ | — | | | $ | 2,188,823 | | | $ | 1,569,700 | | | $ | 572,259 | | | $ | 7,888 | |
Pacific ex-Japan Total Dividend Fund | | | | | | | | | | | | | | | | | | | | |
DEFA Fund | | $ | — | | | $ | 2,129,552 | | | $ | 1,865,589 | | | $ | 348,069 | | | $ | 7,343 | |
Pacific ex-Japan Equity Income Fund | | | — | | | | 89,622 | | | | 84,795 | | | | — | | | | — | |
Total | | $ | — | | | $ | 2,219,174 | | | $ | 1,950,384 | | | $ | 348,069 | | | $ | 7,343 | |
Pacific ex-Japan Equity Income Fund | | | | | | | | | | | | | | | | | | | | |
Pacific ex-Japan Total Dividend Fund | | $ | — | | | $ | 3,388,724 | | | $ | 3,310,592 | | | $ | 136,741 | | | $ | 25,258 | |
International LargeCap Dividend Fund | | | | | | | | | | | | | | | | | | | | |
DEFA Fund | | $ | — | | | $ | 1,392,680 | | | $ | 1,391,773 | | | $ | — | | | $ | 10,166 | |
Pacific ex-Japan Total Dividend Fund | | | — | | | | 1,515,751 | | | | 1,164,160 | | | | 390,104 | | | | 9,446 | |
Total | | $ | — | | | $ | 2,908,431 | | | $ | 2,555,933 | | | $ | 390,104 | | | $ | 19,612 | |
International Dividend ex-Financials Fund | | | | | | | | | | | | | | | | | | | | |
International LargeCap Dividend Fund | | $ | — | | | $ | 2,657,905 | | | $ | 2,604,378 | | | $ | 160,763 | | | $ | 27,837 | |
International MidCap Dividend Fund | | | | | | | | | | | | | | | | | | | | |
International LargeCap Dividend Fund | | $ | — | | | $ | 2,037,596 | | | $ | 1,776,182 | | | $ | 266,492 | | | $ | 15,922 | |
International SmallCap Dividend Fund | | | — | | | | 2,015,188 | | | | 1,825,250 | | | | 271,398 | | | | 14,888 | |
Total | | $ | — | | | $ | 4,052,784 | | | $ | 3,601,432 | | | $ | 537,890 | | | $ | 30,810 | |
| | | | |
| WisdomTree International Dividend and Sector Funds | | | 153 | |
Notes to Financial Statements (concluded)
| | | | | | | | | | | | | | | | | | | | |
| Affiliated Fund Name | | Value at
3/31/2010 | | | Purchases/
Additions | | | Sales/
Reductions | | | Value at
3/31/2011 | | | Dividend
Income | |
International SmallCap Dividend Fund | | | | | | | | | | | | | | | | | | | | |
Europe SmallCap Dividend Fund | | $ | — | | | $ | 1,926,384 | | | $ | 1,276,143 | | | $ | 724,750 | | | $ | 15,994 | |
Japan SmallCap Dividend Fund | | | — | | | | 8,039,464 | | | | 6,840,078 | | | | 1,376,837 | | | | 28,774 | |
International MidCap Dividend Fund | | | — | | | | 909,342 | | | | 852,876 | | | | — | | | | — | |
Total | | $ | — | | | $ | 10,875,190 | | | $ | 8,969,097 | | | $ | 2,101,587 | | | $ | 44,768 | |
Emerging Markets Equity Income Fund | | | | | | | | | | | | | | | | | | | | |
Emerging Markets SmallCap Dividend Fund | | $ | — | | | $ | 8,352,490 | | | $ | 8,868,278 | | | $ | — | | | $ | 44,300 | |
Global Equity Income Fund | | | — | | | | 6,325,798 | | | | 4,512,377 | | | | 1,907,623 | | | | 24,352 | |
Total | | $ | — | | | $ | 14,678,288 | | | $ | 13,380,655 | | | $ | 1,907,623 | | | $ | 68,652 | |
Emerging Markets SmallCap Dividend Fund | | | | | | | | | | | | | | | | | | | | |
Emerging Markets Equity Income Fund | | $ | — | | | $ | 9,450,598 | | | $ | 4,964,972 | | | $ | 4,661,410 | | | $ | 32,052 | |
WisdomTree India Earnings Fund | | | 2,728,210 | | | | 7,880,072 | | | | 523,288 | | | | 10,123,269 | | | | 30,487 | |
Total | | $ | 2,728,210 | | | $ | 17,330,670 | | | $ | 5,488,260 | | | $ | 14,784,679 | | | $ | 62,539 | |
International Hedged Equity Fund | | | | | | | | | | | | | | | | | | | | |
International Dividend ex-Financials Fund | | $ | — | | | $ | 932,662 | | | $ | 975,220 | | | $ | — | | | $ | 5,416 | |
International LargeCap Dividend Fund | | | — | | | | 40,330 | | | | 38,696 | | | | — | | | | — | |
Total | | $ | — | | | $ | 972,992 | | | $ | 1,013,916 | | | $ | — | | | $ | 5,416 | |
International Basic Materials Sector Fund | | | | | | | | | | | | | | | | | | | | |
DEFA Fund | | $ | — | | | $ | 709,382 | | | $ | 675,279 | | | $ | 33,107 | | | $ | 2,674 | |
International Energy Sector Fund | | | | | | | | | | | | | | | | | | | | |
DEFA Fund | | $ | — | | | $ | 1,231,140 | | | $ | 1,114,660 | | | $ | 121,839 | | | $ | 1,523 | |
International Utilities Sector Fund | | | | | | | | | | | | | | | | | | | | |
DEFA Fund | | $ | — | | | $ | 1,508,534 | | | $ | 1,393,695 | | | $ | 107,423 | | | $ | 5,082 | |
International Real Estate Fund | | | | | | | | | | | | | | | | | | | | |
DEFA Fund | | $ | — | | | $ | 2,241,847 | | | $ | 2,027,102 | | | $ | 165,534 | | | $ | 11,366 | |
8. SUBSEQUENT EVENT
Effective June 17, 2011, the WisdomTree Funds listed in the table below will change their investment objective, strategies and fund names. Certain WisdomTree Funds listed below are not part of this report but are part of the 46 funds that comprise the Trust.
| | | | | | |
| Ticker | | Former Fund Name | | New Fund Name | | Primary Change |
DRW | | WisdomTree International Real Estate Fund | | WisdomTree Global ex-U.S. Real Estate Fund | | Broader, global real estate exposure with addition of emerging markets. |
DBU | | WisdomTree International Utilities Sector Fund | | WisdomTree Global ex-U.S. Utility Fund | | Broader, global utilities exposure with addition of emerging markets. |
DBN | | WisdomTree International Basic Materials Sector Fund | | WisdomTree Commodity Country Equity Fund | | More diversified commodity-focused equity strategy; adds emerging markets. |
DKA | | WisdomTree International Energy Sector Fund | | WisdomTree Global Natural Resources Fund | | More diversified energy/natural resources-focused equity strategy; adds emerging markets. |
DND | | WisdomTree Pacific ex-Japan Total Dividend Fund | | WisdomTree Asia Pacific ex-Japan Fund | | Expand portfolio to become a broader Asia-Pacific regional strategy; adds emerging markets. |
DNH | | WisdomTree Pacific ex-Japan Equity Income Fund | | WisdomTree Australia Dividend Fund | | Expand majority Australia portfolio weight to pure Australia dividend strategy. |
DNL | | WisdomTree World ex-U.S. Growth Fund | | WisdomTree Global ex-U.S. Growth Fund | | Name change only. |
The WisdomTree Dreyfus Euro Fund and the WisdomeTree Dreyfus New Zealand Dollar Fund will change their investment objective, strategies and fund names as indicated table below, effective on or after June 27, 2011 and August 26, 2011 respectively.
| | | | | | |
| Ticker | | Former Fund Name | | New Fund Name | | Primary Change/Enhancement |
EU | | WisdomTree Dreyfus Euro Fund | | WisdomTree Dreyfus Euro Debt Fund | | Restructured to provide exposure to debt of issuers in the European Union denominated in Euros. Extend duration to achieve intermediate-term European bond strategy. |
BNZ | | WisdomTree Dreyfus New Zealand Dollar Fund | | WisdomTree Dreyfus Australia & New Zealand Debt Fund | | Restructured to provide exposure to Australia & New Zealand debt denominated in their respective currencies. Extend duration to achieve intermediate-term Australia/New Zealand bond strategy. |
| | |
| 154 | | WisdomTree International Dividend and Sector Funds |
Report of Independent Registered Public Accounting Firm
The Board of Trustees and Shareholders of WisdomTree Trust:
We have audited the accompanying statements of assets and liabilities, including the schedules of investments, of WisdomTree DEFA Fund, WisdomTree DEFA Equity Income Fund, WisdomTree Global Equity Income Fund, WisdomTree Europe SmallCap Dividend Fund, WisdomTree Japan Hedged Equity Fund, WisdomTree World ex-U.S. Growth Fund, WisdomTree Japan SmallCap Dividend Fund, WisdomTree Pacific ex-Japan Total Dividend Fund, WisdomTree Pacific ex-Japan Equity Income Fund, WisdomTree International LargeCap Dividend Fund, WisdomTree International Dividend ex-Financials Fund, WisdomTree International MidCap Dividend Fund, WisdomTree International SmallCap Dividend Fund, WisdomTree Emerging Markets Equity Income Fund, WisdomTree Emerging Markets SmallCap Dividend Fund, WisdomTree Middle East Dividend Fund, WisdomTree International Hedged Equity Fund, WisdomTree International Basic Materials Sector Fund, WisdomTree International Energy Sector Fund, WisdomTree International Utilities Sector Fund and WisdomTree International Real Estate Fund (twenty-one of the investment funds constituting the WisdomTree Trust (the “Trust”)) as of March 31, 2011, and the related statements of operations, the statements of changes in net assets and the financial highlights for each of the periods indicated therein. These financial statements and financial highlights are the responsibility of the Trust’s management. Our responsibility is to express an opinion on these financial statements and financial highlights based on our audits.
We conducted our audits in accordance with the standards of the Public Company Accounting Oversight Board (United States). Those standards require that we plan and perform the audit to obtain reasonable assurance about whether the financial statements and financial highlights are free of material misstatement. We were not engaged to perform an audit of the Trust’s internal control over financial reporting. Our audits included consideration of internal control over financial reporting as a basis for designing audit procedures that are appropriate in the circumstances, but not for the purpose of expressing an opinion on the effectiveness of the Trust’s internal control over financial reporting. Accordingly, we express no such opinion. An audit also includes examining, on a test basis, evidence supporting the amounts and disclosures in the financial statements and financial highlights, assessing the accounting principles used and significant estimates made by management, and evaluating the overall financial statement presentation. Our procedures included confirmation of securities owned as of March 31, 2011, by correspondence with the custodian and brokers or by other appropriate auditing procedures where replies from brokers were not received. We believe that our audits provide a reasonable basis for our opinion.
In our opinion, the financial statements and financial highlights referred to above present fairly, in all material respects, the financial position of WisdomTree DEFA Fund, WisdomTree DEFA Equity Income Fund, WisdomTree Global Equity Income Fund, WisdomTree Europe SmallCap Dividend Fund, WisdomTree Japan Hedged Equity Fund, WisdomTree World ex-US Growth Fund, WisdomTree Japan SmallCap Dividend Fund, WisdomTree Pacific ex-Japan Total Dividend Fund, WisdomTree Pacific ex-Japan Equity Income Fund, WisdomTree International LargeCap Dividend Fund, WisdomTree International Dividend ex-Financials Fund, WisdomTree International MidCap Dividend Fund, WisdomTree International SmallCap Dividend Fund, WisdomTree Emerging Markets Equity Income Fund, WisdomTree Emerging Markets SmallCap Dividend Fund, WisdomTree Middle East Dividend Fund, WisdomTree International Hedged Equity Fund, WisdomTree International Basic Materials Sector Fund, WisdomTree International Energy Sector Fund, WisdomTree International Utilities Sector Fund and WisdomTree International Real Estate Fund of WisdomTree Trust at March 31, 2011, the results of their operations, the changes in their net assets and the financial highlights for each of the indicated periods, in conformity with U.S. generally accepted accounting principles.

New York, New York
May 26, 2011
| | | | |
| WisdomTree International Dividend and Sector Funds | | | 155 | |
Approval of Investment Advisory and Sub-Advisory Agreement (unaudited)
Approval of Investment Advisory Agreement. The Trust and the Investment Adviser have entered into an investment advisory agreement covering each Fund discussed herein. At a meeting held on March 16, 2011, the Board of Trustees re-approved the Investment Advisory Agreement for each Fund. The Board reviewed and analyzed the factors it deemed relevant, including: (i) the nature, quality and extent of the services to be provided to the Funds by WTAM; (ii) the performance of the Funds; (iii) the costs of services to be provided and the profits to be realized by WTAM from its relationship with the Funds; (iv) the extent to which economies of scale would be realized as the Funds grow; (v) whether the fee levels reflect these economies of scale for the benefit of investors; and (vi) the fees charged by the Investment Adviser for non-registered funds.
The Board also considered the nature and quality of the services to be provided by WTAM to the Funds, recognizing WTAM’s operational capabilities and resources. The Board also noted the extensive responsibilities that WTAM has as investment adviser to the Funds, including the selection of the Funds’ Sub-Advisers and oversight of the Sub-Advisers’ compliance with Fund policies and objectives, oversight of general Fund compliance with federal and state laws, and the implementation of Board directives as they relate to the Funds.
The Board gave substantial consideration to the fees payable under the Advisory Agreement. In this connection, the Board evaluated WTAM’s anticipated costs and profitability in serving as investment adviser to the Funds, including the costs associated with the personnel, systems and equipment necessary to manage the Funds and the costs associated with compensating the Sub-Adviser. The Board also examined the fees to be paid by each Fund in light of fees paid to other investment managers by comparable funds and the method of computing each Fund’s fee. After comparing the fees with those of comparable funds and in light of the quality and extent of services to be provided and the costs anticipated to be incurred by WTAM, the Board concluded that the level of the fees paid to WTAM with respect to each Fund is fair and reasonable. The Board also re-approved the Sub-Advisory Agreement between WTAM and Mellon Capital Management (“MCM”), on behalf of each Fund, using essentially the same criteria it used in connection with the Advisory Agreement. The Board considered MCM’s operational capabilities and resources and MCM’s experience in serving as an adviser to ETFs, noting that MCM currently provides investment advisory and management services to other ETFs. The Board considered the investment performance of the Funds, and the expertise and performance of the MCM personnel. The Board also noted that Bank of New York Mellon Corporation, an affiliate of MCM, serves as the Funds’ administrator, accountant, custodian, transfer agent and securities lending agent and receives compensation for acting in these capacities and is responsible for, among other things, coordinating the Funds’ audits, financial statements and tax returns, managing expenses and budgeting for the Funds, processing trades on behalf of each Fund and custodying Fund assets. As such, the Board concluded that the benefits accruing to MCM and its affiliates by virtue of their relationship to the Trust are reasonable and fair in comparison with the anticipated costs of providing the relevant services. The Board noted that WTAM, not the Funds, pays the fees to MCM under the Sub-Advisory Agreement for each Fund.
Based on these considerations and the overall high quality of the personnel, operations, financial condition, investment advisory capabilities, methodologies, and performance of WTAM and MCM, the Board determined that the re-approval of the Advisory Agreements and the Sub-Advisory Agreements was in the best interests of each Fund. After full consideration of these and other factors, the Board, including a majority of the Independent Trustees, with the assistance of independent counsel, approved the Advisory Agreements and Sub-Advisory Agreements.
| | |
| 156 | | WisdomTree International Dividend and Sector Funds |
Frequency Distribution of Discounts & Premiums (unaudited)
The chart below presents information about differences between the per share net asset value (“NAV”) of each Fund and the market trading price of shares of each Fund. For these purposes, the “market price” is the mid-point of the highest bid and lowest offer for Fund shares as of the close of trading on the exchange where Fund shares are listed. The term “premium” is sometimes used to describe a market price in excess of NAV and the term “discount” is sometimes used to describe a market price below NAV. The chart presents information about the size and frequency of premiums or discounts. As with other exchange traded funds, the market price of Fund shares is typically slightly higher or lower than the Fund’s per share NAV. Factors that contribute to the differences between market price and NAV include the supply and demand for Fund shares and investors’ assessments of the underlying value of a Fund’s portfolio securities. Differences between the closing times of U.S. and non-U.S. markets may contribute to differences between the NAV and market price of Fund shares. Many non-U.S. markets close prior to the close of the U.S. securities exchanges. Developments after the close of such markets as a result of ongoing price discovery may be reflected in a Fund’s market price but not in its NAV (or vice versa).
| | | | | | | | | | | | | | | | | | | | |
| | | | | | Market Price Above or
Equal to Net Asset Value | | | Market Price Below
Net Asset Value | |
| | | Basis Point
Differential | | | Number
of Days | | | Percentage of
Total Days | | | Number
of Days | | | Percentage
of Total Days | |
WisdomTree DEFA Fund | | | | | | | | | | | | | | | | | | | | |
June 16, 2006 – March 31, 2011 | | | 0 – 24.9 | | | | 170 | | | | 13.41 | % | | | 93 | | | | 7.34 | % |
| | | 25 – 49.9 | | | | 219 | | | | 17.26 | % | | | 84 | | | | 6.62 | % |
| | | 50 – 74.9 | | | | 198 | | | | 15.62 | % | | | 54 | | | | 4.26 | % |
| | | 75 – 99.9 | | | | 118 | | | | 9.31 | % | | | 43 | | | | 3.39 | % |
| | | 100 – 124.9 | | | | 67 | | | | 5.28 | % | | | 31 | | | | 2.44 | % |
| | | 125 – 174.9 | | | | 64 | | | | 5.05 | % | | | 43 | | | | 3.39 | % |
| | | 175 – 199.9 | | | | 11 | | | | 0.87 | % | | | 11 | | | | 0.87 | % |
| | | 200 – 249.9 | | | | 15 | | | | 1.18 | % | | | 11 | | | | 0.87 | % |
| | | >250 | | | | 18 | | | | 1.42 | % | | | 18 | | | | 1.42 | % |
| | | | Total | | | | 880 | | | | 69.40 | % | | | 388 | | | | 30.60 | % |
WisdomTree DEFA Equity Income Fund | | | | | | | | | | | | | | | | | | | | |
June 16, 2006 – March 31, 2011 | | | 0 – 24.9 | | | | 164 | | | | 12.93 | % | | | 139 | | | | 10.95 | % |
| | | 25 – 49.9 | | | | 185 | | | | 14.59 | % | | | 109 | | | | 8.60 | % |
| | | 50 – 74.9 | | | | 185 | | | | 14.59 | % | | | 62 | | | | 4.89 | % |
| | | 75 – 99.9 | | | | 109 | | | | 8.60 | % | | | 48 | | | | 3.79 | % |
| | | 100 – 124.9 | | | | 49 | | | | 3.86 | % | | | 38 | | | | 3.00 | % |
| | | 125 – 174.9 | | | | 41 | | | | 3.23 | % | | | 43 | | | | 3.39 | % |
| | | 175 – 199.9 | | | | 13 | | | | 1.03 | % | | | 14 | | | | 1.10 | % |
| | | 200 – 249.9 | | | | 13 | | | | 1.03 | % | | | 21 | | | | 1.66 | % |
| | | >250 | | | | 19 | | | | 1.50 | % | | | 16 | | | | 1.26 | % |
| | | | Total | | | | 778 | | | | 61.36 | % | | | 490 | | | | 38.64 | % |
WisdomTree Global Equity Income Fund | | | | | | | | | | | | | | | | | | | | |
June 16, 2006 – March 31, 2011 | | | 0 – 24.9 | | | | 192 | | | | 15.14 | % | | | 123 | | | | 9.71 | % |
| | | 25 – 49.9 | | | | 213 | | | | 16.81 | % | | | 67 | | | | 5.28 | % |
| | | 50 – 74.9 | | | | 199 | | | | 15.69 | % | | | 45 | | | | 3.55 | % |
| | | 75 – 99.9 | | | | 140 | | | | 11.04 | % | | | 42 | | | | 3.31 | % |
| | | 100 – 124.9 | | | | 76 | | | | 5.99 | % | | | 27 | | | | 2.13 | % |
| | | 125 – 174.9 | | | | 51 | | | | 4.02 | % | | | 25 | | | | 1.97 | % |
| | | 175 – 199.9 | | | | 8 | | | | 0.63 | % | | | 6 | | | | 0.47 | % |
| | | 200 – 249.9 | | | | 12 | | | | 0.95 | % | | | 7 | | | | 0.55 | % |
| | | >250 | | | | 18 | | | | 1.42 | % | | | 17 | | | | 1.34 | % |
| | | | Total | | | | 909 | | | | 71.69 | % | | | 359 | | | | 28.31 | % |
WisdomTree Europe SmallCap Dividend Fund | | | | | | | | | | | | | | | | | | | | |
June 16, 2006 – March 31, 2011 | | | 0 – 24.9 | | | | 179 | | | | 14.11 | % | | | 156 | | | | 12.30 | % |
| | | 25 – 49.9 | | | | 144 | | | | 11.35 | % | | | 127 | | | | 10.02 | % |
| | | 50 – 74.9 | | | | 120 | | | | 9.46 | % | | | 90 | | | | 7.10 | % |
| | | 75 – 99.9 | | | | 66 | | | | 5.21 | % | | | 74 | | | | 5.84 | % |
| | | 100 – 124.9 | | | | 38 | | | | 3.00 | % | | | 64 | | | | 5.05 | % |
| | | 125 – 174.9 | | | | 36 | | | | 2.84 | % | | | 75 | | | | 5.91 | % |
| | | 175 – 199.9 | | | | 8 | | | | 0.63 | % | | | 23 | | | | 1.81 | % |
| | | 200 – 249.9 | | | | 12 | | | | 0.95 | % | | | 12 | | | | 0.95 | % |
| | | >250 | | | | 13 | | | | 1.03 | % | | | 31 | | | | 2.44 | % |
| | | | Total | | | | 616 | | | | 48.58 | % | | | 652 | | | | 51.42 | % |
| | | | |
| WisdomTree International Dividend and Sector Funds | | | 157 | |
Frequency Distribution of Discounts & Premiums (unaudited) (continued)
| | | | | | | | | | | | | | | | | | | | |
| | | | | | Market Price Above or
Equal to Net Asset Value | | | Market Price Below
Net Asset Value | |
| | | Basis Point
Differential | | | Number
of Days | | | Percentage of
Total Days | | | Number
of Days | | | Percentage
of Total Days | |
WisdomTree Japan Hedged Equity Fund | | | | | | | | | | | | | | | | | | | | |
June 16, 2006 – March 31, 2011 | | | 0 – 24.9 | | | | 126 | | | | 9.94 | % | | | 108 | | | | 8.51 | % |
| | | 25 – 49.9 | | | | 126 | | | | 9.94 | % | | | 91 | | | | 7.18 | % |
| | | 50 – 74.9 | | | | 138 | | | | 10.89 | % | | | 67 | | | | 5.28 | % |
| | | 75 – 99.9 | | | | 111 | | | | 8.75 | % | | | 50 | | | | 3.94 | % |
| | | 100 –124.9 | | | | 70 | | | | 5.52 | % | | | 37 | | | | 2.92 | % |
| | | 125 –174.9 | | | | 77 | | | | 6.07 | % | | | 84 | | | | 6.62 | % |
| | | 175 –199.9 | | | | 26 | | | | 2.05 | % | | | 13 | | | | 1.03 | % |
| | | 200 –249.9 | | | | 25 | | | | 1.97 | % | | | 22 | | | | 1.74 | % |
| | | >250 | | | | 36 | | | | 2.84 | % | | | 61 | | | | 4.81 | % |
| | | | Total | | | | 735 | | | | 57.97 | % | | | 533 | | | | 42.03 | % |
WisdomTree World ex-U.S.Growth Fund | | | | | | | | | | | | | | | | | | | | |
June 16, 2006 – March 31, 2011 | | | 0 – 24.9 | | | | 127 | | | | 10.02 | % | | | 124 | | | | 9.77 | % |
| | | 25 – 49.9 | | | | 153 | | | | 12.06 | % | | | 76 | | | | 5.99 | % |
| | | 50 – 74.9 | | | | 165 | | | | 13.01 | % | | | 65 | | | | 5.13 | % |
| | | 75 – 99.9 | | | | 116 | | | | 9.15 | % | | | 56 | | | | 4.42 | % |
| | | 100 –124.9 | | | | 68 | | | | 5.36 | % | | | 37 | | | | 2.92 | % |
| | | 125 – 174.9 | | | | 55 | | | | 4.34 | % | | | 57 | | | | 4.50 | % |
| | | 175 – 199.9 | | | | 14 | | | | 1.10 | % | | | 21 | | | | 1.66 | % |
| | | 200 – 249.9 | | | | 22 | | | | 1.74 | % | | | 31 | | | | 2.44 | % |
| | | >250 | | | | 34 | | | | 2.68 | % | | | 47 | | | | 3.71 | % |
| | | | Total | | | | 754 | | | | 59.46 | % | | | 514 | | | | 40.54 | % |
WisdomTree Japan SmallCap Dividend Fund | | | | | | | | | | | | | | | | | | | | |
June 16, 2006 – March 31, 2011 | | | 0 – 24.9 | | | | 134 | | | | 10.57 | % | | | 97 | | | | 7.65 | % |
| | | 25 – 49.9 | | | | 154 | | | | 12.15 | % | | | 103 | | | | 8.12 | % |
| | | 50 – 74.9 | | | | 117 | | | | 9.23 | % | | | 70 | | | | 5.52 | % |
| | | 75 – 99.9 | | | | 97 | | | | 7.65 | % | | | 59 | | | | 4.65 | % |
| | | 100 – 124.9 | | | | 75 | | | | 5.91 | % | | | 38 | | | | 3.00 | % |
| | | 125 – 174.9 | | | | 80 | | | | 6.31 | % | | | 70 | | | | 5.52 | % |
| | | 175 – 199.9 | | | | 17 | | | | 1.34 | % | | | 16 | | | | 1.26 | % |
| | | 200 – 249.9 | | | | 23 | | | | 1.81 | % | | | 37 | | | | 2.92 | % |
| | | >250 | | | | 38 | | | | 3.00 | % | | | 43 | | | | 3.39 | % |
| | | | Total | | | | 735 | | | | 57.97 | % | | | 533 | | | | 42.03 | % |
WisdomTree Pacific ex-Japan Total Dividend Fund | | | | | | | | | | | | | | | | | | | | |
June 16, 2006 – March 31, 2011 | | | 0 – 24.9 | | | | 141 | | | | 11.12 | % | | | 129 | | | | 10.17 | % |
| | | 25 – 49.9 | | | | 167 | | | | 13.18 | % | | | 96 | | | | 7.57 | % |
| | | 50 – 74.9 | | | | 103 | | | | 8.12 | % | | | 68 | | | | 5.36 | % |
| | | 75 – 99.9 | | | | 92 | | | | 7.26 | % | | | 42 | | | | 3.31 | % |
| | | 100 – 124.9 | | | | 59 | | | | 4.65 | % | | | 47 | | | | 3.71 | % |
| | | 125 – 174.9 | | | | 71 | | | | 5.60 | % | | | 62 | | | | 4.89 | % |
| | | 175 – 199.9 | | | | 23 | | | | 1.81 | % | | | 19 | | | | 1.50 | % |
| | | 200 – 249.9 | | | | 26 | | | | 2.05 | % | | | 36 | | | | 2.84 | % |
| | | >250 | | | | 31 | | | | 2.44 | % | | | 56 | | | | 4.42 | % |
| | | | Total | | | | 713 | | | | 56.23 | % | | | 555 | | | | 43.77 | % |
WisdomTree Pacific ex-Japan Equity Income Fund | | | | | | | | | | | | | | | | | | | | |
June 16, 2006 – March 31, 2011 | | | 0 – 24.9 | | | | 144 | | | | 11.35 | % | | | 112 | | | | 8.83 | % |
| | | 25 – 49.9 | | | | 142 | | | | 11.20 | % | | | 93 | | | | 7.33 | % |
| | | 50 – 74.9 | | | | 125 | | | | 9.86 | % | | | 62 | | | | 4.89 | % |
| | | 75 – 99.9 | | | | 91 | | | | 7.18 | % | | | 55 | | | | 4.34 | % |
| | | 100 – 124.9 | | | | 60 | | | | 4.73 | % | | | 46 | | | | 3.63 | % |
| | | 125 – 174.9 | | | | 69 | | | | 5.44 | % | | | 72 | | | | 5.68 | % |
| | | 175 – 199.9 | | | | 18 | | | | 1.42 | % | | | 18 | | | | 1.42 | % |
| | | 200 – 249.9 | | | | 28 | | | | 2.21 | % | | | 32 | | | | 2.52 | % |
| | | >250 | | | | 30 | | | | 2.37 | % | | | 71 | | | | 5.60 | % |
| | | | Total | | | | 707 | | | | 55.76 | % | | | 561 | | | | 44.24 | % |
| | |
| 158 | | WisdomTree International Dividend and Sector Funds |
Frequency Distribution of Discounts & Premiums (unaudited) (continued)
| | | | | | | | | | | | | | | | | | | | |
| | | | | | Market Price Above or
Equal to Net Asset Value | | | Market Price Below
Net Asset Value | |
| | | Basis Point
Differential | | | Number
of Days | | | Percentage of
Total Days | | | Number
of Days | | | Percentage
of Total Days | |
WisdomTree International LargeCap Dividend Fund | | | | | | | | | | | | | | | | | | | | |
June 16, 2006 – March 31, 2011 | | | 0 – 24.9 | | | | 176 | | | | 13.88 | % | | | 116 | | | | 9.15 | % |
| | | 25 – 49.9 | | | | 237 | | | | 18.69 | % | | | 65 | | | | 5.13 | % |
| | | 50 – 74.9 | | | | 178 | | | | 14.04 | % | | | 50 | | | | 3.94 | % |
| | | 75 – 99.9 | | | | 125 | | | | 9.86 | % | | | 40 | | | | 3.15 | % |
| | | 100 – 124.9 | | | | 61 | | | | 4.81 | % | | | 38 | | | | 3.00 | % |
| | | 125 – 174.9 | | | | 63 | | | | 4.97 | % | | | 35 | | | | 2.76 | % |
| | | 175 – 199.9 | | | | 10 | | | | 0.79 | % | | | 11 | | | | 0.87 | % |
| | | 200 – 249.9 | | | | 15 | | | | 1.18 | % | | | 9 | | | | 0.71 | % |
| | | >250 | | | | 23 | | | | 1.81 | % | | | 16 | | | | 1.26 | % |
| | | | Total | | | | 888 | | | | 70.03 | % | | | 380 | | | | 29.97 | % |
WisdomTree International Dividend ex-Financials Fund | | | | | | | | | | | | | | | | | | | | |
June 16, 2006 – March 31, 2011 | | | 0 – 24.9 | | | | 172 | | | | 13.57 | % | | | 144 | | | | 11.35 | % |
| | | 25 – 49.9 | | | | 199 | | | | 15.70 | % | | | 95 | | | | 7.49 | % |
| | | 50 – 74.9 | | | | 174 | | | | 13.72 | % | | | 57 | | | | 4.50 | % |
| | | 75 – 99.9 | | | | 77 | | | | 6.07 | % | | | 41 | | | | 3.23 | % |
| | | 100 – 124.9 | | | | 62 | | | | 4.89 | % | | | 44 | | | | 3.47 | % |
| | | 125 – 174.9 | | | | 50 | | | | 3.94 | % | | | 53 | | | | 4.18 | % |
| | | 175 – 199.9 | | | | 16 | | | | 1.26 | % | | | 18 | | | | 1.42 | % |
| | | 200 – 249.9 | | | | 10 | | | | 0.79 | % | | | 13 | | | | 1.03 | % |
| | | >250 | | | | 15 | | | | 1.18 | % | | | 28 | | | | 2.21 | % |
| | | | Total | | | | 775 | | | | 61.12 | % | | | 493 | | | | 38.88 | % |
WisdomTree International MidCap Dividend Fund | | | | | | | | | | | | | | | | | | | | |
June 16, 2006 – March 31, 2011 | | | 0 – 24.9 | | | | 166 | | | | 13.09 | % | | | 159 | | | | 12.54 | % |
| | | 25 – 49.9 | | | | 188 | | | | 14.83 | % | | | 126 | | | | 9.94 | % |
| | | 50 – 74.9 | | | | 161 | | | | 12.70 | % | | | 57 | | | | 4.50 | % |
| | | 75 – 99.9 | | | | 63 | | | | 4.97 | % | | | 46 | | | | 3.63 | % |
| | | 100 – 124.9 | | | | 58 | | | | 4.57 | % | | | 44 | | | | 3.47 | % |
| | | 125 – 174.9 | | | | 47 | | | | 3.71 | % | | | 62 | | | | 4.89 | % |
| | | 175 – 199.9 | | | | 15 | | | | 1.18 | % | | | 15 | | | | 1.18 | % |
| | | 200 – 249.9 | | | | 6 | | | | 0.47 | % | | | 15 | | | | 1.18 | % |
| | | >250 | | | | 16 | | | | 1.26 | % | | | 24 | | | | 1.89 | % |
| | | | Total | | | | 720 | | | | 56.78 | % | | | 548 | | | | 43.22 | % |
WisdomTree International SmallCap Dividend Fund | | | | | | | | | | | | | | | | | | | | |
June 16, 2006 – March 31, 2011 | | | 0 – 24.9 | | | | 157 | | | | 12.38 | % | | | 110 | | | | 8.68 | % |
| | | 25 – 49.9 | | | | 186 | | | | 14.67 | % | | | 92 | | | | 7.26 | % |
| | | 50 – 74.9 | | | | 157 | | | | 12.38 | % | | | 43 | | | | 3.39 | % |
| | | 75 – 99.9 | | | | 125 | | | | 9.86 | % | | | 44 | | | | 3.47 | % |
| | | 100 – 124.9 | | | | 88 | | | | 6.94 | % | | | 40 | | | | 3.15 | % |
| | | 125 – 174.9 | | | | 82 | | | | 6.47 | % | | | 33 | | | | 2.60 | % |
| | | 175 – 199.9 | | | | 22 | | | | 1.74 | % | | | 14 | | | | 1.10 | % |
| | | 200 – 249.9 | | | | 14 | | | | 1.10 | % | | | 21 | | | | 1.66 | % |
| | | >250 | | | | 24 | | | | 1.89 | % | | | 16 | | | | 1.26 | % |
| | | | Total | | | | 855 | | | | 67.43 | % | | | 413 | | | | 32.57 | % |
| | | | |
| WisdomTree International Dividend and Sector Funds | | | 159 | |
Frequency Distribution of Discounts & Premiums (unaudited) (continued)
| | | | | | | | | | | | | | | | | | | | |
| | | | | | Market Price Above or
Equal to Net Asset Value | | | Market Price Below
Net Asset Value | |
| | | Basis Point
Differential | | | Number
of Days | | | Percentage of
Total Days | | | Number
of Days | | | Percentage
of Total Days | |
WisdomTree Emerging Markets Equity Income Fund | | | | | | | | | | | | | | | | | | | | |
July 13, 2007 – March 31, 2011 | | | 0 – 24.9 | | | | 84 | | | | 8.41 | % | | | 61 | | | | 6.12 | % |
| | | 25 – 49.9 | | | | 80 | | | | 8.01 | % | | | 37 | | | | 3.71 | % |
| | | 50 – 74.9 | | | | 115 | | | | 11.51 | % | | | 21 | | | | 2.10 | % |
| | | 75 – 99.9 | | | | 119 | | | | 11.92 | % | | | 36 | | | | 3.60 | % |
| | | 100 –124.9 | | | | 111 | | | | 11.11 | % | | | 26 | | | | 2.60 | % |
| | | 125 – 174.9 | | | | 131 | | | | 13.11 | % | | | 27 | | | | 2.70 | % |
| | | 175 – 199.9 | | | | 33 | | | | 3.30 | % | | | 15 | | | | 1.50 | % |
| | | 200 – 249.9 | | | | 28 | | | | 2.80 | % | | | 11 | | | | 1.10 | % |
| | | >250 | | | | 37 | | | | 3.70 | % | | | 27 | | | | 2.70 | % |
| | | | Total | | | | 738 | | | | 73.87 | % | | | 261 | | | | 26.13 | % |
WisdomTree Emerging Markets SmallCap Dividend Fund | | | | | | | | | | | | | | | | | | | | |
October 30, 2007 – March 31, 2011 | | | 0 – 24.9 | | | | 84 | | | | 9.10 | % | | | 61 | | | | 6.61 | % |
| | | 25 – 49.9 | | | | 82 | | | | 8.88 | % | | | 37 | | | | 4.01 | % |
| | | 50 – 74.9 | | | | 98 | | | | 10.62 | % | | | 39 | | | | 4.23 | % |
| | | 75 – 99.9 | | | | 92 | | | | 9.97 | % | | | 27 | | | | 2.93 | % |
| | | 100 –124.9 | | | | 90 | | | | 9.75 | % | | | 29 | | | | 3.14 | % |
| | | 125 – 174.9 | | | | 99 | | | | 10.73 | % | | | 30 | | | | 3.25 | % |
| | | 175 – 199.9 | | | | 29 | | | | 3.14 | % | | | 10 | | | | 1.08 | % |
| | | 200 – 249.9 | | | | 35 | | | | 3.79 | % | | | 13 | | | | 1.41 | % |
| | | >250 | | | | 46 | | | | 4.98 | % | | | 22 | | | | 2.38 | % |
| | | | Total | | | | 655 | | | | 70.96 | % | | | 268 | | | | 29.04 | % |
WisdomTree Middle East Dividend Fund | | | | | | | | | | | | | | | | | | | | |
July 16, 2008 – March 31, 2011 | | | 0 – 24.9 | | | | 24 | | | | 3.22 | % | | | 20 | | | | 2.68 | % |
| | | 25 – 49.9 | | | | 53 | | | | 7.11 | % | | | 24 | | | | 3.23 | % |
| | | 50 – 74.9 | | | | 57 | | | | 7.65 | % | | | 10 | | | | 1.34 | % |
| | | 75 – 99.9 | | | | 57 | | | | 7.65 | % | | | 7 | | | | 0.94 | % |
| | | 100 –124.9 | | | | 73 | | | | 9.80 | % | | | 5 | | | | 0.67 | % |
| | | 125 – 174.9 | | | | 119 | | | | 15.98 | % | | | 14 | | | | 1.88 | % |
| | | 175 – 199.9 | | | | 47 | | | | 6.31 | % | | | 1 | | | | 0.13 | % |
| | | 200 – 249.9 | | | | 69 | | | | 9.26 | % | | | 9 | | | | 1.21 | % |
| | | >250 | | | | 141 | | | | 18.93 | % | | | 15 | | | | 2.01 | % |
| | | | Total | | | | 640 | | | | 85.91 | % | | | 105 | | | | 14.09 | % |
WisdomTree International Hedged Equity Income Fund | | | | | | | | | | | | | | | | | | | | |
| | | 0 – 24.9 | | | | 51 | | | | 16.19 | % | | | 37 | | | | 11.75 | % |
| | | 25 – 49.9 | | | | 49 | | | | 15.56 | % | | | 14 | | | | 4.44 | % |
| | | 50 – 74.9 | | | | 44 | | | | 13.97 | % | | | 7 | | | | 2.22 | % |
| | | 75 – 99.9 | | | | 46 | | | | 14.60 | % | | | 11 | | | | 3.49 | % |
| | | 100 – 124.9 | | | | 34 | | | | 10.79 | % | | | 0 | | | | 0.00 | % |
| | | 125 – 174.9 | | | | 10 | | | | 3.17 | % | | | 6 | | | | 1.90 | % |
| | | 175 – 199.9 | | | | 1 | | | | 0.32 | % | | | 1 | | | | 0.32 | % |
| | | 200 – 249.9 | | | | 1 | | | | 0.32 | % | | | 1 | | | | 0.32 | % |
| | | >250 | | | | 1 | | | | 0.32 | % | | | 1 | | | | 0.32 | % |
| | | | Total | | | | 237 | | | | 75.24 | % | | | 78 | | | | 24.76 | % |
| | |
| 160 | | WisdomTree International Dividend and Sector Funds |
Frequency Distribution of Discounts & Premiums (unaudited) (concluded)
| | | | | | | | | | | | | | | | | | | | |
| | | | | | Market Price Above or
Equal to Net Asset Value | | | Market Price Below
Net Asset Value | |
| | | Basis Point
Differential | | | Number
of Days | | | Percentage of
Total Days | | | Number
of Days | | | Percentage
of Total Days | |
WisdomTree International Basic Materials Sector Fund | | | | | | | | | | | | | | | | | | | | |
October 13, 2006 – March 31, 2011 | | | 0 – 24.9 | | | | 157 | | | | 13.25 | % | | | 141 | | | | 11.90 | % |
| | | 25 – 49.9 | | | | 146 | | | | 12.31 | % | | | 92 | | | | 7.76 | % |
| | | 50 – 74.9 | | | | 146 | | | | 12.31 | % | | | 71 | | | | 5.99 | % |
| | | 75 – 99.9 | | | | 86 | | | | 7.26 | % | | | 41 | | | | 3.46 | % |
| | | 100 – 124.9 | | | | 61 | | | | 5.15 | % | | | 39 | | | | 3.29 | % |
| | | 125 – 174.9 | | | | 47 | | | | 3.97 | % | | | 57 | | | | 4.81 | % |
| | | 175 – 199.9 | | | | 13 | | | | 1.10 | % | | | 13 | | | | 1.10 | % |
| | | 200 – 249.9 | | | | 13 | | | | 1.10 | % | | | 18 | | | | 1.52 | % |
| | | >250 | | | | 20 | | | | 1.69 | % | | | 24 | | | | 2.03 | % |
| | | | Total | | | | 689 | | | | 58.14 | % | | | 496 | | | | 41.86 | % |
WisdomTree International Energy Sector Fund | | | | | | | | | | | | | | | | | | | | |
October 13, 2006 – March 31, 2011 | | | 0 – 24.9 | | | | 121 | | | | 10.21 | % | | | 104 | | | | 8.78 | % |
| | | 25 – 49.9 | | | | 139 | | | | 11.73 | % | | | 90 | | | | 7.59 | % |
| | | 50 – 74.9 | | | | 125 | | | | 10.55 | % | | | 60 | | | | 5.06 | % |
| | | 75 – 99.9 | | | | 107 | | | | 9.03 | % | | | 38 | | | | 3.21 | % |
| | | 100 – 124.9 | | | | 96 | | | | 8.10 | % | | | 38 | | | | 3.21 | % |
| | | 125 – 174.9 | | | | 80 | | | | 6.75 | % | | | 56 | | | | 4.73 | % |
| | | 175 – 199.9 | | | | 16 | | | | 1.35 | % | | | 17 | | | | 1.43 | % |
| | | 200 – 249.9 | | | | 24 | | | | 2.03 | % | | | 10 | | | | 0.84 | % |
| | | >250 | | | | 26 | | | | 2.19 | % | | | 38 | | | | 3.21 | % |
| | | | Total | | | | 734 | | | | 61.94 | % | | | 451 | | | | 38.06 | % |
WisdomTree International Utilities Sector Fund | | | | | | | | | | | | | | | | | | | | |
October 13, 2006 – March 31, 2011 | | | 0 – 24.9 | | | | 128 | | | | 10.80 | % | | | 119 | | | | 10.04 | % |
| | | 25 – 49.9 | | | | 153 | | | | 12.92 | % | | | 82 | | | | 6.92 | % |
| | | 50 – 74.9 | | | | 149 | | | | 12.57 | % | | | 74 | | | | 6.24 | % |
| | | 75 – 99.9 | | | | 109 | | | | 9.20 | % | | | 60 | | | | 5.06 | % |
| | | 100 – 124.9 | | | | 57 | | | | 4.81 | % | | | 40 | | | | 3.38 | % |
| | | 125 – 174.9 | | | | 50 | | | | 4.22 | % | | | 62 | | | | 5.23 | % |
| | | 175 – 199.9 | | | | 17 | | | | 1.43 | % | | | 13 | | | | 1.10 | % |
| | | 200 – 249.9 | | | | 11 | | | | 0.93 | % | | | 14 | | | | 1.18 | % |
| | | >250 | | | | 16 | | | | 1.35 | % | | | 31 | | | | 2.62 | % |
| | | | Total | | | | 690 | | | | 58.23 | % | | | 495 | | | | 41.77 | % |
WisdomTree International Real Estate Fund | | | | | | | | | | | | | | | | | | | | |
June 5, 2007 – March 31, 2011 | | | 0 – 24.9 | | | | 113 | | | | 11.01 | % | | | 76 | | | | 7.41 | % |
| | | 25 – 49.9 | | | | 149 | | | | 14.52 | % | | | 59 | | | | 5.75 | % |
| | | 50 – 74.9 | | | | 116 | | | | 11.31 | % | | | 35 | | | | 3.41 | % |
| | | 75 – 99.9 | | | | 88 | | | | 8.58 | % | | | 40 | | | | 3.90 | % |
| | | 100 – 124.9 | | | | 67 | | | | 6.53 | % | | | 36 | | | | 3.51 | % |
| | | 125 – 174.9 | | | | 71 | | | | 6.92 | % | | | 41 | | | | 4.00 | % |
| | | 175 – 199.9 | | | | 25 | | | | 2.44 | % | | | 22 | | | | 2.14 | % |
| | | 200 – 249.9 | | | | 18 | | | | 1.75 | % | | | 14 | | | | 1.36 | % |
| | | >250 | | | | 23 | | | | 2.24 | % | | | 33 | | | | 3.22 | % |
| | | | Total | | | | 670 | | | | 65.30 | % | | | 356 | | | | 34.70 | % |
| | | | |
| WisdomTree International Dividend and Sector Funds | | | 161 | |
Trustee and Officer Information (unaudited)
The Board of Trustees has responsibility for the overall management and operations of the Funds, including general supervision of the duties performed by WisdomTree Asset Management and other service providers. The Board of Trustees elects the officers of the Trust who are responsible for administering the Trust’s day-to-day operations. Each Trustee serves until his or her successor is duly elected or appointed and qualified.
The address of each Trustee and Officer is c/o WisdomTree Asset Management, Inc., 380 Madison Avenue, 21st Floor, New York, NY 10017.
Interested Trustee and Officers
| | | | | | | | | | | | |
Name (year of birth) | | Position | | Term of Office
and Length of
Time Served | | Principal Occupation(s) During the Past 5 Years | | Number of Portfolios
in Fund Complex
Overseen by
Trustee/Officer+ | | | Other Directorships Held by
Trustee/Officer |
Jonathan Steinberg (1964) | | Trustee, President* | | Trustee and Officer since 2005 | | President, WisdomTree Trust since 2005; Chief Executive Officer of WisdomTree Investments, Inc. and Director of WisdomTree Investments, Inc. since 1989. | | | 46 | | | None. |
| | | | | |
Amit Muni (1969) | | Treasurer,* Assistant Secretary* | | Officer since 2008 | | Chief Financial Officer and Assistant Secretary of WisdomTree Investments, Inc. since March 2008; International Securities Exchange Holdings, Inc. (ISE), Controller and Chief Accounting Officer from 2003 to 2008. | | | 46 | | | None. |
| | | | | |
Richard Morris (1967) | | Secretary,* Chief Legal Officer* | | Officer since 2005 | | General Counsel of WisdomTree Asset Management since 2009; Chief Compliance Officer of WisdomTree Trust since 2009; Deputy General Counsel of WisdomTree Investments, Inc. since 2005; Senior Counsel at Barclays Global Investors, N.A. from 2002 to 2005. | | | 46 | | | None. |
| * | Elected by and serves at the pleasure of the Board of Trustees. |
| | |
| 162 | | WisdomTree International Dividend and Sector Funds |
Trustee and Officer Information (unaudited) (concluded)
Independent Trustees
| | | | | | | | | | | | |
Name (year of birth) | | Position | | Term of Office
and Length of
Time Served | | Principal Occupation(s) During the Past 5 Years | | Number of Portfolios
in Fund Complex
Overseen by
Trustee+ | | | Other
Directorships Held by Trustee |
Gregory Barton (1961)* | | Trustee | | Trustee since 2006 | | Executive Vice President of Business Legal Affairs, General Counsel and Secretary of TheStreet.com, Inc., 2009 to present; General Counsel of Martha Stewart Living Omnimedia, Inc. from 2007 to 2008; Executive Vice President of Licensing and Legal Affairs, General Counsel and Secretary of Ziff Davis Media Inc. from 2004 to 2007; Executive Vice President of Legal Affairs, General Counsel and Secretary of Ziff Davis Media Inc. from 2002 to 2004; President from 2001 to 2002, Chief Financial Officer from 2000 to 2002, Vice President of Business Development from 1999 to 2001 and General Counsel and Secretary from 1998 to 2002 of WisdomTree Investments, Inc. | | | 46 | | | Trustee. GLG Investment Series Trust |
| | | | | |
Toni Massaro (1955)** | | Trustee | | Trustee since 2006 | | Dean Emerita at University of Arizona James E. Rogers College of Law (“Rogers College of Law”) since 1999; Dean at the Rogers College of Law from 1999 to 2009; Regents’ Professor since 2006; Milton O. Riepe Chair in Constitutional Law since 1997; Professor at the Rogers College of Law since 1990. | | | 46 | | | None. |
| | | | | |
Victor Ugolyn (1947) | | Trustee, Chairman of the Board of Trustees | | Trustee since 2006 | | Private Investor - 2005 to Present; President and Chief Executive Officer of William D. Witter, Inc. from 2005 to 2006; Consultant to AXA Enterprise in 2004; Chairman, President and Chief Executive Officer of Enterprise Capital Management (subsidiary of The MONY Group, Inc.) and Enterprise Group of Funds, Chairman of MONY Securities Corporation, and Chairman of the Fund Board of Enterprise Group of Funds 1991 to 2004. | | | 46 | | | Member of Board of New York Society of Security Analysts; Member of the Board of Governors of Naismith Memorial Basketball Hall of Fame; Member of the Board of Overseers of Stanford University’s Hoover Institution. |
| * | Chair of the Audit Committee. |
| ** | Chair of the Governance and Nominating Committee. |
| | | | |
| WisdomTree International Dividend and Sector Funds | | | 163 | |
Supplemental Information (unaudited)
Federal Income Tax Information
The following Federal tax information related to the Funds fiscal year ended March 31, 2011, is provided for information purposes only and should not be used for reporting to federal or state revenue agencies. Federal tax information for the calendar year will be reported to you on Form 1099-DIV in January 2012.
Certain dividends paid by the Funds may be subject to a maximum tax rate of 15%, as provided by the Jobs and Growth Tax Relief Reconciliation Act of 2003. Of the distributions paid during the fiscal year ended March 31, 2011, the following represents the maximum amount of ordinary income distributions that may be considered qualified dividend income:
| | | | |
| Fund | | Qualified Dividend Income | |
DEFA Fund | | $ | 10,637,234 | |
DEFA Equity Income Fund | | | 3,494,264 | |
Global Equity Income Fund | | | 1,779,948 | |
Europe SmallCap Dividend Fund | | | 642,479 | |
Japan Hedged Equity Fund | | | 1,758,756 | |
World ex-U.S. Growth Fund | | | 988,162 | |
Japan SmallCap Dividend Fund | | | 2,621,490 | |
Pacific ex-Japan Total Dividend Fund | | | 3,457,742 | |
Pacific ex-Japan Equity Income Fund | | | 4,184,369 | |
International LargeCap Dividend Fund | | | 3,451,552 | |
International Dividend ex-Financials Fund | | | 4,294,385 | |
International MidCap Dividend Fund | | | 3,720,473 | |
International SmallCap Dividend Fund | | | 11,598,584 | |
Emerging Markets Equity Income Fund | | | 31,548,085 | |
Emerging Markets SmallCap Dividend Fund | | | 14,840,425 | |
Middle East Dividend Fund | | | 431,994 | |
International Hedged Equity Fund | | | 512,182 | |
International Basic Materials Sector Fund | | | 783,170 | |
International Energy Sector Fund | | | 955,345 | |
International Utilities Sector Fund | | | 687,502 | |
International Real Estate Fund | | | 2,882,330 | |
The Funds intend to elect to pass through to shareholders the credit for taxes paid during the fiscal year ended March 31, 2011 to foreign countries. The gross foreign source income and foreign taxes paid are as follows:
| | | | | | | | |
| Fund | | Gross Foreign
Income | | | Foreign Taxes
Paid | |
DEFA Fund | | $ | 10,177,584 | | | $ | 575,964 | |
DEFA Equity Income Fund | | | 3,087,448 | | | | 141,905 | |
Global Equity Income Fund | | | 1,346,882 | | | | 95,717 | |
Europe SmallCap Dividend Fund | | | 736,068 | | | | 58,175 | |
Japan Hedged Equity Fund | | | 7,301,919 | | | | 511,033 | |
World ex-U.S. Growth Fund | | | 1,032,158 | | | | 53,329 | |
Japan SmallCap Dividend Fund | | | 4,152,067 | | | | 290,376 | |
Pacific ex-Japan Total Dividend Fund | | | 3,191,893 | | | | 64,097 | |
Pacific ex-Japan Equity Income Fund | | | 3,470,821 | | | | 86,572 | |
International LargeCap Dividend Fund | | | 3,090,788 | | | | 158,724 | |
International Dividend ex-Financials Fund | | | 3,795,081 | | | | 227,330 | |
International MidCap Dividend Fund | | | 3,358,767 | | | | 193,135 | |
International SmallCap Dividend Fund | | | 11,646,518 | | | | 587,272 | |
Emerging Markets Equity Income Fund | | | 35,919,636 | | | | 3,779,125 | |
Emerging Markets SmallCap Dividend Fund | | | 23,523,824 | | | | 3,141,182 | |
Middle East Dividend Fund | | | 900,502 | | | | 34,483 | |
| | |
| 164 | | WisdomTree International Dividend and Sector Funds |
Supplemental Information (unaudited) (concluded)
| | | | | | | | |
| Fund | | Gross Foreign
Income | | | Foreign Taxes
Paid | |
International Hedged Equity Fund | | $ | 622,158 | | | $ | 52,025 | |
International Basic Materials Sector Fund | | | 638,053 | | | | 27,503 | |
International Energy Sector Fund | | | 944,278 | | | | 53,072 | |
International Utilities Sector Fund | | | 631,274 | | | | 27,417 | |
International Real Estate Fund | | | 3,358,382 | | | | 132,602 | |
| | | | |
| WisdomTree International Dividend and Sector Funds | | | 165 | |
General Information (unaudited)
Proxy Voting Policies, Procedures and Record
A complete copy of the Proxy Voting Policy may be obtained by calling 866-909-9473; or writing to: WisdomTree Trust, c/o ALPS Distributors, Inc., 1290 Broadway, Suite 1100, Denver, Colorado 80203.
The Trust is required to disclose annually the Funds’ complete proxy voting record on Form N-PX covering the most recent 12-month period ended June 30 and to file Form N-PX with the Securities and Exchange Commission (“SEC”) no later than August 31 of each year. The current Form N-PX for the Funds is available at no charge upon request by calling 866-909-9473 or through the Trust’s website at www.wisdomtree.com. The Funds’ Form N-PX is also available on the SEC’s website at www.sec.gov.
Shareholder Reports and Quarterly Portfolio Disclosure
The Funds are required to file their complete schedule of portfolio holdings with the SEC for their first and third fiscal quarters on Form N-Q. Copies of the filings are available, without charge, upon request on the SEC’s website at www.sec.gov, and are also available by calling the Trust at 1-866-909-WISE. You can also obtain copies of Form N-Q by (i) visiting the SEC’s Public Reference Room in Washington, DC (information on the operation of the Public Reference Room may be obtained by calling 1-800-SEC-0330), (ii) sending your request and a duplicating fee to the SEC’s Public Reference Room, Washington, DC 20549-0102 or (iii) sending your request electronically to publicinfosec.gov.
Information about each Fund’s portfolio holdings is available daily, without charge, at www.wisdomtree.com.
The Fund’s Statement of Additional Information (“SAI”) has additional information about the Funds’ Trustees and Officers and is available without charge upon request. Contact your financial representative for a free prospectus or SAI.
| | |
| 166 | | WisdomTree International Dividend and Sector Funds |
The WisdomTree Family of Funds
The following is a list of WisdomTree Funds being offered, along with their respective ticker symbols as of March 31, 2011:
| | |
WisdomTree Domestic Dividend Funds WisdomTree Total Dividend Fund (DTD) WisdomTree Equity Income Fund (DHS) WisdomTree LargeCap Dividend Fund (DLN) WisdomTree Dividend ex-Financials Fund (DTN) WisdomTree MidCap Dividend Fund (DON) WisdomTree SmallCap Dividend Fund (DES) WisdomTree International Dividend Funds WisdomTree DEFA Fund (DWM) WisdomTree DEFA Equity Income Fund (DTH) WisdomTree Global Equity Income Fund (DEW) WisdomTree Europe SmallCap Dividend Fund (DFE) WisdomTree Japan Hedged Equity Fund (DXJ) WisdomTree World ex-U.S. Growth Fund (DNL) WisdomTree Japan SmallCap Dividend Fund (DFJ) WisdomTree Pacific ex-Japan Total Dividend Fund (DND) WisdomTree Pacific ex-Japan Equity Income Fund (DNH) WisdomTree International LargeCap Dividend Fund (DOL) WisdomTree International Dividend ex-Financials Fund (DOO) WisdomTree International MidCap Dividend Fund (DIM) WisdomTree International SmallCap Dividend Fund (DLS) WisdomTree Emerging Markets Equity Income Fund (DEM) WisdomTree Emerging Markets SmallCap Dividend Fund (DGS) WisdomTree Middle East Dividend Fund (GULF) WisdomTree International Hedged Equity Fund (HEDJ) WisdomTree International Dividend Sector Funds WisdomTree International Basic Materials Sector Fund (DBN) WisdomTree International Energy Sector Fund (DKA) WisdomTree International Utilities Sector Fund (DBU) WisdomTree International Real Estate Fund (DRW) | | WisdomTree Domestic and International Earnings Funds WisdomTree Total Earnings Fund (EXT) WisdomTree Earnings 500 Fund (EPS) WisdomTree MidCap Earnings Fund (EZM) WisdomTree SmallCap Earnings Fund (EES) WisdomTree LargeCap Value Fund (EZY) WisdomTree LargeCap Growth Fund (ROI) WisdomTree India Earnings Fund (EPI) WisdomTree Currency Income Funds WisdomTree Dreyfus Brazilian Real Fund (BZF) WisdomTree Dreyfus Chinese Yuan Fund (CYB) WisdomTree Dreyfus Commodity Currency Fund (CCX) WisdomTree Dreyfus Emerging Currency Fund (CEW) WisdomTree Dreyfus Euro Fund (EU) WisdomTree Dreyfus Indian Rupee Fund (ICN) WisdomTree Dreyfus Japanese Yen Fund (JYF) WisdomTree Dreyfus New Zealand Dollar Fund (BNZ) WisdomTree Dreyfus South African Rand Fund (SZR) WisdomTree Fixed Income Funds WisdomTree Emerging Markets Local Debt Fund (ELD) WisdomTree Asia Local Debt Fund (ALD) WisdomTree Alternative Fund WisdomTree Managed Futures Strategy Fund (WDTI) |
The WisdomTree Funds are exchange traded funds (“ETFs”) registered with the United States Securities and Exchange Commission as series of WisdomTree Trust (“Trust”). WisdomTree Asset Management, Inc., a wholly owned subsidiary of WisdomTree investments, Inc., serves as the investment adviser to the WisdomTree Trust. None of the WisdomTree entities are affiliated with ALPS Distributors, Inc., the Funds’ distributor. WisdomTree Investments, its affiliates and their independent providers are not liable for any informational errors, incompleteness, or delays, or for any actions taken in reliance on information contained herein
Investors should consider the investment objectives, risks, charges and expenses of the Funds carefully before investing. A prospectus, containing this and other information, is available at www.wisdomtree.com, or by calling 1-866-909-WISE (9473). Investors should read the prospectus carefully before investing. There are risks associated with investing, including possible loss of principal. Past performance does not guarantee future results. Indexes are unmanaged and you can not invest directly in an index.
There are risks associated with investing including possible loss of principal. Foreign investing involves special risks, such as risk of loss from currency fluctuation or political or economic uncertainty. Investments in real estate involve additional special risks, such as credit risk, interest rate fluctuations and the effect of varied economic conditions. Funds that focus its investments in one country increase the impact of events and developments associated with the region which can adversely affect performance. Funds focusing on a single sector and/or smaller companies generally experience greater price volatility.
Investments in emerging, offshore or frontier markets are generally less liquid and less efficient than developed markets and are subject to additional risks, such as of adverse governmental regulation and intervention or political developments. Investments in currency involve additional special risks, such as credit risk and interest rate fluctuations. Derivative investments can be volatile and may be less liquid than other securities and more sensitive to the effect of varied economic conditions. As these Funds can have a high concentration in some issuers, the Funds can be adversely impacted by changes affecting such issuers.
Fixed income investments are subject to interest rate risk; their value will normally decline as interest rates rise. In addition when interest rates fall income may decline. Fixed income investments are also subject to credit risk, the risk that the issuer of a bond will fail to pay interest and principal in a timely manner, or that negative perceptions of the issuer’s ability to make such payments will cause the price of that bond to decline. Unlike typical exchange-traded funds, the Currency Funds, Fixed Income Funds and Alternative Funds do not attempt to track or replicate. Thus, the ability of these Funds to achieve their objectives will depend on the effectiveness of the portfolio manager. Please read each Funds prospectus for specific details regarding the Fund’s risk profile.
Transactions in Fund shares will result in brokerage commissions and will generate tax consequences. Shares may be sold through brokerage accounts, but may be redeemed from the Funds only in large amounts of 50,000 shares or more.
380 Madison Avenue, 21st Floor
New York, NY 10017
1.866.909.WISE (9473)
www.wisdomtree.com
JOIN YOUR FELLOW WISDOMTREE INVESTORS
Help reduce impact to environment by going paperless
Sign up for eDelivery at www.wisdomtree.com
WisdomTree International Dividend and Sector ETFs
WisdomTree DEFA Fund
WisdomTree DEFA Equity Income Fund
WisdomTree Global Equity Income Fund
WisdomTree Europe SmallCap Dividend Fund
WisdomTree Japan Hedged Equity Fund
WisdomTree World ex-U.S. Growth Fund
WisdomTree Japan SmallCap Dividend Fund
WisdomTree Pacific ex-Japan Total Dividend Fund
WisdomTree Pacific ex-Japan Equity Income Fund
WisdomTree International LargeCap Dividend Fund
WisdomTree International Dividend ex-Financials Fund
WisdomTree International MidCap Dividend Fund
WisdomTree International SmallCap Dividend Fund
WisdomTree Emerging Markets Equity Income Fund
WisdomTree Emerging Markets SmallCap Dividend Fund
WisdomTree Middle East Dividend Fund
WisdomTree International Hedged Equity Fund
WisdomTree International Basic Materials Sector Fund
WisdomTree International Energy Sector Fund
WisdomTree International Utilities Sector Fund
WisdomTree International Real Estate Fund
WisdomTree Fund shares are distributed by ALPS Distributors, Inc.
WIS003264 (05/2012)
The Registrant has adopted a code of ethics (the “Code of Ethics”) that applies to persons appointed by the Registrant’s Board of Trustees as the President and Chief Executive Officer, Chief Financial Officer, Treasurer and/or Chief Accounting Officer, and any persons performing similar functions. For the fiscal year ended March 31, 2011, there were no amendments to any provision of the Code of Ethics. A copy of this code is filed with this Form N-CSR under Item 12(a) (1).
| (c) | The Trust has not amended its Code of Ethics during the period covered by the shareholder report presented in Item 1 hereto. |
| (d) | The Trust has not granted a waiver or an implicit waiver from a provision of its Code of Ethics. |
| (f) | The Trust’s Code of Ethics is attached hereto as an exhibit. |
| Item 3. | Audit Committee Financial Expert. |
The Registrant’s Board of Trustees has determined that the Registrant has one audit committee financial expert, as that term is defined under Item 3(b) and 3(c), serving on its audit committee. The audit committee financial expert serving on the Registrant’s audit committee is Greg Barton, who is an independent Trustee of the Trust, as that term is defined under Item 3(a) (2).
| Item 4. | Principal Accountant Fees and Services. |
The principal accountant fees disclosed in item 4(a), 4(b), 4(c), 4(d) and 4(g) are for the thirty-four funds of the Registrant for which the fiscal year-end is March 31, 2011 and whose annual financial statements are reported in Item 1.
(a) Audit Fees. The aggregate fees billed from the Trust’s fiscal year ended March 31, 2011 for professional services rendered by the principal accountant for the audit of the Trust’s annual financial statements or services that are normally provided by the accountant in connection with statutory and regulatory filings or engagements are as follows:
| | |
2011: | | $659,011 |
2010: | | $664,511 |
(b) Audit-Related Fees. The aggregate fees billed from the Trust’s fiscal year ended March 31, 2011 for professional services rendered for assurance and related services by the principal accountant that are reasonably related to the performance of the audit of the Trust’s financial statements and are not reported above in Item 4(a) are as follows:
(c) Tax Fees. The aggregate fees billed from the Trust’s fiscal year ended March 31, 2011 for professional services rendered by the principal accountant for tax compliance, tax advice and tax planning are as follows:
| | |
2011: | | $438,622 |
2010: | | $358,000 |
(d) All Other Fees. The aggregate fees billed from the Trust’s fiscal year ended March 31, 2011 for products and services provided by the principal accountant, other than the services reported above in Items 4(a) through (c) are as follows:
| | |
2011: | | $78,560 |
2010: | | $154,720 |
(e) Audit Committee Pre-Approval Policies and Procedures.
(i) Per Rule 2-01(c) (7) (A), the Registrant’s audit committee charter provides that the audit committee shall select and approve in advance the retention of independent accountants to annually audit and provide their opinion on the Registrant’s financial statements. The audit committee must also approve prior to appointment the engagement of the principal accountant to provide other audit services to the Registrant or to provide non-audit services to the Registrant, its investment adviser, or any entity controlling, controlled by, or under common control with its investment adviser (“adviser/affiliate”) that provides ongoing services to the Registrant, if the engagement by the investment adviser or adviser affiliate relates directly to the operations and financial reporting of the Registrant. The audit committee must also, prior to appointment of the engagement of the principal accountant, review and approve the fees proposed to be charged to the Registrant by the auditors for each audit and non-audit service. The audit committee must also consider whether non-audit services provided by the Registrant’s principal accountant to the Registrant’s investment adviser, or adviser/affiliate that provides ongoing services to the Trust are compatible with maintaining the auditor’s independence.
(ii) The Registrant’s Audit Committee has approved 100% of services described in each of Items 4(b) through (d) pursuant to paragraph (c) (7)(i) (C) of Rule 2-01 of Regulation S-X.
(f) The percentage of hours expended on the principal accountant’s engagement to audit the Trust’s financial statements for the most recent fiscal year attributable to work performed by persons other than the principal accountant’s full-time, permanent employees was 0%.
(g) The aggregate non-audit fees billed by the Trust’s accountant for services rendered to the Trust, the Advisor or any entity controlling, controlled by, or under common control with the Advisor that provides ongoing services to the Trust (except for any sub-advisor whose role is primarily portfolio management and is sub-contracted with or overseen by another investment advisor) that for the fiscal year ended March 31, 2011 are as follows:
| | |
2011: | | $517,182 |
2010: | | $512,720 |
(h) Not applicable.
| Item 5. | Audit Committee of Listed Registrants. |
The Registrant is an issuer as defined in Rule 10A-3 under the Exchange Act and has a separately-designated standing audit committee established in accordance with Section 3(a) (58)A of the Exchange Act. The Registrant’s audit committee members are Greg Barton, Toni Massaro and Victor Ugolyn.
| Item 6. | Schedule of Investments. |
The schedule is included as part of the report to shareholders filed under Item 1 of this form.
| Item 7. | Disclosure of Proxy Voting Policies and Procedures for Closed-End Management Investment Companies. |
Not applicable.
| Item 8. | Portfolio Managers of Closed-End Management Investment Companies. |
Not applicable.
| Item 9. | Purchases of Equity Securities by Closed-End Management Investment Company and Affiliated Purchasers. |
Not applicable.
| Item 10. | Submission of Matters to a Vote of Security Holders. |
Not applicable.
| Item 11. | Controls and Procedures. |
(a) Based on their evaluation of the Registrant’s disclosure controls and procedures (as defined in Rule 30a-3(d) under the Investment Company Act of 1940) as of a date within 90 days prior to the filing date of this report, the President and Treasurer of the Registrant have concluded that such disclosure controls and procedures are reasonably designed and effective to ensure that material information relating to the Registrant, is made known to them by others within those entities.
(b) There were no changes in the Registrant’s internal control over financial reporting (as defined in Rule 30 a-3(d) under the Investment Company Act of 1940) that occurred during the Registrant’s second fiscal quarter that have materially affected, or are reasonably likely to materially affect, the Registrant’s internal control over financial reporting.
| | |
| |
| (a)(1) | | Code of Ethics for Senior Officers that is the subject of Item 2 is attached. |
| |
| (a)(2) | | Certification of each principal executive officer and principal financial officer of the Registrant as required by Rule 30a-2 under the Act (17 CFR 270.30a-2) is attached hereto as a part of EX-99.CERT. |
| |
| (a)(3) | | Not applicable. |
| |
| (b) | | Certification of each principal executive officer and principal financial officer of the Registrant as required by Section 906 of the Sarbanes-Oxley Act of 2002 is attached hereto as a part of EX-99.906CERT. |
SIGNATURES
Pursuant to the requirements of the Securities Exchange Act of 1934 and the Investment Company Act of 1940, the registrant has duly caused this report to be signed on its behalf by the undersigned, thereunto duly authorized.
WisdomTree Trust
| | |
| By: | | /s/ JONATHAN L. STEINBERG |
| Name: | | Jonathan L. Steinberg |
| Title: | | President |
| |
| Date: | | June 8, 2011 |
| |
| By: | | /s/ AMIT MUNI |
| Name: | | Amit Muni |
| Title: | | Treasurer |
| |
| Date: | | June 8, 2011 |
Pursuant to the requirements of the Securities Exchange Act of 1934 and the Investment Company Act of 1940, this report has been signed by the following persons on behalf of the registrant and in the capacities and on the dates indicated.
| | |
| By: | | /s/ JONATHAN L. STEINBERG |
| Name: | | Jonathan L. Steinberg |
| Title: | | President |
| |
| Date: | | June 8, 2011 |
| |
| By: | | /s/ AMIT MUNI |
| Name: | | Amit Muni |
| Title: | | Treasurer |
| |
| Date: | | June 8, 2011 |