UNITED STATES
SECURITIES AND EXCHANGE COMMISSION
Washington, D.C. 20549
FORM N-CSR
CERTIFIED SHAREHOLDER REPORT OF REGISTERED
MANAGEMENT INVESTMENT COMPANIES
Investment Company Act file number 811-21864
WisdomTree Trust
(Exact name of registrant as specified in charter)
380 Madison Avenue, 21st Floor
New York, NY 10017
(Address of principal executive offices) (Zip code)
The Corporation Trust Company
1209 Orange Street
Wilmington, DE 19801
(Name and address of agent for service)
Registrant’s telephone number, including area code: (866)-909-9473
Date of fiscal year end: March 31
Date of reporting period: March 31, 2012
Form N-CSR is to be used by management investment companies to file reports with the Commission not later than 10 days after the transmission to stockholders of any report that is required to be transmitted to stockholders under Rule 30e-1 under the Investment Company Act of 1940 (17 CFR 270.30e-1). The Commission may use the information provided on Form N-CSR in its regulatory, disclosure review, inspection, and policymaking roles.
A registrant is required to disclose the information specified by Form N-CSR, and the Commission will make this information public. A registrant is not required to respond to the collection of information contained in Form N-CSR unless the Form displays a currently valid Office of Management and Budget (“OMB”) control number. Please direct comments concerning the accuracy of the information collection burden estimate and any suggestions for reducing the burden to Secretary, Securities and Exchange Commission, 450 Fifth Street, NW, Washington, DC 20549-0609. The OMB has reviewed this collection of information under the clearance requirements of 44 U.S.C. § 3507.
Item 1. Report(s) to Stockholders.
The Trust’s annual report transmitted to shareholders pursuant to Rule 30e-1 under the Investment Company Act of 1940 is as follows:


WisdomTree Trust
Domestic Dividend Funds
Annual Report
March 31, 2012
WisdomTree Total Dividend Fund (DTD)
WisdomTree Equity Income Fund (DHS)
WisdomTree LargeCap Dividend Fund (DLN)
WisdomTree Dividend ex-Financials Fund (DTN)
WisdomTree MidCap Dividend Fund (DON)
WisdomTree SmallCap Dividend Fund (DES)
Table of Contents
“WisdomTree” is a registered mark of WisdomTree Investments, Inc. and is licensed for use by the WisdomTree Trust.
Management’s Discussion of Funds’ Performance
(unaudited)
Market Environment Overview
The U.S. equity market, as measured by the S&P 500 Index, returned 8.54% for the 12-month period ended March 31, 2012 (the “period”). After bottoming in March of 2009, the S&P 500 recorded its third straight year of gains. Measured from March 31, 2009 through March 31, 2012, the three year cumulative total return on the S&P 500 Index was 87.99%. This represents a substantial recovery in the equity market as earnings and dividend levels reached and surpassed previous records.
While the overall return for the period was positive, it was marked by several bouts of volatility. Investors had to deal with events domestically and abroad that impacted the U.S. market: as the S&P 500 Index fell for the first six months of the period and turned around significantly in the second half of the period.
Much of the volatility experienced in the market revolved around concerns over a debt crisis in the developed world. At home in the United States, politicians squabbled over raising the U.S. debt ceiling in the summer of 2011. After the market close on Friday, August 5, 2011, Standard & Poor’s downgraded the U.S. government from its AAA rating — the highest credit quality rating one can achieve — due to escalating debt levels, large deficits, and the lack of a coherent plan from U.S. politicians attacking these fiscal issues. The following Monday, the S&P 500 closed down 6.65% and many market participants shifted assets away from equities and risky assets to perceived safe havens. Paradoxically, there was a flight to the very bonds that were downgraded as many believed the problems in other parts of the world, such as Europe, were worse than those in the United States.
WisdomTree Funds’ Performance Overview
By the end of September 2011, investors had experienced market uncertainty due to the European debt crisis intensifying. This resulted in the worst quarterly performance for the S&P 500 since 2008 (down 13.87%). To support the economy and credit markets, on September 21, 2011, the Federal Reserve announced “Operation Twist,” which attempted to push down long-term interest rates by shifting the balance of the Treasury’s securities holdings towards longer-term securities and selling shorter-term investments. These Federal Reserve actions, known as a form of quantitative easing, or “QE”, helped support an environment in which many investors were willing to take on more risk. From September 22, 2011, the market rose more than 26% until the end of March 2012, erasing the negative effects of the previous volatility and leaving the U.S. market, as measured by the S&P 500 Index, up 8.54% for the period.
The following table reflects the WisdomTree Funds’ performance versus their capitalization-weighted benchmark indexes:
| | | | | | | | | | | | | | | | |
| Ticker | | WisdomTree Fund | | 1-Year
NAV
Return | | | Cap-Weighted Benchmark | | 1-Year
Return | | | Difference | |
DTD | | WisdomTree Total Dividend Fund | | | 11.81 | % | | Russell 3000® Index | | | 7.18 | % | | | 4.63 | % |
DHS | | WisdomTree Equity Income Fund | | | 14.66 | % | | Russell 1000® Value Index | | | 4.79 | % | | | 9.87 | % |
DLN | | WisdomTree LargeCap Dividend Fund | | | 12.82 | % | | S&P 500® Index | | | 8.54 | % | | | 4.28 | % |
DTN | | WisdomTree Dividend ex-Financials Fund | | | 12.99 | % | | Dow Jones U.S. Select Dividend IndexSM | | | 11.75 | % | | | 1.24 | % |
DON | | WisdomTree MidCap Dividend Fund | | | 6.99 | % | | S&P MidCap 400® Index | | | 1.98 | % | | | 5.01 | % |
DES | | WisdomTree SmallCap Dividend Fund | | | 4.50 | % | | Russell 2000® Index | | | -0.18 | % | | | 4.68 | % |
With all the volatility in the markets during the period, it may not be a surprise that equities considered to be more defensive in nature, such as large cap stocks, or dividend paying stocks fared better than mid cap and small cap stocks and more growth oriented strategies. While the S&P 500 Index was up 8.54%, the Russell 2000 Index, an index of small cap U.S. equities, experienced a decline of -0.18%.
WisdomTree’s dividend weighted Funds are designed to track indexes based on the dividend stream generated by the companies included in the underlying WisdomTree
| | | | |
| WisdomTree Domestic Dividend Funds | | | 1 | |
Management’s Discussion of Funds’ Performance
(unaudited) (concluded)
Index. The dividend stream is defined as the sum of the dollar value of dividends indicated to be paid by each company. There are two primary factors that drive performance differentials of the WisdomTree Funds and Indexes versus market cap-weighted benchmarks. The first is aggregate exposure to one or more sectors. The second is stock selection within each sector. Both of these are determined as part of WisdomTree’s rules-based index methodology. These exposures are not subjectively determined. Rather, they are objectively determined at the Index rebalancing dates based on the dividend stream.
Five of the ten sectors represented within the S&P 500 Index experienced positive performance over the period. The best performing sector over the period was the Information Technology sector. This was spurred by a lively initial public offering market and by earnings strength from some of its biggest components, such as Apple, Google, and IBM. Also, the more defensive sectors outpaced the market, such as Health Care, Consumer Staples, and Utilities. The Energy sector was the worst performing sector for the period, followed by Materials, as the commodities markets experienced a selloff over the period. Financials also lagged the broader market as questions arose about exposures to the European sovereign debt crisis.
The WisdomTree LargeCap Dividend Fund delivered a return of 12.82%, which was more than 4 percentage points ahead of the S&P 500 Index. This Fund, representative of the broader dividend approach, benefited from its focus on dividend paying stocks in the Utilities, Health Care, and Consumer Staples sectors. It also benefited from being underweight financial stocks, many of which had cut their dividends during the crisis and were therefore underweight in the Fund.
The performance of each WisdomTree Fund compared to its cap-weighted benchmarks was favorable for each Fund in the domestic dividend family over the period. This can be partially explained because the Consumer Staples sector experienced strong gains throughout the period. During the period, this sector was more heavily represented in WisdomTree Funds than in their corresponding cap-weighted benchmarks due to this sector’s relatively higher contributions to the dividend stream.
While the WisdomTree Domestic Dividend Funds outperformed their cap-weighted benchmarks for the period, there was a notable sector exposure that created relative drag on performance. The Information Technology sector experienced strong gains during the period. This sector has historically had relatively low dividend payers, which meant that cap-weighted benchmarks were relatively overweight this sector compared to the WisdomTree Dividend Funds during the period.
The WisdomTree Equity Income Fund outperformed its cap-weighted benchmark significantly over the period primarily because it was relatively overweight the Consumer Staples sector, which experienced positive gains over the period as a defensive sector. Additionally, the Fund was significantly underweight Financials, which lagged the broader market for the period.
Fund returns are shown at NAV. Please see Performance Summaries on the subsequent pages for more complete performance information. Please see page 9 for the list of index descriptions.
Fund performance assumes reinvestment of dividends and capital gain distributions. An index is a statistical measure of a specified financial market or sector. An index does not actually hold a portfolio of securities, incur expenses or pay any transaction costs. Therefore index returns do not reflect deductions for fees or expenses and are not available for direct investment. In comparison, the Funds’ performance is negatively impacted by these deductions. Fund returns do not reflect brokerage commissions or taxes on transactions in Fund shares or that a shareholder would pay on Fund distributions. Past performance is no guarantee of future results. For the most recent month end performance information visit www.wisdomtree.com.
| | |
| 2 | | WisdomTree Domestic Dividend Funds |
Performance Summary (unaudited)
WisdomTree Total Dividend Fund (DTD)
Sector Breakdown† as of 3/31/12‡
| | | | |
Financials | | | 16.7% | |
Consumer Staples | | | 14.5% | |
Industrials | | | 11.3% | |
Health Care | | | 10.6% | |
Information Technology | | | 9.9% | |
Energy | | | 9.2% | |
Consumer Discretionary | | | 8.2% | |
Utilities | | | 6.6% | |
Telecommunication Services | | | 6.2% | |
Materials | | | 4.8% | |
Other | | | 2.0% | |
| † | The Fund’s sector breakdown is expressed as a percentage of total investments and may change over time. |
| ‡ | A sector may be comprised of several industries. |
Top Ten Holdings* as of 3/31/12
| | | | |
| |
| Description | | % of Net Assets | |
AT&T, Inc. | | | 3.5% | |
Exxon Mobil Corp. | | | 3.1% | |
Microsoft Corp. | | | 2.6% | |
General Electric Co. | | | 2.4% | |
Chevron Corp. | | | 2.2% | |
Pfizer, Inc. | | | 2.1% | |
Johnson & Johnson | | | 2.0% | |
Philip Morris International, Inc. | | | 2.0% | |
Procter & Gamble Co. (The) | | | 1.9% | |
Verizon Communications, Inc. | | | 1.8% | |
| * | The ten largest holdings are subject to change, and there are no guarantees the Fund will remain invested in any particular company. |
The WisdomTree Total Dividend Fund (the “Fund”) seeks to track the price and yield performance, before fees and expenses, of the WisdomTree Dividend Index.
The Fund returned 11.81% at net asset value (“NAV”) for the fiscal year ended March 31, 2012 (for more complete performance information please see the chart below). The Fund’s performance benefited most from its position in the Consumer Staples sector. The Fund’s position in the Energy sector created the greatest drag on performance.
The following performance chart is provided for comparative purposes and represents the period noted. The Fund’s per share NAV is the value of one share of the Fund and is calculated by dividing the value of total assets less total liabilities by the number of shares outstanding. The NAV return is based on the NAV of the Fund and the market price return is based on the market price per share of the Fund. The price used to calculate market price returns is the mid-point of the highest bid and lowest offer for Fund shares as of the close of trading on the exchange where Fund shares are listed. NAV and market price returns assume that dividends and capital gain distributions have been reinvested in the Fund at NAV and market price, respectively. As with other ETFs, NAV returns and market price returns may differ because of factors such as the supply and demand for Fund shares and investors’ assessments of the underlying value of a Fund’s portfolio securities.
An index is a statistical measure of a specified financial market or sector. An index does not actually hold a portfolio of securities, incur expenses or pay any transaction costs. Therefore, index returns do not reflect deductions for fees or expenses and the index is not available for direct investment. In comparison, the Fund’s performance is negatively impacted by these deductions. Fund returns do not reflect brokerage commissions or taxes on transactions in Fund shares or that a shareholder would pay on Fund distributions. As of the Fund’s current prospectus dated July 29, 2011, the Fund’s annual expense ratio was 0.28%.
Performance as of 3/31/12
| | | | | | | | | | | | | | | | | | | | |
| | | Average Annual Total Return | |
| | | Fund
Net Asset Value | | | Fund
Market Price | | | WisdomTree
Dividend Index | | | Russell 3000®
Index | | | Russell 3000®
Value Index | |
One Year | | | 11.81 | % | | | 11.79 | % | | | 12.22 | % | | | 7.18 | % | | | 4.30 | % |
Three Year | | | 25.56 | % | | | 25.45 | % | | | 26.40 | % | | | 24.26 | % | | | 23.03 | % |
Five Year | | | 1.40 | % | | | 1.42 | % | | | 2.04 | % | | | 2.18 | % | | | -0.75 | % |
Since Inception1 | | | 3.96 | % | | | 3.95 | % | | | 4.45 | % | | | 4.47 | % | | | 2.34 | % |
| 1 | Total returns are calculated based on the commencement of Fund trading on the NYSE Arca, Inc. on June 16, 2006. |
Performance is historical and does not guarantee future results. Current performance may be lower or higher than quoted. Investment returns and the principal value of an investment will fluctuate so that an investor’s shares, when redeemed, may be worth more or less than their original cost. Performance data for the most recent month-end is available at www.wisdomtree.com. WisdomTree shares are bought and sold at market price (not NAV) and are not individually redeemed from the Fund. The returns do not reflect the deduction of taxes that a shareholder would pay on Fund distributions or on the redemption of Fund shares.
| | | | |
| WisdomTree Domestic Dividend Funds | | | 3 | |
Performance Summary (unaudited)
WisdomTree Equity Income Fund (DHS)
Sector Breakdown† as of 3/31/12‡
| | | | |
Health Care | | | 18.1% | |
Consumer Staples | | | 15.8% | |
Telecommunication Services | | | 13.5% | |
Utilities | | | 13.2% | |
Financials | | | 12.4% | |
Industrials | | | 8.5% | |
Materials | | | 5.5% | |
Information Technology | | | 4.5% | |
Energy | | | 4.0% | |
Consumer Discretionary | | | 1.4% | |
Other | | | 3.1% | |
| † | The Fund’s sector breakdown is expressed as a percentage of total investments and may change over time. |
| ‡ | A sector may be comprised of several industries. |
Top Ten Holdings* as of 3/31/12
| | | | |
| |
| Description | | % of Net Assets | |
AT&T, Inc. | | | 7.7% | |
General Electric Co. | | | 5.3% | |
Pfizer, Inc. | | | 4.6% | |
Johnson & Johnson | | | 4.5% | |
Philip Morris International, Inc. | | | 4.4% | |
Procter & Gamble Co. (The) | | | 4.2% | |
Verizon Communications, Inc. | | | 3.9% | |
Merck & Co., Inc. | | | 3.8% | |
Intel Corp. | | | 3.6% | |
ConocoPhillips | | | 2.7% | |
| * | The ten largest holdings are subject to change, and there are no guarantees the Fund will remain invested in any particular company. |
The WisdomTree Equity Income Fund (the “Fund”) seeks to track the price and yield performance, before fees and expenses, of the WisdomTree Equity Income Index.
The Fund returned 14.66% at net asset value (“NAV”) for the fiscal year ended March 31, 2012 (for more complete performance information please see the chart below). The Fund’s performance benefited most from its position in the Consumer Staples sector. The Fund’s position in the Energy sector created the greatest drag on performance.
The following performance chart is provided for comparative purposes and represents the period noted. The Fund’s per share NAV is the value of one share of the Fund and is calculated by dividing the value of total assets less total liabilities by the number of shares outstanding. The NAV return is based on the NAV of the Fund and the market price return is based on the market price per share of the Fund. The price used to calculate market price returns is the mid-point of the highest bid and lowest offer for Fund shares as of the close of trading on the exchange where Fund shares are listed. NAV and market price returns assume that dividends and capital gain distributions have been reinvested in the Fund at NAV and market price, respectively. As with other ETFs, NAV returns and market price returns may differ because of factors such as the supply and demand for Fund shares and investors’ assessments of the underlying value of a Fund’s portfolio securities.
An index is a statistical measure of a specified financial market or sector. An index does not actually hold a portfolio of securities, incur expenses or pay any transaction costs. Therefore, index returns do not reflect deductions for fees or expenses and the index is not available for direct investment. In comparison, the Fund’s performance is negatively impacted by these deductions. Fund returns do not reflect brokerage commissions or taxes on transactions in Fund shares or that a shareholder would pay on Fund distributions. As of the Fund’s current prospectus dated July 29, 2011, the Fund’s annual expense ratio was 0.38%.
Performance as of 3/31/12
| | | | | | | | | | | | | | | | |
| | | Average Annual Total Return | |
| | | Fund
Net Asset Value | | | Fund
Market Price | | | WisdomTree
Equity
Income Index | | | Russell 1000®
Value Index | |
One Year | | | 14.66 | % | | | 14.65 | % | | | 15.17 | % | | | 4.79 | % |
Three Year | | | 29.76 | % | | | 29.77 | % | | | 30.43 | % | | | 22.82 | % |
Five Year | | | -0.91 | % | | | -0.89 | % | | | -0.55 | % | | | -0.81 | % |
Since Inception1 | | | 2.12 | % | | | 2.14 | % | | | 2.42 | % | | | 2.29 | % |
| 1 | Total returns are calculated based on the commencement of Fund trading on the NYSE Arca, Inc. on June 16, 2006. |
Performance is historical and does not guarantee future results. Current performance may be lower or higher than quoted. Investment returns and the principal value of an investment will fluctuate so that an investor’s shares, when redeemed, may be worth more or less than their original cost. Performance data for the most recent month-end is available at www.wisdomtree.com. WisdomTree shares are bought and sold at market price (not NAV) and are not individually redeemed from the Fund. The returns do not reflect the deduction of taxes that a shareholder would pay on Fund distributions or on the redemption of Fund shares.
| | |
| 4 | | WisdomTree Domestic Dividend Funds |
Performance Summary (unaudited)
WisdomTree LargeCap Dividend Fund (DLN)
Sector Breakdown† as of 3/31/12‡
| | | | |
Consumer Staples | | | 16.6% | |
Financials | | | 12.7% | |
Health Care | | | 12.2% | |
Industrials | | | 11.4% | |
Information Technology | | | 10.9% | |
Energy | | | 10.6% | |
Consumer Discretionary | | | 7.8% | |
Telecommunication Services | | | 6.8% | |
Utilities | | | 5.8% | |
Materials | | | 4.4% | |
Other | | | 0.8% | |
| † | The Fund’s sector breakdown is expressed as a percentage of total investments and may change over time. |
| ‡ | A sector may be comprised of several industries. |
Top Ten Holdings* as of 3/31/12
| | | | |
| |
| Description | | % of Net Assets | |
AT&T, Inc. | | | 4.0% | |
Exxon Mobil Corp. | | | 3.6% | |
Microsoft Corp. | | | 3.1% | |
General Electric Co. | | | 2.8% | |
Chevron Corp. | | | 2.5% | |
Pfizer, Inc. | | | 2.4% | |
Johnson & Johnson | | | 2.4% | |
Philip Morris International, Inc. | | | 2.3% | |
Procter & Gamble Co. (The) | | | 2.2% | |
Verizon Communications, Inc. | | | 2.1% | |
| * | The ten largest holdings are subject to change, and there are no guarantees the Fund will remain invested in any particular company. |
The WisdomTree LargeCap Dividend Fund (the “Fund”) seeks to track the price and yield performance, before fees and expenses, of the WisdomTree LargeCap Dividend Index.
The Fund returned 12.82% at net asset value (“NAV”) for the fiscal year ended March 31, 2012 (for more complete performance information please see the chart below). The Fund’s performance benefited most from its position in the Consumer Staples sector. The Fund’s position in the Materials sector created the greatest drag on performance.
The following performance chart is provided for comparative purposes and represents the period noted. The Fund’s per share NAV is the value of one share of the Fund and is calculated by dividing the value of total assets less total liabilities by the number of shares outstanding. The NAV return is based on the NAV of the Fund and the market price return is based on the market price per share of the Fund. The price used to calculate market price returns is the mid-point of the highest bid and lowest offer for Fund shares as of the close of trading on the exchange where Fund shares are listed. NAV and market price returns assume that dividends and capital gain distributions have been reinvested in the Fund at NAV and market price, respectively. As with other ETFs, NAV returns and market price returns may differ because of factors such as the supply and demand for Fund shares and investors’ assessments of the underlying value of a Fund’s portfolio securities.
An index is a statistical measure of a specified financial market or sector. An index does not actually hold a portfolio of securities, incur expenses or pay any transaction costs. Therefore, index returns do not reflect deductions for fees or expenses and the index is not available for direct investment. In comparison, the Fund’s performance is negatively impacted by these deductions. Fund returns do not reflect brokerage commissions or taxes on transactions in Fund shares or that a shareholder would pay on Fund distributions. As of the Fund’s current prospectus dated July 29, 2011, the Fund’s annual expense ratio was 0.28%.
Performance as of 3/31/12
| | | | | | | | | | | | | | | | | | | | |
| | | Average Annual Total Return | | | | |
| | | Fund
Net Asset Value | | | Fund
Market Price | | | WisdomTree
LargeCap
Dividend Index | | | S&P 500® Index | | | Russell 1000®
Value Index | |
One Year | | | 12.82 | % | | | 12.80 | % | | | 13.15 | % | | | 8.54 | % | | | 4.79 | % |
Three Year | | | 24.54 | % | | | 24.48 | % | | | 25.07 | % | | | 23.42 | % | | | 22.82 | % |
Five Year | | | 1.20 | % | | | 1.18 | % | | | 1.66 | % | | | 2.01 | % | | | -0.81 | % |
Since Inception1 | | | 3.77 | % | | | 3.73 | % | | | 4.16 | % | | | 4.25 | % | | | 2.29 | % |
| 1 | Total returns are calculated based on the commencement of Fund trading on the NYSE Arca, Inc. on June 16, 2006. |
Performance is historical and does not guarantee future results. Current performance may be lower or higher than quoted. Investment returns and the principal value of an investment will fluctuate so that an investor’s shares, when redeemed, may be worth more or less than their original cost. Performance data for the most recent month-end is available at www.wisdomtree.com. WisdomTree shares are bought and sold at market price (not NAV) and are not individually redeemed from the Fund. The returns do not reflect the deduction of taxes that a shareholder would pay on Fund distributions or on the redemption of Fund shares.
| | | | |
| WisdomTree Domestic Dividend Funds | | | 5 | |
Performance Summary (unaudited)
WisdomTree Dividend ex-Financials Fund (DTN)
Sector Breakdown† as of 3/31/12‡
| | | | |
Utilities | | | 12.3% | |
Consumer Staples | | | 12.2% | |
Materials | | | 11.4% | |
Industrials | | | 10.6% | |
Telecommunication Services | | | 10.3% | |
Information Technology | | | 9.9% | |
Health Care | | | 9.8% | |
Consumer Discretionary | | | 9.3% | |
Energy | | | 8.9% | |
Other | | | 5.3% | |
| † | The Fund’s sector breakdown is expressed as a percentage of total investments and may change over time. |
| ‡ | A sector may be comprised of several industries. |
Top Ten Holdings* as of 3/31/12
| | | | |
| |
| Description | | % of Net Assets | |
Frontier Communications Corp. | | | 3.0% | |
Southern Copper Corp. | | | 2.7% | |
Windstream Corp. | | | 2.4% | |
CenturyLink, Inc. | | | 2.3% | |
AT&T, Inc. | | | 1.7% | |
Avon Products, Inc. | | | 1.7% | |
Altria Group, Inc. | | | 1.6% | |
Lockheed Martin Corp. | | | 1.6% | |
Lorillard, Inc. | | | 1.5% | |
Reynolds American, Inc. | | | 1.5% | |
| * | The ten largest holdings are subject to change, and there are no guarantees the Fund will remain invested in any particular company. |
The WisdomTree Dividend ex-Financials Fund (the “Fund”) seeks to track the price and yield performance, before fees and expenses, of the WisdomTree Dividend ex-Financials Index.
The Fund returned 12.99% at net asset value (“NAV”) for the fiscal year ended March 31, 2012 (for more complete performance information please see the chart below). The Fund’s performance benefited most from its position in the Consumer Staples sector. The Fund’s performance also benefited because it excludes investments in the Financials sector, which had negative returns for the period. The Fund’s position in the Telecommunication Services sector created the greatest drag on performance.
The following performance chart is provided for comparative purposes and represents the period noted. The Fund’s per share NAV is the value of one share of the Fund and is calculated by dividing the value of total assets less total liabilities by the number of shares outstanding. The NAV return is based on the NAV of the Fund and the market price return is based on the market price per share of the Fund. The price used to calculate market price returns is the mid-point of the highest bid and lowest offer for Fund shares as of the close of trading on the exchange where Fund shares are listed. NAV and market price returns assume that dividends and capital gain distributions have been reinvested in the Fund at NAV and market price, respectively. As with other ETFs, NAV returns and market price returns may differ because of factors such as the supply and demand for Fund shares and investors’ assessments of the underlying value of a Fund’s portfolio securities.
An index is a statistical measure of a specified financial market or sector. An index does not actually hold a portfolio of securities, incur expenses or pay any transaction costs. Therefore, index returns do not reflect deductions for fees or expenses and the index is not available for direct investment. In comparison, the Fund’s performance is negatively impacted by these deductions. Fund returns do not reflect brokerage commissions or taxes on transactions in Fund shares or that a shareholder would pay on Fund distributions. As of the Fund’s current prospectus dated July 29, 2011, the Fund’s annual expense ratio was 0.38%.
Performance as of 3/31/12
| | | | | | | | | | | | | | | | |
| | | Average Annual Total Return | |
| | | Fund
Net Asset Value | | | Fund
Market Price | | | WisdomTree
Dividend Top 100/
Dividend ex-Financials
Spliced Index1 | | | Dow Jones
U.S. Select
Dividend IndexSM | |
One Year | | | 12.99 | % | | | 13.00 | % | | | 13.46 | % | | | 11.75 | % |
Three Year | | | 31.84 | % | | | 31.82 | % | | | 32.55 | % | | | 26.39 | % |
Five Year | | | 2.25 | % | | | 2.25 | % | | | 2.76 | % | | | -0.12 | % |
Since Inception2 | | | 5.35 | % | | | 5.35 | % | | | 5.75 | % | | | 2.75 | % |
| 1 | WisdomTree Dividend Top 100 Index through May 7, 2009; WisdomTree Dividend ex-Financials Index thereafter. |
| 2 | Total returns are calculated based on the commencement of Fund trading on the NYSE Arca, Inc. on June 16, 2006. |
Performance is historical and does not guarantee future results. Current performance may be lower or higher than quoted. Investment returns and the principal value of an investment will fluctuate so that an investor’s shares, when redeemed, may be worth more or less than their original cost. Performance data for the most recent month-end is available at www.wisdomtree.com. WisdomTree shares are bought and sold at market price (not NAV) and are not individually redeemed from the Fund. The returns do not reflect the deduction of taxes that a shareholder would pay on Fund distributions or on the redemption of Fund shares.
| | |
| 6 | | WisdomTree Domestic Dividend Funds |
Performance Summary (unaudited)
WisdomTree MidCap Dividend Fund (DON)
Sector Breakdown† as of 3/31/12‡
| | | | |
Financials | | | 35.7% | |
Utilities | | | 13.5% | |
Consumer Discretionary | | | 11.2% | |
Industrials | | | 10.0% | |
Materials | | | 8.1% | |
Information Technology | | | 3.9% | |
Telecommunication Services | | | 3.3% | |
Consumer Staples | | | 2.5% | |
Energy | | | 2.1% | |
Health Care | | | 1.6% | |
Other | | | 8.1% | |
| † | The Fund’s sector breakdown is expressed as a percentage of total investments and may change over time. |
| ‡ | A sector may be comprised of several industries. |
Top Ten Holdings* as of 3/31/12
| | | | |
| |
| Description | | % of Net Assets | |
Frontier Communications Corp. | | | 1.9% | |
Windstream Corp. | | | 1.6% | |
New York Community Bancorp, Inc. | | | 1.5% | |
Kimco Realty Corp. | | | 1.2% | |
Ares Capital Corp. | | | 1.0% | |
Plum Creek Timber Co., Inc. | | | 1.0% | |
Cincinnati Financial Corp. | | | 0.9% | |
NiSource, Inc. | | | 0.9% | |
Pitney Bowes, Inc. | | | 0.9% | |
Hospitality Properties Trust | | | 0.8% | |
| * | The ten largest holdings are subject to change, and there are no guarantees the Fund will remain invested in any particular company. |
The WisdomTree MidCap Dividend Fund (the “Fund”) seeks to track the price and yield performance, before fees and expenses, of the WisdomTree MidCap Dividend Index.
The Fund returned 6.99% at net asset value (“NAV”) for the fiscal year ended March 31, 2012 (for more complete performance information please see the chart below). The Fund’s performance benefited most from its position in the Utilities sector. The Fund’s position in the Energy sector created the greatest drag on performance.
The following performance chart is provided for comparative purposes and represents the period noted. The Fund’s per share NAV is the value of one share of the Fund and is calculated by dividing the value of total assets less total liabilities by the number of shares outstanding. The NAV return is based on the NAV of the Fund and the market price return is based on the market price per share of the Fund. The price used to calculate market price returns is the mid-point of the highest bid and lowest offer for Fund shares as of the close of trading on the exchange where Fund shares are listed. NAV and market price returns assume that dividends and capital gain distributions have been reinvested in the Fund at NAV and market price, respectively. As with other ETFs, NAV returns and market price returns may differ because of factors such as the supply and demand for Fund shares and investors’ assessments of the underlying value of a Fund’s portfolio securities.
An index is a statistical measure of a specified financial market or sector. An index does not actually hold a portfolio of securities, incur expenses or pay any transaction costs. Therefore, index returns do not reflect deductions for fees or expenses and the index is not available for direct investment. In comparison, the Fund’s performance is negatively impacted by these deductions. Fund returns do not reflect brokerage commissions or taxes on transactions in Fund shares or that a shareholder would pay on Fund distributions. As of the Fund’s current prospectus dated July 29, 2011, the Fund’s annual expense ratio was 0.38%.
Performance as of 3/31/12
| | | | | | | | | | | | | | | | | | | | |
| | | Average Annual Total Return | |
| | | Fund
Net Asset Value | | | Fund
Market Price | | | WisdomTree
MidCap
Dividend Index | | | S&P MidCap 400®
Index | | | Russell MidCap
Value® Index | |
One Year | | | 6.99 | % | | | 7.04 | % | | | 7.34 | % | | | 1.98 | % | | | 2.28 | % |
Three Year | | | 31.77 | % | | | 31.70 | % | | | 32.51 | % | | | 28.55 | % | | | 29.18 | % |
Five Year | | | 2.70 | % | | | 2.72 | % | | | 2.58 | % | | | 4.78 | % | | | 1.26 | % |
Since Inception1 | | | 5.25 | % | | | 5.35 | % | | | 5.12 | % | | | 6.77 | % | | | 4.41 | % |
| 1 | Total returns are calculated based on the commencement of Fund trading on the NYSE Arca, Inc. on June 16, 2006. |
Performance is historical and does not guarantee future results. Current performance may be lower or higher than quoted. Investment returns and the principal value of an investment will fluctuate so that an investor’s shares, when redeemed, may be worth more or less than their original cost. Performance data for the most recent month-end is available at www.wisdomtree.com. WisdomTree shares are bought and sold at market price (not NAV) and are not individually redeemed from the Fund. The returns do not reflect the deduction of taxes that a shareholder would pay on Fund distributions or on the redemption of Fund shares.
| | | | |
| WisdomTree Domestic Dividend Funds | | | 7 | |
Performance Summary (unaudited)
WisdomTree SmallCap Dividend Fund (DES)
Sector Breakdown† as of 3/31/12‡
| | | | |
Financials | | | 49.4% | |
Industrials | | | 11.0% | |
Consumer Discretionary | | | 9.1% | |
Utilities | | | 4.8% | |
Materials | | | 4.8% | |
Information Technology | | | 4.4% | |
Consumer Staples | | | 3.6% | |
Health Care | | | 1.9% | |
Telecommunication Services | | | 1.7% | |
Energy | | | 1.0% | |
Other | | | 8.3% | |
| † | The Fund’s sector breakdown is expressed as a percentage of total investments and may change over time. |
| ‡ | A sector may be comprised of several industries. |
Top Ten Holdings* as of 3/31/12
| | | | |
| |
| Description | | % of Net Assets | |
Apollo Investment Corp. | | | 1.9% | |
CommonWealth REIT | | | 1.4% | |
Prospect Capital Corp. | | | 1.2% | |
Corporate Office Properties Trust | | | 1.0% | |
Vector Group Ltd. | | | 1.0% | |
Healthcare Realty Trust, Inc. | | | 0.9% | |
Brandywine Realty Trust | | | 0.8% | |
WisdomTree MidCap Dividend Fund | | | 0.8% | |
TAL International Group, Inc. | | | 0.7% | |
Lexington Realty Trust | | | 0.7% | |
| * | The ten largest holdings are subject to change, and there are no guarantees the Fund will remain invested in any particular company. |
The WisdomTree SmallCap Dividend Fund (the “Fund”) seeks to track the price and yield performance, before fees and expenses, of the WisdomTree SmallCap Dividend Index.
The Fund returned 4.50% at net asset value (“NAV”) for the fiscal year ended March 31, 2012 (for more complete performance information please see the chart below). The Fund’s performance benefited most from its position in the Financials sector. The Fund’s position in the Energy sector created the greatest drag on performance.
The following performance chart is provided for comparative purposes and represents the period noted. The Fund’s per share NAV is the value of one share of the Fund and is calculated by dividing the value of total assets less total liabilities by the number of shares outstanding. The NAV return is based on the NAV of the Fund and the market price return is based on the market price per share of the Fund. The price used to calculate market price returns is the mid-point of the highest bid and lowest offer for Fund shares as of the close of trading on the exchange where Fund shares are listed. NAV and market price returns assume that dividends and capital gain distributions have been reinvested in the Fund at NAV and market price, respectively. As with other ETFs, NAV returns and market price returns may differ because of factors such as the supply and demand for Fund shares and investors’ assessments of the underlying value of a Fund’s portfolio securities.
An index is a statistical measure of a specified financial market or sector. An index does not actually hold a portfolio of securities, incur expenses or pay any transaction costs. Therefore, index returns do not reflect deductions for fees or expenses and the index is not available for direct investment. In comparison, the Fund’s performance is negatively impacted by these deductions. Fund returns do not reflect brokerage commissions or taxes on transactions in Fund shares or that a shareholder would pay on Fund distributions. As of the Fund’s current prospectus dated July 29, 2011, the Fund’s annual expense ratio was 0.38%.
Performance as of 3/31/12
| | | | | | | | | | | | | | | | | | | | |
| | | Average Annual Total Return | |
| | | Fund
Net Asset Value | | | Fund
Market Price | | | WisdomTree
SmallCap
Dividend Index | | | Russell 2000®
Index | | | Russell 2000®
Value Index | |
One Year | | | 4.50 | % | | | 4.78 | % | | | 4.74 | % | | | -0.18 | % | | | -1.07 | % |
Three Year | | | 31.58 | % | | | 31.44 | % | | | 32.13 | % | | | 26.90 | % | | | 25.36 | % |
Five Year | | | 0.95 | % | | | 1.04 | % | | | 1.16 | % | | | 2.13 | % | | | 0.01 | % |
Since Inception1 | | | 3.57 | % | | | 3.60 | % | | | 3.65 | % | | | 4.59 | % | | | 2.97 | % |
| 1 | Total returns are calculated based on the commencement of Fund trading on the NYSE Arca, Inc. on June 16, 2006. |
Performance is historical and does not guarantee future results. Current performance may be lower or higher than quoted. Investment returns and the principal value of an investment will fluctuate so that an investor’s shares, when redeemed, may be worth more or less than their original cost. Performance data for the most recent month-end is available at www.wisdomtree.com. WisdomTree shares are bought and sold at market price (not NAV) and are not individually redeemed from the Fund. The returns do not reflect the deduction of taxes that a shareholder would pay on Fund distributions or on the redemption of Fund shares.
| | |
| 8 | | WisdomTree Domestic Dividend Funds |
Description of Indexes (unaudited)
Below are descriptions of each Index referenced in this Report:
The WisdomTree Dividend Index defines the dividend-paying portion of the U.S. stock market.
The WisdomTree LargeCap Dividend Index measures the performance of the large-capitalization segment of the U.S. dividend-paying market, selected from the WisdomTree Dividend Index.
The WisdomTree MidCap Dividend Index measures the performance of the mid-capitalization segment of the U.S. dividend-paying market, selected from the WisdomTree Dividend Index.
The WisdomTree SmallCap Dividend Index measures the performance of the small-capitalization segment of the U.S. dividend-paying market, selected from the WisdomTree Dividend Index.
The WisdomTree Equity Income Index measures the performance of companies with high dividend yields, selected from the WisdomTree Dividend Index.
The WisdomTree Dividend ex-Financials Index measures the performance of high dividend-yielding stocks outside the financial sector.
The WisdomTree Dividend Top 100 Index measures the performance of the 100 highest dividend-yielding companies in the WisdomTree LargeCap Dividend Index.
The S&P 500® Index is a capitalization-weighted index of 500 stocks selected by Standard & Poor’s Index Committee, designed to represent the performance of the leading industries in the United States economy.
The S&P MidCap 400® Index is a capitalization-weighted index that measures the performance of the mid-capitalization range of the U.S. stock market, with stocks selected by the Standard & Poor’s Index Committee.
The Russell 2000® Index is a capitalization-weighted index that measures the performance of the smallest 2,000 securities in the Russell 3000 Index, based on total market capitalization.
The Russell 3000® Index is a capitalization-weighted index that measures the performance of the 3,000 largest U.S. companies, based on total market capitalization.
The Russell 1000® Value Index is a capitalization-weighted index that measures the performance of the large-capitalization value segment of the U.S. equity universe, selecting from the Russell 1000 Index.
The Russell 2000® Value Index is a capitalization weighted index that measures the small-capitalization value segment of the U.S. equity universe, selecting from the Russell 2000 Index.
The Russell 3000® Value Index is a capitalization weighted index that measures the performance of the value sector of the broad U.S. equity market. The index is a subset of the Russell 3000 Index and consists of those companies or portion of a company, with lower price-to-book ratios and lower forecasted growth within the Russell 3000 Index.
The Russell MidCap Value® Index is a capitalization weighted index that measures the mid-capitalization value segment of the U.S. equity universe, selecting from the Russell Midcap Index.
The Dow Jones U.S. Select Dividend IndexSM measures the performance of 100 U.S. dividend-paying companies.
Index performance information assumes the reinvestment of net dividends and excludes management fees, transaction costs and expenses. You cannot directly invest in an index.
| | | | |
| WisdomTree Domestic Dividend Funds | | | 9 | |
Shareholder Expense Examples (unaudited)
As a shareholder of a WisdomTree Fund, you incur two types of costs: (1) transaction costs, including brokerage commissions on purchases and sales of your Fund shares and (2) ongoing costs, including management fees and other Fund expenses. The following example is intended to help you understand your ongoing costs (in dollars and cents) of investing in a Fund and to compare these costs with the ongoing costs of investing in other funds.
The example is based on an investment of $1,000 invested at the beginning of the period and held for the entire period from October 1, 2011 to March 31, 2012.
Actual expenses
The first line under each Fund in the table on the next page provides information about actual account values and actual expenses. You may use the information in this line, together with the amount you invested, to estimate the expenses that you paid over the period. Simply divide your account value by $1,000 (for example, an $8,600 account value divided by $1,000 = 8.6), then multiply the result by the number in the first line for your Fund under the heading entitled “Expenses Paid During the Period 10/01/11 to 3/31/12” to estimate the expenses you paid on your account during this period.
Hypothetical example for comparison purposes
The second line under each Fund in the table on the next page provides information about hypothetical account values and hypothetical expenses based on each Fund’s actual expense ratio and an assumed rate of return of 5% per year before expenses, which is not the Fund’s actual return. The hypothetical account values and expenses may not be used to estimate the actual ending account balance or expenses you paid for the period. You may use this information to compare the ongoing costs of investing in your Fund and other funds. To do so, compare this 5% hypothetical example with the 5% hypothetical examples that appear in the shareholder reports of the other funds.
Please note that the expenses shown in the table are meant to highlight your ongoing costs only and do not reflect any transactional costs, such as brokerage commissions paid on purchases and sales of Fund shares. Therefore, the second line under each Fund in the table is useful in comparing ongoing Fund costs only and will not help you determine the relative total costs of owning different funds. In addition, if these transactional costs were included, your costs would have been higher.
| | |
| 10 | | WisdomTree Domestic Dividend Funds |
Shareholder Expense Examples (unaudited) (concluded)
| | | | | | | | | | | | | | |
| | | Beginning
Account Value
10/01/11 | | | Ending
Account Value
3/31/12 | | | Annualized
Expense Ratio
Based on the
Period
10/01/11 to
3/31/12 | | Expenses Paid
During the
Period†
10/01/11 to
3/31/12 | |
WisdomTree Total Dividend Fund | | | | | | | | | | | | | | |
Actual | | $ | 1,000.00 | | | $ | 1,226.80 | | | 0.28% | | $ | 1.56 | |
Hypothetical (5% return before expenses) | | $ | 1,000.00 | | | $ | 1,023.60 | | | 0.28% | | $ | 1.42 | |
WisdomTree Equity Income Fund | | | | | | | | | | | | | | |
Actual | | $ | 1,000.00 | | | $ | 1,184.80 | | | 0.38% | | $ | 2.08 | |
Hypothetical (5% return before expenses) | | $ | 1,000.00 | | | $ | 1,023.10 | | | 0.38% | | $ | 1.92 | |
WisdomTree LargeCap Dividend Fund | | | | | | | | | | | | | | |
Actual | | $ | 1,000.00 | | | $ | 1,225.10 | | | 0.28% | | $ | 1.56 | |
Hypothetical (5% return before expenses) | | $ | 1,000.00 | | | $ | 1,023.60 | | | 0.28% | | $ | 1.42 | |
WisdomTree Dividend ex-Financials Fund | | | | | | | | | | | | | | |
Actual | | $ | 1,000.00 | | | $ | 1,190.80 | | | 0.38% | | $ | 2.08 | |
Hypothetical (5% return before expenses) | | $ | 1,000.00 | | | $ | 1,023.10 | | | 0.38% | | $ | 1.92 | |
WisdomTree MidCap Dividend Fund | | | | | | | | | | | | | | |
Actual | | $ | 1,000.00 | | | $ | 1,235.90 | | | 0.38% | | $ | 2.12 | |
Hypothetical (5% return before expenses) | | $ | 1,000.00 | | | $ | 1,023.10 | | | 0.38% | | $ | 1.92 | |
WisdomTree SmallCap Dividend Fund | | | | | | | | | | | | | | |
Actual | | $ | 1,000.00 | | | $ | 1,263.60 | | | 0.38% | | $ | 2.15 | |
Hypothetical (5% return before expenses) | | $ | 1,000.00 | | | $ | 1,023.10 | | | 0.38% | | $ | 1.92 | |
| † | Expenses are calculated using each Fund’s annualized expense ratio, multiplied by the average account value for the period, multiplied by 183/366 (to reflect the one-half year period). |
| | | | |
| WisdomTree Domestic Dividend Funds | | | 11 | |
Schedule of Investments
WisdomTree Total Dividend Fund (DTD)
March 31, 2012
| | | | | | | | |
| Investments | | Shares | | | Value | |
| | | | | | | | |
| UNITED STATES – 101.6% | |
| COMMON STOCKS – 99.6% | |
| Advertising – 0.1% | |
Harte-Hanks, Inc. | | | 2,479 | | | $ | 22,435 | |
Interpublic Group of Cos., Inc. (The) | | | 8,602 | | | | 98,149 | |
Omnicom Group, Inc.(a) | | | 4,683 | | | | 237,194 | |
| | | | | | | | |
| Total Advertising | | | | | | | 357,778 | |
| Aerospace/Defense – 2.4% | |
Alliant Techsystems, Inc. | | | 208 | | | | 10,425 | |
Boeing Co. (The) | | | 14,125 | | | | 1,050,476 | |
Curtiss-Wright Corp. | | | 488 | | | | 18,061 | |
General Dynamics Corp. | | | 8,017 | | | | 588,288 | |
Goodrich Corp. | | | 952 | | | | 119,419 | |
Kaman Corp. | | | 858 | | | | 29,129 | |
L-3 Communications Holdings, Inc. | | | 2,094 | | | | 148,192 | |
Lockheed Martin Corp. | | | 12,936 | | | | 1,162,429 | |
Northrop Grumman Corp. | | | 7,235 | | | | 441,914 | |
Raytheon Co. | | | 10,242 | | | | 540,573 | |
Rockwell Collins, Inc. | | | 2,097 | | | | 120,703 | |
United Technologies Corp. | | | 18,348 | | | | 1,521,783 | |
| | | | | | | | |
| Total Aerospace/Defense | | | | | | | 5,751,392 | |
| Agriculture – 4.0% | |
Altria Group, Inc. | | | 88,999 | | | | 2,747,399 | |
Archer-Daniels-Midland Co. | | | 12,816 | | | | 405,755 | |
Lorillard, Inc. | | | 4,856 | | | | 628,755 | |
Philip Morris International, Inc. | | | 54,265 | | | | 4,808,422 | |
Reynolds American, Inc. | | | 24,391 | | | | 1,010,763 | |
Universal Corp. | | | 1,000 | | | | 46,600 | |
Vector Group Ltd.(a) | | | 6,274 | | | | 111,175 | |
| | | | | | | | |
| Total Agriculture | | | | | | | 9,758,869 | |
| Apparel – 0.5% | |
Cherokee, Inc. | | | 1,128 | | | | 12,848 | |
Coach, Inc. | | | 3,310 | | | | 255,797 | |
Columbia Sportswear Co.(a) | | | 547 | | | | 25,955 | |
Jones Group, Inc. (The) | | | 1,548 | | | | 19,443 | |
NIKE, Inc. Class B | | | 4,360 | | | | 472,798 | |
Ralph Lauren Corp. | | | 256 | | | | 44,628 | |
VF Corp. | | | 1,916 | | | | 279,698 | |
Wolverine World Wide, Inc. | | | 767 | | | | 28,517 | |
| | | | | | | | |
| Total Apparel | | | | | | | 1,139,684 | |
| Auto Manufacturers – 0.1% | |
PACCAR, Inc. | | | 5,391 | | | | 252,461 | |
| Auto Parts & Equipment – 0.2% | |
Cooper Tire & Rubber Co. | | | 1,732 | | | | 26,361 | |
Douglas Dynamics, Inc. | | | 952 | | | | 13,090 | |
Johnson Controls, Inc. | | | 12,690 | | | | 412,172 | |
Lear Corp. | | | 984 | | | | 45,746 | |
Superior Industries International, Inc. | | | 1,341 | | | | 26,203 | |
| | | | | | | | |
| Total Auto Parts & Equipment | | | | | | | 523,572 | |
| Banks – 6.1% | |
1st Source Corp. | | | 1,195 | | | | 29,242 | |
Arrow Financial Corp. | | | 976 | | | | 23,814 | |
Associated Banc-Corp. | | | 1,096 | | | | 15,300 | |
| | | | | | | | |
BancFirst Corp. | | | 541 | | | $ | 23,566 | |
BancorpSouth, Inc. | | | 1,089 | | | | 14,669 | |
Bank of America Corp. | | | 59,456 | | | | 568,994 | |
Bank of Hawaii Corp. | | | 1,391 | | | | 67,255 | |
Bank of New York Mellon Corp. (The) | | | 24,676 | | | | 595,432 | |
Bank of the Ozarks, Inc. | | | 549 | | | | 17,162 | |
BB&T Corp. | | | 14,551 | | | | 456,756 | |
BOK Financial Corp.(a) | | | 1,004 | | | | 56,505 | |
Capital One Financial Corp. | | | 1,655 | | | | 92,250 | |
Cathay General Bancorp | | | 769 | | | | 13,611 | |
Chemical Financial Corp. | | | 1,213 | | | | 28,433 | |
Citigroup, Inc. | | | 3,428 | | | | 125,293 | |
City Holding Co. | | | 747 | | | | 25,936 | |
City National Corp. | | | 747 | | | | 39,195 | |
Comerica, Inc. | | | 1,754 | | | | 56,759 | |
Commerce Bancshares, Inc. | | | 1,717 | | | | 69,573 | |
Community Bank System, Inc. | | | 1,379 | | | | 39,688 | |
Community Trust Bancorp, Inc. | | | 912 | | | | 29,248 | |
Cullen/Frost Bankers, Inc. | | | 1,690 | | | | 98,341 | |
CVB Financial Corp. | | | 3,649 | | | | 42,839 | |
East West Bancorp, Inc. | | | 1,228 | | | | 28,355 | |
FNB Corp. | | | 5,757 | | | | 69,545 | |
Fifth Third Bancorp | | | 17,803 | | | | 250,132 | |
First Busey Corp. | | | 2,756 | | | | 13,615 | |
First Commonwealth Financial Corp. | | | 1,832 | | | | 11,212 | |
First Financial Bancorp | | | 3,223 | | | | 55,758 | |
First Financial Bankshares, Inc.(a) | | | 814 | | | | 28,661 | |
First Financial Corp. | | | 585 | | | | 18,574 | |
FirstMerit Corp. | | | 4,070 | | | | 68,620 | |
Fulton Financial Corp. | | | 3,778 | | | | 39,669 | |
Glacier Bancorp, Inc. | | | 3,151 | | | | 47,076 | |
Goldman Sachs Group, Inc. (The) | | | 5,631 | | | | 700,327 | |
Hancock Holding Co. | | | 2,030 | | | | 72,085 | |
Hudson Valley Holding Corp. | | | 806 | | | | 13,001 | |
Huntington Bancshares, Inc. | | | 19,510 | | | | 125,839 | |
Iberiabank Corp. | | | 709 | | | | 37,910 | |
Independent Bank Corp. | | | 656 | | | | 18,847 | |
International Bancshares Corp. | | | 1,682 | | | | 35,574 | |
JPMorgan Chase & Co. | | | 91,371 | | | | 4,201,239 | |
KeyCorp | | | 11,542 | | | | 98,107 | |
M&T Bank Corp. | | | 3,570 | | | | 310,162 | |
MB Financial, Inc. | | | 812 | | | | 17,044 | |
Morgan Stanley | | | 19,849 | | | | 389,834 | |
National Penn Bancshares, Inc. | | | 2,987 | | | | 26,435 | |
NBT Bancorp, Inc. | | | 1,369 | | | | 30,227 | |
Northern Trust Corp. | | | 5,152 | | | | 244,462 | |
Old National Bancorp | | | 2,755 | | | | 36,201 | |
PacWest Bancorp | | | 1,314 | | | | 31,930 | |
Park National Corp.(a) | | | 938 | | | | 64,881 | |
Penns Woods Bancorp, Inc.(a) | | | 429 | | | | 17,538 | |
PNC Financial Services Group, Inc. | | | 9,751 | | | | 628,842 | |
Prosperity Bancshares, Inc. | | | 804 | | | | 36,823 | |
Regions Financial Corp. | | | 15,379 | | | | 101,348 | |
Renasant Corp. | | | 1,207 | | | | 19,650 | |
See Notes to Financial Statements.
| | |
| 12 | | WisdomTree Domestic Dividend Funds |
Schedule of Investments (continued)
WisdomTree Total Dividend Fund (DTD)
March 31, 2012
| | | | | | | | |
| Investments | | Shares | | | Value | |
| | | | | | | | |
S&T Bancorp, Inc.(a) | | | 841 | | | $ | 18,241 | |
S.Y. Bancorp, Inc. | | | 1,007 | | | | 23,362 | |
State Street Corp. | | | 6,606 | | | | 300,573 | |
SunTrust Banks, Inc. | | | 5,858 | | | | 141,588 | |
Susquehanna Bancshares, Inc. | | | 2,486 | | | | 24,562 | |
Synovus Financial Corp.(a) | | | 21,066 | | | | 43,185 | |
TCF Financial Corp.(a) | | | 3,020 | | | | 35,908 | |
Tompkins Financial Corp.(a) | | | 426 | | | | 17,066 | |
TrustCo Bank Corp.(a) | | | 6,708 | | | | 38,303 | |
Trustmark Corp. | | | 1,845 | | | | 46,088 | |
U.S. Bancorp | | | 26,774 | | | | 848,200 | |
UMB Financial Corp. | | | 1,027 | | | | 45,943 | |
Umpqua Holdings Corp. | | | 2,475 | | | | 33,561 | |
United Bankshares, Inc.(a) | | | 2,006 | | | | 57,893 | |
Univest Corp. of Pennsylvania | | | 1,207 | | | | 20,253 | |
Valley National Bancorp(a) | | | 7,600 | | | | 98,420 | |
Washington Trust Bancorp, Inc. | | | 563 | | | | 13,591 | |
Webster Financial Corp. | | | 947 | | | | 21,468 | |
Wells Fargo & Co. | | | 72,902 | | | | 2,488,874 | |
WesBanco, Inc. | | | 1,090 | | | | 21,953 | |
Westamerica Bancorp. | | | 650 | | | | 31,200 | |
| | | | | | | | |
| Total Banks | | | | | | | 14,789,616 | |
| Beverages – 2.9% | |
Beam, Inc. | | | 1,734 | | | | 101,560 | |
Brown-Forman Corp. Class A | | | 811 | | | | 66,064 | |
Brown-Forman Corp. Class B | | | 1,218 | | | | 101,569 | |
Coca-Cola Co. (The) | | | 48,905 | | | | 3,619,459 | |
Coca-Cola Enterprises, Inc. | | | 4,940 | | | | 141,284 | |
Dr. Pepper Snapple Group, Inc. | | | 5,478 | | | | 220,271 | |
Molson Coors Brewing Co. Class B | | | 3,663 | | | | 165,751 | |
PepsiCo, Inc. | | | 38,820 | | | | 2,575,707 | |
| | | | | | | | |
| Total Beverages | | | | | | | 6,991,665 | |
| Biotechnology – 0.4% | |
Amgen, Inc. | | | 12,278 | | | | 834,781 | |
PDL BioPharma, Inc. | | | 10,622 | | | | 67,450 | |
| | | | | | | | |
| Total Biotechnology | | | | | | | 902,231 | |
| Building Materials – 0.1% | |
Eagle Materials, Inc. | | | 620 | | | | 21,545 | |
Lennox International, Inc. | | | 837 | | | | 33,731 | |
Martin Marietta Materials, Inc.(a) | | | 745 | | | | 63,794 | |
Masco Corp. | | | 9,475 | | | | 126,681 | |
Simpson Manufacturing Co., Inc. | | | 641 | | | | 20,672 | |
| | | | | | | | |
| Total Building Materials | | | | | | | 266,423 | |
| Chemicals – 2.5% | |
A. Schulman, Inc. | | | 453 | | | | 12,240 | |
Air Products & Chemicals, Inc. | | | 4,557 | | | | 418,333 | |
Airgas, Inc. | | | 1,004 | | | | 89,326 | |
Albemarle Corp. | | | 1,000 | | | | 63,920 | |
Ashland, Inc. | | | 837 | | | | 51,107 | |
Cabot Corp. | | | 796 | | | | 33,973 | |
Celanese Corp. Series A | | | 575 | | | | 26,553 | |
CF Industries Holdings, Inc. | | | 565 | | | | 103,197 | |
| | | | | | | | |
Cytec Industries, Inc. | | | 432 | | | $ | 26,261 | |
Dow Chemical Co. (The) | | | 35,087 | | | | 1,215,414 | |
E.I. du Pont de Nemours & Co. | | | 26,823 | | | | 1,418,937 | |
Eastman Chemical Co. | | | 2,898 | | | | 149,798 | |
Ecolab, Inc. | | | 2,334 | | | | 144,054 | |
FMC Corp. | | | 403 | | | | 42,662 | |
H.B. Fuller Co. | | | 746 | | | | 24,491 | |
Huntsman Corp. | | | 9,403 | | | | 131,736 | |
Innophos Holdings, Inc. | | | 225 | | | | 11,277 | |
International Flavors & Fragrances, Inc. | | | 1,321 | | | | 77,411 | |
Kronos Worldwide, Inc.(a) | | | 3,157 | | | | 78,736 | |
Monsanto Co. | | | 7,432 | | | | 592,776 | |
Mosaic Co. (The) | | | 1,384 | | | | 76,521 | |
NewMarket Corp. | | | 116 | | | | 21,738 | |
Olin Corp. | | | 2,956 | | | | 64,293 | |
PolyOne Corp. | | | 1,529 | | | | 22,018 | |
PPG Industries, Inc. | | | 3,035 | | | | 290,753 | |
Praxair, Inc. | | | 4,518 | | | | 517,944 | |
RPM International, Inc. | | | 3,317 | | | | 86,872 | |
Sensient Technologies Corp. | | | 715 | | | | 27,170 | |
Sherwin-Williams Co. (The) | | | 1,401 | | | | 152,247 | |
Sigma-Aldrich Corp. | | | 989 | | | | 72,256 | |
Valhi, Inc. | | | 608 | | | | 32,254 | |
Valspar Corp. | | | 1,177 | | | | 56,837 | |
Westlake Chemical Corp. | | | 130 | | | | 8,423 | |
| | | | | | | | |
| Total Chemicals | | | | | | | 6,141,528 | |
| Coal – 0.1% | |
Arch Coal, Inc. | | | 6,344 | | | | 67,944 | |
Consol Energy, Inc. | | | 2,271 | | | | 77,441 | |
Peabody Energy Corp. | | | 2,319 | | | | 67,158 | |
Walter Energy, Inc. | | | 1,078 | | | | 63,829 | |
| | | | | | | | |
| Total Coal | | | | | | | 276,372 | |
| Commercial Services – 1.3% | |
ABM Industries, Inc. | | | 1,272 | | | | 30,910 | |
Advance America, Cash Advance Centers, Inc. | | | 2,758 | | | | 28,931 | |
Automatic Data Processing, Inc. | | | 11,603 | | | | 640,370 | |
Brink’s Co. (The) | | | 675 | | | | 16,112 | |
Corporate Executive Board Co. (The) | | | 535 | | | | 23,010 | |
Deluxe Corp. | | | 2,170 | | | | 50,821 | |
DeVry, Inc. | | | 481 | | | | 16,291 | |
Electro Rent Corp. | | | 1,178 | | | | 21,687 | |
Equifax, Inc. | | | 1,774 | | | | 78,517 | |
H&R Block, Inc. | | | 9,244 | | | | 152,249 | |
Healthcare Services Group, Inc. | | | 2,544 | | | | 54,111 | |
Insperity, Inc. | | | 678 | | | | 20,774 | |
Intersections, Inc. | | | 1,410 | | | | 18,020 | |
Iron Mountain, Inc. | | | 4,527 | | | | 130,378 | |
Landauer, Inc. | | | 438 | | | | 23,223 | |
Lender Processing Services, Inc. | | | 1,734 | | | | 45,084 | |
Lincoln Educational Services Corp. | | | 1,308 | | | | 10,346 | |
Manpower, Inc. | | | 1,122 | | | | 53,149 | |
Mastercard, Inc. Class A | | | 164 | | | | 68,968 | |
McGrath Rentcorp | | | 1,010 | | | | 32,431 | |
See Notes to Financial Statements.
| | | | |
| WisdomTree Domestic Dividend Funds | | | 13 | |
Schedule of Investments (continued)
WisdomTree Total Dividend Fund (DTD)
March 31, 2012
| | | | | | | | |
| Investments | | Shares | | | Value | |
| | | | | | | | |
Moody’s Corp. | | | 2,906 | | | $ | 122,343 | |
Paychex, Inc. | | | 12,270 | | | | 380,247 | |
Quad Graphics, Inc.(a) | | | 1,711 | | | | 23,783 | |
R.R. Donnelley & Sons Co.(a) | | | 10,061 | | | | 124,656 | |
Rent-A-Center, Inc. | | | 806 | | | | 30,426 | |
Robert Half International, Inc. | | | 2,420 | | | | 73,326 | |
Rollins, Inc. | | | 2,030 | | | | 43,198 | |
SEI Investments Co. | | | 1,362 | | | | 28,180 | |
Service Corp. International | | | 3,918 | | | | 44,117 | |
Sotheby’s | | | 611 | | | | 24,037 | |
Strayer Education, Inc.(a) | | | 398 | | | | 37,523 | |
Total System Services, Inc. | | | 2,842 | | | | 65,565 | |
Towers Watson & Co. Class A | | | 283 | | | | 18,698 | |
Visa, Inc. Class A | | | 3,560 | | | | 420,080 | |
Weight Watchers International, Inc.(a) | | | 725 | | | | 55,963 | |
Western Union Co. (The) | | | 8,726 | | | | 153,578 | |
| | | | | | | | |
| Total Commercial Services | | | | | | | 3,161,102 | |
| Computers – 1.7% | |
Computer Sciences Corp. | | | 3,573 | | | | 106,976 | |
Diebold, Inc. | | | 2,414 | | | | 92,987 | |
DST Systems, Inc. | | | 429 | | | | 23,265 | |
Hewlett-Packard Co. | | | 27,715 | | | | 660,448 | |
International Business Machines Corp. | | | 14,504 | | | | 3,026,260 | |
j2 Global, Inc.(a) | | | 1,255 | | | | 35,993 | |
Jack Henry & Associates, Inc. | | | 1,111 | | | | 37,907 | |
Lexmark International, Inc. Class A(a) | | | 1,665 | | | | 55,345 | |
MTS Systems Corp. | | | 430 | | | | 22,829 | |
| | | | | | | | |
| Total Computers | | | | | | | 4,062,010 | |
| Cosmetics/Personal Care – 2.4% | |
Avon Products, Inc. | | | 17,204 | | | | 333,069 | |
Colgate-Palmolive Co. | | | 9,668 | | | | 945,337 | |
Estee Lauder Cos., Inc. (The) Class A | | | 1,876 | | | | 116,200 | |
Procter & Gamble Co. (The) | | | 68,211 | | | | 4,584,461 | |
| | | | | | | | |
| Total Cosmetics/Personal Care | | | | | | | 5,979,067 | |
| Distribution/Wholesale – 0.3% | |
Fastenal Co. | | | 3,267 | | | | 176,745 | |
Genuine Parts Co. | | | 3,777 | | | | 237,007 | |
Owens & Minor, Inc. | | | 1,825 | | | | 55,498 | |
Pool Corp. | | | 1,188 | | | | 44,455 | |
United Stationers, Inc. | | | 704 | | | | 21,845 | |
W.W. Grainger, Inc. | | | 823 | | | | 176,789 | |
Watsco, Inc. | | | 854 | | | | 63,230 | |
| | | | | | | | |
| Total Distribution/Wholesale | | | | | | | 775,569 | |
| Diversified Financial Services – 1.8% | | | | | | | | |
American Express Co. | | | 13,709 | | | | 793,203 | |
Ameriprise Financial, Inc. | | | 3,529 | | | | 201,612 | |
Artio Global Investors, Inc. | | | 2,985 | | | | 14,238 | |
BGC Partners, Inc. Class A | | | 9,166 | | | | 67,737 | |
BlackRock, Inc. | | | 3,389 | | | | 694,406 | |
CBOE Holdings, Inc. | | | 1,260 | | | | 35,809 | |
Charles Schwab Corp. (The) | | | 20,844 | | | | 299,528 | |
CME Group, Inc. | | | 1,151 | | | | 333,019 | |
| | | | | | | | |
Cohen & Steers, Inc. | | | 1,111 | | | $ | 35,441 | |
Discover Financial Services | | | 4,203 | | | | 140,128 | |
Eaton Vance Corp.(a) | | | 3,003 | | | | 85,826 | |
Evercore Partners, Inc. Class A | | | 800 | | | | 23,256 | |
Federated Investors, Inc. Class B(a) | | | 5,323 | | | | 119,288 | |
Franklin Resources, Inc. | | | 1,752 | | | | 217,301 | |
GFI Group, Inc. | | | 5,588 | | | | 21,011 | |
Greenhill & Co., Inc. | | | 1,157 | | | | 50,492 | |
Horizon Technology Finance Corp. | | | 946 | | | | 15,713 | |
Interactive Brokers Group, Inc. Class A | | | 1,258 | | | | 21,386 | |
Janus Capital Group, Inc. | | | 5,332 | | | | 47,508 | |
Jefferies Group, Inc. | | | 3,630 | | | | 68,389 | |
Legg Mason, Inc. | | | 1,446 | | | | 40,387 | |
Medley Capital Corp. | | | 1,857 | | | | 20,928 | |
Nelnet, Inc. Class A | | | 649 | | | | 16,816 | |
NYSE Euronext | | | 9,309 | | | | 279,363 | |
Raymond James Financial, Inc. | | | 1,839 | | | | 67,179 | |
SLM Corp. | | | 10,844 | | | | 170,901 | |
T. Rowe Price Group, Inc. | | | 4,611 | | | | 301,098 | |
TD Ameritrade Holding Corp. | | | 6,453 | | | | 127,382 | |
Waddell & Reed Financial, Inc. Class A | | | 2,035 | | | | 65,954 | |
Walter Investment Management Corp. | | | 2,042 | | | | 46,047 | |
| | | | | | | | |
| Total Diversified Financial Services | | | | | | | 4,421,346 | |
| Electric – 5.8% | | | | | | | | |
ALLETE, Inc. | | | 1,461 | | | | 60,617 | |
Alliant Energy Corp. | | | 3,523 | | | | 152,616 | |
Ameren Corp. | | | 9,415 | | | | 306,741 | |
American Electric Power Co., Inc. | | | 17,935 | | | | 691,932 | |
Avista Corp. | | | 2,039 | | | | 52,158 | |
Black Hills Corp. | | | 1,263 | | | | 42,348 | |
Central Vermont Public Service Corp. | | | 496 | | | | 17,459 | |
CH Energy Group, Inc. | | | 579 | | | | 38,637 | |
Cleco Corp. | | | 1,447 | | | | 57,374 | |
CMS Energy Corp. | | | 7,959 | | | | 175,098 | |
Consolidated Edison, Inc. | | | 9,161 | | | | 535,186 | |
Dominion Resources, Inc. | | | 17,084 | | | | 874,872 | |
DTE Energy Co. | | | 5,925 | | | | 326,053 | |
Duke Energy Corp. | | | 48,792 | | | | 1,025,120 | |
Edison International | | | 8,368 | | | | 355,724 | |
Entergy Corp. | | | 6,355 | | | | 427,056 | |
Exelon Corp. | | | 28,606 | | | | 1,121,641 | |
FirstEnergy Corp. | | | 16,021 | | | | 730,397 | |
Great Plains Energy, Inc. | | | 4,408 | | | | 89,350 | |
Hawaiian Electric Industries, Inc. | | | 3,692 | | | | 93,592 | |
IDACORP, Inc. | | | 1,204 | | | | 49,508 | |
Integrys Energy Group, Inc. | | | 3,255 | | | | 172,482 | |
ITC Holdings Corp. | | | 821 | | | | 63,168 | |
MDU Resources Group, Inc. | | | 4,605 | | | | 103,106 | |
MGE Energy, Inc. | | | 770 | | | | 34,180 | |
National Fuel Gas Co. | | | 1,734 | | | | 83,440 | |
NextEra Energy, Inc. | | | 12,518 | | | | 764,599 | |
Northeast Utilities | | | 4,317 | | | | 160,247 | |
NorthWestern Corp. | | | 1,410 | | | | 49,999 | |
NSTAR | | | 2,924 | | | | 142,194 | |
See Notes to Financial Statements.
| | |
| 14 | | WisdomTree Domestic Dividend Funds |
Schedule of Investments (continued)
WisdomTree Total Dividend Fund (DTD)
March 31, 2012
| | | | | | | | |
| Investments | | Shares | | | Value | |
| | | | | | | | |
NV Energy, Inc. | | | 6,414 | | | $ | 103,394 | |
OGE Energy Corp. | | | 2,189 | | | | 117,112 | |
Otter Tail Corp.(a) | | | 1,377 | | | | 29,881 | |
Pepco Holdings, Inc. | | | 9,793 | | | | 184,990 | |
PG&E Corp. | | | 13,703 | | | | 594,847 | |
Pinnacle West Capital Corp. | | | 3,890 | | | | 186,331 | |
PNM Resources, Inc. | | | 2,031 | | | | 37,167 | |
Portland General Electric Co. | | | 2,813 | | | | 70,269 | |
PPL Corp. | | | 21,569 | | | | 609,540 | |
Progress Energy, Inc. | | | 10,295 | | | | 546,767 | |
Public Service Enterprise Group, Inc. | | | 17,090 | | | | 523,125 | |
SCANA Corp.(a) | | | 4,387 | | | | 200,091 | |
Southern Co. (The) | | | 28,153 | | | | 1,264,914 | |
TECO Energy, Inc. | | | 7,926 | | | | 139,101 | |
UIL Holdings Corp. | | | 2,181 | | | | 75,812 | |
Unisource Energy Corp. | | | 1,211 | | | | 44,286 | |
Unitil Corp. | | | 681 | | | | 18,271 | |
Westar Energy, Inc. | | | 4,383 | | | | 122,417 | |
Wisconsin Energy Corp. | | | 5,410 | | | | 190,324 | |
Xcel Energy, Inc. | | | 15,140 | | | | 400,756 | |
| | | | | | | | |
| Total Electric | | | | | | | 14,256,289 | |
| Electrical Components & Equipment – 0.5% | | | | | | | | |
Acuity Brands, Inc. | | | 534 | | | | 33,551 | |
AMETEK, Inc. | | | 940 | | | | 45,599 | |
Emerson Electric Co. | | | 18,732 | | | | 977,436 | |
Hubbell, Inc. Class B | | | 1,188 | | | | 93,353 | |
Littelfuse, Inc. | | | 400 | | | | 25,080 | |
Molex, Inc. | | | 2,016 | | | | 56,690 | |
Molex, Inc. Class A | | | 3,409 | | | | 79,941 | |
| | | | | | | | |
| Total Electrical Components & Equipment | | | | | | | 1,311,650 | |
| Electronics – 0.6% | | | | | | | | |
American Science & Engineering, Inc. | | | 266 | | | | 17,835 | |
Amphenol Corp. Class A | | | 1,156 | | | | 69,094 | |
AVX Corp. | | | 2,353 | | | | 31,201 | |
Brady Corp. Class A | | | 1,119 | | | | 36,200 | |
FLIR Systems, Inc. | | | 1,030 | | | | 26,069 | |
Gentex Corp. | | | 2,057 | | | | 50,397 | |
Honeywell International, Inc. | | | 16,885 | | | | 1,030,829 | |
Jabil Circuit, Inc. | | | 2,746 | | | | 68,980 | |
National Instruments Corp. | | | 1,909 | | | | 54,445 | |
PerkinElmer, Inc. | | | 1,579 | | | | 43,675 | |
Woodward, Inc. | | | 398 | | | | 17,046 | |
| | | | | | | | |
| Total Electronics | | | | | | | 1,445,771 | |
| Energy-Alternate Sources – 0.0% | | | | | | | | |
FutureFuel Corp. | | | 1,369 | | | | 15,032 | |
| Engineering & Construction – 0.1% | | | | | | | | |
Fluor Corp. | | | 1,362 | | | | 81,774 | |
Granite Construction, Inc. | | | 570 | | | | 16,382 | |
KBR, Inc. | | | 1,249 | | | | 44,402 | |
| | | | | | | | |
| Total Engineering & Construction | | | | | | | 142,558 | |
| Entertainment – 0.1% | | | | | | | | |
Cinemark Holdings, Inc. | | | 4,462 | | | | 97,941 | |
| | | | | | | | |
International Game Technology | | | 3,468 | | | $ | 58,228 | |
National CineMedia, Inc. | | | 3,477 | | | | 53,198 | |
Regal Entertainment Group Class A(a) | | | 6,871 | | | | 93,446 | |
Speedway Motorsports, Inc. | | | 1,321 | | | | 24,676 | |
Vail Resorts, Inc. | | | 485 | | | | 20,976 | |
| | | | | | | | |
| Total Entertainment | | | | | | | 348,465 | |
| Environmental Control – 0.4% | | | | | | | | |
Covanta Holding Corp. | | | 2,547 | | | | 41,338 | |
Mine Safety Appliances Co. | | | 1,111 | | | | 45,640 | |
Republic Services, Inc. | | | 8,728 | | | | 266,728 | |
U.S. Ecology, Inc. | | | 745 | | | | 16,196 | |
Waste Connections, Inc. | | | 788 | | | | 25,634 | |
Waste Management, Inc. | | | 14,991 | | | | 524,085 | |
| | | | | | | | |
| Total Environmental Control | | | | | | | 919,621 | |
| Food – 2.5% | | | | | | | | |
B&G Foods, Inc. | | | 1,828 | | | | 41,148 | |
Campbell Soup Co. | | | 8,796 | | | | 297,745 | |
ConAgra Foods, Inc. | | | 12,195 | | | | 320,241 | |
Corn Products International, Inc. | | | 928 | | | | 53,499 | |
Flowers Foods, Inc. | | | 3,847 | | | | 78,363 | |
General Mills, Inc. | | | 15,176 | | | | 598,693 | |
H.J. Heinz Co. | | | 8,965 | | | | 480,076 | |
Harris Teeter Supermarkets, Inc. | | | 805 | | | | 32,280 | |
Hershey Co. (The) | | | 3,007 | | | | 184,419 | |
Hormel Foods Corp. | | | 4,266 | | | | 125,932 | |
J.M. Smucker Co. (The) | | | 2,190 | | | | 178,178 | |
Kellogg Co. | | | 9,825 | | | | 526,915 | |
Kraft Foods, Inc. Class A | | | 42,874 | | | | 1,629,641 | |
Kroger Co. (The) | | | 9,151 | | | | 221,729 | |
Lancaster Colony Corp. | | | 549 | | | | 36,487 | |
McCormick & Co., Inc. | | | 2,348 | | | | 127,802 | |
Safeway, Inc.(a) | | | 7,656 | | | | 154,728 | |
Sanderson Farms, Inc.(a) | | | 318 | | | | 16,863 | |
Sara Lee Corp. | | | 11,820 | | | | 254,485 | |
Snyders-Lance, Inc. | | | 1,768 | | | | 45,703 | |
SUPERVALU, Inc.(a) | | | 8,871 | | | | 50,653 | |
Sysco Corp. | | | 16,744 | | | | 499,976 | |
Tyson Foods, Inc. Class A | | | 1,918 | | | | 36,730 | |
Weis Markets, Inc. | | | 853 | | | | 37,191 | |
Whole Foods Market, Inc. | | | 1,112 | | | | 92,518 | |
| | | | | | | | |
| Total Food | | | | | | | 6,121,995 | |
| Forest Products & Paper – 0.2% | | | | | | | | |
International Paper Co. | | | 12,404 | | | | 435,380 | |
MeadWestvaco Corp. | | | 4,233 | | | | 133,721 | |
PH Glatfelter Co. | | | 1,098 | | | | 17,326 | |
| | | | | | | | |
| Total Forest Products & Paper | | | | | | | 586,427 | |
| Gas – 0.7% | | | | | | | | |
AGL Resources, Inc. | | | 2,779 | | | | 108,992 | |
Atmos Energy Corp. | | | 2,621 | | | | 82,457 | |
CenterPoint Energy, Inc. | | | 13,886 | | | | 273,832 | |
Chesapeake Utilities Corp. | | | 162 | | | | 6,661 | |
Laclede Group, Inc. (The) | | | 907 | | | | 35,391 | |
See Notes to Financial Statements.
| | | | |
| WisdomTree Domestic Dividend Funds | | | 15 | |
Schedule of Investments (continued)
WisdomTree Total Dividend Fund (DTD)
March 31, 2012
| | | | | | | | |
| Investments | | Shares | | | Value | |
| | | | | | | | |
New Jersey Resources Corp. | | | 1,100 | | | $ | 49,027 | |
NiSource, Inc. | | | 8,588 | | | | 209,118 | |
Northwest Natural Gas Co. | | | 720 | | | | 32,688 | |
Piedmont Natural Gas Co., Inc.(a) | | | 2,114 | | | | 65,682 | |
Questar Corp. | | | 4,580 | | | | 88,211 | |
Sempra Energy | | | 6,036 | | | | 361,919 | |
South Jersey Industries, Inc. | | | 752 | | | | 37,630 | |
Southwest Gas Corp. | | | 848 | | | | 36,244 | |
UGI Corp. | | | 3,354 | | | | 91,396 | |
Vectren Corp. | | | 3,188 | | | | 92,643 | |
WGL Holdings, Inc. | | | 1,566 | | | | 63,736 | |
| | | | | | | | |
| Total Gas | | | | | | | 1,635,627 | |
| Hand/Machine Tools – 0.2% | | | | | | | | |
Kennametal, Inc. | | | 1,278 | | | | 56,909 | |
Lincoln Electric Holdings, Inc. | | | 1,458 | | | | 66,077 | |
Regal-Beloit Corp. | | | 553 | | | | 36,249 | |
Snap-On, Inc. | | | 1,248 | | | | 76,091 | |
Stanley Black & Decker, Inc. | | | 3,368 | | | | 259,201 | |
| | | | | | | | |
| Total Hand/Machine Tools | | | | | | | 494,527 | |
| Healthcare-Products – 1.1% | | | | | | | | |
Baxter International, Inc. | | | 11,885 | | | | 710,485 | |
Becton Dickinson and Co. | | | 4,113 | | | | 319,374 | |
C.R. Bard, Inc. | | | 623 | | | | 61,503 | |
DENTSPLY International, Inc. | | | 752 | | | | 30,178 | |
Hill-Rom Holdings, Inc. | | | 800 | | | | 26,728 | |
Medtronic, Inc. | | | 22,116 | | | | 866,726 | |
Meridian Bioscience, Inc. | | | 1,726 | | | | 33,450 | |
Patterson Cos., Inc. | | | 1,217 | | | | 40,648 | |
St. Jude Medical, Inc. | | | 5,602 | | | | 248,225 | |
STERIS Corp. | | | 737 | | | | 23,304 | |
Stryker Corp. | | | 4,442 | | | | 246,442 | |
Techne Corp. | | | 536 | | | | 37,574 | |
Teleflex, Inc. | | | 822 | | | | 50,265 | |
West Pharmaceutical Services, Inc. | | | 461 | | | | 19,606 | |
| | | | | | | | |
| Total Healthcare-Products | | | | | | | 2,714,508 | |
| Healthcare-Services – 0.6% | | | | | | | | |
Aetna, Inc. | | | 3,884 | | | | 194,821 | |
Humana, Inc. | | | 1,384 | | | | 127,992 | |
Lincare Holdings, Inc. | | | 2,321 | | | | 60,067 | |
National Healthcare Corp. | | | 419 | | | | 19,090 | |
Quest Diagnostics, Inc. | | | 1,219 | | | | 74,542 | |
UnitedHealth Group, Inc. | | | 11,205 | | | | 660,423 | |
WellPoint, Inc. | | | 3,820 | | | | 281,916 | |
| | | | | | | | |
| Total Healthcare-Services | | | | | | | 1,418,851 | |
| Holding Companies-Diversified – 0.0% | | | | | | | | |
Leucadia National Corp. | | | 1,921 | | | | 50,138 | |
| Home Builders – 0.1% | | | | | | | | |
D.R. Horton, Inc. | | | 4,035 | | | | 61,211 | |
KB Home(a) | | | 3,254 | | | | 28,961 | |
Lennar Corp. Class A(a) | | | 1,557 | | | | 42,319 | |
MDC Holdings, Inc. | | | 1,648 | | | | 42,502 | |
Ryland Group, Inc. (The) | | | 832 | | | | 16,041 | |
| | | | | | | | |
Thor Industries, Inc. | | | 1,298 | | | $ | 40,965 | |
| | | | | | | | |
| Total Home Builders | | | | | | | 231,999 | |
| Home Furnishings – 0.1% | | | | | | | | |
Harman International Industries, Inc. | | | 470 | | | | 22,001 | |
Whirlpool Corp. | | | 2,426 | | | | 186,462 | |
| | | | | | | | |
| Total Home Furnishings | | | | | | | 208,463 | |
| Household Products/Wares – 0.6% | | | | | | | | |
American Greetings Corp. Class A | | | 538 | | | | 8,253 | |
Avery Dennison Corp. | | | 2,976 | | | | 89,667 | |
Church & Dwight Co., Inc. | | | 1,558 | | | | 76,638 | |
Clorox Co. (The) | | | 3,730 | | | | 256,437 | |
Ennis, Inc. | | | 1,275 | | | | 20,171 | |
Kimberly-Clark Corp. | | | 12,154 | | | | 898,059 | |
Scotts Miracle-Gro Co. (The) Class A(a) | | | 1,286 | | | | 69,650 | |
Tupperware Brands Corp. | | | 1,028 | | | | 65,278 | |
WD-40 Co. | | | 744 | | | | 33,740 | |
| | | | | | | | |
| Total Household Products/Wares | | | | | | | 1,517,893 | |
| Housewares – 0.0% | | | | | | | | |
Newell Rubbermaid, Inc. | | | 4,611 | | | | 82,122 | |
Toro Co. (The) | | | 540 | | | | 38,399 | |
| | | | | | | | |
| Total Housewares | | | | | | | 120,521 | |
| Insurance – 2.6% | | | | | | | | |
Aflac, Inc. | | | 11,269 | | | | 518,261 | |
Allstate Corp. (The) | | | 12,198 | | | | 401,558 | |
American Financial Group, Inc. | | | 1,569 | | | | 60,532 | |
American National Insurance Co. | | | 1,030 | | | | 74,696 | |
AmTrust Financial Services, Inc. | | | 947 | | | | 25,455 | |
Arthur J. Gallagher & Co. | | | 3,599 | | | | 128,628 | |
Assurant, Inc. | | | 1,379 | | | | 55,850 | |
Baldwin & Lyons, Inc. Class B | | | 752 | | | | 16,830 | |
Brown & Brown, Inc. | | | 1,845 | | | | 43,874 | |
Chubb Corp. (The) | | | 5,059 | | | | 349,628 | |
Cincinnati Financial Corp. | | | 6,736 | | | | 232,459 | |
CNA Financial Corp. | | | 2,870 | | | | 84,177 | |
Delphi Financial Group, Inc. Class A | | | 725 | | | | 32,458 | |
Donegal Group, Inc. Class A | | | 1,026 | | | | 14,025 | |
Erie Indemnity Co. Class A | | | 1,042 | | | | 81,214 | |
Fidelity National Financial, Inc. Class A | | | 5,616 | | | | 101,257 | |
First American Financial Corp. | | | 156 | | | | 2,594 | |
Hanover Insurance Group, Inc. (The) | | | 1,336 | | | | 54,936 | |
Harleysville Group, Inc. | | | 680 | | | | 39,236 | |
Hartford Financial Services Group, Inc. | | | 7,886 | | | | 166,237 | |
HCC Insurance Holdings, Inc. | | | 2,243 | | | | 69,914 | |
Horace Mann Educators Corp. | | | 1,364 | | | | 24,034 | |
Kemper Corp. | | | 2,204 | | | | 66,737 | |
Life Partners Holdings, Inc. | | | 863 | | | | 3,512 | |
Lincoln National Corp. | | | 3,765 | | | | 99,245 | |
Loews Corp. | | | 2,057 | | | | 82,013 | |
Marsh & McLennan Cos., Inc. | | | 11,904 | | | | 390,332 | |
Mercury General Corp. | | | 2,315 | | | | 101,258 | |
MetLife, Inc. | | | 19,377 | | | | 723,731 | |
Old Republic International Corp. | | | 14,783 | | | | 155,961 | |
See Notes to Financial Statements.
| | |
| 16 | | WisdomTree Domestic Dividend Funds |
Schedule of Investments (continued)
WisdomTree Total Dividend Fund (DTD)
March 31, 2012
| | | | | | | | |
| Investments | | Shares | | | Value | |
| | | | | | | | |
Principal Financial Group, Inc. | | | 6,731 | | | $ | 198,632 | |
ProAssurance Corp. | | | 292 | | | | 25,728 | |
Progressive Corp. (The) | | | 9,787 | | | | 226,863 | |
Protective Life Corp. | | | 2,132 | | | | 63,150 | |
Prudential Financial, Inc. | | | 10,865 | | | | 688,732 | |
Reinsurance Group of America, Inc. | | | 829 | | | | 49,301 | |
RLI Corp.(a) | | | 489 | | | | 35,032 | |
Safety Insurance Group, Inc. | | | 745 | | | | 31,022 | |
Selective Insurance Group, Inc. | | | 2,205 | | | | 38,830 | |
StanCorp Financial Group, Inc. | | | 1,112 | | | | 45,525 | |
State Auto Financial Corp. | | | 1,904 | | | | 27,818 | |
Symetra Financial Corp. | | | 2,944 | | | | 33,944 | |
Torchmark Corp. | | | 913 | | | | 45,513 | |
Tower Group, Inc. | | | 1,359 | | | | 30,482 | |
Travelers Cos., Inc. (The) | | | 9,290 | | | | 549,968 | |
United Fire Group, Inc. | | | 843 | | | | 15,081 | |
Universal Insurance Holdings, Inc. | | | 2,989 | | | | 11,627 | |
Unum Group | | | 4,499 | | | | 110,136 | |
W.R. Berkley Corp. | | | 1,047 | | | | 37,818 | |
| | | | | | | | |
| Total Insurance | | | | | | | 6,465,844 | |
| Internet – 0.1% | |
Earthlink, Inc. | | | 3,922 | | | | 31,337 | |
Expedia, Inc.(a) | | | 1,069 | | | | 35,747 | |
IAC/InterActiveCorp | | | 678 | | | | 33,283 | |
Nutrisystem, Inc. | | | 1,642 | | | | 18,440 | |
United Online, Inc. | | | 4,426 | | | | 21,643 | |
| | | | | | | | |
| Total Internet | | | | | | | 140,450 | |
| Investment Companies – 0.5% | |
Apollo Investment Corp. | | | 26,717 | | | | 191,561 | |
Ares Capital Corp.(a) | | | 15,128 | | | | 247,343 | |
Arlington Asset Investment Corp. Class A | | | 1,136 | | | | 25,219 | |
BlackRock Kelso Capital Corp. | | | 7,531 | | | | 73,954 | |
Fifth Street Finance Corp.(a) | | | 7,798 | | | | 76,108 | |
Gladstone Capital Corp. | | | 2,667 | | | | 21,629 | |
Golub Capital BDC, Inc. | | | 1,195 | | | | 18,248 | |
Kohlberg Capital Corp. | | | 2,599 | | | | 17,959 | |
Main Street Capital Corp. | | | 1,924 | | | | 47,388 | |
MCG Capital Corp. | | | 10,733 | | | | 45,615 | |
MVC Capital, Inc. | | | 743 | | | | 9,756 | |
NGP Capital Resources Co. | | | 1,523 | | | | 9,976 | |
PennantPark Investment Corp. | | | 4,153 | | | | 43,191 | |
Prospect Capital Corp. | | | 11,514 | | | | 126,424 | |
Solar Capital Ltd. | | | 2,770 | | | | 61,134 | |
THL Credit, Inc. | | | 1,874 | | | | 24,100 | |
TICC Capital Corp. | | | 3,586 | | | | 34,928 | |
Triangle Capital Corp.(a) | | | 2,012 | | | | 39,737 | |
| | | | | | | | |
| Total Investment Companies | | | | | | | 1,114,270 | |
| Iron/Steel – 0.4% | |
AK Steel Holding Corp.(a) | | | 5,872 | | | | 44,392 | |
Allegheny Technologies, Inc. | | | 1,593 | | | | 65,584 | |
Carpenter Technology Corp. | | | 280 | | | | 14,624 | |
Cliffs Natural Resources, Inc. | | | 2,182 | | | | 151,125 | |
Commercial Metals Co. | | | 2,919 | | | | 43,260 | |
| | | | | | | | |
Nucor Corp. | | | 9,361 | | | $ | 402,055 | |
Reliance Steel & Aluminum Co. | | | 379 | | | | 21,406 | |
Steel Dynamics, Inc. | | | 5,378 | | | | 78,196 | |
United States Steel Corp.(a) | | | 2,038 | | | | 59,856 | |
| | | | | | | | |
| Total Iron/Steel | | | | | | | 880,498 | |
| Leisure Time – 0.1% | |
Callaway Golf Co.(a) | | | 2,471 | | | | 16,704 | |
Harley-Davidson, Inc. | | | 2,583 | | | | 126,774 | |
Polaris Industries, Inc. | | | 864 | | | | 62,337 | |
| | | | | | | | |
| Total Leisure Time | | | | | | | 205,815 | |
| Lodging – 0.3% | |
Ameristar Casinos, Inc. | | | 892 | | | | 16,618 | |
Choice Hotels International, Inc. | | | 1,260 | | | | 47,049 | |
Marriott International, Inc. Class A | | | 3,858 | | | | 146,025 | |
Starwood Hotels & Resorts Worldwide, Inc. | | | 1,796 | | | | 101,312 | |
Wyndham Worldwide Corp. | | | 2,274 | | | | 105,764 | |
Wynn Resorts Ltd. | | | 1,816 | | | | 226,782 | |
| | | | | | | | |
| Total Lodging | | | | | | | 643,550 | |
| Machinery-Construction & Mining – 0.5% | |
Caterpillar, Inc. | | | 10,853 | | | | 1,156,062 | |
Joy Global, Inc. | | | 815 | | | | 59,902 | |
| | | | | | | | |
| Total Machinery-Construction & Mining | | | | | | | 1,215,964 | |
| Machinery-Diversified – 0.6% | |
Albany International Corp. Class A | | | 678 | | | | 15,560 | |
Applied Industrial Technologies, Inc. | | | 1,184 | | | | 48,698 | |
Briggs & Stratton Corp. | | | 647 | | | | 11,601 | |
Cognex Corp. | | | 653 | | | | 27,661 | |
Cummins, Inc. | | | 3,033 | | | | 364,081 | |
Deere & Co. | | | 7,002 | | | | 566,462 | |
Flowserve Corp. | | | 558 | | | | 64,455 | |
Graco, Inc. | | | 1,068 | | | | 56,668 | |
IDEX Corp. | | | 1,280 | | | | 53,926 | |
NACCO Industries, Inc. Class A | | | 194 | | | | 22,576 | |
Nordson Corp. | | | 726 | | | | 39,574 | |
Rockwell Automation, Inc. | | | 2,479 | | | | 197,576 | |
Roper Industries, Inc. | | | 404 | | | | 40,061 | |
| | | | | | | | |
| Total Machinery-Diversified | | | | | | | 1,508,899 | |
| Media – 2.3% | |
Belo Corp. Class A | | | 3,355 | | | | 24,055 | |
Cablevision Systems Corp. Class A | | | 7,130 | | | | 104,668 | |
CBS Corp. Class A | | | 1,063 | | | | 36,376 | |
CBS Corp. Class B | | | 7,325 | | | | 248,391 | |
Comcast Corp. Class A | | | 30,572 | | | | 917,466 | |
Comcast Corp. Special Class A | | | 9,393 | | | | 277,187 | |
Courier Corp. | | | 1,318 | | | | 15,289 | |
Factset Research Systems, Inc.(a) | | | 471 | | | | 46,648 | |
Gannett Co., Inc. | | | 4,499 | | | | 68,970 | |
John Wiley & Sons, Inc. Class A | | | 633 | | | | 30,125 | |
McGraw-Hill Cos., Inc. (The) | | | 5,494 | | | | 266,294 | |
Meredith Corp.(a) | | | 1,517 | | | | 49,242 | |
News Corp. Class A | | | 14,593 | | | | 287,336 | |
News Corp. Class B | | | 6,682 | | | | 133,506 | |
See Notes to Financial Statements.
| | | | |
| WisdomTree Domestic Dividend Funds | | | 17 | |
Schedule of Investments (continued)
WisdomTree Total Dividend Fund (DTD)
March 31, 2012
| | | | | | | | |
| Investments | | Shares | | | Value | |
| | | | | | | | |
Scripps Networks Interactive, Inc. Class A | | | 835 | | | $ | 40,656 | |
Sinclair Broadcast Group, Inc. Class A | | | 2,219 | | | | 24,542 | |
Time Warner Cable, Inc. | | | 7,417 | | | | 604,486 | |
Time Warner, Inc. | | | 21,509 | | | | 811,965 | |
Viacom, Inc. Class A | | | 833 | | | | 43,291 | |
Viacom, Inc. Class B | | | 8,864 | | | | 420,685 | |
Walt Disney Co. (The) | | | 22,605 | | | | 989,647 | |
Washington Post Co. (The) Class B(a) | | | 165 | | | | 61,639 | |
World Wrestling Entertainment, Inc. Class A(a) | | | 2,863 | | | | 25,395 | |
| | | | | | | | |
| Total Media | | | | | | | 5,527,859 | |
| Metal Fabricate/Hardware – 0.1% | |
Kaydon Corp. | | | 629 | | | | 16,046 | |
Mueller Industries, Inc. | | | 445 | | | | 20,225 | |
Timken Co. (The) | | | 1,401 | | | | 71,087 | |
Worthington Industries, Inc. | | | 1,151 | | | | 22,076 | |
| | | | | | | | |
| Total Metal Fabricate/Hardware | | | | | | | 129,434 | |
| Mining – 1.4% | |
Alcoa, Inc. | | | 12,917 | | | | 129,428 | |
AMCOL International Corp. | | | 738 | | | | 21,764 | |
Compass Minerals International, Inc. | | | 565 | | | | 40,533 | |
Freeport-McMoRan Copper & Gold, Inc. | | | 19,632 | | | | 746,801 | |
Globe Specialty Metals, Inc. | | | 1,232 | | | | 18,320 | |
Gold Resource Corp. | | | 1,282 | | | | 31,165 | |
Hecla Mining Co.(a) | | | 3,692 | | | | 17,057 | |
Kaiser Aluminum Corp.(a) | | | 183 | | | | 8,649 | |
Newmont Mining Corp. | | | 8,068 | | | | 413,646 | |
Royal Gold, Inc. | | | 213 | | | | 13,892 | |
Southern Copper Corp. | | | 61,880 | | | | 1,962,215 | |
Titanium Metals Corp. | | | 2,614 | | | | 35,446 | |
Vulcan Materials Co. | | | 263 | | | | 11,238 | |
| | | | | | | | |
| Total Mining | | | | | | | 3,450,154 | |
| Miscellaneous Manufacturing – 3.9% | |
3M Co. | | | 15,383 | | | | 1,372,317 | |
A.O. Smith Corp. | | | 294 | | | | 13,215 | |
Aptargroup, Inc. | | | 818 | | | | 44,802 | |
Barnes Group, Inc. | | | 1,183 | | | | 31,125 | |
Carlisle Cos., Inc. | | | 1,106 | | | | 55,212 | |
CLARCOR, Inc. | | | 641 | | | | 31,467 | |
Crane Co. | | | 1,110 | | | | 53,835 | |
Danaher Corp. | | | 1,110 | | | | 62,160 | |
Donaldson Co., Inc. | | | 1,066 | | | | 38,088 | |
Dover Corp. | | | 3,172 | | | | 199,646 | |
Eaton Corp. | | | 8,228 | | | | 410,001 | |
General Electric Co. | | | 287,546 | | | | 5,771,048 | |
Harsco Corp. | | | 2,762 | | | | 64,797 | |
Hillenbrand, Inc. | | | 2,133 | | | | 48,952 | |
Illinois Tool Works, Inc. | | | 11,768 | | | | 672,188 | |
ITT Corp. | | | 1,477 | | | | 33,882 | |
Koppers Holdings, Inc. | | | 649 | | | | 25,025 | |
Leggett & Platt, Inc.(a) | | | 5,686 | | | | 130,835 | |
NL Industries, Inc. | | | 2,722 | | | | 40,558 | |
Pall Corp. | | | 1,119 | | | | 66,726 | |
Parker Hannifin Corp. | | | 2,267 | | | | 191,675 | |
| | | | | | | | |
Pentair, Inc. | | | 1,868 | | | $ | 88,936 | |
SPX Corp. | | | 749 | | | | 58,070 | |
Textron, Inc. | | | 1,477 | | | | 41,105 | |
Trinity Industries, Inc. | | | 1,259 | | | | 41,484 | |
| | | | | | | | |
| Total Miscellaneous Manufacturing | | | | | | | 9,587,149 | |
| Office Furnishings – 0.0% | |
HNI Corp. | | | 1,179 | | | | 32,717 | |
Knoll, Inc. | | | 1,371 | | | | 22,813 | |
Steelcase, Inc. Class A | | | 3,013 | | | | 28,925 | |
| | | | | | | | |
| Total Office Furnishings | | | | | | | 84,455 | |
| Office/Business Equipment – 0.2% | |
Pitney Bowes, Inc.(a) | | | 12,280 | | | | 215,882 | |
Xerox Corp. | | | 22,943 | | | | 185,380 | |
| | | | | | | | |
| Total Office/Business Equipment | | | | | | | 401,262 | |
| Oil & Gas – 8.2% | |
Anadarko Petroleum Corp. | | | 2,035 | | | | 159,422 | |
Apache Corp. | | | 2,202 | | | | 221,169 | |
Berry Petroleum Co. Class A | | | 480 | | | | 22,622 | |
Chesapeake Energy Corp. | | | 7,704 | | | | 178,502 | |
Chevron Corp. | | | 49,322 | | | | 5,289,291 | |
Cimarex Energy Co. | | | 348 | | | | 26,264 | |
ConocoPhillips | | | 39,509 | | | | 3,003,079 | |
Devon Energy Corp. | | | 3,322 | | | | 236,261 | |
Diamond Offshore Drilling, Inc.(a) | | | 763 | | | | 50,930 | |
Energen Corp. | | | 366 | | | | 17,989 | |
EOG Resources, Inc. | | | 1,508 | | | | 167,539 | |
EQT Corp. | | | 1,928 | | | | 92,949 | |
EXCO Resources, Inc.(a) | | | 2,668 | | | | 17,689 | |
Exxon Mobil Corp. | | | 87,284 | | | | 7,570,141 | |
Helmerich & Payne, Inc. | | | 350 | | | | 18,883 | |
Hess Corp. | | | 1,931 | | | | 113,832 | |
HollyFrontier Corp. | | | 2,351 | | | | 75,585 | |
Marathon Oil Corp. | | | 11,395 | | | | 361,221 | |
Marathon Petroleum Corp. | | | 8,238 | | | | 357,200 | |
Murphy Oil Corp. | | | 3,102 | | | | 174,550 | |
Noble Energy, Inc. | | | 1,457 | | | | 142,465 | |
Occidental Petroleum Corp. | | | 12,928 | | | | 1,231,133 | |
Patterson-UTI Energy, Inc. | | | 1,813 | | | | 31,347 | |
Pioneer Natural Resources Co. | | | 2 | | | | 223 | |
Range Resources Corp. | | | 348 | | | | 20,233 | |
Sunoco, Inc. | | | 1,316 | | | | 50,205 | |
Valero Energy Corp. | | | 12,043 | | | | 310,348 | |
| | | | | | | | |
| Total Oil & Gas | | | | | | | 19,941,072 | |
| Oil & Gas Services – 0.3% | |
Baker Hughes, Inc. | | | 4,329 | | | | 181,558 | |
CARBO Ceramics, Inc.(a) | | | 132 | | | | 13,920 | |
Halliburton Co. | | | 8,344 | | | | 276,937 | |
National Oilwell Varco, Inc. | | | 2,513 | | | | 199,708 | |
Oceaneering International, Inc. | | | 1,028 | | | | 55,399 | |
RPC, Inc.(a) | | | 4,013 | | | | 42,578 | |
Targa Resources Corp. | | | 1,102 | | | | 50,086 | |
| | | | | | | | |
| Total Oil & Gas Services | | | | | | | 820,186 | |
See Notes to Financial Statements.
| | |
| 18 | | WisdomTree Domestic Dividend Funds |
Schedule of Investments (continued)
WisdomTree Total Dividend Fund (DTD)
March 31, 2012
| | | | | | | | |
| Investments | | Shares | | | Value | |
| | | | | | | | |
| Packaging & Containers – 0.2% | |
Ball Corp. | | | 1,180 | | | $ | 50,598 | |
Bemis Co., Inc. | | | 2,298 | | | | 74,203 | |
Greif, Inc. Class A | | | 849 | | | | 47,476 | |
Greif, Inc. Class B | | | 984 | | | | 55,862 | |
Packaging Corp. of America | | | 2,475 | | | | 73,235 | |
Rock-Tenn Co. Class A | | | 740 | | | | 49,994 | |
Sealed Air Corp. | | | 4,465 | | | | 86,219 | |
Silgan Holdings, Inc. | | | 714 | | | | 31,559 | |
Sonoco Products Co. | | | 2,861 | | | | 94,985 | |
| | | | | | | | |
| Total Packaging & Containers | | | | | | | 564,131 | |
| Pharmaceuticals – 8.7% | |
Abbott Laboratories | | | 42,323 | | | | 2,593,977 | |
Allergan, Inc. | | | 579 | | | | 55,254 | |
AmerisourceBergen Corp. | | | 2,908 | | | | 115,389 | |
Bristol-Myers Squibb Co. | | | 51,033 | | | | 1,722,364 | |
Cardinal Health, Inc. | | | 5,724 | | | | 246,762 | |
Eli Lilly & Co. | | | 43,619 | | | | 1,756,537 | |
Johnson & Johnson | | | 75,621 | | | | 4,987,961 | |
McKesson Corp. | | | 2,005 | | | | 175,979 | |
Mead Johnson Nutrition Co. | | | 2,229 | | | | 183,848 | |
Medicis Pharmaceutical Corp. Class A | | | 573 | | | | 21,539 | |
Merck & Co., Inc. | | | 109,529 | | | | 4,205,914 | |
Perrigo Co. | | | 263 | | | | 27,170 | |
Pfizer, Inc. | | | 225,122 | | | | 5,101,264 | |
| | | | | | | | |
| Total Pharmaceuticals | | | | | | | 21,193,958 | |
| Pipelines – 0.8% | | | | | | | | |
Crosstex Energy, Inc. | | | 1,512 | | | | 21,380 | |
El Paso Corp. | | | 1,116 | | | | 32,978 | |
Kinder Morgan, Inc.(a) | | | 20,904 | | | | 807,939 | |
ONEOK, Inc. | | | 2,214 | | | | 180,795 | |
Spectra Energy Corp. | | | 18,893 | | | | 596,074 | |
Williams Cos., Inc. (The) | | | 14,328 | | | | 441,446 | |
| | | | | | | | |
| Total Pipelines | | | | | | | 2,080,612 | |
| Private Equity – 0.0% | | | | | | | | |
Hercules Technology Growth Capital, Inc. | | | 3,449 | | | | 38,215 | |
| Real Estate – 0.0% | | | | | | | | |
Sovran Self Storage, Inc. | | | 1,140 | | | | 56,806 | |
| Real Estate Investment Trusts (REITs) – 5.4% | | | | | | | | |
Acadia Realty Trust | | | 1,823 | | | | 41,090 | |
Agree Realty Corp. | | | 773 | | | | 17,454 | |
Alexander’s, Inc. | | | 147 | | | | 57,900 | |
Alexandria Real Estate Equities, Inc. | | | 1,353 | | | | 98,945 | |
American Assets Trust, Inc. | | | 1,432 | | | | 32,650 | |
American Campus Communities, Inc. | | | 1,937 | | | | 86,623 | |
Apartment Investment & Management Co. Class A | | | 1,930 | | | | 50,971 | |
Ashford Hospitality Trust, Inc. | | | 3,159 | | | | 28,463 | |
Associated Estates Realty Corp. | | | 1,281 | | | | 20,932 | |
AvalonBay Communities, Inc. | | | 2,120 | | | | 299,662 | |
BioMed Realty Trust, Inc. | | | 5,380 | | | | 102,112 | |
Boston Properties, Inc. | | | 2,482 | | | | 260,585 | |
Brandywine Realty Trust | | | 7,898 | | | | 90,669 | |
| | | | | | | | |
BRE Properties, Inc. | | | 1,832 | | | $ | 92,608 | |
Camden Property Trust | | | 1,906 | | | | 125,320 | |
Campus Crest Communities, Inc. | | | 1,936 | | | | 22,574 | |
CapLease, Inc. | | | 2,187 | | | | 8,814 | |
CBL & Associates Properties, Inc. | | | 6,437 | | | | 121,788 | |
Cedar Realty Trust, Inc. | | | 2,289 | | | | 11,720 | |
Chesapeake Lodging Trust | | | 723 | | | | 12,992 | |
Cogdell Spencer, Inc. | | | 5,410 | | | | 22,938 | |
Colonial Properties Trust | | | 1,627 | | | | 35,355 | |
CommonWealth REIT | | | 7,887 | | | | 146,856 | |
Corporate Office Properties Trust | | | 4,386 | | | | 101,799 | |
Cousins Properties, Inc. | | | 2,416 | | | | 18,313 | |
CubeSmart | | | 2,982 | | | | 35,486 | |
DCT Industrial Trust, Inc. | | | 11,544 | | | | 68,110 | |
DDR Corp. | | | 5,667 | | | | 82,738 | |
DiamondRock Hospitality Co. | | | 4,783 | | | | 49,217 | |
Digital Realty Trust, Inc.(a) | | | 3,378 | | | | 249,871 | |
Douglas Emmett, Inc. | | | 2,766 | | | | 63,092 | |
Duke Realty Corp. | | | 12,645 | | | | 181,329 | |
DuPont Fabros Technology, Inc. | | | 890 | | | | 21,761 | |
EastGroup Properties, Inc. | | | 863 | | | | 43,340 | |
Education Realty Trust, Inc. | | | 2,757 | | | | 29,886 | |
Entertainment Properties Trust | | | 2,477 | | | | 114,883 | |
Equity Lifestyle Properties, Inc. | | | 656 | | | | 45,749 | |
Equity One, Inc. | | | 4,213 | | | | 85,187 | |
Equity Residential | | | 5,643 | | | | 353,365 | |
Essex Property Trust, Inc. | | | 827 | | | | 125,299 | |
Excel Trust, Inc. | | | 1,615 | | | | 19,509 | |
Extra Space Storage, Inc. | | | 1,396 | | | | 40,191 | |
Federal Realty Investment Trust | | | 1,514 | | | | 146,540 | |
First Potomac Realty Trust | | | 2,375 | | | | 28,714 | |
Franklin Street Properties Corp. | | | 3,078 | | | | 32,627 | |
General Growth Properties, Inc. | | | 18,700 | | | | 317,713 | |
Gladstone Commercial Corp. | | | 1,140 | | | | 19,619 | |
Glimcher Realty Trust | | | 4,829 | | | | 49,352 | |
Government Properties Income Trust | | | 2,955 | | | | 71,245 | |
HCP, Inc. | | | 15,122 | | | | 596,714 | |
Health Care REIT, Inc. | | | 8,107 | | | | 445,561 | |
Healthcare Realty Trust, Inc. | | | 4,358 | | | | 95,876 | |
Hersha Hospitality Trust | | | 6,150 | | | | 33,579 | |
Highwoods Properties, Inc. | | | 3,067 | | | | 102,192 | |
Home Properties, Inc. | | | 1,735 | | | | 105,852 | |
Hospitality Properties Trust | | | 7,479 | | | | 197,969 | |
Host Hotels & Resorts, Inc. | | | 5,779 | | | | 94,891 | |
Hudson Pacific Properties, Inc. | | | 1,304 | | | | 19,730 | |
Inland Real Estate Corp. | | | 5,680 | | | | 50,382 | |
Investors Real Estate Trust | | | 4,827 | | | | 37,120 | |
Kilroy Realty Corp. | | | 1,835 | | | | 85,529 | |
Kimco Realty Corp. | | | 15,535 | | | | 299,204 | |
Kite Realty Group Trust | | | 3,861 | | | | 20,347 | |
LaSalle Hotel Properties | | | 837 | | | | 23,553 | |
Lexington Realty Trust | | | 7,685 | | | | 69,088 | |
Liberty Property Trust | | | 5,585 | | | | 199,496 | |
LTC Properties, Inc. | | | 1,200 | | | | 38,400 | |
See Notes to Financial Statements.
| | | | |
| WisdomTree Domestic Dividend Funds | | | 19 | |
Schedule of Investments (continued)
WisdomTree Total Dividend Fund (DTD)
March 31, 2012
| | | | | | | | |
| Investments | | Shares | | | Value | |
| | | | | | | | |
Macerich Co. (The) | | | 4,615 | | | $ | 266,516 | |
Mack-Cali Realty Corp. | | | 4,748 | | | | 136,837 | |
Medical Properties Trust, Inc. | | | 6,335 | | | | 58,789 | |
Mid-America Apartment Communities, Inc. | | | 1,176 | | | | 78,827 | |
Mission West Properties, Inc. | | | 2,174 | | | | 21,436 | |
Monmouth Real Estate Investment Corp. Class A | | | 2,695 | | | | 26,249 | |
National Health Investors, Inc. | | | 1,463 | | | | 71,365 | |
National Retail Properties, Inc. | | | 4,518 | | | | 122,844 | |
Omega Healthcare Investors, Inc. | | | 6,824 | | | | 145,078 | |
One Liberty Properties, Inc. | | | 738 | | | | 13,505 | |
Parkway Properties, Inc. | | | 1,293 | | | | 13,551 | |
Pebblebrook Hotel Trust | | | 1,243 | | | | 28,067 | |
Pennsylvania Real Estate Investment Trust | | | 2,693 | | | | 41,122 | |
Piedmont Office Realty Trust, Inc. Class A | | | 10,042 | | | | 178,246 | |
Plum Creek Timber Co., Inc. | | | 6,219 | | | | 258,462 | |
Post Properties, Inc. | | | 926 | | | | 43,392 | |
Potlatch Corp.(a) | | | 1,914 | | | | 59,985 | |
ProLogis, Inc. | | | 14,469 | | | | 521,173 | |
PS Business Parks, Inc. | | | 466 | | | | 30,542 | |
Public Storage | | | 3,960 | | | | 547,153 | |
Ramco-Gershenson Properties Trust | | | 1,375 | | | | 16,803 | |
Rayonier, Inc. | | | 3,751 | | | | 165,382 | |
Realty Income Corp. | | | 5,117 | | | | 198,181 | |
Regency Centers Corp. | | | 3,527 | | | | 156,881 | |
Retail Opportunity Investments Corp. | | | 1,727 | | | | 20,793 | |
RLJ Lodging Trust | | | 3,064 | | | | 57,082 | |
Sabra Health Care REIT, Inc. | | | 3,571 | | | | 58,707 | |
Saul Centers, Inc. | | | 709 | | | | 28,615 | |
Senior Housing Properties Trust | | | 8,736 | | | | 192,629 | |
Simon Property Group, Inc. | | | 6,611 | | | | 963,090 | |
SL Green Realty Corp. | | | 432 | | | | 33,502 | |
STAG Industrial, Inc. | | | 1,524 | | | | 21,275 | |
Sun Communities, Inc. | | | 1,011 | | | | 43,807 | |
Tanger Factory Outlet Centers | | | 2,016 | | | | 59,936 | |
Taubman Centers, Inc. | | | 1,348 | | | | 98,337 | |
UDR, Inc. | | | 5,834 | | | | 155,826 | |
Universal Health Realty Income Trust | | | 386 | | | | 15,297 | |
Urstadt Biddle Properties, Inc. Class A | | | 641 | | | | 12,653 | |
Ventas, Inc. | | | 7,809 | | | | 445,894 | |
Vornado Realty Trust | | | 5,383 | | | | 453,249 | |
Washington Real Estate Investment Trust | | | 3,011 | | | | 89,427 | |
Weingarten Realty Investors | | | 4,944 | | | | 130,670 | |
Weyerhaeuser Co. | | | 13,978 | | | | 306,398 | |
Winthrop Realty Trust | | | 2,254 | | | | 26,124 | |
| | | | | | | | |
| Total Real Estate Investment Trusts (REITs) | | | | | | | 13,113,136 | |
| Retail – 6.3% | | | | | | | | |
Abercrombie & Fitch Co. Class A | | | 1,157 | | | | 57,399 | |
Advance Auto Parts, Inc. | | | 219 | | | | 19,397 | |
American Eagle Outfitters, Inc. | | | 4,063 | | | | 69,843 | |
Best Buy Co., Inc. | | | 7,377 | | | | 174,687 | |
Bob Evans Farms, Inc. | | | 825 | | | | 31,119 | |
Brinker International, Inc. | | | 1,788 | | | | 49,259 | |
Buckle, Inc. (The) | | | 1,065 | | | | 51,013 | |
Casey’s General Stores, Inc. | | | 270 | | | | 14,974 | |
| | | | | | | | |
Cato Corp. (The) Class A | | | 1,205 | | | $ | 33,306 | |
CEC Entertainment, Inc. | | | 525 | | | | 19,903 | |
Chico’s FAS, Inc. | | | 1,627 | | | | 24,568 | |
Costco Wholesale Corp. | | | 3,868 | | | | 351,214 | |
Cracker Barrel Old Country Store, Inc. | | | 495 | | | | 27,621 | |
CVS Caremark Corp. | | | 13,242 | | | | 593,242 | |
Darden Restaurants, Inc. | | | 3,929 | | | | 201,008 | |
Dick’s Sporting Goods, Inc. | | | 997 | | | | 47,936 | |
DSW, Inc. Class A | | | 429 | | | | 23,496 | |
Family Dollar Stores, Inc. | | | 1,161 | | | | 73,468 | |
Foot Locker, Inc. | | | 3,434 | | | | 106,626 | |
Gap, Inc. (The) | | | 9,658 | | | | 252,460 | |
Guess?, Inc. | | | 2,030 | | | | 63,437 | |
Home Depot, Inc. (The) | | | 35,018 | | | | 1,761,756 | |
Hot Topic, Inc. | | | 1,915 | | | | 19,437 | |
HSN, Inc. | | | 638 | | | | 24,263 | |
J.C. Penney Co., Inc. | | | 4,092 | | | | 144,980 | |
Kohl’s Corp. | | | 3,857 | | | | 192,966 | |
Lowe’s Cos., Inc. | | | 21,804 | | | | 684,210 | |
Ltd. Brands, Inc. | | | 4,788 | | | | 229,824 | |
Macy’s, Inc. | | | 4,241 | | | | 168,495 | |
McDonald’s Corp. | | | 22,778 | | | | 2,234,522 | |
Men’s Wearhouse, Inc. (The) | | | 826 | | | | 32,024 | |
MSC Industrial Direct Co. Class A | | | 640 | | | | 53,299 | |
Nordstrom, Inc. | | | 3,184 | | | | 177,412 | |
Penske Automotive Group, Inc. | | | 1,451 | | | | 35,738 | |
PetSmart, Inc. | | | 1,020 | | | | 58,364 | |
PF Chang’s China Bistro, Inc. | | | 670 | | | | 26,478 | |
RadioShack Corp.(a) | | | 4,159 | | | | 25,869 | |
Regis Corp. | | | 942 | | | | 17,361 | |
Ross Stores, Inc. | | | 1,806 | | | | 104,929 | |
Staples, Inc. | | | 14,485 | | | | 234,367 | |
Starbucks Corp. | | | 9,018 | | | | 504,016 | |
Target Corp. | | | 11,554 | | | | 673,252 | |
Texas Roadhouse, Inc. | | | 1,496 | | | | 24,893 | |
Tiffany & Co. | | | 1,669 | | | | 115,378 | |
TJX Cos., Inc. | | | 7,267 | | | | 288,573 | |
Tractor Supply Co. | | | 337 | | | | 30,519 | |
Walgreen Co. | | | 17,800 | | | | 596,122 | |
Wal-Mart Stores, Inc. | | | 66,684 | | | | 4,081,061 | |
Wendy’s Co. (The) | | | 5,409 | | | | 27,099 | |
Williams-Sonoma, Inc. | | | 1,468 | | | | 55,021 | |
Yum! Brands, Inc. | | | 7,050 | | | | 501,819 | |
| | | | | | | | |
| Total Retail | | | | | | | 15,410,023 | |
| Savings & Loans – 0.5% | | | | | | | | |
Astoria Financial Corp. | | | 4,140 | | | | 40,820 | |
BankUnited, Inc. | | | 1,805 | | | | 45,125 | |
Berkshire Hills Bancorp, Inc. | | | 756 | | | | 17,328 | |
Brookline Bancorp, Inc. | | | 2,488 | | | | 23,313 | |
Capitol Federal Financial, Inc. | | | 4,133 | | | | 49,017 | |
Dime Community Bancshares, Inc. | | | 1,736 | | | | 25,363 | |
First Niagara Financial Group, Inc. | | | 16,403 | | | | 161,406 | |
Flushing Financial Corp. | | | 1,357 | | | | 18,265 | |
Hudson City Bancorp, Inc. | | | 20,433 | | | | 149,365 | |
See Notes to Financial Statements.
| | |
| 20 | | WisdomTree Domestic Dividend Funds |
Schedule of Investments (continued)
WisdomTree Total Dividend Fund (DTD)
March 31, 2012
| | | | | | | | |
| Investments | | Shares | | | Value | |
| | | | | | | | |
New York Community Bancorp, Inc.(a) | | | 27,403 | | | $ | 381,176 | |
Northwest Bancshares, Inc. | | | 3,569 | | | | 45,326 | |
OceanFirst Financial Corp. | | | 1,854 | | | | 26,401 | |
Oritani Financial Corp. | | | 2,482 | | | | 36,436 | |
People’s United Financial, Inc. | | | 13,971 | | | | 184,976 | |
Provident Financial Services, Inc. | | | 2,193 | | | | 31,864 | |
Roma Financial Corp. | | | 1,840 | | | | 18,014 | |
Washington Federal, Inc. | | | 1,631 | | | | 27,433 | |
| | | | | | | | |
| Total Savings & Loans | | | | | | | 1,281,628 | |
| Semiconductors – 3.3% | | | | | | | | |
Altera Corp. | | | 2,089 | | | | 83,184 | |
Analog Devices, Inc. | | | 6,680 | | | | 269,872 | |
Applied Materials, Inc. | | | 30,736 | | | | 382,356 | |
Brooks Automation, Inc. | | | 4,059 | | | | 50,047 | |
Intel Corp. | | | 140,406 | | | | 3,946,813 | |
Intersil Corp. Class A | | | 4,105 | | | | 45,976 | |
KLA-Tencor Corp. | | | 3,796 | | | | 206,578 | |
Linear Technology Corp. | | | 5,499 | | | | 185,316 | |
Maxim Integrated Products, Inc. | | | 7,879 | | | | 225,261 | |
Microchip Technology, Inc.(a) | | | 5,689 | | | | 211,631 | |
MKS Instruments, Inc. | | | 1,060 | | | | 31,302 | |
QUALCOMM, Inc. | | | 21,338 | | | | 1,451,411 | |
Texas Instruments, Inc. | | | 20,628 | | | | 693,307 | |
Xilinx, Inc. | | | 4,887 | | | | 178,033 | |
| | | | | | | | |
| Total Semiconductors | | | | | | | 7,961,087 | |
| Software – 3.3% | | | | | | | | |
Activision Blizzard, Inc. | | | 12,680 | | | | 162,558 | |
American Software, Inc. Class A | | | 2,675 | | | | 22,952 | |
Blackbaud, Inc. | | | 1,187 | | | | 39,444 | |
Broadridge Financial Solutions, Inc. | | | 2,869 | | | | 68,598 | |
CA, Inc. | | | 3,129 | | | | 86,235 | |
Computer Programs & Systems, Inc. | | | 535 | | | | 30,238 | |
Dun & Bradstreet Corp. (The) | | | 628 | | | | 53,210 | |
Fidelity National Information Services, Inc. | | | 2,108 | | | | 69,817 | |
Intuit, Inc. | | | 2,408 | | | | 144,793 | |
ManTech International Corp. Class A | | | 617 | | | | 21,262 | |
Microsoft Corp. | | | 198,384 | | | | 6,397,884 | |
Oracle Corp. | | | 30,596 | | | | 892,179 | |
Quality Systems, Inc. | | | 706 | | | | 30,873 | |
Solera Holdings, Inc. | | | 481 | | | | 22,073 | |
| | | | | | | | |
| Total Software | | | | | | | 8,042,116 | |
| Telecommunications – 7.1% | | | | | | | | |
ADTRAN, Inc. | | | 828 | | | | 25,825 | |
Alaska Communications Systems Group, Inc. | | | 7,515 | | | | 23,146 | |
AT&T, Inc. | | | 269,676 | | | | 8,421,982 | |
Atlantic Tele-Network, Inc. | | | 401 | | | | 14,580 | |
CenturyLink, Inc. | | | 37,562 | | | | 1,451,771 | |
Cisco Systems, Inc. | | | 52,382 | | | | 1,107,879 | |
Comtech Telecommunications Corp. | | | 647 | | | | 21,079 | |
Consolidated Communications Holdings, Inc. | | | 2,644 | | | | 51,902 | |
Corning, Inc. | | | 28,114 | | | | 395,845 | |
Frontier Communications Corp.(a) | | | 112,136 | | | | 467,607 | |
Harris Corp. | | | 2,835 | | | | 127,802 | |
| | | | | | | | |
IDT Corp. Class B | | | 1,995 | | | $ | 18,633 | |
InterDigital, Inc. | | | 458 | | | | 15,966 | |
Motorola Solutions, Inc. | | | 4,335 | | | | 220,348 | |
NTELOS Holdings Corp. | | | 1,461 | | | | 30,243 | |
Telephone & Data Systems, Inc. | | | 2,370 | | | | 54,866 | |
Tellabs, Inc. | | | 7,067 | | | | 28,621 | |
USA Mobility, Inc. | | | 1,516 | | | | 21,118 | |
Verizon Communications, Inc. | | | 113,055 | | | | 4,322,093 | |
Virgin Media, Inc. | | | 1,921 | | | | 47,987 | |
Windstream Corp. | | | 34,245 | | | | 401,009 | |
| | | | | | | | |
| Total Telecommunications | | | | | | | 17,270,302 | |
| Textiles – 0.0% | | | | | | | | |
Cintas Corp. | | | 1,961 | | | | 76,714 | |
| Toys/Games/Hobbies – 0.2% | | | | | | | | |
Hasbro, Inc. | | | 3,392 | | | | 124,554 | |
Mattel, Inc. | | | 8,647 | | | | 291,058 | |
| | | | | | | | |
| Total Toys/Games/Hobbies | | | | | | | 415,612 | |
| Transportation – 1.6% | | | | | | | | |
Alexander & Baldwin, Inc. | | | 1,447 | | | | 70,107 | |
Bristow Group, Inc. | | | 470 | | | | 22,433 | |
C.H. Robinson Worldwide, Inc. | | | 2,215 | | | | 145,060 | |
Con-way, Inc. | | | 666 | | | | 21,718 | |
CSX Corp. | | | 18,949 | | | | 407,782 | |
Expeditors International of Washington, Inc. | | | 1,956 | | | | 90,974 | |
FedEx Corp. | | | 1,548 | | | | 142,354 | |
International Shipholding Corp. | | | 1,032 | | | | 23,829 | |
JB Hunt Transport Services, Inc. | | | 1,109 | | | | 60,296 | |
Knight Transportation, Inc. | | | 569 | | | | 10,049 | |
Norfolk Southern Corp. | | | 6,345 | | | | 417,691 | |
Ryder System, Inc. | | | 1,174 | | | | 61,987 | |
Tidewater, Inc. | | | 563 | | | | 30,413 | |
Union Pacific Corp. | | | 8,772 | | | | 942,815 | |
United Parcel Service, Inc. Class B | | | 16,673 | | | | 1,345,845 | |
Werner Enterprises, Inc. | | | 696 | | | | 17,303 | |
| | | | | | | | |
| Total Transportation | | | | | | | 3,810,656 | |
| Trucking & Leasing – 0.1% | | | | | | | | |
GATX Corp. | | | 1,298 | | | | 52,310 | |
TAL International Group, Inc. | | | 2,172 | | | | 79,734 | |
| | | | | | | | |
| Total Trucking & Leasing | | | | | | | 132,044 | |
| Water – 0.1% | | | | | | | | |
American States Water Co. | | | 667 | | | | 24,105 | |
American Water Works Co., Inc. | | | 4,127 | | | | 140,442 | |
Aqua America, Inc. | | | 3,041 | | | | 67,784 | |
California Water Service Group | | | 900 | | | | 16,389 | |
Connecticut Water Service, Inc. | | | 880 | | | | 24,895 | |
Middlesex Water Co. | | | 1,395 | | | | 26,351 | |
SJW Corp. | | | 738 | | | | 17,801 | |
| | | | | | | | |
| Total Water | | | | | | | 317,767 | |
TOTAL COMMON STOCKS (Cost: $200,315,275) | | | | | | | 242,972,688 | |
See Notes to Financial Statements.
| | | | |
| WisdomTree Domestic Dividend Funds | | | 21 | |
Schedule of Investments (concluded)
WisdomTree Total Dividend Fund (DTD)
March 31, 2012
| | | | | | | | |
| Investments | | Shares | | | Value | |
| | | | | | | | |
| EXCHANGE-TRADED FUND – 0.2% | | | | | | | | |
WisdomTree Total Earnings Fund(a)(b) | | | | | | | | |
| (Cost: $276,649) | | | 7,470 | | | $ | 378,355 | |
INVESTMENT OF CASH COLLATERAL FOR
SECURITIES LOANED – 1.8% | |
| MONEY MARKET FUND – 1.8% | | | | | | | | |
Dreyfus Institutional Preferred Money Market Fund, 0.18%(c) | | | | | | | | |
| (Cost: $4,511,836)(d) | | | 4,511,836 | | | | 4,511,836 | |
TOTAL INVESTMENTS IN SECURITIES – 101.6% (Cost: $205,103,760) | | | | | | | 247,862,879 | |
Liabilities in Excess of Other Assets – (1.6)% | | | | | | | (3,877,522 | ) |
| | | | | | | | |
| NET ASSETS – 100.0% | | | | | | $ | 243,985,357 | |
| (a) | Security, or portion thereof, was on loan at March 31, 2012 (See Note 2). |
| (b) | Affiliated company. (See Note 7). |
| (c) | Rate shown represents annualized 7-day yield as of March 31, 2012. |
| (d) | At March 31, 2012, the total market value of the Fund’s securities on loan was $4,389,977 and the total market value of the collateral held by the Fund was $4,511,836. |
See Notes to Financial Statements.
| | |
| 22 | | WisdomTree Domestic Dividend Funds |
Schedule of Investments
WisdomTree Equity Income Fund (DHS)
March 31, 2012
| | | | | | | | |
| Investments | | Shares | | | Value | |
| | | | | | | | |
| UNITED STATES – 102.8% | | | | | | | | |
| COMMON STOCKS – 99.6% | | | | | | | | |
| Advertising – 0.0% | | | | | | | | |
Harte-Hanks, Inc. | | | 6,110 | | | $ | 55,296 | |
| Aerospace/Defense – 1.9% | | | | | | | | |
Lockheed Martin Corp. | | | 50,504 | | | | 4,538,289 | |
Northrop Grumman Corp. | | | 28,246 | | | | 1,725,266 | |
Raytheon Co. | | | 39,211 | | | | 2,069,557 | |
| | | | | | | | |
| Total Aerospace/Defense | | | | | | | 8,333,112 | |
| Agriculture – 8.6% | | | | | | | | |
Altria Group, Inc. | | | 348,705 | | | | 10,764,523 | |
Lorillard, Inc. | | | 19,393 | | | | 2,511,006 | |
Philip Morris International, Inc. | | | 212,576 | | | | 18,836,359 | |
Reynolds American, Inc. | | | 96,419 | | | | 3,995,603 | |
Universal Corp. | | | 3,262 | | | | 152,009 | |
Vector Group Ltd.(a) | | | 21,359 | | | | 378,482 | |
| | | | | | | | |
| Total Agriculture | | | | | | | 36,637,982 | |
| Auto Parts & Equipment – 0.0% | | | | | | | | |
Douglas Dynamics, Inc. | | | 3,597 | | | | 49,459 | |
Superior Industries International, Inc. | | | 3,298 | | | | 64,443 | |
| | | | | | | | |
| Total Auto Parts & Equipment | | | | | | | 113,902 | |
| Banks – 1.2% | | | | | | | | |
Arrow Financial Corp.(a) | | | 1,455 | | | | 35,502 | |
Bank of Hawaii Corp.(a) | | | 5,891 | | | | 284,830 | |
Camden National Corp. | | | 736 | | | | 25,870 | |
Chemical Financial Corp. | | | 3,645 | | | | 85,439 | |
Citizens & Northern Corp. | | | 1,271 | | | | 25,420 | |
City Holding Co.(a) | | | 2,112 | | | | 73,329 | |
Community Bank System, Inc. | | | 4,361 | | | | 125,510 | |
Community Trust Bancorp, Inc. | | | 1,924 | | | | 61,703 | |
Cullen/Frost Bankers, Inc. | | | 6,546 | | | | 380,912 | |
CVB Financial Corp. | | | 11,592 | | | | 136,090 | |
FNB Corp.(a) | | | 16,833 | | | | 203,343 | |
First Financial Bancorp | | | 11,646 | | | | 201,476 | |
First of Long Island Corp. (The) | | | 720 | | | | 19,080 | |
FirstMerit Corp. | | | 14,533 | | | | 245,026 | |
Glacier Bancorp, Inc. | | | 9,775 | | | | 146,038 | |
Great Southern Bancorp, Inc. | | | 968 | | | | 23,232 | |
Hudson Valley Holding Corp. | | | 2,121 | | | | 34,212 | |
M&T Bank Corp. | | | 14,575 | | | | 1,266,276 | |
NBT Bancorp, Inc. | | | 4,169 | | | | 92,051 | |
PacWest Bancorp | | | 4,169 | | | | 101,307 | |
Park National Corp.(a) | | | 2,855 | | | | 197,480 | |
Renasant Corp.(a) | | | 3,448 | | | | 56,133 | |
S&T Bancorp, Inc. | | | 2,587 | | | | 56,112 | |
S.Y. Bancorp, Inc. | | | 1,398 | | | | 32,434 | |
Southside Bancshares, Inc. | | | 1,313 | | | | 29,017 | |
Sterling Bancorp | | | 3,959 | | | | 37,967 | |
Tompkins Financial Corp.(a) | | | 1,159 | | | | 46,430 | |
TrustCo Bank Corp.(a) | | | 13,841 | | | | 79,032 | |
Trustmark Corp. | | | 7,924 | | | | 197,941 | |
United Bankshares, Inc.(a) | | | 6,700 | | | | 193,362 | |
| | | | | | | | |
Univest Corp. of Pennsylvania | | | 2,513 | | | $ | 42,168 | |
Valley National Bancorp(a) | | | 30,167 | | | | 390,663 | |
Washington Trust Bancorp, Inc. | | | 1,884 | | | | 45,480 | |
WesBanco, Inc. | | | 3,153 | | | | 63,501 | |
| | | | | | | | |
| Total Banks | | | | | | | 5,034,366 | |
| Beverages – 0.2% | | | | | | | | |
Dr. Pepper Snapple Group, Inc. | | | 21,705 | | | | 872,758 | |
| Biotechnology – 0.1% | | | | | | | | |
PDL BioPharma, Inc. | | | 40,419 | | | | 256,661 | |
| Chemicals – 2.7% | | | | | | | | |
A. Schulman, Inc. | | | 2,804 | | | | 75,764 | |
Dow Chemical Co. (The) | | | 138,257 | | | | 4,789,223 | |
E.I. du Pont de Nemours & Co. | | | 104,337 | | | | 5,519,427 | |
Huntsman Corp. | | | 28,945 | | | | 405,519 | |
Olin Corp. | | | 10,044 | | | | 218,457 | |
RPM International, Inc. | | | 14,931 | | | | 391,043 | |
| | | | | | | | |
| Total Chemicals | | | | | | | 11,399,433 | |
| Commercial Services – 0.9% | | | | | | | | |
CDI Corp. | | | 2,137 | | | | 38,316 | |
Deluxe Corp. | | | 7,239 | | | | 169,537 | |
Electro Rent Corp. | | | 3,260 | | | | 60,017 | |
H&R Block, Inc. | | | 36,189 | | | | 596,033 | |
Healthcare Services Group, Inc. | | | 8,056 | | | | 171,351 | |
Iron Mountain, Inc. | | | 19,009 | | | | 547,459 | |
Landauer, Inc. | | | 1,219 | | | | 64,631 | |
McGrath Rentcorp | | | 2,329 | | | | 74,784 | |
Paychex, Inc. | | | 46,913 | | | | 1,453,834 | |
Quad Graphics, Inc.(a) | | | 5,404 | | | | 75,116 | |
R.R. Donnelley & Sons Co.(a) | | | 41,512 | | | | 514,334 | |
Strayer Education, Inc.(a) | | | 1,558 | | | | 146,888 | |
| | | | | | | | |
| Total Commercial Services | | | | | | | 3,912,300 | |
| Computers – 0.2% | | | | | | | | |
Computer Sciences Corp. | | | 14,381 | | | | 430,567 | |
Diebold, Inc. | | | 7,271 | | | | 280,079 | |
| | | | | | | | |
| Total Computers | | | | | | | 710,646 | |
| Cosmetics/Personal Care – 4.5% | | | | | | | | |
Avon Products, Inc. | | | 69,715 | | | | 1,349,682 | |
Procter & Gamble Co. (The) | | | 266,657 | | | | 17,922,017 | |
| | | | | | | | |
| Total Cosmetics/Personal Care | | | | | | | 19,271,699 | |
| Distribution/Wholesale – 0.1% | | | | | | | | |
Watsco, Inc. | | | 3,357 | | | | 248,552 | |
| Diversified Financial Services – 0.5% | | | | | | | | |
Artio Global Investors, Inc.(a) | | | 7,834 | | | | 37,368 | |
BGC Partners, Inc. Class A | | | 32,671 | | | | 241,439 | |
Federated Investors, Inc. Class B(a) | | | 19,737 | | | | 442,306 | |
GFI Group, Inc. | | | 16,490 | | | | 62,002 | |
Greenhill & Co., Inc. | | | 4,003 | | | | 174,691 | |
NYSE Euronext | | | 34,921 | | | | 1,047,979 | |
Walter Investment Management Corp. | | | 7,436 | | | | 167,682 | |
Westwood Holdings Group, Inc. | | | 790 | | | | 30,597 | |
| | | | | | | | |
| Total Diversified Financial Services | | | | | | | 2,204,064 | |
See Notes to Financial Statements.
| | | | |
| WisdomTree Domestic Dividend Funds | | | 23 | |
Schedule of Investments (continued)
WisdomTree Equity Income Fund (DHS)
March 31, 2012
| | | | | | | | |
| Investments | | Shares | | | Value | |
| | | | | | | | |
| Electric – 12.1% | | | | | | | | |
ALLETE, Inc. | | | 5,147 | | | $ | 213,549 | |
Alliant Energy Corp. | | | 13,566 | | | | 587,679 | |
Ameren Corp. | | | 36,518 | | | | 1,189,756 | |
American Electric Power Co., Inc. | | | 69,872 | | | | 2,695,662 | |
Avista Corp. | | | 8,040 | | | | 205,663 | |
Black Hills Corp. | | | 5,527 | | | | 185,320 | |
CH Energy Group, Inc. | | | 2,091 | | | | 139,532 | |
Cleco Corp. | | | 6,306 | | | | 250,033 | |
CMS Energy Corp. | | | 30,986 | | | | 681,692 | |
Consolidated Edison, Inc. | | | 35,774 | | | | 2,089,917 | |
Dominion Resources, Inc. | | | 66,682 | | | | 3,414,785 | |
DTE Energy Co. | | | 22,993 | | | | 1,265,305 | |
Duke Energy Corp. | | | 190,445 | | | | 4,001,249 | |
Edison International | | | 32,156 | | | | 1,366,952 | |
Entergy Corp. | | | 24,636 | | | | 1,655,539 | |
Exelon Corp. | | | 96,585 | | | | 3,787,098 | |
FirstEnergy Corp. | | | 61,932 | | | | 2,823,480 | |
Great Plains Energy, Inc. | | | 17,294 | | | | 350,549 | |
Hawaiian Electric Industries, Inc. | | | 13,908 | | | | 352,568 | |
Integrys Energy Group, Inc. | | | 12,794 | | | | 677,954 | |
MGE Energy, Inc. | | | 2,464 | | | | 109,377 | |
NextEra Energy, Inc. | | | 48,269 | | | | 2,948,271 | |
NorthWestern Corp. | | | 5,148 | | | | 182,548 | |
NSTAR | | | 11,725 | | | | 570,187 | |
NV Energy, Inc. | | | 24,176 | | | | 389,717 | |
Otter Tail Corp. | | | 6,094 | | | | 132,240 | |
Pepco Holdings, Inc. | | | 37,859 | | | | 715,157 | |
PG&E Corp. | | | 56,415 | | | | 2,448,975 | |
Pinnacle West Capital Corp. | | | 15,170 | | | | 726,643 | |
Portland General Electric Co. | | | 10,525 | | | | 262,915 | |
PPL Corp. | | | 83,727 | | | | 2,366,125 | |
Progress Energy, Inc. | | | 40,208 | | | | 2,135,447 | |
Public Service Enterprise Group, Inc. | | | 66,156 | | | | 2,025,035 | |
SCANA Corp.(a) | | | 17,657 | | | | 805,336 | |
Southern Co. (The) | | | 109,848 | | | | 4,935,471 | |
TECO Energy, Inc. | | | 30,653 | | | | 537,960 | |
UIL Holdings Corp.(a) | | | 8,245 | | | | 286,596 | |
Unisource Energy Corp. | | | 5,041 | | | | 184,349 | |
Unitil Corp. | | | 2,132 | | | | 57,202 | |
Westar Energy, Inc. | | | 16,338 | | | | 456,320 | |
Xcel Energy, Inc. | | | 58,364 | | | | 1,544,895 | |
| | | | | | | | |
| Total Electric | | | | | | | 51,755,048 | |
| Electrical Components & Equipment – 0.1% | | | | | | | | |
Molex, Inc. Class A | | | 10,023 | | | | 235,039 | |
| Entertainment – 0.2% | | | | | | | | |
Cinemark Holdings, Inc. | | | 16,696 | | | | 366,477 | |
National CineMedia, Inc. | | | 11,884 | | | | 181,825 | |
Regal Entertainment Group Class A(a) | | | 25,193 | | | | 342,625 | |
| | | | | | | | |
| Total Entertainment | | | | | | | 890,927 | |
| Environmental Control – 0.5% | | | | | | | | |
U.S. Ecology, Inc. | | | 2,660 | | | | 57,828 | |
Waste Management, Inc. | | | 58,998 | | | | 2,062,570 | |
| | | | | | | | |
| Total Environmental Control | | | | | | | 2,120,398 | |
| | | | | | | | |
| Food – 2.0% | | | | | | | | |
B&G Foods, Inc. | | | 5,915 | | | $ | 133,147 | |
Campbell Soup Co. | | | 34,100 | | | | 1,154,285 | |
ConAgra Foods, Inc. | | | 47,451 | | | | 1,246,063 | |
H.J. Heinz Co. | | | 34,634 | | | | 1,854,651 | |
Kellogg Co. | | | 37,540 | | | | 2,013,270 | |
SUPERVALU, Inc.(a) | | | 31,050 | | | | 177,295 | |
Sysco Corp. | | | 64,843 | | | | 1,936,212 | |
| | | | | | | | |
| Total Food | | | | | | | 8,514,923 | |
| Forest Products & Paper – 0.5% | | | | | | | | |
International Paper Co. | | | 50,160 | | | | 1,760,616 | |
MeadWestvaco Corp. | | | 18,441 | | | | 582,551 | |
| | | | | | | | |
| Total Forest Products & Paper | | | | | | | 2,343,167 | |
| Gas – 1.4% | | | | | | | | |
AGL Resources, Inc. | | | 10,913 | | | | 428,008 | |
Atmos Energy Corp. | | | 11,678 | | | | 367,390 | |
CenterPoint Energy, Inc. | | | 54,081 | | | | 1,066,477 | |
Laclede Group, Inc. (The) | | | 3,283 | | | | 128,103 | |
NiSource, Inc. | | | 35,951 | | | | 875,407 | |
Northwest Natural Gas Co. | | | 3,229 | | | | 146,597 | |
Piedmont Natural Gas Co., Inc. | | | 8,057 | | | | 250,331 | |
Questar Corp. | | | 18,105 | | | | 348,702 | |
Sempra Energy | | | 25,932 | | | | 1,554,883 | |
UGI Corp. | | | 12,933 | | | | 352,424 | |
Vectren Corp. | | | 12,131 | | | | 352,527 | |
WGL Holdings, Inc. | | | 6,322 | | | | 257,305 | |
| | | | | | | | |
| Total Gas | | | | | | | 6,128,154 | |
| Healthcare-Products – 0.0% | | | | | | | | |
Meridian Bioscience, Inc. | | | 4,996 | | | | 96,822 | |
| Healthcare-Services – 0.1% | | | | | | | | |
Lincare Holdings, Inc. | | | 8,625 | | | | 223,215 | |
| Home Builders – 0.1% | | | | | | | | |
KB Home(a) | | | 8,049 | | | | 71,636 | |
MDC Holdings, Inc.(a) | | | 8,536 | | | | 220,144 | |
| | | | | | | | |
| Total Home Builders | | | | | | | 291,780 | |
| Home Furnishings – 0.2% | | | | | | | | |
Whirlpool Corp. | | | 9,798 | | | | 753,074 | |
| Household Products/Wares – 1.2% | | | | | | | | |
American Greetings Corp. Class A | | | 3,968 | | | | 60,869 | |
Avery Dennison Corp. | | | 11,310 | | | | 340,770 | |
Clorox Co. (The) | | | 14,509 | | | | 997,494 | |
Ennis, Inc. | | | 3,413 | | | | 53,994 | |
Kimberly-Clark Corp. | | | 46,878 | | | | 3,463,815 | |
| | | | | | | | |
| Total Household Products/Wares | | | | | | | 4,916,942 | |
| Insurance – 0.8% | | | | | | | | |
American National Insurance Co. | | | 3,482 | | | | 252,515 | |
Arthur J. Gallagher & Co. | | | 13,763 | | | | 491,890 | |
Baldwin & Lyons, Inc. Class B | | | 1,535 | | | | 34,353 | |
Cincinnati Financial Corp. | | | 26,106 | | | | 900,918 | |
Donegal Group, Inc. Class A | | | 1,933 | | | | 26,424 | |
EMC Insurance Group, Inc. | | | 1,506 | | | | 30,256 | |
See Notes to Financial Statements.
| | |
| 24 | | WisdomTree Domestic Dividend Funds |
Schedule of Investments (continued)
WisdomTree Equity Income Fund (DHS)
March 31, 2012
| | | | | | | | |
| Investments | | Shares | | | Value | |
| | | | | | | | |
Hanover Insurance Group, Inc. (The) | | | 4,571 | | | $ | 187,960 | |
Horace Mann Educators Corp. | | | 3,867 | | | | 68,137 | |
Kansas City Life Insurance Co. | | | 952 | | | | 30,654 | |
Kemper Corp. | | | 6,461 | | | | 195,639 | |
Mercury General Corp. | | | 9,008 | | | | 394,010 | |
Old Republic International Corp. | | | 57,404 | | | | 605,612 | |
Safety Insurance Group, Inc. | | | 2,133 | | | | 88,818 | |
State Auto Financial Corp. | | | 5,745 | | | | 83,934 | |
Tower Group, Inc. | | | 4,321 | | | | 96,920 | |
| | | | | | | | |
| Total Insurance | | | | | | | 3,488,040 | |
| Internet – 0.0% | | | | | | | | |
Nutrisystem, Inc.(a) | | | 4,537 | | | | 50,951 | |
United Online, Inc. | | | 20,535 | | | | 100,416 | |
| | | | | | | | |
| Total Internet | | | | | | | 151,367 | |
| Investment Companies – 0.9% | | | | | | | | |
Apollo Investment Corp. | | | 105,485 | | | | 756,327 | |
Ares Capital Corp. | | | 58,811 | | | | 961,560 | |
BlackRock Kelso Capital Corp. | | | 26,493 | | | | 260,161 | |
Fifth Street Finance Corp. | | | 28,721 | | | | 280,317 | |
Golub Capital BDC, Inc. | | | 5,273 | | | | 80,519 | |
Main Street Capital Corp. | | | 6,429 | | | | 158,346 | |
MCG Capital Corp. | | | 37,685 | | | | 160,161 | |
Medallion Financial Corp. | | | 3,331 | | | | 37,174 | |
MVC Capital, Inc. | | | 3,413 | | | | 44,813 | |
PennantPark Investment Corp. | | | 14,837 | | | | 154,305 | |
Prospect Capital Corp. | | | 43,228 | | | | 474,643 | |
Solar Capital Ltd. | | | 12,009 | | | | 265,039 | |
THL Credit, Inc. | | | 5,748 | | | | 73,919 | |
TICC Capital Corp. | | | 11,281 | | | | 109,877 | |
Triangle Capital Corp.(a) | | | 6,873 | | | | 135,742 | |
| | | | | | | | |
| Total Investment Companies | | | | | | | 3,952,903 | |
| Iron/Steel – 0.4% | | | | | | | | |
Commercial Metals Co. | | | 11,576 | | | | 171,556 | |
Nucor Corp. | | | 35,058 | | | | 1,505,741 | |
| | | | | | | | |
| Total Iron/Steel | | | | | | | 1,677,297 | |
| Media – 0.2% | | | | | | | | |
Belo Corp. Class A | | | 9,738 | | | | 69,822 | |
Cablevision Systems Corp. Class A | | | 27,908 | | | | 409,689 | |
Meredith Corp.(a) | | | 5,310 | | | | 172,363 | |
Sinclair Broadcast Group, Inc. Class A | | | 6,985 | | | | 77,254 | |
World Wrestling Entertainment, Inc. Class A(a) | | | 4,583 | | | | 40,651 | |
| | | | | | | | |
| Total Media | | | | | | | 769,779 | |
| Metal Fabricate/Hardware – 0.0% | | | | | | | | |
Ampco-Pittsburgh Corp. | | | 1,097 | | | | 22,083 | |
| Mining – 1.8% | | | | | | | | |
Southern Copper Corp. | | | 243,408 | | | | 7,718,468 | |
| Miscellaneous Manufacturing – 5.6% | | | | | | | | |
General Electric Co. | | | 1,134,311 | | | | 22,765,622 | |
Harsco Corp. | | | 9,878 | | | | 231,738 | |
Hillenbrand, Inc. | | | 6,894 | | | | 158,217 | |
Leggett & Platt, Inc.(a) | | | 21,567 | | | | 496,257 | |
| | | | | | | | |
NL Industries, Inc. | | | 6,326 | | | $ | 94,257 | |
| | | | | | | | |
| Total Miscellaneous Manufacturing | | | | | | | 23,746,091 | |
| Office Furnishings – 0.0% | | | | | | | | |
HNI Corp. | | | 5,110 | | | | 141,803 | |
| Office/Business Equipment – 0.2% | | | | | | | | |
Pitney Bowes, Inc.(a) | | | 47,729 | | | | 839,076 | |
| Oil & Gas – 2.7% | | | | | | | | |
ConocoPhillips | | | 152,188 | | | | 11,567,810 | |
Penn Virginia Corp. | | | 6,126 | | | | 27,873 | |
| | | | | | | | |
| Total Oil & Gas | | | | | | | 11,595,683 | |
| Oil & Gas Services – 0.0% | | | | | | | | |
Targa Resources Corp. | | | 3,979 | | | | 180,846 | |
| Packaging & Containers – 0.2% | | | | | | | | |
Bemis Co., Inc. | | | 9,906 | | | | 319,865 | |
Greif, Inc. Class B(a) | | | 3,790 | | | | 215,158 | |
Sonoco Products Co. | | | 10,738 | | | | 356,502 | |
| | | | | | | | |
| Total Packaging & Containers | | | | | | | 891,525 | |
| Pharmaceuticals – 18.5% | | | | | | | | |
Abbott Laboratories | | | 163,860 | | | | 10,042,979 | |
Bristol-Myers Squibb Co. | | | 197,129 | | | | 6,653,104 | |
Eli Lilly & Co. | | | 168,514 | | | | 6,786,059 | |
Johnson & Johnson | | | 293,129 | | | | 19,334,789 | |
Merck & Co., Inc. | | | 428,320 | | | | 16,447,488 | |
Pfizer, Inc. | | | 876,873 | | | | 19,869,942 | |
| | | | | | | | |
| Total Pharmaceuticals | | | | | | | 79,134,361 | |
| Pipelines – 1.3% | | | | | | | | |
Crosstex Energy, Inc. | | | 4,402 | | | | 62,244 | |
Kinder Morgan, Inc.(a) | | | 86,600 | | | | 3,347,090 | |
Spectra Energy Corp. | | | 74,906 | | | | 2,363,285 | |
| | | | | | | | |
| Total Pipelines | | | | | | | 5,772,619 | |
| Private Equity – 0.0% | | | | | | | | |
Hercules Technology Growth Capital, Inc. | | | 12,160 | | | | 134,733 | |
| Real Estate – 0.0% | | | | | | | | |
Sovran Self Storage, Inc. | | | 4,034 | | | | 201,014 | |
| Real Estate Investment Trusts (REITs) – 8.2% | | | | | | | | |
Acadia Realty Trust | | | 5,752 | | | | 129,650 | |
Agree Realty Corp. | | | 2,134 | | | | 48,186 | |
American Assets Trust, Inc. | | | 4,776 | | | | 108,893 | |
American Campus Communities, Inc. | | | 7,360 | | | | 329,139 | |
Ashford Hospitality Trust, Inc. | | | 10,134 | | | | 91,307 | |
Associated Estates Realty Corp. | | | 5,556 | | | | 90,785 | |
BioMed Realty Trust, Inc. | | | 20,895 | | | | 396,587 | |
Brandywine Realty Trust | | | 28,433 | | | | 326,411 | |
Camden Property Trust | | | 7,386 | | | | 485,630 | |
Campus Crest Communities, Inc. | | | 5,708 | | | | 66,555 | |
CapLease, Inc. | | | 12,246 | | | | 49,351 | |
CBL & Associates Properties, Inc. | | | 24,820 | | | | 469,594 | |
Cedar Realty Trust, Inc. | | | 17,633 | | | | 90,281 | |
Chesapeake Lodging Trust | | | 4,977 | | | | 89,437 | |
CommonWealth REIT | | | 30,075 | | | | 559,997 | |
See Notes to Financial Statements.
| | | | |
| WisdomTree Domestic Dividend Funds | | | 25 | |
Schedule of Investments (continued)
WisdomTree Equity Income Fund (DHS)
March 31, 2012
| | | | | | | | |
| Investments | | Shares | | | Value | |
| | | | | | | | |
Corporate Office Properties Trust | | | 16,436 | | | $ | 381,480 | |
DCT Industrial Trust, Inc. | | | 44,218 | | | | 260,886 | |
DiamondRock Hospitality Co. | | | 17,328 | | | | 178,305 | |
Digital Realty Trust, Inc.(a) | | | 13,250 | | | | 980,103 | |
Duke Realty Corp. | | | 45,539 | | | | 653,029 | |
EastGroup Properties, Inc. | | | 4,006 | | | | 201,181 | |
Entertainment Properties Trust | | | 9,159 | | | | 424,794 | |
Equity One, Inc. | | | 18,810 | | | | 380,338 | |
Excel Trust, Inc. | | | 4,737 | | | | 57,223 | |
First Potomac Realty Trust | | | 9,890 | | | | 119,570 | |
Franklin Street Properties Corp. | | | 18,111 | | | | 191,977 | |
Glimcher Realty Trust | | | 14,869 | | | | 151,961 | |
Government Properties Income Trust | | | 10,685 | | | | 257,615 | |
HCP, Inc. | | | 60,430 | | | | 2,384,568 | |
Health Care REIT, Inc. | | | 32,224 | | | | 1,771,031 | |
Healthcare Realty Trust, Inc. | | | 15,845 | | | | 348,590 | |
Hersha Hospitality Trust | | | 26,518 | | | | 144,788 | |
Highwoods Properties, Inc. | | | 12,796 | | | | 426,363 | |
Home Properties, Inc. | | | 6,508 | | | | 397,053 | |
Hospitality Properties Trust | | | 30,880 | | | | 817,394 | |
Hudson Pacific Properties, Inc. | | | 3,656 | | | | 55,315 | |
Inland Real Estate Corp. | | | 20,624 | | | | 182,935 | |
Investors Real Estate Trust | | | 18,018 | | | | 138,558 | |
Kilroy Realty Corp. | | | 6,787 | | | | 316,342 | |
Kimco Realty Corp. | | | 58,990 | | | | 1,136,147 | |
Kite Realty Group Trust | | | 12,138 | | | | 63,967 | |
Lexington Realty Trust | | | 31,548 | | | | 283,617 | |
Liberty Property Trust | | | 22,306 | | | | 796,770 | |
LTC Properties, Inc. | | | 5,178 | | | | 165,696 | |
Macerich Co. (The) | | | 17,781 | | | | 1,026,853 | |
Mack-Cali Realty Corp. | | | 18,404 | | | | 530,403 | |
Medical Properties Trust, Inc. | | | 28,521 | | | | 264,675 | |
Mid-America Apartment Communities, Inc. | | | 4,820 | | | | 323,085 | |
Monmouth Real Estate Investment Corp. Class A | | | 7,239 | | | | 70,508 | |
National Health Investors, Inc. | | | 4,613 | | | | 225,022 | |
National Retail Properties, Inc.(a) | | | 18,695 | | | | 508,317 | |
Omega Healthcare Investors, Inc. | | | 26,419 | | | | 561,668 | |
One Liberty Properties, Inc. | | | 3,269 | | | | 59,823 | |
Pennsylvania Real Estate Investment Trust | | | 10,255 | | | | 156,594 | |
Piedmont Office Realty Trust, Inc. Class A | | | 39,452 | | | | 700,273 | |
Plum Creek Timber Co., Inc. | | | 23,034 | | | | 957,293 | |
Potlatch Corp. | | | 8,131 | | | | 254,826 | |
ProLogis, Inc. | | | 56,718 | | | | 2,042,982 | |
PS Business Parks, Inc. | | | 2,331 | | | | 152,774 | |
Ramco-Gershenson Properties Trust | | | 8,112 | | | | 99,129 | |
Rayonier, Inc. | | | 14,462 | | | | 637,630 | |
Realty Income Corp. | | | 20,346 | | | | 788,001 | |
Regency Centers Corp. | | | 13,905 | | | | 618,494 | |
Retail Opportunity Investments Corp. | | | 5,132 | | | | 61,789 | |
RLJ Lodging Trust | | | 11,349 | | | | 211,432 | |
Sabra Health Care REIT, Inc. | | | 12,707 | | | | 208,903 | |
Saul Centers, Inc. | | | 2,441 | | | | 98,519 | |
Senior Housing Properties Trust | | | 34,068 | | | | 751,199 | |
Summit Hotel Properties, Inc. | | | 3,857 | | | | 29,236 | |
| | | | | | | | |
Sun Communities, Inc. | | | 4,797 | | | $ | 207,854 | |
UDR, Inc. | | | 21,989 | | | | 587,326 | |
Universal Health Realty Income Trust | | | 2,488 | | | | 98,599 | |
Urstadt Biddle Properties, Inc. Class A | | | 3,856 | | | | 76,117 | |
Ventas, Inc. | | | 30,017 | | | | 1,713,971 | |
Vornado Realty Trust(a) | | | 20,768 | | | | 1,748,666 | |
Washington Real Estate Investment Trust | | | 12,857 | | | | 381,853 | |
Weingarten Realty Investors | | | 19,127 | | | | 505,527 | |
Weyerhaeuser Co. | | | 58,487 | | | | 1,282,035 | |
Winthrop Realty Trust | | | 6,741 | | | | 78,128 | |
| | | | | | | | |
| Total Real Estate Investment Trusts (REITs) | | | | | | | 35,018,903 | |
| Retail – 0.3% | | | | | | | | |
Big 5 Sporting Goods Corp. | | | 2,047 | | | | 16,048 | |
Brown Shoe Co., Inc. | | | 3,998 | | | | 36,902 | |
Cato Corp. (The) Class A | | | 3,048 | | | | 84,247 | |
Darden Restaurants, Inc. | | | 15,722 | | | | 804,338 | |
Einstein Noah Restaurant Group, Inc. | | | 1,683 | | | | 25,110 | |
Hot Topic, Inc. | | | 4,988 | | | | 50,628 | |
PF Chang’s China Bistro, Inc. | | | 2,110 | | | | 83,387 | |
RadioShack Corp.(a) | | | 14,300 | | | | 88,946 | |
| | | | | | | | |
| Total Retail | | | | | | | 1,189,606 | |
| Savings & Loans – 1.0% | | | | | | | | |
Astoria Financial Corp. | | | 18,499 | | | | 182,400 | |
Berkshire Hills Bancorp, Inc. | | | 2,061 | | | | 47,238 | |
Brookline Bancorp, Inc. | | | 7,601 | | | | 71,221 | |
Dime Community Bancshares, Inc. | | | 5,008 | | | | 73,167 | |
First Niagara Financial Group, Inc. | | | 64,755 | | | | 637,189 | |
Flushing Financial Corp. | | | 3,447 | | | | 46,397 | |
Hudson City Bancorp, Inc. | | | 86,294 | | | | 630,809 | |
New York Community Bancorp, Inc.(a) | | | 110,091 | | | | 1,531,366 | |
Northwest Bancshares, Inc. | | | 11,579 | | | | 147,053 | |
OceanFirst Financial Corp. | | | 1,709 | | | | 24,336 | |
Oritani Financial Corp. | | | 5,391 | | | | 79,140 | |
People’s United Financial, Inc. | | | 54,727 | | | | 724,586 | |
Provident Financial Services, Inc. | | | 6,745 | | | | 98,005 | |
Provident New York Bancorp | | | 3,957 | | | | 33,476 | |
Westfield Financial, Inc. | | | 2,678 | | | | 21,183 | |
| | | | | | | | |
| Total Savings & Loans | | | | | | | 4,347,566 | |
| Semiconductors – 4.1% | | | | | | | | |
Brooks Automation, Inc. | | | 6,227 | | | | 76,779 | |
Intel Corp. | | | 545,832 | | | | 15,343,337 | |
Intersil Corp. Class A | | | 17,733 | | | | 198,610 | |
Maxim Integrated Products, Inc. | | | 30,688 | | | | 877,370 | |
Microchip Technology, Inc.(a) | | | 23,389 | | | | 870,071 | |
| | | | | | | | |
| Total Semiconductors | | | | | | | 17,366,167 | |
| Telecommunications – 13.9% | | | | | | | | |
Alaska Communications Systems Group, Inc.(a) | | | 25,013 | | | | 77,040 | |
AT&T, Inc. | | | 1,052,245 | | | | 32,861,611 | |
CenturyLink, Inc. | | | 150,782 | | | | 5,827,724 | |
Comtech Telecommunications Corp. | | | 2,501 | | | | 81,483 | |
Consolidated Communications Holdings, Inc. | | | 7,431 | | | | 145,871 | |
Frontier Communications Corp.(a) | | | 456,667 | | | | 1,904,301 | |
See Notes to Financial Statements.
| | |
| 26 | | WisdomTree Domestic Dividend Funds |
Schedule of Investments (concluded)
WisdomTree Equity Income Fund (DHS)
March 31, 2012
| | | | | | | | |
| Investments | | Shares | | | Value | |
| | | | | | | | |
IDT Corp. Class B | | | 5,888 | | | $ | 54,994 | |
NTELOS Holdings Corp. | | | 5,145 | | | | 106,501 | |
USA Mobility, Inc. | | | 4,606 | | | | 64,162 | |
Verizon Communications, Inc. | | | 440,208 | | | | 16,829,152 | |
Windstream Corp. | | | 136,086 | | | | 1,593,567 | |
| | | | | | | | |
| Total Telecommunications | | | | | | | 59,546,406 | |
| Toys/Games/Hobbies – 0.1% | | | | | | | | |
Hasbro, Inc. | | | 13,717 | | | | 503,688 | |
| Transportation – 0.0% | | | | | | | | |
Alexander & Baldwin, Inc. | | | 4,018 | | | | 194,672 | |
| Trucking & Leasing – 0.1% | | | | | | | | |
TAL International Group, Inc. | | | 7,819 | | | | 287,035 | |
| Water – 0.0% | | | | | | | | |
California Water Service Group | | | 4,262 | | | | 77,611 | |
Connecticut Water Service, Inc. | | | 753 | | | | 21,302 | |
Middlesex Water Co. | | | 1,899 | | | | 35,872 | |
| | | | | | | | |
| Total Water | | | | | | | 134,785 | |
TOTAL COMMON STOCKS
(Cost: $391,441,524) | | | | | | | 426,326,776 | |
| EXCHANGE-TRADED FUND – 0.1% | | | | | | | | |
WisdomTree Total Dividend Fund(a)(b) | | | | | | | | |
| (Cost: $335,913) | | | 7,437 | | | | 394,979 | |
| INVESTMENT OF CASH COLLATERAL FOR SECURITIES LOANED – 3.1% | | | | | | | | |
| MONEY MARKET FUND – 3.1% | | | | | | | | |
Dreyfus Institutional Preferred Money Market Fund, 0.18%(c) | | | | | | | | |
| (Cost: $13,389,390)(d) | | | 13,389,390 | | | | 13,389,390 | |
TOTAL INVESTMENTS IN SECURITIES – 102.8%
(Cost: $405,166,827) | | | | 440,111,145 | |
Liabilities in Excess of Other Assets – (2.8)% | | | | | | | (12,193,581 | ) |
| | | | | | | | |
| NET ASSETS – 100.0% | | | | | | $ | 427,917,564 | |
| (a) | Security, or portion thereof, was on loan at March 31, 2012 (See Note 2). |
| (b) | Affiliated company. (See Note 7). |
| (c) | Rate shown represents annualized 7-day yield as of March 31, 2012. |
| (d) | At March 31, 2012, the total market value of the Fund’s securities on loan was $13,025,793 and the total market value of the collateral held by the Fund was $13,389,390. |
See Notes to Financial Statements.
| | | | |
| WisdomTree Domestic Dividend Funds | | | 27 | |
Schedule of Investments
WisdomTree LargeCap Dividend Fund (DLN)
March 31, 2012
| | | | | | | | |
| Investments | | Shares | | | Value | |
| | | | | | | | |
| UNITED STATES – 100.5% | |
| COMMON STOCKS – 99.7% | |
| Advertising – 0.1% | |
Omnicom Group, Inc.(a) | | | 28,605 | | | $ | 1,448,843 | |
| Aerospace/Defense – 2.7% | |
Boeing Co. (The) | | | 78,674 | | | | 5,850,985 | |
General Dynamics Corp. | | | 46,420 | | | | 3,406,300 | |
Goodrich Corp. | | | 5,292 | | | | 663,828 | |
L-3 Communications Holdings, Inc. | | | 12,425 | | | | 879,317 | |
Lockheed Martin Corp. | | | 74,489 | | | | 6,693,582 | |
Northrop Grumman Corp. | | | 41,564 | | | | 2,538,729 | |
Raytheon Co. | | | 58,204 | | | | 3,072,007 | |
Rockwell Collins, Inc. | | | 11,979 | | | | 689,511 | |
United Technologies Corp. | | | 104,191 | | | | 8,641,602 | |
| | | | | | | | |
| Total Aerospace/Defense | | | | | | | 32,435,861 | |
| Agriculture – 4.6% | |
Altria Group, Inc. | | | 517,433 | | | | 15,973,156 | |
Archer-Daniels-Midland Co. | | | 74,512 | | | | 2,359,050 | |
Lorillard, Inc. | | | 28,667 | | | | 3,711,803 | |
Philip Morris International, Inc. | | | 313,608 | | | | 27,788,805 | |
Reynolds American, Inc. | | | 142,654 | | | | 5,911,582 | |
| | | | | | | | |
| Total Agriculture | | | | | | | 55,744,396 | |
| Apparel – 0.5% | |
Coach, Inc. | | | 19,240 | | | | 1,486,867 | |
NIKE, Inc. Class B | | | 25,043 | | | | 2,715,663 | |
Ralph Lauren Corp. | | | 1,347 | | | | 234,822 | |
VF Corp. | | | 10,814 | | | | 1,578,628 | |
| | | | | | | | |
| Total Apparel | | | | | | | 6,015,980 | |
| Auto Manufacturers – 0.1% | |
PACCAR, Inc. | | | 30,020 | | | | 1,405,837 | |
| Auto Parts & Equipment – 0.2% | |
Johnson Controls, Inc. | | | 74,047 | | | | 2,405,047 | |
| Banks – 6.0% | |
Bank of America Corp. | | | 336,180 | | | | 3,217,243 | |
Bank of New York Mellon Corp. (The) | | | 149,534 | | | | 3,608,255 | |
BB&T Corp. | | | 84,240 | | | | 2,644,294 | |
Capital One Financial Corp. | | | 9,127 | | | | 508,739 | |
Citigroup, Inc. | | | 19,230 | | | | 702,856 | |
Fifth Third Bancorp | | | 107,285 | | | | 1,507,354 | |
Goldman Sachs Group, Inc. (The) | | | 32,195 | | | | 4,004,092 | |
JPMorgan Chase & Co. | | | 529,086 | | | | 24,327,374 | |
KeyCorp | | | 69,555 | | | | 591,218 | |
M&T Bank Corp. | | | 21,671 | | | | 1,882,776 | |
Morgan Stanley | | | 111,066 | | | | 2,181,336 | |
Northern Trust Corp. | | | 30,042 | | | | 1,425,493 | |
PNC Financial Services Group, Inc. | | | 60,995 | | | | 3,933,568 | |
State Street Corp. | | | 38,791 | | | | 1,764,990 | |
SunTrust Banks, Inc. | | | 28,133 | | | | 679,975 | |
U.S. Bancorp | | | 160,776 | | | | 5,093,384 | |
Wells Fargo & Co. | | | 429,042 | | | | 14,647,494 | |
| | | | | | | | |
| Total Banks | | | | | | | 72,720,441 | |
| | | | | | | | |
| Beverages – 3.2% | |
Beam, Inc. | | | 10,432 | | | $ | 611,002 | |
Brown-Forman Corp. Class B | | | 6,796 | | | | 566,719 | |
Coca-Cola Co. (The) | | | 283,299 | | | | 20,966,959 | |
Coca-Cola Enterprises, Inc. | | | 28,237 | | | | 807,578 | |
Dr. Pepper Snapple Group, Inc. | | | 31,820 | | | | 1,279,482 | |
PepsiCo, Inc. | | | 221,036 | | | | 14,665,739 | |
| | | | | | | | |
| Total Beverages | | | | | | | 38,897,479 | |
| Biotechnology – 0.4% | |
Amgen, Inc. | | | 73,996 | | | | 5,030,988 | |
| Chemicals – 2.4% | |
Air Products & Chemicals, Inc. | | | 26,515 | | | | 2,434,077 | |
Celanese Corp. Series A | | | 3,785 | | | | 174,791 | |
CF Industries Holdings, Inc. | | | 3,509 | | | | 640,919 | |
Dow Chemical Co. (The) | | | 202,923 | | | | 7,029,253 | |
E.I. du Pont de Nemours & Co. | | | 153,754 | | | | 8,133,587 | |
Ecolab, Inc. | | | 13,199 | | | | 814,642 | |
Monsanto Co. | | | 41,780 | | | | 3,332,373 | |
Mosaic Co. (The) | | | 5,729 | | | | 316,756 | |
PPG Industries, Inc. | | | 19,286 | | | | 1,847,599 | |
Praxair, Inc. | | | 25,895 | | | | 2,968,603 | |
Sherwin-Williams Co. (The) | | | 8,026 | | | | 872,185 | |
Sigma-Aldrich Corp. | | | 5,904 | | | | 431,346 | |
Valhi, Inc. | | | 4,490 | | | | 238,195 | |
| | | | | | | | |
| Total Chemicals | | | | | | | 29,234,326 | |
| Coal – 0.1% | |
Consol Energy, Inc. | | | 13,374 | | | | 456,054 | |
Peabody Energy Corp. | | | 11,846 | | | | 343,060 | |
| | | | | | | | |
| Total Coal | | | | | | | 799,114 | |
| Commercial Services – 0.9% | |
Automatic Data Processing, Inc. | | | 66,449 | | | | 3,667,320 | |
Mastercard, Inc. Class A | | | 808 | | | | 339,796 | |
Moody’s Corp. | | | 17,764 | | | | 747,864 | |
Paychex, Inc. | | | 69,619 | | | | 2,157,493 | |
Visa, Inc. Class A | | | 21,479 | | | | 2,534,522 | |
Western Union Co. (The) | | | 49,831 | | | | 877,026 | |
| | | | | | | | |
| Total Commercial Services | | | | | | | 10,324,021 | |
| Computers – 1.7% | |
Hewlett-Packard Co. | | | 161,545 | | | | 3,849,618 | |
International Business Machines Corp. | | | 82,625 | | | | 17,239,706 | |
| | | | | | | | |
| Total Computers | | | | | | | 21,089,324 | |
| Cosmetics/Personal Care – 2.9% | |
Avon Products, Inc. | | | 101,670 | | | | 1,968,331 | |
Colgate-Palmolive Co. | | | 55,321 | | | | 5,409,288 | |
Estee Lauder Cos., Inc. (The) Class A | | | 10,846 | | | | 671,801 | |
Procter & Gamble Co. (The) | | | 393,823 | | | | 26,468,844 | |
| | | | | | | | |
| Total Cosmetics/Personal Care | | | | | | | 34,518,264 | |
| Distribution/Wholesale – 0.3% | |
Fastenal Co.(a) | | | 18,085 | | | | 978,399 | |
Genuine Parts Co. | | | 21,550 | | | | 1,352,262 | |
W.W. Grainger, Inc. | | | 4,553 | | | | 978,030 | |
| | | | | | | | |
| Total Distribution/Wholesale | | | | | | | 3,308,691 | |
See Notes to Financial Statements.
| | |
| 28 | | WisdomTree Domestic Dividend Funds |
Schedule of Investments (continued)
WisdomTree LargeCap Dividend Fund (DLN)
March 31, 2012
| | | | | | | | |
| Investments | | Shares | | | Value | |
| | | | | | | | |
| Diversified Financial Services – 1.6% | |
American Express Co. | | | 78,241 | | | $ | 4,527,024 | |
Ameriprise Financial, Inc. | | | 20,237 | | | | 1,156,140 | |
BlackRock, Inc. | | | 20,460 | | | | 4,192,254 | |
Charles Schwab Corp. (The) | | | 121,042 | | | | 1,739,373 | |
CME Group, Inc. | | | 6,792 | | | | 1,965,129 | |
Discover Financial Services | | | 24,030 | | | | 801,160 | |
Franklin Resources, Inc. | | | 10,039 | | | | 1,245,137 | |
NYSE Euronext | | | 52,403 | | | | 1,572,614 | |
T. Rowe Price Group, Inc. | | | 25,352 | | | | 1,655,486 | |
TD Ameritrade Holding Corp. | | | 37,994 | | | | 750,002 | |
| | | | | | | | |
| Total Diversified Financial Services | | | | | | | 19,604,319 | |
| Electric – 5.4% | |
Ameren Corp. | | | 53,924 | | | | 1,756,844 | |
American Electric Power Co., Inc. | | | 103,268 | | | | 3,984,079 | |
Consolidated Edison, Inc. | | | 52,781 | | | | 3,083,466 | |
Dominion Resources, Inc. | | | 98,683 | | | | 5,053,556 | |
DTE Energy Co. | | | 33,921 | | | | 1,866,673 | |
Duke Energy Corp. | | | 282,199 | | | | 5,929,001 | |
Edison International | | | 47,274 | | | | 2,009,618 | |
Entergy Corp. | | | 36,445 | | | | 2,449,104 | |
Exelon Corp. | | | 162,626 | | | | 6,376,566 | |
FirstEnergy Corp. | | | 92,819 | | | | 4,231,618 | |
NextEra Energy, Inc. | | | 71,530 | | | | 4,369,052 | |
PG&E Corp. | | | 83,764 | | | | 3,636,195 | |
PPL Corp. | | | 124,230 | | | | 3,510,740 | |
Progress Energy, Inc. | | | 59,452 | | | | 3,157,496 | |
Public Service Enterprise Group, Inc. | | | 98,196 | | | | 3,005,780 | |
Southern Co. (The) | | | 162,713 | | | | 7,310,695 | |
Wisconsin Energy Corp. | | | 31,774 | | | | 1,117,809 | |
Xcel Energy, Inc. | | | 85,780 | | | | 2,270,597 | |
| | | | | | | | |
| Total Electric | | | | | | | 65,118,889 | |
| Electrical Components & Equipment – 0.5% | |
AMETEK, Inc. | | | 4,492 | | | | 217,907 | |
Emerson Electric Co. | | | 105,145 | | | | 5,486,466 | |
| | | | | | | | |
| Total Electrical Components & Equipment | | | | | | | 5,704,373 | |
| Electronics – 0.5% | |
Amphenol Corp. Class A | | | 7,189 | | | | 429,686 | |
Honeywell International, Inc. | | | 97,931 | | | | 5,978,688 | |
| | | | | | | | |
| Total Electronics | | | | | | | 6,408,374 | |
| Engineering & Construction – 0.0% | |
Fluor Corp. | | | 7,304 | | | | 438,532 | |
| Environmental Control – 0.4% | |
Republic Services, Inc. | | | 53,189 | | | | 1,625,456 | |
Waste Management, Inc. | | | 86,743 | | | | 3,032,535 | |
| | | | | | | | |
| Total Environmental Control | | | | | | | 4,657,991 | |
| Food – 2.7% | |
Campbell Soup Co. | | | 50,562 | | | | 1,711,524 | |
ConAgra Foods, Inc. | | | 69,569 | | | | 1,826,882 | |
General Mills, Inc. | | | 86,929 | | | | 3,429,349 | |
H.J. Heinz Co. | | | 51,399 | | | | 2,752,416 | |
| | | | | | | | |
Hershey Co. (The) | | | 17,006 | | | $ | 1,042,978 | |
Hormel Foods Corp. | | | 25,350 | | | | 748,332 | |
J.M. Smucker Co. (The) | | | 12,621 | | | | 1,026,845 | |
Kellogg Co. | | | 55,738 | | | | 2,989,229 | |
Kraft Foods, Inc. Class A | | | 250,054 | | | | 9,504,552 | |
Kroger Co. (The) | | | 51,377 | | | | 1,244,865 | |
Safeway, Inc. | | | 41,337 | | | | 835,421 | |
Sara Lee Corp. | | | 65,556 | | | | 1,411,421 | |
Sysco Corp. | | | 96,227 | | | | 2,873,338 | |
Whole Foods Market, Inc. | | | 6,501 | | | | 540,883 | |
| | | | | | | | |
| Total Food | | | | | | | 31,938,035 | |
| Forest Products & Paper – 0.2% | |
International Paper Co. | | | 73,137 | | | | 2,567,109 | |
| Gas – 0.3% | |
CenterPoint Energy, Inc. | | | 79,204 | | | | 1,561,903 | |
Sempra Energy | | | 38,830 | | | | 2,328,247 | |
| | | | | | | | |
| Total Gas | | | | | | | 3,890,150 | |
| Hand/Machine Tools – 0.1% | |
Stanley Black & Decker, Inc. | | | 19,225 | | | | 1,479,556 | |
| Healthcare-Products – 1.2% | |
Baxter International, Inc. | | | 68,506 | | | | 4,095,288 | |
Becton Dickinson and Co. | | | 23,686 | | | | 1,839,218 | |
C.R. Bard, Inc. | | | 3,683 | | | | 363,586 | |
Medtronic, Inc. | | | 127,225 | | | | 4,985,948 | |
St. Jude Medical, Inc. | | | 34,040 | | | | 1,508,312 | |
Stryker Corp. | | | 25,777 | | | | 1,430,108 | |
| | | | | | | | |
| Total Healthcare-Products | | | | | | | 14,222,460 | |
| Healthcare-Services – 0.7% | |
Aetna, Inc. | | | 23,780 | | | | 1,192,805 | |
Cigna Corp. | | | 1,374 | | | | 67,670 | |
Humana, Inc. | | | 8,276 | | | | 765,364 | |
Quest Diagnostics, Inc. | | | 8,363 | | | | 511,397 | |
UnitedHealth Group, Inc. | | | 63,932 | | | | 3,768,152 | |
WellPoint, Inc. | | | 23,536 | | | | 1,736,957 | |
| | | | | | | | |
| Total Healthcare-Services | | | | | | | 8,042,345 | |
| Household Products/Wares – 0.5% | |
Clorox Co. (The) | | | 21,419 | | | | 1,472,556 | |
Kimberly-Clark Corp. | | | 69,278 | | | | 5,118,952 | |
| | | | | | | | |
| Total Household Products/Wares | | | | | | | 6,591,508 | |
| Insurance – 2.1% | |
Aflac, Inc. | | | 64,630 | | | | 2,972,334 | |
Allstate Corp. (The) | | | 70,910 | | | | 2,334,357 | |
Chubb Corp. (The) | | | 28,559 | | | | 1,973,713 | |
CNA Financial Corp. | | | 17,800 | | | | 522,074 | |
Hartford Financial Services Group, Inc. | | | 47,581 | | | | 1,003,008 | |
Loews Corp. | | | 11,728 | | | | 467,595 | |
Marsh & McLennan Cos., Inc. | | | 67,799 | | | | 2,223,129 | |
MetLife, Inc. | | | 111,833 | | | | 4,176,963 | |
Principal Financial Group, Inc. | | | 39,640 | | | | 1,169,776 | |
Progressive Corp. (The) | | | 57,716 | | | | 1,337,857 | |
Prudential Financial, Inc. | | | 62,419 | | | | 3,956,740 | |
See Notes to Financial Statements.
| | | | |
| WisdomTree Domestic Dividend Funds | | | 29 | |
Schedule of Investments (continued)
WisdomTree LargeCap Dividend Fund (DLN)
March 31, 2012
| | | | | | | | |
| Investments | | Shares | | | Value | |
| | | | | | | | |
Travelers Cos., Inc. (The) | | | 53,181 | | | $ | 3,148,315 | |
| | | | | | | | |
| Total Insurance | | | | | | | 25,285,861 | |
| Internet – 0.0% | |
Expedia, Inc.(a) | | | 5,441 | | | | 181,947 | |
| Iron/Steel – 0.2% | |
Cliffs Natural Resources, Inc. | | | 11,051 | | | | 765,392 | |
Nucor Corp. | | | 51,359 | | | | 2,205,869 | |
| | | | | | | | |
| Total Iron/Steel | | | | | | | 2,971,261 | |
| Leisure Time – 0.1% | |
Harley-Davidson, Inc. | | | 14,121 | | | | 693,059 | |
| Lodging – 0.2% | |
Marriott International, Inc. Class A | | | 20,649 | | | | 781,565 | |
Starwood Hotels & Resorts Worldwide, Inc. | | | 9,428 | | | | 531,833 | |
Wynn Resorts Ltd. | | | 10,589 | | | | 1,322,354 | |
| | | | | | | | |
| Total Lodging | | | | | | | 2,635,752 | |
| Machinery-Construction & Mining – 0.6% | |
Caterpillar, Inc. | | | 60,015 | | | | 6,392,798 | |
Joy Global, Inc. | | | 4,465 | | | | 328,177 | |
| | | | | | | | |
| Total Machinery-Construction & Mining | | | | | | | 6,720,975 | |
| Machinery-Diversified – 0.5% | |
Cummins, Inc. | | | 15,366 | | | | 1,844,535 | |
Deere & Co. | | | 40,132 | | | | 3,246,679 | |
Rockwell Automation, Inc. | | | 14,643 | | | | 1,167,047 | |
Roper Industries, Inc. | | | 2,694 | | | | 267,137 | |
| | | | | | | | |
| Total Machinery-Diversified | | | | | | | 6,525,398 | |
| Media – 2.4% | |
CBS Corp. Class B | | | 42,692 | | | | 1,447,686 | |
Comcast Corp. Class A | | | 178,264 | | | | 5,349,703 | |
Comcast Corp. Special Class A | | | 53,698 | | | | 1,584,628 | |
McGraw-Hill Cos., Inc. (The) | | | 30,593 | | | | 1,482,843 | |
News Corp. Class A | | | 83,947 | | | | 1,652,916 | |
News Corp. Class B | | | 36,362 | | | | 726,513 | |
Time Warner Cable, Inc. | | | 43,491 | | | | 3,544,516 | |
Time Warner, Inc. | | | 122,649 | | | | 4,630,000 | |
Viacom, Inc. Class B | | | 51,661 | | | | 2,451,831 | |
Walt Disney Co. (The) | | | 136,325 | | | | 5,968,308 | |
| | | | | | | | |
| Total Media | | | | | | | 28,838,944 | |
| Metal Fabricate/Hardware – 0.0% | | | | | | | | |
Precision Castparts Corp. | | | 548 | | | | 94,749 | |
| Mining – 1.6% | | | | | | | | |
Alcoa, Inc. | | | 62,275 | | | | 623,995 | |
Freeport-McMoRan Copper & Gold, Inc. | | | 110,471 | | | | 4,202,317 | |
Newmont Mining Corp. | | | 48,135 | | | | 2,467,881 | |
Southern Copper Corp.(a) | | | 361,451 | | | | 11,461,611 | |
| | | | | | | | |
| Total Mining | | | | | | | 18,755,804 | |
| Miscellaneous Manufacturing – 4.2% | | | | | | | | |
3M Co. | | | 86,198 | | | | 7,689,724 | |
Danaher Corp. | | | 6,486 | | | | 363,216 | |
Dover Corp. | | | 18,593 | | | | 1,170,243 | |
Eaton Corp. | | | 47,455 | | | | 2,364,683 | |
| | | | | | | | |
General Electric Co. | | | 1,679,244 | | | $ | 33,702,427 | |
Illinois Tool Works, Inc. | | | 66,562 | | | | 3,802,021 | |
Parker Hannifin Corp. | | | 12,846 | | | | 1,086,129 | |
| | | | | | | | |
| Total Miscellaneous Manufacturing | | | | | | | 50,178,443 | |
| Office/Business Equipment – 0.1% | | | | | | | | |
Xerox Corp. | | | 132,094 | | | | 1,067,319 | |
| Oil & Gas – 9.4% | | | | | | | | |
Anadarko Petroleum Corp. | | | 10,752 | | | | 842,312 | |
Apache Corp. | | | 11,464 | | | | 1,151,444 | |
Cabot Oil & Gas Corp. | | | 1,483 | | | | 46,225 | |
Chesapeake Energy Corp. | | | 44,730 | | | | 1,036,394 | |
Chevron Corp. | | | 282,669 | | | | 30,313,424 | |
ConocoPhillips | | | 224,876 | | | | 17,092,825 | |
Devon Energy Corp. | | | 19,677 | | | | 1,399,428 | |
Diamond Offshore Drilling, Inc.(a) | | | 5,364 | | | | 358,047 | |
EOG Resources, Inc. | | | 8,570 | | | | 952,127 | |
EQT Corp. | | | 10,525 | | | | 507,410 | |
Exxon Mobil Corp. | | | 499,160 | | | | 43,292,147 | |
Hess Corp. | | | 11,013 | | | | 649,216 | |
Marathon Oil Corp. | | | 69,255 | | | | 2,195,384 | |
Marathon Petroleum Corp. | | | 46,545 | | | | 2,018,191 | |
Murphy Oil Corp. | | | 18,090 | | | | 1,017,924 | |
Noble Energy, Inc. | | | 7,673 | | | | 750,266 | |
Occidental Petroleum Corp. | | | 74,928 | | | | 7,135,394 | |
Pioneer Natural Resources Co. | | | 560 | | | | 62,490 | |
Range Resources Corp. | | | 1,892 | | | | 110,001 | |
Valero Energy Corp. | | | 71,344 | | | | 1,838,535 | |
| | | | | | | | |
| Total Oil & Gas | | | | | | | 112,769,184 | |
| Oil & Gas Services – 0.3% | | | | | | | | |
Baker Hughes, Inc. | | | 24,976 | | | | 1,047,493 | |
Halliburton Co. | | | 46,782 | | | | 1,552,695 | |
National Oilwell Varco, Inc. | | | 13,574 | | | | 1,078,726 | |
| | | | | | | | |
| Total Oil & Gas Services | | | | | | | 3,678,914 | |
| Pharmaceuticals – 10.1% | | | | | | | | |
Abbott Laboratories | | | 242,745 | | | | 14,877,841 | |
Allergan, Inc. | | | 3,246 | | | | 309,766 | |
AmerisourceBergen Corp. | | | 17,231 | | | | 683,726 | |
Bristol-Myers Squibb Co. | | | 293,206 | | | | 9,895,702 | |
Cardinal Health, Inc. | | | 32,241 | | | | 1,389,910 | |
Eli Lilly & Co. | | | 250,030 | | | | 10,068,708 | |
Johnson & Johnson | | | 433,135 | | | | 28,569,585 | |
McKesson Corp. | | | 11,292 | | | | 991,099 | |
Mead Johnson Nutrition Co. | | | 12,825 | | | | 1,057,806 | |
Merck & Co., Inc. | | | 631,361 | | | | 24,244,262 | |
Perrigo Co. | | | 1,345 | | | | 138,952 | |
Pfizer, Inc. | | | 1,298,514 | | | | 29,424,327 | |
| | | | | | | | |
| Total Pharmaceuticals | | | | | | | 121,651,684 | |
| Pipelines – 1.0% | | | | | | | | |
El Paso Corp. | | | 5,532 | | | | 163,471 | |
Kinder Morgan, Inc.(a) | | | 127,261 | | | | 4,918,638 | |
ONEOK, Inc. | | | 12,219 | | | | 997,803 | |
Spectra Energy Corp. | | | 110,710 | | | | 3,492,900 | |
See Notes to Financial Statements.
| | |
| 30 | | WisdomTree Domestic Dividend Funds |
Schedule of Investments (concluded)
WisdomTree LargeCap Dividend Fund (DLN)
March 31, 2012
| | | | | | | | |
| Investments | | Shares | | | Value | |
| | | | | | | | |
Williams Cos., Inc. (The) | | | 84,031 | | | $ | 2,588,995 | |
| | | | | | | | |
| Total Pipelines | | | | | | | 12,161,807 | |
| Real Estate Investment Trusts (REITs) – 3.0% | | | | | | | | |
AvalonBay Communities, Inc. | | | 11,911 | | | | 1,683,620 | |
Boston Properties, Inc. | | | 13,929 | | | | 1,462,406 | |
Digital Realty Trust, Inc.(a) | | | 19,223 | | | | 1,421,925 | |
Equity Residential | | | 32,251 | | | | 2,019,558 | |
General Growth Properties, Inc. | | | 120,743 | | | | 2,051,424 | |
HCP, Inc. | | | 88,972 | | | | 3,510,835 | |
Health Care REIT, Inc. | | | 47,293 | | | | 2,599,223 | |
Host Hotels & Resorts, Inc. | | | 35,513 | | | | 583,123 | |
Macerich Co. (The) | | | 25,817 | | | | 1,490,932 | |
ProLogis, Inc. | | | 85,496 | | | | 3,079,566 | |
Public Storage | | | 22,590 | | | | 3,121,260 | |
Simon Property Group, Inc. | | | 38,697 | | | | 5,637,379 | |
Ventas, Inc. | | | 43,645 | | | | 2,492,129 | |
Vornado Realty Trust(a) | | | 30,844 | | | | 2,597,065 | |
Weyerhaeuser Co. | | | 84,718 | | | | 1,857,019 | |
| | | | | | | | |
| Total Real Estate Investment Trusts (REITs) | | | | | | | 35,607,464 | |
| Retail – 6.7% | | | | | | | | |
Best Buy Co., Inc.(a) | | | 43,333 | | | | 1,026,126 | |
Costco Wholesale Corp. | | | 22,138 | | | | 2,010,130 | |
CVS Caremark Corp. | | | 76,934 | | | | 3,446,643 | |
Family Dollar Stores, Inc. | | | 6,489 | | | | 410,624 | |
Gap, Inc. (The) | | | 55,059 | | | | 1,439,242 | |
Home Depot, Inc. (The) | | | 200,936 | | | | 10,109,090 | |
J.C. Penney Co., Inc. | | | 23,235 | | | | 823,216 | |
Kohl’s Corp. | | | 23,451 | | | | 1,173,254 | |
Lowe’s Cos., Inc. | | | 126,353 | | | | 3,964,957 | |
Ltd. Brands, Inc. | | | 26,767 | | | | 1,284,816 | |
Macy’s, Inc. | | | 24,144 | | | | 959,241 | |
McDonald’s Corp. | | | 129,512 | | | | 12,705,127 | |
Nordstrom, Inc. | | | 18,238 | | | | 1,016,221 | |
Ross Stores, Inc. | | | 9,634 | | | | 559,735 | |
Staples, Inc. | | | 85,786 | | | | 1,388,018 | |
Starbucks Corp. | | | 51,796 | | | | 2,894,879 | |
Target Corp. | | | 67,249 | | | | 3,918,599 | |
Tiffany & Co. | | | 10,152 | | | | 701,808 | |
TJX Cos., Inc. | | | 41,100 | | | | 1,632,081 | |
Walgreen Co. | | | 104,104 | | | | 3,486,443 | |
Wal-Mart Stores, Inc. | | | 382,699 | | | | 23,421,179 | |
Yum! Brands, Inc. | | | 40,300 | | | | 2,868,554 | |
| | | | | | | | |
| Total Retail | | | | | | | 81,239,983 | |
| Semiconductors – 3.7% | | | | | | | | |
Altera Corp. | | | 13,214 | | | | 526,181 | |
Analog Devices, Inc. | | | 38,704 | | | | 1,563,642 | |
Applied Materials, Inc. | | | 178,164 | | | | 2,216,360 | |
Intel Corp. | | | 807,721 | | | | 22,705,037 | |
KLA-Tencor Corp. | | | 21,700 | | | | 1,180,914 | |
Linear Technology Corp. | | | 33,366 | | | | 1,124,434 | |
Maxim Integrated Products, Inc. | | | 45,045 | | | | 1,287,837 | |
Microchip Technology, Inc.(a) | | | 34,678 | | | | 1,290,022 | |
QUALCOMM, Inc. | | | 119,532 | | | | 8,130,567 | |
| | | | | | | | |
Texas Instruments, Inc. | | | 120,954 | | | $ | 4,065,264 | |
Xilinx, Inc. | | | 29,170 | | | | 1,062,663 | |
| | | | | | | | |
| Total Semiconductors | | | | | | | 45,152,921 | |
| Software – 3.8% | | | | | | | | |
Activision Blizzard, Inc. | | | 70,540 | | | | 904,323 | |
CA, Inc. | | | 21,421 | | | | 590,363 | |
Fidelity National Information Services, Inc. | | | 10,957 | | | | 362,896 | |
Intuit, Inc. | | | 14,961 | | | | 899,605 | |
Microsoft Corp. | | | 1,157,809 | | | | 37,339,340 | |
Oracle Corp. | | | 177,557 | | | | 5,177,562 | |
| | | | | | | | |
| Total Software | | | | | | | 45,274,089 | |
| Telecommunications – 7.7% | | | | | | | | |
AT&T, Inc. | | | 1,553,234 | | | | 48,507,498 | |
CenturyLink, Inc. | | | 224,468 | | | | 8,675,688 | |
Cisco Systems, Inc. | | | 316,493 | | | | 6,693,827 | |
Corning, Inc. | | | 155,802 | | | | 2,193,692 | |
Motorola Solutions, Inc. | | | 26,888 | | | | 1,366,717 | |
Verizon Communications, Inc. | | | 652,112 | | | | 24,930,242 | |
| | | | | | | | |
| Total Telecommunications | | | | | | | 92,367,664 | |
| Toys/Games/Hobbies – 0.1% | | | | | | | | |
Mattel, Inc. | | | 49,374 | | | | 1,661,929 | |
| Transportation – 1.7% | | | | | | | | |
C.H. Robinson Worldwide, Inc.(a) | | | 12,590 | | | | 824,519 | |
CSX Corp. | | | 109,924 | | | | 2,365,564 | |
Expeditors International of Washington, Inc. | | | 11,498 | | | | 534,772 | |
FedEx Corp. | | | 9,296 | | | | 854,860 | |
Norfolk Southern Corp. | | | 36,337 | | | | 2,392,065 | |
Union Pacific Corp. | | | 52,288 | | | | 5,619,914 | |
United Parcel Service, Inc. Class B | | | 93,997 | | | | 7,587,438 | |
| | | | | | | | |
| Total Transportation | | | | | | | 20,179,132 | |
TOTAL COMMON STOCKS (Cost: $1,076,491,880) | | | | | | | 1,201,736,536 | |
| EXCHANGE-TRADED FUND – 0.0% | | | | | | | | |
WisdomTree Total Dividend Fund(a)(b)
(Cost: $284,532) | | | 6,172 | | | | 327,795 | |
| INVESTMENT OF CASH COLLATERAL FOR SECURITIES LOANED – 0.8% | | | | | | | | |
| MONEY MARKET FUND – 0.8% | | | | | | | | |
Dreyfus Institutional Preferred Money Market Fund, 0.18%(c) | | | | | | | | |
| (Cost: $9,686,394)(d) | | | 9,686,394 | | | | 9,686,394 | |
TOTAL INVESTMENTS IN SECURITIES – 100.5%
(Cost: $1,086,462,806) | | | | | | | 1,211,750,725 | |
Liabilities in Excess of Other Assets – (0.5)% | | | | | | | (6,536,032 | ) |
| | | | | | | | |
| NET ASSETS – 100.0% | | | | | | $ | 1,205,214,693 | |
| (a) | Security, or portion thereof, was on loan at March 31, 2012 (See Note 2). |
| (b) | Affiliated company. (See Note 7). |
| (c) | Rate shown represents annualized 7-day yield as of March 31, 2012. |
| (d) | At March 31, 2012, the total market value of the Fund’s securities on loan was $9,444,278 and the total market value of the collateral held by the Fund was $9,686,394. |
See Notes to Financial Statements.
| | | | |
| WisdomTree Domestic Dividend Funds | | | 31 | |
Schedule of Investments
WisdomTree Dividend ex-Financials Fund (DTN)
March 31, 2012
| | | | | | | | |
| Investments | | Shares | | | Value | |
| | | | | | | | |
| UNITED STATES – 105.0% | |
| COMMON STOCKS – 99.5% | | | | | | | | |
| Aerospace/Defense – 3.9% | | | | | | | | |
Lockheed Martin Corp. | | | 229,640 | | | $ | 20,635,450 | |
Northrop Grumman Corp. | | | 217,299 | | | | 13,272,623 | |
Raytheon Co. | | | 286,222 | | | | 15,106,797 | |
| | | | | | | | |
| Total Aerospace/Defense | | | | | | | 49,014,870 | |
| Agriculture – 5.9% | | | | | | | | |
Altria Group, Inc. | | | 678,163 | | | | 20,934,892 | |
Lorillard, Inc. | | | 146,607 | | | | 18,982,674 | |
Philip Morris International, Inc. | | | 184,180 | | | | 16,320,190 | |
Reynolds American, Inc. | | | 452,111 | | | | 18,735,480 | |
| | | | | | | | |
| Total Agriculture | | | | | | | 74,973,236 | |
| Chemicals – 5.2% | | | | | | | | |
Air Products & Chemicals, Inc. | | | 117,775 | | | | 10,811,745 | |
Dow Chemical Co. (The) | | | 486,813 | | | | 16,863,202 | |
E.I. du Pont de Nemours & Co. | | | 271,915 | | | | 14,384,304 | |
Eastman Chemical Co. | | | 248,420 | | | | 12,840,830 | |
PPG Industries, Inc. | | | 110,448 | | | | 10,580,918 | |
| | | | | | | | |
| Total Chemicals | | | | | | | 65,480,999 | |
| Commercial Services – 4.1% | | | | | | | | |
Automatic Data Processing, Inc. | | | 206,637 | | | | 11,404,296 | |
H&R Block, Inc. | | | 848,466 | | | | 13,974,235 | |
Iron Mountain, Inc. | | | 385,111 | | | | 11,091,197 | |
Paychex, Inc. | | | 514,490 | | | | 15,944,045 | |
| | | | | | | | |
| Total Commercial Services | | | | | | | 52,413,773 | |
| Cosmetics/Personal Care – 1.7% | | | | | | | | |
Avon Products, Inc. | | | 1,092,087 | | | | 21,142,804 | |
| Distribution/Wholesale – 0.9% | | | | | | | | |
Genuine Parts Co. | | | 183,802 | | | | 11,533,575 | |
| Electric – 12.9% | | | | | | | | |
Ameren Corp. | | | 509,519 | | | | 16,600,129 | |
American Electric Power Co., Inc. | | | 417,345 | | | | 16,101,170 | |
Duke Energy Corp. | | | 784,367 | | | | 16,479,551 | |
Entergy Corp. | | | 228,865 | | | | 15,379,728 | |
Exelon Corp. | | | 376,369 | | | | 14,757,429 | |
FirstEnergy Corp. | | | 384,061 | | | | 17,509,341 | |
Pepco Holdings, Inc. | | | 968,434 | | | | 18,293,718 | |
PG&E Corp. | | | 415,539 | | | | 18,038,548 | |
PPL Corp. | | | 555,454 | | | | 15,697,130 | |
Progress Energy, Inc. | | | 285,764 | | | | 15,176,926 | |
| | | | | | | | |
| Total Electric | | | | | | | 164,033,670 | |
| Electrical Components & Equipment – 0.9% | | | | | | | | |
Emerson Electric Co. | | | 214,013 | | | | 11,167,198 | |
| Environmental Control – 2.3% | | | | | | | | |
Republic Services, Inc. | | | 408,098 | | | | 12,471,475 | |
Waste Management, Inc. | | | 470,458 | | | | 16,447,212 | |
| | | | | | | | |
| Total Environmental Control | | | | | | | 28,918,687 | |
| Food – 3.1% | | | | | | | | |
ConAgra Foods, Inc. | | | 513,376 | | | | 13,481,254 | |
H.J. Heinz Co. | | | 236,516 | | | | 12,665,432 | |
| | | | | | | | |
Sysco Corp. | | | 447,726 | | | $ | 13,369,098 | |
| | | | | | | | |
| Total Food | | | | | | | 39,515,784 | |
| Forest Products & Paper – 2.3% | | | | | | | | |
International Paper Co. | | | 461,715 | | | | 16,206,197 | |
MeadWestvaco Corp. | | | 410,631 | | | | 12,971,833 | |
| | | | | | | | |
| Total Forest Products & Paper | | | | | | | 29,178,030 | |
| Healthcare-Products – 3.1% | | | | | | | | |
Baxter International, Inc. | | | 183,406 | | | | 10,964,011 | |
Becton Dickinson and Co. | | | 116,947 | | | | 9,080,934 | |
Medtronic, Inc. | | | 258,099 | | | | 10,114,900 | |
St. Jude Medical, Inc. | | | 221,736 | | | | 9,825,122 | |
| | | | | | | | |
| Total Healthcare-Products | | | | | | | 39,984,967 | |
| Household Products/Wares – 2.2% | | | | | | | | |
Clorox Co. (The) | | | 194,778 | | | | 13,390,988 | |
Kimberly-Clark Corp. | | | 190,414 | | | | 14,069,690 | |
| | | | | | | | |
| Total Household Products/Wares | | | | | | | 27,460,678 | |
| Iron/Steel – 1.1% | | | | | | | | |
Nucor Corp. | | | 324,716 | | | | 13,946,552 | |
| Media – 1.9% | | | | | | | | |
Time Warner Cable, Inc. | | | 175,052 | | | | 14,266,738 | |
Time Warner, Inc. | | | 272,818 | | | | 10,298,880 | |
| | | | | | | | |
| Total Media | | | | | | | 24,565,618 | |
| Mining – 3.4% | | | | | | | | |
Freeport-McMoRan Copper & Gold, Inc. | | | 230,852 | | | | 8,781,610 | |
Southern Copper Corp. | | | 1,068,765 | | | | 33,890,538 | |
| | | | | | | | |
| Total Mining | | | | | | | 42,672,148 | |
| Miscellaneous Manufacturing – 3.3% | | | | | | | | |
Eaton Corp. | | | 247,583 | | | | 12,337,061 | |
General Electric Co. | | | 773,447 | | | | 15,523,081 | |
Illinois Tool Works, Inc. | | | 236,582 | | | | 13,513,564 | |
| | | | | | | | |
| Total Miscellaneous Manufacturing | | | | | | | 41,373,706 | |
| Oil & Gas – 5.9% | | | | | | | | |
Chevron Corp. | | | 107,045 | | | | 11,479,506 | |
ConocoPhillips | | | 183,950 | | | | 13,982,039 | |
Exxon Mobil Corp. | | | 100,607 | | | | 8,725,645 | |
Marathon Oil Corp. | | | 271,321 | | | | 8,600,876 | |
Marathon Petroleum Corp. | | | 312,266 | | | | 13,539,854 | |
Murphy Oil Corp. | | | 131,030 | | | | 7,373,058 | |
Valero Energy Corp. | | | 453,466 | | | | 11,685,819 | |
| | | | | | | | |
| Total Oil & Gas | | | | | | | 75,386,797 | |
| Pharmaceuticals – 7.1% | | | | | | | | |
Abbott Laboratories | | | 221,556 | | | | 13,579,167 | |
Bristol-Myers Squibb Co. | | | 407,937 | | | | 13,767,874 | |
Eli Lilly & Co. | | | 440,910 | | | | 17,755,445 | |
Johnson & Johnson | | | 191,007 | | | | 12,598,822 | |
Merck & Co., Inc. | | | 452,392 | | | | 17,371,853 | |
Pfizer, Inc. | | | 651,933 | | | | 14,772,802 | |
| | | | | | | | |
| Total Pharmaceuticals | | | | | | | 89,845,963 | |
| Pipelines – 3.4% | | | | | | | | |
Kinder Morgan, Inc.(a) | | | 478,801 | | | | 18,505,659 | |
See Notes to Financial Statements.
| | |
| 32 | | WisdomTree Domestic Dividend Funds |
Schedule of Investments (concluded)
WisdomTree Dividend ex-Financials Fund (DTN)
March 31, 2012
| | | | | | | | |
| Investments | | Shares | | | Value | |
| | | | | | | | |
Spectra Energy Corp.(a) | | | 448,221 | | | $ | 14,141,372 | |
Williams Cos., Inc. (The) | | | 347,146 | | | | 10,695,568 | |
| | | | | | | | |
| Total Pipelines | | | | | | | 43,342,599 | |
| Retail – 3.8% | | | | | | | | |
Darden Restaurants, Inc. | | | 285,821 | | | | 14,622,602 | |
Home Depot, Inc. (The) | | | 258,087 | | | | 12,984,357 | |
McDonald’s Corp. | | | 102,628 | | | | 10,067,807 | |
Staples, Inc. | | | 668,961 | | | | 10,823,789 | |
| | | | | | | | |
| Total Retail | | | | | | | 48,498,555 | |
| Semiconductors – 7.2% | | | | | | | | |
Analog Devices, Inc. | | | 291,302 | | | | 11,768,601 | |
Applied Materials, Inc. | | | 983,062 | | | | 12,229,291 | |
Intel Corp. | | | 493,823 | | | | 13,881,365 | |
KLA-Tencor Corp. | | | 223,963 | | | | 12,188,067 | |
Linear Technology Corp. | | | 374,069 | | | | 12,606,125 | |
Maxim Integrated Products, Inc. | | | 467,136 | | | | 13,355,418 | |
Microchip Technology, Inc.(a) | | | 405,282 | | | | 15,076,490 | |
| | | | | | | | |
| Total Semiconductors | | | | | | | 91,105,357 | |
| Software – 1.1% | | | | | | | | |
Microsoft Corp. | | | 417,980 | | | | 13,479,855 | |
| Telecommunications – 10.8% | | | | | | | | |
AT&T, Inc. | | | 703,793 | | | | 21,979,455 | |
CenturyLink, Inc. | | | 748,003 | | | | 28,910,316 | |
Frontier Communications Corp.(a) | | | 9,190,928 | | | | 38,326,170 | |
Verizon Communications, Inc. | | | 472,348 | | | | 18,057,864 | |
Windstream Corp. | | | 2,574,088 | | | | 30,142,571 | |
| | | | | | | | |
| Total Telecommunications | | | | | | | 137,416,376 | |
| Toys/Games/Hobbies – 2.0% | | | | | | | | |
Hasbro, Inc. | | | 338,646 | | | | 12,435,081 | |
Mattel, Inc. | | | 392,190 | | | | 13,201,116 | |
| | | | | | | | |
| Total Toys/Games/Hobbies | | | | | | | 25,636,197 | |
TOTAL COMMON STOCKS (Cost: $1,145,035,294) | | | | | | | 1,262,087,994 | |
| EXCHANGE-TRADED FUNDS – 0.2% | | | | | | | | |
WisdomTree LargeCap Dividend Fund(b) | | | 30,125 | | | | 1,595,420 | |
WisdomTree MidCap Dividend Fund(b) | | | 28,241 | | | | 1,589,686 | |
| | | | | | | | |
TOTAL EXCHANGE-TRADED FUNDS (Cost: $2,568,371) | | | | | | | 3,185,106 | |
| SHORT-TERM INVESTMENT – 0.0% | | | | | | | | |
| MONEY MARKET FUND – 0.0% | | | | | | | | |
Invesco Treasury Fund Private Class, 0.02%(c) | | | | | | | | |
| (Cost: $152,451) | | | 152,451 | | | | 152,451 | |
| INVESTMENT OF CASH COLLATERAL FOR SECURITIES LOANED – 5.3% | | | | | | | | |
| MONEY MARKET FUND – 5.3% | | | | | | | | |
Dreyfus Institutional Preferred Money Market Fund, 0.18%(c) | | | | | | | | |
| (Cost: $66,956,110)(d) | | | 66,956,110 | | | | 66,956,110 | |
TOTAL INVESTMENTS IN SECURITIES – 105.0% (Cost: $1,214,712,226) | | | | 1,332,381,661 | |
Liabilities in Excess of Other Assets – (5.0)% | | | | | | | (63,570,143 | ) |
| | | | | | | | |
| NET ASSETS – 100.0% | | | | | | $ | 1,268,811,518 | |
| (a) | Security, or portion thereof, was on loan at March 31, 2012 (See Note 2). |
| (b) | Affiliated company. (See Note 7). |
| (c) | Rate shown represents annualized 7-day yield as of March 31, 2012. |
| (d) | At March 31, 2012, the total market value of the Fund’s securities on loan was $64,738,950 and the total market value of the collateral held by the Fund was $66,956,110. |
See Notes to Financial Statements.
| | | | |
| WisdomTree Domestic Dividend Funds | | | 33 | |
Schedule of Investments
WisdomTree MidCap Dividend Fund (DON)
March 31, 2012
| | | | | | | | |
| Investments | | Shares | | | Value | |
| | | | | | | | |
| UNITED STATES – 108.0% | |
| COMMON STOCKS – 99.3% | |
| Advertising – 0.4% | |
Interpublic Group of Cos., Inc. (The) | | | 130,616 | | | $ | 1,490,329 | |
| Aerospace/Defense – 0.1% | |
Alliant Techsystems, Inc. | | | 4,942 | | | | 247,693 | |
Triumph Group, Inc. | | | 1,435 | | | | 89,917 | |
| | | | | | | | |
| Total Aerospace/Defense | | | | | | | 337,610 | |
| Airlines – 0.0% | |
Southwest Airlines Co. | | | 18,434 | | | | 151,896 | |
| Apparel – 0.2% | |
Columbia Sportswear Co.(a) | | | 6,342 | | | | 300,928 | |
Wolverine World Wide, Inc. | | | 6,990 | | | | 259,888 | |
| | | | | | | | |
| Total Apparel | | | | | | | 560,816 | |
| Auto Parts & Equipment – 0.2% | |
Lear Corp. | | | 14,863 | | | | 690,981 | |
| Banks – 4.2% | |
Associated Banc-Corp. | | | 7,024 | | | | 98,055 | |
Bank of Hawaii Corp.(a) | | | 20,933 | | | | 1,012,111 | |
BOK Financial Corp. | | | 17,501 | | | | 984,956 | |
CapitalSource, Inc. | | | 18,823 | | | | 124,232 | |
City National Corp.(a) | | | 10,632 | | | | 557,861 | |
Comerica, Inc. | | | 33,089 | | | | 1,070,760 | |
Commerce Bancshares, Inc. | | | 22,247 | | | | 901,448 | |
Cullen/Frost Bankers, Inc.(a) | | | 23,196 | | | | 1,349,775 | |
East West Bancorp, Inc. | | | 17,275 | | | | 398,880 | |
First Horizon National Corp. | | | 15,486 | | | | 160,745 | |
FirstMerit Corp. | | | 51,827 | | | | 873,803 | |
Fulton Financial Corp. | | | 45,905 | | | | 482,003 | |
Hancock Holding Co. | | | 28,695 | | | | 1,018,960 | |
Huntington Bancshares, Inc. | | | 288,006 | | | | 1,857,639 | |
Prosperity Bancshares, Inc. | | | 10,215 | | | | 467,847 | |
Regions Financial Corp. | | | 132,458 | | | | 872,898 | |
TCF Financial Corp. | | | 35,188 | | | | 418,385 | |
Valley National Bancorp(a) | | | 106,669 | | | | 1,381,364 | |
Webster Financial Corp. | | | 9,932 | | | | 225,158 | |
Zions Bancorp. | | | 5,040 | | | | 108,158 | |
| | | | | | | | |
| Total Banks | | | | | | | 14,365,038 | |
| Beverages – 0.9% | |
Brown-Forman Corp. Class A | | | 10,833 | | | | 882,456 | |
Molson Coors Brewing Co. Class B | | | 51,341 | | | | 2,323,180 | |
| | | | | | | | |
| Total Beverages | | | | | | | 3,205,636 | |
| Building Materials – 1.0% | |
Lennox International, Inc. | | | 12,265 | | | | 494,280 | |
Martin Marietta Materials, Inc.(a) | | | 10,722 | | | | 918,125 | |
Masco Corp. | | | 130,486 | | | | 1,744,598 | |
Simpson Manufacturing Co., Inc. | | | 7,938 | | | | 256,000 | |
| | | | | | | | |
| Total Building Materials | | | | | | | 3,413,003 | |
| Chemicals – 4.0% | |
Airgas, Inc. | | | 13,621 | | | | 1,211,861 | |
Albemarle Corp. | | | 13,564 | | | | 867,011 | |
Ashland, Inc. | | | 10,978 | | | | 670,317 | |
| | | | | | | | |
Cabot Corp. | | | 15,602 | | | $ | 665,893 | |
Cytec Industries, Inc. | | | 5,934 | | | | 360,728 | |
Eastman Chemical Co. | | | 42,232 | | | | 2,182,972 | |
FMC Corp. | | | 5,350 | | | | 566,351 | |
Huntsman Corp. | | | 104,143 | | | | 1,459,044 | |
International Flavors & Fragrances, Inc. | | | 20,132 | | | | 1,179,735 | |
Kronos Worldwide, Inc.(a) | | | 43,111 | | | | 1,075,188 | |
NewMarket Corp. | | | 2,215 | | | | 415,091 | |
RPM International, Inc. | | | 51,631 | | | | 1,352,216 | |
Sensient Technologies Corp. | | | 12,390 | | | | 470,820 | |
Valspar Corp. | | | 19,563 | | | | 944,697 | |
Westlake Chemical Corp. | | | 5,213 | | | | 337,750 | |
| | | | | | | | |
| Total Chemicals | | | | | | | 13,759,674 | |
| Coal – 0.3% | |
Arch Coal, Inc. | | | 68,123 | | | | 729,597 | |
Walter Energy, Inc. | | | 5,307 | | | | 314,228 | |
| | | | | | | | |
| Total Coal | | | | | | | 1,043,825 | |
| Commercial Services – 4.0% | |
Aaron’s, Inc. | | | 1,752 | | | | 45,377 | |
DeVry, Inc. | | | 6,230 | | | | 211,010 | |
Equifax, Inc. | | | 21,537 | | | | 953,228 | |
Global Payments, Inc. | | | 1,479 | | | | 70,208 | |
H&R Block, Inc. | | | 124,440 | | | | 2,049,527 | |
Iron Mountain, Inc. | | | 66,398 | | | | 1,912,262 | |
Lender Processing Services, Inc. | | | 20,460 | | | | 531,960 | |
Manpower, Inc. | | | 19,897 | | | | 942,521 | |
Morningstar, Inc. | | | 1,825 | | | | 115,066 | |
R.R. Donnelley & Sons Co.(a) | | | 146,613 | | | | 1,816,535 | |
Rent-A-Center, Inc. | | | 11,350 | | | | 428,462 | |
Robert Half International, Inc. | | | 31,690 | | | | 960,207 | |
Rollins, Inc. | | | 19,787 | | | | 421,067 | |
SEI Investments Co. | | | 28,467 | | | | 588,982 | |
Service Corp. International | | | 49,227 | | | | 554,296 | |
Sotheby’s | | | 8,282 | | | | 325,814 | |
Total System Services, Inc. | | | 43,840 | | | | 1,011,389 | |
Towers Watson & Co. Class A | | | 3,713 | | | | 245,318 | |
Weight Watchers International, Inc.(a) | | | 9,261 | | | | 714,857 | |
| | | | | | | | |
| Total Commercial Services | | | | | | | 13,898,086 | |
| Computers – 1.2% | |
Computer Sciences Corp. | | | 52,143 | | | | 1,561,161 | |
Diebold, Inc. | | | 25,879 | | | | 996,859 | |
DST Systems, Inc. | | | 6,996 | | | | 379,393 | |
Jack Henry & Associates, Inc. | | | 11,604 | | | | 395,929 | |
Lexmark International, Inc. Class A | | | 24,166 | | | | 803,278 | |
Syntel, Inc. | | | 2,260 | | | | 126,560 | |
| | | | | | | | |
| Total Computers | | | | | | | 4,263,180 | |
| Distribution/Wholesale – 0.4% | |
Owens & Minor, Inc. | | | 18,986 | | | | 577,364 | |
Watsco, Inc. | | | 11,899 | | | | 881,002 | |
| | | | | | | | |
| Total Distribution/Wholesale | | | | | | | 1,458,366 | |
| Diversified Financial Services – 2.6% | |
CBOE Holdings, Inc. | | | 18,000 | | | | 511,560 | |
See Notes to Financial Statements.
| | |
| 34 | | WisdomTree Domestic Dividend Funds |
Schedule of Investments (continued)
WisdomTree MidCap Dividend Fund (DON)
March 31, 2012
| | | | | | | | |
| Investments | | Shares | | | Value | |
| | | | | | | | |
Eaton Vance Corp.(a) | | | 40,760 | | | $ | 1,164,921 | |
Federated Investors, Inc. Class B(a) | | | 70,061 | | | | 1,570,067 | |
Jefferies Group, Inc. | | | 50,573 | | | | 952,795 | |
Legg Mason, Inc. | | | 19,881 | | | | 555,276 | |
Raymond James Financial, Inc. | | | 23,729 | | | | 866,820 | |
SLM Corp. | | | 163,855 | | | | 2,582,355 | |
Waddell & Reed Financial, Inc. Class A | | | 29,616 | | | | 959,855 | |
| | | | | | | | |
| Total Diversified Financial Services | | | | | | | 9,163,649 | |
| Electric – 10.1% | |
Alliant Energy Corp. | | | 47,437 | | | | 2,054,971 | |
Cleco Corp. | | | 22,458 | | | | 890,460 | |
CMS Energy Corp. | | | 108,839 | | | | 2,394,458 | |
Great Plains Energy, Inc. | | | 58,497 | | | | 1,185,734 | |
Hawaiian Electric Industries, Inc. | | | 48,456 | | | | 1,228,360 | |
IDACORP, Inc. | | | 15,353 | | | | 631,315 | |
Integrys Energy Group, Inc. | | | 44,322 | | | | 2,348,623 | |
ITC Holdings Corp. | | | 10,559 | | | | 812,409 | |
MDU Resources Group, Inc. | | | 64,922 | | | | 1,453,603 | |
National Fuel Gas Co. | | | 22,475 | | | | 1,081,497 | |
Northeast Utilities | | | 59,209 | | | | 2,197,838 | |
NSTAR | | | 40,877 | | | | 1,987,848 | |
NV Energy, Inc. | | | 85,028 | | | | 1,370,651 | |
OGE Energy Corp. | | | 29,363 | | | | 1,570,920 | |
Pepco Holdings, Inc. | | | 132,891 | | | | 2,510,311 | |
Pinnacle West Capital Corp. | | | 53,063 | | | | 2,541,718 | |
PNM Resources, Inc. | | | 26,354 | | | | 482,278 | |
Portland General Electric Co. | | | 34,016 | | | | 849,720 | |
SCANA Corp.(a) | | | 62,019 | | | | 2,828,687 | |
TECO Energy, Inc. | | | 107,552 | | | | 1,887,538 | |
UIL Holdings Corp. | | | 26,755 | | | | 930,004 | |
Westar Energy, Inc. | | | 58,290 | | | | 1,628,040 | |
| | | | | | | | |
| Total Electric | | | | | | | 34,866,983 | |
| Electrical Components & Equipment – 0.9% | |
Acuity Brands, Inc. | | | 4,637 | | | | 291,343 | |
Hubbell, Inc. Class B | | | 13,418 | | | | 1,054,386 | |
Molex, Inc. | | | 35,080 | | | | 986,450 | |
Molex, Inc. Class A | | | 35,412 | | | | 830,411 | |
| | | | | | | | |
| Total Electrical Components & Equipment | | | | | | | 3,162,590 | |
| Electronics – 1.1% | |
AVX Corp. | | | 42,600 | | | | 564,876 | |
FLIR Systems, Inc. | | | 15,767 | | | | 399,063 | |
Gentex Corp. | | | 26,621 | | | | 652,215 | |
Jabil Circuit, Inc. | | | 36,020 | | | | 904,822 | |
National Instruments Corp. | | | 19,990 | | | | 570,115 | |
PerkinElmer, Inc. | | | 18,576 | | | | 513,812 | |
Woodward, Inc. | | | 5,288 | | | | 226,485 | |
| | | | | | | | |
| Total Electronics | | | | | | | 3,831,388 | |
| Engineering & Construction – 0.2% | |
EMCOR Group, Inc. | | | 5,871 | | | | 162,744 | |
KBR, Inc. | | | 12,512 | | | | 444,802 | |
| | | | | | | | |
| Total Engineering & Construction | | | | | | | 607,546 | |
| | | | | | | | |
| Entertainment – 1.1% | |
Cinemark Holdings, Inc. | | | 59,146 | | | $ | 1,298,255 | |
International Game Technology | | | 47,275 | | | | 793,747 | |
Regal Entertainment Group Class A(a) | | | 88,985 | | | | 1,210,196 | |
Six Flags Entertainment Corp. | | | 3,802 | | | | 177,819 | |
Vail Resorts, Inc. | | | 5,475 | | | | 236,794 | |
| | | | | | | | |
| Total Entertainment | | | | | | | 3,716,811 | |
| Environmental Control – 0.3% | |
Covanta Holding Corp. | | | 32,452 | | | | 526,696 | |
Waste Connections, Inc. | | | 13,213 | | | | 429,819 | |
| | | | | | | | |
| Total Environmental Control | | | | | | | 956,515 | |
| Food – 1.3% | |
Corn Products International, Inc. | | | 10,348 | | | | 596,562 | |
Flowers Foods, Inc.(a) | | | 44,803 | | | | 912,637 | |
Harris Teeter Supermarkets, Inc. | | | 6,848 | | | | 274,605 | |
Lancaster Colony Corp. | | | 6,047 | | | | 401,884 | |
McCormick & Co., Inc. | | | 31,878 | | | | 1,735,120 | |
Tyson Foods, Inc. Class A | | | 25,096 | | | | 480,588 | |
| | | | | | | | |
| Total Food | | | | | | | 4,401,396 | |
| Forest Products & Paper – 0.6% | |
MeadWestvaco Corp. | | | 63,931 | | | | 2,019,580 | |
| Gas – 3.7% | |
AGL Resources, Inc. | | | 36,753 | | | | 1,441,453 | |
Atmos Energy Corp. | | | 40,851 | | | | 1,285,172 | |
New Jersey Resources Corp. | | | 14,080 | | | | 627,546 | |
NiSource, Inc. | | | 123,705 | | | | 3,012,217 | |
Piedmont Natural Gas Co., Inc. | | | 26,394 | | | | 820,062 | |
Questar Corp. | | | 64,082 | | | | 1,234,219 | |
South Jersey Industries, Inc. | | | 9,396 | | | | 470,176 | |
Southwest Gas Corp. | | | 12,775 | | | | 546,003 | |
UGI Corp. | | | 45,597 | | | | 1,242,518 | |
Vectren Corp. | | | 42,431 | | | | 1,233,045 | |
WGL Holdings, Inc. | | | 19,954 | | | | 812,128 | |
| | | | | | | | |
| Total Gas | | | | | | | 12,724,539 | |
| Hand/Machine Tools – 0.8% | |
Kennametal, Inc. | | | 13,160 | | | | 586,015 | |
Lincoln Electric Holdings, Inc. | | | 16,094 | | | | 729,380 | |
Regal-Beloit Corp. | | | 6,554 | | | | 429,615 | |
Snap-On, Inc. | | | 16,889 | | | | 1,029,722 | |
| | | | | | | | |
| Total Hand/Machine Tools | | | | | | | 2,774,732 | |
| Healthcare-Products – 0.8% | |
Cooper Cos., Inc. (The) | | | 458 | | | | 37,423 | |
DENTSPLY International, Inc. | | | 9,257 | | | | 371,484 | |
Hill-Rom Holdings, Inc. | | | 8,858 | | | | 295,946 | |
Patterson Cos., Inc. | | | 20,846 | | | | 696,256 | |
STERIS Corp. | | | 14,749 | | | | 466,363 | |
Techne Corp. | | | 6,673 | | | | 467,777 | |
Teleflex, Inc. | | | 9,846 | | | | 602,083 | |
| | | | | | | | |
| Total Healthcare-Products | | | | | | | 2,937,332 | |
| Healthcare-Services – 0.3% | |
Lincare Holdings, Inc. | | | 31,015 | | | | 802,668 | |
See Notes to Financial Statements.
| | | | |
| WisdomTree Domestic Dividend Funds | | | 35 | |
Schedule of Investments (continued)
WisdomTree MidCap Dividend Fund (DON)
March 31, 2012
| | | | | | | | |
| Investments | | Shares | | | Value | |
| | | | | | | | |
Universal Health Services, Inc. Class B | | | 5,139 | | | $ | 215,376 | |
| | | | | | | | |
| Total Healthcare-Services | | | | | | | 1,018,044 | |
| Holding Companies-Diversified – 0.2% | |
Leucadia National Corp.(a) | | | 29,016 | | | | 757,318 | |
| Home Builders – 0.3% | |
D.R. Horton, Inc. | | | 42,288 | | | | 641,509 | |
Lennar Corp. Class A(a) | | | 14,291 | | | | 388,429 | |
| | | | | | | | |
| Total Home Builders | | | | | | | 1,029,938 | |
| Home Furnishings – 0.8% | |
Harman International Industries, Inc. | | | 6,391 | | | | 299,163 | |
Whirlpool Corp. | | | 34,177 | | | | 2,626,844 | |
| | | | | | | | |
| Total Home Furnishings | | | | | | | 2,926,007 | |
| Household Products/Wares – 1.2% | |
Avery Dennison Corp. | | | 40,711 | | | | 1,226,622 | |
Church & Dwight Co., Inc. | | | 22,975 | | | | 1,130,140 | |
Scotts Miracle-Gro Co. (The) Class A(a) | | | 17,632 | | | | 954,949 | |
Tupperware Brands Corp. | | | 13,215 | | | | 839,153 | |
| | | | | | | | |
| Total Household Products/Wares | | | | | | | 4,150,864 | |
| Housewares – 0.4% | | | | | | | | |
Newell Rubbermaid, Inc. | | | 65,035 | | | | 1,158,274 | |
Toro Co. (The) | | | 4,838 | | | | 344,030 | |
| | | | | | | | |
| Total Housewares | | | | | | | 1,502,304 | |
| Insurance – 6.5% | |
American Financial Group, Inc. | | | 20,108 | | | | 775,767 | |
American National Insurance Co. | | | 12,440 | | | | 902,149 | |
AmTrust Financial Services, Inc. | | | 9,071 | | | | 243,829 | |
Arthur J. Gallagher & Co. | | | 47,927 | | | | 1,712,911 | |
Assurant, Inc. | | | 17,635 | | | | 714,218 | |
Brown & Brown, Inc. | | | 23,144 | | | | 550,364 | |
Cincinnati Financial Corp. | | | 92,260 | | | | 3,183,893 | |
Erie Indemnity Co. Class A | | | 13,696 | | | | 1,067,466 | |
Fidelity National Financial, Inc. Class A | | | 71,461 | | | | 1,288,442 | |
Hanover Insurance Group, Inc. (The) | | | 16,543 | | | | 680,248 | |
Harleysville Group, Inc. | | | 7,380 | | | | 425,826 | |
HCC Insurance Holdings, Inc. | | | 25,391 | | | | 791,438 | |
Kemper Corp. | | | 22,296 | | | | 675,123 | |
Lincoln National Corp. | | | 54,398 | | | | 1,433,931 | |
Mercury General Corp. | | | 30,988 | | | | 1,355,415 | |
Old Republic International Corp. | | | 204,119 | | | | 2,153,455 | |
Primerica, Inc. | | | 4,073 | | | | 102,680 | |
ProAssurance Corp. | | | 4,120 | | | | 363,013 | |
Protective Life Corp. | | | 26,644 | | | | 789,195 | |
Reinsurance Group of America, Inc. | | | 11,319 | | | | 673,141 | |
Torchmark Corp. | | | 12,059 | | | | 601,141 | |
Unum Group | | | 63,667 | | | | 1,558,568 | |
W.R. Berkley Corp. | | | 13,893 | | | | 501,815 | |
| | | | | | | | |
| Total Insurance | | | | | | | 22,544,028 | |
| Internet – 0.1% | | | | | | | | |
IAC/InterActiveCorp | | | 9,703 | | | | 476,320 | |
| | | | | | | | |
| Investment Companies – 1.0% | | | | | | | | |
Ares Capital Corp. | | | 208,650 | | | $ | 3,411,427 | |
| Iron/Steel – 1.1% | | | | | | | | |
Allegheny Technologies, Inc. | | | 18,347 | | | | 755,346 | |
Carpenter Technology Corp. | | | 6,983 | | | | 364,722 | |
Commercial Metals Co. | | | 42,287 | | | | 626,694 | |
Reliance Steel & Aluminum Co. | | | 8,096 | | | | 457,262 | |
Steel Dynamics, Inc. | | | 74,569 | | | | 1,084,233 | |
United States Steel Corp.(a) | | | 12,019 | | | | 352,998 | |
| | | | | | | | |
| Total Iron/Steel | | | | | | | 3,641,255 | |
| Leisure Time – 0.3% | | | | | | | | |
Brunswick Corp. | | | 2,682 | | | | 69,062 | |
Polaris Industries, Inc. | | | 11,281 | | | | 813,924 | |
| | | | | | | | |
| Total Leisure Time | | | | | | | 882,986 | |
| Lodging – 0.5% | | | | | | | | |
Choice Hotels International, Inc. | | | 12,504 | | | | 466,899 | |
Wyndham Worldwide Corp. | | | 28,331 | | | | 1,317,675 | |
| | | | | | | | |
| Total Lodging | | | | | | | 1,784,574 | |
| Machinery-Diversified – 0.9% | | | | | | | | |
Flowserve Corp. | | | 7,739 | | | | 893,932 | |
Gardner Denver, Inc. | | | 1,385 | | | | 87,282 | |
Graco, Inc. | | | 13,333 | | | | 707,449 | |
IDEX Corp. | | | 16,784 | | | | 707,110 | |
Nordson Corp. | | | 7,859 | | | | 428,394 | |
Robbins & Myers, Inc. | | | 1,721 | | | | 89,578 | |
Wabtec Corp. | | | 897 | | | | 67,607 | |
| | | | | | | | |
| Total Machinery-Diversified | | | | | | | 2,981,352 | |
| Media – 1.5% | | | | | | | | |
Cablevision Systems Corp. Class A | | | 101,425 | | | | 1,488,919 | |
Factset Research Systems, Inc. | | | 5,720 | | | | 566,509 | |
Gannett Co., Inc. | | | 61,585 | | | | 944,098 | |
John Wiley & Sons, Inc. Class A | | | 9,944 | | | | 473,235 | |
Scripps Networks Interactive, Inc. Class A | | | 12,695 | | | | 618,119 | |
Viacom, Inc. Class A | | | 11,429 | | | | 593,965 | |
Washington Post Co. (The) Class B(a) | | | 1,798 | | | | 671,679 | |
| | | | | | | | |
| Total Media | | | | | | | 5,356,524 | |
| Metal Fabricate/Hardware – 0.4% | | | | | | | | |
Timken Co. (The) | | | 22,182 | | | | 1,125,515 | |
Valmont Industries, Inc. | | | 2,438 | | | | 286,245 | |
| | | | | | | | |
| Total Metal Fabricate/Hardware | | | | | | | 1,411,760 | |
| Mining – 0.5% | | | | | | | | |
Compass Minerals International, Inc. | | | 8,980 | | | | 644,225 | |
Hecla Mining Co.(a) | | | 41,989 | | | | 193,989 | |
Royal Gold, Inc. | | | 4,808 | | | | 313,578 | |
Titanium Metals Corp. | | | 37,554 | | | | 509,232 | |
Vulcan Materials Co. | | | 1,564 | | | | 66,830 | |
| | | | | | | | |
| Total Mining | | | | | | | 1,727,854 | |
| Miscellaneous Manufacturing – 2.7% | | | | | | | | |
Aptargroup, Inc. | | | 12,265 | | | | 671,754 | |
Carlisle Cos., Inc. | | | 11,236 | | | | 560,901 | |
CLARCOR, Inc. | | | 5,196 | | | | 255,072 | |
See Notes to Financial Statements.
| | |
| 36 | | WisdomTree Domestic Dividend Funds |
Schedule of Investments (continued)
WisdomTree MidCap Dividend Fund (DON)
March 31, 2012
| | | | | | | | |
| Investments | | Shares | | | Value | |
| | | | | | | | |
Crane Co. | | | 14,055 | | | $ | 681,667 | |
Donaldson Co., Inc. | | | 14,020 | | | | 500,935 | |
Harsco Corp. | | | 35,180 | | | | 825,323 | |
ITT Corp. | | | 18,996 | | | | 435,768 | |
Leggett & Platt, Inc.(a) | | | 76,009 | | | | 1,748,967 | |
Pall Corp. | | | 14,843 | | | | 885,088 | |
Pentair, Inc.(a) | | | 24,485 | | | | 1,165,731 | |
SPX Corp. | | | 9,334 | | | | 723,665 | |
Textron, Inc. | | | 13,887 | | | | 386,475 | |
Trinity Industries, Inc. | | | 11,055 | | | | 364,262 | |
| | | | | | | | |
| Total Miscellaneous Manufacturing | | | | | | | 9,205,608 | |
| Office/Business Equipment – 0.9% | | | | | | | | |
Pitney Bowes, Inc.(a) | | | 169,734 | | | | 2,983,924 | |
| Oil & Gas – 1.2% | | | | | | | | |
Berry Petroleum Co. Class A | | | 4,951 | | | | 233,341 | |
Cimarex Energy Co. | | | 6,026 | | | | 454,782 | |
Energen Corp. | | | 8,718 | | | | 428,490 | |
EXCO Resources, Inc.(a) | | | 36,865 | | | | 244,415 | |
Helmerich & Payne, Inc. | | | 5,754 | | | | 310,428 | |
HollyFrontier Corp. | | | 39,818 | | | | 1,280,149 | |
Patterson-UTI Energy, Inc. | | | 17,709 | | | | 306,188 | |
QEP Resources, Inc. | | | 5,440 | | | | 165,920 | |
SM Energy Co. | | | 990 | | | | 70,062 | |
Sunoco, Inc. | | | 17,478 | | | | 666,786 | |
| | | | | | | | |
| Total Oil & Gas | | | | | | | 4,160,561 | |
| Oil & Gas Services – 0.5% | | | | | | | | |
CARBO Ceramics, Inc.(a) | | | 1,823 | | | | 192,235 | |
Lufkin Industries, Inc. | | | 2,376 | | | | 191,625 | |
Oceaneering International, Inc. | | | 15,519 | | | | 836,319 | |
RPC, Inc.(a) | | | 54,472 | | | | 577,948 | |
| | | | | | | | |
| Total Oil & Gas Services | | | | | | | 1,798,127 | |
| Packaging & Containers – 1.8% | | | | | | | | |
Ball Corp. | | | 14,062 | | | | 602,979 | |
Bemis Co., Inc. | | | 35,937 | | | | 1,160,406 | |
Packaging Corp. of America | | | 34,704 | | | | 1,026,891 | |
Rock-Tenn Co. Class A | | | 10,765 | | | | 727,283 | |
Sealed Air Corp. | | | 60,905 | | | | 1,176,075 | |
Silgan Holdings, Inc. | | | 8,660 | | | | 382,772 | |
Sonoco Products Co. | | | 38,049 | | | | 1,263,227 | |
| | | | | | | | |
| Total Packaging & Containers | | | | | | | 6,339,633 | |
| Pharmaceuticals – 0.1% | | | | | | | | |
Medicis Pharmaceutical Corp. Class A | | | 6,620 | | | | 248,846 | |
Omnicare, Inc. | | | 5,947 | | | | 211,535 | |
| | | | | | | | |
| Total Pharmaceuticals | | | | | | | 460,381 | |
| Real Estate – 0.1% | | | | | | | | |
Jones Lang LaSalle, Inc. | | | 2,433 | | | | 202,693 | |
| Real Estate Investment Trusts (REITs) – 19.9% | | | | | | | | |
Alexander’s, Inc. | | | 1,808 | | | | 712,135 | |
Alexandria Real Estate Equities, Inc. | | | 18,814 | | | | 1,375,868 | |
American Campus Communities, Inc. | | | 25,629 | | | | 1,146,129 | |
Apartment Investment & Management Co. Class A | | | 28,747 | | | | 759,208 | |
| | | | | | | | |
BioMed Realty Trust, Inc. | | | 73,767 | | | $ | 1,400,098 | |
BRE Properties, Inc. | | | 25,079 | | | | 1,267,743 | |
Camden Property Trust | | | 25,700 | | | | 1,689,775 | |
CBL & Associates Properties, Inc. | | | 88,545 | | | | 1,675,271 | |
Colonial Properties Trust | | | 28,719 | | | | 624,064 | |
DDR Corp. | | | 82,570 | | | | 1,205,522 | |
Douglas Emmett, Inc. | | | 39,672 | | | | 904,918 | |
Duke Realty Corp. | | | 160,086 | | | | 2,295,633 | |
Entertainment Properties Trust | | | 32,363 | | | | 1,500,996 | |
Equity Lifestyle Properties, Inc. | | | 10,254 | | | | 715,114 | |
Equity One, Inc. | | | 66,319 | | | | 1,340,970 | |
Essex Property Trust, Inc. | | | 11,180 | | | | 1,693,882 | |
Extra Space Storage, Inc. | | | 24,011 | | | | 691,277 | |
Federal Realty Investment Trust | | | 20,413 | | | | 1,975,774 | |
Highwoods Properties, Inc.(a) | | | 45,243 | | | | 1,507,497 | |
Home Properties, Inc. | | | 22,998 | | | | 1,403,108 | |
Hospitality Properties Trust | | | 107,998 | | | | 2,858,707 | |
Kilroy Realty Corp. | | | 24,093 | | | | 1,122,975 | |
Kimco Realty Corp. | | | 208,612 | | | | 4,017,867 | |
LaSalle Hotel Properties | | | 17,527 | | | | 493,210 | |
Liberty Property Trust | | | 78,979 | | | | 2,821,130 | |
Mack-Cali Realty Corp. | | | 65,331 | | | | 1,882,839 | |
Mid-America Apartment Communities, Inc. | | | 17,216 | | | | 1,153,988 | |
National Retail Properties, Inc. | | | 66,431 | | | | 1,806,259 | |
Omega Healthcare Investors, Inc. | | | 93,732 | | | | 1,992,742 | |
Piedmont Office Realty Trust, Inc. Class A | | | 139,967 | | | | 2,484,414 | |
Plum Creek Timber Co., Inc. | | | 81,317 | | | | 3,379,535 | |
Post Properties, Inc. | | | 11,651 | | | | 545,966 | |
Rayonier, Inc. | | | 50,525 | | | | 2,227,647 | |
Realty Income Corp. | | | 72,118 | | | | 2,793,130 | |
Regency Centers Corp. | | | 49,297 | | | | 2,192,731 | |
RLJ Lodging Trust | | | 40,995 | | | | 763,737 | |
Senior Housing Properties Trust | | | 120,422 | | | | 2,655,305 | |
SL Green Realty Corp. | | | 5,636 | | | | 437,072 | |
Tanger Factory Outlet Centers | | | 25,956 | | | | 771,672 | |
Taubman Centers, Inc. | | | 17,449 | | | | 1,272,905 | |
UDR, Inc. | | | 77,968 | | | | 2,082,525 | |
Washington Real Estate Investment Trust | | | 45,441 | | | | 1,349,598 | |
Weingarten Realty Investors | | | 67,614 | | | | 1,787,038 | |
| | | | | | | | |
| Total Real Estate Investment Trusts (REITs) | | | | | | | 68,777,974 | |
| Retail – 4.0% | | | | | | | | |
Abercrombie & Fitch Co. Class A | | | 13,898 | | | | 689,480 | |
Advance Auto Parts, Inc. | | | 2,725 | | | | 241,353 | |
American Eagle Outfitters, Inc. | | | 60,347 | | | | 1,037,365 | |
Brinker International, Inc. | | | 22,182 | | | | 611,114 | |
Buckle, Inc. (The) | | | 10,335 | | | | 495,047 | |
Casey’s General Stores, Inc. | | | 5,189 | | | | 287,782 | |
Chico’s FAS, Inc. | | | 34,339 | | | | 518,519 | |
Darden Restaurants, Inc. | | | 55,099 | | | | 2,818,865 | |
Dick’s Sporting Goods, Inc. | | | 14,243 | | | | 684,803 | |
Dillard’s, Inc. Class A | | | 2,270 | | | | 143,055 | |
Foot Locker, Inc. | | | 44,845 | | | | 1,392,437 | |
Guess?, Inc. | | | 27,916 | | | | 872,375 | |
HSN, Inc. | | | 8,942 | | | | 340,064 | |
See Notes to Financial Statements.
| | | | |
| WisdomTree Domestic Dividend Funds | | | 37 | |
Schedule of Investments (concluded)
WisdomTree MidCap Dividend Fund (DON)
March 31, 2012
| | | | | | | | |
| Investments | | Shares | | | Value | |
| | | | | | | | |
MSC Industrial Direct Co. Class A | | | 7,351 | | | $ | 612,191 | |
Penske Automotive Group, Inc. | | | 17,683 | | | | 435,532 | |
PetSmart, Inc. | | | 13,430 | | | | 768,465 | |
PriceSmart, Inc. | | | 3,002 | | | | 218,576 | |
PVH Corp. | | | 1,559 | | | | 139,266 | |
Tractor Supply Co. | | | 4,982 | | | | 451,170 | |
Wendy’s Co. (The) | | | 65,330 | | | | 327,303 | |
Williams-Sonoma, Inc. | | | 19,630 | | | | 735,732 | |
World Fuel Services Corp. | | | 2,751 | | | | 112,791 | |
| | | | | | | | |
| Total Retail | | | | | | | 13,933,285 | |
| Savings & Loans – 3.9% | | | | | | | | |
BankUnited, Inc. | | | 25,906 | | | | 647,650 | |
Capitol Federal Financial, Inc. | | | 46,665 | | | | 553,447 | |
First Niagara Financial Group, Inc. | | | 231,909 | | | | 2,281,985 | |
Hudson City Bancorp, Inc. | | | 304,436 | | | | 2,225,427 | |
New York Community Bancorp, Inc.(a) | | | 385,350 | | | | 5,360,218 | |
People’s United Financial, Inc. | | | 193,816 | | | | 2,566,124 | |
| | | | | | | | |
| Total Savings & Loans | | | | | | | 13,634,851 | |
| Software – 0.8% | | | | | | | | |
Broadridge Financial Solutions, Inc. | | | 37,286 | | | | 891,508 | |
Dun & Bradstreet Corp. (The)(a) | | | 10,474 | | | | 887,462 | |
Quality Systems, Inc. | | | 12,399 | | | | 542,208 | |
Solera Holdings, Inc. | | | 6,488 | | | | 297,735 | |
| | | | | | | | |
| Total Software | | | | | | | 2,618,913 | |
| Telecommunications – 4.4% | | | | | | | | |
ADTRAN, Inc. | | | 8,317 | | | | 259,407 | |
Frontier Communications Corp.(a) | | | 1,603,688 | | | | 6,687,379 | |
Harris Corp.(a) | | | 39,704 | | | | 1,789,856 | |
InterDigital, Inc. | | | 4,919 | | | | 171,477 | |
Virgin Media, Inc. | | | 22,837 | | | | 570,468 | |
Windstream Corp. | | | 477,788 | | | | 5,594,898 | |
| | | | | | | | |
| Total Telecommunications | | | | | | | 15,073,485 | |
| Textiles – 0.3% | | | | | | | | |
Cintas Corp. | | | 24,563 | | | | 960,905 | |
| Toys/Games/Hobbies – 0.5% | | | | | | | | |
Hasbro, Inc. | | | 47,917 | | | | 1,759,512 | |
| Transportation – 0.8% | | | | | | | | |
Bristow Group, Inc. | | | 5,274 | | | | 251,728 | |
JB Hunt Transport Services, Inc. | | | 14,787 | | | | 803,969 | |
Landstar System, Inc. | | | 2,345 | | | | 135,353 | |
Ryder System, Inc. | | | 12,306 | | | | 649,757 | |
Tidewater, Inc. | | | 11,531 | | | | 622,905 | |
Werner Enterprises, Inc. | | | 6,679 | | | | 166,040 | |
| | | | | | | | |
| Total Transportation | | | | | | | 2,629,752 | |
| Trucking & Leasing – 0.2% | | | | | | | | |
GATX Corp. | | | 13,869 | | | | 558,921 | |
| Water – 0.8% | | | | | | | | |
American Water Works Co., Inc. | | | 55,459 | | | | 1,887,270 | |
Aqua America, Inc. | | | 45,423 | | | | 1,012,478 | |
| | | | | | | | |
| Total Water | | | | | | | 2,899,748 | |
TOTAL COMMON STOCKS
(Cost: $305,676,278) | | | | | | | 343,402,329 | |
| | | | | | | | |
| EXCHANGE-TRADED FUND – 0.5% | | | | | | | | |
WisdomTree LargeCap Dividend Fund(b) | | | | | | | | |
| (Cost: $1,573,589) | | | 34,971 | | | $ | 1,852,064 | |
| INVESTMENT OF CASH COLLATERAL FOR SECURITIES LOANED – 8.2% | | | | | | | | |
| MONEY MARKET FUND – 8.2% | | | | | | | | |
Dreyfus Institutional Preferred Money Market Fund, 0.18%(c) | | | | | | | | |
| (Cost: $28,326,236)(d) | | | 28,326,236 | | | | 28,326,236 | |
TOTAL INVESTMENTS IN SECURITIES – 108.0%
(Cost: $335,576,103) | | | | | | | 373,580,629 | |
Liabilities in Excess of Other Assets – (8.0)% | | | | | | | (27,617,537 | ) |
| | | | | | | | |
| NET ASSETS – 100.0% | | | | | | $ | 345,963,092 | |
| (a) | Security, or portion thereof, was on loan at March 31, 2012 (See Note 2). |
| (b) | Affiliated company. (See Note 7). |
| (c) | Rate shown represents annualized 7-day yield as of March 31, 2012. |
| (d) | At March 31, 2012, the total market value of the Fund’s securities on loan was $27,592,022 and the total market value of the collateral held by the Fund was $28,326,236. |
See Notes to Financial Statements.
| | |
| 38 | | WisdomTree Domestic Dividend Funds |
Schedule of Investments
WisdomTree SmallCap Dividend Fund (DES)
March 31, 2012
| | | | | | | | |
| Investments | | Shares | | | Value | |
| | | | | | | | |
| UNITED STATES – 108.1% | |
| COMMON STOCKS – 99.1% | |
| Advertising – 0.2% | |
Harte-Hanks, Inc. | | | 50,294 | | | $ | 455,161 | |
Marchex, Inc. Class B | | | 7,077 | | | | 31,563 | |
| | | | | | | | |
| Total Advertising | | | | | | | 486,724 | |
| Aerospace/Defense – 0.5% | |
AAR Corp. | | | 16,893 | | | | 308,297 | |
Cubic Corp. | | | 2,686 | | | | 126,994 | |
Curtiss-Wright Corp. | | | 10,666 | | | | 394,749 | |
HEICO Corp. | | | 803 | | | | 41,427 | |
HEICO Corp. Class A | | | 1,760 | | | | 70,664 | |
Kaman Corp. | | | 14,692 | | | | 498,793 | |
National Presto Industries, Inc.(a) | | | 1,760 | | | | 133,514 | |
| | | | | | | | |
| Total Aerospace/Defense | | | | | | | 1,574,438 | |
| Agriculture – 1.4% | |
Andersons, Inc. (The) | | | 4,570 | | | | 222,513 | |
Griffin Land & Nurseries, Inc. | | | 1,786 | | | | 47,168 | |
Limoneira Co. | | | 2,074 | | | | 35,030 | |
Universal Corp. | | | 25,606 | | | | 1,193,240 | |
Vector Group Ltd.(a) | | | 171,889 | | | | 3,045,873 | |
| | | | | | | | |
| Total Agriculture | | | | | | | 4,543,824 | |
| Airlines – 0.1% | |
SkyWest, Inc. | | | 15,679 | | | | 173,253 | |
| Apparel – 0.4% | |
Cherokee, Inc. | | | 13,091 | | | | 149,106 | |
Jones Group, Inc. (The) | | | 41,173 | | | | 517,133 | |
Oxford Industries, Inc. | | | 4,958 | | | | 251,965 | |
R.G. Barry Corp. | | | 6,003 | | | | 73,237 | |
Weyco Group, Inc. | | | 7,067 | | | | 167,488 | |
| | | | | | | | |
| Total Apparel | | | | | | | 1,158,929 | |
| Auto Parts & Equipment – 0.7% | |
Cooper Tire & Rubber Co. | | | 47,684 | | | | 725,750 | |
Douglas Dynamics, Inc. | | | 29,570 | | | | 406,588 | |
Miller Industries, Inc. | | | 8,083 | | | | 136,764 | |
Spartan Motors, Inc. | | | 16,867 | | | | 89,226 | |
Standard Motor Products, Inc. | | | 7,711 | | | | 136,793 | |
Superior Industries International, Inc. | | | 27,225 | | | | 531,977 | |
Titan International, Inc. | | | 1,247 | | | | 29,492 | |
| | | | | | | | |
| Total Auto Parts & Equipment | | | | | | | 2,056,590 | |
| Banks – 12.7% | |
1st Source Corp. | | | 15,337 | | | | 375,296 | |
Alliance Financial Corp. | | | 4,766 | | | | 144,457 | |
American National Bankshares, Inc. | | | 8,874 | | | | 189,016 | |
Ames National Corp.(a) | | | 6,196 | | | | 147,465 | |
Arrow Financial Corp. | | | 11,838 | | | | 288,847 | |
BancFirst Corp. | | | 10,958 | | | | 477,330 | |
BancorpSouth, Inc.(a) | | | 10,485 | | | | 141,233 | |
Bank of Kentucky Financial Corp.(a) | | | 4,658 | | | | 119,850 | |
Bank of Marin Bancorp(a) | | | 2,339 | | | | 88,905 | |
Bank of the Ozarks, Inc. | | | 11,595 | | | | 362,460 | |
Banner Corp. | | | 938 | | | | 20,664 | |
| | | | | | | | |
Boston Private Financial Holdings, Inc. | | | 9,782 | | | $ | 96,940 | |
Bridge Bancorp, Inc.(a) | | | 7,457 | | | | 156,373 | |
Bryn Mawr Bank Corp. | | | 9,586 | | | | 215,110 | |
Camden National Corp. | | | 5,868 | | | | 206,260 | |
Cardinal Financial Corp. | | | 7,547 | | | | 85,281 | |
Cass Information Systems, Inc.(a) | | | 4,134 | | | | 165,153 | |
Cathay General Bancorp | | | 5,486 | | | | 97,102 | |
Center Bancorp, Inc. | | | 4,532 | | | | 45,456 | |
Centerstate Banks, Inc.(a) | | | 4,640 | | | | 37,862 | |
Century Bancorp, Inc. Class A | | | 1,444 | | | | 39,421 | |
Chemical Financial Corp. | | | 26,240 | | | | 615,066 | |
Citizens & Northern Corp. | | | 10,131 | | | | 202,620 | |
City Holding Co.(a) | | | 15,145 | | | | 525,834 | |
CNB Financial Corp.(a) | | | 11,089 | | | | 185,297 | |
CoBiz Financial, Inc. | | | 6,227 | | | | 44,025 | |
Columbia Banking System, Inc.(a) | | | 16,812 | | | | 382,977 | |
Community Bank System, Inc. | | | 34,818 | | | | 1,002,062 | |
Community Trust Bancorp, Inc. | | | 16,437 | | | | 527,135 | |
CVB Financial Corp. | | | 90,151 | | | | 1,058,373 | |
Enterprise Bancorp, Inc.(a) | | | 6,424 | | | | 105,611 | |
Enterprise Financial Services Corp. | | | 5,921 | | | | 69,513 | |
FNB Corp.(a) | | | 136,761 | | | | 1,652,073 | |
Financial Institutions, Inc.(a) | | | 10,647 | | | | 172,162 | |
First Bancorp | | | 11,176 | | | | 122,154 | |
First Bancorp, Inc. | | | 12,498 | | | | 185,345 | |
First Busey Corp.(a) | | | 63,745 | | | | 314,900 | |
First Citizens BancShares, Inc. Class A | | | 1,471 | | | | 268,737 | |
First Commonwealth Financial Corp. | | | 63,747 | | | | 390,132 | |
First Community Bancshares, Inc. | | | 13,635 | | | | 182,164 | |
First Connecticut Bancorp, Inc. | | | 3,769 | | | | 49,713 | |
First Financial Bancorp | | | 96,335 | | | | 1,666,596 | |
First Financial Bankshares, Inc.(a) | | | 23,069 | | | | 812,260 | |
First Financial Corp. | | | 8,802 | | | | 279,464 | |
First Interstate Bancsystem, Inc. | | | 14,435 | | | | 211,040 | |
First Merchants Corp. | | | 3,124 | | | | 38,550 | |
First Midwest Bancorp, Inc. | | | 7,609 | | | | 91,156 | |
First of Long Island Corp. (The) | | | 7,130 | | | | 188,945 | |
German American Bancorp, Inc.(a) | | | 8,885 | | | | 172,636 | |
Glacier Bancorp, Inc. | | | 78,123 | | | | 1,167,158 | |
Great Southern Bancorp, Inc. | | | 10,274 | | | | 246,576 | |
Heartland Financial USA, Inc.(a) | | | 9,554 | | | | 165,666 | |
Heritage Financial Corp. | | | 5,560 | | | | 75,616 | |
Home Bancshares, Inc. | | | 9,079 | | | | 241,592 | |
Hudson Valley Holding Corp. | | | 17,573 | | | | 283,453 | |
Iberiabank Corp. | | | 19,915 | | | | 1,064,855 | |
Independent Bank Corp. | | | 15,281 | | | | 439,023 | |
International Bancshares Corp. | | | 35,643 | | | | 753,849 | |
Lakeland Bancorp, Inc. | | | 17,014 | | | | 167,588 | |
Lakeland Financial Corp. | | | 9,449 | | | | 245,957 | |
MainSource Financial Group, Inc. | | | 2,522 | | | | 30,390 | |
MB Financial, Inc.(a) | | | 3,164 | | | | 66,412 | |
Merchants Bancshares, Inc. | | | 5,952 | | | | 167,727 | |
Midsouth Bancorp, Inc.(a) | | | 4,447 | | | | 60,479 | |
National Bankshares, Inc.(a) | | | 6,241 | | | | 187,854 | |
See Notes to Financial Statements.
| | | | |
| WisdomTree Domestic Dividend Funds | | | 39 | |
Schedule of Investments (continued)
WisdomTree SmallCap Dividend Fund (DES)
March 31, 2012
| | | | | | | | |
| Investments | | Shares | | | Value | |
| | | | | | | | |
National Penn Bancshares, Inc.(a) | | | 71,094 | | | $ | 629,182 | |
NBT Bancorp, Inc. | | | 30,329 | | | | 669,664 | |
Old National Bancorp | | | 55,583 | | | | 730,361 | |
Pacific Continental Corp. | | | 10,109 | | | | 95,227 | |
PacWest Bancorp | | | 34,525 | | | | 838,958 | |
Park National Corp.(a) | | | 23,095 | | | | 1,597,481 | |
Penns Woods Bancorp, Inc.(a) | | | 4,481 | | | | 183,183 | |
Peoples Bancorp, Inc.(a) | | | 6,810 | | | | 119,447 | |
PrivateBancorp, Inc. | | | 7,725 | | | | 117,188 | |
Renasant Corp.(a) | | | 28,592 | | | | 465,478 | |
Republic Bancorp, Inc. Class A | | | 11,905 | | | | 284,768 | |
S&T Bancorp, Inc.(a) | | | 21,507 | | | | 466,487 | |
S.Y. Bancorp, Inc. | | | 11,343 | | | | 263,158 | |
Sandy Spring Bancorp, Inc. | | | 13,303 | | | | 241,716 | |
SCBT Financial Corp. | | | 8,010 | | | | 262,007 | |
Sierra Bancorp | | | 9,111 | | | | 89,561 | |
Simmons First National Corp. Class A | | | 11,539 | | | | 298,052 | |
Southside Bancshares, Inc. | | | 12,735 | | | | 281,444 | |
StellarOne Corp. | | | 7,711 | | | | 91,530 | |
Sterling Bancorp | | | 31,905 | | | | 305,969 | |
Susquehanna Bancshares, Inc. | | | 76,284 | | | | 753,686 | |
Synovus Financial Corp.(a) | | | 558,262 | | | | 1,144,437 | |
Tompkins Financial Corp.(a) | | | 9,772 | | | | 391,466 | |
TowneBank | | | 17,785 | | | | 239,920 | |
Trico Bancshares | | | 9,267 | | | | 161,431 | |
TrustCo Bank Corp. | | | 111,350 | | | | 635,809 | |
Trustmark Corp. | | | 64,107 | | | | 1,601,393 | |
UMB Financial Corp. | | | 22,984 | | | | 1,028,189 | |
Umpqua Holdings Corp. | | | 62,865 | | | | 852,449 | |
Union First Market Bankshares Corp. | | | 13,122 | | | | 183,708 | |
United Bankshares, Inc.(a) | | | 54,263 | | | | 1,566,030 | |
Univest Corp. of Pennsylvania | | | 22,698 | | | | 380,872 | |
Washington Banking Co. | | | 6,386 | | | | 88,191 | |
Washington Trust Bancorp, Inc. | | | 14,221 | | | | 343,295 | |
WesBanco, Inc. | | | 22,144 | | | | 445,980 | |
West Bancorp., Inc. | | | 11,989 | | | | 119,770 | |
Westamerica Bancorp. | | | 24,449 | | | | 1,173,552 | |
Wintrust Financial Corp. | | | 5,874 | | | | 210,230 | |
| | | | | | | | |
| Total Banks | | | | | | | 39,732,485 | |
| Beverages – 0.1% | |
Coca-Cola Bottling Co. Consolidated | | | 3,084 | | | | 193,490 | |
| Biotechnology – 0.7% | |
PDL BioPharma, Inc.(a) | | | 331,594 | | | | 2,105,622 | |
| Building Materials – 0.6% | |
AAON, Inc.(a) | | | 6,673 | | | | 134,728 | |
Apogee Enterprises, Inc. | | | 20,351 | | | | 263,545 | |
Comfort Systems USA, Inc.(a) | | | 17,209 | | | | 187,750 | |
Eagle Materials, Inc. | | | 19,177 | | | | 666,401 | |
Griffon Corp. | | | 13,073 | | | | 139,881 | |
LSI Industries, Inc. | | | 23,007 | | | | 168,641 | |
Quanex Building Products Corp. | | | 10,398 | | | | 183,317 | |
Universal Forest Products, Inc. | | | 6,676 | | | | 230,189 | |
| | | | | | | | |
| Total Building Materials | | | | | | | 1,974,452 | |
| | | | | | | | |
| Chemicals – 1.7% | |
A. Schulman, Inc. | | | 23,145 | | | $ | 625,378 | |
Aceto Corp. | | | 19,466 | | | | 184,732 | |
American Vanguard Corp. | | | 5,654 | | | | 122,635 | |
Balchem Corp. | | | 2,617 | | | | 79,164 | |
H.B. Fuller Co. | | | 16,780 | | | | 550,887 | |
Hawkins, Inc. | | | 4,301 | | | | 159,997 | |
Innophos Holdings, Inc. | | | 10,882 | | | | 545,406 | |
KMG Chemicals, Inc. | | | 1,633 | | | | 29,476 | |
Minerals Technologies, Inc.(a) | | | 1,507 | | | | 98,573 | |
Oil-Dri Corp. of America(a) | | | 4,197 | | | | 89,354 | |
Olin Corp. | | | 81,092 | | | | 1,763,751 | |
PolyOne Corp. | | | 33,535 | | | | 482,904 | |
Quaker Chemical Corp. | | | 8,418 | | | | 332,090 | |
Stepan Co. | | | 3,547 | | | | 311,427 | |
Zep, Inc. | | | 5,509 | | | | 79,330 | |
| | | | | | | | |
| Total Chemicals | | | | | | | 5,455,104 | |
| Commercial Services – 4.3% | |
ABM Industries, Inc. | | | 34,514 | | | | 838,690 | |
Advance America, Cash Advance Centers, Inc. | | | 42,766 | | | | 448,615 | |
Arbitron, Inc. | | | 7,289 | | | | 269,547 | |
Barrett Business Services, Inc. | | | 5,356 | | | | 106,210 | |
Brink’s Co. (The)(a) | | | 18,749 | | | | 447,539 | |
Carriage Services, Inc. | | | 7,667 | | | | 57,886 | |
CDI Corp. | | | 18,080 | | | | 324,174 | |
Chemed Corp. | | | 6,239 | | | | 391,061 | |
Collectors Universe, Inc. | | | 18,099 | | | | 312,027 | |
Corporate Executive Board Co. (The)(a) | | | 12,976 | | | | 558,098 | |
Deluxe Corp.(a) | | | 57,344 | | | | 1,342,996 | |
Electro Rent Corp. | | | 28,339 | | | | 521,721 | |
Great Lakes Dredge & Dock Corp. | | | 21,834 | | | | 157,641 | |
Healthcare Services Group, Inc. | | | 57,775 | | | | 1,228,874 | |
Heartland Payment Systems, Inc.(a) | | | 6,251 | | | | 180,279 | |
Heidrick & Struggles International, Inc. | | | 10,624 | | | | 234,047 | |
Insperity, Inc. | | | 15,320 | | | | 469,405 | |
Intersections, Inc. | | | 31,012 | | | | 396,333 | |
Kelly Services, Inc. Class A | | | 12,619 | | | | 201,778 | |
Landauer, Inc. | | | 10,005 | | | | 530,465 | |
Lincoln Educational Services Corp. | | | 20,478 | | | | 161,981 | |
Mac-Gray Corp. | | | 5,573 | | | | 84,320 | |
Matthews International Corp. Class A | | | 7,921 | | | | 250,620 | |
MAXIMUS, Inc. | | | 7,032 | | | | 285,991 | |
McGrath Rentcorp | | | 19,714 | | | | 633,017 | |
Monro Muffler Brake, Inc. | | | 6,608 | | | | 274,166 | |
Multi-Color Corp. | | | 3,002 | | | | 67,575 | |
National American University Holdings, Inc. | | | 10,988 | | | | 69,224 | |
National Research Corp. | | | 3,973 | | | | 170,601 | |
Quad Graphics, Inc.(a) | | | 45,036 | | | | 626,000 | |
Resources Connection, Inc. | | | 21,933 | | | | 308,159 | |
Stewart Enterprises, Inc. Class A(a) | | | 51,448 | | | | 312,289 | |
Strayer Education, Inc.(a) | | | 12,931 | | | | 1,219,135 | |
Viad Corp. | | | 4,346 | | | | 84,443 | |
| | | | | | | | |
| Total Commercial Services | | | | | | | 13,564,907 | |
See Notes to Financial Statements.
| | |
| 40 | | WisdomTree Domestic Dividend Funds |
Schedule of Investments (continued)
WisdomTree SmallCap Dividend Fund (DES)
March 31, 2012
| | | | | | | | |
| Investments | | Shares | | | Value | |
| | | | | | | | |
| Computers – 0.5% | |
j2 Global, Inc.(a) | | | 35,595 | | | $ | 1,020,865 | |
MTS Systems Corp. | | | 9,753 | | | | 517,787 | |
Rimage Corp. | | | 14,241 | | | | 142,552 | �� |
| | | | | | | | |
| Total Computers | | | | | | | 1,681,204 | |
| Cosmetics/Personal Care – 0.1% | |
Inter Parfums, Inc. | | | 12,639 | | | | 198,306 | |
| Distribution/Wholesale – 0.6% | |
Core-Mark Holding Co., Inc. | | | 4,815 | | | | 197,126 | |
Houston Wire & Cable Co. | | | 11,644 | | | | 161,735 | |
Pool Corp. | | | 22,540 | | | | 843,447 | |
United Stationers, Inc.(a) | | | 17,363 | | | | 538,774 | |
| | | | | | | | |
| Total Distribution/Wholesale | | | | | | | 1,741,082 | |
| Diversified Financial Services – 4.0% | |
Artio Global Investors, Inc.(a) | | | 64,746 | | | | 308,838 | |
Asta Funding, Inc. | | | 4,331 | | | | 35,384 | |
BGC Partners, Inc. Class A(a) | | | 266,862 | | | | 1,972,110 | |
Calamos Asset Management, Inc. Class A | | | 13,939 | | | | 182,740 | |
Cohen & Steers, Inc. | | | 23,044 | | | | 735,104 | |
Duff & Phelps Corp. Class A | | | 16,157 | | | | 251,080 | |
Edelman Financial Group, Inc. | | | 20,287 | | | | 134,097 | |
Epoch Holding Corp. | | | 7,998 | | | | 190,992 | |
Evercore Partners, Inc. Class A | | | 19,889 | | | | 578,173 | |
Federal Agricultural Mortgage Corp. Class C | | | 2,357 | | | | 53,504 | |
FXCM, Inc. Class A | | | 8,474 | | | | 110,077 | |
Gain Capital Holdings, Inc. | | | 24,152 | | | | 121,243 | |
GAMCO Investors, Inc. Class A | | | 543 | | | | 26,938 | |
GFI Group, Inc. | | | 139,849 | | | | 525,832 | |
Greenhill & Co., Inc.(a) | | | 33,059 | | | | 1,442,695 | |
Horizon Technology Finance Corp. | | | 21,019 | | | | 349,126 | |
Interactive Brokers Group, Inc. Class A | | | 29,700 | | | | 504,900 | |
Janus Capital Group, Inc. | | | 149,714 | | | | 1,333,952 | |
JMP Group, Inc. | | | 8,436 | | | | 62,258 | |
KBW, Inc.(a) | | | 11,112 | | | | 205,572 | |
MarketAxess Holdings, Inc. | | | 11,503 | | | | 428,947 | |
Marlin Business Services Corp. | | | 5,409 | | | | 81,460 | |
Medley Capital Corp. | | | 42,725 | | | | 481,511 | |
Nelnet, Inc. Class A | | | 14,430 | | | | 373,881 | |
Oppenheimer Holdings, Inc. Class A | | | 8,752 | | | | 151,847 | |
Pzena Investment Management, Inc. Class A | | | 5,930 | | | | 34,690 | |
Solar Senior Capital Ltd. | | | 14,779 | | | | 238,090 | |
US Global Investors, Inc. Class A | | | 12,367 | | | | 89,661 | |
Walter Investment Management Corp.(a) | | | 60,929 | | | | 1,373,949 | |
Westwood Holdings Group, Inc. | | | 7,163 | | | | 277,423 | |
| | | | | | | | |
| Total Diversified Financial Services | | | | | | | 12,656,074 | |
| Electric – 3.8% | |
ALLETE, Inc. | | | 39,762 | | | | 1,649,725 | |
Avista Corp. | | | 61,474 | | | | 1,572,505 | |
Black Hills Corp.(a) | | | 43,315 | | | | 1,452,352 | |
Central Vermont Public Service Corp. | | | 8,327 | | | | 293,111 | |
CH Energy Group, Inc. | | | 14,286 | | | | 953,305 | |
El Paso Electric Co. | | | 25,432 | | | | 826,286 | |
| | | | | | | | |
MGE Energy, Inc. | | | 19,039 | | | $ | 845,141 | |
NorthWestern Corp. | | | 37,052 | | | | 1,313,864 | |
Otter Tail Corp.(a) | | | 48,334 | | | | 1,048,848 | |
Unisource Energy Corp. | | | 40,902 | | | | 1,495,786 | |
Unitil Corp. | | | 12,792 | | | | 343,209 | |
| | | | | | | | |
| Total Electric | | | | | | | 11,794,132 | |
| Electrical Components & Equipment – 0.3% | |
Belden, Inc. | | | 6,987 | | | | 264,877 | |
Encore Wire Corp. | | | 1,757 | | | | 52,236 | |
Graham Corp. | | | 1,048 | | | | 22,941 | |
Insteel Industries, Inc. | | | 4,647 | | | | 56,461 | |
Littelfuse, Inc. | | | 9,388 | | | | 588,627 | |
Vicor Corp. | | | 13,682 | | | | 109,456 | |
| | | | | | | | |
| Total Electrical Components & Equipment | | | | | | | 1,094,598 | |
| Electronics – 1.1% | |
American Science & Engineering, Inc. | | | 6,241 | | | | 418,459 | |
Analogic Corp. | | | 2,161 | | | | 145,954 | |
Badger Meter, Inc.(a) | | | 8,720 | | | | 296,393 | |
Bel Fuse, Inc. Class B | | | 3,465 | | | | 61,227 | |
Brady Corp. Class A | | | 28,118 | | | | 909,617 | |
CTS Corp. | | | 11,631 | | | | 122,358 | |
Daktronics, Inc. | | | 11,384 | | | | 101,204 | |
DDi Corp. | | | 22,687 | | | | 276,781 | |
ESCO Technologies, Inc. | | | 7,843 | | | | 288,387 | |
Methode Electronics, Inc. | | | 29,008 | | | | 269,194 | |
Park Electrochemical Corp. | | | 7,563 | | | | 228,630 | |
Watts Water Technologies, Inc. Class A | | | 8,891 | | | | 362,308 | |
| | | | | | | | |
| Total Electronics | | | | | | | 3,480,512 | |
| Energy-Alternate Sources – 0.1% | |
FutureFuel Corp.(a) | | | 31,196 | | | | 342,532 | |
| Engineering & Construction – 0.2% | |
Granite Construction, Inc. | | | 20,526 | | | | 589,917 | |
VSE Corp. | | | 1,463 | | | | 36,297 | |
| | | | | | | | |
| Total Engineering & Construction | | | | | | | 626,214 | |
| Entertainment – 0.8% | |
Churchill Downs, Inc. | | | 4,248 | | | | 237,463 | |
International Speedway Corp. Class A | | | 4,734 | | | | 131,368 | |
National CineMedia, Inc. | | | 96,777 | | | | 1,480,688 | |
Speedway Motorsports, Inc. | | | 30,764 | | | | 574,672 | |
| | | | | | | | |
| Total Entertainment | | | | | | | 2,424,191 | |
| Environmental Control – 0.5% | |
Met-Pro Corp.(a) | | | 10,726 | | | | 113,267 | |
Mine Safety Appliances Co.(a) | | | 28,202 | | | | 1,158,538 | |
U.S. Ecology, Inc. | | | 17,926 | | | | 389,711 | |
| | | | | | | | |
| Total Environmental Control | | | | | | | 1,661,516 | |
| Food – 2.1% | |
Arden Group, Inc. Class A | | | 786 | | | | 71,440 | |
B&G Foods, Inc. | | | 46,735 | | | | 1,052,005 | |
Calavo Growers, Inc.(a) | | | 7,513 | | | | 201,198 | |
Cal-Maine Foods, Inc.(a) | | | 2,706 | | | | 103,532 | |
Ingles Markets, Inc. Class A | | | 13,496 | | | | 238,070 | |
See Notes to Financial Statements.
| | | | |
| WisdomTree Domestic Dividend Funds | | | 41 | |
Schedule of Investments (continued)
WisdomTree SmallCap Dividend Fund (DES)
March 31, 2012
| | | | | | | | |
| Investments | | Shares | | | Value | |
| | | | | | | | |
J&J Snack Foods Corp. | | | 4,003 | | | $ | 209,997 | |
Nash Finch Co. | | | 7,101 | | | | 201,810 | |
Sanderson Farms, Inc.(a) | | | 7,098 | | | | 376,407 | |
Snyders-Lance, Inc. | | | 49,275 | | | | 1,273,759 | |
Spartan Stores, Inc. | | | 8,084 | | | | 146,482 | |
SUPERVALU, Inc.(a) | | | 250,264 | | | | 1,429,007 | |
Tootsie Roll Industries, Inc.(a) | | | 12,064 | | | | 276,386 | |
Village Super Market, Inc. Class A | | | 2,446 | | | | 77,269 | |
Weis Markets, Inc. | | | 19,362 | | | | 844,183 | |
| | | | | | | | |
| Total Food | | | | | | | 6,501,545 | |
| Forest Products & Paper – 0.5% | |
Buckeye Technologies, Inc. | | | 7,308 | | | | 248,253 | |
Deltic Timber Corp. | | | 1,545 | | | | 97,783 | |
Neenah Paper, Inc. | | | 8,152 | | | | 242,440 | |
Orchids Paper Products Co. | | | 8,818 | | | | 158,636 | |
PH Glatfelter Co. | | | 26,279 | | | | 414,683 | |
Schweitzer-Mauduit International, Inc. | | | 3,505 | | | | 242,055 | |
Wausau Paper Corp. | | | 16,940 | | | | 158,897 | |
| | | | | | | | |
| Total Forest Products & Paper | | | | | | | 1,562,747 | |
| Gas – 0.7% | |
Chesapeake Utilities Corp. | | | 7,305 | | | | 300,382 | |
Laclede Group, Inc. (The) | | | 22,499 | | | | 877,911 | |
Northwest Natural Gas Co. | | | 24,771 | | | | 1,124,603 | |
| | | | | | | | |
| Total Gas | | | | | | | 2,302,896 | |
| Hand/Machine Tools – 0.1% | |
Franklin Electric Co., Inc. | | | 6,953 | | | | 341,184 | |
Hardinge, Inc. | | | 2,492 | | | | 23,574 | |
| | | | | | | | |
| Total Hand/Machine Tools | | | | | | | 364,758 | |
| Healthcare-Products – 0.6% | |
Atrion Corp. | | | 388 | | | | 81,561 | |
Cantel Medical Corp. | | | 3,320 | | | | 83,299 | |
Female Health Co. (The)(a) | | | 26,921 | | | | 145,912 | |
Invacare Corp. | | | 2,333 | | | | 38,658 | |
Meridian Bioscience, Inc. | | | 40,257 | | | | 780,181 | |
West Pharmaceutical Services, Inc. | | | 15,900 | | | | 676,227 | |
Young Innovations, Inc. | | | 1,008 | | | | 31,167 | |
| | | | | | | | |
| Total Healthcare-Products | | | | | | | 1,837,005 | |
| Healthcare-Services – 0.3% | |
Assisted Living Concepts, Inc. Class A | | | 13,714 | | | | 227,789 | |
Ensign Group, Inc. (The) | | | 4,477 | | | | 121,595 | |
National Healthcare Corp. | | | 9,646 | | | | 439,472 | |
U.S. Physical Therapy, Inc. | | | 4,572 | | | | 105,385 | |
| | | | | | | | |
| Total Healthcare-Services | | | | | | | 894,241 | |
| Holding Companies-Diversified – 0.1% | |
Primoris Services Corp. | | | 10,061 | | | | 161,580 | |
| Home Builders – 1.2% | |
KB Home(a) | | | 66,242 | | | | 589,554 | |
Lennar Corp. Class B | | | 8,199 | | | | 183,248 | |
MDC Holdings, Inc.(a) | | | 69,481 | | | | 1,791,915 | |
Ryland Group, Inc. (The) | | | 8,752 | | | | 168,738 | |
Thor Industries, Inc. | | | 34,726 | | | | 1,095,953 | |
| | | | | | | | |
| Total Home Builders | | | | | | | 3,829,408 | |
| | | | | | | | |
| Home Furnishings – 0.2% | | | | | | | | |
Ethan Allen Interiors, Inc. | | | 8,627 | | | $ | 218,436 | |
Hooker Furniture Corp. | | | 9,572 | | | | 130,658 | |
Kimball International, Inc. Class B | | | 22,718 | | | | 156,981 | |
| | | | | | | | |
| Total Home Furnishings | | | | | | | 506,075 | |
| Household Products/Wares – 0.5% | | | | | | | | |
American Greetings Corp. Class A | | | 32,842 | | | | 503,796 | |
Blyth, Inc. | | | 727 | | | | 54,401 | |
CSS Industries, Inc. | | | 7,245 | | | | 140,988 | |
Ennis, Inc.(a) | | | 28,880 | | | | 456,882 | |
WD-40 Co. | | | 10,588 | | | | 480,166 | |
| | | | | | | | |
| Total Household Products/Wares | | | | | | | 1,636,233 | |
| Housewares – 0.0% | | | | | | | | |
Lifetime Brands, Inc. | | | 2,355 | | | | 26,470 | |
| Insurance – 3.7% | | | | | | | | |
American Equity Investment Life Holding Co. | | | 15,949 | | | | 203,669 | |
Baldwin & Lyons, Inc. Class B | | | 12,956 | | | | 289,955 | |
Crawford & Co. Class A | | | 20,795 | | | | 81,101 | |
Crawford & Co. Class B | | | 7,825 | | | | 38,342 | |
Delphi Financial Group, Inc. Class A | | | 22,275 | | | | 997,252 | |
Donegal Group, Inc. Class A | | | 15,605 | | | | 213,320 | |
EMC Insurance Group, Inc. | | | 11,854 | | | | 238,147 | |
Employers Holdings, Inc. | | | 11,447 | | | | 202,726 | |
FBL Financial Group, Inc. Class A | | | 8,455 | | | | 284,934 | |
First American Financial Corp. | | | 49,411 | | | | 821,705 | |
Horace Mann Educators Corp. | | | 31,879 | | | | 561,708 | |
Independence Holding Co.(a) | | | 2,482 | | | | 24,721 | |
Infinity Property & Casualty Corp. | | | 3,580 | | | | 187,341 | |
Kansas City Life Insurance Co.(a) | | | 9,143 | | | | 294,405 | |
Life Partners Holdings, Inc. | | | 58,434 | | | | 237,826 | |
Meadowbrook Insurance Group, Inc. | | | 23,494 | | | | 219,199 | |
National Interstate Corp. | | | 6,822 | | | | 174,507 | |
National Western Life Insurance Co. Class A | | | 230 | | | | 31,480 | |
Presidential Life Corp. | | | 17,416 | | | | 199,065 | |
Radian Group, Inc.(a) | | | 14,469 | | | | 62,940 | |
RLI Corp.(a) | | | 8,397 | | | | 601,561 | |
Safety Insurance Group, Inc. | | | 18,279 | | | | 761,138 | |
SeaBright Holdings, Inc. | | | 14,615 | | | | 132,850 | |
Selective Insurance Group, Inc. | | | 39,068 | | | | 687,987 | |
StanCorp Financial Group, Inc. | | | 27,097 | | | | 1,109,351 | |
State Auto Financial Corp. | | | 46,938 | | | | 685,764 | |
Stewart Information Services Corp.(a) | | | 2,437 | | | | 34,630 | |
Symetra Financial Corp. | | | 75,498 | | | | 870,492 | |
Tower Group, Inc. | | | 35,310 | | | | 792,003 | |
United Fire Group, Inc. | | | 18,489 | | | | 330,768 | |
Universal Insurance Holdings, Inc. | | | 81,895 | | | | 318,572 | |
| | | | | | | | |
| Total Insurance | | | | | | | 11,689,459 | |
| Internet – 0.7% | | | | | | | | |
Earthlink, Inc. | | | 84,616 | | | | 676,082 | |
Keynote Systems, Inc. | | | 4,946 | | | | 97,733 | |
Nutrisystem, Inc.(a) | | | 36,697 | | | | 412,107 | |
PC-Tel, Inc. | | | 7,323 | | | | 48,698 | |
See Notes to Financial Statements.
| | |
| 42 | | WisdomTree Domestic Dividend Funds |
Schedule of Investments (continued)
WisdomTree SmallCap Dividend Fund (DES)
March 31, 2012
| | | | | | | | |
| Investments | | Shares | | | Value | |
| | | | | | | | |
United Online, Inc. | | | 164,533 | | | $ | 804,566 | |
| | | | | | | | |
| Total Internet | | | | | | | 2,039,186 | |
| Investment Companies – 8.3% | | | | | | | | |
Apollo Investment Corp. | | | 833,353 | | | | 5,975,141 | |
Arlington Asset Investment Corp. Class A | | | 27,273 | | | | 605,461 | |
BlackRock Kelso Capital Corp. | | | 213,198 | | | | 2,093,604 | |
Capital Southwest Corp. | | | 883 | | | | 83,488 | |
Fifth Street Finance Corp.(a) | | | 231,961 | | | | 2,263,939 | |
Gladstone Capital Corp. | | | 54,183 | | | | 439,424 | |
Golub Capital BDC, Inc.(a) | | | 42,217 | | | | 644,654 | |
Kohlberg Capital Corp. | | | 60,679 | | | | 419,292 | |
Main Street Capital Corp.(a) | | | 52,274 | | | | 1,287,509 | |
MCG Capital Corp. | | | 306,626 | | | | 1,303,160 | |
Medallion Financial Corp. | | | 27,030 | | | | 301,655 | |
MVC Capital, Inc. | | | 22,292 | | | | 292,694 | |
New Mountain Finance Corp. | | | 23,332 | | | | 320,582 | |
NGP Capital Resources Co. | | | 50,187 | | | | 328,725 | |
PennantPark Investment Corp. | | | 120,598 | | | | 1,254,219 | |
Prospect Capital Corp. | | | 350,149 | | | | 3,844,636 | |
Solar Capital Ltd. | | | 96,243 | | | | 2,124,083 | |
THL Credit, Inc. | | | 47,985 | | | | 617,087 | |
TICC Capital Corp. | | | 91,065 | | | | 886,973 | |
Triangle Capital Corp.(a) | | | 55,426 | | | | 1,094,663 | |
| | | | | | | | |
| Total Investment Companies | | | | | | | 26,180,989 | |
| Iron/Steel – 0.2% | | | | | | | | |
AK Steel Holding Corp.(a) | | | 69,939 | | | | 528,739 | |
Schnitzer Steel Industries, Inc. Class A | | | 787 | | | | 31,397 | |
| | | | | | | | |
| Total Iron/Steel | | | | | | | 560,136 | |
| Leisure Time – 0.0% | | | | | | | | |
Callaway Golf Co. | | | 12,199 | | | | 82,465 | |
| Lodging – 0.2% | | | | | | | | |
Ameristar Casinos, Inc. | | | 19,201 | | | | 357,715 | |
Marcus Corp. | | | 13,466 | | | | 168,998 | |
| | | | | | | | |
| Total Lodging | | | | | | | 526,713 | |
| Machinery-Diversified – 1.4% | | | | | | | | |
Alamo Group, Inc. | | | 2,445 | | | | 73,497 | |
Albany International Corp. Class A | | | 14,666 | | | | 336,585 | |
Applied Industrial Technologies, Inc. | | | 22,998 | | | | 945,908 | |
Briggs & Stratton Corp.(a) | | | 34,936 | | | | 626,403 | |
Cascade Corp. | | | 5,987 | | | | 300,068 | |
Cognex Corp. | | | 11,748 | | | | 497,645 | |
Gorman-Rupp Co. (The) | | | 6,574 | | | | 191,829 | |
Lindsay Corp.(a) | | | 2,093 | | | | 138,703 | |
Manitowoc Co., Inc. (The) | | | 29,057 | | | | 402,730 | |
NACCO Industries, Inc. Class A | | | 4,298 | | | | 500,158 | |
Tennant Co. | | | 7,856 | | | | 345,664 | |
Twin Disc, Inc.(a) | | | 2,493 | | | | 65,042 | |
| | | | | | | | |
| Total Machinery-Diversified | | | | | | | 4,424,232 | |
| Media – 1.3% | | | | | | | | |
Belo Corp. Class A | | | 79,931 | | | | 573,105 | |
CBS Corp. Class A | | | 16,391 | | | | 560,900 | |
| | | | | | | | |
Courier Corp. | | | 22,638 | | | $ | 262,601 | |
Meredith Corp.(a) | | | 43,914 | | | | 1,425,448 | |
Scholastic Corp. | | | 11,148 | | | | 393,302 | |
Sinclair Broadcast Group, Inc. Class A | | | 58,051 | | | | 642,044 | |
World Wrestling Entertainment, Inc. Class A(a) | | | 33,399 | | | | 296,249 | |
| | | | | | | | |
| Total Media | | | | | | | 4,153,649 | |
| Metal Fabricate/Hardware – 1.1% | | | | | | | | |
Ampco-Pittsburgh Corp. | | | 9,107 | | | | 183,324 | |
CIRCOR International, Inc. | | | 1,883 | | | | 62,647 | |
Dynamic Materials Corp. | | | 2,579 | | | | 54,443 | |
Eastern Co. (The)(a) | | | 2,670 | | | | 53,400 | |
Haynes International, Inc. | | | 4,878 | | | | 309,021 | |
Kaydon Corp. | | | 21,340 | | | | 544,383 | |
L.B. Foster Co. Class A | | | 870 | | | | 24,804 | |
Lawson Products, Inc. | | | 5,972 | | | | 90,237 | |
Mueller Industries, Inc. | | | 9,766 | | | | 443,865 | |
Mueller Water Products, Inc. Class A | | | 128,358 | | | | 427,432 | |
Olympic Steel, Inc. | | | 887 | | | | 21,288 | |
Sun Hydraulics Corp. | | | 10,554 | | | | 276,093 | |
Worthington Industries, Inc.(a) | | | 51,364 | | | | 985,161 | |
| | | | | | | | |
| Total Metal Fabricate/Hardware | | | | | | | 3,476,098 | |
| Mining – 0.8% | | | | | | | | |
AMCOL International Corp. | | | 20,747 | | | | 611,829 | |
Globe Specialty Metals, Inc. | | | 27,504 | | | | 408,985 | |
Gold Resource Corp. | | | 35,269 | | | | 857,389 | |
Kaiser Aluminum Corp.(a) | | | 10,351 | | | | 489,188 | |
Noranda Aluminum Holding Corp. | | | 23,639 | | | | 235,681 | |
| | | | | | | | |
| Total Mining | | | | | | | 2,603,072 | |
| Miscellaneous Manufacturing – 1.8% | | | | | | | | |
A.O. Smith Corp.(a) | | | 15,719 | | | | 706,569 | |
Actuant Corp. Class A | | | 3,038 | | | | 88,072 | |
AZZ, Inc. | | | 6,966 | | | | 359,724 | |
Barnes Group, Inc. | | | 23,038 | | | | 606,130 | |
Chase Corp.(a) | | | 5,998 | | | | 94,469 | |
Hillenbrand, Inc. | | | 53,991 | | | | 1,239,093 | |
John Bean Technologies Corp. | | | 12,434 | | | | 201,431 | |
Koppers Holdings, Inc. | | | 13,866 | | | | 534,673 | |
Movado Group, Inc. | | | 2,788 | | | | 68,445 | |
Myers Industries, Inc. | | | 17,531 | | | | 258,582 | |
NL Industries, Inc.(a) | | | 45,760 | | | | 681,824 | |
Raven Industries, Inc. | | | 5,311 | | | | 324,024 | |
Standex International Corp. | | | 2,520 | | | | 103,799 | |
Sturm Ruger & Co., Inc. | | | 7,828 | | | | 384,355 | |
Tredegar Corp. | | | 6,380 | | | | 124,984 | |
| | | | | | | | |
| Total Miscellaneous Manufacturing | | | | | | | 5,776,174 | |
| Office Furnishings – 0.9% | | | | | | | | |
CompX International, Inc. | | | 1,931 | | | | 26,860 | |
Herman Miller, Inc. | | | 6,082 | | | | 139,643 | |
HNI Corp. | | | 41,409 | | | | 1,149,100 | |
Interface, Inc. Class A | | | 10,178 | | | | 141,983 | |
Knoll, Inc. | | | 32,846 | | | | 546,558 | |
Steelcase, Inc. Class A | | | 74,179 | | | | 712,118 | |
| | | | | | | | |
| Total Office Furnishings | | | | | | | 2,716,262 | |
See Notes to Financial Statements.
| | | | |
| WisdomTree Domestic Dividend Funds | | | 43 | |
Schedule of Investments (continued)
WisdomTree SmallCap Dividend Fund (DES)
March 31, 2012
| | | | | | | | |
| Investments | | Shares | | | Value | |
| | | | | | | | |
| Oil & Gas – 0.4% | | | | | | | | |
Adams Resources & Energy, Inc. | | | 2,025 | | | $ | 115,790 | |
Alon USA Energy, Inc. | | | 25,266 | | | | 228,657 | |
Delek US Holdings, Inc. | | | 19,660 | | | | 304,927 | |
Panhandle Oil and Gas, Inc. Class A | | | 1,639 | | | | 48,318 | |
Penn Virginia Corp. | | | 50,817 | | | | 231,217 | |
W&T Offshore, Inc.(a) | | | 13,914 | | | | 293,307 | |
| | | | | | | | |
| Total Oil & Gas | | | | | | | 1,222,216 | |
| Oil & Gas Services – 0.5% | | | | | | | | |
Gulf Island Fabrication, Inc. | | | 2,959 | | | | 86,610 | |
Targa Resources Corp. | | | 32,814 | | | | 1,491,396 | |
| | | | | | | | |
| Total Oil & Gas Services | | | | | | | 1,578,006 | |
| Packaging & Containers – 1.0% | | | | | | | | |
Greif, Inc. Class A | | | 23,355 | | | | 1,306,012 | |
Greif, Inc. Class B(a) | | | 31,305 | | | | 1,777,185 | |
| | | | | | | | |
| Total Packaging & Containers | | | | | | | 3,083,197 | |
| Pipelines – 0.2% | | | | | | | | |
Crosstex Energy, Inc. | | | 37,192 | | | | 525,895 | |
| Private Equity – 0.5% | | | | | | | | |
Fidus Investment Corp. | | | 21,737 | | | | 304,536 | |
Gladstone Investment Corp. | | | 43,988 | | | | 332,989 | |
Hercules Technology Growth Capital, Inc. | | | 97,574 | | | | 1,081,120 | |
| | | | | | | | |
| Total Private Equity | | | | | | | 1,718,645 | |
| Real Estate – 0.6% | | | | | | | | |
Consolidated-Tomoka Land Co.(a) | | | 266 | | | | 7,914 | |
Kennedy-Wilson Holdings, Inc. | | | 18,687 | | | | 252,275 | |
Sovran Self Storage, Inc. | | | 29,803 | | | | 1,485,083 | |
| | | | | | | | |
| Total Real Estate | | | | | | | 1,745,272 | |
| Real Estate Investment Trusts (REITs) – 20.1% | | | | | | | | |
Acadia Realty Trust | | | 38,355 | | | | 864,522 | |
Agree Realty Corp. | | | 14,940 | | | | 337,345 | |
American Assets Trust, Inc. | | | 39,440 | | | | 899,232 | |
Ashford Hospitality Trust, Inc. | | | 84,111 | | | | 757,840 | |
Associated Estates Realty Corp. | | | 45,036 | | | | 735,888 | |
Brandywine Realty Trust | | | 228,655 | | | | 2,624,959 | |
Campus Crest Communities, Inc. | | | 46,869 | | | | 546,493 | |
CapLease, Inc. | | | 99,348 | | | | 400,372 | |
Cedar Realty Trust, Inc. | | | 142,466 | | | | 729,426 | |
Chatham Lodging Trust | | | 22,149 | | | | 281,071 | |
Chesapeake Lodging Trust | | | 40,403 | | | | 726,042 | |
Cogdell Spencer, Inc. | | | 124,954 | | | | 529,805 | |
CommonWealth REIT | | | 243,972 | | | | 4,542,759 | |
Coresite Realty Corp. | | | 15,190 | | | | 358,332 | |
Corporate Office Properties Trust | | | 133,464 | | | | 3,097,699 | |
Cousins Properties, Inc. | | | 75,527 | | | | 572,495 | |
Cubesmart | | | 82,156 | | | | 977,656 | |
DCT Industrial Trust, Inc. | | | 356,603 | | | | 2,103,958 | |
DiamondRock Hospitality Co. | | | 143,188 | | | | 1,473,404 | |
DuPont Fabros Technology, Inc. | | | 31,194 | | | | 762,693 | |
EastGroup Properties, Inc. | | | 33,185 | | | | 1,666,551 | |
Education Realty Trust, Inc. | | | 65,996 | | | | 715,397 | |
| | | | | | | | |
Excel Trust, Inc. | | | 38,865 | | | $ | 469,489 | |
First Potomac Realty Trust | | | 79,110 | | | | 956,440 | |
Franklin Street Properties Corp. | | | 146,879 | | | | 1,556,917 | |
Gladstone Commercial Corp. | | | 22,871 | | | | 393,610 | |
Glimcher Realty Trust | | | 120,212 | | | | 1,228,567 | |
Government Properties Income Trust | | | 86,443 | | | | 2,084,141 | |
Healthcare Realty Trust, Inc. | | | 127,542 | | | | 2,805,924 | |
Hersha Hospitality Trust | | | 213,885 | | | | 1,167,812 | |
Hudson Pacific Properties, Inc. | | | 30,152 | | | | 456,200 | |
Inland Real Estate Corp. | | | 166,742 | | | | 1,479,001 | |
Investors Real Estate Trust | | | 142,895 | | | | 1,098,863 | |
Kite Realty Group Trust | | | 84,741 | | | | 446,585 | |
Lexington Realty Trust | | | 254,833 | | | | 2,290,949 | |
LTC Properties, Inc. | | | 41,859 | | | | 1,339,488 | |
Medical Properties Trust, Inc. | | | 228,756 | | | | 2,122,856 | |
Mission West Properties, Inc. | | | 36,208 | | | | 357,011 | |
Monmouth Real Estate Investment Corp. Class A | | | 59,256 | | | | 577,153 | |
National Health Investors, Inc. | | | 37,721 | | | | 1,840,030 | |
One Liberty Properties, Inc. | | | 26,931 | | | | 492,837 | |
Parkway Properties, Inc. | | | 15,977 | | | | 167,439 | |
Pebblebrook Hotel Trust | | | 32,222 | | | | 727,573 | |
Pennsylvania Real Estate Investment Trust | | | 82,340 | | | | 1,257,332 | |
Potlatch Corp.(a) | | | 65,331 | | | | 2,047,474 | |
PS Business Parks, Inc. | | | 19,149 | | | | 1,255,025 | |
Ramco-Gershenson Properties Trust | | | 65,014 | | | | 794,471 | |
Retail Opportunity Investments Corp.(a) | | | 42,099 | | | | 506,872 | |
Sabra Health Care REIT, Inc. | | | 104,843 | | | | 1,723,619 | |
Saul Centers, Inc. | | | 19,556 | | | | 789,280 | |
STAG Industrial, Inc. | | | 34,927 | | | | 487,581 | |
Summit Hotel Properties, Inc. | | | 31,984 | | | | 242,439 | |
Sun Communities, Inc. | | | 38,784 | | | | 1,680,511 | |
Terreno Realty Corp. | | | 6,068 | | | | 86,833 | |
UMH Properties, Inc. | | | 27,706 | | | | 303,658 | |
Universal Health Realty Income Trust | | | 19,896 | | | | 788,478 | |
Urstadt Biddle Properties, Inc. Class A | | | 28,693 | | | | 566,400 | |
Whitestone REIT Class B | | | 20,411 | | | | 266,159 | |
Winthrop Realty Trust | | | 54,670 | | | | 633,625 | |
| | | | | | | | |
| Total Real Estate Investment Trusts (REITs) | | | | | | | 63,192,581 | |
| Retail – 3.1% | | | | | | | | |
bebe Stores, Inc. | | | 24,551 | | | | 226,606 | |
Big 5 Sporting Goods Corp. | | | 16,195 | | | | 126,969 | |
Bob Evans Farms, Inc. | | | 22,002 | | | | 829,915 | |
Brown Shoe Co., Inc. | | | 33,535 | | | | 309,528 | |
Cash America International, Inc.(a) | | | 2,135 | | | | 102,331 | |
Cato Corp. (The) Class A | | | 24,972 | | | | 690,226 | |
CEC Entertainment, Inc. | | | 11,991 | | | | 454,579 | |
Cracker Barrel Old Country Store, Inc. | | | 11,037 | | | | 615,865 | |
Destination Maternity Corp. | | | 14,000 | | | | 259,980 | |
DSW, Inc. Class A | | | 10,240 | | | | 560,845 | |
Einstein Noah Restaurant Group, Inc. | | | 13,595 | | | | 202,837 | |
Finish Line, Inc. (The) Class A | | | 11,879 | | | | 252,072 | |
Fred’s, Inc. Class A | | | 13,271 | | | | 193,889 | |
Group 1 Automotive, Inc. | | | 5,632 | | | | 316,349 | |
Hot Topic, Inc. | | | 40,261 | | | | 408,649 | |
See Notes to Financial Statements.
| | |
| 44 | | WisdomTree Domestic Dividend Funds |
Schedule of Investments (continued)
WisdomTree SmallCap Dividend Fund (DES)
March 31, 2012
| | | | | | | | |
| Investments | | Shares | | | Value | |
| | | | | | | | |
Lithia Motors, Inc. Class A | | | 6,559 | | | $ | 171,846 | |
Men’s Wearhouse, Inc. (The) | | | 18,709 | | | | 725,348 | |
PEP Boys-Manny Moe & Jack (The) | | | 14,460 | | | | 215,743 | |
PetMed Express, Inc.(a) | | | 25,573 | | | | 316,594 | |
PF Chang’s China Bistro, Inc. | | | 17,335 | | | | 685,079 | |
RadioShack Corp.(a) | | | 117,141 | | | | 728,617 | |
Regis Corp. | | | 20,630 | | | | 380,211 | |
Sonic Automotive, Inc. Class A(a) | | | 6,517 | | | | 116,719 | |
Stage Stores, Inc. | | | 19,086 | | | | 309,957 | |
Texas Roadhouse, Inc. | | | 37,433 | | | | 622,885 | |
Winmark Corp. | | | 371 | | | | 21,496 | |
| | | | | | | | |
| Total Retail | | | | | | | 9,845,135 | |
| Savings & Loans – 3.2% | | | | | | | | |
Astoria Financial Corp.(a) | | | 150,482 | | | | 1,483,753 | |
Bank Mutual Corp. | | | 12,940 | | | | 52,278 | |
BankFinancial Corp. | | | 25,207 | | | | 166,870 | |
Berkshire Hills Bancorp, Inc. | | | 16,766 | | | | 384,277 | |
Brookline Bancorp, Inc. | | | 70,263 | | | | 658,364 | |
Clifton Savings Bancorp, Inc.(a) | | | 15,386 | | | | 160,476 | |
Dime Community Bancshares, Inc. | | | 40,423 | | | | 590,580 | |
ESB Financial Corp. | | | 9,707 | | | | 139,975 | |
ESSA Bancorp, Inc. | | | 5,382 | | | | 52,744 | |
First Defiance Financial Corp. | | | 3,194 | | | | 53,851 | |
First Financial Holdings, Inc. | | | 9,554 | | | | 105,094 | |
First PacTrust Bancorp, Inc.(a) | | | 10,544 | | | | 125,684 | |
Flushing Financial Corp. | | | 31,395 | | | | 422,577 | |
Fox Chase Bancorp, Inc. | | | 1,949 | | | | 25,337 | |
Home Federal Bancorp, Inc. | | | 8,803 | | | | 89,174 | |
Kaiser Federal Financial Group, Inc. | | | 4,322 | | | | 60,465 | |
Kearny Financial Corp. | | | 33,540 | | | | 327,015 | |
Northfield Bancorp, Inc.(a) | | | 16,515 | | | | 234,843 | |
Northwest Bancshares, Inc. | | | 85,137 | | | | 1,081,240 | |
OceanFirst Financial Corp. | | | 16,146 | | | | 229,919 | |
Oritani Financial Corp. | | | 43,976 | | | | 645,568 | |
Provident Financial Holdings, Inc. | | | 3,364 | | | | 36,768 | |
Provident Financial Services, Inc. | | | 54,162 | | | | 786,974 | |
Provident New York Bancorp(a) | | | 31,595 | | | | 267,294 | |
Rockville Financial, Inc. | | | 19,801 | | | | 230,682 | |
Roma Financial Corp. | | | 23,914 | | | | 234,118 | |
Territorial Bancorp, Inc. | | | 4,663 | | | | 97,037 | |
United Financial Bancorp, Inc. | | | 8,487 | | | | 134,264 | |
ViewPoint Financial Group | | | 12,482 | | | | 191,973 | |
Washington Federal, Inc. | | | 48,371 | | | | 813,600 | |
Westfield Financial, Inc. | | | 21,558 | | | | 170,524 | |
WSFS Financial Corp. | | | 2,711 | | | | 111,151 | |
| | | | | | | | |
| Total Savings & Loans | | | | | | | 10,164,469 | |
| Semiconductors – 1.2% | | | | | | | | |
Brooks Automation, Inc. | | | 51,090 | | | | 629,940 | |
Cohu, Inc. | | | 11,860 | | | | 134,848 | |
Intersil Corp. Class A(a) | | | 144,266 | | | | 1,615,779 | |
Micrel, Inc. | | | 23,093 | | | | 236,934 | |
MKS Instruments, Inc. | | | 28,940 | | | | 854,598 | |
Power Integrations, Inc. | | | 3,973 | | | | 147,478 | |
| | | | | | | | |
Richardson Electronics Ltd. | | | 5,261 | | | $ | 63,027 | |
| | | | | | | | |
| Total Semiconductors | | | | | | | 3,682,604 | |
| Software – 0.9% | | | | | | | | |
American Software, Inc. Class A | | | 22,767 | | | | 195,341 | |
Blackbaud, Inc. | | | 18,337 | | | | 609,338 | |
Computer Programs & Systems, Inc. | | | 8,377 | | | | 473,468 | |
Ebix, Inc.(a) | | | 7,461 | | | | 172,797 | |
EPIQ Systems, Inc. | | | 13,370 | | | | 161,777 | |
Fair Isaac Corp. | | | 1,901 | | | | 83,454 | |
ManTech International Corp. Class A(a) | | | 14,924 | | | | 514,281 | |
Opnet Technologies, Inc.(a) | | | 6,870 | | | | 199,230 | |
Pegasystems, Inc. | | | 3,462 | | | | 132,110 | |
Schawk, Inc. | | | 15,563 | | | | 194,693 | |
| | | | | | | | |
| Total Software | | | | | | | 2,736,489 | |
| Telecommunications – 2.6% | | | | | | | | |
Alaska Communications Systems Group, Inc.(a) | | | 202,916 | | | | 624,981 | |
Atlantic Tele-Network, Inc. | | | 8,652 | | | | 314,587 | |
Black Box Corp. | | | 4,185 | | | | 106,759 | |
Communications Systems, Inc. | | | 7,979 | | | | 104,764 | |
Comtech Telecommunications Corp. | | | 22,088 | | | | 719,627 | |
Consolidated Communications Holdings, Inc. | | | 59,538 | | | | 1,168,731 | |
HickoryTech Corp. | | | 16,588 | | | | 171,520 | |
IDT Corp. Class B | | | 48,139 | | | | 449,618 | |
NTELOS Holdings Corp. | | | 41,294 | | | | 854,786 | |
Plantronics, Inc. | | | 6,274 | | | | 252,591 | |
Preformed Line Products Co. | | | 1,816 | | | | 118,948 | |
Shenandoah Telecommunications Co. | | | 16,646 | | | | 185,603 | |
SureWest Communications | | | 10,814 | | | | 243,856 | |
Telephone & Data Systems, Inc. | | | 49,803 | | | | 1,152,940 | |
Tellabs, Inc. | | | 185,438 | | | | 751,024 | |
Telular Corp. | | | 21,899 | | | | 185,266 | |
TESSCO Technologies, Inc. | | | 7,820 | | | | 199,175 | |
USA Mobility, Inc. | | | 37,851 | | | | 527,264 | |
| | | | | | | | |
| Total Telecommunications | | | | | | | 8,132,040 | |
| Textiles – 0.1% | | | | | | | | |
G&K Services, Inc. Class A | | | 8,290 | | | | 283,518 | |
UniFirst Corp. | | | 940 | | | | 57,857 | |
| | | | | | | | |
| Total Textiles | | | | | | | 341,375 | |
| Toys/Games/Hobbies – 0.1% | | | | | | | | |
JAKKS Pacific, Inc.(a) | | | 14,784 | | | | 257,981 | |
| Transportation – 1.1% | | | | | | | | |
Alexander & Baldwin, Inc. | | | 31,560 | | | | 1,529,082 | |
Arkansas Best Corp. | | | 4,141 | | | | 77,892 | |
Celadon Group, Inc. | | | 3,852 | | | | 59,899 | |
Con-way, Inc. | | | 19,405 | | | | 632,797 | |
Forward Air Corp. | | | 6,022 | | | | 220,827 | |
Heartland Express, Inc. | | | 11,971 | | | | 173,101 | |
International Shipholding Corp. | | | 13,161 | | | | 303,888 | |
Knight Transportation, Inc. | | | 31,278 | | | | 552,369 | |
Marten Transport Ltd. | | | 2,446 | | | | 53,983 | |
| | | | | | | | |
| Total Transportation | | | | | | | 3,603,838 | |
See Notes to Financial Statements.
| | | | |
| WisdomTree Domestic Dividend Funds | | | 45 | |
Schedule of Investments (concluded)
WisdomTree SmallCap Dividend Fund (DES)
March 31, 2012
| | | | | | | | |
| Investments | | Shares | | | Value | |
| | | | | | | | |
| Trucking & Leasing – 0.7% | | | | | | | | |
TAL International Group, Inc. | | | 63,227 | | | $ | 2,321,063 | |
| Water – 0.7% | | | | | | | | |
American States Water Co. | | | 14,649 | | | | 529,415 | |
Artesian Resources Corp. Class A(a) | | | 7,459 | | | | 140,155 | |
California Water Service Group | | | 34,475 | | | | 627,790 | |
Connecticut Water Service, Inc. | | | 7,057 | | | | 199,642 | |
Middlesex Water Co. | | | 14,932 | | | | 282,065 | |
SJW Corp. | | | 12,833 | | | | 309,532 | |
York Water Co. | | | 9,097 | | | | 157,378 | |
| | | | | | | | |
| Total Water | | | | | | | 2,245,977 | |
TOTAL COMMON STOCKS
(Cost: $278,792,484) | | | | | | | 310,968,355 | |
| EXCHANGE-TRADED FUND – 0.8% | | | | | | | | |
WisdomTree MidCap Dividend Fund(b) | | | | | | | | |
| (Cost: $2,054,134) | | | 41,732 | | | | 2,349,094 | |
| INVESTMENT OF CASH COLLATERAL FOR SECURITIES LOANED – 8.2% | | | | | | | | |
| MONEY MARKET FUND – 8.2% | | | | | | | | |
Dreyfus Institutional Preferred Money Market Fund, 0.18%(c) | | | | | | | | |
| (Cost: $25,788,985)(d) | | | 25,788,985 | | | | 25,788,985 | |
TOTAL INVESTMENTS IN SECURITIES – 108.1%
(Cost: $306,635,603) | | | | 339,106,434 | |
Liabilities in Excess of Other Assets – (8.1)% | | | | | | | (25,315,427 | ) |
| | | | | | | | |
| NET ASSETS – 100.0% | | | | | | $ | 313,791,007 | |
| (a) | Security, or portion thereof, was on loan at March 31, 2012 (See Note 2). |
| (b) | Affiliated company. (See Note 7). |
| (c) | Rate shown represents annualized 7-day yield as of March 31, 2012. |
| (d) | At March 31, 2012, the total market value of the Fund’s securities on loan was $25,039,345 and the total market value of the collateral held by the Fund was $25,788,985. |
See Notes to Financial Statements.
| | |
| 46 | | WisdomTree Domestic Dividend Funds |
Statements of Assets and Liabilities
WisdomTree Domestic Dividend Funds
March 31, 2012
| | | | | | | | | | | | | | | | | | | | | | | | |
| | | WisdomTree
Total
Dividend Fund | | | WisdomTree
Equity
Income Fund | | | WisdomTree
LargeCap
Dividend Fund | | | WisdomTree
Dividend
ex-Financials Fund | | | WisdomTree
MidCap
Dividend Fund | | | WisdomTree
SmallCap
Dividend Fund | |
ASSETS: | |
| | | | | | |
Investments, at cost | | $ | 204,827,111 | | | $ | 404,830,914 | | | $ | 1,086,178,274 | | | $ | 1,212,143,855 | | | $ | 334,002,514 | | | $ | 304,581,469 | |
| | | | | | |
Investment in affiliates, at cost (Note 7) | | | 276,649 | | | | 335,913 | | | | 284,532 | | | | 2,568,371 | | | | 1,573,589 | | | | 2,054,134 | |
Investment in securities, at value (including securities on loan) (Note 2)1 | | | 247,484,524 | | | | 439,716,166 | | | | 1,211,422,930 | | | | 1,329,196,555 | | | | 371,728,565 | | | | 336,757,340 | |
| | | | | | |
Investment in affiliates, at value (Note 7) | | | 378,355 | | | | 394,979 | | | | 327,795 | | | | 3,185,106 | | | | 1,852,064 | | | | 2,349,094 | |
| | | | | | |
Cash | | | — | | | | — | | | | — | | | | 10,062 | | | | 920 | | | | 5,034 | |
| | | | | | |
Receivables: | | | | | | | | | | | | | | | | | | | | | | | | |
| | | | | | |
Dividends and interest | | | 501,705 | | | | 1,273,020 | | | | 2,470,337 | | | | 3,781,706 | | | | 819,888 | | | | 1,068,911 | |
| | | | | | |
Investment securities sold | | | 216,452 | | | | 866,286 | | | | 2,713,118 | | | | — | | | | — | | | | — | |
Total Assets | | | 248,581,036 | | | | 442,250,451 | | | | 1,216,934,180 | | | | 1,336,173,429 | | | | 374,401,437 | | | | 340,180,379 | |
LIABILITIES: | | | | | | | | | | | | | | | | | | | | | | | | |
| | | | | | |
Due to custodian | | | 26,781 | | | | 807,235 | | | | 1,736,896 | | | | — | | | | — | | | | — | |
| | | | | | |
Payables: | | | | | | | | | | | | | | | | | | | | | | | | |
| | | | | | |
Investment securities purchased | | | — | | | | — | | | | — | | | | — | | | | — | | | | 502,304 | |
| | | | | | |
Collateral for securities on loan (Note 2) | | | 4,511,836 | | | | 13,389,390 | | | | 9,686,394 | | | | 66,956,110 | | | | 28,326,236 | | | | 25,788,985 | |
| | | | | | |
Advisory fees (Note 3) | | | 56,177 | | | | 134,692 | | | | 291,599 | | | | 401,126 | | | | 110,817 | | | | 96,949 | |
| | | | | | |
Service fees (Note 2) | | | 885 | | | | 1,570 | | | | 4,598 | | | | 4,675 | | | | 1,292 | | | | 1,134 | |
Total Liabilities | | | 4,595,679 | | | | 14,332,887 | | | | 11,719,487 | | | | 67,361,911 | | | | 28,438,345 | | | | 26,389,372 | |
NET ASSETS | | $ | 243,985,357 | | | $ | 427,917,564 | | | $ | 1,205,214,693 | | | $ | 1,268,811,518 | | | $ | 345,963,092 | | | $ | 313,791,007 | |
NET ASSETS: | | | | | | | | | | | | | | | | | | | | | | | | |
| | | | | | |
Paid-in capital | | $ | 231,100,739 | | | $ | 461,009,925 | | | $ | 1,173,747,583 | | | $ | 1,245,198,001 | | | $ | 348,040,961 | | | $ | 336,607,062 | |
| | | | | | |
Undistributed net investment income | | | 156,833 | | | | 373,665 | | | | 683,066 | | | | 1,487,436 | | | | 423,490 | | | | 319,163 | |
| | | | | | |
Accumulated net realized loss on investments | | | (30,031,334 | ) | | | (68,410,344 | ) | | | (94,503,875 | ) | | | (95,543,354 | ) | | | (40,505,885 | ) | | | (55,606,049 | ) |
| | | | | | |
Net unrealized appreciation on investments | | | 42,759,119 | | | | 34,944,318 | | | | 125,287,919 | | | | 117,669,435 | | | | 38,004,526 | | | | 32,470,831 | |
NET ASSETS | | $ | 243,985,357 | | | $ | 427,917,564 | | | $ | 1,205,214,693 | | | $ | 1,268,811,518 | | | $ | 345,963,092 | | | $ | 313,791,007 | |
Outstanding beneficial interest shares of $0.001 par value (unlimited number of shares authorized) | | | 4,600,000 | | | | 9,550,000 | | | | 22,750,000 | | | | 23,150,000 | | | | 6,150,000 | | | | 6,400,000 | |
Net asset value per share | | $ | 53.04 | | | $ | 44.81 | | | $ | 52.98 | | | $ | 54.81 | | | $ | 56.25 | | | $ | 49.03 | |
| 1 | Market value of securities out on loan were as follows: $4,389,977, $13,025,793, $9,444,278, $64,738,950, $27,592,022 and $25,039,345, respectively. |
See Notes to Financial Statements.
| | | | |
| WisdomTree Domestic Dividend Funds | | | 47 | |
Statements of Operations
WisdomTree Domestic Dividend Funds
For the Year Ended March 31, 2012
| | | | | | | | | | | | | | | | | | | | | | | | |
| | | WisdomTree
Total
Dividend Fund | | | WisdomTree
Equity
Income Fund | | | WisdomTree
LargeCap
Dividend Fund | | | WisdomTree
Dividend ex-
Financials Fund | | | WisdomTree
MidCap
Dividend Fund | | | WisdomTree
SmallCap
Dividend Fund | |
INVESTMENT INCOME: | |
| | | | | | |
Dividends | | $ | 6,194,050 | | | $ | 12,184,550 | | | $ | 27,689,172 | | | $ | 30,946,723 | | | $ | 8,613,827 | | | $ | 9,734,738 | |
| | | | | | |
Dividends from affiliates (Note 7) | | | 15,744 | | | | 30,092 | | | | 47,969 | | | | 113,155 | | | | 68,386 | | | | 53,418 | |
| | | | | | |
Interest | | | 75 | | | | 87 | | | | 242 | | | | 302 | | | | 69 | | | | 71 | |
| | | | | | |
Securities lending income (Note 2) | | | 45,424 | | | | 134,956 | | | | 181,915 | | | | 611,784 | | | | 130,248 | | | | 240,813 | |
Total investment income | | | 6,255,293 | | | | 12,349,685 | | | | 27,919,298 | | | | 31,671,964 | | | | 8,812,530 | | | | 10,029,040 | |
EXPENSES: | | | | | | | | | | | | | | | | | | | | | | | | |
| | | | | | |
Advisory fees (Note 3) | | | 528,147 | | | | 1,073,575 | | | | 2,368,823 | | | | 2,715,230 | | | | 1,050,687 | | | | 936,911 | |
| | | | | | |
Service fees (Note 2) | | | 8,300 | | | | 12,431 | | | | 37,224 | | | | 31,440 | | | | 12,166 | | | | 10,848 | |
Total expenses | | | 536,447 | | | | 1,086,006 | | | | 2,406,047 | | | | 2,746,670 | | | | 1,062,853 | | | | 947,759 | |
Expense reimbursements/waivers (Note 3) | | | (1,466 | ) | | | (4,704 | ) | | | (6,009 | ) | | | (12,198 | ) | | | (8,496 | ) | | | (6,978 | ) |
Net expenses | | | 534,981 | | | | 1,081,302 | | | | 2,400,038 | | | | 2,734,472 | | | | 1,054,357 | | | | 940,781 | |
Net investment income | | | 5,720,312 | | | | 11,268,383 | | | | 25,519,260 | | | | 28,937,492 | | | | 7,758,173 | | | | 9,088,259 | |
NET REALIZED AND UNREALIZED GAIN (LOSS) ON INVESTMENTS: | | | | | | | | | | | | | | | | | | | | | | | | |
| | | | | | |
Net realized gain (loss) from: | | | | | | | | | | | | | | | | | | | | | | | | |
| | | | | | |
Investment transactions | | | (53,432 | ) | | | 3,426,029 | | | | (5,995,224 | ) | | | (15,619,740 | ) | | | (8,227,934 | ) | | | (906,091 | ) |
| | | | | | |
Investment transactions from affiliates (Note 7) | | | 93,749 | | | | (10,342 | ) | | | 75,453 | | | | 488,174 | | | | 153,600 | | | | 183,063 | |
| | | | | | |
In-kind redemptions | | | 939,958 | | | | 5,084,774 | | | | 43,131,664 | | | | 26,869,874 | | | | 13,813,555 | | | | 500,463 | |
| | | | | | |
In-kind redemptions from affiliates (Note 7) | | | — | | | | 14,738 | | | | 52,810 | | | | 36,173 | | | | 47,234 | | | | 7,667 | |
Net realized gain (loss) | | | 980,275 | | | | 8,515,199 | | | | 37,264,703 | | | | 11,774,481 | | | | 5,786,455 | | | | (214,898 | ) |
Net change in unrealized appreciation on investments | | | 18,940,324 | | | | 27,794,701 | | | | 61,341,297 | | | | 86,085,337 | | | | 8,737,342 | | | | 5,721,351 | |
Net realized and unrealized gain on investments | | | 19,920,599 | | | | 36,309,900 | | | | 98,606,000 | | | | 97,859,818 | | | | 14,523,797 | | | | 5,506,453 | |
NET INCREASE IN NET ASSETS RESULTING FROM OPERATIONS | | $ | 25,640,911 | | | $ | 47,578,283 | | | $ | 124,125,260 | | | $ | 126,797,310 | | | $ | 22,281,970 | | | $ | 14,594,712 | |
See Notes to Financial Statements.
| | |
| 48 | | WisdomTree Domestic Dividend Funds |
Statements of Changes in Net Assets
WisdomTree Domestic Dividend Funds
| | | | | | | | | | | | | | | | | | | | | | | | |
| | | WisdomTree
Total Dividend Fund | | | WisdomTree
Equity Income Fund | | | WisdomTree
LargeCap Dividend Fund | |
| | | For the
Year Ended
March 31, 2012 | | | For the
Year Ended
March 31, 2011 | | | For the
Year Ended
March 31, 2012 | | | For the
Year Ended
March 31, 2011 | | | For the
Year Ended
March 31, 2012 | | | For the
Year Ended
March 31, 2011 | |
INCREASE (DECREASE) IN NET ASSETS RESULTING FROM OPERATIONS: | | | | | | | | | | | | | | | | | | | | | | | | |
| | | | | | |
Net investment income | | $ | 5,720,312 | | | $ | 4,473,233 | | | $ | 11,268,383 | | | $ | 6,502,307 | | | $ | 25,519,260 | | | $ | 14,386,241 | |
| | | | | | |
Net realized gain on investments | | | 980,275 | | | | 3,776,127 | | | | 8,515,199 | | | | 14,571,418 | | | | 37,264,703 | | | | 21,047,320 | |
| | | | | | |
Net change in unrealized appreciation on investments | | | 18,940,324 | | | | 16,294,181 | | | | 27,794,701 | | | | 9,399,565 | | | | 61,341,297 | | | | 47,856,444 | |
Net increase in net assets resulting from operations | | | 25,640,911 | | | | 24,543,541 | | | | 47,578,283 | | | | 30,473,290 | | | | 124,125,260 | | | | 83,290,005 | |
DIVIDENDS: | | | | | | | | | | | | | | | | | | | | | |
| | | | | | |
Net investment income | | | (5,704,497 | ) | | | (4,438,769 | ) | | | (11,082,460 | ) | | | (6,474,781 | ) | | | (25,273,380 | ) | | | (14,235,763 | ) |
CAPITAL SHARE TRANSACTIONS: | | | | | | | | | | | | | | | | | | | | | |
| | | | | | |
Net proceeds from sale of shares | | | 55,746,369 | | | | 33,151,332 | | | | 263,895,489 | | | | 177,074,847 | | | | 699,406,625 | | | | 221,454,446 | |
| | | | | | |
Cost of shares redeemed | | | (2,645,587 | ) | | | (15,278,459 | ) | | | (50,746,537 | ) | | | (145,707,467 | ) | | | (204,137,549 | ) | | | (92,223,882 | ) |
Net increase in net assets resulting from capital share transactions | | | 53,100,782 | | | | 17,872,873 | | | | 213,148,952 | | | | 31,367,380 | | | | 495,269,076 | | | | 129,230,564 | |
Net Increase in Net Assets | | | 73,037,196 | | | | 37,977,645 | | | | 249,644,775 | | | | 55,365,889 | | | | 594,120,956 | | | | 198,284,806 | |
NET ASSETS: | | | | | | | | | | | | | | | | | | | | | | | | |
| | | | | | |
Beginning of year | | $ | 170,948,161 | | | $ | 132,970,516 | | | $ | 178,272,789 | | | $ | 122,906,900 | | | $ | 611,093,737 | | | $ | 412,808,931 | |
| | | | | | |
End of year | | $ | 243,985,357 | | | $ | 170,948,161 | | | $ | 427,917,564 | | | $ | 178,272,789 | | | $ | 1,205,214,693 | | | $ | 611,093,737 | |
Undistributed net investment income included in net assets at end of year | | $ | 156,833 | | | $ | 138,984 | | | $ | 373,665 | | | $ | 188,355 | | | $ | 683,066 | | | $ | 481,347 | |
SHARES CREATED AND REDEEMED: | | | | | | | | | | | | | | | | | | | | | |
| | | | | | |
Shares outstanding, beginning of year | | | 3,500,000 | | | | 3,100,000 | | | | 4,400,000 | | | | 3,500,000 | | | | 12,650,000 | | | | 9,700,000 | |
| | | | | | |
Shares created | | | 1,150,000 | | | | 750,000 | | | | 6,400,000 | | | | 4,750,000 | | | | 14,300,000 | | | | 5,000,000 | |
| | | | | | |
Shares redeemed | | | (50,000 | ) | | | (350,000 | ) | | | (1,250,000 | ) | | | (3,850,000 | ) | | | (4,200,000 | ) | | | (2,050,000 | ) |
Shares outstanding, end of year | | | 4,600,000 | | | | 3,500,000 | | | | 9,550,000 | | | | 4,400,000 | | | | 22,750,000 | | | | 12,650,000 | |
See Notes to Financial Statements.
| | | | |
| WisdomTree Domestic Dividend Funds | | | 49 | |
Statements of Changes in Net Assets (concluded)
WisdomTree Domestic Dividend Funds
| | | | | | | | | | | | | | | | | | | | | | | | |
| | | WisdomTree
Dividend ex-Financials Fund | | | WisdomTree
MidCap Dividend Fund | | | WisdomTree
SmallCap Dividend Fund | |
| | | For the
Year Ended
March 31, 2012 | | | For the
Year Ended
March 31, 2011 | | | For the
Year Ended
March 31, 2012 | | | For the
Year Ended
March 31, 2011 | | | For the
Year Ended
March 31, 2012 | | | For the
Year Ended
March 31, 2011 | |
INCREASE (DECREASE) IN NET ASSETS RESULTING FROM OPERATIONS: | | | | | | | | | | | | | | | | | | | | | | | | |
| | | | | | |
Net investment income | | $ | 28,937,492 | | | $ | 10,687,261 | | | $ | 7,758,173 | | | $ | 5,901,079 | | | $ | 9,088,259 | | | $ | 7,763,523 | |
| | | | | | |
Net realized gain (loss) on investments | | | 11,774,481 | | | | 33,084,584 | | | | 5,786,455 | | | | 13,120,941 | | | | (214,898 | ) | | | 17,055,165 | |
| | | | | | |
Net change in unrealized appreciation on investments | | | 86,085,337 | | | | 16,420,742 | | | | 8,737,342 | | | | 19,534,938 | | | | 5,721,351 | | | | 9,067,962 | |
Net increase in net assets resulting from operations | | | 126,797,310 | | | | 60,192,587 | | | | 22,281,970 | | | | 38,556,958 | | | | 14,594,712 | | | | 33,886,650 | |
DIVIDENDS: | | | | | | | | | | | | | | | | | | | | | |
| | | | | | |
Net investment income | | | (27,628,769 | ) | | | (10,527,617 | ) | | | (7,571,610 | ) | | | (5,778,694 | ) | | | (9,064,912 | ) | | | (7,366,770 | ) |
CAPITAL SHARE TRANSACTIONS: | | | | | | | | | | | | | | | | | | | | | |
| | | | | | |
Net proceeds from sale of shares | | | 1,032,619,697 | | | | 255,440,000 | | | | 142,423,733 | | | | 169,491,298 | | | | 62,381,645 | | | | 121,807,365 | |
| | | | | | |
Cost of shares redeemed | | | (206,358,511 | ) | | | (152,000,000 | ) | | | (67,722,877 | ) | | | (67,838,212 | ) | | | (2,291,885 | ) | | | (54,879,905 | ) |
Net increase in net assets resulting from capital share transactions | | | 826,261,186 | | | | 103,440,000 | | | | 74,700,856 | | | | 101,653,086 | | | | 60,089,760 | | | | 66,927,460 | |
Net Increase in Net Assets | | | 925,429,727 | | | | 153,104,970 | | | | 89,411,216 | | | | 134,431,350 | | | | 65,619,560 | | | | 93,447,340 | |
NET ASSETS: | | | | | | | | | | | | | | | | | | | | | | | | |
| | | | | | |
Beginning of year | | $ | 343,381,791 | | | $ | 190,276,821 | | | $ | 256,551,876 | | | $ | 122,120,526 | | | $ | 248,171,447 | | | $ | 154,724,107 | |
| | | | | | |
End of year | | $ | 1,268,811,518 | | | $ | 343,381,791 | | | $ | 345,963,092 | | | $ | 256,551,876 | | | $ | 313,791,007 | | | $ | 248,171,447 | |
Undistributed net investment income included in net assets at end of year | | $ | 1,487,436 | | | $ | 337,857 | | | $ | 423,490 | | | $ | 195,853 | | | $ | 319,163 | | | $ | 583,763 | |
SHARES CREATED AND REDEEMED: | | | | | | | | | | | | | | | | | | | | | | | | |
| | | | | | |
Shares outstanding, beginning of year | | | 6,850,000 | | | | 4,450,000 | | | | 4,750,000 | | | | 2,650,000 | | | | 5,100,000 | | | | 3,650,000 | |
| | | | | | |
Shares created | | | 20,400,000 | | | | 5,600,000 | | | | 2,750,000 | | | | 3,500,000 | | | | 1,350,000 | | | | 2,650,000 | |
| | | | | | |
Shares redeemed | | | (4,100,000 | ) | | | (3,200,000 | ) | | | (1,350,000 | ) | | | (1,400,000 | ) | | | (50,000 | ) | | | (1,200,000 | ) |
Shares outstanding, end of year | | | 23,150,000 | | | | 6,850,000 | | | | 6,150,000 | | | | 4,750,000 | | | | 6,400,000 | | | | 5,100,000 | |
See Notes to Financial Statements.
| | |
| 50 | | WisdomTree Domestic Dividend Funds |
Financial Highlights
WisdomTree Domestic Dividend Funds
March 31, 2012
Selected data for a share of beneficial interest outstanding throughout the period is presented below:
| | | | | | | | | | | | | | | | | | | | |
| WisdomTree Total Dividend Fund | | For the
Year Ended
March 31, 2012 | | | For the
Year Ended
March 31, 2011 | | | For the
Year Ended
March 31, 2010 | | | For the
Year Ended
March 31, 2009 | | | For the
Year Ended
March 31, 2008 | |
Net asset value, beginning of year | | $ | 48.84 | | | $ | 42.89 | | | $ | 29.26 | | | $ | 51.81 | | | $ | 57.87 | |
Investment operations: | | | | | | | | | | | | | | | | | | | | |
Net investment income1 | | | 1.47 | | | | 1.37 | | | | 1.14 | | | | 1.54 | | | | 1.68 | |
Net realized and unrealized gain (loss) | | | 4.15 | | | | 5.92 | | | | 13.61 | | | | (22.56 | ) | | | (6.04 | ) |
Total from investment operations | | | 5.62 | | | | 7.29 | | | | 14.75 | | | | (21.02 | ) | | | (4.36 | ) |
Dividends and distributions to shareholders: | | | | | | | | | | | | | | | | | | | | |
Net investment income | | | (1.42 | ) | | | (1.34 | ) | | | (1.12 | ) | | | (1.53 | ) | | | (1.68 | ) |
Capital gains | | | — | | | | — | | | | — | | | | — | | | | (0.02 | ) |
Total dividends and distributions to shareholders | | | (1.42 | ) | | | (1.34 | ) | | | (1.12 | ) | | | (1.53 | ) | | | (1.70 | ) |
Net asset value, end of year | | $ | 53.04 | | | $ | 48.84 | | | $ | 42.89 | | | $ | 29.26 | | | $ | 51.81 | |
| | | | | |
TOTAL RETURN2 | | | 11.81 | % | | | 17.37 | % | | | 50.83 | % | | | (41.29 | )% | | | (7.77 | )% |
RATIOS/SUPPLEMENTAL DATA: | | | | | | | | | | | | | | | | | | | | |
Net assets, end of year (000’s omitted) | | $ | 243,985 | | | $ | 170,948 | | | $ | 132,971 | | | $ | 84,844 | | | $ | 88,071 | |
Ratios to average net assets3 of: | | | | | | | | | | | | | | | | | | | | |
Expenses, net of expense reimbursements/waivers | | | 0.28 | % | | | 0.28 | % | | | 0.28 | % | | | 0.28 | % | | | 0.28 | % |
Expenses, prior to expense reimbursements/waivers | | | 0.28 | % | | | 0.28 | % | | | 0.28 | % | | | 0.28 | % | | | 0.28 | % |
Net investment income | | | 3.03 | % | | | 3.10 | % | | | 3.01 | % | | | 3.91 | % | | | 2.89 | % |
Portfolio turnover rate4 | | | 15 | % | | | 6 | % | | | 16 | % | | | 23 | % | | | 10 | % |
| | | | | | | | | | | | | | | | | | | | |
| | | | | | |
| WisdomTree Equity Income Fund | | For the
Year Ended
March 31, 2012 | | | For the
Year Ended
March 31, 2011 | | | For the
Year Ended
March 31, 2010 | | | For the
Year Ended
March 31, 2009 | | | For the
Year Ended
March 31, 2008 | |
Net asset value, beginning of year | | $ | 40.52 | | | $ | 35.12 | | | $ | 22.98 | | | $ | 47.81 | | | $ | 57.99 | |
Investment operations: | | | | | | | | | | | | | | | | | | | | |
Net investment income1 | | | 1.66 | | | | 1.61 | | | | 1.17 | | | | 1.95 | | | | 2.22 | |
Net realized and unrealized gain (loss) | | | 4.15 | | | | 5.33 | | | | 12.16 | | | | (24.80 | ) | | | (10.19 | ) |
Total from investment operations | | | 5.81 | | | | 6.94 | | | | 13.33 | | | | (22.85 | ) | | | (7.97 | ) |
Dividends to shareholders: | | | | | | | | | | | | | | | | | | | | |
Net investment income | | | (1.52 | ) | | | (1.54 | ) | | | (1.19 | ) | | | (1.98 | ) | | | (2.21 | ) |
Net asset value, end of year | | $ | 44.81 | | | $ | 40.52 | | | $ | 35.12 | | | $ | 22.98 | | | $ | 47.81 | |
| | | | | |
TOTAL RETURN2 | | | 14.66 | % | | | 20.24 | % | | | 58.47 | % | | | (49.06 | )% | | | (14.18 | )% |
RATIOS/SUPPLEMENTAL DATA: | | | | | | | | | | | | | | | | | | | | |
Net assets, end of year (000’s omitted) | | $ | 427,918 | | | $ | 178,273 | | | $ | 122,907 | | | $ | 101,091 | | | $ | 138,659 | |
Ratios to average net assets3 of: | | | | | | | | | | | | | | | | | | | | |
Expenses, net of expense reimbursements/waivers | | | 0.38 | % | | | 0.38 | % | | | 0.38 | % | | | 0.38 | % | | | 0.38 | % |
Expenses, prior to expense reimbursements/waivers | | | 0.38 | % | | | 0.38 | % | | | 0.38 | % | | | 0.38 | % | | | 0.38 | % |
Net investment income | | | 3.99 | % | | | 4.25 | % | | | 3.72 | % | | | 5.59 | % | | | 3.88 | % |
Portfolio turnover rate4 | | | 22 | % | | | 8 | % | | | 25 | % | | | 45 | % | | | 19 | % |
| 1 | Based on average shares outstanding. |
| 2 | Total return is calculated assuming an initial investment made at the net asset value at the beginning of the period, reinvestment of all dividends and distributions at net asset value during the period and redemption on the last day of the period. Total return calculated for a period of less than one year is not annualized. The total return would have been lower if certain expenses had not been reimbursed/waived by the investment adviser (Notes 2 and 3). |
| 3 | The ratios to average net assets do not include net investment income (loss) or expenses of affiliated funds in which the Fund invests. |
| 4 | Portfolio turnover rate is not annualized and excludes the value of portfolio securities received or delivered as a result of in-kind creations or redemptions of the Fund’s capital shares. |
See Notes to Financial Statements.
| | | | |
| WisdomTree Domestic Dividend Funds | | | 51 | |
Financial Highlights (continued)
WisdomTree Domestic Dividend Funds
March 31, 2012
Selected data for a share of beneficial interest outstanding throughout the period is presented below:
| | | | | | | | | | | | | | | | | | | | |
| WisdomTree LargeCap Dividend Fund | | For the
Year Ended
March 31, 2012 | | | For the
Year Ended
March 31, 2011 | | | For the
Year Ended
March 31, 2010 | | | For the
Year Ended
March 31, 2009 | | | For the
Year Ended
March 31, 2008 | |
Net asset value, beginning of year | | $ | 48.31 | | | $ | 42.56 | | | $ | 29.86 | | | $ | 52.71 | | | $ | 57.97 | |
Investment operations: | | | | | | | | | | | | | | | | | | | | |
Net investment income1 | | | 1.45 | | | | 1.33 | | | | 1.10 | | | | 1.51 | | | | 1.60 | |
Net realized and unrealized gain (loss) | | | 4.59 | | | | 5.68 | | | | 12.69 | | | | (22.91 | ) | | | (5.21 | ) |
Total from investment operations | | | 6.04 | | | | 7.01 | | | | 13.79 | | | | (21.40 | ) | | | (3.61 | ) |
Dividends to shareholders: | | | | | | | | | | | | | | | | | | | | |
Net investment income | | | (1.37 | ) | | | (1.26 | ) | | | (1.09 | ) | | | (1.45 | ) | | | (1.65 | ) |
Net asset value, end of year | | $ | 52.98 | | | $ | 48.31 | | | $ | 42.56 | | | $ | 29.86 | | | $ | 52.71 | |
| | | | | |
TOTAL RETURN2 | | | 12.82 | % | | | 16.83 | % | | | 46.53 | % | | | (41.25 | )% | | | (6.47 | )% |
RATIOS/SUPPLEMENTAL DATA: | | | | | | | | | | | | | | | | | | | | |
Net assets, end of year (000’s omitted) | | $ | 1,205,215 | | | $ | 611,094 | | | $ | 412,809 | | | $ | 294,135 | | | $ | 308,379 | |
Ratios to average net assets3 of: | | | | | | | | | | | | | | | | | | | | |
Expenses, net of expense reimbursements/waivers | | | 0.28 | % | | | 0.28 | % | | | 0.28 | % | | | 0.28 | % | | | 0.28 | % |
Expenses, prior to expense reimbursements/waivers | | | 0.28 | % | | | 0.28 | % | | | 0.28 | % | | | 0.28 | % | | | 0.28 | % |
Net investment income | | | 3.02 | % | | | 3.04 | % | | | 2.89 | % | | | 3.78 | % | | | 2.74 | % |
Portfolio turnover rate4 | | | 14 | % | | | 5 | % | | | 17 | % | | | 25 | % | | | 8 | % |
| | | | | | | | | | | | | | | | | | | | |
| | | | | | |
| WisdomTree Dividend ex-Financials Fund | | For the
Year Ended
March 31, 2012 | | | For the
Year Ended
March 31, 2011 | | | For the
Year Ended
March 31, 2010 | | | For the
Year Ended
March 31, 2009 | | | For the
Year Ended
March 31, 2008 | |
Net asset value, beginning of year | | $ | 50.13 | | | $ | 42.76 | | | $ | 26.74 | | | $ | 51.14 | | | $ | 59.69 | |
Investment operations: | | | | | | | | | | | | | | | | | | | | |
Net investment income1 | | | 2.06 | | | | 1.81 | | | | 1.60 | | | | 1.81 | | | | 2.10 | |
Net realized and unrealized gain (loss) | | | 4.31 | | | | 7.25 | | | | 16.01 | | | | (24.34 | ) | | | (8.56 | ) |
Total from investment operations | | | 6.37 | | | | 9.06 | | | | 17.61 | | | | (22.53 | ) | | | (6.46 | ) |
Dividends to shareholders: | | | | | | | | | | | | | | | | | | | | |
Net investment income | | | (1.69 | ) | | | (1.69 | ) | | | (1.59 | ) | | | (1.87 | ) | | | (2.09 | ) |
Net asset value, end of year | | $ | 54.81 | | | $ | 50.13 | | | $ | 42.76 | | | $ | 26.74 | | | $ | 51.14 | |
| | | | | |
TOTAL RETURN2 | | | 12.99 | % | | | 21.68 | % | | | 66.66 | % | | | (45.10 | )% | | | (11.15 | )% |
RATIOS/SUPPLEMENTAL DATA: | | | | | | | | | | | | | | | | | | | | |
Net assets, end of year (000’s omitted) | | $ | 1,268,812 | | | $ | 343,382 | | | $ | 190,277 | | | $ | 104,277 | | | $ | 166,205 | |
Ratios to average net assets3 of: | | | | | | | | | | | | | | | | | | | | |
Expenses, net of expense reimbursements/waivers | | | 0.38 | % | | | 0.38 | % | | | 0.38 | % | | | 0.38 | % | | | 0.38 | % |
Expenses, prior to expense reimbursements/waivers | | | 0.38 | % | | | 0.38 | % | | | 0.38 | % | | | 0.38 | % | | | 0.38 | % |
Net investment income | | | 4.05 | % | | | 3.99 | % | | | 4.32 | % | | | 4.57 | % | | | 3.57 | % |
Portfolio turnover rate4 | | | 38 | % | | | 5 | % | | | 57 | % | | | 53 | % | | | 16 | % |
| 1 | Based on average shares outstanding. |
| 2 | Total return is calculated assuming an initial investment made at the net asset value at the beginning of the period, reinvestment of all dividends and distributions at net asset value during the period and redemption on the last day of the period. Total return calculated for a period of less than one year is not annualized. The total return would have been lower if certain expenses had not been reimbursed/waived by the investment adviser (Notes 2 and 3). |
| 3 | The ratios to average net assets do not include net investment income (loss) or expenses of affiliated funds in which the Fund invests. |
| 4 | Portfolio turnover rate is not annualized and excludes the value of portfolio securities received or delivered as a result of in-kind creations or redemptions of the Fund’s capital shares. |
See Notes to Financial Statements.
| | |
| 52 | | WisdomTree Domestic Dividend Funds |
Financial Highlights (concluded)
WisdomTree Domestic Dividend Funds
March 31, 2012
Selected data for a share of beneficial interest outstanding throughout the period is presented below:
| | | | | | | | | | | | | | | | | | | | |
| WisdomTree MidCap Dividend Fund | | For the
Year Ended
March 31, 2012 | | | For the
Year Ended
March 31, 2011 | | | For the
Year Ended
March 31, 2010 | | | For the
Year Ended
March 31, 2009 | | | For the
Year Ended
March 31, 2008 | |
Net asset value, beginning of year | | $ | 54.01 | | | $ | 46.08 | | | $ | 26.80 | | | $ | 48.00 | | | $ | 58.02 | |
Investment operations: | | | | | | | | | | | | | | | | | | | | |
Net investment income1 | | | 1.47 | | | | 1.53 | | | | 1.29 | | | | 1.63 | | | | 1.88 | |
Net realized and unrealized gain (loss) | | | 2.17 | | | | 7.79 | | | | 19.22 | | | | (21.16 | ) | | | (10.12 | ) |
Total from investment operations | | | 3.64 | | | | 9.32 | | | | 20.51 | | | | (19.53 | ) | | | (8.24 | ) |
Dividends to shareholders: | | | | | | | | | | | | | | | | | | | | |
Net investment income | | | (1.40 | ) | | | (1.39 | ) | | | (1.23 | ) | | | (1.67 | ) | | | (1.78 | ) |
Net asset value, end of year | | $ | 56.25 | | | $ | 54.01 | | | $ | 46.08 | | | $ | 26.80 | | | $ | 48.00 | |
| | | | | |
TOTAL RETURN2 | | | 6.99 | % | | | 20.60 | % | | | 77.34 | % | | | (41.61 | )% | | | (14.47 | )% |
RATIOS/SUPPLEMENTAL DATA: | | | | | | | | | | | | | | | | | | | | |
Net assets, end of year (000’s omitted) | | $ | 345,963 | | | $ | 256,552 | | | $ | 122,121 | | | $ | 65,655 | | | $ | 91,198 | |
Ratios to average net assets3 of: | | | | | | | | | | | | | | | | | | | | |
Expenses, net of expense reimbursements/waivers | | | 0.38 | % | | | 0.38 | % | | | 0.38 | % | | | 0.38 | % | | | 0.38 | % |
Expenses, prior to expense reimbursements/waivers | | | 0.38 | % | | | 0.38 | % | | | 0.38 | % | | | 0.38 | % | | | 0.38 | % |
Net investment income | | | 2.81 | % | | | 3.16 | % | | | 3.34 | % | | | 4.31 | % | | | 3.38 | % |
Portfolio turnover rate4 | | | 29 | % | | | 10 | % | | | 11 | % | | | 43 | % | | | 30 | % |
| | | | | | | | | | | | | | | | | | | | |
| | | | | | |
| WisdomTree SmallCap Dividend Fund | | For the
Year Ended
March 31, 2012 | | | For the
Year Ended
March 31, 2011 | | | For the
Year Ended
March 31, 2010 | | | For the
Year Ended
March 31, 2009 | | | For the
Year Ended
March 31, 2008 | |
Net asset value, beginning of year | | $ | 48.66 | | | $ | 42.39 | | | $ | 24.06 | | | $ | 46.31 | | | $ | 57.41 | |
Investment operations: | | | | | | | | | | | | | | | | | | | | |
Net investment income1 | | | 1.68 | | | | 1.72 | | | | 1.49 | | | | 1.85 | | | | 2.13 | |
Net realized and unrealized gain (loss) | | | 0.34 | | | | 6.14 | | | | 18.28 | | | | (22.26 | ) | | | (11.10 | ) |
Total from investment operations | | | 2.02 | | | | 7.86 | | | | 19.77 | | | | (20.41 | ) | | | (8.97 | ) |
Dividends to shareholders: | | | | | | | | | | | | | | | | | | | | |
Net investment income | | | (1.65 | ) | | | (1.59 | ) | | | (1.44 | ) | | | (1.84 | ) | | | (2.13 | ) |
Net asset value, end of year | | $ | 49.03 | | | $ | 48.66 | | | $ | 42.39 | | | $ | 24.06 | | | $ | 46.31 | |
| | | | | |
TOTAL RETURN2 | | | 4.50 | % | | | 18.96 | % | | | 83.27 | % | | | (45.27 | )% | | | (15.93 | )% |
RATIOS/SUPPLEMENTAL DATA: | | | | | | | | | | | | | | | | | | | | |
Net assets, end of year (000’s omitted) | | $ | 313,791 | | | $ | 248,171 | | | $ | 154,724 | | | $ | 73,369 | | | $ | 81,040 | |
Ratios to average net assets3 of: | | | | | | | | | | | | | | | | | | | | |
Expenses, net of expense reimbursements/waivers | | | 0.38 | % | | | 0.38 | % | | | 0.38 | % | | | 0.38 | % | | | 0.38 | % |
Expenses, prior to expense reimbursements/waivers | | | 0.38 | % | | | 0.38 | % | | | 0.38 | % | | | 0.38 | % | | | 0.38 | % |
Net investment income | | | 3.69 | % | | | 3.86 | % | | | 4.21 | % | | | 5.15 | % | | | 3.97 | % |
Portfolio turnover rate4 | | | 31 | % | | | 11 | % | | | 16 | % | | | 65 | % | | | 34 | % |
| 1 | Based on average shares outstanding. |
| 2 | Total return is calculated assuming an initial investment made at the net asset value at the beginning of the period, reinvestment of all dividends and distributions at net asset value during the period and redemption on the last day of the period. Total return calculated for a period of less than one year is not annualized. The total return would have been lower if certain expenses had not been reimbursed/waived by the investment adviser (Notes 2 and 3). |
| 3 | The ratios to average net assets do not include net investment income (loss) or expenses of affiliated funds in which the Fund invests. |
| 4 | Portfolio turnover rate is not annualized and excludes the value of portfolio securities received or delivered as a result of in-kind creations or redemptions of the Fund’s capital shares. |
See Notes to Financial Statements.
| | | | |
| WisdomTree Domestic Dividend Funds | | | 53 | |
Notes to Financial Statements
March 31, 2012
1. ORGANIZATION
WisdomTree Trust (the “Trust”) is registered under the Investment Company Act of 1940, as amended (the “1940 Act”), as an open-end management investment company. The Trust was established as a Delaware statutory trust pursuant to a Trust Instrument dated December 15, 2005. As of March 31, 2012, the Trust offered 48 investment funds (each a “Fund”, and collectively, the “Funds”). These notes relate only to funds listed in the table below:
| | | | |
| Fund Name | | Commencement
of Operations | |
WisdomTree Total Dividend Fund (“Total Dividend Fund”) | | | June 16, 2006 | |
WisdomTree Equity Income Fund (“Equity Income Fund”) | | | June 16, 2006 | |
WisdomTree LargeCap Dividend Fund (“LargeCap Dividend Fund”) | | | June 16, 2006 | |
WisdomTree Dividend ex-Financials Fund (“Dividend ex-Financials Fund”) | | | June 16, 2006 | |
WisdomTree MidCap Dividend Fund (“MidCap Dividend Fund”) | | | June 16, 2006 | |
WisdomTree SmallCap Dividend Fund (“SmallCap Dividend Fund”) | | | June 16, 2006 | |
Each Fund seeks to track the price and yield performance, before fees and expenses, of a particular index (“Index”) developed by WisdomTree Investments, Inc. (“WisdomTree Investments”). WisdomTree Investments is the parent company of WisdomTree Asset Management, Inc. (“WTAM”), the investment adviser to each Fund and the Trust. “WisdomTree” is a registered mark of WisdomTree Investments and has been licensed for use by the Trust. Each Fund described herein is considered to be non-diversified.
2. SIGNIFICANT ACCOUNTING POLICIES
The Financial Accounting Standards Board (“FASB”) Accounting Standards Codification (the “Codification”) is the exclusive reference of authoritative U.S. generally accepted accounting principles (“GAAP”) recognized by the FASB to be applied by nongovernmental entities. Rules and interpretive releases of the Securities and Exchange Commission (“SEC”) under authority of federal laws are also sources of authoritative GAAP for SEC registrants.
The following is a summary of significant accounting policies followed by the Funds:
Guarantees — In the normal course of business the Funds may enter into contracts that contain a variety of representations or that provide indemnification for certain liabilities. The Funds’ maximum exposure under these arrangements is unknown, as this would involve future claims that may be made against the Funds that have not yet occurred. However, the Funds have not had prior claims or losses pursuant to these contracts and expect the risk of loss to be remote. Therefore, no liabilities have been recorded in connection with these indemnifications.
Use of Estimates — The preparation of financial statements in conformity with GAAP requires management to make certain estimates and assumptions that affect the reported amounts of assets and liabilities and disclosure of contingent assets and liabilities at the date of the financial statements and the reported amounts of increases and decreases in the net assets from operations during the reporting period. Actual results could differ from those estimates.
Investment Valuation — The net asset value (“NAV”) of each Fund’s shares is calculated each day the national securities exchanges are open for trading as of the close of regular trading on the New York Stock Exchange, generally 4:00 p.m. New York time. NAV per share is calculated by dividing a Fund’s net assets by the number of Fund shares outstanding. Transactions in Fund shares will be priced at NAV only if you purchase or redeem shares directly from a Fund in creation units, which are typically in blocks of 50,000 shares or more. Fund shares are purchased or sold on a national securities exchange at market prices, which may be higher or lower than NAV. In calculating each Fund’s NAV, investments are valued under policies approved by the Board of Trustees.
Securities traded on any recognized U.S. or non-U.S. exchange are valued at the last sale price or official closing price on the exchange or system on which they are principally traded. Events occurring after the close of trading on non-U.S. exchanges may result in adjustments to the valuation of foreign securities to more accurately reflect their fair value as of the close of regular trading on the New York Stock Exchange. The Fund may rely on an independent fair valuation service in adjusting the valuations of foreign securities. Unlisted equity securities are valued at the last quoted sale price or, if no sale price is available, at the mean between the highest bid and lowest ask prices. Securities for which market quotations are not readily available are valued at fair value as determined by management and in accordance with procedures approved by the Board of Trustees. Short-term securities with 60 days or less remaining to maturity are valued using the amortized cost method, which approximates fair value.
In certain instances, such as when reliable market valuations are not readily available or are not deemed to reflect current market values, a Fund’s investments will be valued in accordance with the Fund’s pricing policy and procedures. Securities that may be valued using “fair value” pricing may include, but are not limited to, securities for which there are no current market quotations,
| | |
| 54 | | WisdomTree Domestic Dividend Funds |
Notes to Financial Statements (continued)
securities whose issuer is in default or bankruptcy, securities subject to corporate actions (such as mergers or reorganizations), securities subject to non-U.S. investment limits or currency controls, and securities affected by “significant events”. An example of a significant event is an event occurring after the close of the market in which a security trades but before a Fund’s next NAV calculation time that may materially affect the value of a Fund’s investment (e.g., government action, natural disaster, or significant market fluctuation). Price movements in U.S. markets that are deemed to affect the value of foreign securities, or reflect changes to the value of such securities, also may cause securities to be fair valued. When fair value pricing is employed, the prices of securities used by a Fund to calculate its NAV may differ from quoted or published prices for the same securities. Each Fund may invest in money market funds which are valued at their NAV per share and affiliated ETFs which are valued at their last sale or official closing price on the exchange on which they are principally traded.
Fair Value Measurement — In accordance with Codification Topic 820 (“ASC 820”), Fair Value Measurements and Disclosures, fair value is defined as the price that each Fund would receive upon selling an investment in an orderly transaction to an independent buyer in the principal or most advantageous market of the investment. ASC 820 established a three-tier hierarchy to maximize the use of observable market data and minimize the use of unobservable inputs and to establish classification of fair value measurements for disclosure purposes. Inputs refer broadly to the assumptions that market participants would use in pricing the asset or liability, including assumptions about risk — for example, the risk inherent in a particular valuation technique used to measure fair value (such as a pricing model) and/or the risk inherent in the inputs to the valuation technique. Inputs may be observable or unobservable. Observable inputs reflect the assumptions market participants would use in pricing the asset or liability. Observable inputs are based on market data obtained from sources independent of the reporting entity. Unobservable inputs reflect the reporting entity’s own assumptions about the assumptions market participants would use in pricing the asset or liability. Unobservable inputs are based on the best information available in the circumstances. The three-tier hierarchy of inputs is summarized in the three broad levels listed below:
Level 1 – quoted prices in active markets for identical securities
Level 2 – other significant observable inputs (including quoted prices for similar securities, interest rates, prepayment speeds, credit risk, etc.)
Level 3 – significant unobservable inputs (including each Fund’s assumptions in determining the fair value of investments)
Investments that use Level 2 or Level 3 inputs may include, but are not limited to: (i) an unlisted security related to corporate actions; (ii) a restricted security (e.g., one that may not be publicly sold without registration under the Securities Act of 1933, as amended); (iii) a security whose trading has been suspended or which has been de-listed from its primary trading exchange; (iv) a security that is thinly traded; (v) a security in default or bankruptcy proceedings for which there is no current market quotation; (vi) a security affected by currency controls or restrictions; and (vii) a security affected by a significant event (e.g., an event that occurs after the close of the markets on which the security is traded but before the time as of which a Fund’s NAV is computed and that may materially affect the value of the Fund’s investments).
In January 2010, FASB issued Accounting Standards Update No. 2010-06 “Improving Disclosures about Fair Value Measurements (“ASU 2010-06”).” ASU 2010-06 requires reporting entities to make new disclosures about amounts and reasons for significant
transfers between Level 1 and Level 2 fair value measurements, as well as inputs and valuation techniques used to measure fair value for both recurring and nonrecurring fair value measurements that fall in either Level 2 or Level 3. ASU 2010-06 also requires information on purchases and sales, issuances and settlements on a gross basis in the reconciliation of activity in Level 3 fair value measurements. The new and revised disclosures have been implemented for fiscal periods beginning after December 15, 2009 other than the disclosures surrounding the presentation of purchases, sales, issuances and settlements on a gross basis in the reconciliation of Level 3 fair value measurements which have been implemented for fiscal periods beginning after December 15, 2010.
The inputs or methodology used for valuation are not necessarily an indication of the risk associated with investing in those investments.
The valuation techniques and significant inputs used in determining the fair market value measurements for Level 2 or Level 3 positions are as follows:
Financial instruments are valued by pricing service providers that use broker dealer quotations, reported trades or valuation estimates from their internal pricing models. Depending on the type of financial instrument, the service providers’ internal models use inputs that are observable such as issuer details, interest rates, yield curves, prepayment speeds, credit risks/spreads, default rates and quoted prices for similar assets. Securities that use similar valuation techniques and inputs as described above are categorized as Level 2 of the fair value hierarchy. Short-term investments having a maturity of 60 days or less are generally valued at amortized cost which approximates fair market value. These investments are categorized as Level 2 of the fair value hierarchy. Over-the-counter financial derivative instruments, such as forward foreign currency contracts derive their value from underlying asset prices, indices, reference rates, and other inputs or a combination of these factors. These contracts are normally valued on the basis of broker dealer quotations or pricing service providers. Depending on the product and the terms of the transaction, the value of the financial derivative contracts can be estimated by a pricing service provider using a series of techniques, including simulation pricing models.
| | | | |
| WisdomTree Domestic Dividend Funds | | | 55 | |
Notes to Financial Statements (continued)
The pricing models use inputs that are observed from actively quoted markets such as issuer details, indices, spreads, interest rates, curves, dividends and exchange rates. Financial derivatives that use similar valuation techniques and inputs as described above are categorized as Level 2 of the fair value hierarchy.
In the event that a financial instrument cannot be valued based upon a price from a national securities exchange, pricing service provider or broker quotation, or such prices are deemed to not reflect current market value, WTAM may value the financial instrument in good faith under the policies and procedures approved by the Board of Trustees based on current facts and circumstances. Determination of this value may include significant unobservable inputs and therefore would be reflected as a Level 3 of the fair value hierarchy.
There were no Level 3 securities during or for the year ended March 31, 2012.
No significant transfers between Level 1 or Level 2 fair value measurements occurred during the fiscal year ended March 31, 2012.
The following is a summary of the inputs used as of March 31, 2012 in valuing each Fund’s assets carried at fair value:
| | | | | | | | | | | | |
| Total Dividend Fund | | Level 1 | | | Level 2 | | | Level 3 | |
Investments in Securities | | | | | | | | | | | | |
Common Stocks* | | $ | 242,972,688 | | | $ | — | | | $ | — | |
Money Market Funds | | | — | | | | 4,511,836 | | | | — | |
Exchange-Traded Funds | | | 378,355 | | | | — | | | | — | |
Total | | $ | 243,351,043 | | | $ | 4,511,836 | | | $ | — | |
| | | | | | | | | | | | |
| Equity Income Fund | | Level 1 | | | Level 2 | | | Level 3 | |
Investments in Securities | | | | | | | | | | | | |
Common Stocks* | | $ | 426,326,776 | | | $ | — | | | $ | — | |
Money Market Fund | | | — | | | | 13,389,390 | | | | — | |
Exchange-Traded Funds | | | 394,979 | | | | — | | | | — | |
Total | | $ | 426,721,755 | | | $ | 13,389,390 | | | $ | — | |
| | | | | | | | | | | | |
| LargeCap Dividend Fund | | Level 1 | | | Level 2 | | | Level 3 | |
Investments in Securities | | | | | | | | | | | | |
Common Stocks* | | $ | 1,201,736,536 | | | $ | — | | | $ | — | |
Money Market Fund | | | — | | | | 9,686,394 | | | | — | |
Exchange-Traded Funds | | | 327,795 | | | | — | | | | — | |
Total | | $ | 1,202,064,331 | | | $ | 9,686,394 | | | $ | — | |
| | | | | | | | | | | | |
| Dividend ex-Financials Fund | | Level 1 | | | Level 2 | | | Level 3 | |
Investments in Securities | | | | | | | | | | | | |
Common Stocks* | | $ | 1,262,087,994 | | | $ | — | | | $ | — | |
Money Market Funds | | | — | | | | 67,108,561 | | | | — | |
Exchange-Traded Funds | | | 3,185,106 | | | | — | | | | — | |
Total | | $ | 1,265,273,100 | | | $ | 67,108,561 | | | $ | — | |
| | | | | | | | | | | | |
| MidCap Dividend Fund | | Level 1 | | | Level 2 | | | Level 3 | |
Investments in Securities | | | | | | | | | | | | |
Common Stocks* | | $ | 343,402,329 | | | $ | — | | | $ | — | |
Money Market Funds | | | — | | | | 28,326,236 | | | | — | |
Exchange-Traded Funds | | | 1,852,064 | | | | — | | | | — | |
Total | | $ | 345,254,393 | | | $ | 28,326,236 | | | $ | — | |
| | |
| 56 | | WisdomTree Domestic Dividend Funds |
Notes to Financial Statements (continued)
| | | | | | | | | | | | |
| SmallCap Dividend Fund | | Level 1 | | | Level 2 | | | Level 3 | |
Investments in Securities | | | | | | | | | | | | |
Common Stocks* | | $ | 310,968,355 | | | $ | — | | | $ | — | |
Money Market Fund | | | — | | | | 25,788,985 | | | | — | |
Exchange-Traded Funds | | | 2,349,094 | | | | — | | | | — | |
Total | | $ | 313,317,449 | | | $ | 25,788,985 | | | $ | — | |
* Please refer to Schedule of Investments for a breakdown of the valuation by industry. | |
Derivatives and Hedging Disclosure — Codification Topic 815 (“ASC 815”), Derivatives and Hedging, requires qualitative disclosures about objectives and strategies for using derivatives, quantitative disclosures about fair value amounts of gains and losses on derivative instruments, and disclosures about credit-risk-related contingent features in derivative agreements. The Funds did not invest in derivative instruments for the fiscal year ended March 31, 2012.
Investment Transactions and Investment Income — Investment transactions are recorded as of the date that the securities are purchased or sold (trade date). Realized gains and losses on sales of portfolio securities are calculated using the identified-cost method. Dividend income is recognized on the ex-dividend date. Interest income is accrued daily. The value of additional securities received as dividend payments is recorded as income and as an increase to the cost basis of such securities.
Expenses/Reimbursements — WTAM has agreed to pay all expenses of the Funds, except for: (i) brokerage expenses and other expenses (such as stamp taxes) connected with the execution of portfolio transactions or in connection with creation and redemption transactions; (ii) legal fees or expenses in connection with any arbitration, litigation or pending or threatened arbitration or litigation, including any settlements in connection therewith; (iii) compensation and expenses of each Independent Trustee; (iv) compensation and expenses of counsel to the Independent Trustees; (v) compensation and expenses of the Trust’s chief compliance officer (“CCO”); (vi) extraordinary expenses; (vii) distribution fees and expenses paid by the Trust under any distribution plan adopted pursuant to Rule 12b-1 under the 1940 Act; and (viii) the advisory fee payable to WTAM.
Pursuant to a separate contractual arrangement, WTAM has arranged for the provision of CCO services to the Funds and is liable and responsible for, and administers, payments to the CCO, the Independent Trustees and counsel to the Independent Trustees, in exchange for a service fee paid by each Fund of up to 0.0044% of each Fund’s average daily net assets. Trustees’ fees, which are included in Service Fees on the Statements of Operations, of $63,197 have been paid on behalf of the Funds of the Trust to the Independent Trustees for the fiscal year ended March 31, 2012.
Securities Lending — Each Fund may lend portfolio securities to certain creditworthy borrowers, including the Funds’ securities lending agent. It is the Funds’ policy that, at origination, all loans are secured by collateral of at least 102% of the value of U.S. securities loaned and 105% of the value of foreign securities loaned. Collateral in the form of cash and/or high grade debt obligations, equivalent to at least 100% of the market value of securities, is maintained at all times. The collateral can be invested in certain money market mutual funds which also have exposure to the fluctuations of the market. Each Fund receives compensation for lending its securities from interest or dividends earned on the cash or U.S. government securities held as collateral, net of fee rebates paid to the borrower plus reasonable administrative and custody fees. The dividend and interest income earned on the securities loaned is accounted for in the same manner as other dividend and interest income. The borrower pays to the Funds an amount equal to any dividends or interest received on loaned securities. The Funds retain all or a portion of the interest received on investment of cash collateral or receive a fee from the borrower. Lending portfolio securities could result in a loss or delay in recovering each Fund’s securities if the borrower defaults.
The securities lending income earned by the Funds is disclosed on the Statements of Operations.
Short-Term Investments — Each Fund may invest a portion of its assets in high-quality money market instruments on an ongoing basis to provide liquidity or for other reasons. The instruments include short-term obligations issued by the U.S. Government, its agencies, non-U.S. Government agencies, negotiable certificates of deposit (“CDs”), fixed time deposits and bankers’ acceptances of U.S. and foreign banks and similar institutions, commercial papers, repurchase agreements and money market funds. CDs are short-term negotiable obligations of commercial banks. Time deposits are non-negotiable deposits maintained in banking institutions for specified periods of time at stated interest rates. Banker’s acceptances are time drafts drawn on commercial banks by borrowers, usually in connection with international transactions.
Tax Information and Dividends and Distributions to Shareholders — It is each Fund’s policy to comply with all requirements of the Internal Revenue Code of 1986, as amended (the “Code”). Each Fund intends to qualify for and to elect treatment as a separate Regulated Investment Company (“RIC”) under Subchapter M of the Code. It is the policy of each Fund to pay out dividends, if any, to investors at least annually. There can be no guarantee that a Fund will pay dividends. Taxable net realized gains from investment transactions, reduced by capital loss carryforwards, if any, are declared and distributed to shareholders at least annually. The capital loss carryforward amount, if any, is available to offset future net capital gains. The Funds may occasionally be required to make
| | | | |
| WisdomTree Domestic Dividend Funds | | | 57 | |
Notes to Financial Statements (continued)
supplemental distributions at some other time during the year. The Trust reserves the right to declare special distributions if, in its reasonable discretion, such action is necessary or advisable to preserve the status of each Fund as a RIC or to avoid imposition of income or excise taxes on undistributed income. Dividends and distributions to shareholders are recorded on the ex-dividend date. The amount of dividends and distributions from net investment income and net realized capital gains are determined in accordance with Federal income tax regulations which may differ from GAAP. These “book/tax” differences are either considered temporary or permanent in nature. To the extent these differences are permanent in nature, such amounts are reclassified within the components of net assets based on their Federal tax basis treatment; temporary differences do not require reclassification. Dividends and distributions, which exceed earnings and profit for tax purposes, are reported as a tax return of capital to the extent of a shareholder’s tax basis and thereafter as a capital gain.
3. ADVISORY FEES AND TRANSACTIONS
WTAM has overall responsibility for the general management and administration of the Trust. WTAM provides an investment program for each Fund. WTAM has arranged for Mellon Capital Management (“MCM”) to provide sub-advisory services to the Funds. MCM is compensated by WTAM at no additional cost to the Funds. WTAM also arranges for transfer agency, custody, fund administration, and all other non-distribution related services necessary for the Funds to operate. Under the Investment Advisory Agreement for each Fund, and as also described in Note 2, WTAM agrees to pay all expenses of the Funds, except compensation and expenses of the Independent Trustees, counsel to the Independent Trustees and the Trust’s CCO, interest expenses and taxes, brokerage expenses, and other expenses connected with the execution of portfolio transactions, any distribution fees or expenses, legal fees or expenses and extraordinary expenses.
Pursuant to a separate contractual arrangement, also described in Note 2, WTAM arranges for the provision of CCO services with respect to each Fund and is liable and responsible for, and administers, payments to the CCO, the Independent Trustees and counsel to the Independent Trustees in exchange for a fee of up to 0.0044% of each Fund’s average daily net assets. WTAM expects to receive fees from each Fund, based on a percentage of the Fund’s average daily net assets, as shown in the following table.
| | | | |
| Fund | | Advisory Fee Rate | |
Total Dividend Fund | | | 0.28 | % |
Equity Income Fund | | | 0.38 | % |
LargeCap Dividend Fund | | | 0.28 | % |
Dividend ex-Financials Fund | | | 0.38 | % |
MidCap Dividend Fund | | | 0.38 | % |
SmallCap Dividend Fund | | | 0.38 | % |
Each Fund may purchase shares of affiliated exchange traded funds in secondary market transactions. For the fiscal year ended March 31, 2012, WTAM waived a portion of its advisory fees based on each Fund’s investments in affiliated Funds. The table below indicates the waiver amounts. Please see Note 7 for additional information on Other Affiliated Parties and Transactions.
| | | | |
| Fund | | Advisory Fees Waived | |
Total Dividend Fund | | $ | 1,466 | |
Equity Income Fund | | | 4,704 | |
LargeCap Dividend Fund | | | 6,009 | |
Dividend ex-Financials Fund | | | 12,198 | |
MidCap Dividend Fund | | | 8,496 | |
SmallCap Dividend Fund | | | 6,978 | |
4. CAPITAL SHARE TRANSACTIONS
As of March 31, 2012, there were an unlimited number of $0.001 par value shares of beneficial interest authorized by the Trust. Shares are issued and redeemed by each Fund only in Creation Units or multiples thereof. Except when aggregated in Creation Units, shares of each Fund are not redeemable. Transactions in shares for each Fund are disclosed in detail in the Statements of Changes in Net Assets. The consideration for the purchase of Creation Units of a Fund generally consists of the in-kind contribution of a designated portfolio of equity securities constituting a portfolio sampling representation of the securities included in the relevant Fund’s underlying Index and an amount of cash. Investors purchasing and redeeming Creation Units may be charged a purchase transaction fee and a redemption transaction fee to offset transfer and other transaction costs associated with the issuance and redemption of Creation Units.
| | |
| 58 | | WisdomTree Domestic Dividend Funds |
Notes to Financial Statements (continued)
5. INVESTMENT PORTFOLIO TRANSACTIONS
Purchases and sales of investments (excluding in-kind capital share transactions and short-term investments) for the fiscal year ended March 31, 2012 were as follows:
| | | 00,000,000,000 | | | | 00,000,000,000 | |
| Fund | | Purchases | | | Sales | |
Total Dividend Fund | | $ | 27,845,429 | | | $ | 27,797,799 | |
Equity Income Fund | | | 64,510,359 | | | | 64,066,814 | |
LargeCap Dividend Fund | | | 124,146,503 | | | | 123,465,851 | |
Dividend ex-Financials Fund | | | 273,711,598 | | | | 271,896,705 | |
MidCap Dividend Fund | | | 82,130,027 | | | | 83,779,109 | |
SmallCap Dividend Fund | | | 77,894,845 | | | | 77,379,300 | |
For the fiscal year ended March 31, 2012, the cost of purchases and the proceeds from sales resulting from in-kind capital share transactions were as follows:
| | | 00,000,000,000 | | | | 00,000,000,000 | |
| Fund | | Purchases | | | Sales | |
Total Dividend Fund | | $ | 55,475,928 | | | $ | 2,626,818 | |
Equity Income Fund | | | 262,525,579 | | | | 50,389,685 | |
LargeCap Dividend Fund | | | 696,091,371 | | | | 203,049,321 | |
Dividend ex-Financials Fund | | | 1,027,379,404 | | | | 204,542,987 | |
MidCap Dividend Fund | | | 141,738,583 | | | | 65,464,979 | |
SmallCap Dividend Fund | | | 62,011,780 | | | | 2,267,829 | |
Gains and losses on in-kind redemptions are not recognized by the Funds for tax purposes.
6. FEDERAL INCOME TAXES
At March 31, 2012, the cost of investments (including securities on loan) for Federal income tax purposes was as follows:
| | | | | | | | | | | | | | | | |
| Fund | | Tax Cost | | | Gross Unrealized
Appreciation | | | Gross Unrealized
Depreciation | | | Net Unrealized
Appreciation | |
Total Dividend Fund | | $ | 208,017,458 | | | $ | 43,154,383 | | | $ | (3,308,962 | ) | | $ | 39,845,421 | |
Equity Income Fund | | | 407,419,427 | | | | 37,099,005 | | | | (4,407,287 | ) | | | 32,691,718 | |
LargeCap Dividend Fund | | | 1,095,652,333 | | | | 126,097,162 | | | | (9,998,770 | ) | | | 116,098,392 | |
Dividend ex-Financials Fund | | | 1,227,811,554 | | | | 122,049,439 | | | | (17,479,332 | ) | | | 104,570,107 | |
MidCap Dividend Fund | | | 343,732,085 | | | | 37,892,965 | | | | (8,044,421 | ) | | | 29,848,544 | |
SmallCap Dividend Fund | | | 312,358,979 | | | | 38,846,442 | | | | (12,098,987 | ) | | | 26,747,455 | |
At March 31, 2012, the components of accumulated earnings/(loss) on a tax-basis were as follows:
| | | | | | | | | | | | | | | | |
| Fund | | Undistributed
Ordinary Income | | | Undistributed
Capital and Other
Losses | | | Net Unrealized
Appreciation | | | Total Accumulated
Earnings/(Losses) | |
Total Dividend Fund | | $ | 156,833 | | | $ | (27,117,636 | ) | | $ | 39,845,421 | | | $ | 12,884,618 | |
Equity Income Fund | | | 373,665 | | | | (66,157,744 | ) | | | 32,691,718 | | | | (33,092,361 | ) |
LargeCap Dividend Fund | | | 683,066 | | | | (85,314,348 | ) | | | 116,098,392 | | | | 31,467,110 | |
Dividend ex-Financials Fund | | | 1,487,436 | | | | (82,444,026 | ) | | | 104,570,107 | | | | 23,613,517 | |
MidCap Dividend Fund | | | 423,490 | | | | (32,349,903 | ) | | | 29,848,544 | | | | (2,077,869 | ) |
SmallCap Dividend Fund | | | 319,163 | | | | (49,882,673 | ) | | | 26,747,455 | | | | (22,816,055 | ) |
| | | | |
| WisdomTree Domestic Dividend Funds | | | 59 | |
Notes to Financial Statements (continued)
The tax character of distributions paid during the fiscal years ended March 31, 2012 and March 31, 2011, was as follows:
| | | | | | | | |
| | | Year Ended
March 31, 2012 | | | Year Ended
March 31, 2011 | |
| Fund | | Distributions Paid
from Ordinary
Income* | | | Distributions Paid
from Ordinary
Income* | |
Total Dividend Fund | | $ | 5,704,497 | | | $ | 4,438,769 | |
Equity Income Fund | | | 11,082,460 | | | | 6,474,781 | |
LargeCap Dividend Fund | | | 25,273,380 | | | | 14,235,763 | |
Dividend ex-Financials Fund | | | 27,628,769 | | | | 10,527,617 | |
MidCap Dividend Fund | | | 7,571,610 | | | | 5,778,694 | |
SmallCap Dividend Fund | | | 9,064,912 | | | | 7,366,770 | |
* Includes short-term capital gains. | | | | | | | | |
At March 31, 2012, for Federal income tax purposes, the Funds have capital loss carryforwards available to offset future capital gains through the years indicated. To the extent that these loss carryforwards are utilized, capital gains so offset will not be distributed to shareholders.
| | | | | | | | | | | | | | | | | | | | | | | | | | | | | | | | |
| Fund | | Capital Loss
Available
Through 2015 | | | Capital Loss
Available
Through 2016 | | | Capital Loss
Available
Through 2017 | | | Capital Loss
Available
Through 2018 | | | Capital Loss
Available
Through 2019 | | | Short-Term
Post-Effective
No Expiration* | | | Long-Term
Post-Effective
No Expiration* | | | Capital Loss
Available
Total | |
Total Dividend Fund | | $ | — | | | $ | 29,395 | | | $ | 4,674,701 | | | $ | 11,073,078 | | | $ | 10,786,298 | | | $ | — | | | $ | — | | | $ | 26,563,472 | |
Equity Income Fund | | | — | | | | — | | | | 8,095,468 | | | | 36,880,803 | | | | 21,181,473 | | | | — | | | | — | | | | 66,157,744 | |
LargeCap Dividend Fund | | | 5,452 | | | | 3,165,417 | | | | 12,904,697 | | | | 32,859,591 | | | | 32,903,699 | | | | — | | | | 396,369 | | | | 82,235,225 | |
Dividend ex-Financials Fund | | | — | | | | 791,229 | | | | 9,972,192 | | | | 68,035,975 | | | | 1,318,159 | | | | — | | | | — | | | | 80,117,555 | |
MidCap Dividend Fund | | | — | | | | — | | | | 6,602,518 | | | | 16,904,294 | | | | 5,568,674 | | | | — | | | | — | | | | 29,075,486 | |
SmallCap Dividend Fund | | | — | | | | 414,956 | | | | 10,100,965 | | | | 32,761,958 | | | | 6,604,794 | | | | — | | | | — | | | | 49,882,673 | |
* Under the recently enacted Regulated Investment Company Modernization Act of 2010, a Fund is permitted to carry forward any new capital losses for an unlimited period. Additionally, such capital losses that are carried forward will retain their character as either short-term or long-term capital losses rather than being considered all short-term as under previous law. The character of these losses is noted above. | |
Capital losses incurred after October 31 (“post-October capital losses”) and within the taxable year are deemed to arise on the first business day of each Fund’s next taxable year.
During the year ended March 31, 2012, the following Funds incurred and will elect to defer post-October capital losses as follows:
| | | | | | | | |
| Fund | | Short-Term Post-October
Capital Losses | | | Long-Term Post-October
Capital Losses | |
Total Dividend Fund | | $ | — | | | $ | 554,164 | |
Equity Income Fund | | | — | | | | — | |
LargeCap Dividend Fund | | | 1,197,914 | | | | 1,881,209 | |
Dividend ex-Financials Fund | | | 1,680,534 | | | | 645,937 | |
MidCap Dividend Fund | | | 1,140,526 | | | | 2,133,891 | |
SmallCap Dividend Fund | | | — | | | | — | |
During the fiscal year ended March 31, 2012, the following Funds utilized capital loss carryforwards of the noted amounts to offset realized gains.
| | | | |
| Fund | | Utilized
Capital Loss
Carryforwards | |
Total Dividend Fund | | $ | 381,097 | |
Equity Income Fund | | | 2,652,692 | |
LargeCap Dividend Fund | | | — | |
Dividend ex-Financials Fund | | | 429,754 | |
MidCap Dividend Fund | | | 1,041,551 | |
SmallCap Dividend Fund | | | 404,213 | |
| | |
| 60 | | WisdomTree Domestic Dividend Funds |
Notes to Financial Statements (continued)
At March 31, 2012, the effect of permanent book/tax reclassifications resulted in increases (decreases) to the components of net assets as follows:
| | | | | | | | | | | | |
| Fund | | Undistributed Net
Investment
Income/(Loss) | | | Accumulated Net
Realized Loss | | | Paid-in Capital | |
Total Dividend Fund | | $ | 2,034 | | | $ | (862,885 | ) | | $ | 860,851 | |
Equity Income Fund | | | (613 | ) | | | (4,855,520 | ) | | | 4,856,133 | |
LargeCap Dividend Fund | | | (44,161 | ) | | | (39,949,244 | ) | | | 39,993,405 | |
Dividend ex-Financials Fund | | | (159,144 | ) | | | (24,975,755 | ) | | | 25,134,899 | |
MidCap Dividend Fund | | | 41,074 | | | | (12,854,408 | ) | | | 12,813,334 | |
SmallCap Dividend Fund | | | (287,947 | ) | | | (134,928 | ) | | | 422,875 | |
These differences are primarily due to redemptions-in-kind, the tax treatment of income earned from investments in partnerships, non-deductible expenses, and non-dividend distributions from underlying investments.
GAAP provides guidance on tax provisions that prescribe a minimum threshold for financial statement recognition of the benefit of a tax position taken or expected to be taken in a tax return. Foreign taxes are provided for based on each Fund’s understanding of the tax rules and rates that exist in the foreign markets in which it invests. Taxes are accrued and applied to net investment income, net realized capital gains and net unrealized appreciation, as applicable, as the income is earned or capital gains are recorded. As of and during the fiscal year ended March 31, 2012, the Funds did not have any liabilities for unrecognized tax benefits. If applicable, the Funds will recognize interest accrued related to unrecognized tax benefits in interest expense and penalties in “Other” expenses on the Statements of Operations. The Funds file tax returns with the Internal Revenue Service, the State of New York, and various other states. Generally, each of the tax years in the four-year period ended March 31, 2012, remains subject to examination by taxing authorities.
7. OTHER AFFILIATED PARTIES AND TRANSACTIONS
Affiliated holdings are funds which are managed by the Trust or an affiliate of the Trust. Transactions with affiliated companies during the fiscal year ended March 31, 2012 are as follows:
| | | | | | | | | | | | | | | | | | | | |
| Affiliated Fund Name | | Value at
3/31/2011 | | | Purchases/
Additions | | | Sales/
Reductions | | | Value at
3/31/2012 | | | Dividend
Income | |
Total Dividend Fund | | | | | | | | | | | | | | | | | | | | |
WisdomTree Earnings 500 Fund | | $ | 273,651 | | | $ | 139,918 | | | $ | 414,065 | | | $ | — | | | $ | — | |
WisdomTree Total Earnings Fund | | | 1,158,392 | | | | 1,539,746 | | | | 2,308,350 | | | | 378,355 | | | | 15,744 | |
Total | | $ | 1,432,043 | | | $ | 1,679,664 | | | $ | 2,722,415 | | | $ | 378,355 | | | $ | 15,744 | |
| | | | | |
Equity Income Fund | | | | | | | | | | | | | | | | | | | | |
Total Dividend Fund | | $ | 792,408 | | | $ | 8,813,280 | | | $ | 9,236,665 | | | $ | 394,979 | | | $ | 30,092 | |
| | | | | |
LargeCap Dividend Fund | | | | | | | | | | | | | | | | | | | | |
Total Dividend Fund | | $ | 1,298,687 | | | $ | 15,691,871 | | | $ | 16,579,281 | | | $ | 327,795 | | | $ | 47,969 | |
| | | | | |
Dividend ex-Financials Fund | | | | | | | | | | | | | | | | | | | | |
LargeCap Dividend Fund | | $ | 2,243,546 | | | $ | 12,278,846 | | | $ | 13,234,914 | | | $ | 1,595,420 | | | $ | 58,751 | |
MidCap Dividend Fund | | | 2,256,566 | | | | 12,256,281 | | | | 13,130,488 | | | | 1,589,686 | | | | 54,404 | |
Total | | $ | 4,500,112 | | | $ | 24,535,127 | | | $ | 26,365,402 | | | $ | 3,185,106 | | | $ | 113,155 | |
| | | | | |
MidCap Dividend Fund | | | | | | | | | | | | | | | | | | | | |
LargeCap Dividend Fund | | $ | 3,672,996 | | | $ | 2,272,871 | | | $ | 4,305,690 | | | $ | 1,852,064 | | | $ | 68,386 | |
| | | | | |
SmallCap Dividend Fund | | | | | | | | | | | | | | | | | | | | |
MidCap Dividend Fund | | $ | 3,808,779 | | | $ | 5,122,070 | | | $ | 6,711,657 | | | $ | 2,349,094 | | | $ | 53,418 | |
| | | | |
| WisdomTree Domestic Dividend Funds | | | 61 | |
Notes to Financial Statements (continued)
8. NEW ACCOUNTING PRONOUNCEMENTS
In April 2011, the FASB issued Accounting Standards Update (“ASU”) 2011-03 “Reconsideration of Effective Control for Repurchase Agreements” (“ASU 2011-03”). The objective of ASU 2011-03 is to improve the accounting for repurchase agreements and similar agreements that both entitle and obligate a transferor to repurchase or redeem financial assets before their maturity. Under previous guidance, whether or not to account for a transaction as a sale was based on, in part, if the entity maintained effective control over the transferred financial assets. ASU 2011-03 removes the transferor’s ability criterion from the effective control assessment. This guidance is effective prospectively for interim and annual reporting periods beginning on or after December 15, 2011. Management is currently evaluating the implications of ASU 2011-03 and its impact on the financial statements.
In May 2011, the FASB issued ASU 2011-04 “Amendments to Achieve Common Fair Value Measurement and Disclosure Requirements in U.S. GAAP and IFRS” (“ASU 2011-04”). ASU 2011-04 includes common requirements for measurement of and disclosure about fair value between U.S. GAAP and IFRS. ASU 2011-04 will require reporting entities to disclose the following information for fair value measurements categorized within Level 3 of the fair value hierarchy: quantitative information about the unobservable inputs used in the fair value measurement, the valuation processes used by the reporting entity and a narrative description of the sensitivity of the fair value measurement to changes in unobservable inputs and the interrelationships between those unobservable inputs. In addition, ASU 2011-04 will require reporting entities to make disclosures about amounts and reasons for all transfers in and out of Level 1 and Level 2 fair value measurements. The new and revised disclosures are effective for interim and annual reporting periods beginning after December 15, 2011. At this time, management is evaluating the implications of ASU 2011-04 and its impact on the financial statements.
In December 2011, FASB issued ASU 2011-11 “Disclosures about Offsetting Assets and Liabilities”. The amendments in this ASU require an entity to disclose information about offsetting and related arrangements to enable users of its financial statements to understand the effect of those arrangements on its financial position. The ASU is effective for annual reporting periods beginning on or after January 1, 2013, and for interim periods within those annual reporting periods. The guidance requires retrospective application for all comparative periods presented. Management is currently evaluating the implications of ASU 2011-11 and its impact on the financial statements.
9. LEGAL MATTER
On December 1, 2011, Research Affiliates, LLC filed a complaint in the United States District Court for the Central District of California, naming the Trust, WTAM, and its affiliates, along with other parties, as defendants. The complaint alleges that the fundamentally weighted investment methodology developed by WisdomTree Investments and employed by the Trust infringes three of plaintiff’s patents. The complaint seeks both unspecified monetary damages to be determined and an injunction to prevent further infringement. The Trust filed its answer to the complaint on January 17, 2012. The Trust believes it has strong defenses to this lawsuit based on its belief that (i) the Trust’s Funds do not practice the indexing methods as claimed in the asserted patents because, for example, the factors used to select Fund assets include market capitalization and the price of the assets, and thus fall outside the scope of the asserted patents, which generally provide that selection of the assets to be used for creation of the index must be based upon factors that are sufficiently independent of market capitalization; and (ii) the patents should be declared invalid because, among other reasons, there is ample evidence that the concept of fundamentals based indexing was widely known and in commercial use by asset managers and index providers well before the patent applications at issue were filed by plaintiff. For example, in support of the defenses that the asserted patents are invalid, the Trust intends to present evidence that as far back as the early 1990s, Robert Jones at Goldman Sachs managed an earnings weighted index fund. As another example, the Trust intends to present evidence that Dow Jones launched a dividend weighted stock index in 2003. These examples support the Trust’s view that the asserted patents are invalid at least because earlier publications and activities of investment professionals anticipated or made obvious plaintiff’s alleged inventions.
While at this early stage of the proceedings it is not possible to determine the probability of any outcome or the probability or amount of any loss, the Trust is confident in the merits of its position. Nevertheless, an adverse resolution could have a negative impact on the Trust and the Funds. For example, in the event of an unfavorable outcome the Trust may be required to pay ongoing license fees if WisdomTree Investments cannot change its indexes in a manner that does not infringe on the patents. This could increase the Funds’ expense ratios and have a negative impact on Fund performance. WTAM and WisdomTree Investments have contractually agreed to indemnify the Trust and pay any losses, claims and damages (including legal fees) incurred by the Trust or a Fund in connection with the complaint. The Trust intends to vigorously defend against plaintiff’s claims.
| | |
| 62 | | WisdomTree Domestic Dividend Funds |
Report of Independent Registered Public Accounting Firm
The Board of Trustees and Shareholders of WisdomTree Trust:
We have audited the accompanying statements of assets and liabilities, including the schedules of investments, of WisdomTree Total Dividend Fund, WisdomTree Equity Income Fund, WisdomTree LargeCap Dividend Fund, WisdomTree Dividend ex-Financials Fund, WisdomTree MidCap Dividend Fund and WisdomTree SmallCap Dividend Fund (six of the investment funds constituting the WisdomTree Trust (the “Trust”)) as of March 31, 2012, and the related statements of operations for the year then ended, the statements of changes in net assets for each of the two years in the period then ended, and the financial highlights for each of the five years in the period then ended. These financial statements and financial highlights are the responsibility of the Trust’s management. Our responsibility is to express an opinion on these financial statements and financial highlights based on our audits.
We conducted our audits in accordance with the standards of the Public Company Accounting Oversight Board (United States). Those standards require that we plan and perform the audit to obtain reasonable assurance about whether the financial statements and financial highlights are free of material misstatement. We were not engaged to perform an audit of the Trust’s internal control over financial reporting. Our audits included consideration of internal control over financial reporting as a basis for designing audit procedures that are appropriate in the circumstances, but not for the purpose of expressing an opinion on the effectiveness of the Trust’s internal control over financial reporting. Accordingly, we express no such opinion. An audit also includes examining, on a test basis, evidence supporting the amounts and disclosures in the financial statements and financial highlights, assessing the accounting principles used and significant estimates made by management, and evaluating the overall financial statement presentation. Our procedures included confirmation of securities owned as of March 31, 2012, by correspondence with the custodian and brokers or by other appropriate auditing procedures where replies from brokers were not received. We believe that our audits provide a reasonable basis for our opinion.
In our opinion, the financial statements and financial highlights referred to above present fairly, in all material respects, the financial position of WisdomTree Total Dividend Fund, WisdomTree Equity Income Fund, WisdomTree LargeCap Dividend Fund, WisdomTree Dividend ex-Financials Fund, WisdomTree MidCap Dividend Fund and WisdomTree SmallCap Dividend Fund of WisdomTree Trust at March 31, 2012, the results of their operations for the year then ended, the changes in their net assets for each of the two years in the period then ended, and the financial highlights for each of the five years in the period then ended, in conformity with U.S. generally accepted accounting principles.

New York, New York
May 25, 2012
| | | | |
| WisdomTree Domestic Dividend Funds | | | 63 | |
Approval of Investment Advisory and Sub-Advisory Agreement (unaudited)
Approval of Investment Advisory Agreement. The Trust and the Investment Adviser have entered into an investment advisory agreement covering each Fund discussed herein. At a meeting held on March 1, 2012, the Board of Trustees (the “Board”) re-approved the Investment Advisory Agreement for each Fund. The Board reviewed and analyzed the factors it deemed relevant, including: (i) the nature, quality and extent of the services to be provided to the Funds by WTAM; (ii) the performance of the Funds; (iii) the costs of services to be provided and the profits to be realized by WTAM from its relationship with the Funds; (iv) the extent to which economies of scale would be realized as the Funds grow; and (v) whether the fee levels reflect these economies of scale for the benefit of investors.
The Board also considered the nature and quality of the services to be provided by WTAM to the Funds, recognizing WTAM’s operational capabilities and resources. The Board also noted the extensive responsibilities that WTAM has as investment adviser to the Funds, including the selection of the Funds’ Sub-Adviser, oversight of the Sub-Adviser’s compliance with Fund policies and objectives, oversight of general Fund compliance with federal and state laws, and the implementation of Board directives as they relate to the Funds.
The Board gave substantial consideration to the fees payable under the Advisory Agreement for each Fund. In this connection, the Board evaluated WTAM’s anticipated costs and profitability in serving as investment adviser to the Funds, including the costs associated with the personnel, systems and equipment necessary to manage the Funds and the costs associated with compensating the Sub-Adviser. The Board also examined the fees to be paid by each Fund in light of fees paid to other investment managers by comparable funds and the method of computing each Fund’s fee. After comparing the fees with those of comparable funds and in light of the quality and extent of services to be provided and the costs anticipated to be incurred by WTAM, the Board concluded that the level of the fees paid to WTAM with respect to each Fund is fair and reasonable. The Board also re-approved the Sub-Advisory Agreement between WTAM and MCM, on behalf of each Fund, using essentially the same criteria it used in connection with the Advisory Agreement. The Board considered MCM’s operational capabilities and resources and MCM’s experience in serving as an adviser to ETFs, noting that MCM currently provides investment advisory and management services to other ETFs. The Board considered the investment performance of the Funds, and the expertise and performance of the MCM personnel. The Board also noted that Bank of New York Mellon Corporation, an affiliate of MCM, serves as the Funds’ administrator, accountant, custodian, transfer agent and securities lending agent and receives compensation for acting in these capacities and is responsible for, among other things, coordinating the Funds’ audits, financial statements and tax returns, managing expenses and budgeting for the Funds, processing trades on behalf of each Fund and custodying Fund assets. As such, the Board concluded that the benefits accruing to MCM and its affiliates by virtue of their relationship to the Trust are reasonable and fair in comparison with the anticipated costs of providing the relevant services. The Board noted that WTAM, not the Funds, pays the fees to MCM under the Sub-Advisory Agreement for each Fund.
Based on these considerations and the overall high quality of the personnel, operations, financial condition, investment advisory capabilities, methodologies, and performance of WTAM and MCM, the Board determined that the re-approval of the Advisory Agreement and the Sub-Advisory Agreement for each Fund was in the best interests of each Fund. After full consideration of these and other factors, the Board, including a majority of the Independent Trustees, with the assistance of independent counsel, approved the Advisory Agreement and Sub-Advisory Agreement for each Fund.
| | |
| 64 | | WisdomTree Domestic Dividend Funds |
Frequency Distribution of Discounts & Premiums (unaudited)
The chart below presents information about differences between the per share net asset value (“NAV”) of each Fund and the market trading price of shares of each Fund. For these purposes, the “market price” is the mid-point of the highest bid and lowest offer for Fund shares as of the close of trading on the exchange where Fund shares are listed. The term “premium” is sometimes used to describe a market price in excess of NAV and the term “discount” is sometimes used to describe a market price below NAV. The chart presents information about the size and frequency of premiums or discounts. As with other exchange traded funds, the market price of Fund shares is typically slightly higher or lower than the Fund’s per share NAV. Factors that contribute to the differences between market price and NAV include the supply and demand for Fund shares and investors’ assessments of the underlying value of a Fund’s portfolio securities.
Differences between the closing times of U.S. and non-U.S. markets may contribute to differences between the NAV and market price of Fund shares. Many non-U.S. markets close prior to the close of the U.S. securities exchanges. Developments after the close of such markets as a result of ongoing price discovery may be reflected in a Fund’s market price but not in its NAV (or vice versa).
| | | | | | | | | | | | | | | | | | | | |
| | | | | | Market Price Above or
Equal to Net Asset Value | | | Market Price Below
Net Asset Value | |
| | | Basis Point
Differential* | | | Number
of Days | | | Percentage of
Total Days | | | Number
of Days | | | Percentage
of Total Days | |
WisdomTree Total Dividend Fund | | | | | | | | | | | | | | | | | | | | |
June 16, 2006 – March 31, 2012 | | | 0 – 24.9 | | | | 741 | | | | 48.75 | % | | | 718 | | | | 47.24 | % |
| | | 25 – 49.9 | | | | 27 | | | | 1.78 | % | | | 14 | | | | 0.92 | % |
| | | 50 – 74.9 | | | | 6 | | | | 0.39 | % | | | 5 | | | | 0.33 | % |
| | | 75 – 99.9 | | | | 3 | | | | 0.20 | % | | | 0 | | | | 0.00 | % |
| | | 100 – 124.9 | | | | 1 | | | | 0.07 | % | | | 1 | | | | 0.06 | % |
| | | 125 – 174.9 | | | | 1 | | | | 0.07 | % | | | 0 | | | | 0.00 | % |
| | | 175 – 199.9 | | | | 2 | | | | 0.13 | % | | | 0 | | | | 0.00 | % |
| | | 200 – 249.9 | | | | 0 | | | | 0.00 | % | | | 0 | | | | 0.00 | % |
| | | >250 | | | | 1 | | | | 0.06 | % | | | 0 | | | | 0.00 | % |
| | | | Total | | | | 782 | | | | 51.45 | % | | | 738 | | | | 48.55 | % |
WisdomTree Equity Income Fund | | | | | | | | | | | | | | | | | | | | |
June 16, 2006 – March 31, 2012 | | | 0 – 24.9 | | | | 704 | | | | 46.32 | % | | | 748 | | | | 49.21 | % |
| | | 25 – 49.9 | | | | 31 | | | | 2.04 | % | | | 13 | | | | 0.85 | % |
| | | 50 – 74.9 | | | | 5 | | | | 0.33 | % | | | 5 | | | | 0.33 | % |
| | | 75 – 99.9 | | | | 2 | | | | 0.13 | % | | | 1 | | | | 0.07 | % |
| | | 100 – 124.9 | | | | 2 | | | | 0.13 | % | | | 1 | | | | 0.07 | % |
| | | 125 – 174.9 | | | | 3 | | | | 0.20 | % | | | 1 | | | | 0.07 | % |
| | | 175 – 199.9 | | | | 0 | | | | 0.00 | % | | | 0 | | | | 0.00 | % |
| | | 200 – 249.9 | | | | 0 | | | | 0.00 | % | | | 1 | | | | 0.06 | % |
| | | >250 | | | | 2 | | | | 0.13 | % | | | 1 | | | | 0.06 | % |
| | | | Total | | | | 749 | | | | 49.28 | % | | | 771 | | | | 50.72 | % |
WisdomTree LargeCap Dividend Fund | | | | | | | | | | | | | | | | | | | | |
June 16, 2006 – March 31, 2012 | | | 0 – 24.9 | | | | 862 | | | | 56.71 | % | | | 563 | | | | 37.04 | % |
| | | 25 – 49.9 | | | | 44 | | | | 2.89 | % | | | 17 | | | | 1.12 | % |
| | | 50 – 74.9 | | | | 18 | | | | 1.18 | % | | | 2 | | | | 0.13 | % |
| | | 75 – 99.9 | | | | 2 | | | | 0.13 | % | | | 0 | | | | 0.00 | % |
| | | 100 – 124.9 | | | | 2 | | | | 0.13 | % | | | 0 | | | | 0.00 | % |
| | | 125 – 174.9 | | | | 1 | | | | 0.07 | % | | | 1 | | | | 0.07 | % |
| | | 175 – 199.9 | | | | 1 | | | | 0.07 | % | | | 0 | | | | 0.00 | % |
| | | 200 – 249.9 | | | | 0 | | | | 0.00 | % | | | 0 | | | | 0.00 | % |
| | | >250 | | | | 5 | | | | 0.33 | % | | | 2 | | | | 0.13 | % |
| | | | Total | | | | 935 | | | | 61.51 | % | | | 585 | | | | 38.49 | % |
| | | | |
| WisdomTree Domestic Dividend Funds | | | 65 | |
Frequency Distribution of Discounts & Premiums (unaudited) (concluded)
| | | | | | | | | | | | | | | | | | | | |
| | | | | | Market Price Above or
Equal to Net Asset Value | | | Market Price Below
Net Asset Value | |
| | | Basis Point
Differential* | | | Number
of Days | | | Percentage of
Total Days | | | Number
of Days | | | Percentage
of Total Days | |
WisdomTree Dividend ex-Financials Fund | | | | | | | | | | | | | | | | | | | | |
June 16, 2006 – March 31, 2012 | | | 0 – 24.9 | | | | 793 | | | | 52.17 | % | | | 636 | | | | 41.84 | % |
| | | 25 – 49.9 | | | | 48 | | | | 3.16 | % | | | 18 | | | | 1.18 | % |
| | | 50 – 74.9 | | �� | | 4 | | | | 0.26 | % | | | 2 | | | | 0.13 | % |
| | | 75 – 99.9 | | | | 3 | | | | 0.20 | % | | | 2 | | | | 0.13 | % |
| | | 100 – 124.9 | | | | 2 | | | | 0.13 | % | | | 1 | | | | 0.07 | % |
| | | 125 – 174.9 | | | | 1 | | | | 0.07 | % | | | 1 | | | | 0.07 | % |
| | | 175 – 199.9 | | | | 1 | | | | 0.07 | % | | | 0 | | | | 0.00 | % |
| | | 200 – 249.9 | | | | 4 | | | | 0.26 | % | | | 1 | | | | 0.07 | % |
| | | >250 | | | | 2 | | | | 0.13 | % | | | 1 | | | | 0.06 | % |
| | | | Total | | | | 858 | | | | 56.45 | % | | | 662 | | | | 43.55 | % |
WisdomTree MidCap Dividend Fund | | | | | | | | | | | | | | | | | | | | |
June 16, 2006 – March 31, 2012 | | | 0 – 24.9 | | | | 854 | | | | 56.18 | % | | | 586 | | | | 38.55 | % |
| | | 25 – 49.9 | | | | 26 | | | | 1.71 | % | | | 21 | | | | 1.38 | % |
| | | 50 – 74.9 | | | | 8 | | | | 0.53 | % | | | 4 | | | | 0.26 | % |
| | | 75 – 99.9 | | | | 2 | | | | 0.13 | % | | | 4 | | | | 0.26 | % |
| | | 100 – 124.9 | | | | 2 | | | | 0.13 | % | | | 3 | | | | 0.20 | % |
| | | 125 – 174.9 | | | | 2 | | | | 0.13 | % | | | 1 | | | | 0.07 | % |
| | | 175 – 199.9 | | | | 2 | | | | 0.14 | % | | | 0 | | | | 0.00 | % |
| | | 200 – 249.9 | | | | 4 | | | | 0.26 | % | | | 0 | | | | 0.00 | % |
| | | >250 | | | | 1 | | | | 0.07 | % | | | 0 | | | | 0.00 | % |
| | | | Total | | | | 901 | | | | 59.28 | % | | | 619 | | | | 40.72 | % |
WisdomTree SmallCap Dividend Fund | | | | | | | | | | | | | | | | | | | | |
June 16, 2006 – March 31, 2012 | | | 0 – 24.9 | | | | 732 | | | | 48.16 | % | | | 631 | | | | 41.51 | % |
| | | 25 – 49.9 | | | | 66 | | | | 4.34 | % | | | 51 | | | | 3.36 | % |
| | | 50 – 74.9 | | | | 13 | | | | 0.85 | % | | | 6 | | | | 0.40 | % |
| | | 75 – 99.9 | | | | 2 | | | | 0.13 | % | | | 2 | | | | 0.13 | % |
| | | 100 – 124.9 | | | | 3 | | | | 0.20 | % | | | 2 | | | | 0.13 | % |
| | | 125 – 174.9 | | | | 3 | | | | 0.20 | % | | | 2 | | | | 0.13 | % |
| | | 175 – 199.9 | | | | 0 | | | | 0.00 | % | | | 0 | | | | 0.00 | % |
| | | 200 – 249.9 | | | | 1 | | | | 0.06 | % | | | 1 | | | | 0.07 | % |
| | | >250 | | | | 3 | | | | 0.20 | % | | | 2 | | | | 0.13 | % |
| | | | Total | | | | 823 | | | | 54.14 | % | | | 697 | | | | 45.86 | % |
| * | Basis point (bps) is a unit that is equal to 1/100th of 1%. |
| | |
| 66 | | WisdomTree Domestic Dividend Funds |
Trustees and Officers Information (unaudited)
The Board has responsibility for the overall management and operations of the Funds, including general supervision of the duties performed by WTAM and other service providers. The Board elects the officers of the Trust who are responsible for administering the Trust’s day-to-day operations. Each Trustee serves until his or her successor is duly elected or appointed and qualified.
The address of each Trustee and Officer is c/o WisdomTree Asset Management, Inc., 380 Madison Avenue, 21st Floor, New York, New York 10017.
Interested Trustee and Officers
| | | | | | | | | | |
Name
(year of birth) | | Position | | Term of Office
and Length of
Time Served | | Principal Occupation(s)
During the Past 5 Years | | Number of Portfolios
in Fund Complex
Overseen by Trustee/
Officer† | | Other
Directorships
Held by Trustee/
Officer |
Jonathan Steinberg
(1964) | | Trustee, President* | | Trustee and Officer
since 2005 | | President, WisdomTree Trust since 2005; Chief Executive Officer of WisdomTree Investments, Inc. and Director of WisdomTree Investments, Inc. since 1989. | | 48 | | None. |
| | | | | |
Amit Muni
(1969) | | Treasurer,* Assistant Secretary* | | Officer
since 2008 | | Chief Financial Officer and Assistant Secretary of WisdomTree Investments, Inc. since March 2008; International Securities Exchange Holdings, Inc. (ISE), Controller and Chief Accounting Officer from 2003 to 2008. | | 48 | | None. |
| | | | | |
Richard Morris
(1967) | | Secretary,* Chief Legal Officer* | | Officer
since 2005 | | General Counsel of WisdomTree Asset Management since 2009; Chief Compliance Officer of WisdomTree Trust since 2009; Deputy General Counsel of WisdomTree Investments, Inc. since 2005; Senior Counsel at Barclays Global Investors, N.A. from 2002 to 2005. | | 48 | | None. |
| * | Elected by and serves at the pleasure of the Board of Trustees. |
| | | | |
| WisdomTree Domestic Dividend Funds | | | 67 | |
Trustees and Officers Information (unaudited) (concluded)
Independent Trustees
| | | | | | | | | | |
Name
(year of birth) | | Position | | Term of Office
and Length of
Time Served | | Principal Occupation(s)
During the Past 5 Years | | Number of Portfolios
in Fund Complex
Overseen by
Trustee† | | Other
Directorships
Held by Trustee |
Gregory Barton
(1961)* | | Trustee | | Trustee
since 2006 | | Executive Vice President of Business Legal Affairs, General Counsel and Secretary of TheStreet, Inc. 2009 to present; General Counsel of Martha Stewart Living Omnimedia, Inc. from 2007 to 2008; Executive Vice President of Licensing and Legal Affairs, General Counsel and Secretary of Ziff Davis Media Inc. from 2004 to 2007; Executive Vice President of Legal Affairs, General Counsel and Secretary of Ziff Davis Media Inc. from 2002 to 2004; President from 2001 to 2002, Chief Financial Officer from 2000 to 2002, Vice President of Business Development from 1999 to 2001 and General Counsel and Secretary from 1998 to 2002 of WisdomTree Investments, Inc. | | 48 | | Trustee, GLG Investment Series Trust; and Trustee, Man Long/Short Fund. |
| | | | | |
Toni Massaro
(1955)** | | Trustee | | Trustee
since 2006 | | Dean Emerita at University of Arizona James E. Rogers College of Law (“Rogers College of Law”) since 2009 (distinguished Emerita in July 2009); Dean at the Rogers College of Law from 1999 to 2009; Regents’ Professor since 2006; Milton O. Riepe Chair in Constitutional Law since 1997; Professor at the Rogers College of Law since 1990. | | 48 | | None. |
| | | | | |
Victor Ugolyn
(1947) | | Trustee, Chairman of the Board of Trustees | | Trustee
since 2006 | | Private Investor - 2005 to Present; President and Chief Executive Officer of William D. Witter, Inc. from 2005 to 2006; Consultant to AXA Enterprise in 2004; Chairman, President and Chief Executive Officer of Enterprise Capital Management (subsidiary of The MONY Group, Inc.) and Enterprise Group of Funds, Chairman of MONY Securities Corporation, and Chairman of the Fund Board of Enterprise Group of Funds 1991 to 2004. | | 48 | | Member of Board of New York Society of Security Analysts; Member of the Board of Governors of Naismith Memorial Basketball Hall of Fame. |
| * | Chair of the Audit Committee. |
| ** | Chair of the Governance and Nominating Committee. |
| | |
| 68 | | WisdomTree Domestic Dividend Funds |
Supplemental Information (unaudited)
Federal Income Tax Information
The following Federal tax information related to the Funds fiscal year ended March 31, 2012, is provided for information purposes only and should not be used for reporting to federal or state revenue agencies. Federal tax information for the calendar year will be reported to you on Form 1099-DIV in January 2013.
Certain dividends paid by the Funds may be subject to a maximum tax rate of 15%, as provided by the Jobs and Growth Tax Relief Reconciliation Act of 2003. Of the distributions paid during the fiscal year ended March 31, 2012, the following represents the maximum amount of ordinary income distributions that may be considered qualified dividend income:
| | | | |
| Fund | | Qualified Dividend
Income | |
Total Dividend Fund | | $ | 4,878,946 | |
Equity Income Fund | | | 8,709,371 | |
LargeCap Dividend Fund | | | 23,317,595 | |
Dividend ex-Financials Fund | | | 22,091,647 | |
MidCap Dividend Fund | | | 3,440,628 | |
SmallCap Dividend Fund | | | 4,392,998 | |
The following represents the percentage of dividends paid during the fiscal year ended March 31, 2012, that qualify for the 70% dividends received deduction for corporate shareholders:
| | |
| Fund | | Dividends-Received
Deduction |
| | | | | | |
Total Dividend Fund | | | 86 | % | | |
Equity Income Fund | | | 79 | % | | |
LargeCap Dividend Fund | | | 92 | % | | |
Dividend ex-Financials Fund | | | 80 | % | | |
MidCap Dividend Fund | | | 46 | % | | |
SmallCap Dividend Fund | | | 50 | % | | |
| | | | |
| WisdomTree Domestic Dividend Funds | | | 69 | |
General Information (unaudited)
Proxy Voting Policies, Procedures and Record
A complete copy of the Proxy Voting Policy may be obtained by calling 1-866-909-WISE (9473) or writing to: WisdomTree Trust, c/o ALPS Distributors, Inc., 1290 Broadway, Suite 1100, Denver, Colorado 80203.
The Trust is required to disclose annually the Funds’ complete proxy voting record on Form N-PX covering the most recent 12-month period ended June 30 and to file Form N-PX with the SEC no later than August 31 of each year. The current Form N-PX for the Funds is available at no charge upon request by calling 1-866-909-WISE (9473) or through the Trust’s website at www.wisdomtree.com. The Funds’ Form N-PX is also available on the SEC’s website at www.sec.gov.
Shareholder Reports and Quarterly Portfolio Disclosure
The Funds are required to file their complete schedule of portfolio holdings with the SEC for their first and third fiscal quarters on Form N-Q. Copies of the filings are available, without charge, on the SEC’s website at www.sec.gov and are also available by calling the Trust at 1-866-909-WISE (9473). You can also obtain copies of Form N-Q by (i) visiting the SEC’s Public Reference Room in Washington, DC (information on the operation of the Public Reference Room may be obtained by calling 1-800-SEC-0330); (ii) sending your request and a duplicating fee to the SEC’s Public Reference Room, Washington, DC 20549-0102; or (iii) sending your request electronically to publicinfo@sec.gov.
Information about each Fund’s portfolio holdings is available daily, without charge, at www.wisdomtree.com.
The Fund’s Statement of Additional Information (“SAI”) has additional information about the Funds’ Trustees and Officers and is available without charge upon request. Contact your financial representative for a free prospectus or SAI.
| | |
| 70 | | WisdomTree Domestic Dividend Funds |
The WisdomTree Family of Funds
The following is a list of WisdomTree Funds being offered, along with their respective ticker symbols, as of March 31, 2012:
| | |
WisdomTree Domestic Dividend Funds WisdomTree Total Dividend Fund (DTD) WisdomTree Equity Income Fund (DHS) WisdomTree LargeCap Dividend Fund (DLN) WisdomTree Dividend ex-Financials Fund (DTN) WisdomTree MidCap Dividend Fund (DON) WisdomTree SmallCap Dividend Fund (DES) WisdomTree International Dividend Funds WisdomTree DEFA Fund (DWM) WisdomTree DEFA Equity Income Fund (DTH) WisdomTree Global Equity Income Fund (DEW) WisdomTree Europe SmallCap Dividend Fund (DFE) WisdomTree Japan Hedged Equity Fund (DXJ) WisdomTree Global ex-U.S. Growth Fund (DNL) WisdomTree Japan SmallCap Dividend Fund (DFJ) WisdomTree Asia Pacific ex-Japan Fund (AXJL) WisdomTree Australia Dividend Fund (AUSE) WisdomTree International LargeCap Dividend Fund (DOL) WisdomTree International Dividend ex-Financials Fund (DOO) WisdomTree International MidCap Dividend Fund (DIM) WisdomTree International SmallCap Dividend Fund (DLS) WisdomTree Emerging Markets Equity Income Fund (DEM) WisdomTree Emerging Markets SmallCap Dividend Fund (DGS) WisdomTree Middle East Dividend Fund (GULF) WisdomTree International Hedged Equity Fund (HEDJ) WisdomTree International Dividend
Sector Funds WisdomTree Commodity Country Equity Fund (CCXE) WisdomTree Global Natural Resources Fund (GNAT) WisdomTree Global ex-U.S. Utilities Fund (DBU) WisdomTree Global ex-U.S. Real Estate Fund (DRW) | | WisdomTree Domestic and International
Earnings Funds WisdomTree Total Earnings Fund (EXT) WisdomTree Earnings 500 Fund (EPS) WisdomTree MidCap Earnings Fund (EZM) WisdomTree SmallCap Earnings Fund (EES) WisdomTree LargeCap Value Fund (EZY) WisdomTree LargeCap Growth Fund (ROI) WisdomTree India Earnings Fund (EPI) WisdomTree Currency Funds WisdomTree Dreyfus Brazilian Real Fund (BZF) WisdomTree Dreyfus Chinese Yuan Fund (CYB) WisdomTree Dreyfus Commodity Currency Fund (CCX) WisdomTree Dreyfus Emerging Currency Fund (CEW) WisdomTree Dreyfus Indian Rupee Fund (ICN) WisdomTree Dreyfus Japanese Yen Fund (JYF) WisdomTree Dreyfus South African Rand Fund (SZR) WisdomTree Fixed Income Funds WisdomTree Asia Local Debt Fund (ALD) WisdomTree Australia & New Zealand Debt Fund (AUNZ) WisdomTree Emerging Markets Corporate Bond Fund (EMCB) WisdomTree Emerging Markets Local Debt Fund (ELD) WisdomTree Euro Debt Fund (EU) WisdomTree Alternative Funds WisdomTree Global Real Return Fund (RRF) WisdomTree Managed Futures Strategy Fund (WDTI) |
The WisdomTree Funds are exchange traded funds (“ETFs”) registered with the United States Securities and Exchange Commission as separate series (“Funds”) of WisdomTree Trust (“Trust”). WisdomTree Asset Management, Inc., a wholly owned subsidiary of WisdomTree Investments, Inc., serves as the investment adviser to the Trust. None of the WisdomTree entities are affiliated with ALPS Distributors, Inc., the Funds’ distributor. WisdomTree Investments, its affiliates and their independent providers are not liable for any informational errors, incompleteness, delays, or for any actions taken in reliance on information contained herein.
Investors should consider the investment objectives, risks, charges and expenses of the Funds carefully before investing. A prospectus, containing this and other information, is available at www.wisdomtree.com, or by calling 1-866-909-WISE (9473). Investors should read the prospectus carefully before investing. There are risks associated with investing, including possible loss of principal. Past performance does not guarantee future results. Indexes are unmanaged and you cannot invest directly in an index.
There are risks associated with investing, including possible loss of principal. Funds focusing their investments on certain sectors and/or smaller companies increase their vulnerability to any single economic or regulatory development. This may result in greater share price volatility. Please read the Fund’s prospectus for specific details regarding the Fund’s risk profile.
The Dow Jones U.S. Select Dividend Index is calculated, distributed and marketed by Dow Jones Indexes, a licensed trademark of CME Group Index Services LLC, and has been licensed for use.
Transactions in Fund shares will result in brokerage commissions and will generate tax consequences. Shares may be sold through brokerage accounts, but may be redeemed from the Funds only in large amounts of 50,000 shares or more.
WisdomTree Trust
380 Madison Avenue, 21st Floor
New York, NY 10017
WisdomTree Domestic Dividend Funds
WisdomTree Total Dividend Fund
WisdomTree Equity Income Fund
WisdomTree LargeCap Dividend Fund
WisdomTree Dividend ex-Financials Fund
WisdomTree MidCap Dividend Fund
WisdomTree SmallCap Dividend Fund
WisdomTree Fund shares are distributed by ALPS Distributors, Inc.
WIS004135 (05/2013)


WisdomTree Trust
Domestic and International Earnings Funds
Annual Report
March 31, 2012
WisdomTree Total Earnings Fund (EXT)
WisdomTree Earnings 500 Fund (EPS)
WisdomTree MidCap Earnings Fund (EZM)
WisdomTree SmallCap Earnings Fund (EES)
WisdomTree LargeCap Value Fund (EZY)
WisdomTree LargeCap Growth Fund (ROI)
WisdomTree India Earnings Fund (EPI)
Table of Contents
“WisdomTree” is a registered mark of WisdomTree Investments, Inc. and is licensed for use by the WisdomTree Trust.
Management’s Discussion of Funds’ Performance
(unaudited)
Market Environment Overview
The U.S. equity market, as measured by the S&P 500 Index, returned 8.54% for the 12-month period ended March 31, 2012 (the “period”). After bottoming in March of 2009, the S&P 500 recorded its third straight year of gains. Measured from March 31, 2009 through March 31, 2012, the three year cumulative total return on the S&P 500 Index was 87.99%. This represents a substantial recovery in the equity market as earnings and dividend levels reached and surpassed previous records.
While the overall return for the period was positive, it was marked by several bouts of volatility. Investors had to deal with events domestically and abroad that impacted the U.S. market: as the S&P 500 Index fell for the first six months of the period and turned around significantly in the second half of the period.
Much of the volatility experienced in the market revolved around concerns over a debt crisis in the developed world. At home in the United States, politicians squabbled over raising the U.S. debt ceiling in the summer of 2011. After the market close on Friday, August 5, 2011, Standard & Poor’s downgraded the U.S. government from its AAA rating — the highest credit quality rating one can achieve — due to escalating debt levels, large deficits, and the lack of a coherent plan from U.S. politicians attacking these fiscal issues. The following Monday, the S&P 500 closed down 6.65% and many market participants shifted assets away from equities and risky assets to perceived safe havens. Paradoxically, there was a flight to the very bonds that were downgraded as many believed the problems in other parts of the world, such as Europe, were worse than those in the United States.
WisdomTree Funds’ Performance Overview
By the end of September 2011, investors had experienced market uncertainty due to the European debt crisis intensifying. This resulted in the worst quarterly performance for the S&P 500 since 2008 (down 13.87%). To support the economy and credit markets, on September 21, 2011, the Federal Reserve announced “Operation Twist,” which attempted to push down long-term interest rates by shifting the balance of the Treasury’s securities holdings towards longer-term securities and selling shorter-term investments. These Federal Reserve actions, known as a form of quantitative easing, or “QE”, helped support an environment in which many investors were willing to take on more risk. From September 22, 2011, the market rose more than 26% until the end of March 2012, erasing the negative effects of the previous volatility and leaving the U.S. market, as measured by the S&P 500 Index, up 8.54% for the period.
The following table reflects the WisdomTree Funds’ performance versus their capitalization-weighted benchmark indexes:
| | | | | | | | | | | | |
| Ticker | | WisdomTree Fund | | 1-Year
NAV
Return | | Cap-Weighted Benchmark | | 1-Year
Return | | | Difference |
EXT | | WisdomTree Total Earnings Fund | | 9.74% | | Russell 3000® Index | | | 7.18% | | | 2.56% |
EPS | | WisdomTree Earnings 500 Fund | | 10.60% | | S&P 500® Index | | | 8.54% | | | 2.06% |
EZM | | WisdomTree MidCap Earnings Fund | | 4.92% | | S&P MidCap 400® Index | | | 1.98% | | | 2.94% |
EES | | WisdomTree SmallCap Earnings Fund | | 4.39% | | Russell 2000® Index | | | -0.18% | | | 4.57% |
EZY | | WisdomTree LargeCap Value Fund | | 4.83% | | Russell 1000® Value Index | | | 4.79% | | | 0.04% |
ROI | | WisdomTree LargeCap Growth Fund | | 6.74% | | Russell 1000® Growth Index | | | 11.02% | | | -4.28% |
EPI | | WisdomTree India Earnings Fund | | -21.96% | | MSCI India Index | | | -20.51% | | | -1.45% |
With all the volatility in the markets during the period, it may not be a surprise that equities considered to be more defensive in nature, such as large cap stocks, or dividend paying stocks fared better than mid cap and small cap stocks and more growth oriented strategies. While the S&P 500 Index was up 8.54%, the Russell 2000 Index, an index of small cap U.S. equities, experienced a decline of -0.18%.
WisdomTree’s earnings weighted funds are designed to track indexes based on the earnings stream generated by companies included in the underlying WisdomTree Index.
| | | | |
| WisdomTree Domestic and International Earnings Funds | | | 1 | |
Management’s Discussion of Funds’ Performance (unaudited) (concluded)
The earnings stream is defined as the total dollar level of earnings for all companies within each Index. There are two primary factors that drive performance differentials of the WisdomTree Funds and Indexes versus market cap-weighted benchmarks. The first is aggregate exposure to one or more sectors. The second is stock selection within each sector. Both of these are determined as part of WisdomTree’s rules-based index methodology. These exposures are not subjectively determined. Rather, they are objectively determined at the Index rebalancing dates based on the earnings stream.
Five of the ten sectors represented within the S&P 500 Index experienced positive performance over the period. The best performing sector over the period was the Information Technology sector. This was spurred by a lively initial public offering market and by earnings strength from some of its biggest components, such as Apple, Google, and IBM. Also, the more defensive sectors outpaced the market, such as Health Care, Consumer Staples, and Utilities. The Energy sector was the worst performing sector for the period, followed by Materials, as the commodities markets experienced a selloff over the period. Financials also lagged the broader market as questions arose about exposures to the European sovereign debt crisis.
By including only companies with profits, WisdomTree’s Earnings Funds tend to have a higher quality bias to their investment portfolios than traditional market capitalization weighted indexes. During the period, the strongest gains tended to be in the larger and more defensive stocks. For example, large cap stocks as a group outperformed small cap stocks and defensive sectors as a group outperformed cyclical sectors. As a result, most of the WisdomTree Domestic Earnings Funds outperformed their cap-weighted benchmarks. Domestically, the one exception was the WisdomTree LargeCap Growth Fund, in which performance was hindered mostly by negative stock selection in sectors such as Financials and Information Technology.
Internationally, India is the only region of the world where WisdomTree sets portfolio weights based on earnings. This is because tax regulations in India act as a disincentive to dividend payments. During the period, emerging markets equities lagged the developed world markets. India was in the lower half of countries within the MSCI Emerging Markets Index on the basis of cumulative equity performance from March 31, 2011 through March 31, 2012. The slowdown in India was largely due to concerns about inflation and the effects of increasing energy costs that have persisted for much of the past year. As a result, the India Earnings Fund had the lowest absolute performance of any international WisdomTree Fund, down more than 21% for the period even after favorable equity performance from December 31, 2011 through March 31, 2012.
Fund returns are shown at NAV. Please see Performance Summaries on the subsequent pages for more complete performance information. Please see page 10 for the list of index descriptions.
Fund performance assumes reinvestment of dividends and capital gain distributions. An index is a statistical measure of a specified financial market or sector. An index does not actually hold a portfolio of securities, incur expenses or pay any transaction costs. Therefore index returns do not reflect deductions for fees or expenses and are not available for direct investment. In comparison, the Funds’ performance is negatively impacted by these deductions. Fund returns do not reflect brokerage commissions or taxes on transactions in Fund shares or that a shareholder would pay on Fund distributions. Past performance is no guarantee of future results. For the most recent month end performance information visit www.wisdomtree.com.
| | |
| 2 | | WisdomTree Domestic and International Earnings Funds |
Performance Summary (unaudited)
WisdomTree Total Earnings Fund (EXT)
Sector Breakdown† as of 3/31/12‡
| | | | |
Information Technology | | | 19.1% | |
Financials | | | 16.6% | |
Energy | | | 12.0% | |
Consumer Discretionary | | | 11.5% | |
Industrials | | | 10.4% | |
Health Care | | | 10.1% | |
Consumer Staples | | | 9.2% | |
Materials | | | 4.4% | |
Utilities | | | 3.1% | |
Telecommunication Services | | | 2.1% | |
Other | | | 1.5% | |
| † | The Fund’s sector breakdown is expressed as a percentage of total investments and may change over time. |
| ‡ | A sector may be comprised of several industries. |
Top Ten Holdings* as of 3/31/12
| | | | |
| |
| Description | | % of Net Assets | |
Exxon Mobil Corp. | | | 4.0% | |
Apple, Inc. | | | 3.5% | |
Microsoft Corp. | | | 2.5% | |
Chevron Corp. | | | 2.4% | |
JPMorgan Chase & Co. | | | 2.3% | |
Wells Fargo & Co. | | | 1.6% | |
Wal-Mart Stores, Inc. | | | 1.5% | |
International Business Machines Corp. | | | 1.4% | |
Intel Corp. | | | 1.4% | |
Citigroup, Inc. | | | 1.3% | |
| * | The ten largest holdings are subject to change, and there are no guarantees the Fund will remain invested in any particular company. |
The WisdomTree Total Earnings Fund (the “Fund”) seeks to track the price and yield performance, before fees and expenses, of the WisdomTree Earnings Index.
The Fund returned 9.74% at net asset value (“NAV”) for the fiscal year ended March 31, 2012 (for more complete performance information please see the chart below). The Fund’s performance benefited most from its position in the Information Technology sector. The Fund’s position in the Energy sector created the greatest drag on performance.
The following performance chart is provided for comparative purposes and represents the period noted. The Fund’s per share NAV is the value of one share of the Fund and is calculated by dividing the value of total assets less total liabilities by the number of shares outstanding. The NAV return is based on the NAV of the Fund and the market price return is based on the market price per share of the Fund. The price used to calculate market price returns is the mid-point of the highest bid and lowest offer for Fund shares as of the close of trading on the exchange where Fund shares are listed. NAV and market price returns assume that dividends and capital gain distributions have been reinvested in the Fund at NAV and market price, respectively. As with other ETFs, NAV returns and market price returns may differ because of factors such as the supply and demand for Fund shares and investors’ assessments of the underlying value of a Fund’s portfolio securities.
An index is a statistical measure of a specified financial market or sector. An index does not actually hold a portfolio of securities, incur expenses or pay any transaction costs. Therefore, index returns do not reflect deductions for fees or expenses and the index is not available for direct investment. In comparison, the Fund’s performance is negatively impacted by these deductions. Fund returns do not reflect brokerage commissions or taxes on transactions in Fund shares or that a shareholder would pay on Fund distributions. As of the Fund’s current prospectus dated July 29, 2011, the Fund’s annual expense ratio was 0.28%.
Performance as of 3/31/12
| | | | | | | | | | | | | | | | |
| | | Average Annual Total Return | |
| | | Fund Net Asset Value | | | Fund Market Price | | | WisdomTree
Earnings Index | | | Russell 3000® Index | |
One Year | | | 9.74 | % | | | 9.82 | % | | | 10.13 | % | | | 7.18 | % |
Three Year | | | 24.90 | % | | | 24.89 | % | | | 25.30 | % | | | 24.26 | % |
Five Year | | | 2.69 | % | | | 2.71 | % | | | 2.92 | % | | | 2.18 | % |
Since Inception1 | | | 2.28 | % | | | 2.29 | % | | | 2.50 | % | | | 1.71 | % |
| 1 | Total returns are calculated based on the commencement of Fund trading on the NYSE Arca, Inc. on February 23, 2007. |
Performance is historical and does not guarantee future results. Current performance may be lower or higher than quoted. Investment returns and the principal value of an investment will fluctuate so that an investor’s shares, when redeemed, may be worth more or less than their original cost. Performance data for the most recent month-end is available at www.wisdomtree.com. WisdomTree shares are bought and sold at market price (not NAV) and are not individually redeemed from the Fund. The returns do not reflect the deduction of taxes that a shareholder would pay on Fund distributions or on the redemption of Fund shares.
| | | | |
| WisdomTree Domestic and International Earnings Funds | | | 3 | |
Performance Summary (unaudited)
WisdomTree Earnings 500 Fund (EPS)
Sector Breakdown† as of 3/31/12‡
| | | | |
Information Technology | | | 19.5% | |
Financials | | | 16.8% | |
Energy | | | 13.4% | |
Consumer Discretionary | | | 10.7% | |
Health Care | | | 10.3% | |
Consumer Staples | | | 9.9% | |
Industrials | | | 9.6% | |
Materials | | | 4.1% | |
Utilities | | | 2.8% | |
Telecommunication Services | | | 2.3% | |
Other | | | 0.6% | |
| † | The Fund’s sector breakdown is expressed as a percentage of total investments and may change over time. |
| ‡ | A sector may be comprised of several industries. |
Top Ten Holdings* as of 3/31/12
| | | | |
| |
| Description | | % of Net Assets | |
Exxon Mobil Corp. | | | 4.6% | |
Apple, Inc. | | | 4.1% | |
Microsoft Corp. | | | 2.9% | |
Chevron Corp. | | | 2.8% | |
JPMorgan Chase & Co. | | | 2.7% | |
Wells Fargo & Co. | | | 1.9% | |
Wal-Mart Stores, Inc. | | | 1.6% | |
International Business Machines Corp. | | | 1.6% | |
Intel Corp. | | | 1.5% | |
Citigroup, Inc. | | | 1.5% | |
| * | The ten largest holdings are subject to change, and there are no guarantees the Fund will remain invested in any particular company. |
The WisdomTree Earnings 500 Fund (the “Fund”) seeks to track the price and yield performance, before fees and expenses, of the WisdomTree Earnings 500 Index.
The Fund returned 10.60% at net asset value (“NAV”) for the fiscal year ended March 31, 2012 (for more complete performance information please see the chart below). The Fund’s performance benefited most from its position in the Information Technology sector. The Fund’s position in the Energy sector created the greatest drag on performance.
The following performance chart is provided for comparative purposes and represents the period noted. The Fund’s per share NAV is the value of one share of the Fund and is calculated by dividing the value of total assets less total liabilities by the number of shares outstanding. The NAV return is based on the NAV of the Fund and the market price return is based on the market price per share of the Fund. The price used to calculate market price returns is the mid-point of the highest bid and lowest offer for Fund shares as of the close of trading on the exchange where Fund shares are listed. NAV and market price returns assume that dividends and capital gain distributions have been reinvested in the Fund at NAV and market price, respectively. As with other ETFs, NAV returns and market price returns may differ because of factors such as the supply and demand for Fund shares and investors’ assessments of the underlying value of a Fund’s portfolio securities.
An index is a statistical measure of a specified financial market or sector. An index does not actually hold a portfolio of securities, incur expenses or pay any transaction costs. Therefore, index returns do not reflect deductions for fees or expenses and the index is not available for direct investment. In comparison, the Fund’s performance is negatively impacted by these deductions. Fund returns do not reflect brokerage commissions or taxes on transactions in Fund shares or that a shareholder would pay on Fund distributions. As of the Fund’s current prospectus dated July 29, 2011, the Fund’s annual expense ratio was 0.28%.
Performance as of 3/31/12
| | | | | | | | | | | | | | | | |
| | | Average Annual Total Return | |
| | | Fund Net Asset Value | | | Fund Market Price | | | WisdomTree
Earnings 500
Index | | | S&P 500® Index | |
One Year | | | 10.60 | % | | | 10.61 | % | | | 10.86 | % | | | 8.54 | % |
Three Year | | | 23.52 | % | | | 23.54 | % | | | 23.93 | % | | | 23.42 | % |
Five Year | | | 2.23 | % | | | 2.22 | % | | | 2.53 | % | | | 2.01 | % |
Since Inception1 | | | 1.85 | % | | | 1.85 | % | | | 2.15 | % | | | 1.59 | % |
| 1 | Total returns are calculated based on the commencement of Fund trading on the NYSE Arca, Inc. on February 23, 2007. |
Performance is historical and does not guarantee future results. Current performance may be lower or higher than quoted. Investment returns and the principal value of an investment will fluctuate so that an investor’s shares, when redeemed, may be worth more or less than their original cost. Performance data for the most recent month-end is available at www.wisdomtree.com. WisdomTree shares are bought and sold at market price (not NAV) and are not individually redeemed from the Fund. The returns do not reflect the deduction of taxes that a shareholder would pay on Fund distributions or on the redemption of Fund shares.
| | |
| 4 | | WisdomTree Domestic and International Earnings Funds |
Performance Summary (unaudited)
WisdomTree MidCap Earnings Fund (EZM)
Sector Breakdown† as of 3/31/12‡
| | | | |
Consumer Discretionary | | | 17.4% | |
Information Technology | | | 16.4% | |
Industrials | | | 16.3% | |
Financials | | | 15.9% | |
Health Care | | | 7.3% | |
Materials | | | 7.3% | |
Energy | | | 5.2% | |
Utilities | | | 4.0% | |
Consumer Staples | | | 2.7% | |
Telecommunication Services | | | 0.9% | |
Other | | | 6.6% | |
| † | The Fund’s sector breakdown is expressed as a percentage of total investments and may change over time. |
| ‡ | A sector may be comprised of several industries. |
Top Ten Holdings* as of 3/31/12
| | | | |
| |
| Description | | % of Net Assets | |
TRW Automotive Holdings Corp. | | | 1.3% | |
Whirlpool Corp. | | | 1.1% | |
American Capital Ltd. | | | 0.9% | |
Computer Sciences Corp. | | | 0.9% | |
Constellation Brands, Inc. | | | 0.7% | |
Tesoro Corp. | | | 0.7% | |
ITT Corp. | | | 0.7% | |
Arrow Electronics, Inc. | | | 0.7% | |
Reinsurance Group of America, Inc. | | | 0.6% | |
Harris Corp. | | | 0.6% | |
| * | The ten largest holdings are subject to change, and there are no guarantees the Fund will remain invested in any particular company. |
The WisdomTree MidCap Earnings Fund (the “Fund”) seeks to track the price and yield performance, before fees and expenses, of the WisdomTree MidCap Earnings Index.
The Fund returned 4.92% at net asset value (“NAV”) for the fiscal year ended March 31, 2012 (for more complete performance information please see the chart below). The Fund’s performance benefited most from its position in the Consumer Discretionary sector. The Fund’s position in the Energy sector created the greatest drag on performance.
The following performance chart is provided for comparative purposes and represents the period noted. The Fund’s per share NAV is the value of one share of the Fund and is calculated by dividing the value of total assets less total liabilities by the number of shares outstanding. The NAV return is based on the NAV of the Fund and the market price return is based on the market price per share of the Fund. The price used to calculate market price returns is the mid-point of the highest bid and lowest offer for Fund shares as of the close of trading on the exchange where Fund shares are listed. NAV and market price returns assume that dividends and capital gain distributions have been reinvested in the Fund at NAV and market price, respectively. As with other ETFs, NAV returns and market price returns may differ because of factors such as the supply and demand for Fund shares and investors’ assessments of the underlying value of a Fund’s portfolio securities.
An index is a statistical measure of a specified financial market or sector. An index does not actually hold a portfolio of securities, incur expenses or pay any transaction costs. Therefore, index returns do not reflect deductions for fees or expenses and the index is not available for direct investment. In comparison, the Fund’s performance is negatively impacted by these deductions. Fund returns do not reflect brokerage commissions or taxes on transactions in Fund shares or that a shareholder would pay on Fund distributions. As of the Fund’s current prospectus dated July 29, 2011, the Fund’s annual expense ratio was 0.38%.
Performance as of 3/31/12
| | | | | | | | | | | | | | | | |
| | | Average Annual Total Return | | | | |
| | | Fund
Net Asset Value | | | Fund Market Price | | | WisdomTree
MidCap Earnings
Index | | | S&P MidCap
400® Index | |
One Year | | | 4.92 | % | | | 5.12 | % | | | 5.23 | % | | | 1.98 | % |
Three Year | | | 34.17 | % | | | 34.19 | % | | | 34.84 | % | | | 28.55 | % |
Five Year | | | 5.96 | % | | | 5.97 | % | | | 6.15 | % | | | 4.78 | % |
Since Inception1 | | | 5.35 | % | | | 5.40 | % | | | 5.54 | % | | | 4.25 | % |
| 1 | Total returns are calculated based on the commencement of Fund trading on the NYSE Arca, Inc. on February 23, 2007. |
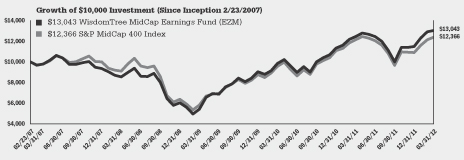
Performance is historical and does not guarantee future results. Current performance may be lower or higher than quoted. Investment returns and the principal value of an investment will fluctuate so that an investor’s shares, when redeemed, may be worth more or less than their original cost. Performance data for the most recent month-end is available at www.wisdomtree.com. WisdomTree shares are bought and sold at market price (not NAV) and are not individually redeemed from the Fund. The returns do not reflect the deduction of taxes that a shareholder would pay on Fund distributions or on the redemption of Fund shares.
| | | | |
| WisdomTree Domestic and International Earnings Funds | | | 5 | |
Performance Summary (unaudited)
WisdomTree SmallCap Earnings Fund (EES)
Sector Breakdown† as of 3/31/12‡
| | | | |
Information Technology | | | 18.4% | |
Financials | | | 17.8% | |
Industrials | | | 15.8% | |
Consumer Discretionary | | | 15.2% | |
Health Care | | | 7.8% | |
Materials | | | 7.4% | |
Consumer Staples | | | 3.9% | |
Energy | | | 3.1% | |
Utilities | | | 1.2% | |
Telecommunication Services | | | 1.1% | |
Other | | | 8.3% | |
| † | The Fund’s sector breakdown is expressed as a percentage of total investments and may change over time. |
| ‡ | A sector may be comprised of several industries. |
Top Ten Holdings* as of 3/31/12
| | | | |
| |
| Description | | % of Net Assets | |
Revlon, Inc. | | | 1.0% | |
Veeco Instruments, Inc. | | | 0.9% | |
Pendrell Corp. | | | 0.8% | |
Western Refining, Inc. | | | 0.8% | |
Cirrus Logic, Inc. | | | 0.7% | |
Nelnet, Inc. | | | 0.7% | |
Symetra Financial Corp. | | | 0.6% | |
Omnivision Technologies, Inc. | | | 0.6% | |
GT Advanced Technologies, Inc. | | | 0.6% | |
Career Education Corp. | | | 0.6% | |
| * | The ten largest holdings are subject to change, and there are no guarantees the Fund will remain invested in any particular company. |
The WisdomTree SmallCap Earnings Fund (the “Fund”) seeks to track the price and yield performance, before fees and expenses, of the WisdomTree SmallCap Earnings Index.
The Fund returned 4.39% at net asset value (“NAV”) for the fiscal year ended March 31, 2012 (for more complete performance information please see the chart below). The Fund’s performance benefited most from its position in the Financials sector. The Fund’s position in the Energy sector created the greatest drag on performance.
The following performance chart is provided for comparative purposes and represents the period noted. The Fund’s per share NAV is the value of one share of the Fund and is calculated by dividing the value of total assets less total liabilities by the number of shares outstanding. The NAV return is based on the NAV of the Fund and the market price return is based on the market price per share of the Fund. The price used to calculate market price returns is the mid-point of the highest bid and lowest offer for Fund shares as of the close of trading on the exchange where Fund shares are listed. NAV and market price returns assume that dividends and capital gain distributions have been reinvested in the Fund at NAV and market price, respectively. As with other ETFs, NAV returns and market price returns may differ because of factors such as the supply and demand for Fund shares and investors’ assessments of the underlying value of a Fund’s portfolio securities.
An index is a statistical measure of a specified financial market or sector. An index does not actually hold a portfolio of securities, incur expenses or pay any transaction costs. Therefore, index returns do not reflect deductions for fees or expenses and the index is not available for direct investment. In comparison, the Fund’s performance is negatively impacted by these deductions. Fund returns do not reflect brokerage commissions or taxes on transactions in Fund shares or that a shareholder would pay on Fund distributions. As of the Fund’s current prospectus dated July 29, 2011, the Fund’s annual expense ratio was 0.38%.
Performance as of 3/31/12
| | | | | | | | | | | | | | | | |
| | | Average Annual Total Return | |
| | | Fund
Net Asset Value | | | Fund
Market Price | | | WisdomTree
SmallCap
Earnings Index | | | Russell 2000® Index | |
One Year | | | 4.39 | % | | | 4.52 | % | | | 4.69 | % | | | -0.18 | % |
Three Year | | | 35.99 | % | | | 35.91 | % | | | 36.46 | % | | | 26.90 | % |
Five Year | | | 4.60 | % | | | 4.65 | % | | | 4.63 | % | | | 2.13 | % |
Since Inception1 | | | 3.69 | % | | | 3.71 | % | | | 3.74 | % | | | 1.48 | % |
| 1 | Total returns are calculated based on the commencement of Fund trading on the NYSE Arca, Inc. on February 23, 2007. |
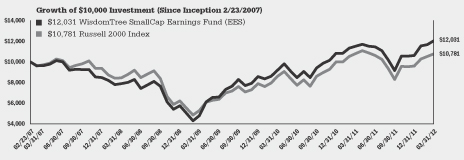
Performance is historical and does not guarantee future results. Current performance may be lower or higher than quoted. Investment returns and the principal value of an investment will fluctuate so that an investor’s shares, when redeemed, may be worth more or less than their original cost. Performance data for the most recent month-end is available at www.wisdomtree.com. WisdomTree shares are bought and sold at market price (not NAV) and are not individually redeemed from the Fund. The returns do not reflect the deduction of taxes that a shareholder would pay on Fund distributions or on the redemption of Fund shares.
| | |
| 6 | | WisdomTree Domestic and International Earnings Funds |
Performance Summary (unaudited)
WisdomTree LargeCap Value Fund (EZY)
Sector Breakdown† as of 3/31/12‡
| | | | |
Energy | | | 31.2% | |
Consumer Discretionary | | | 12.8% | |
Telecommunication Services | | | 11.3% | |
Health Care | | | 10.2% | |
Industrials | | | 8.6% | |
Financials | | | 8.0% | |
Materials | | | 5.9% | |
Information Technology | | | 4.0% | |
Utilities | | | 3.5% | |
Consumer Staples | | | 3.3% | |
Other | | | 1.2% | |
| † | The Fund’s sector breakdown is expressed as a percentage of total investments and may change over time. |
| ‡ | A sector may be comprised of several industries. |
Top Ten Holdings* as of 3/31/12
| | | | |
| |
| Description | | % of Net Assets | |
Exxon Mobil Corp. | | | 13.6% | |
Chevron Corp. | | | 8.5% | |
AT&T, Inc. | | | 8.2% | |
ConocoPhillips | | | 3.3% | |
Verizon Communications, Inc. | | | 3.1% | |
UnitedHealth Group, Inc. | | | 2.8% | |
Comcast Corp. | | | 1.9% | |
News Corp. | | | 1.7% | |
Capital One Financial Corp. | | | 1.4% | |
Travelers Cos., Inc. (The) | | | 1.4% | |
| * | The ten largest holdings are subject to change, and there are no guarantees the Fund will remain invested in any particular company. |
The WisdomTree LargeCap Value Fund (the “Fund”) seeks to track the price and yield performance, before fees and expenses, of the WisdomTree LargeCap Value Index.
The Fund returned 4.83% at net asset value (“NAV”) for the fiscal year ended March 31, 2012 (for more complete performance information please see the chart below). The Fund’s performance benefited most from its position in the Consumer Discretionary sector. The Fund’s position in the Industrials sector created the greatest drag on performance.
The following performance chart is provided for comparative purposes and represents the period noted. The Fund’s per share NAV is the value of one share of the Fund and is calculated by dividing the value of total assets less total liabilities by the number of shares outstanding. The NAV return is based on the NAV of the Fund and the market price return is based on the market price per share of the Fund. The price used to calculate market price returns is the mid-point of the highest bid and lowest offer for Fund shares as of the close of trading on the exchange where Fund shares are listed. NAV and market price returns assume that dividends and capital gain distributions have been reinvested in the Fund at NAV and market price, respectively. As with other ETFs, NAV returns and market price returns may differ because of factors such as the supply and demand for Fund shares and investors’ assessments of the underlying value of a Fund’s portfolio securities.
An index is a statistical measure of a specified financial market or sector. An index does not actually hold a portfolio of securities, incur expenses or pay any transaction costs. Therefore, index returns do not reflect deductions for fees or expenses and the index is not available for direct investment. In comparison, the Fund’s performance is negatively impacted by these deductions. Fund returns do not reflect brokerage commissions or taxes on transactions in Fund shares or that a shareholder would pay on Fund distributions. As of the Fund’s current prospectus dated July 29, 2011, the Fund’s annual expense ratio was 0.38%.
Performance as of 3/31/12
| | | | | | | | | | | | | | | | |
| | | Average Annual Total Return | |
| | | Fund
Net Asset Value | | | Fund
Market Price | | | WisdomTree Low P/E
/LargeCap Value
Spliced Index1 | | | Russell 1000®
Value Index | |
One Year | | | 4.83 | % | | | 4.86 | % | | | 5.26 | % | | | 4.79 | % |
Three Year | | | 24.33 | % | | | 24.31 | % | | | 24.98 | % | | | 22.82 | % |
Five Year | | | -0.09 | % | | | -0.08 | % | | | 0.29 | % | | | -0.81 | % |
Since Inception2 | | | -0.42 | % | | | -0.40 | % | | | -0.06 | % | | | -1.04 | % |
| 1 | WisdomTree Low P/E Index through June 19, 2009; WisdomTree LargeCap Value Index thereafter. |
| 2 | Total returns are calculated based on the commencement of Fund trading on the NYSE Arca, Inc. on February 23, 2007. |

Performance is historical and does not guarantee future results. Current performance may be lower or higher than quoted. Investment returns and the principal value of an investment will fluctuate so that an investor’s shares, when redeemed, may be worth more or less than their original cost. Performance data for the most recent month-end is available at www.wisdomtree.com. WisdomTree shares are bought and sold at market price (not NAV) and are not individually redeemed from the Fund. The returns do not reflect the deduction of taxes that a shareholder would pay on Fund distributions or on the redemption of Fund shares.
| | | | |
| WisdomTree Domestic and International Earnings Funds | | | 7 | |
Performance Summary (unaudited)
WisdomTree LargeCap Growth Fund (ROI)
Sector Breakdown† as of 3/31/12‡
| | | | |
Energy | | | 29.8% | |
Information Technology | | | 26.9% | |
Health Care | | | 10.5% | |
Industrials | | | 9.7% | |
Materials | | | 6.4% | |
Consumer Discretionary | | | 6.4% | |
Consumer Staples | | | 4.7% | |
Financials | | | 3.7% | |
Telecommunication Services | | | 0.7% | |
Utilities | | | 0.4% | |
Other | | | 0.8% | |
| † | The Fund’s sector breakdown is expressed as a percentage of total investments and may change over time. |
| ‡ | A sector may be comprised of several industries. |
Top Ten Holdings* as of 3/31/12
| | | | |
| |
| Description | | % of Net Assets | |
Exxon Mobil Corp. | | | 13.6% | |
Apple, Inc. | | | 12.8% | |
Chevron Corp. | | | 8.5% | |
Merck & Co., Inc. | | | 6.3% | |
ConocoPhillips | | | 3.3% | |
Oracle Corp. | | | 3.2% | |
PepsiCo, Inc. | | | 3.1% | |
Freeport-McMoRan Copper & Gold, Inc. | | | 1.4% | |
Union Pacific Corp. | | | 1.4% | |
E.I. du Pont de Nemours & Co. | | | 1.3% | |
| * | The ten largest holdings are subject to change, and there are no guarantees the Fund will remain invested in any particular company. |
The WisdomTree LargeCap Growth Fund (the “Fund”) seeks to track the price and yield performance, before fees and expenses, of the WisdomTree LargeCap Growth Index.
The Fund returned 6.74% at net asset value (“NAV”) for the fiscal year ended March 31, 2012 (for more complete performance information please see the chart below). The Fund’s performance benefited most from its position in the Information Technology sector. The Fund’s position in the Financials sector created the greatest drag on performance.
The following performance chart is provided for comparative purposes and represents the period noted. The Fund’s per share NAV is the value of one share of the Fund and is calculated by dividing the value of total assets less total liabilities by the number of shares outstanding. The NAV return is based on the NAV of the Fund and the market price return is based on the market price per share of the Fund. The price used to calculate market price returns is the mid-point of the highest bid and lowest offer for Fund shares as of the close of trading on the exchange where Fund shares are listed. NAV and market price returns assume that dividends and capital gain distributions have been reinvested in the Fund at NAV and market price, respectively. As with other ETFs, NAV returns and market price returns may differ because of factors such as the supply and demand for Fund shares and investors’ assessments of the underlying value of a Fund’s portfolio securities.
An index is a statistical measure of a specified financial market or sector. An index does not actually hold a portfolio of securities, incur expenses or pay any transaction costs. Therefore, index returns do not reflect deductions for fees or expenses and the index is not available for direct investment. In comparison, the Fund’s performance is negatively impacted by these deductions. Fund returns do not reflect brokerage commissions or taxes on transactions in Fund shares or that a shareholder would pay on Fund distributions. As of the Fund’s current prospectus dated July 29, 2011, the Fund’s annual expense ratio was 0.38%.
Performance as of 3/31/12
| | | | | | | | | | | | | | | | |
| | | Average Annual Total Return | |
| | | Fund
Net Asset Value | | | Fund
Market Price | | | WisdomTree
LargeCap
Growth Index | | | Russell 1000®
Growth Index | |
One Year | | | 6.74 | % | | | 6.74 | % | | | 7.12 | % | | | 11.02 | % |
Three Year | | | 18.56 | % | | | 18.53 | % | | | 19.20 | % | | | 25.28 | % |
Since Inception1 | | | 17.86 | % | | | 17.87 | % | | | 18.45 | % | | | 24.15 | % |
| 1 | Total returns are calculated based on the commencement of Fund trading on the NYSE Arca, Inc. on December 4, 2008. |
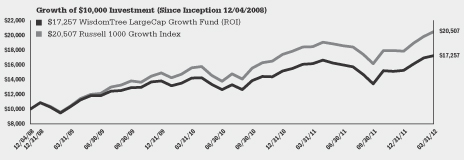
Performance is historical and does not guarantee future results. Current performance may be lower or higher than quoted. Investment returns and the principal value of an investment will fluctuate so that an investor’s shares, when redeemed, may be worth more or less than their original cost. Performance data for the most recent month-end is available at www.wisdomtree.com. WisdomTree shares are bought and sold at market price (not NAV) and are not individually redeemed from the Fund. The returns do not reflect the deduction of taxes that a shareholder would pay on Fund distributions or on the redemption of Fund shares.
| | |
| 8 | | WisdomTree Domestic and International Earnings Funds |
Performance Summary (unaudited)
WisdomTree India Earnings Fund (EPI)
Sector Breakdown† as of 3/31/12‡
| | | | |
Financials | | | 26.4% | |
Energy | | | 17.8% | |
Information Technology | | | 12.4% | |
Materials | | | 12.2% | |
Consumer Discretionary | | | 10.5% | |
Industrials | | | 5.9% | |
Utilities | | | 5.4% | |
Health Care | | | 3.8% | |
Consumer Staples | | | 3.4% | |
Telecommunication Services | | | 2.2% | |
| † | The Fund’s sector breakdown is expressed as a percentage of total investments and may change over time. |
| ‡ | A sector may be comprised of several industries. |
Top Ten Holdings* as of 3/31/12
| | | | |
| |
| |
| Description | | % of Net Assets | |
Reliance Industries Ltd. | | | 7.5% | |
Infosys Ltd. | | | 7.2% | |
Tata Motors Ltd. | | | 5.5% | |
Oil & Natural Gas Corp. Ltd. | | | 4.8% | |
Housing Development Finance Corp. | | | 3.1% | |
ICICI Bank Ltd. | | | 2.9% | |
Tata Consultancy Services Ltd. | | | 2.3% | |
State Bank of India | | | 2.2% | |
HDFC Bank Ltd. | | | 2.0% | |
Tata Steel Ltd. | | | 2.0% | |
| * | The ten largest holdings are subject to change, and there are no guarantees the Fund will remain invested in any particular company. |
The WisdomTree India Earnings Fund (the “Fund”) seeks to track the price and yield performance, before fees and expenses, of the WisdomTree India Earnings Index.
The Fund returned -21.96% at net asset value (“NAV”) for the fiscal year ended March 31, 2012 (for more complete performance information please see the chart below). The Fund’s performance benefited most from its investment in the Consumer Discretionary sector. The Fund’s investment in the Energy sector created the greatest drag on performance.
The following performance chart is provided for comparative purposes and represents the period noted. The Fund’s per share NAV is the value of one share of the Fund and is calculated by dividing the value of total assets less total liabilities by the number of shares outstanding. The NAV return is based on the NAV of the Fund and the market price return is based on the market price per share of the Fund. The price used to calculate market price returns is the mid-point of the highest bid and lowest offer for Fund shares as of the close of trading on the exchange where Fund shares are listed. NAV and market price returns assume that dividends and capital gain distributions have been reinvested in the Fund at NAV and market price, respectively. As with other ETFs, NAV returns and market price returns may differ because of factors such as the supply and demand for Fund shares and investors’ assessments of the underlying value of a Fund’s portfolio securities.
An index is a statistical measure of a specified financial market or sector. An index does not actually hold a portfolio of securities, incur expenses or pay any transaction costs. Therefore, index returns do not reflect deductions for fees or expenses and the index is not available for direct investment. In comparison, the Fund’s performance is negatively impacted by these deductions. Fund returns do not reflect brokerage commissions or taxes on transactions in Fund shares or that a shareholder would pay on Fund distributions. As of the Fund’s current prospectus dated July 29, 2011, the Fund’s annual expense ratio was 0.83%. Fund expenses are capped by contract at 0.88% through July 31, 2013.
Performance as of 3/31/12
| | | | | | | | | | | | | | | | |
| | | Average Annual Total Return | | | | |
| | | Fund
Net Asset Value | | | Fund
Market Price | | | WisdomTree
India Earnings
Index | | | MSCI India Index | |
One Year | | | -21.96 | % | | | -21.67 | % | | | -20.49 | % | | | -20.51 | % |
Three Year | | | 21.21 | % | | | 21.18 | % | | | 22.90 | % | | | 23.39 | % |
Since Inception1 | | | -5.54 | % | | | -5.70 | % | | | -4.07 | % | | | -5.39 | % |
| 1 | Total returns are calculated based on the commencement of Fund trading on the NYSE Arca, Inc. on February 22, 2008. |
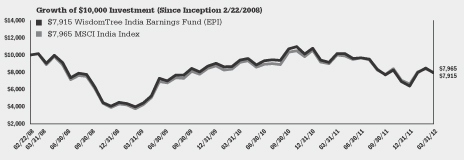
Performance is historical and does not guarantee future results. Current performance may be lower or higher than quoted. Investment returns and the principal value of an investment will fluctuate so that an investor’s shares, when redeemed, may be worth more or less than their original cost. Performance data for the most recent month-end is available at www.wisdomtree.com. WisdomTree shares are bought and sold at market price (not NAV) and are not individually redeemed from the Fund. The returns do not reflect the deduction of taxes that a shareholder would pay on Fund distributions or on the redemption of Fund shares.
| | | | |
| WisdomTree Domestic and International Earnings Funds | | | 9 | |
Description of Indexes (unaudited)
Below are descriptions of each Index referenced in this Report:
The WisdomTree Earnings Index measures the performance of earnings-generating companies within the broad U.S. stock market.
The WisdomTree Earnings 500 Index measures the performance of earnings-generating companies within the large-capitalization segment of the U.S. stock market.
The WisdomTree MidCap Earnings Index measures the performance of earnings-generating companies within the mid-capitalization segment of the U.S. stock market.
The WisdomTree SmallCap Earnings Index measures the performance of earnings-generating companies within the small-capitalization segment of the U.S. stock market.
The WisdomTree LargeCap Value Index measures the performance of the large-capitalization value segment within the earnings-generating companies of the U.S. stock market.
The WisdomTree Low P/E Index measures the performance of companies with the lowest price-to-earnings ratios (P/E ratios) in the WisdomTree Earnings Index.
The WisdomTree LargeCap Growth Index measures the performance of the large-capitalization growth segment within the earnings-generating companies of the U.S. stock market.
The WisdomTree India Earnings Index is a fundamentally weighted index that measures the performance of companies incorporated and traded in India that are profitable and that are eligible to be purchased by foreign investors as of the index measurement date.
The Russell 3000® Index is a capitalization-weighted index that measures the performance of the 3,000 largest U.S. companies, based on total market capitalization.
The S&P 500® Index is a capitalization-weighted index of 500 stocks selected by Standard & Poor’s Index Committee, designed to represent the performance of the leading industries in the United States economy.
The Russell 1000® Growth Index is a capitalization-weighted index that measures the performance of the large-capitalization growth segment of the U.S. equity universe, selecting from the Russell 1000 Index.
The Russell 1000® Value Index is a capitalization-weighted index that measures the performance of the large-capitalization value segment of the U.S. equity universe, selecting from the Russell 1000 Index.
The S&P MidCap 400® Index is a capitalization-weighted index that measures the performance of the mid-capitalization range of the U.S. stock market, with stocks selected by the Standard & Poor’s Index Committee.
The Russell 2000® Index is a capitalization-weighted index that measures the performance of the smallest 2,000 securities in the Russell 3000 Index, based on total market capitalization.
The MSCI Emerging Markets Index is a free float-adjusted market capitalization index that is designed to measure emerging markets equity performance.
The MSCI India Index is a free float-adjusted market capitalization index that is designed to measure the performance of stocks in India.
Index performance information assumes the reinvestment of net dividends and excludes management fees, transaction costs and expenses. Performance information for the MSCI India Index assumes reinvestment of net dividends and excludes management fees, transaction costs and expenses. You cannot directly invest in an index.
The Global Industry Classification Standard (“GICS”) was developed by and is the exclusive property and a service mark of MSCI Inc. (“MSCI”) and Standard & Poor’s (“S&P”), a division of The McGraw-Hill Companies, Inc. and is licensed for use by WisdomTree Investments, Inc. Neither MSCI, S&P nor any other party involved in making or compiling the GICS or any GICS classifications makes any express or implied warranties or representations with respect to
| | |
| 10 | | WisdomTree Domestic and International Earnings Funds |
Description of Indexes (unaudited) (concluded)
such standard or classification (or the results to be obtained by the use thereof), and all such parties hereby expressly disclaim all warranties of originality, accuracy, completeness, merchantability and fitness for a particular purpose with respect to any such standard or classification. Without limiting any of the foregoing, in no event shall MSCI, S&P, any of their affiliates or any third party involved in making or compiling the GICS or any GICS classifications have any liability for any direct, indirect, special, punitive, consequential or any other damages (including lost profits) even if notified of the possibility of such damages.
Neither MSCI nor any other party involved in or related to compiling, computing or creating the MSCI data makes any express or implied warranties or representations with respect to such data (or the results to be obtained by the use thereof), and all such parties hereby expressly disclaim all warranties of originality, accuracy, completeness, merchantability or fitness for a particular purpose with respect to any such data. Without limiting any of the foregoing, in no event shall MSCI, any of its affiliates or any third party involved in or related to compiling, computing or creating the data have any liability for any direct, indirect, special, punitive, consequential or any other damages (including lost profits) even if notified of the possibility of such damages. No further distribution or dissemination of the MSCI data is permitted without MSCI’s express written consent.
| | | | |
| WisdomTree Domestic and International Earnings Funds | | | 11 | |
Shareholder Expense Examples (unaudited)
As a shareholder of a WisdomTree Fund, you incur two types of costs: (1) transaction costs, including brokerage commissions on purchases and sales of your Fund shares and (2) ongoing costs, including management fees and other Fund expenses. The following example is intended to help you understand your ongoing costs (in dollars and cents) of investing in a Fund and to compare these costs with the ongoing costs of investing in other funds.
The example is based on an investment of $1,000 invested at the beginning of the period and held for the entire period from October 1, 2011 to March 31, 2012.
Actual expenses
The first line under each Fund in the table on the next page provides information about actual account values and actual expenses. You may use the information in this line, together with the amount you invested, to estimate the expenses that you paid over the period. Simply divide your account value by $1,000 (for example, an $8,600 account value divided by $1,000 = 8.6), then multiply the result by the number in the first line for your Fund under the heading entitled “Expenses Paid During the Period 10/01/11 to 3/31/12” to estimate the expenses you paid on your account during this period.
Hypothetical example for comparison purposes
The second line under each Fund in the table on the next page provides information about hypothetical account values and hypothetical expenses based on each Fund’s actual expense ratio and an assumed rate of return of 5% per year before expenses, which is not the Fund’s actual return. The hypothetical account values and expenses may not be used to estimate the actual ending account balance or expenses you paid for the period. You may use this information to compare the ongoing costs of investing in your Fund and other funds. To do so, compare this 5% hypothetical example with the 5% hypothetical examples that appear in the shareholder reports of the other funds.
Please note that the expenses shown in the table are meant to highlight your ongoing costs only and do not reflect any transactional costs, such as brokerage commissions paid on purchases and sales of Fund shares. Therefore, the second line under each Fund in the table is useful in comparing ongoing Fund costs only and will not help you determine the relative total costs of owning different funds. In addition, if these transactional costs were included, your costs would have been higher.
| | |
| 12 | | WisdomTree Domestic and International Earnings Funds |
Shareholder Expense Examples (unaudited) (concluded)
| | | | | | | | | | | | | | |
| | | Beginning
Account Value
10/01/11 | | | Ending
Account Value
3/31/2012 | | | Annualized
Expense Ratio
Based on the
Period
10/01/11 to
3/31/12 | | Expenses Paid
During the
Period†
10/01/11 to
3/31/12 | |
WisdomTree Total Earnings Fund | | | | | | | | | | | | | | |
Actual | | $ | 1,000.00 | | | $ | 1,267.70 | | | 0.28% | | $ | 1.59 | |
Hypothetical (5% return before expenses) | | $ | 1,000.00 | | | $ | 1,023.60 | | | 0.28% | | $ | 1.42 | |
WisdomTree Earnings 500 Fund | | | | | | | | | | | | | | |
Actual | | $ | 1,000.00 | | | $ | 1,264.10 | | | 0.28% | | $ | 1.58 | |
Hypothetical (5% return before expenses) | | $ | 1,000.00 | | | $ | 1,023.60 | | | 0.28% | | $ | 1.42 | |
WisdomTree MidCap Earnings Fund | | | | | | | | | | | | | | |
Actual | | $ | 1,000.00 | | | $ | 1,306.20 | | | 0.38% | | $ | 2.19 | |
Hypothetical (5% return before expenses) | | $ | 1,000.00 | | | $ | 1,023.10 | | | 0.38% | | $ | 1.92 | |
WisdomTree SmallCap Earnings Fund | | | | | | | | | | | | | | |
Actual | | $ | 1,000.00 | | | $ | 1,312.10 | | | 0.38% | | $ | 2.20 | |
Hypothetical (5% return before expenses) | | $ | 1,000.00 | | | $ | 1,023.10 | | | 0.38% | | $ | 1.92 | |
WisdomTree LargeCap Value Fund | | | | | | | | | | | | | | |
Actual | | $ | 1,000.00 | | | $ | 1,251.10 | | | 0.38% | | $ | 2.14 | |
Hypothetical (5% return before expenses) | | $ | 1,000.00 | | | $ | 1,023.10 | | | 0.38% | | $ | 1.92 | |
WisdomTree LargeCap Growth Fund | | | | | | | | | | | | | | |
Actual | | $ | 1,000.00 | | | $ | 1,283.20 | | | 0.38% | | $ | 2.17 | |
Hypothetical (5% return before expenses) | | $ | 1,000.00 | | | $ | 1,023.10 | | | 0.38% | | $ | 1.92 | |
WisdomTree India Earnings Fund | | | | | | | | | | | | | | |
Actual | | $ | 1,000.00 | | | $ | 1,026.10 | | | 0.82% | | $ | 4.15 | |
Hypothetical (5% return before expenses) | | $ | 1,000.00 | | | $ | 1,020.90 | | | 0.82% | | $ | 4.14 | |
| † | Expenses are calculated using each Fund’s annualized expense ratio, multiplied by the average account value for the period, multiplied by 183/366 (to reflect one-half year period). |
| | | | |
| WisdomTree Domestic and International Earnings Funds | | | 13 | |
Schedule of Investments
WisdomTree Total Earnings Fund (EXT)
March 31, 2012
| | | | | | | | |
| Investments | | Shares | | | Value | |
| | | | | | | | |
| UNITED STATES – 101.1% | | | | | | | | |
| COMMON STOCKS – 99.6% | | | | | | | | |
| Aerospace & Defense – 2.7% | | | | | | | | |
AAR Corp. | | | 198 | | | $ | 3,614 | |
Alliant Techsystems, Inc. | | | 197 | | | | 9,874 | |
BE Aerospace, Inc.* | | | 194 | | | | 9,015 | |
Boeing Co. (The) | | | 2,075 | | | | 154,318 | |
Ceradyne, Inc. | | | 174 | | | | 5,665 | |
Cubic Corp. | | | 104 | | | | 4,917 | |
Curtiss-Wright Corp. | | | 129 | | | | 4,774 | |
Esterline Technologies Corp.* | | | 100 | | | | 7,146 | |
General Dynamics Corp. | | | 1,567 | | | | 114,986 | |
GeoEye, Inc.* | | | 86 | | | | 2,070 | |
Goodrich Corp. | | | 244 | | | | 30,607 | |
HEICO Corp. | | | 45 | | | | 2,322 | |
Hexcel Corp.* | | | 249 | | | | 5,978 | |
Honeywell International, Inc. | | | 1,879 | | | | 114,713 | |
Huntington Ingalls Industries, Inc.* | | | 223 | | | | 8,974 | |
L-3 Communications Holdings, Inc. | | | 575 | | | | 40,693 | |
Lockheed Martin Corp. | | | 1,499 | | | | 134,700 | |
Moog, Inc. Class A* | | | 135 | | | | 5,790 | |
National Presto Industries, Inc.(a) | | | 35 | | | | 2,655 | |
Northrop Grumman Corp. | | | 1,339 | | | | 81,786 | |
Orbital Sciences Corp.* | | | 167 | | | | 2,196 | |
Precision Castparts Corp. | | | 273 | | | | 47,202 | |
Raytheon Co. | | | 1,718 | | | | 90,676 | |
Rockwell Collins, Inc. | | | 428 | | | | 24,636 | |
Spirit AeroSystems Holdings, Inc. Class A* | | | 398 | | | | 9,735 | |
Teledyne Technologies, Inc.* | | | 100 | | | | 6,305 | |
Textron, Inc. | | | 603 | | | | 16,781 | |
TransDigm Group, Inc.* | | | 80 | | | | 9,261 | |
Triumph Group, Inc. | | | 172 | | | | 10,778 | |
United Technologies Corp. | | | 2,381 | | | | 197,480 | |
| | | | | | | | |
| Total Aerospace & Defense | | | | | | | 1,159,647 | |
| Air Freight & Logistics – 0.6% | | | | | | | | |
Atlas Air Worldwide Holdings, Inc.* | | | 124 | | | | 6,102 | |
C.H. Robinson Worldwide, Inc. | | | 214 | | | | 14,015 | |
Expeditors International of Washington, Inc. | | | 346 | | | | 16,093 | |
FedEx Corp. | | | 674 | | | | 61,981 | |
Forward Air Corp. | | | 81 | | | | 2,970 | |
HUB Group, Inc. Class A* | | | 103 | | | | 3,711 | |
United Parcel Service, Inc. Class B | | | 2,056 | | | | 165,960 | |
| | | | | | | | |
| Total Air Freight & Logistics | | | | | | | 270,832 | |
| Airlines – 0.2% | | | | | | | | |
Alaska Air Group, Inc.* | | | 298 | | | | 10,674 | |
Allegiant Travel Co.* | | | 64 | | | | 3,488 | |
Delta Air Lines, Inc.* | | | 3,056 | | | | 30,285 | |
Hawaiian Holdings, Inc.* | | | 482 | | | | 2,521 | |
JetBlue Airways Corp.* | | | 789 | | | | 3,858 | |
SkyWest, Inc. | | | 252 | | | | 2,784 | |
Southwest Airlines Co. | | | 867 | | | | 7,144 | |
Spirit Airlines, Inc.* | | | 152 | | | | 3,051 | |
United Continental Holdings, Inc.* | | | 1,078 | | | | 23,177 | |
US Airways Group, Inc.*(a) | | | 686 | | | | 5,207 | |
| | | | | | | | |
| Total Airlines | | | | | | | 92,189 | |
| | | | | | | | |
| Auto Components – 0.5% | | | | | | | | |
American Axle & Manufacturing Holdings, Inc.* | | | 534 | | | $ | 6,253 | |
BorgWarner, Inc.* | | | 300 | | | | 25,302 | |
Cooper Tire & Rubber Co. | | | 220 | | | | 3,348 | |
Dana Holding Corp. | | | 208 | | | | 3,224 | |
Dorman Products, Inc.* | | | 52 | | | | 2,631 | |
Federal-Mogul Corp.* | | | 565 | | | | 9,724 | |
Gentex Corp. | | | 146 | | | | 3,577 | |
Goodyear Tire & Rubber Co. (The)* | | | 728 | | | | 8,168 | |
Johnson Controls, Inc. | | | 2,012 | | | | 65,350 | |
Lear Corp. | | | 601 | | | | 27,940 | |
Superior Industries International, Inc. | | | 125 | | | | 2,443 | |
Tenneco, Inc.* | | | 147 | | | | 5,461 | |
TRW Automotive Holdings Corp.* | | | 1,044 | | | | 48,494 | |
Visteon Corp.* | | | 324 | | | | 17,172 | |
| | | | | | | | |
| Total Auto Components | | | | | | | 229,087 | |
| Automobiles – 1.5% | | | | | | | | |
Ford Motor Co. | | | 22,802 | | | | 284,797 | |
General Motors Co.* | | | 12,698 | | | | 325,704 | |
Harley-Davidson, Inc. | | | 455 | | | | 22,331 | |
Thor Industries, Inc. | | | 156 | | | | 4,923 | |
| | | | | | | | |
| Total Automobiles | | | | | | | 637,755 | |
| Beverages – 1.8% | | | | | | | | |
Beam, Inc. | | | 172 | | | | 10,074 | |
Boston Beer Co., Inc. (The) Class A*(a) | | | 18 | | | | 1,922 | |
Brown-Forman Corp. Class B | | | 278 | | | | 23,182 | |
Coca-Cola Bottling Co. Consolidated | | | 49 | | | | 3,074 | |
Coca-Cola Co. (The) | | | 5,208 | | | | 385,444 | |
Coca-Cola Enterprises, Inc. | | | 1,008 | | | | 28,829 | |
Constellation Brands, Inc. Class A* | | | 1,127 | | | | 26,586 | |
Dr. Pepper Snapple Group, Inc. | | | 560 | | | | 22,518 | |
Molson Coors Brewing Co. Class B | | | 618 | | | | 27,965 | |
Monster Beverage Corp.* | | | 252 | | | | 15,647 | |
PepsiCo, Inc. | | | 3,760 | | | | 249,476 | |
| | | | | | | | |
| Total Beverages | | | | | | | 794,717 | |
| Biotechnology – 1.1% | | | | | | | | |
Alexion Pharmaceuticals, Inc.* | | | 139 | | | | 12,908 | |
Amgen, Inc. | | | 2,889 | | | | 196,423 | |
Biogen Idec, Inc.* | | | 462 | | | | 58,198 | |
Celgene Corp.* | | | 629 | | | | 48,760 | |
Cubist Pharmaceuticals, Inc.* | | | 73 | | | | 3,157 | |
Emergent Biosolutions, Inc.* | | | 107 | | | | 1,712 | |
Gilead Sciences, Inc.* | | | 2,857 | | | | 139,565 | |
Momenta Pharmaceuticals, Inc.* | | | 463 | | | | 7,093 | |
Myriad Genetics, Inc.* | | | 234 | | | | 5,536 | |
PDL BioPharma, Inc.(a) | | | 1,414 | | | | 8,979 | |
United Therapeutics Corp.* | | | 143 | | | | 6,740 | |
| | | | | | | | |
| Total Biotechnology | | | | | | | 489,071 | |
| Building Products – 0.1% | | | | | | | | |
A.O. Smith Corp. | | | 117 | | | | 5,259 | |
Armstrong World Industries, Inc. | | | 63 | | | | 3,073 | |
Lennox International, Inc. | | | 103 | | | | 4,151 | |
See Notes to Financial Statements.
| | |
| 14 | | WisdomTree Domestic and International Earnings Funds |
Schedule of Investments (continued)
WisdomTree Total Earnings Fund (EXT)
March 31, 2012
| | | | | | | | |
| Investments | | Shares | | | Value | |
| | | | | | | | |
Owens Corning* | | | 414 | | | $ | 14,916 | |
Simpson Manufacturing Co., Inc. | | | 102 | | | | 3,289 | |
| | | | | | | | |
| Total Building Products | | | | | | | 30,688 | |
| Capital Markets – 2.5% | | | | | | | | |
Affiliated Managers Group, Inc.* | | | 66 | | | | 7,379 | |
American Capital Ltd.* | | | 4,389 | | | | 38,053 | |
Ameriprise Financial, Inc. | | | 1,033 | | | | 59,015 | |
Ares Capital Corp. | | | 1,041 | | | | 17,020 | |
Artio Global Investors, Inc. | | | 517 | | | | 2,466 | |
Bank of New York Mellon Corp. (The) | | | 4,908 | | | | 118,430 | |
BlackRock Kelso Capital Corp. | | | 395 | | | | 3,879 | |
BlackRock, Inc. | | | 516 | | | | 105,728 | |
Charles Schwab Corp. (The) | | | 2,956 | | | | 42,478 | |
Cohen & Steers, Inc. | | | 74 | | | | 2,361 | |
E*TRADE Financial Corp.* | | | 539 | | | | 5,902 | |
Eaton Vance Corp. | | | 321 | | | | 9,174 | |
Federated Investors, Inc. Class B(a) | | | 355 | | | | 7,956 | |
Fifth Street Finance Corp. | | | 239 | | | | 2,333 | |
Financial Engines, Inc.* | | | 88 | | | | 1,968 | |
Franklin Resources, Inc. | | | 711 | | | | 88,185 | |
GAMCO Investors, Inc. Class A | | | 97 | | | | 4,812 | |
GFI Group, Inc. | | | 439 | | | | 1,651 | |
Goldman Sachs Group, Inc. (The) | | | 1,605 | | | | 199,614 | |
Greenhill & Co., Inc. | | | 54 | | | | 2,357 | |
Janus Capital Group, Inc. | | | 1,087 | | | | 9,685 | |
Jefferies Group, Inc. | | | 698 | | | | 13,150 | |
Knight Capital Group, Inc. Class A* | | | 354 | | | | 4,556 | |
Legg Mason, Inc. | | | 300 | | | | 8,379 | |
Main Street Capital Corp.(a) | | | 103 | | | | 2,537 | |
Morgan Stanley | | | 5,770 | | | | 113,323 | |
Northern Trust Corp. | | | 585 | | | | 27,758 | |
Prospect Capital Corp. | | | 429 | | | | 4,710 | |
Raymond James Financial, Inc. | | | 404 | | | | 14,758 | |
SEI Investments Co. | | | 504 | | | | 10,428 | |
Solar Capital Ltd. | | | 146 | | | | 3,222 | |
State Street Corp. | | | 1,605 | | | | 73,027 | |
Stifel Financial Corp.* | | | 137 | | | | 5,184 | |
T. Rowe Price Group, Inc. | | | 522 | | | | 34,087 | |
TD Ameritrade Holding Corp. | | | 1,442 | | | | 28,465 | |
Triangle Capital Corp.(a) | | | 112 | | | | 2,212 | |
Waddell & Reed Financial, Inc. Class A | | | 258 | | | | 8,362 | |
| | | | | | | | |
| Total Capital Markets | | | | | | | 1,084,604 | |
| Chemicals – 2.5% | | | | | | | | |
Air Products & Chemicals, Inc. | | | 557 | | | | 51,133 | |
Airgas, Inc. | | | 157 | | | | 13,968 | |
Albemarle Corp. | | | 309 | | | | 19,751 | |
Balchem Corp. | | | 63 | | | | 1,906 | |
Cabot Corp. | | | 165 | | | | 7,042 | |
Calgon Carbon Corp.* | | | 135 | | | | 2,107 | |
Celanese Corp. Series A | | | 512 | | | | 23,644 | |
CF Industries Holdings, Inc. | | | 327 | | | | 59,727 | |
Cytec Industries, Inc. | | | 131 | | | | 7,963 | |
Dow Chemical Co. (The) | | | 3,789 | | | | 131,251 | |
| | | | | | | | |
E.I. du Pont de Nemours & Co. | | | 2,950 | | | $ | 156,055 | |
Eastman Chemical Co. | | | 550 | | | | 28,430 | |
Ecolab, Inc. | | | 416 | | | | 25,676 | |
Ferro Corp.* | | | 618 | | | | 3,671 | |
FMC Corp. | | | 140 | | | | 14,820 | |
Georgia Gulf Corp.* | | | 154 | | | | 5,372 | |
H.B. Fuller Co. | | | 233 | | | | 7,649 | |
Huntsman Corp. | | | 634 | | | | 8,882 | |
Innophos Holdings, Inc. | | | 45 | | | | 2,255 | |
Innospec, Inc.* | | | 126 | | | | 3,828 | |
International Flavors & Fragrances, Inc. | | | 232 | | | | 13,595 | |
Intrepid Potash, Inc.* | | | 138 | | | | 3,358 | |
Koppers Holdings, Inc. | | | 138 | | | | 5,321 | |
Kraton Performance Polymers, Inc.* | | | 245 | | | | 6,510 | |
Kronos Worldwide, Inc.(a) | | | 529 | | | | 13,193 | |
LSB Industries, Inc.* | | | 92 | | | | 3,581 | |
Minerals Technologies, Inc. | | | 47 | | | | 3,074 | |
Monsanto Co. | | | 864 | | | | 68,913 | |
Mosaic Co. (The) | | | 1,532 | | | | 84,704 | |
NewMarket Corp. | | | 50 | | | | 9,370 | |
Olin Corp. | | | 314 | | | | 6,830 | |
Omnova Solutions, Inc.* | | | 729 | | | | 4,921 | |
PolyOne Corp. | | | 529 | | | | 7,618 | |
PPG Industries, Inc. | | | 518 | | | | 49,624 | |
Praxair, Inc. | | | 552 | | | | 63,281 | |
Rockwood Holdings, Inc.* | | | 307 | | | | 16,010 | |
RPM International, Inc. | | | 364 | | | | 9,533 | |
Scotts Miracle-Gro Co. (The) Class A(a) | | | 132 | | | | 7,149 | |
Sensient Technologies Corp. | | | 140 | | | | 5,320 | |
Sherwin-Williams Co. (The) | | | 228 | | | | 24,777 | |
Sigma-Aldrich Corp. | | | 268 | | | | 19,580 | |
Solutia, Inc. | | | 465 | | | | 12,992 | |
Stepan Co. | | | 51 | | | | 4,478 | |
TPC Group, Inc.* | | | 109 | | | | 4,819 | |
Valhi, Inc. | | | 100 | | | | 5,305 | |
Valspar Corp. | | | 266 | | | | 12,845 | |
W.R. Grace & Co.* | | | 275 | | | | 15,895 | |
Westlake Chemical Corp. | | | 279 | | | | 18,076 | |
| | | | | | | | |
| Total Chemicals | | | | | | | 1,075,802 | |
| Commercial Banks – 3.5% | | | | | | | | |
Associated Banc-Corp. | | | 254 | | | | 3,546 | |
BancFirst Corp. | | | 53 | | | | 2,309 | |
BancorpSouth, Inc.(a) | | | 237 | | | | 3,192 | |
Bank of Hawaii Corp. | | | 157 | | | | 7,591 | |
Bank of the Ozarks, Inc. | | | 160 | | | | 5,001 | |
BB&T Corp. | | | 1,679 | | | | 52,704 | |
BOK Financial Corp. | | | 208 | | | | 11,706 | |
Camden National Corp. | | | 79 | | | | 2,777 | |
Cathay General Bancorp | | | 204 | | | | 3,611 | |
CIT Group, Inc.* | | | 420 | | | | 17,321 | |
City National Corp. | | | 116 | | | | 6,086 | |
Comerica, Inc. | | | 501 | | | | 16,212 | |
Commerce Bancshares, Inc. | | | 279 | | | | 11,305 | |
See Notes to Financial Statements.
| | | | |
| WisdomTree Domestic and International Earnings Funds | | | 15 | |
Schedule of Investments (continued)
WisdomTree Total Earnings Fund (EXT)
March 31, 2012
| | | | | | | | |
| Investments | | Shares | | | Value | |
| | | | | | | | |
Community Bank System, Inc. | | | 117 | | | $ | 3,367 | |
Community Trust Bancorp, Inc. | | | 79 | | | | 2,533 | |
Cullen/Frost Bankers, Inc. | | | 150 | | | | 8,728 | |
CVB Financial Corp. | | | 305 | | | | 3,581 | |
East West Bancorp, Inc. | | | 358 | | | | 8,266 | |
FNB Corp. | | | 265 | | | | 3,201 | |
Fifth Third Bancorp | | | 2,856 | | | | 40,127 | |
First Citizens BancShares, Inc. Class A | | | 30 | | | | 5,481 | |
First Financial Bancorp | | | 176 | | | | 3,045 | |
First Financial Bankshares, Inc.(a) | | | 91 | | | | 3,204 | |
First Niagara Financial Group, Inc. | | | 852 | | | | 8,384 | |
First Republic Bank* | | | 362 | | | | 11,924 | |
FirstMerit Corp. | | | 238 | | | | 4,013 | |
Fulton Financial Corp. | | | 523 | | | | 5,491 | |
Glacier Bancorp, Inc. | | | 181 | | | | 2,704 | |
Hancock Holding Co. | | | 84 | | | | 2,983 | |
Huntington Bancshares, Inc. | | | 2,788 | | | | 17,983 | |
Iberiabank Corp. | | | 85 | | | | 4,545 | |
Independent Bank Corp. | | | 71 | | | | 2,040 | |
International Bancshares Corp. | | | 324 | | | | 6,853 | |
Investors Bancorp, Inc.* | | | 214 | | | | 3,214 | |
KeyCorp | | | 4,182 | | | | 35,547 | |
M&T Bank Corp. | | | 395 | | | | 34,318 | |
National Penn Bancshares, Inc. | | | 318 | | | | 2,814 | |
NBT Bancorp, Inc. | | | 112 | | | | 2,473 | |
Old National Bancorp | | | 220 | | | | 2,891 | |
Oriental Financial Group, Inc. | | | 166 | | | | 2,009 | |
Pacific Capital Bancorp NA* | | | 113 | | | | 5,154 | |
Park National Corp.(a) | | | 51 | | | | 3,528 | |
PNC Financial Services Group, Inc. | | | 2,126 | | | | 137,106 | |
Prosperity Bancshares, Inc. | | | 124 | | | | 5,679 | |
Regions Financial Corp. | | | 1,449 | | | | 9,549 | |
Republic Bancorp, Inc. Class A | | | 204 | | | | 4,880 | |
S&T Bancorp, Inc.(a) | | | 87 | | | | 1,887 | |
Signature Bank* | | | 79 | | | | 4,980 | |
Simmons First National Corp. Class A | | | 88 | | | | 2,273 | |
SunTrust Banks, Inc. | | | 1,061 | | | | 25,644 | |
Susquehanna Bancshares, Inc. | | | 234 | | | | 2,312 | |
SVB Financial Group* | | | 152 | | | | 9,780 | |
TCF Financial Corp. | | | 465 | | | | 5,529 | |
Texas Capital Bancshares, Inc.* | | | 85 | | | | 2,943 | |
Tompkins Financial Corp.(a) | | | 71 | | | | 2,844 | |
Trustmark Corp. | | | 182 | | | | 4,546 | |
U.S. Bancorp | | | 6,127 | | | | 194,103 | |
UMB Financial Corp. | | | 86 | | | | 3,847 | |
Umpqua Holdings Corp. | | | 222 | | | | 3,010 | |
United Bankshares, Inc.(a) | | | 118 | | | | 3,405 | |
Valley National Bancorp(a) | | | 447 | | | | 5,789 | |
Webster Financial Corp. | | | 222 | | | | 5,033 | |
Wells Fargo & Co. | | | 20,270 | | | | 692,018 | |
Westamerica Bancorp. | | | 67 | | | | 3,216 | |
| | | | | | | | |
| Total Commercial Banks | | | | | | | 1,514,135 | |
| | | | | | | | |
| Commercial Services & Supplies – 0.5% | |
ABM Industries, Inc. | | | 154 | | | $ | 3,742 | |
Avery Dennison Corp. | | | 377 | | | | 11,359 | |
Brink’s Co. (The) | | | 185 | | | | 4,416 | |
Cintas Corp. | | | 336 | | | | 13,144 | |
Clean Harbors, Inc.* | | | 78 | | | | 5,252 | |
Consolidated Graphics, Inc.* | | | 53 | | | | 2,398 | |
Copart, Inc.* | | | 302 | | | | 7,873 | |
Corrections Corp. of America* | | | 311 | | | | 8,493 | |
Covanta Holding Corp. | | | 260 | | | | 4,220 | |
Deluxe Corp. | | | 322 | | | | 7,541 | |
Encore Capital Group, Inc.* | | | 113 | | | | 2,548 | |
Ennis, Inc. | | | 208 | | | | 3,291 | |
Geo Group, Inc. (The)* | | | 102 | | | | 1,939 | |
Herman Miller, Inc. | | | 158 | | | | 3,628 | |
HNI Corp. | | | 105 | | | | 2,914 | |
Iron Mountain, Inc. | | | 325 | | | | 9,360 | |
KAR Auction Services, Inc.* | | | 151 | | | | 2,448 | |
Knoll, Inc. | | | 208 | | | | 3,461 | |
McGrath Rentcorp | | | 56 | | | | 1,798 | |
Mine Safety Appliances Co. | | | 112 | | | | 4,601 | |
NL Industries, Inc. | | | 165 | | | | 2,458 | |
Pitney Bowes, Inc.(a) | | | 822 | | | | 14,451 | |
Portfolio Recovery Associates, Inc.* | | | 46 | | | | 3,299 | |
R.R. Donnelley & Sons Co.(a) | | | 516 | | | | 6,393 | |
Republic Services, Inc. | | | 734 | | | | 22,431 | |
Rollins, Inc. | | | 192 | | | | 4,086 | |
Stericycle, Inc.* | | | 114 | | | | 9,535 | |
SYKES Enterprises, Inc.* | | | 180 | | | | 2,844 | |
Tetra Tech, Inc.* | | | 136 | | | | 3,585 | |
UniFirst Corp. | | | 91 | | | | 5,601 | |
United Stationers, Inc. | | | 167 | | | | 5,182 | |
Waste Connections, Inc. | | | 223 | | | | 7,254 | |
Waste Management, Inc. | | | 1,184 | | | | 41,393 | |
| | | | | | | | |
| Total Commercial Services & Supplies | | | | | | | 232,938 | |
| Communications Equipment – 1.5% | |
ADTRAN, Inc. | | | 243 | | | | 7,579 | |
Arris Group, Inc.* | | | 371 | | | | 4,192 | |
Aruba Networks, Inc.* | | | 107 | | | | 2,384 | |
Black Box Corp. | | | 83 | | | | 2,117 | |
Brocade Communications Systems, Inc.* | | | 730 | | | | 4,198 | |
Cisco Systems, Inc. | | | 13,674 | | | | 289,205 | |
Comtech Telecommunications Corp. | | | 79 | | | | 2,574 | |
EchoStar Corp. Class A* | | | 293 | | | | 8,245 | |
F5 Networks, Inc.* | | | 82 | | | | 11,067 | |
Finisar Corp.* | | | 189 | | | | 3,808 | |
Harris Corp. | | | 556 | | | | 25,065 | |
InterDigital, Inc. | | | 115 | | | | 4,009 | |
JDS Uniphase Corp.* | | | 209 | | | | 3,028 | |
Juniper Networks, Inc.* | | | 981 | | | | 22,445 | |
Loral Space & Communications, Inc.* | | | 232 | | | | 18,467 | |
Motorola Solutions, Inc. | | | 562 | | | | 28,566 | |
NETGEAR, Inc.* | | | 86 | | | | 3,285 | |
See Notes to Financial Statements.
| | |
| 16 | | WisdomTree Domestic and International Earnings Funds |
Schedule of Investments (continued)
WisdomTree Total Earnings Fund (EXT)
March 31, 2012
| | | | | | | | |
| Investments | | Shares | | | Value | |
| | | | | | | | |
Plantronics, Inc. | | | 125 | | | $ | 5,033 | |
Polycom, Inc.* | | | 248 | | | | 4,729 | |
QUALCOMM, Inc. | | | 2,930 | | | | 199,299 | |
Westell Technologies, Inc. Class A* | | | 1,184 | | | | 2,759 | |
| | | | | | | | |
| Total Communications Equipment | | | | | | | 652,054 | |
| Computers & Peripherals – 5.0% | |
Apple, Inc.* | | | 2,501 | | | | 1,499,274 | |
Dell, Inc.* | | | 8,776 | | | | 145,681 | |
Diebold, Inc. | | | 164 | | | | 6,317 | |
EMC Corp.* | | | 3,693 | | | | 110,347 | |
Hewlett-Packard Co. | | | 9,802 | | | | 233,582 | |
Lexmark International, Inc. Class A(a) | | | 436 | | | | 14,493 | |
NCR Corp.* | | | 455 | | | | 9,878 | |
NetApp, Inc.* | | | 632 | | | | 28,295 | |
QLogic Corp.* | | | 386 | | | | 6,855 | |
SanDisk Corp.* | | | 942 | | | | 46,714 | |
Synaptics, Inc.*(a) | | | 116 | | | | 4,235 | |
Western Digital Corp.* | | | 1,130 | | | | 46,771 | |
| | | | | | | | |
| Total Computers & Peripherals | | | | | | | 2,152,442 | |
| Construction & Engineering – 0.3% | |
AECOM Technology Corp.* | | | 438 | | | | 9,798 | |
EMCOR Group, Inc. | | | 175 | | | | 4,851 | |
Fluor Corp. | | | 426 | | | | 25,577 | |
Jacobs Engineering Group, Inc.* | | | 301 | | | | 13,356 | |
KBR, Inc. | | | 684 | | | | 24,316 | |
MasTec, Inc.* | | | 292 | | | | 5,282 | |
Primoris Services Corp. | | | 156 | | | | 2,506 | |
Quanta Services, Inc.* | | | 269 | | | | 5,622 | |
Tutor Perini Corp.* | | | 250 | | | | 3,895 | |
URS Corp. | | | 335 | | | | 14,244 | |
| | | | | | | | |
| Total Construction & Engineering | | | | | | | 109,447 | |
| Construction Materials – 0.0% | |
Martin Marietta Materials, Inc.(a) | | | 67 | | | | 5,737 | |
| Consumer Finance – 1.2% | | | | | | | | |
Advance America, Cash Advance Centers, Inc. | | | 449 | | | | 4,710 | |
American Express Co. | | | 3,319 | | | | 192,037 | |
Capital One Financial Corp. | | | 3,015 | | | | 168,056 | |
Cash America International, Inc. | | | 129 | | | | 6,183 | |
Credit Acceptance Corp.* | | | 101 | | | | 10,202 | |
DFC Global Corp.* | | | 177 | | | | 3,340 | |
Discover Financial Services | | | 2,842 | | | | 94,752 | |
Ezcorp, Inc. Class A* | | | 151 | | | | 4,901 | |
First Cash Financial Services, Inc.* | | | 73 | | | | 3,131 | |
Green Dot Corp. Class A*(a) | | | 58 | | | | 1,538 | |
Nelnet, Inc. Class A | | | 382 | | | | 9,898 | |
SLM Corp. | | | 1,888 | | | | 29,755 | |
World Acceptance Corp.*(a) | | | 70 | | | | 4,288 | |
| | | | | | | | |
| Total Consumer Finance | | | | | | | 532,791 | |
| Containers & Packaging – 0.3% | |
Aptargroup, Inc. | | | 151 | | | | 8,270 | |
Ball Corp. | | | 565 | | | | 24,227 | |
Bemis Co., Inc. | | | 219 | | | | 7,072 | |
| | | | | | | | |
Boise, Inc. | | | 746 | | | $ | 6,125 | |
Crown Holdings, Inc.* | | | 439 | | | | 16,168 | |
Graphic Packaging Holding Co.* | | | 947 | | | | 5,227 | |
Greif, Inc. Class A | | | 185 | | | | 10,345 | |
Owens-Illinois, Inc.* | | | 371 | | | | 8,659 | |
Packaging Corp. of America | | | 369 | | | | 10,919 | |
Rock-Tenn Co. Class A | | | 129 | | | | 8,715 | |
Sealed Air Corp. | | | 583 | | | | 11,258 | |
Silgan Holdings, Inc. | | | 183 | | | | 8,089 | |
Sonoco Products Co. | | | 267 | | | | 8,864 | |
| | | | | | | | |
| Total Containers & Packaging | | | | | | | 133,938 | |
| Distributors – 0.1% | |
Core-Mark Holding Co., Inc. | | | 53 | | | | 2,170 | |
Genuine Parts Co. | | | 393 | | | | 24,661 | |
LKQ Corp.* | | | 284 | | | | 8,852 | |
Pool Corp. | | | 169 | | | | 6,324 | |
| | | | | | | | |
| Total Distributors | | | | | | | 42,007 | |
| Diversified Consumer Services – 0.4% | |
Apollo Group, Inc. Class A* | | | 618 | | | | 23,880 | |
Bridgepoint Education, Inc.* | | | 311 | | | | 7,697 | |
Capella Education Co.* | | | 67 | | | | 2,409 | |
Career Education Corp.* | | | 1,066 | | | | 8,592 | |
Coinstar, Inc.*(a) | | | 86 | | | | 5,465 | |
DeVry, Inc. | | | 335 | | | | 11,347 | |
Education Management Corp.*(a) | | | 422 | | | | 5,777 | |
H&R Block, Inc. | | | 1,117 | | | | 18,397 | |
Hillenbrand, Inc. | | | 232 | | | | 5,324 | |
ITT Educational Services, Inc.*(a) | | | 279 | | | | 18,453 | |
Lincoln Educational Services Corp. | | | 329 | | | | 2,602 | |
Matthews International Corp. Class A | | | 82 | | | | 2,595 | |
Regis Corp. | | | 238 | | | | 4,386 | |
Service Corp. International | | | 658 | | | | 7,409 | |
Sotheby’s | | | 232 | | | | 9,127 | |
Strayer Education, Inc.(a) | | | 48 | | | | 4,525 | |
Weight Watchers International, Inc.(a) | | | 193 | | | | 14,898 | |
| | | | | | | | |
| Total Diversified Consumer Services | | | | | | | 152,883 | |
| Diversified Financial Services – 4.5% | |
Bank of America Corp. | | | 15,972 | | | | 152,852 | |
CBOE Holdings, Inc. | | | 285 | | | | 8,100 | |
Citigroup, Inc. | | | 15,314 | | | | 559,727 | |
CME Group, Inc. | | | 188 | | | | 54,394 | |
Gain Capital Holdings, Inc.(a) | | | 431 | | | | 2,163 | |
Interactive Brokers Group, Inc. Class A | | | 139 | | | | 2,363 | |
IntercontinentalExchange, Inc.* | | | 159 | | | | 21,850 | |
JPMorgan Chase & Co. | | | 21,559 | | | | 991,283 | |
Leucadia National Corp. | | | 1,950 | | | | 50,895 | |
Moody’s Corp. | | | 747 | | | | 31,449 | |
MSCI, Inc. Class A* | | | 171 | | | | 6,294 | |
NASDAQ OMX Group, Inc. (The)* | | | 732 | | | | 18,959 | |
NYSE Euronext | | | 947 | | | | 28,419 | |
| | | | | | | | |
| Total Diversified Financial Services | | | | | | | 1,928,748 | |
See Notes to Financial Statements.
| | | | |
| WisdomTree Domestic and International Earnings Funds | | | 17 | |
Schedule of Investments (continued)
WisdomTree Total Earnings Fund (EXT)
March 31, 2012
| | | | | | | | |
| Investments | | Shares | | | Value | |
| | | | | | | | |
| Diversified Telecommunication Services – 2.1% | |
AboveNet, Inc.* | | | 74 | | | $ | 6,127 | |
AT&T, Inc. | | | 16,543 | | | | 516,638 | |
CenturyLink, Inc. | | | 781 | | | | 30,186 | |
Cincinnati Bell, Inc.* | | | 761 | | | | 3,059 | |
Frontier Communications Corp.(a) | | | 1,150 | | | | 4,795 | |
tw telecom, inc.* | | | 227 | | | | 5,030 | |
Verizon Communications, Inc. | | | 8,068 | | | | 308,440 | |
Windstream Corp. | | | 997 | | | | 11,675 | |
| | | | | | | | |
| Total Diversified Telecommunication Services | | | | | | | 885,950 | |
| Electric Utilities – 1.6% | |
ALLETE, Inc. | | | 116 | | | | 4,813 | |
American Electric Power Co., Inc. | | | 853 | | | | 32,909 | |
Cleco Corp. | | | 227 | | | | 9,001 | |
Duke Energy Corp. | | | 3,410 | | | | 71,644 | |
Edison International | | | 1,057 | | | | 44,933 | |
El Paso Electric Co. | | | 137 | | | | 4,451 | |
Empire District Electric Co. (The) | | | 112 | | | | 2,279 | |
Entergy Corp. | | | 771 | | | | 51,811 | |
Exelon Corp. | | | 2,521 | | | | 98,849 | |
FirstEnergy Corp. | | | 975 | | | | 44,450 | |
Great Plains Energy, Inc. | | | 390 | | | | 7,905 | |
Hawaiian Electric Industries, Inc. | | | 216 | | | | 5,476 | |
IDACORP, Inc. | | | 135 | | | | 5,551 | |
ITC Holdings Corp. | | | 97 | | | | 7,463 | |
MGE Energy, Inc. | | | 85 | | | | 3,773 | |
NextEra Energy, Inc. | | | 1,117 | | | | 68,227 | |
Northeast Utilities | | | 517 | | | | 19,191 | |
NV Energy, Inc. | | | 669 | | | | 10,784 | |
Pepco Holdings, Inc. | | | 541 | | | | 10,220 | |
Pinnacle West Capital Corp. | | | 291 | | | | 13,939 | |
Portland General Electric Co. | | | 186 | | | | 4,646 | |
PPL Corp. | | | 1,696 | | | | 47,929 | |
Progress Energy, Inc. | | | 626 | | | | 33,247 | |
Southern Co. (The) | | | 1,853 | | | | 83,255 | |
UIL Holdings Corp. | | | 87 | | | | 3,024 | |
Unisource Energy Corp. | | | 148 | | | | 5,412 | |
Westar Energy, Inc. | | | 311 | | | | 8,686 | |
| | | | | | | | |
| Total Electric Utilities | | | | | | | 703,868 | |
| Electrical Equipment – 0.6% | |
Acuity Brands, Inc. | | | 46 | | | | 2,890 | |
AMETEK, Inc. | | | 352 | | | | 17,076 | |
AZZ, Inc. | | | 33 | | | | 1,704 | |
Babcock & Wilcox Co. (The)* | | | 240 | | | | 6,180 | |
Belden, Inc. | | | 113 | | | | 4,284 | |
Brady Corp. Class A | | | 209 | | | | 6,761 | |
Emerson Electric Co. | | | 1,809 | | | | 94,394 | |
EnerSys* | | | 244 | | | | 8,455 | |
Franklin Electric Co., Inc. | | | 54 | | | | 2,650 | |
Generac Holdings, Inc.*(a) | | | 90 | | | | 2,209 | |
General Cable Corp.* | | | 176 | | | | 5,118 | |
Global Power Equipment Group, Inc.* | | | 102 | | | | 2,825 | |
GrafTech International Ltd.* | | | 438 | | | | 5,230 | |
| | | | | | | | |
Hubbell, Inc. Class B | | | 164 | | | $ | 12,887 | |
II-VI, Inc.* | | | 294 | | | | 6,953 | |
Polypore International, Inc.*(a) | | | 70 | | | | 2,461 | |
Powell Industries, Inc.* | | | 56 | | | | 1,918 | |
Regal-Beloit Corp. | | | 140 | | | | 9,177 | |
Rockwell Automation, Inc. | | | 328 | | | | 26,142 | |
Roper Industries, Inc. | | | 194 | | | | 19,237 | |
Thomas & Betts Corp.* | | | 118 | | | | 8,485 | |
| | | | | | | | |
| Total Electrical Equipment | | | | | | | 247,036 | |
| Electronic Equipment, Instruments & Components – 1.0% | |
Amphenol Corp. Class A | | | 443 | | | | 26,478 | |
Anixter International, Inc.* | | | 115 | | | | 8,341 | |
Arrow Electronics, Inc.* | | | 631 | | | | 26,483 | |
Avnet, Inc.* | | | 822 | | | | 29,913 | |
AVX Corp. | | | 626 | | | | 8,301 | |
Benchmark Electronics, Inc.* | | | 273 | | | | 4,502 | |
Cognex Corp. | | | 75 | | | | 3,177 | |
Coherent, Inc.* | | | 64 | | | | 3,733 | |
Corning, Inc. | | | 8,361 | | | | 117,723 | |
Dolby Laboratories, Inc. Class A* | | | 341 | | | | 12,978 | |
FEI Co.* | | | 90 | | | | 4,420 | |
FLIR Systems, Inc. | | | 391 | | | | 9,896 | |
Ingram Micro, Inc. Class A* | | | 586 | | | | 10,876 | |
Insight Enterprises, Inc.* | | | 348 | | | | 7,632 | |
IPG Photonics Corp.* | | | 103 | | | | 5,361 | |
Jabil Circuit, Inc. | | | 735 | | | | 18,463 | |
Kemet Corp.* | | | 478 | | | | 4,474 | |
Littelfuse, Inc. | | | 91 | | | | 5,706 | |
Molex, Inc. | | | 472 | | | | 13,273 | |
MTS Systems Corp. | | | 99 | | | | 5,256 | |
Multi-Fineline Electronix, Inc.* | | | 123 | | | | 3,376 | |
National Instruments Corp. | | | 185 | | | | 5,276 | |
Newport Corp.* | | | 174 | | | | 3,083 | |
Plexus Corp.* | | | 208 | | | | 7,278 | |
Power-One, Inc.* | | | 1,364 | | | | 6,206 | |
Rofin-Sinar Technologies, Inc.* | | | 136 | | | | 3,586 | |
Sanmina-SCI Corp.* | | | 455 | | | | 5,210 | |
Scansource, Inc.* | | | 150 | | | | 5,598 | |
SYNNEX Corp.* | | | 169 | | | | 6,446 | |
Tech Data Corp.* | | | 187 | | | | 10,147 | |
Trimble Navigation Ltd.* | | | 87 | | | | 4,735 | |
TTM Technologies, Inc.* | | | 223 | | | | 2,562 | |
Vishay Intertechnology, Inc.* | | | 1,465 | | | | 17,814 | |
| | | | | | | | |
| Total Electronic Equipment, Instruments & Components | | | | | | | 408,303 | |
| Energy Equipment & Services – 1.1% | |
Atwood Oceanics, Inc.* | | | 310 | | | | 13,916 | |
Baker Hughes, Inc. | | | 1,283 | | | | 53,809 | |
Bristow Group, Inc. | | | 124 | | | | 5,919 | |
Cameron International Corp.* | | | 471 | | | | 24,883 | |
CARBO Ceramics, Inc.(a) | | | 45 | | | | 4,745 | |
Diamond Offshore Drilling, Inc.(a) | | | 692 | | | | 46,191 | |
Dresser-Rand Group, Inc.* | | | 86 | | | | 3,990 | |
See Notes to Financial Statements.
| | |
| 18 | | WisdomTree Domestic and International Earnings Funds |
Schedule of Investments (continued)
WisdomTree Total Earnings Fund (EXT)
March 31, 2012
| | | | | | | | |
| Investments | | Shares | | | Value | |
| | | | | | | | |
Dril-Quip, Inc.* | | | 61 | | | $ | 3,966 | |
FMC Technologies, Inc.* | | | 326 | | | | 16,437 | |
Gulfmark Offshore, Inc. Class A* | | | 71 | | | | 3,263 | |
Halliburton Co. | | | 3,036 | | | | 100,765 | |
Helix Energy Solutions Group, Inc.* | | | 153 | | | | 2,723 | |
Helmerich & Payne, Inc. | | | 266 | | | | 14,351 | |
Lufkin Industries, Inc. | | | 29 | | | | 2,339 | |
National Oilwell Varco, Inc. | | | 1,075 | | | | 85,430 | |
Newpark Resources* | | | 328 | | | | 2,686 | |
Oceaneering International, Inc. | | | 206 | | | | 11,101 | |
Oil States International, Inc.* | | | 114 | | | | 8,899 | |
Patterson-UTI Energy, Inc. | | | 546 | | | | 9,440 | |
Rowan Cos., Inc.* | | | 244 | | | | 8,035 | |
RPC, Inc.(a) | | | 820 | | | | 8,700 | |
SEACOR Holdings, Inc.* | | | 29 | | | | 2,778 | |
Superior Energy Services, Inc.* | | | 322 | | | | 8,488 | |
Tidewater, Inc. | | | 87 | | | | 4,700 | |
Unit Corp.* | | | 132 | | | | 5,644 | |
| | | | | | | | |
| Total Energy Equipment & Services | | | | | | | 453,198 | |
| Food & Staples Retailing – 2.6% | |
Andersons, Inc. (The) | | | 81 | | | | 3,944 | |
Casey’s General Stores, Inc. | | | 92 | | | | 5,102 | |
Costco Wholesale Corp. | | | 692 | | | | 62,834 | |
CVS Caremark Corp. | | | 3,704 | | | | 165,939 | |
Harris Teeter Supermarkets, Inc. | | | 130 | | | | 5,213 | |
Ingles Markets, Inc. Class A | | | 148 | | | | 2,611 | |
Kroger Co. (The) | | | 1,923 | | | | 46,594 | |
Pantry, Inc. (The)* | | | 52 | | | | 676 | |
PriceSmart, Inc. | | | 62 | | | | 4,514 | |
Safeway, Inc.(a) | | | 1,069 | | | | 21,604 | |
Spartan Stores, Inc. | | | 63 | | | | 1,142 | |
SUPERVALU, Inc.(a) | | | 804 | | | | 4,591 | |
Sysco Corp. | | | 1,580 | | | | 47,179 | |
United Natural Foods, Inc.* | | | 117 | | | | 5,459 | |
Walgreen Co. | | | 2,700 | | | | 90,423 | |
Wal-Mart Stores, Inc. | | | 10,259 | | | | 627,851 | |
Weis Markets, Inc. | | | 66 | | | | 2,878 | |
Whole Foods Market, Inc. | | | 224 | | | | 18,637 | |
| | | | | | | | |
| Total Food & Staples Retailing | | | | | | | 1,117,191 | |
| Food Products – 1.6% | |
Archer-Daniels-Midland Co. | | | 2,898 | | | | 91,751 | |
B&G Foods, Inc. | | | 90 | | | | 2,026 | |
Cal-Maine Foods, Inc.(a) | | | 98 | | | | 3,749 | |
Campbell Soup Co. | | | 970 | | | | 32,835 | |
Chiquita Brands International, Inc.* | | | 175 | | | | 1,538 | |
ConAgra Foods, Inc. | | | 1,068 | | | | 28,046 | |
Corn Products International, Inc. | | | 228 | | | | 13,144 | |
Darling International, Inc.* | | | 573 | | | | 9,982 | |
Dean Foods Co.* | | | 371 | | | | 4,493 | |
Diamond Foods, Inc.(a) | | | 64 | | | | 1,460 | |
Flowers Foods, Inc. | | | 276 | | | | 5,622 | |
General Mills, Inc. | | | 1,623 | | | | 64,027 | |
Green Mountain Coffee Roasters, Inc.*(a) | | | 121 | | | | 5,668 | |
| | | | | | | | |
H.J. Heinz Co. | | | 697 | | | $ | 37,324 | |
Hershey Co. (The) | | | 438 | | | | 26,863 | |
Hormel Foods Corp. | | | 658 | | | | 19,424 | |
J&J Snack Foods Corp. | | | 37 | | | | 1,941 | |
J.M. Smucker Co. (The) | | | 261 | | | | 21,235 | |
Kellogg Co. | | | 935 | | | | 50,144 | |
Kraft Foods, Inc. Class A | | | 3,516 | | | | 133,643 | |
Lancaster Colony Corp. | | | 89 | | | | 5,915 | |
McCormick & Co., Inc. | | | 330 | | | | 17,962 | |
Mead Johnson Nutrition Co. | | | 275 | | | | 22,682 | |
Sara Lee Corp. | | | 702 | | | | 15,114 | |
Seneca Foods Corp. Class A* | | | 75 | | | | 1,976 | |
Smithfield Foods, Inc.* | | | 641 | | | | 14,121 | |
TreeHouse Foods, Inc.* | | | 73 | | | | 4,344 | |
Tyson Foods, Inc. Class A | | | 1,516 | | | | 29,031 | |
| | | | | | | | |
| Total Food Products | | | | | | | 666,060 | |
| Gas Utilities – 0.2% | |
AGL Resources, Inc. | | | 252 | | | | 9,883 | |
Atmos Energy Corp. | | | 283 | | | | 8,903 | |
Laclede Group, Inc. (The) | | | 66 | | | | 2,575 | |
National Fuel Gas Co. | | | 121 | | | | 5,823 | |
New Jersey Resources Corp. | | | 90 | | | | 4,011 | |
Northwest Natural Gas Co. | | | 74 | | | | 3,360 | |
ONEOK, Inc. | | | 201 | | | | 16,414 | |
Piedmont Natural Gas Co., Inc.(a) | | | 165 | | | | 5,127 | |
Questar Corp. | | | 471 | | | | 9,071 | |
South Jersey Industries, Inc. | | | 98 | | | | 4,904 | |
Southwest Gas Corp. | | | 129 | | | | 5,513 | |
UGI Corp. | | | 334 | | | | 9,102 | |
WGL Holdings, Inc. | | | 141 | | | | 5,739 | |
| | | | | | | | |
| Total Gas Utilities | | | | | | | 90,425 | |
| Health Care Equipment & Supplies – 1.5% | |
Align Technology, Inc.* | | | 146 | | | | 4,022 | |
Baxter International, Inc. | | | 1,722 | | | | 102,941 | |
Becton Dickinson and Co. | | | 640 | | | | 49,696 | |
Boston Scientific Corp.* | | | 4,634 | | | | 27,711 | |
C.R. Bard, Inc. | | | 245 | | | | 24,186 | |
CareFusion Corp.* | | | 457 | | | | 11,850 | |
Conceptus, Inc.* | | | 219 | | | | 3,149 | |
CONMED Corp. | | | 102 | | | | 3,047 | |
Cooper Cos., Inc. (The) | | | 109 | | | | 8,906 | |
Cyberonics, Inc.* | | | 75 | | | | 2,860 | |
DENTSPLY International, Inc. | | | 330 | | | | 13,243 | |
Edwards Lifesciences Corp.* | | | 108 | | | | 7,855 | |
Gen-Probe, Inc.* | | | 47 | | | | 3,121 | |
Greatbatch, Inc.* | | | 85 | | | | 2,084 | |
Haemonetics Corp.* | | | 49 | | | | 3,414 | |
Hill-Rom Holdings, Inc. | | | 154 | | | | 5,145 | |
Hologic, Inc.* | | | 194 | | | | 4,181 | |
IDEXX Laboratories, Inc.* | | | 89 | | | | 7,783 | |
Intuitive Surgical, Inc.* | | | 46 | | | | 24,921 | |
Masimo Corp.* | | | 131 | | | | 3,063 | |
Medtronic, Inc. | | | 3,450 | | | | 135,206 | |
See Notes to Financial Statements.
| | | | |
| WisdomTree Domestic and International Earnings Funds | | | 19 | |
Schedule of Investments (continued)
WisdomTree Total Earnings Fund (EXT)
March 31, 2012
| | | | | | | | |
| Investments | | Shares | | | Value | |
| | | | | | | | |
NuVasive, Inc.* | | | 216 | | | $ | 3,637 | |
ResMed, Inc.* | | | 257 | | | | 7,944 | |
Sirona Dental Systems, Inc.* | | | 92 | | | | 4,742 | |
St. Jude Medical, Inc. | | | 1,007 | | | | 44,620 | |
STERIS Corp. | | | 169 | | | | 5,344 | |
Stryker Corp. | | | 991 | | | | 54,981 | |
Teleflex, Inc. | | | 91 | | | | 5,565 | |
Thoratec Corp.* | | | 73 | | | | 2,461 | |
Varian Medical Systems, Inc.* | | | 248 | | | | 17,102 | |
West Pharmaceutical Services, Inc. | | | 82 | | | | 3,487 | |
Zimmer Holdings, Inc. | | | 645 | | | | 41,461 | |
| | | | | | | | |
| Total Health Care Equipment & Supplies | | | | | | | 639,728 | |
| Health Care Providers & Services – 2.8% | |
Aetna, Inc. | | | 1,797 | | | | 90,138 | |
Amedisys, Inc.* | | | 236 | | | | 3,413 | |
AMERIGROUP Corp.* | | | 200 | | | | 13,456 | |
AmerisourceBergen Corp. | | | 778 | | | | 30,871 | |
Amsurg Corp.* | | | 113 | | | | 3,162 | |
Cardinal Health, Inc. | | | 867 | | | | 37,376 | |
Catalyst Health Solutions, Inc.* | | | 65 | | | | 4,142 | |
Centene Corp.* | | | 125 | | | | 6,121 | |
Chemed Corp. | | | 83 | | | | 5,202 | |
Cigna Corp. | | | 1,283 | | | | 63,188 | |
Community Health Systems, Inc.* | | | 657 | | | | 14,612 | |
Coventry Health Care, Inc. | | | 680 | | | | 24,188 | |
DaVita, Inc.* | | | 226 | | | | 20,378 | |
Ensign Group, Inc. (The) | | | 113 | | | | 3,069 | |
Express Scripts Holding Co.* | | | 1,094 | | | | 59,273 | |
Five Star Quality Care, Inc.* | | | 1,163 | | | | 3,966 | |
Hanger Orthopedic Group, Inc.* | | | 106 | | | | 2,317 | |
HCA Holdings, Inc. | | | 1,263 | | | | 31,247 | |
Health Management Associates, Inc. Class A* | | | 1,088 | | | | 7,311 | |
Health Net, Inc.* | | | 341 | | | | 13,545 | |
Healthways, Inc.* | | | 223 | | | | 1,641 | |
Henry Schein, Inc.* | | | 235 | | | | 17,785 | |
Humana, Inc. | | | 668 | | | | 61,777 | |
Kindred Healthcare, Inc.* | | | 197 | | | | 1,702 | |
Laboratory Corp. of America Holdings* | | | 259 | | | | 23,709 | |
Landauer, Inc. | | | 19 | | | | 1,007 | |
LifePoint Hospitals, Inc.* | | | 231 | | | | 9,111 | |
Lincare Holdings, Inc. | | | 305 | | | | 7,893 | |
Magellan Health Services, Inc.* | | | 107 | | | | 5,223 | |
McKesson Corp. | | | 681 | | | | 59,771 | |
Medco Health Solutions, Inc.* | | | 1,032 | | | | 72,550 | |
Mednax, Inc.* | | | 150 | | | | 11,155 | |
Molina Healthcare, Inc.* | | | 228 | | | | 7,668 | |
National Healthcare Corp. | | | 34 | | | | 1,549 | |
Omnicare, Inc. | | | 209 | | | | 7,434 | |
Owens & Minor, Inc. | | | 156 | | | | 4,744 | |
Patterson Cos., Inc. | | | 352 | | | | 11,757 | |
PSS World Medical, Inc.* | | | 138 | | | | 3,497 | |
Quest Diagnostics, Inc. | | | 483 | | | | 29,535 | |
Select Medical Holdings Corp.* | | | 585 | | | | 4,499 | |
Team Health Holdings, Inc.* | | | 120 | | | | 2,467 | |
| | | | | | | | |
Tenet Healthcare Corp.* | | | 1,415 | | | $ | 7,514 | |
Triple-S Management Corp. Class B* | | | 186 | | | | 4,297 | |
UnitedHealth Group, Inc. | | | 4,096 | | | | 241,418 | |
Universal American Corp. | | | 495 | | | | 5,336 | |
Universal Health Services, Inc. Class B | | | 340 | | | | 14,249 | |
VCA Antech, Inc.* | | | 233 | | | | 5,408 | |
WellCare Health Plans, Inc.* | | | 138 | | | | 9,919 | |
WellPoint, Inc. | | | 1,699 | | | | 125,386 | |
| | | | | | | | |
| Total Health Care Providers & Services | | | | | | | 1,196,976 | |
| Health Care Technology – 0.1% | |
Allscripts Healthcare Solutions, Inc.* | | | 117 | | | | 1,942 | |
Cerner Corp.* | | | 209 | | | | 15,918 | |
Quality Systems, Inc. | | | 69 | | | | 3,017 | |
| | | | | | | | |
| Total Health Care Technology | | | | | | | 20,877 | |
| Hotels, Restaurants & Leisure – 1.4% | |
Ameristar Casinos, Inc. | | | 96 | | | | 1,788 | |
Bally Technologies, Inc.* | | | 117 | | | | 5,470 | |
Bob Evans Farms, Inc. | | | 124 | | | | 4,677 | |
Bravo Brio Restaurant Group, Inc.* | | | 150 | | | | 2,994 | |
Brinker International, Inc. | | | 268 | | | | 7,383 | |
Buffalo Wild Wings, Inc.* | | | 32 | | | | 2,902 | |
CEC Entertainment, Inc. | | | 106 | | | | 4,018 | |
Cheesecake Factory, Inc. (The)* | | | 88 | | | | 2,586 | |
Chipotle Mexican Grill, Inc.* | | | 24 | | | | 10,032 | |
Choice Hotels International, Inc. | | | 137 | | | | 5,116 | |
Churchill Downs, Inc. | | | 41 | | | | 2,292 | |
Cracker Barrel Old Country Store, Inc. | | | 117 | | | | 6,529 | |
Darden Restaurants, Inc. | | | 379 | | | | 19,390 | |
Domino’s Pizza, Inc. | | | 181 | | | | 6,570 | |
Einstein Noah Restaurant Group, Inc. | | | 107 | | | | 1,596 | |
Hyatt Hotels Corp. Class A* | | | 73 | | | | 3,119 | |
International Game Technology | | | 664 | | | | 11,149 | |
International Speedway Corp. Class A | | | 150 | | | | 4,162 | |
Interval Leisure Group, Inc. | | | 154 | | | | 2,680 | |
Jack In The Box, Inc.* | | | 181 | | | | 4,339 | |
Las Vegas Sands Corp. | | | 951 | | | | 54,749 | |
Life Time Fitness, Inc.* | | | 98 | | | | 4,956 | |
Marriott International, Inc. Class A | | | 319 | | | | 12,074 | |
McDonald’s Corp. | | | 2,145 | | | | 210,425 | |
Panera Bread Co. Class A* | | | 50 | | | | 8,046 | |
Papa John’s International, Inc.* | | | 107 | | | | 4,030 | |
Penn National Gaming, Inc.* | | | 147 | | | | 6,318 | |
Sonic Corp.* | | | 199 | | | | 1,528 | |
Speedway Motorsports, Inc. | | | 85 | | | | 1,588 | |
Starbucks Corp. | | | 1,127 | | | | 62,988 | |
Starwood Hotels & Resorts Worldwide, Inc. | | | 347 | | | | 19,574 | |
Texas Roadhouse, Inc. | | | 147 | | | | 2,446 | |
Vail Resorts, Inc. | | | 28 | | | | 1,211 | |
WMS Industries, Inc.* | | | 107 | | | | 2,539 | |
Wyndham Worldwide Corp. | | | 499 | | | | 23,208 | |
Wynn Resorts Ltd. | | | 166 | | | | 20,730 | |
Yum! Brands, Inc. | | | 849 | | | | 60,432 | |
| | | | | | | | |
| Total Hotels, Restaurants & Leisure | | | | | | | 605,634 | |
See Notes to Financial Statements.
| | |
| 20 | | WisdomTree Domestic and International Earnings Funds |
Schedule of Investments (continued)
WisdomTree Total Earnings Fund (EXT)
March 31, 2012
| | | | | | | | |
| Investments | | Shares | | | Value | |
| | | | | | | | |
| Household Durables – 0.3% | |
American Greetings Corp. Class A | | | 254 | | | $ | 3,897 | |
Blyth, Inc. | | | 35 | | | | 2,619 | |
D.R. Horton, Inc. | | | 389 | | | | 5,901 | |
Harman International Industries, Inc. | | | 135 | | | | 6,319 | |
Jarden Corp. | | | 271 | | | | 10,902 | |
La-Z-Boy, Inc.* | | | 234 | | | | 3,501 | |
Leggett & Platt, Inc. | | | 311 | | | | 7,156 | |
Lennar Corp. Class A(a) | | | 168 | | | | 4,566 | |
Mohawk Industries, Inc.* | | | 120 | | | | 7,981 | |
Newell Rubbermaid, Inc. | | | 965 | | | | 17,187 | |
NVR, Inc.* | | | 12 | | | | 8,716 | |
Tempur-Pedic International, Inc.* | | | 164 | | | | 13,847 | |
Toll Brothers, Inc.* | | | 169 | | | | 4,054 | |
Tupperware Brands Corp. | | | 184 | | | | 11,684 | |
Whirlpool Corp. | | | 524 | | | | 40,275 | |
| | | | | | | | |
| Total Household Durables | | | | | | | 148,605 | |
| Household Products – 1.6% | |
Central Garden and Pet Co. Class A* | | | 279 | | | | 2,687 | |
Church & Dwight Co., Inc. | | | 304 | | | | 14,954 | |
Clorox Co. (The) | | | 324 | | | | 22,275 | |
Colgate-Palmolive Co. | | | 1,031 | | | | 100,811 | |
Energizer Holdings, Inc.* | | | 151 | | | | 11,201 | |
Kimberly-Clark Corp. | | | 1,016 | | | | 75,072 | |
Procter & Gamble Co. (The) | | | 6,702 | | | | 450,442 | |
WD-40 Co. | | | 44 | | | | 1,995 | |
| | | | | | | | |
| Total Household Products | | | | | | | 679,437 | |
| Independent Power Producers & Energy Traders – 0.0% | |
AES Corp. (The)* | | | 593 | | | | 7,750 | |
NRG Energy, Inc.* | | | 710 | | | | 11,126 | |
Ormat Technologies, Inc.(a) | | | 84 | | | | 1,693 | |
| | | | | | | | |
| Total Independent Power Producers & Energy Traders | | | | | | | 20,569 | |
| Industrial Conglomerates – 1.8% | |
3M Co. | | | 2,011 | | | | 179,401 | |
Carlisle Cos., Inc. | | | 138 | | | | 6,889 | |
Danaher Corp. | | | 1,561 | | | | 87,416 | |
General Electric Co. | | | 24,634 | | | | 494,405 | |
Raven Industries, Inc. | | | 33 | | | | 2,013 | |
Seaboard Corp.* | | | 5 | | | | 9,755 | |
| | | | | | | | |
| Total Industrial Conglomerates | | | | | | | 779,879 | |
| Insurance – 4.1% | |
Aflac, Inc. | | | 2,574 | | | | 118,378 | |
Alleghany Corp.* | | | 18 | | | | 5,924 | |
Allstate Corp. (The) | | | 767 | | | | 25,250 | |
American Equity Investment Life Holding Co. | | | 259 | | | | 3,307 | |
American Financial Group, Inc. | | | 398 | | | | 15,355 | |
American National Insurance Co. | | | 71 | | | | 5,149 | |
AMERISAFE, Inc.* | | | 120 | | | | 2,969 | |
AmTrust Financial Services, Inc. | | | 295 | | | | 7,930 | |
Arthur J. Gallagher & Co. | | | 200 | | | | 7,148 | |
Assurant, Inc. | | | 493 | | | | 19,966 | |
| | | | | | | | |
Berkshire Hathaway, Inc. Class B* | | | 5,549 | | | $ | 450,301 | |
Brown & Brown, Inc. | | | 318 | | | | 7,562 | |
Chubb Corp. (The) | | | 985 | | | | 68,073 | |
Cincinnati Financial Corp. | | | 159 | | | | 5,487 | |
CNA Financial Corp. | | | 1,002 | | | | 29,389 | |
CNO Financial Group, Inc.* | | | 2,467 | | | | 19,193 | |
Crawford & Co. Class B | | | 399 | | | | 1,955 | |
Delphi Financial Group, Inc. Class A | | | 301 | | | | 13,476 | |
Employers Holdings, Inc. | | | 158 | | | | 2,798 | |
Erie Indemnity Co. Class A | | | 105 | | | | 8,184 | |
FBL Financial Group, Inc. Class A | | | 185 | | | | 6,234 | |
Fidelity National Financial, Inc. Class A | | | 797 | | | | 14,370 | |
First American Financial Corp. | | | 447 | | | | 7,434 | |
Genworth Financial, Inc. Class A* | | | 338 | | | | 2,812 | |
Hanover Insurance Group, Inc. (The) | | | 57 | | | | 2,344 | |
Hartford Financial Services Group, Inc. | | | 2,274 | | | | 47,936 | |
HCC Insurance Holdings, Inc. | | | 394 | | | | 12,281 | |
Horace Mann Educators Corp. | | | 202 | | | | 3,559 | |
Infinity Property & Casualty Corp. | | | 64 | | | | 3,349 | |
Kemper Corp. | | | 141 | | | | 4,269 | |
Lincoln National Corp. | | | 2,250 | | | | 59,310 | |
Loews Corp. | | | 1,293 | | | | 51,552 | |
Markel Corp.* | | | 21 | | | | 9,428 | |
Marsh & McLennan Cos., Inc. | | | 950 | | | | 31,150 | |
Meadowbrook Insurance Group, Inc. | | | 184 | | | | 1,717 | |
Mercury General Corp. | | | 136 | | | | 5,949 | |
MetLife, Inc. | | | 4,862 | | | | 181,596 | |
National Western Life Insurance Co. Class A | | | 24 | | | | 3,285 | |
Navigators Group, Inc. (The)* | | | 41 | | | | 1,937 | |
Phoenix Cos., Inc. (The)* | | | 1,461 | | | | 3,579 | |
Primerica, Inc. | | | 374 | | | | 9,428 | |
Principal Financial Group, Inc. | | | 1,286 | | | | 37,950 | |
ProAssurance Corp. | | | 126 | | | | 11,102 | |
Progressive Corp. (The) | | | 2,032 | | | | 47,102 | |
Protective Life Corp. | | | 546 | | | | 16,172 | |
Prudential Financial, Inc. | | | 2,395 | | | | 151,819 | |
Reinsurance Group of America, Inc. | | | 430 | | | | 25,572 | |
RLI Corp. | | | 95 | | | | 6,806 | |
Safety Insurance Group, Inc. | | | 79 | | | | 3,290 | |
Selective Insurance Group, Inc. | | | 105 | | | | 1,849 | |
StanCorp Financial Group, Inc. | | | 227 | | | | 9,293 | |
Symetra Financial Corp. | | | 603 | | | | 6,953 | |
Torchmark Corp. | | | 476 | | | | 23,729 | |
Tower Group, Inc. | | | 123 | | | | 2,759 | |
Travelers Cos., Inc. (The) | | | 1,274 | | | | 75,421 | |
Universal Insurance Holdings, Inc. | | | 929 | | | | 3,614 | |
Unum Group | | | 1,707 | | | | 41,787 | |
W.R. Berkley Corp. | | | 467 | | | | 16,868 | |
| | | | | | | | |
| Total Insurance | | | | | | | 1,763,399 | |
| Internet & Catalog Retail – 0.4% | |
Amazon.com, Inc.* | | | 181 | | | | 36,654 | |
Expedia, Inc.(a) | | | 339 | | | | 11,336 | |
HSN, Inc. | | | 83 | | | | 3,157 | |
See Notes to Financial Statements.
| | | | |
| WisdomTree Domestic and International Earnings Funds | | | 21 | |
Schedule of Investments (continued)
WisdomTree Total Earnings Fund (EXT)
March 31, 2012
| | | | | | | | |
| Investments | | Shares | | | Value | |
| | | | | | | | |
Liberty Interactive Corp. Class A* | | | 1,235 | | | $ | 23,576 | |
Netflix, Inc.* | | | 112 | | | | 12,885 | |
priceline.com, Inc.* | | | 78 | | | | 55,965 | |
TripAdvisor, Inc.* | | | 339 | | | | 12,092 | |
| | | | | | | | |
| Total Internet & Catalog Retail | | | | | | | 155,665 | |
| Internet Software & Services – 1.3% | |
Akamai Technologies, Inc.* | | | 250 | | | | 9,175 | |
Ancestry.com, Inc.*(a) | | | 103 | | | | 2,342 | |
AOL, Inc.* | | | 156 | | | | 2,959 | |
Digital River, Inc.* | | | 129 | | | | 2,414 | |
Earthlink, Inc. | | | 552 | | | | 4,410 | |
eBay, Inc.* | | | 2,359 | | | | 87,024 | |
Equinix, Inc.* | | | 16 | | | | 2,519 | |
Google, Inc. Class A* | | | 609 | | | | 390,515 | |
IAC/InterActiveCorp | | | 91 | | | | 4,467 | |
j2 Global, Inc.(a) | | | 114 | | | | 3,270 | |
Keynote Systems, Inc. | | | 101 | | | | 1,996 | |
Rackspace Hosting, Inc.* | | | 48 | | | | 2,774 | |
United Online, Inc. | | | 413 | | | | 2,020 | |
ValueClick, Inc.* | | | 341 | | | | 6,731 | |
VeriSign, Inc. | | | 88 | | | | 3,374 | |
WebMD Health Corp.* | | | 54 | | | | 1,381 | |
Yahoo!, Inc.* | | | 2,611 | | | | 39,739 | |
| | | | | | | | |
| Total Internet Software & Services | | | | | | | 567,110 | |
| IT Services – 3.1% | |
Acxiom Corp.* | | | 133 | | | | 1,952 | |
Alliance Data Systems Corp.* | | | 123 | | | | 15,493 | |
Automatic Data Processing, Inc. | | | 954 | | | | 52,651 | |
Booz Allen Hamilton Holding Corp. | | | 311 | | | | 5,296 | |
Broadridge Financial Solutions, Inc. | | | 337 | | | | 8,058 | |
CACI International, Inc. Class A* | | | 86 | | | | 5,357 | |
Cardtronics, Inc.* | | | 101 | | | | 2,651 | |
Cognizant Technology Solutions Corp. Class A* | | | 478 | | | | 36,782 | |
Computer Sciences Corp. | | | 1,089 | | | | 32,605 | |
Convergys Corp.* | | | 300 | | | | 4,005 | |
CoreLogic, Inc.* | | | 106 | | | | 1,730 | |
CSG Systems International, Inc.* | | | 169 | | | | 2,559 | |
DST Systems, Inc. | | | 209 | | | | 11,334 | |
Euronet Worldwide, Inc.* | | | 81 | | | | 1,692 | |
Fidelity National Information Services, Inc. | | | 701 | | | | 23,217 | |
Fiserv, Inc.* | | | 314 | | | | 21,788 | |
FleetCor Technologies, Inc.* | | | 134 | | | | 5,195 | |
Gartner, Inc.* | | | 156 | | | | 6,652 | |
Global Payments, Inc. | | | 192 | | | | 9,114 | |
International Business Machines Corp. | | | 2,994 | | | | 624,698 | |
Jack Henry & Associates, Inc. | | | 216 | | | | 7,370 | |
Lender Processing Services, Inc. | | | 362 | | | | 9,412 | |
ManTech International Corp. Class A | | | 160 | | | | 5,514 | |
Mastercard, Inc. Class A | | | 253 | | | | 106,397 | |
MAXIMUS, Inc. | | | 102 | | | | 4,148 | |
NeuStar, Inc. Class A* | | | 205 | | | | 7,636 | |
Paychex, Inc. | | | 743 | | | | 23,026 | |
SAIC, Inc.* | | | 1,525 | | | | 20,130 | |
| | | | | | | | |
Sapient Corp. | | | 368 | | | $ | 4,582 | |
Syntel, Inc. | | | 138 | | | | 7,728 | |
TeleTech Holdings, Inc.* | | | 294 | | | | 4,733 | |
Teradata Corp.* | | | 255 | | | | 17,378 | |
Total System Services, Inc. | | | 504 | | | | 11,627 | |
Unisys Corp.* | | | 297 | | | | 5,857 | |
VeriFone Systems, Inc.* | | | 104 | | | | 5,395 | |
Visa, Inc. Class A | | | 1,465 | | | | 172,870 | |
Western Union Co. (The) | | | 2,041 | | | | 35,922 | |
Wright Express Corp.* | | | 79 | | | | 5,114 | |
| | | | | | | | |
| Total IT Services | | | | 1,327,668 | |
| Leisure Equipment & Products – 0.1% | | | | | | | | |
Hasbro, Inc. | | | 393 | | | | 14,431 | |
Mattel, Inc. | | | 997 | | | | 33,559 | |
Polaris Industries, Inc. | | | 150 | | | | 10,823 | |
| | | | | | | | |
| Total Leisure Equipment & Products | | | | 58,813 | |
| Life Sciences Tools & Services – 0.4% | | | | | | | | |
Agilent Technologies, Inc. | | | 1,066 | | | | 47,448 | |
Bio-Rad Laboratories, Inc. Class A* | | | 73 | | | | 7,569 | |
Bruker Corp.* | | | 307 | | | | 4,700 | |
Charles River Laboratories International, Inc.* | | | 104 | | | | 3,753 | |
Covance, Inc.* | | | 136 | | | | 6,478 | |
Illumina, Inc.*(a) | | | 114 | | | | 5,998 | |
Life Technologies Corp.* | | | 336 | | | | 16,403 | |
Mettler-Toledo International, Inc.*(a) | | | 54 | | | | 9,976 | |
PAREXEL International Corp.* | | | 132 | | | | 3,560 | |
PerkinElmer, Inc. | | | 339 | | | | 9,377 | |
Techne Corp. | | | 82 | | | | 5,748 | |
Thermo Fisher Scientific, Inc. | | | 823 | | | | 46,401 | |
Waters Corp.* | | | 206 | | | | 19,088 | |
| | | | | | | | |
| Total Life Sciences Tools & Services | | | | 186,499 | |
| Machinery – 2.5% | | | | | | | | |
Actuant Corp. Class A | | | 266 | | | | 7,711 | |
AGCO Corp.* | | | 324 | | | | 15,296 | |
Albany International Corp. Class A | | | 96 | | | | 2,203 | |
Astec Industries, Inc.* | | | 90 | | | | 3,283 | |
Barnes Group, Inc. | | | 169 | | | | 4,446 | |
Blount International, Inc.* | | | 148 | | | | 2,469 | |
Briggs & Stratton Corp. | | | 170 | | | | 3,048 | |
Caterpillar, Inc. | | | 1,968 | | | | 209,631 | |
Chart Industries, Inc.* | | | 28 | | | | 2,053 | |
CLARCOR, Inc. | | | 117 | | | | 5,744 | |
Crane Co. | | | 121 | | | | 5,869 | |
Cummins, Inc. | | | 646 | | | | 77,546 | |
Deere & Co. | | | 1,337 | | | | 108,163 | |
Donaldson Co., Inc. | | | 282 | | | | 10,076 | |
Dover Corp. | | | 560 | | | | 35,246 | |
Eaton Corp. | | | 1,150 | | | | 57,305 | |
EnPro Industries, Inc.* | | | 89 | | | | 3,658 | |
ESCO Technologies, Inc. | | | 66 | | | | 2,427 | |
Flowserve Corp. | | | 148 | | | | 17,096 | |
Gardner Denver, Inc. | | | 118 | | | | 7,436 | |
See Notes to Financial Statements.
| | |
| 22 | | WisdomTree Domestic and International Earnings Funds |
Schedule of Investments (continued)
WisdomTree Total Earnings Fund (EXT)
March 31, 2012
| | | | | | | | |
| Investments | | Shares | | | Value | |
| | | | | | | | |
Graco, Inc. | | | 152 | | | $ | 8,065 | |
Harsco Corp. | | | 130 | | | | 3,050 | |
IDEX Corp. | | | 249 | | | | 10,490 | |
Illinois Tool Works, Inc. | | | 1,571 | | | | 89,736 | |
ITT Corp. | | | 1,070 | | | | 24,546 | |
John Bean Technologies Corp. | | | 99 | | | | 1,604 | |
Joy Global, Inc. | | | 285 | | | | 20,948 | |
Kaydon Corp. | | | 97 | | | | 2,474 | |
Kennametal, Inc. | | | 238 | | | | 10,598 | |
Lincoln Electric Holdings, Inc. | | | 183 | | | | 8,294 | |
Meritor, Inc.* | | | 494 | | | | 3,987 | |
Middleby Corp.* | | | 45 | | | | 4,553 | |
Mueller Industries, Inc. | | | 112 | | | | 5,090 | |
NACCO Industries, Inc. Class A | | | 49 | | | | 5,702 | |
Nordson Corp. | | | 171 | | | | 9,321 | |
Oshkosh Corp.* | | | 601 | | | | 13,925 | |
PACCAR, Inc. | | | 783 | | | | 36,668 | |
Pall Corp. | | | 236 | | | | 14,073 | |
Parker Hannifin Corp. | | | 531 | | | | 44,896 | |
Pentair, Inc. | | | 216 | | | | 10,284 | |
Robbins & Myers, Inc. | | | 90 | | | | 4,685 | |
Sauer-Danfoss, Inc. | | | 297 | | | | 13,959 | |
Snap-On, Inc. | | | 189 | | | | 11,523 | |
SPX Corp. | | | 119 | | | | 9,226 | |
Stanley Black & Decker, Inc. | | | 330 | | | | 25,397 | |
Timken Co. (The) | | | 402 | | | | 20,397 | |
Toro Co. (The) | | | 86 | | | | 6,115 | |
Trimas Corp.* | | | 119 | | | | 2,664 | |
Trinity Industries, Inc. | | | 170 | | | | 5,602 | |
Valmont Industries, Inc. | | | 79 | | | | 9,275 | |
WABCO Holdings, Inc.* | | | 279 | | | | 16,874 | |
Wabtec Corp. | | | 116 | | | | 8,743 | |
Watts Water Technologies, Inc. Class A | | | 119 | | | | 4,849 | |
Woodward, Inc. | | | 146 | | | | 6,253 | |
| | | | | | | | |
| Total Machinery | | | | 1,054,572 | |
| Marine – 0.0% | | | | | | | | |
Alexander & Baldwin, Inc. | | | 55 | | | | 2,665 | |
International Shipholding Corp. | | | 92 | | | | 2,124 | |
Kirby Corp.* | | | 115 | | | | 7,566 | |
| | | | | | | | |
| Total Marine | | | | 12,355 | |
| Media – 3.1% | | | | | | | | |
AMC Networks, Inc. Class A* | | | 78 | | | | 3,481 | |
Arbitron, Inc. | | | 62 | | | | 2,293 | |
Belo Corp. Class A | | | 456 | | | | 3,270 | |
Cablevision Systems Corp. Class A | | | 627 | | | | 9,204 | |
CBS Corp. Class B | | | 1,811 | | | | 61,411 | |
Cinemark Holdings, Inc. | | | 382 | | | | 8,385 | |
Comcast Corp. Class A | | | 5,495 | | | | 164,905 | |
Cumulus Media, Inc. Class A* | | | 683 | | | | 2,384 | |
DIRECTV Class A* | | | 1,995 | | | | 98,433 | |
Discovery Communications, Inc. Class C* | | | 871 | | | | 40,832 | |
DISH Network Corp. Class A | | | 1,989 | | | | 65,498 | |
DreamWorks Animation SKG, Inc. Class A*(a) | | | 268 | | | | 4,945 | |
| | | | | | | | |
Entercom Communications Corp. Class A* | | | 464 | | | $ | 3,011 | |
Gannett Co., Inc. | | | 1,434 | | | | 21,983 | |
Harte-Hanks, Inc. | | | 440 | | | | 3,982 | |
Interpublic Group of Cos., Inc. (The) | | | 1,511 | | | | 17,241 | |
John Wiley & Sons, Inc. Class A | | | 148 | | | | 7,043 | |
Madison Square Garden, Inc. Class A* | | | 81 | | | | 2,770 | |
McGraw-Hill Cos., Inc. (The) | | | 790 | | | | 38,291 | |
Meredith Corp.(a) | | | 186 | | | | 6,038 | |
Morningstar, Inc. | | | 70 | | | | 4,413 | |
News Corp. Class A | | | 6,984 | | | | 137,515 | |
Omnicom Group, Inc. | | | 718 | | | | 36,367 | |
Regal Entertainment Group Class A | | | 267 | | | | 3,631 | |
Scholastic Corp. | | | 157 | | | | 5,539 | |
Scripps Networks Interactive, Inc. Class A | | | 404 | | | | 19,671 | |
Sinclair Broadcast Group, Inc. Class A | | | 300 | | | | 3,318 | |
Sirius XM Radio, Inc.*(a) | | | 5,013 | | | | 11,580 | |
Time Warner Cable, Inc. | | | 872 | | | | 71,068 | |
Time Warner, Inc. | | | 3,227 | | | | 121,819 | |
Valassis Communications, Inc.* | | | 192 | | | | 4,416 | |
Viacom, Inc. Class B | | | 1,955 | | | | 92,784 | |
Virgin Media, Inc. | | | 164 | | | | 4,097 | |
Walt Disney Co. (The) | | | 5,115 | | | | 223,935 | |
Washington Post Co. (The) Class B(a) | | | 21 | | | | 7,845 | |
World Wrestling Entertainment, Inc. Class A(a) | | | 216 | | | | 1,916 | |
| | | | | | | | |
| Total Media | | | | 1,315,314 | |
| Metals & Mining – 1.4% | | | | | | | | |
Alcoa, Inc. | | | 3,898 | | | | 39,058 | |
Allegheny Technologies, Inc. | | | 176 | | | | 7,246 | |
AMCOL International Corp. | | | 101 | | | | 2,978 | |
Carpenter Technology Corp. | | | 75 | | | | 3,917 | |
Century Aluminum Co.* | | | 286 | | | | 2,540 | |
Cliffs Natural Resources, Inc. | | | 1,004 | | | | 69,537 | |
Coeur d’Alene Mines Corp.* | | | 98 | | | | 2,327 | |
Compass Minerals International, Inc. | | | 78 | | | | 5,596 | |
Freeport-McMoRan Copper & Gold, Inc. | | | 5,160 | | | | 196,286 | |
Globe Specialty Metals, Inc. | | | 215 | | | | 3,197 | |
Hecla Mining Co.(a) | | | 657 | | | | 3,035 | |
Materion Corp.* | | | 87 | | | | 2,500 | |
Metals USA Holdings Corp.* | | | 188 | | | | 2,709 | |
Molycorp, Inc.*(a) | | | 92 | | | | 3,112 | |
Newmont Mining Corp. | | | 1,425 | | | | 73,060 | |
Noranda Aluminum Holding Corp. | | | 694 | | | | 6,919 | |
Nucor Corp. | | | 545 | | | | 23,408 | |
Reliance Steel & Aluminum Co. | | | 248 | | | | 14,007 | |
Royal Gold, Inc. | | | 36 | | | | 2,348 | |
Schnitzer Steel Industries, Inc. Class A | | | 91 | | | | 3,630 | |
Southern Copper Corp. | | | 2,773 | | | | 87,932 | |
Steel Dynamics, Inc. | | | 711 | | | | 10,338 | |
Stillwater Mining Co.* | | | 443 | | | | 5,600 | |
Titanium Metals Corp. | | | 291 | | | | 3,946 | |
Walter Energy, Inc. | | | 201 | | | | 11,901 | |
Worthington Industries, Inc. | | | 263 | | | | 5,044 | |
| | | | | | | | |
| Total Metals & Mining | | | | 592,171 | |
See Notes to Financial Statements.
| | | | |
| WisdomTree Domestic and International Earnings Funds | | | 23 | |
Schedule of Investments (continued)
WisdomTree Total Earnings Fund (EXT)
March 31, 2012
| | | | | | | | |
| Investments | | Shares | | | Value | |
| | | | | | | | |
| Multiline Retail – 0.8% | | | | | | | | |
Big Lots, Inc.* | | | 249 | | | $ | 10,712 | |
Dillard’s, Inc. Class A | | | 177 | | | | 11,154 | |
Dollar General Corp.* | | | 654 | | | | 30,215 | |
Dollar Tree, Inc.* | | | 228 | | | | 21,544 | |
Family Dollar Stores, Inc. | | | 274 | | | | 17,339 | |
J.C. Penney Co., Inc. | | | 331 | | | | 11,727 | |
Kohl’s Corp. | | | 920 | | | | 46,028 | |
Macy’s, Inc. | | | 1,391 | | | | 55,264 | |
Nordstrom, Inc. | | | 547 | | | | 30,479 | |
Saks, Inc.*(a) | | | 273 | | | | 3,169 | |
Target Corp. | | | 2,122 | | | | 123,649 | |
| | | | | | | | |
| Total Multiline Retail | | | | 361,280 | |
| Multi-Utilities – 1.2% | | | | | | | | |
Alliant Energy Corp. | | | 292 | | | | 12,649 | |
Ameren Corp. | | | 701 | | | | 22,839 | |
Avista Corp. | | | 171 | | | | 4,374 | |
Black Hills Corp. | | | 73 | | | | 2,448 | |
CenterPoint Energy, Inc. | | | 1,585 | | | | 31,256 | |
CH Energy Group, Inc. | | | 71 | | | | 4,738 | |
CMS Energy Corp. | | | 866 | | | | 19,052 | |
Consolidated Edison, Inc. | | | 737 | | | | 43,056 | |
Dominion Resources, Inc. | | | 598 | | | | 30,624 | |
DTE Energy Co. | | | 559 | | | | 30,762 | |
Integrys Energy Group, Inc. | | | 163 | | | | 8,637 | |
MDU Resources Group, Inc. | | | 449 | | | | 10,053 | |
NiSource, Inc. | | | 718 | | | | 17,483 | |
NorthWestern Corp. | | | 134 | | | | 4,752 | |
NSTAR | | | 290 | | | | 14,103 | |
OGE Energy Corp. | | | 268 | | | | 14,338 | |
PG&E Corp. | | | 1,113 | | | | 48,315 | |
Public Service Enterprise Group, Inc. | | | 1,133 | | | | 34,681 | |
SCANA Corp. | | | 372 | | | | 16,967 | |
Sempra Energy | | | 977 | | | | 58,581 | |
TECO Energy, Inc. | | | 510 | | | | 8,950 | |
Vectren Corp. | | | 202 | | | | 5,870 | |
Wisconsin Energy Corp. | | | 551 | | | | 19,384 | |
Xcel Energy, Inc. | | | 1,263 | | | | 33,432 | |
| | | | | | | | |
| Total Multi-Utilities | | | | 497,344 | |
| Office Electronics – 0.1% | | | | | | | | |
Xerox Corp. | | | 4,656 | | | | 37,621 | |
Zebra Technologies Corp. Class A* | | | 146 | | | | 6,012 | |
| | | | | | | | |
| Total Office Electronics | | | | 43,633 | |
| Oil, Gas & Consumable Fuels – 11.1% | | | | | | | | |
Alpha Natural Resources, Inc.* | | | 98 | | | | 1,491 | |
Anadarko Petroleum Corp. | | | 300 | | | | 23,502 | |
Apache Corp. | | | 1,618 | | | | 162,512 | |
Arch Coal, Inc. | | | 291 | | | | 3,117 | |
Berry Petroleum Co. Class A | | | 143 | | | | 6,740 | |
Bill Barrett Corp.*(a) | | | 89 | | | | 2,315 | |
Cabot Oil & Gas Corp. | | | 100 | | | | 3,117 | |
Chesapeake Energy Corp. | | | 1,893 | | | | 43,861 | |
Chevron Corp. | | | 9,791 | | | | 1,049,987 | |
| | | | | | | | |
Cimarex Energy Co. | | | 313 | | | $ | 23,622 | |
Clayton Williams Energy, Inc.* | | | 45 | | | | 3,575 | |
Cloud Peak Energy, Inc.* | | | 279 | | | | 4,444 | |
Concho Resources, Inc.* | | | 200 | | | | 20,416 | |
ConocoPhillips | | | 5,456 | | | | 414,711 | |
Consol Energy, Inc. | | | 542 | | | | 18,482 | |
Contango Oil & Gas Co.* | | | 56 | | | | 3,299 | |
Continental Resources, Inc.* | | | 284 | | | | 24,373 | |
CVR Energy, Inc.* | | | 498 | | | | 13,321 | |
Delek US Holdings, Inc. | | | 320 | | | | 4,963 | |
Denbury Resources, Inc.* | | | 1,244 | | | | 22,678 | |
Devon Energy Corp. | | | 1,322 | | | | 94,021 | |
El Paso Corp. | | | 465 | | | | 13,741 | |
Energen Corp. | | | 278 | | | | 13,664 | |
EOG Resources, Inc. | | | 225 | | | | 24,997 | |
EQT Corp. | | | 261 | | | | 12,583 | |
EXCO Resources, Inc.(a) | | | 715 | | | | 4,740 | |
Exxon Mobil Corp. | | | 19,668 | | | | 1,705,806 | |
Forest Oil Corp.* | | | 271 | | | | 3,284 | |
Gulfport Energy Corp.* | | | 119 | | | | 3,465 | |
Hess Corp. | | | 1,021 | | | | 60,188 | |
HollyFrontier Corp. | | | 1,197 | | | | 38,484 | |
Kinder Morgan, Inc.(a) | | | 551 | | | | 21,296 | |
Marathon Oil Corp. | | | 2,601 | | | | 82,452 | |
Marathon Petroleum Corp. | | | 3,082 | | | | 133,635 | |
Murphy Oil Corp. | | | 718 | | | | 40,402 | |
Newfield Exploration Co.* | | | 470 | | | | 16,300 | |
Noble Energy, Inc. | | | 339 | | | | 33,147 | |
Oasis Petroleum, Inc.* | | | 108 | | | | 3,330 | |
Occidental Petroleum Corp. | | | 2,536 | | | | 241,503 | |
Peabody Energy Corp. | | | 975 | | | | 28,236 | |
Pioneer Natural Resources Co. | | | 210 | | | | 23,434 | |
Plains Exploration & Production Co.* | | | 305 | | | | 13,008 | |
QEP Resources, Inc. | | | 414 | | | | 12,627 | |
Rosetta Resources, Inc.* | | | 51 | | | | 2,487 | |
SandRidge Energy, Inc.* | | | 1,101 | | | | 8,621 | |
SM Energy Co. | | | 92 | | | | 6,511 | |
Southwestern Energy Co.* | | | 715 | | | | 21,879 | |
Spectra Energy Corp. | | | 1,578 | | | | 49,786 | |
Stone Energy Corp.* | | | 244 | | | | 6,976 | |
Swift Energy Co.* | | | 99 | | | | 2,874 | |
Tesoro Corp.* | | | 921 | | | | 24,720 | |
Valero Energy Corp. | | | 3,535 | | | | 91,097 | |
W&T Offshore, Inc. | | | 318 | | | | 6,703 | |
Western Refining, Inc. | | | 514 | | | | 9,673 | |
Whiting Petroleum Corp.* | | | 387 | | | | 21,014 | |
Williams Cos., Inc. (The) | | | 1,067 | | | | 32,874 | |
World Fuel Services Corp. | | | 203 | | | | 8,323 | |
WPX Energy, Inc.* | | | 355 | | | | 6,393 | |
| | | | | | | | |
| Total Oil, Gas & Consumable Fuels | | | | 4,774,800 | |
| Paper & Forest Products – 0.2% | | | | | | | | |
Buckeye Technologies, Inc. | | | 171 | | | | 5,809 | |
Clearwater Paper Corp.* | | | 114 | | | | 3,786 | |
See Notes to Financial Statements.
| | |
| 24 | | WisdomTree Domestic and International Earnings Funds |
Schedule of Investments (continued)
WisdomTree Total Earnings Fund (EXT)
March 31, 2012
| | | | | | | | |
| Investments | | Shares | | | Value | |
| | | | | | | | |
International Paper Co. | | | 1,657 | | | $ | 58,161 | |
KapStone Paper and Packaging Corp.* | | | 285 | | | | 5,614 | |
MeadWestvaco Corp. | | | 283 | | | | 8,940 | |
PH Glatfelter Co. | | | 228 | | | | 3,598 | |
Schweitzer-Mauduit International, Inc. | | | 36 | | | | 2,486 | |
| | | | | | | | |
| Total Paper & Forest Products | | | | 88,394 | |
| Personal Products – 0.2% | | | | | | | | |
Avon Products, Inc. | | | 1,588 | | | | 30,744 | |
Elizabeth Arden, Inc.* | | | 53 | | | | 1,854 | |
Estee Lauder Cos., Inc. (The) Class A | | | 614 | | | | 38,031 | |
Nu Skin Enterprises, Inc. Class A | | | 142 | | | | 8,223 | |
Revlon, Inc. Class A* | | | 778 | | | | 13,420 | |
USANA Health Sciences, Inc.* | | | 66 | | | | 2,464 | |
| | | | | | | | |
| Total Personal Products | | | | 94,736 | |
| Pharmaceuticals – 4.4% | | | | | | | | |
Abbott Laboratories | | | 4,244 | | | | 260,115 | |
Akorn, Inc.* | | | 233 | | | | 2,726 | |
Allergan, Inc. | | | 396 | | | | 37,790 | |
Bristol-Myers Squibb Co. | | | 4,085 | | | | 137,869 | |
DepoMed, Inc.* | | | 701 | | | | 4,388 | |
Eli Lilly & Co. | | | 4,538 | | | | 182,745 | |
Endo Pharmaceuticals Holdings, Inc.* | | | 283 | | | | 10,961 | |
Forest Laboratories, Inc.* | | | 1,400 | | | | 48,566 | |
Hi-Tech Pharmacal Co., Inc.* | | | 52 | | | | 1,868 | |
Hospira, Inc.* | | | 514 | | | | 19,219 | |
Impax Laboratories, Inc.* | | | 249 | | | | 6,120 | |
Jazz Pharmaceuticals PLC* | | | 113 | | | | 5,477 | |
Johnson & Johnson | | | 7,106 | | | | 468,712 | |
Medicines Co. (The)* | | | 276 | | | | 5,539 | |
Medicis Pharmaceutical Corp. Class A | | | 140 | | | | 5,263 | |
Merck & Co., Inc. | | | 4,421 | | | | 169,766 | |
Mylan, Inc.* | | | 899 | | | | 21,082 | |
Par Pharmaceutical Cos., Inc.* | | | 91 | | | | 3,524 | |
Perrigo Co. | | | 137 | | | | 14,154 | |
Pfizer, Inc. | | | 20,080 | | | | 455,013 | |
Questcor Pharmaceuticals, Inc.* | | | 69 | | | | 2,596 | |
Salix Pharmaceuticals Ltd.* | | | 56 | | | | 2,940 | |
Viropharma, Inc.* | | | 227 | | | | 6,826 | |
Watson Pharmaceuticals, Inc.* | | | 157 | | | | 10,528 | |
| | | | | | | | |
| Total Pharmaceuticals | | | | 1,883,787 | |
| Professional Services – 0.2% | | | | | | | | |
Corporate Executive Board Co. (The) | | | 75 | | | | 3,226 | |
Dun & Bradstreet Corp. (The) | | | 115 | | | | 9,744 | |
Equifax, Inc. | | | 245 | | | | 10,844 | |
FTI Consulting, Inc.* | | | 118 | | | | 4,427 | |
IHS, Inc. Class A* | | | 74 | | | | 6,930 | |
Insperity, Inc. | | | 129 | | | | 3,953 | |
Kelly Services, Inc. Class A | | | 159 | | | | 2,542 | |
Korn/Ferry International* | | | 157 | | | | 2,630 | |
Manpower, Inc. | | | 222 | | | | 10,516 | |
Pendrell Corp.* | | | 3,731 | | | | 9,738 | |
Robert Half International, Inc. | | | 188 | | | | 5,696 | |
| | | | | | | | |
Towers Watson & Co. Class A | | | 116 | | | $ | 7,664 | |
Verisk Analytics, Inc. Class A* | | | 224 | | | | 10,521 | |
| | | | | | | | |
| Total Professional Services | | | | 88,431 | |
| Real Estate Investment Trusts (REITs) – 0.7% | | | | | | | | |
Alexander’s, Inc. | | | 10 | | | | 3,939 | |
Alexandria Real Estate Equities, Inc. | | | 64 | | | | 4,680 | |
American Tower Corp. | | | 221 | | | | 13,927 | |
AvalonBay Communities, Inc. | | | 58 | | | | 8,198 | |
BioMed Realty Trust, Inc. | | | 83 | | | | 1,575 | |
Boston Properties, Inc. | | | 75 | | | | 7,874 | |
BRE Properties, Inc. | | | 27 | | | | 1,365 | |
Digital Realty Trust, Inc.(a) | | | 83 | | | | 6,140 | |
Entertainment Properties Trust | | | 51 | | | | 2,365 | |
Equity Lifestyle Properties, Inc. | | | 40 | | | | 2,790 | |
Equity One, Inc. | | | 174 | | | | 3,518 | |
Essex Property Trust, Inc. | | | 6 | | | | 909 | |
Extra Space Storage, Inc. | | | 61 | | | | 1,756 | |
Federal Realty Investment Trust | | | 66 | | | | 6,388 | |
Getty Realty Corp.(a) | | | 292 | | | | 4,549 | |
HCP, Inc. | | | 497 | | | | 19,612 | |
Health Care REIT, Inc. | | | 78 | | | | 4,287 | |
Hospitality Properties Trust | | | 103 | | | | 2,726 | |
Kimco Realty Corp. | | | 303 | | | | 5,836 | |
Liberty Property Trust | | | 182 | | | | 6,501 | |
LTC Properties, Inc. | | | 98 | | | | 3,136 | |
Mack-Cali Realty Corp. | | | 130 | | | | 3,747 | |
National Health Investors, Inc. | | | 99 | | | | 4,829 | |
National Retail Properties, Inc. | | | 130 | | | | 3,535 | |
Omega Healthcare Investors, Inc. | | | 91 | | | | 1,935 | |
Piedmont Office Realty Trust, Inc. Class A | | | 191 | | | | 3,390 | |
Plum Creek Timber Co., Inc. | | | 219 | | | | 9,102 | |
Potlatch Corp. | | | 102 | | | | 3,197 | |
PS Business Parks, Inc. | | | 37 | | | | 2,425 | |
Public Storage | | | 159 | | | | 21,969 | |
Rayonier, Inc. | | | 312 | | | | 13,756 | |
Realty Income Corp. | | | 152 | | | | 5,887 | |
Senior Housing Properties Trust | | | 260 | | | | 5,733 | |
Simon Property Group, Inc. | | | 258 | | | | 37,586 | |
SL Green Realty Corp. | | | 307 | | | | 23,808 | |
Taubman Centers, Inc. | | | 32 | | | | 2,334 | |
Ventas, Inc. | | | 164 | | | | 9,364 | |
Vornado Realty Trust | | | 283 | | | | 23,829 | |
Weyerhaeuser Co. | | | 780 | | | | 17,098 | |
| | | | | | | | |
| Total Real Estate Investment Trusts (REITs) | | | | 305,595 | |
| Real Estate Management & Development – 0.1% | | | | | | | | |
CBRE Group, Inc. Class A* | | | 661 | | | | 13,193 | |
Howard Hughes Corp. (The)* | | | 78 | | | | 4,982 | |
Jones Lang LaSalle, Inc. | | | 96 | | | | 7,998 | |
| | | | | | | | |
| Total Real Estate Management & Development | | | | 26,173 | |
| Road & Rail – 0.8% | | | | | | | | |
AMERCO | | | 58 | | | | 6,120 | |
Con-way, Inc. | | | 103 | | | | 3,359 | |
See Notes to Financial Statements.
| | | | |
| WisdomTree Domestic and International Earnings Funds | | | 25 | |
Schedule of Investments (continued)
WisdomTree Total Earnings Fund (EXT)
March 31, 2012
| | | | | | | | |
| Investments | | Shares | | | Value | |
| | | | | | | | |
CSX Corp. | | | 3,316 | | | $ | 71,360 | |
Dollar Thrifty Automotive Group, Inc.* | | | 72 | | | | 5,825 | |
Genesee & Wyoming, Inc. Class A* | | | 84 | | | | 4,585 | |
Heartland Express, Inc. | | | 166 | | | | 2,400 | |
Hertz Global Holdings, Inc.* | | | 292 | | | | 4,392 | |
JB Hunt Transport Services, Inc. | | | 254 | | | | 13,810 | |
Kansas City Southern* | | | 143 | | | | 10,252 | |
Knight Transportation, Inc. | | | 136 | | | | 2,402 | |
Landstar System, Inc. | | | 106 | | | | 6,118 | |
Norfolk Southern Corp. | | | 989 | | | | 65,106 | |
Old Dominion Freight Line, Inc.* | | | 131 | | | | 6,245 | |
Ryder System, Inc. | | | 89 | | | | 4,699 | |
Union Pacific Corp. | | | 1,177 | | | | 126,504 | |
Werner Enterprises, Inc. | | | 140 | | | | 3,480 | |
| | | | | | | | |
| Total Road & Rail | | | | 336,657 | |
| Semiconductors & Semiconductor Equipment – 3.2% | |
Advanced Energy Industries, Inc.* | | | 225 | | | | 2,952 | |
Advanced Micro Devices, Inc.* | | | 1,976 | | | | 15,848 | |
Altera Corp. | | | 922 | | | | 36,714 | |
Amkor Technology, Inc.*(a) | | | 1,369 | | | | 8,413 | |
Analog Devices, Inc. | | | 939 | | | | 37,936 | |
Applied Materials, Inc. | | | 6,226 | | | | 77,451 | |
Atmel Corp.* | | | 2,005 | | | | 19,769 | |
Broadcom Corp. Class A* | | | 1,227 | | | | 48,221 | |
Brooks Automation, Inc. | | | 459 | | | | 5,659 | |
Cabot Microelectronics Corp. | | | 45 | | | | 1,750 | |
Cirrus Logic, Inc.* | | | 446 | | | | 10,615 | |
Cree, Inc.*(a) | | | 100 | | | | 3,163 | |
Cymer, Inc.* | | | 106 | | | | 5,300 | |
Cypress Semiconductor Corp.* | | | 288 | | | | 4,501 | |
Diodes, Inc.* | | | 203 | | | | 4,706 | |
Entegris, Inc.* | | | 711 | | | | 6,641 | |
Entropic Communications, Inc.* | | | 377 | | | | 2,198 | |
Fairchild Semiconductor International, Inc.* | | | 572 | | | | 8,408 | |
First Solar, Inc.*(a) | | | 534 | | | | 13,377 | |
GT Advanced Technologies, Inc.*(a) | | | 1,181 | | | | 9,767 | |
Hittite Microwave Corp.* | | | 62 | | | | 3,367 | |
Integrated Device Technology, Inc.* | | | 415 | | | | 2,967 | |
Integrated Silicon Solution, Inc.* | | | 238 | | | | 2,656 | |
Intel Corp. | | | 20,792 | | | | 584,463 | |
International Rectifier Corp.* | | | 200 | | | | 4,614 | |
Intersil Corp. Class A | | | 257 | | | | 2,878 | |
KLA-Tencor Corp. | | | 633 | | | | 34,448 | |
Kulicke & Soffa Industries, Inc.* | | | 686 | | | | 8,527 | |
Lam Research Corp.*(a) | | | 552 | | | | 24,630 | |
Lattice Semiconductor Corp.* | | | 339 | | | | 2,180 | |
Linear Technology Corp. | | | 691 | | | | 23,287 | |
LSI Corp.* | | | 443 | | | | 3,845 | |
Maxim Integrated Products, Inc. | | | 748 | | | | 21,385 | |
Microchip Technology, Inc.(a) | | | 470 | | | | 17,484 | |
Micron Technology, Inc.* | | | 2,582 | | | | 20,914 | |
Microsemi Corp.* | | | 125 | | | | 2,680 | |
MKS Instruments, Inc. | | | 251 | | | | 7,412 | |
| | | | | | | | |
Nanometrics, Inc.* | | | 124 | | | $ | 2,295 | |
Novellus Systems, Inc.* | | | 339 | | | | 16,919 | |
NVIDIA Corp.* | | | 1,501 | | | | 23,100 | |
Omnivision Technologies, Inc.* | | | 413 | | | | 8,260 | |
ON Semiconductor Corp.* | | | 666 | | | | 6,001 | |
PMC – Sierra, Inc.* | | | 704 | | | | 5,090 | |
RF Micro Devices, Inc.* | | | 724 | | | | 3,606 | |
Rubicon Technology, Inc.* | | | 217 | | | | 2,263 | |
Semtech Corp.* | | | 156 | | | | 4,440 | |
Silicon Laboratories, Inc.* | | | 48 | | | | 2,064 | |
Skyworks Solutions, Inc.* | | | 561 | | | | 15,512 | |
Spansion, Inc. Class A* | | | 201 | | | | 2,448 | |
Teradyne, Inc.* | | | 865 | | | | 14,610 | |
Texas Instruments, Inc. | | | 3,743 | | | | 125,802 | |
TriQuint Semiconductor, Inc.* | | | 487 | | | | 3,358 | |
Veeco Instruments, Inc.*(a) | | | 424 | | | | 12,126 | |
Xilinx, Inc. | | | 799 | | | | 29,108 | |
| | | | | | | | |
| Total Semiconductors & Semiconductor Equipment | | | | 1,368,128 | |
| Software – 4.1% | | | | | | | | |
ACI Worldwide, Inc.* | | | 272 | | | | 10,953 | |
Activision Blizzard, Inc. | | | 2,194 | | | | 28,127 | |
Adobe Systems, Inc.* | | | 1,227 | | | | 42,098 | |
ANSYS, Inc.* | | | 150 | | | | 9,753 | |
Autodesk, Inc.* | | | 312 | | | | 13,204 | |
BMC Software, Inc.* | | | 436 | | | | 17,510 | |
CA, Inc. | | | 1,478 | | | | 40,734 | |
Cadence Design Systems, Inc.* | | | 245 | | | | 2,901 | |
Citrix Systems, Inc.* | | | 211 | | | | 16,650 | |
Compuware Corp.* | | | 567 | | | | 5,211 | |
Ebix, Inc.(a) | | | 135 | | | | 3,127 | |
Factset Research Systems, Inc.(a) | | | 81 | | | | 8,022 | |
Fair Isaac Corp. | | | 113 | | | | 4,961 | |
Fortinet, Inc.* | | | 88 | | | | 2,433 | |
Informatica Corp.* | | | 119 | | | | 6,295 | |
Intuit, Inc. | | | 512 | | | | 30,787 | |
JDA Software Group, Inc.* | | | 72 | | | | 1,979 | |
Mentor Graphics Corp.* | | | 227 | | | | 3,373 | |
MICROS Systems, Inc.* | | | 116 | | | | 6,414 | |
Microsoft Corp. | | | 33,806 | | | | 1,090,243 | |
MicroStrategy, Inc. Class A* | | | 23 | | | | 3,220 | |
Oracle Corp. | | | 10,944 | | | | 319,127 | |
Parametric Technology Corp.* | | | 143 | | | | 3,995 | |
Progress Software Corp.* | | | 204 | | | | 4,818 | |
Quest Software, Inc.* | | | 141 | | | | 3,281 | |
Red Hat, Inc.* | | | 92 | | | | 5,510 | |
Rovi Corp.* | | | 96 | | | | 3,125 | |
Salesforce.com, Inc.* | | | 6 | | | | 927 | |
SolarWinds, Inc.* | | | 67 | | | | 2,589 | |
Solera Holdings, Inc. | | | 113 | | | | 5,186 | |
SS&C Technologies Holdings, Inc.* | | | 113 | | | | 2,636 | |
Symantec Corp.* | | | 1,750 | | | | 32,725 | |
Synopsys, Inc.* | | | 307 | | | | 9,413 | |
TeleCommunication Systems, Inc. Class A* | | | 763 | | | | 2,121 | |
See Notes to Financial Statements.
| | |
| 26 | | WisdomTree Domestic and International Earnings Funds |
Schedule of Investments (continued)
WisdomTree Total Earnings Fund (EXT)
March 31, 2012
| | | | | | | | |
| Investments | | Shares | | | Value | |
| | | | | | | | |
TeleNav, Inc.* | | | 292 | | | $ | 2,050 | |
TIBCO Software, Inc.* | | | 149 | | | | 4,544 | |
Tyler Technologies, Inc.* | | | 53 | | | | 2,036 | |
VMware, Inc. Class A* | | | 256 | | | | 28,767 | |
| | | | | | | | |
| Total Software | | | | 1,780,845 | |
| Specialty Retail – 2.3% | | | | | | | | |
Aaron’s, Inc. | | | 198 | | | | 5,128 | |
Abercrombie & Fitch Co. Class A | | | 152 | | | | 7,541 | |
Advance Auto Parts, Inc. | | | 219 | | | | 19,397 | |
Aeropostale, Inc.* | | | 304 | | | | 6,572 | |
American Eagle Outfitters, Inc. | | | 470 | | | | 8,079 | |
ANN, Inc.* | | | 138 | | | | 3,952 | |
Ascena Retail Group, Inc.* | | | 288 | | | | 12,764 | |
AutoNation, Inc.*(a) | | | 324 | | | | 11,116 | |
AutoZone, Inc.* | | | 104 | | | | 38,667 | |
Bed Bath & Beyond, Inc.* | | | 586 | | | | 38,541 | |
Best Buy Co., Inc. | | | 1,871 | | | | 44,305 | |
Buckle, Inc. (The) | | | 182 | | | | 8,718 | |
Cabela’s, Inc.* | | | 132 | | | | 5,036 | |
CarMax, Inc.* | | | 440 | | | | 15,246 | |
Cato Corp. (The) Class A | | | 92 | | | | 2,543 | |
Chico’s FAS, Inc. | | | 495 | | | | 7,475 | |
Children’s Place Retail Stores, Inc. (The)* | | | 74 | | | | 3,824 | |
Dick’s Sporting Goods, Inc. | | | 267 | | | | 12,837 | |
DSW, Inc. Class A | | | 141 | | | | 7,723 | |
Express, Inc.* | | | 255 | | | | 6,370 | |
Finish Line, Inc. (The) Class A | | | 189 | | | | 4,011 | |
Foot Locker, Inc. | | | 338 | | | | 10,495 | |
GameStop Corp. Class A(a) | | | 718 | | | | 15,681 | |
Gap, Inc. (The) | | | 2,151 | | | | 56,227 | |
Genesco, Inc.* | | | 48 | | | | 3,439 | |
GNC Holdings, Inc. Class A | | | 132 | | | | 4,605 | |
Group 1 Automotive, Inc. | | | 45 | | | | 2,528 | |
Guess?, Inc. | | | 379 | | | | 11,844 | |
hhgregg, Inc.*(a) | | | 132 | | | | 1,502 | |
Hibbett Sports, Inc.* | | | 49 | | | | 2,673 | |
Home Depot, Inc. (The) | | | 3,642 | | | | 183,229 | |
JOS A Bank Clothiers, Inc.* | | | 89 | | | | 4,487 | |
Lowe’s Cos., Inc. | | | 2,869 | | | | 90,029 | |
Ltd. Brands, Inc. | | | 802 | | | | 38,496 | |
Men’s Wearhouse, Inc. (The) | | | 131 | | | | 5,079 | |
Monro Muffler Brake, Inc. | | | 50 | | | | 2,075 | |
O’Reilly Automotive, Inc.* | | | 241 | | | | 22,015 | |
Penske Automotive Group, Inc. | | | 346 | | | | 8,522 | |
PetSmart, Inc. | | | 239 | | | | 13,676 | |
Pier 1 Imports, Inc.* | | | 481 | | | | 8,745 | |
RadioShack Corp.(a) | | | 642 | | | | 3,993 | |
Rent-A-Center, Inc. | | | 183 | | | | 6,908 | |
Ross Stores, Inc. | | | 556 | | | | 32,304 | |
Sally Beauty Holdings, Inc.* | | | 441 | | | | 10,937 | |
Select Comfort Corp.* | | | 200 | | | | 6,478 | |
Sonic Automotive, Inc. Class A(a) | | | 289 | | | | 5,176 | |
Staples, Inc. | | | 2,443 | | | | 39,528 | |
| | | | | | | | |
Systemax, Inc.* | | | 268 | | | $ | 4,518 | |
Tiffany & Co. | | | 226 | | | | 15,623 | |
TJX Cos., Inc. | | | 1,872 | | | | 74,337 | |
Tractor Supply Co. | | | 119 | | | | 10,777 | |
Ulta Salon Cosmetics & Fragrance, Inc. | | | 44 | | | | 4,087 | |
Urban Outfitters, Inc.* | | | 318 | | | | 9,257 | |
Wet Seal, Inc. (The) Class A* | | | 476 | | | | 1,642 | |
Williams-Sonoma, Inc. | | | 228 | | | | 8,545 | |
| | | | | | | | |
| Total Specialty Retail | | | | 989,302 | |
| Textiles, Apparel & Luxury Goods – 0.7% | | | | | | | | |
Carter’s, Inc.* | | | 120 | | | | 5,972 | |
Coach, Inc. | | | 578 | | | | 44,668 | |
Columbia Sportswear Co.(a) | | | 118 | | | | 5,599 | |
Crocs, Inc.* | | | 271 | | | | 5,669 | |
Deckers Outdoor Corp.*(a) | | | 80 | | | | 5,044 | |
Fossil, Inc.* | | | 148 | | | | 19,533 | |
G-III Apparel Group Ltd.* | | | 92 | | | | 2,615 | |
Hanesbrands, Inc.* | | | 356 | | | | 10,516 | |
Iconix Brand Group, Inc.* | | | 273 | | | | 4,745 | |
Jones Group, Inc. (The) | | | 227 | | | | 2,851 | |
Maidenform Brands, Inc.* | | | 107 | | | | 2,409 | |
NIKE, Inc. Class B | | | 900 | | | | 97,596 | |
PVH Corp. | | | 116 | | | | 10,362 | |
Ralph Lauren Corp. | | | 186 | | | | 32,425 | |
Steven Madden Ltd.* | | | 154 | | | | 6,584 | |
True Religion Apparel, Inc.* | | | 55 | | | | 1,507 | |
Under Armour, Inc. Class A*(a) | | | 53 | | | | 4,982 | |
Vera Bradley, Inc.*(a) | | | 54 | | | | 1,630 | |
VF Corp. | | | 268 | | | | 39,123 | |
Warnaco Group, Inc. (The)* | | | 157 | | | | 9,169 | |
Wolverine World Wide, Inc. | | | 163 | | | | 6,060 | |
| | | | | | | | |
| Total Textiles, Apparel & Luxury Goods | | | | 319,059 | |
| Thrifts & Mortgage Finance – 0.1% | | | | | | | | |
Astoria Financial Corp. | | | 183 | | | | 1,804 | |
Capitol Federal Financial, Inc. | | | 164 | | | | 1,945 | |
Dime Community Bancshares, Inc. | | | 121 | | | | 1,768 | |
Flushing Financial Corp. | | | 163 | | | | 2,194 | |
New York Community Bancorp, Inc.(a) | | | 1,420 | | | | 19,752 | |
Northwest Bancshares, Inc. | | | 290 | | | | 3,683 | |
Ocwen Financial Corp.* | | | 184 | | | | 2,876 | |
People’s United Financial, Inc. | | | 402 | | | | 5,323 | |
Provident Financial Services, Inc. | | | 165 | | | | 2,397 | |
TFS Financial Corp.* | | | 221 | | | | 2,100 | |
Washington Federal, Inc. | | | 446 | | | | 7,502 | |
| | | | | | | | |
| Total Thrifts & Mortgage Finance | | | | 51,344 | |
| Tobacco – 1.5% | | | | | | | | |
Altria Group, Inc. | | | 4,935 | | | | 152,343 | |
Lorillard, Inc. | | | 402 | | | | 52,051 | |
Philip Morris International, Inc. | | | 4,359 | | | | 386,251 | |
Reynolds American, Inc. | | | 1,409 | | | | 58,389 | |
Universal Corp. | | | 122 | | | | 5,685 | |
Vector Group Ltd.(a) | | | 141 | | | | 2,499 | |
| | | | | | | | |
| Total Tobacco | | | | 657,218 | |
See Notes to Financial Statements.
| | | | |
| WisdomTree Domestic and International Earnings Funds | | | 27 | |
Schedule of Investments (concluded)
WisdomTree Total Earnings Fund (EXT)
March 31, 2012
| | | | | | | | |
| Investments | | Shares | | | Value | |
| | | | | | | | |
| Trading Companies & Distributors – 0.2% | | | | | | | | |
Applied Industrial Technologies, Inc. | | | 197 | | | $ | 8,103 | |
Beacon Roofing Supply, Inc.* | | | 81 | | | | 2,086 | |
CAI International, Inc.* | | | 129 | | | | 2,345 | |
Fastenal Co. | | | 355 | | | | 19,205 | |
GATX Corp. | | | 115 | | | | 4,634 | |
Interline Brands, Inc.* | | | 216 | | | | 4,668 | |
Kaman Corp. | | | 85 | | | | 2,886 | |
MSC Industrial Direct Co. Class A | | | 95 | | | | 7,912 | |
TAL International Group, Inc. | | | 184 | | | | 6,755 | |
W.W. Grainger, Inc. | | | 138 | | | | 29,644 | |
Watsco, Inc. | | | 79 | | | | 5,849 | |
WESCO International, Inc.* | | | 129 | | | | 8,425 | |
| | | | | | | | |
| Total Trading Companies & Distributors | | | | 102,512 | |
| Water Utilities – 0.1% | | | | | | | | |
American States Water Co. | | | 86 | | | | 3,108 | |
American Water Works Co., Inc. | | | 391 | | | | 13,306 | |
Aqua America, Inc. | | | 201 | | | | 4,480 | |
California Water Service Group | | | 113 | | | | 2,058 | |
| | | | | | | | |
| Total Water Utilities | | | | 22,952 | |
| Wireless Telecommunication Services – 0.1% | | | | | | | | |
Crown Castle International Corp.* | | | 103 | | | | 5,494 | |
MetroPCS Communications, Inc.* | | | 1,252 | | | | 11,293 | |
NII Holdings, Inc.* | | | 535 | | | | 9,796 | |
NTELOS Holdings Corp. | | | 90 | | | | 1,863 | |
Telephone & Data Systems, Inc. | | | 329 | | | | 7,616 | |
United States Cellular Corp.* | | | 146 | | | | 5,976 | |
USA Mobility, Inc. | | | 305 | | | | 4,249 | |
| | | | | | | | |
| Total Wireless Telecommunication Services | | | | 46,287 | |
TOTAL COMMON STOCKS (Cost: $38,265,956) | | | | | | | 42,857,291 | |
| EXCHANGE-TRADED FUND – 0.2% | | | | | | | | |
WisdomTree LargeCap Growth Fund(a)(b) (Cost: $84,524) | | | 2,232 | | | | 91,512 | |
| SHORT-TERM INVESTMENT – 0.0% | | | | | | | | |
| MONEY MARKET FUND – 0.0% | | | | | | | | |
Invesco Treasury Fund Private Class, 0.02%(c) (Cost: $1,776) | | | 1,776 | | | | 1,776 | |
| INVESTMENT OF CASH COLLATERAL FOR SECURITIES LOANED – 1.3% | | | | | | | | |
| MONEY MARKET FUND – 1.3% | | | | | | | | |
Dreyfus Institutional Preferred Money Market Fund, 0.18%(c) | | | | | | | | |
| (Cost: $543,847)(d) | | | 543,847 | | | | 543,847 | |
TOTAL INVESTMENTS IN SECURITIES – 101.1% (Cost: $38,896,103) | | | | | | | 43,494,426 | |
Liabilities in Excess of Other Assets – (1.1)% | | | | | | | (468,799 | ) |
| | | | | | | | |
| NET ASSETS – 100.0% | | | | | | $ | 43,025,627 | |
| * | Non-income producing security. |
| (a) | Security, or portion thereof, was on loan at March 31, 2012 (See Note 2). |
| (b) | Affiliated company (See Note 7). |
| (c) | Rate shown represents annualized 7-day yield as of March 31, 2012. |
| (d) | At March 31, 2012, the total market value of the Fund’s securities on loan was $530,260 and the total market value of the collateral held by the Fund was $543,847. |
See Notes to Financial Statements.
| | |
| 28 | | WisdomTree Domestic and International Earnings Funds |
Schedule of Investments
WisdomTree Earnings 500 Fund (EPS)
March 31, 2012
| | | | | | | | |
| Investments | | Shares | | | Value | |
| | | | | | | | |
| UNITED STATES – 100.3% | | | | | | | | |
| COMMON STOCKS – 99.8% | | | | | | | | |
| Aerospace & Defense – 2.8% | | | | | | | | |
Boeing Co. (The) | | | 3,820 | | | $ | 284,093 | |
General Dynamics Corp. | | | 2,850 | | | | 209,133 | |
Goodrich Corp. | | | 442 | | | | 55,445 | |
Honeywell International, Inc. | | | 3,556 | | | | 217,094 | |
L-3 Communications Holdings, Inc. | | | 1,092 | | | | 77,281 | |
Lockheed Martin Corp. | | | 2,729 | | | | 245,228 | |
Northrop Grumman Corp. | | | 2,410 | | | | 147,203 | |
Precision Castparts Corp. | | | 500 | | | | 86,450 | |
Raytheon Co. | | | 3,162 | | | | 166,890 | |
Rockwell Collins, Inc. | | | 834 | | | | 48,005 | |
Textron, Inc. | | | 1,234 | | | | 34,342 | |
TransDigm Group, Inc.* | | | 95 | | | | 10,997 | |
United Technologies Corp. | | | 4,356 | | | | 361,287 | |
| | | | | | | | |
| Total Aerospace & Defense | | | | | | | 1,943,448 | |
| Air Freight & Logistics – 0.7% | | | | | | | | |
C.H. Robinson Worldwide, Inc. | | | 417 | | | | 27,309 | |
Expeditors International of Washington, Inc. | | | 634 | | | | 29,487 | |
FedEx Corp. | | | 1,310 | | | | 120,468 | |
United Parcel Service, Inc. Class B | | | 3,841 | | | | 310,046 | |
| | | | | | | | |
| Total Air Freight & Logistics | | | | | | | 487,310 | |
| Airlines – 0.2% | | | | | | | | |
Delta Air Lines, Inc.* | | | 5,671 | | | | 56,200 | |
Southwest Airlines Co. | | | 1,441 | | | | 11,874 | |
United Continental Holdings, Inc.* | | | 2,071 | | | | 44,526 | |
| | | | | | | | |
| Total Airlines | | | | | | | 112,600 | |
| Auto Components – 0.3% | | | | | | | | |
BorgWarner, Inc.*(a) | | | 572 | | | | 48,243 | |
Johnson Controls, Inc. | | | 3,769 | | | | 122,417 | |
| | | | | | | | |
| Total Auto Components | | | | | | | 170,660 | |
| Automobiles – 1.7% | | | | | | | | |
Ford Motor Co. | | | 43,580 | | | | 544,314 | |
General Motors Co.* | | | 23,474 | | | | 602,108 | |
Harley-Davidson, Inc. | | | 873 | | | | 42,847 | |
| | | | | | | | |
| Total Automobiles | | | | | | | 1,189,269 | |
| Beverages – 2.0% | | | | | | | | |
Beam, Inc. | | | 282 | | | | 16,517 | |
Brown-Forman Corp. Class B | | | 538 | | | | 44,864 | |
Coca-Cola Co. (The) | | | 9,516 | | | | 704,279 | |
Coca-Cola Enterprises, Inc. | | | 1,959 | | | | 56,028 | |
Dr. Pepper Snapple Group, Inc. | | | 1,024 | | | | 41,175 | |
Molson Coors Brewing Co. Class B | | | 1,113 | | | | 50,363 | |
Monster Beverage Corp.* | | | 426 | | | | 26,450 | |
PepsiCo, Inc. | | | 6,838 | | | | 453,701 | |
| | | | | | | | |
| Total Beverages | | | | | | | 1,393,377 | |
| Biotechnology – 1.1% | | | | | | | | |
Alexion Pharmaceuticals, Inc.* | | | 186 | | | | 17,272 | |
Amgen, Inc. | | | 4,986 | | | | 338,998 | |
Biogen Idec, Inc.* | | | 744 | | | | 93,722 | |
Celgene Corp.* | | | 1,136 | | | | 88,063 | |
| | | | | | | | |
Gilead Sciences, Inc.* | | | 4,909 | | | $ | 239,804 | |
| | | | | | | | |
| Total Biotechnology | | | | | | | 777,859 | |
| Capital Markets – 2.4% | | | | | | | | |
Affiliated Managers Group, Inc.* | | | 128 | | | | 14,312 | |
Ameriprise Financial, Inc. | | | 1,921 | | | | 109,747 | |
Bank of New York Mellon Corp. (The) | | | 9,267 | | | | 223,613 | |
BlackRock, Inc. | | | 980 | | | | 200,802 | |
Charles Schwab Corp. (The) | | | 5,648 | | | | 81,162 | |
Franklin Resources, Inc. | | | 1,400 | | | | 173,642 | |
Goldman Sachs Group, Inc. (The) | | | 2,751 | | | | 342,142 | |
Morgan Stanley | | | 11,012 | | | | 216,276 | |
Northern Trust Corp. | | | 1,112 | | | | 52,764 | |
State Street Corp. | | | 2,833 | | | | 128,901 | |
T. Rowe Price Group, Inc. | | | 955 | | | | 62,361 | |
TD Ameritrade Holding Corp. | | | 3,011 | | | | 59,437 | |
| | | | | | | | |
| Total Capital Markets | | | | | | | 1,665,159 | |
| Chemicals – 2.3% | | | | | | | | |
Air Products & Chemicals, Inc. | | | 1,022 | | | | 93,820 | |
Airgas, Inc. | | | 263 | | | | 23,399 | |
Albemarle Corp. | | | 580 | | | | 37,074 | |
Celanese Corp. Series A | | | 964 | | | | 44,518 | |
CF Industries Holdings, Inc. | | | 676 | | | | 123,471 | |
Dow Chemical Co. (The) | | | 7,527 | | | | 260,735 | |
E.I. du Pont de Nemours & Co. | | | 5,570 | | | | 294,653 | |
Eastman Chemical Co. | | | 1,021 | | | | 52,775 | |
Ecolab, Inc. | | | 673 | | | | 41,538 | |
FMC Corp. | | | 249 | | | | 26,359 | |
International Flavors & Fragrances, Inc. | | | 422 | | | | 24,729 | |
Monsanto Co. | | | 1,600 | | | | 127,616 | |
Mosaic Co. (The) | | | 3,069 | | | | 169,685 | |
PPG Industries, Inc. | | | 974 | | | | 93,309 | |
Praxair, Inc. | | | 975 | | | | 111,774 | |
Sherwin-Williams Co. (The) | | | 421 | | | | 45,750 | |
Sigma-Aldrich Corp. | | | 514 | | | | 37,553 | |
Valhi, Inc. | | | 192 | | | | 10,186 | |
| | | | | | | | |
| Total Chemicals | | | | | | | 1,618,944 | |
| Commercial Banks – 3.5% | | | | | | | | |
BB&T Corp. | | | 3,120 | | | | 97,937 | |
CIT Group, Inc.* | | | 203 | | | | 8,372 | |
Comerica, Inc. | | | 1,037 | | | | 33,557 | |
Fifth Third Bancorp | | | 6,076 | | | | 85,368 | |
Huntington Bancshares, Inc. | | | 5,785 | | | | 37,313 | |
KeyCorp | | | 8,876 | | | | 75,446 | |
M&T Bank Corp. | | | 731 | | | | 63,509 | |
PNC Financial Services Group, Inc. | | | 4,052 | | | | 261,313 | |
Regions Financial Corp. | | | 2,821 | | | | 18,590 | |
SunTrust Banks, Inc. | | | 2,221 | | | | 53,682 | |
U.S. Bancorp | | | 11,494 | | | | 364,130 | |
Wells Fargo & Co. | | | 38,218 | | | | 1,304,763 | |
| | | | | | | | |
| Total Commercial Banks | | | | | | | 2,403,980 | |
| Commercial Services & Supplies – 0.2% | | | | | | | | |
Iron Mountain, Inc. | | | 575 | | | | 16,560 | |
See Notes to Financial Statements.
| | | | |
| WisdomTree Domestic and International Earnings Funds | | | 29 | |
Schedule of Investments (continued)
WisdomTree Earnings 500 Fund (EPS)
March 31, 2012
| | | | | | | | |
| Investments | | Shares | | | Value | |
| | | | | | | | |
Republic Services, Inc. | | | 1,347 | | | $ | 41,164 | |
Stericycle, Inc.* | | | 235 | | | | 19,656 | |
Waste Management, Inc. | | | 2,227 | | | | 77,856 | |
| | | | | | | | |
| Total Commercial Services & Supplies | | | | | | | 155,236 | |
| Communications Equipment – 1.5% | | | | | | | | |
Cisco Systems, Inc. | | | 24,107 | | | | 509,863 | |
F5 Networks, Inc.* | | | 170 | | | | 22,943 | |
Juniper Networks, Inc.* | | | 1,798 | | | | 41,139 | |
Motorola Solutions, Inc. | | | 1,188 | | | | 60,386 | |
QUALCOMM, Inc. | | | 5,461 | | | | 371,457 | |
| | | | | | | | |
| Total Communications Equipment | | | | | | | 1,005,788 | |
| Computers & Peripherals – 5.7% | | | | | | | | |
Apple, Inc.* | | | 4,670 | | | | 2,799,525 | |
Dell, Inc.* | | | 16,536 | | | | 274,498 | |
EMC Corp.* | | | 6,819 | | | | 203,752 | |
Hewlett-Packard Co. | | | 18,150 | | | | 432,514 | |
NetApp, Inc.* | | | 1,163 | | | | 52,067 | |
SanDisk Corp.* | | | 1,703 | | | | 84,452 | |
Western Digital Corp.* | | | 1,837 | | | | 76,033 | |
| | | | | | | | |
| Total Computers & Peripherals | | | | | | | 3,922,841 | |
| Construction & Engineering – 0.2% | | | | | | | | |
Fluor Corp. | | | 788 | | | | 47,311 | |
Jacobs Engineering Group, Inc.* | | | 608 | | | | 26,977 | |
KBR, Inc. | | | 1,245 | | | | 44,260 | |
Quanta Services, Inc.* | | | 282 | | | | 5,894 | |
| | | | | | | | |
| Total Construction & Engineering | | | | | | | 124,442 | |
| Consumer Finance – 1.3% | | | | | | | | |
American Express Co. | | | 6,172 | | | | 357,112 | |
Capital One Financial Corp. | | | 5,496 | | | | 306,347 | |
Discover Financial Services | | | 5,816 | | | | 193,906 | |
SLM Corp. | | | 3,082 | | | | 48,572 | |
| | | | | | | | |
| Total Consumer Finance | | | | | | | 905,937 | |
| Containers & Packaging – 0.1% | | | | | | | | |
Ball Corp. | | | 999 | | | | 42,837 | |
Crown Holdings, Inc.* | | | 871 | | | | 32,079 | |
| | | | | | | | |
| Total Containers & Packaging | | | | | | | 74,916 | |
| Distributors – 0.1% | | | | | | | | |
Genuine Parts Co. | | | 684 | | | | 42,921 | |
LKQ Corp.* | | | 430 | | | | 13,403 | |
| | | | | | | | |
| Total Distributors | | | | | | | 56,324 | |
| Diversified Consumer Services – 0.1% | | | | | | | | |
Apollo Group, Inc. Class A* | | | 1,002 | | | | 38,717 | |
H&R Block, Inc. | | | 1,796 | | | | 29,580 | |
| | | | | | | | |
| Total Diversified Consumer Services | | | | | | | 68,297 | |
| Diversified Financial Services – 5.2% | | | | | | | | |
Bank of America Corp. | | | 31,671 | | | | 303,091 | |
Citigroup, Inc. | | | 28,589 | | | | 1,044,928 | |
CME Group, Inc. | | | 355 | | | | 102,712 | |
IntercontinentalExchange, Inc.* | | | 300 | | | | 41,226 | |
JPMorgan Chase & Co. | | | 40,439 | | | | 1,859,385 | |
| | | | | | | | |
Leucadia National Corp. | | | 4,076 | | | $ | 106,384 | |
Moody’s Corp. | | | 1,321 | | | | 55,614 | |
NASDAQ OMX Group, Inc. (The)* | | | 1,395 | | | | 36,131 | |
NYSE Euronext | | | 1,674 | | | | 50,237 | |
| | | | | | | | |
| Total Diversified Financial Services | | | | | | | 3,599,708 | |
| Diversified Telecommunication Services – 2.3% | | | | | | | | |
AT&T, Inc. | | | 29,787 | | | | 930,248 | |
CenturyLink, Inc. | | | 1,343 | | | | 51,907 | |
Frontier Communications Corp.(a) | | | 2,058 | | | | 8,582 | |
Verizon Communications, Inc. | | | 15,472 | | | | 591,494 | |
Windstream Corp. | | | 1,935 | | | | 22,659 | |
| | | | | | | | |
| Total Diversified Telecommunication Services | | | | | | | 1,604,890 | |
| Electric Utilities – 1.6% | | | | | | | | |
American Electric Power Co., Inc. | | | 1,221 | | | | 47,106 | |
Duke Energy Corp. | | | 6,026 | | | | 126,606 | |
Edison International | | | 1,759 | | | | 74,775 | |
Entergy Corp. | | | 1,401 | | | | 94,147 | |
Exelon Corp. | | | 4,416 | | | | 173,151 | |
FirstEnergy Corp. | | | 1,546 | | | | 70,482 | |
NextEra Energy, Inc. | | | 1,815 | | | | 110,860 | |
Northeast Utilities | | | 976 | | | | 36,229 | |
Pepco Holdings, Inc. | | | 1,223 | | | | 23,103 | |
Pinnacle West Capital Corp. | | | 501 | | | | 23,998 | |
PPL Corp. | | | 3,190 | | | | 90,150 | |
Progress Energy, Inc. | | | 1,051 | | | | 55,819 | |
Southern Co. (The) | | | 3,201 | | | | 143,821 | |
| | | | | | | | |
| Total Electric Utilities | | | | | | | 1,070,247 | |
| Electrical Equipment – 0.4% | | | | | | | | |
AMETEK, Inc. | | | 569 | | | | 27,602 | |
Emerson Electric Co. | | | 3,406 | | | | 177,725 | |
Rockwell Automation, Inc. | | | 634 | | | | 50,530 | |
Roper Industries, Inc. | | | 331 | | | | 32,822 | |
| | | | | | | | |
| Total Electrical Equipment | | | | | | | 288,679 | |
| Electronic Equipment, Instruments & Components – 0.5% | | | | | |
Amphenol Corp. Class A | | | 852 | | | | 50,924 | |
Avnet, Inc.* | | | 1,550 | | | | 56,404 | |
Corning, Inc. | | | 15,417 | | | | 217,071 | |
Molex, Inc. | | | 856 | | | | 24,071 | |
Trimble Navigation Ltd.* | | | 223 | | | | 12,136 | |
| | | | | | | | |
| Total Electronic Equipment, Instruments & Components | | | | | | | 360,606 | |
| Energy Equipment & Services – 1.0% | | | | | | | | |
Baker Hughes, Inc. | | | 2,603 | | | | 109,170 | |
Cameron International Corp.* | | | 889 | | | | 46,966 | |
Diamond Offshore Drilling, Inc.(a) | | | 1,301 | | | | 86,842 | |
FMC Technologies, Inc.* | | | 599 | | | | 30,202 | |
Halliburton Co. | | | 6,007 | | | | 199,372 | |
Helmerich & Payne, Inc. | | | 521 | | | | 28,108 | |
National Oilwell Varco, Inc. | | | 1,950 | | | | 154,966 | |
Oceaneering International, Inc. | | | 306 | | | | 16,490 | |
| | | | | | | | |
| Total Energy Equipment & Services | | | | | | | 672,116 | |
See Notes to Financial Statements.
| | |
| 30 | | WisdomTree Domestic and International Earnings Funds |
Schedule of Investments (continued)
WisdomTree Earnings 500 Fund (EPS)
March 31, 2012
| | | | | | | | |
| Investments | | Shares | | | Value | |
| | | | | | | | |
| Food & Staples Retailing – 2.8% | | | | | | | | |
Costco Wholesale Corp. | | | 1,225 | | | $ | 111,230 | |
CVS Caremark Corp. | | | 6,356 | | | | 284,749 | |
Kroger Co. (The) | | | 3,523 | | | | 85,362 | |
Safeway, Inc.(a) | | | 1,938 | | | | 39,167 | |
Sysco Corp. | | | 2,884 | | | | 86,116 | |
Walgreen Co. | | | 4,958 | | | | 166,044 | |
Wal-Mart Stores, Inc. | | | 18,549 | | | | 1,135,199 | |
Whole Foods Market, Inc. | | | 375 | | | | 31,200 | |
| | | | | | | | |
| Total Food & Staples Retailing | | | | | | | 1,939,067 | |
| Food Products – 1.6% | | | | | | | | |
Archer-Daniels-Midland Co. | | | 5,381 | | | | 170,362 | |
Campbell Soup Co. | | | 1,719 | | | | 58,188 | |
ConAgra Foods, Inc. | | | 1,923 | | | | 50,498 | |
General Mills, Inc. | | | 2,968 | | | | 117,088 | |
Green Mountain Coffee Roasters, Inc.*(a) | | | 317 | | | | 14,848 | |
H.J. Heinz Co. | | | 1,264 | | | | 67,687 | |
Hershey Co. (The) | | | 743 | | | | 45,568 | |
Hormel Foods Corp. | | | 1,278 | | | | 37,727 | |
J.M. Smucker Co. (The) | | | 439 | | | | 35,717 | |
Kellogg Co. | | | 1,701 | | | | 91,225 | |
Kraft Foods, Inc. Class A | | | 6,393 | | | | 242,998 | |
McCormick & Co., Inc. | | | 553 | | | | 30,100 | |
Mead Johnson Nutrition Co. | | | 509 | | | | 41,982 | |
Sara Lee Corp. | | | 1,044 | | | | 22,477 | |
Tyson Foods, Inc. Class A | | | 2,620 | | | | 50,173 | |
| | | | | | | | |
| Total Food Products | | | | | | | 1,076,638 | |
| Gas Utilities – 0.1% | | | | | | | | |
National Fuel Gas Co. | | | 273 | | | | 13,137 | |
ONEOK, Inc. | | | 305 | | | | 24,906 | |
| | | | | | | | |
| Total Gas Utilities | | | | | | | 38,043 | |
| Health Care Equipment & Supplies – 1.5% | | | | | |
Baxter International, Inc. | | | 3,246 | | | | 194,046 | |
Becton Dickinson and Co. | | | 1,250 | | | | 97,063 | |
Boston Scientific Corp.* | | | 8,735 | | | | 52,235 | |
C.R. Bard, Inc. | | | 465 | | | | 45,905 | |
CareFusion Corp.* | | | 866 | | | | 22,455 | |
DENTSPLY International, Inc. | | | 569 | | | | 22,834 | |
Edwards Lifesciences Corp.* | | | 229 | | | | 16,655 | |
Hologic, Inc.* | | | 345 | | | | 7,435 | |
Intuitive Surgical, Inc.* | | | 78 | | | | 42,257 | |
Medtronic, Inc. | | | 6,259 | | | | 245,290 | |
St. Jude Medical, Inc. | | | 1,918 | | | | 84,987 | |
Stryker Corp. | | | 1,823 | | | | 101,140 | |
Varian Medical Systems, Inc.* | | | 471 | | | | 32,480 | |
Zimmer Holdings, Inc. | | | 1,183 | | | | 76,043 | |
| | | | | | | | |
| Total Health Care Equipment & Supplies | | | | | | | 1,040,825 | |
| Health Care Providers & Services – 2.5% | | | | | | | | |
Aetna, Inc. | | | 3,145 | | | | 157,753 | |
AmerisourceBergen Corp. | | | 1,422 | | | | 56,425 | |
Cardinal Health, Inc. | | | 1,571 | | | | 67,726 | |
Cigna Corp. | | | 2,320 | | | | 114,260 | |
| | | | | | | | |
Coventry Health Care, Inc. | | | 1,067 | | | $ | 37,953 | |
DaVita, Inc.* | | | 409 | | | | 36,880 | |
Express Scripts Holding Co.* | | | 2,032 | | | | 110,094 | |
HCA Holdings, Inc. | | | 2,675 | | | | 66,179 | |
Henry Schein, Inc.* | | | 463 | | | | 35,040 | |
Humana, Inc. | | | 1,090 | | | | 100,803 | |
Laboratory Corp. of America Holdings* | | | 477 | | | | 43,665 | |
McKesson Corp. | | | 1,219 | | | | 106,992 | |
Medco Health Solutions, Inc.* | | | 1,785 | | | | 125,485 | |
Quest Diagnostics, Inc. | | | 814 | | | | 49,776 | |
UnitedHealth Group, Inc. | | | 7,139 | | | | 420,773 | |
WellPoint, Inc. | | | 2,953 | | | | 217,931 | |
| | | | | | | | |
| Total Health Care Providers & Services | | | | | | | 1,747,735 | |
| Health Care Technology – 0.0% | | | | | | | | |
Cerner Corp.* | | | 368 | | | | 28,027 | |
| Hotels, Restaurants & Leisure – 1.4% | | | | | | | | |
Chipotle Mexican Grill, Inc.* | | | 52 | | | | 21,736 | |
Darden Restaurants, Inc. | | | 745 | | | | 38,114 | |
Hyatt Hotels Corp. Class A* | | | 88 | | | | 3,759 | |
International Game Technology | | | 1,374 | | | | 23,070 | |
Las Vegas Sands Corp. | | | 2,027 | | | | 116,695 | |
Marriott International, Inc. Class A | | | 574 | | | | 21,726 | |
McDonald’s Corp. | | | 3,753 | | | | 368,169 | |
Panera Bread Co. Class A* | | | 60 | | | | 9,655 | |
Starbucks Corp. | | | 2,009 | | | | 112,283 | |
Starwood Hotels & Resorts Worldwide, Inc. | | | 724 | | | | 40,841 | |
Wyndham Worldwide Corp. | | | 916 | | | | 42,603 | |
Wynn Resorts Ltd. | | | 348 | | | | 43,458 | |
Yum! Brands, Inc. | | | 1,507 | | | | 107,268 | |
| | | | | | | | |
| Total Hotels, Restaurants & Leisure | | | | | | | 949,377 | |
| Household Durables – 0.1% | | | | | | | | |
Newell Rubbermaid, Inc. | | | 1,952 | | | | 34,765 | |
| Household Products – 1.7% | | | | | | | | |
Church & Dwight Co., Inc. | | | 504 | | | | 24,792 | |
Clorox Co. (The) | | | 576 | | | | 39,600 | |
Colgate-Palmolive Co. | | | 1,820 | | | | 177,959 | |
Energizer Holdings, Inc.* | | | 260 | | | | 19,287 | |
Kimberly-Clark Corp. | | | 1,727 | | | | 127,608 | |
Procter & Gamble Co. (The) | | | 12,058 | | | | 810,418 | |
| | | | | | | | |
| Total Household Products | | | | | | | 1,199,664 | |
| Independent Power Producers & Energy Traders – 0.0% | | | | | |
AES Corp. (The)* | | | 435 | | | | 5,686 | |
NRG Energy, Inc.* | | | 1,142 | | | | 17,895 | |
| | | | | | | | |
| Total Independent Power Producers & Energy Traders | | | | | | | 23,581 | |
| Industrial Conglomerates – 2.0% | | | | | | | | |
3M Co. | | | 3,698 | | | | 329,899 | |
Danaher Corp. | | | 2,823 | | | | 158,088 | |
General Electric Co. | | | 44,190 | | | | 886,893 | |
| | | | | | | | |
| Total Industrial Conglomerates | | | | | | | 1,374,880 | |
See Notes to Financial Statements.
| | | | |
| WisdomTree Domestic and International Earnings Funds | | | 31 | |
Schedule of Investments (continued)
WisdomTree Earnings 500 Fund (EPS)
March 31, 2012
| | | | | | | | |
| Investments | | Shares | | | Value | |
| | | | | | | | |
| Insurance – 3.8% | | | | | | | | |
Aflac, Inc. | | | 4,847 | | | $ | 222,914 | |
Allstate Corp. (The) | | | 691 | | | | 22,748 | |
Berkshire Hathaway, Inc. Class B* | | | 10,147 | | | | 823,429 | |
Chubb Corp. (The) | | | 1,599 | | | | 110,507 | |
Cincinnati Financial Corp. | | | 260 | | | | 8,973 | |
CNA Financial Corp. | | | 1,894 | | | | 55,551 | |
Hartford Financial Services Group, Inc. | | | 3,986 | | | | 84,025 | |
Lincoln National Corp. | | | 4,362 | | | | 114,982 | |
Loews Corp. | | | 2,420 | | | | 96,485 | |
Marsh & McLennan Cos., Inc. | | | 1,760 | | | | 57,710 | |
MetLife, Inc. | | | 9,463 | | | | 353,443 | |
Principal Financial Group, Inc. | | | 2,352 | | | | 69,407 | |
Progressive Corp. (The) | | | 3,608 | | | | 83,633 | |
Prudential Financial, Inc. | | | 4,063 | | | | 257,554 | |
Torchmark Corp. | | | 872 | | | | 43,469 | |
Travelers Cos., Inc. (The) | | | 2,004 | | | | 118,637 | |
Unum Group | | | 3,223 | | | | 78,899 | |
W.R. Berkley Corp. | | | 657 | | | | 23,731 | |
| | | | | | | | |
| Total Insurance | | | | | | | 2,626,097 | |
| Internet & Catalog Retail – 0.4% | | | | | | | | |
Amazon.com, Inc.* | | | 291 | | | | 58,931 | |
Expedia, Inc.(a) | | | 620 | | | | 20,733 | |
Liberty Interactive Corp. Class A* | | | 2,588 | | | | 49,405 | |
priceline.com, Inc.* | | | 146 | | | | 104,755 | |
TripAdvisor, Inc.* | | | 620 | | | | 22,115 | |
| | | | | | | | |
| Total Internet & Catalog Retail | | | | | | | 255,939 | |
| Internet Software & Services – 1.4% | | | | | | | | |
Akamai Technologies, Inc.* | | | 535 | | | | 19,634 | |
eBay, Inc.* | | | 4,421 | | | | 163,091 | |
Equinix, Inc.* | | | 42 | | | | 6,613 | |
Google, Inc. Class A* | | | 1,119 | | | | 717,548 | |
LinkedIn Corp. Class A* | | | 11 | | | | 1,122 | |
Rackspace Hosting, Inc.* | | | 103 | | | | 5,952 | |
VeriSign, Inc. | | | 155 | | | | 5,943 | |
Yahoo!, Inc.* | | | 4,768 | | | | 72,569 | |
| | | | | | | | |
| Total Internet Software & Services | | | | | | | 992,472 | |
| IT Services – 2.9% | | | | | | | | |
Alliance Data Systems Corp.* | | | 191 | | | | 24,058 | |
Automatic Data Processing, Inc. | | | 1,702 | | | | 93,933 | |
Cognizant Technology Solutions Corp. Class A* | | | 916 | | | | 70,486 | |
Fidelity National Information Services, Inc. | | | 1,278 | | | | 42,327 | |
Fiserv, Inc.* | | | 569 | | | | 39,483 | |
International Business Machines Corp. | | | 5,411 | | | | 1,129,005 | |
Mastercard, Inc. Class A | | | 437 | | | | 183,776 | |
Paychex, Inc. | | | 1,286 | | | | 39,853 | |
Teradata Corp.* | | | 470 | | | | 32,031 | |
VeriFone Systems, Inc.* | | | 194 | | | | 10,063 | |
Visa, Inc. Class A | | | 2,568 | | | | 303,024 | |
Western Union Co. (The) | | | 3,764 | | | | 66,247 | |
| | | | | | | | |
| Total IT Services | | | | | | | 2,034,286 | |
| | | | | | | | |
| Leisure Equipment & Products – 0.1% | | | | | | | | |
Hasbro, Inc. | | | 764 | | | $ | 28,054 | |
Mattel, Inc. | | | 1,844 | | | | 62,069 | |
| | | | | | | | |
| Total Leisure Equipment & Products | | | | | | | 90,123 | |
| Life Sciences Tools & Services – 0.4% | | | | | | | | |
Agilent Technologies, Inc. | | | 2,067 | | | | 92,002 | |
Life Technologies Corp.* | | | 605 | | | | 29,536 | |
Mettler-Toledo International, Inc.*(a) | | | 110 | | | | 20,322 | |
Thermo Fisher Scientific, Inc. | | | 1,629 | | | | 91,843 | |
Waters Corp.* | | | 404 | | | | 37,435 | |
| | | | | | | | |
| Total Life Sciences Tools & Services | | | | | | | 271,138 | |
| Machinery – 2.1% | | | | | | | | |
AGCO Corp.* | | | 620 | | | | 29,270 | |
Caterpillar, Inc. | | | 3,638 | | | | 387,520 | |
Cummins, Inc. | | | 1,261 | | | | 151,371 | |
Deere & Co. | | | 2,548 | | | | 206,133 | |
Donaldson Co., Inc. | | | 600 | | | | 21,438 | |
Dover Corp. | | | 1,032 | | | | 64,954 | |
Eaton Corp. | | | 2,185 | | | | 108,879 | |
Flowserve Corp. | | | 296 | | | | 34,191 | |
Gardner Denver, Inc. | | | 215 | | | | 13,549 | |
Illinois Tool Works, Inc. | | | 2,908 | | | | 166,105 | |
Joy Global, Inc. | | | 525 | | | | 38,588 | |
PACCAR, Inc. | | | 1,575 | | | | 73,757 | |
Pall Corp. | | | 418 | | | | 24,925 | |
Parker Hannifin Corp. | | | 1,009 | | | | 85,311 | |
Stanley Black & Decker, Inc. | | | 670 | | | | 51,563 | |
| | | | | | | | |
| Total Machinery | | | | | | | 1,457,554 | |
| Media – 3.2% | | | | | | | | |
CBS Corp. Class B | | | 3,477 | | | | 117,905 | |
Comcast Corp. Class A | | | 9,782 | | | | 293,558 | |
DIRECTV Class A* | | | 3,706 | | | | 182,854 | |
Discovery Communications, Inc. Class C* | | | 1,616 | | | | 75,758 | |
DISH Network Corp. Class A | | | 3,431 | | | | 112,983 | |
Interpublic Group of Cos., Inc. (The) | | | 2,806 | | | | 32,016 | |
McGraw-Hill Cos., Inc. (The) | | | 1,389 | | | | 67,325 | |
News Corp. Class A | | | 11,745 | | | | 231,259 | |
Omnicom Group, Inc. | | | 1,318 | | | | 66,757 | |
Scripps Networks Interactive, Inc. Class A | | | 746 | | | | 36,323 | |
Sirius XM Radio, Inc.* | | | 9,404 | | | | 21,723 | |
Time Warner Cable, Inc. | | | 1,637 | | | | 133,416 | |
Time Warner, Inc. | | | 5,830 | | | | 220,082 | |
Viacom, Inc. Class B | | | 3,498 | | | | 166,015 | |
Virgin Media, Inc. | | | 296 | | | | 7,394 | |
Walt Disney Co. (The) | | | 9,631 | | | | 421,645 | |
| | | | | | | | |
| Total Media | | | | | | | 2,187,013 | |
| Metals & Mining – 1.4% | | | | | | | | |
Alcoa, Inc. | | | 8,298 | | | | 83,146 | |
Allegheny Technologies, Inc. | | | 318 | | | | 13,092 | |
Cliffs Natural Resources, Inc. | | | 2,009 | | | | 139,143 | |
Freeport-McMoRan Copper & Gold, Inc. | | | 10,004 | | | | 380,552 | |
Newmont Mining Corp. | | | 2,613 | | | | 133,969 | |
See Notes to Financial Statements.
| | |
| 32 | | WisdomTree Domestic and International Earnings Funds |
Schedule of Investments (continued)
WisdomTree Earnings 500 Fund (EPS)
March 31, 2012
| | | | | | | | |
| Investments | | Shares | | | Value | |
| | | | | | | | |
Nucor Corp. | | | 1,076 | | | $ | 46,214 | |
Royal Gold, Inc. | | | 61 | | | | 3,979 | |
Southern Copper Corp. | | | 5,385 | | | | 170,758 | |
Walter Energy, Inc. | | | 372 | | | | 22,026 | |
| | | | | | | | |
| Total Metals & Mining | | | | | | | 992,879 | |
| Multiline Retail – 0.9% | | | | | | | | |
Dollar General Corp.* | | | 1,142 | | | | 52,760 | |
Dollar Tree, Inc.* | | | 406 | | | | 38,363 | |
Family Dollar Stores, Inc. | | | 489 | | | | 30,944 | |
J.C. Penney Co., Inc. | | | 605 | | | | 21,435 | |
Kohl’s Corp. | | | 1,720 | | | | 86,052 | |
Macy’s, Inc. | | | 2,607 | | | | 103,576 | |
Nordstrom, Inc. | | | 1,014 | | | | 56,500 | |
Target Corp. | | | 3,897 | | | | 227,078 | |
| | | | | | | | |
| Total Multiline Retail | | | | | | | 616,708 | |
| Multi-Utilities – 1.2% | | | | | | | | |
Alliant Energy Corp. | | | 549 | | | | 23,783 | |
Ameren Corp. | | | 1,218 | | | | 39,682 | |
CenterPoint Energy, Inc. | | | 2,943 | | | | 58,036 | |
CMS Energy Corp. | | | 1,628 | | | | 35,816 | |
Consolidated Edison, Inc. | | | 1,341 | | | | 78,341 | |
Dominion Resources, Inc. | | | 930 | | | | 47,625 | |
DTE Energy Co. | | | 1,008 | | | | 55,470 | |
NiSource, Inc. | | | 1,208 | | | | 29,415 | |
NSTAR | | | 511 | | | | 24,850 | |
OGE Energy Corp. | | | 492 | | | | 26,322 | |
PG&E Corp. | | | 2,090 | | | | 90,727 | |
Public Service Enterprise Group, Inc. | | | 1,570 | | | | 48,058 | |
SCANA Corp. | | | 662 | | | | 30,194 | |
Sempra Energy | | | 1,843 | | | | 110,506 | |
Wisconsin Energy Corp. | | | 1,024 | | | | 36,024 | |
Xcel Energy, Inc. | | | 2,255 | | | | 59,690 | |
| | | | | | | | |
| Total Multi-Utilities | | | | | | | 794,539 | |
| Office Electronics – 0.1% | | | | | | | | |
Xerox Corp. | | | 9,136 | | | | 73,819 | |
| Oil, Gas & Consumable Fuels – 12.5% | | | | | | | | |
Alpha Natural Resources, Inc.* | | | 184 | | | | 2,799 | |
Anadarko Petroleum Corp. | | | 438 | | | | 34,313 | |
Apache Corp. | | | 3,117 | | | | 313,071 | |
Cabot Oil & Gas Corp. | | | 132 | | | | 4,114 | |
Chesapeake Energy Corp. | | | 3,516 | | | | 81,466 | |
Chevron Corp. | | | 18,273 | | | | 1,959,597 | |
Cimarex Energy Co. | | | 571 | | | | 43,093 | |
Concho Resources, Inc.* | | | 370 | | | | 37,770 | |
ConocoPhillips | | | 10,270 | | | | 780,623 | |
Consol Energy, Inc. | | | 996 | | | | 33,964 | |
Continental Resources, Inc.* | | | 524 | | | | 44,970 | |
Denbury Resources, Inc.* | | | 2,452 | | | | 44,700 | |
Devon Energy Corp. | | | 2,378 | | | | 169,123 | |
El Paso Corp. | | | 91 | | | | 2,689 | |
EOG Resources, Inc. | | | 455 | | | | 50,551 | |
EQT Corp. | | | 378 | | | | 18,223 | |
| | | | | | | | |
Exxon Mobil Corp. | | | 36,540 | | | $ | 3,169,114 | |
Hess Corp. | | | 1,917 | | | | 113,007 | |
HollyFrontier Corp. | | | 2,499 | | | | 80,343 | |
Kinder Morgan, Inc.(a) | | | 1,151 | | | | 44,486 | |
Marathon Oil Corp. | | | 4,933 | | | | 156,376 | |
Marathon Petroleum Corp. | | | 5,606 | | | | 243,076 | |
Murphy Oil Corp. | | | 1,338 | | | | 75,289 | |
Newfield Exploration Co.* | | | 864 | | | | 29,964 | |
Noble Energy, Inc. | | | 661 | | | | 64,633 | |
Occidental Petroleum Corp. | | | 4,789 | | | | 456,056 | |
Peabody Energy Corp. | | | 1,914 | | | | 55,429 | |
Pioneer Natural Resources Co. | | | 414 | | | | 46,198 | |
Plains Exploration & Production Co.* | | | 559 | | | | 23,841 | |
QEP Resources, Inc. | | | 808 | | | | 24,644 | |
SM Energy Co. | | | 181 | | | | 12,809 | |
Southwestern Energy Co.* | | | 1,404 | | | | 42,962 | |
Spectra Energy Corp. | | | 2,872 | | | | 90,612 | |
Valero Energy Corp. | | | 7,260 | | | | 187,090 | |
Whiting Petroleum Corp.* | | | 755 | | | | 40,997 | |
Williams Cos., Inc. (The) | | | 2,267 | | | | 69,846 | |
WPX Energy, Inc.* | | | 755 | | | | 13,598 | |
| | | | | | | | |
| Total Oil, Gas & Consumable Fuels | | | | | | | 8,661,436 | |
| Paper & Forest Products – 0.2% | | | | | | | | |
International Paper Co. | | | 3,440 | | | | 120,744 | |
MeadWestvaco Corp. | | | 589 | | | | 18,607 | |
| | | | | | | | |
| Total Paper & Forest Products | | | | | | | 139,351 | |
| Personal Products – 0.2% | | | | | | | | |
Avon Products, Inc. | | | 3,004 | | | | 58,158 | |
Estee Lauder Cos., Inc. (The) Class A | | | 1,094 | | | | 67,762 | |
| | | | | | | | |
| Total Personal Products | | | | | | | 125,920 | |
| Pharmaceuticals – 4.8% | | | | | | | | |
Abbott Laboratories | | | 7,676 | | | | 470,462 | |
Allergan, Inc. | | | 755 | | | | 72,050 | |
Bristol-Myers Squibb Co. | | | 6,954 | | | | 234,697 | |
Eli Lilly & Co. | | | 7,876 | | | | 317,167 | |
Forest Laboratories, Inc.* | | | 2,705 | | | | 93,836 | |
Hospira, Inc.* | | | 967 | | | | 36,156 | |
Johnson & Johnson | | | 12,776 | | | | 842,705 | |
Merck & Co., Inc. | | | 8,292 | | | | 318,413 | |
Mylan, Inc.* | | | 1,660 | | | | 38,927 | |
Perrigo Co. | | | 252 | | | | 26,034 | |
Pfizer, Inc. | | | 37,625 | | | | 852,582 | |
Watson Pharmaceuticals, Inc.* | | | 275 | | | | 18,442 | |
| | | | | | | | |
| Total Pharmaceuticals | | | | | | | 3,321,471 | |
| Professional Services – 0.1% | | | | | | | | |
Equifax, Inc. | | | 439 | | | | 19,430 | |
IHS, Inc. Class A* | | | 176 | | | | 16,482 | |
Towers Watson & Co. Class A | | | 218 | | | | 14,403 | |
Verisk Analytics, Inc. Class A* | | | 513 | | | | 24,096 | |
| | | | | | | | |
| Total Professional Services | | | | | | | 74,411 | |
| Real Estate Investment Trusts (REITs) – 0.6% | | | | | | | | |
American Tower Corp. | | | 346 | | | | 21,805 | |
See Notes to Financial Statements.
| | | | |
| WisdomTree Domestic and International Earnings Funds | | | 33 | |
Schedule of Investments (continued)
WisdomTree Earnings 500 Fund (EPS)
March 31, 2012
| | | | | | | | |
| Investments | | Shares | | | Value | |
| | | | | | | | |
AvalonBay Communities, Inc. | | | 93 | | | $ | 13,145 | |
Boston Properties, Inc. | | | 129 | | | | 13,544 | |
Digital Realty Trust, Inc.(a) | | | 104 | | | | 7,693 | |
Equity Residential | | | 1 | | | | 63 | |
Federal Realty Investment Trust | | | 111 | | | | 10,744 | |
HCP, Inc. | | | 968 | | | | 38,197 | |
Health Care REIT, Inc. | | | 186 | | | | 10,223 | |
Kimco Realty Corp. | | | 434 | | | | 8,359 | |
Macerich Co. (The) | | | 25 | | | | 1,444 | |
Plum Creek Timber Co., Inc. | | | 445 | | | | 18,494 | |
Public Storage | | | 289 | | | | 39,931 | |
Rayonier, Inc. | | | 509 | | | | 22,442 | |
Simon Property Group, Inc. | | | 511 | | | | 74,442 | |
SL Green Realty Corp. | | | 602 | | | | 46,685 | |
Ventas, Inc. | | | 253 | | | | 14,446 | |
Vornado Realty Trust | | | 559 | | | | 47,068 | |
Weyerhaeuser Co. | | | 1,056 | | | | 23,147 | |
| | | | | | | | |
| Total Real Estate Investment Trusts (REITs) | | | | | | | 411,872 | |
| Real Estate Management & Development – 0.0% | | | | | | | | |
CBRE Group, Inc. Class A* | | | 1,216 | | | | 24,271 | |
| Road & Rail – 0.8% | | | | | | | | |
CSX Corp. | | | 6,111 | | | | 131,509 | |
Hertz Global Holdings, Inc.* | | | 516 | | | | 7,761 | |
JB Hunt Transport Services, Inc. | | | 461 | | | | 25,064 | |
Kansas City Southern | | | 300 | | | | 21,507 | |
Norfolk Southern Corp. | | | 1,843 | | | | 121,325 | |
Union Pacific Corp. | | | 2,151 | | | | 231,189 | |
| | | | | | | | |
| Total Road & Rail | | | | | | | 538,355 | |
| Semiconductors & Semiconductor Equipment – 2.9% | | | | | |
Altera Corp. | | | 1,692 | | | | 67,375 | |
Analog Devices, Inc. | | | 1,712 | | | | 69,165 | |
Applied Materials, Inc. | | | 12,308 | | | | 153,112 | |
Broadcom Corp. Class A* | | | 2,293 | | | | 90,115 | |
Intel Corp. | | | 37,450 | | | | 1,052,719 | |
KLA-Tencor Corp. | | | 1,214 | | | | 66,066 | |
Lam Research Corp.*(a) | | | 1,013 | | | | 45,200 | |
Linear Technology Corp. | | | 1,355 | | | | 45,663 | |
Maxim Integrated Products, Inc. | | | 1,369 | | | | 39,140 | |
Microchip Technology, Inc.(a) | | | 781 | | | | 29,053 | |
Micron Technology, Inc.* | | | 1,509 | | | | 12,223 | |
NVIDIA Corp.* | | | 2,930 | | | | 45,093 | |
Texas Instruments, Inc. | | | 6,778 | | | | 227,809 | |
Xilinx, Inc. | | | 1,350 | | | | 49,180 | |
| | | | | | | | |
| Total Semiconductors & Semiconductor Equipment | | | | | | | 1,991,913 | |
| Software – 4.5% | | | | | | | | |
Activision Blizzard, Inc. | | | 4,197 | | | | 53,805 | |
Adobe Systems, Inc.* | | | 2,334 | | | | 80,080 | |
ANSYS, Inc.* | | | 236 | | | | 15,345 | |
Autodesk, Inc.* | | | 560 | | | | 23,699 | |
BMC Software, Inc.* | | | 953 | | | | 38,272 | |
CA, Inc. | | | 2,786 | | | | 76,782 | |
Citrix Systems, Inc.* | | | 350 | | | | 27,618 | |
| | | | | | | | |
Informatica Corp.* | | | 152 | | | $ | 8,041 | |
Intuit, Inc. | | | 890 | | | | 53,516 | |
Microsoft Corp. | | | 62,308 | | | | 2,009,433 | |
Nuance Communications, Inc.* | | | 112 | | | | 2,865 | |
Oracle Corp. | | | 20,662 | | | | 602,504 | |
Red Hat, Inc.* | | | 199 | | | | 11,918 | |
Salesforce.com, Inc.* | | | 13 | | | | 2,009 | |
Symantec Corp.* | | | 3,191 | | | | 59,672 | |
TIBCO Software, Inc.* | | | 238 | | | | 7,259 | |
VMware, Inc. Class A* | | | 488 | | | | 54,837 | |
| | | | | | | | |
| Total Software | | | | | | | 3,127,655 | |
| Specialty Retail – 1.9% | | | | | | | | |
Advance Auto Parts, Inc. | | | 433 | | | | 38,351 | |
AutoNation, Inc.*(a) | | | 506 | | | | 17,361 | |
AutoZone, Inc.* | | | 184 | | | | 68,411 | |
Bed Bath & Beyond, Inc.* | | | 1,016 | | | | 66,822 | |
Best Buy Co., Inc. | | | 3,386 | | | | 80,181 | |
CarMax, Inc.* | | | 982 | | | | 34,026 | |
Dick’s Sporting Goods, Inc. | | | 424 | | | | 20,386 | |
Gap, Inc. (The) | | | 3,734 | | | | 97,607 | |
Home Depot, Inc. (The) | | | 6,500 | | | | 327,015 | |
Lowe’s Cos., Inc. | | | 5,043 | | | | 158,249 | |
Ltd. Brands, Inc. | | | 1,418 | | | | 68,064 | |
O’Reilly Automotive, Inc.* | | | 444 | | | | 40,559 | |
PetSmart, Inc. | | | 420 | | | | 24,033 | |
Ross Stores, Inc. | | | 952 | | | | 55,311 | |
Staples, Inc. | | | 4,572 | | | | 73,975 | |
Tiffany & Co. | | | 447 | | | | 30,901 | |
TJX Cos., Inc. | | | 3,034 | | | | 120,480 | |
Tractor Supply Co. | | | 178 | | | | 16,120 | |
| | | | | | | | |
| Total Specialty Retail | | | | | | | 1,337,852 | |
| Textiles, Apparel & Luxury Goods – 0.6% | | | | | | | | |
Coach, Inc. | | | 1,065 | | | | 82,303 | |
Fossil, Inc.* | | | 282 | | �� | | 37,218 | |
NIKE, Inc. Class B | | | 1,623 | | | | 175,998 | |
PVH Corp. | | | 232 | | | | 20,725 | |
Ralph Lauren Corp. | | | 334 | | | | 58,226 | |
VF Corp. | | | 463 | | | | 67,589 | |
| | | | | | | | |
| Total Textiles, Apparel & Luxury Goods | | | | | | | 442,059 | |
| Thrifts & Mortgage Finance – 0.1% | | | | | | | | |
New York Community Bancorp, Inc.(a) | | | 2,823 | | | | 39,268 | |
People’s United Financial, Inc. | | | 1,144 | | | | 15,147 | |
| | | | | | | | |
| Total Thrifts & Mortgage Finance | | | | | | | 54,415 | |
| Tobacco – 1.6% | | | | | | | | |
Altria Group, Inc. | | | 8,420 | | | | 259,925 | |
Lorillard, Inc. | | | 683 | | | | 88,435 | |
Philip Morris International, Inc. | | | 7,769 | | | | 688,411 | |
Reynolds American, Inc. | | | 2,443 | | | | 101,238 | |
| | | | | | | | |
| Total Tobacco | | | | | | | 1,138,009 | |
| Trading Companies & Distributors – 0.2% | | | | | | | | |
Fastenal Co. | | | 602 | | | | 32,568 | |
MSC Industrial Direct Co. Class A | | | 209 | | | | 17,406 | |
See Notes to Financial Statements.
| | |
| 34 | | WisdomTree Domestic and International Earnings Funds |
Schedule of Investments (concluded)
WisdomTree Earnings 500 Fund (EPS)
March 31, 2012
| | | | | | | | |
| Investments | | Shares | | | Value | |
| | | | | | | | |
W.W. Grainger, Inc. | | | 251 | | | $ | 53,917 | |
| | | | | | | | |
| Total Trading Companies & Distributors | | | | | | | 103,891 | |
| Water Utilities – 0.0% | | | | | | | | |
American Water Works Co., Inc. | | | 703 | | | | 23,923 | |
| Wireless Telecommunication Services – 0.0% | | | | | | | | |
Crown Castle International Corp.* | | | 194 | | | | 10,348 | |
TOTAL COMMON STOCKS
(Cost: $60,585,470) | | | | | | | 69,044,954 | |
| EXCHANGE-TRADED FUND – 0.1% | | | | | | | | |
WisdomTree Equity Income Fund(b)
(Cost: $72,185) | | | 1,874 | | | | 83,955 | |
| SHORT-TERM INVESTMENT – 0.0% | | | | | | | | |
| MONEY MARKET FUND – 0.0% | | | | | | | | |
Invesco Treasury Fund Private Class, 0.02%(c)
(Cost: $866) | | | 866 | | | | 866 | |
| INVESTMENT OF CASH COLLATERAL FOR SECURITIES LOANED – 0.4% | | | | | | | | |
| MONEY MARKET FUND – 0.4% | | | | | | | | |
Dreyfus Institutional Preferred Money Market Fund, 0.18%(c) | | | | | | | | |
| (Cost: $299,255)(d) | | | 299,255 | | | | 299,255 | |
TOTAL INVESTMENTS IN SECURITIES – 100.3%
(Cost: $60,957,776) | | | | | | | 69,429,030 | |
Liabilities in Excess of Other Assets – (0.3)% | | | | | | | (242,443 | ) |
| | | | | | | | |
| NET ASSETS – 100.0% | | | | | | $ | 69,186,587 | |
| * | Non-income producing security. |
| (a) | Security, or portion thereof, was on loan at March 31, 2012 (See Note 2). |
| (b) | Affiliated company (See Note 7). |
| (c) | Rate shown represents annualized 7-day yield as of March 31, 2012. |
| (d) | At March 31, 2012, the total market value of the Fund’s securities on loan was $292,337 and the total market value of the collateral held by the Fund was $299,255. |
See Notes to Financial Statements.
| | | | |
| WisdomTree Domestic and International Earnings Funds | | | 35 | |
Schedule of Investments
WisdomTree MidCap Earnings Fund (EZM)
March 31, 2012
| | | | | | | | |
| Investments | | Shares | | | Value | |
| | | | | | | | |
| UNITED STATES – 106.7% | | | | | | | | |
| COMMON STOCKS – 99.7% | | | | | |
| Aerospace & Defense – 2.0% | | | | | |
Alliant Techsystems, Inc. | | | 7,961 | | | $ | 399,005 | |
BE Aerospace, Inc.* | | | 8,109 | | | | 376,825 | |
Curtiss-Wright Corp. | | | 5,493 | | | | 203,296 | |
Esterline Technologies Corp.* | | | 4,709 | | | | 336,505 | |
HEICO Corp.(a) | | | 1,735 | | | | 89,509 | |
Hexcel Corp.* | | | 7,537 | | | | 180,963 | |
Huntington Ingalls Industries, Inc.* | | | 9,350 | | | | 376,244 | |
Moog, Inc. Class A* | | | 4,737 | | | | 203,170 | |
Spirit AeroSystems Holdings, Inc. Class A* | | | 14,496 | | | | 354,572 | |
Teledyne Technologies, Inc.* | | | 3,837 | | | | 241,923 | |
Triumph Group, Inc. | | | 5,489 | | | | 343,941 | |
| | | | | | | | |
| Total Aerospace & Defense | | | | | | | 3,105,953 | |
| Airlines – 0.2% | | | | | | | | |
Alaska Air Group, Inc.* | | | 10,390 | | | | 372,170 | |
| Auto Components – 3.3% | | | | | | | | |
Dana Holding Corp. | | | 9,819 | | | | 152,195 | |
Federal-Mogul Corp.* | | | 22,402 | | | | 385,538 | |
Gentex Corp. | | | 8,443 | | | | 206,853 | |
Goodyear Tire & Rubber Co. (The)* | | | 30,389 | | | | 340,965 | |
Lear Corp. | | | 22,017 | | | | 1,023,570 | |
Tenneco, Inc.* | | | 6,814 | | | | 253,140 | |
TRW Automotive Holdings Corp.* | | | 43,375 | | | | 2,014,769 | |
Visteon Corp.* | | | 14,815 | | | | 785,195 | |
| | | | | | | | |
| Total Auto Components | | | | | | | 5,162,225 | |
| Automobiles – 0.1% | | | | | | | | |
Thor Industries, Inc. | | | 6,661 | | | | 210,221 | |
| Beverages – 0.8% | | | | | | | | |
Boston Beer Co., Inc. (The) Class A*(a) | | | 680 | | | | 72,617 | |
Constellation Brands, Inc. Class A* | | | 48,659 | | | | 1,147,866 | |
| | | | | | | | |
| Total Beverages | | | | | | | 1,220,483 | |
| Biotechnology – 0.4% | | | | | | | | |
Cepheid, Inc.* | | | 316 | | | | 13,218 | |
Cubist Pharmaceuticals, Inc.*(a) | | | 1,707 | | | | 73,828 | |
Myriad Genetics, Inc.* | | | 7,797 | | | | 184,477 | |
United Therapeutics Corp.* | | | 6,588 | | | | 310,492 | |
| | | | | | | | |
| Total Biotechnology | | | | | | | 582,015 | |
| Building Products – 0.5% | | | | | | | | |
A.O. Smith Corp. | | | 3,449 | | | | 155,033 | |
Armstrong World Industries, Inc. | | | 2,794 | | | | 136,263 | |
Lennox International, Inc. | | | 4,627 | | | | 186,468 | |
Owens Corning* | | | 6,073 | | | | 218,810 | |
Simpson Manufacturing Co., Inc. | | | 1,914 | | | | 61,727 | |
| | | | | | | | |
| Total Building Products | | | | | | | 758,301 | |
| Capital Markets – 4.0% | | | | | | | | |
American Capital Ltd.* | | | 169,912 | | | | 1,473,137 | |
Ares Capital Corp. | | | 34,872 | | | | 570,157 | |
Cohen & Steers, Inc. | | | 2,688 | | | | 85,747 | |
E*TRADE Financial Corp.* | | | 24,834 | | | | 271,932 | |
Eaton Vance Corp.(a) | | | 14,572 | | | | 416,468 | |
| | | | | | | | |
Federated Investors, Inc. Class B(a) | | | 16,253 | | | $ | 364,230 | |
GAMCO Investors, Inc. Class A | | | 1,825 | | | | 90,538 | |
Janus Capital Group, Inc. | | | 43,088 | | | | 383,914 | |
Jefferies Group, Inc. | | | 29,488 | | | | 555,554 | |
Knight Capital Group, Inc. Class A* | | | 10,711 | | | | 137,851 | |
Legg Mason, Inc. | | | 15,103 | | | | 421,827 | |
LPL Investment Holdings, Inc.* | | | 654 | | | | 24,813 | |
Raymond James Financial, Inc. | | | 14,929 | | | | 545,356 | |
SEI Investments Co. | | | 20,458 | | | | 423,276 | |
Stifel Financial Corp.* | | | 6,310 | | | | 238,770 | |
Waddell & Reed Financial, Inc. Class A | | | 11,133 | | | | 360,821 | |
| | | | | | | | |
| Total Capital Markets | | | | | | | 6,364,391 | |
| Chemicals – 3.8% | | | | | | | | |
Balchem Corp. | | | 1,387 | | | | 41,957 | |
Cabot Corp. | | | 8,341 | | | | 355,994 | |
Cytec Industries, Inc. | | | 5,506 | | | | 334,710 | |
Huntsman Corp. | | | 29,159 | | | | 408,518 | |
Intrepid Potash, Inc.* | | | 5,931 | | | | 144,301 | |
Kronos Worldwide, Inc.(a) | | | 24,214 | | | | 603,897 | |
NewMarket Corp. | | | 1,550 | | | | 290,470 | |
Olin Corp. | | | 6,792 | | | | 147,726 | |
Rockwood Holdings, Inc.* | | | 12,988 | | | | 677,324 | |
RPM International, Inc. | | | 12,250 | | | | 320,827 | |
Scotts Miracle-Gro Co. (The) Class A(a) | | | 4,254 | | | | 230,397 | |
Sensient Technologies Corp. | | | 4,900 | | | | 186,200 | |
Solutia, Inc. | | | 21,366 | | | | 596,966 | |
Valspar Corp. | | | 8,762 | | | | 423,117 | |
W.R. Grace & Co.* | | | 9,801 | | | | 566,498 | |
Westlake Chemical Corp. | | | 11,679 | | | | 756,682 | |
| | | | | | | | |
| Total Chemicals | | | | | | | 6,085,584 | |
| Commercial Banks – 4.3% | | | | | | | | |
Associated Banc-Corp. | | | 11,933 | | | | 166,585 | |
Bank of Hawaii Corp.(a) | | | 5,745 | | | | 277,771 | |
BOK Financial Corp. | | | 7,358 | | | | 414,108 | |
City National Corp. | | | 5,409 | | | | 283,810 | |
Commerce Bancshares, Inc. | | | 10,294 | | | | 417,113 | |
Cullen/Frost Bankers, Inc. | | | 6,062 | | | | 352,748 | |
East West Bancorp, Inc. | | | 16,450 | | | | 379,830 | |
FNB Corp. | | | 11,537 | | | | 139,367 | |
First Citizens BancShares, Inc. Class A | | | 863 | | | | 157,661 | |
First Horizon National Corp. | | | 7,011 | | | | 72,774 | |
First Niagara Financial Group, Inc. | | | 27,321 | | | | 268,839 | |
First Republic Bank*(a) | | | 16,608 | | | | 547,068 | |
FirstMerit Corp. | | | 11,965 | | | | 201,730 | |
Fulton Financial Corp. | | | 21,463 | | | | 225,361 | |
Hancock Holding Co. | | | 3,684 | | | | 130,819 | |
Iberiabank Corp. | | | 1,621 | | | | 86,675 | |
International Bancshares Corp. | | | 9,702 | | | | 205,197 | |
Investors Bancorp, Inc.* | | | 8,241 | | | | 123,780 | |
National Penn Bancshares, Inc. | | | 11,937 | | | | 105,642 | |
Prosperity Bancshares, Inc. | | | 5,261 | | | | 240,954 | |
Signature Bank* | | | 3,523 | | | | 222,090 | |
Susquehanna Bancshares, Inc. | | | 8,530 | | | | 84,276 | |
See Notes to Financial Statements.
| | |
| 36 | | WisdomTree Domestic and International Earnings Funds |
Schedule of Investments (continued)
WisdomTree MidCap Earnings Fund (EZM)
March 31, 2012
| | | | | | | | |
| Investments | | Shares | | | Value | |
| | | | | | | | |
SVB Financial Group* | | | 5,040 | | | $ | 324,274 | |
TCF Financial Corp. | | | 18,269 | | | | 217,218 | |
Trustmark Corp. | | | 6,953 | | | | 173,686 | |
UMB Financial Corp. | | | 4,504 | | | | 201,486 | |
Umpqua Holdings Corp. | | | 8,423 | | | | 114,216 | |
United Bankshares, Inc.(a) | | | 3,912 | | | | 112,900 | |
Valley National Bancorp(a) | | | 18,286 | | | | 236,804 | |
Webster Financial Corp. | | | 10,253 | | | | 232,436 | |
Westamerica Bancorp.(a) | | | 3,159 | | | | 151,632 | |
Zions Bancorp. | | | 299 | | | | 6,417 | |
| | | | | | | | |
| Total Commercial Banks | | | | | | | 6,875,267 | |
| Commercial Services & Supplies – 2.5% | | | | | | | | |
Avery Dennison Corp. | | | 15,471 | | | | 466,141 | |
Cintas Corp. | | | 12,280 | | | | 480,394 | |
Clean Harbors, Inc.* | | | 2,803 | | | | 188,726 | |
Copart, Inc.* | | | 10,888 | | | | 283,850 | |
Corrections Corp. of America* | | | 10,958 | | | | 299,263 | |
Covanta Holding Corp. | | | 7,641 | | | | 124,013 | |
Healthcare Services Group, Inc. | | | 2,928 | | | | 62,279 | |
Herman Miller, Inc. | | | 5,882 | | | | 135,051 | |
HNI Corp. | | | 2,400 | | | | 66,600 | |
KAR Auction Services, Inc.* | | | 6,916 | | | | 112,108 | |
Mine Safety Appliances Co. | | | 2,296 | | | | 94,320 | |
Pitney Bowes, Inc.(a) | | | 30,762 | | | | 540,796 | |
Portfolio Recovery Associates, Inc.* | | | 2,039 | | | | 146,237 | |
R.R. Donnelley & Sons Co.(a) | | | 23,714 | | | | 293,816 | |
Rollins, Inc. | | | 6,561 | | | | 139,618 | |
Tetra Tech, Inc.* | | | 6,046 | | | | 159,373 | |
United Stationers, Inc.(a) | | | 5,213 | | | | 161,759 | |
Waste Connections, Inc. | | | 7,424 | | | | 241,503 | |
| | | | | | | | |
| Total Commercial Services & Supplies | | | | | | | 3,995,847 | |
| Communications Equipment – 2.4% | | | | | | | | |
Acme Packet, Inc.*(a) | | | 2,193 | | | | 60,351 | |
ADTRAN, Inc. | | | 7,035 | | | | 219,422 | |
Arris Group, Inc.* | | | 7,852 | | | | 88,728 | |
Aruba Networks, Inc.*(a) | | | 4,776 | | | | 106,409 | |
Brocade Communications Systems, Inc.* | | | 14,596 | | | | 83,927 | |
EchoStar Corp. Class A* | | | 12,639 | | | | 355,661 | |
Finisar Corp.* | | | 7,732 | | | | 155,800 | |
Harris Corp. | | | 22,758 | | | | 1,025,931 | |
InterDigital, Inc. | | | 3,778 | | | | 131,701 | |
JDS Uniphase Corp.* | | | 9,926 | | | | 143,828 | |
Loral Space & Communications, Inc.* | | | 9,631 | | | | 766,628 | |
NETGEAR, Inc.* | | | 3,383 | | | | 129,231 | |
Plantronics, Inc. | | | 4,682 | | | | 188,497 | |
Polycom, Inc.* | | | 10,684 | | | | 203,744 | |
Riverbed Technology, Inc.* | | | 3,306 | | | | 92,832 | |
Viasat, Inc.* | | | 1,078 | | | | 51,970 | |
| | | | | | | | |
| Total Communications Equipment | | | | | | | 3,804,660 | |
| Computers & Peripherals – 0.8% | | | | | | | | |
Diebold, Inc. | | | 3,367 | | | | 129,697 | |
Fusion-io, Inc.*(a) | | | 1,052 | | | | 29,887 | |
Lexmark International, Inc. Class A(a) | | | 15,230 | | | | 506,245 | |
| | | | | | | | |
NCR Corp.* | | | 19,590 | | | $ | 425,299 | |
QLogic Corp.* | | | 14,735 | | | | 261,694 | |
| | | | | | | | |
| Total Computers & Peripherals | | | | | | | 1,352,822 | |
| Construction & Engineering – 0.9% | | | | | | | | |
AECOM Technology Corp.* | | | 20,624 | | | | 461,359 | |
EMCOR Group, Inc. | | | 7,765 | | | | 215,246 | |
MasTec, Inc.* | | | 12,137 | | | | 219,558 | |
URS Corp. | | | 11,689 | | | | 497,016 | |
| | | | | | | | |
| Total Construction & Engineering | | | | | | | 1,393,179 | |
| Construction Materials – 0.1% | | | | | | | | |
Martin Marietta Materials, Inc.(a) | | | 1,712 | | | | 146,599 | |
| Consumer Finance – 0.5% | | | | | | | | |
Cash America International, Inc.(a) | | | 4,296 | | | | 205,907 | |
Credit Acceptance Corp.* | | | 3,185 | | | | 321,717 | |
Ezcorp, Inc. Class A* | | | 6,501 | | | | 210,990 | |
Green Dot Corp. Class A*(a) | | | 2,062 | | | | 54,684 | |
| | | | | | | | |
| Total Consumer Finance | | | | | | | 793,298 | |
| Containers & Packaging – 2.1% | | | | | | | | |
Aptargroup, Inc. | | | 5,505 | | | | 301,509 | |
Bemis Co., Inc. | | | 11,034 | | | | 356,288 | |
Graphic Packaging Holding Co.* | | | 44,035 | | | | 243,073 | |
Greif, Inc. Class A | | | 7,285 | | | | 407,377 | |
Owens-Illinois, Inc.* | | | 15,415 | | | | 359,786 | |
Packaging Corp. of America | | | 10,803 | | | | 319,661 | |
Rock-Tenn Co. Class A | | | 3,990 | | | | 269,565 | |
Sealed Air Corp. | | | 21,735 | | | | 419,703 | |
Silgan Holdings, Inc. | | | 6,820 | | | | 301,444 | |
Sonoco Products Co. | | | 10,852 | | | | 360,286 | |
| | | | | | | | |
| Total Containers & Packaging | | | | | | | 3,338,692 | |
| Distributors – 0.1% | | | | | |
Pool Corp. | | | 3,472 | | | | 129,922 | |
| Diversified Consumer Services – 1.8% | | | | | | | | |
Coinstar, Inc.*(a) | | | 3,596 | | | | 228,526 | |
DeVry, Inc. | | | 13,783 | | | | 466,830 | |
Education Management Corp.* | | | 14,200 | | | | 194,398 | |
Hillenbrand, Inc. | | | 7,086 | | | | 162,624 | |
ITT Educational Services, Inc.*(a) | | | 9,265 | | | | 612,787 | |
Service Corp. International | | | 17,759 | | | | 199,966 | |
Sotheby’s | | | 9,787 | | | | 385,021 | |
Weight Watchers International, Inc.(a) | | | 7,292 | | | | 562,869 | |
| | | | | | | | |
| Total Diversified Consumer Services | | | | | | | 2,813,021 | |
| Diversified Financial Services – 0.3% | | | | | | | | |
CBOE Holdings, Inc. | | | 7,756 | | | | 220,425 | |
MSCI, Inc. Class A* | | | 7,223 | | | | 265,879 | |
| | | | | | | | |
| Total Diversified Financial Services | | | | | | | 486,304 | |
| Diversified Telecommunication Services – 0.1% | | | | | | | | |
AboveNet, Inc.* | | | 1,660 | | | | 137,448 | |
tw telecom, inc.* | | | 4,717 | | | | 104,529 | |
| | | | | | | | |
| Total Diversified Telecommunication Services | | | | | | | 241,977 | |
See Notes to Financial Statements.
| | | | |
| WisdomTree Domestic and International Earnings Funds | | | 37 | |
Schedule of Investments (continued)
WisdomTree MidCap Earnings Fund (EZM)
March 31, 2012
| | | | | | | | |
| Investments | | Shares | | | Value | |
| | | | | | | | |
| Electric Utilities – 1.7% | | | | | | | | |
ALLETE, Inc. | | | 3,386 | | | $ | 140,485 | |
Cleco Corp. | | | 7,637 | | | | 302,807 | |
El Paso Electric Co. | | | 4,486 | | | | 145,750 | |
Great Plains Energy, Inc. | | | 13,097 | | | | 265,476 | |
Hawaiian Electric Industries, Inc. | | | 7,339 | | | | 186,044 | |
IDACORP, Inc. | | | 6,745 | | | | 277,354 | |
ITC Holdings Corp. | | | 3,312 | | | | 254,825 | |
NV Energy, Inc. | | | 20,745 | | | | 334,410 | |
Portland General Electric Co. | | | 8,243 | | | | 205,910 | |
UIL Holdings Corp. | | | 3,574 | | | | 124,232 | |
Unisource Energy Corp. | | | 4,622 | | | | 169,027 | |
Westar Energy, Inc. | | | 12,060 | | | | 336,836 | |
| | | | | | | | |
| Total Electric Utilities | | | | | | | 2,743,156 | |
| Electrical Equipment – 1.9% | | | | | | | | |
Acuity Brands, Inc. | | | 3,074 | | | | 193,140 | |
Babcock & Wilcox Co. (The)* | | | 11,028 | | | | 283,971 | |
Belden, Inc. | | | 4,514 | | | | 171,126 | |
Brady Corp. Class A | | | 5,225 | | | | 169,029 | |
EnerSys* | | | 7,748 | | | | 268,468 | |
Generac Holdings, Inc.*(a) | | | 3,993 | | | | 98,028 | |
General Cable Corp.* | | | 7,242 | | | | 210,597 | |
GrafTech International Ltd.* | | | 18,311 | | | | 218,633 | |
Hubbell, Inc. Class B | | | 5,871 | | | | 461,343 | |
II-VI, Inc.* | | | 6,909 | | | | 163,398 | |
Polypore International, Inc.*(a) | | | 3,275 | | | | 115,149 | |
Regal-Beloit Corp. | | | 4,325 | | | | 283,504 | |
Thomas & Betts Corp.* | | | 4,847 | | | | 348,548 | |
| | | | | | | | |
| Total Electrical Equipment | | | | | | | 2,984,934 | |
| Electronic Equipment, Instruments & Components – 3.7% | | | | | |
Anixter International, Inc.* | | | 4,737 | | | | 343,575 | |
Arrow Electronics, Inc.* | | | 25,145 | | | | 1,055,336 | |
AVX Corp. | | | 29,566 | | | | 392,045 | |
Cognex Corp. | | | 2,917 | | | | 123,564 | |
Coherent, Inc.* | | | 2,633 | | | | 153,583 | |
Dolby Laboratories, Inc. Class A* | | | 14,272 | | | | 543,192 | |
FEI Co.* | | | 3,775 | | | | 185,390 | |
FLIR Systems, Inc. | | | 14,173 | | | | 358,719 | |
Ingram Micro, Inc. Class A* | | | 21,763 | | | | 403,921 | |
IPG Photonics Corp.*(a) | | | 4,780 | | | | 248,799 | |
Jabil Circuit, Inc. | | | 30,056 | | | | 755,007 | |
National Instruments Corp. | | | 6,188 | | | | 176,482 | |
Tech Data Corp.* | | | 6,754 | | | | 366,472 | |
Vishay Intertechnology, Inc.* | | | 59,847 | | | | 727,739 | |
| | | | | | | | |
| Total Electronic Equipment, Instruments & Components | | | | 5,833,824 | |
| Energy Equipment & Services – 2.4% | | | | | | | | |
Atwood Oceanics, Inc.* | | | 10,258 | | | | 460,482 | |
Bristow Group, Inc. | | | 3,234 | | | | 154,359 | |
CARBO Ceramics, Inc.(a) | | | 1,333 | | | | 140,565 | |
Dresser-Rand Group, Inc.* | | | 2,906 | | | | 134,809 | |
Dril-Quip, Inc.* | | | 2,032 | | | | 132,121 | |
Gulfmark Offshore, Inc. Class A* | | | 1,440 | | | | 66,182 | |
Helix Energy Solutions Group, Inc.* | | | 6,780 | | | | 120,684 | |
| | | | | | | | |
Key Energy Services, Inc.* | | | 4,780 | | | $ | 73,851 | |
Lufkin Industries, Inc. | | | 1,386 | | | | 111,781 | |
Oil States International, Inc.* | | | 5,629 | | | | 439,400 | |
Patterson-UTI Energy, Inc. | | | 22,710 | | | | 392,656 | |
Rowan Cos., Inc.* | | | 8,327 | | | | 274,208 | |
RPC, Inc.(a) | | | 35,407 | | | | 375,668 | |
SEACOR Holdings, Inc.* | | | 592 | | | | 56,702 | |
Superior Energy Services, Inc.* | | | 14,842 | | | | 391,235 | |
Tidewater, Inc. | | | 2,910 | | | | 157,198 | |
Unit Corp.* | | | 6,121 | | | | 261,734 | |
| | | | | | | | |
| Total Energy Equipment & Services | | | | | | | 3,743,635 | |
| Food & Staples Retailing – 0.5% | | | | | | | | |
Casey’s General Stores, Inc. | | | 3,009 | | | | 166,879 | |
Fresh Market, Inc. (The)* | | | 587 | | | | 28,147 | |
Harris Teeter Supermarkets, Inc. | | | 3,968 | | | | 159,117 | |
PriceSmart, Inc. | | | 1,330 | | | | 96,837 | |
SUPERVALU, Inc.(a) | | | 34,494 | | | | 196,961 | |
United Natural Foods, Inc.* | | | 2,981 | | | | 139,093 | |
| | | | | | | | |
| Total Food & Staples Retailing | | | | | | | 787,034 | |
| Food Products – 1.4% | | | | | | | | |
Corn Products International, Inc. | | | 9,376 | | | | 540,526 | |
Darling International, Inc.* | | | 18,279 | | | | 318,420 | |
Dean Foods Co.* | | | 10,458 | | | | 126,646 | |
Flowers Foods, Inc. | | | 10,124 | | | | 206,226 | |
Hain Celestial Group, Inc. (The)* | | | 2,168 | | | | 94,980 | |
Lancaster Colony Corp.(a) | | | 2,247 | | | | 149,336 | |
Smithfield Foods, Inc.* | | | 29,237 | | | | 644,091 | |
Tootsie Roll Industries, Inc.(a) | | | 2,670 | | | | 61,170 | |
TreeHouse Foods, Inc.* | | | 2,087 | | | | 124,177 | |
| | | | | | | | |
| Total Food Products | | | | | | | 2,265,572 | |
| Gas Utilities – 1.3% | | | | | | | | |
AGL Resources, Inc. | | | 7,475 | | | | 293,169 | |
Atmos Energy Corp. | | | 9,151 | | | | 287,890 | |
New Jersey Resources Corp. | | | 3,180 | | | | 141,733 | |
Northwest Natural Gas Co. | | | 2,202 | | | | 99,971 | |
Piedmont Natural Gas Co., Inc.(a) | | | 4,841 | | | | 150,410 | |
Questar Corp. | | | 17,168 | | | | 330,656 | |
South Jersey Industries, Inc. | | | 2,173 | | | | 108,737 | |
Southwest Gas Corp. | | | 4,014 | | | | 171,558 | |
UGI Corp. | | | 12,322 | | | | 335,774 | |
WGL Holdings, Inc. | | | 4,034 | | | | 164,184 | |
| | | | | | | | |
| Total Gas Utilities | | | | | | | 2,084,082 | |
| Health Care Equipment & Supplies – 1.6% | | | | | | | | |
Align Technology, Inc.* | | | 3,641 | | | | 100,309 | |
Cooper Cos., Inc. (The) | | | 3,632 | | | | 296,771 | |
Gen-Probe, Inc.* | | | 1,441 | | | | 95,697 | |
Haemonetics Corp.* | | | 1,746 | | | | 121,661 | |
Hill-Rom Holdings, Inc. | | | 7,633 | | | | 255,018 | |
IDEXX Laboratories, Inc.* | | | 3,108 | | | | 271,795 | |
Masimo Corp.* | | | 4,926 | | | | 115,170 | |
ResMed, Inc.* | | | 13,566 | | | | 419,325 | |
Sirona Dental Systems, Inc.* | | | 4,144 | | | | 213,582 | |
See Notes to Financial Statements.
| | |
| 38 | | WisdomTree Domestic and International Earnings Funds |
Schedule of Investments (continued)
WisdomTree MidCap Earnings Fund (EZM)
March 31, 2012
| | | | | | | | |
| Investments | | Shares | | | Value | |
| | | | | | | | |
STERIS Corp. | | | 6,689 | | | $ | 211,506 | |
Teleflex, Inc. | | | 2,790 | | | | 170,608 | |
Thoratec Corp.* | | | 3,379 | | | | 113,906 | |
Volcano Corp.* | | | 762 | | | | 21,603 | |
West Pharmaceutical Services, Inc. | | | 2,658 | | | | 113,045 | |
| | | | | | | | |
| Total Health Care Equipment & Supplies | | | | | | | 2,519,996 | |
| Health Care Providers & Services – 3.8% | | | | | | | | |
Accretive Health, Inc.*(a) | | | 1,453 | | | | 29,016 | |
AMERIGROUP Corp.* | | | 6,563 | | | | 441,559 | |
Catalyst Health Solutions, Inc.* | | | 1,992 | | | | 126,950 | |
Centene Corp.* | | | 4,377 | | | | 214,342 | |
Community Health Systems, Inc.* | | | 25,939 | | | | 576,883 | |
Health Management Associates, Inc. Class A* | | | 40,407 | | | | 271,535 | |
Health Net, Inc.* | | | 10,442 | | | | 414,756 | |
HMS Holdings Corp.* | | | 2,322 | | | | 72,470 | |
LifePoint Hospitals, Inc.* | | | 6,618 | | | | 261,014 | |
Lincare Holdings, Inc. | | | 10,820 | | | | 280,022 | |
Magellan Health Services, Inc.* | | | 4,057 | | | | 198,022 | |
Mednax, Inc.* | | | 4,765 | | | | 354,373 | |
Omnicare, Inc. | | | 6,960 | | | | 247,567 | |
Owens & Minor, Inc. | | | 6,502 | | | | 197,726 | |
Patterson Cos., Inc. | | | 10,913 | | | | 364,494 | |
PSS World Medical, Inc.* | | | 4,619 | | | | 117,045 | |
Select Medical Holdings Corp.* | | | 16,225 | | | | 124,770 | |
Team Health Holdings, Inc.* | | | 4,503 | | | | 92,582 | |
Tenet Healthcare Corp.* | | | 65,010 | | | | 345,203 | |
Universal Health Services, Inc. Class B | | | 13,727 | | | | 575,299 | |
VCA Antech, Inc.* | | | 8,977 | | | | 208,356 | |
WellCare Health Plans, Inc.* | | | 6,345 | | | | 456,079 | |
| | | | | | | | |
| Total Health Care Providers & Services | | | | | | | 5,970,063 | |
| Health Care Technology – 0.1% | | | | | | | | |
Allscripts Healthcare Solutions, Inc.* | | | 3,479 | | | | 57,752 | |
athenahealth, Inc.*(a) | | | 517 | | | | 38,320 | |
Quality Systems, Inc. | | | 3,133 | | | | 137,006 | |
| | | | | | | | |
| Total Health Care Technology | | | | | | | 233,078 | |
| Hotels, Restaurants & Leisure – 1.0% | | | | | | | | |
Bally Technologies, Inc.* | | | 3,842 | | | | 179,614 | |
BJ’s Restaurants, Inc.* | | | 966 | | | | 48,638 | |
Brinker International, Inc. | | | 8,504 | | | | 234,285 | |
Buffalo Wild Wings, Inc.* | | | 1,112 | | | | 100,847 | |
Cheesecake Factory, Inc. (The)*(a) | | | 4,575 | | | | 134,459 | |
Choice Hotels International, Inc. | | | 4,350 | | | | 162,429 | |
Domino’s Pizza, Inc. | | | 4,381 | | | | 159,031 | |
Life Time Fitness, Inc.* | | | 3,263 | | | | 165,010 | |
Penn National Gaming, Inc.* | | | 6,744 | | | | 289,857 | |
Vail Resorts, Inc. | | | 1,105 | | | | 47,791 | |
| | | | | | | | |
| Total Hotels, Restaurants & Leisure | | | | | | | 1,521,961 | |
| Household Durables – 3.0% | | | | | | | | |
D.R. Horton, Inc. | | | 9,223 | | | | 139,913 | |
Harman International Industries, Inc. | | | 6,228 | | | | 291,533 | |
Jarden Corp. | | | 11,746 | | | | 472,542 | |
Leggett & Platt, Inc.(a) | | | 12,034 | | | | 276,902 | |
| | | | | | | | |
Lennar Corp. Class A(a) | | | 5,508 | | | $ | 149,707 | |
Mohawk Industries, Inc.* | | | 4,844 | | | | 322,174 | |
NVR, Inc.* | | | 361 | | | | 262,205 | |
Tempur-Pedic International, Inc.* | | | 5,983 | | | | 505,145 | |
Toll Brothers, Inc.* | | | 7,816 | | | | 187,506 | |
Tupperware Brands Corp. | | | 6,772 | | | | 430,022 | |
Whirlpool Corp. | | | 21,852 | | | | 1,679,545 | |
| | | | | | | | |
| Total Household Durables | | | | | | | 4,717,194 | |
| Industrial Conglomerates – 0.5% | | | | | | | | |
Carlisle Cos., Inc. | | | 5,695 | | | | 284,294 | |
Seaboard Corp.* | | | 230 | | | | 448,730 | |
| | | | | | | | |
| Total Industrial Conglomerates | | | | | | | 733,024 | |
| Insurance – 5.4% | | | | | | | | |
Alleghany Corp.* | | | 687 | | | | 226,092 | |
American Financial Group, Inc. | | | 13,285 | | | | 512,535 | |
American National Insurance Co. | | | 2,854 | | | | 206,972 | |
AmTrust Financial Services, Inc. | | | 9,227 | | | | 248,022 | |
Arthur J. Gallagher & Co. | | | 6,383 | | | | 228,128 | |
Assurant, Inc. | | | 17,603 | | | | 712,922 | |
Brown & Brown, Inc. | | | 10,240 | | | | 243,507 | |
CNO Financial Group, Inc.* | | | 101,449 | | | | 789,273 | |
Delphi Financial Group, Inc. Class A | | | 11,482 | | | | 514,049 | |
Erie Indemnity Co. Class A | | | 3,736 | | | | 291,184 | |
Fidelity National Financial, Inc. Class A | | | 29,162 | | | | 525,791 | |
First American Financial Corp. | | | 10,221 | | | | 169,975 | |
Genworth Financial, Inc. Class A* | | | 1,351 | | | | 11,240 | |
Hanover Insurance Group, Inc. (The) | | | 1,158 | | | | 47,617 | |
HCC Insurance Holdings, Inc. | | | 14,387 | | | | 448,443 | |
Kemper Corp. | | | 4,156 | | | | 125,844 | |
Markel Corp.* | | | 737 | | | | 330,869 | |
Mercury General Corp. | | | 3,670 | | | | 160,526 | |
Primerica, Inc. | | | 12,380 | | | | 312,100 | |
ProAssurance Corp. | | | 4,486 | | | | 395,261 | |
Protective Life Corp. | | | 20,281 | | | | 600,723 | |
Reinsurance Group of America, Inc. | | | 17,256 | | | | 1,026,214 | |
RLI Corp.(a) | | | 2,578 | | | | 184,688 | |
StanCorp Financial Group, Inc. | | | 6,691 | | | | 273,930 | |
| | | | | | | | |
| Total Insurance | | | | | | | 8,585,905 | |
| Internet & Catalog Retail – 0.5% | | | | | | | | |
HomeAway, Inc.*(a) | | | 295 | | | | 7,484 | |
HSN, Inc. | | | 4,841 | | | | 184,103 | |
Netflix, Inc.* | | | 4,837 | | | | 556,449 | |
| | | | | | | | |
| Total Internet & Catalog Retail | | | | | | | 748,036 | |
| Internet Software & Services – 0.5% | | | | | | | | |
AOL, Inc.* | | | 5,669 | | | | 107,541 | |
IAC/InterActiveCorp | | | 4,212 | | | | 206,767 | |
j2 Global, Inc.(a) | | | 6,228 | | | | 178,619 | |
ValueClick, Inc.*(a) | | | 8,599 | | | | 169,744 | |
WebMD Health Corp.*(a) | | | 2,503 | | | | 64,027 | |
| | | | | | | | |
| Total Internet Software & Services | | | | | | | 726,698 | |
See Notes to Financial Statements.
| | | | |
| WisdomTree Domestic and International Earnings Funds | | | 39 | |
Schedule of Investments (continued)
WisdomTree MidCap Earnings Fund (EZM)
March 31, 2012
| | | | | | | | |
| Investments | | Shares | | | Value | |
| | | | | | | | |
| IT Services – 4.1% | | | | | | | | |
Booz Allen Hamilton Holding Corp.(a) | | | 14,345 | | | $ | 244,295 | |
Broadridge Financial Solutions, Inc. | | | 11,536 | | | | 275,826 | |
CACI International, Inc. Class A* | | | 4,085 | | | | 254,455 | |
Cardtronics, Inc.* | | | 3,812 | | | | 100,065 | |
Computer Sciences Corp. | | | 45,340 | | | | 1,357,480 | |
Convergys Corp.* | | | 8,829 | | | | 117,867 | |
CoreLogic, Inc.* | | | 5,387 | | | | 87,916 | |
DST Systems, Inc. | | | 6,802 | | | | 368,872 | |
FleetCor Technologies, Inc.* | | | 6,193 | | | | 240,103 | |
Gartner, Inc.*(a) | | | 5,184 | | | | 221,046 | |
Global Payments, Inc. | | | 7,349 | | | | 348,857 | |
Jack Henry & Associates, Inc. | | | 6,284 | | | | 214,410 | |
Lender Processing Services, Inc. | | | 17,559 | | | | 456,534 | |
ManTech International Corp. Class A | | | 6,187 | | | | 213,204 | |
MAXIMUS, Inc. | | | 3,053 | | | | 124,165 | |
NeuStar, Inc. Class A* | | | 5,571 | | | | 207,520 | |
SAIC, Inc.* | | | 60,683 | | | | 801,016 | |
Sapient Corp. | | | 7,987 | | | | 99,438 | |
Syntel, Inc. | | | 3,628 | | | | 203,168 | |
Total System Services, Inc. | | | 15,620 | | | | 360,353 | |
Wright Express Corp.* | | | 3,185 | | | | 206,165 | |
| | | | | | | | |
| Total IT Services | | | | 6,502,755 | |
| Leisure Equipment & Products – 0.3% | | | | | | | | |
Brunswick Corp. | | | 2,120 | | | | 54,590 | |
Polaris Industries, Inc. | | | 5,474 | | | | 394,949 | |
| | | | | | | | |
| Total Leisure Equipment & Products | | | | | | | 449,539 | |
| Life Sciences Tools & Services – 1.0% | | | | | | | | |
Bio-Rad Laboratories, Inc. Class A* | | | 3,069 | | | | 318,225 | |
Bruker Corp.* | | | 9,854 | | | | 150,865 | |
Charles River Laboratories International, Inc.* | | | 2,385 | | | | 86,075 | |
Covance, Inc.* | | | 4,724 | | | | 225,004 | |
Illumina, Inc.* | | | 6,078 | | | | 319,763 | |
PAREXEL International Corp.* | | | 2,973 | | | | 80,182 | |
PerkinElmer, Inc. | | | 10,330 | | | | 285,728 | |
Techne Corp. | | | 2,536 | | | | 177,773 | |
| | | | | | | | |
| Total Life Sciences Tools & Services | | | | | | | 1,643,615 | |
| Machinery – 6.2% | | | | | | | | |
Actuant Corp. Class A | | | 8,837 | | | | 256,185 | |
Barnes Group, Inc. | | | 4,454 | | | | 117,185 | |
Chart Industries, Inc.* | | | 1,189 | | | | 87,189 | |
CLARCOR, Inc. | | | 3,552 | | | | 174,368 | |
Colfax Corp.* | | | 1,452 | | | | 51,168 | |
Crane Co. | | | 6,086 | | | | 295,171 | |
Graco, Inc. | | | 5,228 | | | | 277,398 | |
Harsco Corp. | | | 2,646 | | | | 62,075 | |
IDEX Corp. | | | 7,812 | | | | 329,119 | |
ITT Corp. | | | 47,083 | | | | 1,080,084 | |
Kennametal, Inc. | | | 10,915 | | | | 486,045 | |
Lincoln Electric Holdings, Inc. | | | 8,410 | | | | 381,141 | |
Middleby Corp.* | | | 1,304 | | | | 131,939 | |
Mueller Industries, Inc. | | | 3,269 | | | | 148,576 | |
Nordson Corp. | | | 7,470 | | | | 407,190 | |
| | | | | | | | |
Oshkosh Corp.* | | | 19,841 | | | $ | 459,716 | |
Pentair, Inc. | | | 9,347 | | | | 445,011 | |
Robbins & Myers, Inc. | | | 2,800 | | | | 145,740 | |
Sauer-Danfoss, Inc. | | | 13,597 | | | | 639,059 | |
Snap-On, Inc. | | | 7,620 | | | | 464,591 | |
SPX Corp. | | | 5,371 | | | | 416,414 | |
Timken Co. (The) | | | 17,543 | | | | 890,132 | |
Toro Co. (The) | | | 2,888 | | | | 205,366 | |
Trinity Industries, Inc. | | | 5,282 | | | | 174,042 | |
Valmont Industries, Inc. | | | 2,699 | | | | 316,889 | |
WABCO Holdings, Inc.* | | | 12,828 | | | | 775,837 | |
Wabtec Corp. | | | 3,735 | | | | 281,507 | |
Watts Water Technologies, Inc. Class A | | | 2,548 | | | | 103,831 | |
Woodward, Inc. | | | 4,987 | | | | 213,593 | |
| | | | | | | | |
| Total Machinery | | | | | | | 9,816,561 | |
| Marine – 0.2% | | | | | | | | |
Alexander & Baldwin, Inc. | | | 1,545 | | | | 74,855 | |
Kirby Corp.* | | | 3,762 | | | | 247,502 | |
| | | | | | | | |
| Total Marine | | | | | | | 322,357 | |
| Media – 2.0% | | | | | | | | |
AMC Networks, Inc. Class A* | | | 5,295 | | | | 236,316 | |
Cablevision Systems Corp. Class A | | | 26,555 | | | | 389,827 | |
Cinemark Holdings, Inc. | | | 11,583 | | | | 254,247 | |
Clear Channel Outdoor Holdings, Inc. Class A* | | | 2,660 | | | | 21,227 | |
DreamWorks Animation SKG, Inc. Class A*(a) | | | 12,577 | | | | 232,046 | |
Gannett Co., Inc. | | | 59,243 | | | | 908,195 | |
John Wiley & Sons, Inc. Class A | | | 6,029 | | | | 286,920 | |
Madison Square Garden Co. (The) Class A* | | | 4,160 | | | | 142,272 | |
Meredith Corp.(a) | | | 5,992 | | | | 194,500 | |
Morningstar, Inc. | | | 2,333 | | | | 147,096 | |
Regal Entertainment Group Class A(a) | | | 5,802 | | | | 78,907 | |
Washington Post Co. (The) Class B(a) | | | 712 | | | | 265,982 | |
| | | | | | | | |
| Total Media | | | | | | | 3,157,535 | |
| Metals & Mining – 1.7% | | | | | | | | |
Allied Nevada Gold Corp.* | | | 1,266 | | | | 41,183 | |
Carpenter Technology Corp. | | | 3,526 | | | | 184,163 | |
Coeur d’Alene Mines Corp.* | | | 4,299 | | | | 102,058 | |
Compass Minerals International, Inc. | | | 3,363 | | | | 241,262 | |
Hecla Mining Co.(a) | | | 29,319 | | | | 135,454 | |
Molycorp, Inc.*(a) | | | 4,097 | | | | 138,602 | |
Reliance Steel & Aluminum Co. | | | 10,092 | | | | 569,996 | |
Schnitzer Steel Industries, Inc. Class A | | | 3,691 | | | | 147,252 | |
Steel Dynamics, Inc. | | | 30,347 | | | | 441,245 | |
Stillwater Mining Co.* | | | 18,729 | | | | 236,735 | |
Titanium Metals Corp. | | | 9,854 | | | | 133,620 | |
United States Steel Corp.(a) | | | 2,667 | | | | 78,330 | |
Worthington Industries, Inc. | | | 9,157 | | | | 175,631 | |
| | | | | | | | |
| Total Metals & Mining | | | | | | | 2,625,531 | |
| Multiline Retail – 0.6% | | | | | | | | |
Big Lots, Inc.* | | | 8,658 | | | | 372,467 | |
Dillard’s, Inc. Class A | | | 7,343 | | | | 462,756 | |
Saks, Inc.*(a) | | | 10,325 | | | | 119,873 | |
| | | | | | | | |
| Total Multiline Retail | | | | | | | 955,096 | |
See Notes to Financial Statements.
| | |
| 40 | | WisdomTree Domestic and International Earnings Funds |
Schedule of Investments (continued)
WisdomTree MidCap Earnings Fund (EZM)
March 31, 2012
| | | | | | | | |
| Investments | | Shares | | | Value | |
| | | | | | | | |
| Multi-Utilities – 1.1% | | | | | | | | |
Avista Corp. | | | 6,380 | | | $ | 163,200 | |
Black Hills Corp. | | | 2,770 | | | | 92,878 | |
Integrys Energy Group, Inc. | | | 7,759 | | | | 411,150 | |
MDU Resources Group, Inc. | | | 16,160 | | | | 361,822 | |
NorthWestern Corp. | | | 3,317 | | | | 117,621 | |
TECO Energy, Inc. | | | 21,040 | | | | 369,252 | |
Vectren Corp. | | | 7,444 | | | | 216,323 | |
| | | | | | | | |
| Total Multi-Utilities | | | | | | | 1,732,246 | |
| Office Electronics – 0.1% | | | | | | | | |
Zebra Technologies Corp. Class A* | | | 4,962 | | | | 204,335 | |
| Oil, Gas & Consumable Fuels – 3.2% | | | | | | | | |
Arch Coal, Inc. | | | 13,159 | | | | 140,933 | |
Berry Petroleum Co. Class A | | | 6,601 | | | | 311,105 | |
Bill Barrett Corp.*(a) | | | 2,710 | | | | 70,487 | |
Cloud Peak Energy, Inc.* | | | 11,953 | | | | 190,411 | |
CVR Energy, Inc.* | | | 22,288 | | | | 596,204 | |
Energen Corp. | | | 10,383 | | | | 510,324 | |
EXCO Resources, Inc.(a) | | | 21,400 | | | | 141,882 | |
Forest Oil Corp.* | | | 12,510 | | | | 151,621 | |
Gulfport Energy Corp.* | | | 4,891 | | | | 142,426 | |
Northern Oil and Gas, Inc.* | | | 2,608 | | | | 54,090 | |
Oasis Petroleum, Inc.*(a) | | | 5,042 | | | | 155,445 | |
Rosetta Resources, Inc.* | | | 2,302 | | | | 112,246 | |
SandRidge Energy, Inc.* | | | 50,447 | | | | 395,000 | |
Stone Energy Corp.* | | | 10,498 | | | | 300,138 | |
Swift Energy Co.* | | | 3,772 | | | | 109,501 | |
Targa Resources Corp. | | | 487 | | | | 22,134 | |
Tesoro Corp.* | | | 42,347 | | | | 1,136,594 | |
W&T Offshore, Inc.(a) | | | 10,863 | | | | 228,992 | |
World Fuel Services Corp. | | | 6,460 | | | | 264,860 | |
| | | | | | | | |
| Total Oil, Gas & Consumable Fuels | | | | | | | 5,034,393 | |
| Paper & Forest Products – 0.1% | | | | | | | | |
Buckeye Technologies, Inc. | | | 4,673 | | | | 158,742 | |
| Personal Products – 0.2% | | | | | | | | |
Nu Skin Enterprises, Inc. Class A(a) | | | 5,053 | | | | 292,619 | |
| Pharmaceuticals – 0.9% | | | | | | | | |
Endo Pharmaceuticals Holdings, Inc.* | | | 8,819 | | | | 341,560 | |
Impax Laboratories, Inc.* | | | 4,923 | �� | | | 121,007 | |
Jazz Pharmaceuticals PLC* | | | 4,677 | | | | 226,694 | |
Medicis Pharmaceutical Corp. Class A | | | 4,886 | | | | 183,665 | |
Par Pharmaceutical Cos., Inc.* | | | 3,825 | | | | 148,142 | |
Questcor Pharmaceuticals, Inc.*(a) | | | 1,803 | | | | 67,829 | |
Salix Pharmaceuticals Ltd.* | | | 2,526 | | | | 132,615 | |
Viropharma, Inc.* | | | 6,555 | | | | 197,109 | |
| | | | | | | | |
| Total Pharmaceuticals | | | | | | | 1,418,621 | |
| Professional Services – 0.8% | | | | | | | | |
Acacia Research Corp.* | | | 870 | | | | 36,314 | |
Corporate Executive Board Co. (The) | | | 1,835 | | | | 78,923 | |
CoStar Group, Inc.* | | | 248 | | | | 17,125 | |
Dun & Bradstreet Corp. (The) | | | 5,440 | | | | 460,931 | |
FTI Consulting, Inc.* | | | 2,668 | | | | 100,103 | |
| | | | | | | | |
Manpower, Inc. | | | 9,389 | | | $ | 444,757 | |
Robert Half International, Inc. | | | 7,167 | | | | 217,160 | |
| | | | | | | | |
| Total Professional Services | | | | | | | 1,355,313 | |
| Real Estate Investment Trusts (REITs) – 1.6% | | | | | | | | |
Alexander’s, Inc. | | | 308 | | | | 121,315 | |
Alexandria Real Estate Equities, Inc. | | | 3,599 | | | | 263,195 | |
American Campus Communities, Inc. | | | 1,335 | | | | 59,701 | |
BioMed Realty Trust, Inc. | | | 1,682 | | | | 31,924 | |
BRE Properties, Inc. | | | 532 | | | | 26,893 | |
Camden Property Trust | | | 208 | | | | 13,676 | |
CBL & Associates Properties, Inc. | | | 1,260 | | | | 23,839 | |
DuPont Fabros Technology, Inc. | | | 2,600 | | | | 63,570 | |
Entertainment Properties Trust | | | 2,303 | | | | 106,813 | |
Equity Lifestyle Properties, Inc. | | | 765 | | | | 53,351 | |
Equity One, Inc. | | | 1,341 | | | | 27,115 | |
Essex Property Trust, Inc. | | | 300 | | | | 45,453 | |
Extra Space Storage, Inc. | | | 2,604 | | | | 74,969 | |
Highwoods Properties, Inc. | | | 1,546 | | | | 51,513 | |
Home Properties, Inc. | | | 788 | | | | 48,076 | |
Hospitality Properties Trust | | | 2,193 | | | | 58,049 | |
Liberty Property Trust | | | 6,009 | | | | 214,641 | |
Mack-Cali Realty Corp. | | | 3,411 | | | | 98,305 | |
Mid-America Apartment Communities, Inc. | | | 794 | | | | 53,222 | |
National Retail Properties, Inc. | | | 4,017 | | | | 109,222 | |
Omega Healthcare Investors, Inc. | | | 2,475 | | | | 52,619 | |
Piedmont Office Realty Trust, Inc. Class A | | | 8,884 | | | | 157,691 | |
Post Properties, Inc. | | | 619 | | | | 29,006 | |
Potlatch Corp.(a) | | | 2,162 | | | | 67,757 | |
PS Business Parks, Inc. | | | 1,346 | | | | 88,217 | |
Realty Income Corp. | | | 5,104 | | | | 197,678 | |
Senior Housing Properties Trust | | | 9,820 | | | | 216,531 | |
Tanger Factory Outlet Centers | | | 2,086 | | | | 62,017 | |
Taubman Centers, Inc. | | | 1,408 | | | | 102,714 | |
Washington Real Estate Investment Trust | | | 660 | | | | 19,602 | |
| | | | | | | | |
| Total Real Estate Investment Trusts (REITs) | | | | | | | 2,538,674 | |
| Real Estate Management & Development – 0.4% | | | | | | | | |
Howard Hughes Corp. (The)*(a) | | | 3,590 | | | | 229,293 | |
Jones Lang LaSalle, Inc. | | | 4,100 | | | | 341,571 | |
St Joe Co. (The)*(a) | | | 983 | | | | 18,687 | |
| | | | | | | | |
| Total Real Estate Management & Development | | | | | | | 589,551 | |
| Road & Rail – 1.1% | | | | | | | | |
AMERCO | | | 3,207 | | | | 338,371 | |
Avis Budget Group, Inc.* | | | 2,875 | | | | 40,681 | |
Con-way, Inc. | | | 3,933 | | | | 128,255 | |
Dollar Thrifty Automotive Group, Inc.* | | | 2,352 | | | | 190,300 | |
Genesee & Wyoming, Inc. Class A* | | | 2,399 | | | | 130,938 | |
Heartland Express, Inc. | | | 5,395 | | | | 78,012 | |
Knight Transportation, Inc. | | | 5,287 | | | | 93,369 | |
Landstar System, Inc. | | | 3,270 | | | | 188,744 | |
Old Dominion Freight Line, Inc.* | | | 4,510 | | | | 214,992 | |
Ryder System, Inc. | | | 4,053 | | | | 213,998 | |
Swift Transportation Co.* | | | 917 | | | | 10,582 | |
Werner Enterprises, Inc. | | | 5,355 | | | | 133,125 | |
| | | | | | | | |
| Total Road & Rail | | | | | | | 1,761,367 | |
See Notes to Financial Statements.
| | | | |
| WisdomTree Domestic and International Earnings Funds | | | 41 | |
Schedule of Investments (continued)
WisdomTree MidCap Earnings Fund (EZM)
March 31, 2012
| | | | | | | | |
| Investments | | Shares | | | Value | |
| | | | | | | | |
| Semiconductors & Semiconductor Equipment – 4.1% | | | | | |
Advanced Micro Devices, Inc.* | | | 90,413 | | | $ | 725,112 | |
Atmel Corp.* | | | 86,804 | | | | 855,887 | |
Cavium, Inc.* | | | 2,240 | | | | 69,306 | |
Cree, Inc.*(a) | | | 6,741 | | | | 213,218 | |
Cymer, Inc.* | | | 3,120 | | | | 156,000 | |
Cypress Semiconductor Corp.* | | | 13,403 | | | | 209,489 | |
Fairchild Semiconductor International, Inc.* | | | 21,999 | | | | 323,385 | |
First Solar, Inc.*(a) | | | 22,862 | | | | 572,693 | |
Hittite Microwave Corp.* | | | 2,460 | | | | 133,603 | |
International Rectifier Corp.* | | | 11,276 | | | | 260,137 | |
Intersil Corp. Class A | | | 9,705 | | | | 108,696 | |
LSI Corp.* | | | 13,796 | | | | 119,749 | |
Microsemi Corp.* | | | 4,681 | | | | 100,361 | |
MKS Instruments, Inc. | | | 7,937 | | | | 234,380 | |
Novellus Systems, Inc.* | | | 12,156 | | | | 606,706 | |
ON Semiconductor Corp.* | | | 18,876 | | | | 170,073 | |
PMC – Sierra, Inc.* | | | 12,198 | | | | 88,191 | |
RF Micro Devices, Inc.* | | | 23,321 | | | | 116,139 | |
Semtech Corp.* | | | 6,486 | | | | 184,591 | |
Silicon Laboratories, Inc.* | | | 1,338 | | | | 57,534 | |
Skyworks Solutions, Inc.* | | | 23,557 | | | | 651,351 | |
Teradyne, Inc.* | | | 30,674 | | | | 518,084 | |
| | | | | | | | |
| Total Semiconductors & Semiconductor Equipment | | | | 6,474,685 | |
| Software – 1.8% | | | | | | | | |
Advent Software, Inc.* | | | 1,813 | | | | 46,413 | |
Aspen Technology, Inc.* | | | 1,136 | | | | 23,322 | |
Blackbaud, Inc. | | | 1,779 | | | | 59,116 | |
Cadence Design Systems, Inc.* | | | 3,600 | | | | 42,624 | |
CommVault Systems, Inc.* | | | 877 | | | | 43,534 | |
Compuware Corp.* | | | 19,466 | | | | 178,893 | |
Factset Research Systems, Inc.(a) | | | 2,837 | | | | 280,976 | |
Fair Isaac Corp. | | | 2,803 | | | | 123,052 | |
Fortinet, Inc.* | | | 4,142 | | | | 114,526 | |
JDA Software Group, Inc.* | | | 2,719 | | | | 74,718 | |
Mentor Graphics Corp.* | | | 8,791 | | | | 130,634 | |
MICROS Systems, Inc.* | | | 4,938 | | | | 273,022 | |
MicroStrategy, Inc. Class A* | | | 252 | | | | 35,280 | |
Parametric Technology Corp.* | | | 6,725 | | | | 187,896 | |
Progress Software Corp.* | | | 4,736 | | | | 111,864 | |
QLIK Technologies, Inc.* | | | 317 | | | | 10,144 | |
Quest Software, Inc.* | | | 5,422 | | | | 126,170 | |
Rovi Corp.* | | | 4,638 | | | | 150,967 | |
SolarWinds, Inc.* | | | 3,030 | | | | 117,110 | |
Solera Holdings, Inc. | | | 5,236 | | | | 240,280 | |
SS&C Technologies Holdings, Inc.* | | | 4,044 | | | | 94,347 | |
Synopsys, Inc.* | | | 11,215 | | | | 343,852 | |
Ultimate Software Group, Inc.* | | | 86 | | | | 6,302 | |
| | | | | | | | |
| Total Software | | | | | | | 2,815,042 | |
| Specialty Retail – 4.6% | | | | | | | | |
Aaron’s, Inc. | | | 7,741 | | | | 200,492 | |
Abercrombie & Fitch Co. Class A | | | 6,276 | | | | 311,352 | |
Aeropostale, Inc.* | | | 9,708 | | | | 209,887 | |
| | | | | | | | |
American Eagle Outfitters, Inc. | | | 14,849 | | | $ | 255,254 | |
ANN, Inc.* | | | 5,474 | | | | 156,775 | |
Ascena Retail Group, Inc.* | | | 9,083 | | | | 402,559 | |
Buckle, Inc. (The) | | | 5,463 | | | | 261,678 | |
Cabela’s, Inc.* | | | 8,579 | | | | 327,289 | |
Chico’s FAS, Inc. | | | 18,621 | | | | 281,177 | |
Children’s Place Retail Stores, Inc. (The)* | | | 2,245 | | | | 115,999 | |
DSW, Inc. Class A | | | 4,312 | | | | 236,168 | |
Express, Inc.* | | | 8,755 | | | | 218,700 | |
Foot Locker, Inc. | | | 15,909 | | | | 493,974 | |
GameStop Corp. Class A(a) | | | 24,738 | | | | 540,278 | |
Genesco, Inc.* | | | 1,916 | | | | 137,281 | |
GNC Holdings, Inc. Class A | | | 6,096 | | | | 212,689 | |
Guess?, Inc. | | | 15,233 | | | | 476,031 | |
Hibbett Sports, Inc.*(a) | | | 1,805 | | | | 98,463 | |
JOS A Bank Clothiers, Inc.* | | | 2,717 | | | | 136,964 | |
Men’s Wearhouse, Inc. (The) | | | 4,307 | | | | 166,982 | |
Monro Muffler Brake, Inc. | | | 1,780 | | | | 73,852 | |
Penske Automotive Group, Inc. | | | 11,869 | | | | 292,334 | |
Pier 1 Imports, Inc.* | | | 12,046 | | | | 218,996 | |
Rent-A-Center, Inc. | | | 6,326 | | | | 238,807 | |
Sally Beauty Holdings, Inc.* | | | 15,781 | | | | 391,369 | |
Ulta Salon Cosmetics & Fragrance, Inc. | | | 1,983 | | | | 184,201 | |
Urban Outfitters, Inc.* | | | 11,842 | | | | 344,721 | |
Williams-Sonoma, Inc. | �� | | 8,747 | | | | 327,838 | |
| | | | | | | | |
| Total Specialty Retail | | | | | | | 7,312,110 | |
| Textiles, Apparel & Luxury Goods – 1.4% | | | | | | | | |
Carter’s, Inc.* | | | 4,304 | | | | 214,210 | |
Columbia Sportswear Co.(a) | | | 2,771 | | | | 131,484 | |
Crocs, Inc.* | | | 11,362 | | | | 237,693 | |
Deckers Outdoor Corp.*(a) | | | 2,463 | | | | 155,292 | |
Hanesbrands, Inc.* | | | 16,442 | | | | 485,697 | |
Iconix Brand Group, Inc.* | | | 10,408 | | | | 180,891 | |
Steven Madden Ltd.* | | | 3,993 | | | | 170,701 | |
Under Armour, Inc. Class A*(a) | | | 1,693 | | | | 159,142 | |
Vera Bradley, Inc.*(a) | | | 1,870 | | | | 56,455 | |
Warnaco Group, Inc. (The)* | | | 4,925 | | | | 287,620 | |
Wolverine World Wide, Inc. | | | 5,426 | | | | 201,739 | |
| | | | | | | | |
| Total Textiles, Apparel & Luxury Goods | | | | | | | 2,280,924 | |
| Thrifts & Mortgage Finance – 0.4% | | | | | | | | |
BankUnited, Inc. | | | 3,164 | | | | 79,100 | |
Capitol Federal Financial, Inc. | | | 5,101 | | | | 60,498 | |
Northwest Bancshares, Inc. | | | 7,599 | | | | 96,507 | |
Ocwen Financial Corp.* | | | 8,721 | | | | 136,309 | |
TFS Financial Corp.* | | | 1,555 | | | | 14,773 | |
Washington Federal, Inc. | | | 14,344 | | | | 241,266 | |
| | | | | | | | |
| Total Thrifts & Mortgage Finance | | | | | | | 628,453 | |
| Tobacco – 0.0% | | | | | | | | |
Vector Group Ltd.(a) | | | 3,572 | | | | 63,296 | |
| Trading Companies & Distributors – 0.6% | | | | | | | | |
Air Lease Corp.*(a) | | | 1,660 | | | | 39,956 | |
Applied Industrial Technologies, Inc. | | | 4,460 | | | | 183,440 | |
See Notes to Financial Statements.
| | |
| 42 | | WisdomTree Domestic and International Earnings Funds |
Schedule of Investments (concluded)
WisdomTree MidCap Earnings Fund (EZM)
March 31, 2012
| | | | | | | | |
| Investments | | Shares | | | Value | |
GATX Corp. | | | 3,331 | | | $ | 134,239 | |
United Rentals, Inc.*(a) | | | 3,241 | | | | 139,007 | |
Watsco, Inc. | | | 1,870 | | | | 138,455 | |
WESCO International, Inc.* | | | 5,271 | | | | 344,249 | |
| | | | | | | | |
| Total Trading Companies & Distributors | | | | | | | 979,346 | |
| Water Utilities – 0.1% | | | | | | | | |
Aqua America, Inc. | | | 9,615 | | | | 214,318 | |
| Wireless Telecommunication Services – 0.8% | | | | | | | | |
MetroPCS Communications, Inc.* | | | 39,601 | | | | 357,201 | |
NII Holdings, Inc.* | | | 22,494 | | | | 411,865 | |
Telephone & Data Systems, Inc. | | | 12,800 | | | | 296,320 | |
United States Cellular Corp.* | | | 6,029 | | | | 246,767 | |
| | | | | | | | |
| Total Wireless Telecommunication Services | | | | | | | 1,312,153 | |
TOTAL COMMON STOCKS
(Cost: $137,564,301) | | | | | | | 158,070,300 | |
| EXCHANGE-TRADED FUND – 0.2% | | | | | | | | |
WisdomTree MidCap Dividend Fund(b)
(Cost: $309,304) | | | 6,729 | | | | 378,776 | |
INVESTMENT OF CASH COLLATERAL FOR
SECURITIES LOANED – 6.8% | | | | | | | | |
| MONEY MARKET FUND – 6.8% | | | | | | | | |
Dreyfus Institutional Preferred Money Market Fund, 0.18%(c) | | | | | | | | |
| (Cost: $10,699,894)(d) | | | 10,699,894 | | | | 10,699,894 | |
TOTAL INVESTMENTS IN SECURITIES – 106.7%
(Cost: $148,573,499) | | | | 169,148,970 | |
Liabilities in Excess of Other Assets – (6.7)% | | | | | | | (10,553,234 | ) |
| | | | | | | | |
| NET ASSETS – 100.0% | | | | | | $ | 158,595,736 | |
| * | Non-income producing security. |
| (a) | Security, or portion thereof, was on loan at March 31, 2012 (See Note 2). |
| (b) | Affiliated company (See Note 7). |
| (c) | Rate shown represents annualized 7-day yield as of March 31, 2012. |
| (d) | At March 31, 2012, the total market value of the Fund’s securities on loan was $10,419,942 and the total market value of the collateral held by the Fund was $10,699,894. |
See Notes to Financial Statements.
| | | | |
| WisdomTree Domestic and International Earnings Funds | | | 43 | |
Schedule of Investments
WisdomTree SmallCap Earnings Fund (EES)
March 31, 2012
| | | | | | | | |
| Investments | | Shares | | | Value | |
| | | | | | | | |
| UNITED STATES – 108.8% | | | | | | | | |
| COMMON STOCKS – 99.8% | | | | | | | | |
| Aerospace & Defense – 1.4% | | | | | | | | |
AAR Corp. | | | 16,022 | | | $ | 292,401 | |
Aerovironment, Inc.* | | | 3,709 | | | | 99,438 | |
American Science & Engineering, Inc. | | | 1,926 | | | | 129,138 | |
Astronics Corp.* | | | 2,267 | | | | 79,254 | |
Ceradyne, Inc. | | | 11,212 | | | | 365,063 | |
Cubic Corp. | | | 7,900 | | | | 373,512 | |
DigitalGlobe, Inc.* | | | 311 | | | | 4,149 | |
Ducommun, Inc.* | | | 1,724 | | | | 20,516 | |
GenCorp, Inc.*(a) | | | 2,118 | | | | 15,038 | |
GeoEye, Inc.* | | | 8,597 | | | | 206,930 | |
KEYW Holding Corp. (The)*(a) | | | 715 | | | | 5,541 | |
LMI Aerospace, Inc.* | | | 3,128 | | | | 56,930 | |
National Presto Industries, Inc.(a) | | | 2,387 | | | | 181,078 | |
Orbital Sciences Corp.* | | | 16,962 | | | | 223,050 | |
| | | | | | | | |
| Total Aerospace & Defense | | | | | | | 2,052,038 | |
| Air Freight & Logistics – 0.8% | | | | | | | | |
Air Transport Services Group, Inc.* | | | 18,711 | | | | 108,337 | |
Atlas Air Worldwide Holdings, Inc.* | | | 11,185 | | | | 550,414 | |
Forward Air Corp. | | | 5,435 | | | | 199,301 | |
HUB Group, Inc. Class A* | | | 6,831 | | | | 246,121 | |
Pacer International, Inc.* | | | 7,436 | | | | 46,995 | |
Park-Ohio Holdings Corp.* | | | 2,373 | | | | 47,579 | |
| | | | | | | | |
| Total Air Freight & Logistics | | | | | | | 1,198,747 | |
| Airlines – 0.9% | | | | | | | | |
Allegiant Travel Co.* | | | 3,842 | | | | 209,389 | |
Hawaiian Holdings, Inc.* | | | 32,159 | | | | 168,192 | |
JetBlue Airways Corp.* | | | 53,244 | | | | 260,363 | |
SkyWest, Inc. | | | 5,668 | | | | 62,631 | |
Spirit Airlines, Inc.* | | | 15,546 | | | | 312,008 | |
US Airways Group, Inc.*(a) | | | 39,259 | | | | 297,976 | |
| | | | | | | | |
| Total Airlines | | | | | | | 1,310,559 | |
| Auto Components – 1.5% | | | | | | | | |
American Axle & Manufacturing Holdings, Inc.* | | | 67,161 | | | | 786,455 | |
Cooper Tire & Rubber Co. | | | 28,706 | | | | 436,905 | |
Dorman Products, Inc.* | | | 5,061 | | | | 256,087 | |
Drew Industries, Inc.* | | | 5,087 | | | | 138,926 | |
Exide Technologies* | | | 30,308 | | | | 94,864 | |
Fuel Systems Solutions, Inc.*(a) | | | 1,131 | | | | 29,587 | |
Modine Manufacturing Co.* | | | 11,101 | | | | 98,022 | |
Spartan Motors, Inc. | | | 2,916 | | | | 15,426 | |
Standard Motor Products, Inc. | | | 6,307 | | | | 111,886 | |
Stoneridge, Inc.* | | | 6,213 | | | | 61,446 | |
Superior Industries International, Inc. | | | 11,979 | | | | 234,070 | |
| | | | | | | | |
| Total Auto Components | | | | | | | 2,263,674 | |
| Automobiles – 0.0% | | | | | | | | |
Winnebago Industries, Inc.*(a) | | | 1,868 | | | | 18,306 | |
| Beverages – 0.2% | | | | | | | | |
Coca-Cola Bottling Co. Consolidated | | | 2,438 | | | | 152,960 | |
National Beverage Corp.* | | | 10,170 | | | | 163,127 | |
| | | | | | | | |
| Total Beverages | | | | | | | 316,087 | |
| | | | | | | | |
| Biotechnology – 1.8% | | | | | | | | |
Acorda Therapeutics, Inc.* | | | 3,702 | | | $ | 98,288 | |
Astex Pharmaceuticals* | | | 27,743 | | | | 51,602 | |
Aveo Pharmaceuticals, Inc.* | | | 11,239 | | | | 139,476 | |
Emergent Biosolutions, Inc.* | | | 4,887 | | | | 78,192 | |
Exelixis, Inc.* | | | 8,079 | | | | 41,849 | |
Genomic Health, Inc.*(a) | | | 1,030 | | | | 31,528 | |
Ligand Pharmaceuticals, Inc. Class B* | | | 1,161 | | | | 18,518 | |
Maxygen, Inc.* | | | 11,683 | | | | 67,060 | |
Momenta Pharmaceuticals, Inc.* | | | 53,018 | | | | 812,236 | |
Neurocrine Biosciences, Inc.* | | | 16,184 | | | | 128,987 | |
Osiris Therapeutics, Inc.*(a) | | | 10,788 | | | | 55,235 | |
PDL BioPharma, Inc.(a) | | | 121,547 | | | | 771,823 | |
Progenics Pharmaceuticals, Inc.* | | | 1,148 | | | | 11,365 | |
Sciclone Pharmaceuticals, Inc.* | | | 16,808 | | | | 106,059 | |
SIGA Technologies, Inc.*(a) | | | 9,372 | | | | 31,490 | |
Spectrum Pharmaceuticals, Inc.*(a) | | | 12,752 | | | | 161,058 | |
| | | | | | | | |
| Total Biotechnology | | | | | | | 2,604,766 | |
| Building Products – 0.3% | | | | | | | | |
AAON, Inc.(a) | | | 3,602 | | | | 72,724 | |
Ameresco, Inc. Class A* | | | 11,431 | | | | 154,890 | |
Gibraltar Industries, Inc.* | | | 686 | | | | 10,393 | |
Quanex Building Products Corp. | | | 3,463 | | | | 61,053 | |
Trex Co., Inc.*(a) | | | 1,050 | | | | 33,684 | |
Universal Forest Products, Inc. | | | 949 | | | | 32,722 | |
| | | | | | | | |
| Total Building Products | | | | | | | 365,466 | |
| Capital Markets – 3.0% | | | | | | | | |
Arlington Asset Investment Corp. Class A | | | 2,923 | | | | 64,891 | |
Artio Global Investors, Inc.(a) | | | 56,894 | | | | 271,384 | |
BGC Partners, Inc. Class A | | | 18,163 | | | | 134,225 | |
BlackRock Kelso Capital Corp. | | | 32,637 | | | | 320,495 | |
Calamos Asset Management, Inc. Class A | | | 6,534 | | | | 85,661 | |
Diamond Hill Investment Group, Inc. | | | 770 | | | | 56,710 | |
Duff & Phelps Corp. Class A | | | 4,520 | | | | 70,241 | |
Edelman Financial Group, Inc. | | | 4,838 | | | | 31,979 | |
Epoch Holding Corp. | | | 4,025 | | | | 96,117 | |
Evercore Partners, Inc. Class A | | | 1,532 | | | | 44,535 | |
Fidus Investment Corp. | | | 667 | | | | 9,345 | |
Fifth Street Finance Corp. | | | 24,461 | | | | 238,739 | |
Financial Engines, Inc.*(a) | | | 3,246 | | | | 72,581 | |
FXCM, Inc. Class A | | | 3,623 | | | | 47,063 | |
GFI Group, Inc. | | | 21,409 | | | | 80,498 | |
Gladstone Investment Corp. | | | 19,012 | | | | 143,921 | |
Golub Capital BDC, Inc. | | | 6,034 | | | | 92,139 | |
Greenhill & Co., Inc. | | | 3,203 | | | | 139,779 | |
Hercules Technology Growth Capital, Inc. | | | 16,909 | | | | 187,352 | |
HFF, Inc. Class A* | | | 10,986 | | | | 180,939 | |
Horizon Technology Finance Corp. | | | 2,593 | | | | 43,070 | |
INTL FCStone, Inc.* | | | 4,095 | | | | 86,405 | |
JMP Group, Inc. | | | 3,834 | | | | 28,295 | |
Main Street Capital Corp.(a) | | | 10,032 | | | | 247,088 | |
Medallion Financial Corp. | | | 5,903 | | | | 65,877 | |
Medley Capital Corp. | | | 2,188 | | | | 24,659 | |
See Notes to Financial Statements.
| | |
| 44 | | WisdomTree Domestic and International Earnings Funds |
Schedule of Investments (continued)
WisdomTree SmallCap Earnings Fund (EES)
March 31, 2012
| | | | | | | | |
| Investments | | Shares | | | Value | |
| | | | | | | | |
MVC Capital, Inc. | | | 1,995 | | | $ | 26,194 | |
New Mountain Finance Corp. | | | 9,110 | | | | 125,171 | |
Oppenheimer Holdings, Inc. Class A | | | 5,525 | | | | 95,859 | |
PennantPark Investment Corp. | | | 4,326 | | | | 44,990 | |
Piper Jaffray Cos.* | | | 3,524 | | | | 93,809 | |
Prospect Capital Corp. | | | 43,113 | | | | 473,381 | |
Solar Capital Ltd. | | | 9,324 | | | | 205,781 | |
THL Credit, Inc. | | | 6,897 | | | | 88,695 | |
TICC Capital Corp. | | | 14,536 | | | | 141,581 | |
Triangle Capital Corp.(a) | | | 10,698 | | | | 211,285 | |
US Global Investors, Inc. Class A | | | 4,352 | | | | 31,552 | |
Virtus Investment Partners, Inc.* | | | 246 | | | | 21,102 | |
Westwood Holdings Group, Inc. | | | 1,441 | | | | 55,810 | |
| | | | | | | | |
| Total Capital Markets | | | | | | | 4,479,198 | |
| Chemicals – 4.8% | | | | | | | | |
A. Schulman, Inc. | | | 7,753 | | | | 209,486 | |
American Vanguard Corp. | | | 5,635 | | | | 122,223 | |
Calgon Carbon Corp.* | | | 13,126 | | | | 204,897 | |
Ferro Corp.* | | | 64,975 | | | | 385,952 | |
FutureFuel Corp. | | | 10,105 | | | | 110,953 | |
Georgia Gulf Corp.* | | | 15,993 | | | | 557,836 | |
H.B. Fuller Co. | | | 14,278 | | | | 468,747 | |
Hawkins, Inc. | | | 2,107 | | | | 78,380 | |
Innophos Holdings, Inc. | | | 6,851 | | | | 343,372 | |
Innospec, Inc.* | | | 12,790 | | | | 388,560 | |
KMG Chemicals, Inc. | | | 2,420 | | | | 43,681 | |
Koppers Holdings, Inc. | | | 6,844 | | | | 263,905 | |
Kraton Performance Polymers, Inc.* | | | 25,291 | | | | 671,982 | |
Landec Corp.* | | | 5,533 | | | | 36,131 | |
LSB Industries, Inc.* | | | 9,569 | | | | 372,425 | |
Minerals Technologies, Inc. | | | 4,836 | | | | 316,323 | |
OM Group, Inc.* | | | 542 | | | | 14,910 | |
Omnova Solutions, Inc.* | | | 77,431 | | | | 522,659 | |
PolyOne Corp. | | | 59,312 | | | | 854,093 | |
Quaker Chemical Corp. | | | 4,499 | | | | 177,486 | |
Stepan Co. | | | 3,468 | | | | 304,490 | |
TPC Group, Inc.* | | | 11,411 | | | | 504,480 | |
Tredegar Corp. | | | 5,433 | | | | 106,432 | |
Zep, Inc. | | | 4,272 | | | | 61,517 | |
| | | | | | | | |
| Total Chemicals | | | | | | | 7,120,920 | |
| Commercial Banks – 8.1% | | | | | | | | |
1st Source Corp. | | | 6,947 | | | | 169,993 | |
1st United Bancorp, Inc.* | | | 3,397 | | | | 20,552 | |
Alliance Financial Corp. | | | 1,628 | | | | 49,345 | |
Arrow Financial Corp.(a) | | | 3,642 | | | | 88,865 | |
BancFirst Corp. | | | 4,666 | | | | 203,251 | |
Bancorp, Inc. (The)* | | | 3,735 | | | | 37,499 | |
BancorpSouth, Inc.(a) | | | 14,924 | | | | 201,026 | |
Bank of Marin Bancorp | | | 1,707 | | | | 64,883 | |
Bank of the Ozarks, Inc.(a) | | | 13,588 | | | | 424,761 | |
BBCN Bancorp, Inc.* | | | 10,419 | | | | 115,963 | |
Boston Private Financial Holdings, Inc. | | | 3,636 | | | | 36,033 | |
Bridge Bancorp, Inc. | | | 1,799 | | | | 37,725 | |
| | | | | | | | |
Bryn Mawr Bank Corp. | | | 4,039 | | | $ | 90,635 | |
Camden National Corp. | | | 3,330 | | | | 117,049 | |
Capital City Bank Group, Inc. | | | 2,778 | | | | 20,696 | |
Cardinal Financial Corp. | | | 9,072 | | | | 102,514 | |
Cathay General Bancorp | | | 21,322 | | | | 377,399 | |
Chemical Financial Corp. | | | 7,283 | | | | 170,714 | |
Citizens & Northern Corp. | | | 4,711 | | | | 94,220 | |
City Holding Co.(a) | | | 4,905 | | | | 170,302 | |
CNB Financial Corp. | | | 3,052 | | | | 50,999 | |
Columbia Banking System, Inc. | | | 9,667 | | | | 220,214 | |
Community Bank System, Inc. | | | 10,182 | | | | 293,038 | |
Community Trust Bancorp, Inc. | | | 5,177 | | | | 166,026 | |
CVB Financial Corp. | | | 28,660 | | | | 336,468 | |
Eagle Bancorp, Inc.*(a) | | | 5,494 | | | | 91,970 | |
Enterprise Financial Services Corp. | | | 7,702 | | | | 90,421 | |
Financial Institutions, Inc. | | | 4,528 | | | | 73,218 | |
First Bancorp | | | 1,572 | | | | 17,182 | |
First Bancorp, Inc. | | | 2,878 | | | | 42,681 | |
First Busey Corp. | | | 19,103 | | | | 94,369 | |
First Commonwealth Financial Corp. | | | 26,217 | | | | 160,448 | |
First Community Bancshares, Inc. | | | 6,646 | | | | 88,791 | |
First Financial Bancorp | | | 15,238 | | | | 263,617 | |
First Financial Bankshares, Inc.(a) | | | 8,316 | | | | 292,806 | |
First Financial Corp. | | | 4,063 | | | | 129,000 | |
First Interstate Bancsystem, Inc. | | | 12,434 | | | | 181,785 | |
First Merchants Corp. | | | 2,344 | | | | 28,925 | |
First of Long Island Corp. (The) | | | 2,719 | | | | 72,054 | |
German American Bancorp, Inc.(a) | | | 3,690 | | | | 71,697 | |
Glacier Bancorp, Inc. | | | 15,314 | | | | 228,791 | |
Great Southern Bancorp, Inc. | | | 3,508 | | | | 84,192 | |
Hanmi Financial Corp.* | | | 16,069 | | | | 162,618 | |
Heartland Financial USA, Inc. | | | 4,850 | | | | 84,099 | |
Heritage Commerce Corp.* | | | 5,984 | | | | 38,477 | |
Heritage Financial Corp. | | | 1,733 | | | | 23,569 | |
Home Bancshares, Inc. | | | 4,051 | | | | 107,797 | |
Hudson Valley Holding Corp. | | | 5,448 | | | | 87,876 | |
Independent Bank Corp. | | | 6,822 | | | | 195,996 | |
Lakeland Bancorp, Inc. | | | 7,441 | | | | 73,294 | |
Lakeland Financial Corp. | | | 4,339 | | | | 112,944 | |
MainSource Financial Group, Inc. | | | 8,842 | | | | 106,546 | |
MB Financial, Inc. | | | 2,904 | | | | 60,955 | |
Merchants Bancshares, Inc. | | | 1,955 | | | | 55,092 | |
National Bankshares, Inc.(a) | | | 2,379 | | | | 71,608 | |
NBT Bancorp, Inc. | | | 10,661 | | | | 235,395 | |
Old National Bancorp | | | 19,732 | | | | 259,278 | |
OmniAmerican Bancorp, Inc.* | | | 691 | | | | 13,378 | |
Oriental Financial Group, Inc. | | | 16,096 | | | | 194,762 | |
Pacific Capital Bancorp NA*(a) | | | 11,760 | | | | 536,374 | |
Pacific Continental Corp. | | | 3,324 | | | | 31,312 | |
PacWest Bancorp | | | 5,762 | | | | 140,017 | |
Park National Corp.(a) | | | 4,266 | | | | 295,079 | |
Pinnacle Financial Partners, Inc.* | | | 9,019 | | | | 165,499 | |
PrivateBancorp, Inc. | | | 13,302 | | | | 201,791 | |
Renasant Corp. | | | 4,824 | | | | 78,535 | |
See Notes to Financial Statements.
| | | | |
| WisdomTree Domestic and International Earnings Funds | | | 45 | |
Schedule of Investments (continued)
WisdomTree SmallCap Earnings Fund (EES)
March 31, 2012
| | | | | | | | |
| Investments | | Shares | | | Value | |
| | | | | | | | |
Republic Bancorp, Inc. Class A | | | 15,288 | | | $ | 365,689 | |
S&T Bancorp, Inc.(a) | | | 7,930 | | | | 172,002 | |
S.Y. Bancorp, Inc.(a) | | | 4,270 | | | | 99,064 | |
Sandy Spring Bancorp, Inc. | | | 7,308 | | | | 132,786 | |
SCBT Financial Corp. | | | 1,082 | | | | 35,392 | |
Simmons First National Corp. Class A | | | 3,538 | | | | 91,387 | |
Southside Bancshares, Inc. | | | 6,850 | | | | 151,385 | |
State Bank Financial Corp.* | | | 11,362 | | | | 198,949 | |
StellarOne Corp. | | | 4,361 | | | | 51,765 | |
Sterling Bancorp | | | 7,299 | | | | 69,997 | |
Texas Capital Bancshares, Inc.*(a) | | | 8,599 | | | | 297,697 | |
Tompkins Financial Corp.(a) | | | 3,496 | | | | 140,050 | |
TowneBank | | | 6,544 | | | | 88,279 | |
Trico Bancshares | | | 3,902 | | | | 67,973 | |
Union First Market Bankshares Corp. | | | 7,274 | | | | 101,836 | |
Univest Corp. of Pennsylvania | | | 4,883 | | | | 81,937 | |
Virginia Commerce Bancorp, Inc.* | | | 11,698 | | | | 102,708 | |
Washington Banking Co. | | | 5,090 | | | | 70,293 | |
Washington Trust Bancorp, Inc. | | | 4,790 | | | | 115,631 | |
WesBanco, Inc. | | | 9,166 | | | | 184,603 | |
West Bancorp., Inc. | | | 4,854 | | | | 48,491 | |
West Coast Bancorp* | | | 3,846 | | | | 72,766 | |
Wintrust Financial Corp. | | | 4,231 | | | | 151,427 | |
| | | | | | | | |
| Total Commercial Banks | | | | | | | 11,896,515 | |
| Commercial Services & Supplies – 3.4% | | | | | | | | |
ABM Industries, Inc. | | | 13,195 | | | | 320,638 | |
ACCO Brands Corp.* | | | 5,463 | | | | 67,796 | |
At Cross Co. Class A* | | | 2,765 | | | | 33,291 | |
Brink’s Co. (The) | | | 14,742 | | | | 351,892 | |
Consolidated Graphics, Inc.* | | | 2,783 | | | | 125,931 | |
Courier Corp. | | | 1,987 | | | | 23,049 | |
Deluxe Corp. | | | 25,138 | | | | 588,732 | |
Encore Capital Group, Inc.* | | | 11,073 | | | | 249,696 | |
EnergySolutions, Inc.* | | | 16,966 | | | | 83,133 | |
Ennis, Inc. | | | 11,944 | | | | 188,954 | |
Fuel Tech, Inc.* | | | 3,175 | | | | 17,335 | |
G&K Services, Inc. Class A | | | 4,656 | | | | 159,235 | |
Geo Group, Inc. (The)* | | | 18,659 | | | | 354,708 | |
InnerWorkings, Inc.* | | | 5,740 | | | | 66,871 | |
Interface, Inc. Class A | | | 8,481 | | | | 118,310 | |
Intersections, Inc. | | | 7,015 | | | | 89,652 | |
Kimball International, Inc. Class B | | | 3,431 | | | | 23,708 | |
Knoll, Inc. | | | 14,321 | | | | 238,301 | |
McGrath Rentcorp | | | 6,832 | | | | 219,376 | |
Metalico, Inc.* | | | 24,669 | | | | 105,337 | |
Mobile Mini, Inc.* | | | 5,126 | | | | 108,261 | |
Multi-Color Corp. | | | 3,672 | | | | 82,657 | |
NL Industries, Inc. | | | 16,014 | | | | 238,609 | |
Quad Graphics, Inc.(a) | | | 2,551 | | | | 35,459 | |
Schawk, Inc. | | | 6,624 | | | | 82,866 | |
Standard Parking Corp.* | | | 4,062 | | | | 83,271 | |
Steelcase, Inc. Class A | | | 13,794 | | | | 132,422 | |
SYKES Enterprises, Inc.* | | | 12,712 | | | | 200,850 | |
| | | | | | | | |
Team, Inc.* | | | 4,054 | | | $ | 125,471 | |
TMS International Corp. Class A* | | | 8,547 | | | | 103,419 | |
U.S. Ecology, Inc. | | | 3,568 | | | | 77,568 | |
UniFirst Corp. | | | 5,255 | | | | 323,445 | |
Viad Corp. | | | 2,223 | | | | 43,193 | |
| | | | | | | | |
| Total Commercial Services & Supplies | | | | | | | 5,063,436 | |
| Communications Equipment – 0.9% | | | | | | | | |
Anaren, Inc.* | | | 3,262 | | | | 59,858 | |
Bel Fuse, Inc. Class B | | | 2,675 | | | | 47,267 | |
Black Box Corp. | | | 7,005 | | | | 178,697 | |
CalAmp Corp.* | | | 1,774 | | | | 8,604 | |
Communications Systems, Inc. | | | 3,282 | | | | 43,093 | |
Comtech Telecommunications Corp. | | | 8,020 | | | | 261,292 | |
Digi International, Inc.* | | | 3,982 | | | | 43,762 | |
Globecomm Systems, Inc.* | | | 5,040 | | | | 72,979 | |
Ixia* | | | 6,722 | | | | 83,958 | |
Oplink Communications, Inc.* | | | 10,379 | | | | 177,481 | |
Procera Networks, Inc.* | | | 479 | | | | 10,710 | |
TESSCO Technologies, Inc. | | | 3,442 | | | | 87,668 | |
Westell Technologies, Inc. Class A* | | | 117,645 | | | | 274,113 | |
| | | | | | | | |
| Total Communications Equipment | | | | | | | 1,349,482 | |
| Computers & Peripherals – 0.9% | | | | | | | | |
3D Systems Corp.*(a) | | | 10,014 | | | | 235,730 | |
Cray, Inc.* | | | 22,880 | | | | 167,482 | |
Datalink Corp.* | | | 4,685 | | | | 44,601 | |
Electronics For Imaging, Inc.* | | | 5,999 | | | | 99,703 | |
Quantum Corp.* | | | 1,954 | | | | 5,120 | |
Rimage Corp. | | | 2,326 | | | | 23,283 | |
STEC, Inc.*(a) | | | 18,153 | | | | 171,364 | |
Stratasys, Inc.*(a) | | | 2,369 | | | | 86,516 | |
Super Micro Computer, Inc.* | | | 10,822 | | | | 188,952 | |
Synaptics, Inc.*(a) | | | 7,338 | | | | 267,910 | |
| | | | | | | | |
| Total Computers & Peripherals | | | | | | | 1,290,661 | |
| Construction & Engineering – 1.0% | | | | | | | | |
Aegion Corp.* | | | 7,439 | | | | 132,637 | |
Comfort Systems USA, Inc. | | | 4,888 | | | | 53,328 | |
Dycom Industries, Inc.* | | | 3,252 | | | | 75,967 | |
Furmanite Corp.* | | | 9,804 | | | | 62,942 | |
Great Lakes Dredge & Dock Corp. | | | 11,026 | | | | 79,608 | |
Layne Christensen Co.* | | | 6,080 | | | | 135,280 | |
Michael Baker Corp.* | | | 2,502 | | | | 59,673 | |
MYR Group, Inc.* | | | 4,058 | | | | 72,476 | |
Northwest Pipe Co.* | | | 1,083 | | | | 23,003 | |
Pike Electric Corp.* | | | 3,422 | | | | 28,163 | |
Primoris Services Corp. | | | 15,536 | | | | 249,508 | |
Sterling Construction Co., Inc.* | | | 6,026 | | | | 58,753 | |
Tutor Perini Corp.* | | | 25,133 | | | | 391,572 | |
| | | | | | | | |
| Total Construction & Engineering | | | | | | | 1,422,910 | |
| Construction Materials – 0.0% | | | | | | | | |
Eagle Materials, Inc. | | | 707 | | | | 24,568 | |
| Consumer Finance – 1.5% | | | | | |
Advance America, Cash Advance Centers, Inc. | | | 25,433 | | | | 266,792 | |
See Notes to Financial Statements.
| | |
| 46 | | WisdomTree Domestic and International Earnings Funds |
Schedule of Investments (continued)
WisdomTree SmallCap Earnings Fund (EES)
March 31, 2012
| | | | | | | | |
| Investments | | Shares | | | Value | |
| | | | | | | | |
DFC Global Corp.* | | | 11,712 | | | $ | 221,006 | |
First Cash Financial Services, Inc.* | | | 7,398 | | | | 317,300 | |
Nelnet, Inc. Class��A | | | 38,476 | | | | 996,913 | |
Netspend Holdings, Inc.* | | | 14,978 | | | | 116,229 | |
World Acceptance Corp.*(a) | | | 5,419 | | | | 331,914 | |
| | | | | | | | |
| Total Consumer Finance | | | | | | | 2,250,154 | |
| Containers & Packaging – 0.4% | | | | | | | | |
AEP Industries, Inc.* | | | 744 | | | | 25,899 | |
Boise, Inc. | | | 56,181 | | | | 461,246 | |
Myers Industries, Inc. | | | 3,320 | | | | 48,970 | |
| | | | | | | | |
| Total Containers & Packaging | | | | | | | 536,115 | |
| Distributors – 0.2% | | | | | | | | |
Core-Mark Holding Co., Inc. | | | 2,230 | | | | 91,296 | |
VOXX International Corp.* | | | 14,769 | | | | 200,268 | |
Weyco Group, Inc. | | | 2,614 | | | | 61,952 | |
| | | | | | | | |
| Total Distributors | | | | | | | 353,516 | |
| Diversified Consumer Services – 2.6% | | | | | | | | |
American Public Education, Inc.*(a) | | | 3,595 | | | | 136,610 | |
Archipelago Learning, Inc.* | | | 2,088 | | | | 23,218 | |
Bridgepoint Education, Inc.* | | | 32,491 | | | | 804,152 | |
Capella Education Co.* | | | 6,907 | | | | 248,307 | |
Career Education Corp.* | | | 111,693 | | | | 900,246 | |
Collectors Universe, Inc. | | | 1,726 | | | | 29,756 | |
Grand Canyon Education, Inc.* | | | 11,609 | | | | 206,176 | |
K12, Inc.*(a) | | | 2,553 | | | | 60,327 | |
Lincoln Educational Services Corp. | | | 21,224 | | | | 167,882 | |
Mac-Gray Corp. | | | 721 | | | | 10,909 | |
Matthews International Corp. Class A | | | 9,300 | | | | 294,252 | |
Regis Corp. | | | 9,910 | | | | 182,641 | |
Stewart Enterprises, Inc. Class A(a) | | | 16,842 | | | | 102,231 | |
Strayer Education, Inc.(a) | | | 4,972 | | | | 468,760 | |
Universal Technical Institute, Inc. | | | 8,505 | | | | 112,181 | |
| | | | | | | | |
| Total Diversified Consumer Services | | | | | | | 3,747,648 | |
| Diversified Financial Services – 0.5% | | | | | | | | |
Gain Capital Holdings, Inc. | | | 44,846 | | | | 225,127 | |
Interactive Brokers Group, Inc. Class A(a) | | | 5,317 | | | | 90,389 | |
Life Partners Holdings, Inc. | | | 18,715 | | | | 76,170 | |
MarketAxess Holdings, Inc. | | | 6,292 | | | | 234,629 | |
Marlin Business Services Corp. | | | 1,598 | | | | 24,066 | |
NewStar Financial, Inc.* | | | 5,394 | | | | 59,981 | |
PHH Corp.*(a) | | | 273 | | | | 4,223 | |
| | | | | | | | |
| Total Diversified Financial Services | | | | | | | 714,585 | |
| Diversified Telecommunication Services – 0.7% | | | | | | | | |
8x8, Inc.* | | | 7,086 | | | | 29,761 | |
Atlantic Tele-Network, Inc. | | | 1,924 | | | | 69,957 | |
Boingo Wireless, Inc.*(a) | | | 6,588 | | | | 79,715 | |
Cincinnati Bell, Inc.*(a) | | | 18,247 | | | | 73,353 | |
Cogent Communications Group, Inc.* | | | 1,020 | | | | 19,462 | |
Consolidated Communications Holdings, Inc. | | | 5,362 | | | | 105,256 | |
General Communication, Inc. Class A* | | | 2,339 | | | | 20,396 | |
HickoryTech Corp. | | | 3,485 | | | | 36,035 | |
IDT Corp. Class B | | | 10,637 | | | | 99,349 | |
| | | | | | | | |
Iridium Communications, Inc.*(a) | | | 21,546 | | | $ | 188,743 | |
Neutral Tandem, Inc.* | | | 10,616 | | | | 129,409 | |
Premiere Global Services, Inc.* | | | 6,768 | | | | 61,183 | |
SureWest Communications | | | 1,037 | | | | 23,384 | |
Vonage Holdings Corp.* | | | 29,891 | | | | 66,059 | |
| | | | | | | | |
| Total Diversified Telecommunication Services | | | | | | | 1,002,062 | |
| Electric Utilities – 0.4% | | | | | | | | |
Central Vermont Public Service Corp. | | | 718 | | | | 25,274 | |
Empire District Electric Co. (The) | | | 11,041 | | | | 224,685 | |
MGE Energy, Inc. | | | 5,957 | | | | 264,431 | |
Otter Tail Corp. | | | 3,749 | | | | 81,353 | |
Unitil Corp. | | | 1,717 | | | | 46,067 | |
| | | | | | | | |
| Total Electric Utilities | | | | | | | 641,810 | |
| Electrical Equipment – 0.9% | | | | | | | | |
AZZ, Inc. | | | 3,483 | | | | 179,862 | |
Coleman Cable, Inc.* | | | 7,901 | | | | 76,798 | |
Encore Wire Corp. | | | 5,752 | | | | 171,007 | |
Franklin Electric Co., Inc. | | | 5,499 | | | | 269,836 | |
Global Power Equipment Group, Inc.* | | | 10,116 | | | | 280,213 | |
LSI Industries, Inc. | | | 5,227 | | | | 38,314 | |
Powell Industries, Inc.* | | | 945 | | | | 32,366 | |
Preformed Line Products Co. | | | 1,961 | | | | 128,446 | |
Vicor Corp. | | | 9,457 | | | | 75,656 | |
| | | | | | | | |
| Total Electrical Equipment | | | | | | | 1,252,498 | |
| Electronic Equipment, Instruments & Components – 5.2% | |
Badger Meter, Inc. | | | 3,453 | | | | 117,367 | |
Benchmark Electronics, Inc.* | | | 20,693 | | | | 341,228 | |
Brightpoint, Inc.* | | | 18,783 | | | | 151,203 | |
CTS Corp. | | | 7,097 | | | | 74,660 | |
Daktronics, Inc. | | | 4,844 | | | | 43,063 | |
DDi Corp. | | | 8,569 | | | | 104,542 | |
DTS, Inc.* | | | 2,474 | | | | 74,764 | |
Electro Rent Corp. | | | 5,854 | | | | 107,772 | |
Electro Scientific Industries, Inc. | | | 6,363 | | | | 95,509 | |
FARO Technologies, Inc.* | | | 1,599 | | | | 93,270 | |
Insight Enterprises, Inc.* | | | 23,427 | | | | 513,754 | |
Kemet Corp.* | | | 51,314 | | | | 480,299 | |
LeCroy Corp.* | | | 5,287 | | | | 54,932 | |
Littelfuse, Inc. | | | 8,264 | | | | 518,153 | |
Measurement Specialties, Inc.* | | | 4,170 | | | | 140,529 | |
Mercury Computer Systems, Inc.* | | | 5,024 | | | | 66,568 | |
Methode Electronics, Inc. | | | 8,028 | | | | 74,500 | |
MTS Systems Corp. | | | 5,094 | | | | 270,440 | |
Multi-Fineline Electronix, Inc.* | | | 7,356 | | | | 201,922 | |
Newport Corp.* | | | 17,830 | | | | 315,948 | |
OSI Systems, Inc.* | | | 3,011 | | | | 184,574 | |
Park Electrochemical Corp. | | | 4,175 | | | | 126,210 | |
PC Connection, Inc. | | | 10,073 | | | | 82,800 | |
Plexus Corp.* | | | 12,571 | | | | 439,859 | |
Power-One, Inc.* | | | 143,083 | | | | 651,028 | |
RealD, Inc.*(a) | | | 6,959 | | | | 93,946 | |
Richardson Electronics Ltd. | | | 1,188 | | | | 14,232 | |
Rofin-Sinar Technologies, Inc.* | | | 10,795 | | | | 284,664 | |
See Notes to Financial Statements.
| | | | |
| WisdomTree Domestic and International Earnings Funds | | | 47 | |
Schedule of Investments (continued)
WisdomTree SmallCap Earnings Fund (EES)
March 31, 2012
| | | | | | | | |
| Investments | | Shares | | | Value | |
| | | | | | | | |
Rogers Corp.* | | | 4,111 | | | $ | 159,301 | |
Sanmina-SCI Corp.* | | | 30,550 | | | | 349,798 | |
Scansource, Inc.* | | | 8,680 | | | | 323,938 | |
SYNNEX Corp.* | | | 18,611 | | | | 709,824 | |
TTM Technologies, Inc.* | | | 23,134 | | | | 265,810 | |
Vishay Precision Group, Inc.* | | | 2,947 | | | | 43,704 | |
X-Rite, Inc.* | | | 6,674 | | | | 30,300 | |
Zygo Corp.* | | | 4,586 | | | | 89,748 | |
| | | | | | | | |
| Total Electronic Equipment, Instruments & Components | | | | 7,690,159 | |
| Energy Equipment & Services – 0.7% | | | | | | | | |
Basic Energy Services, Inc.* | | | 4,975 | | | | 86,316 | |
Global Geophysical Services, Inc.* | | | 1,404 | | | | 14,896 | |
Heckmann Corp.*(a) | | | 1,555 | | | | 6,702 | |
ION Geophysical Corp.* | | | 14,507 | | | | 93,570 | |
Matrix Service Co.* | | | 8,634 | | | | 120,962 | |
Mitcham Industries, Inc.* | | | 1,832 | | | | 41,147 | |
Natural Gas Services Group, Inc.* | | | 2,448 | | | | 32,314 | |
Newpark Resources* | | | 34,220 | | | | 280,262 | |
OYO Geospace Corp.* | | | 1,565 | | | | 164,842 | |
Parker Drilling Co.* | | | 14,222 | | | | 84,905 | |
PHI, Inc.* | | | 194 | | | | 4,491 | |
RigNet, Inc.* | | | 1,238 | | | | 21,702 | |
TGC Industries, Inc.* | | | 4,482 | | | | 44,462 | |
| | | | | | | | |
| Total Energy Equipment & Services | | | | | | | 996,571 | |
| Food & Staples Retailing – 1.0% | | | | | | | | |
Andersons, Inc. (The) | | | 8,645 | | | | 420,925 | |
Ingles Markets, Inc. Class A | | | 8,996 | | | | 158,689 | |
Nash Finch Co. | | | 5,998 | | | | 170,463 | |
Pantry, Inc. (The)* | | | 5,166 | | | | 67,210 | |
Spartan Stores, Inc. | | | 6,775 | | | | 122,763 | |
Susser Holdings Corp.* | | | 7,221 | | | | 185,363 | |
Village Super Market, Inc. Class A | | | 2,769 | | | | 87,473 | |
Weis Markets, Inc. | | | 6,856 | | | | 298,922 | |
| | | | | | | | |
| Total Food & Staples Retailing | | | | | | | 1,511,808 | |
| Food Products – 0.8% | | | | | | | | |
B&G Foods, Inc. | | | 8,768 | | | | 197,368 | |
Calavo Growers, Inc.(a) | | | 1,919 | | | | 51,391 | |
Cal-Maine Foods, Inc.(a) | | | 6,301 | | | | 241,076 | |
Chiquita Brands International, Inc.* | | | 26,784 | | | | 235,431 | |
Diamond Foods, Inc.(a) | | | 6,242 | | | | 142,442 | |
J&J Snack Foods Corp. | | | 3,689 | | | | 193,525 | |
Omega Protein Corp.* | | | 13,317 | | | | 101,342 | |
Seneca Foods Corp. Class A* | | | 1,055 | | | | 27,789 | |
Smart Balance, Inc.* | | | 5,637 | | | | 37,261 | |
| | | | | | | | |
| Total Food Products | | | | | | | 1,227,625 | |
| Gas Utilities – 0.2% | | | | | | | | |
Chesapeake Utilities Corp. | | | 2,421 | | | | 99,552 | |
Laclede Group, Inc. (The) | | | 6,059 | | | | 236,422 | |
| | | | | | | | |
| Total Gas Utilities | | | | | | | 335,974 | |
| Health Care Equipment & Supplies – 2.1% | | | | | | | | |
Abaxis, Inc.* | | | 1,878 | | | | 54,706 | |
Analogic Corp. | | | 1,148 | | | | 77,536 | |
| | | | | | | | |
AngioDynamics, Inc.* | | | 2,069 | | | $ | 25,345 | |
Arthrocare Corp.* | | | 3,538 | | | | 94,995 | |
Atrion Corp. | | | 424 | | | | 89,129 | |
Cantel Medical Corp. | | | 4,577 | | | | 114,837 | |
Conceptus, Inc.*(a) | | | 22,988 | | | | 330,567 | |
CONMED Corp. | | | 5,119 | | | | 152,905 | |
CryoLife, Inc.* | | | 6,573 | | | | 34,640 | |
Cyberonics, Inc.* | | | 3,822 | | | | 145,733 | |
DynaVox, Inc. Class A* | | | 2,456 | | | | 7,565 | |
Exactech, Inc.* | | | 2,457 | | | | 38,943 | |
Greatbatch, Inc.* | | | 6,064 | | | | 148,689 | |
ICU Medical, Inc.* | | | 3,160 | | | | 155,346 | |
Integra LifeSciences Holdings Corp.* | | | 5,406 | | | | 187,534 | |
Invacare Corp. | | | 9,495 | | | | 157,332 | |
Kensey Nash Corp. | | | 189 | | | | 5,530 | |
Meridian Bioscience, Inc. | | | 5,560 | | | | 107,753 | |
Merit Medical Systems, Inc.* | | | 6,351 | | | | 78,879 | |
Natus Medical, Inc.* | | | 4,514 | | | | 53,852 | |
Neogen Corp.* | | | 2,545 | | | | 99,433 | |
NuVasive, Inc.* | | | 22,453 | | | | 378,109 | |
Quidel Corp.* | | | 1,602 | | | | 29,429 | |
RTI Biologics, Inc.* | | | 7,352 | | | | 27,202 | |
Spectranetics Corp.* | | | 954 | | | | 9,922 | |
STAAR Surgical Co.*(a) | | | 182 | | | | 1,971 | |
Symmetry Medical, Inc.* | | | 5,217 | | | | 36,884 | |
Synergetics USA, Inc.* | | | 3,389 | | | | 22,029 | |
Vascular Solutions, Inc.* | | | 7,298 | | | | 78,745 | |
Wright Medical Group, Inc.* | | | 808 | | | | 15,611 | |
Young Innovations, Inc. | | | 2,024 | | | | 62,582 | |
Zoll Medical Corp.* | | | 2,540 | | | | 235,280 | |
| | | | | | | | |
| Total Health Care Equipment & Supplies | | | | | | | 3,059,013 | |
| Health Care Providers & Services – 3.1% | | | | | | | | |
Air Methods Corp.* | | | 2,325 | | | | 202,856 | |
Almost Family, Inc.* | | | 6,362 | | | | 165,476 | |
Amedisys, Inc.* | | | 1,419 | | | | 20,519 | |
AMN Healthcare Services, Inc.* | | | 1,897 | | | | 11,496 | |
Amsurg Corp.* | | | 7,748 | | | | 216,789 | |
Assisted Living Concepts, Inc. Class A | | | 5,749 | | | | 95,491 | |
Bio-Reference Labs, Inc.*(a) | | | 8,377 | | | | 196,943 | |
Capital Senior Living Corp.* | | | 2,304 | | | | 21,289 | |
Chemed Corp. | | | 6,666 | | | | 417,825 | |
Chindex International, Inc.* | | | 1,717 | | | | 16,312 | |
Corvel Corp.* | | | 2,748 | | | | 109,618 | |
Cross Country Healthcare, Inc.* | | | 2,982 | | | | 14,940 | |
Ensign Group, Inc. (The) | | | 7,756 | | | | 210,653 | |
Five Star Quality Care, Inc.* | | | 27,839 | | | | 94,931 | |
Hanger Orthopedic Group, Inc.* | | | 8,660 | | | | 189,308 | |
Healthways, Inc.* | | | 13,348 | | | | 98,241 | |
IPC The Hospitalist Co., Inc.* | | | 2,487 | | | | 91,795 | |
Kindred Healthcare, Inc.* | | | 13,802 | | | | 119,249 | |
Landauer, Inc. | | | 1,863 | | | | 98,776 | |
Metropolitan Health Networks, Inc.* | | | 13,264 | | | | 124,284 | |
MModal, Inc.* | | | 14,041 | | | | 148,133 | |
See Notes to Financial Statements.
| | |
| 48 | | WisdomTree Domestic and International Earnings Funds |
Schedule of Investments (continued)
WisdomTree SmallCap Earnings Fund (EES)
March 31, 2012
| | | | | | | | |
| Investments | | Shares | | | Value | |
| | | | | | | | |
Molina Healthcare, Inc.* | | | 13,475 | | | $ | 453,164 | |
MWI Veterinary Supply, Inc.* | | | 2,410 | | | | 212,080 | |
National Healthcare Corp. | | | 5,086 | | | | 231,718 | |
PharMerica Corp.* | | | 6,100 | | | | 75,823 | |
Providence Service Corp. (The)* | | | 4,582 | | | | 71,067 | |
Sunrise Senior Living, Inc.*(a) | | | 11,366 | | | | 71,833 | |
Triple-S Management Corp. Class B* | | | 11,674 | | | | 269,669 | |
U.S. Physical Therapy, Inc. | | | 3,407 | | | | 78,531 | |
Universal American Corp. | | | 36,181 | | | | 390,031 | |
| | | | | | | | |
| Total Health Care Providers & Services | | | | | | | 4,518,840 | |
| Health Care Technology – 0.3% | | | | | | | | |
Computer Programs & Systems, Inc. | | | 2,144 | | | | 121,179 | |
Epocrates, Inc.*(a) | | | 2,583 | | | | 22,162 | |
HealthStream, Inc.* | | | 1,449 | | | | 33,602 | |
Medidata Solutions, Inc.* | | | 6,083 | | | | 162,051 | |
Merge Healthcare, Inc.*(a) | | | 436 | | | | 2,551 | |
Omnicell, Inc.* | | | 1,805 | | | | 27,454 | |
Transcend Services, Inc.* | | | 2,091 | | | | 61,371 | |
| | | | | | | | |
| Total Health Care Technology | | | | | | | 430,370 | |
| Hotels, Restaurants & Leisure – 3.5% | | | | | | | | |
AFC Enterprises* | | | 5,953 | | | | 100,963 | |
Ameristar Casinos, Inc. | | | 2,454 | | | | 45,718 | |
Biglari Holdings, Inc.* | | | 247 | | | | 99,504 | |
Bob Evans Farms, Inc. | | | 7,737 | | | | 291,840 | |
Bravo Brio Restaurant Group, Inc.* | | | 14,962 | | | | 298,642 | |
Caribou Coffee Co., Inc.*(a) | | | 9,909 | | | | 184,704 | |
Carrols Restaurant Group, Inc.* | | | 5,168 | | | | 78,812 | |
CEC Entertainment, Inc. | | | 6,418 | | | | 243,306 | |
Churchill Downs, Inc. | | | 4,218 | | | | 235,786 | |
Cracker Barrel Old Country Store, Inc. | | | 6,431 | | | | 358,850 | |
Denny’s Corp.* | | | 21,743 | | | | 87,842 | |
Einstein Noah Restaurant Group, Inc. | | | 2,882 | | | | 42,999 | |
International Speedway Corp. Class A | | | 9,260 | | | | 256,965 | |
Interval Leisure Group, Inc. | | | 11,416 | | | | 198,638 | |
Isle of Capri Casinos, Inc.* | | | 1,151 | | | | 8,126 | |
Jack In The Box, Inc.* | | | 11,783 | | | | 282,438 | |
Krispy Kreme Doughnuts, Inc.* | | | 8,560 | | | | 62,488 | |
Marcus Corp. | | | 5,800 | | | | 72,790 | |
Multimedia Games Holding Co., Inc.* | | | 2,897 | | | | 31,751 | |
Papa John’s International, Inc.* | | | 5,749 | | | | 216,507 | |
Peet’s Coffee & Tea, Inc.*(a) | | | 1,381 | | | | 101,780 | |
PF Chang’s China Bistro, Inc. | | | 5,437 | | | | 214,870 | |
Pinnacle Entertainment, Inc.* | | | 5,782 | | | | 66,551 | |
Red Robin Gourmet Burgers, Inc.* | | | 2,703 | | | | 100,525 | |
Ruby Tuesday, Inc.* | | | 23,173 | | | | 211,569 | |
Ruth’s Hospitality Group, Inc.* | | | 10,529 | | | | 79,915 | |
Shuffle Master, Inc.* | | | 9,838 | | | | 173,149 | |
Sonic Corp.* | | | 10,887 | | | | 83,612 | |
Speedway Motorsports, Inc. | | | 13,298 | | | | 248,407 | |
Texas Roadhouse, Inc. | | | 16,995 | | | | 282,797 | |
Town Sports International Holdings, Inc.* | | | 2,270 | | | | 28,670 | |
WMS Industries, Inc.*(a) | | | 12,763 | | | | 302,866 | |
| | | | | | | | |
| Total Hotels, Restaurants & Leisure | | | | | | | 5,093,380 | |
| | | | | | | | |
| Household Durables – 1.0% | | | | | | | | |
American Greetings Corp. Class A | | | 20,307 | | | $ | 311,509 | |
Blyth, Inc. | | | 1,610 | | | | 120,476 | |
Cavco Industries, Inc.* | | | 1,314 | | | | 61,206 | |
CSS Industries, Inc. | | | 1,928 | | | | 37,519 | |
Ethan Allen Interiors, Inc. | | | 5,836 | | | | 147,768 | |
iRobot Corp.*(a) | | | 4,698 | | | | 128,068 | |
La-Z-Boy, Inc.* | | | 24,268 | | | | 363,049 | |
Libbey, Inc.* | | | 7,461 | | | | 96,545 | |
Lifetime Brands, Inc. | | | 6,330 | | | | 71,149 | |
Sealy Corp.* | | | 27,407 | | | | 55,362 | |
Universal Electronics, Inc.* | | | 4,585 | | | | 91,608 | |
Zagg, Inc.*(a) | | | 4,977 | | | | 52,906 | |
| | | | | | | | |
| Total Household Durables | | | | | | | 1,537,165 | |
| Household Products – 0.2% | | | | | | | | |
Central Garden and Pet Co. Class A* | | | 14,171 | | | | 136,467 | |
WD-40 Co. | | | 3,567 | | | | 161,763 | |
| | | | | | | | |
| Total Household Products | | | | | | | 298,230 | |
| Independent Power Producers & Energy Traders – 0.0% | |
Ormat Technologies, Inc.(a) | | | 998 | | | | 20,110 | |
| Industrial Conglomerates – 0.3% | | | | | | | | |
Raven Industries, Inc. | | | 3,178 | | | | 193,890 | |
Standex International Corp. | | | 4,252 | | | | 175,140 | |
| | | | | | | | |
| Total Industrial Conglomerates | | | | | | | 369,030 | |
| Insurance – 3.2% | | | | | | | | |
American Equity Investment Life Holding Co.(a) | | | 26,851 | | | | 342,887 | |
AMERISAFE, Inc.* | | | 4,372 | | | | 108,163 | |
Citizens, Inc.* | | | 5,074 | | | | 50,131 | |
Crawford & Co. Class B | | | 39,112 | | | | 191,649 | |
Donegal Group, Inc. Class A | | | 518 | | | | 7,081 | |
eHealth, Inc.*(a) | | | 3,381 | | | | 55,144 | |
Employers Holdings, Inc. | | | 11,021 | | | | 195,182 | |
FBL Financial Group, Inc. Class A | | | 13,546 | | | | 456,500 | |
Horace Mann Educators Corp. | | | 9,967 | | | | 175,619 | |
Infinity Property & Casualty Corp. | | | 3,142 | | | | 164,421 | |
Kansas City Life Insurance Co. | | | 3,224 | | | | 103,813 | |
Meadowbrook Insurance Group, Inc. | | | 18,021 | | | | 168,136 | |
National Financial Partners Corp.* | | | 12,281 | | | | 185,934 | |
National Interstate Corp. | | | 4,147 | | | | 106,080 | |
National Western Life Insurance Co. Class A | | | 1,827 | | | | 250,062 | |
Navigators Group, Inc. (The)* | | | 1,589 | | | | 75,064 | |
Phoenix Cos., Inc. (The)* | | | 149,105 | | | | 365,307 | |
Presidential Life Corp. | | | 5,084 | | | | 58,110 | |
Safety Insurance Group, Inc. | | | 2,039 | | | | 84,904 | |
Selective Insurance Group, Inc. | | | 6,976 | | | | 122,847 | |
Stewart Information Services Corp. | | | 1,512 | | | | 21,486 | |
Symetra Financial Corp. | | | 82,146 | | | | 947,144 | |
Tower Group, Inc. | | | 13,853 | | | | 310,723 | |
Universal Insurance Holdings, Inc. | | | 28,937 | | | | 112,565 | |
| | | | | | | | |
| Total Insurance | | | | 4,658,952 | |
| Internet & Catalog Retail – 0.2% | | | | | | | | |
1-800-FLOWERS.COM, Inc. Class A* | | | 9,234 | | | | 27,979 | |
See Notes to Financial Statements.
| | | | |
| WisdomTree Domestic and International Earnings Funds | | | 49 | |
Schedule of Investments (continued)
WisdomTree SmallCap Earnings Fund (EES)
March 31, 2012
| | | | | | | | |
| Investments | | Shares | | | Value | |
| | | | | | | | |
Blue Nile, Inc.*(a) | | | 1,360 | | | $ | 44,853 | |
Nutrisystem, Inc.(a) | | | 5,963 | | | | 66,964 | |
PetMed Express, Inc.(a) | | | 6,950 | | | | 86,041 | |
Shutterfly, Inc.*(a) | | | 1,750 | | | | 54,828 | |
| | | | | | | | |
| Total Internet & Catalog Retail | | | | 280,665 | |
| Internet Software & Services – 1.6% | | | | | | | | |
Ancestry.com, Inc.*(a) | | | 10,355 | | | | 235,473 | |
Constant Contact, Inc.* | | | 1,003 | | | | 29,879 | |
DealerTrack Holdings, Inc.* | | | 818 | | | | 24,753 | |
Dice Holdings, Inc.* | | | 13,536 | | | | 126,291 | |
Digital River, Inc.* | | | 4,716 | | | | 88,236 | |
Earthlink, Inc. | | | 23,331 | | | | 186,415 | |
EasyLink Services International Corp. Class A* | | | 21,733 | | | | 110,512 | |
Envestnet, Inc.* | | | 2,375 | | | | 29,735 | |
InfoSpace, Inc.* | | | 4,129 | | | | 52,892 | |
Intralinks Holdings, Inc.* | | | 1,503 | | | | 7,951 | |
Keynote Systems, Inc. | | | 10,131 | | | | 200,189 | |
Liquidity Services, Inc.* | | | 964 | | | | 43,187 | |
LivePerson, Inc.* | | | 3,322 | | | | 55,710 | |
LogMein, Inc.*(a) | | | 931 | | | | 32,799 | |
LoopNet, Inc.*(a) | | | 2,478 | | | | 46,537 | |
Monster Worldwide, Inc.* | | | 16,055 | | | | 156,536 | |
NIC, Inc. | | | 6,890 | | | | 83,576 | |
OpenTable, Inc.*(a) | | | 1,916 | | | | 77,540 | |
Perficient, Inc.* | | | 4,654 | | | | 55,895 | |
QuinStreet, Inc.* | | | 10,501 | | | | 110,155 | |
Responsys, Inc.* | | | 4,493 | | | | 53,781 | |
SciQuest, Inc.* | | | 696 | | | | 10,607 | |
SPS Commerce, Inc.* | | | 147 | | | | 3,951 | |
Stamps.com, Inc.* | | | 2,141 | | | | 59,691 | |
TechTarget, Inc.* | | | 2,303 | | | | 15,960 | |
Travelzoo, Inc.*(a) | | | 2,813 | | | | 64,699 | |
United Online, Inc. | | | 40,602 | | | | 198,544 | |
XO Group, Inc.* | | | 2,317 | | | | 21,757 | |
Zix Corp.* | | | 63,048 | | | | 183,470 | |
| | | | | | | | |
| Total Internet Software & Services | | | | 2,366,721 | |
| IT Services – 1.6% | | | | | | | | |
Acxiom Corp.* | | | 19,423 | | | | 285,130 | |
Cass Information Systems, Inc. | | | 2,466 | | | | 98,517 | |
Computer Task Group, Inc.* | | | 3,262 | | | | 49,974 | |
CSG Systems International, Inc.* | | | 7,767 | | | | 117,592 | |
Dynamics Research Corp.* | | | 4,075 | | | | 39,283 | |
Echo Global Logistics, Inc.*(a) | | | 2,557 | | | | 41,168 | |
Euronet Worldwide, Inc.* | | | 2,794 | | | | 58,367 | |
ExlService Holdings, Inc.* | | | 5,595 | | | | 153,527 | |
Forrester Research, Inc. | | | 2,221 | | | | 71,960 | |
Global Cash Access Holdings, Inc.* | | | 4,661 | | | | 36,356 | |
Hackett Group, Inc. (The)* | | | 16,354 | | | | 97,633 | |
Heartland Payment Systems, Inc. | | | 6,599 | | | | 190,315 | |
Higher One Holdings, Inc.*(a) | | | 7,153 | | | | 106,937 | |
iGate Corp.* | | | 8,871 | | | | 148,678 | |
NCI, Inc. Class A* | | | 6,139 | | | | 39,228 | |
PRGX Global, Inc.* | | | 3,558 | | | | 22,380 | |
| | | | | | | | |
ServiceSource International, Inc.* | | | 3,261 | | | $ | 50,480 | |
TeleTech Holdings, Inc.* | | | 15,430 | | | | 248,423 | |
TNS, Inc.* | | | 433 | | | | 9,409 | |
Unisys Corp.* | | | 20,148 | | | | 397,319 | |
Virtusa Corp.* | | | 4,582 | | | | 79,131 | |
| | | | | | | | |
| Total IT Services | | | | 2,341,807 | |
| Leisure Equipment & Products – 0.4% | | | | | | | | |
Arctic Cat, Inc.* | | | 3,693 | | | | 158,171 | |
Black Diamond, Inc.* | | | 453 | | | | 4,195 | |
JAKKS Pacific, Inc. | | | 8,440 | | | | 147,278 | |
Leapfrog Enterprises, Inc.* | | | 7,940 | | | | 66,378 | |
Steinway Musical Instruments* | | | 995 | | | | 24,875 | |
Sturm Ruger & Co., Inc. | | | 4,369 | | | | 214,518 | |
Summer Infant, Inc.* | | | 2,679 | | | | 16,074 | |
| | | | | | | | |
| Total Leisure Equipment & Products | | | | 631,489 | |
| Life Sciences Tools & Services – 0.2% | | | | | | | | |
Cambrex Corp.* | | | 8,530 | | | | 59,625 | |
eResearch Technology, Inc.* | | | 11,224 | | | | 87,772 | |
Harvard Bioscience, Inc.* | | | 4,992 | | | | 19,568 | |
Luminex Corp.* | | | 2,868 | | | | 66,968 | |
Medtox Scientific, Inc.* | | | 1,173 | | | | 19,777 | |
| | | | | | | | |
| Total Life Sciences Tools & Services | | | | 253,710 | |
| Machinery – 3.9% | | | | | | | | |
Alamo Group, Inc. | | | 4,003 | | | | 120,330 | |
Albany International Corp. Class A | | | 9,661 | | | | 221,720 | |
Altra Holdings, Inc.* | | | 7,953 | | | | 152,698 | |
Ampco-Pittsburgh Corp. | | | 4,787 | | | | 96,362 | |
Astec Industries, Inc.* | | | 4,671 | | | | 170,398 | |
Blount International, Inc.* | | | 14,483 | | | | 241,576 | |
Briggs & Stratton Corp. | | | 17,454 | | | | 312,950 | |
Cascade Corp. | | | 3,499 | | | | 175,370 | |
CIRCOR International, Inc. | | | 4,049 | | | | 134,710 | |
Commercial Vehicle Group, Inc.* | | | 4,951 | | | | 60,452 | |
Douglas Dynamics, Inc. | | | 4,498 | | | | 61,847 | |
Dynamic Materials Corp. | | | 1,952 | | | | 41,207 | |
EnPro Industries, Inc.* | | | 6,171 | | | | 253,628 | |
ESCO Technologies, Inc. | | | 7,774 | | | | 285,850 | |
Flow International Corp.* | | | 2,295 | | | | 9,226 | |
Gorman-Rupp Co. (The) | | | 4,718 | | | | 137,671 | |
Graham Corp. | | | 2,012 | | | | 44,043 | |
Greenbrier Cos., Inc.* | | | 386 | | | | 7,639 | |
Hurco Cos., Inc.* | | | 1,265 | | | | 35,736 | |
John Bean Technologies Corp. | | | 9,913 | | | | 160,591 | |
Kadant, Inc.* | | | 4,449 | | | | 105,975 | |
Kaydon Corp. | | | 6,817 | | | | 173,902 | |
L.B. Foster Co. Class A | | | 2,913 | | | | 83,050 | |
Lindsay Corp.(a) | | | 2,762 | | | | 183,038 | |
Lydall, Inc.* | | | 2,326 | | | | 23,702 | |
Meritor, Inc.* | | | 51,124 | | | | 412,571 | |
Met-Pro Corp. | | | 2,726 | | | | 28,787 | |
Miller Industries, Inc. | | | 5,369 | | | | 90,843 | |
NACCO Industries, Inc. Class A | | | 5,253 | | | | 611,292 | |
NN, Inc.* | | | 12,884 | | | | 105,133 | |
See Notes to Financial Statements.
| | |
| 50 | | WisdomTree Domestic and International Earnings Funds |
Schedule of Investments (continued)
WisdomTree SmallCap Earnings Fund (EES)
March 31, 2012
| | | | | | | | |
| Investments | | Shares | | | Value | |
| | | | | | | | |
PMFG, Inc.*(a) | | | 2,204 | | | $ | 33,082 | |
RBC Bearings, Inc.* | | | 3,840 | | | | 177,139 | |
Sun Hydraulics Corp. | | | 6,647 | | | | 173,886 | |
Tennant Co. | | | 3,783 | | | | 166,452 | |
Titan International, Inc. | | | 7,470 | | | | 176,665 | |
Trimas Corp.* | | | 11,808 | | | | 264,381 | |
Twin Disc, Inc.(a) | | | 3,103 | | | | 80,957 | |
Wabash National Corp.* | | | 7,139 | | | | 73,889 | |
Xerium Technologies, Inc.* | | | 4,565 | | | | 29,444 | |
| | | | | | | | |
| Total Machinery | | | | 5,718,192 | |
| Marine – 0.1% | | | | | | | | |
International Shipholding Corp. | | | 3,913 | | | | 90,351 | |
| Media – 2.3% | | | | | | | | |
Arbitron, Inc. | | | 6,052 | | | | 223,803 | |
Belo Corp. Class A | | | 46,572 | | | | 333,921 | |
Cumulus Media, Inc. Class A*(a) | | | 68,385 | | | | 238,664 | |
Digital Generation, Inc.* | | | 10,695 | | | | 109,196 | |
Entercom Communications Corp. Class A* | | | 48,763 | | | | 316,472 | |
EW Scripps Co. Class A* | | | 2,301 | | | | 22,711 | |
Fisher Communications, Inc.* | | | 1,177 | | | | 36,157 | |
Harte-Hanks, Inc. | | | 19,930 | | | | 180,366 | |
Journal Communications, Inc. Class A* | | | 18,847 | | | | 106,109 | |
Knology, Inc.* | | | 6,450 | | | | 117,390 | |
LIN TV Corp. Class A* | | | 26,009 | | | | 105,336 | |
National CineMedia, Inc. | | | 11,462 | | | | 175,369 | |
New York Times Co. (The) Class A* | | | 12,628 | | | | 85,744 | |
Scholastic Corp. | | | 9,130 | | | | 322,106 | |
Sinclair Broadcast Group, Inc. Class A | | | 31,883 | | | | 352,626 | |
Valassis Communications, Inc.* | | | 20,905 | | | | 480,815 | |
World Wrestling Entertainment, Inc. Class A(a) | | | 16,517 | | | | 146,506 | |
| | | | | | | | |
| Total Media | | | | 3,353,291 | |
| Metals & Mining – 2.0% | | | | | | | | |
A.M. Castle & Co.*(a) | | | 3,760 | | | | 47,564 | |
AMCOL International Corp.(a) | | | 5,600 | | | | 165,144 | |
Century Aluminum Co.* | | | 29,412 | | | | 261,178 | |
Globe Specialty Metals, Inc. | | | 22,357 | | | | 332,449 | |
Gold Resource Corp. | | | 2,244 | | | | 54,552 | |
Handy & Harman Ltd.* | | | 8,363 | | | | 120,762 | |
Haynes International, Inc. | | | 2,583 | | | | 163,633 | |
Horsehead Holding Corp.* | | | 19,408 | | | | 221,057 | |
Kaiser Aluminum Corp.(a) | | | 1,802 | | | | 85,162 | |
Materion Corp.* | | | 8,777 | | | | 252,163 | |
Metals USA Holdings Corp.* | | | 18,794 | | | | 270,821 | |
Noranda Aluminum Holding Corp. | | | 70,441 | | | | 702,297 | |
Olympic Steel, Inc. | | | 3,773 | | | | 90,552 | |
RTI International Metals, Inc.* | | | 1,229 | | | | 28,341 | |
Universal Stainless & Alloy* | | | 2,001 | | | | 85,483 | |
| | | | | | | | |
| Total Metals & Mining | | | | 2,881,158 | |
| Multiline Retail – 0.2% | | | | | | | | |
Fred’s, Inc. Class A | | | 9,155 | | | | 133,754 | |
Gordmans Stores, Inc.* | | | 4,346 | | | | 95,482 | |
Tuesday Morning Corp.* | | | 7,698 | | | | 29,560 | |
| | | | | | | | |
| Total Multiline Retail | | | | 258,796 | |
| | | | | | | | |
| Multi-Utilities – 0.2% | | | | | | | | |
CH Energy Group, Inc. | | | 4,434 | | | $ | 295,881 | |
| Oil, Gas & Consumable Fuels – 2.7% | | | | | | | | |
Abraxas Petroleum Corp.* | | | 6,525 | | | | 20,358 | |
Alon USA Energy, Inc. | | | 13,336 | | | | 120,691 | |
Approach Resources, Inc.* | | | 2,289 | | | | 84,579 | |
Callon Petroleum Co.* | | | 28,187 | | | | 177,296 | |
Carrizo Oil & Gas, Inc.* | | | 822 | | | | 23,230 | |
Clayton Williams Energy, Inc.*(a) | | | 4,769 | | | | 378,849 | |
Contango Oil & Gas Co.* | | | 3,974 | | | | 234,108 | |
Delek US Holdings, Inc. | | | 34,323 | | | | 532,350 | |
Energy Partners Ltd.* | | | 10,470 | | | | 173,907 | |
Evolution Petroleum Corp.* | | | 574 | | | | 5,338 | |
GeoResources, Inc.* | | | 4,428 | | | | 144,973 | |
Green Plains Renewable Energy, Inc.* | | | 15,978 | | | | 172,403 | |
Houston American Energy Corp.*(a) | | | 4,217 | | | | 22,013 | |
James River Coal Co.*(a) | | | 8,240 | | | | 42,189 | |
Panhandle Oil and Gas, Inc. Class A | | | 1,051 | | | | 30,983 | |
Petroleum Development Corp.* | | | 283 | | | | 10,496 | |
Petroquest Energy, Inc.*(a) | | | 2,698 | | | | 16,566 | |
Resolute Energy Corp.*(a) | | | 12,498 | | | | 142,227 | |
REX American Resources Corp.* | | | 695 | | | | 21,336 | |
Vaalco Energy, Inc.* | | | 24,217 | | | | 228,851 | |
Venoco, Inc.* | | | 18,324 | | | | 198,632 | |
Warren Resources, Inc.* | | | 25,109 | | | | 81,855 | |
Western Refining, Inc.(a) | | | 58,752 | | | | 1,105,713 | |
| | | | | | | | |
| Total Oil, Gas & Consumable Fuels | | | | | | | 3,968,943 | |
| Paper & Forest Products – 0.9% | | | | | | | | |
Clearwater Paper Corp.* | | | 7,730 | | | | 256,713 | |
Deltic Timber Corp. | | | 356 | | | | 22,531 | |
KapStone Paper and Packaging Corp.* | | | 15,477 | | | | 304,897 | |
Neenah Paper, Inc. | | | 4,893 | | | | 145,518 | |
PH Glatfelter Co. | | | 12,717 | | | | 200,674 | |
Schweitzer-Mauduit International, Inc. | | | 3,707 | | | | 256,006 | |
Wausau Paper Corp. | | | 11,656 | | | | 109,333 | |
| | | | | | | | |
| Total Paper & Forest Products | | | | | | | 1,295,672 | |
| Personal Products – 1.7% | | | | | | | | |
Elizabeth Arden, Inc.* | | | 5,028 | | | | 175,879 | |
Inter Parfums, Inc. | | | 7,306 | | | | 114,631 | |
Medifast, Inc.*(a) | | | 5,512 | | | | 96,240 | |
Nature’s Sunshine Products, Inc.*(a) | | | 4,810 | | | | 77,056 | |
Nutraceutical International Corp.* | | | 5,582 | | | | 81,274 | |
Prestige Brands Holdings, Inc.* | | | 13,392 | | | | 234,092 | |
Revlon, Inc. Class A* | | | 85,371 | | | | 1,472,650 | |
Schiff Nutrition International, Inc.* | | | 4,602 | | | | 56,559 | |
USANA Health Sciences, Inc.*(a) | | | 6,389 | | | | 238,501 | |
| | | | | | | | |
| Total Personal Products | | | | | | | 2,546,882 | |
| Pharmaceuticals – 1.1% | | | | | | | | |
Acura Pharmaceuticals, Inc.*(a) | | | 8,699 | | | | 30,098 | |
Akorn, Inc.* | | | 23,524 | | | | 275,231 | |
Columbia Laboratories, Inc.* | | | 17,301 | | | | 12,284 | |
DepoMed, Inc.* | | | 74,618 | | | | 467,109 | |
See Notes to Financial Statements.
| | | | |
| WisdomTree Domestic and International Earnings Funds | | | 51 | |
Schedule of Investments (continued)
WisdomTree SmallCap Earnings Fund (EES)
March 31, 2012
| | | | | | | | |
| Investments | | Shares | | | Value | |
| | | | | | | | |
Hi-Tech Pharmacal Co., Inc.* | | | 5,043 | | | $ | 181,195 | |
MAP Pharmaceuticals, Inc.* | | | 1,747 | | | | 25,087 | |
Medicines Co. (The)* | | | 30,945 | | | | 621,066 | |
Obagi Medical Products, Inc.* | | | 3,083 | | | | 41,312 | |
Santarus, Inc.* | | | 1,578 | | | | 9,231 | |
| | | | | | | | |
| Total Pharmaceuticals | | | | | | | 1,662,613 | |
| Professional Services – 2.4% | | | | | | | | |
Advisory Board Co. (The)* | | | 1,065 | | | | 94,380 | |
Barrett Business Services, Inc. | | | 2,132 | | | | 42,278 | |
CBIZ, Inc.*(a) | | | 17,008 | | | | 107,491 | |
CDI Corp. | | | 2,731 | | | | 48,967 | |
CRA International, Inc.* | | | 2,591 | | | | 65,345 | |
Dolan Co. (The)* | | | 8,267 | | | | 75,312 | |
Exponent, Inc.* | | | 2,735 | | | | 132,702 | |
Franklin Covey Co.* | | | 1,948 | | | | 18,331 | |
GP Strategies Corp.* | | | 4,739 | | | | 82,932 | |
Hudson Highland Group, Inc.* | | | 7,047 | | | | 37,913 | |
Huron Consulting Group, Inc.* | | | 3,652 | | | | 137,169 | |
ICF International, Inc.* | | | 5,093 | | | | 129,209 | |
Insperity, Inc. | | | 4,906 | | | | 150,320 | |
Kelly Services, Inc. Class A | | | 15,913 | | | | 254,449 | |
Kforce, Inc.* | | | 9,100 | | | | 135,590 | |
Korn/Ferry International* | | | 15,978 | | | | 267,631 | |
Mistras Group, Inc.* | | | 2,960 | | | | 70,507 | |
Navigant Consulting, Inc.* | | | 11,701 | | | | 162,761 | |
On Assignment, Inc.* | | | 943 | | | | 16,474 | |
Pendrell Corp.* | | | 436,706 | | | | 1,139,803 | |
Resources Connection, Inc. | | | 3,793 | | | | 53,292 | |
RPX Corp.* | | | 7,530 | | | | 127,709 | |
TrueBlue, Inc.* | | | 8,265 | | | | 147,778 | |
VSE Corp. | | | 3,237 | | | | 80,310 | |
| | | | | | | | |
| Total Professional Services | | | | | | | 3,578,653 | |
| Real Estate Investment Trusts (REITs) – 1.3% | | | | | | | | |
Acadia Realty Trust | | | 4,908 | | | | 110,626 | |
Agree Realty Corp. | | | 638 | | | | 14,406 | |
Chesapeake Lodging Trust | | | 1,091 | | | | 19,605 | |
EastGroup Properties, Inc. | | | 1,913 | | | | 96,071 | |
Franklin Street Properties Corp. | | | 7,768 | | | | 82,341 | |
Getty Realty Corp.(a) | | | 12,579 | | | | 195,981 | |
Gladstone Commercial Corp. | | | 260 | | | | 4,475 | |
Government Properties Income Trust | | | 6,826 | | | | 164,575 | |
Investors Real Estate Trust | | | 785 | | | | 6,037 | |
LTC Properties, Inc. | | | 4,950 | | | | 158,400 | |
Medical Properties Trust, Inc. | | | 8,371 | | | | 77,683 | |
Mission West Properties, Inc. | | | 1,028 | | | | 10,136 | |
Monmouth Real Estate Investment Corp. Class A | | | 5,441 | | | | 52,995 | |
National Health Investors, Inc. | | | 6,366 | | | | 310,534 | |
One Liberty Properties, Inc. | | | 2,404 | | | | 43,993 | |
Ramco-Gershenson Properties Trust | | | 3,711 | | | | 45,348 | |
Retail Opportunity Investments Corp.(a) | | | 3,138 | | | | 37,782 | |
Sabra Health Care REIT, Inc. | | | 1,966 | | | | 32,321 | |
Saul Centers, Inc. | | | 1,267 | | | | 51,136 | |
Sovran Self Storage, Inc. | | | 2,795 | | | | 139,275 | |
| | | | | | | | |
Sun Communities, Inc. | | | 86 | | | $ | 3,726 | |
Sunstone Hotel Investors, Inc.* | | | 6,714 | | | | 65,394 | |
UMH Properties, Inc. | | | 1,897 | | | | 20,791 | |
Universal Health Realty Income Trust | | | 1,627 | | | | 64,478 | |
Urstadt Biddle Properties, Inc. Class A | | | 4,129 | | | | 81,507 | |
Whitestone REIT Class B | | | 229 | | | | 2,986 | |
Winthrop Realty Trust | | | 7,439 | | | | 86,218 | |
| | | | | | | | |
| Total Real Estate Investment Trusts (REITs) | | | | | | | 1,978,820 | |
| Real Estate Management & Development – 0.1% | | | | | | | | |
Forestar Group, Inc.* | | | 8,724 | | | | 134,263 | |
Tejon Ranch Co.* | | | 1,477 | | | | 42,301 | |
| | | | | | | | |
| Total Real Estate Management & Development | | | | | | | 176,564 | |
| Road & Rail – 0.4% | | | | | | | | |
Celadon Group, Inc. | | | 4,588 | | | | 71,343 | |
Marten Transport Ltd. | | | 4,655 | | | | 102,736 | |
Quality Distribution, Inc.* | | | 2,996 | | | | 41,285 | |
RailAmerica, Inc.* | | | 11,643 | | | | 249,859 | |
Roadrunner Transportation Systems, Inc.* | | | 6,013 | | | | 104,325 | |
Saia, Inc.* | | | 2,865 | | | | 48,734 | |
| | | | | | | | |
| Total Road & Rail | | | | | | | 618,282 | |
| Semiconductors & Semiconductor Equipment – 8.0% | | | | | |
Advanced Energy Industries, Inc.* | | | 23,000 | | | | 301,760 | |
Amkor Technology, Inc.* | | | 110,297 | | | | 677,775 | |
ATMI, Inc.* | | | 6,655 | | | | 155,062 | |
Axcelis Technologies, Inc.* | | | 33,985 | | | | 58,454 | |
AXT, Inc.* | | | 23,493 | | | | 149,181 | |
Brooks Automation, Inc. | | | 33,542 | | | | 413,573 | |
Cabot Microelectronics Corp. | | | 4,425 | | | | 172,044 | |
Ceva, Inc.* | | | 2,578 | | | | 58,546 | |
Cirrus Logic, Inc.* | | | 44,660 | | | | 1,062,908 | |
Cohu, Inc. | | | 8,141 | | | | 92,563 | |
Diodes, Inc.*(a) | | | 14,537 | | | | 336,968 | |
Entegris, Inc.* | | | 53,232 | | | | 497,187 | |
Entropic Communications, Inc.*(a) | | | 58,728 | | | | 342,384 | |
FSI International, Inc.* | | | 10,074 | | | | 49,262 | |
GSI Technology, Inc.* | | | 11,684 | | | | 49,540 | |
GT Advanced Technologies, Inc.*(a) | | | 109,090 | | | | 902,174 | |
Inphi Corp.* | | | 1,662 | | | | 23,567 | |
Integrated Device Technology, Inc.* | | | 42,344 | | | | 302,760 | |
Integrated Silicon Solution, Inc.* | | | 23,647 | | | | 263,901 | |
IXYS Corp.* | | | 16,039 | | | | 211,715 | |
Kopin Corp.* | | | 4,982 | | | | 20,277 | |
Kulicke & Soffa Industries, Inc.* | | | 56,625 | | | | 703,849 | |
Lattice Semiconductor Corp.* | | | 33,566 | | | | 215,829 | |
LTX-Credence Corp.* | | | 23,817 | | | | 171,244 | |
Micrel, Inc. | | | 16,476 | | | | 169,044 | |
MIPS Technologies, Inc.* | | | 9,061 | | | | 49,292 | |
Monolithic Power Systems, Inc.* | | | 4,396 | | | | 86,469 | |
Nanometrics, Inc.* | | | 12,443 | | | | 230,320 | |
NVE Corp.*(a) | | | 903 | | | | 47,859 | |
Omnivision Technologies, Inc.* | | | 45,983 | | | | 919,660 | |
Pericom Semiconductor Corp.* | | | 2,072 | | | | 16,763 | |
Photronics, Inc.* | | | 9,722 | | | | 64,651 | |
See Notes to Financial Statements.
| | |
| 52 | | WisdomTree Domestic and International Earnings Funds |
Schedule of Investments (continued)
WisdomTree SmallCap Earnings Fund (EES)
March 31, 2012
| | | | | | | | |
| Investments | | Shares | | | Value | |
| | | | | | | | |
Power Integrations, Inc. | | | 4,419 | | | $ | 164,033 | |
Rambus, Inc.* | | | 4,142 | | | | 26,716 | |
Rubicon Technology, Inc.* | | | 21,677 | | | | 226,091 | |
Rudolph Technologies, Inc.* | | | 13,649 | | | | 151,640 | |
Silicon Image, Inc.* | | | 2,303 | | | | 13,542 | |
Spansion, Inc. Class A* | | | 2,380 | | | | 28,988 | |
Standard Microsystems Corp.* | | | 2,238 | | | | 57,897 | |
STR Holdings, Inc.*(a) | | | 17,779 | | | | 86,050 | |
Supertex, Inc.* | | | 1,706 | | | | 30,827 | |
TriQuint Semiconductor, Inc.* | | | 73,800 | | | | 508,851 | |
Ultra Clean Holdings* | | | 12,612 | | | | 95,094 | |
Ultratech, Inc.* | | | 5,893 | | | | 170,779 | |
Veeco Instruments, Inc.*(a) | | | 45,795 | | | | 1,309,737 | |
Volterra Semiconductor Corp.* | | | 4,059 | | | | 139,691 | |
| | | | | | | | |
| Total Semiconductors & Semiconductor Equipment | | | | | | | 11,826,517 | |
| Software – 1.8% | | | | | | | | |
ACI Worldwide, Inc.* | | | 7,395 | | | | 297,797 | |
Actuate Corp.* | | | 6,167 | | | | 38,729 | |
American Software, Inc. Class A | | | 3,577 | | | | 30,691 | |
Bottomline Technologies, Inc.* | | | 6,591 | | | | 184,153 | |
BroadSoft, Inc.*(a) | | | 4,530 | | | | 173,272 | |
Convio, Inc.* | | | 850 | | | | 13,149 | |
Digimarc Corp.* | | | 1,179 | | | | 32,941 | |
Ebix, Inc.(a) | | | 14,056 | | | | 325,537 | |
EPIQ Systems, Inc. | | | 4,176 | | | | 50,530 | |
ePlus, Inc.* | | | 3,020 | �� | | | 96,549 | |
Interactive Intelligence Group, Inc.* | | | 2,713 | | | | 82,774 | |
Majesco Entertainment Co.*(a) | | | 12,299 | | | | 30,379 | |
Manhattan Associates, Inc.* | | | 3,414 | | | | 162,267 | |
Monotype Imaging Holdings, Inc.* | | | 5,596 | | | | 83,380 | |
Netscout Systems, Inc.* | | | 7,081 | | | | 144,028 | |
Opnet Technologies, Inc. | | | 1,745 | | | | 50,605 | |
Pegasystems, Inc. | | | 812 | | | | 30,986 | |
PROS Holdings, Inc.* | | | 1,146 | | | | 21,430 | |
SeaChange International, Inc.* | | | 2,604 | | | | 20,259 | |
Sourcefire, Inc.* | | | 887 | | | | 42,691 | |
Synchronoss Technologies, Inc.* | | | 1,111 | | | | 35,463 | |
TeleCommunication Systems, Inc. Class A* | | | 15,483 | | | | 43,043 | |
TeleNav, Inc.* | | | 18,366 | | | | 128,929 | |
Tyler Technologies, Inc.* | | | 3,506 | | | | 134,665 | |
VASCO Data Security International, Inc.* | | | 10,025 | | | | 108,170 | |
Verint Systems, Inc.* | | | 3,566 | | | | 115,503 | |
Websense, Inc.* | | | 6,584 | | | | 138,857 | |
| | | | | | | | |
| Total Software | | | | | | | 2,616,777 | |
| Specialty Retail – 3.7% | | | | | | | | |
America’s Car-Mart, Inc.* | | | 3,027 | | | | 133,128 | |
Asbury Automotive Group, Inc.* | | | 8,224 | | | | 222,048 | |
bebe Stores, Inc. | | | 3,426 | | | | 31,622 | |
Big 5 Sporting Goods Corp. | | | 7,058 | | | | 55,335 | |
Body Central Corp.* | | | 2,806 | | | | 81,430 | |
Brown Shoe Co., Inc. | | | 7,129 | | | | 65,801 | |
Casual Male Retail Group, Inc.* | | | 18,203 | | | | 61,162 | |
| | | | | | | | |
Cato Corp. (The) Class A | | | 9,684 | | | $ | 267,666 | |
Citi Trends, Inc.* | | | 2,297 | | | | 26,324 | |
Cost Plus, Inc.* | | | 3,898 | | | | 69,774 | |
Destination Maternity Corp. | | | 5,502 | | | | 102,172 | |
Finish Line, Inc. (The) Class A | | | 14,596 | | | | 309,727 | |
Group 1 Automotive, Inc. | | | 5,730 | | | | 321,854 | |
Haverty Furniture Cos., Inc. | | | 1,424 | | | | 15,806 | |
hhgregg, Inc.*(a) | | | 12,589 | | | | 143,263 | |
Kirkland’s, Inc.* | | | 6,399 | | | | 103,536 | |
Lithia Motors, Inc. Class A | | | 7,726 | | | | 202,421 | |
Lumber Liquidators Holdings, Inc.*(a) | | | 5,721 | | | | 143,654 | |
Midas, Inc.* | | | 1,936 | | | | 22,225 | |
OfficeMax, Inc.*(a) | | | 35,641 | | | | 203,867 | |
PEP Boys-Manny Moe & Jack (The) | | | 15,060 | | | | 224,695 | |
RadioShack Corp.(a) | | | 42,619 | | | | 265,090 | |
Rue21, Inc.*(a) | | | 6,151 | | | | 180,470 | |
Select Comfort Corp.* | | | 10,794 | | | | 349,618 | |
Shoe Carnival, Inc.* | | | 4,447 | | | | 143,282 | |
Sonic Automotive, Inc. Class A(a) | | | 31,924 | | | | 571,759 | |
Stage Stores, Inc. | | | 8,576 | | | | 139,274 | |
Stein Mart, Inc.* | | | 19,783 | | | | 130,568 | |
Systemax, Inc.* | | | 13,196 | | | | 222,485 | |
Vitamin Shoppe, Inc.* | | | 4,410 | | | | 194,966 | |
West Marine, Inc.* | | | 8,782 | | | | 105,208 | |
Wet Seal, Inc. (The) Class A* | | | 23,053 | | | | 79,533 | |
Winmark Corp. | | | 893 | | | | 51,740 | |
Zumiez, Inc.* | | | 4,256 | | | | 153,684 | |
| | | | | | | | |
| Total Specialty Retail | | | | | | | 5,395,187 | |
| Textiles, Apparel & Luxury Goods – 0.9% | | | | | | | | |
Cherokee, Inc. | | | 2,312 | | | | 26,334 | |
Delta Apparel, Inc.* | | | 4,195 | | | | 68,924 | |
G-III Apparel Group Ltd.* | | | 9,124 | | | | 259,304 | |
Jones Group, Inc. (The) | | | 22,833 | | | | 286,782 | |
Maidenform Brands, Inc.* | | | 10,148 | | | | 228,432 | |
Oxford Industries, Inc. | | | 2,303 | | | | 117,038 | |
Perry Ellis International, Inc.* | | | 8,875 | | | | 165,696 | |
True Religion Apparel, Inc.* | | | 5,416 | | | | 148,398 | |
Unifi, Inc.* | | | 7,998 | | | | 77,261 | |
| | | | | | | | |
| Total Textiles, Apparel & Luxury Goods | | | | | | | 1,378,169 | |
| Thrifts & Mortgage Finance – 1.6% | | | | | | | | |
Astoria Financial Corp. | | | 39,397 | | | | 388,454 | |
Beneficial Mutual Bancorp, Inc.* | | | 2,315 | | | | 20,233 | |
Berkshire Hills Bancorp, Inc. | | | 2,037 | | | | 46,688 | |
Bofi Holding, Inc.* | | | 5,323 | | | | 90,917 | |
Brookline Bancorp, Inc. | | | 17,517 | | | | 164,134 | |
Dime Community Bancshares, Inc. | | | 15,161 | | | | 221,502 | |
ESB Financial Corp. | | | 4,019 | | | | 57,954 | |
ESSA Bancorp, Inc. | | | 1,912 | | | | 18,738 | |
Federal Agricultural Mortgage Corp. Class C | | | 2,940 | | | | 66,738 | |
First Defiance Financial Corp. | | | 3,147 | | | | 53,058 | |
First PacTrust Bancorp, Inc.(a) | | | 1,408 | | | | 16,783 | |
Flushing Financial Corp. | | | 11,001 | | | | 148,074 | |
Fox Chase Bancorp, Inc. | | | 1,351 | | | | 17,563 | |
See Notes to Financial Statements.
| | | | |
| WisdomTree Domestic and International Earnings Funds | | | 53 | |
Schedule of Investments (concluded)
WisdomTree SmallCap Earnings Fund (EES)
March 31, 2012
| | | | | | | | |
| Investments | | Shares | | | Value | |
| | | | | | | | |
Kearny Financial Corp. | | | 3,512 | | | $ | 34,242 | |
Northfield Bancorp, Inc.(a) | | | 4,724 | | | | 67,175 | |
OceanFirst Financial Corp. | | | 6,140 | | | | 87,434 | |
Oritani Financial Corp. | | | 8,662 | | | | 127,158 | |
Provident Financial Services, Inc. | | | 16,358 | | | | 237,682 | |
Provident New York Bancorp | | | 7,760 | | | | 65,650 | |
Rockville Financial, Inc. | | | 2,083 | | | | 24,267 | |
Territorial Bancorp, Inc. | | | 2,441 | | | | 50,797 | |
TrustCo Bank Corp. | | | 22,638 | | | | 129,263 | |
United Financial Bancorp, Inc. | | | 2,667 | | | | 42,192 | |
ViewPoint Financial Group | | | 6,896 | | | | 106,061 | |
Walker & Dunlop, Inc.* | | | 786 | | | | 9,904 | |
Westfield Financial, Inc. | | | 2,807 | | | | 22,203 | |
WSFS Financial Corp. | | | 1,704 | | | | 69,864 | |
| | | | | | | | |
| Total Thrifts & Mortgage Finance | | | | | | | 2,384,728 | |
| Tobacco – 0.3% | | | | | | | | |
Universal Corp. | | | 8,107 | | | | 377,786 | |
| Trading Companies & Distributors – 1.5% | | | | | | | | |
Aceto Corp. | | | 4,931 | | | | 46,795 | |
Beacon Roofing Supply, Inc.* | | | 9,794 | | | | 252,293 | |
CAI International, Inc.* | | | 12,565 | | | | 228,432 | |
DXP Enterprises, Inc.* | | | 3,668 | | | | 159,521 | |
Houston Wire & Cable Co. | | | 5,721 | | | | 79,465 | |
Interline Brands, Inc.* | | | 7,918 | | | | 171,108 | |
Kaman Corp. | | | 8,746 | | | | 296,927 | |
Rush Enterprises, Inc. Class A* | | | 9,090 | | | | 192,890 | |
TAL International Group, Inc. | | | 16,112 | | | | 591,471 | |
Titan Machinery, Inc.* | | | 5,696 | | | | 160,627 | |
| | | | | | | | |
| Total Trading Companies & Distributors | | | | | | | 2,179,529 | |
| Water Utilities – 0.4% | | | | | | | | |
American States Water Co. | | | 4,980 | | | | 179,977 | |
Artesian Resources Corp. Class A | | | 1,259 | | | | 23,657 | |
California Water Service Group | | | 10,981 | | | | 199,964 | |
Connecticut Water Service, Inc. | | | 1,628 | | | | 46,056 | |
Middlesex Water Co. | | | 3,173 | | | | 59,938 | |
SJW Corp. | | | 2,772 | | | | 66,861 | |
York Water Co. | | | 2,077 | | | | 35,932 | |
| | | | | | | | |
| Total Water Utilities | | | | | | | 612,385 | |
| Wireless Telecommunication Services – 0.5% | | | | | | | | |
NTELOS Holdings Corp. | | | 8,491 | | | | 175,764 | |
Shenandoah Telecommunications Co. | | | 4,641 | | | | 51,747 | |
USA Mobility, Inc. | | | 30,880 | | | | 430,158 | |
| | | | | | | | |
| Total Wireless Telecommunication Services | | | | | | | 657,669 | |
TOTAL COMMON STOCKS (Cost: $128,738,384) | | | | | | | 146,750,185 | |
| EXCHANGE-TRADED FUND – 0.2% | | | | | | | | |
WisdomTree MidCap Earnings Fund(a)(b) (Cost: $236,674) | | | 4,401 | | | | 269,473 | |
| SHORT-TERM INVESTMENT – 0.0% | | | | | | | | |
| MONEY MARKET FUND – 0.0% | | | | | | | | |
Invesco Treasury Fund Private Class, 0.02%(c) (Cost: $30,425) | | | 30,425 | | | | 30,425 | |
| | | | | | | | |
| INVESTMENT OF CASH COLLATERAL FOR SECURITIES LOANED – 8.8% | | | | | | | | |
| MONEY MARKET FUND – 8.8% | | | | | | | | |
Dreyfus Institutional Preferred Money Market Fund, 0.18%(c) | | | | | | | | |
| (Cost: $12,980,279)(d) | | | 12,980,279 | | | $ | 12,980,279 | |
TOTAL INVESTMENTS IN SECURITIES – 108.8% (Cost: $141,985,762) | | | | 160,030,362 | |
Liabilities in Excess of Other Assets – (8.8)% | | | | (12,903,475 | ) |
| | | | | | | | |
| NET ASSETS – 100.0% | | | $ | 147,126,887 | |
| * | Non-income producing security. |
| (a) | Security, or portion thereof, was on loan at March 31, 2012 (See Note 2). |
| (b) | Affiliated company (See Note 7). |
| (c) | Rate shown represents annualized 7-day yield as of March 31, 2012. |
| (d) | At March 31, 2012, the total market value of the Fund’s securities on loan was $12,629,839 and the total market value of the collateral held by the Fund was $12,980,279. |
See Notes to Financial Statements.
| | |
| 54 | | WisdomTree Domestic and International Earnings Funds |
Schedule of Investments
WisdomTree LargeCap Value Fund (EZY)
March 31, 2012
| | | | | | | | |
| Investments | | Shares | | | Value | |
| | | | | | | | |
| UNITED STATES – 100.6% | | | | | | | | |
| COMMON STOCKS – 99.4% | | | | | |
| Aerospace & Defense – 0.5% | | | | | |
Cubic Corp. | | | 174 | | | $ | 8,227 | |
Esterline Technologies Corp.* | | | 307 | | | | 21,938 | |
Moog, Inc. Class A* | | | 395 | | | | 16,942 | |
Teledyne Technologies, Inc.* | | | 364 | | | | 22,950 | |
Textron, Inc. | | | 1,363 | | | | 37,932 | |
Triumph Group, Inc. | | | 492 | | | | 30,829 | |
| | | | | | | | |
| Total Aerospace & Defense | | | | 138,818 | |
| Air Freight & Logistics – 0.1% | | | | | | | | |
Atlas Air Worldwide Holdings, Inc.* | | | 300 | | | | 14,763 | |
| Airlines – 0.2% | | | | | | | | |
Alaska Air Group, Inc.* | | | 1,172 | | | | 41,981 | |
JetBlue Airways Corp.* | | | 2,527 | | | | 12,357 | |
| | | | | | | | |
| Total Airlines | | | | 54,338 | |
| Auto Components – 1.1% | | | | | | | | |
BorgWarner, Inc.* | | | 741 | | | | 62,496 | |
Cooper Tire & Rubber Co. | | | 698 | | | | 10,624 | |
Johnson Controls, Inc. | | | 5,188 | | | | 168,506 | |
TRW Automotive Holdings Corp.* | | | 2,249 | | | | 104,466 | |
| | | | | | | | |
| Total Auto Components | | | | 346,092 | |
| Automobiles – 0.3% | | | | | | | | |
Harley-Davidson, Inc. | | | 1,685 | | | | 82,700 | |
| Beverages – 0.4% | | | | | | | | |
Beam, Inc. | | | 1,058 | | | | 61,967 | |
Constellation Brands, Inc. Class A* | | | 2,383 | | | | 56,215 | |
| | | | | | | | |
| Total Beverages | | | | 118,182 | |
| Building Products – 0.5% | | | | | | | | |
Fortune Brands Home & Security, Inc.* | | | 1,058 | | | | 23,350 | |
Owens Corning* | | | 3,529 | | | | 127,150 | |
| | | | | | | | |
| Total Building Products | | | | 150,500 | |
| Capital Markets – 0.6% | | | | | | | | |
Ameriprise Financial, Inc. | | | 2,525 | | | | 144,253 | |
Raymond James Financial, Inc. | | | 917 | | | | 33,498 | |
Stifel Financial Corp.* | | | 584 | | | | 22,099 | |
| | | | | | | | |
| Total Capital Markets | | | | 199,850 | |
| Chemicals – 4.2% | | | | | | | | |
Ashland, Inc. | | | 802 | | | | 48,970 | |
Cabot Corp. | | | 679 | | | | 28,980 | |
CF Industries Holdings, Inc. | | | 601 | | | | 109,773 | |
Cytec Industries, Inc. | | | 366 | | | | 22,249 | |
Dow Chemical Co. (The) | | | 8,498 | | | | 294,371 | |
E.I. du Pont de Nemours & Co. | | | 7,793 | | | | 412,250 | |
Eastman Chemical Co. | | | 1,572 | | | | 81,257 | |
NewMarket Corp. | | | 159 | | | | 29,797 | |
PolyOne Corp. | | | 1,853 | | | | 26,683 | |
PPG Industries, Inc. | | | 1,122 | | | | 107,487 | |
Rockwood Holdings, Inc.* | | | 684 | | | | 35,671 | |
Sensient Technologies Corp. | | | 363 | | | | 13,794 | |
Solutia, Inc. | | | 1,009 | | | | 28,191 | |
Valspar Corp. | | | 801 | | | | 38,680 | |
| | | | | | | | |
Westlake Chemical Corp. | | | 474 | | | $ | 30,710 | |
| | | | | | | | |
| Total Chemicals | | | | 1,308,863 | |
| Commercial Services & Supplies – 0.4% | | | | | | | | |
ABM Industries, Inc. | | | 438 | | | | 10,643 | |
Avery Dennison Corp. | | | 1,123 | | | | 33,836 | |
Clean Harbors, Inc.* | | | 363 | | | | 24,441 | |
Deluxe Corp. | | | 650 | | | | 15,223 | |
Geo Group, Inc. (The)* | | | 530 | | | | 10,075 | |
Steelcase, Inc. Class A | | | 538 | | | | 5,165 | |
United Stationers, Inc. | | | 406 | | | | 12,598 | |
| | | | | | | | |
| Total Commercial Services & Supplies | | | | 111,981 | |
| Communications Equipment – 0.3% | | | | | | | | |
EchoStar Corp. Class A* | | | 720 | | | | 20,261 | |
Loral Space & Communications, Inc.* | | | 860 | | | | 68,456 | |
| | | | | | | | |
| Total Communications Equipment | | | | 88,717 | |
| Computers & Peripherals – 0.7% | | | | | | | | |
NCR Corp.* | | | 1,067 | | | | 23,164 | |
SanDisk Corp.* | | | 3,737 | | | | 185,318 | |
| | | | | | | | |
| Total Computers & Peripherals | | | | 208,482 | |
| Construction & Engineering – 0.5% | | | | | | | | |
EMCOR Group, Inc. | | | 706 | | | | 19,570 | |
Fluor Corp. | | | 1,559 | | | | 93,602 | |
KBR, Inc. | | | 1,234 | | | | 43,869 | |
MasTec, Inc.* | | | 565 | | | | 10,221 | |
| | | | | | | | |
| Total Construction & Engineering | | | | 167,262 | |
| Consumer Finance – 1.6% | | | | | | | | |
Capital One Financial Corp. | | | 7,743 | | | | 431,595 | |
Cash America International, Inc. | | | 398 | | | | 19,076 | |
Credit Acceptance Corp.* | | | 291 | | | | 29,394 | |
Ezcorp, Inc. Class A* | | | 486 | | | | 15,773 | |
| | | | | | | | |
| Total Consumer Finance | | | | 495,838 | |
| Containers & Packaging – 0.8% | | | | | | | | |
Ball Corp. | | | 1,968 | | | | 84,388 | |
Bemis Co., Inc. | | | 947 | | | | 30,579 | |
Graphic Packaging Holding Co.* | | | 1,894 | | | | 10,455 | |
Greif, Inc. Class A | | | 585 | | | | 32,713 | |
Rock-Tenn Co. Class A | | | 458 | | | | 30,942 | |
Sealed Air Corp. | | | 1,603 | | | | 30,954 | |
Sonoco Products Co. | | | 1,061 | | | | 35,225 | |
| | | | | | | | |
| Total Containers & Packaging | | | | 255,256 | |
| Distributors – 0.2% | | | | | | | | |
Genuine Parts Co. | | | 1,169 | | | | 73,355 | |
| Diversified Consumer Services – 0.1% | | | | | | | | |
Coinstar, Inc.*(a) | | | 229 | | | | 14,553 | |
| Diversified Financial Services – 0.2% | | | | | | | | |
NASDAQ OMX Group, Inc. (The)* | | | 2,259 | | | | 58,508 | |
| Diversified Telecommunication Services – 11.3% | | | | | | | | |
AT&T, Inc. | | | 81,202 | | | | 2,535,938 | |
Verizon Communications, Inc. | | | 25,220 | | | | 964,161 | |
| | | | | | | | |
| Total Diversified Telecommunication Services | | | | 3,500,099 | |
See Notes to Financial Statements.
| | | | |
| WisdomTree Domestic and International Earnings Funds | | | 55 | |
Schedule of Investments (continued)
WisdomTree LargeCap Value Fund (EZY)
March 31, 2012
| | | | | | | | |
| Investments | | Shares | | | Value | |
| | | | | | | | |
| Electric Utilities – 1.4% | | | | | | | | |
Cleco Corp. | | | 390 | | | $ | 15,463 | |
Edison International | | | 4,514 | | | | 191,890 | |
El Paso Electric Co. | | | 381 | | | | 12,379 | |
Northeast Utilities | | | 1,536 | | | | 57,016 | |
NV Energy, Inc. | | | 2,096 | | | | 33,788 | |
Pepco Holdings, Inc. | | | 2,670 | | | | 50,436 | |
PNM Resources, Inc. | | | 1,262 | | | | 23,095 | |
Portland General Electric Co. | | | 670 | | | | 16,737 | |
Unisource Energy Corp. | | | 468 | | | | 17,115 | |
Westar Energy, Inc. | | | 1,067 | | | | 29,801 | |
| | | | | | | | |
| Total Electric Utilities | | | | 447,720 | |
| Electrical Equipment – 0.4% | | | | | | | | |
Belden, Inc. | | | 323 | | | | 12,245 | |
EnerSys* | | | 472 | | | | 16,355 | |
General Cable Corp.* | | | 318 | | | | 9,247 | |
GrafTech International Ltd.* | | | 1,148 | | | | 13,707 | |
Hubbell, Inc. Class B | | | 463 | | | | 36,383 | |
Polypore International, Inc.*(a) | | | 136 | | | | 4,782 | |
Regal-Beloit Corp. | | | 290 | | | | 19,009 | |
Thomas & Betts Corp.* | | | 362 | | | | 26,031 | |
| | | | | | | | |
| Total Electrical Equipment | | | | 137,759 | |
| Electronic Equipment, Instruments & Components – 1.3% | | | | | |
Anixter International, Inc.* | | | 309 | | | | 22,412 | |
Arrow Electronics, Inc.* | | | 1,584 | | | | 66,480 | |
Avnet, Inc.* | | | 2,264 | | | | 82,387 | |
FEI Co.* | | | 252 | | | | 12,376 | |
Ingram Micro, Inc. Class A* | | | 2,005 | | | | 37,213 | |
IPG Photonics Corp.* | | | 116 | | | | 6,038 | |
Jabil Circuit, Inc. | | | 2,260 | | | | 56,771 | |
Molex, Inc. | | | 1,581 | | | | 44,458 | |
Tech Data Corp.* | | | 566 | | | | 30,711 | |
TTM Technologies, Inc.* | | | 590 | | | | 6,779 | |
Vishay Intertechnology, Inc.* | | | 2,664 | | | | 32,394 | |
| | | | | | | | |
| Total Electronic Equipment, Instruments & Components | | | | 398,019 | |
| Energy Equipment & Services – 2.2% | | | | | | | | |
Baker Hughes, Inc. | | | 1,842 | | | | 77,254 | |
Bristow Group, Inc. | | | 389 | | | | 18,567 | |
Dresser-Rand Group, Inc.* | | | 364 | | | | 16,886 | |
Halliburton Co. | | | 5,351 | | | | 177,600 | |
Helmerich & Payne, Inc. | | | 672 | | | | 36,254 | |
Lufkin Industries, Inc. | | | 58 | | | | 4,678 | |
National Oilwell Varco, Inc. | | | 3,034 | | | | 241,112 | |
Oil States International, Inc.* | | | 324 | | | | 25,291 | |
Rowan Cos., Inc.* | | | 1,044 | | | | 34,379 | |
SEACOR Holdings, Inc.* | | | 367 | | | | 35,151 | |
Superior Energy Services, Inc.* | | | 522 | | | | 13,760 | |
| | | | | | | | |
| Total Energy Equipment & Services | | | | 680,932 | |
| Food & Staples Retailing – 1.5% | | | | | | | | |
Casey’s General Stores, Inc. | | | 447 | | | | 24,791 | |
Costco Wholesale Corp. | | | 2,398 | | | | 217,738 | |
Harris Teeter Supermarkets, Inc.* | | | 436 | | | | 17,484 | |
Kroger Co. (The) | | | 6,201 | | | | 150,250 | |
| | | | | | | | |
United Natural Foods, Inc.* | | | 249 | | | $ | 11,618 | |
Whole Foods Market, Inc. | | | 588 | | | | 48,922 | |
| | | | | | | | |
| Total Food & Staples Retailing | | | | 470,803 | |
| Food Products – 1.6% | | | | | | | | |
Archer-Daniels-Midland Co. | | | 7,391 | | | | 233,999 | |
Corn Products International, Inc. | | | 720 | | | | 41,508 | |
Darling International, Inc.* | | | 449 | | | | 7,822 | |
Hain Celestial Group, Inc. (The)* | | | 169 | | | | 7,404 | |
Hormel Foods Corp. | | | 2,091 | | | | 61,726 | |
TreeHouse Foods, Inc.* | | | 233 | | | | 13,863 | |
Tyson Foods, Inc. Class A | | | 6,671 | | | | 127,750 | |
| | | | | | | | |
| Total Food Products | | | | 494,072 | |
| Gas Utilities – 0.5% | | | | | | | | |
Atmos Energy Corp. | | | 743 | | | | 23,375 | |
ONEOK, Inc. | | | 698 | | | | 56,999 | |
Southwest Gas Corp. | | | 390 | | | | 16,668 | |
UGI Corp. | | | 984 | | | | 26,814 | |
WGL Holdings, Inc. | | | 431 | | | | 17,542 | |
| | | | | | | | |
| Total Gas Utilities | | | | 141,398 | |
| Health Care Equipment & Supplies – 0.1% | | | | | | | | |
Cooper Cos., Inc. (The) | | | 325 | | | | 26,556 | |
Hill-Rom Holdings, Inc. | | | 481 | | | | 16,070 | |
| | | | | | | | |
| Total Health Care Equipment & Supplies | | | | 42,626 | |
| Health Care Providers & Services – 9.7% | | | | | | | | |
Aetna, Inc. | | | 6,121 | | | | 307,029 | |
AMERIGROUP Corp.* | | | 572 | | | | 38,484 | |
AmerisourceBergen Corp. | | | 2,089 | | | | 82,892 | |
Cardinal Health, Inc. | | | 2,776 | | | | 119,673 | |
Centene Corp.* | | | 402 | | | | 19,686 | |
Cigna Corp. | | | 4,259 | | | | 209,756 | |
Community Health Systems, Inc.* | | | 1,133 | | | | 25,198 | |
Coventry Health Care, Inc. | | | 2,977 | | | | 105,892 | |
DaVita, Inc.* | | | 742 | | | | 66,906 | |
Health Net, Inc.* | | | 811 | | | | 32,213 | |
Humana, Inc. | | | 2,373 | | | | 219,455 | |
LifePoint Hospitals, Inc.* | | | 532 | | | | 20,982 | |
Magellan Health Services, Inc.* | | | 397 | | | | 19,378 | |
McKesson Corp. | | | 2,259 | | | | 198,272 | |
Omnicare, Inc. | | | 1,247 | | | | 44,356 | |
Tenet Healthcare Corp.* | | | 23,892 | | | | 126,867 | |
UnitedHealth Group, Inc. | | | 14,510 | | | | 855,219 | |
Universal American Corp. | | | 1,165 | | | | 12,559 | |
Universal Health Services, Inc. Class B | | | 810 | | | | 33,947 | |
WellCare Health Plans, Inc.* | | | 660 | | | | 47,441 | |
WellPoint, Inc. | | | 5,663 | | | | 417,929 | |
| | | | | | | | |
| Total Health Care Providers & Services | | | | 3,004,134 | |
| Hotels, Restaurants & Leisure – 0.5% | | | | | | | | |
Brinker International, Inc. | | | 716 | | | | 19,726 | |
Chipotle Mexican Grill, Inc.* | | | 82 | | | | 34,276 | |
Life Time Fitness, Inc.* | | | 360 | | | | 18,205 | |
Wyndham Worldwide Corp. | | | 1,578 | | | | 73,393 | |
| | | | | | | | |
| Total Hotels, Restaurants & Leisure | | | | 145,600 | |
See Notes to Financial Statements.
| | |
| 56 | | WisdomTree Domestic and International Earnings Funds |
Schedule of Investments (continued)
WisdomTree LargeCap Value Fund (EZY)
March 31, 2012
| | | | | | | | |
| Investments | | Shares | | | Value | |
| | | | | | | | |
| Household Durables – 0.4% | | | | | | | | |
Jarden Corp.* | | | 1,029 | | | $ | 41,397 | |
Newell Rubbermaid, Inc. | | | 4,208 | | | | 74,944 | |
| | | | | | | | |
| Total Household Durables | | | | 116,341 | |
| Independent Power Producers & Energy Traders – 0.1% | | | | | |
NRG Energy, Inc.* | | | 2,784 | | | | 43,625 | |
| Industrial Conglomerates – 0.1% | | | | | | | | |
Seaboard Corp.* | | | 17 | | | | 33,167 | |
| Insurance – 5.6% | | | | | | | | |
American Financial Group, Inc. | | | 1,907 | | | | 73,572 | |
Assurant, Inc. | | | 2,204 | | | | 89,262 | |
Chubb Corp. (The) | | | 4,669 | | | | 322,675 | |
CNA Financial Corp. | | | 5,380 | | | | 157,795 | |
CNO Financial Group, Inc.* | | | 5,293 | | | | 41,180 | |
Delphi Financial Group, Inc. Class A | | | 747 | | | | 33,443 | |
Erie Indemnity Co. Class A | | | 348 | | | | 27,123 | |
Kemper Corp. | | | 883 | | | | 26,737 | |
Loews Corp. | | | 4,077 | | | | 162,550 | |
Protective Life Corp. | | | 1,197 | | | | 35,455 | |
Reinsurance Group of America, Inc. | | | 1,251 | | | | 74,397 | |
Symetra Financial Corp. | | | 1,872 | | | | 21,584 | |
Torchmark Corp. | | | 1,571 | | | | 78,314 | |
Travelers Cos., Inc. (The) | | | 7,122 | | | | 421,623 | |
Unum Group | | | 4,510 | | | | 110,405 | |
W.R. Berkley Corp. | | | 1,892 | | | | 68,339 | |
| | | | | | | | |
| Total Insurance | | | | 1,744,454 | |
| Internet Software & Services – 0.0% | | | | | | | | |
Ancestry.com, Inc.*(a) | | | 136 | | | | 3,093 | |
| IT Services – 0.6% | | | | | |
CACI International, Inc. Class A* | | | 276 | | | | 17,192 | |
Convergys Corp.* | | | 1,488 | | | | 19,865 | |
DST Systems, Inc. | | | 720 | | | | 39,046 | |
Fidelity National Information Services, Inc. | | | 2,561 | | | | 84,820 | |
VeriFone Systems, Inc.* | | | 269 | | | | 13,953 | |
| | | | | | | | |
| Total IT Services | | | | 174,876 | |
| Leisure Equipment & Products – 0.1% | | | | | | | | |
Polaris Industries, Inc. | | | 458 | | | | 33,045 | |
| Machinery – 5.0% | | | | | | | | |
Actuant Corp. Class A | | | 535 | | | | 15,510 | |
AGCO Corp.* | | | 605 | | | | 28,562 | |
Caterpillar, Inc. | | | 3,374 | | | | 359,399 | |
Chart Industries, Inc.* | | | 54 | | | | 3,960 | |
Crane Co. | | | 473 | | | | 22,941 | |
Cummins, Inc. | | | 1,236 | | | | 148,369 | |
Deere & Co. | | | 3,086 | | | | 249,657 | |
Dover Corp. | | | 1,472 | | | | 92,648 | |
Eaton Corp. | | | 2,433 | | | | 121,236 | |
Gardner Denver, Inc. | | | 322 | | | | 20,292 | |
Joy Global, Inc. | | | 690 | | | | 50,715 | |
Kennametal, Inc. | | | 615 | | | | 27,386 | |
Lincoln Electric Holdings, Inc. | | | 448 | | | | 20,303 | |
Middleby Corp. | | | 102 | | | | 10,320 | |
Mueller Industries, Inc. | | | 219 | | | | 9,954 | |
| | | | | | | | |
Parker Hannifin Corp. | | | 1,236 | | | $ | 104,504 | |
Robbins & Myers, Inc. | | | 128 | | | | 6,662 | |
Snap-On, Inc. | | | 458 | | | | 27,924 | |
SPX Corp. | | | 445 | | | | 34,501 | |
Stanley Black & Decker, Inc. | | | 1,331 | | | | 102,434 | |
Timken Co. (The) | | | 784 | | | | 39,780 | |
Trinity Industries, Inc. | | | 289 | | | | 9,523 | |
WABCO Holdings, Inc.* | | | 370 | | | | 22,378 | |
Wabtec Corp. | | | 252 | | | | 18,993 | |
Watts Water Technologies, Inc. Class A | | | 332 | | | | 13,529 | |
| | | | | | | | |
| Total Machinery | | | | 1,561,480 | |
| Media – 5.6% | | | | | | | | |
CBS Corp. Class B | | | 4,269 | | | | 144,762 | |
Comcast Corp. Class A | | | 20,184 | | | | 605,722 | |
Interpublic Group of Cos., Inc. (The) | | | 2,720 | | | | 31,035 | |
News Corp. Class A | | | 26,399 | | | | 519,796 | |
Time Warner Cable, Inc. | | | 2,501 | | | | 203,831 | |
Viacom, Inc. Class B | | | 5,043 | | | | 239,341 | |
| | | | | | | | |
| Total Media | | | | 1,744,487 | |
| Metals & Mining – 0.2% | | | | | | | | |
Globe Specialty Metals, Inc. | | | 180 | | | | 2,677 | |
Reliance Steel & Aluminum Co. | | | 482 | | | | 27,223 | |
Schnitzer Steel Industries, Inc. Class A | | | 174 | | | | 6,942 | |
SunCoke Energy, Inc.* | | | 396 | | | | 5,627 | |
Worthington Industries, Inc. | | | 547 | | | | 10,491 | |
| | | | | | | | |
| Total Metals & Mining | | | | 52,960 | |
| Multiline Retail – 1.7% | | | | | | | | |
Big Lots, Inc.* | | | 692 | | | | 29,770 | |
Dillard’s, Inc. Class A | | | 566 | | | | 35,669 | |
Dollar General Corp.* | | | 2,672 | | | | 123,446 | |
Dollar Tree, Inc.* | | | 992 | | | | 93,734 | |
Family Dollar Stores, Inc. | | | 958 | | | | 60,622 | |
Macy’s, Inc. | | | 4,987 | | | | 198,134 | |
| | | | | | | | |
| Total Multiline Retail | | | | 541,375 | |
| Multi-Utilities – 1.3% | | | | | | | | |
Alliant Energy Corp. | | | 1,062 | | | | 46,006 | |
Ameren Corp. | | | 3,430 | | | | 111,749 | |
Avista Corp. | | | 571 | | | | 14,606 | |
CenterPoint Energy, Inc. | | | 3,371 | | | | 66,476 | |
CMS Energy Corp. | | | 2,385 | | | | 52,470 | |
NiSource, Inc. | | | 2,797 | | | | 68,107 | |
OGE Energy Corp. | | | 786 | | | | 42,051 | |
| | | | | | | | |
| Total Multi-Utilities | | | | 401,465 | |
| Office Electronics – 0.4% | | | | | | | | |
Xerox Corp. | | | 14,748 | | | | 119,164 | |
| Oil, Gas & Consumable Fuels – 29.2% | | | | | | | | |
Chevron Corp. | | | 24,685 | | | | 2,647,219 | |
ConocoPhillips | | | 13,465 | | | | 1,023,475 | |
CVR Energy, Inc.* | | | 164 | | | | 4,387 | |
El Paso Corp. | | | 6,578 | | | | 194,380 | |
Exxon Mobil Corp. | | | 48,707 | | | | 4,224,358 | |
Gulfport Energy Corp.* | | | 168 | | | | 4,892 | |
See Notes to Financial Statements.
| | | | |
| WisdomTree Domestic and International Earnings Funds | | | 57 | |
Schedule of Investments (concluded)
WisdomTree LargeCap Value Fund (EZY)
March 31, 2012
| | | | | | | | |
| Investments | | Shares | | | Value | |
| | | | | | | | |
Hess Corp. | | | 4,063 | | | $ | 239,514 | |
HollyFrontier Corp. | | | 422 | | | | 13,567 | |
Marathon Oil Corp. | | | 7,071 | | | | 224,151 | |
Marathon Petroleum Corp. | | | 3,506 | | | | 152,020 | |
Murphy Oil Corp. | | | 1,465 | | | | 82,436 | |
Sunoco, Inc. | | | 747 | | | | 28,498 | |
Williams Cos., Inc. (The) | | | 5,235 | | | | 161,290 | |
World Fuel Services Corp. | | | 546 | | | | 22,386 | |
WPX Energy, Inc.* | | | 1,744 | | | | 31,410 | |
| | | | | | | | |
| Total Oil, Gas & Consumable Fuels | | | | 9,053,983 | |
| Paper & Forest Products – 0.7% | | | | | | | | |
International Paper Co. | | | 4,662 | | | | 163,636 | |
MeadWestvaco Corp. | | | 1,394 | | | | 44,037 | |
| | | | | | | | |
| Total Paper & Forest Products | | | | 207,673 | |
| Pharmaceuticals – 0.5% | | | | | | | | |
Endo Pharmaceuticals Holdings, Inc.* | | | 895 | | | | 34,663 | |
Impax Laboratories, Inc.* | | | 1,183 | | | | 29,078 | |
Viropharma, Inc.* | | | 829 | | | | 24,928 | |
Watson Pharmaceuticals, Inc.* | | | 816 | | | | 54,721 | |
| | | | | | | | |
| Total Pharmaceuticals | | | | 143,390 | |
| Road & Rail – 0.9% | | | | | | | | |
AMERCO | | | 201 | | | | 21,208 | |
Avis Budget Group, Inc.* | | | 971 | | | | 13,740 | |
CSX Corp. | | | 8,374 | | | | 180,208 | |
Dollar Thrifty Automotive Group, Inc.* | | | 286 | | | | 23,140 | |
Genesee & Wyoming, Inc. Class A* | | | 205 | | | | 11,189 | |
Old Dominion Freight Line, Inc.* | | | 268 | | | | 12,776 | |
Ryder System, Inc. | | | 353 | | | | 18,638 | |
| | | | | | | | |
| Total Road & Rail | | | | 280,899 | |
| Semiconductors & Semiconductor Equipment – 0.8% | | | | | |
Cirrus Logic, Inc.* | | | 629 | | | | 14,970 | |
Cymer, Inc.* | | | 224 | | | | 11,200 | |
Diodes, Inc.* | | | 279 | | | | 6,467 | |
GT Advanced Technologies, Inc.* | | | 2,136 | | | | 17,665 | |
Micron Technology, Inc.* | | | 15,507 | | | | 125,607 | |
MKS Instruments, Inc. | | | 563 | | | | 16,625 | |
RF Micro Devices, Inc.* | | | 3,021 | | | | 15,045 | |
Skyworks Solutions, Inc.* | | | 810 | | | | 22,396 | |
TriQuint Semiconductor, Inc.* | | | 2,105 | | | | 14,514 | |
| | | | | | | | |
| Total Semiconductors & Semiconductor Equipment | | | | 244,489 | |
| Software – 0.0% | | | | | | | | |
TIBCO Software, Inc.* | | | 402 | | | | 12,261 | |
| Specialty Retail – 1.9% | | | | | | | | |
Advance Auto Parts, Inc. | | | 726 | | | | 64,302 | |
ANN, Inc.* | | | 318 | | | | 9,107 | |
Ascena Retail Group, Inc.* | | | 721 | | | | 31,955 | |
AutoNation, Inc.*(a) | | | 1,043 | | | | 35,785 | |
Cabela’s, Inc.* | | | 693 | | | | 26,438 | |
CarMax, Inc.* | | | 1,519 | | | | 52,633 | |
Dick’s Sporting Goods, Inc. | | | 647 | | | | 31,108 | |
DSW, Inc. Class A | | | 335 | | | | 18,348 | |
Foot Locker, Inc. | | | 1,183 | | | | 36,732 | |
GameStop Corp. Class A(a) | | | 2,188 | | | | 47,786 | |
| | | | | | | | |
JOS A Bank Clothiers, Inc.* | | | 195 | | | $ | 9,830 | |
O’Reilly Automotive, Inc.* | | | 1,036 | | | | 94,639 | |
Penske Automotive Group, Inc. | | | 775 | | | | 19,088 | |
Rent-A-Center, Inc. | | | 761 | | | | 28,728 | |
Tractor Supply Co. | | | 366 | | | | 33,145 | |
Ulta Salon Cosmetics & Fragrance, Inc. | | | 215 | | | | 19,971 | |
Williams-Sonoma, Inc. | | | 629 | | | | 23,575 | |
| | | | | | | | |
| Total Specialty Retail | | | | 583,170 | |
| Textiles, Apparel & Luxury Goods – 0.8% | | | | | | | | |
Deckers Outdoor Corp.*(a) | | | 234 | | | | 14,754 | |
Fossil, Inc.* | | | 364 | | | | 48,041 | |
PVH Corp. | | | 714 | | | | 63,781 | |
Ralph Lauren Corp. | | | 628 | | | | 109,479 | |
Steven Madden Ltd.* | | | 281 | | | | 12,013 | |
Under Armour, Inc. Class A* | | | 111 | | | | 10,434 | |
| | | | | | | | |
| Total Textiles, Apparel & Luxury Goods | | | | 258,502 | |
| Trading Companies & Distributors – 0.1% | | | | | | | | |
Applied Industrial Technologies, Inc. | | | 417 | | | | 17,151 | |
GATX Corp. | | | 233 | | | | 9,390 | |
WESCO International, Inc.* | | | 281 | | | | 18,352 | |
| | | | | | | | |
| Total Trading Companies & Distributors | | | | 44,893 | |
| Water Utilities – 0.1% | | | | | | | | |
American Water Works Co., Inc. | | | 1,279 | | | | 43,524 | |
| Wireless Telecommunication Services – 0.1% | | | | | | | | |
MetroPCS Communications, Inc.* | | | 2,598 | | | | 23,434 | |
TOTAL COMMON STOCKS (Cost: $27,188,556) | | | | | | | 30,816,970 | |
| EXCHANGE-TRADED FUNDS – 0.6% | | | | | | | | |
WisdomTree Earnings 500 Fund(a)(b) | | | 2,650 | | | | 130,986 | |
WisdomTree MidCap Earnings Fund(b) | | | 912 | | | | 55,842 | |
| | | | | | | | |
TOTAL EXCHANGE-TRADED FUNDS (Cost: $167,439) | | | | | | | 186,828 | |
| SHORT-TERM INVESTMENT – 0.0% | | | | | | | | |
| MONEY MARKET FUND – 0.0% | | | | | | | | |
Invesco Treasury Fund Private Class, 0.02%(c)
(Cost: $574) | | | 574 | | | | 574 | |
| INVESTMENT OF CASH COLLATERAL FOR SECURITIES LOANED – 0.6% | | | | | | | | |
| MONEY MARKET FUND – 0.6% | | | | | | | | |
Dreyfus Institutional Preferred Money Market Fund, 0.18%(c) | | | | | | | | |
| (Cost: $195,089)(d) | | | 195,089 | | | | 195,089 | |
TOTAL INVESTMENTS IN SECURITIES – 100.6% (Cost: $27,551,658) | | | | | | | 31,199,461 | |
Liabilities in Excess of Other Assets – (0.6)% | | | | (184,004 | ) |
| | | | | | | | |
| NET ASSETS – 100.0% | | | $ | 31,015,457 | |
| * | Non-income producing security. |
| (a) | Security, or portion thereof, was on loan at March 31, 2012 (See Note 2). |
| (b) | Affiliated company (See Note 7). |
| (c) | Rate shown represents annualized 7-day yield as of March 31, 2012. |
| (d) | At March 31, 2012, the total market value of the Fund’s securities on loan was $190,055 and the total market value of the collateral held by the Fund was $195,089. |
See Notes to Financial Statements.
| | |
| 58 | | WisdomTree Domestic and International Earnings Funds |
Schedule of Investments
WisdomTree LargeCap Growth Fund (ROI)
March 31, 2012
| | | | | | | | |
| Investments | | Shares | | | Value | |
| | | | | | | | |
| UNITED STATES – 100.8% | | | | | | | | |
| COMMON STOCKS – 99.9% | | | | | | | | |
| Aerospace & Defense – 0.3% | | | | | | | | |
Cubic Corp. | | | 126 | | | $ | 5,957 | |
HEICO Corp. | | | 109 | | | | 5,623 | |
TransDigm Group, Inc.* | | | 232 | | | | 26,857 | |
Triumph Group, Inc. | | | 306 | | | | 19,174 | |
| | | | | | | | |
| Total Aerospace & Defense | | | | | | | 57,611 | |
| Air Freight & Logistics – 0.3% | | | | | | | | |
Atlas Air Worldwide Holdings, Inc.* | | | 206 | | | | 10,137 | |
C.H. Robinson Worldwide, Inc. | | | 462 | | | | 30,257 | |
Expeditors International of Washington, Inc. | | | 606 | | | | 28,185 | |
| | | | | | | | |
| Total Air Freight & Logistics | | | | | | | 68,579 | |
| Airlines – 0.1% | | | | | | | | |
Alaska Air Group, Inc.* | | | 774 | | | | 27,725 | |
| Auto Components – 0.6% | | | | | | | | |
BorgWarner, Inc.* | | | 488 | | | | 41,158 | |
Cooper Tire & Rubber Co. | | | 479 | | | | 7,290 | |
Gentex Corp. | | | 439 | | | | 10,756 | |
TRW Automotive Holdings Corp.* | | | 1,502 | | | | 69,768 | |
| | | | | | | | |
| Total Auto Components | | | | | | | 128,972 | |
| Automobiles – 0.0% | | | | | | | | |
Thor Industries, Inc. | | | 268 | | | | 8,458 | |
| Beverages – 3.7% | | | | | | | | |
Coca-Cola Enterprises, Inc. | | | 2,375 | | | | 67,925 | |
Monster Beverage Corp.* | | | 594 | | | | 36,881 | |
PepsiCo, Inc. | | | 9,702 | | | | 643,727 | |
| | | | | | | | |
| Total Beverages | | | | | | | 748,533 | |
| Biotechnology – 0.7% | | | | | | | | |
Alexion Pharmaceuticals, Inc.* | | | 167 | | | | 15,508 | |
Celgene Corp.* | | | 1,463 | | | | 113,411 | |
United Therapeutics Corp.* | | | 138 | | | | 6,504 | |
| | | | | | | | |
| Total Biotechnology | | | | | | | 135,423 | |
| Building Products – 0.4% | | | | | | | | |
Owens Corning* | | | 2,345 | | | | 84,490 | |
| Capital Markets – 2.7% | | | | | | | | |
Affiliated Managers Group, Inc.* | | | 115 | | | | 12,858 | |
Ameriprise Financial, Inc. | | | 1,689 | | | | 96,493 | |
BlackRock, Inc. | | | 974 | | | | 199,573 | |
Franklin Resources, Inc. | | | 1,129 | | | | 140,030 | |
Raymond James Financial, Inc. | | | 619 | | | | 22,612 | |
Stifel Financial Corp.* | | | 397 | | | | 15,022 | |
T. Rowe Price Group, Inc. | | | 884 | | | | 57,725 | |
Waddell & Reed Financial, Inc. Class A | | | 347 | | | | 11,246 | |
| | | | | | | | |
| Total Capital Markets | | | | | | | 555,559 | |
| Chemicals – 3.4% | | | | | | | | |
Albemarle Corp. | | | 514 | | | | 32,855 | |
Cabot Corp. | | | 461 | | | | 19,675 | |
Celanese Corp. Series A | | | 1,065 | | | | 49,182 | |
CF Industries Holdings, Inc. | | | 399 | | | | 72,877 | |
E.I. du Pont de Nemours & Co. | | | 5,162 | | | | 273,070 | |
| | | | | | | | |
Eastman Chemical Co. | | | 1,042 | | | $ | 53,861 | |
Mosaic Co. (The) | | | 1,803 | | | | 99,688 | |
NewMarket Corp. | | | 102 | | | | 19,115 | |
PolyOne Corp. | | | 1,181 | | | | 17,006 | |
Rockwood Holdings, Inc.* | | | 442 | | | | 23,050 | |
Solutia, Inc. | | | 688 | | | | 19,223 | |
Westlake Chemical Corp. | | | 321 | | | | 20,798 | |
| | | | | | | | |
| Total Chemicals | | | | | | | 700,400 | |
| Commercial Banks – 0.1% | | | | | | | | |
Signature Bank* | | | 159 | | | | 10,023 | |
SVB Financial Group* | | | 146 | | | | 9,394 | |
| | | | | | | | |
| Total Commercial Banks | | | | | | | 19,417 | |
| Commercial Services & Supplies – 0.3% | | | | | | | | |
Clean Harbors, Inc.* | | | 228 | | | | 15,351 | |
Deluxe Corp. | | | 447 | | | | 10,469 | |
Herman Miller, Inc. | | | 238 | | | | 5,464 | |
Portfolio Recovery Associates, Inc.* | | | 78 | | | | 5,594 | |
Steelcase, Inc. Class A | | | 396 | | | | 3,802 | |
Stericycle, Inc.* | | | 218 | | | | 18,234 | |
| | | | | | | | |
| Total Commercial Services & Supplies | | | | | | | 58,914 | |
| Communications Equipment – 0.7% | | | | | | | | |
Acme Packet, Inc.* | | | 57 | | | | 1,569 | |
ADTRAN, Inc. | | | 240 | | | | 7,486 | |
EchoStar Corp. Class A* | | | 490 | | | | 13,789 | |
F5 Networks, Inc.* | | | 164 | | | | 22,133 | |
InterDigital, Inc. | | | 297 | | | | 10,353 | |
Juniper Networks, Inc.* | | | 1,473 | | | | 33,702 | |
Loral Space & Communications, Inc.* | | | 568 | | | | 45,213 | |
Polycom, Inc.* | | | 290 | | | | 5,530 | |
Riverbed Technology, Inc.* | | | 115 | | | | 3,229 | |
| | | | | | | | |
| Total Communications Equipment | | | | | | | 143,004 | |
| Computers & Peripherals – 14.6% | | | | | | | | |
Apple, Inc.* | | | 4,352 | | | | 2,608,894 | |
EMC Corp.* | | | 6,671 | | | | 199,330 | |
NCR Corp.* | | | 669 | | | | 14,524 | |
NetApp, Inc.* | | | 1,127 | | | | 50,456 | |
SanDisk Corp.* | | | 2,471 | | | | 122,537 | |
| | | | | | | | |
| Total Computers & Peripherals | | | | | | | 2,995,741 | |
| Construction & Engineering – 0.0% | | | | | | | | |
MasTec, Inc.* | | | 395 | | | | 7,146 | |
| Consumer Finance – 0.1% | | | | | | | | |
Credit Acceptance Corp.* | | | 199 | | | | 20,101 | |
Ezcorp, Inc. Class A* | | | 335 | | | | 10,872 | |
| | | | | | | | |
| Total Consumer Finance | | | | | | | 30,973 | |
| Containers & Packaging – 0.6% | | | | | | | | |
Ball Corp. | | | 1,316 | | | | 56,430 | |
Bemis Co., Inc. | | | 609 | | | | 19,665 | |
Greif, Inc. Class A | | | 396 | | | | 22,144 | |
Rock-Tenn Co. Class A | | | 293 | | | | 19,795 | |
| | | | | | | | |
| Total Containers & Packaging | | | | | | | 118,034 | |
See Notes to Financial Statements.
| | | | |
| WisdomTree Domestic and International Earnings Funds | | | 59 | |
Schedule of Investments (continued)
WisdomTree LargeCap Growth Fund (ROI)
March 31, 2012
| | | | | | | | |
| Investments | | Shares | | | Value | |
| | | | | | | | |
| Diversified Consumer Services – 0.1% | | | | | | | | |
Coinstar, Inc.*(a) | | | 143 | | | $ | 9,088 | |
Sotheby’s | | | 297 | | | | 11,684 | |
| | | | | | | | |
| Total Diversified Consumer Services | | | | | | | 20,772 | |
| Diversified Financial Services – 0.7% | | | | | | | | |
Leucadia National Corp. | | | 4,734 | | | | 123,558 | |
MSCI, Inc. Class A* | | | 319 | | | | 11,742 | |
| | | | | | | | |
| Total Diversified Financial Services | | | | | | | 135,300 | |
| Diversified Telecommunication Services – 0.7% | | | | | |
CenturyLink, Inc. | | | 2,360 | | | | 91,214 | |
Frontier Communications Corp.(a) | | | 3,107 | | | | 12,956 | |
Windstream Corp. | | | 2,787 | | | | 32,636 | |
| | | | | | | | |
| Total Diversified Telecommunication Services | | | | | | | 136,806 | |
| Electric Utilities – 0.1% | | | | | | | | |
Cleco Corp. | | | 271 | | | | 10,745 | |
| Electrical Equipment – 0.7% | | | | | | | | |
AMETEK, Inc. | | | 576 | | | | 27,942 | |
EnerSys* | | | 273 | | | | 9,459 | |
General Cable Corp.* | | | 196 | | | | 5,700 | |
GrafTech International Ltd.* | | | 782 | | | | 9,337 | |
II-VI, Inc.* | | | 250 | | | | 5,913 | |
Polypore International, Inc.*(a) | | | 96 | | | | 3,375 | |
Rockwell Automation, Inc. | | | 486 | | | | 38,734 | |
Roper Industries, Inc. | | | 338 | | | | 33,516 | |
| | | | | | | | |
| Total Electrical Equipment | | | | | | | 133,976 | |
Electronic Equipment, Instruments &
Components – 1.3% | | | | | |
Amphenol Corp. Class A | | | 832 | | | | 49,729 | |
Arrow Electronics, Inc.* | | | 1,059 | | | | 44,446 | |
Avnet, Inc.* | | | 1,514 | | | | 55,095 | |
IPG Photonics Corp.* | | | 86 | | | | 4,476 | |
Jabil Circuit, Inc. | | | 1,465 | | | | 36,801 | |
Molex, Inc. | | | 1,018 | | | | 28,626 | |
National Instruments Corp. | | | 296 | | | | 8,442 | |
Trimble Navigation Ltd.* | | | 194 | | | | 10,557 | |
TTM Technologies, Inc.* | | | 416 | | | | 4,780 | |
Vishay Intertechnology, Inc.* | | | 1,789 | | | | 21,754 | |
| | | | | | | | |
| Total Electronic Equipment, Instruments & Components | | | | | | | 264,706 | |
| Energy Equipment & Services – 2.0% | | | | | | | | |
Baker Hughes, Inc. | | | 1,234 | | | | 51,754 | |
CARBO Ceramics, Inc.(a) | | | 55 | | | | 5,800 | |
Halliburton Co. | | | 3,525 | | | | 116,995 | |
Helmerich & Payne, Inc. | | | 433 | | | | 23,360 | |
Lufkin Industries, Inc. | | | 45 | | | | 3,629 | |
National Oilwell Varco, Inc. | | | 2,004 | | | | 159,258 | |
Oil States International, Inc.* | | | 216 | | | | 16,861 | |
SEACOR Holdings, Inc.* | | | 236 | | | | 22,604 | |
Superior Energy Services, Inc.* | | | 327 | | | | 8,620 | |
| | | | | | | | |
| Total Energy Equipment & Services | | | | | | | 408,881 | |
| | | | | | | | |
| Food & Staples Retailing – 0.2% | | | | | | | | |
United Natural Foods, Inc.* | | | 149 | | | $ | 6,952 | |
Whole Foods Market, Inc. | | | 380 | | | | 31,616 | |
| | | | | | | | |
| Total Food & Staples Retailing | | | | | | | 38,568 | |
| Food Products – 0.2% | | | | | | | | |
Corn Products International, Inc. | | | 466 | | | | 26,865 | |
Darling International, Inc.* | | | 325 | | | | 5,662 | |
Green Mountain Coffee Roasters, Inc.*(a) | | | 141 | | | | 6,604 | |
| | | | | | | | |
| Total Food Products | | | | | | | 39,131 | |
| Gas Utilities – 0.2% | | | | | | | | |
ONEOK, Inc. | | | 460 | | | | 37,563 | |
| Health Care Equipment & Supplies – 0.4% | | | | | | | | |
Cooper Cos., Inc. (The) | | | 209 | | | | 17,077 | |
Edwards Lifesciences Corp.* | | | 252 | | | | 18,328 | |
Intuitive Surgical, Inc.* | | | 93 | | | | 50,383 | |
| | | | | | | | |
| Total Health Care Equipment & Supplies | | | | | | | 85,788 | |
| Health Care Providers & Services – 1.9% | | | | | | | | |
AMERIGROUP Corp.* | | | 378 | | | | 25,432 | |
Catalyst Health Solutions, Inc.* | | | 135 | | | | 8,604 | |
Express Scripts Holding Co.* | | | 2,056 | | | | 111,394 | |
Health Management Associates, Inc. Class A* | | | 1,376 | | | | 9,247 | |
HMS Holdings Corp.* | | | 152 | | | | 4,744 | |
Humana, Inc. | | | 1,573 | | | | 145,470 | |
Tenet Healthcare Corp.* | | | 15,888 | | | | 84,365 | |
| | | | | | | | |
| Total Health Care Providers & Services | | | | | | | 389,256 | |
| Health Care Technology – 0.0% | | | | | | | | |
Allscripts Healthcare Solutions, Inc.* | | | 126 | | | | 2,092 | |
athenahealth, Inc.*(a) | | | 31 | | | | 2,298 | |
Quality Systems, Inc. | | | 116 | | | | 5,072 | |
| | | | | | | | |
| Total Health Care Technology | | | | | | | 9,462 | |
| Hotels, Restaurants & Leisure – 1.8% | | | | | | | | |
Chipotle Mexican Grill, Inc.* | | | 57 | | | | 23,826 | |
Panera Bread Co. Class A* | | | 78 | | | | 12,552 | |
Starbucks Corp. | | | 2,665 | | | | 148,947 | |
Vail Resorts, Inc. | | | 74 | | | | 3,201 | |
Wynn Resorts Ltd. | | | 146 | | | | 18,232 | |
Yum! Brands, Inc. | | | 2,159 | | | | 153,677 | |
| | | | | | | | |
| Total Hotels, Restaurants & Leisure | | | | | | | 360,435 | |
| Household Durables – 0.1% | | | | | | | | |
Tempur-Pedic International, Inc.* | | | 240 | | | | 20,263 | |
| Household Products – 0.3% | | | | | | | | |
Clorox Co. (The) | | | 798 | | | | 54,863 | |
| Industrial Conglomerates – 0.1% | | | | | | | | |
Seaboard Corp.* | | | 11 | | | | 21,461 | |
| Internet & Catalog Retail – 0.9% | | | | | | | | |
Amazon.com, Inc.* | | | 555 | | | | 112,393 | |
Netflix, Inc.* | | | 58 | | | | 6,672 | |
priceline.com, Inc.* | | | 92 | | | | 66,010 | |
Shutterfly, Inc.* | | | 27 | | | | 846 | |
| | | | | | | | |
| Total Internet & Catalog Retail | | | | | | | 185,921 | |
See Notes to Financial Statements.
| | |
| 60 | | WisdomTree Domestic and International Earnings Funds |
Schedule of Investments (continued)
WisdomTree LargeCap Growth Fund (ROI)
March 31, 2012
| | | | | | | | |
| Investments | | Shares | | | Value | |
| | | | | | | | |
| Internet Software & Services – 0.1% | | | | | | | | |
Ancestry.com, Inc.*(a) | | | 104 | | | $ | 2,365 | |
OpenTable, Inc.*(a) | | | 13 | | | | 526 | |
Rackspace Hosting, Inc.* | | | 92 | | | | 5,317 | |
VeriSign, Inc. | | | 204 | | | | 7,821 | |
| | | | | | | | |
| Total Internet Software & Services | | | | | | | 16,029 | |
| IT Services – 1.5% | | | | | | | | |
Cognizant Technology Solutions Corp. Class A* | | | 805 | | | | 61,945 | |
DST Systems, Inc. | | | 465 | | | | 25,217 | |
Fidelity National Information Services, Inc. | | | 1,712 | | | | 56,701 | |
Gartner, Inc.* | | | 226 | | | | 9,637 | |
Jack Henry & Associates, Inc. | | | 345 | | | | 11,771 | |
Syntel, Inc. | | | 192 | | | | 10,752 | |
Teradata Corp.* | | | 529 | | | | 36,051 | |
VeriFone Systems, Inc.* | | | 185 | | | | 9,596 | |
Western Union Co. (The) | | | 4,071 | | | | 71,650 | |
Wright Express Corp.* | | | 147 | | | | 9,515 | |
| | | | | | | | |
| Total IT Services | | | | | | | 302,835 | |
| Leisure Equipment & Products – 0.1% | | | | | | | | |
Polaris Industries, Inc. | | | 299 | | | | 21,573 | |
| Life Sciences Tools & Services – 0.6% | | | | | | | | |
Agilent Technologies, Inc. | | | 1,714 | | | | 76,291 | |
Bruker Corp.* | | | 479 | | | | 7,333 | |
Illumina, Inc.*(a) | | | 162 | | | | 8,523 | |
Mettler-Toledo International, Inc.*(a) | | | 119 | | | | 21,985 | |
| | | | | | | | |
| Total Life Sciences Tools & Services | | | | | | | 114,132 | |
| Machinery – 4.8% | | | | | | | | |
Caterpillar, Inc. | | | 2,240 | | | | 238,606 | |
Chart Industries, Inc.* | | | 46 | | | | 3,373 | |
Cummins, Inc. | | | 821 | | | | 98,553 | |
Deere & Co. | | | 2,039 | | | | 164,955 | |
Donaldson Co., Inc. | | | 622 | | | | 22,224 | |
Dover Corp. | | | 982 | | | | 61,807 | |
Gardner Denver, Inc. | | | 206 | | | | 12,982 | |
Graco, Inc. | | | 206 | | | | 10,930 | |
Joy Global, Inc. | | | 450 | | | | 33,075 | |
Kennametal, Inc. | | | 392 | | | | 17,456 | |
Lincoln Electric Holdings, Inc. | | | 309 | | | | 14,004 | |
Middleby Corp.* | | | 74 | | | | 7,487 | |
Mueller Industries, Inc. | | | 155 | | | | 7,045 | |
Nordson Corp. | | | 295 | | | | 16,080 | |
Oshkosh Corp.* | | | 2,049 | | | | 47,475 | |
PACCAR, Inc. | | | 802 | | | | 37,558 | |
Parker Hannifin Corp. | | | 825 | | | | 69,754 | |
Robbins & Myers, Inc. | | | 94 | | | | 4,893 | |
Stanley Black & Decker, Inc. | | | 889 | | | | 68,417 | |
Timken Co. (The) | | | 523 | | | | 26,537 | |
WABCO Holdings, Inc.* | | | 253 | | | | 15,301 | |
Wabtec Corp. | | | 158 | | | | 11,908 | |
| | | | | | | | |
| Total Machinery | | | | | | | 990,420 | |
| Marine – 0.0% | | | | | | | | |
Alexander & Baldwin, Inc. | | | 85 | | | | 4,118 | |
| | | | | | | | |
| Media – 0.7% | | | | | | | | |
CBS Corp. Class B | | | 2,838 | | | $ | 96,237 | |
Scripps Networks Interactive, Inc. Class A | | | 793 | | | | 38,611 | |
| | | | | | | | |
| Total Media | | | | | | | 134,848 | |
| Metals & Mining – 2.5% | | | | | | | | |
Allegheny Technologies, Inc. | | | 94 | | | | 3,870 | |
Allied Nevada Gold Corp.* | | | 78 | | | | 2,537 | |
Cliffs Natural Resources, Inc. | | | 928 | | | | 64,273 | |
Compass Minerals International, Inc. | | | 149 | | | | 10,689 | |
Freeport-McMoRan Copper & Gold, Inc. | | | 7,322 | | | | 278,529 | |
Globe Specialty Metals, Inc. | | | 139 | | | | 2,067 | |
Hecla Mining Co.(a) | | | 335 | | | | 1,548 | |
Royal Gold, Inc. | | | 86 | | | | 5,609 | |
Schnitzer Steel Industries, Inc. Class A | | | 124 | | | | 4,947 | |
Southern Copper Corp. | | | 3,732 | | | | 118,342 | |
SunCoke Energy, Inc.* | | | 254 | | | | 3,609 | |
Walter Energy, Inc. | | | 260 | | | | 15,395 | |
| | | | | | | | |
| Total Metals & Mining | | | | | | | 511,415 | |
| Multiline Retail – 0.4% | | | | | | | | |
Dillard’s, Inc. Class A | | | 364 | | | | 22,939 | |
Dollar Tree, Inc.* | | | 663 | | | | 62,647 | |
| | | | | | | | |
| Total Multiline Retail | | | | | | | 85,586 | |
| Multi-Utilities – 0.1% | | | | | | | | |
OGE Energy Corp. | | | 521 | | | | 27,874 | |
| Office Electronics – 0.0% | | | | | | | | |
Zebra Technologies Corp. Class A* | | | 240 | | | | 9,883 | |
| Oil, Gas & Consumable Fuels – 28.0% | | | | | | | | |
Alpha Natural Resources, Inc.* | | | 193 | | | | 2,936 | |
Arch Coal, Inc. | | | 322 | | | | 3,449 | |
Berry Petroleum Co. Class A | | | 46 | | | | 2,168 | |
Chevron Corp. | | | 16,314 | | | | 1,749,513 | |
Concho Resources, Inc.* | | | 166 | | | | 16,945 | |
ConocoPhillips | | | 8,898 | | | | 676,337 | |
Continental Resources, Inc.* | | | 218 | | | | 18,709 | |
CVR Energy, Inc. | | | 128 | | | | 3,424 | |
El Paso Corp. | | | 4,362 | | | | 128,897 | |
EOG Resources, Inc. | | | 125 | | | | 13,888 | |
Exxon Mobil Corp. | | | 32,199 | | | | 2,792,618 | |
Gulfport Energy Corp.* | | | 126 | | | | 3,669 | |
HollyFrontier Corp. | | | 290 | | | | 9,324 | |
Marathon Oil Corp. | | | 4,670 | | | | 148,039 | |
Marathon Petroleum Corp. | | | 2,354 | | | | 102,069 | |
Northern Oil and Gas, Inc.* | | | 23 | | | | 477 | |
Peabody Energy Corp. | | | 1,075 | | | | 31,132 | |
Sunoco, Inc. | | | 480 | | | | 18,312 | |
World Fuel Services Corp. | | | 344 | | | | 14,104 | |
| | | | | | | | |
| Total Oil, Gas & Consumable Fuels | | | | | | | 5,736,010 | |
| Personal Products – 0.4% | | | | | | | | |
Estee Lauder Cos., Inc. (The) Class A | | | 1,306 | | | | 80,894 | |
See Notes to Financial Statements.
| | | | |
| WisdomTree Domestic and International Earnings Funds | | | 61 | |
Schedule of Investments (continued)
WisdomTree LargeCap Growth Fund (ROI)
March 31, 2012
| | | | | | | | |
| Investments | | Shares | | | Value | |
| | | | | | | | |
| Pharmaceuticals – 7.0% | | | | | | | | |
Endo Pharmaceuticals Holdings, Inc.* | | | 608 | | | $ | 23,548 | |
Impax Laboratories, Inc.* | | | 800 | | | | 19,664 | |
Merck & Co., Inc. | | | 33,764 | | | | 1,296,538 | |
Perrigo Co. | | | 309 | | | | 31,923 | |
Viropharma, Inc.* | | | 576 | | | | 17,320 | |
Watson Pharmaceuticals, Inc.* | | | 547 | | | | 36,682 | |
| | | | | | | | |
| Total Pharmaceuticals | | | | | | | 1,425,675 | |
| Professional Services – 0.1% | | | | | | | | |
Corporate Executive Board Co. (The) | | | 115 | | | | 4,946 | |
IHS, Inc. Class A* | | | 163 | | | | 15,265 | |
| | | | | | | | |
| Total Professional Services | | | | | | | 20,211 | |
| Real Estate Investment Trusts (REITs) – 0.0% | | | | | | | | |
Entertainment Properties Trust | | | 198 | | | | 9,183 | |
| Real Estate Management & Development – 0.1% | | | | | |
CBRE Group, Inc. Class A* | | | 730 | | | | 14,571 | |
| Road & Rail – 2.4% | | | | | | | | |
AMERCO | | | 147 | | | | 15,510 | |
Avis Budget Group, Inc.* | | | 668 | | | | 9,452 | |
CSX Corp. | | | 5,517 | | | | 118,726 | |
Dollar Thrifty Automotive Group, Inc.* | | | 209 | | | | 16,910 | |
Genesee & Wyoming, Inc. Class A* | | | 143 | | | | 7,805 | |
Kansas City Southern* | | | 406 | | | | 29,106 | |
Old Dominion Freight Line, Inc.* | | | 191 | | | | 9,105 | |
Union Pacific Corp. | | | 2,584 | | | | 277,729 | |
| | | | | | | | |
| Total Road & Rail | | | | | | | 484,343 | |
| Semiconductors & Semiconductor Equipment – 4.9% | | | | | |
Altera Corp. | | | 1,608 | | | | 64,031 | |
Amkor Technology, Inc.*(a) | | | 3,500 | | | | 21,508 | |
Analog Devices, Inc. | | | 1,872 | | | | 75,629 | |
Applied Materials, Inc. | | | 8,777 | | | | 109,186 | |
Broadcom Corp. Class A* | | | 2,627 | | | | 103,241 | |
Cirrus Logic, Inc.* | | | 441 | | | | 10,496 | |
Cymer, Inc.* | | | 157 | | | | 7,850 | |
Diodes, Inc.* | | | 197 | | | | 4,566 | |
First Solar, Inc.*(a) | | | 407 | | | | 10,195 | |
GT Advanced Technologies, Inc.* | | | 1,363 | | | | 11,272 | |
Hittite Microwave Corp.* | | | 107 | | | | 5,811 | |
Maxim Integrated Products, Inc. | | | 1,654 | | | | 47,288 | |
Microchip Technology, Inc.(a) | | | 888 | | | | 33,034 | |
Micron Technology, Inc.* | | | 10,389 | | | | 84,151 | |
Microsemi Corp.* | | | 291 | | | | 6,239 | |
MKS Instruments, Inc. | | | 388 | | | | 11,458 | |
ON Semiconductor Corp.* | | | 2,977 | | | | 26,823 | |
RF Micro Devices, Inc.* | | | 1,922 | | | | 9,572 | |
Semtech Corp.* | | | 280 | | | | 7,969 | |
Skyworks Solutions, Inc.* | | | 553 | | | | 15,290 | |
SunPower Corp.*(a) | | | 455 | | | | 2,903 | |
Texas Instruments, Inc. | | | 7,996 | | | | 268,745 | |
TriQuint Semiconductor, Inc.* | | | 1,435 | | | | 9,894 | |
Xilinx, Inc. | | | 1,801 | | | | 65,610 | |
| | | | | | | | |
| Total Semiconductors & Semiconductor Equipment | | | | | | | 1,012,761 | |
| | | | | | | | |
| Software – 3.9% | | | | | | | | |
Ariba, Inc.* | | | 58 | | | $ | 1,897 | |
Autodesk, Inc.* | | | 454 | | | | 19,213 | |
Citrix Systems, Inc.* | | | 325 | | | | 25,646 | |
CommVault Systems, Inc.* | | | 49 | | | | 2,432 | |
Fortinet, Inc.* | | | 176 | | | | 4,866 | |
Informatica Corp.* | | | 149 | | | | 7,882 | |
MICROS Systems, Inc.* | | | 222 | | | | 12,274 | |
MicroStrategy, Inc. Class A* | | | 28 | | | | 3,920 | |
Oracle Corp. | | | 22,123 | | | | 645,108 | |
Red Hat, Inc.* | | | 214 | | | | 12,816 | |
Salesforce.com, Inc.* | | | 42 | | | | 6,489 | |
SolarWinds, Inc.* | | | 169 | | | | 6,532 | |
Synchronoss Technologies, Inc.* | | | 32 | | | | 1,021 | |
TIBCO Software, Inc.* | | | 283 | | | | 8,632 | |
VMware, Inc. Class A* | | | 364 | | | | 40,903 | |
| | | | | | | | |
| Total Software | | | | | | | 799,631 | |
| Specialty Retail – 0.7% | | | | | | | | |
Advance Auto Parts, Inc. | | | 480 | | | | 42,513 | |
AutoNation, Inc.*(a) | | | 689 | | | | 23,640 | |
Dick’s Sporting Goods, Inc. | | | 411 | | | | 19,761 | |
DSW, Inc. Class A | | | 215 | | | | 11,776 | |
Tractor Supply Co. | | | 233 | | | | 21,100 | |
Ulta Salon Cosmetics & Fragrance, Inc.* | | | 134 | | | | 12,447 | |
Williams-Sonoma, Inc. | | | 429 | | | | 16,079 | |
| | | | | | | | |
| Total Specialty Retail | | | | | | | 147,316 | |
| Textiles, Apparel & Luxury Goods – 1.0% | | | | | | | | |
Deckers Outdoor Corp.*(a) | | | 147 | | | | 9,268 | |
Fossil, Inc.* | | | 237 | | | | 31,279 | |
Hanesbrands, Inc.* | | | 724 | | | | 21,387 | |
Iconix Brand Group, Inc.* | | | 345 | | | | 5,996 | |
PVH Corp. | | | 465 | | | | 41,538 | |
Ralph Lauren Corp. | | | 417 | | | | 72,697 | |
Steven Madden Ltd.* | | | 199 | | | | 8,507 | |
Under Armour, Inc. Class A*(a) | | | 85 | | | | 7,990 | |
| | | | | | | | |
| Total Textiles, Apparel & Luxury Goods | | | | | | | 198,662 | |
| Trading Companies & Distributors – 0.2% | | | | | | | | |
MSC Industrial Direct Co. Class A | | | 204 | | | | 16,989 | |
Watsco, Inc. | | | 101 | | | | 7,478 | |
WESCO International, Inc.* | | | 175 | | | | 11,429 | |
| | | | | | | | |
| Total Trading Companies & Distributors | | | | | | | 35,896 | |
| Wireless Telecommunication Services – 0.1% | | | | | | | | |
MetroPCS Communications, Inc.* | | | 1,747 | | | | 15,758 | |
TOTAL COMMON STOCKS
(Cost: $18,428,212) | | | | | | | 20,442,500 | |
See Notes to Financial Statements.
| | |
| 62 | | WisdomTree Domestic and International Earnings Funds |
Schedule of Investments (concluded)
WisdomTree LargeCap Growth Fund (ROI)
March 31, 2012
| | | | | | | | |
| Investments | | Shares | | | Value | |
| | | | | | | | |
| INVESTMENT OF CASH COLLATERAL FOR SECURITIES LOANED – 0.9% | | | | | | | | |
| MONEY MARKET FUND – 0.9% | | | | | | | | |
Dreyfus Institutional Preferred Money Market Fund, 0.18%(b)
(Cost: $176,644)(c) | | | 176,644 | | | $ | 176,644 | |
TOTAL INVESTMENTS IN SECURITIES – 100.8%
(Cost: $18,604,856) | | | | | | | 20,619,144 | |
Liabilities in Excess of Other Assets – (0.8)% | | | | | | | (158,406 | ) |
| | | | | | | | |
| NET ASSETS – 100.0% | | | | | | $ | 20,460,738 | |
| * | Non-income producing security. |
| (a) | Security, or portion thereof, was on loan at March 31, 2012 (See Note 2). |
| (b) | Rate shown represents annualized 7-day yield as of March 31, 2012. |
| (c) | At March 31, 2012, the total market value of the Fund’s securities on loan was $172,254 and the total market value of the collateral held by the Fund was $176,644. |
See Notes to Financial Statements.
| | | | |
| WisdomTree Domestic and International Earnings Funds | | | 63 | |
Schedule of Investments
WisdomTree India Earnings Fund (EPI) (consolidated)
March 31, 2012
| | | | | | | | |
| Investments | | Shares | | | Value | |
| | | | | | | | |
| INDIA – 99.8% | | | | | | | | |
| COMMON STOCKS – 99.8% | | | | | |
| Aerospace & Defense – 0.2% | | | | | |
Bharat Electronics Ltd. | | | 65,903 | | | $ | 1,972,562 | |
| Auto Components – 0.6% | | | | | | | | |
Amtek Auto Ltd. | | | 648,171 | | | | 1,691,517 | |
Bharat Forge Ltd. | | | 288,913 | | | | 1,815,028 | |
Exide Industries Ltd. | | | 688,483 | | | | 2,016,325 | |
| | | | | | | | |
| Total Auto Components | | | | 5,522,870 | |
| Automobiles – 8.8% | | | | | | | | |
Bajaj Auto Ltd. | | | 224,194 | | | | 7,387,906 | |
Hero Motocorp Ltd. | | | 152,250 | | | | 6,142,150 | |
Mahindra & Mahindra Ltd. | | | 817,922 | | | | 11,241,711 | |
Maruti Suzuki India Ltd. | | | 228,857 | | | | 6,066,766 | |
Tata Motors Ltd. | | | 9,289,415 | | | | 50,189,645 | |
| | | | | | | | |
| Total Automobiles | | | | 81,028,178 | |
| Building Products – 0.2% | | | | | | | | |
Sintex Industries Ltd. | | | 1,137,449 | | | | 1,925,704 | |
| Capital Markets – 0.2% | | | | | | | | |
Future Capital Holdings Ltd. | | | 61,958 | | | | 146,610 | |
India Infoline Ltd.* | | | 1,091,246 | | | | 1,433,003 | |
JM Financial Ltd. | | | 519,032 | | | | 158,934 | |
| | | | | | | | |
| Total Capital Markets | | | | 1,738,547 | |
| Chemicals – 1.1% | | | | | | | | |
Asian Paints Ltd. | | | 38,166 | | | | 2,428,779 | |
Coromandel International Ltd. | | | 280,253 | | | | 1,560,384 | |
Gujarat Narmada Valley Fertilizers Co., Ltd. | | | 29 | | | | 46 | |
Gujarat State Fertilisers & Chemicals Ltd. | | | 217,613 | | | | 1,808,779 | |
Tata Chemicals Ltd. | | | 286,449 | | | | 1,949,113 | |
United Phosphorus Ltd. | | | 927,482 | | | | 2,368,543 | |
| | | | | | | | |
| Total Chemicals | | | | 10,115,644 | |
| Commercial Banks – 17.1% | | | | | | | | |
Allahabad Bank | | | 782,487 | | | | 2,857,625 | |
Andhra Bank | | | 1,432,437 | | | | 3,350,179 | |
Axis Bank Ltd. | | | 639,026 | | | | 14,377,301 | |
Bank of Baroda | | | 461,885 | | | | 7,218,171 | |
Bank of India | | | 726,902 | | | | 5,174,424 | |
Canara Bank | | | 827,559 | | | | 7,728,974 | |
Central Bank of India | | | 1,156,182 | | | | 2,288,762 | |
Corp. Bank | | | 275,837 | | | | 2,300,040 | |
Dena Bank Ltd. | | | 953,778 | | | | 1,685,891 | |
Federal Bank Ltd. | | | 352,958 | | | | 2,954,884 | |
HDFC Bank Ltd. | | | 1,806,198 | | | | 18,430,700 | |
ICICI Bank Ltd. | | | 1,519,610 | | | | 26,553,280 | |
IDBI Bank Ltd. | | | 1,556,762 | | | | 3,199,391 | |
Indian Bank | | | 800,289 | | | | 3,832,967 | |
Indian Overseas Bank | | | 1,103,278 | | | | 2,042,185 | |
IndusInd Bank Ltd. | | | 598,716 | | | | 3,780,096 | |
Jammu & Kashmir Bank Ltd. | | | 158,381 | | | | 2,857,045 | |
Karnataka Bank Ltd. | | | 747,485 | | | | 1,403,414 | |
Oriental Bank of Commerce | | | 487,575 | | | | 2,418,016 | |
Punjab & Sind Bank | | | 123,180 | | | | 181,343 | |
Punjab National Bank | | | 213,780 | | | | 3,881,568 | |
| | | | | | | | |
South Indian Bank Ltd. | | | 4,218,813 | | | $ | 2,045,435 | |
State Bank of India | | | 491,850 | | | | 20,239,273 | |
Syndicate Bank | | | 1,230,915 | | | | 2,683,151 | |
UCO Bank | | | 1,438,649 | | | | 2,235,137 | |
Union Bank of India Ltd. | | | 1,043,243 | | | | 4,828,672 | |
United Bank of India Ltd. | | | 131,606 | | | | 186,643 | |
Vijaya Bank Ltd. | | | 1,184,465 | | | | 1,358,955 | |
Yes Bank Ltd. | | | 622,466 | | | | 4,506,143 | |
| | | | | | | | |
| Total Commercial Banks | | | | 156,599,665 | |
| Construction & Engineering – 1.6% | | | | | | | | |
Era Infra Engineering Ltd. | | | 493,985 | | | | 1,334,715 | |
IRB Infrastructure Developers Ltd. | | | 420,492 | | | | 1,542,230 | |
Lanco Infratech Ltd.* | | | 4,142,192 | | | | 1,479,790 | |
Larsen & Toubro Ltd. | | | 288,044 | | | | 7,401,111 | |
NCC Ltd. | | | 1,559,021 | | | | 1,724,425 | |
Voltas Ltd. | | | 629,565 | | | | 1,387,156 | |
| | | | | | | | |
| Total Construction & Engineering | | | | 14,869,427 | |
| Construction Materials – 1.6% | | | | | | | | |
ACC Ltd. | | | 112,953 | | | | 3,014,112 | |
Ambuja Cements Ltd. | | | 1,355,761 | | | | 4,582,629 | |
Grasim Industries Ltd. | | | 59,892 | | | | 3,088,415 | |
Ultratech Cement Ltd. | | | 133,354 | | | | 3,964,497 | |
| | | | | | | | |
| Total Construction Materials | | | | 14,649,653 | |
| Consumer Finance – 0.9% | | | | | | | | |
Mahindra & Mahindra Financial Services Ltd. | | | 164,154 | | | | 2,160,150 | |
Manappuram Finance Ltd. | | | 1,639,375 | | | | 979,860 | |
Shriram Transport Finance Co., Ltd. | | | 439,301 | | | | 5,180,293 | |
SKS Microfinance Ltd.* | | | 111,843 | | | | 259,932 | |
| | | | | | | | |
| Total Consumer Finance | | | | 8,580,235 | |
| Containers & Packaging – 0.2% | | | | | | | | |
Uflex Ltd. | | | 903,146 | | | | 2,037,818 | |
| Diversified Consumer Services – 0.1% | | | | | | | | |
Educomp Solutions Ltd. | | | 235,486 | | | | 892,346 | |
| Diversified Financial Services – 3.2% | | | | | | | | |
Bajaj Holdings and Investment Ltd. | | | 352,257 | | | | 5,636,319 | |
Indiabulls Financial Services Ltd. | | | 1,303,159 | | | | 5,297,561 | |
Kotak Mahindra Bank Ltd. | | | 570,226 | | | | 6,104,088 | |
Reliance Capital Ltd. | | | 228,636 | | | | 1,761,051 | |
Rural Electrification Corp., Ltd. | | | 2,329,114 | | | | 9,390,519 | |
SREI Infrastructure Finance Ltd. | | | 1,516,530 | | | | 773,968 | |
| | | | | | | | |
| Total Diversified Financial Services | | | | 28,963,506 | |
| Diversified Telecommunication Services – 0.1% | | | | | |
Tulip Telecom Ltd. | | | 445,106 | | | | 804,677 | |
| Electric Utilities – 2.6% | | | | | | | | |
CESC Ltd. | | | 286,895 | | | | 1,530,069 | |
Indiabulls Infrastructure and Power Ltd.*† | | | 2,455,942 | | | | 373,398 | |
Power Grid Corp. of India Ltd. | | | 2,785,848 | | | | 5,914,014 | |
Reliance Infrastructure Ltd. | | | 661,055 | | | | 7,620,072 | |
Tata Power Co., Ltd. | | | 3,267,433 | | | | 6,474,578 | |
Torrent Power Ltd. | | | 506,903 | | | | 2,007,413 | |
| | | | | | | | |
| Total Electric Utilities | | | | 23,919,544 | |
See Notes to Financial Statements.
| | |
| 64 | | WisdomTree Domestic and International Earnings Funds |
Schedule of Investments (continued)
WisdomTree India Earnings Fund (EPI) (consolidated)
March 31, 2012
| | | | | | | | |
| Investments | | Shares | | | Value | |
| | | | | | | | |
| Electrical Equipment – 1.2% | | | | | | | | |
Bharat Heavy Electricals Ltd. | | | 1,783,613 | | | $ | 9,002,966 | |
Crompton Greaves Ltd. | | | 713,104 | | | | 1,933,058 | |
| | | | | | | | |
| Total Electrical Equipment | | | | 10,936,024 | |
| Food Products – 0.6% | | | | | | | | |
Balrampur Chini Mills Ltd. | | | 1,359,518 | | | | 1,527,773 | |
Nestle India Ltd. | | | 21,747 | | | | 1,976,675 | |
Shree Renuka Sugars Ltd. | | | 2,823,618 | | | | 1,748,653 | |
| | | | | | | | |
| Total Food Products | | | | 5,253,101 | |
| Gas Utilities – 0.9% | | | | | | | | |
GAIL India Ltd. | | | 954,287 | | | | 7,047,806 | |
Gujarat State Petronet Ltd. | | | 613,391 | | | | 921,080 | |
| | | | | | | | |
| Total Gas Utilities | | | | 7,968,886 | |
| Health Care Equipment & Supplies – 0.2% | | | | | | | | |
Opto Circuits India Ltd. | | | 471,686 | | | | 1,865,632 | |
| Household Products – 1.2% | | | | | | | | |
Hindustan Unilever Ltd. | | | 1,355,032 | | | | 10,906,485 | |
| Independent Power Producers & Energy Traders – 1.9% | | | | | |
Adani Power Ltd.* | | | 626,850 | | | | 842,855 | |
GVK Power & Infrastructure Ltd.* | | | 1,293,252 | | | | 441,704 | |
JSW Energy Ltd. | | | 1,885,031 | | | | 2,268,179 | |
NHPC Ltd. | | | 5,631,539 | | | | 2,177,668 | |
NTPC Ltd. | | | 3,600,400 | | | | 11,501,916 | |
| | | | | | | | |
| Total Independent Power Producers & Energy Traders | | | | 17,232,322 | |
| Industrial Conglomerates – 1.3% | | | | | | | | |
Aditya Birla Nuvo Ltd. | | | 106,915 | | | | 1,982,371 | |
Jaiprakash Associates Ltd. | | | 5,060,874 | | | | 8,116,074 | |
Siemens Ltd. | | | 105,195 | | | | 1,568,272 | |
| | | | | | | | |
| Total Industrial Conglomerates | | | | 11,666,717 | |
| Insurance – 0.3% | | | | | | | | |
Bajaj Finserv Ltd. | | | 227,640 | | | | 2,732,395 | |
| IT Services – 12.0% | | | | | | | | |
Core Education & Technologies Ltd. | | | 205,519 | | | | 1,136,617 | |
HCL Technologies Ltd. | | | 461,806 | | | | 4,380,562 | |
Infosys Ltd. | | | 1,172,328 | | | | 65,958,264 | |
Mphasis Ltd. | | | 446,281 | | | | 3,548,698 | |
Rolta India Ltd. | | | 434,571 | | | | 800,986 | |
Tata Consultancy Services Ltd. | | | 894,197 | | | | 20,515,015 | |
Tech Mahindra Ltd. | | | 106,811 | | | | 1,511,120 | |
Wipro Ltd. | | | 1,397,407 | | | | 12,071,819 | |
| | | | | | | | |
| Total IT Services | | | | 109,923,081 | |
| Life Sciences Tools & Services – 0.2% | | | | | | | | |
Divi’s Laboratories Ltd. | | | 103,106 | | | | 1,550,385 | |
| Machinery – 0.4% | | | | | | | | |
Ashok Leyland Ltd. | | | 3,296,319 | | | | 1,963,751 | |
Cummins India Ltd. | | | 181,963 | | | | 1,769,447 | |
| | | | | | | | |
| Total Machinery | | | | 3,733,198 | |
| Marine – 0.1% | | | | | | | | |
Shipping Corp. of India Ltd. | | | 1,055,704 | | | | 1,285,827 | |
| | | | | | | | |
| Media – 0.6% | | | | | | | | |
Sun TV Network Ltd. | | | 332,300 | | | $ | 1,983,885 | |
Zee Entertainment Enterprises Ltd. | | | 1,365,281 | | | | 3,396,789 | |
| | | | | | | | |
| Total Media | | | | 5,380,674 | |
| Metals & Mining – 9.3% | | | | | | | | |
Bhushan Steel Ltd. | | | 357,571 | | | | 2,924,018 | |
Hexa Tradex Ltd.*† | | | 182,626 | | | | 125,467 | |
Hindalco Industries Ltd. | | | 2,911,336 | | | | 7,394,776 | |
Hindustan Zinc Ltd. | | | 929,187 | | | | 2,413,935 | |
Jindal Saw Ltd. | | | 940,956 | | | | 3,222,098 | |
Jindal Steel & Power Ltd. | | | 1,171,613 | | | | 12,537,144 | |
JSW Steel Ltd. | | | 533,972 | | | | 7,561,765 | |
MOIL Ltd. | | | 250,116 | | | | 1,228,610 | |
National Aluminium Co., Ltd. | | | 1,133,805 | | | | 1,211,810 | |
NMDC Ltd. | | | 839,613 | | | | 2,653,405 | |
Sesa Goa Ltd. | | | 2,286,114 | | | | 8,736,999 | |
Steel Authority of India Ltd. | | | 2,669,955 | | | | 4,939,508 | |
Sterlite Industries India Ltd. | | | 4,008,296 | | | | 8,737,290 | |
Tata Steel Ltd. | | | 1,934,732 | | | | 17,915,591 | |
Welspun Corp., Ltd. | | | 1,191,534 | | | | 3,148,110 | |
| | | | | | | | |
| Total Metals & Mining | | | | 84,750,526 | |
| Oil, Gas & Consumable Fuels – 17.7% | | | | | | | | |
Bharat Petroleum Corp., Ltd. | | | 247,185 | | | | 3,397,611 | |
Cairn India Ltd.* | | | 2,179,689 | | | | 14,285,959 | |
Coal India Ltd. | | | 1,158,471 | | | | 7,820,162 | |
Essar Oil Ltd.* | | | 1,013,898 | | | | 1,067,732 | |
Great Eastern Shipping Co., Ltd. (The) | | | 319,639 | | | | 1,533,728 | |
Hindustan Petroleum Corp., Ltd. | | | 481,104 | | | | 2,867,076 | |
Indian Oil Corp., Ltd. | | | 2,113,494 | | | | 10,898,319 | |
Mangalore Refinery & Petrochemicals Ltd. | | | 1,165,280 | | | | 1,559,959 | |
Oil & Natural Gas Corp., Ltd. | | | 8,409,167 | | | | 44,294,827 | |
Oil India Ltd. | | | 482,575 | | | | 4,828,118 | |
Petronet LNG Ltd. | | | 418,896 | | | | 1,381,794 | |
Reliance Industries Ltd. | | | 4,655,506 | | | | 68,592,065 | |
| | | | | | | | |
| Total Oil, Gas & Consumable Fuels | | | | 162,527,350 | |
| Personal Products – 0.4% | | | | | | | | |
Dabur India Ltd. | | | 676,404 | | | | 1,415,343 | |
Godrej Consumer Products Ltd. | | | 203,119 | | | | 1,914,371 | |
| | | | | | | | |
| Total Personal Products | | | | 3,329,714 | |
| Pharmaceuticals – 3.4% | | | | | | | | |
Aurobindo Pharma Ltd. | | | 1,032,585 | | | | 2,411,966 | |
Cadila Healthcare Ltd. | | | 102,818 | | | | 1,530,817 | |
Cipla Ltd. | | | 642,607 | | | | 3,848,452 | |
Dr. Reddy’s Laboratories Ltd. | | | 148,592 | | | | 5,147,271 | |
GlaxoSmithKline Pharmaceuticals Ltd. | | | 33,820 | | | | 1,537,849 | |
Glenmark Pharmaceuticals Ltd. | | | 295,240 | | | | 1,793,056 | |
Lupin Ltd. | | | 274,012 | | | | 2,847,961 | |
Ranbaxy Laboratories Ltd. | | | 397,256 | | | | 3,660,260 | |
Sun Pharmaceutical Industries Ltd. | | | 767,060 | | | | 8,581,527 | |
| | | | | | | | |
| Total Pharmaceuticals | | | | 31,359,159 | |
See Notes to Financial Statements.
| | | | |
| WisdomTree Domestic and International Earnings Funds | | | 65 | |
Schedule of Investments (concluded)
WisdomTree India Earnings Fund (EPI) (consolidated)
March 31, 2012
| | | | | | | | |
| Investments | | Shares | | | Value | |
| Real Estate Management & Development – 1.3% | | | | | |
DLF Ltd. | | | 984,322 | | | $ | 3,898,066 | |
Housing Development & Infrastructure Ltd.* | | | 3,114,966 | | | | 5,236,958 | |
Unitech Ltd.* | | | 5,706,101 | | | | 3,220,147 | |
| | | | | | | | |
| Total Real Estate Management & Development | | | | | | | 12,355,171 | |
| Road & Rail – 0.3% | | | | | | | | |
Container Corp. of India | | | 129,507 | | | | 2,427,319 | |
| Software – 0.4% | | | | | | | | |
Oracle Financial Services Software Ltd.* | | | 62,401 | | | | 3,209,527 | |
| Textiles, Apparel & Luxury Goods – 0.4% | | | | | | | | |
Alok Industries Ltd. | | | 5,321,956 | | | | 2,052,732 | |
S Kumars Nationwide Ltd. | | | 1,833,493 | | | | 1,187,659 | |
| | | | | | | | |
| Total Textiles, Apparel & Luxury Goods | | | | 3,240,391 | |
| Thrifts & Mortgage Finance – 3.3% | | | | | | | | |
Dewan Housing Finance Corp., Ltd. | | | 358,726 | | | | 1,684,664 | |
Housing Development Finance Corp. | | | 2,177,864 | | | | 28,783,116 | |
| | | | | | | | |
| Total Thrifts & Mortgage Finance | | | | 30,467,780 | |
| Tobacco – 1.2% | | | | | | | | |
ITC Ltd. | | | 2,554,862 | | | | 11,378,903 | |
| Trading Companies & Distributors – 0.3% | | | | | | | | |
Adani Enterprises Ltd. | | | 467,643 | | | | 2,798,331 | |
| Transportation Infrastructure – 0.3% | | | | | | | | |
Adani Port and Special Economic Zone | | | 505,603 | | | | 1,285,221 | |
Jaypee Infratech Ltd. | | | 1,588,641 | | | | 1,576,324 | |
| | | | | | | | |
| Total Transportation Infrastructure | | | | 2,861,545 | |
| Wireless Telecommunication Services – 2.1% | | | | | |
Bharti Airtel Ltd. | | | 2,112,200 | | | | 14,009,468 | |
Idea Cellular Ltd.* | | | 1,025,052 | | | | 1,987,931 | |
Reliance Communications Ltd. | | | 2,229,053 | | | | 3,677,533 | |
| | | | | | | | |
| Total Wireless Telecommunication Services | | | | 19,674,932 | |
TOTAL INVESTMENTS IN SECURITIES – 99.8% (Cost: $893,277,019) | | | | 914,435,751 | |
Cash, Foreign Currency and Other Assets in Excess of Liabilities – 0.2% | | | | 1,588,328 | |
| | | | | | | | |
| NET ASSETS – 100.0% | | | $ | 916,024,079 | |
| * | Non-income producing security. |
| † | Security is being fair valued by a valuation committee under the direction of the Board of Trustees. The aggregate value of fair valued securities is $498,865, which represents 0.1% of net assets. |
See Notes to Financial Statements.
| | |
| 66 | | WisdomTree Domestic and International Earnings Funds |
Statements of Assets and Liabilities
WisdomTree Domestic and International Earnings Funds
March 31, 2012
| | | | | | | | | | | | | | | | | | | | | | | | | | | | |
| | | WisdomTree
Total
Earnings Fund | | | WisdomTree
Earnings
500 Fund | | | WisdomTree
MidCap
Earnings Fund | | | WisdomTree
SmallCap
Earnings Fund | | | WisdomTree
LargeCap
Value Fund | | | WisdomTree
LargeCap
Growth Fund | | | WisdomTree India
Earnings Fund
(consolidated) | |
ASSETS: | | | | | | | | | | | | | | | | | | | | | | | | | | | | |
| | | | | | | |
Investments, at cost | | $ | 38,811,579 | | | $ | 60,885,591 | | | $ | 148,264,195 | | | $ | 141,749,088 | | | $ | 27,384,219 | | | $ | 18,604,856 | | | $ | 893,277,019 | |
| | | | | | | |
Investment in affiliates, at cost (Note 7) | | | 84,524 | | | | 72,185 | | | | 309,304 | | | | 236,674 | | | | 167,439 | | | | — | | | | — | |
| | | | | | | |
Foreign currency, at cost | | | — | | | | — | | | | — | | | | — | | | | — | | | | — | | | | 2,061,520 | |
Investment in securities, at value (including securities on loan)(Note 2)1 | | | 43,402,914 | | | | 69,345,075 | | | | 168,770,194 | | | | 159,760,889 | | | | 31,012,633 | | | | 20,619,144 | | | | 914,435,751 | |
| | | | | | | |
Investment in affiliates, at value (Note 7) | | | 91,512 | | | | 83,955 | | | | 378,776 | | | | 269,473 | | | | 186,828 | | | | — | | | | — | |
| | | | | | | |
Cash | | | 126 | | | | — | | | | — | | | | — | | | | — | | | | 4,058 | | | | 186,431 | |
| | | | | | | |
Foreign currency, at value | | | — | | | | — | | | | — | | | | — | | | | — | | | | — | | | | 2,062,462 | |
| | | | | | | |
Receivables: | | | | | | | | | | | | | | | | | | | | | | | | | | | | |
| | | | | | | |
Dividends and interest | | | 47,173 | | | | 78,678 | | | | 186,053 | | | | 123,992 | | | | 21,075 | | | | 20,795 | | | | 122,316 | |
| | | | | | | |
Investment securities sold | | | 37,477 | | | | 70,147 | | | | 49,854 | | | | — | | | | — | | | | — | | | | 2,091,752 | |
Total Assets | | | 43,579,202 | | | | 69,577,855 | | | | 169,384,877 | | | | 160,154,354 | | | | 31,220,536 | | | | 20,643,997 | | | | 918,898,712 | |
LIABILITIES: | | | | | | | | | | | | | | | | | | | | | | | | | | | | |
| | | | | | | |
Due to custodian | | | — | | | | — | | | | 38,292 | | | | — | | | | — | | | | — | | | | — | |
| | | | | | | |
Payables: | | | | | | | | | | | | | | | | | | | | | | | | | | | | |
| | | | | | | |
Collateral for securities on loan (Note 2) | | | 543,847 | | | | 299,255 | | | | 10,699,894 | | | | 12,980,279 | | | | 195,089 | | | | 176,644 | | | | — | |
| | | | | | | |
Investment securities purchased | | | — | | | | 75,588 | | | | — | | | | — | | | | — | | | | — | | | | 1,998,233 | |
| | | | | | | |
Advisory fees (Note 3) | | | 9,577 | | | | 16,170 | | | | 50,370 | | | | 46,646 | | | | 9,875 | | | | 6,540 | | | | 547,639 | |
| | | | | | | |
Service fees (Note 2) | | | 151 | | | | 255 | | | | 585 | | | | 542 | | | | 115 | | | | 75 | | | | 3,544 | |
| | | | | | | |
Other expenses | | | — | | | | — | | | | — | | | | — | | | | — | | | | — | | | | 106,709 | |
| | | | | | | |
Foreign tax withholding | | | — | | | | — | | | | — | | | | — | | | | — | | | | — | | | | 218,508 | |
Total Liabilities | | | 553,575 | | | | 391,268 | | | | 10,789,141 | | | | 13,027,467 | | | | 205,079 | | | | 183,259 | | | | 2,874,633 | |
NET ASSETS | | $ | 43,025,627 | | | $ | 69,186,587 | | | $ | 158,595,736 | | | $ | 147,126,887 | | | $ | 31,015,457 | | | $ | 20,460,738 | | | $ | 916,024,079 | |
NET ASSETS: | | | | | | | | | | | | | | | | | | | | | | | | | | | | |
| | | | | | | |
Paid-in capital | | $ | 44,932,805 | | | $ | 80,706,096 | | | $ | 155,089,664 | | | $ | 149,580,912 | | | $ | 38,798,925 | | | $ | 18,752,737 | | | $ | 1,095,906,081 | |
| | | | | | | |
Undistributed net investment income | | | 17,903 | | | | 27,480 | | | | 96,368 | | | | 99,439 | | | | 8,589 | | | | 2,180 | | | | 344,964 | |
| | | | | | | |
Accumulated net realized loss on investments, forward foreign currency contracts and foreign currency related transactions | | | (6,523,404 | ) | | | (20,018,243 | ) | | | (17,165,767 | ) | | | (20,598,064 | ) | | | (11,439,860 | ) | | | (308,467 | ) | | | (201,396,180 | ) |
| | | | | | | |
Net unrealized appreciation on investments and translation of assets and liabilities denominated in foreign currencies | | | 4,598,323 | | | | 8,471,254 | | | | 20,575,471 | | | | 18,044,600 | | | | 3,647,803 | | | | 2,014,288 | | | | 21,169,214 | |
NET ASSETS | | $ | 43,025,627 | | | $ | 69,186,587 | | | $ | 158,595,736 | | | $ | 147,126,887 | | | $ | 31,015,457 | | | $ | 20,460,738 | | | $ | 916,024,079 | |
Outstanding beneficial interest shares of $0.001 par value (unlimited number of shares authorized) | | | 850,000 | | | | 1,400,000 | | | | 2,600,000 | | | | 2,600,000 | | | | 700,000 | | | | 500,000 | | | | 47,600,000 | |
Net asset value per share | | $ | 50.62 | | | $ | 49.42 | | | $ | 61.00 | | | $ | 56.59 | | | $ | 44.31 | | | $ | 40.92 | | | $ | 19.24 | |
| 1 | Market values of securities out on loan were as follows: $530,260, $292,337, $10,419,942, $12,629,839, $190,055, $172,254 and $0, respectively. |
See Notes to Financial Statements.
| | | | |
| WisdomTree Domestic and International Earnings Funds | | | 67 | |
Statements of Operations
WisdomTree Domestic and International Earnings Funds
For the Year Ended March 31, 2012
| | | | | | | | | | | | | | | | | | | | | | | | | | | | |
| | | WisdomTree
Total
Earnings Fund | | | WisdomTree
Earnings
500 Fund | | | WisdomTree
MidCap
Earnings Fund | | | WisdomTree
SmallCap
Earnings Fund | | | WisdomTree
LargeCap
Value Fund | | | WisdomTree
LargeCap
Growth Fund | | | WisdomTree India
Earnings Fund
(consolidated) | |
INVESTMENT INCOME: | | | | | | | | | | | | | | | | | | | | | | | | | | | | |
| | | | | | | |
Dividends1 | | $ | 988,880 | | | $ | 1,401,847 | | | $ | 1,682,959 | | | $ | 2,158,429 | | | $ | 605,198 | | | $ | 382,454 | | | $ | 17,786,385 | |
| | | | | | | |
Dividends from affiliates (Note 7) | | | 2,245 | | | | 6,435 | | | | 14,566 | | | | 4,950 | | | | 1,980 | | | | — | | | | — | |
| | | | | | | |
Interest | | | 4 | | | | 11 | | | | 36 | | | | 38 | | | | 7 | | | | — | | | | — | |
| | | | | | | |
Securities lending income (Note 2) | | | 8,577 | | | | 6,341 | | | | 140,941 | | | | 175,847 | | | | 1,655 | | | | 4,059 | | | | — | |
Total investment income | | | 999,706 | | | | 1,414,634 | | | | 1,838,502 | | | | 2,339,264 | | | | 608,840 | | | | 386,513 | | | | 17,786,385 | |
EXPENSES: | | | | | | | | | | | | | | | | | | | | | | | | | | | | |
| | | | | | | |
Advisory fees (Note 3) | | | 128,191 | | | | 174,606 | | | | 466,483 | | | | 490,548 | | | | 104,209 | | | | 75,335 | | | | 7,255,521 | |
| | | | | | | |
Service fees (Note 2) | | | 2,015 | | | | 2,744 | | | | 5,401 | | | | 5,680 | | | | 1,207 | | | | 872 | | | | 46,947 | |
| | | | | | | |
Custody and accounting | | | — | | | | — | | | | — | | | | — | | | | — | | | | — | | | | 1,177,649 | |
| | | | | | | |
Printing | | | — | | | | — | | | | — | | | | — | | | | — | | | | — | | | | 80,406 | |
| | | | | | | |
Interest expense (Note 8) | | | — | | | | — | | | | — | | | | — | | | | — | | | | — | | | | 73,100 | |
| | | | | | | |
Professional fees | | | — | | | | — | | | | — | | | | — | | | | — | | | | — | | | | 60,981 | |
| | | | | | | |
IOPV fees2 | | | — | | | | — | | | | — | | | | — | | | | — | | | | — | | | | 24,100 | |
| | | | | | | |
Insurance | | | — | | | | — | | | | — | | | | — | | | | — | | | | — | | | | 17,206 | |
| | | | | | | |
Pricing | | | — | | | | — | | | | — | | | | — | | | | — | | | | — | | | | 16,514 | |
| | | | | | | |
Listing cost | | | — | | | | — | | | | — | | | | — | | | | — | | | | — | | | | 9,375 | |
| | | | | | | |
Compliance | | | — | | | | — | | | | — | | | | — | | | | — | | | | — | | | | 1,915 | |
| | | | | | | |
Other | | | — | | | | — | | | | — | | | | — | | | | — | | | | — | | | | 25,614 | |
Total expenses | | | 130,206 | | | | 177,350 | | | | 471,884 | | | | 496,228 | | | | 105,416 | | | | 76,207 | | | | 8,789,328 | |
Expense reimbursements/waivers (Note 3) | | | (110 | ) | | | (286 | ) | | | (1,624 | ) | | | (1,657 | ) | | | (271 | ) | | | — | | | | (663,000 | ) |
Net expenses | | | 130,096 | | | | 177,064 | | | | 470,260 | | | | 494,571 | | | | 105,145 | | | | 76,207 | | | | 8,126,328 | |
Net investment income | | | 869,610 | | | | 1,237,570 | | | | 1,368,242 | | | | 1,844,693 | | | | 503,695 | | | | 310,306 | | | | 9,660,057 | |
NET REALIZED AND UNREALIZED GAIN (LOSS) ON INVESTMENTS: | | | | | | | | | | | | | | | | | | | | | | | | | | | | |
| | | | | | | |
Net realized gain (loss) from: | | | | | | | | | | | | | | | | | | | | | | | | | | | | |
| | | | | | | |
Investment transactions | | | (346,913 | ) | | | (888,032 | ) | | | (7,246,581 | ) | | | (10,625,510 | ) | | | 1,136,914 | | | | (408,425 | ) | | | (93,366,945 | ) |
| | | | | | | |
Investment transactions from affiliates (Note 7) | | | (16,081 | ) | | | 21,434 | | | | 2,086 | | | | (43,076 | ) | | | 11,543 | | | | 24,301 | | | | — | |
| | | | | | | |
In-kind redemptions | | | 1,935,097 | | | | — | | | | 4,094,509 | | | | 8,923,058 | | | | 410,339 | | | | 2,541,809 | | | | — | |
| | | | | | | |
In-kind redemptions from affiliates (Note 7) | | | (293 | ) | | | — | | | | 3,105 | | | | (6,750 | ) | | | 569 | | | | — | | | | — | |
| | | | | | | |
Forward foreign currency contracts and foreign currency related transactions | | | — | | | | — | | | | — | | | | — | | | | — | | | | — | | | | (850,335 | ) |
Net realized gain (loss) | | | 1,571,810 | | | | (866,598 | ) | | | (3,146,881 | ) | | | (1,752,278 | ) | | | 1,559,365 | | | | 2,157,685 | | | | (94,217,280 | ) |
Net change in unrealized appreciation (depreciation) from: | | | | | | | | | | | | | | | | | | | | | | | | | | | | |
| | | | | | | |
Investment transactions | | | (513,006 | ) | | | 6,228,400 | | | | 8,794,120 | | | | 3,999,459 | | | | 113,089 | | | | (1,443,327 | ) | | | (222,870,810 | ) |
| | | | | | | |
Translation of assets and liabilities denominated in foreign currencies | | | — | | | | — | | | | — | | | | — | | | | — | | | | — | | | | 9,489 | |
Net change in unrealized appreciation (depreciation) | | | (513,006 | ) | | | 6,228,400 | | | | 8,794,120 | | | | 3,999,459 | | | | 113,089 | | | | (1,443,327 | ) | | | (222,861,321 | ) |
Net realized and unrealized gain (loss) on investments | | | 1,058,804 | | | | 5,361,802 | | | | 5,647,239 | | | | 2,247,181 | | | | 1,672,454 | | | | 714,358 | | | | (317,078,601 | ) |
NET INCREASE (DECREASE) IN NET ASSETS RESULTING FROM OPERATIONS | | $ | 1,928,414 | | | $ | 6,599,372 | | | $ | 7,015,481 | | | $ | 4,091,874 | | | $ | 2,176,149 | | | $ | 1,024,664 | | | $ | (307,418,544 | ) |
| 1 | Net of foreign withholding tax of $0, $0, $0, $86, $0, $0 and $550,123, respectively. |
| 2 | IOPV Fees — Indicative Optimized Portfolio Value — is the real-time estimation of net asset value of Fund. |
See Notes to Financial Statements.
| | |
| 68 | | WisdomTree Domestic and International Earnings Funds |
Statements of Changes in Net Assets
WisdomTree Domestic and International Earnings Funds
| | | | | | | | | | | | | | | | | | | | | | | | |
| | | WisdomTree
Total Earnings Fund | | | WisdomTree
Earnings 500 Fund | | | WisdomTree
MidCap Earnings Fund | |
| | | For the
Year Ended
March 31, 2012 | | | For the
Year Ended
March 31, 2011 | | | For the
Year Ended
March 31, 2012 | | | For the
Year Ended
March 31, 2011 | | | For the
Year Ended
March 31, 2012 | | | For the
Year Ended
March 31, 2011 | |
INCREASE (DECREASE) IN NET ASSETS RESULTING
FROM OPERATIONS: | | | | | | | | | | | | | | | | | | | | | |
| | | | | | |
Net investment income | | $ | 869,610 | | | $ | 883,420 | | | $ | 1,237,570 | | | $ | 1,309,968 | | | $ | 1,368,242 | | | $ | 1,216,230 | |
| | | | | | |
Net realized gain (loss) on investments | | | 1,571,810 | | | | 911,680 | | | | (866,598 | ) | | | 1,840,334 | | | | (3,146,881 | ) | | | 12,470,822 | |
| | | | | | |
Net change in unrealized appreciation (depreciation) on investments | | | (513,006 | ) | | | 5,488,680 | | | | 6,228,400 | | | | 4,022,685 | | | | 8,794,120 | | | | 6,831,357 | |
Net increase in net assets resulting from operations | | | 1,928,414 | | | | 7,283,780 | | | | 6,599,372 | | | | 7,172,987 | | | | 7,015,481 | | | | 20,518,409 | |
DIVIDENDS: | | | | | | | | | | | | | | | | | | | | | | | | |
Net investment income | | | (875,900 | ) | | | (879,348 | ) | | | (1,245,174 | ) | | | (1,308,638 | ) | | | (1,297,193 | ) | | | (1,186,680 | ) |
CAPITAL SHARE TRANSACTIONS: | | | | | | | | | | | | | | | | | | | | | | | | |
| | | | | | |
Net proceeds from sales of shares | | | 12,025,302 | | | | 8,872,211 | | | | — | | | | 14,930,099 | | | | 70,509,278 | | | | 103,782,212 | |
| | | | | | |
Cost of shares redeemed | | | (24,245,372 | ) | | | (8,872,443 | ) | | | — | | | | (34,384,325 | ) | | | (23,377,171 | ) | | | (71,674,300 | ) |
Net increase (decrease) in net assets resulting from capital share transactions | | | (12,220,070 | ) | | | (232 | ) | | | — | | | | (19,454,226 | ) | | | 47,132,107 | | | | 32,107,912 | |
Net Increase (Decrease) in Net Assets | | | (11,167,556 | ) | | | 6,404,200 | | | | 5,354,198 | | | | (13,589,877 | ) | | | 52,850,395 | | | | 51,439,641 | |
NET ASSETS: | | | | | | | | | | | | | | | | | | | | | | | | |
| | | | | | |
Beginning of year | | $ | 54,193,183 | | | $ | 47,788,983 | | | $ | 63,832,389 | | | $ | 77,422,266 | | | $ | 105,745,341 | | | $ | 54,305,700 | |
| | | | | | |
End of year | | $ | 43,025,627 | | | $ | 54,193,183 | | | $ | 69,186,587 | | | $ | 63,832,389 | | | $ | 158,595,736 | | | $ | 105,745,341 | |
Undistributed net investment income included in net assets at end of year | | $ | 17,903 | | | $ | 24,687 | | | $ | 27,480 | | | $ | 35,865 | | | $ | 96,368 | | | $ | 15,282 | |
SHARES CREATED AND REDEEMED: | | | | | | | | | | | | | | | | | | | | | | | | |
| | | | | | |
Shares outstanding, beginning of year | | | 1,150,000 | | | | 1,150,000 | | | | 1,400,000 | | | | 1,900,000 | | | | 1,800,000 | | | | 1,150,000 | |
| | | | | | |
Shares created | | | 250,000 | | | | 200,000 | | | | — | | | | 350,000 | | | | 1,250,000 | | | | 2,050,000 | |
| | | | | | |
Shares redeemed | | | (550,000 | ) | | | (200,000 | ) | | | — | | | | (850,000 | ) | | | (450,000 | ) | | | (1,400,000 | ) |
Shares outstanding, end of year | | | 850,000 | | | | 1,150,000 | | | | 1,400,000 | | | | 1,400,000 | | | | 2,600,000 | | | | 1,800,000 | |
See Notes to Financial Statements.
| | | | |
| WisdomTree Domestic and International Earnings Funds | | | 69 | |
Statements of Changes in Net Assets (continued)
WisdomTree Domestic and International Earnings Funds
| | | | | | | | | | | | | | | | |
| | | WisdomTree SmallCap Earnings Fund | | | WisdomTree LargeCap Value Fund | |
| | | For the
Year Ended
March 31, 2012 | | | For the
Year Ended
March 31, 2011 | | | For the
Year Ended
March 31, 2012 | | | For the
Year Ended
March 31, 2011 | |
INCREASE (DECREASE) IN NET ASSETS RESULTING FROM OPERATIONS: | | | | | | | | | | | | | | | | |
| | | | |
Net investment income | | $ | 1,844,693 | | | $ | 1,405,428 | | | $ | 503,695 | | | $ | 360,482 | |
| | | | |
Net realized gain (loss) on investments | | | (1,752,278 | ) | | | 13,449,922 | | | | 1,559,365 | | | | 4,454,246 | |
| | | | |
Net change in unrealized appreciation (depreciation) on investments | | | 3,999,459 | | | | 8,550,393 | | | | 113,089 | | | | (1,467,904 | ) |
Net increase in net assets resulting from operations | | | 4,091,874 | | | | 23,405,743 | | | | 2,176,149 | | | | 3,346,824 | |
DIVIDENDS: | | | | | | | | | | | | | | | | |
| | | | |
Net investment income | | | (1,778,298 | ) | | | (1,365,764 | ) | | | (506,854 | ) | | | (362,140 | ) |
CAPITAL SHARE TRANSACTIONS: | | | | | | | | | | | | | | | | |
| | | | |
Net proceeds from sales of shares | | | 48,829,976 | | | | 76,913,803 | | | | 5,633,589 | | | | 26,563,158 | |
| | | | |
Cost of shares redeemed | | | (38,688,336 | ) | | | (59,588,233 | ) | | | (2,099,393 | ) | | | (38,899,989 | ) |
Net increase (decrease) in net assets resulting from capital share transactions | | | 10,141,640 | | | | 17,325,570 | | | | 3,534,196 | | | | (12,336,831 | ) |
Net Increase (Decrease) in Net Assets | | | 12,455,216 | | | | 39,365,549 | | | | 5,203,491 | | | | (9,352,147 | ) |
NET ASSETS: | | | | | | | | | | | | | | | | |
| | | | |
Beginning of year | | $ | 134,671,671 | | | $ | 95,306,122 | | | $ | 25,811,966 | | | $ | 35,164,113 | |
| | | | |
End of year | | $ | 147,126,887 | | | $ | 134,671,671 | | | $ | 31,015,457 | | | $ | 25,811,966 | |
Undistributed net investment income included in net assets at end of year | | $ | 99,439 | | | $ | 39,297 | | | $ | 8,589 | | | $ | 11,519 | |
SHARES CREATED AND REDEEMED: | | | | | | | | | | | | | | | | |
| | | | |
Shares outstanding, beginning of year | | | 2,450,000 | | | | 2,150,000 | | | | 600,000 | | | | 950,000 | |
| | | | |
Shares created | | | 950,000 | | | | 1,500,000 | | | | 150,000 | | | | 700,000 | |
| | | | |
Shares redeemed | | | (800,000 | ) | | | (1,200,000 | ) | | | (50,000 | ) | | | (1,050,000 | ) |
Shares outstanding, end of year | | | 2,600,000 | | | | 2,450,000 | | | | 700,000 | | | | 600,000 | |
See Notes to Financial Statements.
| | |
| 70 | | WisdomTree Domestic and International Earnings Funds |
Statements of Changes in Net Assets (concluded)
WisdomTree Domestic and International Earnings Funds
| | | | | | | | | | | | | | | | |
| | | WisdomTree LargeCap Growth Fund | | | WisdomTree India Earnings Fund
(consolidated) | |
| | | For the Year Ended March 31, 2012 | | | For the Year Ended March 31, 2011 | | | For the Year Ended March 31, 2012 | | | For the Year Ended March 31, 2011 | |
INCREASE (DECREASE) IN NET ASSETS RESULTING FROM OPERATIONS: | | | | | | | | | | | | | | | | |
| | | | |
Net investment income | | $ | 310,306 | | | $ | 150,850 | | | $ | 9,660,057 | | | $ | 4,534,984 | |
| | | | |
Net realized gain (loss) on investments, forward foreign currency contracts and foreign currency related transactions | | | 2,157,685 | | | | 4,058,027 | | | | (94,217,280 | ) | | | (41,312,824 | ) |
| | | | |
Net change in unrealized appreciation (depreciation) on investments, forward foreign currency contracts and foreign currency related transactions | | | (1,443,327 | ) | | | (822,362 | ) | | | (222,861,321 | ) | | | 90,435,937 | |
Net increase in net assets resulting from operations | | | 1,024,664 | | | | 3,386,515 | | | | (307,418,544 | ) | | | 53,658,097 | |
DIVIDENDS: | | | | | | | | | | | | | | | | |
Net investment income | | | (319,110 | ) | | | (145,072 | ) | | | (8,702,508 | ) | | | (6,420,668 | ) |
CAPITAL SHARE TRANSACTIONS: | | | | | | | | | | | | | | | | |
| | | | |
Net proceeds from sales of shares | | | 17,375,104 | | | | 26,159,681 | | | | 87,306,632 | | | | 710,471,987 | |
| | | | |
Cost of shares redeemed | | | (22,977,099 | ) | | | (26,528,509 | ) | | | (342,250,872 | ) | | | (112,152,803 | ) |
Net increase (decrease) in net assets resulting from capital share transactions | | | (5,601,995 | ) | | | (368,828 | ) | | | (254,944,240 | ) | | | 598,319,184 | |
Net Increase (Decrease) in Net Assets | | | (4,896,441 | ) | | | 2,872,615 | | | | (571,065,292 | ) | | | 645,556,613 | |
NET ASSETS: | | | | | | | | | | | | | | | | |
Beginning of year | | $ | 25,357,179 | | | $ | 22,484,564 | | | $ | 1,487,089,371 | | | $ | 841,532,758 | |
| | | | |
End of year | | $ | 20,460,738 | | | $ | 25,357,179 | | | $ | 916,024,079 | | | $ | 1,487,089,371 | |
Undistributed net investment income included in net assets at end of year | | $ | 2,180 | | | $ | 11,260 | | | $ | 344,964 | | | $ | — | |
SHARES CREATED AND REDEEMED: | | | | | | | | | | | | | | | | |
| | | | |
Shares outstanding, beginning of year | | | 650,000 | | | | 650,000 | | | | 59,800,000 | | | | 36,200,000 | |
| | | | |
Shares created | | | 450,000 | | | | 750,000 | | | | 4,400,000 | | | | 28,400,000 | |
| | | | |
Shares redeemed | | | (600,000 | ) | | | (750,000 | ) | | | (16,600,000 | ) | | | (4,800,000 | ) |
Shares outstanding, end of year | | | 500,000 | | | | 650,000 | | | | 47,600,000 | | | | 59,800,000 | |
See Notes to Financial Statements.
| | | | |
| WisdomTree Domestic and International Earnings Funds | | | 71 | |
Financial Highlights
WisdomTree Domestic and International Earnings Funds
March 31, 2012
Selected data for a share of beneficial interest outstanding throughout the period is presented below:
| | | | | | | | | | | | | | | | | | | | |
| WisdomTree Total Earnings Fund | | For the
Year Ended
March 31, 2012 | | | For the
Year Ended
March 31, 2011 | | | For the
Year Ended
March 31, 2010 | | | For the
Year Ended
March 31, 2009 | | | For the
Year Ended
March 31, 2008 | |
Net asset value, beginning of year | | $ | 47.12 | | | $ | 41.56 | | | $ | 27.52 | | | $ | 45.32 | | | $ | 48.99 | |
Investment operations: | | | | | | | | | | | | | | | | | | | | |
Net investment income1 | | | 0.88 | | | | 0.77 | | | | 0.70 | | | | 0.87 | | | | 0.85 | |
Net realized and unrealized gain (loss) | | | 3.58 | | | | 5.55 | | | | 14.03 | | | | (17.87 | ) | | | (3.56 | ) |
Total from investment operations | | | 4.46 | | | | 6.32 | | | | 14.73 | | | | (17.00 | ) | | | (2.71 | ) |
Dividends to shareholders: | | | | | | | | | | | | | | | | | | | | |
Net investment income | | | (0.96 | ) | | | (0.76 | ) | | | (0.69 | ) | | | (0.80 | ) | | | (0.96 | ) |
Net asset value, end of year | | $ | 50.62 | | | $ | 47.12 | | | $ | 41.56 | | | $ | 27.52 | | | $ | 45.32 | |
| | | | | |
TOTAL RETURN2 | | | 9.74 | % | | | 15.44 | % | | | 53.82 | % | | | (37.86 | )% | | | (5.69 | )% |
RATIOS/SUPPLEMENTAL DATA: | | | | | | | | | | | | | | | | | | | | |
Net assets, end of year (000’s omitted) | | $ | 43,026 | | | $ | 54,193 | | | $ | 47,789 | | | $ | 16,511 | | | $ | 15,861 | |
Ratios to average net assets3 of: | | | | | | | | | | | | | | | | | | | | |
Expenses, net of expense reimbursements | | | 0.28 | % | | | 0.28 | % | | | 0.28 | % | | | 0.28 | % | | | 0.28 | % |
Expenses, prior to expense reimbursements | | | 0.28 | % | | | 0.28 | % | | | 0.28 | % | | | 0.28 | % | | | 0.28 | % |
Net investment income | | | 1.90 | % | | | 1.82 | % | | | 1.92 | % | | | 2.33 | % | | | 1.76 | % |
Portfolio turnover rate4 | | | 12 | % | | | 9 | % | | | 16 | % | | | 23 | % | | | 11 | % |
| | | | | | | | | | | | | | | | | | | | |
| | | | | | |
| WisdomTree Earnings 500 Fund | | For the
Year Ended
March 31, 2012 | | | For the
Year Ended
March 31, 2011 | | | For the
Year Ended
March 31, 2010 | | | For the
Year Ended
March 31, 2009 | | | For the
Year Ended
March 31, 2008 | |
Net asset value, beginning of year | | $ | 45.59 | | | $ | 40.75 | | | $ | 27.77 | | | $ | 45.77 | | | $ | 48.85 | |
Investment operations: | | | | | | | | | | | | | | | | | | | | |
Net investment income1 | | | 0.88 | | | | 0.77 | | | | 0.68 | | | | 0.91 | | | | 0.94 | |
Net realized and unrealized gain (loss) | | | 3.84 | | | | 4.84 | | | | 12.98 | | | | (18.07 | ) | | | (3.18 | ) |
Total from investment operations | | | 4.72 | | | | 5.61 | | | | 13.66 | | | | (17.16 | ) | | | (2.24 | ) |
Dividends to shareholders: | | | | | | | | | | | | | | | | | | | | |
Net investment income | | | (0.89 | ) | | | (0.77 | ) | | | (0.68 | ) | | | (0.84 | ) | | | (0.84 | ) |
Net asset value, end of year | | $ | 49.42 | | | $ | 45.59 | | | $ | 40.75 | | | $ | 27.77 | | | $ | 45.77 | |
| | | | | |
TOTAL RETURN2 | | | 10.60 | % | | | 13.99 | % | | | 49.49 | % | | | (37.83 | )% | | | (4.72 | )% |
RATIOS/SUPPLEMENTAL DATA: | | | | | | | | | | | | | | | | | | | | |
Net assets, end of year (000’s omitted) | | $ | 69,187 | | | $ | 63,832 | | | $ | 77,422 | | | $ | 59,714 | | | $ | 54,927 | |
Ratios to average net assets3 of: | | | | | | | | | | | | | | | | | | | | |
Expenses, net of expense reimbursements | | | 0.28 | % | | | 0.28 | % | | | 0.28 | % | | | 0.28 | % | | | 0.28 | % |
Expenses, prior to expense reimbursements | | | 0.28 | % | | | 0.28 | % | | | 0.28 | % | | | 0.28 | % | | | 0.28 | % |
Net investment income | | | 1.98 | % | | | 1.87 | % | | | 1.95 | % | | | 2.49 | % | | | 1.93 | % |
Portfolio turnover rate4 | | | 16 | % | | | 12 | % | | | 21 | % | | | 21 | % | | | 8 | % |
| 1 | Based on average shares outstanding. |
| 2 | Total return is calculated assuming an initial investment made at the net asset value at the beginning of the period, reinvestment of all dividends and distributions at net asset value during the period and redemption on the last day of the period. Total return calculated for a period of less than one year is not annualized. The total return would have been lower if certain expenses had not been reimbursed by the investment adviser (Notes 2 and 3). |
| 3 | The ratios to average net assets do not include net investment income (loss) or expenses of affiliated funds in which the Fund invests. |
| 4 | Portfolio turnover rate is not annualized and excludes the value of portfolio securities received or delivered as a result of in-kind creations or redemptions of the Fund’s capital shares. |
See Notes to Financial Statements.
| | |
| 72 | | WisdomTree Domestic and International Earnings Funds |
Financial Highlights (continued)
WisdomTree Domestic and International Earnings Funds
March 31, 2012
Selected data for a share of beneficial interest outstanding throughout the period is presented below:
| | | | | | | | | | | | | | | | | | | | |
WisdomTree MidCap
Earnings Fund | | For the
Year Ended
March 31, 2012 | | | For the
Year Ended
March 31, 2011 | | | For the
Year Ended
March 31, 2010 | | | For the
Year Ended
March 31, 2009 | | | For the
Year Ended
March 31, 2008 | |
Net asset value, beginning of year | | $ | 58.75 | | | $ | 47.22 | | | $ | 26.19 | | | $ | 42.08 | | | $ | 48.77 | |
Investment operations: | | | | | | | | | | | | | | | | | | | | |
Net investment income1 | | | 0.62 | | | | 0.73 | | | | 0.61 | | | | 0.54 | | | | 0.81 | |
Net realized and unrealized gain (loss) | | | 2.20 | | | | 11.50 | | | | 20.92 | | | | (15.88 | ) | | | (6.90 | ) |
Total from investment operations | | | 2.82 | | | | 12.23 | | | | 21.53 | | | | (15.34 | ) | | | (6.09 | ) |
Dividends to shareholders: | | | | | | | | | | | | | | | | | | | | |
Net investment income | | | (0.57 | ) | | | (0.70 | ) | | | (0.50 | ) | | | (0.55 | ) | | | (0.60 | ) |
Net asset value, end of year | | $ | 61.00 | | | $ | 58.75 | | | $ | 47.22 | | | $ | 26.19 | | | $ | 42.08 | |
| | | | | |
TOTAL RETURN2 | | | 4.92 | % | | | 26.15 | % | | | 82.49 | % | | | (36.73 | )% | | | (12.57 | )% |
RATIOS/SUPPLEMENTAL DATA: | | | | | | | | | | | | | | | | | | | | |
Net assets, end of year (000’s omitted) | | $ | 158,596 | | | $ | 105,745 | | | $ | 54,306 | | | $ | 14,406 | | | $ | 25,247 | |
Ratios to average net assets3 of: | | | | | | | | | | | | | | | | | | | | |
Expenses, net of expense reimbursements | | | 0.38 | % | | | 0.38 | % | | | 0.38 | % | | | 0.38 | % | | | 0.38 | % |
Expenses, prior to expense reimbursements | | | 0.38 | % | | | 0.38 | % | | | 0.38 | % | | | 0.38 | % | | | 0.38 | % |
Net investment income | | | 1.11 | % | | | 1.45 | % | | | 1.54 | % | | | 1.49 | % | | | 1.70 | % |
Portfolio turnover rate4 | | | 38 | % | | | 18 | % | | | 19 | % | | | 39 | % | | | 45 | % |
| | | | | | | | | | | | | | | | | | | | |
| | | | | | |
WisdomTree SmallCap
Earnings Fund | | For the
Year Ended
March 31, 2012 | | | For the
Year Ended
March 31, 2011 | | | For the
Year Ended
March 31, 2010 | | | For the
Year Ended
March 31, 2009 | | | For the
Year Ended
March 31, 2008 | |
Net asset value, beginning of year | | $ | 54.97 | | | $ | 44.33 | | | $ | 23.25 | | | $ | 38.96 | | | $ | 48.03 | |
Investment operations: | | | | | | | | | | | | | | | | | | | | |
Net investment income1 | | | 0.74 | | | | 0.65 | | | | 0.37 | | | | 0.47 | | | | 0.58 | |
Net realized and unrealized gain (loss) | | | 1.59 | | | | 10.60 | | | | 20.96 | | | | (15.64 | ) | | | (9.17 | ) |
Total from investment operations | | | 2.33 | | | | 11.25 | | | | 21.33 | | | | (15.17 | ) | | | (8.59 | ) |
Dividends to shareholders: | | | | | | | | | | | | | | | | | | | | |
Net investment income | | | (0.71 | ) | | | (0.61 | ) | | | (0.25 | ) | | | (0.54 | ) | | | (0.48 | ) |
Net asset value, end of year | | $ | 56.59 | | | $ | 54.97 | | | $ | 44.33 | | | $ | 23.25 | | | $ | 38.96 | |
| | | | | |
TOTAL RETURN2 | | | 4.39 | % | | | 25.57 | % | | | 91.88 | % | | | (39.31 | )% | | | (17.97 | )% |
RATIOS/SUPPLEMENTAL DATA: | | | | | | | | | | | | | | | | | | | | |
Net assets, end of year (000’s omitted) | | $ | 147,127 | | | $ | 134,672 | | | $ | 95,306 | | | $ | 13,948 | | | $ | 15,585 | |
Ratios to average net assets3 of: | | | | | | | | | | | | | | | | | | | | |
Expenses, net of expense reimbursements | | | 0.38 | % | | | 0.38 | % | | | 0.38 | % | | | 0.38 | % | | | 0.38 | % |
Expenses, prior to expense reimbursements | | | 0.38 | % | | | 0.38 | % | | | 0.38 | % | | | 0.38 | % | | | 0.38 | % |
Net investment income | | | 1.43 | % | | | 1.37 | % | | | 0.97 | % | | | 1.49 | % | | | 1.28 | % |
Portfolio turnover rate4 | | | 41 | % | | | 19 | % | | | 16 | % | | | 51 | % | | | 37 | % |
| 1 | Based on average shares outstanding. |
| 2 | Total return is calculated assuming an initial investment made at the net asset value at the beginning of the period, reinvestment of all dividends and distributions at net asset value during the period and redemption on the last day of the period. Total return calculated for a period of less than one year is not annualized. The total return would have been lower if certain expenses had not been reimbursed by the investment adviser (Notes 2 and 3). |
| 3 | The ratios to average net assets do not include net investment income (loss) or expenses of affiliated funds in which the Fund invests. |
| 4 | Portfolio turnover rate is not annualized and excludes the value of portfolio securities received or delivered as a result of in-kind creations or redemptions of the Fund’s capital shares. |
See Notes to Financial Statements.
| | | | |
| WisdomTree Domestic and International Earnings Funds | | | 73 | |
Financial Highlights (continued)
WisdomTree Domestic and International Earnings Funds
March 31, 2012
Selected data for a share of beneficial interest outstanding throughout the period is presented below:
| | | | | | | | | | | | | | | | | | | | |
WisdomTree LargeCap
Value Fund | | For the
Year Ended
March 31, 2012 | | | For the
Year Ended
March 31, 2011 | | | For the Year Ended
March 31, 2010** | | | For the
Year Ended
March 31, 2009 | | | For the
Year Ended
March 31, 2008 | |
Net asset value, beginning of year | | $ | 43.02 | | | $ | 37.01 | | | $ | 24.24 | | | $ | 43.53 | | | $ | 49.06 | |
Investment operations: | | | | | | | | | | | | | | | | | | | | |
Net investment income1 | | | 0.75 | | | | 0.49 | | | | 0.65 | | | | 0.86 | | | | 1.03 | |
Net realized and unrealized gain (loss) | | | 1.26 | | | | 6.04 | | | | 12.75 | | | | (19.33 | ) | | | (5.49 | ) |
Total from investment operations | | | 2.01 | | | | 6.53 | | | | 13.40 | | | | (18.47 | ) | | | (4.46 | ) |
Dividends to shareholders: | | | | | | | | | | | | | | | | | | | | |
Net investment income | | | (0.72 | ) | | | (0.52 | ) | | | (0.63 | ) | | | (0.82 | ) | | | (1.07 | ) |
Net asset value, end of year | | $ | 44.31 | | | $ | 43.02 | | | $ | 37.01 | | | $ | 24.24 | | | $ | 43.53 | |
| | | | | |
TOTAL RETURN2 | | | 4.83 | % | | | 17.86 | % | | | 55.57 | % | �� | | (42.87 | )% | | | (9.31 | )% |
RATIOS/SUPPLEMENTAL DATA: | | | | | | | | | | | | | | | | | | | | |
Net assets, end of year (000’s omitted) | | $ | 31,015 | | | $ | 25,812 | | | $ | 35,164 | | | $ | 20,607 | | | $ | 23,940 | |
Ratios to average net assets3 of: | | | | | | | | | | | | | | | | | | | | |
Expenses, net of expense reimbursements | | | 0.38 | % | | | 0.38 | % | | | 0.38 | % | | | 0.38 | % | | | 0.38 | % |
Expenses, prior to expense reimbursements | | | 0.38 | % | | | 0.38 | % | | | 0.38 | % | | | 0.38 | % | | | 0.38 | % |
Net investment income | | | 1.84 | % | | | 1.33 | % | | | 2.01 | % | | | 2.60 | % | | | 2.10 | % |
Portfolio turnover rate4 | | | 62 | % | | | 6 | % | | | 71 | % | | | 54 | % | | | 20 | % |
| | | | | | | | | | | | | | | | |
| | | | | |
| WisdomTree LargeCap Growth Fund | | For the
Year Ended
March 31, 2012 | | | For the
Year Ended
March 31, 2011 | | | For the
Year Ended
March 31, 2010 | | | For the Period
December 4, 2008*
through March 31, 2009 | |
Net asset value, beginning of period | | $ | 39.01 | | | $ | 34.59 | | | $ | 26.10 | | | $ | 25.28 | |
Investment operations: | | | | | | | | | | | | | | | | |
Net investment income1 | | | 0.58 | | | | 0.26 | | | | 0.49 | | | | 0.09 | |
Net realized and unrealized gain | | | 1.97 | | | | 4.41 | | | | 9.22 | | | | 0.81 | |
Total from investment operations | | | 2.55 | | | | 4.67 | | | | 9.71 | | | | 0.90 | |
Dividends and distributions to shareholders: | | | | | | | | | | | | | | | | |
Net investment income | | | (0.64 | ) | | | (0.25 | ) | | | (0.46 | ) | | | (0.08 | ) |
Capital gains | | | — | | | | — | | | | (0.76 | ) | | | — | |
Total dividends and distributions to shareholders | | | (0.64 | ) | | | (0.25 | ) | | | (1.22 | ) | | | (0.08 | ) |
Net asset value, end of period | | $ | 40.92 | | | $ | 39.01 | | | $ | 34.59 | | | $ | 26.10 | |
| | | | |
TOTAL RETURN2 | | | 6.74 | % | | | 13.57 | % | | | 37.46 | % | | | 3.56 | % |
RATIOS/SUPPLEMENTAL DATA: | | | | | | | | | | | | | | | | |
Net assets, end of period (000’s omitted) | | $ | 20,461 | | | $ | 25,357 | | | $ | 22,485 | | | $ | 9,136 | |
Ratios to average net assets3 of: | | | | | | | | | | | | | | | | |
Expenses, net of expense reimbursements | | | 0.38 | % | | | 0.38 | % | | | 0.38 | % | | | 0.38 | %5 |
Expenses, prior to expense reimbursements | | | 0.38 | % | | | 0.38 | % | | | 0.38 | % | | | 0.38 | %5 |
Net investment income | | | 1.57 | % | | | 0.73 | % | | | 1.53 | % | | | 1.26 | %5 |
Portfolio turnover rate4 | | | 104 | % | | | 10 | % | | | 44 | % | | | 1 | % |
| * | Commencement of investment operations. |
| ** | This information reflects the investment objective and strategy of WisdomTree Low P/E Fund through June 19, 2009 and the investment objective and strategy of the WisdomTree LargeCap Value Fund thereafter. |
| 1 | Based on average shares outstanding. |
| 2 | Total return is calculated assuming an initial investment made at the net asset value at the beginning of the period, reinvestment of all dividends and distributions at net asset value during the period and redemption on the last day of the period. Total return calculated for a period of less than one year is not annualized. The total return would have been lower if certain expenses had not been reimbursed by the investment adviser (Notes 2 and 3). |
| 3 | The ratios to average net assets do not include net investment income (loss) or expenses of affiliated funds in which the Fund invests. |
| 4 | Portfolio turnover rate is not annualized and excludes the value of portfolio securities received or delivered as a result of in-kind creations or redemptions of the Fund’s capital shares. |
See Notes to Financial Statements.
| | |
| 74 | | WisdomTree Domestic and International Earnings Funds |
Financial Highlights (concluded)
WisdomTree Domestic and International Earnings Funds
March 31, 2012
Selected data for a share of beneficial interest outstanding throughout the period is presented below:
| | | | | | | | | | | | | | | | | | | | |
WisdomTree India
Earnings Fund (consolidated) | | For the
Year Ended
March 31, 2012 | | | For the
Year Ended
March 31, 2011 | | | For the
Year Ended
March 31, 2010 | | | For the
Year Ended
March 31, 2009 | | | For the Period
February 22, 2008*
through March 31, 2008 | |
Net asset value, beginning of period | | $ | 24.87 | | | $ | 23.25 | | | $ | 10.99 | | | $ | 22.57 | | | $ | 24.94 | |
Investment operations: | | | | | | | | | | | | | | | | | | | | |
Net investment income1 | | | 0.19 | | | | 0.09 | | | | 0.04 | | | | 0.12 | | | | (0.01 | ) |
Net realized and unrealized gain (loss) | | | (5.65 | ) | | | 1.67 | | | | 12.27 | | | | (11.60 | ) | | | (2.36 | ) |
Total from investment operations | | | (5.46 | ) | | | 1.76 | | | | 12.31 | | | | (11.48 | ) | | | (2.37 | ) |
Dividends to shareholders: | | | | | | | | | | | | | | | | | | | | |
Net investment income | | | (0.17 | ) | | | (0.14 | ) | | | (0.05 | ) | | | (0.10 | ) | | | — | |
Net asset value, end of period | | $ | 19.24 | | | $ | 24.87 | | | $ | 23.25 | | | $ | 10.99 | | | $ | 22.57 | |
| | | | | |
TOTAL RETURN2 | | | (21.96 | )% | | | 7.59 | % | | | 112.11 | % | | | (50.89 | )% | | | (9.50 | )% |
RATIOS/SUPPLEMENTAL DATA: | | | | | | | | | | | | | | | | | | | | |
Net assets, end of period (000’s omitted) | | $ | 916,024 | | | $ | 1,487,089 | | | $ | 841,533 | | | $ | 169,195 | | | $ | 162,540 | |
Ratios to average net assets4 of: | | | | | | | | | | | | | | | | | | | | |
Expenses, net of expense reimbursements | | | 0.76 | %5 | | | 0.88 | % | | | 0.88 | % | | | 0.88 | % | | | 0.88 | %3 |
Expenses, prior to expense reimbursements | | | 0.82 | % | | | 0.88 | % | | | 0.88 | % | | | 0.92 | % | | | 2.10 | %3 |
Net investment income (loss) | | | 0.91 | % | | | 0.36 | % | | | 0.19 | % | | | 0.77 | % | | | (0.41 | )%3 |
Portfolio turnover rate4 | | | 32 | % | | | 8 | % | | | 33 | % | | | 42 | % | | | 0 | % |
| * | Commencement of investment operations. |
| 1 | Based on average shares outstanding. |
| 2 | Total return is calculated assuming an initial investment made at the net asset value at the beginning of the period, reinvestment of all dividends and distributions at net asset value during the period and redemption on the last day of the period. Total return calculated for a period of less than one year is not annualized. The total return would have been lower if certain expenses had not been reimbursed by the investment adviser (Notes 2 and 3). |
| 4 | Portfolio turnover rate is not annualized and excludes the value of portfolio securities received or delivered as a result of in-kind creations or redemptions of the Fund’s capital shares. |
| 5 | During the period, the Fund was reimbursed for certain expenses that occurred during the previous fiscal year. |
See Notes to Financial Statements.
| | | | |
| WisdomTree Domestic and International Earnings Funds | | | 75 | |
Notes to Financial Statements
March 31, 2012
1. ORGANIZATION
WisdomTree Trust (the “Trust”) is registered under the Investment Company Act of 1940, as amended (the “1940 Act”), as an open-end management investment company. The Trust was established as a Delaware statutory trust pursuant to a Trust Instrument dated December 15, 2005. As of March 31, 2012, the Trust offered 48 investment funds (each a “Fund”, collectively, the “Funds”). These notes relate only to Funds listed in the table below:
| | |
| Fund Name | | Commencement of Operations |
WisdomTree Total Earnings Fund (“Total Earnings Fund”) | | February 23, 2007 |
WisdomTree Earnings 500 Fund (“Earnings 500 Fund”) | | February 23, 2007 |
WisdomTree MidCap Earnings Fund (“MidCap Earnings Fund”) | | February 23, 2007 |
WisdomTree SmallCap Earnings Fund (“SmallCap Earnings Fund”) | | February 23, 2007 |
WisdomTree LargeCap Value Fund (“LargeCap Value Fund”) | | February 23, 2007 |
WisdomTree LargeCap Growth Fund (“LargeCap Growth Fund”) | | December 4, 2008 |
WisdomTree India Earnings Fund (“India Earnings Fund”) (consolidated) | | February 22, 2008 |
The India Earnings Fund makes its investments through the WisdomTree India Investment Portfolio, Inc. (the “Portfolio”), a wholly owned subsidiary organized in the Republic of Mauritius. The Portfolio is advised by WisdomTree Asset Management, Inc. (“WTAM”) and is sub-advised by Mellon Capital Management Corporation, Inc. (“MCM”). For the India Earnings Fund, the accompanying financial statements reflect the financial position of the Fund and the results of operations on a consolidated basis with the Portfolio. All inter-company accounts and transactions have been eliminated in consolidation. This structure should permit the India Earnings Fund to benefit from a tax treaty between India and Mauritius. The Supreme Court of India upheld the validity of this tax treaty in response to a lower court challenge contesting the treaty’s applicability to entities such as the India Earnings Fund. In March of 2012, the Indian Finance Minister introduced a new chapter to the Indian Income Tax Act 1961, which would include certain General Anti-Avoidance Rules (“GAAR”). The implementation of these rules has been postponed until 2013 and it is currently unclear whether the proposed GAAR rules will be enacted and whether such rules will have any impact on the Fund’s ability to benefit from the tax treaty. No assurance can be given that the terms of the treaty will not be subject to re-negotiation in the future or subject to an adverse interpretation under the proposed GAAR. Any change in the provision of this treaty or in its applicability to the India Earnings Fund could result in the imposition of withholding and other taxes on the India Earnings Fund by tax authorities in India. This would reduce the return to the India Earnings Fund on its investments and the return received by India Earnings Fund shareholders. References to investments by the India Earnings Fund herein should be understood to refer to investments by the Portfolio.
Each Fund seeks to track the price and yield performance, before fees and expenses, of a particular index (“Index”) developed by WisdomTree Investments, Inc. (“WisdomTree Investments”). WisdomTree Investments is the parent company of WTAM, the investment adviser to each Fund and the Trust. “WisdomTree” is a registered mark of WisdomTree Investments and has been licensed for use by the Trust. Each Fund described herein is considered to be non-diversified. The securities in each Index are weighted based on earnings or earnings yield.
2. SIGNIFICANT ACCOUNTING POLICIES
The Financial Accounting Standards Board (“FASB”) Accounting Standards Codification (the “Codification”) is the exclusive reference of authoritative U.S. generally accepted accounting principles (“GAAP”) recognized by the FASB to be applied by nongovernmental entities. Rules and interpretive releases of the Securities and Exchange Commission (“SEC”) under authority of federal laws are also sources of authoritative GAAP for SEC registrants.
The following is a summary of significant accounting policies followed by the Funds:
Guarantees — In the normal course of business the Funds may enter into contracts that contain a variety of representations or that provide indemnification for certain liabilities. The Funds’ maximum exposure under these arrangements is unknown, as this would involve future claims that may be made against the Funds that have not yet occurred. However, the Funds have not had prior claims or losses pursuant to these contracts and expect the risk of loss to be remote. Therefore, no liabilities have been recorded in connection with these indemnifications.
Use of Estimates — The preparation of financial statements in conformity with GAAP, requires management to make certain estimates and assumptions that affect the reported amounts of assets and liabilities and disclosure of contingent assets and liabilities at the date of the financial statements and the reported amounts of increases and decreases in the net assets from operations during the reporting period. Actual results could differ from those estimates.
| | |
| 76 | | WisdomTree Domestic and International Earnings Funds |
Notes to Financial Statements (continued)
Investment Valuation — The net asset value (“NAV”) of each Fund’s shares is calculated each day the national securities exchanges are open for trading as of the close of regular trading on the New York Stock Exchange, generally 4:00 p.m. New York time. NAV per share is calculated by dividing a Fund’s net assets by the number of Fund shares outstanding. Transactions in Fund shares will be priced at NAV only if you purchase or redeem shares directly from a Fund in creation units, which are typically in blocks of 50,000 shares or more. Fund shares are purchased or sold on a national securities exchange at market prices, which may be higher or lower than NAV. In calculating each Fund’s NAV, investments are valued under policies approved by the Board of Trustees.
Securities traded on any recognized U.S. or non-U.S. exchange are valued at the last sale price or official closing price on the exchange or system on which they are principally traded. Events occurring after the close of trading on non-U.S. exchanges may result in adjustments to the valuation of foreign securities to more accurately reflect their fair value as of the close of regular trading on the New York Stock Exchange. The Fund may rely on an independent fair valuation service in adjusting the valuations of foreign securities. Unlisted equity securities are valued at the last quoted sale price or, if no sale price is available, at the mean between the highest bid and lowest ask prices. Securities for which market quotations are not readily available are valued at fair value as determined by management and in accordance with procedures approved by the Board of Trustees. Short-term securities with 60 days or less remaining to maturity are valued using the amortized cost method, which approximates fair value. Forward foreign currency contracts are valued daily using WM/Reuters closing spot and forward rates as of 4:00 p.m. London time for Europe and the Americas, and Tullett Prebon closing spot and forward rates as of 2:00 p.m. Singapore time for Asia.
In certain instances, such as when reliable market valuations are not readily available or are not deemed to reflect current market values, a Fund’s investments will be valued in accordance with the Fund’s pricing policy and procedures. Securities that may be valued using “fair value” pricing may include, but are not limited to, securities for which there are no current market quotations, securities whose issuer is in default or bankruptcy, securities subject to corporate actions (such as mergers or reorganizations), securities subject to non-U.S. investment limits or currency controls, and securities affected by “significant events”. An example of a significant event is an event occurring after the close of the market in which a security trades but before a Fund’s next NAV calculation time that may materially affect the value of a Fund’s investment (e.g., government action, natural disaster, or significant market fluctuation). Price movements in U.S. markets that are deemed to affect the value of foreign securities, or reflect changes to the value of such securities, also may cause securities to be fair valued. When fair value pricing is employed, the prices of securities used by a Fund to calculate its NAV may differ from quoted or published prices for the same securities. Each Fund may invest in money market funds which are valued at their NAV per share and affiliated ETFs which are valued at their last sale or official closing price on the exchange on which they are principally traded.
Fair Value Measurement — In accordance with Codification Topic 820 (“ASC 820”), Fair Value Measurements and Disclosures, fair value is defined as the price that each Fund would receive upon selling an investment in an orderly transaction to an independent buyer in the principal or most advantageous market of the investment. ASC 820 established a three-tier hierarchy to maximize the use of observable market data and minimize the use of unobservable inputs and to establish classifications of fair value measurements for disclosure purposes. Inputs refer broadly to the assumptions that market participants would use in pricing the asset or liability, including assumptions about risk — for example, the risk inherent in a particular valuation technique used to measure fair value (such as a pricing model) and/or the risk inherent in the inputs to the valuation technique. Inputs may be observable or unobservable. Observable inputs reflect the assumptions market participants would use in pricing the asset or liability. Observable inputs are based on market data obtained from sources independent of the reporting entity. Unobservable inputs reflect the reporting entity’s own assumptions about the assumptions market participants would use in pricing the asset or liability. Unobservable inputs are based on the best information available in the circumstances. The three-tier hierarchy of inputs is summarized in the three broad levels listed below:
Level 1 – quoted prices in active markets for identical securities
Level 2 – other significant observable inputs (including quoted prices for similar securities, interest rates, prepayment speeds, credit risk, etc.)
Level 3 – significant unobservable inputs (including each Fund’s assumption in determining the fair value of investments)
Investments that use Level 2 or Level 3 inputs may include, but are not limited to: (i) an unlisted security related to corporate actions; (ii) a restricted security (e.g., one that may not be publicly sold without registration under the Securities Act of 1933, as amended); (iii) a security whose trading has been suspended or which has been de-listed from its primary trading exchange; (iv) a security that is thinly traded; (v) a security in default or bankruptcy proceedings for which there is no current market quotation; (vi) a security affected by currency controls or restrictions; and (vii) a security affected by a significant event (e.g., an event that occurs after the close of the markets on which the security is traded but before the time as of which a Fund’s NAV is computed and that may materially affect the value of the Fund’s investments).
In January 2010, FASB issued Accounting Standards Update No. 2010-06 “Improving Disclosures about Fair Value Measurements (“ASU 2010-06”).” ASU 2010-06 requires reporting entities to make new disclosures about amounts and reasons for significant transfers between Level 1 and Level 2 fair value measurements, as well as inputs and valuation techniques used to measure fair value for both recurring and nonrecurring fair value measurements that fall in either Level 2 or Level 3. ASU 2010-06 also requires
| | | | |
| WisdomTree Domestic and International Earnings Funds | | | 77 | |
Notes to Financial Statements (continued)
information on purchases and sales, issuances and settlements on a gross basis in the reconciliation of activity in Level 3 fair value measurements. The new and revised disclosures have been implemented for fiscal periods beginning after December 15, 2009 other than the disclosures surrounding the presentation of purchases, sales, issuances and settlements on a gross basis in the reconciliation of Level 3 fair value measurements which have been implemented for fiscal periods beginning after December 15, 2010.
The inputs or methodology used for valuation are not necessarily an indication of the risk associated with investing in those investments.
The valuation techniques and significant inputs used in determining the fair market value measurements for Level 2 or Level 3 positions are as follows:
Financial instruments are valued by pricing service providers that use broker dealer quotations, reported trades or valuation estimates from their internal pricing models. Depending on the type of financial instrument, the service providers’ internal models use inputs that are observable such as issuer details, interest rates, yield curves, prepayment speeds, credit risks/spreads, default rates and quoted prices for similar assets. Securities that use similar valuation techniques and inputs as described above are categorized as Level 2 of the fair value hierarchy. Short-term investments having a maturity of 60 days or less are generally valued at amortized cost which approximates fair market value. These investments are categorized as Level 2 of the fair value hierarchy. Over-the-counter financial derivative instruments, such as forward foreign currency contracts derive their value from underlying asset prices, indices, reference rates, and other inputs or a combination of these factors. These contracts are normally valued on the basis of broker dealer quotations or pricing service providers. Depending on the product and the terms of the transaction, the value of the financial derivative contracts can be estimated by a pricing service provider using a series of techniques, including simulation pricing models. The pricing models use inputs that are observed from actively quoted markets such as issuer details, indices, spreads, interest rates, curves, dividends and exchange rates. Financial derivatives that use similar valuation techniques and inputs as described above are categorized as Level 2 of the fair value hierarchy.
In the event that a financial instrument cannot be valued based upon a price from a national securities exchange, pricing service provider or broker quotation, or such prices are deemed to not reflect current market value, WTAM may value the financial instrument in good faith under the policies and procedures approved by the Board of Trustees based on current facts and circumstances. Determination of this value may include significant unobservable inputs and therefore would be reflected as a Level 3 of the fair value hierarchy.
No significant transfers between Level 1 or Level 2 fair value measurements occurred during the fiscal year ended March 31, 2012.
The following is a summary of the inputs used as of March 31, 2012 in valuing each Fund’s assets carried at fair value:
| | | | | | | | | | | | |
| Total Earnings Fund | | Level 1 | | | Level 2 | | | Level 3 | |
Investments in Securities | | | | | | | | | | | | |
Common Stocks* | | $ | 42,857,291 | | | $ | — | | | $ | — | |
Money Market Funds | | | — | | | | 545,623 | | | | — | |
Exchange-Traded Funds | | | 91,512 | | | | — | | | | — | |
Total | | $ | 42,948,803 | | | $ | 545,623 | | | $ | — | |
| | | | | | | | | | | | |
| Earnings 500 Fund | | Level 1 | | | Level 2 | | | Level 3 | |
Investments in Securities | | | | | | | | | | | | |
Common Stocks* | | $ | 69,044,954 | | | $ | — | | | $ | — | |
Money Market Funds | | | — | | | | 300,121 | | | | — | |
Exchange-Traded Funds | | | 83,955 | | | | — | | | | — | |
Total | | $ | 69,128,909 | | | $ | 300,121 | | | $ | — | |
| | | | | | | | | | | | |
| MidCap Earnings Fund | | Level 1 | | | Level 2 | | | Level 3 | |
Investments in Securities | | | | | | | | | | | | |
Common Stocks* | | $ | 158,070,300 | | | $ | — | | | $ | — | |
Money Market Funds | | | — | | | | 10,699,894 | | | | — | |
Exchange-Traded Funds | | | 378,776 | | | | — | | | | — | |
Total | | $ | 158,449,076 | | | $ | 10,699,894 | | | $ | — | |
| | |
| 78 | | WisdomTree Domestic and International Earnings Funds |
Notes to Financial Statements (continued)
| | | | | | | | | | | | |
| SmallCap Earnings Fund | | Level 1 | | | Level 2 | | | Level 3 | |
Investments in Securities | | | | | | | | | | | | |
Common Stocks* | | $ | 146,750,185 | | | $ | — | | | $ | — | |
Money Market Funds | | | — | | | | 13,010,704 | | | | — | |
Exchange-Traded Funds | | | 269,473 | | | | — | | | | — | |
Total | | $ | 147,019,658 | | | $ | 13,010,704 | | | $ | — | |
| | | | | | | | | | | | |
| LargeCap Value Fund | | Level 1 | | | Level 2 | | | Level 3 | |
Investments in Securities | | | | | | | | | | | | |
Common Stocks* | | $ | 30,816,970 | | | $ | — | | | $ | — | |
Money Market Funds | | | — | | | | 195,663 | | | | — | |
Exchange-Traded Funds | | | 186,828 | | | | — | | | | — | |
Total | | $ | 31,003,798 | | | $ | 195,663 | | | $ | — | |
| | | | | | | | | | | | |
| LargeCap Growth Fund | | Level 1 | | | Level 2 | | | Level 3 | |
Investments in Securities | | | | | | | | | | | | |
Common Stocks* | | $ | 20,442,500 | | | $ | — | | | $ | — | |
Money Market Funds | | | — | | | | 176,644 | | | | — | |
Total | | $ | 20,442,500 | | | $ | 176,644 | | | $ | — | |
| | | | | | | | | | | | |
| India Earnings Fund (consolidated) | | Level 1 | | | Level 2 | | | Level 3 | |
Investments in Securities | | | | | | | | | | | | |
Common Stocks | | | | | | | | | | | | |
Electric Utilities | | $ | 23,546,146 | | | $ | — | | | $ | 373,398 | |
Metals & Mining | | | 84,625,059 | | | | — | | | | 125,467 | |
Other* | | | 805,765,681 | | | | — | | | | — | |
Total | | $ | 913,936,886 | | | $ | — | | | $ | 498,865 | |
| | * | Please refer to Schedule of Investment for the breakdown of the valuation by industry. |
The following is a reconciliation of assets in which significant unobservable inputs (Level 3) were used in determining fair value. All transfers into or out of Level 3 are done using the beginning of period method. For the period ended March 31, 2012, there were no transfers into or out of Level 3.
| | | | | | | | |
| | | Common Stocks | |
| India Earnings Fund (consolidated) | | Electric Utilities | | | Metals & Mining | |
Balance as of April 1, 2011 | | $ | — | | | $ | — | |
Realized gain (loss)1 | | | — | | | | — | |
Change in unrealized appreciation (depreciation)2 | | | (157,647 | ) | | | (38,429 | ) |
Purchases | | | 531,045 | | | | 163,896 | |
Sales | | | — | | | | — | |
Transfers into Level 33 | | | — | | | | — | |
Transfers out of Level 34 | | | — | | | | — | |
Balance as of March 31, 2012 | | $ | 373,398 | | | $ | 125,467 | |
Net change in unrealized appreciation/(depreciation) from investments still held as of March 31, 2012 is:2 | | $ | (157,647 | ) | | $ | (38,429 | ) |
| | 1 | This amount is included in net realized gain (loss) from investment transactions in the Statement of Operations. |
| | 2 | This amount is included in the net change in unrealized appreciation (depreciation) from investment transactions in the Statement of Operations. Change in unrealized appreciation (depreciation) includes net unrealized appreciation (depreciation) resulting from changes in investment values during the period and the reversal of previously recorded unrealized appreciation (depreciation) when gains or losses are realized. |
| | 3 | Transfers into Level 3 are as a result of the unavailability of a quoted price in an active market for an identical investment or the unavailability of other significant observable inputs. |
| | 4 | Transfers out of Level 3 are as a result of the availability of a quoted price in an active market for an identical investment or the availability of other significant observable inputs. |
| | | | |
| WisdomTree Domestic and International Earnings Funds | | | 79 | |
Notes to Financial Statements (continued)
Derivatives and Hedging Disclosure — Codification Topic 815 (“ASC 815”), Derivatives and Hedging, requires qualitative disclosures about objectives and strategies for using derivatives, quantitative disclosures about fair value amounts of gains and losses on derivative instruments, and disclosures about credit-risk-related contingent features in derivative agreements. The India Earnings Fund has invested in derivatives, specifically forward currency contracts, during the fiscal year ended March 31, 2012, which are detailed in the table herein. The Fund’s derivative agreements contain credit-risk-related contingent features which include, but are not limited to, a percentage decline in the Fund’s NAV or net assets over a specified time period. If an event occurred that triggered a contingent feature, the counterparty to the agreement may require the Fund to post additional collateral or terminate the derivative positions and demand payment. Any collateral posted with respect to the derivative positions would be used to offset or reduce the payment. The maximum exposure to derivatives agreements with the credit-risk-related contingent features would be the total of derivatives in net liability positions for the Fund.
At March 31, 2012, there were no open derivative positions in the Funds.
The effect of such derivative instruments on each Fund’s financial performance as reflected in the Statement of Operations are presented in the summary below:
| | | | | | | | |
Derivatives not designated as hedging instruments, carried at fair value | | Amount of Realized
Gain on Derivatives
Recognized in Income1 | | | Change in Unrealized
Appreciation or (Depreciation)
on Derivatives Recognized in Income | |
India Earnings Fund (consolidated) Foreign exchange contracts | | $ | 1,107,368 | | | $ | — | |
|
1 Realized gains (losses) on derivatives are located on the Statement of Operations as follows: | |
| | |
Foreign exchange contracts | | Net realized gain (loss) from forward foreign currency contracts and foreign currency related transactions |
During the fiscal year ended March 31, 2012, the volume of derivative activity for the Funds was as follows:
| | | | | | | | |
| | | Average Notional | |
| Fund | | Forward
foreign
currency
contracts
(to deliver) | | | Forward
foreign
currency
contracts
(to receive) | |
India Earnings Fund (consolidated) | | | | | | | | |
Forward exchange contracts | | $ | — | | | $ | 645,085 | |
Investment Transactions and Investment Income — Investment transactions are recorded as of the date that the securities are purchased or sold (trade date). Realized gains and losses on sales of portfolio securities are calculated using the identified-cost method. Dividend income is recognized on the ex-dividend date, net of any foreign taxes withheld. Interest income including amortization of premiums and discounts, is accrued daily. The value of additional securities received as dividend payments is recorded as income and as an increase to the cost basis of such securities.
Foreign Currency Translation — The accounting records of the Funds are maintained in U.S. dollars. Foreign currencies, as well as investment securities and other assets and liabilities denominated in foreign currencies, are translated into U.S. dollars using exchange rates prevailing on the respective dates of such transactions that are deemed appropriate by WTAM. Realized and unrealized foreign exchange gains and losses on investments are included as a component of net realized gain (loss) from investment transactions and net change in unrealized appreciation (depreciation) from investment transactions, respectively, on the Statement of Operations. Net realized and unrealized foreign exchange gains or losses arising from sales of foreign currencies, including gains and losses of forward foreign currency contracts, currency gains or losses recognized between the trade and settlement dates on investment transactions, and the difference between the amounts of dividends and foreign withholding taxes recorded on the Funds’ books and the U.S. dollar equivalent of the amounts actually received or paid are included in net realized gain (loss) from forward foreign currency contracts and foreign currency related transactions and/or net change in unrealized appreciation (depreciation) from forward foreign currency contracts and translation of assets and liabilities denominated in foreign currencies on the Statement of Operations. Certain foreign exchange gains and losses included in realized and unrealized gains or losses are included in, or are a reduction of, ordinary income in accordance with U.S. Federal income tax regulations.
Expenses/Reimbursements — WTAM has agreed to pay all expenses of the Funds (other than the India Earnings Fund), except for: (i) brokerage expenses and other expenses (such as stamp taxes) connected with the execution of portfolio transactions or in connection with creation and redemption transactions; (ii) legal fees or expenses in connection with any arbitration, litigation or pending or threatened arbitration or litigation, including any settlements in connection therewith; (iii) compensation and expenses
| | |
| 80 | | WisdomTree Domestic and International Earnings Funds |
Notes to Financial Statements (continued)
of each Independent Trustee; (iv) compensation and expenses of counsel to the Independent Trustees; (v) compensation and expenses of the Trust’s chief compliance officer (“CCO”); (vi) extraordinary expenses; (vii) distribution fees and expenses paid by the Trust under any distribution plan adopted pursuant to Rule 12b-1 under the 1940 Act; and (viii) the advisory fee payable to WTAM.
Pursuant to a separate contractual arrangement, WTAM has arranged for the provision of CCO services to the Funds, and is liable and responsible for, and administers, payments to the CCO, the Independent Trustees and counsel to the Independent Trustees, in exchange for a service fee paid by each Fund of up to 0.0044% of each Fund’s average daily net assets. Trustees’ fees, which are included in Service Fees on the Statements of Operations, of $73,730 have been paid on behalf of the Funds of the Trust to the Independent Trustees for the fiscal year ended March 31, 2012. Expenses in excess of 0.0044% were paid by WTAM. WTAM has agreed to limit the total expenses of the India Earnings Fund to 0.88% through July 31, 2013.
Currency Transactions — The India Earnings Fund may enter into foreign currency forward and foreign currency futures contracts to facilitate local securities settlements or to protect against currency exposure in connection with distributions to shareholders. The India Earnings Fund does not expect to engage in currency transactions for the purpose of hedging against declines in the value of the Fund’s assets that are denominated in one or more foreign currencies. The India Earnings Fund may not enter into such contracts for speculative purposes.
Forward Foreign Currency Transactions — A forward foreign currency contract (“Forward Contract”) involves an obligation to purchase or sell a specific currency at a future date, which may be any fixed number of days from the date of the contract agreed upon by the parties, at a price set at the time of the contract. These contracts are principally traded in the inter-bank market conducted directly between currency traders (usually large, commercial banks) and their customers. A Forward Contract generally has no margin deposit requirement, and no commissions are charged at any stage for trades.
Risks may arise upon entering into Forward Contracts from the potential inability of counterparties to meet the terms of their contracts and from unanticipated movements in the value of foreign currencies relative to the U.S. dollar or each other.
Fluctuations in the value of open Forward Contracts are recorded for book purposes as unrealized gains or losses on Forward Contracts by the Funds. Realized gains and losses on Forward Contracts include net gains or losses recognized by the Funds on contracts which have matured.
There were no Forward Contracts open at March 31, 2012.
Securities Lending — Each Fund may lend portfolio securities to certain creditworthy borrowers, including the Funds’ securities lending agent. It is the Funds’ policy that, at origination, all loans are secured by collateral of at least 102% of the value of U.S. securities loaned and 105% of the value of foreign securities loaned. Collateral in the form of cash and/or high grade debt obligations, equivalent to at least 100% of the market value of securities, is maintained at all times. The collateral can be invested in certain money market mutual funds which also have exposure to the fluctuations of the market. Each Fund receives compensation for lending its securities from interest or dividends earned on the cash or U.S. government securities held as collateral, net of fee rebates paid to the borrower plus reasonable administrative and custody fees. The dividend and interest income earned on the securities loaned is accounted for in the same manner as other dividend and interest income. The borrower pays to the Funds an amount equal to any dividends or interest received on loaned securities. The Funds retain all or a portion of the interest received on investment of cash collateral or receive a fee from the borrower. Lending portfolio securities could result in a loss or delay in recovering each Fund’s securities if the borrower defaults.
The securities lending income earned by the Funds is disclosed on the Statements of Operations.
Short-Term Investments — Each Fund may invest a portion of its assets in high-quality money market instruments on an ongoing basis to provide liquidity or for other reasons. The instruments include short-term obligations issued by the U.S. Government, its agencies, non-U.S. Government agencies, negotiable certificates of deposit (“CDs”), fixed time deposits and bankers’ acceptances of U.S. and foreign banks and similar institutions, commercial papers, repurchase agreements and money market funds. CDs are short-term negotiable obligations of commercial banks. Time deposits are non-negotiable deposits maintained in banking institutions for specified periods of time at stated interest rates. Banker’s acceptances are time drafts drawn on commercial banks by borrowers, usually in connection with international transactions.
Tax Information and Dividends and Distributions to Shareholders — It is each Fund’s policy to comply with all requirements of the Internal Revenue Code of 1986, as amended (the “Code”). Each Fund intends to qualify for and to elect treatment as a separate Regulated Investment Company (“RIC”) under Subchapter M of the Code. It is the policy of each Fund to pay out dividends, if any, to investors at least annually. There can be no guarantee that a Fund will pay dividends. Taxable net realized gains from investment transactions, reduced by capital loss carryforwards, if any, are declared and distributed to shareholders at least annually. The capital loss carryforward amount, if any, is available to offset future net capital gains. The Funds may occasionally be required to make supplemental distributions at some other time during the year. The Trust reserves the right to declare special distributions if, in its
| | | | |
| WisdomTree Domestic and International Earnings Funds | | | 81 | |
Notes to Financial Statements (continued)
reasonable discretion, such action is necessary or advisable to preserve the status of each Fund as a RIC or to avoid imposition of income or excise taxes on undistributed income. Dividends and distributions to shareholders are recorded on the ex-dividend date. The amount of dividends and distributions from net investment income and net realized capital gains are determined in accordance with Federal income tax regulations which may differ from GAAP. These book/tax differences are either considered temporary or permanent in nature. To the extent these differences are permanent in nature, such amounts are reclassified within the components of net assets based on their Federal tax basis treatment; temporary differences do not require reclassification. Dividends and distributions which exceed earnings and profit for tax purposes are reported as a tax return of capital to the extent of a shareholder’s tax basis and thereafter as a capital gain. The India Earnings Fund has filed an election to treat the Portfolio as a “pass-through” entity for tax purposes.
3. ADVISORY FEES AND TRANSACTIONS
WTAM has overall responsibility for the general management and administration of the Trust. WTAM provides an investment program for each Fund. WTAM has arranged for Mellon Capital Management (“MCM”) to provide sub-advisory services to the Funds. MCM is compensated by WTAM at no additional cost to the Funds. WTAM also arranges transfer agency, custody, fund administration, and all other non-distribution related services necessary for the Funds to operate. Under the Investment Advisory Agreement for each Fund, and as also described in Note 2, WTAM agrees to pay all expenses of the Funds, except compensation and expenses of the Independent Trustees, counsel to the Independent Trustees and the Trust’s CCO, interest expenses and taxes, brokerage expenses, and other expenses connected with the execution of portfolio transactions, any distribution fees or expenses, legal fees or expenses and extraordinary expenses. The Investment Advisory Agreement for the India Earnings Fund does not require WTAM to pay any Fund expenses, except sub-advisory fees.
Pursuant to a separate contractual arrangement, as also described in Note 2, WTAM arranges for the provision of CCO services with respect to each Fund, and is liable and responsible for, and administers, payments to the CCO, the Independent Trustees and counsel to the Independent Trustees in exchange for a fee of up to 0.0044% of each Fund’s average daily net assets. WTAM provides CCO services to the Trust. WTAM has agreed to limit net annual operating expenses for the India Earnings Fund to 0.88% through July 31, 2013. WTAM expects to receive fees from each Fund, based on a percentage of the Fund’s average daily net assets, as shown in the following table:
| | | | |
| Fund | | Advisory Fee Rate | |
Total Earnings Fund | | | 0.28 | % |
Earnings 500 Fund | | | 0.28 | % |
MidCap Earnings Fund | | | 0.38 | % |
SmallCap Earnings Fund | | | 0.38 | % |
LargeCap Value Fund | | | 0.38 | % |
LargeCap Growth Fund | | | 0.38 | % |
India Earnings Fund (consolidated) | | | 0.68 | % |
Each Fund may purchase shares of affiliated exchange traded funds in secondary market transactions. For the fiscal year ended March 31, 2012, WTAM waived a portion of its advisory fees based on each Fund’s investment in affiliated Funds. In addition, during the year ended March 31, 2012, the India Earnings Fund was reimbursed for certain expenses that occurred during the previous fiscal year. The table below indicates the waiver and expense reimbursement amounts. Please see Note 7 for additional information on Other Affiliated Parties and Transactions.
| | |
| Fund | | Advisory Fees Waived/
Expense Reimbursement |
| | | | | | |
Total Earnings Fund | | $ | 110 | | | |
Earnings 500 Fund | | | 286 | | | |
MidCap Earnings Fund | | | 1,624 | | | |
SmallCap Earnings Fund | | | 1,657 | | | |
LargeCap Value Fund | | | 271 | | | |
LargeCap Growth Fund | | | — | | | |
India Earnings Fund (consolidated) | | | 663,000 | | | |
4. CAPITAL SHARE TRANSACTIONS
As of March 31, 2012, there was an unlimited number of $0.001 par value shares of beneficial interest authorized by the Trust. Shares are issued and redeemed by each Fund only in Creation Units or multiples thereof. Except when aggregated in Creation Units,
| | |
| 82 | | WisdomTree Domestic and International Earnings Funds |
Notes to Financial Statements (continued)
shares of each Fund are not redeemable. Transactions in shares for each Fund are disclosed in detail in the Statements of Changes in Net Assets. The consideration for the purchase of Creation Units of a Fund generally consists of the in-kind contribution of a designated portfolio of equity securities constituting a portfolio sampling representation of the securities included in the relevant Fund’s underlying Index and an amount of cash. The India Earnings Fund issues and redeems shares on a cash basis only. Investors purchasing and redeeming Creation Units may be charged a purchase transaction fee and a redemption transaction fee to offset transfer and other transaction costs associated with the issuance and redemption of Creation Units.
5. INVESTMENT PORTFOLIO TRANSACTIONS
Purchases and sales of investments (excluding in-kind capital share transactions and short-term investments) for the fiscal year ended March 31, 2012 were as follows:
| | | 000,000,000 | | | | 000,000,000 | |
| Fund | | Purchases | | | Sales | |
Total Earnings Fund | | $ | 5,662,390 | | | $ | 5,751,951 | |
Earnings 500 Fund | | | 10,223,264 | | | | 10,197,683 | |
MidCap Earnings Fund | | | 47,598,902 | | | | 47,857,568 | |
SmallCap Earnings Fund | | | 53,626,397 | | | | 55,269,188 | |
LargeCap Value Fund | | | 17,161,622 | | | | 17,099,884 | |
LargeCap Growth Fund | | | 20,894,698 | | | | 21,289,606 | |
India Earnings Fund (consolidated) | | | 340,685,032 | | | | 597,677,253 | |
For the fiscal year ended March 31, 2012, the cost of purchases and the proceeds from sales resulting from in-kind capital share transactions were as follows:
| | | 000,000,000 | | | | 000,000,000 | |
| Fund | | Purchases | | | Redemptions | |
Total Earnings Fund | | $ | 11,998,373 | | | $ | 24,134,949 | |
Earnings 500 Fund | | | — | | | | — | |
MidCap Earnings Fund | | | 70,380,674 | | | | 22,994,812 | |
SmallCap Earnings Fund | | | 48,705,563 | | | | 36,820,199 | |
LargeCap Value Fund | | | 5,605,014 | | | | 2,096,006 | |
LargeCap Growth Fund | | | 17,355,535 | | | | 22,558,430 | |
India Earnings Fund (consolidated) | | | — | | | | — | |
Gains and losses on in-kind redemptions are not recognized by the Funds for tax purposes.
6. FEDERAL INCOME TAXES
At March 31, 2012, the cost of investments (including securities on loan) for Federal income tax purposes was as follows:
| | | | | | | | | | | | | | | | |
| Fund | | Tax Cost | | | Gross Unrealized
Appreciation | | | Gross Unrealized
Depreciation | | | Net Unrealized
Appreciation
(Depreciation) | |
Total Earnings Fund | | $ | 39,169,648 | | | $ | 5,904,133 | | | $ | (1,579,355 | ) | | $ | 4,324,778 | |
Earnings 500 Fund | | | 61,178,425 | | | | 11,328,128 | | | | (3,077,523 | ) | | | 8,250,605 | |
MidCap Earnings Fund | | | 151,886,152 | | | | 21,126,940 | | | | (3,864,122 | ) | | | 17,262,818 | |
SmallCap Earnings Fund | | | 146,915,494 | | | | 20,826,036 | | | | (7,711,168 | ) | | | 13,114,868 | |
LargeCap Value Fund | | | 27,566,033 | | | | 4,149,081 | | | | (515,653 | ) | | | 3,633,428 | |
LargeCap Growth Fund | | | 18,630,036 | | | | 2,951,924 | | | | (962,816 | ) | | | 1,989,108 | |
India Earnings Fund (consolidated) | | | 956,200,548 | | | | 114,182,590 | | | | (155,947,387 | ) | | | (41,764,797 | ) |
| | | | |
| WisdomTree Domestic and International Earnings Funds | | | 83 | |
Notes to Financial Statements (continued)
At March 31, 2012, the components of accumulated earnings/(loss) on a tax-basis were as follows:
| | | | | | | | | | | | | | | | | | | | |
| Fund | | Undistributed
Ordinary Income | | | Undistributed
Capital and Other
Losses | | | Net Unrealized
Appreciation/
(Depreciation) | | | Currency
Unrealized
Appreciation | | | Total Accumulated
Earnings/(Losses) | |
Total Earnings Fund | | $ | 17,976 | | | $ | (6,249,932 | ) | | $ | 4,324,778 | | | $ | — | | | $ | (1,907,178 | ) |
Earnings 500 Fund | | | 27,480 | | | | (19,797,594 | ) | | | 8,250,605 | | | | — | | | | (11,519,509 | ) |
MidCap Earnings Fund | | | 96,368 | | | | (13,853,114 | ) | | | 17,262,818 | | | | — | | | | 3,506,072 | |
SmallCap Earnings Fund | | | 106,260 | | | | (15,675,153 | ) | | | 13,114,868 | | | | — | | | | (2,454,025 | ) |
LargeCap Value Fund | | | 8,589 | | | | (11,425,485 | ) | | | 3,633,428 | | | | — | | | | (7,783,468 | ) |
LargeCap Growth Fund | | | 2,180 | | | | (283,287 | ) | | | 1,989,108 | | | | — | | | | 1,708,001 | |
India Earnings Fund (consolidated) | | | 344,964 | | | | (138,472,651 | ) | | | (41,764,797 | ) | | | 10,482 | | | | (179,882,002 | ) |
The tax character of distributions paid during the fiscal years ended March 31, 2012 and March 31, 2011, was as follows:
| | | | | | | | |
| | | Year Ended
March 31, 2012 | | | Year Ended
March 31, 2011 | |
| Fund | | Distributions Paid
from Ordinary
Income* | | | Distributions Paid
from Ordinary
Income* | |
Total Earnings Fund | | $ | 875,900 | | | $ | 879,348 | |
Earnings 500 Fund | | | 1,245,174 | | | | 1,308,638 | |
MidCap Earnings Fund | | | 1,297,193 | | | | 1,186,680 | |
SmallCap Earnings Fund | | | 1,778,298 | | | | 1,365,764 | |
LargeCap Value Fund | | | 506,854 | | | | 362,140 | |
LargeCap Growth Fund | | | 319,110 | | | | 145,072 | |
India Earnings Fund (consolidated) | | | 8,702,508 | | | | 6,420,668 | |
* Includes short-term capital gains. | | | | | | | | |
At March 31, 2012, for Federal income tax purposes, the Funds have capital loss carryforwards available to offset future capital gains through the years indicated. To the extent that these loss carryforwards are utilized, capital gains so offset will not be distributed to shareholders.
| | | | | | | | | | | | | | | | | | | | | | | | | | | | |
| Fund | | Capital Loss
Available
Through 2016 | | | Capital Loss
Available
Through 2017 | | | Capital Loss
Available
Through 2018 | | | Capital Loss
Available
Through 2019 | | | Short-Term
Post-Effective
No Expiration* | | | Long-Term
Post-Effective
No Expiration* | | | Capital Loss
Available
Total | |
Total Earnings Fund | | $ | 133,369 | | | $ | 451,951 | | | $ | 3,393,418 | | | $ | 935,380 | | | $ | 38,219 | | | $ | 817,002 | | | $ | 5,769,339 | |
Earnings 500 Fund | | | 194,476 | | | | 1,286,040 | | | | 10,811,338 | | | | 4,536,572 | | | | 54,760 | �� | | | 1,938,700 | | | | 18,821,886 | |
MidCap Earnings Fund | | | 354,730 | | | | 1,545,771 | | | | 6,328,159 | | | | 346,722 | | | | 117,912 | | | | 178,710 | | | | 8,872,004 | |
SmallCap Earnings Fund | | | 31,705 | | | | 1,465,208 | | | | 4,654,874 | | | | 921,406 | | | | 1,312,469 | | | | — | | | | 8,385,662 | |
LargeCap Value Fund | | | — | | | | 220,523 | | | | 10,909,497 | | | | 295,465 | | | | — | | | | — | | | | 11,425,485 | |
LargeCap Growth Fund | | | — | | | | — | | | | — | | | | 92,877 | | | | 190,410 | | | | — | | | | 283,287 | |
India Earnings Fund (consolidated) | | | 1,179 | | | | 20,567,350 | | | | 7,978,486 | | | | 6,294,051 | | | | 67,135,294 | | | | 35,065,312 | | | | 137,041,672 | |
* Under the recently enacted Regulated Investment Company Modernization Act of 2010, a Fund is permitted to carry forward any new capital losses for an unlimited period. Additionally, such capital losses that are carried forward will retain their character as either short-term or long-term capital losses rather than being considered all short-term as under previous law. The character of these losses is noted above. | |
Capital losses incurred after October 31 (“post-October capital losses”) and within the taxable year are deemed to arise on the first business day of each Fund’s next taxable year.
During the fiscal year ended March 31, 2012, the following Funds incurred and will elect to defer post-October capital losses as follows:
| | | | | | | | |
| Fund | | Short-Term
Post-October
Capital Losses | | | Long-Term
Post-October
Capital Losses | |
Total Earnings Fund | | $ | 39,069 | | | $ | 441,524 | |
Earnings 500 Fund | | | 122,065 | | | | 853,643 | |
MidCap Earnings Fund | | | 4,018,536 | | | | 962,574 | |
SmallCap Earnings Fund | | | 4,712,668 | | | | 2,576,823 | |
LargeCap Value Fund | | | — | | | | — | |
LargeCap Growth Fund | | | — | | | | — | |
India Earnings Fund (consolidated) | | | 173,444 | | | | 1,257,535 | |
| | |
| 84 | | WisdomTree Domestic and International Earnings Funds |
Notes to Financial Statements (continued)
During the fiscal year ended March 31, 2012, the following funds utilized capital loss carryforwards of the noted amounts to offset realized gains.
| | | | |
| Fund | | Utilized
Capital Loss
Carryforwards | |
Total Earnings Fund | | $ | — | |
Earnings 500 Fund | | | — | |
MidCap Earnings Fund | | | — | |
SmallCap Earnings Fund | | | — | |
LargeCap Value Fund | | | 1,147,246 | |
LargeCap Growth Fund | | | — | |
India Earnings Fund (consolidated) | | | — | |
At March 31, 2012, the effect of permanent book/tax reclassifications resulted in increases (decreases) to the components of net assets as follows:
| | | | | | | | | | | | |
| Fund | | Undistributed Net
Investment
Income/(Loss) | | | Accumulated Net
Realized Gain/
(Loss) | | | Paid-in Capital | |
Total Earnings Fund | | $ | (494 | ) | | $ | (1,710,353 | ) | | $ | 1,710,847 | |
Earnings 500 Fund | | | (781 | ) | | | 753 | | | | 28 | |
MidCap Earnings Fund | | | 10,037 | | | | (3,995,341 | ) | | | 3,985,304 | |
SmallCap Earnings Fund | | | (6,253 | ) | | | (8,675,947 | ) | | | 8,682,200 | |
LargeCap Value Fund | | | 229 | | | | (409,550 | ) | | | 409,321 | |
LargeCap Growth Fund | | | (276 | ) | | | (2,373,086 | ) | | | 2,373,362 | |
India Earnings Fund (consolidated) | | | (612,585 | ) | | | 612,585 | | | | — | |
These differences are primarily due to redemptions-in-kind, the tax treatment of income earned from investments in partnerships, foreign currency transactions, non-dividend distributions from underlying funds and Passive Foreign Investment Companies (“PFICs”).
GAAP provides guidance on tax provisions that prescribe a minimum threshold for financial statement recognition of the benefit of a tax position taken or expected to be taken in a tax return. Foreign taxes are provided for based on each Fund’s understanding of the tax rules and rates that exist in the foreign markets in which it invests. Taxes are accrued and applied to net investment income, net realized capital gains and net unrealized appreciation, as applicable, as the income is earned or capital gains are recorded. As of and during the fiscal year ended March 31, 2012, the Funds did not have any liabilities for unrecognized tax benefits. If applicable, the Funds will recognize interest accrued related to unrecognized tax benefits in interest expense and penalties in “Other” expenses on the Statements of Operations. The Funds file tax returns with the Internal Revenue Service, the State of New York, and various other states, and with respect to the India Earnings Fund, the Republic of Mauritius. Generally, each of the tax years in the four-year period ended March 31, 2012, remains subject to examination by taxing authorities.
| | | | |
| WisdomTree Domestic and International Earnings Funds | | | 85 | |
Notes to Financial Statements (concluded)
7. OTHER AFFILIATED PARTIES AND TRANSACTIONS
Affiliated holdings are Funds which are managed by the Trust or an affiliate of the Trust. Transactions with affiliated companies during the fiscal year ended March 31, 2012 are as follows:
| | | | | | | | | | | | | | | | | | | | |
| Affiliated Fund Name | | Value at
3/31/2011 | | | Purchases/
Additions | | | Sales/
Reductions | | | Value at
3/31/2012 | | | Dividend
Income | |
Total Earnings Fund | | | | | | | | | | | | | | | | | | | | |
LargeCap Growth Fund | | $ | 392,157 | | | $ | 472,390 | | | $ | 753,302 | | | $ | 91,512 | | | $ | 2,245 | |
| | | | | |
Earnings 500 Fund | | | | | | | | | | | | | | | | | | | | |
WisdomTree Equity Income Fund | | $ | 344,576 | | | $ | 834,428 | | | $ | 1,117,722 | | | $ | 83,955 | | | $ | 6,435 | |
| | | | | |
MidCap Earnings Fund | | | | | | | | | | | | | | | | | | | | |
WisdomTree MidCap Dividend Fund | | $ | 557,285 | | | $ | 328,620 | | | $ | 505,892 | | | $ | 378,776 | | | $ | 14,566 | |
| | | | | |
SmallCap Earnings Fund | | | | | | | | | | | | | | | | | | | | |
MidCap Earnings Fund | | $ | 843,454 | | | $ | 191,170 | | | $ | 710,662 | | | $ | 269,473 | | | $ | 4,950 | |
| | | | | |
LargeCap Value Fund | | | | | | | | | | | | | | | | | | | | |
Earnings 500 Fund | | $ | — | | | $ | 384,096 | | | $ | 261,637 | | | $ | 130,986 | | | $ | 1,623 | |
WisdomTree LargeCap Dividend Fund | | | 222,272 | | | | — | | | | 221,501 | | | | — | | | | — | |
WisdomTree MidCap Dividend Fund | | | 95,994 | | | | — | | | | 95,366 | | | | — | | | | — | |
MidCap Earnings Fund | | | — | | | | 165,308 | | | | 110,833 | | | | 55,842 | | | | 357 | |
Total | | $ | 318,266 | | | $ | 549,404 | | | $ | 689,337 | | | $ | 186,828 | | | $ | 1,980 | |
| | | | | |
LargeCap Growth Fund | | | | | | | | | | | | | | | | | | | | |
Earnings 500 Fund | | $ | 245,226 | | | $ | — | | | $ | 246,182 | | | $ | — | | | $ | — | |
8. LOAN
During the year ended March 31, 2012, the India Earnings Fund had a demand note agreement with Morgan Stanley Bank, N.A. which allowed the Fund to borrow up to $300,000,000 until the stated maturity date of September 30, 2011. During the year ended March 31, 2012, the Fund utilized the demand note and borrowed for a period of 35 days with an average outstanding loan balance of $34,809,479 and a weighted average interest rate of 2.19% per annum. Interest expense related to the loan for the year ended March 31, 2012 was $73,100. At March 31, 2012, the Fund did not have any loan amounts outstanding.
9. NEW ACCOUNTING PRONOUNCEMENTS
In April 2011, the FASB issued Accounting Standards Update (“ASU”) 2011-03 “Reconsideration of Effective Control for Repurchase Agreements” (“ASU 2011-03”). The objective of ASU 2011-03 is to improve the accounting for repurchase agreements and similar agreements that both entitle and obligate a transferor to repurchase or redeem financial assets before their maturity. Under previous guidance, whether or not to account for a transaction as a sale was based on, in part, if the entity maintained effective control over the transferred financial assets. ASU 2011-03 removes the transferor’s ability criterion from the effective control assessment. This guidance is effective prospectively for interim and annual reporting periods beginning on or after December 15, 2011. Management is currently evaluating the implications of ASU 2011-03 and its impact on the financial statements.
In May 2011, the FASB issued ASU 2011-04 “Amendments to Achieve Common Fair Value Measurement and Disclosure Requirements in U.S. GAAP and IFRS” (“ASU 2011-04”). ASU 2011-04 includes common requirements for measurement of and disclosure about fair value between U.S. GAAP and IFRS. ASU 2011-04 will require reporting entities to disclose the following information for fair value measurements categorized within Level 3 of the fair value hierarchy: quantitative information about the unobservable inputs used in the fair value measurement, the valuation processes used by the reporting entity and a narrative description of the sensitivity of the fair value measurement to changes in unobservable inputs and the interrelationships between those unobservable inputs. In addition, ASU 2011-04 will require reporting entities to make disclosures about amounts and reasons for all transfers in and out of Level 1 and Level 2 fair value measurements. The new and revised disclosures are effective for interim and annual reporting periods beginning after December 15, 2011. At this time, management is evaluating the implications of ASU 2011-04 and its impact on the financial statements.
In December 2011, FASB issued ASU 2011-11 “Disclosures about Offsetting Assets and Liabilities”. The amendments in this ASU require an entity to disclose information about offsetting and related arrangements to enable users of its financial statements to understand the effect of those arrangements on its financial position. The ASU is effective for annual reporting periods beginning
| | |
| 86 | | WisdomTree Domestic and International Earnings Funds |
Notes to Financial Statements (concluded)
on or after January 1, 2013, and for interim periods within those annual reporting periods. The guidance requires retrospective application for all comparative periods presented. Management is currently evaluating the implications of ASU 2011-11 and its impact on the financial statements.
10. LEGAL MATTER
On December 1, 2011, Research Affiliates, LLC filed a complaint in the United States District Court for the Central District of California, naming the Trust, WTAM, and its affiliates, along with other parties, as defendants. The complaint alleges that the fundamentally weighted investment methodology developed by WisdomTree Investments and employed by the Trust infringes three of plaintiff’s patents. The complaint seeks both unspecified monetary damages to be determined and an injunction to prevent further infringement. The Trust filed its answer to the complaint on January 17, 2012. The Trust believes it has strong defenses to this lawsuit based on its belief that (i) the Trust’s Funds do not practice the indexing methods as claimed in the asserted patents because, for example, the factors used to select Fund assets include market capitalization and the price of the assets, and thus fall outside the scope of the asserted patents, which generally provide that selection of the assets to be used for creation of the index must be based upon factors that are sufficiently independent of market capitalization; and (ii) the patents should be declared invalid because, among other reasons, there is ample evidence that the concept of fundamentals based indexing was widely known and in commercial use by asset managers and index providers well before the patent applications at issue were filed by plaintiff. For example, in support of the defenses that the asserted patents are invalid, the Trust intends to present evidence that as far back as the early 1990s, Robert Jones at Goldman Sachs managed an earnings weighted index fund. As another example, the Trust intends to present evidence that Dow Jones launched a dividend weighted stock index in 2003. These examples support the Trust’s view that the asserted patents are invalid at least because earlier publications and activities of investment professionals anticipated or made obvious plaintiff’s alleged inventions.
While at this early stage of the proceedings it is not possible to determine the probability of any outcome or the probability or amount of any loss, the Trust is confident in the merits of its position. Nevertheless, an adverse resolution could have a negative impact on the Trust and the Funds. For example, in the event of an unfavorable outcome the Trust may be required to pay ongoing license fees if WisdomTree Investments cannot change its indexes in a manner that does not infringe on the patents. This could increase the Funds’ expense ratios and have a negative impact on Fund performance. WTAM and WisdomTree Investments have contractually agreed to indemnify the Trust and pay any losses, claims and damages (including legal fees) incurred by the Trust or a Fund in connection with the complaint. The Trust intends to vigorously defend against plaintiff’s claims.
| | | | |
| WisdomTree Domestic and International Earnings Funds | | | 87 | |
Report of Independent Registered Public Accounting Firm
The Board of Trustees and Shareholders of WisdomTree Trust:
We have audited the accompanying statements of assets and liabilities, including the schedules of investments, of WisdomTree Total Earnings Fund, WisdomTree Earnings 500 Fund, WisdomTree MidCap Earnings Fund, WisdomTree SmallCap Earnings Fund, WisdomTree LargeCap Value Fund, WisdomTree LargeCap Growth Fund and WisdomTree India Earnings Fund (seven of the investment funds constituting the WisdomTree Trust (the “Trust”)) as of March 31, 2012, and the related statements of operations for the year then ended, the changes in net assets for each of the two years in the period then ended, and the financial highlights for each of the periods indicated therein. These financial statements and financial highlights are the responsibility of the Trust’s management. Our responsibility is to express an opinion on these financial statements and financial highlights based on our audits.
We conducted our audits in accordance with the standards of the Public Company Accounting Oversight Board (United States). Those standards require that we plan and perform the audit to obtain reasonable assurance about whether the financial statements and financial highlights are free of material misstatement. We were not engaged to perform an audit of the Trust’s internal control over financial reporting. Our audits included consideration of internal control over financial reporting as a basis for designing audit procedures that are appropriate in the circumstances, but not for the purpose of expressing an opinion on the effectiveness of the
Trust’s internal control over financial reporting. Accordingly, we express no such opinion. An audit also includes examining, on a test basis, evidence supporting the amounts and disclosures in the financial statements and financial highlights, assessing the accounting principles used and significant estimates made by management, and evaluating the overall financial statement
presentation. Our procedures included confirmation of securities owned as of March 31, 2012, by correspondence with the custodian and brokers or by other appropriate auditing procedures where replies from brokers were not received. We believe that our audits provide a reasonable basis for our opinion.
In our opinion, the financial statements and financial highlights referred to above present fairly, in all material respects, the financial position of WisdomTree Total Earnings Fund, WisdomTree Earnings 500 Fund, WisdomTree MidCap Earnings Fund, WisdomTree SmallCap Earnings Fund, WisdomTree LargeCap Value Fund, WisdomTree LargeCap Growth Fund and WisdomTree India Earnings Fund of WisdomTree Trust at March 31, 2012, the results of their operations for the year then ended, the changes in their net assets for each of the two years in the period then ended, and the financial highlights for each of the indicated periods, in conformity with U.S. generally accepted accounting principles.

New York, New York
May 25, 2012
| | |
| 88 | | WisdomTree Domestic and International Earnings Funds |
Approval of Investment Advisory and Sub-Advisory Agreement (unaudited)
Approval of Investment Advisory Agreement. The Trust and the Investment Adviser have entered into an investment advisory agreement covering each Fund discussed herein. At a meeting held on March 1, 2012, the Board of Trustees (the “Board”) re-approved the Investment Advisory Agreement for each Fund. The Board reviewed and analyzed the factors it deemed relevant, including: (i) the nature, quality and extent of the services to be provided to the Funds by WTAM; (ii) the performance of the Funds; (iii) the costs of services to be provided and the profits to be realized by WTAM from its relationship with the Funds; (iv) the extent to which economies of scale would be realized as the Funds grow; and (v) whether the fee levels reflect these economies of scale for the benefit of investors.
The Board also considered the nature and quality of the services to be provided by WTAM to the Funds, recognizing WTAM’s operational capabilities and resources. The Board also noted the extensive responsibilities that WTAM has as investment adviser to the Funds, including the selection of the Funds’ Sub-Adviser, oversight of the Sub-Adviser’s compliance with Fund policies and objectives, oversight of general Fund compliance with federal and state laws, and the implementation of Board directives as they relate to the Funds.
The Board gave substantial consideration to the fees payable under the Advisory Agreement for each Fund. In this connection, the Board evaluated WTAM’s anticipated costs and profitability in serving as investment adviser to the Funds, including the costs associated with the personnel, systems and equipment necessary to manage the Funds and the costs associated with compensating the Sub-Adviser. The Board also examined the fees to be paid by each Fund in light of fees paid to other investment managers by comparable funds and the method of computing each Fund’s fee. After comparing the fees with those of comparable funds and in light of the quality and extent of services to be provided and the costs anticipated to be incurred by WTAM, the Board concluded that the level of the fees paid to WTAM with respect to each Fund is fair and reasonable. The Board also re-approved the Sub-Advisory Agreement between WTAM and MCM, on behalf of each Fund, using essentially the same criteria it used in connection with the Advisory Agreement. The Board considered MCM’s operational capabilities and resources and MCM’s experience in serving as an adviser to ETFs, noting that MCM currently provides investment advisory and management services to other ETFs. The Board considered the investment performance of the Funds, and the expertise and performance of the MCM personnel. The Board also noted that Bank of New York Mellon Corporation, an affiliate of MCM, serves as the Funds’ administrator, accountant, custodian, transfer agent and securities lending agent and receives compensation for acting in these capacities and is responsible for, among other things, coordinating the Funds’ audits, financial statements and tax returns, managing expenses and budgeting for the Funds, processing trades on behalf of each Fund and custodying Fund assets. As such, the Board concluded that the benefits accruing to MCM and its affiliates by virtue of their relationship to the Trust are reasonable and fair in comparison with the anticipated costs of providing the relevant services. The Board noted that WTAM, not the Funds, pays the fees to MCM under the Sub-Advisory Agreement for each Fund.
Based on these considerations and the overall high quality of the personnel, operations, financial condition, investment advisory capabilities, methodologies, and performance of WTAM and MCM, the Board determined that the re-approval of the Advisory Agreement and the Sub-Advisory Agreement for each Fund was in the best interests of each Fund. After full consideration of these and other factors, the Board, including a majority of the Independent Trustees, with the assistance of independent counsel, approved the Advisory Agreement and Sub-Advisory Agreement for each Fund.
| | | | |
| WisdomTree Domestic and International Earnings Funds | | | 89 | |
Frequency Distribution of Discounts & Premiums (unaudited)
The chart below presents information about differences between the per share net asset value (“NAV”) of each Fund and the market trading price of shares of each Fund. For these purposes, the “market price” is the mid-point of the highest bid and lowest offer for Fund shares as of the close of trading on the exchange where Fund shares are listed. The term “premium” is sometimes used to describe a market price in excess of NAV and the term “discount” is sometimes used to describe a market price below NAV. The chart presents information about the size and frequency of premiums or discounts. As with other exchange traded funds, the market price of Fund shares is typically slightly higher or lower than the Fund’s per share NAV. Factors that contribute to the differences between market price and NAV include the supply and demand for Fund shares and investors’ assessments of the underlying value of a Fund’s portfolio securities.
Differences between the closing times of U.S. and non-U.S. markets may contribute to differences between the NAV and market price of Fund shares. Many non-U.S. markets close prior to the close of the U.S. securities exchanges. Developments after the close of such markets as a result of ongoing price discovery may be reflected in a Fund’s market price but not in its NAV (or vice versa).
| | | | | | | | | | | | | | | | | | | | |
| | | | | | Market Price Above or
Equal to Net Asset Value | | | Market Price Below
Net Asset Value | |
| | | Basis Point
Differential* | | | Number
of Days | | | Percentage of
Total Days | | | Number
of Days | | | Percentage
of Total Days | |
WisdomTree Total Earnings Fund | | | | | | | | | | | | | | | | | | | | |
February 23, 2007 – March 31, 2012 | | | 0 – 24.9 | | | | 550 | | | | 40.80 | % | | | 732 | | | | 54.30 | % |
| | | 25 – 49.9 | | | | 17 | | | | 1.26 | % | | | 27 | | | | 2.00 | % |
| | | 50 – 74.9 | | | | 3 | | | | 0.22 | % | | | 7 | | | | 0.52 | % |
| | | 75 – 99.9 | | | | 5 | | | | 0.37 | % | | | 0 | | | | 0.00 | % |
| | | 100 – 124.9 | | | | 0 | | | | 0.00 | % | | | 1 | | | | 0.08 | % |
| | | 125 – 174.9 | | | | 0 | | | | 0.00 | % | | | 0 | | | | 0.00 | % |
| | | 175 – 199.9 | | | | 0 | | | | 0.00 | % | | | 0 | | | | 0.00 | % |
| | | 200 – 249.9 | | | | 0 | | | | 0.00 | % | | | 1 | | | | 0.08 | % |
| | | >250 | | | | 4 | | | | 0.30 | % | | | 1 | | | | 0.07 | % |
| | | | Total | | | | 579 | | | | 42.95 | % | | | 769 | | | | 57.05 | % |
WisdomTree Earnings 500 Fund | | | | | | | | | | | | | | | | | | | | |
February 23, 2007 – March 31, 2012 | | | 0 – 24.9 | | | | 518 | | | | 38.43 | % | | | 746 | | | | 55.34 | % |
| | | 25 – 49.9 | | | | 20 | | | | 1.48 | % | | | 40 | | | | 2.97 | % |
| | | 50 – 74.9 | | | | 3 | | | | 0.22 | % | | | 6 | | | | 0.44 | % |
| | | 75 – 99.9 | | | | 5 | | | | 0.37 | % | | | 4 | | | | 0.30 | % |
| | | 100 – 124.9 | | | | 3 | | | | 0.22 | % | | | 0 | | | | 0.00 | % |
| | | 125 – 174.9 | | | | 1 | | | | 0.08 | % | | | 1 | | | | 0.07 | % |
| | | 175 – 199.9 | | | | 0 | | | | 0.00 | % | | | 0 | | | | 0.00 | % |
| | | 200 – 249.9 | | | | 0 | | | | 0.00 | % | | | 0 | | | | 0.00 | % |
| | | >250 | | | | 1 | | | | 0.08 | % | | | 0 | | | | 0.00 | % |
| | | | Total | | | | 551 | | | | 40.88 | % | | | 797 | | | | 59.12 | % |
WisdomTree MidCap Earnings Fund | | | | | | | | | | | | | | | | | | | | |
February 23, 2007 – March 31, 2012 | | | 0 – 24.9 | | | | 729 | | | | 54.08 | % | | | 523 | | | | 38.80 | % |
| | | 25 – 49.9 | | | | 23 | | | | 1.71 | % | | | 39 | | | | 2.89 | % |
| | | 50 – 74.9 | | | | 6 | | | | 0.44 | % | | | 13 | | | | 0.97 | % |
| | | 75 – 99.9 | | | | 4 | | | | 0.30 | % | | | 1 | | | | 0.08 | % |
| | | 100 – 124.9 | | | | 2 | | | | 0.15 | % | | | 3 | | | | 0.22 | % |
| | | 125 – 174.9 | | | | 1 | | | | 0.07 | % | | | 2 | | | | 0.15 | % |
| | | 175 – 199.9 | | | | 0 | | | | 0.00 | % | | | 0 | | | | 0.00 | % |
| | | 200 – 249.9 | | | | 0 | | | | 0.00 | % | | | 1 | | | | 0.07 | % |
| | | >250 | | | | 0 | | | | 0.00 | % | | | 1 | | | | 0.07 | % |
| | | | Total | | | | 765 | | | | 56.75 | % | | | 583 | | | | 43.25 | % |
| | |
| 90 | | WisdomTree Domestic and International Earnings Funds |
Frequency Distribution of Discounts & Premiums (unaudited) (concluded)
| | | | | | | | | | | | | | | | | | | | |
| | | | | | Market Price Above or
Equal to Net Asset Value | | | Market Price Below
Net Asset Value | |
| | | Basis Point
Differential* | | | Number
of Days | | | Percentage of
Total Days | | | Number
of Days | | | Percentage
of Total Days | |
WisdomTree SmallCap Earnings Fund | | | | | | | | | | | | | | | | | | | | |
February 23, 2007 – March 31, 2012 | | | 0 – 24.9 | | | | 692 | | | | 51.34 | % | | | 306 | | | | 22.70 | % |
| | | 25 – 49.9 | | | | 76 | | | | 5.64 | % | | | 48 | | | | 3.56 | % |
| | | 50 – 74.9 | | | | 13 | | | | 0.96 | % | | | 8 | | | | 0.59 | % |
| | | 75 – 99.9 | | | | 3 | | | | 0.22 | % | | | 1 | | | | 0.08 | % |
| | | 100 – 124.9 | | | | 4 | | | | 0.30 | % | | | 183 | | | | 13.58 | % |
| | | 125 – 174.9 | | | | 1 | | | | 0.07 | % | | | 6 | | | | 0.45 | % |
| | | 175 – 199.9 | | | | 1 | | | | 0.07 | % | | | 1 | | | | 0.07 | % |
| | | 200 – 249.9 | | | | 2 | | | | 0.15 | % | | | 0 | | | | 0.00 | % |
| | | >250 | | | | 2 | | | | 0.15 | % | | | 1 | | | | 0.07 | % |
| | | | Total | | | | 794 | | | | 58.90 | % | | | 554 | | | | 41.10 | % |
WisdomTree LargeCap Value Fund | | | | | | | | | | | | | | | | | | | | |
February 23, 2007 – March 31, 2012 | | | 0 – 24.9 | | | | 520 | | | | 38.58 | % | | | 723 | | | | 53.63 | % |
| | | 25 – 49.9 | | | | 20 | | | | 1.48 | % | | | 33 | | | | 2.45 | % |
| | | 50 – 74.9 | | | | 10 | | | | 0.74 | % | | | 7 | | | | 0.52 | % |
| | | 75 – 99.9 | | | | 9 | | | | 0.67 | % | | | 4 | | | | 0.30 | % |
| | | 100 – 124.9 | | | | 5 | | | | 0.37 | % | | | 3 | | | | 0.22 | % |
| | | 125 – 174.9 | | | | 2 | | | | 0.15 | % | | | 2 | | | | 0.15 | % |
| | | 175 – 199.9 | | | | 1 | | | | 0.07 | % | | | 0 | | | | 0.00 | % |
| | | 200 – 249.9 | | | | 2 | | | | 0.15 | % | | | 0 | | | | 0.00 | % |
| | | >250 | | | | 6 | | | | 0.45 | % | | | 1 | | | | 0.07 | % |
| | | | Total | | | | 575 | | | | 42.66 | % | | | 773 | | | | 57.34 | % |
WisdomTree LargeCap Growth Fund | | | | | | | | | | | | | | | | | | | | |
December 4, 2008 – March 31, 2012 | | | 0 – 24.9 | | | | 452 | | | | 50.33 | % | | | 421 | | | | 46.89 | % |
| | | 25 – 49.9 | | | | 11 | | | | 1.22 | % | | | 8 | | | | 0.89 | % |
| | | 50 – 74.9 | | | | 0 | | | | 0.00 | % | | | 1 | | | | 0.11 | % |
| | | 75 – 99.9 | | | | 4 | | | | 0.45 | % | | | 0 | | | | 0.00 | % |
| | | 100 – 124.9 | | | | 0 | | | | 0.00 | % | | | 0 | | | | 0.00 | % |
| | | 125 – 174.9 | | | | 0 | | | | 0.00 | % | | | 1 | | | | 0.11 | % |
| | | 175 – 199.9 | | | | 0 | | | | 0.00 | % | | | 0 | | | | 0.00 | % |
| | | 200 – 249.9 | | | | 0 | | | | 0.00 | % | | | 0 | | | | 0.00 | % |
| | | >250 | | | | 0 | | | | 0.00 | % | | | 0 | | | | 0.00 | % |
| | | | Total | | | | 467 | | | | 52.00 | % | | | 431 | | | | 48.00 | % |
WisdomTree India Earnings Fund | | | | | | | | | | | | | | | | | | | | |
February 22, 2008 – March 31, 2012 | | | 0 – 24.9 | | | | 76 | | | | 6.93 | % | | | 83 | | | | 7.57 | % |
| | | 25 – 49.9 | | | | 101 | | | | 9.21 | % | | | 80 | | | | 7.29 | % |
| | | 50 – 74.9 | | | | 107 | | | | 9.75 | % | | | 68 | | | | 6.20 | % |
| | | 75 – 99.9 | | | | 84 | | | | 7.66 | % | | | 48 | | | | 4.37 | % |
| | | 100 – 124.9 | | | | 79 | | | | 7.20 | % | | | 40 | | | | 3.65 | % |
| | | 125 – 174.9 | | | | 71 | | | | 6.47 | % | | | 55 | | | | 5.01 | % |
| | | 175 – 199.9 | | | | 36 | | | | 3.28 | % | | | 23 | | | | 2.10 | % |
| | | 200 – 249.9 | | | | 32 | | | | 2.92 | % | | | 28 | | | | 2.55 | % |
| | | >250 | | | | 45 | | | | 4.10 | % | | | 41 | | | | 3.74 | % |
| | | | Total | | | | 631 | | | | 57.52 | % | | | 466 | | | | 42.48 | % |
| * | Basis point (bps) is a unit that is equal to 1/100th of 1%. |
| | | | |
| WisdomTree Domestic and International Earnings Funds | | | 91 | |
Trustees and Officers Information (unaudited)
The Board has responsibility for the overall management and operations of the Funds, including general supervision of the duties performed by WTAM and other service providers. The Board elects the officers of the Trust who are responsible for administering the Trust’s day-to-day operations. Each Trustee serves until his or her successor is duly elected or appointed and qualified.
The address of each Trustee and Officer is c/o WisdomTree Asset Management, Inc., 380 Madison Avenue, 21st Floor, New York, New York 10017.
Interested Trustee and Officers
| | | | | | | | | | |
Name
(year of birth) | | Position | | Term of Office
and Length of
Time Served | | Principal Occupation(s) During the Past 5 Years | | Number of Portfolios
in Fund Complex
Overseen by
Trustee/Officer+ | | Other
Directorships
Held by Trustee/ Officer |
Jonathan Steinberg (1964) | | Trustee, President* | | Trustee and Officer since 2005 | | President, WisdomTree Trust since 2005; Chief Executive Officer of WisdomTree Investments, Inc. and Director of WisdomTree Investments, Inc. since 1989. | | 48 | | None. |
| | | | | |
Amit Muni (1969) | | Treasurer,* Assistant Secretary* | | Officer since 2008 | | Chief Financial Officer and Assistant Secretary of WisdomTree Investments, Inc. since March 2008; International Securities Exchange Holdings, Inc. (ISE), Controller and Chief Accounting Officer from 2003 to 2008. | | 48 | | None. |
| | | | | |
Richard Morris (1967) | | Secretary,* Chief Legal Officer* | | Officer since 2005 | | General Counsel of WisdomTree Asset Management since 2009; Chief Compliance Officer of WisdomTree Trust since 2009; Deputy General Counsel of WisdomTree Investments, Inc. since 2005; Senior Counsel at Barclays Global Investors, N.A. from 2002 to 2005. | | 48 | | None. |
| * | Elected by and serves at the pleasure of the Board of Trustees. |
| | |
| 92 | | WisdomTree Domestic and International Earnings Funds |
Trustees and Officers Information (unaudited) (concluded)
Independent Trustees
| | | | | | | | | | |
Name (year of birth) | | Position | | Term of Office
and Length of
Time Served | | Principal Occupation(s) During the Past 5 Years | | Number of Portfolios
in Fund Complex
Overseen by
Trustee+ | | Other
Directorships Held by Trustee |
Gregory Barton (1961)* | | Trustee | | Trustee since 2006 | | Executive Vice President of Business Legal Affairs, General Counsel and Secretary of TheStreet, Inc. 2009 to present; General Counsel of Martha Stewart Living Omnimedia, Inc. from 2007 to 2008; Executive Vice President of Licensing and Legal Affairs, General Counsel and Secretary of Ziff Davis Media Inc. from 2004 to 2007; Executive Vice President of Legal Affairs, General Counsel and Secretary of Ziff Davis Media Inc. from 2002 to 2004; President from 2001 to 2002, Chief Financial Officer from 2000 to 2002, Vice President of Business Development from 1999 to 2001 and General Counsel and Secretary from 1998 to 2002 of WisdomTree Investments, Inc. | | 48 | | Trustee, GLG Investment Series Trust; and Trustee, Man Long/Short Fund. |
| | | | | |
Toni Massaro (1955)** | | Trustee | | Trustee since 2006 | | Dean Emerita at University of Arizona James E. Rogers College of Law (“Rogers College of Law”) since 2009 (distinguished Emerita in July 2009); Dean at the Rogers College of Law from 1999 to 2009; Regents’ Professor since 2006; Milton O. Riepe Chair in Constitutional Law since 1997; Professor at the Rogers College of Law since 1990. | | 48 | | None. |
| | | | | |
Victor Ugolyn (1947) | | Trustee, Chairman of the Board of Trustees | | Trustee since 2006 | | Private Investor - 2005 to Present; President and Chief Executive Officer of William D. Witter, Inc. from 2005 to 2006; Consultant to AXA Enterprise in 2004; Chairman, President and Chief Executive Officer of Enterprise Capital Management (subsidiary of The MONY Group, Inc.) and Enterprise Group of Funds, Chairman of MONY Securities Corporation, and Chairman of the Fund Board of Enterprise Group of Funds 1991 to 2004. | | 48 | | Member of Board of New York Society of Security Analysts; Member of the Board of Governors of Naismith Memorial Basketball Hall of Fame. |
| * | Chair of the Audit Committee. |
| ** | Chair of the Governance and Nominating Committee. |
| | | | |
| WisdomTree Domestic and International Earnings Funds | | | 93 | |
Supplemental Information (unaudited)
Federal Income Tax Information
The following Federal tax information related to the Funds fiscal year ended March 31, 2012, is provided for information and purposes only and should not be used for reporting to federal or state revenue agencies. Federal tax information for the calendar year will be reported to you on Form 1099-DIV in January 2013.
Certain dividends paid by the Funds may be subject to a maximum tax rate of 15%, as provided by the Jobs and Growth Tax Relief Reconciliation Act of 2003. Of the distributions paid during the fiscal year ended March 31, 2012, the following represents the maximum amount of ordinary income distributions that may be considered qualified dividend income:
| | | | |
| Fund | | Qualified Dividend
Income | |
Total Earnings Fund | | $ | 875,900 | |
Earnings 500 Fund | | | 1,245,174 | |
MidCap Earnings Fund | | | 983,617 | |
SmallCap Earnings Fund | | | 1,255,651 | |
LargeCap Value Fund | | | 506,854 | |
LargeCap Growth Fund | | | 319,110 | |
India Earnings Fund (consolidated) | | | 9,252,605 | |
The following represents the percentage of dividends paid during the fiscal year ended March 31, 2012, that qualify for the 70% dividends received deduction for corporate shareholders:
| | |
| Fund | | Dividends-Received
Deduction |
| | | | | | |
Total Earnings Fund | | | 100 | % | | |
Earnings 500 Fund | | | 100 | % | | |
MidCap Earnings Fund | | | 76 | % | | |
SmallCap Earnings Fund | | | 69 | % | | |
LargeCap Value Fund | | | 100 | % | | |
LargeCap Growth Fund | | | 99 | % | | |
India Earnings Fund (consolidated) | | | 0 | % | | |
The Fund intends to elect to pass through to shareholders the credit for taxes paid during the fiscal year ended March 31, 2012, to foreign countries. The gross foreign source income and foreign taxes paid are as follows:
| | | | | | | | |
| Fund | | Gross Foreign
Income | | | Foreign Taxes
Paid | |
Total Earnings Fund | | $ | — | | | $ | — | |
Earnings 500 Fund | | | — | | | | — | |
MidCap Earnings Fund | | | — | | | | — | |
SmallCap Earnings Fund | | | — | | | | — | |
LargeCap Value Fund | | | — | | | | — | |
LargeCap Growth Fund | | | — | | | | — | |
India Earnings Fund (consolidated) | | | 18,263,811 | | | | 550,097 | |
| | |
| 94 | | WisdomTree Domestic and International Earnings Funds |
General Information (unaudited)
Proxy Voting Policies, Procedures and Record
A complete copy of the Proxy Voting Policy may be obtained by calling 1-866-909-WISE (9473) or writing to: WisdomTree Trust, c/o ALPS Distributors, Inc., 1290 Broadway, Suite 1100, Denver, Colorado 80203.
The Trust is required to disclose annually the Funds’ complete proxy voting record on Form N-PX covering the most recent 12-month period ended June 30 and to file Form N-PX with the SEC no later than August 31 of each year. The current Form N-PX for the Funds is available at no charge upon request by calling 1-866-909-WISE (9473) or through the Trust’s website at www.wisdomtree.com. The Funds’ Form N-PX is also available on the SEC’s website at www.sec.gov.
Shareholder Reports and Quarterly Portfolio Disclosure
The Funds are required to file their complete schedule of portfolio holdings with the SEC for their first and third fiscal quarters on Form N-Q. Copies of the filings are available, without charge, on the SEC’s website at www.sec.gov and are also available by calling the Trust at 1-866-909-WISE (9473). You can also obtain copies of Form N-Q by (i) visiting the SEC’s Public Reference Room in Washington, DC (information on the operation of the Public Reference Room may be obtained by calling 1-800-SEC-0330); (ii) sending your request and a duplicating fee to the SEC’s Public Reference Room, Washington, DC 20549-0102; or (iii) sending your request electronically to publicinfo@sec.gov.
Information about each Fund’s portfolio holdings is available daily, without charge, at www.wisdomtree.com.
The Fund’s Statement of Additional Information (“SAI”) has additional information about the Funds’ Trustees and Officers and is available without charge upon request. Contact your financial representative for a free prospectus or SAI.
| | | | |
| WisdomTree Domestic and International Earnings Funds | | | 95 | |
The WisdomTree Family of Funds
The following is a list of WisdomTree Funds being offered, along with their respective ticker symbols, as of March 31, 2012:
| | |
WisdomTree Domestic Dividend Funds WisdomTree Total Dividend Fund (DTD) WisdomTree Equity Income Fund (DHS) WisdomTree LargeCap Dividend Fund (DLN) WisdomTree Dividend ex-Financials Fund (DTN) WisdomTree MidCap Dividend Fund (DON) WisdomTree SmallCap Dividend Fund (DES) WisdomTree International Dividend Funds WisdomTree DEFA Fund (DWM) WisdomTree DEFA Equity Income Fund (DTH) WisdomTree Global Equity Income Fund (DEW) WisdomTree Europe SmallCap Dividend Fund (DFE) WisdomTree Japan Hedged Equity Fund (DXJ) WisdomTree Global ex-U.S. Growth Fund (DNL) WisdomTree Japan SmallCap Dividend Fund (DFJ) WisdomTree Asia Pacific ex-Japan Fund (AXJL) WisdomTree Australia Dividend Fund (AUSE) WisdomTree International LargeCap Dividend Fund (DOL) WisdomTree International Dividend ex-Financials Fund (DOO) WisdomTree International MidCap Dividend Fund (DIM) WisdomTree International SmallCap Dividend Fund (DLS) WisdomTree Emerging Markets Equity Income Fund (DEM) WisdomTree Emerging Markets SmallCap Dividend Fund (DGS) WisdomTree Middle East Dividend Fund (GULF) WisdomTree International Hedged Equity Fund (HEDJ) WisdomTree International Dividend
Sector Funds WisdomTree Commodity Country Equity Fund (CCXE) WisdomTree Global Natural Resources Fund (GNAT) WisdomTree Global ex-U.S. Utilities Fund (DBU) WisdomTree Global ex-U.S. Real Estate Fund (DRW) | | WisdomTree Domestic and International
Earnings Funds WisdomTree Total Earnings Fund (EXT) WisdomTree Earnings 500 Fund (EPS) WisdomTree MidCap Earnings Fund (EZM) WisdomTree SmallCap Earnings Fund (EES) WisdomTree LargeCap Value Fund (EZY) WisdomTree LargeCap Growth Fund (ROI) WisdomTree India Earnings Fund (EPI) WisdomTree Currency Funds WisdomTree Dreyfus Brazilian Real Fund (BZF) WisdomTree Dreyfus Chinese Yuan Fund (CYB) WisdomTree Dreyfus Commodity Currency Fund (CCX) WisdomTree Dreyfus Emerging Currency Fund (CEW) WisdomTree Dreyfus Indian Rupee Fund (ICN) WisdomTree Dreyfus Japanese Yen Fund (JYF) WisdomTree Dreyfus South African Rand Fund (SZR) WisdomTree Fixed Income Funds WisdomTree Asia Local Debt Fund (ALD) WisdomTree Australia & New Zealand Debt Fund (AUNZ) WisdomTree Emerging Markets Corporate Bond Fund (EMCB) WisdomTree Emerging Markets Local Debt Fund (ELD) WisdomTree Euro Debt Fund (EU) WisdomTree Alternative Funds WisdomTree Global Real Return Fund (RRF) WisdomTree Managed Futures Strategy Fund (WDTI) |
The WisdomTree Funds are exchange traded funds (“ETFs”) registered with the United States Securities and Exchange Commission as separate series (“Funds”) of WisdomTree Trust (“Trust”). WisdomTree Asset Management, Inc., a wholly owned subsidiary of WisdomTree Investments, Inc., serves as the investment adviser to the Trust. None of the WisdomTree entities are affiliated with ALPS Distributors, Inc., the Funds��� distributor. WisdomTree Investments, its affiliates and their independent providers are not liable for any informational errors, incompleteness, delays, or for any actions taken in reliance on information contained herein.
Investors should consider the investment objectives, risks, charges and expenses of the Funds carefully before investing. A prospectus, containing this and other information, is available at www.wisdomtree.com, or by calling 1-866-909-WISE (9473). Investors should read the prospectus carefully before investing. There are risks associated with investing, including possible loss of principal. Past performance does not guarantee future results. Indexes are unmanaged and you cannot invest directly in an index.
There are risks associated with investing, including possible loss of principal. Funds focusing their investments on certain sectors and/or smaller companies increase their vulnerability to any single economic or regulatory development. This may result in greater share price volatility. Foreign investing involves special risks, such as risk of loss from currency fluctuation or political or economic uncertainty. The WisdomTree India Earnings Fund focuses its investments in India, thereby increasing the impact of events and developments associated with the region which can adversely affect performance. Investments in emerging, offshore or frontier markets such as India are generally less liquid and less efficient than investments in developed markets and are subject to additional risks, such as risks of adverse governmental regulation and intervention or political developments. Due to the investment strategy of certain Fund’s they may make higher capital gain distributions than other ETFs. Please read each Fund’s prospectus for specific details regarding the Fund’s risk profile.
Transactions in Fund shares will result in brokerage commissions and will generate tax consequences. Shares may be sold through brokerage accounts, but may be redeemed from the Funds only in large amounts of 50,000 shares or more.
WisdomTree Trust
380 Madison Avenue, 21st Floor
New York, NY 10017

WisdomTree Domestic and International Earnings Funds
WisdomTree Total Earnings Fund
WisdomTree Earnings 500 Fund
WisdomTree MidCap Earnings Fund
WisdomTree SmallCap Earnings Fund
WisdomTree LargeCap Value Fund
WisdomTree LargeCap Growth Fund
WisdomTree India Earnings Fund
WisdomTree Fund shares are distributed by ALPS Distributors, Inc.
WIS004136 (05/2013)


WisdomTree Trust
International Dividend and Sector Funds
Annual Report
March 31, 2012
WisdomTree DEFA Fund (DWM)
WisdomTree DEFA Equity Income Fund (DTH)
WisdomTree Global Equity Income Fund (DEW)
WisdomTree Europe SmallCap Dividend Fund (DFE)
WisdomTree Japan Hedged Equity Fund (DXJ)
WisdomTree Global ex-U.S. Growth Fund (DNL)
(formerly, WisdomTree World ex-U.S. Growth Fund (DNL))
WisdomTree Japan SmallCap Dividend Fund (DFJ)
WisdomTree Asia Pacific ex-Japan Fund (AXJL)
(formerly, WisdomTree Pacific ex-Japan Total Dividend Fund (DND))
WisdomTree Australia Dividend Fund (AUSE)
(formerly, WisdomTree Pacific ex-Japan Equity Income Fund (DNH))
WisdomTree International LargeCap Dividend Fund (DOL)
WisdomTree International Dividend ex-Financials Fund (DOO)
WisdomTree International MidCap Dividend Fund (DIM)
WisdomTree International SmallCap Dividend Fund (DLS)
WisdomTree Emerging Markets Equity Income Fund (DEM)
WisdomTree Emerging Markets SmallCap Dividend Fund (DGS)
WisdomTree Middle East Dividend Fund (GULF)
WisdomTree International Hedged Equity Fund (HEDJ)
WisdomTree Commodity Country Equity Fund (CCXE)
(formerly, WisdomTree International Basic Materials Sector Fund (DBN))
WisdomTree Global Natural Resources Fund (GNAT)
(formerly, WisdomTree International Energy Sector Fund (DKA))
WisdomTree Global ex-U.S. Utilities Fund (DBU)
(formerly, WisdomTree International Utilities Sector Fund (DBU))
WisdomTree Global ex-U.S. Real Estate Fund (DRW)
(formerly, WisdomTree International Real Estate Fund (DRW))
Table of Contents
“WisdomTree” is a registered mark of WisdomTree Investments, Inc. and is licensed for use by the WisdomTree Trust.
Management’s Discussion of Funds’ Performance
Market Environment Overview
The international equity markets, measured by the MSCI EAFE Index, a broad measure of equity performance for the developed world outside the U.S. and Canada, returned -5.77% in the 12-month period that ended March, 31, 2012 (the “period”). Compared to peak levels reached in 2007, the MSCI EAFE Index is still down on a cumulative basis by more than 25%. The emerging markets, shown through the MSCI Emerging Markets Index, failed to keep pace with the developed world markets for the period. The MSCI Emerging Markets Index returned -8.80% over the period. This was more than 15 percentage points behind the S&P 500 and roughly 3 percentage points behind the MSCI EAFE Index.
One of the main factors for the negative equity performance internationally remained the uncertainties of the peripheral European countries’ mounting debts and their impact on the European Union or, “EU”, as well as the global economy. Largely as a result of these uncertainties the MSCI EAFE Index experienced a significant decline in the first eight months of the period through November 2011. In December 2011, the European Central Bank (“ECB”) announced an emergency operation aimed at reducing fears about the stability of European banks. This program, dubbed LTRO for Long-Term Refinancing Operation, gave European banks the ability to pledge a wide swath of collateral with the ECB in return for loans with a three-year term and 1% interest rate charge. The LTROs alleviated a lot of the pressure of bank funding and helped reduce pressures on European governments, as the banks had more capital that they could use to buy sovereign bonds. The international markets rallied significantly following the LTRO activities in December 2011 to erase much of the losses they experienced in the first 8 months of the period.
With all this volatility in the markets and fears about global growth prospects, there were only two sectors — Consumer Staples and Health Care — that contributed positively to the MSCI EAFE returns over the period. The Consumer Discretionary sector was essentially flat and the remaining seven sectors (Information Technology, Energy, Industrials, Telecommunication Services, Financials, Materials, and Utilities) contributed negatively to the MSCI EAFE performance for the period. Telecommunication Services, Financials, Materials, and Utilities each experienced losses of more than 15% for the period.
WisdomTree Funds’ Performance Overview
Measured in local currency, the MSCI EAFE Index returned -4.12% over the period. The foreign currency component of the developed world returns subtracted a little less than 2 percentage points to the returns of the MSCI EAFE Index. During the period, the euro depreciated against the U.S. dollar, weakening by more than 5% over the period. Weakening currencies relative to the U.S. dollar decrease the value of foreign investments measured in U.S. dollars and tend to lower returns experienced by U.S. investors who invest overseas.
The following table reflects the WisdomTree Funds’ performance versus capitalization- weighted benchmark indexes:
| | | | | | | | | | | | | | |
| Ticker | | WisdomTree Fund | | 1-Year
NAV Return | | Cap-Weighted Benchmark | | 1-Year
Return | | | Difference | |
DWM | | WisdomTree DEFA Fund | | -6.18% | | MSCI EAFE Index | | | -5.77% | | | | -0.41% | |
DTH | | WisdomTree DEFA Equity Income Fund | | -7.45% | | MSCI EAFE Value Index | | | -7.83% | | | | 0.38% | |
DEW | | WisdomTree Global Equity Income Fund | | -2.70% | | MSCI Europe Value/MSCI AC World Spliced Index | | | -0.73% | | | | -1.97% | |
DFE | | WisdomTree Europe SmallCap Dividend Fund | | -9.80% | | MSCI Europe SmallCap Index | | | -10.17% | | | | 0.37% | |
DXJ | | WisdomTree Japan Hedged Equity Fund | | 1.46% | | MSCI Japan/MSCI Japan Local Currency Spliced Index | | | -0.45% | | | | 1.91% | |
DNL | | WisdomTree Global ex-US Growth Fund | | -5.20% | | MSCI Japan Value/MSCI AC World ex-USA Growth Spliced Index | | | -6.26% | | | | 1.06% | |
| | | | |
| WisdomTree International Dividend and Sector Funds | | | 1 | |
Management’s Discussion of Funds’ Performance
(continued)
| | | | | | | | | | | | | | |
| Ticker | | WisdomTree Fund | | 1-Year
NAV Return | | Cap-Weighted Benchmark | | 1-Year
Return | | | Difference | |
DFJ | | WisdomTree Japan SmallCap Dividend Fund | | 7.36% | | MSCI Japan Small Cap Index | | | 5.15% | | | | 2.21% | |
AXJL | | WisdomTree Asia Pacific ex-Japan Fund | | -2.22% | | MSCI Pacific ex-Japan/MSCI AC Asia Pacific ex-Japan Spliced Index | | | -7.03% | | | | 4.81% | |
AUSE | | WisdomTree Australia Dividend Fund | | -3.86% | | MSCI Pacific ex-Japan Value/MSCI Australia Spliced Index | | | -5.32% | | | | 1.46% | |
DOL | | WisdomTree International LargeCap Dividend Fund | | -6.02% | | MSCI EAFE Index | | | -5.77% | | | | -0.25% | |
DOO | | WisdomTree International Dividend ex-Financials Fund | | -7.24% | | MSCI EAFE Value Index | | | -7.83% | | | | 0.59% | |
DIM | | WisdomTree International MidCap Dividend Fund | | -7.21% | | MSCI EAFE Mid Cap Index | | | -6.65% | | | | -0.56% | |
DLS | | WisdomTree International SmallCap Dividend Fund | | -3.41% | | MSCI EAFE Small Cap Index | | | -6.23% | | | | 2.82% | |
DEM | | WisdomTree Emerging Markets Equity Income Fund | | -1.03% | | MSCI Emerging Markets Index | | | -8.80% | | | | 7.77% | |
DGS | | WisdomTree Emerging Markets SmallCap Dividend Fund | | -6.88% | | MSCI Emerging Markets Small Cap Index | | | -12.70% | | | | 5.82% | |
GULF | | WisdomTree Middle East Dividend Fund | | 1.35% | | MSCI Arabian Markets ex Saudi Arabia Index | | | -3.34% | | | | 4.69% | |
HEDJ | | WisdomTree International Hedged Equity Fund | | -4.41% | | MSCI EAFE Local Currency Index | | | -4.12% | | | | -0.29% | |
CCXE | | WisdomTree Commodity Country Equity Fund | | -1.77% | | S&P Developed Ex-U.S. BMI Materials/MSCI ACWI ex-USA Spliced Index | | | -9.84% | | | | 8.07% | |
GNAT | | WisdomTree Global Natural Resources Fund | | -12.70% | | S&P Developed Ex-U.S. BMI Energy/S&P Global Natural Resources Spliced Index | | | -13.92% | | | | 1.22% | |
DBU | | WisdomTree Global ex-U.S. Utilities Sector Fund | | -7.41% | | S&P Developed Ex-U.S. BMI Utilities Sector Index | | | -13.10% | | | | 5.69% | |
DRW | | WisdomTree Global ex-U.S. Real Estate Fund | | -3.99% | | Dow Jones Global ex-U.S. Select Real Estate Securities Index | | | -0.95% | | | | -3.04% | |
WisdomTree’s international dividend weighted Funds are designed to track indexes based on the dividend stream generated by the companies included in the index. The dividend stream is defined as the sum of all dividends paid over the prior 12 months for each company. There are two primary factors that drive performance differentials versus market cap-weighted benchmarks. The first is aggregate exposure to one or more sectors or countries. The second is stock selection within each sector or country. Both of these are determined as part of WisdomTree’s rules-based index methodology. These exposures are not subjectively determined. Rather, they are objectively determined at the Index rebalancing dates based on the dividend stream.
WisdomTree’s best performing region and Funds for the year were Japan. Both the WisdomTree Japan SmallCap Dividend Fund (DFJ) and the WisdomTree Japan Hedged Equity Fund (DXJ) had positive absolute returns for the period. These two examples of positive absolute performance are notable given that Japan was devastated by the earthquake, tsunami, and nuclear disasters only a year ago in March 2011 and exporters were hurt by a strengthening yen for most of the period. Small cap Japanese stocks are more domestically sensitive and more closely tied to the local economy and did well as the country spent billions to rebuild. The WisdomTree Japan SmallCap Dividend Fund returned 7.36% for the period. This was more than 2 percentage points higher than the MSCI Japan Small Cap Index return of 5.15%.
The only other WisdomTree Fund to provide positive absolute returns for the period was the WisdomTree Middle East Dividend Fund (GULF). Even though geopolitical risk was heightened in the Middle East as tensions in the region escalated to violence in countries such as Egypt, Syria, Tunisia, Bahrain, Yemen, and Libya, the WisdomTree Middle East Dividend Fund returned 1.35%, which was more than 4.5 percentage points higher than the MSCI Arabian Markets ex-Saudi Arabia Index return of -3.34%.
| | |
| 2 | | WisdomTree International Dividend and Sector Funds |
Management’s Discussion of Funds’ Performance
(concluded)
While emerging markets, as measured by the MSCI Emerging Markets Index, were down 8.80%, both the WisdomTree Emerging Markets Equity Income Fund (DEM) and the WisdomTree Emerging Markets SmallCap Dividend Fund (DGS) experienced relatively favorable performance for the period only down -1.03% and -6.88% respectively. The MSCI Emerging Markets Index was more exposed to India, China, and Russia compared to the WisdomTree Funds. These markets suffered as investors’ fled risky assets. WisdomTree Emerging Markets Funds are dividend focused and as such India, China and Russia were under represented in both DEM and DGS, which helped the Funds’ performance. Both DEM and DGS benefited from exposure to Taiwan, which had positive returns for the period.
The two WisdomTree International Funds with the lowest returns over the period were the WisdomTree Global Natural Resources Fund and the WisdomTree Europe SmallCap Dividend Fund. The WisdomTree Europe SmallCap Dividend Fund’s decline can be associated with the continuing troubles in the European economy with the ongoing debt crisis. This Fund has both exposure to the euro, which declined 5% over the period, as well as cyclical sectors, such as those that were negatively impacted by fears over the continuing weakness in the European economies. Commodity sectors such as those in the WisdomTree Global Natural Resources Fund, experienced the greatest declines in the global markets. Commodity prices are sensitive to economic conditions and there were ongoing questions about global growth prospects emanating from the same European issues mentioned above.
Fund returns are shown at NAV. Please see Performance Summaries on the subsequent pages for more complete performance information. Please see pages 25-27 for the list of index descriptions.
Fund performance assumes reinvestment of dividends and capital gain distributions. An index is a statistical measure of a specified financial market or sector. An index does not actually hold a portfolio of securities, incur expenses or pay any transaction costs. Therefore index returns do not reflect deductions for fees or expenses and are not available for direct investment. In comparison, the Funds’ performance is negatively impacted by these deductions. Fund returns do not reflect brokerage commissions or taxes on transactions in Fund shares or that a shareholder would pay on Fund distributions. Past performance is no guarantee of future results. For the most recent month end performance information visit www.wisdomtree.com.
| | | | |
| WisdomTree International Dividend and Sector Funds | | | 3 | |
Performance Summary (unaudited)
WisdomTree DEFA Fund (DWM)
Country Breakdown† as of 3/31/12
| | | | |
United Kingdom | | | 18.1% | |
Japan | | | 13.3% | |
Australia | | | 11.5% | |
France | | | 9.5% | |
Germany | | | 6.9% | |
Switzerland | | | 6.5% | |
Spain | | | 4.9% | |
Hong Kong | | | 4.7% | |
Italy | | | 3.2% | |
Sweden | | | 3.2% | |
Singapore | | | 2.0% | |
Norway | | | 1.9% | |
Netherlands | | | 1.8% | |
Finland | | | 1.3% | |
Belgium | | | 1.2% | |
Austria | | | 0.4% | |
Denmark | | | 0.4% | |
Portugal | | | 0.4% | |
Ireland | | | 0.3% | |
New Zealand | | | 0.2% | |
United States | | | 0.1% | |
| † | The Fund’s country breakdown is expressed as a percentage of total investments and may change over time; does not include overnight investments in U.S. money market funds or investments of cash collateral for securities loaned. |
Top Ten Holdings* as of 3/31/12
| | | | |
| |
| Description | | % of Net Assets | |
China Mobile Ltd. | | | 1.9% | |
Vodafone Group PLC | | | 1.7% | |
Nestle S.A. | | | 1.5% | |
Total S.A. | | | 1.4% | |
Commonwealth Bank of Australia | | | 1.4% | |
Roche Holding AG-Genusschein | | | 1.4% | |
Westpac Banking Corp. | | | 1.3% | |
GlaxoSmithKline PLC | | | 1.3% | |
Telefonica S.A. | | | 1.3% | |
HSBC Holdings PLC | | | 1.3% | |
| * | The ten largest holdings are subject to change, and there are no guarantees the Fund will remain invested in any particular company. |
The WisdomTree DEFA Fund (the “Fund”) seeks to track the price and yield performance, before fees and expenses, of the WisdomTree Dividend Index of Europe, Far East Asia and Australasia (“the WisdomTree DEFA Index”).
The Fund returned -6.18% at net asset value (“NAV”) for the fiscal year ended March 31, 2012 (for more complete performance information please see the chart below). The Fund’s performance benefited most from its investment in the United Kingdom. The Fund’s position in France created the greatest drag on performance.
The following performance chart is provided for comparative purposes and represents the period noted. The Fund’s per share NAV is the value of one share of the Fund and is calculated by dividing the value of total assets less total liabilities by the number of shares outstanding. The NAV return is based on the NAV of the Fund and the market price return is based on the market price per share of the Fund. The price used to calculate market price returns is the mid-point of the highest bid and lowest offer for Fund shares as of the close of trading on the exchange where Fund shares are listed. NAV and market price returns assume that dividends and capital gain distributions have been reinvested in the Fund at NAV and market price, respectively. As with other ETFs, NAV returns and market price returns may differ because of factors such as the supply and demand for Fund shares and investors’ assessments of the underlying value of a Fund’s portfolio securities.
An index is a statistical measure of a specified financial market or sector. An index does not actually hold a portfolio of securities, incur expenses or pay any transaction costs. Therefore, index returns do not reflect deductions for fees or expenses and the index is not available for direct investment. In comparison, the Fund’s performance is negatively impacted by these deductions. Fund returns do not reflect brokerage commissions or taxes on transactions in Fund shares or that a shareholder would pay on Fund distributions. As of the Fund’s current prospectus dated July 29, 2011, the Fund’s annual expense ratio was 0.48%.
Performance as of 3/31/12
| | | | | | | | | | | | | | | | |
| | | Average Annual Total Return | |
| | | Fund
Net Asset Value | | | Fund
Market Price | | | WisdomTree
DEFA Index | | | MSCI EAFE Index | |
One Year | | | -6.18 | % | | | -5.67 | % | | | -6.25 | % | | | -5.77 | % |
Three Year | | | 16.51 | % | | | 16.89 | % | | | 16.81 | % | | | 17.13 | % |
Five Year | | | -3.41 | % | | | -3.36 | % | | | -3.08 | % | | | -3.51 | % |
Since Inception1 | | | 1.41 | % | | | 1.55 | % | | | 1.86 | % | | | 0.83 | % |
| 1 | Total returns are calculated based on the commencement of Fund trading on the NYSE Arca, Inc. on June 16, 2006. |
Performance is historical and does not guarantee future results. Current performance may be lower or higher than quoted. Investment returns and the principal value of an investment will fluctuate so that an investor’s shares, when redeemed, may be worth more or less than their original cost. Performance data for the most recent month-end is available at www.wisdomtree.com. WisdomTree shares are bought and sold at market price (not NAV) and are not individually redeemed from the Fund. The returns do not reflect the deduction of taxes that a shareholder would pay on Fund distributions or on the redemption of Fund shares.
| | |
| 4 | | WisdomTree International Dividend and Sector Funds |
Performance Summary (unaudited)
WisdomTree DEFA Equity Income Fund (DTH)
Country Breakdown† as of 3/31/12
| | | | |
United Kingdom | | | 19.8% | |
Australia | | | 16.0% | |
France | | | 11.1% | |
Spain | | | 7.4% | |
Germany | | | 6.2% | |
Switzerland | | | 5.7% | |
Japan | | | 4.8% | |
Hong Kong | | | 4.5% | |
Italy | | | 3.8% | |
Sweden | | | 2.8% | |
Norway | | | 2.8% | |
Singapore | | | 1.9% | |
Netherlands | | | 1.8% | |
Finland | | | 1.7% | |
Portugal | | | 0.7% | |
Belgium | | | 0.6% | |
United States | | | 0.4% | |
New Zealand | | | 0.4% | |
Ireland | | | 0.2% | |
Austria | | | 0.2% | |
Denmark | | | 0.0% | # |
| † | The Fund’s country breakdown is expressed as a percentage of total investments and may change over time; does not include overnight investments in U.S. money market funds or investments of cash collateral for securities loaned. |
| # | Amount represents less than 0.05%. |
Top Ten Holdings* as of 3/31/12
| | | | |
| |
| Description | | % of Net Assets | |
China Mobile Ltd. | | | 3.2% | |
Vodafone Group PLC | | | 2.9% | |
Total S.A. | | | 2.5% | |
Commonwealth Bank of Australia | | | 2.3% | |
GlaxoSmithKline PLC | | | 2.3% | |
Westpac Banking Corp. | | | 2.3% | |
HSBC Holdings PLC | | | 2.2% | |
Telefonica S.A. | | | 2.2% | |
Novartis AG | | | 2.1% | |
ENI SpA | | | 2.0% | |
| * | The ten largest holdings are subject to change, and there are no guarantees the Fund will remain invested in any particular company. |
The WisdomTree DEFA Equity Income Fund (the “Fund”) seeks to track the price and yield performance, before fees and expenses, of the WisdomTree DEFA Equity Income Index.
The Fund returned -7.45% at net asset value (“NAV”) for the fiscal year ended March 31, 2012 (for more complete performance information please see the chart below). The Fund’s performance benefited most from its investments in the United Kingdom. The Fund’s position in France created the greatest drag on performance.
The following performance chart is provided for comparative purposes and represents the period noted. The Fund’s per share NAV is the value of one share of the Fund and is calculated by dividing the value of total assets less total liabilities by the number of shares outstanding. The NAV return is based on the NAV of the Fund and the market price return is based on the market price per share of the Fund. The price used to calculate market price returns is the mid-point of the highest bid and lowest offer for Fund shares as of the close of trading on the exchange where Fund shares are listed. NAV and market price returns assume that dividends and capital gain distributions have been reinvested in the Fund at NAV and market price, respectively. As with other ETFs. NAV returns and market price returns may differ because of factors such as the supply and demand for Fund shares and investors’ assessments of the underlying value of a Fund’s portfolio securities.
An index is a statistical measure of a specified financial market or sector. An index does not actually hold a portfolio of securities, incur expenses or pay any transaction costs. Therefore, index returns do not reflect deductions for fees or expenses and the index is not available for direct investment. In comparison, the Fund’s performance is negatively impacted by these deductions. Fund returns do not reflect brokerage commissions or taxes on transactions in Fund shares or that a shareholder would pay on Fund distributions. As of the Fund’s current prospectus dated July 29, 2011, the Fund’s annual expense ratio was 0.58%.
Performance as of 3/31/12
| | | | | | | | | | | | | | | | |
| | | Average Annual Total Return | |
| | | Fund
Net Asset Value | | | Fund
Market Price | | | WisdomTree
DEFA Equity
Income
Index | | | MSCI EAFE
Value Index | |
One Year | | | -7.45 | % | | | -7.22 | % | | | -7.69 | % | | | -7.83 | % |
Three Year | | | 15.97 | % | | | 16.25 | % | | | 16.31 | % | | | 16.50 | % |
Five Year | | | -4.73 | % | | | -4.78 | % | | | -4.28 | % | | | -5.18 | % |
Since Inception1 | | | 0.14 | % | | | 0.18 | % | | | 0.86 | % | | | -0.47 | % |
| 1 | Total returns are calculated based on the commencement of Fund trading on the NYSE Arca, Inc. on June 16, 2006. |
Performance is historical and does not guarantee future results. Current performance may be lower or higher than quoted. Investment returns and the principal value of an investment will fluctuate so that an investor’s shares, when redeemed, may be worth more or less than their original cost. Performance data for the most recent month-end is available at www.wisdomtree.com. WisdomTree shares are bought and sold at market price (not NAV) and are not individually redeemed from the Fund. The returns do not reflect the deduction of taxes that a shareholder would pay on Fund distributions or on the redemption of Fund shares.
| | | | |
| WisdomTree International Dividend and Sector Funds | | | 5 | |
Performance Summary (unaudited)
WisdomTree Global Equity Income Fund (DEW)
Country Breakdown† as of 3/31/12
| | | | |
United States | | | 18.5% | |
United Kingdom | | | 12.0% | |
Australia | | | 9.2% | |
France | | | 6.7% | |
Switzerland | | | 4.9% | |
Canada | | | 4.4% | |
Spain | | | 4.3% | |
Japan | | | 4.1% | |
Germany | | | 4.1% | |
Brazil | | | 2.9% | |
Hong Kong | | | 2.7% | |
Italy | | | 2.4% | |
Taiwan | | | 2.3% | |
Sweden | | | 1.8% | |
South Africa | | | 1.6% | |
Norway | | | 1.5% | |
Malaysia | | | 1.3% | |
Singapore | | | 1.1% | |
Finland | | | 1.0% | |
Netherlands | | | 1.0% | |
Chile | | | 0.7% | |
Russia | | | 0.6% | |
Thailand | | | 0.6% | |
China | | | 0.5% | |
Turkey | | | 0.5% | |
Czech Republic | | | 0.5% | |
South Korea | | | 0.4% | |
Israel | | | 0.4% | |
Portugal | | | 0.3% | |
Philippines | | | 0.3% | |
Poland | | | 0.3% | |
Belgium | | | 0.3% | |
Indonesia | | | 0.3% | |
Mexico | | | 0.2% | |
Austria | | | 0.2% | |
Argentina | | | 0.2% | |
New Zealand | | | 0.1% | |
Ireland | | | 0.1% | |
Hungary | | | 0.0% | # |
| † | The Fund’s country breakdown is expressed as a percentage of total investments and may change over time; does not include overnight investments in U.S. money market funds or investments of cash collateral for securities loaned. |
| # | Amount represents less than 0.05%. |
Top Ten Holdings* as of 3/31/12
| | | | |
| Description | | % of Net Assets | |
AT&T, Inc. | | | 2.0% | |
China Mobile Ltd. | | | 1.8% | |
Vodafone Group PLC | | | 1.7% | |
Nestle S.A. | | | 1.4% | |
Total S.A. | | | 1.4% | |
Pfizer, Inc. | | | 1.3% | |
GlaxoSmithKline PLC | | | 1.3% | |
Commonwealth Bank of Australia | | | 1.3% | |
Westpac Banking Corp. | | | 1.3% | |
Telefonica S.A. | | | 1.2% | |
| * | The ten largest holdings are subject to change, and there are no guarantees the Fund will remain invested in any particular company. |
The WisdomTree Global Equity Income Fund (the “Fund”) seeks to track the price and yield performance, before fees and expenses, of the WisdomTree Global Equity Income Index.
The Fund returned -2.70% at net asset value (“NAV”) for the fiscal year ended March 31, 2012 (for more complete performance information please see the chart below). The Fund’s performance benefited most from its investment in the United States. The Fund’s position in France created the greatest drag on performance.
The following performance chart is provided for comparative purposes and represents the period noted. The Fund’s per share NAV is the value of one share of the Fund and is calculated by dividing the value of total assets less total liabilities by the number of shares outstanding. The NAV return is based on the NAV of the Fund and the market price return is based on the market price per share of the Fund. The price used to calculate market price returns is the mid-point of the highest bid and lowest offer for Fund shares as of the close of trading on the exchange where Fund shares are listed. NAV and market price returns assume that dividends and capital gain distributions have been reinvested in the Fund at NAV and market price, respectively. As with other ETFs, NAV returns and market price returns may differ because of factors such as the supply and demand for Fund shares and investors’ assessments of the underlying value of a Fund’s portfolio securities.
An index is a statistical measure of a specified financial market or sector. An index does not actually hold a portfolio of securities, incur expenses or pay any transaction costs. Therefore, index returns do not reflect deductions for fees or expenses and the index is not available for direct investment. In comparison, the Fund’s performance is negatively impacted by these deductions. Fund returns do not reflect brokerage commissions or taxes on transactions in Fund shares or that a shareholder would pay on Fund distributions. As of the Fund’s current prospectus dated July 29, 2011, the Fund’s annual expense ratio was 0.58%.
Performance as of 3/31/12
| | | | | | | | | | | | | | | | |
| | | Average Annual Total Return | |
| | | Fund
Net Asset Value | | | Fund
Market Price | | | WisdomTree
Europe Equity Income/
Global Equity Income
Spliced Index1 | | | MSCI
Europe Value/MSCI
AC World Spliced
Index2 | |
One Year | | | -2.70 | % | | | -3.05 | % | | | -2.97 | % | | | -0.73 | % |
Three Year | | | 21.29 | % | | | 21.28 | % | | | 21.35 | % | | | 23.90 | % |
Five Year | | | -3.22 | % | | | -3.25 | % | | | -3.09 | % | | | -3.41 | % |
Since Inception3 | | | 1.36 | % | | | 1.29 | % | | | 1.70 | % | | | 1.40 | % |
| 1 | WisdomTree Europe Equity Income Index through June 19, 2009; WisdomTree Global Equity Income Index thereafter. |
| 2 | MSCI Europe Value Index through June 19, 2009; MSCI AC World Index thereafter. |
| 3 | Total returns are calculated based on the commencement of Fund trading on the NYSE Arca, Inc. on June 16, 2006. |
Performance is historical and does not guarantee future results. Current performance may be lower or higher than quoted. Investment returns and the principal value of an investment will fluctuate so that an investor’s shares, when redeemed, may be worth more or less than their original cost. Performance data for the most recent month-end is available at www.wisdomtree.com. WisdomTree shares are bought and sold at market price (not NAV) and are not individually redeemed from the Fund. The returns do not reflect the deduction of taxes that a shareholder would pay on Fund distributions or on the redemption of Fund shares.
| | |
| 6 | | WisdomTree International Dividend and Sector Funds |
Performance Summary (unaudited)
WisdomTree Europe SmallCap Dividend Fund (DFE)
Country Breakdown† as of 3/31/12
| | | | |
United Kingdom | | | 31.9% | |
Sweden | | | 13.0% | |
Italy | | | 9.2% | |
Germany | | | 7.1% | |
Finland | | | 5.4% | |
Norway | | | 4.0% | |
Belgium | | | 3.7% | |
France | | | 3.5% | |
Netherlands | | | 3.4% | |
Spain | | | 3.1% | |
Portugal | | | 2.0% | |
Ireland | | | 1.9% | |
Austria | | | 1.3% | |
Denmark | | | 1.2% | |
Switzerland | | | 0.7% | |
United States | | | 0.0% | # |
| † | The Fund’s country breakdown is expressed as a percentage of total investments and may change over time; does not include overnight investments in U.S. money market funds or investments of cash collateral for securities loaned. |
| # | Amount represents less than 0.05%. |
Top Ten Holdings* as of 3/31/12
| | | | |
| |
| Description | | % of Net Assets | |
Cofinimmo | | | 1.3% | |
NCC AB Class B | | | 1.3% | |
Close Brothers Group PLC | | | 1.2% | |
Antena 3 de Television S.A. | | | 1.2% | |
De La Rue PLC | | | 1.0% | |
Tieto Oyj | | | 1.0% | |
Banca Generali SpA | | | 1.0% | |
Comdirect Bank AG | | | 0.9% | |
Greene King PLC | | | 0.9% | |
Fabege AB | | | 0.8% | |
| * | The ten largest holdings are subject to change, and there are no guarantees the Fund will remain invested in any particular company. |
The WisdomTree Europe SmallCap Dividend Fund (the “Fund”) seeks to track the price and yield performance, before fees and expenses, of the WisdomTree Europe SmallCap Dividend Index.
The Fund returned -9.80% at net asset value (“NAV”) for the fiscal year ended March 31, 2012 (for more complete performance information please see the chart below). The Fund’s performance benefited most from its investment in the United Kingdom. The Fund’s investment in Italy created the greatest drag on performance.
The following performance chart is provided for comparative purposes and represents the period noted. The Fund’s per share NAV is the value of one share of the Fund and is calculated by dividing the value of total assets less total liabilities by the number of shares outstanding. The NAV return is based on the NAV of the Fund and the market price return is based on the market price per share of the Fund. The price used to calculate market price returns is the mid-point of the highest bid and lowest offer for Fund shares as of the close of trading on the exchange where Fund shares are listed. NAV and market price returns assume that dividends and capital gain distributions have been reinvested in the Fund at NAV and market price, respectively. As with other ETFs, NAV returns and market price returns may differ because of factors such as the supply and demand for Fund shares and investors’ assessments of the underlying value of a Fund’s portfolio securities.
An index is a statistical measure of a specified financial market or sector. An index does not actually hold a portfolio of securities, incur expenses or pay any transaction costs. Therefore, index returns do not reflect deductions for fees or expenses and the index is not available for direct investment. In comparison, the Fund’s performance is negatively impacted by these deductions. Fund returns do not reflect brokerage commissions or taxes on transactions in Fund shares or that a shareholder would pay on Fund distributions. As of the Fund’s current prospectus dated July 29, 2011, the Fund’s annual expense ratio was 0.58%.
Performance as of 3/31/12
| | | | | | | | | | | | | | | | |
| | | Average Annual Total Return | |
| | | Fund
Net Asset Value | | | Fund
Market Price | | | WisdomTree
Europe
SmallCap
Dividend Index | | | MSCI Europe
Small Cap Index | |
One Year | | | -9.80 | % | | | -9.07 | % | | | -9.81 | % | | | -10.17 | % |
Three Year | | | 24.17 | % | | | 24.52 | % | | | 24.93 | % | | | 26.69 | % |
Five Year | | | -5.86 | % | | | -5.79 | % | | | -5.62 | % | | | -3.55 | % |
Since Inception1 | | | 0.61 | % | | | 0.56 | % | | | 0.87 | % | | | 2.83 | % |
| 1 | Total returns are calculated based on the commencement of Fund trading on the NYSE Arca, Inc. on June 16, 2006. |
Performance is historical and does not guarantee future results. Current performance may be lower or higher than quoted. Investment returns and the principal value of an investment will fluctuate so that an investor’s shares, when redeemed, may be worth more or less than their original cost. Performance data for the most recent month-end is available at www.wisdomtree.com. WisdomTree shares are bought and sold at market price (not NAV) and are not individually redeemed from the Fund. The returns do not reflect the deduction of taxes that a shareholder would pay on Fund distributions or on the redemption of Fund shares.
| | | | |
| WisdomTree International Dividend and Sector Funds | | | 7 | |
Performance Summary (unaudited)
WisdomTree Japan Hedged Equity Fund (DXJ)
Sector Breakdown† as of 3/31/12‡
| | | | |
Industrials | | | 13.9% | |
Financials | | | 13.9% | |
Consumer Discretionary | | | 12.0% | |
Information Technology | | | 9.1% | |
Health Care | | | 6.2% | |
Consumer Staples | | | 6.0% | |
Telecommunication Services | | | 5.9% | |
Materials | | | 5.4% | |
Utilities | | | 3.6% | |
Energy | | | 1.4% | |
Other | | | 22.6% | |
| † | The Fund’s sector breakdown is expressed as a percentage of total investments and may change over time. |
| ‡ | A sector may be comprised of several industries. |
Top Ten Holdings* as of 3/31/12
| | | | |
| |
| Description | | % of Net Assets | |
NTT DoCoMo, Inc. | | | 3.5% | |
Toyota Motor Corp. | | | 3.2% | |
Mitsubishi UFJ Financial Group, Inc. | | | 3.1% | |
Nippon Telegraph & Telephone Corp. | | | 3.0% | |
Sumitomo Mitsui Financial Group, Inc. | | | 2.7% | |
Canon, Inc. | | | 2.7% | |
Mizuho Financial Group, Inc. | | | 2.5% | |
Takeda Pharmaceutical Co. Ltd. | | | 2.3% | |
Honda Motor Co., Ltd. | | | 1.6% | |
Mitsubishi Corp. | | | 1.5% | |
| * | The ten largest holdings are subject to change, and there are no guarantees the Fund will remain invested in any particular company. |
The WisdomTree Japan Hedged Equity Fund (the “Fund”) seeks to track the price and yield performance, before fees and expenses, of the WisdomTree Japan Hedged Equity Index. The Fund seeks to provide Japanese equity returns while mitigating or “hedging” against fluctuations between the value of the Japanese yen and the U.S. dollar.
The Fund returned 1.46% at net asset value (“NAV”) for the fiscal year ended March 31, 2012 (for more complete performance information please see the chart below). The Fund’s performance benefited most from its investment in the Consumer Discretionary sector. The Fund’s position in the Utilities sector created the greatest drag on performance.
The following performance chart is provided for comparative purposes and represents the period noted. The Fund’s per share NAV is the value of one share of the Fund and is calculated by dividing the value of total assets less total liabilities by the number of shares outstanding. The NAV return is based on the NAV of the Fund and the market price return is based on the market price per share of the Fund. The price used to calculate market price returns is the mid-point of the highest bid and lowest offer for Fund shares as of the close of trading on the exchange where Fund shares are listed. NAV and market price returns assume that dividends and capital gain distributions have been reinvested in the Fund at NAV and market price, respectively. As with other ETFs, NAV returns and market price returns may differ because of factors such as the supply and demand for Fund shares and investors’ assessments of the underlying value of a Fund’s portfolio securities.
An index is a statistical measure of a specified financial market or sector. An index does not actually hold a portfolio of securities, incur expenses or pay any transaction costs. Therefore, index returns do not reflect deductions for fees or expenses and the index is not available for direct investment. In comparison, the Fund’s performance is negatively impacted by these deductions. Fund returns do not reflect brokerage commissions or taxes on transactions in Fund shares or that a shareholder would pay on Fund distributions. As of the Fund’s current prospectus dated July 29, 2011, the Fund’s annual expense ratio was 0.48%.
Performance as of 3/31/12
| | | | | | | | | | | | | | | | |
| | | Average Annual Total Return | |
| | | Fund
Net Asset Value | | | Fund
Market Price | | | WisdomTree
Japan Dividend/
Japan Hedged Equity
Spliced Index1 | | | MSCI Japan/MSCI
Japan Local
Currency
Spliced Index2 | |
One Year | | | 1.46 | % | | | 2.70 | % | | | 1.63 | % | | | -0.45 | % |
Three Year | | | 6.28 | % | | | 5.64 | % | | | 6.55 | % | | | 7.09 | % |
Five Year | | | -7.01 | % | | | -6.86 | % | | | -7.08 | % | | | -7.68 | % |
Since Inception3 | | | -3.98 | % | | | -3.76 | % | | | -3.99 | % | | | -4.71 | % |
| 1 | WisdomTree Japan Dividend Index through March 31, 2010; WisdomTree Japan Hedged Equity Index thereafter. |
| 2 | MSCI Japan Index through March 31, 2010; MSCI Japan Local Currency Index thereafter. |
| 3 | Total returns are calculated based on the commencement of Fund trading on the NYSE Arca, Inc. on June 16, 2006. |
Performance is historical and does not guarantee future results. Current performance may be lower or higher than quoted. Investment returns and the principal value of an investment will fluctuate so that an investor’s shares, when redeemed, may be worth more or less than their original cost. Performance data for the most recent month-end is available at www.wisdomtree.com. WisdomTree shares are bought and sold at market price (not NAV) and are not individually redeemed from the Fund. The returns do not reflect the deduction of taxes that a shareholder would pay on Fund distributions or on the redemption of Fund shares.
| | |
| 8 | | WisdomTree International Dividend and Sector Funds |
Performance Summary (unaudited)
WisdomTree Global ex-U.S. Growth Fund (DNL)
Country Breakdown† as of 3/31/12
| | | | |
United Kingdom | | | 24.2% | |
Hong Kong | | | 7.4% | |
Russia | | | 6.6% | |
Taiwan | | | 6.6% | |
Brazil | | | 6.1% | |
Thailand | | | 4.4% | |
France | | | 3.9% | |
South Korea | | | 3.2% | |
Spain | | | 3.2% | |
Germany | | | 3.0% | |
China | | | 2.9% | |
Mexico | | | 2.5% | |
South Africa | | | 2.4% | |
Indonesia | | | 2.2% | |
Japan | | | 1.9% | |
Switzerland | | | 1.8% | |
Canada | | | 1.8% | |
Italy | | | 1.7% | |
Denmark | | | 1.3% | |
Turkey | | | 0.9% | |
Sweden | | | 0.9% | |
Malaysia | | | 0.8% | |
Chile | | | 0.8% | |
Australia | | | 0.8% | |
Philippines | | | 0.7% | |
United States | | | 0.7% | |
Singapore | | | 0.5% | |
Portugal | | | 0.5% | |
Finland | | | 0.4% | |
Netherlands | | | 0.2% | |
Norway | | | 0.2% | |
Austria | | | 0.2% | |
Belgium | | | 0.2% | |
Poland | | | 0.2% | |
Ireland | | | 0.1% | |
| † | The Fund’s country breakdown is expressed as a percentage of total investments and may change over time; does not include overnight investments in U.S. money market funds or investments of cash collateral for securities loaned. |
Top Ten Holdings* as of 3/31/12
| | | | |
| |
| Description | | % of Net Assets | |
Royal Dutch Shell PLC Class A | | | 6.0% | |
Royal Dutch Shell PLC Class B | | | 5.2% | |
Taiwan Semiconductor Manufacturing Co., Ltd. | | | 3.0% | |
Gazprom OAO ADR | | | 2.7% | |
CNOOC Ltd. | | | 2.4% | |
National Grid PLC | | | 2.1% | |
Vale S.A. | | | 2.0% | |
BHP Billiton PLC | | | 1.9% | |
Kumba Iron Ore Ltd. | | | 1.6% | |
LVMH Moet Hennessy Louis Vuitton S.A. | | | 1.6% | |
| * | The ten largest holdings are subject to change, and there are no guarantees the Fund will remain invested in any particular company. |
The WisdomTree Global ex-U.S. Growth Fund (the “Fund”) seeks to track the price and yield performance, before fees and expenses, of the WisdomTree Global ex-U.S. Growth Index.
The Fund returned -5.20% at net asset value (“NAV”) for the fiscal year ended March 31, 2012 (for more complete performance information please see the chart below). The Fund’s performance benefited most from its investments in the Consumer Discretionary sector. The Fund’s position in the Materials sector created the greatest drag on performance.
The following performance chart is provided for comparative purposes and represents the period noted. The Fund’s per share NAV is the value of one share of the Fund and is calculated by dividing the value of total assets less total liabilities by the number of shares outstanding. The NAV return is based on the NAV of the Fund and the market price return is based on the market price per share of the Fund. The price used to calculate market price returns is the mid-point of the highest bid and lowest offer for Fund shares as of the close of trading on the exchange where Fund shares are listed. NAV and market price returns assume that dividends and capital gain distributions have been reinvested in the Fund at NAV and market price, respectively. As with other ETFs, NAV returns and market price returns may differ because of factors such as the supply and demand for Fund shares and investors’ assessments of the underlying value of a Fund’s portfolio securities.
An index is a statistical measure of a specified financial market or sector. An index does not actually hold a portfolio of securities, incur expenses or pay any transaction costs. Therefore, index returns do not reflect deductions for fees or expenses and the index is not available for direct investment. In comparison, the Fund’s performance is negatively impacted by these deductions. Fund returns do not reflect brokerage commissions or taxes on transactions in Fund shares or that a shareholder would pay on Fund distributions. As of the Fund’s current prospectus dated July 29, 2011, the Fund’s annual expense ratio was 0.60%.
Performance as of 3/31/12
| | | | | | | | | | | | | | | | |
| | | Average Annual Total Return | |
| | | Fund Net Asset Value | | | Fund Market Price | | | WisdomTree
Japan Equity Income/
Global ex-U.S. Growth
Spliced Index1 | | | MSCI Japan Value/
MSCI AC World
ex-U.S.A. Growth
Spliced Index2 | |
One Year | | | -5.20 | % | | | -5.70 | % | | | -4.44 | % | | | -6.26 | % |
Three Year | | | 16.31 | % | | | 15.61 | % | | | 17.16 | % | | | 19.41 | % |
Five Year | | | -0.42 | % | | | -0.44 | % | | | 0.06 | % | | | 0.22 | % |
Since Inception3 | | | 2.71 | % | | | 2.83 | % | | | 3.22 | % | | | 3.32 | % |
| 1 | WisdomTree Japan Equity Income Index through June 19, 2009; WisdomTree Global ex-U.S. Growth Index thereafter. |
| 2 | MSCI Japan Value Index through June 19, 2009; MSCI AC World ex-U.S.A. Growth Index thereafter. |
| 3 | Total returns are calculated based on the commencement of Fund trading on the NYSE Arca, Inc. on June 16, 2006. |
Performance is historical and does not guarantee future results. Current performance may be lower or higher than quoted. Investment returns and the principal value of an investment will fluctuate so that an investor’s shares, when redeemed, may be worth more or less than their original cost. Performance data for the most recent month-end is available at www.wisdomtree.com. WisdomTree shares are bought and sold at market price (not NAV) and are not individually redeemed from the Fund. The returns do not reflect the deduction of taxes that a shareholder would pay on Fund distributions or on the redemption of Fund shares.
| | | | |
| WisdomTree International Dividend and Sector Funds | | | 9 | |
Performance Summary (unaudited)
WisdomTree Japan SmallCap Dividend Fund (DFJ)
Sector Breakdown† as of 3/31/12‡
| | | | |
Industrials | | | 21.6% | |
Consumer Discretionary | | | 18.8% | |
Financials | | | 12.0% | |
Consumer Staples | | | 10.9% | |
Information Technology | | | 10.6% | |
Materials | | | 9.6% | |
Health Care | | | 4.4% | |
Energy | | | 1.0% | |
Utilities | | | 0.6% | |
Other | | | 10.5% | |
| † | The Fund’s sector breakdown is expressed as a percentage of total investments and may change over time. |
| ‡ | A sector may be comprised of several industries. |
Top Ten Holdings* as of 3/31/12
| | | | |
| |
| Description | | % of Net Assets | |
Park24 Co., Ltd. | | | 0.8% | |
Circle K Sunkus Co., Ltd. | | | 0.6% | |
Alfresa Holdings Corp. | | | 0.6% | |
Yokohama Rubber Co., Ltd. (The) | | | 0.6% | |
Otsuka Corp. | | | 0.6% | |
Century Tokyo Leasing Corp. | | | 0.6% | |
Square Enix Holdings Co., Ltd. | | | 0.6% | |
Hikari Tsushin, Inc. | | | 0.6% | |
Chiyoda Co., Ltd. | | | 0.6% | |
Hitachi Capital Corp. | | | 0.6% | |
| * | The ten largest holdings are subject to change, and there are no guarantees the Fund will remain invested in any particular company. |
The WisdomTree Japan SmallCap Dividend Fund (the “Fund”) seeks to track the price and yield performance, before fees and expenses, of the WisdomTree Japan SmallCap Dividend Index.
The Fund returned 7.36% at net asset value (“NAV”) for the fiscal year ended March 31, 2012 (for more complete performance information please see the chart below). The Fund’s performance benefited most from its investments in the Consumer Discretionary sector. The Fund’s position in the Materials sector created the greatest drag on performance.
The following performance chart is provided for comparative purposes and represents the period noted. The Fund’s per share NAV is the value of one share of the Fund and is calculated by dividing the value of total assets less total liabilities by the number of shares outstanding. The NAV return is based on the NAV of the Fund and the market price return is based on the market price per share of the Fund. The price used to calculate market price returns is the mid-point of the highest bid and lowest offer for Fund shares as of the close of trading on the exchange where Fund shares are listed. NAV and market price returns assume that dividends and capital gain distributions have been reinvested in the Fund at NAV and market price, respectively. As with other ETFs, NAV returns and market price returns may differ because of factors such as the supply and demand for Fund shares and investors’ assessments of the underlying value of a Fund’s portfolio securities.
An index is a statistical measure of a specified financial market or sector. An index does not actually hold a portfolio of securities, incur expenses or pay any transaction costs. Therefore, index returns do not reflect deductions for fees or expenses and the index is not available for direct investment. In comparison, the Fund’s performance is negatively impacted by these deductions. Fund returns do not reflect brokerage commissions or taxes on transactions in Fund shares or that a shareholder would pay on Fund distributions. As of the Fund’s current prospectus dated July 29, 2011, the Fund’s annual expense ratio was 0.58%.
Performance as of 3/31/12
| | | | | | | | | | | | | | | | |
| | | Average Annual Total Return | |
| | | Fund Net Asset Value | | | Fund Market Price | | | WisdomTree Japan
SmallCap Dividend
Index | | | MSCI Japan
Small Cap Index | |
One Year | | | 7.36 | % | | | 8.10 | % | | | 8.41 | % | | | 5.15 | % |
Three Year | | | 15.21 | % | | | 14.79 | % | | | 16.73 | % | | | 15.39 | % |
Five Year | | | -1.13 | % | | | -1.09 | % | | | -0.41 | % | | | -2.26 | % |
Since Inception1 | | | -0.42 | % | | | -0.12 | % | | | 0.31 | % | | | -1.69 | % |
| 1 | Total returns are calculated based on the commencement of Fund trading on the NYSE Arca, Inc. on June 16, 2006. |
Performance is historical and does not guarantee future results. Current performance may be lower or higher than quoted. Investment returns and the principal value of an investment will fluctuate so that an investor’s shares, when redeemed, may be worth more or less than their original cost. Performance data for the most recent month-end is available at www.wisdomtree.com. WisdomTree shares are bought and sold at market price (not NAV) and are not individually redeemed from the Fund. The returns do not reflect the deduction of taxes that a shareholder would pay on Fund distributions or on the redemption of Fund shares.
| | |
| 10 | | WisdomTree International Dividend and Sector Funds |
Performance Summary (unaudited)
WisdomTree Asia Pacific ex-Japan Fund (AXJL)
Country Breakdown† as of 3/31/12
| | | | |
Australia | | | 24.0% | |
Hong Kong | | | 19.1% | |
Taiwan | | | 11.7% | |
China | | | 10.6% | |
South Korea | | | 7.2% | |
Singapore | | | 6.4% | |
Malaysia | | | 6.3% | |
Thailand | | | 4.6% | |
Indonesia | | | 3.9% | |
United States | | | 2.4% | |
Philippines | | | 1.3% | |
New Zealand | | | 0.1% | |
| † | The Fund’s country breakdown is expressed as a percentage of total investments and may change over time; does not include overnight investments in U.S. money market funds or investments of cash collateral for securities loaned. |
Top Ten Holdings* as of 3/31/12
| | | | |
| |
| Description | | % of Net Assets | |
China Mobile Ltd. | | | 7.9% | |
China Construction Bank Corp. Class H | | | 4.5% | |
Commonwealth Bank of Australia | | | 3.3% | |
Westpac Banking Corp. | | | 3.2% | |
Australia & New Zealand Banking Group Ltd. | | | 2.7% | |
Telstra Corp., Ltd. | | | 2.6% | |
WisdomTree India Earnings Fund | | | 2.5% | �� |
Taiwan Semiconductor Manufacturing Co., Ltd. | | | 2.4% | |
National Australia Bank Ltd. | | | 2.3% | |
CNOOC Ltd. | | | 1.9% | |
| * | The ten largest holdings are subject to change, and there are no guarantees the Fund will remain invested in any particular company. |
The WisdomTree Asia Pacific ex-Japan Fund (the “Fund”) seeks to track the price and yield performance, before fees and expenses, of the WisdomTree Asia Pacific ex-Japan Index.
The Fund returned -2.22% at net asset value (“NAV”) for the fiscal year ended March 31, 2012 (for more complete performance information please see the chart below). The Fund’s performance benefited most from its investment in Thailand. The Fund’s investment in China created the greatest drag on performance.
The following performance chart is provided for comparative purposes and represents the period noted. The Fund’s per share NAV is the value of one share of the Fund and is calculated by dividing the value of total assets less total liabilities by the number of shares outstanding. The NAV return is based on the NAV of the Fund and the market price return is based on the market price per share of the Fund. The price used to calculate market price returns is the mid-point of the highest bid and lowest offer for Fund shares as of the close of trading on the exchange where Fund shares are listed. NAV and market price returns assume that dividends and capital gain distributions have been reinvested in the Fund at NAV and market price, respectively. As with other ETFs, NAV returns and market price returns may differ because of factors such as the supply and demand for Fund shares and investors’ assessments of the underlying value of a Fund’s portfolio securities.
An index is a statistical measure of a specified financial market or sector. An index does not actually hold a portfolio of securities, incur expenses or pay any transaction costs. Therefore, index returns do not reflect deductions for fees or expenses and the index is not available for direct investment. In comparison, the Fund’s performance is negatively impacted by these deductions. Fund returns do not reflect brokerage commissions or taxes on transactions in Fund shares or that a shareholder would pay on Fund distributions. As of the Fund’s current prospectus dated July 29, 2011, the Fund’s annual expense ratio was 0.48%.
Performance as of 3/31/12
| | | | | | | | | | | | | | | | |
| | | Average Annual Total Return | |
| | | Fund
Net Asset Value | | | Fund
Market Price | | | WisdomTree
Pacific ex-Japan
Dividend/Asia
Pacific ex-Japan
Spliced Index1 | | | MSCI Pacific
ex-Japan/MSCI AC
Asia Pacific ex-Japan
Spliced Index2 | |
One Year | | | -2.22 | % | | | -1.93 | % | | | -1.42 | % | | | -7.03 | % |
Three Year | | | 24.46 | % | | | 24.43 | % | | | 26.07 | % | | | 25.44 | % |
Five Year | | | 4.06 | % | | | 4.02 | % | | | 5.32 | % | | | 3.07 | % |
Since Inception3 | | | 9.25 | % | | | 9.37 | % | | | 10.50 | % | | | 7.99 | % |
| 1 | WisdomTree Pacific ex-Japan Dividend Index through June 17, 2011; WisdomTree Asia Pacific ex-Japan Index thereafter. |
| 2 | MSCI Pacific ex-Japan Index through June 17, 2011; MSCI AC Asia Pacific ex-Japan Index thereafter. |
| 3 | Total returns are calculated based on the commencement of Fund trading on the NYSE Arca, Inc. on June 16, 2006. |
Performance is historical and does not guarantee future results. Current performance may be lower or higher than quoted. Investment returns and the principal value of an investment will fluctuate so that an investor’s shares, when redeemed, may be worth more or less than their original cost. Performance data for the most recent month-end is available at www.wisdomtree.com. WisdomTree shares are bought and sold at market price (not NAV) and are not individually redeemed from the Fund. The returns do not reflect the deduction of taxes that a shareholder would pay on Fund distributions or on the redemption of Fund shares.
| | | | |
| WisdomTree International Dividend and Sector Funds | | | 11 | |
Performance Summary (unaudited)
WisdomTree Australia Dividend Fund (AUSE)
Sector Breakdown† as of 3/31/12
| | | | |
Financials | | | 18.5% | |
Consumer Discretionary | | | 14.7% | |
Industrials | | | 11.4% | |
Consumer Staples | | | 10.5% | |
Materials | | | 7.9% | |
Energy | | | 7.2% | |
Health Care | | | 7.0% | |
Telecommunication Services | | | 4.9% | |
Information Technology | | | 3.9% | |
Utilities | | | 1.6% | |
Other | | | 12.4% | |
| † | The Fund’s sector breakdown is expressed as a percentage of total investments and may change over time. |
| ‡ | A sector may be comprised of several industries. |
Top Ten Holdings* as of 3/31/12
| | | | |
| |
| Description | | % of Net Assets | |
Telstra Corp., Ltd. | | | 4.4% | |
Metcash Ltd. | | | 3.2% | |
Westpac Banking Corp. | | | 3.0% | |
Australia & New Zealand Banking Group Ltd. | | | 3.0% | |
Myer Holdings Ltd. | | | 2.9% | |
Commonwealth Bank of Australia | | | 2.6% | |
National Australia Bank Ltd. | | | 2.5% | |
QBE Insurance Group Ltd. | | | 2.5% | |
Toll Holdings Ltd. | | | 2.4% | |
Leighton Holdings Ltd. | | | 2.4% | |
| * | The ten largest holdings are subject to change, and there are no guarantees the Fund will remain invested in any particular company. |
The WisdomTree Australia Dividend Fund (the “Fund”) seeks to track the price and yield performance, before fees and expenses, of the WisdomTree Australia Dividend Index.
The Fund returned -3.86% at net asset value (“NAV”) for the fiscal year ended March 31, 2012 (for more complete performance information please see the chart below). The Fund’s performance benefited most from its investment in Telecommunications Services. The Fund’s investments in Consumer Discretionary created the greatest drag on performance.
The following performance chart is provided for comparative purposes and represents the period noted. The Fund’s per share NAV is the value of one share of the Fund and is calculated by dividing the value of total assets less total liabilities by the number of shares outstanding. The NAV return is based on the NAV of the Fund and the market price return is based on the market price per share of the Fund. The price used to calculate market price returns is the mid-point of the highest bid and lowest offer for Fund shares as of the close of trading on the exchange where Fund shares are listed. NAV and market price returns assume that dividends and capital gain distributions have been reinvested in the Fund at NAV and market price, respectively. As with other ETFS, NAV returns and market price returns may differ because of factors such as the supply and demand for Fund shares and investors’ assessments of the underlying value of a Fund’s portfolio securities.
An index is a statistical measure of a specified financial market or sector. An index does not actually hold a portfolio of securities, incur expenses or pay any transaction costs. Therefore, index returns do not reflect deductions for fees or expenses and the index is not available for direct investment. In comparison, the Fund’s performance is negatively impacted by these deductions. Fund returns do not reflect brokerage commissions or taxes on transactions in Fund shares or that a shareholder would pay on Fund distributions. As of the Fund’s current prospectus dated July 29, 2011, the Fund’s annual expense ratio was 0.58%.
Performance as of 3/31/12
| | | | | | | | | | | | | | | | |
| | | Average Annual Total Return | |
| | | Fund
Net Asset Value | | | Fund
Market Price | | | WisdomTree
Pacific ex-Japan
Equity Income/
Australia Dividend
Spliced Index1 | | | MSCI Pacific
ex-Japan
Value/MSCI
Australia Spliced
Index2 | |
One Year | | | -3.86 | % | | | -3.56 | % | | | -3.65 | % | | | -5.32 | % |
Three Year | | | 28.55 | % | | | 28.60 | % | | | 29.26 | % | | | 27.18 | % |
Five Year | | | 3.23 | % | | | 3.17 | % | | | 3.77 | % | | | 2.31 | % |
Since Inception3 | | | 8.67 | % | | | 8.72 | % | | | 9.29 | % | | | 7.20 | % |
| 1 | WisdomTree Pacific ex-Japan Equity Income Index through June 17, 2011; WisdomTree Australia Dividend Index thereafter. |
| 2 | MSCI Pacific ex-Japan Value Index through June 17, 2011; MSCI Australia Index thereafter. |
| 3 | Total returns are calculated based on the commencement of Fund trading on the NYSE Arca, Inc. on June 16, 2006. |
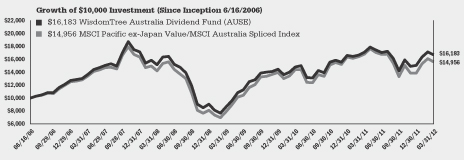
Performance is historical and does not guarantee future results. Current performance may be lower or higher than quoted. Investment returns and the principal value of an investment will fluctuate so that an investor’s shares, when redeemed, may be worth more or less than their original cost. Performance data for the most recent month-end is available at www.wisdomtree.com. WisdomTree shares are bought and sold at market price (not NAV) and are not individually redeemed from the Fund. The returns do not reflect the deduction of taxes that a shareholder would pay on Fund distributions or on the redemption of Fund shares.
| | |
| 12 | | WisdomTree International Dividend and Sector Funds |
Performance Summary (unaudited)
WisdomTree International LargeCap Dividend Fund (DOL)
Country Breakdown† as of 3/31/12
| | | | |
United Kingdom | | | 19.6% | |
Australia | | | 11.3% | |
France | | | 11.2% | |
Japan | | | 9.6% | |
Germany | | | 8.3% | |
Switzerland | | | 8.1% | |
Spain | | | 5.5% | |
Hong Kong | | | 5.2% | |
Italy | | | 3.4% | |
Sweden | | | 2.7% | |
Norway | | | 1.8% | |
Netherlands | | | 1.6% | |
Singapore | | | 1.5% | |
Finland | | | 1.0% | |
Belgium | | | 0.9% | |
Denmark | | | 0.3% | |
Portugal | | | 0.2% | |
Ireland | | | 0.2% | |
Austria | | | 0.2% | |
United States | | | 0.0% | # |
| † | The Fund’s country breakdown is expressed as a percentage of total investments and may change over time; does not include overnight investments in U.S. money market funds or investments of cash collateral for securities loaned. |
| # | Amount represents less than 0.05%. |
Top Ten Holdings* as of 3/31/12
| | | | |
| |
| Description | | % of Net Assets | |
China Mobile Ltd. | | | 2.6% | |
Vodafone Group PLC | | | 2.3% | |
Nestle S.A. | | | 2.1% | |
Total S.A. | | | 1.9% | |
Royal Dutch Shell PLC Class A | | | 1.8% | |
Commonwealth Bank of Australia | | | 1.8% | |
GlaxoSmithKline PLC | | | 1.8% | |
Westpac Banking Corp. | | | 1.8% | |
Telefonica S.A. | | | 1.7% | |
HSBC Holdings PLC | | | 1.7% | |
| * | The ten largest holdings are subject to change, and there are no guarantees the Fund will remain invested in any particular company. |
The WisdomTree International LargeCap Dividend Fund (the “Fund”) seeks to track the price and yield performance, before fees and expenses, of the WisdomTree International LargeCap Dividend Index.
The Fund returned -6.02% at net asset value (“NAV”) for the fiscal year ended March 31, 2012 (for more complete performance information please see the chart below). The Fund’s performance benefited most from its investment in the United Kingdom. The Fund’s position in France created the greatest drag on performance.
The following performance chart is provided for comparative purposes and represents the period noted. The Fund’s per share NAV is the value of one share of the Fund and is calculated by dividing the value of total assets less total liabilities by the number of shares outstanding. The NAV return is based on the NAV of the Fund and the market price return is based on the market price per share of the Fund. The price used to calculate market price returns is the mid-point of the highest bid and lowest offer for Fund shares as of the close of trading on the exchange where Fund shares are listed. NAV and market price returns assume that dividends and capital gain distributions have been reinvested in the Fund at NAV and market price, respectively. As with other ETFs, NAV returns and market price returns may differ because of factors such as the supply and demand for Fund shares and investors’ assessments of the underlying value of a Fund’s portfolio securities.
An index is a statistical measure of a specified financial market or sector. An index does not actually hold a portfolio of securities, incur expenses or pay any transaction costs. Therefore, index returns do not reflect deductions for fees or expenses and the index is not available for direct investment. In comparison, the Fund’s performance is negatively impacted by these deductions. Fund returns do not reflect brokerage commissions or taxes on transactions in Fund shares or that a shareholder would pay on Fund distributions. As of the Fund’s current prospectus dated July 29, 2011, the Fund’s annual expense ratio was 0.48%.
Performance as of 3/31/12
| | | | | | | | | | | | | | | | |
| | | Average Annual Total Return | |
| | | Fund
Net Asset Value | | | Fund
Market Price | | | WisdomTree
International
LargeCap
Dividend Index | | | MSCI
EAFE Index | |
One Year | | | -6.02 | % | | | -5.51 | % | | | -6.08 | % | | | -5.77 | % |
Three Year | | | 15.36 | % | | | 15.28 | % | | | 15.62 | % | | | 17.13 | % |
Five Year | | | -3.35 | % | | | -3.38 | % | | | -3.29 | % | | | -3.51 | % |
Since Inception1 | | | 1.07 | % | | | 1.02 | % | | | 1.39 | % | | | 0.83 | % |
| 1 | Total returns are calculated based on the commencement of Fund trading on the NYSE Arca, Inc. on June 16, 2006. |
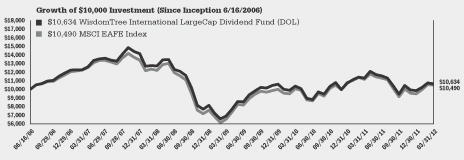
Performance is historical and does not guarantee future results. Current performance may be lower or higher than quoted. Investment returns and the principal value of an investment will fluctuate so that an investor’s shares, when redeemed, may be worth more or less than their original cost. Performance data for the most recent month-end is available at www.wisdomtree.com. WisdomTree shares are bought and sold at market price (not NAV) and are not individually redeemed from the Fund. The returns do not reflect the deduction of taxes that a shareholder would pay on Fund distributions or on the redemption of Fund shares.
| | | | |
| WisdomTree International Dividend and Sector Funds | | | 13 | |
Performance Summary (unaudited)
WisdomTree International Dividend ex-Financials Fund (DOO)
Country Breakdown† as of 3/31/12
| | | | |
United Kingdom | | | 19.9% | |
Australia | | | 15.1% | |
France | | | 10.7% | |
Japan | | | 9.1% | |
Germany | | | 7.6% | |
Spain | | | 5.2% | |
Italy | | | 4.6% | |
Switzerland | | | 3.1% | |
Netherlands | | | 3.1% | |
Finland | | | 2.6% | |
Belgium | | | 2.5% | |
Portugal | | | 2.4% | |
Sweden | | | 2.4% | |
Norway | | | 2.2% | |
Singapore | | | 1.6% | |
Hong Kong | | | 1.1% | |
Ireland | | | 1.0% | |
Austria | | | 0.7% | |
United States | | | 0.0% | # |
| † | The Fund’s country breakdown is expressed as a percentage of total investments and may change over time; does not include overnight investments in U.S. money market funds or investments of cash collateral for securities loaned. |
| # | Amount represents less than 0.05%. |
Top Ten Holdings* as of 3/31/12
| | | | |
| |
| Description | | % of Net Assets | |
Telstra Corp., Ltd. | | | 3.5% | |
Belgacom S.A. | | | 2.1% | |
Nokia Oyj | | | 1.9% | |
RWE AG | | | 1.9% | |
Amcor Ltd. | | | 1.7% | |
SembCorp Marine Ltd. | | | 1.7% | |
E.ON AG | | | 1.7% | |
France Telecom S.A. | | | 1.6% | |
Coca-Cola Amatil Ltd. | | | 1.6% | |
ENI SpA | | | 1.5% | |
| * | The ten largest holdings are subject to change, and there are no guarantees the Fund will remain invested in any particular company. |
The WisdomTree International Dividend ex-Financials Fund (the “Fund”) seeks to track the price and yield performance, before fees and expenses, of the WisdomTree International Dividend ex-Financials Index.
The Fund returned -7.24% at net asset value (“NAV”) for the fiscal year ended March 31, 2012 (for more complete performance information please see the chart below). The Fund’s performance benefited most from its investment in the United Kingdom. The Fund’s position in France created the greatest drag on performance.
The following performance chart is provided for comparative purposes and represents the period noted. The Fund’s per share NAV is the value of one share of the Fund and is calculated by dividing the value of total assets less total liabilities by the number of shares outstanding. The NAV return is based on the NAV of the Fund and the market price return is based on the market price per share of the Fund. The price used to calculate market price returns is the mid-point of the highest bid and lowest offer for Fund shares as of the close of trading on the exchange where Fund shares are listed. NAV and market price returns assume that dividends and capital gain distributions have been reinvested in the Fund at NAV and market price, respectively. As with other ETFs, NAV returns and market price returns may differ because of factors such as the supply and demand for Fund shares and investors’ assessments of the underlying value of a Fund’s portfolio securities.
An index is a statistical measure of a specified financial market or sector. An index does not actually hold a portfolio of securities, incur expenses or pay any transaction costs. Therefore, index returns do not reflect deductions for fees or expenses and the index is not available for direct investment. In comparison, the Fund’s performance is negatively impacted by these deductions. Fund returns do not reflect brokerage commissions or taxes on transactions in Fund shares or that a shareholder would pay on Fund distributions. As of the Fund’s current prospectus dated July 29, 2011, the Fund’s annual expense ratio was 0.58%.
Performance as of 3/31/12
| | | | | | | | | | | | | | | | |
| | | Average Annual Total Return | |
| | | Fund
Net Asset Value | | | Fund
Market Price | | | WisdomTree
International Dividend
Top 100/International
Dividend ex-Financials
Spliced Index1 | | | MSCI EAFE
Value Index | |
One Year | | | -7.24 | % | | | -7.15 | % | | | -7.29 | % | | | -7.83 | % |
Three Year | | | 18.55 | % | | | 18.81 | % | | | 18.44 | % | | | 16.50 | % |
Five Year | | | -3.77 | % | | | -3.86 | % | | | -3.76 | % | | | -5.18 | % |
Since Inception2 | | | 1.73 | % | | | 1.64 | % | | | 1.89 | % | | | -0.47 | % |
| 1 | WisdomTree International Dividend Top 100 Index through May 7, 2009; WisdomTree International Dividend ex-Financials Index thereafter. |
| 2 | Total returns are calculated based on the commencement of Fund trading on the NYSE Arca, Inc. on June 16, 2006. |
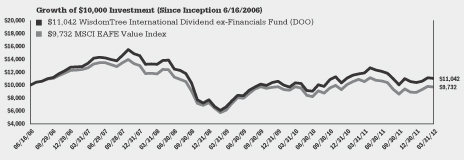
Performance is historical and does not guarantee future results. Current performance may be lower or higher than quoted. Investment returns and the principal value of an investment will fluctuate so that an investor’s shares, when redeemed, may be worth more or less than their original cost. Performance data for the most recent month-end is available at www.wisdomtree.com. WisdomTree shares are bought and sold at market price (not NAV) and are not individually redeemed from the Fund. The returns do not reflect the deduction of taxes that a shareholder would pay on Fund distributions or on the redemption of Fund shares.
| | |
| 14 | | WisdomTree International Dividend and Sector Funds |
Performance Summary (unaudited)
WisdomTree International MidCap Dividend Fund (DIM)
Country Breakdown† as of 3/31/12
| | | | |
Japan | | | 21.7% | |
United Kingdom | | | 13.9% | |
Australia | | | 10.5% | |
France | | | 5.7% | |
Sweden | | | 5.4% | |
Hong Kong | | | 3.8% | |
Singapore | | | 3.7% | |
Spain | | | 3.5% | |
Italy | | | 3.3% | |
Germany | | | 2.8% | |
Finland | | | 2.4% | |
Switzerland | | | 2.4% | |
Netherlands | | | 2.2% | |
Norway | | | 2.0% | |
Belgium | | | 1.6% | |
Portugal | | | 1.2% | |
Austria | | | 1.2% | |
New Zealand | | | 0.7% | |
Denmark | | | 0.5% | |
Ireland | | | 0.5% | |
United States | | | 0.1% | |
| † | The Fund’s country breakdown is expressed as a percentage of total investments and may change over time; does not include overnight investments in U.S. money market funds or investments of cash collateral for securities loaned. |
Top Ten Holdings* as of 3/31/12
| | | | |
| |
| Description | | % of Net Assets | |
Suncorp Group Ltd. | | | 0.8% | |
Leighton Holdings Ltd. | | | 0.7% | |
Legal & General Group PLC | | | 0.7% | |
Amcor Ltd. | | | 0.7% | |
Coca-Cola Amatil Ltd. | | | 0.7% | |
Standard Life PLC | | | 0.6% | |
Orica Ltd. | | | 0.6% | |
Eisai Co., Ltd. | | | 0.6% | |
SembCorp Marine Ltd. | | | 0.6% | |
Terna Rete Elettrica Nazionale SpA | | | 0.6% | |
| * | The ten largest holdings are subject to change, and there are no guarantees the Fund will remain invested in any particular company. |
The WisdomTree International MidCap Dividend Fund (the “Fund”) seeks to track the price and yield performance, before fees and expenses, of the WisdomTree International MidCap Dividend Index.
The Fund returned -7.21% at net asset value (“NAV”) for the fiscal year ended March 31, 2012 (for more complete performance information please see the chart below). The Fund’s performance benefited most from investment in the United Kingdom. The Fund’s position in Italy created the greatest drag on performance.
The following performance chart is provided for comparative purposes and represents the period noted. The Fund’s per share NAV is the value of one share of the Fund and is calculated by dividing the value of total assets less total liabilities by the number of shares outstanding. The NAV return is based on the NAV of the Fund and the market price return is based on the market price per share of the Fund. The price used to calculate market price returns is the mid-point of the highest bid and lowest offer for Fund shares as of the close of trading on the exchange where Fund shares are listed. NAV and market price returns assume that dividends and capital gain distributions have been reinvested in the Fund at NAV and market price, respectively. As with other ETFs, NAV returns and market price returns may differ because of factors such as the supply and demand for Fund shares and investors’ assessments of the underlying value of a Fund’s portfolio securities.
An index is a statistical measure of a specified financial market or sector. An index does not actually hold a portfolio of securities, incur expenses or pay any transaction costs. Therefore, index returns do not reflect deductions for fees or expenses and the index is not available for direct investment. In comparison, the Fund’s performance is negatively impacted by these deductions. Fund returns do not reflect brokerage commissions or taxes on transactions in Fund shares or that a shareholder would pay on Fund distributions. As of the Fund’s current prospectus dated July 29, 2011, the Fund’s annual expense ratio was 0.58%.
Performance as of 3/31/12
| | | | | | | | | | | | | | | | |
| | | Average Annual Total Return | |
| | | Fund
Net Asset Value | | | Fund
Market Price | | | WisdomTree
International MidCap
Dividend Index | | | MSCI EAFE
Mid Cap Index | |
One Year | | | -7.21 | % | | | -6.94 | % | | | -7.99 | % | | | -6.65 | % |
Three Year | | | 19.20 | % | | | 19.09 | % | | | 19.50 | % | | | 19.21 | % |
Five Year | | | -2.85 | % | | | -2.96 | % | | | -3.04 | % | | | -4.19 | % |
Since Inception1 | | | 2.80 | % | | | 2.69 | % | | | 2.79 | % | | | 0.92 | % |
| 1 | Total returns are calculated based on the commencement of Fund trading on the NYSE Arca, Inc. on June 16, 2006. |
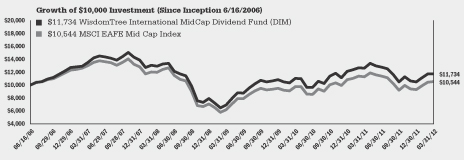
Performance is historical and does not guarantee future results. Current performance may be lower or higher than quoted. Investment returns and the principal value of an investment will fluctuate so that an investor’s shares, when redeemed, may be worth more or less than their original cost. Performance data for the most recent month-end is available at www.wisdomtree.com. WisdomTree shares are bought and sold at market price (not NAV) and are not individually redeemed from the Fund. The returns do not reflect the deduction of taxes that a shareholder would pay on Fund distributions or on the redemption of Fund shares.
| | | | |
| WisdomTree International Dividend and Sector Funds | | | 15 | |
Performance Summary (unaudited)
WisdomTree International SmallCap Dividend Fund (DLS)
Country Breakdown† as of 3/31/12
| | | | |
Japan | | | 33.1% | |
Australia | | | 14.3% | |
United Kingdom | | | 11.9% | |
Sweden | | | 4.2% | |
Italy | | | 3.7% | |
Singapore | | | 3.2% | |
Germany | | | 2.6% | |
New Zealand | | | 2.4% | |
Norway | | | 1.9% | |
Finland | | | 1.7% | |
Hong Kong | | | 1.6% | |
France | | | 1.5% | |
Netherlands | | | 1.4% | |
Spain | | | 1.2% | |
Austria | | | 1.0% | |
Belgium | | | 0.8% | |
Portugal | | | 0.7% | |
Ireland | | | 0.7% | |
Denmark | | | 0.4% | |
Switzerland | | | 0.3% | |
United States | | | 0.0% | # |
| † | The Fund’s country breakdown is expressed as a percentage of total investments and may change over time; does not include overnight investments in U.S. money market funds or investments of cash collateral for securities loaned. |
| # | Amount represents less than 0.05%. |
Top Ten Holdings* as of 3/31/12
| | | | |
| |
| Description | | % of Net Assets | |
Provident Financial PLC | | | 0.7% | |
Monadelphous Group Ltd. | | | 0.6% | |
Cable & Wireless Communications PLC | | | 0.6% | |
Vector Ltd. | | | 0.6% | |
Rallye S.A. | | | 0.6% | |
Envestra Ltd. | | | 0.6% | |
Consolidated Media Holdings Ltd. | | | 0.5% | |
Myer Holdings Ltd. | | | 0.5% | |
Aker ASA Class A | | | 0.5% | |
Oesterreichische Post AG | | | 0.5% | |
| * | The ten largest holdings are subject to change, and there are no guarantees the Fund will remain invested in any particular company. |
The WisdomTree International SmallCap Dividend Fund (the “Fund”) seeks to track the price and yield performance, before fees and expenses, of the WisdomTree International SmallCap Dividend Index.
The Fund returned -3.41% at net asset value (“NAV”) for the fiscal year ended March 31, 2012 (for more complete performance information please see the chart below). The Fund’s performance benefited most from its investment in Japan. The Fund’s position in Australia created the greatest drag on performance.
The following performance chart is provided for comparative purposes and represents the period noted. The Fund’s per share NAV is the value of one share of the Fund and is calculated by dividing the value of total assets less total liabilities by the number of shares outstanding. The NAV return is based on the NAV of the Fund and the market price return is based on the market price per share of the Fund. The price used to calculate market price returns is the mid-point of the highest bid and lowest offer for Fund shares as of the close of trading on the exchange where Fund shares are listed. NAV and market price returns assume that dividends and capital gain distributions have been reinvested in the Fund at NAV and market price, respectively. As with other ETFs, NAV returns and market price returns may differ because of factors such as the supply and demand for Fund shares and investors’ assessments of the underlying value of a Fund’s portfolio securities.
An index is a statistical measure of a specified financial market or sector. An index does not actually hold a portfolio of securities, incur expenses or pay any transaction costs. Therefore, index returns do not reflect deductions for fees or expenses and the index is not available for direct investment. In comparison, the Fund’s performance is negatively impacted by these deductions. Fund returns do not reflect brokerage commissions or taxes on transactions in Fund shares or that a shareholder would pay on Fund distributions. As of the Fund’s current prospectus dated July 29, 2011, the Fund’s annual expense ratio was 0.58%.
Performance as of 3/31/12
| | | | | | | | | | | | | | | | |
| | | Average Annual Total Return | |
| | | Fund
Net Asset Value | | | Fund
Market Price | | | WisdomTree
International SmallCap
Dividend Index | | | MSCI EAFE
Small Cap Index | |
One Year | | | -3.41 | % | | | -2.69 | % | | | -3.60 | % | | | -6.23 | % |
Three Year | | | 23.33 | % | | | 23.25 | % | | | 24.23 | % | | | 24.12 | % |
Five Year | | | -2.56 | % | | | -2.62 | % | | | -2.07 | % | | | -2.55 | % |
Since Inception1 | | | 3.01 | % | | | 3.00 | % | | | 3.38 | % | | | 2.05 | % |
| 1 | Total returns are calculated based on the commencement of Fund trading on the NYSE Arca, Inc. on June 16, 2006. |
Performance is historical and does not guarantee future results. Current performance may be lower or higher than quoted. Investment returns and the principal value of an investment will fluctuate so that an investor’s shares, when redeemed, may be worth more or less than their original cost. Performance data for the most recent month-end is available at www.wisdomtree.com. WisdomTree shares are bought and sold at market price (not NAV) and are not individually redeemed from the Fund. The returns do not reflect the deduction of taxes that a shareholder would pay on Fund distributions or on the redemption of Fund shares.
| | |
| 16 | | WisdomTree International Dividend and Sector Funds |
Performance Summary (unaudited)
WisdomTree Emerging Markets Equity Income Fund (DEM)
Country Breakdown† as of 3/31/12
| | | | |
Taiwan | | | 20.9% | |
Brazil | | | 20.6% | |
South Africa | | | 9.2% | |
Malaysia | | | 9.0% | |
Chile | | | 5.1% | |
Thailand | | | 4.2% | |
Turkey | | | 3.8% | |
South Korea | | | 3.7% | |
Israel | | | 3.3% | |
Czech Republic | | | 3.2% | |
China | | | 2.8% | |
Poland | | | 2.3% | |
Philippines | | | 2.3% | |
Mexico | | | 2.0% | |
Indonesia | | | 1.8% | |
Argentina | | | 1.5% | |
Russia | | | 1.4% | |
Hungary | | | 0.3% | |
United States | | | 0.1% | |
| † | The Fund’s country breakdown is expressed as a percentage of total investments and may change over time; does not include overnight investments in U.S. money market funds or investments of cash collateral for securities loaned. |
Top Ten Holdings* as of 3/31/12
| | | | |
| |
| Description | | % of Net Assets | |
Taiwan Semiconductor Manufacturing Co., Ltd. | | | 4.1% | |
Cia de Bebidas das Americas | | | 3.4% | |
Banco do Brasil S.A. | | | 2.6% | |
Banco Santander Brasil S.A. | | | 2.4% | |
Malayan Banking Bhd | | | 2.3% | |
Kumba Iron Ore Ltd. | | | 2.3% | |
Bank of China Ltd. Class H | | | 2.0% | |
Cielo S.A. | | | 1.9% | |
Advanced Info Service PCL | | | 1.9% | |
Turk Telekomunikasyon A.S. | | | 1.8% | |
| * | The ten largest holdings are subject to change, and there are no guarantees the Fund will remain invested in any particular company. |
The WisdomTree Emerging Markets Equity Income Fund (the “Fund”) seeks to track the price and yield performance, before fees and expenses, of the WisdomTree Emerging Markets Equity Income Index.
The Fund returned -1.03% for the fiscal year ended March 31, 2012 (for more complete performance information please see the chart below). The Fund’s performance benefited most from its investment in Brazil. The Fund’s investment in Israel created the greatest drag on performance.
The following performance chart is provided for comparative purposes and represents the period noted. The Fund’s per share NAV is the value of one share of the Fund and is calculated by dividing the value of total assets less total liabilities by the number of shares outstanding. The NAV return is based on the NAV of the Fund and the market price return is based on the market price per share of the Fund. The price used to calculate market price returns is the mid-point of the highest bid and lowest offer for Fund shares as of the close of trading on the exchange where Fund shares are listed. NAV and market price returns assume that dividends and capital gain distributions have been reinvested in the Fund at NAV and market price, respectively. As with other ETFs, NAV returns and market price returns may differ because of factors such as the supply and demand for Fund shares and investors’ assessments of the underlying value of a Fund’s portfolio securities.
An index is a statistical measure of a specified financial market or sector. An index does not actually hold a portfolio of securities, incur expenses or pay any transaction costs. Therefore, index returns do not reflect deductions for fees or expenses and the index is not available for direct investment. In comparison, the Fund’s performance is negatively impacted by these deductions. Fund returns do not reflect brokerage commissions or taxes on transactions in Fund shares or that a shareholder would pay on Fund distributions. As of the Fund’s current prospectus dated July 29, 2011, the Fund’s annual expense ratio was 0.63%.
Performance as of 3/31/12
| | | | | | | | | | | | | | | | |
| | | Average Annual Total Return | |
| | | Fund
Net Asset Value | | | Fund
Market Price | | | WisdomTree
Emerging
Markets Equity
Income Index | | | MSCI Emerging
Markets Index | |
One Year | | | -1.03 | % | | | -1.48 | % | | | -0.35 | % | | | -8.80 | % |
Three Year | | | 27.46 | % | | | 27.19 | % | | | 28.99 | % | | | 25.07 | % |
Since Inception1 | | | 6.80 | % | | | 6.26 | % | | | 7.75 | % | | | 0.20 | % |
| 1 | Total returns are calculated based on the commencement of Fund trading on the NYSE Arca, Inc. on July 13, 2007. |
Performance is historical and does not guarantee future results. Current performance may be lower or higher than quoted. Investment returns and the principal value of an investment will fluctuate so that an investor’s shares, when redeemed, may be worth more or less than their original cost. Performance data for the most recent month-end is available at www.wisdomtree.com. WisdomTree shares are bought and sold at market price (not NAV) and are not individually redeemed from the Fund. The returns do not reflect the deduction of taxes that a shareholder would pay on Fund distributions or on the redemption of Fund shares.
| | | | |
| WisdomTree International Dividend and Sector Funds | | | 17 | |
Performance Summary (unaudited)
WisdomTree Emerging Markets SmallCap Dividend Fund (DGS)
Country Breakdown† as of 3/31/12
| | | | |
Taiwan | | | 25.7% | |
Thailand | | | 12.1% | |
South Africa | | | 10.4% | |
South Korea | | | 8.7% | |
Malaysia | | | 7.6% | |
Israel | | | 6.9% | |
Brazil | | | 6.2% | |
China | | | 4.1% | |
Turkey | | | 3.7% | |
Philippines | | | 3.2% | |
Chile | | | 3.1% | |
Indonesia | | | 2.0% | |
Mexico | | | 1.8% | |
Argentina | | | 1.7% | |
United States | | | 0.8% | |
Poland | | | 0.4% | |
Russia | | | 0.1% | |
| † | The Fund’s country breakdown is expressed as a percentage of total investments and may change over time; does not include overnight investments in U.S. money market funds or investments of cash collateral for securities loaned. |
Top Ten Holdings* as of 3/31/12
| | | | |
| |
| Description | | % of Net Assets | |
Pretoria Portland Cement Co., Ltd. | | | 1.1% | |
Cia de Saneamento de Minas Gerais-COPASA | | | 1.0% | |
BEC World PCL | | | 0.9% | |
Farglory Land Development Co., Ltd. | | | 0.9% | |
Life Healthcare Group Holdings Ltd. | | | 0.9% | |
Partner Communications Co., Ltd. | | | 0.8% | |
U-Ming Marine Transport Corp. | | | 0.8% | |
Glow Energy PCL | | | 0.8% | |
WisdomTree India Earnings Fund | | | 0.7% | |
Reunert Ltd. | | | 0.7% | |
| * | The ten largest holdings are subject to change, and there are no guarantees the Fund will remain invested in any particular company. |
The WisdomTree Emerging Markets SmallCap Dividend Fund (the “Fund”) seeks to track the price and yield performance, before fees and expenses, of the WisdomTree Emerging Markets SmallCap Dividend Index.
The Fund returned -6.88% for the fiscal year ended March 31, 2012 (for more complete performance information please see the chart below). The Fund’s performance benefited most from investment in Thailand. The Fund’s position in Israel created the greatest drag on performance.
The following performance chart is provided for comparative purposes and represents the period noted. The Fund’s per share NAV is the value of one share of the Fund and is calculated by dividing the value of total assets less total liabilities by the number of shares outstanding. The NAV return is based on the NAV of the Fund and the market price return is based on the market price per share of the Fund. The price used to calculate market price returns is the mid-point of the highest bid and lowest offer for Fund shares as of the close of trading on the exchange where Fund shares are listed. NAV and market price returns assume that dividends and capital gain distributions have been reinvested in the Fund at NAV and market price, respectively. As with other ETFs, NAV returns and market price returns may differ because of factors such as the supply and demand for Fund shares and investors’ assessments of the underlying value of a Fund’s portfolio securities.
An index is a statistical measure of a specified financial market or sector. An index does not actually hold a portfolio of securities, incur expenses or pay any transaction costs. Therefore, index returns do not reflect deductions for fees or expenses and the index is not available for direct investment. In comparison, the Fund’s performance is negatively impacted by these deductions. Fund returns do not reflect brokerage commissions or taxes on transactions in Fund shares or that a shareholder would pay on Fund distributions. As of the Fund’s current prospectus dated July 29, 2011, the Fund’s annual expense ratio was 0.64%.
Performance as of 3/31/12
| | | | | | | | | | | | | | | | |
| | | Average Annual Total Return | |
| | | Fund
Net Asset Value | | | Fund
Market Price | | | WisdomTree
Emerging
Markets
SmallCap
Dividend Index | | | MSCI Emerging
Markets Small Cap
Index | |
One Year | | | -6.88 | % | | | -6.62 | % | | | -6.34 | % | | | -12.70 | % |
Three Year | | | 28.87 | % | | | 29.23 | % | | | 30.83 | % | | | 30.88 | % |
Since Inception1 | | | 1.80 | % | | | 1.98 | % | | | 2.79 | % | | | -2.48 | % |
| 1 | Total returns are calculated based on the commencement of Fund trading on the NYSE Arca, Inc. on October 30, 2007. |
Performance is historical and does not guarantee future results. Current performance may be lower or higher than quoted. Investment returns and the principal value of an investment will fluctuate so that an investor’s shares, when redeemed, may be worth more or less than their original cost. Performance data for the most recent month-end is available at www.wisdomtree.com. WisdomTree shares are bought and sold at market price (not NAV) and are not individually redeemed from the Fund. The returns do not reflect the deduction of taxes that a shareholder would pay on Fund distributions or on the redemption of Fund shares.
| | |
| 18 | | WisdomTree International Dividend and Sector Funds |
Performance Summary (unaudited)
WisdomTree Middle East Dividend Fund (GULF)
Country Breakdown† as of 3/31/12
| | | | |
Qatar | | | 35.2% | |
Kuwait | | | 27.0% | |
United Arab Emirates | | | 19.9% | |
Morocco | | | 10.8% | |
Oman | | | 5.3% | |
Jordan | | | 1.8% | |
| † | The Fund’s country breakdown is expressed as a percentage of total investments and may change over time; does not include overnight investments in U.S. money market funds or investments of cash collateral for securities loaned. |
Top Ten Holdings* as of 3/31/12
| | | | |
| |
| Description | | % of Net Assets | |
Mobile Telecommunications Co. KSC | | | 13.0% | |
Maroc Telecom S.A. | | | 9.6% | |
Industries Qatar QSC | | | 8.0% | |
Qatar National Bank SAQ | | | 4.8% | |
National Bank of Kuwait | | | 4.5% | |
Qatar Telecom Q-Tel QSC | | | 4.5% | |
Oman Telecommunications Co. SAOG | | | 3.8% | |
National Bank of Abu Dhabi PJSC | | | 3.7% | |
First Gulf Bank PJSC | | | 3.6% | |
Commercial Bank of Qatar QSC (The) | | | 3.6% | |
| * | The ten largest holdings are subject to change, and there are no guarantees the Fund will remain invested in any particular company. |
The WisdomTree Middle East Dividend Fund (the “Fund”) seeks to track the price and yield performance, before fees and expenses, of the WisdomTree Middle East Dividend Index.
The Fund returned 1.35% at net asset value (“NAV”) for the fiscal year ended March 31, 2012 (for more complete performance information please see the chart below). The Fund’s performance benefited most from its position in Qatar. The Fund’s position in Kuwait created the greatest drag on performance.
The following performance chart is provided for comparative purposes and represents the period noted. The Fund’s per share NAV is the value of one share of the Fund and is calculated by dividing the value of total assets less total liabilities by the number of shares outstanding. The NAV return is based on the NAV of the Fund and the market price return is based on the market price per share of the Fund. The price used to calculate market price returns is the mid-point of the highest bid and lowest offer for Fund shares as of the close of trading on the exchange where Fund shares are listed. NAV and market price returns assume that dividends and capital gain distributions have been reinvested in the Fund at NAV and market price, respectively. As with other ETFs, NAV returns and market price returns may differ because of factors such as the supply and demand for Fund shares and investors’ assessments of the underlying value of a Fund’s portfolio securities.
An index is a statistical measure of a specified financial market or sector. An index does not actually hold a portfolio of securities, incur expenses or pay any transaction costs. Therefore, index returns do not reflect deductions for fees or expenses and the index is not available for direct investment. In comparison, the Fund’s performance is negatively impacted by these deductions. Fund returns do not reflect brokerage commissions or taxes on transactions in Fund shares or that a shareholder would pay on Fund distributions. As of the Fund’s current prospectus dated July 29, 2011, the net and gross expense ratios were 0.88% and 2.17%, respectively. The net expense ratio reflects a contractual reimbursement of 1.29%. Fund expenses are capped by contract at 0.88% through July 31, 2013.
Performance as of 3/31/12
| | | | | | | | | | | | | | | | |
| | | Average Annual Total Return | |
| | | Fund
Net Asset Value | | | Fund
Market Price | | | WisdomTree
Middle East
Dividend Index | | | MSCI Arabian
Markets ex-Saudi
Arabia Index | |
One Year | | | 1.35 | % | | | -1.44 | % | | | 0.00 | % | | | -3.34 | % |
Three Year | | | 13.96 | % | | | 13.34 | % | | | 15.90 | % | | | 11.24 | % |
Since Inception1 | | | -8.14 | % | | | -8.68 | % | | | -6.58 | % | | | -13.33 | % |
| 1 | Total returns are calculated based on the commencement of Fund trading on the NYSE Arca, Inc. on July 16, 2008. |
Performance is historical and does not guarantee future results. Current performance may be lower or higher than quoted. Investment returns and the principal value of an investment will fluctuate so that an investor’s shares, when redeemed, may be worth more or less than their original cost. Performance data for the most recent month-end is available at www.wisdomtree.com. WisdomTree shares are bought and sold at market price (not NAV) and are not individually redeemed from the Fund. The returns do not reflect the deduction of taxes that a shareholder would pay on Fund distributions or on the redemption of Fund shares.
| | | | |
| WisdomTree International Dividend and Sector Funds | | | 19 | |
Performance Summary (unaudited)
WisdomTree International Hedged Equity Fund (HEDJ)
Country Breakdown† as of 3/31/12
| | | | |
United Kingdom | | | 19.1% | |
Japan | | | 14.1% | |
Australia | | | 12.1% | |
France | | | 9.9% | |
Germany | | | 7.3% | |
Switzerland | | | 6.9% | |
Spain | | | 5.1% | |
Hong Kong | | | 5.0% | |
Sweden | | | 3.5% | |
Italy | | | 3.4% | |
Singapore | | | 2.2% | |
Norway | | | 1.9% | |
Netherlands | | | 1.9% | |
Finland | | | 1.5% | |
Belgium | | | 1.1% | |
Portugal | | | 0.6% | |
Austria | | | 0.5% | |
Denmark | | | 0.4% | |
New Zealand | | | 0.3% | |
Ireland | | | 0.2% | |
United States | | | 0.2% | |
| † | The Fund’s country breakdown is expressed as a percentage of total investments and may change over time; does not include overnight investments in U.S. money market funds or investments of cash collateral for securities loaned. |
Top Ten Holdings* as of 3/31/12
| | | | |
| |
| Description | | % of Net Assets | |
China Mobile Ltd. | | | 1.9% | |
Vodafone Group PLC | | | 1.8% | |
Nestle S.A. | | | 1.5% | |
Total S.A. | | | 1.5% | |
Westpac Banking Corp. | | | 1.3% | |
Commonwealth Bank of Australia | | | 1.3% | |
Telefonica S.A. | | | 1.3% | |
GlaxoSmithKline PLC | | | 1.3% | |
HSBC Holdings PLC | | | 1.3% | |
Novartis AG | | | 1.2% | |
| * | The ten largest holdings are subject to change, and there are no guarantees the Fund will remain invested in any particular company. |
The WisdomTree International Hedged Equity Fund (the “Fund”) seeks to track the price and yield performance, before fees and expenses, of the WisdomTree DEFA International Hedged Equity Index.
The Fund returned -4.41% for the fiscal year ended March 31, 2012 (for more complete information please see the chart below). The Fund’s performance benefited most from its investment in the Consumer Staples sector. The Financials sector created the greatest drag on performance.
The following performance chart is provided for comparative purposes and represents the period noted. The Fund’s per share NAV is the value of one share of the Fund and is calculated by dividing the value of total assets less total liabilities by the number of shares outstanding. The NAV return is based on the NAV of the Fund and the market price return is based on the market price per share of the Fund. The price used to calculate market price returns is the mid-point of the highest bid and lowest offer for Fund shares as of the close of trading on the exchange where Fund shares are listed. NAV and market price returns assume that dividends and capital gain distributions have been reinvested in the Fund at NAV and market price, respectively. As with other ETFs, NAV returns and market price returns may differ because of factors such as the supply and demand for Fund shares and investors’ assessments of the underlying value of a Fund’s portfolio securities.
An index is a statistical measure of a specified financial market or sector. An index does not actually hold a portfolio of securities, incur expenses or pay any transaction costs. Therefore, index returns do not reflect deductions for fees or expenses and the index is not available for direct investment. In comparison, the Fund’s performance is negatively impacted by these deductions. Fund returns do not reflect brokerage commissions or taxes on transactions in Fund shares or that a shareholder would pay on Fund distributions. As of the Fund’s current prospectus dated July 29, 2011, the net and gross expense ratios were 0.58% and 1.65%, respectively. The net expense ratio reflects a contractual reimbursement of 1.07%. Fund expenses are capped by contract at 0.58% through July 31, 2013.
Performance as of 3/31/12
| | | | | | | | | | | | | | | | |
| | | Average Annual Total Return | |
| | | Fund
Net Asset Value | | | Fund
Market Price | | | WisdomTree DEFA
International Hedged
Equity Index | | | MSCI EAFE Local
Currency Index | |
One Year | | | -4.41 | % | | | -3.23 | % | | | -4.15 | % | | | -4.12 | % |
Since Inception1 | | | 0.30 | % | | | 1.14 | % | | | 0.91 | % | | | 0.66 | % |
| 1 | Total returns are calculated based on the commencement of Fund trading on the NYSE Arca, Inc. on December 31, 2009. |
Performance is historical and does not guarantee future results. Current performance may be lower or higher than quoted. Investment returns and the principal value of an investment will fluctuate so that an investor’s shares, when redeemed, may be worth more or less than their original cost. Performance data for the most recent month-end is available at www.wisdomtree.com. WisdomTree shares are bought and sold at market price (not NAV) and are not individually redeemed from the Fund. The returns do not reflect the deduction of taxes that a shareholder would pay on Fund distributions or on the redemption of Fund shares.
| | |
| 20 | | WisdomTree International Dividend and Sector Funds |
Performance Summary (unaudited)
WisdomTree Commodity Country Equity Fund (CCXE)
Country Breakdown† as of 3/31/12
| | | | |
South Africa | | | 12.0% | |
New Zealand | | | 11.7% | |
Chile | | | 11.5% | |
Brazil | | | 11.5% | |
Australia | | | 11.4% | |
Canada | | | 11.4% | |
Norway | | | 11.3% | |
Russia | | | 10.6% | |
United States | | | 0.0% | # |
| † | The Fund’s country breakdown is expressed as a percentage of total investments and may change over time; does not include overnight investments in U.S. money market funds or investments of cash collateral for securities loaned. |
| # | Amount represents less than 0.05%. |
Top Ten Holdings* as of 3/31/12
| | | | |
| |
| Description | | % of Net Assets | |
Statoil ASA | | | 5.5% | |
Gazprom OAO ADR | | | 3.1% | |
Telecom Corp. of New Zealand Ltd. | | | 2.8% | |
Kumba Iron Ore Ltd. | | | 2.2% | |
Lukoil OAO ADR | | | 1.9% | |
Commonwealth Bank of Australia | | | 1.8% | |
Telenor ASA | | | 1.8% | |
Westpac Banking Corp. | | | 1.8% | |
Petroleo Brasileiro S.A. | | | 1.8% | |
Royal Bank of Canada | | | 1.7% | |
| * | The ten largest holdings are subject to change, and there are no guarantees the Fund will remain invested in any particular company. |
The WisdomTree Commodity Country Equity Fund (the “Fund”) seeks to track the price and yield performance, before fees and expenses, of the WisdomTree Commodity Country Equity Index.
The Fund returned -1.77% at net asset value (“NAV”) for the fiscal year ended March 31, 2012 (for more complete performance information please see the chart below). The Fund’s performance benefited most from its position in South Africa. The Fund’s position in Russia created the greatest drag on performance.
The following performance chart is provided for comparative purposes and represents the period noted. The Fund’s per share NAV is the value of one share of the Fund and is calculated by dividing the value of total assets less total liabilities by the number of shares outstanding. The NAV return is based on the NAV of the Fund and the market price return is based on the market price per share of the Fund. The price used to calculate market price returns is the mid-point of the highest bid and lowest offer for Fund shares as of the close of trading on the exchange where Fund shares are listed. NAV and market price returns assume that dividends and capital gain distributions have been reinvested in the Fund at NAV and market price, respectively. As with other ETFs, NAV returns and market price returns may differ because of factors such as the supply and demand for Fund shares and investors’ assessments of the underlying value of a Fund’s portfolio securities.
An index is a statistical measure of a specified financial market or sector. An index does not actually hold a portfolio of securities, incur expenses or pay any transaction costs. Therefore, index returns do not reflect deductions for fees or expenses and the index is not available for direct investment. In comparison, the Fund’s performance is negatively impacted by these deductions. Fund returns do not reflect brokerage commissions or taxes on transactions in Fund shares or that a shareholder would pay on Fund distributions. As of the Fund’s current prospectus dated July 29, 2011, the Fund’s annual expense ratio was 0.58%.
Performance as of 3/31/12
| | | | | | | | | | | | | | | | |
| | | Average Annual Total Return | |
| | | Fund
Net Asset Value | | | Fund
Market Price | | | WisdomTree
International
Basic Materials
Sector/Commodity
Country Equity
Spliced Index1 | | | S&P
Developed
ex-U.S. BMI
Materials sector/
MSCI
ACWI ex-USA
Spliced Index2 | |
One Year | | | -1.77 | % | | | -1.96 | % | | | -1.29 | % | | | -9.84 | % |
Three Year | | | 28.34 | % | | | 27.84 | % | | | 29.25 | % | | | 26.75 | % |
Five Year | | | 2.75 | % | | | 2.48 | % | | | 3.43 | % | | | N/A | |
Since Inception3 | | | 6.91 | % | | | 6.78 | % | | | 7.68 | % | | | -0.09 | % |
| 1 | WisdomTree International Basic Materials Sector Index through June 17, 2011; WisdomTree Commodity Country Equity Index thereafter. |
| 2 | S&P Developed ex-U.S. BMI Materials sector Index through June 17, 2011; MSCI ACWI ex-USA Index thereafter. |
| 3 | Total returns are calculated based on the commencement of Fund trading on the NYSE Arca, Inc. on October 13, 2006. The S&P Developed ex-U.S. Sector Index total returns are based on the index’s inception date of April 1, 2008. |
Performance is historical and does not guarantee future results. Current performance may be lower or higher than quoted. Investment returns and the principal value of an investment will fluctuate so that an investor’s shares, when redeemed, may be worth more or less than their original cost. Performance data for the most recent month-end is available at www.wisdomtree.com. WisdomTree shares are bought and sold at market price (not NAV) and are not individually redeemed from the Fund. The returns do not reflect the deduction of taxes that a shareholder would pay on Fund distributions or on the redemption of Fund shares.
| | | | |
| WisdomTree International Dividend and Sector Funds | | | 21 | |
Performance Summary (unaudited)
WisdomTree Global Natural Resources Fund (GNAT)
Country Breakdown† as of 3/31/12
| | | | |
United States | | | 18.2% | |
United Kingdom | | | 15.8% | |
Russia | | | 8.8% | |
Canada | | | 8.4% | |
Australia | | | 5.9% | |
South Africa | | | 5.3% | |
Mexico | | | 4.4% | |
Italy | | | 4.1% | |
France | | | 3.9% | |
Malaysia | | | 3.1% | |
Norway | | | 3.1% | |
Brazil | | | 2.3% | |
Japan | | | 1.8% | |
Spain | | | 1.7% | |
China | | | 1.6% | |
Thailand | | | 1.4% | |
Switzerland | | | 1.4% | |
Israel | | | 1.3% | |
Hong Kong | | | 1.1% | |
Indonesia | | | 0.8% | |
Germany | | | 0.7% | |
Singapore | | | 0.6% | |
Poland | | | 0.5% | |
| † | The Fund’s country breakdown is expressed as a percentage of total investments and may change over time; does not include overnight investments in U.S. money market funds or investments of cash collateral for securities loaned. |
Top Ten Holdings* as of 3/31/12
| | | | |
| |
| Description | | % of Net Assets | |
Kumba Iron Ore Ltd. | | | 4.2% | |
ENI SpA | | | 3.3% | |
Industrias Penoles S.A.B de C.V. | | | 3.2% | |
Royal Dutch Shell PLC Class B | | | 3.2% | |
Crescent Point Energy Corp. | | | 3.0% | |
Southern Copper Corp. | | | 2.9% | |
Antofagasta PLC | | | 2.8% | |
Total S.A. | | | 2.8% | |
Statoil ASA | | | 2.6% | |
Diamond Offshore Drilling, Inc. | | | 2.6% | |
| * | The ten largest holdings are subject to change, and there are no guarantees the Fund will remain invested in any particular company. |
The WisdomTree Global Natural Resources Fund (the “Fund”) seeks to track the price and yield performance, before fees and expenses, of the WisdomTree Global Natural Resources Index.
The Fund returned -12.70% at net asset value (“NAV”) for the fiscal year ended March 31, 2012 (for more complete performance information please see the chart below). The Fund’s performance benefited most from its investment in Mexico. The Fund’s investment in Russia created the greatest drag on performance.
The following performance chart is provided for comparative purposes and represents the period noted. The Fund’s per share NAV is the value of one share of the Fund and is calculated by dividing the value of total assets less total liabilities by the number of shares outstanding. The NAV return is based on the NAV of the Fund and the market price return is based on the market price per share of the Fund. The price used to calculate market price returns is the mid-point of the highest bid and lowest offer for Fund shares as of the close of trading on the exchange where Fund shares are listed. NAV and market price returns assume that dividends and capital gain distributions have been reinvested in the Fund at NAV and market price, respectively. As with other ETFs, NAV returns and market price returns may differ because of factors such as the supply and demand for Fund shares and investors’ assessments of the underlying value of a Fund’s portfolio securities.
An index is a statistical measure of a specified financial market or sector. An index does not actually hold a portfolio of securities, incur expenses or pay any transaction costs. Therefore, index returns do not reflect deductions for fees or expenses and the index is not available for direct investment. In comparison, the Fund’s performance is negatively impacted by these deductions. Fund returns do not reflect brokerage commissions or taxes on transactions in Fund shares or that a shareholder would pay on Fund distributions. As of the Fund’s current prospectus dated July 29, 2011, the Fund’s annual expense ratio was 0.58%.
Performance as of 3/31/12
| | | | | | | | | | | | | | | | |
| | | Average Annual Total Return | |
| | | Fund
Net Asset Value | | | Fund
Market Price | | | WisdomTree
International
Energy Sector/Global
Natural Resources
Spliced Index1 | | | S&P Developed
ex-U.S. BMI
Energy
sector/S&P Global
Natural Resources
Spliced Index2 | |
One Year | | | -12.70 | % | | | -12.78 | % | | | -12.29 | % | | | -13.92 | % |
Three Year | | | 14.35 | % | | | 14.57 | % | | | 14.86 | % | | | 15.95 | % |
Five Year | | | 1.39 | % | | | 1.29 | % | | | 1.63 | % | | | N/A | |
Since Inception3 | | | 3.45 | % | | | 3.32 | % | | | 3.81 | % | | | -0.73 | % |
| 1 | WisdomTree International Energy Sector Index through June 17, 2011; WisdomTree Global Natural Resources Index thereafter. |
| 2 | S&P Developed ex-U.S. BMI Energy sector Index through June 17, 2011; S&P Global Natural Resources Index thereafter. |
| 3 | Total returns are calculated based on the commencement of Fund trading on the NYSE Arca, Inc. on October 13, 2006. The S&P Developed ex-U.S. BMI Energy Sector Index total returns are based on the index’s inception date of April 1, 2008. |
Performance is historical and does not guarantee future results. Current performance may be lower or higher than quoted. Investment returns and the principal value of an investment will fluctuate so that an investor’s shares, when redeemed, may be worth more or less than their original cost. Performance data for the most recent month-end is available at www.wisdomtree.com. WisdomTree shares are bought and sold at market price (not NAV) and are not individually redeemed from the Fund. The returns do not reflect the deduction of taxes that a shareholder would pay on Fund distributions or on the redemption of Fund shares.
| | |
| 22 | | WisdomTree International Dividend and Sector Funds |
Performance Summary (unaudited)
WisdomTree Global ex-U.S. Utilities Fund (DBU)
Country Breakdown† as of 3/31/12
| | | | |
Brazil | | | 12.8% | |
Japan | | | 11.2% | |
United Kingdom | | | 10.3% | |
Chile | | | 6.7% | |
Italy | | | 6.0% | |
Canada | | | 5.8% | |
Spain | | | 5.1% | |
Hong Kong | | | 4.1% | |
Malaysia | | | 3.6% | |
Germany | | | 3.5% | |
France | | | 3.5% | |
Philippines | | | 2.3% | |
Thailand | | | 2.3% | |
Australia | | | 1.5% | |
Portugal | | | 1.3% | |
Czech Republic | | | 1.1% | |
Belgium | | | 1.1% | |
Austria | | | 1.0% | |
Indonesia | | | 0.8% | |
Finland | | | 0.7% | |
New Zealand | | | 0.7% | |
Switzerland | | | 0.6% | |
Poland | | | 0.5% | |
South Korea | | | 0.5% | |
United States | | | 0.5% | |
China | | | 0.2% | |
| † | The Fund’s country breakdown is expressed as a percentage of total investments and may change over time; does not include overnight investments in U.S. money market funds or investments of cash collateral for securities loaned. |
Top Ten Holdings* as of 3/31/12
| | | | |
| |
| Description | | % of Net Assets | |
Light S.A. | | | 2.8% | |
Cia Energetica de Minas Gerais | | | 2.6% | |
AES Tiete S.A. | | | 2.4% | |
Drax Group PLC | | | 2.3% | |
RWE AG | | | 2.2% | |
Just Energy Group, Inc. | | | 2.1% | |
Aguas Andinas S.A. Class A | | | 2.0% | |
E.ON AG | | | 1.9% | |
Cia de Saneamento de Minas Gerais-COPASA | | | 1.7% | |
AGL Energy Ltd. | | | 1.7% | |
| * | The ten largest holdings are subject to change, and there are no guarantees the Fund will remain invested in any particular company. |
The WisdomTree Global ex-U.S. Utilities Fund (the “Fund”) seeks to track the price and yield performance, before fees and expenses, of the WisdomTree Global ex-U.S. Utilities Index.
The Fund returned -7.41% at net asset value (“NAV”) for the fiscal year ended March 31, 2012 (for more complete performance information please see the chart below). The Fund’s performance benefited most from its investment in the United Kingdom. Investment in France created the greatest drag on performance.
The following performance chart is provided for comparative purposes and represents the period noted. The Fund’s per share NAV is the value of one share of the Fund and is calculated by dividing the value of total assets less total liabilities by the number of shares outstanding. The NAV return is based on the NAV of the Fund and the market price return is based on the market price per share of the Fund. The price used to calculate market price returns is the mid-point of the highest bid and lowest offer for Fund shares as of the close of trading on the exchange where Fund shares are listed. NAV and market price returns assume that dividends and capital gain distributions have been reinvested in the Fund at NAV and market price, respectively. As with other ETFs, NAV returns and market price returns may differ because of factors such as the supply and demand for Fund shares and investors’ assessments of the underlying value of a Fund’s portfolio securities.
An index is a statistical measure of a specified financial market or sector. An index does not actually hold a portfolio of securities, incur expenses or pay any transaction costs. Therefore, index returns do not reflect deductions for fees or expenses and the index is not available for direct investment. In comparison, the Fund’s performance is negatively impacted by these deductions. Fund returns do not reflect brokerage commissions or taxes on transactions in Fund shares or that a shareholder would pay on Fund distributions. As of the Fund’s current prospectus dated July 29, 2011, the Fund’s annual expense ratio was 0.58%.
Performance as of 3/31/12
| | | | | | | | | | | | | | | | |
| | | Average Annual Total Return | |
| | | Fund
Net Asset Value | | | Fund
Market Price | | | WisdomTree
International
Utilities
Sector/Global
ex-U.S. Utilities
Spliced Index1 | | | S&P
Developed
ex-U.S. BMI
Utilities
sector Index | |
One Year | | | -7.41 | % | | | -7.34 | % | | | -.8.04 | % | | | -13.10 | % |
Three Year | | | 6.87 | % | | | 6.66 | % | | | 6.66 | % | | | 4.12 | % |
Five Year | | | -4.70 | % | | | -4.91 | % | | | -4.64 | % | | | N/A | |
Since Inception2 | | | -1.19 | % | | | -1.30 | % | | | -1.06 | % | | | -9.31 | % |
| 1 | WisdomTree International Utilities Sector Index through June 17, 2011; WisdomTree Global ex-U.S. Utilities Index thereafter. |
| 2 | Total returns are calculated based on the commencement of Fund trading on the NYSE Arca, Inc. on October 13, 2006. The S&P Developed ex-U.S. BMI Utilities sector Index total returns are based on the index’s inception date of April 1, 2008 |
Performance is historical and does not guarantee future results. Current performance may be lower or higher than quoted. Investment returns and the principal value of an investment will fluctuate so that an investor’s shares, when redeemed, may be worth more or less than their original cost. Performance data for the most recent month-end is available at www.wisdomtree.com. WisdomTree shares are bought and sold at market price (not NAV) and are not individually redeemed from the Fund. The returns do not reflect the deduction of taxes that a shareholder would pay on Fund distributions or on the redemption of Fund shares.
| | | | |
| WisdomTree International Dividend and Sector Funds | | | 23 | |
Performance Summary (unaudited)
WisdomTree Global ex-U.S. Real Estate Fund (DRW)
Country Breakdown† as of 3/31/12
| | | | |
Australia | | | 23.3% | |
Hong Kong | | | 18.8% | |
Canada | | | 9.1% | |
Singapore | | | 7.5% | |
France | | | 7.5% | |
Japan | | | 5.6% | |
United Kingdom | | | 4.8% | |
South Africa | | | 3.6% | |
Netherlands | | | 2.2% | |
Sweden | | | 1.4% | |
Brazil | | | 1.2% | |
Taiwan | | | 1.0% | |
Philippines | | | 0.9% | |
Switzerland | | | 0.9% | |
China | | | 0.8% | |
Thailand | | | 0.8% | |
Belgium | | | 0.7% | |
Israel | | | 0.5% | |
Germany | | | 0.4% | |
Turkey | | | 0.3% | |
Finland | | | 0.2% | |
Malaysia | | | 0.2% | |
Italy | | | 0.1% | |
Austria | | | 0.1% | |
Chile | | | 0.1% | |
Indonesia | | | 0.1% | |
Norway | | | 0.0% | # |
| † | The Fund’s country breakdown is expressed as a percentage of total investments and may change over time; does not include overnight investments in U.S. money market funds or investments of cash collateral for securities loaned. |
| # | Amount represents less than 0.05%. |
Top Ten Holdings* as of 3/31/12
| | | | |
| |
| Description | | % of Net Assets | |
Westfield Group | | | 9.4% | |
Sun Hung Kai Properties Ltd. | | | 3.4% | |
Cheung Kong Holdings Ltd. | | | 3.3% | |
Stockland | | | 3.0% | |
Unibail-Rodamco SE | | | 2.7% | |
CFS Retail Property Trust | | | 2.1% | |
GPT Group | | | 2.1% | |
RioCan Real Estate Investment Trust | | | 1.6% | |
Mirvac Group | | | 1.6% | |
Daito Trust Construction Co., Ltd. | | | 1.6% | |
| * | The ten largest holdings are subject to change, and there are no guarantees the Fund will remain invested in any particular company. |
The WisdomTree Global ex-U.S. Real Estate Fund (the “Fund”) seeks to track the price and yield performance, before fees and expenses, of the WisdomTree Global ex-U.S. Real Estate Index.
The Fund returned -3.99% at net asset value (“NAV”) for fiscal year ended March 31, 2012 (for more complete performance information please see the chart below). The Fund’s performance benefited most from its position in Canada. The Fund’s position in Hong Kong created the greatest drag on performance.
The following performance chart is provided for comparative purposes and represents the period noted. The Fund’s per share NAV is the value of one share of the Fund and is calculated by dividing the value of total assets less total liabilities by the number of shares outstanding. The NAV return is based on the NAV of the Fund and the market price return is based on the market price per share of the Fund. The price used to calculate market price returns is the mid-point of the highest bid and lowest offer for Fund shares as of the close of trading on the exchange where Fund shares are listed. NAV and market price returns assume that dividends and capital gain distributions have been reinvested in the Fund at NAV and market price, respectively. As with other ETFs, NAV returns and market price returns may differ because of factors such as the supply and demand for Fund shares and investors’ assessments of the underlying value of a Fund’s portfolio securities.
An index is a statistical measure of a specified financial market or sector. An index does not actually hold a portfolio of securities, incur expenses or pay any transaction costs. Therefore, index returns do not reflect deductions for fees or expenses and the index is not available for direct investment. In comparison, the Fund’s performance is negatively impacted by these deductions. Fund returns do not reflect brokerage commissions or taxes on transactions in Fund shares or that a shareholder would pay on Fund distributions. As of the Fund’s current prospectus dated July 29, 2011, the Fund’s annual expense ratio was 0.58%.
Performance as of 3/31/12
| | | | | | | | | | | | | | | | |
| | | Average Annual Total Return | |
| | | Fund
Net Asset Value | | | Fund
Market Price | | | WisdomTree
International
Real Estate/Global
ex-U.S. Real Estate
Spliced Index1 | | | Dow Jones Global
ex-U.S. Select Real
Estate Securities Index | |
One Year | | | -3.99 | % | | | -4.32 | % | | | -4.10 | % | | | -0.95 | % |
Three Year | | | 25.72 | % | | | 25.39 | % | | | 26.17 | % | | | 26.63 | % |
Since Inception2 | | | -7.01 | % | | | -7.19 | % | | | -6.91 | % | | | -7.50 | % |
| 1 | WisdomTree International Real Estate Index through June 17, 2011; WisdomTree Global ex-U.S. Real Estate Index thereafter. |
| 2 | Total returns are calculated based on the commencement of Fund trading on the NYSE Arca, Inc. on June 5, 2007. |
Performance is historical and does not guarantee future results. Current performance may be lower or higher than quoted. Investment returns and the principal value of an investment will fluctuate so that an investor’s shares, when redeemed, may be worth more or less than their original cost. Performance data for the most recent month-end is available at www.wisdomtree.com. WisdomTree shares are bought and sold at market price (not NAV) and are not individually redeemed from the Fund. The returns do not reflect the deduction of taxes that a shareholder would pay on Fund distributions or on the redemption of Fund shares.
| | |
| 24 | | WisdomTree International Dividend and Sector Funds |
Description of Indexes (unaudited)
Below are descriptions of each Index referenced in this Report:
The WisdomTree DEFA Index measures the performance of dividend-paying companies in the industrialized world, excluding Canada and the United States.
The WisdomTree DEFA International Hedged Equity Index measures the performance of dividend-paying companies in the industrialized world, excluding Canada and the United States, and is designed to neutralize exposure to fluctuations between the value of the U.S. dollar and non-U.S. currencies reflected in the index. This index is based on the WisdomTree DEFA Index.
The WisdomTree DEFA Equity Income Index measures the performance of companies with high dividend yields selected from the WisdomTree DEFA Index.
The WisdomTree Global Equity Income Index measures the performance of high dividend-paying companies selected from the WisdomTree Dividend Index and the WisdomTree World ex-U.S. Index.
The WisdomTree Europe Equity Income Index measures the performance of companies with high dividend yields selected from the WisdomTree Europe Dividend Index.
The WisdomTree Europe SmallCap Dividend Index measures the performance of the small-capitalization segment of the European dividend-paying market.
The WisdomTree Japan Dividend Index measures the performance of dividend-paying companies incorporated in Japan, listed on the Tokyo Stock Exchange and that meet other requirements necessary to be included in the WisdomTree DEFA Index.
The WisdomTree Global ex-U.S. Growth Index measures the stock performance of growth companies selected from developed and emerging markets outside the U.S.
The WisdomTree Japan Equity Income Index measures the performance of companies with high dividend yields selected from the WisdomTree Japan Dividend Index.
The WisdomTree Japan SmallCap Dividend Index measures the performance of dividend-paying small-capitalization companies in Japan.
The WisdomTree Japan Hedged Equity Index is designed to provide exposure to Japanese equity markets while at the same time neutralizing exposure to fluctuations of the Japanese Yen movements relative to the U.S. dollar. This index is based on the WisdomTree Japan Dividend Index.
The WisdomTree Pacific ex-Japan Dividend Index measures the performance of dividend-paying companies incorporated in the Pacific region, excluding Japan.
The WisdomTree Asia Pacific ex-Japan Index measures the performance of dividend-paying companies incorporated in emerging market and developed countries in the Pacific region, excluding Japan.
The WisdomTree Pacific ex-Japan Equity Income Index measures the performance of companies with high dividend yields selected from the WisdomTree Pacific ex-Japan Dividend Index.
The WisdomTree Australia Dividend Index measures the performance of dividend-paying companies incorporated in Australia.
The WisdomTree International LargeCap Dividend Index measures the performance of the large-capitalization segment of the dividend-paying market in the industrialized world outside the U.S. and Canada.
The WisdomTree International Dividend ex-Financials Index measures the performance of high dividend-yielding international stocks outside the financial sector.
The WisdomTree International Dividend Top 100 Index measures the performance of the 100 highest dividend-yielding companies in the WisdomTree International LargeCap Dividend Index.
The WisdomTree International MidCap Dividend Index measures the performance of the mid-capitalization segment of the dividend-paying market in the industrialized world outside the U.S. and Canada.
| | | | |
| WisdomTree International Dividend and Sector Funds | | | 25 | |
Description of Indexes (unaudited) (continued)
The WisdomTree International SmallCap Dividend Index measures the performance of the small-capitalization segment of the dividend-paying market in the industrialized world outside the U.S. and Canada.
The WisdomTree Emerging Markets Equity Income Index measures the performance of the highest dividend-yielding stocks selected from the WisdomTree Emerging Markets Dividend Index.
The WisdomTree Emerging Markets SmallCap Dividend Index measures the performance of primarily small-capitalization stocks selected from the WisdomTree Emerging Markets Dividend Index.
The WisdomTree Middle East Dividend Index measures the performance of companies in the Middle East region that pay regular cash dividends on shares of common stock and that meet specified requirements as of the index measurement date.
The WisdomTree International Sector Indexes which encompasses Basic Materials, Energy and Utilities, are derived from the WisdomTree DEFA Index, and measure the performance of dividend-paying companies in developed markets outside the U.S. and Canada, within their specific international sectors.
The WisdomTree Commodity Country Equity Index measures the performance of dividend-paying companies in developed and emerging market countries outside the U.S. and Canada in the Commodities sector.
The WisdomTree Global Natural Resources Index measures the performance of dividend-paying companies in developed and emerging market countries outside the U.S. and Canada in the Natural Resources sector.
The WisdomTree Global ex-U.S. Utilities Index measures the performance of dividend-paying companies in developed and emerging market countries outside the U.S. and Canada in the Utilities sector.
The WisdomTree International Real Estate Index measures the performance of companies in developed markets outside of the U.S. and Canada that pay regular cash dividends and that WisdomTree Investments classifies as being part of the International Real Estate sector.
The WisdomTree Global ex-U.S. Real Estate Index measures the performance of companies in developed and emerging markets outside of Canada and the U.S., which WisdomTree classifies as being Global Real Estate securities.
The MSCI EAFE Index is a market cap-weighted index composed of companies representative of the developed market structure of 21 developed countries in Europe, Australasia and Japan.
The MSCI EAFE Value Index measures the performance of value stocks in the MSCI EAFE Index.
The MSCI EAFE Mid Cap Index is a free float-adjusted market capitalization index that is designed to measure the performance of mid-capitalization equities in the developed markets excluding the U.S. & Canada.
The MSCI EAFE Small Cap Index measures the performance of small-capitalization stocks in the MSCI EAFE Index.
The MSCI Europe Small Cap Index measures the performance of small-capitalization stocks in the MSCI Europe Index.
The MSCI Europe Value Index measures the performance of value stocks in the MSCI Europe Index.
The MSCI AC World Index measures the performance of the world stock market indexes covered by MSCI.
The MSCI Pacific ex-Japan Index is a subset of the MSCI EAFE Index and measures the performance of stocks in Australia, Hong Kong, Singapore and New Zealand.
The MSCI AC Asia Pacific ex-Japan Index measures the performance of large- and mid-capitalization segments of emerging market and developed market countries in the Asia Pacific region, excluding Japan.
| | |
| 26 | | WisdomTree International Dividend and Sector Funds |
Description of Indexes (unaudited) (continued)
The MSCI Pacific ex-Japan Value Index measures the performance of value stocks in the MSCI Pacific ex-Japan Index.
The MSCI Australia Index measures the performance of large- and mid-capitalization segments of the Australia market.
The MSCI Japan Index is a capitalization weighted index that measures the performance of stocks in Japan.
The MSCI Japan Value Index measures the performance of value stocks in the MSCI Japan Index.
The MSCI ACWI ex-U.S.A. Index measures the performance of large- and mid-capitalization segments of the developed and emerging markets covered by MSCI, excluding the U.S.
The MSCI AC World ex-U.S.A. Growth Index measures the performance of growth stocks in the developed and emerging markets covered by MSCI excluding the U.S.
The MSCI Japan Small Cap Index measures the performance of small cap stocks in the MSCI Japan Index.
The MSCI Japan Local Currency Index is a free float-adjusted market capitalization index that is designed to measure developed market equity performance in Japan and uses the same methodology as its corresponding MSCI Japan Index. The price used for each security in the local currency index is the local price, on the primary exchange on which a security is traded, with no conversion into U.S. dollars.
The MSCI Emerging Markets Index is a free float-adjusted market capitalization index that is designed to measure emerging markets equity performance.
The MSCI Emerging Markets Small Cap Index is a free float-adjusted market capitalization index that is designed to measure the performance of small capitalization equities in the emerging markets.
The MSCI Arabian Markets ex-Saudi Arabia Index is a free float-adjusted market capitalization index that is designed to measure the performance of stocks in the Gulf Cooperation Council (GCC) countries and the neighboring region: the United Arab Emirates, Kuwait, Qatar, Bahrain, Oman, Egypt, Jordan, and Morocco.
The MSCI EAFE Local Currency Index is a free float-adjusted market capitalization weighted index that is designed to measure developed market equity performance, excluding the U.S. and Canada. The index is calculated using the same methodology as its corresponding MSCI EAFE Index in U.S. dollars, with the key difference being the currency in which the securities are quoted in. The price used for each security in the local currency index is the local price, on the primary exchange on which a security is traded, with no conversion into U.S. dollars.
The S&P Developed ex-U.S. BMI Sector Indexes are indexes that track specific sectors of developed global markets outside the United States.
The S&P Global Natural Resources Index is comprised of the largest publicly traded companies in natural resources and commodities businesses that meet specific investability requirements.
The Dow Jones Global ex-U.S. Select Real Estate Securities Index is a float-adjusted market capitalization weighted index that defines and measures the investable universe of publicly traded real estate securities in countries outside the U.S.
Index performance information assumes the reinvestment of net dividends and excludes management fees, transaction costs and expenses. You cannot directly invest in an index.
The Global Industry Classification Standard (“GICS”) was developed by and is the exclusive property and a service mark of MSCI Inc. (“MSCI”) and Standard & Poor’s (“S&P”), a division of The McGraw-Hill Companies, Inc. and is licensed for use by WisdomTree Investments, Inc. Neither MSCI, S&P nor any other party involved in making or compiling the GICS or any GICS classifications makes any express or implied warranties or representations with respect to such standard or classification (or the results to be obtained by the use thereof), and all such parties hereby
| | | | |
| WisdomTree International Dividend and Sector Funds | | | 27 | |
Description of Indexes (unaudited) (concluded)
expressly disclaim all warranties of originality, accuracy, completeness, merchantability and fitness for a particular purpose with respect to any such standard or classification. Without limiting any of the foregoing, in no event shall MSCI, S&P, any of their affiliates or any third party involved in making or compiling the GICS or any GICS classifications have any liability for any direct, indirect, special, punitive, consequential or any other damages (including lost profits) even if notified of the possibility of such damages.
Neither MSCI nor any other party involved in or related to compiling, computing or creating the MSCI data makes any express or implied warranties or representations with respect to such data (or the results to be obtained by the use thereof), and all such parties hereby expressly disclaim all warranties of originality, accuracy, completeness, merchantability or fitness for a particular purpose with respect to any such data. Without limiting any of the foregoing, in no event shall MSCI, any of its affiliates or any third party involved in or related to compiling, computing or creating the data have any liability for any direct, indirect, special, punitive, consequential or any other damages (including lost profits) even if notified of the possibility of such damages. No further distribution or dissemination of the MSCI data is permitted without MSCI’s express written consent.
| | |
| 28 | | WisdomTree International Dividend and Sector Funds |
Shareholder Expense Examples (unaudited)
As a shareholder of a WisdomTree Fund, you incur two types of costs: (1) transaction costs, including brokerage commissions on purchases and sales of your Fund shares and (2) ongoing costs, including management fees and other Fund expenses. The following example is intended to help you understand your ongoing costs (in dollars and cents) of investing in a Fund and to compare these costs with the ongoing costs of investing in other funds.
The example is based on an investment of $1,000 invested at the beginning of the period and held for the entire period from October 1, 2011 to March 31, 2012.
Actual expenses
The first line under each Fund in the table on the next page provides information about actual account values and actual expenses. You may use the information in this line, together with the amount you invested, to estimate the expenses that you paid over the period. Simply divide your account value by $1,000 (for example, an $8,600 account value divided by $1,000 = 8.6), then multiply the result by the number in the first line for your Fund under the heading entitled “Expenses Paid During the Period 10/01/11 to 3/31/12” to estimate the expenses you paid on your account during this period.
Hypothetical example for comparison purposes
The second line under each Fund in the table on the next page provides information about hypothetical account values and hypothetical expenses based on each Fund’s actual expense ratio and an assumed rate of return of 5% per year before expenses, which is not the Fund’s actual return. The hypothetical account values and expenses may not be used to estimate the actual ending account balance or expenses you paid for the period. You may use this information to compare the ongoing costs of investing in your Fund and other funds. To do so, compare this 5% hypothetical example with the 5% hypothetical examples that appear in the shareholder reports of the other funds.
Please note that the expenses shown in the table are meant to highlight your ongoing costs only and do not reflect any transactional costs, such as brokerage commissions paid on purchases and sales of Fund shares. Therefore, the second line under each Fund in the table is useful in comparing ongoing Fund costs only and will not help you determine the relative total costs of owning different funds. In addition, if these transactional costs were included, your costs would have been higher.
| | | | |
| WisdomTree International Dividend and Sector Funds | | | 29 | |
Shareholder Expense Examples (unaudited) (continued)
| | | | | | | | | | | | | | |
| | | Beginning
Account Value
10/01/11 | | | Ending
Account Value
3/31/12 | | | Annualized
Expense Ratio
Based on the
Period
10/01/11 to
3/31/12 | | Expenses Paid
During the
Period†
10/01/11 to
3/31/12 | |
WisdomTree DEFA Fund | | | | | | | | | | | | | | |
Actual | | $ | 1,000.00 | | | $ | 1,122.25 | | | 0.48% | | $ | 2.55 | |
Hypothetical (5% return before expenses) | | $ | 1,000.00 | | | $ | 1,022.60 | | | 0.48% | | $ | 2.43 | |
WisdomTree DEFA Equity Income Fund | | | | | | | | | | | | | | |
Actual | | $ | 1,000.00 | | | $ | 1,099.95 | | | 0.58% | | $ | 3.04 | |
Hypothetical (5% return before expenses) | | $ | 1,000.00 | | | $ | 1,022.10 | | | 0.58% | | $ | 2.93 | |
WisdomTree Global Equity Income Fund | | | | | | | | | | | | | | |
Actual | | $ | 1,000.00 | | | $ | 1,128.63 | | | 0.58% | | $ | 3.09 | |
Hypothetical (5% return before expenses) | | $ | 1,000.00 | | | $ | 1,022.10 | | | 0.58% | | $ | 2.93 | |
WisdomTree Europe SmallCap Dividend Fund | | | | | | | | | | | | | | |
Actual | | $ | 1,000.00 | | | $ | 1,171.60 | | | 0.58% | | $ | 3.15 | |
Hypothetical (5% return before expenses) | | $ | 1,000.00 | | | $ | 1,022.10 | | | 0.58% | | $ | 2.93 | |
WisdomTree Japan Hedged Equity Fund | | | | | | | | | | | | | | |
Actual | | $ | 1,000.00 | | | $ | 1,116.78 | | | 0.48% | | $ | 2.54 | |
Hypothetical (5% return before expenses) | | $ | 1,000.00 | | | $ | 1,022.60 | | | 0.48% | | $ | 2.43 | |
WisdomTree Global ex-U.S. Growth Fund | | | | | | | | | | | | | | |
Actual | | $ | 1,000.00 | | | $ | 1,177.20 | | | 0.58% | | $ | 3.16 | |
Hypothetical (5% return before expenses) | | $ | 1,000.00 | | | $ | 1,022.10 | | | 0.58% | | $ | 2.93 | |
WisdomTree Japan SmallCap Dividend Fund | | | | | | | | | | | | | | |
Actual | | $ | 1,000.00 | | | $ | 1,031.79 | | | 0.58% | | $ | 2.95 | |
Hypothetical (5% return before expenses) | | $ | 1,000.00 | | | $ | 1,022.10 | | | 0.58% | | $ | 2.93 | |
WisdomTree Asia Pacific ex-Japan Fund | | | | | | | | | | | | | | |
Actual | | $ | 1,000.00 | | | $ | 1,174.60 | | | 0.48% | | $ | 2.61 | |
Hypothetical (5% return before expenses) | | $ | 1,000.00 | | | $ | 1,022.60 | | | 0.48% | | $ | 2.43 | |
WisdomTree Australia Dividend Fund | | | | | | | | | | | | | | |
Actual | | $ | 1,000.00 | | | $ | 1,190.80 | | | 0.58% | | $ | 3.18 | |
Hypothetical (5% return before expenses) | | $ | 1,000.00 | | | $ | 1,022.10 | | | 0.58% | | $ | 2.93 | |
WisdomTree International LargeCap Dividend Fund | | | | | | | | | | | | | | |
Actual | | $ | 1,000.00 | | | $ | 1,125.60 | | | 0.48% | | $ | 2.55 | |
Hypothetical (5% return before expenses) | | $ | 1,000.00 | | | $ | 1,022.60 | | | 0.48% | | $ | 2.43 | |
WisdomTree International Dividend ex-Financials Fund | | | | | | | | | | | | | | |
Actual | | $ | 1,000.00 | | | $ | 1,094.05 | | | 0.58% | | $ | 3.04 | |
Hypothetical (5% return before expenses) | | $ | 1,000.00 | | | $ | 1,022.10 | | | 0.58% | | $ | 2.93 | |
WisdomTree International MidCap Dividend Fund | | | | | | | | | | | | | | |
Actual | | $ | 1,000.00 | | | $ | 1,115.21 | | | 0.58% | | $ | 3.07 | |
Hypothetical (5% return before expenses) | | $ | 1,000.00 | | | $ | 1,022.10 | | | 0.58% | | $ | 2.93 | |
WisdomTree International SmallCap Dividend Fund | | | | | | | | | | | | | | |
Actual | | $ | 1,000.00 | | | $ | 1,120.89 | | | 0.58% | | $ | 3.08 | |
Hypothetical (5% return before expenses) | | $ | 1,000.00 | | | $ | 1,022.10 | | | 0.58% | | $ | 2.93 | |
WisdomTree Emerging Markets Equity Income Fund | | | | | | | | | | | |
Actual | | $ | 1,000.00 | | | $ | 1,199.44 | | | 0.63% | | $ | 3.46 | |
Hypothetical (5% return before expenses) | | $ | 1,000.00 | | | $ | 1,021.85 | | | 0.63% | | $ | 3.18 | |
WisdomTree Emerging Markets SmallCap Dividend Fund | | | | | | | | | | | | | | |
Actual | | $ | 1,000.00 | | | $ | 1,206.51 | | | 0.63% | | $ | 3.48 | |
Hypothetical (5% return before expenses) | | $ | 1,000.00 | | | $ | 1,021.85 | | | 0.63% | | $ | 3.18 | |
WisdomTree Middle East Dividend Fund | | | | | | | | | | | | | | |
Actual | | $ | 1,000.00 | | | $ | 1,066.40 | | | 0.88% | | $ | 4.55 | |
Hypothetical (5% return before expenses) | | $ | 1,000.00 | | | $ | 1,020.60 | | | 0.88% | | $ | 4.45 | |
WisdomTree International Hedged Equity Fund | | | | | | | | | | | | | | |
Actual | | $ | 1,000.00 | | | $ | 1,116.27 | | | 0.58% | | $ | 3.07 | |
Hypothetical (5% return before expenses) | | $ | 1,000.00 | | | $ | 1,022.10 | | | 0.58% | | $ | 2.93 | |
| | |
| 30 | | WisdomTree International Dividend and Sector Funds |
Shareholder Expense Examples (unaudited) (concluded)
| | | | | | | | | | | | | | |
| | | Beginning
Account Value
10/01/11 | | | Ending
Account Value
3/31/12 | | | Annualized
Expense Ratio
Based on the
Period
10/01/11 to
3/31/12 | | Expenses Paid
During the
Period†
10/01/11 to
3/31/12 | |
WisdomTree Commodity Country Equity Fund | | | | | | | | | | | | | | |
Actual | | $ | 1,000.00 | | | $ | 1,208.16 | | | 0.58% | | $ | 3.20 | |
Hypothetical (5% return before expenses) | | $ | 1,000.00 | | | $ | 1,022.10 | | | 0.58% | | $ | 2.93 | |
WisdomTree Global Natural Resources Fund | | | | | | | | | | | | | | |
Actual | | $ | 1,000.00 | | | $ | 1,190.91 | | | 0.58% | | $ | 3.18 | |
Hypothetical (5% return before expenses) | | $ | 1,000.00 | | | $ | 1,022.10 | | | 0.58% | | $ | 2.93 | |
WisdomTree Global ex-U.S. Utilities Fund | | | | | | | | | | | | | | |
Actual | | $ | 1,000.00 | | | $ | 1,073.00 | | | 0.58% | | $ | 3.01 | |
Hypothetical (5% return before expenses) | | $ | 1,000.00 | | | $ | 1,022.10 | | | 0.58% | | $ | 2.93 | |
WisdomTree Global ex-U.S. Real Estate Fund | | | | | | | | | | | | | | |
Actual | | $ | 1,000.00 | | | $ | 1,166.59 | | | 0.58% | | $ | 3.14 | |
Hypothetical (5% return before expenses) | | $ | 1,000.00 | | | $ | 1,022.10 | | | 0.58% | | $ | 2.93 | |
| † | Expenses are calculated using each Fund’s annualized expense ratio, multiplied by the average account value for the period, multiplied by 183/366 (to reflect one-half year period). |
| | | | |
| WisdomTree International Dividend and Sector Funds | | | 31 | |
Schedule of Investments
WisdomTree DEFA Fund (DWM)
March 31, 2012
| | | | | | | | |
| Investments | | Shares | | | Value | |
| | | | | | | | |
| COMMON STOCKS – 99.2% | | | | | | | | |
| Australia – 12.4% | | | | | | | | |
Adelaide Brighton Ltd. | | | 56,548 | | | $ | 169,885 | |
AGL Energy Ltd. | | | 22,141 | | | | 338,320 | |
Alumina Ltd. | | | 91,077 | | | | 116,524 | |
Amalgamated Holdings Ltd. | | | 28,798 | | | | 184,966 | |
Amcor Ltd. | | | 65,727 | | | | 506,588 | |
AMP Ltd. | | | 137,923 | | | | 617,247 | |
APN News & Media Ltd. | | | 117,232 | | | | 109,909 | |
Australia & New Zealand Banking Group Ltd. | | | 175,019 | | | | 4,217,290 | |
Automotive Holdings Group | | | 58,063 | | | | 143,158 | |
Bank of Queensland Ltd.(a) | | | 23,999 | | | | 180,994 | |
Bank of Queensland Ltd. Placement Shares* | | | 4,828 | | | | 36,411 | |
Bendigo and Adelaide Bank Ltd. | | | 35,962 | | | | 288,725 | |
BHP Billiton Ltd. | | | 83,390 | | | | 2,989,883 | |
Billabong International Ltd.(a) | | | 22,271 | | | | 64,139 | |
Boral Ltd. | | | 33,914 | | | | 141,587 | |
Bradken Ltd. | | | 15,894 | | | | 141,273 | |
Brambles Ltd. | | | 60,355 | | | | 443,926 | |
Caltex Australia Ltd. | | | 18,221 | | | | 262,188 | |
Campbell Brothers Ltd. | | | 3,394 | | | | 236,382 | |
carsales.com Ltd.(a) | | | 26,443 | | | | 152,035 | |
Coca-Cola Amatil Ltd. | | | 37,659 | | | | 486,490 | |
Cochlear Ltd. | | | 2,449 | | | | 157,043 | |
Commonwealth Bank of Australia | | | 102,401 | | | | 5,314,722 | |
Computershare Ltd. | | | 24,081 | | | | 224,520 | |
Consolidated Media Holdings Ltd. | | | 71,709 | | | | 216,175 | |
Crown Ltd. | | | 39,400 | | | | 354,695 | |
CSL Ltd. | | | 16,790 | | | | 624,256 | |
CSR Ltd. | | | 95,882 | | | | 178,792 | |
David Jones Ltd.(a) | | | 55,111 | | | | 137,592 | |
Envestra Ltd.(b) | | | 291,956 | | | | 234,400 | |
Fleetwood Corp., Ltd. | | | 12,911 | | | | 163,845 | |
Flight Centre Ltd.(a) | | | 6,591 | | | | 150,215 | |
Fortescue Metals Group Ltd. | | | 21,271 | | | | 128,027 | |
GUD Holdings Ltd. | | | 15,854 | | | | 135,005 | |
GWA Group Ltd.(a) | | | 57,869 | | | | 128,891 | |
Harvey Norman Holdings Ltd.(a) | | | 78,317 | | | | 163,076 | |
Incitec Pivot Ltd. | | | 52,233 | | | | 170,449 | |
Insurance Australia Group Ltd. | | | 92,504 | | | | 325,820 | |
IOOF Holdings Ltd. | | | 31,197 | | | | 186,801 | |
Iress Market Technology Ltd. | | | 16,774 | | | | 121,639 | |
JB Hi-Fi Ltd.(a) | | | 8,827 | | | | 100,222 | |
Leighton Holdings Ltd. | | | 24,066 | | | | 531,532 | |
Lend Lease Group(b) | | | 28,442 | | | | 220,100 | |
Macquarie Group Ltd. | | | 22,405 | | | | 674,960 | |
Metcash Ltd. | | | 65,387 | | | | 291,272 | |
Monadelphous Group Ltd. | | | 8,330 | | | | 206,244 | |
Myer Holdings Ltd.(a) | | | 66,586 | | | | 161,413 | |
National Australia Bank Ltd. | | | 140,824 | | | | 3,588,809 | |
Navitas Ltd. | | | 29,660 | | | | 109,078 | |
New Hope Corp., Ltd.(a) | | | 31,613 | | | | 173,245 | |
Newcrest Mining Ltd. | | | 7,377 | | | | 226,820 | |
NIB Holdings Ltd. | | | 145,583 | | | | 223,963 | |
| | | | | | | | |
OneSteel Ltd. | | | 128,788 | | | $ | 165,438 | |
Orica Ltd. | | | 14,838 | | | | 429,939 | |
Origin Energy Ltd. | | | 33,335 | | | | 461,021 | |
OZ Minerals Ltd. | | | 20,469 | | | | 206,959 | |
Perpetual Ltd. | | | 6,212 | | | | 163,393 | |
Platinum Asset Management Ltd.(a) | | | 58,821 | | | | 247,398 | |
QBE Insurance Group Ltd. | | | 85,508 | | | | 1,255,207 | |
Ramsay Health Care Ltd. | | | 8,331 | | | | 168,726 | |
Rio Tinto Ltd. | | | 7,423 | | | | 502,916 | |
Santos Ltd. | | | 25,575 | | | | 377,280 | |
Seven West Media Ltd.(a) | | | 38,851 | | | | 157,368 | |
Sonic Healthcare Ltd. | | | 24,742 | | | | 320,906 | |
Suncorp Group Ltd. | | | 58,957 | | | | 513,042 | |
TABCORP Holdings Ltd. | | | 111,551 | | | | 314,326 | |
Tatts Group Ltd. | | | 84,757 | | | | 217,754 | |
Telstra Corp., Ltd. | | | 1,269,054 | | | | 4,325,284 | |
Toll Holdings Ltd. | | | 45,786 | | | | 278,426 | |
Transfield Services Ltd. | | | 37,714 | | | | 96,893 | |
UGL Ltd. | | | 12,797 | | | | 174,993 | |
Wesfarmers Ltd. | | | 53,497 | | | | 1,663,714 | |
Wesfarmers Ltd. PPS | | | 9,006 | | | | 288,290 | |
Westpac Banking Corp. | | | 228,736 | | | | 5,187,031 | |
Woodside Petroleum Ltd. | | | 22,062 | | | | 795,587 | |
Woolworths Ltd. | | | 58,858 | | | | 1,584,102 | |
WorleyParsons Ltd. | | | 8,149 | | | | 241,693 | |
Wotif.com Holdings Ltd.(a) | | | 21,959 | | | | 104,415 | |
| | | | | | | | |
| Total Australia | | | | 47,693,642 | |
| Austria – 0.5% | | | | | | | | |
Andritz AG(a) | | | 1,965 | | | | 192,020 | |
Bank Austria Creditanstalt AG*†(c) | | | 3,774 | | | | — | |
Oesterreichische Post AG | | | 5,303 | | | | 184,318 | |
OMV AG | | | 9,611 | | | | 341,093 | |
Strabag SE | | | 5,802 | | | | 176,513 | |
Telekom Austria AG | | | 32,950 | | | | 383,156 | |
Verbund AG(a) | | | 5,718 | | | | 173,690 | |
Vienna Insurance Group AG Wiener Versicherung Gruppe | | | 4,611 | | | | 203,065 | |
Voestalpine AG | | | 3,872 | | | | 130,017 | |
| | | | | | | | |
| Total Austria | | | | 1,783,872 | |
| Belgium – 1.3% | | | | | | | | |
Ageas | | | 100,421 | | | | 220,388 | |
Anheuser-Busch InBev N.V. | | | 26,484 | | | | 1,932,021 | |
Belgacom S.A. | | | 25,061 | | | | 804,474 | |
Colruyt S.A. | | | 4,352 | | | | 174,678 | |
Delhaize Group S.A. | | | 2,946 | | | | 154,770 | |
Elia System Operator S.A./N.V. | | | 6,590 | | | | 278,635 | |
EVS Broadcast Equipment S.A. | | | 1,985 | | | | 102,776 | |
KBC Groep N.V. | | | 8,888 | | | | 222,638 | |
Mobistar S.A. | | | 3,494 | | | | 173,788 | |
NV Bekaert S.A. | | | 2,460 | | | | 79,131 | |
Solvay S.A. | | | 1,548 | | | | 182,997 | |
Tessenderlo Chemie N.V. | | | 3,456 | | | | 115,197 | |
UCB S.A. | | | 5,787 | | | | 249,307 | |
See Notes to Financial Statements.
| | |
| 32 | | WisdomTree International Dividend and Sector Funds |
Schedule of Investments (continued)
WisdomTree DEFA Fund (DWM)
March 31, 2012
| | | | | | | | |
| Investments | | Shares | | | Value | |
| | | | | | | | |
Umicore S.A. | | | 3,400 | | | $ | 187,020 | |
| | | | | | | | |
| Total Belgium | | | | 4,877,820 | |
| Denmark – 0.4% | | | | | | | | |
Carlsberg A/S Class B(a) | | | 1,303 | | | | 107,523 | |
Coloplast A/S Class B | | | 937 | | | | 162,022 | |
D/S Norden | | | 4,181 | | | | 124,235 | |
FLSmidth & Co. A/S(a) | | | 1,757 | | | | 123,160 | |
H. Lundbeck A/S(a) | | | 7,380 | | | | 147,691 | |
Novo Nordisk A/S Class B | | | 6,311 | | | | 872,676 | |
Novozymes A/S Class B | | | 4,813 | | | | 139,999 | |
Pandora A/S(a) | | | 3,866 | | | | 44,670 | |
| | | | | | | | |
| Total Denmark | | | | 1,721,976 | |
| Finland – 1.4% | | | | | | | | |
Alma Media Oyj(a) | | | 20,215 | | | | 143,754 | |
Elisa Oyj(a) | | | 10,214 | | | | 244,428 | |
Fortum Oyj | | | 28,356 | | | | 687,263 | |
Kone Oyj Class B | | | 5,278 | | | | 293,589 | |
Metso Oyj(a) | | | 5,866 | | | | 250,367 | |
Nokia Oyj | | | 274,888 | | | | 1,494,291 | |
Nokian Renkaat Oyj | | | 3,150 | | | | 153,280 | |
Orion Oyj Class B | | | 9,624 | | | | 189,937 | |
Pohjola Bank PLC Class A(a) | | | 16,235 | | | | 179,555 | |
Sampo Oyj Class A | | | 21,711 | | | | 626,535 | |
Sanoma Oyj(a) | | | 15,524 | | | | 198,464 | |
Stora Enso Oyj Class R | | | 18,008 | | | | 133,575 | |
Tieto Oyj | | | 9,180 | | | | 172,250 | |
UPM-Kymmene Oyj(a) | | | 19,139 | | | | 260,226 | |
Wartsila Oyj Abp | | | 7,756 | | | | 292,095 | |
YIT Oyj | | | 6,459 | | | | 138,655 | |
| | | | | | | | |
| Total Finland | | | | 5,458,264 | |
| France – 10.2% | | | | | | | | |
Accor S.A. | | | 7,169 | | | | 255,572 | |
Aeroports de Paris | | | 2,618 | | | | 214,552 | |
Air Liquide S.A. | | | 5,702 | | | | 759,031 | |
Alstom S.A. | | | 7,385 | | | | 287,760 | |
Arkema S.A. | | | 1,577 | | | | 146,733 | |
AXA S.A. | | | 79,002 | | | | 1,307,722 | |
BNP Paribas S.A. | | | 37,911 | | | | 1,796,042 | |
Bourbon S.A. | | | 3,234 | | | | 96,126 | |
Bouygues S.A. | | | 15,614 | | | | 476,787 | |
Cap Gemini S.A. | | | 4,343 | | | | 194,097 | |
Carrefour S.A. | | | 19,726 | | | | 472,187 | |
Casino Guichard Perrachon S.A. | | | 3,661 | | | | 360,289 | |
Christian Dior S.A. | | | 3,154 | | | | 483,231 | |
Cie de Saint-Gobain | | | 10,230 | | | | 456,176 | |
Cie Generale des Etablissements Michelin | | | 4,331 | | | | 322,005 | |
Cie Generale d’Optique Essilor International S.A. | | | 3,134 | | | | 278,918 | |
CNP Assurances | | | 26,297 | | | | 409,731 | |
Danone | | | 13,302 | | | | 926,456 | |
Edenred | | | 6,359 | | | | 191,044 | |
EDF S.A. | | | 66,153 | | | | 1,507,321 | |
Eiffage S.A. | | | 2,561 | | | | 98,938 | |
Eutelsat Communications S.A. | | | 5,606 | | | | 206,944 | |
| | | | | | | | |
France Telecom S.A. | | | 205,172 | | | $ | 3,034,191 | |
GDF Suez | | | 108,636 | | | | 2,802,268 | |
Hermes International(a) | | | 1,019 | | | | 342,847 | |
ICADE | | | 2,197 | | | | 195,703 | |
Imerys S.A. | | | 2,542 | | | | 154,330 | |
Klepierre | | | 8,678 | | | | 300,469 | |
Lafarge S.A. | | | 10,401 | | | | 495,658 | |
Lagardere SCA | | | 6,327 | | | | 194,886 | |
Legrand S.A. | | | 8,230 | | | | 302,383 | |
L’Oreal S.A. | | | 9,923 | | | | 1,222,205 | |
LVMH Moet Hennessy Louis Vuitton S.A. | | | 6,956 | | | | 1,193,577 | |
M6-Metropole Television S.A. | | | 10,856 | | | | 195,891 | |
Natixis | | | 153,156 | | | | 588,418 | |
Neopost S.A. | | | 2,496 | | | | 160,280 | |
Nexity S.A. | | | 3,886 | | | | 122,751 | |
Pernod-Ricard S.A. | | | 4,317 | | | | 450,718 | |
PPR | | | 3,218 | | | | 552,818 | |
Rallye S.A. | | | 2,797 | | | | 104,945 | |
Rexel S.A. | | | 7,913 | | | | 174,136 | |
Safran S.A. | | | 6,603 | | | | 242,297 | |
Sanofi | | | 48,603 | | | | 3,768,914 | |
Schneider Electric S.A. | | | 12,614 | | | | 822,937 | |
SCOR SE | | | 10,689 | | | | 288,392 | |
Societe BIC S.A. | | | 2,292 | | | | 229,652 | |
Societe d’Edition de Canal+ | | | 26,630 | | | | 168,450 | |
Societe Generale S.A. | | | 26,019 | | | | 761,076 | |
Societe Television Francaise 1 | | | 11,016 | | | | 134,685 | |
Sodexo | | | 3,425 | | | | 280,780 | |
Suez Environnement Co. | | | 17,770 | | | | 272,140 | |
Technip S.A. | | | 2,197 | | | | 258,431 | |
Total S.A. | | | 109,502 | | | | 5,576,302 | |
Vallourec S.A. | | | 2,287 | | | | 144,666 | |
Veolia Environnement S.A. | | | 24,012 | | | | 397,631 | |
Vinci S.A. | | | 17,586 | | | | 915,694 | |
Vivendi S.A. | | | 72,682 | | | | 1,331,839 | |
| | | | | | | | |
| Total France | | | | 39,430,022 | |
| Germany – 7.5% | | | | | | | | |
Adidas AG | | | 3,148 | | | | 245,411 | |
Aixtron SE N.A. | | | 3,128 | | | | 54,402 | |
Allianz SE | | | 17,107 | | | | 2,038,251 | |
Axel Springer AG | | | 4,878 | | | | 246,005 | |
BASF SE | | | 25,193 | | | | 2,200,513 | |
Bayer AG | | | 17,557 | | | | 1,233,096 | |
Bayerische Motoren Werke AG | | | 10,058 | | | | 903,173 | |
Beiersdorf AG | | | 3,668 | | | | 238,983 | |
Bilfinger Berger SE | | | 2,117 | | | | 198,557 | |
Celesio AG | | | 6,539 | | | | 118,167 | |
Comdirect Bank AG | | | 17,217 | | | | 198,853 | |
Daimler AG(a) | | | 33,460 | | | | 2,014,498 | |
Deutsche Bank AG | | | 13,322 | | | | 661,824 | |
Deutsche Boerse AG | | | 7,557 | | | | 508,013 | |
Deutsche Lufthansa AG | | | 14,946 | | | | 208,888 | |
Deutsche Post AG | | | 51,435 | | | | 988,739 | |
Deutsche Telekom AG | | | 229,766 | | | | 2,762,075 | |
See Notes to Financial Statements.
| | | | |
| WisdomTree International Dividend and Sector Funds | | | 33 | |
Schedule of Investments (continued)
WisdomTree DEFA Fund (DWM)
March 31, 2012
| | | | | | | | |
| Investments | | Shares | | | Value | |
| | | | | | | | |
E.ON AG | | | 121,267 | | | $ | 2,900,383 | |
Fielmann AG | | | 1,643 | | | | 157,732 | |
Fraport AG Frankfurt Airport Services Worldwide | | | 2,637 | | | | 164,874 | |
Fresenius Medical Care AG & Co. KGaA | | | 3,614 | | | | 255,750 | |
Fresenius SE & Co. KGaA | | | 1,941 | | | | 198,748 | |
GEA Group AG | | | 4,988 | | | | 171,776 | |
Hannover Rueckversicherung AG | | | 7,293 | | | | 432,576 | |
Henkel AG & Co. KGaA | | | 4,415 | | | | 275,158 | |
Infineon Technologies AG | | | 15,921 | | | | 162,534 | |
K+S AG | | | 3,256 | | | | 170,080 | |
Linde AG | | | 2,804 | | | | 502,421 | |
Merck KGaA | | | 3,090 | | | | 341,459 | |
Metro AG | | | 8,080 | | | | 311,936 | |
MLP AG | | | 9,480 | | | | 84,079 | |
Muenchener Rueckversicherungs AG | | | 8,820 | | | | 1,327,839 | |
Rheinmetall AG | | | 3,275 | | | | 193,621 | |
RWE AG | | | 37,053 | | | | 1,766,743 | |
SAP AG | | | 14,376 | | | | 1,002,407 | |
Siemens AG | | | 20,707 | | | | 2,084,433 | |
SMA Solar Technology AG(a) | | | 1,477 | | | | 66,836 | |
Symrise AG | | | 4,499 | | | | 130,012 | |
ThyssenKrupp AG | | | 6,498 | | | | 161,515 | |
United Internet AG Registered Shares | | | 6,433 | | | | 121,049 | |
Volkswagen AG | | | 4,456 | | | | 717,427 | |
Wacker Chemie AG(a) | | | 1,109 | | | | 97,635 | |
Wincor Nixdorf AG | | | 1,768 | | | | 86,856 | |
| | | | | | | | |
| Total Germany | | | | 28,705,327 | |
| Hong Kong – 5.1% | | | | | | | | |
Bank of East Asia Ltd.(a) | | | 57,800 | | | | 217,383 | |
BOC Hong Kong Holdings Ltd. | | | 357,500 | | | | 987,684 | |
Cathay Pacific Airways Ltd. | | | 188,000 | | | | 348,202 | |
Cheung Kong Holdings Ltd. | | | 49,000 | | | | 633,011 | |
China Merchants Holdings International Co., Ltd. | | | 76,000 | | | | 254,508 | |
China Mobile Ltd. | | | 673,000 | | | | 7,406,987 | |
China Overseas Land & Investment Ltd. | | | 128,000 | | | | 243,339 | |
China Resources Enterprise Ltd. | | | 38,000 | | | | 132,638 | |
China Resources Power Holdings Co., Ltd. | | | 92,000 | | | | 170,397 | |
China Unicom Hong Kong Ltd. | | | 98,000 | | | | 166,110 | |
Citic Pacific Ltd. | | | 69,000 | | | | 116,244 | |
CLP Holdings Ltd. | | | 70,500 | | | | 608,385 | |
CNOOC Ltd. | | | 859,300 | | | | 1,766,413 | |
Fosun International Ltd. | | | 204,000 | | | | 121,391 | |
Guangdong Investment Ltd. | | | 250,000 | | | | 174,201 | |
Hang Lung Properties Ltd. | | | 84,000 | | | | 307,805 | |
Hang Seng Bank Ltd. | | | 64,200 | | | | 853,354 | |
Henderson Land Development Co., Ltd. | | | 45,000 | | | | 248,358 | |
HKT Trust and HKT Ltd.*(b) | | | 7,543 | | | | 5,868 | |
Hong Kong & China Gas Co., Ltd. | | | 122,260 | | | | 313,366 | |
Hong Kong Exchanges and Clearing Ltd. | | | 23,600 | | | | 396,677 | |
Hutchison Whampoa Ltd. | | | 79,000 | | | | 789,593 | |
Lenovo Group Ltd. | | | 162,000 | | | | 145,850 | |
MTR Corp., Ltd. | | | 110,500 | | | | 395,659 | |
New World Development Co., Ltd. | | | 118,000 | | | | 141,801 | |
PCCW Ltd. | | | 371,000 | | | | 132,841 | |
| | | | | | | | |
Power Assets Holdings Ltd. | | | 63,500 | | | $ | 466,190 | |
Shanghai Industrial Holdings Ltd. | | | 46,000 | | | | 141,899 | |
Shenzhen Investment Ltd. | | | 408,000 | | | | 88,810 | |
Shougang Fushan Resources Group Ltd. | | | 176,000 | | | | 59,619 | |
Sino Land Co., Ltd. | | | 160,400 | | | | 256,177 | |
Sino-Ocean Land Holdings Ltd.(a) | | | 228,000 | | | | 108,362 | |
Sinotruk Hong Kong Ltd.(a) | | | 119,000 | | | | 68,972 | |
SJM Holdings Ltd. | | | 91,000 | | | | 185,188 | |
Sun Hung Kai Properties Ltd. | | | 64,000 | | | | 795,466 | |
Television Broadcasts Ltd. | | | 24,000 | | | | 161,824 | |
Wharf Holdings Ltd. | | | 48,000 | | | | 260,896 | |
| | | | | | | | |
| Total Hong Kong | | | | 19,671,468 | |
| Ireland – 0.3% | | | | | | | | |
CRH PLC | | | 27,145 | | | | 553,080 | |
DCC PLC | | | 5,906 | | | | 146,014 | |
Dragon Oil PLC | | | 15,169 | | | | 151,234 | |
Kerry Group PLC Class A | | | 3,354 | | | | 154,988 | |
Paddy Power PLC | | | 2,408 | | | | 151,422 | |
| | | | | | | | |
| Total Ireland | | | | 1,156,738 | |
| Italy – 3.5% | | | | | | | | |
A2A SpA(a) | | | 180,376 | | | | 144,484 | |
ACEA SpA | | | 18,829 | | | | 119,556 | |
Assicurazioni Generali SpA(a) | | | 38,231 | | | | 592,618 | |
Atlantia SpA | | | 25,632 | | | | 424,970 | |
Banca Carige SpA(a) | | | 88,801 | | | | 116,364 | |
Banca Generali SpA | | | 14,431 | | | | 193,331 | |
Banca Monte dei Paschi di Siena SpA | | | 206,682 | | | | 87,003 | |
Credito Artigiano SpA | | | 79,060 | | | | 125,815 | |
Enel Green Power SpA | | | 66,575 | | | | 126,338 | |
Enel SpA | | | 398,602 | | | | 1,439,579 | |
ENI SpA | | | 195,281 | | | | 4,574,379 | |
ERG SpA | | | 14,447 | | | | 127,844 | |
Hera SpA | | | 88,225 | | | | 125,713 | |
Intesa Sanpaolo SpA | | | 447,215 | | | | 800,427 | |
Iren SpA | | | 116,760 | | | | 99,902 | |
Luxottica Group SpA | | | 9,045 | | | | 327,028 | |
MARR SpA | | | 12,446 | | | | 140,219 | |
Mediaset SpA | | | 106,822 | | | | 294,183 | |
Mediobanca SpA | | | 22,890 | | | | 134,245 | |
Mediolanum SpA | | | 43,723 | | | | 207,517 | |
Pirelli & C SpA | | | 17,385 | | | | 206,512 | |
Saipem SpA | | | 7,006 | | | | 361,347 | |
Snam SpA | | | 157,439 | | | | 756,039 | |
Societa Cattolica di Assicurazioni SCRL | | | 8,579 | | | | 173,312 | |
Telecom Italia SpA | | | 649,128 | | | | 770,651 | |
Telecom Italia SpA RSP | | | 489,354 | | | | 480,283 | |
Terna Rete Elettrica Nazionale SpA | | | 99,673 | | | | 400,062 | |
Unione di Banche Italiane SCPA | | | 24,891 | | | | 105,342 | |
| | | | | | | | |
| Total Italy | | | | 13,455,063 | |
| Japan – 14.4% | | | | | | | | |
Aeon Co., Ltd.(a) | | | 19,400 | | | | 256,482 | |
Aisin Seiki Co., Ltd. | | | 4,800 | | | | 169,498 | |
Ajinomoto Co., Inc. | | | 18,000 | | | | 227,037 | |
See Notes to Financial Statements.
| | |
| 34 | | WisdomTree International Dividend and Sector Funds |
Schedule of Investments (continued)
WisdomTree DEFA Fund (DWM)
March 31, 2012
| | | | | | | | |
| Investments | | Shares | | | Value | |
| | | | | | | | |
Asahi Glass Co., Ltd. | | | 28,000 | | | $ | 238,848 | |
Asahi Group Holdings Ltd. | | | 7,800 | | | | 173,733 | |
Asahi Kasei Corp. | | | 38,000 | | | | 235,956 | |
Astellas Pharma, Inc.(a) | | | 16,000 | | | | 661,036 | |
Azbil Corp. | | | 4,900 | | | | 108,962 | |
Bank of Saga Ltd. (The) | | | 81,000 | | | | 232,286 | |
Bank of Yokohama Ltd. (The) | | | 28,000 | | | | 140,859 | |
Bridgestone Corp. | | | 8,600 | | | | 209,631 | |
Brother Industries Ltd. | | | 9,900 | | | | 134,975 | |
Canon, Inc. | | | 34,100 | | | | 1,620,159 | |
Chiba Bank Ltd. (The) | | | 36,000 | | | | 230,974 | |
Chiyoda Co., Ltd. | | | 7,900 | | | | 159,354 | |
Chubu Electric Power Co., Inc.(a) | | | 25,100 | | | | 455,670 | |
Chugai Pharmaceutical Co., Ltd. | | | 15,800 | | | | 292,980 | |
Chugoku Electric Power Co., Inc. (The)(a) | | | 15,600 | | | | 291,357 | |
Circle K Sunkus Co., Ltd. | | | 8,000 | | | | 172,161 | |
Coca-Cola West Co., Ltd. | | | 6,900 | | | | 121,659 | |
Cosmo Oil Co., Ltd.(a) | | | 49,000 | | | | 136,946 | |
Dai Nippon Printing Co., Ltd.(a) | | | 31,000 | | | | 318,683 | |
Daihatsu Motor Co., Ltd.(a) | | | 13,000 | | | | 239,480 | |
Dai-ichi Life Insurance Co., Ltd. (The) | | | 83 | | | | 115,279 | |
Daiichi Sankyo Co., Ltd.(a) | | | 22,200 | | | | 406,800 | |
Daikin Industries Ltd.(a) | | | 4,900 | | | | 134,148 | |
Dainippon Sumitomo Pharma Co., Ltd.(a) | | | 16,000 | | | | 170,509 | |
Daishi Bank Ltd. (The) | | | 65,000 | | | | 229,844 | |
Daito Trust Construction Co., Ltd. | | | 4,600 | | | | 415,311 | |
Daiwa House Industry Co., Ltd. | | | 15,000 | | | | 199,405 | |
Daiwa Securities Group, Inc. | | | 45,000 | | | | 178,808 | |
Denso Corp. | | | 10,800 | | | | 362,865 | |
East Japan Railway Co. | | | 7,700 | | | | 487,478 | |
Eisai Co., Ltd.(a) | | | 12,200 | | | | 487,733 | |
Electric Power Development Co., Ltd.(a) | | | 6,400 | | | | 174,514 | |
Ezaki Glico Co., Ltd. | | | 15,000 | | | | 180,995 | |
FANUC Corp. | | | 3,300 | | | | 588,663 | |
Fast Retailing Co., Ltd. | | | 1,700 | | | | 389,598 | |
Fuji Heavy Industries Ltd. | | | 20,000 | | | | 161,614 | |
FUJIFILM Holdings Corp. | | | 6,700 | | | | 158,025 | |
Fujitsu Ltd. | | | 65,000 | | | | 344,371 | |
Hakuhodo DY Holdings, Inc.(a) | | | 3,030 | | | | 191,458 | |
Hirose Electric Co., Ltd. | | | 400 | | | | 42,238 | |
Hisamitsu Pharmaceutical Co., Inc.(a) | | | 3,800 | | | | 181,238 | |
Hitachi Chemical Co., Ltd. | | | 6,900 | | | | 124,929 | |
Hitachi Ltd. | | | 48,000 | | | | 309,715 | |
Hokkaido Electric Power Co., Inc. | | | 11,800 | | | | 174,215 | |
Hokuhoku Financial Group, Inc. | | | 99,000 | | | | 190,072 | |
Hokuriku Electric Power Co. | | | 10,000 | | | | 181,785 | |
Honda Motor Co., Ltd. | | | 23,700 | | | | 905,723 | |
Hoya Corp. | | | 9,600 | | | | 216,859 | |
Ibiden Co., Ltd. | | | 4,100 | | | | 105,471 | |
Idemitsu Kosan Co., Ltd. | | | 1,400 | | | | 140,349 | |
Isuzu Motors Ltd. | | | 29,000 | | | | 170,910 | |
Ito En Ltd. | | | 8,200 | | | | 147,968 | |
ITOCHU Corp. | | | 31,700 | | | | 347,835 | |
Itochu Enex Co., Ltd. | | | 28,100 | | | | 166,971 | |
| | | | | | | | |
Itochu Techno-Solutions Corp.(a) | | | 6,500 | | | $ | 292,636 | |
Japan Tobacco, Inc. | | | 145 | | | | 821,071 | |
JFE Holdings, Inc. | | | 11,100 | | | | 239,818 | |
JGC Corp. | | | 6,000 | | | | 187,010 | |
Joyo Bank Ltd. (The) | | | 23,000 | | | | 105,924 | |
JS Group Corp. | | | 7,400 | | | | 155,832 | |
JSR Corp. | | | 7,100 | | | | 143,734 | |
Juroku Bank Ltd. (The) | | | 65,000 | | | | 225,105 | |
JX Holdings, Inc. | | | 65,679 | | | | 409,421 | |
Kajima Corp.(a) | | | 49,000 | | | | 150,046 | |
Kaneka Corp. | | | 28,000 | | | | 169,779 | |
Kansai Electric Power Co., Inc. (The)(a) | | | 31,600 | | | | 492,268 | |
Kao Corp.(a) | | | 13,800 | | | | 364,221 | |
Kawasaki Kisen Kaisha Ltd.*(a) | | | 42,000 | | | | 92,885 | |
KDDI Corp.(a) | | | 74 | | | | 481,973 | |
Kewpie Corp. | | | 13,500 | | | | 199,970 | |
Kintetsu Corp.(a) | | | 64,000 | | | | 244,972 | |
Kirin Holdings Co., Ltd. | | | 24,000 | | | | 312,340 | |
Kobe Steel Ltd. | | | 88,000 | | | | 143,289 | |
Kokuyo Co., Ltd. | | | 25,300 | | | | 189,992 | |
Komatsu Ltd. | | | 12,200 | | | | 349,715 | |
Konami Corp.(a) | | | 5,000 | | | | 142,536 | |
Konica Minolta Holdings, Inc. | | | 17,500 | | | | 153,746 | |
Kubota Corp. | | | 31,000 | | | | 299,471 | |
Kuraray Co., Ltd. | | | 10,900 | | | | 155,099 | |
Kyocera Corp. | | | 3,200 | | | | 294,744 | |
Kyowa Hakko Kirin Co., Ltd. | | | 22,000 | | | | 245,944 | |
Kyushu Electric Power Co., Inc. | | | 16,100 | | | | 230,657 | |
Lawson, Inc. | | | 4,800 | | | | 303,882 | |
Lion Corp. | | | 33,000 | | | | 190,072 | |
Makita Corp. | | | 4,000 | | | | 161,371 | |
Marubeni Corp. | | | 42,000 | | | | 304,684 | |
Marui Group Co., Ltd. | | | 15,800 | | | | 132,475 | |
Medipal Holdings Corp. | | | 13,600 | | | | 177,158 | |
MEIJI Holdings Co., Ltd. | | | 4,300 | | | | 188,888 | |
Mitsubishi Chemical Holdings Corp. | | | 24,400 | | | | 131,050 | |
Mitsubishi Corp.(a) | | | 33,400 | | | | 779,245 | |
Mitsubishi Electric Corp. | | | 29,000 | | | | 257,950 | |
Mitsubishi Estate Co., Ltd. | | | 14,000 | | | | 251,097 | |
Mitsubishi Heavy Industries Ltd. | | | 39,000 | | | | 190,036 | |
Mitsubishi Tanabe Pharma Corp. | | | 13,700 | | | | 193,277 | |
Mitsubishi UFJ Financial Group, Inc.(a) | | | 361,900 | | | | 1,811,809 | |
Mitsui & Co., Ltd.(a) | | | 50,500 | | | | 832,718 | |
Mitsui Chemicals, Inc. | | | 40,000 | | | | 122,000 | |
Mitsui Fudosan Co., Ltd. | | | 17,000 | | | | 327,006 | |
Mitsui O.S.K. Lines Ltd.(a) | | | 39,000 | | | | 170,606 | |
Mizuho Financial Group, Inc.(a) | | | 823,200 | | | | 1,350,410 | |
MS&AD Insurance Group Holdings(a) | | | 11,530 | | | | 238,040 | |
Murata Manufacturing Co., Ltd. | | | 1,400 | | | | 83,444 | |
Nagase & Co., Ltd. | | | 14,900 | | | | 185,401 | |
Namco Bandai Holdings, Inc. | | | 13,100 | | | | 190,065 | |
NEC Fielding Ltd. | | | 6,600 | | | | 86,535 | |
Nintendo Co., Ltd. | | | 4,700 | | | | 711,040 | |
Nippon Electric Glass Co., Ltd. | | | 10,000 | | | | 87,369 | |
See Notes to Financial Statements.
| | | | |
| WisdomTree International Dividend and Sector Funds | | | 35 | |
Schedule of Investments (continued)
WisdomTree DEFA Fund (DWM)
March 31, 2012
| | | | | | | | |
| Investments | | Shares | | | Value | |
| | | | | | | | |
Nippon Express Co., Ltd. | | | 64,000 | | | $ | 251,194 | |
Nippon Steel Corp.(a) | | | 94,000 | | | | 259,287 | |
Nippon Telegraph & Telephone Corp.(a) | | | 36,200 | | | | 1,651,753 | |
Nippon Yusen K.K.(a) | | | 49,000 | | | | 154,809 | |
Nissan Chemical Industries Ltd. | | | 11,900 | | | | 112,356 | |
Nissan Motor Co., Ltd. | | | 47,900 | | | | 512,788 | |
Nisshin Seifun Group, Inc. | | | 12,500 | | | | 152,044 | |
Nissin Foods Holdings Co., Ltd.(a) | | | 4,900 | | | | 184,282 | |
Nitto Denko Corp. | | | 3,700 | | | | 149,942 | |
NKSJ Holdings, Inc.(a) | | | 15,319 | | | | 344,373 | |
Nomura Holdings, Inc. | | | 67,600 | | | | 300,645 | |
Nomura Research Institute Ltd. | | | 9,300 | | | | 232,006 | |
NSK Ltd. | | | 14,000 | | | | 108,366 | |
NTN Corp. | | | 25,000 | | | | 106,325 | |
NTT DoCoMo, Inc.(a) | | | 1,218 | | | | 2,033,577 | |
OJI Paper Co., Ltd.(a) | | | 44,000 | | | | 213,865 | |
Oracle Corp. | | | 6,600 | | | | 252,227 | |
Oriental Land Co., Ltd. | | | 1,900 | | | | 204,788 | |
Osaka Gas Co., Ltd. | | | 49,000 | | | | 197,679 | |
Otsuka Corp. | | | 2,300 | | | | 188,092 | |
Otsuka Holdings Co., Ltd. | | | 8,848 | | | | 263,413 | |
Panasonic Corp. | | | 23,300 | | | | 215,460 | |
Park24 Co., Ltd. | | | 17,300 | | | | 234,395 | |
Resona Holdings, Inc. | | | 73,600 | | | | 340,745 | |
Ricoh Co., Ltd.(a) | | | 29,000 | | | | 283,675 | |
Ryosan Co., Ltd. | | | 4,900 | | | | 99,078 | |
Saibu Gas Co., Ltd. | | | 49,000 | | | | 132,778 | |
Sankyo Co., Ltd. | | | 4,400 | | | | 217,073 | |
Secom Co., Ltd. | | | 6,500 | | | | 319,886 | |
Sega Sammy Holdings, Inc. | | | 7,900 | | | | 166,457 | |
Sekisui House Ltd. | | | 23,000 | | | | 226,660 | |
Seven & I Holdings Co., Ltd. | | | 19,600 | | | | 585,416 | |
Sharp Corp.(a) | | | 28,000 | | | | 205,505 | |
Shikoku Electric Power Co., Inc.(a) | | | 9,300 | | | | 263,648 | |
Shin-Etsu Chemical Co., Ltd. | | | 8,700 | | | | 505,328 | |
Shionogi & Co., Ltd.(a) | | | 11,200 | | | | 155,694 | |
Shiseido Co., Ltd. | | | 14,300 | | | | 248,137 | |
Shizuoka Bank Ltd. (The) | | | 23,000 | | | | 238,119 | |
Showa Shell Sekiyu K.K. | | | 14,800 | | | | 94,956 | |
SMC Corp. | | | 1,000 | | | | 159,912 | |
Sony Corp. | | | 4,900 | | | | 101,459 | |
Sony Financial Holdings, Inc. | | | 9,252 | | | | 165,264 | |
Sumitomo Bakelite Co., Ltd.(a) | | | 21,000 | | | | 111,258 | |
Sumitomo Chemical Co., Ltd.(a) | | | 45,000 | | | | 192,478 | |
Sumitomo Corp. | | | 33,800 | | | | 491,218 | |
Sumitomo Electric Industries Ltd. | | | 15,600 | | | | 214,774 | |
Sumitomo Metal Industries Ltd. | | | 154,000 | | | | 312,510 | |
Sumitomo Metal Mining Co., Ltd. | | | 17,000 | | | | 240,245 | |
Sumitomo Mitsui Financial Group, Inc.(a) | | | 47,600 | | | | 1,575,002 | |
Sumitomo Mitsui Trust Holdings, Inc. | | | 64,070 | | | | 205,535 | |
Sumitomo Realty & Development Co., Ltd. | | | 8,000 | | | | 193,936 | |
Suzuken Co., Ltd. | | | 6,500 | | | | 201,568 | |
T&D Holdings, Inc. | | | 19,000 | | | | 221,411 | |
Taisei Corp. | | | 64,000 | | | | 167,981 | |
| | | | | | | | |
Takeda Pharmaceutical Co., Ltd.(a) | | | 29,900 | | | $ | 1,324,327 | |
TDK Corp.(a) | | | 3,200 | | | | 182,368 | |
Tokio Marine Holdings, Inc. | | | 11,700 | | | | 322,871 | |
Tokyo Electron Ltd. | | | 4,700 | | | | 270,423 | |
Tokyo Gas Co., Ltd. | | | 49,000 | | | | 232,213 | |
TonenGeneral Sekiyu K.K. | | | 26,000 | | | | 240,744 | |
Toppan Forms Co., Ltd. | | | 21,900 | | | | 201,982 | |
Toppan Printing Co., Ltd.(a) | | | 36,000 | | | | 282,593 | |
Toshiba Corp. | | | 49,000 | | | | 216,732 | |
Toyota Motor Corp. | | | 40,900 | | | | 1,774,263 | |
Toyota Tsusho Corp.(a) | | | 10,200 | | | | 208,846 | |
Trend Micro, Inc. | | | 6,400 | | | | 197,767 | |
USS Co., Ltd.(a) | | | 2,060 | | | | 210,018 | |
Yahoo! Japan Corp.(a) | | | 761 | | | | 247,641 | |
Yamato Holdings Co., Ltd. | | | 12,800 | | | | 198,933 | |
| | | | | | | | |
| Total Japan | | | | 55,437,341 | |
| Netherlands – 1.9% | | | | | | | | |
Akzo Nobel N.V. | | | 5,663 | | | | 333,858 | |
ASML Holding N.V. | | | 6,422 | | | | 320,536 | |
European Aeronautic Defence and Space Co. N.V. | | | 7,541 | | | | 308,350 | |
Exact Holding N.V.(a) | | | 3,013 | | | | 71,020 | |
Fugro N.V. CVA | | | 2,595 | | | | 184,607 | |
Heineken Holding N.V. | | | 5,613 | | | | 262,367 | |
Heineken N.V. | | | 8,397 | | | | 466,022 | |
Koninklijke Ahold N.V. | | | 26,513 | | | | 366,843 | |
Koninklijke Boskalis Westminster N.V. | | | 4,438 | | | | 166,457 | |
Koninklijke DSM N.V. | | | 4,700 | | | | 271,546 | |
Koninklijke KPN N.V. | | | 102,596 | | | | 1,126,900 | |
Koninklijke Philips Electronics N.V. | | | 32,822 | | | | 664,378 | |
PostNL N.V. | | | 31,052 | | | | 191,459 | |
Randstad Holding N.V. | | | 6,065 | | | | 228,492 | |
Reed Elsevier N.V. | | | 19,071 | | | | 243,200 | |
STMicroelectronics N.V. | | | 27,264 | | | | 222,928 | |
Unilever N.V. CVA | | | 51,458 | | | | 1,748,456 | |
Wolters Kluwer N.V. | | | 12,613 | | | | 238,514 | |
| | | | | | | | |
| Total Netherlands | | | | 7,415,933 | |
| New Zealand – 0.3% | | | | | | | | |
Auckland International Airport Ltd. | | | 141,721 | | | | 285,688 | |
Telecom Corp. of New Zealand Ltd. | | | 145,557 | | | | 289,246 | |
Vector Ltd. | | | 115,960 | | | | 246,111 | |
Warehouse Group Ltd. (The) | | | 71,662 | | | | 163,838 | |
| | | | | | | | |
| Total New Zealand | | | | 984,883 | |
| Norway – 2.0% | | | | | | | | |
ABG Sundal Collier Holding ASA | | | 171,468 | | | | 148,500 | |
Aker ASA Class A | | | 7,383 | | | | 241,395 | |
Aker Solutions ASA | | | 7,949 | | | | 134,271 | |
DNB ASA | | | 66,112 | | | | 848,414 | |
Fred Olsen Energy ASA | | | 7,460 | | | | 292,041 | |
Gjensidige Forsikring ASA | | | 31,211 | | | | 367,974 | |
Marine Harvest ASA | | | 672,830 | | | | 346,792 | |
Norsk Hydro ASA | | | 36,512 | | | | 198,497 | |
Orkla ASA | | | 46,797 | | | | 369,680 | |
SpareBank 1 SMN | | | 37,676 | | | | 241,748 | |
See Notes to Financial Statements.
| | |
| 36 | | WisdomTree International Dividend and Sector Funds |
Schedule of Investments (continued)
WisdomTree DEFA Fund (DWM)
March 31, 2012
| | | | | | | | |
| Investments | | Shares | | | Value | |
| | | | | | | | |
Statoil ASA | | | 115,526 | | | $ | 3,131,165 | |
Telenor ASA | | | 57,465 | | | | 1,063,859 | |
Veidekke ASA | | | 18,110 | | | | 153,667 | |
Yara International ASA | | | 4,177 | | | | 198,889 | |
| | | | | | | | |
| Total Norway | | | | 7,736,892 | |
| Portugal – 0.4% | | | | | | | | |
Banco Espirito Santo S.A. | | | 66,688 | | | | 121,668 | |
Brisa Auto-Estradas de Portugal S.A. | | | 47,465 | | | | 168,768 | |
Cimpor Cimentos de Portugal, SGPS, S.A. | | | 28,818 | | | | 191,885 | |
EDP-Energias de Portugal S.A. | | | 196,323 | | | | 570,208 | |
Mota-Engil, SGPS, S.A. | | | 59,405 | | | | 96,276 | |
Portugal Telecom, SGPS, S.A. | | | 67,157 | | | | 364,797 | |
Sonae | | | 183,538 | | | | 109,010 | |
Zon Multimedia Servicos de Telecomunicacoes e Multimedia, SGPS, S.A.(a) | | | 28,909 | | | | 98,170 | |
| | | | | | | | |
| Total Portugal | | | | 1,720,782 | |
| Singapore – 2.2% | | | | | | | | |
Cityspring Infrastructure Trust | | | 393,000 | | | | 120,336 | |
DBS Group Holdings Ltd. | | | 48,000 | | | | 541,329 | |
Fraser and Neave Ltd. | | | 49,000 | | | | 261,105 | |
Jardine Cycle & Carriage Ltd. | | | 11,000 | | | | 422,468 | |
Keppel Corp., Ltd. | | | 49,100 | | | | 429,164 | |
Keppel Land Ltd.(a) | | | 81,000 | | | | 223,542 | |
M1 Ltd. | | | 88,000 | | | | 177,771 | |
Oversea-Chinese Banking Corp., Ltd. | | | 94,000 | | | | 666,863 | |
Sakari Resources Ltd. | | | 49,000 | | | | 90,802 | |
SATS Ltd. | | | 79,000 | | | | 156,448 | |
SembCorp Industries Ltd. | | | 49,000 | | | | 205,766 | |
SembCorp Marine Ltd.(a) | | | 94,000 | | | | 394,735 | |
SIA Engineering Co., Ltd. | | | 97,000 | | | | 310,900 | |
Singapore Airlines Ltd. | | | 30,000 | | | | 256,969 | |
Singapore Exchange Ltd. | | | 48,000 | | | | 264,938 | |
Singapore Press Holdings Ltd. | | | 117,000 | | | | 364,767 | |
Singapore Technologies Engineering Ltd. | | | 152,000 | | | | 392,890 | |
Singapore Telecommunications Ltd. | | | 562,000 | | | | 1,407,961 | |
StarHub Ltd. | | | 122,000 | | | | 300,791 | |
United Overseas Bank Ltd. | | | 48,000 | | | | 700,521 | |
UOB-Kay Hian Holdings Ltd. | | | 172,000 | | | | 231,185 | |
Venture Corp., Ltd. | | | 28,000 | | | | 189,732 | |
Wilmar International Ltd. | | | 48,000 | | | | 187,060 | |
Yangzijiang Shipbuilding Holdings Ltd. | | | 136,000 | | | | 143,858 | |
| | | | | | | | |
| Total Singapore | | | | 8,441,901 | |
| Spain – 5.3% | | | | | | | | |
Abertis Infraestructuras, S.A. | | | 13,915 | | | | 236,543 | |
Acciona S.A. | | | 2,517 | | | | 175,505 | |
Acerinox S.A. | | | 14,005 | | | | 179,734 | |
ACS Actividades de Construccion y Servicios, S.A. | | | 17,379 | | | | 444,126 | |
Antena 3 de Television S.A. | | | 22,457 | | | | 133,979 | |
Banco Bilbao Vizcaya Argentaria S.A.(a) | | | 183,373 | | | | 1,457,128 | |
Banco de Sabadell S.A. | | | 66,699 | | | | 181,377 | |
Banco Espanol de Credito S.A.(a) | | | 43,464 | | | | 208,024 | |
Banco Popular Espanol S.A.(a) | | | 41,799 | | | | 149,735 | |
Banco Popular Espanol S.A. Temp Line*(a) | | | 504 | | | | 1,806 | |
| | | | | | | | |
Banco Santander S.A. | | | 535,612 | | | $ | 4,115,593 | |
Bolsas y Mercados Espanoles S.A. | | | 8,942 | | | | 228,873 | |
CaixaBank(a) | | | 174,857 | | | | 679,710 | |
Duro Felguera S.A. | | | 18,869 | | | | 122,373 | |
Enagas S.A. | | | 11,376 | | | | 218,606 | |
Endesa S.A. | | | 38,840 | | | | 772,745 | |
Ferrovial S.A. | | | 32,770 | | | | 376,088 | |
Fomento de Construcciones y Contratas S.A.(a) | | | 9,124 | | | | 203,520 | |
Gas Natural SDG S.A. | | | 44,490 | | | | 709,783 | |
Iberdrola S.A. | | | 236,344 | | | | 1,339,845 | |
Inditex S.A. | | | 11,422 | | | | 1,092,431 | |
Indra Sistemas S.A.(a) | | | 11,162 | | | | 136,574 | |
Mapfre S.A.(a) | | | 157,455 | | | | 506,174 | |
Mediaset Espana Comunicacion S.A. | | | 25,367 | | | | 145,259 | |
Red Electrica Corp. S.A. | | | 4,677 | | | | 228,519 | |
Repsol YPF S.A. | | | 38,651 | | | | 968,179 | |
Tecnicas Reunidas S.A. | | | 2,769 | | | | 115,178 | |
Telefonica S.A. | | | 305,363 | | | | 4,995,718 | |
Zardoya Otis S.A. | | | 21,632 | | | | 279,719 | |
| | | | | | | | |
| Total Spain | | | | 20,402,844 | |
| Sweden – 3.5% | | | | | | | | |
Alfa Laval AB | | | 12,164 | | | | 249,500 | |
Assa Abloy AB Class B | | | 9,519 | | | | 298,107 | |
Atlas Copco AB Class A | | | 27,703 | | | | 668,427 | |
Axis Communications AB | | | 4,355 | | | | 117,484 | |
Billerud AB | | | 14,523 | | | | 134,060 | |
Boliden AB | | | 12,989 | | | | 203,389 | |
Electrolux AB Series B(a) | | | 11,670 | | | | 246,051 | |
Fabege AB | | | 18,401 | | | | 158,210 | |
Hennes & Mauritz AB Class B | | | 57,054 | | | | 2,058,479 | |
Husqvarna AB Class B(a) | | | 23,752 | | | | 142,862 | |
Intrum Justitia AB | | | 11,225 | | | | 186,087 | |
Kinnevik Investment AB Class B | | | 9,776 | | | | 226,744 | |
NCC AB Class B | | | 7,985 | | | | 167,875 | |
Nordea Bank AB(a) | | | 121,827 | | | | 1,104,372 | |
Peab AB | | | 29,275 | | | | 149,125 | |
Ratos AB Class B(a) | | | 14,270 | | | | 197,533 | |
Sandvik AB | | | 29,835 | | | | 429,403 | |
Scania AB Class B | | | 23,707 | | | | 491,622 | |
Securitas AB Class B | | | 21,891 | | | | 210,486 | |
Skandinaviska Enskilda Banken AB Class A(a) | | | 58,123 | | | | 411,701 | |
Skanska AB Class B | | | 21,768 | | | | 376,286 | |
SKF AB Class B | | | 11,516 | | | | 280,292 | |
SSAB AB Class B(a) | | | 11,638 | | | | 94,976 | |
Svenska Cellulosa AB Class B(a) | | | 25,164 | | | | 434,611 | |
Svenska Handelsbanken AB Class A(a) | | | 23,479 | | | | 746,264 | |
Swedbank AB Class A(a) | | | 16,534 | | | | 256,157 | |
Swedish Match AB | | | 6,713 | | | | 266,482 | |
Tele2 AB Class B | | | 18,656 | | | | 379,567 | |
Telefonaktiebolaget LM Ericsson Class B | | | 69,590 | | | | 718,936 | |
TeliaSonera AB | | | 199,903 | | | | 1,390,058 | |
Volvo AB Class A | | | 44,519 | | | | 645,777 | |
| | | | | | | | |
| Total Sweden | | | | 13,440,923 | |
See Notes to Financial Statements.
| | | | |
| WisdomTree International Dividend and Sector Funds | | | 37 | |
Schedule of Investments (continued)
WisdomTree DEFA Fund (DWM)
March 31, 2012
| | | | | | | | |
| Investments | | Shares | | | Value | |
| | | | | | | | |
| Switzerland – 7.0% | | | | | | | | |
ABB Ltd.* | | | 51,359 | | | $ | 1,052,352 | |
Actelion Ltd.* | | | 2,977 | | | | 108,692 | |
Adecco S.A.* | | | 4,101 | | | | 214,612 | |
Baloise Holding AG | | | 2,772 | | | | 222,962 | |
Bank Sarasin & Cie AG Class B | | | 2,198 | | | | 68,821 | |
Cie Financiere Richemont S.A. Class A | | | 3,652 | | | | 228,692 | |
Credit Suisse Group AG | | | 33,397 | | | | 950,716 | |
GAM Holding AG* | | | 10,468 | | | | 152,298 | |
Geberit AG* | | | 1,378 | | | | 287,995 | |
Holcim Ltd.* | | | 6,150 | | | | 400,769 | |
Kuehne + Nagel International AG | | | 2,611 | | | | 352,717 | |
Lonza Group AG* | | | 1,818 | | | | 93,852 | |
Nestle S.A. | | | 94,624 | | | | 5,946,388 | |
Novartis AG | | | 88,977 | | | | 4,918,173 | |
Partners Group Holding AG | | | 1,363 | | | | 265,558 | |
Roche Holding AG - Genusschein | | | 29,991 | | | | 5,212,797 | |
Schindler Holding AG Participating Shares | | | 2,269 | | | | 272,626 | |
SGS S.A. | | | 293 | | | | 569,240 | |
Sulzer AG | | | 1,123 | | | | 159,408 | |
Swatch Group AG (The) | | | 3,649 | | | | 292,897 | |
Swiss Re AG* | | | 16,179 | | | | 1,031,940 | |
Swisscom AG(a) | | | 2,675 | | | | 1,079,944 | |
Syngenta AG* | | | 1,898 | | | | 655,381 | |
Vontobel Holding AG | | | 7,639 | | | | 193,542 | |
Zurich Financial Services AG* | | | 8,700 | | | | 2,335,144 | |
| | | | | | | | |
| Total Switzerland | | | | 27,067,516 | |
| United Kingdom – 19.6% | | | | | | | | |
Aberdeen Asset Management PLC | | | 55,683 | | | | 228,647 | |
Admiral Group PLC | | | 11,869 | | | | 225,099 | |
AMEC PLC | | | 10,319 | | | | 182,678 | |
Amlin PLC | | | 36,529 | | | | 192,485 | |
Anglo American PLC | | | 15,553 | | | | 580,740 | |
Antofagasta PLC | | | 46,126 | | | | 848,999 | |
Ashmore Group PLC | | | 36,228 | | | | 212,721 | |
Associated British Foods PLC | | | 18,233 | | | | 355,408 | |
AstraZeneca PLC | | | 64,231 | | | | 2,851,952 | |
Aviva PLC | | | 149,333 | | | | 790,949 | |
BAE Systems PLC | | | 170,031 | | | | 814,730 | |
Balfour Beatty PLC | | | 41,749 | | | | 190,441 | |
Barclays PLC | | | 222,522 | | | | 836,395 | |
Berendsen PLC | | | 23,482 | | | | 195,846 | |
BG Group PLC | | | 30,960 | | | | 716,273 | |
BHP Billiton PLC | | | 42,719 | | | | 1,301,951 | |
BP PLC | | | 320,026 | | | | 2,365,118 | |
British American Tobacco PLC | | | 73,925 | | | | 3,721,172 | |
British Land Co. PLC | | | 25,059 | | | | 192,143 | |
British Sky Broadcasting Group PLC | | | 38,487 | | | | 415,690 | |
BT Group PLC | | | 244,414 | | | | 884,120 | |
Burberry Group PLC | | | 6,595 | | | | 157,741 | |
Cable & Wireless Communications PLC | | | 362,044 | | | | 186,783 | |
Cable & Wireless Worldwide PLC | | | 251,071 | | | | 136,391 | |
Capita PLC | | | 18,742 | | | | 219,347 | |
Carillion PLC | | | 31,160 | | | | 148,561 | |
| | | | | | | | |
Carnival PLC | | | 4,101 | | | $ | 130,916 | |
Centrica PLC | | | 196,677 | | | | 994,258 | |
Close Brothers Group PLC | | | 16,482 | | | | 206,723 | |
Compass Group PLC | | | 49,345 | | | | 516,803 | |
Cookson Group PLC | | | 20,440 | | | | 225,667 | |
Croda International PLC | | | 14,835 | | | | 499,177 | |
Daily Mail & General Trust PLC Class A | | | 21,018 | | | | 151,621 | |
De La Rue PLC | | | 9,065 | | | | 130,352 | |
Diageo PLC | | | 66,993 | | | | 1,608,247 | |
Drax Group PLC | | | 27,437 | | | | 238,695 | |
DS Smith PLC | | | 72,548 | | | | 207,601 | |
Electrocomponents PLC | | | 32,922 | | | | 130,346 | |
Eurasian Natural Resources Corp. PLC | | | 30,578 | | | | 289,472 | |
Fidessa Group PLC | | | 3,901 | | | | 103,153 | |
Firstgroup PLC | | | 38,150 | | | | 144,888 | |
Fresnillo PLC | | | 15,279 | | | | 390,104 | |
G4S PLC | | | 48,313 | | | | 210,349 | |
GKN PLC | | | 51,141 | | | | 168,405 | |
GlaxoSmithKline PLC | | | 232,017 | | | | 5,176,899 | |
Halfords Group PLC | | | 20,332 | | | | 100,900 | |
Hammerson PLC | | | 29,664 | | | | 196,976 | |
Hays PLC | | | 118,237 | | | | 159,348 | |
Home Retail Group PLC(a) | | | 81,229 | | | | 147,953 | |
HSBC Holdings PLC | | | 555,132 | | | | 4,920,867 | |
ICAP PLC | | | 30,126 | | | | 189,070 | |
IG Group Holdings PLC | | | 23,875 | | | | 171,658 | |
IMI PLC | | | 11,248 | | | | 174,773 | |
Imperial Tobacco Group PLC | | | 36,438 | | | | 1,475,847 | |
Inmarsat PLC | | | 19,087 | | | | 140,374 | |
Intercontinental Hotels Group PLC | | | 8,569 | | | | 198,932 | |
International Power PLC | | | 112,461 | | | | 727,723 | |
Investec PLC | | | 23,557 | | | | 143,891 | |
J. Sainsbury PLC | | | 79,750 | | | | 396,660 | |
John Wood Group PLC | | | 9,484 | | | | 108,572 | |
Johnson Matthey PLC | | | 5,854 | | | | 220,643 | |
Kazakhmys PLC | | | 7,457 | | | | 108,183 | |
Kesa Electricals PLC | | | 44,844 | | | | 50,155 | |
Kingfisher PLC | | | 63,655 | | | | 311,929 | |
Ladbrokes PLC | | | 62,513 | | | | 159,908 | |
Legal & General Group PLC | | | 233,957 | | | | 488,563 | |
Logica PLC | | | 81,783 | | �� | | 130,146 | |
London & Stamford Property PLC | | | 100,127 | | | | 176,616 | |
London Stock Exchange Group PLC | | | 10,479 | | | | 173,121 | |
Man Group PLC | | | 161,263 | | | | 347,323 | |
Marks & Spencer Group PLC | | | 64,325 | | | | 389,518 | |
Meggitt PLC | | | 28,961 | | | | 186,894 | |
Melrose PLC | | | 23,643 | | | | 159,829 | |
Mondi PLC | | | 15,991 | | | | 150,615 | |
N. Brown Group PLC | | | 26,662 | | | | 98,830 | |
National Grid PLC | | | 151,270 | | | | 1,523,866 | |
Next PLC | | | 6,371 | | | | 303,648 | |
Old Mutual PLC | | | 168,645 | | | | 427,352 | |
Pearson PLC | | | 25,866 | | | | 481,464 | |
Premier Farnell PLC | | | 27,886 | | | | 95,615 | |
See Notes to Financial Statements.
| | |
| 38 | | WisdomTree International Dividend and Sector Funds |
Schedule of Investments (concluded)
WisdomTree DEFA Fund (DWM)
March 31, 2012
| | | | | | | | |
| Investments | | Shares | | | Value | |
| | | | | | | | |
Provident Financial PLC | | | 12,447 | | | $ | 227,907 | |
Prudential PLC | | | 73,821 | | | | 881,658 | |
Reckitt Benckiser Group PLC | | | 21,317 | | | | 1,203,313 | |
Reed Elsevier PLC | | | 45,038 | | | | 399,375 | |
Rexam PLC | | | 29,005 | | | | 198,393 | |
Rio Tinto PLC | | | 21,094 | | | | 1,161,404 | |
Royal Dutch Shell PLC Class A | | | 134,657 | | | | 4,697,763 | |
Royal Dutch Shell PLC Class B | | | 106,998 | | | | 3,760,179 | |
RSA Insurance Group PLC(a) | | | 218,196 | | | | 364,659 | |
SABMiller PLC | | | 29,492 | | | | 1,182,498 | |
Sage Group PLC (The) | | | 50,032 | | | | 239,176 | |
Segro PLC | | | 45,417 | | | | 170,383 | |
Severn Trent PLC | | | 11,385 | | | | 280,860 | |
Smith & Nephew PLC | | | 15,383 | | | | 155,703 | |
Smiths Group PLC | | | 13,752 | | | | 231,148 | |
SSE PLC | | | 40,901 | | | | 868,496 | |
Standard Chartered PLC | | | 53,912 | | | | 1,343,752 | |
Standard Life PLC | | | 108,458 | | | | 398,044 | |
Tate & Lyle PLC | | | 54,707 | | | | 616,227 | |
TESCO PLC | | | 241,773 | | | | 1,274,767 | |
Travis Perkins PLC | | | 13,590 | | | | 234,288 | |
TUI Travel PLC | | | 62,822 | | | | 197,034 | |
Unilever PLC | | | 43,483 | | | | 1,433,964 | |
United Utilities Group PLC | | | 33,946 | | | | 326,237 | |
Vedanta Resources PLC | | | 4,606 | | | | 90,371 | |
Vodafone Group PLC | | | 2,372,856 | | | | 6,528,501 | |
Weir Group PLC (The) | | | 4,037 | | | | 113,780 | |
WH Smith PLC | | | 18,169 | | | | 158,211 | |
Whitbread PLC | | | 6,113 | | | | 180,104 | |
William Hill PLC | | | 36,738 | | | | 153,437 | |
WM Morrison Supermarkets PLC | | | 77,043 | | | | 366,825 | |
Xstrata PLC | | | 19,500 | | | | 332,748 | |
| | | | | | | | |
| Total United Kingdom | | | | 75,485,023 | |
TOTAL COMMON STOCKS
(Cost: $388,834,721) | | | | | | | 382,088,230 | |
| EXCHANGE-TRADED FUND – 0.1% | | | | | | | | |
| United States – 0.1% | | | | | | | | |
WisdomTree International Dividend ex-Financials Fund(a)(d) | | | | | | | | |
| (Cost: $387,001) | | | 9,299 | | | | 388,791 | |
| INVESTMENT OF CASH COLLATERAL FOR SECURITIES LOANED – 8.9% | | | | | | | | |
| MONEY MARKET FUND – 8.9% | | | | | | | | |
Dreyfus Institutional Preferred Money Market Fund, 0.18%(e) | | | | | | | | |
| (Cost: $34,221,578)(f) | | | 34,221,578 | | | | 34,221,578 | |
TOTAL INVESTMENTS IN SECURITIES – 108.2%
(Cost: $423,443,300) | | | | 416,698,599 | |
Liabilities in Excess of Foreign Currency and Other Assets – (8.2)% | | | | (31,496,183 | ) |
| | | | | |
| NET ASSETS – 100.0% | | | $ | 385,202,416 | |
PPS – Price Protected Shares
RSP – Risparmio Italian Savings Shares
| * | Non-income producing security. |
| † | Security is being fair valued by a valuation committee under the direction of the Board of Trustees. The aggregate value of fair valued securities is $0, which represents 0.0% of net assets. |
| (a) | Security, or portion thereof, was on loan at March 31, 2012 (See Note 2). |
| (b) | Stapled Security — A security contractually bound to one or more other securities to form a single saleable unit which cannot be sold separately. |
| (c) | Escrow security — additional shares issued as a result of a corporate action. |
| (d) | Affiliated company (See Note 7). |
| (e) | Rate shown represents annualized 7-day yield as of March 31, 2012. |
| (f) | At March 31, 2012, the total market value of the Fund’s securities on loan was $32,206,996 and the total market value of the collateral held by the Fund was $34,221,578. |
See Notes to Financial Statements.
| | | | |
| WisdomTree International Dividend and Sector Funds | | | 39 | |
Schedule of Investments
WisdomTree DEFA Equity Income Fund (DTH)
March 31, 2012
| | | | | | | | |
| Investments | | Shares | | | Value | |
| | | | | | | | |
| COMMON STOCKS – 99.0% | | | | | |
| Australia – 17.2% | | | | | |
Adelaide Brighton Ltd. | | | 29,615 | | | $ | 88,971 | |
Aditya Birla Minerals Ltd. | | | 55,968 | | | | 41,456 | |
AGL Energy Ltd. | | | 14,194 | | | | 216,888 | |
Alumina Ltd. | | | 62,654 | | | | 80,159 | |
Amcor Ltd. | | | 47,486 | | | | 365,997 | |
AMP Ltd. | | | 113,946 | | | | 509,943 | |
APN News & Media Ltd. | | | 51,833 | | | | 48,595 | |
Australia & New Zealand Banking Group Ltd. | | | 137,297 | | | | 3,308,334 | |
Automotive Holdings Group | | | 24,543 | | | | 60,512 | |
Bank of Queensland Ltd.(a) | | | 12,450 | | | | 93,894 | |
Bank of Queensland Ltd. Placement Shares* | | | 2,692 | | | | 20,302 | |
Bendigo and Adelaide Bank Ltd. | | | 21,240 | | | | 170,528 | |
Billabong International Ltd.(a) | | | 11,778 | | | | 33,920 | |
Boral Ltd. | | | 19,954 | | | | 83,305 | |
Bradken Ltd. | | | 6,851 | | | | 60,895 | |
Brambles Ltd. | | | 43,707 | | | | 321,476 | |
Brickworks Ltd. | | | 5,440 | | | | 60,751 | |
Cabcharge Australia Ltd. | | | 5,134 | | | | 32,071 | |
Caltex Australia Ltd. | | | 11,405 | | | | 164,110 | |
Cardno Ltd. | | | 10,024 | | | | 72,587 | |
carsales.com Ltd.(a) | | | 11,811 | | | | 67,908 | |
Coca-Cola Amatil Ltd. | | | 27,273 | | | | 352,321 | |
Cochlear Ltd. | | | 1,341 | | | | 85,992 | |
Commonwealth Bank of Australia | | | 77,660 | | | | 4,030,637 | |
Computershare Ltd. | | | 16,189 | | | | 150,939 | |
Consolidated Media Holdings Ltd. | | | 34,238 | | | | 103,214 | |
Crown Ltd. | | | 28,894 | | | | 260,115 | |
CSR Ltd. | | | 47,244 | | | | 88,096 | |
David Jones Ltd.(a) | | | 33,888 | | | | 84,606 | |
DuluxGroup Ltd.(a) | | | 19,134 | | | | 59,069 | |
Envestra Ltd.(b) | | | 102,973 | | | | 82,673 | |
Fairfax Media Ltd.(a) | | | 67,935 | | | | 51,024 | |
FKP Property Group(b) | | | 122,070 | | | | 62,597 | |
Fleetwood Corp., Ltd. | | | 5,351 | | | | 67,906 | |
Flight Centre Ltd.(a) | | | 3,601 | | | | 82,070 | |
GrainCorp Ltd. | | | 6,693 | | | | 62,749 | |
GUD Holdings Ltd. | | | 6,182 | | | | 52,643 | |
GWA Group Ltd.(a) | | | 19,667 | | | | 43,804 | |
Harvey Norman Holdings Ltd.(a) | | | 49,511 | | | | 103,095 | |
Hills Holdings Ltd. | | | 20,826 | | | | 23,193 | |
Insurance Australia Group Ltd. | | | 72,969 | | | | 257,013 | |
IOOF Holdings Ltd. | | | 14,473 | | | | 86,661 | |
Iress Market Technology Ltd. | | | 6,613 | | | | 47,955 | |
JB Hi-Fi Ltd.(a) | | | 4,974 | | | | 56,475 | |
Kingsgate Consolidated Ltd. | | | 5,565 | | | | 36,896 | |
Leighton Holdings Ltd. | | | 17,305 | | | | 382,206 | |
Lend Lease Group(b) | | | 18,070 | | | | 139,835 | |
Macquarie Group Ltd. | | | 17,436 | | | | 525,267 | |
Metcash Ltd. | | | 42,296 | | | | 188,411 | |
Monadelphous Group Ltd. | | | 3,868 | | | | 95,769 | |
Myer Holdings Ltd.(a) | | | 41,646 | | | | 100,955 | |
National Australia Bank Ltd. | | | 108,141 | | | | 2,755,904 | |
| | | | | | | | |
Navitas Ltd. | | | 15,595 | | | $ | 57,353 | |
NIB Holdings Ltd. | | | 39,061 | | | | 60,091 | |
OneSteel Ltd. | | | 83,039 | | | | 106,670 | |
Orica Ltd. | | | 11,650 | | | | 337,565 | |
Origin Energy Ltd. | | | 24,999 | | | | 345,734 | |
OZ Minerals Ltd. | | | 13,986 | | | | 141,411 | |
Perpetual Ltd. | | | 3,158 | | | | 83,064 | |
Platinum Asset Management Ltd.(a) | | | 31,119 | | | | 130,885 | |
Primary Health Care Ltd. | | | 16,817 | | | | 49,826 | |
QBE Insurance Group Ltd. | | | 66,692 | | | | 978,999 | |
Ramsay Health Care Ltd. | | | 4,241 | | | | 85,892 | |
SAI Global Ltd. | | | 5,502 | | | | 28,499 | |
Salmat Ltd.(a) | | | 14,599 | | | | 35,541 | |
Seven West Media Ltd.(a) | | | 22,178 | | | | 89,833 | |
Sonic Healthcare Ltd. | | | 15,669 | | | | 203,228 | |
Suncorp Group Ltd. | | | 46,472 | | | | 404,398 | |
TABCORP Holdings Ltd. | | | 81,184 | | | | 228,759 | |
Tatts Group Ltd. | | | 51,688 | | | | 132,794 | |
Telstra Corp., Ltd. | | | 954,045 | | | | 3,251,647 | |
Toll Holdings Ltd. | | | 28,756 | | | | 174,866 | |
Transfield Services Ltd. | | | 17,237 | | | | 44,285 | |
UGL Ltd.(a) | | | 7,126 | | | | 97,445 | |
Wesfarmers Ltd. | | | 41,310 | | | | 1,284,708 | |
Westpac Banking Corp. | | | 174,498 | | | | 3,957,080 | |
Woolworths Ltd. | | | 44,727 | | | | 1,203,781 | |
WorleyParsons Ltd. | | | 5,964 | | | | 176,888 | |
Wotif.com Holdings Ltd.(a) | | | 11,354 | | | | 53,988 | |
| | | | | | | | |
| Total Australia | | | | 30,167,922 | |
| Austria – 0.2% | | | | | | | | |
Bank Austria Creditanstalt AG*†(c) | | | 3,058 | | | | — | |
Oesterreichische Post AG | | | 2,838 | | | | 98,642 | |
Telekom Austria AG | | | 22,389 | | | | 260,348 | |
| | | | | | | | |
| Total Austria | | | | 358,990 | |
| Belgium – 0.7% | | | | | | | | |
Ageas | | | 73,831 | | | | 162,033 | |
Belgacom S.A. | | | 18,326 | | | | 588,276 | |
Cie Maritime Belge S.A. | | | 2,217 | | | | 52,641 | |
Cofinimmo | | | 813 | | | | 99,822 | |
Elia System Operator S.A./N.V. | | | 2,212 | | | | 93,527 | |
EVS Broadcast Equipment S.A. | | | 890 | | | | 46,081 | |
Mobistar S.A. | | | 2,098 | | | | 104,352 | |
Tessenderlo Chemie N.V. | | | 1,288 | | | | 42,932 | |
| | | | | | | | |
| Total Belgium | | | | 1,189,664 | |
| Denmark – 0.0% | | | | | | | | |
D/S Norden | | | 1,779 | | | | 52,862 | |
| Finland – 1.9% | | | | | | | | |
Alma Media Oyj(a) | | | 6,197 | | | | 44,068 | |
Elisa Oyj | | | 4,961 | | | | 118,720 | |
Fortum Oyj | | | 23,003 | | | | 557,522 | |
Kemira Oyj | | | 3,905 | | | | 51,743 | |
Kesko Oyj Class B | | | 1,431 | | | | 46,365 | |
Metso Oyj(a) | | | 3,773 | | | | 161,035 | |
See Notes to Financial Statements.
| | |
| 40 | | WisdomTree International Dividend and Sector Funds |
Schedule of Investments (continued)
WisdomTree DEFA Equity Income Fund (DTH)
March 31, 2012
| | | | | | | | |
| Investments | | Shares | | | Value | |
| | | | | | | | |
Nokia Oyj | | | 217,142 | | | $ | 1,180,384 | |
Pohjola Bank PLC Class A | | | 9,219 | | | | 101,960 | |
Rautaruukki Oyj(a) | | | 3,413 | | | | 35,770 | |
Sampo Oyj Class A | | | 17,164 | | | | 495,318 | |
Sanoma Oyj(a) | | | 8,647 | | | | 110,546 | |
Tieto Oyj(a) | | | 3,708 | | | | 69,576 | |
Tikkurila Oyj | | | 2,365 | | | | 44,754 | |
UPM-Kymmene Oyj(a) | | | 13,544 | | | | 184,153 | |
Uponor Oyj(a) | | | 3,573 | | | | 41,110 | |
| | | | | | | | |
| Total Finland | | | | 3,243,024 | |
| France – 11.8% | | | | | | | | |
AXA S.A. | | | 63,344 | | | | 1,048,535 | |
BNP Paribas S.A. | | | 29,244 | | | | 1,385,441 | |
Bouygues S.A. | | | 11,490 | | | | 350,857 | |
Casino Guichard Perrachon S.A. | | | 2,650 | | | | 260,793 | |
CNP Assurances | | | 19,041 | | | | 296,676 | |
EDF S.A. | | | 47,432 | | | | 1,080,756 | |
Euler Hermes S.A. | | | 1,362 | | | | 106,831 | |
France Telecom S.A. | | | 154,539 | | | | 2,285,404 | |
GDF Suez | | | 82,948 | | | | 2,139,646 | |
ICADE | | | 1,318 | | | | 117,404 | |
Klepierre | | | 5,340 | | | | 184,893 | |
Lafarge S.A. | | | 7,651 | | | | 364,608 | |
Lagardere SCA | | | 4,054 | | | | 124,872 | |
M6-Metropole Television S.A. | | | 5,530 | | | | 99,786 | |
Natixis | | | 112,180 | | | | 430,990 | |
Neopost S.A. | | | 1,352 | | | | 86,818 | |
Nexity S.A. | | | 1,873 | | | | 59,164 | |
Rallye S.A. | | | 1,327 | | | | 49,790 | |
Sanofi | | | 37,507 | | | | 2,908,476 | |
SCOR SE | | | 6,881 | | | | 185,651 | |
Societe d’Edition de Canal + | | | 8,017 | | | | 50,712 | |
Societe Generale S.A. | | | 19,444 | | | | 568,752 | |
Societe Television Francaise 1 | | | 6,286 | | | | 76,855 | |
Suez Environnement Co. | | | 13,562 | | | | 207,696 | |
Total S.A. | | | 84,703 | | | | 4,313,433 | |
Veolia Environnement S.A. | | | 17,818 | | | | 295,061 | |
Vinci S.A. | | | 13,131 | | | | 683,724 | |
Vivendi S.A. | | | 57,764 | | | | 1,058,479 | |
| | | | | | | | |
| Total France | | | | 20,822,103 | |
| Germany – 6.7% | | | | | | | | |
Allianz SE | | | 13,145 | | | | 1,566,190 | |
Axel Springer AG | | | 2,996 | | | | 151,093 | |
Bilfinger Berger SE | | | 1,178 | | | | 110,487 | |
Comdirect Bank AG(a) | | | 5,217 | | | | 60,255 | |
Daimler AG(a) | | | 25,118 | | | | 1,512,258 | |
Deutsche Boerse AG | | | 4,768 | | | | 320,525 | |
Deutsche Lufthansa AG | | | 10,695 | | | | 149,475 | |
Deutsche Post AG | | | 37,463 | | | | 720,154 | |
Deutsche Telekom AG | | | 175,995 | | | | 2,115,681 | |
E.ON AG | | | 93,197 | | | | 2,229,023 | |
Hannover Rueckversicherung AG | | | 4,877 | | | | 289,274 | |
MLP AG | | | 5,863 | | | | 52,000 | |
| | | | | | | | |
Muenchener Rueckversicherungs AG | | | 7,034 | | | $ | 1,058,959 | |
RWE AG | | | 28,174 | | | | 1,343,379 | |
SMA Solar Technology AG(a) | | | 912 | | | | 41,269 | |
| | | | | | | | |
| Total Germany | | | | 11,720,022 | |
| Hong Kong – 4.8% | | | | | | | | |
BOC Hong Kong Holdings Ltd. | | | 271,000 | | | | 748,706 | |
Cathay Pacific Airways Ltd. | | | 144,000 | | | | 266,708 | |
China Mobile Ltd. | | | 504,500 | | | | 5,552,489 | |
CLP Holdings Ltd. | | | 47,024 | | | | 405,797 | |
Guangdong Investment Ltd. | | | 158,000 | | | | 110,095 | |
Hang Seng Bank Ltd. | | | 51,418 | | | | 683,454 | |
HKT Trust and HKT Ltd.*(b) | | | 4,413 | | | | 3,433 | |
Hopewell Holdings Ltd. | | | 35,000 | | | | 96,020 | |
PCCW Ltd. | | | 209,000 | | | | 74,835 | |
Power Assets Holdings Ltd. | | | 45,518 | | | | 334,174 | |
Shanghai Industrial Holdings Ltd. | | | 34,000 | | | | 104,881 | |
Shenzhen Investment Ltd. | | | 196,000 | | | | 42,664 | |
Television Broadcasts Ltd. | | | 9,000 | | | | 60,684 | |
| | | | | | | | |
| Total Hong Kong | | | | 8,483,940 | |
| Ireland – 0.2% | | | | | | | | |
CRH PLC | | | 19,531 | | | | 397,944 | |
| Italy – 4.1% | | | | | | | | |
A2A SpA(a) | | | 112,480 | | | | 90,098 | |
ACEA SpA | | | 7,642 | | | | 48,523 | |
Atlantia SpA | | | 17,894 | | | | 296,677 | |
Banca Carige SpA(a) | | | 41,593 | | | | 54,503 | |
Banca Generali SpA | | | 4,968 | | | | 66,556 | |
Banca Popolare di Milano SCRL | | | 46,382 | | | | 25,769 | |
Banca Popolare di Sondrio SCRL | | | 7,580 | | | | 55,519 | |
Enel SpA | | | 306,460 | | | | 1,106,802 | |
ENI SpA | | | 151,016 | | | | 3,537,489 | |
ERG SpA | | | 4,559 | | | | 40,343 | |
Fiat SpA RSP | | | 7,638 | | | | 41,825 | |
Geox SpA(a) | | | 9,931 | | | | 32,402 | |
Gruppo Editoriale L’Espresso SpA(a) | | | 20,081 | | | | 28,346 | |
Hera SpA | | | 35,238 | | | | 50,211 | |
Intesa Sanpaolo SpA RSP | | | 35,421 | | | | 54,576 | |
Iren SpA | | | 50,498 | | | | 43,207 | |
Mediaset SpA | | | 74,063 | | | | 203,966 | |
Mediolanum SpA | | | 21,009 | | | | 99,713 | |
Recordati SpA | | | 5,520 | | | | 41,901 | |
Snam SpA | | | 121,238 | | | | 582,198 | |
Societa Cattolica di Assicurazioni SCRL | | | 2,528 | | | | 51,070 | |
Telecom Italia SpA RSP | | | 286,850 | | | | 281,533 | |
Terna Rete Elettrica Nazionale SpA | | | 71,410 | | | | 286,621 | |
| | | | | | | | |
| Total Italy | | | | 7,119,848 | |
| Japan – 5.1% | | | | | | | | |
Astellas Pharma, Inc.(a) | | | 10,900 | | | | 450,331 | |
Azbil Corp. | | | 1,900 | | | | 42,250 | |
Chiyoda Co., Ltd. | | | 5,600 | | | | 112,959 | |
Chubu Electric Power Co., Inc.(a) | | | 23,200 | | | | 421,177 | |
Chugoku Electric Power Co., Inc. (The)(a) | | | 10,000 | | | | 186,767 | |
See Notes to Financial Statements.
| | | | |
| WisdomTree International Dividend and Sector Funds | | | 41 | |
Schedule of Investments (continued)
WisdomTree DEFA Equity Income Fund (DTH)
March 31, 2012
| | | | | | | | |
| Investments | | Shares | | | Value | |
| | | | | | | | |
Daiichi Sankyo Co., Ltd.(a) | | | 17,400 | | | $ | 318,843 | |
Daito Trust Construction Co., Ltd. | | | 1,600 | | | | 144,456 | |
Eisai Co., Ltd.(a) | | | 8,600 | | | | 343,812 | |
Electric Power Development Co., Ltd.(a) | | | 5,500 | | | | 149,973 | |
Hokkaido Electric Power Co., Inc. | | | 7,200 | | | | 106,300 | |
Hokuriku Electric Power Co. | | | 6,900 | | | | 125,432 | |
Hoya Corp. | | | 10,100 | | | | 228,154 | |
Inaba Denki Sangyo Co., Ltd. | | | 1,600 | | | | 48,295 | |
IT Holdings Corp. | | | 4,400 | | | | 51,755 | |
Kansai Electric Power Co., Inc. (The)(a) | | | 26,000 | | | | 405,031 | |
Kyushu Electric Power Co., Inc. | | | 16,000 | | | | 229,224 | |
Lawson, Inc. | | | 2,000 | | | | 126,618 | |
Mizuho Financial Group, Inc.(a) | | | 633,000 | | | | 1,038,398 | |
Moshi Moshi Hotline, Inc. | | | 7,600 | | | | 76,374 | |
NEC Fielding Ltd. | | | 6,300 | | | | 82,602 | |
Nintendo Co., Ltd. | | | 2,600 | | | | 393,341 | |
Nippon Suisan Kaisha Ltd.(a) | | | 8,900 | | | | 30,498 | |
NKSJ Holdings, Inc.(a) | | | 10,498 | | | | 235,996 | |
NSD Co., Ltd. | | | 7,500 | | | | 69,719 | |
Onward Holdings Co., Ltd.(a) | | | 2,000 | | | | 16,404 | |
Oracle Corp. | | | 5,900 | | | | 225,475 | |
Park24 Co., Ltd. | | | 7,000 | | | | 94,842 | |
Plenus Co., Ltd. | | | 5,400 | | | | 98,230 | |
Ricoh Co., Ltd.(a) | | | 13,000 | | | | 127,164 | |
Ryosan Co., Ltd. | | | 2,000 | | | | 40,440 | |
Saibu Gas Co., Ltd. | | | 18,000 | | | | 48,776 | |
Shikoku Electric Power Co., Inc.(a) | | | 6,700 | | | | 189,940 | |
Shiseido Co., Ltd.(a) | | | 9,000 | | | | 156,170 | |
Sumitomo Mitsui Financial Group, Inc.(a) | | | 35,800 | | | | 1,184,560 | |
Taiyo Holdings Co., Ltd.(a) | | | 1,400 | | | | 37,767 | |
Takasago Thermal Engineering Co., Ltd.(a) | | | 8,200 | | | | 64,169 | |
Takeda Pharmaceutical Co., Ltd.(a) | | | 23,700 | | | | 1,049,717 | |
Tokai Tokyo Financial Holdings, Inc. | | | 16,000 | | | | 60,077 | |
TonenGeneral Sekiyu K.K. | | | 10,000 | | | | 92,594 | |
Toppan Forms Co., Ltd. | | | 5,300 | | | | 48,881 | |
Toyo Corp. | | | 800 | | | | 8,749 | |
| | | | | | | | |
| Total Japan | | | | 8,962,260 | |
| Netherlands – 1.9% | | | | | | | | |
CSM | | | 1,786 | | | | 32,025 | |
Delta Lloyd N.V. | | | 4,358 | | | | 76,491 | |
Exact Holding N.V. | | | 1,901 | | | | 44,809 | |
Koninklijke Boskalis Westminster N.V. | | | 2,251 | | | | 84,429 | |
Koninklijke KPN N.V. | | | 77,206 | | | | 848,020 | |
Koninklijke Philips Electronics N.V. | | | 24,440 | | | | 494,710 | |
PostNL N.V. | | | 18,143 | | | | 111,866 | |
Reed Elsevier N.V. | | | 19,154 | | | | 244,259 | |
Unilever N.V. CVA | | | 38,271 | | | | 1,300,384 | |
Wolters Kluwer N.V. | | | 7,432 | | | | 140,540 | |
| | | | | | | | |
| Total Netherlands | | | | 3,377,533 | |
| New Zealand – 0.4% | | | | | | | | |
Air New Zealand Ltd. | | | 94,082 | | | | 65,531 | |
Auckland International Airport Ltd. | | | 48,276 | | | | 97,317 | |
Contact Energy Ltd.* | | | 11,641 | | | | 45,121 | |
| | | | | | | | |
Fisher & Paykel Healthcare Corp., Ltd. | | | 24,614 | | | $ | 45,181 | |
Sky Network Television Ltd. | | | 13,505 | | | | 57,325 | |
SKYCITY Entertainment Group Ltd. | | | 26,360 | | | | 85,107 | |
Telecom Corp. of New Zealand Ltd. | | | 102,472 | | | | 203,629 | |
Vector Ltd. | | | 47,348 | | | | 100,490 | |
Warehouse Group Ltd. (The) | | | 20,356 | | | | 46,539 | |
| | | | | | | | |
| Total New Zealand | | | | 746,240 | |
| Norway – 3.0% | | | | | | | | |
ABG Sundal Collier Holding ASA | | | 51,532 | | | | 44,629 | |
Aker ASA Class A | | | 3,924 | | | | 128,299 | |
Austevoll Seafood ASA | | | 8,955 | | | | 34,225 | |
DNB ASA | | | 56,282 | | | | 722,266 | |
Fred Olsen Energy ASA | | | 4,924 | | | | 192,763 | |
Gjensidige Forsikring ASA | | | 21,587 | | | | 254,508 | |
Leroey Seafood Group ASA | | | 2,337 | | | | 38,513 | |
Marine Harvest ASA | | | 460,890 | | | | 237,553 | |
Orkla ASA | | | 33,564 | | | | 265,144 | |
SpareBank 1 SMN | | | 7,243 | | | | 46,475 | |
SpareBank 1 SR Bank ASA(a) | | | 6,871 | | | | 49,388 | |
Statoil ASA | | | 89,539 | | | | 2,426,825 | |
Telenor ASA | | | 43,688 | | | | 808,803 | |
Veidekke ASA | | | 6,749 | | | | 57,266 | |
| | | | | | | | |
| Total Norway | | | | 5,306,657 | |
| Portugal – 0.7% | | | | | | | | |
Banco Espirito Santo S.A. | | | 40,229 | | | | 73,395 | |
Brisa Auto-Estradas de Portugal S.A.(a) | | | 30,602 | | | | 108,810 | |
Cimpor Cimentos de Portugal, SGPS, S.A. | | | 18,043 | | | | 120,139 | |
EDP-Energias de Portugal S.A. | | | 151,909 | | | | 441,210 | |
Mota-Engil, SGPS, S.A. | | | 24,955 | | | | 40,444 | |
Portugal Telecom, SGPS, S.A. | | | 50,769 | | | | 275,777 | |
REN – Redes Energeticas Nacionais S.A. | | | 21,726 | | | | 65,677 | |
Sonae | | | 89,549 | | | | 53,187 | |
Zon Multimedia Servicos de Telecomunicacoes e Multimedia, SGPS, S.A. | | | 9,777 | | | | 33,201 | |
| | | | | | | | |
| Total Portugal | | | | 1,211,840 | |
| Singapore – 2.0% | | | | | | | | |
ComfortDelGro Corp., Ltd. | | | 64,000 | | | | 79,405 | |
Keppel Land Ltd.(a) | | | 59,000 | | | | 162,827 | |
K-Green Trust | | | 52,000 | | | | 40,943 | |
M1 Ltd. | | | 50,000 | | | | 101,006 | |
SATS Ltd. | | | 52,000 | | | | 102,979 | |
SembCorp Marine Ltd.(a) | | | 89,000 | | | | 373,738 | |
SIA Engineering Co., Ltd. | | | 19,000 | | | | 60,898 | |
Singapore Exchange Ltd. | | | 20,000 | | | | 110,391 | |
Singapore Post Ltd. | | | 71,000 | | | | 57,597 | |
Singapore Press Holdings Ltd. | | | 78,000 | | | | 243,178 | |
Singapore Technologies Engineering Ltd. | | | 95,000 | | | | 245,556 | |
Singapore Telecommunications Ltd. | | | 445,000 | | | | 1,114,845 | |
SMRT Corp., Ltd. | | | 56,000 | | | | 77,274 | |
StarHub Ltd. | | | 77,000 | | | | 189,844 | |
United Overseas Bank Ltd. | | | 29,000 | | | | 423,231 | |
UOB-Kay Hian Holdings Ltd. | | | 60,000 | | | | 80,646 | |
Venture Corp., Ltd. | | | 8,000 | | | | 54,209 | |
| | | | | | | | |
| Total Singapore | | | | 3,518,567 | |
See Notes to Financial Statements.
| | |
| 42 | | WisdomTree International Dividend and Sector Funds |
Schedule of Investments (continued)
WisdomTree DEFA Equity Income Fund (DTH)
March 31, 2012
| | | | | | | | |
| Investments | | Shares | | | Value | |
| | | | | | | | |
| Spain – 7.9% | | | | | | | | |
Acciona S.A. | | | 1,604 | | | $ | 111,843 | |
Acerinox S.A. | | | 8,464 | | | | 108,623 | |
ACS Actividades de Construccion y Servicios, S.A.(a) | | | 12,403 | | | | 316,963 | |
Almirall S.A. | | | 5,827 | | | | 50,672 | |
Antena 3 de Television S.A.(a) | | | 11,627 | | | | 69,367 | |
Banco Bilbao Vizcaya Argentaria S.A.(a) | | | 140,522 | | | | 1,116,623 | |
Banco de Sabadell S.A.(a) | | | 55,694 | | | | 151,450 | |
Banco Espanol de Credito S.A.(a) | | | 23,520 | | | | 112,570 | |
Banco Santander S.A. | | | 406,767 | | | | 3,125,560 | |
Bolsas y Mercados Espanoles S.A. | | | 4,750 | | | | 121,577 | |
CaixaBank(a) | | | 130,978 | | | | 509,142 | |
Caja de Ahorros del Mediterraneo(a) | | | 6,353 | | | | 11,337 | |
Duro Felguera S.A. | | | 6,916 | | | | 44,853 | |
Enagas S.A. | | | 6,984 | | | | 134,208 | |
Endesa S.A. | | | 28,671 | | | | 570,427 | |
Ferrovial S.A. | | | 21,734 | | | | 249,432 | |
Fomento de Construcciones y Contratas S.A.(a) | | | 5,444 | | | | 121,434 | |
Gas Natural SDG S.A. | | | 32,660 | | | | 521,050 | |
Iberdrola S.A. | | | 182,027 | | | | 1,031,919 | |
Indra Sistemas S.A.(a) | | | 6,084 | | | | 74,442 | |
Mapfre S.A.(a) | | | 105,169 | | | | 338,089 | |
Mediaset Espana Comunicacion S.A. | | | 15,342 | | | | 87,853 | |
Red Electrica Corp. S.A. | | | 3,063 | | | | 149,658 | |
Repsol YPF S.A. | | | 31,315 | | | | 784,418 | |
Telefonica S.A. | | | 234,825 | | | | 3,841,721 | |
Zardoya Otis S.A. | | | 12,846 | | | | 166,109 | |
| | | | | | | | |
| Total Spain | | | | 13,921,340 | |
| Sweden – 3.0% | | | | | | | | |
Axfood AB | | | 1,775 | | | | 63,613 | |
Bilia AB Class A | | | 3,209 | | | | 63,234 | |
Billerud AB | | | 5,868 | | | | 54,167 | |
Boliden AB | | | 9,654 | | | | 151,168 | |
Castellum AB | | | 4,423 | | | | 55,560 | |
Electrolux AB Series B(a) | | | 7,717 | | | | 162,705 | |
Fabege AB(a) | | | 5,982 | | | | 51,433 | |
Hakon Invest AB | | | 6,581 | | | | 113,760 | |
Hennes & Mauritz AB Class B | | | 43,465 | | | | 1,568,195 | |
Hoganas AB Class B | | | 1,544 | | | | 56,195 | |
Intrum Justitia AB | | | 4,105 | | | | 68,052 | |
Investment AB Oresund* | | | 3,525 | | | | 56,578 | |
Loomis AB Class B | | | 4,078 | | | | 58,078 | |
NCC AB Class B | | | 3,547 | | | | 74,571 | |
Nordea Bank AB(a) | | | 98,788 | | | | 895,521 | |
Peab AB | | | 11,498 | | | | 58,570 | |
Ratos AB Class B(a) | | | 7,642 | | | | 105,785 | |
Securitas AB Class B | | | 10,846 | | | | 104,286 | |
Skanska AB Class B | | | 13,614 | | | | 235,334 | |
Tele2 AB Class B | | | 12,681 | | | | 258,002 | |
TeliaSonera AB | | | 154,246 | | | | 1,072,575 | |
| | | | | | | | |
| Total Sweden | | | | 5,327,382 | |
| | | | | | | | |
| Switzerland – 6.1% | | | | | | | | |
Baloise Holding AG | | | 1,540 | | | $ | 123,868 | |
Mobilezone Holding AG | | | 5,111 | | | | 57,961 | |
Novartis AG | | | 65,894 | | | | 3,642,268 | |
Roche Holding AG - Genusschein | | | 19,258 | | | | 3,347,272 | |
SGS S.A. | | | 139 | | | | 270,049 | |
Swiss Re AG* | | | 12,178 | | | | 776,746 | |
Swisscom AG(a) | | | 1,603 | | | | 647,159 | |
Vontobel Holding AG | | | 2,331 | | | | 59,058 | |
Zurich Financial Services AG* | | | 6,712 | | | | 1,801,550 | |
| | | | | | | | |
| Total Switzerland | | | | 10,725,931 | |
| United Kingdom – 21.3% | | | | | | | | |
Aberdeen Asset Management PLC | | | 29,507 | | | | 121,162 | |
Admiral Group PLC | | | 7,173 | | | | 136,038 | |
Amlin PLC | | | 18,319 | | | | 96,530 | |
Antofagasta PLC | | | 36,953 | | | | 680,160 | |
Ashmore Group PLC | | | 17,478 | | | | 102,626 | |
AstraZeneca PLC | | | 49,218 | | | | 2,185,352 | |
Aviva PLC | | | 109,916 | | | | 582,175 | |
BAE Systems PLC | | | 127,036 | | | | 608,712 | |
Balfour Beatty PLC | | | 19,769 | | | | 90,178 | |
BBA Aviation PLC | | | 17,345 | | | | 59,306 | |
Berendsen PLC | | | 2,695 | | | | 22,477 | |
British American Tobacco PLC | | | 56,908 | | | | 2,864,585 | |
British Land Co. PLC | | | 23,339 | | | | 178,954 | |
Britvic PLC | | | 8,907 | | | | 54,747 | |
BT Group PLC | | | 176,042 | | | | 636,798 | |
Cable & Wireless Communications PLC | | | 205,777 | | | | 106,163 | |
Cable & Wireless Worldwide PLC | | | 151,709 | | | | 82,414 | |
Carillion PLC | | | 12,058 | | | | 57,489 | |
Centrica PLC | | | 147,912 | | | | 747,737 | |
Close Brothers Group PLC | | | 5,856 | | | | 73,448 | |
Daily Mail & General Trust PLC Class A | | | 9,348 | | | | 67,435 | |
Dairy Crest Group PLC | | | 12,190 | | | | 64,876 | |
De La Rue PLC | | | 4,606 | | | | 66,233 | |
Drax Group PLC | | | 15,733 | | | | 136,873 | |
Electrocomponents PLC | | | 9,214 | | | | 36,480 | |
Fidessa Group PLC | | | 1,864 | | | | 49,289 | |
Firstgroup PLC | | | 19,553 | | | | 74,259 | |
GlaxoSmithKline PLC | | | 177,494 | | | | 3,960,350 | |
Greene King PLC | | | 7,379 | | | | 60,482 | |
Halfords Group PLC | | | 9,241 | | | | 45,859 | |
Hays PLC | | | 56,728 | | | | 76,452 | |
Home Retail Group PLC | | | 46,644 | | | | 84,959 | |
HSBC Holdings PLC | | | 433,406 | | | | 3,841,849 | |
ICAP PLC | | | 17,704 | | | | 111,110 | |
IG Group Holdings PLC | | | 12,119 | | | | 87,134 | |
Imperial Tobacco Group PLC | | | 28,439 | | | | 1,151,864 | |
Inmarsat PLC | | | 11,011 | | | | 80,980 | |
Interserve PLC | | | 5,655 | | | | 26,320 | |
J. Sainsbury PLC | | | 56,259 | | | | 279,821 | |
Jardine Lloyd Thompson Group PLC | | | 4,512 | | | | 50,355 | |
Kesa Electricals PLC | | | 25,492 | | | | 28,511 | |
See Notes to Financial Statements.
| | | | |
| WisdomTree International Dividend and Sector Funds | | | 43 | |
Schedule of Investments (concluded)
WisdomTree DEFA Equity Income Fund (DTH)
March 31, 2012
| | | | | | | | |
| Investments | | Shares | | | Value | |
| | | | | | | | |
Kier Group PLC | | | 2,783 | | | $ | 50,424 | |
Ladbrokes PLC | | | 30,894 | | | | 79,027 | |
Legal & General Group PLC | | | 157,551 | | | | 329,007 | |
London & Stamford Property PLC | | | 27,168 | | | | 47,922 | |
Man Group PLC | | | 113,952 | | | | 245,426 | |
Marks & Spencer Group PLC | | | 45,365 | | | | 274,707 | |
Marston’s PLC | | | 32,802 | | | | 51,414 | |
Melrose PLC | | | 9,018 | | | | 60,962 | |
Micro Focus International PLC | | | 3,917 | | | | 29,602 | |
Mitie Group PLC | | | 15,294 | | | | 68,299 | |
Moneysupermarket.com Group PLC | | | 15,166 | | | | 30,750 | |
N. Brown Group PLC | | | 6,266 | | | | 23,227 | |
National Grid PLC | | | 118,166 | | | | 1,190,383 | |
Next PLC | | | 4,274 | | | | 203,703 | |
Pearson PLC | | | 18,293 | | | | 340,502 | |
Pennon Group PLC | | | 7,237 | | | | 82,270 | |
Premier Farnell PLC | | | 13,005 | | | | 44,591 | |
Provident Financial PLC | | | 4,487 | | | | 82,158 | |
Prudential PLC | | | 56,409 | | | | 673,703 | |
Reckitt Benckiser Group PLC | | | 16,082 | | | | 907,805 | |
Reed Elsevier PLC | | | 31,685 | | | | 280,967 | |
Royal Dutch Shell PLC Class A | | | 958 | | | | 33,422 | |
Royal Dutch Shell PLC Class B | | | 86,781 | | | | 3,049,703 | |
RSA Insurance Group PLC(a) | | | 148,347 | | | | 247,924 | |
Segro PLC | | | 19,709 | | | | 73,939 | |
Severn Trent PLC | | | 7,190 | | | | 177,372 | |
SSE PLC | | | 30,268 | | | | 642,714 | |
Standard Life PLC | | | 94,195 | | | | 345,699 | |
Tate & Lyle PLC | | | 10,654 | | | | 120,008 | |
TESCO PLC | | | 189,370 | | | | 998,468 | |
TUI Travel PLC | | | 38,839 | | | | 121,814 | |
Tullett Prebon PLC | | | 9,927 | | | | 55,513 | |
Unilever PLC | | | 32,728 | | | | 1,079,290 | |
United Utilities Group PLC | | | 23,219 | | | | 223,145 | |
Vodafone Group PLC | | | 1,838,552 | | | | 5,058,456 | |
WH Smith PLC | | | 7,625 | | | | 66,397 | |
William Hill PLC | | | 17,444 | | | | 72,855 | |
WS Atkins PLC | | | 1,997 | | | | 23,420 | |
| | | | | | | | |
| Total United Kingdom | | | | 37,355,530 | |
TOTAL COMMON STOCKS
(Cost: $186,499,377) | | | | 174,009,599 | |
| EXCHANGE-TRADED FUND – 0.5% | | | | | | | | |
| United States – 0.5% | | | | | | | | |
WisdomTree International LargeCap Dividend Fund(a)(d) | | | | | | | | |
| (Cost: $813,350) | | | 19,042 | | | | 820,710 | |
| SHORT-TERM INVESTMENT – 0.0% | | | | | | | | |
| MONEY MARKET FUND – 0.0% | | | | | | | | |
Invesco Treasury Fund Private Class, 0.02%(e)
(Cost: $50,400) | | | 50,400 | | | | 50,400 | |
| | | | | | | | |
INVESTMENT OF CASH COLLATERAL FOR
SECURITIES LOANED – 7.7% | | | | | | | | |
| MONEY MARKET FUND – 7.7% | | | | | | | | |
Dreyfus Institutional Preferred Money Market Fund, 0.18%(e) | | | | | | | | |
| (Cost: $13,561,501)(f) | | | 13,561,501 | | | $ | 13,561,501 | |
TOTAL INVESTMENTS IN SECURITIES – 107.2%
(Cost: $200,924,628) | | | | 188,442,210 | |
Liabilities in Excess of Foreign Currency and Other Assets – (7.2)% | | | | (12,632,729 | ) |
| | | | | | | | |
| NET ASSETS – 100.0% | | | $ | 175,809,481 | |
| RSP | – Risparmio Italian Savings Shares |
| * | Non-income producing security. |
| † | Security is being fair valued by a valuation committee under the direction of the Board of Trustees. The aggregate value of fair valued securities is $0, which represents 0.0% of net assets. |
| (a) | Security, or portion thereof, was on loan at March 31, 2012 (See Note 2). |
| (b) | Stapled Security – A security contractually bound to one or more other securities to form a single saleable unit which cannot be sold separately. |
| (c) | Escrow security – additional shares issued as a result of a corporate action. |
| (d) | Affiliated company (See Note 7). |
| (e) | Rate shown represents annualized 7-day yield as of March 31, 2012. |
| (f) | At March 31, 2012, the total market value of the Fund’s securities on loan was $12,812,908 and the total market value of the collateral held by the Fund was $13,561,501. |
See Notes to Financial Statements.
| | |
| 44 | | WisdomTree International Dividend and Sector Funds |
Schedule of Investments
WisdomTree Global Equity Income Fund (DEW)
March 31, 2012
| | | | | | | | |
| Investments | | Shares | | | Value | |
| | | | | | | | |
| COMMON STOCKS – 99.2% | | | | | | | | |
| Argentina – 0.2% | | | | | | | | |
Telecom Argentina S.A. ADR | | | 976 | | | $ | 17,295 | |
YPF S.A. ADR | | | 5,161 | | | | 146,624 | |
| | | | | | | | |
| Total Argentina | | | | | | | 163,919 | |
| Australia – 9.7% | | | | | | | | |
Adelaide Brighton Ltd. | | | 10,474 | | | | 31,467 | |
AGL Energy Ltd. | | | 5,270 | | | | 80,527 | |
Alumina Ltd. | | | 18,705 | | | | 23,931 | |
Amcor Ltd. | | | 14,767 | | | | 113,816 | |
AMP Ltd. | | | 30,838 | | | | 138,009 | |
Australia & New Zealand Banking Group Ltd. | | | 39,639 | | | | 955,149 | |
Bank of Queensland Ltd.(a) | | | 4,527 | | | | 34,141 | |
Bank of Queensland Ltd. Placement Shares* | | | 957 | | | | 7,217 | |
Bendigo and Adelaide Bank Ltd. | | | 6,508 | | | | 52,250 | |
Boral Ltd. | | | 7,020 | | | | 29,308 | |
Brambles Ltd. | | | 12,791 | | | | 94,081 | |
Caltex Australia Ltd. | | | 3,326 | | | | 47,859 | |
Coca-Cola Amatil Ltd. | | | 8,490 | | | | 109,676 | |
Cochlear Ltd. | | | 430 | | | | 27,574 | |
Commonwealth Bank of Australia | | | 22,700 | | | | 1,178,154 | |
Computershare Ltd. | | | 5,088 | | | | 47,438 | |
Crown Ltd. | | | 9,008 | | | | 81,094 | |
CSL Ltd. | | | 3,458 | | | | 128,569 | |
David Jones Ltd.(a) | | | 11,206 | | | | 27,977 | |
Fairfax Media Ltd. | | | 41,706 | | | | 31,324 | |
Flight Centre Ltd.(a) | | | 1,035 | | | | 23,589 | |
Harvey Norman Holdings Ltd.(a) | | | 17,138 | | | | 35,686 | |
Incitec Pivot Ltd. | | | 11,137 | | | | 36,343 | |
Insurance Australia Group Ltd. | | | 20,928 | | | | 73,713 | |
Leighton Holdings Ltd. | | | 5,385 | | | | 118,935 | |
Lend Lease Group(b) | | | 7,367 | | | | 57,010 | |
Macquarie Group Ltd. | | | 5,237 | | | | 157,767 | |
Metcash Ltd. | | | 14,847 | | | | 66,137 | |
National Australia Bank Ltd. | | | 31,898 | | | | 812,900 | |
OneSteel Ltd. | | | 29,117 | | | | 37,403 | |
Orica Ltd. | | | 3,210 | | | | 93,011 | |
Origin Energy Ltd. | | | 8,087 | | | | 111,843 | |
OZ Minerals Ltd. | | | 4,292 | | | | 43,396 | |
Platinum Asset Management Ltd.(a) | | | 10,055 | | | | 42,291 | |
QBE Insurance Group Ltd. | | | 18,928 | | | | 277,852 | |
Ramsay Health Care Ltd. | | | 1,492 | | | | 30,217 | |
Santos Ltd. | | | 4,457 | | | | 65,749 | |
Sonic Healthcare Ltd. | | | 5,030 | | | | 65,240 | |
Suncorp Group Ltd. | | | 15,066 | | | | 131,104 | |
TABCORP Holdings Ltd. | | | 25,577 | | | | 72,070 | |
Tatts Group Ltd. | | | 18,340 | | | | 47,118 | |
Telstra Corp., Ltd. | | | 288,123 | | | | 982,002 | |
Toll Holdings Ltd. | | | 10,226 | | | | 62,185 | |
UGL Ltd.(a) | | | 2,370 | | | | 32,409 | |
Wesfarmers Ltd. | | | 12,142 | | | | 377,607 | |
Westpac Banking Corp. | | | 51,041 | | | | 1,157,453 | |
Woodside Petroleum Ltd. | | | 4,848 | | | | 174,826 | |
| | | | | | | | |
Woolworths Ltd. | | | 13,268 | | | $ | 357,095 | |
WorleyParsons Ltd. | | | 2,044 | | | | 60,623 | |
| | | | | | | | |
| Total Australia | | | | | | | 8,843,135 | |
| Austria – 0.2% | | | | | | | | |
Oesterreichische Post AG | | | 424 | | | | 14,737 | |
OMV AG | | | 2,138 | | | | 75,877 | |
Telekom Austria AG | | | 7,306 | | | | 84,957 | |
| | | | | | | | |
| Total Austria | | | | | | | 175,571 | |
| Belgium – 0.3% | | | | | | | | |
Ageas | | | 19,704 | | | | 43,243 | |
Belgacom S.A. | | | 6,162 | | | | 197,804 | |
Mobistar S.A. | | | 912 | | | | 45,362 | |
| | | | | | | | |
| Total Belgium | | | | | | | 286,409 | |
| Brazil – 3.0% | | | | | | | | |
AES Tiete S.A. | | | 3,100 | | | | 42,244 | |
Banco do Brasil S.A. | | | 25,700 | | | | 365,291 | |
Banco Santander Brasil S.A. | | | 34,700 | | | | 319,553 | |
BM&F Bovespa S.A. | | | 15,900 | | | | 97,528 | |
CCR S.A. | | | 13,600 | | | | 110,109 | |
Cia de Bebidas das Americas | | | 13,400 | | | | 462,753 | |
Cia de Saneamento Basico do Estado de Sao Paulo* | | | 1,000 | | | | 38,102 | |
Cia de Saneamento de Minas Gerais-COPASA* | | | 800 | | | | 18,848 | |
Cia Energetica de Minas Gerais | | | 4,200 | | | | 86,012 | |
Cia Siderurgica Nacional S.A. | | | 16,800 | | | | 158,027 | |
Cielo S.A. | | | 7,540 | | | | 254,640 | |
CPFL Energia S.A. | | | 10,300 | | | | 154,813 | |
EcoRodovias Infraestrutura e Logistica S.A. | | | 3,700 | | | | 32,512 | |
EDP – Energias do Brasil S.A. | | | 1,200 | | | | 27,206 | |
Light S.A. | | | 4,600 | | | | 64,677 | |
Lojas Renner S.A. | | | 600 | | | | 20,526 | |
Natura Cosmeticos S.A. | | | 3,500 | | | | 75,687 | |
Redecard S.A. | | | 9,600 | | | | 186,548 | |
Souza Cruz S.A. | | | 14,000 | | | | 213,342 | |
Sul America S.A. | | | 2,800 | | | | 25,954 | |
| | | | | | | | |
| Total Brazil | | | | | | | 2,754,372 | |
| Canada – 4.7% | | | | | | | | |
ARC Resources Ltd.(a) | | | 2,695 | | | | 61,749 | |
Bank of Montreal(a) | | | 4,367 | | | | 259,106 | |
Bank of Nova Scotia(a) | | | 6,868 | | | | 383,995 | |
Baytex Energy Corp.(a) | | | 932 | | | | 48,295 | |
BCE, Inc. | | | 7,214 | | | | 288,286 | |
Bell Aliant, Inc. | | | 1,100 | | | | 30,046 | |
Bonavista Energy Corp.(a) | | | 2,051 | | | | 41,453 | |
Canadian Imperial Bank of Commerce | | | 3,400 | | | | 259,359 | |
Canadian Oil Sands Ltd. | | | 4,508 | | | | 94,900 | |
CI Financial Corp. | | | 3,300 | | | | 75,083 | |
Crescent Point Energy Corp.(a) | | | 3,300 | | | | 141,780 | |
Emera, Inc. | | | 800 | | | | 27,143 | |
Enerplus Corp. | | | 2,656 | | | | 59,368 | |
First Capital Realty, Inc.(a) | | | 3,200 | | | | 57,151 | |
Fortis, Inc.(a) | | | 1,100 | | | | 35,517 | |
Great-West Lifeco, Inc.(a) | | | 7,732 | | | | 189,848 | |
See Notes to Financial Statements.
| | | | |
| WisdomTree International Dividend and Sector Funds | | | 45 | |
Schedule of Investments (continued)
WisdomTree Global Equity Income Fund (DEW)
March 31, 2012
| | | | | | | | |
| Investments | | Shares | | | Value | |
| | | | | | | | |
Husky Energy, Inc.(a) | | | 7,570 | | | $ | 192,232 | |
IGM Financial, Inc. | | | 2,600 | | | | 120,836 | |
Just Energy Group, Inc.(a) | | | 2,141 | | | | 29,562 | |
Labrador Iron Ore Royalty Corp. | | | 1,007 | | | | 35,466 | |
Pembina Pipeline Corp.(a) | | | 1,512 | | | | 42,632 | |
Pengrowth Energy Corp.(a) | | | 4,808 | | | | 44,980 | |
Penn West Petroleum Ltd.(a) | | | 4,193 | | | | 81,767 | |
PetroBakken Energy Ltd. Class A(a) | | | 2,141 | | | | 35,582 | |
Power Corp. of Canada | | | 3,500 | | | | 92,591 | |
Power Financial Corp. | | | 5,216 | | | | 153,122 | |
Provident Energy Ltd.(a) | | | 3,565 | | | | 42,946 | |
RioCan Real Estate Investment Trust(a) | | | 3,000 | | | | 81,135 | |
Rogers Communications, Inc. Class B | | | 4,100 | | | | 162,449 | |
Royal Bank of Canada(a) | | | 8,888 | | | | 514,098 | |
Shaw Communications, Inc. Class B | | | 4,000 | | | | 84,486 | |
Sun Life Financial, Inc. | | | 4,704 | | | | 111,405 | |
TELUS Corp. | | | 800 | | | | 46,329 | |
TransAlta Corp.(a) | | | 3,300 | | | | 61,744 | |
TransCanada Corp.(a) | | | 4,862 | | | | 208,354 | |
Veresen, Inc. (a) | | | 2,324 | | | | 35,251 | |
Vermilion Energy, Inc.(a) | | | 854 | | | | 39,314 | |
| | | | | | | | |
| Total Canada | | | | | | | 4,269,360 | |
| Chile – 0.8% | | | | | | | | |
AES Gener S.A. | | | 85,579 | | | | 52,519 | |
Aguas Andinas S.A. Class A | | | 69,202 | | | | 41,395 | |
Banco de Chile | | | 867,648 | | | | 137,110 | |
Banco Santander Chile | | | 1,503,505 | | | | 124,864 | |
Corpbanca | | | 2,846,026 | | | | 38,386 | |
Empresa Nacional de Electricidad S.A. | | | 51,668 | | | | 93,091 | |
Enersis S.A. | | | 213,847 | | | | 86,787 | |
ENTEL Chile S.A. | | | 3,221 | | | | 65,154 | |
Quinenco S.A. | | | 18,058 | | | | 56,891 | |
| | | | | | | | |
| Total Chile | | | | | | | 696,197 | |
| China – 0.5% | | | | | | | | |
Bank of China Ltd. Class H | | | 573,000 | | | | 231,001 | |
Guangzhou R&F Properties Co., Ltd. Class H(a) | | | 38,400 | | | | 45,750 | |
PetroChina Co., Ltd. Class H | | | 118,000 | | | | 166,878 | |
Zhejiang Expressway Co., Ltd. Class H | | | 64,000 | | | | 47,810 | |
| | | | | | | | |
| Total China | | | | | | | 491,439 | |
| Czech Republic – 0.5% | | | | | | | | |
CEZ AS | | | 5,733 | | | | 245,273 | |
Komercni Banka AS | | | 353 | | | | 69,998 | |
Telefonica Czech Republic AS | | | 6,106 | | | | 127,590 | |
| | | | | | | | |
| Total Czech Republic | | | | | | | 442,861 | |
| Finland – 1.1% | | | | | | | | |
Elisa Oyj | | | 1,160 | | | | 27,760 | |
Fortum Oyj | | | 7,624 | | | | 184,782 | |
Metso Oyj(a) | | | 1,039 | | | | 44,345 | |
Nokia Oyj | | | 61,482 | | | | 334,216 | |
Pohjola Bank PLC Class A(a) | | | 3,207 | | | | 35,469 | |
Sampo Oyj Class A | | | 6,101 | | | | 176,062 | |
Sanoma Oyj(a) | | | 2,881 | | | | 36,832 | |
| | | | | | | | |
Stora Enso Oyj Class R | | | 3,705 | | | $ | 27,482 | |
UPM-Kymmene Oyj(a) | | | 4,308 | | | | 58,574 | |
Wartsila Oyj Abp | | | 2,098 | | | | 79,012 | |
| | | | | | | | |
| Total Finland | | | | | | | 1,004,534 | |
| France – 7.0% | | | | | | | | |
Accor S.A. | | | 1,697 | | | | 60,497 | |
AXA S.A. | | | 18,308 | | | | 303,053 | |
BNP Paribas S.A. | | | 8,599 | | | | 407,380 | |
Bouygues S.A. | | | 3,801 | | | | 116,067 | |
Carrefour S.A. | | | 4,654 | | | | 111,404 | |
Casino Guichard Perrachon S.A. | | | 910 | | | | 89,555 | |
CNP Assurances | | | 6,586 | | | | 102,616 | |
EDF S.A. | | | 14,081 | | | | 320,841 | |
Euler Hermes S.A. | | | 300 | | | | 23,531 | |
France Telecom S.A. | | | 45,069 | | | | 666,504 | |
GDF Suez | | | 24,753 | | | | 638,504 | |
ICADE | | | 566 | | | | 50,418 | |
Klepierre | | | 2,122 | | | | 73,473 | |
Lafarge S.A. | | | 2,537 | | | | 120,900 | |
Lagardere SCA | | | 1,538 | | | | 47,374 | |
M6-Metropole Television S.A. | | | 2,355 | | | | 42,495 | |
Natixis | | | 32,247 | | | | 123,891 | |
Neopost S.A. | | | 571 | | | | 36,667 | |
Sanofi | | | 11,035 | | | | 855,708 | |
SCOR SE | | | 2,497 | | | | 67,370 | |
Societe Generale S.A. | | | 6,148 | | | | 179,834 | |
Societe Television Francaise 1 | | | 2,334 | | | | 28,536 | |
Suez Environnement Co. | | | 4,422 | | | | 67,721 | |
Total S.A. | | | 24,708 | | | | 1,258,235 | |
Veolia Environnement S.A. | | | 5,745 | | | | 95,135 | |
Vinci S.A. | | | 4,161 | | | | 216,661 | |
Vivendi S.A. | | | 17,008 | | | | 311,658 | |
| | | | | | | | |
| Total France | | | | | | | 6,416,028 | |
| Germany – 4.3% | | | | | | | | |
Allianz SE | | | 4,007 | | | | 477,423 | |
Axel Springer AG | | | 660 | | | | 33,285 | |
BASF SE | | | 5,746 | | | | 501,891 | |
Bilfinger Berger SE | | | 361 | | | | 33,859 | |
Daimler AG(a) | | | 7,176 | | | | 432,039 | |
Deutsche Boerse AG | | | 1,418 | | | | 95,324 | |
Deutsche Lufthansa AG | | | 3,071 | | | | 42,921 | |
Deutsche Post AG | | | 11,712 | | | | 225,141 | |
Deutsche Telekom AG | | | 51,895 | | | | 623,843 | |
E.ON AG | | | 26,505 | | | | 633,929 | |
Hannover Rueckversicherung AG | | | 1,494 | | | | 88,615 | |
Muenchener Rueckversicherungs AG | | | 2,160 | | | | 325,185 | |
RWE AG | | | 8,769 | | | | 418,119 | |
SMA Solar Technology AG(a) | | | 271 | | | | 12,263 | |
| | | | | | | | |
| Total Germany | | | | | | | 3,943,837 | |
| Hong Kong – 2.8% | | | | | | | | |
BOC Hong Kong Holdings Ltd. | | | 84,500 | | | | 233,452 | |
Cathay Pacific Airways Ltd. | | | 42,000 | | | | 77,790 | |
See Notes to Financial Statements.
| | |
| 46 | | WisdomTree International Dividend and Sector Funds |
Schedule of Investments (continued)
WisdomTree Global Equity Income Fund (DEW)
March 31, 2012
| | | | | | | | |
| Investments | | Shares | | | Value | |
| | | | | | | | |
China Mobile Ltd. | | | 150,000 | | | $ | 1,650,889 | |
CLP Holdings Ltd. | | | 19,000 | | | | 163,962 | |
Guangdong Investment Ltd. | | | 60,000 | | | | 41,808 | |
Hang Seng Bank Ltd. | | | 16,000 | | | | 212,674 | |
Hopewell Holdings Ltd. | | | 7,500 | | | | 20,576 | |
Power Assets Holdings Ltd. | | | 17,500 | | | | 128,477 | |
Shanghai Industrial Holdings Ltd. | | | 8,000 | | | | 24,678 | |
| | | | | | | | |
| Total Hong Kong | | | | | | | 2,554,306 | |
| Hungary – 0.1% | | | | | | | | |
Magyar Telekom Telecommunications PLC | | | 15,515 | | | | 40,490 | |
| Indonesia – 0.3% | | | | | | | | |
Astra Agro Lestari Tbk PT | | | 14,000 | | | | 35,750 | |
Perusahaan Gas Negara Persero Tbk PT | | | 171,000 | | | | 71,063 | |
Telekomunikasi Indonesia Persero Tbk PT | | | 136,000 | | | | 104,112 | |
Vale Indonesia Tbk PT | | | 124,500 | | | | 45,953 | |
| | | | | | | | |
| Total Indonesia | | | | | | | 256,878 | |
| Ireland – 0.1% | | | | | | | | |
CRH PLC | | | 5,690 | | | | 115,934 | |
| Israel – 0.4% | | | | | | | | |
Bank Leumi Le-Israel BM | | | 14,586 | | | | 45,945 | |
Bezeq The Israeli Telecommunication Corp., Ltd. | | | 54,634 | | | | 89,731 | |
Cellcom Israel Ltd. | | | 2,303 | | | | 29,179 | |
Delek Group Ltd. | | | 264 | | | | 51,661 | |
Israel Chemicals Ltd. | | | 8,804 | | | | 100,196 | |
Partner Communications Co., Ltd. | | | 3,747 | | | | 28,911 | |
| | | | | | | | |
| Total Israel | | | | | | | 345,623 | |
| Italy – 2.5% | | | | | | | | |
A2A SpA(a) | | | 46,394 | | | | 37,162 | |
ACEA SpA | | | 2,602 | | | | 16,522 | |
Atlantia SpA | | | 5,642 | | | | 93,543 | |
Banca Carige SpA(a) | | | 18,226 | | | | 23,883 | |
Banca Popolare di Sondrio SCRL | | | 4,289 | | | | 31,414 | |
Enel SpA | | | 93,070 | | | | 336,129 | |
ENI SpA | | | 44,579 | | | | 1,044,245 | |
Intesa Sanpaolo SpA | | | 91,354 | | | | 163,506 | |
Iren SpA | | | 40,724 | | | | 34,844 | |
Mediaset SpA | | | 21,355 | | | | 58,811 | |
Mediolanum SpA | | | 8,176 | | | | 38,805 | |
Snam SpA | | | 34,467 | | | | 165,514 | |
Telecom Italia SpA | | | 132,024 | | | | 156,740 | |
Terna Rete Elettrica Nazionale SpA | | | 23,494 | | | | 94,299 | |
| | | | | | | | |
| Total Italy | | | | | | | 2,295,417 | |
| Japan – 4.4% | | | | | | | | |
Astellas Pharma, Inc. | | | 3,500 | | | | 144,602 | |
Chubu Electric Power Co., Inc. | | | 7,200 | | | | 130,710 | |
Chugoku Electric Power Co., Inc. (The) | | | 3,500 | | | | 65,369 | |
Dai Nippon Printing Co., Ltd. | | | 4,000 | | | | 41,120 | |
Daiichi Sankyo Co., Ltd. | | | 5,100 | | | | 93,454 | |
Daito Trust Construction Co., Ltd. | | | 700 | | | | 63,200 | |
Eisai Co., Ltd. | | | 3,000 | | | | 119,934 | |
Hokuriku Electric Power Co. | | | 2,400 | | | | 43,628 | |
| | | | | | | | |
Hoya Corp. | | | 3,400 | | | $ | 76,804 | |
Kansai Electric Power Co., Inc. (The) | | | 8,500 | | | | 132,414 | |
Kyushu Electric Power Co., Inc. | | | 4,700 | | | | 67,335 | |
Lawson, Inc. | | | 700 | | | | 44,316 | |
Mitsubishi UFJ Financial Group, Inc. | | | 79,200 | | | | 396,505 | |
Mitsui & Co., Ltd. | | | 11,600 | | | | 191,278 | |
Mizuho Financial Group, Inc.(a) | | | 183,100 | | | | 300,365 | |
Nintendo Co., Ltd. | | | 900 | | | | 136,157 | |
Nippon Express Co., Ltd. | | | 6,000 | | | | 23,549 | |
Nippon Telegraph & Telephone Corp. | | | 8,000 | | | | 365,028 | |
Nippon Yusen K.K. | | | 10,000 | | | | 31,594 | |
NKSJ Holdings, Inc. | | | 3,372 | | | | 75,803 | |
NTT DoCoMo, Inc. | | | 267 | | | | 445,784 | |
Oracle Corp. | | | 1,000 | | | | 38,216 | |
Resona Holdings, Inc. | | | 16,600 | | | | 76,853 | |
Ricoh Co., Ltd. | | | 5,000 | | | | 48,909 | |
Sankyo Co., Ltd. | | | 500 | | | | 24,667 | |
Shikoku Electric Power Co., Inc. | | | 1,400 | | | | 39,689 | |
Shiseido Co., Ltd. | | | 2,900 | | | | 50,321 | |
Sumitomo Mitsui Financial Group, Inc. | | | 10,300 | | | | 340,809 | |
Takeda Pharmaceutical Co., Ltd. | | | 7,000 | | | | 310,043 | |
TonenGeneral Sekiyu K.K. | | | 4,000 | | | | 37,038 | |
Toppan Printing Co., Ltd. | | | 5,000 | | | | 39,249 | |
| | | | | | | | |
| Total Japan | | | | | | | 3,994,743 | |
| Malaysia – 1.3% | | | | | | | | |
British American Tobacco Malaysia Bhd | | | 3,900 | | | | 72,080 | |
DiGi.Com Bhd | | | 82,200 | | | | 108,938 | |
IOI Corp. Bhd | | | 41,800 | | | | 72,862 | |
Malayan Banking Bhd | | | 101,400 | | | | 293,592 | |
Maxis Bhd | | | 78,600 | | | | 156,251 | |
MISC Bhd | | | 43,100 | | | | 75,690 | |
Petronas Gas Bhd | | | 20,800 | | | | 114,337 | |
Public Bank Bhd | | | 33,732 | | | | 150,189 | |
Telekom Malaysia Bhd | | | 48,000 | | | | 83,356 | |
UMW Holdings Bhd | | | 14,300 | | | | 34,075 | |
YTL Power International Bhd | | | 74,900 | | | | 45,231 | |
| | | | | | | | |
| Total Malaysia | | | | | | | 1,206,601 | |
| Mexico – 0.2% | | | | | | | | |
Industrias Penoles S.A.B de C.V. | | | 3,310 | | | | 160,303 | |
Kimberly-Clark de Mexico S.A.B de C.V. Class A | | | 24,200 | | | | 53,668 | |
| | | | | | | | |
| Total Mexico | | | | | | | 213,971 | |
| Netherlands – 1.1% | | | | | | | | |
Delta Lloyd N.V. | | | 1,107 | | | | 19,430 | |
Koninklijke Boskalis Westminster N.V. | | | 668 | | | | 25,055 | |
Koninklijke KPN N.V. | | | 20,782 | | | | 228,267 | |
Koninklijke Philips Electronics N.V. | | | 6,992 | | | | 141,531 | |
PostNL N.V. | | | 6,312 | | | | 38,918 | |
Randstad Holding N.V. | | | 1,107 | | | | 41,705 | |
Reed Elsevier N.V. | | | 5,774 | | | | 73,632 | |
Unilever N.V. CVA | | | 11,550 | | | | 392,450 | |
Wolters Kluwer N.V. | | | 2,231 | | | | 42,188 | |
| | | | | | | | |
| Total Netherlands | | | | | | | 1,003,176 | |
See Notes to Financial Statements.
| | | | |
| WisdomTree International Dividend and Sector Funds | | | 47 | |
Schedule of Investments (continued)
WisdomTree Global Equity Income Fund (DEW)
March 31, 2012
| | | | | | | | |
| Investments | | Shares | | | Value | |
| | | | | | | | |
| New Zealand – 0.1% | | | | | | | | |
Auckland International Airport Ltd. | | | 17,052 | | | $ | 34,375 | |
Fletcher Building Ltd. | | | 3,514 | | | | 19,408 | |
Telecom Corp. of New Zealand Ltd. | | | 38,325 | | | | 76,158 | |
| | | | | | | | |
| Total New Zealand | | | | | | | 129,941 | |
| Norway – 1.6% | | | | | | | | |
Aker ASA Class A | | | 1,061 | | | | 34,691 | |
DNB ASA | | | 17,355 | | | | 222,716 | |
Fred Olsen Energy ASA | | | 1,369 | | | | 53,593 | |
Gjensidige Forsikring ASA | | | 5,339 | | | | 62,946 | |
Marine Harvest ASA | | | 142,984 | | | | 73,697 | |
Orkla ASA | | | 12,436 | | | | 98,240 | |
Statoil ASA | | | 25,660 | | | | 695,477 | |
Telenor ASA | | | 12,658 | | | | 234,340 | |
| | | | | | | | |
| Total Norway | | | | | | | 1,475,700 | |
| Philippines – 0.3% | | | | | | | | |
Aboitiz Equity Ventures, Inc. | | | 39,900 | | | | 46,558 | |
Aboitiz Power Corp. | | | 54,700 | | | | 43,189 | |
Globe Telecom, Inc. | | | 2,660 | | | | 70,256 | |
Philippine Long Distance Telephone Co. | | | 2,200 | | | | 138,349 | |
| | | | | | | | |
| Total Philippines | | | | | | | 298,352 | |
| Poland – 0.3% | | | | | | | | |
Bank Handlowy w Warszawie S.A. | | | 819 | | | | 20,115 | |
Bank Pekao S.A. | | | 1,796 | | | | 89,259 | |
Powszechna Kasa Oszczednosci Bank Polski S.A. | | | 9,751 | | | | 105,051 | |
Telekomunikacja Polska S.A. | | | 15,215 | | | | 83,373 | |
| | | | | | | | |
| Total Poland | | | | | | | 297,798 | |
| Portugal – 0.4% | | | | | | | | |
Banco Espirito Santo S.A. | | | 12,478 | | | | 22,765 | |
Brisa Auto-Estradas de Portugal S.A. | | | 9,930 | | | | 35,307 | |
Cimpor Cimentos de Portugal, SGPS, S.A. | | | 8,466 | | | | 56,371 | |
EDP-Energias de Portugal S.A. | | | 46,288 | | | | 134,441 | |
Portugal Telecom, SGPS, S.A. | | | 14,174 | | | | 76,993 | |
| | | | | | | | |
| Total Portugal | | | | | | | 325,877 | |
| Russia – 0.7% | | | | | | | | |
Gazprom Neft JSC ADR | | | 5,536 | | | | 147,756 | |
Lukoil OAO ADR | | | 4,933 | | | | 296,967 | |
Mobile Telesystems OJSC ADR* | | | 9,500 | | | | 174,230 | |
| | | | | | | | |
| Total Russia | | | | | | | 618,953 | |
| Singapore – 1.2% | | | | | | | | |
Keppel Corp., Ltd. | | | 8,800 | | | | 76,917 | |
Keppel Land Ltd. | | | 13,000 | | | | 35,877 | |
SembCorp Industries Ltd. | | | 9,000 | | | | 37,794 | |
SembCorp Marine Ltd.(a) | | | 29,000 | | | | 121,780 | |
SIA Engineering Co., Ltd. | | | 8,000 | | | | 25,641 | |
Singapore Exchange Ltd. | | | 7,000 | | | | 38,637 | |
Singapore Press Holdings Ltd. | | | 33,000 | | | | 102,883 | |
Singapore Technologies Engineering Ltd. | | | 37,000 | | | | 95,638 | |
Singapore Telecommunications Ltd. | | | 129,000 | | | | 323,180 | |
StarHub Ltd. | | | 36,000 | | | | 88,758 | |
United Overseas Bank Ltd. | | | 7,000 | | | | 102,159 | |
| | | | | | | | |
| Total Singapore | | | | | | | 1,049,264 | |
| | | | | | | | |
| South Africa – 1.7% | | | | | | | | |
ABSA Group Ltd. | | | 4,489 | | | $ | 91,248 | |
African Bank Investments Ltd. | | | 12,268 | | | | 63,717 | |
Aveng Ltd. | | | 5,950 | | | | 30,306 | |
FirstRand Ltd. | | | 40,780 | | | | 125,934 | |
Foschini Group Ltd. (The) | | | 2,232 | | | | 35,970 | |
Imperial Holdings Ltd. | | | 1,886 | | | | 38,091 | |
Kumba Iron Ore Ltd.(a) | | | 4,172 | | | | 285,969 | |
MMI Holdings Ltd. | | | 13,491 | | | | 31,132 | |
MTN Group Ltd. | | | 11,207 | | | | 197,167 | |
Nedbank Group Ltd. | | | 3,144 | | | | 67,185 | |
Pick’n Pay Stores Ltd. | | | 4,649 | | | | 26,351 | |
Pretoria Portland Cement Co., Ltd. | | | 9,634 | | | | 41,175 | |
RMB Holdings Ltd. | | | 11,705 | | | | 47,692 | |
Sanlam Ltd. | | | 21,207 | | | | 91,686 | |
Standard Bank Group Ltd. | | | 11,341 | | | | 164,561 | |
Vodacom Group Ltd. | | | 9,998 | | | | 140,892 | |
Woolworths Holdings Ltd. | | | 7,356 | | | | 46,151 | |
| | | | | | | | |
| Total South Africa | | | | | | | 1,525,227 | |
| South Korea – 0.4% | | | | | | | | |
Kangwon Land, Inc. | | | 1,730 | | | | 38,400 | |
Korea Exchange Bank | | | 14,560 | | | | 111,283 | |
KT&G Corp. | | | 1,668 | | | | 118,359 | |
LG Uplus Corp. | | | 12,370 | | | | 74,239 | |
SK Telecom Co., Ltd. | | | 510 | | | | 62,791 | |
| | | | | | | | |
| Total South Korea | | | | | | | 405,072 | |
| Spain – 4.5% | | | | | | | | |
Acciona S.A. | | | 604 | | | | 42,116 | |
Acerinox S.A. | | | 1,709 | | | | 21,933 | |
ACS Actividades de Construccion y Servicios, S.A.(a) | | | 4,371 | | | | 111,702 | |
Banco Bilbao Vizcaya Argentaria S.A.(a) | | | 39,875 | | | | 316,857 | |
Banco de Sabadell S.A. | | | 14,944 | | | | 40,638 | |
Banco Espanol de Credito S.A.(a) | | | 11,464 | | | | 54,868 | |
Banco Santander S.A. | | | 120,396 | | | | 925,112 | |
Bankinter S.A.(a) | | | 5,797 | | | | 30,362 | |
Bolsas y Mercados Espanoles S.A. | | | 870 | | | | 22,268 | |
CaixaBank(a) | | | 40,230 | | | | 156,383 | |
Enagas S.A. | | | 2,627 | | | | 50,482 | |
Endesa S.A. | | | 7,519 | | | | 149,595 | |
Ferrovial S.A. | | | 6,008 | | | | 68,951 | |
Fomento de Construcciones y Contratas S.A. | | | 2,386 | | | | 53,222 | |
Gas Natural SDG S.A. | | | 10,562 | | | | 168,504 | |
Iberdrola S.A. | | | 54,197 | | | | 307,245 | |
Indra Sistemas S.A.(a) | | | 2,108 | | | | 25,793 | |
Mapfre S.A.(a) | | | 25,581 | | | | 82,236 | |
Mediaset Espana Comunicacion S.A. | | | 4,359 | | | | 24,961 | |
Red Electrica Corp. S.A. | | | 1,147 | | | | 56,042 | |
Repsol YPF S.A. | | | 9,645 | | | | 241,600 | |
Telefonica S.A. | | | 68,108 | | | | 1,114,242 | |
Zardoya Otis S.A. | | | 4,839 | | | | 62,572 | |
| | | | | | | | |
| Total Spain | | | | | | | 4,127,684 | |
See Notes to Financial Statements.
| | |
| 48 | | WisdomTree International Dividend and Sector Funds |
Schedule of Investments (continued)
WisdomTree Global Equity Income Fund (DEW)
March 31, 2012
| | | | | | | | |
| Investments | | Shares | | | Value | |
| | | | | | | | |
| Sweden – 1.9% | | | | | | | | |
Boliden AB | | | 2,455 | | | $ | 38,442 | |
Castellum AB | | | 2,050 | | | | 25,751 | |
Electrolux AB Series B(a) | | | 2,458 | | | | 51,825 | |
Hakon Invest AB | | | 2,110 | | | | 36,474 | |
Hennes & Mauritz AB Class B | | | 12,573 | | | | 453,627 | |
Nordea Bank AB(a) | | | 27,348 | | | | 247,912 | |
Peab AB | | | 4,507 | | | | 22,958 | |
Ratos AB Class B(a) | | | 3,229 | | | | 44,697 | |
Scania AB Class B | | | 2,632 | | | | 54,581 | |
Securitas AB Class B | | | 3,867 | | | | 37,182 | |
Skanska AB Class B | | | 4,646 | | | | 80,312 | |
Svenska Cellulosa AB Class B(a) | | | 5,163 | | | | 89,171 | |
Svenska Handelsbanken AB Class A(a) | | | 5,615 | | | | 178,469 | |
Tele2 AB Class B | | | 3,592 | | | | 73,081 | |
TeliaSonera AB | | | 43,556 | | | | 302,874 | |
| | | | | | | | |
| Total Sweden | | | | | | | 1,737,356 | |
| Switzerland – 5.2% | | | | | | | | |
Baloise Holding AG | | | 606 | | | | 48,743 | |
BKW S.A.* | | | 450 | | | | 16,131 | |
Credit Suisse Group AG* | | | 8,840 | | | | 251,649 | |
Nestle S.A. | | | 20,918 | | | | 1,314,535 | |
Novartis AG | | | 19,866 | | | | 1,098,086 | |
Roche Holding AG – Genusschein | | | 5,637 | | | | 979,778 | |
SGS S.A. | | | 47 | | | | 91,312 | |
Swiss Re AG* | | | 3,361 | | | | 214,374 | |
Swisscom AG(a) | | | 529 | | | | 213,567 | |
Zurich Financial Services AG* | | | 1,886 | | | | 506,216 | |
| | | | | | | | |
| Total Switzerland | | | | | | | 4,734,391 | |
| Taiwan – 2.4% | | | | | | | | |
Acer, Inc. | | | 34,000 | | | | 45,100 | |
Asia Cement Corp. | | | 31,082 | | | | 37,859 | |
Asustek Computer, Inc. | | | 6,161 | | | | 58,135 | |
China Development Financial Holding Corp. | | | 80,631 | | | | 24,587 | |
Chunghwa Telecom Co., Ltd. | | | 73,800 | | | | 227,292 | |
Compal Electronics, Inc. | | | 53,335 | | | | 59,995 | |
Delta Electronics, Inc. | | | 13,000 | | | | 38,100 | |
Far EasTone Telecommunications Co., Ltd. | | | 44,000 | | | | 90,193 | |
Formosa Chemicals & Fibre Corp. | | | 41,000 | | | | 119,745 | |
Formosa Petrochemical Corp. | | | 59,000 | | | | 183,910 | |
Formosa Plastics Corp. | | | 40,000 | | | | 117,773 | |
Fubon Financial Holding Co., Ltd. | | | 59,447 | | | | 66,971 | |
Lite-On Technology Corp. | | | 32,120 | | | | 38,852 | |
Macronix International | | | 57,000 | | | | 21,244 | |
MediaTek, Inc. | | | 15,000 | | | | 143,574 | |
Mega Financial Holding Co., Ltd. | | | 69,040 | | | | 48,772 | |
Quanta Computer, Inc. | | | 42,000 | | | | 110,000 | |
Siliconware Precision Industries Co. | | | 42,000 | | | | 50,945 | |
Taiwan Cement Corp. | | | 28,000 | | | | 32,777 | |
Taiwan Mobile Co., Ltd. | | | 36,800 | | | | 112,091 | |
Taiwan Semiconductor Manufacturing Co., Ltd. | | | 180,000 | | | | 517,779 | |
United Microelectronics Corp. | | | 87,000 | | | | 42,594 | |
Wistron Corp. | | | 24,799 | | | | 37,390 | |
| | | | | | | | |
| Total Taiwan | | | | | | | 2,225,678 | |
| | | | | | | | |
| Thailand – 0.6% | | | | | | | | |
Advanced Info Service PCL | | | 43,800 | | | $ | 261,238 | |
Charoen Pokphand Foods PCL | | | 66,200 | | | | 79,934 | |
Land and Houses PCL NVDR | | | 174,486 | | | | 39,026 | |
Siam Cement PCL NVDR | | | 8,595 | | | | 98,905 | |
Total Access Communication PCL NVDR | | | 28,300 | | | | 75,222 | |
| | | | | | | | |
| Total Thailand | | | | | | | 554,325 | |
| Turkey – 0.5% | | | | | | | | |
Arcelik A.S.* | | | 5,108 | | | | 22,805 | |
Eregli Demir ve Celik Fabrikalari TAS | | | 26,645 | | | | 52,456 | |
Ford Otomotiv Sanayi A.S. | | | 7,193 | | | | 67,778 | |
Tofas Turk Otomobil Fabrikasi A.S. | | | 6,522 | | | | 27,875 | |
Tupras Turkiye Petrol Rafinerileri A.S. | | | 3,406 | | | | 86,922 | |
Turk Telekomunikasyon A.S. | | | 50,313 | | | | 218,421 | |
| | | | | | | | |
| Total Turkey | | | | | | | 476,257 | |
| United Kingdom – 12.6% | | | | | | | | |
Aberdeen Asset Management PLC | | | 9,022 | | | | 37,046 | |
Admiral Group PLC | | | 2,743 | | | | 52,022 | |
Amlin PLC | | | 6,583 | | | | 34,688 | |
Antofagasta PLC | | | 10,791 | | | | 198,620 | |
Ashmore Group PLC | | | 8,261 | | | | 48,506 | |
AstraZeneca PLC | | | 13,986 | | | | 620,999 | |
Aviva PLC | | | 36,682 | | | | 194,288 | |
BAE Systems PLC | | | 36,629 | | | | 175,513 | |
Balfour Beatty PLC | | | 7,087 | | | | 32,328 | |
British American Tobacco PLC | | | 16,911 | | | | 851,251 | |
British Land Co. PLC | | | 10,597 | | | | 81,254 | |
BT Group PLC | | | 49,151 | | | | 177,794 | |
Bunzl PLC | | | 2,981 | | | | 47,819 | |
Cable & Wireless Worldwide PLC | | | 47,967 | | | | 26,057 | |
Centrica PLC | | | 45,697 | | | | 231,011 | |
Compass Group PLC | | | 9,750 | | | | 102,114 | |
Diageo PLC | | | 15,953 | | | | 382,971 | |
Drax Group PLC | | | 3,820 | | | | 33,233 | |
Firstgroup PLC | | | 6,982 | | | | 26,517 | |
GlaxoSmithKline PLC | | | 52,848 | | | | 1,179,175 | |
Hays PLC | | | 24,644 | | | | 33,213 | |
Home Retail Group PLC | | | 15,029 | | | | 27,374 | |
HSBC Holdings PLC | | | 122,514 | | | | 1,086,003 | |
ICAP PLC | | | 6,905 | | | | 43,336 | |
Imperial Tobacco Group PLC | | | 8,555 | | | | 346,503 | |
Inmarsat PLC | | | 2,936 | | | | 21,593 | |
Investec PLC | | | 6,516 | | | | 39,801 | |
J. Sainsbury PLC | | | 17,384 | | | | 86,464 | |
Legal & General Group PLC | | | 56,004 | | | | 116,951 | |
Man Group PLC | | | 37,407 | | | | 80,566 | |
Marks & Spencer Group PLC | | | 13,101 | | | | 79,333 | |
National Grid PLC | | | 37,018 | | | | 372,913 | |
Next PLC | | | 1,446 | | | | 68,918 | |
Old Mutual PLC | | | 27,434 | | | | 69,519 | |
Pearson PLC | | | 6,456 | | | | 120,171 | |
Prudential PLC | | | 17,429 | | | | 208,158 | |
Reckitt Benckiser Group PLC | | | 4,417 | | | | 249,333 | |
See Notes to Financial Statements.
| | | | |
| WisdomTree International Dividend and Sector Funds | | | 49 | |
Schedule of Investments (continued)
WisdomTree Global Equity Income Fund (DEW)
March 31, 2012
| | | | | | | | |
| Investments | | Shares | | | Value | |
| | | | | | | | |
Reed Elsevier PLC | | | 10,598 | | | $ | 93,978 | |
Rexam PLC | | | 8,458 | | | | 57,852 | |
Royal Dutch Shell PLC Class A | | | 284 | | | | 9,908 | |
Royal Dutch Shell PLC Class B | | | 25,856 | | | | 908,645 | |
RSA Insurance Group PLC(a) | | | 49,734 | | | | 83,118 | |
Segro PLC | | | 7,830 | | | | 29,374 | |
Severn Trent PLC | | | 2,985 | | | | 73,638 | |
SSE PLC | | | 10,232 | | | | 217,267 | |
Standard Life PLC | | | 32,200 | | | | 118,175 | |
Tate & Lyle PLC | | | 4,540 | | | | 51,139 | |
TESCO PLC | | | 53,672 | | | | 282,990 | |
TUI Travel PLC | | | 11,482 | | | | 36,012 | |
Unilever PLC | | | 8,884 | | | | 292,973 | |
United Utilities Group PLC | | | 9,314 | | | | 89,512 | |
Vodafone Group PLC | | | 549,848 | | | | 1,512,811 | |
WM Morrison Supermarkets PLC | | | 19,971 | | | | 95,088 | |
| | | | | | | | |
| Total United Kingdom | | | | | | | 11,535,835 | |
| United States – 19.3% | | | | | | | | |
Abbott Laboratories | | | 9,186 | | | | 563,010 | |
Alliant Energy Corp. | | | 1,204 | | | | 52,157 | |
Altria Group, Inc. | | | 20,926 | | | | 645,986 | |
Ameren Corp. | | | 2,452 | | | | 79,886 | |
American Eagle Outfitters, Inc. | | | 1,775 | | | | 30,512 | |
American Electric Power Co., Inc. | | | 4,288 | | | | 165,431 | |
Apollo Investment Corp. | | | 3,789 | | | | 27,167 | |
Ares Capital Corp. | | | 2,760 | | | | 45,126 | |
Arthur J. Gallagher & Co. | | | 1,453 | | | | 51,930 | |
AT&T, Inc. | | | 57,779 | | | | 1,804,438 | |
Bristol-Myers Squibb Co. | | | 14,758 | | | | 498,083 | |
Campbell Soup Co. | | | 1,392 | | | | 47,119 | |
Capitol Federal Financial, Inc. | | | 2,717 | | | | 32,224 | |
CBL & Associates Properties, Inc. | | | 2,180 | | | | 41,246 | |
CenterPoint Energy, Inc. | | | 2,098 | | | | 41,373 | |
CenturyLink, Inc. | | | 4,320 | | | | 166,968 | |
Cincinnati Financial Corp. | | | 1,984 | | | | 68,468 | |
ConAgra Foods, Inc. | | | 2,044 | | | | 53,675 | |
ConocoPhillips | | | 8,950 | | | | 680,289 | |
Consolidated Edison, Inc. | | | 2,812 | | | | 164,277 | |
Diamond Offshore Drilling, Inc.(a) | | | 1,488 | | | | 99,324 | |
Digital Realty Trust, Inc.(a) | | | 493 | | | | 36,467 | |
Dominion Resources, Inc. | | | 4,582 | | | | 234,644 | |
DTE Energy Co. | | | 1,450 | | | | 79,793 | |
Duke Energy Corp. | | | 13,478 | | | | 283,173 | |
Duke Realty Corp. | | | 2,667 | | | | 38,245 | |
Edison International | | | 2,284 | | | | 97,093 | |
Eli Lilly & Co. | | | 11,284 | | | | 454,407 | |
Entergy Corp. | | | 1,472 | | | | 98,918 | |
Exelon Corp. | | | 6,067 | | | | 237,887 | |
Fidelity National Financial, Inc. Class A | | | 2,191 | | | | 39,504 | |
First Niagara Financial Group, Inc. | | | 7,238 | | | | 71,222 | |
FirstEnergy Corp. | | | 3,328 | | | | 151,724 | |
Frontier Communications Corp.(a) | | | 15,667 | | | | 65,331 | |
H&R Block, Inc. | | | 2,578 | | | | 42,460 | |
| | | | | | | | |
H.J. Heinz Co. | | | 2,379 | | | $ | 127,395 | |
HCP, Inc. | | | 3,020 | | | | 119,169 | |
Health Care REIT, Inc. | | | 1,604 | | | | 88,156 | |
Hospitality Properties Trust | | | 1,916 | | | | 50,717 | |
Hudson City Bancorp, Inc. | | | 5,148 | | | | 37,632 | |
Integrys Energy Group, Inc. | | | 926 | | | | 49,069 | |
Johnson & Johnson | | | 15,171 | | | | 1,000,679 | |
Kimberly-Clark Corp. | | | 2,978 | | | | 220,044 | |
Kimco Realty Corp. | | | 2,628 | | | | 50,615 | |
Kraft Foods, Inc. Class A | | | 10,953 | | | | 416,324 | |
Leggett & Platt, Inc. | | | 1,044 | | | | 24,022 | |
Liberty Property Trust | | | 1,490 | | | | 53,223 | |
Lockheed Martin Corp. | | | 2,129 | | | | 191,312 | |
Lorillard, Inc. | | | 1,056 | | | | 136,731 | |
Macerich Co. (The) | | | 1,100 | | | | 63,525 | |
Mack-Cali Realty Corp. | | | 1,100 | | | | 31,702 | |
Mattel, Inc. | | | 2,812 | | | | 94,652 | |
Merck & Co., Inc. | | | 22,436 | | | | 861,542 | |
Mercury General Corp. | | | 920 | | | | 40,241 | |
Microchip Technology, Inc. | | | 1,546 | | | | 57,511 | |
New York Community Bancorp, Inc.(a) | | | 4,581 | | | | 63,722 | |
NextEra Energy, Inc. | | | 2,760 | | | | 168,581 | |
NiSource, Inc. | | | 3,507 | | | | 85,395 | |
NSTAR | | | 1,044 | | | | 50,770 | |
Nucor Corp. | | | 1,852 | | | | 79,543 | |
NYSE Euronext | | | 2,202 | | | | 66,082 | |
Old Republic International Corp. | | | 2,880 | | | | 30,384 | |
Omega Healthcare Investors’ Inc. | | | 1,802 | | | | 38,311 | |
Paychex, Inc. | | | 3,353 | | | | 103,909 | |
People’s United Financial, Inc. | | | 3,700 | | | | 48,988 | |
Pepco Holdings, Inc. | | | 3,034 | | | | 57,312 | |
Pfizer, Inc. | | | 52,729 | | | | 1,194,839 | |
PG&E Corp. | | | 2,831 | | | | 122,894 | |
Philip Morris International, Inc. | | | 11,571 | | | | 1,025,306 | |
Pinnacle West Capital Corp. | | | 1,267 | | | | 60,689 | |
Pitney Bowes, Inc.(a) | | | 2,448 | | | | 43,036 | |
Plum Creek Timber Co., Inc. | | | 1,490 | | | | 61,924 | |
PPL Corp. | | | 3,678 | | | | 103,940 | |
Progress Energy, Inc. | | | 3,289 | | | | 174,679 | |
Public Service Enterprise Group, Inc. | | | 3,678 | | | | 112,584 | |
R.R. Donnelley & Sons Co.(a) | | | 2,636 | | | | 32,660 | |
Realty Income Corp. | | | 1,472 | | | | 57,011 | |
Regal Entertainment Group Class A(a) | | | 2,464 | | | | 33,510 | |
Regency Centers Corp. | | | 968 | | | | 43,057 | |
Reynolds American, Inc. | | | 5,832 | | | | 241,678 | |
SCANA Corp.(a) | | | 1,338 | | | | 61,026 | |
Senior Housing Properties Trust | | | 1,875 | | | | 41,344 | |
Southern Co. (The) | | | 6,883 | | | | 309,253 | |
Southern Copper Corp. | | | 9,228 | | | | 292,620 | |
Spectra Energy Corp. | | | 5,135 | | | | 162,009 | |
Sysco Corp. | | | 2,946 | | | | 87,968 | |
TECO Energy, Inc. | | | 2,374 | | | | 41,664 | |
Ventas, Inc. | | | 2,181 | | | | 124,535 | |
Verizon Communications, Inc. | | | 27,070 | | | | 1,034,886 | |
See Notes to Financial Statements.
| | |
| 50 | | WisdomTree International Dividend and Sector Funds |
Schedule of Investments (concluded)
WisdomTree Global Equity Income Fund (DEW)
March 31, 2012
| | | | | | | | |
| Investments | | Shares | | | Value | |
| | | | | | | | |
Waste Management, Inc. | | | 3,308 | | | $ | 115,648 | |
Windstream Corp. | | | 7,482 | | | | 87,614 | |
Xcel Energy, Inc. | | | 4,159 | | | | 110,089 | |
| | | | | | | | |
| Total United States | | | | | | | 17,573,278 | |
TOTAL COMMON STOCKS
(Cost: $88,907,663) | | | | | | | 90,605,789 | |
| EXCHANGE-TRADED FUNDS – 0.3% | | | | | | | | |
| United States – 0.3% | | | | | | | | |
WisdomTree DEFA Equity Income Fund(a)(c) | | | 4,588 | | | | 178,611 | |
WisdomTree Equity Income Fund(a)(c) | | | 1,328 | | | | 59,494 | |
| | | | | | | | |
TOTAL EXCHANGE-TRADED FUNDS
(Cost: $231,536) | | | | | | | 238,105 | |
| INVESTMENT OF CASH COLLATERAL FOR SECURITIES LOANED – 6.1% | | | | | | | | |
| MONEY MARKET FUND – 6.1% | | | | | | | | |
Dreyfus Institutional Preferred Money Market Fund, 0.18%(d) | | | | | | | | |
| (Cost: $5,541,194)(e) | | | 5,541,194 | | | | 5,541,194 | |
TOTAL INVESTMENTS IN SECURITIES – 105.6%
(Cost: $94,680,393) | | | | | | | 96,385,088 | |
Liabilities in Excess of Foreign Currency and Other Assets – (5.6)% | | | | | | | (5,081,059 | ) |
| | | | | | | | |
| NET ASSETS – 100.0% | | | | | | $ | 91,304,029 | |
ADR – American Depositary Receipt
NVDR – Non-Voting Depositary Receipt
| * | Non-income producing security. |
| (a) | Security, or portion thereof, was on loan at March 31, 2012 (See Note 2). |
| (b) | Stapled Security – A security contractually bound to one or more other securities to form a single saleable unit which cannot be sold separately. |
| (c) | Affiliated company (See Note 7). |
| (d) | Rate shown represents annualized 7-day yield as of March 31, 2012. |
| (e) | At March 31, 2012, the total market value of the Fund’s securities on loan was $5,250,315 and the total market value of the collateral held by the Fund was $5,541,194. |
See Notes to Financial Statements.
| | | | |
| WisdomTree International Dividend and Sector Funds | | | 51 | |
Schedule of Investments
WisdomTree Europe SmallCap Dividend Fund (DFE)
March 31, 2012
| | | | | | | | |
| Investments | | Shares | | | Value | |
| | | | | | | | |
| COMMON STOCKS – 99.5% | | | | | | | | |
| Austria – 1.4% | | | | | | | | |
Austriamicrosystems AG | | | 632 | | | $ | 44,961 | |
CAT Oil AG | | | 7,598 | | | | 63,239 | |
RHI AG | | | 3,229 | | | | 81,572 | |
Schoeller-Bleckmann Oilfield Equipment AG | | | 1,139 | | | | 104,705 | |
Semperit AG Holding | | | 2,247 | | | | 96,173 | |
Zumtobel AG | | | 1,388 | | | | 19,575 | |
| | | | | | | | |
| Total Austria | | | | | | | 410,225 | |
| Belgium – 4.0% | | | | | | | | |
Arseus N.V. | | | 3,801 | | | | 62,108 | |
Barco N.V. | | | 795 | | | | 57,360 | |
Cie Maritime Belge S.A. | | | 7,841 | | | | 186,178 | |
Cofinimmo | | | 3,098 | | | | 380,381 | |
EVS Broadcast Equipment S.A. | | | 2,429 | | | | 125,765 | |
Exmar N.V. | | | 12,318 | | | | 106,133 | |
Ion Beam Applications | | | 1,546 | | | | 12,991 | |
Melexis N.V. | | | 3,146 | | | | 55,302 | |
Recticel S.A. | | | 3,903 | | | | 31,654 | |
Tessenderlo Chemie N.V. | | | 3,843 | | | | 128,097 | |
| | | | | | | | |
| Total Belgium | | | | | | | 1,145,969 | |
| Denmark – 1.3% | | | | | | | | |
D/S Norden | | | 6,566 | | | | 195,104 | |
East Asiatic Co., Ltd. A/S(a) | | | 1,858 | | | | 54,211 | |
NKT Holding A/S(a) | | | 590 | | | | 26,825 | |
Royal UNIBREW A/S | | | 1,393 | | | | 96,747 | |
| | | | | | | | |
| Total Denmark | | | | | | | 372,887 | |
| Finland – 5.9% | | | | | | | | |
Aktia Oyj Class A* | | | 6,316 | | | | 46,681 | |
Alma Media Oyj(a) | | | 24,197 | | | | 172,071 | |
Citycon Oyj | | | 11,842 | | | | 39,583 | |
F-Secure Oyj* | | | 11,304 | | | | 30,107 | |
HKScan Oyj Class A | | | 6,809 | | | | 48,421 | |
Huhtamaki Oyj | | | 16,109 | | | | 233,831 | |
Lassila & Tikanoja Oyj* | | | 4,785 | | | | 70,285 | |
Oriola-KD Oyj Class B | | | 6,252 | | | | 15,569 | |
Orion Oyj Class A | | | 10,045 | | | | 198,380 | |
PKC Group Oyj* | | | 2,134 | | | | 48,851 | |
Poyry Oyj | | | 1,138 | | | | 9,093 | |
Raisio PLC Class V(a) | | | 18,557 | | | | 60,792 | |
Ramirent Oyj(a) | | | 9,099 | | | | 79,367 | |
Stockmann Oyj Abp Class B(a) | | | 5,476 | | | | 117,845 | |
Tieto Oyj(a) | | | 14,618 | | | | 274,287 | |
Tikkurila Oyj(a) | | | 6,198 | | | | 117,288 | |
Uponor Oyj(a) | | | 11,773 | | | | 135,459 | |
| | | | | | | | |
| Total Finland | | | | | | | 1,697,910 | |
| France – 3.9% | | | | | | | | |
Alten Ltd. | | | 3,566 | | | | 113,402 | |
April | | | 4,366 | | | | 80,759 | |
Assystem | | | 1,072 | | | | 24,069 | |
Beneteau S.A. | | | 2,638 | | | | 31,969 | |
Groupe Steria SCA | | | 973 | | | | 22,105 | |
| | | | | | | | |
IPSOS | | | 2,061 | | | $ | 73,790 | |
LaCie S.A. | | | 10,994 | | | | 50,218 | |
Mersen | | | 1,367 | | | | 48,378 | |
NRJ Group | | | 9,312 | | | | 81,721 | |
Plastic Omnium S.A. | | | 3,645 | | | | 105,454 | |
Rubis | | | 2,694 | | | | 157,298 | |
Saft Groupe S.A. | | | 2,499 | | | | 80,868 | |
Sechilienne-Sidec | | | 3,648 | | | | 62,329 | |
Societe d’Edition de Canal + | | | 23,720 | | | | 150,043 | |
Sword Group | | | 1,268 | | | | 23,134 | |
| | | | | | | | |
| Total France | | | | | | | 1,105,537 | |
| Germany – 7.7% | | | | | | | | |
Asian Bamboo AG | | | 579 | | | | 8,952 | |
Bauer AG | | | 1,118 | | | | 34,303 | |
BayWa AG | | | 1,667 | | | | 63,291 | |
Bechtle AG | | | 1,388 | | | | 61,737 | |
Bertrandt AG | | | 664 | | | | 49,960 | |
Carl Zeiss Meditec AG | | | 8,709 | | | | 211,079 | |
Comdirect Bank AG(a) | | | 23,383 | | | | 270,070 | |
CropEnergies AG | | | 3,929 | | | | 26,454 | |
Delticom AG | | | 1,291 | | | | 137,366 | |
Demag Cranes AG(a) | | | 928 | | | | 63,027 | |
Deutsche Wohnen AG | | | 5,432 | | | | 80,150 | |
Drillisch AG | | | 10,347 | | | | 124,012 | |
Duerr AG | | | 718 | | | | 45,637 | |
Freenet AG(a) | | | 9,180 | | | | 148,289 | |
Gerresheimer AG | | | 1,356 | | | | 59,230 | |
Gerry Weber International AG | | | 3,553 | | | | 136,126 | |
H&R AG | | | 3,243 | | | | 64,802 | |
Indus Holding AG | | | 1,506 | | | | 46,428 | |
Kontron AG | | | 4,664 | | | | 38,869 | |
Leoni AG | | | 1,697 | | | | 88,136 | |
MLP AG | | | 15,160 | | | | 134,456 | |
Pfeiffer Vacuum Technology AG | | | 1,273 | | | | 144,012 | |
Praktiker AG(a) | | | 2,828 | | | | 6,922 | |
PSI AG Gesellschaft Fuer Produkte und Systeme der Informationstechnologie | | | 583 | | | | 13,078 | |
Solarworld AG(a) | | | 6,735 | | | | 21,230 | |
VTG AG | | | 1,431 | | | | 27,918 | |
Wacker Neuson SE | | | 2,984 | | | | 53,070 | |
Wirecard AG | | | 2,512 | | | | 47,753 | |
| | | | | | | | |
| Total Germany | | | | | | | 2,206,357 | |
| Ireland – 2.1% | | | | | | | | |
C&C Group PLC | | | 21,558 | | | | 110,816 | |
FBD Holdings PLC | | | 5,928 | | | | 71,838 | |
Grafton Group PLC | | | 16,763 | | | | 69,649 | |
Greencore Group PLC | | | 57,134 | | | | 69,605 | |
IFG Group PLC | | | 12,250 | | | | 23,817 | |
Kingspan Group PLC(a) | | | 7,898 | | | | 82,039 | |
Origin Enterprises PLC | | | 8,990 | | | | 44,895 | |
Total Produce PLC | | | 54,967 | | | | 32,940 | |
United Drug PLC | | | 31,118 | | | | 87,852 | |
| | | | | | | | |
| Total Ireland | | | | | | | 593,451 | |
See Notes to Financial Statements.
| | |
| 52 | | WisdomTree International Dividend and Sector Funds |
Schedule of Investments (continued)
WisdomTree Europe SmallCap Dividend Fund (DFE)
March 31, 2012
| | | | | | | | |
| Investments | | Shares | | | Value | |
| | | | | | | | |
| Italy – 10.0% | | | | | | | | |
Alerion Cleanpower SpA | | | 2,721 | | | $ | 14,639 | |
Amplifon SpA | | | 4,682 | | | | 24,130 | |
Ansaldo STS SpA | | | 11,780 | | | | 116,715 | |
Astaldi SpA | | | 9,626 | | | | 76,593 | |
Autostrada Torino-Milano SpA | | | 8,856 | | | | 60,796 | |
Azimut Holding SpA | | | 19,038 | | | | 206,499 | |
Banca Generali SpA | | | 20,464 | | | | 274,154 | |
Banca Piccolo Credito Valtellinese SCRL(a) | | | 31,272 | | | | 73,420 | |
Banca Popolare di Milano SCRL | | | 250,331 | | | | 139,080 | |
Banco di Desio e della Brianza SpA | | | 12,245 | | | | 47,974 | |
BasicNet SpA | | | 12,581 | | | | 36,357 | |
Brembo SpA | | | 6,941 | | | | 79,400 | |
Cairo Communications SpA | | | 19,457 | | | | 91,258 | |
Cementir Holding SpA | | | 12,382 | | | | 28,361 | |
Cofide SpA | | | 27,057 | | | | 18,610 | |
Credito Artigiano SpA | | | 57,161 | | | | 90,965 | |
Danieli & C Officine Meccaniche SpA | | | 2,179 | | | | 59,603 | |
Danieli & C Officine Meccaniche SpA RSP | | | 5,001 | | | | 74,191 | |
Esprinet SpA | | | 6,368 | | | | 33,022 | |
Exor SpA RSP | | | 1,350 | | | | 26,518 | |
Falck Renewables SpA | | | 6,821 | | | | 9,274 | |
Fiat SpA RSP | | | 14,369 | | | | 78,684 | |
Geox SpA(a) | | | 35,346 | | | | 115,322 | |
Gruppo Editoriale L’Espresso SpA(a) | | | 45,228 | | | | 63,844 | |
Immobiliare Grande Distribuzione | | | 50,593 | | | | 61,479 | |
IMMSI SpA | | | 39,780 | | | | 31,626 | |
Indesit Co. SpA | | | 15,569 | | | | 96,907 | |
Interpump Group SpA | | | 5,923 | | | | 50,442 | |
Italcementi SpA(a) | | | 9,946 | | | | 69,007 | |
Italcementi SpA RSP | | | 12,104 | | | | 39,330 | |
KME Group SpA | | | 65,698 | | | | 27,822 | |
Landi Renzo SpA | | | 9,829 | | | | 26,807 | |
Maire Tecnimont SpA(a) | | | 39,987 | | | | 33,814 | |
MARR SpA | | | 12,658 | | | | 142,607 | |
Piaggio & C. SpA | | | 28,968 | | | | 85,023 | |
Piquadro SpA | | | 2,706 | | | | 5,816 | |
Servizi Italia SpA | | | 1,491 | | | | 6,870 | |
Societa Cattolica di Assicurazioni SCRL | | | 9,561 | | | | 193,150 | |
Sogefi SpA | | | 19,296 | | | | 55,248 | |
Trevi Finanziaria Industriale SpA | | | 2,576 | | | | 15,238 | |
Zignago Vetro SpA | | | 12,386 | | | | 84,039 | |
| | | | | | | | |
| Total Italy | | | | | | | 2,864,634 | |
| Netherlands – 3.7% | | | | | | | | |
Arcadis N.V. | | | 5,982 | | | | 124,831 | |
BE Semiconductor Industries N.V. | | | 3,287 | | | | 24,946 | |
Beter Bed Holding N.V. | | | 4,194 | | | | 94,389 | |
BinckBank N.V. | | | 12,387 | | | | 134,242 | |
Brunel International N.V. | | | 1,582 | | | | 69,607 | |
Exact Holding N.V.(a) | | | 6,650 | | | | 156,748 | |
Heijmans N.V. CVA | | | 688 | | | | 7,972 | |
Koninklijke BAM Groep N.V. | | | 5,088 | | | | 23,905 | |
Koninklijke Ten Cate N.V. | | | 1,641 | | | | 56,928 | |
| | | | | | | | |
Koninklijke Wessanen N.V. | | | 2,388 | | | $ | 8,329 | |
Mediq N.V. | | | 5,985 | | | | 93,969 | |
Sligro Food Group N.V. | | | 3,149 | | | | 102,154 | |
TKH Group N.V. | | | 3,518 | | | | 95,408 | |
Unit 4 N.V. | | | 646 | | | | 18,711 | |
USG People N.V. | | | 4,814 | | | | 48,273 | |
| | | | | | | | |
| Total Netherlands | | | | | | | 1,060,412 | |
| Norway – 4.4% | | | | | | | | |
ABG Sundal Collier Holding ASA | | | 195,168 | | | | 169,025 | |
Atea ASA | | | 11,072 | | | | 133,449 | |
Austevoll Seafood ASA | | | 27,082 | | | | 103,503 | |
Leroey Seafood Group ASA | | | 11,632 | | | | 191,690 | |
Nordic Semiconductor ASA | | | 9,870 | | | | 34,780 | |
Sparebank 1 Nord Norge | | | 9,111 | | | | 50,634 | |
SpareBank 1 SMN(a) | | | 22,752 | | | | 145,988 | |
SpareBank 1 SR Bank ASA(a) | | | 23,260 | | | | 167,190 | |
Tomra Systems ASA | | | 6,015 | | | | 49,035 | |
Veidekke ASA | | | 24,697 | | | | 209,559 | |
| | | | | | | | |
| Total Norway | | | | | | | 1,254,853 | |
| Portugal – 2.1% | | | | | | | | |
Mota-Engil, SGPS, S.A. | | | 53,357 | | | | 86,474 | |
REN – Redes Energeticas Nacionais S.A.(a) | | | 64,812 | | | | 195,924 | |
Semapa-Sociedade de Investimento e Gestao, SGPS, S.A. | | | 14,026 | | | | 103,236 | |
Sonaecom – SGPS S.A. | | | 42,247 | | | | 68,356 | |
Zon Multimedia Servicos de Telecomunicacoes e Multimedia, SGPS, S.A.(a) | | | 47,974 | | | | 162,912 | |
| | | | | | | | |
| Total Portugal | | | | | | | 616,902 | |
| Spain – 3.4% | | | | | | | | |
Antena 3 de Television S.A.(a) | | | 57,070 | | | | 340,481 | |
Caja de Ahorros del Mediterraneo(a) | | | 7,768 | | | | 13,862 | |
Campofrio Food Group S.A. | | | 3,448 | | | | 29,479 | |
Duro Felguera S.A. | | | 29,897 | | | | 193,893 | |
Faes Farma S.A. | | | 22,580 | | | | 46,608 | |
Fluidra S.A. | | | 6,551 | | | | 21,984 | |
Grupo Empresarial Ence S.A.(a) | | | 33,975 | | | | 84,381 | |
Laboratorios Farmaceuticos Rovi S.A. | | | 4,575 | | | | 30,767 | |
Papeles y Cartones de Europa S.A. | | | 7,137 | | | | 25,852 | |
Pescanova S.A. | | | 1,347 | | | | 42,603 | |
Viscofan S.A. | | | 3,019 | | | | 134,884 | |
| | | | | | | | |
| Total Spain | | | | | | | 964,794 | |
| Sweden – 14.1% | | | | | | | | |
AarhusKarlshamn AB(a) | | | 2,886 | | | | 90,903 | |
Acando AB | | | 8,426 | | | | 19,810 | |
AF AB Class B | | | 2,937 | | | | 60,751 | |
Atrium Ljungberg AB Class B | | | 11,449 | | | | 135,793 | |
Axis Communications AB | | | 8,245 | | | | 222,423 | |
Bilia AB Class A | | | 8,704 | | | | 171,513 | |
Billerud AB | | | 17,370 | | | | 160,340 | |
Byggmax Group AB | | | 7,444 | | | | 47,679 | |
Clas Ohlson AB Class B | | | 8,712 | | | | 137,533 | |
Duni AB | | | 8,997 | | | | 82,372 | |
See Notes to Financial Statements.
| | | | |
| WisdomTree International Dividend and Sector Funds | | | 53 | |
Schedule of Investments (continued)
WisdomTree Europe SmallCap Dividend Fund (DFE)
March 31, 2012
| | | | | | | | |
| Investments | | Shares | | | Value | |
| | | | | | | | |
Fabege AB(a) | | | 27,592 | | | $ | 237,233 | |
Gunnebo AB | | | 2,623 | | | | 13,282 | |
Hexpol AB | | | 1,595 | | | | 54,085 | |
Hoganas AB Class B | | | 4,757 | | | | 173,136 | |
Husqvarna AB Class A(a) | | | 14,767 | | | | 88,175 | |
Industrial & Financial Systems Class B | | | 1,716 | | | | 26,831 | |
Indutrade AB | | | 3,275 | | | | 101,428 | |
Intrum Justitia AB | | | 11,023 | | | | 182,738 | |
Investment AB Oresund* | | | 9,276 | | | | 148,884 | |
KNOW IT AB | | | 1,972 | | | | 19,912 | |
Kungsleden AB | | | 17,399 | | | | 120,620 | |
Lindab International AB | | | 6,015 | | | | 47,864 | |
Loomis AB Class B | | | 8,149 | | | | 116,057 | |
Mekonomen AB | | | 3,428 | | | | 109,783 | |
MQ Holding AB | | | 5,648 | | | | 21,620 | |
NCC AB Class B | | | 17,930 | | | | 376,956 | |
New Wave Group AB Class B | | | 6,257 | | | | 32,250 | |
Nibe Industrier AB Class B | | | 5,490 | | | | 87,496 | |
Nolato AB Class B | | | 7,353 | | | | 77,848 | |
Nordnet AB Class B | | | 16,122 | | | | 57,098 | |
Proffice AB Class B | | | 3,846 | | | | 14,838 | |
Skandinaviska Enskilda Banken AB Class C | | | 8,861 | | | | 61,977 | |
SkiStar AB | | | 5,997 | | | | 72,982 | |
SSAB AB Class B(a) | | | 9,299 | | | | 75,888 | |
Svenska Cellulosa AB Class A(a) | | | 12,785 | | | | 220,426 | |
Svenska Handelsbanken AB Class B | | | 2,489 | | | | 76,973 | |
Sweco AB Class B | | | 11,522 | | | | 124,591 | |
Systemair AB | | | 1,980 | | | | 25,290 | |
Wihlborgs Fastigheter AB | | | 10,451 | | | | 147,267 | |
| | | | | | | | |
| Total Sweden | | | | | | | 4,042,645 | |
| Switzerland – 0.8% | | | | | | | | |
Ascom Holding AG | | | 1,834 | | | | 17,592 | |
Highlight Communications AG*(a) | | | 5,065 | | | | 26,238 | |
Kudelski S.A. | | | 4,275 | | | | 30,555 | |
Mobilezone Holding AG | | | 7,124 | | | | 80,789 | |
Swisslog Holding AG* | | | 24,518 | | | | 23,600 | |
Tecan Group AG* | | | 523 | | | | 38,479 | |
| | | | | | | | |
| Total Switzerland | | | | | | | 217,253 | |
| United Kingdom – 34.7% | | | | | | | | |
A.G. BARR PLC | | | 2,169 | | | | 40,928 | |
Abcam PLC | | | 5,747 | | | | 32,046 | |
Anite PLC | | | 9,599 | | | | 19,900 | |
Ashtead Group PLC | | | 29,349 | | | | 121,170 | |
Aveva Group PLC | | | 2,233 | | | | 59,118 | |
BBA Aviation PLC | | | 61,960 | | | | 211,853 | |
Bellway PLC | | | 5,746 | | | | 75,098 | |
Berendsen PLC | | | 25,167 | | | | 209,899 | |
Bloomsbury Publishing PLC | | | 11,250 | | | | 19,592 | |
Bodycote PLC | | | 16,826 | | | | 103,825 | |
Booker Group PLC | | | 130,537 | | | | 175,821 | |
Bovis Homes Group PLC | | | 2,921 | | | | 22,486 | |
Brammer PLC | | | 5,806 | | | | 31,540 | |
Brewin Dolphin Holdings PLC | | | 40,751 | | | | 115,245 | |
| | | | | | | | |
Britvic PLC | | | 35,712 | | | $ | 219,505 | |
Chesnara PLC | | | 30,012 | | | | 89,670 | |
Chime Communications PLC | | | 4,787 | | | | 16,827 | |
Cineworld Group PLC | | | 26,673 | | | | 92,585 | |
Close Brothers Group PLC | | | 27,486 | | | | 344,739 | |
Computacenter PLC | | | 16,403 | | | | 115,577 | |
Consort Medical PLC | | | 4,530 | | | | 45,453 | |
Costain Group PLC | | | 10,090 | | | | 35,467 | |
Cranswick PLC | | | 5,634 | | | | 72,464 | |
CSR PLC | | | 7,987 | | | | 29,338 | |
Dairy Crest Group PLC | | | 23,817 | | | | 126,757 | |
De La Rue PLC | | | 20,253 | | | | 291,233 | |
Debenhams PLC | | | 68,793 | | | | 88,811 | |
Dechra Pharmaceuticals PLC | | | 4,699 | | | | 36,713 | |
Development Securities PLC | | | 10,578 | | | | 26,957 | |
Devro PLC | | | 14,983 | | | | 73,182 | |
Dignity PLC | | | 4,552 | | | | 59,056 | |
Diploma PLC | | | 9,525 | | | | 68,484 | |
Domino Printing Sciences PLC | | | 8,702 | | | | 77,582 | |
Domino’s Pizza UK & IRL PLC | | | 15,120 | | | | 104,266 | |
DS Smith PLC | | | 48,980 | | | | 140,160 | |
Dunelm Group PLC | | | 13,163 | | | | 109,152 | |
E2V Technologies PLC | | | 4,570 | | | | 8,926 | |
Elementis PLC | | | 29,329 | | | | 86,504 | |
EMIS Group PLC | | | 4,677 | | | | 40,726 | |
Euromoney Institutional Investor PLC | | | 10,731 | | | | 130,305 | |
F&C Asset Management PLC | | | 82,093 | | | | 87,749 | |
Fenner PLC | | | 12,298 | | | | 85,179 | |
Fiberweb PLC | | | 40,563 | | | | 39,696 | |
Fidessa Group PLC | | | 5,407 | | | | 142,976 | |
Filtrona PLC | | | 17,499 | | | | 132,805 | |
Galliford Try PLC | | | 7,759 | | | | 77,481 | |
Game Group PLC† | | | 199,381 | | | | — | |
Genus PLC | | | 2,493 | | | | 50,786 | |
Go-Ahead Group PLC | | | 6,040 | | | | 120,244 | |
Greene King PLC | | | 31,898 | | | | 261,451 | |
Greggs PLC | | | 12,498 | | | | 103,937 | |
Halfords Group PLC | | | 40,815 | | | | 202,549 | |
Hargreaves Services PLC | | | 2,286 | | | | 43,756 | |
Hill & Smith Holdings PLC | | | 9,963 | | | | 53,327 | |
Hilton Food Group Ltd. | | | 2,633 | | | | 12,053 | |
Hunting PLC | | | 9,259 | | | | 140,169 | |
Interserve PLC | | | 25,296 | | | | 117,734 | |
ITE Group PLC | | | 22,258 | | | | 78,949 | |
JD Sports Fashion PLC | | | 4,144 | | | | 52,671 | |
JD Wetherspoon PLC | | | 3,586 | | | | 23,571 | |
John Menzies PLC | | | 7,732 | | | | 74,123 | |
Kcom Group PLC | | | 54,510 | | | | 64,014 | |
Keller Group PLC | | | 12,894 | | | | 90,852 | |
Kesa Electricals PLC | | | 77,846 | | | | 87,065 | |
Kier Group PLC | | | 5,731 | | | | 103,837 | |
Laird PLC | | | 43,370 | | | | 149,122 | |
London & Stamford Property PLC | | | 107,667 | | | | 189,916 | |
Lookers PLC | | | 31,064 | | | | 31,020 | |
See Notes to Financial Statements.
| | |
| 54 | | WisdomTree International Dividend and Sector Funds |
Schedule of Investments (concluded)
WisdomTree Europe SmallCap Dividend Fund (DFE)
March 31, 2012
| | | | | | | | |
| Investments | | Shares | | | Value | |
| | | | | | | | |
Low & Bonar PLC | | | 23,004 | | | $ | 22,420 | |
Marshalls PLC | | | 27,730 | | | | 43,641 | |
Marston’s PLC | | | 114,040 | | | | 178,746 | |
May Gurney Integrated Services PLC | | | 4,383 | | | | 19,188 | |
Mcbride PLC* | | | 23,443 | | | | 46,071 | |
Mears Group PLC | | | 7,171 | | | | 29,274 | |
Melrose Resources PLC | | | 6,449 | | | | 12,674 | |
Micro Focus International PLC | | | 25,402 | | | | 191,972 | |
Mitie Group PLC | | | 42,476 | | | | 189,686 | |
Moneysupermarket.com Group PLC | | | 63,100 | | | | 127,938 | |
Morgan Crucible Co. PLC | | | 22,702 | | | | 116,796 | |
Morgan Sindall Group PLC | | | 10,130 | | | | 109,736 | |
Mothercare PLC | | | 13,973 | | | | 37,060 | |
N. Brown Group PLC | | | 40,172 | | | | 148,909 | |
NCC Group PLC | | | 1,959 | | | | 28,170 | |
Novae Group PLC | | | 11,349 | | | | 65,278 | |
Oxford Instruments PLC | | | 2,042 | | | | 39,641 | |
Pace PLC | | | 17,426 | | | | 20,812 | |
Phoenix IT Group Ltd. | | | 7,979 | | | | 24,828 | |
Premier Farnell PLC | | | 46,944 | | | | 160,960 | |
Promethean World PLC | | | 25,282 | | | | 29,993 | |
Rank Group PLC | | | 18,991 | | | | 39,203 | |
Restaurant Group PLC | | | 21,275 | | | | 100,651 | |
Robert Walters PLC | | | 5,702 | | | | 22,320 | |
RPC Group PLC | | | 10,189 | | | | 59,908 | |
RPS Group PLC | | | 14,333 | | | | 54,297 | |
RSM Tenon Group PLC | | | 72,707 | | | | 9,863 | |
RWS Holdings PLC | | | 3,800 | | | | 31,723 | |
Savills PLC | | | 16,353 | | | | 98,633 | |
SDL PLC | | | 2,233 | | | | 26,402 | |
Senior PLC | | | 27,660 | | | | 88,343 | |
Severfield-Rowen PLC | | | 10,003 | | | | 28,808 | |
Shanks Group PLC | | | 30,396 | | | | 47,958 | |
Smiths News PLC | | | 61,770 | | | | 87,590 | |
Spirent Communications PLC | | | 23,655 | | | | 60,661 | |
Sportingbet PLC | | | 76,768 | | | | 46,303 | |
ST Modwen Properties PLC | | | 15,330 | | | | 45,252 | |
Sthree PLC | | | 13,517 | | | | 72,457 | |
Synergy Health PLC | | | 1,194 | | | | 16,196 | |
Telecom Plus PLC | | | 7,926 | | | | 87,633 | |
TT electronics PLC | | | 5,754 | | | | 14,962 | |
Tullett Prebon PLC | | | 36,755 | | | | 205,539 | |
Ultra Electronics Holdings PLC | | | 5,613 | | | | 156,853 | |
Umeco PLC | | | 7,523 | | | | 46,697 | |
Vitec Group PLC (The) | | | 3,871 | | | | 41,655 | |
WH Smith PLC | | | 21,901 | | | | 190,708 | |
Wilmington Group PLC | | | 16,977 | | | | 26,650 | |
WS Atkins PLC | | | 11,684 | | | | 137,024 | |
WSP Group PLC | | | 9,609 | | | | 38,919 | |
Yule Catto & Co. PLC | | | 11,732 | | | | 46,487 | |
| | | | | | | | |
| Total United Kingdom | | | | | | | 9,959,480 | |
TOTAL COMMON STOCKS (Cost: $28,090,569) | | | | | | | 28,513,309 | |
| | | | | | | | |
| EXCHANGE-TRADED FUND – 0.0% | | | | | | | | |
| United States – 0.0% | | | | | | | | |
WisdomTree International MidCap Dividend Fund(b)
| | | | | | | | |
| (Cost: $1,092) | | | 26 | | | $ | 1,251 | |
| RIGHTS – 0.0% | | | | | | | | |
| Norway – 0.0% | | | | | | | | |
BWG Homes ASA, expiring 4/10/12* (Cost: $0) | | | 1,533 | | | | 188 | |
TOTAL LONG-TERM INVESTMENTS (Cost: $28,091,661) | | | | | | | 28,514,748 | |
| SHORT-TERM INVESTMENT – 0.0% | | | | | | | | |
| MONEY MARKET FUND – 0.0% | | | | | | | | |
Invesco Treasury Fund Private Class, 0.02%(c) (Cost: $12,495) | | | 12,495 | | | | 12,495 | |
| INVESTMENT OF CASH COLLATERAL FOR SECURITIES LOANED – 9.4% | | | | | | | | |
| MONEY MARKET FUND – 9.4% | | | | | | | | |
Dreyfus Institutional Preferred Money Market Fund, 0.18%(c) | | | | | | | | |
| (Cost: $2,686,845)(d) | | | 2,686,845 | | | | 2,686,845 | |
TOTAL INVESTMENTS IN SECURITIES – 108.9% (Cost: $30,791,001) | | | | | | | 31,214,088 | |
Liabilities in Excess of Other Assets – (8.9)% | | | | | | | (2,546,209 | ) |
| | | | | | | | |
| NET ASSETS – 100.0% | | | | | | $ | 28,667,879 | |
RSP – Risparmio Italian Savings Shares
| * | Non-income producing security. |
| † | Security is being fair valued by a valuation committee under the direction of the Board of Trustees. The aggregate value of fair valued securities is $0, which represents 0.0% of net assets. |
| (a) | Security, or portion thereof, was on loan at March 31, 2012 (See Note 2). |
| (b) | Affiliated company (See Note 7). |
| (c) | Rate shown represents annualized 7-day yield as of March 31, 2012. |
| (d) | At March 31, 2012, the total market value of the Fund’s securities on loan was $2,325,126 and the total market value of the collateral held by the Fund was $2,686,845. |
See Notes to Financial Statements.
| | | | |
| WisdomTree International Dividend and Sector Funds | | | 55 | |
Schedule of Investments
WisdomTree Japan Hedged Equity Fund (DXJ)
March 31, 2012
| | | | | | | | |
| Investments | | Shares | | | Value | |
| | | | | | | | |
| COMMON STOCKS – 98.7% | | | | | | | | |
| Japan – 98.7% | | | | | | | | |
| Advertising – 0.1% | | | | | | | | |
Hakuhodo DY Holdings, Inc.(a) | | | 3,350 | | | $ | 211,678 | |
Moshi Moshi Hotline, Inc. | | | 35,950 | | | | 361,269 | |
| | | | | | | | |
| Total Advertising | | | | | | | 572,947 | |
| Agriculture – 1.4% | | | | | | | | |
Hokuto Corp. | | | 7,400 | | | | 156,732 | |
Japan Tobacco, Inc. | | | 1,473 | | | | 8,340,944 | |
Sakata Seed Corp. | | | 17,500 | | | | 244,547 | |
| | | | | | | | |
| Total Agriculture | | | | | | | 8,742,223 | |
| Airlines – 0.0% | | | | | | | | |
All Nippon Airways Co., Ltd.(a) | | | 80,000 | | | | 243,028 | |
| Apparel – 0.3% | | | | | | | | |
Asics Corp. | | | 11,692 | | | | 132,982 | |
Atsugi Co., Ltd. | | | 185,000 | | | | 238,289 | |
Descente Ltd. | | | 38,558 | | | | 242,232 | |
Gunze Ltd. | | | 55,000 | | | | 161,735 | |
Onward Holdings Co., Ltd.(a) | | | 53,182 | | | | 436,209 | |
Sanyo Shokai Ltd. | | | 61,000 | | | | 166,037 | |
Wacoal Holdings Corp. | | | 25,000 | | | | 298,013 | |
| | | | | | | | |
| Total Apparel | | | | | | | 1,675,497 | |
| Auto Manufacturers – 6.5% | | | | | | | | |
Daihatsu Motor Co., Ltd.(a) | | | 81,000 | | | | 1,492,144 | |
Fuji Heavy Industries Ltd. | | | 109,000 | | | | 880,795 | |
Hino Motors Ltd. | | | 48,000 | | | | 348,794 | |
Honda Motor Co., Ltd. | | | 260,477 | | | | 9,954,434 | |
Isuzu Motors Ltd. | | | 176,000 | | | | 1,037,244 | |
Nissan Motor Co., Ltd. | | | 460,900 | | | | 4,934,114 | |
Nissan Shatai Co., Ltd. | | | 21,000 | | | | 220,985 | |
Shinmaywa Industries Ltd. | | | 37,000 | | | | 185,236 | |
Suzuki Motor Corp. | | | 34,836 | | | | 836,877 | |
Toyota Motor Corp. | | | 454,437 | | | | 19,713,714 | |
| | | | | | | | |
| Total Auto Manufacturers | | | | | | | 39,604,337 | |
| Auto Parts & Equipment – 2.7% | | | | | | | | |
Aisin Seiki Co., Ltd. | | | 42,308 | | | | 1,493,980 | |
Akebono Brake Industry Co., Ltd.(a) | | | 48,400 | | | | 278,773 | |
Bridgestone Corp. | | | 67,568 | | | | 1,647,019 | |
Calsonic Kansei Corp. | | | 25,000 | | | | 153,412 | |
Denso Corp. | | | 103,114 | | | | 3,464,490 | |
Exedy Corp. | | | 4,600 | | | | 131,860 | |
FCC Co., Ltd. | | | 5,700 | | | | 128,067 | |
JTEKT Corp. | | | 27,678 | | | | 333,300 | |
Keihin Corp.(a) | | | 7,800 | | | | 145,204 | |
Koito Manufacturing Co., Ltd. | | | 20,501 | | | | 333,566 | |
KYB Co., Ltd.(a) | | | 19,000 | | | | 116,131 | |
Musashi Seimitsu Industry Co., Ltd. | | | 5,500 | | | | 131,794 | |
NGK Insulators Ltd. | | | 33,012 | | | | 473,749 | |
NGK Spark Plug Co., Ltd. | | | 29,000 | | | | 416,174 | |
NHK Spring Co., Ltd. | | | 31,000 | | | | 335,257 | |
Nifco, Inc. | | | 7,300 | | | | 200,651 | |
Nippon Seiki Co., Ltd. | | | 11,000 | | | | 139,279 | |
| | | | | | | | |
Nissin Kogyo Co., Ltd.(a) | | | 16,500 | | | $ | 270,873 | |
NOK Corp. | | | 22,300 | | | | 487,757 | |
Riken Corp. | | | 59,000 | | | | 272,435 | |
Sanden Corp. | | | 29,000 | | | | 95,146 | |
Stanley Electric Co., Ltd. | | | 34,626 | | | | 553,292 | |
Sumitomo Electric Industries Ltd. | | | 107,000 | | | | 1,473,127 | |
Sumitomo Rubber Industries Ltd. | | | 45,396 | | | | 606,236 | |
Taiho Kogyo Co., Ltd. | | | 23,300 | | | | 293,603 | |
Takata Corp. | | | 7,800 | | | | 208,992 | |
Tokai Rika Co., Ltd. | | | 18,914 | | | | 326,131 | |
Topre Corp. | | | 23,000 | | | | 242,870 | |
Toyo Tire & Rubber Co., Ltd. | | | 58,000 | | | | 162,805 | |
Toyoda Gosei Co., Ltd. | | | 19,640 | | | | 384,471 | |
Toyota Boshoku Corp. | | | 25,000 | | | | 296,494 | |
TS Tech Co., Ltd. | | | 17,600 | | | | 347,103 | |
Unipres Corp. | | | 5,600 | | | | 174,271 | |
Yokohama Rubber Co., Ltd. (The) | | | 70,917 | | | | 513,598 | |
| | | | | | | | |
| Total Auto Parts & Equipment | | | | | | | 16,631,910 | |
| Banks – 12.3% | | | | | | | | |
77 Bank Ltd. (The) | | | 71,000 | | | | 314,904 | |
Akita Bank Ltd. (The) | | | 67,000 | | | | 220,633 | |
Aomori Bank Ltd. (The)(a) | | | 47,000 | | | | 146,206 | |
Aozora Bank Ltd.(a) | | | 171,000 | | | | 496,616 | |
Awa Bank Ltd. (The)(a) | | | 30,000 | | | | 185,187 | |
Bank of Iwate Ltd. (The)(a) | | | 3,400 | | | | 154,930 | |
Bank of Kyoto Ltd. (The) | | | 43,000 | | | | 392,405 | |
Bank of Nagoya Ltd. (The) | | | 56,000 | | | | 202,102 | |
Bank of Saga Ltd. (The) | | | 78,000 | | | | 223,683 | |
Bank of the Ryukyus Ltd. | | | 18,900 | | | | 258,369 | |
Bank of Yokohama Ltd. (The) | | | 311,692 | | | | 1,568,023 | |
Chiba Bank Ltd. (The) | | | 183,045 | | | | 1,174,406 | |
Chugoku Bank Ltd. (The) | | | 29,000 | | | | 394,325 | |
Chukyo Bank Ltd. (The) | | | 80,000 | | | | 208,032 | |
Daisan Bank Ltd. (The) | | | 75,000 | | | | 160,399 | |
Daishi Bank Ltd. (The) | | | 128,000 | | | | 452,616 | |
Ehime Bank Ltd. (The) | | | 59,000 | | | | 169,196 | |
FIDEA Holdings Co., Ltd. | | | 72,600 | | | | 197,611 | |
Fukui Bank Ltd. (The) | | | 74,000 | | | | 235,592 | |
Fukuoka Financial Group, Inc. | | | 206,878 | | | | 922,586 | |
Gunma Bank Ltd. (The) | | | 71,000 | | | | 382,198 | |
Hachijuni Bank Ltd. (The) | | | 59,000 | | | | 349,863 | |
Higo Bank Ltd. (The) | | | 33,000 | | | | 196,488 | |
Hiroshima Bank Ltd. (The)(a) | | | 81,000 | | | | 372,052 | |
Hokkoku Bank Ltd. (The) | | | 70,000 | | | | 264,536 | |
Hokuhoku Financial Group, Inc. | | | 273,000 | | | | 524,139 | |
Hyakugo Bank Ltd. (The) | | | 26,000 | | | | 120,372 | |
Hyakujushi Bank Ltd. (The) | | | 42,000 | | | | 196,488 | |
Iyo Bank Ltd. (The) | | | 33,000 | | | | 293,930 | |
Joyo Bank Ltd. (The) | | | 210,314 | | | | 968,577 | |
Juroku Bank Ltd. (The) | | | 102,000 | | | | 353,241 | |
Kagoshima Bank Ltd. (The) | | | 34,000 | | | | 218,142 | |
Keiyo Bank Ltd. (The) | | | 53,000 | | | | 255,678 | |
Kiyo Holdings, Inc. | | | 164,000 | | | | 245,118 | |
Michinoku Bank Ltd. (The) | | | 44,000 | | | | 90,358 | |
See Notes to Financial Statements.
| | |
| 56 | | WisdomTree International Dividend and Sector Funds |
Schedule of Investments (continued)
WisdomTree Japan Hedged Equity Fund (DXJ)
March 31, 2012
| | | | | | | | |
| Investments | | Shares | | | Value | |
| | | | | | | | |
Mie Bank Ltd. (The) | | | 73,000 | | | $ | 176,524 | |
Mitsubishi UFJ Financial Group, Inc.(a) | | | 3,792,883 | | | | 18,988,612 | |
Miyazaki Bank Ltd. (The) | | | 49,000 | | | | 139,924 | |
Mizuho Financial Group, Inc.(a) | | | 9,263,745 | | | | 15,196,617 | |
Musashino Bank Ltd. (The) | | | 7,000 | | | | 242,250 | |
Nishi-Nippon City Bank Ltd. (The) | | | 184,704 | | | | 525,193 | |
Oita Bank Ltd. (The) | | | 20,000 | | | | 64,159 | |
Resona Holdings, Inc. | | | 669,961 | | | | 3,101,709 | |
San-In Godo Bank Ltd. (The) | | | 42,000 | | | | 334,285 | |
Sapporo Hokuyo Holdings, Inc. | | | 55,000 | | | | 203,840 | |
Senshu Ikeda Holdings, Inc. | | | 315,116 | | | | 440,347 | |
Shiga Bank Ltd. (The) | | | 43,000 | | | | 258,643 | |
Shikoku Bank Ltd. (The) | | | 62,000 | | | | 233,550 | |
Shinsei Bank Ltd. | | | 338,000 | | | | 443,575 | |
Shizuoka Bank Ltd. (The) | | | 123,008 | | | | 1,273,502 | |
Sumitomo Mitsui Financial Group, Inc.(a) | | | 502,359 | | | | 16,622,195 | |
Sumitomo Mitsui Trust Holdings, Inc. | | | 405,517 | | | | 1,300,887 | |
Suruga Bank Ltd. | | | 44,000 | | | | 451,789 | |
Tochigi Bank Ltd. (The) | | | 44,000 | | | | 164,676 | |
Toho Bank Ltd. (The) | | | 78,000 | | | | 268,230 | |
TOMONY Holdings, Inc. | | | 61,373 | | | | 299,799 | |
Tsukuba Bank Ltd. | | | 30,500 | | | | 107,479 | |
Yamagata Bank Ltd. (The) | | | 30,000 | | | | 143,265 | |
Yamaguchi Financial Group, Inc. | | | 45,000 | | | | 411,204 | |
Yamanashi Chuo Bank Ltd. (The) | | | 42,000 | | | | 187,812 | |
| | | | | | | | |
| Total Banks | | | | | | | 74,489,067 | |
| Beverages – 0.9% | | | | | | | | |
Asahi Group Holdings Ltd. | | | 51,714 | | | | 1,151,853 | |
Coca-Cola Central Japan Co., Ltd. | | | 17,811 | | | | 232,228 | |
Coca-Cola West Co., Ltd. | | | 29,628 | | | | 522,392 | |
Ito En Ltd. | | | 27,076 | | | | 488,582 | |
Kagome Co., Ltd.(a) | | | 7,600 | | | | 149,608 | |
Kirin Holdings Co., Ltd. | | | 201,274 | | | | 2,619,411 | |
Sapporo Holdings Ltd. | | | 67,000 | | | | 249,128 | |
Takara Holdings, Inc. | | | 39,000 | | | | 266,809 | |
| | | | | | | | |
| Total Beverages | | | | | | | 5,680,011 | |
| Building Materials – 1.0% | | | | | | | | |
Asahi Glass Co., Ltd. | | | 216,194 | | | | 1,844,197 | |
Central Glass Co., Ltd. | | | 36,000 | | | | 158,795 | |
Daikin Industries Ltd.(a) | | | 27,620 | | | | 756,156 | |
Fujitec Co., Ltd. | | | 25,000 | | | | 165,867 | |
JS Group Corp. | | | 57,349 | | | | 1,207,677 | |
Nichias Corp. | | | 24,000 | | | | 133,568 | |
Nippon Sheet Glass Co., Ltd.(a) | | | 221,092 | | | | 341,196 | |
Rinnai Corp. | | | 2,900 | | | | 210,025 | |
Sanwa Holdings Corp. | | | 68,831 | | | | 270,155 | |
Sumitomo Osaka Cement Co., Ltd. | | | 56,000 | | | | 163,995 | |
Taiheiyo Cement Corp.(a) | | | 193,000 | | | | 431,521 | |
Takara Standard Co., Ltd. | | | 29,000 | | | | 215,663 | |
TOTO Ltd. | | | 61,008 | | | | 461,850 | |
| | | | | | | | |
| Total Building Materials | | | | | | | 6,360,665 | |
| | | | | | | | |
| Chemicals – 4.0% | | | | | | | | |
ADEKA Corp. | | | 29,600 | | | $ | 282,710 | |
Aica Kogyo Co., Ltd. | | | 27,729 | | | | 400,292 | |
Air Water, Inc. | | | 43,000 | | | | 558,041 | |
Asahi Kasei Corp. | | | 248,288 | | | | 1,541,712 | |
Chugoku Marine Paints Ltd. | | | 17,000 | | | | 104,733 | |
Daicel Corp. | | | 43,000 | | | | 278,498 | |
Denki Kagaku Kogyo K.K. | | | 79,000 | | | | 317,747 | |
DIC Corp.(a) | | | 197,715 | | | | 401,220 | |
Hitachi Chemical Co., Ltd. | | | 31,815 | | | | 576,030 | |
JSR Corp. | | | 48,317 | | | | 978,141 | |
Kaneka Corp. | | | 73,925 | | | | 448,248 | |
Kansai Paint Co., Ltd. | | | 40,000 | | | | 405,857 | |
Koatsu Gas Kogyo Co., Ltd. | | | 26,000 | | | | 160,180 | |
Kuraray Co., Ltd. | | | 73,936 | | | | 1,052,057 | |
Kureha Corp. | | | 40,000 | | | | 193,450 | |
Lintec Corp. | | | 5,600 | | | | 114,184 | |
Mitsubishi Chemical Holdings Corp. | | | 219,663 | | | | 1,179,793 | |
Mitsubishi Gas Chemical Co., Inc. | | | 70,109 | | | | 471,113 | |
Mitsui Chemicals, Inc. | | | 203,000 | | | | 619,151 | |
Nihon Nohyaku Co., Ltd. | | | 30,000 | | | | 134,516 | |
Nihon Parkerizing Co., Ltd. | | | 13,000 | | | | 193,827 | |
Nippon Carbon Co., Ltd. | | | 46,000 | | | | 130,239 | |
Nippon Kayaku Co., Ltd. | | | 45,000 | | | | 463,698 | |
Nippon Paint Co., Ltd. | | | 23,000 | | | | 175,235 | |
Nippon Shokubai Co., Ltd. | | | 37,000 | | | | 431,168 | |
Nippon Soda Co., Ltd. | | | 44,000 | | | | 202,637 | |
Nippon Synthetic Chemical Industry Co., Ltd. (The) | | | 19,000 | | | | 117,516 | |
Nissan Chemical Industries Ltd. | | | 28,465 | | | | 268,756 | |
Nitto Denko Corp. | | | 24,867 | | | | 1,007,734 | |
NOF Corp. | | | 42,000 | | | | 205,675 | |
Sakata INX Corp. | | | 29,000 | | | | 145,185 | |
Sanyo Chemical Industries Ltd. | | | 18,000 | | | | 120,736 | |
Sekisui Jushi Corp. | | | 13,000 | | | | 130,640 | |
Shin-Etsu Chemical Co., Ltd.(a) | | | 88,990 | | | | 5,168,871 | |
Showa Denko K.K. | | | 272,181 | | | | 621,788 | |
Sumitomo Bakelite Co., Ltd. | | | 52,000 | | | | 275,497 | |
Sumitomo Chemical Co., Ltd.(a) | | | 329,010 | | | | 1,407,273 | |
Taiyo Holdings Co., Ltd. | | | 16,500 | | | | 445,106 | |
Taiyo Nippon Sanso Corp. | | | 56,022 | | | | 397,556 | |
Takasago International Corp.(a) | | | 28,000 | | | | 132,693 | |
Toagosei Co., Ltd. | | | 31,000 | | | | 143,520 | |
Tokai Carbon Co., Ltd. | | | 33,000 | | | | 176,839 | |
Tokuyama Corp.(a) | | | 47,000 | | | | 146,777 | |
Tosoh Corp.(a) | | | 164,370 | | | | 459,385 | |
Toyo Ink SC Holdings Co., Ltd. | | | 114,000 | | | | 472,374 | |
Ube Industries Ltd. | | | 201,241 | | | | 550,206 | |
Zeon Corp. | | | 15,000 | | | | 139,802 | |
| | | | | | | | |
| Total Chemicals | | | | | | | 24,348,406 | |
| Commercial Services – 1.5% | | | | | | | | |
Aeon Delight Co., Ltd. | | | 18,800 | | | | 398,410 | |
Dai Nippon Printing Co., Ltd.(a) | | | 229,694 | | | | 2,361,275 | |
See Notes to Financial Statements.
| | | | |
| WisdomTree International Dividend and Sector Funds | | | 57 | |
Schedule of Investments (continued)
WisdomTree Japan Hedged Equity Fund (DXJ)
March 31, 2012
| | | | | | | | |
| Investments | | Shares | | | Value | |
| | | | | | | | |
Kanamoto Co., Ltd. | | | 21,000 | | | $ | 251,097 | |
Kyoritsu Maintenance Co., Ltd. | | | 6,400 | | | | 135,318 | |
Meitec Corp. | | | 6,200 | | | | 125,740 | |
Nichii Gakkan Co. | | | 23,600 | | | | 317,745 | |
Nomura Co., Ltd. | | | 43,000 | | | | 155,708 | |
Park24 Co., Ltd. | | | 49,677 | | | | 673,065 | |
Secom Co., Ltd. | | | 49,483 | | | | 2,435,217 | |
Sohgo Security Services Co., Ltd. | | | 24,500 | | | | 292,351 | |
Toppan Forms Co., Ltd. | | | 37,900 | | | | 349,548 | |
Toppan Printing Co., Ltd.(a) | | | 222,517 | | �� | | 1,746,716 | |
| | | | | | | | |
| Total Commercial Services | | | | | | | 9,242,190 | |
| Computers – 1.0% | | | | | | | | |
Fujitsu Ltd.(a) | | | 404,000 | | | | 2,140,397 | |
Ines Corp. | | | 28,800 | | | | 230,974 | |
Information Services International-Dentsu Ltd. | | | 20,900 | | | | 169,140 | |
Itochu Techno-Solutions Corp.(a) | | | 21,586 | | | | 971,823 | |
Melco Holdings, Inc. | | | 5,200 | | | | 132,251 | |
NEC Fielding Ltd. | | | 22,800 | | | | 298,939 | |
NEC Networks & System Integration Corp. | | | 20,100 | | | | 288,696 | |
NS Solutions Corp. | | | 7,000 | | | | 135,585 | |
Otsuka Corp. | | | 6,704 | | | | 548,246 | |
SCSK Corp. | | | 19,200 | | | | 306,099 | |
TDK Corp.(a) | | | 19,851 | | | | 1,131,311 | |
| | | | | | | | |
| Total Computers | | | | | | | 6,353,461 | |
| Cosmetics/Personal Care – 1.3% | | | | | | | | |
Kao Corp.(a) | | | 131,062 | | | | 3,459,100 | |
Kose Corp. | | | 7,800 | | | | 177,714 | |
Lion Corp. | | | 56,291 | | | | 324,223 | |
Mandom Corp. | | | 5,100 | | | | 128,654 | |
Pigeon Corp. | | | 4,000 | | | | 149,949 | |
Pola Orbis Holdings, Inc. | | | 8,645 | | | | 259,471 | |
Shiseido Co., Ltd.(a) | | | 122,451 | | | | 2,124,795 | |
Unicharm Corp. | | | 20,000 | | | | 1,062,033 | |
| | | | | | | | |
| Total Cosmetics/Personal Care | | | | | | | 7,685,939 | |
| Distribution/Wholesale – 5.5% | | | | | | | | |
Ai Holdings Corp. | | | 34,211 | | | | 182,497 | |
Canon Marketing Japan, Inc. | | | 33,400 | | | | 430,614 | |
Daiwabo Holdings Co., Ltd. | | | 66,000 | | | | 148,369 | |
Doshisha Co., Ltd. | | | 5,500 | | | | 159,329 | |
Hakuto Co., Ltd. | | | 22,100 | | | | 221,282 | |
Hitachi High-Technologies Corp. | | | 19,800 | | | | 475,181 | |
Inabata & Co., Ltd. | | | 34,600 | | | | 241,332 | |
ITOCHU Corp. | | | 294,443 | | | | 3,230,841 | |
Itochu Enex Co., Ltd.(a) | | | 51,700 | | | | 307,203 | |
Iwatani Corp. | | | 51,000 | | | | 171,043 | |
Marubeni Corp. | | | 304,278 | | | | 2,207,351 | |
Matsuda Sangyo Co., Ltd. | | | 17,200 | | | | 283,828 | |
Mitsubishi Corp.(a) | | | 392,100 | | | | 9,147,968 | |
Mitsui & Co., Ltd.(a) | | | 511,018 | | | | 8,426,410 | |
Nagase & Co., Ltd. | | | 22,500 | | | | 279,968 | |
Paltac Corp. | | | 18,097 | | | | 261,246 | |
Ryoden Trading Co., Ltd. | | | 28,000 | | | | 169,779 | |
| | | | | | | | |
San-Ai Oil Co., Ltd. | | | 24,000 | | | $ | 125,403 | |
Sinanen Co., Ltd. | | | 18,000 | | | | 79,179 | |
Sojitz Corp. | | | 202,800 | | | | 364,717 | |
Sumitomo Corp. | | | 314,814 | | | | 4,575,218 | |
Toyota Tsusho Corp.(a) | | | 66,210 | | | | 1,355,658 | |
Trusco Nakayama Corp. | | | 7,300 | | | | 149,735 | |
Yamazen Corp. | | | 27,400 | | | | 229,734 | |
Yuasa Trading Co., Ltd. | | | 90,000 | | | | 157,482 | |
| | | | | | | | |
| Total Distribution/Wholesale | | | | | | | 33,381,367 | |
| Diversified Financial Services – 1.0% | | | | | | | | |
Century Tokyo Leasing Corp. | | | 23,505 | | | | 477,269 | |
Daiwa Securities Group, Inc.(a) | | | 230,545 | | | | 916,073 | |
Hitachi Capital Corp. | | | 32,900 | | | | 492,531 | |
Ichiyoshi Securities Co., Ltd. | | | 30,300 | | | | 214,285 | |
Jaccs Co., Ltd. | | | 52,000 | | | | 186,403 | |
Nomura Holdings, Inc. | | | 626,600 | | | | 2,786,750 | |
Okasan Securities Group, Inc. | | | 50,000 | | | | 212,042 | |
Tokai Tokyo Financial Holdings, Inc. | | | 165,000 | | | | 619,539 | |
| | | | | | | | |
| Total Diversified Financial Services | | | | | | | 5,904,892 | |
| Electric – 3.7% | | | | | | | | |
Chubu Electric Power Co., Inc. | | | 290,916 | | | | 5,281,348 | |
Chugoku Electric Power Co., Inc. (The)(a) | | | 132,713 | | | | 2,478,642 | |
Electric Power Development Co., Ltd.(a) | | | 52,395 | | | | 1,428,694 | |
Hokkaido Electric Power Co., Inc. | | | 73,908 | | | | 1,091,175 | |
Hokuriku Electric Power Co. | | | 78,000 | | | | 1,417,923 | |
Kansai Electric Power Co., Inc. (The)(a) | | | 356,020 | | | | 5,546,116 | |
Kyushu Electric Power Co., Inc. | | | 197,210 | | | | 2,825,331 | |
Okinawa Electric Power Co., Inc. (The) | | | 600 | | | | 24,935 | |
Shikoku Electric Power Co., Inc.(a) | | | 73,408 | | | | 2,081,060 | |
| | | | | | | | |
| Total Electric | | | | | | | 22,175,224 | |
| Electrical Components & Equipment – 1.4% | | | | | | | | |
Brother Industries Ltd. | | | 49,509 | | | | 675,000 | |
Casio Computer Co., Ltd.*(a) | | | 66,100 | | | | 474,696 | |
Fujikura Ltd. | | | 46,000 | | | | 154,274 | |
Furukawa Electric Co., Ltd. | | | 76,971 | | | | 205,767 | |
GS Yuasa Corp. | | | 48,000 | | | | 264,803 | |
Hitachi Ltd.(a) | | | 386,000 | | | | 2,490,625 | |
Mitsubishi Electric Corp. | | | 240,000 | | | | 2,134,759 | |
Nidec Corp.(a) | | | 16,100 | | | | 1,475,108 | |
Nippon Signal Co., Ltd. (The) | | | 26,200 | | | | 164,596 | |
Tatsuta Electric Wire and Cable Co., Ltd.(a) | | | 15,051 | | | | 90,897 | |
Tokyo Rope Manufacturing Co., Ltd.(a) | | | 32,000 | | | | 65,715 | |
Ushio, Inc. | | | 20,100 | | | | 284,055 | |
| | | | | | | | |
| Total Electrical Components & Equipment | | | | | | | 8,480,295 | |
| Electronics – 2.6% | | | | | | | | |
Advantest Corp. | | | 17,200 | | | | 272,541 | |
Alps Electric Co., Ltd. | | | 37,600 | | | | 332,618 | |
Anritsu Corp. | | | 15,000 | | | | 197,582 | |
Azbil Corp. | | | 20,458 | | | | 454,926 | |
Cosel Co., Ltd. | | | 16,500 | | | | 230,974 | |
Dainippon Screen Manufacturing Co., Ltd. | | | 15,000 | | | | 135,792 | |
Fujitsu General Ltd.(a) | | | 19,000 | | | | 143,374 | |
See Notes to Financial Statements.
| | |
| 58 | | WisdomTree International Dividend and Sector Funds |
Schedule of Investments (continued)
WisdomTree Japan Hedged Equity Fund (DXJ)
March 31, 2012
| | | | | | | | |
| Investments | | Shares | | | Value | |
| | | | | | | | |
Hamamatsu Photonics K.K. | | | 6,400 | | | $ | 243,028 | |
Hirose Electric Co., Ltd.(a) | | | 5,320 | | | | 561,769 | |
Horiba Ltd. | | | 4,300 | | | | 148,184 | |
Hoya Corp. | | | 128,157 | | | | 2,894,998 | |
Ibiden Co., Ltd. | | | 21,201 | | | | 545,386 | |
Japan Aviation Electronics Industry Ltd. | | | 19,000 | | | | 165,539 | |
Keyence Corp. | | | 1,210 | | | | 286,124 | |
Koa Corp. | | | 20,600 | | | | 221,532 | |
Kuroda Electric Co., Ltd. | | | 20,400 | | | | 225,827 | |
Kyocera Corp. | | | 24,581 | | | | 2,264,098 | |
Minebea Co., Ltd. | | | 56,000 | | | | 245,653 | |
Mitsumi Electric Co., Ltd.* | | | 24,700 | | | | 214,000 | |
Murata Manufacturing Co., Ltd. | | | 34,800 | | | | 2,074,172 | |
Nichicon Corp.(a) | | | 15,500 | | | | 187,782 | |
Nidec Copal Corp. | | | 21,600 | | | | 283,468 | |
Nihon Dempa Kogyo Co., Ltd.(a) | | | 3,300 | | | | 50,004 | |
Nippon Electric Glass Co., Ltd. | | | 39,018 | | | | 340,895 | |
Nohmi Bosai Ltd. | | | 33,242 | | | | 229,032 | |
Ryosan Co., Ltd. | | | 6,800 | | | | 137,496 | |
Sanshin Electronics Co., Ltd. | | | 25,400 | | | | 215,126 | |
SMK Corp. | | | 33,000 | | | | 115,086 | |
Taiyo Yuden Co., Ltd.(a) | | | 10,000 | | | | 107,175 | |
Toshiba Corp. | | | 416,000 | | | | 1,840,015 | |
Toyo Corp. | | | 25,300 | | | | 276,687 | |
Ulvac, Inc.* | | | 5,100 | | | | 56,333 | |
Yaskawa Electric Corp. | | | 12,000 | | | | 113,446 | |
| | | | | | | | |
| Total Electronics | | | | | | | 15,810,662 | |
| Engineering & Construction – 1.3% | | | | | | | | |
Chiyoda Corp. | | | 16,000 | | | | 204,338 | |
COMSYS Holdings Corp.(a) | | | 32,460 | | | | 353,414 | |
Hibiya Engineering Ltd. | | | 21,700 | | | | 240,481 | |
JGC Corp. | | | 25,018 | | | | 779,770 | |
Kajima Corp.(a) | | | 222,386 | | | | 680,980 | |
Kandenko Co., Ltd. | | | 34,000 | | | | 166,086 | |
Kyowa Exeo Corp. | | | 32,300 | | | | 292,405 | |
Maeda Corp. | | | 51,000 | | | | 225,579 | |
Maeda Road Construction Co., Ltd. | | | 14,000 | | | | 175,053 | |
Nippo Corp. | | | 19,000 | | | | 212,176 | |
Nippon Densetsu Kogyo Co., Ltd. | | | 13,000 | | | | 129,692 | |
Nippon Road Co., Ltd. (The)(a) | | | 38,000 | | | | 162,537 | |
Nishimatsu Construction Co., Ltd. | | | 172,000 | | | | 405,468 | |
Obayashi Corp. | | | 165,328 | | | | 725,237 | |
Okumura Corp. | | | 59,000 | | | | 233,003 | |
Penta-Ocean Construction Co., Ltd. | | | 46,500 | | | | 149,736 | |
Raito Kogyo Co., Ltd. | | | 36,400 | | | | 214,963 | |
Sanki Engineering Co., Ltd. | | | 30,000 | | | | 162,950 | |
Shimizu Corp.(a) | | | 177,182 | | | | 714,800 | |
Shinko Plantech Co., Ltd. | | | 15,500 | | | | 132,785 | |
Taisei Corp. | | | 308,145 | | | | 808,789 | |
Takasago Thermal Engineering Co., Ltd. | | | 28,600 | | | | 223,810 | |
Toda Corp. | | | 64,000 | | | | 216,198 | |
Toenec Corp. | | | 27,000 | | | | 157,482 | |
Toshiba Plant Systems & Services Corp. | | | 17,000 | | | | 196,658 | |
| | | | | | | | |
Toyo Engineering Corp. | | | 34,000 | | | $ | 162,780 | |
| | | | | | | | |
| Total Engineering & Construction | | | | | | | 8,127,170 | |
| Entertainment – 0.9% | | | | | | | | |
Avex Group Holdings, Inc. | | | 23,019 | | | | 279,713 | |
Mars Engineering Corp. | | | 19,800 | | | | 441,497 | |
Oriental Land Co., Ltd. | | | 16,400 | | | | 1,767,641 | |
Sankyo Co., Ltd. | | | 29,421 | | | | 1,451,477 | |
Shochiku Co., Ltd. | | | 16,000 | | | | 151,650 | |
Toei Co., Ltd. | | | 37,000 | | | | 191,980 | |
Toho Co., Ltd. | | | 37,543 | | | | 692,968 | |
Tokyotokeiba Co., Ltd. | | | 185,000 | | | | 285,497 | |
| | | | | | | | |
| Total Entertainment | | | | | | | 5,262,423 | |
| Environmental Control – 0.2% | | | | | | | | |
Asahi Holdings, Inc. | | | 18,000 | | | | 390,862 | |
Daiseki Co., Ltd. | | | 6,500 | | | | 121,083 | |
Hitachi Zosen Corp. | | | 179,500 | | | | 235,567 | |
Kurita Water Industries Ltd. | | | 22,232 | | | | 547,865 | |
| | | | | | | | |
| Total Environmental Control | | | | | | | 1,295,377 | |
| Food – 1.8% | | | | | | | | |
Ajinomoto Co., Inc. | | | 152,433 | | | | 1,922,662 | |
Ariake Japan Co., Ltd. | | | 6,800 | | | | 131,794 | |
Ezaki Glico Co., Ltd. | | | 17,000 | | | | 205,128 | |
Fuji Oil Co., Ltd. | | | 20,100 | | | | 287,474 | |
House Foods Corp. | | | 19,000 | | | | 326,691 | |
J-Oil Mills, Inc.(a) | | | 49,000 | | | | 141,710 | |
Kasumi Co., Ltd. | | | 50,572 | | | | 341,059 | |
Kato Sangyo Co., Ltd. | | | 5,800 | | | | 115,161 | |
Kewpie Corp. | | | 27,800 | | | | 411,789 | |
Kikkoman Corp.(a) | | | 30,000 | | | | 348,867 | |
Kyokuyo Co., Ltd. | | | 62,000 | | | | 149,171 | |
Marudai Food Co., Ltd. | | | 43,000 | | | | 167,726 | |
Maruha Nichiro Holdings, Inc. | | | 72,000 | | | | 126,861 | |
MEIJI Holdings Co., Ltd. | | | 17,341 | | | | 761,744 | |
Mitsui Sugar Co., Ltd. | | | 44,000 | | | | 147,567 | |
Morinaga & Co., Ltd. | | | 57,000 | | | | 132,985 | |
Morinaga Milk Industry Co., Ltd. | | | 41,000 | | | | 161,917 | |
Nichirei Corp. | | | 69,551 | | | | 327,915 | |
Nippon Beet Sugar Manufacturing Co., Ltd. | | | 62,000 | | | | 138,623 | |
Nippon Flour Mills Co., Ltd. | | | 39,000 | | | | 180,084 | |
Nippon Meat Packers, Inc. | | | 22,000 | | | | 280,965 | |
Nippon Suisan Kaisha Ltd.(a) | | | 124,335 | | | | 426,058 | |
Nisshin Oillio Group Ltd. (The) | | | 34,000 | | | | 141,297 | |
Nisshin Seifun Group, Inc. | | | 43,113 | | | | 524,407 | |
Nissin Foods Holdings Co., Ltd. | | | 26,028 | | | | 978,877 | |
Prima Meat Packers Ltd. | | | 158,000 | | | | 295,668 | |
Toyo Suisan Kaisha Ltd. | | | 22,000 | | | | 574,494 | |
Yakult Honsha Co., Ltd.(a) | | | 19,200 | | | | 663,758 | |
Yamazaki Baking Co., Ltd. | | | 31,000 | | | | 446,759 | |
| | | | | | | | |
| Total Food | | | | | | | 10,859,211 | |
| Forest Products & Paper – 0.4% | | | | | | | | |
Daio Paper Corp. | | | 8,000 | | | | 48,022 | |
Hokuetsu Kishu Paper Co., Ltd. | | | 38,946 | | | | 260,760 | |
See Notes to Financial Statements.
| | | | |
| WisdomTree International Dividend and Sector Funds | | | 59 | |
Schedule of Investments (continued)
WisdomTree Japan Hedged Equity Fund (DXJ)
March 31, 2012
| | | | | | | | |
| Investments | | Shares | | | Value | |
| | | | | | | | |
Nippon Paper Group, Inc.(a) | | | 33,400 | | | $ | 699,292 | |
OJI Paper Co., Ltd.(a) | | | 275,120 | | | | 1,337,238 | |
| | | | | | | | |
| Total Forest Products & Paper | | | | | | | 2,345,312 | |
| Gas – 1.0% | | | | | | | | |
Osaka Gas Co., Ltd. | | | 514,014 | | | | 2,073,670 | |
Saibu Gas Co., Ltd. | | | 181,000 | | | | 490,467 | |
Shizuoka Gas Co., Ltd. | | | 11,500 | | | | 82,587 | |
Toho Gas Co., Ltd.(a) | | | 105,000 | | | | 622,638 | |
Tokyo Gas Co., Ltd. | | | 556,020 | | | | 2,635,006 | |
| | | | | | | | |
| Total Gas | | | | | | | 5,904,368 | |
| Hand/Machine Tools – 0.5% | | | | | | | | |
Asahi Diamond Industrial Co., Ltd.(a) | | | 6,000 | | | | 70,721 | |
Disco Corp. | | | 2,700 | | | | 150,100 | |
Fuji Electric Co., Ltd. | | | 165,000 | | | | 437,086 | |
Hitachi Koki Co., Ltd. | | | 28,596 | | | | 263,044 | |
Makita Corp. | | | 21,265 | | | | 857,887 | |
Meidensha Corp.*(a) | | | 31,000 | | | | 113,385 | |
OSG Corp.(a) | | | 18,900 | | | | 287,536 | |
SMC Corp. | | | 3,820 | | | | 610,866 | |
THK Co., Ltd. | | | 7,300 | | | | 149,291 | |
Union Tool Co. | | | 6,400 | | | | 119,920 | |
| | | | | | | | |
| Total Hand/Machine Tools | | | | | | | 3,059,836 | |
| Healthcare-Products – 0.4% | | | | | | | | |
Hogy Medical Co., Ltd. | | | 4,400 | | | | 197,558 | |
Nihon Kohden Corp. | | | 6,500 | | | | 175,029 | |
Nipro Corp.(a) | | | 40,900 | | | | 306,644 | |
Paramount Bed Holdings Co., Ltd. | | | 4,800 | | | | 142,142 | |
Shimadzu Corp. | | | 24,000 | | | | 217,851 | |
Sysmex Corp. | | | 10,200 | | | | 413,974 | |
Terumo Corp. | | | 17,128 | | | | 823,151 | |
| | | | | | | | |
| Total Healthcare-Products | | | | | | | 2,276,349 | |
| Heathcare-Services – 0.1% | | | | | | | | |
Miraca Holdings, Inc. | | | 7,882 | | | | 309,361 | |
| Home Builders – 0.6% | | | | | | | | |
Daiwa House Industry Co., Ltd. | | | 79,022 | | | | 1,050,490 | |
PanaHome Corp. | | | 28,000 | | | | 192,235 | |
Sekisui Chemical Co., Ltd. | | | 79,008 | | | | 689,322 | |
Sekisui House Ltd. | | | 180,022 | | | | 1,774,079 | |
| | | | | | | | |
| Total Home Builders | | | | | | | 3,706,126 | |
| Home Furnishings – 1.0% | | | | | | | | |
Alpine Electronics, Inc. | | | 19,300 | | | | 261,961 | |
Canon Electronics, Inc. | | | 16,500 | | | | 424,254 | |
Foster Electric Co., Ltd. | | | 7,600 | | | | 111,744 | |
Hoshizaki Electric Co., Ltd. | | | 16,500 | | | | 391,373 | |
Nidec Sankyo Corp. | | | 30,000 | | | | 181,907 | |
Panasonic Corp. | | | 205,378 | | | | 1,899,176 | |
Sharp Corp.(a) | | | 226,747 | | | | 1,664,198 | |
Sony Corp. | | | 53,821 | | | | 1,114,417 | |
| | | | | | | | |
| Total Home Furnishings | | | | | | | 6,049,030 | |
| Household Products/Wares – 0.0% | | | | | | | | |
Mitsubishi Pencil Co., Ltd. | | | 7,100 | | | | 124,322 | |
| | | | | | | | |
| Insurance – 2.4% | | | | | | | | |
Dai-ichi Life Insurance Co., Ltd. (The) | | | 1,205 | | | $ | 1,673,631 | |
MS&AD Insurance Group Holdings(a) | | | 148,730 | | | | 3,070,567 | |
NKSJ Holdings, Inc.(a) | | | 133,853 | | | | 3,009,029 | |
Sony Financial Holdings, Inc. | | | 55,903 | | | | 998,571 | |
T&D Holdings, Inc. | | | 124,820 | | | | 1,454,552 | |
Tokio Marine Holdings, Inc. | | | 153,243 | | | | 4,228,870 | |
| | | | | | | | |
| Total Insurance | | | | | | | 14,435,220 | |
| Internet – 0.7% | | | | | | | | |
Dena Co., Ltd.(a) | | | 17,468 | | | | 486,714 | |
GMO Internet, Inc. | | | 44,600 | | | | 224,911 | |
Gree, Inc. | | | 5,100 | | | | 129,460 | |
Monex Group, Inc. | | | 1,445 | | | | 317,814 | |
SBI Holdings, Inc.* | | | 3,842 | | | | 364,615 | |
Trend Micro, Inc. | | | 31,318 | | | | 967,758 | |
Yahoo! Japan Corp.(a) | | | 5,316 | | | | 1,729,904 | |
| | | | | | | | |
| Total Internet | | | | | | | 4,221,176 | |
| Iron/Steel – 1.6% | | | | | | | | |
Aichi Steel Corp. | | | 31,000 | | | | 160,848 | |
Daido Metal Co., Ltd. | | | 10,000 | | | | 125,767 | |
Daido Steel Co., Ltd. | | | 37,000 | | | | 257,622 | |
Hitachi Metals Ltd. | | | 48,018 | | | | 599,824 | |
Japan Steel Works Ltd. (The)(a) | | | 69,018 | | | | 475,523 | |
JFE Holdings, Inc. | | | 89,716 | | | | 1,938,332 | |
Kobe Steel Ltd. | | | 520,000 | | | | 846,710 | |
Nippon Steel Corp. | | | 692,010 | | | | 1,908,819 | |
Nisshin Steel Co., Ltd. | | | 174,000 | | | | 293,894 | |
Sanyo Special Steel Co., Ltd. | | | 26,000 | | | | 141,856 | |
Sumitomo Metal Industries Ltd. | | | 1,237,967 | | | | 2,512,188 | |
Topy Industries Ltd. | | | 51,000 | | | | 159,269 | |
Toyo Kohan Co., Ltd. | | | 30,000 | | | | 123,215 | |
Yamato Kogyo Co., Ltd. | | | 5,040 | | | | 147,902 | |
Yodogawa Steel Works Ltd. | | | 55,000 | | | | 241,266 | |
| | | | | | | | |
| Total Iron/Steel | | | | | | | 9,933,035 | |
| Leisure Time – 0.4% | | | | | | | | |
Daikoku Denki Co., Ltd. | | | 22,100 | | | | 318,764 | |
Mizuno Corp. | | | 42,000 | | | | 234,255 | |
Round One Corp.(a) | | | 27,800 | | | | 184,444 | |
Sega Sammy Holdings, Inc. | | | 59,815 | | | | 1,260,334 | |
Yamaha Corp. | | | 24,500 | | | | 255,435 | |
| | | | | | | | |
| Total Leisure Time | | | | | | | 2,253,232 | |
| Lodging – 0.1% | | | | | | | | |
Resorttrust, Inc.(a) | | | 27,100 | | | | 442,254 | |
| Machinery-Construction & Mining – 0.6% | | | | | | | | |
Hitachi Construction Machinery Co., Ltd.(a) | | | 25,900 | | | | 576,255 | |
Komatsu Ltd. | | | 107,006 | | | | 3,067,345 | |
Modec, Inc. | | | 9,500 | | | | 197,630 | |
| | | | | | | | |
| Total Machinery-Construction & Mining | | | | | | | 3,841,230 | |
| Machinery-Diversified – 2.1% | | | | | | | | |
Amada Co., Ltd. | | | 38,014 | | | | 257,753 | |
Daifuku Co., Ltd. | | | 35,000 | | | | 204,144 | |
See Notes to Financial Statements.
| | |
| 60 | | WisdomTree International Dividend and Sector Funds |
Schedule of Investments (continued)
WisdomTree Japan Hedged Equity Fund (DXJ)
March 31, 2012
| | | | | | | | |
| Investments | | Shares | | | Value | |
| | | | | | | | |
Daihen Corp. | | | 36,000 | | | $ | 130,360 | |
Ebara Corp. | | | 34,000 | | | | 122,705 | |
FANUC Corp. | | | 29,700 | | | | 5,297,965 | |
Hisaka Works Ltd. | | | 12,000 | | | | 133,277 | |
IHI Corp. | | | 229,690 | | | | 583,331 | |
Kawasaki Heavy Industries Ltd.(a) | | | 163,355 | | | | 502,203 | |
Kinki Sharyo Co., Ltd. | | | 37,000 | | | | 141,625 | |
Komori Corp. | | | 28,200 | | | | 244,323 | |
Kubota Corp. | | | 219,954 | | | | 2,124,837 | |
Max Co., Ltd. | | | 13,000 | | | | 164,445 | |
Mitsubishi Heavy Industries Ltd. | | | 325,016 | | | | 1,583,710 | |
Nabtesco Corp. | | | 7,000 | | | | 144,431 | |
Nippon Sharyo Ltd.(a) | | | 33,000 | | | | 137,141 | |
Organo Corp. | | | 17,000 | | | | 115,268 | |
Sumitomo Heavy Industries Ltd. | | | 46,000 | | | | 257,124 | |
Torishima Pump Manufacturing Co., Ltd. | | | 17,900 | | | | 246,004 | |
Tsubakimoto Chain Co. | | | 25,000 | | | | 155,234 | |
Tsugami Corp.(a) | | | 19,000 | | | | 217,717 | |
| | | | | | | | |
| Total Machinery-Diversified | | | | | | | 12,763,597 | |
| Media – 0.1% | | | | | | | | |
Gakken Holdings Co., Ltd. | | | 34,000 | | | | 70,235 | |
Kadokawa Group Holdings, Inc.(a) | | | 4,200 | | | | 134,429 | |
Tokyo Broadcasting System Holdings, Inc. | | | 25,300 | | | | 379,369 | |
| | | | | | | | |
| Total Media | | | | | | | 584,033 | |
| Metal Fabricate/Hardware – 0.4% | | | | | | | | |
Furukawa-Sky Aluminum Corp. | | | 62,000 | | | | 199,648 | |
Hanwa Co., Ltd. | | | 49,000 | | | | 223,878 | |
JFE Shoji Holdings, Inc. | | | 56,000 | | | | 293,967 | |
MISUMI Group, Inc. | | | 10,400 | | | | 254,392 | |
Nippon Steel Trading Co., Ltd. | | | 51,000 | | | | 166,705 | |
NSK Ltd. | | | 50,000 | | | | 387,022 | |
NTN Corp. | | | 77,403 | | | | 329,194 | |
Oiles Corp. | | | 7,200 | | | | 142,609 | |
Ryobi Ltd. | | | 50,000 | | | | 190,777 | |
Toho Zinc Co., Ltd. | | | 28,000 | | | | 126,909 | |
| | | | | | | | |
| Total Metal Fabricate/Hardware | | | | | | | 2,315,101 | |
| Mining – 0.5% | | | | | | | | |
Dowa Holdings Co., Ltd.(a) | | | 59,664 | | | | 398,751 | |
Mitsubishi Materials Corp. | | | 51,000 | | | | 162,367 | |
Mitsui Mining & Smelting Co., Ltd. | | | 80,000 | | | | 226,502 | |
Nippon Denko Co., Ltd. | | | 21,000 | | | | 103,348 | |
Nippon Light Metal Co., Ltd. | | | 68,000 | | | | 109,071 | |
Nittetsu Mining Co., Ltd. | | | 37,000 | | | | 178,492 | |
Sumitomo Metal Mining Co., Ltd. | | | 110,000 | | | | 1,554,529 | |
| | | | | | | | |
| Total Mining | | | | | | | 2,733,060 | |
| Miscellaneous Manufacturing – 0.8% | | | | | | | | |
Amano Corp. | | | 38,033 | | | | 355,397 | |
FUJIFILM Holdings Corp. | | | 51,502 | | | | 1,214,720 | |
Konica Minolta Holdings, Inc. | | | 105,032 | | | | 922,755 | |
Nikkiso Co., Ltd. | | | 14,000 | | | | 147,494 | |
Nikon Corp. | | | 34,400 | | | | 1,050,037 | |
Ohara, Inc. | | | 7,600 | | | | 88,564 | |
| | | | | | | | |
Sekisui Plastics Co., Ltd. | | | 35,000 | | | $ | 128,866 | |
Shin-Etsu Polymer Co., Ltd. | | | 34,600 | | | | 181,630 | |
Tamron Co., Ltd. | | | 7,448 | | | | 241,554 | |
Tokai Rubber Industries Ltd. | | | 22,000 | | | | 279,628 | |
Toyo Tanso Co., Ltd. | | | 2,400 | | | | 91,427 | |
| | | | | | | | |
| Total Miscellaneous Manufacturing | | | | | | | 4,702,072 | |
| Office/Business Equipment – 3.2% | | | | | | | | |
Canon, Inc. | | | 346,020 | | | | 16,440,102 | |
Ricoh Co., Ltd.(a) | | | 250,008 | | | | 2,445,549 | |
Sato Holdings Corp. | | | 18,600 | | | | 263,309 | |
Seiko Epson Corp.(a) | | | 29,900 | | | | 421,459 | |
Toshiba TEC Corp. | | | 35,000 | | | | 139,498 | |
| | | | | | | | |
| Total Office/Business Equipment | | | | | | | 19,709,917 | |
| Oil & Gas – 1.6% | | | | | | | | |
Cosmo Oil Co., Ltd.(a) | | | 262,097 | | | | 732,515 | |
Idemitsu Kosan Co., Ltd. | | | 6,420 | | | | 643,599 | |
Inpex Corp. | | | 319 | | | | 2,166,851 | |
JX Holdings, Inc. | | | 613,059 | | | | 3,821,608 | |
Showa Shell Sekiyu K.K. | | | 87,321 | | | | 560,247 | |
TonenGeneral Sekiyu K.K. | | | 211,137 | | | | 1,954,996 | |
| | | | | | | | |
| Total Oil & Gas | | | | | | | 9,879,816 | |
| Packaging & Containers – 0.2% | | | | | | | | |
Achilles Corp. | | | 45,000 | | | | 64,524 | |
Fuji Seal International, Inc. | | | 6,800 | | | | 129,563 | |
Nihon Yamamura Glass Co., Ltd. | | | 54,000 | | | | 132,547 | |
Rengo Co., Ltd. | | | 51,000 | | | | 355,101 | |
Toyo Seikan Kaisha Ltd. | | | 24,100 | | | | 347,612 | |
| | | | | | | | |
| Total Packaging & Containers | | | | | | | 1,029,347 | |
| Pharmaceuticals – 7.5% | | | | | | | | |
Alfresa Holdings Corp. | | | 10,500 | | | | 502,066 | |
Astellas Pharma, Inc.(a) | | | 158,170 | | | | 6,534,759 | |
Chugai Pharmaceutical Co., Ltd. | | | 128,118 | | | | 2,375,698 | |
Daiichi Sankyo Co., Ltd.(a) | | | 229,601 | | | | 4,207,282 | |
Dainippon Sumitomo Pharma Co., Ltd.(a) | | | 83,908 | | | | 894,189 | |
Eisai Co., Ltd.(a) | | | 124,776 | | | | 4,988,311 | |
Hisamitsu Pharmaceutical Co., Inc.(a) | | | 18,557 | | | | 885,063 | |
Kaken Pharmaceutical Co., Ltd. | | | 37,000 | | | | 468,935 | |
Kobayashi Pharmaceutical Co., Ltd. | | | 4,700 | | | | 236,442 | |
KYORIN Holdings, Inc. | | | 25,000 | | | | 476,031 | |
Kyowa Hakko Kirin Co., Ltd. | | | 165,022 | | | | 1,844,829 | |
Medipal Holdings Corp. | | | 55,164 | | | | 718,583 | |
Mitsubishi Tanabe Pharma Corp. | | | 107,843 | | | | 1,521,426 | |
Mochida Pharmaceutical Co., Ltd. | | | 20,000 | | | | 237,195 | |
Otsuka Holdings Co., Ltd. | | | 72,119 | | | | 2,147,051 | |
Sawai Pharmaceutical Co., Ltd. | | | 1,300 | | | | 138,538 | |
Seikagaku Corp. | | | 11,500 | | | | 128,981 | |
Shionogi & Co., Ltd.(a) | | | 90,447 | | | | 1,257,323 | |
Ship Healthcare Holdings, Inc. | | | 9,789 | | | | 201,739 | |
Suzuken Co., Ltd. | | | 32,000 | | | | 992,333 | |
Takeda Pharmaceutical Co., Ltd.(a) | | | 313,658 | | | | 13,892,502 | |
Toho Holdings Co., Ltd. | | | 7,800 | | | | 139,328 | |
Towa Pharmaceutical Co., Ltd. | | | 2,200 | | | | 109,606 | |
See Notes to Financial Statements.
| | | | |
| WisdomTree International Dividend and Sector Funds | | | 61 | |
Schedule of Investments (continued)
WisdomTree Japan Hedged Equity Fund (DXJ)
March 31, 2012
| | | | | | | | |
| Investments | | Shares | | | Value | |
| | | | | | | | |
Tsumura & Co.(a) | | | 17,900 | | | $ | 520,067 | |
| | | | | | | | |
| Total Pharmaceuticals | | | | | | | 45,418,277 | |
| Private Equity – 0.0% | | | | | | | | |
Jafco Co., Ltd.* | | | 6,100 | | | | 148,766 | |
| Real Estate – 1.8% | | | | | | | | |
Arnest One Corp. | | | 24,200 | | | | 271,127 | |
Daito Trust Construction Co., Ltd. | | | 35,903 | | | | 3,241,500 | |
Goldcrest Co., Ltd. | | | 12,570 | | | | 230,948 | |
Heiwa Real Estate Co., Ltd. | | | 91,000 | | | | 248,800 | |
Mitsubishi Estate Co., Ltd. | | | 105,018 | | | | 1,883,548 | |
Mitsui Fudosan Co., Ltd. | | | 141,387 | | | | 2,719,675 | |
Nomura Real Estate Holdings, Inc. | | | 25,505 | | | | 452,176 | |
Sumitomo Realty & Development Co., Ltd. | | | 42,012 | | | | 1,018,457 | |
Tokyu Land Corp. | | | 70,416 | | | | 346,540 | |
Tokyu Livable, Inc. | | | 23,700 | | | | 246,518 | |
Touei Housing Corp. | | | 19,800 | | | | 210,282 | |
| | | | | | | | |
| Total Real Estate | | | | | | | 10,869,571 | |
| Retail – 4.6% | | | | | | | | |
ABC-Mart, Inc. | | | 6,600 | | | | 249,821 | |
Aeon Co., Ltd.(a) | | | 158,025 | | | | 2,089,206 | |
AOKI Holdings, Inc. | | | 17,600 | | | | 332,773 | |
Arcs Co., Ltd. | | | 7,800 | | | | 145,299 | |
ASKUL Corp.(a) | | | 16,900 | | | | 298,797 | |
Chiyoda Co., Ltd. | | | 29,513 | | | | 595,317 | |
Circle K Sunkus Co., Ltd. | | | 19,883 | | | | 427,885 | |
Citizen Holdings Co., Ltd. | | | 60,800 | | | | 387,134 | |
DCM Holdings Co., Ltd. | | | 36,046 | | | | 287,772 | |
Don Quijote Co., Ltd. | | | 4,000 | | | | 146,060 | |
Doutor Nichires Holdings Co., Ltd. | | | 21,900 | | | | 289,800 | |
EDION Corp.(a) | | | 37,789 | | | | 266,330 | |
FamilyMart Co., Ltd. | | | 21,797 | | | | 927,025 | |
Fast Retailing Co., Ltd. | | | 17,038 | | | | 3,904,693 | |
Gulliver International Co., Ltd. | | | 2,930 | | | | 115,712 | |
H2O Retailing Corp. | | | 41,000 | | | | 358,211 | |
Heiwado Co., Ltd. | | | 22,900 | | | | 310,546 | |
Isetan Mitsukoshi Holdings Ltd.(a) | | | 39,400 | | | | 465,360 | |
Izumi Co., Ltd. | | | 20,300 | | | | 385,057 | |
J Front Retailing Co., Ltd. | | | 78,000 | | | | 437,888 | |
Joshin Denki Co., Ltd. | | | 12,000 | | | | 119,278 | |
Kappa Create Co., Ltd.(a) | | | 11,200 | | | | 242,250 | |
Komeri Co., Ltd. | | | 5,300 | | | | 151,925 | |
K’s Holdings Corp. | | | 4,500 | | | | 145,890 | |
Lawson, Inc. | | | 35,700 | | | | 2,260,125 | |
Marui Group Co., Ltd. | | | 80,332 | | | | 673,541 | |
Matsumotokiyoshi Holdings Co., Ltd. | | | 7,800 | | | | 170,132 | |
Nitori Holdings Co., Ltd. | | | 2,400 | | | | 218,142 | |
Parco Co., Ltd. | | | 25,800 | | | | 249,551 | |
Plenus Co., Ltd. | | | 22,623 | | | | 411,527 | |
Point, Inc. | | | 8,990 | | | | 333,732 | |
Ryohin Keikaku Co., Ltd.(a) | | | 4,998 | | | | 259,936 | |
Saizeriya Co., Ltd. | | | 7,400 | | | | 119,684 | |
Seiko Holdings Corp.*(a) | | | 43,000 | | | | 103,980 | |
Seven & I Holdings Co., Ltd. | | | 190,836 | | | | 5,699,920 | |
| | | | | | | | |
Shimachu Co., Ltd. | | | 5,700 | | | $ | 135,063 | |
Shimamura Co., Ltd. | | | 4,000 | | | | 450,088 | |
St. Marc Holdings Co., Ltd. | | | 3,600 | | | | 143,484 | |
Sugi Holdings Co., Ltd. | | | 8,400 | | | | 258,344 | |
Sundrug Co., Ltd. | | | 5,700 | | | | 177,313 | |
Takashimaya Co., Ltd. | | | 54,000 | | | | 450,793 | |
Tsuruha Holdings, Inc. | | | 2,800 | | | | 165,867 | |
United Arrows Ltd. | | | 7,700 | | | | 162,337 | |
UNY Co., Ltd. | | | 51,261 | | | | 558,112 | |
USS Co., Ltd.(a) | | | 8,519 | | | | 868,515 | |
Xebio Co., Ltd. | | | 6,500 | | | | 174,318 | |
Yamada Denki Co., Ltd.(a) | | | 5,230 | | | | 328,563 | |
Zensho Holdings Co., Ltd. | | | 15,800 | | | | 195,064 | |
| | | | | | | | |
| Total Retail | | | | | | | 27,648,160 | |
| Semiconductors – 0.7% | | | | | | | | |
Axell Corp. | | | 7,600 | | | | 180,823 | |
Megachips Corp.* | | | 7,900 | | | | 157,242 | |
Mimasu Semiconductor Industry Co., Ltd. | | | 19,700 | | | | 188,634 | |
Rohm Co., Ltd. | | | 27,100 | | | | 1,345,203 | |
Shinko Electric Industries Co., Ltd.(a) | | | 32,400 | | | | 318,114 | |
Tokyo Electron Ltd. | | | 34,200 | | | | 1,967,762 | |
| | | | | | | | |
| Total Semiconductors | | | | | | | 4,157,778 | |
| Shipbuilding – 0.1% | | | | | | | | |
Mitsui Engineering & Shipbuilding Co., Ltd.(a) | | | 157,000 | | | | 274,719 | |
Sasebo Heavy Industries Co., Ltd.(a) | | | 86,000 | | | | 144,213 | |
| | | | | | | | |
| Total Shipbuilding | | | | | | | 418,932 | |
| Software – 1.1% | | | | | | | | |
Capcom Co., Ltd. | | | 16,500 | | | | 379,142 | |
IT Holdings Corp. | | | 34,400 | | | | 404,632 | |
Konami Corp.(a) | | | 22,796 | | | | 649,850 | |
NEC Mobiling Ltd. | | | 3,282 | | | | 113,940 | |
Nihon Unisys Ltd. | | | 39,300 | | | | 276,979 | |
Nomura Research Institute Ltd. | | | 59,371 | | | | 1,481,119 | |
NSD Co., Ltd. | | | 27,700 | | | | 257,494 | |
Oracle Corp. | | | 49,907 | | | | 1,907,255 | |
Square Enix Holdings Co., Ltd.(a) | | | 22,600 | | | | 477,293 | |
Transcosmos, Inc.* | | | 20,400 | | | | 314,075 | |
Zenrin Co., Ltd. | | | 25,400 | | | | 257,410 | |
| | | | | | | | |
| Total Software | | | | | | | 6,519,189 | |
| Storage/Warehousing – 0.1% | | | | | | | | |
Mitsubishi Logistics Corp. | | | 21,000 | | | | 249,311 | |
Mitsui-Soko Co., Ltd. | | | 52,000 | | | | 223,051 | |
Sumitomo Warehouse Co., Ltd. (The) | | | 48,000 | | | | 249,055 | |
| | | | | | | | |
| Total Storage/Warehousing | | | | | | | 721,417 | |
| Telecommunications – 7.7% | | | | | | | | |
Hikari Tsushin, Inc. | | | 21,883 | | | | 646,691 | |
Hitachi Kokusai Electric, Inc. | | | 17,000 | | | | 156,789 | |
Japan Radio Co., Ltd.* | | | 63,000 | | | | 153,108 | |
KDDI Corp.(a) | | | 836 | | | | 5,444,997 | |
Nippon Telegraph & Telephone Corp.(a) | | | 395,100 | | | | 18,027,833 | |
NTT DoCoMo, Inc.(a) | | | 12,867 | | | | 21,482,785 | |
See Notes to Financial Statements.
| | |
| 62 | | WisdomTree International Dividend and Sector Funds |
Schedule of Investments (concluded)
WisdomTree Japan Hedged Equity Fund (DXJ)
March 31, 2012
| | | | | | | | |
| Investments | | Shares | | | Value | |
| | | | | | | | |
Softbank Corp.* | | | 18,519 | | | $ | 550,653 | |
| | | | | | | | |
| Total Telecommunications | | | | | | | 46,462,856 | |
| Textiles – 0.4% | | | | | | | | |
Japan Vilene Co., Ltd. | | | 31,000 | | | | 144,274 | |
Kurabo Industries Ltd. | | | 125,000 | | | | 244,547 | |
Nisshinbo Holdings, Inc. | | | 32,000 | | | | 304,466 | |
Nitto Boseki Co., Ltd.*(a) | | | 59,000 | | | | 232,286 | |
Seiren Co., Ltd. | | | 29,700 | | | | 198,132 | |
Teijin Ltd. | | | 66,000 | | | | 222,954 | |
Toray Industries, Inc.(a) | | | 113,853 | | | | 849,453 | |
Toyobo Co., Ltd. | | | 235,000 | | | | 336,959 | |
| | | | | | | | |
| Total Textiles | | | | | | | 2,533,071 | |
| Toys/Games/Hobbies – 1.5% | | | | | | | | |
Namco Bandai Holdings, Inc. | | | 63,350 | | | | 919,131 | |
Nintendo Co., Ltd. | | | 53,500 | | | | 8,093,748 | |
Sanrio Co., Ltd. | | | 5,077 | | | | 199,267 | |
Tomy Co., Ltd. | | | 25,300 | | | | 185,996 | |
| | | | | | | | |
| Total Toys/Games/Hobbies | | | | | | | 9,398,142 | |
| Transportation – 3.1% | | | | | | | | |
East Japan Railway Co. | | | 82,205 | | | | 5,204,302 | |
Fukuyama Transporting Co., Ltd.(a) | | | 45,000 | | | | 246,066 | |
Hankyu Hanshin Holdings, Inc. | | | 183,000 | | | | 802,758 | |
Hitachi Transport System Ltd. | | | 21,000 | | | | 384,045 | |
Kamigumi Co., Ltd. | | | 23,000 | | | | 191,445 | |
Kawasaki Kisen Kaisha Ltd.*(a) | | | 176,000 | | | | 389,234 | |
Keikyu Corp.(a) | | | 50,000 | | | | 439,881 | |
Keio Corp. | | | 80,000 | | | | 576,463 | |
Keisei Electric Railway Co., Ltd. | | | 43,000 | | | | 334,407 | |
Kintetsu Corp.(a) | | | 314,899 | | | | 1,205,337 | |
Mitsui O.S.K. Lines Ltd.(a) | | | 268,000 | | | | 1,172,368 | |
Nagoya Railroad Co., Ltd.(a) | | | 165,000 | | | | 457,136 | |
Nippon Express Co., Ltd. | | | 287,149 | | | | 1,127,032 | |
Nippon Konpo Unyu Soko Co., Ltd. | | | 18,000 | | | | 222,444 | |
Nippon Yusen K.K.(a) | | | 502,014 | | | | 1,586,046 | |
Nishi-Nippon Railroad Co., Ltd.(a) | | | 64,154 | | | | 303,249 | |
Odakyu Electric Railway Co., Ltd.(a) | | | 67,008 | | | | 636,737 | |
Sankyu, Inc. | | | 45,379 | | | | 178,660 | |
Seino Holdings Corp. | | | 28,000 | | | | 203,463 | |
Senko Co., Ltd. | | | 46,000 | | | | 185,576 | |
Sotetsu Holdings, Inc.(a) | | | 164,000 | | | | 516,143 | |
Tobu Railway Co., Ltd. | | | 88,486 | | | | 472,026 | |
Tokyu Corp. | | | 214,473 | | | | 1,024,216 | |
Yamato Holdings Co., Ltd. | | | 73,975 | | | | 1,149,693 | |
| | | | | | | | |
| Total Transportation | | | | | | | 19,008,727 | |
TOTAL COMMON STOCKS
(Cost: $596,388,786) | | | | | | | 598,848,982 | |
| SHORT-TERM INVESTMENT – 0.2% | | | | | | | | |
| MONEY MARKET FUND – 0.2% | | | | | | | | |
Invesco Treasury Fund Private Class, 0.02%(b)
(Cost: $973,139) | | | 973,139 | | | | 973,139 | |
| | | | | | | | |
| INVESTMENT OF CASH COLLATERAL FOR SECURITIES LOANED – 28.6% | | | | | | | | |
| MONEY MARKET FUND – 28.6% | | | | | | | | |
Dreyfus Institutional Preferred Money Market Fund, 0.18%(b)
| | | | | | | | |
| (Cost: $173,505,428)(c) | | | 173,505,428 | | | $ | 173,505,428 | |
TOTAL INVESTMENTS IN SECURITIES – 127.5%
(Cost: $770,867,353) | | | | 773,327,549 | |
Liabilities in Excess of Foreign Currency and Other Assets – (27.5)% | | | | | | | (166,620,787 | ) |
| | | | | | | | |
| NET ASSETS – 100.0% | | | | | | $ | 606,706,762 | |
| * | Non-income producing security. |
| (a) | Security, or portion thereof, was on loan at March 31, 2012 (See Note 2). |
| (b) | Rate shown represents annualized 7-day yield as of March 31, 2012. |
| (c) | At March 31, 2012, the total market value of the Fund’s securities on loan was $164,639,402 and the total market value of the collateral held by the Fund was $173,505,428. |
See Notes to Financial Statements.
| | | | |
| WisdomTree International Dividend and Sector Funds | | | 63 | |
Schedule of Investments
WisdomTree Global ex-U.S. Growth Fund (DNL)
March 31, 2012
| | | | | | | | |
| Investments | | Shares | | | Value | |
| | | | | | | | |
| COMMON STOCKS – 99.0% | | | | | | | | |
| Australia – 0.8% | | | | | | | | |
Fortescue Metals Group Ltd. | | | 12,761 | | | $ | 76,807 | |
Rio Tinto Ltd. | | | 5,828 | | | | 394,853 | |
| | | | | | | | |
| Total Australia | | | | | | | 471,660 | |
| Austria – 0.2% | | | | | | | | |
Andritz AG | | | 782 | | | | 76,417 | |
Voestalpine AG | | | 1,522 | | | | 51,107 | |
| | | | | | | | |
| Total Austria | �� | | | | | | 127,524 | |
| Belgium – 0.2% | | | | | | | | |
NV Bekaert S.A. | | | 666 | | | | 21,424 | |
Umicore S.A. | | | 1,574 | | | | 86,579 | |
| | | | | | | | |
| Total Belgium | | | | | | | 108,003 | |
| Brazil – 6.4% | | | | | | | | |
BRF – Brasil Foods S.A.* | | | 5,500 | | | | 108,686 | |
CCR S.A. | | | 42,616 | | | | 345,030 | |
Cia de Saneamento Basico do Estado de Sao Paulo* | | | 4,900 | | | | 186,701 | |
CPFL Energia S.A. | | | 33,100 | | | | 497,507 | |
Duratex S.A.* | | | 6,400 | | | | 40,414 | |
EcoRodovias Infraestrutura e Logistica S.A. | | | 12,500 | | | | 109,837 | |
Lojas Renner S.A. | | | 3,500 | | | | 119,736 | |
MRV Engenharia e Participacoes S.A. | | | 5,900 | | | | 41,817 | |
PDG Realty S.A. Empreendimentos e Participacoes | | | 11,500 | | | | 39,651 | |
Porto Seguro S.A. | | | 7,300 | | | | 79,230 | |
Redecard S.A. | | | 31,900 | | | | 619,884 | |
Tim Participacoes S.A. | | | 11,700 | | | | 74,396 | |
Tractebel Energia S.A. | | | 8,100 | | | | 144,302 | |
Vale S.A. | | | 48,800 | | | | 1,140,085 | |
| | | | | | | | |
| Total Brazil | | | | | | | 3,547,276 | |
| Canada – 1.9% | | | | | | | | |
Baytex Energy Corp.(a) | | | 2,995 | | | | 155,196 | |
Brookfield Asset Management, Inc. Class A(a) | | | 5,991 | | | | 188,641 | |
Centerra Gold, Inc. | | | 4,593 | | | | 71,277 | |
Pembina Pipeline Corp.(a) | | | 7,085 | | | | 199,765 | |
Potash Corp. of Saskatchewan, Inc. | | | 1,597 | | | | 72,767 | |
RioCan Real Estate Investment Trust(a) | | | 8,400 | | | | 227,177 | |
Teck Resources Ltd. Class B | | | 3,794 | | | | 135,179 | |
| | | | | | | | |
| Total Canada | | | | | | | 1,050,002 | |
| Chile – 0.9% | | | | | | | | |
Banco de Credito e Inversiones | | | 1,456 | | | | 101,698 | |
Cencosud S.A. | | | 13,884 | | | | 91,985 | |
Quinenco S.A. | | | 16,923 | | | | 53,315 | |
SACI Falabella | | | 17,315 | | | | 167,283 | |
Sociedad Matriz Banco de Chile Class B | | | 167,074 | | | | 64,006 | |
| | | | | | | | |
| Total Chile | | | | | | | 478,287 | |
| China – 3.0% | | | | | | | | |
Air China Ltd. Class H | | | 46,000 | | | | 31,875 | |
China Coal Energy Co., Ltd. Class H | | | 39,000 | | | | 43,752 | |
China Merchants Bank Co., Ltd. Class H | | | 38,500 | | | | 78,746 | |
China National Building Material Co., Ltd. Class H(a) | | | 24,000 | | | | 30,263 | |
| | | | | | | | |
China Petroleum & Chemical Corp. Class H | | | 258,000 | | | $ | 281,128 | |
China Shenhua Energy Co., Ltd. Class H | | | 51,500 | | | | 217,237 | |
Dongfeng Motor Group Co., Ltd. Class H | | | 91,100 | | | | 164,506 | |
Great Wall Motor Co., Ltd. Class H* | | | 35,500 | | | | 69,043 | |
Guangzhou Automobile Group Co., Ltd. Class H | | | 102,000 | | | | 101,159 | |
PetroChina Co., Ltd. Class H | | | 416,000 | | | | 588,315 | |
Yanzhou Coal Mining Co., Ltd. Class H | | | 24,000 | | | | 52,056 | |
Zhaojin Mining Industry Co., Ltd. Class H | | | 19,000 | | | | 31,862 | |
| | | | | | | | |
| Total China | | | | | | | 1,689,942 | |
| Denmark – 1.4% | | | | | | | | |
H. Lundbeck A/S(a) | | | 3,398 | | | | 68,002 | |
Novo Nordisk A/S Class B | | | 4,629 | | | | 640,091 | |
Novozymes A/S Class B | | | 1,849 | | | | 53,783 | |
| | | | | | | | |
| Total Denmark | | | | | | | 761,876 | |
| Finland – 0.4% | | | | | | | | |
Metso Oyj(a) | | | 3,675 | | | | 156,853 | |
Nokian Renkaat Oyj | | | 1,562 | | | | 76,007 | |
| | | | | | | | |
| Total Finland | | | | | | | 232,860 | |
| France – 4.0% | | | | | | | | |
Bureau Veritas S.A. | | | 1,076 | | | | 94,572 | |
Christian Dior S.A. | | | 2,193 | | | | 335,994 | |
Dassault Systemes S.A. | | | 697 | | | | 64,036 | |
Hermes International(a) | | | 698 | | | | 234,845 | |
LVMH Moet Hennessy Louis Vuitton S.A. | | | 5,131 | | | | 880,426 | |
Schneider Electric S.A. | | | 9,013 | | | | 588,008 | |
SEB S.A. | | | 554 | | | | 46,007 | |
| | | | | | | | |
| Total France | | | | | | | 2,243,888 | |
| Germany – 3.2% | | | | | | | | |
Aixtron SE N.A. | | | 1,455 | | | | 25,305 | |
Bayerische Motoren Werke AG | | | 7,257 | | | | 651,653 | |
Fraport AG Frankfurt Airport Services Worldwide | | | 1,331 | | | | 83,219 | |
K+S AG | | | 2,089 | | | | 109,121 | |
Linde AG | | | 1,946 | | | | 348,685 | |
SMA Solar Technology AG(a) | | | 835 | | | | 37,785 | |
Software AG | | | 739 | | | | 27,634 | |
Volkswagen AG | | | 2,975 | | | | 478,982 | |
| | | | | | | | |
| Total Germany | | | | | | | 1,762,384 | |
| Hong Kong – 7.8% | | | | | | | | |
Cathay Pacific Airways Ltd. | | | 135,000 | | | | 250,039 | |
Cheung Kong Holdings Ltd. | | | 34,000 | | | | 439,232 | |
China Merchants Holdings International Co., Ltd. | | | 48,000 | | | | 160,742 | |
China Resources Enterprise Ltd. | | | 24,000 | | | | 83,771 | |
China Unicom Hong Kong Ltd. | | | 82,000 | | | | 138,990 | |
Citic Pacific Ltd. | | | 49,000 | | | | 82,550 | |
CNOOC Ltd. | | | 638,000 | | | | 1,311,499 | |
Fosun International Ltd. | | | 105,500 | | | | 62,778 | |
Hang Lung Group Ltd. | | | 13,000 | | | | 84,138 | |
Hang Lung Properties Ltd. | | | 57,000 | | | | 208,868 | |
Hong Kong & China Gas Co., Ltd. | | | 84,000 | | | | 215,301 | |
Hutchison Whampoa Ltd. | | | 54,000 | | | | 539,722 | |
Hysan Development Co., Ltd. | | | 13,000 | | | | 52,074 | |
MTR Corp., Ltd. | | | 71,500 | | | | 256,015 | |
See Notes to Financial Statements.
| | |
| 64 | | WisdomTree International Dividend and Sector Funds |
Schedule of Investments (continued)
WisdomTree Global ex-U.S. Growth Fund (DNL)
March 31, 2012
| | | | | | | | |
| Investments | | Shares | | | Value | |
| | | | | | | | |
New World Development Co., Ltd. | | | 68,000 | | | $ | 81,716 | |
Shanghai Industrial Holdings Ltd. | | | 25,000 | | | | 77,119 | |
SJM Holdings Ltd. | | | 62,000 | | | | 126,172 | |
Wharf Holdings Ltd. | | | 31,352 | | | | 170,409 | |
| | | | | | | | |
| Total Hong Kong | | | | | | | 4,341,135 | |
| Indonesia – 2.3% | | | | | | | | |
Astra International Tbk PT | | | 59,600 | | | | 482,001 | |
Bank Mandiri Persero Tbk PT | | | 210,501 | | | | 157,692 | |
Bank Negara Indonesia Persero Tbk PT | | | 117,500 | | | | 51,400 | |
Bank Rakyat Indonesia Persero Tbk PT | | | 212,489 | | | | 161,505 | |
Indofood Sukses Makmur Tbk PT | | | 90,500 | | | | 48,001 | |
United Tractors Tbk PT | | | 58,900 | | | | 212,566 | |
Vale Indonesia Tbk PT | | | 366,500 | | | | 135,273 | |
XL Axiata Tbk PT | | | 90,761 | | | | 50,125 | |
| | | | | | | | |
| Total Indonesia | | | | | | | 1,298,563 | |
| Ireland – 0.1% | | | | | | | | |
Dragon Oil PLC | | | 5,424 | | | | 54,077 | |
| Italy – 1.8% | | | | | | | | |
Banca Monte dei Paschi di Siena SpA(a) | | | 129,738 | | | | 54,613 | |
Mediobanca SpA | | | 12,944 | | | | 75,914 | |
Saipem SpA | | | 4,513 | | | | 232,766 | |
Snam SpA | | | 118,291 | | | | 568,046 | |
Tod’s SpA | | | 480 | | | | 53,918 | |
| | | | | | | | |
| Total Italy | | | | | | | 985,257 | |
| Japan – 2.0% | | | | | | | | |
Daihatsu Motor Co., Ltd.(a) | | | 6,000 | | | | 110,529 | |
FANUC Corp. | | | 2,100 | | | | 374,604 | |
Isuzu Motors Ltd. | | | 12,000 | | | | 70,721 | |
JGC Corp. | | | 2,000 | | | | 62,337 | |
Komatsu Ltd. | | | 8,000 | | | | 229,321 | |
Mitsubishi Chemical Holdings Corp. | | | 13,500 | | | | 72,507 | |
Sega Sammy Holdings, Inc. | | | 3,800 | | | | 80,068 | |
SMC Corp. | | | 400 | | | | 63,965 | |
Softbank Corp.* | | | 1,100 | | | | 32,708 | |
| | | | | | | | |
| Total Japan | | | | | | | 1,096,760 | |
| Malaysia – 0.9% | | | | | | | | |
Genting Bhd | | | 15,200 | | | | 53,784 | |
Hong Leong Financial Group Bhd | | | 14,400 | | | | 57,816 | |
Petronas Dagangan Bhd | | | 23,300 | | | | 144,052 | |
RHB Capital Bhd | | | 36,700 | | | | 92,244 | |
YTL Power International Bhd | | | 229,900 | | | | 138,833 | |
| | | | | | | | |
| Total Malaysia | | | | | | | 486,729 | |
| Mexico – 2.6% | | | | | | | | |
Alfa S.A.B de C.V. Class A | | | 4,200 | | | | 60,388 | |
Arca Continental S.A.B de C.V. | | | 17,298 | | | | 82,571 | |
Grupo Mexico S.A.B de C.V. Series B | | | 133,574 | | | | 421,247 | |
Industrias Penoles S.A.B de C.V. | | | 10,455 | | | | 506,333 | |
Wal-Mart de Mexico S.A.B de C.V. Series V | | | 115,429 | | | | 386,821 | |
| | | | | | | | |
| Total Mexico | | | | | | | 1,457,360 | |
| Netherlands – 0.2% | | | | | | | | |
Randstad Holding N.V. | | | 3,716 | | | | 139,996 | |
| | | | | | | | |
| Norway – 0.2% | | | | | | | | |
Yara International ASA | | | 2,746 | | | $ | 130,752 | |
| Philippines – 0.7% | | | | | | | | |
Aboitiz Equity Ventures, Inc. | | | 127,300 | | | | 148,544 | |
Aboitiz Power Corp. | | | 190,500 | | | | 150,412 | |
Manila Electric Co. | | | 15,310 | | | | 93,425 | |
| | | | | | | | |
| Total Philippines | | | | | | | 392,381 | |
| Poland – 0.1% | | | | | | | | |
KGHM Polska Miedz S.A. | | | 1,869 | | | | 85,755 | |
| Portugal – 0.5% | | | | | | | | |
Portugal Telecom, SGPS, S.A. | | | 50,335 | | | | 273,420 | |
| Russia – 6.9% | | | | | | | | |
Gazprom Neft JSC ADR | | | 18,671 | | | | 498,329 | |
Gazprom OAO ADR | | | 125,211 | | | | 1,527,574 | |
Magnitogorsk Iron & Steel Works Reg S GDR* | | | 6,291 | | | | 37,148 | |
Mechel ADR*(a) | | | 2,600 | | | | 23,348 | |
MMC Norilsk Nickel OJSC ADR | | | 35,375 | | | | 647,363 | |
NovaTek OAO Reg S GDR | | | 599 | | | | 81,164 | |
Novolipetsk Steel OJSC Reg S GDR | | | 6,423 | | | | 133,470 | |
Rosneft Oil Co. Reg S GDR | | | 66,999 | | | | 474,353 | |
Sistema JSFC Reg S GDR | | | 2,044 | | | | 40,246 | |
Tatneft ADR | | | 5,791 | | | | 236,273 | |
Uralkali OJSC Reg S GDR | | | 4,494 | | | | 169,469 | |
| | | | | | | | |
| Total Russia | | | | | | | 3,868,737 | |
| Singapore – 0.6% | | | | | | | | |
Jardine Cycle & Carriage Ltd. | | | 6,390 | | | | 245,416 | |
Yangzijiang Shipbuilding Holdings Ltd. | | | 64,626 | | | | 68,360 | |
| | | | | | | | |
| Total Singapore | | | | | | | 313,776 | |
| South Africa – 2.5% | | | | | | | | |
Kumba Iron Ore Ltd.(a) | | | 13,420 | | | | 919,871 | |
Vodacom Group Ltd. | | | 35,349 | | | | 498,139 | |
| | | | | | | | |
| Total South Africa | | | | | | | 1,418,010 | |
| South Korea – 3.4% | | | | | | | | |
Daewoo Shipbuilding & Marine Engineering Co., Ltd. | | | 1,260 | | | | 33,695 | |
GS Holdings | | | 838 | | | | 48,000 | |
Hankook Tire Co., Ltd. | | | 1,000 | | | | 37,024 | |
Hanwha Chem Corp. | | | 810 | | | | 19,195 | |
Honam Petrochemical Corp. | | | 98 | | | | 29,105 | |
Hyundai Engineering & Construction Co., Ltd. | | | 625 | | | | 44,570 | |
Hyundai Heavy Industries Co., Ltd. | | | 682 | | | | 193,516 | |
Hyundai Mobis | | | 252 | | | | 63,720 | |
Hyundai Motor Co. | | | 868 | | | | 178,495 | |
Kangwon Land, Inc. | | | 4,490 | | | | 99,663 | |
Kia Motors Corp. | | | 1,713 | | | | 112,028 | |
LG Chem Ltd. | | | 320 | | | | 104,497 | |
OCI Co., Ltd. | | | 113 | | | | 22,988 | |
POSCO | | | 1,158 | | | | 388,368 | |
Samsung C&T Corp. | | | 619 | | | | 43,377 | |
Samsung Engineering Co., Ltd. | | | 256 | | | | 54,677 | |
Samsung Heavy Industries Co., Ltd. | | | 1,590 | | | | 52,974 | |
Samsung Life Insurance Co., Ltd.* | | | 1,455 | | | | 127,130 | |
See Notes to Financial Statements.
| | | | |
| WisdomTree International Dividend and Sector Funds | | | 65 | |
Schedule of Investments (continued)
WisdomTree Global ex-U.S. Growth Fund (DNL)
March 31, 2012
| | | | | | | | |
| Investments | | Shares | | | Value | |
| | | | | | | | |
SK Holdings Co., Ltd. | | | 308 | | | $ | 40,095 | |
SK Innovation Co., Ltd. | | | 526 | | | | 76,831 | |
S-Oil Corp. | | | 1,159 | | | | 114,565 | |
| | | | | | | | |
| Total South Korea | | | | | | | 1,884,513 | |
| Spain – 3.4% | | | | | | | | |
CaixaBank(a) | | | 133,644 | | | | 519,505 | |
Endesa S.A. | | | 28,983 | | | | 576,634 | |
Repsol YPF S.A. | | | 31,140 | | | | 780,035 | |
| | | | | | | | |
| Total Spain | | | | | | | 1,876,174 | |
| Sweden – 0.9% | | | | | | | | |
Boliden AB | | | 7,261 | | | | 113,697 | |
Lundbergforetagen AB Class B | | | 1,684 | | | | 57,738 | |
Scania AB Class B | | | 15,718 | | | | 325,950 | |
| | | | | | | | |
| Total Sweden | | | | | | | 497,385 | |
| Switzerland – 1.9% | | | | | | | | |
Cie Financiere Richemont S.A. Class A | | | 2,259 | | | | 141,461 | |
Swatch Group AG (The) | | | 2,264 | | | | 181,726 | |
Swiss Re AG* | | | 11,588 | | | | 739,114 | |
| | | | | | | | |
| Total Switzerland | | | | | | | 1,062,301 | |
| Taiwan – 6.8% | | | | | | | | |
Advanced Semiconductor Engineering, Inc. | | | 40,136 | | | | 40,388 | |
Chang Hwa Commercial Bank | | | 57,770 | | | | 32,981 | |
Cheng Shin Rubber Industry Co., Ltd. | | | 32,400 | | | | 77,832 | |
China Steel Corp. | | | 242,550 | | | | 247,773 | |
Chinatrust Financial Holding Co., Ltd. | | | 165,083 | | | | 103,755 | |
Far Eastern New Century Corp. | | | 83,430 | | | | 96,533 | |
Formosa Chemicals & Fibre Corp. | | | 136,000 | | | | 397,201 | |
Formosa Plastics Corp. | | | 133,000 | | | | 391,594 | |
HTC Corp. | | | 11,550 | | | | 233,626 | |
Nan Ya Plastics Corp. | | | 108,000 | | | | 244,070 | |
President Chain Store Corp. | | | 15,000 | | | | 83,349 | |
Taiwan Cement Corp. | | | 88,000 | | | | 103,014 | |
Taiwan Semiconductor Manufacturing Co., Ltd. | | | 590,000 | | | | 1,697,166 | |
Uni-President Enterprises Corp. | | | 50,880 | | | | 70,421 | |
| | | | | | | | |
| Total Taiwan | | | | | | | 3,819,703 | |
| Thailand – 4.6% | | | | | | | | |
Bank of Ayudhya PCL NVDR | | | 77,400 | | | | 67,741 | |
Banpu PCL | | | 3,500 | | | | 68,979 | |
Charoen Pokphand Foods PCL | | | 156,920 | | | | 189,474 | |
CP ALL PCL | | | 82,778 | | | | 175,752 | |
Indorama Ventures PCL | | | 39,541 | | | | 48,385 | |
IRPC PCL | | | 379,800 | | | | 57,616 | |
Kasikornbank PCL NVDR | | | 39,400 | | | | 196,681 | |
Krung Thai Bank PCL | | | 193,700 | | | | 109,878 | |
PTT Exploration & Production PCL | | | 57,000 | | | | 322,415 | |
PTT Global Chemical PCL | | | 59,310 | | | | 136,500 | |
PTT PCL | | | 50,200 | | | | 576,039 | |
Siam Cement PCL NVDR | | | 27,275 | | | | 313,861 | |
Thai Oil PCL | | | 31,900 | | | | 74,968 | |
Total Access Communication PCL NVDR | | | 87,400 | | | | 232,311 | |
| | | | | | | | |
| Total Thailand | | | | | | | 2,570,600 | |
| | | | | | | | |
| Turkey – 1.0% | | | | | | | | |
BIM Birlesik Magazalar A.S. | | | 2,027 | | | $ | 76,741 | |
KOC Holding A.S. | | | 53,826 | | | | 218,577 | |
Tupras Turkiye Petrol Rafinerileri A.S. | | | 9,781 | | | | 249,613 | |
| | | | | | | | |
| Total Turkey | | | | | | | 544,931 | |
| United Kingdom – 25.4% | | | | | | | | |
Admiral Group PLC | | | 7,065 | | | | 133,990 | |
Aggreko PLC | | | 1,844 | | | | 66,291 | |
AMEC PLC | | | 4,975 | | | | 88,073 | |
Anglo American PLC | | | 11,475 | | | | 428,470 | |
Antofagasta PLC | | | 36,672 | | | | 674,988 | |
ARM Holdings PLC | | | 4,754 | | | | 44,966 | |
Ashmore Group PLC | | | 17,009 | | | | 99,872 | |
Babcock International Group PLC | | | 4,550 | | | | 57,904 | |
BHP Billiton PLC | | | 34,080 | | | | 1,038,659 | |
British Sky Broadcasting Group PLC | | | 27,555 | | | | 297,616 | |
Burberry Group PLC | | | 3,496 | | | | 83,618 | |
Croda International PLC | | | 1,714 | | | | 57,674 | |
Eurasian Natural Resources Corp. PLC | | | 19,906 | | | | 188,443 | |
Ferrexpo PLC | | | 5,472 | | | | 26,718 | |
Fresnillo PLC | | | 10,790 | | | | 275,491 | |
IMI PLC | | | 5,502 | | | | 85,491 | |
Intertek Group PLC | | | 1,520 | | | | 60,982 | |
John Wood Group PLC | | | 2,819 | | | | 32,272 | |
Johnson Matthey PLC | | | 2,862 | | | | 107,871 | |
Kazakhmys PLC | | | 5,052 | | | | 73,292 | |
London Stock Exchange Group PLC | | | 4,791 | | | | 79,151 | |
National Grid PLC | | | 114,474 | | | | 1,153,190 | |
Next PLC | | | 4,068 | | | | 193,884 | |
Rio Tinto PLC | | | 15,955 | | | | 878,458 | |
Royal Dutch Shell PLC Class A | | | 96,582 | | | | 3,369,444 | |
Royal Dutch Shell PLC Class B | | | 83,067 | | | | 2,919,184 | |
SABMiller PLC | | | 21,066 | | | | 844,653 | |
SSE PLC | | | 30,666 | | | | 651,165 | |
Vedanta Resources PLC | | | 4,043 | | | | 79,325 | |
Weir Group PLC (The) | | | 1,892 | | | | 53,325 | |
| | | | | | | | |
| Total United Kingdom | | | | | | | 14,144,460 | |
TOTAL COMMON STOCKS
(Cost: $57,292,590) | | | | | | | 55,216,477 | |
| EXCHANGE-TRADED FUNDS – 0.7% | | | | | | | | |
| United States – 0.7% | | | | | | | | |
WisdomTree DEFA Fund(a)(b) | | | 1,560 | | | | 70,044 | |
WisdomTree Emerging Markets Equity Income Fund(a)(b) | | | 809 | | | | 46,606 | |
WisdomTree India Earnings Fund(a)(b) | | | 13,939 | | | | 268,744 | |
| | | | | | | | |
TOTAL EXCHANGE-TRADED FUNDS
(Cost: $412,281) | | | | | | | 385,394 | |
| SHORT-TERM INVESTMENT – 0.0% | | | | | | | | |
| MONEY MARKET FUND – 0.0% | | | | | | | | |
Invesco Treasury Fund Private Class, 0.02%(c)
(Cost: $1,540) | | | 1,540 | | | | 1,540 | |
See Notes to Financial Statements.
| | |
| 66 | | WisdomTree International Dividend and Sector Funds |
Schedule of Investments (concluded)
WisdomTree Global ex-U.S. Growth Fund (DNL)
March 31, 2012
| | | | | | | | |
| Investments | | Shares | | | Value | |
| | | | | | | | |
| INVESTMENT OF CASH COLLATERAL FOR SECURITIES LOANED – 5.0% | | | | | | | | |
| MONEY MARKET FUND – 5.0% | | | | | | | | |
Dreyfus Institutional Preferred Money Market Fund, 0.18%(c) | | | | | | | | |
| (Cost: $2,801,979)(d) | | | 2,801,979 | | | $ | 2,801,979 | |
TOTAL INVESTMENTS IN SECURITIES – 104.7%
(Cost: $60,508,390) | | | | 58,405,390 | |
Liabilities in Excess of Foreign Currency and Other
Assets – (4.7)% | | | | (2,631,256 | ) |
| | | | | | | | |
| NET ASSETS – 100.0% | | | $ | 55,774,134 | |
ADR – American Depositary Receipt
GDR – Global Depositary Receipt
NVDR – Non-Voting Depositary Receipt
| * | Non-income producing security. |
| (a) | Security, or portion thereof, was on loan at March 31, 2012 (See Note 2). |
| (b) | Affiliated company (See Note 7). |
| (c) | Rate shown represents annualized 7-day yield as of March 31, 2012. |
| (d) | At March 31, 2012, the total market value of the Fund’s securities on loan was $2,668,103 and the total market value of the collateral held by the Fund was $2,801,979. |
See Notes to Financial Statements.
| | | | |
| WisdomTree International Dividend and Sector Funds | | | 67 | |
Schedule of Investments
WisdomTree Japan SmallCap Dividend Fund (DFJ)
March 31, 2012
| | | | | | | | |
| Investments | | Shares | | | Value | |
| | | | | | | | |
| COMMON STOCKS – 98.8% | | | | | |
| Japan – 98.8% | | | | | |
| Advertising – 0.5% | | | | | |
Asatsu-DK, Inc. | | | 10,739 | | | $ | 310,445 | |
Moshi Moshi Hotline, Inc. | | | 64,200 | | | | 645,160 | |
| | | | | | | | |
| Total Advertising | | | | 955,605 | |
| Aerospace/Defense – 0.0% | | | | | | | | |
Sumitomo Precision Products Co., Ltd. | | | 12,895 | | | | 76,779 | |
Agriculture – 0.3% | | | | | | | | |
Hokuto Corp. | | | 21,591 | | | | 457,295 | |
Sakata Seed Corp. | | | 8,400 | | | | 117,383 | |
| | | | | | | | |
| Total Agriculture | | | | 574,678 | |
| Airlines – 0.1% | | | | | | | | |
Skymark Airlines, Inc.* | | | 14,412 | | | | 124,865 | |
| Apparel – 1.5% | | | | | | | | |
Atsugi Co., Ltd. | | | 167,189 | | | | 215,348 | |
Descente Ltd. | | | 12,000 | | | | 75,387 | |
Gunze Ltd. | | | 125,503 | | | | 369,059 | |
Japan Wool Textile Co., Ltd. (The) | | | 48,402 | | | | 379,358 | |
Onward Holdings Co., Ltd. | | | 125,670 | | | | 1,030,771 | |
Sanyo Shokai Ltd. | | | 134,260 | | | | 365,444 | |
Wacoal Holdings Corp.(a) | | | 40,000 | | | | 476,821 | |
| | | | | | | | |
| Total Apparel | | | | 2,912,188 | |
| Auto Manufacturers – 0.5% | | | | | | | | |
Nissan Shatai Co., Ltd. | | | 41,923 | | | | 441,161 | |
Shinmaywa Industries Ltd. | | | 92,801 | | | | 464,597 | |
| | | | | | | | |
| Total Auto Manufacturers | | | | 905,758 | |
| Auto Parts & Equipment – 4.1% | | | | | | | | |
Aisan Industry Co., Ltd. | | | 20,863 | | | | 221,572 | |
Akebono Brake Industry Co., Ltd.(a) | | | 62,900 | | | | 362,289 | |
Calsonic Kansei Corp. | | | 40,000 | | | | 245,458 | |
Exedy Corp. | | | 12,944 | | | | 371,042 | |
FCC Co., Ltd. | | | 18,260 | | | | 410,265 | |
Keihin Corp.(a) | | | 20,821 | | | | 387,603 | |
KYB Co., Ltd.(a) | | | 47,000 | | | | 287,271 | |
Musashi Seimitsu Industry Co., Ltd. | | | 10,582 | | | | 253,572 | |
Nidec-Tosok Corp. | | | 11,601 | | | | 134,484 | |
Nifco, Inc. | | | 20,986 | | | | 576,831 | |
Nippon Seiki Co., Ltd. | | | 5,000 | | | | 63,309 | |
Nissin Kogyo Co., Ltd.(a) | | | 22,800 | | | | 374,297 | |
Riken Corp. | | | 58,687 | | | | 270,989 | |
Sanden Corp. | | | 39,963 | | | | 131,114 | |
Sanoh Industrial Co., Ltd. | | | 26,597 | | | | 227,850 | |
T RAD Co., Ltd. | | | 40,000 | | | | 165,259 | |
Tachi-S Co., Ltd. | | | 6,600 | | | | 130,565 | |
Taiho Kogyo Co., Ltd. | | | 14,200 | | | | 178,934 | |
Tokai Rika Co., Ltd. | | | 37,700 | | | | 650,055 | |
Topre Corp. | | | 12,600 | | | | 133,051 | |
Toyo Tire & Rubber Co., Ltd. | | | 125,682 | | | | 352,786 | |
TPR Co., Ltd. | | | 4,400 | | | | 73,088 | |
TS Tech Co., Ltd. | | | 21,024 | | | | 414,630 | |
Unipres Corp. | | | 9,103 | | | | 283,283 | |
| | | | | | | | |
Yokohama Rubber Co., Ltd. (The) | | | 166,637 | | | $ | 1,206,825 | |
| | | | | | | | |
| Total Auto Parts & Equipment | | | | 7,906,422 | |
| Banks – 10.1% | | | | | | | | |
77 Bank Ltd. (The) | | | 151,000 | | | | 669,725 | |
Akita Bank Ltd. (The) | | | 125,892 | | | | 414,566 | |
Aomori Bank Ltd. (The)(a) | | | 126,102 | | | | 392,273 | |
Awa Bank Ltd. (The)(a) | | | 82,378 | | | | 508,512 | |
Bank of Iwate Ltd. (The)(a) | | | 7,100 | | | | 323,531 | |
Bank of Nagoya Ltd. (The) | | | 126,000 | | | | 454,730 | |
Bank of Saga Ltd. (The) | | | 131,083 | | | | 375,911 | |
Bank of the Ryukyus Ltd. | | | 16,700 | | | | 228,295 | |
Chukyo Bank Ltd. (The) | | | 48,000 | | | | 124,819 | |
Daisan Bank Ltd. (The) | | | 125,602 | | | | 268,618 | |
Daishi Bank Ltd. (The) | | | 238,552 | | | | 843,534 | |
Ehime Bank Ltd. (The) | | | 126,144 | | | | 361,747 | |
FIDEA Holdings Co., Ltd. | | | 83,176 | | | | 226,398 | |
Fukui Bank Ltd. (The) | | | 172,667 | | | | 549,714 | |
Higo Bank Ltd. (The) | | | 104,000 | | | | 619,236 | |
Hokkoku Bank Ltd. (The) | | | 170,621 | | | | 644,792 | |
Hokuetsu Bank Ltd. (The) | | | 208,003 | | | | 447,373 | |
Hyakugo Bank Ltd. (The) | | | 126,000 | | | | 583,340 | |
Hyakujushi Bank Ltd. (The) | | | 177,000 | | | | 828,058 | |
Juroku Bank Ltd. (The) | | | 218,000 | | | | 754,967 | |
Kagoshima Bank Ltd. (The) | | | 85,000 | | | | 545,355 | |
Keiyo Bank Ltd. (The) | | | 139,396 | | | | 672,461 | |
Kiyo Holdings, Inc. | | | 502,593 | | | | 751,187 | |
Michinoku Bank Ltd. (The)(a) | | | 74,000 | | | | 151,965 | |
Mie Bank Ltd. (The) | | | 125,691 | | | | 303,937 | |
Miyazaki Bank Ltd. (The) | | | 125,000 | | | | 356,948 | |
Musashino Bank Ltd. (The) | | | 18,778 | | | | 649,854 | |
Ogaki Kyoritsu Bank Ltd. (The) | | | 210,423 | | | | 761,967 | |
Oita Bank Ltd. (The) | | | 113,000 | | | | 362,501 | |
San-In Godo Bank Ltd. (The) | | | 65,000 | | | | 517,346 | |
Sapporo Hokuyo Holdings, Inc. | | | 89,648 | | | | 332,252 | |
Senshu Ikeda Holdings, Inc. | | | 595,900 | | | | 832,718 | |
Shiga Bank Ltd. (The) | | | 89,923 | | | | 540,882 | |
Shikoku Bank Ltd. (The) | | | 122,000 | | | | 459,566 | |
Tochigi Bank Ltd. (The) | | | 61,679 | | | | 230,842 | |
Toho Bank Ltd. (The) | | | 208,000 | | | | 715,280 | |
Tohoku Bank Ltd. (The) | | | 87,175 | | | | 158,895 | |
Tokyo Tomin Bank Ltd. (The) | | | 12,921 | | | | 156,694 | |
TOMONY Holdings, Inc. | | | 89,929 | | | | 439,291 | |
Tsukuba Bank Ltd. | | | 45,700 | | | | 161,043 | |
Yamagata Bank Ltd. (The) | | | 82,354 | | | | 393,282 | |
Yamanashi Chuo Bank Ltd. (The) | | | 86,066 | | | | 384,863 | |
| | | | | | | | |
| Total Banks | | | | | | | 19,499,268 | |
| Beverages – 1.7% | | | | | | | | |
Coca-Cola Central Japan Co., Ltd. | | | 35,523 | | | | 463,165 | |
Ito En Ltd. | | | 49,584 | | | | 894,735 | |
Kagome Co., Ltd.(a) | | | 14,600 | | | | 287,405 | |
Mikuni Coca-Cola Bottling Co., Ltd. | | | 46,154 | | | | 396,511 | |
Sapporo Holdings Ltd. | | | 159,000 | | | | 591,215 | |
See Notes to Financial Statements.
| | |
| 68 | | WisdomTree International Dividend and Sector Funds |
Schedule of Investments (continued)
WisdomTree Japan SmallCap Dividend Fund (DFJ)
March 31, 2012
| | | | | | | | |
| Investments | | Shares | | | Value | |
| | | | | | | | |
Takara Holdings, Inc. | | | 96,000 | | | $ | 656,759 | |
| | | | | | | | |
| Total Beverages | | | | | | | 3,289,790 | |
| Biotechnology – 0.1% | | | | | | | | |
Eiken Chemical Co., Ltd. | | | 12,629 | | | | 170,648 | |
| Building Materials – 2.0% | | | | | | | | |
Asahi Organic Chemicals Industry Co., Ltd. | | | 41,000 | | | | 110,602 | |
Bunka Shutter Co., Ltd. | | | 42,000 | | | | 153,108 | |
Central Glass Co., Ltd. | | | 63,933 | | | | 282,006 | |
Cleanup Corp. | | | 27,137 | | | | 221,923 | |
Daiken Corp. | | | 62,901 | | | | 218,600 | |
Fujitec Co., Ltd. | | | 40,632 | | | | 269,580 | |
Nichias Corp. | | | 53,827 | | | | 299,566 | |
Nichiha Corp. | | | 14,100 | | | | 175,618 | |
Okabe Co., Ltd. | | | 21,400 | | | | 126,899 | |
Sanwa Holdings Corp. | | | 148,807 | | | | 584,053 | |
Sumitomo Osaka Cement Co., Ltd. | | | 136,404 | | | | 399,458 | |
Taiheiyo Cement Corp.(a) | | | 285,000 | | | | 637,220 | |
Takara Standard Co., Ltd. | | | 64,063 | | | | 476,415 | |
| | | | | | | | |
| Total Building Materials | | | | | | | 3,955,048 | |
| Chemicals – 5.4% | | | | | | | | |
ADEKA Corp. | | | 57,935 | | | | 553,338 | |
Aica Kogyo Co., Ltd. | | | 38,771 | | | | 559,693 | |
Chugoku Marine Paints Ltd. | | | 41,000 | | | | 252,591 | |
Dainichiseika Color & Chemicals Manufacturing Co., Ltd. | | | 41,618 | | | | 196,218 | |
Fujimi, Inc. | | | 25,800 | | | | 323,225 | |
Hodogaya Chemical Co., Ltd.(a) | | | 41,500 | | | | 138,174 | |
Koatsu Gas Kogyo Co., Ltd. | | | 11,000 | | | | 67,768 | |
Kureha Corp. | | | 96,648 | | | | 467,415 | |
Nihon Nohyaku Co., Ltd. | | | 40,000 | | | | 179,355 | |
Nihon Parkerizing Co., Ltd. | | | 30,000 | | | | 447,293 | |
Nippon Carbon Co., Ltd. | | | 46,000 | | | | 130,239 | |
Nippon Chemical Industrial Co., Ltd. | | | 46,000 | | | | 79,373 | |
Nippon Kayaku Co., Ltd. | | | 89,931 | | | | 926,684 | |
Nippon Soda Co., Ltd. | | | 53,091 | | | | 244,504 | |
Nippon Synthetic Chemical Industry Co., Ltd. (The) | | | 40,000 | | | | 247,403 | |
Nissan Chemical Industries Ltd.(a) | | | 90,000 | | | | 849,748 | |
NOF Corp. | | | 112,000 | | | | 548,466 | |
Sanyo Chemical Industries Ltd. | | | 51,208 | | | | 343,482 | |
Shikoku Chemicals Corp. | | | 6,000 | | | | 35,652 | |
Stella Chemifa Corp. | | | 4,000 | | | | 96,336 | |
Sumitomo Bakelite Co., Ltd.(a) | | | 127,010 | | | | 672,901 | |
Sumitomo Seika Chemicals Co., Ltd. | | | 41,835 | | | | 194,700 | |
Taiyo Holdings Co., Ltd.(a) | | | 26,100 | | | | 704,077 | |
Takasago International Corp.(a) | | | 42,000 | | | | 199,040 | |
Toagosei Co., Ltd. | | | 110,000 | | | | 509,265 | |
Tokai Carbon Co., Ltd. | | | 80,974 | | | | 433,921 | |
Tokuyama Corp.(a) | | | 98,000 | | | | 306,045 | |
Toyo Ink SC Holdings Co., Ltd. | | | 179,920 | | | | 745,522 | |
| | | | | | | | |
| Total Chemicals | | | | 10,452,428 | |
| Coal – 0.1% | | | | | | | | |
Mitsui Matsushima Co., Ltd.(a) | | | 65,954 | | | | 140,251 | |
| | | | | | | | |
| Commercial Services – 2.6% | | | | | | | | |
Aeon Delight Co., Ltd. | | | 17,900 | | | $ | 379,338 | |
Kanamoto Co., Ltd. | | | 34,228 | | | | 409,264 | |
Kyoritsu Maintenance Co., Ltd. | | | 12,625 | | | | 266,936 | |
Meiko Network Japan Co., Ltd. | | | 2,700 | | | | 26,280 | |
Meitec Corp. | | | 11,900 | | | | 241,340 | |
Nichii Gakkan Co. | | | 29,200 | | | | 393,142 | |
Nissin Corp. | | | 59,556 | | | | 158,488 | |
Nomura Co., Ltd. | | | 41,533 | | | | 150,396 | |
Park24 Co., Ltd. | | | 109,551 | | | | 1,484,286 | |
Sohgo Security Services Co., Ltd. | | | 51,658 | | | | 616,418 | |
Toppan Forms Co., Ltd. | | | 95,200 | | | | 878,022 | |
| | | | | | | | |
| Total Commercial Services | | | | | | | 5,003,910 | |
| Computers – 2.3% | | | | | | | | |
DTS Corp. | | | 27,463 | | | | 360,411 | |
Ines Corp. | | | 37,600 | | | | 301,549 | |
Information Services International-Dentsu Ltd. | | | 14,800 | | | | 119,774 | |
Melco Holdings, Inc. | | | 10,462 | | | | 266,079 | |
NEC Fielding Ltd. | | | 51,616 | | | | 676,756 | |
NEC Networks & System Integration Corp. | | | 29,268 | | | | 420,375 | |
NS Solutions Corp. | | | 29,190 | | | | 565,391 | |
Otsuka Corp. | | | 14,300 | | | | 1,169,439 | |
Roland DG Corp. | | | 6,100 | | | | 73,457 | |
SCSK Corp. | | | 29,351 | | | | 467,933 | |
| | | | | | | | |
| Total Computers | | | | | | | 4,421,164 | |
| Cosmetics/Personal Care – 1.7% | | | | | | | | |
Fancl Corp. | | | 40,007 | | | | 541,562 | |
Kose Corp. | | | 22,704 | | | | 517,285 | |
Lion Corp. | | | 124,629 | | | | 717,834 | |
Mandom Corp. | | | 12,860 | | | | 324,411 | |
Pigeon Corp. | | | 12,600 | | | | 472,337 | |
Pola Orbis Holdings, Inc. | | | 20,833 | | | | 625,281 | |
| | | | | | | | |
| Total Cosmetics/Personal Care | | | | | | | 3,198,710 | |
| Distribution/Wholesale – 3.3% | | | | | | | | |
Ai Holdings Corp. | | | 84,854 | | | | 452,651 | |
Canon Marketing Japan, Inc. | | | 66,500 | | | | 857,361 | |
Chori Co., Ltd. | | | 126,000 | | | | 156,170 | |
Daiwabo Holdings Co., Ltd. | | | 86,392 | | | | 194,210 | |
Doshisha Co., Ltd. | | | 7,600 | | | | 220,164 | |
Fuji Electronics Co., Ltd. | | | 14,484 | | | | 221,233 | |
Hakuto Co., Ltd. | | | 23,683 | | | | 237,132 | |
Inabata & Co., Ltd. | | | 50,141 | | | | 349,729 | |
Itochu Enex Co., Ltd. | | | 110,081 | | | | 654,106 | |
Iwatani Corp. | | | 94,166 | | | | 315,813 | |
Japan Pulp & Paper Co., Ltd. | | | 54,000 | | | | 194,884 | |
Matsuda Sangyo Co., Ltd. | | | 12,563 | | | | 207,310 | |
Nagase & Co., Ltd. | | | 39,904 | | | | 496,527 | |
Paltac Corp. | | | 22,949 | | | | 331,289 | |
Ryoden Trading Co., Ltd. | | | 40,079 | | | | 243,021 | |
San-Ai Oil Co., Ltd. | | | 41,506 | | | | 216,873 | |
Seika Corp. | | | 52,000 | | | | 157,336 | |
Sinanen Co., Ltd. | | | 78,771 | | | | 346,499 | |
See Notes to Financial Statements.
| | | | |
| WisdomTree International Dividend and Sector Funds | | | 69 | |
Schedule of Investments (continued)
WisdomTree Japan SmallCap Dividend Fund (DFJ)
March 31, 2012
| | | | | | | | |
| Investments | | Shares | | | Value | |
| | | | | | | | |
Tomen Electronics Corp. | | | 2,800 | | | $ | 38,311 | |
Yamazen Corp. | | | 41,806 | | | | 350,521 | |
Yuasa Trading Co., Ltd. | | | 115,000 | | | | 201,227 | |
| | | | | | | | |
| Total Distribution/Wholesale | | | | | | | 6,442,367 | |
| Diversified Financial Services – 2.3% | | | | | | | | |
Century Tokyo Leasing Corp. | | | 56,999 | | | | 1,157,365 | |
Hitachi Capital Corp. | | | 72,100 | | | | 1,079,375 | |
Ichiyoshi Securities Co., Ltd. | | | 54,716 | | | | 386,958 | |
Jaccs Co., Ltd. | | | 102,000 | | | | 365,636 | |
Okasan Securities Group, Inc. | | | 112,000 | | | | 474,974 | |
Tokai Tokyo Financial Holdings, Inc. | | | 236,106 | | | | 886,527 | |
| | | | | | | | |
| Total Diversified Financial Services | | | | | | | 4,350,835 | |
| Electric – 0.1% | | | | | | | | |
Okinawa Electric Power Co., Inc. (The) | | | 6,770 | | | | 281,346 | |
| Electrical Components & Equipment – 0.6% | | | | | | | | |
Fujikura Ltd. | | | 88,000 | | | | 295,133 | |
Kyosan Electric Manufacturing Co., Ltd. | | | 40,000 | | | | 172,550 | |
Nippon Signal Co., Ltd. (The) | | | 32,242 | | | | 202,553 | |
Nissin Electric Co., Ltd. | | | 24,000 | | | | 146,109 | |
Takaoka Electric Manufacturing Co., Ltd.(a) | | | 40,000 | | | | 124,430 | |
Tatsuta Electric Wire and Cable Co., Ltd.(a) | | | 33,060 | | | | 199,658 | |
| | | | | | | | |
| Total Electrical Components & Equipment | | | | | | | 1,140,433 | |
| Electronics – 4.8% | | | | | | | | |
Alps Electric Co., Ltd. | | | 82,900 | | | | 733,352 | |
Anritsu Corp. | | | 37,000 | | | | 487,368 | |
Azbil Corp. | | | 44,100 | | | | 980,655 | |
Cosel Co., Ltd. | | | 7,800 | | | | 109,188 | |
Eizo Nanao Corp. | | | 16,008 | | | | 344,300 | |
Fujitsu General Ltd.(a) | | | 37,000 | | | | 279,203 | |
Horiba Ltd. | | | 6,100 | | | | 210,214 | |
Idec Corp. | | | 17,693 | | | | 176,296 | |
Inaba Denki Sangyo Co., Ltd. | | | 19,594 | | | | 591,427 | |
Japan Aviation Electronics Industry Ltd.(a) | | | 39,000 | | | | 339,790 | |
Kaga Electronics Co., Ltd. | | | 24,659 | | | | 260,089 | |
Koa Corp. | | | 12,400 | | | | 133,349 | |
Kuroda Electric Co., Ltd. | | | 20,802 | | | | 230,277 | |
Mitsumi Electric Co., Ltd.* | | | 34,991 | | | | 303,160 | |
Nichicon Corp.(a) | | | 17,674 | | | | 214,120 | |
Nidec Copal Corp. | | | 27,600 | | | | 362,209 | |
Nihon Dempa Kogyo Co., Ltd.(a) | | | 9,600 | | | | 145,467 | |
Nohmi Bosai Ltd. | | | 35,843 | | | | 246,953 | |
Osaki Electric Co., Ltd. | | | 20,000 | | | | 200,012 | |
Ryosan Co., Ltd. | | | 33,900 | | | | 685,456 | |
Sanshin Electronics Co., Ltd. | | | 27,691 | | | | 234,530 | |
Sanyo Denki Co., Ltd. | | | 30,382 | | | | 186,438 | |
Shinko Shoji Co., Ltd. | | | 28,338 | | | | 248,618 | |
Siix Corp. | | | 8,957 | | | | 138,445 | |
SMK Corp. | | | 42,150 | | | | 146,996 | |
Star Micronics Co., Ltd. | | | 27,934 | | | | 278,338 | |
Taiyo Yuden Co., Ltd.(a) | | | 19,500 | | | | 208,992 | |
Tamura Corp. | | | 40,000 | | | | 111,307 | |
Tokyo Seimitsu Co., Ltd. | | | 7,300 | | | | 152,307 | |
| | | | | | | | |
Toyo Corp. | | | 46,100 | | | $ | 504,162 | |
Ulvac, Inc.*(a) | | | 8,220 | | | | 90,795 | |
| | | | | | | | |
| Total Electronics | | | | | | | 9,333,813 | |
| Engineering & Construction – 5.3% | | | | | | | | |
COMSYS Holdings Corp.(a) | | | 72,807 | | | | 792,698 | |
Hibiya Engineering Ltd. | | | 10,000 | | | | 110,821 | |
Japan Airport Terminal Co., Ltd. | | | 20,987 | | | | 277,719 | |
Kandenko Co., Ltd. | | | 126,138 | | | | 616,167 | |
Kyowa Exeo Corp. | | | 63,066 | | | | 570,924 | |
Kyudenko Corp. | | | 6,000 | | | | 35,434 | |
Maeda Corp. | | | 110,609 | | | | 489,236 | |
Maeda Road Construction Co., Ltd. | | | 41,694 | | | | 521,333 | |
Nippo Corp. | | | 39,358 | | | | 439,516 | |
Nippon Densetsu Kogyo Co., Ltd. | | | 30,000 | | | | 299,289 | |
Nippon Koei Co., Ltd. | | | 51,583 | | | | 180,520 | |
Nippon Road Co., Ltd. (The)(a) | | | 56,596 | | | | 242,078 | |
Nishimatsu Construction Co., Ltd. | | | 193,037 | | | | 455,060 | |
Okumura Corp. | | | 146,096 | | | | 576,963 | |
Penta-Ocean Construction Co., Ltd.(a) | | | 63,000 | | | | 202,868 | |
Raito Kogyo Co., Ltd.(a) | | | 37,800 | | | | 223,231 | |
Sanki Engineering Co., Ltd. | | | 48,718 | | | | 264,621 | |
Shinko Plantech Co., Ltd. | | | 29,208 | | | | 250,217 | |
Taihei Dengyo Kaisha Ltd.(a) | | | 21,000 | | | | 172,757 | |
Taihei Kogyo Co., Ltd. | | | 40,047 | | | | 218,982 | |
Taikisha Ltd. | | | 14,065 | | | | 290,204 | |
Takasago Thermal Engineering Co., Ltd.(a) | | | 72,872 | | | | 570,260 | |
Toa Corp. | | | 67,000 | | | | 131,077 | |
Toda Corp. | | | 154,072 | | | | 520,469 | |
Toenec Corp. | | | 5,000 | | | | 29,163 | |
Tokyo Energy & Systems, Inc. | | | 38,000 | | | | 225,336 | |
Toshiba Plant Systems & Services Corp. | | | 40,000 | | | | 462,726 | |
Totetsu Kogyo Co., Ltd. | | | 26,000 | | | | 278,972 | |
Toyo Engineering Corp. | | | 41,223 | | | | 197,362 | |
Tsukishima Kikai Co., Ltd. | | | 31,000 | | | | 275,363 | |
Yokogawa Bridge Holdings Corp. | | | 25,000 | | | | 174,980 | |
Yurtec Corp. | | | 40,000 | | | | 214,837 | |
| | | | | | | | |
| Total Engineering & Construction | | | | | | | 10,311,183 | |
| Entertainment – 0.9% | | | | | | | | |
Avex Group Holdings, Inc. | | | 36,567 | | | | 444,341 | |
Mars Engineering Corp. | | | 23,014 | | | | 513,162 | |
Shochiku Co., Ltd. | | | 28,000 | | | | 265,387 | |
Toei Co., Ltd. | | | 56,405 | | | | 292,666 | |
Tokyotokeiba Co., Ltd. | | | 208,475 | | | | 321,725 | |
| | | | | | | | |
| Total Entertainment | | | | | | | 1,837,281 | |
| Environmental Control – 0.6% | | | | | | | | |
Asahi Holdings, Inc.(a) | | | 22,200 | | | | 482,063 | |
Daiseki Co., Ltd. | | | 12,400 | | | | 230,988 | |
Hitachi Zosen Corp. | | | 290,175 | | | | 380,812 | |
| | | | | | | | |
| Total Environmental Control | | | | | | | 1,093,863 | |
| Food – 5.1% | | | | | | | | |
Ariake Japan Co., Ltd. | | | 20,528 | | | | 397,863 | |
Ezaki Glico Co., Ltd. | | | 47,865 | | | | 577,556 | |
See Notes to Financial Statements.
| | |
| 70 | | WisdomTree International Dividend and Sector Funds |
Schedule of Investments (continued)
WisdomTree Japan SmallCap Dividend Fund (DFJ)
March 31, 2012
| | | | | | | | |
| Investments | | Shares | | | Value | |
| | | | | | | | |
Fuji Oil Co., Ltd. | | | 37,900 | | | $ | 542,054 | |
House Foods Corp. | | | 38,500 | | | | 661,978 | |
Itoham Foods, Inc. | | | 46,000 | | | | 174,956 | |
Izumiya Co., Ltd. | | | 41,872 | | | | 227,944 | |
J-Oil Mills, Inc.(a) | | | 125,981 | | | | 364,341 | |
Kasumi Co., Ltd. | | | 37,679 | | | | 254,108 | |
Kato Sangyo Co., Ltd. | | | 22,916 | | | | 455,006 | |
Kewpie Corp. | | | 46,500 | | | | 688,784 | |
Kyokuyo Co., Ltd.(a) | | | 79,000 | | | | 190,072 | |
Marudai Food Co., Ltd. | | | 99,000 | | | | 386,160 | |
Maruha Nichiro Holdings, Inc. | | | 243,327 | | | | 428,731 | |
Mitsui Sugar Co., Ltd. | | | 64,879 | | | | 217,590 | |
Morinaga & Co., Ltd. | | | 208,439 | | | | 486,303 | |
Morinaga Milk Industry Co., Ltd. | | | 113,411 | | | | 447,884 | |
Nichirei Corp. | | | 157,096 | | | | 740,668 | |
Nippon Beet Sugar Manufacturing Co., Ltd. | | | 123,885 | | | | 276,989 | |
Nippon Flour Mills Co., Ltd. | | | 116,766 | | | | 539,171 | |
Nippon Suisan Kaisha Ltd.(a) | | | 204,051 | | | | 699,221 | |
Nisshin Oillio Group Ltd. (The) | | | 94,477 | | | | 392,626 | |
Prima Meat Packers Ltd. | | | 126,000 | | | | 235,786 | |
Yokohama Reito Co., Ltd. | | | 49,862 | | | | 390,195 | |
Yonekyu Corp. | | | 5,000 | | | | 45,325 | |
| | | | | | | | |
| Total Food | | | | | | | 9,821,311 | |
| Forest Products & Paper – 0.5% | | | | | | | | |
Daio Paper Corp. | | | 41,597 | | | | 249,698 | |
Hokuetsu Kishu Paper Co., Ltd.(a) | | | 103,132 | | | | 690,513 | |
| | | | | | | | |
| Total Forest Products & Paper | | | | | | | 940,211 | |
| Gas – 0.5% | | | | | | | | |
Saibu Gas Co., Ltd. | | | 292,362 | | | | 792,232 | |
Shizuoka Gas Co., Ltd. | | | 30,392 | | | | 218,260 | |
| | | | | | | | |
| Total Gas | | | | | | | 1,010,492 | |
| Hand/Machine Tools – 0.9% | | | | | | | | |
Asahi Diamond Industrial Co., Ltd.(a) | | | 24,000 | | | | 282,885 | |
Hitachi Koki Co., Ltd. | | | 77,927 | | | | 716,820 | |
Meidensha Corp.*(a) | | | 40,000 | | | | 146,303 | |
OSG Corp.(a) | | | 24,400 | | | | 371,211 | |
Union Tool Co. | | | 8,700 | | | | 163,016 | |
| | | | | | | | |
| Total Hand/Machine Tools | | | | | | | 1,680,235 | |
| Healthcare-Products – 1.0% | | | | | | | | |
Hogy Medical Co., Ltd. | | | 10,000 | | | | 448,994 | |
Nihon Kohden Corp. | | | 20,779 | | | | 559,527 | |
Nipro Corp.(a) | | | 77,396 | | | | 580,270 | |
Paramount Bed Holdings Co., Ltd. | | | 13,473 | | | | 398,976 | |
| | | | | | | | |
| Total Healthcare-Products | | | | | | | 1,987,767 | |
| Healthcare-Services – 0.2% | | | | | | | | |
Ain Pharmaciez, Inc. | | | 3,644 | | | | 196,823 | |
BML, Inc. | | | 9,494 | | | | 242,844 | |
CMIC Holdings Co., Ltd. | | | 2,500 | | | | 41,862 | |
| | | | | | | | |
| Total Healthcare-Services | | | | | | | 481,529 | |
| Home Builders – 0.7% | | | | | | | | |
Mitsui Home Co., Ltd. | | | 57,910 | | | | 315,956 | |
| | | | | | | | |
PanaHome Corp. | | | 106,177 | | | $ | 728,963 | |
Token Corp. | | | 8,297 | | | | 321,616 | |
| | | | | | | | |
| Total Home Builders | | | | | | | 1,366,535 | |
| Home Furnishings – 1.1% | | | | | | | | |
Alpine Electronics, Inc. | | | 26,300 | | | | 356,973 | |
Canon Electronics, Inc. | | | 23,400 | | | | 601,670 | |
Foster Electric Co., Ltd.(a) | | | 17,800 | | | | 261,717 | |
Hoshizaki Electric Co., Ltd. | | | 18,540 | | | | 439,760 | |
Nidec Sankyo Corp. | | | 75,000 | | | | 454,766 | |
| | | | | | | | |
| Total Home Furnishings | | | | 2,114,886 | |
| Household Products/Wares – 0.3% | | | | | | | | |
Kokuyo Co., Ltd. | | | 65,903 | | | | 494,903 | |
Mitsubishi Pencil Co., Ltd. | | | 7,000 | | | | 122,571 | |
| | | | | | | | |
| Total Household Products/Wares | | | | 617,474 | |
| Housewares – 0.1% | | | | | | | | |
Noritake Co., Ltd. | | | 48,099 | | | | 146,702 | |
| Internet – 0.5% | | | | | | | | |
GMO Internet, Inc. | | | 54,621 | | | | 275,445 | |
Gurunavi, Inc. | | | 12,465 | | | | 134,957 | |
Macromill, Inc. | | | 18,800 | | | | 179,102 | |
Monex Group, Inc.(a) | | | 1,583 | | | | 348,166 | |
| | | | | | | | |
| Total Internet | | | | 937,670 | |
| Iron/Steel – 1.5% | | | | | | | | |
Aichi Steel Corp. | | | 66,314 | | | | 344,080 | |
Daido Metal Co., Ltd. | | | 28,000 | | | | 352,148 | |
Kyoei Steel Ltd. | | | 15,814 | | | | 320,527 | |
Mitsubishi Steel Manufacturing Co., Ltd. | | | 40,000 | | | | 137,554 | |
Nisshin Steel Co., Ltd. | | | 270,000 | | | | 456,042 | |
Sanyo Special Steel Co., Ltd.(a) | | | 56,000 | | | | 305,535 | |
Topy Industries Ltd. | | | 102,000 | | | | 318,537 | |
Toyo Kohan Co., Ltd. | | | 42,000 | | | | 172,501 | |
Yodogawa Steel Works Ltd. | | | 125,993 | | | | 552,688 | |
| | | | | | | | |
| Total Iron/Steel | | | | 2,959,612 | |
| Leisure Time – 0.8% | | | | | | | | |
Daikoku Denki Co., Ltd. | | | 15,800 | | | | 227,895 | |
HIS Co., Ltd. | | | 10,214 | | | | 313,389 | |
Mizuno Corp. | | | 97,616 | | | | 544,453 | |
Round One Corp.(a) | | | 65,095 | | | | 431,883 | |
| | | | | | | | |
| Total Leisure Time | | | | 1,517,620 | |
| Lodging – 0.4% | | | | | | | | |
Resorttrust, Inc.(a) | | | 43,360 | | | | 707,607 | |
| Machinery-Construction & Mining – 0.3% | | | | | | | | |
Aichi Corp. | | | 38,915 | | | | 178,745 | |
Modec, Inc.(a) | | | 15,388 | | | | 320,120 | |
| | | | | | | | |
| Total Machinery-Construction & Mining | | | | 498,865 | |
| Machinery-Diversified – 2.4% | | | | | | | | |
Chugai Ro Co., Ltd. | | | 51,986 | | | | 179,403 | |
CKD Corp. | | | 19,500 | | | | 155,204 | |
Daifuku Co., Ltd. | | | 64,062 | | | | 373,653 | |
Daihen Corp. | | | 57,391 | | | | 207,819 | |
See Notes to Financial Statements.
| | | | |
| WisdomTree International Dividend and Sector Funds | | | 71 | |
Schedule of Investments (continued)
WisdomTree Japan SmallCap Dividend Fund (DFJ)
March 31, 2012
| | | | | | | | |
| Investments | | Shares | | | Value | |
| | | | | | | | |
Eagle Industry Co., Ltd. | | | 16,000 | | | $ | 166,815 | |
Hisaka Works Ltd. | | | 17,945 | | | | 199,304 | |
Kinki Sharyo Co., Ltd. | | | 40,000 | | | | 153,108 | |
Komori Corp. | | | 37,829 | | | | 327,749 | |
Makino Milling Machine Co., Ltd.(a) | | | 17,000 | | | | 146,461 | |
Max Co., Ltd. | | | 41,680 | | | | 527,236 | |
Miura Co., Ltd. | | | 15,424 | | | | 402,023 | |
Nippon Sharyo Ltd.(a) | | | 41,000 | | | | 170,387 | |
Nippon Thompson Co., Ltd. | | | 30,000 | | | | 190,291 | |
Organo Corp. | | | 23,000 | | | | 155,951 | |
Sintokogio Ltd. | | | 15,765 | | | | 176,816 | |
Torishima Pump Manufacturing Co., Ltd. | | | 12,400 | | | | 170,416 | |
Toshiba Machine Co., Ltd. | | | 33,806 | | | | 172,121 | |
Toyo Kanetsu K.K. | | | 62,192 | | | | 138,297 | |
Tsubakimoto Chain Co. | | | 46,228 | | | | 287,047 | |
Tsugami Corp.(a) | | | 32,000 | | | | 366,681 | |
| | | | | | | | |
| Total Machinery-Diversified | | | | 4,666,782 | |
| Media – 0.2% | | | | | | | | |
Gakken Holdings Co., Ltd. | | | 81,000 | | | | 167,325 | |
Kadokawa Group Holdings, Inc.(a) | | | 5,400 | | | | 172,837 | |
| | | | | | | | |
| Total Media | | | | 340,162 | |
| Metal Fabricate/Hardware – 1.8% | | | | | | | | |
Daiichi Jitsugyo Co., Ltd. | | | 40,000 | | | | 199,769 | |
Furukawa-Sky Aluminum Corp. | | | 104,000 | | | | 334,893 | |
Hanwa Co., Ltd. | | | 144,114 | | | | 658,447 | |
JFE Shoji Holdings, Inc.(a) | | | 124,000 | | | | 650,926 | |
Kitz Corp. | | | 37,876 | | | | 165,689 | |
Nachi-Fujikoshi Corp. | | | 40,000 | | | | 230,877 | |
Neturen Co., Ltd. | | | 16,400 | | | | 152,053 | |
Oiles Corp. | | | 14,893 | | | | 294,983 | |
Onoken Co., Ltd. | | | 20,837 | | | | 179,771 | |
Ryobi Ltd. | | | 60,000 | | | | 228,932 | |
Shinsho Corp. | | | 55,000 | | | | 130,324 | |
Tocalo Co., Ltd. | | | 6,600 | | | | 131,527 | |
Toho Zinc Co., Ltd. | | | 41,967 | | | | 190,214 | |
| | | | | | | | |
| Total Metal Fabricate/Hardware | | | | 3,548,405 | |
| Mining – 1.1% | | | | | | | | |
Dowa Holdings Co., Ltd.(a) | | | 126,000 | | | | 842,093 | |
Mitsui Mining & Smelting Co., Ltd. | | | 210,000 | | | | 594,568 | |
Nippon Coke & Engineering Co., Ltd. | | | 75,500 | | | | 114,679 | |
Nippon Denko Co., Ltd. | | | 40,000 | | | | 196,853 | |
Nippon Light Metal Co., Ltd. | | | 130,000 | | | | 208,518 | |
Nittetsu Mining Co., Ltd. | | | 40,000 | | | | 192,964 | |
| | | | | | | | |
| Total Mining | | | | 2,149,675 | |
| Miscellaneous Manufacturing – 1.8% | | | | | | | | |
Amano Corp. | | | 59,617 | | | | 557,087 | |
Bando Chemical Industries Ltd. | | | 55,082 | | | | 206,821 | |
JSP Corp.(a) | | | 12,123 | | | | 181,930 | |
Mitsuboshi Belting Co., Ltd. | | | 41,525 | | | | 231,101 | |
Morita Holdings Corp. | | | 26,102 | | | | 168,103 | |
Nikkiso Co., Ltd. | | | 38,000 | | | | 400,340 | |
Nippon Valqua Industries Ltd. | | | 60,042 | | | | 169,996 | |
| | | | | | | | |
Okamoto Industries, Inc. | | | 42,000 | | | $ | 161,784 | |
Sekisui Plastics Co., Ltd. | | | 63,598 | | | | 234,160 | |
Shinagawa Refractories Co., Ltd. | | | 46,187 | | | | 126,278 | |
Shin-Etsu Polymer Co., Ltd. | | | 45,074 | | | | 236,612 | |
Tamron Co., Ltd. | | | 14,366 | | | | 465,920 | |
Tokai Rubber Industries Ltd. | | | 30,600 | | | | 388,937 | |
| | | | | | | | |
| Total Miscellaneous Manufacturing | | | | 3,529,069 | |
| Office Furnishings – 0.1% | | | | | | | | |
Okamura Corp. | | | 41,676 | | | | 291,699 | |
| Office/Business Equipment – 0.6% | | | | | | | | |
Riso Kagaku Corp. | | | 14,806 | | | | 245,402 | |
Sato Holdings Corp. | | | 22,864 | | | | 323,672 | |
Toshiba TEC Corp. | | | 94,070 | | | | 374,931 | |
Uchida Yoko Co., Ltd. | | | 47,388 | | | | 151,444 | |
| | | | | | | | |
| Total Office/Business Equipment | | | | 1,095,449 | |
| Oil & Gas – 0.1% | | | | | | | | |
AOC Holdings, Inc. | | | 19,165 | | | | 114,112 | |
Japan Drilling Co., Ltd.(a) | | | 4,184 | | | | 132,849 | |
| | | | | | | | |
| Total Oil & Gas | | | | 246,961 | |
| Packaging & Containers – 0.7% | | | | | | | | |
Achilles Corp. | | | 127,000 | | | | 182,101 | |
Fuji Seal International, Inc. | | | 5,600 | | | | 106,699 | |
Nihon Yamamura Glass Co., Ltd. | | | 88,714 | | | | 217,756 | |
Rengo Co., Ltd. | | | 117,424 | | | | 817,595 | |
| | | | | | | | |
| Total Packaging & Containers | | | | | | | 1,324,151 | |
| Pharmaceuticals – 3.2% | | | | | | | | |
Alfresa Holdings Corp. | | | 25,300 | | | | 1,209,739 | |
ASKA Pharmaceutical Co., Ltd. | | | 17,442 | | | | 107,032 | |
Fuso Pharmaceutical Industries Ltd. | | | 50,000 | | | | 139,134 | |
Kaken Pharmaceutical Co., Ltd. | | | 53,261 | | | | 675,025 | |
KYORIN Holdings, Inc. | | | 39,963 | | | | 760,946 | |
Mochida Pharmaceutical Co., Ltd. | | | 64,055 | | | | 759,678 | |
Nippon Shinyaku Co., Ltd. | | | 40,000 | | | | 496,263 | |
Sawai Pharmaceutical Co., Ltd.(a) | | | 4,112 | | | | 438,207 | |
Seikagaku Corp. | | | 35,655 | | | | 399,898 | |
Ship Healthcare Holdings, Inc. | | | 16,534 | | | | 340,746 | |
Toho Holdings Co., Ltd. | | | 34,300 | | | | 612,686 | |
Towa Pharmaceutical Co., Ltd. | | | 3,100 | | | | 154,444 | |
| | | | | | | | |
| Total Pharmaceuticals | | | | | | | 6,093,798 | |
| Private Equity – 0.2% | | | | | | | | |
Jafco Co., Ltd.* | | | 12,900 | | | | 314,604 | |
| Real Estate – 0.9% | | | | | | | | |
Arnest One Corp. | | | 51,900 | | | | 581,467 | |
Goldcrest Co., Ltd. | | | 19,744 | | | | 362,755 | |
Heiwa Real Estate Co., Ltd. | | | 126,000 | | | | 344,492 | |
Tokyu Livable, Inc. | | | 31,361 | | | | 326,205 | |
Touei Housing Corp. | | | 14,100 | | | | 149,746 | |
| | | | | | | | |
| Total Real Estate | | | | | | | 1,764,665 | |
| Retail – 10.7% | | | | | | | | |
Alpen Co., Ltd. | | | 21,021 | | | | 422,234 | |
AOKI Holdings, Inc. | | | 28,884 | | | | 546,127 | |
See Notes to Financial Statements.
| | |
| 72 | | WisdomTree International Dividend and Sector Funds |
Schedule of Investments (continued)
WisdomTree Japan SmallCap Dividend Fund (DFJ)
March 31, 2012
| | | | | | | | |
| Investments | | Shares | | | Value | |
| | | | | | | | |
Arc Land Sakamoto Co., Ltd. | | | 4,896 | | | $ | 93,047 | |
Arcs Co., Ltd. | | | 29,194 | | | | 543,829 | |
ASKUL Corp.(a) | | | 19,365 | | | | 342,379 | |
Belluna Co., Ltd. | | | 36,324 | | | | 296,613 | |
Bookoff Corp. | | | 13,381 | | | | 126,989 | |
Cawachi Ltd. | | | 3,900 | | | | 93,075 | |
Chiyoda Co., Ltd. | | | 54,691 | | | | 1,103,190 | |
Circle K Sunkus Co., Ltd. | | | 56,920 | | | | 1,224,926 | |
Citizen Holdings Co., Ltd. | | | 113,500 | | | | 722,693 | |
Cosmos Pharmaceutical Corp. | | | 3,104 | | | | 157,284 | |
Create SD Holdings Co., Ltd. | | | 11,785 | | | | 300,586 | |
DCM Holdings Co., Ltd. | | | 94,845 | | | | 757,193 | |
Doutor Nichires Holdings Co., Ltd. | | | 29,453 | | | | 389,748 | |
EDION Corp.(a) | | | 62,977 | | | | 443,850 | |
Fuji Co., Ltd. | | | 2,800 | | | | 62,740 | |
Gulliver International Co., Ltd. | | | 3,960 | | | | 156,389 | |
H2O Retailing Corp. | | | 78,763 | | | | 688,141 | |
Heiwado Co., Ltd. | | | 36,592 | | | | 496,223 | |
Honeys Co., Ltd. | | | 11,580 | | | | 214,447 | |
Izumi Co., Ltd. | | | 18,100 | | | | 343,327 | |
Joshin Denki Co., Ltd. | | | 35,000 | | | | 347,895 | |
Kappa Create Co., Ltd.(a) | | | 10,887 | | | | 235,480 | |
Keiyo Co., Ltd.(a) | | | 45,120 | | | | 284,553 | |
Kohnan Shoji Co., Ltd. | | | 12,400 | | | | 197,538 | |
Kojima Co., Ltd. | | | 21,000 | | | | 125,548 | |
Komeri Co., Ltd.(a) | | | 17,937 | | | | 514,167 | |
Kyoto Kimono Yuzen Co., Ltd. | | | 19,045 | | | | 228,184 | |
Maruetsu, Inc. (The) | | | 15,000 | | | | 56,869 | |
Matsumotokiyoshi Holdings Co., Ltd.(a) | | | 25,700 | | | | 560,563 | |
MOS Food Services, Inc. | | | 9,300 | | | | 177,423 | |
Parco Co., Ltd. | | | 43,527 | | | | 421,016 | |
Paris Miki Holdings, Inc. | | | 29,316 | | | | 205,545 | |
Plenus Co., Ltd. | | | 38,068 | | | | 692,482 | |
Point, Inc. | | | 17,210 | | | | 638,879 | |
Ryohin Keikaku Co., Ltd.(a) | | | 14,482 | | | | 753,180 | |
Saizeriya Co., Ltd. | | | 15,900 | | | | 257,159 | |
Scroll Corp. | | | 42,227 | | | | 169,842 | |
Seiko Holdings Corp.*(a) | | | 40,000 | | | | 96,725 | |
Senshukai Co., Ltd. | | | 5,800 | | | | 41,230 | |
Shimachu Co., Ltd. | | | 20,564 | | | | 487,269 | |
St. Marc Holdings Co., Ltd. | | | 8,148 | | | | 324,752 | |
Studio Alice Co., Ltd. | | | 4,611 | | | | 77,602 | |
Sugi Holdings Co., Ltd. | | | 11,800 | | | | 362,911 | |
Sundrug Co., Ltd. | | | 12,400 | | | | 385,734 | |
Tsuruha Holdings, Inc. | | | 9,067 | | | | 537,112 | |
United Arrows Ltd. | | | 15,529 | | | | 327,393 | |
UNY Co., Ltd. | | | 93,756 | | | | 1,020,783 | |
Valor Co., Ltd. | | | 22,591 | | | | 378,553 | |
WATAMI Co., Ltd.(a) | | | 12,429 | | | | 267,927 | |
Xebio Co., Ltd. | | | 19,489 | | | | 522,659 | |
Zensho Holdings Co., Ltd.(a) | | | 36,519 | | | | 450,857 | |
| | | | | | | | |
| Total Retail | | | | | | | 20,672,860 | |
| | | | | | | | |
| Semiconductors – 0.9% | | | | | | | | |
Axell Corp. | | | 19,500 | | | $ | 463,953 | |
Megachips Corp.*(a) | | | 12,353 | | | | 245,874 | |
Mimasu Semiconductor Industry Co., Ltd. | | | 18,100 | | | | 173,313 | |
Sanken Electric Co., Ltd.*(a) | | | 28,000 | | | | 133,714 | |
Shinko Electric Industries Co., Ltd.(a) | | | 70,700 | | | | 694,157 | |
| | | | | | | | |
| Total Semiconductors | | | | | | | 1,711,011 | |
| Shipbuilding – 0.4% | | | | | | | | |
Mitsui Engineering & Shipbuilding Co., Ltd.(a) | | | 377,000 | | | | 659,676 | |
Sasebo Heavy Industries Co., Ltd.(a) | | | 126,063 | | | | 211,394 | |
| | | | | | | | |
| Total Shipbuilding | | | | | | | 871,070 | |
| Software – 2.4% | | | | | | | | |
Capcom Co., Ltd. | | | 28,213 | | | | 648,287 | |
Fuji Soft, Inc. | | | 7,600 | | | | 146,376 | |
IT Holdings Corp. | | | 80,000 | | | | 941,005 | |
NEC Mobiling Ltd. | | | 9,861 | | | | 342,340 | |
Nihon Unisys Ltd. | | | 61,000 | | | | 429,917 | |
NSD Co., Ltd. | | | 44,700 | | | | 415,523 | |
Square Enix Holdings Co., Ltd.(a) | | | 54,100 | | | | 1,142,546 | |
SRA Holdings, Inc. | | | 10,407 | | | | 121,907 | |
Transcosmos, Inc.* | | | 12,600 | | | | 193,987 | |
Zenrin Co., Ltd. | | | 30,102 | | | | 305,062 | |
| | | | | | | | |
| Total Software | | | | | | | 4,686,950 | |
| Storage/Warehousing – 0.7% | | | | | | | | |
Mitsubishi Logistics Corp. | | | 40,000 | | | | 474,877 | |
Mitsui-Soko Co., Ltd. | | | 75,746 | | | | 324,908 | |
Sumitomo Warehouse Co., Ltd. (The) | | | 115,417 | | | | 598,859 | |
| | | | | | | | |
| Total Storage/Warehousing | | | | | | | 1,398,644 | |
| Telecommunications – 1.0% | | | | | | | | |
Denki Kogyo Co., Ltd. | | | 41,110 | | | | 209,309 | |
Hikari Tsushin, Inc. | | | 37,665 | | | | 1,113,084 | |
Hitachi Kokusai Electric, Inc. | | | 42,000 | | | | 387,363 | |
Japan Radio Co., Ltd.* | | | 69,000 | | | | 167,689 | |
| | | | | | | | |
| Total Telecommunications | | | | | | | 1,877,445 | |
| Textiles – 1.4% | | | | | | | | |
Japan Vilene Co., Ltd. | | | 41,400 | | | | 192,675 | |
Kurabo Industries Ltd. | | | 187,169 | | | | 366,173 | |
Nisshinbo Holdings, Inc. | | | 69,000 | | | | 656,504 | |
Nitto Boseki Co., Ltd.*(a) | | | 125,960 | | | | 495,911 | |
Seiren Co., Ltd. | | | 35,911 | | | | 239,567 | |
Toyobo Co., Ltd. | | | 546,000 | | | | 782,891 | |
| | | | | | | | |
| Total Textiles | | | | | | | 2,733,721 | |
| Toys/Games/Hobbies – 0.2% | | | | | |
Tomy Co., Ltd. | | | 46,177 | | | | 339,475 | |
| Transportation – 3.2% | | | | | | | | |
Fuji Kyuko Co., Ltd. | | | 12,008 | | | | 73,249 | |
Fukuyama Transporting Co., Ltd.(a) | | | 125,059 | | | | 683,839 | |
Hitachi Transport System Ltd. | | | 29,304 | | | | 535,908 | |
Iino Kaiun Kaisha Ltd. | | | 36,371 | | | | 165,734 | |
Keisei Electric Railway Co., Ltd. | | | 71,000 | | | | 552,160 | |
Kintetsu World Express, Inc. | | | 8,983 | | | | 314,806 | |
See Notes to Financial Statements.
| | | | |
| WisdomTree International Dividend and Sector Funds | | | 73 | |
Schedule of Investments (concluded)
WisdomTree Japan SmallCap Dividend Fund (DFJ)
March 31, 2012
| | | | | | | | |
| Investments | | Shares | | | Value | |
| | | | | | | | |
Nippon Konpo Unyu Soko Co., Ltd. | | | 41,860 | | | $ | 517,305 | |
Nishi-Nippon Railroad Co., Ltd.(a) | | | 140,000 | | | | 661,766 | |
NS United Kaiun Kaisha Ltd.*(a) | | | 78,000 | | | | 127,006 | |
Sankyu, Inc. | | | 159,272 | | | | 627,063 | |
Seino Holdings Corp. | | | 83,711 | | | | 608,289 | |
Senko Co., Ltd. | | | 92,156 | | | | 371,782 | |
Sotetsu Holdings, Inc.(a) | | | 208,000 | | | | 654,621 | |
Yusen Logistics Co., Ltd. | | | 12,600 | | | | 198,887 | |
| | | | | | | | |
| Total Transportation | | | | | | | 6,092,415 | |
TOTAL COMMON STOCKS
(Cost: $178,472,013) | | | | | | | 190,916,160 | |
| SHORT-TERM INVESTMENT – 0.1% | | | | | | | | |
| MONEY MARKET FUND – 0.1% | | | | | | | | |
Invesco Treasury Fund Private Class, 0.02%(b)
(Cost: $123,265) | | | 123,265 | | | | 123,265 | |
| INVESTMENT OF CASH COLLATERAL FOR SECURITIES LOANED – 11.5% | | | | | | | | |
| MONEY MARKET FUND – 11.5% | | | | | | | | |
Dreyfus Institutional Preferred Money Market Fund, 0.18%(b) | | | | | | | | |
| (Cost: $22,221,471)(c) | | | 22,221,471 | | | | 22,221,471 | |
TOTAL INVESTMENTS IN SECURITIES – 110.4%
(Cost: $200,816,749) | | | | 213,260,896 | |
Liabilities in Excess of Foreign Currency and Other Assets – (10.4)% | | | | (20,089,183 | ) |
| | | | | | | | |
| NET ASSETS – 100.0% | | | $ | 193,171,713 | |
| * | Non-income producing security. |
| (a) | Security, or portion thereof, was on loan at March 31, 2012 (See Note 2). |
| (b) | Rate shown represents annualized 7-day yield as of March 31, 2012. |
| (c) | At March 31, 2012, the total market value of the Fund’s securities on loan was $20,983,422 and the total market value of the collateral held by the Fund was $22,221,471. |
See Notes to Financial Statements.
| | |
| 74 | | WisdomTree International Dividend and Sector Funds |
Schedule of Investments
WisdomTree Asia Pacific ex-Japan Fund (AXJL)
March 31, 2012
| | | | | | | | |
| Investments | | Shares | | | Value | |
| | | | | | | | |
| COMMON STOCKS – 97.2% | | | | | |
| Australia – 24.5% | | | | | |
AGL Energy Ltd. | | | 17,775 | | | $ | 271,606 | |
Alumina Ltd. | | | 37,208 | | | | 47,604 | |
Amcor Ltd. | | | 37,586 | | | | 289,693 | |
AMP Ltd. | | | 75,611 | | | | 338,382 | |
Australia & New Zealand Banking Group Ltd. | | | 100,440 | | | | 2,420,221 | |
BHP Billiton Ltd. | | | 44,010 | | | | 1,577,944 | |
Brambles Ltd. | | | 30,688 | | | | 225,718 | |
Coca-Cola Amatil Ltd. | | | 23,542 | | | | 304,122 | |
Commonwealth Bank of Australia | | | 57,129 | | | | 2,965,056 | |
Computershare Ltd. | | | 10,023 | | | | 93,450 | |
Crown Ltd. | | | 19,597 | | | | 176,420 | |
CSL Ltd. | | | 7,979 | | | | 296,661 | |
Incitec Pivot Ltd. | | | 23,489 | | | | 76,650 | |
Insurance Australia Group Ltd. | | | 46,865 | | | | 165,069 | |
Leighton Holdings Ltd. | | | 10,978 | | | | 242,465 | |
Lend Lease Group(a) | | | 12,420 | | | | 96,113 | |
Macquarie Group Ltd. | | | 11,597 | | | | 349,364 | |
National Australia Bank Ltd. | | | 79,352 | | | | 2,022,235 | |
Newcrest Mining Ltd. | | | 3,582 | | | | 110,136 | |
Orica Ltd. | | | 8,015 | | | | 232,239 | |
Origin Energy Ltd. | | | 17,294 | | | | 239,175 | |
QBE Insurance Group Ltd. | | | 46,272 | | | | 679,245 | |
Rio Tinto Ltd. | | | 4,225 | | | | 286,248 | |
Santos Ltd. | | | 14,383 | | | | 212,177 | |
Sonic Healthcare Ltd. | | | 14,062 | | | | 182,385 | |
Suncorp Group Ltd. | | | 32,940 | | | | 286,643 | |
TABCORP Holdings Ltd. | | | 29,198 | | | | 82,274 | |
Telstra Corp., Ltd. | | | 685,936 | | | | 2,337,858 | |
Wesfarmers Ltd. | | | 33,171 | | | | 1,031,592 | |
Westpac Banking Corp. | | | 126,214 | | | | 2,862,147 | |
Woodside Petroleum Ltd. | | | 12,590 | | | | 454,013 | |
Woolworths Ltd. | | | 33,250 | | | | 894,889 | |
WorleyParsons Ltd. | | | 3,877 | | | | 114,989 | |
| | | | | | | | |
| Total Australia | | | | 21,964,783 | |
| China – 10.8% | | | | | |
Agricultural Bank of China Ltd. Class H(b) | | | 305,000 | | | | 130,815 | |
Anhui Conch Cement Co., Ltd. Class H(b) | | | 4,000 | | | | 12,674 | |
Bank of China Ltd. Class H | | | 2,426,000 | | | | 978,024 | |
China Coal Energy Co., Ltd. Class H | | | 51,000 | | | | 57,214 | |
China Communications Construction Co., Ltd. Class H | | | 258,000 | | | | 258,864 | |
China Construction Bank Corp. Class H | | | 5,197,000 | | | | 4,016,229 | |
China Life Insurance Co., Ltd. Class H | | | 89,000 | | | | 230,983 | |
China Longyuan Power Group Corp. Class H | | | 32,000 | | | | 26,749 | |
China Merchants Bank Co., Ltd. Class H | | | 45,000 | | | | 92,040 | |
China National Building Material Co., Ltd. Class H(b) | | | 24,000 | | | | 30,263 | |
China Pacific Insurance Group Co., Ltd. Class H | | | 21,000 | | | | 65,050 | |
China Petroleum & Chemical Corp. Class H | | | 342,000 | | | | 372,658 | |
China Shenhua Energy Co., Ltd. Class H | | | 57,000 | | | | 240,437 | |
China Telecom Corp., Ltd. Class H | | | 966,000 | | | | 535,008 | |
Dongfeng Motor Group Co., Ltd. Class H | | | 98,000 | | | | 176,966 | |
| | | | | | | | |
Guangzhou Automobile Group Co., Ltd. Class H | | | 120,000 | | | $ | 119,011 | |
Industrial & Commercial Bank of China Class H | | | 2,036,000 | | | | 1,313,802 | |
PetroChina Co., Ltd. Class H | | | 560,000 | | | | 791,963 | |
Ping An Insurance Group Co. Class H | | | 15,000 | | | | 113,408 | |
Shandong Weigao Group Medical Polymer Co., Ltd. Class H | | | 16,000 | | | | 18,279 | |
Sinopharm Group Co., Ltd. Class H | | | 10,400 | | | | 29,068 | |
Yanzhou Coal Mining Co., Ltd. Class H | | | 36,000 | | | | 78,083 | |
Zhaojin Mining Industry Co., Ltd. Class H | | | 17,500 | | | | 29,347 | |
| | | | | | | | |
| Total China | | | | 9,716,935 | |
| Hong Kong – 19.5% | | | | | |
Bank of East Asia Ltd.(b) | | | 43,170 | | | | 162,360 | |
Beijing Enterprises Holdings Ltd. | | | 14,000 | | | | 85,381 | |
BOC Hong Kong Holdings Ltd. | | | 322,609 | | | | 891,288 | |
Cathay Pacific Airways Ltd. | | | 173,000 | | | | 320,420 | |
Cheung Kong Holdings Ltd. | | | 47,277 | | | | 610,752 | |
China Merchants Holdings International Co., Ltd. | | | 58,092 | | | | 194,538 | |
China Mobile Ltd. | | | 644,930 | | | | 7,098,051 | |
China Overseas Land & Investment Ltd. | | | 107,565 | | | | 204,490 | |
China Resources Enterprise Ltd. | | | 36,600 | | | | 127,751 | |
China Resources Power Holdings Co., Ltd. | | | 72,218 | | | | 133,758 | |
China Unicom Hong Kong Ltd. | | | 99,648 | | | | 168,904 | |
Citic Pacific Ltd. | | | 54,283 | | | | 91,450 | |
CLP Holdings Ltd. | | | 69,866 | | | | 602,914 | |
CNOOC Ltd. | | | 834,062 | | | | 1,714,532 | |
Fosun International Ltd. | | | 115,000 | | | | 68,431 | |
Hang Lung Group Ltd. | | | 19,000 | | | | 122,971 | |
Hang Lung Properties Ltd. | | | 75,000 | | | | 274,826 | |
Hang Seng Bank Ltd. | | | 61,403 | | | | 816,176 | |
Henderson Land Development Co., Ltd. | | | 31,000 | | | | 171,091 | |
Hong Kong & China Gas Co., Ltd. | | | 123,410 | | | | 316,314 | |
Hong Kong Exchanges and Clearing Ltd. | | | 19,573 | | | | 328,990 | |
Hutchison Whampoa Ltd. | | | 73,027 | | | | 729,894 | |
Hysan Development Co., Ltd. | | | 17,948 | | | | 71,894 | |
Lenovo Group Ltd. | | | 110,000 | | | | 99,034 | |
MTR Corp., Ltd. | | | 94,765 | | | | 339,318 | |
New World Development Co., Ltd. | | | 84,557 | | | | 101,612 | |
Power Assets Holdings Ltd. | | | 64,579 | | | | 474,112 | |
Sino Land Co., Ltd. | | | 122,924 | | | | 196,324 | |
SJM Holdings Ltd. | | | 78,432 | | | | 159,612 | |
Sun Hung Kai Properties Ltd. | | | 48,534 | | | | 603,237 | |
Wharf Holdings Ltd. | | | 36,350 | | | | 197,575 | |
| | | | | | | | |
| Total Hong Kong | | | | 17,478,000 | |
| Indonesia – 4.0% | | | | | |
Adaro Energy Tbk PT | | | 297,500 | | | | 62,793 | |
Astra International Tbk PT | | | 83,000 | | | | 671,243 | |
Bank Central Asia Tbk PT | | | 289,000 | | | | 252,843 | |
Bank Danamon Indonesia TbK PT | | | 134,834 | | | | 67,830 | |
Bank Mandiri Persero Tbk PT | | | 261,000 | | | | 195,522 | |
Bank Negara Indonesia Persero Tbk PT | | | 136,000 | | | | 59,493 | |
Bank Rakyat Indonesia Persero Tbk PT | | | 261,000 | | | | 198,376 | |
Bumi Resources Tbk PT | | | 113,000 | | | | 29,041 | |
Indo Tambangraya Megah Tbk PT | | | 23,000 | | | | 109,290 | |
See Notes to Financial Statements.
| | | | |
| WisdomTree International Dividend and Sector Funds | | | 75 | |
Schedule of Investments (continued)
WisdomTree Asia Pacific ex-Japan Fund (AXJL)
March 31, 2012
| | | | | | | | |
| Investments | | Shares | | | Value | |
| | | | | | | | |
Indocement Tunggal Prakarsa Tbk PT | | | 37,500 | | | $ | 75,664 | |
Indofood Sukses Makmur Tbk PT | | | 113,000 | | | | 59,935 | |
Perusahaan Gas Negara Persero Tbk PT | | | 679,500 | | | | 282,382 | |
Semen Gresik Persero Tbk PT | | | 142,000 | | | | 190,234 | |
Tambang Batubara Bukit Asam Persero Tbk PT | | | 43,500 | | | | 97,523 | |
Telekomunikasi Indonesia Persero Tbk PT | | | 559,500 | | | | 428,314 | |
Unilever Indonesia Tbk PT | | | 156,000 | | | | 341,207 | |
United Tractors Tbk PT | | | 52,500 | | | | 189,469 | |
Vale Indonesia Tbk PT | | | 441,000 | | | | 162,771 | |
XL Axiata Tbk PT | | | 108,626 | | | | 59,991 | |
| | | | | | | | |
| Total Indonesia | | | | 3,533,921 | |
| Malaysia – 6.5% | | | | | |
AMMB Holdings Bhd | | | 59,100 | | | | 121,730 | |
Axiata Group Bhd | | | 122,900 | | | | 208,611 | |
CIMB Group Holdings Bhd | | | 84,000 | | | | 210,857 | |
DiGi.Com Bhd | | | 340,400 | | | | 451,126 | |
Genting Bhd | | | 18,600 | | | | 65,815 | |
Genting Malaysia Bhd | | | 100,900 | | | | 129,110 | |
Hong Leong Bank Bhd | | | 26,920 | | | | 110,896 | |
IOI Corp. Bhd | | | 170,900 | | | | 297,897 | |
Kuala Lumpur Kepong Bhd | | | 22,400 | | | | 179,873 | |
Malayan Banking Bhd | | | 442,300 | | | | 1,280,627 | |
Maxis Bhd | | | 359,700 | | | | 715,056 | |
MISC Bhd | | | 161,900 | | | | 284,322 | |
Petronas Dagangan Bhd | | | 27,800 | | | | 171,873 | |
Petronas Gas Bhd | | | 66,200 | | | | 363,900 | |
Public Bank Bhd | | | 120,300 | | | | 535,627 | |
RHB Capital Bhd | | | 42,100 | | | | 105,817 | |
Sime Darby Bhd | | | 50,100 | | | | 159,286 | |
Tenaga Nasional Bhd | | | 118,500 | | | | 248,720 | |
YTL Power International Bhd | | | 290,200 | | | | 175,247 | |
| | | | | | | | |
| Total Malaysia | | | | 5,816,390 | |
| New Zealand – 0.1% | | | | | |
Fletcher Building Ltd. | | | 15,503 | | | | 85,624 | |
| Philippines – 1.4% | | | | | |
Aboitiz Equity Ventures, Inc. | | | 158,500 | | | | 184,950 | |
Aboitiz Power Corp. | | | 245,400 | | | | 193,759 | |
Manila Electric Co. | | | 20,070 | | | | 122,472 | |
Philippine Long Distance Telephone Co. | | | 9,125 | | | | 573,833 | |
San Miguel Corp. | | | 13,743 | | | | 36,394 | |
SM Investments Corp. | | | 7,390 | | | | 113,600 | |
| | | | | | | | |
| Total Philippines | | | | 1,225,008 | |
| Singapore – 6.5% | | | | | |
City Developments Ltd. | | | 10,000 | | | | 90,269 | |
DBS Group Holdings Ltd. | | | 53,017 | | | | 597,909 | |
Fraser and Neave Ltd. | | | 31,970 | | | | 170,358 | |
Jardine Cycle & Carriage Ltd. | | | 7,676 | | | | 294,806 | |
Keppel Corp., Ltd. | | | 42,235 | | | | 369,159 | |
Oversea-Chinese Banking Corp., Ltd. | | | 83,517 | | | | 592,493 | |
SembCorp Industries Ltd. | | | 50,116 | | | | 210,453 | |
SembCorp Marine Ltd.(b) | | | 108,757 | | | | 456,704 | |
Singapore Airlines Ltd. | | | 22,557 | | | | 193,215 | |
| | | | | | | | |
Singapore Exchange Ltd. | | | 30,869 | | | $ | 170,383 | |
Singapore Press Holdings Ltd. | | | 78,000 | | | | 243,178 | |
Singapore Technologies Engineering Ltd. | | | 114,625 | | | | 296,283 | |
Singapore Telecommunications Ltd. | | | 563,577 | | | | 1,411,912 | |
United Overseas Bank Ltd. | | | 37,574 | | | | 548,362 | |
Wilmar International Ltd. | | | 52,781 | | | | 205,692 | |
| | | | | | | | |
| Total Singapore | | | | 5,851,176 | |
| South Korea – 7.3% | | | | | |
Cheil Industries, Inc. | | | 221 | | | | 18,686 | |
Daewoo Shipbuilding & Marine Engineering Co., Ltd. | | | 1,370 | | | | 36,636 | |
Doosan Heavy Industries & Construction Co., Ltd. | | | 954 | | | | 53,718 | |
GS Engineering & Construction Corp. | | | 281 | | | | 24,775 | |
GS Holdings | | | 1,022 | | | | 58,539 | |
Hana Financial Group, Inc. | | | 3,040 | | | | 114,565 | |
Hankook Tire Co., Ltd. | | | 1,070 | | | | 39,616 | |
Hanwha Chem Corp. | | | 960 | | | | 22,749 | |
Honam Petrochemical Corp. | | | 90 | | | | 26,729 | |
Hynix Semiconductor, Inc.* | | | 2,410 | | | | 62,215 | |
Hyundai Engineering & Construction Co., Ltd. | | | 672 | | | | 47,922 | |
Hyundai Glovis Co., Ltd. | | | 116 | | | | 20,885 | |
Hyundai Heavy Industries Co., Ltd. | | | 776 | | | | 220,188 | |
Hyundai Mobis | | | 302 | | | | 76,363 | |
Hyundai Motor Co. | | | 1,054 | | | | 216,744 | |
Hyundai Steel Co. | | | 241 | | | | 21,695 | |
Industrial Bank of Korea | | | 8,440 | | | | 102,423 | |
Kangwon Land, Inc. | | | 5,630 | | | | 124,968 | |
KB Financial Group, Inc. | | | 762 | | | | 27,809 | |
Kia Motors Corp. | | | 2,186 | | | | 142,961 | |
Korea Exchange Bank | | | 55,100 | | | | 421,134 | |
Korea Life Insurance Co., Ltd.* | | | 8,564 | | | | 56,612 | |
Korea Zinc Co., Ltd. | | | 84 | | | | 29,024 | |
KT Corp. ADR* | | | 24,426 | | | | 334,392 | |
KT&G Corp. | | | 4,751 | | | | 337,126 | |
Kumho Petro chemical Co. | | | 77 | | | | 9,650 | |
LG Chem Ltd. | | | 398 | | | | 129,968 | |
LG Corp. | | | 1,554 | | | | 89,149 | |
LG Display Co., Ltd.* | | | 3,970 | | | | 92,851 | |
LG Electronics, Inc. | | | 296 | | | | 21,631 | |
LG Household & Health Care Ltd. | | | 84 | | | | 44,111 | |
Lotte Shopping Co., Ltd. | | | 72 | | | | 22,559 | |
NCSoft Corp. | | | 34 | | | | 8,987 | |
OCI Co., Ltd. | | | 131 | | | | 26,650 | |
POSCO | | | 1,499 | | | | 502,732 | |
Samsung C&T Corp. | | | 689 | | | | 48,283 | |
Samsung Electro-Mechanics Co., Ltd. | | | 605 | | | | 53,342 | |
Samsung Electronics Co., Ltd. | | | 1,239 | | | | 1,394,223 | |
Samsung Engineering Co., Ltd. | | | 282 | | | | 60,230 | |
Samsung Fire & Marine Insurance Co., Ltd.* | | | 473 | | | | 89,336 | |
Samsung Heavy Industries Co., Ltd. | | | 1,720 | | | | 57,305 | |
Samsung Life Insurance Co., Ltd.* | | | 1,955 | | | | 170,818 | |
Samsung SDI Co., Ltd. | | | 335 | | | | 40,506 | |
Shinhan Financial Group Co., Ltd. | | | 5,254 | | | | 202,871 | |
SK C&C Co., Ltd. | | | 192 | | | | 18,979 | |
See Notes to Financial Statements.
| | |
| 76 | | WisdomTree International Dividend and Sector Funds |
Schedule of Investments (concluded)
WisdomTree Asia Pacific ex-Japan Fund (AXJL)
March 31, 2012
| | | | | | | | |
| Investments | | Shares | | | Value | |
| | | | | | | | |
SK Holdings Co., Ltd. | | | 308 | | | $ | 40,095 | |
SK Innovation Co., Ltd. | | | 617 | | | | 90,123 | |
SK Telecom Co., Ltd. ADR* | | | 33,000 | | | | 459,030 | |
S-Oil Corp. | | | 1,443 | | | | 142,638 | |
Woori Finance Holdings Co., Ltd. | | | 10,830 | | | | 124,257 | |
| | | | | | | | |
| Total South Korea | | | | 6,578,798 | |
| Taiwan – 11.9% | | | | | |
Acer, Inc. | | | 118,000 | | | | 156,523 | |
Advanced Semiconductor Engineering, Inc. | | | 45,446 | | | | 45,732 | |
Asustek Computer, Inc. | | | 27,740 | | | | 261,756 | |
Cathay Financial Holding Co., Ltd. | | | 78,120 | | | | 88,934 | |
Chang Hwa Commercial Bank | | | 56,510 | | | | 32,262 | |
Cheng Shin Rubber Industry Co., Ltd. | | | 35,800 | | | | 85,999 | |
China Steel Corp. | | | 303,800 | | | | 310,341 | |
Chinatrust Financial Holding Co., Ltd. | | | 191,125 | | | | 120,123 | |
Chunghwa Telecom Co., Ltd. | | | 315,000 | | | | 970,150 | |
Compal Electronics, Inc. | | | 223,000 | | | | 250,846 | |
Delta Electronics, Inc. | | | 63,000 | | | | 184,638 | |
Far Eastern New Century Corp. | | | 101,250 | | | | 117,152 | |
Far EasTone Telecommunications Co., Ltd. | | | 146,000 | | | | 299,277 | |
First Financial Holding Co., Ltd. | | | 107,532 | | | | 64,670 | |
Formosa Chemicals & Fibre Corp. | | | 169,000 | | | | 493,581 | |
Formosa Petrochemical Corp. | | | 280,000 | | | | 872,791 | |
Formosa Plastics Corp. | | | 161,000 | | | | 474,035 | |
Foxconn Technology Co., Ltd. | | | 3,150 | | | | 13,021 | |
Fubon Financial Holding Co., Ltd. | | | 307,487 | | | | 346,404 | |
Hon Hai Precision Industry Co., Ltd. | | | 139,500 | | | | 541,183 | |
HTC Corp. | | | 10,450 | | | | 211,376 | |
MediaTek, Inc. | | | 65,000 | | | | 622,152 | |
Mega Financial Holding Co., Ltd. | | | 337,200 | | | | 238,209 | |
Nan Ya Plastics Corp. | | | 138,000 | | | | 311,867 | |
President Chain Store Corp. | | | 20,000 | | | | 111,132 | |
Quanta Computer, Inc. | | | 157,000 | | | | 411,191 | |
Taiwan Cement Corp. | | | 107,000 | | | | 125,255 | |
Taiwan Cooperative Financial Holding* | | | 42,356 | | | | 26,549 | |
Taiwan Mobile Co., Ltd. | | | 158,100 | | | | 481,566 | |
Taiwan Semiconductor Manufacturing Co., Ltd. | | | 760,000 | | | | 2,186,180 | |
Uni-President Enterprises Corp. | | | 61,700 | | | | 85,397 | |
United Microelectronics Corp. | | | 328,000 | | | | 160,585 | |
| | | | | | | | |
| Total Taiwan | | | | 10,700,877 | |
| Thailand – 4.7% | | | | | |
Advanced Info Service PCL | | | 155,900 | | | | 929,841 | |
Bangkok Bank PCL NVDR | | | 36,000 | | | | 215,883 | |
Bank of Ayudhya PCL NVDR | | | 91,000 | | | | 79,644 | |
Banpu PCL | | | 4,600 | | | | 90,658 | |
Charoen Pokphand Foods PCL | | | 211,000 | | | | 254,773 | |
CP ALL PCL | | | 107,900 | | | | 229,091 | |
Indorama Ventures PCL | | | 55,116 | | | | 67,443 | |
Kasikornbank PCL NVDR | | | 33,300 | | | | 166,230 | |
Krung Thai Bank PCL | | | 235,300 | | | | 133,477 | |
PTT Exploration & Production PCL | | | 75,300 | | | | 425,927 | |
PTT Global Chemical PCL | | | 45,194 | | | | 104,012 | |
PTT PCL | | | 63,600 | | | | 729,802 | |
| | | | | | | | |
Siam Cement PCL NVDR | | | 33,271 | | | $ | 382,859 | |
Siam Commercial Bank PCL | | | 69,900 | | | | 325,143 | |
Thai Oil PCL | | | 42,500 | | | | 99,879 | |
| | | | | | | | |
| Total Thailand | | | | 4,234,662 | |
TOTAL COMMON STOCKS
(Cost: $84,269,365) | | | | | | | 87,186,174 | |
| EXCHANGE-TRADED FUND – 2.5% | | | | | | | | |
| United States – 2.5% | | | | | | | | |
WisdomTree India Earnings Fund(b)(c)
(Cost: $2,464,182) | | | 114,015 | | | | 2,198,209 | |
| INVESTMENT OF CASH COLLATERAL FOR SECURITIES LOANED – 2.5% | | | | | | | | |
| MONEY MARKET FUND – 2.5% | | | | | | | | |
Dreyfus Institutional Preferred Money Market Fund, 0.18%(d) | | | | | | | | |
| (Cost: $2,242,390)(e) | | | 2,242,390 | | | | 2,242,390 | |
TOTAL INVESTMENTS IN SECURITIES – 102.2%
(Cost: $88,975,937) | | | | | | | 91,626,773 | |
Liabilities in Excess of Cash, Foreign Currency and Other Assets – (2.2)% | | | | (1,954,339 | ) |
| | | | | |
| NET ASSETS – 100.0% | | | $ | 89,672,434 | |
ADR – American Depositary Receipt
NVDR – Non-Voting Depositary Receipt
| * | Non-income producing security. |
| (a) | Stapled Security — A security contractually bound to one or more other securities to form a single saleable unit which cannot be sold separately. |
| (b) | Security, or portion thereof, was on loan at March 31, 2012 (See Note 2). |
| (c) | Affiliated company (See Note 7). |
| (d) | Rate shown represents annualized 7-day yield as of March 31, 2012. |
| (e) | At March 31, 2012, the total market value of the Fund’s securities on loan was $2,160,524 and the total market value of the collateral held by the Fund was $2,242,390. |
See Notes to Financial Statements.
| | | | |
| WisdomTree International Dividend and Sector Funds | | | 77 | |
Schedule of Investments
WisdomTree Australia Dividend Fund (AUSE)
March 31, 2012
| | | | | | | | |
| Investments | | Shares | | | Value | |
| | | | | | | | |
| COMMON STOCKS – 99.3% | | | | | |
| Australia – 99.3% | | | | | |
| Agriculture – 1.5% | | | | | |
GrainCorp Ltd. | | | 95,214 | | | $ | 892,664 | |
| Banks – 11.2% | | | | | | | | |
Australia & New Zealand Banking Group Ltd. | | | 75,811 | | | | 1,826,756 | |
Commonwealth Bank of Australia(a) | | | 31,352 | | | | 1,627,202 | |
National Australia Bank Ltd. | | | 60,579 | | | | 1,543,817 | |
Westpac Banking Corp. | | | 82,327 | | | | 1,866,924 | |
| | | | | | | | |
| Total Banks | | | | 6,864,699 | |
| Beverages – 2.0% | | | | | | | | |
Coca-Cola Amatil Ltd. | | | 93,071 | | | | 1,202,318 | |
| Biotechnology – 1.2% | | | | | | | | |
CSL Ltd. | | | 19,109 | | | | 710,477 | |
| Chemicals – 0.9% | | | | | | | | |
Incitec Pivot Ltd. | | | 170,600 | | | | 556,709 | |
| Coal – 1.3% | | | | | | | | |
New Hope Corp., Ltd.(a) | | | 94,054 | | | | 515,432 | |
Whitehaven Coal Ltd.(a) | | | 49,621 | | | | 289,923 | |
| | | | | | | | |
| Total Coal | | | | 805,355 | |
| Commercial Services – 1.5% | | | | | | | | |
Brambles Ltd. | | | 121,101 | | | | 890,727 | |
| Computers – 1.3% | | | | | | | | |
Computershare Ltd. | | | 83,833 | | | | 781,621 | |
| Diversified Financial Services – 2.1% | | | | | | | | |
Macquarie Group Ltd. | | | 43,796 | | | | 1,319,373 | |
| Electric – 2.8% | | | | | | | | |
AGL Energy Ltd. | | | 75,034 | | | | 1,146,539 | |
Origin Energy Ltd. | | | 41,156 | | | | 569,184 | |
| | | | | | | | |
| Total Electric | | | | 1,715,723 | |
| Engineering & Construction – 6.7% | | | | | | | | |
Boart Longyear Ltd. | | | 83,008 | | | | 357,727 | |
Leighton Holdings Ltd. | | | 65,454 | | | | 1,445,646 | |
Transfield Services Ltd. | | | 246,900 | | | | 634,324 | |
UGL Ltd. | | | 77,204 | | | | 1,055,729 | |
WorleyParsons Ltd. | | | 21,995 | | | | 652,355 | |
| | | | | | | | |
| Total Engineering & Construction | | | | 4,145,781 | |
| Entertainment – 3.1% | | | | | | | | |
TABCORP Holdings Ltd. | | | 198,777 | | | | 560,110 | |
Tatts Group Ltd. | | | 525,228 | | | | 1,349,392 | |
| | | | | | | | |
| Total Entertainment | | | | 1,909,502 | |
| Food – 5.1% | | | | | | | | |
Metcash Ltd. | | | 439,801 | | | | 1,959,130 | |
Woolworths Ltd. | | | 42,914 | | | | 1,154,986 | |
| | | | | | | | |
| Total Food | | | | 3,114,116 | |
| Healthcare-Products – 0.9% | | | | | | | | |
Cochlear Ltd. | | | 8,968 | | | | 575,075 | |
| Healthcare-Services – 4.8% | | | | | | | | |
Primary Health Care Ltd. | | | 287,156 | | | | 850,790 | |
| | | | | | | | |
Ramsay Health Care Ltd. | | | 37,476 | | | $ | 758,994 | |
Sonic Healthcare Ltd. | | | 103,930 | | | | 1,347,981 | |
| | | | | | | | |
| Total Healthcare-Services | | | | 2,957,765 | |
| Insurance – 7.6% | | | | | | | | |
AMP Ltd. | | | 222,095 | | | | 993,942 | |
Insurance Australia Group Ltd. | | | 273,798 | | | | 964,379 | |
QBE Insurance Group Ltd.(a) | | | 105,058 | | | | 1,542,189 | |
Suncorp Group Ltd.(a) | | | 133,628 | | | | 1,162,828 | |
| | | | | | | | |
| Total Insurance | | | | 4,663,338 | |
| Internet – 5.0% | | | | | | | | |
carsales.com Ltd.(a) | | | 198,800 | | | | 1,143,005 | |
Iress Market Technology Ltd. | | | 108,431 | | | | 786,303 | |
REA Group Ltd. | | | 40,594 | | | | 582,439 | |
Seek Ltd.(a) | | | 77,734 | | | | 566,921 | |
| | | | | | | | |
| Total Internet | | | | 3,078,668 | |
| Iron/Steel – 0.2% | | | | | | | | |
Fortescue Metals Group Ltd. | | | 17,633 | | | | 106,131 | |
| Leisure Time – 1.7% | | | | | | | | |
Flight Centre Ltd.(a) | | | 45,435 | | | | 1,035,504 | |
| Lodging – 1.8% | | | | | | | | |
Crown Ltd. | | | 125,876 | | | | 1,133,186 | |
| Media – 0.8% | | | | | | | | |
Fairfax Media Ltd.(a) | | | 693,144 | | | | 520,595 | |
| Mining – 6.7% | | | | | | | | |
Alumina Ltd. | | | 314,826 | | | | 402,788 | |
BHP Billiton Ltd. | | | 12,997 | | | | 465,997 | |
Iluka Resources Ltd. | | | 8,033 | | | | 148,045 | |
Mineral Resources Ltd. | | | 49,479 | | | | 620,219 | |
Newcrest Mining Ltd. | | | 5,223 | | | | 160,592 | |
Orica Ltd. | | | 34,893 | | | | 1,011,042 | |
OZ Minerals Ltd. | | | 93,694 | | | | 947,328 | |
Rio Tinto Ltd. | | | 5,275 | | | | 357,387 | |
| | | | | | | | |
| Total Mining | | | | 4,113,398 | |
| Miscellaneous Manufacturing – 2.5% | | | | | | | | |
Ansell Ltd. | | | 42,952 | | | | 661,657 | |
Campbell Brothers Ltd. | | | 12,881 | | | | 897,122 | |
| | | | | | | | |
| Total Miscellaneous Manufacturing | | | | 1,558,779 | |
| Oil & Gas – 5.0% | | | | | | | | |
Beach Energy Ltd. | | | 511,873 | | | | 775,546 | |
Caltex Australia Ltd. | | | 80,880 | | | | 1,163,810 | |
Santos Ltd. | | | 43,511 | | | | 641,871 | |
Woodside Petroleum Ltd. | | | 13,660 | | | | 492,599 | |
| | | | | | | | |
| Total Oil & Gas | | | | 3,073,826 | |
| Packaging & Containers – 2.2% | | | | | | | | |
Amcor Ltd. | | | 172,533 | | | | 1,329,792 | |
| Retail – 11.5% | | | | | | | | |
David Jones Ltd.(a) | | | 468,396 | | | | 1,169,415 | |
Harvey Norman Holdings Ltd.(a) | | | 541,772 | | | | 1,128,109 | |
JB Hi-Fi Ltd.(a) | | | 82,102 | | | | 932,187 | |
Myer Holdings Ltd.(a) | | | 741,648 | | | | 1,797,845 | |
See Notes to Financial Statements.
| | |
| 78 | | WisdomTree International Dividend and Sector Funds |
Schedule of Investments (concluded)
WisdomTree Australia Dividend Fund (AUSE)
March 31, 2012
| | | | | | | | |
| Investments | | Shares | | | Value | |
| | | | | | | | |
Wesfarmers Ltd. | | | 36,487 | | | $ | 1,134,717 | |
Wesfarmers Ltd. PPS | | | 29,192 | | | | 934,460 | |
| | | | | | | | |
| Total Retail | | | | 7,096,733 | |
| Telecommunications – 5.5% | | | | | | | | |
Telstra Corp., Ltd. | | | 796,583 | | | | 2,714,973 | |
TPG Telecom Ltd. | | | 374,056 | | | | 689,756 | |
| | | | | | | | |
| Total Telecommunications | | | | 3,404,729 | |
| Transportation – 2.4% | | | | | | | | |
Toll Holdings Ltd. | | | 240,503 | | | | 1,462,504 | |
TOTAL COMMON STOCKS
(Cost: $61,072,357) | | | | | | | 61,019,088 | |
| SHORT-TERM INVESTMENT – 0.0% | | | | | | | | |
| MONEY MARKET FUND – 0.0% | | | | | | | | |
Invesco Treasury Fund Private Class, 0.02%(b)
(Cost: $7,198) | | | 7,198 | | | | 7,198 | |
| INVESTMENT OF CASH COLLATERAL FOR SECURITIES LOANED – 14.1% | | | | | | | | |
| MONEY MARKET FUND – 14.1% | | | | | | | | |
Dreyfus Institutional Preferred Money Market Fund, 0.18%(b) | | | | | | | | |
| (Cost: $8,661,931)(c) | | | 8,661,931 | | | | 8,661,931 | |
TOTAL INVESTMENTS IN SECURITIES – 113.4%
(Cost: $69,741,486) | | | | | | | 69,688,217 | |
Liabilities in Excess of Foreign Currency and Other Assets – (13.4)% | | | | (8,232,382 | ) |
| | | | | |
| NET ASSETS – 100.0% | | | $ | 61,455,835 | |
PPS – Price Protected Shares
| (a) | Security, or portion thereof, was on loan at March 31, 2012 (See Note 2). |
| (b) | Rate shown represents annualized 7-day yield as of March 31, 2012. |
| (c) | At March 31, 2012, the total market value of the Fund’s securities on loan was $8,203,868 and the total market value of the collateral held by the Fund was $8,661,931. |
See Notes to Financial Statements.
| | | | |
| WisdomTree International Dividend and Sector Funds | | | 79 | |
Schedule of Investments
WisdomTree International LargeCap Dividend Fund (DOL)
March 31, 2012
| | | | | | | | |
| Investments | | Shares | | | Value | |
| | | | | | | | |
| COMMON STOCKS – 99.4% | | | | | | | | |
| Australia – 12.1% | | | | | | | | |
AMP Ltd. | | | 87,757 | | | $ | 392,739 | |
Australia & New Zealand Banking Group Ltd. | | | 101,111 | | | | 2,436,389 | |
BHP Billiton Ltd. | | | 50,555 | | | | 1,812,610 | |
Brambles Ltd. | | | 41,728 | | | | 306,919 | |
Commonwealth Bank of Australia | | | 57,639 | | | | 2,991,526 | |
CSL Ltd. | | | 10,263 | | | | 381,581 | |
Macquarie Group Ltd. | | | 13,298 | | | | 400,608 | |
National Australia Bank Ltd. | | | 82,816 | | | | 2,110,513 | |
Newcrest Mining Ltd. | | | 1,685 | | | | 51,809 | |
Origin Energy Ltd. | | | 22,788 | | | | 315,156 | |
QBE Insurance Group Ltd. | | | 50,702 | | | | 744,275 | |
Rio Tinto Ltd. | | | 5,536 | | | | 375,070 | |
Telstra Corp., Ltd. | | | 725,370 | | | | 2,472,260 | |
Wesfarmers Ltd. | | | 34,170 | | | | 1,062,660 | |
Westpac Banking Corp. | | | 129,077 | | | | 2,927,071 | |
Woodside Petroleum Ltd. | | | 14,826 | | | | 534,646 | |
Woolworths Ltd. | | | 36,486 | | | | 981,983 | |
| | | | | | | | |
| Total Australia | | | | | | | 20,297,815 | |
| Austria – 0.2% | | | | | | | | |
Bank Austria Creditanstalt AG*†(a) | | | 1,715 | | | | — | |
OMV AG | | | 8,551 | | | | 303,473 | |
| | | | | | | | |
| Total Austria | | | | | | | 303,473 | |
| Belgium – 1.0% | | | | | | | | |
Anheuser-Busch InBev N.V. | | | 15,612 | | | | 1,138,904 | |
Belgacom S.A. | | | 16,798 | | | | 539,226 | |
| | | | | | | | |
| Total Belgium | | | | | | | 1,678,130 | |
| Denmark – 0.4% | | | | | | | | |
Novo Nordisk A/S Class B | | | 4,278 | | | | 591,556 | |
| Finland – 1.1% | | | | | | | | |
Fortum Oyj* | | | 20,303 | | | | 492,083 | |
Nokia Oyj | | | 165,538 | | | | 899,864 | |
Sampo Oyj Class A | | | 15,418 | | | | 444,932 | |
| | | | | | | | |
| Total Finland | | | | | | | 1,836,879 | |
| France – 12.1% | | | | | | | | |
Air Liquide S.A. | | | 4,140 | | | | 551,103 | |
Alstom S.A. | | | 5,408 | | | | 210,726 | |
AXA S.A. | | | 48,036 | | | | 795,141 | |
BNP Paribas S.A. | | | 21,897 | | | | 1,037,375 | |
Bouygues S.A. | | | 9,654 | | | | 294,793 | |
Carrefour S.A. | | | 11,947 | | | | 285,979 | |
Christian Dior S.A. | | | 2,960 | | | | 453,508 | |
Cie de Saint-Gobain | | | 7,175 | | | | 319,947 | |
Cie Generale des Etablissements Michelin | | | 787 | | | | 58,513 | |
CNP Assurances | | | 18,025 | | | | 280,846 | |
Danone | | | 8,503 | | | | 592,216 | |
EDF S.A. | | | 37,769 | | | | 860,581 | |
France Telecom S.A. | | | 113,352 | | | | 1,676,309 | |
GDF Suez | | | 61,859 | | | | 1,595,654 | |
Lafarge S.A. | | | 6,435 | | | | 306,659 | |
L’Oreal S.A. | | | 6,467 | | | | 796,533 | |
| | | | | | | | |
LVMH Moet Hennessy Louis Vuitton S.A. | | | 5,284 | | | $ | 906,679 | |
Natixis | | | 91,796 | | | | 352,676 | |
Pernod-Ricard S.A. | | | 3,149 | | | | 328,772 | |
PPR | | | 2,621 | | | | 450,260 | |
Sanofi | | | 28,582 | | | | 2,216,388 | |
Schneider Electric S.A. | | | 9,010 | | | | 587,812 | |
Societe Generale S.A. | | | 15,273 | | | | 446,747 | |
Total S.A. | | | 62,425 | | | | 3,178,943 | |
Veolia Environnement S.A. | | | 13,139 | | | | 217,578 | |
Vinci S.A. | | | 11,916 | | | | 620,460 | |
Vivendi S.A. | | | 41,630 | | | | 762,836 | |
| | | | | | | | |
| Total France | | | | | | | 20,185,034 | |
| Germany – 8.9% | | | | | | | | |
Allianz SE | | | 10,161 | | | | 1,210,655 | |
BASF SE | | | 15,943 | | | | 1,392,560 | |
Bayer AG | | | 11,257 | | | | 790,622 | |
Bayerische Motoren Werke AG | | | 6,363 | | | | 571,375 | |
Daimler AG(b) | | | 20,028 | | | | 1,205,809 | |
Deutsche Bank AG | | | 9,178 | | | | 455,954 | |
Deutsche Boerse AG | | | 4,487 | | | | 301,635 | |
Deutsche Post AG | | | 33,872 | | | | 651,124 | |
Deutsche Telekom AG | | | 132,955 | | | | 1,598,286 | |
E.ON AG | | | 71,305 | | | | 1,705,425 | |
Linde AG | | | 2,273 | | | | 407,277 | |
Metro AG | | | 6,295 | | | | 243,025 | |
Muenchener Rueckversicherungs AG | | | 5,298 | | | | 797,607 | |
RWE AG | | | 22,533 | | | | 1,074,407 | |
SAP AG | | | 10,379 | | | | 723,705 | |
Siemens AG | | | 13,272 | | | | 1,336,002 | |
Volkswagen AG | | | 2,937 | | | | 472,864 | |
| | | | | | | | |
| Total Germany | | | | | | | 14,938,332 | |
| Hong Kong – 5.6% | | | | | | | | |
BOC Hong Kong Holdings Ltd. | | | 224,000 | | | | 618,856 | |
Cheung Kong Holdings Ltd. | | | 43,000 | | | | 555,500 | |
China Mobile Ltd. | | | 392,919 | | | | 4,324,437 | |
CLP Holdings Ltd. | | | 32,500 | | | | 280,461 | |
CNOOC Ltd. | | | 541,529 | | | | 1,113,189 | |
Hang Seng Bank Ltd. | | | 37,795 | | | | 502,376 | |
Hong Kong Exchanges and Clearing Ltd. | | | 17,800 | | | | 299,189 | |
Hutchison Whampoa Ltd. | | | 56,000 | | | | 559,712 | |
MTR Corp., Ltd. | | | 75,500 | | | | 270,338 | |
Power Assets Holdings Ltd. | | | 32,500 | | | | 238,601 | |
Sun Hung Kai Properties Ltd. | | | 28,442 | | | | 353,510 | |
Wharf Holdings Ltd. | | | 48,000 | | | | 260,896 | |
| | | | | | | | |
| Total Hong Kong | | | | | | | 9,377,065 | |
| Ireland – 0.2% | | | | | | | | |
CRH PLC | | | 16,070 | | | | 327,426 | |
| Italy – 3.6% | | | | | | | | |
Assicurazioni Generali SpA(b) | | | 25,005 | | | | 387,602 | |
Atlantia SpA | | | 19,170 | | | | 317,832 | |
Enel SpA | | | 229,520 | | | | 828,927 | |
ENI SpA | | | 116,997 | | | | 2,740,608 | |
See Notes to Financial Statements.
| | |
| 80 | | WisdomTree International Dividend and Sector Funds |
Schedule of Investments (continued)
WisdomTree International LargeCap Dividend Fund (DOL)
March 31, 2012
| | | | | | | | |
| Investments | | Shares | | | Value | |
| | | | | | | | |
Intesa Sanpaolo SpA | | | 255,122 | | | $ | 456,619 | |
Luxottica Group SpA | | | 4,008 | | | | 144,912 | |
Saipem SpA | | | 4,180 | | | | 215,591 | |
Snam SpA | | | 109,481 | | | | 525,740 | |
Telecom Italia SpA | | | 380,162 | | | | 451,332 | |
| | | | | | | | |
| Total Italy | | | | | | | 6,069,163 | |
| Japan – 10.3% | | | | | | | | |
Astellas Pharma, Inc.(b) | | | 12,300 | | | | 508,172 | |
Canon, Inc. | | | 22,400 | | | | 1,064,269 | |
Chubu Electric Power Co., Inc.(b) | | | 16,100 | | | | 292,283 | |
Daiichi Sankyo Co., Ltd.(b) | | | 17,500 | | | | 320,676 | |
Denso Corp. | | | 8,300 | | | | 278,869 | |
East Japan Railway Co. | | | 6,400 | | | | 405,176 | |
FANUC Corp. | | | 1,800 | | | | 321,089 | |
Fast Retailing Co., Ltd. | | | 600 | | | | 137,505 | |
Hitachi Ltd. | | | 9,000 | | | | 58,071 | |
Honda Motor Co., Ltd. | | | 16,100 | | | | 615,280 | |
Japan Tobacco, Inc. | | | 101 | | | | 571,918 | |
JX Holdings, Inc. | | | 43,500 | | | | 271,165 | |
Kansai Electric Power Co., Inc. (The)(b) | | | 19,700 | | | | 306,889 | |
KDDI Corp.(b) | | | 60 | | | | 390,789 | |
Mitsubishi Corp.(b) | | | 28,100 | | | | 655,593 | |
Mitsubishi UFJ Financial Group, Inc.(b) | | | 199,600 | | | | 999,273 | |
Mitsui & Co., Ltd.(b) | | | 32,700 | | | | 539,205 | |
Mitsui Fudosan Co., Ltd. | | | 13,000 | | | | 250,064 | |
Mizuho Financial Group, Inc.(b) | | | 499,198 | | | | 818,904 | |
MS&AD Insurance Group Holdings(b) | | | 14,400 | | | | 297,291 | |
Nintendo Co., Ltd. | | | 2,600 | | | | 393,341 | |
Nippon Steel Corp.(b) | | | 82,000 | | | | 226,186 | |
Nippon Telegraph & Telephone Corp.(b) | | | 22,194 | | | | 1,012,680 | |
Nissan Motor Co., Ltd. | | | 31,800 | | | | 340,431 | |
Nomura Holdings, Inc. | | | 58,100 | | | | 258,395 | |
NTT DoCoMo, Inc.(b) | | | 759 | | | | 1,267,229 | |
Seven & I Holdings Co., Ltd. | | | 15,700 | | | | 468,930 | |
Shin-Etsu Chemical Co., Ltd. | | | 7,200 | | | | 418,203 | |
Sumitomo Corp. | | | 23,400 | | | | 340,074 | |
Sumitomo Mitsui Financial Group, Inc.(b) | | | 29,700 | | | | 982,722 | |
Takeda Pharmaceutical Co., Ltd.(b) | | | 20,300 | | | | 899,125 | |
Tokio Marine Holdings, Inc. | | | 13,800 | | | | 380,823 | |
Toyota Motor Corp. | | | 25,000 | | | | 1,084,513 | |
| | | | | | | | |
| Total Japan | | | | | | | 17,175,133 | |
| Netherlands – 1.7% | | | | | | | | |
Akzo Nobel N.V. | | | 4,659 | | | | 274,668 | |
ASML Holding N.V. | | | 2,306 | | | | 115,097 | |
Heineken N.V. | | | 6,477 | | | | 359,465 | |
Koninklijke KPN N.V. | | | 56,315 | | | | 618,556 | |
Koninklijke Philips Electronics N.V. | | | 22,645 | | | | 458,377 | |
Unilever N.V. CVA | | | 30,846 | | | | 1,048,095 | |
| | | | | | | | |
| Total Netherlands | | | | | | | 2,874,258 | |
| Norway – 1.9% | | | | | | | | |
DNB ASA | | | 42,013 | | | | 539,152 | |
Statoil ASA | | | 70,603 | | | | 1,913,592 | |
| | | | | | | | |
Telenor ASA | | | 37,746 | | | $ | 698,798 | |
| | | | | | | | |
| Total Norway | | | | | | | 3,151,542 | |
| Portugal – 0.2% | | | | | | | | |
EDP-Energias de Portugal S.A. | | | 129,695 | | | | 376,691 | |
| Singapore – 1.6% | | | | | | | | |
DBS Group Holdings Ltd. | | | 27,000 | | | | 304,498 | |
Jardine Cycle & Carriage Ltd. | | | 3,000 | | | | 115,218 | |
Keppel Corp., Ltd. | | | 55,000 | | | | 480,733 | |
Oversea-Chinese Banking Corp., Ltd. | | | 58,000 | | | | 411,469 | |
Singapore Airlines Ltd. | | | 5,000 | | | | 42,828 | |
Singapore Telecommunications Ltd. | | | 369,500 | | | | 925,697 | |
United Overseas Bank Ltd. | | | 23,000 | | | | 335,666 | |
| | | | | | | | |
| Total Singapore | | | | | | | 2,616,109 | |
| Spain – 5.9% | | | | | | | | |
ACS Actividades de Construccion y Servicios, S.A.(b) | | | 10,163 | | | | 259,719 | |
Banco Bilbao Vizcaya Argentaria S.A.(b) | | | 96,787 | | | | 769,094 | |
Banco Santander S.A. | | | 288,577 | | | | 2,217,399 | |
CaixaBank(b) | | | 114,262 | | | | 444,163 | |
Endesa S.A. | | | 22,502 | | | | 447,691 | |
Gas Natural SDG S.A. | | | 28,393 | | | | 452,975 | |
Iberdrola S.A. | | | 132,688 | | | | 752,214 | |
Inditex S.A. | | | 8,114 | | | | 776,045 | |
Mapfre S.A.(b) | | | 97,170 | | | | 312,374 | |
Repsol YPF S.A. | | | 25,813 | | | | 646,597 | |
Telefonica S.A. | | | 173,906 | | | | 2,845,090 | |
| | | | | | | | |
| Total Spain | | | | | | | 9,923,361 | |
| Sweden – 2.9% | | | | | | | | |
Atlas Copco AB Class A | | | 14,416 | | | | 347,834 | |
Hennes & Mauritz AB Class B | | | 34,928 | | | | 1,260,184 | |
Nordea Bank AB(b) | | | 67,212 | | | | 609,282 | |
Sandvik AB | | | 20,948 | | | | 301,496 | |
Skandinaviska Enskilda Banken AB Class A(b) | | | 35,590 | | | | 252,094 | |
Svenska Handelsbanken AB Class A(b) | | | 12,936 | | | | 411,162 | |
Telefonaktiebolaget LM Ericsson Class B | | | 42,408 | | | | 438,118 | |
TeliaSonera AB | | | 119,181 | | | | 828,745 | |
Volvo AB Class A | | | 27,853 | | | | 404,026 | |
| | | | | | | | |
| Total Sweden | | | | | | | 4,852,941 | |
| Switzerland – 8.7% | | | | | | | | |
ABB Ltd.* | | | 33,650 | | | | 689,493 | |
Credit Suisse Group AG | | | 20,409 | | | | 580,985 | |
Holcim Ltd.* | | | 5,023 | | | | 327,327 | |
Nestle S.A. | | | 55,881 | | | | 3,511,690 | |
Novartis AG | | | 50,156 | | | | 2,772,356 | |
Roche Holding AG | | | 3,874 | | | | 711,494 | |
Roche Holding AG – Genusschein | | | 13,875 | | | | 2,411,642 | |
SGS S.A. | | | 218 | | | | 423,530 | |
Swiss Re AG* | | | 10,765 | | | | 686,621 | |
Swisscom AG(b) | | | 1,446 | | | | 583,775 | |
Syngenta AG* | | | 1,283 | | | | 443,021 | |
Zurich Financial Services AG* | | | 5,069 | | | | 1,360,557 | |
| | | | | | | | |
| Total Switzerland | | | | | | | 14,502,491 | |
See Notes to Financial Statements.
| | | | |
| WisdomTree International Dividend and Sector Funds | | | 81 | |
Schedule of Investments (concluded)
WisdomTree International LargeCap Dividend Fund (DOL)
March 31, 2012
| | | | | | | | |
| Investments | | Shares | | | Value | |
| | | | | | | | |
| United Kingdom – 21.0% | | | | | | | | |
Anglo American PLC | | | 10,460 | | | $ | 390,570 | |
Antofagasta PLC | | | 33,342 | | | | 613,696 | |
AstraZeneca PLC | | | 36,131 | | | | 1,604,270 | |
Aviva PLC | | | 87,915 | | | | 465,646 | |
BAE Systems PLC | | | 84,764 | | | | 406,160 | |
Barclays PLC | | | 130,698 | | | | 491,256 | |
BG Group PLC | | | 20,876 | | | | 482,975 | |
BHP Billiton PLC | | | 30,738 | | | | 936,805 | |
BP PLC | | | 185,777 | | | | 1,372,965 | |
British American Tobacco PLC | | | 44,477 | | | | 2,238,844 | |
British Sky Broadcasting Group PLC | | | 26,164 | | | | 282,592 | |
BT Group PLC | | | 141,170 | | | | 510,655 | |
Centrica PLC | | | 111,302 | | | | 562,663 | |
Compass Group PLC | | | 36,304 | | | | 380,221 | |
Diageo PLC | | | 41,013 | | | | 984,566 | |
Eurasian Natural Resources Corp. PLC | | | 24,125 | | | | 228,383 | |
Fresnillo PLC | | | 5,150 | | | | 131,490 | |
GlaxoSmithKline PLC | | | 132,384 | | | | 2,953,829 | |
HSBC Holdings PLC | | | 317,248 | | | | 2,812,187 | |
Imperial Tobacco Group PLC | | | 21,501 | | | | 870,854 | |
International Power PLC | | | 63,103 | | | | 408,333 | |
National Grid PLC | | | 79,366 | | | | 799,518 | |
Pearson PLC | | | 18,336 | | | | 341,303 | |
Prudential PLC | | | 49,552 | | | | 591,809 | |
Reckitt Benckiser Group PLC | | | 13,312 | | | | 751,443 | |
Rio Tinto PLC | | | 13,371 | | | | 736,187 | |
Royal Dutch Shell PLC Class A | | | 88,121 | | | | 3,074,267 | |
Royal Dutch Shell PLC Class B | | | 54,699 | | | | 1,922,261 | |
SABMiller PLC | | | 19,371 | | | | 776,691 | |
SSE PLC | | | 20,410 | | | | 433,388 | |
Standard Chartered PLC | | | 32,135 | | | | 800,962 | |
TESCO PLC | | | 151,380 | | | | 798,163 | |
Unilever PLC | | | 25,982 | | | | 856,823 | |
Vodafone Group PLC | | | 1,403,459 | | | | 3,861,373 | |
Xstrata PLC | | | 14,919 | | | | 254,577 | |
| | | | | | | | |
| Total United Kingdom | | | | | | | 35,127,725 | |
TOTAL COMMON STOCKS
(Cost: $172,455,698) | | | | | | | 166,205,124 | |
| EXCHANGE-TRADED FUND – 0.0% | | | | | | | | |
| United States – 0.0% | | | | | | | | |
WisdomTree International MidCap Dividend Fund(c)
(Cost: $26,065) | | | 624 | | | | 30,021 | |
| SHORT-TERM INVESTMENT – 0.0% | | | | | | | | |
| MONEY MARKET FUND – 0.0% | | | | | | | | |
Invesco Treasury Fund Private Class, 0.02%(d)
(Cost: $78,358) | | | 78,358 | | | | 78,358 | |
| | | | | | | | |
| INVESTMENT OF CASH COLLATERAL FOR SECURITIES LOANED – 7.9% | | | | | | | | |
| MONEY MARKET FUND – 7.9% | | | | | | | | |
Dreyfus Institutional Preferred Money Market Fund, 0.18%(d) | | | | | | | | |
| (Cost: $13,139,642)(e) | | | 13,139,642 | | | $ | 13,139,642 | |
TOTAL INVESTMENTS IN SECURITIES – 107.3%
(Cost: $185,699,763) | | | | 179,453,145 | |
Liabilities in Excess of Foreign Currency and Other Assets – (7.3)% | | | | | | | (12,199,993 | ) |
| | | | | | | | |
| NET ASSETS – 100.0% | | | | | | $ | 167,253,152 | |
| * | Non-income producing security. |
| † | Security is being fair valued by a valuation committee under the direction of the Board of Trustees. The aggregate value of fair valued securities is $0, which represents 0.0% of net assets. |
| (a) | Escrow security – additional shares issued as a result of a corporate action. |
| (b) | Security, or portion thereof, was on loan at March 31, 2012 (See Note 2). |
| (c) | Affiliated company (See Note 7). |
| (d) | Rate shown represents annualized 7-day yield as of March 31, 2012. |
| (e) | At March 31, 2012, the total market value of the Fund’s securities on loan was $12,349,997 and the total market value of the collateral held by the Fund was $13,139,642. |
See Notes to Financial Statements.
| | |
| 82 | | WisdomTree International Dividend and Sector Funds |
Schedule of Investments
WisdomTree International Dividend ex-Financials Fund (DOO)
March 31, 2012
| | | | | | | | |
| Investments | | Shares | | | Value | |
| | | | | | | | |
| COMMON STOCKS – 99.6% | | | | | | | | |
| Australia – 15.9% | | | | | | | | |
Amcor Ltd. | | | 804,117 | | | $ | 6,197,703 | |
BHP Billiton Ltd. | | | 59,343 | | | | 2,127,697 | |
Brambles Ltd. | | | 554,224 | | | | 4,076,451 | |
Coca-Cola Amatil Ltd. | | | 433,445 | | | | 5,599,368 | |
CSL Ltd. | | | 90,229 | | | | 3,354,735 | |
Orica Ltd. | | | 160,351 | | | | 4,646,252 | |
Origin Energy Ltd.(a) | | | 199,414 | | | | 2,757,881 | |
Santos Ltd. | | | 202,136 | | | | 2,981,894 | |
Telstra Corp., Ltd. | | | 3,644,770 | | | | 12,422,375 | |
Wesfarmers Ltd. | | | 151,851 | | | | 4,722,445 | |
Woodside Petroleum Ltd. | | | 64,998 | | | | 2,343,919 | |
Woolworths Ltd. | | | 194,474 | | | | 5,234,067 | |
| | | | | | | | |
| Total Australia | | | | | | | 56,464,787 | |
| Austria – 0.8% | | | | | | | | |
OMV AG | | | 74,581 | | | | 2,646,865 | |
| Belgium – 2.7% | | | | | | | | |
Belgacom S.A. | | | 233,618 | | | | 7,499,283 | |
Solvay S.A. | | | 16,944 | | | | 2,003,035 | |
| | | | | | | | |
| Total Belgium | | | | | | | 9,502,318 | |
| Finland – 2.7% | | | | | | | | |
Nokia Oyj(a) | | | 1,242,841 | | | | 6,756,082 | |
UPM-Kymmene Oyj(a) | | | 221,142 | | | | 3,006,791 | |
| | | | | | | | |
| Total Finland | | | | | | | 9,762,873 | |
| France – 11.2% | | | | | | | | |
Accor S.A. | | | 70,233 | | | | 2,503,779 | |
Bouygues S.A. | | | 100,400 | | | | 3,065,802 | |
Cap Gemini S.A. | | | 40,303 | | | | 1,801,215 | |
Casino Guichard Perrachon S.A. | | | 35,479 | | | | 3,491,581 | |
France Telecom S.A. | | | 387,778 | | | | 5,734,665 | |
GDF Suez | | | 152,755 | | | | 3,940,319 | |
Lafarge S.A. | | | 59,693 | | | | 2,844,663 | |
Sanofi | | | 54,072 | | | | 4,193,007 | |
Total S.A. | | | 94,968 | | | | 4,836,169 | |
Veolia Environnement S.A. | | | 181,771 | | | | 3,010,071 | |
Vivendi S.A. | | | 245,851 | | | | 4,505,020 | |
| | | | | | | | |
| Total France | | | | | | | 39,926,291 | |
| Germany – 7.9% | | | | | | | | |
BASF SE | | | 34,107 | | | | 2,979,117 | |
Daimler AG(a) | | | 50,893 | | | | 3,064,071 | |
Deutsche Post AG | | | 246,495 | | | | 4,738,395 | |
Deutsche Telekom AG | | | 405,790 | | | | 4,878,105 | |
E.ON AG | | | 245,594 | | | | 5,873,952 | |
RWE AG | | | 141,116 | | | | 6,728,624 | |
| | | | | | | | |
| Total Germany | | | | | | | 28,262,264 | |
| Hong Kong – 1.2% | | | | | | | | |
Cathay Pacific Airways Ltd. | | | 2,292,000 | | | | 4,245,100 | |
| Ireland – 1.0% | | | | | | | | |
CRH PLC | | | 181,342 | | | | 3,694,844 | |
| | | | | | | | |
| Italy – 4.9% | | | | | | | | |
Atlantia SpA | | | 195,337 | | | $ | 3,238,622 | |
ENI SpA | | | 234,141 | | | | 5,484,659 | |
Snam SpA | | | 878,281 | | | | 4,217,602 | |
Terna Rete Elettrica Nazionale SpA | | | 1,099,006 | | | | 4,411,128 | |
| | | | | | | | |
| Total Italy | | | | | | | 17,352,011 | |
| Japan – 9.6% | | | | | | | | |
Astellas Pharma, Inc.(a) | | | 92,400 | | | | 3,817,486 | |
Canon, Inc. | | | 56,500 | | | | 2,684,428 | |
Daiichi Sankyo Co., Ltd.(a) | | | 172,200 | | | | 3,155,448 | |
Eisai Co., Ltd.(a) | | | 114,100 | | | | 4,561,504 | |
Fujitsu Ltd. | | | 382,000 | | | | 2,023,841 | |
Hoya Corp. | | | 156,600 | | | | 3,537,510 | |
Kyocera Corp. | | | 14,000 | | | | 1,289,507 | |
Murata Manufacturing Co., Ltd. | | | 27,900 | | | | 1,662,914 | |
Nintendo Co., Ltd. | | | 17,200 | | | | 2,602,102 | |
Sumitomo Metal Industries Ltd. | | | 1,306,000 | | | | 2,650,246 | |
Takeda Pharmaceutical Co., Ltd.(a) | | | 90,900 | | | | 4,026,132 | |
Tokyo Electron Ltd. | | | 35,300 | | | | 2,031,053 | |
| | | | | | | | |
| Total Japan | | | | | | | 34,042,171 | |
| Netherlands – 3.2% | | | | | | | | |
Koninklijke KPN N.V. | | | 493,114 | | | | 5,416,295 | |
Reed Elsevier N.V. | | | 312,200 | | | | 3,981,286 | |
STMicroelectronics N.V. | | | 247,379 | | | | 2,022,728 | |
| | | | | | | | |
| Total Netherlands | | | | | | | 11,420,309 | |
| Norway – 2.3% | | | | | | | | |
Orkla ASA | | | 490,575 | | | | 3,875,371 | |
Statoil ASA | | | 159,292 | | | | 4,317,379 | |
| | | | | | | | |
| Total Norway | | | | | | | 8,192,750 | |
| Portugal – 2.5% | | | | | | | | |
EDP-Energias de Portugal S.A. | | | 1,650,285 | | | | 4,793,149 | |
Portugal Telecom, SGPS, S.A. | | | 762,241 | | | | 4,140,496 | |
| | | | | | | | |
| Total Portugal | | | | | | | 8,933,645 | |
| Singapore – 1.7% | | | | | | | | |
SembCorp Marine Ltd. | | | 1,399,000 | | | | 5,874,832 | |
| Spain – 5.5% | | | | | | | | |
ACS Actividades de Construccion y Servicios, S.A.(a) | | | 122,618 | | | | 3,133,542 | |
Ferrovial S.A. | | | 350,047 | | | | 4,017,346 | |
Gas Natural SDG S.A. | | | 266,540 | | | | 4,252,316 | |
Repsol YPF S.A. | | | 111,916 | | | | 2,803,414 | |
Telefonica S.A. | | | 326,316 | | | | 5,338,508 | |
| | | | | | | | |
| Total Spain | | | | | | | 19,545,126 | |
| Sweden – 2.5% | | | | | | | | |
Hennes & Mauritz AB Class B | | | 107,763 | | | | 3,888,033 | |
TeliaSonera AB | | | 716,596 | | | | 4,982,969 | |
| | | | | | | | |
| Total Sweden | | | | | | | 8,871,002 | |
| Switzerland – 3.2% | | | | | | | | |
Novartis AG | | | 55,939 | | | | 3,092,009 | |
Roche Holding AG - Genusschein | | | 23,830 | | | | 4,141,941 | |
Swisscom AG(a) | | | 10,637 | | | | 4,294,342 | |
| | | | | | | | |
| Total Switzerland | | | | | | | 11,528,292 | |
See Notes to Financial Statements.
| | | | |
| WisdomTree International Dividend and Sector Funds | | | 83 | |
Schedule of Investments (concluded)
WisdomTree International Dividend ex-Financials Fund (DOO)
March 31, 2012
| | | | | | | | |
| Investments | | Shares | | | Value | |
| | | | | | | | |
| United Kingdom – 20.8% | | | | | | | | |
Antofagasta PLC | | | 263,923 | | | $ | 4,857,789 | |
AstraZeneca PLC | | | 102,030 | | | | 4,530,283 | |
BAE Systems PLC | | | 1,032,884 | | | | 4,949,222 | |
British American Tobacco PLC | | | 96,268 | | | | 4,845,854 | |
Compass Group PLC | | | 303,444 | | | | 3,178,046 | |
GlaxoSmithKline PLC | | | 233,212 | | | | 5,203,562 | |
Imperial Tobacco Group PLC | | | 120,516 | | | | 4,881,256 | |
J. Sainsbury PLC | | | 831,140 | | | | 4,133,922 | |
Marks & Spencer Group PLC | | | 654,045 | | | | 3,960,552 | |
National Grid PLC | | | 508,907 | | | | 5,126,636 | |
Pearson PLC | | | 179,241 | | | | 3,336,355 | |
Reed Elsevier PLC | | | 409,013 | | | | 3,626,929 | |
Royal Dutch Shell PLC Class A | | | 1,474 | | | | 51,423 | |
Royal Dutch Shell PLC Class B | | | 133,817 | | | | 4,702,667 | |
SSE PLC | | | 232,111 | | | | 4,928,669 | |
TESCO PLC | | | 511,469 | | | | 2,696,759 | |
Unilever PLC | | | 116,603 | | | | 3,845,283 | |
Vodafone Group PLC | | | 1,942,455 | | | | 5,344,327 | |
| | | | | | | | |
| Total United Kingdom | | | | | | | 74,199,534 | |
TOTAL COMMON STOCKS
(Cost: $354,771,452) | | | | | | | 354,465,014 | |
| EXCHANGE-TRADED FUND – 0.0% | | | | | | | | |
| United States – 0.0% | | | | | | | | |
WisdomTree International LargeCap Dividend Fund(a)(b) | | | | | | | | |
| (Cost: $4,505) | | | 121 | | | | 5,215 | |
| INVESTMENT OF CASH COLLATERAL FOR SECURITIES LOANED – 5.3% | | | | | | | | |
| MONEY MARKET FUND – 5.3% | | | | | | | | |
Dreyfus Institutional Preferred Money Market Fund, 0.18%(c) | | | | | | | | |
| (Cost: $18,845,635)(d) | | | 18,845,635 | | | | 18,845,635 | |
TOTAL INVESTMENTS IN SECURITIES – 104.9%
(Cost: $373,621,592) | | | | 373,315,864 | |
Liabilities in Excess of Foreign Currency and Other Assets – (4.9)% | | | | | | | (17,324,124 | ) |
| | | | | | | | |
| NET ASSETS – 100.0% | | | | | | $ | 355,991,740 | |
| (a) | Security, or portion thereof, was on loan at March 31, 2012 (See Note 2). |
| (b) | Affiliated company (See Note 7). |
| (c) | Rate shown represents annualized 7-day yield as of March 31, 2012. |
| (d) | At March 31, 2012, the total market value of the Fund’s securities on loan was $17,951,213 and the total market value of the collateral held by the Fund was $18,845,635. |
See Notes to Financial Statements.
| | |
| 84 | | WisdomTree International Dividend and Sector Funds |
Schedule of Investments
WisdomTree International MidCap Dividend Fund (DIM)
March 31, 2012
| | | | | | | | |
| Investments | | Shares | | | Value | |
| | | | | | | | |
| COMMON STOCKS – 99.1% | | | | | |
| Australia – 11.7% | | | | | |
AGL Energy Ltd. | | | 35,002 | | | $ | 534,840 | |
Alumina Ltd. | | | 116,062 | | | | 148,489 | |
Amcor Ltd. | | | 96,412 | | | | 743,092 | |
Bendigo and Adelaide Bank Ltd. | | | 43,315 | | | | 347,759 | |
Boral Ltd. | | | 36,844 | | | | 153,819 | |
Caltex Australia Ltd. | | | 23,870 | | | | 343,474 | |
Campbell Brothers Ltd. | | | 1,806 | | | | 125,782 | |
Coca-Cola Amatil Ltd. | | | 56,156 | | | | 725,440 | |
Cochlear Ltd. | | | 3,034 | | | | 194,556 | |
Computershare Ltd. | | | 29,633 | | | | 276,285 | |
Crown Ltd. | | | 64,699 | | | | 582,446 | |
Fairfax Media Ltd.(a) | | | 164,378 | | | | 123,458 | |
Flight Centre Ltd.(a) | | | 7,176 | | | | 163,547 | |
Harvey Norman Holdings Ltd.(a) | | | 104,141 | | | | 216,849 | |
Incitec Pivot Ltd. | | | 67,410 | | | | 219,975 | |
Insurance Australia Group Ltd. | | | 138,328 | | | | 487,223 | |
Leighton Holdings Ltd. | | | 34,883 | | | | 770,441 | |
Lend Lease Group(b) | | | 38,746 | | | | 299,838 | |
Metcash Ltd. | | | 93,530 | | | | 416,637 | |
New Hope Corp., Ltd.(a) | | | 36,679 | | | | 201,007 | |
OneSteel Ltd. | | | 173,334 | | | | 222,661 | |
Orica Ltd. | | | 23,473 | | | | 680,142 | |
OZ Minerals Ltd. | | | 29,989 | | | | 303,215 | |
Platinum Asset Management Ltd.(a) | | | 72,506 | | | | 304,957 | |
Ramsay Health Care Ltd. | | | 10,694 | | | | 216,584 | |
Seek Ltd.(a) | | | 12,300 | | | | 89,705 | |
Sims Metal Management Ltd. | | | 5,475 | | | | 83,319 | |
Sonic Healthcare Ltd. | | | 34,002 | | | | 441,009 | |
Suncorp Group Ltd. | | | 96,195 | | | | 837,087 | |
TABCORP Holdings Ltd. | | | 174,739 | | | | 492,377 | |
Tatts Group Ltd. | | | 139,549 | | | | 358,523 | |
Toll Holdings Ltd. | | | 55,458 | | | | 337,241 | |
UGL Ltd.(a) | | | 16,372 | | | | 223,879 | |
Wesfarmers Ltd. PPS | | | 11,095 | | | | 355,160 | |
Whitehaven Coal Ltd. | | | 13,004 | | | | 75,979 | |
WorleyParsons Ltd. | | | 11,406 | | | | 338,293 | |
| | | | | | | | |
| Total Australia | | | | 12,435,088 | |
| Austria – 1.3% | | | | | | | | |
Andritz AG(a) | | | 2,203 | | | | 215,277 | |
EVN AG(a) | | | 10,598 | | | | 142,404 | |
Strabag SE | | | 5,628 | | | | 171,219 | |
Telekom Austria AG | | | 37,328 | | | | 434,065 | |
Vienna Insurance Group AG Wiener Versicherung Gruppe | | | 4,730 | | | | 208,306 | |
Voestalpine AG | | | 5,624 | | | | 188,847 | |
| | | | | | | | |
| Total Austria | | | | 1,360,118 | |
| Belgium – 1.8% | | | | | | | | |
Ageas | | | 151,032 | | | | 331,461 | |
Colruyt S.A. | | | 6,080 | | | | 244,036 | |
Delhaize Group S.A. | | | 4,310 | | | | 226,428 | |
Elia System Operator S.A./N.V. | | | 3,225 | | | | 136,358 | |
| | | | | | | | |
Mobistar S.A. | | | 5,063 | | | $ | 251,828 | |
NV Bekaert S.A. | | | 2,663 | | | | 85,661 | |
UCB S.A. | | | 6,929 | | | | 298,505 | |
Umicore S.A. | | | 5,100 | | | | 280,530 | |
| | | | | | | | |
| Total Belgium | | | | 1,854,807 | |
| Denmark – 0.6% | | | | | | | | |
Coloplast A/S Class B | | | 653 | | | | 112,914 | |
FLSmidth & Co. A/S(a) | | | 1,583 | | | | 110,963 | |
H. Lundbeck A/S(a) | | | 7,256 | | | | 145,210 | |
Novozymes A/S Class B | | | 5,132 | | | | 149,278 | |
Pandora A/S(a) | | | 9,042 | | | | 104,476 | |
| | | | | | | | |
| Total Denmark | | | | 622,841 | |
| Finland – 2.6% | | | | | | | | |
Elisa Oyj(a) | | | 9,872 | | | | 236,243 | |
Kemira Oyj | | | 6,788 | | | | 89,944 | |
Kesko Oyj Class B | | | 2,819 | | | | 91,336 | |
Konecranes Oyj | | | 2,600 | | | | 68,210 | |
Metso Oyj(a) | | | 6,469 | | | | 276,103 | |
Neste Oil Oyj(a) | | | 6,901 | | | | 84,870 | |
Nokian Renkaat Oyj | | | 4,088 | | | | 198,923 | |
Orion Oyj Class B | | | 6,359 | | | | 125,500 | |
Pohjola Bank PLC Class A(a) | | | 21,463 | | | | 237,376 | |
Rautaruukki Oyj(a) | | | 5,951 | | | | 62,369 | |
Sanoma Oyj(a) | | | 19,743 | | | | 252,401 | |
Stora Enso Oyj Class R | | | 25,191 | | | | 186,856 | |
UPM-Kymmene Oyj(a) | | | 29,790 | | | | 405,044 | |
Wartsila Oyj Abp | | | 10,103 | | | | 380,484 | |
YIT Oyj | | | 4,646 | | | | 99,736 | |
| | | | | | | | |
| Total Finland | | | | 2,795,395 | |
| France – 6.4% | | | | | | | | |
Accor S.A. | | | 10,126 | | | | 360,988 | |
Aeroports de Paris | | | 3,103 | | | | 254,300 | |
Arkema S.A. | | | 1,806 | | | | 168,041 | |
BioMerieux | | | 710 | | | | 55,851 | |
Bourbon S.A.(a) | | | 3,178 | | | | 94,461 | |
Bureau Veritas S.A. | | | 3,167 | | | | 278,355 | |
Cap Gemini S.A. | | | 5,414 | | | | 241,962 | |
CFAO S.A. | | | 3,590 | | | | 154,037 | |
Dassault Systemes S.A. | | | 2,128 | | | | 195,508 | |
Edenred | | | 5,741 | | | | 172,478 | |
Eiffage S.A. | | | 3,097 | | | | 119,645 | |
Eramet | | | 202 | | | | 28,514 | |
Etablissements Maurel et Prom | | | 2,101 | | | | 36,890 | |
Euler Hermes S.A. | | | 1,273 | | | | 99,851 | |
Eutelsat Communications S.A. | | | 8,606 | | | | 317,688 | |
ICADE | | | 2,628 | | | | 234,095 | |
Imerys S.A. | | | 2,139 | | | | 129,863 | |
Ipsen S.A. | | | 3,256 | | | | 88,888 | |
Klepierre | | | 8,489 | | | | 293,925 | |
Lagardere SCA | | | 6,689 | | | | 206,036 | |
Legrand S.A. | | | 10,939 | | | | 401,916 | |
M6-Metropole Television S.A. | | | 10,816 | | | | 195,170 | |
Neopost S.A. | | | 1,876 | | | | 120,467 | |
See Notes to Financial Statements.
| | | | |
| WisdomTree International Dividend and Sector Funds | | | 85 | |
Schedule of Investments (continued)
WisdomTree International MidCap Dividend Fund (DIM)
March 31, 2012
| | | | | | | | |
| Investments | | Shares | | | Value | |
| | | | | | | | |
Nexity S.A. | | | 2,159 | | | $ | 68,198 | |
Publicis Groupe S.A. | | | 4,196 | | | | 230,972 | |
Remy Cointreau S.A. | | | 1,738 | | | | 176,365 | |
Rexel S.A. | | | 6,261 | | | | 137,782 | |
Sa des Ciments Vicat | | | 1,934 | | | | 128,273 | |
SCOR SE | | | 15,573 | | | | 420,163 | |
SEB S.A. | | | 1,537 | | | | 127,640 | |
Societe BIC S.A. | | | 2,603 | | | | 260,813 | |
Societe Television Francaise 1 | | | 10,654 | | | | 130,259 | |
Suez Environnement Co. | | | 26,761 | | | | 409,833 | |
Thales S.A. | | | 5,908 | | | | 220,767 | |
Zodiac Aerospace | | | 1,939 | | | | 201,590 | |
| | | | | | | | |
| Total France | | | | 6,761,584 | |
| Germany – 3.1% | | | | | | | | |
Aixtron SE N.A. | | | 2,780 | | | | 48,350 | |
Aurubis AG | | | 1,935 | | | | 102,004 | |
Axel Springer AG | | | 5,667 | | | | 285,795 | |
Bilfinger Berger SE | | | 2,582 | | | | 242,170 | |
Celesio AG | | | 7,405 | | | | 133,817 | |
Deutsche Lufthansa AG | | | 21,120 | | | | 295,177 | |
Fielmann AG | | | 2,015 | | | | 193,444 | |
Fraport AG Frankfurt Airport Services Worldwide | | | 2,820 | | | | 176,316 | |
GEA Group AG | | | 6,366 | | | | 219,231 | |
Hamburger Hafen und Logistik AG | | | 2,024 | | | | 68,058 | |
Hannover Rueckversicherung AG | | | 10,288 | | | | 610,221 | |
Lanxess AG | | | 907 | | | | 74,863 | |
MTU Aero Engines Holding AG | | | 1,189 | | | | 95,621 | |
Rheinmetall AG | | | 1,197 | | | | 70,768 | |
Rhoen Klinikum AG | | | 3,753 | | | | 75,243 | |
SMA Solar Technology AG(a) | | | 1,758 | | | | 79,551 | |
Suedzucker AG | | | 5,399 | | | | 171,657 | |
Symrise AG | | | 6,614 | | | | 191,131 | |
United Internet AG Registered Shares | | | 7,401 | | | | 139,264 | |
| | | | | | | | |
| Total Germany | | | | 3,272,681 | |
| Hong Kong – 4.2% | | | | | | | | |
Bank of East Asia Ltd. | | | 76,400 | | | | 287,336 | |
Beijing Enterprises Holdings Ltd. | | | 31,500 | | | | 192,108 | |
Cathay Pacific Airways Ltd. | | | 307,000 | | | | 568,606 | |
China Agri-Industries Holdings Ltd. | | | 62,000 | | | | 40,886 | |
China Merchants Holdings International Co., Ltd. | | | 98,000 | | | | 328,181 | |
China Resources Enterprise Ltd. | | | 40,000 | | | | 139,619 | |
China Resources Power Holdings Co., Ltd. | | | 124,000 | | | | 229,665 | |
Citic Pacific Ltd. | | | 109,000 | | | | 183,632 | |
Fosun International Ltd. | | | 245,500 | | | | 146,086 | |
Franshion Properties China Ltd. | | | 234,000 | | | | 60,278 | |
Guangdong Investment Ltd. | | | 330,808 | | | | 230,509 | |
Hang Lung Group Ltd. | | | 26,000 | | | | 168,277 | |
HKT Trust and HKT Ltd.*(b) | | | 10,065 | | | | 7,830 | |
Hopewell Holdings Ltd. | | | 49,662 | | | | 136,244 | |
Hysan Development Co., Ltd. | | | 43,000 | | | | 172,244 | |
Lenovo Group Ltd. | | | 212,000 | | | | 190,866 | |
New World Development Co., Ltd. | | | 216,482 | | | | 260,147 | |
PCCW Ltd. | | | 463,000 | | | | 165,783 | |
| | | | | | | | |
Shanghai Industrial Holdings Ltd. | | | 54,000 | | | $ | 166,577 | |
Shougang Fushan Resources Group Ltd. | | | 254,000 | | | | 86,041 | |
Sino Land Co., Ltd. | | | 214,400 | | | | 342,421 | |
Sino-Ocean Land Holdings Ltd.(a) | | | 312,000 | | | | 148,284 | |
Television Broadcasts Ltd. | | | 26,074 | | | | 175,808 | |
Wheelock & Co., Ltd. | | | 18,000 | | | | 54,250 | |
| | | | | | | | |
| Total Hong Kong | | | | 4,481,678 | |
| Ireland – 0.5% | | | | | | | | |
DCC PLC | | | 5,429 | | | | 134,221 | |
Dragon Oil PLC | | | 14,562 | | | | 145,183 | |
Kerry Group PLC Class A | | | 3,331 | | | | 153,925 | |
Paddy Power PLC | | | 1,916 | | | | 120,484 | |
| | | | | | | | |
| Total Ireland | | | | 553,813 | |
| Italy – 3.7% | | | | | | | | |
A2A SpA(a) | | | 148,219 | | | | 118,726 | |
ACEA SpA | | | 21,729 | | | | 137,969 | |
Autogrill SpA | | | 11,977 | | | | 126,242 | |
Banca Carige SpA | | | 60,136 | | | | 78,802 | |
Banca Monte dei Paschi di Siena SpA(a) | | | 326,589 | | | | 137,478 | |
Banca Popolare dell’Emilia Romagna SCRL | | | 9,942 | | | | 71,561 | |
Banca Popolare di Sondrio SCRL | | | 16,429 | | | | 120,332 | |
Davide Campari-Milano SpA | | | 10,506 | | | | 71,423 | |
Exor SpA | | | 3,466 | | | | 87,375 | |
Hera SpA | | | 35,416 | | | | 50,465 | |
Iren SpA | | | 133,079 | | | | 113,865 | |
Mediaset SpA | | | 157,390 | | | | 433,445 | |
Mediobanca SpA | | | 34,173 | | | | 200,418 | |
Mediolanum SpA | | | 34,322 | | | | 162,898 | |
Parmalat SpA | | | 45,826 | | | | 114,303 | |
Pirelli & C SpA | | | 21,858 | | | | 259,646 | |
Prysmian SpA | | | 4,924 | | | | 86,425 | |
Societa Iniziative Autostradali e Servizi SpA | | | 16,391 | | | | 125,292 | |
Telecom Italia SpA RSP | | | 505,839 | | | | 496,462 | |
Terna Rete Elettrica Nazionale SpA | | | 162,355 | | | | 651,651 | |
Tod’s SpA | | | 726 | | | | 81,551 | |
Unione di Banche Italiane SCPA | | | 46,657 | | | | 197,459 | |
| | | | | | | | |
| Total Italy | | | | 3,923,788 | |
| Japan – 24.2% | | | | | | | | |
Aeon Co., Ltd. | | | 19,100 | | | | 252,516 | |
Aisin Seiki Co., Ltd. | | | 5,900 | | | | 208,341 | |
Ajinomoto Co., Inc. | | | 20,000 | | | | 252,263 | |
All Nippon Airways Co., Ltd. | | | 17,000 | | | | 51,643 | |
Amada Co., Ltd. | | | 13,000 | | | | 88,146 | |
Aozora Bank Ltd. | | | 18,000 | | | | 52,275 | |
Asahi Group Holdings Ltd. | | | 7,000 | | | | 155,915 | |
Asahi Kasei Corp. | | | 30,000 | | | | 186,281 | |
Bank of Kyoto Ltd. (The) | | | 13,000 | | | | 118,634 | |
Bank of Yokohama Ltd. (The) | | | 45,000 | | | | 226,381 | |
Brother Industries Ltd. | | | 7,700 | | | | 104,981 | |
Chiba Bank Ltd. (The) | | | 20,000 | | | | 128,319 | |
Chugai Pharmaceutical Co., Ltd. | | | 17,000 | | | | 315,232 | |
Chugoku Bank Ltd. (The) | | | 10,000 | | | | 135,974 | |
Chugoku Electric Power Co., Inc. (The) | | | 19,300 | | | | 360,461 | |
See Notes to Financial Statements.
| | |
| 86 | | WisdomTree International Dividend and Sector Funds |
Schedule of Investments (continued)
WisdomTree International MidCap Dividend Fund (DIM)
March 31, 2012
| | | | | | | | |
| Investments | | Shares | | | Value | |
| | | | | | | | |
Cosmo Oil Co., Ltd.(a) | | | 49,000 | | | $ | 136,946 | |
Dai Nippon Printing Co., Ltd.(a) | | | 27,000 | | | | 277,562 | |
Daicel Corp. | | | 13,000 | | | | 84,197 | |
Daihatsu Motor Co., Ltd.(a) | | | 19,000 | | | | 350,009 | |
Daikin Industries Ltd.(a) | | | 4,100 | | | | 112,246 | |
Dainippon Sumitomo Pharma Co., Ltd.(a) | | | 14,700 | | | | 156,655 | |
Daito Trust Construction Co., Ltd. | | | 6,300 | | | | 568,795 | |
Daiwa House Industry Co., Ltd. | | | 16,000 | | | | 212,698 | |
Daiwa Securities Group, Inc. | | | 58,000 | | | | 230,464 | |
Dena Co., Ltd.(a) | | | 1,600 | | | | 44,581 | |
Denki Kagaku Kogyo K.K. | | | 20,000 | | | | 80,442 | |
Eisai Co., Ltd.(a) | | | 16,800 | | | | 671,633 | |
Electric Power Development Co., Ltd.(a) | | | 5,500 | | | | 149,973 | |
FamilyMart Co., Ltd. | | | 3,500 | | | | 148,855 | |
Fuji Heavy Industries Ltd. | | | 19,000 | | | | 153,533 | |
Fujitsu Ltd. | | | 58,000 | | | | 307,285 | |
Fukuoka Financial Group, Inc. | | | 27,000 | | | | 120,408 | |
Furukawa Electric Co., Ltd. | | | 15,000 | | | | 40,100 | |
GS Yuasa Corp. | | | 13,000 | | | | 71,718 | |
Gunma Bank Ltd. (The) | | | 20,000 | | | | 107,661 | |
Hachijuni Bank Ltd. (The) | | | 19,000 | | | | 112,668 | |
Hankyu Hanshin Holdings, Inc. | | | 24,000 | | | | 105,280 | |
Hirose Electric Co., Ltd. | | | 1,600 | | | | 168,953 | |
Hiroshima Bank Ltd. (The)(a) | | | 20,000 | | | | 91,865 | |
Hisamitsu Pharmaceutical Co., Inc.(a) | | | 1,700 | | | | 81,080 | |
Hitachi Chemical Co., Ltd. | | | 5,800 | | | | 105,012 | |
Hitachi Construction Machinery Co., Ltd. | | | 2,400 | | | | 53,398 | |
Hitachi High-Technologies Corp. | | | 2,900 | | | | 69,597 | |
Hitachi Metals Ltd. | | | 7,000 | | | | 87,442 | |
Hokkaido Electric Power Co., Inc. | | | 12,000 | | | | 177,167 | |
Hokuhoku Financial Group, Inc. | | | 63,000 | | | | 120,955 | |
Hokuriku Electric Power Co. | | | 10,600 | | | | 192,692 | |
Hoya Corp. | | | 19,500 | | | | 440,495 | |
Ibiden Co., Ltd. | | | 2,800 | | | | 72,029 | |
Idemitsu Kosan Co., Ltd. | | | 1,400 | | | | 140,349 | |
Isetan Mitsukoshi Holdings Ltd. | | | 6,100 | | | | 72,048 | |
Isuzu Motors Ltd. | | | 14,000 | | | | 82,508 | |
Japan Steel Works Ltd. (The)(a) | | | 18,000 | | | | 124,017 | |
JGC Corp. | | | 5,000 | | | | 155,842 | |
Joyo Bank Ltd. (The) | | | 37,000 | | | | 170,399 | |
JS Group Corp. | | | 8,300 | | | | 174,785 | |
JSR Corp. | | | 7,700 | | | | 155,881 | |
JTEKT Corp. | | | 4,600 | | | | 55,393 | |
Kajima Corp.(a) | | | 40,000 | | | | 122,486 | |
Kaneka Corp. | | | 14,000 | | | | 84,890 | |
Kansai Paint Co., Ltd. | | | 9,000 | | | | 91,318 | |
Kawasaki Heavy Industries Ltd. | | | 17,000 | | | | 52,263 | |
Kawasaki Kisen Kaisha Ltd.*(a) | | | 33,000 | | | | 72,981 | |
Keikyu Corp.(a) | | | 13,000 | | | | 114,369 | |
Keio Corp. | | | 20,000 | | | | 144,116 | |
Kintetsu Corp.(a) | | | 44,000 | | | | 168,418 | |
Kobe Steel Ltd. | | | 65,000 | | | | 105,839 | |
Konami Corp.(a) | | | 5,000 | | | | 142,536 | |
Konica Minolta Holdings, Inc. | | | 12,500 | | | | 109,818 | |
| | | | | | | | |
Kuraray Co., Ltd. | | | 13,400 | | | $ | 190,673 | |
Kurita Water Industries Ltd. | | | 2,900 | | | | 71,465 | |
Kyowa Hakko Kirin Co., Ltd. | | | 19,000 | | | | 212,407 | |
Kyushu Electric Power Co., Inc. | | | 28,700 | | | | 411,171 | |
Lawson, Inc. | | | 6,300 | | | | 398,846 | |
Makita Corp. | | | 4,400 | | | | 177,508 | |
MEIJI Holdings Co., Ltd. | | | 1,900 | | | | 83,462 | |
Mitsubishi Chemical Holdings Corp. | | | 32,000 | | | | 171,869 | |
Mitsubishi Gas Chemical Co., Inc. | | | 8,000 | | | | 53,758 | |
Mitsubishi Tanabe Pharma Corp. | | | 14,500 | | | | 204,563 | |
Mitsui Chemicals, Inc. | | | 25,000 | | | | 76,250 | |
Mitsui O.S.K. Lines Ltd.(a) | | | 37,000 | | | | 161,857 | |
Namco Bandai Holdings, Inc. | | | 12,100 | | | | 175,556 | |
NGK Insulators Ltd. | | | 8,000 | | | | 114,806 | |
NGK Spark Plug Co., Ltd. | | | 9,000 | | | | 129,157 | |
NHK Spring Co., Ltd. | | | 9,000 | | | | 97,333 | |
Nikon Corp. | | | 4,200 | | | | 128,202 | |
Nippon Electric Glass Co., Ltd. | | | 10,000 | | | | 87,369 | |
Nippon Express Co., Ltd. | | | 36,000 | | | | 141,297 | |
Nippon Paper Group, Inc.(a) | | | 6,000 | | | | 125,621 | |
Nippon Sheet Glass Co., Ltd. | | | 18,000 | | | | 27,778 | |
Nippon Shokubai Co., Ltd. | | | 5,000 | | | | 58,266 | |
Nippon Yusen K.K.(a) | | | 69,000 | | | | 217,996 | |
Nisshin Seifun Group, Inc.(a) | | | 10,000 | | | | 121,636 | |
Nissin Foods Holdings Co., Ltd.(a) | | | 3,600 | | | | 135,391 | |
Nitto Denko Corp. | | | 4,400 | | | | 178,310 | |
NKSJ Holdings, Inc.(a) | | | 20,728 | | | | 465,968 | |
Nomura Real Estate Holdings, Inc. | | | 5,800 | | | | 102,828 | |
Nomura Research Institute Ltd. | | | 8,300 | | | | 207,059 | |
NSK Ltd. | | | 8,000 | | | | 61,924 | |
NTN Corp. | | | 20,000 | | | | 85,060 | |
Obayashi Corp. | | | 24,000 | | | | 105,280 | |
Odakyu Electric Railway Co., Ltd.(a) | | | 13,000 | | | | 123,531 | |
OJI Paper Co., Ltd.(a) | | | 27,000 | | | | 131,235 | |
Oracle Corp. | | | 6,768 | | | | 258,647 | |
Oriental Land Co., Ltd. | | | 1,400 | | | | 150,896 | |
Osaka Gas Co., Ltd. | | | 63,000 | | | | 254,159 | |
Resona Holdings, Inc. | | | 110,000 | | | | 509,265 | |
Ricoh Co., Ltd.(a) | | | 33,000 | | | | 322,802 | |
Rohm Co., Ltd. | | | 3,800 | | | | 188,626 | |
Sankyo Co., Ltd. | | | 4,800 | | | | 236,807 | |
Secom Co., Ltd. | | | 6,300 | | | | 310,043 | |
Sega Sammy Holdings, Inc. | | | 10,100 | | | | 212,812 | |
Seiko Epson Corp. | | | 4,400 | | | | 62,021 | |
Sekisui Chemical Co., Ltd. | | | 13,000 | | | | 113,421 | |
Sekisui House Ltd. | | | 21,000 | | | | 206,951 | |
Sharp Corp.(a) | | | 31,000 | | | | 227,523 | |
Shikoku Electric Power Co., Inc.(a) | | | 10,200 | | | | 289,162 | |
Shimamura Co., Ltd. | | | 1,100 | | | | 123,774 | |
Shimizu Corp.(a) | | | 25,000 | | | | 100,857 | |
Shinsei Bank Ltd. | | | 40,000 | | | | 52,494 | |
Shionogi & Co., Ltd.(a) | | | 14,800 | | | | 205,738 | |
Shiseido Co., Ltd.(a) | | | 16,300 | | | | 282,841 | |
Shizuoka Bank Ltd. (The) | | | 15,000 | | | | 155,295 | |
See Notes to Financial Statements.
| | | | |
| WisdomTree International Dividend and Sector Funds | | | 87 | |
Schedule of Investments (continued)
WisdomTree International MidCap Dividend Fund (DIM)
March 31, 2012
| | | | | | | | |
| Investments | | Shares | | | Value | |
| | | | | | | | |
Showa Denko K.K. | | | 39,000 | | | $ | 89,094 | |
Showa Shell Sekiyu K.K. | | | 11,600 | | | | 74,425 | |
Sojitz Corp. | | | 42,100 | | | | 75,713 | |
Sony Financial Holdings, Inc. | | | 8,231 | | | | 147,027 | |
Stanley Electric Co., Ltd. | | | 4,600 | | | | 73,504 | |
Sumitomo Chemical Co., Ltd.(a) | | | 46,000 | | | | 196,756 | |
Sumitomo Electric Industries Ltd. | | | 14,900 | | | | 205,136 | |
Sumitomo Metal Industries Ltd. | | | 189,000 | | | | 383,535 | |
Sumitomo Metal Mining Co., Ltd. | | | 14,000 | | | | 197,849 | |
Sumitomo Realty & Development Co., Ltd. | | | 8,000 | | | | 193,936 | |
Sumitomo Rubber Industries Ltd. | | | 6,000 | | | | 80,126 | |
T&D Holdings, Inc. | | | 20,700 | | | | 241,221 | |
Taisei Corp. | | | 39,000 | | | | 102,363 | |
Taiyo Nippon Sanso Corp. | | | 13,000 | | | | 92,253 | |
TDK Corp.(a) | | | 3,100 | | | | 176,669 | |
Teijin Ltd. | | | 15,000 | | | | 50,671 | |
Tobu Railway Co., Ltd. | | | 23,000 | | | | 122,693 | |
Toho Co., Ltd. | | | 6,100 | | | | 112,594 | |
Toho Gas Co., Ltd.(a) | | | 19,000 | | | | 112,668 | |
Tokyo Broadcasting System Holdings, Inc. | | | 6,000 | | | | 89,969 | |
Tokyo Electron Ltd. | | | 5,800 | | | | 333,714 | |
Tokyo Gas Co., Ltd. | | | 72,000 | | | | 341,211 | |
Tokyu Corp. | | | 21,000 | | | | 100,286 | |
Tokyu Land Corp. | | | 19,000 | | | | 93,505 | |
TonenGeneral Sekiyu K.K. | | | 28,104 | | | | 260,225 | |
Toppan Printing Co., Ltd.(a) | | | 22,000 | | | | 172,696 | |
Tosoh Corp. | | | 18,000 | | | | 50,307 | |
TOTO Ltd. | | | 10,000 | | | | 75,703 | |
Toyo Suisan Kaisha Ltd. | | | 4,000 | | | | 104,453 | |
Toyoda Gosei Co., Ltd. | | | 2,800 | | | | 54,813 | |
Toyota Boshoku Corp. | | | 4,400 | | | | 52,183 | |
Toyota Tsusho Corp. | | | 6,600 | | | | 135,136 | |
Trend Micro, Inc. | | | 4,500 | | | | 139,055 | |
Ube Industries Ltd. | | | 19,000 | | | | 51,947 | |
Unicharm Corp. | | | 1,000 | | | | 53,102 | |
USS Co., Ltd.(a) | | | 1,300 | | | | 132,535 | |
Yamada Denki Co., Ltd. | | | 810 | | | | 50,886 | |
Yamato Holdings Co., Ltd. | | | 10,300 | | | | 160,079 | |
| | | | | | | | |
| Total Japan | | | | 25,561,616 | |
| Netherlands – 2.4% | | | | | | | | |
Delta Lloyd N.V. | | | 11,546 | | | | 202,653 | |
Fugro N.V. CVA | | | 3,584 | | | | 254,964 | |
Gemalto N.V. | | | 1,538 | | | | 101,363 | |
Imtech N.V. | | | 1,854 | | | | 59,181 | |
Koninklijke Boskalis Westminster N.V. | | | 4,999 | | | | 187,499 | |
Koninklijke Vopak N.V. | | | 3,203 | | | | 184,245 | |
Nutreco N.V.(a) | | | 890 | | | | 63,907 | |
PostNL N.V. | | | 39,051 | | | | 240,779 | |
Randstad Holding N.V. | | | 6,371 | | | | 240,020 | |
Reed Elsevier N.V. | | | 42,745 | | | | 545,100 | |
STMicroelectronics N.V. | | | 35,275 | | | | 288,431 | |
Wolters Kluwer N.V. | | | 10,957 | | | | 207,198 | |
| | | | | | | | |
| Total Netherlands | | | | 2,575,340 | |
| | | | | | | | |
| New Zealand – 0.8% | | | | | | | | |
Auckland International Airport Ltd. | | | 61,473 | | | $ | 123,920 | |
Contact Energy Ltd.* | | | 36,302 | | | | 140,706 | |
Fletcher Building Ltd. | | | 31,322 | | | | 172,994 | |
Telecom Corp. of New Zealand Ltd. | | | 188,131 | | | | 373,848 | |
| | | | | | | | |
| Total New Zealand | | | | 811,468 | |
| Norway – 2.3% | | | | | | | | |
Aker Solutions ASA | | | 11,100 | | | | 187,496 | |
Fred Olsen Energy ASA | | | 9,864 | | | | 386,152 | |
Gjensidige Forsikring ASA | | | 37,644 | | | | 443,818 | |
Kongsberg Gruppen AS | | | 3,739 | | | | 70,138 | |
Marine Harvest ASA | | | 998,703 | | | | 514,755 | |
Orkla ASA | | | 71,597 | | | | 565,591 | |
Schibsted ASA | | | 3,362 | | | | 124,365 | |
TGS Nopec Geophysical Co. ASA | | | 4,110 | | | | 112,476 | |
| | | | | | | | |
| Total Norway | | | | 2,404,791 | |
| Portugal – 1.3% | | | | | | | | |
Banco Espirito Santo S.A. | | | 117,604 | | | | 214,560 | |
Brisa Auto-Estradas de Portugal S.A.(a) | | | 65,092 | | | | 231,444 | |
Cimpor Cimentos de Portugal, SGPS, S.A. | | | 50,629 | | | | 337,113 | |
Portugal Telecom, SGPS, S.A. | | | 106,374 | | | | 577,824 | |
| | | | | | | | |
| Total Portugal | | | | 1,360,941 | |
| Singapore – 4.1% | | | | | | | | |
City Developments Ltd. | | | 19,000 | | | | 171,512 | |
ComfortDelGro Corp., Ltd. | | | 130,000 | | | | 161,292 | |
Cosco Corp. Singapore Ltd.(a) | | | 59,000 | | | | 54,667 | |
Fraser and Neave Ltd. | | | 58,402 | | | | 311,205 | |
Keppel Land Ltd. | | | 88,000 | | | | 242,860 | |
Sakari Resources Ltd. | | | 38,000 | | | | 70,418 | |
SATS Ltd. | | | 73,000 | | | | 144,566 | |
SembCorp Industries Ltd. | | | 92,000 | | | | 386,336 | |
SembCorp Marine Ltd.(a) | | | 156,360 | | | | 656,604 | |
SIA Engineering Co., Ltd. | | | 63,536 | | | | 203,643 | |
Singapore Exchange Ltd. | | | 63,000 | | | | 347,731 | |
Singapore Press Holdings Ltd. | | | 155,148 | | | | 483,700 | |
Singapore Technologies Engineering Ltd. | | | 185,000 | | | | 478,188 | |
SMRT Corp., Ltd. | | | 102,000 | | | | 140,748 | |
StarHub Ltd. | | | 149,594 | | | | 368,824 | |
Yangzijiang Shipbuilding Holdings Ltd. | | | 159,000 | | | | 168,187 | |
| | | | | | | | |
| Total Singapore | | | | 4,390,481 | |
| Spain – 3.9% | | | | | | | | |
Acciona S.A. | | | 3,480 | | | | 242,653 | |
Acerinox S.A. | | | 17,520 | | | | 224,844 | |
Banco de Sabadell S.A. | | | 113,234 | | | | 307,921 | |
Banco Espanol de Credito S.A.(a) | | | 60,882 | | | | 291,389 | |
Banco Popular Espanol S.A.(a) | | | 67,273 | | | | 240,990 | |
Banco Popular Espanol S.A. – Temp Line* | | | 873 | | | | 3,127 | |
Bolsas y Mercados Espanoles S.A. | | | 6,677 | | | | 170,899 | |
Ebro Foods S.A. | | | 5,960 | | | | 115,522 | |
Enagas S.A. | | | 15,360 | | | | 295,164 | |
Ferrovial S.A. | | | 44,466 | | | | 510,318 | |
Fomento de Construcciones y Contratas S.A. | | | 6,421 | | | | 143,227 | |
See Notes to Financial Statements.
| | |
| 88 | | WisdomTree International Dividend and Sector Funds |
Schedule of Investments (continued)
WisdomTree International MidCap Dividend Fund (DIM)
March 31, 2012
| | | | | | | | |
| Investments | | Shares | | | Value | |
| | | | | | | | |
Grupo Catalana Occidente S.A. | | | 8,848 | | | $ | 153,531 | |
Indra Sistemas S.A.(a) | | | 10,837 | | | | 132,598 | |
Mediaset Espana Comunicacion S.A. | | | 35,742 | | | | 204,670 | |
Obrascon Huarte Lain S.A. | | | 4,034 | | | | 119,905 | |
Prosegur Cia de Seguridad, S.A. | | | 2,606 | | | | 152,351 | |
Red Electrica Corp. S.A. | | | 6,712 | | | | 327,949 | |
Sacyr Vallehermoso, S.A. | | | 10,291 | | | | 31,219 | |
Tecnicas Reunidas S.A. | | | 3,985 | | | | 165,759 | |
Zardoya Otis S.A. | | | 20,973 | | | | 271,198 | |
| | | | | | | | |
| Total Spain | | | | 4,105,234 | |
| Sweden – 6.1% | | | | | | | | |
Alfa Laval AB | | | 15,444 | | | | 316,777 | |
Assa Abloy AB Class B | | | 12,206 | | | | 382,257 | |
Atlas Copco AB Class B | | | 18,558 | | | | 398,829 | |
Boliden AB | | | 18,825 | | | | 294,772 | |
Castellum AB | | | 6,986 | | | | 87,755 | |
Electrolux AB Series B(a) | | | 15,319 | | | | 322,987 | |
Getinge AB Class B(a) | | | 6,098 | | | | 173,143 | |
Hakon Invest AB | | | 14,531 | | | | 251,186 | |
Hexagon AB Class B | | | 1,723 | | | | 33,342 | |
Husqvarna AB Class B(a) | | | 20,672 | | | | 124,337 | |
Investment AB Kinnevik Class B | | | 11,443 | | | | 265,408 | |
Lundbergforetagen AB Class B | | | 4,869 | | | | 166,939 | |
Meda AB Class A | | | 19,835 | | | | 188,624 | |
Modern Times Group AB Class B | | | 1,553 | | | | 85,288 | |
Peab AB | | | 23,259 | | | | 118,480 | |
Ratos AB Class B(a) | | | 20,979 | | | | 290,402 | |
Saab AB Class B | | | 3,168 | | | | 58,964 | |
Scania AB Class B | | | 30,186 | | | | 625,980 | |
Securitas AB Class B | | | 19,920 | | | | 191,534 | |
Skanska AB Class B | | | 24,748 | | | | 427,799 | |
SSAB AB Class A | | | 10,895 | | | | 102,705 | |
Svenska Cellulosa AB Class B(a) | | | 29,349 | | | | 506,890 | |
Swedish Match AB | | | 11,069 | | | | 439,400 | |
Tele2 AB Class B | | | 23,830 | | | | 484,835 | |
Trelleborg AB Class B | | | 7,512 | | | | 78,229 | |
| | | | | | | | |
| Total Sweden | | | | 6,416,862 | |
| Switzerland – 2.6% | | | | | | | | |
Actelion Ltd.* | | | 3,276 | | | | 119,608 | |
Baloise Holding AG | | | 3,160 | | | | 254,171 | |
Bank Sarasin & Cie AG Class B | | | 1,395 | | | | 43,678 | |
BKW S.A.* | | | 2,668 | | | | 95,639 | |
GAM Holding AG* | | | 8,130 | | | | 118,282 | |
Geberit AG* | | | 1,868 | | | | 390,402 | |
Givaudan S.A.* | | | 134 | | | | 128,982 | |
Julius Baer Group Ltd.* | | | 5,712 | | | | 230,287 | |
Lonza Group AG* | | | 1,802 | | | | 93,026 | |
Nobel Biocare Holding AG* | | | 4,122 | | | | 51,488 | |
Partners Group Holding AG | | | 1,675 | | | | 326,346 | |
Schindler Holding AG | | | 1,597 | | | | 190,647 | |
Schindler Holding AG Participating Shares | | | 2,108 | | | | 253,282 | |
Sonova Holding AG* | | | 1,071 | | | | 118,849 | |
Sulzer AG | | | 1,315 | | | | 186,662 | |
| | | | | | | | |
Swatch Group AG (The) | | | 1,454 | | | $ | 116,709 | |
Vontobel Holding AG | | | 2,492 | | | | 63,137 | |
| | | | | | | | |
| Total Switzerland | | | | 2,781,195 | |
| United Kingdom – 15.5% | | | | | | | | |
Aberdeen Asset Management PLC | | | 81,757 | | | | 335,712 | |
Admiral Group PLC | | | 16,821 | | | | 319,015 | |
Aegis Group PLC | | | 30,449 | | | | 89,905 | |
Aggreko PLC | | | 2,435 | | | | 87,537 | |
AMEC PLC | | | 11,657 | | | | 206,365 | |
Amlin PLC | | | 44,204 | | | | 232,928 | |
Ashmore Group PLC | | | 48,170 | | | | 282,841 | |
Babcock International Group PLC | | | 6,881 | | | | 87,568 | |
Balfour Beatty PLC | | | 41,008 | | | | 187,061 | |
British Land Co. PLC | | | 56,712 | | | | 434,845 | |
Bunzl PLC | | | 11,884 | | | | 190,636 | |
Burberry Group PLC | | | 10,326 | | | | 246,981 | |
Capita PLC | | | 20,088 | | | | 235,100 | |
Carillion PLC | | | 28,231 | | | | 134,597 | |
Carnival PLC | | | 5,739 | | | | 183,206 | |
Cobham PLC | | | 47,334 | | | | 173,264 | |
Cookson Group PLC | | | 4,804 | | | | 53,038 | |
Croda International PLC | | | 1,986 | | | | 66,826 | |
Daily Mail & General Trust PLC Class A | | | 22,461 | | | | 162,030 | |
Drax Group PLC | | | 34,457 | | | | 299,767 | |
Firstgroup PLC | | | 30,863 | | | | 117,213 | |
G4S PLC | | | 64,937 | | | | 282,727 | |
GKN PLC | | | 45,682 | | | | 150,429 | |
Halma PLC | | | 11,150 | | | | 67,804 | |
Hammerson PLC | | | 28,222 | | | | 187,401 | |
Hargreaves Lansdown PLC | | | 14,788 | | | | 115,090 | |
Hays PLC | | | 93,484 | | | | 125,989 | |
Hikma Pharmaceuticals PLC | | | 4,605 | | | | 49,958 | |
Home Retail Group PLC | | | 111,500 | | | | 203,090 | |
ICAP PLC | | | 38,940 | | | | 244,386 | |
IG Group Holdings PLC | | | 26,430 | | | | 190,028 | |
IMI PLC | | | 12,719 | | | | 197,629 | |
Inchcape PLC | | | 9,912 | | | | 59,578 | |
Inmarsat PLC | | | 25,647 | | | | 188,620 | |
Intercontinental Hotels Group PLC | | | 7,467 | | | | 173,349 | |
Invensys PLC | | | 14,307 | | | | 45,489 | |
Investec PLC | | | 28,449 | | | | 173,772 | |
J. Sainsbury PLC | | | 112,492 | | | | 559,512 | |
Jardine Lloyd Thompson Group PLC | | | 8,680 | | | | 96,871 | |
John Wood Group PLC | | | 5,048 | | | | 57,789 | |
Johnson Matthey PLC | | | 6,592 | | | | 248,459 | |
Kingfisher PLC | | | 74,875 | | | | 366,910 | |
Legal & General Group PLC | | | 365,392 | | | | 763,033 | |
Logica PLC | | | 80,950 | | | | 128,821 | |
London Stock Exchange Group PLC | | | 12,993 | | | | 214,654 | |
Lonmin PLC | | | 1,923 | | | | 31,401 | |
Man Group PLC | | | 257,628 | | | | 554,871 | |
Marks & Spencer Group PLC | | | 86,959 | | | | 526,578 | |
Meggitt PLC | | | 24,961 | | | | 161,081 | |
Melrose PLC | | | 13,536 | | | | 91,505 | |
See Notes to Financial Statements.
| | | | |
| WisdomTree International Dividend and Sector Funds | | | 89 | |
Schedule of Investments (concluded)
WisdomTree International MidCap Dividend Fund (DIM)
March 31, 2012
| | | | | | | | |
| Investments | | Shares | | | Value | |
| | | | | | | | |
Michael Page International PLC | | | 7,315 | | | $ | 56,100 | |
Millennium & Copthorne Hotels PLC | | | 10,685 | | | | 82,031 | |
Mondi PLC | | | 10,538 | | | | 99,255 | |
Next PLC | | | 7,822 | | | | 372,804 | |
Pennon Group PLC | | | 14,403 | | | | 163,733 | |
Persimmon PLC | | | 5,064 | | | | 51,782 | |
PZ Cussons PLC | | | 10,319 | | | | 49,412 | |
Reed Elsevier PLC | | | 64,613 | | | | 572,957 | |
Rexam PLC | | | 38,510 | | | | 263,407 | |
Rotork PLC | | | 3,083 | | | | 100,931 | |
RSA Insurance Group PLC(a) | | | 322,413 | | | | 538,832 | |
Sage Group PLC (The) | | | 59,813 | | | | 285,934 | |
Segro PLC | | | 54,355 | | | | 203,914 | |
Serco Group PLC | | | 8,935 | | | | 77,447 | |
Severn Trent PLC | | | 14,843 | | | | 366,166 | |
Smith & Nephew PLC | | | 21,324 | | | | 215,836 | |
Smiths Group PLC | | | 16,168 | | | | 271,757 | |
Stagecoach Group PLC | | | 13,861 | | | | 56,540 | |
Standard Life PLC | | | 187,174 | | | | 686,935 | |
Tate & Lyle PLC | | | 24,453 | | | | 275,442 | |
TUI Travel PLC | | | 79,171 | | | | 248,311 | |
United Utilities Group PLC | | | 48,010 | | | | 461,399 | |
Vedanta Resources PLC | | | 6,922 | | | | 135,812 | |
Weir Group PLC (The) | | | 2,810 | | | | 79,198 | |
Whitbread PLC | | | 5,117 | | | | 150,760 | |
William Hill PLC | | | 47,871 | | | | 199,934 | |
| | | | | | | | |
| Total United Kingdom | | | | 16,449,888 | |
TOTAL COMMON STOCKS
(Cost: $105,846,180) | | | | | | | 104,919,609 | |
| EXCHANGE-TRADED FUNDS – 0.1% | | | | | |
| United States – 0.1% | | | | | |
WisdomTree Australia Dividend Fund(a)(c) | | | 742 | | | | 41,611 | |
WisdomTree Japan Hedged Equity Fund(a)(c) | | | 1,122 | | | | 41,402 | |
| | | | | | | | |
TOTAL EXCHANGE-TRADED FUNDS
(Cost: $71,003) | | | | | | | 83,013 | |
| SHORT-TERM INVESTMENT – 0.1% | | | | | | | | |
| MONEY MARKET FUND – 0.1% | | | | | | | | |
Invesco Treasury Fund Private Class, 0.02%(d)
(Cost: $62,032) | | | 62,032 | | | | 62,032 | |
| INVESTMENT OF CASH COLLATERAL FOR SECURITIES LOANED – 12.1% | | | | | | | | |
| MONEY MARKET FUND – 12.1% | | | | | | | | |
Dreyfus Institutional Preferred Money Market Fund, 0.18%(d) | | | | | | | | |
| (Cost: $12,838,834)(e) | | | 12,838,834 | | | | 12,838,834 | |
TOTAL INVESTMENTS IN SECURITIES – 111.4%
(Cost: $118,818,049) | | | | 117,903,488 | |
Liabilities in Excess of Foreign Currency and Other Assets – (11.4)% | | | | (12,080,857 | ) |
| | | | | |
| NET ASSETS – 100.0% | | | $ | 105,822,631 | |
PPS – Price Protected Shares
RSP – Risparmio Italian Savings Shares
| * | Non-income producing security. |
| (a) | Security, or portion thereof, was on loan at March 31, 2012 (See Note 2). |
| (b) | Stapled Security – A security contractually bound to one or more other securities to form a single saleable unit which cannot be sold separately. |
| (c) | Affiliated company (See Note 7). |
| (d) | Rate shown represents annualized 7-day yield as of March 31, 2012. |
| (e) | At March 31, 2012, the total market value of the Fund’s securities on loan was $12,069,627 and the total market value of the collateral held by the Fund was $12,838,834. |
See Notes to Financial Statements.
| | |
| 90 | | WisdomTree International Dividend and Sector Funds |
Schedule of Investments
WisdomTree International SmallCap Dividend Fund (DLS)
March 31, 2012
| | | | | | | | |
| Investments | | Shares | | | Value | |
| | | | | | | | |
| COMMON STOCKS – 99.0% | | | | | | | | |
| Australia – 16.0% | | | | | | | | |
Adelaide Brighton Ltd. | | | 689,008 | | | $ | 2,069,955 | |
Aditya Birla Minerals Ltd. | | | 350,832 | | | | 259,863 | |
Amalgamated Holdings Ltd. | | | 123,683 | | | | 794,402 | |
Ansell Ltd. | | | 49,394 | | | | 760,893 | |
APN News & Media Ltd. | | | 1,139,372 | | | | 1,068,200 | |
ARB Corp., Ltd. | | | 85,671 | | | | 816,508 | |
Aristocrat Leisure Ltd. | | | 226,250 | | | | 707,838 | |
ASG Group Ltd.(a) | | | 365,805 | | | | 314,533 | |
Ausdrill Ltd. | | | 265,340 | | | | 1,157,240 | |
Austal Ltd.(a) | | | 210,821 | | | | 409,500 | |
Australian Pharmaceutical Industries Ltd. | | | 1,029,781 | | | | 330,708 | |
Automotive Holdings Group | | | 417,513 | | | | 1,029,403 | |
Bank of Queensland Ltd.(a) | | | 238,689 | | | | 1,800,124 | |
Bank of Queensland Ltd. Placement Shares* | | | 51,608 | | | | 389,213 | |
Beach Energy Ltd. | | | 461,025 | | | | 698,506 | |
Billabong International Ltd.(a) | | | 249,538 | | | | 718,654 | |
Boart Longyear Ltd. | | | 108,909 | | | | 469,349 | |
Bradken Ltd. | | | 122,864 | | | | 1,092,070 | |
Brickworks Ltd. | | | 51,220 | | | | 572,001 | |
BT Investment Management Ltd. | | | 128,502 | | | | 294,199 | |
Cabcharge Australia Ltd. | | | 37,772 | | | | 235,953 | |
Cardno Ltd. | | | 178,239 | | | | 1,290,680 | |
carsales.com Ltd.(a) | | | 179,278 | | | | 1,030,762 | |
Cash Converters International Ltd. | | | 247,861 | | | | 170,753 | |
Challenger Infrastructure Fund Class A(b) | | | 936,867 | | | | 1,145,245 | |
Consolidated Media Holdings Ltd. | | | 764,673 | | | | 2,305,193 | |
CSG Ltd. | | | 424,408 | | | | 281,386 | |
CSR Ltd.(a) | | | 959,427 | | | | 1,789,052 | |
Customers Ltd. | | | 540,135 | | | | 514,788 | |
David Jones Ltd.(a) | | | 704,091 | | | | 1,757,861 | |
DuluxGroup Ltd.(a) | | | 160,736 | | | | 496,213 | |
DWS Ltd. | | | 375,607 | | | | 554,482 | |
Emeco Holdings Ltd. | | | 442,544 | | | | 495,129 | |
Envestra Ltd. | | | 2,919,619 | | | | 2,344,048 | |
FKP Property Group(b) | | | 249,662 | | | | 128,025 | |
Fleetwood Corp., Ltd. | | | 91,605 | | | | 1,162,502 | |
GrainCorp Ltd. | | | 108,130 | | | | 1,013,756 | |
GUD Holdings Ltd. | | | 115,735 | | | | 985,542 | |
GWA Group Ltd.(a) | | | 345,328 | | | | 769,146 | |
Hills Holdings Ltd.(a) | | | 175,366 | | | | 195,296 | |
iiNET Ltd. | | | 118,918 | | | | 373,275 | |
Imdex Ltd. | | | 62,461 | | | | 196,708 | |
IMF Australia Ltd. | | | 252,426 | | | | 356,948 | |
Independence Group NL | | | 38,748 | | | | 158,958 | |
Invocare Ltd.(a) | | | 108,661 | | | | 901,664 | |
IOOF Holdings Ltd. | | | 276,411 | | | | 1,655,091 | |
Iress Market Technology Ltd. | | | 112,471 | | | | 815,600 | |
JB Hi-Fi Ltd.(a) | | | 95,889 | | | | 1,088,724 | |
Kingsgate Consolidated Ltd.(a) | | | 76,925 | | | | 510,019 | |
Medusa Mining Ltd. | | | 36,664 | | | | 191,430 | |
Mermaid Marine Australia Ltd.(a) | | | 117,738 | | | | 397,624 | |
Mincor Resources NL | | | 535,612 | | | | 377,310 | |
| | | | | | | | |
Mineral Resources Ltd. | | | 77,991 | | | $ | 977,616 | |
Monadelphous Group Ltd. | | | 104,263 | | | | 2,581,468 | |
Mortgage Choice Ltd. | | | 443,433 | | | | 599,483 | |
Myer Holdings Ltd.(a) | | | 877,507 | | | | 2,127,184 | |
Navitas Ltd. | | | 314,091 | | | | 1,155,108 | |
NIB Holdings Ltd. | | | 743,323 | | | | 1,143,517 | |
NRW Holdings Ltd. | | | 118,706 | | | | 510,340 | |
Oakton Ltd. | | | 113,566 | | | | 147,649 | |
Pacific Brands Ltd. | | | 815,540 | | | | 515,364 | |
Panoramic Resources Ltd. | | | 300,642 | | | | 347,267 | |
Perpetual Ltd. | | | 65,011 | | | | 1,709,969 | |
Primary Health Care Ltd. | | | 373,009 | | | | 1,105,157 | |
Prime AET&D Holdings*† | | | 124,997 | | | | — | |
Programmed Maintenance Services Ltd. | | | 156,311 | | | | 408,064 | |
Reject Shop Ltd. (The)(a) | | | 31,864 | | | | 399,415 | |
Retail Food Group Ltd. | | | 161,549 | | | | 443,495 | |
Ridley Corp., Ltd. | | | 449,628 | | | | 544,977 | |
SAI Global Ltd. | | | 193,269 | | | | 1,001,085 | |
Salmat Ltd.(a) | | | 222,725 | | | | 542,220 | |
Sedgman Ltd. | | | 182,169 | | | | 464,246 | |
Select Harvests Ltd. | | | 137,921 | | | | 224,320 | |
Servcorp Ltd. | | | 127,515 | | | | 373,840 | |
Seven West Media Ltd.(a) | | | 402,297 | | | | 1,629,529 | |
SMS Management & Technology Ltd.(a) | | | 104,025 | | | | 618,569 | |
Spotless Group Ltd. | | | 62,962 | | | | 153,280 | |
STW Communications Group Ltd. | | | 559,772 | | | | 579,895 | |
Super Retail Group Ltd. | | | 119,563 | | | | 945,061 | |
Technology One Ltd. | | | 661,267 | | | | 794,645 | |
TFS Corp., Ltd. | | | 372,901 | | | | 212,469 | |
TPG Telecom Ltd. | | | 351,850 | | | | 648,808 | |
Transfield Services Ltd. | | | 356,891 | | | | 916,908 | |
Watpac Ltd. | | | 401,364 | | | | 405,398 | |
Webjet Ltd.(a) | | | 144,571 | | | | 486,747 | |
Western Areas NL(a) | | | 72,291 | | | | 405,903 | |
WHK Group Ltd. | | | 610,073 | | | | 527,724 | |
Wotif.com Holdings Ltd.(a) | | | 181,267 | | | | 861,926 | |
| | | | | | | | |
| Total Australia | | | | 67,950,968 | |
| Austria – 1.1% | | | | | | | | |
Oesterreichische Post AG(a) | | | 60,539 | | | | 2,104,176 | |
Schoeller-Bleckmann Oilfield Equipment AG | | | 11,393 | | | | 1,047,327 | |
Semperit AG Holding | | | 30,486 | | | | 1,304,826 | |
Wienerberger AG(a) | | | 14,481 | | | | 169,529 | |
| | | | | | | | |
| Total Austria | | | | 4,625,858 | |
| Belgium – 0.9% | | | | | | | | |
Cie Maritime Belge S.A. | | | 22,940 | | | | 544,692 | |
Cofinimmo | | | 9,418 | | | | 1,156,368 | |
EVS Broadcast Equipment S.A. | | | 16,615 | | | | 860,266 | |
Exmar N.V. | | | 40,693 | | | | 350,615 | |
Tessenderlo Chemie N.V. | | | 29,858 | | | | 995,240 | |
| | | | | | | | |
| Total Belgium | | | | 3,907,181 | |
| Denmark – 0.4% | | | | | | | | |
D/S Norden | | | 22,834 | | | | 678,495 | |
See Notes to Financial Statements.
| | | | |
| WisdomTree International Dividend and Sector Funds | | | 91 | |
Schedule of Investments (continued)
WisdomTree International SmallCap Dividend Fund (DLS)
March 31, 2012
| | | | | | | | |
| Investments | | Shares | | | Value | |
| | | | | | | | |
East Asiatic Co., Ltd. A/S(a) | | | 8,125 | | | $ | 237,065 | |
NKT Holding A/S(a) | | | 10,463 | | | | 475,714 | |
Royal UNIBREW A/S | | | 4,722 | | | | 327,955 | |
| | | | | | | | |
| Total Denmark | | | | 1,719,229 | |
| Finland – 1.9% | | | | | | | | |
Alma Media Oyj(a) | | | 55,181 | | | | 392,407 | |
Amer Sports Oyj | | | 56,030 | | | | 730,855 | |
Citycon Oyj | | | 219,595 | | | | 734,011 | |
Huhtamaki Oyj | | | 87,375 | | | | 1,268,294 | |
Orion Oyj Class A | | | 41,606 | | | | 821,681 | |
Raisio PLC Class V(a) | | | 85,752 | | | | 280,922 | |
Ramirent Oyj(a) | | | 52,456 | | | | 457,555 | |
Stockmann Oyj Abp Class B | | | 39,442 | | | | 848,803 | |
Tieto Oyj(a) | | | 69,297 | | | | 1,300,265 | |
Tikkurila Oyj(a) | | | 20,978 | | | | 396,976 | |
Uponor Oyj(a) | | | 60,602 | | | | 697,280 | |
| | | | | | | | |
| Total Finland | | | | 7,929,049 | |
| France – 1.7% | | | | | | | | |
Havas S.A.(a) | | | 194,281 | | | | 1,128,037 | |
IPSOS | | | 24,622 | | | | 881,535 | |
LaCie S.A. | | | 35,528 | | | | 162,282 | |
Plastic Omnium S.A. | | | 20,290 | | | | 587,014 | |
Rallye S.A. | | | 62,819 | | | | 2,357,009 | |
Rubis | | | 4,243 | | | | 247,742 | |
Saft Groupe S.A. | | | 10,560 | | | | 341,725 | |
Societe d’Edition de Canal+ | | | 69,908 | | | | 442,208 | |
Teleperformance S.A. | | | 31,490 | | | | 898,462 | |
| | | | | | | | |
| Total France | | | | | | | 7,046,014 | |
| Germany – 2.9% | | | | | | | | |
Bauer AG(a) | | | 7,596 | | | | 233,063 | |
Bechtle AG | | | 20,505 | | | | 912,037 | |
Carl Zeiss Meditec AG | | | 35,109 | | | | 850,935 | |
Comdirect Bank AG | | | 107,775 | | | | 1,244,783 | |
Delticom AG | | | 1,807 | | | | 192,270 | |
Douglas Holding AG(a) | | | 15,588 | | | | 693,335 | |
Drillisch AG | | | 81,247 | | | | 973,770 | |
ElringKlinger AG | | | 21,444 | | | | 613,118 | |
Freenet AG(a) | | | 37,017 | | | | 597,955 | |
Gerry Weber International AG | | | 37,315 | | | | 1,429,650 | |
H&R AG | | | 24,823 | | | | 496,017 | |
Indus Holding AG | | | 39,754 | | | | 1,225,570 | |
Kontron AG | | | 43,748 | | | | 364,586 | |
Pfeiffer Vacuum Technology AG | | | 3,319 | | | | 375,471 | |
Praktiker AG(a) | | | 26,344 | | | | 64,481 | |
Solarworld AG(a) | | | 36,454 | | | | 114,908 | |
Vossloh AG | | | 5,181 | | | | 510,704 | |
Wincor Nixdorf AG | | | 15,878 | | | | 780,029 | |
Wirecard AG | | | 38,770 | | | | 737,018 | |
| | | | | | | | |
| Total Germany | | | | | | | 12,409,700 | |
| Hong Kong – 1.8% | | | | | | | | |
China Everbright International Ltd.(a) | | | 748,000 | | | | 351,649 | |
China Pharmaceutical Group Ltd. | | | 564,000 | | | | 129,304 | |
| | | | | | | | |
China Power International Development Ltd. | | | 2,776,000 | | | $ | 607,831 | |
China South City Holdings Ltd.(a) | | | 2,650,000 | | | | 358,385 | |
China Travel International Investment Hong Kong | | | 1,604,000 | | | | 328,485 | |
Citic Telecom International Holdings Ltd. | | | 1,984,000 | | | | 398,640 | |
CPMC Holdings Ltd. | | | 553,282 | | | | 330,658 | |
Dah Chong Hong Holdings Ltd. | | | 867,000 | | | | 920,155 | |
Dah Sing Banking Group Ltd. | | | 391,200 | | | | 386,968 | |
Dah Sing Financial Holdings Ltd. | | | 102,400 | | | | 354,786 | |
Guotai Junan International Holdings Ltd. | | | 910,999 | | | | 275,740 | |
Shenzhen Investment Ltd. | | | 3,698,000 | | | | 804,948 | |
Shougang Concord International Enterprises Co., Ltd.(a) | | | 3,406,000 | | | | 199,605 | |
Shun Tak Holdings Ltd.(a) | | | 1,438,000 | | | | 581,571 | |
Sinotruk Hong Kong Ltd.(a) | | | 1,412,000 | | | | 818,393 | |
Vitasoy International Holdings Ltd. | | | 885,364 | | | | 685,347 | |
Welling Holding Ltd. | | | 1,488,000 | | | | 231,901 | |
| | | | | | | | |
| Total Hong Kong | | | | | | | 7,764,366 | |
| Ireland – 0.7% | | | | | | | | |
C&C Group PLC | | | 144,701 | | | | 743,815 | |
FBD Holdings PLC | | | 30,849 | | | | 373,843 | |
Glanbia PLC | | | 118,379 | | | | 876,508 | |
Grafton Group PLC | | | 82,493 | | | | 342,750 | |
Greencore Group PLC | | | 357,187 | | | | 435,156 | |
Kingspan Group PLC | | | 40,782 | | | | 423,613 | |
| | | | | | | | |
| Total Ireland | | | | | | | 3,195,685 | |
| Italy – 4.1% | | | | | | | | |
Amplifon SpA | | | 34,524 | | | | 177,926 | |
Ansaldo STS SpA | | | 55,546 | | | | 550,341 | |
Astaldi SpA | | | 70,015 | | | | 557,103 | |
Azimut Holding SpA | | | 78,861 | | | | 855,381 | |
Banca Generali SpA | | | 115,579 | | | | 1,548,400 | |
Banca Popolare di Milano SCRL | | | 1,039,858 | | | | 577,730 | |
BasicNet SpA | | | 77,302 | | | | 223,386 | |
Brembo SpA | | | 58,456 | | | | 668,696 | |
Cairo Communications SpA | | | 113,365 | | | | 531,710 | |
CIR-Compagnie Industriali Riunite SpA | | | 139,679 | | | | 197,357 | |
Cofide SpA | | | 238,968 | | | | 164,368 | |
Credito Artigiano SpA | | | 165,332 | | | | 263,106 | |
Credito Emiliano SpA | | | 90,406 | | | | 427,397 | |
Danieli & Co. Officine Meccaniche SpA RSP | | | 32,044 | | | | 475,377 | |
De’Longhi SpA | | | 54,293 | | | | 670,239 | |
ERG SpA | | | 91,308 | | | | 807,998 | |
Esprinet SpA | | | 55,984 | | | | 290,313 | |
Fiat SpA RSP | | | 92,569 | | | | 506,903 | |
Geox SpA(a) | | | 231,686 | | | | 755,914 | |
Gruppo Editoriale L’Espresso SpA(a) | | | 235,560 | | | | 332,517 | |
Immobiliare Grande Distribuzione | | | 399,113 | | | | 484,993 | |
IMMSI SpA | | | 551,692 | | | | 438,609 | |
Indesit Co. SpA | | | 64,526 | | | | 401,633 | |
Intesa Sanpaolo SpA RSP | | | 557,449 | | | | 858,904 | |
Italcementi SpA(a) | | | 56,005 | | | | 388,571 | |
Italcementi SpA RSP | | | 51,418 | | | | 167,075 | |
Maire Tecnimont SpA(a) | | | 144,946 | | | | 122,571 | |
See Notes to Financial Statements.
| | |
| 92 | | WisdomTree International Dividend and Sector Funds |
Schedule of Investments (continued)
WisdomTree International SmallCap Dividend Fund (DLS)
March 31, 2012
| | | | | | | | |
| Investments | | Shares | | | Value | |
| | | | | | | | |
MARR SpA | | | 99,601 | | | $ | 1,122,123 | |
Piaggio & C. SpA | | | 231,817 | | | | 680,398 | |
Recordati SpA | | | 162,005 | | | | 1,229,729 | |
Societa Cattolica di Assicurazioni SCRL | | | 37,056 | | | | 748,601 | |
Trevi Finanziaria Industriale SpA | | | 25,408 | | | | 150,299 | |
| | | | | | | | |
| Total Italy | | | | | | | 17,375,668 | |
| Japan – 37.1% | | | | | | | | |
77 Bank Ltd. (The) | | | 131,000 | | | | 581,019 | |
Achilles Corp. | | | 113,000 | | | | 162,027 | |
ADEKA Corp. | | | 60,100 | | | | 574,015 | |
Aeon Delight Co., Ltd. | | | 15,300 | | | | 324,238 | |
Ai Holdings Corp. | | | 63,400 | | | | 338,205 | |
Aica Kogyo Co., Ltd. | | | 73,900 | | | | 1,066,811 | |
Aichi Steel Corp. | | | 120,000 | | | | 622,638 | |
Air Water, Inc. | | | 75,000 | | | | 973,328 | |
Akebono Brake Industry Co., Ltd.(a) | | | 69,600 | | | | 400,880 | |
Akita Bank Ltd. (The) | | | 162,000 | | | | 533,471 | |
Alfresa Holdings Corp. | | | 22,900 | | | | 1,094,981 | |
Alpen Co., Ltd. | | | 19,800 | | | | 397,708 | |
Alpine Electronics, Inc. | | | 23,900 | | | | 324,398 | |
Alps Electric Co., Ltd. | | | 66,400 | | | | 587,389 | |
Amano Corp. | | | 79,500 | | | | 742,882 | |
Aomori Bank Ltd. (The)(a) | | | 107,000 | | | | 332,851 | |
Arcs Co., Ltd. | | | 17,200 | | | | 320,403 | |
Arnest One Corp. | | | 43,600 | | | | 488,477 | |
ASKUL Corp.(a) | | | 23,600 | | | | 417,255 | |
Atsugi Co., Ltd. | | | 268,000 | | | | 345,197 | |
Avex Group Holdings, Inc. | | | 46,700 | | | | 567,471 | |
Awa Bank Ltd. (The) | | | 62,000 | | | | 382,721 | |
Axell Corp.(a) | | | 16,800 | | | | 399,713 | |
Azbil Corp. | | | 42,400 | | | | 942,852 | |
Bank of Nagoya Ltd. (The) | | | 138,000 | | | | 498,038 | |
Bank of Saga Ltd. (The) | | | 166,000 | | | | 476,043 | |
Bank of the Ryukyus Ltd. | | | 23,100 | | | | 315,785 | |
Bookoff Corp. | | | 26,926 | | | | 255,534 | |
Canon Electronics, Inc. | | | 22,800 | | | | 586,242 | |
Canon Marketing Japan, Inc. | | | 59,500 | | | | 767,112 | |
Capcom Co., Ltd. | | | 26,500 | | | | 608,925 | |
Casio Computer Co., Ltd.(a) | | | 110,700 | | | | 794,990 | |
Cawachi Ltd. | | | 13,400 | | | | 319,796 | |
Central Glass Co., Ltd. | | | 75,000 | | | | 330,822 | |
Century Tokyo Leasing Corp. | | | 55,910 | | | | 1,135,253 | |
Chiyoda Co., Ltd. | | | 57,800 | | | | 1,165,903 | |
Chukyo Bank Ltd. (The) | | | 150,000 | | | | 390,060 | |
Circle K Sunkus Co., Ltd. | | | 8,600 | | | | 185,073 | |
Citizen Holdings Co., Ltd. | | | 102,700 | | | | 653,925 | |
Coca-Cola Central Japan Co., Ltd. | | | 39,700 | | | | 517,627 | |
Coca-Cola West Co., Ltd. | | | 51,600 | | | | 909,795 | |
COMSYS Holdings Corp.(a) | | | 76,700 | | | | 835,084 | |
Daifuku Co., Ltd. | | | 31,500 | | | | 183,729 | |
Daihen Corp. | | | 88,000 | | | | 318,658 | |
Daisan Bank Ltd. (The) | | | 163,000 | | | | 348,600 | |
Daishi Bank Ltd. (The) | | | 83,000 | | | | 293,493 | |
| | | | | | | | |
DCM Holdings Co., Ltd. | | | 80,900 | | | $ | 645,863 | |
DIC Corp.(a) | | | 349,000 | | | | 708,220 | |
Disco Corp.(a) | | | 7,600 | | | | 422,504 | |
Doshisha Co., Ltd. | | | 12,900 | | | | 373,699 | |
Doutor Nichires Holdings Co., Ltd. | | | 18,200 | | | | 240,838 | |
Dowa Holdings Co., Ltd.(a) | | | 163,000 | | | | 1,089,374 | |
DTS Corp. | | | 35,700 | | | | 468,510 | |
EDION Corp.(a) | | | 56,400 | | | | 397,497 | |
Ehime Bank Ltd. (The) | | | 181,000 | | | | 519,059 | |
Exedy Corp. | | | 10,800 | | | | 309,584 | |
Ezaki Glico Co., Ltd. | | | 56,000 | | | | 675,715 | |
Fancl Corp.(a) | | | 44,700 | | | | 605,089 | |
Foster Electric Co., Ltd.(a) | | | 17,200 | | | | 252,895 | |
Fuji Electric Co., Ltd.(a) | | | 178,000 | | | | 471,523 | |
Fuji Oil Co., Ltd. | | | 39,900 | | | | 570,658 | |
Fuji Seal International, Inc. | | | 15,600 | | | | 297,233 | |
Fuji Soft, Inc. | | | 16,100 | | | | 310,086 | |
Fujikura Ltd. | | | 92,000 | | | | 308,548 | |
Fujitec Co., Ltd. | | | 64,000 | | | | 424,619 | |
Fukuyama Transporting Co., Ltd.(a) | | | 157,000 | | | | 858,497 | |
Furukawa-Sky Aluminum Corp. | | | 93,000 | | | | 299,471 | |
Goldcrest Co., Ltd. | | | 22,220 | | | | 408,246 | |
Gunze Ltd. | | | 185,000 | | | | 544,018 | |
Gurunavi, Inc. | | | 30,955 | | | | 335,147 | |
H2O Retailing Corp.(a) | | | 82,000 | | | | 716,423 | |
Hakuhodo DY Holdings, Inc.(a) | | | 7,380 | | | | 466,322 | |
Hanwa Co., Ltd. | | | 105,000 | | | | 479,738 | |
Heiwa Real Estate Co., Ltd. | | | 269,500 | | | | 736,831 | |
Heiwado Co., Ltd. | | | 30,400 | | | | 412,253 | |
Higo Bank Ltd. (The) | | | 67,000 | | | | 398,931 | |
Hikari Tsushin, Inc. | | | 7,300 | | | | 215,731 | |
Hitachi Capital Corp. | | | 66,800 | | | | 1,000,032 | |
Hitachi Koki Co., Ltd. | | | 51,500 | | | | 473,729 | |
Hitachi Kokusai Electric, Inc. | | | 42,000 | | | | 387,363 | |
Hitachi Transport System Ltd.(a) | | | 40,900 | | | | 747,974 | |
Hitachi Zosen Corp. | | | 266,500 | | | | 349,742 | |
Hodogaya Chemical Co., Ltd. | | | 47,000 | | | | 156,486 | |
Hogy Medical Co., Ltd. | | | 6,800 | | | | 305,316 | |
Hokkoku Bank Ltd. (The) | | | 95,000 | | | | 359,013 | |
Hokuetsu Bank Ltd. (The) | | | 296,000 | | | | 636,636 | |
Hokuetsu Kishu Paper Co., Ltd.(a) | | | 123,000 | | | | 823,537 | |
Hokuto Corp. | | | 31,600 | | | | 669,285 | |
Hoshizaki Electric Co., Ltd. | | | 19,700 | | | | 467,275 | |
House Foods Corp. | | | 51,100 | | | | 878,626 | |
Hyakugo Bank Ltd. (The) | | | 36,000 | | | | 166,669 | |
Hyakujushi Bank Ltd. (The) | | | 175,000 | | | | 818,701 | |
Ichiyoshi Securities Co., Ltd. | | | 30,800 | | | | 217,821 | |
Iino Kaiun Kaisha Ltd. | | | 63,100 | | | | 287,533 | |
Inaba Denki Sangyo Co., Ltd. | | | 26,400 | | | | 796,860 | |
Inabata & Co., Ltd. | | | 57,000 | | | | 397,570 | |
Ines Corp. | | | 44,900 | | | | 360,095 | |
IT Holdings Corp. | | | 29,400 | | | | 345,819 | |
Ito En Ltd. | | | 50,400 | | | | 909,460 | |
Itochu Enex Co., Ltd. | | | 96,700 | | | | 574,595 | |
See Notes to Financial Statements.
| | | | |
| WisdomTree International Dividend and Sector Funds | | | 93 | |
Schedule of Investments (continued)
WisdomTree International SmallCap Dividend Fund (DLS)
March 31, 2012
| | | | | | | | |
| Investments | | Shares | | | Value | |
| | | | | | | | |
Itochu Techno-Solutions Corp.(a) | | | 21,400 | | | $ | 963,449 | |
Iwatani Corp. | | | 164,000 | | | | 550,021 | |
Izumi Co., Ltd. | | | 46,500 | | | | 882,028 | |
J Front Retailing Co., Ltd. | | | 199,000 | | | | 1,117,176 | |
Jaccs Co., Ltd. | | | 105,000 | | | | 376,390 | |
Jafco Co., Ltd. | | | 16,900 | | | | 412,155 | |
Japan Aviation Electronics Industry Ltd. | | | 41,000 | | | | 357,215 | |
Japan Vilene Co., Ltd. | | | 75,000 | | | | 349,049 | |
Japan Wool Textile Co., Ltd. (The) | | | 61,000 | | | | 478,097 | |
JFE Shoji Holdings, Inc.(a) | | | 123,000 | | | | 645,677 | |
J-Oil Mills, Inc.(a) | | | 131,000 | | | | 378,857 | |
Joshin Denki Co., Ltd. | | | 28,000 | | | | 278,316 | |
Juroku Bank Ltd. (The) | | | 196,000 | | | | 678,778 | |
Kaga Electronics Co., Ltd. | | | 20,700 | | | | 218,332 | |
Kagome Co., Ltd.(a) | | | 22,100 | | | | 435,045 | |
Kagoshima Bank Ltd. (The) | | | 84,000 | | | | 538,939 | |
Kaken Pharmaceutical Co., Ltd. | | | 87,000 | | | | 1,102,631 | |
Kandenko Co., Ltd. | | | 60,000 | | | | 293,092 | |
Kappa Create Co., Ltd.*(a) | | | 14,550 | | | | 314,709 | |
Kasumi Co., Ltd. | | | 64,700 | | | | 436,339 | |
Keihin Corp.(a) | | | 8,400 | | | | 156,374 | |
Keisei Electric Railway Co., Ltd.(a) | | | 76,000 | | | | 591,044 | |
Keiyo Bank Ltd. (The) | | | 104,000 | | | | 501,707 | |
Keiyo Co., Ltd.(a) | | | 55,800 | | | | 351,907 | |
Kewpie Corp. | | | 75,600 | | | | 1,119,830 | |
Kikkoman Corp.(a) | | | 67,000 | | | | 779,136 | |
Kinki Sharyo Co., Ltd. | | | 84,000 | | | | 321,526 | |
Kiyo Holdings, Inc. | | | 431,800 | | | | 645,378 | |
Kobayashi Pharmaceutical Co., Ltd.(a) | | | 8,300 | | | | 417,547 | |
Komeri Co., Ltd.(a) | | | 22,200 | | | | 636,367 | |
Komori Corp. | | | 49,300 | | | | 427,133 | |
Kose Corp. | | | 25,800 | | | | 587,824 | |
K’s Holdings Corp. | | | 9,900 | | | | 320,958 | |
Kurabo Industries Ltd. | | | 275,000 | | | | 538,004 | |
Kureha Corp. | | | 31,000 | | | | 149,924 | |
Kuroda Electric Co., Ltd. | | | 31,600 | | | | 349,810 | |
KYB Co., Ltd.(a) | | | 28,000 | | | | 171,140 | |
Kyokuyo Co., Ltd.(a) | | | 65,000 | | | | 156,389 | |
KYORIN Holdings, Inc. | | | 56,000 | | | | 1,066,310 | |
Kyoritsu Maintenance Co., Ltd. | | | 18,400 | | | | 389,039 | |
Kyudenko Corp. | | | 67,000 | | | | 395,674 | |
Lintec Corp. | | | 8,400 | | | | 171,276 | |
Lion Corp. | | | 163,000 | | | | 938,842 | |
Maeda Corp. | | | 108,000 | | | | 477,696 | |
Maeda Road Construction Co., Ltd. | | | 53,000 | | | | 662,701 | |
Mars Engineering Corp. | | | 26,900 | | | | 599,812 | |
Maruha Nichiro Holdings, Inc. | | | 250,000 | | | | 440,488 | |
Marui Group Co., Ltd. | | | 122,600 | | | | 1,027,936 | |
Matsuda Sangyo Co., Ltd. | | | 23,800 | | | | 392,738 | |
Matsumotokiyoshi Holdings Co., Ltd.(a) | | | 27,000 | | | | 588,918 | |
Max Co., Ltd. | | | 35,000 | | | | 442,736 | |
Medipal Holdings Corp. | | | 100,300 | | | | 1,306,539 | |
Meitec Corp. | | | 13,900 | | | | 281,902 | |
Michinoku Bank Ltd. (The) | | | 200,000 | | | | 410,718 | |
| | | | | | | | |
Mikuni Coca-Cola Bottling Co., Ltd. | | | 33,800 | | | $ | 290,377 | |
Mimasu Semiconductor Industry Co., Ltd. | | | 28,000 | | | | 268,109 | |
Minebea Co., Ltd. | | | 118,000 | | | | 517,626 | |
Miraca Holdings, Inc. | | | 13,300 | | | | 522,012 | |
Mitsubishi Logistics Corp. | | | 49,000 | | | | 581,724 | |
Mitsui Engineering & Shipbuilding Co., Ltd.(a) | | | 326,000 | | | | 570,436 | |
Mitsui Home Co., Ltd. | | | 73,000 | | | | 398,287 | |
Mitsui Mining & Smelting Co., Ltd. | | | 155,000 | | | | 438,848 | |
Mitsui-Soko Co., Ltd. | | | 102,000 | | | | 437,524 | |
Mitsumi Electric Co., Ltd.* | | | 22,300 | | | | 193,206 | |
Miura Co., Ltd. | | | 30,500 | | | | 794,975 | |
Miyazaki Bank Ltd. (The) | | | 140,000 | | | | 399,781 | |
Mochida Pharmaceutical Co., Ltd. | | | 75,000 | | | | 889,483 | |
Monex Group, Inc.(a) | | | 1,628 | | | | 358,063 | |
Morinaga & Co., Ltd. | | | 159,000 | | | | 370,958 | |
Morinaga Milk Industry Co., Ltd. | | | 134,000 | | | | 529,194 | |
Moshi Moshi Hotline, Inc. | | | 67,100 | | | | 674,302 | |
Musashino Bank Ltd. (The) | | | 19,000 | | | | 657,537 | |
Nagoya Railroad Co., Ltd.(a) | | | 142,000 | | | | 393,414 | |
NEC Fielding Ltd. | | | 24,500 | | | | 321,228 | |
NEC Networks & System Integration Corp. | | | 28,600 | | | | 410,781 | |
Nichii Gakkan Co. | | | 32,600 | | | | 438,919 | |
Nichirei Corp. | | | 170,000 | | | | 801,507 | |
Nidec Copal Corp. | | | 30,500 | | | | 400,267 | |
Nidec Sankyo Corp. | | | 74,000 | | | | 448,703 | |
Nifco, Inc. | | | 15,900 | | | | 437,035 | |
Nihon Dempa Kogyo Co., Ltd.(a) | | | 19,400 | | | | 293,964 | |
Nihon Kohden Corp. | | | 15,000 | | | | 403,913 | |
Nihon Nohyaku Co., Ltd. | | | 61,000 | | | | 273,516 | |
Nihon Unisys Ltd. | | | 66,800 | | | | 470,794 | |
Nippo Corp. | | | 47,000 | | | | 524,856 | |
Nippon Carbon Co., Ltd. | | | 108,000 | | | | 305,778 | |
Nippon Denko Co., Ltd. | | | 45,000 | | | | 221,459 | |
Nippon Kayaku Co., Ltd. | | | 97,000 | | | | 999,526 | |
Nippon Konpo Unyu Soko Co., Ltd. | | | 45,000 | | | | 556,109 | |
Nippon Paint Co., Ltd. | | | 66,000 | | | | 502,849 | |
Nippon Sharyo Ltd.(a) | | | 78,000 | | | | 324,151 | |
Nippon Shinyaku Co., Ltd. | | | 24,000 | | | | 297,758 | |
Nippon Signal Co., Ltd. (The) | | | 46,000 | | | | 288,985 | |
Nippon Soda Co., Ltd. | | | 72,000 | | | | 331,588 | |
Nippon Steel Trading Co., Ltd. | | | 100,000 | | | | 326,873 | |
Nippon Suisan Kaisha Ltd.(a) | | | 182,600 | | | | 625,715 | |
Nipro Corp.(a) | | | 66,000 | | | | 494,830 | |
Nishimatsu Construction Co., Ltd. | | | 210,000 | | | | 495,048 | |
Nishi-Nippon City Bank Ltd. (The) | | | 268,000 | | | | 762,039 | |
Nishi-Nippon Railroad Co., Ltd. | | | 188,000 | | | | 888,657 | |
Nissan Chemical Industries Ltd.(a) | | | 74,200 | | | | 700,570 | |
Nissan Shatai Co., Ltd. | | | 49,000 | | | | 515,633 | |
Nisshin Oillio Group Ltd. (The) | | | 104,000 | | | | 432,201 | |
Nisshin Steel Co., Ltd. | | | 234,000 | | | | 395,237 | |
Nisshinbo Holdings, Inc. | | | 64,000 | | | | 608,931 | |
Nissin Corp. | | | 107,000 | | | | 284,744 | |
Nissin Kogyo Co., Ltd.(a) | | | 21,900 | | | | 359,522 | |
Nitto Boseki Co., Ltd.(a) | | | 142,000 | | | | 559,062 | |
See Notes to Financial Statements.
| | |
| 94 | | WisdomTree International Dividend and Sector Funds |
Schedule of Investments (continued)
WisdomTree International SmallCap Dividend Fund (DLS)
March 31, 2012
| | | | | | | | |
| Investments | | Shares | | | Value | |
| | | | | | | | |
NOF Corp. | | | 130,000 | | | $ | 636,612 | |
NS Solutions Corp. | | | 29,400 | | | | 569,459 | |
NS United Kaiun Kaisha Ltd.*(a) | | | 137,000 | | | | 223,076 | |
Ogaki Kyoritsu Bank Ltd. (The) | | | 23,000 | | | | 83,286 | |
Oita Bank Ltd. (The) | | | 120,000 | | | | 384,957 | |
Okinawa Electric Power Co., Inc. (The) | | | 9,000 | | | | 374,020 | |
Onward Holdings Co., Ltd. | | | 113,000 | | | | 926,849 | |
Otsuka Corp. | | | 13,300 | | | | 1,087,660 | |
Paltac Corp. | | | 26,836 | | | | 387,401 | |
PanaHome Corp. | | | 90,000 | | | | 617,899 | |
Parco Co., Ltd. | | | 43,200 | | | | 417,853 | |
Park24 Co., Ltd. | | | 115,100 | | | | 1,559,469 | |
Pigeon Corp. | | | 9,900 | | | | 371,122 | |
Plenus Co., Ltd. | | | 44,900 | | | | 816,760 | |
Point, Inc. | | | 4,930 | | | | 183,014 | |
Pola Orbis Holdings, Inc. | | | 16,216 | | | | 486,707 | |
Raito Kogyo Co., Ltd. | | | 26,300 | | | | 155,317 | |
Rengo Co., Ltd. | | | 117,000 | | | | 814,642 | |
Resorttrust, Inc.(a) | | | 42,500 | | | | 693,572 | |
Round One Corp.(a) | | | 53,500 | | | | 354,955 | |
Ryobi Ltd. | | | 75,000 | | | | 286,166 | |
Ryoden Trading Co., Ltd. | | | 52,000 | | | | 315,305 | |
Ryohin Keikaku Co., Ltd. | | | 15,500 | | | | 806,124 | |
Ryosan Co., Ltd. | | | 6,900 | | | | 139,518 | |
San-Ai Oil Co., Ltd. | | | 63,000 | | | | 329,182 | |
San-In Godo Bank Ltd. (The) | | | 69,000 | | | | 549,183 | |
Sanken Electric Co., Ltd.* | | | 51,622 | | | | 246,521 | |
Sanki Engineering Co., Ltd. | | | 83,000 | | | | 450,829 | |
Sankyu, Inc. | | | 168,000 | | | | 661,425 | |
Sanshin Electronics Co., Ltd. | | | 29,300 | | | | 248,157 | |
Sanyo Chemical Industries Ltd. | | | 89,000 | | | | 596,974 | |
Sanyo Shokai Ltd. | | | 84,000 | | | | 228,641 | |
Sanyo Special Steel Co., Ltd.(a) | | | 54,000 | | | | 294,623 | |
Sapporo Hokuyo Holdings, Inc. | | | 77,700 | | | | 287,970 | |
Sapporo Holdings Ltd. | | | 142,000 | | | | 528,003 | |
Sasebo Heavy Industries Co., Ltd.(a) | | | 217,000 | | | | 363,886 | |
SBI Holdings, Inc. | | | 5,524 | | | | 524,241 | |
Scroll Corp. | | | 96,608 | | | | 388,569 | |
SCSK Corp.(a) | | | 28,900 | | | | 460,742 | |
Seino Holdings Corp. | | | 76,000 | | | | 552,257 | |
Sekisui Plastics Co., Ltd. | | | 76,000 | | | | 279,823 | |
Senko Co., Ltd. | | | 106,000 | | | | 427,632 | |
Senshu Ikeda Holdings, Inc. | | | 471,100 | | | | 658,321 | |
Shiga Bank Ltd. (The) | | | 82,000 | | | | 493,226 | |
Shikoku Bank Ltd. (The) | | | 132,000 | | | | 497,236 | |
Shimachu Co., Ltd. | | | 16,000 | | | | 379,124 | |
Shinko Electric Industries Co., Ltd.(a) | | | 61,900 | | | | 607,755 | |
Shinko Plantech Co., Ltd. | | | 35,700 | | | | 305,833 | |
Shinmaywa Industries Ltd. | | | 142,000 | | | | 710,906 | |
Sinanen Co., Ltd. | | | 111,000 | | | | 488,268 | |
SMK Corp. | | | 84,000 | | | | 292,946 | |
Sotetsu Holdings, Inc.(a) | | | 196,000 | | | | 616,854 | |
Square Enix Holdings Co., Ltd.(a) | | | 48,100 | | | | 1,015,831 | |
Star Micronics Co., Ltd. | | | 30,100 | | | | 299,921 | |
| | | | | | | | |
Sumitomo Bakelite Co., Ltd.(a) | | | 145,000 | | | $ | 768,212 | |
Sumitomo Osaka Cement Co., Ltd. | | | 179,000 | | | | 524,200 | |
Sumitomo Warehouse Co., Ltd. (The) | | | 111,000 | | | | 575,940 | |
Sundrug Co., Ltd. | | | 12,900 | | | | 401,288 | |
Suruga Bank Ltd. | | | 85,000 | | | | 872,775 | |
Suzuken Co., Ltd. | | | 49,200 | | | | 1,525,711 | |
Taiheiyo Cement Corp.(a) | | | 206,000 | | | | 460,587 | |
Taiyo Holdings Co., Ltd.(a) | | | 31,600 | | | | 852,445 | |
Taiyo Yuden Co., Ltd.(a) | | | 23,000 | | | | 246,503 | |
Takaoka Electric Manufacturing Co., Ltd.(a) | | | 52,000 | | | | 161,760 | |
Takara Holdings, Inc. | | | 25,000 | | | | 171,031 | |
Takara Standard Co., Ltd. | | | 75,000 | | | | 557,750 | |
Takashimaya Co., Ltd. | | | 112,000 | | | | 934,978 | |
Tamron Co., Ltd. | | | 12,300 | | | | 398,915 | |
Tochigi Bank Ltd. (The) | | | 87,000 | | | | 325,609 | |
Toda Corp. | | | 45,000 | | | | 152,014 | |
Toei Co., Ltd. | | | 91,000 | | | | 472,167 | |
Toho Bank Ltd. (The) | | | 93,000 | | | | 319,813 | |
Toho Holdings Co., Ltd. | | | 40,600 | | | | 725,220 | |
Tohoku Bank Ltd. (The) | | | 225,051 | | | | 410,203 | |
Tokai Carbon Co., Ltd. | | | 74,000 | | | | 396,549 | |
Tokai Rika Co., Ltd. | | | 30,800 | | | | 531,080 | |
Tokai Rubber Industries Ltd. | | | 31,000 | | | | 394,021 | |
Tokai Tokyo Financial Holdings, Inc. | | | 106,580 | | | | 400,185 | |
Tokuyama Corp.(a) | | | 89,000 | | | | 277,939 | |
Tokyo Energy & Systems, Inc. | | | 66,000 | | | | 391,372 | |
TOMONY Holdings, Inc. | | | 111,049 | | | | 542,459 | |
Toppan Forms Co., Ltd. | | | 54,200 | | | | 499,882 | |
Toshiba Plant Systems & Services Corp. | | | 40,000 | | | | 462,726 | |
Toshiba TEC Corp. | | | 140,000 | | | | 557,993 | |
Touei Housing Corp. | | | 25,400 | | | | 269,756 | |
Toyo Corp. | | | 24,600 | | | | 269,032 | |
Toyo Ink SC Holdings Co., Ltd. | | | 193,000 | | | | 799,721 | |
Toyo Tire & Rubber Co., Ltd. | | | 124,000 | | | | 348,065 | |
Toyobo Co., Ltd. | | | 166,000 | | | | 238,022 | |
TS Tech Co., Ltd. | | | 22,400 | | | | 441,767 | |
Tsukuba Bank Ltd. | | | 92,700 | | | | 326,666 | |
Tsumura & Co.(a) | | | 20,200 | | | | 586,891 | |
Uchida Yoko Co., Ltd. | | | 109,000 | | | | 348,344 | |
Ulvac, Inc.*(a) | | | 10,400 | | | | 114,875 | |
Union Tool Co. | | | 11,500 | | | | 215,481 | |
UNY Co., Ltd. | | | 82,100 | | | | 893,877 | |
Valor Co., Ltd. | | | 43,200 | | | | 723,893 | |
Wacoal Holdings Corp.(a) | | | 36,000 | | | | 429,139 | |
Xebio Co., Ltd. | | | 20,700 | | | | 555,136 | |
Yamagata Bank Ltd. (The) | | | 74,000 | | | | 353,387 | |
Yamaha Corp. | | | 38,900 | | | | 405,568 | |
Yamato Kogyo Co., Ltd. | | | 12,800 | | | | 375,624 | |
Yodogawa Steel Works Ltd. | | | 90,000 | | | | 394,799 | |
Yokohama Rubber Co., Ltd. (The) | | | 141,000 | | | | 1,021,156 | |
| | | | | | | | |
| Total Japan | | | | | | | 157,214,046 | |
| Netherlands – 1.6% | | | | | | | | |
Arcadis N.V. | | | 41,359 | | | | 863,069 | |
See Notes to Financial Statements.
| | | | |
| WisdomTree International Dividend and Sector Funds | | | 95 | |
Schedule of Investments (continued)
WisdomTree International SmallCap Dividend Fund (DLS)
March 31, 2012
| | | | | | | | |
| Investments | | Shares | | | Value | |
| | | | | | | | |
ASM International N.V. | | | 10,037 | | | $ | 385,617 | |
Beter Bed Holding N.V. | | | 15,719 | | | | 353,767 | |
BinckBank N.V. | | | 73,559 | | | | 797,186 | |
CSM | | | 30,459 | | | | 546,171 | |
Exact Holding N.V. | | | 34,993 | | | | 824,823 | |
Koninklijke BAM Groep N.V. | | | 47,205 | | | | 221,780 | |
Koninklijke Wessanen N.V. | | | 49,924 | | | | 174,121 | |
Mediq N.V. | | | 31,901 | | | | 500,869 | |
Sligro Food Group N.V. | | | 27,735 | | | | 899,729 | |
TKH Group N.V. | | | 36,151 | | | | 980,418 | |
USG People N.V. | | | 21,196 | | | | 212,547 | |
| | | | | | | | |
| Total Netherlands | | | | | | | 6,760,097 | |
| New Zealand – 2.6% | | | | | | | | |
Air New Zealand Ltd. | | | 1,210,588 | | | | 843,214 | |
DNZ Property Fund Ltd. | | | 149,880 | | | | 167,034 | |
Fisher & Paykel Healthcare Corp., Ltd. | | | 377,851 | | | | 693,571 | |
Freightways Ltd. | | | 299,708 | | | | 970,103 | |
Infratil Ltd. | | | 103,911 | | | | 160,933 | |
Kathmandu Holdings Ltd. | | | 176,771 | | | | 236,232 | |
Nuplex Industries Ltd. | | | 132,487 | | | | 279,016 | |
Ryman Healthcare Ltd. | | | 322,004 | | | | 815,346 | |
Sky Network Television Ltd. | | | 301,634 | | | | 1,280,361 | |
SKYCITY Entertainment Group Ltd. | | | 599,454 | | | | 1,935,417 | |
Tower Ltd. | | | 544,549 | | | | 745,205 | |
Vector Ltd. | | | 1,169,957 | | | | 2,483,088 | |
Warehouse Group Ltd. (The) | | | 251,237 | | | | 574,394 | |
| | | | | | | | |
| Total New Zealand | | | | | | | 11,183,914 | |
| Norway – 2.1% | | | | | | | | |
ABG Sundal Collier Holding ASA | | | 881,320 | | | | 763,268 | |
Aker ASA Class A | | | 64,424 | | | | 2,106,412 | |
Atea ASA | | | 105,800 | | | | 1,275,191 | |
Austevoll Seafood ASA | | | 144,401 | | | | 551,878 | |
Leroey Seafood Group ASA | | | 19,607 | | | | 323,114 | |
Sparebank 1 Nord Norge | | | 40,694 | | | | 226,155 | |
SpareBank 1 SMN(a) | | | 71,903 | | | | 461,365 | |
SpareBank 1 SR Bank ASA(a) | | | 74,755 | | | | 537,330 | |
Tomra Systems ASA | | | 122,274 | | | | 996,790 | |
Veidekke ASA | | | 188,826 | | | | 1,602,226 | |
| | | | | | | | |
| Total Norway | | | | | | | 8,843,729 | |
| Portugal – 0.8% | | | | | | | | |
Mota–Engil, SGPS, S.A. | | | 2,270 | | | | 3,679 | |
REN – Redes Energeticas Nacionais S.A. | | | 72,491 | | | | 219,137 | |
Semapa-Sociedade de Investimento e Gestao, SGPS, S.A.*(a) | | | 59,891 | | | | 440,816 | |
Sonae(a) | | | 1,709,621 | | | | 1,015,409 | |
Sonaecom – SGPS S.A.(a) | | | 307,467 | | | | 497,486 | |
Zon Multimedia Servicos de Telecomunicacoes e Multimedia, SGPS, S.A.(a) | | | 309,732 | | | | 1,051,799 | |
| | | | | | | | |
| Total Portugal | | | | | | | 3,228,326 | |
| Singapore – 3.6% | | | | | | | | |
Baker Technology Ltd. | | | 1,120,323 | | | | 271,761 | |
China Aviation Oil Singapore Corp., Ltd. | | | 509,000 | | | | 473,639 | |
| | | | | | | | |
Chip Eng Seng Corp., Ltd. | | | 1,057,000 | | | $ | 437,142 | |
Cityspring Infrastructure Trust | | | 1,695,649 | | | | 519,207 | |
CSE Global Ltd. | | | 283,000 | | | | 185,688 | |
First Resources Ltd.(a) | | | 463,000 | | | | 703,328 | |
Goodpack Ltd. | | | 127,000 | | | | 178,781 | |
Hi-P International Ltd. | | | 814,000 | | | | 637,682 | |
Ho Bee Investment Ltd. | | | 158,000 | | | | 177,182 | |
Hong Leong Asia Ltd. | | | 274,000 | | | | 423,852 | |
Hyflux Ltd.(a) | | | 382,500 | | | | 454,796 | |
K-Green Trust(a) | | | 480,000 | | | | 377,938 | |
M1 Ltd. | | | 798,000 | | | | 1,612,057 | |
Midas Holdings Ltd. | | | 422,000 | | | | 127,538 | |
Otto Marine Ltd. | | | 1,692,274 | | | | 170,930 | |
Raffles Medical Group Ltd. | | | 91,000 | | | | 167,909 | |
Rotary Engineering Ltd. | | | 604,000 | | | | 341,066 | |
Sabana Shari’ah Compliant Industrial Real Estate Investment Trust | | | 685,951 | | | | 521,003 | |
SC Global Developments Ltd. | | | 424,000 | | | | 360,822 | |
Singapore Post Ltd. | | | 1,695,000 | | | | 1,375,035 | |
STX OSV Holdings Ltd. | | | 349,855 | | | | 491,108 | |
Super Group Ltd. | | | 123,000 | | | | 176,574 | |
Tat Hong Holdings Ltd. | | | 486,000 | | | | 359,470 | |
United Engineers Ltd. | | | 326,000 | | | | 653,374 | |
UOB-Kay Hian Holdings Ltd. | | | 862,000 | | | | 1,158,611 | |
Venture Corp., Ltd. | | | 273,000 | | | | 1,849,891 | |
Wing Tai Holdings Ltd. | | | 774,000 | | | | 787,943 | |
Yongnam Holdings Ltd. | | | 1,141,943 | | | | 231,595 | |
| | | | | | | | |
| Total Singapore | | | | | | | 15,225,922 | |
| Spain – 1.4% | | | | | | | | |
Almirall S.A. | | | 148,116 | | | | 1,288,017 | |
Antena 3 de Television S.A.(a) | | | 262,841 | | | | 1,568,113 | |
Caja de Ahorros del Mediterraneo(a) | | | 46,484 | | | | 82,950 | |
Duro Felguera S.A. | | | 202,889 | | | | 1,315,812 | |
Gamesa Corp. Tecnologica S.A.(a) | | | 71,879 | | | | 227,912 | |
Grupo Empresarial Ence S.A. | | | 156,442 | | | | 388,542 | |
Melia Hotels International S.A. | | | 24,600 | | | | 167,075 | |
Viscofan S.A. | | | 20,329 | | | | 908,270 | |
| | | | | | | | |
| Total Spain | | | | | | | 5,946,691 | |
| Sweden – 4.7% | | | | | | | | |
AarhusKarlshamn AB(a) | | | 21,892 | | | | 689,553 | |
Atrium Ljungberg AB Class B | | | 20,943 | | | | 248,399 | |
Axfood AB | | | 35,920 | | | | 1,287,314 | |
Axis Communications AB | | | 49,423 | | | | 1,333,271 | |
Bilia AB Class A | | | 36,142 | | | | 712,180 | |
Billerud AB | | | 72,930 | | | | 673,207 | |
Fabege AB(a) | | | 194,765 | | | | 1,674,568 | |
Hoganas AB Class B | | | 18,824 | | | | 685,118 | |
Holmen AB Class B | | | 34,584 | | | | 947,036 | |
Husqvarna AB Class A(a) | | | 73,813 | | | | 440,741 | |
Intrum Justitia AB | | | 82,119 | | | | 1,361,358 | |
Investment AB Oresund* | | | 35,440 | | | | 568,826 | |
JM AB | | | 42,149 | | | | 778,143 | |
Kungsleden AB | | | 109,431 | | | | 758,638 | |
See Notes to Financial Statements.
| | |
| 96 | | WisdomTree International Dividend and Sector Funds |
Schedule of Investments (continued)
WisdomTree International SmallCap Dividend Fund (DLS)
March 31, 2012
| | | | | | | | |
| Investments | | Shares | | | Value | |
| | | | | | | | |
Lindab International AB | | | 25,334 | | | $ | 201,592 | |
Loomis AB Class B | | | 58,842 | | | | 838,022 | |
Mekonomen AB | | | 32,517 | | | | 1,041,371 | |
MQ Holding AB | | | 88,418 | | | | 338,462 | |
NCC AB Class B | | | 77,720 | | | | 1,633,967 | |
New Wave Group AB Class B | | | 41,737 | | | | 215,121 | |
Nibe Industrier AB Class B | | | 20,432 | | | | 325,632 | |
Nolato AB Class B | | | 20,136 | | | | 213,185 | |
SkiStar AB | | | 32,926 | | | | 400,698 | |
SSAB AB Class B(a) | | | 26,286 | | | | 214,516 | |
Svenska Cellulosa AB Class A(a) | | | 54,439 | | | | 938,582 | |
Wihlborgs Fastigheter AB | | | 113,257 | | | | 1,595,926 | |
| | | | | | | | |
| Total Sweden | | | | | | | 20,115,426 | |
| Switzerland – 0.3% | | | | | | | | |
EFG International AG* | | | 41,057 | | | | 399,736 | |
Kudelski S.A. | | | 14,091 | | | | 100,712 | |
Mobilezone Holding AG | | | 86,807 | | | | 984,424 | |
| | | | | | | | |
| Total Switzerland | | | | | | | 1,484,872 | |
| United Kingdom – 13.3% | | | | | | | | |
Ashtead Group PLC | | | 193,520 | | | | 798,964 | |
BBA Aviation PLC | | | 355,807 | | | | 1,216,570 | |
Bellway PLC | | | 26,030 | | | | 340,202 | |
Bodycote PLC | | | 125,611 | | | | 775,084 | |
Booker Group PLC | | | 444,185 | | | | 598,274 | |
Brewin Dolphin Holdings PLC | | | 319,228 | | | | 902,783 | |
Britvic PLC | | | 142,348 | | | | 874,949 | |
Cable & Wireless Communications PLC | | | 4,838,934 | | | | 2,496,472 | |
Cable & Wireless Worldwide PLC | | | 3,512,168 | | | | 1,907,933 | |
Chemring Group PLC | | | 51,519 | | | | 335,432 | |
Chesnara PLC | | | 171,014 | | | | 510,954 | |
Cineworld Group PLC | | | 243,063 | | | | 843,699 | |
Close Brothers Group PLC | | | 138,933 | | | | 1,742,545 | |
Computacenter PLC | | | 117,377 | | | | 827,048 | |
Cranswick PLC | | | 30,065 | | | | 386,693 | |
De La Rue PLC | | | 79,221 | | | | 1,139,178 | |
Debenhams PLC | | | 337,421 | | | | 435,605 | |
Domino Printing Sciences PLC | | | 78,638 | | | | 701,093 | |
Domino’s Pizza UK & IRL PLC | | | 23,669 | | | | 163,219 | |
DS Smith PLC | | | 278,333 | | | | 796,470 | |
Dunelm Group PLC | | | 98,973 | | | | 820,716 | |
Electrocomponents PLC | | | 249,574 | | | | 988,120 | |
Elementis PLC | | | 291,787 | | | | 860,610 | |
Euromoney Institutional Investor PLC | | | 58,306 | | | | 708,004 | |
F&C Asset Management PLC | | | 147,618 | | | | 157,788 | |
Fenner PLC | | | 59,344 | | | | 411,031 | |
Fidessa Group PLC | | | 21,704 | | | | 573,914 | |
Filtrona PLC | | | 137,655 | | | | 1,044,707 | |
Game Group PLC(a)† | | | 614,597 | | | | — | |
Greene King PLC | | | 188,485 | | | | 1,544,910 | |
Halfords Group PLC | | | 180,792 | | | | 897,201 | |
Hill & Smith Holdings PLC | | | 90,300 | | | | 483,327 | |
Hunting PLC | | | 87,455 | | | | 1,323,954 | |
Interserve PLC | | | 215,109 | | | | 1,001,170 | |
| | | | | | | | |
ITE Group PLC | | | 241,927 | | | $ | 858,117 | |
JD Wetherspoon PLC | | | 60,770 | | | | 399,450 | |
Jupiter Fund Management PLC | | | 104,654 | | | | 416,188 | |
Kcom Group PLC | | | 198,814 | | | | 233,477 | |
Kesa Electricals PLC | | | 415,730 | | | | 464,963 | |
Kier Group PLC | | | 47,685 | | | | 863,980 | |
Ladbrokes PLC | | | 671,339 | | | | 1,717,284 | |
Laird PLC | | | 202,794 | | | | 697,279 | |
London & Stamford Property PLC | | | 465,106 | | | | 820,408 | |
Marston’s PLC | | | 439,331 | | | | 688,604 | |
Mears Group PLC | | | 69,812 | | | | 284,990 | |
Micro Focus International PLC | | | 67,281 | | | | 508,467 | |
Mitie Group PLC | | | 39,851 | | | | 177,963 | |
Moneysupermarket.com Group PLC | | | 494,358 | | | | 1,002,333 | |
Morgan Crucible Co. PLC | | | 191,622 | | | | 985,848 | |
Morgan Sindall Group PLC | | | 83,371 | | | | 903,137 | |
Mothercare PLC | | | 82,904 | | | | 219,883 | |
N. Brown Group PLC | | | 220,759 | | | | 818,305 | |
National Express Group PLC | | | 171,835 | | | | 661,390 | |
Phoenix IT Group Ltd. | | | 63,998 | | | | 199,137 | |
Premier Farnell PLC | | | 293,837 | | | | 1,007,500 | |
Promethean World PLC | | | 235,205 | | | | 279,031 | |
Provident Financial PLC | | | 155,850 | | | | 2,853,648 | |
Renishaw PLC(a) | | | 13,796 | | | | 293,166 | |
Rightmove PLC | | | 26,354 | | | | 611,395 | |
RPC Group PLC | | | 128,214 | | | | 753,863 | |
RPS Group PLC | | | 135,663 | | | | 513,928 | |
RSM Tenon Group PLC | | | 695,695 | | | | 94,370 | |
Savills PLC | | | 148,834 | | | | 897,693 | |
Shanks Group PLC | | | 164,740 | | | | 259,923 | |
Smiths News PLC | | | 329,036 | | | | 466,574 | |
Sportingbet PLC | | | 501,996 | | | | 302,779 | |
St. Modwen Properties PLC | | | 10,365 | | | | 30,596 | |
Sthree PLC | | | 125,651 | | | | 673,546 | |
Synergy Health PLC | | | 43,488 | | | | 589,910 | |
TalkTalk Telecom Group PLC | | | 130,459 | | | | 284,522 | |
Telecom Plus PLC | | | 71,695 | | | | 792,691 | |
Tullett Prebon PLC | | | 172,849 | | | | 966,593 | |
Ultra Electronics Holdings PLC | | | 26,836 | | | | 749,923 | |
Victrex PLC | | | 31,712 | | | | 684,016 | |
WH Smith PLC | | | 116,245 | | | | 1,012,231 | |
Wilmington Group PLC | | | 164,223 | | | | 257,796 | |
WS Atkins PLC | | | 19,298 | | | | 226,317 | |
WSP Group PLC | | | 54,419 | | | | 220,413 | |
| | | | | | | | |
| Total United Kingdom | | | | | | | 56,352,246 | |
TOTAL COMMON STOCKS
(Cost: $381,677,298) | | | | | | | 420,278,987 | |
| EXCHANGE-TRADED FUNDS – 0.1% | | | | | | | | |
| United States – 0.1% | | | | | | | | |
WisdomTree Europe SmallCap Dividend Fund(a)(c) | | | 3,286 | | | | 126,577 | |
WisdomTree Japan SmallCap Dividend Fund(c) | | | 2,317 | | | | 105,609 | |
| | | | | | | | |
TOTAL EXCHANGE-TRADED FUNDS
(Cost: $197,706) | | | | | | | 232,186 | |
See Notes to Financial Statements.
| | | | |
| WisdomTree International Dividend and Sector Funds | | | 97 | |
Schedule of Investments (concluded)
WisdomTree International SmallCap Dividend Fund (DLS)
March 31, 2012
| | | | | | | | |
| Investments | | Shares | | | Value | |
| | | | | | | | |
| INVESTMENT OF CASH COLLATERAL FOR SECURITIES LOANED – 12.7% | | | | | | | | |
| MONEY MARKET FUND – 12.7% | | | | | | | | |
Dreyfus Institutional Preferred Money Market Fund, 0.18%(d)
(Cost: $53,904,019)(e) | | | 53,904,019 | | | $ | 53,904,019 | |
TOTAL INVESTMENTS IN SECURITIES – 111.8%
(Cost: $435,779,023) | | | | 474,415,192 | |
Liabilities in Excess of Foreign Currency and Other Assets – (11.8)% | | | | | | | (50,150,849 | ) |
| | | | | | | | |
| NET ASSETS – 100.0% | | | | | | $ | 424,264,343 | |
RSP – Risparmio Italian Savings Shares
| * | Non-income producing security. |
| † | Security is being fair valued by a valuation committee under the direction of the Board of Trustees. The aggregate value of fair valued securities is $0, which represents 0.0% of net assets. |
| (a) | Security, or portion thereof, was on loan at March 31, 2012 (See Note 2). |
| (b) | Stapled Security – A security contractually bound to one or more other securities to form a single saleable unit which cannot be sold separately. |
| (c) | Affiliated company (See Note 7). |
| (d) | Rate shown represents annualized 7-day yield as of March 31, 2012. |
| (e) | At March 31, 2012, the total market value of the Fund’s securities on loan was $49,974,592 and the total market value of the collateral held by the Fund was $53,904,019. |
See Notes to Financial Statements.
| | |
| 98 | | WisdomTree International Dividend and Sector Funds |
Schedule of Investments
WisdomTree Emerging Markets Equity Income Fund (DEM)
March 31, 2012
| | | | | | | | |
| Investments | | Shares | | | Value | |
| | | | | | | | |
| COMMON STOCKS – 99.5% | | | | | | | | |
| Argentina – 1.6% | | | | | | | | |
Banco Macro S.A. ADR | | | 310,057 | | | $ | 6,080,218 | |
BBVA Banco Frances S.A. ADR | | | 1,238,716 | | | | 7,469,457 | |
IRSA Inversiones y Representaciones S.A. ADR | | | 205,974 | | | | 2,082,397 | |
Telecom Argentina S.A. ADR | | | 219,593 | | | | 3,891,188 | |
YPF S.A. ADR | | | 1,325,439 | | | | 37,655,722 | |
| | | | | | | | |
| Total Argentina | | | | | | | 57,178,982 | |
| Brazil – 21.1% | | | | | | | | |
AES Tiete S.A. | | | 1,185,492 | | | | 16,154,871 | |
Banco do Brasil S.A. | | | 6,718,632 | | | | 95,496,425 | |
Banco Santander Brasil S.A. | | | 9,663,700 | | | | 88,993,126 | |
BM&F Bovespa S.A. | | | 4,997,100 | | | | 30,651,510 | |
CCR S.A. | | | 4,420,700 | | | | 35,791,119 | |
Cia de Bebidas das Americas | | | 3,612,400 | | | | 124,749,877 | |
Cia de Saneamento de Minas Gerais-COPASA | | | 459,000 | | | | 10,813,912 | |
Cia Energetica de Minas Gerais | | | 1,137,505 | | | | 23,295,065 | |
Cia Siderurgica Nacional S.A. | | | 3,947,000 | | | | 37,126,854 | |
Cielo S.A. | | | 2,076,766 | | | | 70,136,246 | |
CPFL Energia S.A. | | | 2,905,180 | | | | 43,666,083 | |
EDP – Energias do Brasil S.A. | | | 436,700 | | | | 9,900,736 | |
Equatorial Energia S.A. | | | 1,273,000 | | | | 9,420,325 | |
Eternit S.A. | | | 242,200 | | | | 1,218,767 | |
Helbor Empreendimentos S.A. | | | 325,744 | | | | 4,892,499 | |
JHSF Participacoes S.A. | | | 2,739,683 | | | | 8,980,598 | |
Light S.A. | | | 1,275,939 | | | | 17,939,941 | |
Natura Cosmeticos S.A. | | | 678,500 | | | | 14,672,381 | |
Paranapanema S.A. | | | 1,933,082 | | | | 3,380,218 | |
Redecard S.A. | | | 2,920,000 | | | | 56,741,764 | |
Souza Cruz S.A. | | | 3,785,100 | | | | 57,680,085 | |
Sul America S.A. | | | 630,717 | | | | 5,846,311 | |
| | | | | | | | |
| Total Brazil | | | | | | | 767,548,713 | |
| Chile – 5.2% | | | | | | | | |
AES Gener S.A. | | | 18,699,926 | | | | 11,475,851 | |
Aguas Andinas S.A. Class A | | | 15,341,615 | | | | 9,176,998 | |
Banco de Chile | | | 225,458,682 | | | | 35,628,153 | |
Banco Santander Chile | | | 446,252,505 | | | | 37,060,487 | |
Cia General de Electricidad S.A. | | | 608,796 | | | | 3,190,333 | |
Corpbanca | | | 821,621,668 | | | | 11,081,752 | |
Empresa Nacional de Electricidad S.A. | | | 14,216,508 | | | | 25,614,178 | |
Enersis S.A. | | | 60,075,430 | | | | 24,380,914 | |
ENTEL Chile S.A. | | | 824,944 | | | | 16,686,801 | |
Inversiones Aguas Metropolitanas S.A. | | | 2,444,319 | | | | 4,131,032 | |
Quinenco S.A. | | | 3,397,986 | | | | 10,705,239 | |
| | | | | | | | |
| Total Chile | | | | | | | 189,131,738 | |
| China – 2.8% | | | | | | | | |
Bank of China Ltd. Class H | | | 184,624,000 | | | | 74,429,820 | |
Beijing Capital Land Ltd. Class H | | | 5,916,000 | | | | 1,668,732 | |
Great Wall Technology Co., Ltd. Class H | | | 970,000 | | | | 224,884 | |
Guangzhou R&F Properties Co., Ltd. Class H(a) | | | 7,405,200 | | | | 8,822,527 | |
| | | | | | | | |
Huaneng Power International, Inc. Class H(a) | | | 17,502,000 | | | $ | 9,512,937 | |
Jiangsu Expressway Co., Ltd. Class H | | | 1,265,646 | | | | 1,224,240 | |
Weiqiao Textile Co., Ltd. Class H | | | 3,057,500 | | | | 1,575,219 | |
Xiamen International Port Co., Ltd. Class H | | | 3,630,000 | | | | 481,569 | |
Xinjiang Xinxin Mining Industry Co., Ltd. Class H | | | 9,509,000 | | | | 2,669,966 | |
Zhejiang Expressway Co., Ltd. Class H | | | 4,172,724 | | | | 3,117,182 | |
| | | | | | | | |
| Total China | | | | | | | 103,727,076 | |
| Czech Republic – 3.3% | | | | | | | | |
CEZ AS(a) | | | 1,460,486 | | | | 62,483,488 | |
Komercni Banka AS(a) | | | 97,004 | | | | 19,235,420 | |
Telefonica Czech Republic AS(a) | | | 1,777,258 | | | | 37,137,104 | |
| | | | | | | | |
| Total Czech Republic | | | | | | | 118,856,012 | |
| Hungary – 0.3% | | | | | | | | |
Magyar Telekom Telecommunications PLC | | | 4,749,496 | | | | 12,394,835 | |
| Indonesia – 1.8% | | | | | | | | |
Bank Pembangunan Daerah Jawa Barat Dan Banten Tbk PT | | | 48,078,494 | | | | 5,836,300 | |
Perusahaan Gas Negara Persero Tbk PT | | | 46,131,000 | | | | 19,170,801 | |
Telekomunikasi Indonesia Persero Tbk PT | | | 32,800,500 | | | | 25,109,744 | |
Vale Indonesia Tbk PT | | | 42,341,000 | | | | 15,627,830 | |
| | | | | | | | |
| Total Indonesia | | | | | | | 65,744,675 | |
| Israel – 3.3% | | | | | | | | |
Amot Investments Ltd. | | | 1,823,239 | | | | 4,758,713 | |
Bank Leumi Le-Israel BM | | | 4,697,394 | | | | 14,796,538 | |
Bezeq The Israeli Telecommunication Corp., Ltd. | | | 15,724,090 | | | | 25,825,164 | |
British Israel Investments Ltd. | | | 1,294,879 | | | | 4,843,573 | |
Cellcom Israel Ltd. | | | 870,707 | | | | 11,031,773 | |
Clal Industries and Investments Ltd. | | | 522,235 | | | | 1,928,101 | |
Clal Insurance Enterprise Holdings, Ltd. | | | 176,601 | | | | 2,609,961 | |
Delek Automotive Systems Ltd. | | | 13,158 | | | | 106,705 | |
Delek Group Ltd. | | | 41,326 | | | | 8,086,878 | |
Discount Investment Corp. | | | 792,531 | | | | 4,340,967 | |
First International Bank of Israel Ltd.* | | | 811,628 | | | | 8,777,315 | |
Harel Insurance Investments & Financial Services Ltd. | | | 129,965 | | | | 4,475,871 | |
Ituran Location and Control Ltd. | | | 12,765 | | | | 171,577 | |
Jerusalem Economy Ltd.* | | | 891,962 | | | | 6,215,830 | |
Mizrahi Tefahot Bank Ltd. | | | 625,214 | | | | 5,635,019 | |
Osem Investments Ltd. | | | 118,413 | | | | 1,823,458 | |
Partner Communications Co., Ltd. | | | 585,600 | | | | 4,518,343 | |
Phoenix Holdings Ltd. (The) | | | 1,085,442 | | | | 2,617,297 | |
Shikun & Binui Ltd. | | | 1,111,378 | | | | 1,928,726 | |
Shufersal Ltd. | | | 1,841,616 | | | | 6,704,913 | |
| | | | | | | | |
| Total Israel | | | | | | | 121,196,722 | |
| Malaysia – 9.1% | | | | | | | | |
Batu Kawan Bhd | | | 440,100 | | | | 2,683,554 | |
Berjaya Sports Toto Bhd | | | 2,542,000 | | | | 3,626,094 | |
Boustead Holdings Bhd | | | 3,655,097 | | | | 6,478,595 | |
British American Tobacco Malaysia Bhd | | | 603,150 | | | | 11,147,496 | |
DiGi.Com Bhd | | | 28,683,200 | | | | 38,013,316 | |
See Notes to Financial Statements.
| | | | |
| WisdomTree International Dividend and Sector Funds | | | 99 | |
Schedule of Investments (continued)
WisdomTree Emerging Markets Equity Income Fund (DEM)
March 31, 2012
| | | | | | | | |
| Investments | | Shares | | | Value | |
| | | | | | | | |
Lafarge Malayan Cement Bhd | | | 2,844,627 | | | $ | 6,685,593 | |
Malayan Banking Bhd | | | 29,104,600 | | | | 84,268,909 | |
Maxis Bhd | | | 18,743,800 | | | | 37,261,218 | |
MISC Bhd | | | 12,336,717 | | | | 21,665,264 | |
OSK Holdings Bhd | | | 1,660,200 | | | | 921,280 | |
Petronas Dagangan Bhd | | | 2,485,600 | | | | 15,367,150 | |
Petronas Gas Bhd | | | 5,612,372 | | | | 30,851,100 | |
Pharmaniaga Bhd†* | | | 33,599 | | | | 55,605 | |
Public Bank Bhd | | | 8,015,376 | | | | 35,687,850 | |
Sunway Bhd* | | | 1,373,630 | | | | 1,179,255 | |
Telekom Malaysia Bhd | | | 13,355,355 | | | | 23,192,587 | |
UMW Holdings Bhd | | | 3,337,800 | | | | 7,953,628 | |
YTL Power International Bhd | | | 10,097,237 | | | | 6,097,564 | |
| | | | | | | | |
| Total Malaysia | | | | | | | 333,136,058 | |
| Mexico – 2.1% | | | | | | | | |
Bolsa Mexicana de Valores S.A.B de C.V. | | | 1,327,500 | | | | 2,681,839 | |
Grupo Aeroportuario del Centro Norte
S.A.B de C.V. | | | 812,237 | | | | 1,647,870 | |
Grupo Aeroportuario del Pacifico
S.A.B de C.V. Class B | | | 1,720,600 | | | | 6,351,600 | |
Grupo Aeroportuario del Sureste
S.A.B de C.V. Class B | | | 1,027,616 | | | | 7,037,411 | |
Industrias Penoles S.A.B de C.V. | | | 861,895 | | | | 41,741,406 | |
Kimberly-Clark de Mexico S.A.B de C.V. Class A | | | 7,064,414 | | | | 15,666,836 | |
| | | | | | | | |
| Total Mexico | | | | | | | 75,126,962 | |
| Philippines – 2.4% | | | | | | | | |
Aboitiz Equity Ventures, Inc. | | | 15,445,600 | | | | 18,023,164 | |
Aboitiz Power Corp. | | | 16,945,000 | | | | 13,379,189 | |
Globe Telecom, Inc. | | | 661,345 | | | | 17,467,456 | |
Philippine Long Distance Telephone Co. | | | 463,675 | | | | 29,158,554 | |
Semirara Mining Corp. | | | 1,443,830 | | | | 8,232,202 | |
| | | | | | | | |
| Total Philippines | | | | | | | 86,260,565 | |
| Poland – 2.4% | | | | | | | | |
Bank Handlowy w Warszawie S.A. | | | 161,431 | | | | 3,964,863 | |
Bank Pekao S.A. | | | 492,449 | | | | 24,474,027 | |
Powszechna Kasa Oszczednosci Bank Polski S.A. | | | 2,534,110 | | | | 27,300,916 | |
Telekomunikacja Polska S.A. | | | 5,787,123 | | | | 31,711,534 | |
| | | | | | | | |
| Total Poland | | | | | | | 87,451,340 | |
| Russia – 1.5% | | | | | | | | |
Mobile Telesystems OJSC ADR | | | 2,899,769 | | | | 53,181,764 | |
| South Africa – 9.4% | | | | | | | | |
African Bank Investments Ltd. | | | 3,203,501 | | | | 16,638,311 | |
Allied Technologies Ltd. | | | 265,289 | | | | 1,849,354 | |
Astral Foods Ltd. | | | 187,145 | | | | 3,048,143 | |
Aveng Ltd. | | | 564,405 | | | | 2,874,773 | |
AVI Ltd. | | | 742,705 | | | | 4,489,395 | |
City Lodge Hotels Ltd. | | | 411,345 | | | | 4,247,688 | |
Coronation Fund Managers Ltd. | | | 985,341 | | | | 3,659,136 | |
FirstRand Ltd. | | | 13,004,335 | | | | 40,159,063 | |
Grindrod Ltd. | | | 567,388 | | | | 1,115,621 | |
| | | | | | | | |
Group Five Ltd. | | | 1,535,292 | | | $ | 5,843,454 | |
Imperial Holdings Ltd. | | | 765,041 | | | | 15,451,245 | |
Kumba Iron Ore Ltd.(a) | | | 1,200,150 | | | | 82,263,964 | |
Lewis Group Ltd. | | | 571,472 | | | | 5,674,100 | |
Life Healthcare Group Holdings Ltd. | | | 1,632,186 | | | | 5,316,879 | |
MMI Holdings Ltd.(a) | | | 3,179,801 | | | | 7,337,795 | |
Pick’n Pay Holdings Ltd. | | | 356,336 | | | | 877,543 | |
Pick’n Pay Stores Ltd. | | | 1,356,704 | | | | 7,689,913 | |
Pretoria Portland Cement Co., Ltd.(a) | | | 1,011,025 | | | | 4,320,986 | |
Raubex Group Ltd.(a) | | | 126,336 | | | | 214,002 | |
Reunert Ltd. | | | 485,001 | | | | 4,423,721 | |
Sanlam Ltd. | | | 4,498,976 | | | | 19,450,785 | |
Santam Ltd. | | | 316,532 | | | | 6,640,344 | |
Spar Group Ltd. (The) | | | 386,559 | | | | 5,830,206 | |
Standard Bank Group Ltd. | | | 2,779,475 | | | | 40,331,008 | |
Vodacom Group Ltd. | | | 2,969,835 | | | | 41,851,008 | |
Woolworths Holdings Ltd. | | | 1,634,083 | | | | 10,252,210 | |
| | | | | | | | |
| Total South Africa | | | | | | | 341,850,647 | |
| South Korea – 3.8% | | | | | | | | |
Bukwang Pharmaceutical Co., Ltd. | | | 280,958 | | | | 3,310,348 | |
Daishin Securities Co., Ltd.* | | | 873,950 | | | | 8,561,710 | |
Hansol Paper Co., Ltd. | | | 805,900 | | | | 5,775,480 | |
Hite Jinro Co., Ltd. | | | 83,760 | | | | 1,903,552 | |
Kangwon Land, Inc. | | | 633,040 | | | | 14,051,415 | |
Korea Exchange Bank | | | 3,508,540 | | | | 26,816,077 | |
KT Corp. ADR | | | 1,228,982 | | | | 16,824,764 | |
KT&G Corp. | | | 303,130 | | | | 21,509,776 | |
LG Uplus Corp. | | | 1,003,120 | | | | 6,020,225 | |
Meritz Fire & Marine Insurance Co., Ltd.* | | | 684,780 | | | | 7,796,357 | |
SK Telecom Co., Ltd. ADR | | | 1,706,282 | | | | 23,734,383 | |
SK Telecom Co., Ltd. | | | 17,716 | | | | 2,181,176 | |
Woongjin Thinkbig Co., Ltd. | | | 7,420 | | | | 83,496 | |
| | | | | | | | |
| Total South Korea | | | | | | | 138,568,759 | |
| Taiwan – 21.3% | | | | | | | | |
Ability Enterprise Co., Ltd. | | | 2,089,000 | | | | 2,087,974 | |
AcBel Polytech, Inc. | | | 1,163,416 | | | | 677,997 | |
Accton Technology Corp. | | | 1,134,989 | | | | 686,427 | |
Acer, Inc. | | | 9,450,000 | | | | 12,535,110 | |
Advantech Co., Ltd. | | | 1,384,160 | | | | 4,807,007 | |
Alpha Networks, Inc. | | | 3,467,000 | | | | 2,948,439 | |
Altek Corp. | | | 1,153,312 | | | | 1,062,870 | |
AmTRAN Technology Co., Ltd. | | | 4,263,306 | | | | 3,358,412 | |
Asia Cement Corp. | | | 10,023,804 | | | | 12,209,448 | |
Asia Vital Components Co., Ltd. | | | 1,350,206 | | | | 914,944 | |
ASROCK, Inc. | | | 603,660 | | | | 2,454,360 | |
Asustek Computer, Inc. | | | 1,894,120 | | | | 17,872,992 | |
AV Tech Corp. | | | 513,000 | | | | 1,746,819 | |
Avermedia Technologies, Inc. | | | 187,460 | | | | 176,570 | |
Chang Wah Electromaterials, Inc. | | | 190,695 | | | | 567,927 | |
Chicony Electronics Co., Ltd. | | | 2,668,510 | | | | 5,243,984 | |
China Development Financial Holding Corp. | | | 39,683,501 | | | | 12,100,883 | |
China Synthetic Rubber Corp. | | | 5,076,000 | | | | 5,004,713 | |
Chinese Maritime Transport Ltd. | | | 458,000 | | | | 682,783 | |
See Notes to Financial Statements.
| | |
| 100 | | WisdomTree International Dividend and Sector Funds |
Schedule of Investments (continued)
WisdomTree Emerging Markets Equity Income Fund (DEM)
March 31, 2012
| | | | | | | | |
| Investments | | Shares | | | Value | |
| | | | | | | | |
Chung Hsin Electric & Machinery Manufacturing Corp. | | | 1,257,000 | | | $ | 721,888 | |
Chunghwa Telecom Co., Ltd. | | | 21,107,248 | | | | 65,006,991 | |
Compal Electronics, Inc. | | | 12,014,000 | | | | 13,514,198 | |
Coxon Precise Industrial Co., Ltd. | | | 715,686 | | | | 1,105,737 | |
CTCI Corp. | | | 2,478,992 | | | | 4,103,026 | |
Cyberlink Corp. | | | 98,433 | | | | 305,493 | |
CyberTAN Technology, Inc. | | | 1,858,000 | | | | 1,850,792 | |
Delta Electronics, Inc. | | | 4,344,000 | | | | 12,731,234 | |
Depo Auto Parts Industries Co., Ltd. | | | 1,885,163 | | | | 3,992,027 | |
D-Link Corp. | | | 1,784,000 | | | | 1,326,765 | |
Eternal Chemical Co., Ltd. | | | 2,298,775 | | | | 2,001,678 | |
Everlight Electronics Co., Ltd. | | | 756,000 | | | | 1,588,101 | |
Far EasTone Telecommunications Co., Ltd. | | | 12,484,595 | | | | 25,591,421 | |
Faraday Technology Corp. | | | 169,134 | | | | 268,189 | |
Farglory Land Development Co., Ltd. | | | 2,354,000 | | | | 4,737,590 | |
Feng Hsin Iron & Steel Co. | | | 1,347,922 | | | | 2,370,264 | |
Formosa Chemicals & Fibre Corp. | | | 10,129,000 | | | | 29,582,741 | |
Formosa Petrochemical Corp. | | | 15,741,000 | | | | 49,066,459 | |
Formosa Plastics Corp. | | | 9,152,000 | | | | 26,946,376 | |
Formosan Rubber Group, Inc. | | | 3,225,000 | | | | 2,261,854 | |
FSP Technology, Inc. | | | 143,897 | | | | 135,050 | |
Fubon Financial Holding Co., Ltd. | | | 16,953,798 | | | | 19,099,554 | |
Gemtek Technology Corp. | | | 168,993 | | | | 150,874 | |
Getac Technology Corp. | | | 2,407,000 | | | | 2,267,177 | |
Giant Manufacturing Co., Ltd. | | | 184,000 | | | | 807,332 | |
Gigabyte Technology Co., Ltd. | | | 848,000 | | | | 712,545 | |
Global Mixed Mode Technology, Inc. | | | 120,000 | | | | 461,468 | |
Grape King Industrial Co. | | | 975,803 | | | | 1,582,008 | |
Greatek Electronics, Inc. | | | 609,700 | | | | 515,408 | |
Holtek Semiconductor, Inc. | | | 798,454 | | | | 959,027 | |
Holy Stone Enterprise Co., Ltd. | | | 1,117,000 | | | | 1,105,097 | |
Huaku Development Co., Ltd. | | | 1,846,601 | | | | 4,686,185 | |
Hung Poo Real Estate Development Corp. | | | 1,128,790 | | | | 1,200,901 | |
Infortrend Technology, Inc. | | | 1,758,000 | | | | 1,536,750 | |
Inventec Corp. | | | 13,672,210 | | | | 5,998,920 | |
I-Sheng Electric Wire & Cable Co., Ltd. | | | 1,356,000 | | | | 2,228,261 | |
ITE Technology, Inc. | | | 467,000 | | | | 439,872 | |
Kindom Construction Co., Ltd. | | | 2,393,000 | | | | 1,654,007 | |
LCY Chemical Corp. | | | 779,386 | | | | 1,241,124 | |
Lealea Enterprise Co., Ltd. | | | 1,880,000 | | | | 796,219 | |
LITE-ON IT Corp. | | | 703,000 | | | | 741,956 | |
Lite-On Technology Corp. | | | 5,819,352 | | | | 7,038,942 | |
Macronix International | | | 14,871,000 | | | | 5,542,394 | |
Makalot Industrial Co., Ltd. | | | 150,000 | | | | 446,730 | |
MediaTek, Inc. | | | 4,421,000 | | | | 42,315,896 | |
Mega Financial Holding Co., Ltd. | | | 19,558,540 | | | | 13,816,787 | |
Merida Industry Co., Ltd. | | | 1,140,646 | | | | 3,663,733 | |
Merry Electronics Co., Ltd. | | | 468,000 | | | | 778,560 | |
Nan Ya Printed Circuit Board Corp. | | | 1,908,046 | | | | 4,176,245 | |
Neo Solar Power Corp. | | | 1,895,678 | | | | 1,483,683 | |
Novatek Microelectronics Corp. | | | 1,765,415 | | | | 5,377,384 | |
Oriental Union Chemical Corp. | | | 1,859,155 | | | | 2,403,116 | |
Pou Chen Corp. | | | 16,406,000 | | | | 14,257,870 | |
| | | | | | | | |
President Securities Corp. | | | 2,726,360 | | | $ | 1,473,359 | |
Quanta Computer, Inc. | | | 12,227,990 | | | | 32,025,737 | |
Realtek Semiconductor Corp. | | | 1,127,430 | | | | 2,058,936 | |
Shih Wei Navigation Co., Ltd. | | | 1,746,127 | | | | 1,650,610 | |
Shin Zu Shing Co., Ltd. | | | 1,874,000 | | | | 4,990,645 | |
Silicon Integrated Systems Corp. | | | 1,354,359 | | | | 536,889 | |
Siliconware Precision Industries Co. | | | 9,470,000 | | | | 11,486,761 | |
Silitech Technology Corp. | | | 2,432,940 | | | | 5,588,891 | |
Sincere Navigation Corp. | | | 636,000 | | | | 630,300 | |
Sonix Technology Co., Ltd. | | | 470,011 | | | | 777,128 | |
Syncmold Enterprise Corp. | | | 551,000 | | | | 769,154 | |
Taiwan Cement Corp. | | | 8,747,364 | | | | 10,239,761 | |
Taiwan Cogeneration Corp. | | | 2,640,510 | | | | 2,191,889 | |
Taiwan Mobile Co., Ltd. | | | 11,424,000 | | | | 34,797,052 | |
Taiwan Navigation Co., Ltd. | | | 672,000 | | | | 743,391 | |
Taiwan Secom Co., Ltd. | | | 1,492,635 | | | | 3,095,064 | |
Taiwan Semiconductor Manufacturing Co., Ltd. | | | 51,904,000 | | | | 149,304,566 | |
Ton Yi Industrial Corp. | | | 7,570,767 | | | | 4,001,557 | |
Transcend Information, Inc. | | | 215,000 | | | | 620,644 | |
Tsann Kuen Enterprise Co., Ltd. | | | 558,257 | | | | 1,333,484 | |
TSRC Corp. | | | 2,397,644 | | | | 6,133,328 | |
U-Ming Marine Transport Corp. | | | 3,292,000 | | | | 5,677,304 | |
Wistron Corp. | | | 4,895,484 | | | | 7,381,085 | |
Young Fast Optoelectronics Co., Ltd. | | | 771,241 | | | | 1,897,105 | |
Zinwell Corp. | | | 132,000 | | | | 159,664 | |
| | | | | | | | |
| Total Taiwan | | | | | | | 775,397,862 | |
| Thailand – 4.2% | | | | | | | | |
Advanced Info Service PCL | | | 11,508,090 | | | | 68,638,203 | |
Bangchak Petroleum PCL | | | 7,428,303 | | | | 5,706,670 | |
Bangkok Expressway PCL | | | 877,700 | | | | 614,532 | |
BEC World PCL | | | 4,374,569 | | | | 7,231,864 | |
Delta Electronics Thailand PCL | | | 3,074,563 | | | | 2,591,204 | |
Dynasty Ceramic PCL | | | 547,826 | | | | 1,158,692 | |
Electricity Generating PCL | | | 418,700 | | | | 1,262,207 | |
Glow Energy PCL | | | 4,145,000 | | | | 8,263,128 | |
Hana Microelectronics PCL | | | 2,271,815 | | | | 1,612,731 | |
Kiatnakin Bank PCL | | | 998,478 | | | | 1,197,526 | |
Land and Houses PCL NVDR | | | 32,875,247 | | | | 7,352,973 | |
LPN Development PCL | | | 2,168,800 | | | | 1,089,673 | |
LPN Development PCL NVDR | | | 302,078 | | | | 151,773 | |
Major Cineplex Group PCL | | | 1,953,100 | | | | 1,139,572 | |
Maybank Kim Eng Securities Thailand PCL | | | 7,340,814 | | | | 3,616,868 | |
MCOT PCL | | | 1,889,100 | | | | 1,745,198 | |
Precious Shipping PCL | | | 1,251,500 | | | | 645,019 | |
Quality Houses PCL | | | 31,486,500 | | | | 1,837,138 | |
Ratchaburi Electricity Generating Holding PCL | | | 4,642,296 | | | | 6,207,284 | |
STP & I PCL | | | 4,688,781 | | | | 4,749,576 | |
Supalai PCL | | | 9,126,508 | | | | 4,615,025 | |
Thai Plastic & Chemical PCL | | | 3,433,700 | | | | 3,283,441 | |
Thai Tap Water Supply PCL | | | 7,990,355 | | | | 1,554,040 | |
Thai Vegetable Oil PCL | | | 2,066,742 | | | | 1,339,865 | |
Thanachart Capital PCL | | | 1,970,474 | | | | 2,139,737 | |
See Notes to Financial Statements.
| | | | |
| WisdomTree International Dividend and Sector Funds | | | 101 | |
Schedule of Investments (concluded)
WisdomTree Emerging Markets Equity Income Fund (DEM)
March 31, 2012
| | | | | | | | |
| Investments | | Shares | | | Value | |
| | | | | | | | |
Tisco Financial Group PCL | | | 172,317 | | | $ | 231,804 | |
Tisco Financial Group PCL-Foreign | | | 285,482 | | | | 384,036 | |
Total Access Communication PCL | | | 2,564,600 | | | | 6,816,765 | |
Total Access Communication PCL NVDR | | | 2,977,990 | | | | 7,915,565 | |
| | | | | | | | |
| Total Thailand | | | | | | | 155,092,109 | |
| Turkey – 3.9% | | | | | | | | |
Arcelik A.S.* | | | 1,815,618 | | | | 8,106,074 | |
Bagfas Bandirma Gubre Fabrik | | | 16,341 | | | | 1,603,946 | |
Cimsa Cimento Sanayi VE Tica | | | 11,934 | | | | 60,242 | |
Eregli Demir ve Celik Fabrikalari TAS(a) | | | 10,108,593 | | | | 19,900,814 | |
Ford Otomotiv Sanayi A.S. | | | 1,828,959 | | | | 17,234,007 | |
Hurriyet Gazetecilik A.S.* | | | 3,156,669 | | | | 2,089,219 | |
Pinar SUT Mamulleri Sanayii A.S. | | | 116,546 | | | | 1,215,859 | |
Tofas Turk Otomobil Fabrikasi A.S.(a) | | | 1,037,866 | | | | 4,435,773 | |
Tupras Turkiye Petrol Rafinerileri A.S. | | | 788,914 | | | | 20,133,259 | |
Turk Telekomunikasyon A.S. | | | 15,100,418 | | | | 65,554,566 | |
Turk Traktor ve Ziraat Makineleri A.S.(a) | | | 49,676 | | | | 1,014,194 | |
| | | | | | | | |
| Total Turkey | | | | | | | 141,347,953 | |
TOTAL COMMON STOCKS
(Cost: $3,428,291,726) | | | | | | | 3,623,192,772 | |
| EXCHANGE-TRADED FUND – 0.1% | | | | | | | | |
| United States – 0.1% | | | | | | | | |
WisdomTree Global Equity Income Fund(b)
(Cost: $2,163,775) | | | 51,250 | | | | 2,136,100 | |
| SHORT-TERM INVESTMENT – 0.0% | | | | | | | | |
| MONEY MARKET FUND – 0.0% | | | | | | | | |
Invesco Treasury Fund Private Class, 0.02%(c)
(Cost: $1,678,631) | | | 1,678,631 | | | | 1,678,631 | |
| INVESTMENT OF CASH COLLATERAL FOR SECURITIES LOANED – 2.5% | | | | | | | | |
| MONEY MARKET FUND – 2.5% | | | | | | | | |
Dreyfus Institutional Preferred Money Market Fund, 0.18%(c) | | | | | | | | |
| (Cost: $90,237,031)(d) | | | 90,237,031 | | | | 90,237,031 | |
TOTAL INVESTMENTS IN SECURITIES – 102.1%
(Cost: $3,522,371,163) | | | | 3,717,244,534 | |
Liabilities in Excess of Foreign Currency and Other Assets – (2.1)% | | | | | | | (76,353,761 | ) |
| | | | | | | | |
| NET ASSETS – 100.0% | | | | | | $ | 3,640,890,773 | |
ADR – American Depositary Receipt
NVDR – Non-Voting Depositary Receipt
| * | Non-income producing security. |
| † | Security is being fair valued by a valuation committee under the direction of the Board of Trustees. The aggregate value of fair valued securities is $55,605, which represents 0.0% of net assets. |
| (a) | Security, or portion thereof, was on loan at March 31, 2012 (See Note 2). |
| (b) | Affiliated company (See Note 7). |
| (c) | Rate shown represents annualized 7-day yield as of March 31, 2012. |
| (d) | At March 31, 2012, the total market value of the Fund’s securities on loan was $84,663,628 and the total market value of the collateral held by the Fund was $90,237,031. |
See Notes to Financial Statements.
| | |
| 102 | | WisdomTree International Dividend and Sector Funds |
Schedule of Investments
WisdomTree Emerging Markets SmallCap Dividend Fund (DGS)
March 31, 2012
| | | | | | | | |
| Investments | | Shares | | | Value | |
| | | | | | | | |
| COMMON STOCKS – 98.8% | | | | | | | | |
| Argentina – 1.7% | | | | | |
Banco Macro S.A. ADR | | | 282,849 | | | $ | 5,546,669 | |
BBVA Banco Frances S.A. ADR | | | 1,017,966 | | | | 6,138,335 | |
Telecom Argentina S.A. ADR | | | 324,983 | | | | 5,758,699 | |
| | | | | | | | |
| Total Argentina | | | | | | | 17,443,703 | |
| Brazil – 6.2% | | | | | | | | |
Aliansce Shopping Centers S.A. | | | 284,657 | | | | 2,702,549 | |
BR Properties S.A. | | | 216,813 | | | | 2,771,517 | |
Brookfield Incorporacoes S.A. | | | 950,772 | | | | 3,048,850 | |
Cia de Saneamento de Minas Gerais-COPASA* | | | 445,987 | | | | 10,507,330 | |
Equatorial Energia S.A. | | | 580,123 | | | | 4,292,967 | |
Estacio Participacoes S.A. | | | 167,435 | | | | 1,817,252 | |
Eternit S.A. | | | 86,660 | | | | 436,079 | |
Even Construtora e Incorporadora S.A. | | | 604,843 | | | | 2,304,259 | |
Fleury S.A.* | | | 71,104 | | | | 940,882 | |
Gafisa S.A. | | | 1,010,600 | | | | 2,393,133 | |
Helbor Empreendimentos S.A. | | | 41,171 | | | | 618,366 | |
Iochpe-Maxion S.A. | | | 144,848 | | | | 2,858,372 | |
JHSF Participacoes S.A. | | | 2,077,321 | | | | 6,809,395 | |
JSL S.A. | | | 102,011 | | | | 610,623 | |
Lojas Americanas S.A. | | | 273,529 | | | | 2,404,980 | |
LPS Brasil Consultoria de Imoveis S.A. | | | 57,882 | | | | 1,189,178 | |
Mills Estruturas e Servicos de Engenharia S.A. | | | 17,995 | | | | 228,846 | |
Paranapanema S.A. | | | 887,362 | | | | 1,551,655 | |
Positivo Informatica S.A. | | | 123,300 | | | | 479,872 | |
Raia Drogasil S.A. | | | 335,659 | | | | 3,225,403 | |
Rossi Residencial S.A. | | | 501,276 | | | | 2,670,834 | |
Santos Brasil Participacoes S.A. | | | 123,893 | | | | 2,167,771 | |
Sao Martinho S.A. | | | 63,782 | | | | 814,625 | |
SLC Agricola S.A. | | | 116,853 | | | | 1,245,202 | |
Tegma Gestao Logistica | | | 145,960 | | | | 2,440,267 | |
TPI – Triunfo Participacoes e Investimentos S.A. | | | 36,338 | | | | 177,278 | |
Valid Solucoes e Servicos de Seguranca em Meios de Pagamento e Identificacao S.A. | | | 210,929 | | | | 3,174,977 | |
| | | | | | | | |
| Total Brazil | | | | | | | 63,882,462 | |
| Chile – 3.2% | | | | | | | | |
Cia General de Electricidad S.A. | | | 245,179 | | | | 1,284,835 | |
Cia Sud Americana de Vapores S.A. | | | 5,483,825 | | | | 719,082 | |
Empresas Iansa S.A. | | | 9,977,214 | | | | 827,773 | |
Empresas La Polar S.A. | | | 1,075,014 | | | | 700,042 | |
Forus S.A. | | | 359,407 | | | | 1,398,164 | |
Inversiones Aguas Metropolitanas S.A. | | | 3,553,728 | | | | 6,005,993 | |
Norte Grande S.A. | | | 228,727,102 | | | | 3,022,206 | |
Parque Arauco S.A. | | | 2,296,454 | | | | 4,657,358 | |
Sigdo Koppers S.A. | | | 1,694,469 | | | | 3,905,106 | |
Socovesa S.A. | | | 1,770,976 | | | | 950,519 | |
Sonda S.A. | | | 1,594,892 | | | | 4,753,801 | |
Vina Concha y Toro S.A. | | | 1,790,033 | | | | 4,107,010 | |
| | | | | | | | |
| Total Chile | | | | | | | 32,331,889 | |
| | | | | | | | |
| China – 4.2% | | | | | | | | |
Anhui Expressway Co. Class H* | | | 2,940,721 | | | $ | 1,621,108 | |
BBMG Corp. Class H | | | 456,540 | | | | 383,978 | |
Beijing Capital Land Ltd. Class H | | | 5,714,948 | | | | 1,612,022 | |
China Railway Construction Corp., Ltd. Class H | | | 4,765,500 | | | | 2,964,627 | |
China Railway Group Ltd. Class H(a) | | | 5,641,000 | | | | 1,809,131 | |
Chongqing Machinery & Electric Co., Ltd. Class H | | | 3,767,305 | | | | 703,580 | |
CSR Corp., Ltd. Class H | | | 1,108,352 | | | | 756,603 | |
Datang International Power Generation Co., Ltd. Class H | | | 8,806,000 | | | | 3,107,733 | |
Dongfang Electric Corp., Ltd. Class H(a) | | | 259,800 | | | | 629,757 | |
Great Wall Technology Co., Ltd. Class H | | | 1,164,000 | | | | 269,861 | |
Guangshen Railway Co., Ltd. Class H(a) | | | 9,527,964 | | | | 3,706,138 | |
Harbin Electric Co., Ltd. Class H | | | 442,174 | | | | 463,588 | |
Huaneng Power International, Inc. Class H | | | 7,644,000 | | | | 4,154,776 | |
Jiangsu Expressway Co., Ltd. Class H | | | 2,469,062 | | | | 2,388,286 | |
Lingbao Gold Co., Ltd. Class H | | | 566,000 | | | | 274,835 | |
Maanshan Iron & Steel Class H(a) | | | 513,917 | | | | 149,595 | |
Metallurgical Corp. of China Ltd. Class H | | | 9,408,000 | | �� | | 2,108,439 | |
Shandong Chenming Paper Holdings Ltd. Class H | | | 601,500 | | | | 283,551 | |
Shanghai Electric Group Co., Ltd. Class H | | | 7,490,000 | | | | 3,810,600 | |
Shanghai Prime Machinery Co., Ltd. Class H | | | 9,482,000 | | | | 1,563,235 | |
Shenzhen Expressway Co., Ltd. Class H | | | 1,621,970 | | | | 668,509 | |
Sinopec Shanghai Petrochemical Co., Ltd. Class H | | | 4,674,941 | | | | 1,691,987 | |
Sinopec Yizheng Chemical Fibre Co., Ltd. Class H | | | 2,826,000 | | | | 698,856 | |
Sinotrans Ltd. Class H | | | 914,000 | | | | 170,698 | |
Tong Ren Tang Technologies Co., Ltd. Class H | | | 406,944 | | | | 539,866 | |
Travelsky Technology Ltd. Class H | | | 2,123,204 | | | | 1,113,014 | |
Weichai Power Co., Ltd. Class H(a) | | | 185,798 | | | | 867,488 | |
Weiqiao Textile Co., Ltd. Class H | | | 3,829,500 | | | | 1,972,952 | |
Xiamen International Port Co., Ltd. Class H | | | 7,860,000 | | | | 1,042,736 | |
Xinjiang Xinxin Mining Industry Co., Ltd. Class H(a) | | | 696,054 | | | | 195,440 | |
ZTE Corp. Class H(a) | | | 411,684 | | | | 1,108,217 | |
| | | | | | | | |
| Total China | | | | | | | 42,831,206 | |
| Indonesia – 2.0% | | | | | | | | |
AKR Corporindo Tbk PT | | | 5,764,841 | | | | 2,710,938 | |
Aneka Tambang Persero Tbk PT | | | 8,096,825 | | | | 1,593,863 | |
Bakrie Sumatera Plantations Tbk PT | | | 12,793,500 | | | | 412,739 | |
Bank Bukopin Tbk PT | | | 23,843,347 | | | | 1,720,977 | |
Bank Pembangunan Daerah Jawa Barat Dan Banten Tbk PT | | | 15,576,584 | | | | 1,890,858 | |
Bank Tabungan Negara Persero Tbk PT | | | 5,490,935 | | | | 720,595 | |
Bumi Serpong Damai PT | | | 2,230,500 | | | | 314,670 | |
Global Mediacom Tbk PT | | | 7,684,438 | | | | 1,344,609 | |
Holcim Indonesia Tbk PT | | | 3,210,479 | | | | 904,088 | |
Medco Energi Internasional Tbk PT | | | 2,999,000 | | | | 705,145 | |
Perusahaan Perkebunan London Sumatra Indonesia Tbk PT | | | 7,254,010 | | | | 2,280,761 | |
See Notes to Financial Statements.
| | | | |
| WisdomTree International Dividend and Sector Funds | | | 103 | |
Schedule of Investments (continued)
WisdomTree Emerging Markets SmallCap Dividend Fund (DGS)
March 31, 2012
| | | | | | | | |
| Investments | | Shares | | | Value | |
| | | | | | | | |
Sampoerna Agro PT | | | 3,644,181 | | | $ | 1,424,754 | |
Summarecon Agung Tbk PT | | | 13,831,022 | | | | 2,374,749 | |
Timah Persero Tbk PT | | | 10,052,662 | | | | 2,044,833 | |
| | | | | | | | |
| Total Indonesia | | | | | | | 20,443,579 | |
| Israel – 6.9% | | | | | | | | |
Amot Investments Ltd. | | | 464,267 | | | | 1,211,752 | |
British Israel Investments Ltd. | | | 450,032 | | | | 1,683,372 | |
Clal Industries and Investments Ltd. | | | 1,056,914 | | | | 3,902,145 | |
Clal Insurance Enterprise Holdings, Ltd. | | | 35,634 | | | | 526,630 | |
Delek Automotive Systems Ltd. | | | 571,404 | | | | 4,633,797 | |
Discount Investment Corp. | | | 711,556 | | | | 3,897,439 | |
Elbit Systems Ltd. | | | 65,551 | | | | 2,543,902 | |
First International Bank of Israel Ltd.* | | | 273,150 | | | | 2,953,968 | |
Gazit-Globe Ltd. | | | 561,826 | | | | 5,759,171 | |
Harel Insurance Investments & Financial Services Ltd. | | | 4,885 | | | | 168,235 | |
Ituran Location and Control Ltd. | | | 47,127 | | | | 633,444 | |
Jerusalem Economy Ltd.* | | | 175,158 | | | | 1,220,626 | |
Migdal Insurance & Financial Holding Ltd. | | | 3,074,139 | | | | 4,733,909 | |
Mizrahi Tefahot Bank Ltd. | | | 734,047 | | | | 6,615,925 | |
Ormat Industries Ltd. | | | 491,502 | | | | 2,544,994 | |
Osem Investments Ltd. | | | 222,358 | | | | 3,424,121 | |
Partner Communications Co., Ltd. | | | 1,093,419 | | | | 8,436,547 | |
Phoenix Holdings Ltd. (The) | | | 718,800 | | | | 1,733,223 | |
Rami Levi Chain Stores Hashikma Marketing 2006 Ltd. | | | 27,465 | | | | 948,091 | |
Shikun & Binui Ltd. | | | 2,464,841 | | | | 4,277,576 | |
Shufersal Ltd. | | | 1,353,268 | | | | 4,926,946 | |
Strauss Group Ltd.* | | | 341,098 | | | | 4,156,097 | |
| | | | | | | | |
| Total Israel | | | | 70,931,910 | |
| Malaysia – 7.7% | | | | | | | | |
Aeon Co. M Bhd | | | 859,613 | | | | 2,665,684 | |
Affin Holdings Bhd | | | 1,645,200 | | | | 1,627,209 | |
Alliance Financial Group Bhd | | | 4,652,332 | | | | 5,907,482 | |
Batu Kawan Bhd | | | 223,800 | | | | 1,364,643 | |
Berjaya Corp. Bhd | | | 780,000 | | | | 241,880 | |
Berjaya Sports Toto Bhd | | | 3,994,538 | | | | 5,698,100 | |
Boustead Holdings Bhd | | | 3,128,830 | | | | 5,545,796 | |
Coastal Contracts Bhd | | | 302,849 | | | | 196,726 | |
Dayang Enterprise Holdings Bhd | | | 314,206 | | | | 210,257 | |
Dialog Group Bhd | | | 2,986,181 | | | | 2,115,232 | |
DRB-Hicom Bhd | | | 2,118,000 | | | | 1,742,242 | |
Eastern & Oriental Bhd | | | 1,345,100 | | | | 658,609 | |
Fraser & Neave Holdings Bhd | | | 78,300 | | | | 482,554 | |
Gamuda Bhd | | | 3,293,683 | | | | 3,913,500 | |
Genting Plantations Bhd | | | 569,300 | | | | 1,763,557 | |
HAP Seng Consolidated Bhd | | | 1,681,419 | | | | 927,566 | |
Hartalega Holdings Bhd | | | 316,596 | | | | 821,589 | |
IGB Corp. Bhd | | | 4,163,371 | | | | 3,764,497 | |
IJM Land Bhd | | | 1,709,954 | | | | 1,216,811 | |
KFC Holdings Malaysia Bhd | | | 1,440,800 | | | | 1,768,372 | |
KNM Group Bhd* | | | 1,117,500 | | | | 304,590 | |
KPJ Healthcare Bhd | | | 1,255,829 | | | | 2,111,154 | |
| | | | | | | | |
Kulim Malaysia Bhd | | | 2,527,839 | | | $ | 3,449,116 | |
Lafarge Malayan Cement Bhd | | | 2,220,100 | | | | 5,217,797 | |
Mah Sing Group Bhd | | | 1,796,365 | | | | 1,213,800 | |
Malaysia Airports Holdings Bhd | | | 1,688,100 | | | | 3,223,563 | |
Media Prima Bhd | | | 1,585,600 | | | | 1,387,109 | |
Mudajaya Group Bhd | | | 735,079 | | | | 686,250 | |
OSK Holdings Bhd | | | 2,906,700 | | | | 1,612,988 | |
Parkson Holdings Bhd | | | 2,460,178 | | | | 4,312,439 | |
Pharmaniaga Bhd*† | | | 44,559 | | | | 73,744 | |
POS Malaysia Bhd | | | 1,874,500 | | | | 1,670,437 | |
QSR Brands Bhd | | | 454,394 | | | | 949,281 | |
SapuraCrest Petroleum Bhd | | | 1,507,640 | | | | 2,401,594 | |
Sunway Bhd* | | | 2,366,707 | | | | 2,031,807 | |
Supermax Corp. Bhd | | | 2,024,682 | | | | 1,242,501 | |
TAN Chong Motor Holdings Bhd | | | 316,900 | | | | 464,462 | |
Top Glove Corp. Bhd | | | 444,500 | | | | 652,930 | |
Unisem M Bhd | | | 1,897,300 | | | | 910,407 | |
Wah Seong Corp. Bhd | | | 1,156,151 | | | | 781,209 | |
WCT Bhd | | | 1,543,400 | | | | 1,229,279 | |
| | | | | | | | |
| Total Malaysia | | | | 78,558,763 | |
| Mexico – 1.9% | | | | | | | | |
Alsea S.A.B de C.V. | | | 840,415 | | | | 1,200,546 | |
Bolsa Mexicana de Valores S.A.B de C.V. | | | 1,688,561 | | | | 3,411,261 | |
Grupo Aeroportuario del Centro Norte S.A.B de C.V.(a) | | | 1,261,888 | | | | 2,560,124 | |
Grupo Aeroportuario del Pacifico S.A.B de C.V. Class B | | | 985,874 | | | | 3,639,357 | |
Grupo Aeroportuario del Sureste S.A.B de C.V. Class B | | | 858,432 | | | | 5,878,790 | |
Grupo Herdez S.A.B de C.V.(a) | | | 655,263 | | | | 1,355,487 | |
TV Azteca S.A.B de C.V. | | | 1,802,500 | | | | 1,129,860 | |
| | | | | | | | |
| Total Mexico | | | | 19,175,425 | |
| Philippines – 3.2% | | | | | | | | |
Alliance Global Group, Inc. | | | 1,370,543 | | | | 402,209 | |
Cebu Air, Inc. | | | 1,597,312 | | | | 2,496,323 | |
First Philippine Holdings Corp. | | | 1,079,200 | | | | 1,630,048 | |
International Container Terminal Services, Inc. | | | 806,928 | | | | 1,231,019 | |
Jollibee Foods Corp. | | | 754,683 | | | | 2,056,549 | |
Manila Water Co., Inc. | | | 7,801,527 | | | | 4,215,568 | |
Megaworld Corp. | | | 13,110,000 | | | | 598,477 | |
Metro Pacific Investments Corp. | | | 19,003,667 | | | | 1,832,425 | |
Philex Mining Corp. | | | 1,759,217 | | | | 866,599 | |
Philweb Corp. | | | 2,081,453 | | | | 808,633 | |
Robinsons Land Corp. | | | 5,348,800 | | | | 2,055,554 | |
Security Bank Corp. | | | 661,847 | | | | 2,204,358 | |
Semirara Mining Corp. | | | 664,450 | | | | 3,788,456 | |
Universal Robina Corp. | | | 4,481,713 | | | | 6,576,172 | |
Vista Land & Lifescapes, Inc. | | | 28,210,797 | | | | 2,529,674 | |
| | | | | | | | |
| Total Philippines | | | | 33,292,064 | |
| Poland – 0.4% | | | | | | | | |
Agora S.A. | | | 72,596 | | | | 295,616 | |
Asseco Poland S.A. | | | 100,614 | | | | 1,608,185 | |
See Notes to Financial Statements.
| | |
| 104 | | WisdomTree International Dividend and Sector Funds |
Schedule of Investments (continued)
WisdomTree Emerging Markets SmallCap Dividend Fund (DGS)
March 31, 2012
| | | | | | | | |
| Investments | | Shares | | | Value | |
| | | | | | | | |
Eurocash S.A. | | | 85,455 | | | $ | 958,999 | |
PBG S.A. | | | 19,985 | | | | 250,037 | |
Polimex-Mostostal S.A. | | | 1,448,683 | | | | 636,365 | |
| | | | | | | | |
| Total Poland | | | | 3,749,202 | |
| Russia – 0.1% | | | | | | | | |
Novorossiysk Commercial Sea Port PJSC, Reg S GDR(a) | | | 103,946 | | | | 785,832 | |
| South Africa – 10.5% | | | | | | | | |
Adcock Ingram Holdings Ltd.* | | | 201,014 | | | | 1,537,487 | |
Aeci Ltd. | | | 313,801 | | | | 3,843,521 | |
African Oxygen Ltd.(a) | | | 169,481 | | | | 417,378 | |
Allied Technologies Ltd. | | | 233,228 | | | | 1,625,854 | |
Astral Foods Ltd. | | | 177,232 | | | | 2,886,684 | |
Aveng Ltd. | | | 1,167,897 | | | | 5,948,635 | |
AVI Ltd. | | | 959,106 | | | | 5,797,464 | |
Barloworld Ltd. | | | 301,286 | | | | 3,924,996 | |
Blue Label Telecoms Ltd. | | | 3,401,459 | | | | 3,044,872 | |
Capitec Bank Holdings Ltd. | | | 24,023 | | | | 641,694 | |
Cipla Medpro South Africa Ltd. | | | 1,533,331 | | | | 1,318,642 | |
City Lodge Hotels Ltd. | | | 105,142 | | | | 1,085,732 | |
Coronation Fund Managers Ltd. | | | 1,645,234 | | | | 6,109,696 | |
Grindrod Ltd. | | | 616,762 | | | | 1,212,702 | |
Group Five Ltd. | | | 187,394 | | | | 713,238 | |
Investec Ltd. | | | 743,523 | | | | 4,568,938 | |
JD Group Ltd. | | | 195,231 | | | | 1,259,218 | |
JSE Ltd. | | | 345,835 | | | | 3,577,969 | |
Lewis Group Ltd. | | | 370,223 | | | | 3,675,915 | |
Life Healthcare Group Holdings Ltd.(a) | | | 2,794,247 | | | | 9,102,315 | |
Mondi Ltd. | | | 271,634 | | | | 2,548,377 | |
Mr. Price Group Ltd. | | | 487,253 | | | | 5,989,595 | |
Nampak Ltd. | | | 1,015,496 | | | | 3,069,823 | |
Northam Platinum Ltd. | | | 33,822 | | | | 150,368 | |
Pick’n Pay Holdings Ltd. | | | 543,992 | | | | 1,339,681 | |
Pretoria Portland Cement Co., Ltd. | | | 2,716,510 | | | | 11,610,000 | |
Reunert Ltd. | | | 813,969 | | | | 7,424,257 | |
Santam Ltd. | | | 240,639 | | | | 5,048,228 | |
Spar Group Ltd. (The) | | | 389,579 | | | | 5,875,754 | |
Sun International Ltd. | | | 48,689 | | | | 529,742 | |
Tongaat Hulett Ltd. | | | 40,409 | | | | 547,541 | |
Wilson Bayly Holmes-Ovcon Ltd. | | | 54,625 | | | | 925,299 | |
| | | | | | | | |
| Total South Africa | | | | 107,351,615 | |
| South Korea – 8.8% | | | | | | | | |
AUK Corp.* | | | 228,560 | | | | 641,473 | |
Bukwang Pharmaceutical Co., Ltd. | | | 116,645 | | | | 1,374,353 | |
Capro Corp. | | | 18,350 | | | | 399,212 | |
Cheil Worldwide, Inc. | | | 199,681 | | | | 3,189,821 | |
Chong Kun Dang Pharm Corp. | | | 24,115 | | | | 393,740 | |
CJ Corp. | | | 24,892 | | | | 1,871,761 | |
CJ O Shopping Co., Ltd. | | | 1,112 | | | | 255,170 | |
Daeduck Electronics Co. | | | 132,567 | | | | 1,310,402 | |
Daewoong Pharmaceutical Co., Ltd. | | | 345 | | | | 8,160 | |
Daishin Securities Co., Ltd.* | | | 328,559 | | | | 3,218,750 | |
Daou Technology, Inc. | | | 100,940 | | | | 1,171,494 | |
| | | | | | | | |
Daum Communications Corp. | | | 2,828 | | | $ | 297,264 | |
Dongkuk Steel Mill Co., Ltd. | | | 108,681 | | | | 2,076,646 | |
Green Cross Corp. | | | 7,336 | | | | 819,032 | |
Green Cross Holdings Corp. | | | 50,812 | | | | 582,989 | |
GS Home Shopping, Inc. | | | 1,850 | | | | 183,522 | |
Halla Climate Control Corp. | | | 197,700 | | | | 3,847,390 | |
Halla Engineering & Construction Corp. | | | 20,929 | | | | 242,899 | |
Hana Tour Service, Inc. | | | 11,023 | | | | 437,301 | |
Handsome Co., Ltd. | | | 64,938 | | | | 1,908,508 | |
Hanjin Heavy Industries & Construction Holdings Co., Ltd. | | | 2,112 | | | | 15,415 | |
Hanjin Shipping Co., Ltd.* | | | 145,180 | | | | 2,011,673 | |
Hanjin Shipping Holdings Co., Ltd.* | | | 81,700 | | | | 575,408 | |
Hansol Paper Co., Ltd. | | | 264,350 | | | | 1,894,464 | |
Hanssem Co., Ltd. | | | 64,888 | | | | 1,268,496 | |
Hite Jinro Co., Ltd. | | | 17,103 | | | | 388,687 | |
Hotel Shilla Co., Ltd. | | | 48,708 | | | | 2,074,190 | |
Huchems Fine Chemical Corp. | | | 71,061 | | | | 1,335,863 | |
Hyosung Corp. | | | 24,396 | | | | 1,291,876 | |
Hyundai Development Co. | | | 46,288 | | | | 1,015,186 | |
Hyundai Elevator Co., Ltd. | | | 2,830 | | | | 288,482 | |
Hyundai Home Shopping Network Corp. | | | 4,380 | | | | 518,000 | |
Hyundai Marine & Fire Insurance Co., Ltd.* | | | 113,593 | | | | 3,268,286 | |
iMarketKorea, Inc. | | | 60,028 | | | | 1,033,093 | |
ISU Chemical Co., Ltd. | | | 30,298 | | | | 739,367 | |
Jeonbuk Bank | | | 184,739 | | | | 829,903 | |
KEPCO Engineering & Construction Co., Inc. | | | 40,761 | | | | 2,939,123 | |
KISCO Corp. | | | 5,730 | | | | 138,566 | |
Kolon Corp. | | | 22,970 | | | | 525,063 | |
Kolon Industries, Inc. | | | 11,858 | | | | 783,870 | |
Korea Gas Corp. | | | 56,828 | | | | 2,164,184 | |
Korea Investment Holdings Co., Ltd.* | | | 50,520 | | | | 2,008,672 | |
Korean Reinsurance Co.* | | | 202,555 | | | | 2,440,206 | |
KP Chemical Corp. | | | 104,303 | | | | 1,422,251 | |
LG Fashion Corp. | | | 41,271 | | | | 1,455,167 | |
LG Innotek Co., Ltd.* | | | 14,338 | | | | 1,247,718 | |
LG International Corp. | | | 43,075 | | | | 1,954,067 | |
LIG Insurance Co., Ltd.* | | | 121,752 | | | | 2,804,578 | |
Lock & Lock Co., Ltd. | | | 24,341 | | | | 719,671 | |
LS Industrial Systems Co., Ltd. | | | 15,002 | | | | 869,892 | |
Meritz Fire & Marine Insurance Co., Ltd.* | | | 192,680 | | | | 2,193,700 | |
Mirae Asset Securities Co., Ltd.* | | | 81,785 | | | | 2,861,988 | |
OCI Materials Co., Ltd. | | | 3,878 | | | | 235,476 | |
Orion Corp. | | | 1,085 | | | | 762,244 | |
Partron Co., Ltd. | | | 64,846 | | | | 755,454 | |
Poongsan Corp. | | | 35,698 | | | | 949,909 | |
S&T Dynamics Co., Ltd. | | | 16,950 | | | | 230,378 | |
S1 Corp. | | | 45,376 | | | | 2,114,516 | |
Samsung Fine Chemicals Co., Ltd. | | | 23,204 | | | | 1,116,118 | |
Samyang Holdings Corp. | | | 6,252 | | | | 409,425 | |
Seoul Semiconductor Co., Ltd. | | | 61,057 | | | | 1,279,823 | |
Silicon Works Co., Ltd. | | | 29,766 | | | | 891,890 | |
SK Chemicals Co., Ltd. | | | 19,224 | | | | 1,085,862 | |
SK Networks Co., Ltd. | | | 183,044 | | | | 1,688,195 | |
See Notes to Financial Statements.
| | | | |
| WisdomTree International Dividend and Sector Funds | | | 105 | |
Schedule of Investments (continued)
WisdomTree Emerging Markets SmallCap Dividend Fund (DGS)
March 31, 2012
| | | | | | | | |
| Investments | | Shares | | | Value | |
| | | | | | | | |
SKC Co., Ltd. | | | 36,333 | | | $ | 1,494,301 | |
STX Corp. Co., Ltd. | | | 13,960 | | | | 168,794 | |
STX Engine Co., Ltd. | | | 26,186 | | | | 394,044 | |
STX Offshore & Shipbuilding Co., Ltd. | | | 69,288 | | | | 871,413 | |
STX Pan Ocean Co., Ltd. | | | 40,420 | | | | 281,465 | |
Sungwoo Hitech Co., Ltd. | | | 75,929 | | | | 847,714 | |
Taeyoung Engineering & Construction Co., Ltd. | | | 86,474 | | | | 431,206 | |
Tong Yang Life Insurance* | | | 118,126 | | | | 1,496,058 | |
Woongjin Thinkbig Co., Ltd. | | | 27,950 | | | | 314,516 | |
Woori Investment & Securities Co., Ltd.* | | | 163,257 | | | | 1,880,326 | |
Youngone Corp. | | | 65,598 | | | | 1,250,533 | |
| | | | | | | | |
| Total South Korea | | | | 90,256,652 | |
| Taiwan – 26.0% | | | | | | | | |
Ability Enterprise Co., Ltd. | | | 3,829,162 | | | | 3,827,281 | |
AcBel Polytech, Inc. | | | 396,119 | | | | 230,844 | |
Accton Technology Corp. | | | 2,096,228 | | | | 1,267,772 | |
ACES Electronic Co., Ltd. | | | 157,677 | | | | 306,117 | |
Advantech Co., Ltd. | | | 1,431,620 | | | | 4,971,829 | |
ALI Corp. | | | 1,162,000 | | | | 1,881,909 | |
Alpha Networks, Inc. | | | 2,983,606 | | | | 2,537,346 | |
Altek Corp. | | | 965,071 | | | | 889,391 | |
AmTRAN Technology Co., Ltd. | | | 4,232,965 | | | | 3,334,511 | |
Apex Biotechnology Corp. | | | 368,194 | | | | 986,774 | |
Asia Vital Components Co., Ltd. | | | 1,492,420 | | | | 1,011,313 | |
ASROCK, Inc. | | | 596,146 | | | | 2,423,809 | |
Aurora Corp. | | | 829,000 | | | | 1,466,188 | |
AV Tech Corp. | | | 383,036 | | | | 1,304,278 | |
Avermedia Technologies, Inc. | | | 64,021 | | | | 60,302 | |
BES Engineering Corp. | | | 806,987 | | | | 229,673 | |
Bright Led Electronics Corp. | | | 578,000 | | | | 464,131 | |
Capital Securities Corp. | | | 692,550 | | | | 268,671 | |
Cathay Real Estate Development Co., Ltd. | | | 4,791,000 | | | | 2,223,880 | |
Champion Building Materials Co., Ltd. | | | 420,102 | | | | 214,930 | |
Chang Wah Electromaterials, Inc. | | | 120,609 | | | | 359,197 | |
Cheng Uei Precision Industry Co., Ltd. | | | 1,122,242 | | | | 2,684,453 | |
Chicony Electronics Co., Ltd. | | | 1,219,401 | | | | 2,396,289 | |
China Chemical & Pharmaceutical Co., Ltd. | | | 1,082,867 | | | | 759,469 | |
China Electric Manufacturing Corp. | | | 409,101 | | | | 279,299 | |
China Life Insurance Co., Ltd. | | | 1,542,210 | | | | 1,502,263 | |
China Motor Corp. | | | 628,000 | | | | 613,861 | |
China Steel Chemical Corp. | | | 838,232 | | | | 3,976,096 | |
China Synthetic Rubber Corp. | | | 842,544 | | | | 830,711 | |
Chinese Maritime Transport Ltd. | | | 1,075,000 | | | | 1,602,602 | |
Chroma ATE, Inc. | | | 624,160 | | | | 1,590,297 | |
Chun Yuan Steel | | | 2,939,919 | | | | 1,279,980 | |
Chung Hsin Electric & Machinery Manufacturing Corp. | | | 1,171,531 | | | | 672,803 | |
Clevo Co. | | | 434,000 | | | | 712,440 | |
Compal Communications, Inc. | | | 1,130,231 | | | | 1,960,658 | |
Coxon Precise Industrial Co., Ltd. | | | 707,184 | | | | 1,092,602 | |
CSBC Corp. | | | 1,678,797 | | | | 1,370,818 | |
CTCI Corp. | | | 2,385,032 | | | | 3,947,511 | |
Cyberlink Corp. | | | 92,201 | | | | 286,151 | |
| | | | | | | | |
CyberPower Systems, Inc. | | | 65,611 | | | $ | 124,044 | |
CyberTAN Technology, Inc. | | | 1,046,000 | | | | 1,041,942 | |
Darfon Electronics Corp. | | | 776,059 | | | | 583,730 | |
Depo Auto Parts Industries Co., Ltd. | | | 479,157 | | | | 1,014,664 | |
D-Link Corp. | | | 1,696,163 | | | | 1,261,440 | |
Edison Opto Corp. | | | 133,278 | | | | 277,263 | |
Elan Microelectronics Corp. | | | 1,037,000 | | | | 1,335,140 | |
Elite Material Co., Ltd. | | | 818,900 | | | | 758,844 | |
Elite Semiconductor Memory Technology, Inc. | | | 125,282 | | | | 117,155 | |
Entire Technology Co., Ltd. | | | 483,326 | | | | 802,418 | |
Eternal Chemical Co., Ltd. | | | 3,299,629 | | | | 2,873,180 | |
Evergreen International Storage & Transport Corp. | | | 2,275,567 | | | | 1,195,049 | |
Everlight Chemical Industrial Corp. | | | 1,046,402 | | | | 712,622 | |
Everlight Electronics Co., Ltd. | | | 407,970 | | | | 857,007 | |
Excelsior Medical Co., Ltd. | | | 109,859 | | | | 232,266 | |
Far Eastern Department Stores Co., Ltd. | | | 781,565 | | | | 999,647 | |
Far Eastern International Bank | | | 2,248,056 | | | | 898,781 | |
Faraday Technology Corp. | | | 76,998 | | | | 122,093 | |
Farglory Land Development Co., Ltd. | | | 4,636,816 | | | | 9,331,917 | |
Feng Hsin Iron & Steel Co. | | | 1,399,950 | | | | 2,461,753 | |
First Insurance Co., Ltd. | | | 1,390,704 | | | | 603,128 | |
First Steamship Co., Ltd. | | | 214,977 | | | | 319,394 | |
Flytech Technology Co., Ltd. | | | 385,135 | | | | 944,748 | |
Forhouse Corp. | | | 1,200,000 | | | | 780,633 | |
Formosa Advanced Technologies Co., Ltd. | | | 158,000 | | | | 167,558 | |
Formosa Epitaxy, Inc. | | | 734,541 | | | | 684,405 | |
Formosa International Hotels Corp. | | | 50,437 | | | | 713,461 | |
Formosan Rubber Group, Inc. | | | 976,080 | | | | 684,574 | |
Fortune Electric Co., Ltd. | | | 622,000 | | | | 315,062 | |
Gemtek Technology Corp. | | | 22,267 | | | | 19,880 | |
GeoVision, Inc. | | | 150,260 | | | | 707,657 | |
Getac Technology Corp. | | | 1,313,000 | | | | 1,236,728 | |
Giant Manufacturing Co., Ltd. | | | 370,464 | | | | 1,625,475 | |
Gigabyte Technology Co., Ltd. | | | 4,484,221 | | | | 3,767,934 | |
Global Brands Manufacture Ltd. | | | 2,671,234 | | | | 1,461,669 | |
Global Mixed Mode Technology, Inc. | | | 3,000 | | | | 11,537 | |
Global Unichip Corp. | | | 54,927 | | | | 206,573 | |
Goldsun Development & Construction Co., Ltd. | | | 2,744,572 | | | | 1,120,537 | |
Grand Pacific Petrochemical | | | 235,406 | | | | 109,270 | |
Grape King Industrial Co. | | | 632,321 | | | | 1,025,142 | |
Great China Metal Industry | | | 621,694 | | | | 837,295 | |
Great Wall Enterprise Co., Ltd. | | | 1,250,257 | | | | 1,279,295 | |
Greatek Electronics, Inc. | | | 4,184,436 | | | | 3,537,301 | |
Green Energy Technology, Inc. | | | 378,577 | | | | 455,352 | |
Hey Song Corp. | | | 773,730 | | | | 975,207 | |
Holtek Semiconductor, Inc. | | | 413,482 | | | | 496,635 | |
Holy Stone Enterprise Co., Ltd. | | | 2,044,636 | | | | 2,022,849 | |
HUA ENG Wire & Cable Co., Ltd. | | | 2,688,000 | | | | 755,002 | |
Huaku Development Co., Ltd. | | | 1,638,560 | | | | 4,158,232 | |
Huang Hsiang Construction Co. | | | 182,287 | | | | 353,278 | |
Hung Poo Real Estate Development Corp. | | | 3,786,745 | | | | 4,028,657 | |
Infortrend Technology, Inc. | | | 1,322,000 | | | | 1,155,622 | |
Inventec Corp. | | | 8,820,501 | | | | 3,870,148 | |
See Notes to Financial Statements.
| | |
| 106 | | WisdomTree International Dividend and Sector Funds |
Schedule of Investments (continued)
WisdomTree Emerging Markets SmallCap Dividend Fund (DGS)
March 31, 2012
| | | | | | | | |
| Investments | | Shares | | | Value | |
| | | | | | | | |
I-Sheng Electric Wire & Cable Co., Ltd. | | | 242,000 | | | $ | 397,669 | |
ITE Technology, Inc. | | | 3,000 | | | | 2,826 | |
ITEQ Corp. | | | 373,498 | | | | 435,323 | |
Jentech Precision Industrial Co., Ltd. | | | 93,162 | | | | 306,179 | |
KEE TAI Properties Co., Ltd. | | | 1,070,360 | | | | 592,942 | |
Kenda Rubber Industrial Co., Ltd. | | | 1,600,521 | | | | 1,868,165 | |
Kerry TJ Logistics Co., Ltd. | | | 325,107 | | | | 366,805 | |
Kindom Construction Co., Ltd. | | | 1,912,045 | | | | 1,321,578 | |
King Slide Works Co., Ltd. | | | 31,518 | | | | 189,549 | |
Kinsus Interconnect Technology Corp. | | | 616,368 | | | | 1,975,585 | |
L&K Engineering Co., Ltd. | | | 355,000 | | | | 410,154 | |
LCY Chemical Corp. | | | 1,401,565 | | | | 2,231,905 | |
Lealea Enterprise Co., Ltd. | | | 3,018,331 | | | | 1,278,325 | |
Lien Hwa Industrial Corp. | | | 550,328 | | | | 358,936 | |
Lingsen Precision Industries Ltd. | | | 369,409 | | | | 235,930 | |
LITE-ON IT Corp. | | | 2,658,054 | | | | 2,805,346 | |
Lotes Co., Ltd. | | | 210,048 | | | | 578,594 | |
Macronix International | | | 11,581,722 | | | | 4,316,487 | |
Makalot Industrial Co., Ltd. | | | 1,295,128 | | | | 3,857,147 | |
Mercuries & Associates Ltd. | | | 474,498 | | | | 497,576 | |
Merida Industry Co., Ltd. | | | 1,174,555 | | | | 3,772,648 | |
Merry Electronics Co., Ltd. | | | 449,203 | | | | 747,289 | |
Micro-Star International Co., Ltd. | | | 142,396 | | | | 69,716 | |
MIN AIK Technology Co., Ltd. | | | 192,819 | | | | 469,725 | |
Mitac International Corp. | | | 753,000 | | | | 298,501 | |
Nan Ya Printed Circuit Board Corp. | | | 1,738,000 | | | | 3,804,056 | |
Nantex Industry Co., Ltd. | | | 235,488 | | | | 215,425 | |
National Petroleum Co., Ltd. | | | 1,837,250 | | | | 2,247,191 | |
Neo Solar Power Corp. | | | 1,705,658 | | | | 1,334,961 | |
Nien Hsing Textile Co., Ltd. | | | 2,864,954 | | | | 2,038,457 | |
Novatek Microelectronics Corp. | | | 1,596,417 | | | | 4,862,623 | |
Nuvoton Technology Corp. | | | 1,000,767 | | | | 1,163,032 | |
Oriental Union Chemical Corp. | | | 2,130,698 | | | | 2,754,108 | |
Orise Technology Co., Ltd. | | | 121,929 | | | | 150,994 | |
Pan-International Industrial | | | 597,820 | | | | 575,246 | |
Phihong Technology Co., Ltd. | | | 686,363 | | | | 975,552 | |
Powertech Technology, Inc. | | | 1,210,779 | | | | 2,358,834 | |
President Securities Corp. | | | 3,712,540 | | | | 2,006,302 | |
Radiant Opto-Electronics Corp. | | | 464,600 | | | | 2,062,125 | |
Radium Life Tech Co., Ltd. | | | 3,012,879 | | | | 2,439,743 | |
Realtek Semiconductor Corp. | | | 762,334 | | | | 1,392,190 | |
Richtek Technology Corp. | | | 76,872 | | | | 474,028 | |
Ruentex Industries Ltd. | | | 577,058 | | | | 1,130,087 | |
San Chih Semiconductor Co. | | | 139,218 | | | | 166,744 | |
SDI Corp. | | | 309,290 | | | | 299,183 | |
Senao International Co., Ltd. | | | 351,240 | | | | 1,642,282 | |
Sesoda Corp. | | | 150,901 | | | | 174,857 | |
Shih Wei Navigation Co., Ltd. | | | 1,724,536 | | | | 1,630,201 | |
Shihlin Electric & Engineering Corp. | | | 1,224,543 | | | | 1,346,336 | |
Shin Zu Shing Co., Ltd. | | | 366,000 | | | | 974,694 | |
Shinkong Synthetic Fibers Corp. | | | 2,269,220 | | | | 776,538 | |
Shiny Chemical Industrial Co., Ltd. | | | 290,280 | | | | 378,654 | |
Sigurd Microelectronics Corp. | | | 1,009,222 | | | | 832,627 | |
Silicon Integrated Systems Corp. | | | 3,348,597 | | | | 1,327,435 | |
| | | | | | | | |
Silitech Technology Corp. | | | 224,518 | | | $ | 515,757 | |
Sincere Navigation Corp. | | | 1,854,000 | | | | 1,837,385 | |
Sitronix Technology Corp. | | | 279,000 | | | | 378,119 | |
Sonix Technology Co., Ltd. | | | 886,302 | | | | 1,465,433 | |
Springsoft, Inc. | | | 151,000 | | | | 234,574 | |
Standard Foods Corp. | | | 306,961 | | | | 1,045,235 | |
Star Comgistic Capital Co., Ltd. | | | 952,919 | | | | 598,914 | |
Sunonwealth Electric Machine Industry Co., Ltd. | | | 1,193,919 | | | | 881,852 | |
Syncmold Enterprise Corp. | | | 1,100,680 | | | | 1,536,466 | |
Taiflex Scientific Co., Ltd. | | | 127,666 | | | | 157,017 | |
Tainan Enterprises Co., Ltd. | | | 661,553 | | | | 841,665 | |
Tainan Spinning Co., Ltd. | | | 3,336,950 | | | | 1,498,063 | |
Taiwan Acceptance Corp. | | | 160,557 | | | | 334,556 | |
Taiwan Cogeneration Corp. | | | 2,304,429 | | | | 1,912,908 | |
Taiwan Fire & Marine Insurance Co. | | | 1,905,000 | | | | 1,426,434 | |
Taiwan Hon Chuan Enterprise Co., Ltd. | | | 839,555 | | | | 1,903,005 | |
Taiwan Navigation Co., Ltd. | | | 592,000 | | | | 654,892 | |
Taiwan PCB Techvest Co., Ltd. | | | 1,718,954 | | | | 2,186,950 | |
Taiwan Secom Co., Ltd. | | | 1,856,936 | | | | 3,850,463 | |
Taiwan Surface Mounting Technology Co., Ltd. | | | 508,591 | | | | 1,168,323 | |
Teco Electric and Machinery Co., Ltd. | | | 4,069,683 | | | | 2,806,012 | |
Thinking Electronic Industrial Co., Ltd. | | | 549,189 | | | | 563,805 | |
Thye Ming Industrial Co., Ltd. | | | 790,000 | | | | 764,184 | |
Ton Yi Industrial Corp. | | | 4,441,538 | | | | 2,347,592 | |
Tong Hsing Electronic Industries Ltd. | | | 150,695 | | | | 528,450 | |
Topco Scientific Co., Ltd. | | | 196,120 | | | | 358,823 | |
Transcend Information, Inc. | | | 1,641,000 | | | | 4,737,102 | |
Tripod Technology Corp. | | | 490,631 | | | | 1,645,715 | |
Tsann Kuen Enterprise Co., Ltd. | | | 1,003,894 | | | | 2,397,958 | |
TSRC Corp. | | | 2,184,120 | | | | 5,587,120 | |
Tung Ho Steel Enterprise Corp. | | | 2,894,559 | | | | 2,937,270 | |
TXC Corp. | | | 650,549 | | | | 1,023,836 | |
U-Ming Marine Transport Corp. | | | 4,847,681 | | | | 8,360,195 | |
United Integrated Services Co., Ltd. | | | 433,031 | | | | 501,042 | |
Unity Opto Technology Co., Ltd. | | | 741,307 | | | | 853,968 | |
Universal Cement Corp. | | | 2,078,794 | | | | 1,010,713 | |
Wah Lee Industrial Corp. | | | 694,152 | | | | 992,502 | |
Wei Chuan Food Corp. | | | 616,194 | | | | 685,831 | |
Weikeng Industrial Co., Ltd. | | | 1,352,481 | | | | 1,177,684 | |
Wistron NeWeb Corp. | | | 374,385 | | | | 824,511 | |
WT Microelectronics Co., Ltd. | | | 207,599 | | | | 308,784 | |
Yageo Corp. | | | 1,069,432 | | | | 321,397 | |
Yeun Chyang Industrial Co., Ltd. | | | 624,000 | | | | 390,073 | |
Yieh Phui Enterprise Co., Ltd. | | | 2,812,941 | | | | 1,029,316 | |
Young Fast Optoelectronics Co., Ltd. | | | 157,099 | | | | 386,433 | |
Young Optics, Inc. | | | 141,420 | | | | 563,006 | |
YungShin Global Holding Corp. | | | 446,015 | | | | 631,670 | |
Yungtay Engineering Co., Ltd. | | | 663,994 | | | | 1,062,993 | |
Zinwell Corp. | | | 236,000 | | | | 285,460 | |
| | | | | | | | |
| Total Taiwan | | | | 265,680,503 | |
| Thailand – 12.2% | | | | | | | | |
Airports of Thailand PCL | | | 466,600 | | | | 881,019 | |
Amata Corp. PCL | | | 919,884 | | | | 497,960 | |
See Notes to Financial Statements.
| | | | |
| WisdomTree International Dividend and Sector Funds | | | 107 | |
Schedule of Investments (continued)
WisdomTree Emerging Markets SmallCap Dividend Fund (DGS)
March 31, 2012
| | | | | | | | |
| Investments | | Shares | | | Value | |
| | | | | | | | |
Asian Property Development PCL | | | 5,639,628 | | | $ | 1,115,129 | |
Bangchak Petroleum PCL | | | 2,202,076 | | | | 1,691,708 | |
Bangkok Dusit Medical Services PCL | | | 1,692,516 | | | | 4,759,344 | |
Bangkok Expressway PCL | | | 3,850,375 | | | | 2,695,887 | |
Bangkok Life Assurance PCL | | | 646,433 | | | | 1,005,795 | |
BEC World PCL | | | 5,708,706 | | | | 9,437,407 | |
Berli Jucker PCL | | | 1,821,539 | | | | 2,435,607 | |
Big C Supercenter PCL | | | 559,139 | | | | 2,972,408 | |
Big C Supercenter PCL NVDR | | | 142,745 | | | | 758,839 | |
Bumrungrad Hospital PCL | | | 1,109,666 | | | | 1,924,380 | |
Central Pattana PCL | | | 3,237,580 | | | | 4,827,510 | |
Delta Electronics Thailand PCL | | | 3,364,772 | | | | 2,835,788 | |
Dynasty Ceramic PCL | | | 1,072,852 | | | | 2,269,160 | |
Electricity Generating PCL | | | 1,211,491 | | | | 3,652,145 | |
Esso Thailand PCL | | | 8,594,063 | | | | 3,565,770 | |
GFPT PCL | | | 1,100,167 | | | | 367,317 | |
Glow Energy PCL | | | 3,999,877 | | | | 7,973,823 | |
Hana Microelectronics PCL | | | 1,916,232 | | | | 1,360,307 | |
Hemaraj Land and Development PCL | | | 13,269,500 | | | | 1,212,966 | |
Jasmine International PCL | | | 10,685,416 | | | | 969,827 | |
Kiatnakin Bank PCL | | | 4,479,310 | | | | 5,372,268 | |
Land and Houses PCL NVDR | | | 30,190,963 | | | | 6,752,598 | |
LPN Development PCL | | | 2,860,302 | | | | 1,437,105 | |
LPN Development PCL NVDR | | | 1,397,300 | | | | 702,047 | |
Major Cineplex Group PCL | | | 1,795,557 | | | | 1,047,651 | |
Maybank Kim Eng Securities Thailand PCL | | | 3,678,086 | | | | 1,812,217 | |
MCOT PCL | | | 2,491,010 | | | | 2,301,257 | |
Minor International PCL | | | 2,286,395 | | | | 1,059,820 | |
Precious Shipping PCL | | | 1,409,800 | | | | 726,607 | |
Pruksa Real Estate PCL | | | 2,234,181 | | | | 1,093,554 | |
Quality Houses PCL | | | 18,034,572 | | | | 1,052,260 | |
Ratchaburi Electricity Generating Holding PCL | | | 5,268,493 | | | | 7,044,581 | |
Robinson Department Store PCL | | | 751,295 | | | | 1,248,100 | |
Samart Corp. PCL | | | 1,818,600 | | | | 542,338 | |
Sansiri PCL | | | 46,060,084 | | | | 2,926,346 | |
Siam Makro PCL | | | 434,696 | | | | 5,044,446 | |
Siamgas & Petrochemicals PCL | | | 890,050 | | | | 441,419 | |
STP & I PCL | | | 3,276,760 | | | | 3,319,246 | |
Supalai PCL | | | 6,400,540 | | | | 3,236,578 | |
Thai Plastic & Chemical PCL | | | 1,638,600 | | | | 1,566,895 | |
Thai Tap Water Supply PCL | | | 14,836,224 | | | | 2,885,489 | |
Thai Union Frozen Products PCL | | | 1,301,076 | | | | 2,983,829 | |
Thai Vegetable Oil PCL | | | 3,076,880 | | | | 1,994,736 | |
Thanachart Capital PCL | | | 6,035,043 | | | | 6,553,450 | |
Tisco Financial Group PCL | | | 1,485,107 | | | | 1,997,794 | |
Tisco Financial Group PCL NVDR | | | 19,516 | | | | 26,253 | |
TPI Polene PCL | | | 2,017,289 | | | | 928,542 | |
| | | | | | | | |
| Total Thailand | | | | 125,307,522 | |
| Turkey – 3.8% | | | | | | | | |
Adana Cimento Sanayii TAS Class A | | | 804,687 | | | | 1,818,884 | |
Akcansa Cimento A.S. | | | 263,720 | | | | 1,260,247 | |
Aksa Akrilik Kimya Sanayii | | | 589,093 | | | | 1,566,157 | |
Albaraka Turk Katilim Bankasi A.S. | | | 621,393 | | | | 707,514 | |
| | | | | | | | |
Anadolu Cam Sanayii A.S. | | | 1,232,055 | | | $ | 2,093,851 | |
Anadolu Hayat Emeklilik A.S. | | | 587,370 | | | | 1,268,369 | |
Anadolu Sigorta* | | | 4,895,921 | | | | 2,663,662 | |
Aselsan Elektronik Sanayi ve Ticaret A.S.(a) | | | 567,386 | | | | 3,373,320 | |
Bagfas Bandirma Gubre Fabrik | | | 3,471 | | | | 340,695 | |
Cimsa Cimento Sanayi ve Tica | | | 153,262 | | | | 773,660 | |
EIS Eczacibasi Ilac ve Sinai ve Finansal Yatirimlar Sanayi ve Ticaret A.S. | | | 642,309 | | | | 752,945 | |
Hurriyet Gazetecilik A.S.* | | | 1,478,059 | | | | 978,243 | |
Koza Altin Isletmeleri A.S. | | | 77,999 | | | | 1,478,695 | |
Pinar SUT Mamulleri Sanayii A.S. | | | 51,751 | | | | 539,889 | |
Sekerbank TAS | | | 3,224,490 | | | | 1,808,565 | |
Selcuk Ecza Deposu Ticaret ve Sanayi A.S. | | | 791,685 | | | | 794,838 | |
Tekfen Holding A.S.(a) | | | 315,414 | | | | 1,093,308 | |
Tofas Turk Otomobil Fabrikasi A.S. | | | 1,723,061 | | | | 7,364,252 | |
Trakya Cam Sanayi A.S. | | | 1,463,314 | | | | 2,273,476 | |
Turcas Petrol A.S.(a) | | | 400,737 | | | | 606,871 | |
Turk Traktor ve Ziraat Makineleri A.S.* | | | 137,130 | | | | 2,799,670 | |
Ulker Biskuvi Sanayi A.S. | | | 774,214 | | | | 2,449,137 | |
| | | | | | | | |
| Total Turkey | | | | 38,806,248 | |
TOTAL COMMON STOCKS (Cost: $976,643,936) | | | | | | | 1,010,828,575 | |
| EXCHANGE-TRADED FUNDS – 0.8% | | | | | | | | |
| United States – 0.8% | | | | | | | | |
WisdomTree Emerging Markets Equity Income Fund(a)(b) | | | 14,431 | | | | 831,370 | |
WisdomTree India Earnings Fund(a)(b) | | | 386,779 | | | | 7,457,099 | |
| | | | | | | | |
TOTAL EXCHANGE-TRADED FUNDS
(Cost: $9,161,949) | | | | | | | 8,288,469 | |
| RIGHTS – 0.0% | | | | | | | | |
| Taiwan – 0.0% | | | | | | | | |
Green Energy Technology, Inc., expiring 4/17/12* | | | | | | | | |
| (Cost: $0) | | | 54,526 | | | | 8,314 | |
TOTAL LONG-TERM INVESTMENTS
(Cost: $985,805,885) | | | | | | | 1,019,125,358 | |
| SHORT-TERM INVESTMENT – 0.1% | | | | | | | | |
| MONEY MARKET FUND – 0.1% | | | | | | | | |
Invesco Treasury Fund Private Class, 0.02%(c)
(Cost: $1,038,298) | | | 1,038,298 | | | | 1,038,298 | |
| INVESTMENT OF CASH COLLATERAL FOR SECURITIES LOANED – 1.4% | | | | | | | | |
| MONEY MARKET FUND – 1.4% | | | | | | | | |
Dreyfus Institutional Preferred Money Market Fund, 0.18%(c) | | | | | | | | |
| (Cost: $14,313,135)(d) | | | 14,313,135 | | | | 14,313,135 | |
TOTAL INVESTMENTS IN SECURITIES – 101.1%
(Cost: $1,001,157,318) | | | | 1,034,476,791 | |
Liabilities in Excess of Cash, Foreign Currency and Other Assets – (1.1)% | | | | | | | (11,609,219 | ) |
| | | | | | | | |
| NET ASSETS – 100.0% | | | | | | $ | 1,022,867,572 | |
See Notes to Financial Statements.
| | |
| 108 | | WisdomTree International Dividend and Sector Funds |
Schedule of Investments (concluded)
WisdomTree Emerging Markets SmallCap Dividend Fund (DGS)
March 31, 2012
ADR – American Depositary Receipt
GDR – Global Depositary Receipt
NVDR – Non-Voting Depositary Receipt
| * | Non-income producing security. |
| † | Security is being fair valued by a valuation committee under the direction of the Board of Trustees. The aggregate value of fair valued securities is $73,744, which represents 0.0% of net assets. |
| (a) | Security, or portion thereof, was on loan at March 31, 2012 (See Note 2). |
| (b) | Affiliated company (See Note 7). |
| (c) | Rate shown represents annualized 7-day yield as of March 31, 2012. |
| (d) | At March 31, 2012, the total market value of the Fund’s securities on loan was $13,664,499 and the total market value of the collateral held by the Fund was $14,313,135. |
See Notes to Financial Statements.
| | | | |
| WisdomTree International Dividend and Sector Funds | | | 109 | |
Schedule of Investments
WisdomTree Middle East Dividend Fund (GULF)
March 31, 2012
| | | | | | | | |
| Investments | | Shares | | | Value | |
| | | | | | | | |
| COMMON STOCKS – 98.9% | | | | | |
| Jordan – 1.7% | | | | | |
Arab Bank PLC | | | 19,935 | | | $ | 229,073 | |
Jordan Petroleum Refinery Co. | | | 2,058 | | | | 15,756 | |
| | | | | | | | |
| Total Jordan | | | | 244,829 | |
| Kuwait – 26.7% | | | | | | | | |
Agility Public Warehousing Co. KSC | | | 175,000 | | | | 251,935 | |
Ahli United Bank | | | 47,250 | | | | 137,745 | |
Gulf Cable & Electrical Industries Co. | | | 13,500 | | | | 66,079 | |
Kuwait Finance House | | | 80,077 | | | | 224,798 | |
Kuwait Foods Americana | | | 32,500 | | | | 168,436 | |
Kuwait Projects Co. Holdings KSC | | | 87,008 | | | | 106,470 | |
Mobile Telecommunications Co. KSC | | | 582,624 | | | | 1,824,304 | |
National Bank of Kuwait | | | 162,268 | | | | 630,734 | |
National Mobile Telecommunications Co. KSC | | | 42,500 | | | | 333,453 | |
| | | | | | | | |
| Total Kuwait | | | | 3,743,954 | |
| Morocco – 10.7% | | | | | | | | |
Attijariwafa Bank | | | 2,935 | | | | 126,043 | |
Banque Centrale Populaire | | | 362 | | | | 8,594 | |
Douja Promotion Groupe Addoha S.A. | | | 1,887 | | | | 16,433 | |
Maroc Telecom S.A. | | | 83,225 | | | | 1,350,217 | |
| | | | | | | | |
| Total Morocco | | | | 1,501,287 | |
| Oman – 5.2% | | | | | | | | |
Bank Sohar | | | 10,258 | | | | 3,917 | |
BankMuscat SAOG | | | 2,565 | | | | 4,097 | |
Galfar Engineering & Contracting SAOG | | | 3,975 | | | | 3,913 | |
Oman International Bank SAOG | | | 5,782 | | | | 4,160 | |
Oman Telecommunications Co. SAOG | | | 159,831 | | | | 536,783 | |
Omani Qatari Telecommunications Co. SAOG | | | 116,840 | | | | 181,785 | |
| | | | | | | | |
| Total Oman | | | | 734,655 | |
| Qatar – 34.9% | | | | | | | | |
Al Khaliji | | | 29,712 | | | | 133,830 | |
Barwa Real Estate Co. | | | 3,880 | | | | 29,945 | |
Commercial Bank of Qatar QSC (The) | | | 24,004 | | | | 506,319 | |
Doha Bank QSC | | | 20,899 | | | | 349,560 | |
Gulf International Services OSC | | | 14,839 | | | | 107,390 | |
Gulf Warehousing Co. | | | 424 | | | | 4,367 | |
Industries Qatar QSC | | | 29,066 | | | | 1,121,607 | |
National Leasing | | | 333 | | | | 4,280 | |
Qatar Electricity & Water Co. | | | 7,313 | | | | 291,235 | |
Qatar Gas Transport Co. Nakilat | | | 41,807 | | | | 201,170 | |
Qatar Insurance Co. | | | 8,915 | | | | 180,210 | |
Qatar International Islamic Bank | | | 15,792 | | | | 220,333 | |
Qatar Islamic Bank | | | 15,834 | | | | 334,423 | |
Qatar National Bank SAQ | | | 18,145 | | | | 673,274 | |
Qatar Telecom Q-Tel QSC | | | 16,953 | | | | 628,579 | |
Qatari Investors’ Group | | | 23,712 | | | | 105,633 | |
Salam International Investment Co. | | | 1,193 | | | | 4,194 | |
| | | | | | | | |
| Total Qatar | | | | 4,896,349 | |
| United Arab Emirates – 19.7% | | | | | | | | |
Aramex PJSC | | | 251,751 | | | | 124,745 | |
DP World Ltd. | | | 30,625 | | | | 355,250 | |
| | | | | | | | |
Dubai Investments PJSC | | | 1,024,825 | | | $ | 245,813 | |
Dubai Islamic Bank PJSC | | | 610,104 | | | | 350,482 | |
Emaar Properties PJSC | | | 412,040 | | | | 339,908 | |
First Gulf Bank PJSC | | | 192,440 | | | | 509,785 | |
National Bank of Abu Dhabi PJSC | | | 219,979 | | | | 520,451 | |
Union National Bank PJSC* | | | 279,855 | | | | 239,244 | |
Waha Capital PJSC | | | 401,602 | | | | 76,537 | |
| | | | | | | | |
| Total United Arab Emirates | | | | 2,762,215 | |
TOTAL COMMON STOCKS
(Cost: $12,662,085) | | | | | | | 13,883,289 | |
| SHORT-TERM INVESTMENT – 0.0% | | | | | | | | |
| MONEY MARKET FUND – 0.0% | | | | | | | | |
Invesco Treasury Fund Private Class, 0.02%(a)
(Cost: $4,567) | | | 4,567 | | | | 4,567 | |
TOTAL INVESTMENTS IN SECURITIES – 98.9%
(Cost: $12,666,652) | | | | | | | 13,887,856 | |
Foreign Currency and Other Assets in
Excess of Liabilities – 1.1% | | | | 150,634 | |
| | | | | | | | |
| NET ASSETS – 100.0% | | | $ | 14,038,490 | |
| * | Non-income producing security. |
| (a) | Rate shown represents annualized 7-day yield as of March 31, 2012. |
See Notes to Financial Statements.
| | |
| 110 | | WisdomTree International Dividend and Sector Funds |
Schedule of Investments
WisdomTree International Hedged Equity Fund (HEDJ)
March 31, 2012
| | | | | | | | |
| Investments | | Shares | | | Value | |
| | | | | | | | |
| COMMON STOCKS – 99.3% | | | | | | | | |
| Australia – 12.3% | | | | | | | | |
Adelaide Brighton Ltd. | | | 2,665 | | | $ | 8,006 | |
AGL Energy Ltd. | | | 1,578 | | | | 24,112 | |
Alumina Ltd. | | | 5,040 | | | | 6,448 | |
Amalgamated Holdings Ltd. | | | 49 | | | | 315 | |
Amcor Ltd. | | | 3,523 | | | | 27,153 | |
AMP Ltd. | | | 7,516 | | | | 33,636 | |
APN News & Media Ltd. | | | 6,984 | | | | 6,548 | |
Australia & New Zealand Banking Group Ltd. | | | 9,939 | | | | 239,492 | |
Automotive Holdings Group | | | 226 | | | | 557 | |
Bank of Queensland Ltd.(a) | | | 1,392 | | | | 10,498 | |
Bank of Queensland Ltd. Placement Shares* | | | 301 | | | | 2,270 | |
Bendigo and Adelaide Bank Ltd. | | | 1,819 | | | | 14,604 | |
BHP Billiton Ltd. | | | 4,759 | | | | 170,630 | |
Boral Ltd. | | | 1,741 | | | | 7,269 | |
Bradken Ltd. | | | 898 | | | | 7,982 | |
Brambles Ltd. | | | 3,500 | | | | 25,743 | |
BT Investment Management Ltd. | | | 3,919 | | | | 8,972 | |
Cabcharge Australia Ltd. | | | 1,612 | | | | 10,070 | |
Caltex Australia Ltd. | | | 929 | | | | 13,368 | |
Campbell Brothers Ltd. | | | 205 | | | | 14,278 | |
Challenger Infrastructure Fund Class A(b) | | | 2,565 | | | | 3,136 | |
Coca-Cola Amatil Ltd. | | | 2,198 | | | | 28,394 | |
Cochlear Ltd. | | | 110 | | | | 7,054 | |
Commonwealth Bank of Australia | | | 5,624 | | | | 291,892 | |
Computershare Ltd. | | | 1,465 | | | | 13,659 | |
Consolidated Media Holdings Ltd. | | | 1,534 | | | | 4,624 | |
Crown Ltd. | | | 2,061 | | | | 18,554 | |
CSL Ltd. | | | 977 | | | | 36,325 | |
CSR Ltd. | | | 7,567 | | | | 14,110 | |
David Jones Ltd.(a) | | | 3,484 | | | | 8,698 | |
Envestra Ltd. | | | 19,511 | | | | 15,665 | |
Fairfax Media Ltd.(a) | | | 6,622 | | | | 4,974 | |
Fleetwood Corp., Ltd. | | | 797 | | | | 10,114 | |
Flight Centre Ltd. | | | 351 | | | | 8,000 | |
Fortescue Metals Group Ltd. | | | 1,336 | | | | 8,041 | |
GrainCorp Ltd. | | | 1,227 | | | | 11,504 | |
GWA Group Ltd. | | | 3,141 | | | | 6,996 | |
Harvey Norman Holdings Ltd.(a) | | | 4,760 | | | | 9,912 | |
Incitec Pivot Ltd. | | | 2,771 | | | | 9,042 | |
Insurance Australia Group Ltd. | | | 7,266 | | | | 25,593 | |
Invocare Ltd. | | | 1,124 | | | | 9,327 | |
IOOF Holdings Ltd. | | | 1,262 | | | | 7,557 | |
Iress Market Technology Ltd. | | | 1,037 | | | | 7,520 | |
JB Hi-Fi Ltd.(a) | | | 606 | | | | 6,881 | |
Leighton Holdings Ltd. | | | 1,244 | | | | 27,476 | |
Lend Lease Group(b) | | | 2,647 | | | | 20,484 | |
Macquarie Group Ltd. | | | 1,266 | | | | 38,139 | |
Metcash Ltd. | | | 2,325 | | | | 10,357 | |
Monadelphous Group Ltd. | | | 419 | | | | 10,374 | |
Myer Holdings Ltd.(a) | | | 4,346 | | | | 10,535 | |
National Australia Bank Ltd. | | | 7,823 | | | | 199,364 | |
New Hope Corp., Ltd.(a) | | | 2,168 | | | | 11,881 | |
| | | | | | | | |
Newcrest Mining Ltd. | | | 493 | | | $ | 15,158 | |
OneSteel Ltd. | | | 6,770 | | | | 8,697 | |
Orica Ltd. | | | 839 | | | | 24,310 | |
Origin Energy Ltd. | | | 1,756 | | | | 24,285 | |
OZ Minerals Ltd. | | | 1,164 | | | | 11,769 | |
Perpetual Ltd. | | | 281 | | | | 7,391 | |
Platinum Asset Management Ltd. | | | 5,160 | | | | 21,703 | |
QBE Insurance Group Ltd. | | | 5,296 | | | | 77,742 | |
Ramsay Health Care Ltd. | | | 474 | | | | 9,600 | |
Rio Tinto Ltd. | | | 465 | | | | 31,504 | |
Salmat Ltd. | | | 2,580 | | | | 6,281 | |
Santos Ltd. | | | 1,165 | | | | 17,186 | |
Seven West Media Ltd. | | | 2,102 | | | | 8,514 | |
Sonic Healthcare Ltd. | | | 1,269 | | | | 16,459 | |
Suncorp Group Ltd. | | | 3,404 | | | | 29,622 | |
TABCORP Holdings Ltd. | | | 7,966 | | | | 22,446 | |
Tatts Group Ltd. | | | 4,534 | | | | 11,649 | |
Telstra Corp., Ltd. | | | 71,872 | | | | 244,959 | |
Toll Holdings Ltd. | | | 2,215 | | | | 13,470 | |
Transfield Services Ltd. | | | 2,211 | | | | 5,680 | |
UGL Ltd. | | | 660 | | | | 9,025 | |
Wesfarmers Ltd. | | | 3,570 | | | | 111,024 | |
Westpac Banking Corp. | | | 13,022 | | | | 295,299 | |
Woodside Petroleum Ltd. | | | 1,107 | | | | 39,920 | |
Woolworths Ltd. | | | 3,924 | | | | 105,610 | |
WorleyParsons Ltd. | | | 463 | | | | 13,732 | |
| | | | | | | | |
| Total Australia | | | | 2,711,168 | |
| Austria – 0.5% | | | | | | | | |
Andritz AG(a) | | | 114 | | | | 11,140 | |
Oesterreichische Post AG | | | 253 | | | | 8,794 | |
OMV AG | | | 597 | | | | 21,187 | |
Raiffeisen Bank International AG(a) | | | 175 | | | | 6,176 | |
Strabag SE | | | 264 | | | | 8,032 | |
Telekom Austria AG | | | 2,021 | | | | 23,501 | |
Verbund AG(a) | | | 289 | | | | 8,779 | |
Vienna Insurance Group AG Wiener Versicherung Gruppe | | | 155 | | | | 6,826 | |
Voestalpine AG | | | 258 | | | | 8,663 | |
| | | | | | | | |
| Total Austria | | | | 103,098 | |
| Belgium – 1.2% | | | | | | | | |
Ageas | | | 4,270 | | | | 9,371 | |
Anheuser-Busch InBev N.V. | | | 1,426 | | | | 104,028 | |
Belgacom S.A. | | | 1,606 | | | | 51,554 | |
Cofinimmo | | | 77 | | | | 9,454 | |
Delhaize Group S.A. | | | 230 | | | | 12,083 | |
Elia System Operator S.A./N.V. | | | 155 | | | | 6,554 | |
EVS Broadcast Equipment S.A. | | | 119 | | | | 6,161 | |
KBC Groep N.V. | | | 469 | | | | 11,748 | |
Mobistar S.A. | | | 161 | | | | 8,008 | |
NV Bekaert S.A. | | | 98 | | | | 3,152 | |
Solvay S.A. | | | 115 | | | | 13,595 | |
UCB S.A. | | | 248 | | | | 10,684 | |
Umicore S.A. | | | 144 | | | | 7,921 | |
| | | | | | | | |
| Total Belgium | | | | 254,313 | |
See Notes to Financial Statements.
| | | | |
| WisdomTree International Dividend and Sector Funds | | | 111 | |
Schedule of Investments (continued)
WisdomTree International Hedged Equity Fund (HEDJ)
March 31, 2012
| | | | | | | | |
| Investments | | Shares | | | Value | |
| | | | | | | | |
| Denmark – 0.4% | | | | | | | | |
Carlsberg A/S Class B(a) | | | 88 | | | $ | 7,262 | |
D/S Norden | | | 411 | | | | 12,213 | |
FLSmidth & Co. A/S(a) | | | 122 | | | | 8,552 | |
H. Lundbeck A/S(a) | | | 507 | | | | 10,146 | |
Novo Nordisk A/S Class B | | | 387 | | | | 53,514 | |
Pandora A/S | | | 237 | | | | 2,738 | |
| | | | | | | | |
| Total Denmark | | | | 94,425 | |
| Finland – 1.5% | | | | | | | | |
Elisa Oyj | | | 659 | | | | 15,770 | |
Fortum Oyj | | | 1,696 | | | | 41,106 | |
Kone Oyj Class B | | | 268 | | | | 14,907 | |
Konecranes Oyj | | | 190 | | | | 4,985 | |
Metso Oyj(a) | | | 353 | | | | 15,066 | |
Neste Oil Oyj | | | 618 | | | | 7,600 | |
Nokia Oyj(a) | | | 16,447 | | | | 89,406 | |
Nokian Renkaat Oyj | | | 182 | | | | 8,856 | |
Orion Oyj Class B | | | 524 | | | | 10,342 | |
Pohjola Bank PLC Class A | | | 958 | | | | 10,595 | |
Rautaruukki Oyj | | | 428 | | | | 4,486 | |
Sampo Oyj Class A | | | 1,199 | | | | 34,601 | |
Sanoma Oyj(a) | | | 803 | | | | 10,266 | |
Stora Enso Oyj Class R | | | 2,201 | | | | 16,326 | |
Tieto Oyj | | | 532 | | | | 9,982 | |
UPM-Kymmene Oyj(a) | | | 1,284 | | | | 17,458 | |
Wartsila Oyj Abp | | | 438 | | | | 16,495 | |
YIT Oyj | | | 376 | | | | 8,072 | |
| | | | | | | | |
| Total Finland | | | | 336,319 | |
| France – 10.1% | | | | | | | | |
Accor S.A. | | | 560 | | | | 19,964 | |
Aeroports de Paris | | | 157 | | | | 12,867 | |
Air Liquide S.A. | | | 316 | | | | 42,065 | |
Alstom S.A. | | | 390 | | | | 15,197 | |
Arkema S.A. | | | 95 | | | | 8,839 | |
AXA S.A. | | | 4,534 | | | | 75,051 | |
BNP Paribas S.A. | | | 2,093 | | | | 99,156 | |
Bouygues S.A. | | | 802 | | | | 24,490 | |
Bureau Veritas S.A. | | | 139 | | | | 12,217 | |
Cap Gemini S.A. | | | 277 | | | | 12,380 | |
Carrefour S.A. | | | 1,058 | | | | 25,326 | |
Casino Guichard Perrachon S.A. | | | 275 | | | | 27,063 | |
Christian Dior S.A. | | | 169 | | | | 25,893 | |
Cie de Saint-Gobain | | | 571 | | | | 25,462 | |
Cie Generale des Etablissements Michelin | | | 257 | | | | 19,108 | |
CNP Assurances | | | 1,335 | | | | 20,800 | |
Danone | | | 676 | | | | 47,082 | |
Edenred | | | 419 | | | | 12,588 | |
EDF S.A. | | | 3,533 | | | | 80,501 | |
Eiffage S.A. | | | 104 | | | | 4,018 | |
Euler Hermes S.A. | | | 131 | | | | 10,275 | |
Eutelsat Communications S.A. | | | 296 | | | | 10,927 | |
France Telecom S.A. | | | 11,403 | | | | 168,634 | |
GDF Suez | | | 6,108 | | | | 157,556 | |
| | | | | | | | |
Hermes International(a) | | | 48 | | | $ | 16,150 | |
ICADE | | | 167 | | | | 14,876 | |
Klepierre | | | 441 | | | | 15,269 | |
Lafarge S.A. | | | 579 | | | | 27,592 | |
Lagardere SCA | | | 328 | | | | 10,103 | |
Legrand S.A. | | | 421 | | | | 15,468 | |
L’Oreal S.A. | | | 535 | | | | 65,895 | |
LVMH Moet Hennessy Louis Vuitton S.A. | | | 418 | | | | 71,724 | |
M6-Metropole Television S.A. | | | 514 | | | | 9,275 | |
Natixis | | | 8,627 | | | | 33,145 | |
Neopost S.A. | | | 159 | | | | 10,210 | |
Nexity S.A. | | | 204 | | | | 6,444 | |
Pernod-Ricard S.A. | | | 269 | | | | 28,085 | |
PPR | | | 195 | | | | 33,499 | |
Publicis Groupe S.A. | | | 164 | | | | 9,027 | |
Rallye S.A. | | | 95 | | | | 3,564 | |
Remy Cointreau S.A. | | | 95 | | | | 9,640 | |
Rexel S.A. | | | 426 | | | | 9,375 | |
Safran S.A. | | | 354 | | | | 12,990 | |
Sanofi | | | 2,780 | | | | 215,575 | |
Schneider Electric S.A. | | | 691 | | | | 45,081 | |
SCOR SE | | | 494 | | | | 13,328 | |
Societe Generale S.A. | | | 1,457 | | | | 42,618 | |
Societe Immobiliere de Location pour l’Industrie et le Commerce | | | 140 | | | | 15,422 | |
Societe Television Francaise 1 | | | 516 | | | | 6,309 | |
Sodexo | | | 189 | | | | 15,494 | |
Suez Environnement Co. | | | 662 | | | | 10,138 | |
Technip S.A. | | | 190 | | | | 22,350 | |
Total S.A. | | | 6,336 | | | | 322,656 | |
Vallourec S.A. | | | 117 | | | | 7,401 | |
Veolia Environnement S.A. | | | 1,083 | | | | 17,934 | |
Vinci S.A. | | | 998 | | | | 51,965 | |
Vivendi S.A. | | | 4,476 | | | | 82,019 | |
| | | | | | | | |
| Total France | | | | 2,228,080 | |
| Germany – 7.5% | | | | | | | | |
Adidas AG | | | 160 | | | | 12,473 | |
Aixtron SE N.A. | | | 156 | | | | 2,713 | |
Allianz SE | | | 936 | | | | 111,522 | |
Axel Springer AG | | | 234 | | | | 11,801 | |
BASF SE | | | 1,538 | | | | 134,338 | |
Bayer AG | | | 990 | | | | 69,532 | |
Bayerische Motoren Werke AG | | | 539 | | | | 48,400 | |
Beiersdorf AG | | | 435 | | | | 28,342 | |
Bilfinger Berger SE | | | 122 | | | | 11,443 | |
Celesio AG | | | 484 | | | | 8,746 | |
Daimler AG | | | 1,896 | | | | 114,151 | |
Deutsche Bank AG | | | 681 | | | | 33,831 | |
Deutsche Boerse AG | | | 447 | | | | 30,049 | |
Deutsche Lufthansa AG | | | 867 | | | | 12,117 | |
Deutsche Post AG | | | 3,460 | | | | 66,512 | |
Deutsche Telekom AG | | | 12,614 | | | | 151,636 | |
E.ON AG | | | 7,026 | | | | 168,043 | |
See Notes to Financial Statements.
| | |
| 112 | | WisdomTree International Dividend and Sector Funds |
Schedule of Investments (continued)
WisdomTree International Hedged Equity Fund (HEDJ)
March 31, 2012
| | | | | | | | |
| Investments | | Shares | | | Value | |
| | | | | | | | |
Fielmann AG | | | 137 | | | $ | 13,152 | |
Fraport AG Frankfurt Airport Services Worldwide | | | 136 | | | | 8,503 | |
Fresenius Medical Care AG & Co. KGaA | | | 303 | | | | 21,442 | |
Fresenius SE & Co. KGaA | | | 111 | | | | 11,366 | |
Hannover Rueckversicherung AG | | | 361 | | | | 21,412 | |
Henkel AG & Co. KGaA | | | 379 | | | | 23,621 | |
Infineon Technologies AG | | | 915 | | | | 9,341 | |
K+S AG | | | 168 | | | | 8,776 | |
Linde AG | | | 158 | | | | 28,311 | |
MAN SE | | | 187 | | | | 24,861 | |
Merck KGaA | | | 138 | | | | 15,250 | |
Metro AG | | | 456 | | | | 17,604 | |
Muenchener Rueckversicherungs AG | | | 533 | | | | 80,242 | |
RWE AG | | | 2,122 | | | | 101,180 | |
SAP AG | | | 674 | | | | 46,997 | |
Siemens AG | | | 1,264 | | | | 127,238 | |
SMA Solar Technology AG(a) | | | 76 | | | | 3,439 | |
Suedzucker AG | | | 288 | | | | 9,157 | |
ThyssenKrupp AG | | | 376 | | | | 9,346 | |
United Internet AG Registered Shares | | | 416 | | | | 7,828 | |
Volkswagen AG | | | 256 | | | | 41,217 | |
Wacker Chemie AG | | | 57 | | | | 5,018 | |
| | | | | | | | |
| Total Germany | | | | 1,650,950 | |
| Hong Kong – 5.1% | | | | | | | | |
Bank of East Asia Ltd.(a) | | | 3,552 | | | | 13,359 | |
BOC Hong Kong Holdings Ltd. | | | 20,476 | | | | 56,570 | |
Cathay Pacific Airways Ltd. | | | 16,000 | | | | 29,634 | |
Cheung Kong Holdings Ltd. | | | 2,419 | | | | 31,250 | |
China Merchants Holdings International Co., Ltd. | | | 4,000 | | | | 13,395 | |
China Mobile Ltd. | | | 38,500 | | | | 423,728 | |
China Overseas Land & Investment Ltd. | | | 6,000 | | | | 11,406 | |
China Resources Enterprise Ltd. | | | 2,000 | | | | 6,981 | |
China Resources Power Holdings Co., Ltd. | | | 4,000 | | | | 7,409 | |
China Unicom Hong Kong Ltd. | | | 8,318 | | | | 14,099 | |
Citic Pacific Ltd. | | | 5,770 | | | | 9,721 | |
CLP Holdings Ltd. | | | 3,534 | | | | 30,497 | |
CNOOC Ltd. | | | 51,207 | | | | 105,263 | |
Fosun International Ltd. | | | 13,766 | | | | 8,192 | |
Guangdong Investment Ltd. | | | 14,670 | | | | 10,222 | |
Hang Lung Properties Ltd. | | | 5,000 | | | | 18,322 | |
Hang Seng Bank Ltd. | | | 3,749 | | | | 49,832 | |
Henderson Land Development Co., Ltd. | | | 2,000 | | | | 11,038 | |
HKT Trust and HKT Ltd.*(b) | | | 434 | | | | 338 | |
Hong Kong & China Gas Co., Ltd. | | | 7,288 | | | | 18,680 | |
Hong Kong Exchanges and Clearing Ltd. | | | 1,654 | | | | 27,801 | |
Hutchison Whampoa Ltd. | | | 5,164 | | | | 51,613 | |
Lenovo Group Ltd. | | | 12,000 | | | | 10,804 | |
MTR Corp., Ltd. | | | 6,001 | | | | 21,487 | |
New World Development Co., Ltd. | | | 7,706 | | | | 9,260 | |
PCCW Ltd. | | | 20,000 | | | | 7,161 | |
Power Assets Holdings Ltd. | | | 3,959 | | | | 29,065 | |
Shanghai Industrial Holdings Ltd. | | | 2,000 | | | | 6,170 | |
Shougang Fushan Resources Group Ltd. | | | 13,263 | | | | 4,493 | |
| | | | | | | | |
Sino Land Co., Ltd. | | | 9,581 | | | $ | 15,302 | |
SJM Holdings Ltd. | | | 6,000 | | | | 12,210 | |
Sun Hung Kai Properties Ltd. | | | 2,525 | | | | 31,384 | |
Television Broadcasts Ltd. | | | 1,000 | | | | 6,743 | |
Wharf Holdings Ltd. | | | 2,463 | | | | 13,387 | |
| | | | | | | | |
| Total Hong Kong | | | | 1,116,816 | |
| Ireland – 0.3% | | | | | | | | |
CRH PLC | | | 1,606 | | | | 32,722 | |
DCC PLC | | | 430 | | | | 10,631 | |
Dragon Oil PLC | | | 828 | | | | 8,255 | |
Kerry Group PLC Class A | | | 105 | | | | 4,852 | |
| | | | | | | | |
| Total Ireland | | | | 56,460 | |
| Italy – 3.5% | | | | | | | | |
A2A SpA(a) | | | 8,575 | | | | 6,869 | |
ACEA SpA | | | 1,155 | | | | 7,334 | |
Assicurazioni Generali SpA(a) | | | 2,485 | | | | 38,520 | |
Atlantia SpA | | | 1,455 | | | | 24,123 | |
Banca Carige SpA(a) | | | 4,606 | | | | 6,036 | |
Banca Monte dei Paschi di Siena SpA(a) | | | 12,932 | | | | 5,444 | |
Credito Emiliano SpA | | | 1,205 | | | | 5,697 | |
Enel Green Power SpA | | | 5,989 | | | | 11,365 | |
Enel SpA | | | 24,808 | | | | 89,596 | |
ENI SpA | | | 11,250 | | | | 263,527 | |
ERG SpA | | | 1,102 | | | | 9,752 | |
Exor SpA | | | 231 | | | | 5,823 | |
Intesa Sanpaolo SpA | | | 26,123 | | | | 46,755 | |
Intesa Sanpaolo SpA RSP | | | 739 | | | | 1,139 | |
Iren SpA | | | 5,472 | | | | 4,682 | |
Luxottica Group SpA | | | 812 | | | | 29,358 | |
Mediaset SpA | | | 7,805 | | | | 21,494 | |
Mediobanca SpA | | | 892 | | | | 5,231 | |
Mediolanum SpA | | | 1,441 | | | | 6,839 | |
Parmalat SpA | | | 1,911 | | | | 4,766 | |
Pirelli & C SpA | | | 1,049 | | | | 12,461 | |
Saipem SpA | | | 418 | | | | 21,559 | |
Snam SpA | | | 10,724 | | | | 51,498 | |
Telecom Italia SpA | | | 35,211 | | | | 41,803 | |
Telecom Italia SpA RSP | | | 24,117 | | | | 23,670 | |
Terna Rete Elettrica Nazionale SpA | | | 5,412 | | | | 21,722 | |
| | | | | | | | |
| Total Italy | | | | 767,063 | |
| Japan – 14.5% | | | | | | | | |
77 Bank Ltd. (The) | | | 3,000 | | | | 13,306 | |
Aeon Co., Ltd. | | | 1,251 | | | | 16,539 | |
Aisin Seiki Co., Ltd. | | | 300 | | | | 10,594 | |
Ajinomoto Co., Inc. | | | 363 | | | | 4,579 | |
Asahi Glass Co., Ltd. | | | 1,000 | | | | 8,530 | |
Asahi Group Holdings Ltd. | | | 700 | | | | 15,591 | |
Asahi Kasei Corp. | | | 1,773 | | | | 11,009 | |
Astellas Pharma, Inc. | | | 879 | | | | 36,316 | |
Axell Corp. | | | 300 | | | | 7,138 | |
Bank of Yokohama Ltd. (The) | | | 5,000 | | | | 25,153 | |
Bridgestone Corp. | | | 649 | | | | 15,820 | |
See Notes to Financial Statements.
| | | | |
| WisdomTree International Dividend and Sector Funds | | | 113 | |
Schedule of Investments (continued)
WisdomTree International Hedged Equity Fund (HEDJ)
March 31, 2012
| | | | | | | | |
| Investments | | Shares | | | Value | |
| | | | | | | | |
Brother Industries Ltd. | | | 600 | | | $ | 8,180 | |
Canon, Inc. | | | 1,900 | | | | 90,273 | |
Century Tokyo Leasing Corp. | | | 600 | | | | 12,183 | |
Chiba Bank Ltd. (The) | | | 2,000 | | | | 12,832 | |
Chiyoda Co., Ltd. | | | 619 | | | | 12,486 | |
Chubu Electric Power Co., Inc. | | | 1,700 | | | | 30,862 | |
Chugai Pharmaceutical Co., Ltd. | | | 746 | | | | 13,833 | |
Chugoku Electric Power Co., Inc. (The) | | | 535 | | | | 9,992 | |
Coca-Cola West Co., Ltd. | | | 491 | | | | 8,657 | |
Cosmo Oil Co., Ltd. | | | 3,000 | | | | 8,384 | |
Dai Nippon Printing Co., Ltd. | | | 1,386 | | | | 14,248 | |
Daihatsu Motor Co., Ltd. | | | 1,000 | | | | 18,422 | |
Dai-ichi Life Insurance Co., Ltd. (The) | | | 7 | | | | 9,722 | |
Daiichi Sankyo Co., Ltd. | | | 1,270 | | | | 23,272 | |
Daikin Industries Ltd. | | | 200 | | | | 5,475 | |
Daio Paper Corp. | | | 1,000 | | | | 6,003 | |
Daito Trust Construction Co., Ltd. | | | 194 | | | | 17,515 | |
Daiwa House Industry Co., Ltd. | | | 612 | | | | 8,136 | |
Daiwa Securities Group, Inc. | | | 1,850 | | | | 7,351 | |
Denso Corp. | | | 676 | | | | 22,713 | |
DIC Corp. | | | 7,000 | | | | 14,205 | |
East Japan Railway Co. | | | 500 | | | | 31,654 | |
Eisai Co., Ltd. | | | 755 | | | | 30,183 | |
Electric Power Development Co., Ltd. | | | 200 | | | | 5,454 | |
FamilyMart Co., Ltd. | | | 200 | | | | 8,506 | |
FANUC Corp. | | | 200 | | | | 35,677 | |
Fast Retailing Co., Ltd. | | | 89 | | | | 20,397 | |
Fuji Heavy Industries Ltd. | | | 1,000 | | | | 8,081 | |
FUJIFILM Holdings Corp. | | | 498 | | | | 11,746 | |
Fujikura Kasei Co., Ltd. | | | 2,100 | | | | 10,998 | |
Fujitsu Ltd. | | | 3,000 | | | | 15,894 | |
Fukuoka Financial Group, Inc. | | | 2,000 | | | | 8,919 | |
Hankyu Hanshin Holdings, Inc. | | | 2,000 | | | | 8,773 | |
Hirose Electric Co., Ltd. | | | 100 | | | | 10,560 | |
Hitachi Capital Corp. | | | 700 | | | | 10,479 | |
Hitachi Ltd. | | | 2,000 | | | | 12,905 | |
Hokkaido Electric Power Co., Inc. | | | 700 | | | | 10,335 | |
Hokuriku Electric Power Co. | | | 600 | | | | 10,907 | |
Honda Motor Co., Ltd. | | | 1,500 | | | | 57,324 | |
Hoya Corp. | | | 888 | | | | 20,059 | |
Ibiden Co., Ltd. | | | 200 | | | | 5,145 | |
Inpex Corp. | | | 2 | | | | 13,585 | |
ITOCHU Corp. | | | 1,600 | | | | 17,556 | |
Itochu Techno-Solutions Corp. | | | 200 | | | | 9,004 | |
Japan Tobacco, Inc. | | | 9 | | | | 50,963 | |
JFE Holdings, Inc. | | | 700 | | | | 15,124 | |
JS Group Corp. | | | 497 | | | | 10,466 | |
JX Holdings, Inc. | | | 5,334 | | | | 33,250 | |
Kajima Corp.(a) | | | 2,479 | | | | 7,591 | |
Kansai Electric Power Co., Inc. (The) | | | 1,800 | | | | 28,041 | |
Kao Corp. | | | 804 | | | | 21,220 | |
Kawasaki Heavy Industries Ltd. | | | 2,000 | | | | 6,149 | |
Kawasaki Kisen Kaisha Ltd.* | | | 2,000 | | | | 4,423 | |
KDDI Corp. | | | 5 | | | | 32,566 | |
| | | | | | | | |
Keisei Electric Railway Co., Ltd. | | | 1,000 | | | $ | 7,777 | |
Kintetsu Corp. | | | 1,000 | | | | 3,828 | |
Kirin Holdings Co., Ltd. | | | 1,000 | | | | 13,014 | |
Kobe Steel Ltd. | | | 6,000 | | | | 9,770 | |
Komatsu Ltd. | | | 600 | | | | 17,199 | |
Konami Corp. | | | 70 | | | | 1,996 | |
Konica Minolta Holdings, Inc. | | | 1,000 | | | | 8,785 | |
Kubota Corp. | | | 1,000 | | | | 9,660 | |
Kuraray Co., Ltd. | | | 600 | | | | 8,538 | |
Kyocera Corp. | | | 161 | | | | 14,829 | |
Kyowa Hakko Kirin Co., Ltd. | | | 1,000 | | | | 11,179 | |
Kyushu Electric Power Co., Inc. | | | 1,200 | | | | 17,192 | |
Lawson, Inc. | | | 234 | | | | 14,814 | |
Lion Corp. | | | 2,000 | | | | 11,520 | |
Makita Corp. | | | 200 | | | | 8,069 | |
Marubeni Corp. | | | 2,000 | | | | 14,509 | |
Marui Group Co., Ltd. | | | 1,000 | | | | 8,384 | |
MEIJI Holdings Co., Ltd. | | | 183 | | | | 8,039 | |
Mikuni Coca-Cola Bottling Co., Ltd. | | | 2,000 | | | | 17,182 | |
Mitsubishi Chemical Holdings Corp. | | | 2,109 | | | | 11,327 | |
Mitsubishi Corp. | | | 2,500 | | | | 58,327 | |
Mitsubishi Electric Corp. | | | 1,000 | | | | 8,895 | |
Mitsubishi Estate Co., Ltd. | | | 1,000 | | | | 17,935 | |
Mitsubishi Heavy Industries Ltd. | | | 2,000 | | | | 9,745 | |
Mitsubishi Tanabe Pharma Corp. | | | 552 | | | | 7,787 | |
Mitsubishi UFJ Financial Group, Inc. | | | 21,200 | | | | 106,135 | |
Mitsui & Co., Ltd. | | | 2,700 | | | | 44,522 | |
Mitsui Chemicals, Inc. | | | 2,000 | | | | 6,100 | |
Mitsui Fudosan Co., Ltd. | | | 713 | | | | 13,715 | |
Mitsui O.S.K. Lines Ltd. | | | 2,000 | | | | 8,749 | |
Mizuho Financial Group, Inc. | | | 49,500 | | | | 81,202 | |
MS&AD Insurance Group Holdings | | | 799 | | | | 16,496 | |
Murata Manufacturing Co., Ltd. | | | 200 | | | | 11,921 | |
Nagoya Railroad Co., Ltd. | | | 3,000 | | | | 8,312 | |
Namco Bandai Holdings, Inc. | | | 900 | | | | 13,058 | |
NEC Mobiling Ltd. | | | 262 | | | | 9,096 | |
Nidec Corp. | | | 100 | | | | 9,162 | |
Nintendo Co., Ltd. | | | 300 | | | | 45,385 | |
Nippon Electric Glass Co., Ltd. | | | 1,000 | | | | 8,737 | |
Nippon Express Co., Ltd. | | | 1,961 | | | | 7,697 | |
Nippon Paper Group, Inc. | | | 500 | | | | 10,468 | |
Nippon Sheet Glass Co., Ltd. | | | 2,000 | | | | 3,086 | |
Nippon Steel Corp. | | | 6,000 | | | | 16,550 | |
Nippon Telegraph & Telephone Corp. | | | 2,083 | | | | 95,044 | |
Nippon Yusen K.K. | | | 5,000 | | | | 15,797 | |
Nishi-Nippon Railroad Co., Ltd. | | | 5,000 | | | | 23,634 | |
Nissan Motor Co., Ltd. | | | 2,200 | | | | 23,552 | |
Nissin Foods Holdings Co., Ltd. | | | 200 | | | | 7,522 | |
Nitto Denko Corp. | | | 178 | | | | 7,213 | |
NKSJ Holdings, Inc. | | | 850 | | | | 19,108 | |
Nomura Holdings, Inc. | | | 3,800 | | | | 16,900 | |
Nomura Research Institute Ltd. | | | 600 | | | | 14,968 | |
NTT DoCoMo, Inc. | | | 71 | | | | 118,542 | |
Obayashi Corp. | | | 1,000 | | | | 4,387 | |
See Notes to Financial Statements.
| | |
| 114 | | WisdomTree International Dividend and Sector Funds |
Schedule of Investments (continued)
WisdomTree International Hedged Equity Fund (HEDJ)
March 31, 2012
| | | | | | | | |
| Investments | | Shares | | | Value | |
| | | | | | | | |
OJI Paper Co., Ltd. | | | 2,000 | | | $ | 9,721 | |
Onoken Co., Ltd. | | | 1,400 | | | | 12,078 | |
Oracle Corp. | | | 462 | | | | 17,656 | |
Oriental Land Co., Ltd. | | | 100 | | | | 10,778 | |
Osaka Gas Co., Ltd. | | | 4,000 | | | | 16,137 | |
Otsuka Holdings Co., Ltd. | | | 445 | | | | 13,248 | |
Panasonic Corp. | | | 1,197 | | | | 11,069 | |
Resona Holdings, Inc. | | | 4,200 | | | | 19,445 | |
Ricoh Co., Ltd. | | | 2,000 | | | | 19,564 | |
Rohm Co., Ltd. | | | 200 | | | | 9,928 | |
Saibu Gas Co., Ltd. | | | 5,000 | | | | 13,549 | |
Sankyo Co., Ltd. | | | 179 | | | | 8,831 | |
Secom Co., Ltd. | | | 440 | | | | 21,654 | |
Sega Sammy Holdings, Inc. | | | 500 | | | | 10,535 | |
Sekisui House Ltd. | | | 1,000 | | | | 9,855 | |
Seven & I Holdings Co., Ltd. | | | 873 | | | | 26,075 | |
Sharp Corp. | | | 1,000 | | | | 7,339 | |
Shikoku Electric Power Co., Inc. | | | 600 | | | | 17,010 | |
Shin-Etsu Chemical Co., Ltd. | | | 539 | | | | 31,307 | |
Shionogi & Co., Ltd. | | | 600 | | | | 8,341 | |
Shiseido Co., Ltd. | | | 763 | | | | 13,240 | |
Shizuoka Bank Ltd. (The) | | | 1,000 | | | | 10,353 | |
Showa Denko K.K. | | | 7,000 | | | | 15,991 | |
Showa Shell Sekiyu K.K. | | | 843 | | | | 5,409 | |
Sojitz Corp. | | | 4,800 | | | | 8,632 | |
Sony Corp. | | | 300 | | | | 6,212 | |
Sumitomo Chemical Co., Ltd. | | | 2,000 | | | | 8,555 | |
Sumitomo Corp. | | | 1,800 | | | | 26,160 | |
Sumitomo Electric Industries Ltd. | | | 851 | | | | 11,716 | |
Sumitomo Metal Industries Ltd. | | | 8,538 | | | | 17,326 | |
Sumitomo Metal Mining Co., Ltd. | | | 1,000 | | | | 14,132 | |
Sumitomo Mitsui Financial Group, Inc. | | | 2,400 | | | | 79,412 | |
Sumitomo Mitsui Trust Holdings, Inc. | | | 2,754 | | | | 8,835 | |
T&D Holdings, Inc. | | | 800 | | | | 9,323 | |
Taisei Corp. | | | 2,947 | | | | 7,735 | |
Takashimaya Co., Ltd. | | | 1,000 | | | | 8,348 | |
Takata Corp. | | | 300 | | | | 8,038 | |
Takeda Pharmaceutical Co., Ltd. | | | 2,107 | | | | 93,323 | |
TDK Corp. | | | 100 | | | | 5,699 | |
Tenma Corp. | | | 1,200 | | | | 14,028 | |
Terumo Corp. | | | 500 | | | | 24,029 | |
Tokio Marine Holdings, Inc. | | | 1,090 | | | | 30,079 | |
Tokyo Electron Ltd. | | | 200 | | | | 11,507 | |
Tokyo Gas Co., Ltd. | | | 6,000 | | | | 28,434 | |
Tokyu Corp. | | | 2,000 | | | | 9,551 | |
TonenGeneral Sekiyu K.K. | | | 2,271 | | | | 21,028 | |
Toppan Printing Co., Ltd. | | | 1,707 | | | | 13,400 | |
Topy Industries Ltd. | | | 4,000 | | | | 12,492 | |
Toray Industries, Inc. | | | 1,000 | | | | 7,461 | |
Toshiba Corp. | | | 2,000 | | | | 8,846 | |
Toyota Motor Corp. | | | 2,200 | | | | 95,437 | |
Toyota Tsusho Corp. | | | 600 | | | | 12,285 | |
Trend Micro, Inc. | | | 273 | | | | 8,436 | |
USS Co., Ltd. | | | 120 | | | | 12,234 | |
| | | | | | | | |
Yahoo! Japan Corp. | | | 49 | | | $ | 15,945 | |
Yakult Honsha Co., Ltd. | | | 200 | | | | 6,914 | |
| | | | | | | | |
| Total Japan | | | | 3,175,276 | |
| Netherlands – 1.9% | | | | | | | | |
Akzo Nobel N.V. | | | 285 | | | | 16,802 | |
ASML Holding N.V. | | | 337 | | | | 16,820 | |
Delta Lloyd N.V. | | | 563 | | | | 9,882 | |
European Aeronautic Defence and Space Co. N.V. | | | 398 | | | | 16,274 | |
Exact Holding N.V. | | | 334 | | | | 7,873 | |
Fugro N.V. CVA | | | 128 | | | | 9,106 | |
Heineken Holding N.V. | | | 325 | | | | 15,191 | |
Heineken N.V. | | | 458 | | | | 25,418 | |
Koninklijke Ahold N.V. | | | 1,980 | | | | 27,396 | |
Koninklijke Boskalis Westminster N.V. | | | 189 | | | | 7,089 | |
Koninklijke DSM N.V. | | | 239 | | | | 13,808 | |
Koninklijke KPN N.V. | | | 5,541 | | | | 60,862 | |
Koninklijke Philips Electronics N.V. | | | 1,683 | | | | 34,067 | |
PostNL N.V. | | | 1,488 | | | | 9,175 | |
Randstad Holding N.V. | | | 307 | | | | 11,566 | |
Reed Elsevier N.V. | | | 2,312 | | | | 29,484 | |
STMicroelectronics N.V. | | | 1,535 | | | | 12,551 | |
Unilever N.V. CVA | | | 2,661 | | | | 90,416 | |
Wolters Kluwer N.V. | | | 544 | | | | 10,287 | |
| | | | | | | | |
| Total Netherlands | | | | 424,067 | |
| New Zealand – 0.4% | | | | | | | | |
Contact Energy Ltd.* | | | 2,857 | | | | 11,074 | |
Nuplex Industries Ltd. | | | 6,954 | | | | 14,645 | |
NZX Ltd. | | | 2,883 | | | | 6,639 | |
Ryman Healthcare Ltd. | | | 2,684 | | | | 6,796 | |
SKYCITY Entertainment Group Ltd. | | | 3,017 | | | | 9,741 | |
Telecom Corp. of New Zealand Ltd. | | | 6,064 | | | | 12,050 | |
Vector Ltd. | | | 188 | | | | 399 | |
Warehouse Group Ltd. (The) | | | 7,187 | | | | 16,431 | |
| | | | | | | | |
| Total New Zealand | | | | 77,775 | |
| Norway – 2.0% | | | | | | | | |
ABG Sundal Collier Holding ASA | | | 13,802 | | | | 11,953 | |
Aker ASA Class A | | | 443 | | | | 14,484 | |
Aker Solutions ASA | | | 464 | | | | 7,838 | |
DNB ASA | | | 3,494 | | | | 44,839 | |
Fred Olsen Energy ASA | | | 433 | | | | 16,951 | |
Gjensidige Forsikring ASA | | | 1,629 | | | | 19,206 | |
Leroey Seafood Group ASA | | | 341 | | | | 5,620 | |
Marine Harvest ASA | | | 48,186 | | | | 24,836 | |
Norsk Hydro ASA | | | 2,096 | | | | 11,395 | |
Orkla ASA | | | 2,431 | | | | 19,204 | |
SpareBank 1 SMN | | | 414 | | | | 2,656 | |
SpareBank 1 SR Bank ASA | | | 1,119 | | | | 8,043 | |
Statoil ASA | | | 6,600 | | | | 178,883 | |
Telenor ASA | | | 3,198 | | | | 59,205 | |
Yara International ASA | | | 239 | | | | 11,380 | |
| | | | | | | | |
| Total Norway | | | | 436,493 | |
See Notes to Financial Statements.
| | | | |
| WisdomTree International Dividend and Sector Funds | | | 115 | |
Schedule of Investments (continued)
WisdomTree International Hedged Equity Fund (HEDJ)
March 31, 2012
| | | | | | | | |
| Investments | | Shares | | | Value | |
| | | | | | | | |
| Portugal – 0.6% | | | | | | | | |
Banco Espirito Santo S.A. | | | 3,819 | | | $ | 6,967 | |
Brisa Auto-Estradas de Portugal S.A. | | | 2,186 | | | | 7,773 | |
Cimpor Cimentos de Portugal, SGPS, S.A. | | | 1,516 | | | | 10,094 | |
EDP-Energias de Portugal S.A. | | | 10,239 | | | | 29,739 | |
Galp Energia, SGPS, S.A. Class B | | | 398 | | | | 6,540 | |
Mota-Engil, SGPS, S.A. | | | 3,537 | | | | 5,732 | |
Portugal Telecom, SGPS, S.A. | | | 5,566 | | | | 30,235 | |
REN – Redes Energeticas Nacionais S.A. | | | 2,719 | | | | 8,219 | |
Sonae | | | 11,949 | | | | 7,097 | |
Sonaecom – SGPS S.A. | | | 5,367 | | | | 8,684 | |
Zon Multimedia Servicos de Telecomunicacoes e Multimedia, SGPS, S.A. | | | 1,773 | | | | 6,021 | |
| | | | | | | | |
| Total Portugal | | | | 127,101 | |
| Singapore – 2.2% | | | | | | | | |
Cityspring Infrastructure Trust | | | 27,359 | | | | 8,377 | |
DBS Group Holdings Ltd. | | | 2,793 | | | | 31,499 | |
Jardine Cycle & Carriage Ltd. | | | 433 | | | | 16,630 | |
Keppel Corp., Ltd. | | | 4,029 | | | | 35,216 | |
Keppel Land Ltd. | | | 5,000 | | | | 13,799 | |
M1 Ltd. | | | 6,000 | | | | 12,121 | |
Oversea-Chinese Banking Corp., Ltd. | | | 5,575 | | | | 39,551 | |
Sakari Resources Ltd. | | | 3,000 | | | | 5,559 | |
SembCorp Industries Ltd. | | | 4,568 | | | | 19,182 | |
SembCorp Marine Ltd.(a) | | | 9,000 | | | | 37,794 | |
Singapore Airlines Ltd. | | | 1,000 | | | | 8,566 | |
Singapore Exchange Ltd. | | | 4,491 | | | | 24,788 | |
Singapore Post Ltd. | | | 14,000 | | | | 11,357 | |
Singapore Press Holdings Ltd. | | | 6,540 | | | | 20,390 | |
Singapore Technologies Engineering Ltd. | | | 8,128 | | | | 21,009 | |
Singapore Telecommunications Ltd. | | | 34,000 | | | | 85,179 | |
StarHub Ltd. | | | 7,438 | | | | 18,338 | |
United Overseas Bank Ltd. | | | 2,000 | | | | 29,188 | |
UOB-Kay Hian Holdings Ltd. | | | 15,082 | | | | 20,272 | |
Venture Corp., Ltd. | | | 1,458 | | | | 9,880 | |
Wilmar International Ltd. | | | 4,019 | | | | 15,662 | |
Yangzijiang Shipbuilding Holdings Ltd. | | | 7,000 | | | | 7,404 | |
| | | | | | | | |
| Total Singapore | | | | 491,761 | |
| Spain – 5.2% | | | | | | | | |
Abertis Infraestructuras, S.A. | | | 666 | | | | 11,321 | |
Acciona S.A. | | | 114 | | | | 7,949 | |
Acerinox S.A. | | | 628 | | | | 8,060 | |
ACS Actividades de Construccion y Servicios, S.A.(a) | �� | | 877 | | | | 22,412 | |
Antena 3 de Television S.A. | | | 1,029 | | | | 6,139 | |
Banco Bilbao Vizcaya Argentaria S.A. | | | 10,468 | | | | 83,181 | |
Banco de Sabadell S.A.(a) | | | 4,382 | | | | 11,916 | |
Banco Espanol de Credito S.A.(a) | | | 2,233 | | | | 10,687 | |
Banco Popular Espanol S.A. | | | 2,162 | | | | 7,745 | |
Banco Popular Espanol S.A. Temp Line* | | | 28 | | | | 100 | |
Banco Santander S.A. | | | 30,039 | | | | 230,817 | |
Bankinter S.A.(a) | | | 1,266 | | | | 6,631 | |
Bolsas y Mercados Espanoles S.A. | | | 76 | | | | 1,945 | |
CaixaBank(a) | | | 10,569 | | | | 41,084 | |
| | | | | | | | |
Ebro Foods S.A. | | | 337 | | | $ | 6,532 | |
Enagas S.A. | | | 543 | | | | 10,435 | |
Endesa S.A. | | | 2,290 | | | | 45,561 | |
Ferrovial S.A. | | | 1,852 | | | | 21,255 | |
Fomento de Construcciones y Contratas S.A. | | | 518 | | | | 11,555 | |
Gas Natural SDG S.A. | | | 2,384 | | | | 38,034 | |
Iberdrola S.A. | | | 13,839 | | | | 78,454 | |
Inditex S.A. | | | 650 | | | | 62,168 | |
Indra Sistemas S.A. | | | 127 | | | | 1,554 | |
Mapfre S.A.(a) | | | 6,958 | | | | 22,368 | |
Mediaset Espana Comunicacion S.A. | | | 1,153 | | | | 6,602 | |
Obrascon Huarte Lain S.A. | | | 187 | | | | 5,558 | |
Red Electrica Corp. S.A. | | | 228 | | | | 11,140 | |
Repsol YPF S.A. | | | 2,314 | | | | 57,964 | |
Telefonica S.A. | | | 17,808 | | | | 291,338 | |
Zardoya Otis S.A. | | | 1,748 | | | | 22,603 | |
| | | | | | | | |
| Total Spain | | | | 1,143,108 | |
| Sweden – 3.5% | | | | | | | | |
Alfa Laval AB | | | 549 | | | | 11,261 | |
Assa Abloy AB Class B | | | 486 | | | | 15,220 | |
Atlas Copco AB Class A | | | 1,533 | | | | 36,989 | |
Axis Communications AB | | | 245 | | | | 6,609 | |
Boliden AB | | | 845 | | | | 13,232 | |
Castellum AB | | | 774 | | | | 9,723 | |
Electrolux AB Series B(a) | | | 631 | | | | 13,304 | |
Hakon Invest AB | | | 946 | | | | 16,353 | |
Hennes & Mauritz AB Class B | | | 3,559 | | | | 128,407 | |
Investment AB Kinnevik Class B | | | 375 | | | | 8,698 | |
Kungsleden AB | | | 989 | | | | 6,856 | |
NCC AB Class B | | | 411 | | | | 8,641 | |
Nordea Bank AB(a) | | | 8,041 | | | | 72,892 | |
Peab AB | | | 1,394 | | | | 7,101 | |
Ratos AB Class B(a) | | | 1,389 | | | | 19,227 | |
Sandvik AB | | | 1,621 | | | | 23,330 | |
Scania AB Class B | | | 1,308 | | | | 27,125 | |
Securitas AB Class B | | | 1,413 | | | | 13,586 | |
Skandinaviska Enskilda Banken AB Class A(a) | | | 3,166 | | | | 22,426 | |
Skanska AB Class B | | | 1,406 | | | | 24,304 | |
SKF AB Class B | | | 631 | | | | 15,358 | |
Svenska Cellulosa AB Class B(a) | | | 1,367 | | | | 23,610 | |
Svenska Handelsbanken AB Class A(a) | | | 1,577 | | | | 50,124 | |
Swedbank AB Class A(a) | | | 767 | | | | 11,883 | |
Swedish Match AB | | | 475 | | | | 18,856 | |
Tele2 AB Class B | | | 1,039 | | | | 21,139 | |
Telefonaktiebolaget LM Ericsson Class B | | | 3,777 | | | | 39,020 | |
TeliaSonera AB | | | 11,391 | | | | 79,209 | |
Volvo AB Class B(a) | | | 2,441 | | | | 35,463 | |
| | | | | | | | |
| Total Sweden | | | | 779,946 | |
| Switzerland – 7.0% | | | | | | | | |
ABB Ltd.* | | | 3,245 | | | | 66,490 | |
Actelion Ltd.* | | | 193 | | | | 7,047 | |
Adecco S.A.* | | | 246 | | | | 12,874 | |
Baloise Holding AG | | | 107 | | | | 8,606 | |
See Notes to Financial Statements.
| | |
| 116 | | WisdomTree International Dividend and Sector Funds |
Schedule of Investments (continued)
WisdomTree International Hedged Equity Fund (HEDJ)
March 31, 2012
| | | | | | | | |
| Investments | | Shares | | | Value | |
| | | | | | | | |
Cie Financiere Richemont S.A. Class A | | | 207 | | | $ | 12,963 | |
Credit Suisse Group AG* | | | 2,120 | | | | 60,350 | |
EFG International AG* | | | 1,018 | | | | 9,911 | |
GAM Holding AG* | | | 500 | | | | 7,274 | |
Geberit AG* | | | 69 | | | | 14,421 | |
Givaudan S.A.* | | | 14 | | | | 13,476 | |
Holcim Ltd.* | | | 374 | | | | 24,372 | |
Kuehne + Nagel International AG | | | 234 | | | | 31,611 | |
Lonza Group AG* | | | 137 | | | | 7,072 | |
Nestle S.A. | | | 5,269 | | | | 331,116 | |
Novartis AG | | | 4,823 | | | | 266,590 | |
Roche Holding AG | | | 377 | | | | 69,239 | |
Roche Holding AG – Genusschein | | | 1,345 | | | | 233,777 | |
Schindler Holding AG | | | 241 | | | | 28,770 | |
SGS S.A. | | | 18 | | | | 34,970 | |
Sulzer AG | | | 61 | | | | 8,659 | |
Swatch Group AG (The) | | | 34 | | | | 15,630 | |
Swiss Re AG* | | | 793 | | | | 50,580 | |
Swisscom AG(a) | | | 127 | | | | 51,272 | |
Syngenta AG* | | | 108 | | | | 37,293 | |
Vontobel Holding AG | | | 297 | | | | 7,525 | |
Zurich Financial Services AG* | | | 487 | | | | 130,714 | |
| | | | | | | | |
| Total Switzerland | | | | 1,542,602 | |
| United Kingdom – 19.6% | | | | | | | | |
Aberdeen Asset Management PLC | | | 2,308 | | | | 9,477 | |
Admiral Group PLC | | | 820 | | | | 15,552 | |
AMEC PLC | | | 543 | | | | 9,613 | |
Amlin PLC | | | 1,928 | | | | 10,159 | |
Anglo American PLC | | | 890 | | | | 33,232 | |
Antofagasta PLC | | | 3,316 | | | | 61,035 | |
Ashmore Group PLC | | | 1,826 | | | | 10,722 | |
Associated British Foods PLC | | | 1,495 | | | | 29,141 | |
AstraZeneca PLC | | | 3,645 | | | | 161,843 | |
Aviva PLC | | | 12,501 | | | | 66,212 | |
Babcock International Group PLC | | | 837 | | | | 10,652 | |
BAE Systems PLC | | | 9,059 | | | | 43,408 | |
Balfour Beatty PLC | | | 2,086 | | | | 9,515 | |
Barclays PLC | | | 12,604 | | | | 47,375 | |
Berendsen PLC | | | 1,748 | | | | 14,579 | |
BG Group PLC | | | 1,964 | | | | 45,438 | |
BHP Billiton PLC | | | 2,673 | | | | 81,465 | |
BP PLC | | | 18,405 | | | | 136,020 | |
British American Tobacco PLC | | | 4,369 | | | | 219,923 | |
British Land Co. PLC | | | 3,612 | | | | 27,695 | |
British Sky Broadcasting Group PLC | | | 2,167 | | | | 23,405 | |
Britvic PLC | | | 1,411 | | | | 8,673 | |
BT Group PLC | | | 13,185 | | | | 47,694 | |
Bunzl PLC | | | 760 | | | | 12,191 | |
Burberry Group PLC | | | 621 | | | | 14,853 | |
Cable & Wireless Communications PLC | | | 21,701 | | | | 11,196 | |
Cable & Wireless Worldwide PLC | | | 13,305 | | | | 7,228 | |
Capita PLC | | | 1,118 | | | | 13,085 | |
Carillion PLC | | | 1,606 | | | | 7,657 | |
| | | | | | | | |
Carnival PLC | | | 244 | | | $ | 7,789 | |
Centrica PLC | | | 10,437 | | | | 52,762 | |
Close Brothers Group PLC | | | 766 | | | | 9,607 | |
Compass Group PLC | | | 2,690 | | | | 28,173 | |
Daily Mail & General Trust PLC Class A | | | 1,167 | | | | 8,419 | |
Diageo PLC | | | 3,950 | | | | 94,824 | |
Drax Group PLC | | | 1,443 | | | | 12,554 | |
Electrocomponents PLC | | | 670 | | | | 2,653 | |
Eurasian Natural Resources Corp. PLC | | | 2,140 | | | | 20,259 | |
Firstgroup PLC | | | 2,457 | | | | 9,331 | |
Fresnillo PLC | | | 782 | | | | 19,966 | |
G4S PLC | | | 3,126 | | | | 13,610 | |
GKN PLC | | | 2,911 | | | | 9,586 | |
GlaxoSmithKline PLC | | | 12,927 | | | | 288,435 | |
Go-Ahead Group PLC | | | 350 | | | | 6,968 | |
Greene King PLC | | | 1,247 | | | | 10,221 | |
Hammerson PLC | | | 1,190 | | | | 7,902 | |
Hays PLC | | | 8,625 | | | | 11,624 | |
Home Retail Group PLC | | | 4,893 | | | | 8,912 | |
HSBC Holdings PLC | | | 32,051 | | | | 284,110 | |
ICAP PLC | | | 1,303 | | | | 8,178 | |
IMI PLC | | | 583 | | | | 9,059 | |
Imperial Tobacco Group PLC | | | 2,170 | | | | 87,891 | |
Inmarsat PLC | | | 1,117 | | | | 8,215 | |
Intercontinental Hotels Group PLC | | | 453 | | | | 10,517 | |
International Power PLC | | | 6,039 | | | | 39,078 | |
Interserve PLC | | | 2,022 | | | | 9,411 | |
Investec PLC | | | 993 | | | | 6,065 | |
J. Sainsbury PLC | | | 4,347 | | | | 21,621 | |
Johnson Matthey PLC | | | 266 | | | | 10,026 | |
Kingfisher PLC | | | 3,891 | | | | 19,067 | |
Ladbrokes PLC | | | 3,854 | | | | 9,858 | |
Legal & General Group PLC | | | 11,852 | | | | 24,750 | |
Logica PLC | | | 5,031 | | | | 8,006 | |
Man Group PLC | | | 10,743 | | | | 23,138 | |
Marks & Spencer Group PLC | | | 4,839 | | | | 29,302 | |
Marston’s PLC | | | 5,486 | | | | 8,599 | |
Meggitt PLC | | | 1,463 | | | | 9,441 | |
Melrose PLC | | | 1,248 | | | | 8,437 | |
Mondi PLC | | | 820 | | | | 7,723 | |
National Grid PLC | | | 8,331 | | | | 83,925 | |
Next PLC | | | 291 | | | | 13,869 | |
Old Mutual PLC | | | 8,187 | | | | 20,746 | |
Pearson PLC | | | 1,338 | | | | 24,905 | |
Pennon Group PLC | | | 424 | | | | 4,820 | |
Premier Farnell PLC | | | 1,917 | | | | 6,573 | |
Provident Financial PLC | | | 932 | | | | 17,065 | |
Prudential PLC | | | 3,925 | | | | 46,877 | |
Reckitt Benckiser Group PLC | | | 1,352 | | | | 76,318 | |
Reed Elsevier PLC | | | 2,960 | | | | 26,248 | |
Rexam PLC | | | 1,634 | | | | 11,176 | |
Rio Tinto PLC | | | 1,254 | | | | 69,043 | |
Royal Dutch Shell PLC Class A | | | 7,619 | | | | 265,803 | |
Royal Dutch Shell PLC Class B | | | 6,590 | | | | 231,589 | |
See Notes to Financial Statements.
| | | | |
| WisdomTree International Dividend and Sector Funds | | | 117 | |
Schedule of Investments (concluded)
WisdomTree International Hedged Equity Fund (HEDJ)
March 31, 2012
| | | | | | | | |
| Investments | | Shares | | | Value | |
| | | | | | | | |
RSA Insurance Group PLC(a) | | | 14,620 | | | $ | 24,434 | |
SABMiller PLC | | | 1,635 | | | | 65,556 | |
Sage Group PLC (The) | | | 1,401 | | | | 6,697 | |
Segro PLC | | | 1,990 | | | | 7,466 | |
Severn Trent PLC | | | 431 | | | | 10,632 | |
Smiths Group PLC | | | 699 | | | | 11,749 | |
SSE PLC | | | 2,288 | | | | 48,584 | |
Standard Chartered PLC | | | 3,368 | | | | 83,947 | |
Standard Life PLC | | | 8,751 | | | | 32,116 | |
Tate & Lyle PLC | | | 1,234 | | | | 13,900 | |
TESCO PLC | | | 14,101 | | | | 74,349 | |
TUI Travel PLC | | | 3,355 | | | | 10,523 | |
Unilever PLC | | | 2,414 | | | | 79,608 | |
United Utilities Group PLC | | | 1,426 | | | | 13,705 | |
Vedanta Resources PLC | | | 274 | | | | 5,376 | |
Vodafone Group PLC | | | 141,535 | | | | 389,409 | |
Weir Group PLC (The) | | | 206 | | | | 5,806 | |
Whitbread PLC | | | 324 | | | | 9,546 | |
William Hill PLC | | | 2,235 | | | | 9,335 | |
WM Morrison Supermarkets PLC | | | 4,215 | | | | 20,069 | |
WS Atkins PLC | | | 706 | | | | 8,280 | |
Xstrata PLC | | | 1,197 | | | | 20,426 | |
| | | | | | | | |
| Total United Kingdom | | | | 4,305,595 | |
TOTAL COMMON STOCKS
(Cost: $21,086,267) | | | | | | | 21,822,416 | |
| EXCHANGE-TRADED FUND – 0.2% | | | | | | | | |
| United States – 0.2% | | | | | | | | |
WisdomTree DEFA Fund(c)
(Cost: $34,544) | | | 773 | | | | 34,707 | |
| SHORT-TERM INVESTMENT – 0.0% | | | | | | | | |
| MONEY MARKET FUND – 0.0% | | | | | | | | |
Invesco Treasury Fund Private Class, 0.02%(d)
(Cost: $2,077) | | | 2,077 | | | | 2,077 | |
| INVESTMENT OF CASH COLLATERAL FOR SECURITIES LOANED – 2.9% | | | | | | | | |
| MONEY MARKET FUND – 2.9% | | | | | | | | |
Dreyfus Institutional Preferred Money Market Fund, 0.18%(d) | | | | | | | | |
| (Cost: $629,327)(e) | | | 629,327 | | | | 629,327 | |
TOTAL INVESTMENTS IN SECURITIES – 102.4%
(Cost: $21,752,215) | | | | 22,488,527 | |
Liabilities in Excess of Foreign Currency and Other
Assets – (2.4)% | | | | (525,378 | ) |
| | | | | | | | |
| NET ASSETS – 100.0% | | | $ | 21,963,149 | |
| * | Non-income producing security. |
| (a) | Security, or portion thereof, was on loan at March 31, 2012 (See Note 2). |
| (b) | Stapled Security – A security contractually bound to one or more other securities to form a single saleable unit which cannot be sold separately. |
| (c) | Affiliated company (See Note 7). |
| (d) | Rate shown represents annualized 7-day yield as of March 31, 2012. |
| (e) | At March 31, 2012, the total market value of the Fund’s securities on loan was $589,006 and the total market value of the collateral held by the Fund was $629,327. |
See Notes to Financial Statements.
| | |
| 118 | | WisdomTree International Dividend and Sector Funds |
Schedule of Investments
WisdomTree Commodity Country Equity Fund (CCXE)
March 31, 2012
| | | | | | | | |
| Investments | | Shares | | | Value | |
| | | | | | | | |
| COMMON STOCKS – 99.3% | | | | | |
| Australia – 12.4% | | | | | |
Amcor Ltd. | | | 7,545 | | | $ | 58,153 | |
AMP Ltd. | | | 16,902 | | | | 75,642 | |
Australia & New Zealand Banking Group Ltd. | | | 19,559 | | | | 471,297 | |
BHP Billiton Ltd. | | | 8,875 | | | | 318,206 | |
Coca-Cola Amatil Ltd. | | | 4,582 | | | | 59,192 | |
Commonwealth Bank of Australia | | | 11,048 | | | | 573,403 | |
CSL Ltd. | | | 1,593 | | | | 59,228 | |
Leighton Holdings Ltd. | | | 2,582 | | | | 57,027 | |
Macquarie Group Ltd. | | | 2,364 | | | | 71,216 | |
National Australia Bank Ltd. | | | 16,195 | | | | 412,719 | |
Origin Energy Ltd. | | | 2,967 | | | | 41,033 | |
QBE Insurance Group Ltd. | | | 9,572 | | | | 140,511 | |
Rio Tinto Ltd. | | | 809 | | | | 54,811 | |
Suncorp Group Ltd. | | | 5,539 | | | | 48,200 | |
Telstra Corp., Ltd. | | | 136,318 | | | | 464,609 | |
Wesfarmers Ltd. | | | 5,808 | | | | 180,624 | |
Westpac Banking Corp. | | | 24,820 | | | | 562,842 | |
Woodside Petroleum Ltd. | | | 2,325 | | | | 83,843 | |
Woolworths Ltd. | | | 6,631 | | | | 178,467 | |
| | | | | | | | |
| Total Australia | | | | 3,911,023 | |
| Brazil – 12.5% | | | | | | | | |
AES Tiete S.A. | | | 3,800 | | | | 51,783 | |
Banco Bradesco S.A. | | | 10,599 | | | | 157,739 | |
Banco do Brasil S.A. | | | 27,400 | | | | 389,455 | |
Banco Santander Brasil S.A. | | | 35,400 | | | | 325,999 | |
BM&F Bovespa S.A. | | | 15,800 | | | | 96,915 | |
CCR S.A. | | | 14,100 | | | | 114,157 | |
Cia de Bebidas das Americas | | | 11,900 | | | | 410,952 | |
Cia de Saneamento Basico do Estado de Sao Paulo* | | | 1,500 | | | | 57,153 | |
Cia Energetica de Minas Gerais | | | 4,300 | | | | 88,060 | |
Cia Siderurgica Nacional S.A. | | | 15,800 | | | | 148,620 | |
Cielo S.A. | | | 7,300 | | | | 246,535 | |
CPFL Energia S.A. | | | 10,600 | | | | 159,323 | |
Itau Unibanco Holding S.A. | | | 12,135 | | | | 206,208 | |
Light S.A. | | | 4,800 | | | | 67,489 | |
Natura Cosmeticos S.A. | | | 3,300 | | | | 71,362 | |
Petroleo Brasileiro S.A. | | | 42,300 | | | | 560,893 | |
Redecard S.A. | | | 10,000 | | | | 194,321 | |
Souza Cruz S.A. | | | 13,900 | | | | 211,818 | |
Tractebel Energia S.A. | | | 800 | | | | 14,252 | |
Vale S.A. | | | 14,800 | | | | 345,763 | |
| | | | | | | | |
| Total Brazil | | | | 3,918,797 | |
| Canada – 12.4% | | | | | | | | |
Bank of Montreal(a) | | | 4,600 | | | | 272,930 | |
Bank of Nova Scotia(a) | | | 6,400 | | | | 357,829 | |
BCE, Inc. | | | 6,700 | | | | 267,745 | |
Canadian Imperial Bank of Commerce | | | 3,000 | | | | 228,846 | |
Canadian Oil Sands Ltd. | | | 4,165 | | | | 87,680 | |
Cenovus Energy, Inc. | | | 2,832 | | | | 101,725 | |
Crescent Point Energy Corp.(a) | | | 2,700 | | | | 116,002 | |
| | | | | | | | |
Enbridge, Inc. | | | 3,900 | | | $ | 151,169 | |
Encana Corp.(a) | | | 3,000 | | | | 58,802 | |
Great-West Lifeco, Inc.(a) | | | 8,300 | | | | 203,794 | |
Husky Energy, Inc.(a) | | | 6,500 | | | | 165,061 | |
Manulife Financial Corp. | | | 9,100 | | | | 123,009 | |
Power Financial Corp. | | | 6,000 | | | | 176,137 | |
Rogers Communications, Inc. Class B | | | 3,600 | | | | 142,638 | |
Royal Bank of Canada(a) | | | 9,000 | | | | 520,576 | |
Sun Life Financial, Inc. | | | 4,800 | | | | 113,679 | |
Suncor Energy, Inc. | | | 2,499 | | | | 81,487 | |
Thomson Reuters Corp. | | | 4,800 | | | | 138,508 | |
Toronto-Dominion Bank (The)(a) | | | 4,600 | | | | 389,650 | |
TransCanada Corp.(a) | | | 4,700 | | | | 201,412 | |
| | | | | | | | |
| Total Canada | | | | 3,898,679 | |
| Chile – 12.5% | | | | | | | | |
AES Gener S.A. | | | 301,558 | | | | 185,062 | |
Aguas Andinas S.A. Class A | | | 319,996 | | | | 191,414 | |
Antarchile S.A. | | | 4,081 | | | | 72,900 | |
Banco de Chile | | | 2,752,833 | | | | 435,017 | |
Banco de Credito e Inversiones | | | 902 | | | | 63,002 | |
Banco Santander Chile | | | 5,307,576 | | | | 440,785 | |
CAP S.A. | | | 1,829 | | | | 77,840 | |
Cencosud S.A. | | | 16,686 | | | | 110,548 | |
Cia Cervecerias Unidas S.A. | | | 7,717 | | | | 121,468 | |
Cia General de Electricidad S.A. | | | 16,632 | | | | 87,158 | |
Corpbanca | | | 12,178,337 | | | | 164,257 | |
Empresa Nacional de Electricidad S.A. | | | 220,815 | | | | 397,847 | |
Empresas CMPC S.A. | | | 38,997 | | | | 167,164 | |
Empresas COPEC S.A. | | | 16,442 | | | | 274,541 | |
Enersis S.A. | | | 864,709 | | | | 350,932 | |
ENTEL Chile S.A. | | | 10,716 | | | | 216,761 | |
Lan Airlines S.A. | | | 5,340 | | | | 157,121 | |
Quinenco S.A. | | | 68,656 | | | | 216,299 | |
SACI Falabella | | | 21,356 | | | | 206,324 | |
| | | | | | | | |
| Total Chile | | | | 3,936,440 | |
| New Zealand – 12.7% | | | | | | | | |
Air New Zealand Ltd. | | | 252,384 | | | | 175,794 | |
Auckland International Airport Ltd. | | | 176,090 | | | | 354,970 | |
Contact Energy Ltd.* | | | 63,368 | | | | 245,614 | |
Fisher & Paykel Healthcare Corp., Ltd. | | | 76,983 | | | | 141,307 | |
Fletcher Building Ltd. | | | 59,542 | | | | 328,856 | |
Freightways Ltd. | | | 24,012 | | | | 77,723 | |
Infratil Ltd. | | | 74,255 | | | | 115,003 | |
Kathmandu Holdings Ltd.(a) | | | 34,588 | | | | 46,222 | |
Mainfreight Ltd. | | | 7,169 | | | | 56,396 | |
Nuplex Industries Ltd. | | | 34,974 | | | | 73,655 | |
NZX Ltd. | | | 25,381 | | | | 58,444 | |
Port of Tauranga Ltd. | | | 17,237 | | | | 153,255 | |
Restaurant Brands New Zealand Ltd. | | | 27,117 | | | | 40,887 | |
Ryman Healthcare Ltd. | | | 34,841 | | | | 88,221 | |
Sky Network Television Ltd. | | | 38,491 | | | | 163,385 | |
SKYCITY Entertainment Group Ltd. | | | 99,302 | | | | 320,610 | |
Telecom Corp. of New Zealand Ltd. | | | 437,299 | | | | 868,985 | |
See Notes to Financial Statements.
| | | | |
| WisdomTree International Dividend and Sector Funds | | | 119 | |
Schedule of Investments (concluded)
WisdomTree Commodity Country Equity Fund (CCXE)
March 31, 2012
| | | | | | | | |
| Investments | | Shares | | | Value | |
| | | | | | | | |
Tower Ltd. | | | 57,876 | | | $ | 79,202 | |
Vector Ltd. | | | 204,410 | | | | 433,835 | |
Warehouse Group Ltd. (The) | | | 73,115 | | | | 167,160 | |
| | | | | | | | |
| Total New Zealand | | | | 3,989,524 | |
| Norway – 12.3% | | | | | | | | |
Aker ASA Class A | | | 2,381 | | | | 77,849 | |
Aker Solutions ASA | | | 3,183 | | | | 53,766 | |
DNB ASA | | | 34,988 | | | | 449,001 | |
Fred Olsen Energy ASA | | | 3,070 | | | | 120,183 | |
Gjensidige Forsikring ASA | | | 15,313 | | | | 180,538 | |
Kongsberg Gruppen ASA | | | 1,673 | | | | 31,383 | |
Leroey Seafood Group ASA | | | 1,602 | | | | 26,400 | |
Marine Harvest ASA | | | 314,601 | | | | 162,153 | |
Norsk Hydro ASA | | | 17,797 | | | | 96,753 | |
Orkla ASA | | | 22,966 | | | | 181,423 | |
Schibsted ASA | | | 699 | | | | 25,857 | |
SpareBank 1 SR Bank ASA(a) | | | 1,458 | | | | 10,480 | |
Statoil ASA | | | 63,672 | | | | 1,725,737 | |
Telenor ASA | | | 30,771 | | | | 569,669 | |
TGS Nopec Geophysical Co. ASA | | | 1,391 | | | | 38,067 | |
Yara International ASA | | | 2,217 | | | | 105,563 | |
| | | | | | | | |
| Total Norway | | | | 3,854,822 | |
| Russia – 11.5% | | | | | | | | |
Gazprom Neft JSC ADR(a) | | | 11,917 | | | | 318,065 | |
Gazprom OAO ADR | | | 79,589 | | | | 970,986 | |
LSR Group Reg S GDR | | | 1,001 | | | | 5,906 | |
Lukoil OAO ADR | | | 9,878 | | | | 594,656 | |
Magnitogorsk Iron & Steel Works Reg S GDR* | | | 4,333 | | | | 25,586 | |
MMC Norilsk Nickel OJSC ADR | | | 19,797 | | | | 362,285 | |
Mobile Telesystems OJSC ADR | | | 18,800 | | | | 344,792 | |
NovaTek OAO Reg S GDR | | | 332 | | | | 44,986 | |
Novolipetsk Steel OJSC Reg S GDR | | | 3,333 | | | | 69,260 | |
Rosneft Oil Co. Reg S GDR | | | 41,423 | | | | 293,275 | |
Severstal OAO Reg S GDR(a) | | | 4,333 | | | | 57,715 | |
Sistema JSFC Reg S GDR(a) | | | 1,454 | | | | 28,629 | |
Surgutneftegas OJSC ADR | | | 22,586 | | | | 220,891 | |
Tatneft ADR | | | 3,499 | | | | 142,759 | |
Uralkali OJSC Reg S GDR(a) | | | 2,749 | | | | 103,665 | |
VTB Bank OJSC Reg S GDR | | | 11,335 | | | | 51,121 | |
| | | | | | | | |
| Total Russia | | | | 3,634,577 | |
| South Africa – 13.0% | | | | | | | | |
ABSA Group Ltd. | | | 10,656 | | | | 216,604 | |
African Bank Investments Ltd. | | | 20,069 | | | | 104,234 | |
Anglo American Platinum Ltd. | | | 1,134 | | | | 78,904 | |
Bidvest Group Ltd. | | | 4,280 | | | | 100,244 | |
Exxaro Resources Ltd.(a) | | | 4,337 | | | | 111,966 | |
FirstRand Ltd. | | | 95,813 | | | | 295,883 | |
Impala Platinum Holdings Ltd. | | | 6,000 | | | | 118,131 | |
Kumba Iron Ore Ltd.(a) | | | 9,993 | | | | 684,968 | |
MMI Holdings Ltd. | | | 33,189 | | | | 76,588 | |
MTN Group Ltd. | | | 27,206 | | | | 478,641 | |
Nedbank Group Ltd. | | | 7,201 | | | | 153,881 | |
| | | | | | | | |
RMB Holdings Ltd. | | | 25,251 | | | $ | 102,885 | |
Sanlam Ltd. | | | 37,567 | | | | 162,416 | |
Sasol Ltd. | | | 8,063 | | | | 389,253 | |
Shoprite Holdings Ltd. | | | 5,425 | | | | 97,055 | |
Standard Bank Group Ltd. | | | 26,111 | | | | 378,878 | |
Truworths International Ltd. | | | 6,909 | | | | 72,704 | |
Vodacom Group Ltd. | | | 25,537 | | | | 359,868 | |
Woolworths Holdings Ltd. | | | 16,522 | | | | 103,659 | |
| | | | | | | | |
| Total South Africa | | | | 4,086,762 | |
TOTAL COMMON STOCKS
(Cost: $31,629,379) | | | | | | | 31,230,624 | |
| EXCHANGE-TRADED FUND – 0.0% | | | | | | | | |
| United States – 0.0% | | | | | | | | |
WisdomTree Global Natural Resources Fund(a)(b)
(Cost: $10,676) | | | 514 | | | | 12,952 | |
| INVESTMENT OF CASH COLLATERAL FOR SECURITIES LOANED – 9.4% | | | | | | | | |
| MONEY MARKET FUND – 9.4% | | | | | | | | |
Dreyfus Institutional Preferred Money Market
Fund, 0.18%(c) (Cost: $2,944,521)(d) | | | 2,944,521 | | | | 2,944,521 | |
TOTAL INVESTMENTS IN SECURITIES – 108.7%
(Cost: $34,584,576) | | | | | | | 34,188,097 | |
Liabilities in Excess of Cash, Foreign Currency and
Other Assets – (8.7)% | | | | (2,749,147 | ) |
| | | | | | | | |
| NET ASSETS – 100.0% | | | $ | 31,438,950 | |
ADR – American Depositary Receipt
GDR – Global Depositary Receipt
| * | Non-income producing security. |
| (a) | Security, or portion thereof, was on loan at March 31, 2012 (See Note 2). |
| (b) | Affiliated company (See Note 7). |
| (c) | Rate shown represents annualized 7-day yield as of March 31, 2012. |
| (d) | At March 31, 2012, the total market value of the Fund’s securities on loan was $2,803,196 and the total market value of the collateral held by the Fund was $2,944,521. |
See Notes to Financial Statements.
| | |
| 120 | | WisdomTree International Dividend and Sector Funds |
Schedule of Investments
WisdomTree Global Natural Resources Fund (GNAT)
March 31, 2012
| | | | | | | | |
| Investments | | Shares | | | Value | |
| | | | | | | | |
| COMMON STOCKS – 99.2% | | | | | | | | |
| Australia – 6.1% | | | | | | | | |
BHP Billiton Ltd. | | | 12,375 | | | $ | 443,696 | |
Fortescue Metals Group Ltd. | | | 15,129 | | | | 91,059 | |
Rio Tinto Ltd. | | | 4,842 | | | | 328,051 | |
Santos Ltd. | | | 39,474 | | | | 582,317 | |
Woodside Petroleum Ltd. | | | 12,794 | | | | 461,370 | |
| | | | | | | | |
| Total Australia | | | | | | | 1,906,493 | |
| Brazil – 2.4% | | | | | | | | |
Petroleo Brasileiro S.A. | | | 32,000 | | | | 424,316 | |
Vale S.A. | | | 13,700 | | | | 320,065 | |
| | | | | | | | |
| Total Brazil | | | | | | | 744,381 | |
| Canada – 8.7% | | | | | | | | |
Agrium, Inc. | | | 400 | | | | 34,455 | |
Cameco Corp. | | | 7,429 | | | | 159,142 | |
Canadian Natural Resources Ltd. | | | 3,200 | | | | 105,850 | |
Canadian Oil Sands Ltd. | | | 28,602 | | | | 602,117 | |
Crescent Point Energy Corp.(a) | | | 21,900 | | | | 940,904 | |
Encana Corp.(a) | | | 11,800 | | | | 231,289 | |
First Quantum Minerals Ltd. | | | 4,596 | | | | 87,464 | |
Imperial Oil Ltd. | | | 3,485 | | | | 158,027 | |
Potash Corp. of Saskatchewan, Inc. | | | 780 | | | | 35,541 | |
Silver Wheaton Corp. | | | 1,013 | | | | 33,529 | |
Suncor Energy, Inc. | | | 3,833 | | | | 124,986 | |
Talisman Energy, Inc. | | | 11,600 | | | | 145,544 | |
Teck Resources Ltd. Class B | | | 2,502 | | | | 89,145 | |
| | | | | | | | |
| Total Canada | | | | | | | 2,747,993 | |
| China – 1.6% | | | | | | | | |
China Shenhua Energy Co., Ltd. Class H | | | 79,000 | | | | 333,237 | |
Yanzhou Coal Mining Co., Ltd. Class H | | | 86,000 | | | | 186,532 | |
| | | | | | | | |
| Total China | | | | | | | 519,769 | |
| France – 4.1% | | | | | | | | |
Technip S.A. | | | 3,385 | | | | 398,175 | |
Total S.A. | | | 17,359 | | | | 883,993 | |
| | | | | | | | |
| Total France | | | | | | | 1,282,168 | |
| Germany – 0.7% | | | | | | | | |
K+S AG | | | 4,268 | | | | 222,943 | |
| Hong Kong – 1.2% | | | | | | | | |
CNOOC Ltd. | | | 179,618 | | | | 369,230 | |
| Indonesia – 0.8% | | | | | | | | |
Adaro Energy Tbk PT | | | 704,500 | | | | 148,697 | |
Bumi Resources Tbk PT | | | 372,000 | | | | 95,604 | |
| | | | | | | | |
| Total Indonesia | | | | | | | 244,301 | |
| Israel – 1.4% | | | | | | | | |
Israel Chemicals Ltd. | | | 38,126 | | | | 433,904 | |
| Italy – 4.3% | | | | | | | | |
ENI SpA | | | 43,999 | | | | 1,030,659 | |
Saipem SpA | | | 6,157 | | | | 317,558 | |
| | | | | | | | |
| Total Italy | | | | | | | 1,348,217 | |
| | | | | | | | |
| Japan – 1.8% | | | | | | | | |
Inpex Corp. | | | 27 | | | $ | 183,401 | |
Sumitomo Metal Mining Co., Ltd. | | | 28,000 | | | | 395,699 | |
| | | | | | | | |
| Total Japan | | | | | | | 579,100 | |
| Malaysia – 3.3% | | | | | | | | |
IOI Corp. Bhd | | | 311,400 | | | | 542,803 | |
Kuala Lumpur Kepong Bhd | | | 60,100 | | | | 482,605 | |
| | | | | | | | |
| Total Malaysia | | | | | | | 1,025,408 | |
| Mexico – 4.5% | | | | | | | | |
Grupo Mexico S.A.B de C.V. Series B | | | 134,207 | | | | 423,243 | |
Industrias Penoles S.A.B de C.V. | | | 20,825 | | | | 1,008,551 | |
| | | | | | | | |
| Total Mexico | | | | | | | 1,431,794 | |
| Norway – 3.2% | | | | | | | | |
Statoil ASA | | | 30,136 | | | | 816,793 | |
Yara International ASA | | | 4,372 | | | | 208,174 | |
| | | | | | | | |
| Total Norway | | | | | | | 1,024,967 | |
| Poland – 0.5% | | | | | | | | |
KGHM Polska Miedz S.A. | | | 3,471 | | | | 159,260 | |
| Russia – 9.1% | | | | | | | | |
Gazprom OAO ADR | | | 22,688 | | | | 276,793 | |
Lukoil OAO ADR | | | 8,965 | | | | 539,693 | |
Magnitogorsk Iron & Steel Works Reg S GDR*(a) | | | 21,667 | | | | 127,944 | |
MMC Norilsk Nickel OJSC ADR | | | 19,786 | | | | 362,084 | |
NovaTek OAO Reg S GDR | | | 546 | | | | 73,983 | |
Novolipetsk Steel OJSC Reg S GDR | | | 7,896 | | | | 164,079 | |
Rosneft Oil Co. Reg S GDR | | | 24,252 | | | | 171,704 | |
Surgutneftegas OJSC ADR | | | 34,267 | | | | 335,131 | |
Tatneft ADR(a) | | | 12,671 | | | | 516,977 | |
Uralkali OJSC Reg S GDR | | | 7,575 | | | | 285,653 | |
| | | | | | | | |
| Total Russia | | | | | | | 2,854,041 | |
| Singapore – 0.6% | | | | | | | | |
Wilmar International Ltd. | | | 49,000 | | | | 190,957 | |
| South Africa – 5.5% | | | | | | | | |
Anglo American Platinum Ltd. | | | 2,002 | | | | 139,300 | |
Impala Platinum Holdings Ltd. | | | 14,427 | | | | 284,045 | |
Kumba Iron Ore Ltd. | | | 19,073 | | | | 1,307,354 | |
| | | | | | | | |
| Total South Africa | | | | | | | 1,730,699 | |
| Spain – 1.7% | | | | | | | | |
Repsol YPF S.A. | | | 21,734 | | | | 544,421 | |
| Switzerland – 1.5% | | | | | | | | |
Syngenta AG | | | 1,353 | | | | 467,192 | |
| Thailand – 1.5% | | | | | | | | |
PTT Exploration & Production PCL | | | 82,600 | | | | 467,219 | |
| United Kingdom – 16.4% | | | | | | | | |
Anglo American PLC | | | 5,450 | | | | 203,500 | |
Antofagasta PLC | | | 48,526 | | | | 893,174 | |
BG Group PLC | | | 9,437 | | | | 218,329 | |
BHP Billiton PLC | | | 13,202 | | | | 402,359 | |
BP PLC | | | 43,149 | | | | 318,888 | |
Eurasian Natural Resources Corp. PLC | | | 33,783 | | | | 319,813 | |
See Notes to Financial Statements.
| | | | |
| WisdomTree International Dividend and Sector Funds | | | 121 | |
Schedule of Investments (concluded)
WisdomTree Global Natural Resources Fund (GNAT)
March 31, 2012
| | | | | | | | |
| Investments | | Shares | | | Value | |
| | | | | | | | |
Fresnillo PLC | | | 15,756 | | | $ | 402,283 | |
Kazakhmys PLC | | | 8,125 | | | | 117,874 | |
Rio Tinto PLC | | | 3,753 | | | | 206,634 | |
Royal Dutch Shell PLC Class A | | | 20,005 | | | | 697,912 | |
Royal Dutch Shell PLC Class B | | | 28,585 | | | | 1,004,549 | |
Tullow Oil PLC | | | 5,379 | | | | 131,235 | |
Vedanta Resources PLC | | | 9,034 | | | | 177,250 | |
Xstrata PLC | | | 4,271 | | | | 72,880 | |
| | | | | | | | |
| Total United Kingdom | | | | | | | 5,166,680 | |
| United States – 18.3% | | | | | | | | |
Anadarko Petroleum Corp. | | | 1,188 | | | | 93,068 | |
Apache Corp. | | | 409 | | | | 41,080 | |
Archer-Daniels-Midland Co. | | | 11,558 | | | | 365,926 | |
Baker Hughes, Inc. | | | 1,801 | | | | 75,534 | |
CF Industries Holdings, Inc. | | | 198 | | | | 36,165 | |
Chesapeake Energy Corp. | | | 4,836 | | | | 112,050 | |
Chevron Corp. | | | 4,905 | | | | 526,012 | |
Cliffs Natural Resources, Inc. | | | 1,532 | | | | 106,106 | |
ConocoPhillips | | | 7,717 | | | | 586,569 | |
Consol Energy, Inc. | | | 2,965 | | | | 101,107 | |
Devon Energy Corp. | | | 1,638 | | | | 116,495 | |
Diamond Offshore Drilling, Inc.(a) | | | 12,176 | | | | 812,748 | |
EOG Resources, Inc. | | | 1,015 | | | | 112,766 | |
Exxon Mobil Corp. | | | 4,669 | | | | 404,942 | |
Freeport-McMoRan Copper & Gold, Inc. | | | 4,946 | | | | 188,146 | |
Halliburton Co. | | | 2,309 | | | | 76,636 | |
Marathon Oil Corp. | | | 6,291 | | | | 199,425 | |
Monsanto Co. | | | 3,824 | | | | 305,002 | |
Mosaic Co. (The) | | | 659 | | | | 36,436 | |
National Oilwell Varco, Inc. | | | 1,279 | | | | 101,642 | |
Noble Energy, Inc. | | | 1,680 | | | | 164,270 | |
Occidental Petroleum Corp. | | | 2,351 | | | | 223,886 | |
Peabody Energy Corp. | | | 2,043 | | | | 59,165 | |
Southern Copper Corp. | | | 28,412 | | | | 900,945 | |
| | | | | | | | |
| Total United States | | | | | | | 5,746,121 | |
TOTAL COMMON STOCKS
(Cost: $33,489,886) | | | | | | | 31,207,258 | |
| EXCHANGE-TRADED FUNDS – 0.6% | | | | | | | | |
| United States – 0.6% | | | | | | | | |
WisdomTree India Earnings Fund(a)(b)
(Cost: $206,525) | | | 9,099 | | | | 175,429 | |
| SHORT-TERM INVESTMENT – 0.0% | | | | | | | | |
| MONEY MARKET FUND – 0.0% | | | | | | | | |
Invesco Treasury Fund Private Class, 0.02%(c)
(Cost: $7,291) | | | 7,291 | | | | 7,291 | |
| | | | | | | | |
| INVESTMENT OF CASH COLLATERAL FOR SECURITIES LOANED – 3.9% | | | | | | | | |
| MONEY MARKET FUND – 3.9% | | | | | | | | |
Dreyfus Institutional Preferred Money Market
Fund, 0.18%(c) (Cost: $1,234,839)(d) | | | 1,234,839 | | | $ | 1,234,839 | |
TOTAL INVESTMENTS IN SECURITIES – 103.7%
(Cost: $34,938,541) | | | | | | | 32,624,817 | |
Liabilities in Excess of Foreign Currency and
Other Assets – (3.7)% | | | | | | | (1,172,821 | ) |
| | | | | | | | |
| NET ASSETS – 100.0% | | | | | | $ | 31,451,996 | |
ADR – American Depositary Receipt
GDR – Global Depositary Receipt
| * | Non-income producing security. |
| (a) | Security, or portion thereof, was on loan at March 31, 2012 (See Note 2). |
| (b) | Affiliated company (See Note 7). |
| (c) | Rate shown represents annualized 7-day yield as of March 31, 2012. |
| (d) | At March 31, 2012, the total market value of the Fund’s securities on loan was $1,179,196 and the total market value of the collateral held by the Fund was $1,234,839. |
See Notes to Financial Statements.
| | |
| 122 | | WisdomTree International Dividend and Sector Funds |
Schedule of Investments
WisdomTree Global ex-U.S. Utilities Fund (DBU)
March 31, 2012
| | | | | | | | |
| Investments | | Shares | | | Value | |
| | | | | | | | |
| COMMON STOCKS – 98.9% | | | | | | | | |
| Australia – 1.7% | | | | | | | | |
AGL Energy Ltd. | | | 33,118 | | | $ | 506,051 | |
Prime AET&D Holdings*† | | | 7,592 | | | | — | |
| | | | | | | | |
| Total Australia | | | | | | | 506,051 | |
| Austria – 1.1% | | | | | | | | |
EVN AG(a) | | | 15,774 | | | | 211,953 | |
Verbund AG(a) | | | 3,912 | | | | 118,831 | |
| | | | | | | | |
| Total Austria | | | | | | | 330,784 | |
| Belgium – 1.2% | | | | | | | | |
Elia System Operator S.A./N.V. | | | 8,811 | | | | 372,542 | |
| Brazil – 14.5% | | | | | | | | |
AES Tiete S.A. | | | 52,800 | | | | 719,513 | |
Centrais Eletricas Brasileiras S.A.* | | | 9,000 | | | | 83,671 | |
Cia de Saneamento Basico do Estado de Sao Paulo* | | | 9,600 | | | | 365,782 | |
Cia de Saneamento de Minas Gerais-COPASA* | | | 21,500 | | | | 506,534 | |
Cia Energetica de Minas Gerais | | | 38,600 | | | | 790,493 | |
CPFL Energia S.A. | | | 31,400 | | | | 471,955 | |
EDP – Energias do Brasil S.A. | | | 19,300 | | | | 437,564 | |
Light S.A. | | | 60,600 | | | | 852,047 | |
Tractebel Energia S.A. | | | 9,300 | | | | 165,680 | |
| | | | | | | | |
| Total Brazil | | | | | | | 4,393,239 | |
| Canada – 6.6% | | | | | | | | |
Atco Ltd. Class I | | | 2,230 | | | | 156,052 | |
Canadian Utilities Ltd. Class A | | | 3,500 | | | | 227,835 | |
Emera, Inc. | | | 9,100 | | | | 308,751 | |
Fortis, Inc.(a) | | | 8,800 | | | | 284,132 | |
Just Energy Group, Inc.(a) | | | 45,002 | | | | 621,370 | |
TransAlta Corp.(a) | | | 20,900 | | | | 391,045 | |
| | | | | | | | |
| Total Canada | | | | | | | 1,989,185 | |
| Chile – 7.6% | | | | | | | | |
AES Gener S.A. | | | 659,742 | | | | 404,873 | |
Aguas Andinas S.A. Class A | | | 992,549 | | | | 593,720 | |
Cia General de Electricidad S.A. | | | 62,831 | | | | 329,259 | |
Colbun S.A. | | | 206,440 | | | | 58,991 | |
E.CL S.A. | | | 106,083 | | | | 293,312 | |
Empresa Nacional de Electricidad S.A. | | | 175,113 | | | | 315,505 | |
Enersis S.A. | | | 740,012 | | | | 300,325 | |
| | | | | | | | |
| Total Chile | | | | | | | 2,295,985 | |
| China – 0.2% | | | | | | | | |
China Longyuan Power Group Corp. Class H | | | 68,000 | | | | 56,842 | |
| Czech Republic – 1.3% | | | | | | | | |
CEZ AS | | | 8,804 | | | | 376,658 | |
| Finland – 0.8% | | | | | | | | |
Fortum Oyj | | | 9,913 | | | | 240,261 | |
| France – 3.9% | | | | | | | | |
EDF S.A. | | | 11,370 | | | | 259,070 | |
GDF Suez | | | 14,399 | | | | 371,423 | |
Suez Environnement Co. | | | 17,162 | | | | 262,828 | |
| | | | | | | | |
Veolia Environnement S.A. | | | 17,991 | | | $ | 297,925 | |
| | | | | | | | |
| Total France | | | | | | | 1,191,246 | |
| Germany – 4.0% | | | | | | | | |
E.ON AG | | | 23,528 | | | | 562,727 | |
RWE AG | | | 13,772 | | | | 656,670 | |
| | | | | | | | |
| Total Germany | | | | | | | 1,219,397 | |
| Hong Kong – 4.7% | | | | | | | | |
China Resources Power Holdings Co., Ltd. | | | 93,700 | | | | 173,545 | |
CLP Holdings Ltd. | | | 37,322 | | | | 322,073 | |
Guangdong Investment Ltd. | | | 614,000 | | | | 427,839 | |
Hong Kong & China Gas Co., Ltd. | | | 64,695 | | | | 165,821 | |
Power Assets Holdings Ltd. | | | 44,386 | | | | 325,863 | |
| | | | | | | | |
| Total Hong Kong | | | | | | | 1,415,141 | |
| Indonesia – 1.0% | | | | | | | | |
Perusahaan Gas Negara Persero Tbk PT | | | 687,000 | | | | 285,499 | |
| Italy – 6.8% | | | | | | | | |
A2A SpA(a) | | | 310,498 | | | | 248,714 | |
ACEA SpA | | | 46,219 | | | | 293,470 | |
Enel Green Power SpA | | | 35,423 | | | | 67,221 | |
Enel SpA | | | 66,276 | | | | 239,361 | |
Hera SpA | | | 159,587 | | | | 227,398 | |
Iren SpA | | | 286,930 | | | | 245,502 | |
Snam SpA | | | 73,429 | | | | 352,614 | |
Terna Rete Elettrica Nazionale SpA | | | 95,562 | | | | 383,561 | |
| | | | | | | | |
| Total Italy | | | | | | | 2,057,841 | |
| Japan – 12.7% | | | | | | | | |
Chubu Electric Power Co., Inc.(a) | | | 24,800 | | | | 450,224 | |
Chugoku Electric Power Co., Inc. (The)(a) | | | 26,400 | | | | 493,065 | |
Electric Power Development Co., Ltd.(a) | | | 12,842 | | | | 350,173 | |
Hokkaido Electric Power Co., Inc. | | | 25,200 | | | | 372,052 | |
Hokuriku Electric Power Co. | | | 18,400 | | | | 334,484 | |
Kansai Electric Power Co., Inc. (The)(a) | | | 22,900 | | | | 356,739 | |
Kyushu Electric Power Co., Inc. | | | 27,900 | | | | 399,710 | |
Osaka Gas Co., Ltd. | | | 62,000 | | | | 250,125 | |
Shikoku Electric Power Co., Inc.(a) | | | 14,261 | | | | 404,288 | |
Toho Gas Co., Ltd.(a) | | | 34,000 | | | | 201,616 | |
Tokyo Gas Co., Ltd. | | | 48,000 | | | | 227,474 | |
| | | | | | | | |
| Total Japan | | | | | | | 3,839,950 | |
| Malaysia – 4.1% | | | | | | | | |
Petronas Gas Bhd | | | 89,600 | | | | 492,530 | |
Tenaga Nasional Bhd | | | 114,200 | | | | 239,695 | |
YTL Corp. Bhd | | | 212,400 | | | | 124,105 | |
YTL Power International Bhd | | | 629,700 | | | | 380,266 | |
| | | | | | | | |
| Total Malaysia | | | | | | | 1,236,596 | |
| New Zealand – 0.8% | | | | | | | | |
Contact Energy Ltd.* | | | 60,580 | | | | 234,808 | |
| Philippines – 2.6% | | | | | | | | |
Aboitiz Power Corp. | | | 518,000 | | | | 408,995 | |
Energy Development Corp. | | | 1,220,400 | | | | 170,546 | |
Manila Electric Co. | | | 35,420 | | | | 216,142 | |
| | | | | | | | |
| Total Philippines | | | | | | | 795,683 | |
See Notes to Financial Statements.
| | | | |
| WisdomTree International Dividend and Sector Funds | | | 123 | |
Schedule of Investments (concluded)
WisdomTree Global ex-U.S. Utilities Fund (DBU)
March 31, 2012
| | | | | | | | |
| Investments | | Shares | | | Value | |
| | | | | | | | |
| Poland – 0.6% | | | | | | | | |
PGE S.A. | | | 27,666 | | | $ | 171,116 | |
| Portugal – 1.5% | | | | | | | | |
EDP-Energias de Portugal S.A. | | | 160,226 | | | | 465,366 | |
| South Korea – 0.5% | | | | | | | | |
Korea Gas Corp. | | | 4,250 | | | | 161,853 | |
| Spain – 5.8% | | | | | | | | |
Acciona S.A. | | | 3,104 | | | | 216,435 | |
Enagas S.A. | | | 17,627 | | | | 338,728 | |
Endesa S.A. | | | 11,919 | | | | 237,136 | |
Gas Natural SDG S.A. | | | 24,866 | | | | 396,706 | |
Iberdrola S.A. | | | 52,548 | | | | 297,897 | |
Red Electrica Corp. S.A. | | | 5,559 | | | | 271,613 | |
| | | | | | | | |
| Total Spain | | | | | | | 1,758,515 | |
| Switzerland – 0.6% | | | | | | | | |
BKW S.A.* | | | 5,400 | | | | 193,572 | |
| Thailand – 2.6% | | | | | | | | |
Glow Energy PCL | | | 193,700 | | | | 386,144 | |
Ratchaburi Electricity Generating Holding PCL | | | 296,300 | | | | 396,187 | |
| | | | | | | | |
| Total Thailand | | | | | | | 782,331 | |
| United Kingdom – 11.7% | | | | | | | | |
Centrica PLC | | | 79,504 | | | | 401,915 | |
Drax Group PLC | | | 80,554 | | | | 700,800 | |
International Power PLC | | | 44,166 | | | | 285,793 | |
National Grid PLC | | | 45,613 | | | | 459,497 | |
Pennon Group PLC | | | 28,260 | | | | 321,259 | |
Severn Trent PLC | | | 17,984 | | | | 443,652 | |
SSE PLC | | | 20,874 | | | | 443,241 | |
United Utilities Group PLC | | | 48,526 | | | | 466,358 | |
| | | | | | | | |
| Total United Kingdom | | | | | | | 3,522,515 | |
TOTAL COMMON STOCKS
(Cost: $34,174,048) | | | | | | | 29,892,976 | |
| EXCHANGE-TRADED FUND – 0.5% | | | | | | | | |
| United States – 0.5% | | | | | | | | |
WisdomTree India Earnings Fund(a)(b)
(Cost: $183,378) | | | 8,221 | | | | 158,501 | |
| SHORT-TERM INVESTMENT – 0.0% | | | | | | | | |
| MONEY MARKET FUND – 0.0% | | | | | | | | |
| Invesco Treasury Fund Private Class, 0.02%(c) (Cost: $14,947) | | | 14,947 | | | | 14,947 | |
| INVESTMENT OF CASH COLLATERAL FOR SECURITIES LOANED – 13.9% | | | | | | | | |
| MONEY MARKET FUND – 13.9% | | | | | | | | |
Dreyfus Institutional Preferred Money Market
Fund, 0.18%(c) (Cost: $4,207,707)(d) | | | 4,207,707 | | | | 4,207,707 | |
TOTAL INVESTMENTS IN SECURITIES – 113.3%
(Cost: $38,580,080) | | | | | | | 34,274,131 | |
Liabilities in Excess of Cash, Foreign Currency and Other Assets – (13.3)% | | | | | | | (4,033,183 | ) |
| | | | | | | | |
| NET ASSETS – 100.0% | | | | | | $ | 30,240,948 | |
| * | Non-income producing security. |
| † | Security is being fair valued by a valuation committee under the direction of the Board of Trustees. The aggregate value of fair valued securities is $0, which represents 0.0% of net assets. |
| (a) | Security, or portion thereof, was on loan at March 31, 2012 (See Note 2). |
| (b) | Affiliated company (See Note 7). |
| (c) | Rate shown represents annualized 7-day yield as of March 31, 2012. |
| (d) | At March 31, 2012, the total market value of the Fund’s securities on loan was $4,002,917 and the total market value of the collateral held by the Fund was $4,207,707. |
See Notes to Financial Statements.
| | |
| 124 | | WisdomTree International Dividend and Sector Funds |
Schedule of Investments
WisdomTree Global ex-U.S. Real Estate Fund (DRW)
March 31, 2012
| | | | | | | | |
| Investments | | Shares | | | Value | |
| | | | | | | | |
| COMMON STOCKS – 99.6% | | | | | | | | |
| Australia – 25.2% | | | | | | | | |
Australand Property Group | | | 270,274 | | | $ | 716,775 | |
CFS Retail Property Trust | | | 1,210,094 | | | | 2,243,937 | |
Charter Hall Office REIT(a) | | | 153,003 | | | | 488,190 | |
Charter Hall Retail REIT | | | 136,466 | | | | 446,735 | |
Commonwealth Property Office Fund | | | 872,074 | | | | 889,873 | |
Dexus Property Group | | | 1,824,537 | | | | 1,644,412 | |
Goodman Group | | | 2,037,975 | | | | 1,456,755 | |
GPT Group | | | 690,200 | | | | 2,230,839 | |
GPT Group In Specie†*‡ | | | 2,305,813 | | | | — | |
Investa Office Fund(b) | | | 1,126,268 | | | | 740,891 | |
Lend Lease Group(b) | | | 139,319 | | | | 1,078,126 | |
Mirvac Group | | | 1,455,738 | | | | 1,764,443 | |
Stockland | | | 1,061,220 | | | | 3,232,149 | |
Westfield Group | | | 1,115,484 | | | | 10,203,817 | |
Westfield Retail Trust | | | 42,188 | | | | 112,758 | |
| | | | | | | | |
| Total Australia | | | | | | | 27,249,700 | |
| Austria – 0.1% | | | | | | | | |
Conwert Immobilien Invest SE | | | 11,103 | | | | 133,590 | |
| Belgium – 0.8% | | | | | | | | |
Befimmo SCA Sicafi | | | 4,749 | | | | 315,137 | |
Cofinimmo | | | 4,172 | | | | 512,250 | |
| | | | | | | | |
| Total Belgium | | | | | | | 827,387 | |
| Brazil – 1.3% | | | | | | | | |
Aliansce Shopping Centers S.A. | | | 4,984 | | | | 47,318 | |
BR Malls Participacoes S.A. | | | 17,800 | | | | 230,269 | |
BR Properties S.A. | | | 3,874 | | | | 49,521 | |
Brasil Brokers Participacoes S.A. | | | 22,400 | | | | 96,879 | |
Iguatemi Empresa de Shopping Centers S.A. | | | 7,100 | | | | 163,071 | |
JHSF Participacoes S.A. | | | 140,700 | | | | 461,210 | |
LPS Brasil Consultoria de Imoveis S.A. | | | 3,600 | | | | 73,962 | |
Multiplan Empreendimentos Imobiliarios S.A. | | | 13,500 | | | | 310,138 | |
| | | | | | | | |
| Total Brazil | | | | | | | 1,432,368 | |
| Canada – 9.9% | | | | | | | | |
Allied Properties Real Estate Investment Trust | | | 11,249 | | | | 291,622 | |
Artis Real Estate Investment Trust(a) | | | 23,718 | | | | 383,731 | |
Boardwalk Real Estate Investment Trust | | | 12,419 | | | | 709,515 | |
Brookfield Asset Management, Inc. Class A(a) | | | 44,315 | | | | 1,395,360 | |
Brookfield Office Properties, Inc. | | | 69,908 | | | | 1,213,571 | |
Calloway Real Estate Investment Trust(a) | | | 26,896 | | | | 729,552 | |
Canadian Apartment Properties REIT(a) | | | 19,157 | | | | 431,461 | |
Canadian Real Estate Investment Trust(a) | | | 12,687 | | | | 468,535 | |
Chartwell Seniors Housing Real Estate Investment Trust(a) | | | 40,695 | | | | 371,750 | |
Cominar Real Estate Investment Trust | | | 19,309 | | | | 452,079 | |
Dundee Real Estate Investment Trust(a) | | | 13,678 | | | | 481,731 | |
Extendicare Real Estate Investment Trust(a) | | | 26,830 | | | | 212,074 | |
First Capital Realty, Inc.(a) | | | 36,938 | | | | 659,706 | |
H&R Real Estate Investment Trust(a) | | | 29,700 | | | | 703,089 | |
Primaris Retail Real Estate Investment Trust(a) | | | 19,761 | | | | 427,863 | |
RioCan Real Estate Investment Trust(a) | | | 65,600 | | | | 1,774,144 | |
| | | | | | | | |
| Total Canada | | | | | | | 10,705,783 | |
| | | | | | | | |
| Chile – 0.1% | | | | | | | | |
Parque Arauco S.A. | | | 53,854 | | | $ | 109,220 | |
| China – 0.9% | | | | | | | | |
Guangzhou R&F Properties Co., Ltd. Class H(a) | | | 831,200 | | | | 990,289 | |
| Finland – 0.2% | | | | | | | | |
Citycon Oyj | | | 12,521 | | | | 41,852 | |
Sponda Oyj | | | 46,828 | | | | 192,695 | |
| | | | | | | | |
| Total Finland | | | | | | | 234,547 | |
| France – 8.1% | | | | | | | | |
Fonciere des Regions | | | 14,635 | | | | 1,173,848 | |
Gecina S.A. | | | 12,835 | | | | 1,339,016 | |
ICADE | | | 9,233 | | | | 822,452 | |
Klepierre | | | 40,508 | | | | 1,402,557 | |
Mercialys S.A. | | | 18,689 | | | | 660,282 | |
Societe Immobiliere de Location pour l’Industrie et le Commerce | | | 3,573 | | | | 393,595 | |
Unibail-Rodamco SE | | | 14,824 | | | | 2,960,181 | |
| | | | | | | | |
| Total France | | | | | | | 8,751,931 | |
| Germany – 0.5% | | | | | | | | |
Alstria Office REIT AG | | | 12,663 | | | | 142,141 | |
Deutsche Euroshop AG | | | 6,852 | | | | 241,351 | |
Deutsche Wohnen AG | | | 7,694 | | | | 113,527 | |
| | | | | | | | |
| Total Germany | | | | | | | 497,019 | |
| Hong Kong – 20.3% | | | | | | | | |
Champion Real Estate Investment Trust | | | 1,193,000 | | | | 505,534 | |
Cheung Kong Holdings Ltd. | | | 276,238 | | | | 3,568,608 | |
China Overseas Land & Investment Ltd. | | | 667,800 | | | | 1,269,543 | |
Franshion Properties China Ltd. | | | 496,000 | | | | 127,769 | |
Hang Lung Group Ltd. | | | 97,649 | | | | 632,002 | |
Hang Lung Properties Ltd. | | | 450,283 | | | | 1,649,994 | |
Henderson Land Development Co., Ltd. | | | 202,320 | | | | 1,116,617 | |
Hopewell Holdings Ltd. | | | 176,000 | | | | 482,844 | |
Hysan Development Co., Ltd. | | | 96,115 | | | | 385,005 | |
Kowloon Development Co., Ltd. | | | 250,398 | | | | 251,559 | |
Link REIT (The) | | | 397,946 | | | | 1,481,278 | |
New World Development Co., Ltd. | | | 618,682 | | | | 743,470 | |
Regal Real Estate Investment Trust | | | 1,254,000 | | | | 316,569 | |
Shenzhen Investment Ltd. | | | 977,900 | | | | 212,861 | |
Sino Land Co., Ltd. | | | 787,735 | | | | 1,258,103 | |
Sino-Ocean Land Holdings Ltd.(a) | | | 824,600 | | | | 391,908 | |
Sun Hung Kai Properties Ltd. | | | 293,871 | | | | 3,652,570 | |
Swire Pacific Ltd. Class A | | | 129,959 | | | | 1,457,101 | |
Swire Pacific Ltd. Class B | | | 445,798 | | | | 981,858 | |
Wharf Holdings Ltd. | | | 248,872 | | | | 1,352,704 | |
Wheelock & Co., Ltd. | | | 39,231 | | | | 118,239 | |
| | | | | | | | |
| Total Hong Kong | | | | | | | 21,956,136 | |
| Indonesia – 0.1% | | | | | | | | |
Bumi Serpong Damai PT | | | 388,574 | | | | 54,819 | |
Lippo Karawaci Tbk PT | | | 559,000 | | | | 48,906 | |
| | | | | | | | |
| Total Indonesia | | | | | | | 103,725 | |
See Notes to Financial Statements.
| | | | |
| WisdomTree International Dividend and Sector Funds | | | 125 | |
Schedule of Investments (continued)
WisdomTree Global ex-U.S. Real Estate Fund (DRW)
March 31, 2012
| | | | | | | | |
| Investments | | Shares | | | Value | |
| | | | | | | | |
| Israel – 0.5% | | | | | | | | |
Azrieli Group | | | 12,860 | | | $ | 311,096 | |
Gazit-Globe Ltd. | | | 23,987 | | | | 245,886 | |
| | | | | | | | |
| Total Israel | | | | | | | 556,982 | |
| Italy - 0.1% | | | | | | | | |
Beni Stabili SpA | | | 258,869 | | | | 158,649 | |
| Japan – 6.0% | | | | | | | | |
Aeon Mall Co., Ltd. | | | 9,196 | | | | 214,884 | |
Daito Trust Construction Co., Ltd. | | | 19,100 | | | | 1,724,443 | |
Daiwa House Industry Co., Ltd. | | | 49,000 | | | | 651,388 | |
Hulic Co., Ltd. | | | 11,100 | | | | 134,611 | |
Mitsubishi Estate Co., Ltd. | | | 56,589 | | | | 1,014,951 | |
Mitsui Fudosan Co., Ltd. | | | 69,308 | | | | 1,333,186 | |
Nomura Real Estate Holdings, Inc. | | | 17,965 | | | | 318,500 | |
Sumitomo Real Estate Sales Co., Ltd. | | | 3,666 | | | | 172,397 | |
Sumitomo Realty & Development Co., Ltd. | | | 29,279 | | | | 709,783 | |
Tokyu Land Corp. | | | 48,168 | | | | 237,050 | |
| | | | | | | | |
| Total Japan | | | | | | | 6,511,193 | |
| Malaysia – 0.2% | | | | | | | | |
IGB Corp. Bhd | | | 129,200 | | | | 116,822 | |
IJM Land Bhd | | | 113,800 | | | | 80,981 | |
| | | | | | | | |
| Total Malaysia | | | | | | | 197,803 | |
| Netherlands – 2.4% | | | | | | | | |
Corio N.V. | | | 24,694 | | | | 1,300,602 | |
Eurocommercial Properties N.V. | | | 9,197 | | | | 347,956 | |
Vastned Retail N.V. | | | 6,379 | | | | 334,487 | |
Wereldhave N.V. | | | 7,285 | | | | 577,332 | |
| | | | | | | | |
| Total Netherlands | | | | | | | 2,560,377 | |
| Norway – 0.0% | | | | | | | | |
Norwegian Property ASA | | | 27,810 | | | | 43,294 | |
| Philippines – 1.0% | | | | | | | | |
Ayala Land, Inc. | | | 496,300 | | | | 239,856 | |
Megaworld Corp. | | | 967,740 | | | | 44,178 | |
Robinsons Land Corp. | | | 574,300 | | | | 220,704 | |
SM Prime Holdings, Inc. | | | 1,501,500 | | | | 591,018 | |
| | | | | | | | |
| Total Philippines | | | | | | | 1,095,756 | |
| Singapore – 8.1% | | | | | | | | |
Ascendas Real Estate Investment Trust | | | 590,901 | | | | 949,314 | |
Ascott Residence Trust | | | 185,118 | | | | 156,799 | |
CapitaCommercial Trust | | | 689,635 | | | | 669,149 | |
CapitaLand Ltd. | | | 400,589 | | | | 994,025 | |
CapitaMall Trust | | | 691,786 | | | | 993,100 | |
CapitaMalls Asia Ltd. | | | 256,000 | | | | 332,891 | |
CDL Hospitality Trusts | | | 202,432 | | | | 279,333 | |
City Developments Ltd. | | | 68,103 | | | | 614,760 | |
GuocoLand Ltd. | | | 144,000 | | | | 222,182 | |
Keppel Land Ltd. | | | 304,168 | | | | 839,434 | |
K-REIT Asia(a) | | | 363,000 | | | | 278,598 | |
Mapletree Industrial Trust | | | 242,173 | | | | 211,866 | |
Mapletree Logistics Trust | | | 500,187 | | | | 375,931 | |
Singapore Land Ltd. | | | 60,544 | | | | 288,912 | |
Suntec Real Estate Investment Trust | | | 599,828 | | | | 596,322 | |
| | | | | | | | |
United Industrial Corp., Ltd. | | | 74,000 | | | $ | 164,202 | |
UOL Group Ltd. | | | 105,000 | | | | 395,832 | |
Wheelock Properties Singapore Ltd. | | | 198,000 | | | | 296,839 | |
Wing Tai Holdings Ltd. | | | 123,000 | | | | 125,216 | |
| | | | | | | | |
| Total Singapore | | | | | | | 8,784,705 | |
| South Africa – 3.9% | | | | | | | | |
Capital Property Fund | | | 227,206 | | | | 270,887 | |
Emira Property Fund | | | 180,755 | | | | 292,051 | |
Fountainhead Property Trust | | | 456,692 | | | | 434,404 | |
Growthpoint Properties Ltd. | | | 512,549 | | | | 1,335,711 | |
Hyprop Investments Ltd. | | | 49,869 | | | | 373,633 | |
Redefine Properties Ltd.* | | | 1,047,741 | | | | 1,089,440 | |
Resilient Property Income Fund Ltd. | | | 86,766 | | | | 435,834 | |
| | | | | | | | |
| Total South Africa | | | | | | | 4,231,960 | |
| Sweden – 1.5% | | | | | | | | |
Atrium Ljungberg AB Class B | | | 17,501 | | | | 207,574 | |
Castellum AB | | | 29,228 | | | | 367,148 | |
Fabege AB | | | 34,822 | | | | 299,396 | |
Hufvudstaden AB Class A | | | 28,290 | | | | 298,234 | |
Kungsleden AB | | | 21,481 | | | | 148,918 | |
Wallenstam AB Class B | | | 15,588 | | | | 150,938 | |
Wihlborgs Fastigheter AB | | | 13,367 | | | | 188,357 | |
| | | | | | | | |
| Total Sweden | | | | | | | 1,660,565 | |
| Switzerland – 1.0% | | | | | | | | |
Swiss Prime Site AG* | | | 12,798 | | | | 1,061,957 | |
| Taiwan – 1.1% | | | | | | | | |
Farglory Land Development Co., Ltd. | | | 285,000 | | | | 573,582 | |
Highwealth Construction Corp. | | | 258,000 | | | | 447,563 | |
Ruentex Development Co., Ltd. | | | 89,105 | | | | 131,328 | |
| | | | | | | | |
| Total Taiwan | | | | | | | 1,152,473 | |
| Thailand – 0.8% | | | | | | | | |
Central Pattana PCL | | | 98,000 | | | | 146,126 | |
Land and Houses PCL NVDR | | | 2,607,786 | | | | 583,265 | |
Pruksa Real Estate PCL | | | 303,300 | | | | 148,455 | |
| | | | | | | | |
| Total Thailand | | | | | | | 877,846 | |
| Turkey – 0.3% | | | | | | | | |
Emlak Konut Gayrimenkul Yatirim Ortakligi AS* | | | 278,415 | | | | 362,288 | |
| United Kingdom – 5.2% | | | | | | | | |
British Land Co. PLC | | | 182,039 | | | | 1,395,803 | |
Capital & Counties Properties PLC | | | 28,862 | | | | 88,447 | |
Capital Shopping Centres Group PLC | | | 134,951 | | | | 714,558 | |
Derwent London PLC | | | 6,934 | | | | 193,325 | |
Great Portland Estates PLC | | | 29,807 | | | | 171,399 | |
Hammerson PLC | | | 113,403 | | | | 753,024 | |
Land Securities Group PLC | | | 110,056 | | | | 1,270,459 | |
London & Stamford Property PLC | | | 131,407 | | | | 231,791 | |
Segro PLC | | | 166,650 | | | | 625,191 | |
Shaftesbury PLC | | | 19,260 | | | | 151,555 | |
| | | | | | | | |
| Total United Kingdom | | | | | | | 5,595,552 | |
TOTAL COMMON STOCKS
(Cost: $108,419,114) | | | | | | | 107,843,095 | |
See Notes to Financial Statements.
| | |
| 126 | | WisdomTree International Dividend and Sector Funds |
Schedule of Investments (concluded)
WisdomTree Global ex-U.S. Real Estate Fund (DRW)
March 31, 2012
| | | | | | | | |
| Investments | | Shares | | | Value | |
| | | | | | | | |
| SHORT-TERM INVESTMENT – 0.2% | | | | | | | | |
| MONEY MARKET FUND – 0.2% | | | | | | | | |
Invesco Treasury Fund Private Class, 0.02%(c)
(Cost: $190,104) | | | 190,104 | | | $ | 190,104 | |
| INVESTMENT OF CASH COLLATERAL FOR SECURITIES LOANED – 8.4% | | | | | | | | |
| MONEY MARKET FUND – 8.4% | | | | | | | | |
Dreyfus Institutional Preferred Money Market Fund, 0.18%(c) | | | | | | | | |
| (Cost: $9,057,136)(d) | | | 9,057,136 | | | | 9,057,136 | |
TOTAL INVESTMENTS IN SECURITIES – 108.2%
(Cost: $117,666,354) | | | | | | | 117,090,335 | |
Liabilities in Excess of Cash, Foreign Currency and Other Assets – (8.2)% | | | | | | | (8,869,114 | ) |
| | | | | | | | |
| NET ASSETS – 100.0% | | | | | | $ | 108,221,221 | |
NVDR – Non-Voting Depositary Receipt
| * | Non-income producing security. |
| † | Security is being fair valued by a valuation committee under the direction of the Board of Trustees. The aggregate value of fair valued securities is $0, which represents 0.0% of net assets. |
| ‡ | Restricted security. At March 31, 2012, the value of the security amounted to $0 and 0.0% of net assets. |
| (a) | Security, or portion thereof, was on loan at March 31, 2012 (See Note 2). |
| (b) | Stapled Security – A security contractually bound to one or more other securities to form a single saleable unit which cannot be sold separately. |
| (c) | Rate shown represents annualized 7-day yield as of March 31, 2012. |
| (d) | At March 31, 2012, the total market value of the Fund’s securities on loan was $8,594,405 and the total market value of the collateral held by the Fund was $9,057,136. |
See Notes to Financial Statements.
| | | | |
| WisdomTree International Dividend and Sector Funds | | | 127 | |
Statements of Assets and Liabilities
WisdomTree International Dividend and Sector Funds
March 31, 2012
| | | | | | | | | | | | | | | | | | | | |
| | | WisdomTree
DEFA Fund | | | WisdomTree
DEFA Equity
Income Fund | | | WisdomTree
Global Equity
Income Fund | | | WisdomTree
Europe
SmallCap
Dividend Fund | | | WisdomTree
Japan Hedged
Equity Fund | |
ASSETS: | | | | | | | | | | | | | | | | | | | | |
| | | | | |
Investments, at cost | | $ | 423,056,299 | | | $ | 200,111,278 | | | $ | 94,448,857 | | | $ | 30,789,909 | | | $ | 770,867,353 | |
| | | | | |
Investment in affiliates, at cost (Note 7) | | | 387,001 | | | | 813,350 | | | | 231,536 | | | | 1,092 | | | | — | |
| | | | | |
Foreign currency, at cost | | | 338,185 | | | | 54,603 | | | | 85,696 | | | | — | | | | 280,116 | |
Investment in securities, at value (including securities on loan) (Note 2)1 | | | 416,309,808 | | | | 187,621,500 | | | | 96,146,983 | | | | 31,212,837 | | | | 773,327,549 | |
| | | | | |
Investment in affiliates, at value (Note 7) | | | 388,791 | | | | 820,710 | | | | 238,105 | | | | 1,251 | | | | — | |
| | | | | |
Foreign currency, at value | | | 338,462 | | | | 54,716 | | | | 85,929 | | | | — | | | | 280,226 | |
| | | | | |
Unrealized appreciation on forward foreign currency contracts | | | — | | | | 118 | | | | 57 | | | | 465 | | | | 8,806,044 | |
| | | | | |
Receivables: | | | | | | | | | | | | | | | | | | | | |
| | | | | |
Dividends and interest | | | 1,749,574 | | | | 799,784 | | | | 382,427 | | | | 125,277 | | | | 7,063,267 | |
| | | | | |
Foreign tax reclaims | | | 618,733 | | | | 176,001 | | | | 47,379 | | | | 26,246 | | | | — | |
| | | | | |
Investment securities and forward foreign currency contracts sold | | | 1,246,077 | | | | — | | | | 200,787 | | | | 196,659 | | | | — | |
| | | | | |
Capital shares sold | | | — | | | | — | | | | — | | | | — | | | | 7,331,802 | |
Total Assets | | | 420,651,445 | | | | 189,472,829 | | | | 97,101,667 | | | | 31,562,735 | | | | 796,808,888 | |
LIABILITIES: | | | | | | | | | | | | | | | | | | | | |
| | | | | |
Due to custodian | | | 1,048,591 | | | | — | | | | 207,433 | | | | 30,251 | | | | — | |
| | | | | |
Unrealized depreciation on forward foreign currency contracts | | | — | | | | — | | | | — | | | | — | | | | 348,516 | |
| | | | | |
Payables: | | | | | | | | | | | | | | | | | | | | |
| | | | | |
Collateral for securities on loan (Note 2) | | | 34,221,578 | | | | 13,561,501 | | | | 5,541,194 | | | | 2,686,845 | | | | 173,505,428 | |
| | | | | |
Investment securities and forward foreign currency contracts purchased | | | 30,259 | | | | 16,872 | | | | 5,998 | | | | 163,665 | | | | 16,020,918 | |
| | | | | |
Advisory fees (Note 3) | | | 147,247 | | | | 84,332 | | | | 42,688 | | | | 13,989 | | | | 225,200 | |
| | | | | |
Service fees (Note 2) | | | 1,354 | | | | 643 | | | | 325 | | | | 106 | | | | 2,064 | |
Total Liabilities | | | 35,449,029 | | | | 13,663,348 | | | | 5,797,638 | | | | 2,894,856 | | | | 190,102,126 | |
NET ASSETS | | $ | 385,202,416 | | | $ | 175,809,481 | | | $ | 91,304,029 | | | $ | 28,667,879 | | | $ | 606,706,762 | |
NET ASSETS: | | | | | | | | | | | | | | | | | | | | |
| | | | | |
Paid-in capital | | $ | 614,628,576 | | | $ | 265,673,360 | | | $ | 111,464,457 | | | $ | 54,050,105 | | | $ | 640,245,108 | |
| | | | | |
Undistributed net investment income | | | 1,022,525 | | | | 299,938 | | | | 173,689 | | | | 83,518 | | | | 5,575,936 | |
| | | | | |
Accumulated net realized loss on investments, forward foreign currency contracts and foreign currency related transactions | | | (223,736,484 | ) | | | (77,687,847 | ) | | | (22,039,721 | ) | | | (25,888,610 | ) | | | (50,082,345 | ) |
| | | | | |
Net unrealized appreciation (depreciation) on investments, forward foreign currency contracts and translation of assets and liabilities denominated in foreign currencies | | | (6,712,201 | ) | | | (12,475,970 | ) | | | 1,705,604 | | | | 422,866 | | | | 10,968,063 | |
NET ASSETS | | $ | 385,202,416 | | | $ | 175,809,481 | | | $ | 91,304,029 | | | $ | 28,667,879 | | | $ | 606,706,762 | |
Outstanding beneficial interest shares of $0.001 par value (unlimited number of shares authorized) | | | 8,650,000 | | | | 4,550,000 | | | | 2,200,000 | | | | 750,000 | | | | 16,550,000 | |
Net asset value per share | | $ | 44.53 | | | $ | 38.64 | | | $ | 41.50 | | | $ | 38.22 | | | $ | 36.66 | |
| 1 | Market value of securities out on loan were as follows: $32,206,996, $12,812,908, $5,250,315, $2,325,126, and $164,639,402, respectively. |
See Notes to Financial Statements.
| | |
| 128 | | WisdomTree International Dividend and Sector Funds |
Statements of Assets and Liabilities (continued)
WisdomTree International Dividend and Sector Funds
March 31, 2012
| | | | | | | | | | | | | | | | | | | | |
| | | WisdomTree
Global ex-U.S.
Growth Fund | | | WisdomTree
Japan SmallCap
Dividend Fund | | | WisdomTree
Asia Pacific
ex-Japan Fund | | | WisdomTree
Australia
Dividend Fund | | | WisdomTree
International
LargeCap
Dividend Fund | |
ASSETS: | | | | | | | | | | | | | | | | | | | | |
| | | | | |
Investments, at cost | | $ | 60,096,109 | | | $ | 200,816,749 | | | $ | 86,511,755 | | | $ | 69,741,486 | | | $ | 185,673,698 | |
| | | | | |
Investment in affiliates, at cost (Note 7) | | | 412,281 | | | | — | | | | 2,464,182 | | | | — | | | | 26,065 | |
| | | | | |
Foreign currency, at cost | | | 30,459 | | | | 139,109 | | | | 60,691 | | | | 34,600 | | | | 94,030 | |
Investment in securities, at value (including securities on loan) (Note 2)1 | | | 58,019,996 | | | | 213,260,896 | | | | 89,428,564 | | | | 69,688,217 | | | | 179,423,124 | |
| | | | | |
Investment in affiliates, at value (Note 7) | | | 385,394 | | | | — | | | | 2,198,209 | | | | — | | | | 30,021 | |
| | | | | |
Cash | | | — | | | | — | | | | 9,421 | | | | — | | | | — | |
| | | | | |
Foreign currency, at value | | | 30,435 | | | | 139,189 | | | | 62,279 | | | | 34,600 | | | | 94,018 | |
| | | | | |
Unrealized appreciation on forward foreign currency contracts | | | — | | | | 795 | | | | — | | | | — | | | | — | |
| | | | | |
Receivables: | | | | | | | | | | | | | | | | | | | | |
| | | | | |
Dividends and interest | | | 162,798 | | | | 2,209,781 | | | | 255,925 | | | | 507,074 | | | | 670,824 | |
| | | | | |
Investment securities and forward foreign currency contracts sold | | | — | | | | 779,924 | | | | — | | | | — | | | | — | |
| | | | | |
Foreign tax reclaims | | | 11,264 | | | | — | | | | 1,312 | | | | — | | | | 242,579 | |
Total Assets | | | 58,609,887 | | | | 216,390,585 | | | | 91,955,710 | | | | 70,229,891 | | | | 180,460,566 | |
LIABILITIES: | | | | | | | | | | | | | | | | | | | | |
| | | | | |
Unrealized depreciation on forward foreign currency contracts | | | 16 | | | | — | | | | — | | | | — | | | | — | |
| | | | | |
Payables: | | | | | | | | | | | | | | | | | | | | |
| | | | | |
Collateral for securities on loan (Note 2) | | | 2,801,979 | | | | 22,221,471 | | | | 2,242,390 | | | | 8,661,931 | | | | 13,139,642 | |
| | | | | |
Investment securities and forward foreign currency contracts purchased | | | 4,733 | | | | 904,256 | | | | 4,839 | | | | 82,654 | | | | — | |
| | | | | |
Advisory fees (Note 3) | | | 28,805 | | | | 92,443 | | | | 35,711 | | | | 29,249 | | | | 67,155 | |
| | | | | |
Service fees (Note 2) | | | 220 | | | | 702 | | | | 336 | | | | 222 | | | | 617 | |
Total Liabilities | | | 2,835,753 | | | | 23,218,872 | | | | 2,283,276 | | | | 8,774,056 | | | | 13,207,414 | |
NET ASSETS | | $ | 55,774,134 | | | $ | 193,171,713 | | | $ | 89,672,434 | | | $ | 61,455,835 | | | $ | 167,253,152 | |
NET ASSETS: | | | | | | | | | | | | | | | | | | | | |
| | | | | |
Paid-in capital | | $ | 71,442,992 | | | $ | 207,597,232 | | | $ | 107,123,936 | | | $ | 78,355,989 | | | $ | 220,882,190 | |
| | | | | |
Undistributed net investment income | | | 60,053 | | | | 1,734,559 | | | | 3,116 | | | | 127,330 | | | | 310,663 | |
| | | | | |
Accumulated net realized loss on investments, forward foreign currency contracts and foreign currency related transactions | | | (13,625,006 | ) | | | (28,614,820 | ) | | | (20,101,529 | ) | | | (16,960,532 | ) | | | (47,708,420 | ) |
| | | | | |
Net unrealized appreciation (depreciation) on investments, forward foreign currency contracts and translation of assets and liabilities denominated in foreign currencies | | | (2,103,905 | ) | | | 12,454,742 | | | | 2,646,911 | | | | (66,952 | ) | | | (6,231,281 | ) |
NET ASSETS | | $ | 55,774,134 | | | $ | 193,171,713 | | | $ | 89,672,434 | | | $ | 61,455,835 | | | $ | 167,253,152 | |
Outstanding beneficial interest shares of $0.001 par value (unlimited number of shares authorized) | | | 1,100,000 | | | | 4,250,000 | | | | 1,400,000 | | | | 1,100,000 | | | | 3,900,000 | |
Net asset value per share | | $ | 50.70 | | | $ | 45.45 | | | $ | 64.05 | | | $ | 55.87 | | | $ | 42.89 | |
| 1 | Market value of securities out on loan were as follows: $2,668,103, $20,983,422, $2,160,524, $8,203,868, and $12,349,997. respectively. |
See Notes to Financial Statements.
| | | | |
| WisdomTree International Dividend and Sector Funds | | | 129 | |
Statements of Assets and Liabilities (continued)
WisdomTree International Dividend and Sector Funds
March 31, 2012
| | | | | | | | | | | | | | | | | | | | |
| | | WisdomTree
International
Dividend
ex-Financials Fund | | | WisdomTree
International
MidCap
Dividend Fund | | | WisdomTree
International
SmallCap
Dividend Fund | | | WisdomTree
Emerging
Markets Equity
Income Fund | | | WisdomTree
Emerging
Markets SmallCap
Dividend Fund | |
ASSETS: | | | | | | | | | | | | | | | | | | | | |
| | | | | |
Investments, at cost | | $ | 373,617,087 | | | $ | 118,747,046 | | | $ | 435,581,317 | | | $ | 3,520,207,388 | | | $ | 991,995,369 | |
| | | | | |
Investment in affiliates, at cost (Note 7) | | | 4,505 | | | | 71,003 | | | | 197,706 | | | | 2,163,775 | | | | 9,161,949 | |
| | | | | |
Foreign currency, at cost | | | 115,741 | | | | 71,040 | | | | 104,628 | | | | 15,254,430 | | | | 6,299,625 | |
Investment in securities, at value (including securities on loan) (Note 2)1 | | | 373,310,649 | | | | 117,820,475 | | | | 474,183,006 | | | | 3,715,108,434 | | | | 1,026,188,322 | |
| | | | | |
Investment in affiliates, at value (Note 7) | | | 5,215 | | | | 83,013 | | | | 232,186 | | | | 2,136,100 | | | | 8,288,469 | |
| | | | | |
Cash | | | — | | | | — | | | | — | | | | — | | | | 637,151 | |
| | | | | |
Foreign currency, at value | | | 115,882 | | | | 71,180 | | | | 104,356 | | | | 15,255,856 | | | | 6,329,648 | |
| | | | | |
Unrealized appreciation on forward foreign currency contracts | | | — | | | | — | | | | — | | | | — | | | | 6,040 | |
| | | | | |
Receivables: | | | | | | | | | | | | | | | | | | | | |
| | | | | |
Dividends and interest | | | 1,183,874 | | | | 640,943 | | | | 3,564,555 | | | | 9,968,889 | | | | 2,603,585 | |
| | | | | |
Foreign tax reclaims | | | 206,193 | | | | 96,857 | | | | 198,942 | | | | 51,336 | | | | 50,409 | |
| | | | | |
Investment securities and forward foreign currency contracts sold | | | 926,892 | | | | 1,016 | | | | 1,017,931 | | | | 2,584,380 | | | | 1,963,967 | |
| | | | | |
Capital shares sold | | | — | | | | — | | | | — | | | | 54,590,170 | | | | 8,215,760 | |
Total Assets | | | 375,748,705 | | | | 118,713,484 | | | | 479,300,976 | | | | 3,799,695,165 | | | | 1,054,283,351 | |
LIABILITIES: | | | | | | | | | | | | | | | | | | | | |
| | | | | |
Due to custodian | | | 741,861 | | | | — | | | | 490,748 | | | | 10,102,926 | | | | — | |
| | | | | |
Unrealized depreciation on forward foreign currency contracts | | | — | | | | — | | | | 389 | | | | 17,420 | | | | 1,462 | |
| | | | | |
Payables: | | | | | | | | | | | | | | | | | | | | |
| | | | | |
Collateral for securities on loan (Note 2) | | | 18,845,635 | | | | 12,838,834 | | | | 53,904,019 | | | | 90,237,031 | | | | 14,313,135 | |
| | | | | |
Investment securities and forward foreign currency contracts purchased | | | — | | | | — | | | | 434,614 | | | | 56,576,088 | | | | 16,576,033 | |
| | | | | |
Advisory fees (Note 3) | | | 168,190 | | | | 51,626 | | | | 205,301 | | | | 1,857,948 | | | | 521,481 | |
| | | | | |
Service fees (Note 2) | | | 1,279 | | | | 393 | | | | 1,562 | | | | 12,979 | | | | 3,668 | |
Total Liabilities | | | 19,756,965 | | | | 12,890,853 | | | | 55,036,633 | | | | 158,804,392 | | | | 31,415,779 | |
NET ASSETS | | $ | 355,991,740 | | | $ | 105,822,631 | | | $ | 424,264,343 | | | $ | 3,640,890,773 | | | $ | 1,022,867,572 | |
NET ASSETS: | | | | | | | | | | | | | | | | | | | | |
| | | | | |
Paid-in capital | | $ | 502,540,444 | | | $ | 186,217,370 | | | $ | 610,517,085 | | | $ | 3,536,315,233 | | | $ | 1,023,786,960 | |
| | | | | |
Undistributed net investment income | | | 455,453 | | | | 441,765 | | | | 2,243,811 | | | | 5,258,481 | | | | 5,299,833 | |
| | | | | |
Accumulated net realized loss on investments, forward foreign currency contracts and foreign currency related transactions | | | (146,700,697 | ) | | | (79,923,116 | ) | | | (227,119,420 | ) | | | (95,408,902 | ) | | | (39,561,966 | ) |
| | | | | |
Net unrealized appreciation (depreciation) on investments, forward foreign currency contracts and translation of assets and liabilities denominated in foreign currencies | | | (303,460 | ) | | | (913,388 | ) | | | 38,622,867 | | | | 194,725,961 | | | | 33,342,745 | |
NET ASSETS | | $ | 355,991,740 | | | $ | 105,822,631 | | | $ | 424,264,343 | | | $ | 3,640,890,773 | | | $ | 1,022,867,572 | |
Outstanding beneficial interest shares of $0.001 par value (unlimited number of shares authorized) | | | 8,550,000 | | | | 2,200,000 | | | | 8,600,000 | | | | 63,500,000 | | | | 21,400,000 | |
Net asset value per share | | $ | 41.64 | | | $ | 48.10 | | | $ | 49.33 | | | $ | 57.34 | | | $ | 47.80 | |
| 1 | Market value of securities out on loan were as follows: $17,951,213, $12,069,627, $49,974,592, $84,663,628, and $13,664,499, respectively. |
See Notes to Financial Statements.
| | |
| 130 | | WisdomTree International Dividend and Sector Funds |
Statements of Assets and Liabilities (concluded)
WisdomTree International Dividend and Sector Funds
March 31, 2012
| | | | | | | | | | | | | | | | | | | | | | | | |
| | | WisdomTree
Middle East
Dividend Fund | | | WisdomTree
International
Hedged
Equity Fund | | | WisdomTree
Commodity
Country
Equity Fund | | | WisdomTree
Global Natural
Resources Fund | | | WisdomTree
Global ex-U.S.
Utilities Fund | | | WisdomTree
Global ex-U.S.
Real
Estate Fund | |
ASSETS: | | | | | | | | | | | | | | | | | | | | | | | | |
Investments, at cost | | $ | 12,666,652 | | | $ | 21,717,671 | | | $ | 34,573,900 | | | $ | 34,732,016 | | | $ | 38,396,702 | | | $ | 117,666,354 | |
Investment in affiliates, at cost (Note 7) | | | — | | | | 34,544 | | | | 10,676 | | | | 206,525 | | | | 183,378 | | | | — | |
Foreign currency, at cost | | | 78,925 | | | | 16,531 | | | | 3,390 | | | | 19,020 | | | | 9,134 | | | | 246,153 | |
Investment in securities, at value (including securities on loan) (Note 2)1 | | | 13,887,856 | | | | 22,453,820 | | | | 34,175,145 | | | | 32,449,388 | | | | 34,115,630 | | | | 117,090,335 | |
Investment in affiliates, at value (Note 7) | | | — | | | | 34,707 | | | | 12,952 | | | | 175,429 | | | | 158,501 | | | | — | |
Cash | | | — | | | | — | | | | 2,389 | | | | — | | | | 1,000 | | | | 234,680 | |
Foreign currency, at value | | | 78,914 | | | | 16,587 | | | | 3,392 | | | | 18,918 | | | | 9,134 | | | | 246,596 | |
Unrealized appreciation on forward foreign currency contracts | | | — | | | | 206,598 | | | | 1 | | | | 2 | | | | — | | | | 549 | |
Receivables: | | | | | | | | | | | | | | | | | | | | | | | | |
Dividends and interest | | | 143,060 | | | | 98,339 | | | | 176,955 | | | | 55,479 | | | | 157,435 | | | | 306,485 | |
Foreign tax reclaims | | | — | | | | 22,057 | | | | 28,395 | | | | 11,248 | | | | 22,271 | | | | 9,730 | |
Investment securities and forward foreign currency contracts sold | | | 53,567 | | | | 39,246 | | | | — | | | | — | | | | — | | | | 1,834 | |
Total Assets | | | 14,163,397 | | | | 22,871,354 | | | | 34,399,229 | | | | 32,710,464 | | | | 34,463,971 | | | | 117,890,209 | |
LIABILITIES: | | | | | | | | | | | | | | | | | | | | | | | | |
Due to custodian | | | — | | | | — | | | | — | | | | 354 | | | | — | | | | — | |
Unrealized depreciation on forward foreign currency contracts | | | 16 | | | | 24,365 | | | | — | | | | — | | | | — | | | | 1,525 | |
Payables: | | | | | | | | | | | | | | | | | | | | | | | | |
Collateral for securities on loan (Note 2) | | | — | | | | 629,327 | | | | 2,944,521 | | | | 1,234,839 | | | | 4,207,707 | | | | 9,057,136 | |
Investment securities and forward foreign currency contracts purchased | | | 114,422 | | | | 243,861 | | | | — | | | | 7,338 | | | | — | | | | 552,983 | |
Advisory fees (Note 3) | | | 8,049 | | | | 8,748 | | | | 15,639 | | | | 15,816 | | | | 15,200 | | | | 56,911 | |
Service fees (Note 2) | | | 52 | | | | 1,824 | | | | 119 | | | | 121 | | | | 116 | | | | 433 | |
Other expenses | | | 2,368 | | | | 80 | | | | — | | | | — | | | | — | | | | — | |
Total Liabilities | | | 124,907 | | | | 908,205 | | | | 2,960,279 | | | | 1,258,468 | | | | 4,223,023 | | | | 9,668,988 | |
NET ASSETS | | $ | 14,038,490 | | | $ | 21,963,149 | | | $ | 31,438,950 | | | $ | 31,451,996 | | | $ | 30,240,948 | | | $ | 108,221,221 | |
NET ASSETS: | | | | | | | | | | | | | | | | | | | | | | | | |
Paid-in capital | | $ | 21,599,052 | | | $ | 23,322,072 | | | $ | 46,709,534 | | | $ | 46,968,822 | | | $ | 55,676,046 | | | $ | 168,728,864 | |
Undistributed (Distributions in excess of) net investment income | | | 151,353 | | | | 62,976 | | | | 76,664 | | | | 17,759 | | | | 68,845 | | | | (4,245,470 | ) |
Accumulated net realized loss on investments, forward foreign currency contracts and foreign currency related transactions | | | (8,933,104 | ) | | | (2,341,390 | ) | | | (14,950,469 | ) | | | (13,220,593 | ) | | | (21,196,712 | ) | | | (55,685,579 | ) |
Net unrealized appreciation (depreciation) on investments, forward foreign currency contracts and translation of assets and liabilities denominated in foreign currencies | | | 1,221,189 | | | | 919,491 | | | | (396,779 | ) | | | (2,313,992 | ) | | | (4,307,231 | ) | | | (576,594 | ) |
NET ASSETS | | $ | 14,038,490 | | | $ | 21,963,149 | | | $ | 31,438,950 | | | $ | 31,451,996 | | | $ | 30,240,948 | | | $ | 108,221,221 | |
Outstanding beneficial interest shares of $0.001 par value (unlimited number of shares authorized) | | | 900,000 | | | | 500,000 | | | | 1,000,000 | | | | 1,250,000 | | | | 1,600,000 | | | | 4,100,000 | |
Net asset value per share | | $ | 15.60 | | | $ | 43.93 | | | $ | 31.44 | | | $ | 25.16 | | | $ | 18.90 | | | $ | 26.40 | |
| 1 | Market value of securities out on loan were as follows: $0, $589,006, $2,803,196, $1,179,196, $4,002,917, and $8,594,405, respectively. |
See Notes to Financial Statements.
| | | | |
| WisdomTree International Dividend and Sector Funds | | | 131 | |
Statements of Operations
WisdomTree International Dividend and Sector Funds
For the Year Ended March 31, 2012
| | | | | | | | | | | | | | | | | | | | |
| | | WisdomTree DEFA Fund | | | WisdomTree DEFA Equity
Income Fund | | | WisdomTree
Global Equity
Income Fund | | | WisdomTree
Europe SmallCap
Dividend Fund | | | WisdomTree Japan Hedged
Equity Fund | |
INVESTMENT INCOME: | | | | | | | | | | | | | | | | | | | | |
| | | | | |
Dividends1 | | $ | 17,829,174 | | | $ | 7,482,335 | | | $ | 3,783,528 | | | $ | 1,048,223 | | | $ | 14,032,638 | |
| | | | | |
Dividends from affiliates (Note 7) | | | 105,941 | | | | 41,516 | | | | 17,171 | | | | 1,100 | | | | — | |
| | | | | |
Interest | | | — | | | | — | | | | 49 | | | | 3,958 | | | | — | |
| | | | | |
Securities lending income (Note 2) | | | 697,262 | | | | 250,266 | | | | 106,557 | | | | 43,660 | | | | 99,038 | |
Total investment income | | | 18,632,377 | | | | 7,774,117 | | | | 3,907,305 | | | | 1,096,941 | | | | 14,131,676 | |
EXPENSES: | | | | | | | | | | | | | | | | | | | | |
| | | | | |
Advisory fees (Note 3) | | | 1,900,693 | | | | 830,776 | | | | 443,128 | | | | 145,341 | | | | 2,347,008 | |
| | | | | |
Service fees (Note 2) | | | 17,423 | | | | 6,302 | | | | 3,362 | | | | 1,103 | | | | 21,514 | |
Total expenses | | | 1,918,116 | | | | 837,078 | | | | 446,490 | | | | 146,444 | | | | 2,368,522 | |
Expense reimbursements/waivers (Note 3) | | | (5,203 | ) | | | (2,245 | ) | | | (1,056 | ) | | | (122 | ) | | | — | |
Net expenses | | | 1,912,913 | | | | 834,833 | | | | 445,434 | | | | 146,322 | | | | 2,368,522 | |
Net investment income | | | 16,719,464 | | | | 6,939,284 | | | | 3,461,871 | | | | 950,619 | | | | 11,763,154 | |
NET REALIZED AND UNREALIZED GAIN (LOSS) ON INVESTMENTS: | | | | | | | | | | | | | | | | | | | | |
| | | | | |
Net realized gain (loss) from: | | | | | | | | | | | | | | | | | | | | |
| | | | | |
Investment transactions | | | 5,547,648 | | | | (1,638,520 | ) | | | 1,464,020 | | | | (20,005 | ) | | | (28,401,065 | ) |
| | | | | |
Investment transactions from affiliates (Note 7) | | | (448,231 | ) | | | (100,802 | ) | | | (42,686 | ) | | | (17,412 | ) | | | — | |
| | | | | |
In-kind redemptions | | | (1,294,220 | ) | | | — | | | | — | | | | (86,566 | ) | | | 4,230,366 | |
| | | | | |
In-kind redemptions from affiliates (Note 7) | | | 2,026 | | | | — | | | | — | | | | 149 | | | | — | |
| | | | | |
Forward foreign currency contracts and foreign currency related transactions | | | (111,962 | ) | | | (42,447 | ) | | | (29,101 | ) | | | (8,944 | ) | | | (9,182,465 | ) |
Net realized gain (loss) | | | 3,695,261 | | | | (1,781,769 | ) | | | 1,392,233 | | | | (132,778 | ) | | | (33,353,164 | ) |
Net change in unrealized appreciation (depreciation) from: | | | | | | | | | | | | | | | | | | | | |
| | | | | |
Investment transactions | | | (53,393,915 | ) | | | (14,023,733 | ) | | | (6,513,214 | ) | | | (3,234,973 | ) | | | 17,438,420 | |
| | | | | |
Forward foreign currency contracts and translation of assets and liabilities denominated in foreign currencies | | | (17,749 | ) | | | (5,876 | ) | | | (3,463 | ) | | | (1,022 | ) | | | (310,028 | ) |
Net change in unrealized appreciation (depreciation) | | | (53,411,664 | ) | | | (14,029,609 | ) | | | (6,516,677 | ) | | | (3,235,995 | ) | | | 17,128,392 | |
Net realized and unrealized loss on investments | | | (49,716,403 | ) | | | (15,811,378 | ) | | | (5,124,444 | ) | | | (3,368,773 | ) | | | (16,224,772 | ) |
NET DECREASE IN NET ASSETS RESULTING FROM OPERATIONS | | $ | (32,996,939 | ) | | $ | (8,872,094 | ) | | $ | (1,662,573 | ) | | $ | (2,418,154 | ) | | $ | (4,461,618 | ) |
| 1 | Net of foreign withholding tax of $1,692,031, $660,682, $315,469, $108,648 and $1,050,284, respectively. |
See Notes to Financial Statements.
| | |
| 132 | | WisdomTree International Dividend and Sector Funds |
Statements of Operations (continued)
WisdomTree International Dividend and Sector Funds
For the Year Ended March 31, 2012
| | | | | | | | | | | | | | | | | | | | |
| | | WisdomTree
Global ex-U.S.
Growth Fund | | | WisdomTree
Japan SmallCap
Dividend Fund | | | WisdomTree
Asia Pacific
ex-Japan Fund | | | WisdomTree
Australia
Dividend Fund | | | WisdomTree
International
LargeCap
Dividend Fund | |
INVESTMENT INCOME: | | | | | | | | | | | | | | | | | | | | |
| | | | | |
Dividends1 | | $ | 1,849,860 | | | $ | 4,536,966 | | | $ | 2,924,467 | | | $ | 3,243,567 | | | $ | 6,480,503 | |
| | | | | |
Dividends from affiliates (Note 7) | | | 4,730 | | | | 1,611 | | | | 18,265 | | | | 2,406 | | | | 30,094 | |
| | | | | |
Securities lending income (Note 2) | | | 39,585 | | | | 81,540 | | | | 16,098 | | | | 55,236 | | | | 229,237 | |
Total investment income | | | 1,894,175 | | | | 4,620,117 | | | | 2,958,830 | | | | 3,301,209 | | | | 6,739,834 | |
EXPENSES: | | | | | | | | | | | | | | | | | | | | |
| | | | | |
Advisory fees (Note 3) | | | 332,537 | | | | 1,240,122 | | | | 364,607 | | | | 332,196 | | | | 670,975 | |
| | | | | |
Service fees (Note 2) | | | 2,523 | | | | 9,408 | | | | 3,342 | | | | 2,520 | | | | 6,151 | |
Total expenses | | | 335,060 | | | | 1,249,530 | | | | 367,949 | | | | 334,716 | | | | 677,126 | |
Expense reimbursements/waivers (Note 3) | | | (3,216 | ) | | | (1,979 | ) | | | (7,180 | ) | | | (29 | ) | | | (1,165 | ) |
Net expenses | | | 331,844 | | | | 1,247,551 | | | | 360,769 | | | | 334,687 | | | | 675,961 | |
Net investment income | | | 1,562,331 | | | | 3,372,566 | | | | 2,598,061 | | | | 2,966,522 | | | | 6,063,873 | |
NET REALIZED AND UNREALIZED GAIN (LOSS) ON INVESTMENTS: | | | | | | | | | | | | | | | | | | | | |
| | | | | |
Net realized gain (loss) from: | | | | | | | | | | | | | | | | | | | | |
| | | | | |
Investment transactions | | | (374,815 | ) | | | (12,602,356 | ) | | | (4,136,599 | ) | | | (1,868,365 | ) | | | (5,054,572 | ) |
| | | | | |
Investment transactions from affiliates (Note 7) | | | (127,512 | ) | | | (39,128 | ) | | | (6,395 | ) | | | (8,509 | ) | | | (83,271 | ) |
| | | | | |
In-kind redemptions | | | 5,078,987 | | | | 13,757,885 | | | | 8,907,657 | | | | 6,763,486 | | | | 4,460,492 | |
| | | | | |
In-kind redemptions from affiliates (Note 7) | | | 643 | | | | (8,488 | ) | | | (10,676 | ) | | | 16,310 | | | | 1,397 | |
| | | | | |
Forward foreign currency contracts and foreign currency related transactions | | | (82,754 | ) | | | 22,096 | | | | (168,679 | ) | | | (32,657 | ) | | | (36,304 | ) |
Net realized gain (loss) | | | 4,494,549 | | | | 1,130,009 | | | | 4,585,308 | | | | 4,870,265 | | | | (712,258 | ) |
Net change in unrealized appreciation (depreciation) from: | | | | | | | | | | | | | | | | | | | | |
| | | | | |
Investment transactions | | | (9,404,378 | ) | | | 8,036,206 | | | | (8,035,319 | ) | | | (8,235,223 | ) | | | (12,409,775 | ) |
| | | | | |
Forward foreign currency contracts and translation of assets and liabilities denominated in foreign currencies | | | (2,135 | ) | | | 29,221 | | | | (13,911 | ) | | | (31,422 | ) | | | (1,766 | ) |
Net change in unrealized appreciation (depreciation) | | | (9,406,513 | ) | | | 8,065,427 | | | | (8,049,230 | ) | | | (8,266,645 | ) | | | (12,411,541 | ) |
Net realized and unrealized gain (loss) on investments | | | (4,911,964 | ) | | | 9,195,436 | | | | (3,463,922 | ) | | | (3,396,380 | ) | | | (13,123,799 | ) |
NET INCREASE (DECREASE) IN NET ASSETS RESULTING FROM OPERATIONS | | $ | (3,349,633 | ) | | $ | 12,568,002 | | | $ | (865,861 | ) | | $ | (429,858 | ) | | $ | (7,059,926 | ) |
| 1 | Net of foreign withholding tax of $184,888, $341,088, $172,180, $36,803 and $622,800, respectively. |
See Notes to Financial Statements.
| | | | |
| WisdomTree International Dividend and Sector Funds | | | 133 | |
Statements of Operations (continued)
WisdomTree International Dividend and Sector Funds
For the Year Ended March 31, 2012
| | | | | | | | | | | | | | | | | | | | |
| | | WisdomTree
International
Dividend
ex-Financials Fund | | | WisdomTree
International
MidCap
Dividend Fund | | | WisdomTree
International
SmallCap
Dividend Fund | | | WisdomTree
Emerging
Markets Equity
Income Fund | | | WisdomTree
Emerging
Markets SmallCap
Dividend Fund | |
INVESTMENT INCOME: | | | | | | | | | | | | | | | | | | | | |
| | | | | |
Dividends1 | | $ | 10,190,108 | | | $ | 5,272,177 | | | $ | 17,000,936 | | | $ | 95,215,379 | | | $ | 31,777,161 | |
| | | | | |
Dividends from affiliates (Note 7) | | | 44,723 | | | | 23,662 | | | | 40,957 | | | | 83,246 | | | | 79,830 | |
| | | | | |
Securities lending income (Note 2) | | | 350,281 | | | | 242,894 | | | | 553,115 | | | | 380,042 | | | | 240,488 | |
Total investment income | | | 10,585,112 | | | | 5,538,733 | | | | 17,595,008 | | | | 95,678,667 | | | | 32,097,479 | |
EXPENSES: | | | | | | | | | | | | | | | | | | | | |
| | | | | |
Advisory fees (Note 3) | | | 1,283,015 | | | | 752,251 | | | | 2,412,430 | | | | 12,679,378 | | | | 5,387,984 | |
| | | | | |
Service fees (Note 2) | | | 9,734 | | | | 5,707 | | | | 18,304 | | | | 88,555 | | | | 37,630 | |
Total expenses | | | 1,292,749 | | | | 757,958 | | | | 2,430,734 | | | | 12,767,933 | | | | 5,425,614 | |
Expense reimbursements/waivers (Note 3) | | | (4,056 | ) | | | (1,685 | ) | | | (5,331 | ) | | | (5,490 | ) | | | (59,054 | ) |
Net expenses | | | 1,288,693 | | | | 756,273 | | | | 2,425,403 | | | | 12,762,443 | | | | 5,366,560 | |
Net investment income | | | 9,296,419 | | | | 4,782,460 | | | | 15,169,605 | | | | 82,916,224 | | | | 26,730,919 | |
NET REALIZED AND UNREALIZED GAIN (LOSS) ON INVESTMENTS: | | | | | | | | | | | | | | | | | | | | |
| | | | | |
Net realized gain (loss) from: | | | | | | | | | | | | | | | | | | | | |
| | | | | |
Investment transactions | | | 2,116,283 | | | | (6,697,133 | ) | | | (7,921,529 | ) | | | (48,548,764 | ) | | | (5,537,031 | ) |
| | | | | |
Investment transactions from affiliates (Note 7) | | | (187,195 | ) | | | (20,700 | ) | | | 44,138 | | | | (140,950 | ) | | | (2,450,200 | ) |
| | | | | |
In-kind redemptions | | | 727,751 | | | | 2,908,195 | | | | 4,129,782 | | | | 36,439,977 | | | | 14,758,247 | |
| | | | | |
In-kind redemptions from affiliates (Note 7) | | | 3,048 | | | | 2,128 | | | | 7,167 | | | | — | | | | 40,509 | |
| | | | | |
Forward foreign currency contracts and foreign currency related transactions | | | (102,629 | ) | | | (22,828 | ) | | | 3,626 | | | | (5,059,484 | ) | | | (626,431 | ) |
Net realized gain (loss) | | | 2,557,258 | | | | (3,830,338 | ) | | | (3,736,816 | ) | | | (17,309,221 | ) | | | 6,185,094 | |
Net change in unrealized appreciation (depreciation) from: | | | | | | | | | | | | | | | | | | | | |
| | | | | |
Investment transactions | | | (15,370,298 | ) | | | (13,497,453 | ) | | | (29,689,976 | ) | | | 521,064 | | | | (97,633,116 | ) |
| | | | | |
Forward foreign currency contracts and translation of assets and liabilities denominated in foreign currencies | | | (22,873 | ) | | | (6,541 | ) | | | 6,452 | | | | (241,093 | ) | | | (56,734 | ) |
Net change in unrealized appreciation (depreciation) | | | (15,393,171 | ) | | | (13,503,994 | ) | | | (29,683,524 | ) | | | 279,971 | | | | (97,689,850 | ) |
Net realized and unrealized loss on investments | | | (12,835,913 | ) | | | (17,334,332 | ) | | | (33,420,340 | ) | | | (17,029,250 | ) | | | (91,504,756 | ) |
NET INCREASE (DECREASE) IN NET ASSETS RESULTING FROM OPERATIONS | | $ | (3,539,494 | ) | | $ | (12,551,872 | ) | | $ | (18,250,735 | ) | | | 65,886,974 | | | | (64,773,837 | ) |
| 1 | Net of foreign withholding tax of $940,887, $505,753, $1,315,761, $11,009,419, and $5,207,986, respectively. |
See Notes to Financial Statements.
| | |
| 134 | | WisdomTree International Dividend and Sector Funds |
Statements of Operations (concluded)
WisdomTree International Dividend and Sector Funds
For the Year Ended March 31, 2012
| | | | | | | | | | | | | | | | | | | | | | | | |
| | | WisdomTree
Middle East
Dividend Fund | | | WisdomTree
International
Hedged
Equity Fund | | | WisdomTree
Commodity
Country
Equity Fund | | | WisdomTree
Global Natural
Resources Fund | | | WisdomTree
Global ex-U.S. Utilities Fund | | | WisdomTree
Global ex-U.S.
Real Estate Fund | |
INVESTMENT INCOME: | | | | | | | | | | | | | | | | | | | | | | | | |
| | | | | | |
Dividends1 | | $ | 1,076,263 | | | $ | 869,809 | | | $ | 1,407,570 | | | $ | 1,587,220 | | | $ | 1,586,203 | | | $ | 5,782,460 | |
| | | | | | |
Dividends from affiliates (Note 7) | | | — | | | | 2,132 | | | | 1,047 | | | | 2,499 | | | | 1,778 | | | | 12,951 | |
| | | | | | |
Securities lending income (Note 2) | | | — | | | | 26,138 | | | | 39,582 | | | | 63,264 | | | | 66,730 | | | | 128,367 | |
Total investment income | | | 1,076,263 | | | | 898,079 | | | | 1,448,199 | | | | 1,652,983 | | | | 1,654,711 | | | | 5,923,778 | |
EXPENSES: | | | | | | | | | | | | | | | | | | | | | | | | |
| | | | | | |
Advisory fees (Note 3) | | | 118,125 | | | | 94,307 | | | | 204,834 | | | | 232,339 | | | | 189,502 | | | | 694,902 | |
| | | | | | |
Service fees (Note 2) | | | 546 | | | | 865 | | | | 1,554 | | | | 1,763 | | | | 1,438 | | | | 5,272 | |
| | | | | | |
Custody and accounting | | | 93,259 | | | | 47,597 | | | | — | | | | — | | | | — | | | | — | |
| | | | | | |
Professional fees | | | 44,156 | | | | 44,192 | | | | — | | | | — | | | | — | | | | — | |
| | | | | | |
IOPV fees2 | | | 18,100 | | | | 10,500 | | | | — | | | | — | | | | — | | | | — | |
| | | | | | |
Printing | | | 17,315 | | | | 17,451 | | | | — | | | | — | | | | — | | | | — | |
| | | | | | |
Pricing | | | 10,584 | | | | 17,845 | | | | — | | | | — | | | | — | | | | — | |
| | | | | | |
Listing costs | | | 6,500 | | | | 5,000 | | | | — | | | | — | | | | — | | | | — | |
| | | | | | |
Insurance | | | 3,705 | | | | 3,734 | | | | — | | | | — | | | | — | | | | — | |
| | | | | | |
Compliance | | | 1,915 | | | | 1,915 | | | | — | | | | — | | | | — | | | | — | |
| | | | | | |
Other | | | 2,979 | | | | 2,996 | | | | — | | | | — | | | | — | | | | — | |
Total expenses | | | 317,184 | | | | 246,402 | | | | 206,388 | | | | 234,102 | | | | 190,940 | | | | 700,174 | |
Expense reimbursements/waivers (Note 3) | | | (163,552 | ) | | | (131,789 | ) | | | (243 | ) | | | (1,257 | ) | | | (1,074 | ) | | | (688 | ) |
Net expenses | | | 153,632 | | | | 114,613 | | | | 206,145 | | | | 232,845 | | | | 189,866 | | | | 699,486 | |
Net investment income | | | 922,631 | | | | 783,466 | | | | 1,242,054 | | | | 1,420,138 | | | | 1,464,845 | | | | 5,224,292 | |
NET REALIZED AND UNREALIZED GAIN (LOSS) ON INVESTMENTS: | | | | | | | | | | | | | | | | | | | | | | | | |
| | | | | | |
Net realized gain (loss) from: | | | | | | | | | | | | | | | | | | | | | | | | |
| | | | | | |
Investment transactions | | | (244,892 | ) | | | (137,026 | ) | | | 2,908,550 | | | | 57,461 | | | | (11,409,758 | ) | | | (160,393 | ) |
| | | | | | |
Investment transactions from affiliates (Note 7) | | | — | | | | (31,242 | ) | | | (30,656 | ) | | | (39,443 | ) | | | (24,863 | ) | | | (122,837 | ) |
| | | | | | |
In-kind redemptions | | | — | | | | 692,610 | | | | 469,212 | | | | (733,100 | ) | | | 242,290 | | | | 2,656,587 | |
| | | | | | |
In-kind redemptions from affiliates (Note 7) | | | — | | | | — | | | | 1,081 | | | | (13,234 | ) | | | 6,811 | | | | (251 | ) |
| | | | | | |
Forward foreign currency contracts and foreign currency related transactions | | | (6,638 | ) | | | (314,304 | ) | | | (28,319 | ) | | | (61,608 | ) | | | (52,774 | ) | | | (26,162 | ) |
Net realized gain (loss) | | | (251,530 | ) | | | 210,038 | | | | 3,319,868 | | | | (789,924 | ) | | | (11,238,294 | ) | | | 2,346,944 | |
Net change in unrealized appreciation (depreciation) from: | | | | | | | | | | | | | | | | | | | | | | | | |
| | | | | | |
Investment transactions | | | (646,916 | ) | | | (2,314,024 | ) | | | (5,934,484 | ) | | | (7,614,566 | ) | | | 7,209,945 | | | | (13,825,824 | ) |
| | | | | | |
Forward foreign currency contracts and translation of assets and liabilities denominated in foreign currencies | | | 310 | | | | 431,526 | | | | (4,082 | ) | | | (2,559 | ) | | | (2,459 | ) | | | 469 | |
Net change in unrealized appreciation (depreciation) | | | (646,606 | ) | | | (1,882,498 | ) | | | (5,938,566 | ) | | | (7,617,125 | ) | | | 7,207,486 | | | | (13,825,355 | ) |
Net realized and unrealized loss on investments | | | (898,136 | ) | | | (1,672,460 | ) | | | (2,618,698 | ) | | | (8,407,049 | ) | | | (4,030,808 | ) | | | (11,478,411 | ) |
NET INCREASE (DECREASE) IN NET ASSETS RESULTING FROM OPERATIONS | | $ | 24,495 | | | $ | (888,994 | ) | | $ | (1,376,644 | ) | | $ | (6,986,911 | ) | | $ | (2,565,963 | ) | | $ | (6,254,119 | ) |
| 1 | Net of foreign withholding tax of $90,823, $84,054, $139,836, $155,272, $183,693, and $437,773, respectively. |
| 2 | IOVP fees – Indicative Optimized Portfolio Value – is the real-time estimation of the net asset value of the Fund. |
See Notes to Financial Statements.
| | | | |
| WisdomTree International Dividend and Sector Funds | | | 135 | |
Statements of Changes in Net Assets
WisdomTree International Dividend and Sector Funds
| | | | | | | | | | | | | | | | | | | | | | | | |
| | | WisdomTree
DEFA Fund | | | WisdomTree DEFA Equity Income Fund | | | WisdomTree Global Equity Income Fund | |
| | | For the
Year Ended
March 31, 2012 | | | For the
Year Ended
March 31, 2011 | | | For the
Year Ended
March 31, 2012 | | | For the
Year Ended
March 31, 2011 | | | For the
Year Ended
March 31, 2012 | | | For the
Year Ended
March 31, 2011 | |
INCREASE (DECREASE) IN NET ASSETS RESULTING FROM OPERATIONS: | | | | | | | | | | | | | | | | | | | | | |
| | | | | | |
Net investment income | | $ | 16,719,464 | | | $ | 14,585,334 | | | $ | 6,939,284 | | | $ | 5,386,264 | | | $ | 3,461,871 | | | $ | 2,136,651 | |
| | | | | | |
Net realized gain (loss) on investments, forward foreign currency contracts and foreign currency related transactions | | | 3,695,261 | | | | (10,765,454 | ) | | | (1,781,769 | ) | | | (8,141,358 | ) | | | 1,392,233 | | | | (791,425 | ) |
| | | | | | |
Net change in unrealized appreciation (depreciation) on investments, forward foreign currency contracts and translation of assets and liabilities denominated in foreign currencies | | | (53,411,664 | ) | | | 38,462,539 | | | | (14,029,609 | ) | | | 11,649,847 | | | | (6,516,677 | ) | | | 6,562,848 | |
Net increase (decrease) in net assets resulting from operations | | | (32,996,939 | ) | | | 42,282,419 | | | | (8,872,094 | ) | | | 8,894,753 | | | | (1,662,573 | ) | | | 7,908,074 | |
DIVIDENDS: | | | | | | | | | | | | | | | | | | | | | | | | |
| | | | | | |
Net investment income | | | (16,801,126 | ) | | | (14,637,890 | ) | | | (6,808,884 | ) | | | (5,400,141 | ) | | | (3,425,601 | ) | | | (2,060,172 | ) |
CAPITAL SHARE TRANSACTIONS: | | | | | | | | | | | | | | | | | | | | | | | | |
| | | | | | |
Net proceeds from sale of shares | | | 33,703,878 | | | | 19,124,551 | | | | 60,036,022 | | | | 2,204,839 | | | | 18,244,724 | | | | 29,257,792 | |
| | | | | | |
Cost of shares redeemed | | | (56,700,428 | ) | | | (24,677,653 | ) | | | — | | | | (16,542,512 | ) | | | — | | | | — | |
Net increase (decrease) in net assets resulting from capital share transactions | | | (22,996,550 | ) | | | (5,553,102 | ) | | | 60,036,022 | | | | (14,337,673 | ) | | | 18,244,724 | | | | 29,257,792 | |
Net Increase (Decrease) in Net Assets | | | (72,794,615 | ) | | | 22,091,427 | | | | 44,355,044 | | | | (10,843,061 | ) | | | 13,156,550 | | | | 35,105,694 | |
NET ASSETS: | | | | | | | | | | | | | | | | | | | | | | | | |
| | | | | | |
Beginning of year | | $ | 457,997,031 | | | $ | 435,905,604 | | | $ | 131,454,437 | | | $ | 142,297,498 | | | $ | 78,147,479 | | | $ | 43,041,785 | |
| | | | | | |
End of year | | $ | 385,202,416 | | | $ | 457,997,031 | | | $ | 175,809,481 | | | $ | 131,454,437 | | | $ | 91,304,029 | | | $ | 78,147,479 | |
Undistributed net investment income included in net assets at end of year | | $ | 1,022,525 | | | $ | 1,092,255 | | | $ | 299,938 | | | $ | 191,867 | | | $ | 173,689 | | | $ | 154,543 | |
SHARES CREATED AND REDEEMED: | | | | | | | | | | | | | | | | | | | | | | | | |
| | | | | | |
Shares outstanding, beginning of year | | | 9,250,000 | | | | 9,450,000 | | | | 3,000,000 | | | | 3,400,000 | | | | 1,750,000 | | | | 1,050,000 | |
| | | | | | |
Shares created | | | 750,000 | | | | 400,000 | | | | 1,550,000 | | | | 50,000 | | | | 450,000 | | | | 700,000 | |
| | | | | | |
Shares redeemed | | | (1,350,000 | ) | | | (600,000 | ) | | | — | | | | (450,000 | ) | | | — | | | | — | |
Shares outstanding, end of year | | | 8,650,000 | | | | 9,250,000 | | | | 4,550,000 | | | | 3,000,000 | | | | 2,200,000 | | | | 1,750,000 | |
See Notes to Financial Statements.
| | |
| 136 | | WisdomTree International Dividend and Sector Funds |
Statements of Changes in Net Assets (continued)
WisdomTree International Dividend and Sector Funds
| | | | | | | | | | | | | | | | | | | | | | | | |
| | | WisdomTree Europe SmallCap Dividend Fund | | | WisdomTree Japan Hedged Equity Fund | | | WisdomTree Global ex-U.S. Growth Fund | |
| | | For the
Year Ended
March 31, 2012 | | | For the
Year Ended
March 31, 2011 | | | For the
Year Ended
March 31, 2012 | | | For the
Year Ended
March 31, 2011 | | | For the
Year Ended
March 31, 2012 | | | For the
Year Ended
March 31, 2011 | |
INCREASE (DECREASE) IN NET ASSETS RESULTING FROM OPERATIONS: | | | | | | | | | | | | | | | | | | | | | |
| | | | | | |
Net investment income | | $ | 950,619 | | | $ | 773,071 | | | $ | 11,763,154 | | | $ | 6,622,465 | | | $ | 1,562,331 | | | $ | 957,587 | |
| | | | | | |
Net realized gain (loss) on investments, forward foreign currency contracts and foreign currency related transactions | | | (132,778 | ) | | | (726,338 | ) | | | (33,353,164 | ) | | | (21,754,422 | ) | | | 4,494,549 | | | | 145,659 | |
| | | | | | |
Net change in unrealized appreciation (depreciation) on investments, forward foreign currency contracts and translation of assets and liabilities denominated in foreign currencies | | | (3,235,995 | ) | | | 5,089,392 | | | | 17,128,392 | | | | (2,893,998 | ) | | | (9,406,513 | ) | | | 3,253,681 | |
Net increase (decrease) in net assets resulting from operations | | | (2,418,154 | ) | | | 5,136,125 | | | | (4,461,618 | ) | | | (18,025,955 | ) | | | (3,349,633 | ) | | | 4,356,927 | |
DIVIDENDS: | | | | | | | | | | | | | | | | | | | | | | | | |
| | | | | | |
Net investment income | | | (1,249,779 | ) | | | (772,916 | ) | | | (9,560,131 | ) | | | (1,252,279 | ) | | | (1,502,577 | ) | | | (917,040 | ) |
CAPITAL SHARE TRANSACTIONS: | | | | | | | | | | | | | | | | | | | | | | | | |
| | | | | | |
Net proceeds from sale of shares | | | 7,023,711 | | | | — | | | | 401,748,182 | | | | 483,187,635 | | | | 54,279,646 | | | | 21,201,069 | |
| | | | | | |
Cost of shares redeemed | | | (3,576,495 | ) | | | (5,569,277 | ) | | | (276,000,932 | ) | | | (23,678,853 | ) | | | (43,099,447 | ) | | | — | |
Net increase (decrease) in net assets resulting from capital share transactions | | | 3,447,216 | | | | (5,569,277 | ) | | | 125,747,250 | | | | 459,508,782 | | | | 11,180,199 | | | | 21,201,069 | |
Net Increase (Decrease) in Net Assets | | | (220,717 | ) | | | (1,206,068 | ) | | | 111,725,501 | | | | 440,230,548 | | | | 6,327,989 | | | | 24,640,956 | |
NET ASSETS: | | | | | | | | | | | | | | | | | | | | | | | | |
| | | | | | |
Beginning of year | | $ | 28,888,596 | | | $ | 30,094,664 | | | $ | 494,981,261 | | | $ | 54,750,713 | | | $ | 49,446,145 | | | $ | 24,805,189 | |
| | | | | | |
End of year | | $ | 28,667,879 | | | $ | 28,888,596 | | | $ | 606,706,762 | | | $ | 494,981,261 | | | $ | 55,774,134 | | | $ | 49,446,145 | |
Undistributed net investment income included in net assets at end of year | | $ | 83,518 | | | $ | 383,628 | | | $ | 5,575,936 | | | $ | 5,918,195 | | | $ | 60,053 | | | $ | 83,053 | |
SHARES CREATED AND REDEEMED: | | | | | | | | | | | | | | | | | | | | | | | | |
| | | | | | |
Shares outstanding, beginning of year | | | 650,000 | | | | 800,000 | | | | 13,400,000 | | | | 1,300,000 | | | | 900,000 | | | | 500,000 | |
| | | | | | |
Shares created | | | 200,000 | | | | — | | | | 11,400,000 | | | | 12,750,000 | | | | 1,000,000 | | | | 400,000 | |
| | | | | | |
Shares redeemed | | | (100,000 | ) | | | (150,000 | ) | | | (8,250,000 | ) | | | (650,000 | ) | | | (800,000 | ) | | | — | |
Shares outstanding, end of year | | | 750,000 | | | | 650,000 | | | | 16,550,000 | | | | 13,400,000 | | | | 1,100,000 | | | | 900,000 | |
See Notes to Financial Statements.
| | | | |
| WisdomTree International Dividend and Sector Funds | | | 137 | |
Statements of Changes in Net Assets (continued)
WisdomTree International Dividend and Sector Funds
| | | | | | | | | | | | | | | | | | | | | | | | |
| | | WisdomTree Japan SmallCap Dividend Fund | | | WisdomTree Asia Pacific ex-Japan Fund | | | WisdomTree Australia Dividend Fund | |
| | | For the
Year Ended
March 31, 2012 | | | For the
Year Ended
March 31, 2011 | | | For the
Year Ended
March 31, 2012 | | | For the
Year Ended
March 31, 2011 | | | For the
Year Ended
March 31, 2012 | | | For the
Year Ended
March 31, 2011 | |
INCREASE (DECREASE) IN NET ASSETS RESULTING FROM OPERATIONS: | | | | | | | | | | | | | | | | | | | | | |
| | | | | | |
Net investment income | | $ | 3,372,566 | | | $ | 3,530,671 | | | $ | 2,598,061 | | | $ | 3,422,364 | | | $ | 2,966,522 | | | $ | 4,257,602 | |
| | | | | | |
Net realized gain (loss) on investments, forward foreign currency contracts and foreign currency related transactions | | | 1,130,009 | | | | (618,739 | ) | | | 4,585,308 | | | | (11,815 | ) | | | 4,870,265 | | | | 772,038 | |
| | | | | | |
Net change in unrealized appreciation (depreciation) on investments, forward foreign currency contracts and translation of assets and liabilities denominated in foreign currencies | | | 8,065,427 | | | | 8,707,119 | | | | (8,049,230 | ) | | | 8,273,031 | | | | (8,266,645 | ) | | | 2,230,713 | |
Net increase (decrease) in net assets resulting from operations | | | 12,568,002 | | | | 11,619,051 | | | | (865,861 | ) | | | 11,683,580 | | | | (429,858 | ) | | | 7,260,353 | |
DIVIDENDS: | | | | | | | | | | | | | | | | | | | | | | | | |
| | | | | | |
Net investment income | | | (4,623,191 | ) | | | (2,383,352 | ) | | | (2,604,968 | ) | | | (3,365,676 | ) | | | (3,116,253 | ) | | | (4,176,991 | ) |
CAPITAL SHARE TRANSACTIONS: | | | | | | | | | | | | | | | | | | | | | | | | |
| | | | | | |
Net proceeds from sale of shares | | | 65,220,185 | | | | 121,144,708 | | | | 51,180,847 | | | | — | | | | 40,313,641 | | | | — | |
| | | | | | |
Cost of shares redeemed | | | (115,678,745 | ) | | | (52,544,856 | ) | | | (46,425,372 | ) | | | (8,963,414 | ) | | | (55,448,586 | ) | | | (40,285,077 | ) |
Net increase (decrease) in net assets resulting from capital share transactions | | | (50,458,560 | ) | | | 68,599,852 | | | | 4,755,475 | | | | (8,963,414 | ) | | | (15,134,945 | ) | | | (40,285,077 | ) |
Net Increase (Decrease) in Net Assets | | | (42,513,749 | ) | | | 77,835,551 | | | | 1,284,646 | | | | (645,510 | ) | | | (18,681,056 | ) | | | (37,201,715 | ) |
NET ASSETS: | | | | | | | | | | | | | | | | | | | | | | | | |
| | | | | | |
Beginning of year | | $ | 235,685,462 | | | $ | 157,849,911 | | | $ | 88,387,788 | | | $ | 89,033,298 | | | $ | 80,136,891 | | | $ | 117,338,606 | |
| | | | | | |
End of year | | $ | 193,171,713 | | | $ | 235,685,462 | | | $ | 89,672,434 | | | $ | 88,387,788 | | | $ | 61,455,835 | | | $ | 80,136,891 | |
Undistributed net investment income included in net assets at end of year | | $ | 1,734,559 | | | $ | 2,617,816 | | | $ | 3,116 | | | $ | 152,356 | | | $ | 127,330 | | | $ | 260,728 | |
SHARES CREATED AND REDEEMED: | | | | | | | | | | | | | | | | | | | | | | | | |
| | | | | | |
Shares outstanding, beginning of year | | | 5,450,000 | | | | 3,800,000 | | | | 1,300,000 | | | | 1,450,000 | | | | 1,300,000 | | | | 2,050,000 | |
| | | | | | |
Shares created | | | 1,550,000 | | | | 2,950,000 | | | | 800,000 | | | | — | | | | 700,000 | | | | — | |
| | | | | | |
Shares redeemed | | | (2,750,000 | ) | | | (1,300,000 | ) | | | (700,000 | ) | | | (150,000 | ) | | | (900,000 | ) | | | (750,000 | ) |
Shares outstanding, end of year | | | 4,250,000 | | | | 5,450,000 | | | | 1,400,000 | | | | 1,300,000 | | | | 1,100,000 | | | | 1,300,000 | |
See Notes to Financial Statements.
| | |
| 138 | | WisdomTree International Dividend and Sector Funds |
Statements of Changes in Net Assets (continued)
WisdomTree International Dividend and Sector Funds
| | | | | | | | | | | | | | | | | | | | | | | | |
| | | WisdomTree
International LargeCap Dividend Fund | | | WisdomTree
International Dividend ex-Financials Fund | | | WisdomTree
International MidCap Dividend Fund | |
| | | For the
Year Ended
March 31, 2012 | | | For the
Year Ended
March 31, 2011 | | | For the
Year Ended
March 31, 2012 | | | For the
Year Ended
March 31, 2011 | | | For the
Year Ended
March 31, 2012 | | | For the
Year Ended
March 31, 2011 | |
INCREASE (DECREASE) IN NET ASSETS RESULTING FROM OPERATIONS: | | | | | | | | | | | | | | | | | | | | | |
| | | | | | |
Net investment income | | $ | 6,063,873 | | | $ | 5,122,716 | | | $ | 9,296,419 | | | $ | 6,468,151 | | | $ | 4,782,460 | | | $ | 4,408,386 | |
| | | | | | |
Net realized gain (loss) on investments, forward foreign currency contracts and foreign currency related transactions | | | (712,258 | ) | | | (7,844,872 | ) | | | 2,557,258 | | | | 5,411,710 | | | | (3,830,338 | ) | | | (8,999,172 | ) |
| | | | | | |
Net change in unrealized appreciation (depreciation) on investments, forward foreign currency contracts and translation of assets and liabilities denominated in foreign currencies | | | (12,411,541 | ) | | | 14,632,223 | | | | (15,393,171 | ) | | | 6,125,539 | | | | (13,503,994 | ) | | | 22,823,910 | |
Net increase (decrease) in net assets resulting from operations | | | (7,059,926 | ) | | | 11,910,067 | | | | (3,539,494 | ) | | | 18,005,400 | | | | (12,551,872 | ) | | | 18,233,124 | |
DIVIDENDS: | | | | | | | | | | | | | | | | | | | | | | | | |
| | | | | | |
Net investment income | | | (6,055,172 | ) | | | (5,111,213 | ) | | | (8,893,281 | ) | | | (6,504,988 | ) | | | (4,866,057 | ) | | | (4,562,537 | ) |
CAPITAL SHARE TRANSACTIONS: | | | | | | | | | | | | | | | | | | | | | | | | |
| | | | | | |
Net proceeds from sale of shares | | | 37,627,329 | | | | 18,012,609 | | | | 232,583,990 | | | | 20,341,799 | | | | 4,726,060 | | | | 7,564,508 | |
| | | | | | |
Cost of shares redeemed | | | (21,748,486 | ) | | | (9,946,346 | ) | | | (14,088,402 | ) | | | (46,250,816 | ) | | | (37,491,140 | ) | | | (11,298,397 | ) |
Net increase (decrease) in net assets resulting from capital share transactions | | | 15,878,843 | | | | 8,066,263 | | | | 218,495,588 | | | | (25,909,017 | ) | | | (32,765,080 | ) | | | (3,733,889 | ) |
Net Increase (Decrease) in Net Assets | | | 2,763,745 | | | | 14,865,117 | | | | 206,062,813 | | | | (14,408,605 | ) | | | (50,183,009 | ) | | | 9,936,698 | |
NET ASSETS: | | | | | | | | | | | | | | | | | | | | | | | | |
| | | | | | |
Beginning of year | | $ | 164,489,407 | | | $ | 149,624,290 | | | $ | 149,928,927 | | | $ | 164,337,532 | | | $ | 156,005,640 | | | $ | 146,068,942 | |
| | | | | | |
End of year | | $ | 167,253,152 | | | $ | 164,489,407 | | | $ | 355,991,740 | | | $ | 149,928,927 | | | $ | 105,822,631 | | | $ | 156,005,640 | |
Undistributed net investment income included in net assets at end of year | | $ | 310,663 | | | $ | 338,266 | | | $ | 455,453 | | | $ | 154,944 | | | $ | 441,765 | | | $ | 529,799 | |
SHARES CREATED AND REDEEMED: | | | | | | | | | | | | | | | | | | | | | | | | |
| | | | | | |
Shares outstanding, beginning of year | | | 3,450,000 | | | | 3,300,000 | | | | 3,200,000 | | | | 3,850,000 | | | | 2,900,000 | | | | 3,000,000 | |
| | | | | | |
Shares created | | | 900,000 | | | | 400,000 | | | | 5,700,000 | | | | 450,000 | | | | 100,000 | | | | 150,000 | |
| | | | | | |
Shares redeemed | | | (450,000 | ) | | | (250,000 | ) | | | (350,000 | ) | | | (1,100,000 | ) | | | (800,000 | ) | | | (250,000 | ) |
Shares outstanding, end of year | | | 3,900,000 | | | | 3,450,000 | | | | 8,550,000 | | | | 3,200,000 | | | | 2,200,000 | | | | 2,900,000 | |
See Notes to Financial Statements.
| | | | |
| WisdomTree International Dividend and Sector Funds | | | 139 | |
Statements of Changes in Net Assets (continued)
WisdomTree International Dividend and Sector Funds
| | | | | | | | | | | | | | | | | | | | | | | | |
| | | WisdomTree
International SmallCap Dividend Fund | | | WisdomTree
Emerging Markets Equity Income Fund | | | WisdomTree
Emerging Markets
SmallCap Dividend Fund | |
| | | For the
Year Ended
March 31, 2012 | | | For the
Year Ended
March 31, 2011 | | | For the
Year Ended
March 31, 2012 | | | For the
Year Ended
March 31, 2011 | | | For the
Year Ended
March 31, 2012 | | | For the
Year Ended
March 31, 2011 | |
INCREASE (DECREASE) IN NET ASSETS RESULTING FROM OPERATIONS: | | | | | | | | | | | | | | | | | | | | | |
| | | | | | |
Net investment income | | $ | 15,169,605 | | | $ | 13,033,395 | | | $ | 82,916,224 | | | $ | 28,686,394 | | | $ | 26,730,919 | | | $ | 16,791,292 | |
| | | | | | |
Net realized gain (loss) on investments, forward foreign currency contracts and foreign currency related transactions | | | (3,736,816 | ) | | | 1,082,096 | | | | (17,309,221 | ) | | | 24,026,620 | | | | 6,185,094 | | | | 20,653,525 | |
| | | | | | |
Net change in unrealized appreciation (depreciation) on investments, forward foreign currency contracts and translation of assets and liabilities denominated in foreign currencies | | | (29,683,524 | ) | | | 54,671,180 | | | | 279,971 | | | | 108,411,349 | | | | (97,689,850 | ) | | | 75,870,725 | |
Net increase (decrease) in net assets resulting from operations | | | (18,250,735 | ) | | | 68,786,671 | | | | 65,886,974 | | | | 161,124,363 | | | | (64,773,837 | ) | | | 113,315,542 | |
DIVIDENDS: | | | | | | | | | | | | | | | | | | | | | | | | |
| | | | | | |
Net investment income | | | (16,614,951 | ) | | | (12,889,846 | ) | | | (77,715,398 | ) | | | (27,419,477 | ) | | | (29,482,802 | ) | | | (16,528,911 | ) |
CAPITAL SHARE TRANSACTIONS: | | | | | | | | | | | | | | | | | | | | | | | | |
| | | | | | |
Net proceeds from sale of shares | | | 14,562,054 | | | | 7,115,479 | | | | 2,547,732,465 | | | | 761,512,984 | | | | 285,736,124 | | | | 603,777,470 | |
| | | | | | |
Cost of shares redeemed | | | (31,135,099 | ) | | | (17,179,451 | ) | | | (220,269,968 | ) | | | (110,950,763 | ) | | | (96,074,894 | ) | | | (115,855,535 | ) |
Net increase (decrease) in net assets resulting from capital share transactions | | | (16,573,045 | ) | | | (10,063,972 | ) | | | 2,327,462,497 | | | | 650,562,221 | | | | 189,661,230 | | | | 487,921,935 | |
Net Increase (Decrease) in Net Assets | | | (51,438,731 | ) | | | 45,832,853 | | | | 2,315,634,073 | | | | 784,267,107 | | | | 95,404,591 | | | | 584,708,566 | |
NET ASSETS: | | | | | | | | | | | | | | | | | | | | | | | | |
| | | | | | |
Beginning of year | | $ | 475,703,074 | | | $ | 429,870,221 | | | $ | 1,325,256,700 | | | $ | 540,989,593 | | | $ | 927,462,981 | | | $ | 342,754,415 | |
| | | | | | |
End of year | | $ | 424,264,343 | | | $ | 475,703,074 | | | $ | 3,640,890,773 | | | $ | 1,325,256,700 | | | $ | 1,022,867,572 | | | $ | 927,462,981 | |
Undistributed net investment income included in net assets at end of year | | $ | 2,243,811 | | | $ | 3,400,417 | | | $ | 5,258,481 | | | $ | 3,108,011 | | | $ | 5,299,833 | | | $ | 2,762,129 | |
SHARES CREATED AND REDEEMED: | | | | | | | | | | | | | | | | | | | | | | | | |
| | | | | | |
Shares outstanding, beginning of year | | | 8,950,000 | | | | 9,150,000 | | | | 21,900,000 | | | | 10,400,000 | | | | 17,400,000 | | | | 7,700,000 | |
| | | | | | |
Shares created | | | 300,000 | | | | 150,000 | | | | 45,400,000 | | | | 13,800,000 | | | | 5,900,000 | | | | 12,300,000 | |
| | | | | | |
Shares redeemed | | | (650,000 | ) | | | (350,000 | ) | | | (3,800,000 | ) | | | (2,300,000 | ) | | | (1,900,000 | ) | | | (2,600,000 | ) |
Shares outstanding, end of year | | | 8,600,000 | | | | 8,950,000 | | | | 63,500,000 | | | | 21,900,000 | | | | 21,400,000 | | | | 17,400,000 | |
See Notes to Financial Statements.
| | |
| 140 | | WisdomTree International Dividend and Sector Funds |
Statements of Changes in Net Assets (continued)
WisdomTree International Dividend and Sector Funds
| | | | | | | | | | | | | | | | | | | | | | | | |
| | | WisdomTree
Middle East Dividend Fund | | | WisdomTree
International Hedged Equity Fund | | | WisdomTree
Commodity Country Equity Fund | |
| | | For the
Year Ended
March 31, 2012 | | | For the
Year Ended
March 31, 2011 | | | For the
Year Ended
March 31, 2012 | | | For the
Year Ended
March 31, 2011 | | | For the
Year Ended
March 31, 2012 | | | For the
Year Ended
March 31, 2011 | |
INCREASE (DECREASE) IN NET ASSETS RESULTING FROM OPERATIONS: | | | | | | | | | | | | | | | | | | | | | |
| | | | | | |
Net investment income | | $ | 922,631 | | | $ | 719,268 | | | $ | 783,466 | | | $ | 550,720 | | | $ | 1,242,054 | | | $ | 768,687 | |
| | | | | | |
Net realized gain (loss) on investments, forward foreign currency contracts and foreign currency related transactions | | | (251,530 | ) | | | (379,688 | ) | | | 210,038 | | | | (1,913,482 | ) | | | 3,319,868 | | | | (1,547,200 | ) |
| | | | | | |
Net change in unrealized appreciation (depreciation) on investments, forward foreign currency contracts and translation of assets and liabilities denominated in foreign currencies | | | (646,606 | ) | | | 704,694 | | | | (1,882,498 | ) | | | 2,487,486 | | | | (5,938,566 | ) | | | 6,543,070 | |
Net increase (decrease) in net assets resulting from operations | | | 24,495 | | | | 1,044,274 | | | | (888,994 | ) | | | 1,124,724 | | | | (1,376,644 | ) | | | 5,764,557 | |
DIVIDENDS: | | | | | | | | | | | | | | | | | | | | | | | | |
| | | | | | |
Net investment income | | | (1,062,273 | ) | | | (520,780 | ) | | | (714,387 | ) | | | (506,947 | ) | | | (1,222,114 | ) | | | (781,200 | ) |
CAPITAL SHARE TRANSACTIONS: | | | | | | | | | | | | | | | | | | | | | | | | |
| | | | | | |
Net proceeds from sale of shares | | | — | | | | 6,532,275 | | | | 6,765,094 | | | | 11,261,965 | | | | — | | | | — | |
| | | | | | |
Cost of shares redeemed | | | (4,494,772 | ) | | | — | | | | (4,623,324 | ) | | | — | | | | (9,134,398 | ) | | | (10,948,551 | ) |
Net increase (decrease) in net assets resulting from capital share transactions | | | (4,494,772 | ) | | | 6,532,275 | | | | 2,141,770 | | | | 11,261,965 | | | | (9,134,398 | ) | | | (10,948,551 | ) |
Net Increase (Decrease) in Net Assets | | | (5,532,550 | ) | | | 7,055,769 | | | | 538,389 | | | | 11,879,742 | | | | (11,733,156 | ) | | | (5,965,194 | ) |
NET ASSETS: | | | | | | | | | | | | | | | | | | | | | | | | |
| | | | | | |
Beginning of year | | $ | 19,571,040 | | | $ | 12,515,271 | | | $ | 21,424,760 | | | $ | 9,545,018 | | | $ | 43,172,106 | | | $ | 49,137,300 | |
| | | | | | |
End of year | | $ | 14,038,490 | | | $ | 19,571,040 | | | $ | 21,963,149 | | | $ | 21,424,760 | | | $ | 31,438,950 | | | $ | 43,172,106 | |
Undistributed net investment income included in net assets at end of year | | $ | 151,353 | | | $ | 273,070 | | | $ | 62,976 | | | $ | 111,910 | | | $ | 76,664 | | | $ | 84,988 | |
SHARES CREATED AND REDEEMED: | | | | | | | | | | | | | | | | | | | | | | | | |
| | | | | | |
Shares outstanding, beginning of year | | | 1,200,000 | | | | 800,000 | | | | 450,002 | | | | 200,002 | | | | 1,300,000 | | | | 1,700,000 | |
| | | | | | |
Shares created | | | — | | | | 400,000 | | | | 150,000 | | | | 250,000 | | | | — | | | | — | |
| | | | | | |
Shares redeemed | | | (300,000 | ) | | | — | | | | (100,002 | ) | | | — | | | | (300,000 | ) | | | (400,000 | ) |
Shares outstanding, end of year | | | 900,000 | | | | 1,200,000 | | | | 500,000 | | | | 450,002 | | | | 1,000,000 | | | | 1,300,000 | |
See Notes to Financial Statements.
| | | | |
| WisdomTree International Dividend and Sector Funds | | | 141 | |
Statements of Changes in Net Assets (concluded)
WisdomTree International Dividend and Sector Funds
| | | | | | | | | | | | | | | | | | | | | | | | |
| | | WisdomTree
Global Natural Resources Fund | | | WisdomTree
Global ex-U.S. Utilities Fund | | | WisdomTree
Global ex-U.S. Real Estate Fund | |
| | | For the
Year Ended
March 31, 2012 | | | For the
Year Ended
March 31, 2011 | | | For the
Year Ended
March 31, 2012 | | | For the
Year Ended
March 31, 2011 | | | For the
Year Ended
March 31, 2012 | | | For the
Year Ended
March 31, 2011 | |
INCREASE (DECREASE) IN NET ASSETS RESULTING FROM OPERATIONS: | | | | | | | | | | | | | | | | | | | | | |
| | | | | | |
Net investment income | | $ | 1,420,138 | | | $ | 1,550,210 | | | $ | 1,464,845 | | | $ | 1,620,265 | | | $ | 5,224,292 | | | $ | 3,499,775 | |
| | | | | | |
Net realized gain (loss) on investments, forward foreign currency contracts and foreign currency related transactions | | | (789,924 | ) | | | (909,192 | ) | | | (11,238,294 | ) | | | (3,178,946 | ) | | | 2,346,944 | | | | (9,494,166 | ) |
| | | | | | |
Net change in unrealized appreciation (depreciation) on investments, forward foreign currency contracts and translation of assets and liabilities denominated in foreign currencies | | | (7,617,125 | ) | | | 12,510,654 | | | | 7,207,486 | | | | 1,889,228 | | | | (13,825,355 | ) | | | 24,163,353 | |
Net increase (decrease) in net assets resulting from operations | | | (6,986,911 | ) | | | 13,151,672 | | | | (2,565,963 | ) | | | 330,547 | | | | (6,254,119 | ) | | | 18,168,962 | |
DIVIDENDS AND DISTRIBUTIONS: | | | | | | | | | | | | | | | | | | | | | | | | |
| | | | | | |
Net investment income | | | (1,347,737 | ) | | | (1,511,977 | ) | | | (1,419,373 | ) | | | (1,705,615 | ) | | | (5,496,750 | ) | | | (10,473,002 | ) |
| | | | | | |
Return of capital | | | — | | | | — | | | | — | | | | — | | | | (371,334 | ) | | | — | |
Total dividends and distributions | | | (1,347,737 | ) | | | (1,511,977 | ) | | | (1,419,373 | ) | | | (1,705,615 | ) | | | (5,868,084 | ) | | | (10,473,002 | ) |
CAPITAL SHARE TRANSACTIONS: | | | | | | | | | | | | | | | | | | | | | | | | |
| | | | | | |
Net proceeds from sale of shares | | | 4,039,593 | | | | 22,597,082 | | | | 1,931,981 | | | | — | | | | 20,078,805 | | | | 31,927,456 | |
| | | | | | |
Cost of shares redeemed | | | (13,525,579 | ) | | | (30,532,835 | ) | | | (5,041,058 | ) | | | (10,637,587 | ) | | | (22,405,761 | ) | | | (1,228,615 | ) |
Net increase (decrease) in net assets resulting from capital share transactions | | | (9,485,986 | ) | | | (7,935,753 | ) | | | (3,109,077 | ) | | | (10,637,587 | ) | | | (2,326,956 | ) | | | 30,698,841 | �� |
Net Increase (Decrease) in Net Assets | | | (17,820,634 | ) | | | 3,703,942 | | | | (7,094,413 | ) | | | (12,012,655 | ) | | | (14,449,159 | ) | | | 38,394,801 | |
NET ASSETS: | | | | | | | | | | | | | | | | | | | | | | | | |
| | | | | | |
Beginning of year | | $ | 49,272,630 | | | $ | 45,568,688 | | | $ | 37,335,361 | | | $ | 49,348,016 | | | $ | 122,670,380 | | | $ | 84,275,579 | |
| | | | | | |
End of year | | $ | 31,451,996 | | | $ | 49,272,630 | | | $ | 30,240,948 | | | $ | 37,335,361 | | | $ | 108,221,221 | | | $ | 122,670,380 | |
Undistributed (Distributions in excess of) net investment income included in net assets at end of year | | $ | 17,759 | | | $ | 6,966 | | | $ | 68,845 | | | $ | 75,147 | | | $ | (4,245,470 | ) | | $ | (10,265,152 | ) |
SHARES CREATED AND REDEEMED: | | | | | | | | | | | | | | | | | | | | | | | | |
| | | | | | |
Shares outstanding, beginning of year | | | 1,650,000 | | | | 1,850,000 | | | | 1,750,000 | | | | 2,300,000 | | | | 4,250,000 | | | | 3,150,000 | |
| | | | | | |
Shares created | | | 150,000 | | | | 950,000 | | | | 100,000 | | | | — | | | | 750,000 | | | | 1,150,000 | |
| | | | | | |
Shares redeemed | | | (550,000 | ) | | | (1,150,000 | ) | | | (250,000 | ) | | | (550,000 | ) | | | (900,000 | ) | | | (50,000 | ) |
Shares outstanding, end of year | | | 1,250,000 | | | | 1,650,000 | | | | 1,600,000 | | | | 1,750,000 | | | | 4,100,000 | | | | 4,250,000 | |
See Notes to Financial Statements.
| | |
| 142 | | WisdomTree International Dividend and Sector Funds |
Financial Highlights
WisdomTree International Dividend and Sector Funds
March 31, 2012
Selected data for a share of beneficial interest outstanding throughout the period is presented below:
| | | | | | | | | | | | | | | | | | | | |
| WisdomTree DEFA Fund | | For the
Year Ended
March 31, 2012 | | | For the
Year Ended
March 31, 2011 | | | For the
Year Ended
March 31, 2010 | | | For the
Year Ended
March 31, 2009 | | | For the
Year Ended
March 31, 2008 | |
Net asset value, beginning of year | | $ | 49.51 | | | $ | 46.13 | | | $ | 32.00 | | | $ | 63.02 | | | $ | 64.15 | |
Investment operations: | | | | | | | | | | | | | | | | | | | | |
Net investment income1 | | | 1.90 | | | | 1.58 | | | | 2.00 | | | | 1.89 | | | | 1.70 | |
Net realized and unrealized gain (loss) | | | (4.99 | ) | | | 3.39 | | | | 14.24 | | | | (31.04 | ) | | | (1.92 | ) |
Total from investment operations | | | (3.09 | ) | | | 4.97 | | | | 16.24 | | | | (29.15 | ) | | | (0.22 | ) |
Dividends and distributions to shareholders: | | | | | | | | | | | | | | | | | | | | |
Net investment income | | | (1.89 | ) | | | (1.59 | ) | | | (2.11 | ) | | | (1.87 | ) | | | (0.91 | ) |
Capital gains | | | — | | | | — | | | | — | | | | — | | | | (0.00 | )2 |
Total dividends and distributions to shareholders | | | (1.89 | ) | | | (1.59 | ) | | | (2.11 | ) | | | (1.87 | ) | | | (0.91 | ) |
Net asset value, end of year | | $ | 44.53 | | | $ | 49.51 | | | $ | 46.13 | | | $ | 32.00 | | | $ | 63.02 | |
| | | | | |
TOTAL RETURN3 | | | (6.18 | )% | | | 11.33 | % | | | 51.43 | % | | | (46.61 | )% | | | (0.44 | )% |
RATIOS/SUPPLEMENTAL DATA: | | | | | | | | | | | | | | | | | | | | |
Net assets, end of year (000’s omitted) | | $ | 385,202 | | | $ | 457,997 | | | $ | 435,906 | | | $ | 302,385 | | | $ | 425,386 | |
Ratio to average net assets4 of: | | | | | | | | | | | | | | | | | | | | |
Expenses, net of expense reimbursements/waivers | | | 0.48 | % | | | 0.48 | % | | | 0.19 | %* | | | 0.48 | % | | | 0.48 | % |
Expenses, prior to expense reimbursements/waivers | | | 0.48 | % | | | 0.48 | % | | | 0.48 | % | | | 0.48 | % | | | 0.48 | % |
Net investment income | | | 4.22 | % | | | 3.50 | % | | | 4.63 | % | | | 4.01 | % | | | 2.54 | % |
Portfolio turnover rate5 | | | 27 | % | | | 30 | % | | | 97 | % | | | 30 | % | | | 10 | % |
| | | | | | | | | | | | | | | | | | | | |
| | | | | | |
| WisdomTree DEFA Equity Income Fund | | For the
Year Ended
March 31, 2012 | | | For the
Year Ended
March 31, 2011 | | | For the
Year Ended
March 31, 2010 | | | For the
Year Ended
March 31, 2009 | | | For the
Year Ended
March 31, 2008 | |
Net asset value, beginning of year | | $ | 43.82 | | | $ | 41.85 | | | $ | 28.43 | | | $ | 60.10 | | | $ | 63.62 | |
Investment operations: | | | | | | | | | | | | | | | | | | | | |
Net investment income1 | | | 1.90 | | | | 1.75 | | | | 1.56 | | | | 2.45 | | | | 2.20 | |
Net realized and unrealized gain (loss) | | | (5.17 | ) | | | 2.01 | | | | 13.44 | | | | (31.09 | ) | | | (3.78 | ) |
Total from investment operations | | | (3.27 | ) | | | 3.76 | | | | 15.00 | | | | (28.64 | ) | | | (1.58 | ) |
Dividends to shareholders: | | | | | | | | | | | | | | | | | | | | |
Net investment income | | | (1.91 | ) | | | (1.79 | ) | | | (1.58 | ) | | | (3.03 | ) | | | (1.94 | ) |
Net asset value, end of year | | $ | 38.64 | | | $ | 43.82 | | | $ | 41.85 | | | $ | 28.43 | | | $ | 60.10 | |
| | | | | |
TOTAL RETURN3 | | | (7.45 | )% | | | 9.74 | % | | | 53.57 | % | | | (48.27 | )% | | | (2.72 | )% |
RATIOS/SUPPLEMENTAL DATA: | | | | | | | | | | | | | | | | | | | | |
Net assets, end of year (000’s omitted) | | $ | 175,809 | | | $ | 131,454 | | | $ | 142,297 | | | $ | 88,123 | | | $ | 240,408 | |
Ratio to average net assets4 of: | | | | | | | | | | | | | | | | | | | | |
Expenses, net of expense reimbursements/waivers | | | 0.58 | % | | | 0.58 | % | | | 0.58 | % | | | 0.58 | % | | | 0.58 | % |
Expenses, prior to expense reimbursements/waivers | | | 0.58 | % | | | 0.58 | % | | | 0.58 | % | | | 0.58 | % | | | 0.58 | % |
Net investment income | | | 4.84 | % | | | 4.39 | % | | | 3.91 | % | | | 5.27 | % | | | 3.32 | % |
Portfolio turnover rate5 | | | 32 | % | | | 34 | % | | | 36 | % | | | 40 | % | | | 16 | % |
| * | Reflects the Fund’s advisory fees, after waiver, and the fees and expenses of the underlying funds that were paid indirectly by the Fund during the period when the Fund operated as a “fund of funds.” |
| 1 | Based on average shares outstanding. |
| 2 | Amount is less than $0.005. |
| 3 | Total return is calculated assuming an initial investment made at the net asset value at the beginning of the period, reinvestment of all dividends and distributions at net asset value during the period and redemption on the last day of the period. Total return calculated for a period of less than one year is not annualized. The total return would have been lower if certain expenses had not been reimbursed/waived by the investment adviser (Note 2 and 3). |
| 4 | The ratios to average net assets do not include net investment income (loss) or expenses of the affiliated funds in which the Fund invests. |
| 5 | Portfolio turnover rate is not annualized and excludes the value of portfolio securities received or delivered as a result of in-kind creations or redemptions of the Fund’s capital shares. |
See Notes to Financial Statements.
| | | | |
| WisdomTree International Dividend and Sector Funds | | | 143 | |
Financial Highlights (continued)
WisdomTree International Dividend and Sector Funds
March 31, 2012
Selected data for a share of beneficial interest outstanding throughout the period is presented below:
| | | | | | | | | | | | | | | | | | | | |
| WisdomTree Global Equity Income Fund | | For the
Year Ended
March 31, 2012 | | | For the
Year Ended
March 31, 2011 | | | For the
Year Ended
March 31, 20101 | | | For the
Year Ended
March 31, 2009 | | | For the
Year Ended
March 31, 2008 | |
Net asset value, beginning of year | | $ | 44.66 | | | $ | 40.99 | | | $ | 26.84 | | | $ | 58.90 | | | $ | 63.15 | |
Investment operations: | | | | | | | | | | | | | | | | | | | | |
Net investment income2 | | | 1.86 | | | | 1.52 | | | | 2.07 | | | | 2.32 | | | | 2.16 | |
Net realized and unrealized gain (loss) | | | (3.14 | ) | | | 3.63 | | | | 14.28 | | | | (31.66 | ) | | | (4.38 | ) |
Total from investment operations | | | (1.28 | ) | | | 5.15 | | | | 16.35 | | | | (29.34 | ) | | | (2.22 | ) |
Dividends and distributions to shareholders: | | | | | | | | | | | | | | | | | | | | |
Net investment income | | | (1.88 | ) | | | (1.48 | ) | | | (2.20 | ) | | | (2.72 | ) | | | (2.03 | ) |
Capital gains | | | — | | | | — | | | | — | | | | — | | | | (0.00 | )3 |
Total dividends and distributions to shareholders | | | (1.88 | ) | | | (1.48 | ) | | | (2.20 | ) | | | (2.72 | ) | | | (2.03 | ) |
Net asset value, end of year | | $ | 41.50 | | | $ | 44.66 | | | $ | 40.99 | | | $ | 26.84 | | | $ | 58.90 | |
| | | | | |
TOTAL RETURN4 | | | (2.70 | )% | | | 13.12 | % | | | 62.13 | % | | | (50.56 | )% | | | (3.76 | )% |
RATIOS/SUPPLEMENTAL DATA: | | | | | | | | | | | | | | | | | | | | |
Net assets, end of year (000’s omitted) | | $ | 91,304 | | | $ | 78,147 | | | $ | 43,042 | | | $ | 18,787 | | | $ | 47,122 | |
Ratio to average net assets5 of: | | | | | | | | | | | | | | | | | | | | |
Expenses, net of expense reimbursements/waivers | | | 0.58 | % | | | 0.58 | % | | | 0.26 | %* | | | 0.58 | % | | | 0.58 | % |
Expenses, prior to expense reimbursements/waivers | | | 0.58 | % | | | 0.58 | % | | | 0.58 | % | | | 0.58 | % | | | 0.58 | % |
Net investment income | | | 4.53 | % | | | 3.74 | % | | | 5.49 | % | | | 5.16 | % | | | 3.32 | % |
Portfolio turnover rate6 | | | 25 | % | | | 35 | % | | | 94 | % | | | 47 | % | | | 21 | % |
| | | | | | | | | | | | | | | | | | | | |
| | | | | | |
| WisdomTree Europe SmallCap Dividend Fund | | For the
Year Ended
March 31, 2012 | | | For the
Year Ended
March 31, 2011 | | | For the
Year Ended
March 31, 2010 | | | For the
Year Ended
March 31, 2009 | | | For the
Year Ended
March 31, 2008 | |
Net asset value, beginning of year | | $ | 44.44 | | | $ | 37.62 | | | $ | 22.44 | | | $ | 58.47 | | | $ | 70.15 | |
Investment operations: | | | | | | | | | | | | | | | | | | | | |
Net investment income2 | | | 1.44 | | | | 1.09 | | | | 0.99 | | | | 2.50 | | | | 2.32 | |
Net realized and unrealized gain (loss) | | | (5.74 | ) | | | 6.85 | | | | 15.37 | | | | (35.53 | ) | | | (9.78 | ) |
Total from investment operations | | | (4.30 | ) | | | 7.94 | | | | 16.36 | | | | (33.03 | ) | | | (7.46 | ) |
Dividends to shareholders: | | | | | | | | | | | | | | | | | | | | |
Net investment income | | | (1.92 | ) | | | (1.12 | ) | | | (1.18 | ) | | | (3.00 | ) | | | (4.22 | ) |
Net asset value, end of year | | $ | 38.22 | | | $ | 44.44 | | | $ | 37.62 | | | $ | 22.44 | | | $ | 58.47 | |
| | | | | |
TOTAL RETURN4 | | | (9.80 | )% | | | 21.86 | % | | | 74.18 | % | | | (56.75 | )% | | | (10.72 | )% |
RATIOS/SUPPLEMENTAL DATA: | | | | | | | | | | | | | | | | | | | | |
Net assets, end of year (000’s omitted) | | $ | 28,668 | | | $ | 28,889 | | | $ | 30,095 | | | $ | 13,467 | | | $ | 46,778 | |
Ratio to average net assets5 of: | | | | | | | | | | | | | | | | | | | | |
Expenses, net of expense reimbursements/waivers | | | 0.58 | % | | | 0.58 | % | | | 0.58 | % | | | 0.58 | % | | | 0.58 | % |
Expenses, prior to expense reimbursements/waivers | | | 0.58 | % | | | 0.58 | % | | | 0.58 | % | | | 0.58 | % | | | 0.58 | % |
Net investment income | | | 3.79 | % | | | 2.81 | % | | | 2.92 | % | | | 6.03 | % | | | 3.33 | % |
Portfolio turnover rate6 | | | 58 | % | | | 60 | % | | | 55 | % | | | 63 | % | | | 22 | % |
| * | Reflects the Fund’s advisory fees, after waiver, and the fees and expenses of the underlying funds that were paid indirectly by the Fund during the period when the Fund operated as a “fund of funds.” |
| 1 | This information reflects the investment objective and strategy of the WisdomTree Europe Equity Income Fund through June 19, 2009 and the investment objective and strategy of the WisdomTree Global Equity Income Fund thereafter. |
| 2 | Based on average shares outstanding. |
| 3 | Amount is less than $0.005. |
| 4 | Total return is calculated assuming an initial investment made at the net asset value at the beginning of the period, reinvestment of all dividends and distributions at net asset value during the period and redemption on the last day of the period. Total return calculated for a period of less than one year is not annualized. The total return would have been lower if certain expenses had not been reimbursed/waived by the investment adviser (Note 2 and 3). |
| 5 | The ratios to average net assets do not include net investment income (loss) or expenses of the affiliated funds in which the Fund invests. |
| 6 | Portfolio turnover rate is not annualized and excludes the value of portfolio securities received or delivered as a result of in-kind creations or redemptions of the Fund’s capital shares. |
See Notes to Financial Statements.
| | |
| 144 | | WisdomTree International Dividend and Sector Funds |
Financial Highlights (continued)
WisdomTree International Dividend and Sector Funds
March 31, 2012
Selected data for a share of beneficial interest outstanding throughout the period is presented below:
| | | | | | | | | | | | | | | | | | | | |
| WisdomTree Japan Hedged Equity Fund | | For the
Year Ended
March 31, 2012 | | | For the
Year Ended
March 31, 2011 | | | For the
Year Ended
March 31, 2010 | | | For the
Year Ended
March 31, 2009 | | | For the
Year Ended
March 31, 2008 | |
Net asset value, beginning of year | | $ | 36.94 | | | $ | 42.12 | | | $ | 32.02 | | | $ | 48.34 | | | $ | 57.00 | |
Investment operations: | | | | | | | | | | | | | | | | | | | | |
Net investment income1 | | | 0.81 | | | | 1.79 | | | | 0.73 | | | | 0.57 | | | | 0.64 | |
Net realized and unrealized gain (loss) | | | (0.34 | ) | | | (6.52 | ) | | | 9.89 | | | | (16.09 | ) | | | (8.82 | ) |
Total from investment operations | | | 0.47 | | | | (4.73 | ) | | | 10.62 | | | | (15.52 | ) | | | (8.18 | ) |
Dividends to shareholders: | | | | | | | | | | | | | | | | | | | | |
Net investment income | | | (0.75 | ) | | | (0.45 | ) | | | (0.52 | ) | | | (0.80 | ) | | | (0.48 | ) |
Net asset value, end of year | | $ | 36.66 | | | $ | 36.94 | | | $ | 42.12 | | | $ | 32.02 | | | $ | 48.34 | |
| | | | | |
TOTAL RETURN2 | | | 1.46 | % | | | (11.25 | )% | | | 33.33 | % | | | (32.36 | )% | | | (14.39 | )% |
RATIOS/SUPPLEMENTAL DATA: | | | | | | | | | | | | | | | | | | | | |
Net assets, end of year (000’s omitted) | | $ | 606,707 | | | $ | 494,981 | | | $ | 54,751 | | | $ | 19,212 | | | $ | 29,004 | |
Ratio to average net assets3 of: | | | | | | | | | | | | | | | | | | | | |
Expenses, net of expense reimbursements/waivers | | | 0.48 | % | | | 0.48 | % | | | 0.48 | % | | | 0.48 | % | | | 0.48 | % |
Expenses, prior to expense reimbursements/waivers | | | 0.48 | % | | | 0.48 | % | | | 0.48 | % | | | 0.48 | % | | | 0.48 | % |
Net investment income | | | 2.41 | % | | | 5.40 | % | | | 1.72 | % | | | 1.38 | % | | | 1.17 | % |
Portfolio turnover rate4 | | | 41 | % | | | 28 | % | | | 13 | % | | | 11 | % | | | 1 | % |
| | | | | | | | | | | | | | | | | | | | |
| | | | | | |
WisdomTree Global
ex-U.S. Growth Fund | | For the
Year Ended
March 31, 2012 | | | For the
Year Ended
March 31, 2011 | | | For the
Year Ended
March 31, 20105 | | | For the
Year Ended
March 31, 2009 | | | For the
Year Ended
March 31, 2008 | |
Net asset value, beginning of year | | $ | 54.94 | | | $ | 49.61 | | | $ | 35.41 | | | $ | 49.59 | | | $ | 59.42 | |
Investment operations: | | | | | | | | | | | | | | | | | | | | |
Net investment income1 | | | 1.39 | | | | 1.41 | | | | 1.11 | | | | 0.75 | | | | 0.65 | |
Net realized and unrealized gain (loss) | | | (4.32 | ) | | | 5.22 | | | | 14.94 | | | | (13.89 | ) | | | (9.50 | ) |
Total from investment operations | | | (2.93 | ) | | | 6.63 | | | | 16.05 | | | | (13.14 | ) | | | (8.85 | ) |
Dividends to shareholders: | | | | | | | | | | | | | | | | | | | | |
Net investment income | | | (1.31 | ) | | | (1.30 | ) | | | (1.85 | ) | | | (1.04 | ) | | | (0.98 | ) |
Net asset value, end of year | | $ | 50.70 | | | $ | 54.94 | | | $ | 49.61 | | | $ | 35.41 | | | $ | 49.59 | |
| | | | | |
TOTAL RETURN2 | | | (5.20 | )% | | | 13.67 | % | | | 46.04 | % | | | (26.84 | )% | | | (14.96 | )% |
RATIOS/SUPPLEMENTAL DATA: | | | | | | | | | | | | | | | | | | | | |
Net assets, end of year (000’s omitted) | | $ | 55,774 | | | $ | 49,446 | | | $ | 24,805 | | | $ | 21,245 | | | $ | 29,754 | |
Ratio to average net assets3 of: | | | | | | | | | | | | | | | | | | | | |
Expenses, net of expense reimbursements/waivers | | | 0.58 | %6 | | | 0.57 | %6 | | | 0.58 | %6 | | | 0.58 | % | | | 0.58 | % |
Expenses, prior to expense reimbursements/waivers | | | 0.58 | % | | | 0.58 | % | | | 0.58 | % | | | 0.58 | % | | | 0.58 | % |
Net investment income | | | 2.73 | % | | | 2.80 | % | | | 2.54 | % | | | 1.70 | % | | | 1.18 | % |
Portfolio turnover rate4 | | | 28 | % | | | 68 | % | | | 121 | % | | | 47 | % | | | 1 | % |
| 1 | Based on average shares outstanding. |
| 2 | Total return is calculated assuming an initial investment made at the net asset value at the beginning of the period, reinvestment of all dividends and distributions at net asset value during the period and redemption on the last day of the period. Total return calculated for a period of less than one year is not annualized. The total return would have been lower if certain expenses had not been reimbursed/waived by the investment adviser (Note 2 and 3). |
| 3 | The ratios to average net assets do not include net investment income (loss) or expenses of the affiliated funds in which the Fund invests. |
| 4 | Portfolio turnover rate is not annualized and excludes the value of portfolio securities received or delivered as a result of in-kind creations or redemptions of the Fund’s capital shares. |
| 5 | This information reflects the investment objective and strategy of the WisdomTree World ex-U.S. Growth Fund through June 19, 2011 and the investment objective and strategy of the WisdomTree Global ex-U.S. Growth Fund thereafter. |
| 6 | Reflects the Fund’s advisory fees, after waiver, and the fees and expenses of the WisdomTree India Earnings Fund that were paid indirectly by the Fund. The Fund invests a portion of its assets in the WisdomTree India Earnings Fund in order to achieve exposure to securities in India. |
See Notes to Financial Statements.
| | | | |
| WisdomTree International Dividend and Sector Funds | | | 145 | |
Financial Highlights (continued)
WisdomTree International Dividend and Sector Funds
March 31, 2012
Selected data for a share of beneficial interest outstanding throughout the period is presented below:
| | | | | | | | | | | | | | | | | | | | |
| WisdomTree Japan SmallCap Dividend Fund | | For the
Year Ended
March 31, 2012 | | | For the
Year Ended
March 31, 2011 | | | For the
Year Ended
March 31, 2010 | | | For the
Year Ended
March 31, 2009 | | | For the
Year Ended
March 31, 2008 | |
Net asset value, beginning of year | | $ | 43.25 | | | $ | 41.54 | | | $ | 31.47 | | | $ | 44.29 | | | $ | 52.33 | |
Investment operations: | | | | | | | | | | | | | | | | | | | | |
Net investment income1 | | | 0.68 | | | | 0.99 | | | | 0.79 | | | | 0.64 | | | | 0.69 | |
Net realized and unrealized gain (loss) | | | 2.42 | | | | 1.47 | | | | 9.96 | | | | (12.97 | ) | | | (8.12 | ) |
Total from investment operations | | | 3.10 | | | | 2.46 | | | | 10.75 | | | | (12.33 | ) | | | (7.43 | ) |
Dividends to shareholders: | | | | | | | | | | | | | | | | | | | | |
Net investment income | | | (0.90 | ) | | | (0.75 | ) | | | (0.68 | ) | | | (0.49 | ) | | | (0.61 | ) |
Net asset value, end of year | | $ | 45.45 | | | $ | 43.25 | | | $ | 41.54 | | | $ | 31.47 | | | $ | 44.29 | |
| | | | | |
TOTAL RETURN2 | | | 7.36 | % | | | 6.02 | % | | | 34.37 | % | | | (27.98 | )% | | | (14.23 | )% |
RATIOS/SUPPLEMENTAL DATA: | | | | | | | | | | | | | | | | | | | | |
Net assets, end of year (000’s omitted) | | $ | 193,172 | | | $ | 235,685 | | | $ | 157,850 | | | $ | 66,078 | | | $ | 75,300 | |
Ratio to average net assets3 of: | | | | | | | | | | | | | | | | | | | | |
Expenses, net of expense reimbursements/waivers | | | 0.58 | % | | | 0.58 | % | | | 0.58 | % | | | 0.58 | % | | | 0.58 | % |
Expenses, prior to expense reimbursements/waivers | | | 0.58 | % | | | 0.58 | % | | | 0.58 | % | | | 0.58 | % | | | 0.58 | % |
Net investment income | | | 1.58 | % | | | 2.51 | % | | | 2.09 | % | | | 1.68 | % | | | 1.44 | % |
Portfolio turnover rate4 | | | 36 | % | | | 39 | % | | | 45 | % | | | 16 | % | | | 3 | % |
| | | | | | | | | | | | | | | | | | | | |
| | | | | | |
| WisdomTree Asia-Pacific ex-Japan Fund | | For the
Year Ended
March 31, 20125 | | | For the
Year Ended
March 31, 2011 | | | For the
Year Ended
March 31, 2010 | | | For the
Year Ended
March 31, 2009 | | | For the
Year Ended
March 31, 2008 | |
Net asset value, beginning of year | | $ | 67.99 | | | $ | 61.40 | | | $ | 37.09 | | | $ | 73.00 | | | $ | 67.57 | |
Investment operations: | | | | | | | | | | | | | | | | | | | | |
Net investment income1 | | | 2.14 | | | | 2.51 | | | | 1.79 | | | | 2.86 | | | | 2.69 | |
Net realized and unrealized gain (loss) | | | (3.85 | ) | | | 6.59 | | | | 24.23 | | | | (34.08 | ) | | | 4.61 | |
Total from investment operations | | | (1.71 | ) | | | 9.10 | | | | 26.02 | | | | (31.22 | ) | | | 7.30 | |
Dividends to shareholders: | | | | | | | | | | | | | | | | | | | | |
Net investment income | | | (2.23 | ) | | | (2.51 | ) | | | (1.71 | ) | | | (4.69 | ) | | | (1.87 | ) |
Net asset value, end of year | | $ | 64.05 | | | $ | 67.99 | | | $ | 61.40 | | | $ | 37.09 | | | $ | 73.00 | |
| | | | | |
TOTAL RETURN2 | | | (2.22 | )% | | | 15.33 | % | | | 70.97 | % | | | (42.77 | )% | | | (10.58 | )% |
RATIOS/SUPPLEMENTAL DATA: | | | | | | | | | | | | | | | | | | | | |
Net assets, end of year (000’s omitted) | | $ | 89,672 | | | $ | 88,388 | | | $ | 89,033 | | | $ | 37,086 | | | $ | 146,008 | |
Ratio to average net assets3 of: | | | | | | | | | | | | | | | | | | | | |
Expenses, net of expense reimbursements/waivers | | | 0.48 | % | | | 0.48 | % | | | 0.48 | % | | | 0.48 | % | | | 0.48 | % |
Expenses, prior to expense reimbursements/waivers | | | 0.48 | % | | | 0.48 | % | | | 0.48 | % | | | 0.48 | % | | | 0.48 | % |
Net investment income | | | 3.42 | % | | | 4.05 | % | | | 3.11 | % | | | 4.76 | % | | | 3.42 | % |
Portfolio turnover rate4 | | | 60 | % | | | 27 | % | | | 18 | % | | | 31 | % | | | 12 | % |
| 1 | Based on average shares outstanding. |
| 2 | Total return is calculated assuming an initial investment made at the net asset value at the beginning of the period, reinvestment of all dividends and distributions at net asset value during the period and redemption on the last day of the period. Total return calculated for a period of less than one year is not annualized. The total return would have been lower if certain expenses had not been reimbursed/waived by the investment adviser (Note 2 and 3). |
| 3 | The ratios to average net assets do not include net investment income (loss) or expenses of the affiliated funds in which the Fund invests. |
| 4 | Portfolio turnover rate is not annualized and excludes the value of portfolio securities received or delivered as a result of in-kind creations or redemptions of the Fund’s capital shares. |
| 5 | This information reflects the investment objective and strategy of the WisdomTree Pacific ex-Japan Total Dividend Fund through June 19, 2011 and the investment objective and strategy of the WisdomTree Asia Pacific ex-Japan Fund thereafter. |
See Notes to Financial Statements.
| | |
| 146 | | WisdomTree International Dividend and Sector Funds |
Financial Highlights (continued)
WisdomTree International Dividend and Sector Funds
March 31, 2012
Selected data for a share of beneficial interest outstanding throughout the period is presented below:
| | | | | | | | | | | | | | | | | | | | |
| WisdomTree Australia Dividend Fund | | For the
Year Ended
March 31, 20121 | | | For the
Year Ended
March 31, 2011 | | | For the
Year Ended
March 31, 2010 | | | For the
Year Ended
March 31, 2009 | | | For the
Year Ended
March 31, 2008 | |
Net asset value, beginning of year | | $ | 61.64 | | | $ | 57.24 | | | $ | 30.80 | | | $ | 63.30 | | | $ | 67.08 | |
Investment operations: | | | | | | | | | | | | | | | | | | | | |
Net investment income2 | | | 2.87 | | | | 2.99 | | | | 2.23 | | | | 3.00 | | | | 3.24 | |
Net realized and unrealized gain (loss) | | | (5.48 | ) | | | 4.62 | | | | 26.27 | | | | (31.22 | ) | | | (3.40 | ) |
Total from investment operations | | | (2.61 | ) | | | 7.61 | | | | 28.50 | | | | (28.22 | ) | | | (0.16 | ) |
Dividends and distributions to shareholders: | | | | | | | | | | | | | | | | | | | | |
Net investment income | | | (3.16 | ) | | | (3.21 | ) | | | (2.06 | ) | | | (4.28 | ) | | | (3.48 | ) |
Capitals gains | | | — | | | | — | | | | — | | | | — | | | | (0.14 | ) |
Total dividends and distributions to shareholders | | | (3.16 | ) | | | (3.21 | ) | | | (2.06 | ) | | | (4.28 | ) | | | (3.62 | ) |
Net asset value, end of year | | $ | 55.87 | | | $ | 61.64 | | | $ | 57.24 | | | $ | 30.80 | | | $ | 63.30 | |
| | | | | |
TOTAL RETURN3 | | | (3.86 | )% | | | 14.03 | % | | | 93.79 | % | | | (44.42 | )% | | | (0.69 | )% |
RATIOS/SUPPLEMENTAL DATA: | | | | | | | | | | | | | | | | | | | | |
Net assets, end of year (000’s omitted) | | $ | 61,456 | | | $ | 80,137 | | | $ | 117,339 | | | $ | 21,559 | | | $ | 56,966 | |
Ratio to average net assets4 of: | | | | | | | | | | | | | | | | | | | | |
Expenses, net of expense reimbursements/waivers | | | 0.58 | % | | | 0.58 | % | | | 0.58 | % | | | 0.58 | % | | | 0.58 | % |
Expenses, prior to expense reimbursements/waivers | | | 0.58 | % | | | 0.58 | % | | | 0.58 | % | | | 0.58 | % | | | 0.58 | % |
Net investment income | | | 5.18 | % | | | 5.42 | % | | | 4.25 | % | | | 6.25 | % | | | 4.42 | % |
Portfolio turnover rate5 | | | 68 | % | | | 46 | % | | | 25 | % | | | 55 | % | | | 16 | % |
| | | | | | | | | | | | | | | | | | | | |
| | | | | | |
WisdomTree International LargeCap Dividend
Fund | | For the
Year Ended
March 31, 2012 | | | For the
Year Ended
March 31, 2011 | | | For the
Year Ended
March 31, 2010 | | | For the
Year Ended
March 31, 2009 | | | For the
Year Ended
March 31, 2008 | |
Net asset value, beginning of year | | $ | 47.68 | | | $ | 45.34 | | | $ | 31.57 | | | $ | 61.86 | | | $ | 62.55 | |
Investment operations: | | | | | | | | | | | | | | | | | | | | |
Net investment income2 | | | 1.86 | | | | 1.56 | | | | 1.50 | | | | 2.11 | | | | 1.80 | |
Net realized and unrealized gain (loss) | | | (4.75 | ) | | | 2.37 | | | | 13.91 | | | | (29.98 | ) | | | (1.11 | ) |
Total from investment operations | | | (2.89 | ) | | | 3.93 | | | | 15.41 | | | | (27.87 | ) | | | 0.69 | |
Dividends to shareholders: | | | | | | | | | | | | | | | | | | | | |
Net investment income | | | (1.90 | ) | | | (1.59 | ) | | | (1.64 | ) | | | (2.42 | ) | | | (1.38 | ) |
Net asset value, end of year | | $ | 42.89 | | | $ | 47.68 | | | $ | 45.34 | | | $ | 31.57 | | | $ | 61.86 | |
| | | | | |
TOTAL RETURN3 | | | (6.02 | )% | | | 9.21 | % | | | 49.56 | % | | | (45.57 | )% | | | 0.93 | % |
RATIOS/SUPPLEMENTAL DATA: | | | | | | | | | | | | | | | | | | | | |
Net assets, end of year (000’s omitted) | | $ | 167,253 | | | $ | 164,489 | | | $ | 149,624 | | | $ | 78,928 | | | $ | 154,658 | |
Ratio to average net assets4 of: | | | | | | | | | | | | | | | | | | | | |
Expenses, net of expense reimbursements/waivers | | | 0.48 | % | | | 0.48 | % | | | 0.48 | % | | | 0.48 | % | | | 0.48 | % |
Expenses, prior to expense reimbursements/waivers | | | 0.48 | % | | | 0.48 | % | | | 0.48 | % | | | 0.48 | % | | | 0.48 | % |
Net investment income | | | 4.34 | % | | | 3.56 | % | | | 3.54 | % | | | 4.38 | % | | | 2.69 | % |
Portfolio turnover rate5 | | | 23 | % | | | 22 | % | | | 26 | % | | | 30 | % | | | 15 | % |
| 1 | This information reflects the investment objective and strategy of the WisdomTree Pacific ex-Japan Equity Income Fund through June 19, 2011 and the investment objective and strategy of the WisdomTree Australia Dividend Fund thereafter. |
| 2 | Based on average shares outstanding. |
| 3 | Total return is calculated assuming an initial investment made at the net asset value at the beginning of the period, reinvestment of all dividends and distributions at net asset value during the period and redemption on the last day of the period. Total return calculated for a period of less than one year is not annualized. The total return would have been lower if certain expenses had not been reimbursed/waived by the investment adviser (Note 2 and 3). |
| 4 | The ratios to average net assets do not include net investment income (loss) or expenses of the affiliated funds in which the Fund invests. |
| 5 | Portfolio turnover rate is not annualized and excludes the value of portfolio securities received or delivered as a result of in-kind creations or redemptions of the Fund’s capital shares. |
See Notes to Financial Statements.
| | | | |
| WisdomTree International Dividend and Sector Funds | | | 147 | |
Financial Highlights (continued)
WisdomTree International Dividend and Sector Funds
March 31, 2012
Selected data for a share of beneficial interest outstanding throughout the period is presented below:
| | | | | | | | | | | | | | | | | | | | |
WisdomTree International Dividend
ex-Financials Fund | | For the
Year Ended
March 31, 2012 | | | For the
Year Ended
March 31, 2011 | | | For the
Year Ended
March 31, 20101 | | | For the
Year Ended
March 31, 2009 | | | For the
Year Ended
March 31, 2008 | |
Net asset value, beginning of year | | $ | 46.85 | | | $ | 42.69 | | | $ | 28.46 | | | $ | 64.01 | | | $ | 66.37 | |
Investment operations: | | | | | | | | | | | | | | | | | | | | |
Net investment income2 | | | 1.74 | | | | 1.83 | | | | 1.50 | | | | 2.93 | | | | 2.29 | |
Net realized and unrealized gain (loss) | | | (5.11 | ) | | | 4.21 | | | | 14.24 | | | | (34.43 | ) | | | (2.86 | ) |
Total from investment operations | | | (3.37 | ) | | | 6.04 | | | | 15.74 | | | | (31.50 | ) | | | (0.57 | ) |
Dividends to shareholders: | | | | | | | | | | | | | | | | | | | | |
Net investment income | | | (1.84 | ) | | | (1.88 | ) | | | (1.51 | ) | | | (4.05 | ) | | | (1.79 | ) |
Net asset value, end of year | | $ | 41.64 | | | $ | 46.85 | | | $ | 42.69 | | | $ | 28.46 | | | $ | 64.01 | |
| | | | | |
TOTAL RETURN3 | | | (7.24 | )% | | | 14.93 | % | | | 56.27 | % | | | (49.95 | )% | | | 1.05 | % |
RATIOS/SUPPLEMENTAL DATA: | | | | | | | | | | | | | | | | | | | | |
Net assets, end of year (000’s omitted) | | $ | 355,992 | | | $ | 149,929 | | | $ | 164,338 | | | $ | 105,305 | | | $ | 390,485 | |
Ratios to average net assets4 of: | | | | | | | | | | | | | | | | | | | | |
Expenses, net of expense reimbursements/waivers | | | 0.58 | % | | | 0.58 | % | | | 0.58 | % | | | 0.58 | % | | | 0.58 | % |
Expenses, prior to expense reimbursements/waivers | | | 0.58 | % | | | 0.58 | % | | | 0.58 | % | | | 0.58 | % | | | 0.58 | % |
Net investment income | | | 4.20 | % | | | 4.30 | % | | | 3.81 | % | | | 5.90 | % | | | 3.28 | % |
Portfolio turnover rate5 | | | 28 | % | | | 52 | % | | | 69 | % | | | 55 | % | | | 24 | % |
| | | | | | | | | | | | | | | | | | | | |
| | | | | | |
WisdomTree International MidCap
Dividend Fund | | For the
Year Ended
March 31, 2012 | | | For the
Year Ended
March 31, 2011 | | | For the
Year Ended
March 31, 2010 | | | For the
Year Ended
March 31, 2009 | | | For the
Year Ended
March 31, 2008 | |
Net asset value, beginning of year | | $ | 53.80 | | | $ | 48.69 | | | $ | 31.55 | | | $ | 62.60 | | | $ | 67.56 | |
Investment operations: | | | | | | | | | | | | | | | | | | | | |
Net investment income2 | | | 1.79 | | | | 1.53 | | | | 1.26 | | | | 1.82 | | | | 1.92 | |
Net realized and unrealized gain (loss) | | | (5.69 | ) | | | 5.19 | | | | 17.27 | | | | (30.64 | ) | | | (4.95 | ) |
Total from investment operations | | | (3.90 | ) | | | 6.72 | | | | 18.53 | | | | (28.82 | ) | | | (3.03 | ) |
Dividends and distributions to shareholders: | | | | | | | | | | | | | | | | | | | | |
Net investment income | | | (1.80 | ) | | | (1.61 | ) | | | (1.39 | ) | | | (2.23 | ) | | | (1.81 | ) |
Capital gains | | | — | | | | — | | | | — | | | | — | | | | (0.12 | ) |
Total dividends and distributions to shareholders | | | (1.80 | ) | | | (1.61 | ) | | | (1.39 | ) | | | (2.23 | ) | | | (1.93 | ) |
Net asset value, end of year | | $ | 48.10 | | | $ | 53.80 | | | $ | 48.69 | | | $ | 31.55 | | | $ | 62.60 | |
| | | | | |
TOTAL RETURN3 | | | (7.21 | )% | | | 14.38 | % | | | 59.59 | % | | | (46.43 | )% | | | (4.61 | )% |
RATIOS/SUPPLEMENTAL DATA: | | | | | | | | | | | | | | | | | | | | |
Net assets, end of year (000’s omitted) | | $ | 105,823 | | | $ | 156,006 | | | $ | 146,069 | | | $ | 88,334 | | | $ | 219,104 | |
Ratios to average net assets4 of: | | | | | | | | | | | | | | | | | | | | |
Expenses, net of expense reimbursements/waivers | | | 0.58 | % | | | 0.58 | % | | | 0.58 | % | | | 0.58 | % | | | 0.58 | % |
Expenses, prior to expense reimbursements/waivers | | | 0.58 | % | | | 0.58 | % | | | 0.58 | % | | | 0.58 | % | | | 0.58 | % |
Net investment income | | | 3.69 | % | | | 3.14 | % | | | 2.88 | % | | | 3.80 | % | | | 2.76 | % |
Portfolio turnover rate5 | | | 47 | % | | | 40 | % | | | 49 | % | | | 32 | % | | | 18 | % |
| 1 | This information reflects the investment objective and strategy of the WisdomTree International Dividend Top 100 Fund through May 8, 2009 and the investment objective and strategy of the WisdomTree International Dividend ex-Financials Fund thereafter. |
| 2 | Based on average shares outstanding. |
| 3 | Total return is calculated assuming an initial investment made at the net asset value at the beginning of the period, reinvestment of all dividends and distributions at net asset value during the period and redemption on the last day of the period. Total return calculated for a period of less than one year is not annualized. The total return would have been lower if certain expenses had not been reimbursed/waived by the investment adviser (Note 2 and 3). |
| 4 | The ratios to average net assets do not include net investment income (loss) or expenses of the affiliated funds in which the Fund invests. |
| 5 | Portfolio turnover rate is not annualized and excludes the value of portfolio securities received or delivered as a result of in-kind creations or redemptions of the Fund’s capital shares. |
See Notes to Financial Statements.
| | |
| 148 | | WisdomTree International Dividend and Sector Funds |
Financial Highlights (continued)
WisdomTree International Dividend and Sector Funds
March 31, 2012
Selected data for a share of beneficial interest outstanding throughout the period is presented below:
| | | | | | | | | | | | | | | | | | | | |
WisdomTree International SmallCap Dividend
Fund | | For the
Year Ended
March 31, 2012 | | | For the
Year Ended
March 31, 2011 | | | For the
Year Ended
March 31, 2010 | | | For the
Year Ended
March 31, 2009 | | | For the
Year Ended
March 31, 2008 | |
Net asset value, beginning of year | | $ | 53.15 | | | $ | 46.98 | | | $ | 29.08 | | | $ | 61.11 | | | $ | 67.80 | |
Investment operations: | | | | | | | | | | | | | | | | | | | | |
Net investment income1 | | | 1.77 | | | | 1.43 | | | | 1.20 | | | | 1.91 | | | | 1.86 | |
Net realized and unrealized gain (loss) | | | (3.66 | ) | | | 6.14 | | | | 17.91 | | | | (31.83 | ) | | | (7.08 | ) |
Total from investment operations | | | (1.89 | ) | | | 7.57 | | | | 19.11 | | | | (29.92 | ) | | | (5.22 | ) |
Dividends and distributions to shareholders: | | | | | | | | | | | | | | | | | | | | |
Net investment income | | | (1.93 | ) | | | (1.40 | ) | | | (1.21 | ) | | | (2.11 | ) | | | (1.41 | ) |
Capital gains | | | — | | | | — | | | | — | | | | — | | | | (0.06 | ) |
Total dividends and distributions to shareholders | | | (1.93 | ) | | | (1.40 | ) | | | (1.21 | ) | | | (2.11 | ) | | | (1.47 | ) |
Net asset value, end of year | | $ | 49.33 | | | $ | 53.15 | | | $ | 46.98 | | | $ | 29.08 | | | $ | 61.11 | |
| | | | | |
TOTAL RETURN2 | | | (3.41 | )% | | | 16.64 | % | | | 66.50 | % | | | (49.23 | )% | | | (7.79 | )% |
RATIOS/SUPPLEMENTAL DATA: | | | | | | | | | | | | | | | | | | | | |
Net assets, end of year (000’s omitted) | | $ | 424,264 | | | $ | 475,703 | | | $ | 429,870 | | | $ | 244,307 | | | $ | 482,761 | |
Ratios to average net assets3 of: | | | | | | | | | | | | | | | | | | | | |
Expenses, net of expense reimbursements/waivers | | | 0.58 | % | | | 0.58 | % | | | 0.58 | % | | | 0.58 | % | | | 0.58 | % |
Expenses, prior of expense reimbursements/waivers | | | 0.58 | % | | | 0.58 | % | | | 0.58 | % | | | 0.58 | % | | | 0.58 | % |
Net investment income | | | 3.65 | % | | | 2.99 | % | | | 2.87 | % | | | 4.31 | % | | | 2.71 | % |
Portfolio turnover rate4 | | | 52 | % | | | 55 | % | | | 63 | % | | | 43 | % | | | 17 | % |
| | | | | | | | | | | | | | | | | | | | |
| | | | | | |
WisdomTree Emerging Markets Equity Income
Fund | | For the
Year Ended
March 31, 2012 | | | For the
Year Ended
March 31, 2011 | | | For the
Year Ended
March 31, 2010 | | | For the
Year Ended
March 31, 2009 | | | For the Period
July 13, 2007*
through
March 31, 2008 | |
Net asset value, beginning of period | | $ | 60.51 | | | $ | 52.02 | | | $ | 31.11 | | | $ | 51.82 | | | $ | 50.68 | |
Investment operations: | | | | | | | | | | | | | | | | | | | | |
Net investment income1 | | | 2.25 | | | | 1.89 | | | | 1.48 | | | | 2.01 | | | | 1.12 | |
Net realized and unrealized gain (loss) | | | (3.11 | ) | | | 8.55 | | | | 21.00 | | | | (20.76 | ) | | | 0.51 | |
Total from investment operations | | | (0.86 | ) | | | 10.44 | | | | 22.48 | | | | (18.75 | ) | | | 1.63 | |
Dividends to shareholders: | | | | | | | | | | | | | | | | | | | | |
Net investment income | | | (2.31 | ) | | | (1.95 | ) | | | (1.57 | ) | | | (1.96 | ) | | | (0.49 | ) |
Net asset value, end of period | | $ | 57.34 | | | $ | 60.51 | | | $ | 52.02 | | | $ | 31.11 | | | $ | 51.82 | |
| | | | | |
TOTAL RETURN2 | | | (1.03 | )% | | | 20.75 | % | | | 73.33 | % | | | (36.21 | )% | | | 3.23 | % |
RATIOS/SUPPLEMENTAL DATA: | | | | | | | | | | | | | | | | | | | | |
Net assets, end of period (000’s omitted) | | $ | 3,640,891 | | | $ | 1,325,257 | | | $ | 540,990 | | | $ | 177,355 | | | $ | 165,813 | |
Ratios to average net assets3 of: | | | | | | | | | | | | | | | | | | | | |
Expenses, net of expense reimbursements/waivers | | | 0.63 | % | | | 0.63 | % | | | 0.63 | % | | | 0.63 | % | | | 0.63 | %5 |
Expenses, prior of expense reimbursements/waivers | | | 0.63 | % | | | 0.63 | % | | | 0.63 | % | | | 0.63 | % | | | 0.63 | %5 |
Net investment income | | | 4.12 | % | | | 3.47 | % | | | 3.26 | % | | | 4.96 | % | | | 3.18 | %5 |
Portfolio turnover rate4 | | | 37 | % | | | 33 | % | | | 44 | % | | | 67 | % | | | 3 | % |
| * | Commencement of investment operations. |
| 1 | Based on average shares outstanding. |
| 2 | Total return is calculated assuming an initial investment made at the net asset value at the beginning of the period, reinvestment of all dividends and distributions at net asset value during the period and redemption on the last day of the period. Total return calculated for a period of less than one year is not annualized. The total return would have been lower if certain expenses had not been reimbursed/waived by the investment adviser (Note 2 and 3). |
| 3 | The ratios to average net assets do not include net investment income (loss) or expenses of the affiliated funds in which the Fund invests. |
| 4 | Portfolio turnover rate is not annualized and excludes the value of portfolio securities received or delivered as a result of in-kind creations or redemptions of the Fund’s capital shares. |
See Notes to Financial Statements.
| | | | |
| WisdomTree International Dividend and Sector Funds | | | 149 | |
Financial Highlights (continued)
WisdomTree International Dividend and Sector Funds
March 31, 2012
Selected data for a share of beneficial interest outstanding throughout the period is presented below:
| | | | | | | | | | | | | | | | | | | | |
WisdomTree Emerging Markets
SmallCap Dividend Fund | | For the
Year Ended
March 31, 2012 | | | For the
Year Ended
March 31, 2011 | | | For the
Year Ended
March 31, 2010 | | | For the
Year Ended
March 31, 2009 | | | For the Period
October 30, 2007*
through
March 31, 2008 | |
Net asset value, beginning of period | | $ | 53.30 | | | $ | 44.51 | | | $ | 24.62 | | | $ | 43.95 | | | $ | 51.50 | |
Investment operations: | | | | | | | | | | | | | | | | | | | | |
Net investment income1 | | | 1.47 | | | | 1.32 | | | | 1.02 | | | | 1.56 | | | | 0.37 | |
Net realized and unrealized gain (loss) | | | (5.31 | ) | | | 8.86 | | | | 20.00 | | | | (19.57 | ) | | | (7.87 | ) |
Total from investment operations | | | (3.84 | ) | | | 10.18 | | | | 21.02 | | | | (18.01 | ) | | | (7.50 | ) |
Dividends to shareholders: | | | | | | | | | | | | | | | | | | | | |
Net investment income | | | (1.66 | ) | | | (1.39 | ) | | | (1.13 | ) | | | (1.32 | ) | | | (0.05 | ) |
Net asset value, end of period | | $ | 47.80 | | | $ | 53.30 | | | $ | 44.51 | | | $ | 24.62 | | | $ | 43.95 | |
| | | | | |
TOTAL RETURN2 | | | (6.88 | )% | | | 23.38 | % | | | 86.26 | % | | | (40.81 | )% | | | (14.57 | )% |
RATIOS/SUPPLEMENTAL DATA: | | | | | | | | | | | | | | | | | | | | |
Net assets, end of period (000’s omitted) | | $ | 1,022,868 | | | $ | 927,463 | | | $ | 342,754 | | | $ | 51,706 | | | $ | 52,742 | |
Ratios to average net assets5 of: | | | | | | | | | | | | | | | | | | | | |
Expenses, net of expense reimbursements/waivers | | | 0.63 | %4 | | | 0.63 | %4 | | | 0.63 | %4 | | | 0.63 | % | | | 0.63 | %3 |
Expenses, prior to expense reimbursements/waivers | | | 0.63 | % | | | 0.63 | % | | | 0.63 | % | | | 0.63 | % | | | 0.63 | %3 |
Net investment income | | | 3.13 | % | | | 2.68 | % | | | 2.59 | % | | | 4.98 | % | | | 1.99 | %3 |
Portfolio turnover rate6 | | | 53 | % | | | 35 | % | | | 38 | % | | | 64 | % | | | 6 | % |
| | | | | | | | | | | | | | | | |
| | | | | |
| WisdomTree Middle East Dividend Fund | | For the
Year Ended
March 31, 2012 | | | For the
Year Ended
March 31, 2011 | | | For the
Year Ended
March 31, 2010 | | | For the Period
July 16, 2008*
through
March 31, 2009 | |
Net asset value, beginning of period | | $ | 16.31 | | | $ | 15.64 | | | $ | 12.13 | | | $ | 24.59 | |
Investment operations: | | | | | | | | | | | | | | | | |
Net investment income1 | | | 0.83 | | | | 0.68 | | | | 0.53 | | | | 0.32 | |
Net realized and unrealized gain (loss) | | | (0.61 | ) | | | 0.49 | | | | 3.68 | | | | (12.78 | ) |
Total from investment operations | | | 0.22 | | | | 1.17 | | | | 4.21 | | | | (12.46 | ) |
Dividends to shareholders: | | | | | | | | | | | | | | | | |
Net investment income | | | (0.93 | ) | | | (0.50 | ) | | | (0.70 | ) | | | — | |
Net asset value, end of period | | $ | 15.60 | | | $ | 16.31 | | | $ | 15.64 | | | $ | 12.13 | |
| | | | |
TOTAL RETURN2 | | | 1.35 | % | | | 7.95 | % | | | 35.25 | % | | | (50.67 | )% |
RATIOS/SUPPLEMENTAL DATA: | | | | | | | | | | | | | | | | |
Net assets, end of period (000’s omitted) | | $ | 14,038 | | | $ | 19,571 | | | $ | 12,515 | | | $ | 7,279 | |
Ratios to average net assets5 of: | | | | | | | | | | | | | | | | |
Expenses, net of expense reimbursements/waivers | | | 0.88 | % | | | 0.88 | % | | | 0.88 | % | | | 0.88 | %3 |
Expenses, prior to expense reimbursements/waivers | | | 1.83 | % | | | 2.17 | % | | | 1.30 | % | | | 1.49 | %3 |
Net investment income | | | 5.31 | % | | | 4.33 | % | | | 3.63 | % | | | 2.86 | %3 |
Portfolio turnover rate6 | | | 37 | % | | | 50 | % | | | 96 | % | | | 26 | % |
| * | Commencement of investment operations. |
| 1 | Based on average shares outstanding. |
| 2 | Total return is calculated assuming an initial investment made at the net asset value at the beginning of the period, reinvestment of all dividends and distributions at net asset value during the period and redemption on the last day of the period. Total return calculated for a period of less than one year is not annualized. The total return would have been lower if certain expenses had not been reimbursed/waived by the investment adviser (Note 2 and 3). |
| 4 | Reflects the Fund’s advisory fees, after waiver, and the fees and expenses of the WisdomTree India Earnings Fund that were paid indirectly by the Fund. The Fund invests a portion of its assets in the WisdomTree India Earnings Fund in order to achieve exposure to securities in India. |
| 5 | The ratios to average net assets do not include net investment income income (loss) or expenses of the affiliated funds in which the Fund invests. |
| 6 | Portfolio turnover rate is not annualized and excludes the value of portfolio securities received or delivered as a result of in-kind creations or redemptions of the Fund’s capital shares. |
See Notes to Financial Statements.
| | |
| 150 | | WisdomTree International Dividend and Sector Funds |
Financial Highlights (continued)
WisdomTree International Dividend and Sector Funds
March 31, 2012
Selected data for a share of beneficial interest outstanding throughout the period is presented below:
| | | | | | | | | | | | |
| WisdomTree International Hedged Equity Fund | | For the
Year Ended
March 31, 2012 | | | For the
Year Ended
March 31, 2011 | | | For the Period
December 31, 2009*
through
March 31, 2010 | |
Net asset value, beginning of period | | $ | 47.61 | | | $ | 47.72 | | | $ | 46.92 | |
Investment operations: | | | | | | | | | | | | |
Net investment income1 | | | 1.73 | | | | 1.43 | | | | 0.29 | |
Net realized and unrealized gain (loss) | | | (3.84 | ) | | | (0.02 | ) | | | 0.64 | |
Total from investment operations | | | (2.11 | ) | | | 1.41 | | | | 0.93 | |
Dividends and distributions to shareholders: | | | | | | | | | | | | |
Net investment income | | | (1.57 | ) | | | (1.52 | ) | | | (0.13 | ) |
Capital gains | | | — | | | | — | | | | 0.00 | 2 |
Total dividends and distributions to shareholders | | | (1.57 | ) | | | (1.52 | ) | | | (0.13 | ) |
Net asset value, end of period | | $ | 43.93 | | | $ | 47.61 | | | $ | 47.72 | |
| | | |
TOTAL RETURN3 | | | (4.41 | )% | | | 3.27 | % | | | 1.98 | % |
RATIOS/SUPPLEMENTAL DATA: | | | | | | | | | | | | |
Net assets, end of period (000’s omitted) | | $ | 21,963 | | | $ | 21,425 | | | $ | 9,545 | |
Ratios to average net assets5 of: | | | | | | | | | | | | |
Expenses, net of expense reimbursements/waivers | | | 0.58 | % | | | 0.58 | % | | | 0.47 | %**4 |
Expenses, prior to expense reimbursements/waivers | | | 1.25 | % | | | 1.65 | % | | | 0.58 | %4 |
Net investment income | | | 3.99 | % | | | 3.11 | % | | | 2.53 | %4 |
Portfolio turnover rate6 | | | 42 | % | | | 38 | % | | | 79 | % |
| | | | | | | | | | | | | | | | | | | | |
| | | | | | |
| WisdomTree Commodity Country Equity Fund | | For the
Year Ended
March 31, 20127 | | | For the
Year Ended
March 31, 2011 | | | For the
Year Ended
March 31, 2010 | | | For the
Year Ended
March 31, 2009 | | | For the
Year Ended
March 31, 2008 | |
Net asset value, beginning of year | | $ | 33.21 | | | $ | 28.90 | | | $ | 16.04 | | | $ | 35.96 | | | $ | 32.03 | |
Investment operations: | | | | | | | | | | | | | | | | | | | | |
Net investment income1 | | | 1.09 | | | | 0.53 | | | | 0.47 | | | | 0.65 | | | | 0.61 | |
Net realized and unrealized gain (loss) | | | (1.76 | ) | | | 4.33 | | | | 12.80 | | | | (19.29 | ) | | | 3.58 | |
Total from investment operations | | | (0.67 | ) | | | 4.86 | | | | 13.27 | | | | (18.64 | ) | | | 4.19 | |
Dividends and distributions to shareholders: | | | | | | | | | | | | | | | | | | | | |
Net investment income | | | (1.10 | ) | | | (0.55 | ) | | | (0.41 | ) | | | (1.28 | ) | | | (0.26 | ) |
Capital gains | | | — | | | | — | | | | — | | | | — | | | | 0.00 | 2 |
Total dividends and distributions to shareholders | | | (1.10 | ) | | | (0.55 | ) | | | (0.41 | ) | | | (1.28 | ) | | | (0.26 | ) |
Net asset value, end of year | | $ | 31.44 | | | $ | 33.21 | | | $ | 28.90 | | | $ | 16.04 | | | $ | 35.96 | |
| | | | | |
TOTAL RETURN3 | | | (1.77 | )% | | | 17.31 | % | | | 83.44 | % | | | (52.10 | )% | | | 13.09 | % |
RATIOS/SUPPLEMENTAL DATA: | | | | | | | | | | | | | | | | | | | | |
Net assets, end of year (000’s omitted) | | $ | 31,439 | | | $ | 43,172 | | | $ | 49,137 | | | $ | 22,460 | | | $ | 93,507 | |
Ratios to average net assets5 of: | | | | | | | | | | | | | | | | | | | | |
Expenses, net of expense reimbursements/waivers | | | 0.58 | % | | | 0.58 | % | | | 0.58 | % | | | 0.58 | % | | | 0.58 | % |
Expenses, prior to expense reimbursements/waivers | | | 0.58 | % | | | 0.58 | % | | | 0.58 | % | | | 0.58 | % | | | 0.58 | % |
Net investment income | | | 3.52 | % | | | 1.86 | % | | | 1.91 | % | | | 2.21 | % | | | 1.62 | % |
Portfolio turnover rate6 | | | 116 | % | | | 35 | % | | | 25 | % | | | 53 | % | | | 11 | % |
| * | Commencement of investment operations. |
| ** | Reflects the Fund’s advisory fees, after waiver, and the fees and expenses of the underlying funds that were paid indirectly by the Fund during the period when the Fund operated as a “fund of funds”. |
| 1 | Based on average shares outstanding. |
| 2 | Amount represents less than $0.005. |
| 3 | Total return is calculated assuming an initial investment made at the net asset value at the beginning of the period, reinvestment of all dividends and distributions at net asset value during the period and redemption on the last day of the period. Total return calculated for a period of less than one year is not annualized. The total return would have been lower if certain expenses had not been reimbursed/waived by the investment adviser (Note 2 and 3). |
| 5 | The ratios to average net assets do not include net investment income (loss) or expenses of the affiliated funds in which the Fund invests. |
| 6 | Portfolio turnover rate is not annualized and excludes the value of portfolio securities received or delivered as a result of in-kind creations or redemptions of the Fund’s capital shares. |
| 7 | This information reflects the investment objective and strategy of the WisdomTree International Basic Materials Sector Fund through June 19, 2011 and the investment objective and strategy of the WisdomTree Commodity Country Equity Fund thereafter. |
See Notes to Financial Statements.
| | | | |
| WisdomTree International Dividend and Sector Funds | | | 151 | |
Financial Highlights (continued)
WisdomTree International Dividend and Sector Funds
March 31, 2012
Selected data for a share of beneficial interest outstanding throughout the period is presented below:
| | | | | | | | | | | | | | | | | | | | |
| WisdomTree Global Natural Resources Fund | | For the
Year Ended
March 31, 20121 | | | For the
Year Ended
March 31, 2011 | | | For the
Year Ended
March 31, 2010 | | | For the
Year Ended
March 31, 2009 | | | For the
Year Ended
March 31, 2008 | |
Net asset value, beginning of year | | $ | 29.86 | | | $ | 24.63 | | | $ | 18.61 | | | $ | 31.98 | | | $ | 28.55 | |
Investment operations: | | | | | | | | | | | | | | | | | | | | |
Net investment income2 | | | 0.93 | | | | 0.72 | | | | 0.80 | | | | 1.01 | | | | 0.79 | |
Net realized and unrealized gain (loss) | | | (4.74 | ) | | | 5.19 | | | | 6.07 | | | | (12.84 | ) | | | 3.18 | |
Total from investment operations | | | (3.81 | ) | | | 5.91 | | | | 6.87 | | | | (11.83 | ) | | | 3.97 | |
Dividends and distributions to shareholders: | | | | | | | | | | | | | | | | | | | | |
Net investment income | | | (0.89 | ) | | | (0.68 | ) | | | (0.85 | ) | | | (1.54 | ) | | | (0.53 | ) |
Capital gains | | | — | | | | — | | | | — | | | | — | | | | (0.01 | ) |
Total dividends and distributions to shareholders | | | (0.89 | ) | | | (0.68 | ) | | | (0.85 | ) | | | (1.54 | ) | | | (0.54 | ) |
Net asset value, end of year | | $ | 25.16 | | | $ | 29.86 | | | $ | 24.63 | | | $ | 18.61 | | | $ | 31.98 | |
| | | | | |
TOTAL RETURN3 | | | (12.70 | )% | | | 24.74 | % | | | 37.29 | % | | | (37.05 | )% | | | 13.84 | % |
RATIOS/SUPPLEMENTAL DATA: | | | | | | | | | | | | | | | | | | | | |
Net assets, end of year (000’s omitted) | | $ | 31,452 | | | $ | 49,273 | | | $ | 45,569 | | | $ | 22,332 | | | $ | 57,562 | |
Ratios to average net assets4 of: | | | | | | | | | | | | | | | | | | | | |
Expenses, net of expense reimbursements/waivers | | | 0.58 | % | | | 0.58 | % | | | 0.58 | % | | | 0.58 | % | | | 0.58 | % |
Expenses, prior to expense reimbursements/waivers | | | 0.58 | % | | | 0.58 | % | | | 0.58 | % | | | 0.58 | % | | | 0.58 | % |
Net investment income | | | 3.54 | % | | | 2.90 | % | | | 3.36 | % | | | 3.49 | % | | | 2.43 | % |
Portfolio turnover rate5 | | | 99 | % | | | 32 | % | | | 16 | % | | | 38 | % | | | 13 | % |
| | | | | | | | | | | | | | | | | | | | |
| | | | | | |
| WisdomTree Global ex-U.S. Utilities Fund | | For the
Year Ended
March 31, 20126 | | | For the
Year Ended
March 31, 2011 | | | For the
Year Ended
March 31, 2010 | | | For the
Year Ended
March 31, 2009 | | | For the
Year Ended
March 31, 2008 | |
Net asset value, beginning of year | | $ | 21.33 | | | $ | 21.46 | | | $ | 17.78 | | | $ | 32.73 | | | $ | 29.71 | |
Investment operations: | | | | | | | | | | | | | | | | | | | | |
Net investment income2 | | | 0.87 | | | | 0.84 | | | | 0.87 | | | | 1.25 | | | | 0.55 | |
Net realized and unrealized gain (loss) | | | (2.45 | ) | | | (0.06 | ) | | | 3.77 | | | | (14.74 | ) | | | 2.75 | |
Total from investment operations | | | (1.58 | ) | | | 0.78 | | | | 4.64 | | | | (13.49 | ) | | | 3.30 | |
Dividends and distributions to shareholders: | | | | | | | | | | | | | | | | | | | | |
Net investment income | | | (0.85 | ) | | | (0.91 | ) | | | (0.96 | ) | | | (1.46 | ) | | | (0.28 | ) |
Capital gains | | | — | | | | — | | | | — | | | | — | | | | (0.00 | )7 |
Total dividends and distributions to shareholders | | | (0.85 | ) | | | (0.91 | ) | | | (0.96 | ) | | | (1.46 | ) | | | (0.28 | ) |
Net asset value, end of year | | $ | 18.90 | | | $ | 21.33 | | | $ | 21.46 | | | $ | 17.78 | | | $ | 32.73 | |
| | | | | |
TOTAL RETURN3 | | | (7.41 | )% | | | 4.27 | % | | | 26.42 | % | | | (42.00 | )% | | | 11.05 | % |
RATIOS/SUPPLEMENTAL DATA: | | | | | | | | | | | | | | | | | | | | |
Net assets, end of year (000’s omitted) | | $ | 30,241 | | | $ | 37,335 | | | $ | 49,348 | | | $ | 28,455 | | | $ | 78,561 | |
Ratios to average net assets4 of: | | | | | | | | | | | | | | | | | | | | |
Expenses, net of expense reimbursements/waivers | | | 0.58 | % | | | 0.58 | % | | | 0.58 | % | | | 0.58 | % | | | 0.58 | % |
Expenses, prior to expense reimbursements/waivers | | | 0.58 | % | | | 0.58 | % | | | 0.58 | % | | | 0.58 | % | | | 0.58 | % |
Net investment income | | | 4.48 | % | | | 4.22 | % | | | 4.17 | % | | | 4.53 | % | | | 1.62 | % |
Portfolio turnover rate5 | | | 66 | % | | | 19 | % | | | 17 | % | | | 50 | % | | | 13 | % |
| 1 | This information reflects the investment objective and strategy of the WisdomTree International Energy Sector Fund through June 19, 2011 and the investment objective and strategy of the WisdomTree Global Natural Resources Fund thereafter. |
| 2 | Based on average shares outstanding. |
| 3 | Total return is calculated assuming an initial investment made at the net asset value at the beginning of the period, reinvestment of all dividends and distributions at net asset value during the period and redemption on the last day of the period. Total return calculated for a period of less than one year is not annualized. The total return would have been lower if certain expenses had not been reimbursed/waived by the investment adviser (Note 2 and 3). |
| 4 | The ratios to average net assets do not include net investment income (loss) or expenses of the affiliated funds in which the Fund invests. |
| 5 | Portfolio turnover rate is not annualized and excludes the value of portfolio securities received or delivered as a result of in-kind creations or redemptions of the Fund’s capital shares. |
| 6 | This information reflects the investment objective and strategy of the WisdomTree International Utilities Sector Fund through June 19, 2011 and the investment objective and strategy of the WisdomTree Global ex-U.S. Utilities Fund thereafter. |
See Notes to Financial Statements.
| | |
| 152 | | WisdomTree International Dividend and Sector Funds |
Financial Highlights (concluded)
WisdomTree International Dividend and Sector Funds
March 31, 2012
Selected data for a share of beneficial interest outstanding throughout the period is presented below:
| | | | | | | | | | | | | | | | | | | | |
| WisdomTree Global ex-U.S. Real Estate Fund | | For the
Year Ended
March 31, 20121 | | | For the
Year Ended
March 31, 2011 | | | For the
Year Ended
March 31, 2010 | | | For the
Year Ended
March 31, 2009 | | | For the Period
June 5, 2007*
through
March 31, 2008 | |
Net asset value, beginning of period | | $ | 28.86 | | | $ | 26.75 | | | $ | 16.92 | | | $ | 41.84 | | | $ | 51.89 | |
Investment operations: | | | | | | | | | | | | | | | | | | | | |
Net investment income2 | | | 1.15 | | | | 0.96 | | | | 0.96 | | | | 1.35 | | | | 1.22 | |
Net realized and unrealized gain (loss) | | | (2.32 | ) | | | 3.83 | | | | 11.39 | | | | (25.46 | ) | | | (9.32 | ) |
Total from investment operations | | | (1.17 | ) | | | 4.79 | | | | 12.35 | | | | (24.11 | ) | | | (8.10 | ) |
Dividends and distributions to shareholders: | | | | | | | | | | | | | | | | | | | | |
Net investment income | | | (1.21 | ) | | | (2.68 | ) | | | (2.52 | ) | | | (0.81 | ) | | | (1.95 | ) |
Return of capital | | | (0.08 | ) | | | — | | | | — | | | | — | | | | — | |
Total dividends and distributions to shareholders | | | (1.29 | ) | | | (2.68 | ) | | | (2.52 | ) | | | (0.81 | ) | | | (1.95 | ) |
Net asset value, end of period | | $ | 26.40 | | | $ | 28.86 | | | $ | 26.75 | | | $ | 16.92 | | | $ | 41.84 | |
| | | | | |
TOTAL RETURN3 | | | (3.99 | )% | | | 18.81 | % | | | 74.20 | % | | | (57.85 | )% | | | (15.90 | )% |
RATIOS/SUPPLEMENTAL DATA: | | | | | | | | | | | | | | | | | | | | |
Net assets, end of period (000’s omitted) | | $ | 108,221 | | | $ | 122,670 | | | $ | 84,276 | | | $ | 40,619 | | | $ | 112,962 | |
Ratios to average net assets4 of: | | | | | | | | | | | | | | | | | | | | |
Expenses, net of expense reimbursements/waivers | | | 0.58 | % | | | 0.58 | % | | | 0.58 | % | | | 0.58 | % | | | 0.58 | %5 |
Expenses, prior to expense reimbursements/waivers | | | 0.58 | % | | | 0.58 | % | | | 0.58 | % | | | 0.58 | % | | | 0.58 | %5 |
Net investment income | | | 4.36 | % | | | 3.48 | % | | | 3.76 | % | | | 4.55 | % | | | 3.17 | %5 |
Portfolio turnover rate6 | | | 43 | % | | | 18 | % | | | 19 | % | | | 35 | % | | | 15 | % |
| * | Commencement of investment operations. |
| 1 | This information reflects the investment objective and strategy of the WisdomTree International Real Estate Fund through June 19, 2011 and the investment objective and strategy of the WisdomTree Global ex-U.S. Real Estate Fund thereafter. |
| 2 | Based on average shares outstanding. |
| 3 | Total return is calculated assuming an initial investment made at the net asset value at the beginning of the period, reinvestment of all dividends and distributions at net asset value during the period and redemption on the last day of the period. Total return calculated for a period of less than one year is not annualized. The total return would have been lower if certain expenses had not been reimbursed/waived by the investment adviser (Note 2 and 3). |
| 4 | The ratios to average net assets do not include net investment income (loss) or expenses of the affiliated funds in which the Fund invests. |
| 6 | Portfolio turnover rate is not annualized and excludes the value of portfolio securities received or delivered as a result of in-kind creations or redemptions of the Fund’s capital shares. |
See Notes to Financial Statements.
| | | | |
| WisdomTree International Dividend and Sector Funds | | | 153 | |
Notes to Financial Statements
1. ORGANIZATION
WisdomTree Trust (the “Trust”) is registered under the Investment Company Act of 1940, as amended (the “1940 Act”), as an open-end management investment company. The Trust was established as a Delaware statutory trust pursuant to a Trust Instrument dated December 15, 2005. As of March 31, 2012, the Trust offered 48 investment funds (each a “Fund,” collectively, the “Funds”). These notes relate only to Funds listed in the table below:
| | |
| Fund Name | | Commencement
of Operations |
WisdomTree DEFA Fund (“DEFA Fund”) | | June 16, 2006 |
WisdomTree DEFA Equity Income Fund (“DEFA Equity Income Fund”) | | June 16, 2006 |
WisdomTree Global Equity Income Fund (“Global Equity Income Fund”) | | June 16, 2006 |
WisdomTree Europe SmallCap Dividend Fund (“Europe SmallCap Dividend Fund”) | | June 16, 2006 |
WisdomTree Japan Hedged Equity Fund (“Japan Hedged Equity Fund”) | | June 16, 2006 |
WisdomTree Global ex-U.S. Growth Fund (“Global ex-U.S. Growth Fund”)
(formerly, WisdomTree World ex-U.S. Growth Fund) | | June 16, 2006 |
WisdomTree Japan SmallCap Dividend Fund (“Japan SmallCap Dividend Fund”) | | June 16, 2006 |
WisdomTree Asia Pacific ex-Japan Fund (“Asia Pacific ex-Japan Fund”)
(formerly, WisdomTree Pacific ex-Japan Total Dividend Fund) | | June 16, 2006 |
WisdomTree Australia Dividend Fund (“Australia Dividend Fund”)
(formerly, WisdomTree Pacific ex-Japan Equity Income Fund) | | June 16, 2006 |
WisdomTree International LargeCap Dividend Fund (“International LargeCap Dividend Fund”) | | June 16, 2006 |
WisdomTree International Dividend ex-Financials Fund (“International Dividend ex-Financials Fund”) | | June 16, 2006 |
WisdomTree International MidCap Dividend Fund (“International MidCap Dividend Fund”) | | June 16, 2006 |
WisdomTree International SmallCap Dividend Fund (“International SmallCap Dividend Fund”) | | June 16, 2006 |
WisdomTree Emerging Markets Equity Income Fund (“Emerging Markets Equity Income Fund”) | | July 13, 2007 |
WisdomTree Emerging Markets SmallCap Dividend Fund (“Emerging Markets SmallCap Dividend Fund”) | | October 30, 2007 |
WisdomTree Middle East Dividend Fund (“Middle East Dividend Fund”) | | July 16, 2008 |
WisdomTree International Hedged Equity Fund (“International Hedged Equity Fund”) | | December 31, 2009 |
WisdomTree Commodity Country Equity Fund (“Commodity Country Equity Fund”)
(formerly, WisdomTree International Basic Materials Sector Fund) | | October 13, 2006 |
WisdomTree Global Natural Resources Fund (“Global Natural Resources Fund”)
(formerly, WisdomTree International Energy Sector Fund) | | October 13, 2006 |
WisdomTree Global ex-U.S. Utilities Fund (“Global ex-U.S. Utilities Fund”)
(formerly, WisdomTree International Utilities Sector Fund) | | October 13, 2006 |
WisdomTree Global ex-U.S. Real Estate Fund (“Global ex-U.S. Real Estate Fund”)
(formerly, WisdomTree International Real Estate Fund) | | June 5, 2007 |
Each Fund seeks to track the price and yield performance, before fees and expenses, of a particular index (“Index”) developed by WisdomTree Investments, Inc. (“WisdomTree Investments”). WisdomTree Investments is the parent company of WisdomTree Asset Management, Inc. (“WTAM”), the investment adviser to each Fund and the Trust. “WisdomTree” is a registered mark of WisdomTree Investments and has been licensed for use by the Trust. Each Fund described herein is considered to be non-diversified.
2. SIGNIFICANT ACCOUNTING POLICIES
The Financial Accounting Standards Board (“FASB”) Accounting Standards Codification (the “Codification”) is the exclusive reference of authoritative U.S. generally accepted accounting principles (“GAAP”) recognized by the FASB to be applied by nongovernmental entities. Rules and interpretive releases of the Securities and Exchange Commission (“SEC”) under authority of federal laws are also sources of authoritative GAAP for SEC registrants.
The following is a summary of significant accounting policies followed by the Funds:
Guarantees — In the normal course of business the Funds may enter into contracts that contain a variety of representations or that provide indemnification for certain liabilities. The Funds’ maximum exposure under these arrangements is unknown, as this would involve future claims that may be made against the Funds that have not yet occurred. However, the Funds have not had prior claims or losses pursuant to these contracts and expect the risk of loss to be remote. Therefore, no liabilities have been recorded in connection to the indemnifications.
Use of Estimates — The preparation of financial statements in conformity with GAAP, requires management to make certain estimates and assumptions that affect the reported amounts of assets and liabilities and disclosure of contingent assets and liabilities
| | |
| 154 | | WisdomTree International Dividend and Sector Funds |
Notes to Financial Statements (continued)
at the date of the financial statements and the reported amounts of increases and decreases in the net assets from operations during the reporting period. Actual results could differ from those estimates.
Investment Valuation — The net asset value (“NAV”) of each Fund’s shares is calculated each day the national securities exchanges are open for trading as of the close of regular trading on the New York Stock Exchange, generally 4:00 p.m. New York time. NAV per share is calculated by dividing a Fund’s net assets by the number of Fund shares outstanding. Transactions in Fund shares will be priced at NAV only if you purchase or redeem shares directly from a Fund in creation units, which are typically in blocks of 50,000 shares or more. Fund shares purchased or sold on a national securities exchange at market prices, which may be higher or lower than NAV. In calculating each Fund’s NAV investments are valued under policies approved by the Board of Trustees.
Securities traded on any recognized U.S. or non-U.S. exchange are valued at the last sale price or official closing price on the exchange or system on which they are principally traded. Events occurring after the close of trading on non-U.S. exchanges may result in adjustments to the valuation of foreign securities to more accurately reflect their fair value as of the close of regular trading on the New York Stock Exchange. The Fund may rely on an independent fair valuation service in adjusting the valuations of foreign securities. Unlisted equity securities are valued at the last quoted sale price or, if no sale price is available, at the mean between the highest bid and lowest ask prices. Securities for which market quotations are not readily available are valued at fair value as determined by management and in accordance with procedures approved by the Board of Trustees. Short-term securities with 60 days or less remaining to maturity are valued using the amortized cost method, which approximates fair value. Forward foreign currency contracts are valued daily using WM/Reuters closing spot and forward rates as of 4:00 p.m. London time for Europe and the Americas and Tullett Prebon closing spot and forward rates as of 2:00 p.m. Singapore time for Asia.
In certain instances, such as when reliable market valuations are not readily available or are not deemed to reflect current market values, a Fund’s investments will be valued in accordance with the Fund’s pricing policy and procedures. Securities that may be valued using fair value pricing may include, but are not limited to, securities for which there are no current market quotations, securities whose issuer is in default or bankruptcy, securities subject to corporate actions (such as mergers or reorganizations), securities subject to non-U.S. investment limits or currency controls, and securities affected by “significant events”. An example of a significant event is an event occurring after the close of the market in which a security trades but before a Fund’s next NAV calculation time that may materially affect the value of a Fund’s investment (e.g., government action, natural disaster, or significant market fluctuation). Price movements in U.S. markets that are deemed to affect the value of foreign securities, or reflect changes to the value of such securities, also may cause securities to be fair valued. When fair value pricing is employed, the prices of securities used by a Fund to calculate its NAV may differ from quoted or published prices for the same securities. Each Fund may invest in money market funds which are valued at their NAV per share and affiliated ETF’s which are valued at their last sale or official closing price on the exchange on which they are principally traded.
Fair Value Measurement — In accordance with Codification Topic 820 (“ASC 820”), Fair Value Measurements and Disclosures, fair value is defined as the price that each Fund would receive upon selling an investment in an orderly transaction to an independent buyer in the principal or most advantageous market of the investment. ASC 820 established a three-tier hierarchy to maximize the use of observable market data and minimize the use of unobservable inputs and to establish classifications of fair value measurements for disclosure purposes. Inputs refer broadly to the assumptions that market participants would use in pricing the asset or liability, including assumptions about risk — for example, the risk inherent in a particular valuation technique used to measure fair value (such as a pricing model) and/or the risk inherent in the inputs to the valuation technique. Inputs may be observable or unobservable. Observable inputs reflect the assumptions market participants would use in pricing the asset or liability. Observable inputs are based on market data obtained from sources independent of the reporting entity. Unobservable inputs reflect the reporting entity’s own assumptions about the assumptions market participants would use in pricing the asset or liability. Unobservable inputs are based on the best information available in the circumstances. The three-tier hierarchy of inputs is summarized in the three broad levels listed below:
Level 1 – quoted prices in active markets for identical securities
Level 2 – other significant observable inputs (including quoted prices for similar securities, interest rates, prepayment speeds, credit risk, etc.)
Level 3 – significant unobservable inputs (including each Fund’s assumptions in determining the fair value of investments)
Investments that use Level 2 or Level 3 inputs may include, but are not limited to: (i) an unlisted security related to corporate actions; (ii) a restricted security (e.g., one that may not be publicly sold without registration under the Securities Act of 1933, as amended); (iii) a security whose trading has been suspended or which has been de-listed from its primary trading exchange; (iv) a security that is thinly traded; (v) a security in default or bankruptcy proceedings for which there is no current market quotation; (vi) a security affected by currency controls or restrictions; and (vii) a security affected by a significant event (e.g., an event that occurs after the close of the markets on which the security is traded but before the time as of which a Fund’s NAV is computed and that may materially affect the value of the Fund’s investments).
| | | | |
| WisdomTree International Dividend and Sector Funds | | | 155 | |
Notes to Financial Statements (continued)
In January 2010, FASB issued Accounting Standards Update No. 2010-06 “Improving Disclosures about Fair Value Measurements (“ASU 2010-06”).” ASU 2010-06 requires reporting entities to make new disclosures about amounts and reasons for significant transfers between of Level 1 and Level 2 fair value measurements, as well as inputs and valuation techniques used to measure fair value for both recurring and nonrecurring fair value measurements that fall in either Level 2 or Level 3. ASU 2010-06 also requires information on purchases and sales, issuances and settlements on a gross basis in the reconciliation of activity in Level 3 fair value measurements. The new and revised disclosures have been implemented for fiscal periods beginning after December 15, 2009 other than the disclosures surrounding the presentation of purchases, sales, issuances and settlements on a gross basis in the reconciliation of Level 3 fair value measurements which have been implemented for fiscal periods beginning after December 15, 2010.
The inputs or methodology used for valuation are not necessarily an indication of the risk associated with investing in those investments.
The valuation techniques and significant inputs used in determining the fair market value measurements for Level 2 or Level 3 positions are as follows:
Financial instruments are valued by pricing service providers that use broker dealer quotations, reported trades or valuation estimates from their internal pricing models. Depending on the type of financial instrument, the service providers’ internal models use inputs that are observable such as issuer details, interest rates, yield curves, prepayment speeds, credit risks/spreads, default rates and quoted prices for similar assets. Securities that use similar valuation techniques and inputs as described above are categorized as Level 2 of the fair value hierarchy. Short-term investments having a maturity of 60 days or less are generally valued at amortized cost which approximates fair market value. These investments are categorized as Level 2 of the fair value hierarchy. Over-the-counter financial derivative instruments, such as forward foreign currency contracts derive their value from underlying asset prices, indices, reference rates, and other inputs or a combination of these factors. These contracts are normally valued on the basis of broker dealer quotations or pricing service providers. Depending on the product and the terms of the transaction, the value of the financial derivative contracts can be estimated by a pricing service provider using a series of techniques, including simulation pricing models. The pricing models use inputs that are observed from actively quoted markets such as issuer details, indices, spreads, interest rates, curves, dividends and exchange rates. Financial derivatives that use similar valuation techniques and inputs as described above are categorized as Level 2 of the fair value hierarchy.
In the event that a financial instrument cannot be valued based upon a price from a national securities exchange, pricing service provider or broker quotation, or such prices are deemed to not reflect current market value, WTAM may value the financial instrument in good faith under the policies and procedures approved by the Board of Trustees based on current facts and circumstances. Determination of this value may include significant unobservable inputs and therefore would be reflected as a Level 3 of the fair value hierarchy.
No significant transfers between Level 1 or Level 2 fair value measurements occurred during the fiscal year ended March 31, 2012.
The following is a summary of the inputs used as of March 31, 2012 in valuing each Fund’s assets carried at fair value:
| | | | | | | | | | | | |
| DEFA Fund | | Level 1 | | | Level 2 | | | Level 3 | |
Investments in Securities | | | | | | | | | | | | |
Common Stocks | | | | | | | | | | | | |
Australia | | $ | 47,657,231 | | | $ | 36,411 | | | $ | — | |
Spain | | | 20,401,038 | | | | 1,806 | | | | — | |
Other* | | | 313,991,744 | | | | — | | | | — | |
Money Market Funds | | | — | | | | 34,221,578 | | | | — | |
Exchange-Traded Funds | | | 388,791 | | | | — | | | | — | |
Total | | $ | 382,438,804 | | | $ | 34,259,795 | | | $ | — | |
| | | | | | | | | | | | |
| DEFA Equity Income Fund | | Level 1 | | | Level 2 | | | Level 3 | |
Investments in Securities | | | | | | | | | | | | |
Common Stocks | | | | | | | | | | | | |
Australia | | $ | 30,147,620 | | | $ | 20,302 | | | $ | — | |
Other* | | | 143,841,677 | | | | — | | | | — | |
Money Market Funds | | | — | | | | 13,611,901 | | | | — | |
Exchange-Traded Funds | | | 820,710 | | | | — | | | | — | |
Total | | | 174,810,007 | | | | 13,632,203 | | | | — | |
Unrealized Appreciation on Forward Foreign Currency Contracts | | | — | | | | 118 | | | | — | |
Total - Net | | $ | 174,810,007 | | | $ | 13,632,321 | | | $ | — | |
| | |
| 156 | | WisdomTree International Dividend and Sector Funds |
Notes to Financial Statements (continued)
| | | | | | | | | | | | |
| Global Equity Income Fund | | Level 1 | | | Level 2 | | | Level 3 | |
Investments in Securities | | | | | | | | | | | | |
Common Stocks | | | | | | | | | | | | |
Australia | | $ | 8,835,918 | | | $ | 7,217 | | | $ | — | |
Other* | | | 81,762,654 | | | | — | | | | — | |
Money Market Funds | | | — | | | | 5,541,194 | | | | — | |
Exchange-Traded Funds | | | 238,105 | | | | — | | | | — | |
Total | | | 90,836,677 | | | | 5,548,411 | | | | — | |
Unrealized Appreciation on Forward Foreign Currency Contracts | | | — | | | | 57 | | | | — | |
Total - Net | | $ | 90,836,677 | | | $ | 5,548,468 | | | $ | — | |
| | | | | | | | | | | | |
| Europe SmallCap Dividend Fund | | Level 1 | | | Level 2 | | | Level 3 | |
Investments in Securities | | | | | | | | | | | | |
Common Stocks* | | $ | 28,513,309 | | | $ | — | | | $ | — | |
Rights | | | | | | | 188 | | | | — | |
Money Market Funds | | | — | | | | 2,699,340 | | | | — | |
Exchange-Traded Funds | | | 1,251 | | | | — | | | | — | |
Total | | | 28,514,560 | | | | 2,699,528 | | | | — | |
Unrealized Appreciation on Forward Foreign Currency Contracts | | | — | | | | 465 | | | | — | |
Total - Net | | $ | 28,514,560 | | | $ | 2,699,993 | | | $ | — | |
| | | | | | | | | | | | |
| Japan Hedged Equity Fund | | Level 1 | | | Level 2 | | | Level 3 | |
Investments in Securities | | | | | | | | | | | | |
Common Stocks* | | $ | 598,848,982 | | | $ | — | | | $ | — | |
Money Market Funds | | | — | | | | 174,478,567 | | | | — | |
Total | | | 598,848,982 | | | | 174,478,567 | | | | — | |
Unrealized Appreciation on Forward Foreign Currency Contracts | | | — | | | | 8,806,044 | | | | — | |
Unrealized Depreciation on Forward Foreign Currency Contracts | | | — | | | | (348,516 | ) | | | — | |
Total - Net | | $ | 598,848,982 | | | $ | 182,936,095 | | | $ | — | |
| | | | | | | | | | | | |
| Global ex-U.S. Growth Fund | | Level 1 | | | Level 2 | | | Level 3 | |
Investments in Securities | | | | | | | | | | | | |
Common Stocks* | | $ | 55,216,477 | | | $ | — | | | $ | — | |
Money Market Funds | | | — | | | | 2,803,519 | | | | — | |
Exchange-Traded Funds | | | 385,394 | | | | — | | | | — | |
Total | | | 55,601,871 | | | | 2,803,519 | | | | — | |
Unrealized Depreciation on Forward Foreign Currency Contracts | | | — | | | | (16 | ) | | | — | |
Total - Net | | $ | 55,601,871 | | | $ | 2,803,503 | | | $ | — | |
| | | | | | | | | | | | |
| Japan SmallCap Dividend Fund | | Level 1 | | | Level 2 | | | Level 3 | |
Investments in Securities | | | | | | | | | | | | |
Common Stocks* | | $ | 190,916,160 | | | $ | — | | | $ | — | |
Money Market Funds | | | — | | | | 22,344,736 | | | | — | |
Total | | | 190,916,160 | | | | 22,344,736 | | | | — | |
Unrealized Depreciation on Forward Foreign Currency Contracts | | | — | | | | 795 | | | | — | |
Total - Net | | $ | 190,916,160 | | | $ | 22,345,531 | | | $ | — | |
| | | | |
| WisdomTree International Dividend and Sector Funds | | | 157 | |
Notes to Financial Statements (continued)
| | | | | | | | | | | | |
| Asia Pacific ex-Japan Fund | | Level 1 | | | Level 2 | | | Level 3 | |
Investments in Securities | | | | | | | | | | | | |
Common Stocks* | | $ | 87,186,174 | | | $ | — | | | $ | — | |
Money Market Funds | | | — | | | | 2,242,390 | | | | — | |
Exchange-Traded Funds | | | 2,198,209 | | | | — | | | | — | |
Total | | $ | 89,384,383 | | | $ | 2,242,390 | | | $ | — | |
| | | | | | | | | | | | |
| Australia Dividend Fund | | Level 1 | | | Level 2 | | | Level 3 | |
Investments in Securities | | | | | | | | | | | | |
Common Stocks* | | $ | 61,019,088 | | | $ | — | | | $ | — | |
Money Market Funds | | | — | | | | 8,669,129 | | | | — | |
Total | | $ | 61,019,088 | | | $ | 8,669,129 | | | $ | — | |
| | | | | | | | | | | | |
| International LargeCap Dividend Fund | | Level 1 | | | Level 2 | | | Level 3 | |
Investments in Securities | | | | | | | | | | | | |
Common Stocks* | | $ | 166,205,124 | | | $ | — | | | $ | — | |
Money Market Funds | | | — | | | | 13,218,000 | | | | — | |
Exchange-Traded Funds | | | 30,021 | | | | — | | | | — | |
Total | | $ | 166,235,145 | | | $ | 13,218,000 | | | $ | — | |
| | | | | | | | | | | | |
| International Dividend ex-Financials Fund | | Level 1 | | | Level 2 | | | Level 3 | |
Investments in Securities | | | | | | | | | | | | |
Common Stocks* | | $ | 354,465,014 | | | $ | — | | | $ | — | |
Money Market Funds | | | — | | | | 18,845,635 | | | | — | |
Exchange-Traded Funds | | | 5,215 | | | | — | | | | — | |
Total | | $ | 354,470,229 | | | $ | 18,845,635 | | | $ | — | |
| | | | | | | | | | | | |
| International MidCap Dividend Fund | | Level 1 | | | Level 2 | | | Level 3 | |
Investments in Securities | | | | | | | | | | | | |
Common Stocks | | | | | | | | | | | | |
Spain | | $ | 4,102,107 | | | $ | 3,127 | | | $ | — | |
Other* | | | 100,814,375 | | | | — | | | | — | |
Money Market Funds | | | — | | | | 12,900,866 | | | | — | |
Exchange-Traded Funds | | | 83,013 | | | | — | | | | — | |
Total | | | 104,999,495 | | | | 12,903,993 | | | | — | |
| | | | | | | | | | | | |
| International SmallCap Dividend Fund | | Level 1 | | | Level 2 | | | Level 3 | |
Investments in Securities | | | | | | | | | | | | |
Common Stocks | | | | | | | | | | | | |
Australia | | $ | 67,561,755 | | | $ | 389,213 | | | $ | — | |
Other* | | | 352,328,019 | | | | — | | | | — | �� |
Money Market Funds | | | — | | | | 53,904,019 | | | | — | |
Exchange-Traded Funds | | | 232,186 | | | | — | | | | — | |
Total | | | 420,121,960 | | | | 54,293,232 | | | | — | |
Unrealized Depreciation on Forward Foreign Currency Contracts | | | — | | | | (389 | ) | | | — | |
Total - Net | | $ | 420,121,960 | | | $ | 54,292,843 | | | $ | — | |
| | |
| 158 | | WisdomTree International Dividend and Sector Funds |
Notes to Financial Statements (continued)
| | | | | | | | | | | | |
| Emerging Markets Equity Income Fund | | Level 1 | | | Level 2 | | | Level 3 | |
Investments in Securities | | | | | | | | | | | | |
Common Stocks | | | | | | | | | | | | |
Malaysia | | $ | 333,080,453 | | | $ | — | | | $ | 55,605 | |
Other* | | | 3,290,056,714 | | | | — | | | | — | |
Money Market Funds | | | — | | | | 91,915,662 | | | | — | |
Exchange-Traded Funds | | | 2,136,100 | | | | — | | | | — | |
Total | | | 3,625,273,267 | | | | 91,915,662 | | | | 55,605 | |
Unrealized Depreciation on Forward Foreign Currency Contracts | | | — | | | | (17,420 | ) | | | — | |
Total - Net | | $ | 3,625,273,267 | | | $ | 91,898,242 | | | $ | 55,605 | |
| | | | | | | | | | | | |
| Emerging Markets SmallCap Dividend Fund | | Level 1 | | | Level 2 | | | Level 3 | |
Investments in Securities | | | | | | | | | | | | |
Common Stocks | | | | | | | | | | | | |
Malaysia | | $ | 78,485,019 | | | $ | — | | | $ | 73,744 | |
Other* | | | 932,269,812 | | | | — | | | | — | |
Rights | | | — | | | | 8,314 | | | | — | |
Money Market Funds | | | — | | | | 15,351,433 | | | | — | |
Exchange-Traded Funds | | | 8,288,469 | | | | — | | | | — | |
Total | | | 1,019,043,300 | | | | 15,359,747 | | | | 73,744 | |
Unrealized Appreciation on Forward Foreign Currency Contracts | | | — | | | | 6,040 | | | | — | |
Unrealized Depreciation on Forward Foreign Currency Contracts | | | — | | | | (1,462 | ) | | | — | |
Total - Net | | $ | 1,019,043,300 | | | $ | 15,364,325 | | | $ | 73,744 | |
| | | | | | | | | | | | |
| Middle East Dividend Fund | | Level 1 | | | Level 2 | | | Level 3 | |
Investments in Securities | | | | | | | | | | | | |
Common Stocks* | | $ | 13,883,289 | | | $ | — | | | $ | — | |
Money Market Funds | | | — | | | | 4,567 | | | | — | |
Total | | | 13,883,289 | | | | 4,567 | | | | — | |
Unrealized Depreciation on Forward Foreign Currency Contracts | | | — | | | | (16 | ) | | | — | |
Total - Net | | $ | 13,883,289 | | | $ | 4,551 | | | $ | — | |
| | | | | | | | | | | | |
| International Hedged Equity Fund | | Level 1 | | | Level 2 | | | Level 3 | |
Investments in Securities | | | | | | | | | | | | |
Common Stocks | | | | | | | | | | | | |
Australia | | $ | 2,708,898 | | | $ | 2,270 | | | $ | — | |
Spain | | | 1,143,008 | | | | 100 | | | | — | |
Other* | | | 17,968,140 | | | | — | | | | — | |
Money Market Funds | | | — | | | | 631,404 | | | | — | |
Exchange-Traded Funds | | | 34,707 | | | | — | | | | — | |
Total | | | 21,854,753 | | | | 633,774 | | | | — | |
Unrealized Appreciation on Forward Foreign Currency Contracts | | | — | | | | 206,597 | | | | — | |
Unrealized Depreciation on Forward Foreign Currency Contracts | | | — | | | | (24,364 | ) | | | — | |
Total - Net | | $ | 21,854,753 | | | $ | 816,007 | | | $ | — | |
| | | | |
| WisdomTree International Dividend and Sector Funds | | | 159 | |
Notes to Financial Statements (continued)
| | | | | | | | | | | | |
| Commodity Country Equity Fund | | Level 1 | | | Level 2 | | | Level 3 | |
Investments in Securities | | | | | | | | | | | | |
Common Stocks* | | $ | 31,230,624 | | | $ | — | | | $ | — | |
Money Market Funds | | | — | | | | 2,944,521 | | | | — | |
Exchange-Traded Funds | | | 12,952 | | | | — | | | | — | |
Total | | | 31,243,576 | | | | 2,944,521 | | | | — | |
Unrealized Appreciation on Forward Foreign Currency Contracts | | | — | | | | 1 | | | | — | |
Total - Net | | $ | 31,243,576 | | | $ | 2,944,522 | | | $ | — | |
| | | | | | | | | | | | |
| Global Natural Resources Fund | | Level 1 | | | Level 2 | | | Level 3 | |
Investments in Securities | | | | | | | | | | | | |
Common Stocks* | | $ | 31,207,258 | | | $ | — | | | $ | — | |
Money Market Funds | | | — | | | | 1,242,130 | | | | — | |
Exchange-Traded Funds | | | 175,429 | | | | — | | | | — | |
Total | | | 31,382,687 | | | | 1,242,130 | | | | — | |
Unrealized Appreciation on Forward Foreign Currency Contracts | | | — | | | | 2 | | | | — | |
Total - Net | | $ | 31,382,687 | | | $ | 1,242,132 | | | $ | — | |
| | | | | | | | | | | | |
| Global ex-U.S. Utilities Fund | | Level 1 | | | Level 2 | | | Level 3 | |
Investments in Securities | | | | | | | | | | | | |
Common Stocks* | | $ | 29,892,976 | | | $ | — | | | $ | — | |
Money Market Funds | | | — | | | | 4,222,654 | | | | — | |
Exchange-Traded Funds | | | 158,501 | | | | — | | | | — | |
Total | | $ | 30,051,477 | | | $ | 4,222,654 | | | $ | — | |
| | | | | | | | | | | | |
| Global ex-U.S. Real Estate Fund | | Level 1 | | | Level 2 | | | Level 3 | |
Investments in Securities | | | | | | | | | | | | |
Common Stocks* | | $ | 107,843,095 | | | $ | — | | | $ | — | |
Money Market Funds | | | — | | | | 9,247,240 | | | | — | |
Total | | | 107,843,095 | | | | 9,247,240 | | | | — | |
Unrealized Appreciation on Forward Foreign Currency Contracts | | | — | | | | 549 | | | | — | |
Unrealized Depreciation on Forward Foreign Currency Contracts | | | — | | | | (1,525 | ) | | | — | |
Total - Net | | $ | 107,843,095 | | | $ | 9,246,264 | | | $ | — | |
* Please refer to Schedule of Investments for a breakdown of the valuation by industry type and country. | |
The following is a reconciliation of assets in which significant unobservable inputs (Level 3) were used in determining fair value. All transfers in or out of Level 3 are done using the beginning of period method. For the fiscal year ended March 31, 2012, there were no transfers in or out of Level 3.
| | | | |
| Europe SmallCap Dividend Fund | | Common Stocks | |
Balance as of April 1, 2011 | | $ | — | |
Realized gain (loss)1 | | | (4,227 | ) |
Change in unrealized appreciation (depreciation)2 | | | (125,018 | ) |
Purchases | | | 56,641 | |
Sales | | | (10,184 | ) |
Transfers into Level 33 | | | 82,788 | |
Transfers out of Level 34 | | | — | |
Balance as of March 31, 2012 | | $ | — | |
Net change in unrealized appreciation/(depreciation) from investments still held as of March 31, 2012 is:2 | | $ | (207,088 | ) |
| | |
| 160 | | WisdomTree International Dividend and Sector Funds |
Notes to Financial Statements (continued)
| | | | |
| International SmallCap Dividend Fund | | Common Stocks | |
Balance as of April 1, 2011 | | $ | — | |
Realized gain (loss)1 | | | (964,065 | ) |
Change in unrealized appreciation (depreciation)2 | | | 571,580 | |
Purchases | | | 214,015 | |
Sales | | | (288,637 | ) |
Transfers into Level 33 | | | 467,107 | |
Transfers out of Level 34 | | | — | |
Balance as of March 31, 2012 | | $ | — | |
Net change in unrealized appreciation/(depreciation) from investments still held as of March 31, 2012 is:2 | | $ | (210,464 | ) |
| | | | |
| Emerging Markets Equity Income Fund | | Common Stocks | |
Balance as of April 1, 2011 | | $ | — | |
Realized gain (loss)1 | | | — | |
Change in unrealized appreciation (depreciation)2 | | | (1,741 | ) |
Purchases | | | 57,346 | |
Sales | | | — | |
Transfers into Level 33 | | | | |
Transfers out of Level 34 | | | — | |
Balance as of March 31, 2012 | | $ | 55,605 | |
Net change in unrealized appreciation/(depreciation) from investments still held as of March 31, 2012 is:2 | | $ | (1,741 | ) |
| | | | |
| Emerging Market SmallCap Dividend Fund | | Common Stocks | |
Balance as of April 1, 2011 | | $ | — | |
Realized gain (loss)1 | | | — | |
Change in unrealized appreciation (depreciation)2 | | | (2,310 | ) |
Purchases | | | 76,054 | |
Sales | | | — | |
Transfers into Level 33 | | | | |
Transfers out of Level 34 | | | — | |
Balance as of March 31, 2012 | | $ | 73,744 | |
Net change in unrealized appreciation/(depreciation) from investments still held as of March 31, 2012 is:2 | | $ | (2,310 | ) |
| | | | |
| Middle East Dividend Fund | | Common Stocks | |
Balance as of April 1, 2011 | | $ | — | |
Realized gain (loss)1 | | | (105,192 | ) |
Change in unrealized appreciation (depreciation)2 | | | 120,667 | |
Purchases | | | — | |
Sales | | | (15,475 | ) |
Transfers into Level 33 | | | | |
Transfers out of Level 34 | | | — | |
Balance as of March 31, 2012 | | $ | — | |
| 1 | This amount is included in net realized gain (loss) from investment transactions in the Statement of Operations. |
| 2 | This amount is included in the net change in unrealized appreciation (depreciation) from investment transactions in the Statement of Operations. Change in unrealized appreciation (depreciation) includes net unrealized appreciation (depreciation) resulting from changes in investment values during the period and the reversal of previously recorded unrealized appreciation (depreciation) when gains or losses are realized. |
| 3 | Transfers into Level 3 are as a result of the unavailability of a quoted price in an active market for an identical investment or the unavailability of other significant observable inputs. |
| 4 | Transfers out of Level 3 are as a result of the availability of a quoted price in an active market for an identical investment or the availability of other significant observable inputs. |
Derivatives and Hedging Disclosure — Codification Topic 815 (“ASC 815”), Derivatives and Hedging, requires qualitative disclosures about objectives and strategies for using derivatives, quantitative disclosures about fair value amounts of gains and losses on derivative instruments, and disclosures about credit-risk-related contingent features in derivative agreements. The Funds have invested in derivatives, specifically forward foreign currency contracts for the fiscal year ended March 31, 2012 which are detailed in the table herein. The Funds’ derivative agreements contain credit-risk related contingent features which include, but are not limited to, a percentage decline in the Funds’ NAV or net assets over a specified time period. If an event occurred that triggered a contingent feature, the counterparty to the agreement may require the Funds to post additional collateral or terminate the derivative positions and demand payment. Any collateral posted with respect to the derivative positions would be used to offset or reduce the payment. The maximum exposure to derivatives agreements with credit-risk related contingent features would be the total value of derivatives in net liability positions for each Fund. As of March 31, 2012 the Funds did not have collateral posted with any counterparty.
| | | | |
| WisdomTree International Dividend and Sector Funds | | | 161 | |
Notes to Financial Statements (continued)
The Funds listed below have invested in derivatives, specifically forward foreign currency contracts for the fiscal year ended March 31, 2012, which are detailed in the table herein. All of the derivative instruments disclosed and described herein are subject to credit risk. Credit risk is where the financial condition of an issuer of a security or instrument may cause it to default or become unable to pay interest or principal due on the security. The counterparty to a derivative contract might default on its obligations. The effect of such derivative instruments on each Fund’s financial position and financial performance as reflected in the Statements of Assets and Liabilities and Statements of Operations are presented in the summary below.
| | | | | | | | | | | | |
Derivatives not designated as hedging
instruments, carried at fair value | | Asset Derivatives | | | Liability Derivatives | |
| | | |
| | Balance Sheet Location | | Fair Value | | | Balance Sheet Location | | Fair Value | |
DEFA Equity Income Fund | | | | | | | | | | | | |
Foreign exchange contracts | | Unrealized appreciation on forward foreign currency contracts | | $ | 118 | | | Unrealized depreciation on forward foreign currency contracts | | $ | — | |
Global Equity Income Fund | | | | | | | | | | | | |
Foreign exchange contracts | | Unrealized appreciation on forward foreign currency contracts | | | 57 | | | Unrealized depreciation on forward foreign currency contracts | | | — | |
Europe SmallCap Dividend Fund | | | | | | | | | | | | |
Foreign exchange contracts | | Unrealized appreciation on forward foreign currency contracts | | | 465 | | | Unrealized depreciation on forward foreign currency contracts | | | — | |
| | | |
Equity contracts | | Investment in securities | | | 188 | | | | | | — | |
Japan Hedged Equity Fund | | | | | | | | | | | | |
Foreign exchange contracts | | Unrealized appreciation on forward foreign currency contracts | | | 8,806,044 | | | Unrealized depreciation on forward foreign currency contracts | | | 348,516 | |
Global ex-U.S. Growth Fund | | | | | | | | | | | | |
Foreign exchange contracts | | Unrealized appreciation on forward foreign currency contracts | | | — | | | Unrealized depreciation on forward foreign currency contracts | | | 16 | |
Japan SmallCap Dividend Fund | | | | | | | | | | | | |
Foreign exchange contracts | | Unrealized appreciation on forward foreign currency contracts | | | 795 | | | Unrealized depreciation on forward foreign currency contracts | | | — | |
International SmallCap Dividend Fund | | | | | | | | | | | | |
Foreign exchange contracts | | Unrealized appreciation on forward foreign currency contracts | | | — | | | Unrealized depreciation on forward foreign currency contracts | | | 389 | |
Emerging Markets Equity Income Fund | | | | | | | | | | | | |
Foreign exchange contracts | | Unrealized appreciation on forward foreign currency contracts | | | — | | | Unrealized depreciation on forward foreign currency contracts | | | 17,420 | |
Emerging Markets SmallCap Dividend Fund | | | | | | | | | | | | |
Foreign exchange contracts | | Unrealized appreciation on forward foreign currency contracts | | | 6,040 | | | Unrealized depreciation on forward foreign currency contracts | | | 1,462 | |
| | | |
Equity contracts | | Investment in securities | | | 8,314 | | | | | | — | |
Middle East Dividend Fund | | | | | | | | | | | | |
Foreign exchange contracts | | Unrealized appreciation on forward foreign currency contracts | | | — | | | Unrealized depreciation on forward foreign currency contracts | | | 16 | |
International Hedged Equity Fund | | | | | | | | | | | | |
Foreign exchange contracts | | Unrealized appreciation on forward foreign currency contracts | | | 206,598 | | | Unrealized depreciation on forward foreign currency contracts | | | 24,365 | |
Commodity Country Equity Fund | | | | | | | | | | | | |
Foreign exchange contracts | | Unrealized appreciation on forward foreign currency contracts | | | 1 | | | Unrealized depreciation on forward foreign currency contracts | | | — | |
Global Natural Resources Fund | | | | | | | | | | | | |
Foreign exchange contracts | | Unrealized appreciation on forward foreign currency contracts | | | 2 | | | Unrealized depreciation on forward foreign currency contracts | | | — | |
Global ex-U.S. Real Estate Fund | | | | | | | | | | | | |
Foreign exchange contracts | | Unrealized appreciation on forward foreign currency contracts | | | 549 | | | Unrealized depreciation on forward foreign currency contracts | | | 1,525 | |
| | |
| 162 | | WisdomTree International Dividend and Sector Funds |
Notes to Financial Statements (continued)
Gain or (Loss) associated with derivatives outstanding throughout the fiscal year ended March 31, 2012 are as follows:
| | | | | | | | |
| Derivatives not designated as hedging instruments, carried at fair value | | Amount of Realized
Gain or (Loss) on Derivatives
Recognized1 | | | Change in Unrealized
Appreciation or (Depreciation) on
Derivatives Recognized2 | |
DEFA Fund | | | | | | | | |
Foreign exchange contracts | | $ | 30,399 | | | $ | 2,807 | |
DEFA Equity Income Fund | | | | | | | | |
Foreign exchange contracts | | | (17,553 | ) | | | 118 | |
Global Equity Income Fund | | | | | | | | |
Foreign exchange contracts | | | 12,662 | | | | (158 | ) |
Europe SmallCap Dividend Fund | | | | | | | | |
Foreign exchange contracts | | | 21,399 | | | | 465 | |
| | | | |
Equity contracts | | | — | | | | 188 | |
Japan Hedged Equity Fund | | | | | | | | |
Foreign exchange contracts | | | (18,182,967 | ) | | | (399,517 | ) |
Global ex-U.S. Growth Fund | | | | | | | | |
Foreign exchange contracts | | | 12,188 | | | | (16 | ) |
Japan SmallCap Dividend Fund | | | | | | | | |
Foreign exchange contracts | | | (1,989 | ) | | | 795 | |
Asia-Pacific ex-Japan Fund | | | | | | | | |
Foreign exchange contracts | | | (133,694 | ) | | | (82 | ) |
| | | | |
Equity contracts | | | — | | | | (60 | ) |
Australia Dividend Fund | | | | | | | | |
Foreign exchange contracts | | | (11,341 | ) | | | 10 | |
International LargeCap Dividend Fund | | | | | | | | |
Foreign exchange contracts | | | 3,431 | | | | — | |
International Dividend ex-Financials Fund | | | | | | | | |
Foreign exchange contracts | | | (168,446 | ) | | | — | |
International MidCap Dividend Fund | | | | | | | | |
Foreign exchange contracts | | | (37,526 | ) | | | — | |
International SmallCap Dividend Fund | | | | | | | | |
Foreign exchange contracts | | | (52,267 | ) | | | 1,778 | |
Emerging Markets Equity Income Fund | | | | | | | | |
Foreign exchange contracts | | | (5,189,858 | ) | | | (17,420 | ) |
Emerging Markets SmallCap Dividend Fund | | | | | | | | |
Foreign exchange contracts | | | (992,216 | ) | | | (3,457 | ) |
| | | | |
Equity contracts | | | — | | | | (238,456 | ) |
Middle East Dividend Fund | | | | | | | | |
Foreign exchange contracts | | | (7,265 | ) | | | (8 | ) |
International Hedged Equity Fund | | | | | | | | |
Foreign exchange contracts | | | 39,249 | | | | 432,779 | |
Commodity Country Equity Fund | | | | | | | | |
Foreign exchange contracts | | | 27,570 | | | | (57 | ) |
Global Natural Resources Fund | | | | | | | | |
Foreign exchange contracts | | | (227,867 | ) | | | (2 | ) |
Global ex-U.S. Utilities Fund | | | | | | | | |
Foreign exchange contracts | | | (97,172 | ) | | | — | |
Global ex-U.S. Real Estate Fund | | | | | | | | |
Foreign exchange contracts | | | (84,148 | ) | | | (898 | ) |
| |
1 Realizedgains (losses) on derivatives are located on the Statement of Operations as follows: | | | | | |
| | |
Foreign exchange contracts | | Net realized gain (loss) from forward foreign currency contracts
and foreign currency related transactions. |
|
2 Changein unrealized appreciation (depreciation) is located on the Statement of Operations as follows: |
| | |
Foreign exchange contracts | | Net change in unrealized appreciation (depreciation) from forward foreign currency contracts and translation of assets and liabilities denominated in foreign currencies. |
Equity contracts | | Net change in unrealized appreciation (depreciation) from investment transactions. |
| | | | |
| WisdomTree International Dividend and Sector Funds | | | 163 | |
Notes to Financial Statements (continued)
During the fiscal year ended March 31, 2012, the volume of derivative activity for the Funds was as follows:
| | | | | | | | |
| | | Average Notional | |
| Fund | | Forward foreign
currency
contracts
(to deliver) | | | Forward foreign
currency
contracts
(to receive) | |
DEFA Fund | | | | | | | | |
Forward exchange contracts | | $ | — | | | $ | 58,646 | |
DEFA Equity Income Fund | | | | | | | | |
Forward exchange contracts | | | 33,610 | | | | 19,322 | |
Global Equity Income Fund | | | | | | | | |
Forward exchange contracts | | | 10,539 | | | | 25,187 | |
Europe SmallCap Dividend Fund | | | | | | | | |
Forward exchange contracts | | | 19,902 | | | | 8,706 | |
Japan Hedged Equity Fund | | | | | | | | |
Forward exchange contracts | | | 214,262,686 | | | | 718,171,658 | |
Global ex-U.S. Growth Fund | | | | | | | | |
Forward exchange contracts | | | 7,728 | | | | 8,316 | |
Japan SmallCap Dividend Fund | | | | | | | | |
Forward exchange contracts | | | 79,173 | | | | 60,081 | |
Asia Pacific ex-Japan Fund | | | | | | | | |
Forward exchange contracts | | | 15,465 | | | | 46,260 | |
Australia Dividend Fund | | | | | | | | |
Forward exchange contracts | | | 6,154 | | | | 1,776 | |
International LargeCap Dividend Fund | | | | | | | | |
Forward exchange contracts | | | 22,048 | | | | 27,351 | |
International Dividend ex-Financials Fund | | | | | | | | |
Forward exchange contracts | | | 87,853 | | | | 101,104 | |
International MidCap Dividend Fund | | | | | | | | |
Forward exchange contracts | | | — | | | | 66,690 | |
International SmallCap Dividend Fund | | | | | | | | |
Forward exchange contracts | | | 241,539 | | | | 401,367 | |
Emerging Markets Equity Income Fund | | | | | | | | |
Forward exchange contracts | | | 3,069,559 | | | | 701,246 | |
Emerging Markets SmallCap Dividend Fund | | | | | | | | |
Forward exchange contracts | | | 1,036,376 | | | | 103,813 | |
Middle East Dividend Fund | | | | | | | | |
Forward exchange contracts | | | 8,907 | | | | 23,260 | |
International Hedged Equity Fund | | | | | | | | |
Forward exchange contracts | | | 7,890,166 | | | | 26,842,637 | |
Commodity Country Equity Fund | | | | | | | | |
Forward exchange contracts | | | — | | | | 6,634 | |
Global Natural Resources Fund | | | | | | | | |
Forward exchange contracts | | | 4,072 | | | | 22,769 | |
Global ex-U.S. Utilities Fund | | | | | | | | |
Forward exchange contracts | | | 223 | | | | 9,477 | |
Global ex-U.S. Real Estate Fund | | | | | | | | |
Forward exchange contracts | | | 56,336 | | | | 21,430 | |
Investment Transactions and Investment Income — Investment transactions are recorded as of the date that the securities are purchased or sold (trade date). Realized gains and losses on sales of portfolio securities are calculated using the identified-cost method. Dividend income is recognized on the ex-dividend date, net of any foreign taxes withheld. Interest income including amortization of premiums and discounts, is accrued daily. The value of additional securities received as dividend payments is recorded as income and as an increase to the cost basis of such securities.
Foreign Currency Translation — The accounting records of the Funds are maintained in U.S. dollars. Foreign currencies, as well as investment securities and other assets and liabilities denominated in foreign currencies, are translated into U.S. dollars using
| | |
| 164 | | WisdomTree International Dividend and Sector Funds |
Notes to Financial Statements (continued)
exchange rates prevailing on the respective dates of such transactions that are deemed, appropriate by WTAM. Realized and unrealized foreign exchange gains and losses on investments are included as a component of net realized gain (loss) from investment transactions and net change in unrealized appreciation (depreciation) from investment transactions, respectively, on the Statement of Operations. Net realized and unrealized foreign exchange gains or losses arising from sales of foreign currencies, including gains and losses of forward foreign currency contracts, currency gains or losses recognized between the trade and settlement dates on investment transactions, and the difference between the amounts of dividends and foreign withholding taxes recorded on the Funds’ books and the U.S. dollar equivalent of the amounts actually received or paid are included in net realized gain (loss) from forward foreign currency contracts and foreign currency related transactions and/or net change in unrealized appreciation (depreciation) from forward foreign currency contracts and translation of assets and liabilities denominated in foreign currencies in the Statement of Operations. Certain foreign exchange gains and losses included in realized and unrealized gains or losses are included in, or are a reduction of, ordinary income in accordance with U.S. Federal income tax regulations.
Expenses/Reimbursements — WTAM has agreed to pay all expenses of the Funds (other than the Middle East Dividend Fund and International Hedged Equity Fund), except for: (i) brokerage expenses and other expenses (such as stamp taxes) connected with the execution of portfolio transactions or in connection with creation and redemption transactions; (ii) legal fees or expenses in connection with any arbitration, litigation or pending or threatened arbitration or litigation, including any settlements in connection therewith; (iii) compensation and expenses of each Independent Trustee; (iv) compensation and expenses of counsel to the Independent Trustees; (v) compensation and expenses of the Trust’s chief compliance officer (“CCO”); (vi) extraordinary expenses; (vii) distribution fees and expenses paid by the Trust under any distribution plan adopted pursuant to Rule 12b-1 under the 1940 Act; and (viii) the advisory fee payable to WTAM.
Pursuant to a separate contractual arrangement, WTAM has arranged for the provision of CCO services to the Funds, and is liable and responsible for, and administers, payments to the CCO, the Independent Trustees and counsel to the Independent Trustees, in exchange for a service fee paid by each Fund, of up to 0.0044% of each Fund’s average daily net assets. Trustees’ fees, which are included in Service Fees on the Statements of Operations, of $221,190 have been paid on behalf of the Funds of the Trust to the Independent Trustees for the fiscal year ended March 31, 2012. Expenses in excess of 0.0044% were paid by WTAM. WTAM has agreed to limit the total expenses of the Middle East Dividend Fund to 0.88% and International Hedged Equity Fund to 0.58% through July 31, 2013.
Currency Transactions— The Funds may enter into foreign currency forward and foreign currency futures contracts to facilitate local securities settlements or to protect against currency exposure in connection with distributions to shareholders. The Funds, other than Japan Hedged Equity Fund and International Hedged Equity Fund, do not expect to engage in currency transactions for the purpose of hedging against declines in the value of a Fund’s assets that are denominated in one or more foreign currencies. The Funds may not enter into such contracts for speculative purposes.
Forward Foreign Currency Contracts— A forward foreign currency contract (“Forward Contract”) involves an obligation to purchase or sell a specific currency at a future date, which may be any fixed number of days from the date of the contract agreed upon by the parties, at a price set at the time of the contract. These contracts are principally traded in the inter-bank market conducted directly between currency traders (usually large, commercial banks) and their customers. A Forward Contract generally has no margin deposit requirement, and no commissions are charged at any stage for trades.
Risks may arise upon entering into Forward Contracts from the potential inability of counterparties to meet the terms of their contracts and from unanticipated movements in the value of foreign currencies relative to the U.S. dollar or each other.
Fluctuations in the value of open Forward Contracts are recorded for book purposes as unrealized gains or losses on Forward Contracts by the Funds. Realized gains and losses on Forward Contracts include net gains or losses recognized by the Funds on contracts which have matured.
The following Forward Contracts were open at March 31, 2012:
| | | | | | | | | | | | | | | | | | | | | | |
| Fund Name | | Settlement Date | | | | | Contracts
To Deliver | | | | | | In
Exchange For | | | Unrealized
Gain (Loss) | |
DEFA Equity Income Fund | | 4/03/12 | | | AUD | | | | 13,705 | | | | USD | | | | 14,213 | | | $ | 16 | |
| | 4/03/12 | | | EUR | | | | 9,608 | | | | USD | | | | 12,819 | | | | 24 | |
| | 4/03/12 | | | SEK | | | | 208,969 | | | | USD | | | | 31,571 | | | | 78 | |
| | | | | | | | | | | | | | | | | | | | | $ | 118 | |
Global Equity Income Fund | | 4/02/12 | | | CAD | | | | 12,024 | | | | USD | | | | 12,054 | | | $ | 23 | |
| | 4/03/12 | | | EUR | | | | 3,919 | | | | USD | | | | 5,228 | | | | 9 | |
| | | | |
| WisdomTree International Dividend and Sector Funds | | | 165 | |
Notes to Financial Statements (continued)
| | | | | | | | | | | | | | | | | | | | | | |
| Fund Name | | Settlement Date | | | | | Contracts
To Deliver | | | | | | In
Exchange For | | | Unrealized
Gain (Loss) | |
| | 4/03/12 | | | HKD | | | | 42,405 | | | | USD | | | | 5,462 | | | $ | — | |
| | 4/03/12 | | | SEK | | | | 58,984 | | | | USD | | | | 8,914 | | | | 25 | |
| | | | | | | | | | | | | | | | | | | | | $ | 57 | |
Europe SmallCap Dividend Fund | | 4/03/12 | | | USD | | | | 28,275 | | | | DKK | | | | 158,396 | | | $ | 78 | |
| | | | | USD | | | | 43,311 | | | | NOK | | | | 249,256 | | | | 387 | |
| | | | | | | | | | | | | | | | | | | | | $ | 465 | |
Japan Hedged Equity Fund | | 4/02/12 | | | USD | | | | 803,703 | | | | JPY | | | | 66,536,858 | | | $ | 4,814 | |
| | 4/04/12 | | | USD | | | | 222,663,790 | | | | JPY | | | | 18,324,116,636 | | | | 1,493 | |
| | 4/04/12 | | | USD | | | | 163,149,778 | | | | JPY | | | | 13,426,313,099 | | | | (96 | ) |
| | 4/04/12 | | | USD | | | | 184,086,586 | | | | JPY | | | | 15,149,221,521 | | | | (1,003 | ) |
| | 4/04/12 | | | USD | | | | 7,823,799 | | | | JPY | | | | 643,859,517 | | | | — | |
| | 4/04/12 | | | JPY | | | | 13,845,885,382 | | | | USD | | | | 171,107,965 | | | | 2,859,854 | |
| | 4/04/12 | | | JPY | | | | 13,426,313,099 | | | | USD | | | | 165,922,875 | | | | 2,773,192 | |
| | 4/04/12 | | | JPY | | | | 14,685,029,951 | | | | USD | | | | 181,475,902 | | | | 3,030,936 | |
| | 4/04/12 | | | JPY | | | | 571,656,314 | | | | USD | | | | 7,082,229 | | | | 135,755 | |
| | 4/04/12 | | | JPY | | | | 286,874,852 | | | | USD | | | | 3,484,028 | | | | (1,928 | ) |
| | 4/04/12 | | | JPY | | | | 1,592,425,151 | | | | USD | | | | 19,264,994 | | | | (85,341 | ) |
| | 4/04/12 | | | JPY | | | | 444,804,973 | | | | USD | | | | 5,319,259 | | | | (85,783 | ) |
| | 4/04/12 | | | JPY | | | | 2,046,661,534 | | | | USD | | | | 24,710,554 | | | | (159,429 | ) |
| | 5/07/12 | | | JPY | | | | 17,517,600,013 | | | | USD | | | | 212,917,811 | | | | (6,470 | ) |
| | 5/07/12 | | | JPY | | | | 16,016,091,441 | | | | USD | | | | 194,671,262 | | | | (2,366 | ) |
| | 5/07/12 | | | JPY | | | | 16,516,594,298 | | | | USD | | | | 200,751,079 | | | | (6,100 | ) |
| | | | | | | | | | | | | | | | | | | | | $ | 8,457,528 | |
Global ex-U.S. Growth Fund | | 4/02/12 | | | KRW | | | | 7,859,729 | | | | USD | | | | 6,927 | | | $ | (10 | ) |
| | 4/02/12 | | | USD | | | | 5,737 | | | | TWD | | | | 169,150 | | | | (6 | ) |
| | | | | | | | | | | | | | | | | | | | | $ | (16 | ) |
Japan SmallCap Dividend Fund | | 4/03/12 | | | USD | | | | 769,674 | | | | JPY | | | | 63,405,760 | | | $ | 795 | |
International SmallCap Dividend Fund | | 4/02/12 | | | GBP | | | | 89,500 | | | | USD | | | | 142,609 | | | $ | (389 | ) |
Emerging Markets Equity Income Fund | | 4/05/12 | | | ZAR | | | | 19,200,000 | | | | USD | | | | 2,484,355 | | | $ | (17,420 | ) |
Emerging Markets SmallCap Dividend Fund | | 4/02/12 | | | USD | | | | 1,213,017 | | | | BRL | | | | 2,217,395 | | | $ | 2,460 | |
| | 4/02/12 | | | USD | | | | 304,683 | | | | IDR | | | | 2,795,463,037 | | | | 1,033 | |
| | 4/02/12 | | | USD | | | | 1,418,318 | | | | MYR | | | | 4,352,819 | | | | 2,546 | |
| | 4/02/12 | | | USD | | | | 675,100 | | | | PHP | | | | 28,971,924 | | | | (315 | ) |
| | 4/02/12 | | | USD | | | | 884,771 | | | | THB | | | | 27,259,798 | | | | (1,147 | ) |
| | 4/03/12 | | | USD | | | | 1,942 | | | | MYR | | | | 5,952 | | | | 1 | |
| | | | | | | | | | | | | | | | | | | | | $ | 4,578 | |
Middle East Dividend Fund | | 4/02/12 | | | AED | | | | 104,500 | | | | USD | | | | 28,449 | | | $ | (2 | ) |
| | 4/02/12 | | | QAR | | | | 18,700 | | | | USD | | | | 5,136 | | | | — | |
| | 4/02/12 | | | USD | | | | 14,435 | | | | KWD | | | | 4,007 | | | | (13 | ) |
| | 4/02/12 | | | OMR | | | | 1,463 | | | | USD | | | | 3,799 | | | | (1 | ) |
| | | | | | | | | | | | | | | | | | | | | $ | (16 | ) |
International Hedged Equity Fund | | 4/03/12 | | | HKD | | | | 13,500 | | | | USD | | | | 1,738 | | | $ | — | |
| | 4/04/12 | | | AUD | | | | 2,349,294 | | | | USD | | | | 2,528,757 | | | | 95,288 | |
| | 4/04/12 | | | AUD | | | | 255,244 | | | | USD | | | | 268,252 | | | | 3,863 | |
| | 4/04/12 | | | AUD | | | | 2,700 | | | | USD | | | | 2,794 | | | | (3 | ) |
| | 4/04/12 | | | CHF | | | | 1,223,260 | | | | USD | | | | 1,358,318 | | | | 4,916 | |
| | 4/04/12 | | | CHF | | | | 133,947 | | | | USD | | | | 145,855 | | | | (2,342 | ) |
| | 4/04/12 | | | CHF | | | | 2,000 | | | | USD | | | | 2,215 | | | | 3 | |
| | 4/04/12 | | | DKK | | | | 7,000 | | | | USD | | | | 1,255 | | | | 2 | |
| | 4/04/12 | | | EUR | | | | 4,904,082 | | | | USD | | | | 6,560,975 | | | | 30,185 | |
| | |
| 166 | | WisdomTree International Dividend and Sector Funds |
Notes to Financial Statements (continued)
| | | | | | | | | | | | | | | | | | | | | | |
| Fund Name | | Settlement Date | | | | | Contracts
To Deliver | | | | | | In
Exchange For | | | Unrealized
Gain (Loss) | |
| | 4/04/12 | | | EUR | | | | 526,694 | | | | USD | | | | 691,138 | | | $ | (10,263 | ) |
| | 4/04/12 | | | EUR | | | | 1,900 | | | | USD | | | | 2,535 | | | | 4 | |
| | 4/04/12 | | | GBP | | | | 2,472,018 | | | | USD | | | | 3,947,961 | | | | (1,680 | ) |
| | 4/04/12 | | | GBP | | | | 270,831 | | | | USD | | | | 425,283 | | | | (7,435 | ) |
| | 4/04/12 | | | JPY | | | | 229,157,532 | | | | USD | | | | 2,831,937 | | | | 47,332 | |
| | 4/04/12 | | | JPY | | | | 25,680,372 | | | | USD | | | | 317,763 | | | | 5,709 | |
| | 4/04/12 | | | JPY | | | | 250,000 | | | | USD | | | | 3,018 | | | | (20 | ) |
| | 4/04/12 | | | NOK | | | | 2,282,487 | | | | USD | | | | 410,103 | | | | 9,965 | |
| | 4/04/12 | | | NOK | | | | 243,906 | | | | USD | | | | 42,953 | | | | 194 | |
| | 4/04/12 | | | SEK | | | | 4,725,167 | | | | USD | | | | 717,620 | | | | 5,528 | |
| | 4/04/12 | | | SEK | | | | 499,026 | | | | USD | | | | 73,187 | | | | (2,017 | ) |
| | 4/04/12 | | | SEK | | | | 25,000 | | | | USD | | | | 3,777 | | | | 9 | |
| | 4/04/12 | | | SGD | | | | 538,279 | | | | USD | | | | 431,680 | | | | 3,574 | |
| | 4/04/12 | | | SGD | | | | 59,209 | | | | USD | | | | 46,883 | | | | (208 | ) |
| | 4/04/12 | | | USD | | | | 2,697,893 | | | | AUD | | | | 2,604,538 | | | | (34 | ) |
| | 4/04/12 | | | USD | | | | 11,509 | | | | AUD | | | | 11,110 | | | | — | |
| | 4/04/12 | | | USD | | | | 1,501,599 | | | | CHF | | | | 1,357,207 | | | | (1 | ) |
| | 4/04/12 | | | USD | | | | 6,530,766 | | | | EUR | | | | 4,904,082 | | | | 24 | |
| | 4/04/12 | | | USD | | | | 701,401 | | | | EUR | | | | 526,694 | | | | — | |
| | 4/04/12 | | | USD | | | | 62,887 | | | | EUR | | | | 47,223 | | | | — | |
| | 4/04/12 | | | USD | | | | 4,382,357 | | | | GBP | | | | 2,742,849 | | | | 1 | |
| | 4/04/12 | | | USD | | | | 3,096,677 | | | | JPY | | | | 254,837,904 | | | | (17 | ) |
| | 4/04/12 | | | USD | | | | 106,981 | | | | JPY | | | | 8,804,017 | | | | — | |
| | 4/04/12 | | | USD | | | | 442,900 | | | | NOK | | | | 2,526,393 | | | | (4 | ) |
| | 4/04/12 | | | USD | | | | 14,652 | | | | NZD | | | | 17,881 | | | | — | |
| | 4/04/12 | | | USD | | | | 787,302 | | | | SEK | | | | 5,224,193 | | | | (6 | ) |
| | 4/04/12 | | | USD | | | | 9,916 | | | | SEK | | | | 8,963 | | | | — | |
| | 4/04/12 | | | USD | | | | 475,196 | | | | SGD | | | | 597,488 | | | | — | |
| | 4/05/12 | | | USD | | | | 9,275 | | | | HKD | | | | 72,014 | | | | — | |
| | 4/02/12 | | | USD | | | | 25,014 | | | | GBP | | | | 15,656 | | | | — | |
| | 5/03/12 | | | AUD | | | | 2,723,111 | | | | USD | | | | 2,811,400 | | | | (79 | ) |
| | 5/03/12 | | | EUR | | | | 5,355,339 | | | | USD | | | | 7,132,669 | | | | (4 | ) |
| | 5/03/12 | | | GBP | | | | 2,717,265 | | | | USD | | | | 4,340,622 | | | | (50 | ) |
| | 5/04/12 | | | CHF | | | | 1,389,016 | | | | USD | | | | 1,537,265 | | | | (58 | ) |
| | 5/04/12 | | | NOK | | | | 2,474,017 | | | | USD | | | | 433,196 | | | | (17 | ) |
| | 5/04/12 | | | SEK | | | | 5,167,331 | | | | USD | | | | 777,749 | | | | (27 | ) |
| | 5/04/12 | | | SGD | | | | 617,153 | | | | USD | | | | 490,840 | | | | (1 | ) |
| | 5/07/12 | | | JPY | | | | 266,534,154 | | | | USD | | | | 3,239,592 | | | | (98 | ) |
| | | | | | | | | | | | | | | | | | | | | $ | 182,233 | |
Commodity Country Equity Fund | | 4/02/12 | | | NZD | | | | 10,000 | | | | USD | | | | 8,196 | | | $ | 1 | |
Global Natural Resources Fund | | 4/03/12 | | | CHF | | | | 2,300 | | | | USD | | | | 2,547 | | | $ | 2 | |
Global ex-U.S. Real Estate Fund | | 4/02/12 | | | AUD | | | | 19,005 | | | | USD | | | | 19,613 | | | $ | (75 | ) |
| | 4/02/12 | | | ILS | | | | 168,577 | | | | USD | | | | 45,105 | | | | (358 | ) |
| | 4/02/12 | | | SEK | | | | 150,863 | | | | USD | | | | 22,597 | | | | (139 | ) |
| | 4/02/12 | | | USD | | | | 44,090 | | | | ILS | | | | 163,407 | | | | (21 | ) |
| | 4/02/12 | | | USD | | | | 103,286 | | | | AUD | | | | 98,948 | | | | (781 | ) |
| | 4/02/12 | | | USD | | | | 43,499 | | | | EUR | | | | 32,643 | | | | (29 | ) |
| | 4/02/12 | | | USD | | | | 43,424 | | | | GBP | | | | 27,314 | | | | 218 | |
| | 4/02/12 | | | USD | | | | 35,360 | | | | JPY | | | | 2,937,174 | | | | 331 | |
| | 4/02/12 | | | USD | | | | 67,242 | | | | SGD | | | | 84,483 | | | | (51 | ) |
| | | | |
| WisdomTree International Dividend and Sector Funds | | | 167 | |
Notes to Financial Statements (continued)
| | | | | | | | | | | | | | | | | | | | | | |
| Fund Name | | Settlement Date | | | | | Contracts
To Deliver | | | | | | In
Exchange For | | | Unrealized
Gain (Loss) | |
| | 4/03/12 | | | USD | | | | 63,993 | | | | SGD | | | | 80,433 | | | $ | (23 | ) |
| | 4/04/12 | | | USD | | | | 43,235 | | | | ZAR | | | | 331,629 | | | | (48 | ) |
| | | | | | | | | | | | | | | | | | | | | $ | (976 | ) |
Currency Legend:
AED – UAE dirham
AUD – Australian dollar
BRL – Brazilian real
CAD – Canadian dollar
CHF – Swiss franc
CLP – Chilean peso
DKK – Danish krone
EUR – Euro
GBP – British pound
HKD – Hong Kong dollar
ILS – Israeli new shekel
JPY – Japanese yen
KRW – South Korean won
KWD – Kuwaiti dinar
MYR – Malaysian ringgit
NOK – Norwegian krone
NZD – New Zealand dollar
OMR – Omani rial
PHP – Philippines peso
QAR – Qatari riyal
SEK – Swedish krona
SGD – Singapore dollar
THB – Thai baht
TWD – New Taiwan dollar
USD – U.S. dollar
ZAR – South African rand
Securities Lending — Each Fund may lend portfolio securities to certain creditworthy borrowers, including the Funds’ securities lending agent. It is the Funds’ policy that, at origination, all loans are secured by collateral of at least 102% of the value of U.S. securities loaned and 105% of the value of foreign securities loaned. Collateral in the form of cash and/or high grade debt obligations, equivalent to at least 100% of the market value of securities, is maintained at all times. The collateral can be invested in certain money market mutual funds which also have exposure to the fluctuations of the market. Each Fund receives compensation for lending its securities from interest or dividends earned on the cash or U.S. government securities held as collateral, net of fee rebates paid to the borrower plus reasonable administrative and custody fees. The dividend and interest income earned on the securities loaned is accounted for in the same manner as other dividend and interest income. The borrower pays to the Funds an amount equal to any dividends or interest received on loaned securities. The Funds retain all or a portion of the interest received on investment of cash collateral or receive a fee from the borrower. Lending portfolio securities could result in a loss or delay in recovering each Fund’s securities if the borrower defaults.
The securities lending income earned by the Funds is disclosed on the Statements of Operations.
Short-Term Investments — Each Fund may invest a portion of its assets in high-quality money market instruments on an ongoing basis to provide liquidity or for other reasons. The instruments include short-term obligations issued by the U.S. Government, negotiable certificates of deposit (“CDs”), fixed time deposits and bankers’ acceptances of U.S. and foreign banks and similar institutions, commercial papers, repurchase agreements and money market funds. CDs are short-term negotiable obligations of commercial banks. Time deposits are non-negotiable deposits maintained in banking institutions for specified periods of time at stated interest rates. Banker’s acceptances are time drafts drawn on commercial banks by borrowers, usually in connection with international transactions.
Tax Information and Dividends and Distributions to Shareholders — It is each Fund’s policy to comply with all requirements of the Internal Revenue Code of 1986, as amended (the “Code”). Each Fund intends to qualify for and to elect treatment as a separate Regulated Investment Company (“RIC”) under Subchapter M of the Code. It is the policy of each Fund to pay out dividends, if any, to investors’ at least annually. There can be no guarantee that a Fund will pay dividends. Taxable net realized gains from investment transactions, reduced by capital loss carryforwards, if any, are declared and distributed to shareholders at least annually. The capital loss carryforward amount, if any, is available to offset future net capital gains. The Funds may occasionally be required to make supplemental distributions at some other time during the year. The Trust reserves the right to declare special distributions if, in its reasonable discretion, such action is necessary or advisable to preserve the status of each Fund as a RIC or to avoid imposition of income or excise taxes on undistributed income. Dividends and distributions to shareholders are recorded on the ex-dividend date. The amount of dividends and distributions from net investment income and net realized capital gains are determined in accordance
| | |
| 168 | | WisdomTree International Dividend and Sector Funds |
Notes to Financial Statements (continued)
with the requirements of the Code and the U.S. Treasury regulations which may differ from GAAP. These book/tax differences are either considered temporary or permanent in nature. To the extent these differences are permanent in nature, such amounts are reclassified within the components of net assets based on their Federal tax basis treatment; temporary differences do not require reclassification. Dividends and distributions, which exceed earnings and profit for tax purposes, are reported for tax purposes as a return of capital to the extent of a shareholder’s tax basis, and thereafter as capital gain.
3. ADVISORY FEES AND TRANSACTIONS
WTAM has overall responsibility for the general management and administration of the Trust. WTAM also provides an investment program for each Fund. WTAM has arranged for Mellon Capital Management (“MCM”) to provide sub-advisory services to the Funds. MCM is compensated by WTAM at no additional cost to the Funds. WTAM also arranges for transfer agency, custody, fund administration, and all other non-distribution related services necessary for the Funds to operate. Under the Investment Advisory Agreement for each Fund, and as also described in Note 2, WTAM agrees to pay all expenses of the Funds (other than the Middle East Dividend Fund and the International Hedged Equity Fund), except compensation and expenses of the Independent Trustees, counsel to the Independent Trustees and the Trust’s CCO, interest expenses and taxes, brokerage expenses, and other expenses connected with the execution of portfolio transactions, any distribution fees or expenses, legal fees or expenses and extraordinary expenses. The Investment Advisory Agreement for the Middle East Dividend Fund and International Hedged Equity Fund does not require WTAM to pay any Fund expenses, except sub-advisory fees.
Pursuant to a separate contractual arrangement, as also described in Note 2, WTAM arranges for the provision of CCO services with respect to each Fund, and is liable and responsible for, and administers, payments to the CCO, the Independent Trustees and counsel to the Independent Trustees in exchange for a fee of up to 0.0044% of each Fund’s average daily net assets. WTAM has agreed to limit net annual operating expenses for the Middle East Dividend Fund to 0.88% and International Hedged Equity Fund to 0.58% through July 31, 2013. WTAM expects to receive fees from each Fund, based on a percentage of the Fund’s average daily net assets as shown in the following table:
| | | | |
| Fund | | Advisory Fee
Rate | |
DEFA Fund | | | 0.48 | % |
DEFA Equity Income Fund | | | 0.58 | % |
Global Equity Income Fund | | | 0.58 | % |
Europe SmallCap Dividend Fund | | | 0.58 | % |
Japan Hedged Equity Fund | | | 0.48 | % |
Global ex-U.S. Growth Fund | | | 0.58 | % |
Japan SmallCap Dividend Fund | | | 0.58 | % |
Asia Pacific ex-Japan Fund | | | 0.48 | % |
Australia Dividend Fund | | | 0.58 | % |
International LargeCap Dividend Fund | | | 0.48 | % |
International Dividend ex-Financials Fund | | | 0.58 | % |
International MidCap Dividend Fund | | | 0.58 | % |
International SmallCap Dividend Fund | | | 0.58 | % |
Emerging Markets Equity Income Fund | | | 0.63 | % |
Emerging Markets SmallCap Dividend Fund | | | 0.63 | % |
Middle East Dividend Fund | | | 0.68 | % |
International Hedged Equity Fund | | | 0.48 | % |
Commodity Country Equity Fund | | | 0.58 | % |
Global Natural Resources Fund | | | 0.58 | % |
Global ex-U.S. Utilities Fund | | | 0.58 | % |
Global ex-U.S. Real Estate Fund | | | 0.58 | % |
| | | | |
| WisdomTree International Dividend and Sector Funds | | | 169 | |
Notes to Financial Statements (continued)
Each Fund may purchase shares of affiliated exchange trade funds in secondary market transactions. For the fiscal year ended March 31, 2012, WTAM waived a portion of its advisory fees based on each Fund’s investment in affiliated Funds. For Middle East Dividend Fund and International Hedged Equity Fund, WTAM waived a portion of its advisory fees to comply with expense limits currently in place for these Funds. The table below indicates the waiver amounts. Please see Note 7 for additional information on Other Affiliated Parties and Transactions.
| | | | |
| Fund | | Advisory Fees
Waived/Expense
Reimbursements | |
DEFA Fund | | $ | 5,203 | |
DEFA Equity Income Fund | | | 2,245 | |
Global Equity Income Fund | | | 1,056 | |
Europe SmallCap Dividend Fund | | | 122 | |
Japan Hedged Equity Fund | | | — | |
Global ex-U.S. Growth Fund | | | 3,216 | |
Japan SmallCap Dividend Fund | | | 1,979 | |
Asia Pacific ex-Japan Fund | | | 7,180 | |
Australia Dividend Fund | | | 29 | |
International LargeCap Dividend Fund | | | 1,165 | |
International Dividend ex-Financials Fund | | | 4,056 | |
International MidCap Dividend Fund | | | 1,685 | |
International SmallCap Dividend Fund | | | 5,331 | |
Emerging Markets Equity Income Fund | | | 5,490 | |
Emerging Markets SmallCap Dividend Fund | | | 59,054 | |
Middle East Dividend Fund | | | 163,552 | |
International Hedged Equity Fund | | | 131,789 | |
Commodity Country Equity Fund | | | 243 | |
Global Natural Resources Fund | | | 1,257 | |
Global ex-U.S. Utilities Fund | | | 1,074 | |
Global ex-U.S. Real Estate Fund | | | 688 | |
4. CAPITAL SHARE TRANSACTIONS
As of March 31, 2012, there was an unlimited number of $0.001 par value shares of beneficial interest authorized by the Trust. Shares are issued and redeemed by each Fund only in Creation Units or multiples thereof. Except when aggregated in Creation Units, shares of each Fund are not redeemable. Transactions in shares for each Fund are disclosed in detail in the Statements of Changes in Net Assets. The consideration for the purchase of Creation Units of a Fund generally consist of the in-kind contribution of a designated portfolio of equity securities constituting a portfolio sampling representation of the securities included in the relevant Fund’s underlying Index and an amount of cash. The Middle East Dividend Fund issues and redeems shares on a cash basis only. Investors purchasing and redeeming Creation Units may be charged a purchase transaction fee and a redemption transaction fee to offset transfer and other transaction costs associated with the issuance and redemption of Creation Units.
5. INVESTMENT PORTFOLIO TRANSACTIONS
Purchases and sales of investments (excluding in-kind capital share transactions and short-term investments) for the year ended March 31, 2012 were as follows:
| | | | | | | | |
| Fund | | Purchases | | | Sales | |
DEFA Fund | | $ | 107,820,391 | | | $ | 108,364,819 | |
DEFA Equity Income Fund | | | 46,839,242 | | | | 46,722,625 | |
Global Equity Income Fund | | | 21,142,693 | | | | 19,814,895 | |
Europe SmallCap Dividend Fund | | | 15,053,890 | | | | 15,409,941 | |
Japan Hedged Equity Fund | | | 206,145,916 | | | | 207,730,227 | |
Global ex-U.S. Growth Fund | | | 54,101,059 | | | | 16,419,846 | |
Japan SmallCap Dividend Fund | | | 76,641,589 | | | | 77,956,594 | |
Asia Pacific ex-Japan Fund | | | 50,642,579 | | | | 45,999,355 | |
Australia Dividend Fund | | | 39,985,179 | | | | 40,178,103 | |
International LargeCap Dividend Fund | | | 32,365,972 | | | | 32,730,851 | |
| | |
| 170 | | WisdomTree International Dividend and Sector Funds |
Notes to Financial Statements (continued)
| | | | | | | | |
| Fund | | Purchases | | | Sales | |
International Dividend ex-Financials Fund | | | 64,307,389 | | | | 63,856,245 | |
International MidCap Dividend Fund | | $ | 62,103,346 | | | $ | 62,193,656 | |
International SmallCap Dividend Fund | | | 221,100,789 | | | | 222,581,811 | |
Emerging Markets Equity Income Fund | | | 2,292,254,803 | | | | 754,079,973 | |
Emerging Markets SmallCap Dividend Fund | | | 624,475,181 | | | | 458,702,187 | |
Middle East Dividend Fund | | | 6,420,732 | | | | 10,904,006 | |
International Hedged Equity Fund | | | 8,363,939 | | | | 9,307,328 | |
Commodity Country Equity Fund | | | 41,577,231 | | | | 43,168,969 | |
Global Natural Resources Fund | | | 39,961,432 | | | | 40,614,887 | |
Global ex-U.S. Utilities Fund | | | 21,735,574 | | | | 22,191,924 | |
Global ex-U.S. Real Estate Fund | | | 51,951,814 | | | | 52,591,798 | |
For the year ended March 31, 2012, the cost of purchases and the proceeds from sales resulting from in-kind capital share transactions were as follows:
| | | | | | | | |
| Fund | | Purchases | | | Redemptions | |
DEFA Fund | | $ | 33,688,678 | | | $ | 56,502,544 | |
DEFA Equity Income Fund | | | 59,749,475 | | | | — | |
Global Equity Income Fund | | | 16,789,800 | | | | — | |
Europe SmallCap Dividend Fund | | | 7,007,314 | | | | 3,562,472 | |
Japan Hedged Equity Fund | | | 399,141,087 | | | | 271,780,487 | |
Global ex-U.S. Growth Fund | | | 13,506,760 | | | | 39,829,479 | |
Japan SmallCap Dividend Fund | | | 64,747,161 | | | | 114,404,956 | |
Asia Pacific ex-Japan Fund | | | 44,703,893 | | | | 44,798,479 | |
Australia Dividend Fund | | | 39,816,278 | | | | 54,936,864 | |
International LargeCap Dividend Fund | | | 37,486,683 | | | | 21,516,367 | |
International Dividend ex-Financials Fund | | | 231,561,609 | | | | 14,010,429 | |
International MidCap Dividend Fund | | | 4,714,146 | | | | 37,376,096 | |
International SmallCap Dividend Fund | | | 14,550,153 | | | | 30,942,341 | |
Emerging Markets Equity Income Fund | | | 961,346,874 | | | | 181,393,866 | |
Emerging Markets SmallCap Dividend Fund | | | 99,795,237 | | | | 78,639,090 | |
Middle East Dividend Fund | | | — | | | | — | |
International Hedged Equity Fund | | | 6,624,070 | | | | 3,526,081 | |
Commodity Country Equity Fund | | | — | | | | 7,617,429 | |
Global Natural Resources Fund | | | 3,967,584 | | | | 12,778,545 | |
Global ex-U.S. Utilities Fund | | | 1,457,001 | | | | 4,223,897 | |
Global ex-U.S. Real Estate Fund | | | 21,699,362 | | | | 24,038,608 | |
Gains and losses on in-kind redemptions are not recognized by the Funds for tax purposes.
6. FEDERAL INCOME TAXES
At March 31, 2012, the cost of investments (including securities on loan) for Federal income tax purposes was as follows:
| | | | | | | | | | | | | | | | |
| Fund | | Tax Cost | | | Gross Unrealized
Appreciation | | | Gross Unrealized
Depreciation | | | Net Unrealized
Appreciation/
(Depreciation) | |
DEFA Fund | | $ | 423,657,738 | | | $ | 33,908,836 | | | $ | (40,867,975 | ) | | $ | (6,959,139 | ) |
DEFA Equity Income Fund | | | 202,851,429 | | | | 10,184,848 | | | | (24,594,067 | ) | | | (14,409,219 | ) |
Global Equity Income Fund | | | 94,791,487 | | | | 8,127,689 | | | | (6,534,088 | ) | | | 1,593,601 | |
Europe SmallCap Dividend Fund | | | 30,896,264 | | | | 3,268,517 | | | | (2,950,693 | ) | | | 317,824 | |
Japan Hedged Equity Fund | | | 777,450,077 | | | | 22,100,373 | | | | (26,222,901 | ) | | | (4,122,528 | ) |
Global ex-U.S. Growth Fund | | | 60,644,489 | | | | 3,303,608 | | | | (5,542,707 | ) | | | (2,239,099 | ) |
Japan SmallCap Dividend Fund | | | 206,638,204 | | | | 15,260,481 | | | | (8,637,789 | ) | | | 6,622,692 | |
Asia Pacific ex-Japan Fund | | | 91,618,542 | | | | 5,329,859 | | | | (5,321,628 | ) | | | 8,231 | |
| | | | |
| WisdomTree International Dividend and Sector Funds | | | 171 | |
Notes to Financial Statements (continued)
| | | | | | | | | | | | | | | | |
| Fund | | Tax Cost | | | Gross Unrealized
Appreciation | | | Gross Unrealized
Depreciation | | | Net Unrealized
Appreciation/
(Depreciation) | |
Australia Dividend Fund | | $ | 70,447,389 | | | $ | 3,506,487 | | | $ | (4,265,659 | ) | | $ | (759,172 | ) |
International LargeCap Dividend Fund | | | 186,639,436 | | | | 12,003,625 | | | | (19,189,916 | ) | | | (7,186,291 | ) |
International Dividend ex-Financials Fund | | | 375,130,219 | | | | 16,460,029 | | | | (18,274,384 | ) | | | (1,814,355 | ) |
International MidCap Dividend Fund | | | 118,921,564 | | | | 11,704,339 | | | | (12,722,415 | ) | | | (1,018,076 | ) |
International SmallCap Dividend Fund | | | 437,997,630 | | | | 63,607,872 | | | | (27,190,310 | ) | | | 36,417,562 | |
Emerging Markets Equity Income Fund | | | 3,557,310,131 | | | | 317,649,998 | | | | (157,715,595 | ) | | | 159,934,403 | |
Emerging Markets SmallCap Dividend Fund | | | 1,010,228,726 | | | | 121,728,995 | | | | (97,480,930 | ) | | | 24,248,065 | |
Middle East Dividend Fund | | | 13,535,868 | | | | 1,463,059 | | | | (1,111,071 | ) | | | 351,988 | |
International Hedged Equity Fund | | | 22,092,151 | | | | 1,927,051 | | | | (1,530,675 | ) | | | 396,376 | |
Commodity Country Equity Fund | | | 34,604,783 | | | | 1,745,703 | | | | (2,162,389 | ) | | | (416,686 | ) |
Global Natural Resources Fund | | | 35,027,169 | | | | 1,317,872 | | | | (3,720,224 | ) | | | (2,402,352 | ) |
Global ex-U.S. Utilities Fund | | | 38,709,538 | | | | 1,717,979 | | | | (6,153,386 | ) | | | (4,435,407 | ) |
Global ex-U.S. Real Estate Fund | | | 126,062,170 | | | | 2,329,708 | | | | (11,301,543 | ) | | | (8,971,835 | ) |
At March 31, 2012, the components of accumulated earnings/(loss) on a tax-basis were as follows:
| | | | | | | | | | | | | | | | | | | | |
| Fund | | Undistributed
Ordinary Income | | | Undistributed
Capital and
Other Losses | | | Net Unrealized
Appreciation/
(Depreciation) | | | Currency
Unrealized
Appreciation/
(Depreciation) | | | Total
Accumulated
Earnings/(Losses) | |
DEFA Fund | | $ | 1,054,629 | | | $ | (223,554,150 | ) | | $ | (6,959,139 | ) | | $ | 32,500 | | | $ | (229,426,160 | ) |
DEFA Equity Income Fund | | | 313,193 | | | | (75,774,301 | ) | | | (14,409,219 | ) | | | 6,448 | | | | (89,863,879 | ) |
Global Equity Income Fund | | | 175,826 | | | | (21,930,764 | ) | | | 1,593,601 | | | | 909 | | | | (20,160,428 | ) |
Europe SmallCap Dividend Fund | | | 98,594 | | | | (25,798,423 | ) | | | 317,824 | | | | (221 | ) | | | (25,382,226 | ) |
Japan Hedged Equity Fund | | | 6,204,475 | | | | (35,675,445 | ) | | | (4,122,528 | ) | | | 55,152 | | | | (33,538,346 | ) |
Global ex-U.S. Growth Fund | | | 73,441 | | | | (13,502,295 | ) | | | (2,239,099 | ) | | | (905 | ) | | | (15,668,858 | ) |
Japan SmallCap Dividend Fund | | | 2,595,885 | | | | (23,654,691 | ) | | | 6,622,692 | | | | 10,595 | | | | (14,425,519 | ) |
Asia Pacific ex-Japan Fund | | | 3,141 | | | | (17,458,949 | ) | | | 8,231 | | | | (3,925 | ) | | | (17,451,502 | ) |
Australia Dividend Fund | | | 127,330 | | | | (16,254,629 | ) | | | (759,172 | ) | | | (13,683 | ) | | | (16,900,154 | ) |
International LargeCap Dividend Fund | | | 310,663 | | | | (46,768,747 | ) | | | (7,186,291 | ) | | | 15,337 | | | | (53,629,038 | ) |
International Dividend ex-Financials Fund | | | 455,453 | | | | (145,192,070 | ) | | | (1,814,355 | ) | | | 2,268 | | | | (146,548,704 | ) |
International MidCap Dividend Fund | | | 477,602 | | | | (79,855,438 | ) | | | (1,018,076 | ) | | | 1,173 | | | | (80,394,739 | ) |
International SmallCap Dividend Fund | | | 3,191,318 | | | | (225,848,320 | ) | | | 36,417,562 | | | | (13,302 | ) | | | (186,252,742 | ) |
Emerging Markets Equity Income Fund | | | 5,819,234 | | | | (61,048,107 | ) | | | 159,934,403 | | | | (129,990 | ) | | | 104,575,540 | |
Emerging Markets SmallCap Dividend Fund | | | 8,436,161 | | | | (33,626,886 | ) | | | 24,248,065 | | | | 23,272 | | | | (919,388 | ) |
Middle East Dividend Fund | | | 200,602 | | | | (8,113,137 | ) | | | 351,988 | | | | (15 | ) | | | (7,560,562 | ) |
International Hedged Equity Fund | | | 69,973 | | | | (1,829,594 | ) | | | 396,376 | | | | 4,322 | | | | (1,358,923 | ) |
Commodity Country Equity Fund | | | 88,758 | | | | (14,942,355 | ) | | | (416,686 | ) | | | (301 | ) | | | (15,270,584 | ) |
Global Natural Resources Fund | | | 17,759 | | | | (13,131,965 | ) | | | (2,402,352 | ) | | | (268 | ) | | | (15,516,826 | ) |
Global ex-U.S. Utilities Fund | | | 68,845 | | | | (21,067,254 | ) | | | (4,435,407 | ) | | | (1,282 | ) | | | (25,435,098 | ) |
Global ex-U.S. Real Estate Fund | | | — | | | | (51,535,281 | ) | | | (8,971,835 | ) | | | (527 | ) | | | (60,507,643 | ) |
The tax character of distributions paid during the fiscal years ended March 31, 2012 and March 31, 2011, was as follows:
| | | | | | | | | | | | |
| | | Year Ended March 31, 2012 | | | Year Ended
March 31, 2011 | |
| Fund | | Distributions Paid
from Ordinary
Income* | | | Distributions Paid
from Return of
Capital | | | Distributions Paid
from Ordinary
Income* | |
DEFA Fund | | $ | 16,801,126 | | | $ | — | | | $ | 14,637,890 | |
DEFA Equity Income Fund | | | 6,808,884 | | | | — | | | | 5,400,141 | |
Global Equity Income Fund | | | 3,425,601 | | | | — | | | | 2,060,172 | |
Europe SmallCap Dividend Fund | | | 1,249,779 | | | | — | | | | 772,916 | |
Japan Hedged Equity Fund | | | 9,560,131 | | | | — | | | | 1,252,279 | |
| | |
| 172 | | WisdomTree International Dividend and Sector Funds |
Notes to Financial Statements (continued)
| | | | | | | | | | | | |
| | | Year Ended March 31, 2012 | | | Year Ended
March 31, 2011 | |
| Fund | | Distributions Paid
from Ordinary
Income* | | | Distributions Paid
from Return of
Capital | | | Distributions Paid
from Ordinary
Income* | |
Global ex-U.S. Growth Fund | | $ | 1,502,577 | | | $ | — | | | $ | 917,040 | |
Japan SmallCap Dividend Fund | | | 4,623,191 | | | | — | | | | 2,383,352 | |
Asia Pacific ex-Japan Fund | | | 2,604,968 | | | | — | | | | 3,365,676 | |
Australia Dividend Fund | | | 3,116,253 | | | | — | | | | 4,176,991 | |
International LargeCap Dividend Fund | | | 6,055,172 | | | | — | | | | 5,111,213 | |
International Dividend ex-Financials Fund | | | 8,893,281 | | | | — | | | | 6,504,988 | |
International MidCap Dividend Fund | | | 4,866,057 | | | | — | | | | 4,562,537 | |
International SmallCap Dividend Fund | | | 16,614,951 | | | | — | | | | 12,889,846 | |
Emerging Markets Equity Income Fund | | | 77,715,398 | | | | — | | | | 27,419,477 | |
Emerging Markets SmallCap Dividend Fund | | | 29,482,802 | | | | — | | | | 16,528,911 | |
Middle East Dividend Fund | | | 1,062,273 | | | | — | | | | 520,780 | |
International Hedged Equity Fund | | | 714,387 | | | | — | | | | 506,947 | |
Commodity Country Equity Fund | | | 1,222,114 | | | | — | | | | 781,200 | |
Global Natural Resources Fund | | | 1,347,737 | | | | — | | | | 1,511,977 | |
Global ex-U.S. Utilities Fund | | | 1,419,373 | | | | — | | | | 1,705,615 | |
Global ex-U.S. Real Estate Fund | | | 5,496,750 | | | | 371,334 | | | | 10,473,002 | |
* Includes short-term capital gains. | | | | | | | | | | | | |
At March 31, 2012, for Federal income tax purposes, the Funds have capital loss carryforwards available to offset future capital gains through the years indicated. To the extent that these loss carryforwards are utilized, capital gains so offset will not be distributed to shareholders.
| | | | | | | | | | | | | | | | | | | | | | | | | | | | | | | | |
| Fund | | Capital Loss
Available
Through 2015 | | | Capital Loss
Available
Through 2016 | | | Capital Loss
Available
Through 2017 | | | Capital Loss
Available
Through 2018 | | | Capital Loss
Available
Through 2019 | | | Short-Term
Post-Effective*
No Expiration | | | Long-Term
Post-Effective*
No Expiration | | | Capital Loss
Available
Total | |
DEFA Fund | | $ | — | | | $ | — | | | $ | 24,645,745 | | | $ | 187,173,747 | | | $ | 8,855,174 | | | $ | — | | | $ | — | | | $ | 220,674,666 | |
DEFA Equity Income Fund | | | — | | | | 972,353 | | | | 24,469,991 | | | | 41,582,445 | | | | 7,637,372 | | | | — | | | | — | | | | 74,662,161 | |
Global Equity Income Fund | | | — | | | | — | | | | 5,329,783 | | | | 15,414,669 | | | | 807,956 | | | | — | | | | — | | | | 21,552,408 | |
Europe SmallCap Dividend Fund | | | — | | | | 801,152 | | | | 6,092,078 | | | | 16,382,086 | | | | 2,102,724 | | | | — | | | | — | | | | 25,378,040 | |
Japan Hedged Equity Fund | | | 61,971 | | | | 147,026 | | | | 456,605 | | | | 3,305,242 | | | | 9,431,908 | | | | 16,533,492 | | | | 5,739,201 | | | | 35,675,445 | |
Global ex-U.S. Growth Fund | | | — | | | | 638,234 | | | | 3,657,374 | | | | 8,823,117 | | | | — | | | | 342,850 | | | | — | | | | 13,461,575 | |
Japan SmallCap Dividend Fund | | | 6,631 | | | | 450,744 | | | | 2,793,131 | | | | 13,069,045 | | | | 3,661,232 | | | | 1,639,554 | | | | 1,675,217 | | | | 23,295,554 | |
Asia Pacific ex-Japan Fund | | | 2,486 | | | | 434,717 | | | | 1,942,155 | | | | 11,545,171 | | | | 2,148,087 | | | | 308,904 | | | | 1,036,895 | | | | 17,418,415 | |
Australia Dividend Fund | | | — | | | | 23,230 | | | | 2,237,436 | | | | 10,402,798 | | | | 2,670,223 | | | | — | | | | — | | | | 15,333,687 | |
International LargeCap Dividend Fund | | | 12,856 | | | | 911,666 | | | | 10,714,056 | | | | 21,950,675 | | | | 8,092,071 | | | | — | | | | 4,492,385 | | | | 46,173,709 | |
International Dividend ex-Financials Fund | | | — | | | | — | | | | 38,137,926 | | | | 106,422,557 | | | | — | | | | — | | | | — | | | | 144,560,483 | |
International MidCap Dividend Fund | | | — | | | | 2,200,353 | | | | 10,045,031 | | | | 49,400,362 | | | | 11,183,904 | | | | — | | | | 5,899,541 | | | | 78,729,191 | |
International SmallCap Dividend Fund | | | — | | | | 2,417,649 | | | | 31,684,635 | | | | 176,126,796 | | | | 6,365,431 | | | | — | | | | 4,976,546 | | | | 221,571,057 | |
Emerging Markets Equity Income Fund | | | — | | | | 166,963 | | | | 3,240,763 | | | | 32,150,807 | | | | 561,494 | | | | 19,858,526 | | | | — | | | | 55,978,553 | |
Emerging Markets SmallCap Dividend Fund | | | — | | | | — | | | | 4,224,150 | | | | 9,367,814 | | | | 4,882,951 | | | | 11,327,466 | | | | — | | | | 29,802,381 | |
Middle East Dividend Fund | | | — | | | | — | | | | 41,648 | | | | 6,522,827 | | | | 763,315 | | | | — | | | | 63,224 | | | | 7,391,014 | |
International Hedged Equity Fund | | | — | | | | — | | | | — | | | | 108,824 | | | | 1,617,839 | | | | — | | | | 100,103 | | | | 1,826,766 | |
| | | | |
| WisdomTree International Dividend and Sector Funds | | | 173 | |
Notes to Financial Statements (continued)
| | | | | | | | | | | | | | | | | | | | | | | | | | | | | | | | |
| Fund | | Capital Loss
Available
Through 2015 | | | Capital Loss
Available
Through 2016 | | | Capital Loss
Available
Through 2017 | | | Capital Loss
Available
Through 2018 | | | Capital Loss
Available
Through 2019 | | | Short-Term
Post-Effective*
No Expiration | | | Long-Term
Post-Effective*
No Expiration | | | Capital Loss
Available
Total | |
Commodity Country Equity Fund | | $ | — | | | $ | — | | | $ | — | | | $ | 11,126,004 | | | $ | 3,769,123 | | | $ | — | | | $ | — | | | $ | 14,895,127 | |
Global Natural Resources Fund | | | — | | | | 45,822 | | | | 1,245,793 | | | | 4,858,681 | | | | 6,793,018 | | | | — | | | | 112,746 | | | | 13,056,060 | |
Global ex-U.S. Utilities Fund | | | — | | | | 13,301 | | | | 1,722,994 | | | | 5,793,876 | | | | 1,986,702 | | | | — | | | | 11,043,351 | | | | 20,560,224 | |
Global ex-U.S. Real Estate Fund | | | — | | | | 261,244 | | | | 12,351,482 | | | | 23,011,711 | | | | 10,538,886 | | | | 63,860 | | | | 4,748,371 | | | | 50,975,554 | |
| | * | Under the recently enacted Regulated Investment Company Modernization Act of 2010, a Fund is permitted to carry forward any new capital losses for an unlimited period. Additionally, such capital losses that are carried forward will retain their character as either short-term or long-term capital losses rather than being considered all short-term as under previous law. The character of these losses is noted above. |
Capital losses incurred after October 31 (“post-October capital losses”) and within the taxable year are deemed to arise on the first business day of each Fund’s next taxable year.
During the year ended March 31, 2012, the following Funds incurred and will elect to defer post-October capital losses as follows.
| | | | | | | | |
| Fund | | Short-Term Post-October Capital Losses | | | Long-Term Post-October Capital Losses | |
DEFA Fund | | $ | 872,386 | | | $ | 2,007,098 | |
DEFA Equity Income Fund | | | 505,995 | | | | 606,145 | |
Global Equity Income Fund | | | 134,025 | | | | 244,331 | |
Europe SmallCap Dividend Fund | | | 292,424 | | | | 127,959 | |
Japan Hedged Equity Fund | | | — | | | | — | |
Global ex-U.S. Growth Fund | | | 40,720 | | | | — | |
Japan SmallCap Dividend Fund | | | 108,913 | | | | 250,224 | |
Asia Pacific ex-Japan Fund | | | 40,534 | | | | — | |
Australia Dividend Fund | | | 906,117 | | | | 14,825 | |
International LargeCap Dividend Fund | | | 39,160 | | | | 555,878 | |
International Dividend ex-Financials Fund | | | 631,587 | | | | — | |
International MidCap Dividend Fund | | | 452,470 | | | | 673,777 | |
International SmallCap Dividend Fund | | | 4,182,196 | | | | 95,067 | |
Emerging Markets Equity Income Fund | | | 5,069,554 | | | | — | |
Emerging Markets SmallCap Dividend Fund | | | 3,824,505 | | | | — | |
Middle East Dividend Fund | | | 66,180 | | | | 655,943 | |
International Hedged Equity Fund | | | 2,828 | | | | — | |
Commodity Country Equity Fund | | | 47,226 | | | | 2 | |
Global Natural Resources Fund | | | 75,905 | | | | — | |
Global ex-U.S. Utilities Fund | | | 160,980 | | | | 346,050 | |
Global ex-U.S. Real Estate Fund | | | 110,158 | | | | 449,569 | |
During the fiscal year ended March 31, 2012, the following Funds utilized capital loss carryforwards of the noted amounts to offset realized gains.
| | | | |
| Fund | | Utilized
Capital Loss
Carryforwards | |
DEFA Fund | | $ | 8,061,534 | |
DEFA Equity Income Fund | | | 119,442 | |
Global Equity Income Fund | | | 1,848,914 | |
Europe SmallCap Dividend Fund | | | 315,537 | |
Japan Hedged Equity Fund | | | — | |
Global ex-U.S. Growth Fund | | | — | |
Japan SmallCap Dividend Fund | | | — | |
Asia Pacific ex-Japan Fund | | | — | |
Australia Dividend Fund | | | 269,416 | |
International LargeCap Dividend Fund | | | — | |
| | |
| 174 | | WisdomTree International Dividend and Sector Funds |
Notes to Financial Statements (continued)
| | | | |
| Fund | | Utilized
Capital Loss
Carryforwards | |
International Dividend ex-Financials Fund | | $ | 3,851,358 | |
International MidCap Dividend Fund | | | — | |
International SmallCap Dividend Fund | | | — | |
Emerging Markets Equity Income Fund | | | — | |
Emerging Markets SmallCap Dividend Fund | | | — | |
Middle East Dividend Fund | | | — | |
International Hedged Equity Fund | | | — | |
Commodity Country Equity Fund | | | 2,740,530 | |
Global Natural Resources Fund | | | — | |
Global ex-U.S. Utilities Fund | | | — | |
Global ex-U.S. Real Estate Fund | | | — | |
At March 31, 2012, the effect of permanent “book/tax” reclassifications resulted in increases (decreases) to the components of net assets as follows:
| | | | | | | | | | | | |
| Fund | | Undistributed Net
Investment
Income/(Loss) | | | Accumulated
Net Realized
Gain/(Loss) | | | Paid-in Capital | |
DEFA Fund | | $ | 11,932 | | | $ | 1,666,651 | | | $ | (1,678,583 | ) |
DEFA Equity Income Fund | | | (22,329 | ) | | | 22,329 | | | | — | |
Global Equity Income Fund | | | (17,124 | ) | | | 17,124 | | | | — | |
Europe SmallCap Dividend Fund | | | (950 | ) | | | 171,829 | | | | (170,879 | ) |
Japan Hedged Equity Fund | | | (2,545,282 | ) | | | 8,840,421 | | | | (6,295,139 | ) |
Global ex-U.S. Growth Fund | | | (82,754 | ) | | | (4,991,259 | ) | | | 5,074,013 | |
Japan SmallCap Dividend Fund | | | 367,368 | | | | (8,463,631 | ) | | | 8,096,263 | |
Asia Pacific ex-Japan Fund | | | (142,333 | ) | | | (8,121,814 | ) | | | 8,264,147 | |
Australia Dividend Fund | | | 16,333 | | | | (6,008,049 | ) | | | 5,991,716 | |
International LargeCap Dividend Fund | | | (36,304 | ) | | | (3,649,085 | ) | | | 3,685,389 | |
International Dividend ex-Financials Fund | | | (102,629 | ) | | | (441,454 | ) | | | 544,083 | |
International MidCap Dividend Fund | | | (4,437 | ) | | | (2,555,217 | ) | | | 2,559,654 | |
International SmallCap Dividend Fund | | | 288,740 | | | | (3,931,320 | ) | | | 3,642,580 | |
Emerging Markets Equity Income Fund | | | (3,050,356 | ) | | | (31,424,055 | ) | | | 34,474,411 | |
Emerging Markets SmallCap Dividend Fund | | | 5,289,587 | | | | (20,006,691 | ) | | | 14,717,104 | |
Middle East Dividend Fund | | | 17,925 | | | | (17,925 | ) | | | — | |
International Hedged Equity Fund | | | (118,013 | ) | | | (527,071 | ) | | | 645,084 | |
Commodity Country Equity Fund | | | (28,264 | ) | | | (436,493 | ) | | | 464,757 | |
Global Natural Resources Fund | | | (61,608 | ) | | | 989,300 | | | | (927,692 | ) |
Global ex-U.S. Utilities Fund | | | (51,774 | ) | | | (114,112 | ) | | | 165,886 | |
Global ex-U.S. Real Estate Fund | | | 6,292,140 | | | | (5,737,155 | ) | | | (554,985 | ) |
The differences are primarily due to redemptions-in-kind, currency gain/loss, Passive Foreign Investment Companies (“PFICs”), the tax treatment of income earned from investments in partnerships, non-deductible expenses, and non-dividend distributions from underlying investments.
GAAP provides guidance on tax provisions that prescribe a minimum threshold for financial statement recognition of the benefit of a tax position taken or expected to be taken in a tax return. Foreign taxes are provided for based on each Fund’s understanding of the tax rules and rates that exist in the foreign markets in which it invests. Taxes are accrued and applied to net investment income, net realized capital gains and net unrealized appreciation, as applicable, as the income is earned or capital gains are recorded. As of and during the fiscal year ended March 31, 2012, the Funds did not have any liabilities for unrecognized tax benefits relating to uncertain income tax positions they have taken or expect to take in the future. If applicable, the Funds will recognize interest accrued related to unrecognized tax benefits in interest expense and penalties in “Other” expenses on the Statements of Operations. The Funds file tax returns with the Internal Revenue Service, the State of New York, and various other states. Generally, each of the tax years in the four-year period ended March 31, 2012, remains subject to examination by taxing authorities.
| | | | |
| WisdomTree International Dividend and Sector Funds | | | 175 | |
Notes to Financial Statements (continued)
7. OTHER AFFILIATED PARTIES AND TRANSACTIONS
Affiliated holdings are Funds which are managed by the Trust or an affiliate of the Trust. Transactions with affiliated companies during the year ended March 31, 2012 are as follows:
| | | | | | | | | | | | | | | | | | | | |
| Affiliated Fund Name | | Value at
3/31/2011 | | | Purchases/
Additions | | | Sales/
Reductions | | | Value at
3/31/2012 | | | Dividend
Income | |
DEFA Fund | | | | | | | | | | | | | | | | | | | | |
International Dividend ex-Financials Fund | | $ | 1,723,819 | | | $ | 14,896,488 | | | $ | 15,647,046 | | | $ | 388,791 | | | $ | 105,941 | |
| | | | | |
DEFA Equity Income Fund | | | | | | | | | | | | | | | | | | | | |
International LargeCap Dividend Fund | | $ | 215,177 | | | $ | 6,406,513 | | | $ | 5,682,180 | | | $ | 820,710 | | | $ | 41,516 | |
| | | | | |
Global Equity Income Fund | | | | | | | | | | | | | | | | | | | | |
DEFA Equity Income Fund | | $ | 170,446 | | | $ | 2,320,859 | | | $ | 2,254,754 | | | $ | 178,611 | | | $ | 13,791 | |
Equity Income Fund | | | 56,591 | | | | 755,027 | | | | 757,632 | | | | 59,494 | | | | 3,380 | |
Total | | $ | 227,037 | | | $ | 3,075,886 | | | $ | 3,012,386 | | | $ | 238,105 | | | $ | 17,171 | |
| | | | | |
Europe SmallCap Dividend Fund | | | | | | | | | | | | | | | | | | | | |
International MidCap Dividend Fund | | $ | 97,451 | | | $ | 1,070,192 | | | $ | 1,142,689 | | | $ | 1,251 | | | $ | 1,100 | |
| | | | | |
Global ex-U.S. Growth Fund | | | | | | | | | | | | | | | | | | | | |
DEFA Fund | | $ | 77,100 | | | $ | 936,288 | | | $ | 896,685 | | | $ | 70,044 | | | $ | 1,196 | |
Emerging Markets Equity Income Fund | | | 51,882 | | | | 613,417 | | | | 588,846 | | | | 46,606 | | | | 941 | |
WisdomTree India Earnings Fund | | | 1,174,699 | | | | 279,976 | | | | 1,028,358 | | | | 268,744 | | | | 2,593 | |
Total | | $ | 1,303,681 | | | $ | 1,829,681 | | | $ | 2,513,889 | | | $ | 385,394 | | | $ | 4,730 | |
| | | | | |
Japan SmallCap Dividend Fund | | | | | | | | | | | | | | | | | | | | |
Japan Hedged Equity Fund | | $ | 572,259 | | | $ | 4,167,524 | | | $ | 4,694,678 | | | $ | — | | | $ | 1,611 | |
| | | | | |
Asia Pacific ex-Japan Fund | | | | | | | | | | | | | | | | | | | | |
DEFA Fund | | $ | 348,069 | | | $ | 71,314 | | | $ | 421,738 | | | $ | — | | | $ | — | |
Global ex-U.S. Real Estate Fund | | | — | | | | 1,507,526 | | | | 1,475,085 | | | | — | | | | 3,758 | |
WisdomTree India Earnings Fund | | | — | | | | 2,644,991 | | | | 167,177 | | | | 2,198,209 | | | | 14,507 | |
Total | | $ | 348,069 | | | $ | 4,223,831 | | | $ | 2,064,000 | | | $ | 2,198,209 | | | $ | 18,265 | |
| | | | | |
Australia Dividend Fund | | | | | | | | | | | | | | | | | | | | |
Asia Pacific ex-Japan Fund | | $ | 136,741 | | | $ | 283,901 | | | $ | 407,826 | | | $ | — | | | $ | 2,406 | |
| | | | | |
International LargeCap Dividend Fund | | | | | | | | | | | | | | | | | | | | |
Asia Pacific ex-Japan Fund | | $ | 390,104 | | | $ | 1,964,344 | | | $ | 2,275,091 | | | $ | — | | | $ | 23,903 | |
International MidCap Dividend Fund | | | — | | | | 2,377,381 | | | | 2,321,893 | | | | 30,021 | | | | 6,191 | |
Total | | $ | 390,104 | | | $ | 4,341,725 | | | $ | 4,596,984 | | | $ | 30,021 | | | $ | 30,094 | |
| | | | | |
International Dividend ex-Financials Fund | | | | | | | | | | | | | | | | | | | | |
International LargeCap Dividend Fund | | $ | 160,763 | | | $ | 8,425,996 | | | $ | 8,390,720 | | | $ | 5,215 | | | $ | 44,723 | |
| | | | | |
International MidCap Dividend Fund | | | | | | | | | | | | | | | | | | | | |
Australia Dividend Fund | | $ | — | | | $ | 1,209,045 | | | $ | 1,136,659 | | | $ | 41,611 | | | $ | 6,861 | |
International LargeCap Dividend Fund | | | 266,492 | | | | 890,937 | | | | 1,131,035 | | | | — | | | | 7,883 | |
International SmallCap Dividend Fund | | | 271,398 | | | | 894,324 | | | | 1,125,625 | | | | — | | | | 7,177 | |
Japan Hedged Equity Fund | | | — | | | | 1,205,585 | | | | 1,181,219 | | | | 41,402 | | | | 1,741 | |
Total | | $ | 537,890 | | | $ | 4,199,891 | | | $ | 4,574,538 | | | $ | 83,013 | | | $ | 23,662 | |
| | | | | |
International SmallCap Dividend Fund | | | | | | | | | | | | | | | | | | | | |
Europe SmallCap Dividend Fund | | $ | 724,750 | | | $ | 1,615,746 | | | $ | 2,094,314 | | | $ | 126,577 | | | $ | 29,179 | |
Japan SmallCap Dividend Fund | | | 1,376,837 | | | | 7,943,026 | | | | 9,352,490 | | | | 105,609 | | | | 11,778 | |
Total | | $ | 2,101,587 | | | $ | 9,558,772 | | | $ | 11,446,804 | | | $ | 232,186 | | | $ | 40,957 | |
| | |
| 176 | | WisdomTree International Dividend and Sector Funds |
Notes to Financial Statements (continued)
| | | | | | | | | | | | | | | | | | | | |
| Affiliated Fund Name | | Value at
3/31/2011 | | | Purchases/
Additions | | | Sales/
Reductions | | | Value at
3/31/2012 | | | Dividend
Income | |
Emerging Markets Equity Income Fund | | | | | | | | | | | | | | | | | | | | |
Emerging Markets SmallCap Dividend Fund | | $ | — | | | $ | 1,062,091 | | | $ | 1,076,181 | | | $ | — | | | $ | — | |
Global Equity Income Fund | | | 1,907,623 | | | | 6,501,608 | | | | 6,058,925 | | | | 2,136,100 | | | | 83,246 | |
Total | | $ | 1,907,623 | | | $ | 7,563,699 | | | $ | 7,135,106 | | | $ | 2,136,100 | | | $ | 83,246 | |
| | | | | |
Emerging Markets SmallCap Dividend Fund | | | | | | | | | | | | | | | | | | | | |
Emerging Markets Equity Income Fund | | $ | 4,661,410 | | | $ | 19,635,924 | | | $ | 22,203,235 | | | $ | 831,370 | | | $ | 26,496 | |
WisdomTree India Earnings Fund | | | 10,123,269 | | | | 8,878,251 | | | | 8,983,683 | | | | 7,457,099 | | | | 53,334 | |
Total | | $ | 14,784,679 | | | $ | 28,514,175 | | | $ | 31,186,918 | | | $ | 8,288,469 | | | $ | 79,830 | |
| | | | | |
International Hedged Equity Fund | | | | | | | | | | | | | | | | | | | | |
DEFA Fund | | $ | — | | | $ | 925,090 | | | $ | 859,304 | | | $ | 34,707 | | | $ | 2,132 | |
| | | | | |
Commodity Country Equity Fund | | | | | | | | | | | | | | | | | | | | |
DEFA Fund | | $ | 33,107 | | | $ | 295,128 | | | $ | 323,402 | | | $ | — | | | $ | 142 | |
Global Natural Resources Fund | | | — | | | | 474,938 | | | | 436,898 | | | | 12,952 | | | | 905 | |
Total | | $ | 33,107 | | | $ | 770,066 | | | $ | 760,300 | | | $ | 12,952 | | | $ | 1,047 | |
| | | | | |
Global Natural Resources Fund | | | | | | | | | | | | | | | | | | | | |
DEFA Fund | | $ | 121,839 | | | $ | 322,526 | | | $ | 440,265 | | | $ | — | | | $ | — | |
Global Equity Income Fund | | | — | | | | 852,037 | | | | 812,248 | | | | — | | | | 1,231 | |
WisdomTree India Earnings Fund | | | — | | | | 287,360 | | | | 66,664 | | | | 175,429 | | | | 1,268 | |
Total | | $ | 121,839 | | | $ | 1,461,923 | | | $ | 1,319,177 | | | $ | 175,429 | | | $ | 2,499 | |
| | | | | |
Global ex-U.S. Utilities Fund | | | | | | | | | | | | | | | | | | | | |
DEFA Fund | | $ | 107,423 | | | $ | 506,131 | | | $ | 608,441 | | | $ | — | | | $ | — | |
Global ex-U.S. Real Estate Fund | | | — | | | | 469,618 | | | | 454,420 | | | | — | | | | 639 | |
WisdomTree India Earnings Fund | | | — | | | | 246,732 | | | | 53,691 | | | | 158,501 | | | | 1,139 | |
Total | | $ | 107,423 | | | $ | 1,222,481 | | | $ | 1,116,552 | | | $ | 158,501 | | | $ | 1,778 | |
| | | | | |
Global ex-U.S. Real Estate Fund | | | | | | | | | | | | | | | | | | | | |
DEFA Fund | | $ | 165,534 | | | $ | 693,736 | | | $ | 844,165 | | | $ | — | | | $ | 4,433 | |
Global Natural Resources Fund | | | — | | | | 1,974,448 | | | | 1,861,665 | | | | — | | | | 8,518 | |
Total | | $ | 165,534 | | | $ | 2,668,184 | | | $ | 2,705,830 | | | $ | — | | | $ | 12,951 | |
8. NEW ACCOUNTING PRONOUNCEMENTS
In April 2011, the FASB issued Accounting Standards Update (“ASU”) 2011-03 “Reconsideration of Effective Control for Repurchase Agreements” (“ASU 2011-03”). The objective of ASU 2011-03 is to improve the accounting for repurchase agreements and similar agreements that both entitle and obligate a transferor to repurchase or redeem financial assets before their maturity. This guidance is effective prospectively for interim and annual reporting periods beginning on or after December 15, 2011. ASU 2011-03 modifies the criteria for determining effective control of transferred assets and as a result certain agreements may now be accounted for as secured borrowings. ASU 2011-03 is effective prospectively for new transfers and existing transactions that are modified in the first interim or annual period beginning on or after December 15, 2011. Management is currently evaluating the implications of this change and its impact on the financial statements.
In May 2011, the FASB issued ASU 2011-04 “Amendments to Achieve Common Fair Value Measurement and Disclosure Requirements in U.S. GAAP and IFRS” (“ASU 2011-04”). ASU 2011-04 includes common requirements for measurement of and disclosure about fair value between U.S. GAAP and IFRS. ASU 2011-04 will require reporting entities to disclose the following information for fair value measurements categorized within Level 3 of the fair value hierarchy: quantitative information about the unobservable inputs used in the fair value measurement, the valuation processes used by the reporting entity and a narrative description of the sensitivity of the fair value measurement to changes in unobservable inputs and the interrelationships between those unobservable inputs. In addition, ASU 2011-04 will require reporting entities to make disclosures about amounts and reasons for all transfers in and out of Level 1 and Level 2 fair value measurements. The new and revised disclosures are effective for interim and annual reporting periods beginning after December 15, 2011. At this time, management is evaluating the implications of ASU 2011-04 and its impact on the financial statements.
| | | | |
| WisdomTree International Dividend and Sector Funds | | | 177 | |
Notes to Financial Statements (concluded)
In December 2011, FASB issued ASU 2011-11 “Disclosures about Offsetting Assets and Liabilities”. The amendments in this ASU require an entity to disclose information about offsetting and related arrangements to enable users of its financial statements to understand the effect of those arrangements on its financial position. The ASU is effective for annual reporting periods beginning on or after January 1, 2013, and for interim periods within those annual reporting periods. The guidance requires retrospective application for all comparative periods presented. Management is currently evaluating the implications of ASU 2011-11 and its impact on the financial statements.
9. LEGAL MATTER
On December 1, 2011, Research Affiliates, LLC filed a complaint in the United States District Court for the Central District of California, naming the Trust, WTAM, and its affiliates, along with other parties, as defendants. The complaint alleges that the fundamentally weighted investment methodology developed by WisdomTree Investments and employed by the Trust infringes three of plaintiff’s patents. The complaint seeks both unspecified monetary damages to be determined and an injunction to prevent further infringement. The Trust filed its answer to the complaint on January 17, 2012. The Trust believes it has strong defenses to this lawsuit based on its belief that (i) the Trust’s Funds do not practice the indexing methods as claimed in the asserted patents because, for example, the factors used to select Fund assets include market capitalization and the price of the assets, and thus fall outside the scope of the asserted patents, which generally provide that selection of the assets to be used for creation of the index must be based upon factors that are sufficiently independent of market capitalization; and (ii) the patents should be declared invalid because, among other reasons, there is ample evidence that the concept of fundamentals based indexing was widely known and in commercial use by asset managers and index providers well before the patent applications at issue were filed by plaintiff. For example, in support of the defenses that the asserted patents are invalid, the Trust intends to present evidence that as far back as the early 1990s, Robert Jones at Goldman Sachs managed an earnings weighted index fund. As another example, the Trust intends to present evidence that Dow Jones launched a dividend weighted stock index in 2003. These examples support the Trust’s view that the asserted patents are invalid at least because earlier publications and activities of investment professionals anticipated or made obvious plaintiff’s alleged inventions.
While at this early stage of the proceedings it is not possible to determine the probability of any outcome or the probability or amount of any loss, the Trust is confident in the merits of its position. Nevertheless, an adverse resolution could have a negative impact on the Trust and the Funds. For example, in the event of an unfavorable outcome the Trust may be required to pay ongoing license fees if WisdomTree Investments cannot change its indexes in a manner that does not infringe on the patents. This could increase the Funds’ expense ratios and have a negative impact on Fund performance. WTAM and WisdomTree Investments have contractually agreed to indemnify the Trust and pay any losses, claims and damages (including legal fees) incurred by the Trust or a Fund in connection with the complaint. The Trust intends to vigorously defend against plaintiff’s claims.
| | |
| 178 | | WisdomTree International Dividend and Sector Funds |
Report of Independent Registered Public Accounting Firm
The Board of Trustees and Shareholders of WisdomTree Trust:
We have audited the accompanying statements of assets and liabilities, including the schedules of investments, of WisdomTree DEFA Fund, WisdomTree DEFA Equity Income Fund, WisdomTree Global Equity Income Fund, WisdomTree Europe SmallCap Dividend Fund, WisdomTree Japan Hedged Equity Fund, WisdomTree Global ex-U.S. Growth Fund, WisdomTree Japan SmallCap Dividend Fund, WisdomTree Asia Pacific ex-Japan Fund, WisdomTree Australia Dividend Fund, WisdomTree International LargeCap Dividend Fund, WisdomTree International Dividend ex-Financials Fund, WisdomTree International MidCap Dividend Fund, WisdomTree International SmallCap Dividend Fund, WisdomTree Emerging Markets Equity Income Fund, WisdomTree Emerging Markets SmallCap Dividend Fund, WisdomTree Middle East Dividend Fund, WisdomTree International Hedged Equity Fund, WisdomTree Commodity Country Equity Fund, WisdomTree Global Natural Resources Fund, WisdomTree Global ex-U.S. Utilities Fund and WisdomTree Global ex-U.S. Real Estate Fund (twenty-one of the investment funds constituting the WisdomTree Trust (the “Trust”)) as of March 31, 2012, and the related statements of operations for the year then ended, the statements of changes in net assets for each of the two years in the period ended, and the financial highlights for each of the periods indicated therein. These financial statements and financial highlights are the responsibility of the Trust’s management. Our responsibility is to express an opinion on these financial statements and financial highlights based on our audits.
We conducted our audits in accordance with the standards of the Public Company Accounting Oversight Board (United States). Those standards require that we plan and perform the audit to obtain reasonable assurance about whether the financial statements and financial highlights are free of material misstatement. We were not engaged to perform an audit of the Trust’s internal control over financial reporting. Our audits included consideration of internal control over financial reporting as a basis for designing audit procedures that are appropriate in the circumstances, but not for the purpose of expressing an opinion on the effectiveness of the Trust’s internal control over financial reporting. Accordingly, we express no such opinion. An audit also includes examining, on a test basis, evidence supporting the amounts and disclosures in the financial statements and financial highlights, assessing the accounting principles used and significant estimates made by management, and evaluating the overall financial statement presentation. Our procedures included confirmation of securities owned as of March 31, 2012, by correspondence with the custodian and brokers or by other appropriate auditing procedures where replies from brokers were not received. We believe that our audits provide a reasonable basis for our opinion.
In our opinion, the financial statements and financial highlights referred to above present fairly, in all material respects, the financial position of WisdomTree DEFA Fund, WisdomTree DEFA Equity Income Fund, WisdomTree Global Equity Income Fund, WisdomTree Europe SmallCap Dividend Fund, WisdomTree Japan Hedged Equity Fund, WisdomTree Global ex-US Growth Fund, WisdomTree Japan SmallCap Dividend Fund, WisdomTree Asia Pacific ex-Japan Fund, WisdomTree Australia Dividend Fund, WisdomTree International LargeCap Dividend Fund, WisdomTree International Dividend ex-Financials Fund, WisdomTree International MidCap Dividend Fund, WisdomTree International SmallCap Dividend Fund, WisdomTree Emerging Markets Equity Income Fund, WisdomTree Emerging Markets SmallCap Dividend Fund, WisdomTree Middle East Dividend Fund, WisdomTree International Hedged Equity Fund, WisdomTree Commodity Country Equity Fund, WisdomTree Global Natural Resources Fund, WisdomTree Global ex-U.S. Utilities Fund and WisdomTree Global ex-U.S. Real Estate Fund of WisdomTree Trust at March 31, 2012, the results of their operations for the year then ended, the changes in their net assets for each of the two years in the period then ended, and the financial highlights for each of the indicated periods, in conformity with U.S. generally accepted accounting principles.

New York, New York
May 25, 2012
| | | | |
| WisdomTree International Dividend and Sector Funds | | | 179 | |
Approval of Investment Advisory and Sub-Advisory Agreement (unaudited)
Approval of Investment Advisory Agreement. The Trust and the Investment Adviser have entered into an investment advisory agreement covering each Fund discussed herein. At a meeting held on March 1, 2012, the Board of Trustees (the “Board”) re-approved the Investment Advisory Agreement for each Fund. The Board reviewed and analyzed the factors it deemed relevant, including: (i) the nature, quality and extent of the services to be provided to the Funds by WTAM; (ii) the performance of the Funds; (iii) the costs of services to be provided and the profits to be realized by WTAM from its relationship with the Funds; (iv) the extent to which economies of scale would be realized as the Funds grow; and (v) whether the fee levels reflect these economies of scale for the benefit of investors’.
The Board also considered the nature and quality of the services to be provided by WTAM to the Funds, recognizing WTAM’s
operational capabilities and resources. The Board also noted the extensive responsibilities that WTAM has as investment adviser to the Funds, including the selection of the Funds’ Sub-Adviser, oversight of the Sub-Adviser’s compliance with Fund policies and objectives, oversight of general Fund compliance with federal and state laws, and the implementation of Board directives as they relate to the Funds.
The Board gave substantial consideration to the fees payable under the Advisory Agreement for each Fund. In this connection, the Board evaluated WTAM’s anticipated costs and profitability in serving as investment adviser to the Funds, including the costs associated with the personnel, systems and equipment necessary to manage the Funds and the costs associated with compensating the Sub-Adviser. The Board also examined the fees to be paid by each Fund in light of fees paid to other investment managers by comparable funds and the method of computing each Fund’s fee. After comparing the fees with those of comparable funds and in light of the quality and extent of services to be provided and the costs anticipated to be incurred by WTAM, the Board concluded that the level of the fees paid to WTAM with respect to each Fund is fair and reasonable. The Board also re-approved the Sub-Advisory Agreement between WTAM and MCM, on behalf of each Fund, using essentially the same criteria it used in connection with the Advisory Agreement. The Board considered MCM’s operational capabilities and resources and MCM’s experience in serving as an adviser to ETFs, noting that MCM currently provides investment advisory and management services to other ETFs. The Board considered the investment performance of the Funds, and the expertise and performance of the MCM personnel. The Board also noted that Bank of New York Mellon Corporation, an affiliate of MCM, serves as the Funds’ administrator, accountant, custodian, transfer agent and securities lending agent and receives compensation for acting in these capacities and is responsible for, among other things, coordinating the Funds’ audits, financial statements and tax returns, managing expenses and budgeting for the Funds, processing trades on behalf of each Fund and custodying Fund assets. As such, the Board concluded that the benefits accruing to MCM and its affiliates by virtue of their relationship to the Trust are reasonable and fair in comparison with the anticipated costs of providing the relevant services. The Board noted that WTAM, not the Funds, pays the fees to MCM under the Sub-Advisory Agreement for each Fund.
Based on these considerations and the overall high quality of the personnel, operations, financial condition, investment advisory
capabilities, methodologies, and performance of WTAM and MCM, the Board determined that the re-approval of the Advisory
Agreement and the Sub-Advisory Agreement for each Fund was in the best interests of each Fund. After full consideration of these and other factors, the Board, including a majority of the Independent Trustees, with the assistance of independent counsel, approved the Advisory Agreement and Sub-Advisory Agreement for each Fund.
| | |
| 180 | | WisdomTree International Dividend and Sector Funds |
Frequency Distribution of Discounts & Premiums (unaudited)
The chart below presents information about differences between the per share net asset value (“NAV”) of each Fund and the market trading price of shares of each Fund. For these purposes, the “market price” is the mid-point of the highest bid and lowest offer for Fund shares as of the close of trading on the exchange where Fund shares are listed. The term “premium” is sometimes used to describe a market price in excess of NAV and the term “discount” is sometimes used to describe a market price below NAV. The chart presents information about the size and frequency of premiums or discounts. As with other exchange traded funds, the market price of Fund shares is typically slightly higher or lower than the Fund’s per share NAV. Factors that contribute to the differences between market price and NAV include the supply and demand for Fund shares and investors’ assessments of the underlying value of a Fund’s portfolio securities.
Differences between the closing times of U.S. and non-U.S. markets may contribute to differences between the NAV and market price of Fund shares. Many non-U.S. markets close prior to the close of the U.S. securities exchanges. Developments after the close of such markets as a result of ongoing price discovery may be reflected in a Fund’s market price but not in its NAV (or vice versa).
| | | | | | | | | | | | | | | | | | | | |
| | | | | | Market Price Above or
Equal to Net Asset Value | | | Market Price Below Net
Asset Value | |
| | | Basis Point
Differential* | | | Number
of Days | | | Percentage of
Total Days | | | Number
of Days | | | Percentage
of Total Days | |
WisdomTree DEFA Fund | | | | | | | | | | | | | | | | | | | | |
June 16, 2006 – March 31, 2012 | | | 0 – 24.9 | | | | 212 | | | | 13.95 | % | | | 112 | | | | 7.37 | % |
| | | 25 – 49.9 | | | | 257 | | | | 16.91 | % | | | 105 | | | | 6.91 | % |
| | | 50 – 74.9 | | | | 231 | | | | 15.20 | % | | | 69 | | | | 4.54 | % |
| | | 75 – 99.9 | | | | 135 | | | | 8.88 | % | | | 52 | | | | 3.42 | % |
| | | 100 – 124.9 | | | | 78 | | | | 5.13 | % | | | 36 | | | | 2.37 | % |
| �� | | 125 – 174.9 | | | | 81 | | | | 5.33 | % | | | 58 | | | | 3.82 | % |
| | | 175 – 199.9 | | | | 13 | | | | 0.86 | % | | | 12 | | | | 0.79 | % |
| | | 200 – 249.9 | | | | 17 | | | | 1.12 | % | | | 13 | | | | 0.86 | % |
| | | >250 | | | | 19 | | | | 1.25 | % | | | 20 | | | | 1.32 | % |
| | | | Total | | | | 1043 | | | | 68.62 | % | | | 477 | | | | 31.38 | % |
WisdomTree DEFA Equity Income Fund | | | | | | | | | | | | | | | | | | | | |
June 16, 2006 – March 31, 2012 | | | 0 – 24.9 | | | | 192 | | | | 12.63 | % | | | 157 | | | | 10.33 | % |
| | | 25 – 49.9 | | | | 218 | | | | 14.34 | % | | | 124 | | | | 8.16 | % |
| | | 50 – 74.9 | | | | 224 | | | | 14.74 | % | | | 71 | | | | 4.67 | % |
| | | 75 – 99.9 | | | | 150 | | | | 9.87 | % | | | 52 | | | | 3.42 | % |
| | | 100 – 124.9 | | | | 67 | | | | 4.41 | % | | | 45 | | | | 2.96 | % |
| | | 125 – 174.9 | | | | 61 | | | | 4.01 | % | | | 46 | | | | 3.03 | % |
| | | 175 – 199.9 | | | | 17 | | | | 1.12 | % | | | 15 | | | | 0.99 | % |
| | | 200 – 249.9 | | | | 21 | | | | 1.38 | % | | | 22 | | | | 1.45 | % |
| | | >250 | | | | 20 | | | | 1.32 | % | | | 18 | | | | 1.18 | % |
| | | | Total | | | | 970 | | | | 63.82 | % | | | 550 | | | | 36.18 | % |
WisdomTree Global Equity Income Fund | | | | | | | | | | | | | | | | | | | | |
June 16, 2006 – March 31, 2012 | | | 0 – 24.9 | | | | 230 | | | | 15.13 | % | | | 147 | | | | 9.67 | % |
| | | 25 – 49.9 | | | | 263 | | | | 17.30 | % | | | 85 | | | | 5.59 | % |
| | | 50 – 74.9 | | | | 233 | | | | 15.33 | % | | | 56 | | | | 3.68 | % |
| | | 75 – 99.9 | | | | 171 | | | | 11.25 | % | | | 47 | | | | 3.09 | % |
| | | 100 – 124.9 | | | | 92 | | | | 6.05 | % | | | 31 | | | | 2.04 | % |
| | | 125 – 174.9 | | | | 60 | | | | 3.95 | % | | | 31 | | | | 2.04 | % |
| | | 175 – 199.9 | | | | 10 | | | | 0.66 | % | | | 7 | | | | 0.46 | % |
| | | 200 – 249.9 | | | | 13 | | | | 0.86 | % | | | 9 | | | | 0.59 | % |
| | | >250 | | | | 18 | | | | 1.18 | % | | | 17 | | | | 1.12 | % |
| | | | Total | | | | 1090 | | | | 71.71 | % | | | 430 | | | | 28.29 | % |
WisdomTree Europe SmallCap Dividend Fund | | | | | | | | | | | | | | | | | | | | |
June 16, 2006 – March 31, 2012 | | | 0 – 24.9 | | | | 204 | | | | 13.42 | % | | | 180 | | | | 11.84 | % |
| | | 25 – 49.9 | | | | 171 | | | | 11.25 | % | | | 150 | | | | 9.87 | % |
| | | 50 – 74.9 | | | | 155 | | | | 10.20 | % | | | 103 | | | | 6.78 | % |
| | | 75 – 99.9 | | | | 95 | | | | 6.25 | % | | | 84 | | | | 5.53 | % |
| | | 100 – 124.9 | | | | 54 | | | | 3.55 | % | | | 76 | | | | 5.00 | % |
| | | 125 – 174.9 | | | | 48 | | | | 3.16 | % | | | 87 | | | | 5.72 | % |
| | | 175 – 199.9 | | | | 10 | | | | 0.66 | % | | | 26 | | | | 1.71 | % |
| | | 200 – 249.9 | | | | 18 | | | | 1.18 | % | | | 13 | | | | 0.86 | % |
| | | >250 | | | | 13 | | | | 0.86 | % | | | 33 | | | | 2.17 | % |
| | | | Total | | | | 768 | | | | 50.53 | % | | | 752 | | | | 49.47 | % |
| | | | |
| WisdomTree International Dividend and Sector Funds | | | 181 | |
Frequency Distribution of Discounts & Premiums (unaudited) (continued)
| | | | | | | | | | | | | | | | | | | | |
| | | | | | Market Price Above or
Equal to Net Asset Value | | | Market Price Below Net
Asset Value | |
| | | Basis Point
Differential* | | | Number
of Days | | | Percentage of
Total Days | | | Number
of Days | | | Percentage
of Total Days | |
WisdomTree Japan Hedged Equity Fund | | | | | | | | | | | | | | | | | | | | |
June 16, 2006 – March 31, 2012 | | | 0 – 24.9 | | | | 158 | | | | 10.39 | % | | | 140 | | | | 9.21 | % |
| | | 25 – 49.9 | | | | 148 | | | | 9.74 | % | | | 115 | | | | 7.57 | % |
| | | 50 – 74.9 | | | | 156 | | | | 10.26 | % | | | 85 | | | | 5.59 | % |
| | | 75 – 99.9 | | | | 129 | | | | 8.49 | % | | | 68 | | | | 4.47 | % |
| | | 100 – 124.9 | | | | 89 | | | | 5.86 | % | | | 46 | | | | 3.03 | % |
| | | 125 – 174.9 | | | | 90 | | | | 5.92 | % | | | 97 | | | | 6.38 | % |
| | | 175 – 199.9 | | | | 29 | | | | 1.91 | % | | | 18 | | | | 1.18 | % |
| | | 200 – 249.9 | | | | 25 | | | | 1.64 | % | | | 26 | | | | 1.71 | % |
| | | >250 | | | | 37 | | | | 2.43 | % | | | 64 | | | | 4.21 | % |
| | | | Total | | | | 861 | | | | 56.64 | % | | | 659 | | | | 43.36 | % |
WisdomTree Global ex-U.S.Growth Fund | | | | | | | | | | | | | | | | | | | | |
June 16, 2006 – March 31, 2012 | | | 0 – 24.9 | | | | 169 | | | | 11.12 | % | | | 149 | | | | 9.80 | % |
| | | 25 – 49.9 | | | | 177 | | | | 11.64 | % | | | 99 | | | | 6.51 | % |
| | | 50 – 74.9 | | | | 195 | | | | 12.83 | % | | | 80 | | | | 5.26 | % |
| | | 75 – 99.9 | | | | 140 | | | | 9.21 | % | | | 69 | | | | 4.54 | % |
| | | 100 – 124.9 | | | | 89 | | | | 5.86 | % | | | 41 | | | | 2.70 | % |
| | | 125 – 174.9 | | | | 71 | | | | 4.67 | % | | | 61 | | | | 4.01 | % |
| | | 175 – 199.9 | | | | 16 | | | | 1.05 | % | | | 24 | | | | 1.58 | % |
| | | 200 – 249.9 | | | | 24 | | | | 1.58 | % | | | 34 | | | | 2.24 | % |
| | | >250 | | | | 34 | | | | 2.24 | % | | | 48 | | | | 3.16 | % |
| | | | Total | | | | 915 | | | | 60.20 | % | | | 605 | | | | 39.80 | % |
WisdomTree Japan SmallCap Dividend Fund | | | | | | | | | | | | | | | | | | | | |
June 16, 2006 – March 31, 2012 | | | 0 – 24.9 | | | | 164 | | | | 10.79 | % | | | 133 | | | | 8.75 | % |
| | | 25 – 49.9 | | | | 173 | | | | 11.38 | % | | | 134 | | | | 8.82 | % |
| | | 50 – 74.9 | | | | 135 | | | | 8.88 | % | | | 90 | | | | 5.92 | % |
| | | 75 – 99.9 | | | | 117 | | | | 7.70 | % | | | 74 | | | | 4.87 | % |
| | | 100 – 124.9 | | | | 84 | | | | 5.53 | % | | | 46 | | | | 3.03 | % |
| | | 125 – 174.9 | | | | 93 | | | | 6.12 | % | | | 87 | | | | 5.72 | % |
| | | 175 – 199.9 | | | | 19 | | | | 1.25 | % | | | 20 | | | | 1.32 | % |
| | | 200 – 249.9 | | | | 25 | | | | 1.64 | % | | | 41 | | | | 2.70 | % |
| | | >250 | | | | 38 | | | | 2.50 | % | | | 47 | | | | 3.09 | % |
| | | | Total | | | | 848 | | | | 55.79 | % | | | 672 | | | | 44.21 | % |
WisdomTree Asia Pacific ex-Japan Fund | | | | | | | | | | | | | | | | | | | | |
June 16, 2006 – March 31, 2012 | | | 0 – 24.9 | | | | 168 | | | | 11.05 | % | | | 160 | | | | 10.53 | % |
| | | 25 – 49.9 | | | | 195 | | | | 12.83 | % | | | 118 | | | | 7.76 | % |
| | | 50 – 74.9 | | | | 128 | | | | 8.42 | % | | | 79 | | | | 5.20 | % |
| | | 75 – 99.9 | | | | 104 | | | | 6.84 | % | | | 53 | | | | 3.49 | % |
| | | 100 –124.9 | | | | 66 | | | | 4.34 | % | | | 59 | | | | 3.88 | % |
| | | 125 –174.9 | | | | 96 | | | | 6.32 | % | | | 74 | | | | 4.87 | % |
| | | 175 –199.9 | | | | 27 | | | | 1.78 | % | | | 22 | | | | 1.45 | % |
| | | 200 –249.9 | | | | 30 | | | | 1.97 | % | | | 39 | | | | 2.57 | % |
| | | >250 | | | | 36 | | | | 2.37 | % | | | 66 | | | | 4.34 | % |
| | | | Total | | | | 850 | | | | 55.92 | % | | | 670 | | | | 44.08 | % |
WisdomTree Australia Dividend Fund | | | | | | | | | | | | | | | | | | | | |
June 16, 2006 – March 31, 2012 | | | 0 – 24.9 | | | | 172 | | | | 11.32 | % | | | 136 | | | | 8.95 | % |
| | | 25 – 49.9 | | | | 177 | | | | 11.64 | % | | | 112 | | | | 7.37 | % |
| | | 50 – 74.9 | | | | 152 | | | | 10.00 | % | | | 82 | | | | 5.39 | % |
| | | 75 – 99.9 | | | | 103 | | | | 6.78 | % | | | 61 | | | | 4.01 | % |
| | | 100 –124.9 | | | | 67 | | | | 4.41 | % | | | 57 | | | | 3.75 | % |
| | | 125 –174.9 | | | | 85 | | | | 5.59 | % | | | 82 | | | | 5.39 | % |
| | | 175 –199.9 | | | | 26 | | | | 1.71 | % | | | 21 | | | | 1.38 | % |
| | | 200 –249.9 | | | | 34 | | | | 2.24 | % | | | 41 | | | | 2.70 | % |
| | | >250 | | | | 35 | | | | 2.30 | % | | | 77 | | | | 5.07 | % |
| | | | Total | | | | 851 | | | | 55.99 | % | | | 669 | | | | 44.01 | % |
| | |
| 182 | | WisdomTree International Dividend and Sector Funds |
Frequency Distribution of Discounts & Premiums (unaudited) (continued)
| | | | | | | | | | | | | | | | | | | | |
| | | | | | Market Price Above or
Equal to Net Asset Value | | | Market Price Below Net
Asset Value | |
| | | Basis Point
Differential* | | | Number
of Days | | | Percentage of
Total Days | | | Number
of Days | | | Percentage
of Total Days | |
WisdomTree International LargeCap Dividend Fund | | | | | | | | | | | | | | | | | | | | |
June 16, 2006 – March 31, 2012 | | | 0 – 24.9 | | | | 205 | | | | 13.49 | % | | | 151 | | | | 9.93 | % |
| | | 25 – 49.9 | | | | 277 | | | | 18.22 | % | | | 79 | | | | 5.20 | % |
| | | 50 – 74.9 | | | | 202 | | | | 13.29 | % | | | 66 | | | | 4.34 | % |
| | | 75 – 99.9 | | | | 154 | | | | 10.13 | % | | | 51 | | | | 3.36 | % |
| | | 100 –124.9 | | | | 70 | | | | 4.61 | % | | | 45 | | | | 2.96 | % |
| | | 125 –174.9 | | | | 72 | | | | 4.74 | % | | | 48 | | | | 3.16 | % |
| | | 175 –199.9 | | | | 17 | | | | 1.12 | % | | | 12 | | | | 0.79 | % |
| | | 200 –249.9 | | | | 19 | | | | 1.25 | % | | | 10 | | | | 0.66 | % |
| | | >250 | | | | 24 | | | | 1.58 | % | | | 18 | | | | 1.18 | % |
| | | | Total | | | | 1040 | | | | 68.42 | % | | | 480 | | | | 31.58 | % |
WisdomTree International Dividend ex-Financials Fund | | | | | | | | | | | | | | | | | | | | |
June 16, 2006 – March 31, 2012 | | | 0 – 24.9 | | | | 204 | | | | 13.42 | % | | | 170 | | | | 11.18 | % |
| | | 25 – 49.9 | | | | 238 | | | | 15.66 | % | | | 110 | | | | 7.24 | % |
| | | 50 – 74.9 | | | | 208 | | | | 13.68 | % | | | 65 | | | | 4.28 | % |
| | | 75 – 99.9 | | | | 110 | | | | 7.24 | % | | | 47 | | | | 3.09 | % |
| | | 100 –124.9 | | | | 76 | | | | 5.00 | % | | | 51 | | | | 3.36 | % |
| | | 125 –174.9 | | | | 68 | | | | 4.47 | % | | | 58 | | | | 3.82 | % |
| | | 175 –199.9 | | | | 18 | | | | 1.18 | % | | | 20 | | | | 1.32 | % |
| | | 200 –249.9 | | | | 18 | | | | 1.18 | % | | | 14 | | | | 0.92 | % |
| | | >250 | | | | 16 | | | | 1.05 | % | | | 29 | | | | 1.91 | % |
| | | | Total | | | | 956 | | | | 62.89 | % | | | 564 | | | | 37.11 | % |
WisdomTree International MidCap Dividend Fund | | | | | | | | | | | | | | | | | | | | |
June 16, 2006 – March 31, 2012 | | | 0 – 24.9 | | | | 199 | | | | 13.09 | % | | | 205 | | | | 13.49 | % |
| | | 25 – 49.9 | | | | 204 | | | | 13.42 | % | | | 155 | | | | 10.20 | % |
| | | 50 – 74.9 | | | | 185 | | | | 12.17 | % | | | 78 | | | | 5.13 | % |
| | | 75 – 99.9 | | | | 79 | | | | 5.20 | % | | | 62 | | | | 4.08 | % |
| | | 100 –124.9 | | | | 65 | | | | 4.28 | % | | | 51 | | | | 3.36 | % |
| | | 125 –174.9 | | | | 56 | | | | 3.68 | % | | | 77 | | | | 5.07 | % |
| | | 175 –199.9 | | | | 15 | | | | 0.99 | % | | | 19 | | | | 1.25 | % |
| | | 200 –249.9 | | | | 7 | | | | 0.46 | % | | | 19 | | | | 1.25 | % |
| | | >250 | | | | 16 | | | | 1.05 | % | | | 28 | | | | 1.84 | % |
| | | | Total | | | | 826 | | | | 54.34 | % | | | 694 | | | | 45.66 | % |
WisdomTree International SmallCap Dividend Fund | | | | | | | | | | | | | | | | | | | | |
June 16, 2006 – March 31, 2012 | | | 0 –24.9 | | | | 185 | | | | 12.17 | % | | | 140 | | | | 9.21 | % |
| | | 25 –49.9 | | | | 224 | | | | 14.74 | % | | | 109 | | | | 7.17 | % |
| | | 50 –74.9 | | | | 178 | | | | 11.71 | % | | | 66 | | | | 4.34 | % |
| | | 75 –99.9 | | | | 141 | | | | 9.28 | % | | | 61 | | | | 4.01 | % |
| | | 100 –124.9 | | | | 94 | | | | 6.18 | % | | | 53 | | | | 3.49 | % |
| | | 125 –174.9 | | | | 91 | | | | 5.99 | % | | | 51 | | | | 3.36 | % |
| | | 175 –199.9 | | | | 22 | | | | 1.45 | % | | | 18 | | | | 1.18 | % |
| | | 200 –249.9 | | | | 15 | | | | 0.99 | % | | | 27 | | | | 1.78 | % |
| | | >250 | | | | 24 | | | | 1.58 | % | | | 21 | | | | 1.38 | % |
| | | | Total | | | | 974 | | | | 64.08 | % | | | 546 | | | | 35.92 | % |
WisdomTree Emerging Markets Equity Income Fund | | | | | | | | | | | | | | | | | | | | |
July 13, 2007 – March 31, 2012 | | | 0 – 24.9 | | | | 106 | | | | 8.47 | % | | | 75 | | | | 6.00 | % |
| | | 25 – 49.9 | | | | 113 | | | | 9.03 | % | | | 46 | | | | 3.68 | % |
| | | 50 – 74.9 | | | | 159 | | | | 12.71 | % | | | 24 | | | | 1.92 | % |
| | | 75 – 99.9 | | | | 143 | | | | 11.43 | % | | | 37 | | | | 2.96 | % |
| | | 100 –124.9 | | | | 140 | | | | 11.19 | % | | | 29 | | | | 2.32 | % |
| | | 125 –174.9 | | | | 176 | | | | 14.07 | % | | | 32 | | | | 2.56 | % |
| | | 175 –199.9 | | | | 36 | | | | 2.88 | % | | | 15 | | | | 1.20 | % |
| | | 200 –249.9 | | | | 37 | | | | 2.96 | % | | | 12 | | | | 0.96 | % |
| | | >250 | | | | 43 | | | | 3.44 | % | | | 28 | | | | 2.24 | % |
| | | | Total | | | | 953 | | | | 76.18 | % | | | 298 | | | | 23.82 | % |
| | | | |
| WisdomTree International Dividend and Sector Funds | | | 183 | |
Frequency Distribution of Discounts & Premiums (unaudited) (continued)
| | | | | | | | | | | | | | | | | | | | |
| | | | | | Market Price Above or
Equal to Net Asset Value | | | Market Price Below Net
Asset Value | |
| | | Basis Point
Differential* | | | Number
of Days | | | Percentage of
Total Days | | | Number
of Days | | | Percentage
of Total Days | |
WisdomTree Emerging Markets SmallCap Dividend Fund | | | | | | | | | | | | | | | | | | | | |
October 30, 2007 – March 31, 2012 | | | 0 –24.9 | | | | 104 | | | | 8.85 | % | | | 83 | | | | 7.06 | % |
| | | 25 – 49.9 | | | | 111 | | | | 9.45 | % | | | 51 | | | | 4.34 | % |
| | | 50 – 74.9 | | | | 137 | | | | 11.66 | % | | | 52 | | | | 4.43 | % |
| | | 75 – 99.9 | | | | 123 | | | | 10.47 | % | | | 35 | | | | 2.98 | % |
| | | 100 – 124.9 | | | | 107 | | | | 9.11 | % | | | 33 | | | | 2.81 | % |
| | | 125 –174.9 | | | | 125 | | | | 10.64 | % | | | 36 | | | | 3.06 | % |
| | | 175 –199.9 | | | | 34 | | | | 2.89 | % | | | 13 | | | | 1.11 | % |
| | | 200 –249.9 | | | | 39 | | | | 3.32 | % | | | 15 | | | | 1.28 | % |
| | | >250 | | | | 50 | | | | 4.26 | % | | | 27 | | | | 2.30 | % |
| | | | Total | | | | 830 | | | | 70.64 | % | | | 345 | | | | 29.36 | % |
WisdomTree Middle East Dividend Fund | | | | | | | | | | | | | | | | | | | | |
July 16, 2008 – March 31, 2012 | | | 0 – 24.9 | | | | 46 | | | | 4.61 | % | | | 57 | | | | 5.72 | % |
| | | 25 – 49.9 | | | | 59 | | | | 5.92 | % | | | 64 | | | | 6.42 | % |
| | | 50 – 74.9 | | | | 65 | | | | 6.52 | % | | | 32 | | | | 3.21 | % |
| | | 75 – 99.9 | | | | 58 | | | | 5.82 | % | | | 37 | | | | 3.71 | % |
| | | 100 –124.9 | | | | 74 | | | | 7.42 | % | | | 27 | | | | 2.71 | % |
| | | 125 –174.9 | | | | 120 | | | | 12.04 | % | | | 44 | | | | 4.41 | % |
| | | 175 –199.9 | | | | 47 | | | | 4.71 | % | | | 8 | | | | 0.80 | % |
| | | 200 –249.9 | | | | 70 | | | | 7.02 | % | | | 18 | | | | 1.81 | % |
| | | >250 | | | | 141 | | | | 14.14 | % | | | 30 | | | | 3.01 | % |
| | | | Total | | | | 680 | | | | 68.20 | % | | | 317 | | | | 31.80 | % |
WisdomTree International Hedged Equity Income Fund | | | | | | | | | | | | | | | | | | | | |
June 16, 2006 – March 31, 2012 | | | 0 – 24.9 | | | | 75 | | | | 13.23 | % | | | 68 | | | | 11.99 | % |
| | | 25 – 49.9 | | | | 81 | | | | 14.29 | % | | | 41 | | | | 7.23 | % |
| | | 50 – 74.9 | | | | 74 | | | | 13.05 | % | | | 28 | | | | 4.94 | % |
| | | 75 – 99.9 | | | | 64 | | | | 11.29 | % | | | 18 | | | | 3.17 | % |
| | | 100 –124.9 | | | | 46 | | | | 8.11 | % | | | 11 | | | | 1.94 | % |
| | | 125 –174.9 | | | | 33 | | | | 5.82 | % | | | 11 | | | | 1.94 | % |
| | | 175 –199.9 | | | | 6 | | | | 1.06 | % | | | 1 | | | | 0.18 | % |
| | | 200 –249.9 | | | | 2 | | | | 0.35 | % | | | 5 | | | | 0.88 | % |
| | | >250 | | | | 1 | | | | 0.18 | % | | | 2 | | | | 0.35 | % |
| | | | Total | | | | 382 | | | | 67.37 | % | | | 185 | | | | 32.63 | % |
WisdomTree Commodity Country Equity Fund | | | | | | | | | | | | | | | | | | | | |
October 13, 2006 – March 31, 2012 | | | 0 – 24.9 | | | | 188 | | | | 13.08 | % | | | 184 | | | | 12.80 | % |
| | | 25 – 49.9 | | | | 185 | | | | 12.87 | % | | | 124 | | | | 8.63 | % |
| | | 50 – 74.9 | | | | 167 | | | | 11.62 | % | | | 90 | | | | 6.26 | % |
| | | 75 – 99.9 | | | | 99 | | | | 6.89 | % | | | 59 | | | | 4.11 | % |
| | | 100 –124.9 | | | | 66 | | | | 4.59 | % | | | 47 | | | | 3.27 | % |
| | | 125 –174.9 | | | | 51 | | | | 3.55 | % | | | 68 | | | | 4.73 | % |
| | | 175 –199.9 | | | | 14 | | | | 0.97 | % | | | 15 | | | | 1.04 | % |
| | | 200 –249.9 | | | | 14 | | | | 0.97 | % | | | 21 | | | | 1.46 | % |
| | | >250 | | | | 20 | | | | 1.39 | % | | | 25 | | | | 1.74 | % |
| | | | Total | | | | 804 | | | | 55.95 | % | | | 633 | | | | 44.05 | % |
WisdomTree Global Natural Resources Fund | | | | | | | | | | | | | | | | | | | | |
October 13, 2006 – March 31, 2012 | | | 0 – 24.9 | | | | 162 | | | | 11.27 | % | | | 157 | | | | 10.93 | % |
| | | 25 – 49.9 | | | | 169 | | | | 11.76 | % | | | 115 | | | | 8.00 | % |
| | | 50 – 74.9 | | | | 142 | | | | 9.88 | % | | | 88 | | | | 6.12 | % |
| | | 75 – 99.9 | | | | 118 | | | | 8.21 | % | | | 50 | | | | 3.48 | % |
| | | 100 –124.9 | | | | 102 | | | | 7.10 | % | | | 49 | | | | 3.41 | % |
| | | 125 –174.9 | | | | 83 | | | | 5.78 | % | | | 64 | | | | 4.45 | % |
| | | 175 –199.9 | | | | 17 | | | | 1.18 | % | | | 19 | | | | 1.32 | % |
| | | 200 –249.9 | | | | 24 | | | | 1.67 | % | | | 13 | | | | 0.90 | % |
| | | >250 | | | | 26 | | | | 1.81 | % | | | 39 | | | | 2.71 | % |
| | | | Total | | | | 843 | | | | 58.66 | % | | | 594 | | | | 41.34 | % |
| | |
| 184 | | WisdomTree International Dividend and Sector Funds |
Frequency Distribution of Discounts & Premiums (unaudited) (concluded)
| | | | | | | | | | | | | | | | | | | | |
| | | | | | Market Price Above or
Equal to Net Asset Value | | | Market Price Below Net
Asset Value | |
| | | Basis Point
Differential* | | | Number
of Days | | | Percentage of
Total Days | | | Number
of Days | | | Percentage
of Total Days | |
WisdomTree Global ex-U.S. Utilities Fund | | | | | | | | | | | | | | | | | | | | |
October 13, 2006 – March 31, 2012 | | | 0 – 24.9 | | | | 168 | | | | 11.69 | % | | | 165 | | | | 11.48 | % |
| | | 25 – 49.9 | | | | 178 | | | | 12.39 | % | | | 115 | | | | 8.00 | % |
| | | 50 – 74.9 | | | | 166 | | | | 11.55 | % | | | 99 | | | | 6.89 | % |
| | | 75 – 99.9 | | | | 116 | | | | 8.07 | % | | | 73 | | | | 5.08 | % |
| | | 100 –124.9 | | | | 67 | | | | 4.66 | % | | | 50 | | | | 3.48 | % |
| | | 125 –174.9 | | | | 56 | | | | 3.90 | % | | | 74 | | | | 5.15 | % |
| | | 175 –199.9 | | | | 18 | | | | 1.25 | % | | | 18 | | | | 1.25 | % |
| | | 200 – 249.9 | | | | 11 | | | | 0.77 | % | | | 14 | | | | 0.97 | % |
| | | >250 | | | | 16 | | | | 1.11 | % | | | 33 | | | | 2.30 | % |
| | | | Total | | | | 796 | | | | 55.39 | % | | | 641 | | | | 44.61 | % |
WisdomTree Global ex-U.S. Real Estate Fund | | | | | | | | | | | | | | | | | | | | |
June 5, 2007 – March 31, 2012 | | | 0 – 24.9 | | | | 142 | | | | 11.11 | % | | | 103 | | | | 8.06 | % |
| | | 25 – 49.9 | | | | 172 | | | | 13.46 | % | | | 78 | | | | 6.10 | % |
| | | 50 – 74.9 | | | | 152 | | | | 11.89 | % | | | 54 | | | | 4.23 | % |
| | | 75 – 99.9 | | | | 107 | | | | 8.37 | % | | | 52 | | | | 4.07 | % |
| | | 100 –124.9 | | | | 79 | | | | 6.18 | % | | | 38 | | | | 2.97 | % |
| | | 125 –174.9 | | | | 83 | | | | 6.49 | % | | | 54 | | | | 4.23 | % |
| | | 175 –199.9 | | | | 33 | | | | 2.58 | % | | | 25 | | | | 1.96 | % |
| | | 200 –249.9 | | | | 22 | | | | 1.72 | % | | | 18 | | | | 1.41 | % |
| | | >250 | | | | 28 | | | | 2.19 | % | | | 38 | | | | 2.97 | % |
| | | | Total | | | | 818 | | | | 64.01 | % | | | 460 | | | | 35.99 | % |
| * | Basis point (bps) is a unit that is equal to 1/100th of 1%. |
| | | | |
| WisdomTree International Dividend and Sector Funds | | | 185 | |
Trustee and Officer Information (unaudited)
The Board has responsibility for the overall management and operations of the Funds, including general supervision of the duties performed by WTAM and other service providers. The Board elects the officers of the Trust who are responsible for administering the Trust’s day-to-day operations. Each Trustee serves until his or her successor is duly elected or appointed and qualified.
The address of each Trustee and Officer is c/o WisdomTree Asset Management, Inc., 380 Madison Avenue, 21st Floor, New York, New York 10017.
Interested Trustee and Officers
| | | | | | | | | | |
Name (year of birth) | | Position | | Term of Office
and Length of
Time Served | | Principal Occupation(s) During the Past 5 Years | | Number of Portfolios
in Fund Complex
Overseen by Trustee/
Officer+ | | Other Directorships Held by Trustee/ Officer |
Jonathan Steinberg
(1964) | | Trustee, President* | | Trustee and Officer
since 2005 | | President, WisdomTree Trust since 2005; Chief Executive Officer of WisdomTree Investments, Inc. and Director of WisdomTree Investments, Inc. since 1989. | | 48 | | None. |
| | | | | |
Amit Muni
(1969) | | Treasurer,* Assistant Secretary* | | Officer
since 2008 | | Chief Financial Officer and Assistant Secretary of WisdomTree Investments, Inc. since March 2008; International Securities Exchange Holdings, Inc. (ISE), Controller and Chief Accounting Officer from 2003 to 2008. | | 48 | | None. |
| | | | | |
Richard Morris
(1967) | | Secretary,* Chief Legal Officer* | | Officer
since 2005 | | General Counsel of WisdomTree Asset Management since 2009; Chief Compliance Officer of WisdomTree Trust since 2009; Deputy General Counsel of WisdomTree Investments, Inc. since 2005; Senior Counsel at Barclays Global Investors’ N.A. from 2002 to 2005. | | 48 | | None. |
| * | Elected by and serves at the pleasure of the Board of Trustees. |
| | |
| 186 | | WisdomTree International Dividend and Sector Funds |
Trustee and Officer Information (unaudited) (concluded)
Independent Trustees
| | | | | | | | | | |
Name (year of birth) | | Position | | Term of Office
and Length of
Time Served | | Principal Occupation(s) During the Past 5 Years | | Number of Portfolios
in Fund Complex
Overseen by
Trustee+ | | Other
Directorships Held by Trustee |
Gregory Barton
(1961)* | | Trustee | | Trustee
since 2006 | | Executive Vice President of Business Legal Affairs, General Counsel and Secretary of TheStreet, Inc. 2009 to present; General Counsel of Martha Stewart Living Omnimedia, Inc. from 2007 to 2008; Executive Vice President of Licensing and Legal Affairs, General Counsel and Secretary of Ziff Davis Media Inc. from 2004 to 2007; Executive Vice President of Legal Affairs, General Counsel and Secretary of Ziff Davis Media Inc. from 2002 to 2004; President from 2001 to 2002, Chief Financial Officer from 2000 to 2002, Vice President of Business Development from 1999 to 2001 and General Counsel and Secretary from 1998 to 2002 of WisdomTree Investments, Inc. | | 48 | | Trustee, GLG Investment Series Trust; and Trustee Man Long Short Fund |
| | | | | |
Toni Massaro
(1955)** | | Trustee | | Trustee
since 2006 | | Dean Emerita at University of Arizona James E. Rogers College of Law (“Rogers College of Law”) since 2009 (distinguished Emerita in July 2009); Dean at the Rogers College of Law from 1999 to 2009; Regents’ Professor since 2006; Milton O. Riepe Chair in Constitutional Law since 1997; Professor at the Rogers College of Law since 1990. | | 48 | | None. |
| | | | | |
Victor Ugolyn
(1947) | | Trustee, Chairman of the Board of Trustees | | Trustee
since 2006 | | Private Investor - 2005 to Present; President and Chief Executive Officer of William D. Witter, Inc. from 2005 to 2006; Consultant to AXA Enterprise in 2004; Chairman, President and Chief Executive Officer of Enterprise Capital Management (subsidiary of The MONY Group, Inc.) and Enterprise Group of Funds, Chairman of MONY Securities Corporation, and Chairman of the Fund Board of Enterprise Group of Funds 1991 to 2004. | | 48 | | Member of Board of New York Society of Security Analysts; Member of the Board of Governors of Naismith Memorial Basketball Hall of Fame. |
| * | Chair of the Audit Committee. |
| ** | Chair of the Governance and Nominating Committee. |
| | | | |
| WisdomTree International Dividend and Sector Funds | | | 187 | |
Supplemental Information (unaudited)
Federal Income Tax Information
The following Federal tax information related to the Funds fiscal year ended March 31, 2012, is provided for information purposes only and should not be used for reporting to federal or state revenue agencies. Federal tax information for the calendar year will be reported to you on Form 1099-DIV in January 2013.
Certain dividends paid by the Funds may be subject to a maximum tax rate of 15%, as provided by the Jobs and Growth Tax Relief Reconciliation Act of 2003. Of the distributions paid during the fiscal year ended March 31, 2012, the following represents the maximum amount of ordinary income distributions that may be considered qualified dividend income:
| | | | |
| Fund | | Qualified Dividend
Income | |
DEFA Fund | | $ | 8,301,699 | |
DEFA Equity Income Fund | | | 3,639,587 | |
Global Equity Income Fund | | | 2,133,927 | |
Europe SmallCap Dividend Fund | | | 1,076,609 | |
Japan Hedged Equity Fund | | | 10,284,313 | |
Global ex-U.S. Growth Fund | | | 1,025,426 | |
Japan SmallCap Dividend Fund | | | 4,616,000 | |
Asia Pacific ex-Japan Fund | | | 1,355,661 | |
Australia Dividend Fund | | | 2,239,915 | |
International LargeCap Dividend Fund | | | 3,666,612 | |
International Dividend ex-Financials Fund | | | 5,577,278 | |
International MidCap Dividend Fund | | | 2,769,596 | |
International SmallCap Dividend Fund | | | 12,510,164 | |
Emerging Markets Equity Income Fund | | | 40,053,764 | |
Emerging Markets SmallCap Dividend Fund | | | 16,741,758 | |
Middle East Dividend Fund | | | 587,951 | |
International Hedged Equity Fund | | | 582,183 | |
Commodity Country Equity Fund | | | 860,175 | |
Global Natural Resources Fund | | | 689,752 | |
Global ex-U.S. Utilities Fund | | | 531,155 | |
Global ex-U.S. Real Estate Fund | | | 2,664,182 | |
| | |
| 188 | | WisdomTree International Dividend and Sector Funds |
Supplemental Information (unaudited) (concluded)
The Fund intends to elect to pass through to shareholders the credit for taxes paid during the fiscal year ended March 31, 2012, to foreign countries. The gross foreign source income and foreign taxes paid are as follows:
| | | | | | | | |
| Fund | | Gross Foreign
Income | | | Foreign Taxes
Paid | |
DEFA Fund | | $ | 9,158,214 | | | $ | 446,379 | |
DEFA Equity Income Fund | | | 4,208,703 | | | | 184,273 | |
Global Equity Income Fund | | | 1,913,542 | | | | 131,233 | |
Europe SmallCap Dividend Fund | | | 944,898 | | | | 78,792 | |
Japan Hedged Equity Fund | | | 11,031,900 | | | | 744,737 | |
Global ex-U.S. Growth Fund | | | 1,409,168 | | | | 124,268 | |
Japan SmallCap Dividend Fund | | | 4,121,702 | | | | 288,815 | |
Asia Pacific ex-Japan Fund | | | 2,559,450 | | | | 172,146 | |
Australia Dividend Fund | | | 2,266,648 | | | | 34,784 | |
International LargeCap Dividend Fund | | | 3,284,179 | | | | 156,921 | |
International Dividend ex-Financials Fund | | | 5,916,087 | | | | 229,189 | |
International MidCap Dividend Fund | | | 3,096,970 | | | | 173,040 | |
International SmallCap Dividend Fund | | | 13,243,977 | | | | 785,691 | |
Emerging Markets Equity Income Fund | | | 95,923,339 | | | | 10,206,373 | |
Emerging Markets SmallCap Dividend Fund | | | 36,205,716 | | | | 5,131,542 | |
Middle East Dividend Fund | | | 1,167,059 | | | | 90,823 | |
International Hedged Equity Fund | | | 558,697 | | | | 36,012 | |
Commodity Country Equity Fund | | | 1,052,778 | | | | 76,157 | |
Global Natural Resources Fund | | | 632,643 | | | | 42,862 | |
Global ex-U.S. Utilities Fund | | | 782,197 | | | | 47,773 | |
Global ex-U.S. Real Estate Fund | | | 4,834,063 | | | | 211,443 | |
| | | | |
| WisdomTree International Dividend and Sector Funds | | | 189 | |
General Information (unaudited)
Proxy Voting Policies, Procedures and Record
A complete copy of the Proxy Voting Policy may be obtained by calling 1-866-909-WISE (9473) or writing to: WisdomTree Trust, c/o ALPS Distributors, Inc., 1290 Broadway, Suite 1100, Denver, Colorado 80203.
The Trust is required to disclose annually the Funds’ complete proxy voting record on Form N-PX covering the most recent 12-month period ended June 30 and to file Form N-PX with the SEC no later than August 31 of each year. The current Form N-PX for the Funds is available at no charge upon request by calling 1-866-909-WISE (9473) or through the Trust’s website at www.wisdomtree.com. The Funds’ Form N-PX is also available on the SEC’s website at www.sec.gov.
Shareholder Reports and Quarterly Portfolio Disclosure
The Funds are required to file their complete schedule of portfolio holdings with the SEC for their first and third fiscal quarters on Form N-Q. Copies of the filings are available, without charge, on the SEC’s website at www.sec.gov, and are also available by calling the Trust at 1-866-909-WISE (9473). You can also obtain copies of Form N-Q by (i) visiting the SEC’s Public Reference Room in Washington, DC (information on the operation of the Public Reference Room may be obtained by calling 1-800-SEC-0330), (ii) sending your request and a duplicating fee to the SEC’s Public Reference Room, Washington, DC 20549-0102 or (iii) sending your request electronically to publicinfo@sec.gov.
Information about each Fund’s portfolio holdings is available daily, without charge, at www.wisdomtree.com.
Each Fund’s Statement of Additional Information (“SAI”) has additional information about the Funds’ Trustees and Officers and is available without charge upon request. Contact your financial representative for a free prospectus or SAI.
| | |
| 190 | | WisdomTree International Dividend and Sector Funds |
The WisdomTree Family of Funds
The following is a list of WisdomTree Funds being offered, along with their respective ticker symbols, as of March 31, 2012:
| | |
WisdomTree Domestic Dividend Funds WisdomTree Total Dividend Fund (DTD) WisdomTree Equity Income Fund (DHS) WisdomTree LargeCap Dividend Fund (DLN) WisdomTree Dividend ex-Financials Fund (DTN) WisdomTree MidCap Dividend Fund (DON) WisdomTree SmallCap Dividend Fund (DES) WisdomTree International Dividend Funds WisdomTree DEFA Fund (DWM) WisdomTree DEFA Equity Income Fund (DTH) WisdomTree Global Equity Income Fund (DEW) WisdomTree Europe SmallCap Dividend Fund (DFE) WisdomTree Japan Hedged Equity Fund (DXJ) WisdomTree Global ex-U.S. Growth Fund (DNL) WisdomTree Japan SmallCap Dividend Fund (DFJ) WisdomTree Asia Pacific ex-Japan Fund (AXJL) WisdomTree Australia Dividend Fund (AUSE) WisdomTree International LargeCap Dividend Fund (DOL) WisdomTree International Dividend ex-Financials Fund (DOO) WisdomTree International MidCap Dividend Fund (DIM) WisdomTree International SmallCap Dividend Fund (DLS) WisdomTree Emerging Markets Equity Income Fund (DEM) WisdomTree Emerging Markets SmallCap Dividend Fund (DGS) WisdomTree Middle East Dividend Fund (GULF) WisdomTree International Hedged Equity Fund (HEDJ) WisdomTree International Dividend
Sector Funds WisdomTree Commodity Country Equity Fund (CCXE) WisdomTree Global Natural Resources Fund (GNAT) WisdomTree Global ex-U.S. Utilities Fund (DBU) WisdomTree Global ex-U.S. Real Estate Fund (DRW) | | WisdomTree Domestic and International Earnings Funds WisdomTree Total Earnings Fund (EXT) WisdomTree Earnings 500 Fund (EPS) WisdomTree MidCap Earnings Fund (EZM) WisdomTree SmallCap Earnings Fund (EES) WisdomTree LargeCap Value Fund (EZY) WisdomTree LargeCap Growth Fund (ROI) WisdomTree India Earnings Fund (EPI) WisdomTree Currency Funds WisdomTree Dreyfus Brazilian Real Fund (BZF) WisdomTree Dreyfus Chinese Yuan Fund (CYB) WisdomTree Dreyfus Commodity Currency Fund (CCX) WisdomTree Dreyfus Emerging Currency Fund (CEW) WisdomTree Dreyfus Indian Rupee Fund (ICN) WisdomTree Dreyfus Japanese Yen Fund (JYF) WisdomTree Dreyfus South African Rand Fund (SZR) WisdomTree Fixed Income Funds WisdomTree Asia Local Debt Fund (ALD) WisdomTree Australia & New Zealand Debt Fund (AUNZ) WisdomTree Emerging Markets Local Debt Fund (ELD) WisdomTree Emerging Markets Corporate Bond Fund (EMCB) WisdomTree Euro Debt Fund (EU) WisdomTree Alternative Funds WisdomTree Global Real Return Fund (RRF) WisdomTree Managed Futures Strategy Fund (WDTI) |
The WisdomTree Funds are exchange traded funds (“ETFs”) registered with the United States Securities and Exchange Commission as separate series (“Funds”) of WisdomTree Trust (“Trust”). WisdomTree Asset Management, Inc., a wholly owned subsidiary of WisdomTree Investments, Inc., serves as the investment adviser to the Trust. None of the WisdomTree entities are affiliated with ALPS Distributors, Inc., the Funds’ distributor. WisdomTree Investments, its affiliates and their independent providers are not liable for any informational errors, incompleteness, delays, or for any actions taken in reliance on information contained herein.
Investors’ should consider the investment objectives, risks, charges and expenses of the Funds carefully before investing. A prospectus, containing this and other information, is available at www.wisdomtree.com, or by calling 1-866-909-WISE (9473). Investors’ should read the prospectus carefully before investing. There are risks associated with investing, including possible loss of principal. Past performance does not guarantee future results. Indexes are unmanaged and you cannot invest directly in an index.
There are risks associated with investing including possible loss of principal. Foreign investing involves special risks, such as risk of loss from currency fluctuation or political or economic uncertainty. Investments in real estate involve additional special risks, such as credit risk, interest rate fluctuations and the effect of varied economic conditions. Funds that focus their investments in one country or region may be significantly impacted by events and developments associated with the region which can adversely affect performance. Funds focusing on a single sector and/or smaller companies generally experience greater price volatility. Investments in emerging, offshore or frontier markets are generally less liquid and less efficient than investments in developed markets and are subject to additional risks, such as risks of adverse governmental regulation and intervention or political developments. Inflation protected securities do not eliminate risks associated with inflation or deflation. Investments in currency involve additional special risks, such as credit risk and interest rate fluctuations. Derivative investments can be volatile and these investments may be less liquid than other securities, and more sensitive to the effect of varied economic conditions. As these Funds can have a high concentration in some issuers the Funds can be adversely impacted by changes affecting such issuers.
One of the risks associated with the Managed Futures Strategy Fund (WDTI) and the Global Real Return Fund (RRF) is the complexity of the different factors which contribute to each Fund’s performance, as well as their correlation (or non-correlation) of such Funds’ to other asset classes. These factors include use of long and short positions in commodity futures contracts, currency forward contracts, swaps and other derivatives. An investment in WDTI is speculative and involves a substantial degree of risk. WDTI should not be used as a proxy for taking long only (or short only) positions in commodities or currencies. In markets without sustained price trends or markets that quickly reverse or “whipsaw” WDTI may suffer significant losses. Unlike typical exchange-traded funds, there are no indexes that the Currency Funds, Fixed Income Funds, WDTI or RRF attempt to track or replicate. Thus, the ability of these Funds to achieve their objectives will depend on the effectiveness of the portfolio manager. Due to the investment strategy of certain Fund’s they may make higher capital gain distributions than other ETFs. Please read each Fund’s prospectus for specific details regarding the Fund’s risk profile.
The Dow Jones Global Select Real Estate Securities (ex-US) Index is calculated, distributed and marketed by Dow Jones Indexes, a licensed trademark of CME Group Index Services LLC, and has been licensed for use.
Transactions in Fund shares will result in brokerage commissions and will generate tax consequences. Shares may be sold through brokerage accounts, but may be redeemed from the Funds only in large amounts of 50,000 shares or more.
WisdomTree Trust
380 Madison Avenue, 21st Floor
New York, NY 10017
WisdomTree International Dividend and Sector Funds
WisdomTree DEFA Fund (DWM)
WisdomTree DEFA Equity Income Fund (DTH)
WisdomTree Global Equity Income Fund (DEW)
WisdomTree Europe SmallCap Dividend Fund (DFE)
WisdomTree Japan Hedged Equity Fund (DXJ)
WisdomTree Global ex-U.S. Growth Fund (DNL)
(formerly, WisdomTree World ex-U.S. Growth Fund (DNL))
WisdomTree Japan SmallCap Dividend Fund (DFJ)
WisdomTree Asia Pacific ex-Japan Fund (AXJL)
(formerly, WisdomTree Pacific ex-Japan Total Dividend Fund (DND))
WisdomTree Australia Dividend Fund (AUSE)
(formerly, WisdomTree Pacific ex-Japan Equity Income Fund (DNH))
WisdomTree International LargeCap Dividend Fund (DOL)
WisdomTree International Dividend ex-Financials Fund (DOO)
WisdomTree International MidCap Dividend Fund (DIM)
WisdomTree International SmallCap Dividend Fund (DLS)
WisdomTree Emerging Markets Equity Income Fund (DEM)
WisdomTree Emerging Markets SmallCap Dividend Fund (DGS)
WisdomTree Middle East Dividend Fund (GULF)
WisdomTree International Hedged Equity Fund (HEDJ)
WisdomTree Commodity Country Equity Fund (CCXE)
(formerly, WisdomTree International Basic Materials Sector Fund (DBN))
WisdomTree Global Natural Resources Fund (GNAT)
(formerly, WisdomTree International Energy Sector Fund (DKA))
WisdomTree Global ex-U.S. Utilities Fund (DBU)
(formerly, WisdomTree International Utilities Sector Fund (DBU))
WisdomTree Global ex-U.S. Real Estate Fund (DRW)
(formerly, WisdomTree International Real Estate Fund (DRW))
WisdomTree Fund shares are distributed by ALPS Distributors, Inc.
WIS004137 (05/2013)
Item 2. Code of Ethics.
(a) The Registrant has adopted a code of ethics (the “Code of Ethics”) that applies to persons appointed by the Registrant’s Board of Trustees as the President and Chief Executive Officer, Chief Financial Officer, Treasurer and/or Chief Accounting Officer, and any persons performing similar functions. For the fiscal year ended March 31, 2012, there were no amendments to any provision of the Code of Ethics. A copy of this code is filed with this Form N-CSR under Item 12(a) (1).
(b) Not applicable.
(c) The Trust has not amended its Code of Ethics during the period covered by the shareholder report presented in Item 1 hereto.
(d) The Trust has not granted a waiver or an implicit waiver from a provision of its Code of Ethics.
(e) Not applicable.
(f) The Trust’s Code of Ethics is attached hereto as an exhibit.
Item 3. Audit Committee Financial Expert.
The Registrant’s Board of Trustees has determined that the Registrant has one audit committee financial expert, as that term is defined under Item 3(b) and 3(c), serving on its audit committee. The audit committee financial expert serving on the Registrant’s audit committee is Greg Barton, who is an independent Trustee of the Trust, as that term is defined under Item 3(a) (2).
Item 4. Principal Accountant Fees and Services.
The principal accountant fees disclosed in item 4(a), 4(b), 4(c), 4(d) and 4(g) are for the thirty-four funds of the Registrant for which the fiscal year-end is March 31, 2012 and whose annual financial statements are reported in Item 1.
(a) Audit Fees. The aggregate fees billed from the Trust’s fiscal year ended March 31, 2012 for professional services rendered by the principal accountant for the audit of the Trust’s annual financial statements or services that are normally provided by the accountant in connection with statutory and regulatory filings or engagements are as follows:
2012: $682,485
2011: $659,011
(b) Audit-Related Fees. The aggregate fees billed from the Trust’s fiscal year ended March 31, 2012 for professional services rendered for assurance and related services by the principal accountant that are reasonably related to the performance of the audit of the Trust’s financial statements and are not reported above in Item 4(a) are as follows:
2012: $0
2011: $0
(c) Tax Fees. The aggregate fees billed from the Trust’s fiscal year ended March 31, 2012 for professional services rendered by the principal accountant for tax compliance, tax advice and tax planning are as follows:
2012: $438,490
2011: $438,622
(d) All Other Fees. The aggregate fees billed from the Trust’s fiscal year ended March 31, 2012 for products and services provided by the principal accountant, other than the services reported above in Items 4(a) through (c) are as follows:
2012: $0
2011: $78,560
| (e) | Audit Committee Pre-Approval Policies and Procedures. |
(i) Per Rule 2-01(c) (7) (A), the Registrant’s audit committee charter provides that the audit committee shall select and approve in advance the retention of independent accountants to annually audit and provide their opinion on the Registrant’s financial statements. The audit committee must also approve prior to appointment the engagement of the principal accountant to provide other audit services to the Registrant or to provide non-audit services to the Registrant, its investment adviser, or any entity controlling, controlled by, or under common control with its investment adviser (“adviser/affiliate”) that provides ongoing services to the Registrant, if the engagement by the investment adviser or adviser affiliate relates directly to the operations and financial reporting of the Registrant. The audit committee must also, prior to appointment of the engagement of the principal accountant, review and approve the fees proposed to be charged to the Registrant by the auditors for each audit and non-audit service. The audit committee must also consider whether non-audit services provided by the Registrant’s principal accountant to the Registrant’s investment adviser, or adviser/affiliate that provides ongoing services to the Trust are compatible with maintaining the auditor’s independence.
(ii) The Registrant’s Audit Committee has approved 100% of services described in each of Items 4(b) through (d) pursuant to paragraph (c) (7) (A) of Rule 2-01 of Regulation S-X.
(f) The percentage of hours expended on the principal accountant’s engagement to audit the Trust’s financial statements for the most recent fiscal year attributable to work performed by persons other than the principal accountant’s full-time, permanent employees was 0%.
(g) The aggregate non-audit fees billed by the Trust’s accountant for services rendered to the Trust, the Advisor or any entity controlling, controlled by, or under common control with the Advisor that provides ongoing services to the Trust (except for any sub-advisor whose role is primarily portfolio management and is sub-contracted with or overseen by another investment advisor) that for the fiscal year ended March 31, 2012 are as follows:
2012: $438,490
2011: $517,182
Item 5. Audit Committee of Listed Registrants.
The Registrant is an issuer as defined in Rule 10A-3 under the Exchange Act and has a separately-designated standing audit committee established in accordance with Section 3(a) (58)A of the Exchange Act. The Registrant’s audit committee members are Greg Barton, Toni Massaro and Victor Ugolyn.
Item 6. Schedule of Investments.
The schedule is included as part of the report to shareholders filed under Item 1 of this form.
Item 7. Disclosure of Proxy Voting Policies and Procedures for Closed-End Management Investment Companies.
Not applicable.
Item 8. Portfolio Managers of Closed-End Management Investment Companies.
Not applicable.
Item 9. Purchases of Equity Securities by Closed-End Management Investment Company and Affiliated Purchasers.
Not applicable.
Item 10. Submission of Matters to a Vote of Security Holders.
Not applicable.
Item 11. Controls and Procedures.
(a) Based on their evaluation of the Registrant’s disclosure controls and procedures (as defined in Rule 30a-3(d) under the Investment Company Act of 1940) as of a date within 90 days prior to the filing date of this report, the President and Treasurer of the Registrant have concluded that such disclosure controls and procedures are reasonably designed and effective to ensure that material information relating to the Registrant, is made known to them by others within those entities.
(b) There were no changes in the Registrant’s internal control over financial reporting (as defined in Rule 30 a-3(d) under the Investment Company Act of 1940) that occurred during the Registrant’s second fiscal quarter that have materially affected, or are reasonably likely to materially affect, the Registrant’s internal control over financial reporting.
Item 12. Exhibits.
(a)(1) Code of Ethics for Senior Officers that is the subject of Item 2 is attached.
(a)(2) Certification of each principal executive officer and principal financial officer of the Registrant as required by Rule 30a-2 under the Act (17 CFR 270.30a-2) is attached hereto as a part of EX-99.CERT.
(a)(3) Not applicable.
(b) Certification of each principal executive officer and principal financial officer of the Registrant as required by Section 906 of the Sarbanes-Oxley Act of 2002 is attached hereto as a part of EX-99.906CERT.
SIGNATURES
Pursuant to the requirements of the Securities Exchange Act of 1934 and the Investment Company Act of 1940, the registrant has duly caused this report to be signed on its behalf by the undersigned, thereunto duly authorized.
(Registrant) WisdomTree Trust
By: /s/ Jonathan L. Steinberg
Name: Jonathan L. Steinberg
Title: President
Date: June 07, 2012
By: /s/ Amit Muni
Name: Amit Muni
Title: Treasurer
Date: June 07, 2012
Pursuant to the requirements of the Securities Exchange Act of 1934 and the Investment Company Act of 1940, this report has been signed by the following persons on behalf of the registrant and in the capacities and on the dates indicated.
By: /s/ Jonathan L. Steinberg
Name: Jonathan L. Steinberg
Title: President
Date: June 07, 2012
By: /s/ Amit Muni
Name: Amit Muni
Title: Treasurer
Date: June 07, 2012