UNITED STATES
SECURITIES AND EXCHANGE COMMISSION
Washington, D.C. 20549
FORM N-CSR
CERTIFIED SHAREHOLDER REPORT OF REGISTERED
MANAGEMENT INVESTMENT COMPANIES
Investment Company Act file number 811-21864
WisdomTree Trust
(Exact name of registrant as specified in charter)
250 West 34th Street, 3rd Floor
New York, NY 10119
(Address of principal executive offices) (Zip code)
The Corporation Trust Company
1209 Orange Street
Wilmington, DE 19801
(Name and address of agent for service)
Registrant’s telephone number, including area code: (866) 909-9473
Date of fiscal year end: March 31
Date of reporting period: March 31, 2022
Form N-CSR is to be used by management investment companies to file reports with the Commission not later than 10 days after the transmission to stockholders of any report that is required to be transmitted to stockholders under Rule 30e-1 under the Investment Company Act of 1940 (17 CFR 270.30e-1). The Commission may use the information provided on Form N-CSR in its regulatory, disclosure review, inspection, and policymaking roles.
A registrant is required to disclose the information specified by Form N-CSR, and the Commission will make this information public. A registrant is not required to respond to the collection of information contained in Form N-CSR unless the Form displays a currently valid Office of Management and Budget (“OMB”) control number. Please direct comments concerning the accuracy of the information collection burden estimate and any suggestions for reducing the burden to Secretary, Securities and Exchange Commission, 100 F Street, NE, Washington, DC 20549. The OMB has reviewed this collection of information under the clearance requirements of 44 U.S.C. § 3507.
| Item 1. | Reports to Stockholders. |
| | (a) | The Reports to Shareholders are attached hereto. |


WisdomTree Trust
Annual Report
March 31, 2022
WisdomTree U.S. AI Enhanced Value Fund (AIVL)
(formerly, WisdomTree U.S. Dividend ex-Financials Fund (DTN))
WisdomTree U.S. ESG Fund (RESP)
WisdomTree U.S. Growth & Momentum Fund (WGRO)
WisdomTree U.S. High Dividend Fund (DHS)
WisdomTree U.S. LargeCap Dividend Fund (DLN)
WisdomTree U.S. LargeCap Fund (EPS)
WisdomTree U.S. MidCap Dividend Fund (DON)
WisdomTree U.S. MidCap Fund (EZM)
WisdomTree U.S. Multifactor Fund (USMF)
WisdomTree U.S. Quality Dividend Growth Fund (DGRW)
WisdomTree U.S. SmallCap Dividend Fund (DES)
WisdomTree U.S. SmallCap Fund (EES)
WisdomTree U.S. SmallCap Quality Dividend Growth Fund (DGRS)
WisdomTree U.S. Total Dividend Fund (DTD)
WisdomTree U.S. Value Fund (WTV)
(formerly, WisdomTree U.S. Quality Shareholder Yield Fund (QSY))
Table of Contents
“WisdomTree” is a registered mark of WisdomTree Investments, Inc. and is licensed for use by the WisdomTree Trust.
Market Environment Overview
(unaudited)
U.S. equity markets, as measured by the S&P 500 Index, returned 15.65% in U.S. dollar terms for the 12-month fiscal period ending March 31, 2022 (the “period”).
U.S. equities moved higher for most of the period as the global economy continued its recovery from the onset of the COVID-19 pandemic in 2020. Vaccine accessibility established confidence in markets as the U.S. economy steadily began to reopen, promoting a revival in cyclical sectors that had been suppressed the year prior. The pace of economic growth accelerated during 2021, along with inflation rates, amid a backdrop of accommodative monetary policy. U.S. real gross domestic product (“GDP”) grew 5.7%, while inflation increased nearly 5% year-over-year during 2021.
During the second quarter of 2021, U.S. markets steadily increased as vaccines became widely approved and accessible for most demographics. The S&P 500 earned over 8.5%, while U.S. small-cap stocks (proxied by the Russell 2000 Index), favored by risk-on investors, returned roughly 4.3% as the economic recovery continued. Real GDP grew 6.7% during the quarter.
The third quarter of 2021 was more tempered than the previous quarter. The S&P 500 was flat during the quarter, as early summertime optimism faded when new and potentially more infectious COVID-19 variants appeared and spread throughout the country. This ignited fear of renewed “lockdowns”, prompting questions of vaccine efficacy, and threatened the ongoing economic recovery. U.S. small-cap stocks suffered during the risk-off quarter, falling about 4.36%, while the U.S. economy briefly sputtered, growing only about 2.3% in real terms (i.e., net of inflation effects).
Entering the fourth quarter of 2021, investors’ concerns quickly abated, and markets regained their footing. The U.S. economy continued to grow and the ongoing monetary policy support from the U.S. Federal Reserve (the “Fed”) helped boost markets. The S&P 500 returned over 11% to finish the 2021 calendar year, while U.S. small-cap stocks fluctuated and managed to hang on to 2.14% gains. As 2021 concluded, investors acknowledged that the economy had recovered quickly and efficiently, and feared that 2022 would likely see the end of the accommodative monetary policies that helped strengthen equity markets. The U.S. unemployment rate fell below 4% by the end of 2021, approaching pre-pandemic lows. Real GDP grew nearly 7% during the quarter.
With 2021 in rearview, investors began 2022 with several concerns that led to risk-off sentiments in the first quarter of 2022. At the forefront were concerns about runaway inflation, and the expectation that the Fed would have to quickly intervene with restrictive monetary policy actions to temper rising inflation. Interest rates rose quickly as bonds sold-off, and the Fed raised its target federal funds rate for the first time since slashing it to 0% at the onset of the COVID-19 pandemic.
Inflationary and interest rate concerns temporarily took a backseat halfway through the first quarter of 2022, as geopolitical tensions between Russia and Ukraine escalated into war. Investor risk-on sentiment deteriorated, and equities declined for several weeks as markets assessed the developments and prospects for resolution.
As a result, U.S. equities sold off in the first quarter of 2022, owing to the near certainty of several upcoming interest rate hikes amid a tightening cycle and geopolitical tensions between Russia and Ukraine. Though the unemployment rate continued to fall, landing at 3.6%, inflation marched higher to 8.5% year-over-year. The S&P 500 fell 4.60% while U.S. small-cap stocks declined over 7.5%.
Many of these risk factors remain paramount, and U.S. financial market performance will be heavily dependent on developments in the war between Russia and Ukraine, economic data, and upcoming central bank activity.
Each WisdomTree Fund’s performance as set forth in “Management’s Discussion of Funds’ Performance” in the pages that follow should also be viewed in light of the foregoing market environment.
Information about Performance and Shareholder Expense Examples (unaudited)
Performance
The performance tables on the following pages are provided for comparative purposes and represent the period noted. Each Fund’s per share net asset value (“NAV”) is the value of one share of the Fund and is calculated by dividing the value of total assets less total liabilities by the number of shares outstanding. The NAV return is based on the NAV of the Fund and the market price return is based on the market price per share of the Fund. The price used to calculate market price returns is the midpoint of the bid and ask price for Fund shares as of the close of trading on the exchange where Fund shares are listed. NAV and market price returns assume that dividends and capital gain distributions have been reinvested in the Fund at NAV and market price, respectively. As with other exchange traded funds (“ETFs”), NAV returns and market price returns may differ because of factors such as the supply and demand for Fund shares and investors’ assessments of the underlying value of a Fund’s portfolio securities.
Fund shares are bought and sold at market price (not NAV) and are not individually redeemed from a Fund. Fund NAV returns are calculated using a Fund’s daily 4:00 p.m. eastern time NAV. Market price returns reflect the midpoint of the bid and ask price as of the close of trading on the exchange where Fund shares are listed. Market price returns do not represent the returns you would receive if you traded shares at other times. The returns do not reflect the deduction of taxes that a shareholder would pay on Fund distributions or on the redemption of Fund shares. Total returns for a period of less than one year are cumulative.
Performance is historical and does not guarantee future results. Current performance may be lower or higher than quoted. Investment returns and the principal value of an investment will fluctuate so that an investor’s shares, when redeemed, may be worth more or less than their original cost. For the most recent month-end performance information visit www.wisdomtree.com.
An index is a statistical measure of a specified financial market or sector. An index does not actually hold a portfolio of securities, incur expenses or pay any transaction costs. Therefore, index returns do not reflect deductions for fees or expenses and an index is not available for direct investment. In comparison, the Funds’ performance is negatively impacted by these deductions. Fund returns do not reflect brokerage commissions or taxes on transactions in Fund shares or taxes that a shareholder would pay on Fund distributions. Past performance is no guarantee of future results.
Shareholder Expense Examples
Each Fund’s performance table is accompanied by a shareholder expense example. As a shareholder of a WisdomTree Fund, you incur two types of cost: (1) transaction costs, including brokerage commissions on purchases and sales of your Fund shares and (2) ongoing costs, including management fees and other Fund expenses. The examples are intended to help you understand your ongoing costs (in dollars and cents) of investing in a Fund and to compare these costs with the ongoing costs of investing in other funds.
The examples are based on an investment of $1,000 invested at the beginning of the period and held for the entire period from October 1, 2021 to March 31, 2022. Except where noted, expenses are calculated using each Fund’s annualized expense ratio (after the effect of contractual or voluntary fee waivers, if any), multiplied by the average account value for the period, multiplied by 182/365 (to reflect the one-half year period). The annualized expense ratio does not include acquired fund fees and expenses (“AFFEs”), which are fees and expenses incurred indirectly by a Fund through its investments in certain underlying investment companies.
Actual expenses
The first line in the shareholder expense example table shown on the following pages provides information about actual account values and actual expenses. You may use the information in this line, together with the amount you invested, to estimate the expenses that you paid over the period. Simply divide your account value by $1,000 (for example, an $8,600 account value divided by $1,000 = 8.6), then multiply the result by the number in the first line for your Fund under the heading entitled “Expenses Paid During the Period” to estimate the expenses you paid on your account during the period.
Hypothetical example for comparison purposes
The second line in the shareholder expense example table shown on the following pages provides information about hypothetical account values and hypothetical expenses based on the Fund’s actual expense ratio and an assumed rate of return of 5% per year before expenses, which is not the Fund’s actual return. The hypothetical account values and expenses may not be used to estimate the actual ending account balance or expenses you paid for the period. You may use this information to compare the ongoing costs of investing in your Fund and other funds. To do so, compare this 5% hypothetical example with the 5% hypothetical examples that appear in the shareholder reports of the other funds.
Please note that the expenses shown in the table are meant to highlight your ongoing costs only and do not reflect any transactional costs, such as brokerage commissions paid on purchases and sales of Fund shares. Therefore, the second line in the table is useful in comparing ongoing Fund costs only and will not help you determine the relative total costs of owning different funds. In addition, if these transactional costs were included, your costs would have been higher.
Management’s Discussion of Funds’ Performance
as of March 31, 2022 (unaudited)
WisdomTree U.S. AI Enhanced Value Fund (AIVL)
(formerly, WisdomTree U.S. Dividend ex-Financials Fund (DTN))
Sector Breakdown†
| | | | |
| |
| Sector | | % of Net Assets | |
Financials | | | 21.1% | |
Health Care | | | 17.5% | |
Industrials | | | 16.0% | |
Information Technology | | | 12.7% | |
Consumer Staples | | | 10.2% | |
Materials | | | 7.2% | |
Utilities | | | 5.2% | |
Consumer Discretionary | | | 4.4% | |
Communication Services | | | 2.8% | |
Energy | | | 2.1% | |
Real Estate | | | 0.4% | |
Investment Company | | | 0.1% | |
Other Assets less Liabilities‡ | | | 0.3% | |
Total | | | 100.0% | |
| † | The Fund’s sector breakdown is expressed as a percentage of net assets and may change over time. In addition, a sector may be comprised of several industries. |
| ‡ | Other assets less liabilities may include investment of cash collateral for securities on loan and/or receivables/payables on derivatives (if any). |
Top Ten Holdings*
| | | | |
| |
| Description | | % of Net Assets | |
Automatic Data Processing, Inc. | | | 3.5% | |
Roper Technologies, Inc. | | | 2.9% | |
Medtronic PLC | | | 2.5% | |
Mondelez International, Inc., Class A | | | 2.5% | |
Keurig Dr. Pepper, Inc. | | | 2.3% | |
Becton Dickinson and Co. | | | 2.3% | |
CME Group, Inc. | | | 2.3% | |
Intercontinental Exchange, Inc. | | | 2.2% | |
Genpact Ltd. | | | 1.9% | |
Arthur J. Gallagher & Co. | | | 1.8% | |
| * | The ten largest holdings are subject to change, and there are no guarantees the Fund will remain invested in any particular company. Excludes derivatives and investment of cash collateral for securities on loan (if any). |
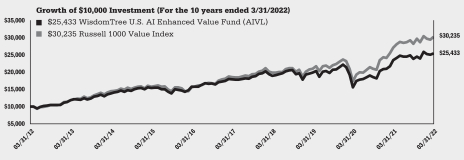
The WisdomTree U.S. AI Enhanced Value Fund (the “Fund”) seeks income and capital appreciation by investing primarily in equity securities selected from a universe of U.S. equities that exhibit value characteristics based on the selection results of a proprietary, quantitative artificial intelligence (“AI”) model developed by the Fund’s sub-adviser, Voya Investment Management Co., LLC. Prior to January 18, 2022, Fund performance reflects the investment objective of the Fund when it was the WisdomTree U.S. Dividend ex-Financials Fund and tracked the price and yield performance, before fees and expenses, of the WisdomTree U.S. Dividend ex-Financials Index (the “Former Index”). In seeking to track the Former Index, the Fund invested in high-dividend-yielding companies in the U.S. excluding the financials sector.
The Fund returned 8.19% at net asset value (“NAV”) for the fiscal year ended March 31, 2022 (for more complete performance information please see the table below). The Fund benefited from a reduced relative weight in the Healthcare sector and increased relative weight in the Real Estate and Utilities sectors, as well as stock selection within Financials. Lower relative weight to Information Technology and stock selection within that sector detracted from Fund performance. Lower relative weight to non-dividend paying companies and negative earners also benefited Fund performance.
Shareholder Expense Example (for the six-month period ended March 31, 2022)
| | | | | | | | | | | | | | | | |
| | | | | |
| | | Beginning
Account Value | | | Ending
Account Value | | | Annualized Net
Expense Ratio | | | Expenses Paid
During the
Period | |
Actual | | $ | 1,000.00 | | | $ | 1,066.80 | | | | 0.38 | % | | $ | 1.96 | |
Hypothetical (5% return before expenses) | | $ | 1,000.00 | | | $ | 1,023.04 | | | | 0.38 | % | | $ | 1.92 | |
Performance
| | | | | | | | | | | | | | | | |
| | |
| | | Average Annual Total Return | |
| | | | |
| | | 1 Year | | | 3 Year | | | 5 Year | | | 10 Year | |
Fund NAV Returns1 | | | 8.19 | % | | | 8.57 | % | | | 7.27 | % | | | 9.78 | % |
Fund Market Price Returns1 | | | 8.08 | % | | | 8.60 | % | | | 7.28 | % | | | 9.78 | % |
Russell 1000® Value Index | | | 11.67 | % | | | 13.02 | % | | | 10.29 | % | | | 11.70 | % |
| 1 | The Fund’s investment objective changed effective January 18, 2022. Prior to January 18, 2022, the Fund’s investment objective sought to track the price and yield performance, before fees and expenses, of the WisdomTree U.S. Dividend ex-Financials Index. |
Performance is historical and does not guarantee future results. The returns do not reflect the deduction of taxes that a shareholder would pay on Fund distributions or on the redemption of Fund shares.
Management’s Discussion of Funds’ Performance
as of March 31, 2022 (unaudited)
WisdomTree U.S. ESG Fund (RESP)
Sector Breakdown†
| | | | |
| |
| Sector | | % of Net Assets | |
Information Technology | | | 30.1% | |
Health Care | | | 13.6% | |
Consumer Discretionary | | | 12.4% | |
Financials | | | 11.5% | |
Communication Services | | | 9.9% | |
Industrials | | | 8.3% | |
Consumer Staples | | | 6.0% | |
Real Estate | | | 2.8% | |
Materials | | | 2.7% | |
Utilities | | | 2.6% | |
Other Assets less Liabilities‡ | | | 0.1% | |
Total | | | 100.0% | |
| † | The Fund’s sector breakdown is expressed as a percentage of net assets and may change over time. In addition, a sector may be comprised of several industries. |
| ‡ | Other assets less liabilities may include investment of cash collateral for securities on loan and/or receivables/payables on derivatives (if any). |
Top Ten Holdings*
| | | | |
| |
| Description | | % of Net Assets | |
Apple, Inc. | | | 7.2% | |
Microsoft Corp. | | | 6.0% | |
Alphabet, Inc., Class A | | | 5.1% | |
Amazon.com, Inc. | | | 3.0% | |
Tesla, Inc. | | | 1.9% | |
Visa, Inc., Class A | | | 1.5% | |
MasterCard, Inc., Class A | | | 1.2% | |
JPMorgan Chase & Co. | | | 0.9% | |
Johnson & Johnson | | | 0.9% | |
UnitedHealth Group, Inc. | | | 0.9% | |
| * | The ten largest holdings are subject to change, and there are no guarantees the Fund will remain invested in any particular company. Excludes derivatives and investment of cash collateral for securities on loan (if any). |
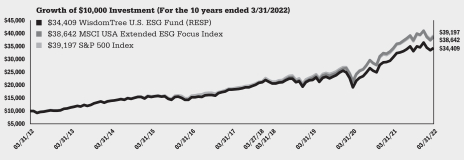
The WisdomTree U.S. ESG Fund (the “Fund”) seeks capital appreciation. The Fund is actively managed using a model-based approach. The Fund seeks to achieve its investment objective by investing primarily in U.S. equity securities that exhibit certain characteristics believed to be indicative of positive future returns as well as incorporating favorable environmental, social, and governance (“ESG”) characteristics.
The Fund returned 11.73% at net asset value (“NAV”) for the fiscal year ended March 31, 2022 (for more complete performance information please see the table below). The Fund benefited from its positions in Materials, Health Care, and Communication Services, primarily due to stock selection effects within each sector. Positions in the Energy, Information Technology, and Consumer Discretionary sectors weighed on performance for the Fund, due to a combination of allocation effects within Energy and stock selection effects within Consumer Discretionary and Information Technology. When analyzing performance by market capitalization, the Fund’s exposure to mid and large cap companies weighed on performance. Mid caps did not perform as poorly as large caps, however, and would have buffered performance on the downside if there had been a larger mid cap allocation.
Shareholder Expense Example (for the six-month period ended March 31, 2022)
| | | | | | | | | | | | | | | | |
| | | | | |
| | | Beginning
Account Value | | | Ending
Account Value | | | Annualized
Expense Ratio | | | Expenses Paid
During the
Period | |
Actual | | $ | 1,000.00 | | | $ | 1,037.70 | | | | 0.28 | % | | $ | 1.42 | |
Hypothetical (5% return before expenses) | | $ | 1,000.00 | | | $ | 1,023.54 | | | | 0.28 | % | | $ | 1.41 | |
Performance
| | | | | | | | | | | | | | | | |
| | |
| | | Average Annual Total Return | |
| | | | |
| | | 1 Year | | | 3 Year | | | 5 Year | | | 10 Year | |
Fund NAV Returns1 | | | 11.73 | % | | | 16.17 | % | | | 13.57 | % | | | 13.15 | % |
Fund Market Price Returns1 | | | 11.76 | % | | | 16.25 | % | | | 13.63 | % | | | 13.16 | % |
MSCI USA Extended ESG Focus Index2 | | | 12.93 | % | | | 19.45 | % | | | N/A | | | | N/A | |
S&P 500® Index | | | 15.65 | % | | | 18.92 | % | | | 15.99 | % | | | 14.64 | % |
| 1 | The Fund’s name, investment objective and strategies changed effective March 16, 2020. Prior to March 16, 2020, Fund performance reflects the investment objective of the Fund when it was known as the WisdomTree U.S. Total Market Fund (EXT) and tracked the performance, before fees and expenses, of the WisdomTree U.S. Total Market Index. |
| 2 | The MSCI USA Extended ESG Focus Index began on March 27, 2018, and the line graph for the Index begins at the same value as the Fund on that date. |
Performance is historical and does not guarantee future results. The returns do not reflect the deduction of taxes that a shareholder would pay on Fund distributions or on the redemption of Fund shares.
Management’s Discussion of Funds’ Performance
as of March 31, 2022 (unaudited)
WisdomTree U.S. Growth & Momentum Fund (WGRO)
Sector Breakdown†
| | | | |
| |
| Sector | | % of Net Assets | |
Information Technology | | | 41.1% | |
Financials | | | 16.3% | |
Consumer Discretionary | | | 13.0% | |
Industrials | | | 11.1% | |
Health Care | | | 6.9% | |
Communication Services | | | 4.0% | |
Materials | | | 3.9% | |
Real Estate | | | 3.6% | |
Other Assets less Liabilities‡ | | | 0.1% | |
Total | | | 100.0% | |
| † | The Fund’s sector breakdown is expressed as a percentage of net assets and may change over time. In addition, a sector may be comprised of several industries. |
| ‡ | Other assets less liabilities may include investment of cash collateral for securities on loan and/or receivables/payables on derivatives (if any). |
Top Ten Holdings*
| | | | |
| |
| Description | | % of Net Assets | |
EPAM Systems, Inc. | | | 2.4% | |
Tesla, Inc. | | | 2.1% | |
Alphabet, Inc., Class A | | | 2.1% | |
Arista Networks, Inc. | | | 2.1% | |
Choice Hotels International, Inc. | | | 2.1% | |
Moderna, Inc. | | | 2.0% | |
WESCO International, Inc. | | | 2.0% | |
Marvell Technology, Inc. | | | 2.0% | |
SeaWorld Entertainment, Inc. | | | 2.0% | |
Accenture PLC, Class A | | | 2.0% | |
| * | The ten largest holdings are subject to change, and there are no guarantees the Fund will remain invested in any particular company. Excludes derivatives and investment of cash collateral for securities on loan (if any). |
The WisdomTree U.S. Growth & Momentum Fund (the “Fund”) seeks to track the price and yield performance, before fees and expenses, of the O’Neil Growth Index (the “Index”), which is comprised of mid- and large capitalization companies that provide exposure to high growth and momentum U.S. listed stocks. The Fund generally uses a representative sampling strategy to achieve its investment objective, meaning it generally will invest in a sample of securities in the Index.
The Fund returned -11.34% at net asset value (“NAV”) for the period from June 24, 2021 through March 31, 2022 (for more complete performance information please see the table below). The Fund benefited from a higher relative weight in the Financials sector. Stock selection in Health Care, Information Technology, and Communication Services detracted from the Fund’s overall performance during the period. Stock selection within the lowest earnings yield, or more expensive, sector of the market detracted from Fund performance.
Shareholder Expense Example (for the six-month period ended March 31, 2022)
| | | | | | | | | | | | | | | | |
| | | | | |
| | | Beginning
Account Value | | | Ending
Account Value | | | Annualized
Expense Ratio | | | Expenses Paid
During the
Period | |
Actual | | $ | 1,000.00 | | | $ | 890.80 | | | | 0.55 | % | | $ | 2.59 | |
Hypothetical (5% return before expenses) | | $ | 1,000.00 | | | $ | 1,022.19 | | | | 0.55 | % | | $ | 2.77 | |
Performance
| | | | |
| | |
| | | Cumulative Total Return | |
| |
| | | Since Inception1 | |
Fund NAV Returns | | | -11.34 | % |
Fund Market Price Returns | | | -11.11 | % |
O’Neil Growth Index | | | -10.94 | % |
Russell 1000® Growth Index | | | 4.41 | % |
MSCI USA Momentum Index | | | -0.49 | % |
| 1 | Total returns are calculated based on the commencement of Fund trading on the NASDAQ on June 24, 2021. |

Performance is historical and does not guarantee future results. The returns do not reflect the deduction of taxes that a shareholder would pay on Fund distributions or on the redemption of Fund shares.
Management’s Discussion of Funds’ Performance
as of March 31, 2022 (unaudited)
WisdomTree U.S. High Dividend Fund (DHS)
Sector Breakdown†
| | | | |
| |
| Sector | | % of Net Assets | |
Health Care | | | 18.7% | |
Energy | | | 18.2% | |
Consumer Staples | | | 17.1% | |
Financials | | | 14.7% | |
Utilities | | | 12.3% | |
Communication Services | | | 4.5% | |
Real Estate | | | 4.5% | |
Information Technology | | | 3.0% | |
Industrials | | | 3.0% | |
Materials | | | 2.6% | |
Consumer Discretionary | | | 0.9% | |
Investment Company | | | 0.2% | |
Other Assets less Liabilities‡ | | | 0.3% | |
Total | | | 100.0% | |
| † | The Fund’s sector breakdown is expressed as a percentage of net assets and may change over time. In addition, a sector may be comprised of several industries. |
| ‡ | Other assets less liabilities may include investment of cash collateral for securities on loan and/or receivables/payables on derivatives (if any). |
Top Ten Holdings*
| | | | |
| |
| Description | | % of Net Assets | |
Exxon Mobil Corp. | | | 6.5% | |
Chevron Corp. | | | 5.4% | |
AbbVie, Inc. | | | 5.0% | |
Pfizer, Inc. | | | 4.9% | |
Coca-Cola Co. | | | 4.6% | |
Philip Morris International, Inc. | | | 4.5% | |
Altria Group, Inc. | | | 4.3% | |
Verizon Communications, Inc. | | | 4.0% | |
Merck & Co., Inc. | | | 2.9% | |
Cisco Systems, Inc. | | | 2.3% | |
| * | The ten largest holdings are subject to change, and there are no guarantees the Fund will remain invested in any particular company. Excludes derivatives and investment of cash collateral for securities on loan (if any). |
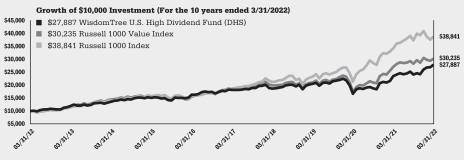
The WisdomTree U.S. High Dividend Fund (the “Fund”) seeks to track the price and yield performance, before fees and expenses, of the WisdomTree U.S. High Dividend Index (the “Index”). In seeking to track the Index, the Fund invests in high dividend yielding companies in the U.S. equity market. The Fund generally uses a representative sampling strategy to achieve its investment objective, meaning it generally will invest in a sample of securities in the Index.
The Fund returned 18.96% at net asset value (“NAV”) for the fiscal year ended March 31, 2022 (for more complete performance information please see the table below). The Fund benefited from its positions in Health Care, Energy and Information Technology, mainly due to allocation effects within Energy and stock selection effects within Health Care and Information Technology. Positions in the Financials, Communication Services and Consumer Staples sectors weighed on performance for the Fund, primarily due to stock selection effects within each sector. When analyzing performance by dividend yield attribution, the 5th and 3rd quintiles of companies ranked by dividend yield weighed on performance the most, though their impacts were still positive. The Fund had no exposure to the 5th quintile, which represents the companies with the lowest dividend yields, which was additive. The 3rd quintile’s impact was primarily due to stock selection despite the Fund having minimal exposure to this group. The companies within the 1st quintile, representing those with the highest dividend yield, and a minimal exposure to companies with zero dividend yield were top contributors due to allocation and stock selection.
Shareholder Expense Example (for the six-month period ended March 31, 2022)
| | | | | | | | | | | | | | | | |
| | | | | |
| | | Beginning
Account Value | | | Ending
Account Value | | | Annualized Net
Expense Ratio | | | Expenses Paid
During the
Period | |
Actual | | $ | 1,000.00 | | | $ | 1,159.10 | | | | 0.38 | % | | $ | 2.05 | |
Hypothetical (5% return before expenses) | | $ | 1,000.00 | | | $ | 1,023.04 | | | | 0.38 | % | | $ | 1.92 | |
Performance
| | | | | | | | | | | | | | | | |
| | |
| | | Average Annual Total Return | |
| | | | |
| | | 1 Year | | | 3 Year | | | 5 Year | | | 10 Year | |
Fund NAV Returns | | | 18.96 | % | | | 10.76 | % | | | 8.97 | % | | | 10.80 | % |
Fund Market Price Returns | | | 18.95 | % | | | 10.80 | % | | | 9.00 | % | | | 10.81 | % |
WisdomTree U.S. High Dividend Index | | | 19.52 | % | | | 11.20 | % | | | 9.39 | % | | | 11.21 | % |
Russell 1000® Value Index | | | 11.67 | % | | | 13.02 | % | | | 10.29 | % | | | 11.70 | % |
Russell 1000® Index | | | 13.27 | % | | | 18.71 | % | | | 15.82 | % | | | 14.53 | % |
Performance is historical and does not guarantee future results. The returns do not reflect the deduction of taxes that a shareholder would pay on Fund distributions or on the redemption of Fund shares.
Management’s Discussion of Funds’ Performance
as of March 31, 2022 (unaudited)
WisdomTree U.S. LargeCap Dividend Fund (DLN)
Sector Breakdown†
| | | | |
| |
| Sector | | % of Net Assets | |
Information Technology | | | 16.6% | |
Health Care | | | 16.3% | |
Consumer Staples | | | 15.0% | |
Financials | | | 13.8% | |
Energy | | | 9.4% | |
Industrials | | | 7.8% | |
Utilities | | | 5.8% | |
Real Estate | | | 5.3% | |
Consumer Discretionary | | | 4.9% | |
Communication Services | | | 2.7% | |
Materials | | | 2.1% | |
Investment Company | | | 0.1% | |
Other Assets less Liabilities‡ | | | 0.2% | |
Total | | | 100.0% | |
| † | The Fund’s sector breakdown is expressed as a percentage of net assets and may change over time. In addition, a sector may be comprised of several industries. |
| ‡ | Other assets less liabilities may include investment of cash collateral for securities on loan and/or receivables/payables on derivatives (if any). |
Top Ten Holdings*
| | | | |
| |
| Description | | % of Net Assets | |
Microsoft Corp. | | | 4.5% | |
Apple, Inc. | | | 3.9% | |
Exxon Mobil Corp. | | | 3.4% | |
Johnson & Johnson | | | 3.1% | |
JPMorgan Chase & Co. | | | 2.5% | |
Chevron Corp. | | | 2.4% | |
AbbVie, Inc. | | | 2.3% | |
Pfizer, Inc. | | | 2.2% | |
Procter & Gamble Co. | | | 2.2% | |
Coca-Cola Co. | | | 2.1% | |
| * | The ten largest holdings are subject to change, and there are no guarantees the Fund will remain invested in any particular company. Excludes derivatives and investment of cash collateral for securities on loan (if any). |
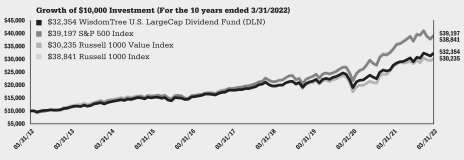
The WisdomTree U.S. LargeCap Dividend Fund (the “Fund”) seeks to track the price and yield performance, before fees and expenses, of the WisdomTree U.S. LargeCap Dividend Index (the “Index”). In seeking to track the Index, the Fund invests in dividend-paying large-cap companies in the U.S. equity market. The Fund generally uses a representative sampling strategy to achieve its investment objective, meaning it generally will invest in a sample of securities in the Index.
The Fund returned 17.16% at net asset value (“NAV”) for the fiscal year ended March 31, 2022 (for more complete performance information please see the table below). The Fund benefited from its positions in Information Technology, Industrials and Health Care, due to stock selection effects within each sector. Positions in Financials and Materials weighed on performance, primarily due to stock selection. When analyzing performance by dividend yield attribution, only the 3rd quintile of companies ranked by dividend yield weighed on performance, due to stock selection effects, while all other quintiles were additive. The Fund’s avoidance of companies with zero dividend yield, or representing non-dividend payers, was also additive.
Shareholder Expense Example (for the six-month period ended March 31, 2022)
| | | | | | | | | | | | | | | | |
| | | | | |
| | | Beginning
Account Value | | | Ending
Account Value | | | Annualized Net
Expense Ratio | | | Expenses Paid
During the
Period | |
Actual | | $ | 1,000.00 | | | $ | 1,112.70 | | | | 0.28 | % | | $ | 1.47 | |
Hypothetical (5% return before expenses) | | $ | 1,000.00 | | | $ | 1,023.54 | | | | 0.28 | % | | $ | 1.41 | |
Performance
| | | | | | | | | | | | | | | | |
| | |
| | | Average Annual Total Return | |
| | | | |
| | | 1 Year | | | 3 Year | | | 5 Year | | | 10 Year | |
Fund NAV Returns | | | 17.16 | % | | | 14.61 | % | | | 12.51 | % | | | 12.46 | % |
Fund Market Price Returns | | | 17.13 | % | | | 14.66 | % | | | 12.54 | % | | | 12.47 | % |
WisdomTree U.S. LargeCap Dividend Index | | | 17.67 | % | | | 15.00 | % | | | 12.87 | % | | | 12.79 | % |
S&P 500® Index | | | 15.65 | % | | | 18.92 | % | | | 15.99 | % | | | 14.64 | % |
Russell 1000® Value Index | | | 11.67 | % | | | 13.02 | % | | | 10.29 | % | | | 11.70 | % |
Russell 1000® Index | | | 13.27 | % | | | 18.71 | % | | | 15.82 | % | | | 14.53 | % |
Performance is historical and does not guarantee future results. The returns do not reflect the deduction of taxes that a shareholder would pay on Fund distributions or on the redemption of Fund shares.
Management’s Discussion of Funds’ Performance
as of March 31, 2022 (unaudited)
WisdomTree U.S. LargeCap Fund (EPS)
Sector Breakdown†
| | | | |
| |
| Sector | | % of Net Assets | |
Information Technology | | | 24.7% | |
Financials | | | 15.5% | |
Health Care | | | 14.9% | |
Communication Services | | | 11.4% | |
Consumer Discretionary | | | 10.2% | |
Consumer Staples | | | 6.5% | |
Industrials | | | 6.4% | |
Energy | | | 3.4% | |
Materials | | | 2.8% | |
Utilities | | | 2.5% | |
Real Estate | | | 1.5% | |
Investment Company | | | 0.1% | |
Other Assets less Liabilities‡ | | | 0.1% | |
Total | | | 100.0% | |
| † | The Fund’s sector breakdown is expressed as a percentage of net assets and may change over time. In addition, a sector may be comprised of several industries. |
| ‡ | Other assets less liabilities may include investment of cash collateral for securities on loan and/or receivables/payables on derivatives (if any). |
Top Ten Holdings*
| | | | |
| |
| Description | | % of Net Assets | |
Apple, Inc. | | | 6.0% | |
Microsoft Corp. | | | 5.1% | |
Alphabet, Inc., Class A | | | 4.6% | |
Amazon.com, Inc. | | | 3.9% | |
Meta Platforms, Inc., Class A | | | 2.2% | |
JPMorgan Chase & Co. | | | 2.1% | |
Berkshire Hathaway, Inc., Class B | | | 1.6% | |
AbbVie, Inc. | | | 1.5% | |
Tesla, Inc. | | | 1.5% | |
Johnson & Johnson | | | 1.4% | |
| * | The ten largest holdings are subject to change, and there are no guarantees the Fund will remain invested in any particular company. Excludes derivatives and investment of cash collateral for securities on loan (if any). |
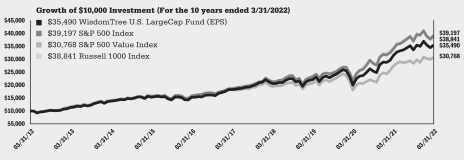
The WisdomTree U.S. LargeCap Fund (the “Fund”) seeks to track the price and yield performance, before fees and expenses, of the WisdomTree U.S. LargeCap Index (the “Index”). In seeking to track the Index, the Fund invests in earnings-generating large-cap companies in the U.S. equity market. The Fund generally uses a representative sampling strategy to achieve its investment objective, meaning it generally will invest in a sample of securities in the Index.
The Fund returned 13.19% at net asset value (“NAV”) for the fiscal year ended March 31, 2022 (for more complete performance information please see the table below). The Fund benefited from its positions in Health Care, Industrials and Materials, primarily due to stock selection effects within each sector. Positions in the Information Technology, Financials and Communication Services sectors weighed on performance for the Fund, as a result of stock selection. When analyzing performance by earnings yield attribution, the 1st and 3rd quintiles of companies ranked by earnings yield detracted from performance, as a result of allocation effects in the former and poor stock selection in the latter. The Fund’s avoidance of companies with negative earnings yield was additive for performance, while an underweight to the 5th quintile, representing the lowest earnings yield, was also beneficial.
Shareholder Expense Example (for the six-month period ended March 31, 2022)
| | | | | | | | | | | | | | | | |
| | | | | |
| | | Beginning
Account Value | | | Ending
Account Value | | | Annualized
Expense Ratio | | | Expenses Paid
During the
Period | |
Actual | | $ | 1,000.00 | | | $ | 1,057.30 | | | | 0.08 | % | | $ | 0.41 | |
Hypothetical (5% return before expenses) | | $ | 1,000.00 | | | $ | 1,024.53 | | | | 0.08 | % | | $ | 0.40 | |
Performance
| | | | | | | | | | | | | | | | |
| | |
| | | Average Annual Total Return | |
| | | | |
| | | 1 Year | | | 3 Year | | | 5 Year | | | 10 Year | |
Fund NAV Returns | | | 13.19 | % | | | 17.12 | % | | | 14.29 | % | | | 13.50 | % |
Fund Market Price Returns | | | 13.16 | % | | | 17.20 | % | | | 14.33 | % | | | 13.52 | % |
WisdomTree U.S. LargeCap Index | | | 13.30 | % | | | 17.26 | % | | | 14.50 | % | | | 13.77 | % |
S&P 500® Index | | | 15.65 | % | | | 18.92 | % | | | 15.99 | % | | | 14.64 | % |
S&P 500® Value Index | | | 12.58 | % | | | 14.12 | % | | | 11.14 | % | | | 11.89 | % |
Russell 1000® Index | | | 13.27 | % | | | 18.71 | % | | | 15.82 | % | | | 14.53 | % |
Performance is historical and does not guarantee future results. The returns do not reflect the deduction of taxes that a shareholder would pay on Fund distributions or on the redemption of Fund shares.
Management’s Discussion of Funds’ Performance
as of March 31, 2022 (unaudited)
WisdomTree U.S. MidCap Dividend Fund (DON)
Sector Breakdown†
| | | | |
| |
| Sector | | % of Net Assets | |
Financials | | | 24.0% | |
Industrials | | | 11.5% | |
Consumer Discretionary | | | 11.3% | |
Utilities | | | 10.3% | |
Materials | | | 10.0% | |
Real Estate | | | 9.8% | |
Energy | | | 8.2% | |
Consumer Staples | | | 4.9% | |
Information Technology | | | 3.6% | |
Communication Services | | | 3.1% | |
Health Care | | | 3.1% | |
Investment Company | | | 0.0% | * |
Other Assets less Liabilities‡ | | | 0.2% | |
Total | | | 100.0% | |
| † | The Fund’s sector breakdown is expressed as a percentage of net assets and may change over time. In addition, a sector may be comprised of several industries. |
| ‡ | Other assets less liabilities may include investment of cash collateral for securities on loan and/or receivables/payables on derivatives (if any). |
| * | Represents less than 0.1%. |
Top Ten Holdings*
| | | | |
| |
| Description | | % of Net Assets | |
Evergy, Inc. | | | 1.4% | |
Fidelity National Financial, Inc. | | | 1.3% | |
Omnicom Group, Inc. | | | 1.3% | |
Cardinal Health, Inc. | | | 1.2% | |
Conagra Brands, Inc. | | | 1.1% | |
Continental Resources, Inc. | | | 1.0% | |
Coterra Energy, Inc. | | | 1.0% | |
OGE Energy Corp. | | | 0.9% | |
Antero Midstream Corp. | | | 0.9% | |
Organon & Co. | | | 0.9% | |
| * | The ten largest holdings are subject to change, and there are no guarantees the Fund will remain invested in any particular company. Excludes derivatives and investment of cash collateral for securities on loan (if any). |
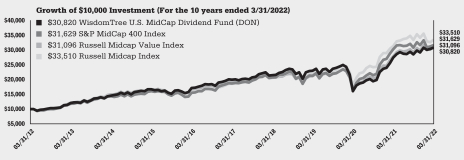
The WisdomTree U.S. MidCap Dividend Fund (the “Fund”) seeks to track the price and yield performance, before fees and expenses, of the WisdomTree U.S. MidCap Dividend Index (the “Index”). In seeking to track the Index, the Fund invests in dividend-paying mid-cap companies in the U.S. equity market. The Fund generally uses a representative sampling strategy to achieve its investment objective, meaning it generally will invest in a sample of securities in the Index.
The Fund returned 12.17% at net asset value (“NAV”) for the fiscal year ended March 31, 2022 (for more complete performance information please see the table below). The Fund benefited from its positions in Communication Services, Industrials and Health Care, due to selection effects within each sector. Positions in the Financials, Consumer Discretionary and Consumer Staples sectors weighed on performance for the Fund, attributable to stock selection. When analyzing performance by dividend yield attribution, the companies within the 4th and 1st quintiles weighed on performance the most, as a result of stock selection within both. The Fund’s near lack of exposure to companies with zero dividend yield was additive, while an overweight to the 3rd quintile was beneficial due to allocation effects.
Shareholder Expense Example (for the six-month period ended March 31, 2022)
| | | | | | | | | | | | | | | | |
| | | | | |
| | | Beginning
Account Value | | | Ending
Account Value | | | Annualized Net
Expense Ratio | | | Expenses Paid
During the
Period | |
Actual | | $ | 1,000.00 | | | $ | 1,080.90 | | | | 0.38 | % | | $ | 1.97 | |
Hypothetical (5% return before expenses) | | $ | 1,000.00 | | | $ | 1,023.04 | | | | 0.38 | % | | $ | 1.92 | |
Performance
| | | | | | | | | | | | | | | | |
| | |
| | | Average Annual Total Return | |
| | | | |
| | | 1 Year | | | 3 Year | | | 5 Year | | | 10 Year | |
Fund NAV Returns | | | 12.17 | % | | | 10.28 | % | | | 9.06 | % | | | 11.91 | % |
Fund Market Price Returns | | | 11.76 | % | | | 10.32 | % | | | 9.09 | % | | | 11.92 | % |
WisdomTree U.S. MidCap Dividend Index | | | 12.69 | % | | | 10.67 | % | | | 9.44 | % | | | 12.28 | % |
S&P MidCap 400® Index | | | 4.59 | % | | | 14.14 | % | | | 11.10 | % | | | 12.20 | % |
Russell Midcap Value Index | | | 11.45 | % | | | 13.69 | % | | | 9.99 | % | | | 12.01 | % |
Russell Midcap Index | | | 6.92 | % | | | 14.89 | % | | | 12.62 | % | | | 12.85 | % |
Performance is historical and does not guarantee future results. The returns do not reflect the deduction of taxes that a shareholder would pay on Fund distributions or on the redemption of Fund shares.
Management’s Discussion of Funds’ Performance
as of March 31, 2022 (unaudited)
WisdomTree U.S. MidCap Fund (EZM)
Sector Breakdown†
| | | | |
| |
| Sector | | % of Net Assets | |
Financials | | | 20.0% | |
Consumer Discretionary | | | 16.2% | |
Industrials | | | 13.9% | |
Information Technology | | | 12.3% | |
Materials | | | 9.0% | |
Health Care | | | 8.4% | |
Energy | | | 5.5% | |
Real Estate | | | 4.4% | |
Utilities | | | 3.5% | |
Communication Services | | | 3.3% | |
Consumer Staples | | | 3.1% | |
Investment Company | | | 0.3% | |
Other Assets less Liabilities‡ | | | 0.1% | |
Total | | | 100.0% | |
| † | The Fund’s sector breakdown is expressed as a percentage of net assets and may change over time. In addition, a sector may be comprised of several industries. |
| ‡ | Other assets less liabilities may include investment of cash collateral for securities on loan and/or receivables/payables on derivatives (if any). |
Top Ten Holdings*
| | | | |
| |
| Description | | % of Net Assets | |
Cleveland-Cliffs, Inc. | | | 1.4% | |
Ovintiv, Inc. | | | 0.9% | |
United States Steel Corp. | | | 0.9% | |
Alcoa Corp. | | | 0.8% | |
DISH Network Corp., Class A | | | 0.8% | |
NRG Energy, Inc. | | | 0.8% | |
Organon & Co. | | | 0.8% | |
APA Corp. | | | 0.8% | |
Jefferies Financial Group, Inc. | | | 0.7% | |
Kohl’s Corp. | | | 0.7% | |
| * | The ten largest holdings are subject to change, and there are no guarantees the Fund will remain invested in any particular company. Excludes derivatives and investment of cash collateral for securities on loan (if any). |
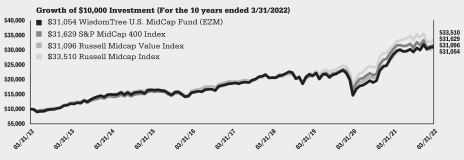
The WisdomTree U.S. MidCap Fund (the “Fund”) seeks to track the price and yield performance, before fees and expenses, of the WisdomTree U.S. MidCap Index (the “Index”). In seeking to track the Index, the Fund invests in earnings-generating mid-cap companies in the U.S. equity market. The Fund generally uses a representative sampling strategy to achieve its investment objective, meaning it generally will invest in a sample of securities in the Index.
The Fund returned 8.93% at net asset value (“NAV”) for the fiscal year ended March 31, 2022 (for more complete performance information please see the table below). The Fund benefited from its positions in Communication Services, Materials and Health Care, mainly due to stock selection. Positions in Financials, Information Technology, and Consumer Staples weighed on performance, also due to stock selection within each sector. When analyzing performance by earnings yield attribution, the 3rd and 4th quintiles of companies weighed on performance the most, almost entirely due to stock selection. The Fund’s lack of exposure to companies with negative earnings yield was additive due to allocation effects, while the 1st quintile was also beneficial due to a combination of allocation and stock selection effects.
Shareholder Expense Example (for the six-month period ended March 31, 2022)
| | | | | | | | | | | | | | | | |
| | | | | |
| | | Beginning
Account Value | | | Ending
Account Value | | | Annualized Net
Expense Ratio | | | Expenses Paid
During the
Period | |
Actual | | $ | 1,000.00 | | | $ | 1,056.60 | | | | 0.38 | % | | $ | 1.95 | |
Hypothetical (5% return before expenses) | | $ | 1,000.00 | | | $ | 1,023.04 | | | | 0.38 | % | | $ | 1.92 | |
Performance
| | | | | | | | | | | | | | | | |
| | |
| | | Average Annual Total Return | |
| | | | |
| | | 1 Year | | | 3 Year | | | 5 Year | | | 10 Year | |
Fund NAV Returns | | | 8.93 | % | | | 13.40 | % | | | 10.77 | % | | | 12.00 | % |
Fund Market Price Returns | | | 8.30 | % | | | 13.41 | % | | | 10.74 | % | | | 11.99 | % |
WisdomTree U.S. MidCap Index | | | 9.30 | % | | | 13.79 | % | | | 11.15 | % | | | 12.33 | % |
S&P MidCap 400® Index | | | 4.59 | % | | | 14.14 | % | | | 11.10 | % | | | 12.20 | % |
Russell Midcap Value Index | | | 11.45 | % | | | 13.69 | % | | | 9.99 | % | | | 12.01 | % |
Russell Midcap Index | | | 6.92 | % | | | 14.89 | % | | | 12.62 | % | | | 12.85 | % |
Performance is historical and does not guarantee future results. The returns do not reflect the deduction of taxes that a shareholder would pay on Fund distributions or on the redemption of Fund shares.
Management’s Discussion of Funds’ Performance
as of March 31, 2022 (unaudited)
WisdomTree U.S. Multifactor Fund (USMF)
Sector Breakdown†
| | | | |
| |
| Sector | | % of Net Assets | |
Information Technology | | | 29.1% | |
Health Care | | | 13.3% | |
Financials | | | 11.4% | |
Consumer Discretionary | | | 11.4% | |
Communication Services | | | 9.6% | |
Industrials | | | 7.8% | |
Consumer Staples | | | 5.9% | |
Energy | | | 3.5% | |
Real Estate | | | 2.8% | |
Materials | | | 2.6% | |
Utilities | | | 2.5% | |
Other Assets less Liabilities‡ | | | 0.1% | |
Total | | | 100.0% | |
| † | The Fund’s sector breakdown is expressed as a percentage of net assets and may change over time. In addition, a sector may be comprised of several industries. |
| ‡ | Other assets less liabilities may include investment of cash collateral for securities on loan and/or receivables/payables on derivatives (if any). |
Top Ten Holdings*
| | | | |
| |
| Description | | % of Net Assets | |
Jack Henry & Associates, Inc. | | | 1.4% | |
International Business Machines Corp. | | | 1.4% | |
SS&C Technologies Holdings, Inc. | | | 1.4% | |
Akamai Technologies, Inc. | | | 1.3% | |
FleetCor Technologies, Inc. | | | 1.3% | |
VeriSign, Inc. | | | 1.2% | |
Cognizant Technology Solutions Corp., Class A | | | 1.2% | |
Microsoft Corp. | | | 1.2% | |
Liberty Media Corp.—Liberty Formula One, Class C | | | 1.2% | |
Verizon Communications, Inc. | | | 1.2% | |
| * | The ten largest holdings are subject to change, and there are no guarantees the Fund will remain invested in any particular company. Excludes derivatives and investment of cash collateral for securities on loan (if any). |
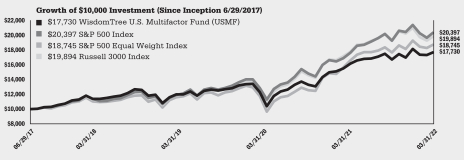
The WisdomTree U.S. Multifactor Fund (the “Fund”) seeks to track the price and yield performance, before fees and expenses, of the WisdomTree U.S. Multifactor Index (the “Index”). In seeking to track the Index, the Fund invests in U.S. companies with the highest composite scores based on two fundamental factors, value and quality measures, and two technical factors, momentum and correlation. The Fund generally uses a representative sampling strategy to achieve its investment objective, meaning it generally will invest in a sample of securities in the Index.
The Fund returned 9.68% at net asset value (“NAV”) for the fiscal year ended March 31, 2022 (for more complete performance information please see the table below). The Fund benefited from its positions in Materials, Real Estate and Energy, due to stock selection effects within each sector. Positions in the Information Technology, Communication Services and Consumer Discretionary sectors weighed on performance for the Fund, due to a combination of allocation and stock selection effects. Information Technology had the most negative impact almost entirely due to poor stock selection. When analyzing performance by market capitalization, large caps had a negative impact due to poor stock selection while mid caps had a negative impact due to allocation effects.
Shareholder Expense Example (for the six-month period ended March 31, 2022)
| | | | | | | | | | | | | | | | |
| | | | | |
| | | Beginning
Account Value | | | Ending
Account Value | | | Annualized
Expense Ratio | | | Expenses Paid
During the
Period | |
Actual | | $ | 1,000.00 | | | $ | 1,059.70 | | | | 0.28 | % | | $ | 1.44 | |
Hypothetical (5% return before expenses) | | $ | 1,000.00 | | | $ | 1,023.54 | | | | 0.28 | % | | $ | 1.41 | |
Performance
| | | | | | | | | | | | |
| | |
| | | Average Annual Total Return | |
| | | |
| | | 1 Year | | | 3 Year | | | Since Inception1 | |
Fund NAV Returns | | | 9.68 | % | | | 13.93 | % | | | 12.80 | % |
Fund Market Price Returns | | | 9.35 | % | | | 13.95 | % | | | 12.79 | % |
WisdomTree U.S. Multifactor Index | | | 10.03 | % | | | 14.15 | % | | | 12.96 | % |
S&P 500® Index | | | 15.65 | % | | | 18.92 | % | | | 16.17 | % |
S&P 500® Equal Weight Index | | | 13.11 | % | | | 16.97 | % | | | 14.12 | % |
Russell 3000® Index | | | 11.92 | % | | | 18.24 | % | | | 15.56 | % |
| 1 | Total returns are calculated based on the commencement of Fund trading on the Cboe BZX Exchange, Inc. on June 29, 2017. |
Performance is historical and does not guarantee future results. The returns do not reflect the deduction of taxes that a shareholder would pay on Fund distributions or on the redemption of Fund shares.
Management’s Discussion of Funds’ Performance
as of March 31, 2022 (unaudited)
WisdomTree U.S. Quality Dividend Growth Fund (DGRW)
Sector Breakdown†
| | | | |
| |
| Sector | | % of Net Assets | |
Information Technology | | | 23.6% | |
Consumer Staples | | | 19.4% | |
Industrials | | | 17.7% | |
Health Care | | | 17.1% | |
Consumer Discretionary | | | 9.8% | |
Financials | | | 4.9% | |
Communication Services | | | 2.4% | |
Materials | | | 2.2% | |
Energy | | | 1.6% | |
Real Estate | | | 0.8% | |
Utilities | | | 0.3% | |
Other Assets less Liabilities‡ | | | 0.2% | |
Total | | | 100.0% | |
| † | The Fund’s sector breakdown is expressed as a percentage of net assets and may change over time. In addition, a sector may be comprised of several industries. |
| ‡ | Other assets less liabilities may include investment of cash collateral for securities on loan and/or receivables/payables on derivatives (if any). |
Top Ten Holdings*
| | | | |
| |
| Description | | % of Net Assets | |
Apple, Inc. | | | 5.2% | |
Johnson & Johnson | | | 4.9% | |
Microsoft Corp. | | | 4.7% | |
Procter & Gamble Co. | | | 3.4% | |
Coca-Cola Co. | | | 3.3% | |
Philip Morris International, Inc. | | | 3.2% | |
Merck & Co., Inc. | | | 3.2% | |
Altria Group, Inc. | | | 3.2% | |
Cisco Systems, Inc. | | | 2.5% | |
UnitedHealth Group, Inc. | | | 2.5% | |
| * | The ten largest holdings are subject to change, and there are no guarantees the Fund will remain invested in any particular company. Excludes derivatives and investment of cash collateral for securities on loan (if any). |
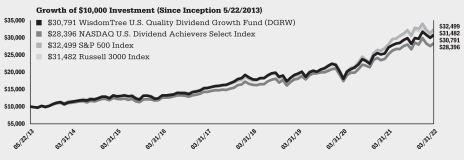
The WisdomTree U.S. Quality Dividend Growth Fund (the “Fund”) seeks to track the price and yield performance, before fees and expenses, of the WisdomTree U.S. Quality Dividend Growth Index (the “Index”). In seeking to track the Index, the Fund invests in dividend-paying large-cap companies with growth characteristics in the U.S. equity market. The Fund generally uses a representative sampling strategy to achieve its investment objective, meaning it generally will invest in a sample of securities in the Index.
The Fund returned 13.36% at net asset value (“NAV”) for the fiscal year ended March 31, 2022 (for more complete performance information please see the table below). The Fund benefited from its positions in Health Care, Financials and Industrials, primarily due to stock selection effects within each sector. Positions in the Energy, Information Technology, and Consumer Discretionary sectors weighed on performance for the Fund, due to a combination of allocation and stock selection effects. When analyzing performance by return-on-equity (“ROE“) attribution, the 1st and 2nd quintiles of companies ranked by ROE weighed on performance the most, as a result of stock selection effects. The 3rd Quintile and those companies with negative ROE were top performance contributors due to allocation and stock selection effects.
Shareholder Expense Example (for the six-month period ended March 31, 2022)
| | | | | | | | | | | | | | | | |
| | | | | |
| | | Beginning
Account Value | | | Ending
Account Value | | | Annualized
Expense Ratio | | | Expenses Paid
During the
Period | |
Actual | | $ | 1,000.00 | | | $ | 1,090.20 | | | | 0.28 | % | | $ | 1.46 | |
Hypothetical (5% return before expenses) | | $ | 1,000.00 | | | $ | 1,023.54 | | | | 0.28 | % | | $ | 1.41 | |
Performance
| | | | | | | | | | | | | | | | |
| | |
| | | Average Annual Total Return | |
| | | | |
| | | 1 Year | | | 3 Year | | | 5 Year | | | Since Inception1 | |
Fund NAV Returns | | | 13.36 | % | | | 16.35 | % | | | 14.82 | % | | | 13.53 | % |
Fund Market Price Returns | | | 13.30 | % | | | 16.39 | % | | | 14.85 | % | | | 13.55 | % |
WisdomTree U.S. Quality Dividend Growth Index | | | 13.68 | % | | | 16.70 | % | | | 15.17 | % | | | 13.86 | % |
NASDAQ U.S. Dividend AchieversTM Select Index | | | 12.48 | % | | | 16.12 | % | | | 14.74 | % | | | 12.50 | % |
S&P 500® Index | | | 15.65 | % | | | 18.92 | % | | | 15.99 | % | | | 14.22 | % |
Russell 3000® Index | | | 11.92 | % | | | 18.24 | % | | | 15.40 | % | | | 13.81 | % |
| 1 | Total returns are calculated based on the commencement of Fund trading on the NASDAQ on May 22, 2013. |
Performance is historical and does not guarantee future results. The returns do not reflect the deduction of taxes that a shareholder would pay on Fund distributions or on the redemption of Fund shares.
Management’s Discussion of Funds’ Performance
as of March 31, 2022 (unaudited)
WisdomTree U.S. SmallCap Dividend Fund (DES)
Sector Breakdown†
| | | | |
| |
| Sector | | % of Net Assets | |
Financials | | | 24.4% | |
Industrials | | | 17.0% | |
Utilities | | | 10.5% | |
Real Estate | | | 10.3% | |
Consumer Discretionary | | | 10.1% | |
Consumer Staples | | | 6.5% | |
Materials | | | 6.1% | |
Information Technology | | | 5.1% | |
Communication Services | | | 3.8% | |
Energy | | | 3.6% | |
Health Care | | | 2.1% | |
Investment Company | | | 0.1% | |
Other Assets less Liabilities‡ | | | 0.4% | |
Total | | | 100.0% | |
| † | The Fund’s sector breakdown is expressed as a percentage of net assets and may change over time. In addition, a sector may be comprised of several industries. |
| ‡ | Other assets less liabilities may include investment of cash collateral for securities on loan and/or receivables/payables on derivatives (if any). |
Top Ten Holdings*
| | | | |
| |
| Description | | % of Net Assets | |
Cogent Communications Holdings, Inc. | | | 1.3% | |
South Jersey Industries, Inc. | | | 1.2% | |
Xerox Holdings Corp. | | | 1.1% | |
New Jersey Resources Corp. | | | 1.0% | |
Spire, Inc. | | | 1.0% | |
ONE Gas, Inc. | | | 1.0% | |
MSC Industrial Direct Co., Inc., Class A | | | 0.9% | |
Vector Group Ltd. | | | 0.9% | |
Greif, Inc., Class A | | | 0.9% | |
NorthWestern Corp. | | | 0.9% | |
| * | The ten largest holdings are subject to change, and there are no guarantees the Fund will remain invested in any particular company. Excludes derivatives and investment of cash collateral for securities on loan (if any). |
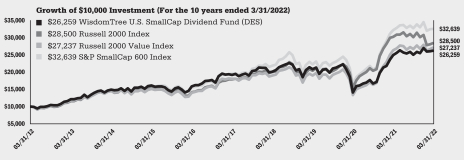
The WisdomTree U.S. SmallCap Dividend Fund (the “Fund”) seeks to track the price and yield performance, before fees and expenses, of the WisdomTree U.S. SmallCap Dividend Index (the “Index”). In seeking to track the Index, the Fund invests in dividend-paying small-cap companies in the U.S. equity market. The Fund generally uses a representative sampling strategy to achieve its investment objective, meaning it generally will invest in a sample of securities in the Index.
The Fund returned 5.18% at net asset value (“NAV”) for the fiscal year ended March 31, 2022 (for more complete performance information please see the table below). The Fund benefited from its positions in Health Care, Financials and Real Estate, due to stock selection effects within each sector. Health Care in particular was also beneficial due to a strong allocation effect from minimal exposure. Positions in the Energy and Consumer Discretionary sectors weighed on performance, due to allocation and stock selection effects. Energy in particular had nearly identical negative impacts from both allocation and stock selection. When analyzing performance by dividend yield attribution, the 4th and 5th quintiles of companies weighed on performance the most, owing primarily to stock selection effects. The Fund’s minimal exposure to companies with zero dividend yield was additive, while the 1st quintile was a strong, positive contributor due to allocation effects.
Shareholder Expense Example (for the six-month period ended March 31, 2022)
| | | | | | | | | | | | | | | | |
| | | | | |
| | | Beginning
Account Value | | | Ending
Account Value | | | Annualized Net
Expense Ratio | | | Expenses Paid
During the
Period | |
Actual | | $ | 1,000.00 | | | $ | 1,048.20 | | | | 0.38 | % | | $ | 1.94 | |
Hypothetical (5% return before expenses) | | $ | 1,000.00 | | | $ | 1,023.04 | | | | 0.38 | % | | $ | 1.92 | |
Performance
| | | | | | | | | | | | | | | | |
| | |
| | | Average Annual Total Return | |
| | | | |
| | | 1 Year | | | 3 Year | | | 5 Year | | | 10 Year | |
Fund NAV Returns | | | 5.18 | % | | | 8.01 | % | | | 6.44 | % | | | 10.14 | % |
Fund Market Price Returns | | | 4.61 | % | | | 8.02 | % | | | 6.48 | % | | | 10.12 | % |
WisdomTree U.S. SmallCap Dividend Index | | | 5.58 | % | | | 8.45 | % | | | 6.83 | % | | | 10.38 | % |
Russell 2000® Index | | | -5.79 | % | | | 11.74 | % | | | 9.74 | % | | | 11.04 | % |
Russell 2000® Value Index | | | 3.32 | % | | | 12.73 | % | | | 8.57 | % | | | 10.54 | % |
S&P SmallCap 600® Index | | | 1.23 | % | | | 13.58 | % | | | 10.89 | % | | | 12.56 | % |
Performance is historical and does not guarantee future results. The returns do not reflect the deduction of taxes that a shareholder would pay on Fund distributions or on the redemption of Fund shares.
Management’s Discussion of Funds’ Performance
as of March 31, 2022 (unaudited)
WisdomTree U.S. SmallCap Fund (EES)
Sector Breakdown†
| | | | |
| |
| Sector | | % of Net Assets | |
Financials | | | 24.8% | |
Consumer Discretionary | | | 16.2% | |
Industrials | | | 16.2% | |
Information Technology | | | 10.1% | |
Health Care | | | 10.0% | |
Consumer Staples | | | 4.8% | |
Materials | | | 4.6% | |
Energy | | | 4.0% | |
Communication Services | | | 4.0% | |
Real Estate | | | 3.5% | |
Utilities | | | 1.6% | |
Other Assets less Liabilities‡ | | | 0.2% | |
Total | | | 100.0% | |
| † | The Fund’s sector breakdown is expressed as a percentage of net assets and may change over time. In addition, a sector may be comprised of several industries. |
| ‡ | Other assets less liabilities may include investment of cash collateral for securities on loan and/or receivables/payables on derivatives (if any). |
Top Ten Holdings*
| | | | |
| |
| Description | | % of Net Assets | |
Mr. Cooper Group, Inc. | | | 0.9% | |
Boise Cascade Co. | | | 0.7% | |
Flagstar Bancorp, Inc. | | | 0.6% | |
CNX Resources Corp. | | | 0.6% | |
Whiting Petroleum Corp. | | | 0.6% | |
Atlas Air Worldwide Holdings, Inc. | | | 0.6% | |
Ironwood Pharmaceuticals, Inc. | | | 0.6% | |
Sage Therapeutics, Inc. | | | 0.6% | |
B. Riley Financial, Inc. | | | 0.5% | |
Genworth Financial, Inc., Class A | | | 0.5% | |
| * | The ten largest holdings are subject to change, and there are no guarantees the Fund will remain invested in any particular company. Excludes derivatives and investment of cash collateral for securities on loan (if any). |
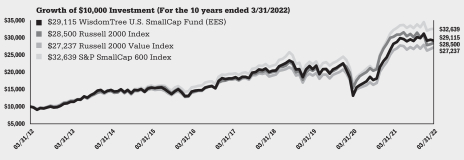
The WisdomTree U.S. SmallCap Fund (the “Fund”) seeks to track the price and yield performance, before fees and expenses, of the WisdomTree U.S. SmallCap Index (the “Index”). In seeking to track the Index, the Fund invests in earnings-generating small-cap companies in the U.S. equity market. The Fund generally uses a representative sampling strategy to achieve its investment objective, meaning it generally will invest in a sample of securities in the Index.
The Fund returned 3.11% at net asset value (“NAV”) for the fiscal year ended March 31, 2022 (for more complete performance information please see the table below). The Fund benefited from its positions in Health Care, Financials and Industrials, due to allocation and stock selection effects within each sector. Overall, Health Care contributed the most to Fund performance. Positions in the Energy, Consumer Discretionary and Real Estate sectors weighed on performance for the Fund, almost entirely due to allocation effects. When analyzing performance by earnings yield attribution, the 4th and 5th quintiles of companies ranked by earnings yield weighed on performance the most, owing primarily to allocation effects. The Fund’s lack of exposure to companies with negative earnings yield was additive, while the 1st quintile was a top contributor almost entirely due to allocation effects.
Shareholder Expense Example (for the six-month period ended March 31, 2022)
| | | | | | | | | | | | | | | | |
| | | | | |
| | | Beginning
Account Value | | | Ending
Account Value | | | Annualized Net
Expense Ratio | | | Expenses Paid
During the
Period | |
Actual | | $ | 1,000.00 | | | $ | 1,002.50 | | | | 0.38 | % | | $ | 1.90 | |
Hypothetical (5% return before expenses) | | $ | 1,000.00 | | | $ | 1,023.04 | | | | 0.38 | % | | $ | 1.92 | |
Performance
| | | | | | | | | | | | | | | | |
| | |
| | | Average Annual Total Return | |
| | | | |
| | | 1 Year | | | 3 Year | | | 5 Year | | | 10 Year | |
Fund NAV Returns | | | 3.11 | % | | | 11.64 | % | | | 9.88 | % | | | 11.28 | % |
Fund Market Price Returns | | | 2.41 | % | | | 11.66 | % | | | 9.88 | % | | | 11.26 | % |
WisdomTree U.S. SmallCap Index | | | 3.51 | % | | | 11.99 | % | | | 10.20 | % | | | 11.52 | % |
Russell 2000® Index | | | -5.79 | % | | | 11.74 | % | | | 9.74 | % | | | 11.04 | % |
Russell 2000® Value Index | | | 3.32 | % | | | 12.73 | % | | | 8.57 | % | | | 10.54 | % |
S&P SmallCap 600® Index | | | 1.23 | % | | | 13.58 | % | | | 10.89 | % | | | 12.56 | % |
Performance is historical and does not guarantee future results. The returns do not reflect the deduction of taxes that a shareholder would pay on Fund distributions or on the redemption of Fund shares.
Management’s Discussion of Funds’ Performance
as of March 31, 2022 (unaudited)
WisdomTree U.S. SmallCap Quality Dividend Growth Fund (DGRS)
Sector Breakdown†
| | | | |
| |
| Sector | | % of Net Assets | |
Industrials | | | 24.0% | |
Financials | | | 21.0% | |
Consumer Discretionary | | | 12.8% | |
Utilities | | | 10.5% | |
Materials | | | 8.4% | |
Information Technology | | | 6.4% | |
Consumer Staples | | | 5.7% | |
Health Care | | | 3.5% | |
Real Estate | | | 3.3% | |
Communication Services | | | 2.3% | |
Energy | | | 1.7% | |
Other Assets less Liabilities‡ | | | 0.4% | |
Total | | | 100.0% | |
| † | The Fund’s sector breakdown is expressed as a percentage of net assets and may change over time. In addition, a sector may be comprised of several industries. |
| ‡ | Other assets less liabilities may include investment of cash collateral for securities on loan and/or receivables/payables on derivatives (if any). |
Top Ten Holdings*
| | | | |
| |
| Description | | % of Net Assets | |
EPR Properties | | | 2.4% | |
Xerox Holdings Corp. | | | 2.1% | |
Spire, Inc. | | | 1.9% | |
Artisan Partners Asset Management, Inc., Class A | | | 1.9% | |
ONE Gas, Inc. | | | 1.8% | |
Mercury General Corp. | | | 1.7% | |
MSC Industrial Direct Co., Inc., Class A | | | 1.7% | |
ALLETE, Inc. | | | 1.6% | |
Avista Corp. | | | 1.6% | |
Flowserve Corp. | | | 1.4% | |
| * | The ten largest holdings are subject to change, and there are no guarantees the Fund will remain invested in any particular company. Excludes derivatives and investment of cash collateral for securities on loan (if any). |
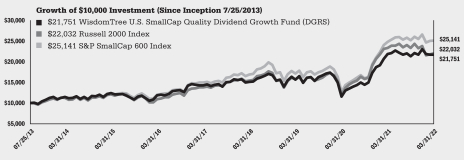
The WisdomTree U.S. SmallCap Quality Dividend Growth Fund (the “Fund”) seeks to track the price and yield performance, before fees and expenses, of the WisdomTree U.S. SmallCap Quality Dividend Growth Index (the “Index”). In seeking to track the Index, the Fund invests in dividend-paying small-cap companies with growth characteristics in the U.S. equity market. The Fund generally uses a representative sampling strategy to achieve its investment objective, meaning it generally will invest in a sample of securities in the Index.
The Fund returned -0.45% at net asset value (“NAV”) for the fiscal year ended March 31, 2022 (for more complete performance information please see the table below). The Fund benefited from its positions in Health Care, Utilities and Financials, primarily due to allocation and stock selection effects within each sector. Positions in the Consumer Discretionary, Energy, and Materials sectors weighed on performance for the Fund, primarily due to stock selection. When analyzing performance by return-on-equity (“ROE“) attribution, the 2nd and 1st quintiles of companies ranked by ROE weighed on performance the most, as a result of a combination of allocation and stock selection effects. The companies within the 4th and 3rd quintiles were top performance contributors due to allocation effects in the latter and stock selection in the former.
Shareholder Expense Example (for the six-month period ended March 31, 2022)
| | | | | | | | | | | | | | | | |
| | | | | |
| | | Beginning
Account Value | | | Ending
Account Value | | | Annualized
Expense Ratio | | | Expenses Paid
During the
Period | |
Actual | | $ | 1,000.00 | | | $ | 1,018.50 | | | | 0.38 | % | | $ | 1.91 | |
Hypothetical (5% return before expenses) | | $ | 1,000.00 | | | $ | 1,023.04 | | | | 0.38 | % | | $ | 1.92 | |
Performance
| | | | | | | | | | | | | | | | |
| | |
| | | Average Annual Total Return | |
| | | | |
| | | 1 Year | | | 3 Year | | | 5 Year | | | Since Inception1 | |
Fund NAV Returns | | | -0.45 | % | | | 11.48 | % | | | 8.80 | % | | | 9.36 | % |
Fund Market Price Returns | | | -1.03 | % | | | 11.50 | % | | | 8.78 | % | | | 9.34 | % |
WisdomTree U.S. SmallCap Quality Dividend Growth Index | | | -0.02 | % | | | 11.90 | % | | | 9.16 | % | | | 9.66 | % |
Russell 2000® Index | | | -5.79 | % | | | 11.74 | % | | | 9.74 | % | | | 9.52 | % |
S&P SmallCap 600® Index | | | 1.23 | % | | | 13.58 | % | | | 10.89 | % | | | 11.20 | % |
| 1 | Total returns are calculated based on the commencement of Fund trading on the NASDAQ on July 25, 2013. |
Performance is historical and does not guarantee future results. The returns do not reflect the deduction of taxes that a shareholder would pay on Fund distributions or on the redemption of Fund shares.
Management’s Discussion of Funds’ Performance
as of March 31, 2022 (unaudited)
WisdomTree U.S. Total Dividend Fund (DTD)
Sector Breakdown†
| | | | |
| |
| Sector | | % of Net Assets | |
Financials | | | 15.8% | |
Information Technology | | | 15.2% | |
Health Care | | | 14.8% | |
Consumer Staples | | | 14.0% | |
Energy | | | 9.2% | |
Industrials | | | 8.4% | |
Utilities | | | 6.4% | |
Consumer Discretionary | | | 5.6% | |
Real Estate | | | 4.8% | |
Communication Services | | | 2.9% | |
Materials | | | 2.7% | |
Other Assets less Liabilities‡ | | | 0.2% | |
Total | | | 100.0% | |
| † | The Fund’s sector breakdown is expressed as a percentage of net assets and may change over time. In addition, a sector may be comprised of several industries. |
| ‡ | Other assets less liabilities may include investment of cash collateral for securities on loan and/or receivables/payables on derivatives (if any). |
Top Ten Holdings*
| | | | |
| |
| Description | | % of Net Assets | |
Microsoft Corp. | | | 4.0% | |
Apple, Inc. | | | 3.5% | |
Exxon Mobil Corp. | | | 3.0% | |
Johnson & Johnson | | | 2.8% | |
JPMorgan Chase & Co. | | | 2.3% | |
Chevron Corp. | | | 2.2% | |
AbbVie, Inc. | | | 2.0% | |
Pfizer, Inc. | | | 2.0% | |
Procter & Gamble Co. | | | 1.9% | |
Coca-Cola Co. | | | 1.9% | |
| * | The ten largest holdings are subject to change, and there are no guarantees the Fund will remain invested in any particular company. Excludes derivatives and investment of cash collateral for securities on loan (if any). |
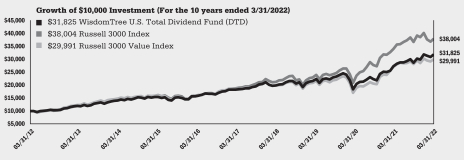
The WisdomTree U.S. Total Dividend Fund (the “Fund”) seeks to track the price and yield performance, before fees and expenses, of the WisdomTree U.S. Dividend Index (the “Index”). In seeking to track the Index, the Fund invests in U.S. equities from a broad range of dividend-paying companies. The Fund generally uses a representative sampling strategy to achieve its investment objective, meaning it generally will invest in a sample of securities in the Index.
The Fund returned 16.73% at net asset value (“NAV”) for the fiscal year ended March 31, 2022 (for more complete performance information please see the table below). The Fund benefited from its positions in Information Technology, Industrials and Health Care, primarily due to stock selection effects within each sector. Positions in Financials and Materials detracted, almost entirely due to stock selection effects. When analyzing performance by dividend yield attribution, all quintiles were beneficial. The 3rd and 2nd quintiles of companies had the least overall impact, while the companies within the 4th quintile were the strongest contributors. The Fund mostly avoided companies with zero dividend yield, which enhanced performance due to allocation effects.
Shareholder Expense Example (for the six-month period ended March 31, 2022)
| | | | | | | | | | | | | | | | |
| | | | | |
| | | Beginning
Account Value | | | Ending
Account Value | | | Annualized
Expense Ratio | | | Expenses Paid
During the
Period | |
Actual | | $ | 1,000.00 | | | $ | 1,110.40 | | | | 0.28 | % | | $ | 1.47 | |
Hypothetical (5% return before expenses) | | $ | 1,000.00 | | | $ | 1,023.54 | | | | 0.28 | % | | $ | 1.41 | |
Performance
| | | | | | | | | | | | | | | | |
| | |
| | | Average Annual Total Return | |
| | | | |
| | | 1 Year | | | 3 Year | | | 5 Year | | | 10 Year | |
Fund NAV Returns | | | 16.73 | % | | | 13.81 | % | | | 11.83 | % | | | 12.27 | % |
Fund Market Price Returns | | | 16.66 | % | | | 13.84 | % | | | 11.87 | % | | | 12.28 | % |
WisdomTree U.S. Dividend Index | | | 17.06 | % | | | 14.17 | % | | | 12.15 | % | | | 12.60 | % |
Russell 3000® Index | | | 11.92 | % | | | 18.24 | % | | | 15.40 | % | | | 14.28 | % |
Russell 3000® Value Index | | | 11.10 | % | | | 12.99 | % | | | 10.16 | % | | | 11.61 | % |
Performance is historical and does not guarantee future results. The returns do not reflect the deduction of taxes that a shareholder would pay on Fund distributions or on the redemption of Fund shares.
Management’s Discussion of Funds’ Performance
as of March 31, 2022 (unaudited)
WisdomTree U.S. Value Fund (WTV)
(formerly, WisdomTree U.S. Quality Shareholder Yield Fund (QSY))
Sector Breakdown†
| | | | |
| |
| Sector | | % of Net Assets | |
Financials | | | 28.8% | |
Consumer Discretionary | | | 12.9% | |
Health Care | | | 12.1% | |
Information Technology | | | 10.9% | |
Industrials | | | 10.7% | |
Communication Services | | | 8.6% | |
Materials | | | 7.1% | |
Energy | | | 6.2% | |
Consumer Staples | | | 2.0% | |
Utilities | | | 0.5% | |
Other Assets less Liabilities‡ | | | 0.2% | |
Total | | | 100.0% | |
| † | The Fund’s sector breakdown is expressed as a percentage of net assets and may change over time. In addition, a sector may be comprised of several industries. |
| ‡ | Other assets less liabilities may include investment of cash collateral for securities on loan and/or receivables/payables on derivatives (if any). |
Top Ten Holdings*
| | | | |
| |
| Description | | % of Net Assets | |
Credit Acceptance Corp. | | | 1.7% | |
eBay, Inc. | | | 1.6% | |
Lumen Technologies, Inc. | | | 1.6% | |
Allstate Corp. | | | 1.5% | |
Apple, Inc. | | | 1.5% | |
DaVita, Inc. | | | 1.4% | |
Oracle Corp. | | | 1.4% | |
Berkshire Hathaway, Inc., Class B | | | 1.3% | |
Goldman Sachs Group, Inc. | | | 1.3% | |
Cigna Corp. | | | 1.3% | |
| * | The ten largest holdings are subject to change, and there are no guarantees the Fund will remain invested in any particular company. Excludes derivatives and investment of cash collateral for securities on loan (if any). |
The WisdomTree U.S. Value Fund (the “Fund”) is actively managed using a model-based approach seeking income and capital appreciation by investing primarily in U.S. equity securities that provide a high total shareholder yield with favorable relative quality characteristics. Prior to January 2, 2022, the Fund was known as the WisdomTree U.S. Quality Shareholder Yield Fund (QSY).
The Fund returned 11.16% at net asset value (“NAV”) for the fiscal year ended March 31, 2022 (for more complete performance information please see the table below). The Fund benefited from its positions in the Information Technology and Industrials sectors, driven by stock selection effects within each sector. Allocation to Consumer Discretionary and stock selection within Health Care detracted from the performance of the Fund. Minimal exposure to companies with lower relative shareholder yields benefited Fund performance, while overweight exposure to the highest relative shareholder yield companies weighed on Fund returns over the period.
Shareholder Expense Example (for the six-month period ended March 31, 2022)
| | | | | | | | | | | | | | | | |
| | | | | |
| | | Beginning
Account Value | | | Ending
Account Value | | | Annualized
Expense Ratio | | | Expenses Paid
During the
Period | |
Actual | | $ | 1,000.00 | | | $ | 1,045.80 | | | | 0.24 | % | | $ | 1.22 | |
Hypothetical (5% return before expenses) | | $ | 1,000.00 | | | $ | 1,023.73 | | | | 0.24 | % | | $ | 1.21 | |
Performance
| | | | | | | | | | | | | | | | |
| | |
| | | Average Annual Total Return | |
| | | | |
| | | 1 Year | | | 3 Year | | | 5 Year | | | 10 Year | |
Fund NAV Returns1 | | | 11.16 | % | | | 15.21 | % | | | 13.76 | % | | | 12.54 | % |
Fund Market Price Returns1 | | | 10.93 | % | | | 15.27 | % | | | 13.78 | % | | | 12.56 | % |
Russell 1000® Value Index | | | 11.67 | % | | | 13.02 | % | | | 10.29 | % | | | 11.70 | % |
| 1 | The Fund’s investment objective changed effective December 18, 2017. Prior to December 18, 2017, the Fund’s investment objective sought to track the price and yield performance, before fees and expenses, of the WisdomTree U.S. LargeCap Value Index. |
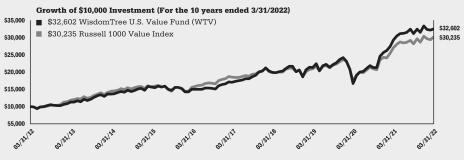
Performance is historical and does not guarantee future results. The returns do not reflect the deduction of taxes that a shareholder would pay on Fund distributions or on the redemption of Fund shares.
Description of Terms and Indexes (unaudited)
Below are descriptions of certain terms and of each Index referenced in this report:
Allocation Effect measures an investment manager’s ability to effectively allocate a portfolio’s assets to various segments. A segment refers to assets or securities that are grouped within a certain classification such as sectors, industries, or countries. The allocation effect determines whether the overweighting or underweighting of segments relative to a benchmark contributes positively or negatively to the overall portfolio return. Positive allocation occurs when the portfolio is overweighted in a segment that outperforms the benchmark and underweighted in a segment that underperforms the benchmark. Negative allocation occurs when the portfolio is overweighted in a segment that underperforms the benchmark and underweighted in a segment that outperforms the benchmark.
Correlation is a statistical measure of how two sets of returns move in relation to each other. Correlation coefficients range from -1 to 1. A correlation of 1 means the two subjects of analysis move in lockstep with each other. A correlation of -1 means the two subjects of analysis have moved in exactly the opposite direction.
Factors generally are attributes that are based on its fundamentals or share price behavior.
Gross Domestic Product (GDP) is the total monetary or market value of all the finished goods and services produced within a country’s borders in a specific time period. As a broad measure of overall domestic production, it functions as a comprehensive scorecard of a country’s economic health.
Growth is generally characterized by higher price levels relative to fundamentals, such as dividends or earnings. Price levels are higher because investors are willing to pay more due to their expectations of future improvements in these fundamentals.
Momentum is generally characterized by assets with recent price increase trends over time. This term is also associated with the momentum factor which associates these stock characteristics with excess return vs. the market over time.
The MSCI USA Extended ESG Focus Index is designed to maximize exposure to positive environmental, social and governance (ESG) factors while exhibiting risk and return characteristics similar to those of the MSCI USA Index, its parent index.
The MSCI USA Momentum Index is designed to reflect the performance of an equity momentum strategy by emphasizing stocks with high price momentum, while maintaining reasonably high trading liquidity, investment capacity and moderate index turnover.
The NASDAQ U.S. Dividend AchieversTM Select Index is a capitalization-weighted index that measures the performance of U.S. common stocks that have a history of increasing dividends for at least ten consecutive years.
The O’Neil Growth Index is a comprised of mid- and large-cap companies that provide exposure to high growth and momentum U.S. exchange-listed companies.
Quality is generally characterized by higher efficiency and profitability. Typical measures include earnings, return-on-equity, return on assets, operating profitability as well as others. This term is also related to the quality factor, which associates these stock characteristics with excess returns vs. the market over time.
Quintiles refers to separating a universe of companies into five groups of equal size on the basis of dividend yield, price-to-earnings, or return-on-equity, as applicable.
Return-on-Equity (ROE) measures a corporation’s profitability by revealing how much profit a company generates with the money shareholders have invested.
Risk-on and Risk-off refers to investors’ appetites for risk which rise and fall over time. During periods when risk is perceived as low, the risk-on risk-off theory states that investors tend to engage in higher-risk investments (i.e., “Risk-on”). When risk is perceived to be high, investors have the tendency to gravitate toward lower-risk investments (i.e., “Risk-off”).
Description of Terms and Indexes (unaudited) (continued)
The Russell 1000® Growth Index measures the performance of the large-cap growth segment of the U.S. equity universe.
The Russell 1000® Index represents the top 1000 companies by market capitalization in the United States.
The Russell 1000® Value Index is a capitalization-weighted index that is comprised of the large-capitalization value segment of the U.S. equity universe, selecting from the Russell 1000 Index.
The Russell 2000® Index is a capitalization-weighted index that is comprised of the smallest 2,000 securities in the Russell 3000 Index, based on total market capitalization.
The Russell 2000® Value Index is a capitalization-weighted index that is comprised of the small-capitalization value segment of the U.S. equity universe, selecting from the Russell 2000 Index.
The Russell 3000® Index is a capitalization-weighted index that is comprised of the 3,000 largest U.S. companies, based on total market capitalization.
The Russell 3000® Value Index is a capitalization-weighted index that measures the performance of the value segment of the broad U.S. equity market, selecting from the Russell 3000 Index.
The Russell Midcap® Index is a market capitalization-weighted index that is comprised of the smallest 800 stocks of the Russell 1000 Index.
The Russell Midcap® Value Index is a capitalization-weighted index that measures the midcap value segment of the U.S. equity universe, selecting from the Russell Midcap Index.
The S&P 500® Equal Weight Index is the equal-weight version of the widely used S&P 500® Index. The index includes the same constituents as the capitalization-weighted S&P 500 Index, but each company is allocated a fixed weight — or 0.2% of the index total at each quarterly rebalance.
The S&P 500® Index is a capitalization-weighted index of 500 stocks selected by the Standard & Poor’s Index Committee, designed to represent the performance of the leading industries in the United States economy.
The S&P 500® Value Index is an index comprised of S&P 500 Index constituents that screen favorably on measures of value such as book value, earnings, and sales to price.
The S&P MidCap 400® Index is a capitalization-weighted index that is comprised of the mid-capitalization range of the U.S. stock market, with stocks selected by the Standard & Poor’s Index Committee.
The S&P SmallCap 600® Index seeks to measure the small-cap segment of the U.S. equity market. The index is designed to track companies that meet specific inclusion criteria to ensure that they are liquid and financially viable.
Selection Effect measures an investment manager’s ability to select securities within a given segment relative to a benchmark. The over or underperformance of the portfolio is weighted by the benchmark weight, therefore, selection is not affected by the investment manager’s allocation to the segment. The weight of the segment in the portfolio determines the size of the effect—the larger the segment, the larger the effect is, positive or negative. A positive selection effect occurs when the portfolio return is greater than the benchmark return. Thus, the investment manager made good decisions in selecting securities that, as a whole, outperformed similar securities in the benchmark. A negative selection effect occurs when the portfolio return is less than the benchmark return. Thus, the investment manager made poor decisions in selecting securities that, as a whole, underperformed similar securities in the benchmark.
Shareholder Yield generally refers to a data point that references a combination of dividend yield and buyback yield.
Description of Terms and Indexes (unaudited) (continued)
Value is generally characterized by lower price levels relative to fundamentals, such as earnings or dividends. Prices are lower because investors are less certain of the performance of these fundamentals in the future. This term is also related to the value factor, which associates these stock characteristics with excess returns vs. the market over time.
Volatility is a statistical measure of the dispersion of returns for a given security or market index around a particular average level. If the price stays relatively stable, the security has low volatility. A highly volatile security hits new highs and lows quickly, moves erratically, and has rapid increases and dramatic falls.
The WisdomTree U.S. Dividend Index defines the dividend-paying portion of the U.S. stock market.
The WisdomTree U.S. High Dividend Index is comprised of companies with high dividend yields, selected from the WisdomTree U.S. Dividend Index.
The WisdomTree U.S. LargeCap Dividend Index is comprised of the large-capitalization segment of the U.S. dividend-paying market, selected from the WisdomTree U.S. Dividend Index.
The WisdomTree U.S. LargeCap Index is a fundamentally weighted index that measures the performance of earnings-generating companies within the large-capitalization segment of the U.S. stock market.
The WisdomTree U.S. MidCap Dividend Index is comprised of the mid-capitalization segment of the U.S. dividend-paying market, selected from the WisdomTree U.S. Dividend Index.
The WisdomTree U.S. MidCap Index is a fundamentally weighted index that measures the performance of earnings-generating companies within the mid-capitalization segment of the U.S. stock market.
The WisdomTree U.S. Multifactor Index is comprised of 200 U.S. companies with the highest composite scores based on two fundamental factors, value and quality measures, and two technical factors, momentum and correlation.
The WisdomTree U.S. Quality Dividend Growth Index is comprised of dividend-paying stocks with growth characteristics.
The WisdomTree U.S. SmallCap Dividend Index is comprised of the small-capitalization segment of the U.S. dividend-paying market, selected from the WisdomTree U.S. Dividend Index.
The WisdomTree U.S. SmallCap Index is a fundamentally weighted index that measures the performance of earnings-generating companies within the small-capitalization segment of the U.S. stock market.
The WisdomTree U.S. SmallCap Quality Dividend Growth Index is comprised of the small-capitalization segment of dividend-paying stocks with growth characteristics.
Index performance information assumes the reinvestment of dividends and excludes management fees, transaction costs and expenses. You cannot directly invest in an index.
The Dow Jones U.S. Select Dividend Index is calculated, distributed and marketed by Dow Jones Indexes, a licensed trademark of CME Group Index Services LLC, and has been licensed for use.
The Global Industry Classification Standard (“GICS”) was developed by and is the exclusive property and a service mark of MSCI Inc. (“MSCI”) and Standard & Poor’s (“S&P”), a division of The McGraw-Hill Companies, Inc., and is licensed for use by WisdomTree Investments, Inc. Neither MSCI, S&P nor any other party involved in making or compiling the GICS or any GICS classifications makes any express or implied warranties or representations with respect to such standard or classification (or the results to be obtained by the use thereof), and all such parties hereby expressly disclaim all warranties of originality, accuracy, completeness, merchantability and fitness for a particular purpose with respect to any such standard or classification. Without limiting any of the foregoing, in no event shall MSCI, S&P, any of their affiliates or any third party involved in making or compiling the GICS or any GICS classifications have any liability for any direct, indirect, special, punitive, consequential or any other damages (including lost profits) even if notified of the possibility of such damages.
Description of Terms and Indexes (unaudited) (concluded)
Neither MSCI nor any other party involved in or related to compiling, computing or creating the MSCI data makes any express or implied warranties or representations with respect to such data (or the results to be obtained by the use thereof), and all such parties hereby expressly disclaim all warranties of originality, accuracy, completeness, merchantability or fitness for a particular purpose with respect to any such data. Without limiting any of the foregoing, in no event shall MSCI, any of its affiliates or any third party involved in or related to compiling, computing or creating the data have any liability for any direct, indirect, special, punitive, consequential or any other damages (including lost profits) even if notified of the possibility of such damages. No further distribution or dissemination of the MSCI data is permitted without MSCI’s express written consent.
The O’Neil Growth Index is calculated, distributed and marketed by O’Neil Global Advisors, Inc. (OGA), a licensed trademark of OGA, and has been licensed for use.
WisdomTree Investments, Inc. and WisdomTree Asset Management, Inc. (together, “WisdomTree”) and the Funds make no representation or warranty, express or implied, to the owners of shares of the Funds or any member of the public regarding the advisability of investing in securities generally or in the Funds particularly or the ability of the underlying Indexes to track the performance of their underlying securities. WisdomTree Investments is the licensor of certain trademarks, service marks and trade names of the Funds. WisdomTree Investments has no obligation to take the needs of the Funds or the owners of shares of the Funds into consideration in determining, composing, or calculating the underlying WisdomTree Indexes of the applicable Funds. WisdomTree Investments is not responsible for, and has not participated in, the determination of the timing of, prices of, or quantities of shares of the Funds to be issued or in the determination or calculation of the equation by which the shares of the Funds are redeemable. WisdomTree and the Funds do not guarantee the accuracy, completeness, or performance of the underlying Indexes or the data included therein and shall have no liability in connection with the underlying Indexes or their calculation.
Schedule of Investments
WisdomTree U.S. AI Enhanced Value Fund (AIVL)
March 31, 2022
| | | | | | | | |
| Investments | | Shares | | | Value | |
| | |
| COMMON STOCKS – 99.6% | | | | | | | | |
| | |
| United States – 96.0% | | | | | | | | |
| | |
| Aerospace & Defense – 1.3% | | | | | | | | |
| | |
HEICO Corp.(a) | | | 29,525 | | | $ | 4,533,269 | |
| | |
L3Harris Technologies, Inc. | | | 8,017 | | | | 1,991,984 | |
| | | | | | | | |
| Total Aerospace & Defense | | | | 6,525,253 | |
|
| Auto Components – 1.0% | |
| | |
Gentex Corp. | | | 169,988 | | | | 4,958,550 | |
|
| Banks – 2.8% | |
| | |
Bank of America Corp. | | | 110,376 | | | | 4,549,699 | |
| | |
Citigroup, Inc. | | | 127,673 | | | | 6,817,738 | |
| | |
U.S. Bancorp | | | 23,144 | | | | 1,230,104 | |
| | |
Wells Fargo & Co. | | | 24,786 | | | | 1,201,129 | |
| | | | | | | | |
| Total Banks | | | | 13,798,670 | |
|
| Beverages – 2.3% | |
| | |
Keurig Dr. Pepper, Inc. | | | 303,187 | | | | 11,490,787 | |
|
| Building Products – 0.2% | |
| | |
Allegion PLC | | | 10,840 | | | | 1,190,015 | |
|
| Capital Markets – 8.0% | |
| | |
CME Group, Inc. | | | 47,210 | | | | 11,229,370 | |
| | |
Franklin Resources, Inc. | | | 62,158 | | | | 1,735,451 | |
| | |
Intercontinental Exchange, Inc. | | | 80,790 | | | | 10,673,975 | |
| | |
Nasdaq, Inc. | | | 31,678 | | | | 5,645,020 | |
| | |
Northern Trust Corp. | | | 22,984 | | | | 2,676,487 | |
| | |
SEI Investments Co. | | | 69,977 | | | | 4,213,315 | |
| | |
Stifel Financial Corp. | | | 50,670 | | | | 3,440,493 | |
| | | | | | | | |
| Total Capital Markets | | | | 39,614,111 | |
|
| Chemicals – 7.2% | |
| | |
Dow, Inc. | | | 99,492 | | | | 6,339,630 | |
| | |
DuPont de Nemours, Inc. | | | 86,374 | | | | 6,355,399 | |
| | |
Eastman Chemical Co. | | | 77,008 | | | | 8,629,516 | |
| | |
Element Solutions, Inc. | | | 54,158 | | | | 1,186,060 | |
| | |
FMC Corp. | | | 21,474 | | | | 2,825,334 | |
| | |
PPG Industries, Inc. | | | 65,836 | | | | 8,629,125 | |
| | |
Valvoline, Inc. | | | 39,478 | | | | 1,245,926 | |
| | | | | | | | |
| Total Chemicals | | | | 35,210,990 | |
|
| Communications Equipment – 0.8% | |
| | |
Juniper Networks, Inc. | | | 100,984 | | | | 3,752,566 | |
|
| Distributors – 1.5% | |
| | |
Genuine Parts Co. | | | 58,868 | | | | 7,418,545 | |
|
| Electric Utilities – 3.3% | |
| | |
Pinnacle West Capital Corp. | | | 41,427 | | | | 3,235,449 | |
| | |
Southern Co. | | | 108,918 | | | | 7,897,644 | |
| | |
Xcel Energy, Inc. | | | 71,217 | | | | 5,139,731 | |
| | | | | | | | |
| Total Electric Utilities | | | | 16,272,824 | |
|
| Electrical Equipment – 1.1% | |
| | |
AMETEK, Inc. | | | 39,921 | | | | 5,316,679 | |
|
| Entertainment – 0.3% | |
| | |
Electronic Arts, Inc. | | | 9,726 | | | | 1,230,436 | |
|
| Equity Real Estate Investment Trusts (REITs) – 0.4% | |
| | |
Realty Income Corp. | | | 28,027 | | | | 1,942,271 | |
|
| Food Products – 2.9% | |
| | |
Flowers Foods, Inc. | | | 82,203 | | | | 2,113,439 | |
| | |
Mondelez International, Inc., Class A | | | 193,773 | | | | 12,165,069 | |
| | | | | | | | |
| Total Food Products | | | | 14,278,508 | |
|
| Health Care Equipment & Supplies – 10.8% | |
| | |
Baxter International, Inc. | | | 85,330 | | | | 6,616,488 | |
| | |
Becton Dickinson and Co. | | | 42,439 | | | | 11,288,774 | |
| | |
Dentsply Sirona, Inc. | | | 95,388 | | | | 4,694,997 | |
| | |
Figs, Inc., Class A* | | | 85,788 | | | | 1,846,158 | |
| | |
Globus Medical, Inc., Class A* | | | 18,989 | | | | 1,401,009 | |
| | |
Integra LifeSciences Holdings Corp.* | | | 37,589 | | | | 2,415,469 | |
| | |
Medtronic PLC | | | 113,032 | | | | 12,540,900 | |
| | |
Stryker Corp. | | | 14,619 | | | | 3,908,390 | |
| | |
Zimmer Biomet Holdings, Inc. | | | 67,876 | | | | 8,681,340 | |
| | | | | | | | |
| Total Health Care Equipment & Supplies | | | | 53,393,525 | |
|
| Health Care Providers & Services – 3.4% | |
| | |
Cigna Corp. | | | 25,660 | | | | 6,148,393 | |
| | |
Humana, Inc. | | | 13,766 | | | | 5,990,550 | |
| | |
UnitedHealth Group, Inc. | | | 9,425 | | | | 4,806,467 | |
| | | | | | | | |
| Total Health Care Providers & Services | | | | 16,945,410 | |
|
| Household Products – 2.2% | |
| | |
Colgate-Palmolive Co. | | | 17,046 | | | | 1,292,598 | |
| | |
Procter & Gamble Co. | | | 54,647 | | | | 8,350,062 | |
| | |
Reynolds Consumer Products, Inc.(a) | | | 42,005 | | | | 1,232,427 | |
| | | | | | | | |
| Total Household Products | | | | 10,875,087 | |
|
| Industrial Conglomerates – 4.7% | |
| | |
3M Co. | | | 26,867 | | | | 3,999,959 | |
| | |
Honeywell International, Inc. | | | 24,984 | | | | 4,861,387 | |
| | |
Roper Technologies, Inc. | | | 30,278 | | | | 14,298,180 | |
| | | | | | | | |
| Total Industrial Conglomerates | | | | 23,159,526 | |
|
| Insurance – 9.1% | |
| | |
Allstate Corp. | | | 64,476 | | | | 8,930,571 | |
| | |
Arthur J. Gallagher & Co. | | | 52,063 | | | | 9,090,200 | |
| | |
Brown & Brown, Inc. | | | 66,360 | | | | 4,795,837 | |
| | |
Hanover Insurance Group, Inc. | | | 42,182 | | | | 6,307,053 | |
| | |
Reinsurance Group of America, Inc. | | | 74,047 | | | | 8,105,184 | |
| | |
Unum Group | | | 248,553 | | | | 7,831,905 | |
| | | | | | | | |
| Total Insurance | | | | 45,060,750 | |
|
| Interactive Media & Services – 0.7% | |
| | |
Meta Platforms, Inc., Class A* | | | 15,436 | | | | 3,432,349 | |
|
| Internet & Direct Marketing Retail – 0.2% | |
| | |
Wayfair, Inc., Class A*(a) | | | 9,408 | | | | 1,042,218 | |
|
| IT Services – 9.9% | |
| | |
Alliance Data Systems Corp.(a) | | | 70,666 | | | | 3,967,896 | |
| | |
Amdocs Ltd. | | | 109,398 | | | | 8,993,610 | |
| | |
Automatic Data Processing, Inc. | | | 74,936 | | | | 17,050,937 | |
| | |
DXC Technology Co.* | | | 49,710 | | | | 1,622,037 | |
| | |
Genpact Ltd. | | | 211,798 | | | | 9,215,331 | |
See Notes to Financial Statements.
Schedule of Investments (continued)
WisdomTree U.S. AI Enhanced Value Fund (AIVL)
March 31, 2022
| | | | | | | | |
| Investments | | Shares | | | Value | |
| | |
GoDaddy, Inc., Class A* | | | 42,295 | | | $ | 3,540,092 | |
| | |
Jack Henry & Associates, Inc. | | | 10,022 | | | | 1,974,835 | |
| | |
Paysafe Ltd.* | | | 672,839 | | | | 2,280,924 | |
| | | | | | | | |
| Total IT Services | | | | 48,645,662 | |
|
| Life Sciences Tools & Services – 1.8% | |
| | |
Agilent Technologies, Inc. | | | 50,263 | | | | 6,651,303 | |
| | |
IQVIA Holdings, Inc.* | | | 9,631 | | | | 2,226,783 | |
| | | | | | | | |
| Total Life Sciences Tools & Services | | | | 8,878,086 | |
|
| Machinery – 7.6% | |
| | |
Allison Transmission Holdings, Inc. | | | 38,110 | | | | 1,496,199 | |
| | |
Donaldson Co., Inc. | | | 24,553 | | | | 1,275,037 | |
| | |
Dover Corp. | | | 17,426 | | | | 2,734,140 | |
| | |
Fortive Corp. | | | 123,571 | | | | 7,529,181 | |
| | |
Lincoln Electric Holdings, Inc. | | | 22,257 | | | | 3,067,237 | |
| | |
Nordson Corp. | | | 20,101 | | | | 4,564,535 | |
| | |
Otis Worldwide Corp. | | | 98,884 | | | | 7,609,124 | |
| | |
PACCAR, Inc. | | | 45,230 | | | | 3,983,406 | |
| | |
Snap-on, Inc. | | | 19,994 | | | | 4,108,367 | |
| | |
Toro Co. | | | 14,259 | | | | 1,219,002 | |
| | | | | | | | |
| Total Machinery | | | | 37,586,228 | |
|
| Media – 1.9% | |
| | |
Comcast Corp., Class A | | | 170,891 | | | | 8,001,117 | |
| | |
DISH Network Corp., Class A*(a) | | | 39,887 | | | | 1,262,423 | |
| | | | | | | | |
| Total Media | | | | 9,263,540 | |
|
| Multi-Utilities – 1.9% | |
| | |
Consolidated Edison, Inc. | | | 40,886 | | | | 3,871,087 | |
| | |
NiSource, Inc. | | | 167,068 | | | | 5,312,762 | |
| | | | | | | | |
| Total Multi-Utilities | | | | 9,183,849 | |
|
| Oil, Gas & Consumable Fuels – 2.1% | |
| | |
APA Corp. | | | 72,216 | | | | 2,984,687 | |
| | |
HF Sinclair Corp.* | | | 41,508 | | | | 1,654,094 | |
| | |
Kinder Morgan, Inc. | | | 229,596 | | | | 4,341,660 | |
| | |
Williams Cos., Inc. | | | 39,365 | | | | 1,315,185 | |
| | | | | | | | |
| Total Oil, Gas & Consumable Fuels | | | | 10,295,626 | |
|
| Pharmaceuticals – 1.4% | |
| | |
Johnson & Johnson | | | 38,618 | | | | 6,844,268 | |
|
| Professional Services – 0.3% | |
| | |
Booz Allen Hamilton Holding Corp. | | | 15,112 | | | | 1,327,438 | |
|
| Semiconductors & Semiconductor Equipment – 1.4% | |
| | |
Intel Corp. | | | 137,402 | | | | 6,809,643 | |
|
| Software – 0.7% | |
| | |
SS&C Technologies Holdings, Inc. | | | 44,912 | | | | 3,369,298 | |
|
| Tobacco – 2.8% | |
| | |
Altria Group, Inc. | | | 118,942 | | | | 6,214,720 | |
| | |
Philip Morris International, Inc. | | | 81,115 | | | | 7,619,943 | |
| | | | | | | | |
| Total Tobacco | | | | 13,834,663 | |
| Total United States | | | | 472,947,371 | |
|
| China – 1.7% | |
| | |
| Hotels, Restaurants & Leisure – 1.7% | | | | | | | | |
| | |
Yum China Holdings, Inc.(a) | | | 195,451 | | | | 8,119,035 | |
|
| Puerto Rico – 1.1% | |
|
| Banks – 1.1% | |
| | |
Popular, Inc. | | | 67,607 | | | | 5,526,196 | |
|
| United Kingdom – 0.8% | |
|
| Machinery – 0.8% | |
| | |
Pentair PLC | | | 72,066 | | | | 3,906,698 | |
TOTAL COMMON STOCKS
(Cost: $496,886,816) | | | | 490,499,300 | |
|
| EXCHANGE-TRADED FUND – 0.1% | |
|
| United States – 0.1% | |
| | |
iShares Russell 1000 Value ETF(a) | | | | | | | | |
| (Cost: $687,399) | | | 4,351 | | | | 722,179 | |
|
| INVESTMENT OF CASH COLLATERAL FOR SECURITIES LOANED – 0.2% | |
|
| United States – 0.2% | |
| | |
State Street Navigator Securities Lending Government Money Market Portfolio, 0.25%(b) | | | | | | | | |
| (Cost: $964,907) | | | 964,907 | | | | 964,907 | |
| |
TOTAL INVESTMENTS IN SECURITIES – 99.9%
(Cost: $498,539,122) | | | | 492,186,386 | |
| |
Other Assets less Liabilities – 0.1% | | | | 449,629 | |
| | | | | | | | |
| NET ASSETS – 100.0% | | | $ | 492,636,015 | |
| * | Non-income producing security. |
| (a) | Security, or portion thereof, was on loan at March 31, 2022 (See Note 2). At March 31, 2022, the total market value of the Fund’s securities on loan identified in the Schedule of Investments was $9,361,617. The Fund also had securities on loan having a total market value of $391,713 that were sold and pending settlement. The total market value of the collateral held by the Fund was $10,151,494. The total market value of the collateral includes non-cash U.S. Government securities collateral having a value of $9,186,587. |
| (b) | Rate shown represents annualized 7-day yield as of March 31, 2022. |
See Notes to Financial Statements.
Schedule of Investments (concluded)
WisdomTree U.S. AI Enhanced Value Fund (AIVL)
March 31, 2022
Affiliated holdings are investments in entities in which the Fund owns 5% or more of the outstanding voting securities or are investments in entities which are under common ownership or control. Investments in affiliates during the fiscal year ended March 31, 2022 were as follows:
| | | | | | | | | | | | | | | | | | | | | | | | | | | | |
| | | | | | | |
| Affiliate | | Value at
3/31/2021 | | | Purchases/
Additions | | | Sales/
Reductions | | | Realized
Gain/(Loss) | | | Change in
Unrealized
Appreciation/
Depreciation | | | Value at
3/31/2022 | | | Dividend
Income | |
WisdomTree U.S. LargeCap Dividend Fund^ | | $ | 177,066 | | | $ | 3,497,452 | | | $ | 3,726,650 | | | $ | 81,127 | | | $ | (28,995 | ) | | $ | — | | | $ | 10,906 | |
WisdomTree U.S. MidCap Dividend Fund^ | | | 179,020 | | | | 3,488,420 | | | | 3,702,858 | | | | 86,438 | | | | (51,020 | ) | | | — | | | | 11,517 | |
Total | | $ | 356,086 | | | $ | 6,985,872 | | | $ | 7,429,508 | | | $ | 167,565 | | | $ | (80,015 | ) | | $ | — | | | $ | 22,423 | |
| ^ | As of March 31, 2022, the Fund did not hold a position in this affiliate. |
The following is a summary of the fair valuations according to the inputs used as of March 31, 2022 in valuing the Fund’s investments (See Note 2 — Fair Value Measurement):
| | | | | | | | | | | | | | | | |
| | | | |
| | | Quoted
Prices in
Active
Markets
(Level 1) | | | Other
Significant
Observable
Inputs
(Level 2) | | | Significant
Unobservable
Inputs
(Level 3) | | | Total | |
Assets: | | | | | | | | | | | | |
Investments in Securities | | | | |
Common Stocks | | $ | 490,499,300 | | | $ | — | | | $ | — | | | $ | 490,499,300 | |
Exchange-Traded Fund | | | 722,179 | | | | — | | | | — | | | | 722,179 | |
Investment of Cash Collateral for Securities Loaned | | | — | | | | 964,907 | | | | — | | | | 964,907 | |
Total Investments in Securities | | $ | 491,221,479 | | | $ | 964,907 | | | $ | — | | | $ | 492,186,386 | |
See Notes to Financial Statements.
Schedule of Investments
WisdomTree U.S. ESG Fund (RESP)
March 31, 2022
| | | | | | | | |
| Investments | | Shares | | | Value | |
|
| COMMON STOCKS – 99.9% | |
|
| United States – 99.9% | |
|
| Air Freight & Logistics – 1.2% | |
| | |
C.H. Robinson Worldwide, Inc. | | | 865 | | | $ | 93,169 | |
| | |
Expeditors International of Washington, Inc. | | | 1,241 | | | | 128,022 | |
| | |
FedEx Corp. | | | 1,123 | | | | 259,851 | |
| | |
United Parcel Service, Inc., Class B | | | 2,066 | | | | 443,074 | |
| | | | | | | | |
| Total Air Freight & Logistics | | | | 924,116 | |
|
| Airlines – 0.2% | |
| | |
Alaska Air Group, Inc.* | | | 2,827 | | | | 163,994 | |
|
| Auto Components – 0.3% | |
| | |
BorgWarner, Inc. | | | 3,416 | | | | 132,882 | |
| | |
Gentex Corp. | | | 4,211 | | | | 122,835 | |
| | | | | | | | |
| Total Auto Components | | | | 255,717 | |
|
| Automobiles – 2.7% | |
| | |
Ford Motor Co. | | | 13,446 | | | | 227,372 | |
| | |
General Motors Co.* | | | 5,542 | | | | 242,407 | |
| | |
Harley-Davidson, Inc. | | | 2,821 | | | | 111,147 | |
| | |
Tesla, Inc.* | | | 1,359 | | | | 1,464,459 | |
| | | | | | | | |
| Total Automobiles | | | | 2,045,385 | |
|
| Banks – 4.3% | |
| | |
Bank of America Corp. | | | 15,432 | | | | 636,107 | |
| | |
Bank OZK | | | 1,732 | | | | 73,956 | |
| | |
BOK Financial Corp. | | | 620 | | | | 58,249 | |
| | |
Citigroup, Inc. | | | 5,530 | | | | 295,302 | |
| | |
Citizens Financial Group, Inc. | | | 2,274 | | | | 103,080 | |
| | |
Comerica, Inc. | | | 1,551 | | | | 140,257 | |
| | |
Fifth Third Bancorp | | | 3,991 | | | | 171,773 | |
| | |
JPMorgan Chase & Co. | | | 5,217 | | | | 711,182 | |
| | |
KeyCorp | | | 7,231 | | | | 161,830 | |
| | |
People’s United Financial, Inc. | | | 1,777 | | | | 35,522 | |
| | |
PNC Financial Services Group, Inc. | | | 1,400 | | | | 258,230 | |
| | |
Regions Financial Corp. | | | 7,380 | | | | 164,279 | |
| | |
Synovus Financial Corp. | | | 1,567 | | | | 76,783 | |
| | |
U.S. Bancorp | | | 4,288 | | | | 227,907 | |
| | |
Valley National Bancorp | | | 3,878 | | | | 50,492 | |
| | |
Webster Financial Corp. | | | 2,187 | | | | 122,734 | |
| | |
Western Alliance Bancorp | | | 690 | | | | 57,146 | |
| | | | | | | | |
| Total Banks | | | | 3,344,829 | |
|
| Beverages – 1.3% | |
| | |
Brown-Forman Corp., Class B | | | 2,069 | | | | 138,664 | |
| | |
Constellation Brands, Inc., Class A | | | 565 | | | | 130,131 | |
| | |
Keurig Dr. Pepper, Inc. | | | 5,041 | | | | 191,054 | |
| | |
Molson Coors Beverage Co., Class B | | | 2,659 | | | | 141,937 | |
| | |
PepsiCo, Inc. | | | 2,418 | | | | 404,725 | |
| | | | | | | | |
| Total Beverages | | | | 1,006,511 | |
|
| Biotechnology – 2.5% | |
| | |
AbbVie, Inc. | | | 3,029 | | | | 491,031 | |
| | |
Amgen, Inc. | | | 1,254 | | | | 303,242 | |
| | |
Biogen, Inc.* | | | 895 | | | | 188,487 | |
| | |
Exelixis, Inc.* | | | 1,624 | | | | 36,816 | |
| | |
Gilead Sciences, Inc. | | | 3,727 | | | | 221,570 | |
| | |
Incyte Corp.* | | | 855 | | | | 67,904 | |
| | |
Moderna, Inc.* | | | 877 | | | | 151,072 | |
| | |
Regeneron Pharmaceuticals, Inc.* | | | 315 | | | | 220,002 | |
| | |
United Therapeutics Corp.* | | | 262 | | | | 47,006 | |
| | |
Vertex Pharmaceuticals, Inc.* | | | 608 | | | | 158,670 | |
| | | | | | | | |
| Total Biotechnology | | | | 1,885,800 | |
|
| Building Products – 0.6% | |
| | |
Builders FirstSource, Inc.* | | | 313 | | | | 20,201 | |
| | |
Lennox International, Inc. | | | 493 | | | | 127,125 | |
| | |
Masco Corp. | | | 2,434 | | | | 124,134 | |
| | |
Owens Corning | | | 2,143 | | | | 196,085 | |
| | | | | | | | |
| Total Building Products | | | | 467,545 | |
|
| Capital Markets – 2.4% | |
| | |
Ameriprise Financial, Inc. | | | 542 | | | | 162,795 | |
| | |
Bank of New York Mellon Corp. | | | 4,203 | | | | 208,595 | |
| | |
CBOE Global Markets, Inc. | | | 596 | | | | 68,194 | |
| | |
FactSet Research Systems, Inc. | | | 334 | | | | 145,006 | |
| | |
Franklin Resources, Inc. | | | 4,530 | | | | 126,478 | |
| | |
Goldman Sachs Group, Inc. | | | 858 | | | | 283,226 | |
| | |
Houlihan Lokey, Inc. | | | 600 | | | | 52,680 | |
| | |
Jefferies Financial Group, Inc. | | | 2,329 | | | | 76,508 | |
| | |
Morgan Stanley | | | 4,174 | | | | 364,807 | |
| | |
S&P Global, Inc. | | | 837 | | | | 343,321 | |
| | | | | | | | |
| Total Capital Markets | | | | 1,831,610 | |
|
| Chemicals – 1.5% | |
| | |
CF Industries Holdings, Inc. | | | 2,348 | | | | 241,985 | |
| | |
Dow, Inc. | | | 5,756 | | | | 366,772 | |
| | |
Huntsman Corp. | | | 5,752 | | | | 215,758 | |
| | |
Mosaic Co. | | | 3,586 | | | | 238,469 | |
| | |
Westlake Corp. | | | 525 | | | | 64,785 | |
| | | | | | | | |
| Total Chemicals | | | | 1,127,769 | |
|
| Commercial Services & Supplies – 0.6% | |
| | |
Republic Services, Inc. | | | 1,487 | | | | 197,028 | |
| | |
Waste Management, Inc. | | | 1,536 | | | | 243,456 | |
| | | | | | | | |
| Total Commercial Services & Supplies | | | | 440,484 | |
|
| Communications Equipment – 1.3% | |
| | |
Ciena Corp.* | | | 2,534 | | | | 153,636 | |
| | |
Cisco Systems, Inc. | | | 11,738 | | | | 654,511 | |
| | |
Juniper Networks, Inc. | | | 5,474 | | | | 203,414 | |
| | | | | | | | |
| Total Communications Equipment | | | | 1,011,561 | |
|
| Construction & Engineering – 0.4% | |
| | |
AECOM | | | 2,285 | | | | 175,511 | |
| | |
EMCOR Group, Inc. | | | 1,457 | | | | 164,102 | |
| | | | | | | | |
| Total Construction & Engineering | | | | 339,613 | |
|
| Consumer Finance – 1.4% | |
| | |
Ally Financial, Inc. | | | 2,703 | | | | 117,526 | |
| | |
American Express Co. | | | 2,014 | | | | 376,618 | |
| | |
Capital One Financial Corp. | | | 1,682 | | | | 220,830 | |
| | |
Credit Acceptance Corp.*(a) | | | 25 | | | | 13,759 | |
| | |
Discover Financial Services | | | 1,329 | | | | 146,443 | |
See Notes to Financial Statements.
Schedule of Investments (continued)
WisdomTree U.S. ESG Fund (RESP)
March 31, 2022
| | | | | | | | |
| Investments | | Shares | | | Value | |
| | |
OneMain Holdings, Inc. | | | 1,774 | | | $ | 84,105 | |
| | |
Synchrony Financial | | | 3,178 | | | | 110,626 | |
| | | | | | | | |
| Total Consumer Finance | | | | 1,069,907 | |
|
| Containers & Packaging – 0.4% | |
| | |
Packaging Corp. of America | | | 1,019 | | | | 159,076 | |
| | |
Sealed Air Corp. | | | 2,395 | | | | 160,369 | |
| | | | | | | | |
| Total Containers & Packaging | | | | | | | 319,445 | |
|
| Distributors – 0.1% | |
| | |
Genuine Parts Co. | | | 699 | | | | 88,088 | |
|
| Diversified Consumer Services – 0.1% | |
| | |
Service Corp. International | | | 929 | | | | 61,147 | |
|
| Diversified Financial Services – 0.2% | |
| | |
Voya Financial, Inc. | | | 2,504 | | | | 166,140 | |
|
| Diversified Telecommunication Services – 1.6% | |
| | |
AT&T, Inc. | | | 24,224 | | | | 572,413 | |
| | |
Verizon Communications, Inc. | | | 12,450 | | | | 634,203 | |
| | | | | | | | |
| Total Diversified Telecommunication Services | | | | 1,206,616 | |
|
| Electric Utilities – 1.2% | |
| | |
Avangrid, Inc.(a) | | | 4,575 | | | | 213,835 | |
| | |
Edison International | | | 2,988 | | | | 209,459 | |
| | |
Eversource Energy | | | 2,536 | | | | 223,650 | |
| | |
Exelon Corp. | | | 5,764 | | | | 274,539 | |
| | | | | | | | |
| Total Electric Utilities | | | | 921,483 | |
|
| Electrical Equipment – 0.2% | |
| | |
Acuity Brands, Inc. | | | 741 | | | | 140,271 | |
|
| Electronic Equipment, Instruments & Components – 0.8% | |
| | |
Arrow Electronics, Inc.* | | | 1,653 | | | | 196,096 | |
| | |
Corning, Inc. | | | 5,344 | | | | 197,247 | |
| | |
Jabil, Inc. | | | 3,796 | | | | 234,327 | |
| | | | | | | | |
| Total Electronic Equipment, Instruments & Components | | | | 627,670 | |
|
| Entertainment – 0.5% | |
| | |
Electronic Arts, Inc. | | | 1,276 | | | | 161,427 | |
| | |
Warner Music Group Corp., Class A | | | 6,696 | | | | 253,443 | |
| | | | | | | | |
| Total Entertainment | | | | 414,870 | |
|
| Equity Real Estate Investment Trusts (REITs) – 2.3% | |
| | |
Brixmor Property Group, Inc. | | | 5,800 | | | | 149,698 | |
| | |
Healthpeak Properties, Inc. | | | 5,750 | | | | 197,397 | |
| | |
Iron Mountain, Inc. | | | 3,864 | | | | 214,104 | |
| | |
Kilroy Realty Corp. | | | 2,898 | | | | 221,465 | |
| | |
Omega Healthcare Investors, Inc. | | | 747 | | | | 23,277 | |
| | |
Public Storage | | | 442 | | | | 172,504 | |
| | |
Simon Property Group, Inc. | | | 1,397 | | | | 183,789 | |
| | |
Ventas, Inc. | | | 3,989 | | | | 246,361 | |
| | |
W.P. Carey, Inc. | | | 1,419 | | | | 114,712 | |
| | |
Weyerhaeuser Co. | | | 5,476 | | | | 207,540 | |
| | | | | | | | |
| Total Equity Real Estate Investment Trusts (REITs) | | | | 1,730,847 | |
|
| Food & Staples Retailing – 0.2% | |
| | |
Sysco Corp. | | | 1,822 | | | | 148,766 | |
|
| Food Products – 2.8% | |
| | |
Archer-Daniels-Midland Co. | | | 2,050 | | | | 185,033 | |
| | |
Campbell Soup Co. | | | 3,528 | | | | 157,243 | |
| | |
Conagra Brands, Inc. | | | 4,334 | | | | 145,492 | |
| | |
Darling Ingredients, Inc.* | | | 1,213 | | | | 97,501 | |
| | |
General Mills, Inc. | | | 2,871 | | | | 194,424 | |
| | |
Hershey Co. | | | 927 | | | | 200,816 | |
| | |
Hormel Foods Corp. | | | 2,943 | | | | 151,682 | |
| | |
Ingredion, Inc. | | | 1,185 | | | | 103,273 | |
| | |
J.M. Smucker Co. | | | 892 | | | | 120,786 | |
| | |
Kellogg Co. | | | 2,523 | | | | 162,708 | |
| | |
Kraft Heinz Co. | | | 3,507 | | | | 138,141 | |
| | |
McCormick & Co., Inc., Non-Voting Shares | | | 1,619 | | | | 161,576 | |
| | |
Mondelez International, Inc., Class A | | | 3,695 | | | | 231,972 | |
| | |
Post Holdings, Inc.* | | | 542 | | | | 37,539 | |
| | |
Tyson Foods, Inc., Class A | | | 1,153 | | | | 103,344 | |
| | | | | | | | |
| Total Food Products | | | | 2,191,530 | |
|
| Gas Utilities – 0.3% | |
| | |
Atmos Energy Corp. | | | 910 | | | | 108,736 | |
| | |
UGI Corp. | | | 2,792 | | | | 101,126 | |
| | | | | | | | |
| Total Gas Utilities | | | | 209,862 | |
|
| Health Care Equipment & Supplies – 2.4% | |
| | |
Abbott Laboratories | | | 3,326 | | | | 393,666 | |
| | |
Baxter International, Inc. | | | 2,343 | | | | 181,676 | |
| | |
Becton Dickinson and Co. | | | 847 | | | | 225,302 | |
| | |
Boston Scientific Corp.* | | | 4,645 | | | | 205,727 | |
| | |
Cooper Cos., Inc. | | | 108 | | | | 45,100 | |
| | |
Dentsply Sirona, Inc. | | | 2,156 | | | | 106,118 | |
| | |
Edwards Lifesciences Corp.* | | | 2,093 | | | | 246,388 | |
| | |
Envista Holdings Corp.* | | | 1,421 | | | | 69,217 | |
| | |
Hologic, Inc.* | | | 1,494 | | | | 114,769 | |
| | |
ResMed, Inc. | | | 580 | | | | 140,656 | |
| | |
Zimmer Biomet Holdings, Inc. | | | 1,118 | | | | 142,992 | |
| | | | | | | | |
| Total Health Care Equipment & Supplies | | | | 1,871,611 | |
|
| Health Care Providers & Services – 4.2% | |
| | |
AmerisourceBergen Corp. | | | 1,069 | | | | 165,385 | |
| | |
Anthem, Inc. | | | 567 | | | | 278,522 | |
| | |
Cardinal Health, Inc. | | | 2,680 | | | | 151,956 | |
| | |
Centene Corp.* | | | 1,708 | | | | 143,797 | |
| | |
Chemed Corp. | | | 39 | | | | 19,755 | |
| | |
Cigna Corp. | | | 948 | | | | 227,150 | |
| | |
CVS Health Corp. | | | 2,918 | | | | 295,331 | |
| | |
DaVita, Inc.* | | | 1,106 | | | | 125,100 | |
| | |
Encompass Health Corp. | | | 1,268 | | | | 90,167 | |
| | |
HCA Healthcare, Inc. | | | 599 | | | | 150,121 | |
| | |
Henry Schein, Inc.* | | | 1,266 | | | | 110,383 | |
| | |
Humana, Inc. | | | 485 | | | | 211,057 | |
| | |
Laboratory Corp. of America Holdings* | | | 360 | | | | 94,918 | |
| | |
McKesson Corp. | | | 570 | | | | 174,494 | |
| | |
Molina Healthcare, Inc.* | | | 226 | | | | 75,391 | |
| | |
Quest Diagnostics, Inc. | | | 1,069 | | | | 146,303 | |
| | |
Tenet Healthcare Corp.* | | | 1,106 | | | | 95,072 | |
See Notes to Financial Statements.
Schedule of Investments (continued)
WisdomTree U.S. ESG Fund (RESP)
March 31, 2022
| | | | | | | | |
| Investments | | Shares | | | Value | |
| | |
UnitedHealth Group, Inc. | | | 1,346 | | | $ | 686,420 | |
| | |
Universal Health Services, Inc., Class B | | | 204 | | | | 29,570 | |
| | | | | | | | |
| Total Health Care Providers & Services | | | | 3,270,892 | |
|
| Health Care Technology – 0.1% | |
| | |
Change Healthcare, Inc.* | | | 1,839 | | | | 40,090 | |
|
| Hotels, Restaurants & Leisure – 1.5% | |
| | |
Darden Restaurants, Inc. | | | 985 | | | | 130,956 | |
| | |
McDonald’s Corp. | | | 1,473 | | | | 364,243 | |
| | |
Scientific Games Corp., Class A* | | | 1,000 | | | | 58,750 | |
| | |
Starbucks Corp. | | | 2,960 | | | | 269,271 | |
| | |
Texas Roadhouse, Inc. | | | 398 | | | | 33,325 | |
| | |
Vail Resorts, Inc. | | | 397 | | | | 103,327 | |
| | |
Yum! Brands, Inc. | | | 1,555 | | | | 184,314 | |
| | | | | | | | |
| Total Hotels, Restaurants & Leisure | | | | 1,144,186 | |
|
| Household Durables – 0.5% | |
| | |
Newell Brands, Inc. | | | 5,170 | | | | 110,690 | |
| | |
PulteGroup, Inc. | | | 1,309 | | | | 54,847 | |
| | |
Tempur Sealy International, Inc. | | | 2,648 | | | | 73,932 | |
| | |
Whirlpool Corp. | | | 726 | | | | 125,438 | |
| | | | | | | | |
| Total Household Durables | | | | 364,907 | |
|
| Household Products – 1.6% | |
| | |
Church & Dwight Co., Inc. | | | 1,272 | | | | 126,411 | |
| | |
Clorox Co. | | | 1,098 | | | | 152,655 | |
| | |
Colgate-Palmolive Co. | | | 2,776 | | | | 210,504 | |
| | |
Kimberly-Clark Corp. | | | 1,253 | | | | 154,320 | |
| | |
Procter & Gamble Co. | | | 3,736 | | | | 570,861 | |
| | |
Reynolds Consumer Products, Inc. | | | 1,368 | | | | 40,137 | |
| | | | | | | | |
| Total Household Products | | | | 1,254,888 | |
|
| Industrial Conglomerates – 0.4% | |
| | |
3M Co. | | | 2,037 | | | | 303,269 | |
|
| Insurance – 3.2% | |
| | |
Aflac, Inc. | | | 3,246 | | | | 209,010 | |
| | |
Alleghany Corp.* | | | 89 | | | | 75,383 | |
| | |
Allstate Corp. | | | 1,445 | | | | 200,147 | |
| | |
American Financial Group, Inc. | | | 564 | | | | 82,130 | |
| | |
American International Group, Inc. | | | 2,675 | | | | 167,910 | |
| | |
CNA Financial Corp. | | | 2,109 | | | | 102,539 | |
| | |
Fidelity National Financial, Inc. | | | 1,239 | | | | 60,513 | |
| | |
First American Financial Corp. | | | 1,281 | | | | 83,034 | |
| | |
Hartford Financial Services Group, Inc. | | | 2,769 | | | | 198,842 | |
| | |
Marsh & McLennan Cos., Inc. | | | 1,254 | | | | 213,707 | |
| | |
MetLife, Inc. | | | 3,485 | | | | 244,926 | |
| | |
Old Republic International Corp. | | | 917 | | | | 23,723 | |
| | |
Progressive Corp. | | | 1,666 | | | | 189,907 | |
| | |
Prudential Financial, Inc. | | | 1,893 | | | | 223,696 | |
| | |
Reinsurance Group of America, Inc. | | | 851 | | | | 93,150 | |
| | |
Travelers Cos., Inc. | | | 1,048 | | | | 191,501 | |
| | |
W.R. Berkley Corp. | | | 1,344 | | | | 89,497 | |
| | | | | | | | |
| Total Insurance | | | | 2,449,615 | |
|
| Interactive Media & Services – 5.1% | |
| | |
Alphabet, Inc., Class A* | | | 1,423 | | | | 3,957,861 | |
|
| Internet & Direct Marketing Retail – 3.2% | |
| | |
Amazon.com, Inc.* | | | 701 | | | | 2,285,225 | |
| | |
eBay, Inc. | | | 3,037 | | | | 173,899 | |
| | | | | | | | |
| Total Internet & Direct Marketing Retail | | | | 2,459,124 | |
|
| IT Services – 6.7% | |
| | |
Akamai Technologies, Inc.* | | | 1,736 | | | | 207,261 | |
| | |
Automatic Data Processing, Inc. | | | 1,627 | | | | 370,208 | |
| | |
Cognizant Technology Solutions Corp., Class A | | | 2,957 | | | | 265,154 | |
| | |
Concentrix Corp. | | | 766 | | | | 127,585 | |
| | |
DXC Technology Co.* | | | 5,653 | | | | 184,457 | |
| | |
EPAM Systems, Inc.* | | | 680 | | | | 201,695 | |
| | |
Fidelity National Information Services, Inc. | | | 2,496 | | | | 250,648 | |
| | |
Gartner, Inc.* | | | 453 | | | | 134,749 | |
| | |
Global Payments, Inc. | | | 1,035 | | | | 141,629 | |
| | |
GoDaddy, Inc., Class A* | | | 767 | | | | 64,198 | |
| | |
International Business Machines Corp. | | | 3,223 | | | | 419,055 | |
| | |
Jack Henry & Associates, Inc. | | | 298 | | | | 58,721 | |
| | |
MasterCard, Inc., Class A | | | 2,651 | | | | 947,414 | |
| | |
PayPal Holdings, Inc.* | | | 4,191 | | | | 484,689 | |
| | |
Visa, Inc., Class A | | | 5,295 | | | | 1,174,272 | |
| | |
Western Union Co. | | | 7,525 | | | | 141,019 | |
| | | | | | | | |
| Total IT Services | | | | 5,172,754 | |
|
| Leisure Products – 0.1% | |
| | |
Brunswick Corp. | | | 1,253 | | | | 101,355 | |
|
| Life Sciences Tools & Services – 1.5% | |
| | |
Agilent Technologies, Inc. | | | 1,425 | | | | 188,570 | |
| | |
IQVIA Holdings, Inc.* | | | 655 | | | | 151,443 | |
| | |
Mettler-Toledo International, Inc.* | | | 107 | | | | 146,931 | |
| | |
Syneos Health, Inc.* | | | 739 | | | | 59,822 | |
| | |
Thermo Fisher Scientific, Inc. | | | 680 | | | | 401,642 | |
| | |
Waters Corp.* | | | 306 | | | | 94,979 | |
| | |
West Pharmaceutical Services, Inc. | | | 350 | | | | 143,749 | |
| | | | | | | | |
| Total Life Sciences Tools & Services | | | | 1,187,136 | |
|
| Machinery – 2.5% | |
| | |
AGCO Corp. | | | 1,144 | | | | 167,058 | |
| | |
Caterpillar, Inc. | | | 1,603 | | | | 357,181 | |
| | |
Deere & Co. | | | 786 | | | | 326,552 | |
| | |
Donaldson Co., Inc. | | | 2,331 | | | | 121,049 | |
| | |
Dover Corp. | | | 897 | | | | 140,739 | |
| | |
Lincoln Electric Holdings, Inc. | | | 1,188 | | | | 163,718 | |
| | |
Nordson Corp. | | | 527 | | | | 119,671 | |
| | |
PACCAR, Inc. | | | 1,546 | | | | 136,156 | |
| | |
Snap-on, Inc. | | | 430 | | | | 88,357 | |
| | |
Stanley Black & Decker, Inc. | | | 1,299 | | | | 181,587 | |
| | |
Toro Co. | | | 1,480 | | | | 126,525 | |
| | | | | | | | |
| Total Machinery | | | | 1,928,593 | |
|
| Media – 2.6% | |
| | |
Charter Communications, Inc., Class A* | | | 467 | | | | 254,758 | |
| | |
Comcast Corp., Class A | | | 12,944 | | | | 606,038 | |
| | |
Discovery, Inc., Class A* | | | 3,462 | | | | 86,273 | |
| | |
Fox Corp., Class A | | | 2,463 | | | | 97,165 | |
| | |
Interpublic Group of Cos., Inc. | | | 6,201 | | | | 219,825 | |
See Notes to Financial Statements.
Schedule of Investments (continued)
WisdomTree U.S. ESG Fund (RESP)
March 31, 2022
| | | | | | | | |
| Investments | | Shares | | | Value | |
| | |
New York Times Co., Class A | | | 2,369 | | | $ | 108,595 | |
| | |
News Corp., Class A | | | 5,917 | | | | 131,062 | |
| | |
Nexstar Media Group, Inc., Class A | | | 167 | | | | 31,476 | |
| | |
Omnicom Group, Inc. | | | 2,088 | | | | 177,229 | |
| | |
Paramount Global, Class B(a) | | | 5,171 | | | | 195,516 | |
| | |
Sirius XM Holdings, Inc.(a) | | | 19,554 | | | | 129,448 | |
| | | | | | | | |
| Total Media | | | | 2,037,385 | |
|
| Metals & Mining – 0.8% | |
| | |
Nucor Corp. | | | 1,227 | | | | 182,394 | |
| | |
Reliance Steel & Aluminum Co. | | | 827 | | | | 151,630 | |
| | |
Steel Dynamics, Inc. | | | 2,374 | | | | 198,063 | |
| | |
United States Steel Corp. | | | 2,795 | | | | 105,483 | |
| | | | | | | | |
| Total Metals & Mining | | | | 637,570 | |
|
| Multi-Utilities – 0.7% | |
| | |
Consolidated Edison, Inc. | | | 2,218 | | | | 210,000 | |
| | |
Sempra Energy | | | 1,750 | | | | 294,210 | |
| | | | | | | | |
| Total Multi-Utilities | | | | 504,210 | |
|
| Multiline Retail – 0.7% | |
| | |
Kohl’s Corp. | | | 2,305 | | | | 139,360 | |
| | |
Macy’s, Inc. | | | 5,199 | | | | 126,648 | |
| | |
Target Corp. | | | 1,219 | | | | 258,696 | |
| | | | | | | | |
| Total Multiline Retail | | | | 524,704 | |
|
| Pharmaceuticals – 2.8% | |
| | |
Bristol-Myers Squibb Co. | | | 4,734 | | | | 345,724 | |
| | |
Eli Lilly & Co. | | | 1,535 | | | | 439,578 | |
| | |
Johnson & Johnson | | | 3,906 | | | | 692,260 | |
| | |
Merck & Co., Inc. | | | 2,972 | | | | 243,853 | |
| | |
Pfizer, Inc. | | | 9,008 | | | | 466,344 | |
| | | | | | | | |
| Total Pharmaceuticals | | | | 2,187,759 | |
|
| Professional Services – 0.7% | |
| | |
Booz Allen Hamilton Holding Corp. | | | 1,803 | | | | 158,376 | |
| | |
Robert Half International, Inc. | | | 1,336 | | | | 152,544 | |
| | |
Verisk Analytics, Inc. | | | 964 | | | | 206,903 | |
| | | | | | | | |
| Total Professional Services | | | | 517,823 | |
|
| Real Estate Management & Development – 0.6% | |
| | |
CBRE Group, Inc., Class A* | | | 2,644 | | | | 241,979 | |
| | |
Jones Lang LaSalle, Inc.* | | | 878 | | | | 210,246 | |
| | | | | | | | |
| Total Real Estate Management & Development | | | | 452,225 | |
|
| Road & Rail – 1.5% | |
| | |
Avis Budget Group, Inc.* | | | 900 | | | | 236,970 | |
| | |
JB Hunt Transport Services, Inc. | | | 481 | | | | 96,580 | |
| | |
Knight-Swift Transportation Holdings, Inc. | | | 1,000 | | | | 50,460 | |
| | |
Norfolk Southern Corp. | | | 809 | | | | 230,743 | |
| | |
Union Pacific Corp. | | | 1,472 | | | | 402,165 | |
| | |
XPO Logistics, Inc.* | | | 1,756 | | | | 127,837 | |
| | | | | | | | |
| Total Road & Rail | | | | 1,144,755 | |
|
| Semiconductors & Semiconductor Equipment – 3.5% | |
| | |
Applied Materials, Inc. | | | 3,356 | | | | 442,321 | |
| | |
First Solar, Inc.* | | | 2,927 | | | | 245,107 | |
| | |
Intel Corp. | | | 12,060 | | | | 597,694 | |
| | |
KLA Corp. | | | 765 | | | | 280,036 | |
| | |
Lam Research Corp. | | | 612 | | | | 329,017 | |
| | |
Micron Technology, Inc. | | | 3,959 | | | | 308,366 | |
| | |
QUALCOMM, Inc. | | | 3,358 | | | | 513,170 | |
| | | | | | | | |
| Total Semiconductors & Semiconductor Equipment | | | | 2,715,711 | |
|
| Software – 9.4% | |
| | |
Adobe, Inc.* | | | 1,406 | | | | 640,602 | |
| | |
Aspen Technology, Inc.* | | | 772 | | | | 127,666 | |
| | |
Autodesk, Inc.* | | | 1,520 | | | | 325,812 | |
| | |
Dolby Laboratories, Inc., Class A | | | 1,704 | | | | 133,287 | |
| | |
Fair Isaac Corp.* | | | 245 | | | | 114,283 | |
| | |
Microsoft Corp. | | | 15,063 | | | | 4,644,073 | |
| | |
NortonLifeLock, Inc. | | | 7,927 | | | | 210,224 | |
| | |
Oracle Corp. | | | 7,266 | | | | 601,116 | |
| | |
PTC, Inc.* | | | 1,138 | | | | 122,585 | |
| | |
SS&C Technologies Holdings, Inc. | | | 578 | | | | 43,362 | |
| | |
VMware, Inc., Class A | | | 2,331 | | | | 265,431 | |
| | | | | | | | |
| Total Software | | | | 7,228,441 | |
|
| Specialty Retail – 2.3% | |
| | |
Advance Auto Parts, Inc. | | | 318 | | | | 65,813 | |
| | |
AutoNation, Inc.* | | | 542 | | | | 53,972 | |
| | |
AutoZone, Inc.* | | | 69 | | | | 141,076 | |
| | |
Best Buy Co., Inc. | | | 1,748 | | | | 158,893 | |
| | |
Home Depot, Inc. | | | 1,659 | | | | 496,589 | |
| | |
Lithia Motors, Inc. | | | 249 | | | | 74,730 | |
| | |
Lowe’s Cos., Inc. | | | 1,446 | | | | 292,367 | |
| | |
O’Reilly Automotive, Inc.* | | | 106 | | | | 72,606 | |
| | |
Penske Automotive Group, Inc. | | | 1,100 | | | | 103,092 | |
| | |
Tractor Supply Co. | | | 611 | | | | 142,589 | |
| | |
Williams-Sonoma, Inc. | | | 913 | | | | 132,385 | |
| | | | | | | | |
| Total Specialty Retail | | | | 1,734,112 | |
|
| Technology Hardware, Storage & Peripherals – 8.4% | |
| | |
Apple, Inc. | | | 31,715 | | | | 5,537,756 | |
| | |
Hewlett Packard Enterprise Co. | | | 16,165 | | | | 270,117 | |
| | |
HP, Inc. | | | 8,318 | | | | 301,944 | |
| | |
NetApp, Inc. | | | 2,320 | | | | 192,560 | |
| | |
Western Digital Corp.* | | | 3,382 | | | | 167,916 | |
| | | | | | | | |
| Total Technology Hardware, Storage & Peripherals | | | | 6,470,293 | |
|
| Textiles, Apparel & Luxury Goods – 1.0% | |
| | |
NIKE, Inc., Class B | | | 3,174 | | | | 427,093 | |
| | |
PVH Corp. | | | 1,750 | | | | 134,068 | |
| | |
Ralph Lauren Corp. | | | 1,060 | | | | 120,246 | |
| | |
Tapestry, Inc. | | | 3,013 | | | | 111,933 | |
| | | | | | | | |
| Total Textiles, Apparel & Luxury Goods | | | | 793,340 | |
|
| Water Utilities – 0.5% | |
| | |
American Water Works Co., Inc. | | | 1,455 | | | | 240,846 | |
| | |
Essential Utilities, Inc. | | | 3,097 | | | | 158,350 | |
| | | | | | | | |
| Total Water Utilities | | | | | | | 399,196 | |
TOTAL COMMON STOCKS (Cost: $60,063,786) | | | | | | | 76,995,381 | |
See Notes to Financial Statements.
Schedule of Investments (concluded)
WisdomTree U.S. ESG Fund (RESP)
March 31, 2022
| | | | | | | | |
| Investments | | Shares | | | Value | |
|
| INVESTMENT OF CASH COLLATERAL FOR SECURITIES LOANED – 0.0% | |
| | |
| United States – 0.0% | | | | | | | | |
| |
State Street Navigator Securities Lending
Government Money Market Portfolio, 0.25%(b)
| | | | | |
| (Cost: $11,792) | | | 11,792 | | | $ | 11,792 | |
| |
TOTAL INVESTMENTS IN SECURITIES – 99.9% (Cost: $60,075,578) | | | | 77,007,173 | |
| |
Other Assets less Liabilities – 0.1% | | | | 50,506 | |
| | | | | | | | |
| NET ASSETS – 100.0% | | | $ | 77,057,679 | |
| * | Non-income producing security. |
| (a) | Security, or portion thereof, was on loan at March 31, 2022 (See Note 2). At March 31, 2022, the total market value of the Fund’s securities on loan identified in the Schedule of Investments was $187,488 and the total market value of the collateral held by the Fund was $192,970. The total market value of the collateral includes non-cash U.S. Government securities collateral having a value of $181,178. |
| (b) | Rate shown represents annualized 7-day yield as of March 31, 2022. |
The following is a summary of the fair valuations according to the inputs used as of March 31, 2022 in valuing the Fund’s investments (See Note 2 — Fair Value Measurement):
| | | | | | | | | | | | | | | | |
| | | | |
| | | Quoted
Prices in
Active
Markets
(Level 1) | | | Other
Significant
Observable
Inputs
(Level 2) | | | Significant
Unobservable
Inputs
(Level 3) | | | Total | |
Assets: | | | | | | | | | | | | | | | | |
Investments in Securities | | | | | | | | | | | | | | | | |
Common Stocks | | $ | 76,995,381 | | | $ | — | | | $ | — | | | $ | 76,995,381 | |
Investment of Cash Collateral for Securities Loaned | | | — | | | | 11,792 | | | | — | | | | 11,792 | |
Total Investments in Securities | | $ | 76,995,381 | | | $ | 11,792 | | | $ | — | | | $ | 77,007,173 | |
See Notes to Financial Statements.
Schedule of Investments
WisdomTree U.S. Growth & Momentum Fund (WGRO)
March 31, 2022
| | | | | | | | |
| Investments | | Shares | | | Value | |
| | |
| COMMON STOCKS – 99.9% | | | | | | | | |
| | |
| United States – 93.4% | | | | | | | | |
| | |
| Automobiles – 2.1% | | | | | | | | |
| | |
Tesla, Inc.* | | | 81 | | | $ | 87,286 | |
| | |
| Banks – 2.6% | | | | | | | | |
| | |
East West Bancorp, Inc. | | | 483 | | | | 38,167 | |
| | |
Signature Bank | | | 233 | | | | 68,383 | |
| | | | | | | | |
| Total Banks | | | | | | | 106,550 | |
| | |
| Biotechnology – 3.1% | | | | | | | | |
| | |
Moderna, Inc.* | | | 486 | | | | 83,718 | |
| | |
Regeneron Pharmaceuticals, Inc.* | | | 63 | | | | 44,001 | |
| | | | | | | | |
| Total Biotechnology | | | | | | | 127,719 | |
| | |
| Building Products – 2.3% | | | | | | | | |
| | |
Builders FirstSource, Inc.* | | | 533 | | | | 34,400 | |
| | |
Trex Co., Inc.* | | | 888 | | | | 58,013 | |
| | | | | | | | |
| Total Building Products | | | | | | | 92,413 | |
| | |
| Capital Markets – 11.8% | | | | | | | | |
| | |
Ameriprise Financial, Inc. | | | 253 | | | | 75,991 | |
| | |
Ares Management Corp., Class A | | | 953 | | | | 77,412 | |
| | |
Blackstone, Inc. | | | 588 | | | | 74,640 | |
| | |
FactSet Research Systems, Inc. | | | 106 | | | | 46,020 | |
| | |
Houlihan Lokey, Inc. | | | 731 | | | | 64,182 | |
| | |
Raymond James Financial, Inc. | | | 713 | | | | 78,366 | |
| | |
Stifel Financial Corp. | | | 991 | | | | 67,289 | |
| | | | | | | | |
| Total Capital Markets | | | | | | | 483,900 | |
| | |
| Chemicals – 0.9% | | | | | | | | |
| | |
Element Solutions, Inc. | | | 1,624 | | | | 35,566 | |
| | |
| Communications Equipment – 3.0% | | | | | | | | |
| | |
Arista Networks, Inc.* | | | 614 | | | | 85,333 | |
| | |
Ciena Corp.* | | | 598 | | | | 36,257 | |
| | | | | | | | |
| Total Communications Equipment | | | | | | | 121,590 | |
| | |
| Consumer Finance – 0.9% | | | | | | | | |
| | |
American Express Co. | | | 197 | | | | 36,839 | |
|
| Electronic Equipment, Instruments & Components – 3.0% | |
| | |
Arrow Electronics, Inc.* | | | 435 | | | | 51,604 | |
| | |
Keysight Technologies, Inc.* | | | 447 | | | | 70,613 | |
| | | | | | | | |
| Total Electronic Equipment, Instruments & Components | | | | 122,217 | |
| | |
| Entertainment – 1.0% | | | | | | | | |
| | |
Live Nation Entertainment, Inc.* | | | 345 | | | | 40,586 | |
| | |
| Health Care Providers & Services – 0.9% | | | | | | | | |
| | |
Tenet Healthcare Corp.* | | | 433 | | | | 37,221 | |
| | |
| Hotels, Restaurants & Leisure – 6.1% | | | | | | | | |
| | |
Choice Hotels International, Inc. | | | 600 | | | | 85,056 | |
| | |
Expedia Group, Inc.* | | | 211 | | | | 41,286 | |
| | |
Hilton Worldwide Holdings, Inc.* | | | 271 | | | | 41,122 | |
| | |
SeaWorld Entertainment, Inc.* | | | 1,095 | | | | 81,512 | |
| | | | | | | | |
| Total Hotels, Restaurants & Leisure | | | | | | | 248,976 | |
| | |
| Household Durables – 1.1% | | | | | | | | |
| | |
Garmin Ltd. | | | 392 | | | | 46,495 | |
| | |
| Insurance – 1.0% | | | | | | | | |
| | |
Arch Capital Group Ltd.* | | | 811 | | | | 39,269 | |
| | |
| Interactive Media & Services – 3.0% | | | | | | | | |
| | |
Alphabet, Inc., Class A* | | | 31 | | | | 86,222 | |
| | |
Ziff Davis, Inc.* | | | 384 | | | | 37,163 | |
| | | | | | | | |
| Total Interactive Media & Services | | | | | | | 123,385 | |
| | |
| IT Services – 7.1% | | | | | | | | |
| | |
Accenture PLC, Class A | | | 240 | | | | 80,935 | |
| | |
Concentrix Corp. | | | 193 | | | | 32,146 | |
| | |
EPAM Systems, Inc.* | | | 334 | | | | 99,068 | |
| | |
Gartner, Inc.* | | | 264 | | | | 78,529 | |
| | | | | | | | |
| Total IT Services | | | | | | | 290,678 | |
| | |
| Life Sciences Tools & Services – 0.8% | | | | | | | | |
| | |
PerkinElmer, Inc. | | | 184 | | | | 32,101 | |
| | |
| Machinery – 2.8% | | | | | | | | |
| | |
Ingersoll Rand, Inc. | | | 1,431 | | | | 72,051 | |
| | |
Middleby Corp.* | | | 256 | | | | 41,969 | |
| | | | | | | | |
| Total Machinery | | | | | | | 114,020 | |
| | |
| Metals & Mining – 1.0% | | | | | | | | |
| | |
Freeport-McMoRan, Inc. | | | 787 | | | | 39,145 | |
| | |
| Paper & Forest Products – 0.8% | | | | | | | | |
| | |
Louisiana-Pacific Corp. | | | 545 | | | | 33,855 | |
| | |
| Pharmaceuticals – 2.0% | | | | | | | | |
| | |
Pfizer, Inc. | | | 811 | | | | 41,985 | |
| | |
Zoetis, Inc. | | | 222 | | | | 41,867 | |
| | | | | | | | |
| Total Pharmaceuticals | | | | | | | 83,852 | |
| | |
| Real Estate Management & Development – 3.6% | | | | | | | | |
| | |
CBRE Group, Inc., Class A* | | | 794 | | | | 72,667 | |
| | |
Jones Lang LaSalle, Inc.* | | | 318 | | | | 76,148 | |
| | | | | | | | |
| Total Real Estate Management & Development | | | | | | | 148,815 | |
| | |
| Road & Rail – 1.4% | | | | | | | | |
| | |
Avis Budget Group, Inc.* | | | 226 | | | | 59,506 | |
|
| Semiconductors & Semiconductor Equipment – 16.3% | |
| | |
Advanced Micro Devices, Inc.* | | | 670 | | | | 73,258 | |
| | |
Applied Materials, Inc. | | | 540 | | | | 71,172 | |
| | |
Broadcom, Inc. | | | 55 | | | | 34,632 | |
| | |
KLA Corp. | | | 200 | | | | 73,212 | |
| | |
Lattice Semiconductor Corp.* | | | 1,187 | | | | 72,348 | |
| | |
Marvell Technology, Inc. | | | 1,146 | | | | 82,180 | |
| | |
NVIDIA Corp. | | | 296 | | | | 80,766 | |
| | |
ON Semiconductor Corp.* | | | 1,246 | | | | 78,012 | |
| | |
QUALCOMM, Inc. | | | 234 | | | | 35,760 | |
| | |
Synaptics, Inc.* | | | 332 | | | | 66,234 | |
| | | | | | | | |
| Total Semiconductors & Semiconductor Equipment | | | | 667,574 | |
| | |
| Software – 6.9% | | | | | | | | |
| | |
Atlassian Corp. PLC, Class A* | | | 247 | | | | 72,576 | |
| | |
Datadog, Inc., Class A* | | | 263 | | | | 39,837 | |
| | |
Fortinet, Inc.* | | | 118 | | | | 40,325 | |
| | |
Microsoft Corp. | | | 151 | | | | 46,555 | |
| | |
Palo Alto Networks, Inc.* | | | 71 | | | | 44,198 | |
See Notes to Financial Statements.
Schedule of Investments (concluded)
WisdomTree U.S. Growth & Momentum Fund (WGRO)
March 31, 2022
| | | | | | | | |
| Investments | | Shares | | | Value | |
| | |
Tyler Technologies, Inc.* | | | 85 | | | $ | 37,816 | |
| | | | | | | | |
| Total Software | | | | 281,307 | |
| | |
| Specialty Retail – 1.2% | | | | | | | | |
| | |
AutoZone, Inc.* | | | 24 | | | | 49,070 | |
|
| Technology Hardware, Storage & Peripherals – 1.3% | |
| | |
Apple, Inc. | | | 294 | | | | 51,335 | |
| | |
| Textiles, Apparel & Luxury Goods – 2.5% | | | | | | | | |
| | |
Capri Holdings Ltd.* | | | 596 | | | | 30,628 | |
| | |
Crocs, Inc.* | | | 925 | | | | 70,670 | |
| | | | | | | | |
| Total Textiles, Apparel & Luxury Goods | | | | 101,298 | |
| | |
| Trading Companies & Distributors – 2.9% | | | | | | | | |
| | |
SiteOne Landscape Supply, Inc.* | | | 227 | | | | 36,704 | |
| | |
WESCO International, Inc.* | | | 638 | | | | 83,029 | |
| | | | | | | | |
| Total Trading Companies & Distributors | | | | 119,733 | |
| Total United States | | | | | | | 3,822,301 | |
|
| China – 1.7% | |
|
| Semiconductors & Semiconductor Equipment – 1.7% | |
| | |
NXP Semiconductors NV | | | 379 | | | | 70,145 | |
|
| Ireland – 1.7% | |
|
| Trading Companies & Distributors – 1.7% | |
| | |
AerCap Holdings NV* | | | 1,392 | | | | 69,990 | |
|
| Switzerland – 1.9% | |
|
| Semiconductors & Semiconductor Equipment – 1.9% | |
| | |
STMicroelectronics NV, Registered Shares | | | 1,803 | | | | 77,926 | |
|
| United Kingdom – 1.2% | |
|
| Chemicals – 1.2% | |
| | |
| Linde PLC | | | 154 | | | | 49,192 | |
| |
TOTAL INVESTMENTS IN SECURITIES – 99.9%
(Cost: $4,215,652) | | | | 4,089,554 | |
| |
Other Assets less Liabilities – 0.1% | | | | 5,930 | |
| | | | | | | | |
| NET ASSETS – 100.0% | | | $ | 4,095,484 | |
| * | Non-income producing security. |
The following is a summary of the fair valuations according to the inputs used as of March 31, 2022 in valuing the Fund’s investments (See Note 2 — Fair Value Measurement):
| | | | | | | | | | | | | | | | |
| | | | |
| | | Quoted
Prices in
Active
Markets
(Level 1) | | | Other
Significant
Observable
Inputs
(Level 2) | | | Significant
Unobservable
Inputs
(Level 3) | | | Total | |
Assets: | | | | | | | | | | | | | | | | |
Investments in Securities | | | | | | | | | | | | | | | | |
Common Stocks | | $ | 4,089,554 | | | $ | — | | | $ | — | | | $ | 4,089,554 | |
Total Investments in Securities | | $ | 4,089,554 | | | $ | — | | | $ | — | | | $ | 4,089,554 | |
See Notes to Financial Statements.
Schedule of Investments
WisdomTree U.S. High Dividend Fund (DHS)
March 31, 2022
| | | | | | | | |
| Investments | | Shares | | | Value | |
| | | | | | | | |
| | |
| COMMON STOCKS – 99.5% | | | | | | | | |
| | |
| United States – 99.5% | | | | | | | | |
| | |
| Aerospace & Defense – 1.5% | | | | | | | | |
| | |
Lockheed Martin Corp. | | | 34,654 | | | $ | 15,296,276 | |
|
| Banks – 6.7% | |
| | |
Associated Banc-Corp. | | | 20,614 | | | | 469,175 | |
| | |
Atlantic Union Bankshares Corp. | | | 11,855 | | | | 434,960 | |
| | |
Bank of Hawaii Corp. | | | 6,768 | | | | 567,971 | |
| | |
Banner Corp. | | | 4,212 | | | | 246,528 | |
| | |
Brookline Bancorp, Inc. | | | 12,506 | | | | 197,845 | |
| | |
Camden National Corp. | | | 2,717 | | | | 127,808 | |
| | |
Cathay General Bancorp | | | 17,065 | | | | 763,659 | |
| | |
Central Pacific Financial Corp. | | | 6,951 | | | | 193,933 | |
| | |
Citigroup, Inc. | | | 246,360 | | | | 13,155,624 | |
| | |
Citizens & Northern Corp. | | | 5,337 | | | | 130,116 | |
| | |
Citizens Financial Group, Inc. | | | 53,187 | | | | 2,410,967 | |
| | |
City Holding Co. | | | 3,580 | | | | 281,746 | |
| | |
Columbia Banking System, Inc. | | | 10,517 | | | | 339,384 | |
| | |
Comerica, Inc. | | | 15,680 | | | | 1,417,942 | |
| | |
Community Trust Bancorp, Inc. | | | 3,803 | | | | 156,684 | |
| | |
CVB Financial Corp. | | | 26,153 | | | | 607,011 | |
| | |
Dime Community Bancshares, Inc. | | | 5,616 | | | | 194,145 | |
| | |
Farmers National Banc Corp. | | | 7,887 | | | | 134,552 | |
| | |
Fifth Third Bancorp | | | 70,216 | | | | 3,022,097 | |
| | |
Financial Institutions, Inc. | | | 4,571 | | | | 137,724 | |
| | |
First Bancorp, Inc. | | | 3,746 | | | | 112,680 | |
| | |
First Busey Corp. | | | 9,955 | | | | 252,260 | |
| | |
First Commonwealth Financial Corp. | | | 16,352 | | | | 247,896 | |
| | |
First Community Bankshares, Inc. | | | 4,443 | | | | 125,337 | |
| | |
First Financial Bancorp | | | 15,947 | | | | 367,578 | |
| | |
First Hawaiian, Inc. | | | 18,890 | | | | 526,842 | |
| | |
First Horizon Corp. | | | 73,716 | | | | 1,731,589 | |
| | |
First Interstate BancSystem, Inc., Class A | | | 6,205 | | | | 228,158 | |
| | |
First of Long Island Corp. | | | 5,755 | | | | 111,992 | |
| | |
Flushing Financial Corp. | | | 7,575 | | | | 169,301 | |
| | |
FNB Corp. | | | 38,578 | | | | 480,296 | |
| | |
Fulton Financial Corp. | | | 18,148 | | | | 301,620 | |
| | |
HBT Financial, Inc. | | | 7,766 | | | | 141,186 | |
| | |
Heritage Commerce Corp. | | | 16,827 | | | | 189,304 | |
| | |
Heritage Financial Corp. | | | 5,812 | | | | 145,649 | |
| | |
Hope Bancorp, Inc. | | | 23,924 | | | | 384,698 | |
| | |
Horizon Bancorp, Inc. | | | 6,987 | | | | 130,447 | |
| | |
Independent Bank Corp. | | | 6,215 | | | | 136,730 | |
| | |
International Bancshares Corp. | | | 7,984 | | | | 337,005 | |
| | |
KeyCorp | | | 119,637 | | | | 2,677,476 | |
| | |
Lakeland Bancorp, Inc. | | | 9,467 | | | | 158,099 | |
| | |
M&T Bank Corp. | | | 15,223 | | | | 2,580,298 | |
| | |
Mercantile Bank Corp. | | | 3,461 | | | | 122,589 | |
| | |
Midland States Bancorp, Inc. | | | 6,905 | | | | 199,278 | |
| | |
MidWestOne Financial Group, Inc. | | | 153 | | | | 5,064 | |
| | |
NBT Bancorp, Inc. | | | 5,734 | | | | 207,169 | |
| | |
Northwest Bancshares, Inc.(a) | | | 26,283 | | | | 355,083 | |
| | |
OceanFirst Financial Corp. | | | 8,145 | | | | 163,714 | |
| | |
Old National Bancorp | | | 28,053 | | | | 459,508 | |
| | |
Pacific Premier Bancorp, Inc. | | | 12,315 | | | | 435,335 | |
| | |
Park National Corp.(a) | | | 3,097 | | | | 406,884 | |
| | |
People’s United Financial, Inc. | | | 67,256 | | | | 1,344,447 | |
| | |
Peoples Bancorp, Inc. | | | 5,594 | | | | 175,148 | |
| | |
Premier Financial Corp. | | | 6,191 | | | | 187,773 | |
| | |
Prosperity Bancshares, Inc. | | | 10,249 | | | | 711,076 | |
| | |
Regions Financial Corp. | | | 107,202 | | | | 2,386,316 | |
| | |
Sandy Spring Bancorp, Inc. | | | 7,000 | | | | 314,440 | |
| | |
Southside Bancshares, Inc. | | | 7,008 | | | | 286,137 | |
| | |
Synovus Financial Corp. | | | 15,388 | | | | 754,012 | |
| | |
Tompkins Financial Corp.(a) | | | 2,306 | | | | 180,491 | |
| | |
Truist Financial Corp. | | | 165,780 | | | | 9,399,726 | |
| | |
Trustmark Corp. | | | 6,769 | | | | 205,710 | |
| | |
U.S. Bancorp | | | 181,959 | | | | 9,671,121 | |
| | |
Umpqua Holdings Corp. | | | 49,978 | | | | 942,585 | |
| | |
United Bankshares, Inc. | | | 18,152 | | | | 633,142 | |
| | |
Univest Financial Corp. | | | 6,121 | | | | 163,798 | |
| | |
Valley National Bancorp | | | 46,233 | | | | 601,954 | |
| | |
Washington Trust Bancorp, Inc. | | | 4,143 | | | | 217,507 | |
| | |
Webster Financial Corp. | | | 9,000 | | | | 505,080 | |
| | |
WesBanco, Inc. | | | 14,668 | | | | 503,992 | |
| | |
West Bancorp, Inc. | | | 5,270 | | | | 143,397 | |
| | | | | | | | |
| Total Banks | | | | 68,208,788 | |
|
| Beverages – 4.6% | |
| | |
Coca-Cola Co. | | | 755,752 | | | | 46,856,624 | |
|
| Biotechnology – 8.4% | |
| | |
AbbVie, Inc. | | | 313,533 | | | | 50,826,835 | |
| | |
Amgen, Inc. | | | 72,689 | | | | 17,577,654 | |
| | |
Gilead Sciences, Inc. | | | 292,991 | | | | 17,418,315 | |
| | | | | | | | |
| Total Biotechnology | | | | 85,822,804 | |
|
| Capital Markets – 3.8% | |
| | |
Artisan Partners Asset Management, Inc., Class A(a) | | | 24,466 | | | | 962,737 | |
| | |
B. Riley Financial, Inc.(a) | | | 8,564 | | | | 599,137 | |
| | |
Blackstone, Inc. | | | 127,259 | | | | 16,154,258 | |
| | |
Federated Hermes, Inc., Class B | | | 11,306 | | | | 385,082 | |
| | |
Franklin Resources, Inc. | | | 66,053 | | | | 1,844,200 | |
| | |
GCM Grosvenor, Inc., Class A(a) | | | 5,454 | | | | 52,958 | |
| | |
Moelis & Co., Class A | | | 14,501 | | | | 680,822 | |
| | |
Morgan Stanley | | | 193,018 | | | | 16,869,773 | |
| | |
Sculptor Capital Management, Inc. | | | 6,492 | | | | 90,434 | |
| | |
Virtu Financial, Inc., Class A | | | 25,819 | | | | 960,983 | |
| | | | | | | | |
| Total Capital Markets | | | | 38,600,384 | |
|
| Chemicals – 1.1% | |
| | |
Cabot Corp. | | | 5,737 | | | | 392,468 | |
| | |
Chemours Co.(a) | | | 20,361 | | | | 640,964 | |
| | |
Dow, Inc. | | | 146,254 | | | | 9,319,305 | |
| | |
Kronos Worldwide, Inc. | | | 27,605 | | | | 428,430 | |
| | | | | | | | |
| Total Chemicals | | | | 10,781,167 | |
|
| Commercial Services & Supplies – 0.1% | |
| | |
ACCO Brands Corp. | | | 14,647 | | | | 117,176 | |
See Notes to Financial Statements.
Schedule of Investments (continued)
WisdomTree U.S. High Dividend Fund (DHS)
March 31, 2022
| | | | | | | | |
| Investments | | Shares | | | Value | |
| | |
Deluxe Corp. | | | 6,082 | | | $ | 183,920 | |
| | |
Ennis, Inc. | | | 7,268 | | | | 134,240 | |
| | |
Healthcare Services Group, Inc.(a) | | | 14,574 | | | | 270,639 | |
| | |
HNI Corp. | | | 7,242 | | | | 268,316 | |
| | |
Pitney Bowes, Inc. | | | 24,285 | | | | 126,282 | |
| | |
Steelcase, Inc., Class A | | | 16,972 | | | | 202,815 | |
| | | | | | | | |
| Total Commercial Services & Supplies | | | | 1,303,388 | |
|
| Communications Equipment – 2.3% | |
| | |
Cisco Systems, Inc. | | | 417,902 | | | | 23,302,216 | |
|
| Construction & Engineering – 0.1% | |
| | |
MDU Resources Group, Inc. | | | 34,350 | | | | 915,427 | |
|
| Consumer Finance – 0.2% | |
| | |
Navient Corp. | | | 18,741 | | | | 319,347 | |
| | |
OneMain Holdings, Inc. | | | 40,071 | | | | 1,899,766 | |
| | | | | | | | |
| Total Consumer Finance | | | | 2,219,113 | |
|
| Containers & Packaging – 0.5% | |
| | |
Greif, Inc., Class B(a) | | | 5,302 | | | | 338,056 | |
| | |
International Paper Co. | | | 57,141 | | | | 2,637,057 | |
| | |
Packaging Corp. of America | | | 10,628 | | | | 1,659,137 | |
| | |
Sonoco Products Co. | | | 11,288 | | | | 706,177 | |
| | | | | | | | |
| Total Containers & Packaging | | | | 5,340,427 | |
|
| Diversified Consumer Services – 0.1% | |
| | |
H&R Block, Inc.(a) | | | 29,832 | | | | 776,825 | |
| | |
Strategic Education, Inc. | | | 3,883 | | | | 257,754 | |
| | | | | | | | |
| Total Diversified Consumer Services | | | | 1,034,579 | |
|
| Diversified Telecommunication Services – 4.1% | |
| | |
Cogent Communications Holdings, Inc. | | | 11,915 | | | | 790,560 | |
| | |
Verizon Communications, Inc. | | | 801,487 | | | | 40,827,748 | |
| | | | | | | | |
| Total Diversified Telecommunication Services | | | | 41,618,308 | |
|
| Electric Utilities – 7.6% | |
| | |
ALLETE, Inc. | | | 8,236 | | | | 551,647 | |
| | |
Alliant Energy Corp. | | | 26,474 | | | | 1,654,096 | |
| | |
American Electric Power Co., Inc. | | | 71,142 | | | | 7,097,837 | |
| | |
Avangrid, Inc.(a) | | | 50,824 | | | �� | 2,375,514 | |
| | |
Duke Energy Corp. | | | 113,729 | | | | 12,698,980 | |
| | |
Edison International | | | 56,183 | | | | 3,938,428 | |
| | |
Entergy Corp. | | | 29,210 | | | | 3,410,268 | |
| | |
Evergy, Inc. | | | 44,497 | | | | 3,040,925 | |
| | |
Eversource Energy | | | 36,417 | | | | 3,211,615 | |
| | |
Exelon Corp. | | | 159,341 | | | | 7,589,412 | |
| | |
FirstEnergy Corp. | | | 123,495 | | | | 5,663,481 | |
| | |
Hawaiian Electric Industries, Inc. | | | 14,622 | | | | 618,657 | |
| | |
NRG Energy, Inc. | | | 31,451 | | | | 1,206,460 | |
| | |
OGE Energy Corp. | | | 50,302 | | | | 2,051,316 | |
| | |
Portland General Electric Co. | | | 11,461 | | | | 632,074 | |
| | |
PPL Corp. | | | 162,275 | | | | 4,634,574 | |
| | |
Southern Co. | | | 246,675 | | | | 17,886,404 | |
| | | | | | | | |
| Total Electric Utilities | | | | 78,261,688 | |
|
| Energy Equipment & Services – 0.4% | |
| | |
Baker Hughes Co. | | | 98,906 | | | | 3,601,167 | |
|
| Equity Real Estate Investment Trusts (REITs) – 4.5% | |
| | |
Agree Realty Corp. | | | 3,582 | | | | 237,702 | |
| | |
American Assets Trust, Inc. | | | 3,902 | | | | 147,847 | |
| | |
American Campus Communities, Inc. | | | 7,685 | | | | 430,129 | |
| | |
Apartment Income REIT Corp. | | | 7,634 | | | | 408,114 | |
| | |
Boston Properties, Inc. | | | 8,273 | | | | 1,065,562 | |
| | |
Brandywine Realty Trust | | | 18,452 | | | | 260,911 | |
| | |
Brixmor Property Group, Inc. | | | 30,026 | | | | 774,971 | |
| | |
Broadstone Net Lease, Inc. | | | 14,200 | | | | 309,276 | |
| | |
CareTrust REIT, Inc. | | | 10,284 | | | | 198,481 | |
| | |
Community Healthcare Trust, Inc. | | | 3,858 | | | | 162,846 | |
| | |
Corporate Office Properties Trust | | | 9,323 | | | | 266,078 | |
| | |
Cousins Properties, Inc. | | | 9,535 | | | | 384,165 | |
| | |
Crown Castle International Corp. | | | 29,971 | | | | 5,532,647 | |
| | |
CubeSmart | | | 15,670 | | | | 815,310 | |
| | |
Douglas Emmett, Inc. | | | 11,327 | | | | 378,548 | |
| | |
Easterly Government Properties, Inc. | | | 10,921 | | | | 230,870 | |
| | |
EPR Properties | | | 6,690 | | | | 366,010 | |
| | |
Equity Residential | | | 23,432 | | | | 2,107,005 | |
| | |
Essential Properties Realty Trust, Inc. | | | 8,942 | | | | 226,233 | |
| | |
Federal Realty Investment Trust | | | 3,522 | | | | 429,931 | |
| | |
Four Corners Property Trust, Inc. | | | 7,820 | | | | 211,453 | |
| | |
Gaming and Leisure Properties, Inc. | | | 30,479 | | | | 1,430,379 | |
| | |
Getty Realty Corp. | | | 6,965 | | | | 199,338 | |
| | |
Gladstone Commercial Corp. | | | 4,735 | | | | 104,265 | |
| | |
Healthcare Realty Trust, Inc. | | | 9,393 | | | | 258,120 | |
| | |
Healthcare Trust of America, Inc., Class A | | | 18,567 | | | | 581,890 | |
| | |
Healthpeak Properties, Inc. | | | 28,322 | | | | 972,294 | |
| | |
Highwoods Properties, Inc. | | | 10,138 | | | | 463,712 | |
| | |
Hudson Pacific Properties, Inc. | | | 10,679 | | | | 296,342 | |
| | |
Industrial Logistics Properties Trust | | | 10,042 | | | | 227,652 | |
| | |
Iron Mountain, Inc. | | | 33,705 | | | | 1,867,594 | |
| | |
JBG SMITH Properties | | | 5,873 | | | | 171,609 | |
| | |
Kilroy Realty Corp. | | | 7,567 | | | | 578,270 | |
| | |
Kimco Realty Corp. | | | 40,330 | | | | 996,151 | |
| | |
Kite Realty Group Trust | | | 11,122 | | | | 253,248 | |
| | |
Lamar Advertising Co., Class A | | | 6,637 | | | | 771,087 | |
| | |
LTC Properties, Inc.(a) | | | 4,562 | | | | 175,500 | |
| | |
LXP Industrial Trust | | | 32,245 | | | | 506,247 | |
| | |
Macerich Co. | | | 10,553 | | | | 165,049 | |
| | |
National Retail Properties, Inc. | | | 18,154 | | | | 815,841 | |
| | |
National Storage Affiliates Trust | | | 8,173 | | | | 512,937 | |
| | |
Necessity Retail REIT, Inc. | | | 21,599 | | | | 170,848 | |
| | |
Office Properties Income Trust | | | 7,927 | | | | 203,962 | |
| | |
Omega Healthcare Investors, Inc.(a) | | | 32,209 | | | | 1,003,632 | |
| | |
One Liberty Properties, Inc. | | | 3,757 | | | | 115,678 | |
| | |
Paramount Group, Inc. | | | 16,000 | | | | 174,560 | |
| | |
Physicians Realty Trust | | | 18,242 | | | | 319,965 | |
| | |
Piedmont Office Realty Trust, Inc., Class A | | | 11,610 | | | | 199,924 | |
| | |
PotlatchDeltic Corp. | | | 5,992 | | | | 315,958 | |
| | |
Rayonier, Inc. | | | 8,601 | | | | 353,673 | |
| | |
Realty Income Corp. | | | 36,119 | | | | 2,503,047 | |
| | |
Regency Centers Corp. | | | 7,959 | | | | 567,795 | |
| | |
Saul Centers, Inc. | | | 2,553 | | | | 134,543 | |
See Notes to Financial Statements.
Schedule of Investments (continued)
WisdomTree U.S. High Dividend Fund (DHS)
March 31, 2022
| | | | | | | | |
| Investments | | Shares | | | Value | |
| | |
Simon Property Group, Inc. | | | 31,593 | | | $ | 4,156,375 | |
| | |
SITE Centers Corp. | | | 8,385 | | | | 140,113 | |
| | |
SL Green Realty Corp.(a) | | | 7,515 | | | | 610,068 | |
| | |
Spirit Realty Capital, Inc. | | | 14,854 | | | | 683,581 | |
| | |
STAG Industrial, Inc. | | | 12,710 | | | | 525,559 | |
| | |
STORE Capital Corp. | | | 26,397 | | | | 771,584 | |
| | |
Tanger Factory Outlet Centers, Inc. | | | 6,455 | | | | 110,961 | |
| | |
Uniti Group, Inc. | | | 23,027 | | | | 316,852 | |
| | |
Ventas, Inc. | | | 21,585 | | | | 1,333,090 | |
| | |
VICI Properties, Inc. | | | 51,250 | | | | 1,458,575 | |
| | |
W.P. Carey, Inc. | | | 22,004 | | | | 1,778,803 | |
| | |
Washington Real Estate Investment Trust | | | 5,471 | | | | 139,511 | |
| | |
Welltower, Inc. | | | 18,882 | | | | 1,815,316 | |
| | | | | | | | |
| Total Equity Real Estate Investment Trusts (REITs) | | | | 46,195,587 | |
|
| Food & Staples Retailing – 0.6% | |
| | |
SpartanNash Co.(a) | | | 8,553 | | | | 282,164 | |
| | |
Walgreens Boots Alliance, Inc. | | | 130,491 | | | | 5,842,082 | |
| | | | | | | | |
| Total Food & Staples Retailing | | | | 6,124,246 | |
|
| Food Products – 2.4% | |
| | |
B&G Foods, Inc. | | | 16,330 | | | | 440,584 | |
| | |
Campbell Soup Co. | | | 41,855 | | | | 1,865,477 | |
| | |
Conagra Brands, Inc. | | | 72,504 | | | | 2,433,959 | |
| | |
Flowers Foods, Inc. | | | 39,835 | | | | 1,024,158 | |
| | |
General Mills, Inc. | | | 72,608 | | | | 4,917,014 | |
| | |
Ingredion, Inc. | | | 6,942 | | | | 604,995 | |
| | |
J.M. Smucker Co. | | | 12,432 | | | | 1,683,417 | |
| | |
Kellogg Co. | | | 47,145 | | | | 3,040,381 | |
| | |
Kraft Heinz Co. | | | 217,764 | | | | 8,577,724 | |
| | | | | | | | |
| Total Food Products | | | | 24,587,709 | |
|
| Gas Utilities – 0.7% | |
| | |
Atmos Energy Corp. | | | 14,076 | | | | 1,681,941 | |
| | |
National Fuel Gas Co. | | | 18,824 | | | | 1,293,209 | |
| | |
New Jersey Resources Corp.(a) | | | 13,551 | | | | 621,449 | |
| | |
Northwest Natural Holding Co. | | | 5,880 | | | | 304,114 | |
| | |
ONE Gas, Inc. | | | 6,285 | | | | 554,588 | |
| | |
South Jersey Industries, Inc. | | | 27,719 | | | | 957,691 | |
| | |
Spire, Inc.(a) | | | 10,448 | | | | 749,749 | |
| | |
UGI Corp. | | | 36,727 | | | | 1,330,252 | |
| | | | | | | | |
| Total Gas Utilities | | | | 7,492,993 | |
|
| Health Care Providers & Services – 0.3% | |
| | |
Cardinal Health, Inc. | | | 44,243 | | | | 2,508,578 | |
| | |
National HealthCare Corp. | | | 2,319 | | | | 162,863 | |
| | |
Patterson Cos., Inc. | | | 16,073 | | | | 520,283 | |
| | | | | | | | |
| Total Health Care Providers & Services | | | | 3,191,724 | |
|
| Hotels, Restaurants & Leisure – 0.2% | |
| | |
Cracker Barrel Old Country Store, Inc. | | | 3,559 | | | | 422,560 | |
| | |
Darden Restaurants, Inc. | | | 14,764 | | | | 1,962,874 | |
| | | | | | | | |
| Total Hotels, Restaurants & Leisure | | | | 2,385,434 | |
|
| Household Durables – 0.3% | |
| | |
Ethan Allen Interiors, Inc.(a) | | | 6,912 | | | | 180,196 | |
| | |
Leggett & Platt, Inc. | | | 19,916 | | | | 693,077 | |
| | |
MDC Holdings, Inc. | | | 11,809 | | | | 446,852 | |
| | |
Newell Brands, Inc. | | | 66,124 | | | | 1,415,715 | |
| | | | | | | | |
| Total Household Durables | | | | 2,735,840 | |
|
| Household Products – 0.6% | |
| | |
Energizer Holdings, Inc. | | | 8,333 | | | | 256,323 | |
| | |
Kimberly-Clark Corp. | | | 42,484 | | | | 5,232,329 | |
| | |
Reynolds Consumer Products, Inc.(a) | | | 24,129 | | | | 707,945 | |
| | | | | | | | |
| Total Household Products | | | | 6,196,597 | |
|
| Independent Power & Renewable Electricity Producers – 0.0% | |
| | |
Clearway Energy, Inc., Class A | | | 9,718 | | | | 323,804 | |
|
| Industrial Conglomerates – 1.1% | |
| | |
3M Co. | | | 73,254 | | | | 10,906,056 | |
|
| Insurance – 3.7% | |
| | |
Aflac, Inc. | | | 71,803 | | | | 4,623,395 | |
| | |
Allstate Corp. | | | 32,009 | | | | 4,433,567 | |
| | |
CNA Financial Corp. | | | 36,434 | | | | 1,771,421 | |
| | |
Donegal Group, Inc., Class A | | | 7,927 | | | | 106,301 | |
| | |
Fidelity National Financial, Inc. | | | 56,923 | | | | 2,780,119 | |
| | |
First American Financial Corp. | | | 16,106 | | | | 1,043,991 | |
| | |
Horace Mann Educators Corp. | | | 4,271 | | | | 178,656 | |
| | |
Mercury General Corp. | | | 15,113 | | | | 831,215 | |
| | |
MetLife, Inc. | | | 102,985 | | | | 7,237,786 | |
| | |
Old Republic International Corp. | | | 63,292 | | | | 1,637,364 | |
| | |
Principal Financial Group, Inc. | | | 36,897 | | | | 2,708,609 | |
| | |
Prudential Financial, Inc. | | | 63,493 | | | | 7,502,968 | |
| | |
Reinsurance Group of America, Inc. | | | 7,003 | | | | 766,548 | |
| | |
Safety Insurance Group, Inc. | | | 4,652 | | | | 422,634 | |
| | |
Universal Insurance Holdings, Inc.(a) | | | 9,658 | | | | 130,287 | |
| | |
Unum Group | | | 40,179 | | | | 1,266,040 | |
| | | | | | | | |
| Total Insurance | | | | 37,440,901 | |
|
| Leisure Products – 0.0% | |
| | |
Sturm Ruger & Co., Inc.(a) | | | 5,057 | | | | 352,068 | |
|
| Machinery – 0.0% | |
| | |
Trinity Industries, Inc. | | | 11,429 | | | | 392,700 | |
|
| Media – 0.5% | |
| | |
Interpublic Group of Cos., Inc. | | | 46,193 | | | | 1,637,542 | |
| | |
Omnicom Group, Inc. | | | 32,519 | | | | 2,760,213 | |
| | |
Sinclair Broadcast Group, Inc., Class A | | | 7,382 | | | | 206,843 | |
| | | | | | | | |
| Total Media | | | | 4,604,598 | |
|
| Metals & Mining – 1.0% | |
| | |
Newmont Corp. | | | 120,218 | | | | 9,551,320 | |
| | |
SunCoke Energy, Inc. | | | 19,996 | | | | 178,164 | |
| | | | | | | | |
| Total Metals & Mining | | | | 9,729,484 | |
|
| Multi-Utilities – 3.9% | |
| | |
Avista Corp. | | | 12,107 | | | | 546,631 | |
| | |
Black Hills Corp. | | | 8,697 | | | | 669,843 | |
| | |
CMS Energy Corp. | | | 46,727 | | | | 3,268,086 | |
| | |
Consolidated Edison, Inc. | | | 51,289 | | | | 4,856,043 | |
| | |
Dominion Energy, Inc. | | | 104,303 | | | | 8,862,626 | |
| | |
DTE Energy Co. | | | 22,852 | | | | 3,021,263 | |
See Notes to Financial Statements.
Schedule of Investments (continued)
WisdomTree U.S. High Dividend Fund (DHS)
March 31, 2022
| | | | | | | | |
| Investments | | Shares | | | Value | |
| | |
NiSource, Inc. | | | 50,235 | | | $ | 1,597,473 | |
| | |
NorthWestern Corp. | | | 9,278 | | | | 561,226 | |
| | |
Public Service Enterprise Group, Inc. | | | 61,154 | | | | 4,280,780 | |
| | |
Sempra Energy | | | 41,844 | | | | 7,034,813 | |
| | |
Unitil Corp.(a) | | | 3,211 | | | | 160,165 | |
| | |
WEC Energy Group, Inc. | | | 52,883 | | | | 5,278,252 | |
| | | | | | | | |
| Total Multi-Utilities | | | | 40,137,201 | |
|
| Multiline Retail – 0.0% | |
| | |
Franchise Group, Inc. | | | 7,652 | | | | 317,022 | |
|
| Oil, Gas & Consumable Fuels – 17.8% | |
| | |
Antero Midstream Corp. | | | 172,833 | | | | 1,878,695 | |
| | |
Chesapeake Energy Corp.(a) | | | 12,963 | | | | 1,127,781 | |
| | |
Chevron Corp. | | | 339,578 | | | | 55,293,486 | |
| | |
Civitas Resources, Inc.(a) | | | 15,828 | | | | 945,090 | |
| | |
Devon Energy Corp. | | | 308,960 | | | | 18,268,805 | |
| | |
DTE Midstream LLC | | | 18,631 | | | | 1,010,918 | |
| | |
EOG Resources, Inc. | | | 77,590 | | | | 9,251,055 | |
| | |
Equitrans Midstream Corp. | | | 99,468 | | | | 839,510 | |
| | |
Exxon Mobil Corp. | | | 810,387 | | | | 66,929,862 | |
| | |
Falcon Minerals Corp. | | | 41,720 | | | | 281,193 | |
| | |
HF Sinclair Corp.* | | | 25,700 | | | | 1,024,145 | |
| | |
Kinder Morgan, Inc. | | | 589,501 | | | | 11,147,464 | |
| | |
Marathon Petroleum Corp. | | | 86,564 | | | | 7,401,222 | |
| | |
ONEOK, Inc. | | | 104,852 | | | | 7,405,697 | |
| | | | | | | | |
| Total Oil, Gas & Consumable Fuels | | | | 182,804,923 | |
|
| Paper & Forest Products – 0.0% | |
| | |
Glatfelter Corp. | | | 6,932 | | | | 85,818 | |
| | |
Neenah, Inc. | | | 3,002 | | | | 119,059 | |
| | |
Schweitzer-Mauduit International, Inc. | | | 7,301 | | | | 200,778 | |
| | | | | | | | |
| Total Paper & Forest Products | | | | 405,655 | |
|
| Personal Products – 0.0% | |
| | |
Nu Skin Enterprises, Inc., Class A | | | 6,835 | | | | 327,260 | |
|
| Pharmaceuticals – 10.1% | |
| | |
Bristol-Myers Squibb Co. | | | 291,951 | | | | 21,321,182 | |
| | |
Merck & Co., Inc. | | | 361,927 | | | | 29,696,110 | |
| | |
Organon & Co. | | | 55,289 | | | | 1,931,245 | |
| | |
Pfizer, Inc. | | | 968,596 | | | | 50,144,215 | |
| | | | | | | | |
| Total Pharmaceuticals | | | | 103,092,752 | |
|
| Professional Services – 0.0% | |
| | |
Resources Connection, Inc. | | | 7,482 | | | | 128,241 | |
|
| Real Estate Management & Development – 0.0% | |
| | |
Kennedy-Wilson Holdings, Inc. | | | 13,178 | | | | 321,411 | |
|
| Road & Rail – 0.1% | |
| | |
Ryder System, Inc. | | | 8,727 | | | | 692,313 | |
|
| Semiconductors & Semiconductor Equipment – 0.0% | |
| | |
NVE Corp. | | | 2,480 | | | | 135,086 | |
|
| Specialty Retail – 0.1% | |
| | |
Big 5 Sporting Goods Corp.(a) | | | 6,153 | | | | 105,524 | |
| | |
Buckle, Inc. | | | 7,866 | | | | 259,893 | |
| | |
Camping World Holdings, Inc., Class A(a) | | | 8,218 | | | | 229,693 | |
| | |
Guess?, Inc. | | | 9,093 | | | | 198,682 | |
| | |
Rent-A-Center, Inc. | | | 6,757 | | | | 170,209 | |
| | | | | | | | |
| Total Specialty Retail | | | | 964,001 | |
|
| Technology Hardware, Storage & Peripherals – 0.7% | |
| | |
Hewlett Packard Enterprise Co. | | | 157,987 | | | | 2,639,963 | |
| | |
HP, Inc.(a) | | | 118,744 | | | | 4,310,407 | |
| | |
Xerox Holdings Corp. | | | 33,646 | | | | 678,640 | |
| | | | | | | | |
| Total Technology Hardware, Storage & Peripherals | | | | 7,629,010 | |
|
| Textiles, Apparel & Luxury Goods – 0.1% | |
| | |
Hanesbrands, Inc.(a) | | | 46,230 | | | | 688,365 | |
| | |
Kontoor Brands, Inc. | | | 7,475 | | | | 309,091 | |
| | | | | | | | |
| Total Textiles, Apparel & Luxury Goods | | | | 997,456 | |
|
| Thrifts & Mortgage Finance – 0.3% | |
| | |
Capitol Federal Financial, Inc. | | | 15,592 | | | | 169,641 | |
| | |
Federal Agricultural Mortgage Corp., Class C(a) | | | 1,771 | | | | 192,118 | |
| | |
New York Community Bancorp, Inc.(a) | | | 94,181 | | | | 1,009,620 | |
| | |
Northfield Bancorp, Inc. | | | 9,857 | | | | 141,547 | |
| | |
Provident Financial Services, Inc.(a) | | | 21,355 | | | | 499,707 | |
| | |
TFS Financial Corp. | | | 66,188 | | | | 1,098,721 | |
| | |
TrustCo Bank Corp. | | | 4,466 | | | | 142,599 | |
| | |
UWM Holdings Corp.(a) | | | 25,032 | | | | 113,395 | |
| | |
Washington Federal, Inc. | | | 5,566 | | | | 182,676 | |
| | | | | | | | |
| Total Thrifts & Mortgage Finance | | | | 3,550,024 | |
|
| Tobacco – 8.9% | |
| | |
Altria Group, Inc. | | | 851,805 | | | | 44,506,811 | |
| | |
Philip Morris International, Inc. | | | 487,721 | | | | 45,816,511 | |
| | |
Universal Corp. | | | 10,950 | | | | 635,866 | |
| | |
Vector Group Ltd. | | | 46,214 | | | | 556,417 | |
| | | | | | | | |
| Total Tobacco | | | | 91,515,605 | |
|
| Trading Companies & Distributors – 0.1% | |
| | |
MSC Industrial Direct Co., Inc., Class A | | | 6,448 | | | | 549,434 | |
|
| Wireless Telecommunication Services – 0.0% | |
| | |
Telephone and Data Systems, Inc.(a) | | | 15,872 | | | | 299,663 | |
| Total United States | | | | 1,019,689,154 | |
|
| Puerto Rico – 0.0% | |
|
| Banks – 0.0% | |
| | |
First Bancorp | | | 32,949 | | | | 432,291 | |
TOTAL COMMON STOCKS
(Cost: $860,511,298) | | | | | | | 1,020,121,445 | |
|
| EXCHANGE-TRADED FUND – 0.2% | |
|
| United States – 0.2% | |
| | |
WisdomTree U.S. Total Dividend Fund(b)
(Cost: $1,567,972) | | | 24,874 | | | | 1,605,865 | |
See Notes to Financial Statements.
Schedule of Investments (concluded)
WisdomTree U.S. High Dividend Fund (DHS)
March 31, 2022
| | | | | | | | |
| Investments | | Shares | | | Value | |
|
| INVESTMENT OF CASH COLLATERAL FOR SECURITIES LOANED – 0.1% | |
|
| United States – 0.1% | |
| | |
State Street Navigator Securities Lending Government Money Market Portfolio, 0.25%(c) | | | | | | | | |
| (Cost: $1,418,979) | | | 1,418,979 | | | $ | 1,418,979 | |
| |
TOTAL INVESTMENTS IN SECURITIES – 99.8% (Cost: $863,498,249) | | | | 1,023,146,289 | |
| |
Other Assets less Liabilities – 0.2% | | | | 1,813,712 | |
| | | | | | | | |
| NET ASSETS – 100.0% | | | $ | 1,024,960,001 | |
| * | Non-income producing security. |
| (a) | Security, or portion thereof, was on loan at March 31, 2022 (See Note 2). At March 31, 2022, the total market value of the Fund’s securities on loan identified in the Schedule of Investments was $16,556,964 and the total market value of the collateral held by the Fund was $17,523,017. The total market value of the collateral includes non-cash U.S. Government securities collateral having a value of $16,104,038. |
| (b) | Affiliated holding. See “Investment in Affiliates” supplementary table included in this Schedule of Investments for additional information. |
| (c) | Rate shown represents annualized 7-day yield as of March 31, 2022. |
Affiliated holdings are investments in entities in which the Fund owns 5% or more of the outstanding voting securities or are investments in entities which are under common ownership or control. Investments in affiliates during the fiscal year ended March 31, 2022 were as follows:
| | | | | | | | | | | | | | | | | | | | | | | | | | | | |
| | | | | | | |
| Affiliate | | Value at
3/31/2021 | | | Purchases/
Additions | | | Sales/
Reductions | | | Realized
Gain/(Loss) | | | Change in
Unrealized
Appreciation/
Depreciation | | | Value at
3/31/2022 | | | Dividend
Income | |
WisdomTree U.S. Total Dividend Fund | | $ | — | | | $ | 18,231,171 | | | $ | 16,781,397 | | | $ | 118,198 | | | $ | 37,893 | | | $ | 1,605,865 | | | $ | 52,441 | |
The following is a summary of the fair valuations according to the inputs used as of March 31, 2022 in valuing the Fund’s investments (See Note 2 — Fair Value Measurement):
| | | | | | | | | | | | | | | | |
| | | | |
| | | Quoted
Prices in
Active
Markets
(Level 1) | | | Other
Significant
Observable
Inputs
(Level 2) | | | Significant
Unobservable
Inputs
(Level 3) | | | Total | |
Assets: | | | | | | | | | |
Investments in Securities | | | | |
Common Stocks | | $ | 1,020,121,445 | | | $ | — | | | $ | — | | | $ | 1,020,121,445 | |
Exchange-Traded Fund | | | 1,605,865 | | | | — | | | | — | | | | 1,605,865 | |
Investment of Cash Collateral for Securities Loaned | | | — | | | | 1,418,979 | | | | — | | | | 1,418,979 | |
Total Investments in Securities | | $ | 1,021,727,310 | | | $ | 1,418,979 | | | $ | — | | | $ | 1,023,146,289 | |
See Notes to Financial Statements.
Schedule of Investments
WisdomTree U.S. LargeCap Dividend Fund (DLN)
March 31, 2022
| | | | | | | | |
| Investments | | Shares | | | Value | |
|
| COMMON STOCKS – 99.8% | |
|
| United States – 99.8% | |
|
| Aerospace & Defense – 2.0% | |
| | |
General Dynamics Corp. | | | 42,474 | | | $ | 10,243,879 | |
| | |
HEICO Corp. | | | 1,026 | | | | 157,532 | |
| | |
L3Harris Technologies, Inc. | | | 22,819 | | | | 5,669,837 | |
| | |
Lockheed Martin Corp. | | | 51,644 | | | | 22,795,662 | |
| | |
Northrop Grumman Corp. | | | 23,938 | | | | 10,705,552 | |
| | |
Raytheon Technologies Corp. | | | 204,712 | | | | 20,280,818 | |
| | | | | | | | |
| Total Aerospace & Defense | | | | 69,853,280 | |
|
| Air Freight & Logistics – 0.7% | |
| | |
Expeditors International of Washington, Inc. | | | 12,790 | | | | 1,319,416 | |
| | |
FedEx Corp. | | | 16,207 | | | | 3,750,138 | |
| | |
United Parcel Service, Inc., Class B | | | 90,386 | | | | 19,384,182 | |
| | | | | | | | |
| Total Air Freight & Logistics | | | | 24,453,736 | |
|
| Automobiles – 0.2% | |
| | |
Ford Motor Co. | | | 442,362 | | | | 7,480,341 | |
|
| Banks – 6.6% | |
| | |
Bank of America Corp. | | | 927,525 | | | | 38,232,580 | |
| | |
Citigroup, Inc. | | | 365,797 | | | | 19,533,560 | |
| | |
Citizens Financial Group, Inc. | | | 67,461 | | | | 3,058,007 | |
| | |
Fifth Third Bancorp | | | 132,151 | | | | 5,687,779 | |
| | |
First Republic Bank | | | 6,805 | | | | 1,103,091 | |
| | |
JPMorgan Chase & Co. | | | 639,937 | | | | 87,236,212 | |
| | |
KeyCorp | | | 154,621 | | | | 3,460,418 | |
| | |
M&T Bank Corp. | | | 23,144 | | | | 3,922,908 | |
| | |
PNC Financial Services Group, Inc. | | | 58,294 | | | | 10,752,328 | |
| | |
Regions Financial Corp. | | | 212,049 | | | | 4,720,211 | |
| | |
Signature Bank | | | 450 | | | | 132,071 | |
| | |
Truist Financial Corp. | | | 267,145 | | | | 15,147,121 | |
| | |
U.S. Bancorp | | | 291,151 | | | | 15,474,676 | |
| | |
Wells Fargo & Co. | | | 367,290 | | | | 17,798,873 | |
| | | | | | | | |
| Total Banks | | | | 226,259,835 | |
|
| Beverages – 4.0% | |
| | |
Brown-Forman Corp., Class B | | | 34,522 | | | | 2,313,665 | |
| | |
Coca-Cola Co. | | | 1,156,221 | | | | 71,685,702 | |
| | |
Constellation Brands, Inc., Class A | | | 12,166 | | | | 2,802,073 | |
| | |
Keurig Dr. Pepper, Inc. | | | 158,566 | | | | 6,009,651 | |
| | |
PepsiCo, Inc. | | | 317,592 | | | | 53,158,549 | |
| | | | | | | | |
| Total Beverages | | | | 135,969,640 | |
|
| Biotechnology – 3.8% | |
| | |
AbbVie, Inc. | | | 479,306 | | | | 77,700,296 | |
| | |
Amgen, Inc. | | | 110,798 | | | | 26,793,172 | |
| | |
Gilead Sciences, Inc. | | | 448,581 | | | | 26,668,140 | |
| | | | | | | | |
| Total Biotechnology | | | | 131,161,608 | |
|
| Building Products – 0.0% | |
| | |
Carrier Global Corp. | | | 31,512 | | | | 1,445,455 | |
|
| Capital Markets – 4.2% | |
| | |
Ameriprise Financial, Inc. | | | 12,016 | | | | 3,609,126 | |
| | |
Bank of New York Mellon Corp. | | | 107,385 | | | | 5,329,518 | |
| | |
BlackRock, Inc. | | | 17,349 | | | | 13,257,585 | |
| | |
Blackstone, Inc. | | | 189,107 | | | | 24,005,243 | |
| | |
Carlyle Group, Inc. | | | 45,712 | | | | 2,235,774 | |
| | |
Charles Schwab Corp. | | | 89,860 | | | | 7,576,097 | |
| | |
CME Group, Inc. | | | 35,654 | | | | 8,480,660 | |
| | |
FactSet Research Systems, Inc. | | | 1,317 | | | | 571,776 | |
| | |
Goldman Sachs Group, Inc. | | | 41,013 | | | | 13,538,391 | |
| | |
Intercontinental Exchange, Inc. | | | 34,263 | | | | 4,526,828 | |
| | |
KKR & Co., Inc. | | | 48,125 | | | | 2,813,869 | |
| | |
Moody’s Corp. | | | 12,923 | | | | 4,360,349 | |
| | |
Morgan Stanley | | | 287,872 | | | | 25,160,013 | |
| | |
MSCI, Inc. | | | 3,998 | | | | 2,010,514 | |
| | |
Nasdaq, Inc. | | | 20,733 | | | | 3,694,621 | |
| | |
Northern Trust Corp. | | | 32,283 | | | | 3,759,355 | |
| | |
Raymond James Financial, Inc. | | | 16,002 | | | | 1,758,780 | |
| | |
S&P Global, Inc. | | | 13,964 | | | | 5,727,753 | |
| | |
State Street Corp. | | | 44,728 | | | | 3,896,703 | |
| | |
T. Rowe Price Group, Inc. | | | 43,744 | | | | 6,613,655 | |
| | | | | | | | |
| Total Capital Markets | | | | 142,926,610 | |
|
| Chemicals – 1.2% | |
| | |
Air Products and Chemicals, Inc. | | | 24,119 | | | | 6,027,579 | |
| | |
Albemarle Corp. | | | 6,055 | | | | 1,339,063 | |
| | |
Corteva, Inc. | | | 45,366 | | | | 2,607,638 | |
| | |
Dow, Inc. | | | 222,329 | | | | 14,166,804 | |
| | |
DuPont de Nemours, Inc. | | | 60,056 | | | | 4,418,921 | |
| | |
Ecolab, Inc. | | | 14,395 | | | | 2,541,581 | |
| | |
International Flavors & Fragrances, Inc. | | | 28,220 | | | | 3,706,133 | |
| | |
PPG Industries, Inc. | | | 20,574 | | | | 2,696,634 | |
| | |
Sherwin-Williams Co. | | | 17,684 | | | | 4,414,280 | |
| | | | | | | | |
| Total Chemicals | | | | 41,918,633 | |
|
| Commercial Services & Supplies – 0.5% | |
| | |
Cintas Corp. | | | 8,140 | | | | 3,462,675 | |
| | |
Republic Services, Inc. | | | 44,994 | | | | 5,961,705 | |
| | |
Waste Management, Inc. | | | 47,495 | | | | 7,527,957 | |
| | | | | | | | |
| Total Commercial Services & Supplies | | | | 16,952,337 | |
|
| Communications Equipment – 1.2% | |
| | |
Cisco Systems, Inc. | | | 654,556 | | | | 36,498,043 | |
| | |
Motorola Solutions, Inc. | | | 16,165 | | | | 3,915,163 | |
| | |
Ubiquiti, Inc.(a) | | | 1,113 | | | | 324,061 | |
| | | | | | | | |
| Total Communications Equipment | | | | 40,737,267 | |
|
| Construction Materials – 0.0% | |
| | |
Martin Marietta Materials, Inc. | | | 3,129 | | | | 1,204,321 | |
|
| Consumer Finance – 0.6% | |
| | |
American Express Co. | | | 54,103 | | | | 10,117,261 | |
| | |
Capital One Financial Corp. | | | 36,321 | | | | 4,768,584 | |
| | |
Discover Financial Services | | | 37,229 | | | | 4,102,264 | |
| | |
Synchrony Financial | | | 81,515 | | | | 2,837,537 | |
| | | | | | | | |
| Total Consumer Finance | | | | 21,825,646 | |
|
| Containers & Packaging – 0.2% | |
| | |
Avery Dennison Corp. | | | 10,838 | | | | 1,885,487 | |
| | |
Ball Corp. | | | 10,081 | | | | 907,290 | |
| | |
International Paper Co. | | | 95,858 | | | | 4,423,847 | |
| | | | | | | | |
| Total Containers & Packaging | | | | 7,216,624 | |
See Notes to Financial Statements.
Schedule of Investments (continued)
WisdomTree U.S. LargeCap Dividend Fund (DLN)
March 31, 2022
| | | | | | | | |
| Investments | | Shares | | | Value | |
|
| Distributors – 0.1% | |
| | |
Genuine Parts Co. | | | 27,722 | | | $ | 3,493,526 | |
| | |
Pool Corp. | | | 1,546 | | | | 653,726 | |
| | | | | | | | |
| Total Distributors | | | | 4,147,252 | |
|
| Diversified Financial Services – 0.1% | |
| | |
Apollo Global Management, Inc. | | | 52,076 | | | | 3,228,191 | |
|
| Diversified Telecommunication Services – 1.9% | |
| | |
Verizon Communications, Inc. | | | 1,243,023 | | | | 63,319,592 | |
|
| Electric Utilities – 4.0% | |
| | |
American Electric Power Co., Inc. | | | 109,791 | | | | 10,953,848 | |
| | |
Avangrid, Inc.(a) | | | 74,589 | | | | 3,486,290 | |
| | |
Duke Energy Corp. | | | 175,074 | | | | 19,548,763 | |
| | |
Edison International | | | 81,157 | | | | 5,689,106 | |
| | |
Entergy Corp. | | | 42,952 | | | | 5,014,646 | |
| | |
Eversource Energy | | | 51,671 | | | | 4,556,865 | |
| | |
Exelon Corp. | | | 231,127 | | | | 11,008,579 | |
| | |
FirstEnergy Corp. | | | 171,901 | | | | 7,883,380 | |
| | |
NextEra Energy, Inc. | | | 306,711 | | | | 25,981,489 | |
| | |
PPL Corp. | | | 235,239 | | | | 6,718,426 | |
| | |
Southern Co. | | | 378,679 | | | | 27,458,014 | |
| | |
Xcel Energy, Inc. | | | 102,810 | | | | 7,419,797 | |
| | | | | | | | |
| Total Electric Utilities | | | | 135,719,203 | |
|
| Electrical Equipment – 0.4% | |
| | |
AMETEK, Inc. | | | 8,743 | | | | 1,164,393 | |
| | |
Emerson Electric Co. | | | 83,022 | | | | 8,140,307 | |
| | |
Rockwell Automation, Inc. | | | 11,600 | | | | 3,248,348 | |
| | | | | | | | |
| Total Electrical Equipment | | | | 12,553,048 | |
|
| Electronic Equipment, Instruments & Components – 0.3% | |
| | |
Amphenol Corp., Class A | | | 41,943 | | | | 3,160,405 | |
| | |
CDW Corp. | | | 9,534 | | | | 1,705,537 | |
| | |
Corning, Inc. | | | 109,156 | | | | 4,028,948 | |
| | | | | | | | |
| Total Electronic Equipment, Instruments & Components | | | | 8,894,890 | |
|
| Energy Equipment & Services – 0.3% | |
| | |
Baker Hughes Co. | | | 189,511 | | | | 6,900,095 | |
| | |
Halliburton Co. | | | 64,232 | | | | 2,432,466 | |
| | | | | | | | |
| Total Energy Equipment & Services | | | | 9,332,561 | |
|
| Entertainment – 0.1% | |
| | |
Activision Blizzard, Inc. | | | 33,842 | | | | 2,711,083 | |
| | |
Electronic Arts, Inc. | | | 9,612 | | | | 1,216,014 | |
| | | | | | | | |
| Total Entertainment | | | | 3,927,097 | |
|
| Equity Real Estate Investment Trusts (REITs) – 5.4% | |
| | |
Alexandria Real Estate Equities, Inc. | | | 24,294 | | | | 4,889,168 | |
| | |
American Tower Corp. | | | 74,864 | | | | 18,807,334 | |
| | |
AvalonBay Communities, Inc. | | | 32,289 | | | | 8,019,619 | |
| | |
Boston Properties, Inc. | | | 31,718 | | | | 4,085,278 | |
| | |
Camden Property Trust | | | 7,782 | | | | 1,293,368 | |
| | |
Crown Castle International Corp. | | | 114,629 | | | | 21,160,513 | |
| | |
Digital Realty Trust, Inc. | | | 51,595 | | | | 7,316,171 | |
| | |
Duke Realty Corp. | | | 50,436 | | | | 2,928,314 | |
| | |
Equinix, Inc. | | | 7,639 | | | | 5,665,235 | |
| | |
Equity Residential | | | 91,788 | | | | 8,253,577 | |
| | |
Essex Property Trust, Inc. | | | 11,401 | | | | 3,938,817 | |
| | |
Extra Space Storage, Inc. | | | 32,927 | | | | 6,769,791 | |
| | |
Healthpeak Properties, Inc. | | | 139,259 | | | | 4,780,761 | |
| | |
Invitation Homes, Inc. | | | 68,305 | | | | 2,744,495 | |
| | |
Mid-America Apartment Communities, Inc. | | | 22,606 | | | | 4,734,827 | |
| | |
Prologis, Inc. | | | 75,435 | | | | 12,181,244 | |
| | |
Public Storage | | | 38,917 | | | | 15,188,527 | |
| | |
Realty Income Corp. | | | 133,106 | | | | 9,224,246 | |
| | |
SBA Communications Corp. | | | 4,933 | | | | 1,697,445 | |
| | |
Simon Property Group, Inc. | | | 119,969 | | | | 15,783,122 | |
| | |
Sun Communities, Inc. | | | 14,149 | | | | 2,480,178 | |
| | |
UDR, Inc. | | | 34,165 | | | | 1,960,046 | |
| | |
Ventas, Inc. | | | 72,875 | | | | 4,500,760 | |
| | |
VICI Properties, Inc. | | | 167,263 | | | | 4,760,305 | |
| | |
Welltower, Inc. | | | 66,761 | | | | 6,418,403 | |
| | |
Weyerhaeuser Co. | | | 98,725 | | | | 3,741,678 | |
| | | | | | | | |
| Total Equity Real Estate Investment Trusts (REITs) | | | | 183,323,222 | |
|
| Food & Staples Retailing – 2.2% | |
| | |
Costco Wholesale Corp. | | | 24,741 | | | | 14,247,105 | |
| | |
Kroger Co. | | | 103,735 | | | | 5,951,277 | |
| | |
Sysco Corp. | | | 77,195 | | | | 6,302,972 | |
| | |
Walgreens Boots Alliance, Inc. | | | 185,720 | | | | 8,314,684 | |
| | |
Walmart, Inc. | | | 262,710 | | | | 39,122,773 | |
| | | | | | | | |
| Total Food & Staples Retailing | | | | 73,938,811 | |
|
| Food Products – 1.8% | |
| | |
Archer-Daniels-Midland Co. | | | 104,097 | | | | 9,395,795 | |
| | |
General Mills, Inc. | | | 126,957 | | | | 8,597,528 | |
| | |
Hershey Co. | | | 22,310 | | | | 4,833,015 | |
| | |
Hormel Foods Corp. | | | 65,934 | | | | 3,398,239 | |
| | |
Kellogg Co. | | | 87,565 | | | | 5,647,067 | |
| | |
Kraft Heinz Co. | | | 312,226 | | | | 12,298,582 | |
| | |
McCormick & Co., Inc., Non-Voting Shares | | | 28,220 | | | | 2,816,356 | |
| | |
Mondelez International, Inc., Class A | | | 178,572 | | | | 11,210,750 | |
| | |
Tyson Foods, Inc., Class A | | | 48,718 | | | | 4,366,594 | |
| | | | | | | | |
| Total Food Products | | | | 62,563,926 | |
|
| Health Care Equipment & Supplies – 1.2% | |
| | |
Abbott Laboratories | | | 210,276 | | | | 24,888,267 | |
| | |
Baxter International, Inc. | | | 35,986 | | | | 2,790,355 | |
| | |
Becton Dickinson and Co. | | | 23,469 | | | | 6,242,754 | |
| | |
Cooper Cos., Inc. | | | 100 | | | | 41,759 | |
| | |
ResMed, Inc. | | | 6,598 | | | | 1,600,081 | |
| | |
Stryker Corp. | | | 22,211 | | | | 5,938,111 | |
| | |
Zimmer Biomet Holdings, Inc. | | | 9,049 | | | | 1,157,367 | |
| | | | | | | | |
| Total Health Care Equipment & Supplies | | | | 42,658,694 | |
|
| Health Care Providers & Services – 2.4% | |
| | |
AmerisourceBergen Corp. | | | 20,611 | | | | 3,188,728 | |
| | |
Anthem, Inc. | | | 17,136 | | | | 8,417,546 | |
| | |
Cigna Corp. | | | 34,207 | | | | 8,196,339 | |
| | |
CVS Health Corp. | | | 176,381 | | | | 17,851,521 | |
| | |
HCA Healthcare, Inc. | | | 12,130 | | | | 3,040,021 | |
| | |
Humana, Inc. | | | 4,949 | | | | 2,153,656 | |
| | |
McKesson Corp. | | | 7,371 | | | | 2,256,484 | |
See Notes to Financial Statements.
Schedule of Investments (continued)
WisdomTree U.S. LargeCap Dividend Fund (DLN)
March 31, 2022
| | | | | | | | |
| Investments | | Shares | | | Value | |
| | |
Quest Diagnostics, Inc. | | | 18,340 | | | $ | 2,510,013 | |
| | |
UnitedHealth Group, Inc. | | | 71,066 | | | | 36,241,528 | |
| | | | | | | | |
| Total Health Care Providers & Services | | | | 83,855,836 | |
|
| Health Care Technology – 0.1% | |
| | |
Cerner Corp. | | | 18,787 | | | | 1,757,712 | |
|
| Hotels, Restaurants & Leisure – 1.6% | |
| | |
Darden Restaurants, Inc. | | | 18,289 | | | | 2,431,523 | |
| | |
Domino’s Pizza, Inc. | | | 2,441 | | | | 993,511 | |
| | |
McDonald’s Corp. | | | 138,166 | | | | 34,165,688 | |
| | |
MGM Resorts International | | | 9,975 | | | | 418,352 | |
| | |
Starbucks Corp. | | | 114,766 | | | | 10,440,263 | |
| | |
Yum! Brands, Inc. | | | 43,080 | | | | 5,106,272 | |
| | | | | | | | |
| Total Hotels, Restaurants & Leisure | | | | 53,555,609 | |
|
| Household Durables – 0.1% | |
| | |
D.R. Horton, Inc. | | | 24,234 | | | | 1,805,675 | |
| | |
Lennar Corp., Class A | | | 17,579 | | | | 1,426,888 | |
| | | | | | | | |
| Total Household Durables | | | | 3,232,563 | |
|
| Household Products – 2.9% | |
| | |
Church & Dwight Co., Inc. | | | 17,736 | | | | 1,762,604 | |
| | |
Clorox Co. | | | 22,418 | | | | 3,116,774 | |
| | |
Colgate-Palmolive Co. | | | 159,891 | | | | 12,124,534 | |
| | |
Kimberly-Clark Corp. | | | 72,718 | | | | 8,955,949 | |
| | |
Procter & Gamble Co. | | | 484,621 | | | | 74,050,089 | |
| | | | | | | | |
| Total Household Products | | | | 100,009,950 | |
|
| Industrial Conglomerates – 1.0% | |
| | |
3M Co. | | | 117,543 | | | | 17,499,802 | |
| | |
General Electric Co. | | | 14,493 | | | | 1,326,109 | |
| | |
Honeywell International, Inc. | | | 72,863 | | | | 14,177,683 | |
| | |
Roper Technologies, Inc. | | | 3,664 | | | | 1,730,251 | |
| | | | | | | | |
| Total Industrial Conglomerates | | | | 34,733,845 | |
|
| Insurance – 2.3% | |
| | |
Aflac, Inc. | | | 111,045 | | | | 7,150,188 | |
| | |
Allstate Corp. | | | 48,619 | | | | 6,734,218 | |
| | |
American International Group, Inc. | | | 113,445 | | | | 7,120,943 | |
| | |
Arthur J. Gallagher & Co. | | | 19,707 | | | | 3,440,842 | |
| | |
Brown & Brown, Inc. | | | 12,481 | | | | 902,002 | |
| | |
Cincinnati Financial Corp. | | | 27,772 | | | | 3,775,881 | |
| | |
Hartford Financial Services Group, Inc. | | | 35,584 | | | | 2,555,287 | |
| | |
Marsh & McLennan Cos., Inc. | | | 61,040 | | | | 10,402,437 | |
| | |
MetLife, Inc. | | | 173,826 | | | | 12,216,491 | |
| | |
Principal Financial Group, Inc. | | | 47,201 | | | | 3,465,025 | |
| | |
Progressive Corp. | | | 20,614 | | | | 2,349,790 | |
| | |
Prudential Financial, Inc. | | | 90,934 | | | | 10,745,671 | |
| | |
Travelers Cos., Inc. | | | 35,113 | | | | 6,416,198 | |
| | | | | | | | |
| Total Insurance | | | | 77,274,973 | |
|
| Internet & Direct Marketing Retail – 0.1% | |
| | |
eBay, Inc. | | | 54,478 | | | | 3,119,410 | |
|
| IT Services – 1.5% | |
| | |
Automatic Data Processing, Inc. | | | 48,153 | | | | 10,956,734 | |
| | |
Broadridge Financial Solutions, Inc. | | | 13,085 | | | | 2,037,465 | |
| | |
Cognizant Technology Solutions Corp., Class A | | | 36,341 | | | | 3,258,698 | |
| | |
MasterCard, Inc., Class A | | | 31,377 | | | | 11,213,512 | |
| | |
Paychex, Inc. | | | 62,712 | | | | 8,558,307 | |
| | |
Visa, Inc., Class A(a) | | | 68,698 | | | | 15,235,155 | |
| | | | | | | | |
| Total IT Services | | | | 51,259,871 | |
|
| Life Sciences Tools & Services – 0.3% | |
| | |
Agilent Technologies, Inc. | | | 16,622 | | | | 2,199,589 | |
| | |
Bio-Techne Corp. | | | 1,513 | | | | 655,189 | |
| | |
Danaher Corp. | | | 14,973 | | | | 4,392,030 | |
| | |
PerkinElmer, Inc. | | | 1,126 | | | | 196,442 | |
| | |
Thermo Fisher Scientific, Inc. | | | 6,127 | | | | 3,618,913 | |
| | |
West Pharmaceutical Services, Inc. | | | 700 | | | | 287,497 | |
| | | | | | | | |
| Total Life Sciences Tools & Services | | | | 11,349,660 | |
|
| Machinery – 1.7% | |
| | |
Caterpillar, Inc. | | | 71,198 | | | | 15,864,338 | |
| | |
Cummins, Inc. | | | 21,300 | | | | 4,368,843 | |
| | |
Deere & Co. | | | 21,889 | | | | 9,094,004 | |
| | |
Dover Corp. | | | 20,579 | | | | 3,228,845 | |
| | |
Fortive Corp. | | | 9,478 | | | | 577,495 | |
| | |
IDEX Corp. | | | 1,262 | | | | 241,963 | |
| | |
Illinois Tool Works, Inc. | | | 58,706 | | | | 12,293,036 | |
| | |
Ingersoll Rand, Inc. | | | 3,278 | | | | 165,047 | |
| | |
Otis Worldwide Corp. | | | 40,790 | | | | 3,138,791 | |
| | |
PACCAR, Inc. | | | 31,572 | | | | 2,780,546 | |
| | |
Parker-Hannifin Corp. | | | 10,354 | | | | 2,938,051 | |
| | |
Stanley Black & Decker, Inc. | | | 15,473 | | | | 2,162,971 | |
| | |
Westinghouse Air Brake Technologies Corp. | | | 7,969 | | | | 766,379 | |
| | |
Xylem, Inc. | | | 7,266 | | | | 619,499 | |
| | | | | | | | |
| Total Machinery | | | | 58,239,808 | |
|
| Media – 0.8% | |
| | |
Comcast Corp., Class A | | | 508,133 | | | | 23,790,787 | |
| | |
Fox Corp., Class A | | | 42,982 | | | | 1,695,640 | |
| | |
Sirius XM Holdings, Inc.(a) | | | 216,168 | | | | 1,431,032 | |
| | | | | | | | |
| Total Media | | | | 26,917,459 | |
|
| Metals & Mining – 0.6% | |
| | |
Freeport-McMoRan, Inc. | | | 51,479 | | | | 2,560,566 | |
| | |
Newmont Corp. | | | 171,027 | | | | 13,588,095 | |
| | |
Nucor Corp. | | | 33,254 | | | | 4,943,207 | |
| | | | | | | | |
| Total Metals & Mining | | | | 21,091,868 | |
|
| Multi-Utilities – 1.7% | |
| | |
Ameren Corp. | | | 37,975 | | | | 3,560,536 | |
| | |
CMS Energy Corp. | | | 61,903 | | | | 4,329,496 | |
| | |
Consolidated Edison, Inc. | | | 74,240 | | | | 7,029,043 | |
| | |
Dominion Energy, Inc. | | | 158,892 | | | | 13,501,053 | |
| | |
DTE Energy Co. | | | 39,185 | | | | 5,180,649 | |
| | |
Public Service Enterprise Group, Inc. | | | 102,741 | | | | 7,191,870 | |
| | |
Sempra Energy | | | 64,464 | | | | 10,837,688 | |
| | |
WEC Energy Group, Inc. | | | 73,635 | | | | 7,349,509 | |
| | | | | | | | |
| Total Multi-Utilities | | | | 58,979,844 | |
|
| Multiline Retail – 0.5% | |
| | |
Dollar General Corp. | | | 8,916 | | | | 1,984,969 | |
| | |
Target Corp. | | | 65,131 | | | | 13,822,101 | |
| | | | | | | | |
| Total Multiline Retail | | | | 15,807,070 | |
See Notes to Financial Statements.
Schedule of Investments (continued)
WisdomTree U.S. LargeCap Dividend Fund (DLN)
March 31, 2022
| | | | | | | | |
| Investments | | Shares | | | Value | |
|
| Oil, Gas & Consumable Fuels – 9.1% | |
| | |
Cheniere Energy, Inc. | | | 21,467 | | | $ | 2,976,400 | |
| | |
Chevron Corp. | | | 512,469 | | | | 83,445,327 | |
| | |
ConocoPhillips | | | 194,861 | | | | 19,486,100 | |
| | |
Devon Energy Corp. | | | 469,298 | | | | 27,749,591 | |
| | |
Diamondback Energy, Inc. | | | 13,638 | | | | 1,869,497 | |
| | |
EOG Resources, Inc. | | | 116,930 | | | | 13,941,564 | |
| | |
Exxon Mobil Corp. | | | 1,426,134 | | | | 117,784,407 | |
| | |
Hess Corp. | | | 15,111 | | | | 1,617,481 | |
| | |
Kinder Morgan, Inc. | | | 897,945 | | | | 16,980,140 | |
| | |
Marathon Petroleum Corp. | | | 121,969 | | | | 10,428,349 | |
| | |
Occidental Petroleum Corp. | | | 22,773 | | | | 1,292,140 | |
| | |
ONEOK, Inc. | | | 152,028 | | | | 10,737,738 | |
| | |
Pioneer Natural Resources Co. | | | 18,280 | | | | 4,570,548 | |
| | | | | | | | |
| Total Oil, Gas & Consumable Fuels | | | | 312,879,282 | |
|
| Personal Products – 0.1% | |
| | |
Estee Lauder Cos., Inc., Class A | | | 7,594 | | | | 2,067,998 | |
|
| Pharmaceuticals – 8.4% | |
| | |
Bristol-Myers Squibb Co. | | | 433,745 | | | | 31,676,397 | |
| | |
Eli Lilly & Co. | | | 79,970 | | | | 22,901,009 | |
| | |
Johnson & Johnson | | | 599,537 | | | | 106,255,942 | |
| | |
Merck & Co., Inc. | | | 565,633 | | | | 46,410,188 | |
| | |
Pfizer, Inc. | | | 1,488,301 | | | | 77,049,343 | |
| | |
Zoetis, Inc. | | | 15,620 | | | | 2,945,776 | |
| | | | | | | | |
| Total Pharmaceuticals | | | | 287,238,655 | |
|
| Professional Services – 0.1% | |
| | |
Equifax, Inc. | | | 6,528 | | | | 1,547,789 | |
| | |
Jacobs Engineering Group, Inc. | | | 3,022 | | | | 416,462 | |
| | |
TransUnion | | | 4,769 | | | | 492,828 | |
| | |
Verisk Analytics, Inc. | | | 7,666 | | | | 1,645,354 | |
| | | | | | | | |
| Total Professional Services | | | | 4,102,433 | |
|
| Road & Rail – 1.1% | |
| | |
CSX Corp. | | | 141,358 | | | | 5,293,857 | |
| | |
JB Hunt Transport Services, Inc. | | | 2,626 | | | | 527,274 | |
| | |
Norfolk Southern Corp. | | | 22,580 | | | | 6,440,268 | |
| | |
Old Dominion Freight Line, Inc. | | | 2,585 | | | | 772,088 | |
| | |
Union Pacific Corp. | | | 94,904 | | | | 25,928,722 | |
| | | | | | | | |
| Total Road & Rail | | | | 38,962,209 | |
|
| Semiconductors & Semiconductor Equipment – 4.2% | |
| | |
Analog Devices, Inc. | | | 44,057 | | | | 7,277,335 | |
| | |
Applied Materials, Inc. | | | 40,527 | | | | 5,341,459 | |
| | |
Broadcom, Inc. | | | 62,682 | | | | 39,469,602 | |
| | |
Entegris, Inc. | | | 975 | | | | 127,979 | |
| | |
Intel Corp. | | | 631,924 | | | | 31,318,153 | |
| | |
KLA Corp. | | | 11,625 | | | | 4,255,447 | |
| | |
Lam Research Corp. | | | 8,587 | | | | 4,616,457 | |
| | |
Marvell Technology, Inc. | | | 6,176 | | | | 442,881 | |
| | |
Microchip Technology, Inc. | | | 33,879 | | | | 2,545,668 | |
| | |
Micron Technology, Inc. | | | 23,886 | | | | 1,860,481 | |
| | |
Monolithic Power Systems, Inc. | | | 682 | | | | 331,234 | |
| | |
NVIDIA Corp. | | | 13,721 | | | | 3,743,912 | |
| | |
QUALCOMM, Inc. | | | 106,305 | | | | 16,245,530 | |
| | |
Skyworks Solutions, Inc. | | | 14,754 | | | | 1,966,413 | |
| | |
Teradyne, Inc. | | | 2,555 | | | | 302,078 | |
| | |
Texas Instruments, Inc. | | | 131,903 | | | | 24,201,562 | |
| | | | | | | | |
| Total Semiconductors & Semiconductor Equipment | | | | 144,046,191 | |
|
| Software – 5.2% | |
| | |
Intuit, Inc. | | | 8,417 | | | | 4,047,231 | |
| | |
Microsoft Corp. | | | 499,720 | | | | 154,068,673 | |
| | |
Oracle Corp. | | | 239,682 | | | | 19,828,892 | |
| | |
SS&C Technologies Holdings, Inc. | | | 9,861 | | | | 739,772 | |
| | | | | | | | |
| Total Software | | | | 178,684,568 | |
|
| Specialty Retail – 2.1% | |
| | |
Bath & Body Works, Inc. | | | 3,738 | | | | 178,676 | |
| | |
Best Buy Co., Inc. | | | 43,129 | | | | 3,920,426 | |
| | |
Home Depot, Inc. | | | 146,927 | | | | 43,979,659 | |
| | |
Lowe’s Cos., Inc. | | | 76,180 | | | | 15,402,834 | |
| | |
Ross Stores, Inc. | | | 15,055 | | | | 1,361,875 | |
| | |
TJX Cos., Inc. | | | 100,430 | | | | 6,084,050 | |
| | |
Tractor Supply Co. | | | 6,829 | | | | 1,593,684 | |
| | | | | | | | |
| Total Specialty Retail | | | | 72,521,204 | |
|
| Technology Hardware, Storage & Peripherals – 4.3% | |
| | |
Apple, Inc. | | | 767,160 | | | | 133,953,807 | |
| | |
Hewlett Packard Enterprise Co. | | | 199,149 | | | | 3,327,780 | |
| | |
HP, Inc.(a) | | | 176,517 | | | | 6,407,567 | |
| | |
NetApp, Inc. | | | 33,614 | | | | 2,789,962 | |
| | | | | | | | |
| Total Technology Hardware, Storage & Peripherals | | | | 146,479,116 | |
|
| Textiles, Apparel & Luxury Goods – 0.3% | |
| | |
NIKE, Inc., Class B | | | 49,755 | | | | 6,695,033 | |
| | |
VF Corp. | | | 52,645 | | | | 2,993,394 | |
| | | | | | | | |
| Total Textiles, Apparel & Luxury Goods | | | | 9,688,427 | |
|
| Tobacco – 4.0% | |
| | |
Altria Group, Inc. | | | 1,302,222 | | | | 68,041,100 | |
| | |
Philip Morris International, Inc. | | | 743,960 | | | | 69,887,602 | |
| | | | | | | | |
| Total Tobacco | | | | 137,928,702 | |
|
| Trading Companies & Distributors – 0.2% | |
| | |
Fastenal Co. | | | 76,260 | | | | 4,529,844 | |
| | |
W.W. Grainger, Inc. | | | 4,016 | | | | 2,071,413 | |
| | | | | | | | |
| Total Trading Companies & Distributors | | | | 6,601,257 | |
|
| Water Utilities – 0.1% | |
| | |
American Water Works Co., Inc. | | | 21,875 | | | | 3,620,969 | |
TOTAL COMMON STOCKS (Cost: $2,425,633,345) | | | | 3,419,018,309 | |
|
| EXCHANGE-TRADED FUND – 0.1% | |
|
| United States – 0.1% | |
| | |
WisdomTree U.S. Total Dividend Fund(b) | | | | | | | | |
| (Cost: $1,632,686) | | | 26,100 | | | | 1,685,016 | |
|
| INVESTMENT OF CASH COLLATERAL FOR SECURITIES LOANED – 0.0% | |
|
| United States – 0.0% | |
| |
State Street Navigator Securities Lending
Government Money Market Portfolio, 0.25%(c) | | | | | |
| (Cost: $1,483,298) | | | 1,483,298 | | | | 1,483,298 | |
| |
TOTAL INVESTMENTS IN SECURITIES – 99.9% (Cost: $2,428,749,329) | | | | 3,422,186,623 | |
| |
Other Assets less Liabilities – 0.1% | | | | 5,053,024 | |
| | | | | | | | |
| NET ASSETS – 100.0% | | | $ | 3,427,239,647 | |
See Notes to Financial Statements.
Schedule of Investments (concluded)
WisdomTree U.S. LargeCap Dividend Fund (DLN)
March 31, 2022
| (a) | Security, or portion thereof, was on loan at March 31, 2022 (See Note 2). At March 31, 2022, the total market value of the Fund’s securities on loan identified in the Schedule of Investments was $26,771,627 and the total market value of the collateral held by the Fund was $28,083,259. The total market value of the collateral includes non-cash U.S. Government securities collateral having a value of $26,599,961. |
| (b) | Affiliated holding. See “Investment in Affiliates” supplementary table included in this Schedule of Investments for additional information. |
| (c) | Rate shown represents annualized 7-day yield as of March 31, 2022. |
Affiliated holdings are investments in entities in which the Fund owns 5% or more of the outstanding voting securities or are investments in entities which are under common ownership or control. Investments in affiliates during the fiscal year ended March 31, 2022 were as follows:
| | | | | | | | | | | | | | | | | | | | | | | | | | | | |
| | | | | | | |
| Affiliate | | Value at
3/31/2021 | | | Purchases/
Additions | | | Sales/
Reductions | | | Realized
Gain/(Loss) | | | Change in
Unrealized
Appreciation/
Depreciation | | | Value at
3/31/2022 | | | Dividend
Income | |
WisdomTree U.S. Total Dividend Fund | | $ | 6,267,390 | | | $ | 25,025,916 | | | $ | 30,319,396 | | | $ | 970,593 | | | $ | (259,487 | ) | | $ | 1,685,016 | | | $ | 125,123 | |
The following is a summary of the fair valuations according to the inputs used as of March 31, 2022 in valuing the Fund’s investments (See Note 2 — Fair Value Measurement):
| | | | | | | | | | | | | | | | |
| | | | |
| | | Quoted
Prices in
Active
Markets
(Level 1) | | | Other
Significant
Observable
Inputs
(Level 2) | | | Significant
Unobservable
Inputs
(Level 3) | | | Total | |
Assets: | | | | | | | | | |
Investments in Securities | | | | |
Common Stocks | | $ | 3,419,018,309 | | | $ | — | | | $ | — | | | $ | 3,419,018,309 | |
Exchange-Traded Fund | | | 1,685,016 | | | | — | | | | — | | | | 1,685,016 | |
Investment of Cash Collateral for Securities Loaned | | | — | | | | 1,483,298 | | | | — | | | | 1,483,298 | |
Total Investments in Securities | | $ | 3,420,703,325 | | | $ | 1,483,298 | | | $ | — | | | $ | 3,422,186,623 | |
See Notes to Financial Statements.
Schedule of Investments
WisdomTree U.S. LargeCap Fund (EPS)
March 31, 2022
| | | | | | | | |
| Investments | | Shares | | | Value | |
| | |
| COMMON STOCKS – 99.8% | | | | | | | | |
| | |
| United States – 99.8% | | | | | | | | |
| | |
| Aerospace & Defense – 1.5% | | | | | | | | |
| | |
Axon Enterprise, Inc.* | | | 471 | | | $ | 64,871 | |
| | |
General Dynamics Corp. | | | 5,830 | | | | 1,406,079 | |
| | |
HEICO Corp. | | | 913 | | | | 140,182 | |
| | |
L3Harris Technologies, Inc. | | | 4,309 | | | | 1,070,657 | |
| | |
Lockheed Martin Corp. | | | 6,317 | | | | 2,788,324 | |
| | |
Northrop Grumman Corp. | | | 4,139 | | | | 1,851,043 | |
| | |
Raytheon Technologies Corp. | | | 25,133 | | | | 2,489,926 | |
| | |
Textron, Inc. | | | 3,257 | | | | 242,256 | |
| | |
TransDigm Group, Inc.* | | | 392 | | | | 255,404 | |
| | | | | | | | |
| Total Aerospace & Defense | | | | | | | 10,308,742 | |
| | |
| Air Freight & Logistics – 0.8% | | | | | | | | |
| | |
C.H. Robinson Worldwide, Inc. | | | 2,393 | | | | 257,750 | |
| | |
Expeditors International of Washington, Inc. | | | 2,990 | | | | 308,448 | |
| | |
FedEx Corp. | | | 6,882 | | | | 1,592,426 | |
| | |
United Parcel Service, Inc., Class B | | | 17,340 | | | | 3,718,737 | |
| | | | | | | | |
| Total Air Freight & Logistics | | | | | | | 5,877,361 | |
| | |
| Automobiles – 2.3% | | | | | | | | |
| | |
Ford Motor Co. | | | 139,800 | | | | 2,364,018 | |
| | |
General Motors Co.* | | | 67,022 | | | | 2,931,542 | |
| | |
Tesla, Inc.* | | | 9,709 | | | | 10,462,419 | |
| | | | | | | | |
| Total Automobiles | | | | | | | 15,757,979 | |
| | |
| Banks – 6.7% | | | | | | | | |
| | |
Bank of America Corp. | | | 234,072 | | | | 9,648,448 | |
| | |
Citigroup, Inc. | | | 102,209 | | | | 5,457,961 | |
| | |
Citizens Financial Group, Inc. | | | 13,685 | | | | 620,341 | |
| | |
Fifth Third Bancorp | | | 18,795 | | | | 808,937 | |
| | |
First Republic Bank | | | 1,725 | | | | 279,622 | |
| | |
JPMorgan Chase & Co. | | | 108,187 | | | | 14,748,052 | |
| | |
KeyCorp | | | 33,349 | | | | 746,351 | |
| | |
M&T Bank Corp. | | | 3,627 | | | | 614,776 | |
| | |
PNC Financial Services Group, Inc. | | | 9,491 | | | | 1,750,615 | |
| | |
Regions Financial Corp. | | | 36,551 | | | | 813,625 | |
| | |
Signature Bank | | | 545 | | | | 159,952 | |
| | |
SVB Financial Group* | | | 794 | | | | 444,203 | |
| | |
Truist Financial Corp. | | | 32,880 | | | | 1,864,296 | |
| | |
U.S. Bancorp | | | 45,693 | | | | 2,428,583 | |
| | |
Wells Fargo & Co. | | | 127,539 | | | | 6,180,540 | |
| | |
Western Alliance Bancorp | | | 1,730 | | | | 143,279 | |
| | | | | | | | |
| Total Banks | | | | | | | 46,709,581 | |
| | |
| Beverages – 1.4% | | | | | | | | |
| | |
Brown-Forman Corp., Class B | | | 3,552 | | | | 238,055 | |
| | |
Coca-Cola Co. | | | 66,314 | | | | 4,111,468 | |
| | |
Constellation Brands, Inc., Class A | | | 2,977 | | | | 685,663 | |
| | |
Keurig Dr. Pepper, Inc. | | | 21,635 | | | | 819,966 | |
| | |
Monster Beverage Corp.* | | | 6,153 | | | | 491,625 | |
| | |
PepsiCo, Inc. | | | 18,415 | | | | 3,082,303 | |
| | | | | | | | |
| Total Beverages | | | | | | | 9,429,080 | |
| | |
| Biotechnology – 3.4% | | | | | | | | |
| | |
AbbVie, Inc. | | | 64,769 | | | | 10,499,703 | |
| | |
Amgen, Inc. | | | 16,414 | | | | 3,969,234 | |
| | |
BioMarin Pharmaceutical, Inc.* | | | 980 | | | | 75,558 | |
| | |
Gilead Sciences, Inc. | | | 57,030 | | | | 3,390,434 | |
| | |
Incyte Corp.* | | | 2,358 | | | | 187,272 | |
| | |
Moderna, Inc.* | | | 9,484 | | | | 1,633,714 | |
| | |
Regeneron Pharmaceuticals, Inc.* | | | 3,894 | | | | 2,719,647 | |
| | |
Vertex Pharmaceuticals, Inc.* | | | 5,456 | | | | 1,423,852 | |
| | | | | | | | |
| Total Biotechnology | | | | | | | 23,899,414 | |
| | |
| Building Products – 0.2% | | | | | | | | |
| | |
Builders FirstSource, Inc.* | | | 7,529 | | | | 485,922 | |
| | |
Carlisle Cos., Inc. | | | 554 | | | | 136,240 | |
| | |
Carrier Global Corp. | | | 11,587 | | | | 531,496 | |
| | |
Fortune Brands Home & Security, Inc. | | | 2,502 | | | | 185,848 | |
| | |
Masco Corp. | | | 4,435 | | | | 226,185 | |
| | |
Trex Co., Inc.* | | | 643 | | | | 42,007 | |
| | | | | | | | |
| Total Building Products | | | | | | | 1,607,698 | |
| | |
| Capital Markets – 3.4% | | | | | | | | |
| | |
Ameriprise Financial, Inc. | | | 2,766 | | | | 830,796 | |
| | |
Bank of New York Mellon Corp. | | | 20,587 | | | | 1,021,733 | |
| | |
BlackRock, Inc. | | | 2,293 | | | | 1,752,242 | |
| | |
CBOE Global Markets, Inc. | | | 988 | | | | 113,047 | |
| | |
Charles Schwab Corp. | | | 24,987 | | | | 2,106,654 | |
| | |
CME Group, Inc. | | | 3,241 | | | | 770,904 | |
| | |
Coinbase Global, Inc., Class A* | | | 2,974 | | | | 564,644 | |
| | |
FactSet Research Systems, Inc. | | | 225 | | | | 97,684 | |
| | |
Franklin Resources, Inc. | | | 17,370 | | | | 484,970 | |
| | |
Goldman Sachs Group, Inc. | | | 16,555 | | | | 5,464,806 | |
| | |
Intercontinental Exchange, Inc. | | | 6,799 | | | | 898,284 | |
| | |
LPL Financial Holdings, Inc. | | | 603 | | | | 110,156 | |
| | |
MarketAxess Holdings, Inc. | | | 263 | | | | 89,473 | |
| | |
Moody’s Corp. | | | 1,822 | | | | 614,761 | |
| | |
Morgan Stanley | | | 52,209 | | | | 4,563,067 | |
| | |
Morningstar, Inc. | | | 242 | | | | 66,107 | |
| | |
MSCI, Inc. | | | 481 | | | | 241,885 | |
| | |
Nasdaq, Inc. | | | 1,721 | | | | 306,682 | |
| | |
Northern Trust Corp. | | | 3,441 | | | | 400,704 | |
| | |
Raymond James Financial, Inc. | | | 4,506 | | | | 495,254 | |
| | |
S&P Global, Inc. | | | 2,280 | | | | 935,210 | |
| | |
State Street Corp. | | | 8,475 | | | | 738,342 | |
| | |
T. Rowe Price Group, Inc. | | | 4,889 | | | | 739,168 | |
| | | | | | | | |
| Total Capital Markets | | | | | | | 23,406,573 | |
| | |
| Chemicals – 1.4% | | | | | | | | |
| | |
Air Products and Chemicals, Inc. | | | 2,386 | | | | 596,285 | |
| | |
Albemarle Corp. | | | 839 | | | | 185,545 | |
| | |
Celanese Corp. | | | 3,717 | | | | 531,048 | |
| | |
CF Industries Holdings, Inc. | | | 3,640 | | | | 375,138 | |
| | |
Corteva, Inc. | | | 11,078 | | | | 636,763 | |
| | |
Dow, Inc. | | | 37,390 | | | | 2,382,491 | |
| | |
DuPont de Nemours, Inc. | | | 11,055 | | | | 813,427 | |
| | |
Eastman Chemical Co. | | | 3,753 | | | | 420,561 | |
See Notes to Financial Statements.
Schedule of Investments (continued)
WisdomTree U.S. LargeCap Fund (EPS)
March 31, 2022
| | | | | | | | |
| Investments | | Shares | | | Value | |
| | |
Ecolab, Inc. | | | 2,028 | | | $ | 358,064 | |
| | |
FMC Corp. | | | 2,569 | | | | 338,003 | |
| | |
International Flavors & Fragrances, Inc. | | | 2,475 | | | | 325,042 | |
| | |
Mosaic Co. | | | 13,514 | | | | 898,681 | |
| | |
PPG Industries, Inc. | | | 3,580 | | | | 469,231 | |
| | |
RPM International, Inc. | | | 1,714 | | | | 139,588 | |
| | |
Sherwin-Williams Co. | | | 2,347 | | | | 585,858 | |
| | |
Westlake Corp. | | | 5,147 | | | | 635,140 | |
| | | | | | | | |
| Total Chemicals | | | | | | | 9,690,865 | |
| | |
| Commercial Services & Supplies – 0.3% | | | | | | | | |
| | |
Cintas Corp. | | | 889 | | | | 378,172 | |
| | |
Copart, Inc.* | | | 2,244 | | | | 281,555 | |
| | |
Republic Services, Inc. | | | 3,375 | | | | 447,187 | |
| | |
Rollins, Inc. | | | 3,556 | | | | 124,638 | |
| | |
Waste Management, Inc. | | | 4,157 | | | | 658,884 | |
| | | | | | | | |
| Total Commercial Services & Supplies | | | | | | | 1,890,436 | |
| | |
| Communications Equipment – 1.0% | | | | | | | | |
| | |
Arista Networks, Inc.* | | | 3,909 | | | | 543,273 | |
| | |
Cisco Systems, Inc. | | | 90,782 | | | | 5,062,004 | |
| | |
F5, Inc.* | | | 1,738 | | | | 363,155 | |
| | |
Motorola Solutions, Inc. | | | 2,938 | | | | 711,584 | |
| | |
Ubiquiti, Inc.(a) | | | 1,351 | | | | 393,357 | |
| | | | | | | | |
| Total Communications Equipment | | | | | | | 7,073,373 | |
| | |
| Construction & Engineering – 0.0% | | | | | | | | |
| | |
Quanta Services, Inc. | | | 1,960 | | | | 257,956 | |
|
| Construction Materials – 0.0% | |
| | |
Martin Marietta Materials, Inc. | | | 606 | | | | 233,243 | |
|
| Consumer Finance – 1.3% | |
| | |
Ally Financial, Inc. | | | 17,824 | | | | 774,987 | |
| | |
American Express Co. | | | 16,477 | | | | 3,081,199 | |
| | |
Capital One Financial Corp. | | | 20,704 | | | | 2,718,228 | |
| | |
Discover Financial Services | | | 14,216 | | | | 1,566,461 | |
| | |
Synchrony Financial | | | 26,595 | | | | 925,772 | |
| | |
Upstart Holdings, Inc.*(a) | | | 498 | | | | 54,327 | |
| | | | | | | | |
| Total Consumer Finance | | | | | | | 9,120,974 | |
| | |
| Containers & Packaging – 0.3% | | | | | | | | |
| | |
Avery Dennison Corp. | | | 1,206 | | | | 209,808 | |
| | |
Ball Corp. | | | 3,870 | | | | 348,300 | |
| | |
Crown Holdings, Inc. | | | 3,069 | | | | 383,901 | |
| | |
International Paper Co. | | | 10,685 | | | | 493,113 | |
| | |
Packaging Corp. of America | | | 1,853 | | | | 289,272 | |
| | |
Westrock Co. | | | 6,757 | | | | 317,781 | |
| | | | | | | | |
| Total Containers & Packaging | | | | | | | 2,042,175 | |
| | |
| Distributors – 0.1% | | | | | | | | |
| | |
Genuine Parts Co. | | | 2,491 | | | | 313,916 | |
| | |
LKQ Corp. | | | 6,840 | | | | 310,604 | |
| | |
Pool Corp. | | | 350 | | | | 147,998 | |
| | | | | | | | |
| Total Distributors | | | | | | | 772,518 | |
| | |
| Diversified Financial Services – 1.6% | | | | | | | | |
| | |
Berkshire Hathaway, Inc., Class B* | | | 31,948 | | | | 11,274,769 | |
| | |
| Diversified Telecommunication Services – 2.4% | | | | | | | | |
| | |
AT&T, Inc. | | | 354,147 | | | | 8,368,493 | |
| | |
Lumen Technologies, Inc.(a) | | | 53,018 | | | | 597,513 | |
| | |
Verizon Communications, Inc. | | | 154,737 | | | | 7,882,303 | |
| | | | | | | | |
| Total Diversified Telecommunication Services | | | | | | | 16,848,309 | |
| | |
| Electric Utilities – 1.5% | | | | | | | | |
| | |
Alliant Energy Corp. | | | 3,633 | | | | 226,990 | |
| | |
American Electric Power Co., Inc. | | | 9,662 | | | | 963,978 | |
| | |
Avangrid, Inc. | | | 5,309 | | | | 248,143 | |
| | |
Constellation Energy Corp. | | | 5,533 | | | | 311,231 | |
| | |
Duke Energy Corp. | | | 14,105 | | | | 1,574,964 | |
| | |
Edison International | | | 8,671 | | | | 607,837 | |
| | |
Entergy Corp. | | | 3,621 | | | | 422,752 | |
| | |
Evergy, Inc. | | | 4,261 | | | | 291,197 | |
| | |
Eversource Energy | | | 5,159 | | | | 454,972 | |
| | |
Exelon Corp. | | | 16,955 | | | | 807,567 | |
| | |
FirstEnergy Corp. | | | 11,577 | | | | 530,921 | |
| | |
NextEra Energy, Inc. | | | 19,789 | | | | 1,676,326 | |
| | |
PPL Corp. | | | 11,594 | | | | 331,124 | |
| | |
Southern Co. | | | 20,445 | | | | 1,482,467 | |
| | |
Xcel Energy, Inc. | | | 8,078 | | | | 582,989 | |
| | | | | | | | |
| Total Electric Utilities | | | | | | | 10,513,458 | |
| | |
| Electrical Equipment – 0.3% | | | | | | | | |
| | |
AMETEK, Inc. | | | 2,592 | | | | 345,203 | |
| | |
Emerson Electric Co. | | | 9,509 | | | | 932,357 | |
| | |
Generac Holdings, Inc.* | | | 562 | | | | 167,060 | |
| | |
Rockwell Automation, Inc. | | | 1,102 | | | | 308,593 | |
| | | | | | | | |
| Total Electrical Equipment | | | | | | | 1,753,213 | |
|
| Electronic Equipment, Instruments & Components – 0.5% | |
| | |
Amphenol Corp., Class A | | | 8,371 | | | | 630,755 | |
| | |
CDW Corp. | | | 2,887 | | | | 516,455 | |
| | |
Cognex Corp. | | | 3,378 | | | | 260,613 | |
| | |
Corning, Inc. | | | 21,206 | | | | 782,713 | |
| | |
Keysight Technologies, Inc.* | | | 2,909 | | | | 459,535 | |
| | |
Teledyne Technologies, Inc.* | | | 774 | | | | 365,816 | |
| | |
Trimble, Inc.* | | | 4,677 | | | | 337,399 | |
| | |
Zebra Technologies Corp., Class A* | | | 892 | | | | 369,020 | |
| | | | | | | | |
| Total Electronic Equipment, Instruments & Components | | | | 3,722,306 | |
| | |
| Energy Equipment & Services – 0.1% | | | | | | | | |
| | |
Baker Hughes Co. | | | 5,860 | | | | 213,363 | |
| | |
Halliburton Co. | | | 12,091 | | | | 457,886 | |
| | | | | | | | |
| Total Energy Equipment & Services | | | | | | | 671,249 | |
| | |
| Entertainment – 0.7% | | | | | | | | |
| | |
Activision Blizzard, Inc. | | | 17,209 | | | | 1,378,613 | |
| | |
Electronic Arts, Inc. | | | 5,417 | | | | 685,305 | |
| | |
Liberty Media Corp. – Liberty Formula One, Class C* | | | 1,055 | | | | 73,681 | |
| | |
Netflix, Inc.* | | | 2,910 | | | | 1,090,057 | |
| | |
ROBLOX Corp., Class A*(a) | | | 3,232 | | | | 149,448 | |
| | |
Roku, Inc.* | | | 698 | | | | 87,438 | |
| | |
Take-Two Interactive Software, Inc.* | | | 1,238 | | | | 190,330 | |
| | |
Walt Disney Co.* | | | 10,002 | | | | 1,371,874 | |
| | | | | | | | |
| Total Entertainment | | | | | | | 5,026,746 | |
See Notes to Financial Statements.
Schedule of Investments (continued)
WisdomTree U.S. LargeCap Fund (EPS)
March 31, 2022
| | | | | | | | |
| Investments | | Shares | | | Value | |
|
| Equity Real Estate Investment Trusts (REITs) – 1.3% | |
| | |
Alexandria Real Estate Equities, Inc. | | | 1,549 | | | $ | 311,736 | |
| | |
American Homes 4 Rent, Class A | | | 1,731 | | | | 69,292 | |
| | |
American Tower Corp. | | | 3,224 | | | | 809,933 | |
| | |
AvalonBay Communities, Inc. | | | 1,431 | | | | 355,417 | |
| | |
Boston Properties, Inc. | | | 1,117 | | | | 143,870 | |
| | |
Camden Property Trust | | | 661 | | | | 109,858 | |
| | |
Crown Castle International Corp. | | | 2,543 | | | | 469,438 | |
| | |
CubeSmart | | | 1,322 | | | | 68,784 | |
| | |
Digital Realty Trust, Inc. | | | 1,625 | | | | 230,425 | |
| | |
Duke Realty Corp. | | | 4,855 | | | | 281,881 | |
| | |
Equinix, Inc. | | | 515 | | | | 381,934 | |
| | |
Equity LifeStyle Properties, Inc. | | | 1,352 | | | | 103,401 | |
| | |
Equity Residential | | | 4,102 | | | | 368,852 | |
| | |
Essex Property Trust, Inc. | | | 483 | | | | 166,867 | |
| | |
Extra Space Storage, Inc. | | | 1,201 | | | | 246,926 | |
| | |
Healthpeak Properties, Inc. | | | 5,406 | | | | 185,588 | |
| | |
Invitation Homes, Inc. | | | 3,127 | | | | 125,643 | |
| | |
Iron Mountain, Inc. | | | 2,808 | | | | 155,591 | |
| | |
Kimco Realty Corp. | | | 4,285 | | | | 105,840 | |
| | |
Medical Properties Trust, Inc. | | | 8,316 | | | | 175,800 | |
| | |
Mid-America Apartment Communities, Inc. | | | 789 | | | | 165,256 | |
| | |
Prologis, Inc. | | | 4,607 | | | | 743,938 | |
| | |
Public Storage | | | 1,487 | | | | 580,346 | |
| | |
Realty Income Corp. | | | 3,238 | | | | 224,393 | |
| | |
Regency Centers Corp. | | | 1,209 | | | | 86,250 | |
| | |
SBA Communications Corp. | | | 638 | | | | 219,536 | |
| | |
Simon Property Group, Inc. | | | 4,633 | | | | 609,518 | |
| | |
Sun Communities, Inc. | | | 642 | | | | 112,536 | |
| | |
UDR, Inc. | | | 1,693 | | | | 97,127 | |
| | |
Ventas, Inc. | | | 2,096 | | | | 129,449 | |
| | |
VICI Properties, Inc. | | | 11,828 | | | | 336,625 | |
| | |
W.P. Carey, Inc. | | | 1,978 | | | | 159,902 | |
| | |
Welltower, Inc. | | | 2,312 | | | | 222,276 | |
| | |
Weyerhaeuser Co. | | | 22,621 | | | | 857,336 | |
| | | | | | | | |
| Total Equity Real Estate Investment Trusts (REITs) | | | | 9,411,564 | |
|
| Food & Staples Retailing – 1.7% | |
| | |
Albertsons Cos., Inc., Class A | | | 13,861 | | | | 460,878 | |
| | |
Costco Wholesale Corp. | | | 3,259 | | | | 1,876,695 | |
| | |
Kroger Co. | | | 20,859 | | | | 1,196,681 | |
| | |
Sysco Corp. | | | 4,361 | | | | 356,076 | |
| | |
Walgreens Boots Alliance, Inc. | | | 31,748 | | | | 1,421,358 | |
| | |
Walmart, Inc. | | | 45,962 | | | | 6,844,661 | |
| | | | | | | | |
| Total Food & Staples Retailing | | | | 12,156,349 | |
|
| Food Products – 1.3% | |
| | |
Archer-Daniels-Midland Co. | | | 15,205 | | | | 1,372,403 | |
| | |
Campbell Soup Co. | | | 6,610 | | | | 294,608 | |
| | |
Conagra Brands, Inc. | | | 12,775 | | | | 428,857 | |
| | |
General Mills, Inc. | | | 12,694 | | | | 859,638 | |
| | |
Hershey Co. | | | 2,794 | | | | 605,264 | |
| | |
Hormel Foods Corp. | | | 6,436 | | | | 331,711 | |
| | |
J.M. Smucker Co. | | | 2,306 | | | | 312,256 | |
| | |
Kellogg Co. | | | 7,311 | | | | 471,486 | |
| | |
Kraft Heinz Co. | | | 37,288 | | | | 1,468,774 | |
| | |
McCormick & Co., Inc., Non-Voting Shares | | | 3,052 | | | | 304,590 | |
| | |
Mondelez International, Inc., Class A | | | 22,467 | | | | 1,410,478 | |
| | |
Tyson Foods, Inc., Class A | | | 12,345 | | | | 1,106,482 | |
| | | | | | | | |
| Total Food Products | | | | 8,966,547 | |
|
| Gas Utilities – 0.0% | |
| | |
Atmos Energy Corp. | | | 2,344 | | | | 280,085 | |
| | |
| Health Care Equipment & Supplies – 1.6% | | | | | | | | |
| | |
Abbott Laboratories | | | 25,762 | | | | 3,049,190 | |
| | |
ABIOMED, Inc.* | | | 340 | | | | 112,622 | |
| | |
Align Technology, Inc.* | | | 505 | | | | 220,180 | |
| | |
Baxter International, Inc. | | | 7,563 | | | | 586,435 | |
| | |
Becton Dickinson and Co. | | | 5,442 | | | | 1,447,572 | |
| | |
Boston Scientific Corp.* | | | 16,955 | | | | 750,937 | |
| | |
Cooper Cos., Inc. | | | 522 | | | | 217,982 | |
| | |
DexCom, Inc.* | | | 573 | | | | 293,147 | |
| | |
Edwards Lifesciences Corp.* | | | 4,331 | | | | 509,845 | |
| | |
Hologic, Inc.* | | | 10,048 | | | | 771,887 | |
| | |
IDEXX Laboratories, Inc.* | | | 532 | | | | 291,036 | |
| | |
Insulet Corp.* | | | 396 | | | | 105,491 | |
| | |
Intuitive Surgical, Inc.* | | | 2,075 | | | | 625,986 | |
| | |
Masimo Corp.* | | | 387 | | | | 56,324 | |
| | |
ResMed, Inc. | | | 1,091 | | | | 264,578 | |
| | |
Stryker Corp. | | | 4,832 | | | | 1,291,835 | |
| | |
Teleflex, Inc. | | | 567 | | | | 201,189 | |
| | |
Zimmer Biomet Holdings, Inc. | | | 4,238 | | | | 542,040 | |
| | |
Zimvie, Inc.* | | | 421 | | | | 9,616 | |
| | | | | | | | |
| Total Health Care Equipment & Supplies | | | | 11,347,892 | |
|
| Health Care Providers & Services – 3.5% | |
| | |
AmerisourceBergen Corp. | | | 5,609 | | | | 867,768 | |
| | |
Anthem, Inc. | | | 5,089 | | | | 2,499,819 | |
| | |
Cardinal Health, Inc. | | | 10,593 | | | | 600,623 | |
| | |
Centene Corp.* | | | 13,031 | | | | 1,097,080 | |
| | |
Cigna Corp. | | | 11,472 | | | | 2,748,806 | |
| | |
CVS Health Corp. | | | 39,496 | | | | 3,997,390 | |
| | |
HCA Healthcare, Inc. | | | 8,750 | | | | 2,192,925 | |
| | |
Humana, Inc. | | | 1,780 | | | | 774,603 | |
| | |
Laboratory Corp. of America Holdings* | | | 3,809 | | | | 1,004,281 | |
| | |
McKesson Corp. | | | 5,288 | | | | 1,618,815 | |
| | |
Molina Healthcare, Inc.* | | | 679 | | | | 226,508 | |
| | |
Quest Diagnostics, Inc. | | | 4,366 | | | | 597,531 | |
| | |
UnitedHealth Group, Inc. | | | 12,720 | | | | 6,486,818 | |
| | | | | | | | |
| Total Health Care Providers & Services | | | | 24,712,967 | |
|
| Health Care Technology – 0.1% | |
| | |
Cerner Corp. | | | 4,148 | | | | 388,087 | |
| | |
Veeva Systems, Inc., Class A* | | | 884 | | | | 187,814 | |
| | | | | | | | |
| Total Health Care Technology | | | | 575,901 | |
|
| Hotels, Restaurants & Leisure – 0.8% | |
| | |
Booking Holdings, Inc.* | | | 229 | | | | 537,795 | |
| | |
Chipotle Mexican Grill, Inc.* | | | 187 | | | | 295,840 | |
| | |
Darden Restaurants, Inc. | | | 1,507 | | | | 200,356 | |
| | |
Domino’s Pizza, Inc. | | | 327 | | | | 133,092 | |
See Notes to Financial Statements.
Schedule of Investments (continued)
WisdomTree U.S. LargeCap Fund (EPS)
March 31, 2022
| | | | | | | | |
| Investments | | Shares | | | Value | |
| | |
Hilton Worldwide Holdings, Inc.* | | | 1,437 | | | $ | 218,050 | |
| | |
Marriott International, Inc., Class A* | | | 1,853 | | | | 325,665 | |
| | |
McDonald’s Corp. | | | 9,143 | | | | 2,260,881 | |
| | |
MGM Resorts International | | | 2,327 | | | | 97,594 | |
| | |
Starbucks Corp. | | | 11,881 | | | | 1,080,815 | |
| | |
Vail Resorts, Inc. | | | 287 | | | | 74,697 | |
| | |
Yum! Brands, Inc. | | | 3,756 | | | | 445,199 | |
| | | | | | | | |
| Total Hotels, Restaurants & Leisure | | | | 5,669,984 | |
|
| Household Durables – 0.5% | |
| | |
D.R. Horton, Inc. | | | 13,934 | | | | 1,038,222 | |
| | |
Lennar Corp., Class A | | | 12,501 | | | | 1,014,706 | |
| | |
NVR, Inc.* | | | 65 | | | | 290,373 | |
| | |
PulteGroup, Inc. | | | 10,834 | | | | 453,945 | |
| | |
Whirlpool Corp. | | | 2,535 | | | | 437,997 | |
| | | | | | | | |
| Total Household Durables | | | | 3,235,243 | |
|
| Household Products – 1.0% | |
| | |
Church & Dwight Co., Inc. | | | 2,603 | | | | 258,686 | |
| | |
Clorox Co. | | | 1,455 | | | | 202,289 | |
| | |
Colgate-Palmolive Co. | | | 11,869 | | | | 900,026 | |
| | |
Kimberly-Clark Corp. | | | 5,730 | | | | 705,707 | |
| | |
Procter & Gamble Co. | | | 34,356 | | | | 5,249,597 | |
| | | | | | | | |
| Total Household Products | | | | 7,316,305 | |
|
| Independent Power & Renewable Electricity Producers – 0.1% | |
| | |
AES Corp. | | | 14,180 | | | | 364,851 | |
|
| Industrial Conglomerates – 0.7% | |
| | |
3M Co. | | | 11,934 | | | | 1,776,734 | |
| | |
General Electric Co. | | | 7,215 | | | | 660,172 | |
| | |
Honeywell International, Inc. | | | 9,717 | | | | 1,890,734 | |
| | |
Roper Technologies, Inc. | | | 1,101 | | | | 519,925 | |
| | | | | | | | |
| Total Industrial Conglomerates | | | | 4,847,565 | |
|
| Insurance – 2.5% | |
| | |
Aflac, Inc. | | | 23,352 | | | | 1,503,635 | |
| | |
Allstate Corp. | | | 14,462 | | | | 2,003,132 | |
| | |
American International Group, Inc. | | | 23,580 | | | | 1,480,117 | |
| | |
Arthur J. Gallagher & Co. | | | 1,795 | | | | 313,407 | |
| | |
Brown & Brown, Inc. | | | 2,108 | | | | 152,345 | |
| | |
Cincinnati Financial Corp. | | | 2,230 | | | | 303,191 | |
| | |
Fidelity National Financial, Inc. | | | 13,254 | | | | 647,325 | |
| | |
Hartford Financial Services Group, Inc. | | | 9,797 | | | | 703,522 | |
| | |
Lincoln National Corp. | | | 6,950 | | | | 454,252 | |
| | |
Loews Corp. | | | 6,357 | | | | 412,061 | |
| | |
Markel Corp.* | | | 271 | | | | 399,790 | |
| | |
Marsh & McLennan Cos., Inc. | | | 5,928 | | | | 1,010,250 | |
| | |
MetLife, Inc. | | | 41,749 | | | | 2,934,120 | |
| | |
Principal Financial Group, Inc. | | | 7,404 | | | | 543,528 | |
| | |
Progressive Corp. | | | 8,575 | | | | 977,464 | |
| | |
Prudential Financial, Inc. | | | 18,488 | | | | 2,184,727 | |
| | |
Travelers Cos., Inc. | | | 7,543 | | | | 1,378,332 | |
| | |
W.R. Berkley Corp. | | | 3,524 | | | | 234,630 | |
| | | | | | | | |
| Total Insurance | | | | 17,635,828 | |
|
| Interactive Media & Services – 6.9% | |
| | |
Alphabet, Inc., Class A* | | | 11,472 | | | | 31,907,647 | |
| | |
Match Group, Inc.* | | | 1,686 | | | | 183,336 | |
| | |
Meta Platforms, Inc., Class A* | | | 68,609 | | | | 15,255,897 | |
| | |
Pinterest, Inc., Class A* | | | 5,931 | | | | 145,962 | |
| | |
Snap, Inc., Class A* | | | 7,447 | | | | 268,018 | |
| | |
Twitter, Inc.* | | | 4,376 | | | | 169,307 | |
| | | | | | | | |
| Total Interactive Media & Services | | | | 47,930,167 | |
|
| Internet & Direct Marketing Retail – 4.0% | |
| | |
Amazon.com, Inc.* | | | 8,298 | | | | 27,051,065 | |
| | |
eBay, Inc. | | | 13,935 | | | | 797,918 | |
| | |
Etsy, Inc.* | | | 881 | | | | 109,491 | |
| | |
Wayfair, Inc., Class A*(a) | | | 638 | | | | 70,677 | |
| | | | | | | | |
| Total Internet & Direct Marketing Retail | | | | 28,029,151 | |
|
| IT Services – 2.9% | |
| | |
Akamai Technologies, Inc.* | | | 4,345 | | | | 518,750 | |
| | |
Automatic Data Processing, Inc. | | | 4,038 | | | | 918,806 | |
| | |
Block, Inc.* | | | 2,759 | | | | 374,120 | |
| | |
Broadridge Financial Solutions, Inc. | | | 1,333 | | | | 207,561 | |
| | |
Cloudflare, Inc., Class A* | | | 1,929 | | | | 230,901 | |
| | |
Cognizant Technology Solutions Corp., Class A | | | 10,746 | | | | 963,594 | |
| | |
EPAM Systems, Inc.* | | | 592 | | | | 175,593 | |
| | |
Fiserv, Inc.* | | | 14,013 | | | | 1,420,918 | |
| | |
FleetCor Technologies, Inc.* | | | 2,435 | | | | 606,461 | |
| | |
Gartner, Inc.* | | | 1,360 | | | | 404,546 | |
| | |
GoDaddy, Inc., Class A* | | | 3,267 | | | | 273,448 | |
| | |
International Business Machines Corp. | | | 23,977 | | | | 3,117,490 | |
| | |
MasterCard, Inc., Class A | | | 7,963 | | | | 2,845,817 | |
| | |
MongoDB, Inc.* | | | 462 | | | | 204,939 | |
| | |
Paychex, Inc. | | | 3,380 | | | | 461,269 | |
| | |
PayPal Holdings, Inc.* | | | 15,891 | | | | 1,837,794 | |
| | |
VeriSign, Inc.* | | | 1,616 | | | | 359,495 | |
| | |
Visa, Inc., Class A | | | 22,467 | | | | 4,982,507 | |
| | | | | | | | |
| Total IT Services | | | | 19,904,009 | |
|
| Leisure Products – 0.0% | |
| | |
Hasbro, Inc. | | | 2,255 | | | | 184,730 | |
|
| Life Sciences Tools & Services – 1.2% | |
| | |
Agilent Technologies, Inc. | | | 3,013 | | | | 398,710 | |
| | |
Avantor, Inc.* | | | 6,432 | | | | 217,530 | |
| | |
Bio-Rad Laboratories, Inc., Class A* | | | 216 | | | | 121,658 | |
| | |
Bio-Techne Corp. | | | 245 | | | | 106,095 | |
| | |
Bruker Corp. | | | 1,249 | | | | 80,311 | |
| | |
Charles River Laboratories International, Inc.* | | | 506 | | | | 143,689 | |
| | |
Danaher Corp. | | | 8,007 | | | | 2,348,693 | |
| | |
IQVIA Holdings, Inc.* | | | 2,133 | | | | 493,171 | |
| | |
Mettler-Toledo International, Inc.* | | | 182 | | | | 249,921 | |
| | |
PerkinElmer, Inc. | | | 2,652 | | | | 462,668 | |
| | |
Repligen Corp.* | | | 347 | | | | 65,267 | |
| | |
Thermo Fisher Scientific, Inc. | | | 5,850 | | | | 3,455,302 | |
| | |
Waters Corp.* | | | 684 | | | | 212,307 | |
| | |
West Pharmaceutical Services, Inc. | | | 537 | | | | 220,551 | |
| | | | | | | | |
| Total Life Sciences Tools & Services | | | | 8,575,873 | |
See Notes to Financial Statements.
Schedule of Investments (continued)
WisdomTree U.S. LargeCap Fund (EPS)
March 31, 2022
| | | | | | | | |
| Investments | | Shares | | | Value | |
|
| Machinery – 1.4% | |
| | |
Caterpillar, Inc. | | | 9,912 | | | $ | 2,208,592 | |
| | |
Cummins, Inc. | | | 3,600 | | | | 738,396 | |
| | |
Deere & Co. | | | 5,987 | | | | 2,487,359 | |
| | |
Dover Corp. | | | 2,147 | | | | 336,864 | |
| | |
Fortive Corp. | | | 3,979 | | | | 242,440 | |
| | |
Graco, Inc. | | | 1,741 | | | | 121,383 | |
| | |
IDEX Corp. | | | 569 | | | | 109,094 | |
| | |
Illinois Tool Works, Inc. | | | 4,004 | | | | 838,438 | |
| | |
Ingersoll Rand, Inc. | | | 4,530 | | | | 228,086 | |
| | |
Nordson Corp. | | | 547 | | | | 124,213 | |
| | |
Otis Worldwide Corp. | | | 5,211 | | | | 400,986 | |
| | |
PACCAR, Inc. | | | 6,924 | | | | 609,797 | |
| | |
Parker-Hannifin Corp. | | | 2,329 | | | | 660,877 | |
| | |
Stanley Black & Decker, Inc. | | | 3,670 | | | | 513,029 | |
| | |
Westinghouse Air Brake Technologies Corp. | | | 2,635 | | | | 253,408 | |
| | |
Xylem, Inc. | | | 1,407 | | | | 119,961 | |
| | | | | | | | |
| Total Machinery | | | | 9,992,923 | |
|
| Media – 1.2% | |
| | |
Charter Communications, Inc., Class A* | | | 2,322 | | | | 1,266,698 | |
| | |
Comcast Corp., Class A | | | 96,915 | | | | 4,537,560 | |
| | |
Fox Corp., Class A | | | 15,607 | | | | 615,696 | |
| | |
Interpublic Group of Cos., Inc. | | | 10,323 | | | | 365,951 | |
| | |
Liberty Broadband Corp., Class C* | | | 1,104 | | | | 149,393 | |
| | |
News Corp., Class A | | | 7,249 | | | | 160,565 | |
| | |
Omnicom Group, Inc. | | | 7,120 | | | | 604,346 | |
| | |
Sirius XM Holdings, Inc.(a) | | | 68,602 | | | | 454,145 | |
| | | | | | | | |
| Total Media | | | | 8,154,354 | |
|
| Metals & Mining – 1.1% | |
| | |
Freeport-McMoRan, Inc. | | | 35,535 | | | | 1,767,511 | |
| | |
Newmont Corp. | | | 16,518 | | | | 1,312,355 | |
| | |
Nucor Corp. | | | 13,881 | | | | 2,063,410 | |
| | |
Southern Copper Corp. | | | 18,701 | | | | 1,419,406 | |
| | |
Steel Dynamics, Inc. | | | 9,888 | | | | 824,956 | |
| | | | | | | | |
| Total Metals & Mining | | | | 7,387,638 | |
|
| Multi-Utilities – 0.8% | |
| | |
Ameren Corp. | | | 3,876 | | | | 363,414 | |
| | |
CenterPoint Energy, Inc. | | | 10,893 | | | | 333,762 | |
| | |
CMS Energy Corp. | | | 4,360 | | | | 304,938 | |
| | |
Consolidated Edison, Inc. | | | 6,075 | | | | 575,181 | |
| | |
Dominion Energy, Inc. | | | 14,435 | | | | 1,226,542 | |
| | |
DTE Energy Co. | | | 3,921 | | | | 518,395 | |
| | |
Public Service Enterprise Group, Inc. | | | 9,992 | | | | 699,440 | |
| | |
Sempra Energy | | | 6,897 | | | | 1,159,524 | |
| | |
WEC Energy Group, Inc. | | | 4,920 | | | | 491,065 | |
| | | | | | | | |
| Total Multi-Utilities | | | | 5,672,261 | |
|
| Multiline Retail – 0.5% | |
| | |
Dollar General Corp. | | | 3,863 | | | | 860,020 | |
| | |
Dollar Tree, Inc.* | | | 3,453 | | | | 552,998 | |
| | |
Target Corp. | | | 9,502 | | | | 2,016,514 | |
| | | | | | | | |
| Total Multiline Retail | | | | 3,429,532 | |
|
| Oil, Gas & Consumable Fuels – 3.4% | |
| | |
Chevron Corp. | | | 32,854 | | | | 5,349,617 | |
| | |
ConocoPhillips | | | 23,517 | | | | 2,351,700 | |
| | |
Continental Resources, Inc. | | | 6,955 | | | | 426,550 | |
| | |
Coterra Energy, Inc. | | | 8,677 | | | | 234,019 | |
| | |
Devon Energy Corp. | | | 11,238 | | | | 664,503 | |
| | |
Diamondback Energy, Inc. | | | 4,569 | | | | 626,318 | |
| | |
EOG Resources, Inc. | | | 14,614 | | | | 1,742,427 | |
| | |
Exxon Mobil Corp. | | | 83,625 | | | | 6,906,589 | |
| | |
Hess Corp. | | | 1,709 | | | | 182,931 | |
| | |
Kinder Morgan, Inc. | | | 65,848 | | | | 1,245,186 | |
| | |
Marathon Oil Corp. | | | 10,316 | | | | 259,035 | |
| | |
Marathon Petroleum Corp. | | | 3,587 | | | | 306,688 | |
| | |
Occidental Petroleum Corp. | | | 5,278 | | | | 299,474 | |
| | |
ONEOK, Inc. | | | 8,107 | | | | 572,597 | |
| | |
Phillips 66 | | | 3,195 | | | | 276,016 | |
| | |
Pioneer Natural Resources Co. | | | 4,403 | | | | 1,100,882 | |
| | |
Targa Resources Corp. | | | 2,085 | | | | 157,355 | |
| | |
Williams Cos., Inc. | | | 19,607 | | | | 655,070 | |
| | | | | | | | |
| Total Oil, Gas & Consumable Fuels | | | | 23,356,957 | |
|
| Personal Products – 0.1% | |
| | |
Estee Lauder Cos., Inc., Class A | | | 2,561 | | | | 697,411 | |
| | |
| Pharmaceuticals – 5.0% | | | | | | | | |
| | |
Bristol-Myers Squibb Co. | | | 101,403 | | | | 7,405,461 | |
| | |
Catalent, Inc.* | | | 1,419 | | | | 157,367 | |
| | |
Eli Lilly & Co. | | | 11,114 | | | | 3,182,716 | |
| | |
Johnson & Johnson | | | 56,285 | | | | 9,975,390 | |
| | |
Merck & Co., Inc. | | | 70,144 | | | | 5,755,315 | |
| | |
Pfizer, Inc. | | | 149,349 | | | | 7,731,798 | |
| | |
Zoetis, Inc. | | | 3,391 | | | | 639,509 | |
| | | | | | | | |
| Total Pharmaceuticals | | | | 34,847,556 | |
|
| Professional Services – 0.2% | |
| | |
Equifax, Inc. | | | 1,094 | | | | 259,387 | |
| | |
Jacobs Engineering Group, Inc. | | | 2,001 | | | | 275,758 | |
| | |
Leidos Holdings, Inc. | | | 3,365 | | | | 363,487 | |
| | |
Robert Half International, Inc. | | | 1,386 | | | | 158,254 | |
| | |
TransUnion | | | 1,770 | | | | 182,912 | |
| | |
Verisk Analytics, Inc. | | | 1,184 | | | | 254,122 | |
| | | | | | | | |
| Total Professional Services | | | | 1,493,920 | |
|
| Real Estate Management & Development – 0.1% | |
| | |
CBRE Group, Inc., Class A* | | | 5,928 | | | | 542,531 | |
| | |
Jones Lang LaSalle, Inc.* | | | 1,055 | | | | 252,630 | |
| | | | | | | | |
| Total Real Estate Management & Development | | | | 795,161 | |
|
| Road & Rail – 0.8% | |
| | |
AMERCO | | | 472 | | | | 281,756 | |
| | |
Avis Budget Group, Inc.* | | | 1,264 | | | | 332,811 | |
| | |
CSX Corp. | | | 32,090 | | | | 1,201,771 | |
| | |
JB Hunt Transport Services, Inc. | | | 1,144 | | | | 229,704 | |
| | |
Norfolk Southern Corp. | | | 3,564 | | | | 1,016,524 | |
| | |
Old Dominion Freight Line, Inc. | | | 911 | | | | 272,097 | |
| | |
Union Pacific Corp. | | | 9,226 | | | | 2,520,635 | |
| | | | | | | | |
| Total Road & Rail | | | | 5,855,298 | |
See Notes to Financial Statements.
Schedule of Investments (continued)
WisdomTree U.S. LargeCap Fund (EPS)
March 31, 2022
| | | | | | | | |
| Investments | | Shares | | | Value | |
|
| Semiconductors & Semiconductor Equipment – 5.7% | |
| | |
Advanced Micro Devices, Inc.* | | | 12,546 | | | $ | 1,371,780 | |
| | |
Analog Devices, Inc. | | | 6,052 | | | | 999,669 | |
| | |
Applied Materials, Inc. | | | 16,450 | | | | 2,168,110 | |
| | |
Broadcom, Inc. | | | 7,525 | | | | 4,738,342 | |
| | |
Enphase Energy, Inc.* | | | 1,232 | | | | 248,593 | |
| | |
Entegris, Inc. | | | 2,097 | | | | 275,252 | |
| | |
Intel Corp. | | | 174,350 | | | | 8,640,786 | |
| | |
KLA Corp. | | | 2,648 | | | | 969,327 | |
| | |
Lam Research Corp. | | | 2,563 | | | | 1,377,894 | |
| | |
Marvell Technology, Inc. | | | 5,306 | | | | 380,493 | |
| | |
Microchip Technology, Inc. | | | 10,939 | | | | 821,957 | |
| | |
Micron Technology, Inc. | | | 32,081 | | | | 2,498,789 | |
| | |
Monolithic Power Systems, Inc. | | | 520 | | | | 252,554 | |
| | |
NVIDIA Corp. | | | 25,676 | | | | 7,005,953 | |
| | |
ON Semiconductor Corp.* | | | 8,049 | | | | 503,948 | |
| | |
Qorvo, Inc.* | | | 4,232 | | | | 525,191 | |
| | |
QUALCOMM, Inc. | | | 21,049 | | | | 3,216,708 | |
| | |
Skyworks Solutions, Inc. | | | 5,135 | | | | 684,393 | |
| | |
Teradyne, Inc. | | | 3,582 | | | | 423,500 | |
| | |
Texas Instruments, Inc. | | | 14,290 | | | | 2,621,929 | |
| | | | | | | | |
| Total Semiconductors & Semiconductor Equipment | | | | 39,725,168 | |
|
| Software – 8.0% | |
| | |
Adobe, Inc.* | | | 4,814 | | | | 2,193,355 | |
| | |
ANSYS, Inc.* | | | 1,040 | | | | 330,356 | |
| | |
AppLovin Corp., Class A*(a) | | | 1,735 | | | | 95,546 | |
| | |
Autodesk, Inc.* | | | 1,996 | | | | 427,843 | |
| | |
Bentley Systems, Inc., Class B | | | 4,877 | | | | 215,466 | |
| | |
Bill.com Holdings, Inc.* | | | 773 | | | | 175,309 | |
| | |
Cadence Design Systems, Inc.* | | | 2,831 | | | | 465,586 | |
| | |
Ceridian HCM Holding, Inc.* | | | 1,618 | | | | 110,606 | |
| | |
Crowdstrike Holdings, Inc., Class A* | | | 1,282 | | | | 291,117 | |
| | |
Datadog, Inc., Class A* | | | 1,612 | | | | 244,170 | |
| | |
DocuSign, Inc.* | | | 1,996 | | | | 213,812 | |
| | |
Dynatrace, Inc.* | | | 3,659 | | | | 172,339 | |
| | |
Fortinet, Inc.* | | | 1,372 | | | | 468,867 | |
| | |
HubSpot, Inc.* | | | 336 | | | | 159,580 | |
| | |
Intuit, Inc. | | | 1,818 | | | | 874,167 | |
| | |
Microsoft Corp. | | | 116,267 | | | | 35,846,279 | |
| | |
NortonLifeLock, Inc. | | | 20,522 | | | | 544,243 | |
| | |
Oracle Corp. | | | 59,287 | | | | 4,904,813 | |
| | |
Palo Alto Networks, Inc.*(a) | | | 749 | | | | 466,260 | |
| | |
Paycom Software, Inc.* | | | 612 | | | | 211,985 | |
| | |
Paylocity Holding Corp.* | | | 802 | | | | 165,028 | |
| | |
PTC, Inc.* | | | 2,714 | | | | 292,352 | |
| | |
salesforce.com, Inc.* | | | 7,771 | | | | 1,649,939 | |
| | |
ServiceNow, Inc.* | | | 1,187 | | | | 661,028 | |
| | |
SS&C Technologies Holdings, Inc. | | | 8,309 | | | | 623,341 | |
| | |
Synopsys, Inc.* | | | 1,506 | | | | 501,905 | |
| | |
Trade Desk, Inc., Class A* | | | 3,466 | | | | 240,020 | |
| | |
Tyler Technologies, Inc.* | | | 499 | | | | 222,000 | |
| | |
UiPath, Inc., Class A* | | | 3,454 | | | | 74,572 | |
| | |
VMware, Inc., Class A | | | 11,344 | | | | 1,291,741 | |
| | |
Workday, Inc., Class A* | | | 1,901 | | | | 455,213 | |
| | |
Zendesk, Inc.* | | | 1,988 | | | | 239,136 | |
| | |
Zoom Video Communications, Inc., Class A* | | | 3,759 | | | | 440,668 | |
| | |
Zscaler, Inc.* | | | 974 | | | | 235,007 | |
| | | | | | | | |
| Total Software | | | | 55,503,649 | |
|
| Specialty Retail – 1.8% | |
| | |
Advance Auto Parts, Inc. | | | 1,131 | | | | 234,072 | |
| | |
AutoZone, Inc.* | | | 393 | | | | 803,520 | |
| | |
Bath & Body Works, Inc. | | | 6,549 | | | | 313,042 | |
| | |
Best Buy Co., Inc. | | | 9,142 | | | | 831,008 | |
| | |
Burlington Stores, Inc.* | | | 579 | | | | 105,476 | |
| | |
CarMax, Inc.* | | | 2,783 | | | | 268,504 | |
| | |
Carvana Co.*(a) | | | 495 | | | | 59,049 | |
| | |
Floor & Decor Holdings, Inc., Class A* | | | 793 | | | | 64,233 | |
| | |
Home Depot, Inc. | | | 13,768 | | | | 4,121,175 | |
| | |
Lowe’s Cos., Inc. | | | 11,601 | | | | 2,345,606 | |
| | |
O’Reilly Automotive, Inc.* | | | 1,086 | | | | 743,867 | |
| | |
RH* | | | 399 | | | | 130,110 | |
| | |
Ross Stores, Inc. | | | 4,626 | | | | 418,468 | |
| | |
TJX Cos., Inc. | | | 14,715 | | | | 891,435 | |
| | |
Tractor Supply Co. | | | 1,452 | | | | 338,853 | |
| | |
Ulta Beauty, Inc.* | | | 610 | | | | 242,914 | |
| | |
Williams-Sonoma, Inc. | | | 2,003 | | | | 290,435 | |
| | | | | | | | |
| Total Specialty Retail | | | | 12,201,767 | |
|
| Technology Hardware, Storage & Peripherals – 6.6% | |
| | |
Apple, Inc. | | | 240,241 | | | | 41,948,481 | |
| | |
Hewlett Packard Enterprise Co. | | | 62,056 | | | | 1,036,956 | |
| | |
HP, Inc. | | | 49,292 | | | | 1,789,300 | |
| | |
NetApp, Inc. | | | 6,044 | | | | 501,652 | |
| | |
Western Digital Corp.* | | | 14,987 | | | | 744,104 | |
| | | | | | | | |
| Total Technology Hardware, Storage & Peripherals | | | | 46,020,493 | |
|
| Textiles, Apparel & Luxury Goods – 0.3% | |
| | |
NIKE, Inc., Class B | | | 12,778 | | | | 1,719,408 | |
| | |
VF Corp. | | | 4,313 | | | | 245,237 | |
| | | | | | | | |
| Total Textiles, Apparel & Luxury Goods | | | | 1,964,645 | |
|
| Tobacco – 1.0% | |
| | |
Altria Group, Inc. | | | 67,379 | | | | 3,520,553 | |
| | |
Philip Morris International, Inc. | | | 36,419 | | | | 3,421,201 | |
| | | | | | | | |
| Total Tobacco | | | | 6,941,754 | |
|
| Trading Companies & Distributors – 0.2% | |
| | |
Fastenal Co. | | | 4,627 | | | | 274,844 | |
| | |
United Rentals, Inc.* | | | 1,436 | | | | 510,081 | |
| | |
W.W. Grainger, Inc. | | | 602 | | | | 310,506 | |
| | | | | | | | |
| Total Trading Companies & Distributors | | | | 1,095,431 | |
|
| Water Utilities – 0.1% | |
| | |
American Water Works Co., Inc. | | | 1,563 | | | | 258,723 | |
| | |
Essential Utilities, Inc. | | | 2,511 | | | | 128,388 | |
| | | | | | | | |
| Total Water Utilities | | | | 387,111 | |
| | |
| Wireless Telecommunication Services – 0.2% | | | | | | | | |
| | |
T-Mobile U.S., Inc.* | | | 10,182 | | | | 1,306,860 | |
TOTAL COMMON STOCKS (Cost: $595,009,412) | | | | | | | 695,862,918 | |
See Notes to Financial Statements.
Schedule of Investments (concluded)
WisdomTree U.S. LargeCap Fund (EPS)
March 31, 2022
| | | | | | | | |
| Investments | | Shares | | | Value | |
| | |
| EXCHANGE-TRADED FUND – 0.1% | | | | | | | | |
| | |
| United States – 0.1% | | | | | | | | |
| | |
WisdomTree U.S. High Dividend Fund(b)
(Cost: $322,554) | | | 4,504 | | | $ | 396,757 | |
|
| INVESTMENT OF CASH COLLATERAL FOR SECURITIES LOANED – 0.0% | |
| | |
| United States – 0.0% | | | | | | | | |
| | |
State Street Navigator Securities Lending
Government Money Market Portfolio, 0.25%(c) | | | | | | | | |
| | |
| (Cost: $168,366) | | | 168,366 | | | | 168,366 | |
| | |
TOTAL INVESTMENTS IN SECURITIES – 99.9% (Cost: $595,500,332) | | | | | | | 696,428,041 | |
| | |
Other Assets less Liabilities – 0.1% | | | | | | | 524,808 | |
| | | | | | | | |
| NET ASSETS – 100.0% | | | | | | $ | 696,952,849 | |
| * | Non-income producing security. |
| (a) | Security, or portion thereof, was on loan at March 31, 2022 (See Note 2). At March 31, 2022, the total market value of the Fund’s securities on loan identified in the Schedule of Investments was $1,568,762 and the total market value of the collateral held by the Fund was $1,625,117. The total market value of the collateral includes non-cash U.S. Government securities collateral having a value of $1,456,751. |
| (b) | Affiliated holding. See “Investment in Affiliates” supplementary table included in this Schedule of Investments for additional information. |
| (c) | Rate shown represents annualized 7-day yield as of March 31, 2022. |
Affiliated holdings are investments in entities in which the Fund owns 5% or more of the outstanding voting securities or are investments in entities which are under common ownership or control. Investments in affiliates during the fiscal year ended March 31, 2022 were as follows:
| | | | | | | | | | | | | | | | | | | | | | | | | | | | |
| | | | | | | |
| Affiliate | | Value at
3/31/2021 | | | Purchases/
Additions | | | Sales/
Reductions | | | Realized
Gain/(Loss) | | | Change in
Unrealized
Appreciation/
Depreciation | | | Value at
3/31/2022 | | | Dividend
Income | |
WisdomTree U.S. High Dividend Fund | | $ | 628,636 | | | $ | 3,650,757 | | | $ | 4,069,852 | | | $ | 256,662 | | | $ | (69,446 | ) | | $ | 396,757 | | | $ | 39,020 | |
The following is a summary of the fair valuations according to the inputs used as of March 31, 2022 in valuing the Fund’s investments (See Note 2 — Fair Value Measurement):
| | | | | | | | | | | | | | | | |
| | | | |
| | | Quoted
Prices in
Active
Markets
(Level 1) | | | Other
Significant
Observable
Inputs
(Level 2) | | | Significant
Unobservable
Inputs
(Level 3) | | | Total | |
Assets: | | | | | | | | | | | | |
Investments in Securities | | | | |
Common Stocks | | $ | 695,862,918 | | | $ | — | | | $ | — | | | $ | 695,862,918 | |
Exchange-Traded Fund | | | 396,757 | | | | — | | | | — | | | | 396,757 | |
Investment of Cash Collateral for Securities Loaned | | | — | | | | 168,366 | | | | — | | | | 168,366 | |
Total Investments in Securities | | $ | 696,259,675 | | | $ | 168,366 | | | $ | — | | | $ | 696,428,041 | |
See Notes to Financial Statements.
Schedule of Investments
WisdomTree U.S. MidCap Dividend Fund (DON)
March 31, 2022
| | | | | | | | |
| Investments | | Shares | | | Value | |
| | |
| COMMON STOCKS – 99.8% | | | | | | | | |
| | |
| United States – 99.4% | | | | | | | | |
| | |
| Aerospace & Defense – 0.6% | | | | | | | | |
| | |
BWX Technologies, Inc. | | | 84,667 | | | $ | 4,560,165 | |
| | |
Curtiss-Wright Corp. | | | 7,372 | | | | 1,106,979 | |
| | |
Huntington Ingalls Industries, Inc. | | | 62,629 | | | | 12,490,728 | |
| | |
Textron, Inc. | | | 5,158 | | | | 383,652 | |
| | |
Woodward, Inc. | | | 17,988 | | | | 2,246,881 | |
| | | | | | | | |
| Total Aerospace & Defense | | | | | | | 20,788,405 | |
| | |
| Air Freight & Logistics – 0.5% | | | | | | | | |
| | |
C.H. Robinson Worldwide, Inc. | | | 147,114 | | | | 15,845,649 | |
| | |
| Auto Components – 0.8% | | | | | | | | |
| | |
BorgWarner, Inc. | | | 226,732 | | | | 8,819,875 | |
| | |
Gentex Corp. | | | 299,733 | | | | 8,743,211 | |
| | |
Lear Corp. | | | 54,798 | | | | 7,813,647 | |
| | | | | | | | |
| Total Auto Components | | | | | | | 25,376,733 | |
| | |
| Automobiles – 0.3% | | | | | | | | |
| | |
Harley-Davidson, Inc. | | | 139,608 | | | | 5,500,555 | |
| | |
Thor Industries, Inc. | | | 58,306 | | | | 4,588,682 | |
| | | | | | | | |
| Total Automobiles | | | | | | | 10,089,237 | |
| | |
| Banks – 9.0% | | | | | | | | |
| | |
Bank OZK | | | 269,603 | | | | 11,512,048 | |
| | |
BOK Financial Corp. | | | 122,561 | | | | 11,514,606 | |
| | |
Cadence Bank | | | 264,302 | | | | 7,733,477 | |
| | |
Comerica, Inc. | | | 230,302 | | | | 20,826,210 | |
| | |
Commerce Bancshares, Inc. | | | 139,208 | | | | 9,965,901 | |
| | |
Cullen/Frost Bankers, Inc. | | | 90,205 | | | | 12,485,274 | |
| | |
East West Bancorp, Inc. | | | 193,474 | | | | 15,288,315 | |
| | |
First Citizens BancShares, Inc., Class A | | | 10,663 | | | | 7,097,293 | |
| | |
First Financial Bankshares, Inc. | | | 131,536 | | | | 5,803,368 | |
| | |
First Horizon Corp. | | | 1,073,180 | | | | 25,208,998 | |
| | |
Glacier Bancorp, Inc. | | | 153,362 | | | | 7,711,041 | |
| | |
Hancock Whitney Corp. | | | 92,964 | | | | 4,848,073 | |
| | |
Home BancShares, Inc. | | | 244,848 | | | | 5,533,565 | |
| | |
PacWest Bancorp | | | 207,407 | | | | 8,945,464 | |
| | |
People’s United Financial, Inc. | | | 1,050,259 | | | | 20,994,677 | |
| | |
Pinnacle Financial Partners, Inc. | | | 41,446 | | | | 3,816,348 | |
| | |
Prosperity Bancshares, Inc. | | | 148,689 | | | | 10,316,043 | |
| | |
ServisFirst Bancshares, Inc. | | | 36,224 | | | | 3,451,785 | |
| | |
SouthState Corp. | | | 86,947 | | | | 7,094,006 | |
| | |
Synovus Financial Corp. | | | 248,263 | | | | 12,164,887 | |
| | |
UMB Financial Corp. | | | 56,324 | | | | 5,472,440 | |
| | |
Umpqua Holdings Corp. | | | 750,236 | | | | 14,149,451 | |
| | |
United Bankshares, Inc. | | | 305,185 | | | | 10,644,853 | |
| | |
Valley National Bancorp | | | 660,722 | | | | 8,602,600 | |
| | |
Webster Financial Corp. | | | 212,246 | | | | 11,911,245 | |
| | |
Western Alliance Bancorp | | | 106,898 | | | | 8,853,292 | |
| | |
Wintrust Financial Corp. | | | 54,563 | | | | 5,070,540 | |
| | |
Zions Bancorp NA | | | 197,900 | | | | 12,974,324 | |
| | | | | | | | |
| Total Banks | | | | | | | 289,990,124 | |
| | |
| Beverages – 0.0% | | | | | | | | |
| | |
Coca-Cola Consolidated, Inc. | | | 1,135 | | | | 563,925 | |
| | |
| Building Products – 1.8% | | | | | | | | |
| | |
A.O. Smith Corp. | | | 95,458 | | | | 6,098,812 | |
| | |
AAON, Inc. | | | 30,525 | | | | 1,701,158 | |
| | |
Advanced Drainage Systems, Inc. | | | 20,393 | | | | 2,422,892 | |
| | |
Armstrong World Industries, Inc. | | | 27,761 | | | | 2,498,768 | |
| | |
Carlisle Cos., Inc. | | | 24,168 | | | | 5,943,395 | |
| | |
Fortune Brands Home & Security, Inc. | | | 70,983 | | | | 5,272,617 | |
| | |
Lennox International, Inc. | | | 25,535 | | | | 6,584,455 | |
| | |
Masco Corp. | | | 275,501 | | | | 14,050,551 | |
| | |
Owens Corning | | | 57,743 | | | | 5,283,485 | |
| | |
Simpson Manufacturing Co., Inc. | | | 36,037 | | | | 3,929,474 | |
| | |
UFP Industries, Inc. | | | 48,964 | | | | 3,778,062 | |
| | |
Zurn Water Solutions Corp. | | | 48,192 | | | | 1,705,997 | |
| | | | | | | | |
| Total Building Products | | | | | | | 59,269,666 | |
| | |
| Capital Markets – 4.2% | | | | | | | | |
| | |
Affiliated Managers Group, Inc. | | | 17,062 | | | | 2,404,889 | |
| | |
Ares Management Corp., Class A | | | 229,813 | | | | 18,667,710 | |
| | |
Blue Owl Capital, Inc.(a) | | | 434,754 | | | | 5,512,681 | |
| | |
CBOE Global Markets, Inc. | | | 94,317 | | | | 10,791,751 | |
| | |
Cohen & Steers, Inc. | | | 74,274 | | | | 6,379,394 | |
| | |
Evercore, Inc., Class A | | | 72,581 | | | | 8,079,717 | |
| | |
Franklin Resources, Inc. | | | 994,125 | | | | 27,755,970 | |
| | |
Hamilton Lane, Inc., Class A | | | 34,840 | | | | 2,692,784 | |
| | |
Houlihan Lokey, Inc. | | | 77,861 | | | | 6,836,196 | |
| | |
Interactive Brokers Group, Inc., Class A | | | 27,059 | | | | 1,783,459 | |
| | |
Jefferies Financial Group, Inc. | | | 515,256 | | | | 16,926,159 | |
| | |
LPL Financial Holdings, Inc. | | | 33,568 | | | | 6,132,202 | |
| | |
MarketAxess Holdings, Inc. | | | 15,530 | | | | 5,283,306 | |
| | |
Morningstar, Inc. | | | 14,477 | | | | 3,954,682 | |
| | |
SEI Investments Co. | | | 103,839 | | | | 6,252,146 | |
| | |
Stifel Financial Corp. | | | 69,832 | | | | 4,741,593 | |
| | |
Tradeweb Markets, Inc., Class A | | | 13,989 | | | | 1,229,213 | |
| | | | | | | | |
| Total Capital Markets | | | | | | | 135,423,852 | |
| | |
| Chemicals – 5.6% | | | | | | | | |
| | |
Ashland Global Holdings, Inc. | | | 31,284 | | | | 3,078,659 | |
| | |
Avient Corp. | | | 103,321 | | | | 4,959,408 | |
| | |
Balchem Corp. | | | 10,952 | | | | 1,497,138 | |
| | |
Celanese Corp. | | | 102,121 | | | | 14,590,027 | |
| | |
CF Industries Holdings, Inc. | | | 263,230 | | | | 27,128,484 | |
| | |
Chemours Co. | | | 332,833 | | | | 10,477,583 | |
| | |
Eastman Chemical Co. | | | 186,865 | | | | 20,940,092 | |
| | |
Element Solutions, Inc. | | | 234,651 | | | | 5,138,857 | |
| | |
FMC Corp. | | | 124,813 | | | | 16,421,646 | |
| | |
Huntsman Corp. | | | 265,567 | | | | 9,961,418 | |
| | |
Mosaic Co. | | | 165,111 | | | | 10,979,882 | |
| | |
Olin Corp. | | | 217,790 | | | | 11,386,061 | |
| | |
Quaker Chemical Corp. | | | 5,030 | | | | 869,234 | |
| | |
RPM International, Inc. | | | 116,714 | | | | 9,505,188 | |
| | |
Scotts Miracle-Gro Co.(a) | | | 65,655 | | | | 8,072,939 | |
| | |
Sensient Technologies Corp. | | | 52,584 | | | | 4,414,427 | |
| | |
Valvoline, Inc. | | | 244,433 | | | | 7,714,306 | |
| | |
Westlake Corp. | | | 99,826 | | | | 12,318,528 | |
| | | | | | | | |
| Total Chemicals | | | | | | | 179,453,877 | |
See Notes to Financial Statements.
Schedule of Investments (continued)
WisdomTree U.S. MidCap Dividend Fund (DON)
March 31, 2022
| | | | | | | | |
| Investments | | Shares | | | Value | |
| | |
| Commercial Services & Supplies – 0.6% | | | | | | | | |
| | |
MSA Safety, Inc. | | | 33,380 | | | $ | 4,429,526 | |
| | |
Rollins, Inc. | | | 327,304 | | | | 11,472,005 | |
| | |
Tetra Tech, Inc. | | | 24,881 | | | | 4,103,872 | |
| | | | | | | | |
| Total Commercial Services & Supplies | | | | | | | 20,005,403 | |
| | |
| Communications Equipment – 0.6% | | | | | | | | |
| | |
Juniper Networks, Inc. | | | 497,802 | | | | 18,498,322 | |
| | |
| Construction & Engineering – 0.7% | | | | | | | | |
| | |
EMCOR Group, Inc. | | | 7,645 | | | | 861,056 | |
| | |
MDU Resources Group, Inc. | | | 559,467 | | | | 14,909,796 | |
| | |
Quanta Services, Inc. | | | 24,504 | | | | 3,224,971 | |
| | |
Valmont Industries, Inc. | | | 12,988 | | | | 3,098,937 | |
| | | | | | | | |
| Total Construction & Engineering | | | | | | | 22,094,760 | |
| | |
| Construction Materials – 0.1% | | | | | | | | |
| | |
Eagle Materials, Inc. | | | 18,074 | | | | 2,319,979 | |
| | |
| Consumer Finance – 1.6% | | | | | | | | |
| | |
Ally Financial, Inc. | | | 412,563 | | | | 17,938,239 | |
| | |
OneMain Holdings, Inc. | | | 579,419 | | | | 27,470,255 | |
| | |
SLM Corp.(a) | | | 360,813 | | | | 6,624,527 | |
| | | | | | | | |
| Total Consumer Finance | | | | | | | 52,033,021 | |
| | |
| Containers & Packaging – 2.5% | | | | | | | | |
| | |
AptarGroup, Inc. | | | 41,932 | | | | 4,927,010 | |
| | |
Crown Holdings, Inc. | | | 53,797 | | | | 6,729,467 | |
| | |
Graphic Packaging Holding Co. | | | 270,737 | | | | 5,425,570 | |
| | |
Packaging Corp. of America | | | 153,298 | | | | 23,931,351 | |
| | |
Sealed Air Corp. | | | 120,664 | | | | 8,079,661 | |
| | |
Silgan Holdings, Inc. | | | 105,014 | | | | 4,854,797 | |
| | |
Sonoco Products Co. | | | 181,941 | | | | 11,382,229 | |
| | |
Westrock Co. | | | 315,938 | | | | 14,858,564 | |
| | | | | | | | |
| Total Containers & Packaging | | | | | | | 80,188,649 | |
| | |
| Distributors – 0.4% | | | | | | | | |
| | |
LKQ Corp. | | | 278,590 | | | | 12,650,772 | |
| | |
| Diversified Consumer Services – 1.0% | | | | | | | | |
| | |
ADT, Inc. | | | 656,552 | | | | 4,983,230 | |
| | |
H&R Block, Inc.(a) | | | 484,589 | | | | 12,618,697 | |
| | |
Service Corp. International | | | 202,018 | | | | 13,296,825 | |
| | | | | | | | |
| Total Diversified Consumer Services | | | | | | | 30,898,752 | |
| | |
| Diversified Financial Services – 0.2% | | | | | | | | |
| | |
Voya Financial, Inc.(a) | | | 76,516 | | | | 5,076,837 | |
| | |
| Electric Utilities – 4.7% | | | | | | | | |
| | |
Alliant Energy Corp. | | | 383,382 | | | | 23,953,708 | |
| | |
Evergy, Inc. | | | 652,241 | | | | 44,574,150 | |
| | |
Hawaiian Electric Industries, Inc. | | | 232,788 | | | | 9,849,260 | |
| | |
IDACORP, Inc. | | | 112,756 | | | | 13,007,532 | |
| | |
NRG Energy, Inc. | | | 476,509 | | | | 18,278,885 | |
| | |
OGE Energy Corp. | | | 743,681 | | | | 30,327,311 | |
| | |
Portland General Electric Co. | | | 188,630 | | | | 10,402,945 | |
| | | | | | | | |
| Total Electric Utilities | | | | | | | 150,393,791 | |
| | |
| Electrical Equipment – 0.7% | | | | | | | | |
| | |
Acuity Brands, Inc. | | | 2,060 | | | | 389,958 | |
| | |
Hubbell, Inc. | | | 67,795 | | | | 12,458,687 | |
| | |
Regal Rexnord Corp. | | | 52,941 | | | | 7,876,562 | |
| | |
Vertiv Holdings Co. | | | 13,860 | | | | 194,040 | |
| | | | | | | | |
| Total Electrical Equipment | | | | 20,919,247 | |
|
| Electronic Equipment, Instruments & Components – 0.7% | |
| | |
Cognex Corp. | | | 26,299 | | | | 2,028,968 | |
| | |
Jabil, Inc. | | | 55,194 | | | | 3,407,125 | |
| | |
Littelfuse, Inc. | | | 12,921 | | | | 3,222,626 | |
| | |
National Instruments Corp. | | | 219,335 | | | | 8,902,808 | |
| | |
TD SYNNEX Corp. | | | 35,003 | | | | 3,612,660 | |
| | |
Vontier Corp. | | | 25,535 | | | | 648,334 | |
| | | | | | | | |
| Total Electronic Equipment, Instruments & Components | | | | 21,822,521 | |
| | |
| Energy Equipment & Services – 0.2% | | | | | | | | |
| | |
NOV, Inc. | | | 358,589 | | | | 7,031,930 | |
| | |
| Entertainment – 0.1% | | | | | | | | |
| | |
Warner Music Group Corp., Class A | | | 85,659 | | | | 3,242,193 | |
|
| Equity Real Estate Investment Trusts (REITs) – 9.8% | |
| | |
Agree Realty Corp. | | | 46,129 | | | | 3,061,120 | |
| | |
American Campus Communities, Inc. | | | 116,551 | | | | 6,523,359 | |
| | |
American Homes 4 Rent, Class A | | | 83,064 | | | | 3,325,052 | |
| | |
Americold Realty Trust | | | 126,475 | | | | 3,526,123 | |
| | |
Apartment Income REIT Corp. | | | 107,088 | | | | 5,724,924 | |
| | |
Brixmor Property Group, Inc. | | | 366,951 | | | | 9,471,005 | |
| | |
Broadstone Net Lease, Inc. | | | 204,307 | | | | 4,449,806 | |
| | |
Cousins Properties, Inc. | | | 101,355 | | | | 4,083,593 | |
| | |
CubeSmart | | | 227,643 | | | | 11,844,265 | |
| | |
Douglas Emmett, Inc. | | | 144,277 | | | | 4,821,737 | |
| | |
EastGroup Properties, Inc. | | | 25,589 | | | | 5,201,732 | |
| | |
Equity LifeStyle Properties, Inc. | | | 88,751 | | | | 6,787,677 | |
| | |
Federal Realty Investment Trust | | | 52,198 | | | | 6,371,810 | |
| | |
First Industrial Realty Trust, Inc. | | | 61,737 | | | | 3,822,138 | |
| | |
Gaming and Leisure Properties, Inc. | | | 436,105 | | | | 20,466,408 | |
| | |
Healthcare Realty Trust, Inc. | | | 141,516 | | | | 3,888,860 | |
| | |
Healthcare Trust of America, Inc., Class A | | | 236,562 | | | | 7,413,853 | |
| | |
Highwoods Properties, Inc. | | | 144,453 | | | | 6,607,280 | |
| | |
Innovative Industrial Properties, Inc. | | | 14,640 | | | | 3,007,056 | |
| | |
Iron Mountain, Inc. | | | 482,426 | | | | 26,731,225 | |
| | |
Kilroy Realty Corp. | | | 99,723 | | | | 7,620,832 | |
| | |
Kimco Realty Corp. | | | 547,040 | | | | 13,511,888 | |
| | |
Kite Realty Group Trust | | | 129,139 | | | | 2,940,495 | |
| | |
Lamar Advertising Co., Class A | | | 88,081 | | | | 10,233,251 | |
| | |
Life Storage, Inc. | | | 68,959 | | | | 9,683,912 | |
| | |
LXP Industrial Trust | | | 332,898 | | | | 5,226,499 | |
| | |
Macerich Co. | | | 104,317 | | | | 1,631,518 | |
| | |
National Retail Properties, Inc. | | | 234,004 | | | | 10,516,140 | |
| | |
National Storage Affiliates Trust | | | 67,192 | | | | 4,216,970 | |
| | |
Omega Healthcare Investors, Inc. | | | 432,294 | | | | 13,470,281 | |
| | |
Physicians Realty Trust | | | 249,193 | | | | 4,370,845 | |
| | |
PS Business Parks, Inc. | | | 16,225 | | | | 2,727,098 | |
| | |
Rayonier, Inc. | | | 105,830 | | | | 4,351,730 | |
| | |
Regency Centers Corp. | | | 119,090 | | | | 8,495,881 | |
| | |
Rexford Industrial Realty, Inc. | | | 52,995 | | | | 3,952,897 | |
See Notes to Financial Statements.
Schedule of Investments (continued)
WisdomTree U.S. MidCap Dividend Fund (DON)
March 31, 2022
| | | | | | | | |
| Investments | | Shares | | | Value | |
| | |
Safehold, Inc. | | | 22,936 | | | $ | 1,271,801 | |
| | |
SL Green Realty Corp.(a) | | | 92,830 | | | | 7,535,939 | |
| | |
Spirit Realty Capital, Inc. | | | 195,034 | | | | 8,975,465 | |
| | |
STAG Industrial, Inc. | | | 169,176 | | | | 6,995,428 | |
| | |
STORE Capital Corp. | | | 358,843 | | | | 10,488,981 | |
| | |
Terreno Realty Corp. | | | 51,247 | | | | 3,794,840 | |
| | |
W.P. Carey, Inc. | | | 303,867 | | | | 24,564,608 | |
| | | | | | | | |
| Total Equity Real Estate Investment Trusts (REITs) | | | | 313,706,322 | |
|
| Food & Staples Retailing – 0.7% | |
| | |
Albertsons Cos., Inc., Class A | | | 547,373 | | | | 18,200,152 | |
| | |
Casey’s General Stores, Inc. | | | 19,646 | | | | 3,893,248 | |
| | | | | | | | |
| Total Food & Staples Retailing | | | | 22,093,400 | |
|
| Food Products – 3.7% | |
| | |
Campbell Soup Co. | | | 598,249 | | | | 26,663,958 | |
| | |
Conagra Brands, Inc. | | | 1,072,150 | | | | 35,992,076 | |
| | |
Flowers Foods, Inc. | | | 624,038 | | | | 16,044,017 | |
| | |
Ingredion, Inc. | | | 111,061 | | | | 9,678,966 | |
| | |
J.M. Smucker Co. | | | 180,728 | | | | 24,472,379 | |
| | |
Lancaster Colony Corp. | | | 33,267 | | | | 4,961,773 | |
| | |
Seaboard Corp. | | | 54 | | | | 227,096 | |
| | | | | | | | |
| Total Food Products | | | | 118,040,265 | |
|
| Gas Utilities – 1.9% | |
| | |
Atmos Energy Corp. | | | 209,115 | | | | 24,987,151 | |
| | |
National Fuel Gas Co. | | | 243,899 | | | | 16,755,861 | |
| | |
UGI Corp. | | | 549,979 | | | | 19,920,240 | |
| | | | | | | | |
| Total Gas Utilities | | | | 61,663,252 | |
|
| Health Care Equipment & Supplies – 0.3% | |
| | |
Dentsply Sirona, Inc. | | | 101,934 | | | | 5,017,191 | |
| | |
Teleflex, Inc. | | | 9,307 | | | | 3,302,403 | |
| | | | | | | | |
| Total Health Care Equipment & Supplies | | | | 8,319,594 | |
|
| Health Care Providers & Services – 1.8% | |
| | |
Cardinal Health, Inc. | | | 660,805 | | | | 37,467,643 | |
| | |
Chemed Corp. | | | 3,074 | | | | 1,557,135 | |
| | |
Encompass Health Corp. | | | 94,458 | | | | 6,716,908 | |
| | |
Ensign Group, Inc. | | | 16,514 | | | | 1,486,425 | |
| | |
Premier, Inc., Class A | | | 202,401 | | | | 7,203,452 | |
| | |
Universal Health Services, Inc., Class B | | | 21,427 | | | | 3,105,844 | |
| | | | | | | | |
| Total Health Care Providers & Services | | | | 57,537,407 | |
|
| Hotels, Restaurants & Leisure – 1.8% | |
| | |
Aramark | | | 180,373 | | | | 6,782,025 | |
| | |
Choice Hotels International, Inc. | | | 24,768 | | | | 3,511,112 | |
| | |
Churchill Downs, Inc. | | | 10,690 | | | | 2,370,828 | |
| | |
Marriott Vacations Worldwide Corp. | | | 33,312 | | | | 5,253,302 | |
| | |
Papa John’s International, Inc. | | | 28,985 | | | | 3,051,541 | |
| | |
Texas Roadhouse, Inc. | | | 72,320 | | | | 6,055,354 | |
| | |
Travel + Leisure Co. | | | 151,834 | | | | 8,797,262 | |
| | |
Vail Resorts, Inc. | | | 22,050 | | | | 5,738,953 | |
| | |
Wendy’s Co. | | | 248,609 | | | | 5,461,940 | |
| | |
Wingstop, Inc. | | | 10,917 | | | | 1,281,110 | |
| | |
Wyndham Hotels & Resorts, Inc. | | | 118,076 | | | | 9,999,856 | |
| | | | | | | | |
| Total Hotels, Restaurants & Leisure | | | | 58,303,283 | |
|
| Household Durables – 1.9% | |
| | |
Leggett & Platt, Inc. | | | 318,658 | | | | 11,089,298 | |
| | |
Newell Brands, Inc. | | | 1,031,704 | | | | 22,088,783 | |
| | |
PulteGroup, Inc. | | | 137,449 | | | | 5,759,113 | |
| | |
Tempur Sealy International, Inc. | | | 116,136 | | | | 3,242,517 | |
| | |
Toll Brothers, Inc. | | | 74,002 | | | | 3,479,574 | |
| | |
Whirlpool Corp. | | | 81,722 | | | | 14,119,927 | |
| | | | | | | | |
| Total Household Durables | | | | 59,779,212 | |
|
| Household Products – 0.5% | |
| | |
Reynolds Consumer Products, Inc.(a) | | | 395,441 | | | | 11,602,239 | |
| | |
Spectrum Brands Holdings, Inc.(a) | | | 48,709 | | | | 4,321,462 | |
| | | | | | | | |
| Total Household Products | | | | 15,923,701 | |
|
| Independent Power & Renewable Electricity Producers – 1.2% | |
| | |
AES Corp. | | | 908,073 | | | | 23,364,718 | |
| | |
Clearway Energy, Inc., Class C(a) | | | 384,652 | | | | 14,043,645 | |
| | |
Ormat Technologies, Inc.(a) | | | 20,240 | | | | 1,656,239 | |
| | | | | | | | |
| Total Independent Power & Renewable Electricity Producers | | | | 39,064,602 | |
|
| Insurance – 7.3% | |
| | |
American Financial Group, Inc. | | | 117,787 | | | | 17,152,143 | |
| | |
Assurant, Inc. | | | 57,548 | | | | 10,463,953 | |
| | |
CNA Financial Corp. | | | 550,580 | | | | 26,769,200 | |
| | |
Erie Indemnity Co., Class A | | | 60,611 | | | | 10,675,415 | |
| | |
Fidelity National Financial, Inc. | | | 829,730 | | | | 40,524,013 | |
| | |
First American Financial Corp. | | | 237,409 | | | | 15,388,851 | |
| | |
Globe Life, Inc. | | | 48,815 | | | | 4,910,789 | |
| | |
Hanover Insurance Group, Inc. | | | 63,098 | | | | 9,434,413 | |
| | |
Kinsale Capital Group, Inc. | | | 2,708 | | | | 617,478 | |
| | |
Lincoln National Corp. | | | 264,371 | | | | 17,279,289 | |
| | |
Loews Corp. | | | 51,868 | | | | 3,362,084 | |
| | |
Old Republic International Corp. | | | 903,039 | | | | 23,361,619 | |
| | |
Primerica, Inc. | | | 39,044 | | | | 5,342,000 | |
| | |
Reinsurance Group of America, Inc. | | | 100,298 | | | | 10,978,619 | |
| | |
RLI Corp. | | | 35,193 | | | | 3,893,402 | |
| | |
Selective Insurance Group, Inc. | | | 71,242 | | | | 6,366,185 | |
| | |
Unum Group | | | 601,695 | | | | 18,959,409 | |
| | |
W.R. Berkley Corp. | | | 146,950 | | | | 9,785,367 | |
| | | | | | | | |
| Total Insurance | | | | 235,264,229 | |
|
| Internet & Direct Marketing Retail – 0.0% | |
| | |
Shutterstock, Inc. | | | 10,300 | | | | 958,724 | |
|
| IT Services – 0.6% | |
| | |
Concentrix Corp. | | | 25,979 | | | | 4,327,062 | |
| | |
Jack Henry & Associates, Inc. | | | 44,558 | | | | 8,780,154 | |
| | |
Maximus, Inc. | | | 41,503 | | | | 3,110,650 | |
| | |
Switch, Inc., Class A | | | 40,643 | | | | 1,252,617 | |
| | |
TTEC Holdings, Inc. | | | 39,387 | | | | 3,250,215 | |
| | | | | | | | |
| Total IT Services | | | | 20,720,698 | |
|
| Leisure Products – 1.1% | |
| | |
Acushnet Holdings Corp. | | | 81,663 | | | | 3,287,752 | |
| | |
Brunswick Corp. | | | 70,396 | | | | 5,694,333 | |
| | |
Hasbro, Inc. | | | 209,295 | | | | 17,145,446 | |
See Notes to Financial Statements.
Schedule of Investments (continued)
WisdomTree U.S. MidCap Dividend Fund (DON)
March 31, 2022
| | | | | | | | |
| Investments | | Shares | | | Value | |
| | |
Polaris, Inc.(a) | | | 85,609 | | | $ | 9,016,340 | |
| | | | | | | | |
| Total Leisure Products | | | | 35,143,871 | |
|
| Life Sciences Tools & Services – 0.1% | |
| | |
Azenta, Inc. | | | 24,585 | | | | 2,037,605 | |
| | |
Bruker Corp. | | | 37,721 | | | | 2,425,460 | |
| | | | | | | | |
| Total Life Sciences Tools & Services | | | | 4,463,065 | |
|
| Machinery – 3.0% | |
| | |
AGCO Corp. | | | 36,977 | | | | 5,399,751 | |
| | |
Crane Co. | | | 78,794 | | | | 8,531,814 | |
| | |
Donaldson Co., Inc. | | | 163,123 | | | | 8,470,977 | |
| | |
Franklin Electric Co., Inc. | | | 39,862 | | | | 3,310,140 | |
| | |
Graco, Inc. | | | 132,041 | | | | 9,205,899 | |
| | |
ITT, Inc. | | | 52,037 | | | | 3,913,703 | |
| | |
John Bean Technologies Corp. | | | 571 | | | | 67,646 | |
| | |
Lincoln Electric Holdings, Inc. | | | 89,571 | | | | 12,343,780 | |
| | |
Nordson Corp. | | | 35,797 | | | | 8,128,783 | |
| | |
Oshkosh Corp. | | | 44,901 | | | | 4,519,286 | |
| | |
Snap-on, Inc. | | | 79,294 | | | | 16,293,331 | |
| | |
Timken Co. | | | 88,278 | | | | 5,358,475 | |
| | |
Toro Co. | | | 101,780 | | | | 8,701,172 | |
| | |
Watts Water Technologies, Inc., Class A | | | 12,275 | | | | 1,713,467 | |
| | | | | | | | |
| Total Machinery | | | | 95,958,224 | |
|
| Media – 3.0% | |
| | |
Cable One, Inc. | | | 1,700 | | | | 2,489,208 | |
| | |
Interpublic Group of Cos., Inc. | | | 719,812 | | | | 25,517,335 | |
| | |
New York Times Co., Class A | | | 60,344 | | | | 2,766,169 | |
| | |
News Corp., Class A | | | 303,377 | | | | 6,719,801 | |
| | |
Nexstar Media Group, Inc., Class A | | | 66,025 | | | | 12,444,392 | |
| | |
Omnicom Group, Inc. | | | 475,158 | | | | 40,331,411 | |
| | |
TEGNA, Inc. | | | 319,401 | | | | 7,154,582 | |
| | | | | | | | |
| Total Media | | | | 97,422,898 | |
|
| Metals & Mining – 1.7% | |
| | |
Alcoa Corp. | | | 80,051 | | | | 7,206,992 | |
| | |
Reliance Steel & Aluminum Co. | | | 101,127 | | | | 18,541,635 | |
| | |
Royal Gold, Inc. | | | 53,325 | | | | 7,533,756 | |
| | |
Steel Dynamics, Inc. | | | 210,335 | | | | 17,548,249 | |
| | |
United States Steel Corp. | | | 108,449 | | | | 4,092,865 | |
| | | | | | | | |
| Total Metals & Mining | | | | 54,923,497 | |
|
| Multi-Utilities – 1.9% | |
| | |
Black Hills Corp. | | | 142,377 | | | | 10,965,877 | |
| | |
CenterPoint Energy, Inc. | | | 851,107 | | | | 26,077,918 | |
| | |
NiSource, Inc. | | | 766,764 | | | | 24,383,095 | |
| | | | | | | | |
| Total Multi-Utilities | | | | 61,426,890 | |
|
| Multiline Retail – 0.6% | |
| | |
Dillard’s, Inc., Class A | | | 2,226 | | | | 597,436 | |
| | |
Kohl’s Corp. | | | 154,649 | | | | 9,350,078 | |
| | |
Macy’s, Inc. | | | 351,927 | | | | 8,572,942 | |
| | | | | | | | |
| Total Multiline Retail | | | | 18,520,456 | |
|
| Oil, Gas & Consumable Fuels – 8.0% | |
| | |
Antero Midstream Corp. | | | 2,658,234 | | | | 28,895,004 | |
| | |
APA Corp. | | | 421,763 | | | | 17,431,465 | |
| | |
Chesapeake Energy Corp.(a) | | | 194,799 | | | | 16,947,513 | |
| | |
Civitas Resources, Inc. | | | 224,783 | | | | 13,421,793 | |
| | |
Continental Resources, Inc.(a) | | | 549,548 | | | | 33,703,779 | |
| | |
Coterra Energy, Inc. | | | 1,219,010 | | | | 32,876,700 | |
| | |
DTE Midstream LLC | | | 264,521 | | | | 14,352,909 | |
| | |
Equitrans Midstream Corp. | | | 1,433,470 | | | | 12,098,487 | |
| | |
HF Sinclair Corp.* | | | 367,145 | | | | 14,630,728 | |
| | |
Marathon Oil Corp. | | | 727,223 | | | | 18,260,569 | |
| | |
Matador Resources Co. | | | 36,711 | | | | 1,944,949 | |
| | |
Murphy Oil Corp.(a) | | | 160,324 | | | | 6,475,486 | |
| | |
Ovintiv, Inc. | | | 354,881 | | | | 19,188,416 | |
| | |
PDC Energy, Inc.(a) | | | 78,628 | | | | 5,714,683 | |
| | |
Targa Resources Corp. | | | 166,762 | | | | 12,585,528 | |
| | |
Texas Pacific Land Corp.(a) | | | 5,750 | | | | 7,774,632 | |
| | | | | | | | |
| Total Oil, Gas & Consumable Fuels | | | | 256,302,641 | |
|
| Paper & Forest Products – 0.2% | |
| | |
Louisiana-Pacific Corp. | | | 88,014 | | | | 5,467,430 | |
|
| Pharmaceuticals – 0.9% | |
| | |
Organon & Co. | | | 826,778 | | | | 28,879,356 | |
|
| Professional Services – 2.1% | |
| | |
Booz Allen Hamilton Holding Corp. | | | 122,420 | | | | 10,753,373 | |
| | |
Exponent, Inc. | | | 34,187 | | | | 3,693,905 | |
| | |
Insperity, Inc. | | | 58,641 | | | | 5,888,729 | |
| | |
KBR, Inc. | | | 97,053 | | | | 5,311,711 | |
| | |
Korn Ferry | | | 11,533 | | | | 748,953 | |
| | |
Leidos Holdings, Inc. | | | 119,692 | | | | 12,929,130 | |
| | |
ManpowerGroup, Inc. | | | 91,927 | | | | 8,633,784 | |
| | |
Robert Half International, Inc. | | | 130,930 | | | | 14,949,587 | |
| | |
Science Applications International Corp. | | | 56,552 | | | | 5,212,398 | |
| | | | | | | | |
| Total Professional Services | | | | 68,121,570 | |
|
| Real Estate Management & Development – 0.0% | |
| | |
eXp World Holdings, Inc.(a) | | | 2,080 | | | | 44,034 | |
|
| Road & Rail – 0.5% | |
| | |
Knight-Swift Transportation Holdings, Inc. | | | 52,546 | | | | 2,651,471 | |
| | |
Landstar System, Inc. | | | 15,157 | | | | 2,286,131 | |
| | |
Ryder System, Inc. | | | 136,573 | | | | 10,834,336 | |
| | | | | | | | |
| Total Road & Rail | | | | 15,771,938 | |
|
| Semiconductors & Semiconductor Equipment – 0.4% | |
| | |
Amkor Technology, Inc. | | | 159,249 | | | | 3,458,888 | |
| | |
MKS Instruments, Inc. | | | 23,453 | | | | 3,517,950 | |
| | |
Power Integrations, Inc. | | | 37,547 | | | | 3,479,856 | |
| | |
Universal Display Corp. | | | 10,274 | | | | 1,715,245 | |
| | | | | | | | |
| Total Semiconductors & Semiconductor Equipment | | | | 12,171,939 | |
|
| Software – 1.3% | |
| | |
Bentley Systems, Inc., Class B | | | 25,322 | | | | 1,118,726 | |
| | |
CDK Global, Inc. | | | 87,410 | | | | 4,255,119 | |
| | |
Citrix Systems, Inc. | | | 122,815 | | | | 12,392,033 | |
| | |
Dolby Laboratories, Inc., Class A | | | 56,434 | | | | 4,414,267 | |
| | |
NortonLifeLock, Inc. | | | 715,853 | | | | 18,984,422 | |
| | |
Pegasystems, Inc. | | | 10,386 | | | | 837,631 | |
| | | | | | | | |
| Total Software | | | | 42,002,198 | |
See Notes to Financial Statements.
Schedule of Investments (concluded)
WisdomTree U.S. MidCap Dividend Fund (DON)
March 31, 2022
| | | | | | | | |
| Investments | | Shares | | | Value | |
|
| Specialty Retail – 2.2% | |
| | |
Advance Auto Parts, Inc. | | | 58,721 | | | $ | 12,152,898 | |
| | |
American Eagle Outfitters, Inc.(a) | | | 252,746 | | | | 4,246,133 | |
| | |
Dick’s Sporting Goods, Inc.(a) | | | 96,156 | | | | 9,617,523 | |
| | |
Foot Locker, Inc. | | | 160,660 | | | | 4,765,176 | |
| | |
Gap, Inc. | | | 549,181 | | | | 7,732,468 | |
| | |
Lithia Motors, Inc. | | | 8,317 | | | | 2,496,098 | |
| | |
Murphy USA, Inc. | | | 14,012 | | | | 2,801,840 | |
| | |
Penske Automotive Group, Inc. | | | 127,302 | | | | 11,930,743 | |
| | |
Williams-Sonoma, Inc. | | | 101,755 | | | | 14,754,475 | |
| | | | | | | | |
| Total Specialty Retail | | | | 70,497,354 | |
|
| Textiles, Apparel & Luxury Goods – 1.3% | |
| | |
Carter’s, Inc. | | | 55,579 | | | | 5,112,712 | |
| | |
Columbia Sportswear Co. | | | 51,370 | | | | 4,650,526 | |
| | |
Hanesbrands, Inc.(a) | | | 739,453 | | | | 11,010,455 | |
| | |
PVH Corp. | | | 5,790 | | | | 443,572 | |
| | |
Ralph Lauren Corp. | | | 56,856 | | | | 6,449,745 | |
| | |
Tapestry, Inc. | | | 353,470 | | | | 13,131,411 | |
| | | | | | | | |
| Total Textiles, Apparel & Luxury Goods | | | | 40,798,421 | |
|
| Thrifts & Mortgage Finance – 1.3% | |
| | |
MGIC Investment Corp. | | | 381,580 | | | | 5,170,409 | |
| | |
New York Community Bancorp, Inc.(a) | | | 1,413,711 | | | | 15,154,982 | |
| | |
TFS Financial Corp. | | | 1,008,559 | | | | 16,742,080 | |
| | |
Walker & Dunlop, Inc. | | | 31,553 | | | | 4,083,589 | |
| | | | | | | | |
| Total Thrifts & Mortgage Finance | | | | 41,151,060 | |
|
| Trading Companies & Distributors – 0.9% | |
| | |
Air Lease Corp. | | | 107,149 | | | | 4,784,203 | |
| | |
Herc Holdings, Inc. | | | 16,013 | | | | 2,675,612 | |
| | |
Watsco, Inc.(a) | | | 74,800 | | | | 22,787,072 | |
| | | | | | | | |
| Total Trading Companies & Distributors | | | | 30,246,887 | |
|
| Water Utilities – 0.5% | |
| | |
Essential Utilities, Inc. | | | 326,581 | | | | 16,698,087 | |
| Total United States | | | | | | | 3,191,364,150 | |
| Puerto Rico – 0.4% | | | | | | | | |
| Banks – 0.4% | | | | | | | | |
| | |
Popular, Inc. | | | 157,888 | | | | 12,905,765 | |
TOTAL COMMON STOCKS (Cost: $2,705,987,353) | | | | | | | 3,204,269,915 | |
| | |
| EXCHANGE-TRADED FUND – 0.0% | | | | | | | | |
| | |
| United States – 0.0% | | | | | | | | |
| | |
WisdomTree U.S. LargeCap Dividend Fund(a)(b)
(Cost: $502,866) | | | 9,792 | | | | 643,530 | |
|
| INVESTMENT OF CASH COLLATERAL FOR SECURITIES LOANED – 1.1% | |
| | |
| United States – 1.1% | | | | | | | | |
| |
State Street Navigator Securities Lending
Government Money Market Portfolio, 0.25%(c) | | | | | |
| (Cost: $34,316,751) | | | 34,316,751 | | | | 34,316,751 | |
| |
TOTAL INVESTMENTS IN SECURITIES – 100.9% (Cost: $2,740,806,970) | | | | 3,239,230,196 | |
| |
Other Assets less Liabilities – (0.9)% | | | | (28,631,457 | ) |
| | | | | | | | |
| NET ASSETS – 100.0% | | | $ | 3,210,598,739 | |
| * | Non-income producing security. |
| (a) | Security, or portion thereof, was on loan at March 31, 2022 (See Note 2). At March 31, 2022, the total market value of the Fund’s securities on loan identified in the Schedule of Investments was $136,612,198 and the total market value of the collateral held by the Fund was $144,364,020. The total market value of the collateral includes non-cash U.S. Government and U.S. Government Agencies securities collateral having a value of $110,047,269. |
| (b) | Affiliated holding. See “Investment in Affiliates” supplementary table included in this Schedule of Investments for additional information. |
| (c) | Rate shown represents annualized 7-day yield as of March 31, 2022. |
Affiliated holdings are investments in entities in which the Fund owns 5% or more of the outstanding voting securities or are investments in entities which are under common ownership or control. Investments in affiliates during the fiscal year ended March 31, 2022 were as follows:
| | | | | | | | | | | | | | | | | | | | | | | | | | | | |
| | | | | | | |
| Affiliate | | Value at
3/31/2021 | | | Purchases/
Additions | | | Sales/
Reductions | | | Realized
Gain/(Loss) | | | Change in
Unrealized
Appreciation/
Depreciation | | | Value at
3/31/2022 | | | Dividend
Income | |
WisdomTree U.S. LargeCap Dividend Fund | | $ | 12,420,991 | | | $ | 30,581,045 | | | $ | 43,010,597 | | | $ | 1,940,934 | | | $ | (1,288,843 | ) | | $ | 643,530 | | | $ | 137,052 | |
The following is a summary of the fair valuations according to the inputs used as of March 31, 2022 in valuing the Fund’s investments (See Note 2 — Fair Value Measurement):
| | | | | | | | | | | | | | | | |
| | | | |
| | | Quoted
Prices in
Active
Markets
(Level 1) | | | Other
Significant
Observable
Inputs
(Level 2) | | | Significant
Unobservable
Inputs
(Level 3) | | | Total | |
Assets: | | | | | | | | | | | | | | | | |
Investments in Securities | | | | | | | | | | | | | | | | |
Common Stocks | | $ | 3,204,269,915 | | | $ | — | | | $ | — | | | $ | 3,204,269,915 | |
Exchange-Traded Fund | | | 643,530 | | | | — | | | | — | | | | 643,530 | |
Investment of Cash Collateral for Securities Loaned | | | — | | | | 34,316,751 | | | | — | | | | 34,316,751 | |
Total Investments in Securities | | $ | 3,204,913,445 | | | $ | 34,316,751 | | | $ | — | | | $ | 3,239,230,196 | |
See Notes to Financial Statements.
Schedule of Investments
WisdomTree U.S. MidCap Fund (EZM)
March 31, 2022
| | | | | | | | |
| Investments | | Shares | | | Value | |
| | |
| COMMON STOCKS – 99.7% | | | | | | | | |
| | |
| United States – 99.7% | | | | | | | | |
| | |
| Aerospace & Defense – 0.9% | | | | | | | | |
| | |
BWX Technologies, Inc. | | | 22,727 | | | $ | 1,224,076 | |
| | |
Curtiss-Wright Corp. | | | 9,244 | | | | 1,388,079 | |
| | |
Huntington Ingalls Industries, Inc. | | | 14,372 | | | | 2,866,352 | |
| | |
Parsons Corp.* | | | 20,613 | | | | 797,723 | |
| | |
Woodward, Inc. | | | 8,235 | | | | 1,028,634 | |
| | | | | | | | |
| Total Aerospace & Defense | | | | | | | 7,304,864 | |
| | |
| Auto Components – 1.3% | | | | | | | | |
| | |
BorgWarner, Inc. | | | 90,416 | | | | 3,517,182 | |
| | |
Dana, Inc. | | | 48,690 | | | | 855,483 | |
| | |
Dorman Products, Inc.* | | | 5,294 | | | | 503,089 | |
| | |
Fox Factory Holding Corp.* | | | 4,283 | | | | 419,520 | |
| | |
Gentex Corp. | | | 47,921 | | | | 1,397,856 | |
| | |
Goodyear Tire & Rubber Co.* | | | 91,284 | | | | 1,304,448 | |
| | |
LCI Industries | | | 6,400 | | | | 664,384 | |
| | |
Lear Corp. | | | 13,869 | | | | 1,977,581 | |
| | |
Visteon Corp.* | | | 2,561 | | | | 279,482 | |
| | | | | | | | |
| Total Auto Components | | | | | | | 10,919,025 | |
| | |
| Automobiles – 0.5% | | | | | | | | |
| | |
Harley-Davidson, Inc. | | | 63,000 | | | | 2,482,200 | |
| | |
Thor Industries, Inc. | | | 23,978 | | | | 1,887,069 | |
| | | | | | | | |
| Total Automobiles | | | | | | | 4,369,269 | |
| | |
| Banks – 8.8% | | | | | | | | |
| | |
Ameris Bancorp | | | 27,503 | | | | 1,206,832 | |
| | |
Associated Banc-Corp. | | | 47,004 | | | | 1,069,811 | |
| | |
Bank of Hawaii Corp. | | | 8,724 | | | | 732,118 | |
| | |
Bank OZK | | | 44,946 | | | | 1,919,194 | |
| | |
BankUnited, Inc. | | | 30,017 | | | | 1,319,547 | |
| | |
BOK Financial Corp. | | | 22,842 | | | | 2,146,006 | |
| | |
Cadence Bank | | | 32,798 | | | | 959,669 | |
| | |
Cathay General Bancorp | | | 23,058 | | | | 1,031,846 | |
| | |
Comerica, Inc. | | | 50,454 | | | | 4,562,555 | |
| | |
Commerce Bancshares, Inc. | | | 28,654 | | | | 2,051,340 | |
| | |
Community Bank System, Inc. | | | 8,606 | | | | 603,711 | |
| | |
Cullen/Frost Bankers, Inc. | | | 11,837 | | | | 1,638,359 | |
| | |
East West Bancorp, Inc. | | | 39,625 | | | | 3,131,168 | |
| | |
Eastern Bankshares, Inc. | | | 21,116 | | | | 454,839 | |
| | |
First Citizens BancShares, Inc., Class A | | | 5,587 | | | | 3,718,707 | |
| | |
First Financial Bankshares, Inc. | | | 14,928 | | | | 658,623 | |
| | |
First Hawaiian, Inc. | | | 34,981 | | | | 975,620 | |
| | |
First Horizon Corp. | | | 221,889 | | | | 5,212,173 | |
| | |
FNB Corp. | | | 109,947 | | | | 1,368,840 | |
| | |
Glacier Bancorp, Inc. | | | 19,647 | | | | 987,851 | |
| | |
Hancock Whitney Corp. | | | 31,370 | | | | 1,635,946 | |
| | |
Home BancShares, Inc. | | | 45,815 | | | | 1,035,419 | |
| | |
Independent Bank Corp. | | | 5,603 | | | | 457,709 | |
| | |
Independent Bank Group, Inc. | | | 10,658 | | | | 758,423 | |
| | |
Live Oak Bancshares, Inc. | | | 5,637 | | | | 286,867 | |
| | |
Pacific Premier Bancorp, Inc. | | | 26,684 | | | | 943,279 | |
| | |
PacWest Bancorp | | | 46,421 | | | | 2,002,138 | |
| | |
People’s United Financial, Inc. | | | 133,168 | | | | 2,662,028 | |
| | |
Pinnacle Financial Partners, Inc. | | | 19,404 | | | | 1,786,720 | |
| | |
Prosperity Bancshares, Inc. | | | 26,096 | | | | 1,810,540 | |
| | |
ServisFirst Bancshares, Inc. | | | 7,827 | | | | 745,835 | |
| | |
Silvergate Capital Corp., Class A* | | | 2,617 | | | | 394,042 | |
| | |
Simmons First National Corp., Class A | | | 33,052 | | | | 866,623 | |
| | |
SouthState Corp. | | | 19,632 | | | | 1,601,775 | |
| | |
Synovus Financial Corp. | | | 56,220 | | | | 2,754,780 | |
| | |
Triumph Bancorp, Inc.* | | | 2,039 | | | | 191,707 | |
| | |
UMB Financial Corp. | | | 14,760 | | | | 1,434,082 | |
| | |
Umpqua Holdings Corp. | | | 85,679 | | | | 1,615,906 | |
| | |
United Bankshares, Inc. | | | 37,571 | | | | 1,310,476 | |
| | |
United Community Banks, Inc. | | | 24,198 | | | | 842,090 | |
| | |
Valley National Bancorp | | | 119,125 | | | | 1,551,008 | |
| | |
Webster Financial Corp. | | | 51,949 | | | | 2,915,378 | |
| | |
Wintrust Financial Corp. | | | 17,634 | | | | 1,638,728 | |
| | |
Zions Bancorp NA | | | 68,420 | | | | 4,485,615 | |
| | | | | | | | |
| Total Banks | | | | | | | 71,475,923 | |
| | |
| Beverages – 0.3% | | | | | | | | |
| | |
Celsius Holdings, Inc.*(a) | | | 6,432 | | | | 354,918 | |
| | |
Coca-Cola Consolidated, Inc. | | | 2,596 | | | | 1,289,822 | |
| | |
National Beverage Corp. | | | 14,432 | | | | 627,792 | |
| | | | | | | | |
| Total Beverages | | | | | | | 2,272,532 | |
| | |
| Biotechnology – 1.0% | | | | | | | | |
| | |
Arrowhead Pharmaceuticals, Inc.* | | | 8,809 | | | | 405,126 | |
| | |
Denali Therapeutics, Inc.* | | | 10,549 | | | | 339,361 | |
| | |
Exelixis, Inc.* | | | 42,470 | | | | 962,795 | |
| | |
Halozyme Therapeutics, Inc.* | | | 50,074 | | | | 1,996,951 | |
| | |
Neurocrine Biosciences, Inc.* | | | 22,066 | | | | 2,068,687 | |
| | |
Sarepta Therapeutics, Inc.* | | | 6,840 | | | | 534,341 | |
| | |
United Therapeutics Corp.* | | | 9,802 | | | | 1,758,577 | |
| | |
Vir Biotechnology, Inc.* | | | 12,771 | | | | 328,470 | |
| | | | | | | | |
| Total Biotechnology | | | | | | | 8,394,308 | |
| | |
| Building Products – 1.5% | | | | | | | | |
| | |
A.O. Smith Corp. | | | 22,738 | | | | 1,452,731 | |
| | |
AAON, Inc. | | | 4,872 | | | | 271,516 | |
| | |
Advanced Drainage Systems, Inc. | | | 7,967 | | | | 946,559 | |
| | |
Armstrong World Industries, Inc. | | | 6,866 | | | | 618,009 | |
| | |
AZEK Co., Inc.* | | | 16,568 | | | | 411,549 | |
| | |
Hayward Holdings, Inc.* | | | 18,885 | | | | 313,869 | |
| | |
Lennox International, Inc. | | | 6,053 | | | | 1,560,827 | |
| | |
Owens Corning | | | 39,766 | | | | 3,638,589 | |
| | |
Resideo Technologies, Inc.* | | | 35,776 | | | | 852,542 | |
| | |
Simpson Manufacturing Co., Inc. | | | 7,271 | | | | 792,830 | |
| | |
UFP Industries, Inc. | | | 19,253 | | | | 1,485,561 | |
| | | | | | | | |
| Total Building Products | | | | | | | 12,344,582 | |
| | |
| Capital Markets – 3.1% | | | | | | | | |
| | |
Affiliated Managers Group, Inc. | | | 16,853 | | | | 2,375,430 | |
| | |
Blue Owl Capital, Inc.(a) | | | 38,002 | | | | 481,865 | |
| | |
Cohen & Steers, Inc. | | | 5,948 | | | | 510,874 | |
| | |
Evercore, Inc., Class A | | | 19,159 | | | | 2,132,780 | |
| | |
Federated Hermes, Inc., Class B | | | 27,444 | | | | 934,743 | |
See Notes to Financial Statements.
Schedule of Investments (continued)
WisdomTree U.S. MidCap Fund (EZM)
March 31, 2022
| | | | | | | | |
| Investments | | Shares | | | Value | |
| | |
Focus Financial Partners, Inc., Class A* | | | 9,090 | | | $ | 415,777 | |
| | |
Hamilton Lane, Inc., Class A | | | 3,988 | | | | 308,233 | |
| | |
Houlihan Lokey, Inc. | | | 14,198 | | | | 1,246,584 | |
| | |
Interactive Brokers Group, Inc., Class A | | | 13,721 | | | | 904,351 | |
| | |
Jefferies Financial Group, Inc. | | | 162,696 | | | | 5,344,564 | |
| | |
Moelis & Co., Class A | | | 22,825 | | | | 1,071,634 | |
| | |
Piper Sandler Cos. | | | 6,012 | | | | 789,075 | |
| | |
SEI Investments Co. | | | 31,258 | | | | 1,882,044 | |
| | |
Stifel Financial Corp. | | | 40,040 | | | | 2,718,716 | |
| | |
Tradeweb Markets, Inc., Class A | | | 11,496 | | | | 1,010,153 | |
| | |
Virtu Financial, Inc., Class A | | | 71,923 | | | | 2,676,974 | |
| | | | | | | | |
| Total Capital Markets | | | | | | | 24,803,797 | |
| | |
| Chemicals – 2.6% | | | | | | | | |
| | |
Ashland Global Holdings, Inc. | | | 10,488 | | | | 1,032,124 | |
| | |
Avient Corp. | | | 19,497 | | | | 935,856 | |
| | |
Balchem Corp. | | | 3,205 | | | | 438,124 | |
| | |
Cabot Corp. | | | 20,610 | | | | 1,409,930 | |
| | |
Chemours Co. | | | 83,683 | | | | 2,634,341 | |
| | |
Element Solutions, Inc. | | | 59,767 | | | | 1,308,897 | |
| | |
H.B. Fuller Co. | | | 10,026 | | | | 662,418 | |
| | |
Huntsman Corp. | | | 84,181 | | | | 3,157,629 | |
| | |
Livent Corp.*(a) | | | 14,716 | | | | 383,646 | |
| | |
NewMarket Corp. | | | 2,987 | | | | 968,923 | |
| | |
Olin Corp. | | | 73,046 | | | | 3,818,845 | |
| | |
Quaker Chemical Corp. | | | 2,294 | | | | 396,426 | |
| | |
Scotts Miracle-Gro Co.(a) | | | 14,997 | | | | 1,844,031 | |
| | |
Sensient Technologies Corp. | | | 5,314 | | | | 446,110 | |
| | |
Valvoline, Inc. | | | 41,008 | | | | 1,294,213 | |
| | | | | | | | |
| Total Chemicals | | | | | | | 20,731,513 | |
| | |
| Commercial Services & Supplies – 0.9% | | | | | | | | |
| | |
ABM Industries, Inc. | | | 20,336 | | | | 936,269 | |
| | |
Brink’s Co. | | | 15,111 | | | | 1,027,548 | |
| | |
Casella Waste Systems, Inc., Class A* | | | 4,273 | | | | 374,529 | |
| | |
Clean Harbors, Inc.* | | | 7,735 | | | | 863,535 | |
| | |
Driven Brands Holdings, Inc.* | | | 15,848 | | | | 416,485 | |
| | |
IAA, Inc.* | | | 25,120 | | | | 960,840 | |
| | |
MSA Safety, Inc. | | | 4,893 | | | | 649,301 | |
| | |
Stericycle, Inc.* | | | 15,215 | | | | 896,468 | |
| | |
Tetra Tech, Inc. | | | 4,952 | | | | 816,783 | |
| | | | | | | | |
| Total Commercial Services & Supplies | | | | | | | 6,941,758 | |
| | |
| Communications Equipment – 1.0% | | | | | | | | |
| | |
Calix, Inc.* | | | 7,455 | | | | 319,894 | |
| | |
Ciena Corp.* | | | 28,063 | | | | 1,701,460 | |
| | |
Juniper Networks, Inc. | | | 74,549 | | | | 2,770,241 | |
| | |
Lumentum Holdings, Inc.*(a) | | | 22,855 | | | | 2,230,648 | |
| | |
ViaSat, Inc.* | | | 11,463 | | | | 559,394 | |
| | |
Viavi Solutions, Inc.* | | | 55,447 | | | | 891,588 | |
| | | | | | | | |
| Total Communications Equipment | | | | | | | 8,473,225 | |
| | |
| Construction & Engineering – 1.2% | | | | | | | | |
| | |
AECOM | | | 23,321 | | | | 1,791,286 | |
| | |
Ameresco, Inc., Class A*(a) | | | 4,067 | | | | 323,326 | |
| | |
API Group Corp.* | | | 38,324 | | | | 805,954 | |
| | |
Comfort Systems USA, Inc. | | | 5,667 | | | | 504,420 | |
| | |
EMCOR Group, Inc. | | | 12,371 | | | | 1,393,346 | |
| | |
MasTec, Inc.*(a) | | | 19,031 | | | | 1,657,600 | |
| | |
MDU Resources Group, Inc. | | | 56,750 | | | | 1,512,387 | |
| | |
Valmont Industries, Inc. | | | 3,585 | | | | 855,381 | |
| | |
WillScot Mobile Mini Holdings Corp.* | | | 19,876 | | | | 777,748 | |
| | | | | | | | |
| Total Construction & Engineering | | | | | | | 9,621,448 | |
| | |
| Construction Materials – 0.2% | | | | | | | | |
| | |
Eagle Materials, Inc. | | | 9,044 | | | | 1,160,888 | |
| | |
Summit Materials, Inc., Class A* | | | 14,287 | | | | 443,754 | |
| | | | | | | | |
| Total Construction Materials | | | | | | | 1,604,642 | |
| | |
| Consumer Finance – 1.6% | | | | | | | | |
| | |
Credit Acceptance Corp.*(a) | | | 5,230 | | | | 2,878,435 | |
| | |
Navient Corp. | | | 110,877 | | | | 1,889,344 | |
| | |
OneMain Holdings, Inc. | | | 91,452 | | | | 4,335,740 | |
| | |
SLM Corp. | | | 203,992 | | | | 3,745,293 | |
| | | | | | | | |
| Total Consumer Finance | | | | | | | 12,848,812 | |
| | |
| Containers & Packaging – 1.4% | | | | | | | | |
| | |
AptarGroup, Inc. | | | 8,355 | | | | 981,713 | |
| | |
Berry Global Group, Inc.* | | | 45,215 | | | | 2,620,661 | |
| | |
Graphic Packaging Holding Co. | | | 64,471 | | | | 1,291,999 | |
| | |
Greif, Inc., Class A | | | 17,519 | | | | 1,139,786 | |
| | |
Sealed Air Corp. | | | 32,353 | | | | 2,166,357 | |
| | |
Silgan Holdings, Inc. | | | 34,442 | | | | 1,592,254 | |
| | |
Sonoco Products Co. | | | 23,086 | | | | 1,444,260 | |
| | | | | | | | |
| Total Containers & Packaging | | | | | | | 11,237,030 | |
| | |
| Diversified Consumer Services – 1.1% | | | | | | | | |
| | |
ADT, Inc. | | | 175,832 | | | | 1,334,565 | |
| | |
Bright Horizons Family Solutions, Inc.* | | | 4,874 | | | | 646,731 | |
| | |
Chegg, Inc.*(a) | | | 29,846 | | | | 1,082,813 | |
| | |
Coursera, Inc.* | | | 12,414 | | | | 286,019 | |
| | |
H&R Block, Inc. | | | 57,052 | | | | 1,485,634 | |
| | |
Service Corp. International | | | 44,943 | | | | 2,958,148 | |
| | |
Terminix Global Holdings, Inc.* | | | 19,678 | | | | 897,907 | |
| | | | | | | | |
| Total Diversified Consumer Services | | | | | | | 8,691,817 | |
| | |
| Diversified Financial Services – 0.5% | | | | | | | | |
| | |
Voya Financial, Inc. | | | 64,400 | | | | 4,272,940 | |
| | |
| Diversified Telecommunication Services – 0.6% | | | | | | | | |
| | |
Cogent Communications Holdings, Inc. | | | 4,177 | | | | 277,144 | |
| | |
Frontier Communications Parent, Inc.* | | | 176,200 | | | | 4,875,454 | |
| | | | | | | | |
| Total Diversified Telecommunication Services | | | | | | | 5,152,598 | |
| | |
| Electric Utilities – 1.8% | | | | | | | | |
| | |
ALLETE, Inc. | | | 10,468 | | | | 701,147 | |
| | |
Hawaiian Electric Industries, Inc. | | | 24,816 | | | | 1,049,965 | |
| | |
IDACORP, Inc. | | | 9,146 | | | | 1,055,082 | |
| | |
NRG Energy, Inc. | | | 166,568 | | | | 6,389,548 | |
| | |
OGE Energy Corp. | | | 51,983 | | | | 2,119,867 | |
| | |
Pinnacle West Capital Corp. | | | 34,399 | | | | 2,686,562 | |
| | |
Portland General Electric Co. | | | 17,860 | | | | 984,979 | |
| | | | | | | | |
| Total Electric Utilities | | | | | | | 14,987,150 | |
See Notes to Financial Statements.
Schedule of Investments (continued)
WisdomTree U.S. MidCap Fund (EZM)
March 31, 2022
| | | | | | | | |
| Investments | | Shares | | | Value | |
| | |
| Electrical Equipment – 1.2% | | | | | | | | |
| | |
Acuity Brands, Inc. | | | 7,507 | | | $ | 1,421,075 | |
| | |
Atkore, Inc.* | | | 22,492 | | | | 2,214,113 | |
| | |
EnerSys | | | 11,062 | | | | 824,893 | |
| | |
GrafTech International Ltd. | | | 153,888 | | | | 1,480,403 | |
| | |
Hubbell, Inc. | | | 8,519 | | | | 1,565,537 | |
| | |
Regal Rexnord Corp. | | | 9,040 | | | | 1,344,971 | |
| | |
Vertiv Holdings Co. | | | 57,855 | | | | 809,970 | |
| | |
Vicor Corp.* | | | 3,219 | | | | 227,100 | |
| | | | | | | | |
| Total Electrical Equipment | | | | | | | 9,888,062 | |
|
| Electronic Equipment, Instruments & Components – 2.3% | |
| | |
Advanced Energy Industries, Inc. | | | 9,305 | | | | 800,974 | |
| | |
Arrow Electronics, Inc.* | | | 32,645 | | | | 3,872,676 | |
| | |
Avnet, Inc. | | | 38,786 | | | | 1,574,324 | |
| | |
Badger Meter, Inc. | | | 3,085 | | | | 307,605 | |
| | |
II-VI, Inc.*(a) | | | 28,544 | | | | 2,069,155 | |
| | |
Insight Enterprises, Inc.* | | | 10,537 | | | | 1,130,831 | |
| | |
IPG Photonics Corp.* | | | 6,447 | | | | 707,623 | |
| | |
Jabil, Inc. | | | 57,502 | | | | 3,549,598 | |
| | |
Littelfuse, Inc. | | | 4,122 | | | | 1,028,068 | |
| | |
National Instruments Corp. | | | 11,766 | | | | 477,582 | |
| | |
TD SYNNEX Corp. | | | 17,355 | | | | 1,791,210 | |
| | |
Vontier Corp. | | | 64,082 | | | | 1,627,042 | |
| | | | | | | | |
| Total Electronic Equipment, Instruments & Components | | | | 18,936,688 | |
|
| Energy Equipment & Services – 0.1% | |
| | |
ChampionX Corp.* | | | 18,158 | | | | 444,508 | |
| | |
| Entertainment – 0.4% | | | | | | | | |
| | |
Warner Music Group Corp., Class A | | | 37,427 | | | | 1,416,612 | |
| | |
Zynga, Inc., Class A* | | | 181,673 | | | | 1,678,658 | |
| | | | | | | | |
| Total Entertainment | | | | | | | 3,095,270 | |
|
| Equity Real Estate Investment Trusts (REITs) – 4.0% | |
| | |
Agree Realty Corp. | | | 6,937 | | | | 460,339 | |
| | |
American Campus Communities, Inc. | | | 10,948 | | | | 612,760 | |
| | |
Brixmor Property Group, Inc. | | | 38,806 | | | | 1,001,583 | |
| | |
Broadstone Net Lease, Inc. | | | 15,407 | | | | 335,564 | |
| | |
Cousins Properties, Inc. | | | 14,585 | | | | 587,630 | |
| | |
Douglas Emmett, Inc. | | | 14,712 | | | | 491,675 | |
| | |
EastGroup Properties, Inc. | | | 3,237 | | | | 658,017 | |
| | |
EPR Properties | | | 5,475 | | | | 299,537 | |
| | |
Essential Properties Realty Trust, Inc. | | | 12,384 | | | | 313,315 | |
| | |
Federal Realty Investment Trust | | | 6,897 | | | | 841,917 | |
| | |
First Industrial Realty Trust, Inc. | | | 15,415 | | | | 954,343 | |
| | |
Gaming and Leisure Properties, Inc. | | | 49,862 | | | | 2,340,024 | |
| | |
Healthcare Realty Trust, Inc. | | | 11,764 | | | | 323,275 | |
| | |
Healthcare Trust of America, Inc., Class A | | | 17,968 | | | | 563,117 | |
| | |
Highwoods Properties, Inc. | | | 24,956 | | | | 1,141,487 | |
| | |
Innovative Industrial Properties, Inc. | | | 2,118 | | | | 435,037 | |
| | |
Kilroy Realty Corp. | | | 37,763 | | | | 2,885,848 | |
| | |
Kite Realty Group Trust | | | 15,343 | | | | 349,360 | |
| | |
Lamar Advertising Co., Class A | | | 13,887 | | | | 1,613,392 | |
| | |
Life Storage, Inc. | | | 6,765 | | | | 950,009 | |
| | |
LXP Industrial Trust | | | 59,490 | | | | 933,993 | |
| | |
National Retail Properties, Inc. | | | 23,641 | | | | 1,062,427 | |
| | |
National Storage Affiliates Trust | | | 7,766 | | | | 487,394 | |
| | |
Omega Healthcare Investors, Inc. | | | 64,353 | | | | 2,005,239 | |
| | |
Physicians Realty Trust | | | 21,054 | | | | 369,287 | |
| | |
PotlatchDeltic Corp. | | | 32,736 | | | | 1,726,169 | |
| | |
PS Business Parks, Inc. | | | 3,686 | | | | 619,543 | |
| | |
Rayonier, Inc. | | | 13,087 | | | | 538,137 | |
| | |
Rexford Industrial Realty, Inc. | | | 11,681 | | | | 871,286 | |
| | |
Safehold, Inc. | | | 5,773 | | | | 320,113 | |
| | |
SL Green Realty Corp. | | | 37,165 | | | | 3,017,055 | |
| | |
Spirit Realty Capital, Inc. | | | 13,376 | | | | 615,564 | |
| | |
STAG Industrial, Inc. | | | 17,849 | | | | 738,056 | |
| | |
STORE Capital Corp. | | | 29,312 | | | | 856,790 | |
| | |
Terreno Realty Corp. | | | 5,974 | | | | 442,375 | |
| | |
Vornado Realty Trust | | | 14,136 | | | | 640,643 | |
| | | | | | | | |
| Total Equity Real Estate Investment Trusts (REITs) | | | | 32,402,300 | |
|
| Food & Staples Retailing – 1.2% | |
| | |
BJ’s Wholesale Club Holdings, Inc.* | | | 48,495 | | | | 3,278,747 | |
| | |
Casey’s General Stores, Inc. | | | 6,253 | | | | 1,239,157 | |
| | |
Performance Food Group Co.* | | | 52,639 | | | | 2,679,852 | |
| | |
Sprouts Farmers Market, Inc.* | | | 41,830 | | | | 1,337,723 | |
| | |
U.S. Foods Holding Corp.* | | | 33,888 | | | | 1,275,205 | |
| | | | | | | | |
| Total Food & Staples Retailing | | | | 9,810,684 | |
|
| Food Products – 1.2% | |
| | |
Darling Ingredients, Inc.* | | | 32,564 | | | | 2,617,494 | |
| | |
Flowers Foods, Inc. | | | 44,412 | | | | 1,141,833 | |
| | |
Hain Celestial Group, Inc.* | | | 15,407 | | | | 530,001 | |
| | |
Ingredion, Inc. | | | 20,441 | | | | 1,781,433 | |
| | |
Lancaster Colony Corp. | | | 4,415 | | | | 658,497 | |
| | |
Pilgrim’s Pride Corp.* | | | 68,210 | | | | 1,712,071 | |
| | |
Post Holdings, Inc.* | | | 6,512 | | | | 451,021 | |
| | |
Simply Good Foods Co.* | | | 13,639 | | | | 517,600 | |
| | | | | | | | |
| Total Food Products | | | | 9,409,950 | |
|
| Gas Utilities – 0.9% | |
| | |
National Fuel Gas Co. | | | 26,077 | | | | 1,791,490 | |
| | |
New Jersey Resources Corp. | | | 21,288 | | | | 976,268 | |
| | |
ONE Gas, Inc. | | | 12,070 | | | | 1,065,057 | |
| | |
Spire, Inc. | | | 16,171 | | | | 1,160,431 | |
| | |
UGI Corp. | | | 56,979 | | | | 2,063,779 | |
| | | | | | | | |
| Total Gas Utilities | | | | 7,057,025 | |
|
| Health Care Equipment & Supplies – 1.8% | |
| | |
CONMED Corp.(a) | | | 3,065 | | | | 455,306 | |
| | |
CryoPort, Inc.*(a) | | | 3,754 | | | | 131,052 | |
| | |
Dentsply Sirona, Inc. | | | 50,514 | | | | 2,486,299 | |
| | |
Envista Holdings Corp.* | | | 36,781 | | | | 1,791,602 | |
| | |
Globus Medical, Inc., Class A* | | | 13,333 | | | | 983,709 | |
| | |
ICU Medical, Inc.* | | | 2,972 | | | | 661,686 | |
| | |
Inari Medical, Inc.* | | | 4,373 | | | | 396,369 | |
| | |
Integra LifeSciences Holdings Corp.* | | | 16,702 | | | | 1,073,270 | |
| | |
iRhythm Technologies, Inc.* | | | 2,648 | | | | 416,981 | |
| | |
Merit Medical Systems, Inc.* | | | 7,939 | | | | 528,102 | |
| | |
Neogen Corp.* | | | 9,709 | | | | 299,426 | |
See Notes to Financial Statements.
Schedule of Investments (continued)
WisdomTree U.S. MidCap Fund (EZM)
March 31, 2022
| | | | | | | | |
| Investments | | Shares | | | Value | |
| | |
Penumbra, Inc.* | | | 3,025 | | | $ | 671,943 | |
| | |
Quidel Corp.* | | | 25,710 | | | | 2,891,347 | |
| | |
Shockwave Medical, Inc.*(a) | | | 2,828 | | | | 586,414 | |
| | |
STAAR Surgical Co.*(a) | | | 4,159 | | | | 332,346 | |
| | |
Tandem Diabetes Care, Inc.* | | | 4,863 | | | | 565,518 | |
| | | | | | | | |
| Total Health Care Equipment & Supplies | | | | 14,271,370 | |
|
| Health Care Providers & Services – 4.1% | |
| | |
Acadia Healthcare Co., Inc.* | | | 20,079 | | | | 1,315,777 | |
| | |
Amedisys, Inc.* | | | 5,766 | | | | 993,424 | |
| | |
AMN Healthcare Services, Inc.* | | | 10,575 | | | | 1,103,290 | |
| | |
Apollo Medical Holdings, Inc.*(a) | | | 6,084 | | | | 294,891 | |
| | |
Chemed Corp. | | | 2,544 | | | | 1,288,663 | |
| | |
CorVel Corp.* | | | 1,573 | | | | 264,956 | |
| | |
DaVita, Inc.* | | | 38,308 | | | | 4,333,018 | |
| | |
Encompass Health Corp. | | | 27,517 | | | | 1,956,734 | |
| | |
Ensign Group, Inc. | | | 10,462 | | | | 941,685 | |
| | |
HealthEquity, Inc.* | | | 9,846 | | | | 664,014 | |
| | |
Henry Schein, Inc.* | | | 34,620 | | | | 3,018,518 | |
| | |
Invitae Corp.*(a) | | | 20,294 | | | | 161,743 | |
| | |
LHC Group, Inc.* | | | 6,347 | | | | 1,070,104 | |
| | |
Option Care Health, Inc.* | | | 16,581 | | | | 473,553 | |
| | |
Owens & Minor, Inc. | | | 32,889 | | | | 1,447,774 | |
| | |
Patterson Cos., Inc. | | | 27,271 | | | | 882,762 | |
| | |
Premier, Inc., Class A | | | 33,301 | | | | 1,185,183 | |
| | |
Progyny, Inc.* | | | 8,119 | | | | 417,317 | |
| | |
R1 RCM, Inc.* | | | 26,728 | | | | 715,241 | |
| | |
Select Medical Holdings Corp. | | | 56,626 | | | | 1,358,458 | |
| | |
Tenet Healthcare Corp.* | | | 56,375 | | | | 4,845,995 | |
| | |
Universal Health Services, Inc., Class B | | | 33,373 | | | | 4,837,416 | |
| | | | | | | | |
| Total Health Care Providers & Services | | | | 33,570,516 | |
|
| Health Care Technology – 0.2% | |
| | |
Certara, Inc.* | | | 13,503 | | | | 290,045 | |
| | |
Inspire Medical Systems, Inc.* | | | 2,270 | | | | 582,686 | |
| | |
Omnicell, Inc.*(a) | | | 4,188 | | | | 542,304 | |
| | | | | | | | |
| Total Health Care Technology | | | | 1,415,035 | |
|
| Hotels, Restaurants & Leisure – 1.6% | |
| | |
Boyd Gaming Corp. | | | 31,597 | | | | 2,078,451 | |
| | |
Choice Hotels International, Inc. | | | 5,983 | | | | 848,150 | |
| | |
Churchill Downs, Inc. | | | 4,067 | | | | 901,979 | |
| | |
Marriott Vacations Worldwide Corp. | | | 3,518 | | | | 554,789 | |
| | |
Papa John’s International, Inc. | | | 3,678 | | | | 387,220 | |
| | |
Penn National Gaming, Inc.* | | | 31,131 | | | | 1,320,577 | |
| | |
Planet Fitness, Inc., Class A* | | | 6,396 | | | | 540,334 | |
| | |
Red Rock Resorts, Inc., Class A | | | 12,017 | | | | 583,545 | |
| | |
Scientific Games Corp., Class A* | | | 11,877 | | | | 697,774 | |
| | |
SeaWorld Entertainment, Inc.* | | | 9,313 | | | | 693,260 | |
| | |
Six Flags Entertainment Corp.* | | | 7,808 | | | | 339,648 | |
| | |
Texas Roadhouse, Inc. | | | 9,704 | | | | 812,516 | |
| | |
Travel + Leisure Co. | | | 16,510 | | | | 956,589 | |
| | |
Wendy’s Co. | | | 35,294 | | | | 775,409 | |
| | |
Wingstop, Inc. | | | 2,483 | | | | 291,380 | |
| | |
Wyndham Hotels & Resorts, Inc. | | | 12,184 | | | | 1,031,863 | |
| | | | | | | | |
| Total Hotels, Restaurants & Leisure | | | | 12,813,484 | |
|
| Household Durables – 2.5% | |
| | |
Installed Building Products, Inc.(a) | | | 4,741 | | | | 400,567 | |
| | |
KB Home | | | 44,746 | | | | 1,448,876 | |
| | |
Leggett & Platt, Inc. | | | 35,683 | | | | 1,241,768 | |
| | |
LGI Homes, Inc.*(a) | | | 11,739 | | | | 1,146,666 | |
| | |
MDC Holdings, Inc. | | | 41,133 | | | | 1,556,473 | |
| | |
Meritage Homes Corp.* | | | 21,586 | | | | 1,710,259 | |
| | |
Mohawk Industries, Inc.* | | | 24,276 | | | | 3,015,079 | |
| | |
Newell Brands, Inc. | | | 148,001 | | | | 3,168,701 | |
| | |
Skyline Champion Corp.* | | | 7,402 | | | | 406,222 | |
| | |
Sonos, Inc.*(a) | | | 21,724 | | | | 613,051 | |
| | |
Taylor Morrison Home Corp., Class A* | | | 56,061 | | | | 1,525,980 | |
| | |
Tempur Sealy International, Inc. | | | 53,897 | | | | 1,504,804 | |
| | |
Toll Brothers, Inc. | | | 36,883 | | | | 1,734,239 | |
| | |
TopBuild Corp.* | | | 4,735 | | | | 858,882 | |
| | | | | | | | |
| Total Household Durables | | | | 20,331,567 | |
|
| Household Products – 0.3% | |
| | |
Reynolds Consumer Products, Inc. | | | 45,996 | | | | 1,349,523 | |
| | |
Spectrum Brands Holdings, Inc. | | | 11,460 | | | | 1,016,731 | |
| | |
WD-40 Co. | | | 1,490 | | | | 273,013 | |
| | | | | | | | |
| Total Household Products | | | | 2,639,267 | |
|
| Independent Power & Renewable Electricity Producers – 0.1% | |
| | |
Clearway Energy, Inc., Class C | | | 16,105 | | | | 587,993 | |
| | |
Ormat Technologies, Inc.(a) | | | 4,790 | | | | 391,966 | |
| | | | | | | | |
| Total Independent Power & Renewable Electricity Producers | | | | 979,959 | |
|
| Insurance – 4.8% | |
| | |
Alleghany Corp.* | | | 2,426 | | | | 2,054,822 | |
| | |
American Equity Investment Life Holding Co. | | | 27,942 | | | | 1,115,165 | |
| | |
American Financial Group, Inc. | | | 25,125 | | | | 3,658,703 | |
| | |
Assurant, Inc. | | | 12,570 | | | | 2,285,603 | |
| | |
Brighthouse Financial, Inc.* | | | 54,272 | | | | 2,803,692 | |
| | |
CNA Financial Corp. | | | 102,213 | | | | 4,969,596 | |
| | |
Erie Indemnity Co., Class A | | | 5,372 | | | | 946,170 | |
| | |
First American Financial Corp. | | | 62,855 | | | | 4,074,261 | |
| | |
Globe Life, Inc. | | | 29,131 | | | | 2,930,579 | |
| | |
Hanover Insurance Group, Inc. | | | 8,121 | | | | 1,214,252 | |
| | |
Kemper Corp. | | | 5,621 | | | | 317,811 | |
| | |
Kinsale Capital Group, Inc. | | | 1,997 | | | | 455,356 | |
| | |
Old Republic International Corp. | | | 137,016 | | | | 3,544,604 | |
| | |
Primerica, Inc. | | | 10,616 | | | | 1,452,481 | |
| | |
Reinsurance Group of America, Inc. | | | 6,072 | | | | 664,641 | |
| | |
RLI Corp. | | | 4,406 | | | | 487,436 | |
| | |
Selective Insurance Group, Inc. | | | 17,637 | | | | 1,576,042 | |
| | |
Unum Group | | | 143,416 | | | | 4,519,038 | |
| | | | | | | | |
| Total Insurance | | | | 39,070,252 | |
|
| Interactive Media & Services – 0.4% | |
| | |
Bumble, Inc., Class A* | | | 19,883 | | | | 576,209 | |
| | |
Cargurus, Inc.* | | | 18,739 | | | | 795,658 | |
| | |
Vimeo, Inc.* | | | 14,134 | | | | 167,912 | |
| | |
Ziff Davis, Inc.*(a) | | | 15,548 | | | | 1,504,736 | |
| | | | | | | | |
| Total Interactive Media & Services | | | | 3,044,515 | |
See Notes to Financial Statements.
Schedule of Investments (continued)
WisdomTree U.S. MidCap Fund (EZM)
March 31, 2022
| | | | | | | | |
| Investments | | Shares | | | Value | |
|
| Internet & Direct Marketing Retail – 0.1% | |
| | |
Overstock.com, Inc.*(a) | | | 5,049 | | | $ | 222,181 | |
| | |
Revolve Group, Inc.* | | | 5,840 | | | | 313,550 | |
| | |
Shutterstock, Inc. | | | 5,211 | | | | 485,040 | |
| | | | | | | | |
| Total Internet & Direct Marketing Retail | | | | 1,020,771 | |
|
| IT Services – 2.6% | |
| | |
Alliance Data Systems Corp. | | | 33,616 | | | | 1,887,538 | |
| | |
Concentrix Corp. | | | 11,371 | | | | 1,893,954 | |
| | |
DigitalOcean Holdings, Inc.*(a) | | | 10,272 | | | | 594,235 | |
| | |
DXC Technology Co.* | | | 110,829 | | | | 3,616,350 | |
| | |
Euronet Worldwide, Inc.* | | | 7,551 | | | | 982,763 | |
| | |
ExlService Holdings, Inc.* | | | 5,426 | | | | 777,383 | |
| | |
Jack Henry & Associates, Inc. | | | 8,492 | | | | 1,673,348 | |
| | |
LiveRamp Holdings, Inc.* | | | 6,425 | | | | 240,231 | |
| | |
Maximus, Inc. | | | 16,147 | | | | 1,210,218 | |
| | |
Perficient, Inc.* | | | 4,181 | | | | 460,286 | |
| | |
Rackspace Technology, Inc.*(a) | | | 64,388 | | | | 718,570 | |
| | |
Switch, Inc., Class A | | | 12,835 | | | | 395,575 | |
| | |
TTEC Holdings, Inc. | | | 11,082 | | | | 914,487 | |
| | |
Western Union Co. | | | 185,350 | | | | 3,473,459 | |
| | |
WEX, Inc.* | | | 11,553 | | | | 2,061,633 | |
| | | | | | | | |
| Total IT Services | | | | 20,900,030 | |
|
| Leisure Products – 1.1% | |
| | |
Acushnet Holdings Corp. | | | 17,044 | | | | 686,192 | |
| | |
Brunswick Corp. | | | 26,591 | | | | 2,150,946 | |
| | |
Callaway Golf Co.*(a) | | | 47,184 | | | | 1,105,049 | |
| | |
Mattel, Inc.* | | | 77,943 | | | | 1,731,114 | |
| | |
Polaris, Inc. | | | 22,891 | | | | 2,410,880 | |
| | |
YETI Holdings, Inc.* | | | 10,355 | | | | 621,093 | |
| | | | | | | | |
| Total Leisure Products | | | | 8,705,274 | |
|
| Life Sciences Tools & Services – 0.5% | |
| | |
Azenta, Inc. | | | 6,986 | | | | 579,000 | |
| | |
Maravai LifeSciences Holdings, Inc., Class A* | | | 20,606 | | | | 726,774 | |
| | |
Medpace Holdings, Inc.* | | | 3,784 | | | | 619,025 | |
| | |
NeoGenomics, Inc.* | | | 10,622 | | | | 129,057 | |
| | |
Sotera Health Co.* | | | 38,032 | | | | 823,773 | |
| | |
Syneos Health, Inc.* | | | 17,355 | | | | 1,404,887 | |
| | | | | | | | |
| Total Life Sciences Tools & Services | | | | 4,282,516 | |
|
| Machinery – 3.5% | |
| | |
AGCO Corp. | | | 22,895 | | | | 3,343,357 | |
| | |
Allison Transmission Holdings, Inc. | | | 41,589 | | | | 1,632,784 | |
| | |
Altra Industrial Motion Corp. | | | 16,144 | | | | 628,486 | |
| | |
Chart Industries, Inc.*(a) | | | 3,655 | | | | 627,819 | |
| | |
Colfax Corp.* | | | 26,665 | | | | 1,061,000 | |
| | |
Crane Co. | | | 15,006 | | | | 1,624,850 | |
| | |
Donaldson Co., Inc. | | | 20,914 | | | | 1,086,064 | |
| | |
Evoqua Water Technologies Corp.* | | | 10,596 | | | | 497,800 | |
| | |
Flowserve Corp. | | | 25,513 | | | | 915,917 | |
| | |
Franklin Electric Co., Inc. | | | 6,436 | | | | 534,445 | |
| | |
Helios Technologies, Inc. | | | 5,172 | | | | 415,053 | |
| | |
Hillenbrand, Inc. | | | 23,922 | | | | 1,056,635 | |
| | |
ITT, Inc. | | | 13,814 | | | | 1,038,951 | |
| | |
John Bean Technologies Corp. | | | 3,606 | | | | 427,203 | |
| | |
Lincoln Electric Holdings, Inc. | | | 10,295 | | | | 1,418,754 | |
| | |
Middleby Corp.* | | | 9,531 | | | | 1,562,512 | |
| | |
Mueller Industries, Inc. | | | 26,521 | | | | 1,436,643 | |
| | |
Oshkosh Corp. | | | 14,232 | | | | 1,432,451 | |
| | |
RBC Bearings, Inc.*(a) | | | 2,574 | | | | 499,047 | |
| | |
Snap-on, Inc. | | | 15,240 | | | | 3,131,515 | |
| | |
SPX FLOW, Inc. | | | 5,466 | | | | 471,279 | |
| | |
Timken Co. | | | 21,430 | | | | 1,300,801 | |
| | |
Toro Co. | | | 15,725 | | | | 1,344,330 | |
| | |
Watts Water Technologies, Inc., Class A | | | 3,772 | | | | 526,533 | |
| | | | | | | | |
| Total Machinery | | | | 28,014,229 | |
|
| Marine – 0.5% | |
| | |
Kirby Corp.* | | | 5,360 | | | | 386,938 | |
| | |
Matson, Inc. | | | 27,940 | | | | 3,370,123 | |
| | | | | | | | |
| Total Marine | | | | 3,757,061 | |
|
| Media – 1.9% | |
| | |
Cable One, Inc. | | | 744 | | | | 1,089,394 | |
| | |
DISH Network Corp., Class A*(a) | | | 202,435 | | | | 6,407,068 | |
| | |
New York Times Co., Class A | | | 18,795 | | | | 861,563 | |
| | |
Nexstar Media Group, Inc., Class A | | | 24,345 | | | | 4,588,546 | |
| | |
TEGNA, Inc. | | | 118,766 | | | | 2,660,358 | |
| | | | | | | | |
| Total Media | | | | 15,606,929 | |
|
| Metals & Mining – 4.4% | |
| | |
Alcoa Corp. | | | 75,836 | | | | 6,827,515 | |
| | |
Cleveland-Cliffs, Inc.* | | | 359,219 | | | | 11,570,444 | |
| | |
Commercial Metals Co. | | | 54,748 | | | | 2,278,612 | |
| | |
Hecla Mining Co. | | | 65,497 | | | | 430,315 | |
| | |
MP Materials Corp.*(a) | | | 15,364 | | | | 880,972 | |
| | |
Reliance Steel & Aluminum Co. | | | 28,735 | | | | 5,268,562 | |
| | |
Royal Gold, Inc. | | | 10,661 | | | | 1,506,186 | |
| | |
United States Steel Corp.(a) | | | 193,445 | | | | 7,300,614 | |
| | | | | | | | |
| Total Metals & Mining | | | | 36,063,220 | |
|
| Multi-Utilities – 0.6% | |
| | |
Black Hills Corp. | | | 14,876 | | | | 1,145,749 | |
| | |
NiSource, Inc. | | | 83,981 | | | | 2,670,596 | |
| | |
NorthWestern Corp. | | | 13,779 | | | | 833,492 | |
| | | | | | | | |
| Total Multi-Utilities | | | | 4,649,837 | |
|
| Multiline Retail – 1.6% | |
| | |
Dillard’s, Inc., Class A | | | 9,683 | | | | 2,598,820 | |
| | |
Kohl’s Corp. | | | 87,720 | | | | 5,303,551 | |
| | |
Macy’s, Inc. | | | 171,060 | | | | 4,167,022 | |
| | |
Nordstrom, Inc.(a) | | | 17,101 | | | | 463,608 | |
| | |
Ollie’s Bargain Outlet Holdings, Inc.*(a) | | | 15,031 | | | | 645,732 | |
| | | | | | | | |
| Total Multiline Retail | | | | 13,178,733 | |
|
| Oil, Gas & Consumable Fuels – 5.5% | |
| | |
Antero Midstream Corp. | | | 138,750 | | | | 1,508,212 | |
| | |
Antero Resources Corp.* | | | 67,861 | | | | 2,071,796 | |
| | |
APA Corp. | | | 147,547 | | | | 6,098,117 | |
| | |
California Resources Corp. | | | 32,352 | | | | 1,447,105 | |
| | |
Callon Petroleum Co.*(a) | | | 25,585 | | | | 1,511,562 | |
See Notes to Financial Statements.
Schedule of Investments (continued)
WisdomTree U.S. MidCap Fund (EZM)
March 31, 2022
| | | | | | | | |
| Investments | | Shares | | | Value | |
| | |
Chesapeake Energy Corp.(a) | | | 51,165 | | | $ | 4,451,355 | |
| | |
Civitas Resources, Inc. | | | 14,139 | | | | 844,240 | |
| | |
Denbury, Inc.* | | | 6,328 | | | | 497,191 | |
| | |
DTE Midstream LLC | | | 25,953 | | | | 1,408,210 | |
| | |
EQT Corp. | | | 32,696 | | | | 1,125,069 | |
| | |
Equitrans Midstream Corp. | | | 130,859 | | | | 1,104,450 | |
| | |
HF Sinclair Corp.* | | | 17,718 | | | | 706,062 | |
| | |
Magnolia Oil & Gas Corp., Class A | | | 62,280 | | | | 1,472,922 | |
| | |
Matador Resources Co. | | | 40,628 | | | | 2,152,471 | |
| | |
Murphy Oil Corp. | | | 19,089 | | | | 771,005 | |
| | |
Ovintiv, Inc. | | | 138,281 | | | | 7,476,854 | |
| | |
PDC Energy, Inc. | | | 50,851 | | | | 3,695,851 | |
| | |
Range Resources Corp.* | | | 58,079 | | | | 1,764,440 | |
| | |
SM Energy Co. | | | 13,367 | | | | 520,645 | |
| | |
Southwestern Energy Co.* | | | 512,276 | | | | 3,673,019 | |
| | | | | | | | |
| Total Oil, Gas & Consumable Fuels | | | | 44,300,576 | |
|
| Paper & Forest Products – 0.4% | |
| | |
Louisiana-Pacific Corp. | | | 57,590 | | | | 3,577,491 | |
| | |
| Personal Products – 0.1% | | | | | | | | |
| | |
Beauty Health Co.*(a) | | | 13,737 | | | | 231,881 | |
| | |
BellRing Brands, Inc.* | | | 8,255 | | | | 190,525 | |
| | |
Coty, Inc., Class A* | | | 64,569 | | | | 580,475 | |
| | | | | | | | |
| Total Personal Products | | | | 1,002,881 | |
|
| Pharmaceuticals – 0.8% | |
| | |
Organon & Co. | | | 181,419 | | | | 6,336,966 | |
|
| Professional Services – 1.8% | |
| | |
ASGN, Inc.* | | | 9,381 | | | | 1,094,857 | |
| | |
Booz Allen Hamilton Holding Corp. | | | 26,764 | | | | 2,350,950 | |
| | |
CACI International, Inc., Class A* | | | 6,937 | | | | 2,089,841 | |
| | |
Exponent, Inc. | | | 4,359 | | | | 470,990 | |
| | |
FTI Consulting, Inc.* | | | 7,161 | | | | 1,125,852 | |
| | |
Insperity, Inc. | | | 5,782 | | | | 580,628 | |
| | |
KBR, Inc. | | | 28,764 | | | | 1,574,254 | |
| | |
Korn Ferry | | | 11,877 | | | | 771,292 | |
| | |
ManpowerGroup, Inc. | | | 14,878 | | | | 1,397,342 | |
| | |
Science Applications International Corp. | | | 19,549 | | | | 1,801,831 | |
| | |
TriNet Group, Inc.* | | | 13,693 | | | | 1,346,843 | |
| | |
Upwork, Inc.* | | | 10,750 | | | | 249,830 | |
| | | | | | | | |
| Total Professional Services | | | | 14,854,510 | |
|
| Real Estate Management & Development – 0.4% | |
| | |
eXp World Holdings, Inc.(a) | | | 13,060 | | | | 276,480 | |
| | |
Kennedy-Wilson Holdings, Inc. | | | 78,319 | | | | 1,910,201 | |
| | |
Newmark Group, Inc., Class A | | | 75,758 | | | | 1,206,067 | |
| | | | | | | | |
| Total Real Estate Management & Development | | | | 3,392,748 | |
|
| Road & Rail – 1.0% | |
| | |
Knight-Swift Transportation Holdings, Inc. | | | 45,063 | | | | 2,273,879 | |
| | |
Landstar System, Inc. | | | 7,979 | | | | 1,203,473 | |
| | |
Ryder System, Inc. | | | 18,344 | | | | 1,455,229 | |
| | |
Saia, Inc.* | | | 2,800 | | | | 682,696 | |
| | |
Werner Enterprises, Inc. | | | 19,251 | | | | 789,291 | |
| | |
XPO Logistics, Inc.* | | | 21,255 | | | | 1,547,364 | |
| | | | | | | | |
| Total Road & Rail | | | | 7,951,932 | |
|
| Semiconductors & Semiconductor Equipment – 2.2% | |
| | |
Allegro MicroSystems, Inc.* | | | 19,171 | | | | 544,456 | |
| | |
Amkor Technology, Inc. | | | 101,253 | | | | 2,199,215 | |
| | |
Cirrus Logic, Inc.* | | | 15,700 | | | | 1,331,203 | |
| | |
CMC Materials, Inc. | | | 6,539 | | | | 1,212,331 | |
| | |
Diodes, Inc.* | | | 8,302 | | | | 722,191 | |
| | |
First Solar, Inc.* | | | 18,759 | | | | 1,570,879 | |
| | |
FormFactor, Inc.* | | | 13,918 | | | | 584,974 | |
| | |
Lattice Semiconductor Corp.* | | | 11,523 | | | | 702,327 | |
| | |
MACOM Technology Solutions Holdings, Inc.* | | | 8,950 | | | | 535,836 | |
| | |
MaxLinear, Inc.* | | | 11,426 | | | | 666,707 | |
| | |
MKS Instruments, Inc. | | | 15,469 | | | | 2,320,350 | |
| | |
Onto Innovation, Inc.* | | | 8,185 | | | | 711,195 | |
| | |
Power Integrations, Inc. | | | 9,051 | | | | 838,847 | |
| | |
Semtech Corp.* | | | 7,501 | | | | 520,119 | |
| | |
Silicon Laboratories, Inc.* | | | 3,380 | | | | 507,676 | |
| | |
SiTime Corp.* | | | 1,696 | | | | 420,303 | |
| | |
SunPower Corp.*(a) | | | 17,296 | | | | 371,518 | |
| | |
Synaptics, Inc.* | | | 5,258 | | | | 1,048,971 | |
| | |
Universal Display Corp. | | | 5,431 | | | | 906,705 | |
| | | | | | | | |
| Total Semiconductors & Semiconductor Equipment | | | | 17,715,803 | |
|
| Software – 3.8% | |
| | |
ACI Worldwide, Inc.* | | | 13,992 | | | | 440,608 | |
| | |
Alarm.com Holdings, Inc.* | | | 6,395 | | | | 425,012 | |
| | |
Altair Engineering, Inc., Class A* | | | 4,804 | | | | 309,378 | |
| | |
Alteryx, Inc., Class A* | | | 5,425 | | | | 388,050 | |
| | |
Anaplan, Inc.* | | | 11,487 | | | | 747,229 | |
| | |
Black Knight, Inc.* | | | 20,241 | | | | 1,173,775 | |
| | |
Blackbaud, Inc.* | | | 8,938 | | | | 535,118 | |
| | |
Blackline, Inc.* | | | 4,937 | | | | 361,487 | |
| | |
Box, Inc., Class A* | | | 22,680 | | | | 659,081 | |
| | |
CDK Global, Inc. | | | 34,023 | | | | 1,656,240 | |
| | |
Citrix Systems, Inc. | | | 33,842 | | | | 3,414,658 | |
| | |
Datto Holding Corp.*(a) | | | 21,444 | | | | 572,984 | |
| | |
Digital Turbine, Inc.*(a) | | | 11,339 | | | | 496,761 | |
| | |
Dolby Laboratories, Inc., Class A | | | 14,851 | | | | 1,161,645 | |
| | |
DoubleVerify Holdings, Inc.* | | | 11,752 | | | | 295,798 | |
| | |
Dropbox, Inc., Class A* | | | 96,586 | | | | 2,245,624 | |
| | |
Duck Creek Technologies, Inc.* | | | 10,780 | | | | 238,454 | |
| | |
Envestnet, Inc.* | | | 8,203 | | | | 610,631 | |
| | |
Everbridge, Inc.* | | | 3,206 | | | | 139,910 | |
| | |
Fair Isaac Corp.* | | | 3,996 | | | | 1,863,974 | |
| | |
Five9, Inc.* | | | 5,848 | | | | 645,619 | |
| | |
Guidewire Software, Inc.* | | | 6,776 | | | | 641,145 | |
| | |
Jamf Holding Corp.*(a) | | | 10,465 | | | | 364,287 | |
| | |
Mandiant, Inc.* | | | 18,657 | | | | 416,238 | |
| | |
Manhattan Associates, Inc.* | | | 5,514 | | | | 764,847 | |
| | |
Marathon Digital Holdings, Inc.*(a) | | | 10,585 | | | | 295,851 | |
| | |
MicroStrategy, Inc., Class A*(a) | | | 832 | | | | 404,618 | |
| | |
Momentive Global, Inc.* | | | 13,414 | | | | 218,112 | |
| | |
nCino, Inc.* | | | 8,868 | | | | 363,411 | |
| | |
NCR Corp.* | | | 32,485 | | | | 1,305,572 | |
| | |
PagerDuty, Inc.*(a) | | | 8,264 | | | | 282,546 | |
See Notes to Financial Statements.
Schedule of Investments (continued)
WisdomTree U.S. MidCap Fund (EZM)
March 31, 2022
| | | | | | | | |
| Investments | | Shares | | | Value | |
| | |
Pegasystems, Inc. | | | 6,698 | | | $ | 540,194 | |
| | |
Q2 Holdings, Inc.*(a) | | | 4,792 | | | | 295,427 | |
| | |
Qualtrics International, Inc., Class A* | | | 11,452 | | | | 326,955 | |
| | |
Qualys, Inc.* | | | 4,693 | | | | 668,330 | |
| | |
Rapid7, Inc.* | | | 4,813 | | | | 535,398 | |
| | |
Riot Blockchain, Inc.*(a) | | | 11,015 | | | | 233,187 | |
| | |
Sailpoint Technologies Holdings, Inc.*(a) | | | 8,496 | | | | 434,825 | |
| | |
Smartsheet, Inc., Class A* | | | 9,620 | | | | 526,984 | |
| | |
Sprout Social, Inc., Class A* | | | 4,198 | | | | 336,344 | |
| | |
SPS Commerce, Inc.* | | | 3,224 | | | | 422,989 | |
| | |
Tenable Holdings, Inc.* | | | 9,151 | | | | 528,836 | |
| | |
Teradata Corp.* | | | 26,156 | | | | 1,289,229 | |
| | |
Varonis Systems, Inc.* | | | 9,076 | | | | 431,473 | |
| | |
Verint Systems, Inc.* | | | 15,063 | | | | 778,757 | |
| | |
Workiva, Inc.* | | | 3,800 | | | | 448,400 | |
| | | | | | | | |
| Total Software | | | | 31,235,991 | |
|
| Specialty Retail – 4.2% | |
| | |
Academy Sports & Outdoors, Inc.(a) | | | 55,697 | | | | 2,194,462 | |
| | |
American Eagle Outfitters, Inc.(a) | | | 67,796 | | | | 1,138,973 | |
| | |
Asbury Automotive Group, Inc.*(a) | | | 10,749 | | | | 1,721,990 | |
| | |
AutoNation, Inc.* | | | 37,908 | | | | 3,774,879 | |
| | |
Boot Barn Holdings, Inc.* | | | 4,320 | | | | 409,493 | |
| | |
Dick’s Sporting Goods, Inc.(a) | | | 49,884 | | | | 4,989,398 | |
| | |
Five Below, Inc.* | | | 5,569 | | | | 881,962 | |
| | |
Foot Locker, Inc. | | | 71,936 | | | | 2,133,622 | |
| | |
Gap, Inc. | | | 180,718 | | | | 2,544,509 | |
| | |
Group 1 Automotive, Inc. | | | 10,746 | | | | 1,803,501 | |
| | |
Leslie’s, Inc.*(a) | | | 31,139 | | | | 602,851 | |
| | |
Lithia Motors, Inc. | | | 12,942 | | | | 3,884,153 | |
| | |
Murphy USA, Inc. | | | 7,526 | | | | 1,504,899 | |
| | |
National Vision Holdings, Inc.* | | | 14,766 | | | | 643,354 | |
| | |
Penske Automotive Group, Inc. | | | 41,811 | | | | 3,918,527 | |
| | |
Petco Health & Wellness Co., Inc.*(a) | | | 42,982 | | | | 841,158 | |
| | |
Urban Outfitters, Inc.* | | | 37,048 | | | | 930,275 | |
| | | | | | | | |
| Total Specialty Retail | | | | 33,918,006 | |
|
| Technology Hardware, Storage & Peripherals – 0.3% | |
| | |
Pure Storage, Inc., Class A* | | | 23,315 | | | | 823,252 | |
| | |
Xerox Holdings Corp. | | | 68,552 | | | | 1,382,694 | |
| | | | | | | | |
| Total Technology Hardware, Storage & Peripherals | | | | 2,205,946 | |
|
| Textiles, Apparel & Luxury Goods – 2.2% | |
| | |
Carter’s, Inc. | | | 13,558 | | | | 1,247,200 | |
| | |
Columbia Sportswear Co. | | | 11,867 | | | | 1,074,320 | |
| | |
Crocs, Inc.* | | | 11,844 | | | | 904,882 | |
| | |
Deckers Outdoor Corp.* | | | 4,548 | | | | 1,245,106 | |
| | |
Hanesbrands, Inc. | | | 143,929 | | | | 2,143,103 | |
| | |
Kontoor Brands, Inc. | | | 19,743 | | | | 816,373 | |
| | |
PVH Corp. | | | 15,646 | | | | 1,198,640 | |
| | |
Ralph Lauren Corp. | | | 17,006 | | | | 1,929,161 | |
| | |
Skechers U.S.A., Inc., Class A* | | | 64,136 | | | | 2,614,183 | |
| | |
Steven Madden Ltd. | | | 13,186 | | | | 509,507 | |
| | |
Tapestry, Inc. | | | 85,489 | | | | 3,175,916 | |
| | |
Under Armour, Inc., Class A* | | | 63,862 | | | | 1,086,931 | |
| | | | | | | | |
| Total Textiles, Apparel & Luxury Goods | | | | | | | 17,945,322 | |
| | |
| Thrifts & Mortgage Finance – 1.2% | | | | | | | | |
| | |
Axos Financial, Inc.* | | | 12,400 | | | | 575,236 | |
| | |
MGIC Investment Corp. | | | 160,500 | | | | 2,174,775 | |
| | |
New York Community Bancorp, Inc.(a) | | | 176,022 | | | | 1,886,956 | |
| | |
PennyMac Financial Services, Inc. | | | 38,876 | | | | 2,068,203 | |
| | |
Radian Group, Inc. | | | 93,386 | | | | 2,074,103 | |
| | |
TFS Financial Corp. | | | 22,420 | | | | 372,172 | |
| | |
Walker & Dunlop, Inc. | | | 5,866 | | | | 759,178 | |
| | | | | | | | |
| Total Thrifts & Mortgage Finance | | | | | | | 9,910,623 | |
| | |
| Trading Companies & Distributors – 1.5% | | | | | | | | |
| | |
Air Lease Corp. | | | 35,621 | | | | 1,590,478 | |
| | |
Applied Industrial Technologies, Inc. | | | 8,228 | | | | 844,686 | |
| | |
Beacon Roofing Supply, Inc.*(a) | | | 24,501 | | | | 1,452,419 | |
| | |
GATX Corp. | | | 5,642 | | | | 695,828 | |
| | |
Herc Holdings, Inc. | | | 4,537 | | | | 758,087 | |
| | |
MSC Industrial Direct Co., Inc., Class A | | | 13,151 | | | | 1,120,597 | |
| | |
SiteOne Landscape Supply, Inc.* | | | 4,234 | | | | 684,595 | |
| | |
Univar Solutions, Inc.* | | | 47,943 | | | | 1,540,888 | |
| | |
Watsco, Inc.(a) | | | 4,658 | | | | 1,419,013 | |
| | |
WESCO International, Inc.* | | | 13,218 | | | | 1,720,191 | |
| | | | | | | | |
| Total Trading Companies & Distributors | | | | | | | 11,826,782 | |
| | |
| Water Utilities – 0.1% | | | | | | | | |
| | |
American States Water Co. | | | 3,875 | | | | 344,953 | |
| | |
California Water Service Group | | | 6,987 | | | | 414,189 | |
| | | | | | | | |
| Total Water Utilities | | | | | | | 759,142 | |
TOTAL COMMON STOCKS (Cost: $714,214,367) | | | | | | | 808,741,004 | |
| | |
| EXCHANGE-TRADED FUND – 0.3% | | | | | | | | |
| | |
| United States – 0.3% | | | | | | | | |
| | |
WisdomTree U.S. MidCap Dividend Fund(b)
(Cost: $2,133,587) | | | 51,648 | | | | 2,294,204 | |
|
| INVESTMENT OF CASH COLLATERAL FOR SECURITIES LOANED – 0.9% | |
| | |
| United States – 0.9% | | | | | | | | |
| |
State Street Navigator Securities Lending
Government Money Market Portfolio, 0.25%(c) | | | | | |
| (Cost: $7,577,119) | | | 7,577,119 | | | | 7,577,119 | |
| |
TOTAL INVESTMENTS IN SECURITIES – 100.9% (Cost: $723,925,073) | | | | 818,612,327 | |
| |
Other Assets less Liabilities – (0.9)% | | | | (6,939,829 | ) |
| | | | | | | | |
| NET ASSETS – 100.0% | | | $ | 811,672,498 | |
| * | Non-income producing security. |
| (a) | Security, or portion thereof, was on loan at March 31, 2022 (See Note 2). At March 31, 2022, the total market value of the Fund’s securities on loan identified in the Schedule of Investments was $42,921,326 and the total market value of the collateral held by the Fund was $45,439,882. The total market value of the collateral includes non-cash U.S. Government securities collateral having a value of $37,862,763. |
| (b) | Affiliated holding. See “Investment in Affiliates” supplementary table included in this Schedule of Investments for additional information. |
| (c) | Rate shown represents annualized 7-day yield as of March 31, 2022. |
See Notes to Financial Statements.
Schedule of Investments (concluded)
WisdomTree U.S. MidCap Fund (EZM)
March 31, 2022
Affiliated holdings are investments in entities in which the Fund owns 5% or more of the outstanding voting securities or are investments in entities which are under common ownership or control. Investments in affiliates during the fiscal year ended March 31, 2022 were as follows:
| | | | | | | | | | | | | | | | | | | | | | | | | | | | |
| | | | | | | |
| Affiliate | | Value at
3/31/2021 | | | Purchases/
Additions | | | Sales/
Reductions | | | Realized
Gain/(Loss) | | | Change in
Unrealized
Appreciation/
Depreciation | | | Value at
3/31/2022 | | | Dividend
Income | |
WisdomTree U.S. MidCap Dividend Fund | | $ | 2,290,925 | | | $ | 3,555,431 | | | $ | 3,821,808 | | | $ | 154,761 | | | $ | 114,895 | | | $ | 2,294,204 | | | $ | 57,389 | |
The following is a summary of the fair valuations according to the inputs used as of March 31, 2022 in valuing the Fund’s investments (See Note 2 — Fair Value Measurement):
| | | | | | | | | | | | | | | | |
| | | | |
| | | Quoted
Prices in
Active
Markets
(Level 1) | | | Other
Significant
Observable
Inputs
(Level 2) | | | Significant
Unobservable
Inputs
(Level 3) | | | Total | |
Assets: | | | | | | | | | | | | | | | | |
Investments in Securities | | | | | | | | | | | | | | | | |
Common Stocks | | $ | 808,741,004 | | | $ | — | | | $ | — | | | $ | 808,741,004 | |
Exchange-Traded Fund | | | 2,294,204 | | | | — | | | | — | | | | 2,294,204 | |
Investment of Cash Collateral for Securities Loaned | | | — | | | | 7,577,119 | | | | — | | | | 7,577,119 | |
Total Investments in Securities | | $ | 811,035,208 | | | $ | 7,577,119 | | | $ | — | | | $ | 818,612,327 | |
See Notes to Financial Statements.
Schedule of Investments
WisdomTree U.S. Multifactor Fund (USMF)
March 31, 2022
| | | | | | | | |
| Investments | | Shares | | | Value | |
|
| COMMON STOCKS – 99.9% | |
|
| United States – 99.9% | |
|
| Aerospace & Defense – 1.6% | |
| | |
Huntington Ingalls Industries, Inc. | | | 3,971 | | | $ | 791,976 | |
| | |
L3Harris Technologies, Inc. | | | 3,113 | | | | 773,487 | |
| | |
Lockheed Martin Corp. | | | 2,243 | | | | 990,060 | |
| | |
Northrop Grumman Corp. | | | 2,044 | | | | 914,118 | |
| | | | | | | | |
| Total Aerospace & Defense | | | | 3,469,641 | |
|
| Air Freight & Logistics – 1.1% | |
| | |
C.H. Robinson Worldwide, Inc. | | | 7,573 | | | | 815,688 | |
| | |
FedEx Corp. | | | 3,531 | | | | 817,038 | |
| | |
United Parcel Service, Inc., Class B | | | 3,474 | | | | 745,034 | |
| | | | | | | | |
| Total Air Freight & Logistics | | | | 2,377,760 | |
|
| Automobiles – 0.7% | |
| | |
Ford Motor Co. | | | 49,182 | | | | 831,668 | |
| | |
Harley-Davidson, Inc. | | | 20,428 | | | | 804,863 | |
| | | | | | | | |
| Total Automobiles | | | | 1,636,531 | |
|
| Banks – 3.6% | |
| | |
Bank OZK | | | 15,642 | | | | 667,913 | |
| | |
BOK Financial Corp. | | | 6,614 | | | | 621,385 | |
| | |
Citigroup, Inc. | | | 15,586 | | | | 832,292 | |
| | |
JPMorgan Chase & Co. | | | 6,776 | | | | 923,704 | |
| | |
KeyCorp | | | 31,107 | | | | 696,175 | |
| | |
People’s United Financial, Inc. | | | 30,656 | | | | 612,814 | |
| | |
Regions Financial Corp. | | | 26,686 | | | | 594,030 | |
| | |
Synovus Financial Corp. | | | 12,066 | | | | 591,234 | |
| | |
U.S. Bancorp | | | 14,337 | | | | 762,012 | |
| | |
Valley National Bancorp | | | 45,573 | | | | 593,361 | |
| | |
Webster Financial Corp. | | | 10,197 | | | | 572,256 | |
| | |
Wells Fargo & Co. | | | 13,694 | | | | 663,611 | |
| | | | | | | | |
| Total Banks | | | | 8,130,787 | |
|
| Beverages – 0.6% | |
| | |
Coca-Cola Co. | | | 12,990 | | | | 805,380 | |
| | |
Molson Coors Beverage Co., Class B | | | 10,565 | | | | 563,960 | |
| | | | | | | | |
| Total Beverages | | | | 1,369,340 | |
|
| Biotechnology – 2.9% | |
| | |
AbbVie, Inc. | | | 6,570 | | | | 1,065,063 | |
| | |
Amgen, Inc. | | | 3,656 | | | | 884,094 | |
| | |
Exelixis, Inc.* | | | 19,895 | | | | 451,020 | |
| | |
Gilead Sciences, Inc. | | | 17,309 | | | | 1,029,020 | |
| | |
Incyte Corp.* | | | 9,637 | | | | 765,370 | |
| | |
Moderna, Inc.* | | | 2,752 | | | | 474,059 | |
| | |
Regeneron Pharmaceuticals, Inc.* | | | 1,330 | | | | 928,899 | |
| | |
Vertex Pharmaceuticals, Inc.* | | | 3,255 | | | | 849,457 | |
| | | | | | | | |
| Total Biotechnology | | | | 6,446,982 | |
|
| Building Products – 0.5% | |
| | |
Builders FirstSource, Inc.* | | | 6,928 | | | | 447,133 | |
| | |
Owens Corning | | | 6,735 | | | | 616,253 | |
| | | | | | | | |
| Total Building Products | | | | 1,063,386 | |
|
| Capital Markets – 0.6% | |
| | |
Houlihan Lokey, Inc. | | | 7,048 | | | | 618,814 | |
| | |
Jefferies Financial Group, Inc. | | | 21,039 | | | | 691,131 | |
| | | | | | | | |
| Total Capital Markets | | | | 1,309,945 | |
|
| Chemicals – 1.2% | |
| | |
CF Industries Holdings, Inc. | | | 8,495 | | | | 875,495 | |
| | |
Huntsman Corp. | | | 23,124 | | | | 867,381 | |
| | |
Westlake Corp. | | | 7,627 | | | | 941,172 | |
| | | | | | | | |
| Total Chemicals | | | | 2,684,048 | |
|
| Commercial Services & Supplies – 0.9% | |
| | |
Republic Services, Inc. | | | 7,545 | | | | 999,712 | |
| | |
Waste Management, Inc. | | | 6,240 | | | | 989,040 | |
| | | | | | | | |
| Total Commercial Services & Supplies | | | | 1,988,752 | |
|
| Communications Equipment – 0.8% | |
| | |
Ciena Corp.* | | | 29,316 | | | | 1,777,429 | |
|
| Consumer Finance – 1.7% | |
| | |
American Express Co. | | | 4,009 | | | | 749,683 | |
| | |
Capital One Financial Corp. | | | 4,866 | | | | 638,857 | |
| | |
Credit Acceptance Corp.*(a) | | | 1,068 | | | | 587,795 | |
| | |
Discover Financial Services | | | 5,439 | | | | 599,323 | |
| | |
OneMain Holdings, Inc. | | | 13,995 | | | | 663,503 | |
| | |
Synchrony Financial | | | 15,480 | | | | 538,859 | |
| | | | | | | | |
| Total Consumer Finance | | | | 3,778,020 | |
|
| Diversified Consumer Services – 0.7% | |
| | |
Service Corp. International | | | 24,529 | | | | 1,614,499 | |
|
| Diversified Financial Services – 0.4% | |
| | |
Voya Financial, Inc. | | | 12,802 | | | | 849,413 | |
|
| Diversified Telecommunication Services – 1.2% | |
| | |
Verizon Communications, Inc. | | | 51,586 | | | | 2,627,791 | |
|
| Electric Utilities – 1.1% | |
| | |
American Electric Power Co., Inc. | | | 8,141 | | | | 812,228 | |
| | |
Evergy, Inc. | | | 12,789 | | | | 874,000 | |
| | |
FirstEnergy Corp. | | | 19,033 | | | | 872,853 | |
| | | | | | | | |
| Total Electric Utilities | | | | 2,559,081 | |
|
| Electronic Equipment, Instruments & Components – 1.1% | |
| | |
Arrow Electronics, Inc.* | | | 21,014 | | | | 2,492,891 | |
|
| Entertainment – 1.2% | |
| | |
Liberty Media Corp. – Liberty Formula One, Class C* | | | 38,703 | | | | 2,703,017 | |
|
| Equity Real Estate Investment Trusts (REITs) – 2.3% | |
| | |
Kilroy Realty Corp. | | | 16,850 | | | | 1,287,677 | |
| | |
Omega Healthcare Investors, Inc. | | | 44,028 | | | | 1,371,913 | |
| | |
Public Storage | | | 3,798 | | | | 1,482,283 | |
| | |
Weyerhaeuser Co. | | | 28,989 | | | | 1,098,683 | |
| | | | | | | | |
| Total Equity Real Estate Investment Trusts (REITs) | | | | 5,240,556 | |
|
| Food & Staples Retailing – 0.4% | |
| | |
Albertsons Cos., Inc., Class A | | | 11,505 | | | | 382,541 | |
| | |
Kroger Co. | | | 8,602 | | | | 493,497 | |
| | | | | | | | |
| Total Food & Staples Retailing | | | | 876,038 | |
|
| Food Products – 2.8% | |
| | |
Archer-Daniels-Midland Co. | | | 9,893 | | | | 892,942 | |
| | |
Campbell Soup Co. | | | 17,039 | | | | 759,428 | |
| | |
Conagra Brands, Inc. | | | 22,600 | | | | 758,682 | |
| | |
General Mills, Inc. | | | 11,614 | | | | 786,500 | |
| | |
J.M. Smucker Co. | | | 5,807 | | | | 786,326 | |
See Notes to Financial Statements.
Schedule of Investments (continued)
WisdomTree U.S. Multifactor Fund (USMF)
March 31, 2022
| | | | | | | | |
| Investments | | Shares | | | Value | |
| | |
Kellogg Co. | | | 12,541 | | | $ | 808,769 | |
| | |
Kraft Heinz Co. | | | 18,104 | | | | 713,117 | |
| | |
Tyson Foods, Inc., Class A | | | 8,427 | | | | 755,312 | |
| | | | | | | | |
| Total Food Products | | | | 6,261,076 | |
|
| Gas Utilities – 0.3% | |
| | |
UGI Corp. | | | 20,144 | | | | 729,616 | |
|
| Health Care Equipment & Supplies – 1.8% | |
| | |
Abbott Laboratories | | | 7,096 | | | | 839,883 | |
| | |
Baxter International, Inc. | | | 10,662 | | | | 826,731 | |
| | |
Becton Dickinson and Co. | | | 3,466 | | | | 921,956 | |
| | |
Dentsply Sirona, Inc. | | | 11,664 | | | | 574,102 | |
| | |
Hologic, Inc.* | | | 11,045 | | | | 848,477 | |
| | | | | | | | |
| Total Health Care Equipment & Supplies | | | | 4,011,149 | |
|
| Health Care Providers & Services – 5.5% | |
| | |
AmerisourceBergen Corp. | | | 6,245 | | | | 966,164 | |
| | |
Anthem, Inc. | | | 1,797 | | | | 882,723 | |
| | |
Cardinal Health, Inc. | | | 12,153 | | | | 689,075 | |
| | |
Centene Corp.* | | | 7,401 | | | | 623,090 | |
| | |
Chemed Corp. | | | 1,604 | | | | 812,506 | |
| | |
Cigna Corp. | | | 2,994 | | | | 717,392 | |
| | |
CVS Health Corp. | | | 9,305 | | | | 941,759 | |
| | |
DaVita, Inc.* | | | 6,741 | | | | 762,475 | |
| | |
HCA Healthcare, Inc. | | | 2,537 | | | | 635,823 | |
| | |
Henry Schein, Inc.* | | | 9,205 | | | | 802,584 | |
| | |
Laboratory Corp. of America Holdings* | | | 3,452 | | | | 910,154 | |
| | |
McKesson Corp. | | | 3,184 | | | | 974,718 | |
| | |
Quest Diagnostics, Inc. | | | 6,785 | | | | 928,595 | |
| | |
UnitedHealth Group, Inc. | | | 1,791 | | | | 913,356 | |
| | |
Universal Health Services, Inc., Class B | | | 4,509 | | | | 653,580 | |
| | | | | | | | |
| Total Health Care Providers & Services | | | | 12,213,994 | |
|
| Health Care Technology – 0.4% | |
| | |
Change Healthcare, Inc.* | | | 44,071 | | | | 960,748 | |
|
| Hotels, Restaurants & Leisure – 3.3% | |
| | |
Boyd Gaming Corp. | | | 13,407 | | | | 881,913 | |
| | |
Choice Hotels International, Inc. | | | 9,420 | | | | 1,335,379 | |
| | |
McDonald’s Corp. | | | 7,203 | | | | 1,781,158 | |
| | |
Penn National Gaming, Inc.* | | | 15,081 | | | | 639,736 | |
| | |
Texas Roadhouse, Inc. | | | 12,317 | | | | 1,031,302 | |
| | |
Yum! Brands, Inc. | | | 13,844 | | | | 1,640,929 | |
| | | | | | | | |
| Total Hotels, Restaurants & Leisure | | | | 7,310,417 | |
|
| Household Products – 1.4% | |
| | |
Colgate-Palmolive Co. | | | 10,938 | | | | 829,428 | |
| | |
Kimberly-Clark Corp. | | | 6,311 | | | | 777,263 | |
| | |
Procter & Gamble Co. | | | 5,222 | | | | 797,922 | |
| | |
Reynolds Consumer Products, Inc. | | | 24,271 | | | | 712,111 | |
| | | | | | | | |
| Total Household Products | | | | 3,116,724 | |
|
| Industrial Conglomerates – 0.4% | |
| | |
3M Co. | | | 6,592 | | | | 981,417 | |
|
| Insurance – 5.1% | |
| | |
Alleghany Corp.* | | | 1,566 | | | | 1,326,402 | |
| | |
Allstate Corp. | | | 7,702 | | | | 1,066,804 | |
| | |
American International Group, Inc. | | | 12,622 | | | | 792,283 | |
| | |
CNA Financial Corp. | | | 19,948 | | | | 969,872 | |
| | |
Fidelity National Financial, Inc. | | | 17,724 | | | | 865,640 | |
| | |
First American Financial Corp. | | | 12,765 | | | | 827,427 | |
| | |
Hartford Financial Services Group, Inc. | | | 10,716 | | | | 769,516 | |
| | |
Old Republic International Corp. | | | 33,752 | | | | 873,164 | |
| | |
Progressive Corp. | | | 8,840 | | | | 1,007,672 | |
| | |
Prudential Financial, Inc. | | | 7,556 | | | | 892,893 | |
| | |
Travelers Cos., Inc. | | | 5,588 | | | | 1,021,095 | |
| | |
W.R. Berkley Corp. | | | 15,265 | | | | 1,016,463 | |
| | | | | | | | |
| Total Insurance | | | | 11,429,231 | |
|
| IT Services – 16.1% | |
| | |
Akamai Technologies, Inc.* | | | 25,234 | | | | 3,012,687 | |
| | |
Cognizant Technology Solutions Corp., Class A | | | 30,946 | | | | 2,774,928 | |
| | |
Concentrix Corp. | | | 10,589 | | | | 1,763,704 | |
| | |
DXC Technology Co.* | | | 49,667 | | | | 1,620,634 | |
| | |
EPAM Systems, Inc.* | | | 6,153 | | | | 1,825,041 | |
| | |
Fidelity National Information Services, Inc. | | | 22,317 | | | | 2,241,073 | |
| | |
Fiserv, Inc.* | | | 22,890 | | | | 2,321,046 | |
| | |
FleetCor Technologies, Inc.* | | | 11,952 | | | | 2,976,765 | |
| | |
Gartner, Inc.* | | | 6,941 | | | | 2,064,670 | |
| | |
Global Payments, Inc. | | | 14,143 | | | | 1,935,328 | |
| | |
GoDaddy, Inc., Class A* | | | 21,342 | | | | 1,786,325 | |
| | |
International Business Machines Corp. | | | 24,150 | | | | 3,139,983 | |
| | |
Jack Henry & Associates, Inc. | | | 16,468 | | | | 3,245,020 | |
| | |
VeriSign, Inc.* | | | 12,556 | | | | 2,793,208 | |
| | |
Western Union Co. | | | 136,852 | | | | 2,564,607 | |
| | | | | | | | |
| Total IT Services | | | | 36,065,019 | |
|
| Life Sciences Tools & Services – 1.0% | |
| | |
Danaher Corp. | | | 2,779 | | | | 815,164 | |
| | |
PerkinElmer, Inc. | | | 3,811 | | | | 664,867 | |
| | |
Thermo Fisher Scientific, Inc. | | | 1,421 | | | | 839,314 | |
| | | | | | | | |
| Total Life Sciences Tools & Services | | | | 2,319,345 | |
|
| Machinery – 1.0% | |
| | |
AGCO Corp. | | | 4,180 | | | | 610,405 | |
| | |
Crane Co. | | | 6,647 | | | | 719,737 | |
| | |
Snap-on, Inc. | | | 4,048 | | | | 831,783 | |
| | | | | | | | |
| Total Machinery | | | | 2,161,925 | |
|
| Media – 7.2% | |
| | |
Charter Communications, Inc., Class A* | | | 4,315 | | | | 2,353,919 | |
| | |
Comcast Corp., Class A | | | 48,165 | | | | 2,255,085 | |
| | |
Fox Corp., Class A | | | 43,817 | | | | 1,728,581 | |
| | |
Liberty Media Corp. – Liberty SiriusXM, Series C* | | | 50,719 | | | | 2,319,380 | |
| | |
Nexstar Media Group, Inc., Class A | | | 9,764 | | | | 1,840,319 | |
| | |
Omnicom Group, Inc. | | | 25,283 | | | | 2,146,021 | |
| | |
Paramount Global, Class B(a) | | | 29,667 | | | | 1,121,709 | |
| | |
Sirius XM Holdings, Inc.(a) | | | 363,972 | | | | 2,409,494 | |
| | | | | | | | |
| Total Media | | | | 16,174,508 | |
|
| Metals & Mining – 1.4% | |
| | |
Alcoa Corp. | | | 6,385 | | | | 574,841 | |
| | |
Nucor Corp. | | | 5,221 | | | | 776,102 | |
| | |
Reliance Steel & Aluminum Co. | | | 5,273 | | | | 966,804 | |
| | |
Steel Dynamics, Inc. | | | 9,304 | | | | 776,233 | |
| | | | | | | | |
| Total Metals & Mining | | | | 3,093,980 | |
|
| Multi-Utilities – 1.1% | |
| | |
CMS Energy Corp. | | | 12,126 | | | | 848,093 | |
See Notes to Financial Statements.
Schedule of Investments (continued)
WisdomTree U.S. Multifactor Fund (USMF)
March 31, 2022
| | | | | | | | |
| Investments | | Shares | | | Value | |
| | |
Consolidated Edison, Inc. | | | 8,630 | | | $ | 817,088 | |
| | |
DTE Energy Co. | | | 5,958 | | | | 787,707 | |
| | | | | | | | |
| Total Multi-Utilities | | | | 2,452,888 | |
|
| Multiline Retail – 1.9% | |
| | |
Dollar General Corp. | | | 7,161 | | | | 1,594,253 | |
| | |
Kohl’s Corp. | | | 11,257 | | | | 680,598 | |
| | |
Macy’s, Inc. | | | 27,607 | | | | 672,507 | |
| | |
Target Corp. | | | 6,221 | | | | 1,320,221 | |
| | | | | | | | |
| Total Multiline Retail | | | | 4,267,579 | |
|
| Oil, Gas & Consumable Fuels – 3.5% | |
| | |
Antero Resources Corp.* | | | 23,562 | | | | 719,348 | |
| | |
Chesapeake Energy Corp.(a) | | | 9,487 | | | | 825,369 | |
| | |
Chevron Corp. | | | 7,099 | | | | 1,155,930 | |
| | |
ConocoPhillips | | | 8,111 | | | | 811,100 | |
| | |
Devon Energy Corp. | | | 10,780 | | | | 637,421 | |
| | |
Diamondback Energy, Inc. | | | 4,681 | | | | 641,672 | |
| | |
EOG Resources, Inc. | | | 6,422 | | | | 765,695 | |
| | |
Exxon Mobil Corp. | | | 11,998 | | | | 990,915 | |
| | |
Marathon Oil Corp. | | | 26,161 | | | | 656,903 | |
| | |
Ovintiv, Inc. | | | 13,345 | | | | 721,564 | |
| | | | | | | | |
| Total Oil, Gas & Consumable Fuels | | | | 7,925,917 | |
|
| Pharmaceuticals – 1.7% | |
| | |
Bristol-Myers Squibb Co. | | | 14,957 | | | | 1,092,310 | |
| | |
Johnson & Johnson | | | 5,876 | | | | 1,041,403 | |
| | |
Merck & Co., Inc. | | | 10,417 | | | | 854,715 | |
| | |
Pfizer, Inc. | | | 15,857 | | | | 820,917 | |
| | | | | | | | |
| Total Pharmaceuticals | | | | 3,809,345 | |
|
| Professional Services – 1.1% | |
| | |
CACI International, Inc., Class A* | | | 2,936 | | | | 884,499 | |
| | |
Leidos Holdings, Inc. | | | 7,235 | | | | 781,525 | |
| | |
Robert Half International, Inc. | | | 7,066 | | | | 806,796 | |
| | | | | | | | |
| Total Professional Services | | | | 2,472,820 | |
|
| Real Estate Management & Development – 0.4% | |
| | |
Jones Lang LaSalle, Inc.* | | | 4,162 | | | | 996,632 | |
|
| Road & Rail – 0.9% | |
| | |
Avis Budget Group, Inc.* | | | 2,041 | | | | 537,395 | |
| | |
JB Hunt Transport Services, Inc. | | | 3,687 | | | | 740,313 | |
| | |
Knight-Swift Transportation Holdings, Inc. | | | 15,934 | | | | 804,030 | |
| | | | | | | | |
| Total Road & Rail | | | | 2,081,738 | |
|
| Software – 8.5% | |
| | |
Aspen Technology, Inc.* | | | 12,000 | | | | 1,984,440 | |
| | |
Dropbox, Inc., Class A* | | | 82,240 | | | | 1,912,080 | |
| | |
Fair Isaac Corp.* | | | 3,367 | | | | 1,570,571 | |
| | |
Microsoft Corp. | | | 8,818 | | | | 2,718,677 | |
| | |
NortonLifeLock, Inc. | | | 80,863 | | | | 2,144,487 | |
| | |
Oracle Corp. | | | 25,364 | | | | 2,098,364 | |
| | |
SS&C Technologies Holdings, Inc. | | | 40,360 | | | | 3,027,807 | |
| | |
VMware, Inc., Class A | | | 19,016 | | | | 2,165,352 | |
| | |
Zoom Video Communications, Inc., Class A* | | | 11,262 | | | | 1,320,244 | |
| | | | | | | | |
| Total Software | | | | 18,942,022 | |
|
| Specialty Retail – 4.8% | |
| | |
Advance Auto Parts, Inc. | | | 6,404 | | | | 1,325,372 | |
| | |
AutoNation, Inc.* | | | 8,404 | | | | 836,870 | |
| | |
AutoZone, Inc.* | | | 776 | | | | 1,586,594 | |
| | |
Best Buy Co., Inc. | | | 9,101 | | | | 827,281 | |
| | |
Dick’s Sporting Goods, Inc.(a) | | | 7,465 | | | | 746,649 | |
| | |
Lithia Motors, Inc. | | | 2,630 | | | | 789,316 | |
| | |
Lowe’s Cos., Inc. | | | 6,099 | | | | 1,233,157 | |
| | |
O’Reilly Automotive, Inc.* | | | 2,489 | | | | 1,704,865 | |
| | |
Penske Automotive Group, Inc. | | | 9,519 | | | | 892,121 | |
| | |
Williams-Sonoma, Inc. | | | 4,891 | | | | 709,195 | |
| | | | | | | | |
| Total Specialty Retail | | | | 10,651,420 | |
|
| Technology Hardware, Storage & Peripherals – 2.6% | |
| | |
Hewlett Packard Enterprise Co. | | | 142,079 | | | | 2,374,140 | |
| | |
HP, Inc. | | | 56,245 | | | | 2,041,694 | |
| | |
Western Digital Corp.* | | | 28,814 | | | | 1,430,615 | |
| | | | | | | | |
| Total Technology Hardware, Storage & Peripherals | | | | 5,846,449 | |
|
| Tobacco – 0.7% | |
| | |
Altria Group, Inc. | | | 14,400 | | | | 752,400 | |
| | |
Philip Morris International, Inc. | | | 8,190 | | | | 769,369 | |
| | | | | | | | |
| Total Tobacco | | | | 1,521,769 | |
|
| Trading Companies & Distributors – 0.4% | |
| | |
W.W. Grainger, Inc. | | | 1,691 | | | | 872,201 | |
TOTAL COMMON STOCKS (Cost: $207,577,839) | | | | 223,665,836 | |
|
| INVESTMENT OF CASH COLLATERAL FOR SECURITIES LOANED – 1.9% | |
|
| United States – 1.9% | |
| | |
State Street Navigator Securities Lending Government Money Market Portfolio, 0.25%(b) | | | | | | | | |
| (Cost: $4,207,090) | | | 4,207,090 | | | | 4,207,090 | |
| |
TOTAL INVESTMENTS IN SECURITIES – 101.8% (Cost: $211,784,929) | | | | 227,872,926 | |
| |
Other Assets less Liabilities – (1.8)% | | | | (3,923,803 | ) |
| | | | | | | | |
| NET ASSETS – 100.0% | | | $ | 223,949,123 | |
| * | Non-income producing security. |
| (a) | Security, or portion thereof, was on loan at March 31, 2022 (See Note 2). At March 31, 2022, the total market value of the Fund’s securities on loan identified in the Schedule of Investments was $4,805,253 and the total market value of the collateral held by the Fund was $5,033,668. The total market value of the collateral includes non-cash U.S. Government securities collateral having a value of $826,578. |
| (b) | Rate shown represents annualized 7-day yield as of March 31, 2022. |
See Notes to Financial Statements.
Schedule of Investments (concluded)
WisdomTree U.S. Multifactor Fund (USMF)
March 31, 2022
The following is a summary of the fair valuations according to the inputs used as of March 31, 2022 in valuing the Fund’s investments (See Note 2 — Fair Value Measurement):
| | | | | | | | | | | | | | | | |
| | | | |
| | | Quoted
Prices in
Active
Markets
(Level 1) | | | Other
Significant
Observable
Inputs
(Level 2) | | | Significant
Unobservable
Inputs
(Level 3) | | | Total | |
Assets: | | | | | | | | | | | | |
Investments in Securities | | | | |
Common Stocks | | $ | 223,665,836 | | | $ | — | | | $ | — | | | $ | 223,665,836 | |
Investment of Cash Collateral for Securities Loaned | | | — | | | | 4,207,090 | | | | — | | | | 4,207,090 | |
Total Investments in Securities | | $ | 223,665,836 | | | $ | 4,207,090 | | | $ | — | | | $ | 227,872,926 | |
See Notes to Financial Statements.
Schedule of Investments
WisdomTree U.S. Quality Dividend Growth Fund (DGRW)
March 31, 2022
| | | | | | | | |
| Investments | | Shares | | | Value | |
|
| COMMON STOCKS – 99.8% | |
|
| United States – 99.8% | |
|
| Aerospace & Defense – 4.8% | |
| | |
BWX Technologies, Inc. | | | 40,700 | | | $ | 2,192,102 | |
| | |
Curtiss-Wright Corp. | | | 7,557 | | | | 1,134,759 | |
| | |
General Dynamics Corp. | | | 188,870 | | | | 45,551,667 | |
| | |
HEICO Corp.(a) | | | 5,674 | | | | 871,186 | |
| | |
Huntington Ingalls Industries, Inc. | | | 27,528 | | | | 5,490,184 | |
| | |
L3Harris Technologies, Inc. | | | 105,370 | | | | 26,181,284 | |
| | |
Lockheed Martin Corp. | | | 259,184 | | | | 114,403,817 | |
| | |
Northrop Grumman Corp. | | | 77,751 | | | | 34,771,802 | |
| | |
Raytheon Technologies Corp. | | | 1,038,015 | | | | 102,836,146 | |
| | |
Textron, Inc. | | | 3,928 | | | | 292,165 | |
| | |
Woodward, Inc. | | | 8,758 | | | | 1,093,962 | |
| | | | | | | | |
| Total Aerospace & Defense | | | | 334,819,074 | |
|
| Air Freight & Logistics – 1.6% | |
| | |
FedEx Corp. | | | 92,662 | | | | 21,441,060 | |
| | |
United Parcel Service, Inc., Class B | | | 416,259 | | | | 89,270,905 | |
| | | | | | | | |
| Total Air Freight & Logistics | | | | 110,711,965 | |
|
| Auto Components – 0.2% | |
| | |
BorgWarner, Inc. | | | 107,342 | | | | 4,175,604 | |
| | |
Gentex Corp. | | | 98,118 | | | | 2,862,102 | |
| | |
Lear Corp. | | | 27,825 | | | | 3,967,567 | |
| | | | | | | | |
| Total Auto Components | | | | 11,005,273 | |
|
| Banks – 0.2% | |
| | |
Cadence Bank | | | 152,778 | | | | 4,470,285 | |
| | |
First Citizens BancShares, Inc., Class A | | | 287 | | | | 191,027 | |
| | |
Signature Bank | | | 12,933 | | | | 3,795,706 | |
| | |
Western Alliance Bancorp | | | 39,878 | | | | 3,302,696 | |
| | | | | | | | |
| Total Banks | | | | 11,759,714 | |
|
| Beverages – 6.1% | |
| | |
Brown-Forman Corp., Class B | | | 132,124 | | | | 8,854,951 | |
| | |
Coca-Cola Co. | | | 3,779,003 | | | | 234,298,186 | |
| | |
Coca-Cola Consolidated, Inc.(a) | | | 200 | | | | 99,370 | |
| | |
Constellation Brands, Inc., Class A | | | 61,893 | | | | 14,255,196 | |
| | |
PepsiCo, Inc. | | | 1,019,109 | | | | 170,578,464 | |
| | | | | | | | |
| Total Beverages | | | | 428,086,167 | |
|
| Biotechnology – 1.9% | |
| | |
Amgen, Inc. | | | 542,083 | | | | 131,086,511 | |
|
| Building Products – 0.3% | |
| | |
A.O. Smith Corp. | | | 53,846 | | | | 3,440,221 | |
| | |
AAON, Inc. | | | 4,463 | | | | 248,723 | |
| | |
Armstrong World Industries, Inc. | | | 12,557 | | | | 1,130,255 | |
| | |
Carlisle Cos., Inc. | | | 14,126 | | | | 3,473,866 | |
| | |
Fortune Brands Home & Security, Inc. | | | 40,223 | | | | 2,987,764 | |
| | |
Lennox International, Inc. | | | 10,959 | | | | 2,825,888 | |
| | |
Masco Corp. | | | 95,903 | | | | 4,891,053 | |
| | |
Simpson Manufacturing Co., Inc. | | | 11,219 | | | | 1,223,320 | |
| | | | | | | | |
| Total Building Products | | | | 20,221,090 | |
|
| Capital Markets – 3.4% | |
| | |
Ameriprise Financial, Inc. | | | 49,256 | | | | 14,794,532 | |
| | |
Blackstone, Inc. | | | 632,268 | | | | 80,260,100 | |
| | |
Charles Schwab Corp. | | | 474,167 | | | | 39,977,020 | |
| | |
Cohen & Steers, Inc. | | | 26,104 | | | | 2,242,073 | |
| | |
Evercore, Inc., Class A | | | 23,668 | | | | 2,634,722 | |
| | |
FactSet Research Systems, Inc. | | | 8,080 | | | | 3,507,932 | |
| | |
Hamilton Lane, Inc., Class A | | | 11,737 | | | | 907,153 | |
| | |
LPL Financial Holdings, Inc. | | | 15,334 | | | | 2,801,215 | |
| | |
MarketAxess Holdings, Inc. | | | 7,238 | | | | 2,462,368 | |
| | |
Moody’s Corp. | | | 33,153 | | | | 11,186,154 | |
| | |
Morningstar, Inc. | | | 5,602 | | | | 1,530,298 | |
| | |
MSCI, Inc. | | | 15,542 | | | | 7,815,761 | |
| | |
Raymond James Financial, Inc. | | | 59,585 | | | | 6,548,987 | |
| | |
S&P Global, Inc. | | | 46,307 | | | | 18,994,205 | |
| | |
SEI Investments Co. | | | 46,411 | | | | 2,794,406 | |
| | |
State Street Corp. | | | 254,746 | | | | 22,193,471 | |
| | |
T. Rowe Price Group, Inc. | | | 139,796 | | | | 21,135,757 | |
| | | | | | | | |
| Total Capital Markets | | | | 241,786,154 | |
|
| Chemicals – 1.7% | |
| | |
Air Products and Chemicals, Inc. | | | 128,599 | | | | 32,138,176 | |
| | |
Albemarle Corp. | | | 21,522 | | | | 4,759,590 | |
| | |
Ashland Global Holdings, Inc. | | | 16,485 | | | | 1,622,289 | |
| | |
Avient Corp. | | | 45,424 | | | | 2,180,352 | |
| | |
Balchem Corp. | | | 3,165 | | | | 432,656 | |
| | |
Chemours Co. | | | 144,161 | | | | 4,538,188 | |
| | |
DuPont de Nemours, Inc. | | | 234,368 | | | | 17,244,798 | |
| | |
Ecolab, Inc. | | | 68,463 | | | | 12,087,827 | |
| | |
FMC Corp. | | | 66,913 | | | | 8,803,743 | |
| | |
PPG Industries, Inc. | | | 97,369 | | | | 12,762,155 | |
| | |
Quaker Chemical Corp. | | | 2,693 | | | | 465,377 | |
| | |
RPM International, Inc. | | | 63,527 | | | | 5,173,639 | |
| | |
Scotts Miracle-Gro Co.(a) | | | 28,196 | | | | 3,466,980 | |
| | |
Sensient Technologies Corp. | | | 21,709 | | | | 1,822,471 | |
| | |
Sherwin-Williams Co. | | | 48,348 | | | | 12,068,628 | |
| | | | | | | | |
| Total Chemicals | | | | 119,566,869 | |
|
| Commercial Services & Supplies – 0.9% | |
| | |
Cintas Corp. | | | 25,938 | | | | 11,033,766 | |
| | |
MSA Safety, Inc. | | | 13,021 | | | | 1,727,887 | |
| | |
Republic Services, Inc. | | | 123,248 | | | | 16,330,360 | |
| | |
Rollins, Inc. | | | 180,329 | | | | 6,320,531 | |
| | |
Tetra Tech, Inc. | | | 7,652 | | | | 1,262,121 | |
| | |
Waste Management, Inc. | | | 167,332 | | | | 26,522,122 | |
| | | | | | | | |
| Total Commercial Services & Supplies | | | | 63,196,787 | |
|
| Communications Equipment – 2.7% | |
| | |
Cisco Systems, Inc. | | | 3,121,048 | | | | 174,029,637 | |
| | |
Motorola Solutions, Inc. | | | 59,101 | | | | 14,314,262 | |
| | | | | | | | |
| Total Communications Equipment | | | | 188,343,899 | |
|
| Construction & Engineering – 0.0% | |
| | |
Quanta Services, Inc. | | | 6,698 | | | | 881,524 | |
| | |
Valmont Industries, Inc. | | | 5,623 | | | | 1,341,648 | |
| | | | | | | | |
| Total Construction & Engineering | | | | 2,223,172 | |
|
| Construction Materials – 0.1% | |
| | |
Eagle Materials, Inc. | | | 5,979 | | | | 767,464 | |
See Notes to Financial Statements.
Schedule of Investments (continued)
WisdomTree U.S. Quality Dividend Growth Fund (DGRW)
March 31, 2022
| | | | | | | | |
| Investments | | Shares | | | Value | |
| | |
Martin Marietta Materials, Inc. | | | 10,814 | | | $ | 4,162,201 | |
| | | | | | | | |
| Total Construction Materials | | | | 4,929,665 | |
|
| Containers & Packaging – 0.4% | |
| | |
AptarGroup, Inc. | | | 23,048 | | | | 2,708,140 | |
| | |
Avery Dennison Corp. | | | 31,060 | | | | 5,403,508 | |
| | |
Ball Corp. | | | 80,862 | | | | 7,277,580 | |
| | |
Crown Holdings, Inc. | | | 28,597 | | | | 3,577,199 | |
| | |
Graphic Packaging Holding Co. | | | 133,477 | | | | 2,674,879 | |
| | |
Sealed Air Corp. | | | 49,386 | | | | 3,306,887 | |
| | |
Silgan Holdings, Inc. | | | 36,013 | | | | 1,664,881 | |
| | | | | | | | |
| Total Containers & Packaging | | | | 26,613,074 | |
|
| Distributors – 0.0% | |
| | |
Pool Corp. | | | 6,935 | | | | 2,932,465 | |
|
| Diversified Consumer Services – 0.1% | |
| | |
H&R Block, Inc.(a) | | | 227,306 | | | | 5,919,048 | |
|
| Diversified Financial Services – 0.2% | |
| | |
Apollo Global Management, Inc. | | | 206,040 | | | | 12,772,420 | |
|
| Electric Utilities – 0.1% | |
| | |
NRG Energy, Inc. | | | 241,814 | | | | 9,275,985 | |
|
| Electrical Equipment – 0.9% | |
| | |
AMETEK, Inc. | | | 38,468 | | | | 5,123,168 | |
| | |
Emerson Electric Co. | | | 380,266 | | | | 37,285,081 | |
| | |
Hubbell, Inc. | | | 32,489 | | | | 5,970,504 | |
| | |
Regal Rexnord Corp. | | | 14,347 | | | | 2,134,547 | |
| | |
Rockwell Automation, Inc. | | | 43,065 | | | | 12,059,492 | |
| | |
Vertiv Holdings Co. | | | 6,041 | | | | 84,574 | |
| | | | | | | | |
| Total Electrical Equipment | | | | 62,657,366 | |
|
| Electronic Equipment, Instruments & Components – 0.3% | |
| | |
Amphenol Corp., Class A | | | 166,237 | | | | 12,525,958 | |
| | |
CDW Corp. | | | 38,558 | | | | 6,897,641 | |
| | |
Cognex Corp. | | | 15,524 | | | | 1,197,676 | |
| | |
TD SYNNEX Corp. | | | 18,292 | | | | 1,887,917 | |
| | | | | | | | |
| Total Electronic Equipment, Instruments & Components | | | | 22,509,192 | |
|
| Energy Equipment & Services – 0.5% | |
| | |
Baker Hughes Co. | | | 774,770 | | | | 28,209,376 | |
| | |
Halliburton Co. | | | 215,395 | | | | 8,157,008 | |
| | | | | | | | |
| Total Energy Equipment & Services | | | | 36,366,384 | |
|
| Entertainment – 0.3% | |
| | |
Activision Blizzard, Inc. | | | 192,937 | | | | 15,456,183 | |
| | |
Electronic Arts, Inc. | | | 48,390 | | | | 6,121,819 | |
| | | | | | | | |
| Total Entertainment | | | | 21,578,002 | |
|
| Equity Real Estate Investment Trusts (REITs) – 0.8% | |
| | |
Kite Realty Group Trust | | | 225,469 | | | | 5,133,929 | |
| | |
Public Storage | | | 117,920 | | | | 46,021,817 | |
| | |
Safehold, Inc. | | | 11,846 | | | | 656,861 | |
| | |
SBA Communications Corp. | | | 19,848 | | | | 6,829,697 | |
| | | | | | | | |
| Total Equity Real Estate Investment Trusts (REITs) | | | | 58,642,304 | |
|
| Food & Staples Retailing – 1.0% | |
| | |
Costco Wholesale Corp. | | | 74,289 | | | | 42,779,321 | |
| | |
Sysco Corp. | | | 377,460 | | | | 30,819,609 | |
| | | | | | | | |
| Total Food & Staples Retailing | | | | 73,598,930 | |
|
| Food Products – 0.8% | |
| | |
Campbell Soup Co. | | | 322,377 | | | | 14,368,343 | |
| | |
Hershey Co. | | | 82,986 | | | | 17,977,257 | |
| | |
Hormel Foods Corp. | | | 374,510 | | | | 19,302,245 | |
| | |
Ingredion, Inc. | | | 52,593 | | | | 4,583,480 | |
| | | | | | | | |
| Total Food Products | | | | 56,231,325 | |
|
| Health Care Equipment & Supplies – 0.7% | |
| | |
Baxter International, Inc. | | | 202,775 | | | | 15,723,173 | |
| | |
Cooper Cos., Inc. | | | 700 | | | | 292,313 | |
| | |
ResMed, Inc. | | | 27,317 | | | | 6,624,646 | |
| | |
Stryker Corp. | | | 105,994 | | | | 28,337,496 | |
| | |
Teleflex, Inc. | | | 4,932 | | | | 1,750,022 | |
| | | | | | | | |
| Total Health Care Equipment & Supplies | | | | 52,727,650 | |
|
| Health Care Providers & Services – 4.4% | |
| | |
Anthem, Inc. | | | 77,128 | | | | 37,886,816 | |
| | |
Cardinal Health, Inc. | | | 336,293 | | | | 19,067,813 | |
| | |
Chemed Corp. | | | 1,755 | | | | 888,995 | |
| | |
Cigna Corp. | | | 181,795 | | | | 43,559,900 | |
| | |
Encompass Health Corp. | | | 48,059 | | | | 3,417,476 | |
| | |
Ensign Group, Inc. | | | 3,941 | | | | 354,729 | |
| | |
HCA Healthcare, Inc. | | | 72,396 | | | | 18,143,886 | |
| | |
Humana, Inc. | | | 23,928 | | | | 10,412,748 | |
| | |
UnitedHealth Group, Inc. | | | 338,696 | | | | 172,724,799 | |
| | | | | | | | |
| Total Health Care Providers & Services | | | | 306,457,162 | |
|
| Health Care Technology – 0.1% | |
| | |
Cerner Corp. | | | 103,213 | | | | 9,656,608 | |
|
| Hotels, Restaurants & Leisure – 3.0% | |
| | |
Churchill Downs, Inc. | | | 3,668 | | | | 813,489 | |
| | |
Darden Restaurants, Inc. | | | 108,184 | | | | 14,383,063 | |
| | |
Domino’s Pizza, Inc. | | | 7,051 | | | | 2,869,827 | |
| | |
Marriott Vacations Worldwide Corp. | | | 15,113 | | | | 2,383,320 | |
| | |
McDonald’s Corp. | | | 459,998 | | | | 113,748,305 | |
| | |
Starbucks Corp. | | | 573,782 | | | | 52,196,949 | |
| | |
Texas Roadhouse, Inc. | | | 33,409 | | | | 2,797,336 | |
| | |
Vail Resorts, Inc. | | | 11,247 | | | | 2,927,257 | |
| | |
Wendy’s Co. | | | 145,604 | | | | 3,198,920 | |
| | |
Wyndham Hotels & Resorts, Inc. | | | 39,080 | | | | 3,309,685 | |
| | |
Yum! Brands, Inc. | | | 129,017 | | | | 15,292,385 | |
| | | | | | | | |
| Total Hotels, Restaurants & Leisure | | | | 213,920,536 | |
|
| Household Durables – 0.4% | |
| | |
D.R. Horton, Inc. | | | 87,649 | | | | 6,530,727 | |
| | |
Leggett & Platt, Inc. | | | 142,443 | | | | 4,957,016 | |
| | |
Lennar Corp., Class A | | | 69,730 | | | | 5,659,984 | |
| | |
PulteGroup, Inc. | | | 86,833 | | | | 3,638,303 | |
| | |
Tempur Sealy International, Inc. | | | 34,550 | | | | 964,636 | |
| | |
Toll Brothers, Inc. | | | 33,603 | | | | 1,580,013 | |
| | |
Whirlpool Corp.(a) | | | 41,078 | | | | 7,097,457 | |
| | | | | | | | |
| Total Household Durables | | | | 30,428,136 | |
See Notes to Financial Statements.
Schedule of Investments (continued)
WisdomTree U.S. Quality Dividend Growth Fund (DGRW)
March 31, 2022
| | | | | | | | |
| Investments | | Shares | | | Value | |
|
| Household Products – 4.9% | |
| | |
Church & Dwight Co., Inc. | | | 76,080 | | | $ | 7,560,830 | |
| | |
Clorox Co. | | | 93,963 | | | | 13,063,676 | |
| | |
Colgate-Palmolive Co. | | | 551,559 | | | | 41,824,719 | |
| | |
Kimberly-Clark Corp. | | | 317,701 | | | | 39,128,055 | |
| | |
Procter & Gamble Co. | | | 1,576,016 | | | | 240,815,245 | |
| | | | | | | | |
| Total Household Products | | | | 342,392,525 | |
|
| Independent Power & Renewable Electricity Producers – 0.2% | |
| | |
AES Corp. | | | 500,002 | | | | 12,865,051 | |
| | |
Ormat Technologies, Inc.(a) | | | 6,930 | | | | 567,082 | |
| | | | | | | | |
| Total Independent Power & Renewable Electricity Producers | | | | 13,432,133 | |
|
| Industrial Conglomerates – 2.3% | |
| | |
3M Co. | | | 544,939 | | | | 81,130,518 | |
| | |
General Electric Co. | | | 115,633 | | | | 10,580,420 | |
| | |
Honeywell International, Inc. | | | 372,036 | | | | 72,390,765 | |
| | | | | | | | |
| Total Industrial Conglomerates | | | | 164,101,703 | |
|
| Insurance – 1.0% | |
| | |
Assurant, Inc. | | | 29,605 | | | | 5,383,077 | |
| | |
Erie Indemnity Co., Class A | | | 27,030 | | | | 4,760,794 | |
| | |
Globe Life, Inc. | | | 22,320 | | | | 2,245,392 | |
| | |
Hanover Insurance Group, Inc. | | | 20,137 | | | | 3,010,884 | |
| | |
Hartford Financial Services Group, Inc. | | | 221,578 | | | | 15,911,516 | |
| | |
Kinsale Capital Group, Inc. | | | 574 | | | | 130,884 | |
| | |
Marsh & McLennan Cos., Inc. | | | 180,027 | | | | 30,680,201 | |
| | |
Primerica, Inc. | | | 13,133 | | | | 1,796,857 | |
| | |
Progressive Corp. | | | 76,354 | | | | 8,703,593 | |
| | | | | | | | |
| Total Insurance | | | | 72,623,198 | |
|
| Internet & Direct Marketing Retail – 0.2% | |
| | |
eBay, Inc. | | | 194,102 | | | | 11,114,280 | |
| | |
Shutterstock, Inc. | | | 6,047 | | | | 562,855 | |
| | | | | | | | |
| Total Internet & Direct Marketing Retail | | | | 11,677,135 | |
|
| IT Services – 3.5% | |
| | |
Automatic Data Processing, Inc. | | | 213,828 | | | | 48,654,423 | |
| | |
Broadridge Financial Solutions, Inc. | | | 47,841 | | | | 7,449,322 | |
| | |
Cognizant Technology Solutions Corp., Class A | | | 180,585 | | | | 16,193,057 | |
| | |
Jack Henry & Associates, Inc. | | | 22,839 | | | | 4,500,425 | |
| | |
MasterCard, Inc., Class A | | | 165,966 | | | | 59,312,929 | |
| | |
Maximus, Inc. | | | 27,244 | | | | 2,041,938 | |
| | |
Paychex, Inc. | | | 221,886 | | | | 30,280,782 | |
| | |
Switch, Inc., Class A | | | 40,733 | | | | 1,255,391 | |
| | |
TTEC Holdings, Inc. | | | 11,955 | | | | 986,527 | |
| | |
Visa, Inc., Class A | | | 356,675 | | | | 79,099,815 | |
| | | | | | | | |
| Total IT Services | | | | 249,774,609 | |
|
| Leisure Products – 0.2% | |
| | |
Brunswick Corp. | | | 28,026 | | | | 2,267,023 | |
| | |
Hasbro, Inc. | | | 109,392 | | | | 8,961,393 | |
| | |
Polaris, Inc.(a) | | | 40,259 | | | | 4,240,078 | |
| | | | | | | | |
| Total Leisure Products | | | | 15,468,494 | |
|
| Life Sciences Tools & Services – 0.2% | |
| | |
Agilent Technologies, Inc. | | | 48,597 | | | | 6,430,841 | |
| | |
Azenta, Inc. | | | 9,857 | | | | 816,948 | |
| | |
Bio-Techne Corp. | | | 3,516 | | | | 1,522,568 | |
| | |
Bruker Corp. | | | 11,299 | | | | 726,526 | |
| | |
West Pharmaceutical Services, Inc. | | | 4,031 | | | | 1,655,572 | |
| | | | | | | | |
| Total Life Sciences Tools & Services | | | | 11,152,455 | |
|
| Machinery – 3.9% | |
| | |
AGCO Corp. | | | 16,189 | | | | 2,364,080 | |
| | |
Caterpillar, Inc. | | | 339,010 | | | | 75,538,208 | |
| | |
Crane Co. | | | 26,116 | | | | 2,827,840 | |
| | |
Cummins, Inc. | | | 107,651 | | | | 22,080,297 | |
| | |
Deere & Co. | | | 104,393 | | | | 43,371,116 | |
| | |
Donaldson Co., Inc. | | | 55,468 | | | | 2,880,453 | |
| | |
Dover Corp. | | | 49,015 | | | | 7,690,454 | |
| | |
Fortive Corp. | | | 47,098 | | | | 2,869,681 | |
| | |
Franklin Electric Co., Inc. | | | 8,027 | | | | 666,562 | |
| | |
Graco, Inc. | | | 48,595 | | | | 3,388,043 | |
| | |
IDEX Corp. | | | 20,578 | | | | 3,945,420 | |
| | |
Illinois Tool Works, Inc. | | | 181,426 | | | | 37,990,604 | |
| | |
Ingersoll Rand, Inc. | | | 19,517 | | | | 982,681 | |
| | |
ITT, Inc. | | | 19,214 | | | | 1,445,085 | |
| | |
John Bean Technologies Corp. | | | 3,052 | | | | 361,570 | |
| | |
Lincoln Electric Holdings, Inc. | | | 28,919 | | | | 3,985,327 | |
| | |
Nordson Corp. | | | 13,413 | | | | 3,045,824 | |
| | |
Oshkosh Corp. | | | 27,004 | | | | 2,717,953 | |
| | |
PACCAR, Inc. | | | 158,462 | | | | 13,955,748 | |
| | |
Parker-Hannifin Corp. | | | 48,580 | | | | 13,785,061 | |
| | |
Snap-on, Inc. | | | 41,735 | | | | 8,575,708 | |
| | |
Stanley Black & Decker, Inc. | | | 79,429 | | | | 11,103,380 | |
| | |
Timken Co. | | | 34,114 | | | | 2,070,720 | |
| | |
Toro Co. | | | 32,761 | | | | 2,800,738 | |
| | |
Watts Water Technologies, Inc., Class A | | | 5,179 | | | | 722,937 | |
| | |
Xylem, Inc. | | | 48,849 | | | | 4,164,866 | |
| | | | | | | | |
| Total Machinery | | | | 275,330,356 | |
|
| Media – 2.1% | |
| | |
Cable One, Inc.(a) | | | 891 | | | | 1,304,638 | |
| | |
Comcast Corp., Class A | | | 2,500,055 | | | | 117,052,575 | |
| | |
Fox Corp., Class A | | | 219,792 | | | | 8,670,794 | |
| | |
New York Times Co., Class A | | | 23,800 | | | | 1,090,992 | |
| | |
Nexstar Media Group, Inc., Class A | | | 22,501 | | | | 4,240,988 | |
| | |
Sirius XM Holdings, Inc.(a) | | | 1,749,922 | | | | 11,584,484 | |
| | |
TEGNA, Inc. | | | 122,784 | | | | 2,750,362 | |
| | | | | | | | |
| Total Media | | | | 146,694,833 | |
|
| Multiline Retail – 0.8% | |
| | |
Dollar General Corp. | | | 52,058 | | | | 11,589,672 | |
| | |
Target Corp. | | | 202,641 | | | | 43,004,473 | |
| | | | | | | | |
| Total Multiline Retail | | | | 54,594,145 | |
|
| Oil, Gas & Consumable Fuels – 1.1% | |
| | |
Civitas Resources, Inc. | | | 74,427 | | | | 4,444,036 | |
| | |
Coterra Energy, Inc. | | | 573,012 | | | | 15,454,134 | |
| | |
Diamondback Energy, Inc. | | | 96,284 | | | | 13,198,611 | |
| | |
Equitrans Midstream Corp. | | | 721,908 | | | | 6,092,903 | |
| | |
HF Sinclair Corp.* | | | 198,073 | | | | 7,893,209 | |
See Notes to Financial Statements.
Schedule of Investments (continued)
WisdomTree U.S. Quality Dividend Growth Fund (DGRW)
March 31, 2022
| | | | | | | | |
| Investments | | Shares | | | Value | |
| | |
Matador Resources Co. | | | 12,016 | | | $ | 636,608 | |
| | |
Murphy Oil Corp.(a) | | | 87,463 | | | | 3,532,630 | |
| | |
Pioneer Natural Resources Co. | | | 98,787 | | | | 24,699,714 | |
| | |
Texas Pacific Land Corp.(a) | | | 1,721 | | | | 2,326,981 | |
| | | | | | | | |
| Total Oil, Gas & Consumable Fuels | | | | 78,278,826 | |
|
| Personal Products – 0.2% | |
| | |
Estee Lauder Cos., Inc., Class A | | | 46,513 | | | | 12,666,420 | |
|
| Pharmaceuticals – 9.8% | |
| | |
Eli Lilly & Co. | | | 376,830 | | | | 107,912,807 | |
| | |
Johnson & Johnson | | | 1,954,215 | | | | 346,345,524 | |
| | |
Merck & Co., Inc. | | | 2,716,390 | | | | 222,879,800 | |
| | |
Zoetis, Inc. | | | 61,759 | | | | 11,647,130 | |
| | | | | | | | |
| Total Pharmaceuticals | | | | 688,785,261 | |
|
| Professional Services – 0.5% | |
| | |
Booz Allen Hamilton Holding Corp. | | | 62,194 | | | | 5,463,121 | |
| | |
Equifax, Inc. | | | 19,754 | | | | 4,683,673 | |
| | |
Exponent, Inc. | | | 11,235 | | | | 1,213,942 | |
| | |
Insperity, Inc. | | | 15,905 | | | | 1,597,180 | |
| | |
Leidos Holdings, Inc. | | | 60,694 | | | | 6,556,166 | |
| | |
ManpowerGroup, Inc. | | | 38,481 | | | | 3,614,136 | |
| | |
Robert Half International, Inc. | | | 46,352 | | | | 5,292,471 | |
| | |
TransUnion | | | 19,791 | | | | 2,045,202 | |
| | |
Verisk Analytics, Inc. | | | 24,706 | | | | 5,302,649 | |
| | | | | | | | |
| Total Professional Services | | | | 35,768,540 | |
|
| Real Estate Management & Development – 0.0% | |
| | |
eXp World Holdings, Inc.(a) | | | 13,399 | | | | 283,657 | |
|
| Road & Rail – 2.1% | |
| | |
CSX Corp. | | | 629,165 | | | | 23,562,229 | |
| | |
JB Hunt Transport Services, Inc. | | | 19,282 | | | | 3,871,633 | |
| | |
Landstar System, Inc. | | | 6,940 | | | | 1,046,760 | |
| | |
Norfolk Southern Corp. | | | 104,866 | | | | 29,909,881 | |
| | |
Old Dominion Freight Line, Inc. | | | 7,912 | | | | 2,363,156 | |
| | |
Union Pacific Corp. | | | 319,153 | | | | 87,195,791 | |
| | | | | | | | |
| Total Road & Rail | | | | 147,949,450 | |
|
| Semiconductors & Semiconductor Equipment – 4.7% | |
| | |
Analog Devices, Inc. | | | 234,129 | | | | 38,673,428 | |
| | |
Applied Materials, Inc. | | | 167,276 | | | | 22,046,977 | |
| | |
Entegris, Inc. | | | 9,781 | | | | 1,283,854 | |
| | |
KLA Corp. | | | 45,491 | | | | 16,652,436 | |
| | |
Lam Research Corp. | | | 35,959 | | | | 19,331,918 | |
| | |
Marvell Technology, Inc. | | | 78,224 | | | | 5,609,443 | |
| | |
Micron Technology, Inc. | | | 167,165 | | | | 13,020,482 | |
| | |
Monolithic Power Systems, Inc. | | | 6,483 | | | | 3,148,663 | |
| | |
NVIDIA Corp. | | | 38,239 | | | | 10,433,894 | |
| | |
QUALCOMM, Inc. | | | 490,771 | | | | 74,999,624 | |
| | |
Skyworks Solutions, Inc. | | | 69,838 | | | | 9,308,009 | |
| | |
Teradyne, Inc. | | | 13,354 | | | | 1,578,843 | |
| | |
Texas Instruments, Inc. | | | 620,130 | | | | 113,781,452 | |
| | |
Universal Display Corp. | | | 5,735 | | | | 957,458 | |
| | | | | | | | |
| Total Semiconductors & Semiconductor Equipment | | | | 330,826,481 | |
|
| Software – 6.5% | |
| | |
Citrix Systems, Inc. | | | 66,912 | | | | 6,751,421 | |
| | |
Dolby Laboratories, Inc., Class A | | | 23,475 | | | | 1,836,214 | |
| | |
Intuit, Inc. | | | 33,975 | | | | 16,336,539 | |
| | |
Microsoft Corp. | | | 1,069,247 | | | | 329,659,542 | |
| | |
NortonLifeLock, Inc.(a) | | | 314,290 | | | | 8,334,971 | |
| | |
Oracle Corp. | | | 1,122,223 | | | | 92,841,509 | |
| | |
Pegasystems, Inc. | | | 898 | | | | 72,424 | |
| | | | | | | | |
| Total Software | | | | 455,832,620 | |
|
| Specialty Retail – 3.9% | |
| | |
Advance Auto Parts, Inc. | | | 29,604 | | | | 6,126,844 | |
| | |
American Eagle Outfitters, Inc.(a) | | | 132,681 | | | | 2,229,041 | |
| | |
Best Buy Co., Inc. | | | 191,903 | | | | 17,443,983 | |
| | |
Gap, Inc. | | | 312,039 | | | | 4,393,509 | |
| | |
Home Depot, Inc. | | | 468,279 | | | | 140,169,953 | |
| | |
Lowe’s Cos., Inc. | | | 244,849 | | | | 49,506,019 | |
| | |
Ross Stores, Inc. | | | 102,519 | | | | 9,273,869 | |
| | |
TJX Cos., Inc. | | | 504,463 | | | | 30,560,368 | |
| | |
Tractor Supply Co. | | | 30,255 | | | | 7,060,609 | |
| | |
Williams-Sonoma, Inc. | | | 34,317 | | | | 4,975,965 | |
| | | | | | | | |
| Total Specialty Retail | | | | 271,740,160 | |
|
| Technology Hardware, Storage & Peripherals – 5.9% | |
| | |
Apple, Inc. | | | 2,112,174 | | | | 368,806,702 | |
| | |
HP, Inc.(a) | | | 917,810 | | | | 33,316,503 | |
| | |
NetApp, Inc. | | | 145,366 | | | | 12,065,378 | |
| | | | | | | | |
| Total Technology Hardware, Storage & Peripherals | | | | 414,188,583 | |
|
| Textiles, Apparel & Luxury Goods – 1.0% | |
| | |
Carter’s, Inc. | | | 25,580 | | | | 2,353,104 | |
| | |
Columbia Sportswear Co. | | | 17,022 | | | | 1,541,002 | |
| | |
Hanesbrands, Inc. | | | 262,424 | | | | 3,907,493 | |
| | |
NIKE, Inc., Class B | | | 256,699 | | | | 34,541,418 | |
| | |
Ralph Lauren Corp. | | | 29,088 | | | | 3,299,743 | |
| | |
Tapestry, Inc. | | | 194,696 | | | | 7,232,956 | |
| | |
VF Corp. | | | 292,034 | | | | 16,605,053 | |
| | | | | | | | |
| Total Textiles, Apparel & Luxury Goods | | | | 69,480,769 | |
|
| Thrifts & Mortgage Finance – 0.1% | |
| | |
MGIC Investment Corp. | | | 237,634 | | | | 3,219,941 | |
| | |
Walker & Dunlop, Inc.(a) | | | 10,636 | | | | 1,376,511 | |
| | | | | | | | |
| Total Thrifts & Mortgage Finance | | | | 4,596,452 | |
|
| Tobacco – 6.4% | |
| | |
Altria Group, Inc. | | | 4,248,474 | | | | 221,982,767 | |
| | |
Philip Morris International, Inc. | | | 2,429,663 | | | | 228,242,542 | |
| | | | | | | | |
| Total Tobacco | | | | 450,225,309 | |
|
| Trading Companies & Distributors – 0.4% | |
| | |
Air Lease Corp. | | | 51,035 | | | | 2,278,713 | |
| | |
Fastenal Co. | | | 296,322 | | | | 17,601,527 | |
| | |
Herc Holdings, Inc. | | | 8,494 | | | | 1,419,262 | |
| | |
W.W. Grainger, Inc. | | | 19,246 | | | | 9,926,894 | |
| | | | | | | | |
| Total Trading Companies & Distributors | | | | 31,226,396 | |
TOTAL COMMON STOCKS (Cost: $5,832,545,558) | | | | 7,019,113,437 | |
See Notes to Financial Statements.
Schedule of Investments (concluded)
WisdomTree U.S. Quality Dividend Growth Fund (DGRW)
March 31, 2022
| | | | | | | | |
| Investments | | Shares | | | Value | |
|
| INVESTMENT OF CASH COLLATERAL FOR SECURITIES LOANED – 0.2% | |
|
| United States – 0.2% | |
| | |
State Street Navigator Securities Lending Government Money Market Portfolio, 0.25%(b) | | | | | | | | |
| (Cost: $11,305,736) | | | 11,305,736 | | | $ | 11,305,736 | |
| |
TOTAL INVESTMENTS IN SECURITIES – 100.0% (Cost: $5,843,851,294) | | | | 7,030,419,173 | |
| |
Other Assets less Liabilities – 0.0% | | | | 2,899,279 | |
| | | | | | | | |
| NET ASSETS – 100.0% | | | $ | 7,033,318,452 | |
| * | Non-income producing security. |
| (a) | Security, or portion thereof, was on loan at March 31, 2022 (See Note 2). At March 31, 2022, the total market value of the Fund’s securities on loan identified in the Schedule of Investments was $65,665,818 and the total market value of the collateral held by the Fund was $70,693,544. The total market value of the collateral includes non-cash U.S. Government securities collateral having a value of $59,387,808. |
| (b) | Rate shown represents annualized 7-day yield as of March 31, 2022. |
The following is a summary of the fair valuations according to the inputs used as of March 31, 2022 in valuing the Fund’s investments (See Note 2 — Fair Value Measurement):
| | | | | | | | | | | | | | | | |
| | | | |
| | | Quoted
Prices in
Active
Markets
(Level 1) | | | Other
Significant
Observable
Inputs
(Level 2) | | | Significant
Unobservable
Inputs
(Level 3) | | | Total | |
Assets: | | | | | | | | | | | | |
Investments in Securities | | | | |
Common Stocks | | $ | 7,019,113,437 | | | $ | — | | | $ | — | | | $ | 7,019,113,437 | |
Investment of Cash Collateral for Securities Loaned | | | — | | | | 11,305,736 | | | | — | | | | 11,305,736 | |
Total Investments in Securities | | $ | 7,019,113,437 | | | $ | 11,305,736 | | | $ | — | | | $ | 7,030,419,173 | |
See Notes to Financial Statements.
Schedule of Investments
WisdomTree U.S. SmallCap Dividend Fund (DES)
March 31, 2022
| | | | | | | | |
| Investments | | Shares | | | Value | |
|
| COMMON STOCKS – 99.6% | |
|
| United States – 99.1% | |
|
| Aerospace & Defense – 0.4% | |
| | |
Kaman Corp. | | | 57,447 | | | $ | 2,497,796 | |
| | |
Moog, Inc., Class A | | | 43,584 | | | | 3,826,675 | |
| | |
Park Aerospace Corp. | | | 94,504 | | | | 1,233,277 | |
| | | | | | | | |
| Total Aerospace & Defense | | | | 7,557,748 | |
|
| Air Freight & Logistics – 0.1% | |
| | |
Forward Air Corp. | | | 23,142 | | | | 2,262,825 | |
|
| Auto Components – 0.9% | |
| | |
Dana, Inc. | | | 297,911 | | | | 5,234,296 | |
| | |
LCI Industries(a) | | | 64,960 | | | | 6,743,498 | |
| | |
Patrick Industries, Inc. | | | 49,884 | | | | 3,008,005 | |
| | |
Standard Motor Products, Inc. | | | 45,817 | | | | 1,976,545 | |
| | | | | | | | |
| Total Auto Components | | | | 16,962,344 | |
|
| Automobiles – 0.1% | |
| | |
Winnebago Industries, Inc. | | | 35,133 | | | | 1,898,236 | |
|
| Banks – 16.0% | |
| | |
1st Source Corp. | | | 43,637 | | | | 2,018,211 | |
| | |
ACNB Corp. | | | 17,029 | | | | 595,164 | |
| | |
Allegiance Bancshares, Inc. | | | 13,598 | | | | 607,559 | |
| | |
Amalgamated Financial Corp. | | | 36,894 | | | | 662,985 | |
| | |
American National Bankshares, Inc. | | | 19,161 | | | | 721,987 | |
| | |
Ameris Bancorp | | | 37,882 | | | | 1,662,262 | |
| | |
Ames National Corp. | | | 23,098 | | | | 574,216 | |
| | |
Arrow Financial Corp. | | | 30,947 | | | | 1,003,302 | |
| | |
Associated Banc-Corp. | | | 291,065 | | | | 6,624,639 | |
| | |
Atlantic Union Bankshares Corp. | | | 128,412 | | | | 4,711,436 | |
| | |
Banc of California, Inc. | | | 27,043 | | | | 523,553 | |
| | |
BancFirst Corp. | | | 49,258 | | | | 4,098,758 | |
| | |
Bank First Corp. | | | 6,138 | | | | 441,875 | |
| | |
Bank of Hawaii Corp. | | | 64,833 | | | | 5,440,785 | |
| | |
Bank of Marin Bancorp | | | 17,758 | | | | 622,773 | |
| | |
Bank of Princeton | | | 7,885 | | | | 227,482 | |
| | |
Bank7 Corp. | | | 21,776 | | | | 514,349 | |
| | |
BankFinancial Corp. | | | 28,606 | | | | 296,358 | |
| | |
BankUnited, Inc. | | | 96,273 | | | | 4,232,161 | |
| | |
Bankwell Financial Group, Inc. | | | 12,835 | | | | 434,208 | |
| | |
Banner Corp. | | | 57,501 | | | | 3,365,534 | |
| | |
Bar Harbor Bankshares | | | 18,055 | | | | 516,734 | |
| | |
BCB Bancorp, Inc. | | | 41,602 | | | | 759,237 | |
| | |
Berkshire Hills Bancorp, Inc. | | | 62,607 | | | | 1,813,725 | |
| | |
Blue Ridge Bankshares, Inc. | | | 26,646 | | | | 404,220 | |
| | |
Brookline Bancorp, Inc. | | | 159,026 | | | | 2,515,791 | |
| | |
Business First Bancshares, Inc.(a) | | | 21,514 | | | | 523,436 | |
| | |
Byline Bancorp, Inc. | | | 19,869 | | | | 530,105 | |
| | |
C&F Financial Corp. | | | 9,176 | | | | 459,809 | |
| | |
Cambridge Bancorp | | | 16,468 | | | | 1,399,780 | |
| | |
Camden National Corp. | | | 30,006 | | | | 1,411,482 | |
| | |
Capital Bancorp, Inc. | | | 1,757 | | | | 40,165 | |
| | |
Capital City Bank Group, Inc. | | | 20,755 | | | | 547,102 | |
| | |
Capstar Financial Holdings, Inc. | | | 9,662 | | | | 203,675 | |
| | |
Cathay General Bancorp | | | 176,139 | | | | 7,882,220 | |
| | |
CB Financial Services, Inc. | | | 11,038 | | | | 259,945 | |
| | |
CBTX, Inc. | | | 29,619 | | | | 918,189 | |
| | |
Central Pacific Financial Corp. | | | 64,654 | | | | 1,803,847 | |
| | |
Central Valley Community Bancorp | | | 21,512 | | | | 502,305 | |
| | |
Chemung Financial Corp. | | | 7,647 | | | | 357,038 | |
| | |
ChoiceOne Financial Services, Inc. | | | 7,773 | | | | 194,791 | |
| | |
Citizens & Northern Corp. | | | 54,938 | | | | 1,339,388 | |
| | |
Citizens Community Bancorp, Inc. | | | 3,681 | | | | 55,620 | |
| | |
Citizens Holding Co. | | | 7,729 | | | | 149,170 | |
| | |
City Holding Co. | | | 40,877 | | | | 3,217,020 | |
| | |
Civista Bancshares, Inc. | | | 21,005 | | | | 506,221 | |
| | |
CNB Financial Corp. | | | 27,617 | | | | 726,879 | |
| | |
Codorus Valley Bancorp, Inc. | | | 20,638 | | | | 454,036 | |
| | |
Colony Bankcorp, Inc. | | | 8,058 | | | | 150,443 | |
| | |
Columbia Banking System, Inc. | | | 136,879 | | | | 4,417,085 | |
| | |
Community Bank System, Inc. | | | 60,382 | | | | 4,235,797 | |
| | |
Community Financial Corp. | | | 8,108 | | | | 324,320 | |
| | |
Community Trust Bancorp, Inc. | | | 44,979 | | | | 1,853,135 | |
| | |
ConnectOne Bancorp, Inc. | | | 40,107 | | | | 1,283,825 | |
| | |
CVB Financial Corp. | | | 266,618 | | | | 6,188,204 | |
| | |
Dime Community Bancshares, Inc. | | | 72,399 | | | | 2,502,833 | |
| | |
Eagle Bancorp Montana, Inc. | | | 4,094 | | | | 91,419 | |
| | |
Eagle Bancorp, Inc. | | | 63,512 | | | | 3,620,819 | |
| | |
Eastern Bankshares, Inc. | | | 137,840 | | | | 2,969,074 | |
| | |
Enterprise Bancorp, Inc. | | | 19,422 | | | | 779,211 | |
| | |
Enterprise Financial Services Corp. | | | 43,170 | | | | 2,042,373 | |
| | |
Equity Bancshares, Inc., Class A | | | 6,301 | | | | 203,585 | |
| | |
Evans Bancorp, Inc. | | | 7,657 | | | | 290,966 | |
| | |
Farmers & Merchants Bancorp, Inc. | | | 23,022 | | | | 832,245 | |
| | |
Farmers National Banc Corp. | | | 71,990 | | | | 1,228,149 | |
| | |
FB Financial Corp. | | | 28,266 | | | | 1,255,576 | |
| | |
Fidelity D&D Bancorp, Inc.(a) | | | 4,468 | | | | 207,449 | |
| | |
Financial Institutions, Inc. | | | 45,305 | | | | 1,365,040 | |
| | |
First Bancorp | | | 37,527 | | | | 1,567,503 | |
| | |
First Bancorp, Inc. | | | 38,046 | | | | 1,144,424 | |
| | |
First Bancshares, Inc. | | | 17,309 | | | | 582,621 | |
| | |
First Bank(a) | | | 11,173 | | | | 158,880 | |
| | |
First Busey Corp. | | | 88,703 | | | | 2,247,734 | |
| | |
First Business Financial Services, Inc. | | | 9,125 | | | | 299,391 | |
| | |
First Capital, Inc. | | | 3,782 | | | | 146,174 | |
| | |
First Commonwealth Financial Corp. | | | 161,258 | | | | 2,444,671 | |
| | |
First Community Bankshares, Inc. | | | 41,059 | | | | 1,158,274 | |
| | |
First Community Corp. | | | 8,723 | | | �� | 184,928 | |
| | |
First Financial Bancorp | | | 202,402 | | | | 4,665,366 | |
| | |
First Financial Corp. | | | 28,019 | | | | 1,212,662 | |
| | |
First Financial Northwest, Inc. | | | 14,427 | | | | 246,846 | |
| | |
First Foundation, Inc. | | | 39,380 | | | | 956,540 | |
| | |
First Guaranty Bancshares, Inc. | | | 12,146 | | | | 290,775 | |
| | |
First Hawaiian, Inc. | | | 250,491 | | | | 6,986,194 | |
| | |
First Internet Bancorp | | | 7,067 | | | | 303,952 | |
| | |
First Interstate BancSystem, Inc., Class A | | | 92,790 | | | | 3,411,888 | |
| | |
First Merchants Corp.(a) | | | 70,353 | | | | 2,926,685 | |
| | |
First Mid Bancshares, Inc. | | | 14,115 | | | | 543,286 | |
See Notes to Financial Statements.
Schedule of Investments (continued)
WisdomTree U.S. SmallCap Dividend Fund (DES)
March 31, 2022
| | | | | | | | |
| Investments | | Shares | | | Value | |
| | |
First National Corp.(a) | | | 2,046 | | | $ | 42,966 | |
| | |
First Northwest Bancorp | | | 8,248 | | | | 182,198 | |
| | |
First of Long Island Corp. | | | 49,555 | | | | 964,340 | |
| | |
First Savings Financial Group, Inc. | | | 2,889 | | | | 70,896 | |
| | |
First United Corp. | | | 18,359 | | | | 413,628 | |
| | |
Five Star Bancorp | | | 18,359 | | | | 519,560 | |
| | |
Flushing Financial Corp. | | | 45,064 | | | | 1,007,180 | |
| | |
FNB Corp. | | | 622,606 | | | | 7,751,445 | |
| | |
FNCB Bancorp, Inc. | | | 30,056 | | | | 284,630 | |
| | |
Fulton Financial Corp. | | | 309,343 | | | | 5,141,281 | |
| | |
German American Bancorp, Inc. | | | 41,675 | | | | 1,583,233 | |
| | |
Great Southern Bancorp, Inc. | | | 22,354 | | | | 1,319,110 | |
| | |
Guaranty Bancshares, Inc. | | | 23,030 | | | | 806,050 | |
| | |
Hanmi Financial Corp. | | | 71,520 | | | | 1,760,107 | |
| | |
HarborOne Bancorp, Inc. | | | 23,983 | | | | 336,242 | |
| | |
Hawthorn Bancshares, Inc. | | | 6,591 | | | | 166,620 | |
| | |
HBT Financial, Inc. | | | 95,699 | | | | 1,739,808 | |
| | |
Heartland Financial USA, Inc. | | | 41,890 | | | | 2,003,599 | |
| | |
Heritage Commerce Corp. | | | 123,253 | | | | 1,386,596 | |
| | |
Heritage Financial Corp. | | | 70,293 | | | | 1,761,543 | |
| | |
Hilltop Holdings, Inc. | | | 70,408 | | | | 2,069,995 | |
| | |
HomeStreet, Inc. | | | 26,924 | | | | 1,275,659 | |
| | |
HomeTrust Bancshares, Inc. | | | 3,582 | | | | 105,776 | |
| | |
Hope Bancorp, Inc. | | | 266,484 | | | | 4,285,063 | |
| | |
Horizon Bancorp, Inc. | | | 78,425 | | | | 1,464,195 | |
| | |
Independent Bank Corp. | | | 114,396 | | | | 5,837,028 | |
| | |
Independent Bank Group, Inc.(a) | | | 39,446 | | | | 2,806,977 | |
| | |
International Bancshares Corp. | | | 130,823 | | | | 5,522,039 | |
| | |
Investar Holding Corp. | | | 2,792 | | | | 53,299 | |
| | |
Lakeland Bancorp, Inc. | | | 81,387 | | | | 1,359,163 | |
| | |
Lakeland Financial Corp. | | | 32,285 | | | | 2,356,805 | |
| | |
LCNB Corp. | | | 32,749 | | | | 575,072 | |
| | |
Level One Bancorp, Inc. | | | 7,261 | | | | 289,932 | |
| | |
Live Oak Bancshares, Inc. | | | 2,454 | | | | 124,884 | |
| | |
Macatawa Bank Corp. | | | 113,011 | | | | 1,018,229 | |
| | |
Mercantile Bank Corp. | | | 39,587 | | | | 1,402,172 | |
| | |
Meridian Corp. | | | 7,186 | | | | 230,599 | |
| | |
Meta Financial Group, Inc. | | | 4,640 | | | | 254,829 | |
| | |
Metrocity Bankshares, Inc. | | | 57,634 | | | | 1,353,246 | |
| | |
Mid Penn Bancorp, Inc.(a) | | | 16,389 | | | | 439,389 | |
| | |
Middlefield Banc Corp. | | | 9,999 | | | | 248,175 | |
| | |
Midland States Bancorp, Inc. | | | 74,115 | | | | 2,138,959 | |
| | |
MidWestOne Financial Group, Inc. | | | 32,475 | | | | 1,074,923 | |
| | |
MVB Financial Corp. | | | 10,231 | | | | 424,587 | |
| | |
National Bank Holdings Corp., Class A | | | 41,151 | | | | 1,657,562 | |
| | |
National Bankshares, Inc. | | | 14,136 | | | | 525,718 | |
| | |
NBT Bancorp, Inc. | | | 69,574 | | | | 2,513,709 | |
| | |
Northeast Bank | | | 3,724 | | | | 127,026 | |
| | |
Northrim Bancorp, Inc. | | | 26,892 | | | | 1,171,684 | |
| | |
Northwest Bancshares, Inc. | | | 344,642 | | | | 4,656,113 | |
| | |
Norwood Financial Corp. | | | 18,430 | | | | 526,914 | |
| | |
OceanFirst Financial Corp. | | | 85,115 | | | | 1,710,812 | |
| | |
Ohio Valley Banc Corp. | | | 4,370 | | | | 131,974 | |
| | |
Old National Bancorp | | | 455,774 | | | | 7,465,578 | |
| | |
Old Second Bancorp, Inc. | | | 19,392 | | | | 281,378 | |
| | |
Orange County Bancorp, Inc.(a) | | | 1,230 | | | | 49,212 | |
| | |
Origin Bancorp, Inc. | | | 21,310 | | | | 901,200 | |
| | |
Orrstown Financial Services, Inc.(a) | | | 28,830 | | | | 661,072 | |
| | |
Pacific Premier Bancorp, Inc. | | | 151,187 | | | | 5,344,460 | |
| | |
Park National Corp. | | | 35,679 | | | | 4,687,507 | |
| | |
Parke Bancorp, Inc. | | | 21,023 | | | | 496,353 | |
| | |
Partners Bancorp(a) | | | 5,290 | | | | 48,721 | |
| | |
PCB Bancorp | | | 41,674 | | | | 956,418 | |
| | |
Peapack-Gladstone Financial Corp. | | | 8,825 | | | | 306,669 | |
| | |
Penns Woods Bancorp, Inc. | | | 13,628 | | | | 332,932 | |
| | |
Peoples Bancorp of North Carolina, Inc. | | | 8,642 | | | | 248,025 | |
| | |
Peoples Bancorp, Inc. | | | 79,487 | | | | 2,488,738 | |
| | |
Peoples Financial Services Corp. | | | 13,066 | | | | 659,572 | |
| | |
Plumas Bancorp(a) | | | 6,902 | | | | 262,966 | |
| | |
Preferred Bank | | | 22,439 | | | | 1,662,506 | |
| | |
Premier Financial Corp. | | | 85,330 | | | | 2,588,059 | |
| | |
Primis Financial Corp. | | | 61,405 | | | | 858,442 | |
| | |
QCR Holdings, Inc. | | | 3,329 | | | | 188,388 | |
| | |
RBB Bancorp | | | 36,155 | | | | 849,281 | |
| | |
Red River Bancshares, Inc. | | | 3,107 | | | | 164,391 | |
| | |
Renasant Corp. | | | 59,930 | | | | 2,004,659 | |
| | |
Republic Bancorp, Inc., Class A | | | 30,571 | | | | 1,373,861 | |
| | |
Richmond Mutual BanCorp, Inc. | | | 11,667 | | | | 199,039 | |
| | |
Riverview Bancorp, Inc. | | | 44,342 | | | | 334,782 | |
| | |
S&T Bancorp, Inc. | | | 66,966 | | | | 1,980,854 | |
| | |
Salisbury Bancorp, Inc.(a) | | | 10,988 | | | | 615,328 | |
| | |
Sandy Spring Bancorp, Inc. | | | 84,407 | | | | 3,791,562 | |
| | |
SB Financial Group, Inc. | | | 7,856 | | | | 156,413 | |
| | |
Seacoast Banking Corp. of Florida | | | 37,478 | | | | 1,312,480 | |
| | |
Shore Bancshares, Inc. | | | 26,466 | | | | 542,024 | |
| | |
Sierra Bancorp | | | 31,688 | | | | 791,566 | |
| | |
Simmons First National Corp., Class A(a) | | | 134,879 | | | | 3,536,527 | |
| | |
SmartFinancial, Inc. | | | 4,442 | | | | 113,626 | |
| | |
South Plains Financial, Inc. | | | 13,793 | | | | 366,618 | |
| | |
Southern States Bancshares, Inc. | | | 2,606 | | | | 60,120 | |
| | |
Southside Bancshares, Inc. | | | 71,423 | | | | 2,916,201 | |
| | |
Spirit of Texas Bancshares, Inc. | | | 14,655 | | | | 385,133 | |
| | |
Stock Yards Bancorp, Inc. | | | 44,771 | | | | 2,368,386 | |
| | |
Summit Financial Group, Inc. | | | 24,942 | | | | 638,266 | |
| | |
Summit State Bank | | | 3,050 | | | | 51,942 | |
| | |
Tompkins Financial Corp.(a) | | | 28,628 | | | | 2,240,714 | |
| | |
Towne Bank | | | 84,553 | | | | 2,531,517 | |
| | |
TriCo Bancshares | | | 42,491 | | | | 1,700,915 | |
| | |
Trustmark Corp. | | | 82,761 | | | | 2,515,107 | |
| | |
Union Bankshares, Inc. | | | 16,190 | | | | 497,843 | |
| | |
United Community Banks, Inc. | | | 158,564 | | | | 5,518,027 | |
| | |
United Security Bancshares | | | 53,096 | | | | 440,697 | |
| | |
Unity Bancorp, Inc. | | | 5,872 | | | | 164,299 | |
| | |
Univest Financial Corp. | | | 61,190 | | | | 1,637,444 | |
| | |
Veritex Holdings, Inc. | | | 67,754 | | | | 2,586,170 | |
| | |
Washington Trust Bancorp, Inc. | | | 33,128 | | | | 1,739,220 | |
| | |
WesBanco, Inc. | | | 115,562 | | | | 3,970,710 | |
| | |
West Bancorp, Inc. | | | 55,709 | | | | 1,515,842 | |
See Notes to Financial Statements.
Schedule of Investments (continued)
WisdomTree U.S. SmallCap Dividend Fund (DES)
March 31, 2022
| | | | | | | | |
| Investments | | Shares | | | Value | |
| | |
Westamerica BanCorp(a) | | | 49,653 | | | $ | 3,004,007 | |
| | | | | | | | |
| Total Banks | | | | 300,269,175 | |
|
| Beverages – 0.1% | |
| | |
MGP Ingredients, Inc.(a) | | | 21,017 | | | | 1,798,845 | |
|
| Building Products – 0.4% | |
| | |
Apogee Enterprises, Inc. | | | 65,555 | | | | 3,111,240 | |
| | |
CSW Industrials, Inc. | | | 7,535 | | | | 886,041 | |
| | |
Griffon Corp. | | | 107,052 | | | | 2,144,252 | |
| | |
Insteel Industries, Inc. | | | 5,363 | | | | 198,377 | |
| | |
Quanex Building Products Corp. | | | 46,332 | | | | 972,509 | |
| | | | | | | | |
| Total Building Products | | | | 7,312,419 | |
|
| Capital Markets – 3.4% | |
| | |
Artisan Partners Asset Management, Inc., Class A(a) | | | 316,006 | | | | 12,434,836 | |
| | |
Associated Capital Group, Inc., Class A | | | 1,281 | | | | 53,687 | |
| | |
B. Riley Financial, Inc.(a) | | | 111,120 | | | | 7,773,955 | |
| | |
BGC Partners, Inc., Class A | | | 160,889 | | | | 707,912 | |
| | |
Bridge Investment Group Holdings, Inc., Class A | | | 52,456 | | | | 1,067,480 | |
| | |
Brightsphere Investment Group, Inc.(a) | | | 2,171 | | | | 52,647 | |
| | |
Cowen, Inc., Class A | | | 9,914 | | | | 268,669 | |
| | |
Diamond Hill Investment Group, Inc. | | | 3,934 | | | | 736,838 | |
| | |
Federated Hermes, Inc., Class B | | | 150,435 | | | | 5,123,816 | |
| | |
GAMCO Investors, Inc., Class A | | | 11,395 | | | | 251,943 | |
| | |
GCM Grosvenor, Inc., Class A(a) | | | 134,765 | | | | 1,308,568 | |
| | |
Greenhill & Co., Inc. | | | 4,680 | | | | 72,400 | |
| | |
Manning & Napier, Inc. | | | 34,862 | | | | 317,593 | |
| | |
Moelis & Co., Class A | | | 179,811 | | | | 8,442,126 | |
| | |
Oppenheimer Holdings, Inc., Class A | | | 14,503 | | | | 632,041 | |
| | |
Perella Weinberg Partners(a) | | | 58,803 | | | | 555,688 | |
| | |
Piper Sandler Cos. | | | 20,037 | | | | 2,629,856 | |
| | |
PJT Partners, Inc., Class A | | | 2,326 | | | | 146,817 | |
| | |
Pzena Investment Management, Inc., Class A | | | 9,876 | | | | 79,206 | |
| | |
Sculptor Capital Management, Inc. | | | 65,080 | | | | 906,564 | |
| | |
Silvercrest Asset Management Group, Inc., Class A | | | 21,251 | | | | 434,583 | |
| | |
StepStone Group, Inc., Class A | | | 42,115 | | | | 1,392,322 | |
| | |
Value Line, Inc.(a) | | | 16,727 | | | | 1,120,709 | |
| | |
Victory Capital Holdings, Inc., Class A | | | 101,827 | | | | 2,939,746 | |
| | |
Virtu Financial, Inc., Class A | | | 292,391 | | | | 10,882,793 | |
| | |
Virtus Investment Partners, Inc. | | | 11,776 | | | | 2,826,122 | |
| | |
Westwood Holdings Group, Inc. | | | 14,651 | | | | 224,453 | |
| | | | | | | | |
| Total Capital Markets | | | | 63,383,370 | |
|
| Chemicals – 2.8% | |
| | |
AdvanSix, Inc. | | | 51,522 | | | | 2,632,259 | |
| | |
American Vanguard Corp. | | | 19,511 | | | | 396,464 | |
| | |
Cabot Corp. | | | 171,932 | | | | 11,761,868 | |
| | |
Chase Corp. | | | 10,555 | | | | 917,335 | |
| | |
H.B. Fuller Co. | | | 60,285 | | | | 3,983,030 | |
| | |
Hawkins, Inc. | | | 55,819 | | | | 2,562,092 | |
| | |
Innospec, Inc. | | | 36,789 | | | | 3,404,822 | |
| | |
Kronos Worldwide, Inc. | | | 598,799 | | | | 9,293,360 | |
| | |
Minerals Technologies, Inc. | | | 8,564 | | | | 566,509 | |
| | |
NewMarket Corp. | | | 31,369 | | | | 10,175,476 | |
| | |
Northern Technologies International Corp. | | | 8,398 | | | | 100,944 | |
| | |
Stepan Co. | | | 33,474 | | | | 3,307,566 | |
| | |
Tredegar Corp. | | | 162,282 | | | | 1,945,761 | |
| | |
Valhi, Inc. | | | 52,327 | | | | 1,533,704 | |
| | | | | | | | |
| Total Chemicals | | | | 52,581,190 | |
|
| Commercial Services & Supplies – 3.5% | |
| | |
ABM Industries, Inc. | | | 124,623 | | | | 5,737,643 | |
| | |
ACCO Brands Corp. | | | 426,974 | | | | 3,415,792 | |
| | |
Acme United Corp. | | | 13,015 | | | | 439,256 | |
| | |
ARC Document Solutions, Inc. | | | 77,175 | | | | 300,982 | |
| | |
Brady Corp., Class A | | | 91,646 | | | | 4,240,460 | |
| | |
Brink’s Co. | | | 72,853 | | | | 4,954,004 | |
| | |
CompX International, Inc. | | | 25,631 | | | | 602,841 | |
| | |
Deluxe Corp. | | | 167,808 | | | | 5,074,514 | |
| | |
Ennis, Inc. | | | 186,295 | | | | 3,440,869 | |
| | |
Healthcare Services Group, Inc.(a) | | | 436,942 | | | | 8,114,013 | |
| | |
HNI Corp. | | | 146,377 | | | | 5,423,268 | |
| | |
Interface, Inc. | | | 33,384 | | | | 453,021 | |
| | |
Kimball International, Inc., Class B | | | 163,562 | | | | 1,382,099 | |
| | |
Matthews International Corp., Class A | | | 102,745 | | | | 3,324,828 | |
| | |
MillerKnoll, Inc. | | | 180,558 | | | | 6,240,084 | |
| | |
NL Industries, Inc. | | | 108,129 | | | | 777,448 | |
| | |
Pitney Bowes, Inc. | | | 691,866 | | | | 3,597,703 | |
| | |
Steelcase, Inc., Class A | | | 487,156 | | | | 5,821,514 | |
| | |
UniFirst Corp. | | | 9,613 | | | | 1,771,484 | |
| | |
VSE Corp. | | | 11,928 | | | | 549,762 | |
| | | | | | | | |
| Total Commercial Services & Supplies | | | | 65,661,585 | |
|
| Communications Equipment – 0.1% | |
| | |
ADTRAN, Inc.(a) | | | 118,315 | | | | 2,182,912 | |
| | |
PCTEL, Inc.* | | | 72,602 | | | | 336,873 | |
| | | | | | | | |
| Total Communications Equipment | | | | 2,519,785 | |
|
| Construction & Engineering – 0.4% | |
| | |
Arcosa, Inc. | | | 17,007 | | | | 973,651 | |
| | |
Argan, Inc.(a) | | | 40,358 | | | | 1,638,131 | |
| | |
Comfort Systems USA, Inc.(a) | | | 20,791 | | | | 1,850,607 | |
| | |
Granite Construction, Inc. | | | 70,833 | | | | 2,323,322 | |
| | |
Primoris Services Corp. | | | 56,453 | | | | 1,344,711 | |
| | | | | | | | |
| Total Construction & Engineering | | | | 8,130,422 | |
|
| Construction Materials – 0.0% | |
| | |
United States Lime & Minerals, Inc. | | | 4,157 | | | | 482,378 | |
|
| Consumer Finance – 0.5% | |
| | |
Curo Group Holdings Corp.(a) | | | 71,485 | | | | 932,879 | |
| | |
FirstCash Holdings, Inc. | | | 34,996 | | | | 2,461,619 | |
| | |
Navient Corp. | | | 241,635 | | | | 4,117,461 | |
| | |
Nelnet, Inc., Class A | | | 12,098 | | | | 1,028,209 | |
| | |
Regional Management Corp. | | | 23,169 | | | | 1,125,318 | |
| | | | | | | | |
| Total Consumer Finance | | | | 9,665,486 | |
|
| Containers & Packaging – 1.0% | |
| | |
Greif, Inc., Class A | | | 255,939 | | | | 16,651,391 | |
| | |
Myers Industries, Inc. | | | 106,688 | | | | 2,304,461 | |
See Notes to Financial Statements.
Schedule of Investments (continued)
WisdomTree U.S. SmallCap Dividend Fund (DES)
March 31, 2022
| | | | | | | | |
| Investments | | Shares | | | Value | |
| | |
TriMas Corp. | | | 17,957 | | | $ | 576,240 | |
| | | | | | | | |
| Total Containers & Packaging | | | | 19,532,092 | |
|
| Distributors – 0.1% | |
| | |
Weyco Group, Inc. | | | 43,862 | | | | 1,084,269 | |
|
| Diversified Consumer Services – 0.7% | |
| | |
Carriage Services, Inc. | | | 23,002 | | | | 1,226,697 | |
| | |
Graham Holdings Co., Class B | | | 5,655 | | | | 3,457,863 | |
| | |
Strategic Education, Inc. | | | 126,600 | | | | 8,403,708 | |
| | | | | | | | |
| Total Diversified Consumer Services | | | | 13,088,268 | |
|
| Diversified Financial Services – 0.0% | |
| | |
Alerus Financial Corp. | | | 11,566 | | | | 319,684 | |
|
| Diversified Telecommunication Services – 1.3% | |
| | |
ATN International, Inc. | | | 34,203 | | | | 1,364,016 | |
| | |
Cogent Communications Holdings, Inc. | | | 362,095 | | | | 24,025,003 | |
| | | | | | | | |
| Total Diversified Telecommunication Services | | | | 25,389,019 | |
|
| Electric Utilities – 2.1% | |
| | |
ALLETE, Inc. | | | 243,477 | | | | 16,308,089 | |
| | |
MGE Energy, Inc.(a) | | | 125,125 | | | | 9,983,724 | |
| | |
Otter Tail Corp. | | | 176,426 | | | | 11,026,625 | |
| | |
Via Renewables, Inc.(a) | | | 229,776 | | | | 1,893,354 | |
| | | | | | | | |
| Total Electric Utilities | | | | 39,211,792 | |
|
| Electrical Equipment – 0.5% | |
| | |
Allied Motion Technologies, Inc. | | | 8,093 | | | | 241,495 | |
| | |
AZZ, Inc. | | | 33,370 | | | | 1,609,769 | |
| | |
Encore Wire Corp. | | | 746 | | | | 85,096 | |
| | |
EnerSys | | | 42,110 | | | | 3,140,143 | |
| | |
GrafTech International Ltd. | | | 87,518 | | | | 841,923 | |
| | |
LSI Industries, Inc. | | | 139,028 | | | | 834,168 | |
| | |
Powell Industries, Inc.(a) | | | 53,602 | | | | 1,040,951 | |
| | |
Preformed Line Products Co.(a) | | | 10,890 | | | | 690,644 | |
| | | | | | | | |
| Total Electrical Equipment | | | | 8,484,189 | |
|
| Electronic Equipment, Instruments & Components – 1.6% | |
| | |
Advanced Energy Industries, Inc.(a) | | | 19,999 | | | | 1,721,514 | |
| | |
Avnet, Inc. | | | 285,940 | | | | 11,606,305 | |
| | |
Badger Meter, Inc. | | | 23,860 | | | | 2,379,081 | |
| | |
Bel Fuse, Inc., Class B | | | 19,909 | | | | 355,176 | |
| | |
Belden, Inc. | | | 13,786 | | | | 763,744 | |
| | |
Benchmark Electronics, Inc. | | | 98,643 | | | | 2,470,021 | |
| | |
CTS Corp. | | | 20,650 | | | | 729,771 | |
| | |
Methode Electronics, Inc. | | | 50,632 | | | | 2,189,834 | |
| | |
PC Connection, Inc. | | | 27,571 | | | | 1,444,445 | |
| | |
Richardson Electronics Ltd. | | | 44,484 | | | | 553,381 | |
| | |
Vishay Intertechnology, Inc. | | | 300,822 | | | | 5,896,111 | |
| | |
Wayside Technology Group, Inc. | | | 16,720 | | | | 571,824 | |
| | | | | | | | |
| Total Electronic Equipment, Instruments & Components | | | | 30,681,207 | |
|
| Energy Equipment & Services – 0.4% | |
| | |
Cactus, Inc., Class A | | | 84,377 | | | | 4,787,551 | |
| | |
Solaris Oilfield Infrastructure, Inc., Class A(a) | | | 245,419 | | | | 2,770,781 | |
| | | | | | | | |
| Total Energy Equipment & Services | | | | 7,558,332 | |
|
| Entertainment – 0.2% | |
| | |
World Wrestling Entertainment, Inc., Class A | | | 46,986 | | | | 2,933,806 | |
|
| Equity Real Estate Investment Trusts (REITs) – 9.7% | |
| | |
Acadia Realty Trust | | | 98,647 | | | | 2,137,681 | |
| | |
Alexander & Baldwin, Inc. | | | 81,217 | | | | 1,883,422 | |
| | |
Alexander’s, Inc. | | | 21,258 | | | | 5,446,937 | |
| | |
Alpine Income Property Trust, Inc. | | | 20,044 | | | | 376,827 | |
| | |
American Assets Trust, Inc. | | | 96,007 | | | | 3,637,705 | |
| | |
Apple Hospitality REIT, Inc. | | | 23,539 | | | | 422,996 | |
| | |
Armada Hoffler Properties, Inc. | | | 101,521 | | | | 1,482,207 | |
| | |
Bluerock Residential Growth REIT, Inc. | | | 58,581 | | | | 1,556,497 | |
| | |
Brandywine Realty Trust | | | 368,796 | | | | 5,214,776 | |
| | |
BRT Apartments Corp. | | | 50,819 | | | | 1,218,132 | |
| | |
CareTrust REIT, Inc. | | | 281,618 | | | | 5,435,227 | |
| | |
CatchMark Timber Trust, Inc., Class A | | | 70,745 | | | | 580,109 | |
| | |
Cedar Realty Trust, Inc. | | | 10,177 | | | | 281,292 | |
| | |
Centerspace | | | 20,479 | | | | 2,009,400 | |
| | |
Clipper Realty, Inc. | | | 74,215 | | | | 673,130 | |
| | |
Community Healthcare Trust, Inc. | | | 59,197 | | | | 2,498,705 | |
| | |
Corporate Office Properties Trust | | | 271,935 | | | | 7,761,025 | |
| | |
Creative Media & Community Trust Corp. | | | 18,939 | | | | 146,588 | |
| | |
CTO Realty Growth, Inc.(a) | | | 22,613 | | | | 1,499,694 | |
| | |
Easterly Government Properties, Inc. | | | 254,686 | | | | 5,384,062 | |
| | |
Empire State Realty Trust, Inc., Class A | | | 84,590 | | | | 830,674 | |
| | |
EPR Properties | | | 185,895 | | | | 10,170,316 | |
| | |
Essential Properties Realty Trust, Inc. | | | 251,264 | | | | 6,356,979 | |
| | |
Farmland Partners, Inc. | | | 31,393 | | | | 431,654 | |
| | |
Four Corners Property Trust, Inc. | | | 166,480 | | | | 4,501,619 | |
| | |
Franklin Street Properties Corp. | | | 211,859 | | | | 1,249,968 | |
| | |
Getty Realty Corp. | | | 142,489 | | | | 4,078,035 | |
| | |
Gladstone Commercial Corp. | | | 123,100 | | | | 2,710,662 | |
| | |
Gladstone Land Corp.(a) | | | 41,183 | | | | 1,499,885 | |
| | |
Global Medical REIT, Inc. | | | 128,197 | | | | 2,092,175 | |
| | |
Hudson Pacific Properties, Inc. | | | 234,370 | | | | 6,503,768 | |
| | |
Independence Realty Trust, Inc. | | | 143,121 | | | | 3,784,119 | |
| | |
Indus Realty Trust, Inc.(a) | | | 3,184 | | | | 232,719 | |
| | |
Industrial Logistics Properties Trust | | | 233,001 | | | | 5,282,133 | |
| | |
InvenTrust Properties Corp. | | | 8,679 | | | | 267,140 | |
| | |
iStar, Inc.(a) | | | 75,657 | | | | 1,771,130 | |
| | |
JBG SMITH Properties | | | 157,882 | | | | 4,613,312 | |
| | |
LTC Properties, Inc. | | | 102,671 | | | | 3,949,753 | |
| | |
Necessity Retail REIT, Inc. | | | 499,844 | | | | 3,953,766 | |
| | |
NETSTREIT Corp. | | | 49,711 | | | | 1,115,515 | |
| | |
NexPoint Residential Trust, Inc. | | | 17,221 | | | | 1,555,229 | |
| | |
Office Properties Income Trust | | | 198,422 | | | | 5,105,398 | |
| | |
One Liberty Properties, Inc. | | | 85,210 | | | | 2,623,616 | |
| | |
Outfront Media, Inc. | | | 84,284 | | | | 2,396,194 | |
| | |
Paramount Group, Inc. | | | 349,000 | | | | 3,807,590 | |
| | |
Pebblebrook Hotel Trust | | | 2,100 | | | | 51,408 | |
| | |
Phillips Edison & Co., Inc. | | | 20,489 | | | | 704,617 | |
| | |
Piedmont Office Realty Trust, Inc., Class A | | | 262,142 | | | | 4,514,085 | |
| | |
Plymouth Industrial REIT, Inc. | | | 33,151 | | | | 898,392 | |
| | |
Postal Realty Trust, Inc., Class A | | | 46,333 | | | | 779,321 | |
| | |
PotlatchDeltic Corp. | | | 114,678 | | | | 6,046,971 | |
See Notes to Financial Statements.
Schedule of Investments (continued)
WisdomTree U.S. SmallCap Dividend Fund (DES)
March 31, 2022
| | | | | | | | |
| Investments | | Shares | | | Value | |
| | |
Preferred Apartment Communities, Inc., Class A | | | 111,512 | | | $ | 2,781,109 | |
| | |
Retail Opportunity Investments Corp. | | | 174,985 | | | | 3,392,959 | |
| | |
Retail Value, Inc. | | | 124,306 | | | | 380,376 | |
| | |
RLJ Lodging Trust | | | 20,557 | | | | 289,443 | |
| | |
RPT Realty | | | 183,568 | | | | 2,527,731 | |
| | |
Saul Centers, Inc. | | | 71,263 | | | | 3,755,560 | |
| | |
SITE Centers Corp. | | | 259,134 | | | | 4,330,129 | |
| | |
Tanger Factory Outlet Centers, Inc. | | | 149,952 | | | | 2,577,675 | |
| | |
UMH Properties, Inc. | | | 91,597 | | | | 2,252,370 | |
| | |
Uniti Group, Inc. | | | 415,232 | | | | 5,713,592 | |
| | |
Universal Health Realty Income Trust | | | 39,822 | | | | 2,324,410 | |
| | |
Urban Edge Properties | | | 146,224 | | | | 2,792,878 | |
| | |
Urstadt Biddle Properties, Inc., Class A | | | 84,940 | | | | 1,597,721 | |
| | |
Washington Real Estate Investment Trust | | | 112,409 | | | | 2,866,430 | |
| | |
Whitestone REIT | | | 111,415 | | | | 1,476,249 | |
| | | | | | | | |
| Total Equity Real Estate Investment Trusts (REITs) | | | | 182,583,187 | |
|
| Food & Staples Retailing – 1.3% | |
| | |
Andersons, Inc. | | | 83,144 | | | | 4,178,817 | |
| | |
Ingles Markets, Inc., Class A | | | 20,807 | | | | 1,852,863 | |
| | |
Natural Grocers by Vitamin Cottage, Inc. | | | 90,472 | | | | 1,773,251 | |
| | |
PriceSmart, Inc. | | | 41,767 | | | | 3,294,163 | |
| | |
SpartanNash Co.(a) | | | 210,008 | | | | 6,928,164 | |
| | |
Village Super Market, Inc., Class A | | | 56,915 | | | | 1,394,418 | |
| | |
Weis Markets, Inc.(a) | | | 64,616 | | | | 4,614,875 | |
| | | | | | | | |
| Total Food & Staples Retailing | | | | 24,036,551 | |
|
| Food Products – 1.5% | |
| | |
Alico, Inc. | | | 66,921 | | | | 2,513,553 | |
| | |
B&G Foods, Inc. | | | 470,916 | | | | 12,705,314 | |
| | |
Cal-Maine Foods, Inc. | | | 19,457 | | | | 1,074,415 | |
| | |
J & J Snack Foods Corp. | | | 40,215 | | | | 6,237,346 | |
| | |
John B. Sanfilippo & Son, Inc. | | | 12,022 | | | | 1,003,116 | |
| | |
Limoneira Co. | | | 45,045 | | | | 661,261 | |
| | |
Tootsie Roll Industries, Inc.(a) | | | 62,994 | | | | 2,202,256 | |
| | |
Utz Brands, Inc.(a) | | | 121,652 | | | | 1,798,016 | |
| | | | | | | | |
| Total Food Products | | | | 28,195,277 | |
|
| Gas Utilities – 5.0% | |
| | |
Chesapeake Utilities Corp. | | | 48,114 | | | | 6,628,185 | |
| | |
New Jersey Resources Corp. | | | 411,978 | | | | 18,893,311 | |
| | |
Northwest Natural Holding Co. | | | 145,969 | | | | 7,549,517 | |
| | |
ONE Gas, Inc. | | | 210,658 | | | | 18,588,462 | |
| | |
RGC Resources, Inc. | | | 42,954 | | | | 918,356 | |
| | |
South Jersey Industries, Inc. | | | 672,527 | | | | 23,235,808 | |
| | |
Spire, Inc. | | | 260,725 | | | | 18,709,626 | |
| | | | | | | | |
| Total Gas Utilities | | | | 94,523,265 | |
|
| Health Care Equipment & Supplies – 0.4% | |
| | |
Atrion Corp. | | | 3,015 | | | | 2,149,695 | |
| | |
CONMED Corp.(a) | | | 29,900 | | | | 4,441,645 | |
| | |
LeMaitre Vascular, Inc. | | | 30,800 | | | | 1,431,276 | |
| | |
Mesa Laboratories, Inc.(a) | | | 1,242 | | | | 316,561 | |
| | | | | | | | |
| Total Health Care Equipment & Supplies | | | | 8,339,177 | |
|
| Health Care Providers & Services – 1.5% | |
| | |
National HealthCare Corp. | | | 68,408 | | | | 4,804,294 | |
| | |
National Research Corp. | | | 28,630 | | | | 1,135,179 | |
| | |
Owens & Minor, Inc. | | | 7,101 | | | | 312,586 | |
| | |
Patterson Cos., Inc. | | | 416,875 | | | | 13,494,244 | |
| | |
Select Medical Holdings Corp. | | | 268,327 | | | | 6,437,165 | |
| | |
U.S. Physical Therapy, Inc. | | | 22,104 | | | | 2,198,243 | |
| | | | | | | | |
| Total Health Care Providers & Services | | | | 28,381,711 | |
|
| Health Care Technology – 0.0% | |
| | |
Simulations Plus, Inc.(a) | | | 11,581 | | | | 590,399 | |
|
| Hotels, Restaurants & Leisure – 1.4% | |
| | |
Cracker Barrel Old Country Store, Inc. | | | 113,018 | | | | 13,418,627 | |
| | |
Dine Brands Global, Inc. | | | 38,560 | | | | 3,005,752 | |
| | |
FAT Brands, Inc., Class A(a) | | | 73,940 | | | | 550,853 | |
| | |
Jack in the Box, Inc.(a) | | | 51,368 | | | | 4,798,285 | |
| | |
Krispy Kreme, Inc. | | | 175,797 | | | | 2,610,586 | |
| | |
Nathan’s Famous, Inc.(a) | | | 12,651 | | | | 685,305 | |
| | |
RCI Hospitality Holdings, Inc. | | | 9,653 | | | | 593,273 | |
| | | | | | | | |
| Total Hotels, Restaurants & Leisure | | | | 25,662,681 | |
|
| Household Durables – 1.6% | |
| | |
Bassett Furniture Industries, Inc. | | | 43,285 | | | | 716,800 | |
| | |
Century Communities, Inc. | | | 29,590 | | | | 1,585,136 | |
| | |
Ethan Allen Interiors, Inc.(a) | | | 163,617 | | | | 4,265,495 | |
| | |
Flexsteel Industries, Inc.(a) | | | 10,743 | | | | 207,340 | |
| | |
Hamilton Beach Brands Holding Co., Class A(a) | | | 29,326 | | | | 341,062 | |
| | |
Hooker Furnishings Corp. | | | 52,707 | | | | 998,271 | |
| | |
Installed Building Products, Inc.(a) | | | 29,166 | | | | 2,464,235 | �� |
| | |
KB Home | | | 139,258 | | | | 4,509,174 | |
| | |
La-Z-Boy, Inc. | | | 91,265 | | | | 2,406,658 | |
| | |
Lifetime Brands, Inc. | | | 51,495 | | | | 661,196 | |
| | |
MDC Holdings, Inc. | | | 312,249 | | | | 11,815,502 | |
| | |
Weber, Inc., Class A(a) | | | 56,958 | | | | 559,897 | |
| | | | | | | | |
| Total Household Durables | | | | 30,530,766 | |
|
| Household Products – 0.6% | |
| | |
Energizer Holdings, Inc. | | | 240,018 | | | | 7,382,954 | |
| | |
Oil-Dri Corp. of America(a) | | | 30,277 | | | | 867,436 | |
| | |
WD-40 Co. | | | 18,642 | | | | 3,415,773 | |
| | | | | | | | |
| Total Household Products | | | | 11,666,163 | |
|
| Insurance – 2.0% | |
| | |
American Equity Investment Life Holding Co. | | | 38,995 | | | | 1,556,290 | |
| | |
AMERISAFE, Inc. | | | 30,962 | | | | 1,537,882 | |
| | |
CNO Financial Group, Inc. | | | 126,855 | | | | 3,182,792 | |
| | |
Crawford & Co., Class A | | | 51,131 | | | | 386,550 | |
| | |
Donegal Group, Inc., Class A | | | 94,217 | | | | 1,263,450 | |
| | |
Employers Holdings, Inc. | | | 30,028 | | | | 1,231,749 | |
| | |
HCI Group, Inc. | | | 11,370 | | | | 775,207 | |
| | |
Heritage Insurance Holdings, Inc. | | | 20,442 | | | | 145,956 | |
| | |
Horace Mann Educators Corp. | | | 61,789 | | | | 2,584,634 | |
| | |
Investors Title Co. | | | 2,703 | | | | 549,277 | |
| | |
Kemper Corp. | | | 67,624 | | | | 3,823,461 | |
| | |
Mercury General Corp. | | | 199,849 | | | | 10,991,695 | |
| | |
National Western Life Group, Inc., Class A | | | 314 | | | | 66,066 | |
| | |
ProAssurance Corp. | | | 23,130 | | | | 621,734 | |
| | |
Safety Insurance Group, Inc. | | | 48,688 | | | | 4,423,305 | |
See Notes to Financial Statements.
Schedule of Investments (continued)
WisdomTree U.S. SmallCap Dividend Fund (DES)
March 31, 2022
| | | | | | | | |
| Investments | | Shares | | | Value | |
| | |
Stewart Information Services Corp. | | | 33,326 | | | $ | 2,019,889 | |
| | |
Tiptree, Inc. | | | 71,094 | | | | 913,558 | |
| | |
United Fire Group, Inc. | | | 32,665 | | | | 1,014,901 | |
| | |
United Insurance Holdings Corp.(a) | | | 113,272 | | | | 374,930 | |
| | |
Universal Insurance Holdings, Inc.(a) | | | 81,834 | | | | 1,103,941 | |
| | | | | | | | |
| Total Insurance | | | | 38,567,267 | |
|
| IT Services – 0.8% | |
| | |
Alliance Data Systems Corp. | | | 67,911 | | | | 3,813,203 | |
| | |
Cass Information Systems, Inc. | | | 42,394 | | | | 1,564,762 | |
| | |
CSG Systems International, Inc. | | | 106,362 | | | | 6,761,432 | |
| | |
Hackett Group, Inc. | | | 91,571 | | | | 2,111,627 | |
| | |
Information Services Group, Inc. | | | 111,076 | | | | 756,428 | |
| | | | | | | | |
| Total IT Services | | | | 15,007,452 | |
|
| Leisure Products – 0.9% | |
| | |
Clarus Corp. | | | 37,348 | | | | 850,787 | |
| | |
Escalade, Inc.(a) | | | 82,816 | | | | 1,093,171 | |
| | |
Johnson Outdoors, Inc., Class A | | | 10,818 | | | | 840,883 | |
| | |
Marine Products Corp.(a) | | | 138,194 | | | | 1,596,141 | |
| | |
Smith & Wesson Brands, Inc. | | | 96,588 | | | | 1,461,377 | |
| | |
Sturm Ruger & Co., Inc.(a) | | | 150,897 | | | | 10,505,449 | |
| | | | | | | | |
| Total Leisure Products | | | | 16,347,808 | |
|
| Machinery – 5.9% | |
| | |
Alamo Group, Inc. | | | 4,016 | | | | 577,461 | |
| | |
Albany International Corp., Class A | | | 36,388 | | | | 3,068,236 | |
| | |
Allison Transmission Holdings, Inc. | | | 253,963 | | | | 9,970,587 | |
| | |
Altra Industrial Motion Corp. | | | 44,464 | | | | 1,730,983 | |
| | |
Astec Industries, Inc. | | | 24,528 | | | | 1,054,704 | |
| | |
Barnes Group, Inc. | | | 76,868 | | | | 3,089,325 | |
| | |
Columbus McKinnon Corp. | | | 17,567 | | | | 744,841 | |
| | |
Douglas Dynamics, Inc. | | | 79,972 | | | | 2,766,231 | |
| | |
Eastern Co. | | | 17,395 | | | | 405,130 | |
| | |
Enerpac Tool Group Corp.(a) | | | 4,175 | | | | 91,391 | |
| | |
EnPro Industries, Inc. | | | 29,038 | | | | 2,837,884 | |
| | |
ESCO Technologies, Inc. | | | 9,004 | | | | 629,560 | |
| | |
Federal Signal Corp. | | | 81,534 | | | | 2,751,772 | |
| | |
Flowserve Corp. | | | 392,537 | | | | 14,092,078 | |
| | |
Gorman-Rupp Co. | | | 41,960 | | | | 1,505,525 | |
| | |
Graham Corp. | | | 29,278 | | | | 225,733 | |
| | |
Greenbrier Cos., Inc.(a) | | | 92,780 | | | | 4,779,098 | |
| | |
Helios Technologies, Inc. | | | 26,157 | | | | 2,099,099 | |
| | |
Hillenbrand, Inc. | | | 222,609 | | | | 9,832,639 | |
| | |
Hurco Cos., Inc. | | | 10,883 | | | | 343,032 | |
| | |
Kadant, Inc. | | | 7,955 | | | | 1,544,781 | |
| | |
Kennametal, Inc. | | | 213,998 | | | | 6,122,483 | |
| | |
Lindsay Corp. | | | 14,711 | | | | 2,309,774 | |
| | |
Miller Industries, Inc. | | | 39,780 | | | | 1,120,205 | |
| | |
Mueller Industries, Inc. | | | 92,283 | | | | 4,998,970 | |
| | |
Mueller Water Products, Inc., Class A | | | 344,680 | | | | 4,453,266 | |
| | |
Omega Flex, Inc.(a) | | | 14,948 | | | | 1,941,297 | |
| | |
Park-Ohio Holdings Corp.(a) | | | 26,901 | | | | 378,497 | |
| | |
REV Group, Inc. | | | 82,044 | | | | 1,099,390 | |
| | |
Shyft Group, Inc. | | | 8,869 | | | | 320,260 | |
| | |
SPX FLOW, Inc. | | | 18,647 | | | | 1,607,744 | |
| | |
Standex International Corp. | | | 19,337 | | | | 1,932,153 | |
| | |
Tennant Co. | | | 36,637 | | | | 2,886,996 | |
| | |
Terex Corp. | | | 84,787 | | | | 3,023,504 | |
| | |
Trinity Industries, Inc. | | | 368,160 | | | | 12,649,978 | |
| | |
Wabash National Corp. | | | 90,886 | | | | 1,348,748 | |
| | | | | | | | |
| Total Machinery | | | | 110,333,355 | |
|
| Marine – 0.7% | |
| | |
Matson, Inc. | | | 110,019 | | | | 13,270,492 | |
|
| Media – 1.7% | |
| | |
Entravision Communications Corp., Class A | | | 203,764 | | | | 1,306,127 | |
| | |
EW Scripps Co., Class A*(a) | | | 96,180 | | | | 1,999,582 | |
| | |
Gray Television, Inc. | | | 146,523 | | | | 3,233,762 | |
| | |
John Wiley & Sons, Inc., Class A | | | 200,623 | | | | 10,639,038 | |
| | |
Paramount Global, Class A(a) | | | 132,475 | | | | 5,353,315 | |
| | |
Saga Communications, Inc., Class A | | | 8,327 | | | | 190,272 | |
| | |
Scholastic Corp. | | | 101,593 | | | | 4,092,166 | |
| | |
Sinclair Broadcast Group, Inc., Class A | | | 197,439 | | | | 5,532,241 | |
| | | | | | | | |
| Total Media | | | | 32,346,503 | |
|
| Metals & Mining – 1.7% | |
| | |
Commercial Metals Co. | | | 254,407 | | | | 10,588,419 | |
| | |
Gold Resource Corp.(a) | | | 189,836 | | | | 425,233 | |
| | |
Haynes International, Inc. | | | 46,648 | | | | 1,987,205 | |
| | |
Hecla Mining Co. | | | 145,923 | | | | 958,714 | |
| | |
Materion Corp. | | | 11,055 | | | | 947,856 | |
| | |
Olympic Steel, Inc.(a) | | | 8,881 | | | | 341,563 | |
| | |
Ryerson Holding Corp. | | | 52,633 | | | | 1,843,208 | |
| | |
Schnitzer Steel Industries, Inc., Class A(a) | | | 45,510 | | | | 2,363,789 | |
| | |
SunCoke Energy, Inc. | | | 456,315 | | | | 4,065,767 | |
| | |
Warrior Met Coal, Inc. | | | 45,394 | | | | 1,684,571 | |
| | |
Worthington Industries, Inc. | | | 125,561 | | | | 6,455,091 | |
| | | | | | | | |
| Total Metals & Mining | | | | 31,661,416 | |
|
| Multi-Utilities – 1.9% | |
| | |
Avista Corp. | | | 360,426 | | | | 16,273,234 | |
| | |
NorthWestern Corp. | | | 271,668 | | | | 16,433,197 | |
| | |
Unitil Corp.(a) | | | 76,696 | | | | 3,825,597 | |
| | | | | | | | |
| Total Multi-Utilities | | | | 36,532,028 | |
|
| Multiline Retail – 0.6% | |
| | |
Big Lots, Inc. | | | 116,892 | | | | 4,044,463 | |
| | |
Franchise Group, Inc. | | | 155,173 | | | | 6,428,818 | |
| | | | | | | | |
| Total Multiline Retail | | | | 10,473,281 | |
|
| Oil, Gas & Consumable Fuels – 3.2% | |
| | |
Adams Resources & Energy, Inc. | | | 27,204 | | | | 1,047,082 | |
| | |
Arch Resources, Inc.(a) | | | 21,486 | | | | 2,951,747 | |
| | |
Berry Corp. | | | 255,262 | | | | 2,634,304 | |
| | |
Brigham Minerals, Inc., Class A | | | 143,523 | | | | 3,667,013 | |
| | |
California Resources Corp. | | | 224,919 | | | | 10,060,627 | |
| | |
Evolution Petroleum Corp. | | | 203,999 | | | | 1,385,153 | |
| | |
Falcon Minerals Corp. | | | 988,762 | | | | 6,664,256 | |
| | |
HighPeak Energy, Inc. | | | 62,740 | | | | 1,392,828 | |
| | |
Magnolia Oil & Gas Corp., Class A | | | 261,961 | | | | 6,195,378 | |
See Notes to Financial Statements.
Schedule of Investments (continued)
WisdomTree U.S. SmallCap Dividend Fund (DES)
March 31, 2022
| | | | | | | | |
| Investments | | Shares | | | Value | |
| | |
NACCO Industries, Inc., Class A | | | 16,407 | | | $ | 643,482 | |
| | |
Northern Oil and Gas, Inc. | | | 150,604 | | | | 4,245,527 | |
| | |
Oasis Petroleum, Inc. | | | 56,481 | | | | 8,263,170 | |
| | |
Riley Exploration Permian, Inc.(a) | | | 175,770 | | | | 4,408,311 | |
| | |
SM Energy Co. | | | 23,968 | | | | 933,554 | |
| | |
VAALCO Energy, Inc. | | | 438,238 | | | | 2,861,694 | |
| | |
World Fuel Services Corp. | | | 124,612 | | | | 3,369,508 | |
| | | | | | | | |
| Total Oil, Gas & Consumable Fuels | | | | 60,723,634 | |
|
| Paper & Forest Products – 0.6% | |
| | |
Glatfelter Corp. | | | 154,277 | | | | 1,909,949 | |
| | |
Neenah, Inc. | | | 86,179 | | | | 3,417,859 | |
| | |
Schweitzer-Mauduit International, Inc. | | | 209,051 | | | | 5,748,903 | |
| | | | | | | | |
| Total Paper & Forest Products | | | | 11,076,711 | |
|
| Personal Products – 1.3% | |
| | |
Edgewell Personal Care Co.(a) | | | 83,675 | | | | 3,068,362 | |
| | |
Inter Parfums, Inc. | | | 59,708 | | | | 5,257,290 | |
| | |
Medifast, Inc. | | | 40,499 | | | | 6,916,419 | |
| | |
Nu Skin Enterprises, Inc., Class A | | | 189,623 | | | | 9,079,149 | |
| | | | | | | | |
| Total Personal Products | | | | 24,321,220 | |
|
| Pharmaceuticals – 0.1% | |
| | |
Phibro Animal Health Corp., Class A | | | 72,645 | | | | 1,449,268 | |
|
| Professional Services – 1.1% | |
| | |
Barrett Business Services, Inc. | | | 18,157 | | | | 1,406,623 | |
| | |
BGSF, Inc. | | | 46,234 | | | | 608,902 | |
| | |
CRA International, Inc. | | | 23,143 | | | | 1,950,029 | |
| | |
Heidrick & Struggles International, Inc. | | | 59,238 | | | | 2,344,640 | |
| | |
HireQuest, Inc.(a) | | | 20,757 | | | | 396,874 | |
| | |
ICF International, Inc. | | | 17,152 | | | | 1,614,689 | |
| | |
Kelly Services, Inc., Class A | | | 37,945 | | | | 823,027 | |
| | |
Kforce, Inc. | | | 50,968 | | | | 3,770,103 | |
| | |
ManTech International Corp., Class A | | | 65,686 | | | | 5,661,476 | |
| | |
Resources Connection, Inc. | | | 115,528 | | | | 1,980,150 | |
| | | | | | | | |
| Total Professional Services | | | | 20,556,513 | |
|
| Real Estate Management & Development – 0.6% | |
| | |
Kennedy-Wilson Holdings, Inc. | | | 347,045 | | | | 8,464,428 | |
| | |
Newmark Group, Inc., Class A(a) | | | 56,971 | | | | 906,978 | |
| | |
RE/MAX Holdings, Inc., Class A | | | 17,685 | | | | 490,405 | |
| | |
RMR Group, Inc., Class A | | | 27,735 | | | | 862,558 | |
| | |
St. Joe Co. | | | 19,346 | | | | 1,146,057 | |
| | | | | | | | |
| Total Real Estate Management & Development | | | | 11,870,426 | |
|
| Road & Rail – 0.8% | |
| | |
ArcBest Corp. | | | 18,928 | | | | 1,523,704 | |
| | |
Heartland Express, Inc. | | | 31,607 | | | | 444,710 | |
| | |
Marten Transport Ltd. | | | 127,427 | | | | 2,263,104 | |
| | |
Schneider National, Inc., Class B | | | 176,924 | | | | 4,511,562 | |
| | |
Universal Logistics Holdings, Inc. | | | 100,582 | | | | 2,026,727 | |
| | |
Werner Enterprises, Inc. | | | 121,933 | | | | 4,999,253 | |
| | | | | | | | |
| Total Road & Rail | | | | 15,769,060 | |
|
| Semiconductors & Semiconductor Equipment – 0.6% | |
| | |
CMC Materials, Inc. | | | 43,432 | | | | 8,052,293 | |
| | |
NVE Corp. | | | 56,904 | | | | 3,099,561 | |
| | | | | | | | |
| Total Semiconductors & Semiconductor Equipment | | | | 11,151,854 | |
|
| Software – 0.8% | |
| | |
A10 Networks, Inc. | | | 109,842 | | | | 1,532,296 | |
| | |
American Software, Inc., Class A | | | 90,636 | | | | 1,888,854 | |
| | |
Ebix, Inc.(a) | | | 28,218 | | | | 935,427 | |
| | |
InterDigital, Inc. | | | 69,855 | | | | 4,456,749 | |
| | |
Progress Software Corp. | | | 71,876 | | | | 3,384,641 | |
| | |
Xperi Holding Corp. | | | 115,857 | | | | 2,006,643 | |
| | | | | | | | |
| Total Software | | | | 14,204,610 | |
|
| Specialty Retail – 2.5% | |
| | |
Aaron’s Co., Inc. | | | 53,954 | | | | 1,083,396 | |
| | |
Big 5 Sporting Goods Corp.(a) | | | 213,286 | | | | 3,657,855 | |
| | |
Buckle, Inc. | | | 242,706 | | | | 8,019,006 | |
| | |
Caleres, Inc. | | | 48,467 | | | | 936,867 | |
| | |
Camping World Holdings, Inc., Class A(a) | | | 251,334 | | | | 7,024,785 | |
| | |
Cato Corp., Class A | | | 142,562 | | | | 2,089,959 | |
| | |
Group 1 Automotive, Inc. | | | 14,315 | | | | 2,402,487 | |
| | |
Guess?, Inc. | | | 281,545 | | | | 6,151,758 | |
| | |
Haverty Furniture Cos., Inc. | | | 57,393 | | | | 1,573,716 | |
| | |
Hibbett, Inc. | | | 20,925 | | | | 927,815 | |
| | |
JOANN, Inc.(a) | | | 212,032 | | | | 2,419,285 | |
| | |
Monro, Inc.(a) | | | 67,392 | | | | 2,988,161 | |
| | |
Rent-A-Center, Inc. | | | 214,074 | | | | 5,392,524 | |
| | |
Shoe Carnival, Inc. | | | 30,715 | | | | 895,650 | |
| | |
Sonic Automotive, Inc., Class A | | | 28,794 | | | | 1,224,033 | |
| | |
Winmark Corp. | | | 4,679 | | | | 1,029,380 | |
| | | | | | | | |
| Total Specialty Retail | | | | 47,816,677 | |
|
| Technology Hardware, Storage & Peripherals – 1.1% | |
| | |
Xerox Holdings Corp. | | | 1,028,332 | | | | 20,741,456 | |
|
| Textiles, Apparel & Luxury Goods – 1.4% | |
| | |
Culp, Inc. | | | 46,508 | | | | 369,274 | |
| | |
Kontoor Brands, Inc. | | | 234,561 | | | | 9,699,097 | |
| | |
Levi Strauss & Co., Class A | | | 134,349 | | | | 2,654,736 | |
| | |
Movado Group, Inc. | | | 64,843 | | | | 2,532,119 | |
| | |
Oxford Industries, Inc. | | | 30,455 | | | | 2,756,178 | |
| | |
Rocky Brands, Inc. | | | 25,464 | | | | 1,059,048 | |
| | |
Steven Madden Ltd. | | | 120,213 | | | | 4,645,030 | |
| | |
Superior Group of Cos., Inc. | | | 31,697 | | | | 565,791 | |
| | |
Wolverine World Wide, Inc. | | | 113,957 | | | | 2,570,870 | |
| | | | | | | | |
| Total Textiles, Apparel & Luxury Goods | | | | 26,852,143 | |
|
| Thrifts & Mortgage Finance – 2.1% | |
| | |
Capitol Federal Financial, Inc. | | | 205,044 | | | | 2,230,879 | |
| | |
CF Bankshares, Inc. | | | 2,474 | | | | 54,923 | |
| | |
ESSA Bancorp, Inc. | | | 19,940 | | | | 357,923 | |
| | |
Federal Agricultural Mortgage Corp., Class C(a) | | | 19,663 | | | | 2,133,042 | |
| | |
Flagstar Bancorp, Inc. | | | 15,994 | | | | 678,146 | |
| | |
FS Bancorp, Inc. | | | 13,762 | | | | 426,622 | |
| | |
Greene County Bancorp, Inc. | | | 9,972 | | | | 445,748 | |
| | |
Guaranty Federal Bancshares, Inc. | | | 1,492 | | | | 46,894 | |
| | |
Hingham Institution for Savings | | | 1,088 | | | | 373,402 | |
| | |
Home Bancorp, Inc. | | | 13,741 | | | | 560,495 | |
See Notes to Financial Statements.
Schedule of Investments (continued)
WisdomTree U.S. SmallCap Dividend Fund (DES)
March 31, 2022
| | | | | | | | |
| Investments | | Shares | | | Value | |
| | |
Home Point Capital, Inc.(a) | | | 75,240 | | | $ | 233,996 | |
| | |
Kearny Financial Corp.(a) | | | 112,564 | | | | 1,449,824 | |
| | |
Luther Burbank Corp. | | | 75,724 | | | | 1,006,372 | |
| | |
Merchants Bancorp | | | 43,024 | | | | 1,177,997 | |
| | |
Northeast Community Bancorp, Inc. | | | 18,439 | | | | 225,878 | |
| | |
Northfield Bancorp, Inc. | | | 64,345 | | | | 923,994 | |
| | |
OP Bancorp | | | 38,382 | | | | 531,591 | |
| | |
PCSB Financial Corp. | | | 9,683 | | | | 185,042 | |
| | |
PennyMac Financial Services, Inc. | | | 51,839 | | | | 2,757,835 | |
| | |
Provident Bancorp, Inc. | | | 4,211 | | | | 68,302 | |
| | |
Provident Financial Holdings, Inc. | | | 21,662 | | | | 358,290 | |
| | |
Provident Financial Services, Inc. | | | 146,896 | | | | 3,437,366 | |
| | |
Prudential Bancorp, Inc. | | | 5,292 | | | | 87,106 | |
| | |
Radian Group, Inc. | | | 362,667 | | | | 8,054,834 | |
| | |
Randolph Bancorp, Inc. | | | 9,966 | | | | 263,202 | |
| | |
Southern Missouri Bancorp, Inc. | | | 13,317 | | | | 665,184 | |
| | |
Territorial Bancorp, Inc. | | | 19,532 | | | | 468,768 | |
| | |
Timberland Bancorp, Inc. | | | 19,261 | | | | 520,240 | |
| | |
TrustCo Bank Corp. | | | 35,055 | | | | 1,119,306 | |
| | |
UWM Holdings Corp.(a) | | | 263,876 | | | | 1,195,358 | |
| | |
Washington Federal, Inc. | | | 87,830 | | | | 2,882,581 | |
| | |
Waterstone Financial, Inc. | | | 64,736 | | | | 1,251,994 | |
| | |
Western New England Bancorp, Inc. | | | 38,390 | | | | 343,207 | |
| | |
WSFS Financial Corp. | | | 59,328 | | | | 2,765,871 | |
| | | | | | | | |
| Total Thrifts & Mortgage Finance | | | | 39,282,212 | |
|
| Tobacco – 1.8% | |
| | |
Turning Point Brands, Inc. | | | 10,863 | | | | 369,451 | |
| | |
Universal Corp. | | | 270,214 | | | | 15,691,327 | |
| | |
Vector Group Ltd. | | | 1,410,273 | | | | 16,979,687 | |
| | | | | | | | |
| Total Tobacco | | | | 33,040,465 | |
|
| Trading Companies & Distributors – 3.2% | |
| | |
Applied Industrial Technologies, Inc. | | | 85,459 | | | | 8,773,221 | |
| | |
Boise Cascade Co. | | | 46,580 | | | | 3,235,913 | |
| | |
GATX Corp. | | | 76,733 | | | | 9,463,481 | |
| | |
Global Industrial Co. | | | 83,089 | | | | 2,677,958 | |
| | |
H&E Equipment Services, Inc. | | | 118,386 | | | | 5,152,159 | |
| | |
McGrath RentCorp | | | 69,928 | | | | 5,942,481 | |
| | |
MSC Industrial Direct Co., Inc., Class A | | | 201,895 | | | | 17,203,473 | |
| | |
Rush Enterprises, Inc., Class A | | | 136,974 | | | | 6,973,346 | |
| | | | | | | | |
| Total Trading Companies & Distributors | | | | 59,422,032 | |
|
| Water Utilities – 1.5% | |
| | |
American States Water Co. | | | 96,924 | | | | 8,628,174 | |
| | |
Artesian Resources Corp., Class A | | | 41,982 | | | | 2,038,226 | |
| | |
California Water Service Group | | | 128,229 | | | | 7,601,415 | |
| | |
Global Water Resources, Inc. | | | 55,476 | | | | 923,121 | |
| | |
Middlesex Water Co. | | | 23,276 | | | | 2,447,937 | |
| | |
SJW Group | | | 68,942 | | | | 4,796,984 | |
| | |
York Water Co. | | | 20,976 | | | | 943,291 | |
| | | | | | | | |
| Total Water Utilities | | | | 27,379,148 | |
|
| Wireless Telecommunication Services – 0.6% | |
| | |
Shenandoah Telecommunications Co. | | | 37,500 | | | | 884,250 | |
| | |
Spok Holdings, Inc. | | | 155,829 | | | | 1,243,515 | |
| | |
Telephone and Data Systems, Inc. | | | 475,386 | | | | 8,975,288 | |
| | | | | | | | |
| Total Wireless Telecommunication Services | | | | | | | 11,103,053 | |
| Total United States | | | | | | | 1,864,577,727 | |
| | |
| Puerto Rico – 0.5% | | | | | | | | |
| | |
| Banks – 0.4% | | | | | | | | |
| | |
First Bancorp | | | 462,253 | | | | 6,064,759 | |
| | |
OFG Bancorp | | | 40,767 | | | | 1,086,033 | |
| | | | | | | | |
| Total Banks | | | | 7,150,792 | |
|
| IT Services – 0.1% | |
| | |
EVERTEC, Inc. | | | 47,721 | | | | 1,953,221 | |
| Total Puerto Rico | | | | | | | 9,104,013 | |
TOTAL COMMON STOCKS
(Cost: $1,683,374,626) | | | | | | | 1,873,681,740 | |
| | |
| EXCHANGE-TRADED FUND – 0.1% | | | | | | | | |
| | |
| United States – 0.1% | | | | | | | | |
| | |
WisdomTree U.S. MidCap Dividend Fund(a)(b)
(Cost: $1,206,686) | | | 27,429 | | | | 1,218,396 | |
|
| INVESTMENT OF CASH COLLATERAL FOR SECURITIES LOANED – 0.5% | |
| | |
| United States – 0.5% | | | | | | | | |
| |
State Street Navigator Securities Lending
Government Money Market Portfolio, 0.25%(c) | | | | | |
| (Cost: $10,687,737) | | | 10,687,737 | | | | 10,687,737 | |
| |
TOTAL INVESTMENTS IN SECURITIES – 100.2% (Cost: $1,695,269,049) | | | | 1,885,587,873 | |
| |
Other Assets less Liabilities – (0.2)% | | | | (4,042,404 | ) |
| | | | | | | | |
| NET ASSETS – 100.0% | | | $ | 1,881,545,469 | |
| * | Non-income producing security. |
| (a) | Security, or portion thereof, was on loan at March 31, 2022 (See Note 2). At March 31, 2022, the total market value of the Fund’s securities on loan identified in the Schedule of Investments was $66,825,714 and the total market value of the collateral held by the Fund was $69,388,698. The total market value of the collateral includes non-cash U.S. Government securities collateral having a value of $58,700,961. |
| (b) | Affiliated holding. See “Investment in Affiliates” supplementary table included in this Schedule of Investments for additional information. |
| (c) | Rate shown represents annualized 7-day yield as of March 31, 2022. |
See Notes to Financial Statements.
Schedule of Investments (concluded)
WisdomTree U.S. SmallCap Dividend Fund (DES)
March 31, 2022
Affiliated holdings are investments in entities in which the Fund owns 5% or more of the outstanding voting securities or are investments in entities which are under common ownership or control. Investments in affiliates during the fiscal year ended March 31, 2022 were as follows:
| | | | | | | | | | | | | | | | | | | | | | | | | | | | |
| | | | | | | |
| Affiliate | | Value at
3/31/2021 | | | Purchases/
Additions | | | Sales/
Reductions | | | Realized
Gain/(Loss) | | | Change in
Unrealized
Appreciation/
Depreciation | | | Value at
3/31/2022 | | | Dividend
Income | |
WisdomTree U.S. MidCap Dividend Fund | | $ | 13,217 | | | $ | 21,459,559 | | | $ | 20,680,875 | | | $ | 420,404 | | | $ | 6,091 | | | $ | 1,218,396 | | | $ | 65,270 | |
| | | | | | | | | | |
| | | |
| FAIR VALUATION SUMMARY | | | | | �� | |
The following is a summary of the fair valuations according to the inputs used as of March 31, 2022 in valuing the Fund’s investments (See Note 2 — Fair Value Measurement):
| | | | | | | | | | | | | | | | |
| | | | |
| | | Quoted
Prices in
Active
Markets
(Level 1) | | | Other
Significant
Observable
Inputs
(Level 2) | | | Significant
Unobservable
Inputs
(Level 3) | | | Total | |
Assets: | | | | | | | | | | | | | | | | |
Investments in Securities | | | | | | | | | | | | | | | | |
Common Stocks | | $ | 1,873,681,740 | | | $ | — | | | $ | — | | | $ | 1,873,681,740 | |
Exchange-Traded Fund | | | 1,218,396 | | | | — | | | | — | | | | 1,218,396 | |
Investment of Cash Collateral for Securities Loaned | | | — | | | | 10,687,737 | | | | — | | | | 10,687,737 | |
Total Investments in Securities | | $ | 1,874,900,136 | | | $ | 10,687,737 | | | $ | — | | | $ | 1,885,587,873 | |
See Notes to Financial Statements.
Schedule of Investments
WisdomTree U.S. SmallCap Fund (EES)
March 31, 2022
| | | | | | | | |
| Investments | | Shares | | | Value | |
|
| COMMON STOCKS – 99.8% | |
|
| United States – 99.8% | |
|
| Aerospace & Defense – 1.2% | |
| | |
AAR Corp.* | | | 18,231 | | | $ | 882,927 | |
| | |
Aerovironment, Inc.* | | | 3,937 | | | | 370,629 | |
| | |
AerSale Corp.*(a) | | | 24,323 | | | | 382,358 | |
| | |
Byrna Technologies, Inc.*(a) | | | 9,296 | | | | 75,948 | |
| | |
Ducommun, Inc.* | | | 7,887 | | | | 413,200 | |
| | |
Kaman Corp. | | | 15,046 | | | | 654,200 | |
| | |
Kratos Defense & Security Solutions, Inc.* | | | 41,896 | | | | 858,030 | |
| | |
Mercury Systems, Inc.* | | | 23,972 | | | | 1,544,995 | |
| | |
Moog, Inc., Class A | | | 19,577 | | | | 1,718,861 | |
| | |
National Presto Industries, Inc. | | | 4,793 | | | | 368,821 | |
| | |
Park Aerospace Corp. | | | 14,536 | | | | 189,695 | |
| | |
Triumph Group, Inc.* | | | 22,677 | | | | 573,275 | |
| | |
Vectrus, Inc.* | | | 10,861 | | | | 389,476 | |
| | | | | | | | |
| Total Aerospace & Defense | | | | 8,422,415 | |
|
| Air Freight & Logistics – 1.1% | |
| | |
Air Transport Services Group, Inc.* | | | 34,157 | | | | 1,142,552 | |
| | |
Atlas Air Worldwide Holdings, Inc.* | | | 47,126 | | | | 4,070,273 | |
| | |
Forward Air Corp. | | | 10,185 | | | | 995,889 | |
| | |
Hub Group, Inc., Class A* | | | 15,762 | | | | 1,216,984 | |
| | | | | | | | |
| Total Air Freight & Logistics | | | | 7,425,698 | |
|
| Airlines – 0.2% | |
| | |
Mesa Air Group, Inc.* | | | 52,351 | | | | 230,344 | |
| | |
SkyWest, Inc.* | | | 28,575 | | | | 824,389 | |
| | |
Sun Country Airlines Holdings, Inc.* | | | 14,283 | | | | 373,929 | |
| | | | | | | | |
| Total Airlines | | | | 1,428,662 | |
|
| Auto Components – 1.2% | |
| | |
American Axle & Manufacturing Holdings, Inc.* | | | 154,289 | | | | 1,197,283 | |
| | |
Gentherm, Inc.* | | | 12,032 | | | | 878,817 | |
| | |
Modine Manufacturing Co.* | | | 57,932 | | | | 521,967 | |
| | |
Motorcar Parts of America, Inc.* | | | 25,811 | | | | 460,210 | |
| | |
Patrick Industries, Inc. | | | 18,047 | | | | 1,088,234 | |
| | |
Standard Motor Products, Inc. | | | 17,747 | | | | 765,606 | |
| | |
Strattec Security Corp.* | | | 6,558 | | | | 244,417 | |
| | |
Tenneco, Inc., Class A* | | | 152,984 | | | | 2,802,667 | |
| | |
XPEL, Inc.*(a) | | | 5,848 | | | | 307,663 | |
| | | | | | | | |
| Total Auto Components | | | | 8,266,864 | |
|
| Automobiles – 0.3% | |
| | |
Winnebago Industries, Inc. | | | 31,436 | | | | 1,698,487 | |
| | |
Workhorse Group, Inc.*(a) | | | 70,903 | | | | 354,515 | |
| | | | | | | | |
| Total Automobiles | | | | 2,053,002 | |
|
| Banks – 12.5% | |
| | |
1st Source Corp. | | | 12,393 | | | | 573,176 | |
| | |
ACNB Corp. | | | 7,772 | | | | 271,631 | |
| | |
Allegiance Bancshares, Inc. | | | 9,115 | | | | 407,258 | |
| | |
Amalgamated Financial Corp. | | | 12,769 | | | | 229,459 | |
| | |
Amerant Bancorp, Inc. | | | 8,834 | | | | 279,066 | |
| | |
American National Bankshares, Inc. | | | 4,886 | | | | 184,105 | |
| | |
Ames National Corp. | | | 11,566 | | | | 287,531 | |
| | |
Arrow Financial Corp. | | | 12,277 | | | | 398,020 | |
| | |
Atlantic Union Bankshares Corp. | | | 63,696 | | | | 2,337,006 | |
| | |
Banc of California, Inc. | | | 13,461 | | | | 260,605 | |
| | |
BancFirst Corp. | | | 16,194 | | | | 1,347,503 | |
| | |
Bancorp, Inc.* | | | 29,175 | | | | 826,528 | |
| | |
Bank First Corp. | | | 2,917 | | | | 209,995 | |
| | |
Bank of Marin Bancorp | | | 1,177 | | | | 41,277 | |
| | |
BankFinancial Corp. | | | 14,334 | | | | 148,500 | |
| | |
Bankwell Financial Group, Inc. | | | 701 | | | | 23,715 | |
| | |
Banner Corp. | | | 19,310 | | | | 1,130,214 | |
| | |
BCB Bancorp, Inc. | | | 9,433 | | | | 172,152 | |
| | |
Berkshire Hills Bancorp, Inc. | | | 13,575 | | | | 393,268 | |
| | |
Brookline Bancorp, Inc. | | | 45,200 | | | | 715,064 | |
| | |
Business First Bancshares, Inc. | | | 9,417 | | | | 229,116 | |
| | |
Byline Bancorp, Inc. | | | 19,953 | | | | 532,346 | |
| | |
Cambridge Bancorp | | | 2,121 | | | | 180,285 | |
| | |
Camden National Corp. | | | 8,906 | | | | 418,938 | |
| | |
Capital City Bank Group, Inc. | | | 4,919 | | | | 129,665 | |
| | |
Capstar Financial Holdings, Inc. | | | 3,465 | | | | 73,042 | |
| | |
Carter Bankshares, Inc.* | | | 5,182 | | | | 90,011 | |
| | |
CBTX, Inc. | | | 4,147 | | | | 128,557 | |
| | |
Central Pacific Financial Corp. | | | 12,841 | | | | 358,264 | |
| | |
Central Valley Community Bancorp | | | 2,066 | | | | 48,241 | |
| | |
Citizens & Northern Corp. | | | 9,895 | | | | 241,240 | |
| | |
City Holding Co. | | | 7,816 | | | | 615,119 | |
| | |
Civista Bancshares, Inc. | | | 6,289 | | | | 151,565 | |
| | |
CNB Financial Corp. | | | 14,682 | | | | 386,430 | |
| | |
Codorus Valley Bancorp, Inc. | | | 1,343 | | | | 29,546 | |
| | |
Columbia Banking System, Inc. | | | 48,395 | | | | 1,561,707 | |
| | |
Community Financial Corp. | | | 2,671 | | | | 106,840 | |
| | |
Community Trust Bancorp, Inc. | | | 9,759 | | | | 402,071 | |
| | |
ConnectOne Bancorp, Inc. | | | 34,118 | | | | 1,092,117 | |
| | |
CrossFirst Bankshares, Inc.* | | | 20,899 | | | | 329,368 | |
| | |
Customers Bancorp, Inc.* | | | 35,683 | | | | 1,860,512 | |
| | |
CVB Financial Corp. | | | 77,821 | | | | 1,806,225 | |
| | |
Dime Community Bancshares, Inc. | | | 24,561 | | | | 849,074 | |
| | |
Eagle Bancorp, Inc. | | | 23,447 | | | | 1,336,714 | |
| | |
Enterprise Bancorp, Inc. | | | 2,113 | | | | 84,774 | |
| | |
Enterprise Financial Services Corp. | | | 14,955 | | | | 707,521 | |
| | |
Equity Bancshares, Inc., Class A | | | 6,885 | | | | 222,454 | |
| | |
Esquire Financial Holdings, Inc.* | | | 3,818 | | | | 128,323 | |
| | |
Farmers National Banc Corp. | | | 27,527 | | | | 469,611 | |
| | |
FB Financial Corp. | | | 28,683 | | | | 1,274,099 | |
| | |
Financial Institutions, Inc. | | | 11,183 | | | | 336,944 | |
| | |
First Bancorp | | | 16,656 | | | | 695,721 | |
| | |
First Bancorp, Inc. | | | 6,344 | | | | 190,828 | |
| | |
First Bancshares, Inc. | | | 8,471 | | | | 285,134 | |
| | |
First Bank | | | 7,783 | | | | 110,674 | |
| | |
First Busey Corp. | | | 28,966 | | | | 733,998 | |
| | |
First Business Financial Services, Inc. | | | 4,203 | | | | 137,900 | |
| | |
First Commonwealth Financial Corp. | | | 58,254 | | | | 883,131 | |
| | |
First Community Bankshares, Inc. | | | 11,336 | | | | 319,789 | |
| | |
First Financial Bancorp | | | 90,089 | | | | 2,076,551 | |
| | |
First Financial Corp. | | | 8,362 | | | | 361,907 | |
| | |
First Foundation, Inc. | | | 33,760 | | | | 820,030 | |
See Notes to Financial Statements.
Schedule of Investments (continued)
WisdomTree U.S. SmallCap Fund (EES)
March 31, 2022
| | | | | | | | |
| Investments | | Shares | | | Value | |
| | |
First Internet Bancorp | | | 5,400 | | | $ | 232,254 | |
| | |
First Interstate BancSystem, Inc., Class A | | | 62,128 | | | | 2,284,447 | |
| | |
First Merchants Corp. | | | 32,812 | | | | 1,364,979 | |
| | |
First Mid Bancshares, Inc. | | | 9,535 | | | | 367,002 | |
| | |
First of Long Island Corp. | | | 16,431 | | | | 319,747 | |
| | |
First Savings Financial Group, Inc. | | | 4,512 | | | | 110,725 | |
| | |
First Western Financial, Inc.* | | | 689 | | | | 21,538 | |
| | |
Flushing Financial Corp. | | | 25,297 | | | | 565,388 | |
| | |
Fulton Financial Corp. | | | 140,397 | | | | 2,333,398 | |
| | |
German American Bancorp, Inc. | | | 10,824 | | | | 411,204 | |
| | |
Great Southern Bancorp, Inc. | | | 10,017 | | | | 591,103 | |
| | |
Guaranty Bancshares, Inc. | | | 2,407 | | | | 84,245 | |
| | |
Hanmi Financial Corp. | | | 13,992 | | | | 344,343 | |
| | |
HarborOne Bancorp, Inc. | | | 31,640 | | | | 443,593 | |
| | |
HBT Financial, Inc. | | | 23,745 | | | | 431,684 | |
| | |
Heartland Financial USA, Inc. | | | 25,578 | | | | 1,223,396 | |
| | |
Heritage Commerce Corp. | | | 12,700 | | | | 142,875 | |
| | |
Heritage Financial Corp. | | | 28,240 | | | | 707,694 | |
| | |
Hilltop Holdings, Inc. | | | 89,270 | | | | 2,624,538 | |
| | |
HomeStreet, Inc. | | | 19,591 | | | | 928,222 | |
| | |
Hope Bancorp, Inc. | | | 105,339 | | | | 1,693,851 | |
| | |
Horizon Bancorp, Inc. | | | 32,510 | | | | 606,962 | |
| | |
Independent Bank Corp. | | | 16,319 | | | | 359,018 | |
| | |
International Bancshares Corp. | | | 54,400 | | | | 2,296,224 | |
| | |
Lakeland Bancorp, Inc. | | | 29,344 | | | | 490,045 | |
| | |
Lakeland Financial Corp. | | | 13,857 | | | | 1,011,561 | |
| | |
LCNB Corp. | | | 8,696 | | | | 152,702 | |
| | |
Level One Bancorp, Inc. | | | 1,126 | | | | 44,961 | |
| | |
Macatawa Bank Corp. | | | 546 | | | | 4,919 | |
| | |
Mercantile Bank Corp. | | | 10,437 | | | | 369,679 | |
| | |
Meridian Corp. | | | 3,748 | | | | 120,273 | |
| | |
Meta Financial Group, Inc. | | | 19,383 | | | | 1,064,514 | |
| | |
Metrocity Bankshares, Inc. | | | 18,224 | | | | 427,900 | |
| | |
Metropolitan Bank Holding Corp.* | | | 5,139 | | | | 522,996 | |
| | |
Mid Penn Bancorp, Inc. | | | 4,872 | | | | 130,618 | |
| | |
Midland States Bancorp, Inc. | | | 9,462 | | | | 273,073 | |
| | |
MidWestOne Financial Group, Inc. | | | 14,768 | | | | 488,821 | |
| | |
MVB Financial Corp. | | | 642 | | | | 26,643 | |
| | |
National Bank Holdings Corp., Class A | | | 21,397 | | | | 861,871 | |
| | |
National Bankshares, Inc. | | | 1,158 | | | | 43,066 | |
| | |
NBT Bancorp, Inc. | | | 24,438 | | | | 882,945 | |
| | |
Nicolet Bankshares, Inc.* | | | 6,099 | | | | 570,683 | |
| | |
Northeast Bank | | | 12,298 | | | | 419,485 | |
| | |
Northrim Bancorp, Inc. | | | 5,809 | | | | 253,098 | |
| | |
Northwest Bancshares, Inc. | | | 71,677 | | | | 968,356 | |
| | |
OceanFirst Financial Corp. | | | 16,764 | | | | 336,956 | |
| | |
Old National Bancorp | | | 190,483 | | | | 3,120,112 | |
| | |
Old Second Bancorp, Inc. | | | 6,437 | | | | 93,401 | |
| | |
Origin Bancorp, Inc. | | | 10,451 | | | | 441,973 | |
| | |
Orrstown Financial Services, Inc. | | | 8,175 | | | | 187,453 | |
| | |
PCB Bancorp | | | 1,068 | | | | 24,511 | |
| | |
Peapack-Gladstone Financial Corp. | | | 6,919 | | | | 240,435 | |
| | |
Peoples Bancorp, Inc. | | | 694 | | | | 21,729 | |
| | |
Peoples Financial Services Corp. | | | 3,386 | | | | 170,925 | |
| | |
Preferred Bank | | | 9,589 | | | | 710,449 | |
| | |
Premier Financial Corp. | | | 25,016 | | | | 758,735 | |
| | |
Primis Financial Corp. | | | 9,692 | | | | 135,494 | |
| | |
Professional Holding Corp., Class A* | | | 4,800 | | | | 108,288 | |
| | |
QCR Holdings, Inc. | | | 15,265 | | | | 863,846 | |
| | |
RBB Bancorp | | | 10,166 | | | | 238,799 | |
| | |
Red River Bancshares, Inc. | | | 3,520 | | | | 186,243 | |
| | |
Renasant Corp. | | | 31,981 | | | | 1,069,764 | |
| | |
Republic Bancorp, Inc., Class A | | | 12,848 | | | | 577,389 | |
| | |
Republic First Bancorp, Inc.* | | | 39,585 | | | | 204,259 | |
| | |
S&T Bancorp, Inc. | | | 20,386 | | | | 603,018 | |
| | |
Sandy Spring Bancorp, Inc. | | | 31,818 | | | | 1,429,265 | |
| | |
Seacoast Banking Corp. of Florida | | | 26,910 | | | | 942,388 | |
| | |
Shore Bancshares, Inc. | | | 6,613 | | | | 135,434 | |
| | |
Sierra Bancorp | | | 8,400 | | | | 209,832 | |
| | |
SmartFinancial, Inc. | | | 3,119 | | | | 79,784 | |
| | |
South Plains Financial, Inc. | | | 10,022 | | | | 266,385 | |
| | |
Southern First Bancshares, Inc.* | | | 171 | | | | 8,694 | |
| | |
Southside Bancshares, Inc. | | | 18,978 | | | | 774,872 | |
| | |
Spirit of Texas Bancshares, Inc. | | | 7,838 | | | | 205,983 | |
| | |
Stock Yards Bancorp, Inc. | | | 12,082 | | | | 639,138 | |
| | |
Summit Financial Group, Inc. | | | 10,309 | | | | 263,807 | |
| | |
Texas Capital Bancshares, Inc.* | | | 29,547 | | | | 1,693,339 | |
| | |
Towne Bank | | | 53,163 | | | | 1,591,700 | |
| | |
TriCo Bancshares | | | 12,695 | | | | 508,181 | |
| | |
Trustmark Corp. | | | 38,248 | | | | 1,162,357 | |
| | |
Unity Bancorp, Inc. | | | 3,724 | | | | 104,198 | |
| | |
Univest Financial Corp. | | | 20,326 | | | | 543,924 | |
| | |
Veritex Holdings, Inc. | | | 26,120 | | | | 997,000 | |
| | |
Washington Trust Bancorp, Inc. | | | 8,141 | | | | 427,403 | |
| | |
WesBanco, Inc. | | | 48,155 | | | | 1,654,606 | |
| | |
West Bancorp, Inc. | | | 5,206 | | | | 141,655 | |
| | |
Westamerica BanCorp | | | 5,810 | | | | 351,505 | |
| | | | | | | | |
| Total Banks | | | | 86,874,323 | |
|
| Beverages – 0.2% | |
| | |
Duckhorn Portfolio, Inc.* | | | 26,166 | | | | 475,959 | |
| | |
MGP Ingredients, Inc.(a) | | | 10,598 | | | | 907,083 | |
| | | | | | | | |
| Total Beverages | | | | 1,383,042 | |
|
| Biotechnology – 3.0% | |
| | |
Agenus, Inc.*(a) | | | 66,942 | | | | 164,677 | |
| | |
Agios Pharmaceuticals, Inc.* | | | 115,237 | | | | 3,354,549 | |
| | |
Alector, Inc.*(a) | | | 17,354 | | | | 247,294 | |
| | |
AnaptysBio, Inc.* | | | 6,158 | | | | 152,349 | |
| | |
Avid Bioservices, Inc.* | | | 11,163 | | | | 227,390 | |
| | |
CareDx, Inc.* | | | 11,216 | | | | 414,880 | |
| | |
Catalyst Pharmaceuticals, Inc.* | | | 81,172 | | | | 672,916 | |
| | |
Coherus Biosciences, Inc.* | | | 17,938 | | | | 231,580 | |
| | |
Eagle Pharmaceuticals, Inc.* | | | 8,841 | | | | 437,541 | |
| | |
Emergent BioSolutions, Inc.* | | | 56,921 | | | | 2,337,176 | |
| | |
Enanta Pharmaceuticals, Inc.* | | | 4,366 | | | | 310,772 | |
| | |
Ironwood Pharmaceuticals, Inc.* | | | 314,070 | | | | 3,951,001 | |
| | |
iTeos Therapeutics, Inc.* | | | 8,812 | | | | 283,570 | |
| | |
Kymera Therapeutics, Inc.* | | | 11,329 | | | | 479,443 | |
See Notes to Financial Statements.
Schedule of Investments (continued)
WisdomTree U.S. SmallCap Fund (EES)
March 31, 2022
| | | | | | | | |
| Investments | | Shares | | | Value | |
| | |
La Jolla Pharmaceutical Co.*(a) | | | 57,590 | | | $ | 245,909 | |
| | |
Ligand Pharmaceuticals, Inc.* | | | 6,070 | | | | 682,814 | |
| | |
OPKO Health, Inc.*(a) | | | 184,659 | | | | 635,227 | |
| | |
Organogenesis Holdings, Inc.*(a) | | | 60,672 | | | | 462,321 | |
| | |
Ovid therapeutics, Inc.*(a) | | | 146,996 | | | | 461,567 | |
| | |
Sage Therapeutics, Inc.* | | | 119,007 | | | | 3,939,132 | |
| | |
Surface Oncology, Inc.* | | | 50,633 | | | | 148,861 | |
| | |
Vanda Pharmaceuticals, Inc.* | | | 21,689 | | | | 245,303 | |
| | |
Vericel Corp.* | | | 10,349 | | | | 395,539 | |
| | |
Xencor, Inc.* | | | 13,341 | | | | 355,938 | |
| | | | | | | | |
| Total Biotechnology | | | | 20,837,749 | |
|
| Building Products – 1.1% | |
| | |
American Woodmark Corp.* | | | 7,609 | | | | 372,461 | |
| | |
Apogee Enterprises, Inc. | | | 14,687 | | | | 697,045 | |
| | |
Cornerstone Building Brands, Inc.* | | | 76,927 | | | | 1,870,865 | |
| | |
CSW Industrials, Inc. | | | 4,973 | | | | 584,775 | |
| | |
Gibraltar Industries, Inc.* | | | 11,365 | | | | 488,127 | |
| | |
Griffon Corp. | | | 37,865 | | | | 758,436 | |
| | |
Insteel Industries, Inc. | | | 16,945 | | | | 626,795 | |
| | |
Janus International Group, Inc.* | | | 27,130 | | | | 244,170 | |
| | |
JELD-WEN Holding, Inc.* | | | 58,398 | | | | 1,184,311 | |
| | |
PGT Innovations, Inc.* | | | 27,651 | | | | 497,165 | |
| | |
Quanex Building Products Corp. | | | 22,558 | | | | 473,492 | |
| | | | | | | | |
| Total Building Products | | | | 7,797,642 | |
|
| Capital Markets – 3.2% | |
| | |
Artisan Partners Asset Management, Inc., Class A | | | 49,528 | | | | 1,948,927 | |
| | |
AssetMark Financial Holdings, Inc.* | | | 24,537 | | | | 545,948 | |
| | |
B. Riley Financial, Inc. | | | 53,224 | | | | 3,723,551 | |
| | |
BGC Partners, Inc., Class A | | | 454,436 | | | | 1,999,518 | |
| | |
Blucora, Inc.* | | | 33,814 | | | | 661,064 | |
| | |
Brightsphere Investment Group, Inc. | | | 82,258 | | | | 1,994,757 | |
| | |
Cowen, Inc., Class A | | | 51,447 | | | | 1,394,214 | |
| | |
Diamond Hill Investment Group, Inc. | | | 1,727 | | | | 323,467 | |
| | |
Donnelley Financial Solutions, Inc.* | | | 13,030 | | | | 433,378 | |
| | |
GAMCO Investors, Inc., Class A | | | 12,871 | | | | 284,578 | |
| | |
GCM Grosvenor, Inc., Class A(a) | | | 64,729 | | | | 628,519 | |
| | |
Greenhill & Co., Inc. | | | 25,972 | | | | 401,787 | |
| | |
Open Lending Corp., Class A* | | | 40,256 | | | | 761,241 | |
| | |
Oppenheimer Holdings, Inc., Class A | | | 22,376 | | | | 975,146 | |
| | |
Perella Weinberg Partners | | | 9,291 | | | | 87,800 | |
| | |
PJT Partners, Inc., Class A | | | 15,237 | | | | 961,759 | |
| | |
Pzena Investment Management, Inc., Class A | | | 31,866 | | | | 255,565 | |
| | |
Silvercrest Asset Management Group, Inc., Class A | | | 4,055 | | | | 82,925 | |
| | |
StepStone Group, Inc., Class A | | | 11,954 | | | | 395,199 | |
| | |
StoneX Group, Inc.* | | | 13,017 | | | | 966,252 | |
| | |
Victory Capital Holdings, Inc., Class A | | | 72,092 | | | | 2,081,296 | |
| | |
Virtus Investment Partners, Inc. | | | 5,697 | | | | 1,367,223 | |
| | |
Westwood Holdings Group, Inc. | | | 3,864 | | | | 59,196 | |
| | | | | | | | |
| Total Capital Markets | | | | 22,333,310 | |
|
| Chemicals – 2.0% | |
| | |
Advanced Emissions Solutions, Inc.* | | | 39,678 | | | | 246,797 | |
| | |
AdvanSix, Inc. | | | 26,069 | | | | 1,331,865 | |
| | |
American Vanguard Corp. | | | 20,277 | | | | 412,029 | |
| | |
Ecovyst, Inc. | | | 116,673 | | | | 1,348,740 | |
| | |
GCP Applied Technologies, Inc.* | | | 23,941 | | | | 752,226 | |
| | |
Hawkins, Inc. | | | 19,725 | | | | 905,377 | |
| | |
Ingevity Corp.* | | | 25,546 | | | | 1,636,732 | |
| | |
Innospec, Inc. | | | 11,083 | | | | 1,025,732 | |
| | |
Intrepid Potash, Inc.* | | | 4,558 | | | | 374,394 | |
| | |
Koppers Holdings, Inc. | | | 30,616 | | | | 842,552 | |
| | |
Kronos Worldwide, Inc. | | | 63,332 | | | | 982,913 | |
| | |
Minerals Technologies, Inc. | | | 23,076 | | | | 1,526,477 | |
| | |
Stepan Co. | | | 10,860 | | | | 1,073,077 | |
| | |
Tredegar Corp. | | | 24,717 | | | | 296,357 | |
| | |
Valhi, Inc. | | | 28,683 | | | | 840,699 | |
| | | | | | | | |
| Total Chemicals | | | | 13,595,967 | |
|
| Commercial Services & Supplies – 2.5% | |
| | |
ACCO Brands Corp. | | | 120,213 | | | | 961,704 | |
| | |
ARC Document Solutions, Inc. | | | 60,394 | | | | 235,537 | |
| | |
Brady Corp., Class A | | | 21,197 | | | | 980,785 | |
| | |
BrightView Holdings, Inc.* | | | 81,589 | | | | 1,110,426 | |
| | |
CECO Environmental Corp.*(a) | | | 32,805 | | | | 180,099 | |
| | |
CoreCivic, Inc.* | | | 114,785 | | | | 1,282,148 | |
| | |
Deluxe Corp. | | | 48,218 | | | | 1,458,112 | |
| | |
Ennis, Inc. | | | 20,056 | | | | 370,434 | |
| | |
GEO Group, Inc.*(a) | | | 191,243 | | | | 1,264,116 | |
| | |
Harsco Corp.* | | | 39,202 | | | | 479,833 | |
| | |
Healthcare Services Group, Inc. | | | 24,525 | | | | 455,429 | |
| | |
Heritage-Crystal Clean, Inc.* | | | 13,297 | | | | 393,724 | |
| | |
HNI Corp. | | | 20,493 | | | | 759,266 | |
| | |
Interface, Inc. | | | 49,599 | | | | 673,058 | |
| | |
KAR Auction Services, Inc.*(a) | | | 51,451 | | | | 928,691 | |
| | |
Kimball International, Inc., Class B | | | 9,251 | | | | 78,171 | |
| | |
Matthews International Corp., Class A | | | 25,833 | | | | 835,956 | |
| | |
MillerKnoll, Inc. | | | 35,363 | | | | 1,222,145 | |
| | |
Performant Financial Corp.*(a) | | | 40,343 | | | | 125,467 | |
| | |
Pitney Bowes, Inc. | | | 75,874 | | | | 394,545 | |
| | |
Quad/Graphics, Inc.* | | | 65,274 | | | | 453,002 | |
| | |
SP Plus Corp.* | | | 14,257 | | | | 447,100 | |
| | |
Steelcase, Inc., Class A | | | 17,937 | | | | 214,347 | |
| | |
U.S. Ecology, Inc.* | | | 5,434 | | | | 260,180 | |
| | |
UniFirst Corp. | | | 6,410 | | | | 1,181,235 | |
| | |
Vidler Water Resources, Inc.* | | | 20,013 | | | | 309,001 | |
| | |
VSE Corp. | | | 9,894 | | | | 456,014 | |
| | | | | | | | |
| Total Commercial Services & Supplies | | | | 17,510,525 | |
|
| Communications Equipment – 1.2% | |
| | |
ADTRAN, Inc. | | | 11,888 | | | | 219,334 | |
| | |
Aviat Networks, Inc.* | | | 11,820 | | | | 363,701 | |
| | |
CalAmp Corp.* | | | 28,248 | | | | 206,493 | |
| | |
Casa Systems, Inc.* | | | 77,684 | | | | 351,132 | |
| | |
Clearfield, Inc.*(a) | | | 6,694 | | | | 436,583 | |
| | |
Digi International, Inc.* | | | 15,471 | | | | 332,936 | |
| | |
DZS, Inc.*(a) | | | 13,100 | | | | 181,697 | |
| | |
EMCORE Corp.* | | | 38,666 | | | | 143,064 | |
| | |
Extreme Networks, Inc.* | | | 56,813 | | | | 693,687 | |
| | |
Genasys, Inc.* | | | 980 | | | | 2,695 | |
See Notes to Financial Statements.
Schedule of Investments (continued)
WisdomTree U.S. SmallCap Fund (EES)
March 31, 2022
| | | | | | | | |
| Investments | | Shares | | | Value | |
| | |
Harmonic, Inc.*(a) | | | 33,543 | | | $ | 311,614 | |
| | |
Infinera Corp.*(a) | | | 45,041 | | | | 390,505 | |
| | |
Lantronix, Inc.* | | | 24,045 | | | | 160,621 | |
| | |
NETGEAR, Inc.* | | | 32,272 | | | | 796,473 | |
| | |
NetScout Systems, Inc.* | | | 38,131 | | | | 1,223,242 | |
| | |
PCTEL, Inc.* | | | 1,541 | | | | 7,150 | |
| | |
Plantronics, Inc.*(a) | | | 55,012 | | | | 2,167,473 | |
| | |
Ribbon Communications, Inc.* | | | 136,236 | | | | 420,969 | |
| | | | | | | | |
| Total Communications Equipment | | | | 8,409,369 | |
|
| Construction & Engineering – 1.1% | |
| | |
Arcosa, Inc. | | | 12,431 | | | | 711,675 | |
| | |
Argan, Inc. | | | 10,725 | | | | 435,328 | |
| | |
Construction Partners, Inc., Class A* | | | 16,931 | | | | 443,254 | |
| | |
Dycom Industries, Inc.* | | | 7,959 | | | | 758,174 | |
| | |
Granite Construction, Inc. | | | 7,263 | | | | 238,226 | |
| | |
Great Lakes Dredge & Dock Corp.*(a) | | | 30,104 | | | | 422,359 | |
| | |
IES Holdings, Inc.* | | | 11,090 | | | | 445,818 | |
| | |
MYR Group, Inc.* | | | 8,570 | | | | 805,923 | |
| | |
Northwest Pipe Co.*(a) | | | 10,684 | | | | 271,908 | |
| | |
NV5 Global, Inc.* | | | 4,978 | | | | 663,567 | |
| | |
Primoris Services Corp. | | | 37,728 | | | | 898,681 | |
| | |
Sterling Construction Co., Inc.* | | | 25,816 | | | | 691,869 | |
| | |
Tutor Perini Corp.* | | | 68,735 | | | | 742,338 | |
| | | | | | | | |
| Total Construction & Engineering | | | | 7,529,120 | |
|
| Construction Materials – 0.1% | |
| | |
Smith-Midland Corp.* | | | 3,407 | | | | 60,474 | |
| | |
United States Lime & Minerals, Inc. | | | 3,000 | | | | 348,120 | |
| | | | | | | | |
| Total Construction Materials | | | | 408,594 | |
|
| Consumer Finance – 2.2% | |
| | |
Atlanticus Holdings Corp.* | | | 16,233 | | | | 840,707 | |
| | |
Curo Group Holdings Corp. | | | 25,301 | | | | 330,178 | |
| | |
Encore Capital Group, Inc.*(a) | | | 44,565 | | | | 2,795,562 | |
| | |
Enova International, Inc.* | | | 63,507 | | | | 2,411,361 | |
| | |
EZCORP, Inc., Class A* | | | 13,543 | | | | 81,800 | |
| | |
FirstCash Holdings, Inc. | | | 14,005 | | | | 985,112 | |
| | |
Green Dot Corp., Class A* | | | 23,906 | | | | 656,937 | |
| | |
Nelnet, Inc., Class A | | | 37,155 | | | | 3,157,803 | |
| | |
Oportun Financial Corp.* | | | 18,764 | | | | 269,451 | |
| | |
PRA Group, Inc.*(a) | | | 29,958 | | | | 1,350,507 | |
| | |
PROG Holdings, Inc.* | | | 48,630 | | | | 1,399,085 | |
| | |
Regional Management Corp. | | | 8,178 | | | | 397,205 | |
| | |
World Acceptance Corp.*(a) | | | 3,178 | | | | 609,668 | |
| | | | | | | | |
| Total Consumer Finance | | | | 15,285,376 | |
|
| Containers & Packaging – 0.6% | |
| | |
Myers Industries, Inc. | | | 19,841 | | | | 428,566 | |
| | |
O-I Glass, Inc.* | | | 216,591 | | | | 2,854,669 | |
| | |
TriMas Corp. | | | 21,388 | | | | 686,341 | |
| | | | | | | | |
| Total Containers & Packaging | | | | 3,969,576 | |
|
| Distributors – 0.1% | |
| | |
Funko, Inc., Class A* | | | 29,802 | | | | 514,085 | |
|
| Diversified Consumer Services – 1.8% | |
| | |
2U, Inc.*(a) | | | 18,792 | | | | 249,558 | |
| | |
Adtalem Global Education, Inc.* | | | 37,172 | | | | 1,104,380 | |
| | |
American Public Education, Inc.* | | | 5,371 | | | | 114,080 | |
| | |
Carriage Services, Inc. | | | 12,331 | | | | 657,612 | |
| | |
Frontdoor, Inc.* | | | 37,299 | | | | 1,113,375 | |
| | |
Graham Holdings Co., Class B | | | 3,854 | | | | 2,356,605 | |
| | |
Grand Canyon Education, Inc.* | | | 29,698 | | | | 2,883,973 | |
| | |
Lincoln Educational Services Corp.* | | | 32,831 | | | | 234,742 | |
| | |
Perdoceo Education Corp.* | | | 79,694 | | | | 914,887 | |
| | |
Strategic Education, Inc. | | | 20,792 | | | | 1,380,173 | |
| | |
Stride, Inc.* | | | 18,238 | | | | 662,586 | |
| | |
Universal Technical Institute, Inc.* | | | 13,842 | | | | 122,502 | |
| | |
WW International, Inc.* | | | 44,760 | | | | 457,895 | |
| | | | | | | | |
| Total Diversified Consumer Services | | | | 12,252,368 | |
|
| Diversified Financial Services – 0.2% | |
| | |
A-Mark Precious Metals, Inc. | | | 16,678 | | | | 1,289,877 | |
| | |
Alerus Financial Corp. | | | 11,321 | | | | 312,912 | |
| | | | | | | | |
| Total Diversified Financial Services | | | | 1,602,789 | |
|
| Diversified Telecommunication Services – 0.4% | |
| | |
Bandwidth, Inc., Class A*(a) | | | 5,809 | | | | 188,153 | |
| | |
Consolidated Communications Holdings, Inc.*(a) | | | 63,403 | | | | 374,078 | |
| | |
EchoStar Corp., Class A* | | | 49,283 | | | | 1,199,548 | |
| | |
IDT Corp., Class B* | | | 17,841 | | | | 608,200 | |
| | |
Ooma, Inc.* | | | 10,012 | | | | 150,080 | |
| | | | | | | | |
| Total Diversified Telecommunication Services | | | | 2,520,059 | |
|
| Electric Utilities – 0.4% | |
| | |
MGE Energy, Inc. | | | 12,954 | | | | 1,033,600 | |
| | |
Otter Tail Corp. | | | 23,901 | | | | 1,493,812 | |
| | |
Via Renewables, Inc. | | | 34,409 | | | | 283,530 | |
| | | | | | | | |
| Total Electric Utilities | | | | 2,810,942 | |
|
| Electrical Equipment – 0.8% | |
| | |
Allied Motion Technologies, Inc. | | | 9,014 | | | | 268,978 | |
| | |
AZZ, Inc. | | | 15,431 | | | | 744,391 | |
| | |
Encore Wire Corp. | | | 26,919 | | | | 3,070,650 | |
| | |
LSI Industries, Inc. | | | 21,499 | | | | 128,994 | |
| | |
Orion Energy Systems, Inc.* | | | 742 | | | | 2,078 | |
| | |
Powell Industries, Inc. | | | 4,012 | | | | 77,913 | |
| | |
Preformed Line Products Co. | | | 5,998 | | | | 380,393 | |
| | |
Shoals Technologies Group, Inc., Class A* | | | 21,936 | | | | 373,789 | |
| | |
Thermon Group Holdings, Inc.* | | | 15,838 | | | | 256,576 | |
| | | | | | | | |
| Total Electrical Equipment | | | | 5,303,762 | |
|
| Electronic Equipment, Instruments & Components – 2.7% | |
| | |
Bel Fuse, Inc., Class B | | | 23,981 | | | | 427,821 | |
| | |
Belden, Inc. | | | 29,059 | | | | 1,609,869 | |
| | |
Benchmark Electronics, Inc. | | | 19,939 | | | | 499,273 | |
| | |
CTS Corp. | | | 17,768 | | | | 627,921 | |
| | |
Daktronics, Inc.* | | | 27,651 | | | | 106,180 | |
| | |
ePlus, Inc.* | | | 19,143 | | | | 1,073,157 | |
| | |
FARO Technologies, Inc.* | | | 3,457 | | | | 179,487 | |
| | |
Identiv, Inc.* | | | 2,296 | | | | 37,126 | |
| | |
Itron, Inc.* | | | 11,227 | | | | 591,438 | |
| | |
Kimball Electronics, Inc.* | | | 24,980 | | | | 499,350 | |
| | |
Knowles Corp.* | | | 52,770 | | | | 1,136,138 | |
See Notes to Financial Statements.
Schedule of Investments (continued)
WisdomTree U.S. SmallCap Fund (EES)
March 31, 2022
| | | | | | | | |
| Investments | | Shares | | | Value | |
| | |
Luna Innovations, Inc.*(a) | | | 19,470 | | | $ | 150,114 | |
| | |
Methode Electronics, Inc. | | | 27,375 | | | | 1,183,969 | |
| | |
Napco Security Technologies, Inc.* | | | 15,524 | | | | 318,552 | |
| | |
nLight, Inc.* | | | 11,443 | | | | 198,422 | |
| | |
OSI Systems, Inc.* | | | 8,358 | | | | 711,433 | |
| | |
PC Connection, Inc. | | | 13,748 | | | | 720,258 | |
| | |
Plexus Corp.* | | | 12,776 | | | | 1,045,205 | |
| | |
Powerfleet, Inc.*(a) | | | 30,173 | | | | 89,614 | |
| | |
Richardson Electronics Ltd. | | | 10,104 | | | | 125,694 | |
| | |
Sanmina Corp.* | | | 59,339 | | | | 2,398,482 | |
| | |
ScanSource, Inc.* | | | 23,884 | | | | 830,924 | |
| | |
TTM Technologies, Inc.* | | | 88,142 | | | | 1,306,264 | |
| | |
Vishay Intertechnology, Inc. | | | 114,787 | | | | 2,249,825 | |
| | |
Vishay Precision Group, Inc.* | | | 10,196 | | | | 327,801 | |
| | | | | | | | |
| Total Electronic Equipment, Instruments & Components | | | | 18,444,317 | |
|
| Energy Equipment & Services – 0.3% | |
| | |
Archrock, Inc. | | | 40,543 | | | | 374,212 | |
| | |
Cactus, Inc., Class A | | | 15,664 | | | | 888,775 | |
| | |
DMC Global, Inc.* | | | 4,043 | | | | 123,311 | |
| | |
Oceaneering International, Inc.* | | | 25,404 | | | | 385,125 | |
| | | | | | | | |
| Total Energy Equipment & Services | | | | 1,771,423 | |
|
| Entertainment – 0.3% | |
| | |
Gaia, Inc.* | | | 24,830 | | | | 122,163 | |
| | |
Sciplay Corp., Class A* | | | 23,615 | | | | 305,106 | |
| | |
World Wrestling Entertainment, Inc., Class A | | | 23,561 | | | | 1,471,149 | |
| | | | | | | | |
| Total Entertainment | | | | 1,898,418 | |
|
| Equity Real Estate Investment Trusts (REITs) – 2.5% | |
| | |
Acadia Realty Trust | | | 36,796 | | | | 797,369 | |
| | |
Alexander & Baldwin, Inc. | | | 18,634 | | | | 432,122 | |
| | |
Alexander’s, Inc. | | | 1,499 | | | | 384,089 | |
| | |
Alpine Income Property Trust, Inc. | | | 8,891 | | | | 167,151 | |
| | |
American Assets Trust, Inc. | | | 18,566 | | | | 703,466 | |
| | |
Armada Hoffler Properties, Inc. | | | 37,130 | | | | 542,098 | |
| | |
Brandywine Realty Trust | | | 45,633 | | | | 645,251 | |
| | |
CareTrust REIT, Inc. | | | 25,293 | | | | 488,155 | |
| | |
Community Healthcare Trust, Inc. | | | 1,968 | | | | 83,069 | |
| | |
Corporate Office Properties Trust | | | 45,694 | | | | 1,304,107 | |
| | |
CTO Realty Growth, Inc.(a) | | | 12,209 | | | | 809,701 | |
| | |
Easterly Government Properties, Inc. | | | 16,086 | | | | 340,058 | |
| | |
Four Corners Property Trust, Inc. | | | 26,186 | | | | 708,069 | |
| | |
Getty Realty Corp. | | | 20,168 | | | | 577,208 | |
| | |
Industrial Logistics Properties Trust | | | 35,271 | | | | 799,594 | |
| | |
LTC Properties, Inc. | | | 18,233 | | | | 701,424 | |
| | |
National Health Investors, Inc. | | | 24,325 | | | | 1,435,418 | |
| | |
NETSTREIT Corp. | | | 8,592 | | | | 192,804 | |
| | |
NexPoint Residential Trust, Inc. | | | 6,061 | | | | 547,369 | |
| | |
Office Properties Income Trust | | | 11,906 | | | | 306,341 | |
| | |
One Liberty Properties, Inc. | | | 17,160 | | | | 528,356 | |
| | |
Piedmont Office Realty Trust, Inc., Class A | | | 38,439 | | | | 661,920 | |
| | |
Postal Realty Trust, Inc., Class A | | | 8,847 | | | | 148,807 | |
| | |
Retail Opportunity Investments Corp. | | | 38,233 | | | | 741,338 | |
| | |
RPT Realty | | | 70,863 | | | | 975,783 | |
| | |
Saul Centers, Inc. | | | 11,803 | | | | 622,018 | |
| | |
Universal Health Realty Income Trust | | | 1,646 | | | | 96,077 | |
| | |
Urban Edge Properties | | | 47,781 | | | | 912,617 | |
| | |
Urstadt Biddle Properties, Inc., Class A | | | 18,580 | | | | 349,490 | |
| | |
Whitestone REIT | | | 37,923 | | | | 502,480 | |
| | | | | | | | |
| Total Equity Real Estate Investment Trusts (REITs) | | | | 17,503,749 | |
|
| Food & Staples Retailing – 1.5% | |
| | |
Andersons, Inc. | | | 22,831 | | | | 1,147,486 | |
| | |
Grocery Outlet Holding Corp.*(a) | | | 29,694 | | | | 973,369 | |
| | |
HF Foods Group, Inc.*(a) | | | 37,922 | | | | 252,561 | |
| | |
Ingles Markets, Inc., Class A | | | 27,929 | | | | 2,487,077 | |
| | |
Natural Grocers by Vitamin Cottage, Inc. | | | 22,376 | | | | 438,570 | |
| | |
PriceSmart, Inc. | | | 12,208 | | | | 962,845 | |
| | |
SpartanNash Co. | | | 34,105 | | | | 1,125,124 | |
| | |
United Natural Foods, Inc.* | | | 40,490 | | | | 1,674,261 | |
| | |
Village Super Market, Inc., Class A | | | 9,848 | | | | 241,276 | |
| | |
Weis Markets, Inc. | | | 15,864 | | | | 1,133,007 | |
| | | | | | | | |
| Total Food & Staples Retailing | | | | 10,435,576 | |
|
| Food Products – 1.1% | |
| | |
Alico, Inc. | | | 8,591 | | | | 322,678 | |
| | |
B&G Foods, Inc. | | | 34,056 | | | | 918,831 | |
| | |
Cal-Maine Foods, Inc. | | | 7,167 | | | | 395,762 | |
| | |
Hostess Brands, Inc.* | | | 63,783 | | | | 1,399,399 | |
| | |
J & J Snack Foods Corp. | | | 3,965 | | | | 614,971 | |
| | |
John B. Sanfilippo & Son, Inc. | | | 7,727 | | | | 644,741 | |
| | |
Mission Produce, Inc.* | | | 29,555 | | | | 373,871 | |
| | |
Seneca Foods Corp., Class A* | | | 16,665 | | | | 858,914 | |
| | |
Tootsie Roll Industries, Inc. | | | 16,017 | | | | 559,969 | |
| | |
TreeHouse Foods, Inc.* | | | 27,762 | | | | 895,602 | |
| | |
Utz Brands, Inc.(a) | | | 36,465 | | | | 538,953 | |
| | |
Vital Farms, Inc.* | | | 15,648 | | | | 193,409 | |
| | | | | | | | |
| Total Food Products | | | | 7,717,100 | |
|
| Gas Utilities – 0.6% | |
| | |
Chesapeake Utilities Corp. | | | 7,839 | | | | 1,079,901 | |
| | |
Northwest Natural Holding Co. | | | 15,183 | | | | 785,265 | |
| | |
South Jersey Industries, Inc. | | | 62,071 | | | | 2,144,553 | |
| | | | | | | | |
| Total Gas Utilities | | | | 4,009,719 | |
|
| Health Care Equipment & Supplies – 2.0% | |
| | |
AngioDynamics, Inc.* | | | 5,942 | | | | 127,991 | |
| | |
Artivion, Inc.*(a) | | | 11,593 | | | | 247,858 | |
| | |
AtriCure, Inc.* | | | 8,567 | | | | 562,595 | |
| | |
Atrion Corp. | | | 522 | | | | 372,186 | |
| | |
Avanos Medical, Inc.* | | | 17,625 | | | | 590,438 | |
| | |
BioLife Solutions, Inc.* | | | 9,210 | | | | 209,343 | |
| | |
Bioventus, Inc., Class A*(a) | | | 47,542 | | | | 670,342 | |
| | |
Co-Diagnostics, Inc.*(a) | | | 52,051 | | | | 321,675 | |
| | |
Conformis, Inc.*(a) | | | 261,839 | | | | 163,335 | |
| | |
Cutera, Inc.*(a) | | | 5,617 | | | | 387,573 | |
| | |
FONAR Corp.* | | | 15,549 | | | | 288,434 | |
| | |
Glaukos Corp.* | | | 10,909 | | | | 630,758 | |
| | |
Haemonetics Corp.* | | | 20,614 | | | | 1,303,217 | |
| | |
Heska Corp.*(a) | | | 2,141 | | | | 296,058 | |
| | |
Inogen, Inc.* | | | 7,703 | | | | 249,731 | |
See Notes to Financial Statements.
Schedule of Investments (continued)
WisdomTree U.S. SmallCap Fund (EES)
March 31, 2022
| | | | | | | | |
| Investments | | Shares | | | Value | |
| | |
Integer Holdings Corp.* | | | 13,123 | | | $ | 1,057,320 | |
| | |
IntriCon Corp.*(a) | | | 12,484 | | | | 297,868 | |
| | |
iRadimed Corp. | | | 7,479 | | | | 335,358 | |
| | |
Lantheus Holdings, Inc.* | | | 15,333 | | | | 848,068 | |
| | |
LeMaitre Vascular, Inc. | | | 9,425 | | | | 437,980 | |
| | |
Meridian Bioscience, Inc.* | | | 31,291 | | | | 812,314 | |
| | |
Mesa Laboratories, Inc. | | | 1,336 | | | | 340,520 | |
| | |
Natus Medical, Inc.* | | | 18,805 | | | | 494,196 | |
| | |
NuVasive, Inc.* | | | 17,593 | | | | 997,523 | |
| | |
Orthofix Medical, Inc.* | | | 10,865 | | | | 355,286 | |
| | |
Semler Scientific, Inc.* | | | 2,822 | | | | 139,858 | |
| | |
Surmodics, Inc.*(a) | | | 4,310 | | | | 195,372 | |
| | |
Tactile Systems Technology, Inc.* | | | 12,529 | | | | 252,585 | |
| | |
UFP Technologies, Inc.*(a) | | | 6,421 | | | | 424,878 | |
| | |
Utah Medical Products, Inc. | | | 2,988 | | | | 268,502 | |
| | |
Varex Imaging Corp.* | | | 17,211 | | | | 366,422 | |
| | |
Zynex, Inc.(a) | | | 13,845 | | | | 86,254 | |
| | | | | | | | |
| Total Health Care Equipment & Supplies | | | | 14,131,838 | |
|
| Health Care Providers & Services – 2.3% | |
| | |
AdaptHealth Corp.* | | | 43,345 | | | | 694,820 | |
| | |
Addus HomeCare Corp.* | | | 6,282 | | | | 586,048 | |
| | |
Agiliti, Inc.* | | | 40,977 | | | | 864,615 | |
| | |
Community Health Systems, Inc.* | | | 196,766 | | | | 2,335,612 | |
| | |
Covetrus, Inc.* | | | 63,933 | | | | 1,073,435 | |
| | |
Cross Country Healthcare, Inc.* | | | 24,526 | | | | 531,478 | |
| | |
Enzo Biochem, Inc.* | | | 63,941 | | | | 185,429 | |
| | |
Fulgent Genetics, Inc.*(a) | | | 56,418 | | | | 3,521,047 | |
| | |
Hanger, Inc.* | | | 16,150 | | | | 296,030 | |
| | |
Innovage Holding Corp.*(a) | | | 31,429 | | | | 201,774 | |
| | |
Joint Corp.* | | | 5,361 | | | | 189,726 | |
| | |
MEDNAX, Inc.* | | | 39,455 | | | | 926,403 | |
| | |
ModivCare, Inc.* | | | 6,260 | | | | 722,341 | |
| | |
National Research Corp. | | | 8,163 | | | | 323,663 | |
| | |
Pennant Group, Inc.* | | | 10,887 | | | | 202,825 | |
| | |
PetIQ, Inc.*(a) | | | 18,170 | | | | 443,348 | |
| | |
RadNet, Inc.* | | | 13,513 | | | | 302,286 | |
| | |
Sharps Compliance Corp.* | | | 15,458 | | | | 91,202 | |
| | |
Signify Health, Inc., Class A*(a) | | | 34,243 | | | | 621,511 | |
| | |
Sonida Senior Living, Inc.* | | | 11,621 | | | | 385,004 | |
| | |
Tivity Health, Inc.* | | | 31,406 | | | | 1,010,331 | |
| | |
U.S. Physical Therapy, Inc. | | | 3,342 | | | | 332,362 | |
| | | | | | | | |
| Total Health Care Providers & Services | | | | 15,841,290 | |
|
| Health Care Technology – 0.5% | |
| | |
Allscripts Healthcare Solutions, Inc.* | | | 71,120 | | | | 1,601,622 | |
| | |
Computer Programs and Systems, Inc.* | | | 11,986 | | | | 412,918 | |
| | |
HealthStream, Inc.* | | | 11,693 | | | | 232,925 | |
| | |
NextGen Healthcare, Inc.* | | | 42,160 | | | | 881,566 | |
| | |
OptimizeRx Corp.* | | | 3,286 | | | | 123,915 | |
| | |
Phreesia, Inc.*(a) | | | 11,221 | | | | 295,785 | |
| | |
Simulations Plus, Inc.(a) | | | 2,429 | | | | 123,830 | |
| | |
UpHealth, Inc.*(a) | | | 117,215 | | | | 138,314 | |
| | | | | | | | |
| Total Health Care Technology | | | | 3,810,875 | |
|
| Hotels, Restaurants & Leisure – 2.1% | |
| | |
Accel Entertainment, Inc.* | | | 39,348 | | | | 479,259 | |
| | |
Bally’s Corp.*(a) | | | 16,114 | | | | 495,344 | |
| | |
Biglari Holdings, Inc., Class B* | | | 5,309 | | | | 767,734 | |
| | |
Bloomin’ Brands, Inc. | | | 100,057 | | | | 2,195,251 | |
| | |
Bluegreen Vacations Holding Corp.* | | | 16,181 | | | | 478,472 | |
| | |
Brinker International, Inc.* | | | 36,017 | | | | 1,374,409 | |
| | |
Century Casinos, Inc.* | | | 19,520 | | | | 233,264 | |
| | |
Cheesecake Factory, Inc.* | | | 15,073 | | | | 599,755 | |
| | |
Chuy’s Holdings, Inc.* | | | 12,617 | | | | 340,659 | |
| | |
Cracker Barrel Old Country Store, Inc. | | | 10,054 | | | | 1,193,711 | |
| | |
Denny’s Corp.* | | | 17,606 | | | | 251,942 | |
| | |
Dine Brands Global, Inc. | | | 10,140 | | | | 790,413 | |
| | |
El Pollo Loco Holdings, Inc.* | | | 15,931 | | | | 185,118 | |
| | |
Everi Holdings, Inc.* | | | 25,975 | | | | 545,475 | |
| | |
Fiesta Restaurant Group, Inc.* | | | 17,927 | | | | 134,004 | |
| | |
Full House Resorts, Inc.*(a) | | | 16,578 | | | | 159,315 | |
| | |
Golden Entertainment, Inc.* | | | 21,101 | | | | 1,225,335 | |
| | |
Golden Nugget Online Gaming, Inc.*(a) | | | 21,207 | | | | 150,782 | |
| | |
Jack in the Box, Inc. | | | 16,648 | | | | 1,555,090 | |
| | |
Monarch Casino & Resort, Inc.* | | | 8,537 | | | | 744,682 | |
| | |
Nathan’s Famous, Inc.(a) | | | 2,056 | | | | 111,374 | |
| | |
Noodles & Co.* | | | 13,837 | | | | 82,607 | |
| | |
ONE Group Hospitality, Inc.* | | | 7,413 | | | | 77,911 | |
| | |
RCI Hospitality Holdings, Inc. | | | 5,109 | | | | 313,999 | |
| | |
Ruth’s Hospitality Group, Inc. | | | 17,740 | | | | 405,891 | |
| | | | | | | | |
| Total Hotels, Restaurants & Leisure | | | | 14,891,796 | |
|
| Household Durables – 2.9% | |
| | |
Bassett Furniture Industries, Inc. | | | 18,055 | | | | 298,991 | |
| | |
Beazer Homes USA, Inc.* | | | 53,013 | | | | 806,858 | |
| | |
Cavco Industries, Inc.* | | | 3,554 | | | | 855,981 | |
| | |
Century Communities, Inc. | | | 44,616 | | | | 2,390,079 | |
| | |
Cricut, Inc., Class A*(a) | | | 67,981 | | | | 889,871 | |
| | |
Dream Finders Homes, Inc., Class A*(a) | | | 47,558 | | | | 812,291 | |
| | |
Ethan Allen Interiors, Inc. | | | 29,176 | | | | 760,618 | |
| | |
Flexsteel Industries, Inc. | | | 11,897 | | | | 229,612 | |
| | |
GoPro, Inc., Class A* | | | 114,869 | | | | 979,833 | |
| | |
Green Brick Partners, Inc.* | | | 46,855 | | | | 925,855 | |
| | |
Hamilton Beach Brands Holding Co., Class A | | | 16,428 | | | | 191,058 | |
| | |
Hooker Furnishings Corp. | | | 19,682 | | | | 372,777 | |
| | |
Hovnanian Enterprises, Inc., Class A* | | | 10,269 | | | | 606,898 | |
| | |
iRobot Corp.* | | | 11,048 | | | | 700,443 | |
| | |
La-Z-Boy, Inc. | | | 30,783 | | | | 811,748 | |
| | |
Landsea Homes Corp.* | | | 38,311 | | | | 327,559 | |
| | |
Legacy Housing Corp.* | | | 21,314 | | | | 457,398 | |
| | |
Lifetime Brands, Inc. | | | 25,495 | | | | 327,356 | |
| | |
Lovesac Co.* | | | 5,449 | | | | 294,573 | |
| | |
M/I Homes, Inc.* | | | 48,319 | | | | 2,142,948 | |
| | |
Tri Pointe Homes, Inc.* | | | 125,867 | | | | 2,527,409 | |
| | |
Tupperware Brands Corp.*(a) | | | 88,350 | | | | 1,718,407 | |
| | |
Universal Electronics, Inc.* | | | 16,460 | | | | 514,210 | |
| | |
Vizio Holding Corp., Class A*(a) | | | 23,853 | | | | 212,053 | |
| | |
VOXX International Corp.* | | | 24,083 | | | | 240,108 | |
| | | | | | | | |
| Total Household Durables | | | | 20,394,934 | |
See Notes to Financial Statements.
Schedule of Investments (continued)
WisdomTree U.S. SmallCap Fund (EES)
March 31, 2022
| | | | | | | | |
| Investments | | Shares | | | Value | |
|
| Household Products – 0.4% | |
| | |
Central Garden & Pet Co., Class A* | | | 32,863 | | | $ | 1,340,153 | |
| | |
Energizer Holdings, Inc. | | | 53,326 | | | | 1,640,308 | |
| | |
Oil-Dri Corp. of America | | | 5,305 | | | | 151,988 | |
| | | | | | | | |
| Total Household Products | | | | 3,132,449 | |
|
| Insurance – 2.5% | |
| | |
Ambac Financial Group, Inc.* | | | 15,328 | | | | 159,411 | |
| | |
AMERISAFE, Inc. | | | 8,989 | | | | 446,484 | |
| | |
BRP Group, Inc., Class A* | | | 11,034 | | | | 296,042 | |
| | |
Citizens, Inc.*(a) | | | 26,882 | | | | 113,980 | |
| | |
CNO Financial Group, Inc. | | | 109,518 | | | | 2,747,807 | |
| | |
Crawford & Co., Class A | | | 11,915 | | | | 90,077 | |
| | |
Donegal Group, Inc., Class A | | | 16,221 | | | | 217,524 | |
| | |
Employers Holdings, Inc. | | | 9,201 | | | | 377,425 | |
| | |
Genworth Financial, Inc., Class A* | | | 960,831 | | | | 3,631,941 | |
| | |
Goosehead Insurance, Inc., Class A | | | 4,022 | | | | 316,009 | |
| | |
HCI Group, Inc. | | | 3,129 | | | | 213,335 | |
| | |
Horace Mann Educators Corp. | | | 26,212 | | | | 1,096,448 | |
| | |
Investors Title Co. | | | 1,997 | | | | 405,810 | |
| | |
Mercury General Corp. | | | 35,238 | | | | 1,938,090 | |
| | |
National Western Life Group, Inc., Class A | | | 6,151 | | | | 1,294,170 | |
| | |
Palomar Holdings, Inc.* | | | 5,993 | | | | 383,492 | |
| | |
ProAssurance Corp. | | | 10,848 | | | | 291,594 | |
| | |
Safety Insurance Group, Inc. | | | 8,418 | | | | 764,775 | |
| | |
Selectquote, Inc.* | | | 61,193 | | | | 170,729 | |
| | |
Stewart Information Services Corp. | | | 28,228 | | | | 1,710,899 | |
| | |
Trean Insurance Group, Inc.* | | | 26,467 | | | | 124,130 | |
| | |
Universal Insurance Holdings, Inc. | | | 16,851 | | | | 227,320 | |
| | | | | | | | |
| Total Insurance | | | | 17,017,492 | |
|
| Interactive Media & Services – 0.2% | |
| | |
Cars.com, Inc.* | | | 58,097 | | | | 838,340 | |
| | |
QuinStreet, Inc.* | | | 23,750 | | | | 275,500 | |
| | |
Travelzoo* | | | 17,669 | | | | 115,908 | |
| | |
Yelp, Inc.* | | | 15,209 | | | | 518,779 | |
| | | | | | | | |
| Total Interactive Media & Services | | | | 1,748,527 | |
|
| Internet & Direct Marketing Retail – 0.3% | |
| | |
1-800-Flowers.com, Inc., Class A* | | | 35,918 | | | | 458,314 | |
| | |
Duluth Holdings, Inc., Class B* | | | 24,071 | | | | 294,388 | |
| | |
Groupon, Inc.*(a) | | | 27,054 | | | | 520,249 | |
| | |
Lands’ End, Inc.* | | | 16,708 | | | | 282,699 | |
| | |
Liquidity Services, Inc.* | | | 13,327 | | | | 228,158 | |
| | |
Remark Holdings, Inc.*(a) | | | 206,408 | | | | 168,924 | |
| | |
Waitr Holdings, Inc.*(a) | | | 206,120 | | | | 76,265 | |
| | | | | | | | |
| Total Internet & Direct Marketing Retail | | | | 2,028,997 | |
|
| IT Services – 1.7% | |
| | |
Brightcove, Inc.* | | | 32,984 | | | | 257,275 | |
| | |
Cass Information Systems, Inc. | | | 7,119 | | | | 262,762 | |
| | |
Conduent, Inc.* | | | 265,992 | | | | 1,372,519 | |
| | |
CSG Systems International, Inc. | | | 20,449 | | | | 1,299,943 | |
| | |
Evo Payments, Inc., Class A* | | | 19,492 | | | | 450,070 | |
| | |
Grid Dynamics Holdings, Inc.* | | | 12,051 | | | | 169,678 | |
| | |
Hackett Group, Inc. | | | 25,320 | | | | 583,879 | |
| | |
I3 Verticals, Inc., Class A*(a) | | | 17,363 | | | | 483,733 | |
| | |
Information Services Group, Inc. | | | 24,538 | | | | 167,104 | |
| | |
Innodata, Inc.* | | | 20,543 | | | | 143,596 | |
| | |
International Money Express, Inc.* | | | 31,966 | | | | 658,819 | |
| | |
MoneyGram International, Inc.* | | | 41,183 | | | | 434,892 | |
| | |
Paya Holdings, Inc.* | | | 74,436 | | | | 436,195 | |
| | |
PFSweb, Inc.* | | | 13,800 | | | | 157,734 | |
| | |
Repay Holdings Corp.* | | | 35,240 | | | | 520,495 | |
| | |
Shift4 Payments, Inc., Class A* | | | 10,872 | | | | 673,303 | |
| | |
SolarWinds Corp. | | | 127,678 | | | | 1,699,394 | |
| | |
Unisys Corp.* | | | 59,050 | | | | 1,276,071 | |
| | |
Verra Mobility Corp.* | | | 58,499 | | | | 952,364 | |
| | | | | | | | |
| Total IT Services | | | | 11,999,826 | |
|
| Leisure Products – 1.4% | |
| | |
American Outdoor Brands, Inc.*(a) | | | 15,183 | | | | 199,353 | |
| | |
AMMO, Inc.*(a) | | | 57,293 | | | | 275,006 | |
| | |
Clarus Corp. | | | 10,242 | | | | 233,313 | |
| | |
Escalade, Inc. | | | 12,782 | | | | 168,722 | |
| | |
JAKKS Pacific, Inc.* | | | 19,545 | | | | 274,216 | |
| | |
Johnson Outdoors, Inc., Class A | | | 6,245 | | | | 485,424 | |
| | |
Malibu Boats, Inc., Class A* | | | 15,798 | | | | 916,442 | |
| | |
Marine Products Corp. | | | 31,712 | | | | 366,274 | |
| | |
MasterCraft Boat Holdings, Inc.* | | | 22,092 | | | | 543,684 | |
| | |
Nautilus, Inc.* | | | 53,044 | | | | 218,541 | |
| | |
Smith & Wesson Brands, Inc. | | | 125,738 | | | | 1,902,416 | |
| | |
Sturm Ruger & Co., Inc. | | | 19,562 | | | | 1,361,907 | |
| | |
Vista Outdoor, Inc.* | | | 74,711 | | | | 2,666,436 | |
| | | | | | | | |
| Total Leisure Products | | | | 9,611,734 | |
|
| Life Sciences Tools & Services – 0.1% | |
| | |
Codexis, Inc.* | | | 13,524 | | | | 278,865 | |
| | |
Harvard Bioscience, Inc.* | | | 30,087 | | | | 186,840 | |
| | | | | | | | |
| Total Life Sciences Tools & Services | | | | 465,705 | |
|
| Machinery – 3.2% | |
| | |
Alamo Group, Inc. | | | 4,977 | | | | 715,643 | |
| | |
Albany International Corp., Class A | | | 12,060 | | | | 1,016,899 | |
| | |
Astec Industries, Inc. | | | 6,324 | | | | 271,932 | |
| | |
Barnes Group, Inc. | | | 18,398 | | | | 739,416 | |
| | |
Blue Bird Corp.*(a) | | | 12,831 | | | | 241,479 | |
| | |
CIRCOR International, Inc.* | | | 16,023 | | | | 426,532 | |
| | |
Columbus McKinnon Corp. | | | 12,275 | | | | 520,460 | |
| | |
Commercial Vehicle Group, Inc.* | | | 39,469 | | | | 333,513 | |
| | |
Douglas Dynamics, Inc. | | | 9,147 | | | | 316,395 | |
| | |
Energy Recovery, Inc.* | | | 20,585 | | | | 414,582 | |
| | |
Enerpac Tool Group Corp. | | | 19,239 | | | | 421,142 | |
| | |
EnPro Industries, Inc. | | | 8,843 | | | | 864,226 | |
| | |
ESCO Technologies, Inc. | | | 7,752 | | | | 542,020 | |
| | |
Federal Signal Corp. | | | 26,801 | | | | 904,534 | |
| | |
Gorman-Rupp Co. | | | 13,725 | | | | 492,453 | |
| | |
Greenbrier Cos., Inc. | | | 15,539 | | | | 800,414 | |
| | |
Hurco Cos., Inc. | | | 7,316 | | | | 230,600 | |
| | |
Kadant, Inc. | | | 4,500 | | | | 873,855 | |
| | |
Kennametal, Inc. | | | 30,211 | | | | 864,337 | |
| | |
L.B. Foster Co., Class A* | | | 239 | | | | 3,673 | |
See Notes to Financial Statements.
Schedule of Investments (continued)
WisdomTree U.S. SmallCap Fund (EES)
March 31, 2022
| | | | | | | | |
| Investments | | Shares | | | Value | |
| | |
Lindsay Corp. | | | 3,997 | | | $ | 627,569 | |
| | |
Manitowoc Co., Inc.* | | | 17,311 | | | | 261,050 | |
| | |
Mayville Engineering Co., Inc.* | | | 11,740 | | | | 110,004 | |
| | |
Meritor, Inc.* | | | 66,206 | | | | 2,354,947 | |
| | |
Miller Industries, Inc. | | | 8,709 | | | | 245,245 | |
| | |
Mueller Water Products, Inc., Class A | | | 61,908 | | | | 799,851 | |
| | |
NN, Inc.* | | | 60,131 | | | | 173,177 | |
| | |
Omega Flex, Inc.(a) | | | 1,485 | | | | 192,857 | |
| | |
Park-Ohio Holdings Corp. | | | 11,859 | | | | 166,856 | |
| | |
REV Group, Inc. | | | 41,366 | | | | 554,304 | |
| | |
Shyft Group, Inc. | | | 15,193 | | | | 548,619 | |
| | |
SPX Corp.* | | | 15,921 | | | | 786,657 | |
| | |
Standex International Corp. | | | 7,430 | | | | 742,406 | |
| | |
Tennant Co. | | | 9,551 | | | | 752,619 | |
| | |
Terex Corp. | | | 33,493 | | | | 1,194,360 | |
| | |
Titan International, Inc.* | | | 43,913 | | | | 646,839 | |
| | |
Trinity Industries, Inc. | | | 21,293 | | | | 731,628 | |
| | |
Wabash National Corp. | | | 18,464 | | | | 274,006 | |
| | | | | | | | |
| Total Machinery | | | | 22,157,099 | |
|
| Media – 2.7% | |
| | |
Advantage Solutions, Inc.*(a) | | | 237,024 | | | | 1,512,213 | |
| | |
AMC Networks, Inc., Class A*(a) | | | 57,427 | | | | 2,333,259 | |
| | |
Boston Omaha Corp., Class A*(a) | | | 27,986 | | | | 710,005 | |
| | |
Daily Journal Corp.* | | | 940 | | | | 293,271 | |
| | |
Entravision Communications Corp., Class A | | | 72,574 | | | | 465,199 | |
| | |
EW Scripps Co., Class A* | | | 94,949 | | | | 1,973,990 | |
| | |
Fluent, Inc.*(a) | | | 39,591 | | | | 82,349 | |
| | |
Gray Television, Inc. | | | 97,150 | | | | 2,144,100 | |
| | |
Hemisphere Media Group, Inc.* | | | 43,837 | | | | 200,335 | |
| | |
John Wiley & Sons, Inc., Class A | | | 28,573 | | | | 1,515,226 | |
| | |
Lee Enterprises, Inc.* | | | 10,027 | | | | 269,927 | |
| | |
Magnite, Inc.* | | | 37,250 | | | | 492,073 | |
| | |
PubMatic, Inc., Class A*(a) | | | 16,167 | | | | 422,282 | |
| | |
Scholastic Corp. | | | 6,924 | | | | 278,899 | |
| | |
Sinclair Broadcast Group, Inc., Class A | | | 48,047 | | | | 1,346,277 | |
| | |
TechTarget, Inc.* | | | 6,714 | | | | 545,714 | |
| | |
Thryv Holdings, Inc.* | | | 40,683 | | | | 1,144,006 | |
| | |
Townsquare Media, Inc., Class A* | | | 22,253 | | | | 284,616 | |
| | |
WideOpenWest, Inc.*(a) | | | 159,442 | | | | 2,780,668 | |
| | | | | | | | |
| Total Media | | | | 18,794,409 | |
|
| Metals & Mining – 1.7% | |
| | |
Coeur Mining, Inc.* | | | 71,674 | | | | 318,949 | |
| | |
Materion Corp. | | | 8,968 | | | | 768,916 | |
| | |
Olympic Steel, Inc. | | | 21,283 | | | | 818,544 | |
| | |
Ramaco Resources, Inc. | | | 20,903 | | | | 330,267 | |
| | |
Ryerson Holding Corp. | | | 59,177 | | | | 2,072,379 | |
| | |
Schnitzer Steel Industries, Inc., Class A | | | 30,615 | | | | 1,590,143 | |
| | |
SunCoke Energy, Inc. | | | 53,328 | | | | 475,153 | |
| | |
TimkenSteel Corp.* | | | 79,534 | | | | 1,740,204 | |
| | |
Warrior Met Coal, Inc. | | | 18,399 | | | | 682,787 | |
| | |
Worthington Industries, Inc. | | | 61,245 | | | | 3,148,606 | |
| | | | | | | | |
| Total Metals & Mining | | | | 11,945,948 | |
|
| Multi-Utilities – 0.3% | |
| | |
Avista Corp. | | | 32,295 | | | | 1,458,119 | |
| | |
Unitil Corp. | | | 8,721 | | | | 435,004 | |
| | | | | | | | |
| Total Multi-Utilities | | | | 1,893,123 | |
|
| Multiline Retail – 0.4% | |
| | |
Big Lots, Inc. | | | 48,985 | | | | 1,694,881 | |
| | |
Franchise Group, Inc. | | | 20,871 | | | | 864,686 | |
| | | | | | | | |
| Total Multiline Retail | | | | 2,559,567 | |
|
| Oil, Gas & Consumable Fuels – 3.8% | |
| | |
Arch Resources, Inc.(a) | | | 4,327 | | | | 594,443 | |
| | |
Berry Corp. | | | 38,838 | | | | 400,808 | |
| | |
Brigham Minerals, Inc., Class A | | | 27,435 | | | | 700,964 | |
| | |
CNX Resources Corp.* | | | 199,485 | | | | 4,133,329 | |
| | |
Comstock Resources, Inc.* | | | 247,126 | | | | 3,224,994 | |
| | |
Earthstone Energy, Inc., Class A*(a) | | | 44,764 | | | | 565,369 | |
| | |
Falcon Minerals Corp. | | | 63,568 | | | | 428,448 | |
| | |
Kinetik Holdings, Inc., Class A | | | 7,270 | | | | 472,623 | |
| | |
Laredo Petroleum, Inc.* | | | 16,066 | | | | 1,271,463 | |
| | |
NACCO Industries, Inc., Class A | | | 7,680 | | | | 301,210 | |
| | |
Oasis Petroleum, Inc. | | | 18,816 | | | | 2,752,781 | |
| | |
Ranger Oil Corp., Class A* | | | 26,516 | | | | 915,598 | |
| | |
Renewable Energy Group, Inc.* | | | 34,462 | | | | 2,090,120 | |
| | |
REX American Resources Corp.* | | | 3,534 | | | | 351,986 | |
| | |
SandRidge Energy, Inc.* | | | 65,796 | | | | 1,054,052 | |
| | |
SilverBow Resources, Inc.* | | | 31,029 | | | | 992,928 | |
| | |
VAALCO Energy, Inc. | | | 96,865 | | | | 632,529 | |
| | |
Vertex Energy, Inc.*(a) | | | 32,302 | | | | 321,082 | |
| | |
W&T Offshore, Inc.* | | | 68,068 | | | | 260,020 | |
| | |
Whiting Petroleum Corp. | | | 50,257 | | | | 4,096,448 | |
| | |
World Fuel Services Corp. | | | 23,949 | | | | 647,581 | |
| | | | | | | | |
| Total Oil, Gas & Consumable Fuels | | | | 26,208,776 | |
|
| Paper & Forest Products – 0.3% | |
| | |
Clearwater Paper Corp.* | | | 10,032 | | | | 281,197 | |
| | |
Glatfelter Corp. | | | 25,713 | | | | 318,327 | |
| | |
Neenah, Inc. | | | 8,580 | | | | 340,283 | |
| | |
Schweitzer-Mauduit International, Inc. | | | 33,391 | | | | 918,252 | |
| | | | | | | | |
| Total Paper & Forest Products | | | | 1,858,059 | |
|
| Personal Products – 1.1% | |
| | |
BellRing Brands, Inc.* | | | 17,207 | | | | 397,138 | |
| | |
Edgewell Personal Care Co. | | | 34,457 | | | | 1,263,538 | |
| | |
elf Beauty, Inc.* | | | 15,352 | | | | 396,542 | |
| | |
Inter Parfums, Inc. | | | 10,355 | | | | 911,758 | |
| | |
Medifast, Inc. | | | 6,667 | | | | 1,138,590 | |
| | |
Nature’s Sunshine Products, Inc.* | | | 16,736 | | | | 281,500 | |
| | |
Nu Skin Enterprises, Inc., Class A | | | 43,178 | | | | 2,067,363 | |
| | |
USANA Health Sciences, Inc.* | | | 12,689 | | | | 1,008,141 | |
| | |
Veru, Inc.* | | | 17,315 | | | | 83,631 | |
| | | | | | | | |
| Total Personal Products | | | | 7,548,201 | |
|
| Pharmaceuticals – 2.1% | |
| | |
Amneal Pharmaceuticals, Inc.* | | | 243,309 | | | | 1,014,598 | |
| | |
Amphastar Pharmaceuticals, Inc.* | | | 24,863 | | | | 892,582 | |
| | |
ANI Pharmaceuticals, Inc.* | | | 11,374 | | | | 319,723 | |
See Notes to Financial Statements.
Schedule of Investments (continued)
WisdomTree U.S. SmallCap Fund (EES)
March 31, 2022
| | | | | | | | |
| Investments | | Shares | | | Value | |
| | |
Antares Pharma, Inc.* | | | 203,311 | | | $ | 833,575 | |
| | |
Atea Pharmaceuticals, Inc.*(a) | | | 54,250 | | | | 391,685 | |
| | |
Cara Therapeutics, Inc.* | | | 26,462 | | | | 321,513 | |
| | |
Collegium Pharmaceutical, Inc.* | | | 64,438 | | | | 1,311,958 | |
| | |
Corcept Therapeutics, Inc.* | | | 42,557 | | | | 958,384 | |
| | |
Harmony Biosciences Holdings, Inc.*(a) | | | 11,617 | | | | 565,167 | |
| | |
Innoviva, Inc.* | | | 137,482 | | | | 2,660,277 | |
| | |
NGM Biopharmaceuticals, Inc.* | | | 16,720 | | | | 254,980 | |
| | |
Opiant Pharmaceuticals, Inc.* | | | 3,840 | | | | 82,253 | |
| | |
Pacira BioSciences, Inc.* | | | 21,516 | | | | 1,642,101 | |
| | |
Phibro Animal Health Corp., Class A | | | 22,171 | | | | 442,311 | |
| | |
Prestige Consumer Healthcare, Inc.* | | | 30,578 | | | | 1,618,799 | |
| | |
SIGA Technologies, Inc.* | | | 35,275 | | | | 250,100 | |
| | |
Supernus Pharmaceuticals, Inc.* | | | 28,471 | | | | 920,183 | |
| | | | | | | | |
| Total Pharmaceuticals | | | | 14,480,189 | |
|
| Professional Services – 1.5% | |
| | |
Atlas Technical Consultants, Inc.* | | | 37,710 | | | | 454,028 | |
| | |
Barrett Business Services, Inc. | | | 5,559 | | | | 430,656 | |
| | |
BGSF, Inc. | | | 10,944 | | | | 144,133 | |
| | |
CBIZ, Inc.* | | | 25,124 | | | | 1,054,454 | |
| | |
CRA International, Inc. | | | 6,859 | | | | 577,939 | |
| | |
First Advantage Corp.* | | | 31,834 | | | | 642,728 | |
| | |
Forrester Research, Inc.* | | | 7,716 | | | | 435,337 | |
| | |
Franklin Covey Co.* | | | 3,920 | | | | 177,262 | |
| | |
Heidrick & Struggles International, Inc. | | | 17,994 | | | | 712,203 | |
| | |
Huron Consulting Group, Inc.* | | | 8,311 | | | | 380,727 | |
| | |
ICF International, Inc. | | | 10,816 | | | | 1,018,218 | |
| | |
Kelly Services, Inc., Class A | | | 21,647 | | | | 469,523 | |
| | |
Kforce, Inc. | | | 11,950 | | | | 883,942 | |
| | |
ManTech International Corp., Class A | | | 16,433 | | | | 1,416,360 | |
| | |
Mistras Group, Inc.* | | | 21,988 | | | | 145,341 | |
| | |
Resources Connection, Inc. | | | 31,068 | | | | 532,506 | |
| | |
TrueBlue, Inc.* | | | 20,290 | | | | 586,178 | |
| | |
Willdan Group, Inc.*(a) | | | 7,110 | | | | 218,206 | |
| | | | | | | | |
| Total Professional Services | | | | 10,279,741 | |
|
| Real Estate Management & Development – 1.0% | |
| | |
Douglas Elliman, Inc. | | | 61,929 | | | | 452,082 | |
| | |
Forestar Group, Inc.* | | | 36,605 | | | | 650,105 | |
| | |
FRP Holdings, Inc.* | | | 3,741 | | | | 216,230 | |
| | |
Marcus & Millichap, Inc. | | | 20,011 | | | | 1,054,179 | |
| | |
RE/MAX Holdings, Inc., Class A | | | 9,797 | | | | 271,671 | |
| | |
Realogy Holdings Corp.* | | | 164,249 | | | | 2,575,424 | |
| | |
RMR Group, Inc., Class A | | | 17,556 | | | | 545,991 | |
| | |
St. Joe Co. | | | 12,978 | | | | 768,817 | |
| | |
Tejon Ranch Co.* | | | 16,323 | | | | 298,058 | |
| | | | | | | | |
| Total Real Estate Management & Development | | | | 6,832,557 | |
|
| Road & Rail – 1.2% | |
| | |
ArcBest Corp. | | | 15,776 | | | | 1,269,968 | |
| | |
Covenant Logistics Group, Inc., Class A | | | 22,167 | | | | 477,256 | |
| | |
Daseke, Inc.* | | | 52,534 | | | | 529,017 | |
| | |
Heartland Express, Inc. | | | 43,068 | | | | 605,967 | |
| | |
Marten Transport Ltd. | | | 40,567 | | | | 720,470 | |
| | |
PAM Transportation Services, Inc.* | | | 16,228 | | | | 563,923 | |
| | |
Schneider National, Inc., Class B | | | 115,521 | | | | 2,945,786 | |
| | |
U.S. Xpress Enterprises, Inc., Class A* | | | 18,524 | | | | 71,873 | |
| | |
Universal Logistics Holdings, Inc. | | | 31,715 | | | | 639,057 | |
| | |
USA Truck, Inc.* | | | 14,047 | | | | 289,368 | |
| | | | | | | | |
| Total Road & Rail | | | | 8,112,685 | |
|
| Semiconductors & Semiconductor Equipment – 1.0% | |
| | |
ACM Research, Inc., Class A*(a) | | | 14,553 | | | | 301,102 | |
| | |
Amtech Systems, Inc.* | | | 15,207 | | | | 152,982 | |
| | |
Axcelis Technologies, Inc.* | | | 13,224 | | | | 998,809 | |
| | |
AXT, Inc.* | | | 33,055 | | | | 232,046 | |
| | |
Ceva, Inc.* | | | 6,043 | | | | 245,648 | |
| | |
Cohu, Inc.* | | | 39,987 | | | | 1,183,615 | |
| | |
CyberOptics Corp.* | | | 6,437 | | | | 261,214 | |
| | |
Impinj, Inc.*(a) | | | 4,532 | | | | 287,963 | |
| | |
NVE Corp. | | | 3,555 | | | | 193,641 | |
| | |
Photronics, Inc.* | | | 41,904 | | | | 711,111 | |
| | |
Rambus, Inc.* | | | 19,978 | | | | 637,098 | |
| | |
Ultra Clean Holdings, Inc.* | | | 25,090 | | | | 1,063,565 | |
| | |
Veeco Instruments, Inc.* | | | 22,064 | | | | 599,920 | |
| | | | | | | | |
| Total Semiconductors & Semiconductor Equipment | | | | 6,868,714 | |
|
| Software – 2.6% | |
| | |
8x8, Inc.* | | | 27,241 | | | | 342,964 | |
| | |
A10 Networks, Inc. | | | 35,829 | | | | 499,815 | |
| | |
Agilysys, Inc.* | | | 5,854 | | | | 233,458 | |
| | |
Alkami Technology, Inc.* | | | 23,919 | | | | 342,281 | |
| | |
American Software, Inc., Class A | | | 12,053 | | | | 251,185 | |
| | |
Appfolio, Inc., Class A* | | | 4,062 | | | | 459,859 | |
| | |
Appian Corp.*(a) | | | 9,460 | | | | 575,357 | |
| | |
Asure Software, Inc.* | | | 19,117 | | | | 113,746 | |
| | |
Avaya Holdings Corp.*(a) | | | 117,635 | | | | 1,490,435 | |
| | |
Bottomline Technologies DE, Inc.* | | | 9,933 | | | | 563,002 | |
| | |
Cerence, Inc.*(a) | | | 13,126 | | | | 473,849 | |
| | |
ChannelAdvisor Corp.* | | | 18,897 | | | | 313,123 | |
| | |
CommVault Systems, Inc.* | | | 15,012 | | | | 996,046 | |
| | |
CoreCard Corp.*(a) | | | 4,262 | | | | 116,779 | |
| | |
Ebix, Inc.(a) | | | 27,396 | | | | 908,177 | |
| | |
eGain Corp.* | | | 15,293 | | | | 177,093 | |
| | |
Greenidge Generation Holdings, Inc.* | | | 13,327 | | | | 114,612 | |
| | |
Intapp, Inc.* | | | 13,787 | | | | 331,026 | |
| | |
InterDigital, Inc. | | | 7,584 | | | | 483,859 | |
| | |
KnowBe4, Inc., Class A* | | | 10,983 | | | | 252,829 | |
| | |
LivePerson, Inc.* | | | 17,156 | | | | 418,950 | |
| | |
Mitek Systems, Inc.*(a) | | | 16,754 | | | | 245,781 | |
| | |
Model N, Inc.*(a) | | | 10,968 | | | | 295,039 | |
| | |
Olo, Inc., Class A* | | | 11,290 | | | | 149,593 | |
| | |
ON24, Inc.* | | | 22,646 | | | | 297,795 | |
| | |
Ping Identity Holding Corp.* | | | 18,880 | | | | 517,878 | |
| | |
Progress Software Corp. | | | 30,493 | | | | 1,435,915 | |
| | |
Rimini Street, Inc.*(a) | | | 73,348 | | | | 425,418 | |
| | |
SecureWorks Corp., Class A*(a) | | | 13,536 | | | | 179,352 | |
| | |
SEMrush Holdings, Inc., Class A* | | | 9,174 | | | | 109,538 | |
| | |
Smith Micro Software, Inc.* | | | 23,267 | | | | 87,717 | |
| | |
Sumo Logic, Inc.* | | | 29,054 | | | | 339,060 | |
See Notes to Financial Statements.
Schedule of Investments (continued)
WisdomTree U.S. SmallCap Fund (EES)
March 31, 2022
| | | | | | | | |
| Investments | | Shares | | | Value | |
| | |
Upland Software, Inc.* | | | 34,204 | | | $ | 602,332 | |
| | |
Vertex, Inc., Class A* | | | 30,855 | | | | 473,316 | |
| | |
Viant Technology, Inc., Class A* | | | 28,532 | | | | 186,885 | |
| | |
Xperi Holding Corp. | | | 175,692 | | | | 3,042,985 | |
| | |
Zuora, Inc., Class A* | | | 23,748 | | | | 355,745 | |
| | | | | | | | |
| Total Software | | | | 18,202,794 | |
|
| Specialty Retail – 4.6% | |
| | |
Aaron’s Co., Inc. | | | 48,222 | | | | 968,298 | |
| | |
Abercrombie & Fitch Co., Class A* | | | 67,986 | | | | 2,174,872 | |
| | |
America’s Car-Mart, Inc.* | | | 7,571 | | | | 609,920 | |
| | |
Arko Corp. | | | 30,904 | | | | 281,226 | |
| | |
Big 5 Sporting Goods Corp.(a) | | | 47,383 | | | | 812,618 | |
| | |
Buckle, Inc. | | | 41,677 | | | | 1,377,008 | |
| | |
Build-A-Bear Workshop, Inc. | | | 12,633 | | | | 230,931 | |
| | |
Caleres, Inc. | | | 47,238 | | | | 913,111 | |
| | |
Camping World Holdings, Inc., Class A | | | 69,638 | | | | 1,946,382 | |
| | |
Cato Corp., Class A | | | 23,282 | | | | 341,314 | |
| | |
Children’s Place, Inc.* | | | 15,578 | | | | 767,995 | |
| | |
Citi Trends, Inc.*(a) | | | 7,457 | | | | 228,371 | |
| | |
Conn’s, Inc.*(a) | | | 44,311 | | | | 682,832 | |
| | |
Container Store Group, Inc.* | | | 78,054 | | | | 637,701 | |
| | |
Destination XL Group, Inc.* | | | 39,570 | | | | 193,102 | |
| | |
Genesco, Inc.* | | | 10,969 | | | | 697,738 | |
| | |
Guess?, Inc. | | | 67,651 | | | | 1,478,174 | |
| | |
Haverty Furniture Cos., Inc. | | | 27,122 | | | | 743,685 | |
| | |
Hibbett, Inc. | | | 19,806 | | | | 878,198 | |
| | |
JOANN, Inc. | | | 80,956 | | | | 923,708 | |
| | |
Kirkland’s, Inc.*(a) | | | 22,811 | | | | 211,914 | |
| | |
Lazydays Holdings, Inc.*(a) | | | 25,597 | | | | 516,547 | |
| | |
LL Flooring Holdings, Inc.*(a) | | | 22,747 | | | | 318,913 | |
| | |
LMP Automotive Holdings, Inc.* | | | 23,803 | | | | 119,015 | |
| | |
MarineMax, Inc.* | | | 24,179 | | | | 973,447 | |
| | |
Monro, Inc. | | | 10,694 | | | | 474,172 | |
| | |
ODP Corp.* | | | 48,358 | | | | 2,216,247 | |
| | |
OneWater Marine, Inc., Class A | | | 13,022 | | | | 448,608 | |
| | |
Party City Holdco, Inc.*(a) | | | 98,108 | | | | 351,227 | |
| | |
Rent-A-Center, Inc. | | | 62,716 | | | | 1,579,816 | |
| | |
Sally Beauty Holdings, Inc.* | | | 110,539 | | | | 1,727,725 | |
| | |
Shoe Carnival, Inc. | | | 29,472 | | | | 859,404 | |
| | |
Sleep Number Corp.* | | | 20,990 | | | | 1,064,403 | |
| | |
Sonic Automotive, Inc., Class A | | | 49,981 | | | | 2,124,692 | |
| | |
Tile Shop Holdings, Inc. | | | 22,323 | | | | 146,216 | |
| | |
Tilly’s, Inc., Class A | | | 34,286 | | | | 320,917 | |
| | |
Winmark Corp. | | | 1,952 | | | | 429,440 | |
| | |
Zumiez, Inc.*(a) | | | 23,756 | | | | 907,717 | |
| | | | | | | | |
| Total Specialty Retail | | | | 31,677,604 | |
|
| Technology Hardware, Storage & Peripherals – 0.8% | |
| | |
3D Systems Corp.*(a) | | | 28,089 | | | | 468,525 | |
| | |
Avid Technology, Inc.* | | | 17,272 | | | | 602,275 | |
| | |
Corsair Gaming, Inc.*(a) | | | 67,781 | | | | 1,434,246 | |
| | |
Diebold Nixdorf, Inc.* | | | 104,453 | | | | 702,969 | |
| | |
Eastman Kodak Co.*(a) | | | 78,349 | | | | 513,186 | |
| | |
Immersion Corp.*(a) | | | 62,030 | | | | 344,887 | |
| | |
Quantum Corp.*(a) | | | 30,901 | | | | 70,145 | |
| | |
Super Micro Computer, Inc.* | | | 30,792 | | | | 1,172,251 | |
| | |
Turtle Beach Corp.*(a) | | | 19,198 | | | | 408,725 | |
| | | | | | | | |
| Total Technology Hardware, Storage & Peripherals | | | | 5,717,209 | |
|
| Textiles, Apparel & Luxury Goods – 1.2% | |
| | |
Fossil Group, Inc.*(a) | | | 37,813 | | | | 364,517 | |
| | |
G-III Apparel Group Ltd.* | | | 35,919 | | | | 971,609 | |
| | |
Lakeland Industries, Inc.* | | | 8,661 | | | | 166,205 | |
| | |
Levi Strauss & Co., Class A | | | 162,008 | | | | 3,201,278 | |
| | |
Movado Group, Inc. | | | 17,057 | | | | 666,076 | |
| | |
Oxford Industries, Inc. | | | 6,821 | | | | 617,300 | |
| | |
Rocky Brands, Inc. | | | 9,789 | | | | 407,125 | |
| | |
Superior Group of Cos., Inc. | | | 19,439 | | | | 346,986 | |
| | |
Unifi, Inc.* | | | 15,432 | | | | 279,319 | |
| | |
Vera Bradley, Inc.* | | | 34,576 | | | | 265,198 | |
| | |
Wolverine World Wide, Inc. | | | 41,948 | | | | 946,347 | |
| | | | | | | | |
| Total Textiles, Apparel & Luxury Goods | | | | 8,231,960 | |
|
| Thrifts & Mortgage Finance – 4.1% | |
| | |
Bridgewater Bancshares, Inc.* | | | 11,779 | | | | 196,474 | |
| | |
Capitol Federal Financial, Inc. | | | 3,779 | | | | 41,116 | |
| | |
Columbia Financial, Inc.* | | | 37,861 | | | | 814,390 | |
| | |
Federal Agricultural Mortgage Corp., Class C | | | 7,973 | | | | 864,911 | |
| | |
Finance of America Cos., Inc., Class A* | | | 108,045 | | | | 328,457 | |
| | |
Flagstar Bancorp, Inc. | | | 104,469 | | | | 4,429,486 | |
| | |
FS Bancorp, Inc. | | | 8,254 | | | | 255,874 | |
| | |
Hingham Institution for Savings | | | 1,901 | | | | 652,423 | |
| | |
Home Bancorp, Inc. | | | 5,463 | | | | 222,836 | |
| | |
Kearny Financial Corp. | | | 30,351 | | | | 390,921 | |
| | |
Luther Burbank Corp. | | | 30,963 | | | | 411,498 | |
| | |
Merchants Bancorp | | | 60,209 | | | | 1,648,523 | |
| | |
Mr. Cooper Group, Inc.* | | | 137,736 | | | | 6,290,403 | |
| | |
NMI Holdings, Inc., Class A* | | | 75,605 | | | | 1,558,975 | |
| | |
Northfield Bancorp, Inc. | | | 19,851 | | | | 285,060 | |
| | |
Ocwen Financial Corp.* | | | 5,199 | | | | 123,528 | |
| | |
PCSB Financial Corp. | | | 9,087 | | | | 173,653 | |
| | |
Provident Bancorp, Inc. | | | 9,615 | | | | 155,955 | |
| | |
Provident Financial Services, Inc. | | | 35,373 | | | | 827,728 | |
| | |
Rocket Cos., Inc., Class A | | | 257,175 | | | | 2,859,786 | |
| | |
Southern Missouri Bancorp, Inc. | | | 7,472 | | | | 373,226 | |
| | |
Territorial Bancorp, Inc. | | | 184 | | | | 4,416 | |
| | |
TrustCo Bank Corp. | | | 6,287 | | | | 200,744 | |
| | |
UWM Holdings Corp.(a) | | | 199,825 | | | | 905,207 | |
| | |
Washington Federal, Inc. | | | 54,675 | | | | 1,794,434 | |
| | |
Waterstone Financial, Inc. | | | 38,939 | | | | 753,080 | |
| | |
Western New England Bancorp, Inc. | | | 12,001 | | | | 107,289 | |
| | |
WSFS Financial Corp. | | | 43,165 | | | | 2,012,352 | |
| | | | | | | | |
| Total Thrifts & Mortgage Finance | | | | 28,682,745 | |
|
| Tobacco – 0.4% | |
| | |
Turning Point Brands, Inc. | | | 15,112 | | | | 513,959 | |
| | |
Universal Corp. | | | 17,348 | | | | 1,007,399 | |
| | |
Vector Group Ltd. | | | 123,880 | | | | 1,491,515 | |
| | | | | | | | |
| Total Tobacco | | | | 3,012,873 | |
See Notes to Financial Statements.
Schedule of Investments (concluded)
WisdomTree U.S. SmallCap Fund (EES)
March 31, 2022
| | | | | | | | |
| Investments | | Shares | | | Value | |
|
| Trading Companies & Distributors – 2.3% | |
| | |
BlueLinx Holdings, Inc.* | | | 17,361 | | | $ | 1,247,909 | |
| | |
Boise Cascade Co. | | | 72,796 | | | | 5,057,138 | |
| | |
DXP Enterprises, Inc.* | | | 7,552 | | | | 204,584 | |
| | |
Global Industrial Co. | | | 16,187 | | | | 521,707 | |
| | |
GMS, Inc.* | | | 28,855 | | | | 1,436,113 | |
| | |
H&E Equipment Services, Inc. | | | 12,194 | | | | 530,683 | |
| | |
Hudson Technologies, Inc.* | | | 61,169 | | | | 379,860 | |
| | |
Huttig Building Products, Inc.* | | | 45,534 | | | | 485,392 | |
| | |
Karat Packaging, Inc.* | | | 14,003 | | | | 277,960 | |
| | |
Lawson Products, Inc.* | | | 2,352 | | | | 90,646 | |
| | |
McGrath RentCorp | | | 14,609 | | | | 1,241,473 | |
| | |
MRC Global, Inc.* | | | 28,273 | | | | 336,731 | |
| | |
Rush Enterprises, Inc., Class A | | | 33,417 | | | | 1,701,259 | |
| | |
Titan Machinery, Inc.* | | | 17,584 | | | | 496,924 | |
| | |
Transcat, Inc.* | | | 5,199 | | | | 421,847 | |
| | |
Veritiv Corp.* | | | 11,892 | | | | 1,588,652 | |
| | |
Willis Lease Finance Corp.*(a) | | | 5,094 | | | | 163,976 | |
| | | | | | | | |
| Total Trading Companies & Distributors | | | | 16,182,854 | |
|
| Water Utilities – 0.3% | |
| | |
Artesian Resources Corp., Class A | | | 8,971 | | | | 435,542 | |
| | |
Global Water Resources, Inc. | | | 10,917 | | | | 181,659 | |
| | |
Middlesex Water Co. | | | 4,949 | | | | 520,486 | |
| | |
Pure Cycle Corp.* | | | 22,732 | | | | 273,239 | |
| | |
SJW Group | | | 7,511 | | | | 522,615 | |
| | |
York Water Co. | | | 3,867 | | | | 173,899 | |
| | | | | | | | |
| Total Water Utilities | | | | 2,107,440 | |
|
| Wireless Telecommunication Services – 0.4% | |
| | |
Shenandoah Telecommunications Co. | | | 10,033 | | | | 236,578 | |
| | |
Telephone and Data Systems, Inc. | | | 58,472 | | | | 1,103,951 | |
| | |
United States Cellular Corp.* | | | 38,517 | | | | 1,164,369 | |
| | | | | | | | |
| Total Wireless Telecommunication Services | | | | 2,504,898 | |
TOTAL COMMON STOCKS (Cost: $642,417,364) | | | | | | | 691,250,449 | |
| RIGHTS – 0.0% | | | | | | | | |
| United States – 0.0% | | | | | | | | |
| | |
Quantum Corp., expiring 4/18/22* (Cost: $0) | | | 30,687 | | | | 259 | |
|
| INVESTMENT OF CASH COLLATERAL FOR SECURITIES LOANED – 1.5% | |
| | |
| United States – 1.5% | | | | | | | | |
| |
State Street Navigator Securities Lending
Government Money Market Portfolio, 0.25%(b) | | | | | |
| (Cost: $10,374,295) | | | 10,374,295 | | | | 10,374,295 | |
| |
TOTAL INVESTMENTS IN SECURITIES – 101.3% (Cost: $652,791,659) | | | | 701,625,003 | |
| |
Other Assets less Liabilities – (1.3)% | | | | (8,892,642 | ) |
| | | | | | | | |
| NET ASSETS – 100.0% | | | $ | 692,732,361 | |
| * | Non-income producing security. |
| (a) | Security, or portion thereof, was on loan at March 31, 2022 (See Note 2). At March 31, 2022, the total market value of the Fund’s securities on loan identified in the Schedule of Investments was $38,690,944 and the total market value of the collateral held by the Fund was $40,423,758. The total market value of the collateral includes non-cash U.S. Government securities collateral having a value of $30,049,463. |
| (b) | Rate shown represents annualized 7-day yield as of March 31, 2022. |
Affiliated holdings are investments in entities in which the Fund owns 5% or more of the outstanding voting securities or are investments in entities which are under common ownership or control. Investments in affiliates during the fiscal year ended March 31, 2022 were as follows:
| | | | | | | | | | | | | | | | | | | | | | | | | | | | |
| | | | | | | |
| Affiliate | | Value at
3/31/2021 | | | Purchases/
Additions | | | Sales/
Reductions | | | Realized
Gain/
(Loss) | | | Change in
Unrealized
Appreciation/
Depreciation | | | Value at
3/31/2022 | | | Dividend
Income | |
WisdomTree U.S. MidCap Fund^ | | $ | 1,167,519 | | | $ | 18,366,148 | | | $ | 19,520,076 | | | $ | 136,097 | | | $ | (149,688 | ) | | $ | — | | | $ | 39,476 | |
| ^ | As of March 31, 2022, the Fund did not hold a position in this affiliate. |
The following is a summary of the fair valuations according to the inputs used as of March 31, 2022 in valuing the Fund’s investments (See Note 2 — Fair Value Measurement):
| | | | | | | | | | | | | | | | |
| | | | |
| | | Quoted
Prices in
Active
Markets
(Level 1) | | | Other
Significant
Observable
Inputs
(Level 2) | | | Significant
Unobservable
Inputs
(Level 3) | | | Total | |
Assets: | | | | | | | | | | | | |
Investments in Securities | | | | |
Common Stocks | | $ | 691,250,449 | | | $ | — | | | $ | — | | | $ | 691,250,449 | |
Rights | | | — | | | | 259 | | | | — | | | | 259 | |
Investment of Cash Collateral for Securities Loaned | | | — | | | | 10,374,295 | | | | — | | | | 10,374,295 | |
Total Investments in Securities | | $ | 691,250,449 | | | $ | 10,374,554 | | | $ | — | | | $ | 701,625,003 | |
See Notes to Financial Statements.
Schedule of Investments
WisdomTree U.S. SmallCap Quality Dividend Growth Fund (DGRS)
March 31, 2022
| | | | | | | | |
| Investments | | Shares | | | Value | |
|
| COMMON STOCKS – 99.6% | |
|
| United States – 98.5% | |
|
| Aerospace & Defense – 0.7% | |
| | |
Kaman Corp. | | | 13,826 | | | $ | 601,154 | |
| | |
Moog, Inc., Class A | | | 10,062 | | | | 883,444 | |
| | | | | | | | |
| Total Aerospace & Defense | | | | 1,484,598 | |
| | |
| Air Freight & Logistics – 0.2% | | | | | | | | |
| | |
Forward Air Corp. | | | 5,846 | | | | 571,622 | |
| | |
| Auto Components – 1.7% | | | | | | | | |
| | |
Dana, Inc. | | | 66,396 | | | | 1,166,578 | |
| | |
LCI Industries | | | 14,624 | | | | 1,518,117 | |
| | |
Patrick Industries, Inc. | | | 9,609 | | | | 579,423 | |
| | |
Standard Motor Products, Inc. | | | 10,776 | | | | 464,877 | |
| | | | | | | | |
| Total Auto Components | | | | 3,728,995 | |
| | |
| Automobiles – 0.2% | | | | | | | | |
| | |
Winnebago Industries, Inc. | | | 8,481 | | | | 458,228 | |
| | |
| Banks – 6.0% | | | | | | | | |
| | |
Amalgamated Financial Corp. | | | 14,460 | | | | 259,846 | |
| | |
Bank7 Corp. | | | 5,339 | | | | 126,107 | |
| | |
BankFinancial Corp. | | | 12,565 | | | | 130,173 | |
| | |
Blue Ridge Bankshares, Inc. | | | 11,269 | | | | 170,951 | |
| | |
Cathay General Bancorp | | | 65,929 | | | | 2,950,323 | |
| | |
City Holding Co. | | | 12,199 | | | | 960,061 | |
| | |
Eagle Bancorp Montana, Inc. | | | 4,103 | | | | 91,620 | |
| | |
Enterprise Financial Services Corp. | | | 16,283 | | | | 770,349 | |
| | |
First Bancorp | | | 15,560 | | | | 649,941 | |
| | |
First Bancorp, Inc. | | | 9,286 | | | | 279,323 | |
| | |
First Foundation, Inc. | | | 14,935 | | | | 362,771 | |
| | |
First Mid Bancshares, Inc. | | | 9,488 | | | | 365,193 | |
| | |
Investar Holding Corp. | | | 5,401 | | | | 103,105 | |
| | |
Lakeland Financial Corp. | | | 12,987 | | | | 948,051 | |
| | |
Meta Financial Group, Inc. | | | 3,216 | | | | 176,623 | |
| | |
Metrocity Bankshares, Inc. | | | 11,126 | | | | 261,239 | |
| | |
Mid Penn Bancorp, Inc. | | | 5,993 | | | | 160,672 | |
| | |
MVB Financial Corp. | | | 2,923 | | | | 121,305 | |
| | |
OceanFirst Financial Corp. | | | 47,913 | | | | 963,051 | |
| | |
Old Second Bancorp, Inc. | | | 11,381 | | | | 165,138 | |
| | |
Parke Bancorp, Inc. | | | 8,650 | | | | 204,227 | |
| | |
Plumas Bancorp | | | 2,424 | | | | 92,354 | |
| | |
Preferred Bank | | | 9,854 | | | | 730,083 | |
| | |
QCR Holdings, Inc. | | | 2,660 | | | | 150,530 | |
| | |
RBB Bancorp | | | 11,919 | | | | 279,977 | |
| | |
Shore Bancshares, Inc. | | | 10,634 | | | | 217,784 | |
| | |
Stock Yards Bancorp, Inc. | | | 13,309 | | | | 704,046 | |
| | |
Unity Bancorp, Inc. | | | 5,072 | | | | 141,915 | |
| | |
Veritex Holdings, Inc. | | | 23,557 | | | | 899,171 | |
| | | | | | | | |
| Total Banks | | | | 13,435,929 | |
| | |
| Beverages – 0.1% | | | | | | | | |
| | |
MGP Ingredients, Inc.(a) | | | 3,490 | | | | 298,709 | |
| | |
| Building Products – 0.7% | | | | | | | | |
| | |
Apogee Enterprises, Inc. | | | 12,646 | | | | 600,179 | |
| | |
CSW Industrials, Inc. | | | 2,150 | | | | 252,819 | |
| | |
Griffon Corp. | | | 20,150 | | | | 403,605 | |
| | |
Quanex Building Products Corp. | | | 11,658 | | | | 244,701 | |
| | | | | | | | |
| Total Building Products | | | | 1,501,304 | |
| | |
| Capital Markets – 7.1% | | | | | | | | |
| | |
Artisan Partners Asset Management, Inc., Class A | | | 106,538 | | | | 4,192,270 | |
| | |
B. Riley Financial, Inc. | | | 38,400 | | | | 2,686,464 | |
| | |
BGC Partners, Inc., Class A | | | 69,268 | | | | 304,779 | |
| | |
Brightsphere Investment Group, Inc. | | | 3,382 | | | | 82,014 | |
| | |
Diamond Hill Investment Group, Inc. | | | 1,612 | | | | 301,928 | |
| | |
Federated Hermes, Inc., Class B | | | 78,892 | | | | 2,687,062 | |
| | |
Greenhill & Co., Inc. | | | 5,386 | | | | 83,321 | |
| | |
Manning & Napier, Inc. | | | 12,583 | | | | 114,631 | |
| | |
Moelis & Co., Class A | | | 61,853 | | | | 2,903,998 | |
| | |
Oppenheimer Holdings, Inc., Class A | | | 3,784 | | | | 164,907 | |
| | |
Pzena Investment Management, Inc., Class A | | | 6,124 | | | | 49,114 | |
| | |
Silvercrest Asset Management Group, Inc., Class A | | | 11,439 | | | | 233,928 | |
| | |
Value Line, Inc. | | | 4,332 | | | | 290,244 | |
| | |
Victory Capital Holdings, Inc., Class A | | | 35,093 | | | | 1,013,135 | |
| | |
Virtus Investment Partners, Inc. | | | 4,019 | | | | 964,520 | |
| | | | | | | | |
| Total Capital Markets | | | | 16,072,315 | |
| | |
| Chemicals – 3.8% | | | | | | | | |
| | |
AdvanSix, Inc. | | | 8,133 | | | | 415,515 | |
| | |
American Vanguard Corp. | | | 5,115 | | | | 103,937 | |
| | |
Cabot Corp. | | | 39,585 | | | | 2,708,010 | |
| | |
Chase Corp. | | | 2,359 | | | | 205,021 | |
| | |
H.B. Fuller Co. | | | 12,034 | | | | 795,086 | |
| | |
Hawkins, Inc. | | | 8,129 | | | | 373,121 | |
| | |
Innospec, Inc. | | | 8,748 | | | | 809,627 | |
| | |
Minerals Technologies, Inc. | | | 3,383 | | | | 223,785 | |
| | |
NewMarket Corp. | | | 6,887 | | | | 2,234,005 | |
| | |
Northern Technologies International Corp. | | | 2,793 | | | | 33,572 | |
| | |
Stepan Co. | | | 6,491 | | | | 641,376 | |
| | | | | | | | |
| Total Chemicals | | | | 8,543,055 | |
| | |
| Commercial Services & Supplies – 5.0% | | | | | | | | |
| | |
ABM Industries, Inc. | | | 28,820 | | | | 1,326,873 | |
| | |
ACCO Brands Corp. | | | 88,517 | | | | 708,136 | |
| | |
Acme United Corp. | | | 1,155 | | | | 38,981 | |
| | |
Brady Corp., Class A | | | 21,277 | | | | 984,487 | |
| | |
Brink’s Co. | | | 16,303 | | | | 1,108,604 | |
| | |
Deluxe Corp. | | | 39,733 | | | | 1,201,526 | |
| | |
Ennis, Inc. | | | 35,755 | | | | 660,395 | |
| | |
Healthcare Services Group, Inc. | | | 96,825 | | | | 1,798,040 | |
| | |
HNI Corp. | | | 34,603 | | | | 1,282,041 | |
| | |
Interface, Inc. | | | 3,786 | | | | 51,376 | |
| | |
Kimball International, Inc., Class B | | | 28,467 | | | | 240,546 | |
| | |
MillerKnoll, Inc. | | | 37,227 | | | | 1,286,565 | |
| | |
UniFirst Corp. | | | 2,206 | | | | 406,522 | |
| | |
VSE Corp. | | | 3,127 | | | | 144,123 | |
| | | | | | | | |
| Total Commercial Services & Supplies | | | | 11,238,215 | |
| | |
| Construction & Engineering – 0.6% | | | | | | | | |
| | |
Arcosa, Inc. | | | 4,351 | | | | 249,095 | |
| | |
Argan, Inc. | | | 9,941 | | | | 403,505 | |
See Notes to Financial Statements.
Schedule of Investments (continued)
WisdomTree U.S. SmallCap Quality Dividend Growth Fund (DGRS)
March 31, 2022
| | | | | | | | |
| Investments | | Shares | | | Value | |
| | |
Comfort Systems USA, Inc. | | | 5,467 | | | $ | 486,618 | |
| | |
Primoris Services Corp. | | | 14,031 | | | | 334,218 | |
| | | | | | | | |
| Total Construction & Engineering | | | | 1,473,436 | |
| | |
| Construction Materials – 0.1% | | | | | | | | |
| | |
United States Lime & Minerals, Inc. | | | 1,161 | | | | 134,722 | |
| | |
| Consumer Finance – 0.9% | | | | | | | | |
| | |
Curo Group Holdings Corp. | | | 28,695 | | | | 374,470 | |
| | |
FirstCash Holdings, Inc. | | | 19,836 | | | | 1,395,264 | |
| | |
Regional Management Corp. | | | 5,064 | | | | 245,958 | |
| | | | | | | | |
| Total Consumer Finance | | | | 2,015,692 | |
| | |
| Containers & Packaging – 1.4% | | | | | | | | |
| | |
Greif, Inc., Class A | | | 36,703 | | | | 2,387,897 | |
| | |
Myers Industries, Inc. | | | 25,672 | | | | 554,515 | |
| | |
TriMas Corp. | | | 5,072 | | | | 162,761 | |
| | | | | | | | |
| Total Containers & Packaging | | | | 3,105,173 | |
| | |
| Diversified Consumer Services – 1.2% | | | | | | | | |
| | |
Carriage Services, Inc. | | | 3,983 | | | | 212,414 | |
| | |
Graham Holdings Co., Class B | | | 1,162 | | | | 710,528 | |
| | |
Strategic Education, Inc. | | | 28,063 | | | | 1,862,822 | |
| | | | | | | | |
| Total Diversified Consumer Services | | | | 2,785,764 | |
| | |
| Electric Utilities – 2.4% | | | | | | | | |
| | |
ALLETE, Inc. | | | 54,952 | | | | 3,680,685 | |
| | |
MGE Energy, Inc. | | | 19,526 | | | | 1,557,979 | |
| | |
Via Renewables, Inc. | | | 24,174 | | | | 199,194 | |
| | | | | | | | |
| Total Electric Utilities | | | | 5,437,858 | |
| | |
| Electrical Equipment – 0.7% | | | | | | | | |
| | |
Allied Motion Technologies, Inc. | | | 1,510 | | | | 45,058 | |
| | |
AZZ, Inc. | | | 8,451 | | | | 407,676 | |
| | |
Encore Wire Corp. | | | 579 | | | | 66,046 | |
| | |
EnerSys | | | 9,966 | | | | 743,165 | |
| | |
LSI Industries, Inc. | | | 21,727 | | | | 130,362 | |
| | |
Preformed Line Products Co. | | | 1,542 | | | | 97,794 | |
| | | | | | | | |
| Total Electrical Equipment | | | | 1,490,101 | |
| |
| Electronic Equipment, Instruments & Components – 1.7% | | | | | |
| | |
Advanced Energy Industries, Inc. | | | 4,371 | | | | 376,256 | |
| | |
Badger Meter, Inc. | | | 6,203 | | | | 618,501 | |
| | |
Benchmark Electronics, Inc. | | | 23,667 | | | | 592,622 | |
| | |
Methode Electronics, Inc. | | | 13,164 | | | | 569,343 | |
| | |
PC Connection, Inc. | | | 5,573 | | | | 291,969 | |
| | |
Vishay Intertechnology, Inc. | | | 66,538 | | | | 1,304,145 | |
| | |
Wayside Technology Group, Inc. | | | 1,434 | | | | 49,043 | |
| | | | | | | | |
| Total Electronic Equipment, Instruments & Components | | | | 3,801,879 | |
|
| Energy Equipment & Services – 0.7% | |
| | |
Cactus, Inc., Class A | | | 16,100 | | | | 913,514 | |
| | |
Solaris Oilfield Infrastructure, Inc., Class A | | | 57,536 | | | | 649,581 | |
| | | | | | | | |
| Total Energy Equipment & Services | | | | 1,563,095 | |
| | |
| Entertainment – 0.3% | | | | | | | | |
| | |
World Wrestling Entertainment, Inc., Class A | | | 11,555 | | | | 721,494 | |
| |
| Equity Real Estate Investment Trusts (REITs) – 3.2% | | | | | |
| | |
Apple Hospitality REIT, Inc. | | | 15,169 | | | | 272,587 | |
| | |
Cedar Realty Trust, Inc. | | | 3,591 | | | | 99,255 | |
| | |
Creative Media & Community Trust Corp. | | | 28,706 | | | | 222,185 | |
| | |
EPR Properties | | | 99,317 | | | | 5,433,633 | |
| | |
NexPoint Residential Trust, Inc. | | | 12,532 | | | | 1,131,765 | |
| | | | | | | | |
| Total Equity Real Estate Investment Trusts (REITs) | | | | 7,159,425 | |
| | |
| Food & Staples Retailing – 1.4% | | | | | | | | |
| | |
Ingles Markets, Inc., Class A | | | 3,540 | | | | 315,237 | |
| | |
Natural Grocers by Vitamin Cottage, Inc. | | | 18,150 | | | | 355,740 | |
| | |
PriceSmart, Inc. | | | 6,850 | | | | 540,259 | |
| | |
SpartanNash Co. | | | 31,006 | | | | 1,022,888 | |
| | |
Weis Markets, Inc. | | | 14,128 | | | | 1,009,022 | |
| | | | | | | | |
| Total Food & Staples Retailing | | | | 3,243,146 | |
| | |
| Food Products – 0.7% | | | | | | | | |
| | |
J & J Snack Foods Corp. | | | 8,990 | | | | 1,394,349 | |
| | |
John B. Sanfilippo & Son, Inc. | | | 2,345 | | | | 195,667 | |
| | | | | | | | |
| Total Food Products | | | | 1,590,016 | |
| | |
| Gas Utilities – 4.2% | | | | | | | | |
| | |
Chesapeake Utilities Corp. | | | 7,193 | | | | 990,908 | |
| | |
ONE Gas, Inc. | | | 46,915 | | | | 4,139,780 | |
| | |
RGC Resources, Inc. | | | 3,293 | | | | 70,404 | |
| | |
Spire, Inc. | | | 58,485 | | | | 4,196,883 | |
| | | | | | | | |
| Total Gas Utilities | | | | 9,397,975 | |
| | |
| Health Care Equipment & Supplies – 0.6% | | | | | | | | |
| | |
Atrion Corp. | | | 543 | | | | 387,159 | |
| | |
CONMED Corp. | | | 4,450 | | | | 661,047 | |
| | |
LeMaitre Vascular, Inc. | | | 5,019 | | | | 233,233 | |
| | | | | | | | |
| Total Health Care Equipment & Supplies | | | | 1,281,439 | |
| | |
| Health Care Providers & Services – 2.7% | | | | | | | | |
| | |
National HealthCare Corp. | | | 13,232 | | | | 929,283 | |
| | |
National Research Corp. | | | 7,445 | | | | 295,194 | |
| | |
Patterson Cos., Inc. | | | 89,320 | | | | 2,891,289 | |
| | |
Select Medical Holdings Corp. | | | 59,677 | | | | 1,431,651 | |
| | |
U.S. Physical Therapy, Inc. | | | 5,501 | | | | 547,075 | |
| | | | | | | | |
| Total Health Care Providers & Services | | | | 6,094,492 | |
| | |
| Health Care Technology – 0.1% | | | | | | | | |
| | |
Simulations Plus, Inc.(a) | | | 3,335 | | | | 170,018 | |
|
| Household Durables – 2.4% | |
| | |
Bassett Furniture Industries, Inc. | | | 10,074 | | | | 166,825 | |
| | |
Century Communities, Inc. | | | 6,306 | | | | 337,812 | |
| | |
Hamilton Beach Brands Holding Co., Class A | | | 6,947 | | | | 80,794 | |
| | |
Hooker Furnishings Corp. | | | 9,348 | | | | 177,051 | |
| | |
Installed Building Products, Inc. | | | 6,440 | | | | 544,116 | |
| | |
KB Home | | | 30,905 | | | | 1,000,704 | |
| | |
La-Z-Boy, Inc. | | | 20,972 | | | | 553,032 | |
| | |
MDC Holdings, Inc. | | | 69,609 | | | | 2,634,004 | |
| | | | | | | | |
| Total Household Durables | | | | 5,494,338 | |
| | |
| Household Products – 1.2% | | | | | | | | |
| | |
Energizer Holdings, Inc. | | | 54,109 | | | | 1,664,393 | |
| | |
Oil-Dri Corp. of America | | | 5,010 | | | | 143,537 | |
| | |
WD-40 Co. | | | 4,371 | | | | 800,898 | |
| | | | | | | | |
| Total Household Products | | | | 2,608,828 | |
See Notes to Financial Statements.
Schedule of Investments (continued)
WisdomTree U.S. SmallCap Quality Dividend Growth Fund (DGRS)
March 31, 2022
| | | | | | | | |
| Investments | | Shares | | | Value | |
| | |
| Insurance – 3.6% | | | | | | | | |
| | |
American Equity Investment Life Holding Co. | | | 22,922 | | | $ | 914,817 | |
| | |
AMERISAFE, Inc. | | | 10,303 | | | | 511,750 | |
| | |
Crawford & Co., Class A | | | 21,991 | | | | 166,252 | |
| | |
Donegal Group, Inc., Class A | | | 23,737 | | | | 318,313 | |
| | |
Employers Holdings, Inc. | | | 17,795 | | | | 729,951 | |
| | |
HCI Group, Inc. | | | 3,475 | | | | 236,926 | |
| | |
Investors Title Co. | | | 604 | | | | 122,739 | |
| | |
Mercury General Corp. | | | 70,979 | | | | 3,903,845 | |
| | |
Stewart Information Services Corp. | | | 12,384 | | | | 750,594 | |
| | |
Universal Insurance Holdings, Inc. | | | 33,614 | | | | 453,453 | |
| | | | | | | | |
| Total Insurance | | | | 8,108,640 | |
| | |
| IT Services – 0.6% | | | | | | | | |
| | |
CSG Systems International, Inc. | | | 16,172 | | | | 1,028,054 | |
| | |
Hackett Group, Inc. | | | 14,383 | | | | 331,672 | |
| | |
Information Services Group, Inc. | | | 16,406 | | | | 111,725 | |
| | | | | | | | |
| Total IT Services | | | | 1,471,451 | |
| | |
| Leisure Products – 1.2% | | | | | | | | |
| | |
Clarus Corp. | | | 3,458 | | | | 78,773 | |
| | |
Escalade, Inc. | | | 11,936 | | | | 157,555 | |
| | |
Johnson Outdoors, Inc., Class A | | | 2,662 | | | | 206,917 | |
| | |
Marine Products Corp. | | | 35,852 | | | | 414,091 | |
| | |
Smith & Wesson Brands, Inc. | | | 24,199 | | | | 366,131 | |
| | |
Sturm Ruger & Co., Inc. | | | 22,265 | | | | 1,550,089 | |
| | | | | | | | |
| Total Leisure Products | | | | 2,773,556 | |
| | |
| Machinery – 7.9% | | | | | | | | |
| | |
Alamo Group, Inc. | | | 1,193 | | | | 171,542 | |
| | |
Albany International Corp., Class A | | | 8,075 | | | | 680,884 | |
| | |
Allison Transmission Holdings, Inc. | | | 56,118 | | | | 2,203,193 | |
| | |
Altra Industrial Motion Corp. | | | 9,980 | | | | 388,521 | |
| | |
Astec Industries, Inc. | | | 3,741 | | | | 160,863 | |
| | |
Barnes Group, Inc. | | | 18,081 | | | | 726,675 | |
| | |
Columbus McKinnon Corp. | | | 4,524 | | | | 191,818 | |
| | |
Douglas Dynamics, Inc. | | | 16,393 | | | | 567,034 | |
| | |
Eastern Co. | | | 1,974 | | | | 45,974 | |
| | |
EnPro Industries, Inc. | | | 5,474 | | | | 534,974 | |
| | |
ESCO Technologies, Inc. | | | 2,273 | | | | 158,928 | |
| | |
Federal Signal Corp. | | | 12,712 | | | | 429,030 | |
| | |
Flowserve Corp. | | | 87,914 | | | | 3,156,113 | |
| | |
Gorman-Rupp Co. | | | 10,380 | | | | 372,434 | |
| | |
Graham Corp. | | | 10,585 | | | | 81,610 | |
| | |
Helios Technologies, Inc. | | | 3,281 | | | | 263,300 | |
| | |
Hillenbrand, Inc. | | | 32,459 | | | | 1,433,714 | |
| | |
Kadant, Inc. | | | 1,544 | | | | 299,829 | |
| | |
Kennametal, Inc. | | | 47,436 | | | | 1,357,144 | |
| | |
Lindsay Corp. | | | 2,365 | | | | 371,329 | |
| | |
Miller Industries, Inc. | | | 6,052 | | | | 170,424 | |
| | |
Mueller Industries, Inc. | | | 13,687 | | | | 741,425 | |
| | |
Mueller Water Products, Inc., Class A | | | 68,270 | | | | 882,048 | |
| | |
Omega Flex, Inc.(a) | | | 2,617 | | | | 339,870 | |
| | |
Shyft Group, Inc. | | | 2,402 | | | | 86,736 | |
| | |
Standex International Corp. | | | 3,473 | | | | 347,022 | |
| | |
Tennant Co. | | | 6,057 | | | | 477,292 | |
| | |
Terex Corp. | | | 19,466 | | | | 694,158 | |
| | |
Wabash National Corp. | | | 22,653 | | | | 336,171 | |
| | | | | | | | |
| Total Machinery | | | | 17,670,055 | |
| | |
| Marine – 0.8% | | | | | | | | |
| | |
Matson, Inc. | | | 15,564 | | | | 1,877,330 | |
| | |
| Media – 1.1% | | | | | | | | |
| | |
Entravision Communications Corp., Class A | | | 27,619 | | | | 177,038 | |
| | |
Gray Television, Inc. | | | 35,373 | | | | 780,682 | |
| | |
John Wiley & Sons, Inc., Class A | | | 30,754 | | | | 1,630,885 | |
| | | | | | | | |
| Total Media | | | | 2,588,605 | |
| | |
| Metals & Mining – 2.3% | | | | | | | | |
| | |
Commercial Metals Co. | | | 56,157 | | | | 2,337,254 | |
| | |
Gold Resource Corp. | | | 53,739 | | | | 120,375 | |
| | |
Materion Corp. | | | 2,605 | | | | 223,353 | |
| | |
Schnitzer Steel Industries, Inc., Class A | | | 10,899 | | | | 566,094 | |
| | |
Warrior Met Coal, Inc. | | | 12,027 | | | | 446,322 | |
| | |
Worthington Industries, Inc. | | | 29,263 | | | | 1,504,411 | |
| | | | | | | | |
| Total Metals & Mining | | | | 5,197,809 | |
| | |
| Multi-Utilities – 1.9% | | | | | | | | |
| | |
Avista Corp. | | | 77,890 | | | | 3,516,734 | |
| | |
Unitil Corp. | | | 14,005 | | | | 698,569 | |
| | | | | | | | |
| Total Multi-Utilities | | | | 4,215,303 | |
| | |
| Multiline Retail – 0.4% | | | | | | | | |
| | |
Big Lots, Inc. | | | 23,248 | | | | 804,381 | |
| | |
| Oil, Gas & Consumable Fuels – 1.0% | | | | | | | | |
| | |
Adams Resources & Energy, Inc. | | | 4,370 | | | | 168,201 | |
| | |
Berry Corp. | | | 61,872 | | | | 638,519 | |
| | |
NACCO Industries, Inc., Class A | | | 3,946 | | | | 154,762 | |
| | |
VAALCO Energy, Inc. | | | 62,480 | | | | 407,995 | |
| | |
World Fuel Services Corp. | | | 30,084 | | | | 813,471 | |
| | | | | | | | |
| Total Oil, Gas & Consumable Fuels | | | | 2,182,948 | |
| | |
| Paper & Forest Products – 0.9% | | | | | | | | |
| | |
Neenah, Inc. | | | 16,737 | | | | 663,789 | |
| | |
Schweitzer-Mauduit International, Inc. | | | 48,667 | | | | 1,338,343 | |
| | | | | | | | |
| Total Paper & Forest Products | | | | 2,002,132 | |
| | |
| Personal Products – 2.2% | | | | | | | | |
| | |
Edgewell Personal Care Co. | | | 19,825 | | | | 726,983 | |
| | |
Inter Parfums, Inc. | | | 8,530 | | | | 751,066 | |
| | |
Medifast, Inc. | | | 8,505 | | | | 1,452,484 | |
| | |
Nu Skin Enterprises, Inc., Class A | | | 43,144 | | | | 2,065,735 | |
| | | | | | | | |
| Total Personal Products | | | | 4,996,268 | |
| | |
| Pharmaceuticals – 0.1% | | | | | | | | |
| | |
Phibro Animal Health Corp., Class A | | | 12,442 | | | | 248,218 | |
| | |
| Professional Services – 1.1% | | | | | | | | |
| | |
Barrett Business Services, Inc. | | | 3,218 | | | | 249,299 | |
| | |
BGSF, Inc. | | | 7,902 | | | | 104,069 | |
| | |
CRA International, Inc. | | | 2,939 | | | | 247,640 | |
| | |
Heidrick & Struggles International, Inc. | | | 7,392 | | | | 292,575 | |
| | |
HireQuest, Inc.(a) | | | 2,656 | | | | 50,783 | |
| | |
ICF International, Inc. | | | 2,831 | | | | 266,510 | |
See Notes to Financial Statements.
Schedule of Investments (continued)
WisdomTree U.S. SmallCap Quality Dividend Growth Fund (DGRS)
March 31, 2022
| | | | | | | | |
| Investments | | Shares | | | Value | |
| | |
Kelly Services, Inc., Class A | | | 11,918 | | | $ | 258,502 | |
| | |
Kforce, Inc. | | | 8,392 | | | | 620,756 | |
| | |
Resources Connection, Inc. | | | 28,027 | | | | 480,383 | |
| | | | | | | | |
| Total Professional Services | | | | 2,570,517 | |
| | |
| Real Estate Management & Development – 0.1% | | | | | | | | |
| | |
Newmark Group, Inc., Class A | | | 14,101 | | | | 224,488 | |
| | |
| Road & Rail – 1.1% | | | | | | | | |
| | |
ArcBest Corp. | | | 2,286 | | | | 184,023 | |
| | |
Heartland Express, Inc. | | | 9,129 | | | | 128,445 | |
| | |
Marten Transport Ltd. | | | 19,225 | | | | 341,436 | |
| | |
Schneider National, Inc., Class B | | | 28,571 | | | | 728,560 | |
| | |
Universal Logistics Holdings, Inc. | | | 15,299 | | | | 308,275 | |
| | |
Werner Enterprises, Inc. | | | 18,193 | | | | 745,913 | |
| | | | | | | | |
| Total Road & Rail | | | | 2,436,652 | |
| |
| Semiconductors & Semiconductor Equipment – 0.8% | | | | | |
| | |
CMC Materials, Inc. | | | 9,531 | | | | 1,767,047 | |
| | |
| Software – 1.1% | | | | | | | | |
| | |
A10 Networks, Inc. | | | 27,244 | | | | 380,054 | |
| | |
Ebix, Inc. | | | 7,489 | | | | 248,261 | |
| | |
InterDigital, Inc. | | | 16,154 | | | | 1,030,625 | |
| | |
Progress Software Corp. | | | 16,325 | | | | 768,744 | |
| | | | | | | | |
| Total Software | | | | 2,427,684 | |
| | |
| Specialty Retail – 3.6% | | | | | | | | |
| | |
Big 5 Sporting Goods Corp.(a) | | | 27,963 | | | | 479,565 | |
| | |
Buckle, Inc. | | | 36,249 | | | | 1,197,667 | |
| | |
Camping World Holdings, Inc., Class A | | | 56,302 | | | | 1,573,641 | |
| | |
Group 1 Automotive, Inc. | | | 3,372 | | | | 565,923 | |
| | |
Guess?, Inc. | | | 63,339 | | | | 1,383,957 | |
| | |
Haverty Furniture Cos., Inc. | | | 14,233 | | | | 390,269 | |
| | |
Hibbett, Inc. | | | 5,118 | | | | 226,932 | |
| | |
Monro, Inc. | | | 15,916 | | | | 705,715 | |
| | |
Rent-A-Center, Inc. | | | 45,651 | | | | 1,149,949 | |
| | |
Shoe Carnival, Inc. | | | 5,268 | | | | 153,615 | |
| | |
Sonic Automotive, Inc., Class A | | | 7,641 | | | | 324,819 | |
| | | | | | | | |
| Total Specialty Retail | | | | 8,152,052 | |
| |
| Technology Hardware, Storage & Peripherals – 2.1% | | | | | |
| | |
Xerox Holdings Corp. | | | 230,290 | | | | 4,644,949 | |
| | |
| Textiles, Apparel & Luxury Goods – 2.1% | | | | | | | | |
| | |
Kontoor Brands, Inc. | | | 50,310 | | | | 2,080,319 | |
| | |
Levi Strauss & Co., Class A | | | 31,807 | | | | 628,506 | |
| | |
Rocky Brands, Inc. | | | 4,056 | | | | 168,689 | |
| | |
Steven Madden Ltd. | | | 26,358 | | | | 1,018,473 | |
| | |
Superior Group of Cos., Inc. | | | 8,860 | | | | 158,151 | |
| | |
Wolverine World Wide, Inc. | | | 27,234 | | | | 614,399 | |
| | | | | | | | |
| Total Textiles, Apparel & Luxury Goods | | | | 4,668,537 | |
| | |
| Thrifts & Mortgage Finance – 2.4% | | | | | | | | |
| | |
Federal Agricultural Mortgage Corp., Class C | | | 7,216 | | | | 782,792 | |
| | |
Greene County Bancorp, Inc. | | | 1,642 | | | | 73,397 | |
| | |
Hingham Institution for Savings | | | 513 | | | | 176,062 | |
| | |
Merchants Bancorp | | | 10,963 | | | | 300,167 | |
| | |
PennyMac Financial Services, Inc. | | | 17,785 | | | | 946,162 | |
| | |
Radian Group, Inc. | | | 126,417 | | | | 2,807,722 | |
| | |
Southern Missouri Bancorp, Inc. | | | 4,792 | | | | 239,360 | |
| | |
Timberland Bancorp, Inc. | | | 4,841 | | | | 130,755 | |
| | | | | | | | |
| Total Thrifts & Mortgage Finance | | | | 5,456,417 | |
| | |
| Tobacco – 0.0% | | | | | | | | |
| | |
Turning Point Brands, Inc. | | | 2,711 | | | | 92,201 | |
| | |
| Trading Companies & Distributors – 5.2% | | | | | | | | |
| | |
Applied Industrial Technologies, Inc. | | | 12,794 | | | | 1,313,432 | |
| | |
Boise Cascade Co. | | | 7,480 | | | | 519,636 | |
| | |
GATX Corp. | | | 17,444 | | | | 2,151,369 | |
| | |
Global Industrial Co. | | | 16,597 | | | | 534,921 | |
| | |
H&E Equipment Services, Inc. | | | 23,471 | | | | 1,021,458 | |
| | |
McGrath RentCorp | | | 14,228 | | | | 1,209,095 | |
| | |
MSC Industrial Direct Co., Inc., Class A | | | 44,710 | | | | 3,809,739 | |
| | |
Rush Enterprises, Inc., Class A | | | 20,323 | | | | 1,034,644 | |
| | | | | | | | |
| Total Trading Companies & Distributors | | | | 11,594,294 | |
| | |
| Water Utilities – 2.0% | | | | | | | | |
| | |
American States Water Co. | | | 13,782 | | | | 1,226,874 | |
| | |
Artesian Resources Corp., Class A | | | 5,264 | | | | 255,567 | |
| | |
California Water Service Group | | | 19,063 | | | | 1,130,055 | |
| | |
Middlesex Water Co. | | | 5,378 | | | | 565,604 | |
| | |
SJW Group | | | 15,540 | | | | 1,081,273 | |
| | |
York Water Co. | | | 6,477 | | | | 291,271 | |
| | | | | | | | |
| Total Water Utilities | | | | 4,550,644 | |
| | |
| Wireless Telecommunication Services – 0.9% | | | | | | | | |
| | |
Shenandoah Telecommunications Co. | | | 2,977 | | | | 70,197 | |
| | |
Telephone and Data Systems, Inc. | | | 99,319 | | | | 1,875,143 | |
| | | | | | | | |
| Total Wireless Telecommunication Services | | | | 1,945,340 | |
| Total United States | | | | 221,569,379 | |
| | |
| Puerto Rico – 1.1% | | | | | | | | |
| | |
| Banks – 0.9% | | | | | | | | |
| | |
First Bancorp | | | 158,954 | | | | 2,085,477 | |
| | |
| IT Services – 0.2% | | | | | | | | |
| | |
EVERTEC, Inc. | | | 8,141 | | | | 333,211 | |
| Total Puerto Rico | | | | 2,418,688 | |
TOTAL COMMON STOCKS
(Cost: $214,499,175) | | | | 223,988,067 | |
|
| INVESTMENT OF CASH COLLATERAL FOR SECURITIES LOANED – 0.2% | |
| | |
| United States – 0.2% | | | | | | | | |
| | |
State Street Navigator Securities Lending Government Money Market Portfolio, 0.25%(b) | | | | | | | | |
| (Cost: $492,729) | | | 492,729 | | | | 492,729 | |
| | |
TOTAL INVESTMENTS IN SECURITIES – 99.8% (Cost: $214,991,904) | | | | | | | 224,480,796 | |
| | |
Other Assets less Liabilities – 0.2% | | | | | | | 351,989 | |
| | | | | | | | |
| NET ASSETS – 100.0% | | | $ | 224,832,785 | |
| (a) | Security, or portion thereof, was on loan at March 31, 2022 (See Note 2). At March 31, 2022, the total market value of the Fund’s securities on loan identified in the Schedule of Investments was $1,180,619 and the total market value of the collateral held by the Fund was $1,209,726. The total market value of the collateral includes non-cash U.S. Government securities collateral having a value of $716,997. |
| (b) | Rate shown represents annualized 7-day yield as of March 31, 2022. |
See Notes to Financial Statements.
Schedule of Investments (concluded)
WisdomTree U.S. SmallCap Quality Dividend Growth Fund (DGRS)
March 31, 2022
The following is a summary of the fair valuations according to the inputs used as of March 31, 2022 in valuing the Fund’s investments (See Note 2 — Fair Value Measurement):
| | | | | | | | | | | | | | | | |
| | | | |
| | | Quoted
Prices in
Active
Markets
(Level 1) | | | Other
Significant
Observable
Inputs
(Level 2) | | | Significant
Unobservable
Inputs
(Level 3) | | | Total | |
Assets: | | | | | | | | | |
Investments in Securities | | | | |
Common Stocks | | $ | 223,988,067 | | | $ | — | | | $ | — | | | $ | 223,988,067 | |
Investment of Cash Collateral for Securities Loaned | | | — | | | | 492,729 | | | | — | | | | 492,729 | |
Total Investments in Securities | | $ | 223,988,067 | | | $ | 492,729 | | | $ | — | | | $ | 224,480,796 | |
See Notes to Financial Statements.
Schedule of Investments
WisdomTree U.S. Total Dividend Fund (DTD)
March 31, 2022
| | | | | | | | |
| Investments | | Shares | | | Value | |
|
| COMMON STOCKS – 99.8% | |
|
| United States – 99.7% | |
|
| Aerospace & Defense – 1.9% | |
| | |
BWX Technologies, Inc. | | | 6,965 | | | $ | 375,135 | |
| | |
General Dynamics Corp. | | | 11,082 | | | | 2,672,757 | |
| | |
Huntington Ingalls Industries, Inc. | | | 2,694 | | | | 537,292 | |
| | |
L3Harris Technologies, Inc. | | | 5,745 | | | | 1,427,460 | |
| | |
Lockheed Martin Corp. | | | 14,673 | | | | 6,476,662 | |
| | |
Northrop Grumman Corp. | | | 6,306 | | | | 2,820,169 | |
| | |
Raytheon Technologies Corp. | | | 58,318 | | | | 5,777,564 | |
| | | | | | | | |
| Total Aerospace & Defense | | | | 20,087,039 | |
| | |
| Air Freight & Logistics – 0.7% | | | | | | | | |
| | |
C.H. Robinson Worldwide, Inc. | | | 6,568 | | | | 707,439 | |
| | |
Expeditors International of Washington, Inc. | | | 3,316 | | | | 342,079 | |
| | |
FedEx Corp. | | | 4,720 | | | | 1,092,161 | |
| | |
United Parcel Service, Inc., Class B | | | 23,281 | | | | 4,992,843 | |
| | | | | | | | |
| Total Air Freight & Logistics | | | | 7,134,522 | |
| | |
| Auto Components – 0.1% | | | | | | | | |
| | |
BorgWarner, Inc. | | | 4,320 | | | | 168,048 | |
| | |
Dana, Inc. | | | 7,953 | | | | 139,734 | |
| | |
Gentex Corp. | | | 13,196 | | | | 384,927 | |
| | |
LCI Industries | | | 2,191 | | | | 227,448 | |
| | |
Lear Corp. | | | 1,426 | | | | 203,334 | |
| | | | | | | | |
| Total Auto Components | | | | 1,123,491 | |
| | |
| Automobiles – 0.2% | | | | | | | | |
| | |
Ford Motor Co. | | | 122,366 | | | | 2,069,209 | |
| | |
Harley-Davidson, Inc. | | | 4,995 | | | | 196,803 | |
| | |
Thor Industries, Inc. | | | 1,331 | | | | 104,750 | |
| | | | | | | | |
| Total Automobiles | | | | 2,370,762 | |
| | |
| Banks – 7.4% | | | | | | | | |
| | |
Associated Banc-Corp. | | | 17,977 | | | | 409,156 | |
| | |
Banc of California, Inc. | | | 15,150 | | | | 293,304 | |
| | |
Bank of America Corp. | | | 259,041 | | | | 10,677,670 | |
| | |
Bank OZK | | | 12,635 | | | | 539,514 | |
| | |
BOK Financial Corp. | | | 5,348 | | | | 502,445 | |
| | |
Cadence Bank | | | 15,399 | | | | 450,575 | |
| | |
Citigroup, Inc. | | | 109,092 | | | | 5,825,513 | |
| | |
Citizens Community Bancorp, Inc. | | | 23,479 | | | | 354,768 | |
| | |
Citizens Financial Group, Inc. | | | 27,181 | | | | 1,232,115 | |
| | |
Comerica, Inc. | | | 9,411 | | | | 851,037 | |
| | |
Commerce Bancshares, Inc. | | | 7,403 | | | | 529,981 | |
| | |
Cullen/Frost Bankers, Inc. | | | 3,575 | | | | 494,816 | |
| | |
East West Bancorp, Inc. | | | 8,545 | | | | 675,226 | |
| | |
Equity Bancshares, Inc., Class A | | | 10,573 | | | | 341,614 | |
| | |
Fifth Third Bancorp | | | 35,515 | | | | 1,528,566 | |
| | |
First Citizens BancShares, Inc., Class A | | | 554 | | | | 368,742 | |
| | |
First Horizon Corp. | | | 44,518 | | | | 1,045,728 | |
| | |
First Interstate BancSystem, Inc., Class A | | | 7,471 | | | | 274,709 | |
| | |
First National Corp. | | | 15,754 | | | | 330,834 | |
| | |
First Republic Bank | | | 1,906 | | | | 308,963 | |
| | |
Five Star Bancorp | | | 1,676 | | | | 47,431 | |
| | |
FNB Corp. | | | 38,298 | | | | 476,810 | |
| | |
Hanmi Financial Corp. | | | 13,138 | | | | 323,326 | |
| | |
HomeTrust Bancshares, Inc. | | | 10,660 | | | | 314,790 | |
| | |
JPMorgan Chase & Co. | | | 182,132 | | | | 24,828,234 | |
| | |
KeyCorp | | | 60,492 | | | | 1,353,811 | |
| | |
M&T Bank Corp. | | | 8,023 | | | | 1,359,898 | |
| | |
Old National Bancorp | | | 8,040 | | | | 131,695 | |
| | |
PacWest Bancorp | | | 1,210 | | | | 52,187 | |
| | |
Partners Bancorp | | | 34,321 | | | | 316,096 | |
| | |
People’s United Financial, Inc. | | | 41,082 | | | | 821,229 | |
| | |
PNC Financial Services Group, Inc. | | | 18,295 | | | | 3,374,513 | |
| | |
Prosperity Bancshares, Inc. | | | 7,069 | | | | 490,447 | |
| | |
Regions Financial Corp. | | | 56,364 | | | | 1,254,663 | |
| | |
S&T Bancorp, Inc. | | | 12,688 | | | | 375,311 | |
| | |
Seacoast Banking Corp. of Florida | | | 9,346 | | | | 327,297 | |
| | |
Signature Bank | | | 1,374 | | | | 403,255 | |
| | |
Southern States Bancshares, Inc. | | | 8,792 | | | | 202,831 | |
| | |
SouthState Corp. | | | 5,432 | | | | 443,197 | |
| | |
Summit State Bank | | | 11,400 | | | | 194,142 | |
| | |
Truist Financial Corp. | | | 73,830 | | | | 4,186,161 | |
| | |
U.S. Bancorp | | | 81,989 | | | | 4,357,715 | |
| | |
Umpqua Holdings Corp. | | | 33,002 | | | | 622,418 | |
| | |
Valley National Bancorp | | | 32,119 | | | | 418,189 | |
| | |
Webster Financial Corp. | | | 1,329 | | | | 74,583 | |
| | |
Wells Fargo & Co. | | | 110,920 | | | | 5,375,183 | |
| | |
Western Alliance Bancorp | | | 5,210 | | | | 431,492 | |
| | |
Zions Bancorp NA | | | 9,337 | | | | 612,134 | |
| | | | | | | | |
| Total Banks | | | | 80,204,314 | |
| | |
| Beverages – 3.5% | | | | | | | | |
| | |
Brown-Forman Corp., Class B | | | 7,462 | | | | 500,103 | |
| | |
Coca-Cola Co. | | | 322,646 | | | | 20,004,052 | |
| | |
Constellation Brands, Inc., Class A | | | 2,864 | | | | 659,636 | |
| | |
Keurig Dr. Pepper, Inc. | | | 46,325 | | | | 1,755,718 | |
| | |
PepsiCo, Inc. | | | 87,999 | | | | 14,729,273 | |
| | | | | | | | |
| Total Beverages | | | | 37,648,782 | |
| | |
| Biotechnology – 3.4% | | | | | | | | |
| | |
AbbVie, Inc. | | | 133,603 | | | | 21,658,382 | |
| | |
Amgen, Inc. | | | 31,830 | | | | 7,697,131 | |
| | |
Gilead Sciences, Inc. | | | 125,963 | | | | 7,488,500 | |
| | | | | | | | |
| Total Biotechnology | | | | 36,844,013 | |
| | |
| Building Products – 0.3% | | | | | | | | |
| | |
A.O. Smith Corp. | | | 4,589 | | | | 293,191 | |
| | |
Carlisle Cos., Inc. | | | 1,637 | | | | 402,571 | |
| | |
Carrier Global Corp. | | | 9,801 | | | | 449,572 | |
| | |
Fortune Brands Home & Security, Inc. | | | 3,888 | | | | 288,801 | |
| | |
Lennox International, Inc. | | | 1,066 | | | | 274,879 | |
| | |
Masco Corp. | | | 9,510 | | | | 485,010 | |
| | |
Owens Corning | | | 3,584 | | | | 327,936 | |
| | |
UFP Industries, Inc. | | | 3,263 | | | | 251,773 | |
| | | | | | | | |
| Total Building Products | | | | 2,773,733 | |
| | |
| Capital Markets – 4.3% | | | | | | | | |
| | |
Ameriprise Financial, Inc. | | | 3,124 | | | | 938,325 | |
| | |
Ares Management Corp., Class A | | | 6,403 | | | | 520,116 | |
See Notes to Financial Statements.
Schedule of Investments (continued)
WisdomTree U.S. Total Dividend Fund (DTD)
March 31, 2022
| | | | | | | | |
| Investments | | Shares | | | Value | |
| | |
Artisan Partners Asset Management, Inc., Class A | | | 14,832 | | | $ | 583,639 | |
| | |
B. Riley Financial, Inc. | | | 6,330 | | | | 442,847 | |
| | |
Bank of New York Mellon Corp. | | | 32,982 | | | | 1,636,897 | |
| | |
BlackRock, Inc. | | | 4,798 | | | | 3,666,488 | |
| | |
Blackstone, Inc. | | | 53,611 | | | | 6,805,380 | |
| | |
Blue Owl Capital, Inc.(a) | | | 9,136 | | | | 115,844 | |
| | |
Carlyle Group, Inc. | | | 15,163 | | | | 741,622 | |
| | |
CBOE Global Markets, Inc. | | | 3,561 | | | | 407,450 | |
| | |
Charles Schwab Corp. | | | 26,771 | | | | 2,257,063 | |
| | |
CME Group, Inc. | | | 10,124 | | | | 2,408,095 | |
| | |
Cohen & Steers, Inc. | | | 4,643 | | | | 398,787 | |
| | |
Evercore, Inc., Class A | | | 3,431 | | | | 381,939 | |
| | |
FactSet Research Systems, Inc. | | | 681 | | | | 295,656 | |
| | |
Federated Hermes, Inc., Class B | | | 10,757 | | | | 366,383 | |
| | |
Franklin Resources, Inc. | | | 29,118 | | | | 812,974 | |
| | |
Goldman Sachs Group, Inc. | | | 10,430 | | | | 3,442,943 | |
| | |
Hamilton Lane, Inc., Class A | | | 3,102 | | | | 239,754 | |
| | |
Houlihan Lokey, Inc. | | | 3,945 | | | | 346,371 | |
| | |
Intercontinental Exchange, Inc. | | | 9,405 | | | | 1,242,589 | |
| | |
Jefferies Financial Group, Inc. | | | 15,332 | | | | 503,656 | |
| | |
KKR & Co., Inc. | | | 9,977 | | | | 583,355 | |
| | |
MarketAxess Holdings, Inc. | | | 939 | | | | 319,448 | |
| | |
Moelis & Co., Class A | | | 9,150 | | | | 429,592 | |
| | |
Moody’s Corp. | | | 2,555 | | | | 862,082 | |
| | |
Morgan Stanley | | | 80,015 | | | | 6,993,311 | |
| | |
Morningstar, Inc. | | | 606 | | | | 165,541 | |
| | |
MSCI, Inc. | | | 643 | | | | 323,352 | |
| | |
Nasdaq, Inc. | | | 4,798 | | | | 855,004 | |
| | |
Northern Trust Corp. | | | 9,753 | | | | 1,135,737 | |
| | |
Raymond James Financial, Inc. | | | 7,491 | | | | 823,336 | |
| | |
S&P Global, Inc. | | | 3,799 | | | | 1,558,274 | |
| | |
Sculptor Capital Management, Inc. | | | 13,061 | | | | 181,940 | |
| | |
State Street Corp. | | | 14,180 | | | | 1,235,362 | |
| | |
StepStone Group, Inc., Class A | | | 6,139 | | | | 202,955 | |
| | |
T. Rowe Price Group, Inc. | | | 12,594 | | | | 1,904,087 | |
| | |
Victory Capital Holdings, Inc., Class A | | | 9,268 | | | | 267,567 | |
| | |
Virtu Financial, Inc., Class A | | | 16,911 | | | | 629,427 | |
| | | | | | | | |
| Total Capital Markets | | | | 47,025,188 | |
| | |
| Chemicals – 1.6% | | | | | | | | |
| | |
Air Products and Chemicals, Inc. | | | 8,058 | | | | 2,013,775 | |
| | |
Albemarle Corp. | | | 944 | | | | 208,766 | |
| | |
Ashland Global Holdings, Inc. | | | 3,063 | | | | 301,430 | |
| | |
Cabot Corp. | | | 6,198 | | | | 424,005 | |
| | |
Celanese Corp. | | | 2,986 | | | | 426,610 | |
| | |
CF Industries Holdings, Inc. | | | 6,416 | | | | 661,233 | |
| | |
Chemours Co. | | | 8,542 | | | | 268,902 | |
| | |
Corteva, Inc. | | | 13,948 | | | | 801,731 | |
| | |
Dow, Inc. | | | 58,816 | | | | 3,747,756 | |
| | |
DuPont de Nemours, Inc. | | | 13,047 | | | | 959,998 | |
| | |
Eastman Chemical Co. | | | 6,022 | | | | 674,825 | |
| | |
Ecolab, Inc. | | | 4,452 | | | | 786,045 | |
| | |
Element Solutions, Inc. | | | 14,512 | | | | 317,813 | |
| | |
FMC Corp. | | | 4,426 | | | | 582,329 | |
| | |
Huntsman Corp. | | | 10,964 | | | | 411,260 | |
| | |
International Flavors & Fragrances, Inc. | | | 8,522 | | | | 1,119,194 | |
| | |
Mosaic Co. | | | 2,957 | | | | 196,641 | |
| | |
Olin Corp. | | | 5,073 | | | | 265,216 | |
| | |
PPG Industries, Inc. | | | 5,692 | | | | 746,050 | |
| | |
RPM International, Inc. | | | 5,787 | | | | 471,293 | |
| | |
Scotts Miracle-Gro Co. | | | 2,181 | | | | 268,176 | |
| | |
Sensient Technologies Corp. | | | 3,832 | | | | 321,696 | |
| | |
Sherwin-Williams Co. | | | 4,040 | | | | 1,008,465 | |
| | |
Valvoline, Inc. | | | 9,931 | | | | 313,422 | |
| | |
Westlake Corp. | | | 2,719 | | | | 335,525 | |
| | | | | | | | |
| Total Chemicals | | | | 17,632,156 | |
| | |
| Commercial Services & Supplies – 0.6% | | | | | | | | |
| | |
ABM Industries, Inc. | | | 6,395 | | | | 294,426 | |
| | |
Brink’s Co. | | | 2,549 | | | | 173,332 | |
| | |
Cintas Corp. | | | 2,138 | | | | 909,484 | |
| | |
Deluxe Corp. | | | 8,605 | | | | 260,215 | |
| | |
Healthcare Services Group, Inc. | | | 18,409 | | | | 341,855 | |
| | |
Pitney Bowes, Inc. | | | 39,273 | | | | 204,220 | |
| | |
Republic Services, Inc. | | | 12,115 | | | | 1,605,237 | |
| | |
Rollins, Inc. | | | 9,788 | | | | 343,069 | |
| | |
Waste Management, Inc. | | | 15,600 | | | | 2,472,600 | |
| | | | | | | | |
| Total Commercial Services & Supplies | | | | 6,604,438 | |
| | |
| Communications Equipment – 1.1% | | | | | | | | |
| | |
Cisco Systems, Inc. | | | 179,893 | | | | 10,030,833 | |
| | |
Juniper Networks, Inc. | | | 18,630 | | | | 692,291 | |
| | |
Motorola Solutions, Inc. | | | 4,825 | | | | 1,168,615 | |
| | | | | | | | |
| Total Communications Equipment | | | | 11,891,739 | |
| | |
| Construction & Engineering – 0.1% | | | | | | | | |
| | |
MDU Resources Group, Inc. | | | 22,489 | | | | 599,332 | |
| | |
| Consumer Finance – 0.7% | | | | | | | | |
| | |
Ally Financial, Inc. | | | 8,626 | | | | 375,058 | |
| | |
American Express Co. | | | 12,940 | | | | 2,419,780 | |
| | |
Capital One Financial Corp. | | | 12,840 | | | | 1,685,764 | |
| | |
Discover Financial Services | | | 7,384 | | | | 813,643 | |
| | |
FirstCash Holdings, Inc. | | | 4,539 | | | | 319,273 | |
| | |
Navient Corp. | | | 10,993 | | | | 187,321 | |
| | |
OneMain Holdings, Inc. | | | 14,618 | | | | 693,039 | |
| | |
SLM Corp. | | | 14,283 | | | | 262,236 | |
| | |
Synchrony Financial | | | 13,741 | | | | 478,324 | |
| | | | | | | | |
| Total Consumer Finance | | | | 7,234,438 | |
| | |
| Containers & Packaging – 0.4% | | | | | | | | |
| | |
Avery Dennison Corp. | | | 1,450 | | | | 252,256 | |
| | |
Ball Corp. | | | 4,909 | | | | 441,810 | |
| | |
Crown Holdings, Inc. | | | 1,932 | | | | 241,674 | |
| | |
Graphic Packaging Holding Co. | | | 10,591 | | | | 212,244 | |
| | |
Greif, Inc., Class A | | | 5,223 | | | | 339,808 | |
| | |
International Paper Co. | | | 21,137 | | | | 975,473 | |
| | |
Packaging Corp. of America | | | 4,719 | | | | 736,683 | |
| | |
Sealed Air Corp. | | | 4,160 | | | | 278,554 | |
| | |
Sonoco Products Co. | | | 8,282 | | | | 518,122 | |
| | |
Westrock Co. | | | 6,967 | | | | 327,658 | |
| | | | | | | | |
| Total Containers & Packaging | | | | 4,324,282 | |
See Notes to Financial Statements.
Schedule of Investments (continued)
WisdomTree U.S. Total Dividend Fund (DTD)
March 31, 2022
| | | | | | | | |
| Investments | | Shares | | | Value | |
|
| Distributors – 0.1% | |
| | |
Genuine Parts Co. | | | 5,746 | | | $ | 724,111 | |
| | |
LKQ Corp. | | | 5,506 | | | | 250,028 | |
| | |
Pool Corp. | | | 585 | | | | 247,367 | |
| | | | | | | | |
| Total Distributors | | | | 1,221,506 | |
| | |
| Diversified Consumer Services – 0.1% | | | | | | | | |
| | |
ADT, Inc. | | | 18,446 | | | | 140,005 | |
| | |
H&R Block, Inc. | | | 17,068 | | | | 444,451 | |
| | |
Service Corp. International | | | 6,947 | | | | 457,251 | |
| | | | | | | | |
| Total Diversified Consumer Services | | | | 1,041,707 | |
| | |
| Diversified Financial Services – 0.1% | | | | | | | | |
| | |
Apollo Global Management, Inc. | | | 15,450 | | | | 957,745 | |
| | |
Voya Financial, Inc. | | | 5,614 | | | | 372,489 | |
| | | | | | | | |
| Total Diversified Financial Services | | | | 1,330,234 | |
| |
| Diversified Telecommunication Services – 1.7% | | | | | |
| | |
Cogent Communications Holdings, Inc. | | | 7,512 | | | | 498,421 | |
| | |
Verizon Communications, Inc. | | | 343,284 | | | | 17,486,887 | |
| | | | | | | | |
| Total Diversified Telecommunication Services | | | | 17,985,308 | |
| | |
| Electric Utilities – 4.0% | | | | | | | | |
| | |
Alliant Energy Corp. | | | 14,970 | | | | 935,325 | |
| | |
American Electric Power Co., Inc. | | | 30,709 | | | | 3,063,837 | |
| | |
Avangrid, Inc. | | | 24,739 | | | | 1,156,301 | |
| | |
Duke Energy Corp. | | | 49,842 | | | | 5,565,358 | |
| | |
Edison International | | | 23,150 | | | | 1,622,815 | |
| | |
Entergy Corp. | | | 11,937 | | | | 1,393,645 | |
| | |
Evergy, Inc. | | | 20,752 | | | | 1,418,192 | |
| | |
Eversource Energy | | | 17,838 | | | | 1,573,133 | |
| | |
Exelon Corp. | | | 66,619 | | | | 3,173,063 | |
| | |
FirstEnergy Corp. | | | 49,040 | | | | 2,248,974 | |
| | |
IDACORP, Inc. | | | 5,361 | | | | 618,445 | |
| | |
NextEra Energy, Inc. | | | 83,473 | | | | 7,070,998 | |
| | |
NRG Energy, Inc. | | | 11,940 | | | | 458,018 | |
| | |
OGE Energy Corp. | | | 27,771 | | | | 1,132,501 | |
| | |
PPL Corp. | | | 66,421 | | | | 1,896,984 | |
| | |
Southern Co. | | | 105,933 | | | | 7,681,202 | |
| | |
Xcel Energy, Inc. | | | 26,799 | | | | 1,934,084 | |
| | | | | | | | |
| Total Electric Utilities | | | | 42,942,875 | |
| | |
| Electrical Equipment – 0.4% | | | | | | | | |
| | |
AMETEK, Inc. | | | 3,154 | | | | 420,050 | |
| | |
Emerson Electric Co. | | | 21,863 | | | | 2,143,667 | |
| | |
Hubbell, Inc. | | | 2,825 | | | | 519,150 | |
| | |
Rockwell Automation, Inc. | | | 2,627 | | | | 735,639 | |
| | | | | | | | |
| Total Electrical Equipment | | | | 3,818,506 | |
|
| Electronic Equipment, Instruments & Components – 0.4% | |
| | |
Amphenol Corp., Class A | | | 9,909 | | | | 746,643 | |
| | |
Avnet, Inc. | | | 9,466 | | | | 384,225 | |
| | |
CDW Corp. | | | 3,687 | | | | 659,568 | |
| | |
Corning, Inc. | | | 34,752 | | | | 1,282,696 | |
| | |
Jabil, Inc. | | | 3,531 | | | | 217,969 | |
| | |
National Instruments Corp. | | | 10,714 | | | | 434,881 | |
| | |
Richardson Electronics Ltd. | | | 11,928 | | | | 148,384 | |
| | |
TD SYNNEX Corp. | | | 1,496 | | | | 154,402 | |
| | |
Vishay Intertechnology, Inc. | | | 13,990 | | | | 274,204 | |
| | |
Wayside Technology Group, Inc. | | | 1,630 | | | | 55,746 | |
| | | | | | | | |
| Total Electronic Equipment, Instruments & Components | | | | 4,358,718 | |
| | |
| Energy Equipment & Services – 0.2% | | | | | | | | |
| | |
Baker Hughes Co. | | | 37,731 | | | | 1,373,786 | |
| | |
Halliburton Co. | | | 4,769 | | | | 180,602 | |
| | |
NOV, Inc. | | | 26,203 | | | | 513,841 | |
| | | | | | | | |
| Total Energy Equipment & Services | | | | 2,068,229 | |
| | |
| Entertainment – 0.1% | | | | | | | | |
| | |
Activision Blizzard, Inc. | | | 9,400 | | | | 753,034 | |
| | |
Electronic Arts, Inc. | | | 2,390 | | | | 302,359 | |
| | |
Warner Music Group Corp., Class A | | | 5,377 | | | | 203,519 | |
| | | | | | | | |
| Total Entertainment | | | | 1,258,912 | |
| |
| Equity Real Estate Investment Trusts (REITs) – 4.7% | | | | | |
| | |
Agree Realty Corp. | | | 5,686 | | | | 377,323 | |
| | |
Alexandria Real Estate Equities, Inc. | | | 3,535 | | | | 711,419 | |
| | |
American Tower Corp. | | | 12,303 | | | | 3,090,760 | |
| | |
Americold Realty Trust | | | 8,869 | | | | 247,268 | |
| | |
Apartment Income REIT Corp. | | | 7,438 | | | | 397,635 | |
| | |
AvalonBay Communities, Inc. | | | 6,098 | | | | 1,514,560 | |
| | |
Boston Properties, Inc. | | | 6,008 | | | | 773,830 | |
| | |
Brixmor Property Group, Inc. | | | 23,162 | | | | 597,811 | |
| | |
Broadstone Net Lease, Inc. | | | 18,236 | | | | 397,180 | |
| | |
Camden Property Trust | | | 3,231 | | | | 536,992 | |
| | |
Crown Castle International Corp. | | | 19,420 | | | | 3,584,932 | |
| | |
CubeSmart | | | 13,740 | | | | 714,892 | |
| | |
Digital Realty Trust, Inc. | | | 8,005 | | | | 1,135,109 | |
| | |
Duke Realty Corp. | | | 11,999 | | | | 696,662 | |
| | |
EPR Properties | | | 9,096 | | | | 497,642 | |
| | |
Equinix, Inc. | | | 1,346 | | | | 998,221 | |
| | |
Equity LifeStyle Properties, Inc. | | | 6,956 | | | | 531,995 | |
| | |
Equity Residential | | | 16,513 | | | | 1,484,849 | |
| | |
Essential Properties Realty Trust, Inc. | | | 13,660 | | | | 345,598 | |
| | |
Essex Property Trust, Inc. | | | 2,200 | | | | 760,056 | |
| | |
Extra Space Storage, Inc. | | | 4,602 | | | | 946,171 | |
| | |
Federal Realty Investment Trust | | | 4,064 | | | | 496,092 | |
| | |
First Industrial Realty Trust, Inc. | | | 6,590 | | | | 407,987 | |
| | |
Gaming and Leisure Properties, Inc. | | | 23,994 | | | | 1,126,038 | |
| | |
Healthcare Trust of America, Inc., Class A | | | 18,666 | | | | 584,992 | |
| | |
Healthpeak Properties, Inc. | | | 21,715 | | | | 745,476 | |
| | |
Highwoods Properties, Inc. | | | 11,860 | | | | 542,476 | |
| | |
Industrial Logistics Properties Trust | | | 14,583 | | | | 330,597 | |
| | |
Innovative Industrial Properties, Inc. | | | 730 | | | | 149,942 | |
| | |
Invitation Homes, Inc. | | | 13,752 | | | | 552,555 | |
| | |
Iron Mountain, Inc. | | | 18,654 | | | | 1,033,618 | |
| | |
Kilroy Realty Corp. | | | 8,436 | | | | 644,679 | |
| | |
Kimco Realty Corp. | | | 24,402 | | | | 602,729 | |
| | |
Kite Realty Group Trust | | | 17,550 | | | | 399,614 | |
| | |
Lamar Advertising Co., Class A | | | 5,659 | | | | 657,463 | |
| | |
Life Storage, Inc. | | | 4,443 | | | | 623,931 | |
| | |
LXP Industrial Trust | | | 24,036 | | | | 377,365 | |
| | |
Macerich Co. | | | 9,069 | | | | 141,839 | |
See Notes to Financial Statements.
Schedule of Investments (continued)
WisdomTree U.S. Total Dividend Fund (DTD)
March 31, 2022
| | | | | | | | |
| Investments | | Shares | | | Value | |
| | |
Mid-America Apartment Communities, Inc. | | | 4,249 | | | $ | 889,953 | |
| | |
National Retail Properties, Inc. | | | 16,762 | | | | 753,284 | |
| | |
National Storage Affiliates Trust | | | 6,351 | | | | 398,589 | |
| | |
Omega Healthcare Investors, Inc. | | | 22,882 | | | | 713,003 | |
| | |
PotlatchDeltic Corp. | | | 6,366 | | | | 335,679 | |
| | |
Prologis, Inc. | | | 11,836 | | | | 1,911,277 | |
| | |
Public Storage | | | 6,721 | | | | 2,623,072 | |
| | |
Rayonier, Inc. | | | 11,366 | | | | 467,370 | |
| | |
Realty Income Corp. | | | 22,613 | | | | 1,567,081 | |
| | |
Regency Centers Corp. | | | 7,426 | | | | 529,771 | |
| | |
SBA Communications Corp. | | | 125 | | | | 43,013 | |
| | |
Simon Property Group, Inc. | | | 19,262 | | | | 2,534,109 | |
| | |
SL Green Realty Corp.(a) | | | 7,730 | | | | 627,521 | |
| | |
Spirit Realty Capital, Inc. | | | 14,777 | | | | 680,038 | |
| | |
STAG Industrial, Inc. | | | 13,237 | | | | 547,350 | |
| | |
STORE Capital Corp. | | | 22,943 | | | | 670,624 | |
| | |
Sun Communities, Inc. | | | 3,245 | | | | 568,816 | |
| | |
Tanger Factory Outlet Centers, Inc. | | | 13,753 | | | | 236,414 | |
| | |
UDR, Inc. | | | 10,414 | | | | 597,451 | |
| | |
Uniti Group, Inc. | | | 20,572 | | | | 283,071 | |
| | |
Ventas, Inc. | | | 13,980 | | | | 863,405 | |
| | |
VICI Properties, Inc. | | | 25,188 | | | | 716,851 | |
| | |
W.P. Carey, Inc. | | | 15,733 | | | | 1,271,856 | |
| | |
Welltower, Inc. | | | 11,406 | | | | 1,096,573 | |
| | |
Weyerhaeuser Co. | | | 17,516 | | | | 663,856 | |
| | | | | | | | |
| Total Equity Real Estate Investment Trusts (REITs) | | | | 51,348,325 | |
| | |
| Food & Staples Retailing – 2.0% | | | | | | | | |
| | |
Albertsons Cos., Inc., Class A | | | 15,517 | | | | 515,940 | |
| | |
Costco Wholesale Corp. | | | 6,804 | | | | 3,918,083 | |
| | |
Kroger Co. | | | 23,142 | | | | 1,327,657 | |
| | |
SpartanNash Co. | | | 11,559 | | | | 381,331 | |
| | |
Sysco Corp. | | | 20,458 | | | | 1,670,396 | |
| | |
Walgreens Boots Alliance, Inc. | | | 54,724 | | | | 2,449,994 | |
| | |
Walmart, Inc. | | | 74,328 | | | | 11,068,926 | |
| | | | | | | | |
| Total Food & Staples Retailing | | | | 21,332,327 | |
| | |
| Food Products – 2.1% | | | | | | | | |
| | |
Archer-Daniels-Midland Co. | | | 30,837 | | | | 2,783,348 | |
| | |
B&G Foods, Inc. | | | 13,735 | | | | 370,570 | |
| | |
Cal-Maine Foods, Inc. | | | 5,757 | | | | 317,902 | |
| | |
Campbell Soup Co. | | | 19,255 | | | | 858,195 | |
| | |
Conagra Brands, Inc. | | | 29,813 | | | | 1,000,822 | |
| | |
Flowers Foods, Inc. | | | 25,044 | | | | 643,881 | |
| | |
General Mills, Inc. | | | 30,630 | | | | 2,074,264 | |
| | |
Hershey Co. | | | 7,392 | | | | 1,601,329 | |
| | |
Hormel Foods Corp. | | | 25,397 | | | | 1,308,961 | |
| | |
Ingredion, Inc. | | | 5,090 | | | | 443,593 | |
| | |
J.M. Smucker Co. | | | 6,527 | | | | 883,821 | |
| | |
Kellogg Co. | | | 20,432 | | | | 1,317,660 | |
| | |
Kraft Heinz Co. | | | 89,968 | | | | 3,543,840 | |
| | |
McCormick & Co., Inc., Non-Voting Shares | | | 7,744 | | | | 772,851 | |
| | |
Mondelez International, Inc., Class A | | | 51,039 | | | | 3,204,228 | |
| | |
Tyson Foods, Inc., Class A | | | 14,974 | | | | 1,342,120 | |
| | | | | | | | |
| Total Food Products | | | | 22,467,385 | |
| | |
| Gas Utilities – 0.3% | | | | | | | | |
| | |
Atmos Energy Corp. | | | 8,434 | | | | 1,007,779 | |
| | |
National Fuel Gas Co. | | | 9,993 | | | | 686,519 | |
| | |
New Jersey Resources Corp. | | | 11,023 | | | | 505,515 | |
| | |
South Jersey Industries, Inc. | | | 17,817 | | | | 615,577 | |
| | |
UGI Corp. | | | 20,709 | | | | 750,080 | |
| | | | | | | | |
| Total Gas Utilities | | | | 3,565,470 | |
| | |
| Health Care Equipment & Supplies – 1.1% | | | | | | | | |
| | |
Abbott Laboratories | | | 59,167 | | | | 7,003,006 | |
| | |
Baxter International, Inc. | | | 11,942 | | | | 925,983 | |
| | |
Becton Dickinson and Co. | | | 6,595 | | | | 1,754,270 | |
| | |
Dentsply Sirona, Inc. | | | 5,258 | | | | 258,799 | |
| | |
ResMed, Inc. | | | 1,745 | | | | 423,180 | |
| | |
Stryker Corp. | | | 6,119 | | | | 1,635,914 | |
| | |
Zimmer Biomet Holdings, Inc. | | | 2,443 | | | | 312,460 | |
| | | | | | | | |
| Total Health Care Equipment & Supplies | | | | 12,313,612 | |
| | |
| Health Care Providers & Services – 2.4% | | | | | | | | |
| | |
AmerisourceBergen Corp. | | | 4,962 | | | | 767,671 | |
| | |
Anthem, Inc. | | | 4,398 | | | | 2,160,386 | |
| | |
Cardinal Health, Inc. | | | 18,971 | | | | 1,075,656 | |
| | |
Cigna Corp. | | | 9,973 | | | | 2,389,631 | |
| | |
CVS Health Corp. | | | 45,157 | | | | 4,570,340 | |
| | |
Encompass Health Corp. | | | 6,371 | | | | 453,042 | |
| | |
HCA Healthcare, Inc. | | | 3,536 | | | | 886,192 | |
| | |
Humana, Inc. | | | 1,376 | | | | 598,794 | |
| | |
McKesson Corp. | | | 1,996 | | | | 611,035 | |
| | |
Patterson Cos., Inc. | | | 12,631 | | | | 408,865 | |
| | |
Premier, Inc., Class A | | | 11,885 | | | | 422,987 | |
| | |
Quest Diagnostics, Inc. | | | 4,785 | | | | 654,875 | |
| | |
Select Medical Holdings Corp. | | | 5,728 | | | | 137,415 | |
| | |
UnitedHealth Group, Inc. | | | 19,968 | | | | 10,183,081 | |
| | |
Universal Health Services, Inc., Class B | | | 1,262 | | | | 182,927 | |
| | | | | | | | |
| Total Health Care Providers & Services | | | | 25,502,897 | |
| | |
| Health Care Technology – 0.1% | | | | | | | | |
| | |
Cerner Corp. | | | 7,412 | | | | 693,467 | |
| | |
| Hotels, Restaurants & Leisure – 1.6% | | | | | | | | |
| | |
Aramark | | | 5,613 | | | | 211,049 | |
| | |
Choice Hotels International, Inc. | | | 1,185 | | | | 167,986 | |
| | |
Darden Restaurants, Inc. | | | 5,503 | | | | 731,624 | |
| | |
Dine Brands Global, Inc. | | | 3,227 | | | | 251,545 | |
| | |
Domino’s Pizza, Inc. | | | 358 | | | | 145,710 | |
| | |
Jack in the Box, Inc. | | | 3,214 | | | | 300,220 | |
| | |
Marriott Vacations Worldwide Corp. | | | 357 | | | | 56,299 | |
| | |
McDonald’s Corp. | | | 38,512 | | | | 9,523,247 | |
| | |
Papa John’s International, Inc. | | | 1,989 | | | | 209,402 | |
| | |
Starbucks Corp. | | | 31,451 | | | | 2,861,097 | |
| | |
Texas Roadhouse, Inc. | | | 4,473 | | | | 374,524 | |
| | |
Travel + Leisure Co. | | | 4,670 | | | | 270,580 | |
| | |
Vail Resorts, Inc. | | | 603 | | | | 156,943 | |
| | |
Wendy’s Co. | | | 17,385 | | | | 381,948 | |
| | |
Wyndham Hotels & Resorts, Inc. | | | 3,334 | | | | 282,356 | |
| | |
Yum! Brands, Inc. | | | 10,029 | | | | 1,188,737 | |
| | | | | | | | |
| Total Hotels, Restaurants & Leisure | | | | 17,113,267 | |
See Notes to Financial Statements.
Schedule of Investments (continued)
WisdomTree U.S. Total Dividend Fund (DTD)
March 31, 2022
| | | | | | | | |
| Investments | | Shares | | | Value | |
| | |
| Household Durables – 0.3% | | | | | | | | |
| | |
D.R. Horton, Inc. | | | 4,834 | | | $ | 360,181 | |
| | |
Leggett & Platt, Inc. | | | 12,377 | | | | 430,720 | |
| | |
Lennar Corp., Class A | | | 4,325 | | | | 351,060 | |
| | |
MDC Holdings, Inc. | | | 8,242 | | | | 311,877 | |
| | |
Newell Brands, Inc. | | | 29,890 | | | | 639,945 | |
| | |
PulteGroup, Inc. | | | 5,793 | | | | 242,727 | |
| | |
Tempur Sealy International, Inc. | | | 3,525 | | | | 98,418 | |
| | |
Toll Brothers, Inc. | | | 3,826 | | | | 179,898 | |
| | |
Whirlpool Corp. | | | 2,246 | | | | 388,064 | |
| | | | | | | | |
| Total Household Durables | | | | 3,002,890 | |
| | |
| Household Products – 2.6% | | | | | | | | |
| | |
Church & Dwight Co., Inc. | | | 4,621 | | | | 459,235 | |
| | |
Clorox Co. | | | 5,407 | | | | 751,735 | |
| | |
Colgate-Palmolive Co. | | | 45,727 | | | | 3,467,478 | |
| | |
Energizer Holdings, Inc. | | | 8,252 | | | | 253,832 | |
| | |
Kimberly-Clark Corp. | | | 17,136 | | | | 2,110,470 | |
| | |
Procter & Gamble Co. | | | 135,359 | | | | 20,682,855 | |
| | |
Reynolds Consumer Products, Inc. | | | 17,580 | | | | 515,797 | |
| | |
Spectrum Brands Holdings, Inc. | | | 2,371 | | | | 210,355 | |
| | | | | | | | |
| Total Household Products | | | | 28,451,757 | |
|
| Independent Power & Renewable Electricity Producers – 0.1% | |
| | |
AES Corp. | | | 21,578 | | | | 555,202 | |
| | |
Clearway Energy, Inc., Class A | | | 9,478 | | | | 315,807 | |
| | |
Clearway Energy, Inc., Class C | | | 12,970 | | | | 473,535 | |
| | | | | | | | |
| Total Independent Power & Renewable Electricity Producers | | | | 1,344,544 | |
| | |
| Industrial Conglomerates – 0.9% | | | | | | | | |
| | |
3M Co. | | | 31,424 | | | | 4,678,405 | |
| | |
General Electric Co. | | | 5,509 | | | | 504,074 | |
| | |
Honeywell International, Inc. | | | 21,549 | | | | 4,193,004 | |
| | |
Roper Technologies, Inc. | | | 1,031 | | | | 486,869 | |
| | | | | | | | |
| Total Industrial Conglomerates | | | | 9,862,352 | |
| | |
| Insurance – 2.9% | | | | | | | | |
| | |
Aflac, Inc. | | | 31,556 | | | | 2,031,891 | |
| | |
Allstate Corp. | | | 13,996 | | | | 1,938,586 | |
| | |
American Financial Group, Inc. | | | 4,553 | | | | 663,008 | |
| | |
American International Group, Inc. | | | 29,964 | | | | 1,880,840 | |
| | |
Arthur J. Gallagher & Co. | | | 4,097 | | | | 715,336 | |
| | |
Assurant, Inc. | | | 2,986 | | | | 542,944 | |
| | |
Brown & Brown, Inc. | | | 5,465 | | | | 394,955 | |
| | |
Cincinnati Financial Corp. | | | 10,140 | | | | 1,378,634 | |
| | |
CNA Financial Corp. | | | 20,274 | | | | 985,722 | |
| | |
CNO Financial Group, Inc. | | | 13,224 | | | | 331,790 | |
| | |
Fidelity National Financial, Inc. | | | 24,378 | | | | 1,190,621 | |
| | |
First American Financial Corp. | | | 9,901 | | | | 641,783 | |
| | |
Hanover Insurance Group, Inc. | | | 3,483 | | | | 520,778 | |
| | |
Hartford Financial Services Group, Inc. | | | 14,375 | | | | 1,032,269 | |
| | |
Kemper Corp. | | | 6,166 | | | | 348,626 | |
| | |
Lincoln National Corp. | | | 7,824 | | | | 511,377 | |
| | |
Marsh & McLennan Cos., Inc. | | | 15,280 | | | | 2,604,018 | |
| | |
Mercury General Corp. | | | 10,696 | | | | 588,280 | |
| | |
MetLife, Inc. | | | 42,585 | | | | 2,992,874 | |
| | |
Old Republic International Corp. | | | 35,734 | | | | 924,438 | |
| | |
Primerica, Inc. | | | 2,620 | | | | 358,468 | |
| | |
Principal Financial Group, Inc. | | | 17,703 | | | | 1,299,577 | |
| | |
Progressive Corp. | | | 6,423 | | | | 732,158 | |
| | |
Prudential Financial, Inc. | | | 25,451 | | | | 3,007,545 | |
| | |
Reinsurance Group of America, Inc. | | | 5,133 | | | | 561,858 | |
| | |
Travelers Cos., Inc. | | | 10,686 | | | | 1,952,653 | |
| | |
Unum Group | | | 22,313 | | | | 703,083 | |
| | |
W.R. Berkley Corp. | | | 8,235 | | | | 548,369 | |
| | | | | | | | |
| Total Insurance | | | | 31,382,481 | |
| | |
| Internet & Direct Marketing Retail – 0.1% | | | | | | | | |
| | |
eBay, Inc. | | | 11,055 | | | | 633,009 | |
| | |
| IT Services – 1.4% | | | | | | | | |
| | |
Alliance Data Systems Corp. | | | 719 | | | | 40,372 | |
| | |
Automatic Data Processing, Inc. | | | 12,472 | | | | 2,837,879 | |
| | |
Broadridge Financial Solutions, Inc. | | | 2,714 | | | | 422,597 | |
| | |
Cognizant Technology Solutions Corp., Class A | | | 9,633 | | | | 863,791 | |
| | |
Concentrix Corp. | | | 823 | | | | 137,079 | |
| | |
Jack Henry & Associates, Inc. | | | 2,626 | | | | 517,453 | |
| | |
MasterCard, Inc., Class A | | | 9,132 | | | | 3,263,594 | |
| | |
Maximus, Inc. | | | 4,090 | | | | 306,545 | |
| | |
Paychex, Inc. | | | 18,723 | | | | 2,555,128 | |
| | |
Switch, Inc., Class A | | | 3,741 | | | | 115,298 | |
| | |
Visa, Inc., Class A | | | 20,033 | | | | 4,442,718 | |
| | | | | | | | |
| Total IT Services | | | | 15,502,454 | |
| | |
| Leisure Products – 0.1% | | | | | | | | |
| | |
Brunswick Corp. | | | 3,270 | | | | 264,510 | |
| | |
Hasbro, Inc. | | | 6,847 | | | | 560,906 | |
| | |
Polaris, Inc. | | | 2,398 | | | | 252,558 | |
| | |
Sturm Ruger & Co., Inc. | | | 5,286 | | | | 368,011 | |
| | | | | | | | |
| Total Leisure Products | | | | 1,445,985 | |
| | |
| Life Sciences Tools & Services – 0.3% | | | | | | | | |
| | |
Agilent Technologies, Inc. | | | 4,123 | | | | 545,596 | |
| | |
Danaher Corp. | | | 4,639 | | | | 1,360,758 | |
| | |
Thermo Fisher Scientific, Inc. | | | 1,614 | | | | 953,309 | |
| | |
West Pharmaceutical Services, Inc. | | | 418 | | | | 171,677 | |
| | | | | | | | |
| Total Life Sciences Tools & Services | | | | 3,031,340 | |
| | |
| Machinery – 1.9% | | | | | | | | |
| | |
Allison Transmission Holdings, Inc. | | | 8,765 | | | | 344,114 | |
| | |
Caterpillar, Inc. | | | 19,129 | | | | 4,262,324 | |
| | |
Crane Co. | | | 4,504 | | | | 487,693 | |
| | |
Cummins, Inc. | | | 5,801 | | | | 1,189,843 | |
| | |
Deere & Co. | | | 5,772 | | | | 2,398,035 | |
| | |
Donaldson Co., Inc. | | | 8,251 | | | | 428,474 | |
| | |
Dover Corp. | | | 4,677 | | | | 733,821 | |
| | |
Flowserve Corp. | | | 12,084 | | | | 433,816 | |
| | |
Fortive Corp. | | | 2,976 | | | | 181,328 | |
| | |
Illinois Tool Works, Inc. | | | 15,861 | | | | 3,321,293 | |
| | |
Kennametal, Inc. | | | 8,624 | | | | 246,733 | |
| | |
Lincoln Electric Holdings, Inc. | | | 3,932 | | | | 541,869 | |
| | |
Mueller Industries, Inc. | | | 4,896 | | | | 265,216 | |
See Notes to Financial Statements.
Schedule of Investments (continued)
WisdomTree U.S. Total Dividend Fund (DTD)
March 31, 2022
| | | | | | | | |
| Investments | | Shares | | | Value | |
| | |
Oshkosh Corp. | | | 3,304 | | | $ | 332,548 | |
| | |
Otis Worldwide Corp. | | | 10,352 | | | | 796,586 | |
| | |
PACCAR, Inc. | | | 8,261 | | | | 727,546 | |
| | |
Parker-Hannifin Corp. | | | 2,472 | | | | 701,455 | |
| | |
Snap-on, Inc. | | | 3,196 | | | | 656,714 | |
| | |
Stanley Black & Decker, Inc. | | | 4,389 | | | | 613,538 | |
| | |
Timken Co. | | | 5,149 | | | | 312,544 | |
| | |
Toro Co. | | | 4,711 | | | | 402,743 | |
| | |
Trinity Industries, Inc. | | | 12,418 | | | | 426,683 | |
| | |
Xylem, Inc. | | | 3,252 | | | | 277,266 | |
| | | | | | | | |
| Total Machinery | | | | 20,082,182 | |
| | |
| Marine – 0.0% | | | | | | | | |
| | |
Matson, Inc. | | | 3,661 | | | | 441,590 | |
| | |
| Media – 1.0% | | | | | | | | |
| | |
Comcast Corp., Class A | | | 140,318 | | | | 6,569,689 | |
| | |
Fox Corp., Class A | | | 4,133 | | | | 163,047 | |
| | |
Fox Corp., Class B | | | 11,944 | | | | 433,328 | |
| | |
Gray Television, Inc. | | | 11,990 | | | | 264,619 | |
| | |
Interpublic Group of Cos., Inc. | | | 17,702 | | | | 627,536 | |
| | |
John Wiley & Sons, Inc., Class A | | | 6,634 | | | | 351,801 | |
| | |
New York Times Co., Class A | | | 2,151 | | | | 98,602 | |
| | |
News Corp., Class A | | | 549 | | | | 12,160 | |
| | |
News Corp., Class B | | | 12,404 | | | | 279,338 | |
| | |
Nexstar Media Group, Inc., Class A | | | 2,230 | | | | 420,311 | |
| | |
Omnicom Group, Inc. | | | 12,930 | | | | 1,097,499 | |
| | |
Sirius XM Holdings, Inc.(a) | | | 82,157 | | | | 543,879 | |
| | |
TEGNA, Inc. | | | 17,940 | | | | 401,856 | |
| | | | | | | | |
| Total Media | | | | 11,263,665 | |
| | |
| Metals & Mining – 0.7% | | | | | | | | |
| | |
Alcoa Corp. | | | 1,443 | | | | 129,913 | |
| | |
Commercial Metals Co. | | | 9,977 | | | | 415,243 | |
| | |
Freeport-McMoRan, Inc. | | | 15,789 | | | | 785,345 | |
| | |
Newmont Corp. | | | 52,912 | | | | 4,203,859 | |
| | |
Nucor Corp. | | | 5,899 | | | | 876,886 | |
| | |
Reliance Steel & Aluminum Co. | | | 4,072 | | | | 746,601 | |
| | |
Steel Dynamics, Inc. | | | 4,957 | | | | 413,563 | |
| | |
United States Steel Corp. | | | 1,330 | | | | 50,194 | |
| | | | | | | | |
| Total Metals & Mining | | | | 7,621,604 | |
| | |
| Multi-Utilities – 1.8% | | | | | | | | |
| | |
Ameren Corp. | | | 12,836 | | | | 1,203,503 | |
| | |
CenterPoint Energy, Inc. | | | 24,871 | | | | 762,048 | |
| | |
CMS Energy Corp. | | | 23,443 | | | | 1,639,603 | |
| | |
Consolidated Edison, Inc. | | | 22,674 | | | | 2,146,774 | |
| | |
Dominion Energy, Inc. | | | 43,944 | | | | 3,733,922 | |
| | |
DTE Energy Co. | | | 11,112 | | | | 1,469,118 | |
| | |
NiSource, Inc. | | | 26,907 | | | | 855,643 | |
| | |
Public Service Enterprise Group, Inc. | | | 27,275 | | | | 1,909,250 | |
| | |
Sempra Energy | | | 17,577 | | | | 2,955,045 | |
| | |
WEC Energy Group, Inc. | | | 24,982 | | | | 2,493,453 | |
| | | | | | | | |
| Total Multi-Utilities | | | | 19,168,359 | |
| | |
| Multiline Retail – 0.5% | | | | | | | | |
| | |
Big Lots, Inc. | | | 5,117 | | | | 177,048 | |
| | |
Dollar General Corp. | | | 2,716 | | | | 604,663 | |
| | |
Franchise Group, Inc. | | | 6,308 | | | | 261,341 | |
| | |
Kohl’s Corp. | | | 4,222 | | | | 255,262 | |
| | |
Macy’s, Inc. | | | 8,948 | | | | 217,973 | |
| | |
Target Corp. | | | 17,513 | | | | 3,716,609 | |
| | | | | | | | |
| Total Multiline Retail | | | | 5,232,896 | |
| | |
| Oil, Gas & Consumable Fuels – 9.0% | | | | | | | | |
| | |
Antero Midstream Corp. | | | 70,887 | | | | 770,542 | |
| | |
APA Corp. | | | 9,973 | | | | 412,184 | |
| | |
California Resources Corp. | | | 4,423 | | | | 197,841 | |
| | |
Cheniere Energy, Inc. | | | 6,909 | | | | 957,933 | |
| | |
Chesapeake Energy Corp.(a) | | | 5,505 | | | | 478,935 | |
| | |
Chevron Corp. | | | 147,711 | | | | 24,051,782 | |
| | |
Civitas Resources, Inc. | | | 6,018 | | | | 359,335 | |
| | |
ConocoPhillips | | | 53,087 | | | | 5,308,700 | |
| | |
Continental Resources, Inc. | | | 14,743 | | | | 904,188 | |
| | |
Coterra Energy, Inc. | | | 38,004 | | | | 1,024,968 | |
| | |
Devon Energy Corp. | | | 128,873 | | | | 7,620,260 | |
| | |
Diamondback Energy, Inc. | | | 5,240 | | | | 718,299 | |
| | |
DTE Midstream LLC | | | 8,702 | | | | 472,171 | |
| | |
EOG Resources, Inc. | | | 32,212 | | | | 3,840,637 | |
| | |
Equitrans Midstream Corp. | | | 45,555 | | | | 384,484 | |
| | |
Exxon Mobil Corp. | | | 397,076 | | | | 32,794,507 | |
| | |
Falcon Minerals Corp. | | | 57,704 | | | | 388,925 | |
| | |
Hess Corp. | | | 6,882 | | | | 736,649 | |
| | |
HF Sinclair Corp.* | | | 13,671 | | | | 544,789 | |
| | |
Kinder Morgan, Inc. | | | 245,013 | | | | 4,633,196 | |
| | |
Magnolia Oil & Gas Corp., Class A | | | 9,227 | | | | 218,219 | |
| | |
Marathon Oil Corp. | | | 16,724 | | | | 419,940 | |
| | |
Marathon Petroleum Corp. | | | 35,835 | | | | 3,063,892 | |
| | |
Murphy Oil Corp. | | | 7,973 | | | | 322,029 | |
| | |
Northern Oil and Gas, Inc. | | | 11,531 | | | | 325,059 | |
| | |
Oasis Petroleum, Inc. | | | 2,472 | | | | 361,654 | |
| | |
Occidental Petroleum Corp. | | | 1,012 | | | | 57,421 | |
| | |
ONEOK, Inc. | | | 41,640 | | | | 2,941,033 | |
| | |
Ovintiv, Inc. | | | 9,972 | | | | 539,186 | |
| | |
PDC Energy, Inc. | | | 3,881 | | | | 282,071 | |
| | |
Pioneer Natural Resources Co. | | | 5,237 | | | | 1,309,407 | |
| | |
Targa Resources Corp. | | | 4,550 | | | | 343,389 | |
| | |
Texas Pacific Land Corp. | | | 139 | | | | 187,943 | |
| | | | | | | | |
| Total Oil, Gas & Consumable Fuels | | | | 96,971,568 | |
| | |
| Paper & Forest Products – 0.0% | | | | | | | | |
| | |
Louisiana-Pacific Corp. | | | 1,691 | | | | 105,045 | |
| | |
| Personal Products – 0.1% | | | | | | | | |
| | |
Edgewell Personal Care Co. | | | 6,041 | | | | 221,524 | |
| | |
Estee Lauder Cos., Inc., Class A | | | 2,237 | | | | 609,180 | |
| | |
Inter Parfums, Inc. | | | 563 | | | | 49,572 | |
| | |
Medifast, Inc. | | | 1,207 | | | | 206,131 | |
| | |
Nu Skin Enterprises, Inc., Class A | | | 7,281 | | | | 348,614 | |
| | | | | | | | |
| Total Personal Products | | | | 1,435,021 | |
|
| Pharmaceuticals – 7.5% | |
| | |
Bristol-Myers Squibb Co. | | | 124,586 | | | | 9,098,516 | |
| | |
Eli Lilly & Co. | | | 22,133 | | | | 6,338,227 | |
See Notes to Financial Statements.
Schedule of Investments (continued)
WisdomTree U.S. Total Dividend Fund (DTD)
March 31, 2022
| | | | | | | | |
| Investments | | Shares | | | Value | |
| | |
Johnson & Johnson | | | 168,890 | | | $ | 29,932,375 | |
| | |
Merck & Co., Inc. | | | 155,940 | | | | 12,794,877 | |
| | |
Organon & Co. | | | 20,094 | | | | 701,883 | |
| | |
Pfizer, Inc. | | | 415,940 | | | | 21,533,214 | |
| | |
Zoetis, Inc. | | | 6,043 | | | | 1,139,649 | |
| | | | | | | | |
| Total Pharmaceuticals | | | | 81,538,741 | |
| | |
| Professional Services – 0.3% | | | | | | | | |
| | |
Booz Allen Hamilton Holding Corp. | | | 4,306 | | | | 378,239 | |
| | |
Equifax, Inc. | | | 1,359 | | | | 322,219 | |
| | |
Exponent, Inc. | | | 2,531 | | | | 273,475 | |
| | |
Insperity, Inc. | | | 2,244 | | | | 225,342 | |
| | |
Jacobs Engineering Group, Inc. | | | 1,129 | | | | 155,587 | |
| | |
Leidos Holdings, Inc. | | | 3,745 | | | | 404,535 | |
| | |
ManpowerGroup, Inc. | | | 3,784 | | | | 355,393 | |
| | |
Robert Half International, Inc. | | | 3,756 | | | | 428,860 | |
| | |
Science Applications International Corp. | | | 4,094 | | | | 377,344 | |
| | |
TransUnion | | | 640 | | | | 66,138 | |
| | |
Verisk Analytics, Inc. | | | 2,386 | | | | 512,107 | |
| | | | | | | | |
| Total Professional Services | | | | 3,499,239 | |
|
| Real Estate Management & Development – 0.0% | |
| | |
Kennedy-Wilson Holdings, Inc. | | | 18,074 | | | | 440,825 | |
| | |
| Road & Rail – 1.1% | | | | | | | | |
| | |
CSX Corp. | | | 35,926 | | | | 1,345,429 | |
| | |
JB Hunt Transport Services, Inc. | | | 2,164 | | | | 434,509 | |
| | |
Knight-Swift Transportation Holdings, Inc. | | | 2,709 | | | | 136,696 | |
| | |
Norfolk Southern Corp. | | | 6,141 | | | | 1,751,536 | |
| | |
Old Dominion Freight Line, Inc. | | | 767 | | | | 229,088 | |
| | |
Ryder System, Inc. | | | 4,865 | | | | 385,940 | |
| | |
Union Pacific Corp. | | | 27,441 | | | | 7,497,156 | |
| | | | | | | | |
| Total Road & Rail | | | | 11,780,354 | |
|
| Semiconductors & Semiconductor Equipment – 3.7% | |
| | |
Amkor Technology, Inc. | | | 6,722 | | | | 146,002 | |
| | |
Analog Devices, Inc. | | | 13,571 | | | | 2,241,658 | |
| | |
Applied Materials, Inc. | | | 9,080 | | | | 1,196,744 | |
| | |
Broadcom, Inc. | | | 17,065 | | | | 10,745,489 | |
| | |
Intel Corp. | | | 180,171 | | | | 8,929,275 | |
| | |
KLA Corp. | | | 2,572 | | | | 941,506 | |
| | |
Lam Research Corp. | | | 2,023 | | | | 1,087,585 | |
| | |
Marvell Technology, Inc. | | | 4,601 | | | | 329,938 | |
| | |
Microchip Technology, Inc. | | | 9,323 | | | | 700,530 | |
| | |
Micron Technology, Inc. | | | 8,161 | | | | 635,660 | |
| | |
Monolithic Power Systems, Inc. | | | 536 | | | | 260,325 | |
| | |
NVIDIA Corp. | | | 2,803 | | | | 764,827 | |
| | |
Power Integrations, Inc. | | | 3,163 | | | | 293,147 | |
| | |
QUALCOMM, Inc. | | | 27,981 | | | | 4,276,056 | |
| | |
Skyworks Solutions, Inc. | | | 3,969 | | | | 528,988 | |
| | |
Teradyne, Inc. | | | 710 | | | | 83,943 | |
| | |
Texas Instruments, Inc. | | | 36,266 | | | | 6,654,086 | |
| | |
Universal Display Corp. | | | 880 | | | | 146,916 | |
| | | | | | | | |
| Total Semiconductors & Semiconductor Equipment | | | | 39,962,675 | |
| | |
| Software – 4.8% | | | | | | | | |
| | |
A10 Networks, Inc. | | | 3,543 | | | | 49,425 | |
| | |
Bentley Systems, Inc., Class B | | | 1,293 | | | | 57,125 | |
| | |
CDK Global, Inc. | | | 7,411 | | | | 360,767 | |
| | |
Citrix Systems, Inc. | | | 4,211 | | | | 424,890 | |
| | |
Dolby Laboratories, Inc., Class A | | | 4,214 | | | | 329,619 | |
| | |
InterDigital, Inc. | | | 3,981 | | | | 253,988 | |
| | |
Intuit, Inc. | | | 1,895 | | | | 911,192 | |
| | |
Microsoft Corp. | | | 141,136 | | | | 43,513,640 | |
| | |
NortonLifeLock, Inc. | | | 18,358 | | | | 486,854 | |
| | |
Oracle Corp. | | | 61,538 | | | | 5,091,039 | |
| | |
SS&C Technologies Holdings, Inc. | | | 4,226 | | | | 317,034 | |
| | | | | | | | |
| Total Software | | | | 51,795,573 | |
| | |
| Specialty Retail – 2.1% | | | | | | | | |
| | |
Advance Auto Parts, Inc. | | | 1,811 | | | | 374,805 | |
| | |
American Eagle Outfitters, Inc.(a) | | | 5,582 | | | | 93,778 | |
| | |
Bath & Body Works, Inc. | | | 467 | | | | 22,323 | |
| | |
Best Buy Co., Inc. | | | 10,048 | | | | 913,363 | |
| | |
Big 5 Sporting Goods Corp.(a) | | | 9,761 | | | | 167,401 | |
| | |
Buckle, Inc. | | | 5,654 | | | | 186,808 | |
| | |
Camping World Holdings, Inc., Class A | | | 5,677 | | | | 158,672 | |
| | |
Dick’s Sporting Goods, Inc.(a) | | | 2,243 | | | | 224,345 | |
| | |
Foot Locker, Inc. | | | 4,005 | | | | 118,788 | |
| | |
Gap, Inc. | | | 12,459 | | | | 175,423 | |
| | |
Guess?, Inc. | | | 10,098 | | | | 220,641 | |
| | |
Home Depot, Inc. | | | 41,072 | | | | 12,294,082 | |
| | |
Lithia Motors, Inc. | | | 178 | | | | 53,421 | |
| | |
Lowe’s Cos., Inc. | | | 20,895 | | | | 4,224,760 | |
| | |
Penske Automotive Group, Inc. | | | 3,604 | | | | 337,767 | |
| | |
Rent-A-Center, Inc. | | | 4,896 | | | | 123,330 | |
| | |
Ross Stores, Inc. | | | 4,949 | | | | 447,687 | |
| | |
TJX Cos., Inc. | | | 26,140 | | | | 1,583,561 | |
| | |
Tractor Supply Co. | | | 1,695 | | | | 395,562 | |
| | |
Williams-Sonoma, Inc. | | | 2,789 | | | | 404,405 | |
| | | | | | | | |
| Total Specialty Retail | | | | 22,520,922 | |
|
| Technology Hardware, Storage & Peripherals – 3.8% | |
| | |
Apple, Inc. | | | 214,431 | | | | 37,441,797 | |
| | |
Hewlett Packard Enterprise Co. | | | 58,566 | | | | 978,638 | |
| | |
HP, Inc. | | | 45,957 | | | | 1,668,239 | |
| | |
NetApp, Inc. | | | 8,579 | | | | 712,057 | |
| | |
Xerox Holdings Corp. | | | 20,984 | | | | 423,247 | |
| | | | | | | | |
| Total Technology Hardware, Storage & Peripherals | | | | 41,223,978 | |
| | |
| Textiles, Apparel & Luxury Goods – 0.4% | | | | | | | | |
| | |
Carter’s, Inc. | | | 3,256 | | | | 299,519 | |
| | |
Hanesbrands, Inc. | | | 21,197 | | | | 315,623 | |
| | |
Kontoor Brands, Inc. | | | 5,585 | | | | 230,940 | |
| | |
NIKE, Inc., Class B | | | 14,858 | | | | 1,999,293 | |
| | |
Ralph Lauren Corp. | | | 2,118 | | | | 240,266 | |
| | |
Steven Madden Ltd. | | | 5,998 | | | | 231,763 | |
| | |
Tapestry, Inc. | | | 7,905 | | | | 293,671 | |
| | |
VF Corp. | | | 15,492 | | | | 880,875 | |
| | |
Wolverine World Wide, Inc. | | | 8,058 | | | | 181,788 | |
| | | | | | | | |
| Total Textiles, Apparel & Luxury Goods | | | | 4,673,738 | |
See Notes to Financial Statements.
Schedule of Investments (concluded)
WisdomTree U.S. Total Dividend Fund (DTD)
March 31, 2022
| | | | | | | | |
| Investments | | Shares | | | Value | |
| | |
| Thrifts & Mortgage Finance – 0.3% | | | | | | | | |
| | |
Guaranty Federal Bancshares, Inc. | | | 1,675 | | | $ | 52,645 | |
| | |
MGIC Investment Corp. | | | 26,485 | | | | 358,872 | |
| | |
New York Community Bancorp, Inc. | | | 59,184 | | | | 634,453 | |
| | |
PennyMac Financial Services, Inc. | | | 3,441 | | | | 183,061 | |
| | |
Radian Group, Inc. | | | 21,716 | | | | 482,312 | |
| | |
TFS Financial Corp. | | | 40,003 | | | | 664,050 | |
| | |
UWM Holdings Corp.(a) | | | 39,523 | | | | 179,039 | |
| | |
Walker & Dunlop, Inc. | | | 2,207 | | | | 285,630 | |
| | | | | | | | |
| Total Thrifts & Mortgage Finance | | | | 2,840,062 | |
| | |
| Tobacco – 3.7% | | | | | | | | |
| | |
Altria Group, Inc. | | | 363,612 | | | | 18,998,727 | |
| | |
Philip Morris International, Inc. | | | 209,221 | | | | 19,654,221 | |
| | |
Universal Corp. | | | 8,013 | | | | 465,315 | |
| | |
Vector Group Ltd. | | | 31,822 | | | | 383,137 | |
| | | | | | | | |
| Total Tobacco | | | | 39,501,400 | |
| |
| Trading Companies & Distributors – 0.4% | | | | | |
| | |
Air Lease Corp. | | | 3,707 | | | | 165,518 | |
| | |
Applied Industrial Technologies, Inc. | | | 3,259 | | | | 334,569 | |
| | |
Fastenal Co. | | | 18,746 | | | | 1,113,512 | |
| | |
H&E Equipment Services, Inc. | | | 6,157 | | | | 267,953 | |
| | |
Herc Holdings, Inc. | | | 489 | | | | 81,707 | |
| | |
MSC Industrial Direct Co., Inc., Class A | | | 5,339 | | | | 454,936 | |
| | |
Rush Enterprises, Inc., Class A | | | 5,317 | | | | 270,689 | |
| | |
W.W. Grainger, Inc. | | | 1,299 | | | | 670,011 | |
| | |
Watsco, Inc. | | | 2,741 | | | | 835,018 | |
| | | | | | | | |
| Total Trading Companies & Distributors | | | | 4,193,913 | |
| | |
| Water Utilities – 0.2% | | | | | | | | |
| | |
American Water Works Co., Inc. | | | 7,350 | | | | 1,216,646 | |
| | |
Essential Utilities, Inc. | | | 13,063 | | | | 667,911 | |
| | | | | | | | |
| Total Water Utilities | | | | 1,884,557 | |
| |
| Wireless Telecommunication Services – 0.0% | | | | | |
| | |
Telephone and Data Systems, Inc. | | | 17,011 | | | | 321,168 | |
| Total United States | | | | 1,077,016,861 | |
| | |
| Puerto Rico – 0.1% | | | | | | | | |
| | |
| Banks – 0.1% | | | | | | | | |
| | |
First Bancorp | | | 30,307 | | | | 397,628 | |
| | |
Popular, Inc. | | | 7,110 | | | | 581,171 | |
| | | | | | | | |
| Total Banks | | | | 978,799 | |
| Total Puerto Rico | | | | 978,799 | |
TOTAL COMMON STOCKS (Cost: $782,431,340) | | | | 1,077,995,660 | |
|
| INVESTMENT OF CASH COLLATERAL FOR SECURITIES LOANED – 0.1% | |
|
| United States – 0.1% | |
| |
State Street Navigator Securities Lending
Government Money Market Portfolio, 0.25%(b) | | | | | |
| (Cost: $1,461,326) | | | 1,461,326 | | | | 1,461,326 | |
| |
TOTAL INVESTMENTS IN SECURITIES – 99.9% (Cost: $783,892,666) | | | | 1,079,456,986 | |
| |
Other Assets less Liabilities – 0.1% | | | | 1,172,098 | |
| | | | | | | | |
| NET ASSETS – 100.0% | | | $ | 1,080,629,084 | |
| * | Non-income producing security. |
| (a) | Security, or portion thereof, was on loan at March 31, 2022 (See Note 2). At March 31, 2022, the total market value of the Fund’s securities on loan identified in the Schedule of Investments was $1,711,777 and the total market value of the collateral held by the Fund was $1,790,447. The total market value of the collateral includes non-cash U.S. Government securities collateral having a value of $329,121. |
| (b) | Rate shown represents annualized 7-day yield as of March 31, 2022. |
The following is a summary of the fair valuations according to the inputs used as of March 31, 2022 in valuing the Fund’s investments (See Note 2 — Fair Value Measurement):
| | | | | | | | | | | | | | | | |
| | | | |
| | | Quoted
Prices in
Active
Markets
(Level 1) | | | Other
Significant
Observable
Inputs
(Level 2) | | | Significant
Unobservable
Inputs
(Level 3) | | | Total | |
Assets: | | | | | | | | | |
Investments in Securities | | | | |
Common Stocks | | $ | 1,077,995,660 | | | $ | — | | | $ | — | | | $ | 1,077,995,660 | |
Investment of Cash Collateral for Securities Loaned | | | — | | | | 1,461,326 | | | | — | | | | 1,461,326 | |
Total Investments in Securities | | $ | 1,077,995,660 | | | $ | 1,461,326 | | | $ | — | | | $ | 1,079,456,986 | |
See Notes to Financial Statements.
Schedule of Investments
WisdomTree U.S. Value Fund (WTV)
March 31, 2022
| | | | | | | | |
| Investments | | Shares | | | Value | |
|
| COMMON STOCKS – 99.8% | |
|
| United States – 99.8% | |
|
| Aerospace & Defense – 1.4% | |
| | |
L3Harris Technologies, Inc. | | | 2,939 | | | $ | 730,254 | |
| | |
Northrop Grumman Corp. | | | 1,806 | | | | 807,679 | |
| | | | | | | | |
| Total Aerospace & Defense | | | | 1,537,933 | |
| | |
| Air Freight & Logistics – 0.5% | | | | | | | | |
| | |
C.H. Robinson Worldwide, Inc. | | | 5,459 | | | | 587,989 | |
| | |
| Banks – 5.9% | | | | | | | | |
| | |
Bank of America Corp. | | | 21,460 | | | | 884,581 | |
| | |
BOK Financial Corp. | | | 3,864 | | | | 363,023 | |
| | |
Citigroup, Inc. | | | 9,862 | | | | 526,631 | |
| | |
Comerica, Inc. | | | 11,625 | | | | 1,051,249 | |
| | |
Commerce Bancshares, Inc. | | | 6,470 | | | | 463,187 | |
| | |
JPMorgan Chase & Co. | | | 3,988 | | | | 543,644 | |
| | |
KeyCorp | | | 25,160 | | | | 563,081 | |
| | |
Synovus Financial Corp. | | | 10,591 | | | | 518,959 | |
| | |
Truist Financial Corp. | | | 10,537 | | | | 597,448 | |
| | |
U.S. Bancorp | | | 5,563 | | | | 295,673 | |
| | |
Zions Bancorp NA | | | 13,976 | | | | 916,267 | |
| | | | | | | | |
| Total Banks | | | | 6,723,743 | |
| | |
| Beverages – 0.4% | | | | | | | | |
| | |
Constellation Brands, Inc., Class A | | | 1,915 | | | | 441,063 | |
| | |
| Biotechnology – 1.9% | | | | | | | | |
| | |
AbbVie, Inc. | | | 2,479 | | | | 401,871 | |
| | |
Amgen, Inc. | | | 3,174 | | | | 767,536 | |
| | |
Biogen, Inc.* | | | 973 | | | | 204,914 | |
| | |
Gilead Sciences, Inc. | | | 13,323 | | | | 792,052 | |
| | | | | | | | |
| Total Biotechnology | | | | 2,166,373 | |
| | |
| Building Products – 2.7% | | | | | | | | |
| | |
Advanced Drainage Systems, Inc. | | | 3,285 | | | | 390,291 | |
| | |
Builders FirstSource, Inc.* | | | 7,201 | | | | 464,753 | |
| | |
Lennox International, Inc. | | | 2,256 | | | | 581,732 | |
| | |
Masco Corp. | | | 12,622 | | | | 643,722 | |
| | |
Owens Corning | | | 11,051 | | | | 1,011,166 | |
| | | | | | | | |
| Total Building Products | | | | 3,091,664 | |
| | |
| Capital Markets – 6.3% | | | | | | | | |
| | |
Affiliated Managers Group, Inc. | | | 4,800 | | | | 676,560 | |
| | |
Ameriprise Financial, Inc. | | | 4,296 | | | | 1,290,347 | |
| | |
Bank of New York Mellon Corp. | | | 18,723 | | | | 929,222 | |
| | |
Goldman Sachs Group, Inc. | | | 4,375 | | | | 1,444,188 | |
| | |
Houlihan Lokey, Inc. | | | 3,876 | | | | 340,313 | |
| | |
Jefferies Financial Group, Inc. | | | 31,678 | | | | 1,040,622 | |
| | |
Morgan Stanley | | | 13,217 | | | | 1,155,166 | |
| | |
SEI Investments Co. | | | 4,387 | | | | 264,141 | |
| | | | | | | | |
| Total Capital Markets | | | | 7,140,559 | |
| | |
| Chemicals – 2.7% | | | | | | | | |
| | |
Celanese Corp. | | | 8,093 | | | | 1,156,247 | |
| | |
Dow, Inc. | | | 7,614 | | | | 485,164 | |
| | |
DuPont de Nemours, Inc. | | | 7,515 | | | | 552,954 | |
| | |
FMC Corp. | | | 4,279 | | | | 562,988 | |
| | |
Sherwin-Williams Co. | | | 1,281 | | | | 319,763 | |
| | | | | | | | |
| Total Chemicals | | | | 3,077,116 | |
| | |
| Commercial Services & Supplies – 0.3% | | | | | | | | |
| | |
Cintas Corp. | | | 866 | | | | 368,388 | |
| | |
| Communications Equipment – 0.6% | | | | | | | | |
| | |
Lumentum Holdings, Inc.* | | | 7,340 | | | | 716,384 | |
| | |
| Construction & Engineering – 1.4% | | | | | | | | |
| | |
AECOM | | | 14,881 | | | | 1,143,010 | |
| | |
WillScot Mobile Mini Holdings Corp.* | | | 12,155 | | | | 475,625 | |
| | | | | | | | |
| Total Construction & Engineering | | | | 1,618,635 | |
| | |
| Construction Materials – 0.3% | | | | | | | | |
| | |
Eagle Materials, Inc. | | | 2,551 | | | | 327,446 | |
| | |
| Consumer Finance – 5.3% | | | | | | | | |
| | |
Ally Financial, Inc. | | | 27,906 | | | | 1,213,353 | |
| | |
American Express Co. | | | 3,162 | | | | 591,294 | |
| | |
Capital One Financial Corp. | | | 6,622 | | | | 869,402 | |
| | |
Credit Acceptance Corp.*(a) | | | 3,444 | | | | 1,895,474 | |
| | |
Discover Financial Services | | | 6,371 | | | | 702,021 | |
| | |
Synchrony Financial | | | 20,491 | | | | 713,292 | |
| | | | | | | | |
| Total Consumer Finance | | | | 5,984,836 | |
| | |
| Containers & Packaging – 1.7% | | | | | | | | |
| | |
Crown Holdings, Inc. | | | 6,465 | | | | 808,707 | |
| | |
International Paper Co. | | | 12,027 | | | | 555,046 | |
| | |
Sealed Air Corp. | | | 8,253 | | | | 552,621 | |
| | | | | | | | |
| Total Containers & Packaging | | | | 1,916,374 | |
| | |
| Diversified Consumer Services – 0.9% | | | | | | | | |
| | |
Service Corp. International | | | 15,889 | | | | 1,045,814 | |
| | |
| Diversified Financial Services – 3.3% | | | | | | | | |
| | |
Berkshire Hathaway, Inc., Class B* | | | 4,265 | | | | 1,505,161 | |
| | |
Equitable Holdings, Inc. | | | 41,091 | | | | 1,270,123 | |
| | |
Voya Financial, Inc. | | | 14,568 | | | | 966,587 | |
| | | | | | | | |
| Total Diversified Financial Services | | | | 3,741,871 | |
|
| Diversified Telecommunication Services – 1.6% | |
| | |
Lumen Technologies, Inc.(a) | | | 157,735 | | | | 1,777,673 | |
| | |
| Electric Utilities – 0.4% | | | | | | | | |
| | |
PPL Corp. | | | 17,700 | | | | 505,512 | |
| | |
| Electrical Equipment – 0.7% | | | | | | | | |
| | |
Acuity Brands, Inc. | | | 4,241 | | | | 802,821 | |
|
| Electronic Equipment, Instruments & Components – 1.6% | |
| | |
Arrow Electronics, Inc.* | | | 9,500 | | | | 1,126,985 | |
| | |
CDW Corp. | | | 3,592 | | | | 642,573 | |
| | | | | | | | |
| Total Electronic Equipment, Instruments & Components | | | | 1,769,558 | |
|
| Entertainment – 0.6% | |
| | |
Liberty Media Corp. – Liberty Formula One, Class C* | | | 9,414 | | | | 657,474 | |
| | |
| Health Care Equipment & Supplies – 0.4% | | | | | | | | |
| | |
Becton Dickinson and Co. | | | 1,626 | | | | 432,516 | |
| | |
| Health Care Providers & Services – 7.8% | | | | | | | | |
| | |
Anthem, Inc. | | | 1,317 | | | | 646,937 | |
See Notes to Financial Statements.
Schedule of Investments (continued)
WisdomTree U.S. Value Fund (WTV)
March 31, 2022
| | | | | | | | |
| Investments | | Shares | | | Value | |
| | |
Cardinal Health, Inc. | | | 19,106 | | | $ | 1,083,310 | |
| | |
Chemed Corp. | | | 1,160 | | | | 587,598 | |
| | |
Cigna Corp. | | | 5,957 | | | | 1,427,357 | |
| | |
DaVita, Inc.* | | | 13,939 | | | | 1,576,640 | |
| | |
HCA Healthcare, Inc. | | | 2,903 | | | | 727,550 | |
| | |
Humana, Inc. | | | 2,284 | | | | 993,928 | |
| | |
McKesson Corp. | | | 2,347 | | | | 718,487 | |
| | |
Quest Diagnostics, Inc. | | | 4,593 | | | | 628,598 | |
| | |
Universal Health Services, Inc., Class B | | | 3,678 | | | | 533,126 | |
| | | | | | | | |
| Total Health Care Providers & Services | | | | 8,923,531 | |
| | |
| Hotels, Restaurants & Leisure – 1.8% | | | | | | | | |
| | |
Domino’s Pizza, Inc. | | | 1,782 | | | | 725,292 | |
| | |
Starbucks Corp. | | | 9,360 | | | | 851,479 | |
| | |
Yum! Brands, Inc. | | | 3,721 | | | | 441,050 | |
| | | | | | | | |
| Total Hotels, Restaurants & Leisure | | | | 2,017,821 | |
| | |
| Household Durables – 2.5% | | | | | | | | |
| | |
Mohawk Industries, Inc.* | | | 3,835 | | | | 476,307 | |
| | |
NVR, Inc.* | | | 144 | | | | 643,287 | |
| | |
PulteGroup, Inc. | | | 14,049 | | | | 588,653 | |
| | |
Tempur Sealy International, Inc. | | | 23,848 | | | | 665,836 | |
| | |
Whirlpool Corp. | | | 2,371 | | | | 409,661 | |
| | | | | | | | |
| Total Household Durables | | | | 2,783,744 | |
| | |
| Household Products – 0.4% | | | | | | | | |
| | |
Procter & Gamble Co. | | | 3,124 | | | | 477,347 | |
| | |
| Insurance – 8.1% | | | | | | | | |
| | |
Aflac, Inc. | | | 21,429 | | | | 1,379,813 | |
| | |
Alleghany Corp.* | | | 551 | | | | 466,697 | |
| | |
Allstate Corp. | | | 12,663 | | | | 1,753,952 | |
| | |
American Financial Group, Inc. | | | 5,359 | | | | 780,378 | |
| | |
American International Group, Inc. | | | 11,715 | | | | 735,351 | |
| | |
Assurant, Inc. | | | 5,335 | | | | 970,063 | |
| | |
Fidelity National Financial, Inc. | | | 11,810 | | | | 576,801 | |
| | |
Hartford Financial Services Group, Inc. | | | 11,299 | | | | 811,381 | |
| | |
Loews Corp. | | | 13,110 | | | | 849,790 | |
| | |
Travelers Cos., Inc. | | | 4,703 | | | | 859,379 | |
| | | | | | | | |
| Total Insurance | | | | 9,183,605 | |
| | |
| Interactive Media & Services – 1.9% | | | | | | | | |
| | |
Alphabet, Inc., Class A* | | | 104 | | | | 289,260 | |
| | |
Meta Platforms, Inc., Class A* | | | 4,104 | | | | 912,566 | |
| | |
Twitter, Inc.* | | | 24,471 | | | | 946,783 | |
| | | | | | | | |
| Total Interactive Media & Services | | | | 2,148,609 | |
|
| Internet & Direct Marketing Retail – 1.6% | |
| | |
eBay, Inc. | | | 31,978 | | | | 1,831,060 | |
| | |
| IT Services – 2.1% | | | | | | | | |
| | |
Gartner, Inc.* | | | 2,264 | | | | 673,450 | |
| | |
GoDaddy, Inc., Class A* | | | 5,584 | | | | 467,381 | |
| | |
Jack Henry & Associates, Inc. | | | 4,084 | | | | 804,752 | |
| | |
Western Union Co. | | | 21,930 | | | | 410,968 | |
| | | | | | | | |
| Total IT Services | | | | 2,356,551 | |
| | |
| Life Sciences Tools & Services – 0.3% | | | | | | | | |
| | |
Mettler-Toledo International, Inc.* | | | 263 | | | | 361,149 | |
| | |
| Machinery – 0.6% | | | | | | | | |
| | |
Snap-on, Inc. | | | 1,958 | | | | 402,330 | |
| | |
Stanley Black & Decker, Inc. | | | 2,078 | | | | 290,483 | |
| | | | | | | | |
| Total Machinery | | | | 692,813 | |
| | |
| Media – 4.5% | | | | | | | | |
| | |
Charter Communications, Inc., Class A* | | | 1,162 | | | | 633,894 | |
| | |
Fox Corp., Class A | | | 28,224 | | | | 1,113,437 | |
| | |
Liberty Broadband Corp., Class C* | | | 7,446 | | | | 1,007,593 | |
| | |
News Corp., Class A | | | 38,721 | | | | 857,670 | |
| | |
Omnicom Group, Inc. | | | 6,938 | | | | 588,897 | |
| | |
Sirius XM Holdings, Inc.(a) | | | 146,005 | | | | 966,553 | |
| | | | | | | | |
| Total Media | | | | 5,168,044 | |
| | |
| Metals & Mining – 2.5% | | | | | | | | |
| | |
Nucor Corp. | | | 6,472 | | | | 962,063 | |
| | |
Reliance Steel & Aluminum Co. | | | 5,419 | | | | 993,573 | |
| | |
Steel Dynamics, Inc. | | | 10,123 | | | | 844,562 | |
| | | | | | | | |
| Total Metals & Mining | | | | 2,800,198 | |
| | |
| Multiline Retail – 0.8% | | | | | | | | |
| | |
Dollar General Corp. | | | 2,139 | | | | 476,206 | |
| | |
Target Corp. | | | 2,197 | | | | 466,247 | |
| | | | | | | | |
| Total Multiline Retail | | | | 942,453 | |
| | |
| Oil, Gas & Consumable Fuels – 6.2% | | | | | | | | |
| | |
Chevron Corp. | | | 7,781 | | | | 1,266,980 | |
| | |
ConocoPhillips | | | 6,034 | | | | 603,400 | |
| | |
Exxon Mobil Corp. | | | 13,580 | | | | 1,121,572 | |
| | |
Kinder Morgan, Inc. | | | 61,958 | | | | 1,171,626 | |
| | |
Marathon Petroleum Corp. | | | 12,683 | | | | 1,084,397 | |
| | |
ONEOK, Inc. | | | 5,991 | | | | 423,144 | |
| | |
Williams Cos., Inc. | | | 42,583 | | | | 1,422,698 | |
| | | | | | | | |
| Total Oil, Gas & Consumable Fuels | | | | 7,093,817 | |
| | |
| Pharmaceuticals – 1.6% | | | | | | | | |
| | |
Bristol-Myers Squibb Co. | | | 16,297 | | | | 1,190,170 | |
| | |
Merck & Co., Inc. | | | 5,982 | | | | 490,823 | |
| | |
Pfizer, Inc. | | | 3,017 | | | | 156,190 | |
| | | | | | | | |
| Total Pharmaceuticals | | | | 1,837,183 | |
| | |
| Road & Rail – 2.6% | | | | | | | | |
| | |
Avis Budget Group, Inc.* | | | 3,076 | | | | 809,911 | |
| | |
CSX Corp. | | | 13,308 | | | | 498,385 | |
| | |
Norfolk Southern Corp. | | | 2,638 | | | | 752,410 | |
| | |
Union Pacific Corp. | | | 3,237 | | | | 884,381 | |
| | | | | | | | |
| Total Road & Rail | | | | | | | 2,945,087 | |
| |
| Semiconductors & Semiconductor Equipment – 1.6% | | | | | |
| | |
Lam Research Corp. | | | 2,344 | | | | 1,260,158 | |
| | |
Qorvo, Inc.* | | | 4,317 | | | | 535,740 | |
| | | | | | | | |
| Total Semiconductors & Semiconductor Equipment | | | | 1,795,898 | |
| | |
| Software – 2.8% | | | | | | | | |
| | |
Dropbox, Inc., Class A* | | | 18,557 | | | | 431,450 | |
| | |
Fair Isaac Corp.* | | | 2,619 | | | | 1,221,659 | |
| | |
Oracle Corp. | | | 18,851 | | | | 1,559,543 | |
| | | | | | | | |
| Total Software | | | | | | | 3,212,652 | |
See Notes to Financial Statements.
Schedule of Investments (concluded)
WisdomTree U.S. Value Fund (WTV)
March 31, 2022
| | | | | | | | |
| Investments | | Shares | | | Value | |
| | |
| Specialty Retail – 4.9% | | | | | | | | |
| | |
Advance Auto Parts, Inc. | | | 3,482 | | | $ | 720,635 | |
| | |
AutoNation, Inc.* | | | 10,181 | | | | 1,013,824 | |
| | |
Bath & Body Works, Inc. | | | 10,200 | | | | 487,560 | |
| | |
Best Buy Co., Inc. | | | 7,773 | | | | 706,566 | |
| | |
Dick’s Sporting Goods, Inc.(a) | | | 5,137 | | | | 513,803 | |
| | |
Home Depot, Inc. | | | 1,667 | | | | 498,983 | |
| | |
Lowe’s Cos., Inc. | | | 4,697 | | | | 949,686 | |
| | |
Williams-Sonoma, Inc. | | | 4,918 | | | | 713,110 | |
| | | | | | | | |
| Total Specialty Retail | | | | | | | 5,604,167 | |
| |
| Technology Hardware, Storage & Peripherals – 2.2% | | | | | |
| | |
Apple, Inc. | | | 9,515 | | | | 1,661,414 | |
| | |
HP, Inc. | | | 23,070 | | | | 837,441 | |
| | | | | | | | |
| Total Technology Hardware, Storage & Peripherals | | | | 2,498,855 | |
| | |
| Textiles, Apparel & Luxury Goods – 0.4% | | | | | | | | |
| | |
Crocs, Inc.* | | | 5,666 | | | | 432,882 | |
| | |
| Tobacco – 1.2% | | | | | | | | |
| | |
Altria Group, Inc. | | | 26,747 | | | | 1,397,531 | |
| | |
| Trading Companies & Distributors – 0.5% | | | | | | | | |
| | |
W.W. Grainger, Inc. | | | 1,105 | | | | 569,948 | |
TOTAL COMMON STOCKS (Cost: $106,812,636) | | | | | | | 113,506,687 | |
|
| INVESTMENT OF CASH COLLATERAL FOR SECURITIES LOANED – 2.4% | |
| | |
| United States – 2.4% | | | | | | | | |
| | |
State Street Navigator Securities Lending Government Money Market Portfolio, 0.25%(b) | | | | | | | | |
| (Cost: $2,659,917) | | | 2,659,917 | | | | 2,659,917 | |
| |
TOTAL INVESTMENTS IN SECURITIES – 102.2% (Cost: $109,472,553) | | | | 116,166,604 | |
| | |
Other Assets less Liabilities – (2.2)% | | | | | | | (2,452,185 | ) |
| | | | | | | | |
| NET ASSETS – 100.0% | | | | | | $ | 113,714,419 | |
| * | Non-income producing security. |
| (a) | Security, or portion thereof, was on loan at March 31, 2022 (See Note 2). At March 31, 2022, the total market value of the Fund’s securities on loan identified in the Schedule of Investments was $4,637,784 and the total market value of the collateral held by the Fund was $4,862,897. The total market value of the collateral includes non-cash U.S. Government securities collateral having a value of $2,202,980. |
| (b) | Rate shown represents annualized 7-day yield as of March 31, 2022. |
The following is a summary of the fair valuations according to the inputs used as of March 31, 2022 in valuing the Fund’s investments (See Note 2 — Fair Value Measurement):
| | | | | | | | | | | | | | | | |
| | | | |
| | | Quoted
Prices in
Active
Markets
(Level 1) | | | Other
Significant
Observable
Inputs
(Level 2) | | | Significant
Unobservable
Inputs
(Level 3) | | | Total | |
Assets: | | | | | | | | | |
Investments in Securities | | | | |
Common Stocks | | $ | 113,506,687 | | | $ | — | | | $ | — | | | $ | 113,506,687 | |
Investment of Cash Collateral for Securities Loaned | | | — | | | | 2,659,917 | | | | — | | | | 2,659,917 | |
Total Investments in Securities | | $ | 113,506,687 | | | $ | 2,659,917 | | | $ | — | | | $ | 116,166,604 | |
See Notes to Financial Statements.
Statements of Assets and Liabilities
WisdomTree Trust
March 31, 2022
| | | | | | | | | | | | | | | | | | | | |
| | | WisdomTree U.S.
AI Enhanced
Value Fund | | | WisdomTree
U.S. ESG Fund | | | WisdomTree
U.S. Growth &
Momentum
Fund | | | WisdomTree
U.S. High
Dividend Fund | | | WisdomTree U.S. LargeCap
Dividend Fund | |
ASSETS: | | | | | | | | | | | | | | | | | | | | |
| | | | | |
Investments, at cost | | $ | 498,539,122 | | | $ | 60,075,578 | | | $ | 4,215,652 | | | $ | 861,930,277 | | | $ | 2,427,116,643 | |
| | | | | |
Investment in affiliates, at cost (Note 3) | | | — | | | | — | | | | — | | | | 1,567,972 | | | | 1,632,686 | |
Investments in securities, at value1,2 (Note 2) | | | 492,186,386 | | | | 77,007,173 | | | | 4,089,554 | | | | 1,021,540,424 | | | | 3,420,501,607 | |
| | | | | |
Investment in affiliates, at value (Note 3) | | | — | | | | — | | | | — | | | | 1,605,865 | | | | 1,685,016 | |
| | | | | |
Cash | | | 272,742 | | | | 16,631 | | | | 7,489 | | | | 626,477 | | | | 2,204,704 | |
| | | | | |
Receivables: | | | | | | | | | | | | | | | | | | | | |
| | | | | |
Investment securities sold3 | | | 2,895,469 | | | | — | | | | — | | | | — | | | | — | |
| | | | | |
Capital shares sold | | | — | | | | — | | | | — | | | | 4,442,302 | | | | 9,983,198 | |
| | | | | |
Dividends | | | 912,857 | | | | 63,823 | | | | 408 | | | | 2,896,898 | | | | 5,116,235 | |
| | | | | |
Securities lending income | | | 1,933 | | | | 9 | | | | — | | | | 1,898 | | | | 3,459 | |
Total Assets | | | 496,269,387 | | | | 77,087,636 | | | | 4,097,451 | | | | 1,031,113,864 | | | | 3,439,494,219 | |
LIABILITIES: | |
|
Payables: | |
| | | | | |
Cash collateral received for securities loaned (Note 2) | | | 964,907 | | | | 11,792 | | | | — | | | | 1,418,979 | | | | 1,483,298 | |
| | | | | |
Investment securities purchased | | | — | | | | — | | | | — | | | | 4,417,228 | | | | 9,965,181 | |
| | | | | |
Capital shares redeemed | | | 2,508,460 | | | | — | | | | — | | | | — | | | | — | |
| | | | | |
Advisory fees (Note 3) | | | 158,174 | | | | 17,884 | | | | 1,951 | | | | 314,018 | | | | 793,612 | |
| | | | | |
Service fees (Note 2) | | | 1,831 | | | | 281 | | | | 16 | | | | 3,638 | | | | 12,481 | |
Total Liabilities | | | 3,633,372 | | | | 29,957 | | | | 1,967 | | | | 6,153,863 | | | | 12,254,572 | |
NET ASSETS | | $ | 492,636,015 | | | $ | 77,057,679 | | | $ | 4,095,484 | | | $ | 1,024,960,001 | | | $ | 3,427,239,647 | |
NET ASSETS: | | | | | | | | | | | | | | | | | | | | |
| | | | | |
Paid-in capital | | $ | 593,268,186 | | | $ | 67,686,839 | | | $ | 5,159,604 | | | $ | 931,681,723 | | | $ | 2,632,832,912 | |
| | | | | |
Total distributable earnings (loss) | | | (100,632,171 | ) | | | 9,370,840 | | | | (1,064,120 | ) | | | 93,278,278 | | | | 794,406,735 | |
NET ASSETS | | $ | 492,636,015 | | | $ | 77,057,679 | | | $ | 4,095,484 | | | $ | 1,024,960,001 | | | $ | 3,427,239,647 | |
Outstanding beneficial interest shares of $0.001 par value (unlimited number of shares authorized) | | | 4,975,000 | | | | 1,600,000 | | | | 180,000 | | | | 11,650,000 | | | | 52,200,000 | |
Net asset value per share | | $ | 99.02 | | | $ | 48.16 | | | $ | 22.75 | | | $ | 87.98 | | | $ | 65.66 | |
1 Includes market value of securities out on loan of: | | $ | 9,361,617 | | | $ | 187,488 | | | | — | | | $ | 16,556,964 | | | $ | 26,771,627 | |
2 Investments in securities include investment of cash collateral for securities loaned (see Schedule of Investments for additional information). | | | | | |
3 Includes market value of securities out on loan, which were sold and pending settlement, of: | | $ | 391,713 | | | | — | | | | — | | | | — | | | | — | |
See Notes to Financial Statements.
Statements of Assets and Liabilities (continued)
WisdomTree Trust
March 31, 2022
| | | | | | | | | | | | | | | | | | | | |
| | | WisdomTree
U.S. LargeCap
Fund | | | WisdomTree
U.S. MidCap
Dividend Fund | | | WisdomTree
U.S. MidCap
Fund | | | WisdomTree
U.S. Multifactor
Fund | | | WisdomTree
U.S. Quality
Dividend
Growth Fund | |
ASSETS: | | | | | | | | | | | | | | | | | | | | |
| | | | | |
Investments, at cost | | $ | 595,177,778 | | | $ | 2,740,304,104 | | | $ | 721,791,486 | | | $ | 211,784,929 | | | $ | 5,843,851,294 | |
| | | | | |
Investment in affiliates, at cost (Note 3) | | | 322,554 | | | | 502,866 | | | | 2,133,587 | | | | — | | | | — | |
Investments in securities, at value1,2 (Note 2) | | | 696,031,284 | | | | 3,238,586,666 | | | | 816,318,123 | | | | 227,872,926 | | | | 7,030,419,173 | |
| | | | | |
Investment in affiliates, at value (Note 3) | | | 396,757 | | | | 643,530 | | | | 2,294,204 | | | | — | | | | — | |
| | | | | |
Cash | | | 215,679 | | | | 1,083,710 | | | | 250,100 | | | | 113,766 | | | | 2,392,347 | |
| | | | | |
Receivables: | | | | | | | | | | | | | | | | | | | | |
| | | | | |
Capital shares sold | | | — | | | | 2,246,895 | | | | — | | | | — | | | | 12,881,505 | |
| | | | | |
Dividends | | | 525,358 | | | | 5,598,417 | | | | 640,891 | | | | 218,631 | | | | 13,415,693 | |
| | | | | |
Securities lending income | | | 718 | | | | 18,998 | | | | 7,530 | | | | 2,810 | | | | 19,138 | |
Total Assets | | | 697,169,796 | | | | 3,248,178,216 | | | | 819,510,848 | | | | 228,208,133 | | | | 7,059,127,856 | |
LIABILITIES: | |
|
Payables: | |
| | | | | |
Cash collateral received for securities loaned (Note 2) | | | 168,366 | | | | 34,316,751 | | | | 7,577,119 | | | | 4,207,090 | | | | 11,305,736 | |
| | | | | |
Investment securities purchased | | | — | | | | 2,237,215 | | | | — | | | | — | | | | 12,862,643 | |
| | | | | |
Advisory fees (Note 3) | | | 46,048 | | | | 1,013,771 | | | | 258,235 | | | | 51,117 | | | | 1,615,636 | |
| | | | | |
Service fees (Note 2) | | | 2,533 | | | | 11,740 | | | | 2,996 | | | | 803 | | | | 25,389 | |
Total Liabilities | | | 216,947 | | | | 37,579,477 | | | | 7,838,350 | | | | 4,259,010 | | | | 25,809,404 | |
NET ASSETS | | $ | 696,952,849 | | | $ | 3,210,598,739 | | | $ | 811,672,498 | | | $ | 223,949,123 | | | $ | 7,033,318,452 | |
NET ASSETS: | | | | | | | | | | | | | | | | | | | | |
| | | | | |
Paid-in capital | | $ | 623,412,726 | | | $ | 3,075,808,728 | | | $ | 798,433,945 | | | $ | 226,473,868 | | | $ | 6,168,304,510 | |
| | | | | |
Total distributable earnings (loss) | | | 73,540,123 | | | | 134,790,011 | | | | 13,238,553 | | | | (2,524,745 | ) | | | 865,013,942 | |
NET ASSETS | | $ | 696,952,849 | | | $ | 3,210,598,739 | | | $ | 811,672,498 | | | $ | 223,949,123 | | | $ | 7,033,318,452 | |
Outstanding beneficial interest shares of $0.001 par value (unlimited number of shares authorized) | | | 14,450,000 | | | | 72,450,000 | | | | 14,850,000 | | | | 5,475,000 | | | | 110,650,000 | |
Net asset value per share | | $ | 48.23 | | | $ | 44.31 | | | $ | 54.66 | | | $ | 40.90 | | | $ | 63.56 | |
1 Includes market value of securities out on loan of: | | $ | 1,568,762 | | | $ | 136,612,198 | | | $ | 42,921,326 | | | $ | 4,805,253 | | | $ | 65,665,818 | |
2 Investments in securities include investment of cash collateral for securities loaned (see Schedule of Investments for additional information). | | | | | |
See Notes to Financial Statements.
Statements of Assets and Liabilities (concluded)
WisdomTree Trust
March 31, 2022
| | | | | | | | | | | | | | | | | | | | |
| | | WisdomTree
U.S. SmallCap
Dividend Fund | | | WisdomTree
U.S. SmallCap
Fund | | | WisdomTree
U.S. SmallCap
Quality Dividend
Growth Fund | | | WisdomTree
U.S. Total
Dividend Fund | | | WisdomTree
U.S. Value Fund | |
ASSETS: | | | | | | | | | | | | | | | | | | | | |
| | | | | |
Investments, at cost | | $ | 1,694,062,363 | | | $ | 652,791,659 | | | $ | 214,991,904 | | | $ | 783,892,666 | | | $ | 109,472,553 | |
| | | | | |
Investment in affiliates, at cost (Note 3) | | | 1,206,686 | | | | — | | | | — | | | | — | | | | — | |
Investments in securities, at value1,2 (Note 2) | | | 1,884,369,477 | | | | 701,625,003 | | | | 224,480,796 | | | | 1,079,456,986 | | | | 116,166,604 | |
| | | | | |
Investment in affiliates, at value (Note 3) | | | 1,218,396 | | | | — | | | | — | | | | — | | | | — | |
| | | | | |
Cash | | | 1,174,193 | | | | 2,820,905 | | | | 200,037 | | | | 946,274 | | | | 80,991 | |
| | | | | |
Receivables: | | | | | | | | | | | | | | | | | | | | |
| | | | | |
Investment securities sold | | | 2,393,442 | | | | 919,296 | | | | 396,576 | | | | 302,643 | | | | — | |
| | | | | |
Capital shares sold | | | 3,210,860 | | | | 4,847,480 | | | | — | | | | — | | | | — | |
| | | | | |
Dividends | | | 3,616,700 | | | | 525,459 | | | | 320,538 | | | | 1,685,897 | | | | 137,297 | |
| | | | | |
Securities lending income | | | 53,083 | | | | 40,074 | | | | 744 | | | | 1,428 | | | | 1,665 | |
Total Assets | | | 1,896,036,151 | | | | 710,778,217 | | | | 225,398,691 | | | | 1,082,393,228 | | | | 116,386,557 | |
LIABILITIES: | |
|
Payables: | |
| | | | | |
Cash collateral received for securities loaned (Note 2) | | | 10,687,737 | | | | 10,374,295 | | | | 492,729 | | | | 1,461,326 | | | | 2,659,917 | |
| | | | | |
Investment securities purchased | | | 3,191,459 | | | | 7,445,291 | | | | — | | | | 47,201 | | | | — | |
| | | | | |
Advisory fees (Note 3) | | | 604,484 | | | | 223,677 | | | | 72,339 | | | | 251,662 | | | | 11,789 | |
| | | | | |
Service fees (Note 2) | | | 7,002 | | | | 2,593 | | | | 838 | | | | 3,955 | | | | 432 | |
Total Liabilities | | | 14,490,682 | | | | 18,045,856 | | | | 565,906 | | | | 1,764,144 | | | | 2,672,138 | |
NET ASSETS | | $ | 1,881,545,469 | | | $ | 692,732,361 | | | $ | 224,832,785 | | | $ | 1,080,629,084 | | | $ | 113,714,419 | |
NET ASSETS: | | | | | | | | | | | | | | | | | | | | |
| | | | | |
Paid-in capital | | $ | 2,051,454,633 | | | $ | 709,215,427 | | | $ | 231,213,513 | | | $ | 868,369,073 | | | $ | 112,659,871 | |
| | | | | |
Total distributable earnings (loss) | | | (169,909,164 | ) | | | (16,483,066 | ) | | | (6,380,728 | ) | | | 212,260,011 | | | | 1,054,548 | |
NET ASSETS | | $ | 1,881,545,469 | | | $ | 692,732,361 | | | $ | 224,832,785 | | | $ | 1,080,629,084 | | | $ | 113,714,419 | |
Outstanding beneficial interest shares of $0.001 par value (unlimited number of shares authorized) | | | 59,050,000 | | | | 14,450,000 | | | | 5,035,000 | | | | 16,750,000 | | | | 1,850,000 | |
Net asset value per share | | $ | 31.86 | | | $ | 47.94 | | | $ | 44.65 | | | $ | 64.52 | | | $ | 61.47 | |
1 Includes market value of securities out on loan of: | | $ | 66,825,714 | | | $ | 38,690,944 | | | $ | 1,180,619 | | | $ | 1,711,777 | | | $ | 4,637,784 | |
2 Investments in securities include investment of cash collateral for securities loaned (see Schedule of Investments for additional information). | | | | | |
See Notes to Financial Statements.
Statements of Operations
WisdomTree Trust
For the Year or Period Ended March 31, 2022
| | | | | | | | | | | | | | | | | | | | |
| | | WisdomTree
U.S. AI
Enhanced
Value Fund | | | WisdomTree
U.S. ESG Fund | | | WisdomTree
U.S. Growth &
Momentum
Fund1 | | | WisdomTree
U.S. High
Dividend Fund | | | WisdomTree
U.S. LargeCap
Dividend Fund | |
INVESTMENT INCOME: | | | | | | | | | | | | | | | | | | | | |
| | | | | |
Dividends | | $ | 17,197,965 | | | $ | 1,392,900 | | | $ | 19,002 | | | $ | 33,112,288 | | | $ | 80,034,730 | |
| | | | | |
Dividends from affiliates (Note 3) | | | 22,423 | | | | — | | | | — | | | | 52,441 | | | | 125,123 | |
| | | | | |
Securities lending income, net (Note 2) | | | 26,187 | | | | 2,384 | | | | — | | | | 33,946 | | | | 53,247 | |
| | | | | |
Less: Foreign withholding taxes on dividends | | | (3,756 | ) | | | — | | | | (75 | ) | | | (310 | ) | | | — | |
Total investment income | | | 17,242,819 | | | | 1,395,284 | | | | 18,927 | | | | 33,198,365 | | | | 80,213,100 | |
EXPENSES: | | | | | | | | | | | | | | | | | | | | |
| | | | | |
Advisory fees (Note 3) | | | 2,083,429 | | | | 263,370 | | | | 25,887 | | | | 3,196,275 | | | | 8,772,468 | |
| | | | | |
Service fees (Note 2) | | | 24,124 | | | | 4,139 | | | | 207 | | | | 37,010 | | | | 137,853 | |
Total expenses | | | 2,107,553 | | | | 267,509 | | | | 26,094 | | | | 3,233,285 | | | | 8,910,321 | |
Expense waivers (Note 3) | | | (1,351 | ) | | | — | | | | — | | | | (3,400 | ) | | | (6,236 | ) |
Net expenses | | | 2,106,202 | | | | 267,509 | | | | 26,094 | | | | 3,229,885 | | | | 8,904,085 | |
Net investment income (loss) | | | 15,136,617 | | | | 1,127,775 | | | | (7,167 | ) | | | 29,968,480 | | | | 71,309,015 | |
NET REALIZED AND UNREALIZED GAIN (LOSS) ON INVESTMENTS: | |
| | | | | |
Net realized gain (loss) from: | | | | | | | | | | | | | | | | | | | | |
| | | | | |
Investment transactions | | | (3,103,553 | ) | | | 479,190 | | | | (956,293 | ) | | | 31,246,162 | | | | (44,869,158 | ) |
| | | | | |
Investment transactions in affiliates (Note 3) | | | 167,565 | | | | — | | | | — | | | | 118,198 | | | | 970,593 | |
| | | | | |
In-kind redemptions | | | 113,925,493 | | | | 14,254,933 | | | | (112,076 | ) | | | 2,655,671 | | | | 270,091,036 | |
Net realized gain (loss) | | | 110,989,505 | | | | 14,734,123 | | | | (1,068,369 | ) | | | 34,020,031 | | | | 226,192,471 | |
Net increase (decrease) in unrealized appreciation/depreciation: | | | | | | | | | | | | | | | | | | | | |
| | | | | |
Investment transactions | | | (82,580,686 | ) | | | (5,774,969 | ) | | | (126,098 | ) | | | 86,256,554 | | | | 190,174,611 | |
| | | | | |
Investment transactions in affiliates (Note 3) | | | (80,015 | ) | | | — | | | | — | | | | 37,893 | | | | (259,487 | ) |
Net increase (decrease) in unrealized appreciation/depreciation | | | (82,660,701 | ) | | | (5,774,969 | ) | | | (126,098 | ) | | | 86,294,447 | | | | 189,915,124 | |
Net realized and unrealized gain (loss) on investments | | | 28,328,804 | | | | 8,959,154 | | | | (1,194,467 | ) | | | 120,314,478 | | | | 416,107,595 | |
NET INCREASE (DECREASE) IN NET ASSETS RESULTING FROM OPERATIONS | | $ | 43,465,421 | | | $ | 10,086,929 | | | $ | (1,201,634 | ) | | $ | 150,282,958 | | | $ | 487,416,610 | |
1 For the period June 24, 2021 (commencement of operations) through March 31, 2022. | | | | | |
See Notes to Financial Statements.
Statements of Operations (continued)
WisdomTree Trust
For the Year Ended March 31, 2022
| | | | | | | | | | | | | | | | | | | | |
| | | WisdomTree
U.S. LargeCap
Fund | | | WisdomTree
U.S. MidCap
Dividend Fund | | | WisdomTree
U.S. MidCap
Fund | | | WisdomTree
U.S. Multifactor
Fund | | | WisdomTree
U.S. Quality
Dividend
Growth Fund | |
INVESTMENT INCOME: | | | | | | | | | | | | | | | | | | | | |
| | | | | |
Dividends | | $ | 10,675,342 | | | $ | 82,022,714 | | | $ | 13,188,462 | | | $ | 2,862,425 | | | $ | 145,507,923 | |
| | | | | |
Dividends from affiliates (Note 3) | | | 39,020 | | | | 137,052 | | | | 57,389 | | | | — | | | | — | |
| | | | | |
Non-cash dividends | | | 7,863 | | | | — | | | | — | | | | — | | | | — | |
| | | | | |
Securities lending income, net (Note 2) | | | 20,759 | | | | 174,737 | | | | 69,691 | | | | 20,498 | | | | 118,328 | |
| | | | | |
Less: Foreign withholding taxes on dividends | | | — | | | | (29,609 | ) | | | — | | | | — | | | | — | |
Total investment income | | | 10,742,984 | | | | 82,304,894 | | | | 13,315,542 | | | | 2,882,923 | | | | 145,626,251 | |
EXPENSES: | | | | | | | | | | | | | | | | | | | | |
| | | | | |
Advisory fees (Note 3) | | | 495,313 | | | | 11,621,902 | | | | 2,943,067 | | | | 432,847 | | | | 18,036,033 | |
| | | | | |
Service fees (Note 2) | | | 27,242 | | | | 134,569 | | | | 34,077 | | | | 6,802 | | | | 283,423 | |
Total expenses | | | 522,555 | | | | 11,756,471 | | | | 2,977,144 | | | | 439,649 | | | | 18,319,456 | |
Expense waivers (Note 3) | | | — | | | | (9,736 | ) | | | (4,477 | ) | | | — | | | | — | |
Net expenses | | | 522,555 | | | | 11,746,735 | | | | 2,972,667 | | | | 439,649 | | | | 18,319,456 | |
Net investment income | | | 10,220,429 | | | | 70,558,159 | | | | 10,342,875 | | | | 2,443,274 | | | | 127,306,795 | |
NET REALIZED AND UNREALIZED GAIN (LOSS) ON INVESTMENTS: | |
| | | | | |
Net realized gain (loss) from: | | | | | | | | | | | | | | | | | | | | |
| | | | | |
Investment transactions | | | (5,970,286 | ) | | | (10,689,792 | ) | | | (3,836,367 | ) | | | 1,289,910 | | | | (74,602,695 | ) |
| | | | | |
Investment transactions in affiliates (Note 3) | | | 256,662 | | | | 1,940,934 | | | | 154,761 | | | | — | | | | — | |
| | | | | |
In-kind redemptions | | | 68,246,107 | | | | 271,164,136 | | | | 94,393,202 | | | | 14,644,171 | | | | 660,771,867 | |
| | | | | |
Futures contracts | | | — | | | | — | | | | — | | | | 43,850 | | | | — | |
Net realized gain | | | 62,532,483 | | | | 262,415,278 | | | | 90,711,596 | | | | 15,977,931 | | | | 586,169,172 | |
Net increase (decrease) in unrealized appreciation/depreciation: | | | | | | | | | | | | | | | | | | | | |
| | | | | |
Investment transactions | | | (7,511,243 | ) | | | 8,887,047 | | | | (41,817,748 | ) | | | (3,360,106 | ) | | | 54,598,644 | |
| | | | | |
Investment transactions in affiliates (Note 3) | | | (69,446 | ) | | | (1,288,843 | ) | | | 114,895 | | | | — | | | | — | |
Net increase (decrease) in unrealized appreciation/depreciation | | | (7,580,689 | ) | | | 7,598,204 | | | | (41,702,853 | ) | | | (3,360,106 | ) | | | 54,598,644 | |
Net realized and unrealized gain on investments | | | 54,951,794 | | | | 270,013,482 | | | | 49,008,743 | | | | 12,617,825 | | | | 640,767,816 | |
NET INCREASE IN NET ASSETS RESULTING FROM OPERATIONS | | $ | 65,172,223 | | | $ | 340,571,641 | | | $ | 59,351,618 | | | $ | 15,061,099 | | | $ | 768,074,611 | |
See Notes to Financial Statements.
Statements of Operations (concluded)
WisdomTree Trust
For the Year Ended March 31, 2022
| | | | | | | | | | | | | | | | | | | | |
| | | WisdomTree
U.S. SmallCap
Dividend Fund | | | WisdomTree
U.S. SmallCap
Fund | | | WisdomTree
U.S. SmallCap
Quality Dividend
Growth Fund | | | WisdomTree
U.S. Total
Dividend Fund | | | WisdomTree
U.S. Value Fund | |
INVESTMENT INCOME: | | | | | | | | | | | | | | | | | | | | |
| | | | | |
Dividends | | $ | 56,539,901 | | | $ | 11,548,852 | | | $ | 5,923,646 | | | $ | 25,561,165 | | | $ | 1,710,759 | |
| | | | | |
Dividends from affiliates (Note 3) | | | 65,270 | | | | 39,476 | | | | — | | | | — | | | | — | |
| | | | | |
Interest | | | 286 | | | | — | | | | — | | | | — | | | | — | |
| | | | | |
Non-cash dividends | | | 22,610 | | | | — | | | | — | | | | — | | | | — | |
| | | | | |
Securities lending income, net (Note 2) | | | 368,367 | | | | 366,940 | | | | 14,370 | | | | 10,918 | | | | 11,252 | |
| | | | | |
Less: Foreign withholding taxes on dividends | | | (13,822 | ) | | | — | | | | (4,457 | ) | | | (1,332 | ) | | | — | |
Total investment income | | | 56,982,612 | | | | 11,955,268 | | | | 5,933,559 | | | | 25,570,751 | | | | 1,722,011 | |
EXPENSES: | | | | | | | | | | | | | | | | | | | | |
| | | | | |
Advisory fees (Note 3) | | | 7,101,580 | | | | 2,446,455 | | | | 785,508 | | | | 2,741,193 | | | | 246,690 | |
| | | | | |
Service fees (Note 2) | | | 82,229 | | | | 28,327 | | | | 9,095 | | | | 43,076 | | | | 3,662 | |
Total expenses | | | 7,183,809 | | | | 2,474,782 | | | | 794,603 | | | | 2,784,269 | | | | 250,352 | |
Expense waivers (Note 3) | | | (4,302 | ) | | | (2,365 | ) | | | — | | | | — | | | | — | |
Net expenses | | | 7,179,507 | | | | 2,472,417 | | | | 794,603 | | | | 2,784,269 | | | | 250,352 | |
Net investment income | | | 49,803,105 | | | | 9,482,851 | | | | 5,138,956 | | | | 22,786,482 | | | | 1,471,659 | |
NET REALIZED AND UNREALIZED GAIN (LOSS) ON INVESTMENTS: | |
| | | | | |
Net realized gain (loss) from: | | | | | | | | | | | | | | | | | | | | |
| | | | | |
Investment transactions | | | (23,510,089 | ) | | | 4,180,270 | | | | 2,969,440 | | | | (13,531,877 | ) | | | (620,133 | ) |
| | | | | |
Investment transactions in affiliates (Note 3) | | | 420,404 | | | | 136,097 | | | | — | | | | — | | | | — | |
| | | | | |
In-kind redemptions | | | 161,562,820 | | | | 64,289,621 | | | | 12,831,258 | | | | 88,389,818 | | | | 8,236,965 | |
Net realized gain | | | 138,473,135 | | | | 68,605,988 | | | | 15,800,698 | | | | 74,857,941 | | | | 7,616,832 | |
Net increase (decrease) in unrealized appreciation/depreciation: | | | | | | | | | | | | | | | | | | | | |
| | | | | |
Investment transactions | | | (98,332,399 | ) | | | (63,268,389 | ) | | | (22,533,592 | ) | | | 49,959,306 | | | | (1,931,528 | ) |
| | | | | |
Investment transactions in affiliates (Note 3) | | | 6,091 | | | | (149,688 | ) | | | — | | | | — | | | | — | |
Net increase (decrease) in unrealized appreciation/depreciation | | | (98,326,308 | ) | | | (63,418,077 | ) | | | (22,533,592 | ) | | | 49,959,306 | | | | (1,931,528 | ) |
Net realized and unrealized gain (loss) on investments | | | 40,146,827 | | | | 5,187,911 | | | | (6,732,894 | ) | | | 124,817,247 | | | | 5,685,304 | |
NET INCREASE (DECREASE) IN NET ASSETS RESULTING FROM OPERATIONS | | $ | 89,949,932 | | | $ | 14,670,762 | | | $ | (1,593,938 | ) | | $ | 147,603,729 | | | $ | 7,156,963 | |
See Notes to Financial Statements.
Statements of Changes in Net Assets
WisdomTree Trust
| | | | | | | | | | | | | | | | | | | | |
| | | |
| | | WisdomTree U.S. AI Enhanced Value Fund | | | WisdomTree U.S. ESG Fund | | | WisdomTree
U.S. Growth &
Momentum Fund | |
| | | | | |
| | | For the
Year Ended
March 31, 2022 | | | For the
Year Ended
March 31, 2021 | | | For the
Year Ended
March 31, 2022 | | | For the
Year Ended
March 31, 2021 | | | For the Period
June 24, 2021*
through
March 31, 2022 | |
INCREASE (DECREASE) IN NET ASSETS RESULTING FROM OPERATIONS: | |
| | | | | |
Net investment income (loss) | | $ | 15,136,617 | | | $ | 18,081,851 | | | $ | 1,127,775 | | | $ | 1,047,661 | | | $ | (7,167 | ) |
| | | | | |
Net realized gain (loss) on investments | | | 110,989,505 | | | | (30,926,076 | ) | | | 14,734,123 | | | | 13,899,040 | | | | (1,068,369 | ) |
| | | | | |
Net increase (decrease) in unrealized appreciation/depreciation on investments | | | (82,660,701 | ) | | | 229,877,885 | | | | (5,774,969 | ) | | | 23,008,203 | | | | (126,098 | ) |
Net increase (decrease) in net assets resulting from operations | | | 43,465,421 | | | | 217,033,660 | | | | 10,086,929 | | | | 37,954,904 | | | | (1,201,634 | ) |
DISTRIBUTIONS TO SHAREHOLDERS: | |
| | | | | |
Distributable earnings | | | (15,541,024 | ) | | | (17,898,781 | ) | | | (1,160,908 | ) | | | (1,018,751 | ) | | | — | |
CAPITAL SHARE TRANSACTIONS: | |
| | | | | |
Net proceeds from sale of shares | | | 364,669,874 | | | | 3,076,020 | | | | 24,008,059 | | | | 17,089,290 | | | | 16,954,907 | |
| | | | | |
Cost of shares redeemed | | | (455,449,072 | ) | | | (189,730,575 | ) | | | (44,250,848 | ) | | | (38,475,090 | ) | | | (11,657,889 | ) |
Net increase (decrease) in net assets resulting from capital share transactions | | | (90,779,198 | ) | | | (186,654,555 | ) | | | (20,242,789 | ) | | | (21,385,800 | ) | | | 5,297,018 | |
Net Increase (Decrease) in Net Assets | | | (62,854,801 | ) | | | 12,480,324 | | | | (11,316,768 | ) | | | 15,550,353 | | | | 4,095,384 | |
NET ASSETS: | |
| | | | | |
Beginning of period | | $ | 555,490,816 | | | $ | 543,010,492 | | | $ | 88,374,447 | | | $ | 72,824,094 | | | $ | 100 | |
| | | | | |
End of period | | $ | 492,636,015 | | | $ | 555,490,816 | | | $ | 77,057,679 | | | $ | 88,374,447 | | | $ | 4,095,484 | |
SHARES CREATED AND REDEEMED: | |
| | | | | |
Shares outstanding, beginning of year | | | 5,900,000 | | | | 8,400,000 | | | | 2,025,000 | | | | 2,650,000 | | | | 4 | |
| | | | | |
Shares created | | | 3,575,000 | | | | 50,000 | | | | 500,000 | | | | 450,000 | | | | 640,000 | |
| | | | | |
Shares redeemed | | | (4,500,000 | ) | | | (2,550,000 | ) | | | (925,000 | ) | | | (1,075,000 | ) | | | (460,004 | ) |
Shares outstanding, end of year | | | 4,975,000 | | | | 5,900,000 | | | | 1,600,000 | | | | 2,025,000 | | | | 180,000 | |
* Commencement of operations. The commencement of operations date is considered to be the date that the Fund began trading in the secondary market. | |
See Notes to Financial Statements.
Statements of Changes in Net Assets (continued)
WisdomTree Trust
| | | | | | | | | | | | | | | | | | | | | | | | |
| | | |
| | | WisdomTree U.S. High Dividend Fund | | | WisdomTree U.S. LargeCap Dividend Fund | | | WisdomTree U.S. LargeCap Fund | |
| | | | | | |
| | | For the
Year Ended
March 31, 2022 | | | For the
Year Ended
March 31, 2021 | | | For the
Year Ended
March 31, 2022 | | | For the
Year Ended
March 31, 2021 | | | For the
Year Ended
March 31, 2022 | | | For the
Year Ended
March 31, 2021 | |
INCREASE (DECREASE) IN NET ASSETS RESULTING FROM OPERATIONS: | | | | | | | | | | | | | |
| | | | | | |
Net investment income | | $ | 29,968,480 | | | $ | 30,375,864 | | | $ | 71,309,015 | | | $ | 64,831,610 | | | $ | 10,220,429 | | | $ | 8,416,957 | |
| | | | | | |
Net realized gain (loss) on investments | | | 34,020,031 | | | | (18,329,771 | ) | | | 226,192,471 | | | | (33,987,478 | ) | | | 62,532,483 | | | | 12,953,450 | |
| | | | | | |
Net increase (decrease) in unrealized appreciation/depreciation on investments | | | 86,294,447 | | | | 239,062,782 | | | | 189,915,124 | | | | 829,329,898 | | | | (7,580,689 | ) | | | 162,594,605 | |
Net increase in net assets resulting from operations | | | 150,282,958 | | | | 251,108,875 | | | | 487,416,610 | | | | 860,174,030 | | | | 65,172,223 | | | | 183,965,012 | |
DISTRIBUTIONS TO SHAREHOLDERS: | |
| | | | | | |
Distributable earnings | | | (25,589,520 | ) | | | (32,948,834 | ) | | | (68,529,090 | ) | | | (64,521,145 | ) | | | (10,044,472 | ) | | | (8,454,532 | ) |
CAPITAL SHARE TRANSACTIONS: | |
| | | | | | |
Net proceeds from sale of shares | | | 138,112,763 | | | | 16,615,726 | | | | 622,081,915 | | | | 299,263,631 | | | | 307,846,850 | | | | 67,242,141 | |
| | | | | | |
Cost of shares redeemed | | | (11,880,667 | ) | | | (139,676,472 | ) | | | (437,197,112 | ) | | | (121,142,441 | ) | | | (176,815,594 | ) | | | (73,381,483 | ) |
Net increase (decrease) in net assets resulting from capital share transactions | | | 126,232,096 | | | | (123,060,746 | ) | | | 184,884,803 | | | | 178,121,190 | | | | 131,031,256 | | | | (6,139,342 | ) |
Net Increase in Net Assets | | | 250,925,534 | | | | 95,099,295 | | | | 603,772,323 | | | | 973,774,075 | | | | 186,159,007 | | | | 169,371,138 | |
NET ASSETS: | |
| | | | | | |
Beginning of year | | $ | 774,034,467 | | | $ | 678,935,172 | | | $ | 2,823,467,324 | | | $ | 1,849,693,249 | | | $ | 510,793,842 | | | $ | 341,422,704 | |
| | | | | | |
End of year | | $ | 1,024,960,001 | | | $ | 774,034,467 | | | $ | 3,427,239,647 | | | $ | 2,823,467,324 | | | $ | 696,952,849 | | | $ | 510,793,842 | |
SHARES CREATED AND REDEEMED: | |
| | | | | | |
Shares outstanding, beginning of year | | | 10,150,000 | | | | 12,000,000 | | | | 49,300,000 | 1 | | | 45,700,000 | 1 | | | 11,800,000 | | | | 12,150,000 | |
| | | | | | |
Shares created | | | 1,650,000 | | | | 250,000 | | | | 9,750,000 | 1 | | | 6,100,000 | 1 | | | 6,300,000 | | | | 1,700,000 | |
| | | | | | |
Shares redeemed | | | (150,000 | ) | | | (2,100,000 | ) | | | (6,850,000 | )1 | | | (2,500,000 | )1 | | | (3,650,000 | ) | | | (2,050,000 | ) |
Shares outstanding, end of year | | | 11,650,000 | | | | 10,150,000 | | | | 52,200,000 | 1 | | | 49,300,000 | 1 | | | 14,450,000 | | | | 11,800,000 | |
1 Shares were adjusted to reflect a 2:1 stock split effective December 23, 2021 (Note 7). | |
See Notes to Financial Statements.
Statements of Changes in Net Assets (continued)
WisdomTree Trust
| | | | | | | | | | | | | | | | | | | | | | | | |
| | | |
| | | WisdomTree U.S. MidCap Dividend Fund | | | WisdomTree U.S. MidCap Fund | | | WisdomTree U.S. Multifactor Fund | |
| | | | | | |
| | | For the
Year Ended
March 31, 2022 | | | For the
Year Ended
March 31, 2021 | | | For the
Year Ended
March 31, 2022 | | | For the
Year Ended
March 31, 2021 | | | For the
Year Ended
March 31, 2022 | | | For the
Year Ended
March 31, 2021 | |
INCREASE (DECREASE) IN NET ASSETS RESULTING FROM OPERATIONS: | | | | | | | | | | | | | |
| | | | | | |
Net investment income | | $ | 70,558,159 | | | $ | 66,862,905 | | | $ | 10,342,875 | | | $ | 8,828,790 | | | $ | 2,443,274 | | | $ | 1,714,691 | |
| | | | | | |
Net realized gain on investments and futures contracts | | | 262,415,278 | | | | 2,636,071 | | | | 90,711,596 | | | | 16,090,231 | | | | 15,977,931 | | | | 19,942,438 | |
| | | | | | |
Net increase (decrease) in unrealized appreciation/depreciation on investments | | | 7,598,204 | | | | 1,341,649,935 | | | | (41,702,853 | ) | | | 370,153,834 | | | | (3,360,106 | ) | | | 41,578,768 | |
Net increase in net assets resulting from operations | | | 340,571,641 | | | | 1,411,148,911 | | | | 59,351,618 | | | | 395,072,855 | | | | 15,061,099 | | | | 63,235,897 | |
DISTRIBUTIONS TO SHAREHOLDERS: | |
| | | | | | |
Distributable earnings | | | (69,041,808 | ) | | | (69,319,287 | ) | | | (10,460,358 | ) | | | (8,770,455 | ) | | | (2,386,625 | ) | | | (1,705,277 | ) |
CAPITAL SHARE TRANSACTIONS: | |
| | | | | | |
Net proceeds from sale of shares | | | 742,558,113 | | | | 55,709,893 | | | | 301,475,820 | | | | 11,230,457 | | | | 116,237,028 | | | | 28,173,706 | |
| | | | | | |
Cost of shares redeemed | | | (707,983,566 | ) | | | (978,306,188 | ) | | | (245,691,713 | ) | | | (251,144,450 | ) | | | (53,452,146 | ) | | | (82,522,173 | ) |
Net increase (decrease) in net assets resulting from capital share transactions | | | 34,574,547 | | | | (922,596,295 | ) | | | 55,784,107 | | | | (239,913,993 | ) | | | 62,784,882 | | | | (54,348,467 | ) |
Net Increase in Net Assets | | | 306,104,380 | | | | 419,233,329 | | | | 104,675,367 | | | | 146,388,407 | | | | 75,459,356 | | | | 7,182,153 | |
NET ASSETS: | |
| | | | | | |
Beginning of year | | $ | 2,904,494,359 | | | $ | 2,485,261,030 | | | $ | 706,997,131 | | | $ | 560,608,724 | | | $ | 148,489,767 | | | $ | 141,307,614 | |
| | | | | | |
End of year | | $ | 3,210,598,739 | | | $ | 2,904,494,359 | | | $ | 811,672,498 | | | $ | 706,997,131 | | | $ | 223,949,123 | | | $ | 148,489,767 | |
SHARES CREATED AND REDEEMED: | |
| | | | | | |
Shares outstanding, beginning of year | | | 71,900,000 | | | | 102,750,000 | | | | 13,900,000 | | | | 21,200,000 | | | | 3,925,000 | | | | 5,750,000 | |
| | | | | | |
Shares created | | | 17,050,000 | | | | 1,700,000 | | | | 5,500,000 | | | | 250,000 | | | | 2,900,000 | | | | 825,000 | |
| | | | | | |
Shares redeemed | | | (16,500,000 | ) | | | (32,550,000 | ) | | | (4,550,000 | ) | | | (7,550,000 | ) | | | (1,350,000 | ) | | | (2,650,000 | ) |
Shares outstanding, end of year | | | 72,450,000 | | | | 71,900,000 | | | | 14,850,000 | | | | 13,900,000 | | | | 5,475,000 | | | | 3,925,000 | |
See Notes to Financial Statements.
Statements of Changes in Net Assets (continued)
WisdomTree Trust
| | | | | | | | | | | | | | | | | | | | | | | | |
| | | |
| | | WisdomTree U.S. Quality Dividend Growth Fund | | | WisdomTree U.S. SmallCap Dividend Fund | | | WisdomTree U.S. SmallCap Fund | |
| | | | | | |
| | | For the Year Ended
March 31, 2022 | | | For the
Year Ended
March 31, 2021 | | | For the
Year Ended
March 31, 2022 | | | For the
Year Ended
March 31, 2021 | | | For the
Year Ended
March 31, 2022 | | | For the
Year Ended
March 31, 2021 | |
INCREASE (DECREASE) IN NET ASSETS RESULTING FROM OPERATIONS: | | | | | | | | | | | | | |
| | | | | | |
Net investment income | | $ | 127,306,795 | | | $ | 91,692,637 | | | $ | 49,803,105 | | | $ | 40,928,097 | | | $ | 9,482,851 | | | $ | 5,883,606 | |
| | | | | | |
Net realized gain (loss) on investments | | | 586,169,172 | | | | 275,474,139 | | | | 138,473,135 | | | | (64,013,287 | ) | | | 68,605,988 | | | | (43,267,606 | ) |
| | | | | | |
Net increase (decrease) in unrealized appreciation/depreciation on investments | | | 54,598,644 | | | | 1,242,219,741 | | | | (98,326,308 | ) | | | 862,869,556 | | | | (63,418,077 | ) | | | 373,427,903 | |
Net increase in net assets resulting from operations | | | 768,074,611 | | | | 1,609,386,517 | | | | 89,949,932 | | | | 839,784,366 | | | | 14,670,762 | | | | 336,043,903 | |
DISTRIBUTIONS TO SHAREHOLDERS: | |
| | | | | | |
Distributable earnings | | | (123,175,321 | ) | | | (90,898,526 | ) | | | (48,960,885 | ) | | | (41,528,464 | ) | | | (10,226,320 | ) | | | (5,647,946 | ) |
CAPITAL SHARE TRANSACTIONS: | |
| | | | | | |
Net proceeds from sale of shares | | | 2,834,445,980 | | | | 2,329,055,020 | | | | 380,148,570 | | | | 44,957,078 | | | | 240,692,318 | | | | 74,445,010 | |
| | | | | | |
Cost of shares redeemed | | | (2,022,674,106 | ) | | | (994,378,619 | ) | | | (369,415,022 | ) | | | (330,309,232 | ) | | | (161,731,595 | ) | | | (215,189,958 | ) |
Net increase (decrease) in net assets resulting from capital share transactions | | | 811,771,874 | | | | 1,334,676,401 | | | | 10,733,548 | | | | (285,352,154 | ) | | | 78,960,723 | | | | (140,744,948 | ) |
Net Increase in Net Assets | | | 1,456,671,164 | | | | 2,853,164,392 | | | | 51,722,595 | | | | 512,903,748 | | | | 83,405,165 | | | | 189,651,009 | |
NET ASSETS: | |
| | | | | | |
Beginning of year | | $ | 5,576,647,288 | | | $ | 2,723,482,896 | | | $ | 1,829,822,874 | | | $ | 1,316,919,126 | | | $ | 609,327,196 | | | $ | 419,676,187 | |
| | | | | | |
End of year | | $ | 7,033,318,452 | | | $ | 5,576,647,288 | | | $ | 1,881,545,469 | | | $ | 1,829,822,874 | | | $ | 692,732,361 | | | $ | 609,327,196 | |
SHARES CREATED AND REDEEMED: | |
| | | | | | |
Shares outstanding, beginning of year | | | 97,600,000 | | | | 70,100,000 | | | | 58,850,000 | | | | 72,700,000 | | | | 12,900,000 | | | | 18,750,000 | |
| | | | | | |
Shares created | | | 44,950,000 | | | | 46,600,000 | | | | 11,850,000 | | | | 1,800,000 | | | | 4,850,000 | | | | 1,700,000 | |
| | | | | | |
Shares redeemed | | | (31,900,000 | ) | | | (19,100,000 | ) | | | (11,650,000 | ) | | | (15,650,000 | ) | | | (3,300,000 | ) | | | (7,550,000 | ) |
Shares outstanding, end of year | | | 110,650,000 | | | | 97,600,000 | | | | 59,050,000 | | | | 58,850,000 | | | | 14,450,000 | | | | 12,900,000 | |
See Notes to Financial Statements.
Statements of Changes in Net Assets (concluded)
WisdomTree Trust
| | | | | | | | | | | | | | | | | | | | | | | | |
| | | |
| | | WisdomTree
U.S. SmallCap Quality Dividend
Growth Fund | | | WisdomTree
U.S. Total Dividend Fund | | | WisdomTree
U.S. Value Fund | |
| | | | | | |
| | | For the
Year Ended
March 31, 2022 | | | For the
Year Ended
March 31, 2021 | | | For the
Year Ended
March 31, 2022 | | | For the
Year Ended
March 31, 2021 | | | For the
Year Ended
March 31, 2022 | | | For the
Year Ended
March 31, 2021 | |
INCREASE (DECREASE) IN NET ASSETS RESULTING FROM OPERATIONS: | | | | | | | | | | | | | |
| | | | | | |
Net investment income | | $ | 5,138,956 | | | $ | 3,099,271 | | | $ | 22,786,482 | | | $ | 20,668,770 | | | $ | 1,471,659 | | | $ | 1,037,842 | |
| | | | | | |
Net realized gain (loss) on investments | | | 15,800,698 | | | | 8,396,753 | | | | 74,857,941 | | | | (12,257,262 | ) | | | 7,616,832 | | | | 8,228,075 | |
| | | | | | |
Net increase (decrease) in unrealized appreciation/depreciation on investments | | | (22,533,592 | ) | | | 60,716,996 | | | | 49,959,306 | | | | 281,999,291 | | | | (1,931,528 | ) | | | 24,326,602 | |
Net increase (decrease) in net assets resulting from operations | | | (1,593,938 | ) | | | 72,213,020 | | | | 147,603,729 | | | | 290,410,799 | | | | 7,156,963 | | | | 33,592,519 | |
DISTRIBUTIONS TO SHAREHOLDERS: | |
| | | | | | |
Distributable earnings | | | (5,126,380 | ) | | | (3,076,752 | ) | | | (21,438,300 | ) | | | (20,745,554 | ) | | | (1,432,409 | ) | | | (1,059,051 | ) |
CAPITAL SHARE TRANSACTIONS: | |
| | | | | | |
Net proceeds from sale of shares | | | 86,414,103 | | | | 67,747,027 | | | | 224,200,288 | | | | 35,217,669 | | | | 79,294,095 | | | | 23,568,030 | |
| | | | | | |
Cost of shares redeemed | | | (42,593,588 | ) | | | (22,953,191 | ) | | | (145,267,142 | ) | | | (64,308,529 | ) | | | (29,744,857 | ) | | | (59,455,621 | ) |
Net increase (decrease) in net assets resulting from capital share transactions | | | 43,820,515 | | | | 44,793,836 | | | | 78,933,146 | | | | (29,090,860 | ) | | | 49,549,238 | | | | (35,887,591 | ) |
Net Increase (Decrease) in Net Assets | | | 37,100,197 | | | | 113,930,104 | | | | 205,098,575 | | | | 240,574,385 | | | | 55,273,792 | | | | (3,354,123 | ) |
NET ASSETS: | |
| | | | | | |
Beginning of year | | $ | 187,732,588 | | | $ | 73,802,484 | | | $ | 875,530,509 | | | $ | 634,956,124 | | | $ | 58,440,627 | | | $ | 61,794,750 | |
| | | | | | |
End of year | | $ | 224,832,785 | | | $ | 187,732,588 | | | $ | 1,080,629,084 | | | $ | 875,530,509 | | | $ | 113,714,419 | | | $ | 58,440,627 | |
SHARES CREATED AND REDEEMED: | |
| | | | | | |
Shares outstanding, beginning of year | | | 4,085,000 | | | | 2,950,000 | | | | 15,500,000 | 1 | | | 16,200,000 | 1 | | | 1,040,000 | 2 | | | 1,900,000 | 2 |
| | | | | | |
Shares created | | | 1,880,000 | | | | 1,755,000 | | | | 3,550,000 | 1 | | | 700,000 | 1 | | | 1,290,000 | 2 | | | 480,000 | 2 |
| | | | | | |
Shares redeemed | | | (930,000 | ) | | | (620,000 | ) | | | (2,300,000 | )1 | | | (1,400,000 | )1 | | | (480,000 | )2 | | | (1,340,000 | )2 |
Shares outstanding, end of year | | | 5,035,000 | | | | 4,085,000 | | | | 16,750,000 | 1 | | | 15,500,000 | 1 | | | 1,850,000 | 2 | | | 1,040,000 | 2 |
1 Shares were adjusted to reflect a 2:1 stock split effective December 23, 2021 (Note 7). | |
2 Shares were adjusted to reflect a 2:1 stock split effective June 10, 2021. | |
See Notes to Financial Statements.
Financial Highlights
WisdomTree Trust
Selected data for a share of beneficial interest outstanding throughout the period is presented below:
| | | | | | | | | | | | | | | | | | | | |
WisdomTree U.S. AI
Enhanced Value Fund | | For the
Year Ended
March 31, 2022^ | | | For the
Year Ended
March 31, 2021^ | | | For the
Year Ended
March 31, 2020^ | | | For the
Year Ended
March 31, 2019^ | | | For the
Year Ended
March 31, 2018^ | |
Net asset value, beginning of year | | $ | 94.15 | | | $ | 64.64 | | | $ | 85.52 | | | $ | 84.43 | | | $ | 82.50 | |
Investment operations: | |
| | | | | |
Net investment income1 | | | 2.70 | | | | 2.67 | | | | 3.11 | | | | 3.06 | | | | 2.73 | |
| | | | | |
Net realized and unrealized gain (loss) | | | 4.95 | | | | 29.49 | | | | (20.83 | ) | | | 1.05 | | | | 1.96 | |
Total from investment operations | | | 7.65 | | | | 32.16 | | | | (17.72 | ) | | | 4.11 | | | | 4.69 | |
Dividends and distributions to shareholders: | |
| | | | | |
Net investment income | | | (2.78 | ) | | | (2.65 | ) | | | (3.16 | ) | | | (2.96 | ) | | | (2.76 | ) |
| | | | | |
Capital gains | | | — | | | | — | | | | — | | | | (0.06 | ) | | | — | |
Total dividends and distributions to shareholders | | | (2.78 | ) | | | (2.65 | ) | | | (3.16 | ) | | | (3.02 | ) | | | (2.76 | ) |
Net asset value, end of year | | $ | 99.02 | | | $ | 94.15 | | | $ | 64.64 | | | $ | 85.52 | | | $ | 84.43 | |
| | | | | |
TOTAL RETURN2 | | | 8.19 | % | | | 50.69 | % | | | (21.49 | )% | | | 4.99 | % | | | 5.71 | % |
RATIOS/SUPPLEMENTAL DATA: | |
| | | | | |
Net assets, end of year (000’s omitted) | | $ | 492,636 | | | $ | 555,491 | | | $ | 543,010 | | | $ | 791,069 | | | $ | 810,510 | |
| | | | | |
Ratios to average net assets3 of: | | | | | | | | | | | | | | | | | | | | |
| | | | | |
Expenses4 | | | 0.38 | % | | | 0.38 | % | | | 0.38 | % | | | 0.38 | % | | | 0.38 | % |
| | | | | |
Net investment income | | | 2.76 | % | | | 3.40 | % | | | 3.61 | % | | | 3.57 | % | | | 3.22 | % |
Portfolio turnover rate5 | | | 96 | %8,9 | | | 47 | % | | | 46 | % | | | 32 | % | | | 34 | % |
| | | | | | | | | | | | | | | | | | | | |
| | | | | | |
| WisdomTree U.S. ESG Fund | | For the
Year Ended
March 31, 2022 | | | For the
Year Ended
March 31, 2021 | | | For the
Year Ended
March 31, 20206 | | | For the
Year Ended
March 31, 20196 | | | For the
Year Ended
March 31, 20186,7 | |
Net asset value, beginning of year | | $ | 43.64 | | | $ | 27.48 | | | $ | 32.29 | | | $ | 31.09 | | | $ | 27.89 | |
Investment operations: | |
| | | | | |
Net investment income1 | | | 0.57 | | | | 0.47 | | | | 0.64 | | | | 0.60 | | | | 0.53 | |
| | | | | |
Net realized and unrealized gain (loss) | | | 4.55 | | | | 16.16 | | | | (4.62 | ) | | | 1.29 | | | | 3.17 | |
Total from investment operations | | | 5.12 | | | | 16.63 | | | | (3.98 | ) | | | 1.89 | | | | 3.70 | |
Dividends to shareholders: | |
| | | | | |
Net investment income | | | (0.60 | ) | | | (0.47 | ) | | | (0.83 | ) | | | (0.69 | ) | | | (0.50 | ) |
Net asset value, end of year | | $ | 48.16 | | | $ | 43.64 | | | $ | 27.48 | | | $ | 32.29 | | | $ | 31.09 | |
| | | | | |
TOTAL RETURN2 | | | 11.73 | % | | | 60.80 | % | | | (12.73 | )% | | | 6.34 | % | | | 13.31 | % |
RATIOS/SUPPLEMENTAL DATA: | |
| | | | | |
Net assets, end of year (000’s omitted) | | $ | 77,058 | | | $ | 88,374 | | | $ | 72,824 | | | $ | 113,025 | | | $ | 69,946 | |
| | | | | |
Ratios to average net assets of: | | | | | | | | | | | | | | | | | | | | |
| | | | | |
Expenses | | | 0.28 | % | | | 0.28 | % | | | 0.28 | % | | | 0.28 | % | | | 0.28 | % |
| | | | | |
Net investment income | | | 1.20 | % | | | 1.29 | % | | | 1.90 | % | | | 1.89 | % | | | 1.75 | % |
Portfolio turnover rate5 | | | 69 | % | | | 78 | % | | | 56 | % | | | 22 | % | | | 22 | % |
| ^ | The information reflects the investment objective and strategy of the WisdomTree U.S. Dividend ex-Financials Fund through January 17, 2022 and the investment objective and strategy of the WisdomTree U.S. AI Enhanced Value Fund thereafter. |
| 1 | Based on average shares outstanding. |
| 2 | Total return is calculated assuming an initial investment made at the net asset value at the beginning of the period, reinvestment of all dividends and distributions at net asset value during the period and redemption on the last day of the period. For the periods in which the investment advisor waived advisory fees for the WisdomTree U.S. AI Enhanced Value Fund, the total return would have been lower if certain expenses had not been waived (Notes 2 and 3). |
| 3 | The ratios to average net assets do not include net investment income (loss) or expenses of other funds in which the Fund invests. |
| 4 | The expense ratio includes investment advisory fee waivers. Without these investment advisory fee waivers, the expense ratio would have been unchanged. |
| 5 | Portfolio turnover rate excludes the value of the portfolio securities received or delivered as a result of in-kind creations or redemptions of the Fund’s capital shares. Short-term securities with maturities less than or equal to 365 days are excluded from the portfolio turnover calculation. |
| 6 | The information reflects the investment objective and strategy of the WisdomTree U.S. Total Market Fund through March 16, 2020 and the investment objective and strategy of the WisdomTree U.S. ESG Fund thereafter. |
| 7 | Per share amounts were adjusted to reflect a 3:1 stock split effective November 10, 2017. |
| 8 | The increase in the portfolio turnover rate was primarily a result of the change in investment objective and strategy on January 18, 2022. |
| 9 | On January 7, 2022, Voya Investment Management Co., LLC replaced Mellon Investments Corporation as sub-advisor to the Fund. |
See Notes to Financial Statements.
Financial Highlights (continued)
WisdomTree Trust
Selected data for a share of beneficial interest outstanding throughout the period is presented below:
| | | | |
| WisdomTree U.S. Growth & Momentum Fund | | For the Period
June 24, 2021*
through
March 31, 2022 | |
Net asset value, beginning of period | | $ | 25.66 | |
Investment operations: | |
| |
Net investment loss1 | | | (0.03 | ) |
| |
Net realized and unrealized loss | | | (2.88 | ) |
Total from investment operations | | | (2.91 | ) |
Net asset value, end of period | | $ | 22.75 | |
| |
TOTAL RETURN2 | | | (11.34 | )% |
RATIOS/SUPPLEMENTAL DATA: | |
| |
Net assets, end of period (000’s omitted) | | $ | 4,095 | |
| |
Ratios to average net assets of: | | | | |
| |
Expenses | | | 0.55 | %3 |
| |
Net investment loss | | | (0.15 | )%3 |
Portfolio turnover rate4 | | | 254 | % |
| | | | | | | | | | | | | | | | | | | | |
| | | | | | |
| WisdomTree U.S. High Dividend Fund | | For the
Year Ended
March 31, 2022 | | | For the
Year Ended
March 31, 2021 | | | For the
Year Ended
March 31, 2020 | | | For the
Year Ended
March 31, 2019 | | | For the
Year Ended
March 31, 2018 | |
Net asset value, beginning of year | | $ | 76.26 | | | $ | 56.58 | | | $ | 72.49 | | | $ | 68.11 | | | $ | 68.48 | |
Investment operations: | |
| | | | | |
Net investment income1 | | | 2.88 | | | | 2.71 | | | | 2.65 | | | | 2.49 | | | | 2.21 | |
| | | | | |
Net realized and unrealized gain (loss) | | | 11.30 | | | | 19.94 | | | | (15.81 | ) | | | 4.28 | | | | (0.34 | ) |
Total from investment operations | | | 14.18 | | | | 22.65 | | | | (13.16 | ) | | | 6.77 | | | | 1.87 | |
Dividends to shareholders: | |
| | | | | |
Net investment income | | | (2.46 | ) | | | (2.97 | ) | | | (2.75 | ) | | | (2.39 | ) | | | (2.24 | ) |
Net asset value, end of year | | $ | 87.98 | | | $ | 76.26 | | | $ | 56.58 | | | $ | 72.49 | | | $ | 68.11 | |
| | | | | |
TOTAL RETURN2 | | | 18.96 | % | | | 40.97 | % | | | (18.99 | )% | | | 10.15 | % | | | 2.69 | % |
RATIOS/SUPPLEMENTAL DATA: | |
| | | | | |
Net assets, end of year (000’s omitted) | | $ | 1,024,960 | | | $ | 774,034 | | | $ | 678,935 | | | $ | 953,276 | | | $ | 1,035,295 | |
|
Ratios to average net assets5 of: | |
| | | | | |
Expenses6 | | | 0.38 | % | | | 0.38 | % | | | 0.38 | % | | | 0.38 | % | | | 0.38 | %7 |
| | | | | |
Net investment income | | | 3.56 | % | | | 4.13 | % | | | 3.63 | % | | | 3.55 | % | | | 3.17 | % |
Portfolio turnover rate4 | | | 38 | % | | | 43 | % | | | 39 | % | | | 20 | % | | | 17 | % |
| * | Commencement of operations. The commencement of operations date is considered to be the date that the Fund began trading in the secondary market. |
| 1 | Based on average shares outstanding. |
| 2 | Total return is calculated assuming an initial investment made at the net asset value at the beginning of the period, reinvestment of all dividends and distributions at net asset value during the period and redemption on the last day of the period. Total return calculated for a period of less than one year is not annualized. For the periods in which the investment advisor waived advisory fees for the WisdomTree U.S. High Dividend Fund, the total return would have been lower if certain expenses had not been waived (Notes 2 and 3). |
| 4 | Portfolio turnover rate is not annualized for fiscal periods less than one year and excludes the value of the portfolio securities received or delivered as a result of in-kind creations or redemptions of the Fund’s capital shares. Short-term securities with maturities less than or equal to 365 days are excluded from the portfolio turnover calculation. |
| 5 | The ratios to average net assets do not include net investment income (loss) or expenses of other funds in which the Fund invests. |
| 6 | The expense ratio includes investment advisory fee waivers. Without these investment advisory fee waivers, the expense ratio would have been unchanged. |
| 7 | Included in the expense ratio are legal expenses. Without these legal expenses, the annualized expense ratio would have been unchanged. |
See Notes to Financial Statements.
Financial Highlights (continued)
WisdomTree Trust
Selected data for a share of beneficial interest outstanding throughout the period is presented below:
| | | | | | | | | | | | | | | | | | | | |
WisdomTree U.S. LargeCap
Dividend Fund | | For the
Year Ended
March 31, 20221 | | | For the
Year Ended
March 31, 20211 | | | For the
Year Ended
March 31, 20201 | | | For the
Year Ended
March 31, 20191 | | | For the
Year Ended
March 31, 20181 | |
Net asset value, beginning of year | | $ | 57.27 | | | $ | 40.47 | | | $ | 47.11 | | | $ | 44.25 | | | $ | 41.46 | |
Investment operations: | |
| | | | | |
Net investment income2 | | | 1.42 | | | | 1.36 | | | | 1.36 | | | | 1.27 | | | | 1.11 | |
| | | | | |
Net realized and unrealized gain (loss) | | | 8.33 | | | | 16.79 | | | | (6.64 | ) | | | 2.83 | | | | 2.79 | |
Total from investment operations | | | 9.75 | | | | 18.15 | | | | (5.28 | ) | | | 4.10 | | | | 3.90 | |
Dividends to shareholders: | |
| | | | | |
Net investment income | | | (1.36 | ) | | | (1.35 | ) | | | (1.36 | ) | | | (1.24 | ) | | | (1.11 | ) |
Net asset value, end of year | | $ | 65.66 | | | $ | 57.27 | | | $ | 40.47 | | | $ | 47.11 | | | $ | 44.25 | |
| | | | | |
TOTAL RETURN3 | | | 17.16 | % | | | 45.40 | % | | | (11.62 | )% | | | 9.44 | % | | | 9.44 | % |
RATIOS/SUPPLEMENTAL DATA: | |
| | | | | |
Net assets, end of year (000’s omitted) | | $ | 3,427,240 | | | $ | 2,823,467 | | | $ | 1,849,693 | | | $ | 2,034,965 | | | $ | 1,933,552 | |
|
Ratios to average net assets4 of: | |
| | | | | |
Expenses5 | | | 0.28 | % | | | 0.28 | % | | | 0.28 | % | | | 0.28 | % | | | 0.28 | % |
| | | | | |
Net investment income | | | 2.28 | % | | | 2.73 | % | | | 2.76 | % | | | 2.79 | % | | | 2.54 | % |
Portfolio turnover rate6 | | | 19 | % | | | 20 | % | | | 13 | % | | | 11 | % | | | 10 | % |
| | | | | | | | | | | | | | | | | | | | |
| | | | | | |
| WisdomTree U.S. LargeCap Fund | | For the
Year Ended
March 31, 2022 | | | For the
Year Ended
March 31, 2021 | | | For the
Year Ended
March 31, 2020 | | | For the
Year Ended
March 31, 2019 | | | For the
Year Ended
March 31, 20187 | |
Net asset value, beginning of year | | $ | 43.29 | | | $ | 28.10 | | | $ | 31.77 | | | $ | 30.30 | | | $ | 27.14 | |
Investment operations: | |
| | | | | |
Net investment income2 | | | 0.78 | | | | 0.73 | | | | 0.73 | | | | 0.60 | | | | 0.53 | |
| | | | | |
Net realized and unrealized gain (loss) | | | 4.92 | | | | 15.19 | | | | (3.72 | ) | | | 1.46 | | | | 3.11 | |
Total from investment operations | | | 5.70 | | | | 15.92 | | | | (2.99 | ) | | | 2.06 | | | | 3.64 | |
Dividends to shareholders: | |
| | | | | |
Net investment income | | | (0.76 | ) | | | (0.73 | ) | | | (0.68 | ) | | | (0.59 | ) | | | (0.48 | ) |
Net asset value, end of year | | $ | 48.23 | | | $ | 43.29 | | | $ | 28.10 | | | $ | 31.77 | | | $ | 30.30 | |
| | | | | |
TOTAL RETURN3 | | | 13.19 | % | | | 57.11 | % | | | (9.65 | )% | | | 6.93 | % | | | 13.49 | % |
RATIOS/SUPPLEMENTAL DATA: | |
| | | | | |
Net assets, end of year (000’s omitted) | | $ | 696,953 | | | $ | 510,794 | | | $ | 341,423 | | | $ | 239,851 | | | $ | 184,813 | |
|
Ratios to average net assets4 of: | |
| | | | | |
Expenses | | | 0.08 | % | | | 0.08 | % | | | 0.08 | %5 | | | 0.28 | %5 | | | 0.28 | %5 |
| | | | | |
Net investment income | | | 1.65 | % | | | 2.00 | % | | | 2.16 | % | | | 1.94 | % | | | 1.80 | % |
Portfolio turnover rate6 | | | 22 | % | | | 21 | % | | | 22 | % | | | 14 | % | | | 17 | % |
| 1 | Per share amounts were adjusted to reflect a 2:1 stock split effective December 23, 2021 (Note 7). |
| 2 | Based on average shares outstanding. |
| 3 | Total return is calculated assuming an initial investment made at the net asset value at the beginning of the period, reinvestment of all dividends and distributions at net asset value during the period and redemption on the last day of the period. For the periods in which the investment advisor waived advisory fees, the total return would have been lower if certain expenses had not been waived (Notes 2 and 3). |
| 4 | The ratios to average net assets do not include net investment income (loss) or expenses of other funds in which the Fund invests. |
| 5 | The expense ratio includes investment advisory fee waivers. Without these investment advisory fee waivers, the expense ratio would have been unchanged. |
| 6 | Portfolio turnover rate excludes the value of the portfolio securities received or delivered as a result of in-kind creations or redemptions of the Fund’s capital shares. Short-term securities with maturities less than or equal to 365 days are excluded from the portfolio turnover calculation. |
| 7 | Per share amounts were adjusted to reflect a 3:1 stock split effective November 10, 2017. |
See Notes to Financial Statements.
Financial Highlights (continued)
WisdomTree Trust
Selected data for a share of beneficial interest outstanding throughout the period is presented below:
| | | | | | | | | | | | | | | | | | | | |
WisdomTree U.S. MidCap
Dividend Fund | | For the
Year Ended
March 31, 2022 | | | For the
Year Ended
March 31, 2021 | | | For the
Year Ended
March 31, 2020 | | | For the
Year Ended
March 31, 2019 | | | For the
Year Ended
March 31, 20181 | |
Net asset value, beginning of year | | $ | 40.40 | | | $ | 24.19 | | | $ | 35.76 | | | $ | 34.11 | | | $ | 32.50 | |
Investment operations: | |
| | | | | |
Net investment income2 | | | 0.99 | | | | 0.80 | | | | 1.01 | | | | 0.82 | | | | 0.76 | |
| | | | | |
Net realized and unrealized gain (loss) | | | 3.89 | | | | 16.24 | | | | (11.56 | ) | | | 1.61 | | | | 1.59 | |
Total from investment operations | | | 4.88 | | | | 17.04 | | | | (10.55 | ) | | | 2.43 | | | | 2.35 | |
Dividends to shareholders: | |
| | | | | |
Net investment income | | | (0.97 | ) | | | (0.83 | ) | | | (1.02 | ) | | | (0.78 | ) | | | (0.74 | ) |
Net asset value, end of year | | $ | 44.31 | | | $ | 40.40 | | | $ | 24.19 | | | $ | 35.76 | | | $ | 34.11 | |
| | | | | |
TOTAL RETURN3 | | | 12.17 | % | | | 71.52 | % | | | (30.28 | )% | | | 7.21 | % | | | 7.30 | % |
RATIOS/SUPPLEMENTAL DATA: | |
| | | | | |
Net assets, end of year (000’s omitted) | | $ | 3,210,599 | | | $ | 2,904,494 | | | $ | 2,485,261 | | | $ | 3,733,683 | | | $ | 3,064,477 | |
|
Ratios to average net assets4 of: | |
| | | | | |
Expenses5 | | | 0.38 | % | | | 0.38 | % | | | 0.38 | % | | | 0.38 | % | | | 0.38 | %6 |
| | | | | |
Net investment income | | | 2.31 | % | | | 2.55 | % | | | 2.84 | % | | | 2.34 | % | | | 2.26 | % |
Portfolio turnover rate7 | | | 38 | % | | | 57 | % | | | 33 | % | | | 27 | % | | | 27 | % |
| | | | | | | | | | | | | | | | | | | | |
| | | | | | |
| WisdomTree U.S. MidCap Fund | | For the
Year Ended
March 31, 2022 | | | For the
Year Ended
March 31, 2021 | | | For the
Year Ended
March 31, 2020 | | | For the
Year Ended
March 31, 2019 | | | For the
Year Ended
March 31, 2018 | |
Net asset value, beginning of year | | $ | 50.86 | | | $ | 26.44 | | | $ | 39.30 | | | $ | 38.63 | | | $ | 35.25 | |
Investment operations: | |
| | | | | |
Net investment income2 | | | 0.72 | | | | 0.56 | | | | 0.62 | | | | 0.53 | | | | 0.47 | |
| | | | | |
Net realized and unrealized gain (loss) | | | 3.81 | | | | 24.45 | | | | (12.83 | ) | | | 0.68 | | | | 3.32 | |
Total from investment operations | | | 4.53 | | | | 25.01 | | | | (12.21 | ) | | | 1.21 | | | | 3.79 | |
Dividends to shareholders: | |
| | | | | |
Net investment income | | | (0.73 | ) | | | (0.59 | ) | | | (0.65 | ) | | | (0.54 | ) | | | (0.41 | ) |
Net asset value, end of year | | $ | 54.66 | | | $ | 50.86 | | | $ | 26.44 | | | $ | 39.30 | | | $ | 38.63 | |
| | | | | |
TOTAL RETURN3 | | | 8.93 | % | | | 95.30 | % | | | (31.45 | )% | | | 3.22 | % | | | 10.77 | %8 |
RATIOS/SUPPLEMENTAL DATA: | |
| | | | | |
Net assets, end of year (000’s omitted) | | $ | 811,672 | | | $ | 706,997 | | | $ | 560,609 | | | $ | 1,098,311 | | | $ | 1,035,164 | |
|
Ratios to average net assets4 of: | |
| | | | | |
Expenses5 | | | 0.38 | % | | | 0.38 | % | | | 0.38 | % | | | 0.38 | % | | | 0.38 | % |
| | | | | |
Net investment income | | | 1.34 | % | | | 1.49 | % | | | 1.58 | % | | | 1.34 | % | | | 1.25 | % |
Portfolio turnover rate7 | | | 50 | % | | | 50 | % | | | 41 | % | | | 36 | % | | | 45 | % |
| 1 | Per share amounts were adjusted to reflect a 3:1 stock split effective November 10, 2017. |
| 2 | Based on average shares outstanding. |
| 3 | Total return is calculated assuming an initial investment made at the net asset value at the beginning of the period, reinvestment of all dividends and distributions at net asset value during the period and redemption on the last day of the period. For the periods in which the investment advisor waived advisory fees, the total return would have been lower if certain expenses had not been waived (Notes 2 and 3). |
| 4 | The ratios to average net assets do not include net investment income (loss) or expenses of other funds in which the Fund invests. |
| 5 | The expense ratio includes investment advisory fee waivers. Without these investment advisory fee waivers, the expense ratio would have been unchanged. |
| 6 | Included in the expense ratio are legal expenses. Without these legal expenses, the annualized expense ratio would have been unchanged. |
| 7 | Portfolio turnover rate excludes the value of the portfolio securities received or delivered as a result of in-kind creations or redemptions of the Fund’s capital shares. Short-term securities with maturities less than or equal to 365 days are excluded from the portfolio turnover calculation. |
| 8 | Includes a reimbursement from the sub-advisor for an operational error. Excluding the reimbursement, total return would have been unchanged. |
See Notes to Financial Statements.
Financial Highlights (continued)
WisdomTree Trust
Selected data for a share of beneficial interest outstanding throughout the period is presented below:
| | | | | | | | | | | | | | | | | | | | |
| WisdomTree U.S. Multifactor Fund | | For the
Year Ended
March 31, 2022 | | | For the
Year Ended
March 31, 2021 | | | For the
Year Ended
March 31, 2020 | | | For the
Year Ended
March 31, 2019 | | | For the Period
June 29, 2017*
through
March 31, 2018 | |
Net asset value, beginning of year | | $ | 37.83 | | | $ | 24.58 | | | $ | 28.98 | | | $ | 27.91 | | | $ | 24.75 | |
Investment operations: | |
| | | | | |
Net investment income1 | | | 0.63 | | | | 0.39 | | | | 0.59 | | | | 0.47 | | | | 0.34 | |
| | | | | |
Net realized and unrealized gain (loss) | | | 3.03 | | | | 13.26 | | | | (4.43 | ) | | | 0.97 | | | | 3.09 | |
Total from investment operations | | | 3.66 | | | | 13.65 | | | | (3.84 | ) | | | 1.44 | | | | 3.43 | |
Dividends to shareholders: | |
| | | | | |
Net investment income | | | (0.59 | ) | | | (0.40 | ) | | | (0.56 | ) | | | (0.37 | ) | | | (0.27 | ) |
Net asset value, end of year | | $ | 40.90 | | | $ | 37.83 | | | $ | 24.58 | | | $ | 28.98 | | | $ | 27.91 | |
| | | | | |
TOTAL RETURN2 | | | 9.68 | % | | | 55.76 | % | | | (13.43 | )% | | | 5.25 | % | | | 13.90 | % |
RATIOS/SUPPLEMENTAL DATA: | |
| | | | | |
Net assets, end of year (000’s omitted) | | $ | 223,949 | | | $ | 148,490 | | | $ | 141,308 | | | $ | 114,481 | | | $ | 5,582 | |
|
Ratios to average net assets of: | |
| | | | | |
Expenses | | | 0.28 | % | | | 0.28 | % | | | 0.28 | %3,4 | | | 0.28 | %3,4 | | | 0.28 | %5 |
| | | | | |
Net investment income | | | 1.58 | % | | | 1.21 | % | | | 1.94 | %3 | | | 1.65 | %3 | | | 1.66 | %5 |
Portfolio turnover rate6 | | | 152 | % | | | 147 | % | | | 145 | % | | | 179 | % | | | 143 | % |
| | | | | | | | | | | | | | | | | | | | |
| | | | | | |
WisdomTree U.S. Quality Dividend
Growth Fund | | For the
Year Ended
March 31, 2022 | | | For the
Year Ended
March 31, 2021 | | | For the
Year Ended
March 31, 2020 | | | For the
Year Ended
March 31, 2019 | | | For the
Year Ended
March 31, 2018 | |
Net asset value, beginning of year | | $ | 57.14 | | | $ | 38.85 | | | $ | 43.04 | | | $ | 40.32 | | | $ | 35.45 | |
Investment operations: | |
| | | | | |
Net investment income1 | | | 1.22 | | | | 1.07 | | | | 1.09 | | | | 0.97 | | | | 0.78 | |
| | | | | |
Net realized and unrealized gain (loss) | | | 6.37 | | | | 18.27 | | | | (4.21 | ) | | | 2.71 | | | | 4.84 | |
Total from investment operations | | | 7.59 | | | | 19.34 | | | | (3.12 | ) | | | 3.68 | | | | 5.62 | |
Dividends and distributions to shareholders: | |
| | | | | |
Net investment income | | | (1.17 | ) | | | (1.05 | ) | | | (1.07 | ) | | | (0.93 | ) | | | (0.75 | ) |
| | | | | |
Capital gains | | | — | | | | — | | | | — | | | | (0.03 | ) | | | — | |
Total dividends and distributions to shareholders | | | (1.17 | ) | | | (1.05 | ) | | | (1.07 | ) | | | (0.96 | ) | | | (0.75 | ) |
Net asset value, end of year | | $ | 63.56 | | | $ | 57.14 | | | $ | 38.85 | | | $ | 43.04 | | | $ | 40.32 | |
| | | | | |
TOTAL RETURN2 | | | 13.36 | % | | | 50.24 | % | | | (7.52 | )% | | | 9.25 | % | | | 15.95 | %7 |
RATIOS/SUPPLEMENTAL DATA: | |
| | | | | |
Net assets, end of year (000’s omitted) | | $ | 7,033,318 | | | $ | 5,576,647 | | | $ | 2,723,483 | | | $ | 2,780,361 | | | $ | 2,064,305 | |
|
Ratios to average net assets of: | |
| | | | | |
Expenses | | | 0.28 | % | | | 0.28 | % | | | 0.28 | % | | | 0.28 | % | | | 0.28 | % |
| | | | | |
Net investment income | | | 1.98 | % | | | 2.15 | % | | | 2.43 | % | | | 2.33 | % | | | 1.99 | % |
Portfolio turnover rate6 | | | 30 | % | | | 30 | % | | | 41 | % | | | 29 | % | | | 29 | % |
| * | Commencement of operations. The commencement of operations date is considered to be the date that the Fund began trading in the secondary market. |
| 1 | Based on average shares outstanding. |
| 2 | Total return is calculated assuming an initial investment made at the net asset value at the beginning of the period, reinvestment of all dividends and distributions at net asset value during the period and redemption on the last day of the period. For the periods in which the investment advisor waived advisory fees for the WisdomTree U.S. Multifactor Fund, the total return would have been lower if certain expenses had not been waived (Notes 2 and 3). |
| 3 | The ratios to average net assets do not include net investment income (loss) or expenses of other funds in which the Fund invests. |
| 4 | The expense ratio includes investment advisory fee waivers. Without these investment advisory fee waivers, the expense ratio would have been unchanged. |
| 6 | Portfolio turnover rate is not annualized for fiscal periods less than one year and excludes the value of the portfolio securities received or delivered as a result of in-kind creations or redemptions of the Fund’s capital shares. Short-term securities with maturities less than or equal to 365 days are excluded from the portfolio turnover calculation. |
| 7 | Includes a reimbursement from the sub-advisor for an operational error. Excluding the reimbursement, total return would have been unchanged. |
See Notes to Financial Statements.
Financial Highlights (continued)
WisdomTree Trust
Selected data for a share of beneficial interest outstanding throughout the period is presented below:
| | | | | | | | | | | | | | | | | | | | |
WisdomTree U.S. SmallCap
Dividend Fund | | For the
Year Ended
March 31, 2022 | | | For the
Year Ended
March 31, 2021 | | | For the
Year Ended
March 31, 2020 | | | For the
Year Ended
March 31, 2019 | | | For the
Year Ended
March 31, 20181 | |
Net asset value, beginning of year | | $ | 31.09 | | | $ | 18.11 | | | $ | 27.54 | | | $ | 27.43 | | | $ | 26.88 | |
Investment operations: | |
| | | | | |
Net investment income2 | | | 0.85 | | | | 0.66 | | | | 0.79 | | | | 0.82 | | | | 0.81 | |
| | | | | |
Net realized and unrealized gain (loss) | | | 0.76 | | | | 12.99 | | | | (9.40 | ) | | | 0.08 | | | | 0.53 | |
Total from investment operations | | | 1.61 | | | | 13.65 | | | | (8.61 | ) | | | 0.90 | | | | 1.34 | |
Dividends to shareholders: | |
| | | | | |
Net investment income | | | (0.84 | ) | | | (0.67 | ) | | | (0.82 | ) | | | (0.79 | ) | | | (0.79 | ) |
Net asset value, end of year | | $ | 31.86 | | | $ | 31.09 | | | $ | 18.11 | | | $ | 27.54 | | | $ | 27.43 | |
| | | | | |
TOTAL RETURN3 | | | 5.18 | % | | | 76.76 | % | | | (32.22 | )% | | | 3.25 | % | | | 5.02 | %4 |
RATIOS/SUPPLEMENTAL DATA: | |
| | | | | |
Net assets, end of year (000’s omitted) | | $ | 1,881,545 | | | $ | 1,829,823 | | | $ | 1,316,919 | | | $ | 2,087,705 | | | $ | 1,965,277 | |
|
Ratios to average net assets5 of: | |
| | | | | |
Expenses6 | | | 0.38 | % | | | 0.38 | % | | | 0.38 | % | | | 0.38 | % | | | 0.38 | % |
| | | | | |
Net investment income | | | 2.66 | % | | | 2.78 | % | | | 2.94 | % | | | 2.91 | % | | | 2.93 | % |
Portfolio turnover rate7 | | | 39 | % | | | 53 | % | | | 50 | % | | | 26 | % | | | 36 | % |
| | | | | | | | | | | | | | | | | | | | |
| | | | | | |
| WisdomTree U.S. SmallCap Fund | | For the
Year Ended
March 31, 2022 | | | For the
Year Ended
March 31, 2021 | | | For the
Year Ended
March 31, 2020 | | | For the
Year Ended
March 31, 2019 | | | For the
Year Ended
March 31, 2018 | |
Net asset value, beginning of year | | $ | 47.23 | | | $ | 22.38 | | | $ | 36.08 | | | $ | 35.70 | | | $ | 32.16 | |
Investment operations: | |
| | | | | |
Net investment income2 | | | 0.73 | | | | 0.44 | | | | 0.51 | | | | 0.58 | | | | 0.37 | |
| | | | | |
Net realized and unrealized gain (loss) | | | 0.78 | | | | 24.85 | | | | (13.66 | ) | | | 0.38 | | | | 3.51 | |
Total from investment operations | | | 1.51 | | | | 25.29 | | | | (13.15 | ) | | | 0.96 | | | | 3.88 | |
Dividends to shareholders: | |
| | | | | |
Net investment income | | | (0.80 | ) | | | (0.44 | ) | | | (0.55 | ) | | | (0.58 | ) | | | (0.34 | ) |
Net asset value, end of year | | $ | 47.94 | | | $ | 47.23 | | | $ | 22.38 | | | $ | 36.08 | | | $ | 35.70 | |
| | | | | |
TOTAL RETURN3 | | | 3.11 | % | | | 113.74 | % | | | (36.87 | )% | | | 2.72 | % | | | 12.09 | %4 |
RATIOS/SUPPLEMENTAL DATA: | |
| | | | | |
Net assets, end of year (000’s omitted) | | $ | 692,732 | | | $ | 609,327 | | | $ | 419,676 | | | $ | 736,098 | | | $ | 588,999 | |
|
Ratios to average net assets5 of: | |
| | | | | |
Expenses6 | | | 0.38 | % | | | 0.38 | % | | | 0.38 | % | | | 0.38 | % | | | 0.38 | % |
| | | | | |
Net investment income | | | 1.47 | % | | | 1.33 | % | | | 1.45 | % | | | 1.56 | % | | | 1.08 | % |
Portfolio turnover rate7 | | | 54 | % | | | 56 | % | | | 55 | % | | | 45 | % | | | 48 | % |
| 1 | Per share amounts were adjusted to reflect a 3:1 stock split effective November 10, 2017. |
| 2 | Based on average shares outstanding. |
| 3 | Total return is calculated assuming an initial investment made at the net asset value at the beginning of the period, reinvestment of all dividends and distributions at net asset value during the period and redemption on the last day of the period. For the periods in which the investment advisor waived advisory fees, the total return would have been lower if certain expenses had not been waived (Notes 2 and 3). |
| 4 | Includes a reimbursement from the sub-advisor for an operational error. Excluding the reimbursement, total return would have been unchanged. |
| 5 | The ratios to average net assets do not include net investment income (loss) or expenses of other funds in which the Fund invests. |
| 6 | The expense ratio includes investment advisory fee waivers. Without these investment advisory fee waivers, the expense ratio would have been unchanged. |
| 7 | Portfolio turnover rate excludes the value of the portfolio securities received or delivered as a result of in-kind creations or redemptions of the Fund’s capital shares. Short-term securities with maturities less than or equal to 365 days are excluded from the portfolio turnover calculation. |
See Notes to Financial Statements.
Financial Highlights (continued)
WisdomTree Trust
Selected data for a share of beneficial interest outstanding throughout the period is presented below:
| | | | | | | | | | | | | | | | | | | | |
WisdomTree U.S. SmallCap Quality
Dividend Growth Fund | | For the
Year Ended
March 31, 2022 | | | For the
Year Ended
March 31, 2021 | | | For the
Year Ended
March 31, 2020 | | | For the
Year Ended
March 31, 2019 | | | For the
Year Ended
March 31, 2018 | |
Net asset value, beginning of year | | $ | 45.96 | | | $ | 25.02 | | | $ | 34.70 | | | $ | 34.26 | | | $ | 33.06 | |
Investment operations: | |
| | | | | |
Net investment income1 | | | 1.14 | | | | 0.94 | | | | 0.80 | | | | 0.88 | | | | 0.76 | |
| | | | | |
Net realized and unrealized gain (loss) | | | (1.32 | ) | | | 20.92 | | | | (9.68 | ) | | | 0.41 | | | | 1.21 | |
Total from investment operations | | | (0.18 | ) | | | 21.86 | | | | (8.88 | ) | | | 1.29 | | | | 1.97 | |
Dividends to shareholders: | |
| | | | | |
Net investment income | | | (1.13 | ) | | | (0.92 | ) | | | (0.80 | ) | | | (0.85 | ) | | | (0.77 | ) |
Net asset value, end of year | | $ | 44.65 | | | $ | 45.96 | | | $ | 25.02 | | | $ | 34.70 | | | $ | 34.26 | |
| | | | | |
TOTAL RETURN2 | | | (0.45 | )% | | | 88.65 | % | | | (26.22 | )% | | | 3.81 | % | | | 5.97 | % |
RATIOS/SUPPLEMENTAL DATA: | |
| | | | | |
Net assets, end of year (000’s omitted) | | $ | 224,833 | | | $ | 187,733 | | | $ | 73,802 | | | $ | 119,699 | | | $ | 101,060 | |
|
Ratios to average net assets of: | |
| | | | | |
Expenses | | | 0.38 | % | | | 0.38 | % | | | 0.38 | % | | | 0.38 | % | | | 0.38 | % |
| | | | | |
Net investment income | | | 2.49 | % | | | 2.67 | % | | | 2.29 | % | | | 2.47 | % | | | 2.24 | % |
Portfolio turnover rate3 | | | 60 | % | | | 83 | % | | | 51 | % | | | 42 | % | | | 51 | % |
| | | | | | | | | | | | | | | | | | | | |
| | | | | | |
| WisdomTree U.S. Total Dividend Fund | | For the
Year Ended
March 31, 20224 | | | For the
Year Ended
March 31, 20214 | | | For the
Year Ended
March 31, 20204 | | | For the
Year Ended
March 31, 20194 | | | For the
Year Ended
March 31, 20184 | |
Net asset value, beginning of year | | $ | 56.49 | | | $ | 39.19 | | | $ | 47.31 | | | $ | 44.56 | | | $ | 42.02 | |
Investment operations: | |
| | | | | |
Net investment income1 | | | 1.43 | | | | 1.33 | | | | 1.38 | | | | 1.28 | | | | 1.14 | |
| | | | | |
Net realized and unrealized gain (loss) | | | 7.94 | | | | 17.30 | | | | (8.13 | ) | | | 2.71 | | | | 2.52 | |
Total from investment operations | | | 9.37 | | | | 18.63 | | | | (6.75 | ) | | | 3.99 | | | | 3.66 | |
Dividends to shareholders: | |
| | | | | |
Net investment income | | | (1.34 | ) | | | (1.33 | ) | | | (1.37 | ) | | | (1.24 | ) | | | (1.12 | ) |
Net asset value, end of year | | $ | 64.52 | | | $ | 56.49 | | | $ | 39.19 | | | $ | 47.31 | | | $ | 44.56 | |
| | | | | |
TOTAL RETURN2 | | | 16.73 | % | | | 48.15 | % | | | (14.75 | )% | | | 9.10 | % | | | 8.76 | %5 |
RATIOS/SUPPLEMENTAL DATA: | |
| | | | | |
Net assets, end of year (000’s omitted) | | $ | 1,080,629 | | | $ | 875,531 | | | $ | 634,956 | | | $ | 648,103 | | | $ | 579,232 | |
|
Ratios to average net assets of: | |
| | | | | |
Expenses | | | 0.28 | % | | | 0.28 | % | | | 0.28 | %6,7 | | | 0.28 | %6,7 | | | 0.28 | %6,7,8 |
| | | | | |
Net investment income | | | 2.33 | % | | | 2.73 | % | | | 2.82 | %6 | | | 2.78 | %6 | | | 2.56 | %6 |
Portfolio turnover rate3 | | | 22 | % | | | 22 | % | | | 16 | % | | | 11 | % | | | 11 | % |
| 1 | Based on average shares outstanding. |
| 2 | Total return is calculated assuming an initial investment made at the net asset value at the beginning of the period, reinvestment of all dividends and distributions at net asset value during the period and redemption on the last day of the period. For the periods in which the investment advisor waived advisory fees for the WisdomTree U.S. Total Dividend Fund, the total return would have been lower if certain expenses had not been waived (Notes 2 and 3). |
| 3 | Portfolio turnover rate excludes the value of the portfolio securities received or delivered as a result of in-kind creations or redemptions of the Fund’s capital shares. Short-term securities with maturities less than or equal to 365 days are excluded from the portfolio turnover calculation. |
| 4 | Per share amounts were adjusted to reflect a 2:1 stock split effective December 23, 2021 (Note 7). |
| 5 | Includes a reimbursement from the sub-advisor for an operational error. Excluding the reimbursement, total return would have been unchanged. |
| 6 | The ratios to average net assets do not include net investment income (loss) or expenses of other funds in which the Fund invests. |
| 7 | The expense ratio includes investment advisory fee waivers. Without these investment advisory fee waivers, the expense ratio would have been unchanged. |
| 8 | Included in the expense ratio are legal expenses. Without these legal expenses, the annualized expense ratio would have been unchanged. |
See Notes to Financial Statements.
Financial Highlights (concluded)
WisdomTree Trust
Selected data for a share of beneficial interest outstanding throughout the period is presented below:
| | | | | | | | | | | | | | | | | | | | |
| WisdomTree U.S. Value Fund | | For the
Year Ended
March 31, 20221 | | | For the
Year Ended
March 31, 20211 | | | For the
Year Ended
March 31, 20201 | | | For the
Year Ended
March 31, 20191 | | | For the
Year Ended
March 31, 20181,2 | |
Net asset value, beginning of year | | $ | 56.19 | | | $ | 32.52 | | | $ | 42.35 | | | $ | 40.43 | | | $ | 35.13 | |
Investment operations: | |
| | | | | |
Net investment income3 | | | 1.08 | | | | 0.76 | | | | 0.76 | | | | 0.72 | | | | 0.57 | |
| | | | | |
Net realized and unrealized gain (loss) | | | 5.19 | | | | 23.79 | | | | (9.88 | ) | | | 1.94 | | | | 5.30 | |
Total from investment operations | | | 6.27 | | | | 24.55 | | | | (9.12 | ) | | | 2.66 | | | | 5.87 | |
Dividends to shareholders: | |
| | | | | |
Net investment income | | | (0.99 | ) | | | (0.88 | ) | | | (0.71 | ) | | | (0.74 | ) | | | (0.57 | ) |
Net asset value, end of year | | $ | 61.47 | | | $ | 56.19 | | | $ | 32.52 | | | $ | 42.35 | | | $ | 40.43 | |
| | | | | |
TOTAL RETURN4 | | | 11.16 | % | | | 76.07 | % | | | (21.86 | )% | | | 6.70 | % | | | 16.77 | % |
RATIOS/SUPPLEMENTAL DATA: | |
| | | | | |
Net assets, end of year (000’s omitted) | | $ | 113,714 | | | $ | 58,441 | | | $ | 61,795 | | | $ | 38,113 | | | $ | 44,466 | |
|
Ratios to average net assets of: | |
| | | | | |
Expenses | | | 0.30 | %5 | | | 0.38 | % | | | 0.38 | % | | | 0.38 | % | | | 0.38 | %6,7 |
| | | | | |
Net investment income | | | 1.77 | % | | | 1.76 | % | | | 1.75 | % | | | 1.73 | % | | | 1.48 | %6 |
Portfolio turnover rate8 | | | 62 | % | | | 59 | % | | | 101 | % | | | 54 | % | | | 82 | % |
| 1 | Per share amounts were adjusted to reflect a 2:1 stock split effective June 10, 2021. |
| 2 | The information reflects the investment objective and strategy of the WisdomTree U.S. LargeCap Value Fund through December 17, 2017 and the investment objective and strategy of the WisdomTree U.S. Value Fund (formerly, WisdomTree U.S. Quality Shareholder Yield Fund) thereafter. |
| 3 | Based on average shares outstanding. |
| 4 | Total return is calculated assuming an initial investment made at the net asset value at the beginning of the period, reinvestment of all dividends and distributions at net asset value during the period and redemption on the last day of the period. For the periods in which the investment advisor waived advisory fees, the total return would have been lower if certain expenses had not been waived (Notes 2 and 3). |
| 5 | Prior to January 3, 2022, the Fund’s annual advisory fee rate was 0.38% and, thereafter, was reduced to 0.12% per annum. |
| 6 | The ratios to average net assets do not include net investment income (loss) or expenses of other funds in which the Fund invests. |
| 7 | The expense ratio includes investment advisory fee waivers. Without these investment advisory fee waivers, the expense ratio would have been unchanged. |
| 8 | Portfolio turnover rate excludes the value of the portfolio securities received or delivered as a result of in-kind creations or redemptions of the Fund’s capital shares. Short-term securities with maturities less than or equal to 365 days are excluded from the portfolio turnover calculation. |
See Notes to Financial Statements.
Notes to Financial Statements
1. ORGANIZATION
WisdomTree Trust (the “Trust”) is registered under the Investment Company Act of 1940, as amended (the “1940 Act”), as an open-end management investment company. The Trust was established as a Delaware statutory trust on December 15, 2005 and is authorized to have multiple series of portfolios (each a “Fund”, collectively, the “Funds”). These notes relate only to the Funds listed below. In accordance with Accounting Standards Codification Topic 946, Financial Services-Investment Companies, each Fund listed below qualifies as an investment company and is applying the accounting and reporting guidance for investment companies.
| | | | |
| | |
| Fund | | Commencement of Operations | |
WisdomTree U.S. AI Enhanced Value Fund (“U.S. AI Enhanced Value Fund”) (formerly, WisdomTree U.S. Dividend ex-Financials Fund (DTN)) | | | June 16, 2006 | |
WisdomTree U.S. ESG Fund (“U.S. ESG Fund”) | | | February 23, 2007 | |
WisdomTree U.S. Growth & Momentum Fund (“U.S. Growth & Momentum Fund”) | | | June 24, 2021 | |
WisdomTree U.S. High Dividend Fund (“U.S. High Dividend Fund”) | | | June 16, 2006 | |
WisdomTree U.S. LargeCap Dividend Fund (“U.S. LargeCap Dividend Fund”) | | | June 16, 2006 | |
WisdomTree U.S. LargeCap Fund (“U.S. LargeCap Fund”) | | | February 23, 2007 | |
WisdomTree U.S. MidCap Dividend Fund (“U.S. MidCap Dividend Fund”) | | | June 16, 2006 | |
WisdomTree U.S. MidCap Fund (“U.S. MidCap Fund”) | | | February 23, 2007 | |
WisdomTree U.S. Multifactor Fund (“U.S. Multifactor Fund”) | | | June 29, 2017 | |
WisdomTree U.S. Quality Dividend Growth Fund (“U.S. Quality Dividend Growth Fund”) | | | May 22, 2013 | |
WisdomTree U.S. SmallCap Dividend Fund (“U.S. SmallCap Dividend Fund”) | | | June 16, 2006 | |
WisdomTree U.S. SmallCap Fund (“U.S. SmallCap Fund”) | | | February 23, 2007 | |
WisdomTree U.S. SmallCap Quality Dividend Growth Fund (“U.S. SmallCap Quality Dividend Growth Fund”) | | | July 25, 2013 | |
WisdomTree U.S. Total Dividend Fund (“U.S. Total Dividend Fund”) | | | June 16, 2006 | |
WisdomTree U.S. Value Fund (“U.S. Value Fund”) (formerly, WisdomTree U.S. Quality Shareholder Yield Fund (QSY)) | | | February 23, 2007 | |
Each Fund, except the U.S. AI Enhanced Value Fund, U.S. ESG Fund and U.S. Value Fund, seeks to track the price and yield performance, before fees and expenses, of a particular index (“Index”) developed by WisdomTree Investments, Inc. (“WisdomTree Investments”) or an Index developed by a third party. The U.S. AI Enhanced Value Fund and U.S. Value Fund are actively managed using a model-based approach seeking income and capital appreciation. Prior to January 18, 2022, the U.S. AI Enhanced Value Fund was known as the WisdomTree U.S. Dividend ex-Financials Fund, which was a passively managed fund that sought to track the price and yield performance, before fees and expenses, of an index developed by WisdomTree Investments. The U.S. ESG Fund is actively managed using a model-based approach seeking capital appreciation. WisdomTree Investments is the parent company of WisdomTree Asset Management, Inc. (“WTAM”), the investment adviser to each Fund and the Trust. “WisdomTree” is a registered trademark of WisdomTree Investments and has been licensed for use by the Trust. Each Fund described herein is considered to be non-diversified as defined under the 1940 Act.
In the normal course of business, the Funds may enter into contracts that contain a variety of representations or that provide indemnification for certain liabilities. The Funds’ maximum exposure under these arrangements is unknown, as this would involve future claims that may be made against the Funds that have not yet occurred. However, the Funds have not had prior claims or losses pursuant to these contracts and believes such exposure to be remote.
2. SIGNIFICANT ACCOUNTING POLICIES
The Financial Accounting Standards Board (“FASB”) Accounting Standards Codification (the “Codification”) is the exclusive reference of authoritative U.S. generally accepted accounting principles (“GAAP”) recognized by the FASB to be applied by nongovernmental entities. Rules and interpretive releases of the Securities and Exchange Commission (“SEC”) under authority of federal laws are also sources of authoritative GAAP for SEC registrants.
The following is a summary of significant accounting policies followed by the Funds:
Use of Estimates — The preparation of financial statements in conformity with GAAP, requires management to make certain estimates and assumptions that affect the reported amounts of assets and liabilities and disclosure of contingent assets and liabilities at the date of the financial statements and the reported amounts of increases and decreases in the net assets from operations during the reporting period. Actual results could differ from those estimates.
Investment Valuation — The net asset value (“NAV”) of each Fund’s shares is calculated each day a Fund is open for business as of the regularly scheduled close of regular trading on the New York Stock Exchange, normally 4:00 p.m. Eastern time (the “NAV
Notes to Financial Statements (continued)
Calculation Time”). NAV per share is calculated by dividing a Fund’s net assets by the number of Fund shares outstanding. Each Fund issues and redeems shares at NAV only in large blocks of shares known as creation units, which only certain institutions (e.g., broker-dealers) may purchase or redeem. Shares of each Fund are listed on a national securities exchange and trade at market prices. Most investors will buy and sell shares in the secondary market through brokers. Because Fund shares trade at market prices rather than NAV, shares may trade at a price greater than NAV or less than NAV. In calculating each Fund’s NAV, investments are valued under policies approved by the Board of Trustees of the Trust (the “Board of Trustees”). Equity securities (including preferred stock) traded on any recognized U.S. or non-U.S. exchange are valued at the last sale price or official closing price on the exchange on which they are principally traded. Unlisted equity securities (including preferred stock) are valued at the last sale price or, if no sale price is available, at the mean between the highest bid and lowest ask price. Each Fund may invest in money market funds which are valued at their NAV per share and exchange-traded funds (“ETFs” or “ETF”) or exchange-traded notes (“ETNs” or “ETN”) which are valued at their last sale or official closing price on the exchange on which they are principally traded or at their NAV per share in instances where the ETF or ETN has not traded on its principal exchange. Futures contracts generally are valued at the settlement price, the price at which a futures contract settles once a given trading day has ended, on the primary exchange on which they trade.
In certain instances, such as when reliable market valuations are not readily available, a Fund’s investments will be fair valued in accordance with the Fund’s pricing policy. The Board of Trustees has established a pricing committee (the “Pricing Committee”) which is comprised of senior representatives of WTAM and which reports to the Board of Trustees on a quarterly basis. In the event that a financial instrument cannot be valued based upon a price from the exchange or system on which it is principally traded, independent pricing service provider or broker-dealer quotation, or such prices are deemed to not reflect current market value, the Pricing Committee may value the financial instrument in good faith under the policies and procedures approved by the Board of Trustees based on current facts and circumstances. Securities that may be valued using “fair value” pricing may include, but are not limited to, securities for which there are no current market quotations, securities whose issuer is in default or bankruptcy, securities subject to corporate actions (such as mergers or reorganizations), securities subject to non-U.S. investment limits or currency controls, and securities affected by “significant events.” An example of a significant event is an event occurring after the close of the market in which a security trades but before a Fund’s next NAV Calculation Time that may materially affect the value of a Fund’s investment (e.g., government action, natural disaster, or significant market fluctuation). When fair value pricing is employed, the prices of securities used by a Fund to calculate its NAV may differ from quoted or published prices for the same securities.
Fair Value Measurement — In accordance with Codification Topic 820 (“ASC 820”), Fair Value Measurements and Disclosures, fair value is defined as the price that would be received to sell an asset or paid to transfer a liability in an orderly transaction between market participants at the measurement date. The Pricing Committee will perform other procedures (consistent with GAAP) to value an investment when a market quote is not available. ASC 820 established a three-tier hierarchy of inputs to be used when determining fair value measurements for disclosure purposes. Inputs refer broadly to the assumptions that market participants would use in pricing the asset or liability, including assumptions about risk — for example, the risk inherent in a particular valuation technique used to measure fair value (such as a pricing model) and/or the risk inherent in the inputs to the valuation technique. Inputs may be observable or unobservable. Observable inputs reflect the assumptions market participants would use in pricing the asset or liability. Observable inputs are based on market data obtained from sources independent of the reporting entity. Unobservable inputs reflect the reporting entity’s own assumptions about the assumptions market participants would use in pricing the asset or liability. Unobservable inputs are based on the best information available in the circumstances. The three-tier hierarchy of inputs is summarized in the three broad levels listed below:
Level 1 – quoted prices in active markets for identical securities
Level 2 – other significant observable inputs (including quoted prices for similar securities, interest rates, prepayment speeds, credit risk, etc.)
Level 3 – significant unobservable inputs (including each Fund’s assumptions in determining the fair value of investments)
The inputs or methodology used for valuation are not necessarily an indication of the risk associated with investing in those investments.
Investments that use Level 2 or Level 3 inputs may include, but are not limited to: (i) an unlisted security related to corporate actions; (ii) a restricted security (e.g., one that may not be publicly sold without registration under the Securities Act of 1933, as amended); (iii) a security whose trading has been suspended (either due to events affecting the issuer of the security specifically or events affecting the primary trading exchange more broadly) or which has been de-listed from its primary trading exchange; (iv) a security that is thinly traded; (v) a security in default or bankruptcy proceedings for which there is no current market quotation or market activity; (vi) a security affected by currency controls or restrictions; and (vii) a security affected by a significant event (e.g., an event that occurs after the close of the markets in which the security is traded but before the time as of which a Fund’s NAV is computed and that may materially affect the value of the Fund’s investments).
Notes to Financial Statements (continued)
The valuation techniques and significant inputs used in determining the fair market value measurements for Level 2 and Level 3 positions are as follows:
Financial instruments are generally valued by independent pricing service providers that use broker-dealer quotations, reported trades or valuation estimates from their internal pricing models. Depending on the type of financial instrument, the independent pricing service providers’ internal pricing models may use inputs that are observable such as issuer details (e.g., credit rating, debt ranking, coupon date, maturity date, etc.), interest rates, yield curves, prepayment speeds, credit risks/spreads, default rates and quoted prices for similar assets. Financial instruments that use similar valuation techniques and observable inputs as described above and have an appropriate level of market activity are categorized as Level 2 of the fair value hierarchy, otherwise a Level 3 fair value classification is appropriate.
Determination of a fair value by the Pricing Committee may include significant unobservable inputs and therefore such financial instruments would be reflected as a Level 3 of the fair value hierarchy. The Pricing Committee may employ a market-based valuation approach which may use, among other potential considerations, related or comparable securities, recent transactions, market multiples, and other relevant information to determine fair value. The Pricing Committee may also use an income-based valuation approach in which anticipated future cash flows of the financial instrument are discounted to calculate fair value.
The summary of fair valuations according to the inputs used in valuing each Fund’s assets as of the measurement date is included in a “Fair Valuation Summary” supplementary table in each applicable Fund’s Schedule of Investments.
During the fiscal year or period ended March 31, 2022, there were no significant transfers into or out of Level 3 of the fair value hierarchy.
Derivatives and Hedging Disclosure — Codification Topic 815 (“ASC 815”), Derivatives and Hedging, requires qualitative disclosures about objectives and strategies for using derivatives, quantitative disclosures about fair value amounts of gains and losses on derivative instruments, and disclosures about credit-risk-related contingent features in derivative agreements. All of the derivative instruments disclosed and described herein are subject to risk.
For the fiscal year ended March 31, 2022, the effects of derivative instruments on each applicable Fund’s financial performance as reflected in the Statements of Operations are presented in the summary below:
| | | | |
| | |
| Fund | | Amount of Realized Gain
or (Loss) on Derivatives
Recognized1 | |
U.S. Multifactor Fund | |
Equity risk | | $ | 43,850 | |
| | 1 | Realized gains (losses) on derivatives are located on the Statements of Operations as follows: |
| | |
Equity risk | | Net realized gain (loss) from futures contracts |
During the fiscal year ended March 31, 2022, the volume of derivative activity (based on the average of month-end balances, except where footnoted) for each Fund was as follows:
| | | | |
| | |
| | | Average Notional | |
| |
| Fund | | Futures
contracts (long) | |
U.S. Multifactor Fund | |
Equity risk1 | | $ | 352,907 | |
| | 1 | The volume of derivative activity for the period is based on intra-month balances. |
Investment Transactions and Investment Income — Investment transactions are recorded as of the date that the securities are purchased or sold (trade date). Realized gains and losses on sales of portfolio securities are calculated using the identified-cost method. Dividend income (less foreign taxes withheld, if any) is recognized on the ex-dividend date. Non-cash dividend income is recognized on the ex-dividend date at the fair value of securities to be received. On each measurement date, the Funds evaluate the collectability of receivable balances. Generally, the Funds will write-off dividend receivable balances that are canceled by the issuer as of the date that the dividend receivable cancellation notification was publicly made available or when it becomes probable that dividends will not be collected and the amount of uncollectable dividends can be reasonably estimated. Income earned from securities lending activities (i.e., securities lending income), net of fees payable to the securities borrower and/or securities lending agent, is accrued daily.
Expenses — Under the investment advisory agreement for each Fund, except for Funds that commenced operations on or after March 26, 2013, WTAM has agreed to pay all expenses of the Trust, except for: (i) brokerage expenses and other expenses (such as stamp taxes) connected with the execution of portfolio transactions or in connection with creation and redemption transactions; (ii) legal fees or expenses in connection with any arbitration, litigation or pending or threatened arbitration or litigation, including
Notes to Financial Statements (continued)
any settlements in connection therewith; (iii) compensation and expenses of trustees who are not interested persons of the Funds (“Independent Trustees”); (iv) compensation and expenses of counsel to the Independent Trustees; (v) compensation and expenses of the Trust’s Chief Compliance Officer (“CCO”); (vi) extraordinary expenses; (vii) distribution fees and expenses paid by the Trust under any distribution plan adopted pursuant to Rule 12b-1 under the 1940 Act; and (viii) the advisory fee payable to WTAM.
Under the investment advisory agreement for Funds that commenced operations on or after March 26, 2013, WTAM has agreed to pay all expenses of the Trust, except for: (i) brokerage expenses and other fees, charges, taxes, levies or expenses (such as stamp taxes) incurred in connection with the execution of portfolio transactions or in connection with creation and redemption transactions (including without limitation any fees, charges, taxes, levies or expenses related to the purchase or sale of an amount of any currency, or the patriation or repatriation of any security or other asset, related to the execution of portfolio transactions or any creation or redemption transactions); (ii) legal fees or expenses in connection with any arbitration, litigation or pending or threatened arbitration or litigation, including any settlements in connection therewith; (iii) compensation and expenses of each Independent Trustee; (iv) compensation and expenses of counsel to the Independent Trustees; (v) compensation and expenses of the Trust’s CCO; (vi) extraordinary expenses (in each case as determined by a majority of the Independent Trustees); (vii) distribution fees and expenses paid by the Trust under any distribution plan adopted pursuant to Rule 12b-1 under the 1940 Act; (viii) interest and taxes of any kind or nature (including, but not limited to, income, excise, transfer and withholding taxes); (ix) fees and expenses related to the provision of securities lending services; and (x) the advisory fee payable to WTAM.
Acquired fund fees and expenses (“AFFEs”) (which are fees and expenses incurred indirectly by a Fund through its investments in certain underlying investment companies) are not operating expenses of the Funds and are not paid by WTAM.
Pursuant to a separate contractual arrangement, WTAM arranges for the provision of CCO services with respect to each Fund, and is liable and responsible for, and administers, payments to the CCO, the Independent Trustees and counsel to the Independent Trustees. WTAM receives a fee, as shown on the Statements of Operations under “Service fees”, of up to 0.0044% per annum of each Fund’s average daily net assets for providing such services and paying such expenses. WTAM provides CCO services to the Trust.
Futures Contracts — The U.S. Multifactor Fund utilized equity futures contracts on a temporary basis during the fiscal period to obtain market exposure consistent with its investment objective. When a Fund purchases a listed futures contract, it agrees to purchase a specified reference asset (e.g., commodity, currency or U.S. Treasury security) at a specified future date. When a Fund sells a listed futures contract, it agrees to sell a specified reference asset (e.g., commodity, currency or U.S. Treasury security) at a specified future date. The price at which the purchase and sale will take place is fixed when the Fund enters into the contract. The exchange clearing corporation is the ultimate counterparty for all exchange-listed contracts, so credit risk is limited to the creditworthiness of the exchange clearing corporation.
Upon entering into a futures contract, a Fund is required to deliver to a broker an amount of cash and/or U.S. government securities equal to a certain percentage of the contract amount. This amount is known as the “initial margin”. Cash deposited as initial margin, if any, is shown as “Deposits at broker for futures contracts” in the Statement of Assets and Liabilities, and U.S. government securities deposited as initial margin, if any, are designated in the Schedule of Investments. Subsequent payments, known as “variation margin”, generally are made or received by the Fund each day or at other agreed-upon time periods depending on the fluctuations in the value of the underlying futures contracts, except that in the case of certain futures contracts, variation margin payments may be made or received when the futures contract expires. Variation margin is recorded for financial statement purposes on a daily basis as an unrealized gain or loss on futures until the financial futures contract is closed, at which time the net gain or loss is reclassified to realized gain or loss on futures. When a Fund purchases or sells a futures contract, the Fund is required to “cover” its position in order to limit the risk associated with the use of leverage and other related risks. To cover its position, a Fund will segregate assets consisting of, or take other measures with respect to, cash or liquid securities that, when added to any amounts deposited with a futures commission merchant as margin, will “cover” its position in a manner consistent with the 1940 Act or the rules and SEC interpretations thereunder. This will function as a practical limit on the amount of leverage which a Fund may undertake and on the potential increase in the speculative character of a Fund’s outstanding portfolio securities.
As of March 31, 2022, there were no open futures contracts in the Funds.
Securities Lending — Each Fund may lend portfolio securities to certain creditworthy borrowers, including the Funds’ securities lending agent. It is the Funds’ policy that, at origination, all loans are secured by collateral of at least 102% of the value of U.S. securities loaned and 105% of the value of foreign securities loaned. Collateral in the form of cash and/or securities issued or guaranteed by the U.S. government or its agencies, equivalent to at least 100% of the market value of securities, is maintained at all times. The cash collateral can be invested in certain money market mutual funds which also have exposure to the fluctuations of the market. The values of the investments of cash collateral for securities on loan along with the obligations to return such collateral are included on the Statements of Assets and Liabilities. The total value of securities received as collateral for securities on loan is included in a footnote following each Schedule of Investments, but is not included within the Statements of Assets and Liabilities because the receiving Fund does not have the right to sell or repledge the securities received as collateral. As compensation for lending its securities, each Fund retains all or a portion of the interest received on investment of cash collateral or receives a fee from
Notes to Financial Statements (continued)
the borrower (net of any fee rebates paid to the borrower). The lending agent receives a portion of the income earned by the Funds in connection with the lending program. The net securities lending income earned by the Funds is disclosed on the Statements of Operations. The dividend and interest income earned on the securities loaned is accounted for in the same manner as other dividend and interest income. The borrower pays to the Funds an amount equal to any dividends or interest received on loaned securities. Dividends received while a security is out on loan are not considered Qualified Dividend Income (“QDI”) under the specific criteria issued by the Internal Revenue Service and are subject to taxation at the shareholder’s ordinary income tax rate instead of the lower long-term capital gains tax rate. Lending portfolio securities could result in a loss or delay in recovering each Fund’s securities if the borrower defaults. In the event of a borrower default with respect to the failure to return to each Fund some or all of the securities loaned, the securities lending agent shall indemnify each Fund against the failure of the borrower if the value of the collateral received is insufficient to cover the market value of the securities loaned.
Master Netting Arrangements — Codification Topic 210 (“ASC 210”), Balance Sheet, requires disclosures generally intended to (i) help investors and other financial statement users to better assess the effect or potential effect of offsetting arrangements on a company’s financial position, (ii) improve transparency in the reporting of how companies mitigate credit risk, and (iii) facilitate comparisons between those entities that prepare their financial statements on the basis of GAAP and those entities that prepare their financial statements on the basis of international financial reporting standards. ASC 210 requires entities to disclose (i) gross and net information about both instruments and transactions eligible for offset in the financial statements, and (ii) instruments and transactions subject to an agreement similar to a master netting agreement. ASC 210 is limited in scope to the following financial instruments, to the extent they are offset in the financial statements or subject to an enforceable master netting arrangement or similar agreement: (i) recognized derivative instruments accounted for under ASC 815 (Derivatives and Hedging); (ii) repurchase agreements and reverse repurchase agreements; and (iii) securities borrowing and securities lending transactions.
The Funds’ securities lending activities are governed by a Securities Lending Authorization Agreement (“Lending Agreement”) between the Funds and the lending agent. The Lending Agreement authorizes the lending agent to lend qualifying U.S. and foreign securities held by a Fund to approved borrowers (each a “Borrower”). To mitigate borrower risk, a Fund typically receives from a Borrower collateral in the form of U.S. dollar cash and/or securities issued or guaranteed by the U.S. government or its agencies in excess of the market value of the securities loaned. Under the provisions of the Lending Agreement, a Fund shall have, as to the collateral, all of the rights and remedies of a secured party under applicable law. A Fund is exposed to risk of loss if a Borrower defaults on its obligation to return borrowed securities and the value of the collateral a Fund received is insufficient to cover the market value of the securities loaned. Also, the lending agent is permitted to invest the cash collateral it receives from a Borrower into a money market fund which is subject to market fluctuation. Therefore, a Fund is exposed to risk of loss if the value of invested cash collateral is insufficient to satisfy the Fund’s obligation to return the full amount owed to such Borrower.
For financial reporting purposes, the Funds elect to not offset assets and liabilities subject to the Lending Agreement or similar arrangements in the Statements of Assets and Liabilities. Therefore, all qualifying transactions, if any at March 31, 2022, are presented on a gross basis in the Statements of Assets and Liabilities. As of March 31, 2022, certain of the Funds had securities on loan and the value of the related collateral received by each of those Funds exceeded the value of the securities loaned by each of those Funds. The value of the securities loaned by each Fund is located in the Statements of Assets and Liabilities in “Investments in securities, at value” and also in the footnotes below the Schedules of Investments. In addition, a breakout of the total amount of cash and non-cash securities lending collateral received is located in the footnotes below the Schedules of Investments.
Short-Term Investments — Each Fund may invest a portion of its assets in high-quality money market instruments on an ongoing basis to provide liquidity or for other reasons. The instruments include short-term obligations issued by the U.S. government, its agencies, non-U.S. government agencies, negotiable certificates of deposit (“CDs”), fixed time deposits and bankers’ acceptances of U.S. and foreign banks and similar institutions, commercial papers, repurchase agreements and money market funds. CDs are short-term negotiable obligations of commercial banks. Time deposits are non-negotiable deposits maintained in banking institutions for specified periods of time at stated interest rates. Banker’s acceptances are time drafts drawn on commercial banks by borrowers, usually in connection with international transactions.
Tax Information and Dividends and Distributions to Shareholders — It is each Fund’s policy to comply with all requirements of the Internal Revenue Code of 1986, as amended (the “Code”). A portion of the Code, known as subchapter M (“Subchapter M”), addresses the ways by which investment companies and investment trusts may pass income through to shareholders in order to avoid double taxation. Each Fund intends to qualify for and to elect treatment as a separate Regulated Investment Company (“RIC”) under Subchapter M of the Code so that it will not be subject to federal income tax on income and gains that are timely distributed to Fund shareholders. Accordingly, no provision for U.S. federal income taxes is required. In order to qualify for the special tax treatment accorded to RICs and their shareholders, each Fund must, among other things, distribute with respect to each taxable year an amount equal to or greater than the sum of 90% of its investment company taxable income and 90% of its net tax-exempt interest income. There can be no guarantee that a Fund will pay dividends. Taxable net realized gains from investment transactions, reduced by capital loss carryforwards, if any, are declared and distributed to shareholders at least annually. The capital loss carryforward amount, if any, is available to offset future net capital gains. The Funds may occasionally be required to make supplemental
Notes to Financial Statements (continued)
distributions at some other time during the year. The Trust reserves the right to declare special distributions if, in its reasonable discretion, such action is necessary or advisable to preserve the status of each Fund as a RIC or to avoid imposition of income or excise taxes on undistributed income. Dividends and distributions to shareholders are recorded on the ex-dividend date. The amount of dividends and distributions from net investment income and net realized capital gains is determined in accordance with the requirements of the Code and the U.S. Treasury regulations. These book/tax differences are either considered temporary or permanent in nature. To the extent these differences are permanent in nature, such amounts are reclassified within the components of net assets based on their Federal tax basis treatment; temporary differences do not require reclassification. Dividends and distributions that exceed earnings and profit for tax purposes are reported for tax purposes as a return of capital.
3. ADVISORY FEES AND OTHER TRANSACTIONS WITH AFFILIATES
WTAM has overall responsibility for the general management and administration of the Trust. WTAM provides an investment program for each Fund. WTAM has arranged for Mellon Investments Corporation (“Mellon”) to provide sub-advisory services to the Funds, except for U.S. AI Enhanced Value Fund. Prior to January 7, 2022, sub-advisory services for the U.S. AI Enhanced Value Fund were provided by Mellon and thereafter by Voya Investment Management Co., LLC (“Voya IM”). Mellon and Voya IM are compensated by WTAM at no additional cost to the Funds. WTAM also arranges for transfer agency, custody, fund accounting, fund administration, securities lending and all other non-distribution related services necessary for the Funds to operate, which are generally under separate agreements entered into between the Trust on behalf of the Funds and the applicable service provider. Under the investment advisory agreement for each Fund, WTAM agrees to pay all expenses of the Funds, except for certain expenses described in Note 2.
Pursuant to a separate contractual arrangement, as also described in Note 2, WTAM arranges for the provision of CCO services with respect to each Fund, and is liable and responsible for, and administers, payments to the CCO, the Independent Trustees and counsel to the Independent Trustees in exchange for a fee, accrued daily and paid monthly in arrears, of up to 0.0044% per annum of each Fund’s average daily net assets.
WTAM expects to receive annual advisory fees from each Fund, based on a percentage of the Fund’s average daily net assets, as shown in the following table:
| | | | |
| | |
| Fund | | Advisory Fee Rate | |
U.S. AI Enhanced Value Fund | | | 0.38 | % |
U.S. ESG Fund | | | 0.28 | % |
U.S. Growth & Momentum Fund1 | | | 0.55 | % |
U.S. High Dividend Fund | | | 0.38 | % |
U.S. LargeCap Dividend Fund | | | 0.28 | % |
U.S. LargeCap Fund | | | 0.08 | % |
U.S. MidCap Dividend Fund | | | 0.38 | % |
U.S. MidCap Fund | | | 0.38 | % |
U.S. Multifactor Fund | | | 0.28 | % |
U.S. Quality Dividend Growth Fund | | | 0.28 | % |
U.S. SmallCap Dividend Fund | | | 0.38 | % |
U.S. SmallCap Fund | | | 0.38 | % |
U.S. SmallCap Quality Dividend Growth Fund | | | 0.38 | % |
U.S. Total Dividend Fund | | | 0.28 | % |
U.S. Value Fund | | | 0.12 | %2 |
| | 1 | Since the commencement of operations on June 24, 2021. |
| | 2 | Prior to January 3, 2022, WTAM received an annual advisory fee of 0.38% based on the Fund’s average daily net assets. |
Notes to Financial Statements (continued)
Affiliated holdings are investments in entities in which the Fund owns 5% or more of the outstanding voting securities or are investments in entities which are under common ownership or control. Transactions in shares of affiliated ETFs for the fiscal year or period ended March 31, 2022, as applicable, are included in an “Investment in Affiliates” supplementary table in each applicable Fund’s Schedule of Investments. For these transactions, WTAM voluntarily waives a portion of the advisory fees, that it would otherwise charge, in an amount equal to the indirect AFFE (which are fees and expenses incurred indirectly by a Fund through its investments in certain underlying investment companies) attributable to each Fund’s investment in affiliated ETFs. The dollar amount of advisory fees waived during the period for the Funds, if any, are included in the Statement of Operations in “Expense waivers”.
During the fiscal year ended March 31, 2022, certain Funds engaged in purchase and sale transactions with funds that have a common investment adviser, WTAM. These interfund purchase and sale transactions were effected in accordance with Rule 17a-7 under the 1940 Act. For the fiscal year ended March 31, 2022, the cost of purchases, proceeds from sales and the net realized gain or loss recognized upon the disposal of securities resulting from interfund transactions are shown in the following table:
| | | | | | | | | | | | |
| | | | |
| Fund | | Purchases | | | Sales | | | Net Realized
Gain/(Loss) | |
U.S. High Dividend Fund | | $ | 29,887,619 | | | $ | 57,017,406 | | | $ | 12,999,201 | |
U.S. LargeCap Dividend Fund | | | 14,849,450 | | | | 66,252,327 | | | | 5,364,847 | |
U.S. LargeCap Fund | | | 18,627,756 | | | | 13,335,186 | | | | 287,900 | |
U.S. MidCap Dividend Fund | | | 80,016,462 | | | | 295,487,612 | | | | 8,080,903 | |
U.S. MidCap Fund | | | 54,951,367 | | | | 75,707,705 | | | | 668,739 | |
U.S. Quality Dividend Growth Fund | | | 90,406,379 | | | | 61,988,215 | | | | (527,702 | ) |
U.S. SmallCap Dividend Fund | | | 243,953,385 | | | | 49,507,625 | | | | 857,931 | |
U.S. SmallCap Fund | | | 68,468,186 | | | | 30,693,688 | | | | 3,140,399 | |
U.S. SmallCap Quality Dividend Growth Fund | | | 53,803,567 | | | | 14,257,355 | | | | 2,480,664 | |
U.S. Total Dividend Fund | | | 20,410,137 | | | | 11,127,189 | | | | 850,484 | |
WTAM and/or WisdomTree Investments (collectively herein, “WT”) may from time to time own shares of a Fund. As of and for the fiscal year ended March 31, 2022, WT held shares of and received distributions from the following Funds, which were purchased through an unaffiliated broker in ordinary brokerage transactions in the secondary market in which the Funds’ shares trade:
| | | | | | | | | | | | | | | | |
| | | | |
| | | At March 31, 2022 | | | | | | For the Fiscal Year Ended
March 31, 2022 | |
| | | | |
| Fund | | Fund Shares
held by WT | | | Market Value of
Fund Shares
held by WT | | | | | | Dividends and
Distributions paid to WT on Fund Shares held by WT | |
U.S. AI Enhanced Value Fund | | | — | | | $ | — | | | | | | | $ | 11 | |
U.S. ESG Fund | | | 250 | | | | 12,070 | | | | | | | | 154 | |
U.S. High Dividend Fund | | | — | | | | — | | | | | | | | 78 | |
U.S. LargeCap Fund | | | 1,744 | | | | 84,340 | | | | | | | | 1,441 | |
U.S. MidCap Dividend Fund | | | 446 | | | | 19,811 | | | | | | | | 437 | |
U.S. Multifactor Fund | | | 1,136 | | | | 46,540 | | | | | | | | 677 | |
U.S. Quality Dividend Growth Fund | | | 804 | | | | 51,191 | | | | | | | | 914 | |
U.S. SmallCap Dividend Fund | | | 120 | | | | 3,824 | | | | | | | | 12 | |
U.S. SmallCap Fund | | | 103 | | | | 4,940 | | | | | | | | 64 | |
U.S. SmallCap Quality Dividend Growth Fund | | | 478 | | | | 21,328 | | | | | | | | 473 | |
U.S. Total Dividend Fund | | | 410 | | | | 26,470 | | | | | | | | 627 | |
U.S. Value Fund | | | 78 | | | | 4,804 | | | | | | | | 18 | |
Notes to Financial Statements (continued)
4. CAPITAL SHARE TRANSACTIONS
As of March 31, 2022, there were an unlimited number of $0.001 par value shares of beneficial interest authorized by the Trust. Shares are issued and redeemed by each Fund only in creation units or multiples thereof. Except when aggregated in creation units, shares of each Fund are not redeemable. Transactions in shares for each Fund are disclosed in detail in the Statements of Changes in Net Assets. The consideration for the purchase of creation units of a Fund generally consists of the in-kind contribution of a basket of securities and/or an amount of cash. Investors purchasing and redeeming creation units may be charged a purchase transaction fee and a redemption transaction fee to offset transfer and other transaction costs associated with the issuance and redemption of creation units.
5. INVESTMENT PORTFOLIO TRANSACTIONS
Purchases and sales of investments (excluding purchases and sales resulting from in-kind capital share transactions and short-term investments) and the cost of purchases and the proceeds from sales resulting from in-kind capital share transactions (excluding short-term investments) for the fiscal year or period ended March 31, 2022 are shown in the following table. Realized gains and losses on sales resulting from in-kind capital share redemptions, as shown on the Statements of Operations, are not recognized by the Funds for tax purposes.
| | | | | | | | | | | | | | | | |
| | | | |
| | | | | | | | | In-kind Capital Share Transactions | |
| | | | |
| Fund | | Purchases | | | Sales | | | Purchases | | | Sales | |
U.S. AI Enhanced Value Fund | | $ | 517,247,273 | | | $ | 515,447,322 | | | $ | 358,712,630 | | | $ | 449,633,106 | |
U.S. ESG Fund | | | 64,336,370 | | | | 64,276,210 | | | | 23,924,294 | | | | 44,068,986 | |
U.S. Growth & Momentum Fund1 | | | 16,889,099 | | | | 16,912,983 | | | | 16,966,169 | | | | 11,658,265 | |
U.S. High Dividend Fund | | | 320,960,416 | | | | 314,783,586 | | | | 137,616,581 | | | | 11,859,025 | |
U.S. LargeCap Dividend Fund | | | 585,177,404 | | | | 585,029,516 | | | | 620,939,380 | | | | 432,917,976 | |
U.S. LargeCap Fund | | | 139,757,183 | | | | 135,670,121 | | | | 305,055,586 | | | | 177,579,062 | |
U.S. MidCap Dividend Fund | | | 1,178,428,142 | | | | 1,167,519,266 | | | | 731,215,976 | | | | 694,417,893 | |
U.S. MidCap Fund | | | 386,303,767 | | | | 389,526,086 | | | | 301,048,260 | | | | 240,308,527 | |
U.S. Multifactor Fund | | | 237,739,726 | | | | 237,235,129 | | | | 115,901,669 | | | | 53,374,188 | |
U.S. Quality Dividend Growth Fund | | | 1,937,541,392 | | | | 1,926,537,876 | | | | 2,771,208,947 | | | | 1,970,117,995 | |
U.S. SmallCap Dividend Fund | | | 745,866,029 | | | | 728,483,231 | | | | 376,730,084 | | | | 367,259,272 | |
U.S. SmallCap Fund | | | 345,980,188 | | | | 343,551,669 | | | | 239,955,828 | | | | 160,757,032 | |
U.S. SmallCap Quality Dividend Growth Fund | | | 124,249,159 | | | | 123,966,317 | | | | 84,460,754 | | | | 41,297,000 | |
U.S. Total Dividend Fund | | | 210,789,690 | | | | 209,678,503 | | | | 223,713,440 | | | | 144,182,796 | |
U.S. Value Fund | | | 51,574,344 | | | | 51,376,487 | | | | 79,289,126 | | | | 29,945,075 | |
| | 1 | For the period June 24, 2021 (commencement of operations) through March 31, 2022. |
6. FEDERAL INCOME TAXES
At March 31, 2022, the cost of investments (including securities on loan and derivatives) for Federal income tax purposes was as follows:
| | | | | | | | | | | | | | | | |
| | | | | |
| Fund | | Tax Cost | | | Gross Unrealized
Appreciation | | | Gross Unrealized
Depreciation | | | Net Unrealized
Appreciation/
(Depreciation) | |
U.S. AI Enhanced Value Fund | | $ | 498,724,821 | | | $ | 19,506,633 | | | $ | (26,045,068 | ) | | $ | (6,538,435 | ) |
U.S. ESG Fund | | | 60,190,383 | | | | 18,196,395 | | | | (1,379,605 | ) | | | 16,816,790 | |
U.S. Growth & Momentum Fund | | | 4,244,088 | | | | 212,377 | | | | (366,911 | ) | | | (154,534 | ) |
U.S. High Dividend Fund | | | 866,433,740 | | | | 172,074,119 | | | | (15,361,570 | ) | | | 156,712,549 | |
U.S. LargeCap Dividend Fund | | | 2,438,721,578 | | | | 1,006,674,590 | | | | (23,209,545 | ) | | | 983,465,045 | |
U.S. LargeCap Fund | | | 597,745,085 | | | | 114,892,526 | | | | (16,209,570 | ) | | | 98,682,956 | |
U.S. MidCap Dividend Fund | | | 2,747,167,607 | | | | 559,261,276 | | | | (67,198,687 | ) | | | 492,062,589 | |
U.S. MidCap Fund | | | 725,629,614 | | | | 121,493,986 | | | | (28,511,273 | ) | | | 92,982,713 | |
U.S. Multifactor Fund | | | 212,232,871 | | | | 19,887,281 | | | | (4,247,226 | ) | | | 15,640,055 | |
U.S. Quality Dividend Growth Fund | | | 5,873,772,456 | | | | 1,294,448,154 | | | | (137,801,437 | ) | | | 1,156,646,717 | |
U.S. SmallCap Dividend Fund | | | 1,703,703,781 | | | | 251,790,398 | | | | (69,906,306 | ) | | | 181,884,092 | |
U.S. SmallCap Fund | | | 654,813,683 | | | | 87,579,161 | | | | (40,767,841 | ) | | | 46,811,320 | |
U.S. SmallCap Quality Dividend Growth Fund | | | 215,507,643 | | | | 23,087,762 | | | | (14,114,609 | ) | | | 8,973,153 | |
U.S. Total Dividend Fund | | | 788,417,958 | | | | 299,136,220 | | | | (8,097,192 | ) | | | 291,039,028 | |
U.S. Value Fund | | | 109,659,104 | | | | 10,477,245 | | | | (3,969,745 | ) | | | 6,507,500 | |
Notes to Financial Statements (continued)
At March 31, 2022, the components of total distributable earnings (loss) on a tax-basis were as follows:
| | | | | | | | | | | | | | | | |
| | | | | |
| Fund | | Undistributed
Ordinary Income | | | Undistributed
Capital and
Other Losses | | | Net Unrealized
Appreciation/ (Depreciation) | | | Total
Distributable
Earnings (Loss) | |
U.S. AI Enhanced Value Fund | | $ | 368,401 | | | $ | (94,462,137 | ) | | $ | (6,538,435 | ) | | $ | (100,632,171 | ) |
U.S. ESG Fund | | | — | | | | (7,445,950 | ) | | | 16,816,790 | | | | 9,370,840 | |
U.S. Growth & Momentum Fund | | | — | | | | (909,586 | ) | | | (154,534 | ) | | | (1,064,120 | ) |
U.S. High Dividend Fund | | | 4,378,960 | | | | (67,813,231 | ) | | | 156,712,549 | | | | 93,278,278 | |
U.S. LargeCap Dividend Fund | | | 4,633,929 | | | | (193,692,239 | ) | | | 983,465,045 | | | | 794,406,735 | |
U.S. LargeCap Fund | | | 365,609 | | | | (25,508,442 | ) | | | 98,682,956 | | | | 73,540,123 | |
U.S. MidCap Dividend Fund | | | 3,742,332 | | | | (361,014,910 | ) | | | 492,062,589 | | | | 134,790,011 | |
U.S. MidCap Fund | | | 175,398 | | | | (79,919,558 | ) | | | 92,982,713 | | | | 13,238,553 | |
U.S. Multifactor Fund | | | 92,430 | | | | (18,257,230 | ) | | | 15,640,055 | | | | (2,524,745 | ) |
U.S. Quality Dividend Growth Fund | | | 8,534,180 | | | | (300,166,955 | ) | | | 1,156,646,717 | | | | 865,013,942 | |
U.S. SmallCap Dividend Fund | | | 999,340 | | | | (352,792,596 | ) | | | 181,884,092 | | | | (169,909,164 | ) |
U.S. SmallCap Fund | | | — | | | | (63,294,386 | ) | | | 46,811,320 | | | | (16,483,066 | ) |
U.S. SmallCap Quality Dividend Growth Fund | | | 146,992 | | | | (15,500,873 | ) | | | 8,973,153 | | | | (6,380,728 | ) |
U.S. Total Dividend Fund | | | 1,975,726 | | | | (80,754,743 | ) | | | 291,039,028 | | | | 212,260,011 | |
U.S. Value Fund | | | 69,193 | | | | (5,522,145 | ) | | | 6,507,500 | | | | 1,054,548 | |
The tax character of distributions paid during the fiscal years or periods ended March 31, 2022 and March 31, 2021, was as follows:
| | | | | | | | |
| | | |
| | | Year or Period Ended
March 31, 2022 | | | Year Ended
March 31, 2021 | |
| | |
| Fund | | Distributions Paid
from Ordinary
Income* | | | Distributions Paid
from Ordinary
Income* | |
U.S. AI Enhanced Value Fund | | $ | 15,541,024 | | | $ | 17,898,781 | |
U.S. ESG Fund | | | 1,160,908 | | | | 1,018,751 | |
U.S. Growth & Momentum Fund | | | — | 1 | | | N/A | |
U.S. High Dividend Fund | | | 25,589,520 | | | | 32,948,834 | |
U.S. LargeCap Dividend Fund | | | 68,529,090 | | | | 64,521,145 | |
U.S. LargeCap Fund | | | 10,044,472 | | | | 8,454,532 | |
U.S. MidCap Dividend Fund | | | 69,041,808 | | | | 69,319,287 | |
U.S. MidCap Fund | | | 10,460,358 | | | | 8,770,455 | |
U.S. Multifactor Fund | | | 2,386,625 | | | | 1,705,277 | |
U.S. Quality Dividend Growth Fund | | | 123,175,321 | | | | 90,898,526 | |
U.S. SmallCap Dividend Fund | | | 48,960,885 | | | | 41,528,464 | |
U.S. SmallCap Fund | | | 10,226,320 | | | | 5,647,946 | |
U.S. SmallCap Quality Dividend Growth Fund | | | 5,126,380 | | | | 3,076,752 | |
U.S. Total Dividend Fund | | | 21,438,300 | | | | 20,745,554 | |
U.S. Value Fund | | | 1,432,409 | | | | 1,059,051 | |
| | * | Includes short-term capital gains, if any. |
| | 1 | For the period June 24, 2021 (commencement of operations) through March 31, 2022. |
Notes to Financial Statements (continued)
At March 31, 2022, for Federal tax purposes, the Funds have capital loss carryforwards available to offset future capital gains as indicated in the following table. The loss carryforward amounts do not have an expiration date and, therefore, can be carried forward indefinitely until utilized. To the extent that these loss carryforwards are utilized, capital gains so offset will not be distributed to shareholders.
| | | | | | | | | | | | |
| | | | |
| Fund | | Short-Term | | | Long-Term | | | Capital Loss
Available Total | |
U.S. AI Enhanced Value Fund | | $ | 29,487,398 | | | $ | 64,974,739 | | | $ | 94,462,137 | |
U.S. ESG Fund | | | 4,428,012 | | | | 3,017,938 | | | | 7,445,950 | |
U.S. Growth & Momentum Fund | | | 909,586 | | | | — | | | | 909,586 | |
U.S. High Dividend Fund | | | 6,582,719 | | | | 61,230,512 | | | | 67,813,231 | |
U.S. LargeCap Dividend Fund | | | 24,974,604 | | | | 168,717,635 | | | | 193,692,239 | |
U.S. LargeCap Fund | | | 10,080,574 | | | | 15,427,868 | | | | 25,508,442 | |
U.S. MidCap Dividend Fund | | | 143,806,023 | | | | 217,208,887 | | | | 361,014,910 | |
U.S. MidCap Fund | | | 34,508,759 | | | | 45,410,799 | | | | 79,919,558 | |
U.S. Multifactor Fund | | | 18,257,230 | | | | — | | | | 18,257,230 | |
U.S. Quality Dividend Growth Fund | | | 159,375,095 | | | | 140,791,860 | | | | 300,166,955 | |
U.S. SmallCap Dividend Fund | | | 66,703,897 | | | | 286,088,699 | | | | 352,792,596 | |
U.S. SmallCap Fund | | | 16,707,936 | | | | 46,450,740 | | | | 63,158,676 | |
U.S. SmallCap Quality Dividend Growth Fund | | | 2,894,482 | | | | 12,606,391 | | | | 15,500,873 | |
U.S. Total Dividend Fund | | | 24,111,508 | | | | 56,643,235 | | | | 80,754,743 | |
U.S. Value Fund | | | 3,930,788 | | | | 1,591,357 | | | | 5,522,145 | |
Capital losses incurred after October 31 (“post-October capital losses”) and late year ordinary losses incurred after December 31 within the taxable year are deemed to arise on the first business day of each Fund’s next taxable year. At March 31, 2022, the Funds did not have any post-October capital losses to defer.
During the fiscal year or period ended March 31, 2022, the following Funds incurred and will elect to defer late year ordinary losses as follows:
| | | | |
| | |
| Fund | | Late Year
Ordinary Loss | |
U.S. AI Enhanced Value Fund | | $ | — | |
U.S. ESG Fund | | | — | |
U.S. Growth & Momentum Fund1 | | | — | |
U.S. High Dividend Fund | | | — | |
U.S. LargeCap Dividend Fund | | | — | |
U.S. LargeCap Fund | | | — | |
U.S. MidCap Dividend Fund | | | — | |
U.S. MidCap Fund | | | — | |
U.S. Multifactor Fund | | | — | |
U.S. Quality Dividend Growth Fund | | | — | |
U.S. SmallCap Dividend Fund | | | — | |
U.S. SmallCap Fund | | | 135,710 | |
U.S. SmallCap Quality Dividend Growth Fund | | | — | |
U.S. Total Dividend Fund | | | — | |
U.S. Value Fund | | | — | |
| | 1 | For the period June 24, 2021 (commencement of operations) through March 31, 2022. |
Notes to Financial Statements (continued)
During the fiscal year or period ended March 31, 2022, the amount of capital loss carryforwards used to offset realized gains are shown in the following table:
| | | | |
| | |
| Fund | | Utilized
Capital Loss
Carryforward | |
U.S. AI Enhanced Value Fund | | $ | — | |
U.S. ESG Fund | | | 588,989 | |
U.S. Growth & Momentum Fund1 | | | — | |
U.S. High Dividend Fund | | | 29,233,850 | |
U.S. LargeCap Dividend Fund | | | — | |
U.S. LargeCap Fund | | | — | |
U.S. MidCap Dividend Fund | | | — | |
U.S. MidCap Fund | | | — | |
U.S. Multifactor Fund | | | 1,615,105 | |
U.S. Quality Dividend Growth Fund | | | — | |
U.S. SmallCap Dividend Fund | | | — | |
U.S. SmallCap Fund | | | 5,287,709 | |
U.S. SmallCap Quality Dividend Growth Fund | | | 2,694,655 | |
U.S. Total Dividend Fund | | | — | |
U.S. Value Fund | | | — | |
| | 1 | For the period June 24, 2021 (commencement of operations) through March 31, 2022. |
At March 31, 2022, the effect of permanent “book/tax” reclassifications resulted in increases (decreases) to the components of net assets as shown in the following table. These differences are primarily due to redemptions-in-kind and distributions in excess of current earnings.
| | | | | | | | |
| | | |
| Fund | | Total
Distributable
Earnings (Loss) | | | Paid-in Capital | |
U.S. AI Enhanced Value Fund | | $ | (111,610,460 | ) | | $ | 111,610,460 | |
U.S. ESG Fund | | | (14,084,456 | ) | | | 14,084,456 | |
U.S. Growth & Momentum Fund | | | 137,514 | | | | (137,514 | ) |
U.S. High Dividend Fund | | | (2,634,171 | ) | | | 2,634,171 | |
U.S. LargeCap Dividend Fund | | | (269,698,411 | ) | | | 269,698,411 | |
U.S. LargeCap Fund | | | (67,308,268 | ) | | | 67,308,268 | |
U.S. MidCap Dividend Fund | | | (268,595,554 | ) | | | 268,595,554 | |
U.S. MidCap Fund | | | (93,777,676 | ) | | | 93,777,676 | |
U.S. Multifactor Fund | | | (14,549,827 | ) | | | 14,549,827 | |
U.S. Quality Dividend Growth Fund | | | (653,948,127 | ) | | | 653,948,127 | |
U.S. SmallCap Dividend Fund | | | (160,769,451 | ) | | | 160,769,451 | |
U.S. SmallCap Fund | | | (63,665,468 | ) | | | 63,665,468 | |
U.S. SmallCap Quality Dividend Growth Fund | | | (12,659,823 | ) | | | 12,659,823 | |
U.S. Total Dividend Fund | | | (88,118,460 | ) | | | 88,118,460 | |
U.S. Value Fund | | | (8,196,938 | ) | | | 8,196,938 | |
GAAP provides guidance on tax provisions that prescribe a minimum threshold for financial statement recognition of the benefit of a tax position taken or expected to be taken in a tax return. Foreign withholding taxes, as applicable, are accrued based on each Fund’s understanding of the tax rules and rates that exist in the foreign markets in which it invests. Foreign withholding taxes are accrued and applied to foreign income as the foreign income is earned. The dollar amount of applicable foreign withholding taxes on foreign income is included net in the Statements of Operations in “Less: Foreign withholding taxes on dividends”. As of and during the fiscal year or period ended March 31, 2022, the Funds did not have any liabilities for unrecognized tax benefits relating to uncertain income tax positions they have taken or expect to take in the future. If applicable, the Funds will recognize interest accrued related to unrecognized tax benefits in interest expense and penalties in “Other” expenses on the Statements of Operations. The Funds file tax returns with the Internal Revenue Service, the State of New York, and various other states. Generally, each of the tax years in the four-year period ended March 31, 2022, remains subject to examination by taxing authorities.
Notes to Financial Statements (continued)
7. ADDITIONAL INFORMATION
The Board of Trustees authorized a two-for-one stock split for the U.S. Value Fund, effective after the close of trading on June 9, 2021, for the shareholders of record on June 7, 2021 and a two-for-one stock split for the U.S. LargeCap Dividend Fund and U.S. Total Dividend Fund, effective after the close of trading on December 22, 2021, for the shareholders of record on December 20, 2021. The impact of the stock split was to increase the number of shares outstanding by a factor of two, while decreasing the NAV per share by a factor of two, resulting in no effect on the net assets of the Funds. The financial statements for the Funds have been adjusted to reflect the stock split.
* * * * *
The respiratory disease caused by a novel coronavirus (“COVID-19”) has spread globally since 2019, resulting in a global pandemic and major disruption to global markets and economies. In an organized attempt to contain and mitigate the effects of COVID-19, governments and businesses world-wide took aggressive measures, including businesses canceling dividends to preserve cash, governments closing borders, restricting international and domestic travel, and the imposition of prolonged quarantines of large populations. COVID-19 has resulted in the disruption of and delays in the delivery of healthcare services and processes, the cancellation of organized events and educational institutions, the disruption of production and supply chains, a decline in consumer demand for certain goods and services, and general concern and uncertainty, all of which have contributed to increased volatility in global markets. In recent months, however, the rapid COVID-19 vaccination rollout in the United States and certain other developed countries, coupled with the passage of stimulus programs in the U.S. and abroad, have resulted in a reversal of many of these trends including the re-opening of businesses, a reduction in quarantine requirements, increased consumer demand, and the resumption of certain in-person schooling, travel and events. Despite these positive trends, the prevalence of new COVID-19 variants, a failure to achieve herd immunity, or other unforeseen circumstances may result in the continued spread of the virus throughout unvaccinated populations or a resurgence in infections among vaccinated populations. As a result, it remains unclear if recent positive trends will continue in developed markets and whether such trends will spread world-wide to countries with limited access to vaccines that are still experiencing rising COVID-19 cases, hospitalizations and deaths.
The effects of COVID-19 have affected and are likely to continue to affect certain sectors and industries more dramatically than others, and the effects borne by some will negatively affect the value of the issuers in those sectors and industries, which may adversely affect the value of a Fund’s investments in those sectors or industries. It is also true that the speed at which global economies recover, or fail to recover, from the COVID-19 pandemic will affect certain sectors, industries, and issuers more dramatically than others, which in turn may adversely affect certain Fund investments.
COVID-19, and other epidemics and pandemics that may arise in the future, could adversely affect the economies of many nations, the global economy, individual companies and capital markets in ways that cannot be foreseen at the present time. In addition, the impact of infectious diseases in developing or emerging market countries may be greater due to limited health care resources, including access to COVID-19 vaccinations and treatments. Political, economic and social stresses caused by COVID-19 also may exacerbate other pre-existing political, social and economic risks in certain countries. The duration of COVID-19 and its effects cannot be determined fully at this time, but the effects could be present for an extended period of time. It is impossible to predict the effects on the Funds of these or similar events and market conditions in the future. However, it is possible that these or similar events and market conditions could have a significant and adverse effect on the NAV and/or risk profile of a Fund.
* * * * *
Russia’s military invasion of Ukraine initiated in February 2022 and the economic and diplomatic responses by the United States and other countries have led to increased volatility and uncertainty in the financial markets and could continue to adversely affect regional and global economies for the foreseeable future. In response to Russia’s actions, the governments of the United States, the European Union, the United Kingdom, and many other countries collectively imposed heavy and broad-ranging economic sanctions on certain Russian individuals, corporate and banking entities, and other industries and businesses. The sanctions restrict companies from doing business with Russia and Russian companies, prohibit transactions with the Russian central bank and other key Russian financial institutions and entities, ban Russian airlines and ships from using many other countries’ airspace and ports, respectively, and place a freeze on certain Russian assets. The sanctions also removed some Russian banks from the Society for Worldwide Interbank Financial Telecommunications (SWIFT), the electronic network that connects banks globally to facilitate cross-border payments. In addition, the United States has banned oil and other energy imports from Russia, and the United Kingdom made a commitment to phase out oil import from Russia by the end of 2022.
These sanctions, as well as other economic consequences related to the invasion, such as additional sanctions, boycotts or changes in consumer or purchaser preferences or cyberattacks on governments, companies or individuals, may further decrease the value and liquidity of certain Russian securities and securities of issuers in other countries that are subject to economic sanctions related to the invasion or otherwise adversely affected by the sanctions. To the extent a Fund has exposure to Russian investments or investments in
Notes to Financial Statements (concluded)
countries affected by the invasion or the sanctions, the Fund’s ability to price, buy, sell, receive or deliver such investments may be impaired. In certain circumstances, such as when there is no market for a security or other means of valuing or disposing of a security, a Fund may determine to value the affected security at zero. In addition, any exposure a Fund may have to counterparties in Russia or in countries affected by the invasion could negatively affect the Fund’s portfolio. The extent and duration of Russia’s military actions and the repercussions of such actions are impossible to predict, but could result in continued significant market disruptions, including in the oil and natural gas markets, and may negatively affect global supply chains, inflation and global growth. Further, an escalation of the military conflict beyond Ukraine’s borders could result in significant, long-lasting damage to the economies of Eastern and Western Europe as well as the global economy. These and any related events could significantly and adversely affect a Fund’s performance and the value of an investment in the Fund, even in the absence of direct exposure to Russian issuers or issuers in other countries affected by the invasion.
Report of Independent Registered Public Accounting Firm
To the Shareholders of WisdomTree U.S. Al Enhanced Value Fund (formerly, WisdomTree U.S. Dividend ex-Financials Fund), WisdomTree U.S. ESG Fund, WisdomTree U.S. Growth & Momentum Fund, WisdomTree U.S. High Dividend Fund, WisdomTree U.S. LargeCap Dividend Fund, WisdomTree U.S. LargeCap Fund, WisdomTree U.S. MidCap Dividend Fund, WisdomTree U.S. MidCap Fund, WisdomTree U.S. Multifactor Fund, WisdomTree U.S. Quality Dividend Growth Fund, WisdomTree U.S. SmallCap Dividend Fund, WisdomTree U.S. SmallCap Fund, WisdomTree U.S. SmallCap Quality Dividend Growth Fund, WisdomTree U.S. Total Dividend Fund and WisdomTree U.S. Value Fund (formerly, WisdomTree U.S. Quality Shareholder Yield Fund), and the Board of Trustees of WisdomTree Trust
Opinion on the Financial Statements
We have audited the accompanying statements of assets and liabilities of WisdomTree U.S. Al Enhanced Value Fund (formerly, WisdomTree U.S. Dividend ex-Financials Fund), WisdomTree U.S. ESG Fund, WisdomTree U.S. Growth & Momentum Fund, WisdomTree U.S. High Dividend Fund, WisdomTree U.S. LargeCap Dividend Fund, WisdomTree U.S. LargeCap Fund, WisdomTree U.S. MidCap Dividend Fund, WisdomTree U.S. MidCap Fund, WisdomTree U.S. Multifactor Fund, WisdomTree U.S. Quality Dividend Growth Fund, WisdomTree U.S. SmallCap Dividend Fund, WisdomTree U.S. SmallCap Fund, WisdomTree U.S. SmallCap Quality Dividend Growth Fund, WisdomTree U.S. Total Dividend Fund and WisdomTree U.S. Value Fund (formerly, WisdomTree U.S. Quality Shareholder Yield Fund) (collectively referred to as the “Funds”), (fifteen of the funds constituting WisdomTree Trust (the “Trust”)), including the schedules of investments, as of March 31, 2022, and the related statements of operations and changes in net assets, and the financial highlights for each of the periods indicated in the table below and the related notes (collectively referred to as the “financial statements”). In our opinion, the financial statements present fairly, in all material respects, the financial position of each of the Funds (fifteen of the funds constituting WisdomTree Trust) at March 31, 2022, and the results of their operations, changes in net assets and financial highlights for each of the periods indicated in the table below, in conformity with U.S. generally accepted accounting principles.
| | | | | | |
| | | | |
| Individual fund constituting the WisdomTree Trust | | Statement of operations | | Statements of changes in net assets | | Financial highlights |
WisdomTree U.S. Al Enhanced Value Fund (formerly, WisdomTree U.S. Dividend ex-Financials Fund) WisdomTree U.S. ESG Fund WisdomTree U.S. High Dividend Fund WisdomTree U.S. LargeCap Dividend Fund WisdomTree U.S. LargeCap Fund WisdomTree U.S. MidCap Dividend Fund WisdomTree U.S. MidCap Fund WisdomTree U.S. Quality Dividend Growth Fund WisdomTree U.S. SmallCap Dividend Fund WisdomTree U.S. SmallCap Fund WisdomTree U.S. SmallCap Quality Dividend Growth Fund WisdomTree U.S. Total Dividend Fund WisdomTree U.S. Value Fund (formerly, WisdomTree U.S. Quality Shareholder Yield Fund) | | For the year ended March 31, 2022 | | For each of the two years in the period ended March 31, 2022 | | For each of the five years in the period ended March 31, 2022 |
WisdomTree U.S. Multifactor Fund | | For the year ended March 31, 2022 | | For each of the two years in the period ended March 31, 2022 | | For each of the four years in the period ended March 31, 2022 and for the period June 29, 2017 (commencement of operations) through March 31, 2018 |
WisdomTree U.S. Growth & Momentum Fund | | For the period June 24, 2021 (commencement of operations) through March 31, 2022 |
Basis for Opinion
These financial statements are the responsibility of the Trust’s management. Our responsibility is to express an opinion on each of the Funds’ financial statements based on our audits. We are a public accounting firm registered with the Public Company Accounting Oversight Board (United States) (“PCAOB”) and are required to be independent with respect to the Trust in accordance with the U.S. federal securities laws and the applicable rules and regulations of the Securities and Exchange Commission and the PCAOB.
We conducted our audits in accordance with the standards of the PCAOB. Those standards require that we plan and perform the audit to obtain reasonable assurance about whether the financial statements are free of material misstatement, whether due to error or fraud. The Trust is not required to have, nor were we engaged to perform, an audit of the Trust’s internal control over financial reporting. As part of our audits, we are required to obtain an understanding of internal control over financial reporting, but not for
Report of Independent Registered Public Accounting Firm (concluded)
the purpose of expressing an opinion on the effectiveness of the Trust’s internal control over financial reporting. Accordingly, we express no such opinion.
Our audits included performing procedures to assess the risks of material misstatement of the financial statements, whether due to error or fraud, and performing procedures that respond to those risks. Such procedures included examining, on a test basis, evidence regarding the amounts and disclosures in the financial statements. Our procedures included confirmation of securities owned as of March 31, 2022, by correspondence with the custodian and brokers or by other appropriate auditing procedures where replies from brokers were not received. Our audits also included evaluating the accounting principles used and significant estimates made by management, as well as evaluating the overall presentation of the financial statements. We believe that our audits provide a reasonable basis for our opinion.

We have served as the auditor of one or more WisdomTree investment companies since 2006.
New York, New York
May 25, 2022
Approval of Investment Advisory and Sub-Advisory Agreements (unaudited)
Consideration of the Approval of Investment Advisory Agreement
WisdomTree U.S. Value Fund (the “Fund”)
At a meeting of the Board of Trustees (the “Board”) of the WisdomTree Trust (the “Trust”) held on December 7-8, 2021, the Trustees (the “Trustees”), including those Trustees who are not “interested persons” (as defined in the Investment Company Act of 1940, as amended) of the Trust (the “Independent Trustees”), considered the approval of an amendment to the Amended and Restated Investment Advisory Agreement between the Trust, on behalf of the Fund, and WisdomTree Asset Management, Inc. (“WTAM”), pursuant to which WTAM provides the Fund with investment advisory services (the “Advisory Agreement”). WTAM representatives discussed with the Board its proposal to lower the advisory fee paid to WTAM by the Fund pursuant to the Advisory Agreement as follows:
| | • | | WisdomTree U.S. Value Fund: from 0.38% to 0.12% of the value of the Fund’s average net assets |
Since the Board had approved the renewal of the Advisory Agreement at a meeting held on September 27-28, 2021 (the “September Meeting”), and, other than as discussed below, there had been no material changes in the information presented, the Board addressed certain of the relevant considerations by reference to their considerations and determinations at the September Meeting.
In considering whether to approve the amendment to the Advisory Agreement, the Trustees considered and discussed a memorandum addressing the proposed new fee structures provided by WTAM and information provided by Broadridge Financial Solutions, Inc., an independent provider of investment company data. The Independent Trustees were assisted in their review by independent legal counsel and met with counsel in executive session separate from representatives of WTAM. In considering the approval of the amendment of the Advisory Agreement, the Board considered all factors that it believed to be relevant, including those discussed below. The Board did not identify any one factor as dispositive, and each Trustee may have attributed different weights to the factors considered.
Analysis of Nature, Extent, and Quality of Services Provided to the Fund. WTAM represented that there was expected to be no diminution in the nature, extent or quality of the services provided to the Fund by WTAM. The nature, extent and quality of services provided had been considered at the September Meeting, and there had been no material changes in this information.
Comparative Analysis of the Fund’s Performance, Advisory Fees and Fund Expenses. The Board had considered the Fund’s performance at the September Meeting. The Board considered the fee to be paid to WTAM by the Fund. The Board examined the fee to be paid to WTAM by the Fund in light of fees paid to other investment advisers by comparable funds and the method of computing the Fund’s fee. The Board concluded that the proposed change did not alter the conclusions the Board had reached at the September Meeting.
Analysis of Profitability and Economies of Scale. The Board had considered profitability, economies of scale and the potential benefits to WTAM at the September Meeting. WTAM representatives noted that the proposed new fee structures would result in a reduction in the fees paid to WTAM by the Fund and that potential benefits would not change materially as a result of the amendment from those considered at the September Meeting.
* * * * * *
In evaluating the Advisory Agreement, the Board considered the conclusions and determinations discussed above and also relied on its knowledge, gained through meetings and other interactions with WTAM, of other funds advised by WTAM. In light of the foregoing, the Board, including a majority of the Independent Trustees, determined to approve amendment of the Advisory Agreement for the Fund.
Approval of Investment Advisory and Sub-Advisory Agreements (unaudited) (concluded)
Consideration of the Approval of Sub-Advisory Agreement
WisdomTree U.S. AI Enhanced Value Fund (the “Fund”)
At a meeting of the Board of Trustees (the “Board”) of the WisdomTree Trust (the “Trust”) held on September 27-28, 2021, the Trustees (the “Trustees”), including those Trustees who are not “interested persons” (as defined in the Investment Company Act of 1940, as amended) of the Trust (the “Independent Trustees”), considered the approval of the Sub-Advisory Agreement (the “Agreement”), pursuant to which Voya Investment Management Co., LLC (“Voya”) will coordinate the investment and reinvestment of the assets of the Fund. Management discussed with the Board its proposal to terminate Mellon Investments Corporation as the sub-adviser to the Fund and to appoint Voya as the Fund’s sub-adviser. Management noted that Voya currently serves as the sub-adviser to certain other series of the Trust.
In considering whether to approve the Agreement, the Trustees considered and discussed information and analysis provided by WisdomTree Asset Management, Inc. (“WTAM”). The Independent Trustees were assisted in their review by independent legal counsel and met with counsel in executive session separate from WTAM representatives and Voya. In considering the approval of the Agreement, the Board considered all factors that it believed to be relevant, including those discussed below. The Board did not identify any one factor as dispositive, and each Trustee may have attributed different weights to the factors considered.
Analysis of Nature, Extent, and Quality of Services to be Provided to the Fund. The Board considered information provided to them at the meeting and in previous presentations throughout the year from WTAM representatives regarding the nature, extent, and quality of the services provided to the WisdomTree funds, recognizing Voya’s operational capabilities and resources. The Board also considered WTAM’s favorable assessment of the nature and quality of the sub-advisory services expected to be provided to the Fund by Voya and WTAM’s recommendation to engage Voya.
Based on review of this information and the other factors considered at the meeting, the Board concluded that the nature, extent and quality of services to be provided by Voya under the Agreement are adequate and appropriate and supported the Board’s approval of the Agreement.
Comparative Analysis of the Fund’s Performance, Advisory Fees and Fund Expenses. Because Voya would be a newly-appointed sub-adviser for the Fund, the Board could not consider Voya’s investment performance in managing the Fund’s portfolio as a factor in evaluating the Agreement during the meeting. The Board discussed the portfolio management team and the investment strategies to be employed in the management of the Fund’s assets. The Board noted the reputation and experience of Voya.
The Board considered the proposed fees to be paid under the Agreement, noting that Voya’s fee would be paid by WTAM (out of its fee paid by the Fund), and not the Fund, and thus would not impact the fees paid by the Fund. The Board considered the fee to be paid to Voya in relation to the fee to be paid to WTAM by the Fund and the respective services to be provided by Voya and WTAM. Based on this review, the Board concluded that the fees to be paid to Voya supported the Board’s approval of the Agreement.
Analysis of Profitability and Economies of Scale. The Board recognized that, because Voya’s fee would be paid by WTAM, and not the Fund, an analysis of profitability and economies of scale was more appropriate in the context of the Board’s consideration of the investment advisory agreement between the Trust and WTAM. Accordingly, the Board did not consider Voya’s profitability to be relevant to its deliberations with respect to approval of the Agreement. The Board considered potential benefits to Voya from acting as sub-adviser to the Fund.
* * * * * *
In evaluating the Agreement, the Board considered the conclusions and determinations discussed above and also relied on its knowledge, gained through meetings and other interactions with WTAM and Voya, of other funds sub-advised by Voya. In light of the foregoing, the Board, including a majority of the Independent Trustees, determined to approve the Agreement.
Liquidity Risk Management Program (unaudited)
The Funds adopted a liquidity risk management program (the “Program”) pursuant to the requirements of Rule 22e-4 (the “Rule”) under the Investment Company Act of 1940, as amended. The Rule requires registered open-end funds, including exchange-traded funds such as the Funds, to establish liquidity risk management programs in order to effectively manage fund liquidity and shareholder redemptions. The Rule is designed to mitigate the risk that a Fund could not meet redemption requests without significantly diluting the interest of remaining investors. The Board has appointed WisdomTree Asset Management, Inc., the investment advisor to the Funds, as the Program Administrator for each Fund’s Program.
The Rule requires the Funds to assess, manage and review their liquidity risk at least annually considering applicable factors such as investment strategy and liquidity during normal and foreseeable stressed conditions, including whether the strategy is appropriate for an open-ended fund and whether the Fund has a relatively concentrated portfolio or large positions in particular issuers. The Funds must also assess their use of borrowings and derivatives, short-term and long-term cash flow projections in normal and stressed conditions, holdings of cash and cash equivalents, and borrowing arrangements and other funding sources.
The Rule also requires the Funds to classify their investments into one of four liquidity categories: highly liquid, moderately liquid, less liquid or illiquid based on the number of days a Fund expects it would take to liquidate the investment, and to review these classifications at least monthly or more often under certain conditions. The periods range from three or fewer business days for a highly liquid investment to greater than seven calendar days for settlement of a less liquid investment. Illiquid investments are those a Fund does not expect to be able to sell or dispose of within seven calendar days without significantly changing the market value of the investment. A Fund is prohibited from acquiring an investment if, after the acquisition, its holdings of illiquid assets will exceed 15% of its net assets. In addition, if a Fund permits redemptions in-kind, the Rule requires the Fund to establish redemption in-kind policies and procedures governing how and when it will engage in such redemptions.
Pursuant to the Rule’s requirements, the Program has been reviewed and approved by the Fund’s Board. Furthermore, the Board has received a written report prepared by the Program Administrator that addresses the operation of the Program, assesses its adequacy and effectiveness and describes any material changes made to the Program. The Program Administrator has monitored the Fund’s liquidity risk and the liquidity classifications of the securities held by the Fund and has determined that the Program is operating effectively.
During the period from January 1, 2021 to December 31, 2021, there were no material changes to the Program and no material liquidity events that impacted the Funds. During the period, the Funds held sufficient highly liquid assets to meet fund redemptions.
Under normal expected foreseeable Fund redemption forecasts and foreseeable stressed Fund redemption forecasts, the Program Administrator believes that the Funds maintain sufficient highly liquid assets to meet Fund redemptions.
Supplemental Information (unaudited)
Federal Income Tax Information
The following Federal tax information related to the Funds’ fiscal year or period ended March 31, 2022, is provided for information purposes only and should not be used for reporting to federal or state revenue agencies. Federal tax information for the calendar year will be reported to you on Form 1099-DIV in January 2023.
Certain dividends paid by the Funds may be subject to a maximum tax rate of 15%, as provided by the Jobs and Growth Tax Relief Reconciliation Act of 2003. Of the distributions paid during the fiscal year or period ended March 31, 2022, the following represents the maximum amount of ordinary income distributions that may be considered qualified dividend income:
| | | | |
| | |
| Fund | | Qualified Dividend
Income | |
U.S. AI Enhanced Value Fund | | $ | 15,541,024 | |
U.S. ESG Fund | | | 1,160,908 | |
U.S. Growth & Momentum Fund1 | | | — | |
U.S. High Dividend Fund | | | 25,589,520 | |
U.S. LargeCap Dividend Fund | | | 68,529,090 | |
U.S. LargeCap Fund | | | 10,044,472 | |
U.S. MidCap Dividend Fund | | | 69,041,808 | |
U.S. MidCap Fund | | | 10,460,358 | |
U.S. Multifactor Fund | | | 2,386,625 | |
U.S. Quality Dividend Growth Fund | | | 123,175,321 | |
U.S. SmallCap Dividend Fund | | | 48,960,885 | |
U.S. SmallCap Fund | | | 10,226,320 | |
U.S. SmallCap Quality Dividend Growth Fund | | | 5,126,380 | |
U.S. Total Dividend Fund | | | 21,438,300 | |
U.S. Value Fund | | | 1,432,409 | |
| | 1 | For the period June 24, 2021 (commencement of operations) through March 31, 2022. |
The following represents the percentage of dividends paid during the fiscal year or period ended March 31, 2022, that qualify for the 70% dividends received deduction for corporate shareholders:
| | | | |
| | |
| Fund | | Dividends-Received
Deduction | |
U.S. AI Enhanced Value Fund | | | 100.00 | % |
U.S. ESG Fund | | | 100.00 | % |
U.S. Growth & Momentum Fund1 | | | — | |
U.S. High Dividend Fund | | | 100.00 | % |
U.S. LargeCap Dividend Fund | | | 100.00 | % |
U.S. LargeCap Fund | | | 100.00 | % |
U.S. MidCap Dividend Fund | | | 99.99 | % |
U.S. MidCap Fund | | | 100.00 | % |
U.S. Multifactor Fund | | | 100.00 | % |
U.S. Quality Dividend Growth Fund | | | 100.00 | % |
U.S. SmallCap Dividend Fund | | | 100.00 | % |
U.S. SmallCap Fund | | | 100.00 | % |
U.S. SmallCap Quality Dividend Growth Fund | | | 100.00 | % |
U.S. Total Dividend Fund | | | 100.00 | % |
U.S. Value Fund | | | 100.00 | % |
| | 1 | For the period June 24, 2021 (commencement of operations) through March 31, 2022. |
Trustees and Officers Information (unaudited)
| | | | | | | | | | |
Name
and Year of Birth
of Trustee/Officer | | Position(s) Held with the Trust, Term of Office and Length
of Time Served | | Principal Occupation(s) During Past 5 Years | | Number of Portfolios
in Fund Complex
Overseen by Trustee/
Officer+ | | | Other Directorships Held by Trustee |
Trustees Who Are Interested Persons of the Trust |
| | | | |
Jonathan Steinberg
(1964) | | Trustee, 2005- present; President, 2005-present | | Chief Executive Officer, WisdomTree Investments, Inc. and WisdomTree Asset Management since 2005; President, WisdomTree Investments, Inc. and WisdomTree Asset Management from 2012 to 2019. | | | 77 | | | Director, WisdomTree Investments, Inc. and WisdomTree Asset Management. |
Trustees Who Are Not Interested Persons of the Trust |
| | | | |
David G. Chrencik*
(1948) | | Trustee, 2014-present | | Chief Financial Officer of Sarus Indochina Select LP (hedge fund) since 2012; Chief Financial Officer of GeoGreen BioFuels, Inc. (biodiesel fuel producer) from 2010 to 2014; Audit Partner at PricewaterhouseCoopers LLP (public accounting firm) from 1972 to 2009 (includes positions prior to becoming Audit Partner and predecessor firms). | | | 77 | | | Trustee, Vericimetry Funds (2011 to 2014). |
| | | | |
Joel Goldberg**, ***
(1945) | | Trustee, 2012-present | | Attorney, Partner at Stroock & Stroock & Lavan LLP from 2010 to 2018; Attorney, Partner at Willkie Farr & Gallagher LLP from 2006 to 2010. | | | 77 | | | Director, Better Business Bureau (Metropolitan New York, Long Island and the Mid-Hudson Region). |
| | | | |
Toni Massaro***
(1955) | | Trustee, 2006-present | | Dean Emerita at the University of Arizona James E. Rogers College of Law (“Rogers College of Law”) since 2009 (distinguished Emerita in July 2009); Dean of the Rogers College of Law from 1999 to 2009; Regents’ Professor since 2006; Milton O. Riepe Chair in Constitutional Law since 1997; Professor at the Rogers College of Law since 1990. | | | 77 | | | None |
| | | | |
Melinda A.
Raso Kirstein**** (1955) | | Trustee, 2014-present | | Retired since 2004, Merrill Lynch Investment Management, Vice President; Senior Portfolio Manager, Fixed Income Management; Director, Tax Exempt Fund Management. | | | 77 | | | Associate Alumnae of Douglass College, Chair of Investment Committee. |
| | | | |
Victor Ugolyn
(1947) | | Trustee, 2006-present; Chairman of the Board, 2006-present | | Private Investor, from 2005 to present; President and Chief Executive Officer of William D. Witter, Inc. from 2005 to 2006; Consultant to AXA Enterprise in 2004; Chairman, President and Chief Executive Officer of Enterprise Capital Management (subsidiary of The MONY Group, Inc.) and Enterprise Group of Funds, Chairman of MONY Securities Corporation, and Chairman of the Fund Board of Enterprise Group of Funds from 1991 to 2004. | | | 77 | | | None |
Trustees and Officers Information (unaudited) (concluded)
| | | | | | | | | | |
Name
and Year of Birth
of Trustee/Officer | | Position(s) Held with the Trust, Term of Office and Length
of Time Served | | Principal Occupation(s) During Past 5 Years | | Number of Portfolios
in Fund Complex
Overseen by Trustee/
Officer+ | | | Other Directorships Held by Trustee |
Officers of the Trust |
| | | | |
Jonathan
Steinberg***** (1964) | | President, 2005- present; Trustee, 2005-present | | Chief Executive Officer, WisdomTree Investments, Inc. and WisdomTree Asset Management since 2005; President, WisdomTree Investments, Inc. and WisdomTree Asset Management from 2012 to 2019. | | | 77 | | | None |
| | | | |
David Castano***** (1971) | | Treasurer, 2013-present | | Head of Fund Accounting & Administration, WisdomTree Asset Management, since 2020; Director of Fund Accounting & Administration, WisdomTree Asset Management, 2011 to 2020. | | | 77 | | | None |
| | | | |
Terry Jane Feld***** (1960) | | Chief Compliance Officer, 2012-present | | Head of Compliance, WisdomTree Asset Management since 2022; Chief Compliance Officer, WisdomTree Asset Management since 2012. | | | 77 | | | None |
| | | | |
Joanne Antico***** (1975) | | Chief Legal Officer and Secretary, 2021-present | | General Counsel, WisdomTree Asset Management since 2021; Assistant General Counsel, WisdomTree Asset Management, 2016 to 2021; Executive Director and Assistant Secretary, Morgan Stanley Investment Management Inc., 2005 to 2016. | | | 77 | | | None |
| | | | |
TJ Darnowski***** (1984) | | Assistant Secretary, 2021-present | | Senior Investment Management Paralegal, WisdomTree Asset Management since 2021; Senior Legal Administrator, Ultimus Fund Solutions, 2019-2021; Assistant Vice President, State Street Bank & Trust Company, 2010 to 2019. | | | 77 | | | None |
| | | | |
Clint Martin***** (1977) | | Assistant Treasurer, 2015-present | | Director of Fund Accounting & Administration, WisdomTree Asset Management, since 2020; Fund Manager, Fund Accounting & Administration, WisdomTree Asset Management, 2012 to 2020. | | | 77 | | | None |
| * | Chair of the Audit Committee. |
| ** | Chair of the Contracts Review Committee. |
| *** | Co-Chair of the Governance, Nominating and Compliance Committee. |
| **** | Chair of the Investment Committee. |
| ***** | Elected by and serves at the pleasure of the Board. |
General Information (unaudited)
Proxy Voting Policies, Procedures and Record
A complete copy of the Proxy Voting Policy may be obtained upon request, at no charge, by calling 1-866-909-WISE (9473) or writing to: WisdomTree Trust, c/o Foreside Fund Services, LLC, Three Canal Plaza Suite 100, Portland, ME, 04101.
The Trust is required to disclose annually the Funds’ complete proxy voting record on Form N-PX covering the most recent
12-month period ended June 30 and to file Form N-PX with the SEC no later than August 31 of each year. The current Form N-PX for the Funds is available at no charge upon request by calling 1-866-909-WISE (9473) or through the Trust’s website at www.wisdomtree.com. The Funds’ Form N-PX is also available on the SEC’s website at www.sec.gov.
Shareholder Reports and Quarterly Portfolio Disclosure
The Funds file their complete schedule of portfolio holdings with the SEC for their first and third fiscal quarters as an exhibit to their reports on Form N-PORT. Copies of the filings are available, without charge, on the SEC’s website at www.sec.gov and are also available by calling the Trust at 1-866-909-WISE (9473). Copies of the filings may also be obtained, after paying a duplicating fee, by electronic request at the following E-mail address: publicinfo@sec.gov.
Information about each Fund’s portfolio holdings is available daily, without charge, at www.wisdomtree.com.
The Statement of Additional Information (“SAI”) has additional information about the Funds’ Trustees and Officers and is available without charge upon request. Contact your financial representative for a free prospectus or SAI.
Frequency Distribution of Discounts & Premiums
Information about differences between the per share net asset value of each Fund and the market trading price of shares of each Fund are available, without charge, at www.wisdomtree.com.
The WisdomTree Funds are exchange traded funds (“ETFs”) registered with the United States Securities and Exchange Commission as separate series (“Funds”) of WisdomTree Trust (“Trust”). WisdomTree Asset Management, Inc., a wholly owned subsidiary of WisdomTree Investments, Inc., serves as the investment adviser to the Trust. None of the WisdomTree entities are affiliated with Foreside Fund Services, LLC, the Funds’ distributor. WisdomTree Investments, its affiliates and their independent providers are not liable for any informational errors, incompleteness, delays, or for any actions taken in reliance on information contained herein.
There are risks associated with investing, including possible loss of principal. Funds focusing their investments on certain sectors and/or smaller companies increase their vulnerability to any single economic or regulatory development. This may result in greater share price volatility. Due to the investment strategy of certain Funds they may make higher capital gain distributions than other ETFs. Please read the Fund’s prospectus for specific details regarding the Fund’s risk profile.
Indexes are unmanaged and you cannot invest directly in an index.
Transactions in Fund shares will result in brokerage commissions and will generate tax consequences. Shares may be sold through brokerage accounts, but may be redeemed from the Funds only by Authorized Participants in large creation unit sizes of shares.
This report is intended for the Funds’ shareholders. It may not be distributed to prospective investors unless it is preceded or accompanied by the current prospectus.
Scan the QR code with your
smartphone camera to

learn more at
WisdomTree.com
WisdomTree Fund shares are distributed by Foreside Fund Services, LLC, in the U.S. only.
WTGM - 6330


WisdomTree Trust
Annual Report
March 31, 2022
WisdomTree China ex-State-Owned Enterprises Fund (CXSE)
WisdomTree Emerging Markets ex-State-Owned Enterprises Fund (XSOE)
WisdomTree Emerging Markets High Dividend Fund (DEM)
WisdomTree Emerging Markets Multifactor Fund (EMMF)
WisdomTree Emerging Markets Quality Dividend Growth Fund (DGRE)
WisdomTree Emerging Markets SmallCap Dividend Fund (DGS)
WisdomTree Global ex-U.S. Quality Dividend Growth Fund (DNL)
WisdomTree Global ex-U.S. Real Estate Fund (DRW)
WisdomTree Global High Dividend Fund (DEW)
WisdomTree Growth Leaders Fund (PLAT)
WisdomTree India Earnings Fund (EPI)
WisdomTree India ex-State-Owned Enterprises Fund (IXSE)
Table of Contents
“WisdomTree” is a registered mark of WisdomTree Investments, Inc. and is licensed for use by the WisdomTree Trust.
Market Environment Overview
(unaudited)
Global equity markets, as measured by the MSCI All Country World Index (“ACWI“), returned 7.28% in U.S. dollar (“USD”) terms for the 12-month fiscal period ending March 31, 2022 (the “period”). Emerging markets (“EM“) (measured by the MSCI Emerging Markets Index) were not as fortunate, however, and fell 11.37% in USD terms.
International currency market performance was mixed during the period, although the USD broadly strengthened relative to a basket of global currencies. Among emerging market currencies, the Chinese yuan renminbi strengthened relative to the USD, though this may have had an adverse impact on Chinese equity market performance since that would make exports more expensive in an economy that heavily relies on them. The Russian ruble weakened significantly versus the USD as a result of economic sanctions levied against Russia by the rest of the world for its war with Ukraine. The Indian rupee also weakened versus the USD, while the Brazilian real fluctuated for most of the period, before strengthening toward the end of the period.
Global equities generally moved higher for most of the period as the global economy continued its recovery from the COVID-19 pandemic that began in 2020. Vaccine accessibility established confidence in global markets as regional economies steadily began to reopen, promoting a revival in cyclical sectors that had been adversely affected the prior year. The pace of economic growth quickened during 2021, along with the inflation rates around the world, amid a global backdrop of accommodative monetary policy. EM, however, suffered as a result of concentrated and severe headwinds during the period.
During the second quarter of 2021, both global and EM stocks gradually moved higher, with the above equity indexes returning between 5-7.4% in USD terms. Their growth was partially due to the approval and distribution of vaccines around the world, which enabled a return to economic growth and a revival in cyclical economic sectors, which heavily comprise EM especially. Coupled with accommodative monetary policy around the world, equities benefitted during the quarter.
Growth slowed in the third quarter of 2021 with global equities falling approximately 1% in USD terms, while the selloff in EM was more pronounced, falling over 8%. Early summertime optimism faded as new and potentially more infectious COVID-19 variants appeared and spread throughout the world. This elicited fear of renewed “lockdowns” and threatened the ongoing economic recovery.
EM equities had a more difficult quarter for additional reasons. As the largest portion of the region, headwinds in China had an adverse impact on broader EM. Beginning in the late-spring and early-summer months, Chinese government officials became very critical of what they viewed as excessive wealth creation by business owners and executives. These attitudes weighed on China’s heavyweight technology sector, and a steep sell-off ensued. Chinese equities fell into correction territory, declining over 13% in USD terms during June 2021 alone.
Global equities regained their footing heading into the fourth quarter of 2021, returning about 6.68% in USD terms. However, EM, once again, was not as fortunate. More bad news came in the fall, as China’s real estate market began to severely struggle amid default concerns from one of its largest property developers. Fears of systemic impacts briefly sent global markets down further, though they finished 2021 strong once their contagion concerns were allayed. EM equities were unable to maintain the gains they earned in October 2021, and finished the quarter in negative territory.
With 2021 in rearview, investors began 2022 with several concerns that led to risk-off sentiments in the first quarter of 2022. At the forefront were concerns about runaway inflation around the world, and the expectation that global central banks would have to quickly intervene with restrictive monetary policy actions to temper rising inflation. Interest rates around the world rose quickly as bonds sold-off, and the U.S. Federal Reserve raised its target federal funds rate for the first time since slashing it to 0% at the onset of the pandemic in 2020.
Market Environment Overview
(unaudited) (concluded)
Inflationary and interest rate concerns temporarily took a backseat halfway through the first quarter of 2022, as geopolitical tensions between Russia and Ukraine escalated into war. Investor risk-on sentiment deteriorated, and equities declined for several weeks as markets assessed the developments and prospects for resolution.
As a result, global equities sold off in the first quarter of 2022, owing to the near-certainty of several upcoming interest rate hikes amid a tightening cycle and geopolitical tensions between Russia and Ukraine. Both global and EM equities sold off between 5 and 7% in USD terms, as the confluence of rising rates and geopolitical risks reduced the attractiveness of equities as an asset class, and riskier international and EM equities in particular. The latter are particularly susceptible to changes in overall global economic growth, and they underperformed other regions during the downturn in the first quarter of 2022, accordingly.
Many of these risk factors remain paramount, and global financial market performance will be heavily dependent on developments in the war between Russia and Ukraine, economic data, and upcoming central bank activity.
Each WisdomTree Fund’s performance as set forth in “Management’s Discussion of Funds’ Performance” in the pages that follow should also be viewed in light of the foregoing market environment.
Information about Performance and Shareholder Expense Examples (unaudited)
Performance
The performance tables on the following pages are provided for comparative purposes and represent the period noted. Each Fund’s per share net asset value (“NAV”) is the value of one share of the Fund and is calculated by dividing the value of total assets less total liabilities by the number of shares outstanding. The NAV return is based on the NAV of the Fund and the market price return is based on the market price per share of the Fund. The price used to calculate market price returns is the midpoint of the bid and ask price for Fund shares as of the close of trading on the exchange where Fund shares are listed. NAV and market price returns assume that dividends and capital gain distributions have been reinvested in the Fund at NAV and market price, respectively. As with other exchange traded funds (“ETFs”), NAV returns and market price returns may differ because of factors such as the supply and demand for Fund shares and investors’ assessments of the underlying value of a Fund’s portfolio securities.
Fund shares are bought and sold at market price (not NAV) and are not individually redeemed from a Fund. Fund NAV returns are calculated using a Fund’s daily 4:00 p.m. eastern time NAV. Market price returns reflect the midpoint of the bid and ask price as of the close of trading on the exchange where Fund shares are listed. Market price returns do not represent the returns you would receive if you traded shares at other times. The returns do not reflect the deduction of taxes that a shareholder would pay on Fund distributions or on the redemption of Fund shares. Total returns for a period of less than one year are cumulative.
Performance is historical and does not guarantee future results. Current performance may be lower or higher than quoted. Investment returns and the principal value of an investment will fluctuate so that an investor’s shares, when redeemed, may be worth more or less than their original cost. For the most recent month-end performance information visit www.wisdomtree.com.
An index is a statistical measure of a specified financial market or sector. An index does not actually hold a portfolio of securities, incur expenses or pay any transaction costs. Therefore, index returns do not reflect deductions for fees or expenses and an index is not available for direct investment. In comparison, the Funds’ performance is negatively impacted by these deductions. Fund returns do not reflect brokerage commissions or taxes on transactions in Fund shares or taxes that a shareholder would pay on Fund distributions. Past performance is no guarantee of future results.
Shareholder Expense Examples
Each Fund’s performance table is accompanied by a shareholder expense example. As a shareholder of a WisdomTree Fund, you incur two types of cost: (1) transaction costs, including brokerage commissions on purchases and sales of your Fund shares and (2) ongoing costs, including management fees and other Fund expenses. The examples are intended to help you understand your ongoing costs (in dollars and cents) of investing in a Fund and to compare these costs with the ongoing costs of investing in other funds.
The examples are based on an investment of $1,000 invested at the beginning of the period and held for the entire period from October 1, 2021 to March 31, 2022. Except where noted, expenses are calculated using each Fund’s annualized expense ratio (after the effect of contractual or voluntary fee waivers, if any), multiplied by the average account value for the period, multiplied by 182/365 (to reflect the one-half year period). The annualized expense ratio does not include acquired fund fees and expenses (“AFFEs”), which are fees and expenses incurred indirectly by a Fund through its investments in certain underlying investment companies.
Actual expenses
The first line in the shareholder expense example table shown on the following pages provides information about actual account values and actual expenses. You may use the information in this line, together with the amount you invested, to estimate the expenses that you paid over the period. Simply divide your account value by $1,000 (for example, an $8,600 account value divided by $1,000 = 8.6), then multiply the result by the number in the first line for your Fund under the heading entitled “Expenses Paid During the Period” to estimate the expenses you paid on your account during the period.
Hypothetical example for comparison purposes
The second line in the shareholder expense example table shown on the following pages provides information about hypothetical account values and hypothetical expenses based on the Fund’s actual expense ratio and an assumed rate of return of 5% per year before expenses, which is not the Fund’s actual return. The hypothetical account values and expenses may not be used to estimate the actual ending account balance or expenses you paid for the period. You may use this information to compare the ongoing costs of investing in your Fund and other funds. To do so, compare this 5% hypothetical example with the 5% hypothetical examples that appear in the shareholder reports of the other funds.
Please note that the expenses shown in the table are meant to highlight your ongoing costs only and do not reflect any transactional costs, such as brokerage commissions paid on purchases and sales of Fund shares. Therefore, the second line in the table is useful in comparing ongoing Fund costs only and will not help you determine the relative total costs of owning different funds. In addition, if these transactional costs were included, your costs would have been higher.
Management’s Discussion of Funds’ Performance
| as | of March 31, 2022 (unaudited) |
WisdomTree China ex-State-Owned Enterprises Fund (CXSE)
Sector Breakdown†
| | | | |
| |
| Sector | | % of Net Assets | |
Consumer Discretionary | | | 30.9% | |
Communication Services | | | 18.1% | |
Health Care | | | 11.0% | |
Information Technology | | | 10.7% | |
Industrials | | | 8.5% | |
Financials | | | 7.1% | |
Consumer Staples | | | 5.4% | |
Materials | | | 4.6% | |
Real Estate | | | 2.7% | |
Utilities | | | 0.7% | |
Energy | | | 0.3% | |
Other Assets less Liabilities‡ | | | 0.0% | * |
Total | | | 100.0% | |
| † | The Fund’s sector breakdown is expressed as a percentage of net assets and may change over time. In addition, a sector may be comprised of several industries. It does not include derivatives (if any). |
| ‡ | Other assets less liabilities may include investment of cash collateral for securities on loan and/or receivables/payables on derivatives (if any). |
| * | Represents less than 0.1%. |
Top Ten Holdings*
| | | | |
| |
| Description | | % of Net Assets | |
Tencent Holdings Ltd. | | | 12.1% | |
Alibaba Group Holding Ltd. | | | 9.6% | |
Meituan, Class B | | | 3.8% | |
JD.com, Inc., Class A | | | 2.9% | |
Contemporary Amperex Technology Co. Ltd., Class A | | | 2.6% | |
Ping An Insurance Group Co. of China Ltd., Class A | | | 2.1% | |
Ping An Insurance Group Co. of China Ltd., Class H | | | 2.1% | |
Baidu, Inc., Class A | | | 2.0% | |
NetEase, Inc. | | | 1.7% | |
Wuxi Biologics Cayman, Inc. | | | 1.6% | |
| * | The ten largest holdings are subject to change, and there are no guarantees the Fund will remain invested in any particular company. Excludes derivatives and investment of cash collateral for securities on loan (if any). |
The WisdomTree China ex-State-Owned Enterprises Fund (the ‘‘Fund’’) seeks to track the price and yield performance, before fees and expenses, of the WisdomTree China ex-State-Owned Enterprises Index (the ‘‘Index’’). In seeking to track the Index, the Fund invests in Chinese companies that are not state-owned enterprises (“SOEs”), which is defined as government ownership of greater than 20%. The Fund generally uses a representative sampling strategy to achieve its investment objective, meaning it generally will invest in a sample of securities in the Index.
The Fund returned -35.81% at net asset value (“NAV”) for the fiscal year ended March 31, 2022 (for more complete performance information please see the table below). The Fund benefited from its positions in Consumer Discretionary, Information Technology and Industrials, due to allocation effects within Industrials and stock selection effects within Consumer Discretionary and Information Technology. Positions in the Financials, Energy and Materials sectors weighed negatively on performance for the Fund, due to both allocation and stock selection effects. When analyzing performance by State-Ownership attribution, the Fund’s lack of exposure to SOEs weighed on performance the most, owing to allocation effects, since SOEs performed much better than non-state-owned enterprises (“Non-SOEs”) during the fiscal year. Non-SOEs, representing the entirety of the Fund, were still additive due positive stock selection, but not enough to offset the losses from eliminating SOEs. Chinese equities had a difficult fiscal year due to a combination of COVID-19 lockdown impacts, economic growth concerns, severe risks in its Real Estate market, and changing governmental attitudes toward profit-seeking enterprises. The confluence of these factors sent the Chinese equity market down sharply for the fiscal year.
Shareholder Expense Example (for the six-month period ended March 31, 2022)
| | | | | | | | | | | | | | | | |
| | | | | |
| | | Beginning
Account Value | | | Ending
Account Value | | | Annualized
Expense Ratio | | | Expenses Paid
During the
Period | |
Actual | | $ | 1,000.00 | | | $ | 769.00 | | | | 0.32 | % | | $ | 1.41 | |
Hypothetical (5% return before expenses) | | $ | 1,000.00 | | | $ | 1,023.34 | | | | 0.32 | % | | $ | 1.61 | |
Performance
| | | | | | | | | | | | | | | | |
| | |
| | | Average Annual Total Return | |
| | | | |
| | | 1 Year | | | 3 Year | | | 5 Year | | | Since Inception1 | |
Fund NAV Returns | | | -35.81 | % | | | 2.72 | % | | | 8.49 | % | | | 6.85 | % |
Fund Market Price Returns | | | -37.89 | % | | | 1.96 | % | | | 8.00 | % | | | 6.53 | % |
WisdomTree China Dividend ex-Financials/China ex-State-Owned Enterprises Spliced Index2 | | | -35.75 | % | | | 2.96 | % | | | 8.24 | % | | | 7.15 | % |
MSCI China Index | | | -32.54 | % | | | -3.01 | % | | | 3.51 | % | | | 4.91 | % |
FTSE China 50 Index | | | -27.13 | % | | | -6.59 | % | | | -0.05 | % | | | 2.51 | % |
| 1 | Total returns are calculated based on the commencement of Fund trading on the NASDAQ on September 19, 2012. |
| 2 | WisdomTree China Dividend ex-Financials Index through June 30, 2015; WisdomTree China ex-State-Owned Enterprises Index thereafter. |
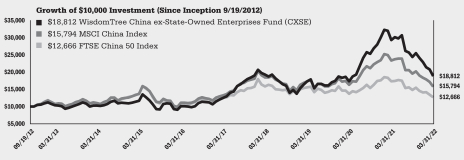
Performance is historical and does not guarantee future results. The returns do not reflect the deduction of taxes that a shareholder would pay on Fund distributions or on the redemption of Fund shares.
Management’s Discussion of Funds’ Performance
| as | of March 31, 2022 (unaudited) |
WisdomTree Emerging Markets ex-State-Owned Enterprises Fund (XSOE)
Sector Breakdown†
| | | | |
| |
| Sector | | % of Net Assets | |
Information Technology | | | 25.2% | |
Financials | | | 16.4% | |
Consumer Discretionary | | | 14.8% | |
Communication Services | | | 10.5% | |
Materials | | | 8.0% | |
Consumer Staples | | | 6.7% | |
Health Care | | | 6.2% | |
Industrials | | | 6.1% | |
Energy | | | 3.0% | |
Real Estate | | | 1.6% | |
Utilities | | | 1.5% | |
Other Assets less Liabilities‡ | | | 0.0% | * |
Total | | | 100.0% | |
| † | The Fund’s sector breakdown is expressed as a percentage of net assets and may change over time. In addition, a sector may be comprised of several industries. It does not include derivatives (if any). |
| ‡ | Other assets less liabilities may include investment of cash collateral for securities on loan and/or receivables/payables on derivatives (if any). |
| * | Represents less than 0.1%. |
Top Ten Holdings*
| | | | |
| |
| Description | | % of Net Assets | |
Taiwan Semiconductor Manufacturing Co. Ltd. | | | 6.7% | |
Samsung Electronics Co. Ltd. | | | 5.1% | |
Tencent Holdings Ltd. | | | 4.3% | |
Alibaba Group Holding Ltd. | | | 2.9% | |
Reliance Industries Ltd., GDR | | | 1.9% | |
Infosys Ltd., ADR | | | 1.6% | |
Meituan, Class B | | | 1.2% | |
Housing Development Finance Corp. Ltd. | | | 1.1% | |
JD.com, Inc., Class A | | | 0.9% | |
SK Hynix, Inc. | | | 0.9% | |
| * | The ten largest holdings are subject to change, and there are no guarantees the Fund will remain invested in any particular company. Excludes derivatives and investment of cash collateral for securities on loan (if any). |
The WisdomTree Emerging Markets ex-State-Owned Enterprises Fund (the ‘‘Fund’’) seeks to track the price and yield performance, before fees and expenses, of the WisdomTree Emerging Markets ex-State-Owned Enterprises Index (the ‘‘Index’’). In seeking to track the Index, the Fund invests in emerging market companies that are not state-owned enterprises, which is defined as government ownership of more than 20%. The Fund generally uses a representative sampling strategy to achieve its investment objective, meaning it generally will invest in a sample of securities in the Index.
The Fund returned -16.70% at net asset value (“NAV”) for the fiscal year ended March 31, 2022 (for more complete performance information please see the table below). The Fund benefited from its positions in Information Technology, Consumer Staples and Consumer Discretionary, primarily due to stock selection effects within each. Positions in the Financials, Energy and Materials sectors weighed negatively on performance, due to poor stock selection in the latter two and a combination of stock selection and effects within Financials. When analyzing performance by country, exposures within China and Russia weighed negatively on performance the most, owing to combination of allocation and stock selection effects resulting from the recent volatility in both equity markets. India and Taiwan were the strongest contributors due to allocation effects in the former and stock selection impacts in the latter. The Fund’s underperformance relative to its Index was also attributable to the Index valuing Russian securities that suspended trading at their last traded price in accordance with the Index’s calculation methodology, whereas, the Fund is valuing Russian securities that suspended trading in accordance with U.S. Generally Accepted Accounting Principles (“U.S. GAAP”) applicable to the Fund which requires assets to be fair valued at the price at which an orderly transaction to sell the asset would take place between market participants at the measurement date under current market conditions; which the Fund has estimated to be zero.
Shareholder Expense Example (for the six-month period ended March 31, 2022)
| | | | | | | | | | | | | | | | |
| | | | | |
| | | Beginning
Account Value | | | Ending
Account Value | | | Annualized
Expense Ratio | | | Expenses Paid
During the
Period | |
Actual | | $ | 1,000.00 | | | $ | 883.60 | | | | 0.32 | % | | $ | 1.50 | |
Hypothetical (5% return before expenses) | | $ | 1,000.00 | | | $ | 1,023.34 | | | | 0.32 | % | | $ | 1.61 | |
Performance
| | | | | | | | | | | | | | | | |
| | |
| | | Average Annual Total Return | |
| | | | |
| | | 1 Year | | | 3 Year | | | 5 Year | | | Since Inception1 | |
Fund NAV Returns | | | -16.70 | % | | | 6.46 | % | | | 7.51 | % | | | 5.88 | % |
Fund Market Price Returns | | | -18.66 | % | | | 5.94 | % | | | 7.20 | % | | | 5.80 | % |
WisdomTree Emerging Markets ex-State-Owned Enterprises Index | | | -15.90 | % | | | 7.19 | % | | | 8.15 | % | | | 6.88 | % |
MSCI Emerging Markets Index | | | -11.37 | % | | | 4.94 | % | | | 5.98 | % | | | 4.80 | % |
| 1 | Total returns are calculated based on the commencement of Fund trading on the NYSE Arca, Inc. on December 10, 2014. |
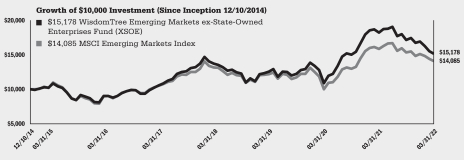
Performance is historical and does not guarantee future results. The returns do not reflect the deduction of taxes that a shareholder would pay on Fund distributions or on the redemption of Fund shares.
Management’s Discussion of Funds’ Performance
| as | of March 31, 2022 (unaudited) |
WisdomTree Emerging Markets High Dividend Fund (DEM)
Sector Breakdown†
| | | | |
| |
| Sector | | % of Net Assets | |
Financials | | | 25.2% | |
Materials | | | 24.1% | |
Energy | | | 11.8% | |
Information Technology | | | 11.2% | |
Consumer Staples | | | 5.7% | |
Real Estate | | | 4.9% | |
Utilities | | | 4.9% | |
Industrials | | | 4.9% | |
Communication Services | | | 4.3% | |
Consumer Discretionary | | | 2.0% | |
Health Care | | | 0.5% | |
Investment Company | | | 0.1% | |
Other Assets less Liabilities‡ | | | 0.4% | |
Total | | | 100.0% | |
| † | The Fund’s sector breakdown is expressed as a percentage of net assets and may change over time. In addition, a sector may be comprised of several industries. It does not include derivatives (if any). |
| ‡ | Other assets less liabilities may include investment of cash collateral for securities on loan and/or receivables/payables on derivatives (if any). |
Top Ten Holdings*
| | | | |
| |
| Description | | % of Net Assets | |
Vale SA | | | 10.8% | |
Petroleo Brasileiro SA | | | 4.1% | |
China Construction Bank Corp., Class H | | | 3.4% | |
Hon Hai Precision Industry Co. Ltd. | | | 2.1% | |
Grupo Mexico SAB de CV, Series B | | | 2.1% | |
Industrial & Commercial Bank of China Ltd., Class H | | | 2.1% | |
Bank of China Ltd., Class H | | | 1.9% | |
Impala Platinum Holdings Ltd. | | | 1.4% | |
Sibanye Stillwater Ltd. | | | 1.3% | |
Asustek Computer, Inc. | | | 1.3% | |
| * | The ten largest holdings are subject to change, and there are no guarantees the Fund will remain invested in any particular company. Excludes derivatives and investment of cash collateral for securities on loan (if any). |
The WisdomTree Emerging Markets High Dividend Fund (the ‘‘Fund’’) seeks to track the price and yield performance, before fees and expenses, of the WisdomTree Emerging Markets High Dividend Index (the ‘‘Index’’). In seeking to track the Index, the Fund invests in high-dividend-yielding companies in the emerging markets region. The Fund generally uses a representative sampling strategy to achieve its investment objective, meaning it generally will invest in a sample of securities in the Index.
The Fund returned 5.65% at net asset value (“NAV”) for the fiscal year ended March 31, 2022 (for more complete performance information please see the table below). The Fund benefited from its positions in Consumer Discretionary, Communication Services and Energy, primarily due to stock selection effects within each. Positions in the Real Estate, Industrials and Consumer Staples sectors weighed on performance for the Fund, due to poor stock selection effects in the latter two and allocation effects in Consumer Discretionary. When analyzing performance by country, exposures within India and Russia were the largest detractors from performance, due to allocation impacts from an underweight position in India and allocations to Russian issuers that were relatively poor performers over the fiscal year as a result of economic sanctions levied against Russia. China and Brazil were top performance contributors. The Fund was underweight the former during its difficult year and managed to pick stronger-performing stocks, while it was overweight the latter during a strong year for Brazilian equities. The Fund’s underperformance relative to its Index was also attributable to the Index valuing Russian securities that suspended trading at their last traded price in accordance with the Index’s calculation methodology, whereas, the Fund is valuing Russian securities that suspended trading in accordance with U.S. Generally Accepted Accounting Principles (“U.S. GAAP”) applicable to the Fund, requiring assets to be fair valued at the price at which an orderly transaction to sell the asset would take place between market participants at the measurement date under current market conditions, which the Fund has estimated to be zero.
Shareholder Expense Example (for the six-month period ended March 31, 2022)
| | | | | | | | | | | | | | | | |
| | | | | |
| | | Beginning
Account Value | | | Ending
Account Value | | | Annualized Net
Expense Ratio1 | | | Expenses Paid
During the
Period1 | |
Actual | | $ | 1,000.00 | | | $ | 1,024.10 | | | | 0.64 | % | | $ | 3.23 | |
Hypothetical (5% return before expenses) | | $ | 1,000.00 | | | $ | 1,021.74 | | | | 0.64 | % | | $ | 3.23 | |
| 1 | Included in the expense ratio are “Other fees” described in Note 6 which are not annualized. Without these expenses, the expense ratio would have been 0.63% and the actual and hypothetical expenses paid during the period would have been $3.18, respectively. |
Performance
| | | | | | | | | | | | | | | | |
| | |
| | | Average Annual Total Return | |
| | | | |
| | | 1 Year | | | 3 Year | | | 5 Year | | | 10 Year | |
Fund NAV Returns | | | 5.65 | % | | | 5.69 | % | | | 6.62 | % | | | 1.83 | % |
Fund Market Price Returns | | | 4.96 | % | | | 5.47 | % | | | 6.45 | % | | | 1.74 | % |
WisdomTree Emerging Markets High Dividend Index | | | 7.77 | % | | | 7.02 | % | | | 7.68 | % | | | 2.92 | % |
MSCI Emerging Markets Index | | | -11.37 | % | | | 4.94 | % | | | 5.98 | % | | | 3.36 | % |
MSCI Emerging Markets Value Index | | | -3.53 | % | | | 3.22 | % | | | 4.24 | % | | | 1.58 | % |
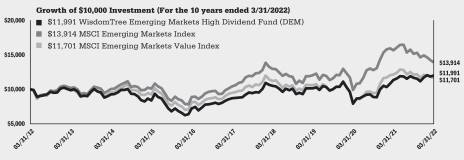
Performance is historical and does not guarantee future results. The returns do not reflect the deduction of taxes that a shareholder would pay on Fund distributions or on the redemption of Fund shares.
Management’s Discussion of Funds’ Performance
| as | of March 31, 2022 (unaudited) |
WisdomTree Emerging Markets Multifactor Fund (EMMF)
Sector Breakdown†
| | | | |
| |
| Sector | | % of Net Assets | |
Information Technology | | | 19.5% | |
Financials | | | 19.3% | |
Materials | | | 11.2% | |
Consumer Staples | | | 10.6% | |
Communication Services | | | 8.7% | |
Consumer Discretionary | | | 7.9% | |
Energy | | | 7.2% | |
Industrials | | | 6.9% | |
Utilities | | | 6.4% | |
Health Care | | | 2.0% | |
Other Assets less Liabilities‡ | | | 0.3% | |
Total | | | 100.0% | |
| † | The Fund’s sector breakdown is expressed as a percentage of net assets and may change over time. In addition, a sector may be comprised of several industries. It does not include derivatives (if any). |
| ‡ | Other assets less liabilities may include investment of cash collateral for securities on loan and/or receivables/payables on derivatives (if any). |
Top Ten Holdings*
| | | | |
| |
| Description | | % of Net Assets | |
Taiwan Semiconductor Manufacturing Co. Ltd. | | | 3.5% | |
China Development Financial Holding Corp. | | | 2.1% | |
Cathay Financial Holding Co. Ltd. | | | 1.4% | |
Want Want China Holdings Ltd. | | | 1.3% | |
Zhongsheng Group Holdings Ltd. | | | 1.2% | |
Kingboard Holdings Ltd. | | | 1.1% | |
Samsung Electronics Co. Ltd. | | | 1.1% | |
Bajaj Auto Ltd. | | | 1.0% | |
Tencent Holdings Ltd. | | | 1.0% | |
China Hongqiao Group Ltd. | | | 1.0% | |
| * | The ten largest holdings are subject to change, and there are no guarantees the Fund will remain invested in any particular company. Excludes derivatives and investment of cash collateral for securities on loan (if any). |
The WisdomTree Emerging Markets Multifactor Fund (the ‘‘Fund’’) seeks capital appreciation by investing in equity securities of emerging markets countries with the highest composite scores based on two fundamental factors, value and quality measures, and two technical factors, momentum and correlation.
The Fund returned -5.72% at net asset value (“NAV”) for the fiscal year ended March 31, 2022 (for more complete performance information please see the table below). The Fund’s position in the Consumer Discretionary and Communication Services sectors were additive for a positive performance mostly due to stock selection effects. The Materials sector detracted from performance primarily due to stock selection effects as well. Exposures in China and Taiwan were additive primarily due to stock selection effects. A lack of exposure to Saudi Arabia weighed negatively on performance, while exposures in Russia also detracted from performance as a result of stock selection. Over the fiscal year, uncertainty and volatility have entered the global markets as investors are accessing the impacts of inflation and rising rates, China regulatory crackdowns, Russia’s invasion of Ukraine, and global supply chains being disrupted due to COVID-19 issues. This has resulted in global equity markets largely being down during the fiscal year. However, higher quality and lower valuation companies have continued to be a preferred destination over their more growth-oriented and lower quality counterparts, which are two of the screening factors withing the Fund’s methodology. During the fiscal year, the Fund’s overweight to the higher quality companies and its underweight to lower quality companies were both positive contributors to performance. Further, the Fund’s overweight in lower price-to-earnings companies and underweight in higher price-to-earnings companies were both beneficial to performance as lower multiple companies benefited from the rotation from growth into value during the period.
Shareholder Expense Example (for the six-month period ended March 31, 2022)
| | | | | | | | | | | | | | | | |
| | | | | |
| | | Beginning
Account Value | | | Ending
Account Value | | | Annualized Net
Expense Ratio | | | Expenses Paid
During the
Period | |
Actual | | $ | 1,000.00 | | | $ | 940.20 | | | | 0.48 | % | | $ | 2.32 | |
Hypothetical (5% return before expenses) | | $ | 1,000.00 | | | $ | 1,022.54 | | | | 0.48 | % | | $ | 2.42 | |
Performance
| | | | | | | | | | | | |
| | |
| | | Average Annual Total Return | |
| | | |
| | | 1 Year | | | 3 Year | | | Since Inception1 | |
Fund NAV Returns | | | -5.72 | % | | | 2.70 | % | | | 1.22 | % |
Fund Market Price Returns | | | -7.38 | % | | | 2.09 | % | | | 1.05 | % |
MSCI Emerging Markets Index | | | -11.37 | % | | | 4.94 | % | | | 4.24 | % |
| 1 | Total returns are calculated based on the commencement of Fund trading on the NYSE Arca, Inc. on August 10, 2018. |
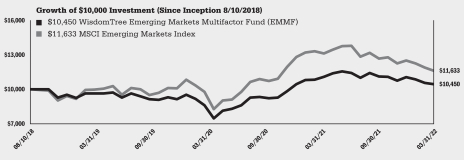
Performance is historical and does not guarantee future results. The returns do not reflect the deduction of taxes that a shareholder would pay on Fund distributions or on the redemption of Fund shares.
Management’s Discussion of Funds’ Performance
| as | of March 31, 2022 (unaudited) |
WisdomTree Emerging Markets Quality Dividend Growth Fund (DGRE)
Sector Breakdown†
| | | | |
| |
| Sector | | % of Net Assets | |
Information Technology | | | 27.6% | |
Materials | | | 15.4% | |
Consumer Staples | | | 10.5% | |
Consumer Discretionary | | | 8.4% | |
Communication Services | | | 7.8% | |
Industrials | | | 6.9% | |
Health Care | | | 6.5% | |
Financials | | | 6.0% | |
Energy | | | 5.1% | |
Utilities | | | 3.7% | |
Real Estate | | | 2.2% | |
Other Assets less Liabilities‡ | | | -0.1% | |
Total | | | 100.0% | |
| † | The Fund’s sector breakdown is expressed as a percentage of net assets and may change over time. In addition, a sector may be comprised of several industries. It does not include derivatives (if any). |
| ‡ | Other assets less liabilities may include investment of cash collateral for securities on loan and/or receivables/payables on derivatives (if any). |
Top Ten Holdings*
| | | | |
| |
| Description | | % of Net Assets | |
Taiwan Semiconductor Manufacturing Co. Ltd. | | | 6.1% | |
Tencent Holdings Ltd. | | | 4.3% | |
Samsung Electronics Co. Ltd. | | | 3.6% | |
Infosys Ltd. | | | 1.5% | |
Vale SA | | | 1.2% | |
Tata Consultancy Services Ltd. | | | 1.0% | |
Zhongsheng Group Holdings Ltd. | | | 1.0% | |
JSW Steel Ltd. | | | 0.9% | |
Tech Mahindra Ltd. | | | 0.7% | |
ENN Energy Holdings Ltd. | | | 0.7% | |
| * | The ten largest holdings are subject to change, and there are no guarantees the Fund will remain invested in any particular company. Excludes derivatives and investment of cash collateral for securities on loan (if any). |
The WisdomTree Emerging Markets Quality Dividend Growth Fund (the ‘‘Fund’’) seeks income and capital appreciation by investing in dividend-paying companies with growth characteristics in the emerging markets region.
The Fund returned -8.48% at net asset value (“NAV”) for the fiscal year ended March 31, 2022 (for more complete performance information please see the table below). The Fund’s position in the Consumer Discretionary sector contributed most positively to performance. The Fund’s position in the Consumer Discretionary sector was by far the strongest performer, owing to stock selection effects, while its position in Financials weighed negatively on performance due to a combination of allocation and stock selection effects. Exposures in China were additive due to a combination of allocation and selection effects. Positions in India were also additive, primarily due to allocation effects. Exposures in Taiwan had negative performance impacts, owing mainly to poor stock selection. Over the fiscal year, uncertainty and volatility have entered the global markets as investors are accessing the impacts of inflation and rising rates, China regulatory crackdowns, Russia’s invasion of Ukraine, and global supply chains being disrupted due to COVID-19 issues. This has resulted in global equity markets largely being down during the fiscal year. However, quality companies have continued to be a preferred destination over their more risky, less certain counterparts. Inherent in the Fund’s methodology is a quality screening process. During the fiscal year, the Fund’s overweight to the higher quality companies and its underweight to the lower quality companies were both positive contributors to performance. Further, negative earning companies were amongst the worst performing subset of the emerging markets equity universe, and the Fund has minimal exposure to those names.
Shareholder Expense Example (for the six-month period ended March 31, 2022)
| | | | | | | | | | | | | | | | |
| | | | | |
| | | Beginning
Account Value | | | Ending
Account Value | | | Annualized
Expense Ratio | | | Expenses Paid
During the
Period | |
Actual | | $ | 1,000.00 | | | $ | 946.70 | | | | 0.32 | % | | $ | 1.55 | |
Hypothetical (5% return before expenses) | | $ | 1,000.00 | | | $ | 1,023.34 | | | | 0.32 | % | | $ | 1.61 | |
Performance
| | | | | | | | | | | | | | | | |
| | |
| | | Average Annual Total Return | |
| | | | |
| | | 1 Year | | | 3 Year | | | 5 Year | | | Since Inception1 | |
Fund NAV Returns | | | -8.48 | % | | | 4.76 | % | | | 5.28 | % | | | 2.99 | % |
Fund Market Price Returns | | | -10.34 | % | | | 4.12 | % | | | 4.82 | % | | | 2.62 | % |
MSCI Emerging Markets Index | | | -11.37 | % | | | 4.94 | % | | | 5.98 | % | | | 4.45 | % |
| 1 | Total returns are calculated based on the commencement of Fund trading on the NASDAQ on August 1, 2013. |
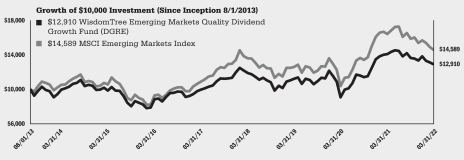
Performance is historical and does not guarantee future results. The returns do not reflect the deduction of taxes that a shareholder would pay on Fund distributions or on the redemption of Fund shares.
Management’s Discussion of Funds’ Performance
as of March 31, 2022 (unaudited)
WisdomTree Emerging Markets SmallCap Dividend Fund (DGS)
Sector Breakdown†
| | | | |
| |
| Sector | | % of Net Assets | |
Information Technology | | | 17.5% | |
Financials | | | 15.2% | |
Materials | | | 13.9% | |
Industrials | | | 13.3% | |
Consumer Discretionary | | | 9.3% | |
Consumer Staples | | | 8.4% | |
Real Estate | | | 8.0% | |
Utilities | | | 5.9% | |
Health Care | | | 3.1% | |
Communication Services | | | 2.8% | |
Energy | | | 1.4% | |
Investment Company | | | 0.5% | |
Other Assets less Liabilities‡ | | | 0.7% | |
Total | | | 100.0% | |
| † | The Fund’s sector breakdown is expressed as a percentage of net assets and may change over time. In addition, a sector may be comprised of several industries. It does not include derivatives (if any). |
| ‡ | Other assets less liabilities may include investment of cash collateral for securities on loan and/or receivables/payables on derivatives (if any). |
Top Ten Holdings*
| | | | |
| |
| Description | | % of Net Assets | |
Transmissora Alianca de Energia Eletrica SA | | | 1.7% | |
African Rainbow Minerals Ltd. | | | 1.1% | |
Synnex Technology International Corp. | | | 1.1% | |
Royal Bafokeng Platinum Ltd. | | | 0.9% | |
Meritz Securities Co. Ltd. | | | 0.8% | |
SPAR Group Ltd. | | | 0.8% | |
Truworths International Ltd. | | | 0.8% | |
CAP SA | | | 0.8% | |
Banco del Bajio SA | | | 0.7% | |
Meritz Fire & Marine Insurance Co. Ltd. | | | 0.7% | |
| * | The ten largest holdings are subject to change, and there are no guarantees the Fund will remain invested in any particular company. Excludes derivatives and investment of cash collateral for securities on loan (if any). |
The WisdomTree Emerging Markets SmallCap Dividend Fund (the ‘‘Fund’’) seeks to track the price and yield performance, before fees and expenses, of the WisdomTree Emerging Markets SmallCap Dividend Index (the ‘‘Index’’). In seeking to track the Index, the Fund invests in dividend-paying small-cap companies in the emerging markets region. The Fund generally uses a representative sampling strategy to achieve its investment objective, meaning it generally will invest in a sample of securities in the Index.
The Fund returned 9.48% at net asset value (“NAV”) for the fiscal year ended March 31, 2022 (for more complete performance information please see the table below). The Fund benefited from its positions in Health Care, Utilities and Consumer Discretionary, due to allocation and stock selection effects within each sector. Positions in the Real Estate, Industrials and Energy sectors weighed negatively on performance for the Fund, due to a combination of allocation and stock selection. When analyzing performance by country, exposures within Thailand and India were the largest detractors from performance, owing to allocation effects in both. South Korea and Brazil were top performance contributors due to allocation and stock selection.
Shareholder Expense Example (for the six-month period ended March 31, 2022)
| | | | | | | | | | | | | | | | |
| | | | | |
| | | Beginning
Account Value | | | Ending
Account Value | | | Annualized Net
Expense Ratio | | | Expenses Paid
During the
Period | |
Actual | | $ | 1,000.00 | | | $ | 1,010.30 | | | | 0.58 | % | | $ | 2.91 | |
Hypothetical (5% return before expenses) | | $ | 1,000.00 | | | $ | 1,022.04 | | | | 0.58 | % | | $ | 2.92 | |
Performance
| | | | | | | | | | | | | | | | |
| | |
| | | Average Annual Total Return | |
| | | | |
| | | 1 Year | | | 3 Year | | | 5 Year | | | 10 Year | |
Fund NAV Returns | | | 9.48 | % | | | 8.71 | % | | | 7.77 | % | | | 4.74 | % |
Fund Market Price Returns | | | 8.23 | % | | | 8.57 | % | | | 7.61 | % | | | 4.66 | % |
WisdomTree Emerging Markets SmallCap Dividend Index | | | 10.43 | % | | | 9.93 | % | | | 8.81 | % | | | 5.91 | % |
MSCI Emerging Markets Small Cap Index | | | 5.52 | % | | | 11.93 | % | | | 7.81 | % | | | 5.31 | % |
MSCI Emerging Markets Index | | | -11.37 | % | | | 4.94 | % | | | 5.98 | % | | | 3.36 | % |
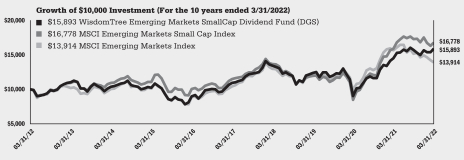
Performance is historical and does not guarantee future results. The returns do not reflect the deduction of taxes that a shareholder would pay on Fund distributions or on the redemption of Fund shares.
Management’s Discussion of Funds’ Performance
as of March 31, 2022 (unaudited)
WisdomTree Global ex-U.S. Quality Dividend Growth Fund (DNL)
Sector Breakdown†
| | | | |
| |
| Sector | | % of Net Assets | |
Materials | | | 24.0% | |
Information Technology | | | 20.3% | |
Consumer Discretionary | | | 16.8% | |
Health Care | | | 13.6% | |
Industrials | | | 11.9% | |
Consumer Staples | | | 3.3% | |
Financials | | | 3.2% | |
Communication Services | | | 3.1% | |
Energy | | | 2.3% | |
Utilities | | | 0.9% | |
Real Estate | | | 0.1% | |
Investment Company | | | 0.1% | |
Other Assets less Liabilities‡ | | | 0.4% | |
Total | | | 100.0% | |
| † | The Fund’s sector breakdown is expressed as a percentage of net assets and may change over time. In addition, a sector may be comprised of several industries. It does not include derivatives (if any). |
| ‡ | Other assets less liabilities may include investment of cash collateral for securities on loan and/or receivables/payables on derivatives (if any). |
Top Ten Holdings*
| | | | |
| |
| Description | | % of Net Assets | |
BHP Group Ltd. | | | 7.2% | |
Anglo American PLC | | | 6.8% | |
Novo Nordisk A/S, Class B | | | 6.4% | |
LVMH Moet Hennessy Louis Vuitton SE | | | 5.6% | |
Tokyo Electron Ltd. | | | 3.7% | |
Taiwan Semiconductor Manufacturing Co. Ltd. | | | 3.7% | |
Roche Holding AG, Bearer Shares | | | 3.5% | |
Vale SA | | | 3.4% | |
ASML Holding NV | | | 2.7% | |
Industria de Diseno Textil SA | | | 2.7% | |
| * | The ten largest holdings are subject to change, and there are no guarantees the Fund will remain invested in any particular company. Excludes derivatives and investment of cash collateral for securities on loan (if any). |
The WisdomTree Global ex-U.S. Quality Dividend Growth Fund (the ‘‘Fund’’) seeks to track the price and yield performance, before fees and expenses, of the WisdomTree Global ex-U.S. Quality Dividend Growth Index (the ‘‘Index’’). In seeking to track the Index, the Fund invests in dividend-paying companies with growth characteristics in developed and emerging equity markets, excluding the U.S. The Fund generally uses a representative sampling strategy to achieve its investment objective, meaning it generally will invest in a sample of securities in the Index.
The Fund returned 5.57% at net asset value (“NAV”) for the fiscal year ended March 31, 2022 (for more complete performance information please see the table below). The Fund benefited from its positions in Materials, Health Care and Industrials, mainly due to stock selection. Positions in the Energy, Financials and Consumer Staples sectors weighed negatively on performance for the Fund. Poor stock selection hurt exposures within Energy and Consumer Staples, while Financials exposure was dragged down by allocation impacts. When analyzing performance by country, exposures within Canada and Taiwan weighed on performance the most, owing to stock selection effects in both. Denmark and the United Kingdom were top performance contributors due to allocation and stock selection impacts. The Fund’s underperformance relative to its Index was also attributable to the Index valuing Russian securities that suspended trading at their last traded price in accordance with the Index’s calculation methodology, whereas, the Fund is valuing Russian securities that suspended trading in accordance with U.S. Generally Accepted Accounting Principles (“U.S. GAAP”) applicable to the Fund which requires assets to be fair valued at the price at which an orderly transaction to sell the asset would take place between market participants at the measurement date under current market conditions; which the Fund has estimated to be zero.
Shareholder Expense Example (for the six-month period ended March 31, 2022)
| | | | | | | | | | | | | | | | |
| | | | | |
| | | Beginning
Account Value | | | Ending
Account Value | | | Annualized Net
Expense Ratio | | | Expenses Paid
During the
Period | |
Actual | | $ | 1,000.00 | | | $ | 992.50 | | | | 0.50 | % | | $ | 2.48 | |
Hypothetical (5% return before expenses) | | $ | 1,000.00 | | | $ | 1,022.44 | | | | 0.50 | % | | $ | 2.52 | |
Performance
| | | | | | | | | | | | | | | | |
| | |
| | | Average Annual Total Return | |
| | | | |
| | | 1 Year | | | 3 Year | | | 5 Year | | | 10 Year | |
Fund NAV Returns | | | 5.57 | % | | | 15.32 | % | | | 12.17 | % | | | 7.03 | % |
Fund Market Price Returns | | | 4.33 | % | | | 14.93 | % | | | 12.04 | % | | | 6.94 | % |
WisdomTree Global ex-U.S. Quality Dividend Growth Index | | | 6.50 | % | | | 16.13 | % | | | 12.98 | % | | | 7.79 | % |
MSCI AC World ex-USA Growth Index | | | -6.16 | % | | | 9.12 | % | | | 8.60 | % | | | 6.70 | % |
MSCI AC World ex-USA Index | | | -1.48 | % | | | 7.51 | % | | | 6.76 | % | | | 5.55 | % |
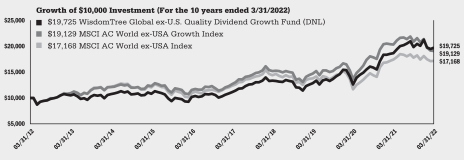
Performance is historical and does not guarantee future results. The returns do not reflect the deduction of taxes that a shareholder would pay on Fund distributions or on the redemption of Fund shares.
Management’s Discussion of Funds’ Performance
as of March 31, 2022 (unaudited)
WisdomTree Global ex-U.S. Real Estate Fund (DRW)
Sector Breakdown†
| | | | |
| |
| Sector | | % of Net Assets | |
Real Estate | | | 98.9% | |
Consumer Discretionary | | | 0.4% | |
Financials | | | 0.2% | |
Other Assets less Liabilities‡ | | | 0.5% | |
Total | | | 100.0% | |
| † | The Fund’s sector breakdown is expressed as a percentage of net assets and may change over time. In addition, a sector may be comprised of several industries. It does not include derivatives (if any). |
| ‡ | Other assets less liabilities may include investment of cash collateral for securities on loan and/or receivables/payables on derivatives (if any). |
Top Ten Holdings*
| | | | |
| |
| Description | | % of Net Assets | |
Vonovia SE | | | 4.2% | |
Sun Hung Kai Properties Ltd. | | | 3.8% | |
Link REIT | | | 3.5% | |
Daito Trust Construction Co. Ltd. | | | 2.8% | |
China Resources Land Ltd. | | | 2.8% | |
Goodman Group | | | 2.7% | |
Daiwa House Industry Co. Ltd. | | | 2.5% | |
China Overseas Land & Investment Ltd. | | | 2.4% | |
Swiss Prime Site AG, Registered Shares | | | 2.1% | |
Dexus | | | 2.0% | |
| * | The ten largest holdings are subject to change, and there are no guarantees the Fund will remain invested in any particular company. Excludes derivatives and investment of cash collateral for securities on loan (if any). |
The WisdomTree Global ex-U.S. Real Estate Fund (the ‘‘Fund’’) seeks to track the price and yield performance, before fees and expenses, of the WisdomTree Global ex-U.S. Real Estate Index (the ‘‘Index’’). In seeking to track the Index, the Fund invests in dividend-paying companies in the Real Estate sector in developed and emerging equity markets, excluding the U.S. The Fund generally uses a representative sampling strategy to achieve its investment objective, meaning it generally will invest in a sample of securities in the Index.
The Fund returned -6.45% at net asset value (“NAV”) for the fiscal year ended March 31, 2022 (for more complete performance information please see the table below). The Fund benefited from an absence of positions in Consumer Discretionary and Communication Services, as a result of its focus on Real Estate. Real Estate was not a strong performer over the fiscal year, and this sector’s focus in the Fund weighed negatively on overall performance. By country, positions in Australia, Sweden and Singapore were additive due to allocation effects while exposures in Germany, Hong Kong and China negatively impacted performance, also a result of allocation.
Shareholder Expense Example (for the six-month period ended March 31, 2022)
| | | | | | | | | | | | | | | | |
| | | | | |
| | | Beginning
Account Value | | | Ending
Account Value | | | Annualized
Expense Ratio1 | | | Expenses Paid
During the
Period1 | |
Actual | | $ | 1,000.00 | | | $ | 952.00 | | | | 0.59 | % | | $ | 2.87 | |
Hypothetical (5% return before expenses) | | $ | 1,000.00 | | | $ | 1,021.99 | | | | 0.59 | % | | $ | 2.97 | |
| 1 | Included in the expense ratio are “Other fees” described in Note 6 which are not annualized. Without these expenses, the expense ratio would have been 0.58% and the actual and hypothetical expenses paid during the period would have been $2.82 and $2.92, respectively. |
Performance
| | | | | | | | | | | | | | | | |
| | |
| | | Average Annual Total Return | |
| | | | |
| | | 1 Year | | | 3 Year | | | 5 Year | | | 10 Year | |
Fund NAV Returns | | | -6.45 | % | | | -4.87 | % | | | 1.86 | % | | | 4.42 | % |
Fund Market Price Returns | | | -7.43 | % | | | -5.19 | % | | | 1.62 | % | | | 4.28 | % |
WisdomTree Global ex-U.S. Real Estate Index | | | -6.54 | % | | | -4.83 | % | | | 2.02 | % | | | 4.61 | % |
Dow Jones Global ex-U.S. Select Real Estate Securities Index | | | 3.97 | % | | | 1.20 | % | | | 3.43 | % | | | 4.73 | % |
MSCI AC World ex-USA Index | | | -1.48 | % | | | 7.51 | % | | | 6.76 | % | | | 5.55 | % |
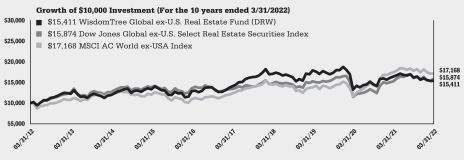
Performance is historical and does not guarantee future results. The returns do not reflect the deduction of taxes that a shareholder would pay on Fund distributions or on the redemption of Fund shares.
Management’s Discussion of Funds’ Performance
as of March 31, 2022 (unaudited)
WisdomTree Global High Dividend Fund (DEW)
Sector Breakdown†
| | | | |
| |
| Sector | | % of Net Assets | |
Financials | | | 23.0% | |
Consumer Staples | | | 12.0% | |
Health Care | | | 11.9% | |
Utilities | | | 10.9% | |
Real Estate | | | 8.7% | |
Information Technology | | | 7.6% | |
Materials | | | 7.1% | |
Energy | | | 7.0% | |
Communication Services | | | 6.2% | |
Industrials | | | 3.7% | |
Consumer Discretionary | | | 1.3% | |
Investment Company | | | 0.0% | * |
Other Assets less Liabilities‡ | | | 0.6% | |
Total | | | 100.0% | |
| † | The Fund’s sector breakdown is expressed as a percentage of net assets and may change over time. In addition, a sector may be comprised of several industries. It does not include derivatives (if any). |
| ‡ | Other assets less liabilities may include investment of cash collateral for securities on loan and/or receivables/payables on derivatives (if any). |
| * | Represents less than 0.1%. |
Top Ten Holdings*
| | | | |
| |
| Description | | % of Net Assets | |
AbbVie, Inc. | | | 2.9% | |
Coca-Cola Co. | | | 2.6% | |
Philip Morris International, Inc. | | | 2.3% | |
Pfizer, Inc. | | | 2.3% | |
Verizon Communications, Inc. | | | 2.2% | |
Cisco Systems, Inc. | | | 2.0% | |
PepsiCo, Inc. | | | 1.9% | |
Broadcom, Inc. | | | 1.6% | |
BHP Group Ltd. | | | 1.6% | |
Altria Group, Inc. | | | 1.5% | |
| * | The ten largest holdings are subject to change, and there are no guarantees the Fund will remain invested in any particular company. Excludes derivatives and investment of cash collateral for securities on loan (if any). |
The WisdomTree Global High Dividend Fund (the ‘‘Fund’’) seeks to track the price and yield performance, before fees and expenses, of the WisdomTree Global High Dividend Index (the ‘‘Index’’). In seeking to track the Index, the Fund invests in high-dividend-yielding companies in the U.S. and in developed and emerging equity markets. The Fund generally uses a representative sampling strategy to achieve its investment objective, meaning it generally will invest in a sample of securities in the Index.
The Fund returned 12.96% at net asset value (“NAV”) for the fiscal year ended March 31, 2022 (for more complete performance information please see the table below). The Fund benefited from its positions in Health Care, Consumer Discretionary and Energy, due to allocation effects in the latter two and positive stock selection in Health Care. Positions in the Information Technology, Communication Services and Consumer Staples sectors weighed negatively on performance for the Fund, primarily due to a combination of stock selection and allocation effects. When analyzing performance by country, exposures within Switzerland and France were the largest detractors from performance. Exposures within the United States and Japan were top performance contributors due to stock selection.
Shareholder Expense Example (for the six-month period ended March 31, 2022)
| | | | | | | | | | | | | | | | |
| | | | | |
| | | Beginning
Account Value | | | Ending
Account Value | | | Annualized Net
Expense Ratio1 | | | Expenses Paid
During the
Period1 | |
Actual | | $ | 1,000.00 | | | $ | 1,098.70 | | | | 0.59 | % | | $ | 3.09 | |
Hypothetical (5% return before expenses) | | $ | 1,000.00 | | | $ | 1,021.99 | | | | 0.59 | % | | $ | 2.97 | |
| 1 | Included in the expense ratio are “Other fees” described in Note 6 which are not annualized. Without these expenses, the expense ratio would have been 0.58% and the actual and hypothetical expenses paid during the period would have been $3.03 and $2.92, respectively. |
Performance
| | | | | | | | | | | | | | | | |
| | |
| | | Average Annual Total Return | |
| | | | |
| | | 1 Year | | | 3 Year | | | 5 Year | | | 10 Year | |
Fund NAV Returns | | | 12.96 | % | | | 7.64 | % | | | 6.69 | % | | | 6.21 | % |
Fund Market Price Returns | | | 13.13 | % | | | 7.68 | % | | | 6.65 | % | | | 6.16 | % |
WisdomTree Global High Dividend Index | | | 12.77 | % | | | 7.37 | % | | | 6.45 | % | | | 6.15 | % |
MSCI AC World Index | | | 7.28 | % | | | 13.75 | % | | | 11.64 | % | | | 10.00 | % |

Performance is historical and does not guarantee future results. The returns do not reflect the deduction of taxes that a shareholder would pay on Fund distributions or on the redemption of Fund shares.
Management’s Discussion of Funds’ Performance
as of March 31, 2022 (unaudited)
WisdomTree Growth Leaders Fund (PLAT)
Sector Breakdown†
| | | | |
| |
| Sector | | % of Net Assets | |
Information Technology | | | 33.8% | |
Communication Services | | | 24.8% | |
Consumer Discretionary | | | 23.1% | |
Financials | | | 10.1% | |
Industrials | | | 5.1% | |
Health Care | | | 1.9% | |
Real Estate | | | 1.1% | |
Other Assets less Liabilities‡ | | | 0.1% | |
Total | | | 100.0% | |
| † | The Fund’s sector breakdown is expressed as a percentage of net assets and may change over time. In addition, a sector may be comprised of several industries. It does not include derivatives (if any). |
| ‡ | Other assets less liabilities may include investment of cash collateral for securities on loan and/or receivables/payables on derivatives (if any). |
Top Ten Holdings*
| | | | |
| |
| Description | | % of Net Assets | |
Apple, Inc. | | | 11.7% | |
Microsoft Corp. | | | 10.5% | |
Alphabet, Inc., Class A | | | 9.9% | |
Amazon.com, Inc. | | | 8.2% | |
Meta Platforms, Inc., Class A | | | 3.8% | |
salesforce.com, Inc. | | | 2.8% | |
Intercontinental Exchange, Inc. | | | 2.3% | |
Cargurus, Inc. | | | 2.2% | |
Airbnb, Inc., Class A | | | 2.2% | |
Anaplan, Inc. | | | 1.9% | |
| * | The ten largest holdings are subject to change, and there are no guarantees the Fund will remain invested in any particular company. Excludes derivatives and investment of cash collateral for securities on loan (if any). |
The WisdomTree Growth Leaders Fund (the ‘‘Fund’’) seeks to track the price and yield performance, before fees and expenses, of the WisdomTree Growth Leaders Index (the ‘‘Index’’). In seeking to track the Index, the Fund invests in high growth mid- and large-cap companies that are generating substantial revenue from a modern platform business. The Fund generally uses a representative sampling strategy to achieve its investment objective, meaning it generally will invest in a sample of securities in the Index.
The Fund returned -16.53% at net asset value (“NAV”) for the fiscal year ended March 31, 2022 (for more complete performance information please see the table below). Stock selection in Consumer Discretionary, Communication Services, and Information Technology detracted from performance, while selection within Materials and Utilities benefited the Fund. The Fund benefited from exposure to Japan, Korea, and Hong Kong while stock selection within the United States weighed negatively on Fund performance during the period.
Shareholder Expense Example (for the six-month period ended March 31, 2022)
| | | | | | | | | | | | | | | | |
| | | | | |
| | | Beginning
Account Value | | | Ending
Account Value | | | Annualized
Expense Ratio | | | Expenses Paid
During the
Period | |
Actual | | $ | 1,000.00 | | | $ | 807.40 | | | | 0.20 | % | | $ | 0.90 | |
Hypothetical (5% return before expenses) | | $ | 1,000.00 | | | $ | 1,023.93 | | | | 0.20 | % | | $ | 1.01 | |
Performance
| | | | | | | | |
| | |
| | | Average Annual Total Return | |
| | |
| | | 1 Year | | | Since Inception1 | |
Fund NAV Returns | | | -16.53 | % | | | 15.17 | % |
Fund Market Price Returns | | | -16.89 | % | | | 15.22 | % |
WisdomTree Growth Leaders Index | | | -16.43 | % | | | 15.57 | % |
MSCI AC World Index | | | 7.28 | % | | | 14.50 | % |
S&P 500® Index | | | 15.65 | % | | | 19.49 | % |
| 1 | Total returns are calculated based on the commencement of Fund trading on the NYSE Arca, Inc. on May 22, 2019. |
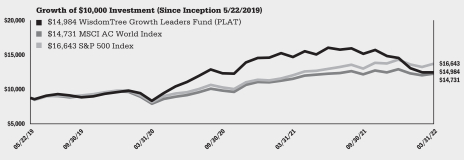
Performance is historical and does not guarantee future results. The returns do not reflect the deduction of taxes that a shareholder would pay on Fund distributions or on the redemption of Fund shares.
Management’s Discussion of Funds’ Performance
as of March 31, 2022 (unaudited)
WisdomTree India Earnings Fund (EPI)
Sector Breakdown†
| | | | |
| |
| Sector | | % of Net Assets | |
Financials | | | 23.6% | |
Energy | | | 18.8% | |
Materials | | | 16.8% | |
Information Technology | | | 14.4% | |
Utilities | | | 8.4% | |
Industrials | | | 6.4% | |
Health Care | | | 4.5% | |
Consumer Discretionary | | | 4.3% | |
Consumer Staples | | | 4.1% | |
Communication Services | | | 1.7% | |
Real Estate | | | 0.4% | |
Investment Company | | | 0.0% | * |
Other Assets less Liabilities‡ | | | -3.4% | |
Total | | | 100.0% | |
| † | The Fund’s sector breakdown is expressed as a percentage of net assets and may change over time. In addition, a sector may be comprised of several industries. It does not include derivatives (if any). |
| ‡ | Other assets less liabilities may include investment of cash collateral for securities on loan and/or receivables/payables on derivatives (if any). |
| * | Represents less than 0.1%. |
Top Ten Holdings*
| | | | |
| |
| Description | | % of Net Assets | |
Reliance Industries Ltd. | | | 8.8% | |
Infosys Ltd. | | | 6.1% | |
Housing Development Finance Corp. Ltd. | | | 4.7% | |
ICICI Bank Ltd. | | | 3.8% | |
Tata Consultancy Services Ltd. | | | 3.1% | |
NTPC Ltd. | | | 2.7% | |
Power Grid Corp. of India Ltd. | | | 2.3% | |
Oil & Natural Gas Corp. Ltd. | | | 2.0% | |
Larsen & Toubro Ltd. | | | 2.0% | |
Indian Oil Corp. Ltd. | | | 2.0% | |
| * | The ten largest holdings are subject to change, and there are no guarantees the Fund will remain invested in any particular company. Excludes derivatives and investment of cash collateral for securities on loan (if any). |
The WisdomTree India Earnings Fund (the ‘‘Fund’’) seeks to track the price and yield performance, before fees and expenses, of the WisdomTree India Earnings Index (the ‘‘Index’’). In seeking to track the Index, the Fund invests in profitable companies in the Indian equity market. The Fund generally uses a representative sampling strategy to achieve its investment objective, meaning it generally will invest in a sample of securities in the Index.
The Fund returned 17.85% at net asset value (“NAV”) for the fiscal year ended March 31, 2022 (for more complete performance information please see the table below). The Fund benefited from its positions in Materials, Consumer Staples and Energy, due to allocation effects in Consumer Staples and positive stock selection in the other sectors. Positions in the Financials, Health Care and Industrials sectors weighed negatively on performance for the Fund, due to poor stock selection. When analyzing performance by earnings yield attribution, companies in the 4th and 3rd quintiles ranked by earnings yield weighed negatively on performance the most, owing to a combination of allocation and stock selection effects. The companies in the 1st and 5th quintiles were top contributors to performance due to an overweight allocation in the former and an underweight allocation in the latter. India was among the strongest equity markets in the world last year and the Fund benefited from this focus. The Fund’s underperformance relative to its Index was primarily attributable to foreign capital gain tax recognized by the Fund but which is not recognized by the Index.
Shareholder Expense Example (for the six-month period ended March 31, 2022)
| | | | | | | | | | | | | | | | |
| | | | | |
| | | Beginning
Account Value | | | Ending
Account Value | | | Annualized Net
Expense Ratio | | | Expenses Paid
During the
Period | |
Actual | | $ | 1,000.00 | | | $ | 975.30 | | | | 0.83 | % | | $ | 4.09 | |
Hypothetical (5% return before expenses) | | $ | 1,000.00 | | | $ | 1,020.79 | | | | 0.83 | % | | $ | 4.18 | |
Performance
| | | | | | | | | | | | | | | | |
| | |
| | | Average Annual Total Return | |
| | | | |
| | | 1 Year | | | 3 Year | | | 5 Year | | | 10 Year | |
Fund NAV Returns | | | 17.85 | % | | | 12.61 | % | | | 9.79 | % | | | 7.72 | % |
Fund Market Price Returns | | | 15.61 | % | | | 12.26 | % | | | 9.53 | % | | | 7.62 | % |
WisdomTree India Earnings Index | | | 20.92 | % | | | 14.77 | % | | | 11.54 | % | | | 9.20 | % |
MSCI India Index | | | 17.86 | % | | | 12.85 | % | | | 11.08 | % | | | 8.64 | % |
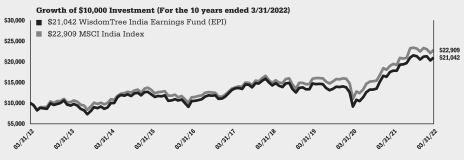
Performance is historical and does not guarantee future results. The returns do not reflect the deduction of taxes that a shareholder would pay on Fund distributions or on the redemption of Fund shares.
Management’s Discussion of Funds’ Performance
as of March 31, 2022 (unaudited)
WisdomTree India ex-State-Owned Enterprises Fund (IXSE)
Sector Breakdown†
| | | | |
| |
| Sector | | % of Net Assets | |
Financials | | | 26.7% | |
Information Technology | | | 16.3% | |
Materials | | | 11.9% | |
Energy | | | 11.2% | |
Consumer Discretionary | | | 9.8% | |
Consumer Staples | | | 8.0% | |
Health Care | | | 7.4% | |
Communication Services | | | 4.0% | |
Industrials | | | 3.2% | |
Utilities | | | 3.0% | |
Real Estate | | | 1.0% | |
Other Assets less Liabilities‡ | | | -2.5% | |
Total | | | 100.0% | |
| † | The Fund’s sector breakdown is expressed as a percentage of net assets and may change over time. In addition, a sector may be comprised of several industries. It does not include derivatives (if any). |
| ‡ | Other assets less liabilities may include investment of cash collateral for securities on loan and/or receivables/payables on derivatives (if any). |
Top Ten Holdings*
| | | | |
| |
| Description | | % of Net Assets | |
Reliance Industries Ltd. | | | 11.2% | |
Infosys Ltd. | | | 10.2% | |
Housing Development Finance Corp. Ltd. | | | 6.3% | |
ICICI Bank Ltd. | | | 5.4% | |
Kotak Mahindra Bank Ltd. | | | 2.8% | |
Bajaj Finance Ltd. | | | 2.8% | |
Hindustan Unilever Ltd. | | | 2.7% | |
Bharti Airtel Ltd. | | | 2.6% | |
Axis Bank Ltd. | | | 2.4% | |
Asian Paints Ltd. | | | 2.0% | |
| * | The ten largest holdings are subject to change, and there are no guarantees the Fund will remain invested in any particular company. Excludes derivatives and investment of cash collateral for securities on loan (if any). |
The WisdomTree India ex-State-Owned Enterprises Fund (the ‘‘Fund’’) seeks to track the price and yield performance, before fees and expenses, of the WisdomTree India ex-State-Owned Enterprises Index (the ‘‘Index’’). In seeking to track the Index, the Fund invests in Indian companies that are not state-owned, which is defined as government ownership greater than 20%. The Fund generally uses a representative sampling strategy to achieve its investment objective, meaning it generally will invest in a sample of securities in the Index.
The Fund returned 15.04% at net asset value (“NAV”) for the fiscal year ended March 31, 2022 (for more complete performance information please see the table below). The Fund benefited from its positions in Consumer Discretionary, Energy and Information Technology, due to stock selection effects within each sector. Positions in the Financials, Consumer Staples and Health Care sectors weighed negatively on performance for the Fund, due to combination of allocation and stock selection effects. When analyzing performance by State-Ownership attribution, the Fund’s emphasis on non-state-owned enterprises (“Non-SOEs“) weighed negatively on performance the most, owing to poor stock selection effects. The absence of state-owned enterprises (“SOEs“) also weighed on performance modestly, as SOEs performed better than their Non-SOE counterparts during the fiscal year. India was among the strongest equity markets in the world last year and the Fund benefited from this focus. The Fund’s underperformance relative to its Index was primarily attributable to foreign capital gain tax recognized by the Fund but which is not recognized by the Index.
Shareholder Expense Example (for the six-month period ended March 31, 2022)
| | | | | | | | | | | | | | | | |
| | | | | |
| | | Beginning
Account Value | | | Ending
Account Value | | | Annualized
Expense Ratio | | | Expenses Paid
During the
Period | |
Actual | | $ | 1,000.00 | | | $ | 969.40 | | | | 0.58 | % | | $ | 2.85 | |
Hypothetical (5% return before expenses) | | $ | 1,000.00 | | | $ | 1,022.04 | | | | 0.58 | % | | $ | 2.92 | |
Performance
| | | | | | | | |
| | |
| | | Average Annual Total Return | |
| | |
| | | 1 Year | | | Since Inception1 | |
Fund NAV Returns | | | 15.04 | % | | | 12.34 | % |
Fund Market Price Returns | | | 12.97 | % | | | 11.52 | % |
WisdomTree India ex-State-Owned Enterprises Index | | | 16.66 | % | | | 15.71 | % |
MSCI India Index | | | 17.86 | % | | | 12.84 | % |
| 1 | Total returns are calculated based on the commencement of Fund trading on the NYSE Arca, Inc. on April 4, 2019. |
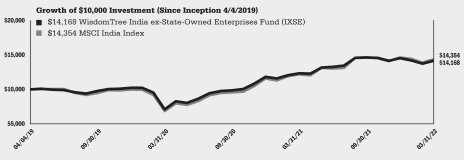
Performance is historical and does not guarantee future results. The returns do not reflect the deduction of taxes that a shareholder would pay on Fund distributions or on the redemption of Fund shares.
Description of Terms and Indexes (unaudited)
Below are descriptions of certain terms and of each Index referenced in this report:
Allocation Effect measures an investment manager’s ability to effectively allocate a portfolio’s assets to various segments. A segment refers to assets or securities that are grouped within a certain classification such as sectors, industries, or countries. The
allocation effect determines whether the overweighting or underweighting of segments relative to a benchmark contributes positively or negatively to the overall portfolio return. Positive allocation occurs when the portfolio is overweighted in a segment that outperforms the benchmark and underweighted in a segment that underperforms the benchmark. Negative allocation occurs when the portfolio is overweighted in a segment that underperforms the benchmark and underweighted in a segment that outperforms
the benchmark.
Correlation is a statistical measure of how two sets of returns move in relation to each
other. Correlation coefficients range from -1 to 1. A correlation of 1 means the two
subjects of analysis move in lockstep with each other. A correlation of -1 means the two
subjects of analysis have moved in exactly the opposite direction.
The Dow Jones Global ex-U.S. Select Real Estate Securities Index is a float-adjusted
market capitalization weighted index that defines and measures the investable universe of
publicly traded real estate securities in countries outside the U.S.
Factors generally are attributes that are based on its fundamentals or share price behavior.
The FTSE China 50 Index is a capitalization weighted index that is comprised of the 50
largest and most liquid Chinese securities.
Growth is generally characterized by higher price levels relative to fundamentals, such as
dividends or earnings. Price levels are higher because investors are willing to pay more
due to their expectations of future improvements in these fundamentals.
Momentum is generally characterized by assets with recent price increase trends over
time. This term is also associated with the momentum factor which associates these stock
characteristics with excess return vs. the market over time.
The MSCI AC World ex-USA Growth Index is comprised of growth stocks in the
developed and emerging markets covered by MSCI, excluding the U.S.
The MSCI AC World ex-USA Index is a free float-adjusted market capitalization-weighted
index designed to measure the combined equity market performance of developed and
emerging markets countries, excluding the U.S.
The MSCI AC World Index is comprised of the world stock market indexes covered by
MSCI.
The MSCI China Index is a free float-adjusted market capitalization weighted index
designed to measure the performance of the Chinese equity market.
The MSCI Emerging Markets Index is a free float-adjusted market capitalization index
that is designed to measure emerging markets equity performance.
The MSCI Emerging Markets Small Cap Index is a free float-adjusted market
capitalization index that is designed to measure the performance of small capitalization
equities in the emerging markets.
The MSCI Emerging Markets Value Index captures large- and mid-cap securities exhibiting overall value style characteristics across 24 emerging markets countries.
The MSCI India Index is a free float-adjusted market capitalization index that is designed
to measure the performance of the Indian equity market.
Quality is generally characterized by higher efficiency and profitability. Typical measures
include earnings, return-on-equity, return on assets, operating profitability as well as
others. This term is also related to the quality factor, which associates these stock
characteristics with excess returns vs. the market over time.
Risk-on and Risk-off refers to investors’ appetites for risk which rise and fall over time. During periods when risk is perceived as low, the risk-on risk-off theory states that
Description of Terms and Indexes (unaudited) (continued)
investors tend to engage in higher-risk investments (i.e., “Risk-on”). When risk is perceived to be high, investors have the tendency to gravitate toward lower-risk investments (i.e., “Risk-off”).
The S&P 500® Index is a capitalization-weighted index of 500 stocks selected by the
Standard & Poor’s Index Committee, designed to represent the performance of the
leading industries in the United States economy.
Selection Effect measures an investment manager’s ability to select securities within a
given segment relative to a benchmark. The over or underperformance of the portfolio is
weighted by the benchmark weight, therefore, selection is not affected by the investment
manager’s allocation to the segment. The weight of the segment in the portfolio
determines the size of the effect—the larger the segment, the larger the effect is, positive
or negative. A positive selection effect occurs when the portfolio return is greater than the
benchmark return. Thus, the investment manager made good decisions in selecting
securities that, as a whole, outperformed similar securities in the benchmark. A negative
selection effect occurs when the portfolio return is less than the benchmark return. Thus,
the investment manager made poor decisions in selecting securities that, as a whole,
underperformed similar securities in the benchmark.
The WisdomTree China Dividend ex-Financials Index is comprised of Chinese dividend
paying stocks outside the Financials sector.
The WisdomTree China ex-State-Owned Enterprises Index measures the performance of
Chinese stocks that are not state-owned enterprises. WisdomTree Investments, Inc., as index provider, defines state-owned enterprises as companies with over 20% government ownership.
The WisdomTree Emerging Markets ex-State-Owned Enterprises Index is a modified market capitalization weighted index that consists of common stocks in emerging markets, excluding common stocks of “state-owned enterprises.” WisdomTree Investments, Inc., as index provider, defines state-owned enterprises as companies with over 20% government ownership.
The WisdomTree Emerging Markets High Dividend Index is comprised of the highest
dividend-yielding stocks selected from the WisdomTree Emerging Markets Dividend
Index.
The WisdomTree Emerging Markets SmallCap Dividend Index is comprised of primarily
small-capitalization stocks selected from the WisdomTree Emerging Markets Dividend
Index.
The WisdomTree Global ex-U.S. Quality Dividend Growth Index is comprised of growth
companies selected from developed and emerging markets outside the U.S.
The WisdomTree Global ex-U.S. Real Estate Index is comprised of companies in
developed and emerging markets outside of Canada and the U.S., which WisdomTree
classifies as being Global Real Estate securities.
The WisdomTree Global High Dividend Index is comprised of high dividend-paying
companies selected from the WisdomTree Global Dividend Index.
The WisdomTree Growth Leaders Index is a modified market capitalization-weighted
index that is designed to provide exposure to mid and large-cap companies that are
leveraging platform-based business models with high revenue growth.
The WisdomTree India Earnings Index is a fundamentally weighted index that is
comprised of companies incorporated and traded in India that are profitable and that are
eligible to be purchased by foreign investors as of the index measurement date.
The WisdomTree India ex-State-Owned Enterprises Index measures the performance
of Indian stocks that are not state-owned enterprises. State-owned enterprises are defined
as government ownership of more than 20% of outstanding shares of companies.
The Dow Jones Global ex-U.S. Select Real Estate Securities Index is calculated, distributed and marketed by Dow Jones Indexes, a licensed trademark of CME Group Index Services LLC, and has been licensed for use.
Description of Terms and Indexes (unaudited) (concluded)
The Global Industry Classification Standard (“GICS”) was developed by and is the exclusive property and a service mark of MSCI Inc. (“MSCI”) and Standard & Poor’s (“S&P”), a division of The McGraw-Hill Companies, Inc. and is licensed for use by WisdomTree Investments, Inc. Neither MSCI, S&P nor any other party involved in making or compiling the GICS or any GICS classifications makes any express or implied warranties or representations with respect to such standard or classification (or the results to be obtained by the use thereof), and all such parties hereby expressly disclaim all warranties of originality, accuracy, completeness, merchantability and fitness for a particular purpose with respect to any such standard or classification. Without limiting any of the foregoing, in no event shall MSCI, S&P, any of their affiliates or any third party involved in making or compiling the GICS or any GICS classifications have any liability for any direct, indirect, special, punitive, consequential or any other damages (including lost profits) even if notified of the possibility of such damages.
Neither MSCI nor any other party involved in or related to compiling, computing or creating the MSCI data makes any express or implied warranties or representations with respect to such data (or the results to be obtained by the use thereof), and all such parties hereby expressly disclaim all warranties of originality, accuracy, completeness, merchantability or fitness for a particular purpose with respect to any such data. Without limiting any of the foregoing, in no event shall MSCI, any of its affiliates or any third party involved in or related to compiling, computing or creating the data have any liability for any direct, indirect, special, punitive, consequential or any other damages (including lost profits) even if notified of the possibility of such damages. No further distribution or dissemination of the MSCI data is permitted without MSCI’s express written consent.
WisdomTree Investments, Inc. and WisdomTree Asset Management, Inc. (together, “WisdomTree”) and the Funds make no representation or warranty, express or implied, to the owners of shares of the Funds or any member of the public regarding the advisability of investing in securities generally or in the Funds particularly or the ability of the underlying Indexes to track the performance of their underlying securities. WisdomTree Investments is the licensor of certain trademarks, service marks and trade names of the Funds. WisdomTree Investments has no obligation to take the needs of the Funds or the owners of shares of the Funds into consideration in determining, composing, or calculating the underlying WisdomTree Indexes of the applicable Funds. WisdomTree Investments is not responsible for, and has not participated in, the determination of the timing of, prices of, or quantities of shares of the Funds to be issued or in the determination or calculation of the equation by which the shares of the Funds are redeemable. WisdomTree and the Funds do not guarantee the accuracy, completeness, or performance of the underlying Indexes or the data included therein and shall have no liability in connection with the underlying Indexes or their calculation.
Index performance information assumes the reinvestment of dividends and excludes
management fees, transaction costs and expenses. You cannot directly invest in an index.
* * * * * *
Abbreviations used in the schedules of investments and related tables included in this report are as follows:
| | | | | | | | | | |
| | | |
| CURRENCY ABBREVIATIONS: | | | | | | |
| AUD | | Australian dollar | | HUF | | Hungary forint | | PHP | | Philippine peso |
| BRL | | Brazilian real | | INR | | Indian rupee | | SGD | | Singapore dollar |
| CHF | | Swiss franc | | KRW | | South Korean won | | TWD | | New Taiwan dollar |
| CNH | | Offshore Chinese renminbi | | MXN | | Mexican peso | | USD | | U.S. Dollar |
| CZK | | Czech koruna | | MYR | | Malaysian ringgit | | ZAR | | South African rand |
| HKD | | Hong Kong dollar | | | | | | | | |
| | | | | | | | | | |
| | | | |
| OTHER ABBREVIATIONS: | | | | | | | | |
| ADR | | American Depositary Receipt |
| CVA | | Certificaten Van Aandelen (Certificate of Stock) |
| GDR | | Global Depositary Receipt | | |
| NVDR | | Non-Voting Depositary Receipt | | |
Schedule of Investments
WisdomTree China ex-State-Owned Enterprises Fund (CXSE)
March 31, 2022
| | | | | | | | |
| Investments | | Shares | | | Value | |
|
| COMMON STOCKS – 100.0% | |
|
| China – 100.0% | |
|
| Air Freight & Logistics – 0.9% | |
| | |
SF Holding Co. Ltd., Class A | | | 485,161 | | | $ | 3,492,676 | |
| | |
ZTO Express Cayman, Inc. | | | 167,082 | | | | 4,258,443 | |
| | | | | | | | |
| Total Air Freight & Logistics | | | | 7,751,119 | |
|
| Auto Components – 0.5% | |
| | |
Fuyao Glass Industry Group Co. Ltd., Class A | | | 360,367 | | | | 2,019,795 | |
| | |
Fuyao Glass Industry Group Co. Ltd., Class H(a) | | | 277,300 | | | | 1,140,161 | |
| | |
Minth Group Ltd. | | | 265,200 | | | | 654,246 | |
| | | | | | | | |
| Total Auto Components | | | | 3,814,202 | |
|
| Automobiles – 5.2% | |
| | |
BYD Co. Ltd., Class A | | | 211,088 | | | | 7,641,345 | |
| | |
BYD Co. Ltd., Class H | | | 326,900 | | | | 9,366,953 | |
| | |
Geely Automobile Holdings Ltd. | | | 2,196,900 | | | | 3,467,283 | |
| | |
Great Wall Motor Co. Ltd., Class A | | | 257,800 | | | | 1,112,730 | |
| | |
Great Wall Motor Co. Ltd., Class H | | | 1,237,900 | | | | 1,985,344 | |
| | |
Li Auto, Inc., ADR* | | | 112,398 | | | | 2,900,992 | |
| | |
NIO, Inc., ADR* | | | 585,416 | | | | 12,323,007 | |
| | |
Niu Technologies, ADR* | | | 11,071 | | | | 106,946 | |
| | |
XPeng, Inc., ADR* | | | 128,918 | | | | 3,556,848 | |
| | |
Yadea Group Holdings Ltd.(a) | | | 372,200 | | | | 576,023 | |
| | | | | | | | |
| Total Automobiles | | | | 43,037,471 | |
|
| Banks – 1.3% | |
| | |
China Minsheng Banking Corp. Ltd., Class A | | | 8,135,036 | | | | 4,895,297 | |
| | |
China Minsheng Banking Corp. Ltd., Class H(b) | | | 2,600,900 | | | | 979,730 | |
| | |
Ping An Bank Co. Ltd., Class A | | | 2,168,900 | | | | 5,254,751 | |
| | | | | | | | |
| Total Banks | | | | 11,129,778 | |
|
| Beverages – 0.7% | |
| | |
JiuGui Liquor Co. Ltd., Class A | | | 65,000 | | | | 1,514,390 | |
| | |
Nongfu Spring Co. Ltd., Class H(a)(b) | | | 786,100 | | | | 4,190,780 | |
| | | | | | | | |
| Total Beverages | | | | 5,705,170 | |
|
| Biotechnology – 2.5% | |
| | |
Akeso, Inc.*(a)(b) | | | 194,600 | | | | 414,476 | |
| | |
BeiGene Ltd.*(b) | | | 304,900 | | | | 4,718,681 | |
| | |
Beijing Wantai Biological Pharmacy Enterprise Co. Ltd., Class A | | | 41,300 | | | | 1,808,636 | |
| | |
Chongqing Zhifei Biological Products Co. Ltd., Class A | | | 213,600 | | | | 4,643,405 | |
| | |
I-Mab, ADR* | | | 15,648 | | | | 254,123 | |
| | |
InnoCare Pharma Ltd.*(a)(b) | | | 218,300 | | | | 340,632 | |
| | |
Innovent Biologics, Inc.*(a) | | | 417,200 | | | | 1,435,700 | |
| | |
Remegen Co. Ltd., Class H*(a)(b) | | | 50,000 | | | | 296,882 | |
| | |
Shenzhen Kangtai Biological Products Co. Ltd., Class A | | | 94,500 | | | | 1,388,152 | |
| | |
Walvax Biotechnology Co. Ltd., Class A | | | 476,000 | | | | 4,114,321 | |
| | |
Zai Lab Ltd.*(b) | | | 303,730 | | | | 1,394,271 | |
| | | | | | | | |
| Total Biotechnology | | | | 20,809,279 | |
|
| Building Products – 0.4% | |
| | |
China Lesso Group Holdings Ltd. | | | 493,300 | | | | 599,665 | |
| | |
Xinyi Glass Holdings Ltd. | | | 1,247,000 | | | | 3,025,385 | |
| | | | | | | | |
| Total Building Products | | | | 3,625,050 | |
|
| Capital Markets – 1.2% | |
| | |
East Money Information Co. Ltd., Class A | | | 2,325,114 | | | | 9,281,263 | |
| | |
Futu Holdings Ltd., ADR*(b) | | | 29,907 | | | | 973,772 | |
| | | | | | | | |
| Total Capital Markets | | | | 10,255,035 | |
Chemicals – 2.2% | |
| | |
Dongyue Group Ltd. | | | 783,900 | | | | 1,079,046 | |
| | |
Guangzhou Tinci Materials Technology Co. Ltd., Class A | | | 186,000 | | | | 2,754,210 | |
| | |
Hengli Petrochemical Co. Ltd., Class A | | | 503,900 | | | | 1,650,270 | |
| | |
Jiangsu Eastern Shenghong Co. Ltd., Class A | | | 473,900 | | | | 1,060,062 | |
| | |
LB Group Co. Ltd., Class A | | | 326,600 | | | | 1,190,003 | |
| | |
Rongsheng Petrochemical Co. Ltd., Class A | | | 834,200 | | | | 1,879,154 | |
| | |
Shanghai Putailai New Energy Technology Co. Ltd., Class A | | | 89,300 | | | | 1,977,005 | |
| | |
Shenzhen Capchem Technology Co. Ltd., Class A | | | 75,600 | | | | 971,185 | |
| | |
Sichuan Yahua Industrial Group Co. Ltd., Class A | | | 300,300 | | | | 1,365,237 | |
| | |
Suzhou TA&A Ultra Clean Technology Co. Ltd., Class A | | | 100,700 | | | | 1,135,792 | |
| | |
Tongkun Group Co. Ltd., Class A | | | 466,000 | | | | 1,283,168 | |
| | |
Zhejiang Longsheng Group Co. Ltd., Class A | | | 676,300 | | | | 1,161,240 | |
| | |
Zhejiang Yongtai Technology Co. Ltd., Class A* | | | 177,300 | | | | 1,068,029 | |
| | | | | | | | |
| Total Chemicals | | | | 18,574,401 | |
|
| Commercial Services & Supplies – 0.1% | |
| | |
China Conch Environment Protection Holdings Ltd.* | | | 656,663 | | | | 821,730 | |
|
| Communications Equipment – 0.1% | |
| | |
BYD Electronic International Co. Ltd.(b) | | | 300,700 | | | | 606,668 | |
|
| Construction & Engineering – 0.2% | |
| | |
China Conch Venture Holdings Ltd. | | | 629,163 | | | | 1,839,752 | |
|
| Construction Materials – 0.5% | |
| | |
Beijing Oriental Yuhong Waterproof Technology Co. Ltd., Class A | | | 381,300 | | | | 2,699,331 | |
| | |
China Jushi Co. Ltd., Class A | | | 669,100 | | | | 1,606,320 | |
| | | | | | | | |
| Total Construction Materials | | | | 4,305,651 | |
|
| Consumer Finance – 0.2% | |
| | |
360 DigiTech, Inc., ADR(b) | | | 43,768 | | | | 673,589 | |
| | |
Lufax Holding Ltd., ADR* | | | 224,384 | | | | 1,249,819 | |
| | | | | | | | |
| Total Consumer Finance | | | | 1,923,408 | |
|
| Diversified Consumer Services – 0.2% | |
| | |
Fu Shou Yuan International Group Ltd. | | | 789,700 | | | | 582,842 | |
| | |
New Oriental Education & Technology Group, Inc.*(b) | | | 506,263 | | | | 622,534 | |
| | |
TAL Education Group, ADR* | | | 186,062 | | | | 560,046 | |
| | | | | | | | |
| Total Diversified Consumer Services | | | | 1,765,422 | |
|
| Electrical Equipment – 4.4% | |
| | |
Contemporary Amperex Technology Co. Ltd., Class A | | | 264,859 | | | | 21,374,469 | |
| | |
Gotion High-tech Co. Ltd., Class A* | | | 276,000 | | | | 1,496,063 | |
| | |
Ming Yang Smart Energy Group Ltd., Class A | | | 372,700 | | | | 1,301,611 | |
| | |
Sungrow Power Supply Co. Ltd., Class A | | | 275,200 | | | | 4,649,888 | |
| | |
TBEA Co. Ltd., Class A | | | 954,300 | | | | 3,063,694 | |
See Notes to Financial Statements.
Schedule of Investments (continued)
WisdomTree China ex-State-Owned Enterprises Fund (CXSE)
March 31, 2022
| | | | | | | | |
| Investments | | Shares | | | Value | |
| | |
Xinjiang Goldwind Science & Technology Co. Ltd., Class A | | | 708,700 | | | $ | 1,465,829 | |
| | |
Xinjiang Goldwind Science & Technology Co. Ltd., Class H | | | 416,800 | | | | 629,080 | |
| | |
Zhejiang Chint Electrics Co. Ltd., Class A | | | 350,100 | | | | 2,182,851 | |
| | |
Zhuzhou CRRC Times Electric Co. Ltd., Class H | | | 252,500 | | | | 991,442 | |
| | | | | | | | |
| Total Electrical Equipment | | | | 37,154,927 | |
|
| Electronic Equipment, Instruments & Components – 3.7% | |
| | |
AAC Technologies Holdings, Inc.(b) | | | 367,700 | | | | 891,149 | |
| | |
BOE Technology Group Co. Ltd., Class A | | | 7,822,000 | | | | 5,310,695 | |
| | |
Chaozhou Three-Circle Group Co. Ltd., Class A | | | 309,200 | | | | 1,363,323 | |
| | |
Foxconn Industrial Internet Co. Ltd., Class A | | | 792,600 | | | | 1,267,291 | |
| | |
GoerTek, Inc., Class A | | | 656,700 | | | | 3,558,621 | |
| | |
Hollysys Automation Technologies Ltd. | | | 23,668 | | | | 377,978 | |
| | |
Kingboard Holdings Ltd. | | | 289,300 | | | | 1,407,453 | |
| | |
Lens Technology Co. Ltd., Class A | | | 503,200 | | | | 925,055 | |
| | |
Luxshare Precision Industry Co. Ltd., Class A | | | 1,137,976 | | | | 5,682,620 | |
| | |
Maxscend Microelectronics Co. Ltd., Class A | | | 61,300 | | | | 2,027,078 | |
| | |
Sunny Optical Technology Group Co. Ltd. | | | 327,100 | | | | 5,266,914 | |
| | |
Wingtech Technology Co. Ltd., Class A | | | 156,700 | | | | 2,006,854 | |
| | |
Zhejiang Dahua Technology Co. Ltd., Class A | | | 425,400 | | | | 1,109,051 | |
| | | | | | | | |
| Total Electronic Equipment, Instruments & Components | | | | 31,194,082 | |
|
| Energy Equipment & Services – 0.0% | |
| | |
China Common Rich Renewable Energy Investments Ltd.*†(b) | | | 502,000 | | | | 0 | |
|
| Entertainment – 2.6% | |
| | |
Alibaba Pictures Group Ltd.*(b) | | | 4,308,300 | | | | 357,586 | |
| | |
Bilibili, Inc., Class Z* | | | 85,625 | | | | 2,366,020 | |
| | |
iQIYI, Inc., ADR*(b) | | | 137,573 | | | | 624,581 | |
| | |
Kingsoft Corp. Ltd. | | | 408,400 | | | | 1,324,586 | |
| | |
NetEase, Inc. | | | 766,515 | | | | 14,074,732 | |
| | |
Tencent Music Entertainment Group, ADR* | | | 210,385 | | | | 1,024,575 | |
| | |
XD, Inc.*(b) | | | 96,500 | | | | 299,429 | |
| | |
Zhejiang Century Huatong Group Co. Ltd., Class A* | | | 1,473,200 | | | | 1,455,075 | |
| | | | | | | | |
| Total Entertainment | | | | 21,526,584 | |
|
| Food Products – 4.5% | |
| | |
China Feihe Ltd.(a) | | | 1,296,100 | | | | 1,284,283 | |
| | |
Dali Foods Group Co. Ltd.(a) | | | 919,700 | | | | 482,668 | |
| | |
Foshan Haitian Flavouring & Food Co. Ltd., Class A | | | 322,751 | | | | 4,444,620 | |
| | |
Guangdong Haid Group Co. Ltd., Class A | | | 209,103 | | | | 1,808,376 | |
| | |
Inner Mongolia Yili Industrial Group Co. Ltd., Class A | | | 1,389,700 | | | | 8,075,807 | |
| | |
Muyuan Foods Co. Ltd., Class A | | | 624,874 | | | | 5,597,003 | |
| | |
Tingyi Cayman Islands Holding Corp. | | | 763,000 | | | | 1,286,054 | |
| | |
Tongwei Co. Ltd., Class A | | | 668,658 | | | | 4,496,623 | |
| | |
Uni-President China Holdings Ltd. | | | 536,000 | | | | 467,462 | |
| | |
Want Want China Holdings Ltd. | | | 2,538,100 | | | | 2,346,432 | |
| | |
Wens Foodstuffs Group Co. Ltd., Class A | | | 1,208,100 | | | | 4,196,312 | |
| | |
WH Group Ltd.(a) | | | 3,810,183 | | | | 2,408,306 | |
| | |
Yihai International Holding Ltd.*(b) | | | 169,300 | | | | 486,407 | |
| | | | | | | | |
| Total Food Products | | | | 37,380,353 | |
Gas Utilities – 0.6% | |
| | |
ENN Energy Holdings Ltd. | | | 358,000 | | | | 5,371,326 | |
|
| Health Care Equipment & Supplies – 1.3% | |
| | |
Lepu Medical Technology Beijing Co. Ltd., Class A | | | 321,100 | | | | 1,020,240 | |
| | |
Lifetech Scientific Corp.*(b) | | | 1,370,100 | | | | 458,368 | |
| | |
Microport Scientific Corp.(b) | | | 332,600 | | | | 755,118 | |
| | |
Ovctek China, Inc., Class A | | | 118,700 | | | | 683,056 | |
| | |
Peijia Medical Ltd.*(a)(b) | | | 79,700 | | | | 72,257 | |
| | |
Shandong Weigao Group Medical Polymer Co. Ltd., Class H | | | 1,004,000 | | | | 1,075,613 | |
| | |
Shenzhen Mindray Bio-Medical Electronics Co. Ltd., Class A | | | 142,674 | | | | 6,905,466 | |
| | |
Venus MedTech Hangzhou, Inc., Class H*(a)(b) | | | 97,400 | | | | 201,481 | |
| | | | | | | | |
| Total Health Care Equipment & Supplies | | | | 11,171,599 | |
|
| Health Care Providers & Services – 0.7% | |
| | |
Aier Eye Hospital Group Co. Ltd., Class A | | | 639,525 | | | | 3,178,434 | |
| | |
Guangzhou Kingmed Diagnostics Group Co. Ltd., Class A | | | 82,700 | | | | 956,871 | |
| | |
Hygeia Healthcare Holdings Co. Ltd.(a)(b) | | | 91,300 | | | | 356,158 | |
| | |
Jinxin Fertility Group Ltd.*(a)(b) | | | 576,600 | | | | 443,969 | |
| | |
Topchoice Medical Corp., Class A* | | | 58,800 | | | | 1,325,295 | |
| | | | | | | | |
| Total Health Care Providers & Services | | | | 6,260,727 | |
|
| Health Care Technology – 0.0% | |
| | |
Yidu Tech, Inc.*(a)(b) | | | 188,700 | | | | 235,893 | |
|
| Hotels, Restaurants & Leisure – 2.0% | |
| | |
Haidilao International Holding Ltd.(a)(b) | | | 355,000 | | | | 696,274 | |
| | |
Huazhu Group Ltd. | | | 513,370 | | | | 1,753,537 | |
| | |
Jiumaojiu International Holdings Ltd.(a)(b) | | | 276,700 | | | | 593,580 | |
| | |
Tongcheng Travel Holdings Ltd.* | | | 512,000 | | | | 915,290 | |
| | |
Trip.com Group Ltd.*(b) | | | 197,877 | | | | 4,765,380 | |
| | |
Yum China Holdings, Inc. | | | 183,606 | | | | 7,626,993 | |
| | | | | | | | |
| Total Hotels, Restaurants & Leisure | | | | 16,351,054 | |
|
| Household Durables – 1.9% | |
| | |
Gree Electric Appliances, Inc. of Zhuhai, Class A | | | 1,231,400 | | | | 6,265,531 | |
| | |
Haier Smart Home Co. Ltd., Class A | | | 999,700 | | | | 3,637,792 | |
| | |
Haier Smart Home Co. Ltd., Class H | | | 1,075,300 | | | | 3,494,444 | |
| | |
TCL Technology Group Corp., Class A | | | 3,036,500 | | | | 2,348,611 | |
| | | | | | | | |
| Total Household Durables | | | | 15,746,378 | |
|
| Household Products – 0.0% | |
| | |
Blue Moon Group Holdings Ltd.(a)(b) | | | 477,300 | | | | 341,303 | |
Independent Power & Renewable Electricity Producers – 0.1% | |
| | |
Xinyi Energy Holdings Ltd.(b) | | | 958,000 | | | | 582,282 | |
|
| Industrial Conglomerates – 0.3% | |
| | |
China Baoan Group Co. Ltd., Class A | | | 624,600 | | | | 1,101,003 | |
| | |
Fosun International Ltd. | | | 1,057,700 | | | | 1,152,052 | |
| | | | | | | | |
| Total Industrial Conglomerates | | | | 2,253,055 | |
|
| Insurance – 4.3% | |
| | |
Ping An Insurance Group Co. of China Ltd., Class A | | | 2,304,094 | | | | 17,585,317 | |
| | |
Ping An Insurance Group Co. of China Ltd., Class H | | | 2,458,400 | | | | 17,469,413 | |
See Notes to Financial Statements.
Schedule of Investments (continued)
WisdomTree China ex-State-Owned Enterprises Fund (CXSE)
March 31, 2022
| | | | | | | | |
| Investments | | Shares | | | Value | |
| | |
ZhongAn Online P&C Insurance Co. Ltd., Class H*(a)(b) | | | 278,100 | | | $ | 948,141 | |
| | | | | | | | |
| Total Insurance | | | | 36,002,871 | |
|
| Interactive Media & Services – 15.1% | |
| | |
Autohome, Inc., Class A(b) | | | 99,240 | | | | 779,966 | |
| | |
Baidu, Inc., Class A* | | | 928,530 | | | | 16,776,949 | |
| | |
Hello Group, Inc., ADR | | | 46,792 | | | | 270,458 | |
| | |
JOYY, Inc., ADR | | | 23,080 | | | | 847,728 | |
| | |
Kuaishou Technology*(a) | �� | | 653,400 | | | | 6,190,755 | |
| | |
Tencent Holdings Ltd. | | | 2,109,300 | | | | 100,786,585 | |
| | |
Weibo Corp., ADR* | | | 18,189 | | | | 445,812 | |
| | | | | | | | |
| Total Interactive Media & Services | | | | 126,098,253 | |
|
| Internet & Direct Marketing Retail – 17.9% | |
| | |
Alibaba Group Holding Ltd.* | | | 5,604,000 | | | | 80,216,615 | |
| | |
Dada Nexus Ltd., ADR* | | | 35,748 | | | | 326,379 | |
| | |
JD Health International, Inc.*(a)(b) | | | 472,200 | | | | 2,900,225 | |
| | |
JD.com, Inc., Class A* | | | 820,752 | | | | 24,523,836 | |
| | |
Meituan, Class B*(a) | | | 1,598,400 | | | | 31,758,184 | |
| | |
Pinduoduo, Inc., ADR* | | | 184,596 | | | | 7,404,146 | |
| | |
Ping An Healthcare and Technology Co. Ltd.*(a)(b) | | | 216,200 | | | | 568,700 | |
| | |
Vipshop Holdings Ltd., ADR* | | | 162,180 | | | | 1,459,620 | |
| | | | | | | | |
| Total Internet & Direct Marketing Retail | | | | 149,157,705 | |
|
| IT Services – 0.5% | |
| | |
Chinasoft International Ltd.* | | | 1,275,200 | | | | 1,056,778 | |
| | |
Chindata Group Holdings Ltd., ADR* | | | 48,533 | | | | 306,729 | |
| | |
GDS Holdings Ltd., Class A*(b) | | | 395,900 | | | | 2,019,588 | |
| | |
Kingsoft Cloud Holdings Ltd., ADR*(b) | | | 40,400 | | | | 245,228 | |
| | |
Vnet Group, Inc., ADR* | | | 52,580 | | | | 306,541 | |
| | | | | | | | |
| Total IT Services | | | | 3,934,864 | |
|
| Life Sciences Tools & Services – 4.1% | |
| | |
Genscript Biotech Corp.* | | | 498,400 | | | | 1,597,395 | |
| | |
Hangzhou Tigermed Consulting Co. Ltd., Class A | | | 146,067 | | | | 2,475,829 | |
| | |
Hangzhou Tigermed Consulting Co. Ltd., Class H(a) | | | 58,600 | | | | 713,849 | |
| | |
Pharmaron Beijing Co. Ltd., Class A | | | 70,300 | | | | 1,306,753 | |
| | |
Pharmaron Beijing Co. Ltd., Class H(a) | | | 67,200 | | | | 819,041 | |
| | |
WuXi AppTec Co. Ltd., Class A | | | 599,747 | | | | 10,617,282 | |
| | |
WuXi AppTec Co. Ltd., Class H(a) | | | 176,795 | | | | 2,810,606 | |
| | |
Wuxi Biologics Cayman, Inc.*(a) | | | 1,631,400 | | | | 13,550,907 | |
| | | | | | | | |
| Total Life Sciences Tools & Services | | | | 33,891,662 | |
|
| Machinery – 1.8% | |
| | |
Haitian International Holdings Ltd. | | | 279,400 | | | | 726,025 | |
| | |
Jiangsu Hengli Hydraulic Co. Ltd., Class A | | | 106,500 | | | | 873,226 | |
| | |
Sany Heavy Equipment International Holdings Co. Ltd. | | | 434,600 | | | | 453,945 | |
| | |
Sany Heavy Industry Co. Ltd., Class A | | | 1,668,348 | | | | 4,604,442 | |
| | |
Shenzhen Inovance Technology Co. Ltd., Class A | | | 463,800 | | | | 4,164,490 | |
| | |
Wuxi Lead Intelligent Equipment Co. Ltd., Class A | | | 289,900 | | | | 2,668,791 | |
| | |
Zhejiang Sanhua Intelligent Controls Co. Ltd., Class A* | | | 491,200 | | | | 1,286,014 | |
| | | | | | | | |
| Total Machinery | | | | 14,776,933 | |
|
| Marine – 0.3% | |
| | |
SITC International Holdings Co. Ltd. | | | 649,000 | | | | 2,299,685 | |
|
| Media – 0.4% | |
| | |
China Literature Ltd.*(a)(b) | | | 199,400 | | | | 831,321 | |
| | |
Focus Media Information Technology Co. Ltd., Class A | | | 2,748,324 | | | | 2,645,242 | |
| | | | | | | | |
| Total Media | | | | 3,476,563 | |
|
| Metals & Mining – 1.5% | |
| | |
China Hongqiao Group Ltd.(b) | | | 968,100 | | | | 1,293,042 | |
| | |
Ganfeng Lithium Co. Ltd., Class A | | | 225,700 | | | | 4,467,353 | |
| | |
Ganfeng Lithium Co. Ltd., Class H(a)(b) | | | 130,700 | | | | 1,869,193 | |
| | |
GEM Co. Ltd., Class A | | | 1,194,000 | | | | 1,576,176 | |
| | |
Zhejiang Huayou Cobalt Co. Ltd., Class A | | | 225,400 | | | | 3,472,554 | |
| | | | | | | | |
| Total Metals & Mining | | | | 12,678,318 | |
|
| Oil, Gas & Consumable Fuels – 0.3% | |
| | |
Guanghui Energy Co. Ltd., Class A* | | | 1,382,400 | | | | 1,785,681 | |
| | |
United Energy Group Ltd.(b) | | | 3,459,000 | | | | 397,515 | |
| | | | | | | | |
| Total Oil, Gas & Consumable Fuels | | | | 2,183,196 | |
|
| Paper & Forest Products – 0.3% | |
| | |
Chengxin Lithium Group Co. Ltd., Class A* | | | 197,200 | | | | 1,579,004 | |
| | |
Lee & Man Paper Manufacturing Ltd. | | | 1,067,300 | | | | 557,404 | |
| | |
Nine Dragons Paper Holdings Ltd. | | | 812,100 | | | | 709,294 | |
| | | | | | | | |
| Total Paper & Forest Products | | | | 2,845,702 | |
|
| Personal Products – 0.2% | |
| | |
Hengan International Group Co. Ltd. | | | 299,400 | | | | 1,383,952 | |
|
| Pharmaceuticals – 2.3% | |
| | |
Asymchem Laboratories Tianjin Co. Ltd., Class A | | | 48,005 | | | | 2,775,293 | |
| | |
CanSino Biologics, Inc., Class H*(a)(b) | | | 39,000 | | | | 626,976 | |
| | |
China Medical System Holdings Ltd. | | | 568,000 | | | | 895,002 | |
| | |
Hansoh Pharmaceutical Group Co. Ltd.(a) | | | 444,100 | | | | 744,004 | |
| | |
Jiangsu Hengrui Medicine Co. Ltd., Class A | | | 984,468 | | | | 5,710,073 | |
| | |
Kangmei Pharmaceutical Co. Ltd., Class A* | | | 199,602 | | | | 88,354 | |
| | |
Shanghai Fosun Pharmaceutical Group Co. Ltd., Class A | | | 289,104 | | | | 2,428,745 | |
| | |
Shanghai Fosun Pharmaceutical Group Co. Ltd., Class H(b) | | | 245,900 | | | | 1,202,591 | |
| | |
Sino Biopharmaceutical Ltd. | | | 4,811,150 | | | | 3,004,127 | |
| | |
Zhejiang NHU Co. Ltd., Class A | | | 377,800 | | | | 1,885,399 | |
| | | | | | | | |
| Total Pharmaceuticals | | | | 19,360,564 | |
|
| Professional Services – 0.1% | |
| | |
51job, Inc., ADR*(b) | | | 11,577 | | | | 677,833 | |
|
| Real Estate Management & Development – 2.7% | |
| | |
A-Living Smart City Services Co. Ltd.(a)(b) | | | 226,500 | | | | 316,985 | |
| | |
Agile Group Holdings Ltd.(b) | | | 621,800 | | | | 315,211 | |
| | |
CIFI Ever Sunshine Services Group Ltd.(b) | | | 314,000 | | | | 425,007 | |
| | |
CIFI Holdings Group Co. Ltd. | | | 1,792,500 | | | | 1,055,166 | |
See Notes to Financial Statements.
Schedule of Investments (continued)
WisdomTree China ex-State-Owned Enterprises Fund (CXSE)
March 31, 2022
| | | | | | | | |
| Investments | | Shares | | | Value | |
| | |
Country Garden Holdings Co. Ltd.(b) | | | 3,299,936 | | | $ | 2,540,876 | |
| | |
Country Garden Services Holdings Co. Ltd. | | | 817,300 | | | | 3,506,561 | |
| | |
Evergrande Property Services Group Ltd.*†(a)(b) | | | 1,795,500 | | | | 527,319 | |
| | |
Gemdale Corp., Class A | | | 1,135,900 | | | | 2,555,198 | |
| | |
Greentown Service Group Co. Ltd. | | | 523,800 | | | | 527,051 | |
| | |
Guangzhou R&F Properties Co. Ltd., Class H(b) | | | 848,700 | | | | 301,273 | |
| | |
Jinke Smart Services Group Co. Ltd., Class H(b) | | | 464,600 | | | | 1,678,905 | |
| | |
KE Holdings, Inc., ADR* | | | 191,192 | | | | 2,365,045 | |
| | |
KWG Group Holdings Ltd.(b) | | | 513,900 | | | | 212,610 | |
| | |
Longfor Group Holdings Ltd.(a) | | | 690,200 | | | | 3,551,735 | |
| | |
Powerlong Real Estate Holdings Ltd.(b) | | | 586,300 | | | | 154,971 | |
| | |
Seazen Group Ltd.* | | | 1,009,000 | | | | 543,706 | |
| | |
Shimao Group Holdings Ltd.(b) | | | 561,400 | | | | 316,851 | |
| | |
Shimao Services Holdings Ltd.(a)(b) | | | 325,400 | | | | 174,513 | |
| | |
Sunac China Holdings Ltd.(b) | | | 1,592,600 | | | | 931,393 | |
| | |
Sunac Services Holdings Ltd.(a)(b) | | | 313,719 | | | | 194,287 | |
| | |
Zhenro Properties Group Ltd. | | | 883,800 | | | | 68,841 | |
| | | | | | | | |
| Total Real Estate Management & Development | | | | 22,263,504 | |
|
| Semiconductors & Semiconductor Equipment – 4.5% | |
| | |
Daqo New Energy Corp., ADR* | | | 22,296 | | | | 921,271 | |
| | |
Flat Glass Group Co. Ltd., Class H*(b) | | | 173,700 | | | | 672,052 | |
| | |
Gigadevice Semiconductor Beijing, Inc., Class A | | | 145,112 | | | | 3,223,822 | |
| | |
Hangzhou First Applied Material Co. Ltd., Class A | | | 94,400 | | | | 1,687,663 | |
| | |
Hangzhou Silan Microelectronics Co. Ltd., Class A | | | 241,700 | | | | 1,846,608 | |
| | |
JA Solar Technology Co. Ltd., Class A | | | 152,600 | | | | 1,891,364 | |
| | |
JCET Group Co. Ltd., Class A | | | 294,200 | | | | 1,139,150 | |
| | |
JinkoSolar Holding Co. Ltd., ADR*(b) | | | 14,760 | | | | 712,760 | |
| | |
LONGi Green Energy Technology Co. Ltd., Class A | | | 1,146,392 | | | | 13,036,663 | |
| | |
SG Micro Corp., Class A | | | 45,900 | | | | 2,360,906 | |
| | |
Will Semiconductor Co. Ltd., Class A | | | 150,760 | | | | 4,593,025 | |
| | |
Xinyi Solar Holdings Ltd. | | | 2,052,765 | | | | 3,622,496 | |
| | |
Zhejiang Jingsheng Mechanical & Electrical Co. Ltd., Class A | | | 171,500 | | | | 1,620,958 | |
| | | | | | | | |
| Total Semiconductors & Semiconductor Equipment | | | | 37,328,738 | |
|
| Software – 1.8% | |
| | |
360 Security Technology, Inc., Class A* | | | 802,800 | | | | 1,262,101 | |
| | |
Agora, Inc., ADR* | | | 32,680 | | | | 324,839 | |
| | |
Beijing Kingsoft Office Software, Inc., Class A | | | 53,982 | | | | 1,595,794 | |
| | |
Glodon Co. Ltd., Class A | | | 273,475 | | | | 2,138,482 | |
| | |
Hundsun Technologies, Inc., Class A | | | 312,208 | | | | 2,186,602 | |
| | |
Kingdee International Software Group Co. Ltd.* | | | 1,127,700 | | | | 2,508,432 | |
| | |
Ming Yuan Cloud Group Holdings Ltd.(b) | | | 253,400 | | | | 348,808 | |
| | |
Sangfor Technologies, Inc., Class A | | | 61,800 | | | | 1,086,058 | |
| | |
Thunder Software Technology Co. Ltd., Class A | | | 78,500 | | | | 1,226,698 | |
| | |
Weimob, Inc.*(a)(b) | | | 817,000 | | | | 538,310 | |
| | |
Yonyou Network Technology Co. Ltd., Class A | | | 538,313 | | | | 1,941,899 | |
| | | | | | | | |
| Total Software | | | | 15,158,023 | |
|
| Specialty Retail – 0.7% | |
| | |
China Meidong Auto Holdings Ltd. | | | 210,912 | | | | 807,948 | |
| | |
China Yongda Automobiles Services Holdings Ltd. | | | 576,900 | | | | 628,362 | |
| | |
GOME Retail Holdings Ltd.*(b) | | | 7,055,800 | | | | 441,472 | |
| | |
Pop Mart International Group Ltd.*(a)(b) | | | 315,300 | | | | 1,384,978 | |
| | |
Topsports International Holdings Ltd.(a) | | | 1,231,200 | | | | 1,029,747 | |
| | |
Zhongsheng Group Holdings Ltd. | | | 244,100 | | | | 1,726,784 | |
| | | | | | | | |
| Total Specialty Retail | | | | 6,019,291 | |
|
| Technology Hardware, Storage & Peripherals – 0.1% | |
| | |
Shenzhen Transsion Holdings Co. Ltd., Class A | | | 67,605 | | | | 1,018,212 | |
|
| Textiles, Apparel & Luxury Goods – 2.7% | |
| | |
ANTA Sports Products Ltd. | | | 585,500 | | | | 7,356,692 | |
| | |
Li Ning Co. Ltd. | | | 1,108,500 | | | | 9,568,481 | |
| | |
Shenzhou International Group Holdings Ltd. | | | 356,600 | | | | 4,772,031 | |
| | |
Xtep International Holdings Ltd.(b) | | | 575,200 | | | | 872,561 | |
| | | | | | | | |
| Total Textiles, Apparel & Luxury Goods | | | | 22,569,765 | |
|
| Tobacco – 0.1% | |
| | |
RLX Technology, Inc., ADR*(b) | | | 313,604 | | | | 561,351 | |
TOTAL COMMON STOCKS (Cost: $1,111,656,772) | | | | 835,220,684 | |
|
| INVESTMENT OF CASH COLLATERAL FOR SECURITIES LOANED – 1.1% | |
|
| United States – 1.1% | |
| | |
State Street Navigator Securities Lending Government Money Market Portfolio, 0.25%(c) | | | | | | | | |
| (Cost: $8,864,709) | | | 8,864,709 | | | | 8,864,709 | |
| |
TOTAL INVESTMENTS IN SECURITIES – 101.1% (Cost: $1,120,521,481) | | | | 844,085,393 | |
| |
Other Assets less Liabilities – (1.1)% | | | | (8,805,289 | ) |
| | | | | | | | |
| NET ASSETS – 100.0% | | | $ | 835,280,104 | |
| * | Non-income producing security. |
| † | Security is being fair valued using significant unobservable inputs by a pricing committee under the direction of the Board of Trustees. The aggregate value of fair valued securities is $527,319, which represents 0.06% of net assets. |
| (a) | This security is exempt from registration under rule 144A of the Securities Act of 1933. This security may be sold in transactions that are exempt from registration, normally to qualified institutional buyers. |
| (b) | Security, or portion thereof, was on loan at March 31, 2022 (See Note 2). At March 31, 2022, the total market value of the Fund’s securities on loan identified in the Schedule of Investments was $41,658,950 and the total market value of the collateral held by the Fund was $45,876,708. The total market value of the collateral includes non-cash U.S. Government securities collateral having a value of $37,011,999. |
| (c) | Rate shown represents annualized 7-day yield as of March 31, 2022. |
See Notes to Financial Statements.
Schedule of Investments (concluded)
WisdomTree China ex-State-Owned Enterprises Fund (CXSE)
March 31, 2022
| | | | | | | | | | | | | | | | | | | | | | | | | | | | |
| | | |
| FINANCIAL DERIVATIVE INSTRUMENTS | | | | | | | | | | |
|
| FOREIGN CURRENCY CONTRACTS (OTC – OVER THE COUNTER) | |
| | | | | |
| Counterparty | | Settlement
Date | | | Amount and
Description of
Currency to be
Purchased | | | Amount and
Description of
Currency to
be Sold | | | Unrealized
Appreciation | | | Unrealized
Depreciation | |
Canadian Imperial Bank of Commerce | | | 4/1/2022 | | | | 5,000 | | | | CNH | | | | 788 | | | | USD | | | $ | — | | | $ | (0 | )^ |
Deutsche Bank AG | | | 4/1/2022 | | | | 150,000 | | | | HKD | | | | 19,164 | | | | USD | | | | — | | | | (10 | ) |
Goldman Sachs | | | 4/1/2022 | | | | 9,232,718 | | | | HKD | | | | 1,179,595 | | | | USD | | | | — | | | | (660 | ) |
| | | | | | | | | | | | | | | | | | | | | | | $ | — | | | $ | (670 | ) |
| ^ | Amount represents less than $1. |
The following is a summary of the fair valuations according to the inputs used as of March 31, 2022 in valuing the Fund’s investments (See Note 2 — Fair Value Measurement):
| | | | | | | | | | | | | | | | |
| | | | |
| | | Quoted
Prices in
Active
Markets
(Level 1) | | | Other
Significant
Observable
Inputs
(Level 2) | | | Significant
Unobservable
Inputs
(Level 3) | | | Total | |
Assets: | | | | | | | | | | | | | | | | |
Investments in Securities | | | | | | | | | | | | | | | | |
Common Stocks | | | | | | | | | | | | | | | | |
Energy Equipment & Services | | $ | — | | | $ | — | | | $ | 0 | * | | $ | 0 | |
Real Estate Management & Development | | | 21,736,185 | | | | — | | | | 527,319 | * | | | 22,263,504 | |
Other | | | 812,957,180 | | | | — | | | | — | | | | 812,957,180 | |
Investment of Cash Collateral for Securities Loaned | | | — | | | | 8,864,709 | | | | — | | | | 8,864,709 | |
Total Investments in Securities | | $ | 834,693,365 | | | $ | 8,864,709 | | | $ | 527,319 | | | $ | 844,085,393 | |
Liabilities: | | | | | | | | | | | | | | | | |
Financial Derivative Instruments | | | | | | | | | | | | | | | | |
Foreign Currency Contracts1 | | $ | — | | | $ | (670 | ) | | $ | — | | | $ | (670 | ) |
Total – Net | | $ | 834,693,365 | | | $ | 8,864,039 | | | $ | 527,319 | | | $ | 844,084,723 | |
| * | Securities are being fair valued using significant unobservable inputs by the Pricing Committee. |
| 1 | Amount shown represents the unrealized appreciation (depreciation) on the financial instrument. |
See Notes to Financial Statements.
Schedule of Investments
WisdomTree Emerging Markets ex-State-Owned Enterprises Fund (XSOE)
March 31, 2022
| | | | | | | | |
| Investments | | Shares | | | Value | |
|
| COMMON STOCKS – 100.0% | |
|
| Brazil – 4.6% | |
| | |
Ambev SA | | | 3,703,462 | | | $ | 12,002,086 | |
| | |
Americanas SA | | | 410,547 | | | | 2,820,812 | |
| | |
Atacadao SA | | | 500,361 | | | | 2,371,264 | |
| | |
B3 SA – Brasil Bolsa Balcao | | | 6,053,906 | | | | 20,014,281 | |
| | |
Banco Inter SA | | | 1,093,281 | | | | 2,735,431 | |
| | |
BR Malls Participacoes SA* | | | 1,631,232 | | | | 3,185,604 | |
| | |
BRF SA* | | | 653,135 | | | | 2,555,115 | |
| | |
CCR SA | | | 1,005,440 | | | | 2,898,711 | |
| | |
Cia de Locacao das Americas | | | 413,113 | | | | 2,361,167 | |
| | |
Cia Siderurgica Nacional SA | | | 738,096 | | | | 4,043,106 | |
| | |
Cosan SA | | | 979,579 | | | | 4,875,271 | |
| | |
Embraer SA* | | | 501,457 | | | | 1,578,678 | |
| | |
Energisa SA | | | 107,525 | | | | 1,104,451 | |
| | |
Equatorial Energia SA | | | 394,232 | | | | 2,257,400 | |
| | |
Grupo De Moda Soma SA* | | | 409,922 | | | | 1,314,663 | |
| | |
Hapvida Participacoes e Investimentos SA(a) | | | 2,933,264 | | | | 7,308,547 | |
| | |
Hypera SA | | | 284,117 | | | | 2,314,454 | |
| | |
Localiza Rent a Car SA | | | 555,988 | | | | 7,148,827 | |
| | |
Locaweb Servicos de Internet SA*(a) | | | 438,352 | | | | 931,692 | |
| | |
Lojas Renner SA | | | 881,698 | | | | 5,102,473 | |
| | |
Magazine Luiza SA | | | 2,398,695 | | | | 3,442,608 | |
| | |
Marfrig Global Foods SA | | | 215,006 | | | | 968,261 | |
| | |
Natura & Co. Holding SA* | | | 763,427 | | | | 4,185,076 | |
| | |
Pet Center Comercio e Participacoes SA | | | 384,182 | | | | 1,508,609 | |
| | |
Petro Rio SA* | | | 468,648 | | | | 2,348,196 | |
| | |
Raia Drogasil SA | | | 1,208,150 | | | | 6,086,577 | |
| | |
Rede D’Or Sao Luiz SA(a) | | | 574,486 | | | | 6,032,650 | |
| | |
Rumo SA* | | | 1,050,711 | | | | 4,101,619 | |
| | |
Sendas Distribuidora SA | | | 778,362 | | | | 2,668,277 | |
| | |
Sul America SA | | | 309,382 | | | | 2,238,355 | |
| | |
Suzano SA | | | 584,493 | | | | 6,783,487 | |
| | |
TOTVS SA | | | 429,646 | | | | 3,289,286 | |
| | |
Transmissora Alianca de Energia Eletrica SA | | | 156,370 | | | | 1,452,493 | |
| | |
Ultrapar Participacoes SA | | | 860,586 | | | | 2,562,588 | |
| | |
Via SA | | | 1,342,847 | | | | 1,178,395 | |
| | |
Vibra Energia SA | | | 892,924 | | | | 4,393,262 | |
| | |
WEG SA | | | 1,388,225 | | | | 10,186,851 | |
| | |
YDUQS Participacoes SA | | | 334,576 | | | | 1,474,347 | |
| | | | | | | | |
| Total Brazil | | | | 153,824,970 | |
|
| Chile – 0.4% | |
| | |
Banco de Chile | | | 43,097,551 | | | | 4,613,575 | |
| | |
Banco Santander Chile | | | 61,887,602 | | | | 3,484,754 | |
| | |
Empresas CMPC SA | | | 504,875 | | | | 934,782 | |
| | |
Enel Americas SA | | | 9,221,226 | | | | 1,113,215 | |
| | |
Enel Chile SA | | | 57,237,321 | | | | 1,709,282 | |
| | |
Falabella SA | | | 233,376 | | | | 745,836 | |
| | | | | | | | |
| Total Chile | | | | 12,601,444 | |
|
| China – 27.1% | |
| | |
360 DigiTech, Inc., ADR | | | 55,680 | | | | 856,915 | |
| | |
51job, Inc., ADR*(b) | | | 20,631 | | | | 1,207,945 | |
| | |
A-Living Smart City Services Co. Ltd.(a) | | | 246,750 | | | | 345,325 | |
| | |
AAC Technologies Holdings, Inc.(b) | | | 445,500 | | | $ | 1,079,703 | |
| | |
Agora, Inc., ADR* | | | 36,557 | | | | 363,377 | |
| | |
Aier Eye Hospital Group Co. Ltd., Class A | | | 430,019 | | | | 2,137,191 | |
| | |
Akeso, Inc.*(a)(b) | | | 253,000 | | | | 538,861 | |
| | |
Alibaba Group Holding Ltd.* | | | 6,759,232 | | | | 96,752,804 | |
| | |
Alibaba Pictures Group Ltd.* | | | 18,360,000 | | | | 1,523,865 | |
| | |
ANTA Sports Products Ltd. | | | 887,300 | | | | 11,148,750 | |
| | |
Asymchem Laboratories Tianjin Co. Ltd., Class A | | | 33,700 | | | | 1,948,284 | |
| | |
Autohome, Inc., Class A(b) | | | 97,672 | | | | 767,642 | |
| | |
Baidu, Inc., Class A* | | | 952,020 | | | | 17,201,373 | |
| | |
BeiGene Ltd.* | | | 382,500 | | | | 5,919,631 | |
| | |
Beijing Kingsoft Office Software, Inc., Class A | | | 40,577 | | | | 1,199,521 | |
| | |
Beijing Oriental Yuhong Waterproof Technology Co. Ltd., Class A | | | 136,167 | | | | 963,965 | |
| | |
Beijing Wantai Biological Pharmacy Enterprise Co. Ltd., Class A | | | 31,200 | | | | 1,366,330 | |
| | |
Bilibili, Inc., Class Z* | | | 107,614 | | | | 2,973,628 | |
| | |
BOE Technology Group Co. Ltd., Class A | | | 4,082,900 | | | | 2,772,058 | |
| | |
BYD Co. Ltd., Class A | | | 157,674 | | | | 5,707,768 | |
| | |
BYD Co. Ltd., Class H | | | 368,000 | | | | 10,544,628 | |
| | |
BYD Electronic International Co. Ltd.(b) | | | 350,000 | | | | 706,132 | |
| | |
CanSino Biologics, Inc., Class H*(a) | | | 45,000 | | | | 723,434 | |
| | |
Chaozhou Three-Circle Group Co. Ltd., Class A | | | 264,600 | | | | 1,166,673 | |
| | |
Chengxin Lithium Group Co. Ltd., Class A* | | | 179,500 | | | | 1,437,278 | |
| | |
China Baoan Group Co. Ltd., Class A | | | 620,800 | | | | 1,094,304 | |
| | |
China Common Rich Renewable Energy Investments Ltd.*† | | | 102,000 | | | | 0 | |
| | |
China Conch Environment Protection Holdings Ltd.* | | | 1,525,900 | | | | 1,909,470 | |
| | |
China Conch Venture Holdings Ltd. | | | 1,525,900 | | | | 4,461,924 | |
| | |
China Feihe Ltd.(a) | | | 1,743,000 | | | | 1,727,109 | |
| | |
China Hongqiao Group Ltd.(b) | | | 962,500 | | | | 1,285,562 | |
| | |
China Jushi Co. Ltd., Class A | | | 551,500 | | | | 1,323,996 | |
| | |
China Lesso Group Holdings Ltd. | | | 905,000 | | | | 1,100,135 | |
| | |
China Literature Ltd.*(a)(b) | | | 201,400 | | | | 839,660 | |
| | |
China Medical System Holdings Ltd. | | | 1,142,000 | | | | 1,799,459 | |
| | |
China Meidong Auto Holdings Ltd. | | | 356,288 | | | | 1,364,844 | |
| | |
China Minsheng Banking Corp. Ltd., Class A | | | 8,848,679 | | | | 5,324,736 | |
| | |
China Minsheng Banking Corp. Ltd., Class H(b) | | | 4,832,000 | | | | 1,820,160 | |
| | |
China Yongda Automobiles Services Holdings Ltd. | | | 889,500 | | | | 968,848 | |
| | |
Chinasoft International Ltd.* | | | 1,238,000 | | | | 1,025,949 | |
| | |
Chongqing Zhifei Biological Products Co. Ltd., Class A | | | 143,600 | | | | 3,121,690 | |
| | |
Contemporary Amperex Technology Co. Ltd., Class A | | | 213,317 | | | | 17,214,962 | |
| | |
Country Garden Holdings Co. Ltd.(b) | | | 6,898,935 | | | | 5,312,023 | |
| | |
Country Garden Services Holdings Co. Ltd. | | | 988,000 | | | | 4,238,936 | |
| | |
Dada Nexus Ltd., ADR* | | | 41,405 | | | | 378,028 | |
| | |
Daqo New Energy Corp., ADR* | | | 25,857 | | | | 1,068,411 | |
| | |
Dongyue Group Ltd. | | | 955,000 | | | | 1,314,567 | |
See Notes to Financial Statements.
Schedule of Investments (continued)
WisdomTree Emerging Markets ex-State-Owned Enterprises Fund (XSOE)
March 31, 2022
| | | | | | | | |
| Investments | | Shares | | | Value | |
| | |
East Money Information Co. Ltd., Class A | | | 2,044,718 | | | $ | 8,161,994 | |
| | |
ENN Energy Holdings Ltd. | | | 555,700 | | | | 8,337,558 | |
| | |
Evergrande Property Services Group Ltd.*†(a)(b) | | | 2,120,500 | | | | 622,769 | |
| | |
Focus Media Information Technology Co. Ltd., Class A | | | 3,005,300 | | | | 2,892,579 | |
| | |
Foshan Haitian Flavouring & Food Co. Ltd., Class A | | | 282,433 | | | | 3,889,399 | |
| | |
Futu Holdings Ltd., ADR*(b) | | | 37,880 | | | | 1,233,373 | |
| | |
Fuyao Glass Industry Group Co. Ltd., Class A | | | 335,182 | | | | 1,878,637 | |
| | |
Ganfeng Lithium Co. Ltd., Class A | | | 182,400 | | | | 3,610,302 | |
| | |
Ganfeng Lithium Co. Ltd., Class H(a) | | | 111,000 | | | | 1,587,456 | |
| | |
GDS Holdings Ltd., Class A* | | | 450,252 | | | | 2,296,852 | |
| | |
Geely Automobile Holdings Ltd. | | | 2,816,000 | | | | 4,444,385 | |
| | |
GEM Co. Ltd., Class A | | | 1,120,900 | | | | 1,479,678 | |
| | |
Gemdale Corp., Class A | | | 1,073,700 | | | | 2,415,279 | |
| | |
Genscript Biotech Corp.* | | | 590,000 | | | | 1,890,977 | |
| | |
Gigadevice Semiconductor Beijing, Inc., Class A | | | 102,300 | | | | 2,272,707 | |
| | |
GOME Retail Holdings Ltd.*(b) | | | 8,246,000 | | | | 515,941 | |
| | |
Gotion High-tech Co. Ltd., Class A* | | | 241,400 | | | | 1,308,513 | |
| | |
Great Wall Motor Co. Ltd., Class H | | | 1,791,700 | | | | 2,873,529 | |
| | |
Gree Electric Appliances, Inc. of Zhuhai, Class A | | | 566,800 | | | | 2,883,956 | |
| | |
Greentown Service Group Co. Ltd. | | | 1,470,000 | | | | 1,479,122 | |
| | |
Guangdong Haid Group Co. Ltd., Class A | | | 115,900 | | | | 1,002,333 | |
| | |
Guanghui Energy Co. Ltd., Class A* | | | 1,303,300 | | | | 1,683,505 | |
| | |
Guangzhou Kingmed Diagnostics Group Co. Ltd., Class A | | | 84,000 | | | | 971,913 | |
| | |
Guangzhou Tinci Materials Technology Co. Ltd., Class A | | | 145,700 | | | | 2,157,464 | |
| | |
Haidilao International Holding Ltd.(a)(b) | | | 599,300 | | | | 1,175,428 | |
| | |
Haier Smart Home Co. Ltd., Class A | | | 651,000 | | | | 2,368,913 | |
| | |
Haier Smart Home Co. Ltd., Class H | | | 944,800 | | | | 3,070,353 | |
| | |
Hangzhou First Applied Material Co. Ltd., Class A | | | 64,300 | | | | 1,149,542 | |
| | |
Hangzhou Silan Microelectronics Co. Ltd., Class A | | | 180,500 | | | | 1,379,035 | |
| | |
Hangzhou Tigermed Consulting Co. Ltd., Class A | | | 129,200 | | | | 2,189,934 | |
| | |
Hansoh Pharmaceutical Group Co. Ltd.(a) | | | 606,000 | | | | 1,015,236 | |
| | |
Hello Group, Inc., ADR | | | 99,530 | | | | 575,283 | |
| | |
Hengan International Group Co. Ltd. | | | 520,500 | | | | 2,405,968 | |
| | |
Hengli Petrochemical Co. Ltd., Class A | | | 255,100 | | | | 835,451 | |
| | |
Hollysys Automation Technologies Ltd. | | | 51,760 | | | | 826,607 | |
| | |
Huazhu Group Ltd. | | | 697,470 | | | | 2,382,374 | |
| | |
Hundsun Technologies, Inc., Class A | | | 250,432 | | | | 1,753,943 | |
| | |
I-Mab, ADR* | | | 2,095 | | | | 34,023 | |
| | |
Inner Mongolia Yili Industrial Group Co. Ltd., Class A | | | 1,423,800 | | | | 8,273,969 | |
| | |
Innovent Biologics, Inc.*(a) | | | 546,500 | | | | 1,880,657 | |
| | |
iQIYI, Inc., ADR*(b) | | | 139,682 | | | | 634,156 | |
| | |
JA Solar Technology Co. Ltd., Class A | | | 112,200 | | | | 1,390,636 | |
| | |
JCET Group Co. Ltd., Class A | | | 250,400 | | | | 969,555 | |
| | |
JD Health International, Inc.*(a)(b) | | | 504,600 | | | | 3,099,224 | |
| | |
JD.com, Inc., Class A* | | | 1,014,809 | | | | 30,322,204 | |
| | |
Jiangsu Eastern Shenghong Co. Ltd., Class A | | | 354,000 | | | | 791,859 | |
| | |
Jiangsu Hengli Hydraulic Co. Ltd., Class A | | | 82,500 | | | | 676,443 | |
| | |
Jiangsu Hengrui Medicine Co. Ltd., Class A | | | 951,713 | | | | 5,520,088 | |
| | |
Jinke Smart Services Group Co. Ltd., Class H(b) | | | 309,400 | | | | 1,118,066 | |
| | |
JinkoSolar Holding Co. Ltd., ADR*(b) | | | 19,263 | | | | 930,210 | |
| | |
Jinxin Fertility Group Ltd.*(a) | | | 616,000 | | | | 474,306 | |
| | |
JiuGui Liquor Co. Ltd., Class A | | | 49,900 | | | | 1,162,586 | |
| | |
Jiumaojiu International Holdings Ltd.(a)(b) | | | 402,000 | | | | 862,375 | |
| | |
JOYY, Inc., ADR | | | 35,783 | | | | 1,314,310 | |
| | |
Kangmei Pharmaceutical Co. Ltd., Class A* | | | 31,038 | | | | 13,739 | |
| | |
KE Holdings, Inc., ADR* | | | 210,071 | | | | 2,598,578 | |
| | |
Kingboard Holdings Ltd. | | | 603,000 | | | | 2,933,613 | |
| | |
Kingdee International Software Group Co. Ltd.* | | | 1,707,000 | | | | 3,797,015 | |
| | |
Kingsoft Cloud Holdings Ltd., ADR*(b) | | | 48,645 | | | | 295,275 | |
| | |
Kingsoft Corp. Ltd. | | | 749,600 | | | | 2,431,218 | |
| | |
Kuaishou Technology*(a) | | | 713,000 | | | | 6,755,446 | |
| | |
LB Group Co. Ltd., Class A | | | 283,600 | | | | 1,033,328 | |
| | |
Lee & Man Paper Manufacturing Ltd. | | | 1,500,000 | | | | 783,385 | |
| | |
Lens Technology Co. Ltd., Class A | | | 410,818 | | | | 755,225 | |
| | |
Lepu Medical Technology Beijing Co. Ltd., Class A | | | 301,300 | | | | 957,329 | |
| | |
Li Auto, Inc., ADR* | | | 109,045 | | | | 2,814,451 | |
| | |
Li Ning Co. Ltd. | | | 1,458,500 | | | | 12,589,652 | |
| | |
Lifetech Scientific Corp.*(b) | | | 1,738,000 | | | | 581,449 | |
| | |
Longfor Group Holdings Ltd.(a) | | | 1,142,500 | | | | 5,879,249 | |
| | |
LONGi Green Energy Technology Co. Ltd., Class A | | | 810,180 | | | | 9,213,291 | |
| | |
Lufax Holding Ltd., ADR* | | | 207,056 | | | | 1,153,302 | |
| | |
Luxshare Precision Industry Co. Ltd., Class A | | | 729,900 | | | | 3,644,843 | |
| | |
Maxscend Microelectronics Co. Ltd., Class A | | | 49,700 | | | | 1,643,488 | |
| | |
Meituan, Class B*(a) | | | 1,938,700 | | | | 38,519,514 | |
| | |
Microport Scientific Corp.(b) | | | 338,600 | | | | 768,740 | |
| | |
Ming Yang Smart Energy Group Ltd., Class A | | | 314,300 | | | | 1,097,656 | |
| | |
Ming Yuan Cloud Group Holdings Ltd.(b) | | | 298,000 | | | | 410,200 | |
| | |
Minth Group Ltd. | | | 328,000 | | | | 809,173 | |
| | |
Muyuan Foods Co. Ltd., Class A | | | 518,976 | | | | 4,648,474 | |
| | |
NetEase, Inc. | | | 925,930 | | | | 17,001,907 | |
| | |
New Oriental Education & Technology Group, Inc.*(b) | | | 673,136 | | | | 827,732 | |
| | |
Nine Dragons Paper Holdings Ltd. | | | 858,000 | | | | 749,383 | |
| | |
NIO, Inc., ADR* | | | 717,917 | | | | 15,112,153 | |
| | |
Nongfu Spring Co. Ltd., Class H(a)(b) | | | 629,400 | | | | 3,355,396 | |
| | |
Ovctek China, Inc., Class A | | | 129,100 | | | | 742,903 | |
| | |
Pharmaron Beijing Co. Ltd., Class A | | | 82,800 | | | | 1,539,106 | |
| | |
Pinduoduo, Inc., ADR* | | | 226,066 | | | | 9,067,507 | |
| | |
Ping An Bank Co. Ltd., Class A | | | 2,869,326 | | | | 6,951,723 | |
| | |
Ping An Healthcare and Technology Co. Ltd.*(a)(b) | | | 224,100 | | | | 589,481 | |
| | |
Ping An Insurance Group Co. of China Ltd., Class A | | | 1,787,400 | | | | 13,641,803 | |
| | |
Ping An Insurance Group Co. of China Ltd., Class H | | | 2,766,500 | | | | 19,658,774 | |
| | |
Pop Mart International Group Ltd.*(a)(b) | | | 337,200 | | | | 1,481,176 | |
See Notes to Financial Statements.
Schedule of Investments (continued)
WisdomTree Emerging Markets ex-State-Owned Enterprises Fund (XSOE)
March 31, 2022
| | | | | | | | |
| Investments | | Shares | | | Value | |
| | |
RLX Technology, Inc., ADR*(b) | | | 345,346 | | | $ | 618,169 | |
| | |
Rongsheng Petrochemical Co. Ltd., Class A | | | 406,800 | | | | 916,375 | |
| | |
Sangfor Technologies, Inc., Class A | | | 46,900 | | | | 824,209 | |
| | |
Sany Heavy Industry Co. Ltd., Class A | | | 1,688,536 | | | | 4,660,158 | |
| | |
SF Holding Co. Ltd., Class A | | | 275,973 | | | | 1,986,731 | |
| | |
SG Micro Corp., Class A | | | 38,000 | | | | 1,954,563 | |
| | |
Shandong Weigao Group Medical Polymer Co. Ltd., Class H | | | 2,193,000 | | | | 2,349,423 | |
| | |
Shanghai Fosun Pharmaceutical Group Co. Ltd., Class H | | | 646,000 | | | | 3,159,307 | |
| | |
Shanghai Putailai New Energy Technology Co. Ltd., Class A | | | 64,900 | | | | 1,436,815 | |
| | |
Shenzhen Capchem Technology Co. Ltd., Class A | | | 65,900 | | | | 846,575 | |
| | |
Shenzhen Inovance Technology Co. Ltd., Class A | | | 314,100 | | | | 2,820,324 | |
| | |
Shenzhen Kangtai Biological Products Co. Ltd., Class A | | | 82,900 | | | | 1,217,754 | |
| | |
Shenzhen Mindray Bio-Medical Electronics Co. Ltd., Class A | | | 88,600 | | | | 4,288,267 | |
| | |
Shenzhen Transsion Holdings Co. Ltd., Class A | | | 53,664 | | | | 808,244 | |
| | |
Shenzhou International Group Holdings Ltd. | | | 535,600 | | | | 7,167,413 | |
| | |
Sichuan Yahua Industrial Group Co. Ltd., Class A | | | 312,500 | | | | 1,420,701 | |
| | |
Sino Biopharmaceutical Ltd. | | | 7,920,000 | | | | 4,945,323 | |
| | |
SITC International Holdings Co. Ltd. | | | 663,000 | | | | 2,349,293 | |
| | |
Sunac China Holdings Ltd.(b) | | | 1,722,000 | | | | 1,007,069 | |
| | |
Sungrow Power Supply Co. Ltd., Class A | | | 201,400 | | | | 3,402,934 | |
| | |
Sunny Optical Technology Group Co. Ltd. | | | 460,900 | | | | 7,421,341 | |
| | |
Suzhou TA&A Ultra Clean Technology Co. Ltd., Class A | | | 88,700 | | | | 1,000,444 | |
| | |
TBEA Co. Ltd., Class A | | | 724,400 | | | | 2,325,621 | |
| | |
TCL Technology Group Corp., Class A | | | 4,279,000 | | | | 3,309,634 | |
| | |
Tencent Holdings Ltd. | | | 2,995,300 | | | | 143,121,442 | |
| | |
Tencent Music Entertainment Group, ADR* | | | 310,775 | | | | 1,513,474 | |
| | |
Thunder Software Technology Co. Ltd., Class A | | | 74,600 | | | | 1,165,754 | |
| | |
Tingyi Cayman Islands Holding Corp. | | | 1,966,000 | | | | 3,313,737 | |
| | |
Tongcheng Travel Holdings Ltd.* | | | 1,067,600 | | | | 1,908,522 | |
| | |
Tongkun Group Co. Ltd., Class A | | | 451,300 | | | | 1,242,691 | |
| | |
Tongwei Co. Ltd., Class A | | | 651,158 | | | | 4,378,938 | |
| | |
Topchoice Medical Corp., Class A* | | | 50,200 | | | | 1,131,459 | |
| | |
Topsports International Holdings Ltd.(a) | | | 1,374,000 | | | | 1,149,181 | |
| | |
Trip.com Group Ltd.* | | | 225,320 | | | | 5,426,278 | |
| | |
United Energy Group Ltd.(b) | | | 7,304,000 | | | | 839,390 | |
| | |
Venus MedTech Hangzhou, Inc., Class H*(a)(b) | | | 253,000 | | | | 523,355 | |
| | |
Vipshop Holdings Ltd., ADR* | | | 241,754 | | | | 2,175,786 | |
| | |
Vnet Group, Inc., ADR* | | | 16,205 | | | | 94,475 | |
| | |
Walvax Biotechnology Co. Ltd., Class A | | | 421,000 | | | | 3,638,927 | |
| | |
Want Want China Holdings Ltd. | | | 3,226,000 | | | | 2,982,384 | |
| | |
Weimob, Inc.*(a)(b) | | | 1,616,000 | | | | 1,064,760 | |
| | |
Wens Foodstuffs Group Co. Ltd., Class A | | | 707,100 | | | | 2,456,098 | |
| | |
WH Group Ltd.(a) | | | 6,899,730 | | | | 4,361,118 | |
| | |
Will Semiconductor Co. Ltd., Class A | | | 97,200 | | | | 2,961,277 | |
| | |
Wingtech Technology Co. Ltd., Class A | | | 104,870 | | | | 1,343,068 | |
| | |
WuXi AppTec Co. Ltd., Class A | | | 583,273 | | | | 10,325,644 | |
| | |
Wuxi Biologics Cayman, Inc.*(a) | | | 2,108,000 | | | | 17,509,692 | |
| | |
Wuxi Lead Intelligent Equipment Co. Ltd., Class A | | | 204,600 | | | | 1,883,528 | |
| | |
XD, Inc.*(b) | | | 118,000 | | | | 366,141 | |
| | |
Xinjiang Goldwind Science & Technology Co. Ltd., Class A | | | 938,700 | | | | 1,941,546 | |
| | |
Xinyi Glass Holdings Ltd. | | | 2,030,000 | | | | 4,925,045 | |
| | |
Xinyi Solar Holdings Ltd. | | | 2,709,753 | | | | 4,781,876 | |
| | |
XPeng, Inc., ADR* | | | 141,692 | | | | 3,909,282 | |
| | |
Xtep International Holdings Ltd.(b) | | | 770,500 | | | | 1,168,825 | |
| | |
Yidu Tech, Inc.*(a)(b) | | | 247,100 | | | | 308,899 | |
| | |
Yihai International Holding Ltd.* | | | 195,000 | | | | 560,245 | |
| | |
Yonyou Network Technology Co. Ltd., Class A | | | 450,300 | | | | 1,624,403 | |
| | |
Yum China Holdings, Inc. | | | 224,785 | | | | 9,337,569 | |
| | |
Zai Lab Ltd.*(b) | | | 371,590 | | | | 1,705,782 | |
| | |
Zhejiang Century Huatong Group Co. Ltd., Class A* | | | 1,204,400 | | | | 1,189,582 | |
| | |
Zhejiang Chint Electrics Co. Ltd., Class A | | | 250,600 | | | | 1,562,475 | |
| | |
Zhejiang Dahua Technology Co. Ltd., Class A | | | 342,000 | | | | 891,621 | |
| | |
Zhejiang Huayou Cobalt Co. Ltd., Class A | | | 166,700 | | | | 2,568,211 | |
| | |
Zhejiang Jingsheng Mechanical & Electrical Co. Ltd., Class A | | | 130,100 | | | | 1,229,659 | |
| | |
Zhejiang Longsheng Group Co. Ltd., Class A | | | 802,200 | | | | 1,377,417 | |
| | |
Zhejiang NHU Co. Ltd., Class A | | | 242,700 | | | | 1,211,187 | |
| | |
Zhejiang Sanhua Intelligent Controls Co. Ltd., Class A* | | | 350,600 | | | | 917,908 | |
| | |
Zhejiang Yongtai Technology Co. Ltd., Class A* | | | 165,400 | | | | 996,345 | |
| | |
ZhongAn Online P&C Insurance Co. Ltd., Class H*(a)(b) | | | 303,700 | | | | 1,035,420 | |
| | |
Zhongsheng Group Holdings Ltd. | | | 251,000 | | | | 1,775,596 | |
| | |
Zhuzhou CRRC Times Electric Co. Ltd., Class H | | | 247,400 | | | | 971,416 | |
| | |
ZTO Express Cayman, Inc. | | | 253,712 | | | | 6,466,394 | |
| | | | | | | | |
| Total China | | | | 900,937,995 | |
|
| Czech Republic – 0.0% | |
| | |
Moneta Money Bank AS(a) | | | 330,022 | | | | 1,346,246 | |
|
| Hungary – 0.3% | |
| | |
MOL Hungarian Oil & Gas PLC | | | 312,077 | | | | 2,770,371 | |
| | |
OTP Bank Nyrt* | | | 167,104 | | | | 6,148,836 | |
| | | | | | | | |
| Total Hungary | | | | 8,919,207 | |
|
| India – 18.2% | |
| | |
Aarti Industries Ltd. | | | 245,080 | | | | 3,094,105 | |
| | |
Aavas Financiers Ltd.* | | | 27,779 | | | | 941,956 | |
| | |
Adani Green Energy Ltd.* | | | 268,612 | | | | 6,787,349 | |
| | |
Adani Total Gas Ltd. | | | 161,366 | | | | 4,578,088 | |
| | |
Adani Transmission Ltd.* | | | 147,732 | | | | 4,616,978 | |
| | |
Alkem Laboratories Ltd. | | | 27,178 | | | | 1,298,626 | |
| | |
APL Apollo Tubes Ltd.* | | | 120,964 | | | | 1,460,029 | |
| | |
Apollo Hospitals Enterprise Ltd. | | | 109,504 | | | | 6,526,308 | |
| | |
Ashok Leyland Ltd. | | | 2,215,808 | | | | 3,428,617 | |
| | |
Asian Paints Ltd. | | | 329,877 | | | | 13,408,178 | |
| | |
Astral Ltd. | | | 126,951 | | | | 3,389,185 | |
| | |
Atul Ltd. | | | 25,076 | | | | 3,406,084 | |
See Notes to Financial Statements.
Schedule of Investments (continued)
WisdomTree Emerging Markets ex-State-Owned Enterprises Fund (XSOE)
March 31, 2022
| | | | | | | | |
| Investments | | Shares | | | Value | |
| | |
AU Small Finance Bank Ltd.*(a) | | | 125,510 | | | $ | 2,064,227 | |
| | |
Aurobindo Pharma Ltd. | | | 208,168 | | | | 1,836,631 | |
| | |
Avenue Supermarts Ltd.*(a) | | | 118,177 | | | | 6,243,535 | |
| | |
Axis Bank Ltd.* | | | 1,491,446 | | | | 14,981,381 | |
| | |
Bajaj Finance Ltd. | | | 183,079 | | | | 17,540,672 | |
| | |
Bajaj Finserv Ltd. | | | 15,219 | | | | 3,426,499 | |
| | |
Bandhan Bank Ltd.(a) | | | 500,755 | | | | 2,031,436 | |
| | |
Bata India Ltd. | | | 2,403 | | | | 62,201 | |
| | |
Bharat Forge Ltd. | | | 330,373 | | | | 3,054,561 | |
| | |
Bharti Airtel Ltd.* | | | 1,678,260 | | | | 16,720,586 | |
| | |
Biocon Ltd.* | | | 167,148 | | | | 740,282 | |
| | |
Britannia Industries Ltd. | | | 96,409 | | | | 4,079,522 | |
| | |
Carborundum Universal Ltd. | | | 110,329 | | | | 1,161,530 | |
| | |
CG Power & Industrial Solutions Ltd.* | | | 524,285 | | | | 1,310,799 | |
| | |
Cholamandalam Investment and Finance Co. Ltd. | | | 186,843 | | | | 1,771,526 | |
| | |
Cipla Ltd. | | | 385,325 | | | | 5,176,907 | |
| | |
Coforge Ltd. | | | 14,195 | | | | 835,028 | |
| | |
Crompton Greaves Consumer Electricals Ltd. | | | 551,672 | | | | 2,722,868 | |
| | |
Cummins India Ltd. | | | 105,189 | | | | 1,556,561 | |
| | |
Cyient Ltd. | | | 71,026 | | | | 869,606 | |
| | |
Dalmia Bharat Ltd. | | | 62,297 | | | | 1,229,580 | |
| | |
Deepak Nitrite Ltd. | | | 33,099 | | | | 980,084 | |
| | |
Divi’s Laboratories Ltd. | | | 109,330 | | | | 6,351,384 | |
| | |
Dr. Lal PathLabs Ltd.(a) | | | 19,588 | | | | 674,872 | |
| | |
Dr. Reddy’s Laboratories Ltd. | | | 92,773 | | | | 5,259,014 | |
| | |
Eicher Motors Ltd. | | | 144,509 | | | | 4,685,982 | |
| | |
Emami Ltd. | | | 221,064 | | | | 1,304,504 | |
| | |
Escorts Ltd. | | | 73,615 | | | | 1,642,652 | |
| | |
Exide Industries Ltd. | | | 22,977 | | | | 45,818 | |
| | |
Federal Bank Ltd. | | | 1,196,069 | | | | 1,537,408 | |
| | |
Fortis Healthcare Ltd.* | | | 351,343 | | | | 1,346,486 | |
| | |
Gland Pharma Ltd.*(a) | | | 21,354 | | | | 922,259 | |
| | |
Godrej Consumer Products Ltd.* | | | 348,667 | | | | 3,438,586 | |
| | |
Godrej Properties Ltd.* | | | 134,453 | | | | 2,967,104 | |
| | |
Grasim Industries Ltd. | | | 269,395 | | | | 5,915,847 | |
| | |
Happiest Minds Technologies Ltd. | | | 42,553 | | | | 593,383 | |
| | |
Havells India Ltd. | | | 72,123 | | | | 1,097,002 | |
| | |
HCL Technologies Ltd. | | | 808,923 | | | | 12,423,413 | |
| | |
HDFC Life Insurance Co. Ltd.(a) | | | 681,618 | | | | 4,841,264 | |
| | |
Hero MotoCorp Ltd. | | | 109,571 | | | | 3,317,352 | |
| | |
Hindustan Unilever Ltd. | | | 597,847 | | | | 16,163,369 | |
| | |
Housing Development Finance Corp. Ltd. | | | 1,187,598 | | | | 37,463,995 | |
| | |
ICICI Bank Ltd., ADR | | | 1,207,726 | | | | 22,874,330 | |
| | |
ICICI Lombard General Insurance Co. Ltd.(a) | | | 209,388 | | | | 3,670,473 | |
| | |
ICICI Prudential Life Insurance Co. Ltd.(a) | | | 385,826 | | | | 2,550,449 | |
| | |
IDFC First Bank Ltd.* | | | 1,685,836 | | | | 883,242 | |
| | |
Indiabulls Housing Finance Ltd. | | | 283,918 | | | | 591,254 | |
| | |
IndiaMart InterMesh Ltd.(a) | | | 8,647 | | | | 493,276 | |
| | |
Indian Hotels Co. Ltd. | | | 349,863 | | | | 1,101,185 | |
| | |
Indus Towers Ltd.* | | | 845,021 | | | | 2,476,238 | |
| | |
Info Edge India Ltd. | | | 51,681 | | | | 3,075,591 | |
| | |
Infosys Ltd., ADR | | | 2,125,657 | | | | 52,907,603 | |
| | |
Ipca Laboratories Ltd. | | | 123,412 | | | | 1,735,748 | |
| | |
Jindal Steel & Power Ltd. | | | 299,700 | | | | 2,107,491 | |
| | |
JSW Steel Ltd. | | | 416,690 | | | | 4,028,874 | |
| | |
Jubilant Foodworks Ltd. | | | 35,428 | | | | 1,232,675 | |
| | |
Kajaria Ceramics Ltd. | | | 76,688 | | | | 1,031,581 | |
| | |
Kotak Mahindra Bank Ltd. | | | 767,769 | | | | 17,770,395 | |
| | |
Laurus Labs Ltd.(a) | | | 234,083 | | | | 1,822,928 | |
| | |
Lupin Ltd. | | | 231,588 | | | | 2,283,178 | |
| | |
Mahindra & Mahindra Financial Services Ltd. | | | 356,074 | | | | 747,861 | |
| | |
Mahindra & Mahindra Ltd. | | | 746,565 | | | | 7,946,447 | |
| | |
Maruti Suzuki India Ltd. | | | 94,341 | | | | 9,413,931 | |
| | |
Max Financial Services Ltd.* | | | 193,613 | | | | 1,926,293 | |
| | |
Max Healthcare Institute Ltd.* | | | 182,149 | | | | 835,686 | |
| | |
Motherson Sumi Systems Ltd. | | | 1,288,444 | | | | 2,371,145 | |
| | |
Motherson Sumi Wiring India Ltd.* | | | 1,327,004 | | | | 1,128,676 | |
| | |
Mphasis Ltd. | | | 38,100 | | | | 1,697,895 | |
| | |
Navin Fluorine International Ltd. | | | 35,639 | | | | 1,919,967 | |
| | |
Nestle India Ltd. | | | 30,817 | | | | 7,068,511 | |
| | |
Page Industries Ltd. | | | 5,982 | | | | 3,409,551 | |
| | |
Persistent Systems Ltd. | | | 32,396 | | | | 2,037,303 | |
| | |
PI Industries Ltd. | | | 79,436 | | | | 2,955,879 | |
| | |
Piramal Enterprises Ltd. | | | 134,772 | | | | 3,889,579 | |
| | |
RBL Bank Ltd.*(a) | | | 440,617 | | | | 757,088 | |
| | |
Reliance Industries Ltd., GDR(a) | | | 68,168 | | | | 4,703,592 | |
| | |
Reliance Industries Ltd., GDR(a)(b) | | | 923,493 | | | | 63,721,017 | |
| | |
Shriram Transport Finance Co. Ltd. | | | 151,487 | | | | 2,268,756 | |
| | |
Sun Pharmaceutical Industries Ltd. | | | 819,688 | | | | 9,895,211 | |
| | |
Sundaram Finance Ltd. | | | 118,656 | | | | 3,038,157 | |
| | |
Supreme Industries Ltd. | | | 101,703 | | | | 2,747,692 | |
| | |
Tata Chemicals Ltd. | | | 99,242 | | | | 1,276,100 | |
| | |
Tata Consumer Products Ltd. | | | 434,005 | | | | 4,452,596 | |
| | |
Tata Elxsi Ltd. | | | 17,720 | | | | 2,067,271 | |
| | |
Tata Motors Ltd.* | | | 1,237,672 | | | | 7,084,662 | |
| | |
Tata Steel Ltd. | | | 712,017 | | | | 12,283,057 | |
| | |
Tech Mahindra Ltd. | | | 479,090 | | | | 9,480,323 | |
| | |
Titan Co. Ltd. | | | 326,374 | | | | 10,923,569 | |
| | |
Torrent Pharmaceuticals Ltd. | | | 70,384 | | | | 2,593,317 | |
| | |
Trent Ltd. | | | 159,659 | | | | 2,687,497 | |
| | |
Tube Investments of India Ltd. | | | 62,885 | | | | 1,348,324 | |
| | |
UltraTech Cement Ltd. | | | 103,786 | | | | 9,042,907 | |
| | |
United Spirits Ltd.* | | | 329,376 | | | | 3,861,447 | |
| | |
Vedanta Ltd. | | | 1,328,400 | | | | 7,071,067 | |
| | |
Vodafone Idea Ltd.* | | | 6,817,738 | | | | 868,244 | |
| | |
Voltas Ltd. | | | 275,864 | | | | 4,533,963 | |
| | |
Wipro Ltd. | | | 1,000,802 | | | | 7,817,548 | |
| | |
Zee Entertainment Enterprises Ltd. | | | 1,032,825 | | | | 3,930,255 | |
| | | | | | | | |
| Total India | | | | 603,762,114 | |
|
| Indonesia – 2.1% | |
| | |
Astra International Tbk PT | | | 19,145,500 | | | | 8,764,607 | |
| | |
Bank Central Asia Tbk PT | | | 51,898,700 | | | | 28,817,555 | |
| | |
Bank Jago Tbk PT* | | | 3,774,500 | | | | 3,850,056 | |
| | |
Barito Pacific Tbk PT | | | 24,002,500 | | | | 1,512,429 | |
| | |
Chandra Asri Petrochemical Tbk PT | | | 2,500,900 | | | | 1,758,683 | |
See Notes to Financial Statements.
Schedule of Investments (continued)
WisdomTree Emerging Markets ex-State-Owned Enterprises Fund (XSOE)
March 31, 2022
| | | | | | | | |
| Investments | | Shares | | | Value | |
| | |
Charoen Pokphand Indonesia Tbk PT | | | 8,958,100 | | | $ | 3,523,987 | |
| | |
Elang Mahkota Teknologi Tbk PT* | | | 21,385,000 | | | | 3,647,920 | |
| | |
Indocement Tunggal Prakarsa Tbk PT | | | 2,663,400 | | | | 1,998,129 | |
| | |
Kalbe Farma Tbk PT | | | 25,602,500 | | | | 2,869,976 | |
| | |
Merdeka Copper Gold Tbk PT* | | | 9,842,600 | | | | 3,104,402 | |
| | |
Sarana Menara Nusantara Tbk PT | | | 33,056,200 | | | | 2,462,673 | |
| | |
Sumber Alfaria Trijaya Tbk PT | | | 19,394,000 | | | | 2,052,489 | |
| | |
Tower Bersama Infrastructure Tbk PT | | | 7,894,800 | | | | 1,577,586 | |
| | |
United Tractors Tbk PT | | | 1,595,400 | | | | 2,838,118 | |
| | | | | | | | |
| Total Indonesia | | | | 68,778,610 | |
|
| Malaysia – 1.5% | |
| | |
AMMB Holdings Bhd* | | | 1,661,500 | | | | 1,466,000 | |
| | |
Genting Malaysia Bhd | | | 4,694,900 | | | | 3,327,380 | |
| | |
Hartalega Holdings Bhd | | | 2,762,100 | | | | 3,185,965 | |
| | |
Hong Leong Bank Bhd | | | 2,089,508 | | | | 10,038,186 | |
| | |
Inari Amertron Bhd | | | 3,308,500 | | | | 2,415,624 | |
| | |
Malaysian Pacific Industries Bhd | | | 126,500 | | | | 1,095,095 | |
| | |
MR DIY Group M Bhd(a) | | | 2,063,500 | | | | 1,698,011 | |
| | |
My EG Services Bhd | | | 4,663,500 | | | | 1,131,285 | |
| | |
Nestle Malaysia Bhd | | | 232,200 | | | | 7,377,827 | |
| | |
Press Metal Aluminium Holdings Bhd | | | 7,165,800 | | | | 10,566,136 | |
| | |
QL Resources Bhd | | | 2,041,925 | | | | 2,437,830 | |
| | |
Top Glove Corp. Bhd | | | 8,008,900 | | | | 3,657,075 | |
| | |
VS Industry Bhd | | | 4,028,000 | | | | 986,703 | |
| | | | | | | | |
| Total Malaysia | | | | 49,383,117 | |
|
| Mexico – 2.6% | |
| | |
Alfa SAB de CV, Class A | | | 4,630,933 | | | | 3,508,845 | |
| | |
Alsea SAB de CV* | | | 513,337 | | | | 1,283,471 | |
| | |
America Movil SAB de CV, Series L | | | 16,051,251 | | | | 16,999,419 | |
| | |
Banco del Bajio SA(a) | | | 913,030 | | | | 2,500,279 | |
| | |
Cemex SAB de CV, Series CPO*(b) | | | 9,540,807 | | | | 5,114,393 | |
| | |
Controladora Vuela Cia de Aviacion SAB de CV, Class A*(b) | | | 630,343 | | | | 1,148,664 | |
| | |
Corp. Inmobiliaria Vesta SAB de CV(b) | | | 952,840 | | | | 1,817,573 | |
| | |
Fibra Uno Administracion SA de CV | | | 3,284,503 | | | | 3,837,575 | |
| | |
Fomento Economico Mexicano SAB de CV | | | 1,387,959 | | | | 11,509,021 | |
| | |
Grupo Aeroportuario del Centro Norte SAB de CV | | | 152,597 | | | | 1,138,853 | |
| | |
Grupo Aeroportuario del Pacifico SAB de CV, Class B* | | | 255,192 | | | | 4,128,347 | |
| | |
Grupo Aeroportuario del Sureste SAB de CV, Class B | | | 78,667 | | | | 1,751,211 | |
| | |
Grupo Bimbo SAB de CV, Series A | | | 558,187 | | | | 1,681,111 | |
| | |
Grupo Elektra SAB de CV(b) | | | 358 | | | | 23,217 | |
| | |
Grupo Financiero Banorte SAB de CV, Class O | | | 1,425,051 | | | | 10,686,811 | |
| | |
Grupo Televisa SAB, Series CPO | | | 1,581,711 | | | | 3,708,796 | |
| | |
Megacable Holdings SAB de CV, Series CPO | | | 660,393 | | | | 1,984,623 | |
| | |
Wal-Mart de Mexico SAB de CV | | | 3,530,206 | | | | 14,501,779 | |
| | | | | | | | |
| Total Mexico | | | | 87,323,988 | |
|
| Philippines – 0.8% | |
| | |
Ayala Corp. | | | 62,610 | | | | 997,017 | |
| | |
Ayala Land, Inc. | | | 3,167,900 | | | | 2,145,809 | |
| | |
Globe Telecom, Inc. | | | 11,705 | | | | 574,562 | |
| | |
JG Summit Holdings, Inc. | | | 898,530 | | | | 1,064,449 | |
| | |
Jollibee Foods Corp. | | | 593,030 | | | | 2,578,640 | |
| | |
PLDT, Inc. | | | 35,765 | | | | 1,278,679 | |
| | |
SM Investments Corp. | | | 389,795 | | | | 6,847,496 | |
| | |
SM Prime Holdings, Inc. | | | 10,148,600 | | | | 7,423,413 | |
| | |
Universal Robina Corp. | | | 1,012,430 | | | | 2,367,456 | |
| | | | | | | | |
| Total Philippines | | | | 25,277,521 | |
|
| Poland – 0.8% | |
| | |
Allegro.eu SA*(a)(b) | | | 347,197 | | | | 2,963,536 | |
| | |
Asseco Poland SA | | | 119,268 | | | | 2,308,228 | |
| | |
Bank Polska Kasa Opieki SA | | | 109,932 | | | | 2,978,300 | |
| | |
CCC SA* | | | 5,945 | | | | 84,883 | |
| | |
CD Projekt SA(b) | | | 70,837 | | | | 2,953,319 | |
| | |
Cyfrowy Polsat SA | | | 519,088 | | | | 3,457,888 | |
| | |
LPP SA | | | 1,692 | | | | 4,657,086 | |
| | |
Orange Polska SA* | | | 1,065,114 | | | | 2,016,618 | |
| | |
Santander Bank Polska SA | | | 64,663 | | | | 4,732,669 | |
| | | | | | | | |
| Total Poland | | | | 26,152,527 | |
|
| Russia – 0.0% | |
| | |
Evraz PLC† | | | 757,034 | | | | 0 | |
| | |
HeadHunter Group PLC, ADR† | | | 35,535 | | | | 0 | |
| | |
Lukoil PJSC, ADR† | | | 474,585 | | | | 0 | |
| | |
Magnitogorsk Iron & Steel Works PJSC, GDR†(c) | | | 101,979 | | | | 0 | |
| | |
Mobile TeleSystems PJSC, ADR† | | | 777,676 | | | | 0 | |
| | |
Novatek PJSC, GDR†(c) | | | 113,858 | | | | 0 | |
| | |
Novolipetsk Steel PJSC, GDR† | | | 94,854 | | | | 0 | |
| | |
Ozon Holdings PLC, ADR*†(b) | | | 43,104 | | | | 0 | |
| | |
PhosAgro PJSC, GDR†(c) | | | 130,360 | | | | 0 | |
| | |
Polymetal International PLC | | | 354,651 | | | | 1,434,946 | |
| | |
Polyus PJSC, GDR†(c) | | | 75,186 | | | | 0 | |
| | |
Severstal PAO, GDR†(c) | | | 123,722 | | | | 0 | |
| | |
Sistema PJSFC, GDR†(c) | | | 212,810 | | | | 0 | |
| | |
Surgutneftegas PJSC, ADR† | | | 720,104 | | | | 0 | |
| | |
VK Co. Ltd., GDR*† | | | 167,707 | | | | 0 | |
| | |
X5 Retail Group NV, GDR†(c) | | | 166,238 | | | | 0 | |
| | |
Yandex NV, Class A*† | | | 402,553 | | | | 0 | |
| | | | | | | | |
| Total Russia | | | | 1,434,946 | |
|
| South Africa – 5.0% | |
| | |
Absa Group Ltd. | | | 573,806 | | | | 7,478,229 | |
| | |
Anglo American Platinum Ltd. | | | 20,805 | | | | 2,856,845 | |
| | |
AngloGold Ashanti Ltd. | | | 258,709 | | | | 6,205,475 | |
| | |
Aspen Pharmacare Holdings Ltd. | | | 334,802 | | | | 4,551,016 | |
| | |
AVI Ltd. | | | 458,239 | | | | 2,261,012 | |
| | |
Barloworld Ltd. | | | 100,587 | | | | 801,943 | |
| | |
Bid Corp. Ltd. | | | 264,306 | | | | 5,752,239 | |
| | |
Capitec Bank Holdings Ltd. | | | 63,461 | | | | 10,169,177 | |
| | |
Clicks Group Ltd. | | | 215,092 | | | | 4,549,131 | |
| | |
Discovery Ltd.* | | | 334,494 | | | | 4,170,044 | |
| | |
FirstRand Ltd.(b) | | | 3,886,419 | | | | 20,604,337 | |
| | |
Gold Fields Ltd. | | | 592,692 | | | | 9,249,849 | |
| | |
Growthpoint Properties Ltd. | | | 4,957,193 | | | | 4,993,662 | |
See Notes to Financial Statements.
Schedule of Investments (continued)
WisdomTree Emerging Markets ex-State-Owned Enterprises Fund (XSOE)
March 31, 2022
| | | | | | | | |
| Investments | | Shares | | | Value | |
| | |
Impala Platinum Holdings Ltd. | | | 472,170 | | | $ | 7,271,337 | |
| | |
Investec Ltd. | | | 195,465 | | | | 1,304,349 | |
| | |
Motus Holdings Ltd. | | | 132,965 | | | | 976,093 | |
| | |
Mr. Price Group Ltd. | | | 96,053 | | | | 1,423,195 | |
| | |
MultiChoice Group | | | 268,604 | | | | 2,421,434 | |
| | |
Naspers Ltd., Class N | | | 135,674 | | | | 15,451,005 | |
| | |
Nedbank Group Ltd. | | | 448,644 | | | | 7,155,891 | |
| | |
Northam Platinum Holdings Ltd.* | | | 233,102 | | | | 3,478,863 | |
| | |
Old Mutual Ltd. | | | 1,485,306 | | | | 1,399,669 | |
| | |
Pick n Pay Stores Ltd. | | | 397,715 | | | | 1,463,210 | |
| | |
Redefine Properties Ltd. | | | 2,960,236 | | | | 935,931 | |
| | |
Sanlam Ltd. | | | 1,642,583 | | | | 8,115,962 | |
| | |
Shoprite Holdings Ltd. | | | 357,903 | | | | 5,796,498 | |
| | |
Sibanye Stillwater Ltd.(b) | | | 1,724,361 | | | | 7,056,752 | |
| | |
Standard Bank Group Ltd. | | | 1,016,355 | | | | 12,668,530 | |
| | |
Tiger Brands Ltd. | | | 143,928 | | | | 1,594,658 | |
| | |
Vodacom Group Ltd. | | | 226,386 | | | | 2,478,820 | |
| | |
Woolworths Holdings Ltd.(b) | | | 257,306 | | | | 1,017,426 | |
| | | | | | | | |
| Total South Africa | | | | 165,652,582 | |
|
| South Korea – 15.5% | |
| | |
AfreecaTV Co. Ltd. | | | 6,835 | | | | 834,603 | |
| | |
Alteogen, Inc.* | | | 20,325 | | | | 949,132 | |
| | |
Amorepacific Corp. | | | 22,143 | | | | 2,923,048 | |
| | |
Bioneer Corp.*(b) | | | 17,185 | | | | 551,542 | |
| | |
BNC Korea Co. Ltd.*(b) | | | 31,155 | | | | 350,865 | |
| | |
Celltrion Healthcare Co. Ltd. | | | 59,088 | | | | 3,168,780 | |
| | |
Celltrion Pharm, Inc.* | | | 12,245 | | | | 988,046 | |
| | |
Celltrion, Inc.(b) | | | 61,936 | | | | 8,763,685 | |
| | |
Coway Co. Ltd. | | | 62,836 | | | | 3,551,228 | |
| | |
CS Wind Corp.(b) | | | 14,470 | | | | 756,898 | |
| | |
Daejoo Electronic Materials Co. Ltd. | | | 9,245 | | | | 726,145 | |
| | |
DB HiTek Co. Ltd. | | | 25,630 | | | | 1,583,835 | |
| | |
DB Insurance Co. Ltd. | | | 62,752 | | | | 3,618,964 | |
| | |
DGB Financial Group, Inc. | | | 154,657 | | | | 1,191,780 | |
| | |
Dongsuh Cos., Inc. | | | 65,916 | | | | 1,490,119 | |
| | |
Doosan Fuel Cell Co. Ltd.*(b) | | | 32,029 | | | | 1,080,802 | |
| | |
Doosan Heavy Industries & Construction Co. Ltd.*(b) | | | 184,494 | | | | 3,112,827 | |
| | |
Douzone Bizon Co. Ltd. | | | 13,744 | | | | 526,718 | |
| | |
E-Mart, Inc. | | | 18,866 | | | | 2,194,716 | |
| | |
Ecopro BM Co. Ltd.(b) | | | 8,150 | | | | 2,674,192 | |
| | |
Ecopro Co. Ltd.(b) | | | 10,874 | | | | 826,282 | |
| | |
Eubiologics Co. Ltd.* | | | 21,105 | | | | 430,092 | |
| | |
Fila Holdings Corp.(b) | | | 42,989 | | | | 1,115,469 | |
| | |
GeneOne Life Science, Inc.* | | | 45,214 | | | | 557,691 | |
| | |
Genexine, Inc.*(b) | | | 15,532 | | | | 590,755 | |
| | |
Green Cross Corp. | | | 5,186 | | | | 864,298 | |
| | |
GS Engineering & Construction Corp. | | | 117,875 | | | | 4,512,520 | |
| | |
GS Holdings Corp. | | | 83,171 | | | | 3,012,423 | |
| | |
Hana Financial Group, Inc. | | | 258,986 | | | | 10,384,654 | |
| | |
Hanmi Pharm Co. Ltd. | | | 10,209 | | | | 2,307,880 | |
| | |
Hanmi Science Co. Ltd.(b) | | | 30,771 | | | | 1,133,555 | |
| | |
Hanon Systems | | | 239,648 | | | | 2,333,110 | |
| | |
Hansol Chemical Co. Ltd. | | | 5,225 | | | | 1,058,321 | |
| | |
Hanwha Solutions Corp.* | | | 98,296 | | | | 2,915,508 | |
| | |
HLB Life Science Co. Ltd.*(b) | | | 75,410 | | | | 637,723 | |
| | |
HLB, Inc.*(b) | | | 61,454 | | | | 1,554,032 | |
| | |
HYBE Co. Ltd.* | | | 9,345 | | | | 2,386,269 | |
| | |
Hyundai Glovis Co. Ltd. | | | 18,962 | | | | 3,011,580 | |
| | |
Hyundai Heavy Industries Holdings Co. Ltd. | | | 78,115 | | | | 3,467,338 | |
| | |
Hyundai Motor Co. | | | 75,843 | | | | 11,294,634 | |
| | |
Hyundai Steel Co. | | | 76,860 | | | | 2,634,820 | |
| | |
Kakao Corp. | | | 180,042 | | | | 15,819,870 | |
| | |
Kakao Games Corp.* | | | 17,990 | | | | 1,162,177 | |
| | |
KB Financial Group, Inc. | | | 283,266 | | | | 14,326,311 | |
| | |
Kia Corp. | | | 165,837 | | | | 10,124,944 | |
| | |
Korea Investment Holdings Co. Ltd. | | | 18,551 | | | | 1,199,949 | |
| | |
Korea Shipbuilding & Offshore Engineering Co. Ltd.* | | | 20,712 | | | | 1,519,159 | |
| | |
Korean Air Lines Co. Ltd.* | | | 53,970 | | | | 1,344,742 | |
| | |
Kumho Petrochemical Co. Ltd. | | | 7,335 | | | | 938,018 | |
| | |
L&F Co. Ltd.*(b) | | | 10,350 | | | | 1,928,163 | |
| | |
LEENO Industrial, Inc. | | | 6,935 | | | | 1,055,656 | |
| | |
LG Chem Ltd. | | | 26,159 | | | | 11,481,860 | |
| | |
LG Corp. | | | 73,325 | | | | 4,621,946 | |
| | |
LG Electronics, Inc. | | | 69,657 | | | | 6,925,183 | |
| | |
LG Household & Health Care Ltd. | | | 5,659 | | | | 4,005,958 | |
| | |
LG Innotek Co. Ltd. | | | 13,122 | | | | 4,189,773 | |
| | |
Lotte Chemical Corp.(b) | | | 11,224 | | | | 1,940,042 | |
| | |
Lotte Corp.(b) | | | 81,806 | | | | 2,186,803 | |
| | |
Macquarie Korea Infrastructure Fund | | | 357,814 | | | | 4,044,430 | |
| | |
Mando Corp. | | | 47,881 | | | | 1,987,059 | |
| | |
Mezzion Pharma Co. Ltd.* | | | 5,975 | | | | 361,344 | |
| | |
NAVER Corp. | | | 83,717 | | | | 23,518,533 | |
| | |
NCSoft Corp. | | | 10,666 | | | | 4,113,985 | |
| | |
Netmarble Corp.(a) | | | 28,143 | | | | 2,588,956 | |
| | |
OCI Co. Ltd. | | | 9,346 | | | | 809,645 | |
| | |
Osstem Implant Co. Ltd.† | | | 7,445 | | | | 657,400 | |
| | |
Pearl Abyss Corp.*(b) | | | 38,613 | | | | 3,169,831 | |
| | |
POSCO Chemical Co. Ltd. | | | 25,776 | | | | 2,562,607 | |
| | |
POSCO Holdings, Inc. | | | 51,824 | | | | 12,527,892 | |
| | |
Samsung Biologics Co. Ltd.*(a) | | | 10,224 | | | | 6,975,989 | |
| | |
Samsung Electro-Mechanics Co. Ltd. | | | 41,988 | | | | 5,715,952 | |
| | |
Samsung Electronics Co. Ltd. | | | 2,965,686 | | | | 170,299,695 | |
| | |
Samsung Engineering Co. Ltd.* | | | 67,671 | | | | 1,462,795 | |
| | |
Samsung Fire & Marine Insurance Co. Ltd. | | | 19,111 | | | | 3,453,083 | |
| | |
Samsung Heavy Industries Co. Ltd.* | | | 270,662 | | | | 1,268,397 | |
| | |
Samsung Life Insurance Co. Ltd. | | | 59,630 | | | | 3,242,124 | |
| | |
Samsung SDI Co. Ltd. | | | 33,738 | | | | 16,589,949 | |
| | |
Samsung SDS Co. Ltd. | | | 30,788 | | | | 3,518,121 | |
| | |
Seegene, Inc. | | | 30,050 | | | | 1,266,907 | |
| | |
Shin Poong Pharmaceutical Co. Ltd.*(b) | | | 18,595 | | | | 593,727 | |
| | |
Shinhan Financial Group Co. Ltd. | | | 393,433 | | | | 13,470,954 | |
| | |
Shinsegae, Inc. | | | 9,021 | | | | 1,909,069 | |
| | |
SK Chemicals Co. Ltd. | | | 11,175 | | | | 1,253,909 | |
| | |
SK Hynix, Inc. | | | 308,277 | | | | 30,012,529 | |
| | |
SK Innovation Co. Ltd.* | | | 33,577 | | | | 5,956,070 | |
See Notes to Financial Statements.
Schedule of Investments (continued)
WisdomTree Emerging Markets ex-State-Owned Enterprises Fund (XSOE)
March 31, 2022
| | | | | | | | |
| Investments | | Shares | | | Value | |
| | |
SK Square Co. Ltd.*(b) | | | 63,796 | | | $ | 2,989,656 | |
| | |
SK Telecom Co. Ltd. | | | 98,736 | | | | 4,635,187 | |
| | |
SM Entertainment Co. Ltd. | | | 13,522 | | | | 910,355 | |
| | |
Wemade Co. Ltd.(b) | | | 7,435 | | | | 634,893 | |
| | |
Yuhan Corp. | | | 14,539 | | | | 700,530 | |
| | | | | | | | |
| Total South Korea | | | | 516,039,006 | |
|
| Switzerland – 0.1% | |
| | |
Mediclinic International PLC* | | | 403,140 | | | | 1,905,828 | |
|
| Taiwan – 18.3% | |
| | |
Accton Technology Corp. | | | 391,000 | | | | 3,036,403 | |
| | |
Airtac International Group | | | 76,390 | | | | 2,482,212 | |
| | |
Alchip Technologies Ltd. | | | 66,000 | | | | 2,533,899 | |
| | |
AP Memory Technology Corp. | | | 114,000 | | | | 1,253,338 | |
| | |
ASE Technology Holding Co. Ltd. | | | 2,774,062 | | | | 10,020,956 | |
| | |
Asia Cement Corp. | | | 875,000 | | | | 1,484,215 | |
| | |
ASMedia Technology, Inc. | | | 24,000 | | | | 1,629,234 | |
| | |
Asustek Computer, Inc. | | | 603,000 | | | | 7,860,688 | |
| | |
AU Optronics Corp. | | | 8,040,000 | | | | 5,570,180 | |
| | |
Capital Securities Corp. | | | 2,855,000 | | | | 1,639,172 | |
| | |
Catcher Technology Co. Ltd. | | | 727,000 | | | | 3,666,527 | |
| | |
Cathay Financial Holding Co. Ltd. | | | 6,680,854 | | | | 15,039,879 | |
| | |
Chailease Holding Co. Ltd. | | | 1,075,702 | | | | 9,517,493 | |
| | |
Cheng Shin Rubber Industry Co. Ltd. | | | 589,000 | | | | 728,759 | |
| | |
Chroma ATE, Inc. | | | 316,000 | | | | 1,985,236 | |
| | |
CTBC Financial Holding Co. Ltd. | | | 19,358,672 | | | | 19,864,404 | |
| | |
Delta Electronics, Inc. | | | 1,191,500 | | | | 11,165,829 | |
| | |
E.Sun Financial Holding Co. Ltd. | | | 12,520,848 | | | | 14,443,014 | |
| | |
Elite Semiconductor Microelectronics Technology, Inc. | | | 254,000 | | | | 1,427,290 | |
| | |
ENNOSTAR, Inc.* | | | 461,000 | | | | 1,150,428 | |
| | |
Evergreen Marine Corp. Taiwan Ltd. | | | 1,931,000 | | | | 9,098,477 | |
| | |
Far Eastern International Bank | | | 3,490,974 | | | | 1,486,480 | |
| | |
Far Eastern New Century Corp. | | | 3,986,080 | | | | 4,229,336 | |
| | |
Feng TAY Enterprise Co. Ltd. | | | 520,000 | | | | 3,475,560 | |
| | |
Formosa Chemicals & Fibre Corp. | | | 3,505,000 | | | | 9,664,241 | |
| | |
Formosa Petrochemical Corp. | | | 298,000 | | | | 980,800 | |
| | |
Formosa Plastics Corp. | | | 2,945,000 | | | | 10,946,809 | |
| | |
Fubon Financial Holding Co. Ltd. | | | 5,517,160 | | | | 14,730,913 | |
| | |
Genius Electronic Optical Co. Ltd. | | | 81,000 | | | | 1,287,734 | |
| | |
Giant Manufacturing Co. Ltd. | | | 120,000 | | | | 1,091,042 | |
| | |
Great Wall Enterprise Co. Ltd. | | | 11,040 | | | | 20,846 | |
| | |
Hiwin Technologies Corp. | | | 123,000 | | | | 1,030,313 | |
| | |
Hon Hai Precision Industry Co. Ltd. | | | 7,071,068 | | | | 26,160,348 | |
| | |
Hotai Motor Co. Ltd. | | | 194,000 | | | | 4,049,072 | |
| | |
Innolux Corp. | | | 9,445,000 | | | | 5,538,139 | |
| | |
ITEQ Corp. | | | 168,000 | | | | 703,628 | |
| | |
King Yuan Electronics Co. Ltd. | | | 1,705,000 | | | | 2,549,928 | |
| | |
Kinsus Interconnect Technology Corp. | | | 112,000 | | | | 760,309 | |
| | |
Largan Precision Co. Ltd. | | | 75,000 | | | | 4,934,297 | |
| | |
Lien Hwa Industrial Holdings Corp. | | | 80,100 | | | | 179,482 | |
| | |
Lite-On Technology Corp. | | | 1,122,000 | | | | 2,666,813 | |
| | |
Macronix International Co. Ltd. | | | 1,380,000 | | | | 1,931,417 | |
| | |
MediaTek, Inc. | | | 931,000 | | | | 29,407,012 | |
| | |
Merida Industry Co. Ltd. | | | 83,000 | | | | 732,911 | |
| | |
Micro-Star International Co. Ltd. | | | 848,000 | | | | 3,847,617 | |
| | |
momo.com, Inc. | | | 31,000 | | | | 1,018,132 | |
| | |
Nan Ya Plastics Corp. | | | 4,509,000 | | | | 14,667,253 | |
| | |
Nan Ya Printed Circuit Board Corp. | | | 105,000 | | | | 1,920,318 | |
| | |
Novatek Microelectronics Corp. | | | 438,000 | | | | 6,519,973 | |
| | |
Pegatron Corp. | | | 1,453,000 | | | | 3,671,612 | |
| | |
President Chain Store Corp. | | | 96,000 | | | | 881,210 | |
| | |
Quanta Computer, Inc. | | | 2,068,000 | | | | 6,373,293 | |
| | |
Realtek Semiconductor Corp. | | | 307,000 | | | | 4,612,795 | |
| | |
Shanghai Commercial & Savings Bank Ltd. | | | 2,710,000 | | | | 4,748,163 | |
| | |
TA Chen Stainless Pipe* | | | 689,000 | | | | 1,178,333 | |
| | |
Taishin Financial Holding Co. Ltd. | | | 2,524,510 | | | | 1,806,274 | |
| | |
Taiwan Cement Corp. | | | 5,484,104 | | | | 9,551,220 | |
| | |
Taiwan Mobile Co. Ltd. | | | 1,405,000 | | | | 5,148,945 | |
| | |
Taiwan Semiconductor Manufacturing Co. Ltd. | | | 10,627,000 | | | | 221,430,606 | |
| | |
Tong Hsing Electronic Industries Ltd. | | | 134,000 | | | | 1,356,299 | |
| | |
Uni-President Enterprises Corp. | | | 3,836,160 | | | | 8,783,208 | |
| | |
Unimicron Technology Corp. | | | 1,033,000 | | | | 8,977,436 | |
| | |
United Microelectronics Corp. | | | 6,958,000 | | | | 13,113,868 | |
| | |
Voltronic Power Technology Corp. | | | 36,000 | | | | 1,834,459 | |
| | |
Walsin Lihwa Corp. | | | 1,044,000 | | | | 1,071,274 | |
| | |
Walsin Technology Corp.* | | | 282,000 | | | | 1,397,623 | |
| | |
Wan Hai Lines Ltd. | | | 833,000 | | | | 4,608,153 | |
| | |
Winbond Electronics Corp. | | | 3,308,000 | | | | 3,602,241 | |
| | |
Wisdom Marine Lines Co. Ltd. | | | 440,000 | | | | 1,326,842 | |
| | |
Wiwynn Corp. | | | 69,000 | | | | 2,456,416 | |
| | |
Yageo Corp. | | | 311,396 | | | | 4,716,886 | |
| | |
Yieh Phui Enterprise Co. Ltd.* | | | 915,000 | | | | 790,404 | |
| | |
Yuanta Financial Holding Co. Ltd. | | | 10,909,765 | | | | 10,052,451 | |
| | |
Zhen Ding Technology Holding Ltd. | | | 503,000 | | | | 1,887,248 | |
| | | | | | | | |
| Total Taiwan | | | | 607,505,615 | |
|
| Thailand – 2.1% | |
| | |
Advanced Info Service PCL, NVDR | | | 473,600 | | | | 3,318,761 | |
| | |
B Grimm Power PCL, NVDR(b) | | | 1,482,300 | | | | 1,571,461 | |
| | |
Bangkok Expressway & Metro PCL, NVDR(b) | | | 19,206,600 | | | | 5,025,486 | |
| | |
BTS Group Holdings PCL, NVDR(b) | | | 17,361,400 | | | | 4,803,756 | |
| | |
Bumrungrad Hospital PCL, NVDR | | | 927,900 | | | | 4,367,409 | |
| | |
Carabao Group PCL, NVDR(b) | | | 408,800 | | | | 1,327,832 | |
| | |
Central Pattana PCL, NVDR | | | 507,100 | | | | 899,816 | |
| | |
Central Retail Corp. PCL, NVDR | | | 3,258,683 | | | | 3,895,719 | |
| | |
CP ALL PCL, NVDR | | | 2,758,300 | | | | 5,392,165 | |
| | |
Delta Electronics Thailand PCL, NVDR | | | 320,300 | | | | 3,737,636 | |
| | |
Energy Absolute PCL, NVDR(b) | | | 2,303,700 | | | | 6,789,853 | |
| | |
Gulf Energy Development PCL, NVDR(b) | | | 5,396,200 | | | | 8,317,451 | |
| | |
Hana Microelectronics PCL, NVDR(b) | | | 517,400 | | | | 758,594 | |
| | |
Home Product Center PCL, NVDR | | | 7,577,800 | | | | 3,623,670 | |
| | |
Indorama Ventures PCL, NVDR(b) | | | 879,800 | | | | 1,230,397 | |
| | |
Intouch Holdings PCL, NVDR | | | 2,119,700 | | | | 4,956,592 | |
| | |
KCE Electronics PCL, NVDR | | | 356,000 | | | | 701,293 | |
| | |
Minor International PCL, NVDR* | | | 1,392,100 | | | | 1,402,567 | |
| | |
Muangthai Capital PCL, NVDR(b) | | | 1,099,200 | | | | 1,735,579 | |
See Notes to Financial Statements.
Schedule of Investments (continued)
WisdomTree Emerging Markets ex-State-Owned Enterprises Fund (XSOE)
March 31, 2022
| | | | | | | | |
| Investments | | Shares | | | Value | |
| | |
Osotspa PCL, NVDR | | | 2,657,600 | | | $ | 2,997,293 | |
| | |
True Corp. PCL, NVDR(b) | | | 19,247,200 | | | | 2,981,145 | |
| | | | | | | | |
| Total Thailand | | | | 69,834,475 | |
|
| Turkey – 0.3% | |
| | |
Akbank TAS | | | 1,807,803 | | | | 894,796 | |
| | |
BIM Birlesik Magazalar AS | | | 605,898 | | | | 3,496,737 | |
| | |
Enka Insaat ve Sanayi AS | | | 3,201,164 | | | | 3,509,381 | |
| | |
Turkiye Garanti Bankasi AS | | | 1,964,371 | | | | 1,633,879 | |
| | | | | | | | |
| Total Turkey | | | | 9,534,793 | |
|
| United Kingdom – 0.3% | |
| | |
Avast PLC(a) | | | 664,370 | | | | 5,035,926 | |
| | |
Investec PLC | | | 686,538 | | | | 4,559,223 | |
| | | | | | | | |
| Total United Kingdom | | | | 9,595,149 | |
TOTAL COMMON STOCKS (Cost: $3,331,984,792) | | | | 3,319,810,133 | |
| | |
| | | Principal
Amount | | | | |
|
| FOREIGN CORPORATE BOND – 0.0% | |
|
| India – 0.0% | |
| | |
Britannia Industries Ltd.
5.50%, 6/3/24
| | | | | | | | |
| (Cost: $45,084) | | | 3,280,857 | INR | | | 43,381 | |
|
| INVESTMENT OF CASH COLLATERAL FOR SECURITIES LOANED – 0.8% | |
|
| United States – 0.8% | |
| | |
State Street Navigator Securities Lending Government Money Market Portfolio, 0.25%(d) | | | | | | | | |
| (Cost: $27,500,748) | | | 27,500,748 | | | | 27,500,748 | |
| |
TOTAL INVESTMENTS IN SECURITIES – 100.8% (Cost: $3,359,530,624) | | | | 3,347,354,262 | |
| |
Other Assets less Liabilities – (0.8)% | | | | (27,488,612 | ) |
| | | | | | | | |
| NET ASSETS – 100.0% | | | $ | 3,319,865,650 | |
| * | Non-income producing security. |
| † | Security is being fair valued using significant unobservable inputs by a pricing committee under the direction of the Board of Trustees. The aggregate value of fair valued securities is $1,280,169, which represents 0.04% of net assets. |
| (a) | This security is exempt from registration under rule 144A of the Securities Act of 1933. This security may be sold in transactions that are exempt from registration, normally to qualified institutional buyers. |
| (b) | Security, or portion thereof, was on loan at March 31, 2022 (See Note 2). At March 31, 2022, the total market value of the Fund’s securities on loan identified in the Schedule of Investments was $103,535,801 and the total market value of the collateral held by the Fund was $111,235,127. The total market value of the collateral includes non-cash U.S. Government securities collateral having a value of $83,734,379. |
| (c) | This security is exempt from registration under Regulation S of the Securities Act of 1933, which exempts from registration securities offered and sold outside the United States. This security may not be offered or sold in the United States except pursuant to an exemption from, or in a transaction not subject to, the registration requirements of the Securities Act of 1933. |
| (d) | Rate shown represents annualized 7-day yield as of March 31, 2022. |
The following is a summary of the fair valuations according to the inputs used as of March 31, 2022 in valuing the Fund’s investments (See Note 2 — Fair Value Measurement):
| | | | | | | | | | | | | | | | |
| | | | |
| | | Quoted
Prices in
Active
Markets
(Level 1) | | | Other
Significant
Observable
Inputs
(Level 2) | | | Significant
Unobservable
Inputs
(Level 3) | | | Total | |
Assets: | | | | | | | | | | | | | | | | |
Investments in Securities | | | | | | | | | | | | | | | | |
Common Stocks | | | | | | | | | | | | | | | | |
China | | $ | 900,315,226 | | | $ | — | | | $ | 622,769 | * | | $ | 900,937,995 | |
Russia | | | 1,434,946 | | | | — | | | | 0 | * | | | 1,434,946 | |
South Korea | | | 515,381,606 | | | �� | — | | | | 657,400 | * | | | 516,039,006 | |
Other | | | 1,901,398,186 | | | | — | | | | — | | | | 1,901,398,186 | |
Foreign Corporate Bond | | | — | | | | 43,381 | | | | — | | | | 43,381 | |
Investment of Cash Collateral for Securities Loaned | | | — | | | | 27,500,748 | | | | — | | | | 27,500,748 | |
Total Investments in Securities | | $ | 3,318,529,964 | | | $ | 27,544,129 | | | $ | 1,280,169 | | | $ | 3,347,354,262 | |
| * | Securities are being fair valued using significant unobservable inputs by the Pricing Committee. |
See Notes to Financial Statements.
Schedule of Investments (concluded)
WisdomTree Emerging Markets ex-State-Owned Enterprises Fund (XSOE)
March 31, 2022
The following is a reconciliation of assets in which significant unobservable inputs (Level 3) were used in determining fair value:
| | | | | | | | | | | | |
| | |
| | | Common Stocks | |
| | | |
| | | China | | | Russia | | | South Korea | |
Balance as of March 31, 2021 | | $ | — | | | $ | — | | | $ | — | |
Realized gain (loss) | | | (38,211 | ) | | | 10,832,184 | | | | (6,092 | ) |
Change in unrealized appreciation (depreciation) | | | (664,373 | ) | | | (143,551,036 | ) | | | (235,601 | ) |
Purchases | | | 1,402,471 | | | | 27,601,633 | | | | 947,577 | |
Sales | | | (77,118 | ) | | | (35,379,198 | ) | | | (48,484 | ) |
Transfers into Level 3(1) | | | — | | | | 140,496,417 | | | | — | |
Transfers out of Level 3 | | | — | | | | — | | | | — | |
Balance as of March 31, 2022 | | $ | 622,769 | | | $ | 0 | | | $ | 657,400 | |
Net change in unrealized appreciation (depreciation) from investments still held as of March 31, 2022 is: | | | | | | | | | | $ | (144,451,010 | ) |
| | (1) | Transferred into Level 3 because of a lack of observable market data, resulting from a decrease in market activity for the securities. |
See Notes to Financial Statements.
Schedule of Investments
WisdomTree Emerging Markets High Dividend Fund (DEM)
March 31, 2022
| | | | | | | | |
| Investments | | Shares | | | Value | |
|
| COMMON STOCKS – 99.5% | |
|
| Brazil – 20.8% | |
| | |
B3 SA – Brasil Bolsa Balcao | | | 5,111,234 | | | $ | 16,897,797 | |
| | |
Banco Bradesco SA | | | 1,196,400 | | | | 4,599,844 | |
| | |
Banco do Brasil SA | | | 1,225,307 | | | | 8,947,517 | |
| | |
Banco Santander Brasil SA | | | 304,522 | | | | 2,363,403 | |
| | |
BB Seguridade Participacoes SA | | | 448,263 | | | | 2,411,137 | |
| | |
BrasilAgro – Co. Brasileira de Propriedades Agricolas | | | 74,927 | | | | 502,357 | |
| | |
Camil Alimentos SA | | | 242,347 | | | | 492,145 | |
| | |
Centrais Eletricas Brasileiras SA | | | 577,498 | | | | 4,615,658 | |
| | |
Cia Brasileira de Distribuicao | | | 372,783 | | | | 1,894,529 | |
| | |
Cia de Saneamento de Minas Gerais-COPASA | | | 317,454 | | | | 915,896 | |
| | |
Cia de Saneamento do Parana | | | 290,938 | | | | 1,247,153 | |
| | |
Cia Energetica de Minas Gerais | | | 401,696 | | | | 1,718,553 | |
| | |
Cia Paranaense de Energia | | | 712,828 | | | | 1,020,051 | |
| | |
Cia Siderurgica Nacional SA | | | 1,080,145 | | | | 5,916,766 | |
| | |
CPFL Energia SA | | | 806,791 | | | | 5,478,834 | |
| | |
CSN Mineracao SA | | | 1,193,840 | | | | 1,514,926 | |
| | |
Cyrela Brazil Realty SA Empreendimentos e Participacoes | | | 914,037 | | | | 3,364,199 | |
| | |
EDP – Energias do Brasil SA | | | 527,537 | | | | 2,611,069 | |
| | |
Engie Brasil Energia SA | | | 651,214 | | | | 5,925,671 | |
| | |
Grendene SA | | | 580,879 | | | | 1,221,179 | |
| | |
Industrias Romi SA | | | 35,172 | | | | 103,326 | |
| | |
JBS SA | | | 1,650,464 | | | | 12,930,855 | |
| | |
JHSF Participacoes SA | | | 399,703 | | | | 552,625 | |
| | |
Marfrig Global Foods SA | | | 827,237 | | | | 3,725,391 | |
| | |
Minerva SA | | | 627,004 | | | | 1,670,445 | |
| | |
Petroleo Brasileiro SA | | | 11,736,300 | | | | 87,035,262 | |
| | |
Porto Seguro SA | | | 134,862 | | | | 599,109 | |
| | |
Sul America SA | | | 185,903 | | | | 1,344,994 | |
| | |
SYN prop e tech SA | | | 168,426 | | | | 250,231 | |
| | |
Telefonica Brasil SA | | | 754,778 | | | | 8,527,874 | |
| | |
Transmissora Alianca de Energia Eletrica SA | | | 998,240 | | | | 9,272,470 | |
| | |
Unipar Carbocloro SA | | | 31,986 | | | | 670,421 | |
| | |
Vale SA | | | 11,337,252 | | | | 228,083,480 | |
| | |
Vibra Energia SA | | | 2,478,169 | | | | 12,192,803 | |
| | | | | | | | |
| Total Brazil | | | | 440,617,970 | |
|
| Chile – 0.9% | |
| | |
CAP SA | | | 241,796 | | | | 3,748,656 | |
| | |
Cencosud SA | | | 5,012,480 | | | | 9,873,043 | |
| | |
Empresas CMPC SA | | | 2,698,649 | | | | 4,996,577 | |
| | | | | | | | |
| Total Chile | | | | 18,618,276 | |
|
| China – 25.9% | |
| | |
Agricultural Bank of China Ltd., Class A | | | 7,821,300 | | | | 3,794,774 | |
| | |
Agricultural Bank of China Ltd., Class H | | | 25,434,000 | | | | 9,775,563 | |
| | |
Anhui Conch Cement Co. Ltd., Class A | | | 539,200 | | | | 3,354,233 | |
| | |
Anhui Conch Cement Co. Ltd., Class H | | | 1,283,000 | | | | 6,602,255 | |
| | |
Bank of Beijing Co. Ltd., Class A | | | 2,689,349 | | | | 1,940,300 | |
| | |
Bank of China Ltd., Class A | | | 4,119,900 | | | | 2,122,221 | |
| | |
Bank of China Ltd., Class H | | | 99,306,000 | | | | 39,943,548 | |
| | |
Bank of Communications Co. Ltd., Class A | | | 4,474,700 | | | | 3,601,978 | |
| | |
Bank of Communications Co. Ltd., Class H | | | 17,381,000 | | | | 12,473,021 | |
| | |
Bank of Jiangsu Co. Ltd., Class A | | | 1,717,470 | | | | 1,907,368 | |
| | |
Bank of Nanjing Co. Ltd., Class A | | | 842,900 | | | | 1,416,761 | |
| | |
Bank of Shanghai Co. Ltd., Class A | | | 1,217,700 | | | | 1,273,693 | |
| | |
Beijing Enterprises Water Group Ltd. | | | 4,758,000 | | | | 1,464,206 | |
| | |
C&D International Investment Group Ltd. | | | 751,798 | | | | 1,641,564 | |
| | |
Central China New Life Ltd.* | | | 599,000 | | | | 332,718 | |
| | |
China CITIC Bank Corp. Ltd., Class H | | | 8,379,000 | | | | 4,247,597 | |
| | |
China Communications Services Corp. Ltd., Class H | | | 2,472,000 | | | | 1,120,566 | |
| | |
China Construction Bank Corp., Class A | | | 1,115,300 | | | | 1,105,092 | |
| | |
China Construction Bank Corp., Class H | | | 95,657,054 | | | | 71,943,720 | |
| | |
China Everbright Bank Co. Ltd., Class A | | | 2,995,000 | | | | 1,556,923 | |
| | |
China Everbright Environment Group Ltd. | | | 3,956,000 | | | | 2,394,392 | |
| | |
China Galaxy Securities Co. Ltd., Class H | | | 2,186,000 | | | | 1,225,393 | |
| | |
China Hongqiao Group Ltd.(a) | | | 4,312,000 | | | | 5,759,318 | |
| | |
China Life Insurance Co. Ltd., Class H | | | 6,258,000 | | | | 9,621,054 | |
| | |
China Merchants Port Holdings Co. Ltd. | | | 2,280,000 | | | | 4,134,127 | |
| | |
China Merchants Securities Co. Ltd., Class H(b) | | | 543,800 | | | | 641,611 | |
| | |
China Merchants Shekou Industrial Zone Holdings Co. Ltd., Class A | | | 659,182 | | | | 1,574,203 | |
| | |
China Minsheng Banking Corp. Ltd., Class A | | | 3,863,800 | | | | 2,325,060 | |
| | |
China National Building Material Co. Ltd., Class H | | | 4,910,000 | | | | 6,106,622 | |
| | |
China Pacific Insurance Group Co. Ltd., Class A | | | 436,800 | | | | 1,577,079 | |
| | |
China Pacific Insurance Group Co. Ltd., Class H | | | 1,456,800 | | | | 3,556,710 | |
| | |
China Petroleum & Chemical Corp., Class A | | | 5,697,900 | | | | 3,877,527 | |
| | |
China Petroleum & Chemical Corp., Class H | | | 44,298,000 | | | | 22,229,887 | |
| | |
China Railway Group Ltd., Class H | | | 4,633,000 | | | | 2,597,093 | |
| | |
China Reinsurance Group Corp., Class H | | | 4,754,000 | | | | 437,071 | |
| | |
China Resources Land Ltd. | | | 2,714,000 | | | | 12,649,207 | |
| | |
China Risun Group Ltd., Class H | | | 1,567,000 | | | | 830,382 | |
| | |
China Shenhua Energy Co. Ltd., Class A | | | 1,117,000 | | | | 5,238,274 | |
| | |
China Shenhua Energy Co. Ltd., Class H | | | 7,809,500 | | | | 25,029,810 | |
| | |
China South City Holdings Ltd. | | | 5,112,000 | | | | 450,402 | |
| | |
China Vanke Co. Ltd., Class A | | | 1,782,200 | | | | 5,376,275 | |
| | |
China Vanke Co. Ltd., Class H | | | 2,370,400 | | | | 5,369,525 | |
| | |
China Yuhua Education Corp. Ltd.(b) | | | 1,042,000 | | | | 236,836 | |
| | |
Chongqing Water Group Co. Ltd., Class A | | | 241,500 | | | | 241,192 | |
| | |
CIFI Holdings Group Co. Ltd. | | | 6,790,000 | | | | 3,996,974 | |
| | |
CITIC Ltd. | | | 8,597,000 | | | | 9,561,492 | |
| | |
CITIC Telecom International Holdings Ltd. | | | 4,012,000 | | | | 1,475,414 | |
| | |
Consun Pharmaceutical Group Ltd. | | | 908,000 | | | | 442,904 | |
| | |
COSCO Shipping Development Co. Ltd., Class H(a) | | | 3,493,000 | | | | 709,180 | |
| | |
COSCO Shipping Energy Transportation Co. Ltd., Class H(a) | | | 1,836,000 | | | | 851,020 | |
| | |
Country Garden Holdings Co. Ltd.(a) | | | 10,265,850 | | | | 7,904,471 | |
| | |
CSC Financial Co. Ltd., Class H(b) | | | 617,500 | | | | 585,061 | |
See Notes to Financial Statements.
Schedule of Investments (continued)
WisdomTree Emerging Markets High Dividend Fund (DEM)
March 31, 2022
| | | | | | | | |
| Investments | | Shares | | | Value | |
| | |
Datang International Power Generation Co. Ltd., Class H | | | 3,820,000 | | | $ | 551,191 | |
| | |
Excellence Commercial Property & Facilities Management Group Ltd. | | | 562,000 | | | | 285,614 | |
| | |
Fangda Carbon New Material Co. Ltd., Class A | | | 575,200 | | | | 765,653 | |
| | |
Fangda Special Steel Technology Co. Ltd., Class A | | | 652,300 | | | | 885,749 | |
| | |
FAW Jiefang Group Co. Ltd., Class A | | | 285,600 | | | | 388,712 | |
| | |
Fufeng Group Ltd.* | | | 1,934,000 | | | | 768,029 | |
| | |
Fujian Sunner Development Co. Ltd., Class A | | | 142,800 | | | | 445,849 | |
| | |
Gemdale Corp., Class A | | | 1,253,909 | | | | 2,820,658 | |
| | |
Genertec Universal Medical Group Co. Ltd.(b) | | | 1,352,000 | | | | 890,814 | |
| | |
Greenland Holdings Corp. Ltd., Class A | | | 873,740 | | | | 741,869 | |
| | |
Greenland Hong Kong Holdings Ltd. | | | 2,235,000 | | | | 505,140 | |
| | |
Guangdong Investment Ltd. | | | 3,422,000 | | | | 4,684,200 | |
| | |
Guotai Junan Securities Co. Ltd., Class H*(b) | | | 857,400 | | | | 1,158,323 | |
| | |
Haitong Securities Co. Ltd., Class A | | | 919,000 | | | | 1,491,108 | |
| | |
Haitong Securities Co. Ltd., Class H | | | 3,667,600 | | | | 2,800,553 | |
| | |
Henan Shuanghui Investment & Development Co. Ltd., Class A | | | 444,500 | | | | 2,034,809 | |
| | |
Hengan International Group Co. Ltd. | | | 862,000 | | | | 3,984,524 | |
| | |
Hisense Home Appliances Group Co. Ltd., Class H | | | 308,000 | | | | 293,393 | |
| | |
Huadian Power International Corp. Ltd., Class H(a) | | | 5,676,000 | | | | 1,746,707 | |
| | |
Huaibei Mining Holdings Co. Ltd., Class A | | | 244,300 | | | | 607,277 | |
| | |
Huaneng Power International, Inc., Class H(a) | | | 4,002,000 | | | | 1,711,916 | |
| | |
Huaxin Cement Co. Ltd., Class A | | | 176,700 | | | | 550,022 | |
| | |
Industrial & Commercial Bank of China Ltd., Class A | | | 5,050,400 | | | | 3,794,901 | |
| | |
Industrial & Commercial Bank of China Ltd., Class H | | | 71,950,823 | | | | 44,191,774 | |
| | |
Industrial Bank Co. Ltd., Class A | | | 1,593,700 | | | | 5,189,234 | |
| | |
Inner Mongolia Junzheng Energy & Chemical Industry Group Co. Ltd., Class A | | | 830,500 | | | | 600,494 | |
| | |
Jiangsu Expressway Co. Ltd., Class H | | | 2,583,727 | | | | 2,705,335 | |
| | |
Jiangsu Zhongnan Construction Group Co. Ltd., Class A | | | 1,119,800 | | | | 772,629 | |
| | |
Jiangxi Zhengbang Technology Co. Ltd., Class A | | | 497,200 | | | | 603,868 | |
| | |
Jiayuan International Group Ltd. | | | 2,318,000 | | | | 464,701 | |
| | |
Jinke Properties Group Co. Ltd., Class A | | | 1,522,700 | | | | 1,177,747 | |
| | |
Jizhong Energy Resources Co. Ltd., Class A | | | 162,200 | | | | 180,134 | |
| | |
JNBY Design Ltd. | | | 418,500 | | | | 500,721 | |
| | |
Kingboard Holdings Ltd. | | | 991,000 | | | | 4,821,245 | |
| | |
Kingfa Sci & Tech Co. Ltd., Class A | | | 380,200 | | | | 583,347 | |
| | |
Lakala Payment Co. Ltd., Class A | | | 129,900 | | | | 484,355 | |
| | |
Lee & Man Paper Manufacturing Ltd. | | | 2,512,000 | | | | 1,311,909 | |
| | |
Livzon Pharmaceutical Group, Inc., Class H | | | 134,200 | | | | 482,382 | |
| | |
Longfor Group Holdings Ltd.(b) | | | 1,650,000 | | | | 8,490,819 | |
| | |
Lonking Holdings Ltd. | | | 4,659,000 | | | | 1,273,113 | |
| | |
Maanshan Iron & Steel Co. Ltd., Class H | | | 1,524,000 | | | | 612,994 | |
| | |
Nanjing Iron & Steel Co. Ltd., Class A | | | 1,100,900 | | | | 626,053 | |
| | |
New China Life Insurance Co. Ltd., Class H | | | 542,200 | | | | 1,516,227 | |
| | |
People’s Insurance Co. Group of China Ltd., Class H | | | 7,693,000 | | | | 2,524,582 | |
| | |
PetroChina Co. Ltd., Class H | | | 41,244,000 | | | | 21,381,955 | |
| | |
PICC Property & Casualty Co. Ltd., Class H | | | 4,470,000 | | | | 4,577,649 | |
| | |
Ping An Insurance Group Co. of China Ltd., Class A | | | 1,021,000 | | | | 7,792,481 | |
| | |
Ping An Insurance Group Co. of China Ltd., Class H | | | 2,838,000 | | | | 20,166,854 | |
| | |
Poly Developments and Holdings Group Co. Ltd., Class A | | | 1,886,600 | | | | 5,260,286 | |
| | |
Poly Property Group Co. Ltd. | | | 1,988,000 | | | | 502,623 | |
| | |
Postal Savings Bank of China Co. Ltd., Class A | | | 1,417,000 | | | | 1,203,136 | |
| | |
Postal Savings Bank of China Co. Ltd., Class H(a)(b) | | | 4,623,000 | | | | 3,748,506 | |
| | |
Powerlong Real Estate Holdings Ltd.(a) | | | 2,609,000 | | | | 689,612 | |
| | |
Qingdao Port International Co. Ltd., Class H(a)(b) | | | 2,402,000 | | | | 1,232,990 | |
| | |
RiseSun Real Estate Development Co. Ltd., Class A | | | 917,200 | | | | 644,399 | |
| | |
Seazen Holdings Co. Ltd., Class A | | | 219,100 | | | | 1,110,324 | |
| | |
Shaanxi Coal Industry Co. Ltd., Class A | | | 1,008,200 | | | | 2,612,575 | |
| | |
Shanghai Industrial Holdings Ltd. | | | 871,000 | | | | 1,307,935 | |
| | |
Shanghai Pudong Development Bank Co. Ltd., Class A | | | 2,171,900 | | | | 2,737,071 | |
| | |
Shenzhen Expressway Corp. Ltd., Class H | | | 1,626,000 | | | | 1,712,912 | |
| | |
Shenzhen Overseas Chinese Town Co. Ltd., Class A | | | 1,143,200 | | | | 1,325,428 | |
| | |
Shijiazhuang Yiling Pharmaceutical Co. Ltd., Class A | | | 203,600 | | | | 1,074,432 | |
| | |
Shougang Fushan Resources Group Ltd. | | | 4,694,739 | | | | 1,846,387 | |
| | |
Sino-Ocean Group Holding Ltd. | | | 6,339,500 | | | | 1,351,861 | |
| | |
Sinopec Engineering Group Co. Ltd., Class H | | | 2,963,000 | | | | 1,513,395 | |
| | |
Sinopec Kantons Holdings Ltd. | | | 1,336,000 | | | | 464,019 | |
| | |
Sinotrans Ltd., Class H | | | 2,259,000 | | | | 706,713 | |
| | |
SITC International Holdings Co. Ltd. | | | 2,549,000 | | | | 9,032,197 | |
| | |
Tech-Bank Food Co. Ltd., Class A | | | 447,200 | | | | 617,109 | |
| | |
Tian Lun Gas Holdings Ltd. | | | 512,000 | | | | 363,501 | |
| | |
Tianli Education International Holdings Ltd. | | | 175,000 | | | | 17,206 | |
| | |
Tingyi Cayman Islands Holding Corp. | | | 2,184,000 | | | | 3,681,181 | |
| | |
Uni-President China Holdings Ltd. | | | 1,717,000 | | | | 1,497,447 | |
| | |
Xiamen C & D, Inc., Class A | | | 420,600 | | | | 842,777 | |
| | |
Xinyi Glass Holdings Ltd. | | | 3,191,000 | | | | 7,741,783 | |
| | |
Yango Group Co. Ltd., Class A | | | 1,019,900 | | | | 682,815 | |
| | |
Yankuang Energy Group Co. Ltd., Class H(a) | | | 1,428,000 | | | | 4,239,472 | |
| | |
Yuexiu Transport Infrastructure Ltd. | | | 1,534,000 | | | | 1,036,195 | |
| | |
Zhejiang Expressway Co. Ltd., Class H | | | 1,862,000 | | | | 1,564,466 | |
| | | | | | | | |
| Total China | | | | 549,924,033 | |
|
| Hong Kong – 0.1% | |
| | |
Kingboard Laminates Holdings Ltd. | | | 920,500 | | | | 1,516,261 | |
| | |
Perfect Medical Health Management Ltd. | | | 1,278,000 | | | | 791,468 | |
| | |
Wasion Holdings Ltd. | | | 1,132,000 | | | | 407,621 | |
| | | | | | | | |
| Total Hong Kong | | | | 2,715,350 | |
See Notes to Financial Statements.
Schedule of Investments (continued)
WisdomTree Emerging Markets High Dividend Fund (DEM)
March 31, 2022
| | | | | | | | |
| Investments | | Shares | | | Value | |
|
| India – 5.8% | |
| | |
Ambuja Cements Ltd. | | | 1,233,922 | | | $ | 4,872,995 | |
| | |
Bharat Petroleum Corp. Ltd. | | | 3,774,565 | | | | 17,900,230 | |
| | |
CESC Ltd. | | | 1,369,271 | | | | 1,370,626 | |
| | |
Coal India Ltd. | | | 2,487,329 | | | | 6,008,652 | |
| | |
Gujarat Pipavav Port Ltd. | | | 367,476 | | | | 370,507 | |
| | |
Hindustan Petroleum Corp. Ltd. | | | 1,724,287 | | | | 6,129,155 | |
| | |
Indiabulls Housing Finance Ltd. | | | 204,315 | | | | 425,482 | |
| | |
IRCON International Ltd.(b) | | | 697,763 | | | | 366,492 | |
| | |
ITC Ltd. | | | 5,067,490 | | | | 16,762,341 | |
| | |
Mindspace Business Parks REIT(b) | | | 384,867 | | | | 1,760,103 | |
| | |
NHPC Ltd. | | | 5,476,776 | | | | 2,009,296 | |
| | |
NMDC Ltd. | | | 1,707,872 | | | | 3,663,670 | |
| | |
NTPC Ltd. | | | 7,879,157 | | | | 14,037,429 | |
| | |
Oracle Financial Services Software Ltd. | | | 39,337 | | | | 1,862,505 | |
| | |
Petronet LNG Ltd. | | | 1,479,314 | | | | 3,782,476 | |
| | |
Power Finance Corp. Ltd. | | | 2,043,456 | | | | 3,036,531 | |
| | |
Power Grid Corp. of India Ltd. | | | 6,738,692 | | | | 19,280,085 | |
| | |
PTC India Ltd. | | | 528,531 | | | | 573,694 | |
| | |
Rail Vikas Nigam Ltd. | | | 1,256,232 | | | | 542,115 | |
| | |
REC Ltd. | | | 1,056,027 | | | | 1,714,868 | |
| | |
SJVN Ltd. | | | 1,517,629 | | | | 549,771 | |
| | |
Vedanta Ltd. | | | 2,888,011 | | | | 15,372,870 | |
| | | | | | | | |
| Total India | | | | 122,391,893 | |
|
| Indonesia – 1.6% | |
| | |
Bank Pembangunan Daerah Jawa Barat Dan Banten Tbk PT | | | 6,850,525 | | | | 727,384 | |
| | |
Hanjaya Mandala Sampoerna Tbk PT | | | 14,809,500 | | | | 953,789 | |
| | |
Indocement Tunggal Prakarsa Tbk PT | | | 3,020,300 | | | | 2,265,882 | |
| | |
Indofood Sukses Makmur Tbk PT | | | 4,443,700 | | | | 1,840,906 | |
| | |
Puradelta Lestari Tbk PT | | | 38,084,800 | | | | 490,561 | |
| | |
Telkom Indonesia Persero Tbk PT | | | 81,370,000 | | | | 25,947,753 | |
| | |
Unilever Indonesia Tbk PT | | | 5,625,900 | | | | 1,433,650 | |
| | | | | | | | |
| Total Indonesia | | | | 33,659,925 | |
|
| Malaysia – 2.7% | |
| | |
Astro Malaysia Holdings Bhd | | | 5,064,600 | | | | 1,324,944 | |
| | |
British American Tobacco Malaysia Bhd | | | 206,300 | | | | 610,351 | |
| | |
Bursa Malaysia Bhd | | | 632,600 | | | | 1,063,674 | |
| | |
Eco World Development Group Bhd | | | 2,107,900 | | | | 496,301 | |
| | |
Hartalega Holdings Bhd | | | 3,676,800 | | | | 4,241,032 | |
| | |
Kossan Rubber Industries Bhd | | | 3,954,000 | | | | 1,843,116 | |
| | |
Malayan Banking Bhd | | | 10,607,600 | | | | 22,553,527 | |
| | |
MISC Bhd | | | 1,801,900 | | | | 3,149,763 | |
| | |
Petronas Gas Bhd | | | 1,524,100 | | | | 6,038,767 | |
| | |
Public Bank Bhd | | | 9,640,900 | | | | 10,707,653 | |
| | |
Sime Darby Bhd | | | 6,503,200 | | | | 3,711,916 | |
| | |
Uchi Technologies Bhd | | | 688,800 | | | | 494,720 | |
| | | | | | | | |
| Total Malaysia | | | | 56,235,764 | |
|
| Mexico – 4.0% | |
| | |
Alpek SAB de CV | | | 973,728 | | | | 1,322,751 | |
| | |
Arca Continental SAB de CV | | | 957,482 | | | | 6,493,804 | |
| | |
Banco del Bajio SA(b) | | | 813,758 | | | | 2,228,429 | |
| | |
Coca-Cola Femsa SAB de CV | | | 950,563 | | | | 5,220,899 | |
| | |
Corp. Inmobiliaria Vesta SAB de CV | | | 1,302,097 | | | $ | 2,483,791 | |
| | |
Fibra Uno Administracion SA de CV | | | 7,190,714 | | | | 8,401,546 | |
| | |
Grupo Aeroportuario del Pacifico SAB de CV, Class B* | | | 629,234 | | | | 10,179,379 | |
| | |
Grupo Mexico SAB de CV, Series B | | | 7,522,833 | | | | 44,891,040 | |
| | |
Kimberly-Clark de Mexico SAB de CV, Class A | | | 2,020,837 | | | | 2,835,374 | |
| | |
Regional SAB de CV | | | 153,150 | | | | 1,073,478 | |
| | | | | | | | |
| Total Mexico | | | | 85,130,491 | |
|
| Philippines – 0.5% | |
| | |
DMCI Holdings, Inc. | | | 8,655,500 | | | | 1,510,468 | |
| | |
LT Group, Inc. | | | 4,739,300 | | | | 815,147 | |
| | |
Manila Electric Co. | | | 329,970 | | | | 2,382,390 | |
| | |
PLDT, Inc. | | | 112,809 | | | | 4,033,175 | |
| | |
Semirara Mining & Power Corp. | | | 2,118,000 | | | | 1,256,597 | |
| | | | | | | | |
| Total Philippines | | | | 9,997,777 | |
|
| Poland – 0.6% | |
| | |
Ciech SA | | | 51,621 | | | | 535,131 | |
| | |
Polski Koncern Naftowy Orlen SA | | | 436,105 | | | | 7,955,535 | |
| | |
Powszechny Zaklad Ubezpieczen SA | | | 640,219 | | | | 5,200,423 | |
| | | | | | | | |
| Total Poland | | | | 13,691,089 | |
|
| Russia – 0.0% | |
| | |
Evraz PLC† | | | 2,288,532 | | | | 0 | |
| | |
Magnit PJSC, GDR†(c) | | | 1,003,101 | | | | 0 | |
| | |
Magnitogorsk Iron & Steel Works PJSC, GDR†(c) | | | 298,929 | | | | 0 | |
| | |
MMC Norilsk Nickel PJSC, ADR† | | | 1,485,203 | | | | 0 | |
| | |
Mobile TeleSystems PJSC, ADR† | | | 1,549,581 | | | | 0 | |
| | |
Novolipetsk Steel PJSC, GDR† | | | 521,340 | | | | 0 | |
| | |
PhosAgro PJSC, GDR†(c) | | | 289,238 | | | | 0 | |
| | |
Polyus PJSC, GDR†(c) | | | 70,957 | | | | 0 | |
| | |
Sberbank of Russia PJSC, ADR† | | | 2,425,119 | | | | 0 | |
| | |
Severstal PAO, GDR†(c) | | | 775,843 | | | | 0 | |
| | |
Tatneft PJSC, ADR† | | | 231,842 | | | | 0 | |
| | | | | | | | |
| Total Russia | | | | 0 | |
|
| South Africa – 8.3% | |
| | |
AECI Ltd. | | | 209,899 | | | | 1,673,159 | |
| | |
African Rainbow Minerals Ltd.(a) | | | 276,192 | | | | 5,408,543 | |
| | |
Anglo American Platinum Ltd. | | | 101,631 | | | | 13,955,492 | |
| | |
Astral Foods Ltd. | | | 66,727 | | | | 693,322 | |
| | |
AVI Ltd. | | | 683,259 | | | | 3,371,290 | |
| | |
Cashbuild Ltd.(a) | | | 103,680 | | | | 1,953,973 | |
| | |
Coronation Fund Managers Ltd. | | | 449,025 | | | | 1,424,281 | |
| | |
DRDGOLD Ltd. | | | 749,300 | | | | 707,637 | |
| | |
Equites Property Fund Ltd. | | | 1,480,943 | | | | 2,324,916 | |
| | |
Exxaro Resources Ltd. | | | 1,004,556 | | | | 15,229,378 | |
| | |
Gold Fields Ltd. | | | 854,973 | | | | 13,343,137 | |
| | |
Impala Platinum Holdings Ltd.(a) | | | 1,936,490 | | | | 29,821,615 | |
| | |
JSE Ltd. | | | 90,927 | | | | 695,370 | |
| | |
Kumba Iron Ore Ltd.(a) | | | 156,208 | | | | 7,005,922 | |
| | |
MultiChoice Group | | | 814,199 | | | | 7,339,910 | |
| | |
Oceana Group Ltd.(a) | | | 169,759 | | | | 662,191 | |
| | |
Resilient REIT Ltd.(a) | | | 652,182 | | | | 2,721,200 | |
| | |
Royal Bafokeng Platinum Ltd.(a) | | | 439,411 | | | | 4,856,450 | |
See Notes to Financial Statements.
Schedule of Investments (continued)
WisdomTree Emerging Markets High Dividend Fund (DEM)
March 31, 2022
| | | | | | | | |
| Investments | | Shares | | | Value | |
| | |
Sanlam Ltd. | | | 1,159,510 | | | $ | 5,729,110 | |
| | |
Sibanye Stillwater Ltd.(a) | | | 6,898,419 | | | | 28,230,998 | |
| | |
SPAR Group Ltd. | | | 379,807 | | | | 4,411,090 | |
| | |
Tiger Brands Ltd. | | | 223,517 | | | | 2,476,469 | |
| | |
Truworths International Ltd. | | | 1,104,710 | | | | 4,411,280 | |
| | |
Vodacom Group Ltd. | | | 1,636,695 | | | | 17,921,040 | |
| | | | | | | | |
| Total South Africa | | | | 176,367,773 | |
|
| South Korea – 4.7% | |
| | |
Daishin Securities Co. Ltd. | | | 40,203 | | | | 590,416 | |
| | |
DGB Financial Group, Inc. | | | 98,104 | | | | 755,985 | |
| | |
Dongsung Chemical Co. Ltd. | | | 109,736 | | | | 435,938 | |
| | |
DTR Automotive Corp. | | | 10,377 | | | | 604,444 | |
| | |
GS Holdings Corp. | | | 116,137 | | | | 4,206,439 | |
| | |
Hana Financial Group, Inc. | | | 180,220 | | | | 7,226,345 | |
| | |
Hansol Paper Co. Ltd. | | | 38,372 | | | | 424,227 | |
| | |
Hyundai Motor Securities Co. Ltd. | | | 43,734 | | | | 400,518 | |
| | |
iMarketKorea, Inc. | | | 53,319 | | | | 477,300 | |
| | |
Industrial Bank of Korea | | | 180,772 | | | | 1,618,230 | |
| | |
JB Financial Group Co. Ltd. | | | 103,441 | | | | 721,155 | |
| | |
KB Financial Group, Inc. | | | 234,346 | | | | 11,852,159 | |
| | |
KCC Glass Corp. | | | 22,850 | | | | 1,195,239 | |
| | |
Koentec Co. Ltd.(a) | | | 61,445 | | | | 419,755 | |
| | |
Korea Asset In Trust Co. Ltd. | | | 121,366 | | | | 410,545 | |
| | |
Korea Electric Power Corp.* | | | 356,809 | | | | 6,667,814 | |
| | |
Korean Reinsurance Co. | | | 106,144 | | | | 861,728 | |
| | |
KT Corp., ADR(a) | | | 211,135 | | | | 3,027,676 | |
| | |
KT&G Corp. | | | 258,777 | | | | 17,229,738 | |
| | |
Kumho E&C Co. Ltd. | | | 50,643 | | | | 463,791 | |
| | |
Kyobo Securities Co. Ltd. | | | 42,665 | | | | 269,637 | |
| | |
Kyungdong Pharm Co. Ltd. | | | 32,640 | | | | 300,265 | |
| | |
LG Uplus Corp. | | | 292,213 | | | | 3,375,258 | |
| | |
Macquarie Korea Infrastructure Fund | | | 897,189 | | | | 10,141,074 | |
| | |
Meritz Fire & Marine Insurance Co. Ltd. | | | 50,331 | | | | 1,970,386 | |
| | |
Meritz Securities Co. Ltd. | | | 456,642 | | | | 2,463,957 | |
| | |
NH Investment & Securities Co. Ltd. | | | 164,943 | | | | 1,551,380 | |
| | |
Orion Holdings Corp.(a) | | | 46,792 | | | | 550,131 | |
| | |
Samsung Card Co. Ltd. | | | 14,949 | | | | 398,377 | |
| | |
Samsung Securities Co. Ltd. | | | 59,608 | | | | 2,060,621 | |
| | |
Shinhan Financial Group Co. Ltd. | | | 320,255 | | | | 10,965,375 | |
| | |
SSANGYONG C&E Co. Ltd. | | | 183,192 | | | | 1,243,901 | |
| | |
TS Corp. | | | 100,565 | | | | 239,786 | |
| | |
Woori Financial Group, Inc. | | | 344,299 | | | | 4,360,373 | |
| | | | | | | | |
| Total South Korea | | | | 99,479,963 | |
|
| Taiwan – 20.2% | |
| | |
AcBel Polytech, Inc.(a) | | | 582,000 | | | | 721,114 | |
| | |
Acer, Inc.(a) | | | 4,925,000 | | | | 5,148,203 | |
| | |
Arcadyan Technology Corp.(a) | | | 335,000 | | | | 1,420,606 | |
| | |
Asia Cement Corp. | | | 6,781,000 | | | | 11,502,246 | |
| | |
ASROCK, Inc. | | | 24,000 | | | | 180,095 | |
| | |
Asustek Computer, Inc.(a) | | | 2,080,000 | | | | 27,114,811 | |
| | |
C Sun Manufacturing Ltd.(a) | | | 344,000 | | | | 593,714 | |
| | |
Capital Securities Corp.(a) | | | 2,389,000 | | | | 1,371,623 | |
| | |
Catcher Technology Co. Ltd.(a) | | | 1,449,000 | | | | 7,307,837 | |
| | |
Cathay Financial Holding Co. Ltd.(a) | | | 7,393,000 | | | | 16,643,055 | |
| | |
Cathay Real Estate Development Co. Ltd. | | | 688,000 | | | | 453,840 | |
| | |
Charoen Pokphand Enterprise | | | 317,000 | | | | 899,503 | |
| | |
Cheng Loong Corp.(a) | | | 1,360,000 | | | | 1,661,344 | |
| | |
Cheng Uei Precision Industry Co. Ltd.(a) | | | 621,000 | | | | 820,371 | |
| | |
Chicony Electronics Co. Ltd.(a) | | | 1,795,386 | | | | 5,627,128 | |
| | |
Chicony Power Technology Co. Ltd. | | | 335,000 | | | | 968,117 | |
| | |
China Bills Finance Corp. | | | 781,000 | | | | 482,477 | |
| | |
China Development Financial Holding Corp. | | | 11,143,000 | | | | 7,467,169 | |
| | |
China Steel Structure Co. Ltd.(a) | | | 267,000 | | | | 536,768 | |
| | |
ChipMOS Technologies, Inc.(a) | | | 685,000 | | | | 1,228,871 | |
| | |
Chong Hong Construction Co. Ltd.(a) | | | 358,000 | | | | 914,633 | |
| | |
Chung-Hsin Electric & Machinery Manufacturing Corp.(a) | | | 503,000 | | | | 960,302 | |
| | |
Cleanaway Co. Ltd.(a) | | | 137,000 | | | | 951,538 | |
| | |
Compal Electronics, Inc.(a) | | | 7,061,000 | | | | 6,604,708 | |
| | |
Continental Holdings Corp.(a) | | | 808,000 | | | | 744,506 | |
| | |
CTBC Financial Holding Co. Ltd. | | | 17,702,000 | | | | 18,164,452 | |
| | |
CTCI Corp. | | | 803,000 | | | | 1,299,026 | |
| | |
D-Link Corp. | | | 615,480 | | | | 361,965 | |
| | |
Darfon Electronics Corp.(a) | | | 476,000 | | | | 825,688 | |
| | |
Daxin Materials Corp. | | | 118,000 | | | | 471,563 | |
| | |
Edom Technology Co. Ltd. | | | 376,000 | | | | 482,935 | |
| | |
Elan Microelectronics Corp.(a) | | | 423,000 | | | | 2,539,343 | |
| | |
Everlight Electronics Co. Ltd.(a) | | | 565,000 | | | | 962,323 | |
| | |
Far Eastern Department Stores Ltd. | | | 925,000 | | | | 684,432 | |
| | |
Far Eastern New Century Corp.(a) | | | 4,803,000 | | | | 5,096,110 | |
| | |
Far EasTone Telecommunications Co. Ltd.(a) | | | 2,088,000 | | | | 5,356,369 | |
| | |
Farglory Land Development Co. Ltd.(a) | | | 589,000 | | | | 1,406,125 | |
| | |
Feng Hsin Steel Co. Ltd. | | | 636,000 | | | | 2,142,087 | |
| | |
First Financial Holding Co. Ltd. | | | 5,667,072 | | | | 5,627,217 | |
| | |
FLEXium Interconnect, Inc.*(a) | | | 440,000 | | | | 1,558,732 | |
| | |
Flytech Technology Co. Ltd. | | | 198,000 | | | | 508,623 | |
| | |
Formosan Union Chemical(a) | | | 969,000 | | | | 936,820 | |
| | |
Fubon Financial Holding Co. Ltd.(a) | | | 6,024,684 | | | | 16,086,010 | |
| | |
Getac Holdings Corp.(a) | | | 1,149,000 | | | | 1,995,105 | |
| | |
Gigabyte Technology Co. Ltd.(a) | | | 488,000 | | | | 2,214,195 | |
| | |
Global Mixed Mode Technology, Inc. | | | 91,000 | | | | 755,912 | |
| | |
Goldsun Building Materials Co. Ltd. | | | 1,515,000 | | | | 1,573,085 | |
| | |
Great Wall Enterprise Co. Ltd. | | | 1,394,690 | | | | 2,633,465 | |
| | |
Highwealth Construction Corp.(a) | | | 1,838,000 | | | | 2,912,420 | |
| | |
Hiyes International Co. Ltd. | | | 115,000 | | | | 405,389 | |
| | |
Ho Tung Chemical Corp. | | | 1,955,000 | | | | 713,043 | |
| | |
Holtek Semiconductor, Inc.(a) | | | 316,000 | | | | 1,317,976 | |
| | |
Holy Stone Enterprise Co. Ltd. | | | 315,000 | | | | 1,319,303 | |
| | |
Hon Hai Precision Industry Co. Ltd. | | | 12,175,000 | | | | 45,043,017 | |
| | |
Hong TAI Electric Industrial(a) | | | 644,000 | | | | 722,636 | |
| | |
Hsing TA Cement Co. | | | 483,000 | | | | 358,227 | |
| | |
Huaku Development Co. Ltd.(a) | | | 431,000 | | | | 1,356,864 | |
| | |
Huang Hsiang Construction Corp. | | | 448,000 | | | | 855,299 | |
| | |
Hung Ching Development & Construction Co. Ltd. | | | 284,000 | | | | 297,367 | |
| | |
Hung Sheng Construction Ltd. | | | 361,000 | | | | 313,732 | |
| | |
I-Sheng Electric Wire & Cable Co. Ltd. | | | 467,000 | | | | 708,206 | |
See Notes to Financial Statements.
Schedule of Investments (continued)
WisdomTree Emerging Markets High Dividend Fund (DEM)
March 31, 2022
| | | | | | | | |
| Investments | | Shares | | | Value | |
| | |
IBF Financial Holdings Co. Ltd. | | | 1,456,667 | | | $ | 851,584 | |
| | |
Inventec Corp.(a) | | | 5,763,000 | | | | 4,968,190 | |
| | |
ITE Technology, Inc. | | | 240,000 | | | | 938,171 | |
| | |
Jia Wei Lifestyle, Inc.(a) | | | 137,000 | | | | 352,882 | |
| | |
Kindom Development Co. Ltd.(a) | | | 633,000 | | | | 797,560 | |
| | |
King Yuan Electronics Co. Ltd.(a) | | | 1,504,000 | | | | 2,249,320 | |
| | |
King’s Town Bank Co. Ltd.(a) | | | 798,000 | | | | 1,122,433 | |
| | |
Kung Long Batteries Industrial Co. Ltd. | | | 176,000 | | | | 844,633 | |
| | |
Lelon Electronics Corp.(a) | | | 151,000 | | | | 343,092 | |
| | |
Lite-On Technology Corp. | | | 7,292,000 | | | | 17,331,909 | |
| | |
Mega Financial Holding Co. Ltd. | | | 6,773,302 | | | | 10,141,691 | |
| | |
Micro-Star International Co. Ltd.(a) | | | 814,000 | | | | 3,693,349 | |
| | |
Mirle Automation Corp. | | | 320,000 | | | | 456,800 | |
| | |
Nak Sealing Technologies Corp. | | | 191,000 | | | | 593,969 | |
| | |
Namchow Holdings Co. Ltd. | | | 124,000 | | | | 210,767 | |
| | |
Nan Liu Enterprise Co. Ltd.(a) | | | 112,000 | | | | 388,559 | |
| | |
Nantex Industry Co. Ltd.(a) | | | 345,000 | | | | 788,702 | |
| | |
Nichidenbo Corp. | | | 434,000 | | | | 830,086 | |
| | |
OptoTech Corp.(a) | | | 746,000 | | | | 1,335,700 | |
| | |
Pan German Universal Motors Ltd. | | | 56,000 | | | | 414,359 | |
| | |
Pegatron Corp. | | | 3,695,000 | | | | 9,336,963 | |
| | |
Powertech Technology, Inc. | | | 1,518,000 | | | | 5,033,244 | |
| | |
President Securities Corp.(a) | | | 1,265,000 | | | | 1,015,479 | |
| | |
Primax Electronics Ltd.(a) | | | 606,000 | | | | 1,101,953 | |
| | |
Promate Electronic Co. Ltd. | | | 353,000 | | | | 564,278 | |
| | |
Qisda Corp.(a) | | | 3,169,000 | | | | 3,677,617 | |
| | |
Quanta Computer, Inc. | | | 7,223,990 | | | | 22,263,348 | |
| | |
Radium Life Tech Co. Ltd. | | | 788,000 | | | | 287,406 | |
| | |
Rexon Industrial Corp. Ltd.(a) | | | 287,000 | | | | 452,765 | |
| | |
Sampo Corp.(a) | | | 1,227,000 | | | | 1,383,247 | |
| | |
Sanyang Motor Co. Ltd.(a) | | | 873,000 | | | | 877,525 | |
| | |
Shanghai Commercial & Savings Bank Ltd. | | | 2,202,000 | | | | 3,858,102 | |
| | |
Shin Foong Specialty & Applied Materials Co. Ltd.(a) | | | 76,000 | | | | 346,160 | |
| | |
Shin Kong Financial Holding Co. Ltd.(a) | | | 7,712,776 | | | | 2,907,282 | |
| | |
Shin Zu Shing Co. Ltd.(a) | | | 381,000 | | | | 1,105,042 | |
| | |
Sigurd Microelectronics Corp.(a) | | | 561,000 | | | | 1,166,976 | |
| | |
Sinon Corp.(a) | | | 1,073,000 | | | | 1,263,939 | |
| | |
SinoPac Financial Holdings Co. Ltd. | | | 7,648,440 | | | | 4,911,830 | |
| | |
Sinyi Realty, Inc. | | | 652,000 | | | | 840,843 | |
| | |
Sonix Technology Co. Ltd.(a) | | | 285,000 | | | | 895,241 | |
| | |
Standard Foods Corp.(a) | | | 431,000 | | | | 747,629 | |
| | |
Stark Technology, Inc. | | | 162,000 | | | | 523,575 | |
| | |
Sunonwealth Electric Machine Industry Co. Ltd.(a) | | | 390,000 | | | | 585,990 | |
| | |
Supreme Electronics Co. Ltd. | | | 725,539 | | | | 1,316,791 | |
| | |
Symtek Automation Asia Co. Ltd.(a) | | | 112,000 | | | | 476,903 | |
| | |
Syncmold Enterprise Corp.(a) | | | 267,000 | | | | 670,960 | |
| | |
Synnex Technology International Corp. | | | 3,280,000 | | | | 8,620,282 | |
| | |
Systex Corp.(a) | | | 370,000 | | | | 1,044,727 | |
| | |
TA-I Technology Co. Ltd.(a) | | | 176,000 | | | | 367,339 | |
| | |
Taiflex Scientific Co. Ltd.(a) | | | 391,000 | | | | 615,469 | |
| | |
Taisun Enterprise Co. Ltd. | | | 406,000 | | | | 396,768 | |
| | |
Taita Chemical Co. Ltd.(a) | | | 362,000 | | | | 428,313 | |
| | |
Taiwan Cement Corp.(a) | | | 8,718,135 | | | | 15,183,671 | |
| | |
Taiwan Cogeneration Corp. | | | 452,000 | | | | 607,368 | |
| | |
Taiwan FU Hsing Industrial Co. Ltd. | | | 579,000 | | | | 883,106 | |
| | |
Taiwan Hon Chuan Enterprise Co. Ltd.(a) | | | 471,000 | | | | 1,295,388 | |
| | |
Taiwan Mobile Co. Ltd. | | | 1,827,253 | | | | 6,696,388 | |
| | |
Taiwan PCB Techvest Co. Ltd. | | | 755,000 | | | | 1,338,638 | |
| | |
Taiwan Sakura Corp. | | | 290,000 | | | | 671,064 | |
| | |
Taiwan Secom Co. Ltd. | | | 506,000 | | | | 1,924,995 | |
| | |
Test Research, Inc.(a) | | | 208,000 | | | | 492,931 | |
| | |
Topco Scientific Co. Ltd.(a) | | | 358,435 | | | | 2,126,728 | |
| | |
Transcend Information, Inc.(a) | | | 334,000 | | | | 867,305 | |
| | |
Tripod Technology Corp. | | | 802,000 | | | | 3,750,868 | |
| | |
Unitech Computer Co. Ltd. | | | 308,000 | | | | 396,133 | |
| | |
United Integrated Services Co. Ltd.(a) | | | 611,000 | | | | 4,158,421 | |
| | |
Universal Cement Corp.(a) | | | 752,000 | | | | 560,362 | |
| | |
Wah Lee Industrial Corp. | | | 276,000 | | | | 1,054,814 | |
| | |
Weikeng Industrial Co. Ltd. | | | 762,000 | | | | 860,363 | |
| | |
WinWay Technology Co. Ltd. | | | 15,000 | | | | 232,972 | |
| | |
Wistron Corp. | | | 5,794,561 | | | | 6,016,725 | |
| | |
WPG Holdings Ltd. | | | 2,253,280 | | | | 4,404,086 | |
| | |
WT Microelectronics Co. Ltd.(a) | | | 510,000 | | | | 1,411,549 | |
| | |
YC INOX Co. Ltd. | | | 561,000 | | | | 687,262 | |
| | |
YFY, Inc. | | | 1,592,000 | | | | 1,900,298 | |
| | |
Yuanta Financial Holding Co. Ltd. | | | 7,495,000 | | | | 6,906,026 | |
| | |
Yulon Nissan Motor Co. Ltd.(a) | | | 139,000 | | | | 1,220,128 | |
| | |
Zeng Hsing Industrial Co. Ltd.(a) | | | 128,000 | | | | 623,213 | |
| | |
Zenitron Corp. | | | 496,000 | | | | 682,938 | |
| | |
ZongTai Real Estate Development Co. Ltd.(a) | | | 570,000 | | | | 690,330 | |
| | | | | | | | |
| Total Taiwan | | | | 427,711,452 | |
|
| Thailand – 2.1% | |
| | |
Asia Plus Group Holdings PCL, NVDR(a) | | | 5,175,300 | | | | 535,430 | |
| | |
Bangkok Insurance PCL, NVDR | | | 79,000 | | | | 634,376 | |
| | |
BG Container Glass PCL, NVDR | | | 595,900 | | | | 182,802 | |
| | |
Dynasty Ceramic PCL, NVDR | | | 13,079,000 | | | | 1,172,193 | |
| | |
Eastern Water Resources Development and Management PCL, NVDR(a) | | | 2,318,500 | | | | 509,024 | |
| | |
Haad Thip PCL, NVDR | | | 425,300 | | | | 418,905 | |
| | |
Kiatnakin Phatra Bank PCL, NVDR | | | 581,900 | | | | 1,207,552 | |
| | |
Land & Houses PCL, NVDR | | | 11,008,800 | | | | 3,145,371 | |
| | |
LPN Development PCL, NVDR(a) | | | 5,686,600 | | | | 796,979 | |
| | |
MCS Steel PCL, NVDR | | | 556,400 | | | | 229,254 | |
| | |
Noble Development PCL, Class C, NVDR(a) | | | 4,624,700 | | | | 702,398 | |
| | |
Pruksa Holding PCL, NVDR | | | 2,752,200 | | | | 1,133,989 | |
| | |
PTT Exploration & Production PCL, NVDR | | | 999,300 | | | | 4,327,796 | |
| | |
PTT Global Chemical PCL, NVDR | | | 1,066,200 | | | | 1,627,358 | |
| | |
PTT PCL, NVDR | | | 9,051,500 | | | | 10,480,684 | |
| | |
Quality Houses PCL, NVDR | | | 18,271,400 | | | | 1,263,886 | |
| | |
Ratch Group PCL, NVDR(a) | | | 747,400 | | | | 989,041 | |
| | |
Regional Container Lines PCL, NVDR(a) | | | 436,400 | | | | 570,929 | |
| | |
SC Asset Corp. PCL, NVDR | | | 9,431,900 | | | | 1,077,931 | |
| | |
Siam City Cement PCL, NVDR | | | 221,400 | | | | 1,022,102 | |
| | |
Somboon Advance Technology PCL, NVDR | | | 1,018,900 | | | | 637,387 | |
| | |
SPCG PCL, NVDR | | | 1,675,700 | | | | 871,868 | |
See Notes to Financial Statements.
Schedule of Investments (continued)
WisdomTree Emerging Markets High Dividend Fund (DEM)
March 31, 2022
| | | | | | | | |
| Investments | | Shares | | | Value | |
| | |
Sri Trang Agro-Industry PCL, NVDR | | | 2,449,600 | | | $ | 1,933,895 | |
| | |
Sri Trang Gloves Thailand PCL, NVDR(a) | | | 3,710,300 | | | | 2,817,596 | |
| | |
Thai Vegetable Oil PCL, NVDR(a) | | | 963,897 | | | | 905,918 | |
| | |
Thanachart Capital PCL, NVDR | | | 933,300 | | | | 1,206,975 | |
| | |
TMT Steel PCL, NVDR | | | 1,338,600 | | | | 462,974 | |
| | |
TPI Polene Power PCL, NVDR | | | 10,850,400 | | | | 1,272,679 | |
| | |
TTW PCL, NVDR(a) | | | 4,743,577 | | | | 1,583,570 | |
| | |
United Paper PCL, NVDR(a) | | | 764,400 | | | | 377,027 | |
| | |
WHA Utilities and Power PCL, NVDR(a) | | | 6,124,000 | | | | 755,140 | |
| | | | | | | | |
| Total Thailand | | | | 44,853,029 | |
|
| Turkey – 1.3% | |
| | |
Aksa Akrilik Kimya Sanayii AS | | | 339,189 | | | | 1,008,242 | |
| | |
Arcelik AS(a) | | | 539,116 | | | | 2,223,689 | |
| | |
BIM Birlesik Magazalar AS | | | 778,077 | | | | 4,490,411 | |
| | |
Dogus Otomotiv Servis ve Ticaret AS | | | 149,376 | | | | 627,333 | |
| | |
EGE Endustri VE Ticaret AS | | | 2,890 | | | | 363,857 | |
| | |
Eregli Demir ve Celik Fabrikalari TAS | | | 3,733,613 | | | | 8,257,463 | |
| | |
Goodyear Lastikleri TAS | | | 411,541 | | | | 279,173 | |
| | |
Iskenderun Demir ve Celik AS | | | 589,549 | | | | 1,101,303 | |
| | |
Nuh Cimento Sanayi AS | | | 92,618 | | | | 290,462 | |
| | |
Otokar Otomotiv Ve Savunma Sanayi AS | | | 14,977 | | | | 436,105 | |
| | |
Turk Telekomunikasyon AS(a) | | | 959,444 | | | | 681,591 | |
| | |
Turk Traktor ve Ziraat Makineleri AS | | | 51,313 | | | | 813,368 | |
| | |
Turkcell Iletisim Hizmetleri AS | | | 3,899,748 | | | | 5,992,761 | |
| | |
Ulker Biskuvi Sanayi AS | | | 386,824 | | | | 404,289 | |
| | |
Vestel Beyaz Esya Sanayi ve Ticaret AS | | | 1,082,347 | | | | 585,900 | |
| | |
Vestel Elektronik Sanayi ve Ticaret AS | | | 342,699 | | | | 602,794 | |
| | | | | | | | |
| Total Turkey | | | | 28,158,741 | |
TOTAL COMMON STOCKS (Cost: $1,942,128,738) | | | | 2,109,553,526 | |
|
| EXCHANGE-TRADED FUND – 0.1% | |
|
| United States – 0.1% | |
| | |
WisdomTree Global High Dividend Fund(d)
(Cost: $1,219,572) | | | 24,389 | | | | 1,246,049 | |
|
| INVESTMENT OF CASH COLLATERAL FOR SECURITIES LOANED – 0.7% | |
|
| United States – 0.7% | |
| | |
State Street Navigator Securities Lending Government Money Market Portfolio, 0.25%(e) | | | | | | | | |
| (Cost: $14,840,667) | | | 14,840,667 | | | | 14,840,667 | |
| |
TOTAL INVESTMENTS IN SECURITIES – 100.3% (Cost: $1,958,188,977) | | | | 2,125,640,242 | |
| |
Other Assets less Liabilities – (0.3)% | | | | (5,794,831 | ) |
| | | | | | | | |
| NET ASSETS – 100.0% | | | $ | 2,119,845,411 | |
| * | Non-income producing security. |
| † | Security is being fair valued using significant unobservable inputs by a pricing committee under the direction of the Board of Trustees. The aggregate value of fair valued securities is $0, which represents 0.0% of net assets. |
| (a) | Security, or portion thereof, was on loan at March 31, 2022 (See Note 2). At March 31, 2022, the total market value of the Fund’s securities on loan identified in the Schedule of Investments was $165,227,619 and the total market value of the collateral held by the Fund was $180,371,997. The total market value of the collateral includes non-cash U.S. Government securities collateral having a value of $165,531,330. |
| (b) | This security is exempt from registration under rule 144A of the Securities Act of 1933. This security may be sold in transactions that are exempt from registration, normally to qualified institutional buyers. |
| (c) | This security is exempt from registration under Regulation S of the Securities Act of 1933, which exempts from registration securities offered and sold outside the United States. This security may not be offered or sold in the United States except pursuant to an exemption from, or in a transaction not subject to, the registration requirements of the Securities Act of 1933. |
| (d) | Affiliated holding. See “Investment in Affiliates” supplementary table included in this Schedule of Investments for additional information. |
| (e) | Rate shown represents annualized 7-day yield as of March 31, 2022. |
Affiliated holdings are investments in entities in which the Fund owns 5% or more of the outstanding voting securities or are investments in entities which are under common ownership or control. Investments in affiliates during the fiscal year ended March 31, 2022 were as follows:
| | | | | | | | | | | | | | | | | | | | | | | | | | | | |
| | | | | | | |
| Affiliate | | Value at
3/31/2021 | | | Purchases/
Additions | | | Sales/
Reductions | | | Realized
Gain/(Loss) | | | Change in
Unrealized
Appreciation/
Depreciation | | | Value at
3/31/2022 | | | Dividend
Income | |
WisdomTree Global High Dividend Fund | | $ | 1,640,275 | | | $ | 6,790,097 | | | $ | 7,139,286 | | | $ | (31,264 | ) | | $ | (13,773 | ) | | $ | 1,246,049 | | | $ | 62,348 | |
See Notes to Financial Statements.
Schedule of Investments (concluded)
WisdomTree Emerging Markets High Dividend Fund (DEM)
March 31, 2022
The following is a summary of the fair valuations according to the inputs used as of March 31, 2022 in valuing the Fund’s investments (See Note 2 — Fair Value Measurement):
| | | | | | | | | | | | | | | | |
| | | | |
| | | Quoted
Prices in
Active
Markets
(Level 1) | | | Other
Significant
Observable
Inputs
(Level 2) | | | Significant
Unobservable
Inputs
(Level 3) | | | Total | |
Assets: | | | | | | | | | | | | | | | | |
Investments in Securities | | | | | | | | | | | | | | | | |
Common Stocks | | | | | | | | | | | | | | | | |
Russia | | $ | — | | | $ | — | | | $ | 0 | * | | $ | 0 | |
Other | | | 2,109,553,526 | | | | — | | | | — | | | | 2,109,553,526 | |
Exchange-Traded Fund | | | 1,246,049 | | | | — | | | | — | | | | 1,246,049 | |
Investment of Cash Collateral for Securities Loaned | | | — | | | | 14,840,667 | | | | — | | | | 14,840,667 | |
Total Investments in Securities | | $ | 2,110,799,575 | | | $ | 14,840,667 | | | $ | 0 | | | $ | 2,125,640,242 | |
| * | Securities are being fair valued using significant unobservable inputs by the Pricing Committee. |
The following is a reconciliation of assets in which significant unobservable inputs (Level 3) were used in determining fair value:
| | | | |
| | |
| | | Common Stocks | |
| |
| | | Russia | |
Balance as of March 31, 2021 | | $ | — | |
Realized gain (loss) | | | 47,989,371 | |
Change in unrealized appreciation (depreciation) | | | (209,364,639 | ) |
Purchases | | | 95,540,732 | |
Sales | | | (184,061,475 | ) |
Transfers into Level 3(1) | | | 249,896,011 | |
Transfers out of Level 3 | | | — | |
Balance as of March 31, 2022 | | $ | 0 | |
Net change in unrealized appreciation (depreciation) from investments still held as of March 31, 2022 is: | | $ | (209,364,639 | ) |
| | (1) | Transferred into Level 3 because of a lack of observable market data, resulting from a decrease in market activity for the securities. |
See Notes to Financial Statements.
Schedule of Investments
WisdomTree Emerging Markets Multifactor Fund (EMMF)
March 31, 2022
| | | | | | | | |
| Investments | |
Shares | | | Value | |
|
| COMMON STOCKS — 97.9% | |
|
| Brazil – 5.9% | |
| | |
Atacadao SA | | | 1,341 | | | $ | 6,355 | |
| | |
Banco do Brasil SA | | | 683 | | | | 4,987 | |
| | |
BB Seguridade Participacoes SA | | | 1,021 | | | | 5,492 | |
| | |
Cia de Saneamento Basico do Estado de Sao Paulo | | | 369 | | | | 3,705 | |
| | |
Energisa SA | | | 1,456 | | | | 14,955 | |
| | |
Engie Brasil Energia SA | | | 1,652 | | | | 15,032 | |
| | |
Equatorial Energia SA | | | 2,231 | | | | 12,775 | |
| | |
JBS SA | | | 331 | | | | 2,593 | |
| | |
Klabin SA | | | 2,396 | | | | 12,162 | |
| | |
Suzano SA | | | 989 | | | | 11,478 | |
| | |
Telefonica Brasil SA | | | 1,680 | | | | 18,982 | |
| | |
TIM SA | | | 5,666 | | | | 16,443 | |
| | |
Vale SA | | | 142 | | | | 2,857 | |
| | |
Vibra Energia SA | | | 2,623 | | | | 12,905 | |
| | | | | | | | |
| Total Brazil | | | | 140,721 | |
|
| Chile – 0.4% | |
| | |
Cencosud SA | | | 2,047 | | | | 4,032 | |
| | |
Cia Cervecerias Unidas SA | | | 613 | | | | 4,587 | |
| | | | | | | | |
| Total Chile | | | | 8,619 | |
|
| China – 25.2% | |
| | |
Agricultural Bank of China Ltd., Class H | | | 28,000 | | | | 10,762 | |
| | |
Bank of China Ltd., Class H | | | 27,000 | | | | 10,860 | |
| | |
Bank of Communications Co. Ltd., Class H | | | 13,000 | | | | 9,329 | |
| | |
Beijing Enterprises Holdings Ltd. | | | 2,500 | | | | 7,933 | |
| | |
BOE Technology Group Co. Ltd., Class A | | | 16,500 | | | | 11,202 | |
| | |
China Bohai Bank Co. Ltd., Class H(a)(b) | | | 17,500 | | | | 2,905 | |
| | |
China CITIC Bank Corp. Ltd., Class H | | | 20,000 | | | | 10,139 | |
| | |
China Coal Energy Co. Ltd., Class H | | | 9,000 | | | | 6,769 | |
| | |
China Construction Bank Corp., Class H | | | 14,000 | | | | 10,529 | |
| | |
China Everbright Bank Co. Ltd., Class H* | | | 24,000 | | | | 9,102 | |
| | |
China Galaxy Securities Co. Ltd., Class H | | | 15,500 | | | | 8,689 | |
| | |
China Hongqiao Group Ltd. | | | 17,000 | | | | 22,706 | |
| | |
China Merchants Port Holdings Co. Ltd. | | | 4,000 | | | | 7,253 | |
| | |
China Petroleum & Chemical Corp., Class H | | | 24,000 | | | | 12,044 | |
| | |
China Railway Group Ltd., Class H | | | 27,000 | | | | 15,135 | |
| | |
China Resources Gas Group Ltd. | | | 2,000 | | | | 8,491 | |
| | |
China Resources Sanjiu Medical & Pharmaceutical Co. Ltd., Class A | | | 500 | | | | 3,573 | |
| | |
China Shenhua Energy Co. Ltd., Class H | | | 3,000 | | | | 9,615 | |
| | |
COSCO Shipping Holdings Co. Ltd., Class H*(b) | | | 4,400 | | | | 7,675 | |
| | |
Dali Foods Group Co. Ltd.(a) | | | 18,000 | | | | 9,447 | |
| | |
Daqo New Energy Corp., ADR* | | | 547 | | | | 22,602 | |
| | |
ENN Energy Holdings Ltd. | | | 1,000 | | | | 15,004 | |
| | |
FAW Jiefang Group Co. Ltd., Class A | | | 4,800 | | | | 6,533 | |
| | |
Haitian International Holdings Ltd. | | | 5,000 | | | | 12,993 | |
| | |
Haitong Securities Co. Ltd., Class H | | | 20,000 | | | | 15,272 | |
| | |
Hengan International Group Co. Ltd. | | | 2,000 | | | | 9,245 | |
| | |
Hesteel Co. Ltd., Class A | | | 7,500 | | | | 2,812 | |
| | |
Industrial & Commercial Bank of China Ltd., Class H | | | 17,000 | | | | 10,441 | |
| | |
Inner Mongolia Yuan Xing Energy Co. Ltd., Class A* | | | 4,200 | | | | 6,477 | |
| | |
JCET Group Co. Ltd., Class A | | | 1,600 | | | | 6,195 | |
| | |
JD.com, Inc., Class A* | | | 28 | | | | 837 | |
| | |
Jiangsu Expressway Co. Ltd., Class H | | | 8,000 | | | | 8,376 | |
| | |
Kingboard Holdings Ltd. | | | 5,500 | | | | 26,758 | |
| | |
Kunlun Energy Co. Ltd. | | | 6,000 | | | | 5,233 | |
| | |
Lakala Payment Co. Ltd., Class A | | | 600 | | | | 2,237 | |
| | |
Lenovo Group Ltd. | | | 12,000 | | | | 13,055 | |
| | |
Metallurgical Corp. of China Ltd., Class A | | | 3,500 | | | | 2,067 | |
| | |
People’s Insurance Co. Group of China Ltd., Class H | | | 61,000 | | | | 20,018 | |
| | |
PetroChina Co. Ltd., Class H | | | 30,000 | | | | 15,553 | |
| | |
PICC Property & Casualty Co. Ltd., Class H | | | 22,000 | | | | 22,530 | |
| | |
Postal Savings Bank of China Co. Ltd., Class H(a) | | | 10,000 | | | | 8,108 | |
| | |
Power Construction Corp. of China Ltd., Class A | | | 1,900 | | | | 2,182 | |
| | |
Shanghai Baosight Software Co. Ltd., Class B | | | 3,900 | | | | 15,873 | |
| | |
Shanghai International Port Group Co. Ltd., Class A | | | 3,500 | | | | 3,016 | |
| | |
Shanghai Yuyuan Tourist Mart Group Co. Ltd., Class A | | | 4,200 | | | | 6,729 | |
| | |
Shanxi Lu’an Environmental Energy Development Co. Ltd., Class A | | | 1,200 | | | | 3,138 | |
| | |
Shanxi Taigang Stainless Steel Co. Ltd., Class A | | | 2,000 | | | | 2,111 | |
| | |
Shenzhen Overseas Chinese Town Co. Ltd., Class A | | | 4,300 | | | | 4,985 | |
| | |
Sichuan Hebang Biotechnology Co. Ltd., Class A* | | | 11,200 | | | | 6,193 | |
| | |
Sinotrans Ltd., Class A | | | 3,500 | | | | 2,205 | |
| | |
TCL Technology Group Corp., Class A | | | 8,200 | | | | 6,342 | |
| | |
Tencent Holdings Ltd. | | | 500 | | | | 23,891 | |
| | |
Tingyi Cayman Islands Holding Corp. | | | 4,000 | | | | 6,742 | |
| | |
Titan Wind Energy Suzhou Co. Ltd., Class A | | | 2,000 | | | | 4,184 | |
| | |
Uni-President China Holdings Ltd. | | | 7,000 | | | | 6,105 | |
| | |
Want Want China Holdings Ltd. | | | 32,000 | | | | 29,583 | |
| | |
Wuchan Zhongda Group Co. Ltd., Class A | | | 3,900 | | | | 3,281 | |
| | |
Zhefu Holding Group Co. Ltd., Class A | | | 7,100 | | | | 5,939 | |
| | |
Zhejiang Expressway Co. Ltd., Class H | | | 10,000 | | | | 8,402 | |
| | |
Zhongsheng Group Holdings Ltd. | | | 4,000 | | | | 28,296 | |
| | | | | | | | |
| Total China | | | | 595,701 | |
|
| Czech Republic – 0.6% | |
| | |
Moneta Money Bank AS(a) | | | 3,462 | | | | 14,122 | |
|
| Hong Kong – 0.3% | |
| | |
Vinda International Holdings Ltd. | | | 3,000 | | | | 6,788 | |
|
| Hungary – 0.8% | |
| | |
MOL Hungarian Oil & Gas PLC | | | 2,073 | | | | 18,403 | |
|
| India – 10.8% | |
| | |
Bajaj Auto Ltd. | | | 501 | | | | 24,153 | |
| | |
Bharat Petroleum Corp. Ltd. | | | 3,141 | | | | 14,896 | |
| | |
Britannia Industries Ltd. | | | 316 | | | | 13,372 | |
| | |
Cipla Ltd. | | | 1,212 | | | | 16,283 | |
| | |
Colgate-Palmolive India Ltd. | | | 753 | | | | 15,326 | |
| | |
GAIL India Ltd. | | | 5,146 | | | | 10,570 | |
| | |
Indian Oil Corp. Ltd. | | | 10,127 | | | | 15,897 | |
| | |
Infosys Ltd. | | | 842 | | | | 21,189 | |
| | |
ITC Ltd. | | | 2,232 | | | | 7,383 | |
| | |
Nestle India Ltd. | | | 63 | | | | 14,450 | |
| | |
NTPC Ltd. | | | 6,640 | | | | 11,830 | |
| | |
Oil & Natural Gas Corp. Ltd. | | | 6,542 | | | | 14,150 | |
| | |
Power Grid Corp. of India Ltd. | | | 4,160 | | | | 11,902 | |
See Notes to Financial Statements.
Schedule of Investments (continued)
WisdomTree Emerging Markets Multifactor Fund (EMMF)
March 31, 2022
| | | | | | | | |
| Investments | |
Shares | | | Value | |
| | |
Sun Pharmaceutical Industries Ltd. | | | 1,242 | | | $ | 14,993 | |
| | |
Tata Steel Ltd. | | | 900 | | | | 15,526 | |
| | |
Tech Mahindra Ltd. | | | 900 | | | | 17,809 | |
| | |
Vedanta Ltd. | | | 3,095 | | | | 16,475 | |
| | | | | | | | |
| Total India | | | | 256,204 | |
|
| Indonesia – 4.1% | |
| | |
Adaro Energy Indonesia Tbk PT | | | 59,100 | | | | 11,069 | |
| | |
Astra International Tbk PT | | | 34,900 | | | | 15,977 | |
| | |
Bank Central Asia Tbk PT | | | 26,600 | | | | 14,770 | |
| | |
Bank Mandiri Persero Tbk PT | | | 9,200 | | | | 5,060 | |
| | |
Bank Negara Indonesia Persero Tbk PT | | | 6,600 | | | | 3,791 | |
| | |
Charoen Pokphand Indonesia Tbk PT | | | 12,900 | | | | 5,075 | |
| | |
Gudang Garam Tbk PT | | | 2,900 | | | | 6,380 | |
| | |
Indofood CBP Sukses Makmur Tbk PT | | | 13,700 | | | | 7,011 | |
| | |
Indofood Sukses Makmur Tbk PT | | | 18,900 | | | | 7,830 | |
| | |
Telkom Indonesia Persero Tbk PT | | | 27,900 | | | | 8,897 | |
| | |
United Tractors Tbk PT | | | 6,700 | | | | 11,919 | |
| | | | | | | | |
| Total Indonesia | | | | 97,779 | |
|
| Malaysia – 4.4% | |
| | |
HAP Seng Consolidated Bhd | | | 6,100 | | | | 10,852 | |
| | |
Hartalega Holdings Bhd | | | 2,800 | | | | 3,230 | |
| | |
Hong Leong Bank Bhd | | | 2,700 | | | | 12,971 | |
| | |
Hong Leong Financial Group Bhd | | | 2,100 | | | | 9,789 | |
| | |
IHH Healthcare Bhd | | | 1,800 | | | | 2,654 | |
| | |
IOI Corp. Bhd | | | 2,100 | | | | 2,058 | |
| | |
Kuala Lumpur Kepong Bhd | | | 400 | | | | 2,397 | |
| | |
MISC Bhd | | | 2,900 | | | | 5,069 | |
| | |
Nestle Malaysia Bhd | | | 200 | | | | 6,355 | |
| | |
Petronas Chemicals Group Bhd | | | 2,600 | | | | 5,936 | |
| | |
Petronas Gas Bhd | | | 1,400 | | | | 5,547 | |
| | |
RHB Bank Bhd | | | 4,400 | | | | 6,237 | |
| | |
Sime Darby Bhd | | | 9,600 | | | | 5,479 | |
| | |
Sime Darby Plantation Bhd | | | 1,900 | | | | 2,246 | |
| | |
Telekom Malaysia Bhd | | | 6,600 | | | | 7,676 | |
| | |
Tenaga Nasional Bhd | | | 2,500 | | | | 5,351 | |
| | |
Westports Holdings Bhd | | | 9,500 | | | | 9,037 | |
| | | | | | | | |
| Total Malaysia | | | | 102,884 | |
|
| Mexico – 4.4% | |
| | |
America Movil SAB de CV, Series L | | | 17,821 | | | | 18,874 | |
| | |
Arca Continental SAB de CV | | | 1,498 | | | | 10,160 | |
| | |
Coca-Cola Femsa SAB de CV | | | 1,500 | | | | 8,239 | |
| | |
Gruma SAB de CV, Class B | | | 784 | | | | 9,834 | |
| | |
Grupo Bimbo SAB de CV, Series A | | | 2,596 | | | | 7,818 | |
| | |
Grupo Mexico SAB de CV, Series B | | | 1,700 | | | | 10,144 | |
| | |
Grupo Televisa SAB, Series CPO | | | 5,749 | | | | 13,480 | |
| | |
Industrias Penoles SAB de CV | | | 775 | | | | 9,766 | |
| | |
Megacable Holdings SAB de CV, Series CPO | | | 2,647 | | | | 7,955 | |
| | |
Wal-Mart de Mexico SAB de CV | | | 1,800 | | | | 7,394 | |
| | | | | | | | |
| Total Mexico | | | | 103,664 | |
|
| Philippines – 3.7% | |
| | |
BDO Unibank, Inc. | | | 4,560 | | | | 11,694 | |
| | |
GT Capital Holdings, Inc. | | | 890 | | | | 9,494 | |
| | |
International Container Terminal Services, Inc. | | | 2,320 | | | | 10,079 | |
| | |
Jollibee Foods Corp. | | | 2,780 | | | | 12,088 | |
| | |
Manila Electric Co. | | | 1,900 | | | | 13,718 | |
| | |
Metropolitan Bank & Trust Co. | | | 10,360 | | | | 11,412 | |
| | |
PLDT, Inc. | | | 405 | | | | 14,480 | |
| | |
Universal Robina Corp. | | | 2,200 | | | | 5,145 | |
| | | | | | | | |
| Total Philippines | | | | 88,110 | |
|
| Russia – 0.0% | |
| | |
Lukoil PJSC, ADR† | | | 113 | | | | 0 | |
| | |
Magnit PJSC, GDR†(c) | | | 161 | | | | 0 | |
| | |
MMC Norilsk Nickel PJSC, ADR† | | | 301 | | | | 0 | |
| | |
Mobile TeleSystems PJSC, ADR† | | | 1,696 | | | | 0 | |
| | |
Novolipetsk Steel PJSC, GDR† | | | 311 | | | | 0 | |
| | |
PhosAgro PJSC, GDR†(c) | | | 538 | | | | 0 | |
| | |
Polyus PJSC, GDR†(c) | | | 118 | | | | 0 | |
| | |
Rosneft Oil Co. PJSC, GDR†(c) | | | 1,588 | | | | 0 | |
| | |
Sberbank of Russia PJSC, ADR† | | | 639 | | | | 0 | |
| | |
Severstal PAO, GDR†(c) | | | 475 | | | | 0 | |
| | |
VTB Bank PJSC, GDR*†(c) | | | 8,268 | | | | 0 | |
| | |
X5 Retail Group NV, GDR†(c) | | | 223 | | | | 0 | |
| | | | | | | | |
| Total Russia | | | | 0 | |
|
| South Africa – 4.8% | |
| | |
Anglo American Platinum Ltd. | | | 41 | | | | 5,630 | |
| | |
Bidvest Group Ltd. | | | 411 | | | | 6,292 | |
| | |
Gold Fields Ltd. | | | 498 | | | | 7,772 | |
| | |
Harmony Gold Mining Co. Ltd. | | | 1,319 | | | | 6,669 | |
| | |
Impala Platinum Holdings Ltd. | | | 373 | | | | 5,744 | |
| | |
MTN Group Ltd. | | | 342 | | | | 4,447 | |
| | |
MultiChoice Group | | | 1,610 | | | | 14,514 | |
| | |
Northam Platinum Holdings Ltd.* | | | 373 | | | | 5,567 | |
| | |
Pepkor Holdings Ltd.(a) | | | 8,682 | | | | 13,784 | |
| | |
Sasol Ltd.* | | | 104 | | | | 2,527 | |
| | |
Shoprite Holdings Ltd. | | | 403 | | | | 6,527 | |
| | |
Sibanye Stillwater Ltd. | | | 1,456 | | | | 5,958 | |
| | |
Vodacom Group Ltd. | | | 1,481 | | | | 16,216 | |
| | |
Woolworths Holdings Ltd. | | | 3,296 | | | | 13,033 | |
| | | | | | | | |
| Total South Africa | | | | 114,680 | |
|
| South Korea – 10.5% | |
| | |
BGF Retail Co. Ltd. | | | 18 | | | | 2,591 | |
| | |
Cheil Worldwide, Inc. | | | 582 | | | | 11,308 | |
| | |
Coway Co. Ltd. | | | 246 | | | | 13,903 | |
| | |
DB Insurance Co. Ltd. | | | 361 | | | | 20,819 | |
| | |
GS Holdings Corp. | | | 312 | | | | 11,301 | |
| | |
Hana Financial Group, Inc. | | | 201 | | | | 8,060 | |
| | |
HMM Co. Ltd. | | | 80 | | | | 1,924 | |
| | |
Industrial Bank of Korea | | | 1,217 | | | | 10,894 | |
| | |
Kia Corp. | | | 187 | | | | 11,417 | |
| | |
Korea Zinc Co. Ltd. | | | 14 | | | | 6,757 | |
| | |
KT&G Corp. | | | 157 | | | | 10,453 | |
| | |
Kumho Petrochemical Co. Ltd. | | | 69 | | | | 8,824 | |
| | |
LG Innotek Co. Ltd. | | | 44 | | | | 14,049 | |
| | |
LG Uplus Corp. | | | 1,141 | | | | 13,179 | |
| | |
Meritz Securities Co. Ltd. | | | 2,217 | | | | 11,963 | |
See Notes to Financial Statements.
Schedule of Investments (continued)
WisdomTree Emerging Markets Multifactor Fund (EMMF)
March 31, 2022
| | | | | | | | |
| Investments | |
Shares | | | Value | |
| | |
NH Investment & Securities Co. Ltd. | | | 1,074 | | | $ | 10,102 | |
| | |
POSCO Holdings, Inc. | | | 49 | | | | 11,845 | |
| | |
S-Oil Corp. | | | 127 | | | | 10,132 | |
| | |
Samsung Electronics Co. Ltd. | | | 448 | | | | 25,726 | |
| | |
Samsung Engineering Co. Ltd.* | | | 460 | | | | 9,944 | |
| | |
Samsung Securities Co. Ltd. | | | 454 | | | | 15,695 | |
| | |
Seegene, Inc. | | | 152 | | | | 6,408 | |
| | | | | | | | |
| Total South Korea | | | | 247,294 | |
|
| Taiwan – 20.2% | |
| | |
Acer, Inc. | | | 11,000 | | | | 11,498 | |
| | |
ASE Technology Holding Co. Ltd. | | | 3,000 | | | | 10,837 | |
| | |
Asia Cement Corp. | | | 8,000 | | | | 13,570 | |
| | |
Asustek Computer, Inc. | | | 1,000 | | | | 13,036 | |
| | |
AU Optronics Corp. | | | 10,000 | | | | 6,928 | |
| | |
Cathay Financial Holding Co. Ltd. | | | 15,000 | | | | 33,768 | |
| | |
Cheng Shin Rubber Industry Co. Ltd. | | | 11,000 | | | | 13,610 | |
| | |
China Development Financial Holding Corp. | | | 74,943 | | | | 50,221 | |
| | |
China Steel Corp. | | | 2,000 | | | | 2,719 | |
| | |
Compal Electronics, Inc. | | | 14,000 | | | | 13,095 | |
| | |
Evergreen Marine Corp. Taiwan Ltd. | | | 1,000 | | | | 4,712 | |
| | |
Far EasTone Telecommunications Co. Ltd. | | | 6,000 | | | | 15,392 | |
| | |
Formosa Plastics Corp. | | | 3,000 | | | | 11,151 | |
| | |
Fubon Financial Holding Co. Ltd. | | | 4,000 | | | | 10,680 | |
| | |
Innolux Corp. | | | 12,000 | | | | 7,036 | |
| | |
Lite-On Technology Corp. | | | 5,000 | | | | 11,884 | |
| | |
Micro-Star International Co. Ltd. | | | 2,000 | | | | 9,075 | |
| | |
Nan Ya Plastics Corp. | | | 4,000 | | | | 13,012 | |
| | |
Nanya Technology Corp. | | | 3,000 | | | | 7,246 | |
| | |
Novatek Microelectronics Corp. | | | 1,000 | | | | 14,886 | |
| | |
Pegatron Corp. | | | 5,000 | | | | 12,635 | |
| | |
Quanta Computer, Inc. | | | 4,000 | | | | 12,327 | |
| | |
Realtek Semiconductor Corp. | | | 1,000 | | | | 15,025 | |
| | |
SinoPac Financial Holdings Co. Ltd. | | | 21,000 | | | | 13,486 | |
| | |
Synnex Technology International Corp. | | | 5,000 | | | | 13,141 | |
| | |
Taiwan Semiconductor Manufacturing Co. Ltd. | | | 4,000 | | | | 83,346 | |
| | |
Unimicron Technology Corp. | | | 1,000 | | | | 8,691 | |
| | |
United Microelectronics Corp. | | | 4,000 | | | | 7,539 | |
| | |
Vanguard International Semiconductor Corp. | | | 2,000 | | | | 8,691 | |
| | |
Wan Hai Lines Ltd. | | | 1,200 | | | | 6,638 | |
| | |
Winbond Electronics Corp. | | | 6,000 | | | | 6,534 | |
| | |
WPG Holdings Ltd. | | | 6,000 | | | | 11,727 | |
| | |
Yang Ming Marine Transport Corp.* | | | 1,000 | | | | 4,345 | |
| | | | | | | | |
| Total Taiwan | | | | 478,481 | |
|
| Thailand – 1.8% | |
| | |
Indorama Ventures PCL, NVDR | | | 7,000 | | | | 9,790 | |
| | |
PTT Exploration & Production PCL, NVDR | | | 1,700 | | | | 7,362 | |
| | |
PTT Global Chemical PCL, NVDR | | | 3,000 | | | | 4,579 | |
| | |
Ratch Group PCL, NVDR | | | 3,500 | | | | 4,632 | |
| | |
Srisawad Corp. PCL, NVDR | | | 5,700 | | | | 9,771 | |
| | |
Thai Union Group PCL, NVDR | | | 10,800 | | | | 6,139 | |
| | | | | | | | |
| Total Thailand | | | | 42,273 | |
TOTAL COMMON STOCKS (Cost: $2,217,439) | | | | 2,315,723 | |
|
| FOREIGN CORPORATE BOND – 0.0% | |
|
| India – 0.0% | |
| | |
Britannia Industries Ltd.
5.50%, 6/3/24 (Cost: $124) | | | 9,164 | INR | | | 121 | |
| | |
| | | Shares | | | | |
|
| PREFERRED STOCKS – 1.8% | |
|
| Brazil – 1.8% | |
| | |
Braskem SA, Class A | | | 912 | | | | 8,502 | |
| | |
Cia Energetica de Minas Gerais | | | 1,681 | | | | 5,381 | |
| | |
Gerdau SA | | | 1,613 | | | | 10,458 | |
| | |
Itau Unibanco Holding SA | | | 2,144 | | | | 12,398 | |
| | |
Petroleo Brasileiro SA | | | 1,002 | | | | 7,053 | |
TOTAL PREFERRED STOCKS (Cost: $39,137) | | | | 43,792 | |
| |
TOTAL INVESTMENTS IN SECURITIES – 99.7% (Cost: $2,256,700) | | | | 2,359,636 | |
| |
Other Assets less Liabilities – 0.3% | | | | 6,609 | |
| | | | | | | | |
| NET ASSETS – 100.0% | | | $ | 2,366,245 | |
| * | Non-income producing security. |
| † | Security is being fair valued using significant unobservable inputs by a pricing committee under the direction of the Board of Trustees. The aggregate value of fair valued securities is $0, which represents 0.0% of net assets. |
| (a) | This security is exempt from registration under rule 144A of the Securities Act of 1933. This security may be sold in transactions that are exempt from registration, normally to qualified institutional buyers. |
| (b) | Security, or portion thereof, was on loan at March 31, 2022 (See Note 2). At March 31, 2022, the total market value of the Fund’s securities on loan identified in the Schedule of Investments was $8,559 and the total market value of the collateral held by the Fund was $9,023, which was entirely composed of non-cash U.S. Government securities. |
| (c) | This security is exempt from registration under Regulation S of the Securities Act of 1933, which exempts from registration securities offered and sold outside the United States. This security may not be offered or sold in the United States except pursuant to an exemption from, or in a transaction not subject to, the registration requirements of the Securities Act of 1933. |
See Notes to Financial Statements.
Schedule of Investments (continued)
WisdomTree Emerging Markets Multifactor Fund (EMMF)
March 31, 2022
Affiliated holdings are investments in entities in which the Fund owns 5% or more of the outstanding voting securities or are investments in entities which are under common ownership or control. Investments in affiliates during the fiscal year ended March 31, 2022 were as follows:
| | | | | | | | | | | | | | | | | | | | | | | | | | | | |
| | | | | | | |
| Affiliate | | Value at
3/31/2021 | | | Purchases/
Additions | | | Sales/
Reductions | | | Realized
Gain/(Loss) | | | Change in
Unrealized
Appreciation/ Depreciation | | | Value at
3/31/2022 | | | Dividend
Income | |
WisdomTree Emerging Markets Multifactor Fund^ | | $ | — | | | $ | 35,334 | | | $ | 34,736 | | | $ | (598 | ) | | $ | — | | | $ | — | | | $ | 291 | |
| ^ | As of March 31, 2022, the Fund did not hold a position in this affiliate. |
| | | | | | | | | | | | | | | | | | | | | | | | | | | | |
|
| FINANCIAL DERIVATIVE INSTRUMENTS | |
|
| FOREIGN CURRENCY CONTRACTS (OTC – OVER THE COUNTER) | |
| | | | | |
| Counterparty | | Settlement
Date | | | Amount and
Description of
Currency to be
Purchased | | | Amount and
Description of
Currency to
be Sold | | | Unrealized
Appreciation | | | Unrealized
Depreciation | |
Citibank NA | | | 4/6/2022 | | | | 96,203 | | | | USD | | | | 1,977,292 | | | | MXN | | | $ | — | | | $ | (2,916 | ) |
Goldman Sachs | | | 4/5/2022 | | | | 84,306 | | | | USD | | | | 4,426,074 | | | | PHP | | | | — | | | | (1,226 | ) |
Goldman Sachs | | | 4/6/2022 | | | | 255,019 | | | | USD | | | | 19,445,677 | | | | INR | | | | — | | | | (1,576 | ) |
Goldman Sachs | | | 4/6/2022 | | | | 238,876 | | | | USD | | | | 290,544,567 | | | | KRW | | | | — | | | | (826 | ) |
Goldman Sachs | | | 4/6/2022 | | | | 102,947 | | | | USD | | | | 433,407 | | | | MYR | | | | — | | | | (122 | ) |
Goldman Sachs | | | 4/8/2022 | | | | 477,182 | | | | USD | | | | 13,537,667 | | | | TWD | | | | 4,691 | | | | — | |
HSBC Holdings PLC | | | 4/6/2022 | | | | 13,418 | | | | USD | | | | 300,551 | | | | CZK | | | | — | | | | (270 | ) |
HSBC Holdings PLC | | | 4/6/2022 | | | | 16,375 | | | | USD | | | | 5,517,573 | | | | HUF | | | | — | | | | (338 | ) |
JP Morgan Chase Bank NA | | | 4/1/2022 | | | | 642 | | | | USD | | | | 9,300 | | | | ZAR | | | | 6 | | | | — | |
| | | | | | | | | | | | | | | | | | | | | | | $ | 4,697 | | | $ | (7,274 | ) |
The following is a summary of the fair valuations according to the inputs used as of March 31, 2022 in valuing the Fund’s investments (See Note 2 — Fair Value Measurement):
| | | | | | | | | | | | | | | | |
| | | | |
| | | Quoted Prices in Active
Markets
(Level 1) | | | Other
Significant
Observable
Inputs
(Level 2) | | | Significant
Unobservable
Inputs
(Level 3) | | | Total | |
Assets: | | | | | | | | | | | | | | | | |
Investments in Securities | | | | | | | | | | | | | | | | |
Common Stocks | | | | | | | | | | | | | | | | |
Russia | | $ | — | | | $ | — | | | $ | 0 | * | | $ | 0 | |
Other | | | 2,315,723 | | | | — | | | | — | | | | 2,315,723 | |
Foreign Corporate Bond | | | — | | | | 121 | | | | — | | | | 121 | |
Preferred Stocks | | | 43,792 | | | | — | | | | — | | | | 43,792 | |
Total Investments in Securities | | $ | 2,359,515 | | | $ | 121 | | | $ | 0 | | | $ | 2,359,636 | |
Financial Derivative Instruments | | | | | | | | | | | | | | | | |
Foreign Currency Contracts1 | | $ | — | | | $ | 4,697 | | | $ | — | | | $ | 4,697 | |
Liabilities: | | | | | | | | | | | | | | | | |
Financial Derivative Instruments | | | | | | | | | | | | | | | | |
Foreign Currency Contracts1 | | $ | — | | | $ | (7,274 | ) | | $ | — | | | $ | (7,274 | ) |
Total – Net | | $ | 2,359,515 | | | $ | (2,456 | ) | | $ | 0 | | | $ | 2,357,059 | |
| * | Securities are being fair valued using significant unobservable inputs by the Pricing Committee. |
| 1 | Amount shown represents the unrealized appreciation (depreciation) on the financial instrument. |
See Notes to Financial Statements.
Schedule of Investments (concluded)
WisdomTree Emerging Markets Multifactor Fund (EMMF)
March 31, 2022
The following is a reconciliation of assets in which significant unobservable inputs (Level 3) were used in determining fair value:
| | | | |
| | |
| | | Common Stocks | |
| |
| | | Russia | |
Balance as of March 31, 2021 | | $ | — | |
Realized gain (loss) | | | 28,289 | |
Change in unrealized appreciation (depreciation) | | | (127,738 | ) |
Purchases | | | 198,083 | |
Sales | | | (209,697 | ) |
Transfers into Level 3(1) | | | 111,063 | |
Transfers out of Level 3 | | | — | |
Balance as of March 31, 2022 | | $ | 0 | |
Net change in unrealized appreciation (depreciation) from investments still held as of March 31, 2022 is: | | $ | (127,738 | ) |
| | (1) | Transferred into Level 3 because of a lack of observable market data, resulting from a decrease in market activity for the securities. |
See Notes to Financial Statements.
Schedule of Investments
WisdomTree Emerging Markets Quality Dividend Growth Fund (DGRE)
March 31, 2022
| | | | | | | | |
| Investments | | Shares | | | Value | |
|
| COMMON STOCKS – 97.2% | |
|
| Brazil – 5.0% | |
| | |
Ambev SA | | | 85,800 | | | $ | 278,058 | |
| | |
Atacadao SA | | | 55,000 | | | | 260,651 | |
| | |
Cia Siderurgica Nacional SA | | | 37,800 | | | | 207,059 | |
| | |
CPFL Energia SA | | | 30,350 | | | | 206,104 | |
| | |
Equatorial Energia SA | | | 53,833 | | | | 308,252 | |
| | |
JBS SA | | | 36,600 | | | | 286,749 | |
| | |
Localiza Rent a Car SA | | | 20,500 | | | | 263,586 | |
| | |
Magazine Luiza SA | | | 79,500 | | | | 114,098 | |
| | |
Petroleo Brasileiro SA | | | 66,359 | | | | 492,112 | |
| | |
Telefonica Brasil SA | | | 18,963 | | | | 214,254 | |
| | |
TOTVS SA | | | 28,200 | | | | 215,894 | |
| | |
Vale SA | | | 51,745 | | | | 1,041,009 | |
| | |
Vibra Energia SA | | | 38,150 | | | | 187,701 | |
| | |
WEG SA | | | 37,457 | | | | 274,861 | |
| | | | | | | | |
| Total Brazil | | | | 4,350,388 | |
|
| Chile – 0.4% | |
| | |
Banco Santander Chile | | | 3,356,863 | | | | 189,017 | |
| | |
Empresas CMPC SA | | | 102,561 | | | | 189,893 | |
| | | | | | | | |
| Total Chile | | | | 378,910 | |
|
| China – 28.1% | |
| | |
A-Living Smart City Services Co. Ltd.(a)(b) | | | 60,250 | | | | 84,320 | |
| | |
ANTA Sports Products Ltd. | | | 46,600 | | | | 585,520 | |
| | |
AviChina Industry & Technology Co. Ltd., Class H(b) | | | 378,000 | | | | 209,963 | |
| | |
Beijing New Building Materials PLC, Class A | | | 18,700 | | | | 89,286 | |
| | |
BGI Genomics Co. Ltd., Class A* | | | 6,300 | | | | 80,079 | |
| | |
BOE Technology Group Co. Ltd., Class A | | | 200,500 | | | | 136,128 | |
| | |
Bosideng International Holdings Ltd.(b) | | | 538,000 | | | | 251,434 | |
| | |
Brilliance China Automotive Holdings Ltd.*† | | | 242,000 | | | | 111,320 | |
| | |
By-health Co. Ltd., Class A | | | 25,700 | | | | 86,192 | |
| | |
BYD Co. Ltd., Class H | | | 13,500 | | | | 386,827 | |
| | |
BYD Electronic International Co. Ltd.(b) | | | 52,000 | | | | 104,911 | |
| | |
C&S Paper Co. Ltd., Class A | | | 28,700 | | | | 54,252 | |
| | |
China Feihe Ltd.(a) | | | 179,000 | | | | 177,368 | |
| | |
China Galaxy Securities Co. Ltd., Class H | | | 371,000 | | | | 207,969 | |
| | |
China Hongqiao Group Ltd.(b) | | | 272,500 | | | | 363,964 | |
| | |
China Lesso Group Holdings Ltd. | | | 158,000 | | | | 192,068 | |
| | |
China Medical System Holdings Ltd. | | | 273,000 | | | | 430,168 | |
| | |
China Meidong Auto Holdings Ltd. | | | 60,000 | | | | 229,844 | |
| | |
China Mengniu Dairy Co. Ltd.* | | | 114,000 | | | | 614,296 | |
| | |
China National Building Material Co. Ltd., Class H | | | 454,000 | | | | 564,645 | |
| | |
China Northern Rare Earth Group High-Tech Co. Ltd., Class A | | | 17,700 | | | | 107,988 | |
| | |
China Oilfield Services Ltd., Class H(b) | | | 418,000 | | | | 428,600 | |
| | |
China Overseas Property Holdings Ltd. | | | 360,000 | | | | 428,429 | |
| | |
China Resources Beer Holdings Co. Ltd. | | | 52,000 | | | | 319,049 | |
| | |
China Resources Gas Group Ltd. | | | 76,000 | | | | 322,675 | |
| | |
China Shenhua Energy Co. Ltd., Class H | | | 169,500 | | | | 543,255 | |
| | |
China Yuhua Education Corp. Ltd.(a) | | | 234,000 | | | | 53,186 | |
| | |
Chinasoft International Ltd.* | | | 186,000 | | | | 154,141 | |
| | |
Chongqing Zhifei Biological Products Co. Ltd., Class A | | | 25,500 | | | | 554,339 | |
| | |
CIFI Ever Sunshine Services Group Ltd. | | | 104,000 | | | | 140,767 | |
| | |
CIFI Holdings Group Co. Ltd. | | | 576,000 | | | | 339,066 | |
| | |
Contemporary Amperex Technology Co. Ltd., Class A | | | 5,400 | | | | 435,787 | |
| | |
CSPC Pharmaceutical Group Ltd. | | | 314,000 | | | | 362,860 | |
| | |
Daan Gene Co. Ltd., Class A | | | 25,960 | | | | 76,268 | |
| | |
ENN Energy Holdings Ltd. | | | 41,900 | | | | 628,655 | |
| | |
FAW Jiefang Group Co. Ltd., Class A | | | 57,000 | | | | 77,579 | |
| | |
Focus Media Information Technology Co. Ltd., Class A | | | 95,500 | | | | 91,918 | |
| | |
G-bits Network Technology Xiamen Co. Ltd., Class A | | | 1,300 | | | | 73,825 | |
| | |
Gigadevice Semiconductor Beijing, Inc., Class A | | | 5,900 | | | | 131,075 | |
| | |
Great Wall Motor Co. Ltd., Class H | | | 127,000 | | | | 203,683 | |
| | |
Greentown Service Group Co. Ltd. | | | 206,000 | | | | 207,278 | |
| | |
Guangdong Kinlong Hardware Products Co. Ltd., Class A | | | 4,500 | | | | 76,041 | |
| | |
Guangzhou Kingmed Diagnostics Group Co. Ltd., Class A | | | 6,500 | | | | 75,208 | |
| | |
Guangzhou Shiyuan Electronic Technology Co. Ltd., Class A | | | 7,300 | | | | 73,735 | |
| | |
Guangzhou Tinci Materials Technology Co. Ltd., Class A | | | 5,600 | | | | 82,922 | |
| | |
Guangzhou Wondfo Biotech Co. Ltd., Class A | | | 12,500 | | | | 94,654 | |
| | |
Hangzhou Silan Microelectronics Co. Ltd., Class A | | | 15,600 | | | | 119,185 | |
| | |
Hengli Petrochemical Co. Ltd., Class A | | | 31,500 | | | | 103,162 | |
| | |
Huafon Chemical Co. Ltd., Class A | | | 60,900 | | | | 87,396 | |
| | |
Inspur Electronic Information Industry Co. Ltd., Class A | | | 19,200 | | | | 82,116 | |
| | |
Intco Medical Technology Co. Ltd., Class A | | | 11,900 | | | | 86,680 | |
| | |
Jafron Biomedical Co. Ltd., Class A | | | 10,700 | | | | 76,507 | |
| | |
JCET Group Co. Ltd., Class A | | | 24,000 | | | | 92,929 | |
| | |
JD.com, Inc., Class A* | | | 3,780 | | | | 112,945 | |
| | |
Jiangsu Hengli Hydraulic Co. Ltd., Class A | | | 10,000 | | | | 81,993 | |
| | |
JiuGui Liquor Co. Ltd., Class A | | | 3,100 | | | | 72,225 | |
| | |
Kingboard Holdings Ltd. | | | 62,500 | | | | 304,064 | |
| | |
Kingfa Sci & Tech Co. Ltd., Class A | | | 39,700 | | | | 60,912 | |
| | |
Lenovo Group Ltd.(b) | | | 490,000 | | | | 533,085 | |
| | |
Li Ning Co. Ltd. | | | 47,000 | | | | 405,700 | |
| | |
Longfor Group Holdings Ltd.(a) | | | 115,000 | | | | 591,784 | |
| | |
Luzhou Laojiao Co. Ltd., Class A | | | 4,600 | | | | 134,694 | |
| | |
Maccura Biotechnology Co. Ltd., Class A | | | 21,000 | | | | 81,346 | |
| | |
Mango Excellent Media Co. Ltd., Class A | | | 17,400 | | | | 85,409 | |
| | |
Muyuan Foods Co. Ltd., Class A | | | 18,000 | | | | 161,226 | |
| | |
NanJi E-Commerce Co. Ltd., Class A | | | 89,500 | | | | 76,697 | |
| | |
New China Life Insurance Co. Ltd., Class H | | | 91,600 | | | | 256,153 | |
| | |
Ovctek China, Inc., Class A | | | 9,500 | | | | 54,668 | |
| | |
PetroChina Co. Ltd., Class H | | | 568,000 | | | | 294,466 | |
| | |
Proya Cosmetics Co. Ltd., Class A | | | 3,100 | | | | 92,066 | |
| | |
Shaanxi Coal Industry Co. Ltd., Class A | | | 51,200 | | | | 132,676 | |
| | |
Shandong Weigao Group Medical Polymer Co. Ltd., Class H | | | 148,000 | | | | 158,557 | |
| | |
Shanghai Bairun Investment Holding Group Co. Ltd., Class A | | | 9,300 | | | | 52,784 | |
| | |
Shanghai Baosight Software Co. Ltd., Class A | | | 11,730 | | | | 90,080 | |
| | |
Shanghai M&G Stationery, Inc., Class A | | | 8,600 | | | | 66,220 | |
See Notes to Financial Statements.
Schedule of Investments (continued)
WisdomTree Emerging Markets Quality Dividend Growth Fund (DGRE)
March 31, 2022
| | | | | | | | |
| Investments | | Shares | | | Value | |
| | |
Shanghai Zhangjiang High-Tech Park Development Co. Ltd., Class A | | | 33,700 | | | $ | 72,729 | |
| | |
Shenzhen Inovance Technology Co. Ltd., Class A | | | 16,100 | | | | 144,563 | |
| | |
Shijiazhuang Yiling Pharmaceutical Co. Ltd., Class A | | | 32,900 | | | | 173,619 | |
| | |
Silergy Corp. | | | 3,000 | | | | 359,144 | |
| | |
Sino Biopharmaceutical Ltd. | | | 593,000 | | | | 370,275 | |
| | |
Sinoma Science & Technology Co. Ltd., Class A | | | 20,500 | | | | 78,408 | |
| | |
StarPower Semiconductor Ltd., Class A | | | 2,200 | | | | 133,980 | |
| | |
Sungrow Power Supply Co. Ltd., Class A | | | 7,400 | | | | 125,033 | |
| | |
Sunny Optical Technology Group Co. Ltd. | | | 27,100 | | | | 436,360 | |
| | |
Tencent Holdings Ltd. | | | 78,800 | | | | 3,765,222 | |
| | |
Tsingtao Brewery Co. Ltd., Class H | | | 28,000 | | | | 222,744 | |
| | |
Unigroup Guoxin Microelectronics Co. Ltd., Class A | | | 3,700 | | | | 119,216 | |
| | |
Wanhua Chemical Group Co. Ltd., Class A | | | 10,400 | | | | 132,521 | |
| | |
Will Semiconductor Co. Ltd., Class A | | | 4,600 | | | | 140,143 | |
| | |
Wuhu Sanqi Interactive Entertainment Network Technology Group Co. Ltd., Class A | | | 72,600 | | | | 268,186 | |
| | |
Xinyi Solar Holdings Ltd. | | | 157,547 | | | | 278,022 | |
| | |
Yadea Group Holdings Ltd.(a) | | | 192,000 | | | | 297,142 | |
| | |
Yihai International Holding Ltd.*(b) | | | 58,000 | | | | 166,637 | |
| | |
Zhaojin Mining Industry Co. Ltd., Class H | | | 296,000 | | | | 261,174 | |
| | |
Zhongsheng Group Holdings Ltd. | | | 118,700 | | | | 839,694 | |
| | |
Zijin Mining Group Co. Ltd., Class H | | | 274,000 | | | | 421,948 | |
| | | | | | | | |
| Total China | | | | 24,398,022 | |
|
| Hong Kong – 0.1% | |
| Vinda International Holdings Ltd.(b) | | | 50,000 | | | | 113,134 | |
|
| Hungary – 0.2% | |
| Richter Gedeon Nyrt | | | 6,672 | | | | 141,906 | |
|
| India – 20.0% | |
| | |
Adani Ports & Special Economic Zone Ltd. | | | 38,975 | | | | 398,211 | |
| | |
Asian Paints Ltd. | | | 8,051 | | | | 327,241 | |
| | |
Aurobindo Pharma Ltd. | | | 16,932 | | | | 149,388 | |
| | |
Bajaj Finance Ltd. | | | 6,226 | | | | 596,509 | |
| | |
Balkrishna Industries Ltd. | | | 5,160 | | | | 145,467 | |
| | |
Berger Paints India Ltd. | | | 20,925 | | | | 193,220 | |
| | |
Bharat Electronics Ltd. | | | 69,307 | | | | 192,807 | |
| | |
Bharat Petroleum Corp. Ltd. | | | 42,304 | | | | 200,619 | |
| | |
Cipla Ltd. | | | 45,132 | | | | 606,356 | |
| | |
Dabur India Ltd. | | | 24,458 | | | | 173,070 | |
| | |
Divi’s Laboratories Ltd. | | | 4,087 | | | | 237,429 | |
| | |
GAIL India Ltd. | | | 159,869 | | | | 328,388 | |
| | |
Grasim Industries Ltd. | | | 16,367 | | | | 359,415 | |
| | |
Havells India Ltd. | | | 17,577 | | | | 267,349 | |
| | |
HCL Technologies Ltd. | | | 20,693 | | | | 317,802 | |
| | |
Hero MotoCorp Ltd. | | | 4,348 | | | | 131,639 | |
| | |
Hindalco Industries Ltd. | | | 38,297 | | | | 287,828 | |
| | |
Hindustan Petroleum Corp. Ltd. | | | 51,699 | | | | 183,769 | |
| | |
Hindustan Unilever Ltd. | | | 15,222 | | | | 411,541 | |
| | |
ICICI Bank Ltd. | | | 52,521 | | | | 506,184 | |
| | |
ICICI Lombard General Insurance Co. Ltd.(a) | | | 8,888 | | | | 155,802 | |
| | |
Indian Oil Corp. Ltd. | | | 136,921 | | | | 214,936 | |
| | |
Indraprastha Gas Ltd. | | | 30,231 | | | | 148,871 | |
| | |
Info Edge India Ltd. | | | 3,430 | | | | 204,123 | |
| | |
Infosys Ltd. | | | 52,459 | | | | 1,320,111 | |
| | |
Ipca Laboratories Ltd. | | | 14,270 | | | | 200,703 | |
| | |
ITC Ltd. | | | 91,144 | | | | 301,488 | |
| | |
JSW Steel Ltd. | | | 80,640 | | | | 779,688 | |
| | |
Jubilant Foodworks Ltd. | | | 5,802 | | | | 201,874 | |
| | |
Larsen & Toubro Infotech Ltd.(a) | | | 2,396 | | | | 194,633 | |
| | |
Larsen & Toubro Ltd. | | | 13,645 | | | | 318,305 | |
| | |
Lupin Ltd. | | | 13,088 | | | | 129,032 | |
| | |
Marico Ltd. | | | 52,111 | | | | 346,398 | |
| | |
Motherson Sumi Systems Ltd. | | | 47,482 | | | | 87,382 | |
| | |
MRF Ltd. | | | 151 | | | | 129,572 | |
| | |
Nestle India Ltd. | | | 1,693 | | | | 388,324 | |
| | |
NTPC Ltd. | | | 121,911 | | | | 217,195 | |
| | |
Oil & Natural Gas Corp. Ltd. | | | 94,162 | | | | 203,671 | |
| | |
Page Industries Ltd. | | | 393 | | | | 223,998 | |
| | |
Petronet LNG Ltd. | | | 90,565 | | | | 231,567 | |
| | |
PI Industries Ltd. | | | 4,007 | | | | 149,104 | |
| | |
Pidilite Industries Ltd. | | | 10,841 | | | | 351,133 | |
| | |
Piramal Enterprises Ltd. | | | 8,620 | | | | 248,777 | |
| | |
Power Grid Corp. of India Ltd. | | | 140,306 | | | | 401,430 | |
| | |
Shree Cement Ltd. | | | 888 | | | | 281,636 | |
| | |
Shriram Transport Finance Co. Ltd. | | | 16,308 | | | | 244,238 | |
| | |
Sun Pharmaceutical Industries Ltd. | | | 31,939 | | | | 385,565 | |
| | |
Tata Consultancy Services Ltd. | | | 17,279 | | | | 852,822 | |
| | |
Tata Consumer Products Ltd. | | | 17,633 | | | | 180,903 | |
| | |
Tata Steel Ltd. | | | 17,868 | | | | 308,242 | |
| | |
Tech Mahindra Ltd. | | | 32,748 | | | | 648,024 | |
| | |
Torrent Pharmaceuticals Ltd. | | | 5,555 | | | | 204,675 | |
| | |
UltraTech Cement Ltd. | | | 3,327 | | | | 289,883 | |
| | |
UPL Ltd. | | | 21,854 | | | | 221,958 | |
| | |
Vedanta Ltd. | | | 47,917 | | | | 255,062 | |
| | |
Wipro Ltd. | | | 38,475 | | | | 300,539 | |
| | | | | | | | |
| Total India | | | | | | | 17,335,896 | |
| | |
| Indonesia – 1.2% | | | | | | | | |
| | |
Aneka Tambang Tbk PT | | | 1,338,800 | | | | 227,444 | |
| | |
Charoen Pokphand Indonesia Tbk PT | | | 754,400 | | | | 296,770 | |
| | |
Kalbe Farma Tbk PT | | | 2,449,231 | | | | 274,553 | |
| | |
Sarana Menara Nusantara Tbk PT | | | 1,953,500 | | | | 145,535 | |
| | |
Semen Indonesia Persero Tbk PT | | | 289,500 | | | | 134,042 | |
| | | | | | | | |
| Total Indonesia | | | | | | | 1,078,344 | |
| | |
| Malaysia – 1.0% | | | | | | | | |
| | |
Hartalega Holdings Bhd | | | 191,900 | | | | 221,348 | |
| | |
Kossan Rubber Industries Bhd | | | 76,900 | | | | 35,846 | |
| | |
Sime Darby Plantation Bhd | | | 178,400 | | | | 210,868 | |
| | |
Supermax Corp. Bhd | | | 410,750 | | | | 115,271 | |
| | |
Telekom Malaysia Bhd | | | 135,900 | | | | 158,048 | |
| | |
Westports Holdings Bhd | | | 150,700 | | | | 143,362 | |
| | | | | | | | |
| Total Malaysia | | | | | | | 884,743 | |
| | |
| Mexico – 3.3% | | | | | | | | |
| | |
America Movil SAB de CV, Series L | | | 420,400 | | | | 445,234 | |
| | |
Arca Continental SAB de CV | | | 32,500 | | | | 220,420 | |
| | |
Coca-Cola Femsa SAB de CV | | | 27,800 | | | | 152,689 | |
See Notes to Financial Statements.
Schedule of Investments (continued)
WisdomTree Emerging Markets Quality Dividend Growth Fund (DGRE)
March 31, 2022
| | | | | | | | |
| Investments | | Shares | | | Value | |
| | |
Gruma SAB de CV, Class B | | | 21,328 | | | $ | 267,536 | |
| | |
Grupo Bimbo SAB de CV, Series A | | | 162,315 | | | | 488,850 | |
| | |
Grupo Mexico SAB de CV, Series B | | | 74,100 | | | | 442,177 | |
| | |
Kimberly-Clark de Mexico SAB de CV, Class A | | | 88,482 | | | | 124,146 | |
| | |
Megacable Holdings SAB de CV, Series CPO | | | 61,500 | | | | 184,821 | |
| | |
Orbia Advance Corp. SAB de CV | | | 66,600 | | | | 175,367 | |
| | |
Wal-Mart de Mexico SAB de CV | | | 76,600 | | | | 314,666 | |
| | | | | | | | |
| Total Mexico | | | | | | | 2,815,906 | |
| | |
| Philippines – 0.7% | | | | | | | | |
| International Container Terminal Services, Inc. | | | 136,990 | | | | 595,137 | |
| | |
| Poland – 0.8% | | | | | | | | |
| | |
CD Projekt SA | | | 5,227 | | | | 217,923 | |
| | |
Cyfrowy Polsat SA | | | 17,761 | | | | 118,315 | |
| | |
Polski Koncern Naftowy Orlen SA | | | 12,443 | | | | 226,988 | |
| | |
Polskie Gornictwo Naftowe i Gazownictwo SA | | | 92,249 | | | | 137,380 | |
| | | | | | | | |
| Total Poland | | | | | | | 700,606 | |
| | |
| Russia – 0.1% | | | | | | | | |
| | |
MMC Norilsk Nickel PJSC, ADR† | | | 9,933 | | | | 0 | |
| | |
Mobile TeleSystems PJSC, ADR† | | | 24,869 | | | | 0 | |
| | |
Novolipetsk Steel PJSC, GDR† | | | 7,165 | | | | 0 | |
| | |
PhosAgro PJSC, GDR†(c) | | | 8,985 | | | | 0 | |
| | |
Polymetal International PLC | | | 14,002 | | | | 56,653 | |
| | |
Polyus PJSC, GDR†(c) | | | 2,668 | | | | 0 | |
| | |
Severstal PAO, GDR†(c) | | | 8,497 | | | | 0 | |
| | |
Surgutneftegas PJSC, ADR† | | | 34,905 | | | | 0 | |
| | |
TCS Group Holding PLC, GDR*†(c) | | | 2,248 | | | | 0 | |
| | | | | | | | |
| Total Russia | | | | | | | 56,653 | |
| | |
| South Africa – 4.8% | | | | | | | | |
| | |
African Rainbow Minerals Ltd.(b) | | | 14,245 | | | | 278,953 | |
| | |
Anglo American Platinum Ltd. | | | 2,879 | | | | 395,331 | |
| | |
AngloGold Ashanti Ltd. | | | 14,274 | | | | 342,381 | |
| | |
Capitec Bank Holdings Ltd. | | | 1,922 | | | | 307,987 | |
| | |
Clicks Group Ltd. | | | 10,782 | | | | 228,036 | |
| | |
Exxaro Resources Ltd. | | | 26,522 | | | | 402,082 | |
| | |
Gold Fields Ltd. | | | 19,779 | | | | 308,681 | |
| | |
Harmony Gold Mining Co. Ltd. | | | 39,902 | | | | 201,742 | |
| | |
Impala Platinum Holdings Ltd. | | | 16,421 | | | | 252,880 | |
| | |
Kumba Iron Ore Ltd. | | | 8,433 | | | | 378,220 | |
| | |
Mr. Price Group Ltd. | | | 12,613 | | | | 186,884 | |
| | |
Shoprite Holdings Ltd. | | | 15,552 | | | | 251,876 | |
| | |
SPAR Group Ltd. | | | 19,315 | | | | 224,325 | |
| | |
Tiger Brands Ltd. | | | 11,965 | | | | 132,567 | |
| | |
Vodacom Group Ltd. | | | 22,407 | | | | 245,346 | |
| | | | | | | | |
| Total South Africa | | | | | | | 4,137,291 | |
| | |
| South Korea – 10.1% | | | | | | | | |
| | |
BGF Retail Co. Ltd. | | | 1,354 | | | | 194,937 | |
| | |
Cheil Worldwide, Inc. | | | 12,465 | | | | 242,194 | |
| | |
Fila Holdings Corp. | | | 6,043 | | | | 156,802 | |
| | |
Green Cross Corp. | | | 680 | | | | 113,329 | |
| | |
GS Engineering & Construction Corp. | | | 11,988 | | | | 458,928 | |
| | |
Hankook Tire & Technology Co. Ltd. | | | 4,021 | | | | 111,634 | |
| | |
Korea Investment Holdings Co. Ltd. | | | 3,087 | | | | 199,679 | |
| | |
Korea Zinc Co. Ltd. | | | 392 | | | | 189,200 | |
| | |
KT&G Corp. | | | 2,447 | | | | 162,925 | |
| | |
Kumho Petrochemical Co. Ltd. | | | 3,406 | | | | 435,568 | |
| | |
LG Chem Ltd. | | | 627 | | | | 275,206 | |
| | |
LG Corp. | | | 2,331 | | | | 146,931 | |
| | |
LG Electronics, Inc. | | | 5,076 | | | | 504,647 | |
| | |
LG Household & Health Care Ltd. | | | 299 | | | | 211,660 | |
| | |
LG Innotek Co. Ltd. | | | 1,144 | | | | 365,272 | |
| | |
LG Uplus Corp. | | | 14,045 | | | | 162,229 | |
| | |
Meritz Securities Co. Ltd. | | | 43,157 | | | | 232,867 | |
| | |
NH Investment & Securities Co. Ltd. | | | 14,413 | | | | 135,562 | |
| | |
Orion Corp. | | | 1,249 | | | | 91,507 | |
| | |
POSCO Holdings, Inc. | | | 1,173 | | | | 283,560 | |
| | |
S-1 Corp. | | | 2,373 | | | | 139,594 | |
| | |
S-Oil Corp. | | | 1,817 | | | | 144,964 | |
| | |
Samsung Electro-Mechanics Co. Ltd. | | | 1,666 | | | | 226,798 | |
| | |
Samsung Electronics Co. Ltd. | | | 54,034 | | | | 3,102,815 | |
| | |
Samsung Securities Co. Ltd. | | | 7,657 | | | | 264,699 | |
| | |
Seegene, Inc. | | | 4,174 | | | | 175,976 | |
| | | | | | | | |
| Total South Korea | | | | 8,729,483 | |
|
| Taiwan – 18.6% | |
| | |
Accton Technology Corp. | | | 26,000 | | | | 201,909 | |
| | |
Acer, Inc.(b) | | | 218,000 | | | | 227,880 | |
| | |
Advantech Co. Ltd. | | | 25,895 | | | | 333,951 | |
| | |
Airtac International Group | | | 7,000 | | | | 227,457 | |
| | |
Asia Cement Corp. | | | 177,000 | | | | 300,236 | |
| | |
ASMedia Technology, Inc. | | | 3,000 | | | | 203,654 | |
| | |
Asustek Computer, Inc. | | | 20,000 | | | | 260,719 | |
| | |
Chailease Holding Co. Ltd. | | | 68,877 | | | | 609,403 | |
| | |
Delta Electronics, Inc. | | | 31,000 | | | | 290,508 | |
| | |
Eclat Textile Co. Ltd. | | | 15,000 | | | | 249,987 | |
| | |
Evergreen Marine Corp. Taiwan Ltd. | | | 79,000 | | | | 372,232 | |
| | |
Feng TAY Enterprise Co. Ltd. | | | 43,377 | | | | 289,922 | |
| | |
Fubon Financial Holding Co. Ltd. | | | 116,000 | | | | 309,722 | |
| | |
Giant Manufacturing Co. Ltd. | | | 18,000 | | | | 163,656 | |
| | |
Innolux Corp. | | | 395,000 | | | | 231,611 | |
| | |
Lite-On Technology Corp. | | | 101,000 | | | | 240,061 | |
| | |
MediaTek, Inc. | | | 18,000 | | | | 568,557 | |
| | |
Micro-Star International Co. Ltd. | | | 67,000 | | | | 303,998 | |
| | |
momo.com, Inc. | | | 4,000 | | | | 131,372 | |
| | |
Nan Ya Printed Circuit Board Corp. | | | 16,000 | | | | 292,620 | |
| | |
Nien Made Enterprise Co. Ltd. | | | 28,000 | | | | 328,848 | |
| | |
Novatek Microelectronics Corp.(b) | | | 42,000 | | | | 625,203 | |
| | |
Phison Electronics Corp. | | | 13,000 | | | | 215,748 | |
| | |
Powertech Technology, Inc. | | | 72,000 | | | | 238,731 | |
| | |
Quanta Computer, Inc. | | | 72,000 | | | | 221,894 | |
| | |
Realtek Semiconductor Corp. | | | 33,000 | | | | 495,838 | |
| | |
Synnex Technology International Corp. | | | 198,000 | | | | 520,371 | |
| | |
Taiwan Cement Corp. | | | 171,000 | | | | 297,817 | |
| | |
Taiwan Semiconductor Manufacturing Co. Ltd. | | | 253,291 | | | | 5,277,725 | |
| | |
Unimicron Technology Corp.(b) | | | 42,000 | | | | 365,007 | |
| | |
United Microelectronics Corp.(b) | | | 217,000 | | | | 408,984 | |
| | |
Vanguard International Semiconductor Corp. | | | 38,000 | | | | 165,122 | |
| | |
Walsin Technology Corp.* | | | 60,000 | | | | 297,367 | |
| | |
Wan Hai Lines Ltd. | | | 38,000 | | | | 210,216 | |
See Notes to Financial Statements.
Schedule of Investments (continued)
WisdomTree Emerging Markets Quality Dividend Growth Fund (DGRE)
March 31, 2022
| | | | | | | | |
| Investments | | Shares | | | Value | |
| | |
Wistron Corp. | | | 166,000 | | | $ | 172,364 | |
| | |
Wiwynn Corp. | | | 5,000 | | | | 178,001 | |
| | |
Yuanta Financial Holding Co. Ltd. | | | 308,000 | | | | 283,797 | |
| | | | | | | | |
| Total Taiwan | | | | 16,112,488 | |
|
| Thailand – 1.1% | |
| | |
Carabao Group PCL, NVDR | | | 44,000 | | | | 142,917 | |
| | |
Charoen Pokphand Foods PCL, NVDR(b) | | | 197,900 | | | | 143,440 | |
| | |
Delta Electronics Thailand PCL, NVDR | | | 14,000 | | | | 163,369 | |
| | |
Gulf Energy Development PCL, NVDR | | | 122,500 | | | | 188,816 | |
| | |
Srisawad Corp. PCL, NVDR | | | 93,100 | | | | 159,600 | |
| | |
Thai Union Group PCL, NVDR | | | 241,900 | | | | 137,501 | |
| | | | | | | | |
| Total Thailand | | | | 935,643 | |
|
| Turkey – 1.7% | |
| | |
Aselsan Elektronik Sanayi ve Ticaret AS | | | 137,275 | | | | 225,925 | |
| | |
BIM Birlesik Magazalar AS | | | 30,007 | | | | 173,175 | |
| | |
Eregli Demir ve Celik Fabrikalari TAS | | | 98,428 | | | | 217,689 | |
| | |
Ford Otomotiv Sanayi AS | | | 19,815 | | | | 403,521 | |
| | |
KOC Holding AS | | | 63,834 | | | | 172,600 | |
| | |
Turkcell Iletisim Hizmetleri AS | | | 65,104 | | | | 100,046 | |
| | |
Turkiye Sise ve Cam Fabrikalari AS | | | 190,460 | | | | 197,501 | |
| | | | | | | | |
| Total Turkey | | | | 1,490,457 | |
TOTAL COMMON STOCKS (Cost: $72,904,578) | | | | 84,255,007 | |
| | |
| | | Principal
Amount | | | | |
|
| FOREIGN CORPORATE BOND – 0.0% | |
|
| India – 0.0% | |
| | |
Britannia Industries Ltd.
5.50%, 6/3/24 (Cost: $2,260) | | | 164,430 | INR | | | 2,174 | |
| | |
| | | Shares | | | | |
|
| PREFERRED STOCKS – 2.9% | |
|
| Brazil – 2.1% | |
| | |
Bradespar SA | | | 21,800 | | | | 151,758 | |
| | |
Cia Energetica de Minas Gerais | | | 70,500 | | | | 225,656 | |
| | |
Cia Paranaense de Energia, Class A | | | 124,896 | | | | 198,700 | |
| | |
Gerdau SA | | | 52,100 | | | | 337,798 | |
| | |
Itausa SA | | | 146,009 | | | | 330,306 | |
| | |
Petroleo Brasileiro SA | | | 77,900 | | | | 548,355 | |
| | | | | | | | |
| Total Brazil | | | | 1,792,573 | |
|
| South Korea – 0.8% | |
| | |
LG Chem Ltd. | | | 627 | | | | 141,224 | |
| | |
Samsung Electronics Co. Ltd. | | | 11,314 | | | | 588,080 | |
| | | | | | | | |
| Total South Korea | | | | 729,304 | |
TOTAL PREFERRED STOCKS (Cost: $2,346,283) | | | | | | | 2,521,877 | |
|
| INVESTMENT OF CASH COLLATERAL FOR SECURITIES LOANED – 0.3% | |
|
| United States – 0.3% | |
| | |
State Street Navigator Securities Lending Government Money Market Portfolio, 0.25%(d) | | | | | | | | |
| (Cost: $273,743) | | | 273,743 | | | | 273,743 | |
| |
TOTAL INVESTMENTS IN SECURITIES – 100.4% (Cost: $75,526,864) | | | | 87,052,801 | |
| |
Other Assets less Liabilities — (0.4)% | | | | (347,621 | ) |
| | | | | | | | |
| NET ASSETS – 100.0% | | | $ | 86,705,180 | |
| * | Non-income producing security. |
| † | Security is being fair valued using significant unobservable inputs by a pricing committee under the direction of the Board of Trustees. The aggregate value of fair valued securities is $111,320, which represents 0.13% of net assets. |
| (a) | This security is exempt from registration under rule 144A of the Securities Act of 1933. This security may be sold in transactions that are exempt from registration, normally to qualified institutional buyers. |
| (b) | Security, or portion thereof, was on loan at March 31, 2022 (See Note 2). At March 31, 2022, the total market value of the Fund’s securities on loan identified in the Schedule of Investments was $2,829,834 and the total market value of the collateral held by the Fund was $3,041,766. The total market value of the collateral includes non-cash U.S. Government securities collateral having a value of $2,768,023. |
| (c) | This security is exempt from registration under Regulation S of the Securities Act of 1933, which exempts from registration securities offered and sold outside the United States. This security may not be offered or sold in the United States except pursuant to an exemption from, or in a transaction not subject to, the registration requirements of the Securities Act of 1933. |
| (d) | Rate shown represents annualized 7-day yield as of March 31, 2022. |
See Notes to Financial Statements.
Schedule of Investments (concluded)
WisdomTree Emerging Markets Quality Dividend Growth Fund (DGRE)
March 31, 2022
The following is a summary of the fair valuations according to the inputs used as of March 31, 2022 in valuing the Fund’s investments (See Note 2 — Fair Value Measurement):
| | | | | | | | | | | | | | | | |
| | | | |
| | | Quoted
Prices in
Active
Markets
(Level 1) | | | Other
Significant
Observable
Inputs
(Level 2) | | | Significant
Unobservable
Inputs
(Level 3) | | | Total | |
Assets: | | | | | | | | | | | | | | | | |
Investments in Securities | | | | | | | | | | | | | | | | |
Common Stocks | | | | | | | | | | | | | | | | |
China | | $ | 24,286,702 | | | $ | — | | | $ | 111,320 | * | | $ | 24,398,022 | |
Russia | | | 56,653 | | | | — | | | | 0 | * | | | 56,653 | |
Other | | | 59,800,332 | | | | — | | | | — | | | | 59,800,332 | |
Foreign Corporate Bond | | | — | | | | 2,174 | | | | — | | | | 2,174 | |
Preferred Stocks | | | 2,521,877 | | | | — | | | | — | | | | 2,521,877 | |
Investment of Cash Collateral for Securities Loaned | | | — | | | | 273,743 | | | | — | | | | 273,743 | |
Total Investments in Securities | | $ | 86,665,564 | | | $ | 275,917 | | | $ | 111,320 | | | $ | 87,052,801 | |
| * | Securities are being fair valued using significant unobservable inputs by the Pricing Committee. |
The following is a reconciliation of assets in which significant unobservable inputs (Level 3) were used in determining fair value:
| | | | | | | | |
| | |
| | | Common Stocks | |
| | |
| | | China | | | Russia | |
Balance as of March 31, 2021 | | $ | — | | | $ | — | |
Realized gain (loss) | | | — | | | | 1,521 | |
Change in unrealized appreciation (depreciation) | | | (115,912 | ) | | | (1,849,297 | ) |
Purchase | | | — | | | | 1,516,893 | |
Sales | | | — | | | | (23,646 | ) |
Transfers into Level 3(1) | | | 227,232 | | | | 354,529 | |
Transfers out of Level 3 | | | — | | | | — | |
Balance as of March 31, 2022 | | $ | 111,320 | | | $ | 0 | |
Net change in unrealized appreciation (depreciation) from investments still held as of March 31, 2022 is : | | | | | | $ | (1,965,209 | ) |
| | (1) | Transferred into Level 3 because of la lack of observable market data, resulting from a decrease in market activity for the securities. |
See Notes to Financial Statements.
Schedule of Investments
WisdomTree Emerging Markets SmallCap Dividend Fund (DGS)
March 31, 2022
| | | | | | | | |
| Investments | | Shares | | | Value | |
|
| COMMON STOCKS – 98.8% | |
| | |
| Brazil – 7.6% | | | | | | | | |
| | |
Aliansce Sonae Shopping Centers SA | | | 314,827 | | | $ | 1,533,075 | |
| | |
Alupar Investimento SA | | | 920,368 | | | | 5,343,691 | |
| | |
Arezzo Industria e Comercio SA | | | 102,144 | | | | 1,938,435 | |
| | |
BR Properties SA | | | 978,596 | | | | 1,830,768 | |
| | |
BrasilAgro – Co. Brasileira de Propriedades Agricolas | | | 450,388 | | | | 3,019,679 | |
| | |
Camil Alimentos SA | | | 1,115,101 | | | | 2,264,486 | |
| | |
Cia Brasileira de Distribuicao | | | 1,661,302 | | | | 8,442,943 | |
| | |
Cia de Locacao das Americas | | | 687,036 | | | | 3,926,788 | |
| | |
Cia de Saneamento de Minas Gerais-COPASA | | | 1,040,957 | | | | 3,003,298 | |
| | |
Cia de Saneamento do Parana | | | 3,643,242 | | | | 7,513,390 | |
| | |
Cury Construtora e Incorporadora SA | | | 976,147 | | | | 1,555,032 | |
| | |
Cyrela Brazil Realty SA Empreendimentos e Participacoes | | | 4,504,362 | | | | 16,578,729 | |
| | |
Dexco SA | | | 718,678 | | | | 2,220,182 | |
| | |
EDP – Energias do Brasil SA | | | 2,738,164 | | | | 13,552,672 | |
| | |
Ez Tec Empreendimentos e Participacoes SA | | | 121,599 | | | | 479,799 | |
| | |
Fleury SA | | | 1,067,098 | | | | 3,595,206 | |
| | |
Fras-Le SA | | | 357,230 | | | | 1,074,257 | |
| | |
Grendene SA | | | 2,564,157 | | | | 5,390,614 | |
| | |
Guararapes Confeccoes SA | | | 360,790 | | | | 875,411 | |
| | |
Iguatemi SA* | | | 173,070 | | | | 744,806 | |
| | |
Industrias Romi SA | | | 454,115 | | | | 1,334,072 | |
| | |
Irani Papel e Embalagem SA | | | 691,411 | | | | 989,403 | |
| | |
JHSF Participacoes SA | | | 2,052,677 | | | | 2,838,011 | |
| | |
Kepler Weber SA | | | 123,521 | | | | 1,411,461 | |
| | |
Light SA | | | 1,354,074 | | | | 2,949,245 | |
| | |
M. Dias Branco SA | | | 164,232 | | | | 850,891 | |
| | |
Mahle-Metal Leve SA | | | 179,678 | | | | 969,863 | |
| | |
Minerva SA | | | 2,910,201 | | | | 7,753,269 | |
| | |
Movida Participacoes SA | | | 455,673 | | | | 1,675,230 | |
| | |
MPM Corporeos SA | | | 336,755 | | | | 389,767 | |
| | |
Multiplan Empreendimentos Imobiliarios SA | | | 887,426 | | | | 4,571,637 | |
| | |
Odontoprev SA | | | 2,149,866 | | | | 5,673,317 | |
| | |
Portobello SA | | | 668,928 | | | | 1,396,430 | |
| | |
Positivo Tecnologia SA | | | 398,735 | | | | 776,165 | |
| | |
Sao Martinho SA | | | 870,705 | | | | 8,128,131 | |
| | |
SIMPAR SA | | | 263,813 | | | | 651,767 | |
| | |
SLC Agricola SA | | | 473,162 | | | | 4,958,694 | |
| | |
Sul America SA | | | 1,827,882 | | | | 13,224,589 | |
| | |
SYN prop e tech SA | | | 806,647 | | | | 1,198,440 | |
| | |
Transmissora Alianca de Energia Eletrica SA | | | 4,794,887 | | | | 44,538,834 | |
| | |
Unipar Carbocloro SA | | | 87,386 | | | | 1,831,595 | |
| | |
Wiz Solucoes e Corretagem de Seguros SA | | | 580,411 | | | | 1,056,525 | |
| | |
YDUQS Participacoes SA | | | 590,738 | | | | 2,603,153 | |
| | | | | | | | |
| Total Brazil | | | | 196,653,750 | |
| | |
| Chile – 1.1% | | | | | | | | |
| | |
CAP SA | | | 1,250,300 | | | | 19,383,880 | |
| | |
Empresa Nacional de Telecomunicaciones SA | | | 692,493 | | | | 3,026,316 | |
| | |
SMU SA | | | 12,890,727 | | | | 1,474,303 | |
| | |
SONDA SA | | | 1,674,302 | | | | 667,572 | |
| | |
Vina Concha y Toro SA | | | 2,715,305 | | | | 4,379,407 | |
| | | | | | | | |
| Total Chile | | | | 28,931,478 | |
| | |
| China – 14.1% | | | | | | | | |
| | |
Anhui Guangxin Agrochemical Co. Ltd., Class A | | | 140,900 | | | | 708,040 | |
| | |
Aoyuan Healthy Life Group Co. Ltd.*(a) | | | 2,448,000 | | | | 581,413 | |
| | |
Asiainfo Technologies Ltd.(a)(b) | | | 1,530,400 | | | | 2,696,775 | |
| | |
Ausnutria Dairy Corp. Ltd.*(a) | | | 2,384,000 | | | | 2,319,647 | |
| | |
BAIC Motor Corp. Ltd., Class H(b) | | | 7,294,500 | | | | 2,449,694 | |
| | |
Bank of Chongqing Co. Ltd., Class A | | | 1,225,100 | | | | 1,760,040 | |
| | |
Bank of Chongqing Co. Ltd., Class H(a) | | | 3,302,500 | | | | 2,036,810 | |
| | |
Beijing Jingneng Clean Energy Co. Ltd., Class H | | | 7,430,000 | | | | 1,688,766 | |
| | |
Beijing Tong Ren Tang Chinese Medicine Co. Ltd.(a) | | | 857,000 | | | | 1,188,424 | |
| | |
Biem.L.Fdlkk Garment Co. Ltd., Class A | | | 172,600 | | | | 642,210 | |
| | |
Binjiang Service Group Co. Ltd. | | | 625,500 | | | | 1,769,138 | |
| | |
Bluefocus Intelligent Communications Group Co. Ltd., Class A | | | 1,723,200 | | | | 2,272,047 | |
| | |
Bright Dairy & Food Co. Ltd., Class A | | | 413,800 | | | | 745,715 | |
| | |
C&D International Investment Group Ltd.(a) | | | 3,931,302 | | | | 8,584,067 | |
| | |
Cabbeen Fashion Ltd. | | | 1,329,000 | | | | 461,588 | |
| | |
Central China New Life Ltd.*(a) | | | 3,325,000 | | | | 1,846,892 | |
| | |
Chengdu Wintrue Holding Co. Ltd., Class A | | | 344,100 | | | | 732,854 | |
| | |
Chengdu Xingrong Environment Co. Ltd., Class A | | | 1,353,700 | | | | 1,059,827 | |
| | |
China Automotive Engineering Research Institute Co. Ltd., Class A | | | 432,700 | | | | 984,261 | |
| | |
China Bohai Bank Co. Ltd., Class H(a)(b) | | | 12,536,000 | | | | 2,080,956 | |
| | |
China Communications Services Corp. Ltd., Class H | | | 12,992,000 | | | | 5,889,317 | |
| | |
China Datang Corp. Renewable Power Co. Ltd., Class H(a) | | | 2,767,000 | | | | 1,148,294 | |
| | |
China East Education Holdings Ltd.(a)(b) | | | 1,279,000 | | | | 746,358 | |
| | |
China Everbright Greentech Ltd.(a)(b) | | | 2,449,000 | | | | 709,864 | |
| | |
China Foods Ltd. | | | 4,266,000 | | | | 1,476,219 | |
| | |
China Hanking Holdings Ltd. | | | 8,058,000 | | | | 1,563,981 | |
| | |
China Harmony Auto Holding Ltd. | | | 2,325,500 | | | | 1,184,813 | |
| | |
China Kepei Education Group Ltd. | | | 1,364,000 | | | | 384,917 | |
| | |
China Modern Dairy Holdings Ltd.(a) | | | 8,635,000 | | | | 1,400,318 | |
| | |
China New Higher Education Group Ltd.(a)(b) | | | 2,507,000 | | | | 800,304 | |
| | |
China Nonferrous Mining Corp. Ltd. | | | 6,239,000 | | | | 3,138,859 | |
| | |
China Reinsurance Group Corp., Class H | | | 53,391,000 | | | | 4,908,640 | |
| | |
China Renaissance Holdings Ltd.*(a)(b) | | | 648,500 | | | | 802,406 | |
| | |
China Risun Group Ltd., Class H(a) | | | 8,987,000 | | | | 4,762,373 | |
| | |
China South City Holdings Ltd.(a) | | | 18,510,000 | | | | 1,630,858 | |
| | |
China South Publishing & Media Group Co. Ltd., Class A | | | 3,230,300 | | | | 4,824,001 | |
| | |
China Tianbao Group Development Co. Ltd.* | | | 284,000 | | | | 113,870 | |
| | |
China Water Affairs Group Ltd.(a) | | | 4,102,000 | | | | 4,494,108 | |
| | |
China World Trade Center Co. Ltd., Class A | | | 368,600 | | | | 940,647 | |
| | |
China XLX Fertiliser Ltd. | | | 875,000 | | | | 850,263 | |
| | |
China Yuhua Education Corp. Ltd.(a)(b) | | | 10,268,000 | | | | 2,333,815 | |
| | |
CIMC Enric Holdings Ltd.(a) | | | 1,584,000 | | | | 1,972,061 | |
See Notes to Financial Statements.
Schedule of Investments (continued)
WisdomTree Emerging Markets SmallCap Dividend Fund (DGS)
March 31, 2022
| | | | | | | | |
| Investments | | Shares | | | Value | |
| | |
CITIC Telecom International Holdings Ltd. | | | 17,498,000 | | | $ | 6,434,895 | |
| | |
CMGE Technology Group Ltd.*(a) | | | 5,120,000 | | | | 1,490,615 | |
| | |
Consun Pharmaceutical Group Ltd. | | | 4,493,000 | | | | 2,191,595 | |
| | |
CTS International Logistics Corp. Ltd., Class A | | | 817,800 | | | | 1,507,264 | |
| | |
DaFa Properties Group Ltd.(a) | | | 833,000 | | | | 412,703 | |
| | |
Datang Group Holdings Ltd.(a) | | | 2,093,000 | | | | 1,031,614 | |
| | |
Dexin China Holdings Co. Ltd.*(a) | | | 6,620,000 | | | | 2,535,945 | |
| | |
Dynagreen Environmental Protection Group Co. Ltd., Class H | | | 2,433,000 | | | | 1,118,421 | |
| | |
E-Star Commercial Management Co. Ltd. | | | 1,137,000 | | | | 389,095 | |
| | |
Edvantage Group Holdings Ltd. | | | 1,306,000 | | | | 473,611 | |
| | |
EEKA Fashion Holdings Ltd.(a) | | | 1,036,000 | | | | 1,732,972 | |
| | |
Excellence Commercial Property & Facilities Management Group Ltd. | | | 3,958,000 | | | | 2,011,497 | |
| | |
Fangda Special Steel Technology Co. Ltd., Class A | | | 7,155,777 | | | | 9,716,734 | |
| | |
Fire Rock Holdings Ltd.(a) | | | 1,664,000 | | | | 118,988 | |
| | |
Fu Shou Yuan International Group Ltd. | | | 3,471,000 | | | | 2,561,787 | |
| | |
Fufeng Group Ltd.* | | | 5,660,000 | | | | 2,247,695 | |
| | |
Fulu Holdings Ltd.(a) | | | 1,096,000 | | | | 925,066 | |
| | |
Ganglong China Property Group Ltd.(a) | | | 2,911,000 | | | | 1,717,294 | |
| | |
Gansu Shangfeng Cement Co. Ltd., Class A | | | 862,700 | | | | 2,969,392 | |
| | |
Genertec Universal Medical Group Co. Ltd.(b) | | | 6,018,500 | | | | 3,965,506 | |
| | |
Greenland Hong Kong Holdings Ltd. | | | 11,782,000 | | | | 2,662,888 | |
| | |
Greentown Management Holdings Co. Ltd.(b) | | | 4,388,000 | | | | 3,759,670 | |
| | |
Guangdong Baolihua New Energy Stock Co. Ltd., Class A | | | 4,577,105 | | | | 3,489,735 | |
| | |
Guangdong Xinbao Electrical Appliances Holdings Co. Ltd., Class A | | | 591,500 | | | | 1,554,200 | |
| | |
Guizhou Panjiang Refined Coal Co. Ltd., Class A | | | 982,800 | | | | 1,332,983 | |
| | |
Hainan Strait Shipping Co. Ltd., Class A | | | 770,300 | | | | 647,974 | |
| | |
Hangcha Group Co. Ltd., Class A | | | 469,980 | | | | 989,845 | |
| | |
Hangzhou Binjiang Real Estate Group Co. Ltd., Class A | | | 3,195,000 | | | | 3,452,639 | |
| | |
Health & Happiness H&H International Holdings Ltd. | | | 989,500 | | | | 1,392,381 | |
| | |
Hisense Home Appliances Group Co. Ltd., Class H(a) | | | 1,988,000 | | | | 1,893,720 | |
| | |
Huapont Life Sciences Co. Ltd., Class A | | | 2,257,200 | | | | 2,179,650 | |
| | |
Hubei Jumpcan Pharmaceutical Co. Ltd., Class A | | | 831,900 | | | | 3,450,470 | |
| | |
Huijing Holdings Co. Ltd.(a) | | | 3,816,000 | | | | 916,066 | |
| | |
JH Educational Technology, Inc.*(a) | | | 5,928,000 | | | | 2,513,083 | |
| | |
Jiangsu Provincial Agricultural Reclamation and Development Corp. | | | 603,400 | | | | 1,334,531 | |
| | |
Jiangsu Shagang Co. Ltd., Class A | | | 1,363,200 | | | | 1,215,436 | |
| | |
Jiangsu Zhongnan Construction Group Co. Ltd., Class A | | | 11,639,400 | | | | 8,030,839 | |
| | |
Jiayuan International Group Ltd.(a) | | | 12,916,000 | | | | 2,589,335 | |
| | |
Jiayuan Services Holdings Ltd. | | | 1,585,000 | | | | 688,127 | |
| | |
Jingrui Holdings Ltd.(a) | | | 9,077,000 | | | | 1,924,026 | |
| | |
Jinlei Technology Co. Ltd., Class A* | | | 98,000 | | | | 519,170 | |
| | |
Jinneng Science & Technology Co. Ltd., Class A | | | 420,100 | | | | 822,584 | |
| | |
JNBY Design Ltd. | | | 2,892,500 | | | | 3,460,776 | |
| | |
Kaisa Prosperity Holdings Ltd.* | | | 322,000 | | | | 337,567 | |
| | |
Kehua Data Co. Ltd., Class A | | | 130,700 | | | | 527,280 | |
| | |
KingClean Electric Co. Ltd., Class A | | | 376,782 | | | | 1,242,269 | |
| | |
KWG Living Group Holdings Ltd. | | | 1,824,000 | | | | 680,093 | |
| | |
Lao Feng Xiang Co. Ltd., Class A | | | 171,800 | | | | 1,149,375 | |
| | |
Legend Holdings Corp., Class H(b) | | | 2,347,500 | | | | 2,955,583 | |
| | |
Liuzhou Iron & Steel Co. Ltd., Class A | | | 1,838,400 | | | | 1,447,992 | |
| | |
Lonking Holdings Ltd. | | | 30,814,000 | | | | 8,420,201 | |
| | |
Maccura Biotechnology Co. Ltd., Class A | | | 391,300 | | | | 1,515,740 | |
| | |
NanJi E-Commerce Co. Ltd., Class A | | | 2,689,700 | | | | 2,304,937 | |
| | |
Nantong Jianghai Capacitor Co. Ltd., Class A | | | 112,900 | | | | 381,663 | |
| | |
NetDragon Websoft Holdings Ltd. | | | 1,070,500 | | | | 2,241,770 | |
| | |
Newland Digital Technology Co. Ltd., Class A | | | 910,700 | | | | 2,415,871 | |
| | |
Opple Lighting Co. Ltd., Class A | | | 204,000 | | | | 589,688 | |
| | |
People.cn Co. Ltd., Class A | | | 579,400 | | | | 1,003,985 | |
| | |
Poly Property Group Co. Ltd. | | | 16,399,000 | | | | 4,146,132 | |
| | |
Poly Property Services Co. Ltd., Class H(a) | | | 172,200 | | | | 1,246,743 | |
| | |
Powerlong Commercial Management Holdings Ltd.(a) | | | 260,500 | | | | 207,232 | |
| | |
Prinx Chengshan Holdings Ltd.(a) | | | 1,301,500 | | | | 1,236,453 | |
| | |
Pujiang International Group Ltd. | | | 1,218,000 | | | | 455,696 | |
| | |
Q Technology Group Co. Ltd.(a) | | | 400,000 | | | | 309,523 | |
| | |
Qinhuangdao Port Co. Ltd., Class A | | | 1,816,000 | | | | 792,413 | |
| | |
Radiance Holdings Group Co. Ltd.(a) | | | 6,133,000 | | | | 3,445,770 | |
| | |
Redco Properties Group Ltd.(a)(b) | | | 2,970,000 | | | | 921,559 | |
| | |
Redsun Properties Group Ltd.(a) | | | 6,754,000 | | | | 2,250,931 | |
| | |
S-Enjoy Service Group Co. Ltd.*(a) | | | 444,000 | | | | 535,766 | |
| | |
Sanquan Food Co. Ltd., Class A | | | 590,068 | | | | 1,396,138 | |
| | |
Shandong Bohui Paper Industrial Co. Ltd., Class A | | | 449,800 | | | | 634,160 | |
| | |
Shandong Chenming Paper Holdings Ltd., Class A | | | 1,076,800 | | | | 1,085,604 | |
| | |
Shandong Chenming Paper Holdings Ltd., Class H(a) | | | 3,087,500 | | | | 1,226,106 | |
| | |
Shanghai Chinafortune Co. Ltd., Class A | | | 366,200 | | | | 710,698 | |
| | |
Shanghai Environment Group Co. Ltd., Class A | | | 330,300 | | | | 552,573 | |
| | |
Shanghai Flyco Electrical Appliance Co. Ltd., Class A | | | 91,500 | | | | 726,454 | |
| | |
Shanghai Industrial Holdings Ltd. | | | 4,107,000 | | | | 6,167,265 | |
| | |
Shanghai Liangxin Electrical Co. Ltd., Class A | | | 720,700 | | | | 1,369,172 | |
| | |
Shanying International Holding Co. Ltd., Class A | | | 2,107,500 | | | | 1,002,607 | |
| | |
Shenzhen Expressway Corp. Ltd., Class A | | | 828,492 | | | | 1,254,203 | |
| | |
Shenzhen Expressway Corp. Ltd., Class H | | | 8,426,000 | | | | 8,876,382 | |
| | |
Shenzhen Huaqiang Industry Co. Ltd., Class A | | | 371,700 | | | | 738,353 | |
| | |
Shenzhen Jinjia Group Co. Ltd., Class A | | | 1,592,385 | | | | 3,464,160 | |
| | |
Shenzhen Megmeet Electrical Co. Ltd., Class A | | | 111,300 | | | | 405,534 | |
| | |
Shinsun Holdings Group Co. Ltd.*(a) | | | 8,657,000 | | | | 784,849 | |
| | |
Shougang Fushan Resources Group Ltd. | | | 28,008,412 | | | | 11,015,388 | |
| | |
Shui On Land Ltd. | | | 22,952,500 | | | | 3,516,996 | |
| | |
Simcere Pharmaceutical Group Ltd.(b) | | | 1,711,000 | | | | 2,311,513 | |
| | |
Sinic Holdings Group Co. Ltd., Class H*† | | | 3,669,000 | | | | 117,125 | |
See Notes to Financial Statements.
Schedule of Investments (continued)
WisdomTree Emerging Markets SmallCap Dividend Fund (DGS)
March 31, 2022
| | | | | | | | |
| Investments | | Shares | | | Value | |
| | |
Sino-Ocean Group Holding Ltd. | | | 36,198,000 | | | $ | 7,719,011 | |
| | |
Sino-Ocean Service Holding Ltd.(b) | | | 1,104,000 | | | | 538,509 | |
| | |
Sinopec Engineering Group Co. Ltd., Class H | | | 14,970,500 | | | | 7,646,398 | |
| | |
Sinopec Kantons Holdings Ltd. | | | 8,500,000 | | | | 2,952,218 | |
| | |
Sinosoft Co. Ltd., Class A | | | 389,100 | | | | 1,593,642 | |
| | |
Skyfame Realty Holdings Ltd. | | | 19,968,000 | | | | 1,784,815 | |
| | |
Sunkwan Properties Group Ltd.*(a) | | | 1,722,000 | | | | 393,592 | |
| | |
Suofeiya Home Collection Co. Ltd., Class A | | | 1,155,600 | | | | 3,502,425 | |
| | |
Suzhou Gold Mantis Construction Decoration Co. Ltd., Class A | | | 2,664,300 | | | | 2,295,761 | |
| | |
SY Holdings Group Ltd.(a) | | | 13,000 | | | | 9,794 | |
| | |
TangShan Port Group Co. Ltd., Class A | | | 11,119,500 | | | | 5,219,847 | |
| | |
Tian Lun Gas Holdings Ltd.(a) | | | 3,681,000 | | | | 2,613,372 | |
| | |
Tiangong International Co. Ltd.(a) | | | 3,362,000 | | | | 1,373,752 | |
| | |
Tianjin ZhongXin Pharmaceutical Group Corp. Ltd., Class A | | | 218,500 | | | | 916,598 | |
| | |
Tianli Education International Holdings Ltd.(a) | | | 12,123,000 | | | | 1,191,959 | |
| | |
Times Neighborhood Holdings Ltd.(a) | | | 2,246,000 | | | | 665,363 | |
| | |
Tong Ren Tang Technologies Co. Ltd., Class H | | | 2,287,888 | | | | 1,954,436 | |
| | |
Tongling Jingda Special Magnet Wire Co. Ltd., Class A | | | 826,300 | | | | 679,461 | |
| | |
Tongyu Heavy Industry Co. Ltd., Class A | | | 2,371,100 | | | | 1,101,864 | |
| | |
Valiant Co. Ltd., Class A | | | 378,000 | | | | 1,077,176 | |
| | |
Vesync Co. Ltd. | | | 19,000 | | | | 13,004 | |
| | |
Wasu Media Holding Co. Ltd., Class A | | | 753,700 | | | | 961,700 | |
| | |
Wuxi Taiji Industry Co. Ltd., Class A | | | 1,740,700 | | | | 1,971,556 | |
| | |
Xiabuxiabu Catering Management China Holdings Co. Ltd.*(b) | | | 904,000 | | | | 457,114 | |
| | |
Xiamen ITG Group Corp. Ltd., Class A | | | 3,542,400 | | | | 4,319,115 | |
| | |
Xiamen Xiangyu Co. Ltd., Class A | | | 2,316,400 | | | | 3,211,090 | |
| | |
Xinjiang Tianshan Cement Co. Ltd., Class A | | | 1,054,800 | | | | 2,189,988 | |
| | |
Xinte Energy Co. Ltd., Class H(a) | | | 188,800 | | | | 465,286 | |
| | |
Yangtze Optical Fibre and Cable Joint Stock Ltd. Co., Class H(a)(b) | | | 461,000 | | | | 635,748 | |
| | |
Yuexiu Transport Infrastructure Ltd. | | | 9,320,000 | | | | 6,295,528 | |
| | |
Zhaojin Mining Industry Co. Ltd., Class H(a) | | | 1,721,000 | | | | 1,518,516 | |
| | |
Zhejiang Expressway Co. Ltd., Class H(a) | | | 11,610,000 | | | | 9,754,808 | |
| | |
Zhejiang Jiahua Energy Chemical Industry Co. Ltd., Class A | | | 1,925,700 | | | | 3,048,674 | |
| | |
Zhejiang JIULI Hi-tech Metals Co. Ltd., Class A | | | 884,800 | | | | 2,053,072 | |
| | |
Zhejiang Medicine Co. Ltd., Class A | | | 533,200 | | | | 1,311,981 | |
| | |
Zhejiang Wanliyang Co. Ltd., Class A | | | 1,283,300 | | | | 1,534,356 | |
| | |
Zhengzhou Coal Mining Machinery Group Co. Ltd., Class H(a) | | | 971,200 | | | | 1,077,678 | |
| | |
Zhenro Properties Group Ltd.(a) | | | 9,389,000 | | | | 731,324 | |
| | |
Zhenro Services Group Ltd.(a) | | | 1,217,000 | | | | 149,184 | |
| | |
Zhongliang Holdings Group Co. Ltd.(a) | | | 8,325,500 | | | | 2,296,279 | |
| | |
Zhongshan Broad Ocean Motor Co. Ltd., Class A | | | 2,164,500 | | | | 2,069,677 | |
| | |
Zhongshan Public Utilities Group Co. Ltd., Class A | | | 1,306,702 | | | | 1,659,082 | |
| | |
Zhou Hei Ya International Holdings Co. Ltd.*(a)(b) | | | 1,028,500 | | | | 567,347 | |
| | | | | | | | |
| Total China | | | | 362,697,879 | |
| | |
| Hong Kong – 0.5% | | | | | | | | |
| | |
Canvest Environmental Protection Group Co. Ltd. | | | 2,183,000 | | | | 964,474 | |
| | |
Concord New Energy Group Ltd. | | | 28,720,000 | | | | 2,677,120 | |
| | |
Digital China Holdings Ltd. | | | 4,120,000 | | | | 2,004,393 | |
| | |
Huisen Household International Group Ltd.(a) | | | 3,804,000 | | | | 398,304 | |
| | |
IMAX China Holding, Inc.(b) | | | 745,600 | | | | 894,941 | |
| | |
IVD Medical Holding Ltd. | | | 2,062,000 | | | | 737,237 | |
| | |
Modern Dental Group Ltd. | | | 656,000 | | | | 250,458 | |
| | |
Nissin Foods Co. Ltd.(a) | | | 659,000 | | | | 461,975 | |
| | |
Perfect Medical Health Management Ltd.(a) | | | 6,086,000 | | | | 3,769,071 | |
| | |
VPower Group International Holdings Ltd., Class H(a)(b) | | | 2,005,000 | | | | 248,340 | |
| | |
Wasion Holdings Ltd. | | | 4,468,000 | | | | 1,608,877 | |
| | | | | | | | |
| Total Hong Kong | | | | 14,015,190 | |
| | |
| Hungary – 0.1% | | | | | | | | |
| | |
Magyar Telekom Telecommunications PLC | | | 1,160,945 | | | | 1,421,025 | |
| | |
| India – 7.4% | | | | | | | | |
| | |
Aegis Logistics Ltd. | | | 316,474 | | | | 858,479 | |
| | |
AIA Engineering Ltd. | | | 28,077 | | | | 601,261 | |
| | |
Ajanta Pharma Ltd. | | | 35,509 | | | | 848,537 | |
| | |
Alembic Pharmaceuticals Ltd. | | | 134,748 | | | | 1,318,761 | |
| | |
Amara Raja Batteries Ltd. | | | 176,284 | | | | 1,247,888 | |
| | |
Angel One Ltd. | | | 37,291 | | | | 756,278 | |
| | |
Apollo Tyres Ltd. | | | 573,698 | | | | 1,446,075 | |
| | |
Avanti Feeds Ltd. | | | 80,741 | | | | 439,374 | |
| | |
Bajaj Consumer Care Ltd. | | | 477,085 | | | | 1,028,149 | |
| | |
Balmer Lawrie & Co. Ltd. | | | 667,698 | | | | 993,066 | |
| | |
Balrampur Chini Mills Ltd. | | | 169,062 | | | | 1,091,903 | |
| | |
Bharat Dynamics Ltd. | | | 104,728 | | | | 759,183 | |
| | |
Birla Corp. Ltd. | | | 27,852 | | | | 434,532 | |
| | |
Birlasoft Ltd. | | | 312,361 | | | | 1,875,403 | |
| | |
Blue Star Ltd. | | | 96,420 | | | | 1,338,682 | |
| | |
Carborundum Universal Ltd. | | | 37,567 | | | | 395,501 | |
| | |
Care Ratings Ltd. | | | 137,703 | | | | 927,621 | |
| | |
Castrol India Ltd. | | | 3,246,907 | | | | 4,325,639 | |
| | |
CCL Products India Ltd. | | | 155,133 | | | | 826,489 | |
| | |
Ceat Ltd. | | | 50,421 | | | | 620,256 | |
| | |
CESC Ltd. | | | 6,266,177 | | | | 6,272,379 | |
| | |
Chambal Fertilisers and Chemicals Ltd. | | | 668,046 | | | | 3,721,309 | |
| | |
Cochin Shipyard Ltd.(b) | | | 210,025 | | | | 815,432 | |
| | |
Computer Age Management Services Ltd. | | | 32,305 | | | | 987,312 | |
| | |
Cosmo Films Ltd. | | | 54,329 | | | | 1,242,738 | |
| | |
CRISIL Ltd. | | | 61,305 | | | | 2,668,416 | |
| | |
Cyient Ltd. | | | 177,704 | | | | 2,175,716 | |
| | |
DB Corp. Ltd. | | | 505,531 | | | | 567,743 | |
| | |
DCM Shriram Ltd. | | | 88,393 | | | | 1,318,283 | |
| | |
Deepak Fertilisers & Petrochemicals Corp. Ltd. | | | 143,847 | | | | 1,065,635 | |
| | |
Edelweiss Financial Services Ltd. | | | 1,232,264 | | | | 954,588 | |
| | |
Emami Ltd. | | | 555,957 | | | | 3,280,715 | |
| | |
Endurance Technologies Ltd.(b) | | | 24,390 | | | | 352,388 | |
| | |
Engineers India Ltd. | | | 1,589,552 | | | | 1,343,594 | |
| | |
EPL Ltd. | | | 227,071 | | | | 580,151 | |
See Notes to Financial Statements.
Schedule of Investments (continued)
WisdomTree Emerging Markets SmallCap Dividend Fund (DGS)
March 31, 2022
| | | | | | | | |
| Investments | | Shares | | | Value | |
| | |
Equitas Holdings Ltd. | | | 527,713 | | | $ | 741,688 | |
| | |
Eris Lifesciences Ltd.(b) | | | 99,729 | | | | 906,412 | |
| | |
Exide Industries Ltd. | | | 659,099 | | | | 1,314,284 | |
| | |
Federal Bank Ltd. | | | 1,443,325 | | | | 1,855,227 | |
| | |
Finolex Cables Ltd. | | | 231,399 | | | | 1,153,254 | |
| | |
Finolex Industries Ltd. | | | 548,940 | | | | 1,120,337 | |
| | |
Firstsource Solutions Ltd. | | | 971,588 | | | | 1,603,393 | |
| | |
Galaxy Surfactants Ltd. | | | 6,114 | | | | 231,118 | |
| | |
Gateway Distriparks Ltd.* | | | 1,583,576 | | | | 1,393,923 | |
| | |
Geojit Financial Services Ltd. | | | 689,275 | | | | 568,521 | |
| | |
GHCL Ltd. | | | 180,871 | | | | 1,306,974 | |
| | |
Glenmark Pharmaceuticals Ltd. | | | 108,265 | | | | 631,516 | |
| | |
Godawari Power and Ispat Ltd. | | | 140,572 | | | | 716,913 | |
| | |
Godfrey Phillips India Ltd. | | | 61,022 | | | | 813,036 | |
| | |
Godrej Agrovet Ltd.(b) | | | 60,852 | | | | 355,074 | |
| | |
Graphite India Ltd. | | | 65,426 | | | | 434,173 | |
| | |
Great Eastern Shipping Co. Ltd. | | | 447,895 | | | | 2,041,314 | |
| | |
Grindwell Norton Ltd. | | | 42,168 | | | | 1,001,653 | |
| | |
Gujarat Narmada Valley Fertilizers & Chemicals Ltd. | | | 259,000 | | | | 2,886,342 | |
| | |
Gujarat Pipavav Port Ltd. | | | 1,494,895 | | | | 1,507,225 | |
| | |
Gujarat State Fertilizers & Chemicals Ltd. | | | 827,100 | | | | 1,768,810 | |
| | |
Gujarat State Petronet Ltd. | | | 428,107 | | | | 1,463,558 | |
| | |
Gulf Oil Lubricants India Ltd. | | | 75,635 | | | | 421,769 | |
| | |
HeidelbergCement India Ltd. | | | 479,145 | | | | 1,198,890 | |
| | |
Hinduja Global Solutions Ltd. | | | 11,044 | | | | 149,201 | |
| | |
Housing & Urban Development Corp. Ltd. | | | 2,113,972 | | | | 913,660 | |
| | |
ICICI Securities Ltd.(b) | | | 386,439 | | | | 3,168,264 | |
| | |
IIFL Finance Ltd. | | | 209,131 | | | | 788,226 | |
| | |
IIFL Wealth Management Ltd. | | | 178,671 | | | | 3,935,124 | |
| | |
Indiabulls Housing Finance Ltd. | | | 1,742,065 | | | | 3,627,817 | |
| | |
Indian Bank | | | 322,195 | | | | 654,382 | |
| | |
Indian Energy Exchange Ltd.(b) | | | 484,135 | | | | 1,435,634 | |
| | |
IRCON International Ltd.(b) | | | 2,676,495 | | | | 1,405,800 | |
| | |
JB Chemicals & Pharmaceuticals Ltd. | | | 70,519 | | | | 1,465,660 | |
| | |
Jindal Saw Ltd. | | | 507,109 | | | | 602,976 | |
| | |
JK Lakshmi Cement Ltd. | | | 51,575 | | | | 323,199 | |
| | |
JK Paper Ltd. | | | 365,103 | | | | 1,464,508 | |
| | |
JK Tyre & Industries Ltd. | | | 236,267 | | | | 365,898 | |
| | |
Jubilant Pharmova Ltd. | | | 94,658 | | | | 484,876 | |
| | |
Jyothy Labs Ltd. | | | 276,869 | | | | 538,757 | |
| | |
Kajaria Ceramics Ltd. | | | 109,479 | | | | 1,472,675 | |
| | |
Kalpataru Power Transmission Ltd. | | | 253,417 | | | | 1,226,535 | |
| | |
KEC International Ltd. | | | 160,102 | | | | 800,668 | |
| | |
Kirloskar Ferrous Industries Ltd. | | | 227,519 | | | | 644,349 | |
| | |
Kirloskar Oil Engines Ltd. | | | 172,701 | | | | 300,731 | |
| | |
KPIT Technologies Ltd. | | | 32,779 | | | | 260,004 | |
| | |
LIC Housing Finance Ltd. | | | 1,170,859 | | | | 5,546,418 | |
| | |
Mahanagar Gas Ltd. | | | 216,927 | | | | 2,230,247 | |
| | |
Manappuram Finance Ltd. | | | 915,524 | | | | 1,371,927 | |
| | |
Mazagon Dock Shipbuilders Ltd. | | | 112,999 | | | | 357,451 | |
| | |
Metropolis Healthcare Ltd.(b) | | | 21,953 | | | | 589,783 | |
| | |
Mindspace Business Parks REIT(b) | | | 1,695,248 | | | | 7,752,837 | |
| | |
Motilal Oswal Financial Services Ltd. | | | 73,789 | | | | 847,149 | |
| | |
Multi Commodity Exchange of India Ltd. | | | 47,273 | | | | 883,043 | |
| | |
Natco Pharma Ltd. | | | 97,460 | | | | 972,542 | |
| | |
National Aluminium Co. Ltd. | | | 5,838,153 | | | | 9,384,191 | |
| | |
Navin Fluorine International Ltd. | | | 19,932 | | | | 1,073,790 | |
| | |
NBCC India Ltd. | | | 889,143 | | | | 425,944 | |
| | |
NCC Ltd. | | | 487,012 | | | | 376,306 | |
| | |
NIIT Ltd. | | | 282,271 | | | | 2,315,907 | |
| | |
NLC India Ltd. | | | 1,049,570 | | | | 866,389 | |
| | |
Orient Cement Ltd. | | | 254,166 | | | | 477,305 | |
| | |
Orient Electric Ltd. | | | 23,808 | | | | 100,935 | |
| | |
PCBL Ltd. | | | 394,072 | | | | 1,189,367 | |
| | |
Polyplex Corp. Ltd. | | | 109,439 | | | | 3,502,192 | |
| | |
Praj Industries Ltd. | | | 135,050 | | | | 710,138 | |
| | |
Prestige Estates Projects Ltd. | | | 120,463 | | | | 785,017 | |
| | |
PTC India Ltd. | | | 2,442,471 | | | | 2,651,181 | |
| | |
Quess Corp. Ltd.(b) | | | 59,072 | | | | 513,776 | |
| | |
Rail Vikas Nigam Ltd. | | | 6,853,983 | | | | 2,957,773 | |
| | |
Railtel Corp. of India Ltd. | | | 329,881 | | | | 366,123 | |
| | |
Rallis India Ltd. | | | 198,543 | | | | 623,730 | |
| | |
Ramco Cements Ltd. | | | 53,081 | | | | 538,025 | |
| | |
Rashtriya Chemicals & Fertilizers Ltd. | | | 918,181 | | | | 1,083,884 | |
| | |
Ratnamani Metals & Tubes Ltd. | | | 15,486 | | | | 529,998 | |
| | |
Redington India Ltd. | | | 2,506,327 | | | | 4,794,353 | |
| | |
Sanofi India Ltd. | | | 27,102 | | | | 2,682,284 | |
| | |
Sasken Technologies Ltd. | | | 28,451 | | | | 344,416 | |
| | |
Shriram City Union Finance Ltd. | | | 31,271 | | | | 670,237 | |
| | |
SJVN Ltd. | | | 7,661,024 | | | | 2,775,257 | |
| | |
SKF India Ltd. | | | 16,073 | | | | 749,699 | |
| | |
Sonata Software Ltd. | | | 190,409 | | | | 1,857,980 | |
| | |
Sterlite Technologies Ltd. | | | 248,390 | | | | 735,746 | |
| | |
Subex Ltd. | | | 1,036,943 | | | | 439,957 | |
| | |
Sudarshan Chemical Industries | | | 79,280 | | | | 545,047 | |
| | |
Sundram Fasteners Ltd. | | | 144,587 | | | | 1,716,917 | |
| | |
Supreme Petrochem Ltd. | | | 130,932 | | | | 1,599,262 | |
| | |
Suven Pharmaceuticals Ltd. | | | 76,530 | | | | 624,612 | |
| | |
Swaraj Engines Ltd. | | | 44,515 | | | | 768,020 | |
| | |
Tata Chemicals Ltd. | | | 226,644 | | | | 2,914,293 | |
| | |
Techno Electric & Engineering Co. Ltd. | | | 263,389 | | | | 861,163 | |
| | |
Thermax Ltd. | | | 73,915 | | | | 1,891,453 | |
| | |
Thyrocare Technologies Ltd.(b) | | | 76,122 | | | | 778,850 | |
| | |
Torrent Power Ltd. | | | 442,747 | | | | 2,873,839 | |
| | |
Trident Ltd. | | | 2,247,675 | | | | 1,582,494 | |
| | |
UTI Asset Management Co. Ltd. | | | 92,938 | | | | 1,219,876 | |
| | |
V-Guard Industries Ltd. | | | 81,354 | | | | 231,688 | |
| | |
Vaibhav Global Ltd. | | | 61,851 | | | | 305,235 | |
| | |
Vardhman Textiles Ltd. | | | 142,940 | | | | 822,459 | |
| | |
Welspun Corp. Ltd. | | | 647,611 | | | | 1,430,684 | |
| | |
Yes Bank Ltd.*(c) | | | 5,997,912 | | | | 973,597 | |
| | |
Zensar Technologies Ltd. | | | 107,477 | | | | 520,471 | |
| | | | | | | | |
| Total India | | | | 190,677,081 | |
| | |
| Indonesia – 1.3% | | | | | | | | |
| | |
Ace Hardware Indonesia Tbk PT | | | 20,569,600 | | | | 1,467,978 | |
| | |
AKR Corporindo Tbk PT | | | 46,812,325 | | | | 2,966,003 | |
| | |
Astra Agro Lestari Tbk PT | | | 1,380,600 | | | | 1,206,373 | |
See Notes to Financial Statements.
Schedule of Investments (continued)
WisdomTree Emerging Markets SmallCap Dividend Fund (DGS)
March 31, 2022
| | | | | | | | |
| Investments | | Shares | | | Value | |
| | |
Bank BTPN Syariah Tbk PT | | | 2,617,500 | | | $ | 601,410 | |
| | |
Bank Danamon Indonesia Tbk PT | | | 3,432,700 | | | | 583,171 | |
| | |
Bank Pembangunan Daerah Jawa Barat Dan Banten Tbk PT | | | 19,257,528 | | | | 2,044,751 | |
| | |
Bank Pembangunan Daerah Jawa Timur Tbk PT | | | 36,209,400 | | | | 1,991,675 | |
| | |
BFI Finance Indonesia Tbk PT | | | 27,255,800 | | | | 2,429,063 | |
| | |
Bukit Asam Tbk PT | | | 12,404,600 | | | | 2,841,506 | |
| | |
Ciputra Development Tbk PT | | | 10,386,000 | | | | 752,059 | |
| | |
Erajaya Swasembada Tbk PT | | | 22,708,000 | | | | 917,016 | |
| | |
Indo Tambangraya Megah Tbk PT | | | 1,223,300 | | | | 2,431,695 | |
| | |
Industri Jamu Dan Farmasi Sido Muncul Tbk PT | | | 46,092,870 | | | | 3,273,436 | |
| | |
Japfa Comfeed Indonesia Tbk PT | | | 14,229,400 | | | | 1,634,709 | |
| | |
Link Net Tbk PT | | | 2,570,200 | | | | 767,705 | |
| | |
Media Nusantara Citra Tbk PT | | | 13,343,000 | | | | 924,371 | |
| | |
Medikaloka Hermina Tbk PT | | | 3,628,800 | | | | 296,873 | |
| | |
Mitra Keluarga Karyasehat Tbk PT | | | 11,869,700 | | | | 1,793,368 | |
| | |
Perusahaan Perkebunan London Sumatra Indonesia Tbk PT | | | 6,696,700 | | | | 659,762 | |
| | |
Puradelta Lestari Tbk PT | | | 156,575,500 | | | | 2,016,812 | |
| | |
Sawit Sumbermas Sarana Tbk PT | | | 19,240,400 | | | | 1,426,703 | |
| | | | | | | | |
| Total Indonesia | | | | 33,026,439 | |
| | |
| Malaysia – 3.5% | | | | | | | | |
| | |
Aeon Co. M Bhd | | | 2,762,500 | | | | 1,038,052 | |
| | |
Ann Joo Resources Bhd | | | 937,800 | | | | 388,078 | |
| | |
Astro Malaysia Holdings Bhd | | | 19,369,700 | | | | 5,067,286 | |
| | |
Bank Islam Malaysia Bhd | | | 3,799,000 | | | | 2,665,331 | |
| | |
Bermaz Auto Bhd | | | 3,665,500 | | | | 1,560,436 | |
| | |
British American Tobacco Malaysia Bhd | | | 1,029,100 | | | | 3,044,653 | |
| | |
Bursa Malaysia Bhd | | | 6,816,850 | | | | 11,462,068 | |
| | |
Carlsberg Brewery Malaysia Bhd | | | 522,400 | | | | 2,698,502 | |
| | |
DRB-Hicom Bhd | | | 655,800 | | | | 229,271 | |
| | |
Dufu Technology Corp. Bhd | | | 561,000 | | | | 386,920 | |
| | |
Duopharma Biotech Bhd | | | 2,270,333 | | | | 804,518 | |
| | |
Eco World Development Group Bhd | | | 10,247,200 | | | | 2,412,683 | |
| | |
FGV Holdings Bhd | | | 2,574,100 | | | | 1,212,133 | |
| | |
Fraser & Neave Holdings Bhd | | | 420,000 | | | | 2,097,628 | |
| | |
Frontken Corp. Bhd | | | 1,418,700 | | | | 1,022,335 | |
| | |
Genting Plantations Bhd | | | 617,400 | | | | 1,255,430 | |
| | |
Globetronics Technology Bhd | | | 2,832,633 | | | | 1,023,985 | |
| | |
Heineken Malaysia Bhd | | | 458,500 | | | | 2,451,294 | |
| | |
Hextar Global Bhd | | | 1,422,400 | | | | 537,872 | |
| | |
IJM Corp. Bhd | | | 11,001,700 | | | | 4,369,544 | |
| | |
Inari Amertron Bhd | | | 13,583,675 | | | | 9,917,803 | |
| | |
Kossan Rubber Industries Bhd | | | 20,029,900 | | | | 9,336,727 | |
| | |
KPJ Healthcare Bhd | | | 3,058,900 | | | | 734,762 | |
| | |
Lotte Chemical Titan Holding Bhd(b) | | | 1,316,300 | | | | 698,103 | |
| | |
Malaysia Building Society Bhd | | | 13,637,428 | | | | 1,946,003 | |
| | |
Malaysian Pacific Industries Bhd | | | 96,300 | | | | 833,657 | |
| | |
Malaysian Resources Corp. Bhd | | | 8,491,000 | | | | 737,075 | |
| | |
Mega First Corp. Bhd | | | 2,126,200 | | | | 1,881,078 | |
| | |
My EG Services Bhd | | | 6,774,896 | | | | 1,643,473 | |
| | |
Scientex Bhd | | | 2,644,800 | | | | 2,553,752 | |
| | |
SKP Resources Bhd | | | 2,554,025 | | | | 856,454 | |
| | |
Sunway Bhd | | | 3,200,900 | | | | 1,332,202 | |
| | |
Supermax Corp. Bhd | | | 3,981,126 | | | | 1,117,243 | |
| | |
Syarikat Takaful Malaysia Keluarga Bhd | | | 804,700 | | | | 694,705 | |
| | |
TIME dotCom Bhd | | | 4,742,800 | | | | 4,850,238 | |
| | |
Uchi Technologies Bhd | | | 2,942,500 | | | | 2,113,407 | |
| | |
UMW Holdings Bhd | | | 787,700 | | | | 616,335 | |
| | |
Unisem M Bhd | | | 480,700 | | | | 358,974 | |
| | |
ViTrox Corp. Bhd | | | 177,600 | | | | 346,351 | |
| | |
VS Industry Bhd | | | 6,313,150 | | | | 1,546,476 | |
| | |
Yinson Holdings Bhd | | | 936,500 | | | | 1,069,077 | |
| | | | | | | | |
| Total Malaysia | | | | 90,911,914 | |
| | |
| Mexico – 3.5% | | | | | | | | |
| | |
Alpek SAB de CV(a) | | | 4,119,496 | | | | 5,596,086 | |
| | |
Banco del Bajio SA(b) | | | 7,005,656 | | | | 19,184,579 | |
| | |
Bolsa Mexicana de Valores SAB de CV | | | 4,206,570 | | | | 8,872,146 | |
| | |
Corp. Inmobiliaria Vesta SAB de CV | | | 6,345,290 | | | | 12,103,843 | |
| | |
GCC SAB de CV(a) | | | 357,118 | | | | 2,568,162 | |
| | |
Grupo Comercial Chedraui SA de CV | | | 416,748 | | | | 1,069,142 | |
| | |
Grupo Rotoplas SAB de CV*(a) | | | 560,657 | | | | 712,418 | |
| | |
Industrias Bachoco SAB de CV, Series B(a) | | | 825,161 | | | | 3,215,902 | |
| | |
Megacable Holdings SAB de CV, Series CPO | | | 4,567,449 | | | | 13,726,167 | |
| | |
Promotora y Operadora de Infraestructura SAB de CV | | | 539,255 | | | | 4,261,147 | |
| | |
Qualitas Controladora SAB de CV(a) | | | 1,725,819 | | | | 9,864,914 | |
| | |
Regional SAB de CV(a) | | | 1,155,824 | | | | 8,101,548 | |
| | | | | | | | |
| Total Mexico | | | | 89,276,054 | |
| | |
| Philippines – 1.3% | | | | | | | | |
| | |
Alliance Global Group, Inc. | | | 2,177,600 | | | | 526,883 | |
| | |
Century Pacific Food, Inc. | | | 3,040,800 | | | | 1,380,980 | |
| | |
D&L Industries, Inc. | | | 6,226,100 | | | | 961,379 | |
| | |
DMCI Holdings, Inc. | | | 36,575,200 | | | | 6,382,724 | |
| | |
First Gen Corp. | | | 2,547,200 | | | | 1,299,567 | |
| | |
GT Capital Holdings, Inc. | | | 61,330 | | | | 654,250 | |
| | |
LT Group, Inc. | | | 23,178,400 | | | | 3,986,622 | |
| | |
Megaworld Corp. | | | 21,593,000 | | | | 1,256,062 | |
| | |
Metro Pacific Investments Corp. | | | 30,536,000 | | | | 2,242,474 | |
| | |
Nickel Asia Corp. | | | 14,662,500 | | | | 2,221,548 | |
| | |
Puregold Price Club, Inc. | | | 1,308,600 | | | | 904,096 | |
| | |
Robinsons Land Corp. | | | 7,403,926 | | | | 2,933,239 | |
| | |
Robinsons Retail Holdings, Inc. | | | 673,700 | | | | 723,239 | |
| | |
Security Bank Corp. | | | 1,120,520 | | | | 2,360,357 | |
| | |
Semirara Mining & Power Corp. | | | 9,232,600 | | | | 5,477,646 | |
| | |
Wilcon Depot, Inc. | | | 1,554,400 | | | | 811,070 | |
| | | | | | | | |
| Total Philippines | | | | 34,122,136 | |
| | |
| Poland – 0.6% | | | | | | | | |
| | |
Asseco Poland SA | | | 268,364 | | | | 5,193,726 | |
| | |
Bank Handlowy w Warszawie SA | | | 147,538 | | | | 2,265,866 | |
| | |
Ciech SA | | | 226,355 | | | | 2,346,520 | |
| | |
LiveChat Software SA | | | 61,235 | | | | 1,504,701 | |
| | |
TEN Square Games SA | | | 13,500 | | | | 635,599 | |
| | |
Warsaw Stock Exchange | | | 237,554 | | | | 2,331,504 | |
| | | | | | | | |
| Total Poland | | | | 14,277,916 | |
See Notes to Financial Statements.
Schedule of Investments (continued)
WisdomTree Emerging Markets SmallCap Dividend Fund (DGS)
March 31, 2022
| | | | | | | | |
| Investments | | Shares | | | Value | |
| | |
| South Africa – 9.6% | | | | | | | | |
| | |
Adcock Ingram Holdings Ltd.(a) | | | 608,755 | | | $ | 2,180,895 | |
| | |
Advtech Ltd. | | | 2,778,664 | | | | 3,405,705 | |
| | |
AECI Ltd. | | | 738,876 | | | | 5,889,771 | |
| | |
African Rainbow Minerals Ltd.(a) | | | 1,430,045 | | | | 28,003,927 | |
| | |
Afrimat Ltd. | | | 571,408 | | | | 2,717,732 | |
| | |
Astral Foods Ltd. | | | 288,987 | | | | 3,002,696 | |
| | |
AVI Ltd. | | | 3,228,848 | | | | 15,931,561 | |
| | |
Cashbuild Ltd.(a) | | | 203,783 | | | | 3,840,534 | |
| | |
Coronation Fund Managers Ltd. | | | 2,130,637 | | | | 6,758,257 | |
| | |
DataTec Ltd. | | | 691,080 | | | | 1,923,437 | |
| | |
Dis-Chem Pharmacies Ltd.(b) | | | 687,697 | | | | 1,794,013 | |
| | |
DRDGOLD Ltd. | | | 3,318,445 | | | | 3,133,929 | |
| | |
Equites Property Fund Ltd. | | | 6,591,758 | | | | 10,348,327 | |
| | |
Harmony Gold Mining Co. Ltd. | | | 1,751,894 | | | | 8,857,480 | |
| | |
Investec Ltd. | | | 1,624,761 | | | | 10,842,118 | |
| | |
Italtile Ltd. | | | 2,516,835 | | | | 2,871,216 | |
| | |
JSE Ltd. | | | 718,026 | | | | 5,491,148 | |
| | |
KAP Industrial Holdings Ltd. | | | 10,362,796 | | | | 3,460,766 | |
| | |
Metair Investments Ltd. | | | 920,606 | | | | 1,890,038 | |
| | |
Momentum Metropolitan Holdings(a) | | | 2,653,972 | | | | 3,143,901 | |
| | |
Motus Holdings Ltd. | | | 1,269,695 | | | | 9,320,799 | |
| | |
Oceana Group Ltd.(a) | | | 667,402 | | | | 2,603,382 | |
| | |
Omnia Holdings Ltd. | | | 986,129 | | | | 5,074,895 | |
| | |
Pick n Pay Stores Ltd. | | | 1,362,691 | | | | 5,013,397 | |
| | |
PSG Group Ltd.* | | | 863,172 | | | | 5,659,573 | |
| | |
Raubex Group Ltd. | | | 589,418 | | | | 1,591,277 | |
| | |
Resilient REIT Ltd.(a) | | | 2,709,396 | | | | 11,304,833 | |
| | |
Royal Bafokeng Platinum Ltd.(a) | | | 2,124,051 | | | | 23,475,397 | |
| | |
Santam Ltd.(a) | | | 141,548 | | | | 2,799,478 | |
| | |
SPAR Group Ltd. | | | 1,774,010 | | | | 20,603,404 | |
| | |
Tiger Brands Ltd. | | | 1,046,394 | | | | 11,593,580 | |
| | |
Transaction Capital Ltd. | | | 380,655 | | | | 1,288,170 | |
| | |
Truworths International Ltd. | | | 4,911,375 | | | | 19,611,889 | |
| | |
Wilson Bayly Holmes-Ovcon Ltd. | | | 190,290 | | | | 1,054,034 | |
| | | | | | | | |
| Total South Africa | | | | 246,481,559 | |
| | |
| South Korea – 11.4% | | | | | | | | |
| | |
Aekyung Chemical Co. Ltd. | | | 57,132 | | | | 494,935 | |
| | |
AfreecaTV Co. Ltd. | | | 8,335 | | | | 1,017,763 | |
| | |
Ahnlab, Inc.(a) | | | 12,133 | | | | 1,239,277 | |
| | |
APTC Co. Ltd. | | | 62,792 | | | | 1,214,861 | |
| | |
BGF Retail Co. Ltd. | | | 17,332 | | | | 2,495,305 | |
| | |
BH Co. Ltd. | | | 48,549 | | | | 977,349 | |
| | |
Binggrae Co. Ltd. | | | 16,623 | | | | 740,598 | |
| | |
BNK Financial Group, Inc. | | | 1,385,902 | | | | 9,101,753 | |
| | |
Caregen Co. Ltd.(a) | | | 14,246 | | | | 1,180,065 | |
| | |
Cheil Worldwide, Inc. | | | 505,022 | | | | 9,812,523 | |
| | |
Chong Kun Dang Pharmaceutical Corp. | | | 6,989 | | | | 567,400 | |
| | |
CJ Corp. | | | 39,085 | | | | 2,721,648 | |
| | |
CS Wind Corp.(a) | | | 18,865 | | | | 986,792 | |
| | |
Cuckoo Holdings Co. Ltd. | | | 32,911 | | | | 481,969 | |
| | |
Dae Won Kang Up Co. Ltd. | | | 183,263 | | | | 484,599 | |
| | |
Daeduck Electronics Co. Ltd. | | | 78,449 | | | | 1,838,168 | |
| | |
Daesang Corp. | | | 62,724 | | | | 1,205,783 | |
| | |
Daesang Holdings Co. Ltd. | | | 40,184 | | | | 305,678 | |
| | |
Daishin Securities Co. Ltd. | | | 363,185 | | | | 5,333,685 | |
| | |
Danawa Co. Ltd.*(a) | | | 30,725 | | | | 613,461 | |
| | |
DB Financial Investment Co. Ltd. | | | 240,971 | �� | | | 1,330,057 | |
| | |
DB HiTek Co. Ltd.(a) | | | 47,343 | | | | 2,925,614 | |
| | |
DGB Financial Group, Inc. | | | 860,703 | | | | 6,632,537 | |
| | |
Digital Daesung Co. Ltd. | | | 162,280 | | | | 1,218,389 | |
| | |
DL Holdings Co. Ltd.(a) | | | 28,693 | | | | 1,448,795 | |
| | |
Dohwa Engineering Co. Ltd. | | | 66,304 | | | | 433,256 | |
| | |
DongKook Pharmaceutical Co. Ltd. | | | 24,135 | | | | 428,120 | |
| | |
Dongkuk Steel Mill Co. Ltd. | | | 95,869 | | | | 1,324,868 | |
| | |
Dongsuh Cos., Inc.(a) | | | 166,911 | | | | 3,773,245 | |
| | |
Dongsung Chemical Co. Ltd. | | | 112,491 | | | | 446,883 | |
| | |
Dongsung Finetec Co. Ltd.(a) | | | 93,472 | | | | 883,012 | |
| | |
Dongwon Development Co. Ltd. | | | 358,393 | | | | 1,599,692 | |
| | |
DoubleUGames Co. Ltd. | | | 7,886 | | | | 335,727 | |
| | |
Douzone Bizon Co. Ltd. | | | 10,906 | | | | 417,956 | |
| | |
DTR Automotive Corp. | | | 35,833 | | | | 2,087,216 | |
| | |
EBEST Investment & Securities Co. Ltd.(a) | | | 214,855 | | | | 1,350,765 | |
| | |
Echo Marketing, Inc.(a) | | | 60,158 | | | | 1,082,005 | |
| | |
Ecopro Co. Ltd.(a) | | | 10,321 | | | | 784,261 | |
| | |
Eugene Investment & Securities Co. Ltd. | | | 214,739 | | | | 593,520 | |
| | |
F&F Holdings Co. Ltd. | | | 55,580 | | | | 1,254,167 | |
| | |
Fila Holdings Corp. | | | 19,445 | | | | 504,554 | |
| | |
GOLFZON Co. Ltd. | | | 13,050 | | | | 1,688,247 | |
| | |
Green Cross Corp. | | | 3,603 | | | | 600,475 | |
| | |
Green Cross Holdings Corp. | | | 78,869 | | | | 1,555,191 | |
| | |
GS Engineering & Construction Corp. | | | 295,413 | | | | 11,309,074 | |
| | |
HAESUNG DS Co. Ltd. | | | 30,628 | | | | 1,316,545 | |
| | |
Halla Holdings Corp. | | | 48,741 | | | | 1,638,708 | |
| | |
Han Kuk Carbon Co. Ltd. | | | 73,816 | | | | 715,596 | |
| | |
Hana Materials, Inc.(a) | | | 11,076 | | | | 509,000 | |
| | |
Hana Pharm Co. Ltd. | | | 8,740 | | | | 139,531 | |
| | |
Handsome Co. Ltd. | | | 24,791 | | | | 730,200 | |
| | |
Hanil Cement Co. Ltd. | | | 109,906 | | | | 1,913,301 | |
| | |
Hanil Holdings Co. Ltd. | | | 12,273 | | | | 131,636 | |
| | |
Hanjin Transportation Co. Ltd.(a) | | | 8,078 | | | | 206,607 | |
| | |
Hankook & Co. Co. Ltd.(a) | | | 112,120 | | | | 1,355,190 | |
| | |
Hanmi Semiconductor Co. Ltd. | | | 72,179 | | | | 2,084,291 | |
| | |
Hansae Co. Ltd.(a) | | | 56,044 | | | | 1,232,270 | |
| | |
Hansol Chemical Co. Ltd. | | | 11,496 | | | | 2,328,508 | |
| | |
Hansol Paper Co. Ltd. | | | 96,365 | | | | 1,065,378 | |
| | |
Hanssem Co. Ltd.(a) | | | 21,741 | | | | 1,528,265 | |
| | |
Hanwha Aerospace Co. Ltd. | | | 47,225 | | | | 2,033,864 | |
| | |
Hanwha Corp.(a) | | | 115,659 | | | | 3,001,094 | |
| | |
Hanwha Life Insurance Co. Ltd.*(a) | | | 319,082 | | | | 829,263 | |
| | |
Hanwha Systems Co. Ltd.(a) | | | 110,999 | | | | 1,501,905 | |
| | |
Hanyang Eng Co. Ltd. | | | 50,101 | | | | 651,038 | |
| | |
HDC Holdings Co. Ltd. | | | 82,770 | | | | 484,854 | |
| | |
Hite Jinro Co. Ltd.(a) | | | 86,888 | | | | 2,684,671 | |
| | |
HS Industries Co. Ltd. | | | 194,356 | | | | 889,960 | |
| | |
Huchems Fine Chemical Corp.(a) | | | 92,072 | | | | 1,716,783 | |
| | |
Huons Co. Ltd.(a) | | | 7,166 | | | | 277,878 | |
| | |
Huvis Corp. | | | 21,613 | | | | 129,102 | |
See Notes to Financial Statements.
Schedule of Investments (continued)
WisdomTree Emerging Markets SmallCap Dividend Fund (DGS)
March 31, 2022
| | | | | | | | |
| Investments | | Shares | | | Value | |
| | |
Hyosung TNC Corp. | | | 3,710 | | | $ | 1,423,332 | |
| | |
Hyundai Department Store Co. Ltd. | | | 22,364 | | | | 1,396,770 | |
| | |
Hyundai Elevator Co. Ltd.(a) | | | 51,041 | | | | 1,608,652 | |
| | |
Hyundai Greenfood Co. Ltd.(a) | | | 110,146 | | | | 816,973 | |
| | |
Hyundai Marine & Fire Insurance Co. Ltd. | | | 270,292 | | | | 7,169,579 | |
| | |
Hyundai Motor Securities Co. Ltd. | | | 186,220 | | | | 1,705,410 | |
| | |
Hyundai Wia Corp.(a) | | | 22,501 | | | | 1,193,692 | |
| | |
iMarketKorea, Inc. | | | 175,369 | | | | 1,569,864 | |
| | |
Innocean Worldwide, Inc.(a) | | | 35,187 | | | | 1,460,258 | |
| | |
IS Dongseo Co. Ltd.(a) | | | 35,889 | | | | 1,687,779 | |
| | |
JB Financial Group Co. Ltd. | | | 1,060,148 | | | | 7,390,991 | |
| | |
JW Life Science Corp.(a) | | | 44,983 | | | | 541,852 | |
| | |
KCC Glass Corp. | | | 92,175 | | | | 4,821,497 | |
| | |
KEPCO Plant Service & Engineering Co. Ltd.(a) | | | 91,122 | | | | 3,142,527 | |
| | |
Kginicis Co. Ltd. | | | 34,173 | | | | 654,110 | |
| | |
KIWOOM Securities Co. Ltd.(a) | | | 55,927 | | | | 4,558,878 | |
| | |
Koentec Co. Ltd.(a) | | | 189,781 | | | | 1,296,470 | |
| | |
Koh Young Technology, Inc.(a) | | | 44,960 | | | | 702,935 | |
| | |
Kolon Corp. | | | 19,425 | | | | 476,790 | |
| | |
Kolon Industries, Inc. | | | 41,471 | | | | 2,169,268 | |
| | |
Korea Aerospace Industries Ltd. | | | 75,573 | | | | 2,637,464 | |
| | |
Korea Asset In Trust Co. Ltd. | | | 515,154 | | | | 1,742,611 | |
| | |
Korea Electric Terminal Co. Ltd.(a) | | | 14,984 | | | | 788,729 | |
| | |
Korea Petrochemical Ind Co. Ltd.(a) | | | 9,041 | | | | 1,249,427 | |
| | |
Korea Real Estate Investment & Trust Co. Ltd.(a) | | | 1,062,684 | | | | 2,064,783 | |
| | |
Korean Reinsurance Co. | | | 678,371 | | | | 5,507,339 | |
| | |
KSS LINE Ltd. | | | 44,045 | | | | 425,169 | |
| | |
KTB Investment & Securities Co. Ltd. | | | 217,527 | | | | 944,014 | |
| | |
Kukdo Chemical Co. Ltd. | | | 12,655 | | | | 608,710 | |
| | |
Kumho E&C Co. Ltd.(a) | | | 191,506 | | | | 1,753,819 | |
| | |
Kyobo Securities Co. Ltd. | | | 90,189 | | | | 569,983 | |
| | |
Kyungdong Pharm Co. Ltd. | | | 135,411 | | | | 1,245,685 | |
| | |
LEADCORP, Inc. | | | 137,167 | | | | 1,004,944 | |
| | |
LEENO Industrial, Inc.(a) | | | 18,388 | | | | 2,799,048 | |
| | |
LF Corp. | | | 57,669 | | | | 842,161 | |
| | |
LIG Nex1 Co. Ltd. | | | 34,186 | | | | 2,027,947 | |
| | |
Lotte Chilsung Beverage Co. Ltd.(a) | | | 8,356 | | | | 1,254,727 | |
| | |
Lotte Data Communication Co. | | | 13,824 | | | | 438,540 | |
| | |
LOTTE Fine Chemical Co. Ltd.(a) | | | 37,702 | | | | 2,463,593 | |
| | |
LOTTE Himart Co. Ltd. | | | 39,819 | | | | 818,030 | |
| | |
LS Cable & System Asia Ltd. | | | 69,316 | | | | 472,382 | |
| | |
LS Corp. | | | 78,835 | | | | 3,434,254 | |
| | |
LS Electric Co. Ltd. | | | 38,571 | | | | 1,436,806 | |
| | |
LX International Corp. | | | 55,795 | | | | 1,585,857 | |
| | |
LX Semicon Co. Ltd.(a) | | | 31,772 | | | | 3,808,813 | |
| | |
Maeil Dairies Co. Ltd. | | | 8,815 | | | | 493,823 | |
| | |
Mcnex Co. Ltd. | | | 25,108 | | | | 907,331 | |
| | |
MegaStudyEdu Co. Ltd.(a) | | | 22,526 | | | | 1,914,259 | |
| | |
Meritz Fire & Marine Insurance Co. Ltd. | | | 448,336 | | | | 17,551,704 | |
| | |
Meritz Securities Co. Ltd.(a) | | | 3,985,758 | | | | 21,506,421 | |
| | |
Mirae Asset Life Insurance Co. Ltd. | | | 222,815 | | | | 738,090 | |
| | |
NICE Holdings Co. Ltd.(a) | | | 44,843 | | | | 627,110 | |
| | |
NICE Information Service Co. Ltd.(a) | | | 54,887 | | | | 892,103 | |
| | |
NongShim Co. Ltd.(a) | | | 6,014 | | | | 1,486,071 | |
| | |
Orion Holdings Corp. | | | 84,163 | | | | 989,499 | |
| | |
Osstem Implant Co. Ltd.†(a) | | | 8,023 | | | | 708,437 | |
| | |
Partron Co. Ltd.(a) | | | 141,323 | | | | 1,265,092 | |
| | |
PI Advanced Materials Co. Ltd. | | | 28,662 | | | | 1,090,152 | |
| | |
Poongsan Corp.(a) | | | 50,363 | | | | 1,379,524 | |
| | |
Posco International Corp.(a) | | | 180,031 | | | | 3,193,487 | |
| | |
Samjin Pharmaceutical Co. Ltd. | | | 60,767 | | | | 1,265,927 | |
| | |
SAMT Co. Ltd. | | | 276,349 | | | | 975,846 | |
| | |
Samyang Holdings Corp.(a) | | | 18,902 | | | | 1,342,735 | |
| | |
Samyang Packaging Corp. | | | 43,640 | | | | 828,118 | |
| | |
SaraminHR Co. Ltd.(a) | | | 26,571 | | | | 898,817 | |
| | |
Seohee Construction Co. Ltd. | | | 893,617 | | | | 1,408,200 | |
| | |
Seoul Semiconductor Co. Ltd. | | | 47,214 | | | | 549,249 | |
| | |
SFA Engineering Corp. | | | 47,841 | | | | 1,620,290 | |
| | |
SGC Energy Co. Ltd.(a) | | | 27,120 | | | | 1,123,241 | |
| | |
Shinsegae, Inc. | | | 3,616 | | | | 765,236 | |
| | |
SIMMTECH Co. Ltd. | | | 29,373 | | | | 1,357,112 | |
| | |
SK D&D Co. Ltd. | | | 10,135 | | | | 251,274 | |
| | |
SK Discovery Co. Ltd. | | | 25,469 | | | | 872,046 | |
| | |
SK Networks Co. Ltd. | | | 324,362 | | | | 1,263,140 | |
| | |
SL Corp.(a) | | | 44,378 | | | | 906,196 | |
| | |
SNT Dynamics Co. Ltd. | | | 74,750 | | | | 511,881 | |
| | |
SNT Motiv Co. Ltd. | | | 32,974 | | | | 1,258,238 | |
| | |
Soulbrain Co. Ltd.(a) | | | 4,742 | | | | 957,751 | |
| | |
Taeyoung Engineering & Construction Co. Ltd. | | | 95,096 | | | | 800,280 | |
| | |
TES Co. Ltd. | | | 38,270 | | | | 865,144 | |
| | |
Tongyang Life Insurance Co. Ltd. | | | 293,082 | | | | 1,600,761 | |
| | |
TS Corp. | | | 793,339 | | | | 1,891,630 | |
| | |
Unid Co. Ltd. | | | 17,090 | | | | 1,480,508 | |
| | |
Wemade Co. Ltd.(a) | | | 6,816 | | | | 582,035 | |
| | |
WiSoL Co. Ltd. | | | 14,176 | | | | 135,672 | |
| | |
WONIK IPS Co. Ltd.(a) | | | 23,664 | | | | 743,862 | |
| | |
Woongjin Thinkbig Co. Ltd. | | | 309,765 | | | | 792,270 | |
| | |
Youlchon Chemical Co. Ltd. | | | 39,365 | | | | 766,482 | |
| | |
Youngone Corp.(a) | | | 39,730 | | | | 1,560,289 | |
| | |
Yuanta Securities Korea Co. Ltd. | | | 312,909 | | | | 955,211 | |
| | | | | | | | |
| Total South Korea | | | | 292,701,682 | |
| | |
| Taiwan – 26.7% | | | | | | | | |
| | |
AcBel Polytech, Inc.(a) | | | 1,740,303 | | | | 2,156,283 | |
| | |
Acer, Inc.(a) | | | 15,575,000 | | | | 16,280,867 | |
| | |
Advancetek Enterprise Co. Ltd.(a) | | | 614,000 | | | | 503,604 | |
| | |
Alltek Technology Corp.(a) | | | 620,000 | | | | 817,968 | |
| | |
Arcadyan Technology Corp.(a) | | | 922,681 | | | | 3,912,736 | |
| | |
Asia Optical Co., Inc.*(a) | | | 378,000 | | | | 1,042,249 | |
| | |
Asia Vital Components Co. Ltd.(a) | | | 512,000 | | | | 2,081,846 | |
| | |
ASROCK, Inc.(a) | | | 194,000 | | | | 1,455,770 | |
| | |
BES Engineering Corp.(a) | | | 3,313,000 | | | | 1,162,091 | |
| | |
C Sun Manufacturing Ltd.(a) | | | 869,000 | | | | 1,499,819 | |
| | |
Capital Futures Corp. | | | 922,000 | | | | 1,201,916 | |
| | |
Capital Securities Corp.(a) | | | 12,623,340 | | | | 7,247,577 | |
| | |
Cathay Real Estate Development Co. Ltd.(a) | | | 2,027,000 | | | | 1,337,113 | |
| | |
Central Reinsurance Co. Ltd. | | | 933,000 | | | | 1,027,386 | |
| | |
Century Iron & Steel Industrial Co. Ltd.(a) | | | 396,000 | | | | 1,534,161 | |
See Notes to Financial Statements.
Schedule of Investments (continued)
WisdomTree Emerging Markets SmallCap Dividend Fund (DGS)
March 31, 2022
| | | | | | | | |
| Investments | | Shares | | | Value | |
| | |
Chang Wah Electromaterials, Inc.(a) | | | 1,099,000 | | | $ | 1,426,899 | |
| | |
Charoen Pokphand Enterprise(a) | | | 1,221,000 | | | | 3,464,646 | |
| | |
Chenbro Micom Co. Ltd. | | | 444,000 | | | | 1,106,455 | |
| | |
Cheng Loong Corp.(a) | | | 3,931,000 | | | | 4,802,017 | |
| | |
Cheng Uei Precision Industry Co. Ltd.(a) | | | 1,522,000 | | | | 2,010,635 | |
| | |
Chicony Electronics Co. Ltd.(a) | | | 5,497,652 | | | | 17,230,831 | |
| | |
Chicony Power Technology Co. Ltd.(a) | | | 876,625 | | | | 2,533,360 | |
| | |
China Bills Finance Corp. | | | 4,261,000 | | | | 2,632,312 | |
| | |
China Chemical & Pharmaceutical Co. Ltd. | | | 1,823,000 | | | | 1,412,512 | |
| | |
China General Plastics Corp.(a) | | | 1,848,000 | | | | 2,257,473 | |
| | |
China Metal Products(a) | | | 815,000 | | | | 975,673 | |
| | |
China Steel Chemical Corp.(a) | | | 408,726 | | | | 1,661,923 | |
| | |
China Steel Structure Co. Ltd.(a) | | | 645,000 | | | | 1,296,686 | |
| | |
ChipMOS Technologies, Inc.(a) | | | 2,037,000 | | | | 3,654,322 | |
| | |
Chong Hong Construction Co. Ltd.(a) | | | 1,154,000 | | | | 2,948,285 | |
| | |
Chroma ATE, Inc.(a) | | | 841,132 | | | | 5,284,322 | |
| | |
Chun Yuan Steel Industry Co. Ltd.(a) | | | 922,000 | | | | 781,970 | |
| | |
Chung Hung Steel Corp.(a) | | | 786,000 | | | | 1,266,038 | |
| | |
Chung-Hsin Electric & Machinery Manufacturing Corp.(a) | | | 1,520,000 | | | | 2,901,907 | |
| | |
Cleanaway Co. Ltd.(a) | | | 526,161 | | | | 3,654,470 | |
| | |
Compeq Manufacturing Co. Ltd.(a) | | | 3,224,000 | | | | 5,434,941 | |
| | |
Continental Holdings Corp.(a) | | | 2,168,000 | | | | 1,997,634 | |
| | |
CTCI Corp. | | | 2,343,190 | | | | 3,790,617 | |
| | |
D-Link Corp.(a) | | | 1,929,240 | | | | 1,134,590 | |
| | |
DA CIN Construction Co. Ltd.(a) | | | 2,081,000 | | | | 2,545,732 | |
| | |
Darfon Electronics Corp.(a) | | | 965,000 | | | | 1,673,926 | |
| | |
Daxin Materials Corp.(a) | | | 363,000 | | | | 1,450,657 | |
| | |
Eastern Media International Corp.(a) | | | 402,800 | | | | 438,628 | |
| | |
Edom Technology Co. Ltd.(a) | | | 1,312,000 | | | | 1,685,133 | |
| | |
Elan Microelectronics Corp.(a) | | | 1,369,409 | | | | 8,220,803 | |
| | |
Elite Advanced Laser Corp.(a) | | | 640,000 | | | | 1,102,351 | |
| | |
Elite Material Co. Ltd.(a) | | | 1,098,163 | | | | 9,888,699 | |
| | |
Elite Semiconductor Microelectronics Technology, Inc.(a) | | | 590,000 | | | | 3,315,359 | |
| | |
Ennoconn Corp.(a) | | | 85,243 | | | | 600,984 | |
| | |
Eternal Materials Co. Ltd.(a) | | | 3,249,494 | | | | 4,122,615 | |
| | |
Everlight Electronics Co. Ltd.(a) | | | 1,320,165 | | | | 2,248,540 | |
| | |
Far Eastern Department Stores Ltd. | | | 2,861,841 | | | | 2,117,552 | |
| | |
Far Eastern International Bank | | | 8,510,459 | | | | 3,623,810 | |
| | |
Faraday Technology Corp.(a) | | | 200,000 | | | | 2,132,524 | |
| | |
Farglory F T Z Investment Holding Co. Ltd.(a) | | | 544,000 | | | | 1,086,044 | |
| | |
Farglory Land Development Co. Ltd. | | | 2,002,640 | | | | 4,780,922 | |
| | |
Feng Hsin Steel Co. Ltd.(a) | | | 1,950,950 | | | | 6,570,919 | |
| | |
Fitipower Integrated Technology, Inc.(a) | | | 186,000 | | | | 1,334,066 | |
| | |
FLEXium Interconnect, Inc.*(a) | | | 1,356,028 | | | | 4,803,827 | |
| | |
Flytech Technology Co. Ltd.(a) | | | 827,000 | | | | 2,124,398 | |
| | |
Formosa International Hotels Corp.(a) | | | 301,000 | | | | 1,806,956 | |
| | |
Formosa Sumco Technology Corp.(a) | | | 153,000 | | | | 1,545,940 | |
| | |
Formosan Union Chemical(a) | | | 2,343,000 | | | | 2,265,190 | |
| | |
Fortune Electric Co. Ltd.(a) | | | 398,000 | | | | 570,923 | |
| | |
Foxsemicon Integrated Technology, Inc.(a) | | | 192,197 | | | | 1,569,694 | |
| | |
Fusheng Precision Co. Ltd.(a) | | | 396,000 | | | | 2,805,717 | |
| | |
Fwusow Industry Co. Ltd.(a) | | | 1,097,000 | | | | 763,840 | |
| | |
Gemtek Technology Corp.(a) | | | 1,209,000 | | | | 1,392,493 | |
| | |
Generalplus Technology, Inc.(a) | | | 326,000 | | | | 900,009 | |
| | |
Genius Electronic Optical Co. Ltd.(a) | | | 192,280 | | | | 3,056,857 | |
| | |
Getac Holdings Corp.(a) | | | 3,364,292 | | | | 5,841,702 | |
| | |
Gigabyte Technology Co. Ltd.(a) | | | 1,573,000 | | | | 7,137,148 | |
| | |
Global Brands Manufacture Ltd.(a) | | | 754,400 | | | | 897,860 | |
| | |
Global Mixed Mode Technology, Inc.(a) | | | 327,000 | | | | 2,716,298 | |
| | |
Global PMX Co. Ltd.(a) | | | 172,000 | | | | 897,475 | |
| | |
Global Unichip Corp.(a) | | | 67,000 | | | | 1,180,915 | |
| | |
Gold Circuit Electronics Ltd.(a) | | | 463,000 | | | | 1,373,576 | |
| | |
Goldsun Building Materials Co. Ltd.(a) | | | 4,802,000 | | | | 4,986,109 | |
| | |
Grape King Bio Ltd.(a) | | | 349,988 | | | | 1,789,548 | |
| | |
Great Wall Enterprise Co. Ltd.(a) | | | 4,191,676 | | | | 7,914,757 | |
| | |
Greatek Electronics, Inc.(a) | | | 1,616,000 | | | | 4,185,023 | |
| | |
HannsTouch Solution, Inc. | | | 1,617,000 | | | | 773,185 | |
| | |
Highwealth Construction Corp.(a) | | | 5,663,000 | | | | 8,973,359 | |
| | |
Hiyes International Co. Ltd.(a) | | | 407,000 | | | | 1,434,724 | |
| | |
Ho Tung Chemical Corp.(a) | | | 4,241,000 | | | | 1,546,811 | |
| | |
Holiday Entertainment Co. Ltd. | | | 341,000 | | | | 689,105 | |
| | |
Holtek Semiconductor, Inc.(a) | | | 1,069,773 | | | | 4,461,821 | |
| | |
Holy Stone Enterprise Co. Ltd.(a) | | | 845,000 | | | | 3,539,082 | |
| | |
Hong TAI Electric Industrial(a) | | | 1,326,000 | | | | 1,487,912 | |
| | |
Hota Industrial Manufacturing Co. Ltd.(a) | | | 285,146 | | | | 811,106 | |
| | |
Hotai Finance Co. Ltd.(a) | | | 527,000 | | | | 2,179,624 | |
| | |
Hsin Kuang Steel Co. Ltd.(a) | | | 519,000 | | | | 1,228,145 | |
| | |
Hsin Yung Chien Co. Ltd.(a) | | | 344,000 | | | | 1,548,819 | |
| | |
Hsing TA Cement Co. | | | 1,798,000 | | | | 1,333,525 | |
| | |
Huaku Development Co. Ltd.(a) | | | 1,460,296 | | | | 4,597,271 | |
| | |
Huang Hsiang Construction Corp.(a) | | | 1,462,000 | | | | 2,791,177 | |
| | |
Hung Ching Development & Construction Co. Ltd.(a) | | | 669,000 | | | | 700,487 | |
| | |
Hung Sheng Construction Ltd. | | | 1,463,000 | | | | 1,271,441 | |
| | |
I-Sheng Electric Wire & Cable Co. Ltd. | | | 1,278,000 | | | | 1,938,087 | |
| | |
IBF Financial Holdings Co. Ltd.(a) | | | 13,293,117 | | | | 7,771,311 | |
| | |
ITE Technology, Inc. | | | 734,000 | | | | 2,869,239 | |
| | |
ITEQ Corp.(a) | | | 751,000 | | | | 3,145,385 | |
| | |
Jentech Precision Industrial Co. Ltd.(a) | | | 92,000 | | | | 1,316,510 | |
| | |
Jia Wei Lifestyle, Inc.(a) | | | 497,000 | | | | 1,280,163 | |
| | |
Kenda Rubber Industrial Co. Ltd.(a) | | | 1,089,000 | | | | 1,220,072 | |
| | |
Kerry TJ Logistics Co. Ltd.(a) | | | 785,000 | | | | 1,200,042 | |
| | |
Kindom Development Co. Ltd.(a) | | | 2,410,200 | | | | 3,036,777 | |
| | |
King Slide Works Co. Ltd. | | | 88,004 | | | | 1,342,259 | |
| | |
King Yuan Electronics Co. Ltd.(a) | | | 4,718,000 | | | | 7,056,046 | |
| | |
King’s Town Bank Co. Ltd.(a) | | | 4,305,000 | | | | 6,055,233 | |
| | |
Kinik Co.(a) | | | 641,495 | | | | 2,843,476 | |
| | |
Kinsus Interconnect Technology Corp. | | | 113,000 | | | | 767,098 | |
| | |
KS Terminals, Inc.(a) | | | 199,000 | | | | 595,232 | |
| | |
Kung Long Batteries Industrial Co. Ltd.(a) | | | 610,000 | | | | 2,927,421 | |
| | |
L&K Engineering Co. Ltd. | | | 581,000 | | | | 646,874 | |
| | |
Lelon Electronics Corp.(a) | | | 423,000 | | | | 961,112 | |
| | |
Lian HWA Food Corp.(a) | | | 162,000 | | | | 461,379 | |
| | |
Lien Hwa Industrial Holdings Corp.(a) | | | 2,446,451 | | | | 5,481,813 | |
| | |
Longchen Paper & Packaging Co. Ltd.(a) | | | 1,395,026 | | | | 1,041,954 | |
| | |
Lotes Co. Ltd.(a) | | | 151,106 | | | | 3,697,025 | |
See Notes to Financial Statements.
Schedule of Investments (continued)
WisdomTree Emerging Markets SmallCap Dividend Fund (DGS)
March 31, 2022
| | | | | | | | |
| Investments | | Shares | | | Value | |
| | |
Machvision, Inc.(a) | | | 151,000 | | | $ | 1,143,640 | |
| | |
Macronix International Co. Ltd.(a) | | | 5,012,000 | | | | 7,014,683 | |
| | |
Makalot Industrial Co. Ltd.(a) | | | 577,881 | | | | 4,144,793 | |
| | |
Marketech International Corp.(a) | | | 141,000 | | | | 762,787 | |
| | |
Mayer Steel Pipe Corp.(a) | | | 662,000 | | | | 747,455 | |
| | |
Mercuries & Associates Holding Ltd.(a) | | | 1,496,000 | | | | 1,109,541 | |
| | |
Merida Industry Co. Ltd.(a) | | | 486,043 | | | | 4,291,883 | |
| | |
Mirle Automation Corp.(a) | | | 931,560 | | | | 1,329,801 | |
| | |
Nak Sealing Technologies Corp.(a) | | | 414,000 | | | | 1,287,451 | |
| | |
Namchow Holdings Co. Ltd. | | | 558,000 | | | | 948,453 | |
| | |
Nan Kang Rubber Tire Co. Ltd.(a) | | | 838,000 | | | | 1,240,117 | |
| | |
Nan Liu Enterprise Co. Ltd.(a) | | | 452,000 | | | | 1,568,113 | |
| | |
Nantex Industry Co. Ltd.(a) | | | 1,039,615 | | | | 2,376,657 | |
| | |
Nichidenbo Corp.(a) | | | 1,399,000 | | | | 2,675,783 | |
| | |
Nuvoton Technology Corp.(a) | | | 123,872 | | | | 825,770 | |
| | |
O-Bank Co. Ltd.(a) | | | 1,792,000 | | | | 641,083 | |
| | |
Ocean Plastics Co. Ltd. | | | 678,000 | | | | 811,664 | |
| | |
OptoTech Corp.(a) | | | 2,200,000 | | | | 3,939,061 | |
| | |
Pan German Universal Motors Ltd.(a) | | | 175,000 | | | | 1,294,871 | |
| | |
Pan Jit International, Inc.(a) | | | 462,000 | | | | 1,644,731 | |
| | |
Pan-International Industrial Corp.(a) | | | 825,000 | | | | 1,156,091 | |
| | |
Polytronics Technology Corp.(a) | | | 288,017 | | | | 1,045,452 | |
| | |
Power Wind Health Industry, Inc.(a) | | | 123,901 | | | | 568,661 | |
| | |
Powertech Technology, Inc.(a) | | | 4,489,000 | | | | 14,884,212 | |
| | |
President Securities Corp.(a) | | | 7,400,520 | | | | 5,940,770 | |
| | |
Primax Electronics Ltd.(a) | | | 2,257,000 | | | | 4,104,138 | |
| | |
Prince Housing & Development Corp.(a) | | | 4,612,000 | | | | 2,116,741 | |
| | |
Promate Electronic Co. Ltd.(a) | | | 1,484,000 | | | | 2,372,204 | |
| | |
Qisda Corp.(a) | | | 9,595,000 | | | | 11,134,975 | |
| | |
Radium Life Tech Co. Ltd.(a) | | | 1,786,000 | | | | 651,404 | |
| | |
Rechi Precision Co. Ltd. | | | 1,539,000 | | | | 966,860 | |
| | |
Rexon Industrial Corp. Ltd.(a) | | | 817,000 | | | | 1,288,882 | |
| | |
RichWave Technology Corp.(a) | | | 86,000 | | | | 570,302 | |
| | |
Ruentex Engineering & Construction Co. | | | 25,000 | | | | 126,957 | |
| | |
Sampo Corp.(a) | | | 3,471,000 | | | | 3,912,999 | |
| | |
Sanyang Motor Co. Ltd.(a) | | | 2,755,000 | | | | 2,769,279 | |
| | |
SDI Corp.(a) | | | 278,000 | | | | 1,591,260 | |
| | |
Sercomm Corp.(a) | | | 660,488 | | | | 1,823,451 | |
| | |
Shin Foong Specialty & Applied Materials Co. Ltd.(a) | | | 265,000 | | | | 1,207,005 | |
| | |
Shin Zu Shing Co. Ltd.(a) | | | 1,016,000 | | | | 2,946,778 | |
| | |
Shiny Chemical Industrial Co. Ltd.(a) | | | 289,110 | | | | 2,260,288 | |
| | |
Sigurd Microelectronics Corp.(a) | | | 1,400,000 | | | | 2,912,238 | |
| | |
Sinbon Electronics Co. Ltd.(a) | | | 520,120 | | | | 4,719,865 | |
| | |
Sincere Navigation Corp.(a) | | | 669,000 | | | | 651,453 | |
| | |
Sinon Corp.(a) | | | 2,885,000 | | | | 3,398,382 | |
| | |
Sinyi Realty, Inc. | | | 1,745,000 | | | | 2,250,414 | |
| | |
Sitronix Technology Corp.(a) | | | 364,000 | | | | 3,690,627 | |
| | |
Sonix Technology Co. Ltd.(a) | | | 847,000 | | | | 2,660,594 | |
| | |
Standard Chemical & Pharmaceutical Co. Ltd.(a) | | | 937,000 | | | | 1,399,703 | |
| | |
Standard Foods Corp.(a) | | | 1,444,896 | | | | 2,506,372 | |
| | |
Stark Technology, Inc.(a) | | | 822,000 | | | | 2,656,657 | |
| | |
Sunny Friend Environmental Technology Co. Ltd.(a) | | | 209,000 | | | | 1,499,031 | |
| | |
Sunonwealth Electric Machine Industry Co. Ltd.(a) | | | 1,312,000 | | | | 1,971,331 | |
| | |
Sunrex Technology Corp.(a) | | | 556,000 | | | | 805,333 | |
| | |
Supreme Electronics Co. Ltd. | | | 2,204,506 | | | | 4,000,988 | |
| | |
Symtek Automation Asia Co. Ltd.(a) | | | 327,000 | | | | 1,392,388 | |
| | |
Syncmold Enterprise Corp.(a) | | | 918,915 | | | | 2,309,194 | |
| | |
Synnex Technology International Corp. | | | 10,529,600 | | | | 27,673,207 | |
| | |
Systex Corp.(a) | | | 996,000 | | | | 2,812,293 | |
| | |
T3EX Global Holdings Corp.(a) | | | 292,000 | | | | 1,248,451 | |
| | |
TA-I Technology Co. Ltd.(a) | | | 646,000 | | | | 1,348,299 | |
| | |
Taichung Commercial Bank Co. Ltd. | | | 5,897,316 | | | | 3,118,313 | |
| | |
Taiflex Scientific Co. Ltd.(a) | | | 1,300,000 | | | | 2,046,315 | |
| | |
Tainan Spinning Co. Ltd.(a) | | | 1,487,000 | | | | 1,214,450 | |
| | |
Taisun Enterprise Co. Ltd.(a) | | | 1,507,000 | | | | 1,472,733 | |
| | |
Taita Chemical Co. Ltd.(a) | | | 904,000 | | | | 1,069,598 | |
| | |
Taiwan Business Bank(a) | | | 5,288,958 | | | | 2,372,061 | |
| | |
Taiwan Cogeneration Corp.(a) | | | 1,994,970 | | | | 2,680,709 | |
| | |
Taiwan Fertilizer Co. Ltd.(a) | | | 2,229,000 | | | | 5,702,518 | |
| | |
Taiwan FU Hsing Industrial Co. Ltd.(a) | | | 1,707,000 | | | | 2,603,560 | |
| | |
Taiwan Hon Chuan Enterprise Co. Ltd.(a) | | | 1,694,692 | | | | 4,660,898 | |
| | |
Taiwan Mask Corp.(a) | | | 460,300 | | | | 1,556,745 | |
| | |
Taiwan Navigation Co. Ltd.(a) | | | 684,000 | | | | 864,206 | |
| | |
Taiwan Paiho Ltd.(a) | | | 777,000 | | | | 1,949,856 | |
| | |
Taiwan PCB Techvest Co. Ltd. | | | 1,833,302 | | | | 3,250,501 | |
| | |
Taiwan Sakura Corp.(a) | | | 1,076,000 | | | | 2,489,880 | |
| | |
Taiwan Secom Co. Ltd.(a) | | | 1,312,000 | | | | 4,991,292 | |
| | |
Taiwan Styrene Monomer(a) | | | 1,585,000 | | | | 929,375 | |
| | |
Taiwan Surface Mounting Technology Corp.(a) | | | 679,000 | | | | 2,796,433 | |
| | |
Test Research, Inc.(a) | | | 1,059,115 | | | | 2,509,953 | |
| | |
Thinking Electronic Industrial Co. Ltd.(a) | | | 296,000 | | | | 1,539,326 | |
| | |
Ton Yi Industrial Corp. | | | 1,948,000 | | | | 1,227,210 | |
| | |
Tong Hsing Electronic Industries Ltd. | | | 331,552 | | | | 3,355,848 | |
| | |
Tong Yang Industry Co. Ltd.(a) | | | 1,114,685 | | | | 1,250,794 | |
| | |
Topco Scientific Co. Ltd. | | | 1,099,521 | | | | 6,523,867 | |
| | |
Topkey Corp. | | | 308,000 | | | | 1,429,733 | |
| | |
Transcend Information, Inc.(a) | | | 865,479 | | | | 2,247,409 | |
| | |
Tripod Technology Corp.(a) | | | 2,423,928 | | | | 11,336,452 | |
| | |
Tsann Kuen Enterprise Co. Ltd.(a) | | | 187,000 | | | | 261,721 | |
| | |
TSRC Corp. | | | 749,000 | | | | 912,347 | |
| | |
Ttet Union Corp.(a) | | | 157,000 | | | | 863,044 | |
| | |
Tung Ho Steel Enterprise Corp.(a) | | | 2,185,722 | | | | 5,370,568 | |
| | |
TXC Corp.(a) | | | 747,549 | | | | 2,674,337 | |
| | |
Tyntek Corp.(a) | | | 979,000 | | | | 895,234 | |
| | |
U-Ming Marine Transport Corp.(a) | | | 816,420 | | | | 1,684,045 | |
| | |
Unitech Computer Co. Ltd.(a) | | | 623,000 | | | | 801,269 | |
| | |
United Integrated Services Co. Ltd.(a) | | | 1,934,000 | | | | 13,162,662 | |
| | |
Universal Cement Corp.(a) | | | 2,273,000 | | | | 1,693,753 | |
| | |
UPC Technology Corp.(a) | | | 2,444,000 | | | | 1,565,272 | |
| | |
USI Corp.(a) | | | 2,674,000 | | | | 2,809,186 | |
| | |
Visual Photonics Epitaxy Co. Ltd.(a) | | | 381,750 | | | | 1,512,264 | |
| | |
Wah Lee Industrial Corp. | | | 919,580 | | | | 3,514,441 | |
| | |
Walsin Lihwa Corp.(a) | | | 6,997,000 | | | | 7,179,792 | |
| | |
Wan Hai Lines Ltd.(a) | | | 381,000 | | | | 2,107,691 | |
| | |
Wei Chuan Foods Corp.(a) | | | 1,411,000 | | | | 1,056,348 | |
See Notes to Financial Statements.
Schedule of Investments (continued)
WisdomTree Emerging Markets SmallCap Dividend Fund (DGS)
March 31, 2022
| | | | | | | | |
| Investments | | Shares | | | Value | |
| | |
Weikeng Industrial Co. Ltd.(a) | | | 1,813,431 | | | $ | 2,047,519 | |
| | |
Weltrend Semiconductor(a) | | | 435,000 | | | | 1,308,727 | |
| | |
WinWay Technology Co. Ltd. | | | 119,000 | | | | 1,848,245 | |
| | |
Wistron NeWeb Corp.(a) | | | 802,722 | | | | 2,006,000 | |
| | |
Wowprime Corp.(a) | | | 160,000 | | | | 681,291 | |
| | |
WPG Holdings Ltd.(a) | | | 7,069,058 | | | | 13,816,633 | |
| | |
WT Microelectronics Co. Ltd.(a) | | | 1,253,678 | | | | 3,469,859 | |
| | |
YC INOX Co. Ltd. | | | 1,569,793 | | | | 1,923,101 | |
| | |
Yem Chio Co. Ltd.(a) | | | 2,321,000 | | | | 1,251,573 | |
| | |
YFY, Inc.(a) | | | 5,209,000 | | | | 6,217,748 | |
| | |
Yulon Finance Corp. | | | 681,675 | | | | 5,400,772 | |
| | |
Yulon Motor Co. Ltd.(a) | | | 1,143,000 | | | | 1,623,653 | |
| | |
Zeng Hsing Industrial Co. Ltd.(a) | | | 436,000 | | | | 2,122,821 | |
| | |
Zenitron Corp.(a) | | | 1,020,000 | | | | 1,404,429 | |
| | |
Zero One Technology Co. Ltd. | | | 903,184 | | | | 1,404,354 | |
| | |
Zippy Technology Corp.(a) | | | 1,078,000 | | | | 1,623,500 | |
| | |
ZongTai Real Estate Development Co. Ltd.(a) | | | 2,085,000 | | | | 2,525,156 | |
| | | | | | | | |
| Total Taiwan | | | | 688,482,781 | |
| | |
| Thailand – 7.5% | | | | | | | | |
| | |
Amata Corp. PCL, NVDR(a) | | | 1,474,900 | | | | 980,309 | |
| | |
Asia Plus Group Holdings PCL, NVDR(a) | | | 22,156,300 | | | | 2,292,261 | |
| | |
Asian Sea Corp. PCL, NVDR | | | 1,202,600 | | | | 560,611 | |
| | |
Asiasoft Corp. PCL, NVDR(a) | | | 1,508,900 | | | | 1,107,283 | |
| | |
Bangchak Corp. PCL, NVDR | | | 2,052,700 | | | | 1,836,626 | |
| | |
Bangkok Chain Hospital PCL, NVDR | | | 3,051,300 | | | | 1,890,429 | |
| | |
Bangkok Commercial Asset Management PCL, NVDR | | | 5,276,900 | | | | 3,269,297 | |
| | |
Bangkok Insurance PCL, NVDR | | | 381,500 | | | | 3,063,474 | |
| | |
Banpu PCL, NVDR(a) | | | 7,539,600 | | | | 2,494,304 | |
| | |
Banpu Power PCL, NVDR(a) | | | 3,081,100 | | | | 1,538,233 | |
| | |
BCPG PCL, NVDR(a) | | | 2,303,112 | | | | 831,198 | |
| | |
Chularat Hospital PCL, NVDR | | | 21,893,500 | | | | 2,541,621 | |
| | |
Com7 PCL, NVDR(a) | | | 2,238,800 | | | | 2,895,290 | |
| | |
Dynasty Ceramic PCL, NVDR | | | 42,155,600 | | | | 3,778,156 | |
| | |
Eastern Polymer Group PCL, NVDR(a) | | | 3,647,200 | | | | 1,042,057 | |
| | |
Eastern Water Resources Development and Management PCL, NVDR(a) | | | 4,745,700 | | | | 1,041,913 | |
| | |
Exotic Food PCL, NVDR | | | 1,613,900 | | | | 834,860 | |
| | |
Forth Smart Service PCL, NVDR | | | 2,635,700 | | | | 1,212,818 | |
| | |
GFPT PCL, NVDR(a) | | | 1,650,500 | | | | 640,344 | |
| | |
Gunkul Engineering PCL, NVDR(a) | | | 34,377,000 | | | | 6,306,758 | |
| | |
Haad Thip PCL, NVDR | | | 978,800 | | | | 964,081 | |
| | |
Hana Microelectronics PCL, NVDR(a) | | | 1,609,800 | | | | 2,360,233 | |
| | |
Ichitan Group PCL, NVDR | | | 3,532,600 | | | | 1,243,050 | |
| | |
IRPC PCL, NVDR(a) | | | 55,948,100 | | | | 5,990,233 | |
| | |
Jay Mart PCL, NVDR(a) | | | 1,097,700 | | | | 1,956,052 | |
| | |
JMT Network Services PCL, NVDR(a) | | | 1,180,100 | | | | 2,732,863 | |
| | |
KCE Electronics PCL, NVDR(a) | | | 1,505,400 | | | | 2,965,525 | |
| | |
Kerry Express Thailand PCL, NVDR | | | 2,681,800 | | | | 1,766,359 | |
| | |
KGI Securities Thailand PCL, NVDR | | | 8,870,000 | | | | 1,787,338 | |
| | |
Kiatnakin Phatra Bank PCL, NVDR | | | 3,649,700 | | | | 7,573,814 | |
| | |
LPN Development PCL, NVDR(a) | | | 10,158,700 | | | | 1,423,746 | |
| | |
MC Group PCL, NVDR | | | 4,136,100 | | | | 1,125,766 | |
| | |
MCS Steel PCL, NVDR | | | 3,776,700 | | | | 1,556,114 | |
| | |
Mega Lifesciences PCL, NVDR | | | 1,803,200 | | | | 2,467,537 | |
| | |
MK Restaurants Group PCL, NVDR | | | 610,700 | | | | 987,222 | |
| | |
Noble Development PCL, Class C, NVDR(a) | | | 15,258,800 | | | | 2,317,502 | |
| | |
Northeast Rubber PCL, NVDR(a) | | | 4,081,300 | | | | 877,633 | |
| | |
Origin Property PCL, NVDR | | | 7,674,800 | | | | 2,631,360 | |
| | |
Plan B Media PCL, NVDR*(a) | | | 4,227,736 | | | | 1,004,485 | |
| | |
Polyplex Thailand PCL, NVDR | | | 2,265,300 | | | | 1,682,794 | |
| | |
Precious Shipping PCL, NVDR(a) | | | 3,694,300 | | | | 1,899,926 | |
| | |
Prima Marine PCL, NVDR(a) | | | 8,296,100 | | | | 1,484,565 | |
| | |
Pruksa Holding PCL, NVDR(a) | | | 1,945,900 | | | | 801,769 | |
| | |
PTG Energy PCL, NVDR(a) | | | 2,334,600 | | | | 947,883 | |
| | |
Quality Houses PCL, NVDR | | | 50,148,400 | | | | 3,468,912 | |
| | |
Rajthanee Hospital PCL, NVDR | | | 1,361,100 | | | | 1,309,931 | |
| | |
Ratch Group PCL, NVDR(a) | | | 2,619,300 | | | | 3,466,141 | |
| | |
Ratchthani Leasing PCL, NVDR(a) | | | 12,883,000 | | | | 1,611,828 | |
| | |
Regional Container Lines PCL, NVDR(a) | | | 2,053,200 | | | | 2,686,141 | |
| | |
Sansiri PCL, NVDR | | | 29,503,100 | | | | 1,082,520 | |
| | |
SC Asset Corp. PCL, NVDR | | | 23,792,100 | | | | 2,719,097 | |
| | |
Siam City Cement PCL, NVDR | | | 906,454 | | | | 4,184,682 | |
| | |
Siamgas & Petrochemicals PCL, NVDR(a) | | | 4,971,700 | | | | 1,839,155 | |
| | |
Sino-Thai Engineering & Construction PCL, NVDR(a) | | | 2,189,200 | | | | 882,264 | |
| | |
Somboon Advance Technology PCL, NVDR | | | 2,364,000 | | | | 1,478,833 | |
| | |
SPCG PCL, NVDR | | | 3,097,900 | | | | 1,611,840 | |
| | |
Sri Trang Agro-Industry PCL, NVDR(a) | | | 7,288,900 | | | | 5,754,395 | |
| | |
Sri Trang Gloves Thailand PCL, NVDR(a) | | | 8,035,800 | | | | 6,102,374 | |
| | |
Srisawad Corp. PCL, NVDR(a) | | | 2,442,700 | | | | 4,187,486 | |
| | |
Srisawad Finance PCL, NVDR | | | 789,200 | | | | 617,119 | |
| | |
Supalai PCL, NVDR(a) | | | 7,162,100 | | | | 4,674,213 | |
| | |
Synnex Thailand PCL, NVDR(a) | | | 818,800 | | | | 652,577 | |
| | |
Thai Union Group PCL, NVDR(a) | | | 10,718,700 | | | | 6,092,735 | |
| | |
Thai Vegetable Oil PCL, NVDR | | | 3,320,900 | | | | 3,121,147 | |
| | |
Thaifoods Group PCL, NVDR | | | 8,507,900 | | | | 1,059,330 | |
| | |
Thanachart Capital PCL, NVDR | | | 5,807,600 | | | | 7,510,580 | |
| | |
Tisco Financial Group PCL, NVDR(a) | | | 5,096,200 | | | | 15,403,552 | |
| | |
TMT Steel PCL, NVDR | | | 6,298,200 | | | | 2,178,325 | |
| | |
TOA Paint Thailand PCL, NVDR(a) | | | 1,544,600 | | | | 1,382,011 | |
| | |
TPI Polene PCL, NVDR(a) | | | 23,273,400 | | | | 1,140,922 | |
| | |
TPI Polene Power PCL, NVDR(a) | | | 29,090,400 | | | | 3,412,107 | |
| | |
TQM Corp. PCL, NVDR(a) | | | 819,100 | | | | 985,383 | |
| | |
TTW PCL, NVDR(a) | | | 14,359,900 | | | | 4,793,831 | |
| | |
United Paper PCL, NVDR(a) | | | 2,484,300 | | | | 1,225,339 | |
| | |
Vibhavadi Medical Center PCL, NVDR | | | 19,037,600 | | | | 1,408,496 | |
| | |
WHA Corp. PCL, NVDR(a) | | | 30,070,700 | | | | 3,056,811 | |
| | |
WHA Utilities and Power PCL, NVDR | | | 9,734,100 | | | | 1,200,295 | |
| | |
Workpoint Entertainment PCL, NVDR(a) | | | 1,111,700 | | | | 961,244 | |
| | | | | | | | |
| Total Thailand | | | | 193,967,308 | |
| | |
| Turkey – 2.6% | | | | | | | | |
| | |
Aksa Akrilik Kimya Sanayii AS | | | 1,271,774 | | | | 3,780,358 | |
| | |
Aksigorta AS* | | | 4,848,914 | | | | 1,114,066 | |
| | |
Alkim Alkali Kimya AS | | | 295,330 | | | | 473,164 | |
| | |
Anadolu Anonim Turk Sigorta Sirketi* | | | 799,348 | | | | 292,104 | |
| | |
Anadolu Hayat Emeklilik AS | | | 840,438 | | | | 736,284 | |
| | |
Arcelik AS(a) | | | 2,170,056 | | | | 8,950,820 | |
See Notes to Financial Statements.
Schedule of Investments (continued)
WisdomTree Emerging Markets SmallCap Dividend Fund (DGS)
March 31, 2022
| | | | | | | | |
| Investments | | Shares | | | Value | |
| | |
Aygaz AS | | | 452,796 | | | $ | 822,999 | |
| | |
Brisa Bridgestone Sabanci Sanayi ve Ticaret AS | | | 232,061 | | | | 455,650 | |
| | |
Coca-Cola Icecek AS | | | 347,783 | | | | 2,778,897 | |
| | |
Dogus Otomotiv Servis ve Ticaret AS | | | 498,657 | | | | 2,094,205 | |
| | |
EGE Endustri VE Ticaret AS | | | 6,223 | | | | 783,489 | |
| | |
Emlak Konut Gayrimenkul Yatirim Ortakligi AS | | | 3,712,758 | | | | 594,841 | |
| | |
Enerjisa Enerji AS(b) | | | 2,547,108 | | | | 2,821,871 | |
| | |
Goodyear Lastikleri TAS | | | 651,923 | | | | 442,238 | |
| | |
Haci Omer Sabanci Holding AS | | | 6,006,646 | | | | 7,186,967 | |
| | |
Is Yatirim Menkul Degerler AS, Class A | | | 1,086,897 | | | | 1,427,929 | |
| | |
Nuh Cimento Sanayi AS | | | 313,817 | | | | 984,172 | |
| | |
Otokar Otomotiv Ve Savunma Sanayi AS | | | 58,142 | | | | 1,692,996 | |
| | |
Sarkuysan Elektrolitik Bakir Sanayi ve Ticaret AS | | | 673,878 | | | | 891,291 | |
| | |
Sok Marketler Ticaret AS(a) | | | 360,894 | | | | 307,311 | |
| | |
Tekfen Holding AS | | | 501,255 | | | | 727,905 | |
| | |
Tofas Turk Otomobil Fabrikasi AS(a) | | | 1,418,089 | | | | 7,526,596 | |
| | |
Turk Traktor ve Ziraat Makineleri AS(a) | | | 169,646 | | | | 2,689,076 | |
| | |
Turkiye Is Bankasi AS, Group C | | | 6,065,190 | | | | 3,651,250 | |
| | |
Turkiye Sigorta AS | | �� | 2,548,696 | | | | 934,839 | |
| | |
Turkiye Sise ve Cam Fabrikalari AS(a) | | | 4,955,785 | | | | 5,138,995 | |
| | |
Ulker Biskuvi Sanayi AS | | | 1,019,682 | | | | 1,065,721 | |
| | |
Vestel Beyaz Esya Sanayi ve Ticaret AS | | | 3,893,827 | | | | 2,107,821 | |
| | |
Vestel Elektronik Sanayi ve Ticaret AS(a) | | | 1,322,864 | | | | 2,326,866 | |
| | |
Yapi ve Kredi Bankasi AS(a) | | | 7,674,301 | | | | 2,134,693 | |
| | | | | | | | |
| Total Turkey | | | | | | | 66,935,414 | |
TOTAL COMMON STOCKS (Cost: $2,209,531,771) | | | | | | | 2,544,579,606 | |
| | |
| WARRANTS – 0.0% | | | | | | | | |
| | |
| Thailand – 0.0% | | | | | | | | |
| | |
Noble Development PCL, expiring 1/12/24*
(Cost: $0) | | | 2,236,800 | | | | 47,090 | |
| | |
| EXCHANGE-TRADED FUND – 0.5% | | | | | | | | |
| | |
| United States – 0.5% | | | | | | | | |
| | |
WisdomTree Emerging Markets High Dividend Fund(a)(d) | | | | | | | | |
| (Cost: $12,242,086) | | | 286,645 | | | | 12,543,585 | |
|
| INVESTMENT OF CASH COLLATERAL FOR SECURITIES LOANED – 3.1% | |
| | |
| United States – 3.1% | | | | | | | | |
| |
State Street Navigator Securities Lending
Government Money Market Portfolio, 0.25%(e) | | | | | |
| (Cost: $80,792,166) | | | 80,792,166 | | | | 80,792,166 | |
| |
TOTAL INVESTMENTS IN SECURITIES – 102.4%
(Cost: $2,302,566,023) | | | | 2,637,962,447 | |
| | |
Other Assets less Liabilities – (2.4)% | | | | | | | (62,370,571 | ) |
| | | | | | | | |
| NET ASSETS – 100.0% | | | | | | $ | 2,575,591,876 | |
| * | Non-income producing security. |
| † | Security is being fair valued using significant unobservable inputs by a pricing committee under the direction of the Board of Trustees. The aggregate value of fair valued securities is $825,562, which represents 0.03% of net assets. |
| (a) | Security, or portion thereof, was on loan at March 31, 2022 (See Note 2). At March 31, 2022, the total market value of the Fund’s securities on loan identified in the Schedule of Investments was $410,875,658 and the total market value of the collateral held by the Fund was $452,312,791. The total market value of the collateral includes non-cash U.S. Government securities collateral having a value of $371,520,625. |
| (b) | This security is exempt from registration under rule 144A of the Securities Act of 1933. This security may be sold in transactions that are exempt from registration, normally to qualified institutional buyers. |
| (c) | This security, or a portion thereof, is restricted from resale (see Note 2 – Restricted Securities). In accordance with a reconstruction scheme notified by the government of India applicable to Yes Bank Ltd., effective March 16, 2020, 75% of all shares of Yes Bank Ltd. held by then-existing shareholders are subject to a three-year lock-in period and are unable to be sold. At March 31, 2022, the value of the restricted portion of this security is as follows: |
| | | | | | | | | | | | | | | | | | | | |
| | | | | |
| Investment | | Restricted
Shares | | | Acquisition Date | | | Acquisition Cost | | | Value | | | Value as a
Percentage of Net
Assets | |
India
Yes Bank
Ltd. | | | 5,997,912 | | |
| 10/18/19 –
1/10/20 |
| | $ | 4,322,484 | | | $ | 973,597 | | | | 0.0 | % |
| (d) | Affiliated holding. See “Investment in Affiliates” supplementary table included in this Schedule of Investments for additional information. |
| (e) | Rate shown represents annualized 7-day yield as of March 31, 2022. |
Affiliated holdings are investments in entities in which the Fund owns 5% or more of the outstanding voting securities or are investments in entities which are under common ownership or control. Investments in affiliates during the fiscal year ended March 31, 2022 were as follows:
| | | | | | | | | | | | | | | | | | | | | | | | | | | | |
| | | | | | | |
| Affiliate | | Value at
3/31/2021 | | | Purchases/
Additions | | | Sales/
Reductions | | | Realized
Gain/(Loss) | | | Change in
Unrealized
Appreciation/
Depreciation | | | Value at
3/31/2022 | | | Dividend
Income | |
WisdomTree Emerging Markets High Dividend Fund | | $ | 2,224,743 | | | $ | 48,975,326 | | | $ | 38,440,747 | | | $ | (470,429 | ) | | $ | 254,692 | | | $ | 12,543,585 | | | $ | 737,144 | |
See Notes to Financial Statements.
Schedule of Investments (concluded)
WisdomTree Emerging Markets SmallCap Dividend Fund (DGS)
March 31, 2022
The following is a summary of the fair valuations according to the inputs used as of March 31, 2022 in valuing the Fund’s investments (See Note 2 — Fair Value Measurement):
| | | | | | | | | | | | | | | | |
| | | | |
| | | Quoted
Prices in
Active
Markets
(Level 1) | | | Other
Significant
Observable
Inputs
(Level 2) | | | Significant
Unobservable
Inputs
(Level 3) | | | Total | |
Assets: | | | | | | | | | | | | | | | | |
Investments in Securities | | | | | | | | | | | | | | | | |
Common Stocks | | | | | | | | | | | | | | | | |
China | | $ | 362,580,754 | | | $ | — | | | $ | 117,125 | * | | $ | 362,697,879 | |
South Korea | | | 291,993,245 | | | | — | | | | 708,437 | * | | | 292,701,682 | |
Other | | | 1,889,180,045 | | | | — | | | | — | | | | 1,889,180,045 | |
Warrants | | | 47,090 | | | | — | | | | — | | | | 47,090 | |
Exchange-Traded Fund | | | 12,543,585 | | | | — | | | | — | | | | 12,543,585 | |
Investment of Cash Collateral for Securities Loaned | | | — | | | | 80,792,166 | | | | — | | | | 80,792,166 | |
Total Investments in Securities | | $ | 2,556,344,719 | | | $ | 80,792,166 | | | $ | 825,562 | | | $ | 2,637,962,447 | |
| * | Securities are being fair valued using significant unobservable inputs by the Pricing Committee. |
See Notes to Financial Statements.
Schedule of Investments
WisdomTree Global ex-U.S. Quality Dividend Growth Fund (DNL)
March 31, 2022
| | | | | | | | |
| Investments | | Shares | | | Value | |
| | |
| COMMON STOCKS – 99.5% | | | | | | | | |
| | |
| Australia – 8.7% | | | | | | | | |
| | |
Aristocrat Leisure Ltd. | | | 24,382 | | | $ | 671,964 | |
| | |
BHP Group Ltd.(a) | | | 1,056,761 | | | | 41,067,476 | |
| | |
Breville Group Ltd.(a) | | | 20,346 | | | | 419,251 | |
| | |
carsales.com Ltd. | | | 68,940 | | | | 1,083,038 | |
| | |
Domino’s Pizza Enterprises Ltd.(a) | | | 14,163 | | | | 934,346 | |
| | |
Eagers Automotive Ltd.(a) | | | 89,438 | | | | 959,094 | |
| | |
Evolution Mining Ltd.(a) | | | 452,111 | | | | 1,493,856 | |
| | |
Netwealth Group Ltd. | | | 1,380 | | | | 15,524 | |
| | |
Pro Medicus Ltd.(a) | | | 5,861 | | | | 215,621 | |
| | |
REA Group Ltd.(a) | | | 14,429 | | | | 1,467,879 | |
| | |
Technology One Ltd. | | | 63,869 | | | | 550,609 | |
| | |
WiseTech Global Ltd. | | | 6,942 | | | | 266,285 | |
| | | | | | | | |
| Total Australia | | | | 49,144,943 | |
| | |
| Belgium – 0.2% | | | | | | | | |
| | |
Melexis NV | | | 14,616 | | | | 1,366,050 | |
| | |
| Brazil – 5.7% | | | | | | | | |
| | |
Ambev SA | | | 910,483 | | | | 2,950,670 | |
| | |
BB Seguridade Participacoes SA | | | 300,390 | | | | 1,615,751 | |
| | |
Cia de Locacao das Americas | | | 68,281 | | | | 390,263 | |
| | |
Cia de Saneamento Basico do Estado de Sao Paulo | | | 52,654 | | | | 528,651 | |
| | |
Cia Siderurgica Nacional SA | | | 197,427 | | | | 1,081,456 | |
| | |
CPFL Energia SA | | | 137,094 | | | | 930,991 | |
| | |
Engie Brasil Energia SA | | | 40,370 | | | | 367,344 | |
| | |
Equatorial Energia SA | | | 125,565 | | | | 718,994 | |
| | |
JBS SA | | | 247,875 | | | | 1,942,021 | |
| | |
Localiza Rent a Car SA | | | 19,913 | | | | 256,039 | |
| | |
Magazine Luiza SA | | | 24,330 | | | | 34,919 | |
| | |
Marfrig Global Foods SA | | | 101,454 | | | | 456,889 | |
| | |
Raia Drogasil SA | | | 36,197 | | | | 182,358 | |
| | |
Transmissora Alianca de Energia Eletrica SA | | | 154,098 | | | | 1,431,388 | |
| | |
Vale SA | | | 969,844 | | | | 19,511,377 | |
| | | | | | | | |
| Total Brazil | | | | 32,399,111 | |
| | |
| Canada – 1.1% | | | | | | | | |
| | |
CI Financial Corp. | | | 89,606 | | | | 1,424,743 | |
| | |
Constellation Software, Inc. | | | 850 | | | | 1,454,265 | |
| | |
goeasy Ltd. | | | 966 | | | | 108,491 | |
| | |
Onex Corp. | | | 3,540 | | | | 237,445 | |
| | |
Parex Resources, Inc.(a) | | | 14,389 | | | | 295,487 | |
| | |
Stella-Jones, Inc. | | | 8,090 | | | | 243,338 | |
| | |
TFI International, Inc. | | | 8,780 | | | | 935,957 | |
| | |
Toromont Industries Ltd. | | | 13,885 | | | | 1,317,410 | |
| | |
West Fraser Timber Co. Ltd.(a) | | | 6,288 | | | | 517,821 | |
| | | | | | | | |
| Total Canada | | | | 6,534,957 | |
| | |
| China – 3.4% | | | | | | | | |
| | |
ANTA Sports Products Ltd. | | | 57,200 | | | | 718,707 | |
| | |
China Feihe Ltd.(a)(b) | | | 340,000 | | | | 336,900 | |
| | |
China Gas Holdings Ltd. | | | 419,400 | | | | 537,679 | |
| | |
China Lesso Group Holdings Ltd. | | | 374,000 | | | | 454,642 | |
| | |
China Medical System Holdings Ltd. | | | 308,000 | | | | 485,318 | |
| | |
China Meidong Auto Holdings Ltd.(a) | | | 34,000 | | | | 130,245 | |
| | |
China Resources Mixc Lifestyle Services Ltd.(b) | | | 21,600 | | | | 106,878 | |
| | |
China Risun Group Ltd., Class H(a) | | | 189,000 | | | | 100,155 | |
| | |
CIFI Ever Sunshine Services Group Ltd.(a) | | | 50,000 | | | | 67,676 | |
| | |
Country Garden Services Holdings Co. Ltd. | | | 39,000 | | | | 167,326 | |
| | |
Dongyue Group Ltd. | | | 22,000 | | | | 30,283 | |
| | |
Flat Glass Group Co. Ltd., Class H*(a) | | | 10,000 | | | | 38,690 | |
| | |
Fuyao Glass Industry Group Co. Ltd., Class H(b) | | | 68,000 | | | | 279,592 | |
| | |
Haitian International Holdings Ltd. | | | 117,000 | | | | 304,026 | |
| | |
JD.com, Inc., Class A* | | | 4,671 | | | | 139,568 | |
| | |
Jinke Smart Services Group Co. Ltd., Class H(a) | | | 76,100 | | | | 274,999 | |
| | |
Lenovo Group Ltd.(a) | | | 1,754,000 | | | | 1,908,226 | |
| | |
Li Ning Co. Ltd. | | | 73,500 | | | | 634,446 | |
| | |
Nongfu Spring Co. Ltd., Class H(a)(b) | | | 85,000 | | | | 453,144 | |
| | |
Pop Mart International Group Ltd.*(a)(b) | | | 19,600 | | | | 86,094 | |
| | |
Shenzhou International Group Holdings Ltd. | | | 72,400 | | | | 968,859 | |
| | |
Shimao Services Holdings Ltd.(a)(b) | | | 29,000 | | | | 15,553 | |
| | |
Sino Biopharmaceutical Ltd. | | | 757,875 | | | | 473,224 | |
| | |
SITC International Holdings Co. Ltd. | | | 477,000 | | | | 1,690,215 | |
| | |
Smoore International Holdings Ltd.(a)(b) | | | 148,000 | | | | 355,288 | |
| | |
Sunny Optical Technology Group Co. Ltd. | | | 25,100 | | | | 404,156 | |
| | |
Tencent Holdings Ltd. | | | 113,900 | | | | 5,442,371 | |
| | |
Topsports International Holdings Ltd.(b) | | | 23,000 | | | | 19,237 | |
| | |
WuXi AppTec Co. Ltd., Class H(b) | | | 10,440 | | | | 165,970 | |
| | |
Xinyi Glass Holdings Ltd. | | | 952,000 | | | | 2,309,676 | |
| | |
Yadea Group Holdings Ltd.(b) | | | 44,000 | | | | 68,095 | |
| | |
Yihai International Holding Ltd.*(a) | | | 21,000 | | | | 60,334 | |
| | |
Zhongsheng Group Holdings Ltd. | | | 22,800 | | | | 161,289 | |
| | | | | | | | |
| Total China | | | | 19,388,861 | |
| | |
| Denmark – 9.1% | | | | | | | | |
| | |
Alten SA | | | 3,115 | | | | 476,562 | |
| | |
AP Moller – Maersk A/S, Class B | | | 2,088 | | | | 6,362,054 | |
| | |
Chemometec A/S | | | 709 | | | | 87,547 | |
| | |
Coloplast A/S, Class B | | | 46,116 | | | | 7,067,071 | |
| | |
GN Store Nord A/S | | | 5,083 | | | | 252,958 | |
| | |
Novo Nordisk A/S, Class B | | | 322,173 | | | | 36,090,161 | |
| | |
Royal Unibrew A/S | | | 10,885 | | | | 1,029,665 | |
| | |
SimCorp A/S | | | 3,122 | | | | 232,095 | |
| | | | | | | | |
| Total Denmark | | | | 51,598,113 | |
| | |
| Finland – 1.7% | | | | | | | | |
| | |
Kesko Oyj, Class B | | | 86,935 | | | | 2,419,174 | |
| | |
Neste Oyj | | | 153,196 | | | | 7,070,414 | |
| | | | | | | | |
| Total Finland | | | | 9,489,588 | |
| | |
| France – 8.8% | | | | | | | | |
| | |
Bureau Veritas SA | | | 71,808 | | | | 2,072,533 | |
| | |
Hermes International | | | 4,017 | | | | 5,772,380 | |
| | |
Kering SA | | | 15,057 | | | | 9,644,803 | |
| | |
LVMH Moet Hennessy Louis Vuitton SE | | | 43,802 | | | | 31,649,358 | |
| | |
Verallia SA(b) | | | 42,319 | | | | 1,014,238 | |
| | | | | | | | |
| Total France | | | | 50,153,312 | |
| | |
| Germany – 4.2% | | | | | | | | |
| | |
adidas AG | | | 22,882 | | | | 5,394,903 | |
| | |
Dermapharm Holding SE | | | 6,883 | | | | 441,888 | |
| | |
Eckert & Ziegler Strahlen – und Medizintechnik AG | | | 433 | | | | 28,039 | |
See Notes to Financial Statements.
Schedule of Investments (continued)
WisdomTree Global ex-U.S. Quality Dividend Growth Fund (DNL)
March 31, 2022
| | | | | | | | |
| Investments | | Shares | | | Value | |
| | |
Fielmann AG | | | 20,518 | | | $ | 1,127,770 | |
| | |
Hapag-Lloyd AG(b) | | | 42,522 | | | | 14,979,016 | |
| | |
Nemetschek SE | | | 3,373 | | | | 329,511 | |
| | |
Puma SE | | | 1,700 | | | | 146,478 | |
| | |
Varta AG(a) | | | 10,332 | | | | 1,033,482 | |
| | |
VERBIO Vereinigte BioEnergie AG | | | 1,804 | | | | 140,706 | |
| | | | | | | | |
| Total Germany | | | | 23,621,793 | |
| | |
| Hong Kong – 0.9% | | | | | | | | |
| | |
Kingboard Laminates Holdings Ltd.(a) | | | 335,000 | | | | 551,817 | |
| | |
Techtronic Industries Co. Ltd. | | | 241,500 | | | | 3,913,266 | |
| | |
Vitasoy International Holdings Ltd.(a) | | | 280,000 | | | | 531,297 | |
| | | | | | | | |
| Total Hong Kong | | | | 4,996,380 | |
| | |
| India – 3.1% | | | | | | | | |
| | |
Asian Paints Ltd. | | | 20,588 | | | | 836,820 | |
| | |
Berger Paints India Ltd. | | | 1,286 | | | | 11,875 | |
| | |
Colgate-Palmolive India Ltd. | | | 5,490 | | | | 111,738 | |
| | |
Eicher Motors Ltd. | | | 6,863 | | | | 222,546 | |
| | |
ICICI Securities Ltd.(b) | | | 26,282 | | | | 215,476 | |
| | |
Infosys Ltd. | | | 383,905 | | | | 9,660,828 | |
| | |
L&T Technology Services Ltd.(b) | | | 3,322 | | | | 223,818 | |
| | |
Larsen & Toubro Infotech Ltd.(b) | | | 4,185 | | | | 339,958 | |
| | |
Marico Ltd. | | | 99,321 | | | | 660,218 | |
| | |
Mphasis Ltd. | | | 15,384 | | | | 685,575 | |
| | |
Nestle India Ltd. | | | 900 | | | | 206,433 | |
| | |
Page Industries Ltd. | | | 155 | | | | 88,345 | |
| | |
Pidilite Industries Ltd. | | | 11,085 | | | | 359,036 | |
| | |
Supreme Industries Ltd. | | | 8,829 | | | | 238,532 | |
| | |
Tata Consultancy Services Ltd. | | | 70,366 | | | | 3,472,983 | |
| | | | | | | | |
| Total India | | | | 17,334,181 | |
|
Indonesia – 0.1% | |
| | |
Bukit Asam Tbk PT | | | 626,000 | | | | 143,397 | |
| | |
Sarana Menara Nusantara Tbk PT | | | 2,674,400 | | | | 199,242 | |
| | |
Sumber Alfaria Trijaya Tbk PT | | | 1,130,900 | | | | 119,684 | |
| | | | | | | | |
| Total Indonesia | | | | 462,323 | |
| | |
| Israel – 0.2% | | | | | | | | |
| | |
Maytronics Ltd. | | | 10,536 | | | | 206,609 | |
| | |
Strauss Group Ltd. | | | 29,117 | | | | 869,701 | |
| | | | | | | | |
| Total Israel | | | | 1,076,310 | |
| | |
| Italy – 1.0% | | | | | | | | |
| | |
Carel Industries SpA(b) | | | 8,391 | | | | 217,068 | |
| | |
De’ Longhi SpA | | | 21,952 | | | | 604,272 | |
| | |
DiaSorin SpA | | | 1,688 | | | | 266,510 | |
| | |
Ferrari NV | | | 10,649 | | | | 2,354,319 | |
| | |
Interpump Group SpA | | | 10,922 | | | | 555,363 | |
| | |
Moncler SpA | | | 20,724 | | | | 1,169,992 | |
| | |
Technogym SpA(b) | | | 44,149 | | | | 353,190 | |
| | | | | | | | |
| Total Italy | | | | 5,520,714 | |
| | |
| Japan – 7.9% | | | | | | | | |
| | |
BayCurrent Consulting, Inc. | | | 500 | | | | 184,552 | |
| | |
Benefit One, Inc.(a) | | | 17,800 | | | | 379,831 | |
| | |
Fast Retailing Co. Ltd. | | | 5,000 | | | | 2,594,851 | |
| | |
Hoya Corp. | | | 26,800 | | | | 3,097,870 | |
| | |
Japan Elevator Service Holdings Co. Ltd. | | | 4,500 | | | | 59,283 | |
| | |
JCR Pharmaceuticals Co. Ltd. | | | 13,100 | | | | 243,598 | |
| | |
Justsystems Corp. | | | 2,700 | | | | 128,799 | |
| | |
Kakaku.com, Inc.(a) | | | 40,900 | | | | 929,032 | |
| | |
Koei Tecmo Holdings Co. Ltd.(a) | | | 38,000 | | | | 1,257,013 | |
| | |
Lasertec Corp.(a) | | | 3,900 | | | | 667,860 | |
| | |
M3, Inc.(a) | | | 9,700 | | | | 357,152 | |
| | |
Milbon Co. Ltd. | | | 4,500 | | | | 203,172 | |
| | |
MonotaRO Co. Ltd. | | | 17,600 | | | | 381,944 | |
| | |
Nihon M&A Center Holdings, Inc. | | | 23,200 | | | | 330,104 | |
| | |
Nippon Shinyaku Co. Ltd. | | | 12,200 | | | | 837,289 | |
| | |
Nomura Research Institute Ltd. | | | 70,900 | | | | 2,348,243 | |
| | |
Olympus Corp. | | | 89,700 | | | | 1,728,596 | |
| | |
Recruit Holdings Co. Ltd. | | | 60,800 | | | | 2,712,018 | |
| | |
Shionogi & Co. Ltd. | | | 57,000 | | | | 3,536,231 | |
| | |
SMS Co. Ltd. | | | 1,200 | | | | 33,565 | |
| | |
Systena Corp.(a) | | | 54,400 | | | | 193,173 | |
| | |
Toei Animation Co. Ltd.(a) | | | 3,200 | | | | 268,128 | |
| | |
Tokyo Electron Ltd. | | | 40,700 | | | | 21,209,269 | |
| | |
West Holdings Corp.(a) | | | 4,200 | | | | 167,481 | |
| | |
Workman Co. Ltd.(a) | | | 300 | | | | 12,383 | |
| | |
ZOZO, Inc. | | | 40,652 | | | | 1,100,242 | |
| | | | | | | | |
| Total Japan | | | | 44,961,679 | |
| | |
| Malaysia – 0.1% | | | | | | | | |
| | |
Fraser & Neave Holdings Bhd | | | 57,000 | | | | 284,678 | |
| | |
ViTrox Corp. Bhd | | | 1,600 | | | | 3,120 | |
| | |
Westports Holdings Bhd | | | 131,400 | | | | 125,002 | |
| | | | | | | | |
| Total Malaysia | | | | 412,800 | |
|
| Mexico – 1.4% | |
| | |
America Movil SAB de CV, Series L | | | 2,980,561 | | | | 3,156,627 | |
| | |
Grupo Mexico SAB de CV, Series B | | | 847,274 | | | | 5,055,942 | |
| | | | | | | | |
| Total Mexico | | | | 8,212,569 | |
| | |
| Netherlands – 3.3% | | | | | | | | |
| | |
ASM International NV | | | 3,797 | | | | 1,403,034 | |
| | |
ASML Holding NV | | | 22,827 | | | | 15,493,065 | |
| | |
BE Semiconductor Industries NV(a) | | | 19,724 | | | | 1,708,709 | |
| | | | | | | | |
| Total Netherlands | | | | 18,604,808 | |
| | |
| Norway – 1.2% | | | | | | | | |
| | |
AF Gruppen ASA | | | 41,149 | | | | 941,194 | |
| | |
Aker BP ASA(a) | | | 136,176 | | | | 5,148,649 | |
| | |
Tomra Systems ASA | | | 11,392 | | | | 587,970 | |
| Total Norway | | | | 6,677,813 | |
| | |
| Philippines – 0.1% | | | | | | | | |
| | |
Manila Electric Co. | | | 62,830 | | | | 453,634 | |
| | |
San Miguel Food and Beverage, Inc. | | | 72,150 | | | | 86,100 | |
| | | | | | | | |
| Total Philippines | | | | 539,734 | |
| | |
| Poland – 0.1% | | | | | | | | |
| | |
CD Projekt SA | | | 12,086 | | | | 503,887 | |
| | |
KGHM Polska Miedz SA | | | 4,648 | | | | 192,846 | |
| | | | | | | | |
| Total Poland | | | | 696,733 | |
See Notes to Financial Statements.
Schedule of Investments (continued)
WisdomTree Global ex-U.S. Quality Dividend Growth Fund (DNL)
March 31, 2022
| | | | | | | | |
| Investments | | Shares | | | Value | |
| | |
| Portugal – 0.5% | | | | | | | | |
| | |
Jeronimo Martins SGPS SA | | | 124,723 | | | $ | 3,015,539 | |
| | |
| Russia – 0.0% | | | | | | | | |
| | |
Evraz PLC† | | | 243,480 | | | | 0 | |
| | |
Lukoil PJSC, ADR† | | | 70,640 | | | | 0 | |
| | |
Magnitogorsk Iron & Steel Works PJSC, GDR†(c) | | | 54,588 | | | | 0 | |
| | |
MMC Norilsk Nickel PJSC, ADR† | | | 162,102 | | | | 0 | |
| | |
Novatek PJSC, GDR†(c) | | | 9,747 | | | | 0 | |
| | |
PhosAgro PJSC, GDR†(c) | | | 25,677 | | | | 0 | |
| | | | | | | | |
| Total Russia | | | | 0 | |
| | |
| South Africa – 2.3% | | | | | | | | |
| | |
Anglo American Platinum Ltd. | | | 16,279 | | | | 2,235,356 | |
| | |
Capitec Bank Holdings Ltd. | | | 8,816 | | | | 1,412,702 | |
| | |
Clicks Group Ltd. | | | 33,285 | | | | 703,968 | |
| | |
Gold Fields Ltd. | | | 163,099 | | | | 2,545,405 | |
| | |
Impala Platinum Holdings Ltd.(a) | | | 344,417 | | | | 5,303,963 | |
| | |
Mr. Price Group Ltd. | | | 43,056 | | | | 637,950 | |
| | | | | | | | |
| Total South Africa | | | | 12,839,344 | |
| | |
| South Korea – 0.5% | | | | | | | | |
| | |
Coway Co. Ltd. | | | 4,170 | | | | 235,671 | |
| | |
DB HiTek Co. Ltd. | | | 4,026 | | | | 248,791 | |
| | |
Fila Holdings Corp. | | | 1,745 | | | | 45,279 | |
| | |
Kumho Petrochemical Co. Ltd. | | | 1,791 | | | | 229,038 | |
| | |
LG Household & Health Care Ltd. | | | 183 | | | | 129,544 | |
| | |
Macquarie Korea Infrastructure Fund | | | 131,830 | | | | 1,490,096 | |
| | |
Seegene, Inc. | | | 9,949 | | | | 419,450 | |
| | | | | | | | |
| Total South Korea | | | | 2,797,869 | |
| | |
| Spain – 2.8% | | | | | | | | |
| | |
Cie Automotive SA | | | 29,812 | | | | 685,299 | |
| | |
Industria de Diseno Textil SA | | | 691,523 | | | | 15,219,192 | |
| | |
Laboratorios Farmaceuticos Rovi SA | | | 3,280 | | | | 245,246 | |
| | | | | | | | |
| Total Spain | | | | 16,149,737 | |
| | |
| Sweden – 2.5% | | | | | | | | |
| | |
AddLife AB, Class B | | | 5,423 | | | | 153,157 | |
| | |
AddTech AB, Class B | | | 16,850 | | | | 329,066 | |
| | |
Atlas Copco AB, Class B | | | 85,660 | | | | 3,947,783 | |
| | |
Epiroc AB, Class B | | | 66,731 | | | | 1,221,213 | |
| | |
EQT AB(a) | | | 74,887 | | | | 2,990,048 | |
| | |
Evolution AB(b) | | | 14,179 | | | | 1,472,916 | |
| | |
Hexpol AB | | | 66,452 | | | | 658,573 | |
| | |
HMS Networks AB | | | 1,139 | | | | 54,021 | |
| | |
Husqvarna AB, Class B | | | 108,988 | | | | 1,153,804 | |
| | |
Instalco AB | | | 11,462 | | | | 87,127 | |
| | |
Lagercrantz Group AB, Class B | | | 25,630 | | | | 293,719 | |
| | |
Lifco AB, Class B | | | 44,345 | | | | 1,146,287 | |
| | |
Mycronic AB | | | 12,757 | | | | 240,920 | |
| | |
Thule Group AB(a)(b) | | | 14,098 | | | | 567,284 | |
| | |
Troax Group AB | | | 4,101 | | | | 108,252 | |
| | |
Vitrolife AB | | | 1,092 | | | | 36,512 | |
| | | | | | | | |
| Total Sweden | | | | 14,460,682 | |
| | |
| Switzerland – 8.5% | | | | | | | | |
| | |
EMS-Chemie Holding AG, Registered Shares | | | 3,599 | | | | 3,525,671 | |
| | |
Kuehne + Nagel International AG, Registered Shares | | | 21,904 | | | | 6,262,366 | |
| | |
Logitech International SA, Registered Shares | | | 19,896 | | | | 1,496,119 | |
| | |
Partners Group Holding AG | | | 6,435 | | | | 8,066,039 | |
| | |
Roche Holding AG, Bearer Shares | | | 45,648 | | | | 20,089,584 | |
| | |
Schindler Holding AG, Participation Certificate | | | 6,210 | | | | 1,342,885 | |
| | |
SFS Group AG | | | 7,980 | | | | 1,116,896 | |
| | |
STMicroelectronics NV | | | 72,683 | | | | 3,203,291 | |
| | |
Straumann Holding AG, Registered Shares | | | 577 | | | | 932,041 | |
| | |
Temenos AG, Registered Shares | | | 5,207 | | | | 503,584 | |
| | |
VAT Group AG(b) | | | 3,744 | | | | 1,441,862 | |
| | | | | | | | |
| Total Switzerland | | | | 47,980,338 | |
| | |
| Taiwan – 7.8% | | | | | | | | |
| | |
Accton Technology Corp. | | | 113,000 | | | | 877,528 | |
| | |
Advantech Co. Ltd. | | | 46,496 | | | | 599,629 | |
| | |
Chicony Electronics Co. Ltd. | | | 339,000 | | | | 1,062,499 | |
| | |
Eclat Textile Co. Ltd. | | | 30,283 | | | | 504,690 | |
| | |
Elite Material Co. Ltd. | | | 37,000 | | | | 333,176 | |
| | |
Feng TAY Enterprise Co. Ltd. | | | 117,620 | | | | 786,145 | |
| | |
Giant Manufacturing Co. Ltd. | | | 29,000 | | | | 263,669 | |
| | |
Lotes Co. Ltd. | | | 8,000 | | | | 195,732 | |
| | |
Macronix International Co. Ltd. | | | 533,000 | | | | 745,975 | |
| | |
Makalot Industrial Co. Ltd. | | | 13,000 | | | | 93,241 | |
| | |
MediaTek, Inc. | | | 414,000 | | | | 13,076,802 | |
| | |
Merida Industry Co. Ltd. | | | 16,000 | | | | 141,284 | |
| | |
Micro-Star International Co. Ltd. | | | 142,000 | | | | 644,294 | |
| | |
momo.com, Inc. | | | 2,600 | | | | 85,392 | |
| | |
Nien Made Enterprise Co. Ltd. | | | 29,000 | | | | 340,593 | |
| | |
Novatek Microelectronics Corp. | | | 119,000 | | | | 1,771,408 | |
| | |
Realtek Semiconductor Corp. | | | 96,000 | | | | 1,442,438 | |
| | |
Taiwan Semiconductor Manufacturing Co. Ltd. | | | 1,001,000 | | | | 20,857,442 | |
| | |
Wan Hai Lines Ltd. | | | 25,000 | | | | 138,300 | |
| | |
Wiwynn Corp. | | | 15,000 | | | | 534,004 | |
| | | | | | | | |
| Total Taiwan | | | | 44,494,241 | |
| | |
| Thailand – 0.2% | | | | | | | | |
| | |
Carabao Group PCL, NVDR | | | 52,100 | | | | 169,227 | |
| | |
Home Product Center PCL, NVDR | | | 336,200 | | | | 160,770 | |
| | |
Krungthai Card PCL, NVDR | | | 103,800 | | | | 191,991 | |
| | |
Muangthai Capital PCL, NVDR | | | 75,000 | | | | 118,421 | |
| | |
Srisawad Corp. PCL, NVDR | | | 132,600 | | | | 227,314 | |
| | | | | | | | |
| Total Thailand | | | | 867,723 | |
| | |
| Turkey – 0.5% | | | | | | | | |
| | |
BIM Birlesik Magazalar AS | | | 214,514 | | | | 1,237,996 | |
| | |
Coca-Cola Icecek AS | | | 1,380 | | | | 11,027 | |
| | |
Ford Otomotiv Sanayi AS | | | 17,284 | | | | 351,978 | |
| | |
Iskenderun Demir ve Celik AS | | | 79,996 | | | | 149,436 | |
| | |
Tofas Turk Otomobil Fabrikasi AS | | | 9,673 | | | | 51,340 | |
| | |
Turk Telekomunikasyon AS(a) | | | 536,935 | | | | 381,440 | |
| | |
Turkcell Iletisim Hizmetleri AS | | | 380,506 | | | | 584,725 | |
| | | | | | | | |
| Total Turkey | | | | 2,767,942 | |
See Notes to Financial Statements.
Schedule of Investments (continued)
WisdomTree Global ex-U.S. Quality Dividend Growth Fund (DNL)
March 31, 2022
| | | | | | | | |
| Investments | | Shares | | | Value | |
| | |
| United Kingdom – 11.6% | | | | | | | | |
| | |
Anglo American PLC | | | 740,028 | | | $ | 38,706,381 | |
| | |
Antofagasta PLC | | | 307,376 | | | | 6,770,744 | |
| | |
Ashtead Group PLC | | | 38,679 | | | | 2,461,288 | |
| | |
Auto Trader Group PLC(b) | | | 121,524 | | | | 1,012,509 | |
| | |
Computacenter PLC | | | 29,955 | | | | 1,160,333 | |
| | |
Dunelm Group PLC | | | 59,096 | | | | 848,894 | |
| | |
Electrocomponents PLC | | | 94,376 | | | | 1,346,981 | |
| | |
Ferrexpo PLC | | | 636,421 | | | | 1,562,766 | |
| | |
Fevertree Drinks PLC | | | 14,446 | | | | 340,654 | |
| | |
Fresnillo PLC | | | 206,337 | | | | 1,994,085 | |
| | |
Games Workshop Group PLC | | | 1,605 | | | | 153,526 | |
| | |
Gamma Communications PLC | | | 8,339 | | | | 148,663 | |
| | |
Greggs PLC | | | 1,389 | | | | 45,007 | |
| | |
Howden Joinery Group PLC | | | 119,914 | | | | 1,212,240 | |
| | |
Impax Asset Management Group PLC | | | 11,557 | | | | 150,644 | |
| | |
Kainos Group PLC | | | 16,470 | | | | 286,896 | |
| | |
Pagegroup PLC | | | 24,368 | | | | 157,982 | |
| | |
Rightmove PLC | | �� | 116,932 | | | | 974,250 | |
| | |
Softcat PLC | | | 34,515 | | | | 774,369 | |
| | |
Spirax-Sarco Engineering PLC | | | 6,510 | | | | 1,074,424 | |
| | |
Synthomer PLC | | | 127,748 | | | | 514,017 | |
| | |
Taylor Wimpey PLC | | | 2,069,600 | | | | 3,561,496 | |
| | |
Victrex PLC | | | 18,602 | | | | 448,210 | |
| | | | | | | | |
| Total United Kingdom | | | | | | | 65,706,359 | |
| | |
| United States – 0.0% | | | | | | | | |
| | |
JS Global Lifestyle Co. Ltd.(a)(b) | | | 84,500 | | | | 99,375 | |
TOTAL COMMON STOCKS (Cost: $535,046,418) | | | | | | | 564,371,921 | |
| | |
| EXCHANGE-TRADED FUNDS – 0.1% | | | | | | | | |
| | |
| United States – 0.1% | | | | | | | | |
| | |
WisdomTree Emerging Markets High Dividend Fund(d) | | | 3,811 | | | | 166,769 | |
| | |
WisdomTree International Equity Fund(a)(d) | | | 4,672 | | | | 246,448 | |
TOTAL EXCHANGE-TRADED FUNDS (Cost: $399,983) | | | | | | | 413,217 | |
|
| INVESTMENT OF CASH COLLATERAL FOR SECURITIES LOANED – 0.7% | |
| | |
| United States – 0.7% | | | | | | | | |
| | |
State Street Navigator Securities Lending Government Money Market Portfolio, 0.25%(e) | | | | | | | | |
| | |
| (Cost: $4,393,392) | | | 4,393,392 | | | | 4,393,392 | |
| | |
TOTAL INVESTMENTS IN SECURITIES – 100.3% (Cost: $539,839,793) | | | | | | | 569,178,530 | |
| | |
Other Assets less Liabilities – (0.3)% | | | | | | | (1,939,744 | ) |
| | | | | | | | |
| NET ASSETS – 100.0% | | | | | | $ | 567,238,786 | |
| * | Non-income producing security. |
| † | Security is being fair valued using significant unobservable inputs by a pricing committee under the direction of the Board of Trustees. The aggregate value of fair valued securities is $0, which represents 0.0% of net assets. |
| (a) | Security, or portion thereof, was on loan at March 31, 2022 (See Note 2). At March 31, 2022, the total market value of the Fund’s securities on loan identified in the Schedule of Investments was $43,934,988 and the total market value of the collateral held by the Fund was $46,773,193. The total market value of the collateral includes non-cash U.S. Government securities collateral having a value of $42,379,801. |
| (b) | This security is exempt from registration under rule 144A of the Securities Act of 1933. This security may be sold in transactions that are exempt from registration, normally to qualified institutional buyers. |
| (c) | This security is exempt from registration under Regulation S of the Securities Act of 1933, which exempts from registration securities offered and sold outside the United States. This security may not be offered or sold in the United States except pursuant to an exemption from, or in a transaction not subject to, the registration requirements of the Securities Act of 1933. |
| (d) | Affiliated holding. See “Investment in Affiliates” supplementary table included in this Schedule of Investments for additional information. |
| (e) | Rate shown represents annualized 7-day yield as of March 31, 2022. |
Affiliated holdings are investments in entities in which the Fund owns 5% or more of the outstanding voting securities or are investments in entities which are under common ownership or control. Investments in affiliates during the fiscal year ended March 31, 2022 were as follows:
| | | | | | | | | | | | | | | | | | | | | | | | | | | | |
| | | | | | | |
| Affiliate | | Value at
3/31/2021 | | | Purchases/
Additions | | | Sales/
Reductions | | | Realized
Gain/
(Loss) | | | Change in
Unrealized
Appreciation/
Depreciation | | | Value at
3/31/2022 | | | Dividend
Income | |
WisdomTree Emerging Markets High Dividend Fund | | $ | 55,849 | | | $ | 18,737,451 | | | $ | 18,404,913 | | | $ | (229,189 | ) | | $ | 7,571 | | | $ | 166,769 | | | $ | 37,471 | |
WisdomTree International Equity Fund | | | 82,296 | | | | 19,044,599 | | | | 18,780,938 | | | | (105,125 | ) | | | 5,616 | | | | 246,448 | | | | 31,598 | |
Total | | $ | 138,145 | | | $ | 37,782,050 | | | $ | 37,185,851 | | | $ | (334,314 | ) | | $ | 13,187 | | | $ | 413,217 | | | $ | 69,069 | |
See Notes to Financial Statements.
Schedule of Investments (continued)
WisdomTree Global ex-U.S. Quality Dividend Growth Fund (DNL)
March 31, 2022
| | | | | | | | | | | | | | | | | | | | | | | | | | | | |
|
| FINANCIAL DERIVATIVE INSTRUMENTS | |
|
| FOREIGN CURRENCY CONTRACTS (OTC — OVER THE COUNTER) | |
| | | | | |
| Counterparty | | Settlement
Date | | | Amount and
Description of
Currency to
be Purchased | | | Amount and
Description of
Currency to
be Sold | | | Unrealized
Appreciation | | | Unrealized
Depreciation | |
Bank of America NA | | | 4/1/2022 | | | | 71,054,160 | | | | KRW | | | | 58,630 | | | | USD | | | $ | — | | | $ | (7 | ) |
Bank of America NA | | | 4/1/2022 | | | | 23,684,700 | | | | KRW | | | | 19,543 | | | | USD | | | | — | | | | (2 | ) |
Bank of America NA | | | 4/1/2022 | | | | 25,925,725 | | | | TWD | | | | 905,481 | | | | USD | | | | — | | | | (616 | ) |
Citibank NA | | | 4/1/2022 | | | | 64,000 | | | | HKD | | | | 8,176 | | | | USD | | | | — | | | | (4 | ) |
Goldman Sachs | | | 4/1/2022 | | | | 2,540,710 | | | | HKD | | | | 324,608 | | | | USD | | | | — | | | | (181 | ) |
JP Morgan Chase Bank NA | | | 4/1/2022 | | | | 8,641,907 | | | | TWD | | | | 302,249 | | | | USD | | | | — | | | | (628 | ) |
JP Morgan Chase Bank NA | | | 4/4/2022 | | | | 1,088,856 | | | | BRL | | | | 229,247 | | | | USD | | | | — | | | | (109 | ) |
JP Morgan Chase Bank NA | | | 4/4/2022 | | | | 3,895,665 | | | | HKD | | | | 497,445 | | | | USD | | | | — | | | | (4 | ) |
JP Morgan Chase Bank NA | | | 4/4/2022 | | | | 1,298,555 | | | | HKD | | | | 165,815 | | | | USD | | | | — | | | | (1 | ) |
Merrill Lynch International | | | 4/1/2022 | | | | 2,173,840 | | | | BRL | | | | 457,083 | | | | USD | | | | 380 | | | | — | |
Merrill Lynch International | | | 4/1/2022 | | | | 36,095 | | | | MYR | | | | 8,586 | | | | USD | | | | — | | | | (2 | ) |
Merrill Lynch International | | | 4/1/2022 | | | | 12,033 | | | | MYR | | | | 2,862 | | | | USD | | | | — | | | | (1 | ) |
Merrill Lynch International | | | 4/4/2022 | | | | 3,266,485 | | | | BRL | | | | 687,739 | | | | USD | | | | — | | | | (340 | ) |
State Street Bank and Trust | | | 4/1/2022 | | | | 48,600 | | | | USD | | | | 1,389,000 | | | | TWD | | | | 121 | | | | — | |
State Street Bank and Trust | | | 4/5/2022 | | | | 194,062 | | | | PHP | | | | 3,751 | | | | USD | | | | — | | | | (0 | )^ |
| | | | | | | | | | | | | | | | | | | | | | | $ | 501 | | | $ | (1,895 | ) |
| ^ | Amount represents less than $1. |
The following is a summary of the fair valuations according to the inputs used as of March 31, 2022 in valuing the Fund’s investments (See Note 2 — Fair Value Measurement):
| | | | | | | | | | | | | | | | |
| | | | |
| | | Quoted
Prices in
Active
Markets
(Level 1) | | | Other
Significant
Observable
Inputs
(Level 2) | | | Significant
Unobservable
Inputs
(Level 3) | | | Total | |
Assets: | | | | | | | | | | | | | | | | |
Investments in Securities | | | | | | | | | | | | | | | | |
Common Stocks | | | | | | | | | | | | | | | | |
Russia | | $ | — | | | $ | — | | | $ | 0 | * | | $ | 0 | |
Other | | | 564,371,921 | | | | — | | | | — | | | | 564,371,921 | |
Exchange-Traded Funds | | | 413,217 | | | | — | | | | — | | | | 413,217 | |
Investment of Cash Collateral for Securities Loaned | | | — | | | | 4,393,392 | | | | — | | | | 4,393,392 | |
Total Investments in Securities | | $ | 564,785,138 | | | $ | 4,393,392 | | | $ | 0 | | | $ | 569,178,530 | |
Financial Derivative Instruments | | | | | | | | | | | | | | | | |
Foreign Currency Contracts1 | | $ | — | | | $ | 501 | | | $ | — | | | $ | 501 | |
Liabilities: | | | | | | | | | | | | | | | | |
Financial Derivative Instruments | | | | | | | | | | | | | | | | |
Foreign Currency Contracts1 | | $ | — | | | $ | (1,895 | ) | | $ | — | | | $ | (1,895 | ) |
Total – Net | | $ | 564,785,138 | | | $ | 4,391,998 | | | $ | 0 | | | $ | 569,177,136 | |
| * | Securities are being fair valued using significant unobservable inputs by the Pricing Committee. |
| 1 | Amount shown represents the unrealized appreciation (depreciation) on the financial instrument. |
See Notes to Financial Statements.
Schedule of Investments (concluded)
WisdomTree Global ex-U.S. Quality Dividend Growth Fund (DNL)
March 31, 2022
The following is a reconciliation of assets in which significant unobservable inputs (Level 3) were used in determining fair value:
| | | | |
| | |
| | | Common Stocks | |
| |
| | | Russia | |
Balance as of March 31, 2021 | | $ | — | |
Realized gain (loss) | | | (106,316 | ) |
Change in unrealized appreciation (depreciation) | | | (18,023,790 | ) |
Purchases | | | 20,297,481 | |
Sales | | | (2,167,375 | ) |
Transfers into Level 3 | | | — | |
Transfers out of Level 3 | | | — | |
Balance as of March 31, 2022 | | $ | 0 | |
Net change in unrealized appreciation (depreciation) from investments still held as of March 31, 2022 is: | | $ | (18,023,790 | ) |
See Notes to Financial Statements.
Schedule of Investments
WisdomTree Global ex-U.S. Real Estate Fund (DRW)
March 31, 2022
| | | | | | | | |
| Investments | | Shares | | | Value | |
|
| COMMON STOCKS – 99.5% | |
|
| Australia – 11.7% | |
| | |
Abacus Property Group(a) | | | 44,960 | | | $ | 111,755 | |
| | |
BWP Trust | | | 46,682 | | | | 141,275 | |
| | |
Centuria Industrial REIT | | | 44,568 | | | | 128,518 | |
| | |
Charter Hall Group | | | 28,500 | | | | 353,348 | |
| | |
Charter Hall Long Wale REIT | | | 51,428 | | | | 205,458 | |
| | |
Charter Hall Retail REIT | | | 67,036 | | | | 211,934 | |
| | |
Cromwell Property Group(a) | | | 344,935 | | | | 214,994 | |
| | |
Dexus | | | 133,982 | | | | 1,101,721 | |
| | |
Goodman Group | | | 87,486 | | | | 1,503,818 | |
| | |
Growthpoint Properties Australia Ltd. | | | 39,523 | | | | 130,294 | |
| | |
Ingenia Communities Group | | | 21,169 | | | | 80,438 | |
| | |
Mirvac Group | | | 355,470 | | | | 664,681 | |
| | |
Shopping Centres Australasia Property Group | | | 121,434 | | | | 266,277 | |
| | |
Stockland | | | 320,604 | | | | 1,028,034 | |
| | |
Waypoint REIT Ltd. | | | 130,920 | | | | 262,499 | |
| | | | | | | | |
| Total Australia | | | | 6,405,044 | |
| | |
| Austria – 0.3% | | | | | | | | |
| | |
CA Immobilien Anlagen AG | | | 5,985 | | | | 186,791 | |
| | |
| Belgium – 2.7% | | | | | | | | |
| | |
Aedifica SA | | | 2,700 | | | | 342,474 | |
| | |
Befimmo SA | | | 2,407 | | | | 126,944 | |
| | |
Cofinimmo SA | | | 3,875 | | | | 569,121 | |
| | |
Warehouses De Pauw CVA | | | 10,615 | | | | 461,801 | |
| | | | | | | | |
| Total Belgium | | | | 1,500,340 | |
| | |
| Canada – 4.0% | | | | | | | | |
| | |
Allied Properties Real Estate Investment Trust | | | 6,283 | | | | 234,559 | |
| | |
Altus Group Ltd.(a) | | | 1,506 | | | | 60,889 | |
| | |
Canadian Apartment Properties REIT | | | 5,578 | | | | 239,590 | |
| | |
Choice Properties Real Estate Investment Trust | | | 29,408 | | | | 364,701 | |
| | |
CT Real Estate Investment Trust | | | 9,192 | | | | 130,111 | |
| | |
Dream Industrial Real Estate Investment Trust | | | 9,808 | | | | 126,737 | |
| | |
First Capital Real Estate Investment Trust | | | 13,125 | | | | 188,618 | |
| | |
FirstService Corp. | | | 629 | | | | 91,063 | |
| | |
Granite Real Estate Investment Trust | | | 2,312 | | | | 178,400 | |
| | |
InterRent Real Estate Investment Trust | | | 5,505 | | | | 70,474 | |
| | |
Killam Apartment Real Estate Investment Trust | | | 6,489 | | | | 111,280 | |
| | |
NorthWest Healthcare Properties Real Estate Investment Trust | | | 11,328 | | | | 124,884 | |
| | |
Summit Industrial Income REIT | | | 6,642 | | | | 117,094 | |
| | |
Tricon Residential, Inc.(a) | | | 10,939 | | | | 174,019 | |
| | | | | | | | |
| Total Canada | | | | 2,212,419 | |
| | |
| Chile – 0.2% | | | | | | | | |
| | |
Cencosud Shopping SA | | | 55,611 | | | | 65,241 | |
| | |
Parque Arauco SA* | | | 37,706 | | | | 39,482 | |
| | | | | | | | |
| Total Chile | | | | 104,723 | |
| | |
| China – 14.1% | | | | | | | | |
| | |
Agile Group Holdings Ltd.(a) | | | 420,000 | | | | 212,912 | |
| | |
C&D International Investment Group Ltd.(a) | | | 53,860 | | | | 117,604 | |
| | |
Central China Real Estate Ltd.(a) | | | 262,000 | | | | 25,426 | |
| | |
China Aoyuan Group Ltd.(a) | | | 234,000 | | | | 35,258 | |
| | |
China Jinmao Holdings Group Ltd. | | | 645,000 | | | | 191,901 | |
| | |
China Overseas Grand Oceans Group Ltd. | | | 214,000 | | | | 125,699 | |
| | |
China Overseas Land & Investment Ltd. | | | 431,549 | | | | 1,292,211 | |
| | |
China Resources Land Ltd. | | | 332,000 | | | | 1,547,361 | |
| | |
China SCE Group Holdings Ltd.(a) | | | 278,000 | | | | 50,407 | |
| | |
China Vanke Co. Ltd., Class H | | | 175,900 | | | | 398,456 | |
| | |
CIFI Holdings Group Co. Ltd. | | | 533,900 | | | | 314,283 | |
| | |
Country Garden Holdings Co. Ltd.(a) | | | 1,048,972 | | | | 807,685 | |
| | |
Dexin China Holdings Co. Ltd.*(a) | | | 182,000 | | | | 69,719 | |
| | |
Greentown China Holdings Ltd. | | | 38,500 | | | | 70,399 | |
| | |
Hopson Development Holdings Ltd.(a) | | | 77,880 | | | | 148,174 | |
| | |
Jiayuan International Group Ltd.(a) | | | 140,000 | | | | 28,067 | |
| | |
KWG Group Holdings Ltd.(a) | | | 344,500 | | | | 142,526 | |
| | |
Logan Group Co. Ltd.(a) | | | 129,000 | | | | 36,733 | |
| | |
Longfor Group Holdings Ltd.(b) | | | 172,500 | | | | 887,677 | |
| | |
Midea Real Estate Holding Ltd.(a)(b) | | | 53,600 | | | | 107,728 | |
| | |
Powerlong Real Estate Holdings Ltd.(a) | | | 202,000 | | | | 53,393 | |
| | |
Redsun Properties Group Ltd.(a) | | | 154,000 | | | | 51,324 | |
| | |
Seazen Group Ltd.* | | | 222,000 | | | | 119,626 | |
| | |
Shenzhen Investment Ltd. | | | 440,000 | | | | 98,322 | |
| | |
Shimao Group Holdings Ltd.(a) | | | 127,000 | | | | 71,678 | |
| | |
Sunac China Holdings Ltd.(a) | | | 255,271 | | | | 149,289 | |
| | |
Times China Holdings Ltd.(a) | | | 158,000 | | | | 52,657 | |
| | |
Wharf Holdings Ltd. | | | 60,872 | | | | 185,770 | |
| | |
Yanlord Land Group Ltd. | | | 105,600 | | | | 96,755 | |
| | |
Yuexiu Property Co. Ltd. | | | 179,800 | | | | 178,850 | |
| | |
Yuzhou Group Holdings Co. Ltd.(a) | | | 497,163 | | | | 25,711 | |
| | |
Zhenro Properties Group Ltd.(a) | | | 104,700 | | | | 8,155 | |
| | |
Zhongliang Holdings Group Co. Ltd.(a) | | | 141,000 | | | | 38,890 | |
| | | | | | | | |
| Total China | | | | 7,740,646 | |
| | |
| Finland – 0.4% | | | | | | | | |
| | |
Kojamo Oyj(a) | | | 8,362 | | | | 202,641 | |
|
| France – 1.9% | |
| | |
Gecina SA | | | 5,680 | | | | 722,359 | |
| | |
Nexity SA | | | 8,254 | | | | 292,964 | |
| | | | | | | | |
| Total France | | | | 1,015,323 | |
| | |
| Germany – 8.4% | | | | | | | | |
| | |
alstria office REIT AG | | | 26,400 | | | | 361,593 | |
| | |
Deutsche Wohnen SE, Bearer Shares | | | 24,234 | | | | 819,705 | |
| | |
LEG Immobilien SE | | | 6,662 | | | | 765,338 | |
| | |
PATRIZIA AG | | | 2,085 | | | | 39,577 | |
| | |
TAG Immobilien AG | | | 14,962 | | | | 342,106 | |
| | |
Vonovia SE | | | 48,714 | | | | 2,293,272 | |
| | | | | | | | |
| Total Germany | | | | 4,621,591 | |
| | |
| Hong Kong – 13.4% | | | | | | | | |
| | |
Champion REIT(a) | | | 296,000 | | | | 134,556 | |
| | |
Hang Lung Group Ltd. | | | 85,649 | | | | 181,985 | |
| | |
Hang Lung Properties Ltd. | | | 154,283 | | | | 311,269 | |
| | |
Henderson Land Development Co. Ltd. | | | 186,915 | | | | 778,077 | |
| | |
Hui Xian Real Estate Investment Trust | | | 478,634 | | | | 85,954 | |
| | |
Hysan Development Co. Ltd. | | | 79,115 | | | | 231,342 | |
See Notes to Financial Statements.
Schedule of Investments (continued)
WisdomTree Global ex-U.S. Real Estate Fund (DRW)
March 31, 2022
| | | | | | | | |
| Investments | | Shares | | | Value | |
| | |
Kowloon Development Co. Ltd. | | | 74,000 | | | $ | 99,216 | |
| | |
Link REIT | | | 222,714 | | | | 1,905,386 | |
| | |
New World Development Co. Ltd. | | | 167,013 | | | | 679,235 | |
| | |
Sino Land Co. Ltd. | | | 369,735 | | | | 479,673 | |
| | |
Sun Hung Kai Properties Ltd. | | | 174,310 | | | | 2,083,333 | |
| | |
Swire Properties Ltd. | | | 102,941 | | | | 255,795 | |
| | |
Yuexiu Real Estate Investment Trust(a) | | | 223,900 | | | | 96,348 | |
| | | | | | | | |
| Total Hong Kong | | | | 7,322,169 | |
| | |
| India – 0.1% | | | | | | | | |
| | |
Embassy Office Parks REIT | | | 15,098 | | | | 74,070 | |
| | |
| Israel – 1.2% | | | | | | | | |
| | |
Alony Hetz Properties & Investments Ltd. | | | 11,560 | | | | 192,458 | |
| | |
Amot Investments Ltd. | | | 33,418 | | | | 251,532 | |
| | |
Azrieli Group Ltd. | | | 1,459 | | | | 128,835 | |
| | |
Mivne Real Estate KD Ltd. | | | 28,113 | | | | 110,118 | |
| | | | | | | | |
| Total Israel | | | | 682,943 | |
| | |
| Italy – 0.2% | | | | | | | | |
| | |
Cromwell European Real Estate Investment Trust | | | 48,760 | | | | 123,696 | |
| | |
| Japan – 14.0% | | | | | | | | |
| | |
Aeon Mall Co. Ltd.(a) | | | 5,430 | | | | 72,788 | |
| | |
Daito Trust Construction Co. Ltd. | | | 14,500 | | | | 1,551,843 | |
| | |
Daiwa House Industry Co. Ltd. | | | 51,900 | | | | 1,368,749 | |
| | |
GLP J-REIT | | | 281 | | | | 429,227 | |
| | |
Heiwa Real Estate Co. Ltd.(a) | | | 2,600 | | | | 84,721 | |
| | |
Hulic Co. Ltd.(a) | | | 37,900 | | | | 343,793 | |
| | |
Ichigo, Inc. | | | 12,800 | | | | 33,219 | |
| | |
Japan Metropolitan Fund Invest | | | 623 | | | | 528,684 | |
| | |
Katitas Co. Ltd. | | | 2,100 | | | | 58,480 | |
| | |
Mitsubishi Estate Co. Ltd. | | | 57,389 | | | | 860,067 | |
| | |
Mitsui Fudosan Co. Ltd. | | | 51,008 | | | | 1,101,058 | |
| | |
Nomura Real Estate Holdings, Inc. | | | 10,965 | | | | 264,967 | |
| | |
Open House Group Co. Ltd. | | | 5,300 | | | | 236,671 | |
| | |
Relo Group, Inc. | | | 3,200 | | | | 48,326 | |
| | |
Starts Corp., Inc. | | | 2,600 | | | | 51,390 | |
| | |
Sumitomo Realty & Development Co. Ltd. | | | 13,979 | | | | 390,318 | |
| | |
Tokyo Tatemono Co. Ltd. | | | 17,000 | | | | 256,873 | |
| | | | | | | | |
| Total Japan | | | | 7,681,174 | |
| | |
| Malaysia – 0.4% | | | | | | | | |
| | |
IGB Real Estate Investment Trust | | | 145,100 | | | | 52,798 | |
| | |
KLCCP Stapled Group | | | 53,600 | | | | 83,624 | |
| | |
Sunway Real Estate Investment Trust | | | 201,596 | | | | 67,602 | |
| | | | | | | | |
| Total Malaysia | | | | 204,024 | |
| | |
| Mexico – 0.5% | | | | | | | | |
| | |
PLA Administradora Industrial S de RL de CV | | | 103,695 | | | | 145,647 | |
| | |
Prologis Property Mexico SA de CV | | | 46,057 | | | | 119,935 | |
| | | | | | | | |
| Total Mexico | | | | 265,582 | |
| | |
| Norway – 0.8% | | | | | | | | |
| | |
Entra ASA(b) | | | 20,504 | | | | 414,348 | |
| | |
| Philippines – 0.4% | | | | | | | | |
| | |
Robinsons Land Corp. | | | 150,247 | | | | 59,524 | |
| | |
SM Prime Holdings, Inc. | | | 185,375 | | | | 135,596 | |
| | | | | | | | |
| Total Philippines | | | | 195,120 | |
| | |
| Singapore – 9.7% | | | | | | | | |
| | |
Ascendas India Trust | | | 119,500 | | | | 105,076 | |
| | |
Ascendas Real Estate Investment Trust | | | 337,636 | | | | 730,981 | |
| | |
Ascott Residence Trust(a) | | | 248,688 | | | | 207,646 | |
| | |
CapitaLand Integrated Commercial Trust | | | 457,198 | | | | 760,111 | |
| | |
Capitaland Investment Ltd.* | | | 230,289 | | | | 678,947 | |
| | |
City Developments Ltd.(a) | | | 19,403 | | | | 112,832 | |
| | |
Frasers Centrepoint Trust | | | 53,018 | | | | 95,588 | |
| | |
Frasers Logistics & Commercial Trust | | | 91,600 | | | | 98,819 | |
| | |
Keppel DC REIT(a) | | | 90,504 | | | | 152,473 | |
| | |
Keppel REIT | | | 203,700 | | | | 183,629 | |
| | |
Manulife U.S. Real Estate Investment Trust | | | 224,072 | | | | 151,249 | |
| | |
Mapletree Commercial Trust | | | 132,720 | | | | 185,348 | |
| | |
Mapletree Industrial Trust | | | 188,509 | | | | 374,692 | |
| | |
Mapletree Logistics Trust | | | 329,458 | | | | 450,362 | |
| | |
Mapletree North Asia Commercial Trust | | | 241,700 | | | | 219,670 | |
| | |
OUE Commercial Real Estate Investment Trust(a) | | | 237,300 | | | | 73,644 | |
| | |
Parkway Life Real Estate Investment Trust | | | 44,500 | | | | 154,542 | |
| | |
SPH REIT | | | 100,600 | | | | 72,104 | |
| | |
Suntec Real Estate Investment Trust | | | 269,528 | | | | 348,523 | |
| | |
UOL Group Ltd. | | | 26,400 | | | | 137,330 | |
| | | | | | | | |
| Total Singapore | | | | | | | 5,293,566 | |
| | |
| Spain – 1.1% | | | | | | | | |
| | |
Inmobiliaria Colonial Socimi SA | | | 17,223 | | | | 157,905 | |
| | |
Merlin Properties Socimi SA | | | 39,582 | | | | 466,173 | |
| | | | | | | | |
| Total Spain | | | | | | | 624,078 | |
| | |
| Sweden – 3.2% | | | | | | | | |
| | |
Atrium Ljungberg AB, Class B | | | 5,885 | | | | 121,560 | |
| | |
Castellum AB(a) | | | 30,363 | | | | 760,101 | |
| | |
Catena AB | | | 1,738 | | | | 106,114 | |
| | |
Fabege AB(a) | | | 16,453 | | | | 246,281 | |
| | |
Hufvudstaden AB, Class A | | | 9,091 | | | | 130,472 | |
| | |
Samhallsbyggnadsbolaget i Norden AB(a) | | | 21,516 | | | | 97,544 | |
| | |
Wallenstam AB, Class B | | | 3,665 | | | | 53,838 | |
| | |
Wihlborgs Fastigheter AB | | | 11,805 | | | | 249,923 | |
| | | | | | | | |
| Total Sweden | | | | | | | 1,765,833 | |
| | |
| Switzerland – 3.5% | | | | | | | | |
| | |
Allreal Holding AG, Registered Shares | | | 1,639 | | | | 353,002 | |
| | |
PSP Swiss Property AG, Registered Shares | | | 3,125 | | | | 412,931 | |
| | |
Swiss Prime Site AG, Registered Shares | | | 11,725 | | | | 1,162,626 | |
| | | | | | | | |
| Total Switzerland | | | | | | | 1,928,559 | |
| | |
| Taiwan – 0.6% | | | | | | | | |
| | |
Farglory Land Development Co. Ltd. | | | 81,000 | | | | 193,372 | |
| | |
Ruentex Development Co. Ltd. | | | 53,200 | | | | 147,244 | |
| | | | | | | | |
| Total Taiwan | | | | | | | 340,616 | |
See Notes to Financial Statements.
Schedule of Investments (concluded)
WisdomTree Global ex-U.S. Real Estate Fund (DRW)
March 31, 2022
| | | | | | | | |
| Investments | | Shares | | | Value | |
| | |
| Thailand – 0.6% | | | | | | | | |
| | |
Central Pattana PCL, NVDR | | | 63,974 | | | $ | 113,518 | |
| | |
Supalai PCL, NVDR | | | 143,300 | | | | 93,522 | |
| | |
WHA Corp. PCL, NVDR | | | 967,100 | | | | 98,310 | |
| | | | | | | | |
| Total Thailand | | | | | | | 305,350 | |
| | |
| United Kingdom – 6.1% | | | | | | | | |
| | |
Assura PLC | | | 300,883 | | | | 265,030 | |
| | |
Big Yellow Group PLC | | | 10,610 | | | | 214,574 | |
| | |
CLS Holdings PLC | | | 17,863 | | | | 47,274 | |
| | |
Grainger PLC | | | 25,677 | | | | 98,718 | |
| | |
Great Portland Estates PLC | | | 12,522 | | | | 117,388 | |
| | |
Londonmetric Property PLC | | | 70,452 | | | | 255,834 | |
| | |
Primary Health Properties PLC(a) | | | 86,339 | | | | 168,585 | |
| | |
Safestore Holdings PLC | | | 15,969 | | | | 281,743 | |
| | |
Secure Income REIT PLC | | | 39,551 | | | | 235,639 | |
| | |
Segro PLC | | | 57,534 | | | | 1,019,245 | |
| | |
Tritax Big Box REIT PLC | | | 150,108 | | | | 477,893 | |
| | |
Workspace Group PLC | | | 17,648 | | | | 159,168 | |
| | | | | | | | |
| Total United Kingdom | | | | | | | 3,341,091 | |
TOTAL COMMON STOCKS
(Cost: $55,201,628) | | | | | | | 54,551,737 | |
| | |
| RIGHTS – 0.0% | | | | | | | | |
| | |
| Austria – 0.0% | | | | | | | | |
| | |
CA Immobilien Anlagen AG*† | | | | | | | | |
| (Cost: $0) | | | 5,761 | | | | 0 | |
|
| INVESTMENT OF CASH COLLATERAL FOR SECURITIES LOANED – 1.9% | |
|
| United States – 1.9% | |
| | |
State Street Navigator Securities Lending Government Money Market Portfolio, 0.25%(c) | | | | | | | | |
| (Cost: $1,066,023) | | | 1,066,023 | | | | 1,066,023 | |
| |
TOTAL INVESTMENTS IN SECURITIES – 101.4%
(Cost: $56,267,651) | | | | 55,617,760 | |
| |
Other Assets less Liabilities – (1.4)% | | | | (767,443 | ) |
| | | | | | | | |
| NET ASSETS – 100.0% | | | | | | $ | 54,850,317 | |
| * | Non-income producing security. |
| † | Security is being fair valued using significant unobservable inputs by a pricing committee under the direction of the Board of Trustees. The aggregate value of fair valued securities is $0, which represents 0.0% of net assets. |
| (a) | Security, or portion thereof, was on loan at March 31, 2022 (See Note 2). At March 31, 2022, the total market value of the Fund’s securities on loan identified in the Schedule of Investments was $4,808,028 and the total market value of the collateral held by the Fund was $5,182,470. The total market value of the collateral includes non-cash U.S. Government securities collateral having a value of $4,116,447. |
| (b) | This security is exempt from registration under rule 144A of the Securities Act of 1933. This security may be sold in transactions that are exempt from registration, normally to qualified institutional buyers. |
| (c) | Rate shown represents annualized 7-day yield as of March 31, 2022. |
| | | | | | | | | | | | | | | | | | | | | | | | | | | | |
|
| FINANCIAL DERIVATIVE INSTRUMENTS | |
|
| FOREIGN CURRENCY CONTRACTS (OTC – OVER THE COUNTER) | |
| | | | | |
| Counterparty | | Settlement
Date | | | Amount and
Description of
Currency to
be Purchased | | | Amount and
Description of
Currency to
be Sold | | | Unrealized
Appreciation | | | Unrealized
Depreciation | |
Bank of America NA | | | 4/1/2022 | | | | 1,425 | | | | AUD | | | | 1,067 | | | | USD | | | $ | 3 | | | $ | — | |
Bank of America NA | | | 4/1/2022 | | | | 12,766 | | | | CHF | | | | 13,821 | | | | USD | | | | 51 | | | | — | |
Deutsche Bank AG | | | 4/1/2022 | | | | 210 | | | | SGD | | | | 155 | | | | USD | | | | 0 | ^ | | | — | |
| | | | | | | | | | | | | | | | | | | | | | | $ | 54 | | | $ | — | |
| ^ | Amount represents less than $1. |
The following is a summary of the fair valuations according to the inputs used as of March 31, 2022 in valuing the Fund’s investments (See Note 2 — Fair Value Measurement):
| | | | | | | | | | | | | | | | |
| | | | |
| | | Quoted
Prices in
Active
Markets
(Level 1) | | | Other
Significant
Observable
Inputs
(Level 2) | | | Significant
Unobservable
Inputs
(Level 3) | | | Total | |
Assets: | | | | | | | | | |
Investments in Securities | | | | |
Common Stocks | | $ | 54,551,737 | | | $ | — | | | $ | — | | | $ | 54,551,737 | |
Rights | | | — | | | | — | | | | 0 | * | | | 0 | |
Investment of Cash Collateral for Securities Loaned | | | — | | | | 1,066,023 | | | | — | | | | 1,066,023 | |
Total Investments in Securities | | $ | 54,551,737 | | | $ | 1,066,023 | | | $ | 0 | | | $ | 55,617,760 | |
Financial Derivative Instruments | | | | | | | | | | | | | | | | |
Foreign Currency Contracts1 | | $ | — | | | $ | 54 | | | $ | — | | | $ | 54 | |
Total – Net | | $ | 54,551,737 | | | $ | 1,066,077 | | | $ | 0 | | | $ | 55,617,814 | |
| * | Securities are being fair valued using significant unobservable inputs by the Pricing Committee. |
| 1 | Amount shown represents the unrealized appreciation (depreciation) on the financial instrument. |
See Notes to Financial Statements.
Schedule of Investments
WisdomTree Global High Dividend Fund (DEW)
March 31, 2022
| | | | | | | | |
| Investments | | Shares | | | Value | |
|
| COMMON STOCKS – 99.4% | |
|
| Australia – 4.2% | |
| | |
Alumina Ltd. | | | 6,972 | | | $ | 10,524 | |
| | |
APA Group(a) | | | 4,381 | | | | 35,103 | |
| | |
Atlas Arteria Ltd. | | | 6,286 | | | | 30,919 | |
| | |
Australia & New Zealand Banking Group Ltd. | | | 5,350 | | | | 110,885 | |
| | |
Bendigo & Adelaide Bank Ltd.(a) | | | 2,763 | | | | 21,350 | |
| | |
BHP Group Ltd. | | | 27,974 | | | | 1,087,116 | |
| | |
Coles Group Ltd. | | | 3,653 | | | | 49,131 | |
| | |
Commonwealth Bank of Australia | | | 4,365 | | | | 346,703 | |
| | |
Fortescue Metals Group Ltd. | | | 18,309 | | | | 284,057 | |
| | |
GPT Group | | | 9,051 | | | | 35,208 | |
| | |
Growthpoint Properties Australia Ltd. | | | 4,940 | | | | 16,285 | |
| | |
Insurance Australia Group Ltd.(a) | | | 5,625 | | | | 18,501 | |
| | |
JB Hi-Fi Ltd.(a) | | | 480 | | | | 19,544 | |
| | |
Magellan Financial Group Ltd.(a) | | | 733 | | | | 8,774 | |
| | |
Medibank Pvt Ltd. | | | 9,592 | | | | 22,186 | |
| | |
Mineral Resources Ltd. | | | 941 | | | | 37,247 | |
| | |
Mirvac Group | | | 9,195 | | | | 17,193 | |
| | |
National Australia Bank Ltd. | | | 7,704 | | | | 187,155 | |
| | |
Newcrest Mining Ltd. | | | 1,503 | | | | 30,181 | |
| | |
Scentre Group | | | 13,651 | | | | 31,266 | |
| | |
Stockland | | | 8,020 | | | | 25,717 | |
| | |
Suncorp Group Ltd. | | | 5,342 | | | | 44,609 | |
| | |
Telstra Corp. Ltd. | | | 42,281 | | | | 125,734 | |
| | |
Vicinity Centres | | | 16,542 | | | | 23,167 | |
| | |
Wesfarmers Ltd. | | | 3,218 | | | | 121,819 | |
| | |
Westpac Banking Corp.(a) | | | 6,314 | | | | 114,934 | |
| | |
Worley Ltd. | | | 1,544 | | | | 14,969 | |
| | | | | | | | |
| Total Australia | | | | 2,870,277 | |
|
| Austria – 0.2% | |
| | |
BAWAG Group AG*(b) | | | 614 | | | | 31,398 | |
| | |
Oesterreichische Post AG(a) | | | 286 | | | | 10,247 | |
| | |
OMV AG | | | 845 | | | | 40,795 | |
| | |
Strabag SE, Bearer Shares | | | 1,011 | | | | 40,777 | |
| | |
Telekom Austria AG* | | | 2,090 | | | | 16,278 | |
| | | | | | | | |
| Total Austria | | | | 139,495 | |
|
| Belgium – 0.1% | |
| | |
Cofinimmo SA | | | 116 | | | | 17,037 | |
| | |
Etablissements Franz Colruyt NV | | | 245 | | | | 10,223 | |
| | |
Proximus SADP | | | 1,249 | | | | 23,416 | |
| | |
Solvay SA(a) | | | 216 | | | | 21,500 | |
| | |
Telenet Group Holding NV | | | 788 | | | | 25,619 | |
| | | | | | | | |
| Total Belgium | | | | 97,795 | |
|
| Brazil – 1.9% | |
| | |
B3 SA – Brasil Bolsa Balcao | | | 24,190 | | | | 79,972 | |
| | |
Banco Bradesco SA | | | 6,526 | | | | 25,091 | |
| | |
Banco do Brasil SA | | | 5,952 | | | | 43,463 | |
| | |
Cia Siderurgica Nacional SA | | | 3,038 | | | | 16,641 | |
| | |
Engie Brasil Energia SA | | | 2,812 | | | | 25,588 | |
| | |
Gerdau SA | | | 1,013 | | | | 5,129 | |
| | |
JBS SA | | | 4,050 | | | | 31,731 | |
| | |
Petroleo Brasileiro SA | | | 25,990 | | | | 192,739 | |
| | |
Telefonica Brasil SA | | | 2,363 | | | | 26,698 | |
| | |
Transmissora Alianca de Energia Eletrica SA | | | 3,038 | | | | 28,220 | |
| | |
Vale SA | | | 38,736 | | | | 779,293 | |
| | |
Vibra Energia SA | | | 6,455 | | | | 31,759 | |
| | | | | | | | |
| Total Brazil | | | | 1,286,324 | |
|
| Canada – 4.9% | |
| | |
Algonquin Power & Utilities Corp.(a) | | | 1,670 | | | | 25,925 | |
| | |
Allied Properties Real Estate Investment Trust | | | 397 | | | | 14,821 | |
| | |
AltaGas Ltd.(a) | | | 1,556 | | | | 34,881 | |
| | |
B2Gold Corp. | | | 3,664 | | | | 16,838 | |
| | |
Bank of Montreal(a) | | | 1,640 | | | | 193,155 | |
| | |
Bank of Nova Scotia | | | 4,160 | | | | 298,416 | |
| | |
BCE, Inc.(a) | | | 2,597 | | | | 144,087 | |
| | |
Canadian Imperial Bank of Commerce(a) | | | 1,454 | | | | 176,650 | |
| | |
Canadian Natural Resources Ltd.(a) | | | 3,078 | | | | 190,759 | |
| | |
Canadian Utilities Ltd., Class A(a) | | | 693 | | | | 21,261 | |
| | |
Capital Power Corp.(a) | | | 592 | | | | 19,295 | |
| | |
Choice Properties Real Estate Investment Trust | | | 1,292 | | | | 16,023 | |
| | |
Emera, Inc. | | | 673 | | | | 33,390 | |
| | |
Enbridge, Inc. | | | 6,203 | | | | 285,803 | |
| | |
First National Financial Corp.(a) | | | 368 | | | | 11,941 | |
| | |
Fortis, Inc. | | | 959 | | | | 47,472 | |
| | |
Gibson Energy, Inc.(a) | | | 667 | | | | 13,355 | |
| | |
Granite Real Estate Investment Trust | | | 370 | | | | 28,550 | |
| | |
Great-West Lifeco, Inc. | | | 3,273 | | | | 96,535 | |
| | |
H&R Real Estate Investment Trust | | | 1,275 | | | | 13,321 | |
| | |
IGM Financial, Inc. | | | 1,088 | | | | 38,475 | |
| | |
Keyera Corp.(a) | | | 791 | | | | 20,069 | |
| | |
Manulife Financial Corp. | | | 6,451 | | | | 137,692 | |
| | |
National Bank of Canada(a) | | | 710 | | | | 54,473 | |
| | |
Pembina Pipeline Corp.(a) | | | 1,696 | | | | 63,777 | |
| | |
Power Corp. of Canada(a) | | | 1,969 | | | | 61,007 | |
| | |
Restaurant Brands International, Inc.(a) | | | 594 | | | | 34,735 | |
| | |
RioCan Real Estate Investment Trust | | | 1,463 | | | | 29,552 | |
| | |
Rogers Communications, Inc., Class B | | | 917 | | | | 51,949 | |
| | |
Royal Bank of Canada | | | 3,445 | | | | 379,624 | |
| | |
Shaw Communications, Inc., Class B | | | 934 | | | | 29,013 | |
| | |
SmartCentres Real Estate Investment Trust | | | 896 | | | | 23,550 | |
| | |
Sun Life Financial, Inc.(a) | | | 1,292 | | | | 72,200 | |
| | |
Suncor Energy, Inc. | | | 2,155 | | | | 70,220 | |
| | |
TC Energy Corp.(a) | | | 2,521 | | | | 142,313 | |
| | |
TELUS Corp. | | | 3,156 | | | | 82,523 | |
| | |
Toronto-Dominion Bank | | | 5,042 | | | | 400,397 | |
| | |
TransAlta Renewables, Inc.(a) | | | 966 | | | | 14,292 | |
| | | | | | | | |
| Total Canada | | | | 3,388,339 | |
|
| Chile – 0.1% | |
| | |
Banco Santander Chile | | | 281,476 | | | | 15,849 | |
| | |
Cencosud SA | | | 16,921 | | | | 33,329 | |
| | |
Empresas CMPC SA | | | 7,994 | | | | 14,801 | |
| | | | | | | | |
| Total Chile | | | | 63,979 | |
|
| China – 3.1% | |
| | |
Agricultural Bank of China Ltd., Class H | | | 142,074 | | | | 54,606 | |
| | |
Anhui Conch Cement Co. Ltd., Class H | | | 4,000 | | | | 20,584 | |
See Notes to Financial Statements.
Schedule of Investments (continued)
WisdomTree Global High Dividend Fund (DEW)
March 31, 2022
| | | | | | | | |
| Investments | | Shares | | | Value | |
| | |
Bank of China Ltd., Class H | | | 558,000 | | | $ | 224,443 | |
| | |
Bank of Communications Co. Ltd., Class H | | | 103,000 | | | | 73,915 | |
| | |
BOC Hong Kong Holdings Ltd. | | | 30,000 | | | | 113,773 | |
| | |
China CITIC Bank Corp. Ltd., Class H | | | 52,000 | | | | 26,361 | |
| | |
China Construction Bank Corp., Class H | | | 615,536 | | | | 462,945 | |
| | |
China Everbright Environment Group Ltd. | | | 16,000 | | | | 9,684 | |
| | |
China Hongqiao Group Ltd.(a) | | | 13,500 | | | | 18,031 | |
| | |
China Life Insurance Co. Ltd., Class H | | | 34,000 | | | | 52,272 | |
| | |
China Merchants Port Holdings Co. Ltd. | | | 8,000 | | | | 14,506 | |
| | |
China National Building Material Co. Ltd., Class H | | | 14,000 | | | | 17,412 | |
| | |
China Pacific Insurance Group Co. Ltd., Class H | | | 9,200 | | | | 22,461 | |
| | |
China Petroleum & Chemical Corp., Class H | | | 124,000 | | | | 62,226 | |
| | |
China Resources Land Ltd. | | | 8,000 | | | | 37,286 | |
| | |
China Shenhua Energy Co. Ltd., Class H | | | 23,500 | | | | 75,319 | |
| | |
China Vanke Co. Ltd., Class H | | | 7,500 | | | | 16,989 | |
| | |
CIFI Holdings Group Co. Ltd. | | | 24,000 | | | | 14,128 | |
| | |
CITIC Ltd. | | | 27,000 | | | | 30,029 | |
| | |
Country Garden Holdings Co. Ltd.(a) | | | 31,668 | | | | 24,384 | |
| | |
Guangdong Investment Ltd. | | | 12,000 | | | | 16,426 | |
| | |
Haitong Securities Co. Ltd., Class H | | | 24,000 | | | | 18,326 | |
| | |
Hengan International Group Co. Ltd.(a) | | | 3,000 | | | | 13,867 | |
| | |
Industrial & Commercial Bank of China Ltd., Class H | | | 402,000 | | | | 246,906 | |
| | |
Kingboard Holdings Ltd. | | | 3,000 | | | | 14,595 | |
| | |
Lenovo Group Ltd.(a) | | | 16,000 | | | | 17,407 | |
| | |
Longfor Group Holdings Ltd.(b) | | | 4,500 | | | | 23,157 | |
| | |
New China Life Insurance Co. Ltd., Class H | | | 4,600 | | | | 12,864 | |
| | |
People’s Insurance Co. Group of China Ltd., Class H | | | 53,000 | | | | 17,393 | |
| | |
PetroChina Co. Ltd., Class H | | | 116,000 | | | | 60,137 | |
| | |
PICC Property & Casualty Co. Ltd., Class H | | | 24,000 | | | | 24,578 | |
| | |
Ping An Insurance Group Co. of China Ltd., Class H | | | 16,000 | | | | 113,696 | |
| | |
Postal Savings Bank of China Co. Ltd., Class H(a)(b) | | | 28,000 | | | | 22,703 | |
| | |
Sinopharm Group Co. Ltd., Class H | | | 8,800 | | | | 20,091 | |
| | |
SITC International Holdings Co. Ltd. | | | 7,000 | | | | 24,804 | |
| | |
Tingyi Cayman Islands Holding Corp. | | | 14,000 | | | | 23,597 | |
| | |
Wilmar International Ltd. | | | 15,300 | | | | 53,248 | |
| | |
Xinyi Glass Holdings Ltd. | | | 12,000 | | | | 29,114 | |
| | | | | | | | |
| Total China | | | | 2,124,263 | |
|
| Denmark – 0.1% | |
| | |
Tryg A/S | | | 1,832 | | | | 45,010 | |
| | |
| Finland – 0.6% | | | | | | | | |
| | |
Elisa Oyj | | | 480 | | | | 29,171 | |
| | |
Fortum Oyj | | | 2,813 | | | | 51,737 | |
| | |
Nokian Renkaat Oyj | | | 540 | | | | 8,877 | |
| | |
Nordea Bank Abp(a) | | | 20,816 | | | | 217,331 | |
| | |
Orion Oyj, Class B(a) | | | 291 | | | | 13,324 | |
| | |
Sampo Oyj, Class A | | | 992 | | | | 48,984 | |
| | |
TietoEVRY Oyj(a) | | | 405 | | | | 10,878 | |
| | |
UPM-Kymmene Oyj(a) | | | 1,235 | | | | 40,757 | |
| | |
Valmet Oyj(a) | | | 381 | | | | 11,959 | |
| | | | | | | | |
| Total Finland | | | | 433,018 | |
|
| France – 2.1% | |
| | |
ALD SA(b) | | | 1,857 | | | | 24,877 | |
| | |
Amundi SA(b) | | | 460 | | | | 31,835 | |
| | |
AXA SA | | | 11,297 | | | | 333,912 | |
| | |
BNP Paribas SA | | | 2,917 | | | | 168,544 | |
| | |
Bouygues SA | | | 1,008 | | | | 35,475 | |
| | |
Covivio(a) | | | 278 | | | | 22,314 | |
| | |
Credit Agricole SA | | | 9,884 | | | | 119,718 | |
| | |
Danone SA | | | 1,217 | | | | 67,745 | |
| | |
Eiffage SA | | | 206 | | | | 21,371 | |
| | |
Engie SA(a) | | | 5,736 | | | | 76,165 | |
| | |
Eutelsat Communications SA | | | 1,089 | | | | 11,928 | |
| | |
ICADE | | | 265 | | | | 17,205 | |
| | |
Klepierre SA*(a) | | | 800 | | | | 21,523 | |
| | |
Metropole Television SA | | | 1,047 | | | | 20,829 | |
| | |
Nexity SA | | | 306 | | | | 10,861 | |
| | |
Orange SA | | | 12,768 | | | | 152,065 | |
| | |
Publicis Groupe SA | | | 755 | | | | 46,421 | |
| | |
Sanofi | | | 2,439 | | | | 251,049 | |
| | | | | | | | |
| Total France | | | | 1,433,837 | |
|
| Germany – 1.7% | |
| | |
Allianz SE, Registered Shares | | | 984 | | | | 237,089 | |
| | |
BASF SE | | | 2,374 | | | | 136,721 | |
| | |
Bayer AG, Registered Shares | | | 2,087 | | | | 144,202 | |
| | |
Deutsche Telekom AG, Registered Shares | | | 9,112 | | | | 171,665 | |
| | |
DWS Group GmbH & Co. KGaA(b) | | | 599 | | | | 22,167 | |
| | |
E.ON SE | | | 9,138 | | | | 107,185 | |
| | |
Evonik Industries AG | | | 1,190 | | | | 33,340 | |
| | |
Freenet AG | | | 819 | | | | 22,144 | |
| | |
Hannover Rueck SE | | | 255 | | | | 43,793 | |
| | |
HeidelbergCement AG | | | 424 | | | | 24,371 | |
| | |
Hochtief AG | | | 227 | | | | 15,457 | |
| | |
METRO AG* | | | 1,865 | | | | 16,738 | |
| | |
Muenchener Rueckversicherungs – Gesellschaft AG in Muenchen, Registered Shares | | | 282 | | | | 76,245 | |
| | |
Talanx AG | | | 600 | | | | 26,717 | |
| | |
Vonovia SE | | | 1,279 | | | | 60,210 | |
| | | | | | | | |
| Total Germany | | | | 1,138,044 | |
|
| Hong Kong – 0.8% | |
| | |
Bank of East Asia Ltd. | | | 14,600 | | | | 22,931 | |
| | |
CLP Holdings Ltd. | | | 8,500 | | | | 82,868 | |
| | |
Hang Lung Properties Ltd. | | | 16,000 | | | | 32,280 | |
| | |
Hang Seng Bank Ltd. | | | 5,600 | | | | 108,119 | |
| | |
Henderson Land Development Co. Ltd. | | | 15,100 | | | | 62,857 | |
| | |
Hysan Development Co. Ltd. | | | 3,000 | | | | 8,773 | |
| | |
Link REIT | | | 4,500 | | | | 38,499 | |
| | |
Power Assets Holdings Ltd. | | | 10,500 | | | | 68,446 | |
| | |
Sino Land Co. Ltd. | | | 30,000 | | | | 38,920 | |
| | |
Sun Hung Kai Properties Ltd. | | | 6,000 | | | | 71,711 | |
| | |
Swire Pacific Ltd., Class A | | | 2,000 | | | | 12,233 | |
| | |
Swire Properties Ltd. | | | 13,000 | | | | 32,303 | |
| | | | | | | | |
| Total Hong Kong | | | | 579,940 | |
|
| India – 0.4% | |
| | |
Ambuja Cements Ltd. | | | 3,895 | | | | 15,382 | |
| | |
Bharat Petroleum Corp. Ltd. | | | 8,551 | | | | 40,551 | |
| | |
Coal India Ltd. | | | 6,762 | | | | 16,335 | |
See Notes to Financial Statements.
Schedule of Investments (continued)
WisdomTree Global High Dividend Fund (DEW)
March 31, 2022
| | | | | | | | |
| Investments | | Shares | | | Value | |
| | |
Hindustan Petroleum Corp. Ltd. | | | 4,641 | | | $ | 16,497 | |
| | |
ITC Ltd. | | | 11,891 | | | | 39,333 | |
| | |
NTPC Ltd. | | | 18,615 | | | | 33,164 | |
| | |
Power Finance Corp. Ltd. | | | 11,391 | | | | 16,927 | |
| | |
Power Grid Corp. of India Ltd. | | | 15,833 | | | | 45,300 | |
| | |
REC Ltd. | | | 6,682 | | | | 10,851 | |
| | |
Vedanta Ltd. | | | 6,795 | | | | 36,170 | |
| | | | | | | | |
| Total India | | | | 270,510 | |
|
| Indonesia – 0.1% | |
| | |
Bank Mandiri Persero Tbk PT | | | 45,800 | | | | 25,192 | |
| | |
Telkom Indonesia Persero Tbk PT | | | 201,200 | | | | 64,160 | |
| | | | | | | | |
| Total Indonesia | | | | 89,352 | |
|
| Italy – 1.4% | |
| | |
A2A SpA(a) | | | 12,888 | | | | 22,291 | |
| | |
ACEA SpA | | | 673 | | | | 12,483 | |
| | |
Assicurazioni Generali SpA(a) | | | 6,067 | | | | 140,207 | |
| | |
Azimut Holding SpA | | | 611 | | | | 14,365 | |
| | |
Banca Mediolanum SpA | | | 3,268 | | | | 28,202 | |
| | |
Enel SpA | | | 27,476 | | | | 185,506 | |
| | |
Eni SpA | | | 9,773 | | | | 144,558 | |
| | |
Intesa Sanpaolo SpA | | | 64,102 | | | | 148,602 | |
| | |
Iren SpA | | | 5,017 | | | | 13,420 | |
| | |
Italgas SpA | | | 3,791 | | | | 24,566 | |
| | |
Poste Italiane SpA(b) | | | 2,568 | | | | 29,487 | |
| | |
Snam SpA(a) | | | 13,340 | | | | 77,657 | |
| | |
Terna – Rete Elettrica Nazionale(a) | | | 6,767 | | | | 58,623 | |
| | |
Unipol Gruppo SpA | | | 2,298 | | | | 12,733 | |
| | |
UnipolSai Assicurazioni SpA(a) | | | 11,291 | | | | 33,744 | |
| | | | | | | | |
| Total Italy | | | | 946,444 | |
|
| Japan – 4.3% | |
| | |
Aisin Corp. | | | 600 | | | | 20,737 | |
| | |
Canon, Inc.(a) | | | 2,300 | | | | 56,716 | |
| | |
Chubu Electric Power Co., Inc.(a) | | | 2,100 | | | | 21,852 | |
| | |
Chugoku Electric Power Co., Inc.(a) | | | 1,700 | | | | 11,863 | |
| | |
Concordia Financial Group Ltd. | | | 6,500 | | | | 24,527 | |
| | |
Daito Trust Construction Co. Ltd. | | | 200 | | | | 21,405 | |
| | |
Daiwa House Industry Co. Ltd. | | | 1,000 | | | | 26,373 | |
| | |
ENEOS Holdings, Inc. | | | 12,500 | | | | 47,168 | |
| | |
Haseko Corp.(a) | | | 1,100 | | | | 12,751 | |
| | |
Honda Motor Co. Ltd. | | | 3,300 | | | | 94,806 | |
| | |
Hulic Co. Ltd.(a) | | | 1,800 | | | | 16,328 | |
| | |
Idemitsu Kosan Co. Ltd.(a) | | | 900 | | | | 25,026 | |
| | |
Inpex Corp. | | | 2,400 | | | | 28,474 | |
| | |
Isuzu Motors Ltd. | | | 1,600 | | | | 20,933 | |
| | |
Japan Post Holdings Co. Ltd. | | | 10,500 | | | | 77,719 | |
| | |
Japan Post Insurance Co. Ltd. | | | 1,700 | | | | 29,917 | |
| | |
Japan Tobacco, Inc. | | | 10,600 | | | | 182,307 | |
| | |
JFE Holdings, Inc.(a) | | | 1,600 | | | | 22,713 | |
| | |
Kajima Corp. | | | 1,700 | | | | 20,883 | |
| | |
Kansai Electric Power Co., Inc. | | | 2,700 | | | | 25,560 | |
| | |
KDDI Corp. | | | 6,100 | | | | 201,281 | |
| | |
Marubeni Corp. | | | 3,869 | | | | 45,456 | |
| | |
Mitsubishi Corp. | | | 2,800 | | | | 106,141 | |
| | |
Mitsubishi HC Capital, Inc. | | | 4,700 | | | | 22,072 | |
| | |
Mitsubishi Heavy Industries Ltd. | | | 700 | | | | 23,184 | |
| | |
Mitsubishi UFJ Financial Group, Inc. | | | 29,300 | | | | 183,537 | |
| | |
Mitsui OSK Lines Ltd.(a) | | | 2,100 | | | | 59,172 | |
| | |
Mizuho Financial Group, Inc. | | | 6,130 | | | | 79,141 | |
| | |
MS&AD Insurance Group Holdings, Inc. | | | 1,200 | | | | 39,329 | |
| | |
Nintendo Co. Ltd. | | | 200 | | | | 101,619 | |
| | |
Nippon Steel Corp. | | | 1,800 | | | | 32,196 | |
| | |
Nippon Telegraph & Telephone Corp. | | | 11,000 | | | | 321,277 | |
| | |
Nippon Yusen KK | | | 600 | | | | 53,191 | |
| | |
Resona Holdings, Inc. | | | 7,300 | | | | 31,522 | |
| | |
SBI Holdings, Inc.(a) | | | 500 | | | | 12,770 | |
| | |
Sekisui House Ltd. | | | 1,600 | | | | 31,255 | |
| | |
Shimizu Corp.(a) | | | 2,100 | | | | 12,717 | |
| | |
SoftBank Corp. | | | 21,900 | | | | 257,658 | |
| | |
Sompo Holdings, Inc. | | | 1,100 | | | | 48,767 | |
| | |
Sumitomo Chemical Co. Ltd. | | | 3,800 | | | | 17,595 | |
| | |
Sumitomo Corp. | | | 2,986 | | | | 52,130 | |
| | |
Sumitomo Metal Mining Co. Ltd. | | | 600 | | | | 30,466 | |
| | |
Sumitomo Mitsui Financial Group, Inc.(a) | | | 3,400 | | | | 109,444 | |
| | |
Sumitomo Mitsui Trust Holdings, Inc.(a) | | | 900 | | | | 29,668 | |
| | |
Sumitomo Rubber Industries Ltd. | | | 1,100 | | | | 10,187 | |
| | |
Taisei Corp. | | | 900 | | | | 26,212 | |
| | |
Takeda Pharmaceutical Co. Ltd.(a) | | | 4,700 | | | | 135,453 | |
| | |
Tokio Marine Holdings, Inc. | | | 1,100 | | | | 64,600 | |
| | |
Tosoh Corp. | | | 800 | | | | 11,956 | |
| | |
Yamaha Motor Co. Ltd. | | | 1,000 | | | | 22,707 | |
| | | | | | | | |
| Total Japan | | | | 2,960,761 | |
|
| Malaysia – 0.3% | |
| | |
Hartalega Holdings Bhd | | | 8,900 | | | | 10,266 | |
| | |
Malayan Banking Bhd | | | 45,100 | | | | 95,890 | |
| | |
Petronas Gas Bhd | | | 7,900 | | | | 31,301 | |
| | |
Public Bank Bhd | | | 41,500 | | | | 46,092 | |
| | |
Sime Darby Bhd | | | 21,700 | | | | 12,386 | |
| | |
Tenaga Nasional Bhd | | | 7,700 | | | | 16,481 | |
| | | | | | | | |
| Total Malaysia | | | | 212,416 | |
|
| Mexico – 0.3% | |
| | |
Arca Continental SAB de CV | | | 2,925 | | | | 19,838 | |
| | |
Coca-Cola Femsa SAB de CV | | | 5,412 | | | | 29,725 | |
| | |
Fibra Uno Administracion SA de CV | | | 18,452 | | | | 21,559 | |
| | |
Grupo Aeroportuario del Pacifico SAB de CV, Class B* | | | 1,574 | | | | 25,463 | |
| | |
Grupo Mexico SAB de CV, Series B | | | 17,327 | | | | 103,396 | |
| | |
Orbia Advance Corp. SAB de CV | | | 5,026 | | | | 13,234 | |
| | | | | | | | |
| Total Mexico | | | | 213,215 | |
|
| Netherlands – 0.5% | |
| | |
ASR Nederland NV | | | 435 | | | | 20,439 | |
| | |
ING Groep NV | | | 7,432 | | | | 78,649 | |
| | |
Koninklijke Ahold Delhaize NV | | | 1,826 | | | | 59,153 | |
| | |
Koninklijke KPN NV | | | 16,186 | | | | 56,603 | |
| | |
NN Group NV | | | 1,642 | | | | 83,785 | |
| | |
PostNL NV(a) | | | 4,193 | | | | 16,142 | |
| | |
Randstad NV(a) | | | 553 | | | | 33,620 | |
See Notes to Financial Statements.
Schedule of Investments (continued)
WisdomTree Global High Dividend Fund (DEW)
March 31, 2022
| | | | | | | | |
| Investments | | Shares | | | Value | |
| | |
Signify NV(b) | | | 359 | | | $ | 16,948 | |
| | | | | | | | |
| Total Netherlands | | | | 365,339 | |
|
| Norway – 0.5% | |
| | |
AF Gruppen ASA | | | 652 | | | | 14,913 | |
| | |
Aker BP ASA(a) | | | 760 | | | | 28,735 | |
| | |
DNB Bank ASA | | | 3,167 | | | | 72,475 | |
| | |
Gjensidige Forsikring ASA | | | 1,462 | | | | 36,567 | |
| | |
Kongsberg Gruppen ASA | | | 544 | | | | 21,837 | |
| | |
Orkla ASA | | | 2,149 | | | | 19,258 | |
| | |
Salmar ASA | | | 239 | | | | 19,089 | |
| | |
Telenor ASA | | | 6,719 | | | | 97,396 | |
| | |
Yara International ASA | | | 940 | | | | 47,516 | |
| | | | | | | | |
| Total Norway | | | | 357,786 | |
|
| Poland – 0.1% | |
| | |
Polski Koncern Naftowy Orlen SA | | | 1,035 | | | | 18,881 | |
| | |
Powszechny Zaklad Ubezpieczen SA | | | 2,817 | | | | 22,882 | |
| | | | | | | | |
| Total Poland | | | | 41,763 | |
|
| Portugal – 0.1% | |
| | |
EDP – Energias de Portugal SA | | | 8,807 | | | | 43,753 | |
| | |
Galp Energia SGPS SA | | | 2,597 | | | | 33,273 | |
| | | | | | | | |
| Total Portugal | | | | 77,026 | |
|
| Russia – 0.0% | |
| | |
Evraz PLC† | | | 5,263 | | | | 0 | |
| | |
Magnit PJSC, GDR†(c) | | | 2,236 | | | | 0 | |
| | |
Magnitogorsk Iron & Steel Works PJSC, GDR†(c) | | | 1,299 | | | | 0 | |
| | |
MMC Norilsk Nickel PJSC, ADR† | | | 3,215 | | | | 0 | |
| | |
Mobile TeleSystems PJSC, ADR† | | | 3,583 | | | | 0 | |
| | |
Novolipetsk Steel PJSC, GDR† | | | 1,164 | | | | 0 | |
| | |
PhosAgro PJSC, GDR†(c) | | | 746 | | | | 0 | |
| | |
Polyus PJSC, GDR†(c) | | | 166 | | | | 0 | |
| | |
Sberbank of Russia PJSC, ADR† | | | 9,987 | | | | 0 | |
| | |
Severstal PAO, GDR†(c) | | | 1,737 | | | | 0 | |
| | |
Tatneft PJSC, ADR† | | | 439 | | | | 0 | |
| | | | | | | | |
| Total Russia | | | | 0 | |
|
| Singapore – 0.8% | |
| | |
DBS Group Holdings Ltd. | | | 5,414 | | | | 143,336 | |
| | |
Jardine Cycle & Carriage Ltd. | | | 700 | | | | 12,946 | |
| | |
Keppel Corp. Ltd. | | | 3,800 | | | | 18,026 | |
| | |
NetLink NBN Trust | | | 43,400 | | | | 31,267 | |
| | |
Olam Group Ltd. | | | 10,200 | | | | 13,190 | |
| | |
Oversea-Chinese Banking Corp. Ltd. | | | 11,613 | | | | 106,232 | |
| | |
Singapore Exchange Ltd. | | | 2,300 | | | | 16,944 | |
| | |
Singapore Technologies Engineering Ltd. | | | 10,100 | | | | 30,747 | |
| | |
Singapore Telecommunications Ltd. | | | 25,100 | | | | 48,963 | |
| | |
United Overseas Bank Ltd. | | | 4,713 | | | | 111,509 | |
| | |
Venture Corp. Ltd.(a) | | | 800 | | | | 10,386 | |
| | | | | | | | |
| Total Singapore | | | | 543,546 | |
|
| South Africa – 0.7% | |
| | |
Anglo American Platinum Ltd. | | | 236 | | | | 32,406 | |
| | |
Exxaro Resources Ltd. | | | 2,246 | | | | 34,050 | |
| | |
FirstRand Ltd.(a) | | | 20,161 | | | | 106,886 | |
| | |
Gold Fields Ltd. | | | 2,071 | | | | 32,321 | |
| | |
Impala Platinum Holdings Ltd.(a) | | | 4,410 | | | | 67,913 | |
| | |
Kumba Iron Ore Ltd.(a) | | | 375 | | | | 16,819 | |
| | |
MultiChoice Group | | | 2,111 | | | | 19,030 | |
| | |
Sanlam Ltd. | | | 5,221 | | | | 25,797 | |
| | |
Sibanye Stillwater Ltd.(a) | | | 15,660 | | | | 64,087 | |
| | |
SPAR Group Ltd. | | | 963 | | | | 11,184 | |
| | |
Standard Bank Group Ltd.(a) | | | 3,178 | | | | 39,613 | |
| | |
Vodacom Group Ltd. | | | 3,811 | | | | 41,729 | |
| | | | | | | | |
| Total South Africa | | | | 491,835 | |
|
| South Korea – 1.6% | |
| | |
GS Holdings Corp. | | | 325 | | | | 11,771 | |
| | |
Hana Financial Group, Inc. | | | 835 | | | | 33,481 | |
| | |
KB Financial Group, Inc. | | | 1,042 | | | | 52,700 | |
| | |
Korea Electric Power Corp.* | | | 859 | | | | 16,053 | |
| | |
KT&G Corp. | | | 615 | | | | 40,948 | |
| | |
LG Uplus Corp. | | | 896 | | | | 10,349 | |
| | |
Macquarie Korea Infrastructure Fund | | | 2,228 | | | | 25,184 | |
| | |
NH Investment & Securities Co. Ltd. | | | 1,099 | | | | 10,337 | |
| | |
POSCO Holdings, Inc. | | | 172 | | | | 41,579 | |
| | |
Samsung Electronics Co. Ltd. | | | 12,756 | | | | 732,493 | |
| | |
Samsung Fire & Marine Insurance Co. Ltd. | | | 76 | | | | 13,732 | |
| | |
Samsung Securities Co. Ltd. | | | 357 | | | | 12,341 | |
| | |
Shinhan Financial Group Co. Ltd. | | | 1,395 | | | | 47,764 | |
| | |
SK Telecom Co. Ltd. | | | 251 | | | | 11,783 | |
| | |
Woori Financial Group, Inc. | | | 1,647 | | | | 20,858 | |
| | | | | | | | |
| Total South Korea | | | | 1,081,373 | |
|
| Spain – 0.7% | |
| | |
Acerinox SA | | | 969 | | | | 10,760 | |
| | |
Bankinter SA | | | 2,027 | | | | 12,008 | |
| | |
Cia de Distribucion Integral Logista Holdings SA | | | 815 | | | | 15,053 | |
| | |
Enagas SA(a) | | | 1,101 | | | | 24,684 | |
| | |
Fomento de Construcciones y Contratas SA | | | 945 | | | | 11,419 | |
| | |
Iberdrola SA | | | 14,427 | | | | 159,238 | |
| | |
Mapfre SA | | | 11,585 | | | | 24,491 | |
| | |
Naturgy Energy Group SA(a) | | | 3,689 | | | | 111,480 | |
| | |
Red Electrica Corp. SA | | | 1,645 | | | | 34,062 | |
| | |
Repsol SA | | | 3,948 | | | | 52,379 | |
| | | | | | | | |
| Total Spain | | | | 455,574 | |
|
| Sweden – 0.4% | |
| | |
Axfood AB(a) | | | 680 | | | | 22,342 | |
| | |
Castellum AB(a) | | | 791 | | | | 19,802 | |
| | |
Electrolux AB, Class B(a) | | | 758 | | | | 11,639 | |
| | |
Lundin Energy AB(a) | | | 908 | | | | 38,904 | |
| | |
Peab AB, Class B | | | 1,268 | | | | 12,899 | |
| | |
Skandinaviska Enskilda Banken AB, Class A | | | 5,299 | | | | 58,253 | |
| | |
Svenska Handelsbanken AB, Class A | | | 3,862 | | | | 36,012 | |
| | |
Tele2 AB, Class B(a) | | | 2,595 | | | | 39,624 | |
| | |
Telia Co. AB(a) | | | 11,677 | | | | 47,287 | |
| | | | | | | | |
| Total Sweden | | | | 286,762 | |
See Notes to Financial Statements.
Schedule of Investments (continued)
WisdomTree Global High Dividend Fund (DEW)
March 31, 2022
| | | | | | | | |
| Investments | | Shares | | | Value | |
|
| Switzerland – 1.6% | |
| | |
Adecco Group AG, Registered Shares | | | 775 | | | $ | 35,379 | |
| | |
Baloise Holding AG, Registered Shares | | | 117 | | | | 20,991 | |
| | |
Banque Cantonale Vaudoise, Registered Shares | | | 262 | | | | 22,833 | |
| | |
Clariant AG, Registered Shares*(a) | | | 950 | | | | 16,610 | |
| | |
Helvetia Holding AG, Registered Shares | | | 272 | | | | 35,676 | |
| | |
Holcim Ltd., Registered Shares* | | | 1,447 | | | | 71,214 | |
| | |
Novartis AG, Registered Shares | | | 4,848 | | | | 428,036 | |
| | |
PSP Swiss Property AG, Registered Shares | | | 135 | | | | 17,839 | |
| | |
Sulzer AG, Registered Shares(a) | | | 120 | | | | 10,028 | |
| | |
Swiss Life Holding AG, Registered Shares | | | 72 | | | | 46,490 | |
| | |
Swiss Prime Site AG, Registered Shares | | | 180 | | | | 17,848 | |
| | |
Swisscom AG, Registered Shares | | | 159 | | | | 95,892 | |
| | |
Zurich Insurance Group AG | | | 586 | | | | 290,883 | |
| | | | | | | | |
| Total Switzerland | | | | 1,109,719 | |
|
| Taiwan – 1.8% | |
| | |
Acer, Inc. | | | 22,000 | | | | 22,997 | |
| | |
ASE Technology Holding Co. Ltd. | | | 8,000 | | | | 28,899 | |
| | |
Asia Cement Corp. | | | 19,000 | | | | 32,229 | |
| | |
Asustek Computer, Inc. | | | 4,000 | | | | 52,144 | |
| | |
Catcher Technology Co. Ltd. | | | 3,000 | | | | 15,130 | |
| | |
Cathay Financial Holding Co. Ltd. | | | 31,000 | | | | 69,787 | |
| | |
Chicony Electronics Co. Ltd. | | | 4,000 | | | | 12,537 | |
| | |
China Development Financial Holding Corp. | | | 52,000 | | | | 34,846 | |
| | |
Chunghwa Telecom Co. Ltd. | | | 10,000 | | | | 44,326 | |
| | |
Compal Electronics, Inc. | | | 19,000 | | | | 17,772 | |
| | |
CTBC Financial Holding Co. Ltd. | | | 73,480 | | | | 75,400 | |
| | |
Far Eastern New Century Corp. | | | 10,000 | | | | 10,610 | |
| | |
Far EasTone Telecommunications Co. Ltd. | | | 5,000 | | | | 12,827 | |
| | |
First Financial Holding Co. Ltd. | | | 23,000 | | | | 22,838 | |
| | |
Fubon Financial Holding Co. Ltd. | | | 25,751 | | | | 68,756 | |
| | |
Hon Hai Precision Industry Co. Ltd. | | | 27,000 | | | | 99,890 | |
| | |
Inventec Corp. | | | 17,000 | | | | 14,655 | |
| | |
Lite-On Technology Corp. | | | 18,000 | | | | 42,783 | |
| | |
MediaTek, Inc. | | | 5,000 | | | | 157,932 | |
| | |
Mega Financial Holding Co. Ltd. | | | 27,941 | | | | 41,836 | |
| | |
Novatek Microelectronics Corp. | | | 1,000 | | | | 14,886 | |
| | |
Pegatron Corp. | | | 7,680 | | | | 19,407 | |
| | |
Powertech Technology, Inc. | | | 7,000 | | | | 23,210 | |
| | |
Quanta Computer, Inc. | | | 17,210 | | | | 53,039 | |
| | |
Shanghai Commercial & Savings Bank Ltd. | | | 9,000 | | | | 15,769 | |
| | |
Shin Kong Financial Holding Co. Ltd. | | | 36,000 | | | | 13,570 | |
| | |
SinoPac Financial Holdings Co. Ltd. | | | 52,559 | | | | 33,753 | |
| | |
Synnex Technology International Corp. | | | 14,000 | | | | 36,794 | |
| | |
Taiwan Cement Corp. | | | 21,850 | | | | 38,054 | |
| | |
Taiwan Mobile Co. Ltd. | | | 4,000 | | | | 14,659 | |
| | |
Uni-President Enterprises Corp. | | | 18,000 | | | | 41,212 | |
| | |
Wistron Corp. | | | 16,000 | | | | 16,613 | |
| | |
WPG Holdings Ltd. | | | 11,000 | | | | 21,500 | |
| | |
Yuanta Financial Holding Co. Ltd. | | | 47,000 | | | | 43,307 | |
| | | | | | | | |
| Total Taiwan | | | | 1,263,967 | |
|
| Thailand – 0.1% | |
| | |
Land & Houses PCL, NVDR | | | 26,700 | | | | 7,629 | |
| | |
PTT Exploration & Production PCL, NVDR | | | 13,000 | | | | 56,301 | |
| | |
PTT PCL, NVDR | | | 19,400 | | | | 22,463 | |
| | |
Siam Cement PCL, NVDR | | | 700 | | | | 8,063 | |
| | |
Tisco Financial Group PCL, NVDR | | | 2,800 | | | | 8,463 | |
| | | | | | | | |
| Total Thailand | | | | 102,919 | |
|
| Turkey – 0.1% | |
| | |
BIM Birlesik Magazalar AS | | | 2,087 | | | | 12,044 | |
| | |
Eregli Demir ve Celik Fabrikalari TAS | | | 8,954 | | | | 19,803 | |
| | |
Turkcell Iletisim Hizmetleri AS | | | 11,015 | | | | 16,927 | |
| | | | | | | | |
| Total Turkey | | | | 48,774 | |
|
| United Kingdom – 4.7% | |
| | |
abrdn PLC | | | 12,556 | | | | 35,527 | |
| | |
Admiral Group PLC | | | 1,850 | | | | 62,430 | |
| | |
Anglo American PLC | | | 4,306 | | | | 225,221 | |
| | |
Antofagasta PLC | | | 1,925 | | | | 42,403 | |
| | |
Aviva PLC | | | 15,806 | | | | 94,086 | |
| | |
BAE Systems PLC | | | 9,931 | | | | 93,805 | |
| | |
Barratt Developments PLC | | | 2,738 | | | | 18,833 | |
| | |
BP PLC | | | 46,265 | | | | 228,644 | |
| | |
Direct Line Insurance Group PLC | | | 6,272 | | | | 22,718 | |
| | |
Ferrexpo PLC | | | 6,171 | | | | 15,153 | |
| | |
GlaxoSmithKline PLC | | | 14,941 | | | | 324,038 | |
| | |
Hargreaves Lansdown PLC | | | 945 | | | | 12,542 | |
| | |
HSBC Holdings PLC | | | 38,260 | | | | 264,671 | |
| | |
Imperial Brands PLC | | | 6,423 | | | | 136,198 | |
| | |
J. Sainsbury PLC | | | 4,734 | | | | 15,751 | |
| | |
Kingfisher PLC | | | 4,616 | | | | 15,522 | |
| | |
Land Securities Group PLC | | | 2,236 | | | | 23,128 | |
| | |
Legal & General Group PLC | | | 19,307 | | | | 69,144 | |
| | |
National Grid PLC | | | 10,190 | | | | 157,297 | |
| | |
Rio Tinto PLC | | | 7,873 | | | | 646,170 | |
| | |
Schroders PLC | | | 698 | | | | 29,694 | |
| | |
Severn Trent PLC | | | 684 | | | | 27,720 | |
| | |
Shell PLC | | | 7,130 | | | | 197,940 | |
| | |
SSE PLC | | | 4,216 | | | | 97,059 | |
| | |
St. James’s Place PLC | | | 1,241 | | | | 23,668 | |
| | |
Tate & Lyle PLC | | | 2,425 | | | | 23,378 | |
| | |
Taylor Wimpey PLC | | | 11,592 | | | | 19,948 | |
| | |
Tesco PLC | | | 14,259 | | | | 51,817 | |
| | |
Unilever PLC | | | 5,008 | | | | 227,815 | |
| | |
United Utilities Group PLC | | | 2,673 | | | | 39,576 | |
| | | | | | | | |
| Total United Kingdom | | | | 3,241,896 | |
|
| United States – 59.1% | |
| | |
3M Co. | | | 4,184 | | | | 622,914 | |
| | |
AbbVie, Inc. | | | 12,333 | | | | 1,999,303 | |
| | |
Agree Realty Corp.(a) | | | 381 | | | | 25,283 | |
| | |
ALLETE, Inc. | | | 352 | | | | 23,577 | |
| | |
Alliant Energy Corp. | | | 1,065 | | | | 66,541 | |
| | |
Altria Group, Inc. | | | 19,716 | | | | 1,030,161 | |
See Notes to Financial Statements.
Schedule of Investments (continued)
WisdomTree Global High Dividend Fund (DEW)
March 31, 2022
| | | | | | | | |
| Investments | | Shares | | | Value | |
| | |
Ameren Corp. | | | 988 | | | $ | 92,635 | |
| | |
American Campus Communities, Inc. | | | 761 | | | | 42,593 | |
| | |
American Electric Power Co., Inc. | | | 2,571 | | | | 256,509 | |
| | |
American Financial Group, Inc. | | | 831 | | | | 121,010 | |
| | |
Americold Realty Trust | | | 1,151 | | | | 32,090 | |
| | |
Amgen, Inc. | | | 2,807 | | | | 678,789 | |
| | |
Antero Midstream Corp. | | | 6,892 | | | | 74,916 | |
| | |
Apartment Income REIT Corp. | | | 600 | | | | 32,076 | |
| | |
Apollo Global Management, Inc. | | | 1,103 | | | | 68,375 | |
| | |
Artisan Partners Asset Management, Inc., Class A | | | 844 | | | | 33,211 | |
| | |
Associated Banc-Corp. | | | 866 | | | | 19,710 | |
| | |
Atlantic Union Bankshares Corp. | | | 394 | | | | 14,456 | |
| | |
Atmos Energy Corp. | | | 540 | | | | 64,525 | |
| | |
AvalonBay Communities, Inc. | | | 846 | | | | 210,121 | |
| | |
Avangrid, Inc. | | | 1,916 | | | | 89,554 | |
| | |
Avista Corp. | | | 449 | | | | 20,272 | |
| | |
Baker Hughes Co. | | | 3,346 | | | | 121,828 | |
| | |
Bank of Hawaii Corp. | | | 223 | | | | 18,714 | |
| | |
Bank of New York Mellon Corp. | | | 2,857 | | | | 141,793 | |
| | |
Bank OZK | | | 757 | | | | 32,324 | |
| | |
Black Hills Corp. | | | 335 | | | | 25,802 | |
| | |
Blackstone, Inc. | | | 3,926 | | | | 498,366 | |
| | |
Boston Properties, Inc.(a) | | | 763 | | | | 98,274 | |
| | |
Brandywine Realty Trust | | | 2,128 | | | | 30,090 | |
| | |
Bristol-Myers Squibb Co. | | | 11,052 | | | | 807,128 | |
| | |
Brixmor Property Group, Inc. | | | 2,455 | | | | 63,364 | |
| | |
Broadcom, Inc. | | | 1,779 | | | | 1,120,201 | |
| | |
Broadstone Net Lease, Inc. | | | 1,401 | | | | 30,514 | |
| | |
Cabot Corp. | | | 282 | | | | 19,292 | |
| | |
Campbell Soup Co. | | | 1,572 | | | | 70,064 | |
| | |
Cardinal Health, Inc. | | | 1,699 | | | | 96,333 | |
| | |
Cathay General Bancorp | | | 423 | | | | 18,929 | |
| | |
CenterPoint Energy, Inc. | | | 2,299 | | | | 70,441 | |
| | |
Chemours Co. | | | 834 | | | | 26,254 | |
| | |
Cisco Systems, Inc. | | | 24,958 | | | | 1,391,658 | |
| | |
Citigroup, Inc. | | | 8,242 | | | | 440,123 | |
| | |
Citizens Financial Group, Inc. | | | 2,005 | | | | 90,887 | |
| | |
Clearway Energy, Inc., Class C | | | 490 | | | | 17,890 | |
| | |
Clorox Co. | | | 502 | | | | 69,793 | |
| | |
CME Group, Inc. | | | 1,545 | | | | 367,494 | |
| | |
CMS Energy Corp. | | | 1,808 | | | | 126,452 | |
| | |
CNA Financial Corp. | | | 1,754 | | | | 85,280 | |
| | |
Coca-Cola Co. | | | 28,799 | | | | 1,785,538 | |
| | |
Cogent Communications Holdings, Inc. | | | 295 | | | | 19,573 | |
| | |
Cohen & Steers, Inc. | | | 368 | | | | 31,608 | |
| | |
Columbia Banking System, Inc. | | | 405 | | | | 13,069 | |
| | |
Comerica, Inc. | | | 647 | | | | 58,508 | |
| | |
Compass Minerals International, Inc. | | | 208 | | | | 13,060 | |
| | |
Conagra Brands, Inc. | | | 2,485 | | | | 83,421 | |
| | |
ConocoPhillips | | | 4,479 | | | | 447,900 | |
| | |
Consolidated Edison, Inc. | | | 2,078 | | | | 196,745 | |
| | |
Corporate Office Properties Trust | | | 1,009 | | | | 28,797 | |
| | |
Cousins Properties, Inc. | | | 707 | | | | 28,485 | |
| | |
Crown Castle International Corp. | | | 2,942 | | | | 543,093 | |
| | |
CubeSmart | | | 1,205 | | | | 62,696 | |
| | |
Cullen/Frost Bankers, Inc. | | | 239 | | | | 33,080 | |
| | |
CVB Financial Corp. | | | 873 | | | | 20,262 | |
| | |
Devon Energy Corp. | | | 4,601 | | | | 272,057 | |
| | |
Digital Realty Trust, Inc. | | | 1,326 | | | | 188,027 | |
| | |
Dominion Energy, Inc. | | | 6,068 | | | | 515,598 | |
| | |
Douglas Emmett, Inc. | | | 893 | | | | 29,844 | |
| | |
DTE Energy Co. | | | 1,007 | | | | 133,135 | |
| | |
Duke Energy Corp. | | | 6,470 | | | | 722,440 | |
| | |
Eastman Chemical Co. | | | 543 | | | | 60,849 | |
| | |
Energizer Holdings, Inc. | | | 357 | | | | 10,981 | |
| | |
Entergy Corp. | | | 1,077 | | | | 125,740 | |
| | |
Equitrans Midstream Corp. | | | 3,532 | | | | 29,810 | |
| | |
Equity Commonwealth* | | | 1,739 | | | | 49,057 | |
| | |
Equity Residential | | | 1,563 | | | | 140,545 | |
| | |
Essential Properties Realty Trust, Inc. | | | 639 | | | | 16,167 | |
| | |
Essex Property Trust, Inc. | | | 238 | | | | 82,224 | |
| | |
Evergy, Inc. | | | 1,728 | | | | 118,092 | |
| | |
Eversource Energy | | | 1,380 | | | | 121,702 | |
| | |
Exelon Corp. | | | 4,447 | | | | 211,811 | |
| | |
Extra Space Storage, Inc. | | | 697 | | | | 143,303 | |
| | |
Federal Realty Investment Trust | | | 398 | | | | 48,584 | |
| | |
Federated Hermes, Inc., Class B | | | 540 | | | | 18,392 | |
| | |
Fidelity National Financial, Inc. | | | 1,936 | | | | 94,554 | |
| | |
Fifth Third Bancorp | | | 2,566 | | | | 110,441 | |
| | |
First American Financial Corp. | | | 631 | | | | 40,901 | |
| | |
First Financial Bancorp | | | 693 | | | | 15,974 | |
| | |
First Hawaiian, Inc. | | | 761 | | | | 21,224 | |
| | |
First Horizon Corp. | | | 4,104 | | | | 96,403 | |
| | |
FirstEnergy Corp. | | | 5,176 | | | | 237,371 | |
| | |
Flowers Foods, Inc. | | | 1,638 | | | | 42,113 | |
| | |
FNB Corp. | | | 2,178 | | | | 27,116 | |
| | |
Four Corners Property Trust, Inc. | | | 553 | | | | 14,953 | |
| | |
Franklin Resources, Inc. | | | 2,855 | | | | 79,712 | |
| | |
Fulton Financial Corp. | | | 991 | | | | 16,470 | |
| | |
Gaming and Leisure Properties, Inc. | | | 2,737 | | | | 128,447 | |
| | |
General Mills, Inc. | | | 2,875 | | | | 194,695 | |
| | |
Genuine Parts Co. | | | 543 | | | | 68,429 | |
| | |
Gilead Sciences, Inc. | | | 11,388 | | | | 677,017 | |
| | |
Glacier Bancorp, Inc. | | | 396 | | | | 19,911 | |
| | |
H&R Block, Inc. | | | 1,306 | | | | 34,008 | |
| | |
Hanesbrands, Inc. | | | 1,911 | | | | 28,455 | |
| | |
Hasbro, Inc. | | | 620 | | | | 50,790 | |
| | |
Hawaiian Electric Industries, Inc. | | | 874 | | | | 36,979 | |
| | |
Healthcare Realty Trust, Inc. | | | 823 | | | | 22,616 | |
| | |
Healthcare Trust of America, Inc., Class A | | | 1,254 | | | | 39,300 | |
| | |
Healthpeak Properties, Inc. | | | 2,911 | | | | 99,935 | |
| | |
Helmerich & Payne, Inc. | | | 551 | | | | 23,572 | |
| | |
Hewlett Packard Enterprise Co. | | | 6,252 | | | | 104,471 | |
| | |
Highwoods Properties, Inc. | | | 1,008 | | | | 46,106 | |
| | |
HP, Inc. | | | 4,893 | | | | 177,616 | |
| | |
Hudson Pacific Properties, Inc. | | | 873 | | | | 24,226 | |
| | |
IDACORP, Inc. | | | 336 | | | | 38,761 | |
| | |
Ingredion, Inc. | | | 282 | | | | 24,576 | |
See Notes to Financial Statements.
Schedule of Investments (continued)
WisdomTree Global High Dividend Fund (DEW)
March 31, 2022
| | | | | | | | |
| Investments | | Shares | | | Value | |
| | |
International Bancshares Corp. | | | 457 | | | $ | 19,290 | |
| | |
International Business Machines Corp. | | | 6,059 | | | | 787,791 | |
| | |
International Paper Co. | | | 1,890 | | | | 87,224 | |
| | |
Interpublic Group of Cos., Inc. | | | 2,535 | | | | 89,866 | |
| | |
Investors Bancorp, Inc. | | | 2,016 | | | | 30,099 | |
| | |
Iron Mountain, Inc. | | | 3,618 | | | | 200,473 | |
| | |
J.M. Smucker Co. | | | 486 | | | | 65,809 | |
| | |
JBG SMITH Properties | | | 643 | | | | 18,788 | |
| | |
John Wiley & Sons, Inc., Class A | | | 302 | | | | 16,015 | |
| | |
Juniper Networks, Inc. | | | 1,411 | | | | 52,433 | |
| | |
Kellogg Co. | | | 1,832 | | | | 118,146 | |
| | |
Kennedy-Wilson Holdings, Inc. | | | 1,320 | | | | 32,195 | |
| | |
KeyCorp | | | 4,504 | | | | 100,800 | |
| | |
Kilroy Realty Corp. | | | 750 | | | | 57,315 | |
| | |
Kimberly-Clark Corp. | | | 1,643 | | | | 202,352 | |
| | |
Kimco Realty Corp. | | | 4,076 | | | | 100,677 | |
| | |
Kinder Morgan, Inc. | | | 28,813 | | | | 544,854 | |
| | |
Kontoor Brands, Inc. | | | 437 | | | | 18,070 | |
| | |
Kraft Heinz Co. | | | 7,713 | | | | 303,815 | |
| | |
Lamar Advertising Co., Class A | | | 485 | | | | 56,347 | |
| | |
Leggett & Platt, Inc. | | | 746 | | | | 25,961 | |
| | |
Life Storage, Inc. | | | 441 | | | | 61,930 | |
| | |
Lockheed Martin Corp. | | | 1,171 | | | | 516,879 | |
| | |
LXP Industrial Trust | | | 1,889 | | | | 29,657 | |
| | |
M&T Bank Corp. | | | 547 | | | | 92,717 | |
| | |
Macerich Co. | | | 1,102 | | | | 17,235 | |
| | |
Marathon Petroleum Corp. | | | 3,311 | | | | 283,091 | |
| | |
MDC Holdings, Inc. | | | 354 | | | | 13,395 | |
| | |
MDU Resources Group, Inc. | | | 1,306 | | | | 34,805 | |
| | |
Merck & Co., Inc. | | | 12,059 | | | | 989,441 | |
| | |
Mercury General Corp. | | | 567 | | | | 31,185 | |
| | |
MetLife, Inc. | | | 3,539 | | | | 248,721 | |
| | |
Moelis & Co., Class A | | | 435 | | | | 20,423 | |
| | |
MSC Industrial Direct Co., Inc., Class A | | | 180 | | | | 15,338 | |
| | |
National Fuel Gas Co. | | | 669 | | | | 45,960 | |
| | |
National Instruments Corp. | | | 566 | | | | 22,974 | |
| | |
National Retail Properties, Inc. | | | 1,777 | | | | 79,858 | |
| | |
National Storage Affiliates Trust | | | 533 | | | | 33,451 | |
| | |
Navient Corp. | | | 1,237 | | | | 21,078 | |
| | |
New Jersey Resources Corp. | | | 576 | | | | 26,415 | |
| | |
New York Community Bancorp, Inc. | | | 3,391 | | | | 36,352 | |
| | |
Newell Brands, Inc. | | | 2,602 | | | | 55,709 | |
| | |
Newmont Corp. | | | 4,155 | | | | 330,115 | |
| | |
NiSource, Inc. | | | 2,017 | | | | 64,141 | |
| | |
Northern Trust Corp. | | | 734 | | | | 85,474 | |
| | |
NorthWestern Corp.(a) | | | 361 | | | | 21,837 | |
| | |
NRG Energy, Inc. | | | 1,123 | | | | 43,078 | |
| | |
Nu Skin Enterprises, Inc., Class A | | | 319 | | | | 15,274 | |
| | |
OGE Energy Corp. | | | 1,598 | | | | 65,166 | |
| | |
Old National Bancorp | | | 1,667 | | | | 27,305 | |
| | |
Old Republic International Corp. | | | 2,371 | | | | 61,338 | |
| | |
Omnicom Group, Inc. | | | 1,186 | | | | 100,668 | |
| | |
ONE Gas, Inc. | | | 294 | | | | 25,943 | |
| | |
OneMain Holdings, Inc. | | | 3,352 | | | | 158,918 | |
| | |
ONEOK, Inc. | | | 5,771 | | | | 407,606 | |
| | |
Otter Tail Corp. | | | 323 | | | | 20,188 | |
| | |
PACCAR, Inc. | | | 1,202 | | | | 105,860 | |
| | |
Pacific Premier Bancorp, Inc. | | | 467 | | | | 16,508 | |
| | |
Packaging Corp. of America | | | 411 | | | | 64,161 | |
| | |
Patterson Cos., Inc. | | | 529 | | | | 17,124 | |
| | |
People’s United Financial, Inc. | | | 2,609 | | | | 52,154 | |
| | |
PepsiCo, Inc. | | | 7,998 | | | | 1,338,705 | |
| | |
Pfizer, Inc. | | | 30,495 | | | | 1,578,726 | |
| | |
Philip Morris International, Inc. | | | 17,221 | | | | 1,617,741 | |
| | |
Physicians Realty Trust | | | 1,613 | | | | 28,292 | |
| | |
Piedmont Office Realty Trust, Inc., Class A | | | 944 | | | | 16,256 | |
| | |
Pinnacle West Capital Corp. | | | 830 | | | | 64,823 | |
| | |
PNC Financial Services Group, Inc. | | | 1,410 | | | | 260,075 | |
| | |
PNM Resources, Inc. | | | 503 | | | | 23,978 | |
| | |
PotlatchDeltic Corp. | | | 463 | | | | 24,414 | |
| | |
PPL Corp. | | | 6,505 | | | | 185,783 | |
| | |
Principal Financial Group, Inc. | | | 1,347 | | | | 98,883 | |
| | |
Progressive Corp. | | | 4,564 | | | | 520,250 | |
| | |
Prosperity Bancshares, Inc. | | | 390 | | | | 27,058 | |
| | |
Prudential Financial, Inc. | | | 2,283 | | | | 269,782 | |
| | |
PS Business Parks, Inc. | | | 162 | | | | 27,229 | |
| | |
Public Service Enterprise Group, Inc. | | | 2,469 | | | | 172,830 | |
| | |
Public Storage | | | 981 | | | | 382,865 | |
| | |
Rayonier, Inc. | | | 632 | | | | 25,988 | |
| | |
Realty Income Corp. | | | 3,026 | | | | 209,702 | |
| | |
Regal Rexnord Corp. | | | 369 | | | | 54,900 | |
| | |
Regency Centers Corp. | | | 850 | | | | 60,639 | |
| | |
Regions Financial Corp. | | | 3,996 | | | | 88,951 | |
| | |
Reynolds Consumer Products, Inc. | | | 1,109 | | | | 32,538 | |
| | |
Ryder System, Inc. | | | 333 | | | | 26,417 | |
| | |
Sandy Spring Bancorp, Inc. | | | 369 | | | | 16,575 | |
| | |
Sempra Energy | | | 1,604 | | | | 269,665 | |
| | |
Simon Property Group, Inc. | | | 1,941 | | | | 255,358 | |
| | |
SL Green Realty Corp.(a) | | | 705 | | | | 57,232 | |
| | |
Sonoco Products Co. | | | 338 | | | | 21,145 | |
| | |
South Jersey Industries, Inc. | | | 959 | | | | 33,133 | |
| | |
Southern Co. | | | 9,569 | | | | 693,848 | |
| | |
Southwest Gas Holdings, Inc. | | | 349 | | | | 27,323 | |
| | |
Spire, Inc. | | | 344 | | | | 24,685 | |
| | |
Spirit Realty Capital, Inc. | | | 1,394 | | | | 64,152 | |
| | |
STAG Industrial, Inc. | | | 1,244 | | | | 51,439 | |
| | |
STORE Capital Corp. | | | 1,734 | | | | 50,685 | |
| | |
Synovus Financial Corp. | | | 975 | | | | 47,775 | |
| | |
Telephone and Data Systems, Inc. | | | 624 | | | | 11,781 | |
| | |
TFS Financial Corp. | | | 2,405 | | | | 39,923 | |
| | |
Trinity Industries, Inc. | | | 471 | | | | 16,184 | |
| | |
Truist Financial Corp. | | | 5,824 | | | | 330,221 | |
| | |
U.S. Bancorp | | | 5,954 | | | | 316,455 | |
| | |
UDR, Inc. | | | 1,164 | | | | 66,779 | |
| | |
UGI Corp. | | | 1,433 | | | | 51,903 | |
| | |
Umpqua Holdings Corp. | | | 2,134 | | | | 40,247 | |
| | |
United Bankshares, Inc. | | | 1,151 | | | | 40,147 | |
| | |
Uniti Group, Inc.(a) | | | 1,823 | | | | 25,085 | |
See Notes to Financial Statements.
Schedule of Investments (continued)
WisdomTree Global High Dividend Fund (DEW)
March 31, 2022
| | | | | | | | |
| Investments | | Shares | | | Value | |
| | |
Unum Group | | | 1,277 | | | $ | 40,238 | |
| | |
Valley National Bancorp | | | 2,103 | | | | 27,381 | |
| | |
Ventas, Inc. | | | 1,865 | | | | 115,182 | |
| | |
Verizon Communications, Inc. | | | 29,329 | | | | 1,494,019 | |
| | |
VF Corp. | | | 1,543 | | | | 87,735 | |
| | |
VICI Properties, Inc. | | | 5,837 | | | | 166,121 | |
| | |
Virtu Financial, Inc., Class A | | | 667 | | | | 24,826 | |
| | |
W.P. Carey, Inc. | | | 2,217 | | | | 179,222 | |
| | |
Washington Real Estate Investment Trust | | | 587 | | | | 14,969 | |
| | |
Watsco, Inc. | | | 198 | | | | 60,319 | |
| | |
Webster Financial Corp. | | | 405 | | | | 22,729 | |
| | |
WEC Energy Group, Inc. | | | 2,082 | | | | 207,804 | |
| | |
Welltower, Inc. | | | 1,788 | | | | 171,898 | |
| | |
WesBanco, Inc. | | | 422 | | | | 14,500 | |
| | |
Western Union Co. | | | 2,937 | | | | 55,039 | |
| | |
Williams Cos., Inc. | | | 9,881 | | | | 330,125 | |
| | |
Xcel Energy, Inc. | | | 2,222 | | | | 160,362 | |
| | |
Xerox Holdings Corp. | | | 1,326 | | | | 26,744 | |
| | | | | | | | |
| Total United States | | | | 40,714,814 | |
TOTAL COMMON STOCKS (Cost: $60,319,928) | | | | 68,476,112 | |
|
| EXCHANGE-TRADED FUNDS – 0.0% | |
|
| United States – 0.0% | |
| | |
WisdomTree International High Dividend Fund(d) | | | 74 | | | | 2,943 | |
| | |
WisdomTree U.S. High Dividend Fund(d) | | | 11 | | | | 969 | |
TOTAL EXCHANGE-TRADED FUNDS (Cost: $3,625) | | | | 3,912 | |
|
| INVESTMENT OF CASH COLLATERAL FOR SECURITIES LOANED – 2.5% | |
|
| United States – 2.5% | |
| | |
State Street Navigator Securities Lending Government Money Market Portfolio, 0.25%(e) | | | | | | | | |
| (Cost: $1,695,565) | | | 1,695,565 | | | | 1,695,565 | |
| | |
TOTAL INVESTMENTS IN SECURITIES – 101.9% (Cost: $62,019,118) | | | | | | | 70,175,589 | |
| | |
Other Assets less Liabilities – (1.9)% | | | | | | | (1,286,257 | ) |
| | | | | | | | |
| NET ASSETS – 100.0% | | | $ | 68,889,332 | |
| * | Non-income producing security. |
| † | Security is being fair valued using significant unobservable inputs by a pricing committee under the direction of the Board of Trustees. The aggregate value of fair valued securities is $0, which represents 0.0% of net assets. |
| (a) | Security, or portion thereof, was on loan at March 31, 2022 (See Note 2). At March 31, 2022, the total market value of the Fund’s securities on loan identified in the Schedule of Investments was $2,825,551 and the total market value of the collateral held by the Fund was $2,991,030. The total market value of the collateral includes non-cash U.S. Government and U.S. Government Agencies securities collateral having a value of $1,295,465. |
| (b) | This security is exempt from registration under rule 144A of the Securities Act of 1933. This security may be sold in transactions that are exempt from registration, normally to qualified institutional buyers. |
| (c) | This security is exempt from registration under Regulation S of the Securities Act of 1933, which exempts from registration securities offered and sold outside the United States. This security may not be offered or sold in the United States except pursuant to an exemption from, or in a transaction not subject to, the registration requirements of the Securities Act of 1933. |
| (d) | Affiliated holding. See “Investment in Affiliates” supplementary table included in this Schedule of Investments for additional information. |
| (e) | Rate shown represents annualized 7-day yield as of March 31, 2022. |
Affiliated holdings are investments in entities in which the Fund owns 5% or more of the outstanding voting securities or are investments in entities which are under common ownership or control. Investments in affiliates during the fiscal year ended March 31, 2022 were as follows:
| | | | | | | | | | | | | | | | | | | | | | | | | | | | |
| | | | | | | |
| Affiliate | | Value at
3/31/2021 | | | Purchases/
Additions | | | Sales/
Reductions | | | Realized
Gain/
(Loss) | | | Change in
Unrealized
Appreciation/
Depreciation | | | Value at
3/31/2022 | | | Dividend
Income | |
WisdomTree International High Dividend Fund | | $ | 54,322 | | | $ | 984,676 | | | $ | 1,031,015 | | | $ | (1,706 | ) | | $ | (3,334 | ) | | $ | 2,943 | | | $ | 11,166 | |
WisdomTree U.S. High Dividend Fund | | | 18,159 | | | | 327,114 | | | | 351,827 | | | | 9,141 | | | | (1,618 | ) | | | 969 | | | | 1,700 | |
Total | | $ | 72,481 | | | $ | 1,311,790 | | | $ | 1,382,842 | | | $ | 7,435 | | | $ | (4,952 | ) | | $ | 3,912 | | | $ | 12,866 | |
The following is a summary of the fair valuations according to the inputs used as of March 31, 2022 in valuing the Fund’s investments (See Note 2 — Fair Value Measurement):
| | | | | | | | | | | | | | | | |
| | | | |
| | | Quoted
Prices in
Active
Markets
(Level 1) | | | Other
Significant
Observable
Inputs
(Level 2) | | | Significant
Unobservable
Inputs
(Level 3) | | | Total | |
Assets: | | | | | | | | | |
Investments in Securities | | | | |
Common Stocks | | | | | | | | | | | | | | | | |
Russia | | $ | — | | | $ | — | | | $ | 0 | * | | $ | 0 | |
Other | | | 68,476,112 | | | | — | | | | — | | | | 68,476,112 | |
Exchange-Traded Funds | | | 3,912 | | | | — | | | | — | | | | 3,912 | |
Investment of Cash Collateral for Securities Loaned | | | — | | | | 1,695,565 | | | | — | | | | 1,695,565 | |
Total Investments in Securities | | $ | 68,480,024 | | | $ | 1,695,565 | | | $ | 0 | | | $ | 70,175,589 | |
| * | Securities are being fair valued using significant unobservable inputs by the Pricing Committee. |
See Notes to Financial Statements.
Schedule of Investments (concluded)
WisdomTree Global High Dividend Fund (DEW)
March 31, 2022
The following is a reconciliation of assets in which significant unobservable inputs (Level 3) were used in determining fair value:
| | | | |
| | |
| | | Common Stocks | |
| |
| | | Russia | |
Balance as of March 31, 2021 | | $ | — | |
Realized gain (loss) | | | 343,838 | |
Change in unrealized appreciation (depreciation) | | | (677,373 | ) |
Purchases | | | 449,899 | |
Sales | | | (1,150,568 | ) |
Transfers into Level 3(1) | | | 1,034,204 | |
Transfers out of Level 3 | | | — | |
Balance as of March 31, 2022 | | $ | 0 | |
Net change in unrealized appreciation (depreciation) from investments still held as of March 31, 2022 is: | | $ | (677,373 | ) |
| | (1) | Transferred into Level 3 because of a lack of observable market data, resulting from a decrease in market activity for the securities. |
See Notes to Financial Statements.
Schedule of Investments
WisdomTree Growth Leaders Fund (PLAT)
March 31, 2022
| | | | | | | | |
| Investments | | Shares | | | Value | |
|
| COMMON STOCKS – 99.9% | |
|
| Argentina – 1.7% | |
| | |
MercadoLibre, Inc.* | | | 224 | | | $ | 266,444 | |
| | |
| China – 3.3% | | | | | | | | |
| | |
Alibaba Group Holding Ltd., ADR* | | | 2,407 | | | | 261,882 | |
| | |
Bilibili, Inc., Class Z* | | | 1,200 | | | | 33,159 | |
| | |
JD Health International, Inc.*(a)(b) | | | 9,300 | | | | 57,120 | |
| | |
Meituan, Class B*(a) | | | 6,300 | | | | 125,173 | |
| | |
Ping An Healthcare and Technology Co. Ltd.*(a)(b) | | | 10,100 | | | | 26,567 | |
| | | | | | | | |
| Total China | | | | 503,901 | |
| | |
| Germany – 2.2% | | | | | | | | |
| | |
Delivery Hero SE*(a) | | | 1,753 | | | | 77,746 | |
| | |
Just Eat Takeaway.com NV*(a) | | | 4,867 | | | | 166,546 | |
| | |
TeamViewer AG*(a) | | | 5,952 | | | | 89,172 | |
| | | | | | | | |
| Total Germany | | | | 333,464 | |
|
| Israel – 0.5% | |
| | |
Fiverr International Ltd.*(b) | | | 1,072 | | | | 81,547 | |
| | |
| United Kingdom – 1.1% | | | | | | | | |
| | |
Deliveroo PLC*(a)(b) | | | 61,950 | | | | 91,926 | |
| | |
Farfetch Ltd., Class A* | | | 4,828 | | | | 72,999 | |
| | | | | | | | |
| Total United Kingdom | | | | 164,925 | |
|
| United States – 91.1% | |
| | |
ACV Auctions, Inc., Class A* | | | 8,103 | | | | 120,005 | |
| | |
Airbnb, Inc., Class A* | | | 1,962 | | | | 336,993 | |
| | |
Alphabet, Inc., Class A* | | | 546 | | | | 1,518,617 | |
| | |
Amazon.com, Inc.* | | | 384 | | | | 1,251,821 | |
| | |
American Well Corp., Class A* | | | 15,497 | | | | 65,242 | |
| | |
Anaplan, Inc.* | | | 4,434 | | | | 288,432 | |
| | |
Angi, Inc., Class A* | | | 15,130 | | | | 85,787 | |
| | |
Appian Corp.* | | | 2,403 | | | | 146,150 | |
| | |
Apple, Inc. | | | 10,317 | | | | 1,801,451 | |
| | |
Bumble, Inc., Class A* | | | 4,500 | | | | 130,410 | |
| | |
Cargurus, Inc.* | | | 8,100 | | | | 343,926 | |
| | |
CBOE Global Markets, Inc. | | | 2,018 | | | | 230,900 | |
| | |
Chegg, Inc.*(b) | | | 2,865 | | | | 103,942 | |
| | |
CoStar Group, Inc.* | | | 2,930 | | | | 195,167 | |
| | |
Coupa Software, Inc.* | | | 1,015 | | | | 103,154 | |
| | |
Coursera, Inc.* | | | 5,858 | | | | 134,968 | |
| | |
DoorDash, Inc., Class A* | | | 1,613 | | | | 189,027 | |
| | |
Dropbox, Inc., Class A* | | | 7,755 | | | | 180,304 | |
| | |
Etsy, Inc.* | | | 1,467 | | | | 182,319 | |
| | |
GoodRx Holdings, Inc., Class A*(b) | | | 5,817 | | | | 112,443 | |
| | |
Intercontinental Exchange, Inc. | | | 2,629 | | | | 347,344 | |
| | |
LendingTree, Inc.* | | | 1,086 | | | | 129,962 | |
| | |
Lyft, Inc., Class A* | | | 4,100 | | | | 157,440 | |
| | |
MarketAxess Holdings, Inc. | | | 519 | | | | 176,564 | |
| | |
Match Group, Inc.* | | | 1,813 | | | | 197,146 | |
| | |
Meta Platforms, Inc., Class A* | | | 2,614 | | | | 581,249 | |
| | |
Microsoft Corp. | | | 5,236 | | | | 1,614,311 | |
| | |
Nasdaq, Inc. | | | 1,366 | | | | 243,421 | |
| | |
PayPal Holdings, Inc.* | | | 2,283 | | | | 264,029 | |
| | |
Pinterest, Inc., Class A* | | | 4,572 | | | | 112,517 | |
| | |
Poshmark, Inc., Class A* | | | 4,623 | | | | 58,527 | |
| | |
Redfin Corp.*(b) | | | 3,740 | | | | 67,470 | |
| | |
ROBLOX Corp., Class A* | | | 2,381 | | | | 110,097 | |
| | |
Roku, Inc.* | | | 802 | | | | 100,467 | |
| | |
salesforce.com, Inc.* | | | 2,000 | | | | 424,640 | |
| | |
Selectquote, Inc.* | | | 8,784 | | | | 24,507 | |
| | |
Skillz, Inc.*(b) | | | 11,787 | | | | 35,361 | |
| | |
Snap, Inc., Class A* | | | 5,167 | | | | 185,960 | |
| | |
Snowflake, Inc., Class A* | | | 1,204 | | | | 275,873 | |
| | |
Teladoc Health, Inc.*(b) | | | 1,604 | | | | 115,697 | |
| | |
ThredUp, Inc., Class A*(b) | | | 9,167 | | | | 70,586 | |
| | |
Tradeweb Markets, Inc., Class A | | | 2,887 | | | | 253,681 | |
| | |
Twitter, Inc.* | | | 4,391 | | | | 169,888 | |
| | |
Uber Technologies, Inc.* | | | 5,906 | | | | 210,726 | |
| | |
Upstart Holdings, Inc.*(b) | | | 1,272 | | | | 138,762 | |
| | |
Upwork, Inc.* | | | 4,666 | | | | 108,438 | |
| | |
Zillow Group, Inc., Class A* | | | 2,100 | | | | 101,283 | |
| | |
Zynga, Inc., Class A* | | | 21,475 | | | | 198,428 | |
| | | | | | | | |
| Total United States | | | | 13,995,432 | |
TOTAL COMMON STOCKS (Cost: $17,683,213) | | | | 15,345,713 | |
|
| INVESTMENT OF CASH COLLATERAL FOR SECURITIES LOANED – 3.1% | |
|
| United States – 3.1% | |
| | |
State Street Navigator Securities Lending Government Money Market Portfolio, 0.25%(c) | | | | | | | | |
| (Cost: $476,955) | | | 476,955 | | | | 476,955 | |
| |
TOTAL INVESTMENTS IN SECURITIES – 103.0% (Cost: $18,160,168) | | | | 15,822,668 | |
| |
Other Assets less Liabilities – (3.0)% | | | | (466,195 | ) |
| | | | | | | | |
| NET ASSETS – 100.0% | | | $ | 15,356,473 | |
| * | Non-income producing security. |
| (a) | This security is exempt from registration under rule 144A of the Securities Act of 1933. This security may be sold in transactions that are exempt from registration, normally to qualified institutional buyers. |
| (b) | Security, or portion thereof, was on loan at March 31, 2022 (See Note 2). At March 31, 2022, the total market value of the Fund’s securities on loan identified in the Schedule of Investments was $814,747 and the total market value of the collateral held by the Fund was $848,003. The total market value of the collateral includes non-cash U.S. Government securities collateral having a value of $371,048. |
| (c) | Rate shown represents annualized 7-day yield as of March 31, 2022. |
See Notes to Financial Statements.
Schedule of Investments (concluded)
WisdomTree Growth Leaders Fund (PLAT)
March 31, 2022
The following is a summary of the fair valuations according to the inputs used as of March 31, 2022 in valuing the Fund’s investments (See Note 2 — Fair Value Measurement):
| | | | | | | | | | | | | | | | |
| | | | |
| | | Quoted
Prices in
Active
Markets
(Level 1) | | | Other
Significant
Observable
Inputs
(Level 2) | | | Significant
Unobservable
Inputs
(Level 3) | | | Total | |
Assets: | | | | | | | | | | | | | | | | |
Investments in Securities | | | | | | | | | | | | | | | | |
Common Stocks | | $ | 15,345,713 | | | $ | — | | | $ | — | | | $ | 15,345,713 | |
Investment of Cash Collateral for Securities Loaned | | | — | | | | 476,955 | | | | — | | | | 476,955 | |
Total Investments in Securities | | $ | 15,345,713 | | | $ | 476,955 | | | $ | — | | | $ | 15,822,668 | |
See Notes to Financial Statements.
Schedule of Investments
WisdomTree India Earnings Fund (EPI) (consolidated)
March 31, 2022
| | | | | | | | |
| Investments | | Shares | | | Value | |
|
| COMMON STOCKS – 103.4% | |
|
| India – 103.4% | |
|
| Aerospace & Defense – 0.6% | |
| | |
Bharat Dynamics Ltd. | | | 43,835 | | | $ | 317,764 | |
| | |
Bharat Electronics Ltd. | | | 1,256,291 | | | | 3,494,901 | |
| | |
Hindustan Aeronautics Ltd. | | | 68,355 | | | | 1,339,497 | |
| | |
Mazagon Dock Shipbuilders Ltd. | | | 83,301 | | | | 263,507 | |
| | | | | | | | |
| Total Aerospace & Defense | | | | 5,415,669 | |
|
| Air Freight & Logistics – 0.0% | |
| | |
Allcargo Logistics Ltd. | | | 28,855 | | | | 136,478 | |
| | |
TCI Express Ltd. | | | 5,971 | | | | 134,451 | |
| | |
Transport Corp. of India Ltd. | | | 7,970 | | | | 63,013 | |
| | | | | | | | |
| Total Air Freight & Logistics | | | | 333,942 | |
|
| Auto Components – 0.9% | |
| | |
Apollo Tyres Ltd. | | | 143,760 | | | | 362,364 | |
| | |
Balkrishna Industries Ltd. | | | 73,972 | | | | 2,085,371 | |
| | |
Bosch Ltd. | | | 240 | | | | 45,731 | |
| | |
Ceat Ltd. | | | 34,899 | | | | 429,312 | |
| | |
Endurance Technologies Ltd.(a) | | | 18,592 | | | | 268,618 | |
| | |
Exide Industries Ltd. | | | 510,482 | | | | 1,017,932 | |
| | |
Gabriel India Ltd. | | | 1,464 | | | | 2,162 | |
| | |
Jamna Auto Industries Ltd. | | | 153,867 | | | | 202,043 | |
| | |
JK Tyre & Industries Ltd. | | | 411,637 | | | | 637,487 | |
| | |
Minda Industries Ltd. | | | 10,463 | | | | 128,732 | |
| | |
Motherson Sumi Systems Ltd. | | | 530,144 | | | | 975,633 | |
| | |
Motherson Sumi Wiring India Ltd.* | | | 572,397 | | | | 486,849 | |
| | |
Sundram Fasteners Ltd. | | | 21,606 | | | | 256,563 | |
| | |
Suprajit Engineering Ltd. | | | 22,229 | | | | 100,386 | |
| | |
Tube Investments of India Ltd. | | | 37,868 | | | | 811,932 | |
| | |
TVS Srichakra Ltd. | | | 4,652 | | | | 98,096 | |
| | | | | | | | |
| Total Auto Components | | | | 7,909,211 | |
|
| Automobiles – 2.2% | |
| | |
Bajaj Auto Ltd. | | | 78,554 | | | | 3,786,971 | |
| | |
Eicher Motors Ltd. | | | 61,783 | | | | 2,003,433 | |
| | |
Hero MotoCorp Ltd. | | | 125,012 | | | | 3,784,840 | |
| | |
Mahindra & Mahindra Ltd. | | | 333,683 | | | | 3,551,726 | |
| | |
Maruti Suzuki India Ltd. | | | 55,233 | | | | 5,511,492 | |
| | |
TVS Motor Co. Ltd. | | | 98,623 | | | | 814,299 | |
| | | | | | | | |
| Total Automobiles | | | | 19,452,761 | |
|
| Banks – 11.2% | |
| | |
AU Small Finance Bank Ltd.*(a) | | | 72,244 | | | | 1,188,177 | |
| | |
Axis Bank Ltd.* | | | 1,223,335 | | | | 12,288,241 | |
| | |
Bandhan Bank Ltd.(a) | | | 593,454 | | | | 2,407,493 | |
| | |
Bank of Baroda* | | | 444,899 | | | | 655,239 | |
| | |
Bank of India* | | | 796,011 | | | | 481,651 | |
| | |
Bank of Maharashtra* | | | 843,664 | | | | 185,934 | |
| | |
Canara Bank* | | | 609,923 | | | | 1,833,190 | |
| | |
City Union Bank Ltd. | | | 361,750 | | | | 615,369 | |
| | |
CSB Bank Ltd.* | | | 25,110 | | | | 70,119 | |
| | |
DCB Bank Ltd.* | | | 481,369 | | | | 440,871 | |
| | |
Equitas Small Finance Bank Ltd.*(a) | | | 48,796 | | | | 32,906 | |
| | |
Federal Bank Ltd. | | | 3,129,192 | | | | 4,022,214 | |
| | |
ICICI Bank Ltd. | | | 3,565,233 | | | | 34,360,800 | |
| | |
IDFC First Bank Ltd.* | | | 623,523 | | | | 326,676 | |
| | |
Indian Bank | | | 972,905 | | | | 1,975,983 | |
| | |
Indian Overseas Bank* | | | 130,419 | | | | 31,239 | |
| | |
IndusInd Bank Ltd. | | | 439,298 | | | | 5,422,888 | |
| | |
Jammu & Kashmir Bank Ltd.* | | | 874,380 | | | | 372,715 | |
| | |
Karnataka Bank Ltd. | | | 1,168,259 | | | | 854,899 | |
| | |
Karur Vysya Bank Ltd. | | | 1,392,694 | | | | 850,963 | |
| | |
Kotak Mahindra Bank Ltd. | | | 558,001 | | | | 12,915,210 | |
| | |
Punjab National Bank* | | | 2,587,527 | | | | 1,196,870 | |
| | |
RBL Bank Ltd.*(a) | | | 460,038 | | | | 790,458 | |
| | |
South Indian Bank Ltd.* | | | 2,207,220 | | | | 218,464 | |
| | |
State Bank of India | | | 2,261,076 | | | | 14,727,206 | |
| | |
Union Bank of India Ltd.* | | | 2,533,226 | | | | 1,293,776 | |
| | |
Yes Bank Ltd.*(b) | | | 3,906,791 | | | | 634,161 | |
| | | | | | | | |
| Total Banks | | | | 100,193,712 | |
|
| Beverages – 0.2% | |
| | |
Radico Khaitan Ltd. | | | 55,811 | | | | 654,007 | |
| | |
United Spirits Ltd.* | | | 62,036 | | | | 727,281 | |
| | |
Varun Beverages Ltd. | | | 35,968 | | | | 446,805 | |
| | | | | | | | |
| Total Beverages | | | | 1,828,093 | |
|
| Biotechnology – 0.1% | |
| | |
Biocon Ltd.* | | | 168,399 | | | | 745,823 | |
| | |
| Building Products – 0.1% | | | | | | | | |
| | |
Astral Ltd. | | | 16,709 | | | | 446,077 | |
| | |
Blue Star Ltd. | | | 25,947 | | | | 360,245 | |
| | |
Kajaria Ceramics Ltd. | | | 10,717 | | | | 144,161 | |
| | |
Prince Pipes & Fittings Ltd. | | | 21,416 | | | | 179,256 | |
| | | | | | | | |
| Total Building Products | | | | 1,129,739 | |
|
| Capital Markets – 0.4% | |
| | |
Care Ratings Ltd. | | | 23,186 | | | | 156,190 | |
| | |
CRISIL Ltd. | | | 8,725 | | | | 379,772 | |
| | |
Edelweiss Financial Services Ltd. | | | 308,533 | | | | 239,009 | |
| | |
Geojit Financial Services Ltd. | | | 137,918 | | | | 113,756 | |
| | |
HDFC Asset Management Co. Ltd.(a) | | | 1,205 | | | | 34,127 | |
| | |
ICICI Securities Ltd.(a) | | | 75,200 | | | | 616,536 | |
| | |
IIFL Securities Ltd. | | | 166,038 | | | | 194,030 | |
| | |
IIFL Wealth Management Ltd. | | | 2,022 | | | | 44,533 | |
| | |
Indian Energy Exchange Ltd.(a) | | | 118,589 | | | | 351,659 | |
| | |
JM Financial Ltd. | | | 465,814 | | | | 415,560 | |
| | |
Motilal Oswal Financial Services Ltd. | | | 57,531 | | | | 660,496 | |
| | |
Multi Commodity Exchange of India Ltd. | | | 12,122 | | | | 226,435 | |
| | |
Nippon Life India Asset Management Ltd.(a) | | | 66,185 | | | | 303,652 | |
| | |
UTI Asset Management Co. Ltd. | | | 2,930 | | | | 38,458 | |
| | | | | | | | |
| Total Capital Markets | | | | 3,774,213 | |
|
| Chemicals – 5.1% | |
| | |
Aarti Industries Ltd. | | | 84,611 | | | | 1,068,203 | |
| | |
Advanced Enzyme Technologies Ltd. | | | 48,905 | | | | 182,067 | |
| | |
Alkyl Amines Chemicals | | | 3,250 | | | | 122,585 | |
| | |
Asian Paints Ltd. | | | 101,445 | | | | 4,123,333 | |
| | |
Atul Ltd. | | | 9,100 | | | | 1,236,057 | |
| | |
Balaji Amines Ltd. | | | 5,327 | | | | 204,257 | |
See Notes to Financial Statements.
Schedule of Investments (continued)
WisdomTree India Earnings Fund (EPI) (consolidated)
March 31, 2022
| | | | | | | | |
| Investments | | Shares | | | Value | |
| | |
BASF India Ltd. | | | 1,833 | | | $ | 74,817 | |
| | |
Bayer CropScience Ltd. | | | 636 | | | | 41,709 | |
| | |
Berger Paints India Ltd. | | | 84,465 | | | | 779,943 | |
| | |
Bhansali Engineering Polymers Ltd. | | | 150,200 | | | | 251,539 | |
| | |
Carborundum Universal Ltd. | | | 3,764 | | | | 39,627 | |
| | |
Castrol India Ltd. | | | 396,891 | | | | 528,752 | |
| | |
Chambal Fertilisers and Chemicals Ltd. | | | 610,477 | | | | 3,400,625 | |
| | |
Coromandel International Ltd. | | | 91,447 | | | | 964,976 | |
| | |
DCM Shriram Ltd. | | | 92,959 | | | | 1,386,380 | |
| | |
Deepak Fertilisers & Petrochemicals Corp. Ltd. | | | 88,248 | | | | 653,751 | |
| | |
Deepak Nitrite Ltd. | | | 49,566 | | | | 1,467,683 | |
| | |
Dhanuka Agritech Ltd. | | | 7,874 | | | | 74,578 | |
| | |
EID Parry India Ltd. | | | 168,196 | | | | 1,004,293 | |
| | |
Finolex Industries Ltd. | | | 310,311 | | | | 633,317 | |
| | |
Galaxy Surfactants Ltd. | | | 4,991 | | | | 188,667 | |
| | |
GHCL Ltd. | | | 94,734 | | | | 684,548 | |
| | |
Gujarat Alkalies & Chemicals Ltd. | | | 119,160 | | | | 1,409,870 | |
| | |
Gujarat Narmada Valley Fertilizers & Chemicals Ltd. | | | 294,087 | | | | 3,277,358 | |
| | |
Gujarat State Fertilizers & Chemicals Ltd. | | | 567,790 | | | | 1,214,258 | |
| | |
Gulf Oil Lubricants India Ltd. | | | 58,062 | | | | 323,776 | |
| | |
Himadri Speciality Chemical Ltd. | | | 263,797 | | | | 258,662 | |
| | |
I G Petrochemicals Ltd. | | | 11,333 | | | | 104,872 | |
| | |
India Glycols Ltd. | | | 8,322 | | | | 110,945 | |
| | |
INEOS Styrolution India Ltd. | | | 3,511 | | | | 45,192 | |
| | |
Jindal Poly Films Ltd. | | | 32,592 | | | | 478,138 | |
| | |
Jubilant Ingrevia Ltd. | | | 71,782 | | | | 426,145 | |
| | |
Kansai Nerolac Paints Ltd. | | | 65,290 | | | | 403,027 | |
| | |
Kiri Industries Ltd.* | | | 88,820 | | | | 573,887 | |
| | |
Linde India Ltd. | | | 14,569 | | | | 727,710 | |
| | |
Manali Petrochemicals Ltd. | | | 201,680 | | | | 288,380 | |
| | |
National Fertilizers Ltd.* | | | 302,878 | | | | 212,045 | |
| | |
Navin Fluorine International Ltd. | | | 16,323 | | | | 879,363 | |
| | |
NOCIL Ltd. | | | 5,334 | | | | 17,521 | |
| | |
PCBL Ltd. | | | 105,616 | | | | 318,764 | |
| | |
PI Industries Ltd. | | | 32,602 | | | | 1,213,147 | |
| | |
Pidilite Industries Ltd. | | | 42,747 | | | | 1,384,546 | |
| | |
Polyplex Corp. Ltd. | | | 44,888 | | | | 1,436,475 | |
| | |
Rain Industries Ltd. | | | 260,617 | | | | 667,235 | |
| | |
Rallis India Ltd. | | | 26,324 | | | | 82,698 | |
| | |
Rashtriya Chemicals & Fertilizers Ltd. | | | 360,605 | | | | 425,683 | |
| | |
SH Kelkar & Co. Ltd.(a) | | | 53,828 | | | | 101,973 | |
| | |
Sharda Cropchem Ltd. | | | 45,793 | | | | 371,662 | |
| | |
Solar Industries India Ltd. | | | 3,848 | | | | 142,012 | |
| | |
SRF Ltd. | | | 73,494 | | | | 2,598,695 | |
| | |
Sudarshan Chemical Industries | | | 29,133 | | | | 200,288 | |
| | |
Sumitomo Chemical India Ltd. | | | 22,040 | | | | 130,451 | |
| | |
Supreme Industries Ltd. | | | 28,846 | | | | 779,327 | |
| | |
Supreme Petrochem Ltd. | | | 25,176 | | | | 307,511 | |
| | |
Tata Chemicals Ltd. | | | 4,147 | | | | 53,324 | |
| | |
Thirumalai Chemicals Ltd. | | | 1,937 | | | | 6,800 | |
| | |
UPL Ltd. | | | 544,680 | | | | 5,531,979 | |
| | |
Valiant Organics Ltd.*(a) | | | 5,348 | | | | 64,995 | |
| | |
Vinati Organics Ltd. | | | 11,752 | | | | 302,923 | |
| | | | | | | | |
| Total Chemicals | | | | 45,983,344 | |
|
| Commercial Services & Supplies – 0.1% | |
| | |
Indian Railway Catering & Tourism Corp. Ltd. | | | 42,838 | | | | 437,963 | |
| | |
ION Exchange India Ltd. | | | 1,944 | | | | 42,165 | |
| | |
SIS Ltd.* | | | 29,690 | | | | 190,051 | |
| | | | | | | | |
| Total Commercial Services & Supplies | | | | 670,179 | |
|
| Communications Equipment – 0.1% | |
| | |
Sterlite Technologies Ltd. | | | 163,900 | | | | 485,481 | |
| | |
| Construction & Engineering – 2.8% | | | | | | | | |
| | |
Ashoka Buildcon Ltd.* | | | 299,645 | | | | 339,288 | |
| | |
Dilip Buildcon Ltd.(a) | | | 5,415 | | | | 17,229 | |
| | |
Engineers India Ltd. | | | 622,020 | | | | 525,772 | |
| | |
GE Power India Ltd. | | | 3,034 | | | | 6,088 | |
| | |
HG Infra Engineering Ltd. | | | 5,717 | | | | 42,096 | |
| | |
IRB Infrastructure Developers Ltd.* | | | 228,067 | | | | 756,210 | |
| | |
IRCON International Ltd.(a) | | | 421,514 | | | | 221,396 | |
| | |
J Kumar Infraprojects Ltd. | | | 11,355 | | | | 25,010 | |
| | |
Kalpataru Power Transmission Ltd. | | | 127,814 | | | | 618,618 | |
| | |
KEC International Ltd. | | | 137,041 | | | | 685,341 | |
| | |
KNR Constructions Ltd. | | | 200,951 | | | | 753,550 | |
| | |
Larsen & Toubro Ltd. | | | 763,657 | | | | 17,814,296 | |
| | |
NBCC India Ltd. | | | 276,708 | | | | 132,557 | |
| | |
NCC Ltd. | | | 780,916 | | | | 603,400 | |
| | |
PNC Infratech Ltd. | | | 17,537 | | | | 59,976 | |
| | |
Praj Industries Ltd. | | | 19,150 | | | | 100,697 | |
| | |
PSP Projects Ltd. | | | 9,984 | | | | 71,038 | |
| | |
Rail Vikas Nigam Ltd. | | | 744,021 | | | | 321,075 | |
| | |
Techno Electric & Engineering Co. Ltd. | | | 60,298 | | | | 197,147 | |
| | |
Voltas Ltd. | | | 85,610 | | | | 1,407,043 | |
| | |
Welspun Enterprises Ltd. | | | 238,877 | | | | 230,129 | |
| | | | | | | | |
| Total Construction & Engineering | | | | 24,927,956 | |
|
| Construction Materials – 2.8% | |
| | |
ACC Ltd. | | | 77,501 | | | | 2,200,353 | |
| | |
Ambuja Cements Ltd. | | | 665,932 | | | | 2,629,893 | |
| | |
Birla Corp. Ltd. | | | 57,494 | | | | 896,990 | |
| | |
Dalmia Bharat Ltd. | | | 17,276 | | | | 340,983 | |
| | |
Grasim Industries Ltd. | | | 408,465 | | | | 8,969,789 | |
| | |
HeidelbergCement India Ltd. | | | 87,416 | | | | 218,727 | |
| | |
HIL Ltd. | | | 1,575 | | | | 82,603 | |
| | |
India Cements Ltd. | | | 151,212 | | | | 418,066 | |
| | |
JK Cement Ltd. | | | 22,428 | | | | 719,620 | |
| | |
JK Lakshmi Cement Ltd. | | | 115,529 | | | | 723,972 | |
| | |
KCP Ltd. | | | 90,139 | | | | 137,811 | |
| | |
Orient Cement Ltd. | | | 32,445 | | | | 60,929 | |
| | |
Ramco Cements Ltd. | | | 80,940 | | | | 820,402 | |
| | |
Sagar Cements Ltd. | | | 25,769 | | | | 83,777 | |
| | |
Shree Cement Ltd. | | | 3,179 | | | | 1,008,243 | |
| | |
Star Cement Ltd.* | | | 32,073 | | | | 37,925 | |
| | |
UltraTech Cement Ltd. | | | 67,007 | | | | 5,838,341 | |
| | | | | | | | |
| Total Construction Materials | | | | 25,188,424 | |
|
| Consumer Finance – 2.6% | |
| | |
Bajaj Finance Ltd. | | | 63,895 | | | | 6,121,735 | |
| | |
Capri Global Capital Ltd. | | | 17,176 | | | | 139,448 | |
See Notes to Financial Statements.
Schedule of Investments (continued)
WisdomTree India Earnings Fund (EPI) (consolidated)
March 31, 2022
| | | | | | | | |
| Investments | | Shares | | | Value | |
| | |
Cholamandalam Financial Holdings Ltd. | | | 108,699 | | | $ | 887,308 | |
| | |
Cholamandalam Investment and Finance Co. Ltd. | | | 342,330 | | | | 3,245,754 | |
| | |
Equitas Holdings Ltd. | | | 623,436 | | | | 876,225 | |
| | |
Mahindra & Mahindra Financial Services Ltd. | | | 453,312 | | | | 952,090 | |
| | |
Manappuram Finance Ltd. | | | 1,174,634 | | | | 1,760,207 | |
| | |
MAS Financial Services Ltd.(a) | | | 10,743 | | | | 76,013 | |
| | |
Muthoot Finance Ltd. | | | 131,465 | | | | 2,309,117 | |
| | |
Paisalo Digital Ltd. | | | 7,433 | | | | 77,665 | |
| | |
Repco Home Finance Ltd. | | | 149,970 | | | | 349,122 | |
| | |
SBI Cards & Payment Services Ltd. | | | 17,176 | | | | 193,056 | |
| | |
Shriram City Union Finance Ltd. | | | 20,424 | | | | 437,751 | |
| | |
Shriram Transport Finance Co. Ltd. | | | 301,906 | | | | 4,521,518 | |
| | |
Sundaram Finance Ltd. | | | 59,964 | | | | 1,535,363 | |
| | | | | | | | |
| Total Consumer Finance | | | | 23,482,372 | |
|
| Containers & Packaging – 0.2% | |
| | |
Cosmo Films Ltd. | | | 1,203 | | | | 27,518 | |
| | |
EPL Ltd. | | | 3,115 | | | | 7,958 | |
| | |
Huhtamaki India Ltd. | | | 49,986 | | | | 99,543 | |
| | |
Jai Corp. Ltd. | | | 46,249 | | | | 66,711 | |
| | |
Time Technoplast Ltd. | | | 264,631 | | | | 223,160 | |
| | |
Uflex Ltd. | | | 215,399 | | | | 1,729,304 | |
| | | | | | | | |
| Total Containers & Packaging | | | | 2,154,194 | |
|
| Diversified Financial Services – 3.2% | |
| | |
Aditya Birla Capital Ltd.* | | | 119,535 | | | | 169,818 | |
| | |
Bajaj Finserv Ltd. | | | 18,144 | | | | 4,085,052 | |
| | |
Bajaj Holdings & Investment Ltd. | | | 48,120 | | | | 3,182,207 | |
| | |
Housing & Urban Development Corp. Ltd. | | | 882,564 | | | | 381,445 | |
| | |
Indian Railway Finance Corp. Ltd.(a) | | | 3,574,235 | | | | 1,011,776 | |
| | |
L&T Finance Holdings Ltd.* | | | 778,780 | | | | 828,369 | |
| | |
Piramal Enterprises Ltd. | | | 36,079 | | | | 1,041,256 | |
| | |
Power Finance Corp. Ltd. | | | 7,173,682 | | | | 10,659,935 | |
| | |
REC Ltd. | | | 4,645,822 | | | | 7,544,288 | |
| | | | | | | | |
| Total Diversified Financial Services | | | | 28,904,146 | |
|
| Diversified Telecommunication Services – 0.5% | |
| | |
HFCL Ltd. | | | 683,479 | | | | 709,862 | |
| | |
Indus Towers Ltd.* | | | 1,053,597 | | | | 3,087,446 | |
| | |
Railtel Corp. of India Ltd. | | | 85,683 | | | | 95,097 | |
| | |
Tata Communications Ltd. | | | 58,848 | | | | 954,149 | |
| | | | | | | | |
| Total Diversified Telecommunication Services | | | | 4,846,554 | |
|
| Electric Utilities – 3.4% | |
| | |
Adani Transmission Ltd.* | | | 51,868 | | | | 1,620,999 | |
| | |
CESC Ltd. | | | 2,035,490 | | | | 2,037,505 | |
| | |
Power Grid Corp. of India Ltd. | | | 7,165,430 | | | | 20,501,026 | |
| | |
SJVN Ltd. | | | 1,653,201 | | | | 598,883 | |
| | |
Tata Power Co. Ltd. | | | 1,226,358 | | | | 3,862,360 | |
| | |
Torrent Power Ltd. | | | 225,871 | | | | 1,466,112 | |
| | | | | | | | |
| Total Electric Utilities | | | | 30,086,885 | |
|
| Electrical Equipment – 0.5% | |
| | |
ABB India Ltd. | | | 2,853 | | | | 81,249 | |
| | |
Amara Raja Batteries Ltd. | | | 28,331 | | | | 200,551 | |
| | |
Finolex Cables Ltd. | | | 111,907 | | | | 557,726 | |
| | |
Havells India Ltd. | | | 116,441 | | | | 1,771,086 | |
| | |
KEI Industries Ltd. | | | 81,778 | | | | 1,360,898 | |
| | |
Polycab India Ltd. | | | 17,544 | | | | 547,424 | |
| | |
Suzlon Energy Ltd.* | | | 997,580 | | | | 120,460 | |
| | |
V-Guard Industries Ltd. | | | 80,307 | | | | 228,707 | |
| | | | | | | | |
| Total Electrical Equipment | | | | 4,868,101 | |
|
| Electronic Equipment, Instruments & Components – 0.2% | |
| | |
Redington India Ltd. | | | 975,071 | | | | 1,865,213 | |
|
| Equity Real Estate Investment Trusts (REITs) – 0.0% | |
| | |
Mindspace Business Parks REIT(a) | | | 57,479 | | | | 262,867 | |
| | |
| Food & Staples Retailing – 0.1% | | | | | | | | |
| | |
Avenue Supermarts Ltd.*(a) | | | 17,089 | | | | 902,847 | |
| | |
| Food Products – 1.4% | | | | | | | | |
| | |
ADF Foods Ltd. | | | 2,229 | | | | 22,893 | |
| | |
Avanti Feeds Ltd. | | | 47,345 | | | | 257,641 | |
| | |
Balrampur Chini Mills Ltd. | | | 344,115 | | | | 2,222,499 | |
| | |
Bombay Burmah Trading Co. | | | 4,567 | | | | 51,881 | |
| | |
Britannia Industries Ltd. | | | 29,932 | | | | 1,266,565 | |
| | |
CCL Products India Ltd. | | | 69,738 | | | | 371,537 | |
| | |
Dalmia Bharat Sugar & Industries Ltd. | | | 18,360 | | | | 116,545 | |
| | |
Dhampur Sugar Mills Ltd. | | | 82,488 | | | | 582,070 | |
| | |
Godrej Agrovet Ltd.(a) | | | 15,204 | | | | 88,716 | |
| | |
Gujarat Ambuja Exports Ltd. | | | 104,062 | | | | 357,333 | |
| | |
Heritage Foods Ltd. | | | 49,507 | | | | 209,233 | |
| | |
Kaveri Seed Co. Ltd. | | | 58,751 | | | | 424,108 | |
| | |
KRBL Ltd. | | | 124,420 | | | | 331,020 | |
| | |
LT Foods Ltd. | | | 502,393 | | | | 517,808 | |
| | |
Marico Ltd. | | | 226,045 | | | | 1,502,591 | |
| | |
Nestle India Ltd. | | | 8,481 | | | | 1,945,291 | |
| | |
Tata Coffee Ltd. | | | 39,493 | | | | 112,994 | |
| | |
Tata Consumer Products Ltd. | | | 143,956 | | | | 1,476,890 | |
| | |
Triveni Engineering & Industries Ltd. | | | 69,280 | | | | 284,480 | |
| | |
Venky’s India Ltd. | | | 8,508 | | | | 240,554 | |
| | | | | | | | |
| Total Food Products | | | | 12,382,649 | |
|
| Gas Utilities – 1.6% | |
| | |
Adani Total Gas Ltd. | | | 39,951 | | | | 1,133,443 | |
| | |
GAIL India Ltd. | | | 4,086,827 | | | | 8,394,782 | |
| | |
Gujarat Gas Ltd. | | | 140,520 | | | | 933,246 | |
| | |
Gujarat State Petronet Ltd. | | | 583,489 | | | | 1,994,758 | |
| | |
Indraprastha Gas Ltd. | | | 247,585 | | | | 1,219,219 | |
| | |
Mahanagar Gas Ltd. | | | 78,342 | | | | 805,442 | |
| | | | | | | | |
| Total Gas Utilities | | | | 14,480,890 | |
|
| Health Care Equipment & Supplies – 0.0% | |
| | |
Poly Medicure Ltd. | | | 10,515 | | | | 131,758 | |
| | |
| Health Care Providers & Services – 0.2% | | | | | | | | |
| | |
Apollo Hospitals Enterprise Ltd. | | | 15,509 | | | | 924,318 | |
| | |
Aster DM Healthcare Ltd.*(a) | | | 71,420 | | | | 186,149 | |
| | |
Dr. Lal PathLabs Ltd.(a) | | | 6,140 | | | | 211,543 | |
| | |
Metropolis Healthcare Ltd.(a) | | | 1,144 | | | | 30,735 | |
| | | | | | | | |
| Total Health Care Providers & Services | | | | 1,352,745 | |
|
| Hotels, Restaurants & Leisure – 0.1% | |
| | |
Jubilant Foodworks Ltd. | | | 20,453 | | | | 711,638 | |
See Notes to Financial Statements.
Schedule of Investments (continued)
WisdomTree India Earnings Fund (EPI) (consolidated)
March 31, 2022
| | | | | | | | |
| Investments | | Shares | | | Value | |
| | |
| Household Durables – 0.3% | | | | | | | | |
| | |
Amber Enterprises India Ltd.* | | | 5,088 | | | $ | 236,573 | |
| | |
Bajaj Electricals Ltd.* | | | 5,203 | | | | 73,793 | |
| | |
Crompton Greaves Consumer Electricals Ltd. | | | 235,204 | | | | 1,160,888 | |
| | |
Dixon Technologies India Ltd. | | | 797 | | | | 45,320 | |
| | |
Orient Electric Ltd. | | | 53,601 | | | | 227,243 | |
| | |
Symphony Ltd. | | | 9,000 | | | | 130,400 | |
| | |
Whirlpool of India Ltd. | | | 20,128 | | | | 417,794 | |
| | | | | | | | |
| Total Household Durables | | | | 2,292,011 | |
|
| Household Products – 0.0% | |
| | |
Jyothy Labs Ltd. | | | 38,906 | | | | 75,707 | |
|
| Independent Power & Renewable Electricity Producers – 3.4% | |
| | |
Adani Power Ltd.* | | | 411,742 | | | | 1,005,786 | |
| | |
Jaiprakash Power Ventures Ltd.* | | | 3,872,976 | | | | 347,558 | |
| | |
JSW Energy Ltd. | | | 275,570 | | | | 1,099,007 | |
| | |
NHPC Ltd. | | | 5,967,615 | | | | 2,189,372 | |
| | |
NLC India Ltd. | | | 216,103 | | | | 178,387 | |
| | |
NTPC Ltd. | | | 13,376,369 | | | | 23,831,208 | |
| | |
PTC India Ltd. | | | 1,120,355 | | | | 1,216,090 | |
| | |
Reliance Power Ltd.* | | | 2,010,061 | | | | 358,111 | |
| | | | | | | | |
| Total Independent Power & Renewable Electricity Producers | | | | 30,225,519 | |
|
| Industrial Conglomerates – 0.3% | |
| | |
Apar Industries Ltd. | | | 10,416 | | | | 89,245 | |
| | |
Balmer Lawrie & Co. Ltd. | | | 199,128 | | | | 296,163 | |
| | |
Godrej Industries Ltd.* | | | 51,291 | | | | 314,075 | |
| | |
Nava Bharat Ventures Ltd. | | | 434,125 | | | | 807,235 | |
| | |
Siemens Ltd. | | | 46,778 | | | | 1,461,955 | |
| | | | | | | | |
| Total Industrial Conglomerates | | | | 2,968,673 | |
|
| Insurance – 0.5% | |
| | |
General Insurance Corp. of India*(a) | | | 381,356 | | | | 572,978 | |
| | |
HDFC Life Insurance Co. Ltd.(a) | | | 72,569 | | | | 515,429 | |
| | |
ICICI Lombard General Insurance Co. Ltd.(a) | | | 45,818 | | | | 803,168 | |
| | |
ICICI Prudential Life Insurance Co. Ltd.(a) | | | 114,083 | | | | 754,130 | |
| | |
Max Financial Services Ltd.* | | | 50,670 | | | | 504,125 | |
| | |
New India Assurance Co. Ltd.*(a) | | | 295,894 | | | | 435,982 | |
| | |
SBI Life Insurance Co. Ltd.(a) | | | 73,680 | | | | 1,090,445 | |
| | | | | | | | |
| Total Insurance | | | | 4,676,257 | |
|
| Interactive Media & Services – 0.5% | |
| | |
Brightcom Group Ltd.* | | | 911,355 | | | | 1,185,874 | |
| | |
Brightcom Group Ltd. | | | 1,367,032 | | | | 1,778,810 | |
| | |
Info Edge India Ltd. | | | 12,973 | | | | 772,037 | |
| | |
Just Dial Ltd.* | | | 39,285 | | | | 368,820 | |
| | | | | | | | |
| Total Interactive Media & Services | | | | 4,105,541 | |
|
| IT Services – 13.7% | |
| | |
Cigniti Technologies Ltd. | | | 5,991 | | | | 33,977 | |
| | |
Coforge Ltd. | | | 13,106 | | | | 770,967 | |
| | |
Computer Age Management Services Ltd. | | | 1,867 | | | | 57,060 | |
| | |
eClerx Services Ltd. | | | 15,931 | | | | 498,523 | |
| | |
Firstsource Solutions Ltd. | | | 287,308 | | | | 474,139 | |
| | |
HCL Technologies Ltd. | | | 929,121 | | | | 14,269,410 | |
| | |
Hinduja Global Solutions Ltd. | | | 2,444 | | | | 33,018 | |
| | |
Infibeam Avenues Ltd. | | | 603,918 | | | | 154,217 | |
| | |
Infosys Ltd. | | | 2,174,871 | | | | 54,729,829 | |
| | |
Larsen & Toubro Infotech Ltd.(a) | | | 19,805 | | | | 1,608,812 | |
| | |
Mastek Ltd. | | | 1,192 | | | | 52,255 | |
| | |
Mindtree Ltd. | | | 26,403 | | | | 1,499,300 | |
| | |
Mphasis Ltd. | | | 53,285 | | | | 2,374,602 | |
| | |
NIIT Ltd. | | | 11,178 | | | | 91,710 | |
| | |
Persistent Systems Ltd. | | | 24,938 | | | | 1,568,288 | |
| | |
Sonata Software Ltd. | | | 51,643 | | | | 503,924 | |
| | |
Tata Consultancy Services Ltd. | | | 557,325 | | | | 27,507,326 | |
| | |
Tech Mahindra Ltd. | | | 438,725 | | | | 8,681,573 | |
| | |
Vakrangee Ltd. | | | 317,491 | | | | 145,390 | |
| | |
Wipro Ltd. | | | 959,469 | | | | 7,494,684 | |
| | | | | | | | |
| Total IT Services | | | | 122,549,004 | |
|
| Life Sciences Tools & Services – 0.3% | |
| | |
Divi’s Laboratories Ltd. | | | 46,062 | | | | 2,675,912 | |
| | |
Syngene International Ltd.*(a) | | | 41,514 | | | | 327,400 | |
| | | | | | | | |
| Total Life Sciences Tools & Services | | | | 3,003,312 | |
|
| Machinery – 0.7% | |
| | |
AIA Engineering Ltd. | | | 33,483 | | | | 717,029 | |
| | |
BEML Ltd. | | | 17,280 | | | | 414,777 | |
| | |
Cochin Shipyard Ltd.(a) | | | 124,281 | | | | 482,527 | |
| | |
Cummins India Ltd. | | | 90,163 | | | | 1,334,210 | |
| | |
Escorts Ltd. | | | 59,493 | | | | 1,327,532 | |
| | |
Grindwell Norton Ltd. | | | 985 | | | | 23,397 | |
| | |
ISGEC Heavy Engineering Ltd. | | | 5,605 | | | | 37,968 | |
| | |
Kirloskar Brothers Ltd. | | | 9,302 | | | | 34,747 | |
| | |
Kirloskar Oil Engines Ltd. | | | 28,604 | | | | 49,809 | |
| | |
Schaeffler India Ltd. | | | 4,666 | | | | 119,583 | |
| | |
SKF India Ltd. | | | 16,369 | | | | 763,505 | |
| | |
Thermax Ltd. | | | 21,529 | | | | 550,918 | |
| | |
Timken India Ltd. | | | 11,323 | | | | 319,943 | |
| | | | | | | | |
| Total Machinery | | | | 6,175,945 | |
|
| Marine – 0.1% | |
| | |
Shipping Corp. of India Ltd. | | | 475,238 | | | | 723,440 | |
| | |
| Media – 0.7% | | | | | | | | |
| | |
Affle India Ltd.* | | | 685 | | | | 11,391 | |
| | |
DB Corp. Ltd. | | | 464,316 | | | | 521,455 | |
| | |
Jagran Prakashan Ltd.* | | | 302,092 | | | | 258,936 | |
| | |
Sun TV Network Ltd. | | | 137,108 | | | | 886,339 | |
| | |
TV Today Network Ltd. | | | 40,613 | | | | 199,139 | |
| | |
TV18 Broadcast Ltd.* | | | 738,265 | | | | 721,459 | |
| | |
Zee Entertainment Enterprises Ltd. | | | 956,061 | | | | 3,638,142 | |
| | | | | | | | |
| Total Media | | | | 6,236,861 | |
|
| Metals & Mining – 8.3% | |
| | |
APL Apollo Tubes Ltd.* | | | 87,635 | | | | 1,057,749 | |
| | |
Godawari Power and Ispat Ltd. | | | 164,270 | | | | 837,771 | |
| | |
Hindalco Industries Ltd. | | | 1,241,889 | | | | 9,333,630 | |
| | |
Hindustan Zinc Ltd. | | | 367,902 | | | | 1,505,837 | |
| | |
Indian Metals & Ferro Alloys Ltd. | | | 40,085 | | | | 219,271 | |
| | |
Jindal Saw Ltd. | | | 345,340 | | | | 410,625 | |
| | |
Jindal Stainless Hisar Ltd.* | | | 136,661 | | | | 702,197 | |
| | |
Jindal Stainless Ltd.* | | | 72,954 | | | | 195,009 | |
See Notes to Financial Statements.
Schedule of Investments (continued)
WisdomTree India Earnings Fund (EPI) (consolidated)
March 31, 2022
| | | | | | | | |
| Investments | | Shares | | | Value | |
| | |
Jindal Steel & Power Ltd. | | | 718,791 | | | $ | 5,054,540 | |
| | |
JSW Steel Ltd. | | | 1,146,829 | | | | 11,088,410 | |
| | |
Kalyani Steels Ltd. | | | 73,353 | | | | 286,926 | |
| | |
Kirloskar Ferrous Industries Ltd. | | | 93,751 | | | | 265,509 | |
| | |
Maithan Alloys Ltd. | | | 14,535 | | | | 254,667 | |
| | |
Mishra Dhatu Nigam Ltd.(a) | | | 193,636 | | | | 423,303 | |
| | |
National Aluminium Co. Ltd. | | | 1,073,102 | | | | 1,724,894 | |
| | |
NMDC Ltd. | | | 3,202,677 | | | | 6,870,276 | |
| | |
Ratnamani Metals & Tubes Ltd. | | | 1,607 | | | | 54,998 | |
| | |
Sarda Energy & Minerals Ltd. | | | 29,764 | | | | 444,899 | |
| | |
Steel Authority of India Ltd. | | | 3,046,754 | | | | 3,962,489 | |
| | |
Sunflag Iron & Steel Co.* | | | 330,257 | | | | 274,361 | |
| | |
Surya Roshni Ltd. | | | 17,469 | | | | 95,316 | |
| | |
Tata Metaliks Ltd. | | | 33,751 | | | | 343,612 | |
| | |
Tata Steel Long Products Ltd. | | | 32,167 | | | | 305,072 | |
| | |
Tata Steel Ltd. | | | 714,919 | | | | 12,333,114 | |
| | |
Tinplate Co. of India Ltd. | | | 6,349 | | | | 33,624 | |
| | |
Usha Martin Ltd.* | | | 213,980 | | | | 379,813 | |
| | |
Vedanta Ltd. | | | 2,718,691 | | | | 14,471,580 | |
| | |
Welspun Corp. Ltd. | | | 743,248 | | | | 1,641,963 | |
| | | | | | | | |
| Total Metals & Mining | | | | 74,571,455 | |
|
| Oil, Gas & Consumable Fuels – 18.8% | |
| | |
Aegis Logistics Ltd. | | | 103,999 | | | | 282,111 | |
| | |
Bharat Petroleum Corp. Ltd. | | | 2,664,497 | | | | 12,635,922 | |
| | |
Chennai Petroleum Corp. Ltd.* | | | 305,744 | | | | 515,054 | |
| | |
Coal India Ltd. | | | 6,105,982 | | | | 14,750,248 | |
| | |
Great Eastern Shipping Co. Ltd. | | | 479,597 | | | | 2,185,798 | |
| | |
Hindustan Oil Exploration Co. Ltd.* | | | 24,930 | | | | 72,347 | |
| | |
Hindustan Petroleum Corp. Ltd. | | | 4,305,451 | | | | 15,304,167 | |
| | |
Indian Oil Corp. Ltd. | | | 11,222,328 | | | | 17,616,574 | |
| | |
Oil & Natural Gas Corp. Ltd. | | | 8,346,407 | | | | 18,053,132 | |
| | |
Oil India Ltd. | | | 1,444,820 | | | | 4,545,630 | |
| | |
Petronet LNG Ltd. | | | 1,444,737 | | | | 3,694,065 | |
| | |
Reliance Industries Ltd. | | | 2,251,637 | | | | 78,291,001 | |
| | | | | | | | |
| Total Oil, Gas & Consumable Fuels | | | | 167,946,049 | |
|
| Paper & Forest Products – 0.2% | |
| | |
Century Plyboards India Ltd. | | | 44,830 | | | | 423,777 | |
| | |
Greenply Industries Ltd. | | | 2,446 | | | | 7,098 | |
| | |
JK Paper Ltd. | | | 378,372 | | | | 1,517,733 | |
| | | | | | | | |
| Total Paper & Forest Products | | | | 1,948,608 | |
|
| Personal Products – 1.3% | |
| | |
Bajaj Consumer Care Ltd. | | | 185,816 | | | | 400,445 | |
| | |
Colgate-Palmolive India Ltd. | | | 42,854 | | | | 872,208 | |
| | |
Dabur India Ltd. | | | 213,281 | | | | 1,509,222 | |
| | |
Emami Ltd. | | | 59,239 | | | | 349,571 | |
| | |
Godrej Consumer Products Ltd.* | | | 182,139 | | | | 1,796,272 | |
| | |
Hindustan Unilever Ltd. | | | 232,538 | | | | 6,286,888 | |
| | | | | | | | |
| Total Personal Products | | | | 11,214,606 | |
|
| Pharmaceuticals – 4.0% | |
| | |
Aarti Drugs Ltd. | | | 39,521 | | | | 223,800 | |
| | |
Ajanta Pharma Ltd. | | | 15,283 | | | | 365,209 | |
| | |
Alembic Ltd. | | | 305,750 | | | | 292,334 | |
| | |
Alembic Pharmaceuticals Ltd. | | | 87,701 | | | | 858,318 | |
| | |
Alkem Laboratories Ltd. | | | 16,511 | | | | 788,933 | |
| | |
Amrutanjan Health Care Ltd. | | | 4,612 | | | | 48,363 | |
| | |
AstraZeneca Pharma India Ltd. | | | 974 | | | | 32,801 | |
| | |
Aurobindo Pharma Ltd. | | | 748,468 | | | | 6,603,607 | |
| | |
Caplin Point Laboratories Ltd. | | | 19,379 | | | | 173,446 | |
| | |
Cipla Ltd. | | | 299,523 | | | | 4,024,142 | |
| | |
Dr. Reddy’s Laboratories Ltd. | | | 64,424 | | | | 3,651,997 | |
| | |
Eris Lifesciences Ltd.(a) | | | 13,860 | | | | 125,970 | |
| | |
FDC Ltd.* | | | 60,997 | | | | 206,959 | |
| | |
Gland Pharma Ltd.*(a) | | | 887 | | | | 38,309 | |
| | |
GlaxoSmithKline Pharmaceuticals Ltd. | | | 1,117 | | | | 24,572 | |
| | |
Glenmark Pharmaceuticals Ltd. | | | 202,505 | | | | 1,181,224 | |
| | |
Granules India Ltd. | | | 186,615 | | | | 754,833 | |
| | |
Indoco Remedies Ltd. | | | 15,510 | | | | 77,176 | |
| | |
IOL Chemicals and Pharmaceuticals Ltd. | | | 98,329 | | | | 458,977 | |
| | |
Ipca Laboratories Ltd. | | | 70,540 | | | | 992,121 | |
| | |
JB Chemicals & Pharmaceuticals Ltd. | | | 15,266 | | | | 317,287 | |
| | |
Jubilant Pharmova Ltd. | | | 136,019 | | | | 696,744 | |
| | |
Laurus Labs Ltd.(a) | | | 157,102 | | | | 1,223,436 | |
| | |
Lupin Ltd. | | | 123,325 | | | | 1,215,836 | |
| | |
Marksans Pharma Ltd. | | | 504,260 | | | | 302,789 | |
| | |
Morepen Laboratories Ltd.* | | | 328,534 | | | | 158,468 | |
| | |
Natco Pharma Ltd. | | | 70,113 | | | | 699,650 | |
| | |
Pfizer Ltd. | | | 3,678 | | | | 211,052 | |
| | |
Sanofi India Ltd. | | | 420 | | | | 41,567 | |
| | |
Shilpa Medicare Ltd. | | | 8,804 | | | | 46,265 | |
| | |
Solara Active Pharma Sciences Ltd. | | | 9,850 | | | | 86,586 | |
| | |
Strides Pharma Science Ltd. | | | 84,906 | | | | 388,366 | |
| | |
Sun Pharmaceutical Industries Ltd. | | | 494,142 | | | | 5,965,244 | |
| | |
Suven Pharmaceuticals Ltd. | | | 126,988 | | | | 1,036,433 | |
| | |
Torrent Pharmaceuticals Ltd. | | | 21,643 | | | | 797,442 | |
| | |
Wockhardt Ltd.* | | | 109,934 | | | | 382,430 | |
| | |
Zydus Lifesciences Ltd. | | | 205,205 | | | | 943,767 | |
| | | | | | | | |
| Total Pharmaceuticals | | | | 35,436,453 | |
|
| Professional Services – 0.1% | |
| | |
L&T Technology Services Ltd.(a) | | | 16,214 | | | | 1,092,410 | |
|
| Real Estate Management & Development – 0.4% | |
| | |
DLF Ltd. | | | 10,326 | | | | 51,845 | |
| | |
NESCO Ltd. | | | 19,216 | | | | 140,110 | |
| | |
Oberoi Realty Ltd.* | | | 103,947 | | | | 1,289,272 | |
| | |
Phoenix Mills Ltd. | | | 28,732 | | | | 417,074 | |
| | |
Prestige Estates Projects Ltd. | | | 161,926 | | | | 1,055,217 | |
| | |
Sobha Ltd. | | | 49,797 | | | | 465,111 | |
| | |
Sunteck Realty Ltd. | | | 17,423 | | | | 100,422 | |
| | | | | | | | |
| Total Real Estate Management & Development | | | | 3,519,051 | |
|
| Road & Rail – 0.0% | |
| | |
Container Corp. of India Ltd. | | | 32,225 | | | | 285,847 | |
| | |
| Software – 0.5% | | | | | | | | |
| | |
Birlasoft Ltd. | | | 191,751 | | | | 1,151,265 | |
| | |
Cyient Ltd. | | | 70,479 | | | | 862,909 | |
| | |
Intellect Design Arena Ltd.* | | | 11,769 | | | | 146,889 | |
See Notes to Financial Statements.
Schedule of Investments (continued)
WisdomTree India Earnings Fund (EPI) (consolidated)
March 31, 2022
| | | | | | | | |
| Investments | | Shares | | | Value | |
| | |
KPIT Technologies Ltd. | | | 10,283 | | | $ | 81,565 | |
| | |
Oracle Financial Services Software Ltd. | | | 10,095 | | | | 477,972 | |
| | |
Subex Ltd. | | | 28,418 | | | | 12,057 | |
| | |
Tanla Platforms Ltd. | | | 2,450 | | | | 49,338 | |
| | |
Tata Elxsi Ltd. | | | 12,175 | | | | 1,420,374 | |
| | |
Zensar Technologies Ltd. | | | 7,350 | | | | 35,593 | |
| | | | | | | | |
| Total Software | | | | 4,237,962 | |
|
| Textiles, Apparel & Luxury Goods – 0.9% | |
| | |
Filatex India Ltd. | | | 99,674 | | | | 166,397 | |
| | |
Garware Technical Fibres Ltd. | | | 1,997 | | | | 74,365 | |
| | |
Indo Count Industries Ltd. | | | 34,633 | | | | 72,648 | |
| | |
Kalyan Jewellers India Ltd.* | | | 19,846 | | | | 15,387 | |
| | |
KPR Mill Ltd. | | | 7,540 | | | | 61,947 | |
| | |
LUX Industries Ltd. | | | 5,169 | | | | 149,456 | |
| | |
Page Industries Ltd. | | | 651 | | | | 371,049 | |
| | |
Rajesh Exports Ltd. | | | 78,546 | | | | 716,373 | |
| | |
Relaxo Footwears Ltd. | | | 18,914 | | | | 266,169 | |
| | |
Rupa & Co. Ltd. | | | 6,367 | | | | 36,816 | |
| | |
Titan Co. Ltd. | | | 112,181 | | | | 3,754,640 | |
| | |
Trident Ltd. | | | 1,997,709 | | | | 1,406,503 | |
| | |
Vaibhav Global Ltd. | | | 4,336 | | | | 21,398 | |
| | |
Vardhman Textiles Ltd. | | | 8,840 | | | | 50,864 | |
| | |
Welspun India Ltd. | | | 432,727 | | | | 518,816 | |
| | | | | | | | |
| Total Textiles, Apparel & Luxury Goods | | | | 7,682,828 | |
|
| Thrifts & Mortgage Finance – 5.6% | |
| | |
Aavas Financiers Ltd.* | | | 7,363 | | | | 249,671 | |
| | |
Can Fin Homes Ltd. | | | 117,404 | | | | 978,354 | |
| | |
Housing Development Finance Corp. Ltd. | | | 1,340,020 | | | | 42,272,304 | |
| | |
IIFL Finance Ltd. | | | 153,285 | | | | 577,739 | |
| | |
Indiabulls Housing Finance Ltd. | | | 696,059 | | | | 1,449,530 | |
| | |
LIC Housing Finance Ltd. | | | 789,846 | | | | 3,741,540 | |
| | |
PNB Housing Finance Ltd.*(a) | | | 66,919 | | | | 332,807 | |
| | | | | | | | |
| Total Thrifts & Mortgage Finance | | | | 49,601,945 | |
|
| Tobacco – 1.2% | |
| | |
Godfrey Phillips India Ltd. | | | 24,853 | | | | 331,133 | |
| | |
ITC Ltd. | | | 3,073,351 | | | | 10,166,089 | |
| | | | | | | | |
| Total Tobacco | | | | 10,497,222 | |
|
| Trading Companies & Distributors – 0.2% | |
| | |
Adani Enterprises Ltd. | | | 65,794 | | | | 1,749,369 | |
| | |
IndiaMart InterMesh Ltd.(a) | | | 387 | | | | 22,077 | |
| | |
MSTC Ltd. | | | 5,034 | | | | 20,335 | |
| | | | | | | | |
| Total Trading Companies & Distributors | | | | 1,791,781 | |
|
| Transportation Infrastructure – 0.8% | |
| | |
Adani Ports & Special Economic Zone Ltd. | | | 632,112 | | | | 6,458,345 | |
| | |
Gateway Distriparks Ltd.* | | | 103,244 | | | | 90,880 | |
| | |
Gujarat Pipavav Port Ltd. | | | 452,109 | | | | 455,838 | |
| | | | | | | | |
| Total Transportation Infrastructure | | | | 7,005,063 | |
|
| Water Utilities – 0.0% | |
| | |
VA Tech Wabag Ltd.* | | | 42,790 | | | | 158,341 | |
TOTAL COMMON STOCKS (Cost: $510,608,859) | | | | | | | 924,493,297 | |
| | |
| | | Principal
Amount | | | | |
|
| FOREIGN CORPORATE BOND – 0.0% | |
|
| India – 0.0% | |
| | |
Britannia Industries Ltd.
5.50%, 6/3/24 | | | | | | | | |
| | |
| (Cost: $11,593) | | | 843,639 | INR | | | 11,155 | |
| | |
| | | Shares | | | | |
|
| EXCHANGE-TRADED FUND – 0.0% | |
|
| United States – 0.0% | |
| | |
WisdomTree India ex-State-Owned Enterprises Fund(c) | | | | | | | | |
| | |
| (Cost: $26,901) | | | 1,100 | | | | 38,156 | |
| | |
TOTAL INVESTMENTS IN SECURITIES – 103.4% (Cost: $510,647,353) | | | | | | | 924,542,608 | |
| | |
Other Assets less Liabilities – (3.4)% | | | | | | | (30,701,195 | ) |
| | | | | | | | |
| NET ASSETS – 100.0% | | | | | | $ | 893,841,413 | |
| * | Non-income producing security. |
| (a) | This security is exempt from registration under rule 144A of the Securities Act of 1933. This security may be sold in transactions that are exempt from registration, normally to qualified institutional buyers. |
| (b) | This security, or a portion thereof, is restricted from resale (see Note 2 – Restricted Securities). In accordance with a reconstruction scheme notified by the government of India applicable to Yes Bank Ltd., effective March 16, 2020, 75% of all shares of Yes Bank Ltd. held by then-existing shareholders are subject to a three-year lock-in period and are unable to be sold. At March 31, 2022, the value of the restricted portion of this security is as follows: |
| | | | | | | | | | | | | | | | | | | | |
| | | | | |
| Investment | | Restricted
Shares | | | Acquisition Date | | | Acquisition Cost | | | Value | | | Value as a
Percentage of Net
Assets | |
India – Banks
Yes Bank
Ltd. | | | 3,906,791 | | |
| 9/21/15 –
3/13/20 |
| | $ | 3,947,791 | | | $ | 634,161 | | | | 0.1 | % |
| (c) | Affiliated holding. See “Investment in Affiliates” supplementary table included in this Schedule of Investments for additional information. |
See Notes to Financial Statements.
Schedule of Investments (concluded)
WisdomTree India Earnings Fund (EPI) (consolidated)
March 31, 2022
Affiliated holdings are investments in entities in which the Fund owns 5% or more of the outstanding voting securities or are investments in entities which are under common ownership or control. Investments in affiliates during the fiscal year ended March 31, 2022 were as follows:
| | | | | | | | | | | | | | | | | | | | | | | | | | | | |
| | | | | | | |
| Affiliate | | Value at
3/31/2021 | | | Purchases/
Additions | | | Sales/
Reductions | | | Realized
Gain/ (Loss) | | | Change in
Unrealized
Appreciation/
Depreciation | | | Value at
3/31/2022 | | | Dividend
Income | |
WisdomTree India ex-State-Owned Enterprises Fund | | $ | 33,709 | | | $ | — | | | $ | — | | | $ | — | | | $ | 4,447 | | | $ | 38,156 | | | $ | — | |
The following is a summary of the fair valuations according to the inputs used as of March 31, 2022 in valuing the Fund’s investments (See Note 2 — Fair Value Measurement):
| | | | | | | | | | | | | | | | |
| | | | |
| | | Quoted
Prices in
Active
Markets
(Level 1) | | | Other
Significant
Observable
Inputs
(Level 2) | | | Significant
Unobservable
Inputs
(Level 3) | | | Total | |
Assets: | | | | | | | | | |
Investments in Securities | | | | |
Common Stocks | | $ | 924,493,297 | | | $ | — | | | $ | — | | | $ | 924,493,297 | |
Foreign Corporate Bond | | | — | | | | 11,155 | | | | — | | | | 11,155 | |
Exchange-Traded Fund | | | 38,156 | | | | — | | | | — | | | | 38,156 | |
Total Investments in Securities | | $ | 924,531,453 | | | $ | 11,155 | | | $ | — | | | $ | 924,542,608 | |
See Notes to Financial Statements.
Schedule of Investments
WisdomTree India ex-State-Owned Enterprises Fund (IXSE)
March 31, 2022
| | | | | | | | |
| Investments | | Shares | | | Value | |
| | |
| COMMON STOCKS – 102.5% | | | | | | | | |
| | |
| India – 102.5% | | | | | | | | |
| | |
| Airlines – 0.2% | | | | | | | | |
| | |
InterGlobe Aviation Ltd.*(a) | | | 617 | | | $ | 16,400 | |
| | |
| Auto Components – 1.5% | | | | | | | | |
| | |
Balkrishna Industries Ltd. | | | 613 | | | | 17,281 | |
| | |
Bharat Forge Ltd. | | | 1,914 | | | | 17,697 | |
| | |
Bosch Ltd. | | | 96 | | | | 18,292 | |
| | |
Exide Industries Ltd. | | | 2,632 | | | | 5,248 | |
| | |
Motherson Sumi Systems Ltd. | | | 9,224 | | | | 16,975 | |
| | |
Motherson Sumi Wiring India Ltd.* | | | 9,224 | | | | 7,846 | |
| | |
Sundram Fasteners Ltd. | | | 524 | | | | 6,222 | |
| | |
Tube Investments of India Ltd. | | | 633 | | | | 13,572 | |
| | | | | | | | |
| Total Auto Components | | | | | | | 103,133 | |
| | |
| Automobiles – 4.8% | | | | | | | | |
| | |
Bajaj Auto Ltd. | | | 560 | | | | 26,997 | |
| | |
Eicher Motors Ltd. | | | 914 | | | | 29,638 | |
| | |
Hero MotoCorp Ltd. | | | 860 | | | | 26,037 | |
| | |
Mahindra & Mahindra Ltd. | | | 7,227 | | | | 76,924 | |
| | |
Maruti Suzuki India Ltd. | | | 926 | | | | 92,402 | |
| | |
Tata Motors Ltd.* | | | 12,989 | | | | 74,352 | |
| | |
Tata Motors Ltd., Class A* | | | 221 | | | | 602 | |
| | |
TVS Motor Co. Ltd. | | | 1,352 | | | | 11,163 | |
| | | | | | | | |
| Total Automobiles | | | | | | | 338,115 | |
| | |
| Banks – 12.4% | | | | | | | | |
| | |
AU Small Finance Bank Ltd.*(a) | | | 1,105 | | | | 18,174 | |
| | |
Axis Bank Ltd.* | | | 16,770 | | | | 168,453 | |
| | |
Bandhan Bank Ltd.(a) | | | 3,885 | | | | 15,760 | |
| | |
Federal Bank Ltd. | | | 12,012 | | | | 15,440 | |
| | |
ICICI Bank Ltd. | | | 39,331 | | | | 379,062 | |
| | |
IDFC First Bank Ltd.* | | | 24,010 | | | | 12,579 | |
| | |
IndusInd Bank Ltd. | | | 4,224 | | | | 52,143 | |
| | |
Kotak Mahindra Bank Ltd. | | | 8,485 | | | | 196,390 | |
| | |
RBL Bank Ltd.*(a) | | | 3,644 | | | | 6,261 | |
| | |
Yes Bank Ltd.*(b) | | | 3,819 | | | | 620 | |
| | | | | | | | |
| Total Banks | | | | | | | 864,882 | |
| | |
| Beverages – 0.8% | | | | | | | | |
| | |
United Breweries Ltd. | | | 500 | | | | 9,829 | |
| | |
United Spirits Ltd.* | | | 2,575 | | | | 30,188 | |
| | |
Varun Beverages Ltd. | | | 1,198 | | | | 14,882 | |
| | | | | | | | |
| Total Beverages | | | | | | | 54,899 | |
| | |
| Biotechnology – 0.1% | | | | | | | | |
| | |
Biocon Ltd.* | | | 1,734 | | | | 7,680 | |
| | |
| Building Products – 0.4% | | | | | | | | |
| | |
Astral Ltd. | | | 812 | | | | 21,678 | |
| | |
Kajaria Ceramics Ltd. | | | 552 | | | | 7,425 | |
| | | | | | | | |
| Total Building Products | | | | | | | 29,103 | |
| | |
| Capital Markets – 0.3% | | | | | | | | |
| | |
HDFC Asset Management Co. Ltd.(a) | | | 448 | | | | 12,688 | |
| | |
Indian Energy Exchange Ltd.(a) | | | 3,091 | | | | 9,166 | |
| | | | | | | | |
| Total Capital Markets | | | | | | | 21,854 | |
| | |
| Chemicals – 4.8% | | | | | | | | |
| | |
Aarti Industries Ltd. | | | 1,469 | | | | 18,546 | |
| | |
Asian Paints Ltd. | | | 3,369 | | | | 136,936 | |
| | |
Atul Ltd. | | | 146 | | | | 19,831 | |
| | |
Berger Paints India Ltd. | | | 2,080 | | | | 19,207 | |
| | |
Carborundum Universal Ltd. | | | 705 | | | | 7,422 | |
| | |
Coromandel International Ltd. | | | 1,095 | | | | 11,555 | |
| | |
Deepak Nitrite Ltd. | | | 411 | | | | 12,170 | |
| | |
Kansai Nerolac Paints Ltd. | | | 1,147 | | | | 7,080 | |
| | |
Navin Fluorine International Ltd. | | | 279 | | | | 15,030 | |
| | |
PI Industries Ltd. | | | 602 | | | | 22,401 | |
| | |
SRF Ltd. | | | 1,061 | | | | 37,516 | |
| | |
Supreme Industries Ltd. | | | 563 | | | | 15,211 | |
| | |
Tata Chemicals Ltd. | | | 1,021 | | | | 13,129 | |
| | | | | | | | |
| Total Chemicals | | | | | | | 336,034 | |
| | |
| Construction & Engineering – 0.5% | | | | | | | | |
| | |
GMR Power & Urban Infra Ltd.* | | | 1,444 | | | | 640 | |
| | |
Voltas Ltd. | | | 1,942 | | | | 31,918 | |
| | | | | | | | |
| Total Construction & Engineering | | | | | | | 32,558 | |
| | |
| Construction Materials – 3.3% | | | | | | | | |
| | |
ACC Ltd. | | | 564 | | | | 16,013 | |
| | |
Ambuja Cements Ltd. | | | 5,123 | | | | 20,232 | |
| | |
Dalmia Bharat Ltd. | | | 620 | | | | 12,237 | |
| | |
Grasim Industries Ltd. | | | 3,383 | | | | 74,290 | |
| | |
JK Cement Ltd. | | | 210 | | | | 6,738 | |
| | |
Ramco Cements Ltd. | | | 938 | | | | 9,507 | |
| | |
Shree Cement Ltd. | | | 56 | | | | 17,761 | |
| | |
UltraTech Cement Ltd. | | | 831 | | | | 72,405 | |
| | | | | | | | |
| Total Construction Materials | | | | | | | 229,183 | |
| | |
| Consumer Finance – 4.2% | | | | | | | | |
| | |
Bajaj Finance Ltd. | | | 2,028 | | | | 194,301 | |
| | |
Cholamandalam Investment and Finance Co. Ltd. | | | 3,190 | | | | 30,246 | |
| | |
Mahindra & Mahindra Financial Services Ltd. | | | 4,866 | | | | 10,220 | |
| | |
Manappuram Finance Ltd. | | | 3,963 | | | | 5,939 | |
| | |
Muthoot Finance Ltd. | | | 905 | | | | 15,896 | |
| | |
Shriram Transport Finance Co. Ltd. | | | 1,368 | | | | 20,488 | |
| | |
Sundaram Finance Ltd. | | | 523 | | | | 13,391 | |
| | | | | | | | |
| Total Consumer Finance | | | | | | | 290,481 | |
| | |
| Diversified Financial Services – 1.6% | | | | | | | | |
| | |
Bajaj Finserv Ltd. | | | 302 | | | | 67,994 | |
| | |
Bajaj Holdings & Investment Ltd. | | | 222 | | | | 14,681 | |
| | |
Piramal Enterprises Ltd. | | | 956 | | | | 27,591 | |
| | | | | | | | |
| Total Diversified Financial Services | | | | | | | 110,266 | |
| | |
| Diversified Telecommunication Services – 0.3% | | | | | | | | |
| | |
Indus Towers Ltd.* | | | 7,254 | | | | 21,257 | |
| | |
| Electric Utilities – 1.0% | | | | | | | | |
| | |
Adani Transmission Ltd.* | | | 1,909 | | | | 59,661 | |
| | |
Torrent Power Ltd. | | | 1,332 | | | | 8,646 | |
| | | | | | | | |
| Total Electric Utilities | | | | | | | 68,307 | |
See Notes to Financial Statements.
Schedule of Investments (continued)
WisdomTree India ex-State-Owned Enterprises Fund (IXSE)
March 31, 2022
| | | | | | | | |
| Investments | | Shares | | | Value | |
| | |
| Electrical Equipment – 0.9% | | | | | | | | |
| | |
ABB India Ltd. | | | 411 | | | $ | 11,704 | |
| | |
CG Power & Industrial Solutions Ltd.* | | | 4,640 | | | | 11,601 | |
| | |
Havells India Ltd. | | | 1,889 | | | | 28,732 | |
| | |
Polycab India Ltd. | | | 256 | | | | 7,988 | |
| | | | | | | | |
| Total Electrical Equipment | | | | | | | 60,025 | |
| | |
| Entertainment – 0.1% | | | | | | | | |
| | |
PVR Ltd.* | | | 292 | | | | 7,408 | |
| | |
| Food & Staples Retailing – 0.9% | | | | | | | | |
| | |
Avenue Supermarts Ltd.*(a) | | | 1,146 | | | | 60,545 | |
| | |
| Food Products – 2.5% | | | | | | | | |
| | |
Britannia Industries Ltd. | | | 823 | | | | 34,825 | |
| | |
Hatsun Agro Product Ltd. | | | 427 | | | | 6,041 | |
| | |
Marico Ltd. | | | 4,282 | | | | 28,464 | |
| | |
Nestle India Ltd. | | | 249 | | | | 57,113 | |
| | |
Tata Consumer Products Ltd. | | | 4,570 | | | | 46,885 | |
| | | | | | | | |
| Total Food Products | | | | | | | 173,328 | |
| | |
| Gas Utilities – 1.0% | | | | | | | | |
| | |
Adani Total Gas Ltd. | | | 2,158 | | | | 61,224 | |
| | |
Gujarat Gas Ltd. | | | 1,423 | | | | 9,451 | |
| | | | | | | | |
| Total Gas Utilities | | | | | | | 70,675 | |
| | |
| Health Care Providers & Services – 1.1% | | | | | | | | |
| | |
Apollo Hospitals Enterprise Ltd. | | | 741 | | | | 44,163 | |
| | |
Dr. Lal PathLabs Ltd.(a) | | | 282 | | | | 9,716 | |
| | |
Fortis Healthcare Ltd.* | | | 4,282 | | | | 16,410 | |
| | |
Max Healthcare Institute Ltd.* | | | 2,163 | | | | 9,924 | |
| | | | | | | | |
| Total Health Care Providers & Services | | | | | | | 80,213 | |
| | |
| Hotels, Restaurants & Leisure – 0.4% | | | | | | | | |
| | |
Indian Hotels Co. Ltd. | | | 3,372 | | | | 10,613 | |
| | |
Jubilant Foodworks Ltd. | | | 576 | | | | 20,041 | |
| | | | | | | | |
| Total Hotels, Restaurants & Leisure | | | | | | | 30,654 | |
| | |
| Household Durables – 0.4% | | | | | | | | |
| | |
Crompton Greaves Consumer Electricals Ltd. | | | 3,637 | | | | 17,951 | |
| | |
Dixon Technologies India Ltd. | | | 168 | | | | 9,553 | |
| | | | | | | | |
| Total Household Durables | | | | | | | 27,504 | |
|
| Independent Power & Renewable Electricity Producers – 1.0% | |
| | |
Adani Green Energy Ltd.* | | | 2,852 | | | | 72,065 | |
| | |
| Industrial Conglomerates – 0.4% | | | | | | | | |
| | |
Siemens Ltd. | | | 804 | | | | 25,127 | |
|
| Insurance – 1.7% | |
| | |
HDFC Life Insurance Co. Ltd.(a) | | | 7,393 | | | | 52,510 | |
| | |
ICICI Lombard General Insurance Co. Ltd.(a) | | | 1,702 | | | | 29,835 | |
| | |
ICICI Prudential Life Insurance Co. Ltd.(a) | | | 2,971 | | | | 19,639 | |
| | |
Max Financial Services Ltd.* | | | 1,643 | | | | 16,347 | |
| | | | | | | | |
| Total Insurance | | | | | | | 118,331 | |
| | |
| Interactive Media & Services – 0.5% | | | | | | | | |
| | |
Info Edge India Ltd. | | | 570 | | | | 33,921 | |
| | |
| IT Services – 15.6% | | | | | | | | |
| | |
Coforge Ltd. | | | 192 | | | | 11,295 | |
| | |
Happiest Minds Technologies Ltd. | | | 453 | | | | 6,317 | |
| | |
HCL Technologies Ltd. | | | 8,541 | | | | 131,172 | |
| | |
Infosys Ltd. | | | 28,243 | | | | 710,725 | |
| | |
Mphasis Ltd. | | | 660 | | | | 29,412 | |
| | |
Persistent Systems Ltd. | | | 356 | | | | 22,388 | |
| | |
Tech Mahindra Ltd. | | | 4,599 | | | | 91,006 | |
| | |
Wipro Ltd. | | | 11,308 | | | | 88,330 | |
| | | | | | | | |
| Total IT Services | | | | | | | 1,090,645 | |
| | |
| Life Sciences Tools & Services – 0.8% | | | | | | | | |
| | |
Divi’s Laboratories Ltd. | | | 981 | | | | 56,990 | |
| | |
| Machinery – 0.7% | | | | | | | | |
| | |
Ashok Leyland Ltd. | | | 12,053 | | | | 18,650 | |
| | |
Cummins India Ltd. | | | 1,073 | | | | 15,878 | |
| | |
Escorts Ltd. | | | 598 | | | | 13,344 | |
| | | | | | | | |
| Total Machinery | | | | | | | 47,872 | |
| | |
| Media – 0.4% | | | | | | | | |
| | |
Zee Entertainment Enterprises Ltd. | | | 8,222 | | | | 31,287 | |
| | |
| Metals & Mining – 3.8% | | | | | | | | |
| | |
APL Apollo Tubes Ltd.* | | | 958 | | | | 11,563 | |
| | |
Jindal Steel & Power Ltd. | | | 3,573 | | | | 25,125 | |
| | |
JSW Steel Ltd. | | | 7,487 | | | | 72,390 | |
| | |
Tata Steel Ltd. | | | 5,815 | | | | 100,315 | |
| | |
Vedanta Ltd. | | | 10,010 | | | | 53,283 | |
| | | | | | | | |
| Total Metals & Mining | | | | | | | 262,676 | |
| | |
| Multiline Retail – 0.4% | | | | | | | | |
| | |
Trent Ltd. | | | 1,610 | | | | 27,101 | |
| | |
| Oil, Gas & Consumable Fuels – 11.2% | | | | | | | | |
| | |
Reliance Industries Ltd. | | | 22,466 | | | | 781,159 | |
| | |
| Personal Products – 3.9% | | | | | | | | |
| | |
Colgate-Palmolive India Ltd. | | | 1,242 | | | | 25,279 | |
| | |
Dabur India Ltd. | | | 3,908 | | | | 27,654 | |
| | |
Emami Ltd. | | | 1,401 | | | | 8,267 | |
| | |
Godrej Consumer Products Ltd.* | | | 2,666 | | | | 26,292 | |
| | |
Hindustan Unilever Ltd. | | | 6,869 | | | | 185,710 | |
| | | | | | | | |
| Total Personal Products | | | | | | | 273,202 | |
| | |
| Pharmaceuticals – 5.3% | | | | | | | | |
| | |
Alkem Laboratories Ltd. | | | 336 | | | | 16,055 | |
| | |
Aurobindo Pharma Ltd. | | | 1,701 | | | | 15,008 | |
| | |
Cipla Ltd. | | | 3,989 | | | | 53,593 | |
| | |
Dr. Reddy’s Laboratories Ltd. | | | 983 | | | | 55,723 | |
| | |
Gland Pharma Ltd.*(a) | | | 384 | | | | 16,584 | |
| | |
Glenmark Pharmaceuticals Ltd. | | | 1,172 | | | | 6,836 | |
| | |
Ipca Laboratories Ltd. | | | 1,032 | | | | 14,515 | |
| | |
Laurus Labs Ltd.(a) | | | 2,989 | | | | 23,277 | |
| | |
Lupin Ltd. | | | 1,650 | | | | 16,267 | |
| | |
Natco Pharma Ltd. | | | 531 | | | | 5,299 | |
| | |
Pfizer Ltd. | | | 154 | | | | 8,837 | |
| | |
Sun Pharmaceutical Industries Ltd. | | | 9,235 | | | | 111,484 | |
| | |
Torrent Pharmaceuticals Ltd. | | | 434 | | | | 15,991 | |
| | |
Zydus Lifesciences Ltd. | | | 2,157 | | | | 9,920 | |
| | | | | | | | |
| Total Pharmaceuticals | | | | | | | 369,389 | |
See Notes to Financial Statements.
Schedule of Investments (concluded)
WisdomTree India ex-State-Owned Enterprises Fund (IXSE)
March 31, 2022
| | | | | | | | |
| Investments | | Shares | | | Value | |
| | |
| Real Estate Management & Development – 1.0% | | | | | | | | |
| | |
DLF Ltd. | | | 5,218 | | | $ | 26,198 | |
| | |
Godrej Properties Ltd.* | | | 1,012 | | | | 22,333 | |
| | |
Oberoi Realty Ltd.* | | | 793 | | | | 9,836 | |
| | |
Phoenix Mills Ltd. | | | 599 | | | | 8,695 | |
| | | | | | | | |
| Total Real Estate Management & Development | | | | | | | 67,062 | |
| | |
| Software – 0.6% | | | | | | | | |
| | |
Cyient Ltd. | | | 566 | | | | 6,930 | |
| | |
Oracle Financial Services Software Ltd. | | | 184 | | | | 8,712 | |
| | |
Tata Elxsi Ltd. | | | 243 | | | | 28,349 | |
| | | | | | | | |
| Total Software | | | | | | | 43,991 | |
| | |
| Textiles, Apparel & Luxury Goods – 2.3% | | | | | | | | |
| | |
Bata India Ltd. | | | 538 | | | | 13,926 | |
| | |
Page Industries Ltd. | | | 51 | | | | 29,068 | |
| | |
Rajesh Exports Ltd. | | | 617 | | | | 5,627 | |
| | |
Relaxo Footwears Ltd. | | | 271 | | | | 3,814 | |
| | |
Titan Co. Ltd. | | | 3,169 | | | | 106,065 | |
| | | | | | | | |
| Total Textiles, Apparel & Luxury Goods | | | | | | | 158,500 | |
| | |
| Thrifts & Mortgage Finance – 6.5% | | | | | | | | |
| | |
Aavas Financiers Ltd.* | | | 269 | | | | 9,122 | |
| | |
Housing Development Finance Corp. Ltd. | | | 14,028 | | | | 442,528 | |
| | |
Indiabulls Housing Finance Ltd. | | | 2,636 | | | | 5,489 | |
| | | | | | | | |
| Total Thrifts & Mortgage Finance | | | | | | | 457,139 | |
| | |
| Trading Companies & Distributors – 0.1% | | | | | | | | |
| | |
IndiaMart InterMesh Ltd.(a) | | | 96 | | | | 5,476 | |
| | |
| Transportation Infrastructure – 0.1% | | | | | | | | |
| | |
GMR Infrastructure Ltd.* | | | 14,443 | | | | 7,043 | |
| | |
| Wireless Telecommunication Services – 2.7% | | | | | | | | |
| | |
Bharti Airtel Ltd.* | | | 17,888 | | | | 178,219 | |
| | |
Vodafone Idea Ltd.* | | | 66,403 | | | | 8,456 | |
| | | | | | | | |
| Total Wireless Telecommunication Services | | | | | | | 186,675 | |
TOTAL COMMON STOCKS (Cost: $5,486,159) | | | | | | | 7,150,155 | |
| | |
| | | Principal
Amount | | | | |
| | |
| FOREIGN CORPORATE BOND – 0.0% | | | | | | | | |
| | |
| India – 0.0% | | | | | | | | |
| | |
Britannia Industries Ltd.
5.50%, 6/3/24 | | | | | | | | |
| (Cost: $328) | | | 23,867 | INR | | | 316 | |
| | |
TOTAL INVESTMENTS IN SECURITIES – 102.5% (Cost: $5,486,487) | | | | | | | 7,150,471 | |
| |
Other Assets less Liabilities – (2.5)% | | | | (174,119 | ) |
| | | | | | | | |
| NET ASSETS – 100.0% | | | $ | 6,976,352 | |
| * | Non-income producing security. |
| (a) | This security is exempt from registration under rule 144A of the Securities Act of 1933. This security may be sold in transactions that are exempt from registration, normally to qualified institutional buyers. |
| (b) | This security, or a portion thereof, is restricted from resale (see Note 2 – Restricted Securities). In accordance with a reconstruction scheme notified by the government of India applicable to Yes Bank Ltd., effective March 16, 2020, 75% of all shares of Yes Bank Ltd. held by then-existing shareholders are subject to a three-year lock-in period and are unable to be sold. At March 31, 2022, the value of the restricted portion of this security is as follows: |
| | | | | | | | | | | | | | | | | | | | |
| | | | | |
| Investment | | Restricted
Shares | | | Acquisition Date | | | Acquisition Cost | | | Value | | | Value as a
Percentage of Net
Assets | |
India – Banks
Yes Bank Ltd. | | | 3,819 | | |
| 4/2/19 –
10/18/19 |
| | $ | 11,551 | | | $ | 620 | | | | 0.0 | % |
The following is a summary of the fair valuations according to the inputs used as of March 31, 2022 in valuing the Fund’s investments (See Note 2 — Fair Value Measurement):
| | | | | | | | | | | | | | | | |
| | | | |
| | | Quoted
Prices in
Active
Markets
(Level 1) | | | Other
Significant
Observable
Inputs
(Level 2) | | | Significant
Unobservable
Inputs
(Level 3) | | | Total | |
Assets: | | | | | | | | | |
Investments in Securities | | | | |
Common Stocks | | $ | 7,150,155 | | | $ | — | | | $ | — | | | $ | 7,150,155 | |
Foreign Corporate Bond | | | — | | | | 316 | | | | — | | | | 316 | |
Total Investments in Securities | | $ | 7,150,155 | | | $ | 316 | | | $ | — | | | $ | 7,150,471 | |
See Notes to Financial Statements.
Statements of Assets and Liabilities
WisdomTree Trust
March 31, 2022
| | | | | | | | | | | | | | | | | | | | |
| | | WisdomTree
China
ex-State-Owned
Enterprises Fund | | | WisdomTree
Emerging Markets
ex-State-Owned
Enterprises Fund | | | WisdomTree
Emerging Markets
High Dividend Fund | | | WisdomTree
Emerging
Markets
Multifactor
Fund | | | WisdomTree
Emerging
Markets
Quality
Dividend
Growth Fund | |
ASSETS: | |
| | | | | |
Investments, at cost | | $ | 1,120,521,481 | | | $ | 3,359,530,624 | | | $ | 1,956,969,405 | | | $ | 2,256,700 | | | $ | 75,526,864 | |
| | | | | |
Investment in affiliates, at cost (Note 3) | | | — | | | | — | | | | 1,219,572 | | | | — | | | | — | |
| | | | | |
Foreign currency, at cost | | | 23,979 | | | | 2,130,433 | | | | 1,292,646 | | | | 2,412 | | | | 160,956 | |
| | | | | |
Investments in securities, at value1,2 (Note 2) | | | 844,085,393 | | | | 3,347,354,262 | | | | 2,124,394,193 | | | | 2,359,636 | | | | 87,052,801 | |
| | | | | |
Investment in affiliates, at value (Note 3) | | | — | | | | — | | | | 1,246,049 | | | | — | | | | — | |
| | | | | |
Cash | | | 1,403,966 | | | | 1,744,548 | | | | 1,951,528 | | | | 1,025 | | | | 54,067 | |
| | | | | |
Foreign currency, at value | | | 33,287 | | | | 2,096,133 | | | | 1,290,430 | | | | 2,426 | | | | 160,675 | |
| | | | | |
Unrealized appreciation on foreign currency contracts | | | — | | | | — | | | | — | | | | 4,697 | | | | — | |
|
Receivables: | |
| | | | | |
Dividends | | | 30,058 | | | | 8,685,079 | | | | 6,992,745 | | | | 9,644 | | | | 243,257 | |
| | | | | |
Securities lending income | | | 27,660 | | | | 83,335 | | | | 146,647 | | | | — | | | | 2,907 | |
| | | | | |
Interest | | | — | | | | 1,870 | | | | — | | | | 6 | | | | 94 | |
| | | | | |
Foreign tax reclaims | | | — | | | | 30,746 | | | | 47,109 | | | | 284 | | | | 817 | |
Total Assets | | | 845,580,364 | | | | 3,359,995,973 | | | | 2,136,068,701 | | | | 2,377,718 | | | | 87,514,618 | |
LIABILITIES: | |
| | | | | |
Unrealized depreciation on foreign currency contracts | | | 670 | | | | — | | | | — | | | | 7,274 | | | | — | |
| | | | | |
Payables: | | | | | | | | | | | | | | | | | | | | |
| | | | | |
Cash collateral received for securities loaned (Note 2) | | | 8,864,709 | | | | 27,500,748 | | | | 14,840,667 | | | | — | | | | 273,743 | |
| | | | | |
Investment securities purchased | | | 1,205,263 | | | | — | | | | — | | | | — | | | | — | |
| | | | | |
Advisory fees (Note 3) | | | 226,503 | | | | 885,355 | | | | 1,102,021 | | | | 950 | | | | 23,237 | |
| | | | | |
Service fees (Note 2) | | | 3,115 | | | | 12,174 | | | | 7,697 | | | | 9 | | | | 320 | |
| | | | | |
Foreign capital gains tax | | | — | | | | 11,732,046 | | | | 272,905 | | | | 3,240 | | | | 512,138 | |
Total Liabilities | | | 10,300,260 | | | | 40,130,323 | | | | 16,223,290 | | | | 11,473 | | | | 809,438 | |
NET ASSETS | | $ | 835,280,104 | | | $ | 3,319,865,650 | | | $ | 2,119,845,411 | | | $ | 2,366,245 | | | $ | 86,705,180 | |
NET ASSETS: | |
| | | | | |
Paid-in capital | | $ | 1,258,861,022 | | | $ | 3,598,360,339 | | | $ | 3,420,844,837 | | | $ | 3,392,708 | | | $ | 94,080,804 | |
| | | | | |
Total distributable earnings (loss) | | | (423,580,918 | ) | | | (278,494,689 | ) | | | (1,300,999,426 | ) | | | (1,026,463 | ) | | | (7,375,624 | ) |
NET ASSETS | | $ | 835,280,104 | | | $ | 3,319,865,650 | | | $ | 2,119,845,411 | | | $ | 2,366,245 | | | $ | 86,705,180 | |
Outstanding beneficial interest shares of $0.001 par value (unlimited number of shares authorized) | | | 20,425,000 | | | | 100,300,000 | | | | 48,200,000 | | | | 100,000 | | | | 3,300,000 | |
Net asset value per share | | $ | 40.89 | | | $ | 33.10 | | | $ | 43.98 | | | $ | 23.66 | | | $ | 26.27 | |
1 Includes market value of securities out on loan of: | | $ | 41,658,950 | | | $ | 103,535,801 | | | $ | 165,227,619 | | | $ | 8,559 | | | $ | 2,829,834 | |
2 Investments in securities include investment of cash collateral for securities loaned (see Schedule of Investments for additional information). | | | | | |
See Notes to Financial Statements.
Statements of Assets and Liabilities (continued)
WisdomTree Trust
March 31, 2022
| | | | | | | | | | | | | | | | | | | | |
| | | WisdomTree
Emerging Markets
SmallCap Dividend
Fund | | | WisdomTree
Global ex-U.S.
Quality Dividend
Growth Fund | | | WisdomTree
Global ex-U.S.
Real Estate
Fund | | | WisdomTree
Global High
Dividend Fund | | | WisdomTree
Growth
Leaders Fund | |
ASSETS: | | | | | | | | | | | | | | | | | | | | |
| | | | | |
Investments, at cost | | $ | 2,290,323,937 | | | $ | 539,439,810 | | | $ | 56,267,651 | | | $ | 62,015,493 | | | $ | 18,160,168 | |
| | | | | |
Investment in affiliates, at cost (Note 3) | | | 12,242,086 | | | | 399,983 | | | | — | | | | 3,625 | | | | — | |
| | | | | |
Foreign currency, at cost | | | 3,182,649 | | | | 1,138,627 | | | | 2,687 | | | | 56,002 | | | | 5,489 | |
| | | | | |
Investments in securities, at value1,2 (Note 2) | | | 2,625,418,862 | | | | 568,765,313 | | | | 55,617,760 | | | | 70,171,677 | | | | 15,822,668 | |
| | | | | |
Investment in affiliates, at value (Note 3) | | | 12,543,585 | | | | 413,217 | | | | — | | | | 3,912 | | | | — | |
| | | | | |
Cash | | | 2,787,038 | | | | 1,139,344 | | | | 104,573 | | | | 54,499 | | | | 7,514 | |
| | | | | |
Foreign currency, at value | | | 3,193,420 | | | | 1,137,969 | | | | 2,724 | | | | 56,047 | | | | 5,556 | |
| | | | | |
Unrealized appreciation on foreign currency contracts | | | — | | | | 501 | | | | 54 | | | | — | | | | — | |
|
Receivables: | |
| | | | | |
Investment securities sold | | | — | | | | — | | | | — | | | | — | | | | — | |
| | | | | |
Capital shares sold | | | 469 | | | | 15,982,753 | | | | — | | | | — | | | | — | |
| | | | | |
Dividends | | | 14,429,710 | | | | 1,867,916 | | | | 180,536 | | | | 281,276 | | | | — | |
| | | | | |
Securities lending income | | | 788,055 | | | | 14,849 | | | | 2,179 | | | | 3,215 | | | | 235 | |
| | | | | |
Foreign tax reclaims | | | 48,032 | | | | 549,660 | | | | 35,625 | | | | 47,187 | | | | — | |
Total Assets | | | 2,659,209,171 | | | | 589,871,522 | | | | 55,943,451 | | | | 70,617,813 | | | | 15,835,973 | |
LIABILITIES: | |
| | | | | |
Unrealized depreciation on foreign currency contracts | | | — | | | | 1,895 | | | | — | | | | — | | | | — | |
|
Payables: | |
| | | | | |
Cash collateral received for securities loaned (Note 2) | | | 80,792,166 | | | | 4,393,392 | | | | 1,066,023 | | | | 1,695,565 | | | | 476,955 | |
| | | | | |
Investment securities purchased | | | — | | | | 17,445,887 | | | | — | | | | — | | | | — | |
| | | | | |
Advisory fees (Note 3) | | | 1,206,320 | | | | 185,213 | | | | 26,562 | | | | 32,315 | | | | 2,490 | |
| | | | | |
Service fees (Note 2) | | | 9,170 | | | | 1,943 | | | | 202 | | | | 245 | | | | 55 | |
| | | | | |
Foreign capital gains tax | | | 1,609,639 | | | | 604,406 | | | | 347 | | | | 356 | | | | — | |
Total Liabilities | | | 83,617,295 | | | | 22,632,736 | | | | 1,093,134 | | | | 1,728,481 | | | | 479,500 | |
NET ASSETS | | $ | 2,575,591,876 | | | $ | 567,238,786 | | | $ | 54,850,317 | | | $ | 68,889,332 | | | $ | 15,356,473 | |
NET ASSETS: | | | | | | | | | | | | | | | | | | | | |
| | | | | |
Paid-in capital | | $ | 2,649,404,850 | | | $ | 548,653,659 | | | $ | 91,741,237 | | | $ | 78,561,656 | | | $ | 17,895,330 | |
| | | | | |
Total distributable earnings (loss) | | | (73,812,974 | ) | | | 18,585,127 | | | | (36,890,920 | ) | | | (9,672,324 | ) | | | (2,538,857 | ) |
NET ASSETS | | $ | 2,575,591,876 | | | $ | 567,238,786 | | | $ | 54,850,317 | | | $ | 68,889,332 | | | $ | 15,356,473 | |
Outstanding beneficial interest shares of $0.001 par value (unlimited number of shares authorized) | | | 48,200,000 | | | | 14,200,000 | | | | 2,350,000 | | | | 1,350,000 | | | | 415,000 | |
Net asset value per share | | $ | 53.44 | | | $ | 39.95 | | | $ | 23.34 | | | $ | 51.03 | | | $ | 37.00 | |
1 Includes market value of securities out on loan of: | | $ | 410,875,658 | | | $ | 43,934,988 | | | $ | 4,808,028 | | | $ | 2,825,551 | | | $ | 814,747 | |
2 Investments in securities include investment of cash collateral for securities loaned (see Schedule of Investments for additional information). | |
See Notes to Financial Statements.
Statements of Assets and Liabilities (concluded)
WisdomTree Trust
March 31, 2022
| | | | | | | | |
| | | WisdomTree
India Earnings
Fund
(consolidated) | | | WisdomTree
India
ex-State-Owned
Enterprises
Fund | |
ASSETS: | |
| | |
Investments, at cost | | $ | 510,620,452 | | | $ | 5,486,487 | |
| | |
Investment in affiliates, at cost (Note 3) | | | 26,901 | | | | — | |
| | |
Foreign currency, at cost | | | 2,187,430 | | | | 66 | |
Investments in securities, at value | | | 924,504,452 | | | | 7,150,471 | |
| | |
Investment in affiliates, at value (Note 3) | | | 38,156 | | | | — | |
| | |
Cash | | | 685,110 | | | | 5,487 | |
| | |
Foreign currency, at value | | | 2,203,820 | | | | 67 | |
|
Receivables: | |
| | |
Capital shares sold | | | 40,370 | | | | — | |
| | |
Dividends | | | 154,547 | | | | 390 | |
| | |
Interest | | | 481 | | | | 13 | |
Total Assets | | | 927,626,936 | | | | 7,156,428 | |
LIABILITIES: | |
| | |
Payables: | | | | | | | | |
| | |
Investment securities purchased | | | 1,552,540 | | | | — | |
| | |
Advisory fees (Note 3) | | | 614,732 | | | | 3,296 | |
| | |
Service fees (Note 2) | | | 3,259 | | | | 25 | |
| | |
Foreign capital gains tax | | | 31,614,992 | | | | 176,755 | |
Total Liabilities | | | 33,785,523 | | | | 180,076 | |
NET ASSETS | | $ | 893,841,413 | | | $ | 6,976,352 | |
NET ASSETS: | |
| | |
Paid-in capital | | $ | 568,220,588 | | | $ | 5,635,572 | |
| | |
Total distributable earnings (loss) | | | 325,620,825 | | | | 1,340,780 | |
NET ASSETS | | $ | 893,841,413 | | | $ | 6,976,352 | |
Outstanding beneficial interest shares of $0.001 par value (unlimited number of shares authorized) | | | 24,600,000 | | | | 200,000 | |
Net asset value per share | | $ | 36.34 | | | $ | 34.88 | |
See Notes to Financial Statements.
Statements of Operations
WisdomTree Trust
For the Year Ended March 31, 2022
| | | | | | | | | | | | | | | | | | | | |
| | | WisdomTree
China
ex-State-Owned
Enterprises Fund | | | WisdomTree
Emerging Markets
ex-State-Owned
Enterprises Fund | | | WisdomTree
Emerging Markets
High Dividend Fund | | | WisdomTree
Emerging
Markets
Multifactor
Fund | | | WisdomTree
Emerging
Markets Quality
Dividend
Growth Fund | |
INVESTMENT INCOME: | |
| | | | | |
Dividends | | $ | 13,992,224 | | | $ | 88,587,552 | | | $ | 148,488,946 | | | $ | 198,604 | | | $ | 3,308,538 | |
| | | | | |
Dividends from affiliates (Note 3) | | | — | | | | — | | | | 62,348 | | | | 291 | | | | — | |
| | | | | |
Interest | | | — | | | | — | | | | — | | | | — | | | | 105 | |
| | | | | |
Non-cash dividends | | | 49,549 | | | | 4,709,284 | | | | 497,264 | | | | 1,360 | | | | 18,519 | |
| | | | | |
Other income (Note 6) | | | — | | | | — | | | | 336,475 | | | | — | | | | — | |
| | | | | |
Securities lending income, net (Note 2) | | | 838,606 | | | | 2,020,097 | | | | 1,490,506 | | | | 1,206 | | | | 28,515 | |
| | | | | |
Less: Foreign withholding taxes on dividends | | | (488,411 | ) | | | (11,824,575 | ) | | | (16,720,823 | ) | | | (24,843 | ) | | | (358,302 | ) |
Total investment income | | | 14,391,968 | | | | 83,492,358 | | | | 134,154,716 | | | | 176,618 | | | | 2,997,375 | |
EXPENSES: | | | | | | | | | | | | | | | | | | | | |
| | | | | |
Advisory fees (Note 3) | | | 3,240,553 | | | | 13,733,215 | | | | 12,432,930 | | | | 19,274 | | | | 298,310 | |
| | | | | |
Service fees (Note 2) | | | 44,558 | | | | 188,832 | | | | 86,833 | | | | 177 | | | | 4,102 | |
| | | | | |
Other fees (Note 6) | | | — | | | | — | | | | 99,251 | | | | — | | | | — | |
Total expenses | | | 3,285,111 | | | | 13,922,047 | | | | 12,619,014 | | | | 19,451 | | | | 302,412 | |
Expense waivers (Note 3) | | | — | | | | — | | | | (3,299 | ) | | | (5 | ) | | | — | |
Net expenses | | | 3,285,111 | | | | 13,922,047 | | | | 12,615,715 | | | | 19,446 | | | | 302,412 | |
Net investment income | | | 11,106,857 | | | | 69,570,311 | | | | 121,539,001 | | | | 157,172 | | | | 2,694,963 | |
NET REALIZED AND UNREALIZED GAIN (LOSS) ON INVESTMENTS: | | | | | | | | | | | | | | | | | | | | |
| | | | | |
Net realized gain (loss) from: | | | | | | | | | | | | | | | | | | | | |
| | | | | |
Investment transactions1 | | | (117,911,787 | ) | | | (186,983,386 | ) | | | 158,931,989 | | | | 293,932 | | | | 1,574,352 | |
| | | | | |
Investment transactions in affiliates (Note 3) | | | — | | | | — | | | | (31,264 | ) | | | (598 | ) | | | — | |
| | | | | |
In-kind redemptions | | | 31,152,312 | | | | 112,154,317 | | | | 2,965,801 | | | | 118,975 | | | | — | |
| | | | | |
Foreign currency contracts | | | (265,633 | ) | | | 380,277 | | | | (57,051 | ) | | | (3,949 | ) | | | (43,659 | ) |
| | | | | |
Foreign currency related transactions | | | 20,527 | | | | (1,152,462 | ) | | | (1,151,380 | ) | | | 3,568 | | | | 7,769 | |
Net realized gain (loss) | | | (87,004,581 | ) | | | (75,601,254 | ) | | | 160,658,095 | | | | 411,928 | | | | 1,538,462 | |
Net increase (decrease) in unrealized appreciation/depreciation: | | | | | | | | | | | | | | | | | | | | |
| | | | | |
Investment transactions2 | | | (383,934,376 | ) | | | (719,302,896 | ) | | | (183,160,469 | ) | | | (644,569 | ) | | | (12,245,549 | ) |
| | | | | |
Investment transactions in affiliates (Note 3) | | | — | | | | — | | | | (13,773 | ) | | | — | | | | — | |
| | | | | |
Foreign currency contracts | | | (4,642 | ) | | | (27,093 | ) | | | 4,559 | | | | (24,593 | ) | | | — | |
| | | | | |
Translation of assets and liabilities denominated in foreign currencies | | | 19,013 | | | | 213,239 | | | | 75,323 | | | | 445 | | | | 9,237 | |
Net decrease in unrealized appreciation/depreciation | | | (383,920,005 | ) | | | (719,116,750 | ) | | | (183,094,360 | ) | | | (668,717 | ) | | | (12,236,312 | ) |
Net realized and unrealized loss on investments | | | (470,924,586 | ) | | | (794,718,004 | ) | | | (22,436,265 | ) | | | (256,789 | ) | | | (10,697,850 | ) |
Net increase from payment by affiliate (Note 3) | | | — | | | | 83,629 | | | | — | | | | — | | | | — | |
NET INCREASE (DECREASE) IN NET ASSETS RESULTING FROM OPERATIONS | | $ | (459,817,729 | ) | | $ | (725,064,064 | ) | | $ | 99,102,736 | | | $ | (99,617 | ) | | $ | (8,002,887 | ) |
1 Net of foreign capital gains tax of: | | | — | | | $ | 5,966,221 | | | $ | 4,153,351 | | | $ | 19,571 | | | $ | 140,524 | |
2 Includes net increase (decrease) in accrued foreign capital gain taxes of: | | | — | | | $ | (372,770 | ) | | $ | (2,757,124 | ) | | $ | (3,716 | ) | | $ | 57,948 | |
See Notes to Financial Statements.
Statements of Operations (continued)
WisdomTree Trust
For the Year Ended March 31, 2022
| | | | | | | | | | | | | | | | | | | | |
| | | WisdomTree
Emerging Markets
SmallCap Dividend
Fund | | | WisdomTree
Global ex-U.S.
Quality Dividend
Growth Fund | | | WisdomTree
Global ex-U.S.
Real Estate
Fund | | | WisdomTree
Global High
Dividend Fund | | | WisdomTree
Growth
Leaders Fund | |
INVESTMENT INCOME: | | | | | | | | | | | | | | | | | | | | |
| | | | | |
Dividends | | $ | 102,177,406 | | | $ | 14,120,988 | | | $ | 3,121,816 | | | $ | 3,183,051 | | | $ | 33,457 | |
| | | | | |
Dividends from affiliates (Note 3) | | | 737,144 | | | | 69,069 | | | | — | | | | 12,866 | | | | — | |
| | | | | |
Non-cash dividends | | | 815,796 | | | | 27,274 | | | | 26,506 | | | | 44,483 | | | | — | |
| | | | | |
Other income (Note 6) | | | 198,430 | | | | 15,254 | | | | 19,292 | | | | 1,324 | | | | — | |
| | | | | |
Securities lending income, net (Note 2) | | | 8,415,631 | | | | 109,587 | | | | 17,686 | | | | 13,145 | | | | 3,471 | |
| | | | | |
Less: Foreign withholding taxes on dividends | | | (13,346,182 | ) | | | (1,145,528 | ) | | | (154,890 | ) | | | (148,069 | ) | | | (67 | ) |
Total investment income | | | 98,998,225 | | | | 13,196,644 | | | | 3,030,410 | | | | 3,106,800 | | | | 36,861 | |
EXPENSES: | | | | | | | | | | | | | | | | | | | | |
| | | | | |
Advisory fees (Note 3) | | | 13,623,816 | | | | 2,365,703 | | | | 346,664 | | | | 394,700 | | | | 32,198 | |
| | | | | |
Service fees (Note 2) | | | 99,922 | | | | 19,500 | | | | 2,630 | | | | 2,994 | | | | 708 | |
| | | | | |
Other fees (Note 6) | | | 53,387 | | | | 4,342 | | | | 5,497 | | | | 384 | | | | — | |
Total expenses | | | 13,777,125 | | | | 2,389,545 | | | | 354,791 | | | | 398,078 | | | | 32,906 | |
Expense waivers (Note 3) | | | (16,871 | ) | | | (908 | ) | | | — | | | | (52 | ) | | | — | |
Net expenses | | | 13,760,254 | | | | 2,388,637 | | | | 354,791 | | | | 398,026 | | | | 32,906 | |
Net investment income | | | 85,237,971 | | | | 10,808,007 | | | | 2,675,619 | | | | 2,708,774 | | | | 3,955 | |
NET REALIZED AND UNREALIZED GAIN (LOSS) ON INVESTMENTS: | | | | | | | | | | | | | | | | | | | | |
| | | | | |
Net realized gain (loss) from: | | | | | | | | | | | | | | | | | | | | |
| | | | | |
Investment transactions1 | | | 137,362,405 | | | | 10,793,905 | | | | (91,527 | ) | | | 1,698,807 | | | | (107,885 | ) |
| | | | | |
Investment transactions in affiliates (Note 3) | | | (470,429 | ) | | | (334,314 | ) | | | — | | | | 7,435 | | | | — | |
| | | | | |
In-kind redemptions | | | — | | | | 21,235,206 | | | | 638,564 | | | | 4,595,591 | | | | 297,245 | |
| | | | | |
Futures contracts | | | — | | | | (28,563 | ) | | | — | | | | — | | | | — | |
| | | | | |
Foreign currency contracts | | | (2,616,201 | ) | | | (182,825 | ) | | | (3,940 | ) | | | 6,496 | | | | 665 | |
| | | | | |
Foreign currency related transactions | | | 1,201,817 | | | | 77,184 | | | | (21,265 | ) | | | (8,865 | ) | | | (526 | ) |
Net realized gain | | | 135,477,592 | | | | 31,560,593 | | | | 521,832 | | | | 6,299,464 | | | | 189,499 | |
Net increase (decrease) in unrealized appreciation/depreciation: | | | | | | | | | | | | | | | | | | | | |
| | | | | |
Investment transactions2 | | | (24,141,617 | ) | | | (29,723,202 | ) | | | (6,993,526 | ) | | | (1,051,731 | ) | | | (3,284,829 | ) |
| | | | | |
Investment transactions in affiliates (Note 3) | | | 254,692 | | | | 13,187 | | | | — | | | | (4,952 | ) | | | — | |
| | | | | |
Foreign currency contracts | | | (6,854 | ) | | | (1,196 | ) | | | 185 | | | | — | | | | — | |
| | | | | |
Translation of assets and liabilities denominated in foreign currencies | | | 266,669 | | | | 23,947 | | | | (21 | ) | | | 226 | | | | 34 | |
Net decrease in unrealized appreciation/depreciation | | | (23,627,110 | ) | | | (29,687,264 | ) | | | (6,993,362 | ) | | | (1,056,457 | ) | | | (3,284,795 | ) |
Net realized and unrealized gain (loss) on investments | | | 111,850,482 | | | | 1,873,329 | | | | (6,471,530 | ) | | | 5,243,007 | | | | (3,095,296 | ) |
NET INCREASE (DECREASE) IN NET ASSETS RESULTING FROM OPERATIONS | | $ | 197,088,453 | | | $ | 12,681,336 | | | $ | (3,795,911 | ) | | $ | 7,951,781 | | | $ | (3,091,341 | ) |
1 Net of foreign capital gains tax of: | | $ | 10,501,227 | | | $ | 1,119,391 | | | | — | | | $ | 14,552 | | | | — | |
2 Includes net increase (decrease) in accrued foreign capital gain taxes of: | | $ | (4,209,148 | ) | | $ | (393,500 | ) | | $ | 347 | | | $ | (8,143 | ) | | | — | |
See Notes to Financial Statements.
Statements of Operations (concluded)
WisdomTree Trust
For the Year Ended March 31, 2022
| | | | | | | | |
| | | WisdomTree
India Earnings
Fund
(consolidated) | | | WisdomTree
India
ex-State-Owned
Enterprises
Fund | |
INVESTMENT INCOME: | | | | | | | | |
| | |
Dividends | | $ | 22,288,828 | | | $ | 54,747 | |
| | |
Interest | | | 528 | | | | 13 | |
| | |
Less: Foreign withholding taxes on dividends | | | (4,873,246 | ) | | | (13,082 | ) |
Total investment income | | | 17,416,110 | | | | 41,678 | |
EXPENSES: | | | | | | | | |
| | |
Advisory fees (Note 3) | | | 7,547,035 | | | | 35,017 | |
| | |
Service fees (Note 2) | | | 40,008 | | | | 266 | |
| | |
Interest expense (Note 8) | | | 66,976 | | | | — | |
Total expenses | | | 7,654,019 | | | | 35,283 | |
Expense waivers (Note 3) | | | (153 | ) | | | — | |
Net expenses | | | 7,653,866 | | | | 35,283 | |
Net investment income | | | 9,762,244 | | | | 6,395 | |
NET REALIZED AND UNREALIZED GAIN (LOSS) ON INVESTMENTS: | | | | | | | | |
| | |
Net realized gain (loss) from: | | | | | | | | |
| | |
Investment transactions1 | | | 92,897,428 | | | | (39,172 | ) |
| | |
Futures contracts | | | — | | | | (3,983 | ) |
| | |
Foreign currency contracts | | | (583,591 | ) | | | (2,324 | ) |
| | |
Foreign currency related transactions | | | 184,401 | | | | (10,307 | ) |
Net realized gain (loss) | | | 92,498,238 | | | | (55,786 | ) |
Net increase (decrease) in unrealized appreciation/depreciation: | | | | | | | | |
| | |
Investment transactions2 | | | 34,957,675 | | | | 662,949 | |
| | |
Investment transactions in affiliates (Note 3) | | | 4,447 | | | | — | |
| | |
Translation of assets and liabilities denominated in foreign currencies | | | 16,751 | | | | 5,611 | |
Net increase in unrealized appreciation/depreciation | | | 34,978,873 | | | | 668,560 | |
Net realized and unrealized gain on investments | | | 127,477,111 | | | | 612,774 | |
Net increase from payment by affiliate (Note 3) | | | 3,791 | | | | — | |
NET INCREASE IN NET ASSETS RESULTING FROM OPERATIONS | | $ | 137,243,146 | | | $ | 619,169 | |
1 Net of foreign capital gains tax of: | | | — | | | $ | 48,734 | |
2 Includes net increase (decrease) in accrued foreign capital gain taxes of: | | $ | 17,999,468 | | | $ | 18,140 | |
See Notes to Financial Statements.
Statements of Changes in Net Assets
WisdomTree Trust
| | | | | | | | | | | | | | | | | | | | | | | | |
| | | |
| | | WisdomTree China ex-State-Owned Enterprises Fund | | | WisdomTree Emerging Markets ex-State-
Owned Enterprises Fund | | | WisdomTree Emerging Markets High
Dividend Fund | |
| | | | | | |
| | | For the
Year Ended
March 31, 2022 | | | For the
Year Ended
March 31, 2021 | | | For the
Year Ended
March 31, 2022 | | | For the
Year Ended
March 31, 2021 | | | For the
Year Ended
March 31, 2022 | | | For the
Year Ended
March 31, 2021 | |
INCREASE (DECREASE) IN NET ASSETS RESULTING FROM OPERATIONS: | |
| | | | | | |
Net investment income | | $ | 11,106,857 | | | $ | 1,829,366 | | | $ | 69,570,311 | | | $ | 26,686,732 | | | $ | 121,539,001 | | | $ | 76,740,500 | |
| | | | | | |
Net realized gain (loss) on investments, foreign currency contracts and foreign currency related transactions | | | (87,004,581 | ) | | | 16,741,964 | | | | (75,601,254 | ) | | | 10,543,210 | | | | 160,658,095 | | | | (297,152,828 | ) |
| | | | | | |
Net increase (decrease) in unrealized appreciation/depreciation on investments, foreign currency contracts and translation of assets and liabilities denominated in foreign currencies | | | (383,920,005 | ) | | | 111,338,289 | | | | (719,116,750 | ) | | | 824,760,014 | | | | (183,094,360 | ) | | | 821,792,478 | |
| | | | | | |
Net increase from payment by affiliate | | | — | | | | — | | | | 83,629 | | | | 3,285 | | | | — | | | | — | |
Net increase (decrease) in net assets resulting from operations | | | (459,817,729 | ) | | | 129,909,619 | | | | (725,064,064 | ) | | | 861,993,241 | | | | 99,102,736 | | | | 601,380,150 | |
DISTRIBUTIONS TO SHAREHOLDERS: | |
| | | | | | |
Distributable earnings | | | (10,485,930 | ) | | | (2,251,505 | ) | | | (62,418,244 | ) | | | (27,862,429 | ) | | | (121,113,777 | ) | | | (80,570,083 | ) |
| | | | | | |
Tax return of capital | | | — | | | | (39,686 | ) | | | — | | | | — | | | | — | | | | — | |
Total distributions to shareholders | | | (10,485,930 | ) | | | (2,291,191 | ) | | | (62,418,244 | ) | | | (27,862,429 | ) | | | (121,113,777 | ) | | | (80,570,083 | ) |
CAPITAL SHARE TRANSACTIONS: | |
| | | | | | |
Net proceeds from sale of shares | | | 529,146,692 | | | | 628,390,433 | | | | 219,724,718 | | | | 3,227,187,036 | | | | 273,134,390 | | | | 78,417,646 | |
| | | | | | |
Cost of shares redeemed | | | (138,255,251 | ) | | | (29,667,552 | ) | | | (832,312,478 | ) | | | (151,373,568 | ) | | | (47,979,758 | ) | | | (321,460,657 | ) |
Net increase (decrease) in net assets resulting from capital share transactions | | | 390,891,441 | | | | 598,722,881 | | | | (612,587,760 | ) | | | 3,075,813,468 | | | | 225,154,632 | | | | (243,043,011 | ) |
Net Increase (Decrease) in Net Assets | | | (79,412,218 | ) | | | 726,341,309 | | | | (1,400,070,068 | ) | | | 3,909,944,280 | | | | 203,143,591 | | | | 277,767,056 | |
NET ASSETS: | |
| | | | | | |
Beginning of year | | $ | 914,692,322 | | | $ | 188,351,013 | | | $ | 4,719,935,718 | | | $ | 809,991,438 | | | $ | 1,916,701,820 | | | $ | 1,638,934,764 | |
| | | | | | |
End of year | | $ | 835,280,104 | | | $ | 914,692,322 | | | $ | 3,319,865,650 | | | $ | 4,719,935,718 | | | $ | 2,119,845,411 | | | $ | 1,916,701,820 | |
SHARES CREATED AND REDEEMED: | |
| | | | | | |
Shares outstanding, beginning of year | | | 14,200,000 | | | | 4,900,000 | 1 | | | 117,100,000 | | | | 33,200,000 | | | | 43,300,000 | | | | 50,500,000 | |
| | | | | | |
Shares created | | | 8,875,000 | | | | 9,800,000 | 1 | | | 5,300,000 | | | | 88,200,000 | | | | 6,000,000 | | | | 1,900,000 | |
| | | | | | |
Shares redeemed | | | (2,650,000 | ) | | | (500,000 | )1 | | | (22,100,000 | ) | | | (4,300,000 | ) | | | (1,100,000 | ) | | | (9,100,000 | ) |
Shares outstanding, end of year | | | 20,425,000 | | | | 14,200,000 | 1 | | | 100,300,000 | | | | 117,100,000 | | | | 48,200,000 | | | | 43,300,000 | |
| 1 | Shares were adjusted to reflect a 2:1 stock split effective October 16, 2020. |
See Notes to Financial Statements.
Statements of Changes in Net Assets (continued)
WisdomTree Trust
| | | | | | | | | | | | | | | | | | | | | | | | |
| | | |
| | | WisdomTree Emerging Markets Multifactor Fund | | | WisdomTree Emerging Markets Quality Dividend Growth Fund | | | WisdomTree Emerging Markets SmallCap Dividend Fund | |
| | | | | | |
| | | For the
Year Ended
March 31, 2022 | | | For the
Year Ended
March 31, 2021 | | | For the
Year Ended
March 31, 2022 | | | For the
Year Ended
March 31, 2021 | | | For the
Year Ended
March 31, 2022 | | | For the
Year Ended
March 31, 2021 | |
INCREASE (DECREASE) IN NET ASSETS RESULTING FROM OPERATIONS: | |
| | | | | | |
Net investment income | | $ | 157,172 | | | $ | 203,033 | | | $ | 2,694,963 | | | $ | 2,066,541 | | | $ | 85,237,971 | | | $ | 57,625,627 | |
| | | | | | |
Net realized gain (loss) on investments, foreign currency contracts and foreign currency related transactions | | | 411,928 | | | | 1,196,370 | | | | 1,538,462 | | | | (239,534 | ) | | | 135,477,592 | | | | (97,887,181 | ) |
| | | | | | |
Net increase (decrease) in unrealized appreciation/depreciation on investments, foreign currency contracts and translation of assets and liabilities denominated in foreign currencies | | | (668,717 | ) | | | 1,986,595 | | | | (12,236,312 | ) | | | 35,187,300 | | | | (23,627,110 | ) | | | 757,381,087 | |
Net increase (decrease) in net assets resulting from operations | | | (99,617 | ) | | | 3,385,998 | | | | (8,002,887 | ) | | | 37,014,307 | | | | 197,088,453 | | | | 717,119,533 | |
DISTRIBUTIONS TO SHAREHOLDERS: | |
| | | | | | |
Distributable earnings | | | (134,000 | ) | | | (161,416 | ) | | | (2,582,002 | ) | | | (2,069,274 | ) | | | (91,424,730 | ) | | | (65,877,942 | ) |
CAPITAL SHARE TRANSACTIONS: | |
| | | | | | |
Net proceeds from sale of shares | | | — | | | | — | | | | 2,859,531 | | | | 14,122,476 | | | | 534,715,596 | | | | 159,200,522 | |
| | | | | | |
Cost of shares redeemed | | | (2,561,737 | ) | | | (5,164,535 | ) | | | — | | | | (24,573,035 | ) | | | — | | | | (92,079,674 | ) |
Net increase (decrease) in net assets resulting from capital share transactions | | | (2,561,737 | ) | | | (5,164,535 | ) | | | 2,859,531 | | | | (10,450,559 | ) | | | 534,715,596 | | | | 67,120,848 | |
Net Increase (Decrease) in Net Assets | | | (2,795,354 | ) | | | (1,939,953 | ) | | | (7,725,358 | ) | | | 24,494,474 | | | | 640,379,319 | | | | 718,362,439 | |
NET ASSETS: | |
| | | | | | |
Beginning of year | | $ | 5,161,599 | | | $ | 7,101,552 | | | $ | 94,430,538 | | | $ | 69,936,064 | | | $ | 1,935,212,557 | | | $ | 1,216,850,118 | |
| | | | | | |
End of year | | $ | 2,366,245 | | | $ | 5,161,599 | | | $ | 86,705,180 | | | $ | 94,430,538 | | | $ | 2,575,591,876 | | | $ | 1,935,212,557 | |
SHARES CREATED AND REDEEMED: | |
| | | | | | |
Shares outstanding, beginning of year | | | 200,000 | | | | 400,000 | | | | 3,200,000 | | | | 3,600,000 | | | | 38,100,000 | | | | 36,900,000 | |
| | | | | | |
Shares created | | | — | | | | — | | | | 100,000 | | | | 500,000 | | | | 10,100,000 | | | | 3,400,000 | |
| | | | | | |
Shares redeemed | | | (100,000 | ) | | | (200,000 | ) | | | — | | | | (900,000 | ) | | | — | | | | (2,200,000 | ) |
Shares outstanding, end of year | | | 100,000 | | | | 200,000 | | | | 3,300,000 | | | | 3,200,000 | | | | 48,200,000 | | | | 38,100,000 | |
See Notes to Financial Statements.
Statements of Changes in Net Assets (continued)
WisdomTree Trust
| | | | | | | | | | | | | | | | | | | | | | | | |
| | | |
| | | WisdomTree Global ex-U.S. Quality Dividend Growth Fund | | | WisdomTree Global ex-U.S. Real Estate Fund | | | WisdomTree Global High Dividend Fund | |
| | | | | | |
| | | For the
Year Ended
March 31, 2022 | | | For the
Year Ended
March 31, 2021 | | | For the
Year Ended
March 31, 2022 | | | For the
Year Ended
March 31, 2021 | | | For the
Year Ended
March 31, 2022 | | | For the
Year Ended
March 31, 2021 | |
INCREASE (DECREASE) IN NET ASSETS RESULTING FROM OPERATIONS: | | | | | | | | | | | | | |
| | | | | | |
Net investment income | | $ | 10,808,007 | | | $ | 5,309,362 | | | $ | 2,675,619 | | | $ | 2,685,588 | | | $ | 2,708,774 | | | $ | 2,822,640 | |
| | | | | | |
Net realized gain (loss) on investments, futures contracts, foreign currency contracts and foreign currency related transactions | | | 31,560,593 | | | | 718,159 | | | | 521,832 | | | | (13,108,094 | ) | | | 6,299,464 | | | | (7,471,861 | ) |
| | | | | | |
Net increase (decrease) in unrealized appreciation/depreciation on investments, foreign currency contracts and translation of assets and liabilities denominated in foreign currencies | | | (29,687,264 | ) | | | 68,162,420 | | | | (6,993,362 | ) | | | 26,560,759 | | | | (1,056,457 | ) | | | 28,567,524 | |
Net increase (decrease) in net assets resulting from operations | | | 12,681,336 | | | | 74,189,941 | | | | (3,795,911 | ) | | | 16,138,253 | | | | 7,951,781 | | | | 23,918,303 | |
DISTRIBUTIONS TO SHAREHOLDERS: | |
| | | | | | |
Distributable earnings | | | (9,420,001 | ) | | | (5,009,804 | ) | | | (3,737,023 | ) | | | (2,194,990 | ) | | | (2,682,732 | ) | | | (2,796,745 | ) |
CAPITAL SHARE TRANSACTIONS: | |
| | | | | | |
Net proceeds from sale of shares | | | 258,196,116 | | | | 210,638,439 | | | | 1,325,684 | | | | — | | | | 19,674,154 | | | | 11,563,727 | |
| | | | | | |
Cost of shares redeemed | | | (49,348,920 | ) | | | (20,349,003 | ) | | | (2,653,067 | ) | | | (30,935,826 | ) | | | (21,694,612 | ) | | | (33,996,396 | ) |
Net increase (decrease) in net assets resulting from capital share transactions | | | 208,847,196 | | | | 190,289,436 | | | | (1,327,383 | ) | | | (30,935,826 | ) | | | (2,020,458 | ) | | | (22,432,669 | ) |
Net Increase (Decrease) in Net Assets | | | 212,108,531 | | | | 259,469,573 | | | | (8,860,317 | ) | | | (16,992,563 | ) | | | 3,248,591 | | | | (1,311,111 | ) |
NET ASSETS: | |
| | | | | | |
Beginning of year | | $ | 355,130,255 | | | $ | 95,660,682 | | | $ | 63,710,634 | | | $ | 80,703,197 | | | $ | 65,640,741 | | | $ | 66,951,852 | |
| | | | | | |
End of year | | $ | 567,238,786 | | | $ | 355,130,255 | | | $ | 54,850,317 | | | $ | 63,710,634 | | | $ | 68,889,332 | | | $ | 65,640,741 | |
SHARES CREATED AND REDEEMED: | |
| | | | | | |
Shares outstanding, beginning of year | | | 9,200,000 | 1 | | | 3,600,000 | 1 | | | 2,400,000 | | | | 3,650,000 | | | | 1,400,000 | | | | 1,950,000 | |
| | | | | | |
Shares created | | | 6,200,000 | 1 | | | 6,200,000 | 1 | | | 50,000 | | | | — | | | | 400,000 | | | | 300,000 | |
| | | | | | |
Shares redeemed | | | (1,200,000 | )1 | | | (600,000 | )1 | | | (100,000 | ) | | | (1,250,000 | ) | | | (450,000 | ) | | | (850,000 | ) |
Shares outstanding, end of year | | | 14,200,000 | 1 | | | 9,200,000 | 1 | | | 2,350,000 | | | | 2,400,000 | | | | 1,350,000 | | | | 1,400,000 | |
| 1 | Shares were adjusted to reflect a 2:1 stock split effective June 9, 2021. |
See Notes to Financial Statements.
Statements of Changes in Net Assets (concluded)
WisdomTree Trust
| | | | | | | | | | | | | | | | | | | | | | | | |
| | | |
| | | WisdomTree Growth Leaders Fund | | | WisdomTree India Earnings Fund (consolidated) | | | WisdomTree India ex-State-Owned Enterprises Fund | |
| | | | | | |
| | | For the
Year Ended
March 31, 2022 | | | For the
Year Ended
March 31, 2021 | | | For the
Year Ended
March 31, 2022 | | | For the
Year Ended
March 31, 2021 | | | For the
Year Ended
March 31, 2022 | | | For the
Year Ended
March 31, 2021 | |
INCREASE (DECREASE) IN NET ASSETS RESULTING FROM OPERATIONS: | | | | | | | | | | | | | |
| | | | | | |
Net investment income | | $ | 3,955 | | | $ | 5,261 | | | $ | 9,762,244 | | | $ | 4,431,585 | | | $ | 6,395 | | | $ | 4,592 | |
| | | | | | |
Net realized gain (loss) on investments, futures contracts and foreign currency related transactions | | | 189,499 | | | | 1,160,601 | | | | 92,498,238 | | | | 48,844,220 | | | | (55,786 | ) | | | 20,380 | |
| | | | | | |
Net increase (decrease) in unrealized appreciation/depreciation on investments and translation of assets and liabilities denominated in foreign currencies | | | (3,284,795 | ) | | | 1,100,813 | | | | 34,978,873 | | | | 374,039,346 | | | | 668,560 | | | | 1,173,632 | |
| | | | | | |
Net increase from payment by affiliate | | | — | | | | — | | | | 3,791 | | | | — | | | | — | | | | — | |
Net increase (decrease) in net assets resulting from operations | | | (3,091,341 | ) | | | 2,266,675 | | | | 137,243,146 | | | | 427,315,151 | | | | 619,169 | | | | 1,198,604 | |
DISTRIBUTIONS TO SHAREHOLDERS: | | | | | | | | | |
| | | | | | |
Distributable earnings | | | (5,287 | ) | | | (11,858 | ) | | | (12,894,200 | ) | | | (6,924,754 | ) | | | (1,470 | ) | | | (4,497 | ) |
CAPITAL SHARE TRANSACTIONS: | | | | | | | | | |
| | | | | | |
Net proceeds from sale of shares | | | 5,203,072 | | | | 13,488,300 | | | | 82,707,196 | | | | — | | | | 1,809,189 | | | | 2,473,495 | |
| | | | | | |
Cost of shares redeemed | | | (1,160,393 | ) | | | (3,083,581 | ) | | | (101,040,011 | ) | | | (195,882,462 | ) | | | — | | | | — | |
Net increase (decrease) in net assets resulting from capital share transactions | | | 4,042,679 | | | | 10,404,719 | | | | (18,332,815 | ) | | | (195,882,462 | ) | | | 1,809,189 | | | | 2,473,495 | |
Net Increase in Net Assets | | | 946,051 | | | | 12,659,536 | | | | 106,016,131 | | | | 224,507,935 | | | | 2,426,888 | | | | 3,667,602 | |
NET ASSETS: | | | | | | | | | |
| | | | | | |
Beginning of year | | $ | 14,410,422 | | | $ | 1,750,886 | | | $ | 787,825,282 | | | $ | 563,317,347 | | | $ | 4,549,464 | | | $ | 881,862 | |
| | | | | | |
End of year | | $ | 15,356,473 | | | $ | 14,410,422 | | | $ | 893,841,413 | | | $ | 787,825,282 | | | $ | 6,976,352 | | | $ | 4,549,464 | |
SHARES CREATED AND REDEEMED: | | | | | | | | | |
| | | | | | |
Shares outstanding, beginning of year | | | 325,004 | | | | 75,004 | | | | 25,200,000 | | | | 34,800,000 | | | | 150,000 | | | | 50,000 | |
| | | | | | |
Shares created | | | 115,000 | | | | 325,000 | | | | 2,200,000 | | | | — | | | | 50,000 | | | | 100,000 | |
| | | | | | |
Shares redeemed | | | (25,004 | ) | | | (75,000 | ) | | | (2,800,000 | ) | | | (9,600,000 | ) | | | — | | | | — | |
Shares outstanding, end of year | | | 415,000 | | | | 325,004 | | | | 24,600,000 | | | | 25,200,000 | | | | 200,000 | | | | 150,000 | |
See Notes to Financial Statements.
Financial Highlights
WisdomTree Trust
Selected data for a share of beneficial interest outstanding throughout the period is presented below:
| | | | | | | | | | | | | | | | | | | | |
WisdomTree China ex-State-Owned Enterprises Fund | | For the
Year Ended
March 31, 2022 | | | For the
Year Ended
March 31, 20211 | | | For the
Year Ended
March 31, 20201 | | | For the
Year Ended
March 31, 20191 | | | For the
Year Ended
March 31, 20181 | |
Net asset value, beginning of year | | $ | 64.41 | | | $ | 38.44 | | | $ | 38.84 | | | $ | 43.62 | | | $ | 28.59 | |
Investment operations: | | | | | | | | | | | | | | | | | | | | |
| | | | | |
Net investment income2 | | | 0.60 | | | | 0.23 | | | | 0.39 | | | | 0.49 | | | | 0.06 | |
| | | | | |
Net realized and unrealized gain (loss) | | | (23.54 | ) | | | 26.10 | | | | (0.39 | ) | | | (4.82 | ) | | | 15.28 | |
Total from investment operations | | | (22.94 | ) | | | 26.33 | | | | 0.00 | 3 | | | (4.33 | ) | | | 15.34 | |
Dividends and distributions to shareholders: | | | | | | | | | | | | | | | | | | | | |
| | | | | |
Net investment income | | | (0.58 | ) | | | (0.35 | ) | | | (0.40 | ) | | | (0.45 | ) | | | (0.31 | ) |
| | | | | |
Tax return of capital | | | — | | | | (0.01 | ) | | | — | | | | (0.00 | )3 | | | — | |
Total dividends and distributions to shareholders | | | (0.58 | ) | | | (0.36 | ) | | | (0.40 | ) | | | (0.45 | ) | | | (0.31 | ) |
Net asset value, end of year | | $ | 40.89 | | | $ | 64.41 | | | $ | 38.44 | | | $ | 38.84 | | | $ | 43.62 | |
| | | | | |
TOTAL RETURN4 | | | (35.81 | )% | | | 68.71 | % | | | 0.07 | % | | | (9.91 | )% | | | 53.95 | % |
RATIOS/SUPPLEMENTAL DATA: | | | | | | | | | | | | | | | | | | | | |
| | | | | |
Net assets, end of year (000’s omitted) | | $ | 835,280 | | | $ | 914,692 | | | $ | 188,351 | | | $ | 143,699 | | | $ | 215,928 | |
| | | | | |
Ratios to average net assets of: | | | | | | | | | | | | | | | | | | | | |
| | | | | |
Expenses, net of expense waivers | | | 0.32 | % | | | 0.32 | %5 | | | 0.32 | %6 | | | 0.32 | %6 | | | 0.33 | %6,7 |
| | | | | |
Expenses, prior to expense waivers | | | 0.32 | % | | | 0.38 | % | | | 0.63 | % | | | 0.63 | % | | | 0.63 | % |
| | | | | |
Net investment income | | | 1.10 | % | | | 0.37 | % | | | 1.03 | % | | | 1.31 | % | | | 0.14 | % |
Portfolio turnover rate8 | | | 36 | % | | | 20 | % | | | 22 | % | | | 35 | % | | | 20 | % |
| | | | | | | | | | | | | | | | | | | | |
| | | | | | |
WisdomTree Emerging Markets ex-State-Owned Enterprises Fund | | For the
Year Ended
March 31, 2022 | | | For the
Year Ended
March 31, 2021 | | | For the
Year Ended
March 31, 2020 | | | For the
Year Ended
March 31, 2019 | | | For the
Year Ended
March 31, 2018 | |
Net asset value, beginning of year | | $ | 40.31 | | | $ | 24.40 | | | $ | 28.79 | | | $ | 31.99 | | | $ | 24.72 | |
Investment operations: | | | | | | | | | | | | | | | | | | | | |
| | | | | |
Net investment income2 | | | 0.62 | | | | 0.41 | | | | 0.62 | | | | 0.42 | | | | 0.28 | |
| | | | | |
Net realized and unrealized gain (loss) | | | (7.28 | ) | | | 15.91 | | | | (4.38 | ) | | | (3.20 | ) | | | 7.20 | |
| | | | | |
Net increase from payment by affiliate | | | 0.00 | 3 | | | 0.00 | 3 | | | — | | | | 0.00 | 3 | | | — | |
Total from investment operations | | | (6.66 | ) | | | 16.32 | | | | (3.76 | ) | | | (2.78 | ) | | | 7.48 | |
Dividends to shareholders: | | | | | | | | | | | | | | | | | | | | |
| | | | | |
Net investment income | | | (0.55 | ) | | | (0.41 | ) | | | (0.63 | ) | | | (0.42 | ) | | | (0.21 | ) |
Net asset value, end of year | | $ | 33.10 | | | $ | 40.31 | | | $ | 24.40 | | | $ | 28.79 | | | $ | 31.99 | |
| | | | | |
TOTAL RETURN4 | | | (16.70 | )%9 | | | 67.18 | %10 | | | (13.36 | )% | | | (8.64 | )%10 | | | 30.30 | % |
RATIOS/SUPPLEMENTAL DATA: | | | | | | | | | | | | | | | | | | | | |
| | | | | |
Net assets, end of year (000’s omitted) | | $ | 3,319,866 | | | $ | 4,719,936 | | | $ | 809,991 | | | $ | 305,184 | | | $ | 92,776 | |
| | | | | |
Ratios to average net assets of: | | | | | | | | | | | | | | | | | | | | |
| | | | | |
Expenses, net of expense waivers | | | 0.32 | % | | | 0.32 | %5 | | | 0.32 | %6 | | | 0.32 | %6 | | | 0.33 | %6 |
| | | | | |
Expenses, prior to expense waivers | | | 0.32 | % | | | 0.37 | % | | | 0.58 | % | | | 0.58 | % | | | 0.58 | % |
| | | | | |
Net investment income | | | 1.62 | % | | | 1.11 | % | | | 2.14 | % | | | 1.51 | % | | | 0.92 | % |
Portfolio turnover rate8 | | | 18 | % | | | 34 | % | | | 19 | % | | | 24 | % | | | 68 | % |
| 1 | Shares were adjusted to reflect a 2:1 stock split effective October 16, 2020. |
| 2 | Based on average shares outstanding. |
| 3 | Amount represents less than $0.005. |
| 4 | Total return is calculated assuming an initial investment made at the net asset value at the beginning of the period, reinvestment of all dividends and distributions at net asset value during the period and redemption on the last day of the period. For the periods in which the investment advisor waived advisory fees, the total return would have been lower if certain expenses had not been waived (Notes 2 and 3). |
| 5 | The investment advisor had contractually agreed to limit the advisory fee to 0.32% through July 31, 2020. On July 31, 2020, the contractual waiver expired and the advisory fee was permanently reduced to 0.32%. |
| 6 | Effective June 30, 2017, the investment advisor contractually agreed to limit the advisory fee to 0.32% through July 31, 2020, unless earlier terminated by the Board of Trustees of the Trust. |
| 7 | Effective July 1, 2015, the investment advisor contractually agreed to limit the advisory fee to 0.53% through July 31, 2017, unless earlier terminated by the Board of Trustees of the Trust. |
| 8 | Portfolio turnover rate excludes the value of the portfolio securities received or delivered as a result of in-kind creations or redemptions of the Fund’s capital shares. Short-term securities with maturities less than or equal to 365 days are excluded from the portfolio turnover calculation. |
| 9 | Includes a voluntary reimbursement from the sub-advisor for investment losses on certain foreign exchange transactions during the period. Excluding this voluntary reimbursement, total return would have been unchanged (Note 3). |
| 10 | Includes a reimbursement from the sub-advisor for an operational error that resulted in investment transaction losses. Excluding the reimbursement, total return would have been unchanged. |
See Notes to Financial Statements.
Financial Highlights (continued)
WisdomTree Trust
Selected data for a share of beneficial interest outstanding throughout the period is presented below:
| | | | | | | | | | | | | | | | | | | | |
WisdomTree Emerging Markets High
Dividend Fund | | For the
Year Ended
March 31, 2022 | | | For the
Year Ended
March 31, 2021 | | | For the
Year Ended
March 31, 2020 | | | For the
Year Ended
March 31, 2019 | | | For the
Year Ended
March 31, 2018 | |
Net asset value, beginning of year | | $ | 44.27 | | | $ | 32.45 | | | $ | 43.72 | | | $ | 47.35 | | | $ | 40.69 | |
Investment operations: | | | | | | | | | | | | | | | | | | | | |
| | | | | |
Net investment income1 | | | 2.75 | | | | 1.76 | | | | 2.10 | | | | 1.84 | | | | 1.67 | |
| | | | | |
Net realized and unrealized gain (loss) | | | (0.30 | ) | | | 11.93 | | | | (11.25 | ) | | | (3.57 | ) | | | 6.65 | |
Total from investment operations | | | 2.45 | | | | 13.69 | | | | (9.15 | ) | | | (1.73 | ) | | | 8.32 | |
Dividends to shareholders: | | | | | | | | | | | | | | | | | | | | |
| | | | | |
Net investment income | | | (2.74 | ) | | | (1.87 | ) | | | (2.12 | ) | | | (1.90 | ) | | | (1.66 | ) |
Net asset value, end of year | | $ | 43.98 | | | $ | 44.27 | | | $ | 32.45 | | | $ | 43.72 | | | $ | 47.35 | |
| | | | | |
TOTAL RETURN2 | | | 5.65 | % | | | 43.37 | % | | | (22.06 | )% | | | (3.51 | )% | | | 20.98 | % |
RATIOS/SUPPLEMENTAL DATA: | | | | | | | | | | | | | | | | | | | | |
| | | | | |
Net assets, end of year (000’s omitted) | | $ | 2,119,845 | | | $ | 1,916,702 | | | $ | 1,638,935 | | | $ | 2,173,006 | | | $ | 2,282,176 | |
| | | | | |
Ratios to average net assets3 of: | | | | | | | | | | | | | | | | | | | | |
| | | | | |
Expenses4 | | | 0.64 | %5 | | | 0.63 | % | | | 0.63 | % | | | 0.63 | % | | | 0.63 | % |
| | | | | |
Net investment income | | | 6.16 | % | | | 4.58 | % | | | 4.91 | % | | | 4.23 | % | | | 3.81 | % |
Portfolio turnover rate6 | | | 53 | % | | | 62 | % | | | 41 | % | | | 44 | % | | | 41 | % |
| | | | | | | | | | | | | | | | | | | | |
| | | | | | |
WisdomTree Emerging Markets
Multifactor Fund | | | | | For the
Year Ended
March 31, 2022 | | | For the
Year Ended
March 31, 2021 | | | For the
Year Ended
March 31, 2020 | | | For the Period
August 10, 2018*
through
March 31, 2019 | |
Net asset value, beginning of period | | | | | | $ | 25.81 | | | $ | 17.75 | | | $ | 23.61 | | | $ | 24.68 | |
Investment operations: | | | | | | | | | | | | | | | | | | | | |
| | | | | |
Net investment income1 | | | | | | | 1.01 | | | | 0.56 | | | | 0.73 | | | | 0.29 | |
| | | | | |
Net realized and unrealized gain (loss) | | | | | | | (2.44 | ) | | | 7.90 | | | | (5.91 | ) | | | (1.16 | ) |
Total from investment operations | | | | | | | (1.43 | ) | | | 8.46 | | | | (5.18 | ) | | | (0.87 | ) |
Dividends to shareholders: | | | | | | | | | | | | | | | | | | | | |
| | | | | |
Net investment income | | | | | | | (0.72 | ) | | | (0.40 | ) | | | (0.68 | ) | | | (0.20 | ) |
Net asset value, end of period | | | | | | $ | 23.66 | | | $ | 25.81 | | | $ | 17.75 | | | $ | 23.61 | |
| | | | | |
TOTAL RETURN2 | | | | | | | (5.72 | )% | | | 48.12 | % | | | (22.44 | )% | | | (3.52 | )% |
RATIOS/SUPPLEMENTAL DATA: | | | | | | | | | | | | | | | | | | | | |
| | | | | |
Net assets, end of period (000’s omitted) | | | | | | $ | 2,366 | | | $ | 5,162 | | | $ | 7,102 | | | $ | 18,886 | |
| | | | | |
Ratios to average net assets of: | | | | | | | | | | | | | | | | | | | | |
| | | | | |
Expenses | | | | | | | 0.48 | %3,4 | | | 0.48 | %3,4 | | | 0.48 | % | | | 0.48 | %4,7 |
| | | | | |
Net investment income | | | | | | | 3.91 | %3 | | | 2.51 | %3 | | | 3.24 | % | | | 1.97 | %7 |
Portfolio turnover rate6 | | | | | | | 115 | % | | | 125 | % | | | 166 | % | | | 133 | % |
| * | Commencement of operations. The commencement of operations date is considered to be the date that the Fund began trading in the secondary market. |
| 1 | Based on average shares outstanding. |
| 2 | Total return is calculated assuming an initial investment made at the net asset value at the beginning of the period, reinvestment of all dividends and distributions at net asset value during the period and redemption on the last day of the period. Total return calculated for a period of less than one year is not annualized. For the periods in which the investment advisor waived advisory fees, the total return would have been lower if certain expenses had not been waived (Notes 2 and 3). |
| 3 | The ratios to average net assets do not include net investment income (loss) or expenses of other funds in which the Fund invests. |
| 4 | The expense ratio includes investment advisory fee waivers. Without these investment advisory fee waivers, the expense ratio would have been unchanged. |
| 5 | Included in the expense ratio are “Other fees” described in Note 6. Without these expenses, the expense ratio would have been 0.63%. |
| 6 | Portfolio turnover rate is not annualized for fiscal periods less than one year and excludes the value of the portfolio securities received or delivered as a result of in-kind creations or redemptions of the Fund’s capital shares. Short-term securities with maturities less than or equal to 365 days are excluded from the portfolio turnover calculation. |
See Notes to Financial Statements.
Financial Highlights (continued)
WisdomTree Trust
Selected data for a share of beneficial interest outstanding throughout the period is presented below:
| | | | | | | | | | | | | | | | | | | | |
WisdomTree Emerging Markets Quality Dividend Growth Fund | | For the
Year Ended
March 31, 2022 | | | For the
Year Ended
March 31, 2021 | | | For the
Year Ended
March 31, 2020 | | | For the
Year Ended
March 31, 2019 | | | For the
Year Ended
March 31, 2018 | |
Net asset value, beginning of year | | $ | 29.51 | | | $ | 19.43 | | | $ | 24.71 | | | $ | 26.94 | | | $ | 23.03 | |
Investment operations: |
| | | | | |
Net investment income1 | | | 0.83 | | | | 0.61 | | | | 0.66 | | | | 0.71 | | | | 0.56 | |
| | | | | |
Net realized and unrealized gain (loss) | | | (3.28 | ) | | | 10.08 | | | | (5.32 | ) | | | (2.30 | ) | | | 3.87 | |
Total from investment operations | | | (2.45 | ) | | | 10.69 | | | | (4.66 | ) | | | (1.59 | ) | | | 4.43 | |
Dividends to shareholders: |
| | | | | |
Net investment income | | | (0.79 | ) | | | (0.61 | ) | | | (0.62 | ) | | | (0.64 | ) | | | (0.52 | ) |
Net asset value, end of year | | $ | 26.27 | | | $ | 29.51 | | | $ | 19.43 | | | $ | 24.71 | | | $ | 26.94 | |
| | | | | |
TOTAL RETURN2 | | | (8.48 | )% | | | 55.66 | % | | | (19.30 | )% | | | (5.79 | )% | | | 19.44 | % |
RATIOS/SUPPLEMENTAL DATA: | | | | | | | | | | | | | | | | | | | | |
| | | | | |
Net assets, end of year (000’s omitted) | | $ | 86,705 | | | $ | 94,431 | | | $ | 69,936 | | | $ | 69,189 | | | $ | 75,442 | |
| | | | | |
Ratios to average net assets of: | | | | | | | | | | | | | | | | | | | | |
| | | | | |
Expenses, net of expense waivers | | | 0.32 | % | | | 0.32 | %3 | | | 0.32 | %4 | | | 0.32 | %4 | | | 0.39 | %4 |
| | | | | |
Expenses, prior to expense waivers | | | 0.32 | % | | | 0.42 | % | | | 0.63 | % | | | 0.63 | % | | | 0.63 | % |
| | | | | |
Net investment income | | | 2.89 | % | | | 2.38 | % | | | 2.74 | % | | | 2.93 | % | | | 2.17 | % |
Portfolio turnover rate5 | | | 42 | % | | | 57 | % | | | 55 | % | | | 81 | % | | | 62 | % |
| | | | | | | | | | | | | | | | | | | | |
| | | | | | |
WisdomTree Emerging Markets SmallCap Dividend Fund | | For the
Year Ended
March 31, 2022 | | | For the
Year Ended
March 31, 2021 | | | For the
Year Ended
March 31, 2020 | | | For the
Year Ended
March 31, 2019 | | | For the
Year Ended
March 31, 2018 | |
Net asset value, beginning of year | | $ | 50.79 | | | $ | 32.98 | | | $ | 47.03 | | | $ | 53.47 | | | $ | 44.62 | |
Investment operations: |
| | | | | |
Net investment income1 | | | 1.99 | | | | 1.58 | | | | 1.82 | | | | 1.79 | | | | 1.42 | |
| | | | | |
Net realized and unrealized gain (loss) | | | 2.80 | | | | 18.04 | | | | (14.02 | ) | | | (6.35 | ) | | | 8.89 | |
Total from investment operations | | | 4.79 | | | | 19.62 | | | | (12.20 | ) | | | (4.56 | ) | | | 10.31 | |
Dividends to shareholders: |
| | | | | |
Net investment income | | | (2.14 | ) | | | (1.81 | ) | | | (1.85 | ) | | | (1.88 | ) | | | (1.46 | ) |
Net asset value, end of year | | $ | 53.44 | | | $ | 50.79 | | | $ | 32.98 | | | $ | 47.03 | | | $ | 53.47 | |
| | | | | |
TOTAL RETURN2 | | | 9.48 | % | | | 60.63 | % | | | (26.95 | )% | | | (8.40 | )% | | | 23.55 | % |
RATIOS/SUPPLEMENTAL DATA: | | | | | | | | | | | | | | | | | | | | |
| | | | | |
Net assets, end of year (000’s omitted) | | $ | 2,575,592 | | | $ | 1,935,213 | | | $ | 1,216,850 | | | $ | 1,424,969 | | | $ | 1,743,104 | |
| | | | | |
Ratios to average net assets6 of: | | | | | | | | | | | | | | | | | | | | |
| | | | | |
Expenses7 | | | 0.61 | %8,9 | | | 0.63 | % | | | 0.63 | % | | | 0.63 | % | | | 0.63 | % |
| | | | | |
Net investment income | | | 3.75 | % | | | 3.65 | % | | | 4.05 | % | | | 3.81 | % | | | 2.88 | % |
Portfolio turnover rate5 | | | 45 | % | | | 59 | % | | | 47 | % | | | 40 | % | | | 48 | % |
| 1 | Based on average shares outstanding. |
| 2 | Total return is calculated assuming an initial investment made at the net asset value at the beginning of the period, reinvestment of all dividends and distributions at net asset value during the period and redemption on the last day of the period. For the periods in which the investment advisor waived advisory fees, the total return would have been lower if certain expenses had not been waived (Notes 2 and 3). |
| 3 | The investment advisor had contractually agreed to limit the advisory fee to 0.32% through July 31, 2020. On July 31, 2020, the contractual waiver expired and the advisory fee was permanently reduced to 0.32%. |
| 4 | Effective June 30, 2017, the investment advisor contractually agreed to limit the advisory fee to 0.32% through July 31, 2020, unless earlier terminated by the Board of Trustees of the Trust. |
| 5 | Portfolio turnover rate excludes the value of the portfolio securities received or delivered as a result of in-kind creations or redemptions of the Fund’s capital shares. Short-term securities with maturities less than or equal to 365 days are excluded from the portfolio turnover calculation. |
| 6 | The ratios to average net assets do not include net investment income (loss) or expenses of other funds in which the Fund invests. |
| 7 | The expense ratio includes investment advisory fee waivers. Without these investment advisory fee waivers, the expense ratio would have been unchanged. |
| 8 | Prior to September 1, 2021, the Fund’s annual advisory fee rate was 0.63% and, thereafter, was reduced to 0.58% per annum. |
| 9 | Included in the expense ratio are “Other fees” described in Note 6. Without these expenses, the expense ratio would have been 0.60%. |
See Notes to Financial Statements.
Financial Highlights (continued)
WisdomTree Trust
Selected data for a share of beneficial interest outstanding throughout the period is presented below:
| | | | | | | | | | | | | | | | | | | | |
WisdomTree Global ex-U.S.
Quality Dividend Growth Fund | | For the
Year Ended
March 31, 20221 | | | For the
Year Ended
March 31, 20211 | | | For the
Year Ended
March 31, 20201 | | | For the
Year Ended
March 31, 20191 | | | For the
Year Ended
March 31, 20181 | |
Net asset value, beginning of year | | $ | 38.60 | | | $ | 26.57 | | | $ | 27.80 | | | $ | 29.52 | | | $ | 25.02 | |
Investment operations: | | | | | | | | | | | | | | | | | | | | |
| | | | | |
Net investment income2 | | | 1.01 | | | | 0.80 | | | | 0.80 | | | | 0.58 | | | | 0.62 | |
| | | | | |
Net realized and unrealized gain (loss) | | | 1.15 | | | | 11.94 | | | | (1.31 | ) | | | (1.67 | ) | | | 4.40 | |
Total from investment operations | | | 2.16 | | | | 12.74 | | | | (0.51 | ) | | | (1.09 | ) | | | 5.02 | |
Dividends to shareholders: | | | | | | | | | | | | | | | | | | | | |
| | | | | |
Net investment income | | | (0.81 | ) | | | (0.71 | ) | | | (0.72 | ) | | | (0.63 | ) | | | (0.52 | ) |
Net asset value, end of year | | $ | 39.95 | | | $ | 38.60 | | | $ | 26.57 | | | $ | 27.80 | | | $ | 29.52 | |
| | | | | |
TOTAL RETURN3 | | | 5.57 | % | | | 48.25 | % | | | (2.01 | )% | | | (3.65 | )% | | | 20.18 | % |
RATIOS/SUPPLEMENTAL DATA: | | | | | | | | | | | | | | | | | | | | |
| | | | | |
Net assets, end of year (000’s omitted) | | $ | 567,239 | | | $ | 355,130 | | | $ | 95,661 | | | $ | 72,280 | | | $ | 70,841 | |
| | | | | |
Ratios to average net assets4 of: | | | | | | | | | | | | | | | | | | | | |
| | | | | |
Expenses | | | 0.54 | %5,6,7 | | | 0.58 | % | | | 0.58 | %5 | | | 0.58 | %5 | | | 0.58 | %5 |
| | | | | |
Net investment income | | | 2.44 | % | | | 2.29 | % | | | 2.68 | % | | | 2.11 | % | | | 2.20 | % |
Portfolio turnover rate8 | | | 59 | % | | | 56 | % | | | 56 | % | | | 60 | % | | | 67 | % |
| | | | | | | | | | | | | | | | | | | | |
WisdomTree Global ex-U.S. Real
Estate Fund | | For the
Year Ended
March 31, 2022 | | | For the
Year Ended
March 31, 2021 | | | For the
Year Ended
March 31, 2020 | | | For the
Year Ended
March 31, 2019 | | | For the
Year Ended
March 31, 2018 | |
Net asset value, beginning of year | | $ | 26.55 | | | $ | 22.11 | | | $ | 32.15 | | | $ | 32.04 | | | $ | 28.16 | |
Investment operations: | | | | | | | | | | | | | | | | | | | | |
| | | | | |
Net investment income2 | | | 1.14 | | | | 0.89 | | | | 1.13 | | | | 1.12 | | | | 1.11 | |
| | | | | |
Net realized and unrealized gain (loss) | | | (2.74 | ) | | | 4.35 | | | | (8.79 | ) | | | 0.24 | | | | 4.92 | |
Total from investment operations | | | (1.60 | ) | | | 5.24 | | | | (7.66 | ) | | | 1.36 | | | | 6.03 | |
Dividends to shareholders: | | | | | | | | | | | | | | | | | | | | |
| | | | | |
Net investment income | | | (1.61 | ) | | | (0.80 | ) | | | (2.38 | ) | | | (1.25 | ) | | | (2.15 | ) |
Net asset value, end of year | | $ | 23.34 | | | $ | 26.55 | | | $ | 22.11 | | | $ | 32.15 | | | $ | 32.04 | |
| | | | | |
TOTAL RETURN3 | | | (6.45 | )% | | | 23.92 | % | | | (25.74 | )% | | | 4.51 | % | | | 21.90 | % |
RATIOS/SUPPLEMENTAL DATA: | | | | | | | | | | | | | | | | | | | | |
| | | | | |
Net assets, end of year (000’s omitted) | | $ | 54,850 | | | $ | 63,711 | | | $ | 80,703 | | | $ | 114,146 | | | $ | 107,329 | |
| | | | | |
Ratios to average net assets of: | | | | | | | | | | | | | | | | | | | | |
| | | | | |
Expenses | | | 0.59 | %9 | | | 0.58 | % | | | 0.58 | %4 | | | 0.58 | %4 | | | 0.58 | %4 |
| | | | | |
Net investment income | | | 4.48 | % | | | 3.59 | % | | | 3.75 | %4 | | | 3.72 | %4 | | | 3.56 | %4 |
Portfolio turnover rate8 | | | 7 | % | | | 39 | % | | | 21 | % | | | 17 | % | | | 23 | % |
| 1 | Per share amounts were adjusted to reflect a 2:1 stock split effective June 9, 2021. |
| 2 | Based on average shares outstanding. |
| 3 | Total return is calculated assuming an initial investment made at the net asset value at the beginning of the period, reinvestment of all dividends and distributions at net asset value during the period and redemption on the last day of the period. For the periods in which the investment advisor waived advisory fees for the WisdomTree Global ex-U.S. Quality Dividend Fund, the total return would have been lower if certain expenses had not been waived (Notes 2 and 3). |
| 4 | The ratios to average net assets do not include net investment income (loss) or expenses of other funds in which the Fund invests. |
| 5 | The expense ratio includes investment advisory fee waivers. Without these investment advisory fee waivers, the expense ratio would have been unchanged. |
| 6 | Prior to January 1, 2022, the Fund’s annual advisory fee rate was 0.58% and, thereafter, was reduced to 0.42% per annum. |
| 7 | Included in the expense ratio are “Other fees” described in Note 6. Without these expenses, the expense ratio would have been unchanged. |
| 8 | Portfolio turnover rate excludes the value of the portfolio securities received or delivered as a result of in-kind creations or redemptions of the Fund’s capital shares. Short-term securities with maturities less than or equal to 365 days are excluded from the portfolio turnover calculation. |
| 9 | Included in the expense ratio are “Other fees” described in Note 6. Without these expenses, the expense ratio would have been 0.58%. |
See Notes to Financial Statements.
Financial Highlights (continued)
WisdomTree Trust
Selected data for a share of beneficial interest outstanding throughout the period is presented below:
| | | | | | | | | | | | | | | | | | | | |
| WisdomTree Global High Dividend Fund | | For the
Year Ended
March 31, 2022 | | | For the
Year Ended
March 31, 2021 | | | For the
Year Ended
March 31, 2020 | | | For the
Year Ended
March 31, 2019 | | | For the
Year Ended
March 31, 2018 | |
Net asset value, beginning of year | | $ | 46.89 | | | $ | 34.33 | | | $ | 46.11 | | | $ | 46.38 | | | $ | 44.75 | |
Investment operations: |
| | | | | |
Net investment income1 | | | 1.95 | | | | 1.63 | | | | 1.78 | | | | 1.77 | | | | 1.59 | |
| | | | | |
Net realized and unrealized gain (loss) | | | 4.02 | | | | 12.62 | | | | (11.79 | ) | | | (0.18 | ) | | | 1.54 | |
Total from investment operations | | | 5.97 | | | | 14.25 | | | | (10.01 | ) | | | 1.59 | | | | 3.13 | |
Dividends to shareholders: |
| | | | | |
Net investment income | | | (1.83 | ) | | | (1.69 | ) | | | (1.77 | ) | | | (1.86 | ) | | | (1.50 | ) |
Net asset value, end of year | | $ | 51.03 | | | $ | 46.89 | | | $ | 34.33 | | | $ | 46.11 | | | $ | 46.38 | |
| | | | | |
TOTAL RETURN2 | | | 12.96 | % | | | 42.38 | % | | | (22.46 | )% | | | 3.59 | % | | | 7.02 | % |
RATIOS/SUPPLEMENTAL DATA: | | | | | | | | | | | | | | | | | | | | |
| | | | | |
Net assets, end of year (000’s omitted) | | $ | 68,889 | | | $ | 65,641 | | | $ | 66,952 | | | $ | 92,227 | | | $ | 104,358 | |
| | | | | |
Ratios to average net assets3 of: | | | | | | | | | | | | | | | | | | | | |
| | | | | |
Expenses4 | | | 0.58 | %5 | | | 0.58 | % | | | 0.58 | % | | | 0.58 | % | | | 0.58 | % |
| | | | | |
Net investment income | | | 3.98 | % | | | 4.05 | % | | | 3.88 | % | | | 3.86 | % | | | 3.41 | % |
Portfolio turnover rate6 | | | 39 | % | | | 48 | % | | | 32 | % | | | 19 | % | | | 21 | % |
| | | | | | | | | | | | | | | | | | | | |
| | | | | | |
| WisdomTree Growth Leaders Fund | | | | | | | | For the
Year Ended
March 31, 2022 | | | For the
Year Ended
March 31, 20217 | | | For the Period
May 22, 2019*
through
March 31, 2020 | |
Net asset value, beginning of period | | | | | | | | | | $ | 44.34 | | | $ | 23.34 | | | $ | 24.80 | |
Investment operations: | | | | | | | | | | | | | | | | | | | | |
| | | | | |
Net investment income1 | | | | | | | | | | | 0.01 | | | | 0.03 | | | | 0.06 | |
| | | | | |
Net realized and unrealized gain (loss) | | | | | | | | | | | (7.34 | ) | | | 21.02 | | | | (1.44 | ) |
Total from investment operations | | | | | | | | | | | (7.33 | ) | | | 21.05 | | | | (1.38 | ) |
Dividends to shareholders: | | | | | | | | | | | | | | | | | | | | |
| | | | | |
Net investment income | | | | | | | | | | | (0.01 | ) | | | (0.05 | ) | | | (0.08 | ) |
Net asset value, end of period | | | | | | | | | | $ | 37.00 | | | $ | 44.34 | | | $ | 23.34 | |
| | | | | |
TOTAL RETURN2 | | | | | | | | | | | (16.53 | )% | | | 90.18 | % | | | (5.61 | )% |
RATIOS/SUPPLEMENTAL DATA: | | | | | | | | | | | | | | | | | | | | |
| | | | | |
Net assets, end of period (000’s omitted) | | | | | | | | | | $ | 15,356 | | | $ | 14,410 | | | $ | 1,751 | |
| | | | | |
Ratios to average net assets of: | | | | | | | | | | | | | | | | | | | | |
| | | | | |
Expenses | | | | | | | | | | | 0.20 | % | | | 0.24 | %8 | | | 0.45 | %9 |
| | | | | |
Net investment income | | | | | | | | | | | 0.02 | % | | | 0.08 | % | | | 0.27 | %9 |
Portfolio turnover rate6 | | | | | | | | | | | 52 | % | | | 40 | % | | | 9 | % |
| * | Commencement of operations. The commencement of operations date is considered to be the date that the Fund began trading in the secondary market. |
| 1 | Based on average shares outstanding. |
| 2 | Total return is calculated assuming an initial investment made at the net asset value at the beginning of the period, reinvestment of all dividends and distributions at net asset value during the period and redemption on the last day of the period. Total return calculated for a period of less than one year is not annualized. For the periods in which the investment advisor waived advisory fees for the WisdomTree Global High Dividend Fund, the total return would have been lower if certain expenses had not been waived (Notes 2 and 3). |
| 3 | The ratios to average net assets do not include net investment income (loss) or expenses of other funds in which the Fund invests. |
| 4 | The expense ratio includes investment advisory fee waivers. Without these investment advisory fee waivers, the expense ratio would have been unchanged. |
| 5 | Included in the expense ratio are “Other fees” described in Note 6. Without these expenses, the expense ratio would have been unchanged. |
| 6 | Portfolio turnover rate excludes the value of the portfolio securities received or delivered as a result of in-kind creations or redemptions of the Fund’s capital shares. Short-term securities with maturities less than or equal to 365 days are excluded from the portfolio turnover calculation. |
| 7 | The information reflects the investment objective and strategy of the WisdomTree Modern Tech Platforms Fund through July 31, 2020 and the investment objective and strategy of the WisdomTree Growth Leaders Fund thereafter. The increase in portfolio turnover rate was primarily a result of the aforementioned investment objective and strategy change. |
| 8 | Prior to August 1, 2020, the Fund’s net expense ratio was 0.45% and, thereafter, was reduced to 0.20% per annum. |
See Notes to Financial Statements.
Financial Highlights (concluded)
WisdomTree Trust
Selected data for a share of beneficial interest outstanding throughout the period is presented below:
| | | | | | | | | | | | | | | | | | | | |
| | | | | |
WisdomTree India Earnings Fund (consolidated) | | For the
Year Ended
March 31, 2022 | | | For the
Year Ended
March 31, 2021 | | | For the
Year Ended
March 31, 2020 | | | For the
Year Ended
March 31, 2019 | | | For the
Year Ended
March 31, 2018 | |
Net asset value, beginning of year | | $ | 31.26 | | | $ | 16.19 | | | $ | 26.26 | | | $ | 25.88 | | | $ | 24.07 | |
Investment operations: | | | | | | | | | | | | | | | | | | | | |
| | | | | |
Net investment income1 | | | 0.38 | | | | 0.16 | | | | 0.30 | | | | 0.28 | | | | 0.24 | |
| | | | | |
Net realized and unrealized gain (loss) | | | 5.20 | | | | 15.16 | | | | (10.18 | ) | | | 0.45 | | | | 1.79 | |
| | | | | |
Net increase from payment by affiliate | | | 0.00 | 2 | | | — | | | | — | | | | — | | | | — | |
Total from investment operations | | | 5.58 | | | | 15.32 | | | | (9.88 | ) | | | 0.73 | | | | 2.03 | |
Dividends and distributions to shareholders: | | | | | | | | | | | | | | | | | | | | |
| | | | | |
Net investment income | | | (0.50 | ) | | | (0.25 | ) | | | (0.19 | ) | | | (0.34 | ) | | | (0.22 | ) |
| | | | | |
Tax return of capital | | | — | | | | — | | | | — | | | | (0.01 | ) | | | — | |
Total dividends and distributions to shareholders | | | (0.50 | ) | | | (0.25 | ) | | | (0.19 | ) | | | (0.35 | ) | | | (0.22 | ) |
Net asset value, end of year | | $ | 36.34 | | | $ | 31.26 | | | $ | 16.19 | | | $ | 26.26 | | | $ | 25.88 | |
| | | | | |
TOTAL RETURN3 | | | 17.85 | %4 | | | 95.10 | % | | | (37.84 | )% | | | 2.89 | % | | | 8.46 | % |
RATIOS/SUPPLEMENTAL DATA: | | | | | | | | | | | | | | | | | | | | |
| | | | | |
Net assets, end of year (000’s omitted) | | $ | 893,841 | | | $ | 787,825 | | | $ | 563,317 | | | $ | 1,323,424 | | | $ | 1,671,567 | |
| | | | | |
Ratios to average net assets of: | | | | | | | | | | | | | | | | | | | | |
| | | | | |
Expenses5 | | | 0.84 | %6,7 | | | 0.84 | %6,7 | | | 0.84 | %6,7 | | | 0.85 | % | | | 0.84 | % |
| | | | | |
Net investment income | | | 1.07 | %6 | | | 0.67 | %6 | | | 1.22 | %6 | | | 1.14 | % | | | 0.91 | % |
Portfolio turnover rate8 | | | 30 | % | | | 23 | % | | | 32 | % | | | 37 | % | | | 22 | % |
| | | | | | | | | | | | | | | | | | | | |
| | | | |
| WisdomTree India ex-State-Owned Enterprises Fund | | | For the
Year Ended
March 31, 2022 | | | For the
Year Ended
March 31, 2021 | | | For the Period
April 4, 2019*
through
March 31, 2020 | |
Net asset value, beginning of period | | | | | | | | | | $ | 30.33 | | | $ | 17.64 | | | $ | 24.67 | |
Investment operations: | | | | | | | | | | | | | | | | | | | | |
| | | | | |
Net investment income1 | | | | | | | | | | | 0.04 | | | | 0.05 | | | | 0.19 | |
| | | | | |
Net realized and unrealized gain (loss) | | | | | | | | | | | 4.52 | | | | 12.69 | | | | (7.22 | ) |
Total from investment operations | | | | | | | | | | | 4.56 | | | | 12.74 | | | | (7.03 | ) |
Dividends to shareholders: | | | | | | | | | | | | | | | | | | | | |
| | | | | |
Net investment income | | | | | | | | | | | (0.01 | ) | | | (0.05 | ) | | | — | |
Net asset value, end of period | | | | | | | | | | $ | 34.88 | | | $ | 30.33 | | | $ | 17.64 | |
| | | | | |
TOTAL RETURN3 | | | | | | | | | | | 15.04 | % | | | 72.25 | % | | | (28.50 | )% |
RATIOS/SUPPLEMENTAL DATA: | | | | | | | | | | | | | | | | | | | | |
| | | | | |
Net assets, end of period (000’s omitted) | | | | | | | | | | $ | 6,976 | | | $ | 4,549 | | | $ | 882 | |
| | | | | |
Ratios to average net assets of: | | | | | | | | | | | | | | | | | | | | |
| | | | | |
Expenses | | | | | | | | | | | 0.58 | % | | | 0.58 | % | | | 0.58 | %9 |
| | | | | |
Net investment income | | | | | | | | | | | 0.11 | % | | | 0.20 | % | | | 0.80 | %9 |
Portfolio turnover rate8 | | | | | | | | | | | 15 | % | | | 36 | % | | | 82 | % |
| * | Commencement of operations. The commencement of operations date is considered to be the date that the Fund began trading in the secondary market. |
| 1 | Based on average shares outstanding. |
| 2 | Amount represents less than $0.005. |
| 3 | Total return is calculated assuming an initial investment made at the net asset value at the beginning of the period, reinvestment of all dividends and distributions at net asset value during the period and redemption on the last day of the period. Total return calculated for a period of less than one year is not annualized. For the periods in which the investment advisor waived advisory fees for the WisdomTree India Earnings Fund, the total return would have been lower if certain expenses had not been waived (Notes 2 and 3). |
| 4 | Includes a voluntary reimbursement from the sub-advisor for investment losses on certain foreign exchange transactions during the period. Excluding this voluntary reimbursement, total return would have been 0.04% lower (Note 3). |
| 5 | Includes interest expense of 0.01% for each of the fiscal years presented. |
| 6 | The ratios to average net assets do not include net investment income (loss) or expenses of other funds in which the Fund invests. |
| 7 | The expense ratio includes investment advisory fee waivers. Without these investment advisory fee waivers, the expense ratio would have been unchanged. |
| 8 | Portfolio turnover rate is not annualized for fiscal periods less than one year and excludes the value of the portfolio securities received or delivered as a result of in-kind creations or redemptions of the Fund’s capital shares. Short-term securities with maturities less than or equal to 365 days are excluded from the portfolio turnover calculation. |
See Notes to Financial Statements.
Notes to Financial Statements
1. ORGANIZATION
WisdomTree Trust (the “Trust”) is registered under the Investment Company Act of 1940, as amended (the “1940 Act”), as an open-end management investment company. The Trust was established as a Delaware statutory trust on December 15, 2005 and is authorized to have multiple series of portfolios (each a “Fund”, collectively, the “Funds”). These notes relate only to the Funds listed below. In accordance with Accounting Standards Codification Topic 946, Financial Services-Investment Companies, each Fund listed below qualifies as an investment company and is applying the accounting and reporting guidance for investment companies.
| | | | |
| | |
| Fund | | Commencement
of Operations | |
WisdomTree China ex-State-Owned Enterprises Fund (“China ex-State-Owned Enterprises Fund’’) | | | September 19, 2012 | |
WisdomTree Emerging Markets ex-State-Owned Enterprises Fund (“Emerging Markets ex-State-Owned Enterprises Fund’’) | | | December 10, 2014 | |
WisdomTree Emerging Markets High Dividend Fund (“Emerging Markets High Dividend Fund’’) | | | July 13, 2007 | |
WisdomTree Emerging Markets Multifactor Fund (“Emerging Markets Multifactor Fund’’) | | | August 10, 2018 | |
WisdomTree Emerging Markets Quality Dividend Growth Fund (“Emerging Markets Quality Dividend Growth Fund’’) | | | August 1, 2013 | |
WisdomTree Emerging Markets SmallCap Dividend Fund (“Emerging Markets SmallCap Dividend Fund’’) | | | October 30, 2007 | |
WisdomTree Global ex-U.S. Quality Dividend Growth Fund (“Global ex-U.S. Quality Dividend Growth Fund’’) | | | June 16, 2006 | |
WisdomTree Global ex-U.S. Real Estate Fund (“Global ex-U.S. Real Estate Fund’’) | | | June 5, 2007 | |
WisdomTree Global High Dividend Fund (“Global High Dividend Fund’’) | | | June 16, 2006 | |
WisdomTree Growth Leaders Fund (“Growth Leaders Fund’’) | | | May 22, 2019 | |
WisdomTree India Earnings Fund (“India Earnings Fund’’) (consolidated) | | | February 22, 2008 | |
WisdomTree India ex-State-Owned Enterprises Fund (“India ex-State-Owned Enterprises Fund’’) | | | April 4, 2019 | |
The India Earnings Fund makes its investments through the WisdomTree India Investment Portfolio, Inc. (the “Portfolio”), a wholly owned subsidiary organized in the Republic of Mauritius (“Mauritius”). The Portfolio was incorporated under the provisions of the Mauritius Companies Act, 2001 and holds a Global Business License Category 1 issued by the Financial Services Commission.
Each Fund, except for the Emerging Markets Multifactor Fund and Emerging Markets Quality Dividend Growth Fund, seeks to track the price and yield performance, before fees and expenses, of a particular index (“Index”) developed by WisdomTree Investments, Inc. (“WisdomTree Investments’’) or an Index developed by a third party. The Emerging Markets Multifactor Fund is actively managed using a model-based approach seeking capital appreciation. The Emerging Markets Quality Dividend Growth Fund is actively managed using a model-based approach seeking income and capital appreciation. WisdomTree Investments is the parent company of WisdomTree Asset Management, Inc. (‘‘WTAM’’), the investment adviser to each Fund (including the Portfolio) and the Trust. “WisdomTree” is a registered trademark of WisdomTree Investments and has been licensed for use by the Trust. Each Fund described herein is considered to be non-diversified as defined under the 1940 Act.
In the normal course of business, the Funds may enter into contracts that contain a variety of representations or that provide indemnification for certain liabilities. The Funds’ maximum exposure under these arrangements is unknown, as this would involve future claims that may be made against the Funds that have not yet occurred. However, the Funds have not had prior claims or losses pursuant to these contracts and believes such exposure to be remote.
2. SIGNIFICANT ACCOUNTING POLICIES
The Financial Accounting Standards Board (“FASB”) Accounting Standards Codification (the “Codification”) is the exclusive reference of authoritative U.S. generally accepted accounting principles (“GAAP”) recognized by the FASB to be applied by nongovernmental entities. Rules and interpretive releases of the Securities and Exchange Commission (“SEC”) under authority of federal laws are also sources of authoritative GAAP for SEC registrants.
The following is a summary of significant accounting policies followed by the Funds:
Use of Estimates — The preparation of financial statements in conformity with GAAP, requires management to make certain estimates and assumptions that affect the reported amounts of assets and liabilities and disclosure of contingent assets and liabilities at the date of the financial statements and the reported amounts of increases and decreases in the net assets from operations during the reporting period. Actual results could differ from those estimates.
Basis of Consolidation — The financial statements for the India Earnings Fund include the accounts of a wholly-owned and controlled Mauritius subsidiary (the “Subsidiary”). The India Earnings Fund’s accompanying financial statements reflect the financial position and the results of operations on a consolidated basis with its Subsidiary. All intercompany accounts and transactions have been eliminated in the consolidation.
Notes to Financial Statements (continued)
Investment Valuation — The net asset value (“NAV”) of each Fund’s shares is calculated each day a Fund is open for business as of the regularly scheduled close of regular trading on the New York Stock Exchange, normally 4:00 p.m. Eastern time (the “NAV Calculation Time”). NAV per share is calculated by dividing a Fund’s net assets by the number of Fund shares outstanding. Each Fund issues and redeems shares at NAV only in large blocks of shares known as creation units, which only certain institutions (e.g., broker-dealers) may purchase or redeem. Shares of each Fund are listed on a national securities exchange and trade at market prices. Most investors will buy and sell shares in the secondary market through brokers. Because Fund shares trade at market prices rather than NAV, shares may trade at a price greater than NAV or less than NAV. In calculating each Fund’s NAV, investments are valued under policies approved by the Board of Trustees of the Trust (the “Board of Trustees”). Equity securities (including preferred stock) traded on any recognized U.S. or non-U.S. exchange are valued at the last sale price or official closing price on the exchange on which they are principally traded. Unlisted equity securities (including preferred stock) are valued at the last sale price or, if no sale price is available, at the mean between the highest bid and lowest ask price. Fixed income securities generally are valued at current market quotations or mean prices obtained from broker-dealers or independent pricing service providers. Broker-dealers or independent pricing service providers, in determining the value of securities, may consider such factors as recent transactions, indications from yields and quoted prices from broker-dealers on similar securities, and market sentiment for the type of security. U.S. fixed income securities may be valued as of the announced closing time for such securities on any day that the Securities Industry and Financial Markets Association announces an early closing time. Each Fund may invest in money market funds which are valued at their NAV per share and exchange-traded funds (“ETFs” or “ETF”) or exchange-traded notes (“ETNs” or “ETN”) which are valued at their last sale or official closing price on the exchange on which they are principally traded or at their NAV per share in instances where the ETF or ETN has not traded on its principal exchange. Foreign currency contracts that settle within two business days after the trade date (‘‘Spot Contracts’’) and foreign currency contracts having a settlement period greater than two business days after the trade date (‘‘Forward Contracts’’) are valued daily using WM/Reuters closing spot and forward rates, respectively, as of 4:00 p.m. London time. Futures contracts generally are valued at the settlement price, the price at which a futures contract settles once a given trading day has ended, on the primary exchange on which they trade.
In certain instances, such as when reliable market valuations are not readily available, a Fund’s investments, which include derivatives, will be fair valued in accordance with the Fund’s pricing policy. The Board of Trustees has established a pricing committee (the “Pricing Committee”) which is comprised of senior representatives of WTAM and which reports to the Board of Trustees on a quarterly basis. In the event that a financial instrument cannot be valued based upon a price from the exchange or system on which it is principally traded, independent pricing service provider or broker-dealer quotation, or such prices are deemed to not reflect current market value, the Pricing Committee may value the financial instrument in good faith under the policies and procedures approved by the Board of Trustees based on current facts and circumstances. Securities that may be valued using “fair value” pricing may include, but are not limited to, securities for which there are no current market quotations, securities whose issuer is in default or bankruptcy, securities subject to corporate actions (such as mergers or reorganizations), securities subject to non-U.S. investment limits or currency controls, and securities affected by “significant events.” An example of a significant event is an event occurring after the close of the market in which a security trades but before a Fund’s next NAV Calculation Time that may materially affect the value of a Fund’s investment (e.g., government action, natural disaster, or significant market fluctuation). When fair value pricing is employed, the prices of securities used by a Fund to calculate its NAV may differ from quoted or published prices for the same securities.
Fair Value Measurement — In accordance with Codification Topic 820 (“ASC 820”), Fair Value Measurements and Disclosures, fair value is defined as the price that would be received to sell an asset or paid to transfer a liability in an orderly transaction between market participants at the measurement date. The Pricing Committee will perform other procedures (consistent with GAAP) to value an investment when a market quote is not available. ASC 820 established a three-tier hierarchy of inputs to be used when determining fair value measurements for disclosure purposes. Inputs refer broadly to the assumptions that market participants would use in pricing the asset or liability, including assumptions about risk — for example, the risk inherent in a particular valuation technique used to measure fair value (such as a pricing model) and/or the risk inherent in the inputs to the valuation technique. Inputs may be observable or unobservable. Observable inputs reflect the assumptions market participants would use in pricing the asset or liability. Observable inputs are based on market data obtained from sources independent of the reporting entity. Unobservable inputs reflect the reporting entity’s own assumptions about the assumptions market participants would use in pricing the asset or liability. Unobservable inputs are based on the best information available in the circumstances. The three-tier hierarchy of inputs is summarized in the three broad levels listed below:
Level 1 – quoted prices in active markets for identical securities
Level 2 – other significant observable inputs (including quoted prices for similar securities, interest rates,
prepayment speeds, credit risk, etc.)
Level 3 – significant unobservable inputs (including each Fund’s assumptions in determining the fair value of investments)
Notes to Financial Statements (continued)
The inputs or methodology used for valuation are not necessarily an indication of the risk associated with investing in those investments.
Investments that use Level 2 or Level 3 inputs may include, but are not limited to: (i) an unlisted security related to corporate actions; (ii) a restricted security (e.g., one that may not be publicly sold without registration under the Securities Act of 1933, as amended); (iii) a security whose trading has been suspended (either due to events affecting the issuer of the security specifically or events affecting the primary trading exchange more broadly) or which has been de-listed from its primary trading exchange; (iv) a security that is thinly traded; (v) a security in default or bankruptcy proceedings for which there is no current market quotation or market activity; (vi) a security affected by currency controls or restrictions; and (vii) a security affected by a significant event (e.g., an event that occurs after the close of the markets in which the security is traded but before the time as of which a Fund’s NAV is computed and that may materially affect the value of the Fund’s investments).
The valuation techniques and significant inputs used in determining the fair market value measurements for Level 2 and Level 3 positions are as follows:
Financial instruments are generally valued by independent pricing service providers that use broker-dealer quotations, reported trades or valuation estimates from their internal pricing models. Depending on the type of financial instrument, the independent pricing service providers’ internal pricing models may use inputs that are observable such as issuer details (e.g., credit rating, debt ranking, coupon date, maturity date, etc.), interest rates, yield curves, prepayment speeds, credit risks/spreads, default rates and quoted prices for similar assets. Financial instruments that use similar valuation techniques and observable inputs as described above and have an appropriate level of market activity are categorized as Level 2 of the fair value hierarchy, otherwise a Level 3 fair value classification is appropriate. Over-the-counter financial derivative instruments derive their value from underlying asset prices, indices, reference rates, and other inputs or a combination of these factors. These instruments are normally valued on the basis of broker-dealer quotations or prices obtained from independent pricing service providers. Depending on the product and the terms of the transaction, the value of the financial derivative instruments can be estimated by an independent pricing service provider using a series of techniques including simulation pricing models. The pricing models may use inputs that are observed from actively quoted markets such as issuer details, indices, credit risks/spreads, interest rates, yield curves, default and exchange rates. Derivative contracts that use similar valuation techniques and observable inputs as described above and have an appropriate level of market activity are categorized as Level 2 of the fair value hierarchy, otherwise a Level 3 fair value classification is appropriate.
Determination of a fair value by the Pricing Committee may include significant unobservable inputs and therefore such financial instruments would be reflected as a Level 3 of the fair value hierarchy. The Pricing Committee may employ a market-based valuation approach which may use, among other potential considerations, related or comparable securities, recent transactions, market multiples, and other relevant information to determine fair value. The Pricing Committee may also use an income-based valuation approach in which anticipated future cash flows of the financial instrument are discounted to calculate fair value.
The summary of fair valuations according to the inputs used in valuing each Fund’s assets as of the measurement date and significant transfers into or out of Level 3 of the fair value hierarchy during the fiscal year ended March 31, 2022, if any, are included in a “Fair Valuation Summary” supplementary table in each applicable Fund’s Schedule of Investments.
Derivatives and Hedging Disclosure — Codification Topic 815 (“ASC 815”), Derivatives and Hedging, requires qualitative disclosures about objectives and strategies for using derivatives, quantitative disclosures about fair value amounts as well as gains and losses on derivative instruments, and disclosures about credit-risk-related contingent features in derivative agreements. The Funds have invested in derivatives, specifically foreign currency contracts and equity futures contracts during the fiscal year ended March 31, 2022 and open positions in such derivatives as of March 31, 2022 are detailed in each Fund’s Schedule of Investments. All of the derivative instruments disclosed and described herein are subject to risk. Risks may arise upon entering into foreign currency contracts from potential inability of a counterparty to meet the terms of their contracts and from unanticipated movements in the value of the foreign currencies relative to the U.S. dollar or each other. The Funds’ derivative agreements may also contain credit-risk related contingent features which include, but are not limited to, a percentage decline in the Funds’ NAV over a specified time period. If an event occurred at March 31, 2022 that triggered a contingent feature, the counterparty to the agreement may require the Funds to post additional collateral or terminate the derivative positions and demand payment. Any collateral posted with respect to the derivative positions would be used to offset or reduce the payment. The maximum exposure to derivatives agreements with credit-risk related contingent features would be the total value of derivatives in net liability positions for each Fund, as disclosed in the table included in Note 2—Master Netting Arrangements. Information with respect to the amounts and types of collateral received and/or posted for derivative instruments as of March 31, 2022, if any, is reflected as a footnote within each Fund’s Schedule of Investments.
Notes to Financial Statements (continued)
As of March 31, 2022, the effects of such derivative instruments on each Fund’s financial position as reflected in the Statements of Assets and Liabilities are presented in the summary below:
| | | | | | | | | | | | |
| | | |
| | | Asset Derivatives | | | Liability Derivatives | |
| | | | |
| Fund | | Balance Sheet Location | | Value | | | Balance Sheet Location | | Value | |
China ex-State-Owned Enterprises Fund | |
Foreign currency risk | | Unrealized appreciation on
foreign currency contracts | | $ | — | | | Unrealized depreciation on
foreign currency contracts | | $ | 670 | |
Emerging Markets Multifactor Fund | |
Foreign currency risk | | Unrealized appreciation on
foreign currency contracts | | | 4,697 | | | Unrealized depreciation on
foreign currency contracts | | | 7,274 | |
Global ex-U.S. Quality Dividend Growth Fund | |
Foreign currency risk | | Unrealized appreciation on
foreign currency contracts | | | 501 | | | Unrealized depreciation on
foreign currency contracts | | | 1,895 | |
Global ex-U.S. Real Estate Fund | |
Foreign currency risk | | Unrealized appreciation on
foreign currency contracts | | | 54 | | | Unrealized depreciation on
foreign currency contracts | | | — | |
For the fiscal year ended March 31, 2022, the effects of derivative instruments on each applicable Fund’s financial performance as reflected in the Statements of Operations are presented in the summary below:
| | | | | | | | |
| | | |
| Fund | | Amount of Realized Gain
or (Loss) on Derivatives
Recognized1 | | | Change in Unrealized
Appreciation or
(Depreciation) on
Derivatives Recognized2 | |
China ex-State-Owned Enterprises Fund | |
Foreign currency risk | | $ | (265,633 | ) | | $ | (4,642 | ) |
Emerging Markets ex-State-Owned Enterprises Fund | |
Foreign currency risk | | | 380,277 | | | | (27,093 | ) |
Emerging Markets High Dividend Fund | |
Foreign currency risk | | | (57,051 | ) | | | 4,559 | |
Emerging Markets Multifactor Fund | |
Foreign currency risk | | | (3,949 | ) | | | (24,593 | ) |
Emerging Markets Quality Dividend Growth Fund | |
Foreign currency risk | | | (43,659 | ) | | | — | |
Emerging Markets SmallCap Dividend Fund | |
Foreign currency risk | | | (2,616,201 | ) | | | (6,854 | ) |
Global ex-U.S. Quality Dividend Growth Fund | |
Equity risk | | | (28,563 | ) | | | — | |
Foreign currency risk | | | (182,825 | ) | | | (1,196 | ) |
Global ex-U.S. Real Estate Fund | |
Foreign currency risk | | | (3,940 | ) | | | 185 | |
Global High Dividend Fund | | | | | | | | |
Foreign currency risk | | | 6,496 | | | | — | |
Growth Leaders Fund | | | | | | | | |
Foreign currency risk | | | 665 | | | | — | |
India Earnings Fund (consolidated) | | | | | | | | |
Foreign currency risk | | | (583,591 | ) | | | — | |
India ex-State-Owned Enterprises Fund | | | | | | | | |
Equity risk | | | (3,983 | ) | | | — | |
Foreign currency risk | | | (2,324 | ) | | | — | |
| | 1 | Realized gains (losses) on derivatives are located on the Statements of Operations as follows: |
| | |
Foreign currency risk | | Net realized gain (loss) from foreign currency contracts |
Equity risk | | Net realized gain (loss) from futures contracts |
| | 2 | Change in unrealized appreciation (depreciation) is located on the Statements of Operations as follows: |
| | |
Foreign currency risk | | Net increase (decrease) in unrealized appreciation/depreciation from foreign currency contracts |
Notes to Financial Statements (continued)
During the fiscal year ended March 31, 2022, the volume of derivative activity (based on the average of month-end balances, except where footnoted) for each Fund was as follows:
| | | | | | | | | | | | |
| | |
| | | Average Notional | |
| | | |
| Fund | | Foreign currency
contracts
(to deliver
USD) | | | Foreign currency
contracts
(to receive
USD) | | | Futures
contracts
(long) | |
China ex-State-Owned Enterprises Fund | |
Foreign currency risk | | $ | 12,606,468 | | | $ | 46,715 | | | $ | — | |
Emerging Markets ex-State-Owned Enterprises Fund | |
Foreign currency risk | | | 3,587,964 | | | | 5,401,983 | | | | — | |
Emerging Markets High Dividend Fund | |
Foreign currency risk | | | 193,892 | | | | 796,379 | | | | — | |
Emerging Markets Multifactor Fund | |
Foreign currency risk | | | 267,940 | | | | 958,479 | | | | — | |
Emerging Markets Quality Dividend Growth Fund | |
Foreign currency risk | | | 1,546 | | | | 3,464 | | | | — | |
Emerging Markets SmallCap Dividend Fund | |
Foreign currency risk | | | 605,481 | | | | 542,552 | | | | — | |
Global ex-U.S. Quality Dividend Growth Fund | |
Equity risk1 | | | — | | | | — | | | | 752,940 | |
Foreign currency risk | | | 442,452 | | | | 156,451 | | | | — | |
Global ex-U.S. Real Estate Fund | | | | | | | | | | | | |
Foreign currency risk | | | 25,617 | | | | 26,702 | | | | — | |
Global High Dividend Fund | | | | | | | | | | | | |
Foreign currency risk | | | 8,276 | | | | 4,764 | | | | — | |
Growth Leaders Fund | | | | | | | | | | | | |
Foreign currency risk1 | | | 53,496 | | | | 19,595 | | | | — | |
India Earnings Fund (consolidated) | | | | | | | | | | | | |
Foreign currency risk1 | | | 21,246,647 | | | | 24,281,745 | | | | — | |
India ex-State-Owned Enterprises Fund | | | | | | | | | | | | |
Equity risk1 | | | — | | | | — | | | | 50,398 | |
Foreign currency risk | | | 148,994 | | | | 132,223 | | | | — | |
| | 1 | The volume of derivatives for the period is based on intra-month balances. |
Investment Transactions and Investment Income — Investment transactions are recorded as of the date that the securities are purchased or sold (trade date). Realized gains and losses on sales of portfolio securities are calculated using the identified-cost method. Dividend income (less foreign taxes withheld, if any) is recognized on the ex-dividend date or as soon as practicable (with respect to foreign dividends) after the existence of a dividend declaration has been determined. Non-cash dividend income is recognized on the ex-dividend date, or as soon as practicable (with respect to foreign dividends) after the existence of a dividend declaration has been determined, at the fair value of securities to be received. On each measurement date, the Funds evaluate the collectability of receivable balances. Generally, the Funds will write-off dividend receivable balances that are canceled by the issuer as of the date that the dividend receivable cancellation notification was publicly made available or when it becomes probable that dividends will not be collected and the amount of uncollectable dividends can be reasonably estimated. In addition, the Funds generally will write-off interest receivable balances in default by the issuer as of the date any applicable interest payment grace period or forbearance period expires or as of the date any interest payment cancellation notification was publicly made available or when it becomes probable that interest will not be collected and the amount of uncollectable interest can be reasonably estimated. Interest income (including amortization of premiums and accretion of discounts), less any foreign taxes withheld, is accrued daily. Generally, amortization of premiums and accretion of discounts are recognized daily using the effective interest method (also known as the scientific amortization method). Income earned from securities lending activities (i.e., securities lending income), net of fees payable to the securities borrower and/or securities lending agent, is accrued daily.
Foreign Currency Translation — The accounting records of the Funds are maintained in U.S. dollars. Foreign currencies, as well as investment securities and other assets and liabilities denominated in foreign currencies, are translated into U.S. dollars using exchange rates prevailing on the respective dates of such transactions that are deemed appropriate by WTAM. Realized and unrealized foreign exchange gains and losses on investments are included as a component of “net realized gain (loss) from investment transactions” and “net increase (decrease) in unrealized appreciation/depreciation from investment transactions”, respectively, on the Statements of Operations. Realized and unrealized foreign exchange gains or losses from foreign currency contracts are included in “net realized
Notes to Financial Statements (continued)
gain (loss) from foreign currency contracts” and “net increase (decrease) in unrealized appreciation/depreciation from foreign currency contracts”, respectively, on the Statements of Operations. Realized and unrealized foreign exchange gains or losses arising from sales of foreign currencies, currency gains or losses recognized between the trade and settlement dates on investment transactions, and the difference between the amounts of dividends and foreign withholding taxes recorded on the Funds’ books and the U.S. dollar equivalent of the amounts actually received or paid are included in “net realized gain (loss) from foreign currency related transactions” and/or “net increase (decrease) in unrealized appreciation/depreciation from translation of assets and liabilities denominated in foreign currencies” in the Statements of Operations. Certain foreign exchange gains and losses included in realized and unrealized gains or losses are included in, or are a reduction of, ordinary income in accordance with U.S. Federal income tax regulations.
Expenses — Under the investment advisory agreement for each Fund, except for Funds that commenced operations on or after March 26, 2013, WTAM has agreed to pay all expenses of the Trust, except for: (i) brokerage expenses and other expenses (such as stamp taxes) connected with the execution of portfolio transactions or in connection with creation and redemption transactions; (ii) legal fees or expenses in connection with any arbitration, litigation or pending or threatened arbitration or litigation, including any settlements in connection therewith; (iii) compensation and expenses of trustees who are not interested persons of the Funds (“Independent Trustees”); (iv) compensation and expenses of counsel to the Independent Trustees; (v) compensation and expenses of the Trust’s Chief Compliance Officer (‘‘CCO’’); (vi) extraordinary expenses; (vii) distribution fees and expenses paid by the Trust under any distribution plan adopted pursuant to Rule 12b-1 under the 1940 Act; and (viii) the advisory fee payable to WTAM.
Under the investment advisory agreement for Funds that commenced operations on or after March 26, 2013, WTAM has agreed to pay all expenses of the Trust, except for: (i) brokerage expenses and other fees, charges, taxes, levies or expenses (such as stamp taxes) incurred in connection with the execution of portfolio transactions or in connection with creation and redemption transactions (including without limitation any fees, charges, taxes, levies or expenses related to the purchase or sale of an amount of any currency, or the patriation or repatriation of any security or other asset, related to the execution of portfolio transactions or any creation or redemption transactions); (ii) legal fees or expenses in connection with any arbitration, litigation or pending or threatened arbitration or litigation, including any settlements in connection therewith; (iii) compensation and expenses of each Independent Trustee; (iv) compensation and expenses of counsel to the Independent Trustees; (v) compensation and expenses of the Trust’s CCO; (vi) extraordinary expenses (in each case as determined by a majority of the Independent Trustees); (vii) distribution fees and expenses paid by the Trust under any distribution plan adopted pursuant to Rule 12b-1 under the 1940 Act; (viii) interest and taxes of any kind or nature (including, but not limited to, income, excise, transfer and withholding taxes); (ix) fees and expenses related to the provision of securities lending services; and (x) the advisory fee payable to WTAM.
Acquired fund fees and expenses (“AFFEs”) (which are fees and expenses incurred indirectly by a Fund through its investments in certain underlying investment companies) are not operating expenses of the Funds and are not paid by WTAM.
Interest expense associated with a short-term loan from a U.S. bank that is incurred in connection with the execution of portfolio rebalancing trades is not paid by WTAM.
Pursuant to a separate contractual arrangement, WTAM arranges for the provision of CCO services with respect to each Fund, and is liable and responsible for, and administers, payments to the CCO, the Independent Trustees and counsel to the Independent Trustees. WTAM receives a fee, as shown on the Statements of Operations under “Service fees”, of up to 0.0044% per annum of each Fund’s average daily net assets for providing such services and paying such expenses. WTAM provides CCO services to the Trust.
Foreign Currency Contracts — The Funds may enter into foreign currency contracts to facilitate local securities settlements or to protect against currency exposure. The Funds, other than the Emerging Markets Multifactor Fund, do not expect to engage in currency transactions for the purpose of hedging against currency exposures of the Fund’s assets that are denominated in one or more foreign currencies. The Funds may not enter into such contracts for speculative purposes. During the fiscal year ended March 31, 2022, the Funds, except for the Emerging Markets Multifactor Fund, utilized foreign currency contracts primarily to facilitate foreign security settlements. The Emerging Markets Multifactor Fund utilized foreign currency contracts primarily to offset applicable international currency exposure from certain positions in emerging market equities. A foreign currency contract involves an obligation to purchase or sell a specific currency at a future date, which may be any fixed number of days from the date of the contract agreed upon by the parties, at a price set at the time of the contract. These contracts are principally traded in the inter-bank market conducted directly between currency traders (usually large, commercial banks) and their customers. A foreign currency contract generally does not require an initial margin deposit and no commissions are charged at any stage for trades. However, if a Fund is in an unrealized loss position on a foreign currency contract, it may be required to pledge collateral (or additional collateral) to the counterparty. If a Fund is in an unrealized gain position on a foreign currency contract, it may receive collateral from the counterparty. In the event of a default or inability of counterparties to meet the terms of their contracts, the non-defaulting party generally has the right to liquidate the collateral and apply the proceeds in satisfaction of the contract terms.
Risks may arise upon entering into foreign currency contracts from the potential inability of counterparties to meet the terms of their contracts and from unanticipated movements in the value of foreign currencies relative to the U.S. dollar or each other.
Notes to Financial Statements (continued)
Fluctuations in the value of open foreign currency contracts are recorded for book purposes as unrealized gains or losses on foreign currency contracts by the Funds and are included in “net increase (decrease) in unrealized appreciation/depreciation from foreign currency contracts” on the Statements of Operations. Realized gains and losses on foreign currency contracts include net gains or losses recognized by the Funds on contracts which have settled are included in “net realized gain (loss)” from foreign currency contracts on the Statements of Operations.
Futures Contracts — The Global ex-U.S. Quality Dividend Growth Fund utilized equity futures contracts on a temporary basis during the fiscal period to obtain market exposure consistent with their investment objectives. The India ex-State-Owned Enterprises Fund utilized equity futures contracts on a temporary basis during the fiscal period to obtain market exposure consistent with its investment objective during the Fund’s annual portfolio rebalance. When a Fund purchases a listed futures contract, it agrees to purchase a specified reference asset (e.g., commodity, currency or U.S. Treasury security) at a specified future date. When a Fund sells a listed futures contract, it agrees to sell a specified reference asset (e.g., commodity, currency or U.S. Treasury security) at a specified future date. The price at which the purchase and sale will take place is fixed when the Fund enters into the contract. The exchange clearing corporation is the ultimate counterparty for all exchange-listed contracts, so credit risk is limited to the creditworthiness of the exchange clearing corporation.
Upon entering into a futures contract, a Fund is required to deliver to a broker an amount of cash and/or U.S. government securities equal to a certain percentage of the contract amount. This amount is known as the “initial margin”. Cash deposited as initial margin, if any, is shown as “Deposits at broker for futures contracts” in the Statement of Assets and Liabilities, and U.S. government securities deposited, if any, are designated in the Schedule of Investments. Subsequent payments, known as “variation margin”, generally are made or received by the Fund each day or at other agreed-upon time periods depending on the fluctuations in the value of the underlying futures contracts, except that in the case of certain futures contracts, variation margin payments may be made or received when the futures contract expires. Variation margin is recorded for financial statement purposes on a daily basis as an unrealized gain or loss on futures until the financial futures contract is closed, at which time the net gain or loss is reclassified to realized gain or loss on futures. When a Fund purchases or sells a futures contract, the Fund is required to “cover” its position in order to limit the risk associated with the use of leverage and other related risks. To cover its position, a Fund will segregate assets consisting of, or take other measures with respect to, cash or liquid securities that, when added to any amounts deposited with a futures commission merchant as margin, will “cover” its position in a manner consistent with the 1940 Act or the rules and SEC interpretations thereunder. This will function as a practical limit on the amount of leverage which a Fund may undertake and on the potential increase in the speculative character of a Fund’s outstanding portfolio securities.
As of March 31, 2022, there were no open futures contracts in the Funds.
Securities Lending — Each Fund may lend portfolio securities to certain creditworthy borrowers, including the Funds’ securities lending agent. It is the Funds’ policy that, at origination, all loans are secured by collateral of at least 102% of the value of U.S. securities loaned and 105% of the value of foreign securities loaned. Collateral in the form of cash and/or securities issued or guaranteed by the U.S. government or its agencies, equivalent to at least 100% of the market value of securities, is maintained at all times. The cash collateral can be invested in certain money market mutual funds which also have exposure to the fluctuations of the market. The values of the investments of cash collateral for securities on loan along with the obligations to return such collateral are included on the Statements of Assets and Liabilities. The total value of securities received as collateral for securities on loan is included in a footnote following each Schedule of Investments, but is not included within the Statements of Assets and Liabilities because the receiving Fund does not have the right to sell or repledge the securities received as collateral. As compensation for lending its securities, each Fund retains all or a portion of the interest received on investment of cash collateral or receives a fee from the borrower (net of any fee rebates paid to the borrower). The lending agent receives a portion of the income earned by the Funds in connection with the lending program. The net securities lending income earned by the Funds is disclosed on the Statements of Operations. The dividend and interest income earned on the securities loaned is accounted for in the same manner as other dividend and interest income. The borrower pays to the Funds an amount equal to any dividends or interest received on loaned securities. Dividends received while a security is out on loan are not considered Qualified Dividend Income (“QDI”) under the specific criteria issued by the Internal Revenue Service and are subject to taxation at the shareholder’s ordinary income tax rate instead of the lower long-term capital gains tax rate. Lending portfolio securities could result in a loss or delay in recovering each Fund’s securities if the borrower defaults. In the event of a borrower default with respect to the failure to return to each Fund some or all of the securities loaned, the securities lending agent shall indemnify each Fund against the failure of the borrower if the value of the collateral received is insufficient to cover the market value of the securities loaned.
Master Netting Arrangements — Codification Topic 210 (“ASC 210”), Balance Sheet, requires disclosures generally intended to (i) help investors and other financial statement users to better assess the effect or potential effect of offsetting arrangements on a company’s financial position, (ii) improve transparency in the reporting of how companies mitigate credit risk, and (iii) facilitate comparisons between those entities that prepare their financial statements on the basis of GAAP and those entities that prepare their financial statements on the basis of international financial reporting standards. ASC 210 requires entities to disclose (i) gross and net information about both instruments and transactions eligible for offset in the financial statements, and (ii) instruments and
Notes to Financial Statements (continued)
transactions subject to an agreement similar to a master netting agreement. ASC 210 is limited in scope to the following financial instruments, to the extent they are offset in the financial statements or subject to an enforceable master netting arrangement or similar agreement: (i) recognized derivative instruments accounted for under ASC 815 (Derivatives and Hedging); (ii) repurchase agreements and reverse repurchase agreements; and (iii) securities borrowing and securities lending transactions.
In order to better define its contractual rights and to secure rights that will help a Fund mitigate its counterparty risk, a Fund enters into an International Swaps and Derivatives Association, Inc. Master Agreement (“ISDA Master Agreement”) with its counterparties. An ISDA Master Agreement is a bilateral agreement between a Fund and a counterparty that governs over-the-counter derivatives (“OTC”), such as foreign currency contracts, and typically contains, among other things, collateral posting terms, netting and rights of set-off provisions in the event of a default and/or termination event. Under an ISDA Master Agreement, a Fund may, under certain circumstances, offset with the counterparty certain derivative financial instruments’ payables and receivables to create a single net payment. The provisions of the ISDA Master Agreement typically permit a single net payment in the event of a default (close-out netting) or similar event, including the bankruptcy or insolvency of the counterparty.
Collateral requirements generally differ by type of derivative. Collateral terms are contract-specific for OTC derivatives (e.g., foreign currency contracts, options and certain swaps). Generally, for transactions traded under an ISDA Master Agreement, the collateral requirements are calculated by netting the marked to market amount for each transaction under such agreement and comparing that amount to the value of any collateral currently pledged by a Fund and the counterparty. Generally, the amount of collateral due from or to a counterparty must exceed a minimum transfer amount threshold before a transfer is required to be made. To the extent amounts due to a Fund from its derivatives counterparties are not fully collateralized, contractually or otherwise, the Fund bears the risk of loss from a counterparty’s non-performance.
The Funds’ securities lending activities are governed by a Securities Lending Authorization Agreement (“Lending Agreement”) between the Funds and the lending agent. The Lending Agreement authorizes the lending agent to lend qualifying U.S. and foreign securities held by a Fund to approved borrowers (each a “Borrower”). To mitigate borrower risk, a Fund typically receives from a Borrower collateral in the form of U.S. dollar cash and/or securities issued or guaranteed by the U.S. government or its agencies in excess of the market value of the securities loaned. Under the provisions of the Lending Agreement, a Fund shall have, as to the collateral, all of the rights and remedies of a secured party under applicable law. A Fund is exposed to risk of loss if a Borrower defaults on its obligation to return borrowed securities and the value of the collateral a Fund received is insufficient to cover the market value of the securities loaned. Also, the lending agent is permitted to invest the cash collateral it receives from a Borrower into a money market fund which is subject to market fluctuation. Therefore, a Fund is exposed to risk of loss if the value of invested cash collateral is insufficient to satisfy the Fund’s obligation to return the full amount owed to such Borrower.
For financial reporting purposes, the Funds elect to not offset assets and liabilities subject to an ISDA Master Agreement or Lending Agreement, if any, in the Statements of Assets and Liabilities. Therefore, all qualifying transactions are presented on a gross basis in the Statements of Assets and Liabilities. As of March 31, 2022, the impact of netting of assets and liabilities and the offsetting of collateral pledged or received based on contractual netting/set-off provisions in the ISDA Master Agreement and the Lending Agreement are detailed in the following table:
| | | | | | | | | | | | | | | | | | | | | | | | | | | | | | | | |
| | | |
| | | Assets | | | Liabilities | |
| | | | | | |
| | | Gross Amounts
in the
Statements of Assets and
Liabilities | | | Gross Amounts Not Offset
in the Statements of
Assets and Liabilities | | | Net Amount | | | Gross Amounts
in the
Statements of Assets and
Liabilities | | | Gross Amounts Not Offset
in the Statements of
Assets and Liabilities | | | Net Amount | |
| Fund | | Financial
Instruments | | | Collateral
Received | | | Financial
Instruments | | | Collateral
Posted | |
China ex-State-Owned Enterprises Fund | | | | | | | | | | | | | | | | | | | | | | | | | | | | | | | | |
Securities Lending | | $ | 41,658,950 | | | $ | — | | | $ | (41,658,950 | )1 | | $ | — | | | $ | — | | | $ | — | | | $ | — | | | $ | — | |
Foreign Currency Contracts | | | — | | | | — | | | | — | | | | — | | | | 670 | | | | — | | | | — | | | | 670 | |
Emerging Markets ex-State-Owned Enterprises Fund | | | | | | | | | | | | | | | | | | | | | | | | | | | | | | | | |
Securities Lending | | | 103,535,801 | | | | — | | | | (103,535,801 | )1 | | | — | | | | — | | | | — | | | | — | | | | — | |
Emerging Markets High Dividend Fund | | | | | | | | | | | | | | | | | | | | | | | | | | | | | | | | |
Securities Lending | | | 165,227,619 | | | | — | | | | (165,227,619 | )1 | | | — | | | | — | | | | — | | | | — | | | | — | |
Emerging Markets Multifactor Fund | | | | | | | | | | | | | | | | | | | | | | | | | | | | | | | | |
Securities Lending | | | 8,559 | | | | — | | | | (8,559 | )1 | | | — | | | | — | | | | — | | | | — | | | | — | |
Foreign Currency Contracts | | | 4,697 | | | | (3,750 | ) | | | — | | | | 947 | | | | 7,274 | | | | (3,750 | ) | | | — | | | | 3,524 | |
Emerging Markets Quality Dividend Growth Fund | | | | | | | | | | | | | | | | | | | | | | | | | | | | | | | | |
Securities Lending | | | 2,829,834 | | | | — | | | | (2,829,834 | )1 | | | — | | | | — | | | | — | | | | — | | | | — | |
Emerging Markets SmallCap Dividend Fund | | | | | | | | | | | | | | | | | | | | | | | | | | | | | | | | |
Securities Lending | | | 410,875,658 | | | | — | | | | (410,875,658 | )1 | | | — | | | | — | | | | — | | | | — | | | | — | |
Notes to Financial Statements (continued)
| | | | | | | | | | | | | | | | | | | | | | | | | | | | | | | | |
| | | |
| | | Assets | | | Liabilities | |
| | | | | | |
| | | Gross Amounts
in the
Statements of Assets and
Liabilities | | | Gross Amounts Not Offset
in the Statements of
Assets and Liabilities | | | Net Amount | | | Gross Amounts
in the
Statements of Assets and
Liabilities | | | Gross Amounts Not Offset
in the Statements of
Assets and Liabilities | | | Net Amount | |
| Fund | | Financial
Instruments | | | Collateral
Received | | | Financial
Instruments | | | Collateral
Posted | |
Global ex-U.S. Quality Dividend Growth Fund | | | | | | | | | | | | | | | | | | | | | | | | | | | | | | | | |
Securities Lending | | $ | 43,934,988 | | | $ | — | | | $ | (43,934,988 | )1 | | $ | — | | | $ | — | | | $ | — | | | $ | — | | | $ | — | |
Foreign Currency Contracts | | | 501 | | | | (343 | ) | | | — | | | | 158 | | | | 1,895 | | | | (343 | ) | | | — | | | | 1,552 | |
Global ex-U.S. Real Estate Fund | | | | | | | | | | | | | | | | | | | | | | | | | | | | | | | | |
Securities Lending | | | 4,808,028 | | | | — | | | | (4,808,028 | )1 | | | — | | | | — | | | | — | | | | — | | | | — | |
Foreign Currency Contracts | | | 54 | | | | — | | | | — | | | | 54 | | | | — | | | | — | | | | — | | | | — | |
Global High Dividend Fund | | | | | | | | | | | | | | | | | | | | | | | | | | | | | | | | |
Securities Lending | | | 2,825,551 | | | | — | | | | (2,825,551 | )1 | | | — | | | | — | | | | — | | | | — | | | | — | |
Growth Leaders Fund | | | | | | | | | | | | | | | | | | | | | | | | | | | | | | | | |
Securities Lending | | | 814,747 | | | | — | | | | (814,747 | )1 | | | — | | | | — | | | | — | | | | — | | | | — | |
| | 1 | The amount of collateral presented has been limited such that the net amount by counterparty cannot be less than zero. |
Short-Term Investments — Each Fund may invest a portion of its assets in high-quality money market instruments on an ongoing basis to provide liquidity or for other reasons. The instruments include short-term obligations issued by the U.S. government, its agencies, non-U.S. government agencies, negotiable certificates of deposit (“CDs”), fixed time deposits and bankers’ acceptances of U.S. and foreign banks and similar institutions, commercial papers, repurchase agreements and money market funds. CDs are short-term negotiable obligations of commercial banks. Time deposits are non-negotiable deposits maintained in banking institutions for specified periods of time at stated interest rates. Banker’s acceptances are time drafts drawn on commercial banks by borrowers, usually in connection with international transactions.
Restricted Securities — Each Fund may invest in securities that are subject to legal or contractual restrictions on resale. These securities generally may be resold in transactions exempt from registration or to the public if the securities are registered. Disposal of these securities may involve time-consuming negotiations and expense, and prompt sale at an acceptable price may be difficult. Information regarding restricted securities, if any, is included at the end of each Fund’s Schedule of Investments.
Emerging Market Investments — Investments in securities listed and traded in emerging markets are subject to additional risks that may not be present for U.S. investments or investments in more developed non-U.S. markets. Such risks may include: (i) greater market volatility; (ii) lower trading volume; (iii) greater social, political and economic uncertainty; (iv) governmental controls on foreign investments and limitations on repatriation of invested capital; (v) the risk that companies may be held to lower disclosure, corporate governance, auditing and financial reporting standards than companies in more developed markets; and (vi) the risk that there may be less protection of property rights than in other countries. Emerging markets are generally less liquid and less efficient than developed securities markets.
Tax Information and Dividends and Distributions to Shareholders — It is each Fund’s policy to comply with all requirements of the Internal Revenue Code of 1986, as amended (the “Code”). A portion of the Code, known as subchapter M (“Subchapter M”), addresses the ways by which investment companies and investment trusts may pass income through to shareholders in order to avoid double taxation. Each Fund intends to qualify for and to elect treatment as a separate Regulated Investment Company (“RIC”) under Subchapter M of the Code so that it will not be subject to federal income tax on income and gains that are timely distributed to Fund shareholders. Accordingly, no provision for U.S. federal income taxes is required. In order to qualify for the special tax treatment accorded to RICs and their shareholders, each Fund must, among other things, distribute with respect to each taxable year an amount equal to or greater than the sum of 90% of its investment company taxable income and 90% of its net tax-exempt interest income. There can be no guarantee that a Fund will pay dividends. Taxable net realized gains from investment transactions, reduced by capital loss carryforwards, if any, are declared and distributed to shareholders at least annually. The capital loss carryforward amount, if any, is available to offset future net capital gains. The Funds may occasionally be required to make supplemental distributions at some other time during the year. The Trust reserves the right to declare special distributions if, in its reasonable discretion, such action is necessary or advisable to preserve the status of each Fund as a RIC or to avoid imposition of income or excise taxes on undistributed income. Dividends and distributions to shareholders are recorded on the ex-dividend date. The amount of dividends and distributions from net investment income and net realized capital gains is determined in accordance with the requirements of the Code and the U.S. Treasury regulations. These book/tax differences are either considered temporary or permanent in nature. To the extent these differences are permanent in nature, such amounts are reclassified within the components of net assets based on their Federal tax basis treatment; temporary differences do not require reclassification. Dividends and distributions that exceed earnings and profit for tax purposes are reported for tax purposes as a return of capital. The India Earnings Fund has filed an election to treat the Portfolio as a ‘‘pass-through’’ entity for tax purposes.
Notes to Financial Statements (continued)
3. ADVISORY FEES AND OTHER TRANSACTIONS WITH AFFILIATES
WTAM has overall responsibility for the general management and administration of the Trust. WTAM provides an investment program for each Fund. WTAM has arranged for Mellon Investments Corporation (‘‘Mellon’’) to provide sub-advisory services to the Funds. Additionally, the Portfolio is also advised by WTAM and is sub-advised by Mellon. Mellon is compensated by WTAM at no additional cost to the Funds or the Portfolio. WTAM also arranges for transfer agency, custody, fund accounting, fund administration, securities lending and all other non-distribution related services necessary for the Funds to operate, which are generally under separate agreements entered into between the Trust on behalf of the Funds and the applicable service provider. Under the investment advisory agreement for each Fund, WTAM agrees to pay all expenses of the Funds, except for certain expenses described in Note 2.
Pursuant to a separate contractual arrangement, as also described in Note 2, WTAM arranges for the provision of CCO services with respect to each Fund, and is liable and responsible for, and administers, payments to the CCO, the Independent Trustees and counsel to the Independent Trustees in exchange for a fee, accrued daily and paid monthly in arrears, of up to 0.0044% per annum of each Fund’s average daily net assets.
WTAM expects to receive annual advisory fees from each Fund, based on a percentage of the Fund’s average daily net assets and, with respect to the India Earnings Fund, based on the average daily net assets of the India Earnings Fund and the Portfolio on a consolidated basis, as shown in the following table:
| | | | |
| | |
| Fund | | Advisory Fee Rate | |
China ex-State-Owned Enterprises Fund | | | 0.32 | % |
Emerging Markets ex-State-Owned Enterprises Fund | | | 0.32 | % |
Emerging Markets High Dividend Fund | | | 0.63 | % |
Emerging Markets Multifactor Fund | | | 0.48 | % |
Emerging Markets Quality Dividend Growth Fund | | | 0.32 | % |
Emerging Markets SmallCap Dividend Fund | | | 0.58 | %1 |
Global ex-U.S. Quality Dividend Growth Fund | | | 0.42 | %2 |
Global ex-U.S. Real Estate Fund | | | 0.58 | % |
Global High Dividend Fund | | | 0.58 | % |
Growth Leaders Fund | | | 0.20 | % |
India Earnings Fund (consolidated) | | | 0.83 | % |
India ex-State-Owned Enterprises Fund | | | 0.58 | % |
| | 1 | Prior to September 1, 2021, WTAM received an annual advisory fee of 0.63% based on the Fund’s average daily net assets. |
| | 2 | Prior to January 1, 2022, WTAM received an annual advisory fee of 0.58% based on the Fund’s average daily net assets. |
During the year ended March 31, 2022, the Emerging Markets ex-State-Owned Enterprises Fund and India Earnings Fund received a voluntary reimbursement of $83,629 and $3,791, respectively, from Mellon for investment losses on certain foreign exchange transactions. The dollar amount of the reimbursement is shown in the Statements of Operations in “Net increase from payment by affiliate”.
Affiliated holdings are investments in entities in which the Fund owns 5% or more of the outstanding voting securities or are investments in entities which are under common ownership or control. Transactions in shares of affiliated ETFs for the fiscal year ended March 31, 2022, as applicable, are included in an ‘‘Investment in Affiliates’’ supplementary table in each applicable Fund’s Schedule of Investments. For these transactions, WTAM voluntarily waives a portion of the advisory fees, that it would otherwise charge, in an amount equal to the indirect AFFE (which are fees and expenses incurred indirectly by a Fund through its investments in certain underlying investment companies) attributable to each Fund’s investment in affiliated ETFs. The dollar amount of advisory fees waived during the period for the Funds, if any, are included in the Statement of Operations in “Expense waivers”.
Notes to Financial Statements (continued)
WTAM and/or WisdomTree Investments (collectively herein, “WT”) may from time to time own shares of a Fund. As of and for the fiscal year ended March 31, 2022, WT held shares of and received distributions from the following Funds, which were purchased through an unaffiliated broker in ordinary brokerage transactions in the secondary market in which the Funds’ shares trade:
| | | | | | | | | | | | | | | | |
| | | | |
| | | At March 31, 2022 | | | | | | For the fiscal year ended
March 31, 2022 | |
| | | | |
| Fund | | Fund Shares
held by WT | | | Market Value of
Fund Shares
held by WT | | | | | | Dividends and
Distributions paid to WT on Fund Shares held by WT | |
Emerging Markets ex-State-Owned Enterprises Fund | | | 1,018 | | | $ | 33,248 | | | | | | | $ | 522 | |
Emerging Markets High Dividend Fund | | | 176 | | | | 7,702 | | | | | | | | 478 | |
Emerging Markets Quality Dividend Growth Fund | | | 300 | | | | 7,806 | | | | | | | | 228 | |
Emerging Markets SmallCap Dividend Fund | | | 403 | | | | 21,480 | | | | | | | | 848 | |
Global ex-U.S. Quality Dividend Growth Fund | | | 131 | | | | 5,203 | | | | | | | | 104 | |
Global ex-U.S. Real Estate Fund | | | — | | | | — | | | | | | | | 22 | |
Growth Leaders Fund | | | 145 | | | | 5,377 | | | | | | | | 2 | |
4. CAPITAL SHARE TRANSACTIONS
As of March 31, 2022, there were an unlimited number of $0.001 par value shares of beneficial interest authorized by the Trust. Shares are issued and redeemed by each Fund only in creation units or multiples thereof. Except when aggregated in creation units, shares of each Fund are not redeemable. Transactions in shares for each Fund are disclosed in detail in the Statements of Changes in Net Assets. The consideration for the purchase of creation units of a Fund generally consists of the in-kind contribution of a basket of securities and/or an amount of cash. The India Earnings Fund and India ex-State-Owned Enterprises Fund issue and redeem shares on a cash basis only as certain securities markets in which these Funds invest do not permit in-kind transfers of securities. Investors purchasing and redeeming creation units may be charged a purchase transaction fee and a redemption transaction fee to offset transfer and other transaction costs associated with the issuance and redemption of creation units.
5. INVESTMENT PORTFOLIO TRANSACTIONS
Purchases and sales of investments (excluding purchases and sales resulting from in-kind capital share transactions and short-term investments) and the cost of purchases and the proceeds from sales resulting from in-kind capital share transactions (excluding short-term investments) for the fiscal year ended March 31, 2022 are shown in the following table. Realized gains and losses on sales resulting from in-kind capital share redemptions, as shown on the Statements of Operations, are not recognized by the Funds for tax purposes.
| | | | | | | | | | | | | | | | |
| | | | |
| | | | | | | | | In-kind Capital Share Transactions | |
| | | | |
| Fund | | Purchases | | | Sales | | | Purchases | | | Sales | |
China ex-State-Owned Enterprises Fund | | $ | 729,593,824 | | | $ | 362,729,849 | | | $ | 106,642,860 | | | $ | 84,032,667 | |
Emerging Markets ex-State-Owned Enterprises Fund | | | 754,094,540 | | | | 1,080,134,995 | | | | 47,019,696 | | | | 334,659,921 | |
Emerging Markets High Dividend Fund | | | 1,227,905,281 | | | | 1,043,428,780 | | | | 56,633,497 | | | | 22,470,755 | |
Emerging Markets Multifactor Fund | | | 4,514,735 | | | | 5,788,227 | | | | — | | | | 1,267,707 | |
Emerging Markets Quality Dividend Growth Fund | | | 41,929,577 | | | | 39,558,732 | | | | 380,232 | | | | — | |
Emerging Markets SmallCap Dividend Fund | | | 1,415,929,826 | | | | 1,015,584,670 | | | | 110,603,313 | | | | — | |
Global ex-U.S. Quality Dividend Growth Fund | | | 350,647,801 | | | | 261,274,753 | | | | 166,998,655 | | | | 48,671,016 | |
Global ex-U.S. Real Estate Fund | | | 4,348,079 | | | | 4,175,736 | | | | 923,861 | | | | 2,777,449 | |
Global High Dividend Fund | | | 26,386,746 | | | | 26,390,449 | | | | 17,847,643 | | | | 19,835,087 | |
Growth Leaders Fund | | | 8,381,601 | | | | 8,362,736 | | | | 5,188,956 | | | | 1,163,701 | |
India Earnings Fund (consolidated) | | | 280,624,262 | | | | 301,471,596 | | | | — | | | | — | |
India ex-State-Owned Enterprises Fund | | | 2,736,734 | | | | 952,523 | | | | — | | | | — | |
Notes to Financial Statements (continued)
6. FEDERAL INCOME TAXES
At March 31, 2022, the cost of investments (including securities on loan and derivatives) for Federal income tax purposes was as follows:
| | | | | | | | | | | | | | | | | | | | | | | | | | | | | | | | | | | | |
| | | | | |
| | | Investments in Long Securities | | | | | | Investments in Financial Derivatives1 | | | | |
| | | | | | | | | |
| Fund | | Tax Cost | | | Gross
Unrealized
Appreciation | | | Gross
Unrealized
Depreciation | | | Net Unrealized
Appreciation/
(Depreciation) | | | | | | Gross
Unrealized
Appreciation | | | Gross
Unrealized
Depreciation | | | Net Unrealized
Appreciation/
(Depreciation) | | | Total Net
Unrealized
Appreciation/
(Depreciation) | |
China ex-State-Owned Enterprises Fund | | $ | 1,156,904,780 | | | $ | 42,618,810 | | | $ | (355,438,197 | ) | | $ | (312,819,387 | ) | | | | | | $ | — | | | $ | (670 | ) | | $ | (670 | ) | | $ | (312,820,057 | ) |
Emerging Markets ex-State-Owned Enterprises Fund | | | 3,401,994,821 | | | | 609,501,771 | | | | (664,142,330 | ) | | | (54,640,559 | ) | | | | | | | — | | | | — | | | | — | | | | (54,640,559 | ) |
Emerging Markets High Dividend Fund | | | 1,966,892,355 | | | | 377,350,510 | | | | (218,602,623 | ) | | | 158,747,887 | | | | | | | | — | | | | — | | | | — | | | | 158,747,887 | |
Emerging Markets Multifactor Fund | | | 2,265,181 | | | | 296,616 | | | | (202,161 | ) | | | 94,455 | | | | | | | | 4,697 | | | | (1,348 | ) | | | 3,349 | | | | 97,804 | |
Emerging Markets Quality Dividend Growth Fund | | | 76,655,602 | | | | 18,310,396 | | | | (7,913,197 | ) | | | 10,397,199 | | | | | | | | — | | | | — | | | | — | | | | 10,397,199 | |
Emerging Markets SmallCap Dividend Fund | | | 2,331,938,972 | | | | 455,879,277 | | | | (149,855,802 | ) | | | 306,023,475 | | | | | | | | — | | | | — | | | | — | | | | 306,023,475 | |
Global ex-U.S. Quality Dividend Growth Fund | | | 540,147,080 | | | | 82,906,201 | | | | (53,874,751 | ) | | | 29,031,450 | | | | | | | | 501 | | | | (1,895 | ) | | | (1,394 | ) | | | 29,030,056 | |
Global ex-U.S. Real Estate Fund | | | 59,201,969 | | | | 6,383,763 | | | | (9,967,972 | ) | | | (3,584,209 | ) | | | | | | | 54 | | | | — | | | | 54 | | | | (3,584,155 | ) |
Global High Dividend Fund | | | 62,091,347 | | | | 10,423,396 | | | | (2,339,154 | ) | | | 8,084,242 | | | | | | | | — | | | | — | | | | — | | | | 8,084,242 | |
Growth Leaders Fund | | | 18,206,087 | | | | 1,799,447 | | | | (4,182,866 | ) | | | (2,383,419 | ) | | | | | | | — | | | | — | | | | — | | | | (2,383,419 | ) |
India Earnings Fund (consolidated) | | | 565,759,813 | | | | 375,317,690 | | | | (16,534,895 | ) | | | 358,782,795 | | | | | | | | — | | | | — | | | | — | | | | 358,782,795 | |
India ex-State Owned Enterprises Fund | | | 5,691,138 | | | | 1,582,235 | | | | (122,902 | ) | | | 1,459,333 | | | | | | | | — | | | | — | | | | — | | | | 1,459,333 | |
| | 1 | Certain financial derivatives may be considered section 1256 contracts under the Code. Each section 1256 contract held at the close of a taxable year shall be treated as sold for its fair market value on the last business day of such taxable year (and any realized gain and loss shall be taken into account for the taxable year). As such, the unrealized appreciation/(depreciation) for financial derivatives on a tax basis may not correspond to the unrealized appreciation/(depreciation) on a GAAP basis. The unrealized appreciation/(depreciation) for financial derivatives on a GAAP basis is located in the respective financial derivatives tables in each Fund’s Schedule of Investments. |
At March 31, 2022, the components of total distributable earnings (loss) on a tax-basis were as follows:
| | | | | | | | | | | | | | | | | | | | |
| | | | | | |
| Fund | | Undistributed
Ordinary Income | | | Undistributed
Capital and Other
Losses | | | Net Unrealized
Appreciation/
(Depreciation) | | | Currency and
Other Unrealized
Appreciation/
(Depreciation) | | | Total Distributable
Earnings (Loss) | |
China ex-State-Owned Enterprises Fund | | $ | 42,583 | | | $ | (110,813,432 | ) | | $ | (312,820,057 | ) | | $ | 9,988 | | | $ | (423,580,918 | ) |
Emerging Markets ex-State-Owned Enterprises Fund | | | 21,555,226 | | | | (233,761,773 | ) | | | (54,640,559 | ) | | | (11,647,583 | ) | | | (278,494,689 | ) |
Emerging Markets High Dividend Fund | | | 2,197,430 | | | | (1,461,653,049 | ) | | | 158,747,887 | | | | (291,694 | ) | | | (1,300,999,426 | ) |
Emerging Markets Multifactor Fund | | | — | | | | (1,120,882 | ) | | | 97,804 | | | | (3,385 | ) | | | (1,026,463 | ) |
Emerging Markets Quality Dividend Growth Fund | | | 970,675 | | | | (18,230,757 | ) | | | 10,397,199 | | | | (512,741 | ) | | | (7,375,624 | ) |
Emerging Markets SmallCap Dividend Fund | | | 15,729,482 | | | | (393,912,992 | ) | | | 306,023,475 | | | | (1,652,939 | ) | | | (73,812,974 | ) |
Global ex-U.S. Quality Dividend Growth Fund | | | 920,385 | | | | (10,763,681 | ) | | | 29,030,056 | | | | (601,633 | ) | | | 18,585,127 | |
Global ex-U.S. Real Estate Fund | | | 60,827 | | | | (33,366,695 | ) | | | (3,584,155 | ) | | | (897 | ) | | | (36,890,920 | ) |
Global High Dividend Fund | | | 165,664 | | | | (17,923,172 | ) | | | 8,084,242 | | | | 942 | | | | (9,672,324 | ) |
Growth Leaders Fund | | | 1,453 | | | | (156,958 | ) | | | (2,383,419 | ) | | | 67 | | | | (2,538,857 | ) |
India Earnings Fund (consolidated) | | | 40,594,902 | | | | (42,155,446 | ) | | | 358,782,795 | | | | (31,601,426 | ) | | | 325,620,825 | |
India ex-State-Owned Enterprises Fund | | | 109,258 | | | | (51,056 | ) | | | 1,459,333 | | | | (176,755 | ) | | | 1,340,780 | |
Notes to Financial Statements (continued)
The tax character of distributions paid during the fiscal years ended March 31, 2022 and March 31, 2021, was as follows:
| | | | | | | | | | | | |
| | | |
| | | Year Ended March 31, 2022 | | | Year Ended March 31, 2021 | |
| | | |
| Fund | | Distributions Paid
from Ordinary
Income* | | | Distributions Paid
from Ordinary
Income* | | | Distributions Paid
from Return of
Capital | |
China ex-State-Owned Enterprises Fund | | $ | 10,485,930 | | | $ | 2,251,505 | | | $ | 39,686 | |
Emerging Markets ex-State-Owned Enterprises Fund | | | 62,418,244 | | | | 27,862,429 | | | | — | |
Emerging Markets High Dividend Fund | | | 121,113,777 | | | | 80,570,083 | | | | — | |
Emerging Markets Multifactor Fund | | | 134,000 | | | | 161,416 | | | | — | |
Emerging Markets Quality Dividend Growth Fund | | | 2,582,002 | | | | 2,069,274 | | | | — | |
Emerging Markets SmallCap Dividend Fund | | | 91,424,730 | | | | 65,877,942 | | | | — | |
Global ex-U.S. Quality Dividend Growth Fund | | | 9,420,001 | | | | 5,009,804 | | | | — | |
Global ex-U.S. Real Estate Fund | | | 3,737,023 | | | | 2,194,990 | | | | — | |
Global High Dividend Fund | | | 2,682,732 | | | | 2,796,745 | | | | — | |
Growth Leaders Fund | | | 5,287 | | | | 11,858 | | | | — | |
India Earnings Fund (consolidated) | | | 12,894,200 | | | | 6,924,754 | | | | — | |
India ex-State-Owned Enterprises Fund | | | 1,470 | | | | 4,497 | | | | — | |
| | * | Includes short-term capital gains, if any. |
At March 31, 2022, for Federal tax purposes, the Funds have capital loss carryforwards available to offset future capital gains as indicated in the following table. The loss carryforward amounts do not have an expiration date and, therefore, can be carried forward indefinitely until utilized. To the extent that these loss carryforwards are utilized, capital gains so offset will not be distributed to shareholders.
| | | | | | | | | | | | |
| | | | |
| Fund | | Short-Term | | | Long-Term | | | Capital Loss
Available Total | |
China ex-State-Owned Enterprises Fund | | $ | 85,747,681 | | | $ | 25,065,751 | | | $ | 110,813,432 | |
Emerging Markets ex-State-Owned Enterprises Fund | | | 172,177,824 | | | | 61,583,949 | | | | 233,761,773 | |
Emerging Markets High Dividend Fund | | | 399,452,925 | | | | 1,062,200,124 | | | | 1,461,653,049 | |
Emerging Markets Multifactor Fund | | | 1,115,768 | | | | — | | | | 1,115,768 | |
Emerging Markets Quality Dividend Growth Fund | | | 8,661,249 | | | | 9,569,508 | | | | 18,230,757 | |
Emerging Markets SmallCap Dividend Fund | | | 204,231,428 | | | | 189,681,564 | | | | 393,912,992 | |
Global ex-U.S. Quality Dividend Growth Fund | | | 10,763,681 | | | | — | | | | 10,763,681 | |
Global ex-U.S. Real Estate Fund | | | 5,241,105 | | | | 28,125,590 | | | | 33,366,695 | |
Global High Dividend Fund | | | 3,024,903 | | | | 14,898,269 | | | | 17,923,172 | |
Growth Leaders Fund | | | 150,461 | | | | 6,497 | | | | 156,958 | |
India Earnings Fund (consolidated) | | | 42,155,446 | | | | — | | | | 42,155,446 | |
India ex-State-Owned Enterprises Fund | | | 49,173 | | | | 1,883 | | | | 51,056 | |
Capital losses incurred after October 31 (“post-October capital losses”) and late year ordinary losses incurred after December 31 within the taxable year are deemed to arise on the first business day of each Fund’s next taxable year. At March 31, 2022, the Funds did not have any post-October capital losses to defer.
Notes to Financial Statements (continued)
During the fiscal year ended March 31, 2022, the following Funds incurred and will elect to defer late year ordinary losses as follows:
| | | | |
| | |
| Fund | | Late Year
Ordinary Loss | |
China ex-State-Owned Enterprises Fund | | $ | — | |
Emerging Markets ex-State-Owned Enterprises Fund | | | — | |
Emerging Markets High Dividend Fund | | | — | |
Emerging Markets Multifactor Fund | | | 5,114 | |
Emerging Markets Quality Dividend Growth Fund | | | — | |
Emerging Markets SmallCap Dividend Fund | | | — | |
Global ex-U.S. Quality Dividend Growth Fund | | | — | |
Global ex-U.S. Real Estate Fund | | | — | |
Global High Dividend Fund | | | — | |
Growth Leaders Fund | | | — | |
India Earnings Fund (consolidated) | | | — | |
India ex-State-Owned Enterprises Fund | | | — | |
During the fiscal year ended March 31, 2022, the amount of capital loss carryforwards used to offset realized gains are shown in the following table:
| | | | |
| | |
| Fund | | Utilized
Capital Loss
Carryforward | |
China ex-State-Owned Enterprises Fund | | $ | — | |
Emerging Markets ex-State-Owned Enterprises Fund | | | — | |
Emerging Markets High Dividend Fund | | | 155,320,695 | |
Emerging Markets Multifactor Fund | | | 304,420 | |
Emerging Markets Quality Dividend Growth Fund | | | 1,545,510 | |
Emerging Markets SmallCap Dividend Fund | | | 133,859,931 | |
Global ex-U.S. Quality Dividend Growth Fund | | | 11,634,156 | |
Global ex-U.S. Real Estate Fund | | | 146,735 | |
Global High Dividend Fund | | | 1,714,273 | |
Growth Leaders Fund | | | — | |
India Earnings Fund (consolidated) | | | 88,161,857 | |
India ex-State-Owned Enterprises Fund | | | 5,559 | |
At March 31, 2022, the effect of permanent “book/tax” reclassifications resulted in increases (decreases) to the components of net assets as shown in the following table. The differences are primarily due to redemptions-in-kind.
| | | | | | | | |
| | | |
| Fund | | Total
Distributable
Earnings (Loss) | | | Paid-in Capital | |
China ex-State-Owned Enterprises Fund | | $ | (30,114,966 | ) | | $ | 30,114,966 | |
Emerging Markets ex-State-Owned Enterprises Fund | | | (109,210,832 | ) | | | 109,210,832 | |
Emerging Markets High Dividend Fund | | | (2,681,679 | ) | | | 2,681,679 | |
Emerging Markets Multifactor Fund | | | (114,764 | ) | | | 114,764 | |
Emerging Markets Quality Dividend Growth Fund | | | — | | | | — | |
Emerging Markets SmallCap Dividend Fund | | | — | | | | — | |
Global ex-U.S. Quality Dividend Growth Fund | | | (21,204,866 | ) | | | 21,204,866 | |
Global ex-U.S. Real Estate Fund | | | (372,826 | ) | | | 372,826 | |
Global High Dividend Fund | | | (4,489,109 | ) | | | 4,489,109 | |
Growth Leaders Fund | | | (294,694 | ) | | | 294,694 | |
India Earnings Fund (consolidated) | | | — | | | | — | |
India ex-State-Owned Enterprises Fund | | | — | | | | — | |
GAAP provides guidance on tax provisions that prescribe a minimum threshold for financial statement recognition of the benefit of a tax position taken or expected to be taken in a tax return. Foreign withholding taxes, as applicable, are accrued based on each
Notes to Financial Statements (continued)
Fund’s understanding of the tax rules and rates that exist in the foreign markets in which it invests. Foreign withholding taxes are accrued and applied to foreign income, net realized capital gains and net unrealized appreciation, as applicable, as the foreign income is earned or capital gains and unrealized appreciation are recorded. The dollar amount of applicable foreign withholding taxes on foreign income is included net in the Statements of Operations in “Less: Foreign withholding taxes,” the foreign capital gains tax applicable on the disposal of securities is included in the Statements of Operations in “Net realized gain (loss) from investment transactions” and the dollar amount of deferred foreign capital gains tax applicable on the unrealized appreciation on securities held is included in the Statements of Operations in “Net increase (decrease) in unrealized appreciation/depreciation from investment transactions”. The Funds record a foreign tax reclaim receivable on the ex-dividend date if the tax reclaim is “more likely than not” to be sustained assuming examination by tax authorities. This determination is based on, among other things, a jurisdiction’s legal obligation to pay reclaims as well as payment history and market convention. Foreign tax reclaims that have been recorded but not yet received are shown on the Statements of Assets and Liabilities in “Receivables: Foreign tax reclaims”.
As of and during the fiscal year ended March 31, 2022, the Funds did not have any liabilities for unrecognized tax benefits relating to uncertain income tax positions they have taken or expect to take in the future. If applicable, the Funds will recognize interest accrued related to unrecognized tax benefits in interest expense and penalties in “Other” expenses on the Statements of Operations. The Funds file tax returns with the Internal Revenue Service, the State of New York, and various other states. Specific to U.S. federal and state taxes, generally, each of the tax years in the four-year period ended March 31, 2022, remains subject to examination by taxing authorities. Specific to foreign countries in which the Funds invest, all open tax years remain subject to examination by taxing authorities in the respective jurisdictions.
As a result of several European Court of Justice (“ECJ”) court cases in certain countries across the European Union (“EU”), certain Funds have filed additional tax reclaims for previously withheld taxes on dividends earned in those countries (“ECJ tax reclaims”). These additional filings are subject to various administrative proceedings by the local jurisdictions’ tax authorities within the EU, as well as a number of related judicial proceedings. Income recognized, if any, for ECJ tax reclaims is reflected as “Other income” in the Statements of Operations and the cost to file these additional ECJ tax reclaims is reflected as “Other fees” in the Statements of Operations. When the ECJ tax reclaim is not “more likely than not” to be sustained assuming examination by tax authorities due to the uncertainty that exists as to the ultimate resolution of these proceedings, the likelihood of receipt of these ECJ tax reclaims, and the potential timing of payment, no amounts are reflected in the financial statements. For U.S. income tax purposes, ECJ tax reclaims received by the Funds, if any, reduce the amounts of foreign taxes Fund shareholders can use as tax credits in their individual income tax returns. In the event that ECJ tax reclaims received by a Fund during the fiscal year exceed foreign withholding taxes paid, and a Fund previously passed foreign tax credits on to its shareholders, a Fund must either amend historic tax reporting to shareholders or enter into a closing agreement with the Internal Revenue Service in order to pay the associated tax liability on behalf of the respective Fund’s shareholders. During the fiscal year ended March 31, 2022, the ECJ tax reclaims received by the Funds did not exceed the foreign withholding taxes of the respective Funds.
7. MAURITIUS AND INDIA TAXATION
The Portfolio holds a tax residency certificate issued by the Mauritian Revenue authorities as well as other tax residency related documentation prescribed by the Indian Revenue authorities and should be regarded as the beneficial owner of the investments made in Indian securities, which should entitle it to claim the benefits of the double taxation avoidance agreement entered between the Government of India and Mauritius (“tax treaty”).
The taxable profits derived from the Portfolio are subject to income tax at the rate of 15% in the Republic of Mauritius (“Mauritius”) and eligible for a presumed foreign tax credit of 80% of the Mauritian tax on the respective foreign income which effectively limits the maximum income tax payable to an effective rate of 3%. The Mauritius income tax is paid by WTAM (out of its fee paid by the India Earnings Fund), accordingly, no provision for Mauritius income taxes is required.
Under the tax treaty, as amended, Mauritius entities (such as the Portfolio) are subject to tax on capital gains arising on the disposal of shares of an Indian company. However, investments in shares acquired up to March 31, 2017 are grandfathered, thus exempted from capital gains tax in India irrespective of the date of disposal (subject to the entity being eligible for the tax treaty benefits). The Indian tax rates applicable on disposal of securities would depend on the nature of securities, the holding period and the manner of disposal.
U.S. domiciled funds that invest in India are also subject to tax on capital gains in accordance with the provisions of India domestic tax law. India foreign capital gain tax liability accrued by the Funds and the Portfolio is reflected in the Statements of Assets and Liabilities in “Foreign capital gains tax”.
Changes in India tax law could reduce the return to each Fund with investments in India and the return received by each Fund’s shareholders.
Reference to investments by the India Earnings Fund herein should be understood to refer to investments by the Portfolio.
Notes to Financial Statements (continued)
8. DEMAND NOTE
On September 17, 2021, the India Earnings Fund had entered into a demand note agreement with Bank of America, N.A. which allowed the Fund to borrow up to $300,000,000 with a final maturity date of September 28, 2021. The Fund utilized the demand note and borrowed for a period of 10 days (the “Note Period”) with an average outstanding note balance of $117,220,000 and a weighted average interest rate of 2.09% per annum. Interest expense related to the note for the Note Period was $66,976 and any borrowed amounts under the demand note were repaid (with interest) by the Fund prior to the final maturity date.
9. SUBSEQUENT EVENT
Effective April 20, 2022, at the recommendation of WTAM, the investment adviser of the WisdomTree Global ex-U.S. Real Estate Fund (the “Affected Fund”), the Board of Trustees of the Trust, with respect to the Affected Fund, approved changes to the Affected Fund’s name, ticker symbol, investment objective, and investment strategies. The Affected Fund has been renamed WisdomTree New Economy Real Estate Fund, ticker symbol “WTRE”. The new strategy allows investors access to the technology focused real estate sector that tracks the CenterSquare New Economy Real Estate Index.
10. ADDITIONAL INFORMATION
The Board of Trustees authorized a two-for-one stock split for the Global ex-U.S. Quality Dividend Growth Fund, effective after the close of trading on June 9, 2021, for the shareholders of record on June 7, 2021. The impact of the stock split was to increase the number of shares outstanding by a factor of two, while decreasing the NAV per share by a factor of two, resulting in no effect on the net assets of the Fund. The financial statements for the Fund have been adjusted to reflect the stock split.
* * * * *
The respiratory disease caused by a novel coronavirus (“COVID-19”) has spread globally since 2019, resulting in a global pandemic and major disruption to global markets and economies. In an organized attempt to contain and mitigate the effects of COVID-19, governments and businesses world-wide took aggressive measures, including businesses canceling dividends to preserve cash, governments closing borders, restricting international and domestic travel, and the imposition of prolonged quarantines of large populations. COVID-19 has resulted in the disruption of and delays in the delivery of healthcare services and processes, the cancellation of organized events and educational institutions, the disruption of production and supply chains, a decline in consumer demand for certain goods and services, and general concern and uncertainty, all of which have contributed to increased volatility in global markets. In recent months, however, the rapid COVID-19 vaccination rollout in the United States and certain other developed countries, coupled with the passage of stimulus programs in the U.S. and abroad, have resulted in a reversal of many of these trends including the re-opening of businesses, a reduction in quarantine requirements, increased consumer demand, and the resumption of certain in-person schooling, travel and events. Despite these positive trends, the prevalence of new COVID-19 variants, a failure to achieve herd immunity, or other unforeseen circumstances may result in the continued spread of the virus throughout unvaccinated populations or a resurgence in infections among vaccinated populations. As a result, it remains unclear if recent positive trends will continue in developed markets and whether such trends will spread world-wide to countries with limited access to vaccines that are still experiencing rising COVID-19 cases, hospitalizations and deaths.
The effects of COVID-19 have affected and are likely to continue to affect certain sectors and industries more dramatically than others, and the effects borne by some will negatively affect the value of the issuers in those sectors and industries, which may adversely affect the value of a Fund’s investments in those sectors or industries. It is also true that the speed at which global economies recover, or fail to recover, from the COVID-19 pandemic will affect certain sectors, industries, and issuers more dramatically than others, which in turn may adversely affect certain Fund investments.
COVID-19, and other epidemics and pandemics that may arise in the future, could adversely affect the economies of many nations, the global economy, individual companies and capital markets in ways that cannot be foreseen at the present time. In addition, the impact of infectious diseases in developing or emerging market countries may be greater due to limited health care resources, including access to COVID-19 vaccinations and treatments. Political, economic and social stresses caused by COVID-19 also may exacerbate other pre-existing political, social and economic risks in certain countries. The duration of COVID-19 and its effects cannot be determined fully at this time, but the effects could be present for an extended period of time. It is impossible to predict the effects on the Funds of these or similar events and market conditions in the future. However, it is possible that these or similar events and market conditions could have a significant and adverse effect on the NAV and/or risk profile of a Fund.
* * * * *
Russia’s military invasion of Ukraine initiated in February 2022 and the economic and diplomatic responses by the United States and other countries have led to increased volatility and uncertainty in the financial markets and could continue to adversely affect
Notes to Financial Statements (concluded)
regional and global economies for the foreseeable future. In response to Russia’s actions, the governments of the United States, the European Union, the United Kingdom, and many other countries collectively imposed heavy and broad-ranging economic sanctions on certain Russian individuals, corporate and banking entities, and other industries and businesses. The sanctions restrict companies from doing business with Russia and Russian companies, prohibit transactions with the Russian central bank and other key Russian financial institutions and entities, ban Russian airlines and ships from using many other countries’ airspace and ports, respectively, and place a freeze on certain Russian assets. The sanctions also removed some Russian banks from the Society for Worldwide Interbank Financial Telecommunications (SWIFT), the electronic network that connects banks globally to facilitate cross-border payments. In addition, the United States has banned oil and other energy imports from Russia, and the United Kingdom made a commitment to phase out oil import from Russia by the end of 2022.
These sanctions, as well as other economic consequences related to the invasion, such as additional sanctions, boycotts or changes in consumer or purchaser preferences or cyberattacks on governments, companies or individuals, may further decrease the value and liquidity of certain Russian securities and securities of issuers in other countries that are subject to economic sanctions related to the invasion or otherwise adversely affected by the sanctions. To the extent a Fund has exposure to Russian investments or investments in countries affected by the invasion or the sanctions, the Fund’s ability to price, buy, sell, receive or deliver such investments may be impaired. In certain circumstances, such as when there is no market for a security or other means of valuing or disposing of a security, a Fund may determine to value the affected security at zero. In addition, any exposure a Fund may have to counterparties in Russia or in countries affected by the invasion could negatively affect the Fund’s portfolio. The extent and duration of Russia’s military actions and the repercussions of such actions are impossible to predict, but could result in continued significant market disruptions, including in the oil and natural gas markets, and may negatively affect global supply chains, inflation and global growth. Further, an escalation of the military conflict beyond Ukraine’s borders could result in significant, long-lasting damage to the economies of Eastern and Western Europe as well as the global economy. These and any related events could significantly and adversely affect a Fund’s performance and the value of an investment in the Fund, even in the absence of direct exposure to Russian issuers or issuers in other countries affected by the invasion.
Report of Independent Registered Public Accounting Firm
To the Shareholders of WisdomTree China ex-State-Owned Enterprises Fund, WisdomTree Emerging Markets ex-State-Owned Enterprises Fund, WisdomTree Emerging Markets High Dividend Fund, WisdomTree Emerging Markets Multifactor Fund, WisdomTree Emerging Markets Quality Dividend Growth Fund, WisdomTree Emerging Markets SmallCap Dividend Fund, WisdomTree Global ex-U.S. Quality Dividend Growth Fund, WisdomTree Global ex-U.S. Real Estate Fund, WisdomTree Global High Dividend Fund, WisdomTree Growth Leaders Fund, WisdomTree India Earnings Fund and WisdomTree India ex-State-Owned Enterprises Fund and the Board of Trustees of WisdomTree Trust
Opinion on the Financial Statements
We have audited the accompanying statements of assets and liabilities (consolidated as it relates to WisdomTree India Earnings Fund) of WisdomTree China ex-State-Owned Enterprises Fund, WisdomTree Emerging Markets ex-State-Owned Enterprises Fund, WisdomTree Emerging Markets High Dividend Fund, WisdomTree Emerging Markets Multifactor Fund, WisdomTree Emerging Markets Quality Dividend Growth Fund, WisdomTree Emerging Markets SmallCap Dividend Fund, WisdomTree Global ex-U.S. Quality Dividend Growth Fund, WisdomTree Global ex-U.S. Real Estate Fund, WisdomTree Global High Dividend Fund, WisdomTree Growth Leaders Fund, WisdomTree India Earnings Fund and WisdomTree India ex-State-Owned Enterprises Fund, (twelve of the funds constituting WisdomTree Trust (the “Trust”)), including the schedules of investments (consolidated as it relates to WisdomTree India Earnings Fund), as of March 31, 2022, and the related statements of operations and changes in net assets (consolidated as it relates to WisdomTree India Earnings Fund), and the financial highlights (consolidated as it relates to WisdomTree India Earnings Fund) for each of the periods indicated in the table below, and the related notes (collectively referred to as the “financial statements”). In our opinion, the financial statements present fairly, in all material respects, the financial position (consolidated as it relates to WisdomTree India Earnings Fund) of each of the Funds (twelve of the funds constituting WisdomTree Trust) at March 31, 2022, and the results of their operations (consolidated as it relates to WisdomTree India Earnings Fund), changes in net assets (consolidated as it relates to WisdomTree India Earnings Fund) and financial highlights (consolidated as it relates to WisdomTree India Earnings Fund) for each of the periods indicated in the table below, in conformity with U.S. generally accepted accounting principles.
| | | | | | |
| | | | |
| Individual fund constituting the WisdomTree Trust | | Statement of operations | | Statements of changes in net assets | | Financial highlights |
WisdomTree China ex-State-Owned Enterprises Fund WisdomTree Emerging Markets ex-State-Owned Enterprises Fund WisdomTree Emerging Markets High Dividend Fund WisdomTree Emerging Markets Quality Dividend Growth Fund WisdomTree Emerging Markets SmallCap Dividend Fund WisdomTree Global ex-U.S. Quality Dividend Growth Fund WisdomTree Global ex-U.S. Real Estate Fund WisdomTree Global High Dividend Fund WisdomTree India Earnings Fund | | For the year ended March 31, 2022 | | For each of the two years in the period ended March 31, 2022 | | For each of the five years in the period ended March 31, 2022 |
WisdomTree Emerging Markets Multifactor Fund | | For the year ended March 31, 2022 | | For each of the two years in the period ended March 31, 2022 | | For each of the three years in the period ended March 31, 2022 and the period from August 10, 2018 (commencement of operations) through March 31, 2019 |
WisdomTree Growth Leaders Fund | | For the year ended March 31, 2022 | | For each of the two years in the period ended March 31, 2022 | | For each of the two years in the period ended March 31, 2022 and the period from May 22, 2019 (commencement of operations) through March 31, 2020 |
WisdomTree India ex-State-Owned Enterprises Fund | | For the year ended March 31, 2022 | | For each of the two years in the period ended March 31, 2022 | | For each of the two years in the period ended March 31, 2022 and the period from April 4, 2019 (commencement of operations) through March 31, 2020 |
Report of Independent Registered Public Accounting Firm (concluded)
Basis for Opinion
These financial statements are the responsibility of the Trust’s management. Our responsibility is to express an opinion on each of the Funds’ financial statements based on our audits. We are a public accounting firm registered with the Public Company Accounting Oversight Board (United States) (“PCAOB”) and are required to be independent with respect to the Trust in accordance with the U.S. federal securities laws and the applicable rules and regulations of the Securities and Exchange Commission and the PCAOB.
We conducted our audits in accordance with the standards of the PCAOB. Those standards require that we plan and perform the audit to obtain reasonable assurance about whether the financial statements are free of material misstatement, whether due to error or fraud. The Trust is not required to have, nor were we engaged to perform, an audit of the Trust’s internal control over financial reporting. As part of our audits, we are required to obtain an understanding of internal control over financial reporting, but not for the purpose of expressing an opinion on the effectiveness of the Trust’s internal control over financial reporting. Accordingly, we express no such opinion.
Our audits included performing procedures to assess the risks of material misstatement of the financial statements, whether due to error or fraud, and performing procedures that respond to those risks. Such procedures included examining, on a test basis, evidence regarding the amounts and disclosures in the financial statements. Our procedures included confirmation of securities owned as of March 31, 2022, by correspondence with the custodian and brokers or by other appropriate auditing procedures where replies from brokers were not received. Our audits also included evaluating the accounting principles used and significant estimates made by management, as well as evaluating the overall presentation of the financial statements. We believe that our audits provide a reasonable basis for our opinion.

We have served as the auditor of one or more WisdomTree investment companies since 2006.
New York, New York
May 25, 2022
Approval of Investment Advisory and Sub-Advisory Agreements (unaudited)
Consideration of the Approval of Investment Advisory Agreement
WisdomTree Global ex-U.S. Quality Dividend Growth Fund (the “Fund”)
At a meeting of the Board of Trustees (the “Board”) of the WisdomTree Trust (the “Trust”) held on December 7-8, 2021, the Trustees (the “Trustees”), including those Trustees who are not “interested persons” (as defined in the Investment Company Act of 1940, as amended) of the Trust (the “Independent Trustees”), considered the approval of an amendment to the Amended and Restated Investment Advisory Agreement between the Trust, on behalf of the Fund, and WisdomTree Asset Management, Inc. (“WTAM”), pursuant to which WTAM provides the Fund with investment advisory services (the “Advisory Agreement”). WTAM representatives discussed with the Board its proposal to lower the advisory fee paid to WTAM by the Fund pursuant to the Advisory Agreement as follows:
| | • | | WisdomTree Global ex-U.S. Quality Dividend Growth Fund: from 0.58% to 0.42% of the value of the Fund’s average net assets |
Since the Board had approved the renewal of the Advisory Agreement at a meeting held on September 27-28, 2021 (the “September Meeting”), and, other than as discussed below, there had been no material changes in the information presented, the Board addressed certain of the relevant considerations by reference to their considerations and determinations at the September Meeting.
In considering whether to approve the amendment to the Advisory Agreement, the Trustees considered and discussed a memorandum discussing the proposed new fee structures provided by WTAM and information provided by Broadridge Financial Solutions, Inc., an independent provider of investment company data. The Independent Trustees were assisted in their review by independent legal counsel and met with counsel in executive session separate from representatives of WTAM. In considering the approval of the amendment of the Advisory Agreement, the Board considered all factors that it believed to be relevant, including those discussed below. The Board did not identify any one factor as dispositive, and each Trustee may have attributed different weights to the factors considered.
Analysis of Nature, Extent, and Quality of Services Provided to the Fund. WTAM represented that there was expected to be no diminution in the nature, extent or quality of the services provided to the Fund by WTAM. The nature, extent and quality of services provided had been considered at the September Meeting, and there had been no material changes in this information.
Comparative Analysis of the Fund’s Performance, Advisory Fees and Fund Expenses. The Board had considered the Fund’s performance at the September Meeting. The Board considered the fee to be paid to WTAM by the Fund. The Board examined the fee to be paid to WTAM by the Fund in light of fees paid to other investment advisers by comparable funds and the method of computing the Fund’s fee. The Board concluded that the proposed change did not alter the conclusions the Board had reached at the September Meeting.
Analysis of Profitability and Economies of Scale. The Board had considered profitability, economies of scale and the potential benefits to WTAM at the September Meeting. WTAM representatives noted that the proposed new fee structures would result in a reduction in the fees paid to WTAM by the Fund and that potential benefits would not change materially as a result of the amendment from those considered at the September Meeting.
* * * * * *
In evaluating the Advisory Agreement, the Board considered the conclusions and determinations discussed above and also relied on its knowledge, gained through meetings and other interactions with WTAM, of other funds advised by WTAM. In light of the foregoing, the Board, including a majority of the Independent Trustees, determined to approve amendment of the Advisory Agreement for the Fund.
Liquidity Risk Management Program (unaudited)
The Funds adopted a liquidity risk management program (the “Program”) pursuant to the requirements of Rule 22e-4 (the “Rule”) under the Investment Company Act of 1940, as amended. The Rule requires registered open-end funds, including exchange-traded funds such as the Funds, to establish liquidity risk management programs in order to effectively manage fund liquidity and shareholder redemptions. The Rule is designed to mitigate the risk that a Fund could not meet redemption requests without significantly diluting the interest of remaining investors. The Board has appointed WisdomTree Asset Management, Inc., the investment advisor to the Funds, as the Program Administrator for each Fund’s Program.
The Rule requires the Funds to assess, manage and review their liquidity risk at least annually considering applicable factors such as investment strategy and liquidity during normal and foreseeable stressed conditions, including whether the strategy is appropriate for an open-ended fund and whether the Fund has a relatively concentrated portfolio or large positions in particular issuers. The Funds must also assess their use of borrowings and derivatives, short-term and long-term cash flow projections in normal and stressed conditions, holdings of cash and cash equivalents, and borrowing arrangements and other funding sources.
The Rule also requires the Funds to classify their investments into one of four liquidity categories: highly liquid, moderately liquid, less liquid or illiquid based on the number of days a Fund expects it would take to liquidate the investment, and to review these classifications at least monthly or more often under certain conditions. The periods range from three or fewer business days for a highly liquid investment to greater than seven calendar days for settlement of a less liquid investment. Illiquid investments are those a Fund does not expect to be able to sell or dispose of within seven calendar days without significantly changing the market value of the investment. A Fund is prohibited from acquiring an investment if, after the acquisition, its holdings of illiquid assets will exceed 15% of its net assets. In addition, if a Fund permits redemptions in-kind, the Rule requires the Fund to establish redemption in-kind policies and procedures governing how and when it will engage in such redemptions.
Pursuant to the Rule’s requirements, the Program has been reviewed and approved by the Fund’s Board. Furthermore, the Board has received a written report prepared by the Program Administrator that addresses the operation of the Program, assesses its adequacy and effectiveness and describes any material changes made to the Program. The Program Administrator has monitored the Fund’s liquidity risk and the liquidity classifications of the securities held by the Fund and has determined that the Program is operating effectively.
During the period from January 1, 2021 to December 31, 2021, there were no material changes to the Program and no material liquidity events that impacted the Funds. During the period, the Funds held sufficient highly liquid assets to meet fund redemptions.
Under normal expected foreseeable Fund redemption forecasts and foreseeable stressed Fund redemption forecasts, the Program Administrator believes that the Funds maintain sufficient highly liquid assets to meet Fund redemptions.
Trustees and Officers Information (unaudited)
| | | | | | | | | | |
Name
and Year of Birth
of Trustee/Officer | | Position(s) Held with the Trust, Term of Office and Length
of Time Served | | Principal Occupation(s)
During Past 5 Years | | Number of Portfolios
in Fund Complex
Overseen by Trustee/
Officer+ | | | Other Directorships Held by Trustee |
Trustees Who Are Interested Persons of the Trust |
| | | | |
Jonathan Steinberg
(1964) | | Trustee, 2005- present; President, 2005-present | | Chief Executive Officer, WisdomTree Investments, Inc. and WisdomTree Asset Management since 2005; President, WisdomTree Investments, Inc. and WisdomTree Asset Management from 2012 to 2019. | | | 77 | | | Director, WisdomTree Investments, Inc. and WisdomTree Asset Management. |
|
Trustees Who Are Not Interested Persons of the Trust |
| | | | |
David G. Chrencik*
(1948) | | Trustee, 2014-present | | Chief Financial Officer of Sarus Indochina Select LP (hedge fund) since 2012; Chief Financial Officer of GeoGreen BioFuels, Inc. (biodiesel fuel producer) from 2010 to 2014; Audit Partner at PricewaterhouseCoopers LLP (public accounting firm) from 1972 to 2009 (includes positions prior to becoming Audit Partner and predecessor firms). | | | 77 | | | Trustee, Vericimetry Funds (2011 to 2014). |
| | | | |
Joel Goldberg**, ***
(1945) | | Trustee, 2012-present | | Attorney, Partner at Stroock & Stroock & Lavan LLP from 2010 to 2018; Attorney, Partner at Willkie Farr & Gallagher LLP from 2006 to 2010. | | | 77 | | | Director, Better Business Bureau (Metropolitan New York, Long Island and the Mid-Hudson Region). |
| | | | |
Toni Massaro***
(1955) | | Trustee, 2006-present | | Dean Emerita at the University of Arizona James E. Rogers College of Law (“Rogers College of Law”) since 2009 (distinguished Emerita in July 2009); Dean of the Rogers College of Law from 1999 to 2009; Regents’ Professor since 2006; Milton O. Riepe Chair in Constitutional Law since 1997; Professor at the Rogers College of Law since 1990. | | | 77 | | | None |
| | | | |
Melinda A.
Raso Kirstein**** (1955) | | Trustee, 2014-present | | Retired since 2004, Merrill Lynch Investment Management, Vice President; Senior Portfolio Manager, Fixed Income Management; Director, Tax Exempt Fund Management. | | | 77 | | | Associate Alumnae of Douglass College, Chair of Investment Committee. |
| | | | |
Victor Ugolyn
(1947) | | Trustee, 2006-present; Chairman of the Board, 2006-present | | Private Investor, from 2005 to present; President and Chief Executive Officer of William D. Witter, Inc. from 2005 to 2006; Consultant to AXA Enterprise in 2004; Chairman, President and Chief Executive Officer of Enterprise Capital Management (subsidiary of The MONY Group, Inc.) and Enterprise Group of Funds, Chairman of MONY Securities Corporation, and Chairman of the Fund Board of Enterprise Group of Funds from 1991 to 2004. | | | 77 | | | None |
Trustees and Officers Information (unaudited) (concluded)
| | | | | | | | | | |
Name
and Year of Birth
of Trustee/Officer | | Position(s) Held with the Trust, Term of Office and Length
of Time Served | | Principal Occupation(s)
During Past 5 Years | | Number of Portfolios
in Fund Complex
Overseen by Trustee/
Officer+ | | | Other Directorships Held by Trustee |
Officers of the Trust |
| | | | |
Jonathan Steinberg***** (1964) | | President, 2005- present; Trustee, 2005-present | | Chief Executive Officer, WisdomTree Investments, Inc. and WisdomTree Asset Management since 2005; President, WisdomTree Investments, Inc. and WisdomTree Asset Management from 2012 to 2019. | | | 77 | | | None |
| | | | |
David Castano***** (1971) | | Treasurer, 2013-present | | Head of Fund Accounting & Administration, WisdomTree Asset Management, since 2020; Director of Fund Accounting & Administration, WisdomTree Asset Management, 2011 to 2020. | | | 77 | | | None |
| | | | |
Terry Jane Feld***** (1960) | | Chief Compliance Officer, 2012-present | | Head of Compliance, WisdomTree Asset Management since 2022; Chief Compliance Officer, WisdomTree Asset Management since 2012. | | | 77 | | | None |
| | | | |
Joanne Antico***** (1975) | | Chief Legal Officer and Secretary, 2021-present | | General Counsel, WisdomTree Asset Management since 2021; Assistant General Counsel, WisdomTree Asset Management, 2016 to 2021; Executive Director and Assistant Secretary, Morgan Stanley Investment Management Inc., 2005 to 2016. | | | 77 | | | None |
| | | | |
TJ Darnowski***** (1984) | | Assistant Secretary, 2021-present | | Senior Investment Management Paralegal, WisdomTree Asset Management since 2021; Senior Legal Administrator, Ultimus Fund Solutions, 2019-2021; Assistant Vice President, State Street Bank & Trust Company, 2010 to 2019. | | | 77 | | | None |
| | | | |
Clint Martin***** (1977) | | Assistant Treasurer, 2015-present | | Director of Fund Accounting & Administration, WisdomTree Asset Management, since 2020; Fund Manager, Fund Accounting & Administration, WisdomTree Asset Management, 2012 to 2020. | | | 77 | | | None |
| * | Chair of the Audit Committee. |
| ** | Chair of the Contracts Review Committee. |
| *** | Co-Chair of the Governance, Nominating and Compliance Committee. |
| **** | Chair of the Investment Committee. |
| ***** | Elected by and serves at the pleasure of the Board. |
Supplemental Information (unaudited)
Federal Income Tax Information
The following Federal tax information related to the Funds’ fiscal year ended March 31, 2022, is provided for information purposes only and should not be used for reporting to federal or state revenue agencies. Federal tax information for the calendar year will be reported to you on Form 1099-DIV in January 2023.
Certain dividends paid by the Funds may be subject to a maximum tax rate of 15%, as provided by the Jobs and Growth Tax Relief Reconciliation Act of 2003. Of the distributions paid during the fiscal year ended March 31, 2022, the following represents the maximum amount of ordinary income distributions that may be considered qualified dividend income:
| | | | |
| | |
| Fund | | Qualified Dividend
Income | |
China ex-State-Owned Enterprises Fund | | $ | 4,864,272 | |
Emerging Markets ex-State-Owned Enterprises Fund | | | 45,666,855 | |
Emerging Markets High Dividend Fund | | | 62,840,743 | |
Emerging Markets Multifactor Fund | | | 111,178 | |
Emerging Markets Quality Dividend Growth Fund | | | 1,272,881 | |
Emerging Markets SmallCap Dividend Fund | | | 38,152,806 | |
Global ex-U.S. Quality Dividend Growth Fund | | | 9,420,001 | |
Global ex-U.S. Real Estate Fund | | | 927,296 | |
Global High Dividend Fund | | | 2,470,552 | |
Growth Leaders Fund | | | 5,287 | |
India Earnings Fund (consolidated) | | | 12,894,200 | |
India ex-State-Owned Enterprises Fund | | | 1,470 | |
The Funds intend to elect to pass through to shareholders the credit for taxes paid to foreign countries during the fiscal year ended March 31, 2022. The gross foreign source income and foreign taxes paid are as follows:
| | | | | | | | |
| | | |
| Fund | | Gross Foreign
Income | | | Foreign
Taxes Paid | |
China ex-State-Owned Enterprises Fund | | $ | 10,705,018 | | | $ | 452,342 | |
Emerging Markets ex-State-Owned Enterprises Fund | | | 79,429,655 | | | | 16,960,657 | |
Emerging Markets High Dividend Fund | | | 136,578,091 | | | | 15,579,519 | |
Emerging Markets Multifactor Fund | | | 181,373 | | | | 43,876 | |
Emerging Markets Quality Dividend Growth Fund | | | 3,025,586 | | | | 463,560 | |
Emerging Markets SmallCap Dividend Fund | | | 90,034,080 | | | | 19,698,802 | |
Global ex-U.S. Quality Dividend Growth Fund | | | 11,833,965 | | | | 2,076,559 | |
Global ex-U.S. Real Estate Fund | | | 2,799,206 | | | | 86,492 | |
Global High Dividend Fund | | | — | | | | — | |
Growth Leaders Fund | | | — | | | | — | |
India Earnings Fund (consolidated) | | | 14,634,962 | | | | 4,873,246 | |
India ex-State-Owned Enterprises Fund | | | 19,464 | | | | 61,816 | |
Supplemental Information (unaudited) (concluded)
The following represents the percentage of dividends paid during the fiscal year ended March 31, 2022, that qualify for the 70% dividends received deduction for corporate shareholders:
| | | | |
| | |
| Fund | | Dividends-Received
Deduction | |
China ex-State-Owned Enterprises Fund | | | 0.88 | % |
Emerging Markets ex-State-Owned Enterprises Fund | | | 0.16 | % |
Emerging Markets High Dividend Fund | | | 0.02 | % |
Emerging Markets Multifactor Fund | | | 0.13 | % |
Emerging Markets Quality Dividend Growth Fund | | | — | |
Emerging Markets SmallCap Dividend Fund | | | — | |
Global ex-U.S. Quality Dividend Growth Fund | | | — | |
Global ex-U.S. Real Estate Fund | | | — | |
Global High Dividend Fund | | | 54.84 | % |
Growth Leaders Fund | | | 100.00 | % |
India Earnings Fund (consolidated) | | | — | |
India ex-State-Owned Enterprises Fund | | | — | |
General Information (unaudited)
Proxy Voting Policies, Procedures and Record
A complete copy of the Proxy Voting Policy may be obtained upon request, at no charge, by calling 1-866-909-WISE (9473) or writing to: WisdomTree Trust, c/o Foreside Fund Services, LLC, Three Canal Plaza Suite 100, Portland, ME, 04101.
The Trust is required to disclose annually the Funds’ complete proxy voting record on Form N-PX covering the most recent
12-month period ended June 30 and to file Form N-PX with the SEC no later than August 31 of each year. The current Form N-PX for the Funds is available at no charge upon request by calling 1-866-909-WISE (9473) or through the Trust’s website at www.wisdomtree.com. The Funds’ Form N-PX is also available on the SEC’s website at www.sec.gov.
Shareholder Reports and Quarterly Portfolio Disclosure
The Funds file their complete schedule of portfolio holdings with the SEC for their first and third fiscal quarters as an exhibit to their reports on Form N-PORT. Copies of the filings are available, without charge, on the SEC’s website at www.sec.gov and are also available by calling the Trust at 1-866-909-WISE (9473). Copies of the filings may also be obtained, after paying a duplicating fee, by electronic request at the following E-mail address: publicinfo@sec.gov.
Information about each Fund’s portfolio holdings is available daily, without charge, at www.wisdomtree.com.
The Statement of Additional Information (“SAI”) has additional information about the Funds’ Trustees and Officers and is available without charge upon request. Contact your financial representative for a free prospectus or SAI.
Frequency Distribution of Discounts & Premiums
Information about differences between the per share net asset value of each Fund and the market trading price of shares of each Fund are available, without charge, at www.wisdomtree.com.
The WisdomTree Funds are exchange traded funds (“ETFs”) registered with the United States Securities and Exchange Commission as separate series (“Funds”) of WisdomTree Trust (“Trust”). WisdomTree Asset Management, Inc., a wholly owned subsidiary of WisdomTree Investments, Inc., serves as the investment adviser to the Trust. None of the WisdomTree entities are affiliated with Foreside Fund Services, LLC, the Funds’ distributor. WisdomTree Investments, its affiliates and their independent providers are not liable for any informational errors, incompleteness, delays, or for any actions taken in reliance on information contained herein.
There are risks associated with investing including possible loss of principal. Foreign investing involves special risks, such as risk of loss from currency fluctuation or political or economic uncertainty. Investments in real estate involve additional special risks, such as credit risk, interest rate fluctuations and the effect of varied economic conditions. Funds that focus their investments in one country or region may be significantly impacted by events and developments associated with the region which can adversely affect performance. Funds focusing on a single sector and/or smaller companies generally experience greater price volatility. Investments in emerging, offshore or frontier markets are generally less liquid and less efficient than investments in developed markets and are subject to additional risks, such as risks of adverse governmental regulation and intervention or political developments. Investments in currency involve additional special risks, such as credit risk and interest rate fluctuations. Derivative investments can be volatile and these investments may be less liquid than other securities, and more sensitive to the effect of varied economic conditions. As these Funds can have a high concentration in some issuers the Funds can be adversely impacted by changes affecting such issuers. Due to the investment strategy of certain Funds they may make higher capital gain distributions than other ETFs. Please read the Fund’s prospectus for specific details regarding the Fund’s risk profile.
Indexes are unmanaged and you cannot invest directly in an index.
The Dow Jones Global ex-U.S. Select Real Estate Securities Index is calculated, distributed and marketed by Dow Jones Indexes, a licensed trademark of CME Group Index Services LLC, and has been licensed for use.
Transactions in Fund shares will result in brokerage commissions and will generate tax consequences. Shares may be sold through brokerage accounts, but may be redeemed from the Funds only by Authorized Participants in large creation unit sizes of shares.
This report is intended for the Funds’ shareholders. It may not be distributed to prospective investors unless it is preceded or accompanied by the current prospectus.
Scan the QR code with your
smartphone camera to

learn more at
WisdomTree.com
WisdomTree Fund shares are distributed by Foreside Fund Services, LLC, in the U.S. only.
WTGM - 6332


WisdomTree Trust
Annual Report
March 31, 2022
WisdomTree Europe Hedged Equity Fund (HEDJ)
WisdomTree Europe Hedged SmallCap Equity Fund (EUSC)
WisdomTree Germany Hedged Equity Fund (DXGE)
WisdomTree International Hedged Quality Dividend Growth Fund (IHDG)
WisdomTree Japan Hedged Equity Fund (DXJ)
WisdomTree Japan Hedged SmallCap Equity Fund (DXJS)
Table of Contents
“WisdomTree” is a registered mark of WisdomTree Investments, Inc. and is licensed for use by the WisdomTree Trust.
Market Environment Overview
(unaudited)
Developed international equity markets, as measured by the MSCI EAFE Index, were roughly flat for the 12-month fiscal period ending March 31, 2022 (the “period”), returning only 1.16% in U.S. dollar (“USD”) terms.
International currency market performance was mixed during the period, although the USD broadly strengthened relative to a basket of global currencies. The euro (“EUR”) steadily weakened against the USD during the period, as the European region generally saw slower economic growth than the U.S. Although not in Europe, this effect was even more pronounced in the Japanese yen (“JPY”), which was being suppressed by the Bank of Japan in an attempt to stimulate economic growth while the rest of the global economy was overheating. The JPY weakened slightly for most of the period, though it sold off considerably in March 2022, the final month of the period. The British pound sterling fluctuated during the period but also weakened versus the USD, alongside the JPY and EUR.
Developed international equities increased their value for most of the period as the global economy continued its recovery from the COVID-19 pandemic that began in 2020. Vaccine accessibility established confidence in global markets as regional economies steadily began to reopen, promoting a revival in cyclical sectors that had been suppressed the prior year. The pace of economic growth improved during 2021, along with the inflation rates around the world, amid a global backdrop of accommodative policy. However, several headwinds in the first quarter of 2022 forced international equities to give up most of their gains from the previous nine months.
During the second quarter of 2021, markets gradually moved higher, with the MSCI EAFE Index returning 5.17% in USD terms. This was mainly due to the improved outlook for economic growth amid vaccine accessibility. The developed international economic region has significant concentration in cyclical sectors tied to overall levels of economic growth, so the improved economic outlook contributed positively to performance.
The third quarter of 2021 was more tempered than the previous quarter. The MSCI EAFE Index was flat during the quarter in USD terms, and early summertime optimism faded as new and potentially more infectious COVID-19 variants appeared and spread throughout the world. This ignited fear of renewed “lockdowns”, questions of vaccine efficacy, and threatened the ongoing economic recovery.
However, investors’ concerns quickly abated during the fourth quarter of 2021. Fears of systemic impacts from the downturn in the Chinese real estate markets briefly sent markets into negative territory, but they finished 2021 strong once their contagion concerns were allayed. Developed international markets ultimately finished the quarter in positive territory, returning 2.69% on a USD basis.
With 2021 in rearview, investors began 2022 with several concerns that led to risk-off sentiments in the first quarter of 2022. At the forefront were concerns about runaway inflation, and the expectation that global central banks would have to quickly intervene with restrictive monetary policy actions to temper rising inflation. Interest rates around the world rose quickly as bonds sold-off, and the U.S. Federal Reserve raised its target federal funds rate for the first time since slashing it to 0% at the onset of the pandemic in 2020.
Inflationary and interest rate concerns temporarily took a backseat halfway through the first quarter of 2022, as geopolitical tensions between Russia and Ukraine escalated into war. Investor risk-on sentiment deteriorated, and equities declined for several weeks as markets assessed the developments and prospects for resolution.
As a result, international equities sold off in the first quarter of 2022, owing to the near certainty of several upcoming interest rate hikes amid a tightening cycle and geopolitical tensions between Russia and Ukraine. The MSCI EAFE Index fell nearly 6% in dollar terms, although it regained some ground from its -15% low on March 8, 2022.
Many of these risk factors remain paramount, and global financial market performance will be heavily dependent on developments in the war between Russia and Ukraine, economic data, and upcoming central bank activity.
Each WisdomTree Fund’s performance as set forth in “Management’s Discussion of Funds’ Performance” in the pages that follow should also be viewed in light of the foregoing market environment.
Information about Performance and Shareholder Expense Examples (unaudited)
Performance
The performance tables on the following pages are provided for comparative purposes and represent the period noted. Each Fund’s per share net asset value (“NAV”) is the value of one share of the Fund and is calculated by dividing the value of total assets less total liabilities by the number of shares outstanding. The NAV return is based on the NAV of the Fund and the market price return is based on the market price per share of the Fund. The price used to calculate market price returns is the midpoint of the bid and ask price for Fund shares as of the close of trading on the exchange where Fund shares are listed. NAV and market price returns assume that dividends and capital gain distributions have been reinvested in the Fund at NAV and market price, respectively. As with other exchange traded funds (“ETFs”), NAV returns and market price returns may differ because of factors such as the supply and demand for Fund shares and investors’ assessments of the underlying value of a Fund’s portfolio securities.
Fund shares are bought and sold at market price (not NAV) and are not individually redeemed from a Fund. Fund NAV returns are calculated using a Fund’s daily 4:00 p.m. eastern time NAV. Market price returns reflect the midpoint of the bid and ask price as of the close of trading on the exchange where Fund shares are listed. Market price returns do not represent the returns you would receive if you traded shares at other times. The returns do not reflect the deduction of taxes that a shareholder would pay on Fund distributions or on the redemption of Fund shares. Total returns for a period of less than one year are cumulative.
Performance is historical and does not guarantee future results. Current performance may be lower or higher than quoted. Investment returns and the principal value of an investment will fluctuate so that an investor’s shares, when redeemed, may be worth more or less than their original cost. For the most recent month-end performance information visit www.wisdomtree.com.
An index is a statistical measure of a specified financial market or sector. An index does not actually hold a portfolio of securities, incur expenses or pay any transaction costs. Therefore, index returns do not reflect deductions for fees or expenses and an index is not available for direct investment. In comparison, the Funds’ performance is negatively impacted by these deductions. Fund returns do not reflect brokerage commissions or taxes on transactions in Fund shares or taxes that a shareholder would pay on Fund distributions. Past performance is no guarantee of future results.
Shareholder Expense Examples
Each Fund’s performance table is accompanied by a shareholder expense example. As a shareholder of a WisdomTree Fund, you incur two types of cost: (1) transaction costs, including brokerage commissions on purchases and sales of your Fund shares and (2) ongoing costs, including management fees and other Fund expenses. The examples are intended to help you understand your ongoing costs (in dollars and cents) of investing in a Fund and to compare these costs with the ongoing costs of investing in other funds.
The examples are based on an investment of $1,000 invested at the beginning of the period and held for the entire period from October 1, 2021 to March 31, 2022. Except where noted, expenses are calculated using each Fund’s annualized expense ratio (after the effect of contractual or voluntary fee waivers, if any), multiplied by the average account value for the period, multiplied by 182/365 (to reflect the one-half year period). The annualized expense ratio does not include acquired fund fees and expenses (“AFFEs”), which are fees and expenses incurred indirectly by a Fund through its investments in certain underlying investment companies.
Actual expenses
The first line in the shareholder expense example table shown on the following pages provides information about actual account values and actual expenses. You may use the information in this line, together with the amount you invested, to estimate the expenses that you paid over the period. Simply divide your account value by $1,000 (for example, an $8,600 account value divided by $1,000 = 8.6), then multiply the result by the number in the first line for your Fund under the heading entitled “Expenses Paid During the Period” to estimate the expenses you paid on your account during the period.
Hypothetical example for comparison purposes
The second line in the shareholder expense example table shown on the following pages provides information about hypothetical account values and hypothetical expenses based on the Fund’s actual expense ratio and an assumed rate of return of 5% per year before expenses, which is not the Fund’s actual return. The hypothetical account values and expenses may not be used to estimate the actual ending account balance or expenses you paid for the period. You may use this information to compare the ongoing costs of investing in your Fund and other funds. To do so, compare this 5% hypothetical example with the 5% hypothetical examples that appear in the shareholder reports of the other funds.
Please note that the expenses shown in the table are meant to highlight your ongoing costs only and do not reflect any transactional costs, such as brokerage commissions paid on purchases and sales of Fund shares. Therefore, the second line in the table is useful in comparing ongoing Fund costs only and will not help you determine the relative total costs of owning different funds. In addition, if these transactional costs were included, your costs would have been higher.
Management’s Discussion of Funds’ Performance
as of March 31, 2022 (unaudited)
WisdomTree Europe Hedged Equity Fund (HEDJ)
Sector Breakdown†
| | | | |
| |
| Sector | | % of Net Assets | |
Materials | | | 18.7% | |
Industrials | | | 18.1% | |
Consumer Staples | | | 14.9% | |
Consumer Discretionary | | | 12.6% | |
Health Care | | | 11.4% | |
Financials | | | 9.0% | |
Information Technology | | | 8.9% | |
Communication Services | | | 4.5% | |
Energy | | | 0.8% | |
Utilities | | | 0.2% | |
Other Assets less Liabilities‡ | | | 0.9% | |
Total | | | 100.0% | |
| † | The Fund’s sector breakdown is expressed as a percentage of net assets and may change over time. In addition, a sector may be comprised of several industries. It does not include derivatives (if any). |
| ‡ | Other assets less liabilities may include investment of cash collateral for securities on loan and/or receivables/payables on derivatives (if any). |
Top Ten Holdings*
| | | | |
| |
| Description | | % of Net Assets | |
Linde PLC | | | 5.5% | |
ASML Holding NV | | | 4.4% | |
Sanofi | | | 4.0% | |
Banco Bilbao Vizcaya Argentaria SA | | | 3.6% | |
LVMH Moet Hennessy Louis Vuitton SE | | | 3.6% | |
L’Oreal SA | | | 3.4% | |
Deutsche Telekom AG, Registered Shares | | | 3.4% | |
Siemens AG, Registered Shares | | | 2.9% | |
Bayer AG, Registered Shares | | | 2.7% | |
BASF SE | | | 2.7% | |
| * | The ten largest holdings are subject to change, and there are no guarantees the Fund will remain invested in any particular company. Excludes derivatives and investment of cash collateral for securities on loan (if any). |
The WisdomTree Europe Hedged Equity Fund (the “Fund”) seeks to track the price and yield performance, before fees and expenses, of the WisdomTree Europe Hedged Equity Index (the “Index”). In seeking to track the Index, the Fund invests in European dividend-paying companies while at the same time hedging exposure to the fluctuations of the value of the euro relative to the U.S. dollar. The Fund generally uses a representative sampling strategy to achieve its investment objective, meaning it generally will invest in a sample of securities in the Index.
The Fund returned 4.04% at net asset value (“NAV”) for the fiscal year ended March 31, 2022 (for more complete performance information please see the table below). The Fund benefited from its positions in Consumer Discretionary, Information Technology and Consumer Staples, almost entirely due to stock selection effects. Stock selection in the Energy, Industrials and Utilities sectors weighed negatively on performance for the Fund. When analyzing performance by country, exposures within Finland and Spain weighed negatively on performance the most, due to stock selection. Netherlands and Ireland were top performance contributors primarily due to stock selection. The Fund’s use of foreign currency contracts to hedge euro currency exposure contributed to performance due to the overall appreciation of the U.S. dollar against the euro during the fiscal year.
Shareholder Expense Example (for the six-month period ended March 31, 2022)
| | | | | | | | | | | | | | | | |
| | | | | |
| | | Beginning
Account Value | | | Ending
Account Value | | | Annualized
Expense Ratio | | | Expenses Paid
During the
Period | |
Actual | | $ | 1,000.00 | | | $ | 979.10 | | | | 0.58 | % | | $ | 2.86 | |
Hypothetical (5% return before expenses) | | $ | 1,000.00 | | | $ | 1,022.04 | | | | 0.58 | % | | $ | 2.92 | |
Performance
| | | | | | | | | | | | | | | | |
| | |
| | | Average Annual Total Return | |
| | | | |
| | | 1 Year | | | 3 Year | | | 5 Year | | | 10 Year | |
Fund NAV Returns | | | 4.04 | % | | | 7.52 | % | | | 5.76 | % | | | 8.96 | % |
Fund Market Price Returns | | | 3.39 | % | | | 7.30 | % | | | 5.66 | % | | | 8.71 | % |
WisdomTree DEFA International Hedged Equity/Europe Hedged Equity Spliced Index1 | | | 4.55 | % | | | 8.07 | % | | | 6.20 | % | | | 9.42 | % |
MSCI EAFE Local Currency/MSCI EMU Local Currency Spliced Index2 | | | 1.81 | % | | | 7.17 | % | | | 4.79 | % | | | 7.83 | % |
| 1 | WisdomTree DEFA International Hedged Equity Index prior to August 29, 2012; WisdomTree Europe Hedged Equity Index thereafter. |
| 2 | MSCI EAFE Local Currency Index prior to August 29, 2012; MSCI EMU Local Currency Index thereafter. |
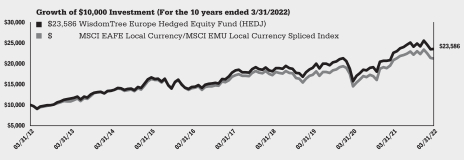
Performance is historical and does not guarantee future results. The returns do not reflect the deduction of taxes that a shareholder would pay on Fund distributions or on the redemption of Fund shares.
Management’s Discussion of Funds’ Performance
as of March 31, 2022 (unaudited)
WisdomTree Europe Hedged SmallCap Equity Fund (EUSC)
Sector Breakdown†
| | | | |
| |
| Sector | | % of Net Assets | |
Industrials | | | 21.0% | |
Financials | | | 14.9% | |
Utilities | | | 13.9% | |
Real Estate | | | 13.6% | |
Communication Services | | | 9.3% | |
Materials | | | 7.2% | |
Consumer Discretionary | | | 6.0% | |
Information Technology | | | 4.6% | |
Consumer Staples | | | 4.4% | |
Health Care | | | 2.6% | |
Energy | | | 1.7% | |
Other Assets less Liabilities‡ | | | 0.8% | |
Total | | | 100.0% | |
| † | The Fund’s sector breakdown is expressed as a percentage of net assets and may change over time. In addition, a sector may be comprised of several industries. It does not include derivatives (if any). |
| ‡ | Other assets less liabilities may include investment of cash collateral for securities on loan and/or receivables/payables on derivatives (if any). |
Top Ten Holdings*
| | | | |
| |
| Description | | % of Net Assets | |
Enagas SA | | | 2.3% | |
Proximus SADP | | | 2.0% | |
BAWAG Group AG | | | 1.8% | |
Italgas SpA | | | 1.8% | |
Acciona SA | | | 1.7% | |
Mapfre SA | | | 1.7% | |
Klepierre SA | | | 1.7% | |
Covivio | | | 1.7% | |
Freenet AG | | | 1.6% | |
A2A SpA | | | 1.6% | |
| * | The ten largest holdings are subject to change, and there are no guarantees the Fund will remain invested in any particular company. Excludes derivatives and investment of cash collateral for securities on loan (if any). |
The WisdomTree Europe Hedged SmallCap Equity Fund (the “Fund”) seeks to track the price and yield performance, before fees and expenses, of the WisdomTree Europe Hedged SmallCap Equity Index (the “Index”). In seeking to track the Index, the Fund invests in European small-cap dividend-paying companies while at the same time hedging exposure to fluctuations of the value of the euro relative to the U.S. dollar. The Fund generally uses a representative sampling strategy to achieve its investment objective, meaning it generally will invest in a sample of securities in the Index.
The Fund returned 4.86% at net asset value (“NAV”) for the fiscal year ended March 31, 2022 (for more complete performance information please see the table below). The Fund benefited from its positions in Information Technology, Health Care and Real Estate, due to stock selection effects within each sector. Positions in the Materials, Financials and Communication Services sectors weighed negatively on performance for the Fund, largely attributable to stock selection effects. When analyzing performance by country, exposures within France and Austria weighed negatively on performance the most, as a result of stock selection effects. Netherlands and Germany were top performance contributors also primarily due to stock selection effects. The Fund’s use of foreign currency contracts to hedge euro currency exposure contributed to performance due to the overall appreciation of the U.S. dollar against the euro during the fiscal year.
Shareholder Expense Example (for the six-month period ended March 31, 2022)
| | | | | | | | | | | | | | | | |
| | | | | |
| | | Beginning
Account Value | | | Ending
Account Value | | | Annualized
Expense Ratio1 | | | Expenses Paid
During the
Period1 | |
Actual | | $ | 1,000.00 | | | $ | 982.30 | | | | 0.60 | % | | $ | 2.97 | |
Hypothetical (5% return before expenses) | | $ | 1,000.00 | | | $ | 1,021.94 | | | | 0.60 | % | | $ | 3.02 | |
| 1 | Included in the expense ratio are “Other fees” described in Note 6 which are not annualized. Without these expenses, the expense ratio would have been 0.58% and the actual and hypothetical expenses paid during the period would have been $2.87 and $2.92, respectively. |
Performance
| | | | | | | | | | | | | | | | |
| | |
| | | Average Annual Total Return | |
| | | | |
| | | 1 Year | | | 3 Year | | | 5 Year | | | Since
Inception1 | |
Fund NAV Returns | | | 4.86 | % | | | 8.25 | % | | | 6.98 | % | | | 7.88 | % |
Fund Market Price Returns | | | 4.68 | % | | | 8.19 | % | | | 6.96 | % | | | 7.71 | % |
WisdomTree Europe Hedged SmallCap Equity Index | | | 4.91 | % | | | 8.50 | % | | | 7.00 | % | | | 8.01 | % |
MSCI European Economic and Monetary Union (EMU) Small Cap Local Currency Index | | | 3.88 | % | | | 11.14 | % | | | 7.97 | % | | | 8.37 | % |
MSCI EMU Small Cap Index | | | -1.61 | % | | | 10.82 | % | | | 8.84 | % | | | 8.15 | % |
1 Total returns are calculated based on the commencement of Fund trading on the NYSE Arca, Inc. on March 4, 2015.
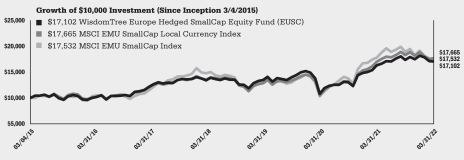
Performance is historical and does not guarantee future results. The returns do not reflect the deduction of taxes that a shareholder would pay on Fund distributions or on the redemption of Fund shares.
Management’s Discussion of Funds’ Performance
as of March 31, 2022 (unaudited)
WisdomTree Germany Hedged Equity Fund (DXGE)
Sector Breakdown†
| | | | |
| |
| Sector | | % of Net Assets | |
Industrials | | | 20.6% | |
Financials | | | 17.4% | |
Consumer Discretionary | | | 13.3% | |
Health Care | | | 12.0% | |
Materials | | | 10.8% | |
Communication Services | | | 8.3% | |
Utilities | | | 7.2% | |
Information Technology | | | 6.1% | |
Consumer Staples | | | 2.9% | |
Energy | | | 0.1% | |
Real Estate | | | 0.1% | |
Other Assets less Liabilities‡ | | | 1.2% | |
Total | | | 100.0% | |
| † | The Fund’s sector breakdown is expressed as a percentage of net assets and may change over time. In addition, a sector may be comprised of several industries. It does not include derivatives (if any). |
| ‡ | Other assets less liabilities may include investment of cash collateral for securities on loan and/or receivables/payables on derivatives (if any). |
Top Ten Holdings*
| | | | |
| |
| Description | | % of Net Assets | |
Allianz SE, Registered Shares | | | 6.9% | |
Bayer AG, Registered Shares | | | 6.8% | |
Deutsche Telekom AG, Registered Shares | | | 6.4% | |
Siemens AG, Registered Shares | | | 5.5% | |
BASF SE | | | 5.0% | |
E.ON SE | | | 4.9% | |
Deutsche Post AG, Registered Shares | | | 4.8% | |
SAP SE | | | 4.8% | |
Mercedes-Benz Group AG, Registered Shares | | | 4.6% | |
Muenchener Rueckversicherungs—Gesellschaft AG in Muenchen, Registered Shares | | | 3.7% | |
| * | The ten largest holdings are subject to change, and there are no guarantees the Fund will remain invested in any particular company. Excludes derivatives and investment of cash collateral for securities on loan (if any). |
The WisdomTree Germany Hedged Equity Fund (the “Fund”) seeks to track the price and yield performance, before fees and expenses, of the WisdomTree Germany Hedged Equity Index (the “Index”). In seeking to track the Index, the Fund invests in German dividend-paying companies with an exporter tilt while at the same time hedging exposure to fluctuations of the value of the euro relative to the U.S. dollar. The Fund generally uses a representative sampling strategy to achieve its investment objective, meaning it generally will invest in a sample of securities in the Index.
The Fund returned 0.50% at net asset value (“NAV”) for the fiscal year ended March 31, 2022 (for more complete performance information please see the table below). The Fund benefited from its positions in Industrials due to positive stock selection, Consumer Discretionary due to allocation and stock selection effects and Utilities due to a combination of both. Positions in Financials and Materials weighed negatively on performance for the Fund, due to stock selection effects within Financials and a combination of both poor stock selection and allocation effects within Materials. The Fund’s use of foreign currency contracts to hedge euro currency exposure contributed to performance due to the overall appreciation of the U.S. dollar against the euro during the fiscal year.
Shareholder Expense Example (for the six-month period ended March 31, 2022)
| | | | | | | | | | | | | | | | |
| | | | | |
| | | Beginning
Account Value | | | Ending
Account Value | | | Annualized
Expense Ratio | | | Expenses Paid
During the
Period | |
Actual | | $ | 1,000.00 | | | $ | 980.40 | | | | 0.48 | % | | $ | 2.37 | |
Hypothetical (5% return before expenses) | | $ | 1,000.00 | | | $ | 1,022.54 | | | | 0.48 | % | | $ | 2.42 | |
Performance
| | | | | | | | | | | | | | | | |
| | |
| | | Average Annual Total Return | |
| | | | |
| | | 1 Year | | | 3 Year | | | 5 Year | | | Since
Inception1 | |
Fund NAV Returns | | | 0.50 | % | | | 9.31 | % | | | 5.34 | % | | | 7.41 | % |
Fund Market Price Returns | | | -0.09 | % | | | 9.11 | % | | | 5.24 | % | | | 7.25 | % |
WisdomTree Germany Hedged Equity Index | | | 0.69 | % | | | 9.67 | % | | | 5.58 | % | | | 7.64 | % |
MSCI Germany Local Currency Index | | | -7.00 | % | | | 5.28 | % | | | 1.74 | % | | | 4.86 | % |
MSCI Germany Index | | | -11.96 | % | | | 4.96 | % | | | 2.54 | % | | | 2.34 | % |
| 1 | Total returns are calculated based on the commencement of Fund trading on the NASDAQ on October 17, 2013. |
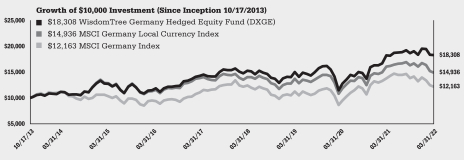
Performance is historical and does not guarantee future results. The returns do not reflect the deduction of taxes that a shareholder would pay on Fund distributions or on the redemption of Fund shares.
Management’s Discussion of Funds’ Performance
as of March 31, 2022 (unaudited)
WisdomTree International Hedged Quality Dividend Growth Fund (IHDG)
Sector Breakdown†
| | | | |
| |
| Sector | | % of Net Assets | |
Materials | | | 21.1% | |
Health Care | | | 19.3% | |
Industrials | | | 18.6% | |
Consumer Discretionary | | | 16.6% | |
Information Technology | | | 11.2% | |
Consumer Staples | | | 6.1% | |
Financials | | | 2.2% | |
Energy | | | 1.8% | |
Communication Services | | | 1.2% | |
Real Estate | | | 0.2% | |
Investment Company | | | 0.1% | |
Utilities | | | 0.0% | * |
Other Assets less Liabilities‡ | | | 1.6% | |
Total | | | 100.0% | |
| † | The Fund’s sector breakdown is expressed as a percentage of net assets and may change over time. In addition, a sector may be comprised of several industries. It does not include derivatives (if any). |
| ‡ | Other assets less liabilities may include investment of cash collateral for securities on loan and/or receivables/payables on derivatives (if any). |
| * | Represents less than 0.1%. |
Top Ten Holdings*
| | | | |
| |
| Description | | % of Net Assets | |
BHP Group Ltd. | | | 5.7% | |
Anglo American PLC | | | 5.5% | |
Rio Tinto PLC | | | 5.0% | |
Novo Nordisk A/S, Class B | | | 4.9% | |
LVMH Moet Hennessy Louis Vuitton SE | | | 4.9% | |
Roche Holding AG | | | 4.8% | |
Tokyo Electron Ltd. | | | 2.9% | |
Diageo PLC | | | 2.8% | |
Industria de Diseno Textil SA | | | 2.5% | |
Deutsche Post AG, Registered Shares | | | 2.4% | |
| * | The ten largest holdings are subject to change, and there are no guarantees the Fund will remain invested in any particular company. Excludes derivatives and investment of cash collateral for securities on loan (if any). |
The WisdomTree International Hedged Quality Dividend Growth Fund (the “Fund”) seeks to track the price and yield performance, before fees and expenses, of the WisdomTree International Hedged Quality Dividend Growth Index (the “Index”). In seeking to track the Index, the Fund invests in dividend-paying companies with growth characteristics in developed countries, excluding U.S. and Canada, while at the same time hedging exposure to fluctuations of the value of the applicable foreign currencies relative to the U.S. dollar. The Fund generally uses a representative sampling strategy to achieve its investment objective, meaning it generally will invest in a sample of securities in the Index.
The Fund returned 7.93% at net asset value (“NAV”) for the fiscal year ended March 31, 2022 (for more complete performance information please see the table below). The Fund benefited from its positions in Materials, Health Care and Information Technology, due to stock selection effects within each sector. Positions in the Energy, Financials and Consumer Discretionary sectors weighed negatively on performance for the Fund, as a result of asset allocation effects in Consumer Discretionary, poor stock selection effects in Financials, and a combination of the two in Energy. When analyzing performance by country, exposures within Australia and Spain weighed negatively on performance the most, almost entirely due to poor stock selection effects. United Kingdom and Germany were top performance contributors due to allocation and stock selection effects in both sectors. The Fund’s use of foreign currency contracts contributed positively to Fund performance as a result of the overall strengthening of the U.S. dollar against applicable international currencies during the fiscal year.
Shareholder Expense Example (for the six-month period ended March 31, 2022)
| | | | | | | | | | | | | | | | |
| | | | | |
| | | Beginning
Account Value | | | Ending
Account Value | | | Annualized Net
Expense Ratio | | | Expenses Paid
During the
Period | |
Actual | | $ | 1,000.00 | | | $ | 1,006.00 | | | | 0.58 | % | | $ | 2.90 | |
Hypothetical (5% return before expenses) | | $ | 1,000.00 | | | $ | 1,022.04 | | | | 0.58 | % | | $ | 2.92 | |
Performance
| | | | | | | | | | | | | | | | |
| | |
| | | Average Annual Total Return | |
| | | | |
| | | 1 Year | | | 3 Year | | | 5 Year | | | Since
Inception1 | |
Fund NAV Returns | | | 7.93 | % | | | 13.13 | % | | | 10.59 | % | | | 9.69 | % |
Fund Market Price Returns | | | 7.36 | % | | | 12.97 | % | | | 10.48 | % | | | 9.55 | % |
WisdomTree International Hedged Quality Dividend Growth Index | | | 8.78 | % | | | 13.85 | % | | | 11.36 | % | | | 10.38 | % |
MSCI EAFE Local Currency Index | | | 6.21 | % | | | 8.23 | % | | | 6.55 | % | | | 6.87 | % |
| 1 | Total returns are calculated based on the commencement of Fund trading on the NYSE Arca, Inc. on May 7, 2014. |
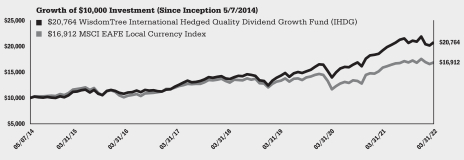
Performance is historical and does not guarantee future results. The returns do not reflect the deduction of taxes that a shareholder would pay on Fund distributions or on the redemption of Fund shares.
Management’s Discussion of Funds’ Performance
as of March 31, 2022 (unaudited)
WisdomTree Japan Hedged Equity Fund (DXJ)
Sector Breakdown†
| | | | |
| |
| Sector | | % of Net Assets | |
Industrials | | | 22.4% | |
Consumer Discretionary | | | 17.7% | |
Financials | | | 15.0% | |
Information Technology | | | 11.8% | |
Materials | | | 9.1% | |
Consumer Staples | | | 8.8% | |
Health Care | | | 7.9% | |
Communication Services | | | 3.9% | |
Energy | | | 2.4% | |
Other Assets less Liabilities‡ | | | 1.0% | |
Total | | | 100.0% | |
| † | The Fund’s sector breakdown is expressed as a percentage of net assets and may change over time. In addition, a sector may be comprised of several industries. It does not include derivatives (if any). |
| ‡ | Other assets less liabilities may include investment of cash collateral for securities on loan and/or receivables/payables on derivatives (if any). |
Top Ten Holdings*
| | | | |
| |
| Description | | % of Net Assets | |
Toyota Motor Corp. | | | 5.4% | |
Mitsubishi UFJ Financial Group, Inc. | | | 4.4% | |
Japan Tobacco, Inc. | | | 4.1% | |
Takeda Pharmaceutical Co. Ltd. | | | 3.3% | |
Nintendo Co. Ltd. | | | 3.1% | |
Tokyo Electron Ltd. | | | 3.0% | |
ITOCHU Corp. | | | 2.9% | |
Sumitomo Mitsui Financial Group, Inc. | | | 2.9% | |
Mitsubishi Corp. | | | 2.6% | |
Honda Motor Co. Ltd. | | | 2.1% | |
| * | The ten largest holdings are subject to change, and there are no guarantees the Fund will remain invested in any particular company. Excludes derivatives and investment of cash collateral for securities on loan (if any). |
The WisdomTree Japan Hedged Equity Fund (the “Fund”) seeks to track the price and yield performance, before fees and expenses, of the WisdomTree Japan Hedged Equity Index (the “Index”). The Fund seeks to provide Japanese equity returns while mitigating or “hedging” against fluctuations between the value of the Japanese yen and the U.S. dollar. In seeking to track the Index, the Fund invests in Japanese dividend-paying companies with an exporter tilt while at the same time hedging exposure to fluctuations of the value of the Japanese yen relative to the U.S. dollar. The Fund generally uses a representative sampling strategy to achieve its investment objective, meaning it generally will invest in a sample of securities in the Index.
The Fund returned 8.79% at net asset value (“NAV”) for the fiscal year ended March 31, 2022 (for more complete performance information please see the table below). The Fund benefited from its positions in Industrials, Communication Services and Financials, due to allocation and stock selection effects. Industrials’ contribution was entirely due to positive stock selection effects. Positions in the Materials, Real Estate and Utilities sectors were all positive contributors as well, but had the most negligible impacts of all sector exposures. When analyzing performance by earnings yield attribution, the 2nd and 4th quintiles of companies ranked by earnings yield weighed negatively on performance the most, owing to poorer stock selection effects. The companies with 1st and 5th quintiles were top performance contributors due to allocation effects, where the Fund was overweight the former and significantly underweight the latter. The Fund’s use of foreign currency contracts contributed positively to Fund performance as a result of the U.S. dollar strengthening against the Japanese yen during the fiscal year.
Shareholder Expense Example (for the six-month period ended March 31, 2022)
| | | | | | | | | | | | | | | | |
| | | | | |
| | | Beginning
Account Value | | | Ending
Account Value | | | Annualized
Expense Ratio | | | Expenses Paid
During the
Period | |
Actual | | $ | 1,000.00 | | | $ | 1,035.00 | | | | 0.48 | % | | $ | 2.44 | |
Hypothetical (5% return before expenses) | | $ | 1,000.00 | | | $ | 1,022.54 | | | | 0.48 | % | | $ | 2.42 | |
Performance
| | | | | | | | | | | | | | | | |
| | |
| | | Average Annual Total Return | |
| | | | |
| | | 1 Year | | | 3 Year | | | 5 Year | | | 10 Year | |
Fund NAV Returns | | | 8.79 | % | | | 11.51 | % | | | 7.86 | % | | | 9.72 | % |
Fund Market Price Returns | | | 6.89 | % | | | 11.02 | % | | | 7.56 | % | | | 9.49 | % |
WisdomTree Japan Hedged Equity Index | | | 9.09 | % | | | 11.93 | % | | | 8.37 | % | | | 10.33 | % |
MSCI Japan Local Currency Index | | | 2.73 | % | | | 10.17 | % | | | 7.93 | % | | | 10.68 | % |
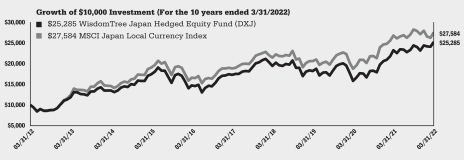
Performance is historical and does not guarantee future results. The returns do not reflect the deduction of taxes that a shareholder would pay on Fund distributions or on the redemption of Fund shares.
Management’s Discussion of Funds’ Performance
as of March 31, 2022 (unaudited)
WisdomTree Japan Hedged SmallCap Equity Fund (DXJS)
Sector Breakdown†
| | | | |
| |
| Sector | | % of Net Assets | |
Industrials | | | 24.6% | |
Consumer Discretionary | | | 15.6% | |
Materials | | | 15.1% | |
Financials | | | 13.1% | |
Information Technology | | | 11.8% | |
Consumer Staples | | | 6.7% | |
Health Care | | | 3.9% | |
Communication Services | | | 2.4% | |
Utilities | | | 2.2% | |
Real Estate | | | 2.0% | |
Energy | | | 1.2% | |
Other Assets less Liabilities‡ | | | 1.4% | |
Total | | | 100.0% | |
| † | The Fund’s sector breakdown is expressed as a percentage of net assets and may change over time. In addition, a sector may be comprised of several industries. It does not include derivatives (if any). |
| ‡ | Other assets less liabilities may include investment of cash collateral for securities on loan and/or receivables/payables on derivatives (if any). |
Top Ten Holdings*
| | | | |
| |
| Description | | % of Net Assets | |
Nishimatsu Construction Co. Ltd. | | | 0.8% | |
Electric Power Development Co. Ltd. | | | 0.8% | |
Aozora Bank Ltd. | | | 0.7% | |
Mebuki Financial Group, Inc. | | | 0.7% | |
Konica Minolta, Inc. | | | 0.7% | |
Toyo Seikan Group Holdings Ltd. | | | 0.6% | |
Seven Bank Ltd. | | | 0.6% | |
H.U. Group Holdings, Inc. | | | 0.6% | |
Cosmo Energy Holdings Co. Ltd. | | | 0.5% | |
Sankyo Co. Ltd. | | | 0.5% | |
| * | The ten largest holdings are subject to change, and there are no guarantees the Fund will remain invested in any particular company. Excludes derivatives and investment of cash collateral for securities on loan (if any). |
The WisdomTree Japan Hedged SmallCap Equity Fund (the “Fund”) seeks to track the price and yield performance, before fees and expenses, of the WisdomTree Japan Hedged SmallCap Equity Index (the “Index”). In seeking to track the Index, the Fund invests in Japanese small-cap dividend-paying companies while at the same time hedging exposure to fluctuations of the value of the Japanese yen relative to the U.S. dollar. The Fund generally uses a representative sampling strategy to achieve its investment objective, meaning it generally will invest in a sample of securities in the Index.
The Fund returned -1.80% at net asset value (“NAV”) for the fiscal year ended March 31, 2022 (for more complete performance information please see the table below). The Fund benefited from its positions in Information Technology, Materials and Health Care, due to stock selection effects within each sector. Positions in the Real Estate, Consumer Discretionary and Industrials sectors weighed negatively on performance for the Fund, due to stock selection effects in Consumer Discretionary and Industrials and allocation effects in the Real Estate sector. When analyzing performance by earnings yield attribution, underweighting companies with negative earnings yield and the lowest earnings yields (5th quintile) contributed positively to performance the most, as a result of a combination of allocation and stock selection effects. Only the companies within the 3rd quintile detracted from performance, though its impact was modest. The Fund’s use of foreign currency contracts contributed positively to Fund performance as a result of the U.S. dollar strengthening against the Japanese yen during the fiscal year.
Shareholder Expense Example (for the six-month period ended March 31, 2022)
| | | | | | | | | | | | | | | | |
| | | | | |
| | | Beginning
Account Value | | | Ending
Account Value | | | Annualized
Expense Ratio | | | Expenses Paid
During the
Period | |
Actual | | $ | 1,000.00 | | | $ | 951.00 | | | | 0.58 | % | | $ | 2.82 | |
Hypothetical (5% return before expenses) | | $ | 1,000.00 | | | $ | 1,022.04 | | | | 0.58 | % | | $ | 2.92 | |
Performance
| | | | | | | | | | | | | | | | |
| | |
| | | Average Annual Total Return | |
| | | | |
| | | 1 Year | | | 3 Year | | | 5 Year | | | Since
Inception1 | |
Fund NAV Returns | | | -1.80 | % | | | 5.44 | % | | | 5.19 | % | | | 8.91 | % |
Fund Market Price Returns | | | -3.12 | % | | | 4.96 | % | | | 4.91 | % | | | 8.68 | % |
WisdomTree Japan Hedged SmallCap Equity Index | | | -1.53 | % | | | 5.96 | % | | | 5.77 | % | | | 9.69 | % |
MSCI Japan Small Cap Local Currency Index | | | -3.63 | % | | | 5.67 | % | | | 5.33 | % | | | 9.04 | % |
MSCI Japan Small Cap Index | | | -12.27 | % | | | 2.47 | % | | | 3.55 | % | | | 6.58 | % |
| 1 | Total returns are calculated based on the commencement of Fund trading on the NASDAQ on June 28, 2013. |
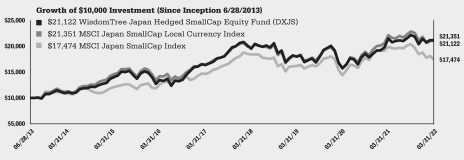
Performance is historical and does not guarantee future results. The returns do not reflect the deduction of taxes that a shareholder would pay on Fund distributions or on the redemption of Fund shares.
Description of Terms and Indexes (unaudited)
Below are descriptions of certain terms and of each Index referenced in this report:
Allocation Effect measures an investment manager’s ability to effectively allocate a portfolio’s assets to various segments. A segment refers to assets or securities that are grouped within a certain classification such as sectors, industries, or countries. The allocation effect determines whether the overweighting or underweighting of segments relative to a benchmark contributes positively or negatively to the overall portfolio return. Positive allocation occurs when the portfolio is overweighted in a segment that outperforms the benchmark and underweighted in a segment that underperforms the benchmark. Negative allocation occurs when the portfolio is overweighted in a segment that underperforms the benchmark and underweighted in a segment that outperforms the benchmark.
Growth is generally characterized by higher price levels relative to fundamentals, such as dividends or earnings. Price levels are higher because investors are willing to pay more due to their expectations of future improvements in these fundamentals.
The MSCI EAFE Local Currency Index is a free float-adjusted market capitalization weighted index that is designed to measure developed market equity performance, excluding the U.S. and Canada, calculated in local currency.
The MSCI European Economic and Monetary Union (EMU) Local Currency Index is a free float-adjusted market capitalization weighted index that is designed to measure the equity market performance of the developed market countries within the EMU. The securities are priced in local currency terms with no conversion into U.S. dollars.
The MSCI European Economic and Monetary Union (EMU) Small Cap Local Currency Index is a free float-adjusted market capitalization weighted index that captures small cap representation across the 10 Developed Market countries in the EMU and is calculated in local currency.
The MSCI EMU Small Cap Index captures small-cap representation across the 10 developed markets countries in the European Economic and Monetary Union (“EMU”).
The MSCI Germany Local Currency Index is a capitalization weighted index that measures the performance of the Germany equity market and provides local currency returns, which are not translated back to U.S. dollars.
The MSCI Germany Index is designed to measure the performance of the large- and mid-cap segments of the German market. With 61 constituents, the index covers about 85% of the equity universe in Germany.
The MSCI Japan Index is a capitalization weighted index that is comprised of stocks in Japan.
The MSCI Japan Local Currency Index is a free float-adjusted market capitalization index that is designed to measure developed market equity performance in Japan and calculated in local currency.
The MSCI Japan Small Cap Local Currency Index is a free float-adjusted market capitalization index that is designed to measure the performance of small cap stocks within Japan and calculated in local currency.
The MSCI Japan Small Cap Index is a free float-adjusted market capitalization index that is designed to measure the performance of small cap stocks within Japan.
Quality is generally characterized by higher efficiency and profitability. Typical measures include earnings, return-on-equity, return on assets, operating profitability as well as others. This term is also related to the quality factor, which associates these stock characteristics with excess returns vs. the market over time.
Return-on-Equity (ROE) measures a corporation’s profitability by revealing how much profit a company generates with the money shareholders have invested.
Risk-on and Risk-off refers to investors’ appetites for risk which rise and fall over time. During periods when risk is perceived as low, the risk-on risk-off theory states that
Description of Terms and Indexes (unaudited) (continued)
investors tend to engage in higher-risk investments (i.e., “Risk-on”). When risk is perceived to be high, investors have the tendency to gravitate toward lower-risk investments (i.e., “Risk-off”).
Selection Effect measures an investment manager’s ability to select securities within a given segment relative to a benchmark. The over or underperformance of the portfolio is weighted by the benchmark weight, therefore, selection is not affected by the investment manager’s allocation to the segment. The weight of the segment in the portfolio determines the size of the effect—the larger the segment, the larger the effect is, positive or negative. A positive selection effect occurs when the portfolio return is greater than the benchmark return. Thus, the investment manager made good decisions in selecting securities that, as a whole, outperformed similar securities in the benchmark. A negative selection effect occurs when the portfolio return is less than the benchmark return. Thus, the investment manager made poor decisions in selecting securities that, as a whole, underperformed similar securities in the benchmark.
The WisdomTree DEFA International Hedged Equity Index is a dividend weighted index designed to provide exposure to developed world, non-U.S. equity securities while at the same time neutralizing exposure to fluctuations between the value of the U.S. dollar and non-U.S. currencies reflected in the index. This index is based on the WisdomTree International Equity Index.
The WisdomTree Europe Hedged Equity Index is designed to provide exposure to European equities while at the same time neutralizing exposure to fluctuations between the Euro and the U.S. dollar.
The WisdomTree Europe Hedged SmallCap Equity Index is designed to provide exposure to the European equity markets while at the same time neutralizing exposure to fluctuations of the Euro movements relative to U.S. dollar.
The WisdomTree Germany Hedged Equity Index is designed to provide exposure to Germany equity markets while at the same time neutralizing exposure to fluctuations of the Euro movements relative to the U.S. dollar. In this sense, the Index “hedges” against fluctuations in the relative value of the Euro against the U.S. dollar.
The WisdomTree International Hedged Quality Dividend Growth Index is designed to provide exposure to the developed market companies while at the same time neutralizing exposure to fluctuations between the value of foreign currencies and the U.S. dollar.
The WisdomTree Japan Hedged Equity Index is designed to provide exposure to Japanese equity markets while at the same time neutralizing exposure to fluctuations of the Japanese Yen movements relative to the U.S. dollar.
The WisdomTree Japan Hedged SmallCap Equity Index is designed to provide exposure to the small-capitalization segment of the Japanese equity markets while at the same time neutralizing exposure to fluctuations of the Japanese Yen movements relative to the U.S. dollar.
The Global Industry Classification Standard (“GICS”) was developed by and is the exclusive property and a service mark of MSCI Inc. (“MSCI”) and Standard & Poor’s (“S&P”), a division of The McGraw-Hill Companies, Inc. and is licensed for use by WisdomTree Investments, Inc. Neither MSCI, S&P nor any other party involved in making or compiling the GICS or any GICS classifications makes any express or implied warranties or representations with respect to such standard or classification (or the results to be obtained by the use thereof), and all such parties hereby expressly disclaim all warranties of originality, accuracy, completeness, merchantability and fitness for a particular purpose with respect to any such standard or classification. Without limiting any of the foregoing, in no event shall MSCI, S&P, any of their affiliates or any third party involved in making or compiling the GICS or any GICS classifications have any liability for any direct, indirect, special, punitive, consequential or any other damages (including lost profits) even if notified of the possibility of such damages.
Neither MSCI nor any other party involved in or related to compiling, computing or creating the MSCI data makes any express or implied warranties or representations with respect to such data (or the results to be obtained by the use thereof), and all such parties hereby expressly disclaim all
Description of Terms and Indexes (unaudited) (concluded)
warranties of originality, accuracy, completeness, merchantability or fitness for a particular purpose with respect to any such data. Without limiting any of the foregoing, in no event shall MSCI, any of its affiliates or any third party involved in or related to compiling, computing or creating the data have any liability for any direct, indirect, special, punitive, consequential or any other damages (including lost profits) even if notified of the possibility of such damages. No further distribution or dissemination of the MSCI data is permitted without MSCI’s express written consent.
WisdomTree Investments, Inc. and WisdomTree Asset Management, Inc. (together, “WisdomTree”) and the Funds make no representation or warranty, express or implied, to the owners of shares of the Funds or any member of the public regarding the advisability of investing in securities generally or in the Funds particularly or the ability of the underlying Indexes to track the performance of their underlying securities. WisdomTree Investments is the licensor of certain trademarks, service marks and trade names of the Funds. WisdomTree Investments has no obligation to take the needs of the Funds or the owners of shares of the Funds into consideration in determining, composing, or calculating the underlying WisdomTree Indexes of the applicable Funds. WisdomTree Investments is not responsible for, and has not participated in, the determination of the timing of, prices of, or quantities of shares of the Funds to be issued or in the determination or calculation of the equation by which the shares of the Funds are redeemable. WisdomTree and the Funds do not guarantee the accuracy, completeness, or performance of the underlying Indexes or the data included therein and shall have no liability in connection with the underlying Indexes or their calculation.
Index performance information assumes the reinvestment of dividends and excludes management fees, transaction costs and expenses. You cannot directly invest in an index.
* * * * * *
Abbreviations used in the schedules of investments and related tables included in this report are as follows:
| | | | | | | | | | |
| |
| Currency abbreviations: | | |
| AUD | | Australian dollar | | ILS | | Israeli new shekel | | | | |
| CHF | | Swiss franc | | JPY | | Japanese yen | | | | |
| DKK | | Danish krone | | NOK | | Norwegian krone | | | | |
| EUR | | Euro | | SEK | | Swedish krona | | | | |
| GBP | | British pound | | SGD | | Singapore dollar | | | | |
| HKD | | Hong Kong dollar | | USD | | U.S. dollar | | | | |
| | | | |
| Other abbreviations: | | | | | | | | |
| CVA | | Certificaten Van Aandelen (Certificate of Stock) | | |
| RSP | | Risparmio Italian Savings Shares | | |
Schedule of Investments
WisdomTree Europe Hedged Equity Fund (HEDJ)
March 31, 2022
| | | | | | | | |
| Investments | | Shares | | | Value | |
|
| COMMON STOCKS – 99.1% | |
|
| Austria – 0.4% | |
| | |
Andritz AG | | | 145,978 | | | $ | 6,818,495 | |
| | |
AT&S Austria Technologie & Systemtechnik AG | | | 21,931 | | | | 1,229,837 | |
| | | | | | | | |
| Total Austria | | | | 8,048,332 | |
|
| Belgium – 4.9% | |
| | |
Anheuser-Busch InBev SA/NV | | | 826,312 | | | | 49,886,442 | |
| | |
Bekaert SA | | | 103,627 | | | | 4,090,866 | |
| | |
Fagron | | | 36,081 | | | | 663,204 | |
| | |
Melexis NV | | | 38,554 | | | | 3,603,358 | |
| | |
Solvay SA(a) | | | 179,442 | | | | 17,861,243 | |
| | |
UCB SA | | | 118,599 | | | | 14,310,976 | |
| | | | | | | | |
| Total Belgium | | | | 90,416,089 | |
|
| Finland – 3.9% | |
| | |
Cargotec Oyj, Class B | | | 64,641 | | | | 2,484,214 | |
| | |
Fiskars Oyj Abp | | | 54,031 | | | | 1,292,529 | |
| | |
Huhtamaki Oyj(a) | | | 123,929 | | | | 4,354,555 | |
| | |
Kemira Oyj(a) | | | 315,724 | | | | 4,169,817 | |
| | |
Kone Oyj, Class B | | | 644,924 | | | | 34,149,388 | |
| | |
Konecranes Oyj(a) | | | 91,246 | | | | 2,839,651 | |
| | |
Metso Outotec Oyj | | | 960,185 | | | | 8,209,202 | |
| | |
Neles Oyj | | | 134,545 | | | | 1,383,242 | |
| | |
Revenio Group Oyj | | | 11,630 | | | | 618,797 | |
| | |
Valmet Oyj(a) | | | 284,630 | | | | 8,933,928 | |
| | |
Wartsila Oyj Abp(a) | | | 485,002 | | | | 4,482,230 | |
| | | | | | | | |
| Total Finland | | | | 72,917,553 | |
|
| France – 25.9% | |
| | |
Air Liquide SA | | | 258,365 | | | | 45,684,715 | |
| | |
Arkema SA(a) | | | 40,555 | | | | 4,907,184 | |
| | |
BioMerieux | | | 11,759 | | | | 1,265,713 | |
| | |
Bureau Veritas SA | | | 184,074 | | | | 5,312,771 | |
| | |
Cie Generale des Etablissements Michelin SCA | | | 87,506 | | | | 11,970,852 | |
| | |
Danone SA | | | 452,805 | | | | 25,205,795 | |
| | |
Dassault Systemes SE | | | 96,661 | | | | 4,809,093 | |
| | |
EssilorLuxottica SA | | | 108,667 | | | | 20,107,062 | |
| | |
Eutelsat Communications SA | | | 326,237 | | | | 3,573,251 | |
| | |
Faurecia SE(a) | | | 58,309 | | | | 1,534,353 | |
| | |
Hermes International | | | 10,295 | | | | 14,793,790 | |
| | |
Imerys SA | | | 53,269 | | | | 2,311,521 | |
| | |
IPSOS | | | 27,364 | | | | 1,376,185 | |
| | |
Kering SA | | | 29,172 | | | | 18,686,205 | |
| | |
L’Oreal SA | | | 158,412 | | | | 64,131,166 | |
| | |
Lectra | | | 1,856 | | | | 89,005 | |
| | |
Legrand SA | | | 113,559 | | | | 10,914,238 | |
| | |
LVMH Moet Hennessy Louis Vuitton SE(a) | | | 92,793 | | | | 67,048,054 | |
| | |
Nexans SA | | | 7,911 | | | | 748,625 | |
| | |
Pernod Ricard SA | | | 70,475 | | | | 15,627,916 | |
| | |
Publicis Groupe SA | | | 261,587 | | | | 16,083,691 | |
| | |
Remy Cointreau SA | | | 7,746 | | | | 1,611,676 | |
| | |
Rubis SCA | | | 126,327 | | | | 3,748,676 | |
| | |
Safran SA | | | 32,882 | | | | 3,924,232 | |
| | |
Sanofi | | | 732,960 | | | | 75,444,509 | |
| | |
Sartorius Stedim Biotech(a) | | | 3,342 | | | | 1,385,133 | |
| | |
Schneider Electric SE | | | 294,095 | | | | 49,790,538 | |
| | |
SEB SA | | | 15,950 | | | | 2,246,741 | |
| | |
Societe BIC SA | | | 45,274 | | | | 2,303,105 | |
| | |
Teleperformance | | | 9,822 | | | | 3,784,523 | |
| | |
Valeo(a) | | | 53,926 | | | | 1,005,313 | |
| | |
Vicat SA(a) | | | 40,581 | | | | 1,388,438 | |
| | | | | | | | |
| Total France | | | | 482,814,069 | |
|
| Germany – 24.7% | |
| | |
adidas AG | | | 39,588 | | | | 9,333,686 | |
| | |
AIXTRON SE | | | 14,213 | | | | 316,203 | |
| | |
BASF SE | | | 870,715 | | | | 50,145,155 | |
| | |
Bayer AG, Registered Shares | | | 735,558 | | | | 50,823,808 | |
| | |
Bayerische Motoren Werke AG | | | 235,292 | | | | 20,577,300 | |
| | |
Beiersdorf AG | | | 38,384 | | | | 4,065,799 | |
| | |
Brenntag SE | | | 71,654 | | | | 5,847,093 | |
| | |
Covestro AG(b) | | | 82,558 | | | | 4,210,779 | |
| | |
Deutsche Telekom AG, Registered Shares | | | 3,339,065 | | | | 62,905,963 | |
| | |
Duerr AG | | | 13,106 | | | | 391,100 | |
| | |
Eckert & Ziegler Strahlen – und Medizintechnik AG | | | 3,945 | | | | 255,463 | |
| | |
Evonik Industries AG | | | 362,534 | | | | 10,156,946 | |
| | |
Fresenius SE & Co. KGaA | | | 222,558 | | | | 8,257,196 | |
| | |
GEA Group AG | | | 106,589 | | | | 4,424,827 | |
| | |
Hannover Rueck SE | | | 86,804 | | | | 14,907,508 | |
| | |
Hapag-Lloyd AG(a)(b) | | | 86,950 | | | | 30,629,449 | |
| | |
HeidelbergCement AG | | | 125,556 | | | | 7,216,898 | |
| | |
Henkel AG & Co. KGaA | | | 104,488 | | | | 6,969,703 | |
| | |
Hochtief AG | | | 71,822 | | | | 4,890,661 | |
| | |
Infineon Technologies AG | | | 142,447 | | | | 4,910,927 | |
| | |
Knorr-Bremse AG | | | 49,130 | | | | 3,806,836 | |
| | |
LANXESS AG | | | 27,979 | | | | 1,241,809 | |
| | |
Mercedes-Benz Group AG, Registered Shares | | | 475,534 | | | | 33,762,065 | |
| | |
Merck KGaA | | | 25,298 | | | | 5,343,865 | |
| | |
NORMA Group SE | | | 8,987 | | | | 260,584 | |
| | |
Puma SE | | | 7,737 | | | | 666,648 | |
| | |
SAP SE | | | 329,965 | | | | 37,124,757 | |
| | |
Siemens AG, Registered Shares | | | 384,618 | | | | 53,775,610 | |
| | |
Siemens Healthineers AG(b) | | | 279,696 | | | | 17,502,104 | |
| | |
Software AG | | | 28,035 | | | | 973,850 | |
| | |
Symrise AG | | | 20,643 | | | | 2,500,115 | |
| | |
Wacker Chemie AG | | | 17,518 | | | | 3,016,295 | |
| | | | | | | | |
| Total Germany | | | | 461,211,002 | |
|
| Ireland – 2.6% | |
| | |
CRH PLC | | | 904,027 | | | | 36,563,225 | |
| | |
Glanbia PLC | | | 424,844 | | | | 4,958,652 | |
| | |
Kerry Group PLC, Class A | | | 65,630 | | | | 7,382,650 | |
| | | | | | | | |
| Total Ireland | | | | 48,904,527 | |
|
| Italy – 2.6% | |
| | |
Carel Industries SpA(b) | | | 31,633 | | | | 818,318 | |
| | |
Danieli & C. Officine Meccaniche SpA | | | 11,655 | | | | 257,284 | |
| | |
Datalogic SpA | | | 30,198 | | | | 333,478 | |
| | |
Davide Campari-Milano NV(a) | | | 402,633 | | | | 4,728,531 | |
See Notes to Financial Statements.
Schedule of Investments (continued)
WisdomTree Europe Hedged Equity Fund (HEDJ)
March 31, 2022
| | | | | | | | |
| Investments | | Shares | | | Value | |
| | |
DiaSorin SpA(a) | | | 13,873 | | | $ | 2,190,340 | |
| | |
El.En. SpA | | | 36,753 | | | | 591,316 | |
| | |
Ferrari NV(a) | | | 60,164 | | | | 13,301,274 | |
| | |
GVS SpA(a)(b) | | | 93,243 | | | | 854,874 | |
| | |
Moncler SpA(a) | | | 151,409 | | | | 8,547,928 | |
| | |
Piaggio & C. SpA | | | 866,797 | | | | 2,474,758 | |
| | |
Pirelli & C. SpA(b) | | | 717,621 | | | | 3,937,212 | |
| | |
Prysmian SpA | | | 194,816 | | | | 6,710,954 | |
| | |
Reply SpA | | | 9,399 | | | | 1,568,670 | |
| | |
Webuild SpA(a) | | | 1,245,150 | | | | 2,231,906 | |
| | | | | | | | |
| Total Italy | | | | 48,546,843 | |
|
| Netherlands – 18.3% | |
| | |
Aegon NV | | | 3,180,504 | | | | 16,993,263 | |
| | |
Akzo Nobel NV | | | 181,264 | | | | 15,775,679 | |
| | |
AMG Advanced Metallurgical Group NV | | | 13,335 | | | | 580,728 | |
| | |
Arcadis NV | | | 78,186 | | | | 3,558,041 | |
| | |
ASM International NV | | | 20,075 | | | | 7,417,936 | |
| | |
ASML Holding NV | | | 119,618 | | | | 81,186,731 | |
| | |
BE Semiconductor Industries NV | | | 134,789 | | | | 11,676,899 | |
| | |
Corbion NV | | | 30,715 | | | | 1,062,844 | |
| | |
EXOR NV | | | 63,530 | | | | 4,912,724 | |
| | |
Heineken Holding NV | | | 159,022 | | | | 12,580,141 | |
| | |
Heineken NV | | | 284,954 | | | | 27,450,548 | |
| | |
IMCD NV(a) | | | 22,113 | | | | 3,819,777 | |
| | |
Koninklijke Ahold Delhaize NV | | | 1,488,480 | | | | 48,219,031 | |
| | |
Koninklijke DSM NV(a) | | | 108,170 | | | | 19,557,749 | |
| | |
Koninklijke Philips NV | | | 917,232 | | | | 28,300,085 | |
| | |
Koninklijke Vopak NV | | | 198,657 | | | | 6,491,820 | |
| | |
SBM Offshore NV(a) | | | 473,567 | | | | 7,595,472 | |
| | |
Signify NV(b) | | | 294,016 | | | | 13,880,422 | |
| | |
Wolters Kluwer NV | | | 287,384 | | | | 30,882,217 | |
| | | | | | | | |
| Total Netherlands | | | | 341,942,107 | |
|
| Spain – 9.1% | |
| | |
Acerinox SA | | | 833,037 | | | | 9,250,251 | |
| | |
Applus Services SA | | | 140,434 | | | | 1,169,561 | |
| | |
Banco Bilbao Vizcaya Argentaria SA | | | 11,738,149 | | | | 68,044,969 | |
| | |
Banco Santander SA | | | 11,998,710 | | | | 41,386,141 | |
| | |
Cie Automotive SA | | | 130,570 | | | | 3,001,459 | |
| | |
Fluidra SA | | | 235,130 | | | | 6,880,539 | |
| | |
Grifols SA(a) | | | 366,899 | | | | 6,727,635 | |
| | |
Mapfre SA(a) | | | 10,374,767 | | | | 21,932,626 | |
| | |
Prosegur Cash SA(b) | | | 2,712,542 | | | | 1,783,703 | |
| | |
Prosegur Cia de Seguridad SA | | | 1,295,085 | | | | 2,841,606 | |
| | |
Viscofan SA | | | 100,430 | | | | 6,011,798 | |
| | | | | | | | |
| Total Spain | | | | 169,030,288 | |
|
| Switzerland – 0.6% | |
| | |
STMicroelectronics NV | | | 246,569 | | | | 10,866,808 | |
|
| United Kingdom – 6.1% | |
| | |
CNH Industrial NV(a) | | | 707,694 | | | | 11,334,852 | |
| | |
Linde PLC | | | 318,082 | | | | 102,812,025 | |
| | | | | | | | |
| Total United Kingdom | | | | 114,146,877 | |
TOTAL COMMON STOCKS (Cost: $1,704,921,673) | | | | 1,848,844,495 | |
|
| INVESTMENT OF CASH COLLATERAL FOR SECURITIES LOANED – 5.0% | |
|
| United States – 5.0% | |
| | |
State Street Navigator Securities Lending Government Money Market Portfolio, 0.25%(c) | | | | | | | | |
| (Cost: $93,888,007) | | | 93,888,007 | | | | 93,888,007 | |
| |
TOTAL INVESTMENTS IN SECURITIES – 104.1% (Cost: $1,798,809,680) | | | | 1,942,732,502 | |
| |
Other Assets less Liabilities – (4.1)% | | | | (76,985,097 | ) |
| | | | | | | | |
| NET ASSETS – 100.0% | | | $ | 1,865,747,405 | |
| (a) | Security, or portion thereof, was on loan at March 31, 2022 (See Note 2). At March 31, 2022, the total market value of the Fund’s securities on loan identified in the Schedule of Investments was $92,957,718 and the total market value of the collateral held by the Fund was $97,310,699. The total market value of the collateral includes non-cash U.S. Government securities collateral having a value of $3,422,692. |
| (b) | This security is exempt from registration under rule 144A of the Securities Act of 1933. This security may be sold in transactions that are exempt from registration, normally to qualified institutional buyers. |
| (c) | Rate shown represents annualized 7-day yield as of March 31, 2022. |
See Notes to Financial Statements.
Schedule of Investments (concluded)
WisdomTree Europe Hedged Equity Fund (HEDJ)
March 31, 2022
| | | | | | | | | | | | | | | | | | | | | | | | | | | | |
|
| FINANCIAL DERIVATIVE INSTRUMENTS | |
|
| FOREIGN CURRENCY CONTRACTS (OTC – OVER THE COUNTER) | |
| | | | | |
| Counterparty | | Settlement
Date | | | Amount and
Description of
Currency to
be Purchased | | | Amount and
Description of
Currency to
be Sold | | | Unrealized
Appreciation | | | Unrealized
Depreciation | |
Bank of America NA | | | 4/5/2022 | | | | 420,861,702 | | | | EUR | | | | 468,265,039 | | | | USD | | | $ | 19,715 | | | $ | — | |
Bank of America NA | | | 4/5/2022 | | | | 495,208,861 | | | | USD | | | | 440,308,549 | | | | EUR | | | | 5,285,973 | | | | — | |
Bank of America NA | | | 5/4/2022 | | | | 472,553,594 | | | | USD | | | | 424,355,698 | | | | EUR | | | | — | | | | (25,154 | ) |
Barclays Bank PLC | | | 4/5/2022 | | | | 420,850,734 | | | | EUR | | | | 468,265,040 | | | | USD | | | | 7,510 | | | | — | |
Barclays Bank PLC | | | 5/4/2022 | | | | 472,553,594 | | | | USD | | | | 424,343,123 | | | | EUR | | | | — | | | | (11,150 | ) |
Citibank NA | | | 4/5/2022 | | | | 495,208,861 | | | | USD | | | | 440,300,719 | | | | EUR | | | | 5,294,685 | | | | — | |
Goldman Sachs | | | 4/5/2022 | | | | 495,208,861 | | | | USD | | | | 440,310,507 | | | | EUR | | | | 5,283,795 | | | | — | |
JP Morgan Chase Bank NA | | | 4/5/2022 | | | | 70,881,524 | | | | EUR | | | | 78,044,173 | | | | USD | | | | 824,341 | | | | — | |
JP Morgan Chase Bank NA | | | 4/5/2022 | | | | 420,848,842 | | | | EUR | | | | 468,265,039 | | | | USD | | | | 5,405 | | | | — | |
JP Morgan Chase Bank NA | | | 4/5/2022 | | | | 495,208,861 | | | | USD | | | | 440,287,410 | | | | EUR | | | | 5,309,494 | | | | — | |
JP Morgan Chase Bank NA | | | 5/4/2022 | | | | 472,553,594 | | | | USD | | | | 424,342,742 | | | | EUR | | | | — | | | | (10,726 | ) |
UBS AG | | | 4/5/2022 | | | | 3,356,423 | | | | EUR | | | | 3,716,389 | | | | USD | | | | 18,238 | | | | — | |
UBS AG | | | 4/5/2022 | | | | 13,654,423 | | | | EUR | | | | 14,865,557 | | | | USD | | | | 327,458 | | | | — | |
UBS AG | | | 4/5/2022 | | | | 10,135,045 | | | | EUR | | | | 11,149,168 | | | | USD | | | | 127,903 | | | | — | |
UBS AG | | | 4/5/2022 | | | | 420,859,811 | | | | EUR | | | | 468,265,039 | | | | USD | | | | 17,610 | | | | — | |
UBS AG | | | 5/4/2022 | | | | 472,553,594 | | | | USD | | | | 424,351,887 | | | | EUR | | | | — | | | | (20,911 | ) |
| | | | | | | | | | | | | | | | | | | | | | | $ | 22,522,127 | | | $ | (67,941 | ) |
The following is a summary of the fair valuations according to the inputs used as of March 31, 2022 in valuing the Fund’s investments (See Note 2 — Fair Value Measurement):
| | | | | | | | | | | | | | | | |
| | | | |
| | | Quoted
Prices in
Active
Markets
(Level 1) | | | Other
Significant
Observable
Inputs
(Level 2) | | | Significant
Unobservable
Inputs
(Level 3) | | | Total | |
Assets: | | | | | | | | | |
Investments in Securities | | | | |
Common Stocks | | $ | 1,848,844,495 | | | $ | — | | | $ | — | | | $ | 1,848,844,495 | |
Investment of Cash Collateral for Securities Loaned | | | — | | | | 93,888,007 | | | | — | | | | 93,888,007 | |
Total Investments in Securities | | $ | 1,848,844,495 | | | $ | 93,888,007 | | | $ | — | | | $ | 1,942,732,502 | |
Financial Derivative Instruments | | | | |
Foreign Currency Contracts1 | | $ | — | | | $ | 22,522,127 | | | $ | — | | | $ | 22,522,127 | |
Liabilities: | | | | | | | | | |
Financial Derivative Instruments | | | | |
Foreign Currency Contracts1 | | $ | — | | | $ | (67,941 | ) | | $ | — | | | $ | (67,941 | ) |
Total – Net | | $ | 1,848,844,495 | | | $ | 116,342,193 | | | $ | — | | | $ | 1,965,186,688 | |
| 1 | Amount shown represents the unrealized appreciation (depreciation) on the financial instrument. |
See Notes to Financial Statements.
Schedule of Investments
WisdomTree Europe Hedged SmallCap Equity Fund (EUSC)
March 31, 2022
| | | | | | | | |
| Investments | | Shares | | | Value | |
|
| COMMON STOCKS – 99.2% | |
|
| Austria – 6.7% | |
| | |
Andritz AG | | | 9,081 | | | $ | 424,165 | |
| | |
AT&S Austria Technologie & Systemtechnik AG | | | 1,328 | | | | 74,471 | |
| | |
BAWAG Group AG*(a) | | | 21,649 | | | | 1,107,074 | |
| | |
CA Immobilien Anlagen AG | | | 11,899 | | | | 371,366 | |
| | |
EVN AG | | | 9,753 | | | | 252,844 | |
| | |
Oesterreichische Post AG(b) | | | 11,404 | | | | 408,575 | |
| | |
POLYTEC Holding AG(b) | | | 3,343 | | | | 24,810 | |
| | |
S IMMO AG | | | 4,924 | | | | 121,353 | |
| | |
S&T AG(b) | | | 2,548 | | | | 48,110 | |
| | |
Semperit AG Holding | | | 4,435 | | | | 112,262 | |
| | |
Telekom Austria AG* | | | 14,801 | | | | 115,278 | |
| | |
UNIQA Insurance Group AG | | | 19,046 | | | | 152,367 | |
| | |
Vienna Insurance Group AG Wiener Versicherung Gruppe | | | 7,678 | | | | 200,332 | |
| | |
Voestalpine AG | | | 11,678 | | | | 351,085 | |
| | |
Wienerberger AG | | | 9,101 | | | | 277,459 | |
| | |
Zumtobel Group AG | | | 4,083 | | | | 33,300 | |
| | | | | | | | |
| Total Austria | | | | 4,074,851 | |
|
| Belgium – 10.7% | |
| | |
Ackermans & van Haaren NV | | | 1,469 | | | | 276,555 | |
| | |
Aedifica SA | | | 3,199 | | | | 405,768 | |
| | |
Befimmo SA | | | 4,994 | | | | 263,382 | |
| | |
Bekaert SA | | | 6,512 | | | | 257,073 | |
| | |
Cofinimmo SA | | | 5,157 | | | | 757,408 | |
| | |
D’ieteren Group | | | 1,396 | | | | 237,804 | |
| | |
Deceuninck NV | | | 8,432 | | | | 25,612 | |
| | |
Econocom Group SA/NV | | | 22,438 | | | | 100,612 | |
| | |
Elia Group SA/NV | | | 3,220 | | | | 495,134 | |
| | |
Etablissements Franz Colruyt NV | | | 13,034 | | | | 543,836 | |
| | |
Fagron | | | 2,411 | | | | 44,316 | |
| | |
Intervest Offices & Warehouses NV | | | 5,057 | | | | 153,889 | |
| | |
Ion Beam Applications | | | 1,653 | | | | 32,076 | |
| | |
Melexis NV | | | 2,523 | | | | 235,806 | |
| | |
Proximus SADP | | | 65,573 | | | | 1,229,373 | |
| | |
Recticel SA | | | 2,455 | | | | 59,002 | |
| | |
Telenet Group Holding NV | | | 15,642 | | | | 508,547 | |
| | |
TINC Comm VA | | | 3,693 | | | | 55,636 | |
| | |
Warehouses De Pauw CVA | | | 15,500 | | | | 674,322 | |
| | |
Xior Student Housing NV | | | 2,174 | | | | 122,396 | |
| | | | | | | | |
| Total Belgium | | | | 6,478,547 | |
|
| Denmark – 0.3% | |
| | |
Alten SA | | | 708 | | | | 108,316 | |
| | |
Cementir Holding NV | | | 10,259 | | | | 78,305 | |
| | | | | | | | |
| Total Denmark | | | | 186,621 | |
|
| Finland – 8.3% | |
| | |
Aktia Bank Oyj | | | 12,714 | | | | 154,194 | |
| | |
Anora Group Oyj | | | 14,438 | | | | 141,367 | |
| | |
Cargotec Oyj, Class B | | | 3,647 | | | | 140,158 | |
| | |
Caverion Oyj | | | 5,732 | | | | 33,260 | |
| | |
Huhtamaki Oyj | | | 7,421 | | | | 260,755 | |
| | |
Kamux Corp. | | | 1,921 | | | | 24,003 | |
| | |
Kemira Oyj | | | 17,838 | | | | 235,589 | |
| | |
Kojamo Oyj | | | 13,273 | | | | 321,652 | |
| | |
Konecranes Oyj(b) | | | 5,152 | | | | 160,334 | |
| | |
Lassila & Tikanoja Oyj(b) | | | 4,609 | | | | 55,487 | |
| | |
Metsa Board Oyj, Class B | | | 27,425 | | | | 280,122 | |
| | |
Metso Outotec Oyj | | | 54,004 | | | | 461,713 | |
| | |
Musti Group Oyj | | | 993 | | | | 26,472 | |
| | |
Neles Oyj | | | 7,045 | | | | 72,429 | |
| | |
Nokian Renkaat Oyj | | | 21,569 | | | | 354,582 | |
| | |
Oma Saastopankki Oyj | | | 2,140 | | | | 42,978 | |
| | |
Orion Oyj, Class B(b) | | | 11,767 | | | | 538,759 | |
| | |
Raisio Oyj, Class V | | | 13,172 | | | | 39,131 | |
| | |
Revenio Group Oyj | | | 443 | | | | 23,571 | |
| | |
Rovio Entertainment Oyj(a) | | | 4,377 | | | | 36,988 | |
| | |
Sanoma Oyj | | | 6,210 | | | | 88,581 | |
| | |
Suominen Oyj | | | 4,903 | | | | 19,339 | |
| | |
Taaleri Oyj | | | 3,403 | | | | 53,388 | |
| | |
Talenom Oyj | | | 1,291 | | | | 14,120 | |
| | |
Terveystalo Oyj(a) | | | 6,021 | | | | 75,300 | |
| | |
TietoEVRY Oyj(b) | | | 16,065 | | | | 431,496 | |
| | |
Tokmanni Group Corp. | | | 9,659 | | | | 161,744 | |
| | |
Uponor Oyj | | | 7,325 | | | | 149,555 | |
| | |
Valmet Oyj(b) | | | 16,356 | | | | 513,380 | |
| | |
Verkkokauppa.com Oyj(b) | | | 5,929 | | | | 31,632 | |
| | |
WithSecure Oyj* | | | 3,972 | | | | 20,175 | |
| | |
YIT Oyj(b) | | | 17,728 | | | | 67,657 | |
| | | | | | | | |
| Total Finland | | | | 5,029,911 | |
|
| France – 15.9% | |
| | |
ABC Arbitrage | | | 4,561 | | | | 37,706 | |
| | |
AKWEL | | | 1,655 | | | | 36,829 | |
| | |
Albioma SA | | | 2,135 | | | | 104,760 | |
| | |
Bigben Interactive | | | 1,002 | | | | 16,612 | |
| | |
Chargeurs SA | | | 3,945 | | | | 89,368 | |
| | |
Cie Plastic Omnium SA | | | 8,765 | | | | 160,914 | |
| | |
Coface SA | | | 17,885 | | | | 217,504 | |
| | |
Covivio(b) | | | 12,828 | | | | 1,029,660 | |
| | |
Eutelsat Communications SA | | | 48,381 | | | | 529,914 | |
| | |
Faurecia SE(b) | | | 8,866 | | | | 233,301 | |
| | |
Fnac Darty SA | | | 1,287 | | | | 66,673 | |
| | |
Groupe SFPI | | | 6,848 | | | | 22,706 | |
| | |
ICADE | | | 11,219 | | | | 728,373 | |
| | |
Imerys SA | | | 7,199 | | | | 312,389 | |
| | |
IPSOS | | | 4,124 | | | | 207,403 | |
| | |
Kaufman & Broad SA | | | 3,202 | | | | 107,059 | |
| | |
Klepierre SA* | | | 38,536 | | | | 1,036,768 | |
| | |
Korian SA | | | 3,160 | | | | 73,624 | |
| | |
Lectra | | | 790 | | | | 37,885 | |
| | |
Maisons du Monde SA(a) | | | 2,003 | | | | 38,734 | |
| | |
Mersen SA | | | 1,164 | | | | 43,516 | |
| | |
Nexans SA | | | 1,514 | | | | 143,271 | |
| | |
Nexity SA | | | 12,001 | | | | 425,958 | |
| | |
Quadient SA | | | 2,280 | | | | 43,228 | |
See Notes to Financial Statements.
Schedule of Investments (continued)
WisdomTree Europe Hedged SmallCap Equity Fund (EUSC)
March 31, 2022
| | | | | | | | |
| Investments | | Shares | | | Value | |
| | |
Rexel SA* | | | 33,616 | | | $ | 726,737 | |
| | |
Rothschild & Co. | | | 6,010 | | | | 239,730 | |
| | |
Rubis SCA | | | 18,357 | | | | 544,733 | |
| | |
Societe BIC SA | | | 6,844 | | | | 348,157 | |
| | |
Sopra Steria Group SACA | | | 672 | | | | 126,287 | |
| | |
SPIE SA | | | 12,090 | | | | 288,948 | |
| | |
Television Francaise 1 | | | 30,664 | | | | 300,582 | |
| | |
Trigano SA | | | 1,806 | | | | 265,247 | |
| | |
Valeo | | | 8,176 | | | | 152,421 | |
| | |
Verallia SA(a) | | | 10,103 | | | | 242,133 | |
| | |
Vicat SA | | | 4,648 | | | | 159,027 | |
| | |
Wendel SE | | | 4,756 | | | | 490,017 | |
| | | | | | | | |
| Total France | | | | 9,628,174 | |
|
| Germany – 14.5% | |
| | |
1&1 AG | | | 883 | | | | 19,944 | |
| | |
7C Solarparken AG | | | 10,093 | | | | 49,861 | |
| | |
Aareal Bank AG | | | 2,398 | | | | 76,042 | |
| | |
AIXTRON SE | | | 1,635 | | | | 36,375 | |
| | |
alstria office REIT AG | | | 15,872 | | | | 217,394 | |
| | |
AURELIUS Equity Opportunities SE & Co. KGaA | | | 3,211 | | | | 89,961 | |
| | |
Aurubis AG | | | 2,244 | | | | 270,777 | |
| | |
Bechtle AG | | | 2,423 | | | | 138,033 | |
| | |
Bilfinger SE | | | 7,695 | | | | 295,897 | |
| | |
CANCOM SE | | | 1,337 | | | | 84,050 | |
| | |
CompuGroup Medical SE & Co. KgaA | | | 1,024 | | | | 63,120 | |
| | |
CropEnergies AG | | | 7,471 | | | | 99,253 | |
| | |
Dermapharm Holding SE | | | 2,270 | | | | 145,734 | |
| | |
Deutsche Pfandbriefbank AG(a) | | | 9,319 | | | | 114,627 | |
| | |
DIC Asset AG | | | 10,028 | | | | 161,674 | |
| | |
Duerr AG | | | 1,477 | | | | 44,076 | |
| | |
Eckert & Ziegler Strahlen – und Medizintechnik AG | | | 300 | | | | 19,427 | |
| | |
Encavis AG | | | 6,521 | | | | 137,929 | |
| | |
Fielmann AG | | | 4,867 | | | | 267,514 | |
| | |
Freenet AG | | | 35,694 | | | | 965,073 | |
| | |
GEA Group AG | | | 15,482 | | | | 642,704 | |
| | |
Gerresheimer AG | | | 1,340 | | | | 98,850 | |
| | |
GFT Technologies SE | | | 559 | | | | 25,812 | |
| | |
GRENKE AG | | | 1,068 | | | | 30,064 | |
| | |
Hamborner REIT AG | | | 16,157 | | | | 172,185 | |
| | |
Hamburger Hafen und Logistik AG | | | 4,739 | | | | 85,156 | |
| | |
Hensoldt AG | | | 2,706 | | | | 79,787 | |
| | |
Hochtief AG | | | 10,995 | | | | 748,696 | |
| | |
Hornbach Holding AG & Co. KGaA | | | 811 | | | | 102,959 | |
| | |
Instone Real Estate Group SE(a) | | | 2,211 | | | | 41,674 | |
| | |
Jenoptik AG | | | 1,163 | | | | 35,559 | |
| | |
JOST Werke AG(a) | | | 824 | | | | 33,464 | |
| | |
LANXESS AG | | | 4,056 | | | | 180,020 | |
| | |
METRO AG* | | | 51,446 | | | | 461,709 | |
| | |
MLP SE | | | 7,342 | | | | 59,226 | |
| | |
Mutares SE & Co. KGaA | | | 3,337 | | | | 82,984 | |
| | |
NORMA Group SE | | | 1,654 | | | | 47,959 | |
| | |
PATRIZIA AG | | | 3,530 | | | | 67,006 | |
| | |
ProSiebenSat.1 Media SE | | | 32,692 | | | | 421,583 | |
| | |
Rheinmetall AG | | | 2,903 | | | | 620,487 | |
| | |
Scout24 SE(a) | | | 3,386 | | | | 195,906 | |
| | |
Software AG | | | 4,164 | | | | 144,645 | |
| | |
Stroeer SE & Co. KGaA | | | 4,334 | | | | 301,871 | |
| | |
Suedzucker AG | | | 8,529 | | | | 111,031 | |
| | |
TAG Immobilien AG | | | 13,257 | | | | 303,121 | |
| | |
Varta AG(b) | | | 2,128 | | | | 212,858 | |
| | |
VERBIO Vereinigte BioEnergie AG | | | 798 | | | | 62,241 | |
| | |
Wacker Neuson SE | | | 4,177 | | | | 94,438 | |
| | |
Wuestenrot & Wuerttembergische AG | | | 2,798 | | | | 56,847 | |
| | | | | | | | |
| Total Germany | | | | 8,817,603 | |
|
| Ireland – 0.8% | |
| | |
Glanbia PLC | | | 23,671 | | | | 276,281 | |
| | |
Hibernia REIT PLC | | | 80,549 | | | | 144,831 | |
| | |
Origin Enterprises PLC | | | 11,397 | | | | 50,723 | |
| | |
Uniphar PLC | | | 5,192 | | | | 21,779 | |
| | | | | | | | |
| Total Ireland | | | | 493,614 | |
|
| Italy – 17.0% | |
| | |
A2A SpA | | | 546,290 | | | | 944,871 | |
| | |
ACEA SpA | | | 16,839 | | | | 312,328 | |
| | |
Alerion Cleanpower SpA(b) | | | 1,917 | | | | 64,415 | |
| | |
Anima Holding SpA(a) | | | 73,604 | | | | 334,297 | |
| | |
Ascopiave SpA | | | 13,648 | | | | 52,314 | |
| | |
Avio SpA(b) | | | 1,768 | | | | 20,931 | |
| | |
Azimut Holding SpA | | | 23,891 | | | | 561,685 | |
| | |
Banca IFIS SpA | | | 4,466 | | | | 92,773 | |
| | |
Banca Popolare di Sondrio SPA | | | 28,510 | | | | 117,941 | |
| | |
Banco BPM SpA | | | 84,693 | | | | 253,489 | |
| | |
BFF Bank SpA(a) | | | 58,963 | | | | 441,851 | |
| | |
BPER Banca(b) | | | 75,627 | | | | 133,751 | |
| | |
Brembo SpA(b) | | | 17,998 | | | | 202,658 | |
| | |
Buzzi Unicem SpA | | | 6,543 | | | | 122,706 | |
| | |
Cairo Communication SpA | | | 12,431 | | | | 31,051 | |
| | |
Carel Industries SpA(a) | | | 1,400 | | | | 36,217 | |
| | |
Credito Emiliano SpA | | | 28,399 | | | | 188,957 | |
| | |
Danieli & C. Officine Meccaniche SpA | | | 752 | | | | 16,600 | |
| | |
Danieli & C. Officine Meccaniche SpA, RSP | | | 1,481 | | | | 23,762 | |
| | |
Datalogic SpA | | | 1,679 | | | | 18,541 | |
| | |
De’ Longhi SpA | | | 6,675 | | | | 183,742 | |
| | |
doValue SpA*(a) | | | 6,619 | | | | 56,560 | |
| | |
El.En. SpA | | | 1,855 | | | | 29,845 | |
| | |
Emak SpA | | | 14,833 | | | | 23,238 | |
| | |
ERG SpA | | | 10,110 | | | | 339,267 | |
| | |
Esprinet SpA | | | 6,297 | | | | 67,401 | |
| | |
Falck Renewables SpA | | | 6,010 | | | | 58,980 | |
| | |
Fila SpA | | | 1,507 | | | | 15,795 | |
| | |
Gruppo MutuiOnline SpA | | | 1,412 | | | | 50,902 | |
| | |
GVS SpA(a) | | | 5,211 | | | | 47,776 | |
| | |
Hera SpA | | | 190,042 | | | | 707,513 | |
| | |
Interpump Group SpA | | | 1,890 | | | | 96,103 | |
| | |
Iren SpA | | | 188,768 | | | | 504,919 | |
| | |
Italgas SpA | | | 165,391 | | | | 1,071,746 | |
| | |
La Doria SpA | | | 3,940 | | | | 72,158 | |
See Notes to Financial Statements.
Schedule of Investments (continued)
WisdomTree Europe Hedged SmallCap Equity Fund (EUSC)
March 31, 2022
| | | | | | | | |
| Investments | | Shares | | | Value | |
| | |
Maire Tecnimont SpA(b) | | | 28,242 | | | $ | 98,481 | |
| | |
MARR SpA | | | 3,058 | | | | 51,071 | |
| | |
Piaggio & C. SpA | | | 51,404 | | | | 146,762 | |
| | |
Pirelli & C. SpA(a) | | | 41,879 | | | | 229,768 | |
| | |
Prysmian SpA | | | 11,370 | | | | 391,670 | |
| | |
RAI Way SpA(a) | | | 34,007 | | | | 214,541 | |
| | |
Reply SpA | | | 502 | | | | 83,783 | |
| | |
SAES Getters SpA | | | 565 | | | | 13,987 | |
| | |
Salcef SpA | | | 4,797 | | | | 107,281 | |
| | |
Sanlorenzo SpA | | | 1,155 | | | | 47,228 | |
| | |
Sesa SpA | | | 320 | | | | 53,051 | |
| | |
SOL SpA | | | 4,148 | | | | 76,152 | |
| | |
Technogym SpA(a) | | | 12,074 | | | | 96,591 | |
| | |
Telecom Italia SpA | | | 1,263,840 | | | | 468,972 | |
| | |
Tinexta SpA | | | 789 | | | | 23,281 | |
| | |
Unieuro SpA(a) | | | 6,516 | | | | 127,963 | |
| | |
Unipol Gruppo SpA | | | 111,635 | | | | 618,569 | |
| | |
Webuild SpA(b) | | | 69,131 | | | | 123,916 | |
| | |
Zignago Vetro SpA | | | 4,303 | | | | 56,878 | |
| | | | | | | | |
| Total Italy | | | | 10,327,028 | |
|
| Netherlands – 9.1% | |
| | |
Aalberts NV | | | 5,741 | | | | 301,373 | |
| | |
AMG Advanced Metallurgical Group NV | | | 573 | | | | 24,954 | |
| | |
Arcadis NV | | | 4,846 | | | | 220,529 | |
| | |
ASR Nederland NV | | | 19,671 | | | | 924,286 | |
| | |
BE Semiconductor Industries NV | | | 7,806 | | | | 676,241 | |
| | |
Boskalis Westminster | | | 6,967 | | | | 252,090 | |
| | |
Brunel International NV | | | 5,275 | | | | 64,562 | |
| | |
Corbion NV | | | 2,253 | | | | 77,962 | |
| | |
Eurocommercial Properties NV | | | 3,447 | | | | 95,288 | |
| | |
Heijmans NV, CVA | | | 5,616 | | | | 92,855 | |
| | |
Koninklijke Vopak NV | | | 11,854 | | | | 387,371 | |
| | |
Ordina NV | | | 26,290 | | | | 136,312 | |
| | |
PostNL NV | | | 206,962 | | | | 796,756 | |
| | |
SBM Offshore NV | | | 28,221 | | | | 452,632 | |
| | |
Signify NV(a) | | | 16,974 | | | | 801,338 | |
| | |
TKH Group NV, CVA | | | 2,413 | | | | 135,852 | |
| | |
Van Lanschot Kempen NV | | | 947 | | | | 25,446 | |
| | |
Wereldhave NV(b) | | | 4,332 | | | | 85,121 | |
| | | | | | | | |
| Total Netherlands | | | | 5,550,968 | |
|
| Portugal – 2.1% | |
| | |
Altri SGPS SA | | | 25,367 | | | | 171,041 | |
| | |
Corticeira Amorim SGPS SA | | | 5,450 | | | | 61,003 | |
| | |
CTT – Correios de Portugal SA | | | 6,814 | | | | 34,193 | |
| | |
Navigator Co. SA | | | 86,592 | | | | 325,652 | |
| | |
REN – Redes Energeticas Nacionais SGPS SA | | | 105,741 | | | | 335,310 | |
| | |
Sonae SGPS SA | | | 286,604 | | | | 332,284 | |
| | | | | | | | |
| Total Portugal | | | | 1,259,483 | |
|
| Spain – 13.8% | |
| | |
Acciona SA | | | 5,488 | | | | 1,059,430 | |
| | |
Acerinox SA | | | 46,881 | | | | 520,578 | |
| | |
Aedas Homes SA(a) | | | 7,063 | | | | 180,749 | |
| | |
Almirall SA | | | 7,353 | | | | 94,330 | |
| | |
Applus Services SA | | | 7,775 | | | | 64,752 | |
| | |
Audax Renovables SA(b) | | | 21,086 | | | | 30,171 | |
| | |
Bankinter SA | | | 96,473 | | | | 571,482 | |
| | |
Cia de Distribucion Integral Logista Holdings SA | | | 36,070 | | | | 666,213 | |
| | |
Cie Automotive SA | | | 7,430 | | | | 170,796 | |
| | |
Ebro Foods SA(b) | | | 13,199 | | | | 234,093 | |
| | |
Enagas SA | | | 62,572 | | | | 1,402,858 | |
| | |
Faes Farma SA | | | 47,782 | | | | 195,540 | |
| | |
Grupo Catalana Occidente SA | | | 3,248 | | | | 100,466 | |
| | |
Grupo Empresarial San Jose SA | | | 5,406 | | | | 26,466 | |
| | |
Inmobiliaria Colonial Socimi SA | | | 39,857 | | | | 365,418 | |
| | |
Laboratorios Farmaceuticos Rovi SA | | | 1,480 | | | | 110,660 | |
| | |
Linea Directa Aseguradora SA Cia de Seguros y Reaseguros | | | 121,681 | | | | 188,867 | |
| | |
Mapfre SA | | | 490,933 | | | | 1,037,850 | |
| | |
Neinor Homes SA*(a) | | | 9,944 | | | | 131,664 | |
| | |
Pharma Mar SA(b) | | | 435 | | | | 33,115 | |
| | |
Prosegur Cash SA(a)(b) | | | 97,390 | | | | 64,041 | |
| | |
Prosegur Cia de Seguridad SA | | | 64,455 | | | | 141,424 | |
| | |
Sacyr SA | | | 70,754 | | | | 172,564 | |
| | |
Unicaja Banco SA(a) | | | 75,516 | | | | 79,234 | |
| | |
Viscofan SA | | | 5,853 | | | | 350,364 | |
| | |
Zardoya Otis SA | | | 53,320 | | | | 418,252 | |
| | | | | | | | |
| Total Spain | | | | 8,411,377 | |
TOTAL COMMON STOCKS (Cost: $61,892,367) | | | | 60,258,177 | |
|
| RIGHTS – 0.0% | |
|
| Austria – 0.0% | |
| | |
CA Immobilien Anlagen AG*† (Cost: $0) | | | 8,284 | | | | 0 | |
|
| INVESTMENT OF CASH COLLATERAL FOR SECURITIES LOANED – 4.0% | |
|
| United States – 4.0% | |
| | |
State Street Navigator Securities Lending Government Money Market Portfolio, 0.25%(c) | | | | | | | | |
| | |
| (Cost: $2,439,931) | | | 2,439,931 | | | | 2,439,931 | |
| |
TOTAL INVESTMENTS IN SECURITIES – 103.2%
(Cost: $64,332,298) | | | | 62,698,108 | |
| |
Other Assets less Liabilities – (3.2)% | | | | (1,926,575 | ) |
| | | | | | | | |
| NET ASSETS – 100.0% | | | $ | 60,771,533 | |
| * | Non-income producing security. |
| † | Security is being fair valued using significant unobservable inputs by a pricing committee under the direction of the Board of Trustees. The aggregate value of fair valued securities is $0, which represents 0.0% of net assets. |
| (a) | This security is exempt from registration under rule 144A of the Securities Act of 1933. This security may be sold in transactions that are exempt from registration, normally to qualified institutional buyers. |
| (b) | Security, or portion thereof, was on loan at March 31, 2022 (See Note 2). At March 31, 2022, the total market value of the Fund’s securities on loan identified in the Schedule of Investments was $2,970,630 and the total market value of the collateral held by the Fund was $3,132,931. The total market value of the collateral includes non-cash U.S. Government securities collateral having a value of $693,000. |
| (c) | Rate shown represents annualized 7-day yield as of March 31, 2022. |
See Notes to Financial Statements.
Schedule of Investments (concluded)
WisdomTree Europe Hedged SmallCap Equity Fund (EUSC)
March 31, 2022
| | | | | | | | | | | | | | | | | | | | | | | | | | | | |
|
| FINANCIAL DERIVATIVE INSTRUMENTS | |
|
| FOREIGN CURRENCY CONTRACTS (OTC – OVER THE COUNTER) | |
| | | | | |
| Counterparty | | Settlement
Date | | | Amount and
Description of
Currency to
be Purchased | | | Amount and
Description of
Currency to
be Sold | | | Unrealized
Appreciation | | | Unrealized
Depreciation | |
Bank of America NA | | | 4/5/2022 | | | | 13,769,281 | | | | EUR | | | | 15,320,170 | | | | USD | | | $ | 645 | | | $ | — | |
Bank of America NA | | | 4/5/2022 | | | | 14,882,451 | | | | USD | | | | 13,232,539 | | | | EUR | | | | 158,859 | | | | — | |
Bank of America NA | | | 5/4/2022 | | | | 15,349,528 | | | | USD | | | | 13,783,960 | | | | EUR | | | | — | | | | (817 | ) |
Barclays Bank PLC | | | 4/5/2022 | | | | 13,768,923 | | | | EUR | | | | 15,320,171 | | | | USD | | | | 246 | | | | — | |
Barclays Bank PLC | | | 5/4/2022 | | | | 15,349,526 | | | | USD | | | | 13,783,549 | | | | EUR | | | | — | | | | (362 | ) |
Citibank NA | | | 4/5/2022 | | | | 14,882,451 | | | | USD | | | | 13,232,303 | | | | EUR | | | | 159,120 | | | | — | |
Goldman Sachs | | | 4/5/2022 | | | | 14,882,451 | | | | USD | | | | 13,232,598 | | | | EUR | | | | 158,793 | | | | — | |
JP Morgan Chase Bank NA | | | 4/5/2022 | | | | 13,768,860 | | | | EUR | | | | 15,320,170 | | | | USD | | | | 177 | | | | — | |
JP Morgan Chase Bank NA | | | 4/5/2022 | | | | 14,882,451 | | | | USD | | | | 13,231,903 | | | | EUR | | | | 159,565 | | | | — | |
JP Morgan Chase Bank NA | | | 4/5/2022 | | | | 1,750,877 | | | | USD | | | | 1,569,670 | | | | EUR | | | | 4,336 | | | | — | |
JP Morgan Chase Bank NA | | | 5/4/2022 | | | | 15,349,528 | | | | USD | | | | 13,783,539 | | | | EUR | | | | — | | | | (348 | ) |
UBS AG | | | 4/5/2022 | | | | 13,769,219 | | | | EUR | | | | 15,320,170 | | | | USD | | | | 576 | | | | — | |
UBS AG | | | 5/4/2022 | | | | 15,349,528 | | | | USD | | | | 13,783,836 | | | | EUR | | | | — | | | | (679 | ) |
| | | | | | | | | | | | | | | | | | | | | | | $ | 642,317 | | | $ | (2,206 | ) |
The following is a summary of the fair valuations according to the inputs used as of March 31, 2022 in valuing the Fund’s investments (See Note 2 — Fair Value Measurement):
| | | | | | | | | | | | | | | | |
| | | | |
| | | Quoted
Prices in
Active
Markets
(Level 1) | | | Other
Significant
Observable
Inputs
(Level 2) | | | Significant
Unobservable
Inputs
(Level 3) | | | Total | |
Assets: | | | | | | | | | |
Investments in Securities | | | | |
Common Stocks | | $ | 60,258,177 | | | $ | — | | | $ | — | | | $ | 60,258,177 | |
Rights | | | — | | | | — | | | | 0 | * | | | 0 | |
Investment of Cash Collateral for Securities Loaned | | | — | | | | 2,439,931 | | | | — | | | | 2,439,931 | |
Total Investments in Securities | | $ | 60,258,177 | | | $ | 2,439,931 | | | $ | 0 | | | $ | 62,698,108 | |
Financial Derivative Instruments | | | | |
Foreign Currency Contracts1 | | $ | — | | | $ | 642,317 | | | $ | — | | | $ | 642,317 | |
Liabilities: | | | | | | | | | |
Financial Derivative Instruments | | | | |
Foreign Currency Contracts1 | | $ | — | | | $ | (2,206 | ) | | $ | — | | | $ | (2,206 | ) |
Total – Net | | $ | 60,258,177 | | | $ | 3,080,042 | | | $ | 0 | | | $ | 63,338,219 | |
| * | Securities are being fair valued using significant unobservable inputs by the Pricing Committee. |
| 1 | Amount shown represents the unrealized appreciation (depreciation) on the financial instrument. |
See Notes to Financial Statements.
Schedule of Investments
WisdomTree Germany Hedged Equity Fund (DXGE)
March 31, 2022
| | | | | | | | |
| Investments | | Shares | | | Value | |
|
| COMMON STOCKS – 98.8% | |
|
| Germany – 98.8% | |
|
| Aerospace & Defense – 1.5% | |
| | |
Hensoldt AG | | | 579 | | | $ | 17,072 | |
| | |
Rheinmetall AG | | | 1,711 | | | | 365,709 | |
| | | | | | | | |
| Total Aerospace & Defense | | | | 382,781 | |
|
| Air Freight & Logistics – 4.8% | |
| | |
Deutsche Post AG, Registered Shares | | | 25,231 | | | | 1,222,591 | |
|
| Auto Components – 0.7% | |
| | |
Hella GmbH & Co. KGaA | | | 2,606 | | | | 168,871 | |
|
| Automobiles – 10.5% | |
| | |
Bayerische Motoren Werke AG | | | 8,460 | | | | 739,864 | |
| | |
Mercedes-Benz Group AG, Registered Shares | | | 16,306 | | | | 1,157,697 | |
| | |
Volkswagen AG | | | 3,057 | | | | 769,390 | |
| | | | | | | | |
| Total Automobiles | | | | 2,666,951 | |
|
| Capital Markets – 3.2% | |
| | |
Deutsche Boerse AG | | | 2,892 | | | | 524,499 | |
| | |
DWS Group GmbH & Co. KGaA(a) | | | 7,925 | | | | 293,278 | |
| | | | | | | | |
| Total Capital Markets | | | | 817,777 | |
|
| Chemicals – 9.4% | |
| | |
BASF SE | | | 22,161 | | | | 1,276,269 | |
| | |
Covestro AG(a) | | | 4,180 | | | | 213,196 | |
| | |
Evonik Industries AG | | | 14,143 | | | | 396,238 | |
| | |
LANXESS AG | | | 2,383 | | | | 105,766 | |
| | |
Symrise AG | | | 1,444 | | | | 174,886 | |
| | |
Wacker Chemie AG | | | 1,205 | | | | 207,480 | |
| | | | | | | | |
| Total Chemicals | | | | 2,373,835 | |
|
| Commercial Services & Supplies – 0.7% | |
| | |
Bilfinger SE | | | 4,612 | | | | 177,346 | |
|
| Construction & Engineering – 1.0% | |
| | |
Hochtief AG | | | 3,603 | | | | 245,343 | |
|
| Construction Materials – 1.2% | |
| | |
HeidelbergCement AG | | | 5,323 | | | | 305,963 | |
|
| Diversified Financial Services – 0.0% | |
| | |
GRENKE AG | | | 224 | | | | 6,306 | |
|
| Diversified Telecommunication Services – 7.6% | |
| | |
Deutsche Telekom AG, Registered Shares | | | 85,819 | | | | 1,616,778 | |
| | |
Vantage Towers AG | | | 8,617 | | | | 307,670 | |
| | | | | | | | |
| Total Diversified Telecommunication Services | | | | 1,924,448 | |
|
| Electrical Equipment – 0.4% | |
| | |
Varta AG(b) | | | 1,151 | | | | 115,131 | |
|
| Electronic Equipment, Instruments & Components – 0.0% | |
| | |
Jenoptik AG | | | 280 | | | | 8,561 | |
|
| Food & Staples Retailing – 0.7% | |
| | |
METRO AG* | | | 19,247 | | | | 172,735 | |
|
| Food Products – 0.1% | |
| | |
Suedzucker AG | | | 1,821 | | | | 23,706 | |
|
| Health Care Equipment & Supplies – 2.6% | |
| | |
Carl Zeiss Meditec AG, Bearer Shares | | | 157 | | | | 25,670 | |
| | |
Eckert & Ziegler Strahlen – und Medizintechnik AG | | | 68 | | | | 4,404 | |
| | |
Siemens Healthineers AG(a) | | | 10,204 | | | | 638,520 | |
| | | | | | | | |
| Total Health Care Equipment & Supplies | | | | 668,594 | |
|
| Health Care Providers & Services – 1.4% | |
| | |
Fresenius SE & Co. KGaA | | | 9,446 | | | | 350,459 | |
|
| Health Care Technology – 0.1% | |
| | |
CompuGroup Medical SE & Co. KgaA | | | 228 | | | | 14,054 | |
|
| Household Products – 1.3% | |
| | |
Henkel AG & Co. KGaA | | | 5,070 | | | | 338,186 | |
|
| Independent Power & Renewable Electricity Producers – 0.1% | |
| | |
Encavis AG | | | 1,473 | | | | 31,156 | |
|
| Industrial Conglomerates – 5.5% | |
| | |
Siemens AG, Registered Shares | | | 9,937 | | | | 1,389,348 | |
|
| Insurance – 14.1% | |
| | |
Allianz SE, Registered Shares | | | 7,278 | | | | 1,753,594 | |
| | |
Hannover Rueck SE | | | 3,547 | | | | 609,153 | |
| | |
Muenchener Rueckversicherungs – Gesellschaft AG in Muenchen, Registered Shares | | | 3,495 | | | | 944,957 | |
| | |
Talanx AG | | | 5,900 | | | | 262,717 | |
| | | | | | | | |
| Total Insurance | | | | 3,570,421 | |
|
| IT Services – 0.2% | |
| | |
Bechtle AG | | | 527 | | | | 30,022 | |
| | |
CANCOM SE | | | 300 | | | | 18,859 | |
| | | | | | | | |
| Total IT Services | | | | 48,881 | |
|
| Life Sciences Tools & Services – 0.1% | |
| | |
Gerresheimer AG | | | 305 | | | | 22,500 | |
|
| Machinery – 2.2% | |
| | |
Duerr AG | | | 324 | | | | 9,669 | |
| | |
GEA Group AG | | | 5,394 | | | | 223,921 | |
| | |
KION Group AG | | | 351 | | | | 23,432 | |
| | |
Knorr-Bremse AG | | | 2,554 | | | | 197,897 | |
| | |
NORMA Group SE | | | 391 | | | | 11,337 | |
| | |
Traton SE | | | 4,256 | | | | 79,887 | |
| | |
Wacker Neuson SE | | | 936 | | | | 21,162 | |
| | | | | | | | |
| Total Machinery | | | | 567,305 | |
|
| Marine – 3.2% | |
| | |
Hapag-Lloyd AG(a) | | | 2,343 | | | | 825,357 | |
|
| Media – 0.7% | |
| | |
ProSiebenSat.1 Media SE | | | 13,118 | | | | 169,165 | |
|
| Metals & Mining – 0.2% | |
| | |
Aurubis AG | | | 506 | | | | 61,058 | |
|
| Multi-Utilities – 7.1% | |
| | |
E.ON SE | | | 106,113 | | | | 1,244,659 | |
| | |
RWE AG | | | 12,698 | | | | 558,497 | |
| | | | | | | | |
| Total Multi-Utilities | | | | 1,803,156 | |
See Notes to Financial Statements.
Schedule of Investments (continued)
WisdomTree Germany Hedged Equity Fund (DXGE)
March 31, 2022
| | | | | | | | |
| Investments | | Shares | | | Value | |
|
| Oil, Gas & Consumable Fuels – 0.1% | |
| | |
CropEnergies AG | | | 1,649 | | | $ | 21,907 | |
|
| Personal Products – 0.8% | |
| | |
Beiersdorf AG | | | 1,996 | | | | 211,425 | |
|
| Pharmaceuticals – 7.8% | |
| | |
Bayer AG, Registered Shares | | | 24,968 | | | | 1,725,179 | |
| | |
Merck KGaA | | | 1,231 | | | | 260,032 | |
| | | | | | | | |
| Total Pharmaceuticals | | | | 1,985,211 | |
|
| Real Estate Management & Development – 0.1% | |
| | |
PATRIZIA AG | | | 722 | | | | 13,705 | |
|
| Semiconductors & Semiconductor Equipment – 0.9% | |
| | |
AIXTRON SE | | | 388 | | | | 8,632 | |
| | |
Infineon Technologies AG | | | 6,525 | | | | 224,952 | |
| | | | | | | | |
| Total Semiconductors & Semiconductor Equipment | | | | 233,584 | |
|
| Software – 5.0% | |
| | |
Nemetschek SE | | | 204 | | | | 19,929 | |
| | |
SAP SE | | | 10,799 | | | | 1,215,008 | |
| | |
Software AG | | | 920 | | | | 31,958 | |
| | | | | | | | |
| Total Software | | | | 1,266,895 | |
|
| Specialty Retail – 0.7% | |
| | |
Fielmann AG | | | 2,625 | | | | 144,283 | |
| | |
Hornbach Holding AG & Co. KGaA | | | 179 | | | | 22,725 | |
| | | | | | | | |
| Total Specialty Retail | | | | 167,008 | |
|
| Textiles, Apparel & Luxury Goods – 1.5% | |
| | |
adidas AG | | | 1,564 | | | | 368,745 | |
| | |
Puma SE | | | 142 | | | | 12,235 | |
| | | | | | | | |
| Total Textiles, Apparel & Luxury Goods | | | | 380,980 | |
|
| Thrifts & Mortgage Finance – 0.1% | |
| | |
Aareal Bank AG | | | 559 | | | | 17,726 | |
|
| Trading Companies & Distributors – 1.1% | |
| | |
Brenntag SE | | | 3,299 | | | | 269,204 | |
|
| Transportation Infrastructure – 0.1% | |
| | |
Hamburger Hafen und Logistik AG | | | 1,039 | | | | 18,670 | |
TOTAL COMMON STOCKS (Cost: $24,872,626) | | | | 25,058,300 | |
|
| INVESTMENT OF CASH COLLATERAL FOR SECURITIES LOANED – 0.5% | |
|
| United States – 0.5% | |
| | |
State Street Navigator Securities Lending Government Money Market Portfolio, 0.25%(c) | | | | | | | | |
| (Cost: $120,280) | | | 120,280 | | | | 120,280 | |
| |
TOTAL INVESTMENTS IN SECURITIES – 99.3% (Cost: $24,992,906) | | | | 25,178,580 | |
| |
Other Assets less Liabilities – 0.7% | | | | 176,774 | |
| | | | | | | | |
| NET ASSETS – 100.0% | | | $ | 25,355,354 | |
| * | Non-income producing security. |
| (a) | This security is exempt from registration under rule 144A of the Securities Act of 1933. This security may be sold in transactions that are exempt from registration, normally to qualified institutional buyers. |
| (b) | Security, or portion thereof, was on loan at March 31, 2022 (See Note 2). At March 31, 2022, the total market value of the Fund’s securities on loan identified in the Schedule of Investments was $115,131 and the total market value of the collateral held by the Fund was $120,280. |
| (c) | Rate shown represents annualized 7-day yield as of March 31, 2022. |
| | | | | | | | | | | | | | | | | | | | | | | | | | | | |
|
| FINANCIAL DERIVATIVE INSTRUMENTS | |
|
| FOREIGN CURRENCY CONTRACTS (OTC – OVER THE COUNTER) | |
| | | | | |
| Counterparty | | Settlement
Date | | | Amount and
Description of
Currency to
be Purchased | | | Amount and
Description of
Currency to
be Sold | | | Unrealized
Appreciation | | | Unrealized
Depreciation | |
Bank of America NA | | | 4/5/2022 | | | | 5,750,467 | | | | EUR | | | | 6,398,165 | | | | USD | | | $ | 269 | | | $ | — | |
Bank of America NA | | | 4/5/2022 | | | | 7,251,253 | | | | USD | | | | 6,447,358 | | | | EUR | | | | 77,401 | | | | — | |
Bank of America NA | | | 5/4/2022 | | | | 6,418,081 | | | | USD | | | | 5,763,472 | | | | EUR | | | | — | | | | (342 | ) |
Barclays Bank PLC | | | 4/5/2022 | | | | 5,750,316 | | | | EUR | | | | 6,398,164 | | | | USD | | | | 103 | | | | — | |
Barclays Bank PLC | | | 5/4/2022 | | | | 6,418,082 | | | | USD | | | | 5,763,302 | | | | EUR | | | | — | | | | (151 | ) |
Citibank NA | | | 4/5/2022 | | | | 7,251,254 | | | | USD | | | | 6,447,244 | | | | EUR | | | | 77,529 | | | | — | |
Goldman Sachs | | | 4/5/2022 | | | | 7,251,253 | | | | USD | | | | 6,447,386 | | | | EUR | | | | 77,370 | | | | — | |
HSBC Holdings PLC | | | 4/5/2022 | | | | 1,539,932 | | | | EUR | | | | 1,706,177 | | | | USD | | | | 7,276 | | | | — | |
JP Morgan Chase Bank NA | | | 4/5/2022 | | | | 5,750,291 | | | | EUR | | | | 6,398,165 | | | | USD | | | | 74 | | | | — | |
JP Morgan Chase Bank NA | | | 4/5/2022 | | | | 7,251,253 | | | | USD | | | | 6,447,048 | | | | EUR | | | | 77,746 | | | | — | |
JP Morgan Chase Bank NA | | | 5/4/2022 | | | | 6,418,081 | | | | USD | | | | 5,763,296 | | | | EUR | | | | — | | | | (146 | ) |
UBS AG | | | 4/5/2022 | | | | 1,540,918 | | | | EUR | | | | 1,706,177 | | | | USD | | | | 8,373 | | | | — | |
UBS AG | | | 4/5/2022 | | | | 5,750,441 | | | | EUR | | | | 6,398,165 | | | | USD | | | | 241 | | | | — | |
UBS AG | | | 5/4/2022 | | | | 6,418,081 | | | | USD | | | | 5,763,420 | | | | EUR | | | | — | | | | (284 | ) |
| | | | | | | | | | | | | | | | | | | | | | | $ | 326,382 | | | $ | (923 | ) |
See Notes to Financial Statements.
Schedule of Investments (concluded)
WisdomTree Germany Hedged Equity Fund (DXGE)
March 31, 2022
The following is a summary of the fair valuations according to the inputs used as of March 31, 2022 in valuing the Fund’s investments (See Note 2 — Fair Value Measurement):
| | | | | | | | | | | | | | | | |
| | | | |
| | | Quoted
Prices in
Active
Markets
(Level 1) | | | Other
Significant
Observable
Inputs
(Level 2) | | | Significant
Unobservable
Inputs
(Level 3) | | | Total | |
Assets: | | | | | | | | | |
Investments in Securities | | | | |
Common Stocks | | $ | 25,058,300 | | | $ | — | | | $ | — | | | $ | 25,058,300 | |
Investment of Cash Collateral for Securities Loaned | | | — | | | | 120,280 | | | | — | | | | 120,280 | |
Total Investments in Securities | | $ | 25,058,300 | | | $ | 120,280 | | | $ | — | | | $ | 25,178,580 | |
Financial Derivative Instruments | | | | |
Foreign Currency Contracts1 | | $ | — | | | $ | 326,382 | | | $ | — | | | $ | 326,382 | |
Liabilities: | | | | | | | | | |
Financial Derivative Instruments | | | | |
Foreign Currency Contracts1 | | $ | — | | | $ | (923 | ) | | $ | — | | | $ | (923 | ) |
Total – Net | | $ | 25,058,300 | | | $ | 445,739 | | | $ | — | | | $ | 25,504,039 | |
| 1 | Amount shown represents the unrealized appreciation (depreciation) on the financial instrument. |
See Notes to Financial Statements.
Schedule of Investments
WisdomTree International Hedged Quality Dividend Growth Fund (IHDG)
March 31, 2022
| | | | | | | | |
| Investments | | Shares | | | Value | |
|
| COMMON STOCKS – 98.3% | |
|
| Australia – 10.3% | |
| | |
ARB Corp. Ltd. | | | 18,870 | | | $ | 588,639 | |
| | |
Aristocrat Leisure Ltd. | | | 57,886 | | | | 1,595,330 | |
| | |
Beach Energy Ltd.(a) | | | 864,240 | | | | 1,009,196 | |
| | |
BHP Group Ltd. | | | 1,732,020 | | | | 67,309,156 | |
| | |
carsales.com Ltd. | | | 124,901 | | | | 1,962,178 | |
| | |
Cochlear Ltd. | | | 17,814 | | | | 3,014,334 | |
| | |
Coles Group Ltd. | | | 985,192 | | | | 13,250,350 | |
| | |
CSL Ltd. | | | 96,954 | | | | 19,523,353 | |
| | |
Domino’s Pizza Enterprises Ltd.(a) | | | 23,276 | | | | 1,535,540 | |
| | |
Eagers Automotive Ltd.(a) | | | 156,972 | | | | 1,683,299 | |
| | |
Evolution Mining Ltd. | | | 1,016,296 | | | | 3,358,024 | |
| | |
Netwealth Group Ltd. | | | 79,803 | | | | 897,722 | |
| | |
OZ Minerals Ltd. | | | 78,455 | | | | 1,571,283 | |
| | |
Pro Medicus Ltd.(a) | | | 9,027 | | | | 332,095 | |
| | |
REA Group Ltd. | | | 23,611 | | | | 2,401,975 | |
| | |
Technology One Ltd. | | | 109,143 | | | | 940,911 | |
| | |
WiseTech Global Ltd. | | | 11,915 | | | | 457,042 | |
| | | | | | | | |
| Total Australia | | | | 121,430,427 | |
|
| Belgium – 0.2% | |
| | |
Melexis NV | | | 21,717 | | | | 2,029,728 | |
|
| China – 1.1% | |
| | |
Beijing Tong Ren Tang Chinese Medicine Co. Ltd.(a) | | | 543,500 | | | | 753,685 | |
| | |
BYD Electronic International Co. Ltd.(a) | | | 535,500 | | | | 1,080,382 | |
| | |
China Nonferrous Mining Corp. Ltd. | | | 2,489,500 | | | | 1,252,475 | |
| | |
Lenovo Group Ltd.(a) | | | 9,450,600 | | | | 10,281,573 | |
| | | | | | | | |
| Total China | | | | 13,368,115 | |
|
| Denmark – 7.6% | |
| | |
Alten SA | | | 8,034 | | | | 1,229,117 | |
| | |
AP Moller – Maersk A/S, Class B | | | 3,028 | | | | 9,226,198 | |
| | |
Coloplast A/S, Class B | | | 73,700 | | | | 11,294,195 | |
| | |
DSV A/S | | | 13,289 | | | | 2,585,107 | |
| | |
GN Store Nord A/S | | | 19,147 | | | | 952,861 | |
| | |
Novo Nordisk A/S, Class B | | | 515,607 | | | | 57,758,843 | |
| | |
Royal Unibrew A/S | | | 23,354 | | | | 2,209,169 | |
| | |
SimCorp A/S | | | 14,923 | | | | 1,109,401 | |
| | |
Vestas Wind Systems A/S | | | 120,481 | | | | 3,599,823 | |
| | | | | | | | |
| Total Denmark | | | | 89,964,714 | |
|
| Finland – 2.3% | |
| | |
Kesko Oyj, Class A | | | 47,065 | | | | 1,225,385 | |
| | |
Kesko Oyj, Class B | | | 174,784 | | | | 4,863,781 | |
| | |
Neste Oyj | | | 257,745 | | | | 11,895,636 | |
| | |
Nokian Renkaat Oyj | | | 97,199 | | | | 1,597,894 | |
| | |
Orion Oyj, Class B(a) | | | 101,871 | | | | 4,664,221 | |
| | |
Tokmanni Group Corp. | | | 32,553 | | | | 545,113 | |
| | |
Uponor Oyj | | | 15,931 | | | | 325,265 | |
| | |
Valmet Oyj(a) | | | 78,272 | | | | 2,456,791 | |
| | | | | | | | |
| Total Finland | | | | 27,574,086 | |
|
| France – 10.1% | |
| | |
Arkema SA | | | 39,087 | | | | 4,729,555 | |
| | |
BioMerieux | | | 16,020 | | | | 1,724,357 | |
| | |
Bureau Veritas SA | | | 134,578 | | | | 3,884,210 | |
| | |
Cie Generale des Etablissements Michelin SCA | | | 61,359 | | | | 8,393,933 | |
| | |
Hermes International | | | 7,223 | | | | 10,379,363 | |
| | |
Kering SA | | | 29,018 | | | | 18,587,560 | |
| | |
La Francaise des Jeux SAEM(b) | | | 77,552 | | | | 3,102,926 | |
| | |
LVMH Moet Hennessy Louis Vuitton SE | | | 79,104 | | | | 57,156,998 | |
| | |
Sartorius Stedim Biotech | | | 2,630 | | | | 1,090,036 | |
| | |
SEB SA | | | 21,406 | | | | 3,015,282 | |
| | |
Teleperformance | | | 9,081 | | | | 3,499,007 | |
| | |
Trigano SA | | | 8,391 | | | | 1,232,385 | |
| | |
Verallia SA(b) | | | 64,635 | | | | 1,549,074 | |
| | | | | | | | |
| Total France | | | | 118,344,686 | |
|
| Germany – 6.5% | |
| | |
adidas AG | | | 40,358 | | | | 9,515,230 | |
| | |
Covestro AG(b) | | | 104,207 | | | | 5,314,962 | |
| | |
Dermapharm Holding SE | | | 14,599 | | | | 937,255 | |
| | |
Deutsche Post AG, Registered Shares | | | 588,048 | | | | 28,494,407 | |
| | |
Eckert & Ziegler Strahlen – und Medizintechnik AG | | | 161 | | | | 10,426 | |
| | |
Fielmann AG | | | 45,172 | | | | 2,482,875 | |
| | |
Hamburger Hafen und Logistik AG | | | 50,578 | | | | 908,851 | |
| | |
Hapag-Lloyd AG(a)(b) | | | 63,908 | | | | 22,512,557 | |
| | |
Instone Real Estate Group SE(b) | | | 17,640 | | | | 332,484 | |
| | |
Knorr-Bremse AG | | | 42,943 | | | | 3,327,437 | |
| | |
Nemetschek SE | | | 9,123 | | | | 891,232 | |
| | |
Varta AG(a) | | | 16,047 | | | | 1,605,137 | |
| | |
VERBIO Vereinigte BioEnergie AG | | | 3,890 | | | | 303,407 | |
| | | | | | | | |
| Total Germany | | | | 76,636,260 | |
|
| Hong Kong – 0.6% | |
| | |
Techtronic Industries Co. Ltd. | | | 422,500 | | | | 6,846,190 | |
| | |
Vitasoy International Holdings Ltd. | | | 340,000 | | | | 645,146 | |
| | | | | | | | |
| Total Hong Kong | | | | 7,491,336 | |
|
| Ireland – 0.1% | |
| | |
Kingspan Group PLC | | | 14,414 | | | | 1,428,000 | |
|
| Israel – 0.7% | |
| | |
Altshuler Shaham Provident Funds & Pension Ltd. | | | 114,553 | | | | 538,439 | |
| | |
AudioCodes Ltd. | | | 12,984 | | | | 328,338 | |
| | |
Delek Automotive Systems Ltd. | | | 213,223 | | | | 3,291,969 | |
| | |
Hilan Ltd. | | | 10,044 | | | | 622,862 | |
| | |
Matrix IT Ltd. | | | 3,288 | | | | 86,032 | |
| | |
Maytronics Ltd. | | | 24,365 | | | | 477,795 | |
| | |
One Software Technologies Ltd. | | | 33,579 | | | | 584,509 | |
| | |
Strauss Group Ltd. | | | 92,257 | | | | 2,755,640 | |
| | | | | | | | |
| Total Israel | | | | 8,685,584 | |
|
| Italy – 1.5% | |
| | |
Amplifon SpA | | | 22,174 | | | | 1,000,199 | |
| | |
Carel Industries SpA(b) | | | 7,939 | | | | 205,375 | |
| | |
De’ Longhi SpA | | | 46,808 | | | | 1,288,482 | |
| | |
DiaSorin SpA | | | 5,496 | | | | 867,736 | |
| | |
Ferrari NV | | | 20,666 | | | | 4,568,914 | |
| | |
Gruppo MutuiOnline SpA | | | 7,926 | | | | 285,731 | |
See Notes to Financial Statements.
Schedule of Investments (continued)
WisdomTree International Hedged Quality Dividend Growth Fund (IHDG)
March 31, 2022
| | | | | | | | |
| Investments | | Shares | | | Value | |
| | |
GVS SpA(b) | | | 46,641 | | | $ | 427,616 | |
| | |
Moncler SpA | | | 36,694 | | | | 2,071,592 | |
| | |
RAI Way SpA(b) | | | 273,436 | | | | 1,725,033 | |
| | |
Recordati Industria Chimica e Farmaceutica SpA | | | 90,163 | | | | 4,578,600 | |
| | |
Sesa SpA | | | 454 | | | | 75,266 | |
| | |
Technogym SpA(b) | | | 97,894 | | | | 783,148 | |
| | |
Tinexta SpA | | | 975 | | | | 28,770 | |
| | | | | | | | |
| Total Italy | | | | 17,906,462 | |
|
| Japan – 12.2% | |
| | |
Anritsu Corp.(a) | | | 112,300 | | | | 1,436,885 | |
| | |
Asahi Holdings, Inc.(a) | | | 47,100 | | | | 878,941 | |
| | |
Astellas Pharma, Inc. | | | 959,300 | | | | 15,103,788 | |
| | |
BayCurrent Consulting, Inc. | | | 1,600 | | | | 590,566 | |
| | |
Benefit One, Inc.(a) | | | 18,800 | | | | 401,170 | |
| | |
BML, Inc. | | | 32,800 | | | | 835,032 | |
| | |
Capcom Co. Ltd. | | | 69,100 | | | | 1,689,712 | |
| | |
Cosmos Pharmaceutical Corp. | | | 4,000 | | | | 488,733 | |
| | |
Cybozu, Inc.(a) | | | 7,400 | | | | 85,050 | |
| | |
Daiwabo Holdings Co. Ltd. | | | 72,400 | | | | 983,626 | |
| | |
Digital Arts, Inc. | | | 1,300 | | | | 79,473 | |
| | |
Disco Corp. | | | 18,591 | | | | 5,269,046 | |
| | |
DTS Corp. | | | 62,500 | | | | 1,378,991 | |
| | |
eGuarantee, Inc. | | | 5,800 | | | | 98,009 | |
| | |
eRex Co. Ltd.(a) | | | 8,900 | | | | 127,001 | |
| | |
Fast Retailing Co. Ltd. | | | 12,581 | | | | 6,529,163 | |
| | |
Fujimi, Inc. | | | 11,600 | | | | 642,241 | |
| | |
Future Corp. | | | 43,800 | | | | 629,349 | |
| | |
Goldwin, Inc. | | | 9,900 | | | | 506,521 | |
| | |
Haseko Corp. | | | 302,900 | | | | 3,511,269 | |
| | |
Hoya Corp. | | | 38,000 | | | | 4,392,503 | |
| | |
Infocom Corp.(a) | | | 47,400 | | | | 827,132 | |
| | |
Infomart Corp. | | | 100 | | | | 545 | |
| | |
IR Japan Holdings Ltd. | | | 2,400 | | | | 86,113 | |
| | |
Japan Lifeline Co. Ltd.(a) | | | 114,700 | | | | 970,520 | |
| | |
Japan Material Co. Ltd. | | | 48,500 | | | | 695,283 | |
| | |
JCR Pharmaceuticals Co. Ltd. | | | 18,900 | | | | 351,451 | |
| | |
Kakaku.com, Inc.(a) | | | 48,891 | | | | 1,110,546 | |
| | |
Kaken Pharmaceutical Co. Ltd. | | | 54,200 | | | | 1,737,079 | |
| | |
Kanematsu Electronics Ltd. | | | 51,400 | | | | 1,624,049 | |
| | |
Keyence Corp. | | | 14,900 | | | | 7,028,012 | |
| | |
KH Neochem Co. Ltd. | | | 31,200 | | | | 709,728 | |
| | |
Kobe Bussan Co. Ltd.(a) | | | 21,700 | | | | 674,913 | |
| | |
Koei Tecmo Holdings Co. Ltd.(a) | | | 62,200 | | | | 2,057,532 | |
| | |
Lasertec Corp. | | | 5,600 | | | | 958,978 | |
| | |
M3, Inc.(a) | | | 24,300 | | | | 894,721 | |
| | |
Maruwa Unyu Kikan Co. Ltd. | | | 10,800 | | | | 99,925 | |
| | |
MCJ Co. Ltd. | | | 94,000 | | | | 721,022 | |
| | |
Meitec Corp. | | | 21,300 | | | | 1,167,003 | |
| | |
Milbon Co. Ltd. | | | 11,000 | | | | 496,643 | |
| | |
MonotaRO Co. Ltd. | | | 43,400 | | | | 941,838 | |
| | |
Nihon M&A Center Holdings, Inc. | | | 21,600 | | | | 307,338 | |
| | |
Nippon Shinyaku Co. Ltd. | | | 19,500 | | | | 1,338,290 | |
| | |
Nissan Chemical Corp. | | | 53,068 | | | | 3,161,126 | |
| | |
Nomura Research Institute Ltd. | | | 104,900 | | | | 3,474,340 | |
| | |
NSD Co. Ltd. | | | 69,100 | | | | 1,247,928 | |
| | |
Olympus Corp. | | | 143,400 | | | | 2,763,441 | |
| | |
Otsuka Corp. | | | 94,700 | | | | 3,390,084 | |
| | |
Recruit Holdings Co. Ltd. | | | 116,200 | | | | 5,183,166 | |
| | |
Seria Co. Ltd. | | | 37,800 | | | | 863,600 | |
| | |
Shionogi & Co. Ltd. | | | 103,600 | | | | 6,427,254 | |
| | |
Solasto Corp. | | | 61,800 | | | | 503,056 | |
| | |
Sysmex Corp. | | | 21,436 | | | | 1,575,888 | |
| | |
Systena Corp.(a) | | | 124,200 | | | | 441,032 | |
| | |
Taiyo Yuden Co. Ltd.(a) | | | 35,900 | | | | 1,641,565 | |
| | |
TechnoPro Holdings, Inc. | | | 37,800 | | | | 1,037,067 | |
| | |
Toei Animation Co. Ltd. | | | 8,000 | | | | 670,319 | |
| | |
Tokyo Electron Ltd. | | | 65,358 | | | | 34,058,855 | |
| | |
Trend Micro, Inc. | | | 57,200 | | | | 3,374,270 | |
| | |
UT Group Co. Ltd. | | | 6,500 | | | | 166,282 | |
| | |
West Holdings Corp.(a) | | | 7,500 | | | | 299,073 | |
| | |
Workman Co. Ltd.(a) | | | 17,700 | | | | 730,604 | |
| | |
ZOZO, Inc. | | | 62,200 | | | | 1,683,436 | |
| | | | | | | | |
| Total Japan | | | | 143,148,116 | |
|
| Netherlands – 3.9% | |
| | |
ASM International NV | | | 8,953 | | | | 3,308,233 | |
| | |
ASML Holding NV | | | 37,067 | | | | 25,157,991 | |
| | |
BE Semiconductor Industries NV | | | 36,845 | | | | 3,191,917 | |
| | |
Randstad NV(a) | | | 163,891 | | | | 9,963,788 | |
| | |
Signify NV(b) | | | 82,724 | | | | 3,905,380 | |
| | | | | | | | |
| Total Netherlands | | | | 45,527,309 | |
|
| Norway – 0.9% | |
| | |
AF Gruppen ASA | | | 72,207 | | | | 1,651,578 | |
| | |
Aker BP ASA | | | 221,455 | | | | 8,372,944 | |
| | |
Tomra Systems ASA | | | 20,572 | | | | 1,061,773 | |
| | | | | | | | |
| Total Norway | | | | 11,086,295 | |
|
| Portugal – 0.5% | |
| | |
Altri SGPS SA | | | 201,936 | | | | 1,361,586 | |
| | |
Jeronimo Martins SGPS SA | | | 196,820 | | | | 4,758,692 | |
| | | | | | | | |
| Total Portugal | | | | 6,120,278 | |
|
| Singapore – 0.7% | |
| | |
iFAST Corp. Ltd.(a) | | | 10,400 | | | | 46,569 | |
| | |
Japfa Ltd.(a) | | | 1,694,600 | | | | 870,246 | |
| | |
Sheng Siong Group Ltd. | | | 2,229,300 | | | | 2,503,813 | |
| | |
Singapore Exchange Ltd. | | | 589,900 | | | | 4,345,737 | |
| | | | | | | | |
| Total Singapore | | | | 7,766,365 | |
|
| Spain – 2.8% | |
| | |
Cie Automotive SA | | | 67,557 | | | | 1,552,956 | |
| | |
Faes Farma SA | | | 281,984 | | | | 1,153,971 | |
| | |
Industria de Diseno Textil SA | | | 1,326,471 | | | | 29,193,269 | |
| | |
Laboratorios Farmaceuticos Rovi SA | | | 9,592 | | | | 717,195 | |
| | | | | | | | |
| Total Spain | | | | 32,617,391 | |
|
| Sweden – 6.0% | |
| | |
AddLife AB, Class B | | | 17,308 | | | | 488,815 | |
| | |
Assa Abloy AB, Class B | | | 310,580 | | | | 8,494,843 | |
See Notes to Financial Statements.
Schedule of Investments (continued)
WisdomTree International Hedged Quality Dividend Growth Fund (IHDG)
March 31, 2022
| | | | | | | | |
| Investments | | Shares | | | Value | |
| | |
Atlas Copco AB, Class A | | | 201,788 | | | $ | 10,646,518 | |
| | |
Atlas Copco AB, Class B | | | 118,964 | | | | 5,482,653 | |
| | |
Bilia AB, Class A | | | 90,834 | | | | 1,310,940 | |
| | |
Epiroc AB, Class A | | | 173,831 | | | | 3,771,555 | |
| | |
Epiroc AB, Class B | | | 92,103 | | | | 1,685,534 | |
| | |
EQT AB | | | 114,344 | | | | 4,565,466 | |
| | |
Evolution AB(b) | | | 20,680 | | | | 2,148,240 | |
| | |
Hexpol AB | | | 186,971 | | | | 1,852,978 | |
| | |
Husqvarna AB, Class B(a) | | | 228,067 | | | | 2,414,436 | |
| | |
Indutrade AB | | | 55,570 | | | | 1,420,942 | |
| | |
JM AB(a) | | | 52,910 | | | | 1,703,221 | |
| | |
Lagercrantz Group AB, Class B | | | 64,132 | | | | 734,950 | |
| | |
Lifco AB, Class B | | | 43,836 | | | | 1,133,130 | |
| | |
Mycronic AB | | | 28,247 | | | | 533,454 | |
| | |
Nibe Industrier AB, Class B | | | 97,094 | | | | 1,094,462 | |
| | |
Nolato AB, Class B | | | 53,793 | | | | 404,051 | |
| | |
Nordnet AB publ | | | 55,736 | | | | 1,016,709 | |
| | |
Paradox Interactive AB(a) | | | 31,937 | | | | 615,821 | |
| | |
Samhallsbyggnadsbolaget i Norden AB(a) | | | 496,954 | | | | 2,252,968 | |
| | |
Sandvik AB(a) | | | 485,049 | | | | 10,461,494 | |
| | |
SKF AB, Class B(a) | | | 262,877 | | | | 4,342,545 | |
| | |
Thule Group AB(b) | | | 35,096 | | | | 1,412,215 | |
| | | | | | | | |
| Total Sweden | | | | 69,987,940 | |
|
| Switzerland – 11.2% | |
| | |
Coca-Cola HBC AG* | | | 171,327 | | | | 3,608,117 | |
| | |
EMS-Chemie Holding AG, Registered Shares | | | 9,083 | | | | 8,897,935 | |
| | |
Kuehne + Nagel International AG, Registered Shares | | | 34,271 | | | | 9,798,098 | |
| | |
Logitech International SA, Registered Shares | | | 39,044 | | | | 2,935,990 | |
| | |
Partners Group Holding AG | | | 10,545 | | | | 13,217,775 | |
| | |
Roche Holding AG | | | 142,982 | | | | 56,936,435 | |
| | |
Roche Holding AG, Bearer Shares | | | 33,328 | | | | 14,667,579 | |
| | |
Schindler Holding AG, Participation Certificate | | | 6,833 | | | | 1,477,606 | |
| | |
Schindler Holding AG, Registered Shares | | | 27,656 | | | | 5,947,430 | |
| | |
SFS Group AG | | | 12,009 | | | | 1,680,803 | |
| | |
Sonova Holding AG, Registered Shares | | | 10,567 | | | | 4,450,714 | |
| | |
STMicroelectronics NV | | | 70,059 | | | | 3,087,646 | |
| | |
Straumann Holding AG, Registered Shares | | | 1,115 | | | | 1,801,084 | |
| | |
Temenos AG, Registered Shares | | | 9,685 | | | | 936,664 | |
| | |
VAT Group AG(b) | | | 6,007 | | | | 2,313,372 | |
| | | | | | | | |
| Total Switzerland | | | | 131,757,248 | |
|
| United Kingdom – 19.1% | |
| | |
Alpha FX Group PLC | | | 2,284 | | | | 62,250 | |
| | |
Anglo American PLC | | | 1,236,616 | | | | 64,679,890 | |
| | |
Antofagasta PLC | | | 515,611 | | | | 11,357,654 | |
| | |
Ashtead Group PLC | | | 52,356 | | | | 3,331,607 | |
| | |
Bellway PLC | | | 40,518 | | | | 1,297,425 | |
| | |
Burberry Group PLC | | | 102,472 | | | | 2,258,558 | |
| | |
Clipper Logistics PLC | | | 8,616 | | | | 100,056 | |
| | |
Computacenter PLC | | | 36,076 | | | | 1,397,435 | |
| | |
Croda International PLC | | | 28,156 | | | | 2,921,243 | |
| | |
Diageo PLC | | | 648,357 | | | | 32,981,137 | |
| | |
Dunelm Group PLC(a) | | | 73,456 | | | | 1,055,170 | |
| | |
Electrocomponents PLC | | | 64,038 | | | | 913,982 | |
| | |
EMIS Group PLC | | | 20,021 | | | | 351,651 | |
| | |
Ferrexpo PLC | | | 1,047,187 | | | | 2,571,423 | |
| | |
Fresnillo PLC | | | 402,694 | | | | 3,891,721 | |
| | |
Games Workshop Group PLC | | | 7,317 | | | | 699,905 | |
| | |
Hikma Pharmaceuticals PLC | | | 58,842 | | | | 1,596,746 | |
| | |
Howden Joinery Group PLC | | | 88,343 | | | | 893,081 | |
| | |
IMI PLC | | | 92,903 | | | | 1,667,232 | |
| | |
Impax Asset Management Group PLC | | | 32,233 | | | | 420,152 | |
| | |
Intertek Group PLC | | | 39,081 | | | | 2,688,062 | |
| | |
Kainos Group PLC | | | 16,256 | | | | 283,168 | |
| | |
Polar Capital Holdings PLC | | | 85,819 | | | | 701,691 | |
| | |
RELX PLC | | | 564,140 | | | | 17,700,333 | |
| | |
Rightmove PLC | | | 156,560 | | | | 1,304,421 | |
| | |
Rio Tinto PLC | | | 741,584 | | | | 59,375,306 | |
| | |
Softcat PLC | | | 46,449 | | | | 1,042,117 | |
| | |
Spirax-Sarco Engineering PLC | | | 8,457 | | | | 1,395,761 | |
| | |
Synthomer PLC | | | 95,948 | | | | 386,064 | |
| | |
Taylor Wimpey PLC | | | 2,558,906 | | | | 4,403,525 | |
| | |
Vivo Energy PLC(b) | | | 654,290 | | | | 1,176,770 | |
| | | | | | | | |
| Total United Kingdom | | | | 224,905,536 | |
TOTAL COMMON STOCKS (Cost: $1,064,178,574) | | | | 1,157,775,876 | |
|
| EXCHANGE-TRADED FUND – 0.1% | |
|
| United States – 0.1% | |
| | |
WisdomTree International Quality Dividend Growth Fund(c) | | | | | | | | |
| (Cost: $882,631) | | | 30,722 | | | | 1,121,046 | |
|
| INVESTMENT OF CASH COLLATERAL FOR SECURITIES LOANED – 2.3% | |
|
| United States – 2.3% | |
| | |
State Street Navigator Securities Lending Government Money Market Portfolio, 0.25%(d) | | | | | | | | |
| (Cost: $26,747,300) | | | 26,747,300 | | | | 26,747,300 | |
| |
TOTAL INVESTMENTS IN SECURITIES – 100.7% (Cost: $1,091,808,505) | | | | 1,185,644,222 | |
| |
Other Assets less Liabilities – (0.7)% | | | | (8,551,661 | ) |
| | | | | | | | |
| NET ASSETS – 100.0% | | | $ | 1,177,092,561 | |
| * | Non-income producing security. |
| (a) | Security, or portion thereof, was on loan at March 31, 2022 (See Note 2). At March 31, 2022, the total market value of the Fund’s securities on loan identified in the Schedule of Investments was $48,372,496 and the total market value of the collateral held by the Fund was $51,170,882. The total market value of the collateral includes non-cash U.S. Government securities collateral having a value of $24,423,582. |
| (b) | This security is exempt from registration under rule 144A of the Securities Act of 1933. This security may be sold in transactions that are exempt from registration, normally to qualified institutional buyers. |
| (c) | Affiliated holding. See “Investment in Affiliates” supplementary table included in this Schedule of Investments for additional information. |
| (d) | Rate shown represents annualized 7-day yield as of March 31, 2022. |
See Notes to Financial Statements.
Schedule of Investments (continued)
WisdomTree International Hedged Quality Dividend Growth Fund (IHDG)
March 31, 2022
Affiliated holdings are investments in entities in which the Fund owns 5% or more of the outstanding voting securities or are investments in entities which are under common ownership or control. Investments in affiliates during the fiscal year ended March 31, 2022 were as follows:
| | | | | | | | | | | | | | | | | | | | | | | | | | | | |
| | | | | | | |
| Affiliate | | Value at
3/31/2021 | | | Purchases/
Additions | | | Sales/
Reductions | | | Realized
Gain/
(Loss) | | | Change in
Unrealized
Appreciation/
Depreciation | | | Value at
3/31/2022 | | | Dividend
Income | |
WisdomTree International Quality Dividend Growth Fund | | $ | 1,615,390 | | | $ | — | | | $ | 481,935 | | | $ | 110,708 | | | $ | (123,117 | ) | | $ | 1,121,046 | | | $ | 33,146 | |
| | | | | | | | | | | | | | | | | | | | | | | | | | | | |
|
| FINANCIAL DERIVATIVE INSTRUMENTS | |
|
| FOREIGN CURRENCY CONTRACTS (OTC – OVER THE COUNTER) | |
| | | | | |
| Counterparty | | Settlement
Date | | | Amount and
Description of
Currency to
be Purchased | | | Amount and
Description of
Currency to
be Sold | | | Unrealized
Appreciation | | | Unrealized
Depreciation | |
| | | | | | | |
Bank of America NA | | | 4/5/2022 | | | | 35,227,737 | | | | AUD | | | | 26,454,234 | | | | USD | | | $ | 314 | | | $ | — | |
| | | | | | | |
Bank of America NA | | | 4/5/2022 | | | | 27,721,622 | | | | CHF | | | | 30,123,586 | | | | USD | | | | 1,365 | | | | — | |
| | | | | | | |
Bank of America NA | | | 4/5/2022 | | | | 138,613,780 | | | | DKK | | | | 20,733,650 | | | | USD | | | | 855 | | | | — | |
| | | | | | | |
Bank of America NA | | | 4/5/2022 | | | | 76,977,971 | | | | EUR | | | | 85,648,308 | | | | USD | | | | 3,606 | | | | — | |
| | | | | | | |
Bank of America NA | | | 4/5/2022 | | | | 41,974,309 | | | | GBP | | | | 55,266,271 | | | | USD | | | | — | | | | (1,269 | ) |
| | | | | | | |
Bank of America NA | | | 4/5/2022 | | | | 6,774,265 | | | | ILS | | | | 2,122,731 | | | | USD | | | | 57 | | | | — | |
| | | | | | | |
Bank of America NA | | | 4/5/2022 | | | | 4,368,418,396 | | | | JPY | | | | 35,990,555 | | | | USD | | | | 1,106 | | | | — | |
| | | | | | | |
Bank of America NA | | | 4/5/2022 | | | | 21,062,749 | | | | NOK | | | | 2,408,787 | | | | USD | | | | 8 | | | | — | |
| | | | | | | |
Bank of America NA | | | 4/5/2022 | | | | 160,174,684 | | | | SEK | | | | 17,186,975 | | | | USD | | | | 528 | | | | — | |
| | | | | | | |
Bank of America NA | | | 4/5/2022 | | | | 2,404,233 | | | | SGD | | | | 1,776,479 | | | | USD | | | | 15 | | | | — | |
| | | | | | | |
Bank of America NA | | | 4/5/2022 | | | | 25,943,844 | | | | USD | | | | 35,738,867 | | | | AUD | | | | — | | | | (894,540 | ) |
| | | | | | | |
Bank of America NA | | | 4/5/2022 | | | | 29,542,402 | | | | USD | | | | 27,064,179 | | | | CHF | | | | 131,891 | | | | — | |
| | | | | | | |
Bank of America NA | | | 4/5/2022 | | | | 20,333,629 | | | | USD | | | | 134,490,059 | | | | DKK | | | | 215,970 | | | | — | |
| | | | | | | |
Bank of America NA | | | 4/5/2022 | | | | 83,995,868 | | | | USD | | | | 74,683,839 | | | | EUR | | | | 896,591 | | | | — | |
| | | | | | | |
Bank of America NA | | | 4/5/2022 | | | | 54,200,001 | | | | USD | | | | 40,382,968 | | | | GBP | | | | 1,030,219 | | | | — | |
| | | | | | | |
Bank of America NA | | | 4/5/2022 | | | | 2,081,777 | | | | USD | | | | 6,668,352 | | | | ILS | | | | — | | | | (7,822 | ) |
| | | | | | | |
Bank of America NA | | | 4/5/2022 | | | | 35,296,178 | | | | USD | | | | 4,062,247,714 | | | | JPY | | | | 1,827,076 | | | | — | |
| | | | | | | |
Bank of America NA | | | 4/5/2022 | | | | 2,362,313 | | | | USD | | | | 20,777,974 | | | | NOK | | | | — | | | | (13,914 | ) |
| | | | | | | |
Bank of America NA | | | 4/5/2022 | | | | 16,855,381 | | | | USD | | | | 158,944,372 | | | | SEK | | | | — | | | | (200,104 | ) |
| | | | | | | |
Bank of America NA | | | 4/5/2022 | | | | 1,742,206 | | | | USD | | | | 2,365,341 | | | | SGD | | | | — | | | | (5,550 | ) |
| | | | | | | |
Bank of America NA | | | 4/6/2022 | | | | 42,133,642 | | | | HKD | | | | 5,380,171 | | | | USD | | | | 12 | | | | — | |
| | | | | | | |
Bank of America NA | | | 4/6/2022 | | | | 5,276,370 | | | | USD | | | | 41,228,062 | | | | HKD | | | | 11,824 | | | | — | |
| | | | | | | |
Bank of America NA | | | 5/4/2022 | | | | 30,434,187 | | | | USD | | | | 40,514,956 | | | | AUD | | | | — | | | | (1,327 | ) |
| | | | | | | |
Bank of America NA | | | 5/4/2022 | | | | 31,942,100 | | | | USD | | | | 29,367,024 | | | | CHF | | | | — | | | | (2,397 | ) |
| | | | | | | |
Bank of America NA | | | 5/4/2022 | | | | 22,646,857 | | | | USD | | | | 151,279,872 | | | | DKK | | | | — | | | | (1,583 | ) |
| | | | | | | |
Bank of America NA | | | 5/4/2022 | | | | 86,042,231 | | | | USD | | | | 77,266,392 | | | | EUR | | | | — | | | | (4,580 | ) |
| | | | | | | |
Bank of America NA | | | 5/4/2022 | | | | 2,158,241 | | | | USD | | | | 6,885,430 | | | | ILS | | | | — | | | | (390 | ) |
| | | | | | | |
Bank of America NA | | | 5/4/2022 | | | | 2,897,327 | | | | USD | | | | 25,344,834 | | | | NOK | | | | — | | | | (63 | ) |
| | | | | | | |
Bank of America NA | | | 5/4/2022 | | | | 17,872,478 | | | | USD | | | | 166,478,361 | | | | SEK | | | | — | | | | (871 | ) |
| | | | | | | |
Bank of America NA | | | 5/5/2022 | | | | 57,951,375 | | | | USD | | | | 44,022,351 | | | | GBP | | | | 340 | | | | — | |
| | | | | | | |
Bank of America NA | | | 5/5/2022 | | | | 5,299,249 | | | | USD | | | | 41,489,013 | | | | HKD | | | | — | | | | (26 | ) |
| | | | | | | |
Bank of America NA | | | 5/6/2022 | | | | 1,886,335 | | | | USD | | | | 2,553,249 | | | | SGD | | | | — | | | | (35 | ) |
| | | | | | | |
Bank of America NA | | | 5/9/2022 | | | | 36,346,889 | | | | USD | | | | 4,408,834,019 | | | | JPY | | | | — | | | | (1,504 | ) |
| | | | | | | |
Barclays Bank PLC | | | 4/5/2022 | | | | 35,227,267 | | | | AUD | | | | 26,454,233 | | | | USD | | | | — | | | | (39 | ) |
| | | | | | | |
Barclays Bank PLC | | | 4/5/2022 | | | | 27,720,596 | | | | CHF | | | | 30,123,584 | | | | USD | | | | 252 | | | | — | |
| | | | | | | |
Barclays Bank PLC | | | 4/5/2022 | | | | 138,608,791 | | | | DKK | | | | 20,733,648 | | | | USD | | | | 110 | | | | — | |
| | | | | | | |
Barclays Bank PLC | | | 4/5/2022 | | | | 76,975,964 | | | | EUR | | | | 85,648,307 | | | | USD | | | | 1,374 | | | | — | |
| | | | | | | |
Barclays Bank PLC | | | 4/5/2022 | | | | 41,975,870 | | | | GBP | | | | 55,266,270 | | | | USD | | | | 788 | | | | — | |
| | | | | | | |
Barclays Bank PLC | | | 4/5/2022 | | | | 6,773,368 | | | | ILS | | | | 2,122,732 | | | | USD | | | | — | | | | (225 | ) |
See Notes to Financial Statements.
Schedule of Investments (continued)
WisdomTree International Hedged Quality Dividend Growth Fund (IHDG)
March 31, 2022
| | | | | | | | | | | | | | | | | | | | | | | | | | | | |
|
| FINANCIAL DERIVATIVE INSTRUMENTS | |
|
| FOREIGN CURRENCY CONTRACTS (OTC – OVER THE COUNTER) | |
| | | | | |
| Counterparty | | Settlement
Date | | | Amount and
Description of
Currency to
be Purchased | | | Amount and
Description of
Currency to
be Sold | | | Unrealized
Appreciation | | | Unrealized
Depreciation | |
| | | | | | | |
Barclays Bank PLC | | | 4/5/2022 | | | | 4,368,346,172 | | | | JPY | | | | 35,990,553 | | | | USD | | | $ | 513 | | | $ | — | |
| | | | | | | |
Barclays Bank PLC | | | 4/5/2022 | | | | 21,062,900 | | | | NOK | | | | 2,408,785 | | | | USD | | | | 27 | | | | — | |
| | | | | | | |
Barclays Bank PLC | | | 4/5/2022 | | | | 160,171,779 | | | | SEK | | | | 17,186,975 | | | | USD | | | | 216 | | | | — | |
| | | | | | | |
Barclays Bank PLC | | | 4/5/2022 | | | | 2,404,253 | | | | SGD | | | | 1,776,480 | | | | USD | | | | 28 | | | | — | |
| | | | | | | |
Barclays Bank PLC | | | 4/6/2022 | | | | 42,132,673 | | | | HKD | | | | 5,380,171 | | | | USD | | | | — | | | | (112 | ) |
| | | | | | | |
Barclays Bank PLC | | | 5/4/2022 | | | | 30,434,188 | | | | USD | | | | 40,515,227 | | �� | | AUD | | | | — | | | | (1,530 | ) |
| | | | | | | |
Barclays Bank PLC | | | 5/4/2022 | | | | 31,942,099 | | | | USD | | | | 29,365,777 | | | | CHF | | | | — | | | | (1,042 | ) |
| | | | | | | |
Barclays Bank PLC | | | 5/4/2022 | | | | 22,646,855 | | | | USD | | | | 151,282,124 | | | | DKK | | | | — | | | | (1,922 | ) |
| | | | | | | |
Barclays Bank PLC | | | 5/4/2022 | | | | 86,042,232 | | | | USD | | | | 77,264,103 | | | | EUR | | | | — | | | | (2,030 | ) |
| | | | | | | |
Barclays Bank PLC | | | 5/4/2022 | | | | 2,158,242 | | | | USD | | | | 6,886,298 | | | | ILS | | | | — | | | | (662 | ) |
| | | | | | | |
Barclays Bank PLC | | | 5/4/2022 | | | | 2,897,325 | | | | USD | | | | 25,344,730 | | | | NOK | | | | — | | | | (53 | ) |
| | | | | | | |
Barclays Bank PLC | | | 5/4/2022 | | | | 17,872,477 | | | | USD | | | | 166,478,370 | | | | SEK | | | | — | | | | (873 | ) |
| | | | | | | |
Barclays Bank PLC | | | 5/5/2022 | | | | 57,951,375 | | | | USD | | | | 44,023,956 | | | | GBP | | | | — | | | | (1,773 | ) |
| | | | | | | |
Barclays Bank PLC | | | 5/5/2022 | | | | 5,299,249 | | | | USD | | | | 41,489,055 | | | | HKD | | | | — | | | | (32 | ) |
| | | | | | | |
Barclays Bank PLC | | | 5/6/2022 | | | | 1,886,334 | | | | USD | | | | 2,553,285 | | | | SGD | | | | — | | | | (63 | ) |
| | | | | | | |
Barclays Bank PLC | | | 5/9/2022 | | | | 36,346,890 | | | | USD | | | | 4,408,714,195 | | | | JPY | | | | — | | | | (515 | ) |
| | | | | | | |
Citibank NA | | | 4/5/2022 | | | | 25,943,844 | | | | USD | | | | 35,734,682 | | | | AUD | | | | — | | | | (891,398 | ) |
| | | | | | | |
Citibank NA | | | 4/5/2022 | | | | 391,605 | | | | USD | | | | 534,159 | | | | AUD | | | | — | | | | (9,526 | ) |
| | | | | | | |
Citibank NA | | | 4/5/2022 | | | | 29,542,400 | | | | USD | | | | 27,063,172 | | | | CHF | | | | 132,982 | | | | — | |
| | | | | | | |
Citibank NA | | | 4/5/2022 | | | | 445,923 | | | | USD | | | | 412,373 | | | | CHF | | | | — | | | | (2,200 | ) |
| | | | | | | |
Citibank NA | | | 4/5/2022 | | | | 20,333,627 | | | | USD | | | | 134,488,968 | | | | DKK | | | | 216,131 | | | | — | |
| | | | | | | |
Citibank NA | | | 4/5/2022 | | | | 306,923 | | | | USD | | | | 2,098,381 | | | | DKK | | | | — | | | | (6,963 | ) |
| | | | | | | |
Citibank NA | | | 4/5/2022 | | | | 83,995,867 | | | | USD | | | | 74,682,510 | | | | EUR | | | | 898,069 | | | | — | |
| | | | | | | |
Citibank NA | | | 4/5/2022 | | | | 1,267,862 | | | | USD | | | | 1,164,644 | | | | EUR | | | | — | | | | (28,015 | ) |
| | | | | | | |
Citibank NA | | | 4/5/2022 | | | | 54,200,001 | | | | USD | | | | 40,384,262 | | | | GBP | | | | 1,028,515 | | | | — | |
| | | | | | | |
Citibank NA | | | 4/5/2022 | | | | 818,113 | | | | USD | | | | 622,822 | | | | GBP | | | | — | | | | (1,919 | ) |
| | | | | | | |
Citibank NA | | | 4/5/2022 | | | | 2,081,776 | | | | USD | | | | 6,668,099 | | | | ILS | | | | — | | | | (7,744 | ) |
| | | | | | | |
Citibank NA | | | 4/5/2022 | | | | 31,423 | | | | USD | | | | 103,176 | | | | ILS | | | | — | | | | (908 | ) |
| | | | | | | |
Citibank NA | | | 4/5/2022 | | | | 35,296,176 | | | | USD | | | | 4,062,314,547 | | | | JPY | | | | 1,826,523 | | | | — | |
| | | | | | | |
Citibank NA | | | 4/5/2022 | | | | 532,772 | | | | USD | | | | 61,437,775 | | | | JPY | | | | 26,582 | | | | — | |
| | | | | | | |
Citibank NA | | | 4/5/2022 | | | | 2,362,312 | | | | USD | | | | 20,778,277 | | | | NOK | | | | — | | | | (13,950 | ) |
| | | | | | | |
Citibank NA | | | 4/5/2022 | | | | 35,658 | | | | USD | | | | 322,553 | | | | NOK | | | | — | | | | (1,230 | ) |
| | | | | | | |
Citibank NA | | | 4/5/2022 | | | | 16,855,381 | | | | USD | | | | 158,942,973 | | | | SEK | | | | — | | | | (199,954 | ) |
| | | | | | | |
Citibank NA | | | 4/5/2022 | | | | 254,421 | | | | USD | | | | 2,534,621 | | | | SEK | | | | — | | | | (17,556 | ) |
| | | | | | | |
Citibank NA | | | 4/5/2022 | | | | 1,742,204 | | | | USD | | | | 2,365,310 | | | | SGD | | | | — | | | | (5,530 | ) |
| | | | | | | |
Citibank NA | | | 4/5/2022 | | | | 26,297 | | | | USD | | | | 35,815 | | | | SGD | | | | — | | | | (166 | ) |
| | | | | | | |
Citibank NA | | | 4/6/2022 | | | | 5,276,369 | | | | USD | | | | 41,227,025 | | | | HKD | | | | 11,955 | | | | — | |
| | | | | | | |
Citibank NA | | | 4/6/2022 | | | | 79,643 | | | | USD | | | | 622,472 | | | | HKD | | | | 158 | | | | — | |
| | | | | | | |
Goldman Sachs | | | 4/5/2022 | | | | 671,691 | | | | AUD | | | | 503,874 | | | | USD | | | | 538 | | | | — | |
| | | | | | | |
Goldman Sachs | | | 4/5/2022 | | | | 533,940 | | | | CHF | | | | 573,764 | | | | USD | | | | 6,466 | | | | — | |
| | | | | | | |
Goldman Sachs | | | 4/5/2022 | | | | 2,673,857 | | | | DKK | | | | 394,914 | | | | USD | | | | 5,054 | | | | — | |
| | | | | | | |
Goldman Sachs | | | 4/5/2022 | | | | 1,484,740 | | | | EUR | | | | 1,631,343 | | | | USD | | | | 20,698 | | | | — | |
| | | | | | | |
Goldman Sachs | | | 4/5/2022 | | | | 797,846 | | | | GBP | | | | 1,052,656 | | | | USD | | | | — | | | | (2,182 | ) |
| | | | | | | |
Goldman Sachs | | | 4/5/2022 | | | | 130,007 | | | | ILS | | | | 40,432 | | | | USD | | | | 307 | | | | — | |
| | | | | | | |
Goldman Sachs | | | 4/5/2022 | | | | 83,602,849 | | | | JPY | | | | 685,512 | | | | USD | | | | 3,297 | | | | — | |
| | | | | | | |
Goldman Sachs | | | 4/5/2022 | | | | 396,181 | | | | NOK | | | | 45,880 | | | | USD | | | | — | | | | (572 | ) |
| | | | | | | |
Goldman Sachs | | | 4/5/2022 | | | | 3,087,105 | | | | SEK | | | | 327,360 | | | | USD | | | | 3,901 | | | | — | |
| | | | | | | |
Goldman Sachs | | | 4/5/2022 | | | | 45,960 | | | | SGD | | | | 33,837 | | | | USD | | | | 123 | | | | — | |
| | | | | | | |
Goldman Sachs | | | 4/5/2022 | | | | 25,943,844 | | | | USD | | | | 35,737,144 | | | | AUD | | | | — | | | | (893,247 | ) |
| | | | | | | |
Goldman Sachs | | | 4/5/2022 | | | | 29,542,402 | | | | USD | | | | 27,062,583 | | | | CHF | | | | 133,624 | | | | — | |
See Notes to Financial Statements.
Schedule of Investments (continued)
WisdomTree International Hedged Quality Dividend Growth Fund (IHDG)
March 31, 2022
| | | | | | | | | | | | | | | | | | | | | | | | | | | | |
|
| FINANCIAL DERIVATIVE INSTRUMENTS | |
|
| FOREIGN CURRENCY CONTRACTS (OTC – OVER THE COUNTER) | |
| | | | | |
| Counterparty | | Settlement
Date | | | Amount and
Description of
Currency to
be Purchased | | | Amount and
Description of
Currency to
be Sold | | | Unrealized
Appreciation | | | Unrealized
Depreciation | |
| | | | | | | |
Goldman Sachs | | | 4/5/2022 | | | | 20,333,629 | | | | USD | | | | 134,503,214 | | | | DKK | | | $ | 214,002 | | | $ | — | |
| | | | | | | |
Goldman Sachs | | | 4/5/2022 | | | | 83,995,868 | | | | USD | | | | 74,684,171 | | | | EUR | | | | 896,222 | | | | — | |
| | | | | | | |
Goldman Sachs | | | 4/5/2022 | | | | 54,200,001 | | | | USD | | | | 40,383,660 | | | | GBP | | | | 1,029,308 | | | | — | |
| | | | | | | |
Goldman Sachs | | | 4/5/2022 | | | | 2,081,777 | | | | USD | | | | 6,669,218 | | | | ILS | | | | — | | | | (8,094 | ) |
| | | | | | | |
Goldman Sachs | | | 4/5/2022 | | | | 35,296,178 | | | | USD | | | | 4,062,304,188 | | | | JPY | | | | 1,826,611 | | | | — | |
| | | | | | | |
Goldman Sachs | | | 4/5/2022 | | | | 2,362,313 | | | | USD | | | | 20,780,908 | | | | NOK | | | | — | | | | (14,250 | ) |
| | | | | | | |
Goldman Sachs | | | 4/5/2022 | | | | 16,855,381 | | | | USD | | | | 158,946,951 | | | | SEK | | | | — | | | | (200,380 | ) |
| | | | | | | |
Goldman Sachs | | | 4/5/2022 | | | | 1,742,206 | | | | USD | | | | 2,365,398 | | | | SGD | | | | — | | | | (5,593 | ) |
| | | | | | | |
Goldman Sachs | | | 4/6/2022 | | | | 802,108 | | | | HKD | | | | 102,476 | | | | USD | | | | — | | | | (52 | ) |
| | | | | | | |
Goldman Sachs | | | 4/6/2022 | | | | 5,276,370 | | | | USD | | | | 41,230,072 | | | | HKD | | | | 11,567 | | | | — | |
| | | | | | | |
JP Morgan Chase Bank NA | | | 4/4/2022 | | | | 659,320 | | | | HKD | | | | 84,190 | | | | USD | | | | — | | | | (1 | ) |
| | | | | | | |
JP Morgan Chase Bank NA | | | 4/5/2022 | | | | 35,227,737 | | | | AUD | | | | 26,454,234 | | | | USD | | | | 314 | | | | — | |
| | | | | | | |
JP Morgan Chase Bank NA | | | 4/5/2022 | | | | 27,720,658 | | | | CHF | | | | 30,123,586 | | | | USD | | | | 318 | | | | — | |
| | | | | | | |
JP Morgan Chase Bank NA | | | 4/5/2022 | | | | 138,609,489 | | | | DKK | | | | 20,733,650 | | | | USD | | | | 213 | | | | — | |
| | | | | | | |
JP Morgan Chase Bank NA | | | 4/5/2022 | | | | 76,975,619 | | | | EUR | | | | 85,648,308 | | | | USD | | | | 989 | | | | — | |
| | | | | | | |
JP Morgan Chase Bank NA | | | 4/5/2022 | | | | 41,974,627 | | | | GBP | | | | 55,266,271 | | | | USD | | | | — | | | | (849 | ) |
| | | | | | | |
JP Morgan Chase Bank NA | | | 4/5/2022 | | | | 6,774,210 | | | | ILS | | | | 2,122,731 | | | | USD | | | | 40 | | | | — | |
| | | | | | | |
JP Morgan Chase Bank NA | | | 4/5/2022 | | | | 4,368,324,820 | | | | JPY | | | | 35,990,555 | | | | USD | | | | 335 | | | | — | |
| | | | | | | |
JP Morgan Chase Bank NA | | | 4/5/2022 | | | | 21,062,838 | | | | NOK | | | | 2,408,787 | | | | USD | | | | 18 | | | | — | |
| | | | | | | |
JP Morgan Chase Bank NA | | | 4/5/2022 | | | | 160,171,195 | | | | SEK | | | | 17,186,975 | | | | USD | | | | 154 | | | | — | |
| | | | | | | |
JP Morgan Chase Bank NA | | | 4/5/2022 | | | | 2,404,226 | | | | SGD | | | | 1,776,479 | | | | USD | | | | 10 | | | | — | |
| | | | | | | |
JP Morgan Chase Bank NA | | | 4/5/2022 | | | | 25,943,844 | | | | USD | | | | 35,733,206 | | | | AUD | | | | — | | | | (890,289 | ) |
| | | | | | | |
JP Morgan Chase Bank NA | | | 4/5/2022 | | | | 587,408 | | | | USD | | | | 808,830 | | | | AUD | | | | — | | | | (19,989 | ) |
| | | | | | | |
JP Morgan Chase Bank NA | | | 4/5/2022 | | | | 783,210 | | | | USD | | | | 1,083,311 | | | | AUD | | | | — | | | | (30,311 | ) |
| | | | | | | |
JP Morgan Chase Bank NA | | | 4/5/2022 | | | | 391,605 | | | | USD | | | | 523,636 | | | | AUD | | | | — | | | | (1,624 | ) |
| | | | | | | |
JP Morgan Chase Bank NA | | | 4/5/2022 | | | | 29,542,402 | | | | USD | | | | 27,062,317 | | | | CHF | | | | 133,913 | | | | — | |
| | | | | | | |
JP Morgan Chase Bank NA | | | 4/5/2022 | | | | 668,885 | | | | USD | | | | 614,200 | | | | CHF | | | | 1,437 | | | | — | |
| | | | | | | |
JP Morgan Chase Bank NA | | | 4/5/2022 | | | | 891,846 | | | | USD | | | | 834,028 | | | | CHF | | | | — | | | | (14,488 | ) |
| | | | | | | |
JP Morgan Chase Bank NA | | | 4/5/2022 | | | | 445,923 | | | | USD | | | | 416,962 | | | | CHF | | | | — | | | | (7,188 | ) |
| | | | | | | |
JP Morgan Chase Bank NA | | | 4/5/2022 | | | | 20,333,629 | | | | USD | | | | 134,484,691 | | | | DKK | | | | 216,773 | | | | — | |
| | | | | | | |
JP Morgan Chase Bank NA | | | 4/5/2022 | | | | 460,384 | | | | USD | | | | 3,070,108 | | | | DKK | | | | 1,143 | | | | — | |
| | | | | | | |
JP Morgan Chase Bank NA | | | 4/5/2022 | | | | 613,845 | | | | USD | | | | 4,157,247 | | | | DKK | | | | — | | | | (8,016 | ) |
| | | | | | | |
JP Morgan Chase Bank NA | | | 4/5/2022 | | | | 306,923 | | | | USD | | | | 2,081,283 | | | | DKK | | | | — | | | | (4,405 | ) |
| | | | | | | |
JP Morgan Chase Bank NA | | | 4/5/2022 | | | | 83,995,868 | | | | USD | | | | 74,680,253 | | | | EUR | | | | 900,581 | | | | — | |
| | | | | | | |
JP Morgan Chase Bank NA | | | 4/5/2022 | | | | 1,901,793 | | | | USD | | | | 1,704,967 | | | | EUR | | | | 4,709 | | | | — | |
| | | | | | | |
JP Morgan Chase Bank NA | | | 4/5/2022 | | | | 2,535,724 | | | | USD | | | | 2,307,914 | | | | EUR | | | | — | | | | (32,248 | ) |
| | | | | | | |
JP Morgan Chase Bank NA | | | 4/5/2022 | | | | 1,267,862 | | | | USD | | | | 1,155,586 | | | | EUR | | | | — | | | | (17,937 | ) |
| | | | | | | |
JP Morgan Chase Bank NA | | | 4/5/2022 | | | | 54,200,001 | | | | USD | | | | 40,379,809 | | | | GBP | | | | 1,034,378 | | | | — | |
| | | | | | | |
JP Morgan Chase Bank NA | | | 4/5/2022 | | | | 1,227,170 | | | | USD | | | | 919,007 | | | | GBP | | | | 17,169 | | | | — | |
| | | | | | | |
JP Morgan Chase Bank NA | | | 4/5/2022 | | | | 1,636,226 | | | | USD | | | | 1,254,102 | | | | GBP | | | | — | | | | (14,974 | ) |
| | | | | | | |
JP Morgan Chase Bank NA | | | 4/5/2022 | | | | 818,113 | | | | USD | | | | 625,280 | | | | GBP | | | | — | | | | (5,155 | ) |
| | | | | | | |
JP Morgan Chase Bank NA | | | 4/5/2022 | | | | 2,081,777 | | | | USD | | | | 6,668,398 | | | | ILS | | | | — | | | | (7,837 | ) |
| | | | | | | |
JP Morgan Chase Bank NA | | | 4/5/2022 | | | | 47,135 | | | | USD | | | | 151,876 | | | | ILS | | | | — | | | | (457 | ) |
| | | | | | | |
JP Morgan Chase Bank NA | | | 4/5/2022 | | | | 62,846 | | | | USD | | | | 206,077 | | | | ILS | | | | — | | | | (1,731 | ) |
| | | | | | | |
JP Morgan Chase Bank NA | | | 4/5/2022 | | | | 31,423 | | | | USD | | | | 101,246 | | | | ILS | | | | — | | | | (303 | ) |
| | | | | | | |
JP Morgan Chase Bank NA | | | 4/5/2022 | | | | 35,296,178 | | | | USD | | | | 4,062,177,122 | | | | JPY | | | | 1,827,658 | | | | — | |
| | | | | | | |
JP Morgan Chase Bank NA | | | 4/5/2022 | | | | 799,159 | | | | USD | | | | 91,684,635 | | | | JPY | | | | 43,764 | | | | — | |
| | | | | | | |
JP Morgan Chase Bank NA | | | 4/5/2022 | | | | 1,065,545 | | | | USD | | | | 125,699,573 | | | | JPY | | | | 29,899 | | | | — | |
| | | | | | | |
JP Morgan Chase Bank NA | | | 4/5/2022 | | | | 532,772 | | | | USD | | | | 65,809,755 | | | | JPY | | | | — | | | | (9,439 | ) |
| | | | | | | |
JP Morgan Chase Bank NA | | | 4/5/2022 | | | | 2,362,313 | | | | USD | | | | 20,778,378 | | | | NOK | | | | — | | | | (13,960 | ) |
See Notes to Financial Statements.
Schedule of Investments (continued)
WisdomTree International Hedged Quality Dividend Growth Fund (IHDG)
March 31, 2022
| | | | | | | | | | | | | | | | | | | | | | | | | | | | |
|
| FINANCIAL DERIVATIVE INSTRUMENTS | |
|
| FOREIGN CURRENCY CONTRACTS (OTC – OVER THE COUNTER) | |
| | | | | |
| Counterparty | | Settlement
Date | | | Amount and
Description of
Currency to
be Purchased | | | Amount and
Description of
Currency to
be Sold | | | Unrealized
Appreciation | | | Unrealized
Depreciation | |
| | | | | | | |
JP Morgan Chase Bank NA | | | 4/5/2022 | | | | 53,486 | | | | USD | | | | 473,318 | | | | NOK | | | $ | — | | | $ | (644 | ) |
| | | | | | | |
JP Morgan Chase Bank NA | | | 4/5/2022 | | | | 71,315 | | | | USD | | | | 642,327 | | | | NOK | | | | — | | | | (2,143 | ) |
| | | | | | | |
JP Morgan Chase Bank NA | | | 4/5/2022 | | | | 35,658 | | | | USD | | | | 311,766 | | | | NOK | | | | 4 | | | | — | |
| | | | | | | |
JP Morgan Chase Bank NA | | | 4/5/2022 | | | | 16,855,381 | | | | USD | | | | 158,939,872 | | | | SEK | | | | — | | | | (199,621 | ) |
| | | | | | | |
JP Morgan Chase Bank NA | | | 4/5/2022 | | | | 381,631 | | | | USD | | | | 3,654,753 | | | | SEK | | | | — | | | | (10,541 | ) |
| | | | | | | |
JP Morgan Chase Bank NA | | | 4/5/2022 | | | | 508,842 | | | | USD | | | | 4,870,638 | | | | SEK | | | | — | | | | (13,801 | ) |
| | | | | | | |
JP Morgan Chase Bank NA | | | 4/5/2022 | | | | 254,421 | | | | USD | | | | 2,424,010 | | | | SEK | | | | — | | | | (5,687 | ) |
| | | | | | | |
JP Morgan Chase Bank NA | | | 4/5/2022 | | | | 1,742,206 | | | | USD | | | | 2,365,309 | | | | SGD | | | | — | | | | (5,527 | ) |
| | | | | | | |
JP Morgan Chase Bank NA | | | 4/5/2022 | | | | 39,446 | | | | USD | | | | 53,551 | | | | SGD | | | | — | | | | (123 | ) |
| | | | | | | |
JP Morgan Chase Bank NA | | | 4/5/2022 | | | | 52,595 | | | | USD | | | | 71,735 | | | | SGD | | | | — | | | | (410 | ) |
| | | | | | | |
JP Morgan Chase Bank NA | | | 4/5/2022 | | | | 26,297 | | | | USD | | | | 35,798 | | | | SGD | | | | — | | | | (155 | ) |
| | | | | | | |
JP Morgan Chase Bank NA | | | 4/6/2022 | | | | 42,133,217 | | | | HKD | | | | 5,380,171 | | | | USD | | | | — | | | | (42 | ) |
| | | | | | | |
JP Morgan Chase Bank NA | | | 4/6/2022 | | | | 5,276,370 | | | | USD | | | | 41,227,392 | | | | HKD | | | | 11,909 | | | | — | |
| | | | | | | |
JP Morgan Chase Bank NA | | | 4/6/2022 | | | | 119,465 | | | | USD | | | | 933,766 | | | | HKD | | | | 229 | | | | — | |
| | | | | | | |
JP Morgan Chase Bank NA | | | 4/6/2022 | | | | 159,287 | | | | USD | | | | 1,246,997 | | | | HKD | | | | 54 | | | | — | |
| | | | | | | |
JP Morgan Chase Bank NA | | | 4/6/2022 | | | | 79,643 | | | | USD | | | | 623,543 | | | | HKD | | | | 21 | | | | — | |
| | | | | | | |
JP Morgan Chase Bank NA | | | 5/4/2022 | | | | 446,740 | | | | USD | | | | 594,696 | | | | AUD | | | | — | | | | (6 | ) |
| | | | | | | |
JP Morgan Chase Bank NA | | | 5/4/2022 | | | | 30,434,187 | | | | USD | | | | 40,514,147 | | | | AUD | | | | — | | | | (720 | ) |
| | | | | | | |
JP Morgan Chase Bank NA | | | 5/4/2022 | | | | 468,875 | | | | USD | | | | 431,041 | | | | CHF | | | | 2 | | | | — | |
| | | | | | | |
JP Morgan Chase Bank NA | | | 5/4/2022 | | | | 31,942,100 | | | | USD | | | | 29,365,459 | | | | CHF | | | | — | | | | (695 | ) |
| | | | | | | |
JP Morgan Chase Bank NA | | | 5/4/2022 | | | | 332,431 | | | | USD | | | | 2,220,554 | | | | DKK | | | | — | | | | (13 | ) |
| | | | | | | |
JP Morgan Chase Bank NA | | | 5/4/2022 | | | | 22,646,857 | | | | USD | | | | 151,274,437 | | | | DKK | | | | — | | | | (770 | ) |
| | | | | | | |
JP Morgan Chase Bank NA | | | 5/4/2022 | | | | 1,263,005 | | | | USD | | | | 1,134,119 | | | | EUR | | | | 6 | | | | — | |
| | | | | | | |
JP Morgan Chase Bank NA | | | 5/4/2022 | | | | 86,042,231 | | | | USD | | | | 77,264,032 | | | | EUR | | | | — | | | | (1,953 | ) |
| | | | | | | |
JP Morgan Chase Bank NA | | | 5/4/2022 | | | | 31,681 | | | | USD | | | | 101,057 | | | | ILS | | | | — | | | | (1 | ) |
| | | | | | | |
JP Morgan Chase Bank NA | | | 5/4/2022 | | | | 2,158,241 | | | | USD | | | | 6,884,521 | | | | ILS | | | | — | | | | (106 | ) |
| | | | | | | |
JP Morgan Chase Bank NA | | | 5/4/2022 | | | | 42,530 | | | | USD | | | | 372,037 | | | | NOK | | | | — | | | | (1 | ) |
| | | | | | | |
JP Morgan Chase Bank NA | | | 5/4/2022 | | | | 2,897,327 | | | | USD | | | | 25,344,110 | | | | NOK | | | | 20 | | | | — | |
| | | | | | | |
JP Morgan Chase Bank NA | | | 5/4/2022 | | | | 262,348 | | | | USD | | | | 2,443,609 | | | | SEK | | | | — | | | | (1 | ) |
| | | | | | | |
JP Morgan Chase Bank NA | | | 5/4/2022 | | | | 17,872,478 | | | | USD | | | | 166,473,107 | | | | SEK | | | | — | | | | (307 | ) |
| | | | | | | |
JP Morgan Chase Bank NA | | | 5/5/2022 | | | | 850,662 | | | | USD | | | | 646,204 | | | | GBP | | | | — | | | | (1 | ) |
| | | | | | | |
JP Morgan Chase Bank NA | | | 5/5/2022 | | | | 57,951,375 | | | | USD | | | | 44,022,384 | | | | GBP | | | | 296 | | | | — | |
| | | | | | | |
JP Morgan Chase Bank NA | | | 5/5/2022 | | | | 77,787 | | | | USD | | | | 609,031 | | | | HKD | | | | — | | | | (3 | ) |
| | | | | | | |
JP Morgan Chase Bank NA | | | 5/5/2022 | | | | 5,299,249 | | | | USD | | | | 41,490,136 | | | | HKD | | | | — | | | | (170 | ) |
| | | | | | | |
JP Morgan Chase Bank NA | | | 5/6/2022 | | | | 27,689 | | | | USD | | | | 37,478 | | | | SGD | | | | — | | | | (0 | )^ |
| | | | | | | |
JP Morgan Chase Bank NA | | | 5/6/2022 | | | | 1,886,335 | | | | USD | | | | 2,553,241 | | | | SGD | | | | — | | | | (29 | ) |
| | | | | | | |
JP Morgan Chase Bank NA | | | 5/9/2022 | | | | 533,532 | | | | USD | | | | 64,713,910 | | | | JPY | | | | 2 | | | | — | |
| | | | | | | |
JP Morgan Chase Bank NA | | | 5/9/2022 | | | | 36,346,889 | | | | USD | | | | 4,408,703,170 | | | | JPY | | | | — | | | | (425 | ) |
| | | | | | | |
Royal Bank of Canada | | | 4/5/2022 | | | | 391,605 | | | | USD | | | | 534,874 | | | | AUD | | | | — | | | | (10,063 | ) |
| | | | | | | |
Royal Bank of Canada | | | 4/5/2022 | | | | 445,923 | | | | USD | | | | 409,915 | | | | CHF | | | | 470 | | | | — | |
| | | | | | | |
Royal Bank of Canada | | | 4/5/2022 | | | | 306,923 | | | | USD | | | | 2,062,487 | | | �� | DKK | | | | — | | | | (1,594 | ) |
| | | | | | | |
Royal Bank of Canada | | | 4/5/2022 | | | | 1,267,862 | | | | USD | | | | 1,145,124 | | | | EUR | | | | — | | | | (6,296 | ) |
| | | | | | | |
Royal Bank of Canada | | | 4/5/2022 | | | | 818,113 | | | | USD | | | | 613,330 | | | | GBP | | | | 10,579 | | | | — | |
| | | | | | | |
Royal Bank of Canada | | | 4/5/2022 | | | | 31,423 | | | | USD | | | | 101,916 | | | | ILS | | | | — | | | | (513 | ) |
| | | | | | | |
Royal Bank of Canada | | | 4/5/2022 | | | | 532,772 | | | | USD | | | | 61,575,687 | | | | JPY | | | | 25,446 | | | | — | |
| | | | | | | |
Royal Bank of Canada | | | 4/5/2022 | | | | 35,658 | | | | USD | | | | 318,201 | | | | NOK | | | | — | | | | (732 | ) |
| | | | | | | |
Royal Bank of Canada | | | 4/5/2022 | | | | 254,421 | | | | USD | | | | 2,483,400 | | | | SEK | | | | — | | | | (12,060 | ) |
| | | | | | | |
Royal Bank of Canada | | | 4/5/2022 | | | | 26,297 | | | | USD | | | | 35,722 | | | | SGD | | | | — | | | | (98 | ) |
| | | | | | | |
Royal Bank of Canada | | | 4/6/2022 | | | | 79,643 | | | | USD | | | | 622,283 | | | | HKD | | | | 182 | | | | — | |
| | | | | | | |
UBS AG | | | 4/5/2022 | | | | 35,227,503 | | | | AUD | | | | 26,454,234 | | | | USD | | | | 138 | | | | — | |
See Notes to Financial Statements.
Schedule of Investments (concluded)
WisdomTree International Hedged Quality Dividend Growth Fund (IHDG)
March 31, 2022
| | | | | | | | | | | | | | | | | | | | | | | | | | | | |
|
| FINANCIAL DERIVATIVE INSTRUMENTS | |
|
| FOREIGN CURRENCY CONTRACTS (OTC – OVER THE COUNTER) | |
| | | | | |
| Counterparty | | Settlement
Date | | | Amount and
Description of
Currency to
be Purchased | | | Amount and
Description of
Currency to
be Sold | | | Unrealized
Appreciation | | | Unrealized
Depreciation | |
| | | | | | | |
UBS AG | | | 4/5/2022 | | | | 27,720,534 | | | | CHF | | | | 30,123,586 | | | | USD | | | $ | 184 | | | $ | — | |
| | | | | | | |
UBS AG | | | 4/5/2022 | | | | 138,608,315 | | | | DKK | | | | 20,733,650 | | | | USD | | | | 37 | | | | — | |
| | | | | | | |
UBS AG | | | 4/5/2022 | | | | 76,977,625 | | | | EUR | | | | 85,648,308 | | | | USD | | | | 3,221 | | | | — | |
| | | | | | | |
UBS AG | | | 4/5/2022 | | | | 41,974,500 | | | | GBP | | | | 55,266,271 | | | | USD | | | | — | | | | (1,017 | ) |
| | | | | | | |
UBS AG | | | 4/5/2022 | | | | 6,773,936 | | | | ILS | | | | 2,122,731 | | | | USD | | | | — | | | | (46 | ) |
| | | | | | | |
UBS AG | | | 4/5/2022 | | | | 4,368,396,801 | | | | JPY | | | | 35,990,555 | | | | USD | | | | 928 | | | | — | |
| | | | | | | |
UBS AG | | | 4/5/2022 | | | | 21,062,836 | | | | NOK | | | | 2,408,787 | | | | USD | | | | 18 | | | | — | |
| | | | | | | |
UBS AG | | | 4/5/2022 | | | | 160,170,800 | | | | SEK | | | | 17,186,975 | | | | USD | | | | 111 | | | | — | |
| | | | | | | |
UBS AG | | | 4/5/2022 | | | | 2,404,223 | | | | SGD | | | | 1,776,479 | | | | USD | | | | 7 | | | | — | |
| | | | | | | |
UBS AG | | | 4/6/2022 | | | | 42,132,364 | | | | HKD | | | | 5,380,171 | | | | USD | | | | — | | | | (151 | ) |
| | | | | | | |
UBS AG | | | 5/4/2022 | | | | 30,434,187 | | | | USD | | | | 40,514,902 | | | | AUD | | | | — | | | | (1,287 | ) |
| | | | | | | |
UBS AG | | | 5/4/2022 | | | | 31,942,100 | | | | USD | | | | 29,366,225 | | | | CHF | | | | — | | | | (1,529 | ) |
| | | | | | | |
UBS AG | | | 5/4/2022 | | | | 22,646,857 | | | | USD | | | | 151,279,963 | | | | DKK | | | | — | | | | (1,597 | ) |
| | | | | | | |
UBS AG | | | 5/4/2022 | | | | 86,042,231 | | | | USD | | | | 77,265,698 | | | | EUR | | | | — | | | | (3,807 | ) |
| | | | | | | |
UBS AG | | | 5/4/2022 | | | | 2,158,241 | | | | USD | | | | 6,883,509 | | | | ILS | | | | 212 | | | | — | |
| | | | | | | |
UBS AG | | | 5/4/2022 | | | | 2,897,327 | | | | USD | | | | 25,344,620 | | | | NOK | | | | — | | | | (39 | ) |
| | | | | | | |
UBS AG | | | 5/4/2022 | | | | 17,872,478 | | | | USD | | | | 166,476,288 | | | | SEK | | | | — | | | | (649 | ) |
| | | | | | | |
UBS AG | | | 5/5/2022 | | | | 57,951,375 | | | | USD | | | | 44,023,154 | | | | GBP | | | | — | | | | (717 | ) |
| | | | | | | |
UBS AG | | | 5/5/2022 | | | | 5,299,249 | | | | USD | | | | 41,488,870 | | | | HKD | | | | — | | | | (8 | ) |
| | | | | | | |
UBS AG | | | 5/6/2022 | | | | 1,886,335 | | | | USD | | | | 2,553,292 | | | | SGD | | | | — | | | | (67 | ) |
UBS AG | | | 5/9/2022 | | | | 36,346,889 | | | | USD | | | | 4,408,790,403 | | | | JPY | | | | — | | | | (1,145 | ) |
| | | | | | | | | | | | | | | | | | | | | | | $ | 16,685,609 | | | $ | (4,826,786 | ) |
| ^ | Amount represents less than $1. |
The following is a summary of the fair valuations according to the inputs used as of March 31, 2022 in valuing the Fund’s investments (See Note 2 — Fair Value Measurement):
| | | | | | | | | | | | | | | | |
| | | | |
| | | Quoted
Prices in
Active
Markets
(Level 1) | | | Other
Significant
Observable
Inputs
(Level 2) | | | Significant
Unobservable
Inputs
(Level 3) | | | Total | |
Assets: | | | | | | | | | | | | | | | | |
Investments in Securities | | | | | | | | | | | | | | | | |
Common Stocks | | $ | 1,157,775,876 | | | $ | — | | | $ | — | | | $ | 1,157,775,876 | |
Exchange-Traded Fund | | | 1,121,046 | | | | — | | | | — | | | | 1,121,046 | |
Investment of Cash Collateral for Securities Loaned | | | — | | | | 26,747,300 | | | | — | | | | 26,747,300 | |
Total Investments in Securities | | $ | 1,158,896,922 | | | $ | 26,747,300 | | | $ | — | | | $ | 1,185,644,222 | |
Financial Derivative Instruments | | | | | | | | | | | | | | | | |
Foreign Currency Contracts1 | | $ | — | | | $ | 16,685,609 | | | $ | — | | | $ | 16,685,609 | |
Liabilities: | | | | | | | | | | | | | | | | |
Financial Derivative Instruments | | | | | | | | | | | | | | | | |
Foreign Currency Contracts1 | | $ | — | | | $ | (4,826,786 | ) | | $ | — | | | $ | (4,826,786 | ) |
Total – Net | | $ | 1,158,896,922 | | | $ | 38,606,123 | | | $ | — | | | $ | 1,197,503,045 | |
| 1 | Amount shown represents the unrealized appreciation (depreciation) on the financial instrument. |
See Notes to Financial Statements.
Schedule of Investments
WisdomTree Japan Hedged Equity Fund (DXJ)
March 31, 2022
| | | | | | | | |
| Investments | | Shares | | | Value | |
|
| COMMON STOCKS – 99.0% | |
|
| Japan – 99.0% | |
|
| Air Freight & Logistics – 0.1% | |
| | |
Kintetsu World Express, Inc. | | | 54,200 | | | $ | 1,399,934 | |
| | |
Mitsui-Soko Holdings Co. Ltd. | | | 21,600 | | | | 446,860 | |
| | | | | | | | |
| Total Air Freight & Logistics | | | | 1,846,794 | |
|
| Auto Components – 4.7% | |
| | |
Aisan Industry Co. Ltd. | | | 58,400 | | | | 351,242 | |
| | |
Aisin Corp. | | | 267,508 | | | | 9,245,694 | |
| | |
Bridgestone Corp. | | | 493,485 | | | | 19,345,019 | |
| | |
Daikyonishikawa Corp. | | | 106,800 | | | | 475,156 | |
| | |
Denso Corp. | | | 331,279 | | | | 21,452,959 | |
| | |
Eagle Industry Co. Ltd. | | | 77,900 | | | | 626,409 | |
| | |
Exedy Corp. | | | 53,900 | | | | 699,423 | |
| | |
FCC Co. Ltd. | | | 34,700 | | | | 383,951 | |
| | |
FuKoKu Co. Ltd. | | | 32,100 | | | | 244,899 | |
| | |
Furukawa Battery Co. Ltd.(a) | | | 15,000 | | | | 158,682 | |
| | |
Futaba Industrial Co. Ltd. | | | 51,300 | | | | 153,847 | |
| | |
G-Tekt Corp. | | | 34,900 | | | | 367,187 | |
| | |
H-One Co. Ltd. | | | 43,000 | | | | 215,399 | |
| | |
JTEKT Corp. | | | 135,478 | | | | 1,076,011 | |
| | |
Koito Manufacturing Co. Ltd. | | | 34,701 | | | | 1,422,348 | |
| | |
KYB Corp. | | | 22,100 | | | | 541,689 | |
| | |
Musashi Seimitsu Industry Co. Ltd. | | | 36,500 | | | | 454,690 | |
| | |
NGK Spark Plug Co. Ltd. | | | 210,564 | | | | 3,429,743 | |
| | |
NHK Spring Co. Ltd. | | | 175,700 | | | | 1,281,108 | |
| | |
Nifco, Inc. | | | 38,790 | | | | 891,651 | |
| | |
NOK Corp. | | | 125,800 | | | | 1,188,816 | |
| | |
Pacific Industrial Co. Ltd. | | | 58,700 | | | | 458,477 | |
| | |
Press Kogyo Co. Ltd. | | | 141,700 | | | | 441,298 | |
| | |
Riken Corp. | | | 12,200 | | | | 245,558 | |
| | |
Sanoh Industrial Co. Ltd. | | | 28,900 | | | | 166,674 | |
| | |
Shoei Co. Ltd. | | | 14,000 | | | | 528,857 | |
| | |
Stanley Electric Co. Ltd. | | | 70,607 | | | | 1,351,931 | |
| | |
Sumitomo Electric Industries Ltd. | | | 508,883 | | | | 6,129,656 | |
| | |
Sumitomo Riko Co. Ltd. | | | 58,500 | | | | 289,668 | |
| | |
Sumitomo Rubber Industries Ltd. | | | 405,291 | | | | 3,753,220 | |
| | |
Suncall Corp.(a) | | | 60,100 | | | | 245,104 | |
| | |
Tachi-S Co. Ltd. | | | 24,100 | | | | 197,565 | |
| | |
Taiho Kogyo Co. Ltd.(a) | | | 20,300 | | | | 118,079 | |
| | |
Tokai Rika Co. Ltd. | | | 73,714 | | | | 914,023 | |
| | |
Topre Corp. | | | 43,800 | | | | 424,016 | |
| | |
Toyo Tire Corp. | | | 89,400 | | | | 1,151,244 | |
| | |
Toyoda Gosei Co. Ltd. | | | 92,200 | | | | 1,539,009 | |
| | |
Toyota Boshoku Corp. | | | 207,536 | | | | 3,423,168 | |
| | |
TPR Co. Ltd. | | | 38,494 | | | | 412,611 | |
| | |
TS Tech Co. Ltd. | | | 111,964 | | | | 1,268,387 | |
| | |
Yokohama Rubber Co. Ltd. | | | 192,300 | | | | 2,680,713 | |
| | |
Yorozu Corp.(a) | | | 20,500 | | | | 150,150 | |
| | | | | | | | |
| Total Auto Components | | | | 89,895,331 | |
|
| Automobiles – 9.2% | |
| | |
Honda Motor Co. Ltd. | | | 1,397,847 | | | | 40,158,949 | |
| | |
Isuzu Motors Ltd. | | | 600,800 | | | | 7,860,518 | |
| | |
Subaru Corp. | | | 458,367 | | | | 7,356,531 | |
| | |
Suzuki Motor Corp. | | | 226,436 | | | | 7,859,731 | |
| | |
Toyota Motor Corp. | | | 5,637,750 | | | | 103,232,951 | |
| | |
Yamaha Motor Co. Ltd. | | | 437,500 | | | | 9,934,089 | |
| | | | | | | | |
| Total Automobiles | | | | 176,402,769 | |
|
| Banks – 9.3% | |
| | |
Mitsubishi UFJ Financial Group, Inc. | | | 13,376,522 | | | | 83,791,305 | |
| | |
Mizuho Financial Group, Inc. | | | 3,032,364 | | | | 39,149,037 | |
| | |
Sumitomo Mitsui Financial Group, Inc. | | | 1,705,100 | | | | 54,886,309 | |
| | | | | | | | |
| Total Banks | | | | 177,826,651 | |
|
| Beverages – 1.4% | |
| | |
Asahi Group Holdings Ltd. | | | 261,800 | | | | 9,622,161 | |
| | |
Kirin Holdings Co. Ltd. | | | 725,945 | | | | 10,939,266 | |
| | |
Suntory Beverage & Food Ltd. | | | 134,400 | | | | 5,160,074 | |
| | |
Takara Holdings, Inc. | | | 69,200 | | | | 627,718 | |
| | | | | | | | |
| Total Beverages | | | | 26,349,219 | |
|
| Biotechnology – 0.0% | |
| | |
Takara Bio, Inc. | | | 34,000 | | | | 627,757 | |
|
| Building Products – 1.5% | |
| | |
AGC, Inc. | | | 204,147 | | | | 8,249,978 | |
| | |
Aica Kogyo Co. Ltd. | | | 52,400 | | | | 1,290,411 | |
| | |
Central Glass Co. Ltd. | | | 31,900 | | | | 548,509 | |
| | |
Daikin Industries Ltd. | | | 46,649 | | | | 8,613,010 | |
| | |
Lixil Corp. | | | 197,700 | | | | 3,730,035 | |
| | |
Nihon Flush Co. Ltd. | | | 17,600 | | | | 142,975 | |
| | |
Noritz Corp. | | | 35,800 | | | | 432,992 | |
| | |
Okabe Co. Ltd. | | | 93,100 | | | | 529,260 | |
| | |
Sanwa Holdings Corp. | | | 195,631 | | | | 2,005,067 | |
| | |
TOTO Ltd. | | | 58,800 | | | | 2,393,178 | |
| | | | | | | | |
| Total Building Products | | | | 27,935,415 | |
|
| Capital Markets – 0.4% | |
| | |
Monex Group, Inc.(a) | | | 70,000 | | | | 378,332 | |
| | |
SBI Holdings, Inc. | | | 240,300 | | | | 6,137,425 | |
| | |
Sparx Group Co. Ltd.(a) | | | 219,600 | | | | 495,740 | |
| | | | | | | | |
| Total Capital Markets | | | | 7,011,497 | |
|
| Chemicals – 6.2% | |
| | |
ADEKA Corp. | | | 80,000 | | | | 1,782,245 | |
| | |
Arakawa Chemical Industries Ltd.(a) | | | 36,600 | | | | 322,050 | |
| | |
Asahi Kasei Corp. | | | 954,622 | | | | 8,356,629 | |
| | |
Chugoku Marine Paints Ltd.(a) | | | 88,800 | | | | 661,382 | |
| | |
Daicel Corp. | | | 280,742 | | | | 1,889,732 | |
| | |
Denka Co. Ltd. | | | 71,415 | | | | 2,000,503 | |
| | |
DIC Corp. | | | 86,553 | | | | 1,787,752 | |
| | |
Fujimi, Inc. | | | 22,000 | | | | 1,218,043 | |
| | |
Fuso Chemical Co. Ltd. | | | 6,100 | | | | 226,661 | |
| | |
Ishihara Sangyo Kaisha Ltd. | | | 33,100 | | | | 293,707 | |
| | |
JCU Corp. | | | 10,000 | | | | 341,916 | |
| | |
JSP Corp.(a) | | | 47,900 | | | | 606,569 | |
| | |
JSR Corp.(a) | | | 87,000 | | | | 2,601,936 | |
| | |
Kaneka Corp. | | | 54,200 | | | | 1,583,020 | |
| | |
Kansai Paint Co. Ltd. | | | 80,100 | | | | 1,302,058 | |
See Notes to Financial Statements.
Schedule of Investments (continued)
WisdomTree Japan Hedged Equity Fund (DXJ)
March 31, 2022
| | | | | | | | |
| Investments | | Shares | | | Value | |
| | |
KH Neochem Co. Ltd. | | | 23,200 | | | $ | 527,746 | |
| | |
Kumiai Chemical Industry Co. Ltd. | | | 69,500 | | | | 506,756 | |
| | |
Kuraray Co. Ltd. | | | 322,537 | | | | 2,808,829 | |
| | |
Kureha Corp. | | | 13,900 | | | | 1,123,452 | |
| | |
Kyowa Leather Cloth Co. Ltd. | | | 40,800 | | | | 219,169 | |
| | |
Lintec Corp. | | | 102,547 | | | | 2,053,897 | |
| | |
MEC Co. Ltd. | | | 5,000 | | | | 139,032 | |
| | |
Mitsubishi Chemical Holdings Corp. | | | 924,263 | | | | 6,222,165 | |
| | |
Mitsubishi Gas Chemical Co., Inc. | | | 160,682 | | | | 2,754,927 | |
| | |
Mitsui Chemicals, Inc. | | | 152,315 | | | | 3,877,679 | |
| | |
Nihon Nohyaku Co. Ltd. | | | 117,600 | | | | 591,997 | |
| | |
Nihon Parkerizing Co. Ltd. | | | 84,300 | | | | 647,313 | |
| | |
Nippon Kayaku Co. Ltd. | | | 192,100 | | | | 1,837,513 | |
| | |
Nippon Pillar Packing Co. Ltd.(a) | | | 26,300 | | | | 667,386 | |
| | |
Nippon Sanso Holdings Corp. | | | 127,553 | | | | 2,449,648 | |
| | |
Nippon Shokubai Co. Ltd. | | | 23,900 | | | | 1,049,532 | |
| | |
Nippon Soda Co. Ltd. | | | 29,000 | | | | 805,191 | |
| | |
Nissan Chemical Corp. | | | 57,153 | | | | 3,404,459 | |
| | |
Nitto Denko Corp. | | | 94,674 | | | | 6,879,709 | |
| | |
NOF Corp. | | | 45,700 | | | | 1,890,126 | |
| | |
Riken Technos Corp. | | | 83,900 | | | | 315,899 | |
| | |
Sanyo Chemical Industries Ltd. | | | 21,700 | | | | 901,075 | |
| | |
Shin-Etsu Chemical Co. Ltd. | | | 151,079 | | | | 23,388,461 | |
| | |
Showa Denko KK | | | 100,400 | | | | 2,010,068 | |
| | |
Sumitomo Bakelite Co. Ltd. | | | 32,900 | | | | 1,352,593 | |
| | |
Sumitomo Chemical Co. Ltd. | | | 1,338,585 | | | | 6,198,021 | |
| | |
Sumitomo Seika Chemicals Co. Ltd. | | | 17,600 | | | | 448,791 | |
| | |
T Hasegawa Co. Ltd. | | | 29,200 | | | | 627,183 | |
| | |
Taiyo Holdings Co. Ltd. | | | 33,652 | | | | 901,083 | |
| | |
Teijin Ltd. | | | 156,700 | | | | 1,759,688 | |
| | |
Tokai Carbon Co. Ltd. | | | 106,300 | | | | 1,008,044 | |
| | |
Tokuyama Corp. | | | 67,300 | | | | 952,596 | |
| | |
Tokyo Ohka Kogyo Co. Ltd. | | | 20,800 | | | | 1,261,281 | |
| | |
Toray Industries, Inc. | | | 683,818 | | | | 3,598,953 | |
| | |
Tosoh Corp. | | | 259,007 | | | | 3,870,968 | |
| | |
Toyo Ink SC Holdings Co. Ltd. | | | 80,900 | | | | 1,268,405 | |
| | |
Toyobo Co. Ltd. | | | 67,351 | | | | 606,506 | |
| | |
Ube Industries Ltd. | | | 108,700 | | | | 1,788,456 | |
| | |
Zeon Corp. | | | 129,400 | | | | 1,454,184 | |
| | | | | | | | |
| Total Chemicals | | | | 119,142,984 | |
|
| Commercial Services & Supplies – 0.1% | |
| | |
Pilot Corp. | | | 16,000 | | | | 693,388 | |
| | |
Sato Holdings Corp. | | | 30,200 | | | | 427,714 | |
| | | | | | | | |
| Total Commercial Services & Supplies | | | | 1,121,102 | |
|
| Communications Equipment – 0.0% | |
| | |
Uniden Holdings Corp.(a) | | | 13,200 | | | | 374,657 | |
|
| Construction & Engineering – 0.4% | |
| | |
Kajima Corp. | | | 501,300 | | | | 6,158,091 | |
| | |
Penta-Ocean Construction Co. Ltd. | | | 215,400 | | | | 1,087,870 | |
| | |
Taikisha Ltd. | | | 37,700 | | | | 945,800 | |
| | | | | | | | |
| Total Construction & Engineering | | | | 8,191,761 | |
|
| Construction Materials – 0.1% | |
| | |
Krosaki Harima Corp. | | | 15,300 | | | | 520,610 | |
| | |
Taiheiyo Cement Corp. | | | 77,100 | | | | 1,282,512 | |
| | | | | | | | |
| Total Construction Materials | | | | 1,803,122 | |
|
| Consumer Finance – 0.1% | |
| | |
Acom Co. Ltd. | | | 600,800 | | | | 1,579,034 | |
| | |
AEON Financial Service Co. Ltd. | | | 124,100 | | | | 1,244,323 | |
| | | | | | | | |
| Total Consumer Finance | | | | 2,823,357 | |
|
| Containers & Packaging – 0.1% | |
| | |
Toyo Seikan Group Holdings Ltd. | | | 228,400 | | | | 2,645,771 | |
|
| Diversified Financial Services – 0.4% | |
| | |
Mitsubishi HC Capital, Inc. | | | 1,605,990 | | | | 7,542,033 | |
|
| Electrical Equipment – 1.6% | |
| | |
Daihen Corp. | | | 19,300 | | | | 672,618 | |
| | |
Fuji Electric Co. Ltd. | | | 60,573 | | | | 3,074,189 | |
| | |
Furukawa Electric Co. Ltd. | | | 39,981 | | | | 716,776 | |
| | |
GS Yuasa Corp. | | | 56,484 | | | | 1,089,426 | |
| | |
Idec Corp. | | | 14,300 | | | | 303,142 | |
| | |
Mabuchi Motor Co. Ltd. | | | 15,200 | | | | 479,011 | |
| | |
Mitsubishi Electric Corp. | | | 1,289,314 | | | | 14,977,818 | |
| | |
Nidec Corp. | | | 69,416 | | | | 5,575,013 | |
| | |
Nippon Carbon Co. Ltd. | | | 23,300 | | | | 804,342 | |
| | |
Nissin Electric Co. Ltd. | | | 88,400 | | | | 1,075,002 | |
| | |
Sanyo Denki Co. Ltd. | | | 8,200 | | | | 332,729 | |
| | |
Sinfonia Technology Co. Ltd. | | | 36,200 | | | | 397,268 | |
| | |
Tatsuta Electric Wire and Cable Co. Ltd. | | | 100,500 | | | | 382,542 | |
| | | | | | | | |
| Total Electrical Equipment | | | | 29,879,876 | |
|
| Electronic Equipment, Instruments & Components – 3.5% | |
| | |
A&D Co. Ltd.(a) | | | 15,400 | | | | 122,819 | |
| | |
Ai Holdings Corp. | | | 26,000 | | | | 366,945 | |
| | |
Amano Corp. | | | 47,233 | | | | 854,961 | |
| | |
Anritsu Corp.(a) | | | 61,900 | | | | 792,014 | |
| | |
Canon Electronics, Inc. | | | 33,800 | | | | 446,675 | |
| | |
Citizen Watch Co. Ltd.(a) | | | 183,900 | | | | 789,387 | |
| | |
Dexerials Corp. | | | 59,200 | | | | 1,631,506 | |
| | |
Elematec Corp. | | | 31,400 | | | | 270,085 | |
| | |
Furuno Electric Co. Ltd.(a) | | | 41,900 | | | | 350,044 | |
| | |
Hakuto Co. Ltd.(a) | | | 32,219 | | | | 650,884 | |
| | |
Hamamatsu Photonics KK | | | 33,000 | | | | 1,780,845 | |
| | |
Hioki EE Corp. | | | 5,700 | | | | 331,081 | |
| | |
Hirose Electric Co. Ltd. | | | 14,260 | | | | 2,098,320 | |
| | |
Horiba Ltd. | | | 15,500 | | | | 855,613 | |
| | |
Ibiden Co. Ltd. | | | 19,001 | | | | 947,115 | |
| | |
Innotech Corp. | | | 17,900 | | | | 204,108 | |
| | |
Iriso Electronics Co. Ltd. | | | 5,000 | | | | 137,590 | |
| | |
Japan Aviation Electronics Industry Ltd. | | | 44,800 | | | | 734,886 | |
| | |
Kaga Electronics Co. Ltd. | | | 25,600 | | | | 686,533 | |
| | |
Keyence Corp. | | | 18,240 | | | | 8,603,419 | |
| | |
Macnica Fuji Electronics Holdings, Inc. | | | 49,100 | | | | 1,068,772 | |
| | |
Meiko Electronics Co. Ltd. | | | 10,800 | | | | 360,816 | |
| | |
Murata Manufacturing Co. Ltd. | | | 345,468 | | | | 23,103,306 | |
| | |
Nichicon Corp. | | | 41,500 | | | | 401,751 | |
See Notes to Financial Statements.
Schedule of Investments (continued)
WisdomTree Japan Hedged Equity Fund (DXJ)
March 31, 2022
| | | | | | | | |
| Investments | | Shares | | | Value | |
| | |
Nippon Electric Glass Co. Ltd. | | | 84,560 | | | $ | 1,892,193 | |
| | |
Nissha Co. Ltd.(a) | | | 25,600 | | | | 306,462 | |
| | |
Omron Corp. | | | 40,600 | | | | 2,747,587 | |
| | |
Optex Group Co. Ltd. | | | 29,200 | | | | 417,160 | |
| | |
Osaki Electric Co. Ltd. | | | 109,400 | | | | 421,827 | |
| | |
Restar Holdings Corp. | | | 26,000 | | | | 423,497 | |
| | |
Ryosan Co. Ltd. | | | 13,445 | | | | 243,367 | |
| | |
Sanshin Electronics Co. Ltd. | | | 33,854 | | | | 448,226 | |
| | |
Shimadzu Corp. | | | 87,200 | | | | 3,042,571 | |
| | |
Siix Corp.(a) | | | 43,900 | | | | 384,837 | |
| | |
Taiyo Yuden Co. Ltd.(a) | | | 43,400 | | | | 1,984,511 | |
| | |
TDK Corp. | | | 141,504 | | | | 5,199,653 | |
| | |
Tokyo Electron Device Ltd.(a) | | | 10,800 | | | | 463,588 | |
| | |
Topcon Corp. | | | 20,700 | | | | 266,904 | |
| | |
V Technology Co. Ltd. | | | 9,900 | | | | 269,166 | |
| | |
Yokogawa Electric Corp. | | | 96,538 | | | | 1,669,481 | |
| | | | | | | | |
| Total Electronic Equipment, Instruments & Components | | | | 67,770,505 | |
|
| Energy Equipment & Services – 0.0% | |
| | |
Modec, Inc. | | | 24,300 | | | | 255,263 | |
|
| Entertainment – 3.6% | |
| | |
Capcom Co. Ltd. | | | 78,200 | | | | 1,912,236 | |
| | |
Koei Tecmo Holdings Co. Ltd.(a) | | | 68,622 | | | | 2,269,968 | |
| | |
Konami Holdings Corp.(a) | | | 46,400 | | | | 2,962,719 | |
| | |
Marvelous, Inc. | | | 67,900 | | | | 403,903 | |
| | |
Nintendo Co. Ltd. | | | 118,500 | | | | 60,209,227 | |
| | |
Square Enix Holdings Co. Ltd. | | | 29,500 | | | | 1,319,753 | |
| | |
Toei Animation Co. Ltd. | | | 3,500 | | | | 293,265 | |
| | | | | | | | |
| Total Entertainment | | | | 69,371,071 | |
|
| Food & Staples Retailing – 1.1% | |
| | |
Cosmos Pharmaceutical Corp. | | | 3,500 | | | | 427,642 | |
| | |
Seven & I Holdings Co. Ltd. | | | 444,624 | | | | 21,294,330 | |
| | | | | | | | |
| Total Food & Staples Retailing | | | | 21,721,972 | |
|
| Food Products – 1.1% | |
| | |
Ajinomoto Co., Inc. | | | 296,913 | | | | 8,500,702 | |
| | |
Ariake Japan Co. Ltd. | | | 6,800 | | | | 290,768 | |
| | |
Fuji Oil Holdings, Inc. | | | 45,000 | | | | 734,089 | |
| | |
Kagome Co. Ltd. | | | 34,900 | | | | 897,121 | |
| | |
Kikkoman Corp. | | | 23,500 | | | | 1,574,089 | |
| | |
Nippon Suisan Kaisha Ltd. | | | 110,100 | | | | 497,094 | |
| | |
Nisshin Seifun Group, Inc. | | | 163,100 | | | | 2,292,470 | |
| | |
Nissin Foods Holdings Co. Ltd. | | | 36,100 | | | | 2,548,935 | |
| | |
Riken Vitamin Co. Ltd. | | | 29,800 | | | | 411,737 | |
| | |
Toyo Suisan Kaisha Ltd. | | | 50,800 | | | | 1,829,009 | |
| | |
Yakult Honsha Co. Ltd.(a) | | | 42,387 | | | | 2,276,937 | |
| | | | | | | | |
| Total Food Products | | | | 21,852,951 | |
|
| Health Care Equipment & Supplies – 1.0% | |
| | |
Hoya Corp. | | | 70,857 | | | | 8,190,515 | |
| | |
Jeol Ltd. | | | 5,100 | | | | 288,667 | |
| | |
Mani, Inc. | | | 29,900 | | | | 361,633 | |
| | |
Nakanishi, Inc. | | | 34,400 | | | | 639,960 | |
| | |
Nihon Kohden Corp. | | | 27,600 | | | | 671,041 | |
| | |
Nipro Corp. | | | 119,500 | | | | 1,008,181 | |
| | |
Olympus Corp. | | | 145,300 | | | | 2,800,055 | |
| | |
Sysmex Corp. | | | 26,160 | | | | 1,923,178 | |
| | |
Terumo Corp. | | | 109,912 | | | | 3,372,295 | |
| | | | | | | | |
| Total Health Care Equipment & Supplies | | | | 19,255,525 | |
|
| Health Care Technology – 0.1% | |
| | |
M3, Inc. | | | 29,100 | | | | 1,071,455 | |
|
| Household Durables – 2.1% | |
| | |
Casio Computer Co. Ltd.(a) | | | 172,857 | | | | 2,005,212 | |
| | |
Fujitsu General Ltd. | | | 29,300 | | | | 576,947 | |
| | |
JVCKenwood Corp. | | | 127,200 | | | | 186,543 | |
| | |
Nikon Corp.(a) | | | 189,800 | | | | 2,054,766 | |
| | |
Panasonic Corp. | | | 971,070 | | | | 9,508,685 | |
| | |
Rinnai Corp. | | | 14,500 | | | | 1,095,489 | |
| | |
Sekisui Chemical Co. Ltd. | | | 315,100 | | | | 4,566,516 | |
| | |
Sharp Corp.(a) | | | 305,500 | | | | 2,892,025 | |
| | |
Sony Group Corp. | | | 137,200 | | | | 14,389,751 | |
| | |
Sumitomo Forestry Co. Ltd. | | | 143,100 | | | | 2,556,052 | |
| | |
Toa Corp. | | | 43,300 | | | | 242,587 | |
| | |
Zojirushi Corp.(a) | | | 46,700 | | | | 558,669 | |
| | | | | | | | |
| Total Household Durables | | | | 40,633,242 | |
|
| Household Products – 0.3% | |
| | |
Pigeon Corp. | | | 87,100 | | | | 1,545,016 | |
| | |
Unicharm Corp. | | | 118,600 | | | | 4,259,340 | |
| | | | | | | | |
| Total Household Products | | | | 5,804,356 | |
|
| Industrial Conglomerates – 1.6% | |
| | |
Hitachi Ltd. | | | 381,505 | | | | 19,377,782 | |
| | |
Nisshinbo Holdings, Inc. | | | 154,824 | | | | 1,355,946 | |
| | |
Toshiba Corp. | | | 241,800 | | | | 9,263,604 | |
| | | | | | | | |
| Total Industrial Conglomerates | | | | 29,997,332 | |
|
| Insurance – 4.8% | |
| | |
Dai-ichi Life Holdings, Inc. | | | 684,500 | | | | 14,093,228 | |
| | |
MS&AD Insurance Group Holdings, Inc. | | | 619,600 | | | | 20,307,055 | |
| | |
Sompo Holdings, Inc. | | | 534,500 | | | | 23,696,350 | |
| | |
Tokio Marine Holdings, Inc. | | | 582,800 | | | | 34,226,145 | |
| | | | | | | | |
| Total Insurance | | | | 92,322,778 | |
|
| Internet & Direct Marketing Retail – 0.0% | |
| | |
Aucnet, Inc. | | | 12,200 | | | | 160,522 | |
|
| IT Services – 0.9% | |
| | |
Fujitsu Ltd. | | | 48,432 | | | | 7,348,097 | |
| | |
GMO GlobalSign Holdings KK(a) | | | 3,300 | | | | 168,841 | |
| | |
NEC Corp. | | | 103,700 | | | | 4,400,041 | |
| | |
NTT Data Corp. | | | 293,000 | | | | 5,837,067 | |
| | | | | | | | |
| Total IT Services | | | | 17,754,046 | |
|
| Leisure Products – 0.8% | |
| | |
Bandai Namco Holdings, Inc. | | | 73,200 | | | | 5,603,908 | |
| | |
GLOBERIDE, Inc. | | | 6,700 | | | | 159,972 | |
| | |
Mizuno Corp. | | | 10,500 | | | | 182,620 | |
| | |
Roland Corp. | | | 25,500 | | | | 847,724 | |
| | |
Sega Sammy Holdings, Inc. | | | 152,600 | | | | 2,656,591 | |
| | |
Shimano, Inc. | | | 21,800 | | | | 5,056,882 | |
| | |
Yamaha Corp. | | | 40,407 | | | | 1,781,071 | |
| | | | | | | | |
| Total Leisure Products | | | | 16,288,768 | |
See Notes to Financial Statements.
Schedule of Investments (continued)
WisdomTree Japan Hedged Equity Fund (DXJ)
March 31, 2022
| | | | | | | | |
| Investments | | Shares | | | Value | |
|
| Machinery – 5.2% | |
| | |
Amada Co. Ltd. | | | 251,993 | | | $ | 2,250,549 | |
| | |
Anest Iwata Corp. | | | 48,500 | | | | 331,658 | |
| | |
Bando Chemical Industries Ltd. | | | 66,400 | | | | 483,058 | |
| | |
CKD Corp. | | | 29,000 | | | | 450,381 | |
| | |
Daifuku Co. Ltd. | | | 26,400 | | | | 1,911,893 | |
| | |
DMG Mori Co. Ltd. | | | 42,300 | | | | 583,400 | |
| | |
Ebara Corp. | | | 60,731 | | | | 3,422,451 | |
| | |
FANUC Corp. | | | 87,489 | | | | 15,602,055 | |
| | |
Fujitec Co. Ltd.(a) | | | 55,000 | | | | 1,427,394 | |
| | |
Glory Ltd.(a) | | | 44,600 | | | | 761,369 | |
| | |
Hino Motors Ltd.(a) | | | 152,000 | | | | 901,668 | |
| | |
Hitachi Zosen Corp. | | | 42,200 | | | | 259,371 | |
| | |
Hokuetsu Industries Co. Ltd. | | | 40,600 | | | | 292,353 | |
| | |
Hoshizaki Corp. | | | 21,869 | | | | 1,515,290 | |
| | |
IHI Corp. | | | 36,500 | | | | 887,127 | |
| | |
Iwaki Co. Ltd. | | | 22,900 | | | | 206,407 | |
| | |
Japan Steel Works Ltd. | | | 22,600 | | | | 711,283 | |
| | |
Kawasaki Heavy Industries Ltd.(a) | | | 29,500 | | | | 541,026 | |
| | |
Kito Corp. | | | 34,300 | | | | 501,607 | |
| | |
Komatsu Ltd. | | | 468,906 | | | | 11,369,643 | |
| | |
Kubota Corp. | | | 475,302 | | | | 9,018,501 | |
| | |
Kurita Water Industries Ltd.(a) | | | 36,500 | | | | 1,366,777 | |
| | |
Makita Corp. | | | 83,938 | | | | 2,721,286 | |
| | |
Meidensha Corp.(a) | | | 28,400 | | | | 594,557 | |
| | |
MINEBEA MITSUMI, Inc. | | | 99,701 | | | | 2,212,931 | |
| | |
MISUMI Group, Inc. | | | 52,600 | | | | 1,588,293 | |
| | |
Mitsubishi Heavy Industries Ltd. | | | 326,219 | | | | 10,804,535 | |
| | |
Mitsubishi Logisnext Co. Ltd. | | | 13,400 | | | | 102,894 | |
| | |
Mitsuboshi Belting Ltd. | | | 39,500 | | | | 659,662 | |
| | |
Miura Co. Ltd.(a) | | | 24,700 | | | | 617,627 | |
| | |
Nabtesco Corp. | | | 56,400 | | | | 1,514,842 | |
| | |
NGK Insulators Ltd. | | | 196,375 | | | | 2,836,213 | |
| | |
Nissei ASB Machine Co. Ltd. | | | 10,500 | | | | 269,475 | |
| | |
Nissei Plastic Industrial Co. Ltd. | | | 15,800 | | | | 131,347 | |
| | |
Nitta Corp. | | | 30,900 | | | | 703,667 | |
| | |
Nomura Micro Science Co. Ltd.(a) | | | 4,600 | | | | 161,261 | |
| | |
Noritake Co. Ltd. | | | 6,600 | | | | 242,521 | |
| | |
Obara Group, Inc.(a) | | | 18,700 | | | | 460,355 | |
| | |
Organo Corp. | | | 3,800 | | | | 317,149 | |
| | |
OSG Corp. | | | 33,524 | | | | 518,983 | |
| | |
Sansei Technologies, Inc. | | | 25,800 | | | | 156,022 | |
| | |
Shibaura Machine Co. Ltd. | | | 24,100 | | | | 679,069 | |
| | |
SMC Corp. | | | 14,751 | | | | 8,366,293 | |
| | |
Sodick Co. Ltd. | | | 83,300 | | | | 538,748 | |
| | |
Star Micronics Co. Ltd. | | | 46,500 | | | | 589,990 | |
| | |
Sumitomo Heavy Industries Ltd. | | | 97,337 | | | | 2,259,903 | |
| | |
Takeuchi Manufacturing Co. Ltd. | | | 19,400 | | | | 422,285 | |
| | |
Teikoku Electric Manufacturing Co. Ltd. | | | 22,000 | | | | 285,298 | |
| | |
Tocalo Co. Ltd. | | | 63,000 | | | | 705,911 | |
| | |
Torishima Pump Manufacturing Co. Ltd. | | | 36,100 | | | | 305,158 | |
| | |
Tsubaki Nakashima Co. Ltd. | | | 20,200 | | | | 160,934 | |
| | |
Tsubakimoto Chain Co. | | | 28,200 | | | | 709,792 | |
| | |
Tsugami Corp. | | | 28,200 | | | | 309,009 | |
| | |
YAMABIKO Corp. | | | 30,500 | | | | 375,926 | |
| | |
Yaskawa Electric Corp. | | | 48,800 | | | | 1,935,918 | |
| | |
Yushin Precision Equipment Co. Ltd. | | | 41,000 | | | | 226,999 | |
| | | | | | | | |
| Total Machinery | | | | 99,280,114 | |
|
| Marine – 2.7% | |
| | |
Iino Kaiun Kaisha Ltd. | | | 130,400 | | | | 887,418 | |
| | |
Mitsui OSK Lines Ltd.(a) | | | 835,700 | | | | 23,547,633 | |
| | |
Nippon Yusen KK(a) | | | 291,300 | | | | 25,824,000 | |
| | |
NS United Kaiun Kaisha Ltd. | | | 22,000 | | | | 763,090 | |
| | | | | | | | |
| Total Marine | | | | 51,022,141 | |
|
| Media – 0.3% | |
| | |
Dentsu Group, Inc. | | | 131,100 | | | | 5,422,220 | |
|
| Metals & Mining – 2.4% | |
| | |
Asahi Holdings, Inc. | | | 80,600 | | | | 1,504,091 | |
| | |
Daido Steel Co. Ltd. | | | 23,200 | | | | 705,318 | |
| | |
Daiki Aluminium Industry Co. Ltd.(a) | | | 44,300 | | | | 574,851 | |
| | |
Dowa Holdings Co. Ltd. | | | 30,100 | | | | 1,391,234 | |
| | |
JFE Holdings, Inc. | | | 580,400 | | | | 8,239,169 | |
| | |
Kobe Steel Ltd. | | | 273,600 | | | | 1,332,215 | |
| | |
Kyoei Steel Ltd. | | | 55,500 | | | | 612,272 | |
| | |
Maruichi Steel Tube Ltd. | | | 76,300 | | | | 1,735,020 | |
| | |
Mitsubishi Materials Corp. | | | 107,800 | | | | 1,903,319 | |
| | |
Mitsui Mining & Smelting Co. Ltd. | | | 34,900 | | | | 964,692 | |
| | |
Neturen Co. Ltd. | | | 38,900 | | | | 189,412 | |
| | |
Nippon Steel Corp. | | | 728,500 | | | | 13,030,472 | |
| | |
Nippon Yakin Kogyo Co. Ltd.(a) | | | 12,010 | | | | 278,048 | |
| | |
Nittetsu Mining Co. Ltd. | | | 2,900 | | | | 169,162 | |
| | |
Sanyo Special Steel Co. Ltd. | | | 30,000 | | | | 524,737 | |
| | |
Sumitomo Metal Mining Co. Ltd. | | | 266,500 | | | | 13,531,942 | |
| | | | | | | | |
| Total Metals & Mining | | | | 46,685,954 | |
|
| Multiline Retail – 0.1% | |
| | |
Ryohin Keikaku Co. Ltd. | | | 127,000 | | | | 1,497,318 | |
|
| Oil, Gas & Consumable Fuels – 2.4% | |
| | |
ENEOS Holdings, Inc. | | | 5,516,300 | | | | 20,815,369 | |
| | |
Idemitsu Kosan Co. Ltd. | | | 398,000 | | | | 11,066,941 | |
| | |
Inpex Corp. | | | 1,158,800 | | | | 13,748,070 | |
| | |
Nippon Coke & Engineering Co. Ltd.(a) | | | 280,300 | | | | 332,550 | |
| | | | | | | | |
| Total Oil, Gas & Consumable Fuels | | | | 45,962,930 | |
|
| Paper & Forest Products – 0.3% | |
| | |
Daiken Corp. | | | 20,300 | | | | 363,267 | |
| | |
Hokuetsu Corp.(a) | | | 124,700 | | | | 714,039 | |
| | |
Nippon Paper Industries Co. Ltd.(a) | | | 85,500 | | | | 731,901 | |
| | |
Oji Holdings Corp. | | | 631,700 | | | | 3,159,151 | |
| | | | | | | | |
| Total Paper & Forest Products | | | | 4,968,358 | |
|
| Personal Products – 0.7% | |
| | |
Kao Corp. | | | 257,380 | | | | 10,655,691 | |
| | |
Rohto Pharmaceutical Co. Ltd. | | | 27,200 | | | | 828,045 | |
| | |
Shiseido Co. Ltd. | | | 49,122 | | | | 2,516,504 | |
| | | | | | | | |
| Total Personal Products | | | | 14,000,240 | |
|
| Pharmaceuticals – 6.8% | |
| | |
Astellas Pharma, Inc. | | | 1,058,804 | | | | 16,670,438 | |
| | |
Chugai Pharmaceutical Co. Ltd. | | | 577,800 | | | | 19,503,577 | |
| | |
Kyowa Kirin Co. Ltd. | | | 161,270 | | | | 3,784,115 | |
| | |
Nippon Shinyaku Co. Ltd. | | | 21,900 | | | | 1,503,003 | |
See Notes to Financial Statements.
Schedule of Investments (continued)
WisdomTree Japan Hedged Equity Fund (DXJ)
March 31, 2022
| | | | | | | | |
| Investments | | Shares | | | Value | |
| | |
Ono Pharmaceutical Co. Ltd. | | | 293,200 | | | $ | 7,406,395 | |
| | |
Otsuka Holdings Co. Ltd. | | | 291,500 | | | | 10,163,773 | |
| | |
Shionogi & Co. Ltd. | | | 111,977 | | | | 6,946,956 | |
| | |
Sumitomo Dainippon Pharma Co. Ltd. | | | 125,400 | | | | 1,248,059 | |
| | |
Takeda Pharmaceutical Co. Ltd. | | | 2,169,763 | | | | 62,532,078 | |
| | |
Towa Pharmaceutical Co. Ltd. | | | 23,300 | | | | 527,526 | |
| | | | | | | | |
| Total Pharmaceuticals | | | | 130,285,920 | |
|
| Professional Services – 0.3% | |
| | |
Outsourcing, Inc. | | | 10,400 | | | | 108,905 | |
| | |
Persol Holdings Co. Ltd. | | | 58,000 | | | | 1,320,799 | |
| | |
Recruit Holdings Co. Ltd. | | | 119,200 | | | | 5,316,983 | |
| | | | | | | | |
| Total Professional Services | | | | 6,746,687 | |
|
| Road & Rail – 0.3% | |
| | |
Alps Logistics Co. Ltd. | | | 26,600 | | | | 235,373 | |
| | |
Hitachi Transport System Ltd. | | | 36,800 | | | | 2,037,454 | |
| | |
Nippon Express Holdings, Inc. | | | 61,600 | | | | 4,273,302 | |
| | | | | | | | |
| Total Road & Rail | | | | 6,546,129 | |
|
| Semiconductors & Semiconductor Equipment – 4.4% | |
| | |
Advantest Corp. | | | 95,700 | | | | 7,624,461 | |
| | |
Disco Corp. | | | 21,200 | | | | 6,008,486 | |
| | |
Ferrotec Holdings Corp. | | | 14,100 | | | | 319,581 | |
| | |
Furuya Metal Co. Ltd. | | | 2,300 | | | | 195,938 | |
| | |
Lasertec Corp. | | | 10,200 | | | | 1,746,711 | |
| | |
Micronics Japan Co. Ltd. | | | 10,900 | | | | 150,333 | |
| | |
Mitsui High-Tec, Inc. | | | 3,600 | | | | 369,269 | |
| | |
Optorun Co. Ltd. | | | 28,300 | | | | 490,805 | |
| | |
Rohm Co. Ltd. | | | 36,500 | | | | 2,883,914 | |
| | |
SCREEN Holdings Co. Ltd.(a) | | | 10,960 | | | | 1,116,092 | |
| | |
Shibaura Mechatronics Corp. | | | 1,700 | | | | 120,733 | |
| | |
Shinko Electric Industries Co. Ltd. | | | 43,459 | | | | 2,094,625 | |
| | |
SUMCO Corp. | | | 82,300 | | | | 1,374,435 | |
| | |
Tokyo Electron Ltd. | | | 109,453 | | | | 57,037,300 | |
| | |
Tokyo Seimitsu Co. Ltd. | | | 27,800 | | | | 1,117,726 | |
| | |
Ulvac, Inc. | | | 17,400 | | | | 903,151 | |
| | |
Yamaichi Electronics Co. Ltd.(a) | | | 28,000 | | | | 433,005 | |
| | | | | | | | |
| Total Semiconductors & Semiconductor Equipment | | | | 83,986,565 | |
|
| Software – 0.3% | |
| | |
Cybernet Systems Co. Ltd.(a) | | | 33,000 | | | | 201,739 | |
| | |
Trend Micro, Inc. | | | 83,708 | | | | 4,937,996 | |
| | | | | | | | |
| Total Software | | | | 5,139,735 | |
|
| Specialty Retail – 0.6% | |
| | |
ABC-Mart, Inc. | | | 62,800 | | | | 2,387,823 | |
| | |
Fast Retailing Co. Ltd. | | | 17,100 | | | | 8,874,389 | |
| | |
IDOM, Inc. | | | 32,400 | | | | 194,333 | |
| | |
VT Holdings Co. Ltd. | | | 159,700 | | | | 586,828 | |
| | | | | | | | |
| Total Specialty Retail | | | | 12,043,373 | |
|
| Technology Hardware, Storage & Peripherals – 2.7% | |
| | |
Brother Industries Ltd. | | | 184,043 | | | | 3,392,002 | |
| | |
Canon, Inc.(a) | | | 1,004,897 | | | | 24,779,870 | |
| | |
Eizo Corp. | | | 17,200 | | | | 508,737 | |
| | |
FUJIFILM Holdings Corp. | | | 219,395 | | | | 13,560,464 | |
| | |
Konica Minolta, Inc.(a) | | | 607,800 | | | | 2,583,932 | |
| | |
MCJ Co. Ltd. | | | 66,300 | | | | 508,550 | |
| | |
Riso Kagaku Corp. | | | 15,700 | | | | 256,633 | |
| | |
Roland DG Corp. | | | 6,700 | | | | 186,579 | |
| | |
Seiko Epson Corp.(a) | | | 296,600 | | | | 4,498,790 | |
| | |
Toshiba TEC Corp. | | | 15,200 | | | | 615,514 | |
| | |
Wacom Co. Ltd.(a) | | | 86,900 | | | | 675,153 | |
| | | | | | | | |
| Total Technology Hardware, Storage & Peripherals | | | | 51,566,224 | |
|
| Textiles, Apparel & Luxury Goods – 0.2% | |
| | |
Asics Corp. | | | 53,792 | | | | 1,052,129 | |
| | |
Kurabo Industries Ltd. | | | 26,347 | | | | 381,394 | |
| | |
Onward Holdings Co. Ltd.(a) | | | 128,900 | | | | 271,871 | |
| | |
Seiko Holdings Corp. | | | 17,000 | | | | 321,302 | |
| | |
Seiren Co. Ltd.(a) | | | 30,210 | | | | 553,549 | |
| | |
Wacoal Holdings Corp. | | | 30,700 | | | | 465,907 | |
| | | | | | | | |
| Total Textiles, Apparel & Luxury Goods | | | | 3,046,152 | |
|
| Tobacco – 4.1% | |
| | |
Japan Tobacco, Inc. | | | 4,579,331 | | | | 78,758,834 | |
|
| Trading Companies & Distributors – 8.7% | |
| | |
Alconix Corp. | | | 15,800 | | | | 182,115 | |
| | |
Chori Co. Ltd. | | | 22,700 | | | | 328,975 | |
| | |
Hanwa Co. Ltd. | | | 22,100 | | | | 589,940 | |
| | |
Inabata & Co. Ltd. | | | 96,586 | | | | 1,641,664 | |
| | |
ITOCHU Corp. | | | 1,618,894 | | | | 55,272,476 | |
| | |
Kokusai Pulp & Paper Co. Ltd. | | | 70,700 | | | | 185,232 | |
| | |
Marubeni Corp. | | | 1,698,078 | | | | 19,950,230 | |
| | |
Mitsubishi Corp. | | | 1,329,000 | | | | 50,378,818 | |
| | |
Nagase & Co. Ltd. | | | 88,500 | | | | 1,327,773 | |
| | |
Nippon Steel Trading Corp. | | | 43,100 | | | | 1,885,569 | |
| | |
Sanyo Trading Co. Ltd. | | | 38,300 | | | | 311,449 | |
| | |
Shinsho Corp. | | | 11,800 | | | | 346,101 | |
| | |
Sojitz Corp.(a) | | | 195,104 | | | | 3,242,223 | |
| | |
Sumitomo Corp. | | | 1,303,877 | | | | 22,763,463 | |
| | |
Toyota Tsusho Corp. | | | 209,210 | | | | 8,721,752 | |
| | | | | | | | |
| Total Trading Companies & Distributors | | | | 167,127,780 | |
|
| Transportation Infrastructure – 0.0% | |
| | |
Nissin Corp. | | | 15,800 | | | | 212,706 | |
TOTAL COMMON STOCKS (Cost: $2,005,586,852) | | | | 1,899,979,262 | |
|
| INVESTMENT OF CASH COLLATERAL FOR SECURITIES LOANED – 1.1% | |
|
| United States – 1.1% | |
| | |
State Street Navigator Securities Lending Government Money Market Portfolio, 0.25%(b) | | | | | | | | |
| (Cost: $21,586,729) | | | 21,586,729 | | | | 21,586,729 | |
| |
TOTAL INVESTMENTS IN SECURITIES – 100.1% (Cost: $2,027,173,581) | | | | 1,921,565,991 | |
| | |
Other Assets less Liabilities – (0.1)% | | | | | | | (1,721,537 | ) |
| | | | | | | | |
| NET ASSETS – 100.0% | | | | | | $ | 1,919,844,454 | |
| (a) | Security, or portion thereof, was on loan at March 31, 2022 (See Note 2). At March 31, 2022, the total market value of the Fund’s securities on loan identified in the Schedule of Investments was $73,768,650. The Fund also had securities on loan having a total market value of $25,910 that were sold and pending settlement. The total market value of the collateral held by the Fund was $78,229,658. The total market value of the collateral includes non-cash U.S. Government securities collateral having a value of $56,642,929. |
| (b) | Rate shown represents annualized 7-day yield as of March 31, 2022. |
See Notes to Financial Statements.
Schedule of Investments (concluded)
WisdomTree Japan Hedged Equity Fund (DXJ)
March 31, 2022
| | | | | | | | | | | | | | | | | | | | | | | | | | | | |
| | | | | | | |
| FINANCIAL DERIVATIVE INSTRUMENTS | | | | | | | | | | | | | | | | | | | | | |
| | | | | | | |
| FOREIGN CURRENCY CONTRACTS (OTC – OVER THE COUNTER) | | | | | | | | | | | | | | | | | | | | | |
| | | | | |
| Counterparty | | Settlement
Date | | | Amount and
Description of
Currency to
be Purchased | | | Amount and
Description of
Currency to
be Sold | | | Unrealized
Appreciation | | | Unrealized
Depreciation | |
Bank of America NA | | | 4/5/2022 | | | | 56,329,832,787 | | | | JPY | | | | 464,090,607 | | | | USD | | | $ | 14,257 | | | $ | — | |
Bank of America NA | | | 4/5/2022 | | | | 500,143,927 | | | | USD | | | | 57,561,714,601 | | | | JPY | | | | 25,889,515 | | | | — | |
Bank of America NA | | | 5/9/2022 | | | | 492,590,660 | | | | USD | | | | 59,750,655,949 | | | | JPY | | | | — | | | | (20,384 | ) |
Barclays Bank PLC | | | 4/5/2022 | | | | 56,328,904,485 | | | | JPY | | | | 464,090,606 | | | | USD | | | | 6,609 | | | | — | |
Barclays Bank PLC | | | 5/9/2022 | | | | 492,590,659 | | | | USD | | | | 59,749,030,278 | | | | JPY | | | | — | | | | (6,983 | ) |
Citibank NA | | | 4/5/2022 | | | | 500,143,927 | | | | USD | | | | 57,562,664,875 | | | | JPY | | | | 25,881,686 | | | | — | |
Goldman Sachs | | | 4/5/2022 | | | | 1,496,833,248 | | | | JPY | | | | 12,273,471 | | | | USD | | | | 59,028 | | | | — | |
Goldman Sachs | | | 4/5/2022 | | | | 500,143,927 | | | | USD | | | | 57,562,514,831 | | | | JPY | | | | 25,882,922 | | | | — | |
HSBC Holdings PLC | | | 5/9/2022 | | | | 4,345,226,367 | | | | JPY | | | | 35,824,775 | | | | USD | | | | — | | | | (792 | ) |
JP Morgan Chase Bank NA | | | 4/5/2022 | | | | 1,422,611,886 | | | | JPY | | | | 12,273,471 | | | | USD | | | | — | | | | (552,487 | ) |
JP Morgan Chase Bank NA | | | 4/5/2022 | | | | 7,239,347,078 | | | | JPY | | | | 61,367,353 | | | | USD | | | | — | | | | (1,721,939 | ) |
JP Morgan Chase Bank NA | | | 4/5/2022 | | | | 56,328,626,152 | | | | JPY | | | | 464,090,607 | | | | USD | | | | 4,315 | | | | — | |
JP Morgan Chase Bank NA | | | 4/5/2022 | | | | 500,143,927 | | | | USD | | | | 57,560,714,313 | | | | JPY | | | | 25,897,757 | | | | — | |
JP Morgan Chase Bank NA | | | 5/9/2022 | | | | 492,590,660 | | | | USD | | | | 59,748,882,622 | | | | JPY | | | | — | | | | (5,764 | ) |
UBS AG | | | 4/5/2022 | | | | 5,672,091,228 | | | | JPY | | | | 49,093,883 | | | | USD | | | | — | | | | (2,361,184 | ) |
UBS AG | | | 4/5/2022 | | | | 1,087,513,881 | | | | JPY | | | | 9,205,103 | | | | USD | | | | — | | | | (245,011 | ) |
UBS AG | | | 4/5/2022 | | | | 56,329,554,333 | | | | JPY | | | | 464,090,607 | | | | USD | | | | 11,963 | | | | — | |
UBS AG | | | 5/9/2022 | | | | 492,590,660 | | | | USD | | | | 59,750,064,840 | | | | JPY | | | | — | | | | (15,511 | ) |
| | | | | | | | | | | | | | | | | | | | | | | $ | 103,648,052 | | | $ | (4,930,055 | ) |
The following is a summary of the fair valuations according to the inputs used as of March 31, 2022 in valuing the Fund’s investments (See Note 2 — Fair Value Measurement):
| | | | | | | | | | | | | | | | |
| | | | |
| | | Quoted
Prices in
Active
Markets
(Level 1) | | | Other
Significant
Observable
Inputs
(Level 2) | | | Significant
Unobservable
Inputs
(Level 3) | | | Total | |
Assets: | | | | | | | | | |
Investments in Securities | | | | |
Common Stocks | | $ | 1,899,979,262 | | | $ | — | | | $ | — | | | $ | 1,899,979,262 | |
Investment of Cash Collateral for Securities Loaned | | | — | | | | 21,586,729 | | | | — | | | | 21,586,729 | |
Total Investments in Securities | | $ | 1,899,979,262 | | | $ | 21,586,729 | | | $ | — | | | $ | 1,921,565,991 | |
Financial Derivative Instruments | | | | | | | | | | | | | | | | |
Foreign Currency Contracts1 | | $ | — | | | $ | 103,648,052 | | | $ | — | | | $ | 103,648,052 | |
Liabilities: | | | | | | | | | | | | |
Financial Derivative Instruments | | | | | | | | | | | | | | | | |
Foreign Currency Contracts1 | | $ | — | | | $ | (4,930,055 | ) | | $ | — | | | $ | (4,930,055 | ) |
Total – Net | | $ | 1,899,979,262 | | | $ | 120,304,726 | | | $ | — | | | $ | 2,020,283,988 | |
| 1 | Amount shown represents the unrealized appreciation (depreciation) on the financial instrument. |
See Notes to Financial Statements.
Schedule of Investments
WisdomTree Japan Hedged SmallCap Equity Fund (DXJS)
March 31, 2022
| | | | | | | | |
| Investments | | Shares | | | Value | |
|
| COMMON STOCKS – 98.6% | |
|
| Japan – 98.6% | |
|
| Air Freight & Logistics – 0.7% | |
| | |
AIT Corp.(a) | | | 2,000 | | | $ | 25,129 | |
| | |
Kintetsu World Express, Inc. | | | 3,300 | | | | 85,236 | |
| | |
Konoike Transport Co. Ltd. | | | 1,500 | | | | 14,274 | |
| | |
Maruwa Unyu Kikan Co. Ltd. | | | 1,400 | | | | 12,953 | |
| | |
Mitsui-Soko Holdings Co. Ltd. | | | 1,400 | | | | 28,963 | |
| | |
SBS Holdings, Inc. | | | 800 | | | | 22,047 | |
| | | | | | | | |
| Total Air Freight & Logistics | | | | | | | 188,602 | |
|
| Auto Components – 3.8% | |
| | |
Aisan Industry Co. Ltd.(a) | | | 4,200 | | | | 25,261 | |
| | |
Daikyonishikawa Corp.(a) | | | 5,700 | | | | 25,359 | |
| | |
Eagle Industry Co. Ltd.(a) | | | 4,700 | | | | 37,794 | |
| | |
Exedy Corp. | | | 2,600 | | | | 33,738 | |
| | |
FCC Co. Ltd. | | | 2,500 | | | | 27,662 | |
| | |
FuKoKu Co. Ltd.(a) | | | 2,100 | | | | 16,021 | |
| | |
Furukawa Battery Co. Ltd.(a) | | | 1,100 | | | | 11,637 | |
| | |
Futaba Industrial Co. Ltd.(a) | | | 3,500 | | | | 10,496 | |
| | |
G-Tekt Corp.(a) | | | 2,498 | | | | 26,282 | |
| | |
H-One Co. Ltd. | | | 3,000 | | | | 15,028 | |
| | |
IJTT Co. Ltd. | | | 2,500 | | | | 11,081 | |
| | |
KYB Corp. | | | 1,500 | | | | 36,766 | |
| | |
Musashi Seimitsu Industry Co. Ltd.(a) | | | 2,700 | | | | 33,635 | |
| | |
NHK Spring Co. Ltd. | | | 10,700 | | | | 78,019 | |
| | |
Nihon Tokushu Toryo Co. Ltd. | | | 2,100 | | | | 14,499 | |
| | |
NOK Corp. | | | 6,900 | | | | 65,205 | |
| | |
Pacific Industrial Co. Ltd. | | | 3,100 | | | | 24,213 | |
| | |
Press Kogyo Co. Ltd. | | | 8,600 | | | | 26,783 | |
| | |
Riken Corp. | | | 800 | | | | 16,102 | |
| | |
Sanoh Industrial Co. Ltd.(a) | | | 2,100 | | | | 12,111 | |
| | |
Shoei Co. Ltd. | | | 800 | | | | 30,220 | |
| | |
Sumitomo Riko Co. Ltd. | | | 3,200 | | | | 15,845 | |
| | |
Tachi-S Co. Ltd.(a) | | | 1,600 | | | | 13,116 | |
| | |
Taiho Kogyo Co. Ltd.(a) | | | 1,500 | | | | 8,725 | |
| | |
Tokai Rika Co. Ltd. | | | 5,125 | | | | 63,548 | |
| | |
Topre Corp. | | | 1,900 | | | | 18,393 | |
| | |
Toyo Tire Corp. | | | 5,800 | | | | 74,689 | |
| | |
Toyoda Gosei Co. Ltd. | | | 6,000 | | | | 100,153 | |
| | |
TPR Co. Ltd.(a) | | | 2,306 | | | | 24,718 | |
| | |
TS Tech Co. Ltd. | | | 6,100 | | | | 69,104 | |
| | |
Yorozu Corp.(a) | | | 1,500 | | | | 10,987 | |
| | | | | | | | |
| Total Auto Components | | | | | | | 977,190 | |
|
| Automobiles – 0.1% | |
| | |
Nissan Shatai Co. Ltd. | | | 3,300 | | | | 15,117 | |
|
| Banks – 8.5% | |
| | |
77 Bank Ltd. | | | 4,300 | | | | 54,842 | |
| | |
Aichi Bank Ltd. | | | 1,000 | | | | 37,405 | |
| | |
Akita Bank Ltd. | | | 1,800 | | | | 24,944 | |
| | |
Aomori Bank Ltd. | | | 1,400 | | | | 21,743 | |
| | |
Aozora Bank Ltd.(a) | | | 8,400 | | | | 179,177 | |
| | |
Awa Bank Ltd. | | | 1,100 | | | | 19,675 | |
| | |
Bank of Iwate Ltd. | | | 1,500 | | | | 22,838 | |
| | |
Bank of Nagoya Ltd. | | | 700 | | | | 16,673 | |
| | |
Bank of Saga Ltd. | | | 2,200 | | | | 26,500 | |
| | |
Bank of the Ryukyus Ltd. | | | 3,900 | | | | 25,609 | |
| | |
Chugoku Bank Ltd. | | | 7,900 | | | | 56,952 | |
| | |
Daishi Hokuetsu Financial Group, Inc. | | | 3,100 | | | | 63,979 | |
| | |
Ehime Bank Ltd.(a) | | | 2,200 | | | | 16,929 | |
| | |
FIDEA Holdings Co. Ltd.(a) | | | 2,000 | | | | 20,976 | |
| | |
Fukui Bank Ltd.(a) | | | 1,800 | | | | 20,910 | |
| | |
Gunma Bank Ltd.(a) | | | 24,500 | | | | 71,456 | |
| | |
Hachijuni Bank Ltd.(a) | | | 26,900 | | | | 90,202 | |
| | |
Hokkoku Financial Holdings, Inc.(a) | | | 1,100 | | | | 27,732 | |
| | |
Hokuhoku Financial Group, Inc. | | | 8,000 | | | | 58,859 | |
| | |
Hyakugo Bank Ltd. | | | 10,900 | | | | 30,084 | |
| | |
Hyakujushi Bank Ltd. | | | 2,300 | | | | 31,437 | |
| | |
Iyo Bank Ltd. | | | 12,500 | | | | 61,792 | |
| | |
Juroku Financial Group, Inc. | | | 1,900 | | | | 33,985 | |
| | |
Keiyo Bank Ltd. | | | 8,800 | | | | 35,889 | |
| | |
Kiyo Bank Ltd. | | | 2,898 | | | | 32,902 | |
| | |
Kyushu Financial Group, Inc. | | | 23,000 | | | | 75,988 | |
| | |
Mebuki Financial Group, Inc. | | | 82,100 | | | | 173,162 | |
| | |
Miyazaki Bank Ltd. | | | 1,500 | | | | 25,495 | |
| | |
Musashino Bank Ltd. | | | 2,700 | | | | 39,107 | |
| | |
Nanto Bank Ltd. | | | 1,900 | | | | 30,964 | |
| | |
Nishi-Nippon Financial Holdings, Inc. | | | 10,100 | | | | 62,992 | |
| | |
North Pacific Bank Ltd. | | | 24,100 | | | | 47,654 | |
| | |
Ogaki Kyoritsu Bank Ltd. | | | 2,700 | | | | 42,355 | |
| | |
Oita Bank Ltd.(a) | | | 1,300 | | | | 20,532 | |
| | |
Okinawa Financial Group, Inc. | | | 1,340 | | | | 22,676 | |
| | |
San ju San Financial Group, Inc. | | | 2,700 | | | | 32,834 | |
| | |
San-In Godo Bank Ltd. | | | 8,700 | | | | 44,943 | |
| | |
Senshu Ikeda Holdings, Inc.(a) | | | 22,600 | | | | 32,213 | |
| | |
Seven Bank Ltd. | | | 80,400 | | | | 158,316 | |
| | |
Shiga Bank Ltd. | | | 1,400 | | | | 25,503 | |
| | |
Shikoku Bank Ltd.(a) | | | 4,900 | | | | 30,157 | |
| | |
Suruga Bank Ltd. | | | 4,500 | | | | 15,164 | |
| | |
Toho Bank Ltd.(a) | | | 14,600 | | | | 24,659 | |
| | |
Tokyo Kiraboshi Financial Group, Inc.(a) | | | 1,900 | | | | 27,457 | |
| | |
TOMONY Holdings, Inc.(a) | | | 8,100 | | | | 21,889 | |
| | |
Towa Bank Ltd. | | | 4,800 | | | | 21,316 | |
| | |
Yamagata Bank Ltd. | | | 2,700 | | | | 19,287 | |
| | |
Yamaguchi Financial Group, Inc. | | | 14,700 | | | | 82,356 | |
| | |
Yamanashi Chuo Bank Ltd. | | | 3,100 | | | | 24,315 | |
| | | | | | | | |
| Total Banks | | | | | | | 2,184,824 | |
|
| Beverages – 0.3% | |
| | |
Sapporo Holdings Ltd. | | | 2,100 | | | | 39,915 | |
| | |
Takara Holdings, Inc.(a) | | | 4,400 | | | | 39,913 | |
| | | | | | | | |
| Total Beverages | | | | | | | 79,828 | |
|
| Biotechnology – 0.0% | |
| | |
Pharma Foods International Co. Ltd. | | | 100 | | | | 1,633 | |
|
| Building Products – 1.5% | |
| | |
Aica Kogyo Co. Ltd. | | | 2,900 | | | | 71,416 | |
| | |
Bunka Shutter Co. Ltd. | | | 6,900 | | | | 55,939 | |
| | |
Central Glass Co. Ltd. | | | 2,400 | | | | 41,267 | |
See Notes to Financial Statements.
Schedule of Investments (continued)
WisdomTree Japan Hedged SmallCap Equity Fund (DXJS)
March 31, 2022
| | | | | | | | |
| Investments | | Shares | | | Value | |
| | |
Nichias Corp. | | | 2,800 | | | $ | 58,295 | |
| | |
Nichiha Corp. | | | 1,500 | | | | 31,020 | |
| | |
Noritz Corp. | | | 1,800 | | | | 21,770 | |
| | |
Shin Nippon Air Technologies Co. Ltd. | | | 900 | | | | 14,304 | |
| | |
Sinko Industries Ltd.(a) | | | 1,300 | | | | 18,508 | |
| | |
Takara Standard Co. Ltd. | | | 2,417 | | | | 25,270 | |
| | |
Takasago Thermal Engineering Co. Ltd. | | | 2,800 | | | | 40,025 | |
| | | | | | | | |
| Total Building Products | | | | | | | 377,814 | |
|
| Capital Markets – 2.2% | |
| | |
GMO Financial Holdings, Inc. | | | 10,500 | | | | 71,197 | |
| | |
Ichiyoshi Securities Co. Ltd.(a) | | | 5,300 | | | | 27,029 | |
| | |
IwaiCosmo Holdings, Inc. | | | 5,000 | | | | 54,871 | |
| | |
Kyokuto Securities Co. Ltd.(a) | | | 5,100 | | | | 30,800 | |
| | |
Marusan Securities Co. Ltd. | | | 5,200 | | | | 21,335 | |
| | |
Matsui Securities Co. Ltd.(a) | | | 19,100 | | | | 126,992 | |
| | |
Mito Securities Co. Ltd.(a) | | | 8,300 | | | | 18,805 | |
| | |
Monex Group, Inc.(a) | | | 6,665 | | | | 36,023 | |
| | |
Morningstar Japan KK | | | 7,099 | | | | 34,274 | |
| | |
Okasan Securities Group, Inc. | | | 12,700 | | | | 38,715 | |
| | |
Sparx Group Co. Ltd.(a) | | | 11,600 | | | | 26,187 | |
| | |
Tokai Tokyo Financial Holdings, Inc. | | | 20,600 | | | | 68,398 | |
| | | | | | | | |
| Total Capital Markets | | | | | | | 554,626 | |
|
| Chemicals – 9.1% | |
| | |
ADEKA Corp. | | | 4,900 | | | | 109,163 | |
| | |
Arakawa Chemical Industries Ltd.(a) | | | 2,100 | | | | 18,478 | |
| | |
Asahi Yukizai Corp.(a) | | | 1,300 | | | | 21,496 | |
| | |
Chugoku Marine Paints Ltd.(a) | | | 4,000 | | | | 29,792 | |
| | |
CI Takiron Corp. | | | 6,300 | | | | 28,288 | |
| | |
Daicel Corp.(a) | | | 17,200 | | | | 115,777 | |
| | |
Dainichiseika Color & Chemicals Manufacturing Co. Ltd.(a) | | | 800 | | | | 13,578 | |
| | |
DIC Corp. | | | 4,700 | | | | 97,079 | |
| | |
DKS Co. Ltd. | | | 600 | | | | 13,639 | |
| | |
Fujimi, Inc. | | | 1,400 | | | | 77,512 | |
| | |
Fujimori Kogyo Co. Ltd. | | | 500 | | | | 15,407 | |
| | |
Fuso Chemical Co. Ltd. | | | 500 | | | | 18,579 | |
| | |
Ishihara Sangyo Kaisha Ltd. | | | 1,000 | | | | 8,873 | |
| | |
JCU Corp. | | | 600 | | | | 20,515 | |
| | |
JSP Corp.(a) | | | 1,617 | | | | 20,476 | |
| | |
Kaneka Corp. | | | 3,548 | | | | 103,626 | |
| | |
KeePer Technical Laboratory Co. Ltd.(a) | | | 600 | | | | 12,309 | |
| | |
KH Neochem Co. Ltd. | | | 1,200 | | | | 27,297 | |
| | |
Koatsu Gas Kogyo Co. Ltd. | | | 2,100 | | | | 11,436 | |
| | |
Konishi Co. Ltd. | | | 1,700 | | | | 21,920 | |
| | |
Kumiai Chemical Industry Co. Ltd. | | | 3,394 | | | | 24,747 | |
| | |
Kureha Corp. | | | 800 | | | | 64,659 | |
| | |
Kyowa Leather Cloth Co. Ltd.(a) | | | 3,300 | | | | 17,727 | |
| | |
Lintec Corp. | | | 5,600 | | | | 112,162 | |
| | |
MEC Co. Ltd. | | | 400 | | | | 11,123 | |
| | |
Nihon Nohyaku Co. Ltd.(a) | | | 4,800 | | | | 24,163 | |
| | |
Nihon Parkerizing Co. Ltd. | | | 4,700 | | | | 36,090 | |
| | |
Nippon Chemical Industrial Co. Ltd.(a) | | | 500 | | | | 9,940 | |
| | |
Nippon Kayaku Co. Ltd.(a) | | | 9,900 | | | | 94,697 | |
| | |
Nippon Pillar Packing Co. Ltd. | | | 1,500 | | | | 38,064 | |
| | |
Nippon Shokubai Co. Ltd. | | | 1,300 | | | | 57,088 | |
| | |
Nippon Soda Co. Ltd. | | | 1,600 | | | | 44,424 | |
| | |
Okamoto Industries, Inc.(a) | | | 600 | | | | 19,304 | |
| | |
Okura Industrial Co. Ltd.(a) | | | 1,000 | | | | 14,987 | |
| | |
Osaka Organic Chemical Industry Ltd. | | | 600 | | | | 15,151 | |
| | |
Osaka Soda Co. Ltd. | | | 1,077 | | | | 27,729 | |
| | |
Riken Technos Corp.(a) | | | 6,300 | | | | 23,721 | |
| | |
Sakata INX Corp. | | | 2,700 | | | | 21,511 | |
| | |
Sanyo Chemical Industries Ltd. | | | 1,100 | | | | 45,677 | |
| | |
Sekisui Kasei Co. Ltd.(a) | | | 3,400 | | | | 12,241 | |
| | |
Shikoku Chemicals Corp.(a) | | | 1,500 | | | | 16,560 | |
| | |
Shin-Etsu Polymer Co. Ltd. | | | 2,700 | | | | 25,182 | |
| | |
Stella Chemifa Corp. | | | 800 | | | | 17,111 | |
| | |
Sumitomo Bakelite Co. Ltd. | | | 2,100 | | | | 86,336 | |
| | |
Sumitomo Seika Chemicals Co. Ltd. | | | 500 | | | | 12,750 | |
| | |
T Hasegawa Co. Ltd. | | | 1,300 | | | | 27,923 | |
| | |
Taiyo Holdings Co. Ltd. | | | 1,900 | | | | 50,875 | |
| | |
Takasago International Corp.(a) | | | 1,000 | | | | 22,624 | |
| | |
Tayca Corp. | | | 1,600 | | | | 17,018 | |
| | |
Teijin Ltd. | | | 10,600 | | | | 119,034 | |
| | |
Tokai Carbon Co. Ltd.(a) | | | 6,800 | | | | 64,484 | |
| | |
Tokuyama Corp.(a) | | | 3,400 | | | | 48,125 | |
| | |
Tokyo Ohka Kogyo Co. Ltd. | | | 1,300 | | | | 78,830 | |
| | |
Toyo Ink SC Holdings Co. Ltd. | | | 4,000 | | | | 62,715 | |
| | |
Toyobo Co. Ltd.(a) | | | 2,800 | | | | 25,214 | |
| | |
Ube Industries Ltd. | | | 6,780 | | | | 111,552 | |
| | |
Valqua Ltd. | | | 1,500 | | | | 32,861 | |
| | | | | | | | |
| Total Chemicals | | | | | | | 2,319,639 | |
|
| Commercial Services & Supplies – 1.5% | |
| | |
Aeon Delight Co. Ltd. | | | 2,900 | | | | 72,754 | |
| | |
Daiseki Co. Ltd. | | | 740 | | | | 28,167 | |
| | |
Itoki Corp.(a) | | | 5,100 | | | | 14,581 | |
| | |
Japan Elevator Service Holdings Co. Ltd. | | | 800 | | | | 10,539 | |
| | |
King Jim Co. Ltd. | | | 3,100 | | | | 23,370 | |
| | |
Matsuda Sangyo Co. Ltd.(a) | | | 800 | | | | 16,320 | |
| | |
Nippon Air Conditioning Services Co. Ltd. | | | 3,500 | | | | 22,838 | |
| | |
Nippon Kanzai Co. Ltd. | | | 1,900 | | | | 44,223 | |
| | |
Nippon Parking Development Co. Ltd. | | | 18,300 | | | | 23,219 | |
| | |
Okamura Corp. | | | 5,800 | | | | 57,916 | |
| | |
Pilot Corp. | | | 800 | | | | 34,669 | |
| | |
Sato Holdings Corp. | | | 800 | | | | 11,330 | |
| | |
Studio Alice Co. Ltd. | | | 900 | | | | 16,172 | |
| | | | | | | | |
| Total Commercial Services & Supplies | | | | | | | 376,098 | |
|
| Communications Equipment – 0.1% | |
| | |
Uniden Holdings Corp.(a) | | | 900 | | | | 25,545 | |
|
| Construction & Engineering – 7.6% | |
| | |
Asanuma Corp.(a) | | | 1,000 | | | | 41,112 | |
| | |
Dai-Dan Co. Ltd.(a) | | | 1,200 | | | | 20,752 | |
| | |
Daiho Corp.(a) | | | 800 | | | | 29,858 | |
| | |
EXEO Group, Inc. | | | 5,400 | | | | 100,592 | |
| | |
Fudo Tetra Corp. | | | 1,500 | | | | 18,810 | |
| | |
Hazama Ando Corp. | | | 10,900 | | | | 81,183 | |
See Notes to Financial Statements.
Schedule of Investments (continued)
WisdomTree Japan Hedged SmallCap Equity Fund (DXJS)
March 31, 2022
| | | | | | | | |
| Investments | | Shares | | | Value | |
| | |
INFRONEER Holdings, Inc.(a) | | | 10,768 | | | $ | 92,443 | |
| | |
JDC Corp.(a) | | | 5,500 | | | | 25,013 | |
| | |
Kandenko Co. Ltd. | | | 8,900 | | | | 61,154 | |
| | |
Kumagai Gumi Co. Ltd. | | | 2,700 | | | | 60,284 | |
| | |
Kyudenko Corp. | | | 2,300 | | | | 54,309 | |
| | |
Meisei Industrial Co. Ltd.(a) | | | 4,500 | | | | 25,582 | |
| | |
Mirait Holdings Corp. | | | 4,844 | | | | 77,783 | |
| | |
Nippon Densetsu Kogyo Co. Ltd. | | | 1,800 | | | | 23,476 | |
| | |
Nishimatsu Construction Co. Ltd.(a) | | | 7,000 | | | | 211,658 | |
| | |
Nittoc Construction Co. Ltd.(a) | | | 5,800 | | | | 33,593 | |
| | |
Okumura Corp. | | | 3,100 | | | | 75,856 | |
| | |
Penta-Ocean Construction Co. Ltd. | | | 12,100 | | | | 61,111 | |
| | |
PS Mitsubishi Construction Co. Ltd. | | | 3,900 | | | | 18,797 | |
| | |
Raito Kogyo Co. Ltd. | | | 3,100 | | | | 49,881 | |
| | |
Raiznext Corp. | | | 3,300 | | | | 29,146 | |
| | |
Sanki Engineering Co. Ltd. | | | 4,800 | | | | 55,287 | |
| | |
Seikitokyu Kogyo Co. Ltd.(a) | | | 5,400 | | | | 33,190 | |
| | |
Shinnihon Corp. | | | 2,700 | | | | 16,217 | |
| | |
SHO-BOND Holdings Co. Ltd. | | | 2,700 | | | | 118,566 | |
| | |
Sumitomo Densetsu Co. Ltd. | | | 1,800 | | | | 33,027 | |
| | |
Sumitomo Mitsui Construction Co. Ltd. | | | 8,840 | | | | 30,371 | |
| | |
Taihei Dengyo Kaisha Ltd. | | | 1,400 | | | | 30,497 | |
| | |
Taikisha Ltd. | | | 1,500 | | | | 37,631 | |
| | |
Takamatsu Construction Group Co. Ltd. | | | 2,000 | | | | 33,944 | |
| | |
Tekken Corp.(a) | | | 1,100 | | | | 16,667 | |
| | |
Tess Holdings Co. Ltd. | | | 400 | | | | 5,224 | |
| | |
Toa Corp. | | | 1,100 | | | | 22,612 | |
| | |
Toda Corp.(a) | | | 18,500 | | | | 112,943 | |
| | |
Tokyo Energy & Systems, Inc. | | | 1,800 | | | | 14,430 | |
| | |
Tokyu Construction Co. Ltd. | | | 5,900 | | | | 32,666 | |
| | |
Totetsu Kogyo Co. Ltd. | | | 1,900 | | | | 35,503 | |
| | |
Toyo Construction Co. Ltd.* | | | 7,100 | | | | 45,335 | |
| | |
Yahagi Construction Co. Ltd. | | | 3,100 | | | | 20,484 | |
| | |
Yokogawa Bridge Holdings Corp. | | | 2,400 | | | | 38,400 | |
| | |
Yurtec Corp. | | | 3,900 | | | | 22,235 | |
| | | | | | | | |
| Total Construction & Engineering | | | | | | | 1,947,622 | |
|
| Construction Materials – 0.9% | |
| | |
Krosaki Harima Corp. | | | 600 | | | | 20,416 | |
| | |
Mitani Sekisan Co. Ltd.(a) | | | 300 | | | | 16,461 | |
| | |
Shinagawa Refractories Co. Ltd.(a) | | | 600 | | | | 18,760 | |
| | |
Sumitomo Osaka Cement Co. Ltd.(a) | | | 2,100 | | | | 58,134 | |
| | |
Taiheiyo Cement Corp.(a) | | | 5,000 | | | | 83,172 | |
| | |
Vertex Corp. | | | 600 | | | | 14,257 | |
| | |
Yotai Refractories Co. Ltd. | | | 900 | | | | 9,336 | |
| | | | | | | | |
| Total Construction Materials | | | | | | | 220,536 | |
|
| Consumer Finance – 1.2% | |
| | |
AEON Financial Service Co. Ltd. | | | 7,500 | | | | 75,201 | |
| | |
Credit Saison Co. Ltd.(a) | | | 8,800 | | | | 94,471 | |
| | |
Jaccs Co. Ltd. | | | 2,300 | | | | 58,365 | |
| | |
Orient Corp.(a) | | | 49,500 | | | | 50,570 | |
| | |
Premium Group Co. Ltd. | | | 500 | | | | 16,663 | |
| | | | | | | | |
| Total Consumer Finance | | | | | | | 295,270 | |
|
| Containers & Packaging – 1.1% | |
| | |
Fuji Seal International, Inc. | | | 1,300 | | | | 18,026 | |
| | |
Pack Corp.(a) | | | 800 | | | | 16,959 | |
| | |
Rengo Co. Ltd. | | | 11,081 | | | | 71,393 | |
| | |
Tomoku Co. Ltd. | | | 1,000 | | | | 13,108 | |
| | |
Toyo Seikan Group Holdings Ltd. | | | 13,800 | | | | 159,859 | |
| | | | | | | | |
| Total Containers & Packaging | | | | | | | 279,345 | |
|
| Distributors – 0.5% | |
| | |
Arata Corp. | | | 700 | | | | 21,021 | |
| | |
Doshisha Co. Ltd. | | | 2,000 | | | | 24,700 | |
| | |
Happinet Corp. | | | 2,100 | | | | 26,126 | |
| | |
PALTAC Corp. | | | 1,400 | | | | 52,482 | |
| | |
Yamae Group Holdings Co. Ltd. | | | 1,500 | | | | 12,754 | |
| | | | | | | | |
| Total Distributors | | | | | | | 137,083 | |
|
| Diversified Consumer Services – 0.4% | |
| | |
Asante, Inc.(a) | | | 1,200 | | | | 14,425 | |
| | |
Benesse Holdings, Inc. | | | 3,000 | | | | 55,538 | |
| | |
Riso Kyoiku Co. Ltd. | | | 4,900 | | | | 15,341 | |
| | |
Tokyo Individualized Educational Institute, Inc. | | | 4,000 | | | | 19,971 | |
| | | | | | | | |
| Total Diversified Consumer Services | | | | | | | 105,275 | |
|
| Diversified Financial Services – 1.2% | |
| | |
eGuarantee, Inc. | | | 600 | | | | 10,139 | |
| | |
Financial Products Group Co. Ltd. | | | 3,600 | | | | 25,596 | |
| | |
Fuyo General Lease Co. Ltd. | | | 1,600 | | | | 92,144 | |
| | |
Japan Securities Finance Co. Ltd.(a) | | | 5,200 | | | | 39,458 | |
| | |
Mizuho Leasing Co. Ltd.(a) | | | 2,300 | | | | 56,394 | |
| | |
NEC Capital Solutions Ltd. | | | 1,200 | | | | 20,525 | |
| | |
Ricoh Leasing Co. Ltd.(a) | | | 2,100 | | | | 57,615 | |
| | | | | | | | |
| Total Diversified Financial Services | | | | | | | 301,871 | |
|
| Diversified Telecommunication Services – 0.2% | |
| | |
ARTERIA Networks Corp. | | | 4,500 | | | | 48,642 | |
| | |
Usen-Next Holdings Co. Ltd. | | | 500 | | | | 10,509 | |
| | | | | | | | |
| Total Diversified Telecommunication Services | | | | | | | 59,151 | |
|
| Electric Utilities – 0.7% | |
| | |
Hokkaido Electric Power Co., Inc. | | | 16,000 | | | | 63,802 | |
| | |
Okinawa Electric Power Co., Inc. | | | 3,683 | | | | 41,814 | |
| | |
Shikoku Electric Power Co., Inc. | | | 12,500 | | | | 81,154 | |
| | | | | | | | |
| Total Electric Utilities | | | | | | | 186,770 | |
|
| Electrical Equipment – 1.5% | |
| | |
Daihen Corp. | | | 1,200 | | | | 41,821 | |
| | |
Furukawa Electric Co. Ltd. | | | 1,826 | | | | 32,736 | |
| | |
GS Yuasa Corp.(a) | | | 2,900 | | | | 55,933 | |
| | |
Idec Corp. | | | 1,100 | | | | 23,319 | |
| | |
Mabuchi Motor Co. Ltd. | | | 800 | | | | 25,211 | |
| | |
Nippon Carbon Co. Ltd. | | | 900 | | | | 31,069 | |
| | |
Nippon Seisen Co. Ltd.(a) | | | 400 | | | | 14,665 | |
| | |
Nissin Electric Co. Ltd. | | | 5,100 | | | | 62,019 | |
| | |
Nitto Kogyo Corp. | | | 3,000 | | | | 38,954 | |
| | |
Sanyo Denki Co. Ltd. | | | 200 | | | | 8,115 | |
| | |
Sinfonia Technology Co. Ltd. | | | 1,500 | | | | 16,461 | |
| | |
SWCC Showa Holdings Co. Ltd. | | | 600 | | | | 9,289 | |
See Notes to Financial Statements.
Schedule of Investments (continued)
WisdomTree Japan Hedged SmallCap Equity Fund (DXJS)
March 31, 2022
| | | | | | | | |
| Investments | | Shares | | | Value | |
| | |
Takaoka Toko Co. Ltd. | | | 1,400 | | | $ | 17,060 | |
| | |
Tatsuta Electric Wire and Cable Co. Ltd. | | | 4,400 | | | | 16,748 | |
| | | | | | | | |
| Total Electrical Equipment | | | | | | | 393,400 | |
|
| Electronic Equipment, Instruments & Components – 4.9% | |
| | |
A&D Co. Ltd.(a) | | | 1,500 | | | | 11,963 | |
| | |
Ai Holdings Corp. | | | 1,900 | | | | 26,815 | |
| | |
Amano Corp. | | | 3,100 | | | | 56,113 | |
| | |
Anritsu Corp.(a) | | | 4,200 | | | | 53,739 | |
| | |
Canon Electronics, Inc. | | | 2,100 | | | | 27,752 | |
| | |
Citizen Watch Co. Ltd.(a) | | | 10,500 | | | | 45,071 | |
| | |
CONEXIO Corp.(a) | | | 2,500 | | | | 28,939 | |
| | |
Daiwabo Holdings Co. Ltd. | | | 6,700 | | | | 91,026 | |
| | |
Dexerials Corp. | | | 3,600 | | | | 99,213 | |
| | |
Elematec Corp. | | | 2,558 | | | | 22,003 | |
| | |
ESPEC Corp. | | | 1,200 | | | | 19,457 | |
| | |
Furuno Electric Co. Ltd. | | | 2,900 | | | | 24,227 | |
| | |
Hakuto Co. Ltd.(a) | | | 1,700 | | | | 34,343 | |
| | |
Hioki EE Corp.(a) | | | 500 | | | | 29,042 | |
| | |
I-PEX, Inc. | | | 700 | | | | 8,466 | |
| | |
Innotech Corp. | | | 1,700 | | | | 19,385 | |
| | |
Iriso Electronics Co. Ltd.(a) | | | 200 | | | | 5,504 | |
| | |
Japan Aviation Electronics Industry Ltd. | | | 2,400 | | | | 39,369 | |
| | |
Kaga Electronics Co. Ltd. | | | 1,300 | | | | 34,863 | |
| | |
Koa Corp.(a) | | | 1,100 | | | | 13,023 | |
| | |
Kyosan Electric Manufacturing Co. Ltd. | | | 2,800 | | | | 10,081 | |
| | |
Macnica Fuji Electronics Holdings, Inc. | | | 3,000 | | | | 65,302 | |
| | |
Maruwa Co. Ltd. | | | 200 | | | | 26,925 | |
| | |
Meiko Electronics Co. Ltd. | | | 500 | | | | 16,705 | |
| | |
Nichicon Corp. | | | 2,700 | | | | 26,138 | |
| | |
Nippon Ceramic Co. Ltd. | | | 800 | | | | 16,115 | |
| | |
Nippon Electric Glass Co. Ltd. | | | 5,200 | | | | 116,360 | |
| | |
Nippon Signal Co. Ltd.(a) | | | 3,500 | | | | 25,434 | |
| | |
Nissha Co. Ltd. | | | 1,300 | | | | 15,563 | |
| | |
Nohmi Bosai Ltd. | | | 1,466 | | | | 23,601 | |
| | |
Optex Group Co. Ltd.(a) | | | 1,500 | | | | 21,430 | |
| | |
Restar Holdings Corp. | | | 1,700 | | | | 27,690 | |
| | |
Riken Keiki Co. Ltd. | | | 500 | | | | 20,185 | |
| | |
Ryoden Corp.(a) | | | 1,600 | | | | 22,463 | |
| | |
Ryosan Co. Ltd.(a) | | | 1,100 | | | | 19,911 | |
| | |
Sanshin Electronics Co. Ltd. | | | 1,000 | | | | 13,240 | |
| | |
Siix Corp.(a) | | | 2,100 | | | | 18,409 | |
| | |
Tachibana Eletech Co. Ltd. | | | 1,200 | | | | 16,283 | |
| | |
Tokyo Electron Device Ltd. | | | 500 | | | | 21,462 | |
| | |
Topcon Corp. | | | 1,600 | | | | 20,630 | |
| | |
V Technology Co. Ltd. | | | 500 | | | | 13,594 | |
| | |
Yokowo Co. Ltd.(a) | | | 700 | | | | 14,926 | |
| | | | | | | | |
| Total Electronic Equipment, Instruments & Components | | | | 1,262,760 | |
|
| Energy Equipment & Services – 0.1% | |
| | |
Modec, Inc. | | | 1,500 | | | | 15,757 | |
| | |
Toyo Kanetsu KK(a) | | | 900 | | | | 18,182 | |
| | | | | | | | |
| Total Energy Equipment & Services | | | | | | | 33,939 | |
|
| Entertainment – 0.8% | |
| | |
Akatsuki, Inc. | | | 700 | | | | 16,760 | |
| | |
Avex, Inc.(a) | | | 8,400 | | | | 92,322 | |
| | |
Daiichikosho Co. Ltd. | | | 2,300 | | | | 65,944 | |
| | |
Marvelous, Inc. | | | 4,300 | | | | 25,579 | |
| | | | | | | | |
| Total Entertainment | | | | | | | 200,605 | |
|
| Food & Staples Retailing – 2.2% | |
| | |
Aeon Hokkaido Corp.(a) | | | 2,100 | | | | 19,447 | |
| | |
Ain Holdings, Inc. | | | 500 | | | | 26,200 | |
| | |
Arcs Co. Ltd. | | | 2,400 | | | | 41,840 | |
| | |
Axial Retailing, Inc. | | | 900 | | | | 23,728 | |
| | |
Belc Co. Ltd. | | | 400 | | | | 17,895 | |
| | |
Cawachi Ltd. | | | 1,100 | | | | 20,364 | |
| | |
Create SD Holdings Co. Ltd. | | | 1,300 | | | | 34,435 | |
| | |
Fuji Co. Ltd. | | | 600 | | | | 11,419 | |
| | |
G-7 Holdings, Inc.(a) | | | 1,900 | | | | 25,892 | |
| | |
Heiwado Co. Ltd. | | | 2,100 | | | | 32,804 | |
| | |
Kato Sangyo Co. Ltd. | | | 1,500 | | | | 39,176 | |
| | |
Life Corp. | | | 1,100 | | | | 28,548 | |
| | |
Mitsubishi Shokuhin Co. Ltd. | | | 1,500 | | | | 37,199 | |
| | |
Okuwa Co. Ltd. | | | 2,500 | | | | 18,970 | |
| | |
Qol Holdings Co. Ltd. | | | 1,200 | | | | 11,538 | |
| | |
Retail Partners Co. Ltd.(a) | | | 1,500 | | | | 17,747 | |
| | |
San-A Co. Ltd. | | | 800 | | | | 27,254 | |
| | |
United Super Markets Holdings, Inc.(a) | | | 3,600 | | | | 31,262 | |
| | |
Valor Holdings Co. Ltd. | | | 2,000 | | | | 34,851 | |
| | |
Yaoko Co. Ltd. | | | 700 | | | | 38,294 | |
| | |
Yokorei Co. Ltd.(a) | | | 3,700 | | | | 26,125 | |
| | | | | | | | |
| Total Food & Staples Retailing | | | | | | | 564,988 | |
|
| Food Products – 3.3% | |
| | |
Ariake Japan Co. Ltd. | | | 400 | | | | 17,104 | |
| | |
Ezaki Glico Co. Ltd. | | | 1,800 | | | | 55,168 | |
| | |
Fuji Oil Holdings, Inc. | | | 2,051 | | | | 33,458 | |
| | |
Fujicco Co. Ltd.(a) | | | 1,600 | | | | 25,429 | |
| | |
Hokuto Corp.(a) | | | 2,500 | | | | 39,258 | |
| | |
Itoham Yonekyu Holdings, Inc. | | | 18,900 | | | | 101,060 | |
| | |
J-Oil Mills, Inc.(a) | | | 2,000 | | | | 26,480 | |
| | |
Kagome Co. Ltd. | | | 1,800 | | | | 46,270 | |
| | |
Kameda Seika Co. Ltd. | | | 500 | | | | 16,375 | |
| | |
Kyokuyo Co. Ltd.(a) | | | 900 | | | | 24,692 | |
| | |
Maruha Nichiro Corp. | | | 1,300 | | | | 25,673 | |
| | |
Megmilk Snow Brand Co. Ltd.(a) | | | 2,000 | | | | 32,626 | |
| | |
Mitsui DM Sugar Holdings Co. Ltd. | | | 1,700 | | | | 26,934 | |
| | |
Morinaga & Co. Ltd. | | | 1,800 | | | | 56,503 | |
| | |
Nippn Corp. | | | 2,700 | | | | 36,994 | |
| | |
Nippon Suisan Kaisha Ltd. | | | 7,800 | | | | 35,216 | |
| | |
Nisshin Oillio Group Ltd. | | | 1,500 | | | | 35,209 | |
| | |
Prima Meat Packers Ltd. | | | 1,900 | | | | 34,470 | |
| | |
Riken Vitamin Co. Ltd.(a) | | | 1,400 | | | | 19,343 | |
| | |
S Foods, Inc. | | | 1,100 | | | | 29,726 | |
| | |
Sakata Seed Corp. | | | 1,400 | | | | 42,793 | |
| | |
Showa Sangyo Co. Ltd. | | | 1,500 | | | | 32,354 | |
| | |
Starzen Co. Ltd. | | | 1,600 | | | | 26,365 | |
See Notes to Financial Statements.
Schedule of Investments (continued)
WisdomTree Japan Hedged SmallCap Equity Fund (DXJS)
March 31, 2022
| | | | | | | | |
| Investments | | Shares | | | Value | |
| | |
Warabeya Nichiyo Holdings Co. Ltd.(a) | | | 900 | | | $ | 13,184 | |
| | |
Yukiguni Maitake Co. Ltd. | | | 2,100 | | | | 19,741 | |
| | | | | | | | |
| Total Food Products | | | | | | | 852,425 | |
|
| Gas Utilities – 0.6% | |
| | |
Hokkaido Gas Co. Ltd. | | | 1,500 | | | | 18,191 | |
| | |
Nippon Gas Co. Ltd.(a) | | | 6,100 | | | | 74,934 | |
| | |
Saibu Gas Holdings Co. Ltd.(a) | | | 1,800 | | | | 29,586 | |
| | |
Shizuoka Gas Co. Ltd. | | | 3,000 | | | | 21,034 | |
| | | | | | | | |
| Total Gas Utilities | | | | | | | 143,745 | |
|
| Health Care Equipment & Supplies – 1.2% | |
| | |
Eiken Chemical Co. Ltd.(a) | | | 1,900 | | | | 27,034 | |
| | |
Hogy Medical Co. Ltd. | | | 1,100 | | | | 29,364 | |
| | |
Japan Lifeline Co. Ltd.(a) | | | 3,200 | | | | 27,076 | |
| | |
Mani, Inc. | | | 2,100 | | | | 25,399 | |
| | |
Mizuho Medy Co. Ltd.(a) | | | 200 | | | | 3,299 | |
| | |
Nagaileben Co. Ltd. | | | 1,900 | | | | 31,292 | |
| | |
Nakanishi, Inc. | | | 2,700 | | | | 50,230 | |
| | |
Nipro Corp. | | | 7,523 | | | | 63,469 | |
| | |
Paramount Bed Holdings Co. Ltd. | | | 2,306 | | | | 37,903 | |
| | | | | | | | |
| Total Health Care Equipment & Supplies | | | | | | | 295,066 | |
|
| Health Care Providers & Services – 1.2% | |
| | |
BML, Inc. | | | 2,100 | | | | 53,462 | |
| | |
FALCO HOLDINGS Co. Ltd.(a) | | | 900 | | | | 14,882 | |
| | |
France Bed Holdings Co. Ltd. | | | 3,000 | | | | 21,380 | |
| | |
H.U. Group Holdings, Inc. | | | 6,400 | | | | 153,178 | |
| | |
Ship Healthcare Holdings, Inc. | | | 2,018 | | | | 33,053 | |
| | |
Solasto Corp. | | | 1,600 | | | | 13,024 | |
| | |
Tokai Corp. | | | 700 | | | | 9,943 | |
| | | | | | | | |
| Total Health Care Providers & Services | | | | | | | 298,922 | |
|
| Hotels, Restaurants & Leisure – 1.9% | |
| | |
Aeon Fantasy Co. Ltd.(a) | | | 700 | | | | 11,096 | |
| | |
Arcland Service Holdings Co. Ltd.(a) | | | 900 | | | | 16,187 | |
| | |
Doutor Nichires Holdings Co. Ltd. | | | 1,300 | | | | 16,312 | |
| | |
Heiwa Corp.(a) | | | 6,000 | | | | 90,068 | |
| | |
Hiday Hidaka Corp. | | | 1,222 | | | | 18,052 | |
| | |
Ichibanya Co. Ltd.(a) | | | 900 | | | | 34,295 | |
| | |
KFC Holdings Japan Ltd.(a) | | | 900 | | | | 21,074 | |
| | |
KOMEDA Holdings Co. Ltd. | | | 2,400 | | | | 40,259 | |
| | |
Kura Sushi, Inc.(a) | | | 300 | | | | 8,305 | |
| | |
Monogatari Corp. | | | 200 | | | | 9,590 | |
| | |
MOS Food Services, Inc. | | | 700 | | | | 16,667 | |
| | |
Ohsho Food Service Corp.(a) | | | 900 | | | | 44,490 | |
| | |
Plenus Co. Ltd. | | | 3,200 | | | | 52,993 | |
| | |
Resorttrust, Inc. | | | 2,400 | | | | 41,386 | |
| | |
Round One Corp. | | | 2,000 | | | | 22,245 | |
| | |
Saizeriya Co. Ltd. | | | 500 | | | | 11,081 | |
| | |
Tokyotokeiba Co. Ltd. | | | 600 | | | | 21,553 | |
| | | | | | | | |
| Total Hotels, Restaurants & Leisure | | | | | | | 475,653 | |
|
| Household Durables – 1.9% | |
| | |
Cleanup Corp. | | | 4,500 | | | | 19,650 | |
| | |
ES-Con Japan Ltd.(a) | | | 7,200 | | | | 48,405 | |
| | |
FJ Next Holdings Co. Ltd.(a) | | | 4,100 | | | | 33,408 | |
| | |
Fuji Corp. Ltd.(a) | | | 4,200 | | | | 21,350 | |
| | |
Fujitsu General Ltd. | | | 1,900 | | | | 37,413 | |
| | |
Hinokiya Group Co. Ltd.(a) | | | 1,500 | | | | 29,092 | |
| | |
Hoosiers Holdings | | | 2,900 | | | | 15,578 | |
| | |
JVCKenwood Corp. | | | 10,900 | | | | 15,985 | |
| | |
Ki-Star Real Estate Co. Ltd.(a) | | | 1,200 | | | | 52,103 | |
| | |
LEC, Inc.(a) | | | 2,800 | | | | 20,301 | |
| | |
Pressance Corp. | | | 1,817 | | | | 27,351 | |
| | |
Sanei Architecture Planning Co. Ltd.(a) | | | 1,500 | | | | 19,687 | |
| | |
Sangetsu Corp. | | | 3,300 | | | | 41,571 | |
| | |
Tama Home Co. Ltd. | | | 3,000 | | | | 63,127 | |
| | |
Tamron Co. Ltd.(a) | | | 900 | | | | 17,655 | |
| | |
Zojirushi Corp.(a) | | | 2,100 | | | | 25,122 | |
| | | | | | | | |
| Total Household Durables | | | | | | | 487,798 | |
|
| Household Products – 0.5% | |
| | |
Earth Corp. | | | 600 | | | | 27,584 | |
| | |
Pigeon Corp. | | | 5,600 | | | | 99,335 | |
| | |
Transaction Co. Ltd. | | | 1,000 | | | | 8,190 | |
| | | | | | | | |
| Total Household Products | | | | | | | 135,109 | |
|
| Independent Power & Renewable Electricity Producers – 0.9% | |
| | |
Electric Power Development Co. Ltd. | | | 13,500 | | | | 194,422 | |
| | |
eRex Co. Ltd. | | | 900 | | | | 12,843 | |
| | |
West Holdings Corp. | | | 600 | | | | 23,926 | |
| | | | | | | | |
| Total Independent Power & Renewable Electricity Producers | | | | 231,191 | |
|
| Industrial Conglomerates – 0.6% | |
| | |
Nisshinbo Holdings, Inc. | | | 7,700 | | | | 67,436 | |
| | |
Noritsu Koki Co. Ltd.(a) | | | 500 | | | | 9,640 | |
| | |
TOKAI Holdings Corp. | | | 10,200 | | | | 72,440 | |
| | | | | | | | |
| Total Industrial Conglomerates | | | | | | | 149,516 | |
|
| Insurance – 0.0% | |
| | |
Advance Create Co. Ltd. | | | 1,500 | | | | 11,753 | |
|
| Interactive Media & Services – 0.1% | |
| | |
Dip Corp.(a) | | | 1,200 | | | | 33,219 | |
|
| Internet & Direct Marketing Retail – 0.3% | |
| | |
ASKUL Corp. | | | 2,300 | | | | 30,395 | |
| | |
Aucnet, Inc.(a) | | | 600 | | | | 7,895 | |
| | |
Belluna Co. Ltd.(a) | | | 3,400 | | | | 20,337 | |
| | |
Scroll Corp.(a) | | | 4,300 | | | | 29,511 | |
| | | | | | | | |
| Total Internet & Direct Marketing Retail | | | | | | | 88,138 | |
|
| IT Services – 3.2% | |
| | |
Bell System24 Holdings, Inc. | | | 3,300 | | | | 37,384 | |
| | |
Comture Corp. | | | 500 | | | | 12,770 | |
| | |
Digital Garage, Inc. | | | 500 | | | | 18,950 | |
| | |
DTS Corp. | | | 2,000 | | | | 44,128 | |
| | |
Future Corp. | | | 2,400 | | | | 34,485 | |
| | |
GMO GlobalSign Holdings KK(a) | | | 300 | | | | 15,349 | |
| | |
GMO Internet, Inc. | | | 2,700 | | | | 62,331 | |
| | |
Ines Corp.(a) | | | 1,300 | | | | 17,469 | |
| | |
Infocom Corp. | | | 1,500 | | | | 26,175 | |
| | |
Infomart Corp. | | | 700 | | | | 3,812 | |
| | |
Information Services International-Dentsu Ltd. | | | 1,200 | | | | 38,657 | |
See Notes to Financial Statements.
Schedule of Investments (continued)
WisdomTree Japan Hedged SmallCap Equity Fund (DXJS)
March 31, 2022
| | | | | | | | |
| Investments | | Shares | | | Value | |
| | |
JBCC Holdings, Inc.(a) | | | 1,500 | | | $ | 19,180 | |
| | |
Kanematsu Electronics Ltd. | | | 1,600 | | | | 50,554 | |
| | |
Mitsubishi Research Institute, Inc. | | | 800 | | | | 26,365 | |
| | |
NEC Networks & System Integration Corp. | | | 4,500 | | | | 66,216 | |
| | |
NET One Systems Co. Ltd. | | | 2,600 | | | | 61,286 | |
| | |
Nihon Unisys Ltd. | | | 3,700 | | | | 94,958 | |
| | |
NSD Co. Ltd. | | | 2,900 | | | | 52,373 | |
| | |
Relia, Inc. | | | 3,500 | | | | 30,682 | |
| | |
SB Technology Corp.(a) | | | 500 | | | | 10,435 | |
| | |
TDC Soft, Inc.(a) | | | 1,400 | | | | 13,472 | |
| | |
TKC Corp. | | | 1,500 | | | | 41,030 | |
| | |
Transcosmos, Inc. | | | 1,500 | | | | 39,423 | |
| | |
Uchida Yoko Co. Ltd. | | | 300 | | | | 12,012 | |
| | | | | | | | |
| Total IT Services | | | | | | | 829,496 | |
|
| Leisure Products – 1.1% | |
| | |
Daikoku Denki Co. Ltd. | | | 1,400 | | | | 13,991 | |
| | |
Furyu Corp.(a) | | | 1,200 | | | | 10,935 | |
| | |
GLOBERIDE, Inc.(a) | | | 500 | | | | 11,938 | |
| | |
Mizuno Corp. | | | 800 | | | | 13,914 | |
| | |
Roland Corp. | | | 1,900 | | | | 63,164 | |
| | |
Sankyo Co. Ltd. | | | 4,800 | | | | 134,262 | |
| | |
Tomy Co. Ltd. | | | 2,600 | | | | 26,155 | |
| | | | | | | | |
| Total Leisure Products | | | | | | | 274,359 | |
|
| Machinery – 4.6% | |
| | |
Aichi Corp. | | | 5,200 | | | | 37,787 | |
| | |
Aida Engineering Ltd. | | | 2,000 | | | | 17,417 | |
| | |
Alinco, Inc. | | | 2,100 | | | | 15,001 | |
| | |
Bando Chemical Industries Ltd. | | | 4,200 | | | | 30,555 | |
| | |
CKD Corp.(a) | | | 1,500 | | | | 23,296 | |
| | |
DMG Mori Co. Ltd. | | | 1,900 | | | | 26,205 | |
| | |
Ebara Jitsugyo Co. Ltd. | | | 800 | | | | 16,194 | |
| | |
Fujitec Co. Ltd.(a) | | | 3,100 | | | | 80,453 | |
| | |
Fukushima Galilei Co. Ltd.(a) | | | 500 | | | | 15,839 | |
| | |
Furukawa Co. Ltd. | | | 2,900 | | | | 30,798 | |
| | |
Giken Ltd. | | | 700 | | | | 21,425 | |
| | |
Glory Ltd.(a) | | | 2,600 | | | | 44,385 | |
| | |
Hitachi Zosen Corp. | | | 3,135 | | | | 19,268 | |
| | |
Japan Steel Works Ltd. | | | 1,203 | | | | 37,862 | |
| | |
Kito Corp.(a) | | | 1,400 | | | | 20,474 | |
| | |
Kitz Corp. | | | 2,500 | | | | 14,150 | |
| | |
Kyokuto Kaihatsu Kogyo Co. Ltd. | | | 2,000 | | | | 22,871 | |
| | |
Meidensha Corp.(a) | | | 1,300 | | | | 27,216 | |
| | |
METAWATER Co. Ltd. | | | 1,700 | | | | 28,040 | |
| | |
Mitsubishi Logisnext Co. Ltd. | | | 900 | | | | 6,911 | |
| | |
Mitsuboshi Belting Ltd. | | | 1,500 | | | | 25,050 | |
| | |
Morita Holdings Corp. | | | 1,900 | | | | 19,348 | |
| | |
Nachi-Fujikoshi Corp. | | | 400 | | | | 13,808 | |
| | |
Nikko Co. Ltd.(a) | | | 5,700 | | | | 28,506 | |
| | |
Nippon Thompson Co. Ltd. | | | 2,100 | | | | 9,360 | |
| | |
Nissei ASB Machine Co. Ltd. | | | 600 | | | | 15,399 | |
| | |
Nitta Corp. | | | 1,300 | | | | 29,604 | |
| | |
Nomura Micro Science Co. Ltd.(a) | | | 200 | | | | 7,011 | |
| | |
Noritake Co. Ltd. | | | 500 | | | | 18,373 | |
| | |
Obara Group, Inc. | | | 600 | | | | 14,771 | |
| | |
Oiles Corp.(a) | | | 1,800 | | | | 22,468 | |
| | |
OKUMA Corp. | | | 500 | | | | 21,009 | |
| | |
Organo Corp. | | | 300 | | | | 25,038 | |
| | |
OSG Corp. | | | 1,800 | | | | 27,866 | |
| | |
Shibaura Machine Co. Ltd. | | | 1,300 | | | | 36,630 | |
| | |
Shibuya Corp. | | | 900 | | | | 18,085 | |
| | |
Shinmaywa Industries Ltd. | | | 4,200 | | | | 31,316 | |
| | |
Sodick Co. Ltd. | | | 3,000 | | | | 19,403 | |
| | |
Star Micronics Co. Ltd. | | | 2,700 | | | | 34,257 | |
| | |
Takeuchi Manufacturing Co. Ltd. | | | 1,200 | | | | 26,121 | |
| | |
Teikoku Electric Manufacturing Co. Ltd. | | | 1,200 | | | | 15,562 | |
| | |
Tocalo Co. Ltd. | | | 2,700 | | | | 30,253 | |
| | |
Torishima Pump Manufacturing Co. Ltd. | | | 2,700 | | | | 22,824 | |
| | |
Tsubaki Nakashima Co. Ltd. | | | 1,400 | | | | 11,154 | |
| | |
Tsubakimoto Chain Co. | | | 1,600 | | | | 40,272 | |
| | |
Tsugami Corp. | | | 1,500 | | | | 16,437 | |
| | |
Union Tool Co. | | | 600 | | | | 18,834 | |
| | |
YAMABIKO Corp. | | | 2,200 | | | | 27,116 | |
| | |
Yushin Precision Equipment Co. Ltd. | | | 3,200 | | | | 17,717 | |
| | | | | | | | |
| Total Machinery | | | | | | | 1,179,739 | |
|
| Marine – 0.4% | |
| | |
Iino Kaiun Kaisha Ltd. | | | 7,500 | | | | 51,040 | |
| | |
Japan Transcity Corp.(a) | | | 3,400 | | | | 16,948 | |
| | |
NS United Kaiun Kaisha Ltd. | | | 1,200 | | | | 41,623 | |
| | | | | | | | |
| Total Marine | | | | | | | 109,611 | |
|
| Media – 0.9% | |
| | |
Carta Holdings, Inc.(a) | | | 1,400 | | | | 27,706 | |
| | |
Digital Holdings, Inc.(a) | | | 1,100 | | | | 12,661 | |
| | |
Intage Holdings, Inc. | | | 1,800 | | | | 25,463 | |
| | |
Proto Corp. | | | 1,400 | | | | 11,927 | |
| | |
SKY Perfect JSAT Holdings, Inc. | | | 19,200 | | | | 65,490 | |
| | |
TV Tokyo Holdings Corp. | | | 1,800 | | | | 29,512 | |
| | |
ValueCommerce Co. Ltd. | | | 600 | | | | 18,463 | |
| | |
Wowow, Inc. | | | 1,900 | | | | 25,125 | |
| | |
Zenrin Co. Ltd. | | | 3,200 | | | | 26,285 | |
| | | | | | | | |
| Total Media | | | | | | | 242,632 | |
|
| Metals & Mining – 3.6% | |
| | |
Aichi Steel Corp. | | | 900 | | | | 17,818 | |
| | |
Asahi Holdings, Inc. | | | 5,000 | | | | 93,306 | |
| | |
Daido Steel Co. Ltd. | | | 1,200 | | | | 36,482 | |
| | |
Daiki Aluminium Industry Co. Ltd.(a) | | | 2,500 | | | | 32,441 | |
| | |
Dowa Holdings Co. Ltd. | | | 1,800 | | | | 83,197 | |
| | |
Hakudo Co. Ltd.(a) | | | 900 | | | | 19,146 | |
| | |
Kobe Steel Ltd. | | | 16,300 | | | | 79,368 | |
| | |
Kurimoto Ltd. | | | 900 | | | | 11,642 | |
| | |
Kyoei Steel Ltd.(a) | | | 3,200 | | | | 35,302 | |
| | |
Maruichi Steel Tube Ltd. | | | 4,800 | | | | 109,149 | |
| | |
Mitsubishi Materials Corp. | | | 6,700 | | | | 118,295 | |
| | |
Mitsui Mining & Smelting Co. Ltd. | | | 2,100 | | | | 58,047 | |
| | |
Neturen Co. Ltd. | | | 2,800 | | | | 13,634 | |
| | |
Nippon Denko Co. Ltd. | | | 7,600 | | | | 21,227 | |
| | |
Nippon Light Metal Holdings Co. Ltd.(a) | | | 4,900 | | | | 69,155 | |
See Notes to Financial Statements.
Schedule of Investments (continued)
WisdomTree Japan Hedged SmallCap Equity Fund (DXJS)
March 31, 2022
| | | | | | | | |
| Investments | | Shares | | | Value | |
| | |
Nippon Yakin Kogyo Co. Ltd.(a) | | | 900 | | | $ | 20,836 | |
| | |
Nittetsu Mining Co. Ltd. | | | 300 | | | | 17,499 | |
| | |
Sanyo Special Steel Co. Ltd.(a) | | | 2,100 | | | | 36,732 | |
| | |
Toho Titanium Co. Ltd. | | | 1,400 | | | | 16,783 | |
| | |
Toho Zinc Co. Ltd.(a) | | | 300 | | | | 7,282 | |
| | |
Tokyo Steel Manufacturing Co. Ltd.(a) | | | 2,700 | | | | 25,893 | |
| | |
Tokyo Tekko Co. Ltd. | | | 800 | | | | 8,799 | |
| | | | | | | | |
| Total Metals & Mining | | | | | | | 932,033 | |
|
| Multiline Retail – 1.3% | |
| | |
H2O Retailing Corp.(a) | | | 5,100 | | | | 35,590 | |
| | |
Izumi Co. Ltd. | | | 2,500 | | | | 66,323 | |
| | |
J. Front Retailing Co. Ltd. | | | 12,900 | | | | 105,963 | |
| | |
Mr. Max Holdings Ltd. | | | 3,300 | | | | 15,878 | |
| | |
Seria Co. Ltd. | | | 2,000 | | | | 45,693 | |
| | |
Takashimaya Co. Ltd. | | | 6,000 | | | | 57,442 | |
| | | | | | | | |
| Total Multiline Retail | | | | | | | 326,889 | |
|
| Oil, Gas & Consumable Fuels – 1.0% | |
| | |
Cosmo Energy Holdings Co. Ltd. | | | 6,200 | | | | 134,344 | |
| | |
Itochu Enex Co. Ltd. | | | 7,900 | | | | 66,845 | |
| | |
Nippon Coke & Engineering Co. Ltd.(a) | | | 20,700 | | | | 24,559 | |
| | |
Sala Corp. | | | 4,300 | | | | 22,638 | |
| | |
San-Ai Oil Co. Ltd. | | | 1,900 | | | | 14,699 | |
| | | | | | | | |
| Total Oil, Gas & Consumable Fuels | | | | | | | 263,085 | |
|
| Paper & Forest Products – 0.5% | |
| | |
Daiken Corp. | | | 1,500 | | | | 26,843 | |
| | |
Hokuetsu Corp.(a) | | | 7,500 | | | | 42,945 | |
| | |
Nippon Paper Industries Co. Ltd.(a) | | | 5,700 | | | | 48,793 | |
| | | | | | | | |
| Total Paper & Forest Products | | | | | | | 118,581 | |
|
| Personal Products – 0.4% | |
| | |
Milbon Co. Ltd. | | | 500 | | | | 22,574 | |
| | |
Noevir Holdings Co. Ltd. | | | 1,800 | | | | 73,335 | |
| | | | | | | | |
| Total Personal Products | | | | | | | 95,909 | |
|
| Pharmaceuticals – 1.6% | |
| | |
Astena Holdings Co. Ltd. | | | 3,400 | | | | 12,465 | |
| | |
Kaken Pharmaceutical Co. Ltd. | | | 2,400 | | | | 76,919 | |
| | |
KYORIN Holdings, Inc. | | | 3,700 | | | | 54,170 | |
| | |
Mochida Pharmaceutical Co. Ltd. | | | 1,800 | | | | 55,390 | |
| | |
Sawai Group Holdings Co. Ltd. | | | 1,700 | | | | 62,467 | |
| | |
Seikagaku Corp.(a) | | | 2,500 | | | | 18,023 | |
| | |
Towa Pharmaceutical Co. Ltd. | | | 1,700 | | | | 38,489 | |
| | |
Tsumura & Co. | | | 2,100 | | | | 55,366 | |
| | |
ZERIA Pharmaceutical Co. Ltd. | | | 1,600 | | | | 25,099 | |
| | | | | | | | |
| Total Pharmaceuticals | | | | | | | 398,388 | |
|
| Professional Services – 1.4% | |
| | |
Altech Corp. | | | 1,450 | | | | 22,471 | |
| | |
en Japan, Inc. | | | 700 | | | | 17,025 | |
| | |
Forum Engineering, Inc. | | | 2,600 | | | | 17,458 | |
| | |
FULLCAST Holdings Co. Ltd. | | | 900 | | | | 19,435 | |
| | |
Funai Soken Holdings, Inc.(a) | | | 1,340 | | | | 24,388 | |
| | |
IR Japan Holdings Ltd.(a) | | | 300 | | | | 10,764 | |
| | |
JAC Recruitment Co. Ltd. | | | 3,300 | | | | 50,380 | |
| | |
LIKE, Inc.(a) | | | 900 | | | | 15,216 | |
| | |
Link and Motivation, Inc.(a) | | | 300 | | | | 1,347 | |
| | |
Meitec Corp. | | | 1,200 | | | | 65,747 | |
| | |
Nomura Co. Ltd. | | | 3,900 | | | | 29,497 | |
| | |
Outsourcing, Inc. | | | 900 | | | | 9,424 | |
| | |
Pasona Group, Inc. | | | 800 | | | | 16,247 | |
| | |
Tanseisha Co. Ltd. | | | 3,000 | | | | 19,749 | |
| | |
UT Group Co. Ltd. | | | 300 | | | | 7,675 | |
| | |
World Holdings Co. Ltd. | | | 900 | | | | 17,425 | |
| | |
YAMADA Consulting Group Co. Ltd.(a) | | | 1,300 | | | | 12,649 | |
| | | | | | | | |
| Total Professional Services | | | | | | | 356,897 | |
|
| Real Estate Management & Development – 1.9% | |
| | |
Aoyama Zaisan Networks Co. Ltd.(a) | | | 1,700 | | | | 17,284 | |
| | |
CRE, Inc. | | | 900 | | | | 13,288 | |
| | |
Daibiru Corp.* | | | 2,500 | | | | 45,211 | |
| | |
Dear Life Co. Ltd.(a) | | | 5,800 | | | | 25,326 | |
| | |
Goldcrest Co. Ltd. | | | 2,300 | | | | 31,949 | |
| | |
Heiwa Real Estate Co. Ltd.(a) | | | 1,600 | | | | 52,136 | |
| | |
Ichigo, Inc. | | | 16,500 | | | | 42,822 | |
| | |
Katitas Co. Ltd. | | | 1,100 | | | | 30,632 | |
| | |
Keihanshin Building Co. Ltd.(a) | | | 2,100 | | | | 25,935 | |
| | |
SAMTY Co. Ltd. | | | 3,400 | | | | 61,627 | |
| | |
Shinoken Group Co. Ltd. | | | 2,800 | | | | 23,669 | |
| | |
Starts Corp., Inc. | | | 1,800 | | | | 35,577 | |
| | |
Sun Frontier Fudousan Co. Ltd. | | | 6,700 | | | | 57,961 | |
| | |
Takara Leben Co. Ltd. | | | 9,200 | | | | 22,664 | |
| | |
Tosei Corp. | | | 1,400 | | | | 13,449 | |
| | | | | | | | |
| Total Real Estate Management & Development | | | | | | | 499,530 | |
|
| Road & Rail – 1.2% | |
| | |
Alps Logistics Co. Ltd.(a) | | | 1,800 | | | | 15,928 | |
| | |
Fukuyama Transporting Co. Ltd.(a) | | | 900 | | | | 27,065 | |
| | |
Hamakyorex Co. Ltd. | | | 700 | | | | 16,546 | |
| | |
Maruzen Showa Unyu Co. Ltd.(a) | | | 800 | | | | 20,861 | |
| | |
Nankai Electric Railway Co. Ltd. | | | 1,900 | | | | 36,990 | |
| | |
Nikkon Holdings Co. Ltd. | | | 2,700 | | | | 45,491 | |
| | |
Nishi-Nippon Railroad Co. Ltd.(a) | | | 1,100 | | | | 24,316 | |
| | |
Sakai Moving Service Co. Ltd. | | | 400 | | | | 13,940 | |
| | |
Seino Holdings Co. Ltd. | | | 5,300 | | | | 48,644 | |
| | |
Senko Group Holdings Co. Ltd. | | | 9,400 | | | | 69,547 | |
| | | | | | | | |
| Total Road & Rail | | | | | | | 319,328 | |
|
| Semiconductors & Semiconductor Equipment – 1.2% | |
| | |
Ferrotec Holdings Corp. | | | 700 | | | | 15,866 | |
| | |
Furuya Metal Co. Ltd. | | | 200 | | | | 17,038 | |
| | |
Japan Material Co. Ltd. | | | 1,600 | | | | 22,937 | |
| | |
MegaChips Corp. | | | 300 | | | | 9,343 | |
| | |
Micronics Japan Co. Ltd. | | | 1,000 | | | | 13,792 | |
| | |
Mimasu Semiconductor Industry Co. Ltd. | | | 700 | | | | 14,787 | |
| | |
Mitsui High-Tec, Inc. | | | 300 | | | | 30,772 | |
| | |
Optorun Co. Ltd. | | | 1,500 | | | | 26,015 | |
| | |
Shibaura Mechatronics Corp.(a) | | | 200 | | | | 14,204 | |
| | |
Tokyo Seimitsu Co. Ltd. | | | 1,700 | | | | 68,350 | |
| | |
Ulvac, Inc. | | | 1,100 | | | | 57,096 | |
| | |
Yamaichi Electronics Co. Ltd.(a) | | | 1,300 | | | | 20,104 | |
| | | | | | | | |
| Total Semiconductors & Semiconductor Equipment | | | | | | | 310,304 | |
See Notes to Financial Statements.
Schedule of Investments (continued)
WisdomTree Japan Hedged SmallCap Equity Fund (DXJS)
March 31, 2022
| | | | | | | | |
| Investments | | Shares | | | Value | |
|
| Software – 0.9% | |
| | |
Broadleaf Co. Ltd. | | | 4,500 | | | $ | 13,681 | |
| | |
Computer Engineering & Consulting Ltd. | | | 1,700 | | | | 17,984 | |
| | |
Cresco Ltd.(a) | | | 1,200 | | | | 19,437 | |
| | |
Cybernet Systems Co. Ltd.(a) | | | 2,800 | | | | 17,117 | |
| | |
Digital Arts, Inc. | | | 200 | | | | 12,227 | |
| | |
Fuji Soft, Inc. | | | 500 | | | | 25,376 | |
| | |
Fukui Computer Holdings, Inc.(a) | | | 400 | | | | 10,711 | |
| | |
Miroku Jyoho Service Co. Ltd. | | | 1,300 | | | | 15,252 | |
| | |
Scala, Inc. | | | 1,500 | | | | 9,331 | |
| | |
SRA Holdings(a) | | | 1,600 | | | | 36,633 | |
| | |
Systena Corp. | | | 6,300 | | | | 22,371 | |
| | |
UNITED, Inc.(a) | | | 900 | | | | 13,814 | |
| | |
WingArc1st, Inc. | | | 800 | | | | 9,353 | |
| | | | | | | | |
| Total Software | | | | | | | 223,287 | |
|
| Specialty Retail – 3.4% | |
| | |
Adastria Co. Ltd. | | | 2,022 | | | | 31,936 | |
| | |
Alleanza Holdings Co. Ltd.(a) | | | 1,900 | | | | 15,247 | |
| | |
Alpen Co. Ltd. | | | 1,200 | | | | 20,238 | |
| | |
Arcland Sakamoto Co. Ltd. | | | 1,100 | | | | 13,730 | |
| | |
Asahi Co. Ltd. | | | 1,700 | | | | 18,586 | |
| | |
Autobacs Seven Co. Ltd. | | | 7,400 | | | | 82,002 | |
| | |
Bic Camera, Inc.(a) | | | 4,400 | | | | 39,224 | |
| | |
Chiyoda Co. Ltd. | | | 3,500 | | | | 21,224 | |
| | |
DCM Holdings Co. Ltd. | | | 6,800 | | | | 59,050 | |
| | |
EDION Corp. | | | 6,900 | | | | 64,523 | |
| | |
Honeys Holdings Co. Ltd. | | | 2,100 | | | | 18,080 | |
| | |
IDOM, Inc. | | | 1,500 | | | | 8,997 | |
| | |
JINS Holdings, Inc.(a) | | | 300 | | | | 14,262 | |
| | |
Joshin Denki Co. Ltd. | | | 1,500 | | | | 23,753 | |
| | |
Joyful Honda Co. Ltd. | | | 2,500 | | | | 30,896 | |
| | |
K’s Holdings Corp.(a) | | | 12,900 | | | | 134,234 | |
| | |
Kohnan Shoji Co. Ltd. | | | 900 | | | | 25,916 | |
| | |
Kojima Co. Ltd. | | | 2,500 | | | | 11,843 | |
| | |
Komeri Co. Ltd. | | | 1,300 | | | | 28,158 | |
| | |
Nafco Co. Ltd. | | | 1,300 | | | | 18,208 | |
| | |
Nextage Co. Ltd. | | | 700 | | | | 12,798 | |
| | |
Nojima Corp. | | | 1,400 | | | | 26,725 | |
| | |
PAL GROUP Holdings Co. Ltd. | | | 1,400 | | | | 17,902 | |
| | |
PC Depot Corp. | | | 2,900 | | | | 7,240 | |
| | |
T-Gaia Corp. | | | 2,800 | | | | 37,764 | |
| | |
VT Holdings Co. Ltd.(a) | | | 7,254 | | | | 26,655 | |
| | |
Xebio Holdings Co. Ltd. | | | 2,400 | | | | 18,725 | |
| | |
Yellow Hat Ltd. | | | 3,300 | | | | 42,740 | |
| | | | | | | | |
| Total Specialty Retail | | | | | | | 870,656 | |
|
| Technology Hardware, Storage & Peripherals – 1.5% | |
| | |
Eizo Corp. | | | 1,000 | | | | 29,578 | |
| | |
Elecom Co. Ltd. | | | 3,100 | | | | 37,596 | |
| | |
Konica Minolta, Inc.(a) | | | 40,100 | | | | 170,476 | |
| | |
MCJ Co. Ltd. | | | 4,100 | | | | 31,449 | |
| | |
Riso Kagaku Corp. | | | 1,100 | | | | 17,980 | |
| | |
Roland DG Corp. | | | 500 | | | | 13,924 | |
| | |
Toshiba TEC Corp. | | | 900 | | | | 36,445 | |
| | |
Wacom Co. Ltd.(a) | | | 4,700 | | | | 36,516 | |
| | | | | | | | |
| Total Technology Hardware, Storage & Peripherals | | | | | | | 373,964 | |
|
| Textiles, Apparel & Luxury Goods – 0.9% | |
| | |
Baroque Japan Ltd. | | | 2,900 | | | | 18,684 | |
| | |
Fujibo Holdings, Inc. | | | 600 | | | | 17,104 | |
| | |
Gunze Ltd. | | | 900 | | | | 27,769 | |
| | |
Japan Wool Textile Co. Ltd. | | | 4,100 | | | | 30,131 | |
| | |
Kurabo Industries Ltd.(a) | | | 1,000 | | | | 14,476 | |
| | |
Onward Holdings Co. Ltd.(a) | | | 9,339 | | | | 19,698 | |
| | |
Seiko Holdings Corp. | | | 1,400 | | | | 26,460 | |
| | |
Seiren Co. Ltd.(a) | | | 1,500 | | | | 27,485 | |
| | |
Wacoal Holdings Corp. | | | 1,800 | | | | 27,317 | |
| | |
Yondoshi Holdings, Inc. | | | 2,000 | | | | 27,024 | |
| | | | | | | | |
| Total Textiles, Apparel & Luxury Goods | | | | | | | 236,148 | |
|
| Thrifts & Mortgage Finance – 0.1% | |
| | |
Aruhi Corp.(a) | | | 2,200 | | | | 18,071 | |
|
| Trading Companies & Distributors – 3.0% | |
| | |
Advan Group Co. Ltd. | | | 2,700 | | | | 20,021 | |
| | |
Alconix Corp. | | | 1,100 | | | | 12,679 | |
| | |
Chori Co. Ltd. | | | 1,500 | | | | 21,739 | |
| | |
Daiichi Jitsugyo Co. Ltd. | | | 400 | | | | 14,072 | |
| | |
Hanwa Co. Ltd. | | | 1,100 | | | | 29,364 | |
| | |
Inaba Denki Sangyo Co. Ltd. | | | 2,800 | | | | 57,303 | |
| | |
Inabata & Co. Ltd.(a) | | | 5,700 | | | | 96,882 | |
| | |
Kamei Corp. | | | 2,100 | | | | 17,440 | |
| | |
Kanamoto Co. Ltd. | | | 1,400 | | | | 23,092 | |
| | |
Kanematsu Corp. | | | 5,200 | | | | 57,495 | |
| | |
Kokusai Pulp & Paper Co. Ltd. | | | 5,000 | | | | 13,100 | |
| | |
Nagase & Co. Ltd. | | | 4,300 | | | | 64,513 | |
| | |
Nichiden Corp.(a) | | | 900 | | | | 15,994 | |
| | |
Nippon Steel Trading Corp. | | | 2,196 | | | | 96,072 | |
| | |
Nishio Rent All Co. Ltd. | | | 1,200 | | | | 27,653 | |
| | |
Onoken Co. Ltd.(a) | | | 2,700 | | | | 34,302 | |
| | |
Sanyo Trading Co. Ltd.(a) | | | 2,500 | | | | 20,330 | |
| | |
Sato Shoji Corp.(a) | | | 1,500 | | | | 14,249 | |
| | |
Shinsho Corp. | | | 700 | | | | 20,531 | |
| | |
Trusco Nakayama Corp. | | | 1,200 | | | | 23,718 | |
| | |
Wakita & Co. Ltd. | | | 2,700 | | | | 22,245 | |
| | |
Yamazen Corp.(a) | | | 2,800 | | | | 21,777 | |
| | |
Yuasa Trading Co. Ltd. | | | 1,300 | | | | 31,018 | |
| | | | | | | | |
| Total Trading Companies & Distributors | | | | | | | 755,589 | |
|
| Transportation Infrastructure – 0.6% | |
| | |
Kamigumi Co. Ltd. | | | 4,200 | | | | 76,128 | |
| | |
Mitsubishi Logistics Corp.(a) | | | 2,600 | | | | 65,121 | |
| | |
Nissin Corp.(a) | | | 1,000 | | | | 13,462 | |
| | | | | | | | |
| Total Transportation Infrastructure | | | | 154,711 | |
|
| Wireless Telecommunication Services – 0.3% | |
| | |
Okinawa Cellular Telephone Co. | | | 1,800 | | | | 73,112 | |
TOTAL COMMON STOCKS (Cost: $30,272,343) | | | | 25,254,385 | |
See Notes to Financial Statements.
Schedule of Investments (concluded)
WisdomTree Japan Hedged SmallCap Equity Fund (DXJS)
March 31, 2022
| | | | | | | | |
| Investments | | Shares | | | Value | |
|
| INVESTMENT OF CASH COLLATERAL FOR SECURITIES LOANED – 13.0% | |
|
| United States – 13.0% | |
State Street Navigator Securities Lending Government Money Market Portfolio, 0.25%(b) | | | | | | | | |
| | |
| (Cost: $3,316,275) | | | 3,316,275 | | | $ | 3,316,275 | |
| |
TOTAL INVESTMENTS IN SECURITIES – 111.6% (Cost: $33,588,618) | | | | 28,570,660 | |
| |
Other Assets less Liabilities – (11.6)% | | | | (2,967,174 | ) |
| | | | | | | | |
| NET ASSETS – 100.0% | | | $ | 25,603,486 | |
| * | Non-income producing security. |
| (a) | Security, or portion thereof, was on loan at March 31, 2022 (See Note 2). At March 31, 2022, the total market value of the Fund’s securities on loan identified in the Schedule of Investments was $5,450,730 and the total market value of the collateral held by the Fund was $5,784,842. The total market value of the collateral includes non-cash U.S. Government securities collateral having a value of $2,468,567. |
| (b) | Rate shown represents annualized 7-day yield as of March 31, 2022. |
| | | | | | | | | | | | | | | | | | | | | | | | | | | | |
|
| FINANCIAL DERIVATIVE INSTRUMENTS | |
|
| FOREIGN CURRENCY CONTRACTS (OTC – OVER THE COUNTER) | |
| | | | | |
| Counterparty | | Settlement
Date | | | Amount and
Description of
Currency to
be Purchased | | | Amount and
Description of
Currency to
be Sold | | | Unrealized
Appreciation | | | Unrealized
Depreciation | |
Bank of America NA | | | 4/5/2022 | | | | 768,176,531 | | | | JPY | | | | 6,328,858 | | | | USD | | | $ | 195 | | | $ | — | |
Bank of America NA | | | 4/5/2022 | | | | 8,438,477 | | | | USD | | | | 971,186,849 | | | | JPY | | | | 436,810 | | | | — | |
Bank of America NA | | | 5/9/2022 | | | | 6,478,008 | | | | USD | | | | 785,774,596 | | | | JPY | | | | — | | | | (268 | ) |
Barclays Bank PLC | | | 4/5/2022 | | | | 768,163,873 | | | | JPY | | | | 6,328,858 | | | | USD | | | | 90 | | | | — | |
Barclays Bank PLC | | | 5/9/2022 | | | | 6,478,007 | | | | USD | | | | 785,753,098 | | | | JPY | | | | — | | | | (92 | ) |
Citibank NA | | | 4/5/2022 | | | | 8,438,477 | | | | USD | | | | 971,202,882 | | | | JPY | | | | 436,678 | | | | — | |
Goldman Sachs | | | 4/5/2022 | | | | 8,438,477 | | | | USD | | | | 971,200,351 | | | | JPY | | | | 436,699 | | | | — | |
JP Morgan Chase Bank NA | | | 4/5/2022 | | | | 486,538,054 | | | | JPY | | | | 4,219,238 | | | | USD | | | | — | | | | (210,622 | ) |
JP Morgan Chase Bank NA | | | 4/5/2022 | | | | 508,990,729 | | | | JPY | | | | 4,219,238 | | | | USD | | | | — | | | | (25,633 | ) |
JP Morgan Chase Bank NA | | | 4/5/2022 | | | | 768,160,076 | | | | JPY | | | | 6,328,858 | | | | USD | | | | 59 | | | | — | |
JP Morgan Chase Bank NA | | | 4/5/2022 | | | | 8,438,477 | | | | USD | | | | 971,169,972 | | | | JPY | | | | 436,950 | | | | — | |
JP Morgan Chase Bank NA | | | 5/9/2022 | | | | 6,478,008 | | | | USD | | | | 785,751,275 | | | | JPY | | | | — | | | | (76 | ) |
UBS AG | | | 4/5/2022 | | | | 768,172,734 | | | | JPY | | | | 6,328,858 | | | | USD | | | | 163 | | | | — | |
UBS AG | | | 5/9/2022 | | | | 6,478,008 | | | | USD | | | | 785,766,823 | | | | JPY | | | | — | | | | (204 | ) |
| | | | | | | | | | | | | | | | | | | | | | | $ | 1,747,644 | | | $ | (236,895 | ) |
The following is a summary of the fair valuations according to the inputs used as of March 31, 2022 in valuing the Fund’s investments (See Note 2 — Fair Value Measurement):
| | | | | | | | | | | | | | | | |
| | | | |
| | | Quoted
Prices in
Active
Markets
(Level 1) | | | Other
Significant
Observable
Inputs
(Level 2) | | | Significant
Unobservable
Inputs
(Level 3) | | | Total | |
Assets: | | | | | | | | | | | | | | | | |
Investments in Securities | | | | | | | | | | | | | | | | |
Common Stocks | | | | | | | | | | | | | | | | |
Banks | | $ | 2,163,081 | | | $ | 21,743 | | | $ | — | | | $ | 2,184,824 | |
Other | | | 23,069,561 | | | | — | | | | — | | | | 23,069,561 | |
Investment of Cash Collateral for Securities Loaned | | | — | | | | 3,316,275 | | | | — | | | | 3,316,275 | |
Total Investments in Securities | | $ | 25,232,642 | | | $ | 3,338,018 | | | $ | — | | | $ | 28,570,660 | |
Financial Derivative Instruments | | | | | | | | | | | | | | | | |
Foreign Currency Contracts1 | | $ | — | | | $ | 1,747,644 | | | $ | — | | | $ | 1,747,644 | |
| | | | |
| Liabilities: | | | | | | | | | | | | | | | | |
Financial Derivative Instruments | | | | | | | | | | | | | | | | |
Foreign Currency Contracts1 | | $ | — | | | $ | (236,895 | ) | | $ | — | | | $ | (236,895 | ) |
Total – Net | | $ | 25,232,642 | | | $ | 4,848,767 | | | $ | — | | | $ | 30,081,409 | |
| 1 | Amount shown represents the unrealized appreciation (depreciation) on the financial instrument. |
See Notes to Financial Statements.
Statements of Assets and Liabilities
WisdomTree Trust
March 31, 2022
| | | | | | | | | | | | | | | | | | | | | | | | |
| | | WisdomTree Europe Hedged
Equity Fund | | | WisdomTree
Europe Hedged
SmallCap
Equity Fund | | | WisdomTree
Germany
Hedged
Equity Fund | | | WisdomTree
International
Hedged Quality Dividend
Growth Fund | | | WisdomTree Japan Hedged
Equity Fund | | | WisdomTree
Japan Hedged
SmallCap
Equity Fund | |
ASSETS: | | | | | | | | | | | | | | | | | | | | | | | | |
| | | | | | |
Investments, at cost | | $ | 1,798,809,680 | | | $ | 64,332,298 | | | $ | 24,992,906 | | | $ | 1,090,925,874 | | | $ | 2,027,173,581 | | | $ | 33,588,618 | |
| | | | | | |
Investment in affiliates, at cost (Note 3) | | | — | | | | — | | | | — | | | | 882,631 | | | | — | | | | — | |
| | | | | | |
Foreign currency, at cost | | | 1,983,387 | | | | 50,989 | | | | 26,474 | | | | 763,608 | | | | 1,520,789 | | | | 42,318 | |
Investments in securities, at value1,2 (Note 2) | | | 1,942,732,502 | | | | 62,698,108 | | | | 25,178,580 | | | | 1,184,523,176 | | | | 1,921,565,991 | | | | 28,570,660 | |
| | | | | | |
Investment in affiliates, at value (Note 3) | | | — | | | | — | | | | — | | | | 1,121,046 | | | | — | | | | — | |
| | | | | | |
Cash | | | 187,440 | | | | 779 | | | | 4,918 | | | | 1,214,848 | | | | 5,205 | | | | 11,911 | |
| | | | | | |
Foreign currency, at value | | | 1,986,189 | | | | 51,020 | | | | 27,085 | | | | 765,125 | | | | 1,530,511 | | | | 42,564 | |
| | | | | | |
Unrealized appreciation on foreign currency contracts | | | 22,522,127 | | | | 642,317 | | | | 326,382 | | | | 16,685,609 | | | | 103,648,052 | | | | 1,747,644 | |
|
Receivables: | |
| | | | | | |
Investment securities sold3 | | | — | | | | — | | | | — | | | | — | | | | 32,088,994 | | | | — | |
| | | | | | |
Capital shares sold | | | — | | | | — | | | | — | | | | 4,303,913 | | | | — | | | | — | |
| | | | | | |
Dividends | | | 1,100,088 | | | | 78,989 | | | | 116 | | | | 7,977,496 | | | | 24,653,304 | | | | 375,245 | |
| | | | | | |
Securities lending income | | | 53,269 | | | | 3,825 | | | | 893 | | | | 23,831 | | | | 29,493 | | | | 1,141 | |
| | | | | | |
Foreign tax reclaims | | | 4,354,394 | | | | 105,500 | | | | 137,324 | | | | 2,464,151 | | | | — | | | | — | |
| | | | | | |
Other (Note 6) | | | — | | | | 20,812 | | | | — | | | | — | | | | — | | | | — | |
Total Assets | | | 1,972,936,009 | | | | 63,601,350 | | | | 25,675,298 | | | | 1,219,079,195 | | | | 2,083,521,550 | | | | 30,749,165 | |
LIABILITIES: | |
| | | | | | |
Unrealized depreciation on foreign currency contracts | | | 67,941 | | | | 2,206 | | | | 923 | | | | 4,826,786 | | | | 4,930,055 | | | | 236,895 | |
| | | | | | |
Payables: | | | | | | | | | | | | | | | | | | | | | | | | |
| | | | | | |
Cash collateral received for securities loaned (Note 2) | | | 93,888,007 | | | | 2,439,931 | | | | 120,280 | | | | 26,747,300 | | | | 21,586,729 | | | | 3,316,275 | |
| | | | | | |
Investment securities purchased | | | 12,295,302 | | | | 352,097 | | | | 188,419 | | | | 9,853,842 | | | | 100,810,831 | | | | 1,577,884 | |
| | | | | | |
Capital shares redeemed | | | — | | | | — | | | | — | | | | — | | | | 35,553,355 | | | | — | |
| | | | | | |
Advisory fees (Note 3) | | | 930,297 | | | | 29,118 | | | | 10,228 | | | | 554,497 | | | | 788,894 | | | | 14,515 | |
| | | | | | |
Service fees (Note 2) | | | 7,057 | | | | 221 | | | | 94 | | | | 4,209 | | | | 7,232 | | | | 110 | |
| | | | | | |
Other (Note 6) | | | — | | | | 6,244 | | | | — | | | | — | | | | — | | | | — | |
Total Liabilities | | | 107,188,604 | | | | 2,829,817 | | | | 319,944 | | | | 41,986,634 | | | | 163,677,096 | | | | 5,145,679 | |
NET ASSETS | | $ | 1,865,747,405 | | | $ | 60,771,533 | | | $ | 25,355,354 | | | $ | 1,177,092,561 | | �� | $ | 1,919,844,454 | | | $ | 25,603,486 | |
NET ASSETS: | | | | | | | | | | | | | | | | | | | | | | | | |
| | | | | | |
Paid-in capital | | $ | 3,761,349,593 | | | $ | 81,292,613 | | | $ | 57,466,540 | | | $ | 1,083,200,831 | | | $ | 3,664,481,540 | | | $ | 51,882,800 | |
| | | | | | |
Total distributable earnings (loss) | | | (1,895,602,188 | ) | | | (20,521,080 | ) | | | (32,111,186 | ) | | | 93,891,730 | | | | (1,744,637,086 | ) | | | (26,279,314 | ) |
NET ASSETS | | $ | 1,865,747,405 | | | $ | 60,771,533 | | | $ | 25,355,354 | | | $ | 1,177,092,561 | | | $ | 1,919,844,454 | | | $ | 25,603,486 | |
Outstanding beneficial interest shares of $0.001 par value (unlimited number of shares authorized) | | | 25,200,000 | | | | 1,750,000 | | | | 750,000 | | | | 27,350,000 | | | | 29,700,000 | | | | 600,000 | |
Net asset value per share | | $ | 74.04 | | | $ | 34.73 | | | $ | 33.81 | | | $ | 43.04 | | | $ | 64.64 | | | $ | 42.67 | |
1 Includes market value of securities out on loan of: | | $ | 92,957,718 | | | $ | 2,970,630 | | | $ | 115,131 | | | $ | 48,372,496 | | | $ | 73,768,650 | | | $ | 5,450,730 | |
2 Investments in securities include investment of cash collateral for securities loaned (see Schedule of Investments for additional information). | | | | | |
3 Includes market value of securities out of loan, which were sold and pending settlement, of: | | | — | | | | — | | | | — | | | | — | | | $ | 25,910 | | | | — | |
See Notes to Financial Statements.
Statements of Operations
WisdomTree Trust
For the Year Ended March 31, 2022
| | | | | | | | | | | | | | | | | | | | | | | | |
| | | WisdomTree
Europe
Hedged
Equity Fund | | | WisdomTree
Europe
Hedged
SmallCap
Equity Fund | | | WisdomTree
Germany
Hedged
Equity Fund | | | WisdomTree
International
Hedged Quality Dividend
Growth Fund | | | WisdomTree
Japan Hedged
Equity Fund | | | WisdomTree
Japan Hedged
SmallCap
Equity Fund | |
INVESTMENT INCOME: | |
| | | | | | |
Dividends | | $ | 50,056,000 | | | $ | 1,472,654 | | | $ | 1,162,425 | | | $ | 37,933,460 | | | $ | 60,928,810 | | | $ | 1,044,334 | |
| | | | | | |
Dividends from affiliates (Note 3) | | | — | | | | — | | | | — | | | | 33,146 | | | | — | | | | — | |
| | | | | | |
Non-cash dividends | | | 3,206,159 | | | | 52,379 | | | | — | | | | 17,804 | | | | — | | | | — | |
| | | | | | |
Other income (Note 6) | | | 91,988 | | | | 78,708 | | | | — | | | | — | | | | — | | | | — | |
| | | | | | |
Securities lending income, net (Note 2) | | | 416,944 | | | | 26,793 | | | | 3,926 | | | | 163,776 | | | | 174,795 | | | | 8,544 | |
| | | | | | |
Less: Foreign withholding taxes on dividends | | | (5,094,995 | ) | | | (229,264 | ) | | | (119,961 | ) | | | (1,826,078 | ) | | | (6,095,547 | ) | | | (104,478 | ) |
Total investment income | | | 48,676,096 | | | | 1,401,270 | | | | 1,046,390 | | | | 36,322,108 | | | | 55,008,058 | | | | 948,400 | |
EXPENSES: | |
| | | | | | |
Advisory fees (Note 3) | | | 11,885,055 | | | | 299,874 | | | | 148,232 | | | | 6,138,491 | | | | 8,999,672 | | | | 193,247 | |
| | | | | | |
Service fees (Note 2) | | | 90,162 | | | | 2,275 | | | | 1,359 | | | | 46,568 | | | | 82,497 | | | | 1,466 | |
| | | | | | |
Other fees (Note 6) | | | 26,950 | | | | 23,602 | | | | — | | | | — | | | | — | | | | — | |
Total expenses | | | 12,002,167 | | | | 325,751 | | | | 149,591 | | | | 6,185,059 | | | | 9,082,169 | | | | 194,713 | |
Expense waivers (Note 3) | | | — | | | | — | | | | — | | | | (3,548 | ) | | | — | | | | — | |
Net expenses | | | 12,002,167 | | | | 325,751 | | | | 149,591 | | | | 6,181,511 | | | | 9,082,169 | | | | 194,713 | |
Net investment income | | | 36,673,929 | | | | 1,075,519 | | | | 896,799 | | | | 30,140,597 | | | | 45,925,889 | | | | 753,687 | |
NET REALIZED AND UNREALIZED GAIN (LOSS) ON INVESTMENTS: | |
|
Net realized gain (loss) from: | |
| | | | | | |
Investment transactions | | | 31,418,120 | | | | 3,428,339 | | | | (170,050 | ) | | | (4,487,639 | ) | | | (41,577,543 | ) | | | (1,438,477 | ) |
| | | | | | |
Investment transactions in affiliates (Note 3) | | | — | | | | — | | | | — | | | | 110,708 | | | | — | | | | — | |
| | | | | | |
In-kind redemptions | | | 38,270,557 | | | | — | | | | 957,998 | | | | 76,249,053 | | | | 139,326,341 | | | | 1,012,685 | |
| | | | | | |
Foreign currency contracts | | | 172,094,740 | | | | 4,308,411 | | | | 2,584,987 | | | | 68,824,693 | | | | 142,852,050 | | | | 3,063,005 | |
| | | | | | |
Foreign currency related transactions | | | (918,025 | ) | | | (28,562 | ) | | | 3,741 | | | | (696,459 | ) | | | (860,288 | ) | | | (15,677 | ) |
Net realized gain | | | 240,865,392 | | | | 7,708,188 | | | | 3,376,676 | | | | 140,000,356 | | | | 239,740,560 | | | | 2,621,536 | |
Net increase (decrease) in unrealized appreciation/depreciation: | |
| | | | | | |
Investment transactions | | | (163,701,429 | ) | | | (6,876,323 | ) | | | (3,518,621 | ) | | | (84,945,247 | ) | | | (178,410,352 | ) | | | (5,035,653 | ) |
| | | | | | |
Investment transactions in affiliates (Note 3) | | | — | | | | — | | | | — | | | | (123,117 | ) | | | — | | | | — | |
| | | | | | |
Foreign currency contracts | | | (36,872,569 | ) | | | (523,375 | ) | | | (615,195 | ) | | | (11,258,913 | ) | | | 41,813,700 | | | | 443,999 | |
| | | | | | |
Translation of assets and liabilities denominated in foreign currencies | | | (313,975 | ) | | | (11,060 | ) | | | (30,810 | ) | | | 37,923 | | | | 156,234 | | | | 1,949 | |
Net decrease in unrealized appreciation/depreciation | | | (200,887,973 | ) | | | (7,410,758 | ) | | | (4,164,626 | ) | | | (96,289,354 | ) | | | (136,440,418 | ) | | | (4,589,705 | ) |
Net realized and unrealized gain (loss) on investments | | | 39,977,419 | | | | 297,430 | | | | (787,950 | ) | | | 43,711,002 | | | | 103,300,142 | | | | (1,968,169 | ) |
Net increase from payment by affiliate (Note 3) | | | — | | | | — | | | | — | | | | 13,616 | | | | — | | | | — | |
NET INCREASE (DECREASE) IN NET ASSETS RESULTING FROM OPERATIONS | | $ | 76,651,348 | | | $ | 1,372,949 | | | $ | 108,849 | | | $ | 73,865,215 | | | $ | 149,226,031 | | | $ | (1,214,482 | ) |
See Notes to Financial Statements.
Statements of Changes in Net Assets
WisdomTree Trust
| | | | | | | | | | | | | | | | | | | | | | | | |
| | | |
| | | WisdomTree Europe
Hedged Equity Fund | | | WisdomTree Europe Hedged
SmallCap Equity Fund | | | WisdomTree Germany
Hedged Equity Fund | |
| | | | | | |
| | | For the
Year Ended
March 31, 2022 | | | For the
Year Ended
March 31, 2021 | | | For the
Year Ended
March 31, 2022 | | | For the
Year Ended
March 31, 2021 | | | For the
Year Ended
March 31, 2022 | | | For the
Year Ended
March 31, 2021 | |
INCREASE (DECREASE) IN NET ASSETS RESULTING FROM OPERATIONS: | |
| | | | | | |
Net investment income | | $ | 36,673,929 | | | $ | 54,377,375 | | | $ | 1,075,519 | | | $ | 1,365,252 | | | $ | 896,799 | | | $ | 1,037,775 | |
| | | | | | |
Net realized gain (loss) on investments, foreign currency contracts and foreign currency related transactions | | | 240,865,392 | | | | (582,339,314 | ) | | | 7,708,188 | | | | (14,664,028 | ) | | | 3,376,676 | | | | (5,635,798 | ) |
| | | | | | |
Net increase (decrease) in unrealized appreciation/depreciation on investments, foreign currency contracts and translation of assets and liabilities denominated in foreign currencies | | | (200,887,973 | ) | | | 1,251,892,332 | | | | (7,410,758 | ) | | | 29,161,949 | | | | (4,164,626 | ) | | | 19,346,445 | |
Net increase in net assets resulting from operations | | | 76,651,348 | | | | 723,930,393 | | | | 1,372,949 | | | | 15,863,173 | | | | 108,849 | | | | 14,748,422 | |
DISTRIBUTIONS TO SHAREHOLDERS: | |
| | | | | | |
Distributable earnings | | | (44,246,812 | ) | | | (53,199,944 | ) | | | (1,117,302 | ) | | | (1,413,257 | ) | | | (1,209,360 | ) | | | (1,043,996 | ) |
CAPITAL SHARE TRANSACTIONS: | |
| | | | | | |
Net proceeds from sale of shares | | | 55,365,070 | | | | 42,516,333 | | | | 23,162,889 | | | | — | | | | — | | | | — | |
| | | | | | |
Cost of shares redeemed | | | (159,690,153 | ) | | | (975,850,079 | ) | | | — | | | | (26,293,657 | ) | | | (5,002,952 | ) | | | (11,867,822 | ) |
| | | | | | |
Net increase (decrease) in net assets resulting from capital share transactions | | | (104,325,083 | ) | | | (933,333,746 | ) | | | 23,162,889 | | | | (26,293,657 | ) | | | (5,002,952 | ) | | | (11,867,822 | ) |
Net Increase (Decrease) in Net Assets | | | (71,920,547 | ) | | | (262,603,297 | ) | | | 23,418,536 | | | | (11,843,741 | ) | | | (6,103,463 | ) | | | 1,836,604 | |
NET ASSETS: | |
| | | | | | |
Beginning of year | | $ | 1,937,667,952 | | | $ | 2,200,271,249 | | | $ | 37,352,997 | | | $ | 49,196,738 | | | $ | 31,458,817 | | | $ | 29,622,213 | |
| | | | | | |
End of year | | $ | 1,865,747,405 | | | $ | 1,937,667,952 | | | $ | 60,771,533 | | | $ | 37,352,997 | | | $ | 25,355,354 | | | $ | 31,458,817 | |
SHARES CREATED AND REDEEMED: | |
| | | | | | |
Shares outstanding, beginning of year | | | 26,650,000 | | | | 42,450,000 | | | | 1,100,000 | | | | 2,100,000 | | | | 900,000 | | | | 1,300,000 | |
| | | | | | |
Shares created | | | 700,000 | | | | 650,000 | | | | 650,000 | | | | — | | | | — | | | | — | |
| | | | | | |
Shares redeemed | | | (2,150,000 | ) | | | (16,450,000 | ) | | | — | | | | (1,000,000 | ) | | | (150,000 | ) | | | (400,000 | ) |
Shares outstanding, end of year | | | 25,200,000 | | | | 26,650,000 | | | | 1,750,000 | | | | 1,100,000 | | | | 750,000 | | | | 900,000 | |
See Notes to Financial Statements.
Statements of Changes in Net Assets (concluded)
WisdomTree Trust
| | | | | | | | | | | | | | | | | | | | | | | | |
| | | |
| | | WisdomTree International Hedged
Quality Dividend Growth Fund | | | WisdomTree Japan Hedged Equity Fund | | | WisdomTree Japan Hedged
SmallCap Equity Fund | |
| | | | | | |
| | | For the
Year Ended
March 31, 2022 | | | For the
Year Ended
March 31, 2021 | | | For the
Year Ended
March 31, 2022 | | | For the
Year Ended
March 31, 2021 | | | For the
Year Ended
March 31, 2022 | | | For the
Year Ended
March 31, 2021 | |
INCREASE (DECREASE) IN NET ASSETS RESULTING FROM OPERATIONS: | |
| | | | | | |
Net investment income | | $ | 30,140,597 | | | $ | 18,842,679 | | | $ | 45,925,889 | | | $ | 32,351,041 | | | $ | 753,687 | | | $ | 545,208 | |
| | | | | | |
Net realized gain (loss) on investments, foreign currency contracts and foreign currency related transactions | | | 140,000,356 | | | | (8,931,167 | ) | | | 239,740,560 | | | | (47,209,430 | ) | | | 2,621,536 | | | | (3,219,356 | ) |
| | | | | | |
Net increase (decrease) in unrealized appreciation/depreciation on investments, foreign currency contracts and translation of assets and liabilities denominated in foreign currencies | | | (96,289,354 | ) | | | 231,873,633 | | | | (136,440,418 | ) | | | 630,004,213 | | | | (4,589,705 | ) | | | 12,647,009 | |
| | | | | | |
Net increase from payment by affiliate | | | 13,616 | | | | 1,756,103 | | | | — | | | | 22,753 | | | | — | | | | — | |
Net increase (decrease) in net assets resulting from operations | | | 73,865,215 | | | | 243,541,248 | | | | 149,226,031 | | | | 615,168,577 | | | | (1,214,482 | ) | | | 9,972,861 | |
DISTRIBUTIONS TO SHAREHOLDERS: | |
Distributable earnings | | | (34,880,873 | ) | | | (20,307,783 | ) | | | (51,969,830 | ) | | | (43,598,753 | ) | | | (980,043 | ) | | | (1,037,117 | ) |
CAPITAL SHARE TRANSACTIONS: | |
| | | | | | |
Net proceeds from sale of shares | | | 480,736,121 | | | | 167,467,543 | | | | 911,652,905 | | | | 234,513,759 | | | | 13,925,653 | | | | — | |
| | | | | | |
Cost of shares redeemed | | | (242,118,958 | ) | | | (83,555,794 | ) | | | (763,823,383 | ) | | | (841,125,421 | ) | | | (17,459,472 | ) | | | (21,653,342 | ) |
Net increase (decrease) in net assets resulting from capital share transactions | | | 238,617,163 | | | | 83,911,749 | | | | 147,829,522 | | | | (606,611,662 | ) | | | (3,533,819 | ) | | | (21,653,342 | ) |
Net Increase (Decrease) in Net Assets | | | 277,601,505 | | | | 307,145,214 | | | | 245,085,723 | | | | (35,041,838 | ) | | | (5,728,344 | ) | | | (12,717,598 | ) |
NET ASSETS: | |
| | | | | | |
Beginning of year | | $ | 899,491,056 | | | $ | 592,345,842 | | | $ | 1,674,758,731 | | | $ | 1,709,800,569 | | | $ | 31,331,830 | | | $ | 44,049,428 | |
| | | | | | |
End of year | | $ | 1,177,092,561 | | | $ | 899,491,056 | | | $ | 1,919,844,454 | | | $ | 1,674,758,731 | | | $ | 25,603,486 | | | $ | 31,331,830 | |
SHARES CREATED AND REDEEMED: | |
| | | | | | |
Shares outstanding, beginning of year | | | 21,850,000 | | | | 19,350,000 | | | | 27,450,000 | | | | 40,100,000 | | | | 700,000 | | | | 1,300,000 | |
| | | | | | |
Shares created | | | 10,850,000 | | | | 4,750,000 | | | | 14,700,000 | | | | 4,200,000 | | | | 300,000 | | | | — | |
Shares redeemed | | | (5,350,000 | ) | | | (2,250,000 | ) | | | (12,450,000 | ) | | | (16,850,000 | ) | | | (400,000 | ) | | | (600,000 | ) |
Shares outstanding, end of year | | | 27,350,000 | | | | 21,850,000 | | | | 29,700,000 | | | | 27,450,000 | | | | 600,000 | | | | 700,000 | |
See Notes to Financial Statements.
Financial Highlights
WisdomTree Trust
Selected data for a share of beneficial interest outstanding throughout the period is presented below:
| | | | | | | | | | | | | | | | | | | | |
WisdomTree Europe Hedged
Equity Fund | | For the
Year Ended
March 31, 2022 | | | For the
Year Ended
March 31, 2021 | | | For the
Year Ended
March 31, 2020 | | | For the
Year Ended
March 31, 2019 | | | For the
Year Ended
March 31, 2018 | |
Net asset value, beginning of year | | $ | 72.71 | | | $ | 51.83 | | | $ | 63.90 | | | $ | 62.67 | | | $ | 62.80 | |
Investment operations: | | | | | | | | | | | | | | | | | | | | |
| | | | | |
Net investment income1 | | | 1.38 | | | | 1.76 | | | | 1.52 | | | | 1.79 | | | | 1.23 | |
| | | | | |
Net realized and unrealized gain (loss) | | | 1.62 | | | | 20.86 | | | | (12.21 | ) | | | 0.90 | | | | 0.08 | |
Total from investment operations | | | 3.00 | | | | 22.62 | | | | (10.69 | ) | | | 2.69 | | | | 1.31 | |
Dividends and distributions to shareholders: | | | | | | | | | | | | | | | | | | | | |
| | | | | |
Net investment income | | | (1.67 | ) | | | (1.74 | ) | | | (1.38 | ) | | | (1.29 | ) | | | (1.44 | ) |
| | | | | |
Tax return of capital | | | — | | | | — | | | | — | | | | (0.17 | ) | | | — | |
Total dividends and distributions to shareholders | | | (1.67 | ) | | | (1.74 | ) | | | (1.38 | ) | | | (1.46 | ) | | | (1.44 | ) |
Net asset value, end of year | | $ | 74.04 | | | $ | 72.71 | | | $ | 51.83 | | | $ | 63.90 | | | $ | 62.67 | |
| | | | | |
TOTAL RETURN2 | | | 4.04 | % | | | 44.22 | % | | | (17.15 | )% | | | 4.33 | % | | | 2.03 | % |
RATIOS/SUPPLEMENTAL DATA: | | | | | | | | | | | | | | | | | | | | |
| | | | | |
Net assets, end of year (000’s omitted) | | $ | 1,865,747 | | | $ | 1,937,668 | | | $ | 2,200,271 | | | $ | 3,744,358 | | | $ | 6,332,946 | |
| | | | | |
Ratios to average net assets of: | | | | | | | | | | | | | | | | | | | | |
| | | | | |
Expenses | | | 0.59 | %3 | | | 0.58 | % | | | 0.58 | % | | | 0.58 | % | | | 0.58 | % |
| | | | | |
Net investment income | | | 1.79 | % | | | 2.81 | % | | | 2.29 | % | | | 2.86 | % | | | 1.91 | % |
Portfolio turnover rate4 | | | 34 | % | | | 55 | % | | | 26 | % | | | 18 | % | | | 20 | % |
| | | | | | | | | | | | | | | | | | | | |
| | | | | | |
WisdomTree Europe Hedged
SmallCap Equity Fund | | For the
Year Ended
March 31, 2022 | | | For the
Year Ended
March 31, 2021 | | | For the
Year Ended
March 31, 2020 | | | For the
Year Ended
March 31, 2019 | | | For the
Year Ended
March 31, 2018 | |
Net asset value, beginning of year | | $ | 33.96 | | | $ | 23.43 | | | $ | 30.17 | | | $ | 30.62 | | | $ | 28.29 | |
Investment operations: | | | | | | | | | | | | | | | | | | | | |
| | | | | |
Net investment income1 | | | 0.75 | | | | 1.02 | | | | 1.22 | | | | 1.06 | | | | 0.74 | |
| | | | | |
Net realized and unrealized gain (loss) | | | 0.91 | ^ | | | 10.56 | | | | (6.92 | ) | | | (0.89 | ) | | | 2.05 | |
Total from investment operations | | | 1.66 | ^ | | | 11.58 | | | | (5.70 | ) | | | 0.17 | | | | 2.79 | |
Dividends and distributions to shareholders: | | | | | | | | | | | | | | | | | | | | |
| | | | | |
Net investment income | | | (0.89 | ) | | | (1.05 | ) | | | (1.04 | ) | | | (0.62 | ) | | | (0.45 | ) |
| | | | | |
Tax return of capital | | | — | | | | — | | | | — | | | | — | | | | (0.01 | ) |
Total dividends and distributions to shareholders | | | (0.89 | ) | | | (1.05 | ) | | | (1.04 | ) | | | (0.62 | ) | | | (0.46 | ) |
Net asset value, end of year | | $ | 34.73 | | | $ | 33.96 | | | $ | 23.43 | | | $ | 30.17 | | | $ | 30.62 | |
| | | | | |
TOTAL RETURN2 | | | 4.86 | % | | | 50.50 | % | | | (19.62 | )% | | | 0.54 | % | | | 9.88 | % |
RATIOS/SUPPLEMENTAL DATA: | | | | | | | | | | | | | | | | | | | | |
| | | | | |
Net assets, end of year (000’s omitted) | | $ | 60,772 | | | $ | 37,353 | | | $ | 49,197 | | | $ | 120,671 | | | $ | 154,624 | |
| | | | | |
Ratios to average net assets of: | | | | | | | | | | | | | | | | | | | | |
| | | | | |
Expenses | | | 0.63 | %3 | | | 0.58 | % | | | 0.58 | % | | | 0.58 | % | | | 0.58 | % |
| | | | | |
Net investment income | | | 2.08 | % | | | 3.59 | % | | | 3.99 | % | | | 3.55 | % | | | 2.43 | % |
Portfolio turnover rate4 | | | 57 | % | | | 77 | % | | | 49 | % | | | 37 | % | | | 37 | % |
| ^ | The amount per share does not correspond with the amount reported within the Statements of Changes due to the timing of capital share transactions of Fund shares and fluctuating market values during the fiscal year. |
| 1 | Based on average shares outstanding. |
| 2 | Total return is calculated assuming an initial investment made at the net asset value at the beginning of the period, reinvestment of all dividends and distributions at net asset value during the period and redemption on the last day of the period. |
| 3 | Included in the expense ratio are “Other fees” described in Note 6. Without these expenses, the expense ratio would have been 0.58%. |
| 4 | Portfolio turnover rate excludes the value of the portfolio securities received or delivered as a result of in-kind creations or redemptions of the Fund’s capital shares. Short-term securities with maturities less than or equal to 365 days are excluded from the portfolio turnover calculation. |
See Notes to Financial Statements.
Financial Highlights (continued)
WisdomTree Trust
Selected data for a share of beneficial interest outstanding throughout the period is presented below:
| | | | | | | | | | | | | | | | | | | | |
WisdomTree Germany Hedged
Equity Fund | | For the
Year Ended
March 31, 2022 | | | For the
Year Ended
March 31, 2021 | | | For the
Year Ended
March 31, 2020 | | | For the
Year Ended
March 31, 2019 | | | For the
Year Ended
March 31, 2018 | |
Net asset value, beginning of year | | $ | 34.95 | | | $ | 22.79 | | | $ | 28.63 | | | $ | 30.95 | | | $ | 30.40 | |
Investment operations: | | | | | | | | | | | | | | | | | | | | |
| | | | | |
Net investment income1 | | | 1.03 | | | | 0.98 | | | | 0.88 | | | | 1.10 | | | | 0.87 | |
| | | | | |
Net realized and unrealized gain (loss) | | | (0.79 | ) | | | 12.16 | | | | (5.87 | ) | | | (2.64 | ) | | | 0.54 | |
Total from investment operations | | | 0.24 | | | | 13.14 | | | | (4.99 | ) | | | (1.54 | ) | | | 1.41 | |
Dividends and distributions to shareholders: | | | | | | | | | | | | | | | | | | | | |
| | | | | |
Net investment income | | | (1.38 | ) | | | (0.98 | ) | | | (0.85 | ) | | | (0.59 | ) | | | (0.64 | ) |
| | | | | |
Tax return of capital | | | — | | | | — | | | | — | | | | (0.19 | ) | | | (0.22 | ) |
Total dividends and distributions to shareholders | | | (1.38 | ) | | | (0.98 | ) | | | (0.85 | ) | | | (0.78 | ) | | | (0.86 | ) |
Net asset value, end of year | | $ | 33.81 | | | $ | 34.95 | | | $ | 22.79 | | | $ | 28.63 | | | $ | 30.95 | |
| | | | | |
TOTAL RETURN2 | | | 0.50 | % | | | 58.59 | % | | | (18.06 | )% | | | (5.07 | )% | | | 4.63 | % |
RATIOS/SUPPLEMENTAL DATA: | | | | | | | | | | | | | | | | | | | | |
| | | | | |
Net assets, end of year (000’s omitted) | | $ | 25,355 | | | $ | 31,459 | | | $ | 29,622 | | | $ | 51,541 | | | $ | 91,302 | |
| | | | | |
Ratios to average net assets of: | | | | | | | | | | | | | | | | | | | | |
| | | | | |
Expenses | | | 0.48 | % | | | 0.48 | % | | | 0.48 | % | | | 0.48 | % | | | 0.48 | % |
| | | | | |
Net investment income | | | 2.90 | % | | | 3.38 | % | | | 2.95 | % | | | 3.66 | % | | | 2.78 | % |
Portfolio turnover rate3 | | | 24 | % | | | 46 | % | | | 41 | % | | | 16 | % | | | 20 | % |
| | | | | | | | | | | | | | | | | | | | |
| | | | | | |
WisdomTree International Hedged
Quality Dividend Growth Fund | | For the
Year Ended
March 31, 2022 | | | For the
Year Ended
March 31, 2021 | | | For the
Year Ended
March 31, 2020 | | | For the
Year Ended
March 31, 2019 | | | For the
Year Ended
March 31, 2018 | |
Net asset value, beginning of year | | $ | 41.17 | | | $ | 30.61 | | | $ | 32.14 | | | $ | 30.78 | | | $ | 28.39 | |
Investment operations: | | | | | | | | | | | | | | | | | | | | |
| | | | | |
Net investment income1 | | | 1.25 | | | | 0.88 | | | | 0.78 | | | | 0.64 | | | | 0.58 | |
| | | | | |
Net realized and unrealized gain (loss) | | | 2.03 | | | | 10.54 | | | | (1.59 | ) | | | 0.83 | | | | 1.99 | |
| | | | | |
Net increase from payment by affiliate | | | 0.00 | 4 | | | 0.08 | | | | — | | | | — | | | | — | |
Total from investment operations | | | 3.28 | | | | 11.50 | | | | (0.81 | ) | | | 1.47 | | | | 2.57 | |
Dividends to shareholders: | | | | | | | | | | | | | | | | | | | | |
| | | | | |
Net investment income | | | (1.41 | ) | | | (0.94 | ) | | | (0.72 | ) | | | (0.11 | ) | | | (0.18 | ) |
Net asset value, end of year | | $ | 43.04 | | | $ | 41.17 | | | $ | 30.61 | | | $ | 32.14 | | | $ | 30.78 | |
| | | | | |
TOTAL RETURN2 | | | 7.93 | %5 | | | 37.85 | %6 | | | (2.70 | )% | | | 4.78 | % | | | 9.05 | % |
RATIOS/SUPPLEMENTAL DATA: | | | | | | | | | | | | | | | | | | | | |
| | | | | |
Net assets, end of year (000’s omitted) | | $ | 1,177,093 | | | $ | 899,491 | | | $ | 592,346 | | | $ | 438,708 | | | $ | 543,192 | |
| | | | | |
Ratios to average net assets of: | | | | | | | | | | | | | | | | | | | | |
| | | | | |
Expenses | | | 0.58 | %7,8 | | | 0.58 | %7,8 | | | 0.58 | %7,8 | | | 0.58 | % | | | 0.58 | % |
| | | | | |
Net investment income | | | 2.85 | %7 | | | 2.37 | %7 | | | 2.32 | %7 | | | 2.07 | % | | | 1.89 | % |
Portfolio turnover rate3 | | | 61 | % | | | 67 | % | | | 61 | % | | | 56 | % | | | 42 | % |
| 1 | Based on average shares outstanding. |
| 2 | Total return is calculated assuming an initial investment made at the net asset value at the beginning of the period, reinvestment of all dividends and distributions at net asset value during the period and redemption on the last day of the period. For the periods in which the investment advisor waived advisory fees for the WisdomTree International Hedged Quality Dividend Growth Fund, the total return would have been lower if certain expenses had not been waived (Notes 2 and 3). |
| 3 | Portfolio turnover rate excludes the value of the portfolio securities received or delivered as a result of in-kind creations or redemptions of the Fund’s capital shares. Short-term securities with maturities less than or equal to 365 days are excluded from the portfolio turnover calculation. |
| 4 | Amount represents less than $0.005. |
| 5 | Includes a voluntary reimbursement from the sub-advisor for investment losses on certain equity transactions during the period. Excluding this voluntary reimbursement, total return would have been unchanged (Note 3). |
| 6 | Includes a voluntary reimbursement from the sub-advisor for investment losses on certain foreign exchange transactions during the period. Excluding this voluntary reimbursement, total return would have been 0.27% lower. |
| 7 | The ratios to average net assets do not include net investment income (loss) or expenses of other funds in which the Fund invests. |
| 8 | The expense ratio includes investment advisory fee waivers. Without these investment advisory fee waivers, the expense ratio would have been unchanged. |
See Notes to Financial Statements.
Financial Highlights (concluded)
WisdomTree Trust
Selected data for a share of beneficial interest outstanding throughout the period is presented below:
| | | | | | | | | | | | | | | | | | | | |
WisdomTree Japan Hedged
Equity Fund | | For the
Year Ended
March 31, 2022 | | | For the
Year Ended
March 31, 2021 | | | For the
Year Ended
March 31, 2020 | | | For the
Year Ended
March 31, 2019 | | | For the
Year Ended
March 31, 2018 | |
Net asset value, beginning of year | | $ | 61.01 | | | $ | 42.64 | | | $ | 50.42 | | | $ | 55.76 | | | $ | 50.40 | |
Investment operations: | | | | | | | | | | | | | | | | | | | | |
| | | | | |
Net investment income1 | | | 1.52 | | | | 1.02 | | | | 1.05 | | | | 1.06 | | | | 0.92 | |
| | | | | |
Net realized and unrealized gain (loss) | | | 3.76 | | | | 18.73 | | | | (7.52 | ) | | | (5.03 | ) | | | 5.81 | |
| | | | | |
Net increase from payment by affiliate | | | — | | | | 0.00 | 2 | | | — | | | | — | | | | — | |
Total from investment operations | | | 5.28 | | | | 19.75 | | | | (6.47 | ) | | | (3.97 | ) | | | 6.73 | |
Dividends to shareholders: | | | | | | | | | | | | | | | | | | | | |
| | | | | |
Net investment income | | | (1.65 | ) | | | (1.38 | ) | | | (1.31 | ) | | | (1.37 | ) | | | (1.37 | ) |
Net asset value, end of year | | $ | 64.64 | | | $ | 61.01 | | | $ | 42.64 | | | $ | 50.42 | | | $ | 55.76 | |
| | | | | |
TOTAL RETURN3 | | | 8.79 | % | | | 46.97 | %4 | | | (13.26 | )% | | | (7.20 | )% | | | 13.45 | % |
RATIOS/SUPPLEMENTAL DATA: | | | | | | | | | | | | | | | | | | | | |
| | | | | |
Net assets, end of year (000’s omitted) | | $ | 1,919,844 | | | $ | 1,674,759 | | | $ | 1,709,801 | | | $ | 3,254,417 | | | $ | 6,607,000 | |
| | | | | |
Ratios to average net assets of: | | | | | | | | | | | | | | | | | | | | |
| | | | | |
Expenses | | | 0.48 | % | | | 0.48 | % | | | 0.48 | % | | | 0.48 | % | | | 0.48 | % |
| | | | | |
Net investment income | | | 2.45 | % | | | 2.03 | % | | | 2.08 | % | | | 1.96 | % | | | 1.67 | % |
Portfolio turnover rate5 | | | 22 | % | | | 25 | % | | | 20 | % | | | 23 | % | | | 18 | % |
| | | | | | | | | | | | | | | | | | | | |
| | | | | | |
WisdomTree Japan Hedged
SmallCap Equity Fund | | For the
Year Ended
March 31, 2022 | | | For the
Year Ended
March 31, 2021 | | | For the
Year Ended
March 31, 2020 | | | For the
Year Ended
March 31, 2019 | | | For the
Year Ended
March 31, 2018 | |
Net asset value, beginning of year | | $ | 44.76 | | | $ | 33.88 | | | $ | 39.57 | | | $ | 44.13 | | | $ | 37.28 | |
Investment operations: | | | | | | | | | | | | | | | | | | | | |
| | | | | |
Net investment income1 | | | 0.99 | | | | 0.64 | | | | 0.75 | | | | 0.51 | | | | 0.64 | |
| | | | | |
Net realized and unrealized gain (loss) | | | (1.80 | ) | | | 11.45 | | | | (5.52 | ) | | | (4.31 | ) | | | 6.91 | |
Total from investment operations | | | (0.81 | ) | | | 12.09 | | | | (4.77 | ) | | | (3.80 | ) | | | 7.55 | |
Dividends to shareholders: | | | | | | | | | | | | | | | | | | | | |
| | | | | |
Net investment income | | | (1.28 | ) | | | (1.21 | ) | | | (0.92 | ) | | | (0.76 | ) | | | (0.70 | ) |
Net asset value, end of year | | $ | 42.67 | | | $ | 44.76 | | | $ | 33.88 | | | $ | 39.57 | | | $ | 44.13 | |
| | | | | |
TOTAL RETURN3 | | | (1.80 | )% | | | 36.31 | % | | | (12.41 | )% | | | (8.77 | )% | | | 20.42 | % |
RATIOS/SUPPLEMENTAL DATA: | | | | | | | | | | | | | | | | | | | | |
| | | | | |
Net assets, end of year (000’s omitted) | | $ | 25,603 | | | $ | 31,332 | | | $ | 44,049 | | | $ | 83,097 | | | $ | 207,434 | |
| | | | | |
Ratios to average net assets of: | | | | | | | | | | | | | | | | | | | | |
| | | | | |
Expenses | | | 0.58 | % | | | 0.58 | % | | | 0.58 | % | | | 0.58 | % | | | 0.58 | % |
| | | | | |
Net investment income | | | 2.26 | % | | | 1.67 | % | | | 1.90 | % | | | 1.20 | % | | | 1.51 | % |
Portfolio turnover rate5 | | | 41 | % | | | 41 | % | | | 36 | % | | | 38 | % | | | 30 | % |
| 1 | Based on average shares outstanding. |
| 2 | Amount represents less than $0.005. |
| 3 | Total return is calculated assuming an initial investment made at the net asset value at the beginning of the period, reinvestment of all dividends and distributions at net asset value during the period and redemption on the last day of the period. |
| 4 | Includes a voluntary reimbursement from the sub-advisor for investment losses on certain foreign exchange transactions during the period. Excluding this voluntary reimbursement, total return would have been unchanged. |
| 5 | Portfolio turnover rate excludes the value of the portfolio securities received or delivered as a result of in-kind creations or redemptions of the Fund’s capital shares. Short-term securities with maturities less than or equal to 365 days are excluded from the portfolio turnover calculation. |
See Notes to Financial Statements.
Notes to Financial Statements
1. ORGANIZATION
WisdomTree Trust (the “Trust”) is registered under the Investment Company Act of 1940, as amended (the “1940 Act”), as an open-end management investment company. The Trust was established as a Delaware statutory trust on December 15, 2005 and is authorized to have multiple series of portfolios (each a “Fund”, collectively, the “Funds”). These notes relate only to the Funds listed below. In accordance with Accounting Standards Codification Topic 946, Financial Services-Investment Companies, each Fund listed below qualifies as an investment company and is applying the accounting and reporting guidance for investment companies.
| | | | |
| | |
| Fund | | Commencement
of Operations | |
WisdomTree Europe Hedged Equity Fund (“Europe Hedged Equity Fund”) | | | December 31, 2009 | |
WisdomTree Europe Hedged SmallCap Equity Fund (“Europe Hedged SmallCap Equity Fund”) | | | March 4, 2015 | |
WisdomTree Germany Hedged Equity Fund (“Germany Hedged Equity Fund”) | | | October 17, 2013 | |
WisdomTree International Hedged Quality Dividend Growth Fund (“International Hedged Quality Dividend Growth Fund”) | | | May 7, 2014 | |
WisdomTree Japan Hedged Equity Fund (“Japan Hedged Equity Fund”) | | | June 16, 2006 | |
WisdomTree Japan Hedged SmallCap Equity Fund (“Japan Hedged SmallCap Equity Fund”) | | | June 28, 2013 | |
Each Fund seeks to track the price and yield performance, before fees and expenses, of a particular index (“Index”) developed by WisdomTree Investments, Inc. (“WisdomTree Investments”). WisdomTree Investments is the parent company of WisdomTree Asset Management, Inc. (“WTAM”), the investment adviser to each Fund and the Trust. “WisdomTree” is a registered trademark of WisdomTree Investments and has been licensed for use by the Trust. Each Fund described herein is considered to be non-diversified as defined under the 1940 Act.
In the normal course of business, the Funds may enter into contracts that contain a variety of representations or that provide indemnification for certain liabilities. The Funds’ maximum exposure under these arrangements is unknown, as this would involve future claims that may be made against the Funds that have not yet occurred. However, the Funds have not had prior claims or losses pursuant to these contracts and believes such exposure to be remote.
2. SIGNIFICANT ACCOUNTING POLICIES
The Financial Accounting Standards Board (“FASB”) Accounting Standards Codification (the “Codification”) is the exclusive reference of authoritative U.S. generally accepted accounting principles (“GAAP”) recognized by the FASB to be applied by nongovernmental entities. Rules and interpretive releases of the Securities and Exchange Commission (“SEC”) under authority of federal laws are also sources of authoritative GAAP for SEC registrants.
The following is a summary of significant accounting policies followed by the Funds:
Use of Estimates — The preparation of financial statements in conformity with GAAP, requires management to make certain estimates and assumptions that affect the reported amounts of assets and liabilities and disclosure of contingent assets and liabilities at the date of the financial statements and the reported amounts of increases and decreases in the net assets from operations during the reporting period. Actual results could differ from those estimates.
Investment Valuation — The net asset value (“NAV”) of each Fund’s shares is calculated each day a Fund is open for business as of the regularly scheduled close of regular trading on the New York Stock Exchange, normally 4:00 p.m. Eastern time (the “NAV Calculation Time”). NAV per share is calculated by dividing a Fund’s net assets by the number of Fund shares outstanding. Each Fund issues and redeems shares at NAV only in large blocks of shares known as creation units, which only certain institutions (e.g., broker-dealers) may purchase or redeem. Shares of each Fund are listed on a national securities exchange and trade at market prices. Most investors will buy and sell shares in the secondary market through brokers. Because Fund shares trade at market prices rather than NAV, shares may trade at a price greater than NAV or less than NAV. In calculating each Fund’s NAV, investments are valued under policies approved by the Board of Trustees of the Trust (the “Board of Trustees”). Equity securities (including preferred stock) traded on any recognized U.S. or non-U.S. exchange are valued at the last sale price or official closing price on the exchange on which they are principally traded. Unlisted equity securities (including preferred stock) are valued at the last sale price or, if no sale price is available, at the mean between the highest bid and lowest ask price. Each Fund may invest in money market funds which are valued at their NAV per share and exchange-traded funds (“ETFs” or “ETF”) or exchange-traded notes (“ETNs” or “ETN”) which are valued at their last sale or official closing price on the exchange on which they are principally traded or at their NAV per share in instances where the ETF or ETN has not traded on its principal exchange. Foreign currency contracts that settle within two business days after the trade date (“Spot Contracts”) and foreign currency contracts having a settlement period greater than two business days after the trade date (“Forward Contracts”) are valued daily using WM/Reuters closing spot and forward rates, respectively, as of 4:00 p.m. London time.
Notes to Financial Statements (continued)
In certain instances, such as when reliable market valuations are not readily available, a Fund’s investments, which include derivatives, will be fair valued in accordance with the Fund’s pricing policy. The Board of Trustees has established a pricing committee (the “Pricing Committee”) which is comprised of senior representatives of WTAM and which reports to the Board of Trustees on a quarterly basis. In the event that a financial instrument cannot be valued based upon a price from the exchange or system on which it is principally traded, independent pricing service provider or broker-dealer quotation, or such prices are deemed to not reflect current market value, the Pricing Committee may value the financial instrument in good faith under the policies and procedures approved by the Board of Trustees based on current facts and circumstances. Securities that may be valued using “fair value” pricing may include, but are not limited to, securities for which there are no current market quotations, securities whose issuer is in default or bankruptcy, securities subject to corporate actions (such as mergers or reorganizations), securities subject to non-U.S. investment limits or currency controls, and securities affected by “significant events.” An example of a significant event is an event occurring after the close of the market in which a security trades but before a Fund’s next NAV Calculation Time that may materially affect the value of a Fund’s investment (e.g., government action, natural disaster, or significant market fluctuation). When fair value pricing is employed, the prices of securities used by a Fund to calculate its NAV may differ from quoted or published prices for the same securities.
Fair Value Measurement — In accordance with Codification Topic 820 (“ASC 820”), Fair Value Measurements and Disclosures, fair value is defined as the price that would be received to sell an asset or paid to transfer a liability in an orderly transaction between market participants at the measurement date. The Pricing Committee will perform other procedures (consistent with GAAP) to value an investment when a market quote is not available. ASC 820 established a three-tier hierarchy of inputs to be used when determining fair value measurements for disclosure purposes. Inputs refer broadly to the assumptions that market participants would use in pricing the asset or liability, including assumptions about risk — for example, the risk inherent in a particular valuation technique used to measure fair value (such as a pricing model) and/or the risk inherent in the inputs to the valuation technique. Inputs may be observable or unobservable. Observable inputs reflect the assumptions market participants would use in pricing the asset or liability. Observable inputs are based on market data obtained from sources independent of the reporting entity. Unobservable inputs reflect the reporting entity’s own assumptions about the assumptions market participants would use in pricing the asset or liability. Unobservable inputs are based on the best information available in the circumstances. The three-tier hierarchy of inputs is summarized in the three broad levels listed below:
Level 1 – quoted prices in active markets for identical securities
Level 2 – other significant observable inputs (including quoted prices for similar securities, interest rates,
prepayment speeds, credit risk, etc.)
Level 3 – significant unobservable inputs (including each Fund’s assumptions in determining the fair value of investments)
The inputs or methodology used for valuation are not necessarily an indication of the risk associated with investing in those investments.
Investments that use Level 2 or Level 3 inputs may include, but are not limited to: (i) an unlisted security related to corporate actions; (ii) a restricted security (e.g., one that may not be publicly sold without registration under the Securities Act of 1933, as amended); (iii) a security whose trading has been suspended (either due to events affecting the issuer of the security specifically or events affecting the primary trading exchange more broadly) or which has been de-listed from its primary trading exchange; (iv) a security that is thinly traded; (v) a security in default or bankruptcy proceedings for which there is no current market quotation or market activity; (vi) a security affected by currency controls or restrictions; and (vii) a security affected by a significant event (e.g., an event that occurs after the close of the markets in which the security is traded but before the time as of which a Fund’s NAV is computed and that may materially affect the value of the Fund’s investments).
The valuation techniques and significant inputs used in determining the fair market value measurements for Level 2 and Level 3 positions are as follows:
Financial instruments are generally valued by independent pricing service providers that use broker-dealer quotations, reported trades or valuation estimates from their internal pricing models. Depending on the type of financial instrument, the independent pricing service providers’ internal pricing models may use inputs that are observable such as issuer details (e.g., credit rating, debt ranking, coupon date, maturity date, etc.), interest rates, yield curves, prepayment speeds, credit risks/spreads, default rates and quoted prices for similar assets. Financial instruments that use similar valuation techniques and observable inputs as described above and have an appropriate level of market activity are categorized as Level 2 of the fair value hierarchy, otherwise a Level 3 fair value classification is appropriate. Over-the-counter financial derivative instruments derive their value from underlying asset prices, indices, reference rates, and other inputs or a combination of these factors. These instruments are normally valued on the basis of broker-dealer quotations or prices obtained from independent pricing service providers. Depending on the product and the terms of the transaction, the value of the financial derivative instruments can be estimated by an independent pricing service provider using a series of techniques including simulation pricing models. The pricing models may use inputs that are observed from actively quoted markets such as issuer details, indices, credit risks/spreads, interest rates, yield curves, default and exchange rates. Derivative
Notes to Financial Statements (continued)
contracts that use similar valuation techniques and observable inputs as described above and have an appropriate level of market activity are categorized as Level 2 of the fair value hierarchy, otherwise a Level 3 fair value classification is appropriate.
Determination of a fair value by the Pricing Committee may include significant unobservable inputs and therefore such financial instruments would be reflected as a Level 3 of the fair value hierarchy. The Pricing Committee may employ a market-based valuation approach which may use, among other potential considerations, related or comparable securities, recent transactions, market multiples, and other relevant information to determine fair value. The Pricing Committee may also use an income-based valuation approach in which anticipated future cash flows of the financial instrument are discounted to calculate fair value.
The summary of fair valuations according to the inputs used in valuing each Fund’s assets as of the measurement date is included in a “Fair Valuation Summary” supplementary table in each applicable Fund’s Schedule of Investments.
During the fiscal year ended March 31, 2022, there were no significant transfers into or out of Level 3 of the fair value hierarchy.
Derivatives and Hedging Disclosure — Codification Topic 815 (“ASC 815”), Derivatives and Hedging, requires qualitative disclosures about objectives and strategies for using derivatives, quantitative disclosures about fair value amounts as well as gains and losses on derivative instruments, and disclosures about credit-risk-related contingent features in derivative agreements. The Funds have invested in derivatives, specifically foreign currency contracts during the fiscal year ended March 31, 2022 and open positions in such derivatives as of March 31, 2022 are detailed in each Fund’s Schedule of Investments. All of the derivative instruments disclosed and described herein are subject to risk. Risks may arise upon entering into foreign currency contracts from potential inability of a counterparty to meet the terms of their contracts and from unanticipated movements in the value of the foreign currencies relative to the U.S. dollar or each other. The Funds’ derivative agreements may also contain credit-risk related contingent features which include, but are not limited to, a percentage decline in the Funds’ NAV over a specified time period. If an event occurred at March 31, 2022 that triggered a contingent feature, the counterparty to the agreement may require the Funds to post additional collateral or terminate the derivative positions and demand payment. Any collateral posted with respect to the derivative positions would be used to offset or reduce the payment. The maximum exposure to derivatives agreements with credit-risk related contingent features would be the total value of derivatives in net liability positions for each Fund, as disclosed in the table included in Note 2 — Master Netting Arrangements. Information with respect to the amounts and types of collateral received and/or posted for derivative instruments as of March 31, 2022, if any, is reflected as a footnote within each Fund’s Schedule of Investments.
As of March 31, 2022, the effects of such derivative instruments on each Fund’s financial position as reflected in the Statements of Assets and Liabilities are presented in the summary below:
| | | | | | | | | | | | |
| | | |
| | | Asset Derivatives | | | Liability Derivatives | |
| | | | |
| Fund | | Balance Sheet Location | | Value | | | Balance Sheet Location | | Value | |
Europe Hedged Equity Fund | |
Foreign currency risk | | Unrealized appreciation on
foreign currency contracts | | $ | 22,522,127 | | | Unrealized depreciation on
foreign currency contracts | | $ | 67,941 | |
Europe Hedged SmallCap Equity Fund | |
Foreign currency risk | | Unrealized appreciation on
foreign currency contracts | | | 642,317 | | | Unrealized depreciation on
foreign currency contracts | | | 2,206 | |
Germany Hedged Equity Fund | |
Foreign currency risk | | Unrealized appreciation on
foreign currency contracts | | | 326,382 | | | Unrealized depreciation on
foreign currency contracts | | | 923 | |
International Hedged Quality Dividend Growth Fund | |
Foreign currency risk | | Unrealized appreciation on
foreign currency contracts | | | 16,685,609 | | | Unrealized depreciation on
foreign currency contracts | | | 4,826,786 | |
Japan Hedged Equity Fund | |
Foreign currency risk | | Unrealized appreciation on
foreign currency contracts | | | 103,648,052 | | | Unrealized depreciation on
foreign currency contracts | | | 4,930,055 | |
Japan Hedged SmallCap Equity Fund | |
Foreign currency risk | | Unrealized appreciation on
foreign currency contracts | | | 1,747,644 | | | Unrealized depreciation on
foreign currency contracts | | | 236,895 | |
Notes to Financial Statements (continued)
For the fiscal year ended March 31, 2022, the effects of derivative instruments on each applicable Fund’s financial performance as reflected in the Statements of Operations are presented in the summary below:
| | | | | | | | |
| | |
| Fund | | Amount of Realized Gain
or (Loss) on Derivatives
Recognized1 | | | Change in Unrealized
Appreciation or
(Depreciation) on
Derivatives Recognized2 | |
Europe Hedged Equity Fund | |
Foreign currency risk | | $ | 172,094,740 | | | $ | (36,872,569 | ) |
Europe Hedged SmallCap Equity Fund | |
Foreign currency risk | | | 4,308,411 | | | | (523,375 | ) |
Germany Hedged Equity Fund | |
Foreign currency risk | | | 2,584,987 | | | | (615,195 | ) |
International Hedged Quality Dividend Growth Fund | |
Foreign currency risk | | | 68,824,693 | | | | (11,258,913 | ) |
Japan Hedged Equity Fund | |
Foreign currency risk | | | 142,852,050 | | | | 41,813,700 | |
Japan Hedged SmallCap Equity Fund | |
Foreign currency risk | | | 3,063,005 | | | | 443,999 | |
| | 1 | Realized gains (losses) on derivatives are located on the Statements of Operations as follows: |
| | |
Foreign currency risk | | Net realized gain (loss) from foreign currency contracts |
| | 2 | Change in unrealized appreciation (depreciation) is located on the Statements of Operations as follows: |
| | |
Foreign currency risk | | Net increase (decrease) in unrealized appreciation/depreciation from foreign currency contracts |
During the fiscal year ended March 31, 2022, the volume of derivative activity (based on the average of month-end balances) for each Fund was as follows:
| | | | | | | | |
| | |
| | | Average Notional | |
| | |
| Fund | | Foreign currency
contracts
(to deliver
USD) | | | Foreign currency
contracts
(to receive
USD) | |
Europe Hedged Equity Fund | |
Foreign currency risk | | $ | 2,036,545,957 | | | $ | 4,069,284,946 | |
Europe Hedged SmallCap Equity Fund | |
Foreign currency risk | | | 51,140,942 | | | | 102,469,806 | |
Germany Hedged Equity Fund | |
Foreign currency risk | | | 31,038,897 | | | | 61,809,616 | |
International Hedged Quality Dividend Growth Fund | |
Foreign currency risk | | | 1,067,126,919 | | | | 2,122,125,075 | |
Japan Hedged Equity Fund | |
Foreign currency risk | | | 1,941,698,002 | | | | 3,800,246,955 | |
Japan Hedged SmallCap Equity Fund | |
Foreign currency risk | | | 34,259,563 | | | | 67,179,690 | |
Investment Transactions and Investment Income — Investment transactions are recorded as of the date that the securities are purchased or sold (trade date). Realized gains and losses on sales of portfolio securities are calculated using the identified-cost method. Dividend income (less foreign taxes withheld, if any) is recognized on the ex-dividend date or as soon as practicable (with respect to foreign dividends) after the existence of a dividend declaration has been determined. Non-cash dividend income is recognized on the ex-dividend date, or as soon as practicable (with respect to foreign dividends) after the existence of a dividend declaration has been determined, at the fair value of securities to be received. On each measurement date, the Funds evaluate the collectability of receivable balances. Generally, the Funds will write-off dividend receivable balances that are canceled by the issuer as of date that the dividend receivable cancellation notification was publicly made available or when it becomes probable that dividends will not be collected and the amount of uncollectable dividends can be reasonably estimated. Income earned from securities lending activities (i.e., securities lending income), net of fees payable to the securities borrower and/or securities lending agent, is accrued daily.
Foreign Currency Translation — The accounting records of the Funds are maintained in U.S. dollars. Foreign currencies, as well as investment securities and other assets and liabilities denominated in foreign currencies, are translated into U.S. dollars using exchange rates prevailing on the respective dates of such transactions that are deemed appropriate by WTAM. Realized and unrealized foreign exchange gains and losses on investments are included as a component of “net realized gain (loss) from investment
Notes to Financial Statements (continued)
transactions” and “net increase (decrease) in unrealized appreciation/depreciation from investment transactions”, respectively, on the Statements of Operations. Realized and unrealized foreign exchange gains or losses from foreign currency contracts are included in “net realized gain (loss) from foreign currency contracts” and “net increase (decrease) in unrealized appreciation/depreciation from foreign currency contracts”, respectively, on the Statements of Operations. Realized and unrealized foreign exchange gains or losses arising from sales of foreign currencies, currency gains or losses recognized between the trade and settlement dates on investment transactions, and the difference between the amounts of dividends and foreign withholding taxes recorded on the Funds’ books and the U.S. dollar equivalent of the amounts actually received or paid are included in “net realized gain (loss) from foreign currency related transactions” and/or “net increase (decrease) in unrealized appreciation/depreciation from translation of assets and liabilities denominated in foreign currencies” in the Statements of Operations. Certain foreign exchange gains and losses included in realized and unrealized gains or losses are included in, or are a reduction of, ordinary income in accordance with U.S. Federal income tax regulations.
Expenses — Under the investment advisory agreement for each Fund, except for Funds that commenced operations on or after March 26, 2013, WTAM has agreed to pay all expenses of the Trust, except for: (i) brokerage expenses and other expenses (such as stamp taxes) connected with the execution of portfolio transactions or in connection with creation and redemption transactions; (ii) legal fees or expenses in connection with any arbitration, litigation or pending or threatened arbitration or litigation, including any settlements in connection therewith; (iii) compensation and expenses of trustees who are not interested persons of the Funds (“Independent Trustees”); (iv) compensation and expenses of counsel to the Independent Trustees; (v) compensation and expenses of the Trust’s Chief Compliance Officer (“CCO”); (vi) extraordinary expenses; (vii) distribution fees and expenses paid by the Trust under any distribution plan adopted pursuant to Rule 12b-1 under the 1940 Act; and (viii) the advisory fee payable to WTAM.
Under the investment advisory agreement for Funds that commenced operations on or after March 26, 2013, WTAM has agreed to pay all expenses of the Trust, except for: (i) brokerage expenses and other fees, charges, taxes, levies or expenses (such as stamp taxes) incurred in connection with the execution of portfolio transactions or in connection with creation and redemption transactions (including without limitation any fees, charges, taxes, levies or expenses related to the purchase or sale of an amount of any currency, or the patriation or repatriation of any security or other asset, related to the execution of portfolio transactions or any creation or redemption transactions); (ii) legal fees or expenses in connection with any arbitration, litigation or pending or threatened arbitration or litigation, including any settlements in connection therewith; (iii) compensation and expenses of each Independent Trustee; (iv) compensation and expenses of counsel to the Independent Trustees; (v) compensation and expenses of the Trust’s CCO; (vi) extraordinary expenses (in each case as determined by a majority of the Independent Trustees); (vii) distribution fees and expenses paid by the Trust under any distribution plan adopted pursuant to Rule 12b-1 under the 1940 Act; (viii) interest and taxes of any kind or nature (including, but not limited to, income, excise, transfer and withholding taxes); (ix) fees and expenses related to the provision of securities lending services; and (x) the advisory fee payable to WTAM.
Acquired fund fees and expenses (“AFFEs”) (which are fees and expenses incurred indirectly by a Fund through its investments in certain underlying investment companies) are not operating expenses of the Funds and are not paid by WTAM.
Pursuant to a separate contractual arrangement, WTAM arranges for the provision of CCO services with respect to each Fund, and is liable and responsible for, and administers, payments to the CCO, the Independent Trustees and counsel to the Independent Trustees. WTAM receives a fee, as shown on the Statements of Operations under “Service fees”, of up to 0.0044% per annum of each Fund’s average daily net assets for providing such services and paying such expenses. WTAM provides CCO services to the Trust.
Foreign Currency Contracts — The Funds may enter into foreign currency contracts to facilitate local securities settlements or to protect against currency exposure. The Funds may not enter into such contracts for speculative purposes. During the fiscal year ended March 31, 2022, the Funds utilized foreign currency contracts primarily to offset exposure to foreign currencies consistent with each Fund’s investment objective. A foreign currency contract involves an obligation to purchase or sell a specific currency at a future date, which may be any fixed number of days from the date of the contract agreed upon by the parties, at a price set at the time of the contract. These contracts are principally traded in the inter-bank market conducted directly between currency traders (usually large, commercial banks) and their customers. A foreign currency contract generally does not require an initial margin deposit and no commissions are charged at any stage for trades. However, if a Fund is in an unrealized loss position on a foreign currency contract, it may be required to pledge collateral (or additional collateral) to the counterparty. If a Fund is in an unrealized gain position on a foreign currency contract, it may receive collateral from the counterparty. In the event of a default or inability of counterparties to meet the terms of their contracts, the non-defaulting party generally has the right to liquidate the collateral and apply the proceeds in satisfaction of the contract terms.
Risks may arise upon entering into foreign currency contracts from the potential inability of counterparties to meet the terms of their contracts and from unanticipated movements in the value of foreign currencies relative to the U.S. dollar or each other.
Fluctuations in the value of open foreign currency contracts are recorded for book purposes as unrealized gains or losses on foreign currency contracts by the Funds and are included in “net increase (decrease) in unrealized appreciation/depreciation from foreign currency contracts” on the Statements of Operations. Realized gains and losses on foreign currency contracts include net gains or losses
Notes to Financial Statements (continued)
recognized by the Funds on contracts which have settled are included in “net realized gain (loss)” from foreign currency contracts on the Statements of Operations.
Securities Lending — Each Fund may lend portfolio securities to certain creditworthy borrowers, including the Funds’ securities lending agent. It is the Funds’ policy that, at origination, all loans are secured by collateral of at least 102% of the value of U.S. securities loaned and 105% of the value of foreign securities loaned. Collateral in the form of cash and/or securities issued or guaranteed by the U.S. government or its agencies, equivalent to at least 100% of the market value of securities, is maintained at all times. The cash collateral can be invested in certain money market mutual funds which also have exposure to the fluctuations of the market. The values of the investments of cash collateral for securities on loan along with the obligations to return such collateral are included on the Statements of Assets and Liabilities. The total value of securities received as collateral for securities on loan is included in a footnote following each Schedule of Investments, but is not included within the Statements of Assets and Liabilities because the receiving Fund does not have the right to sell or repledge the securities received as collateral. As compensation for lending its securities, each Fund retains all or a portion of the interest received on investment of cash collateral or receives a fee from the borrower (net of any fee rebates paid to the borrower). The lending agent receives a portion of the income earned by the Funds in connection with the lending program. The net securities lending income earned by the Funds is disclosed on the Statements of Operations. The dividend income earned on the securities loaned is accounted for in the same manner as other dividend income. The borrower pays to the Funds an amount equal to any dividends or interest received on loaned securities. Dividends received while a security is out on loan are not considered Qualified Dividend Income (“QDI”) under the specific criteria issued by the Internal Revenue Service and are subject to taxation at the shareholder’s ordinary income tax rate instead of the lower long-term capital gains tax rate. Lending portfolio securities could result in a loss or delay in recovering each Fund’s securities if the borrower defaults. In the event of a borrower default with respect to the failure to return to each Fund some or all of the securities loaned, the securities lending agent shall indemnify each Fund against the failure of the borrower if the value of the collateral received is insufficient to cover the market value of the securities loaned.
Master Netting Arrangements — Codification Topic 210 (“ASC 210”), Balance Sheet, requires disclosures generally intended to (i) help investors and other financial statement users to better assess the effect or potential effect of offsetting arrangements on a company’s financial position, (ii) improve transparency in the reporting of how companies mitigate credit risk, and (iii) facilitate comparisons between those entities that prepare their financial statements on the basis of GAAP and those entities that prepare their financial statements on the basis of international financial reporting standards. ASC 210 requires entities to disclose (i) gross and net information about both instruments and transactions eligible for offset in the financial statements, and (ii) instruments and transactions subject to an agreement similar to a master netting agreement. ASC 210 is limited in scope to the following financial instruments, to the extent they are offset in the financial statements or subject to an enforceable master netting arrangement or similar agreement: (i) recognized derivative instruments accounted for under ASC 815 (Derivatives and Hedging); (ii) repurchase agreements and reverse repurchase agreements; and (iii) securities borrowing and securities lending transactions.
In order to better define its contractual rights and to secure rights that will help a Fund mitigate its counterparty risk, a Fund enters into an International Swaps and Derivatives Association, Inc. Master Agreement (“ISDA Master Agreement”) with its counterparties. An ISDA Master Agreement is a bilateral agreement between a Fund and a counterparty that governs over-the-counter derivatives (“OTC”), such as foreign currency contracts, and typically contains, among other things, collateral posting terms, netting and rights of set-off provisions in the event of a default and/or termination event. Under an ISDA Master Agreement, a Fund may, under certain circumstances, offset with the counterparty certain derivative financial instruments’ payables and receivables to create a single net payment. The provisions of the ISDA Master Agreement typically permit a single net payment in the event of a default (close-out netting) or similar event, including the bankruptcy or insolvency of the counterparty.
Collateral requirements generally differ by type of derivative. Collateral terms are contract-specific for OTC derivatives (e.g., foreign currency contracts, options and certain swaps). Generally, for transactions traded under an ISDA Master Agreement, the collateral requirements are calculated by netting the marked to market amount for each transaction under such agreement and comparing that amount to the value of any collateral currently pledged by a Fund and the counterparty. Generally, the amount of collateral due from or to a counterparty must exceed a minimum transfer amount threshold before a transfer is required to be made. To the extent amounts due to a Fund from its derivatives counterparties are not fully collateralized, contractually or otherwise, the Fund bears the risk of loss from a counterparty’s non-performance.
The Funds’ securities lending activities are governed by a Securities Lending Authorization Agreement (“Lending Agreement”) between the Funds and the lending agent. The Lending Agreement authorizes the lending agent to lend qualifying U.S. and foreign securities held by a Fund to approved borrowers (each a “Borrower”). To mitigate borrower risk, a Fund typically receives from a Borrower collateral in the form of U.S. dollar cash and/or securities issued or guaranteed by the U.S. government or its agencies in excess of the market value of the securities loaned. Under the provisions of the Lending Agreement, a Fund shall have, as to the collateral, all of the rights and remedies of a secured party under applicable law. A Fund is exposed to risk of loss if a Borrower defaults on its obligation to return borrowed securities and the value of the collateral a Fund received is insufficient to cover the
Notes to Financial Statements (continued)
market value of the securities loaned. Also, the lending agent is permitted to invest the cash collateral it receives from a Borrower into a money market fund which is subject to market fluctuation. Therefore, a Fund is exposed to risk of loss if the value of invested cash collateral is insufficient to satisfy the Fund’s obligation to return the full amount owed to such Borrower.
For financial reporting purposes, the Funds elect to not offset assets and liabilities subject to an ISDA Master Agreement or Lending Agreement, if any, in the Statements of Assets and Liabilities. Therefore, all qualifying transactions are presented on a gross basis in the Statements of Assets and Liabilities. As of March 31, 2022, the impact of netting of assets and liabilities and the offsetting of collateral pledged or received based on contractual netting/set-off provisions in the ISDA Master Agreement and the Lending Agreement are detailed in the following table:
| | | | | | | | | | | | | | | | | | | | | | | | | | | | | | | | |
| | | |
| | | Assets | | | Liabilities | |
| | | | | | |
| | | Gross Amounts
in the
Statements of Assets and
Liabilities | | | Gross Amounts Not Offset
in the Statements of
Assets and Liabilities | | | Net Amount | | | Gross Amounts
in the
Statements of Assets and
Liabilities | | | Gross Amounts Not Offset
in the Statements of
Assets and Liabilities | | | Net Amount | |
| Fund | | Financial
Instruments | | | Collateral
Received | | | Financial
Instruments | | | Collateral
Posted | |
Europe Hedged Equity Fund | |
Securities Lending | | $ | 92,957,718 | | | $ | — | | | $ | (92,957,718 | )1 | | $ | — | | | $ | — | | | $ | — | | | $ | — | | | $ | — | |
Foreign Currency Contracts | | | 22,522,127 | | | | (64,301 | ) | | | — | | | | 22,457,826 | | | | 67,941 | | | | (64,301 | ) | | | — | | | | 3,640 | |
Europe Hedged SmallCap Equity Fund | |
Securities Lending | | | 2,970,630 | | | | — | | | | (2,970,630 | )1 | | | — | | | | — | | | | — | | | | — | | | | — | |
Foreign Currency Contracts | | | 642,317 | | | | (1,987 | ) | | | — | | | | 640,330 | | | | 2,206 | | | | (1,987 | ) | | | — | | | | 219 | |
Germany Hedged Equity Fund | |
Securities Lending | | | 115,131 | | | | — | | | | (115,131 | )1 | | | — | | | | — | | | | — | | | | — | | | | — | |
Foreign Currency Contracts | | | 326,382 | | | | (875 | ) | | | — | | | | 325,507 | | | | 923 | | | | (875 | ) | | | — | | | | 48 | |
International Hedged Quality Dividend Growth Fund | |
Securities Lending | | | 48,372,496 | | | | — | | | | (48,372,496 | )1 | | | — | | | | — | | | | — | | | | — | | | | — | |
Foreign Currency Contracts | | | 16,685,609 | | | | (4,812,020 | ) | | | — | | | | 11,873,589 | | | | 4,826,786 | | | | (4,812,020 | ) | | | — | | | | 14,766 | |
Japan Hedged Equity Fund | |
Securities Lending | | | 73,794,560 | | | | — | | | | (73,794,560 | )1 | | | — | | | | — | | | | — | | | | — | | | | — | |
Foreign Currency Contracts | | | 103,648,052 | | | | (2,319,146 | ) | | | — | | | | 101,328,906 | | | | 4,930,055 | | | | (2,319,146 | ) | | | — | | | | 2,610,909 | |
Japan Hedged SmallCap Equity Fund | |
Securities Lending | | | 5,450,730 | | | | — | | | | (5,450,730 | )1 | | | — | | | | — | | | | — | | | | — | | | | — | |
Foreign Currency Contracts | | | 1,747,644 | | | | (236,852 | ) | | | — | | | | 1,510,792 | | | | 236,895 | | | | (236,852 | ) | | | — | | | | 43 | |
| | 1 | The amount of collateral presented has been limited such that the net amount by counterparty cannot be less than zero. |
Short-Term Investments — Each Fund may invest a portion of its assets in high-quality money market instruments on an ongoing basis to provide liquidity or for other reasons. The instruments include short-term obligations issued by the U.S. government, its agencies, non-U.S. government agencies, negotiable certificates of deposit (“CDs”), fixed time deposits and bankers’ acceptances of U.S. and foreign banks and similar institutions, commercial papers, repurchase agreements and money market funds. CDs are short-term negotiable obligations of commercial banks. Time deposits are non-negotiable deposits maintained in banking institutions for specified periods of time at stated interest rates. Banker’s acceptances are time drafts drawn on commercial banks by borrowers, usually in connection with international transactions.
Tax Information and Dividends and Distributions to Shareholders — It is each Fund’s policy to comply with all requirements of the Internal Revenue Code of 1986, as amended (the “Code”). A portion of the Code, known as subchapter M (“Subchapter M”), addresses the ways by which investment companies and investment trusts may pass income through to shareholders in order to avoid double taxation. Each Fund intends to qualify for and to elect treatment as a separate Regulated Investment Company (“RIC”) under Subchapter M of the Code so that it will not be subject to federal income tax on income and gains that are timely distributed to Fund shareholders. Accordingly, no provision for U.S. federal income taxes is required. In order to qualify for the special tax treatment accorded to RICs and their shareholders, each Fund must, among other things, distribute with respect to each taxable year an amount equal to or greater than the sum of 90% of its investment company taxable income and 90% of its net tax-exempt interest income. There can be no guarantee that a Fund will pay dividends. Taxable net realized gains from investment transactions, reduced by capital loss carryforwards, if any, are declared and distributed to shareholders at least annually. The capital loss carryforward
Notes to Financial Statements (continued)
amount, if any, is available to offset future net capital gains. The Funds may occasionally be required to make supplemental distributions at some other time during the year. The Trust reserves the right to declare special distributions if, in its reasonable discretion, such action is necessary or advisable to preserve the status of each Fund as a RIC or to avoid imposition of income or excise taxes on undistributed income. Dividends and distributions to shareholders are recorded on the ex-dividend date. The amount of dividends and distributions from net investment income and net realized capital gains is determined in accordance with the requirements of the Code and the U.S. Treasury regulations. These book/tax differences are either considered temporary or permanent in nature. To the extent these differences are permanent in nature, such amounts are reclassified within the components of net assets based on their Federal tax basis treatment; temporary differences do not require reclassification. Dividends and distributions that exceed earnings and profit for tax purposes are reported for tax purposes as a return of capital.
3. ADVISORY FEES AND OTHER TRANSACTIONS WITH AFFILIATES
WTAM has overall responsibility for the general management and administration of the Trust. WTAM provides an investment program for each Fund. WTAM has arranged for Mellon Investments Corporation (“Mellon”) to provide sub-advisory services to the Funds. Mellon is compensated by WTAM at no additional cost to the Funds. WTAM also arranges for transfer agency, custody, fund accounting, fund administration, securities lending and all other non-distribution related services necessary for the Funds to operate, which are generally under separate agreements entered into between the Trust on behalf of the Funds and the applicable service provider. Under the investment advisory agreement for each Fund, WTAM agrees to pay all expenses of the Funds, except for certain expenses described in Note 2.
Pursuant to a separate contractual arrangement, as also described in Note 2, WTAM arranges for the provision of CCO services with respect to each Fund, and is liable and responsible for, and administers, payments to the CCO, the Independent Trustees and counsel to the Independent Trustees in exchange for a fee, accrued daily and paid monthly in arrears, of up to 0.0044% per annum of each Fund’s average daily net assets.
WTAM expects to receive annual advisory fees from each Fund, based on a percentage of the Fund’s average daily net assets, as shown in the following table:
| | | | |
| | |
| Fund | | Advisory
Fee Rate | |
Europe Hedged Equity Fund | | | 0.58 | % |
Europe Hedged SmallCap Equity Fund | | | 0.58 | % |
Germany Hedged Equity Fund | | | 0.48 | % |
International Hedged Quality Dividend Growth Fund | | | 0.58 | % |
Japan Hedged Equity Fund | | | 0.48 | % |
Japan Hedged SmallCap Equity Fund | | | 0.58 | % |
During the year ended March 31, 2022, the International Hedged Quality Dividend Growth Fund received a voluntary reimbursement of $13,616 from Mellon for investment losses on certain equity transactions. The dollar amount of the reimbursement is shown in the Statements of Operations in “Net increase from payment by affiliate”.
Affiliated holdings are investments in entities in which the Fund owns 5% or more of the outstanding voting securities or are investments in entities which are under common ownership or control. Transactions in shares of affiliated ETFs for the fiscal year ended March 31, 2022, as applicable, are included in an “Investment in Affiliates” supplementary table in each applicable Fund’s Schedule of Investments. For these transactions, WTAM voluntarily waives a portion of the advisory fees, that it would otherwise charge, in an amount equal to the indirect AFFE (which are fees and expenses incurred indirectly by a Fund through its investments in certain underlying investment companies) attributable to each Fund’s investment in affiliated ETFs. The dollar amount of advisory fees waived during the period for the Funds, if any, are included in the Statement of Operations in “Expense waivers”.
During the fiscal year ended March 31, 2022, certain Funds engaged in purchase and sale transactions with funds that have a common investment adviser, WTAM. These interfund purchase and sale transactions were effected in accordance with Rule 17a-7 under the 1940 Act. For the fiscal year ended March 31, 2022, the cost of purchases, proceeds from sales and the net realized gain or loss recognized upon the disposal of securities resulting from interfund transactions are shown in the following table:
| | | | | | | | | | | | |
| | | | |
| Fund | | Purchases | | | Sales | | | Net Realized
Gain/Loss | |
Europe Hedged Equity Fund | | $ | 20,717,432 | | | $ | 10,382,422 | | | $ | (171,699 | ) |
Europe Hedged SmallCap Equity Fund | | | 1,278,862 | | | | 3,105,259 | | | | (29,348 | ) |
Germany Hedged Equity Fund | | | 436,868 | | | | 349,193 | | | | 16,551 | |
International Hedged Quality Dividend Growth Fund | | | 40,172,769 | | | | 20,375,011 | | | | (3,542,548 | ) |
Japan Hedged Equity Fund | | | 31,513,237 | | | | 13,047,927 | | | | 104,412 | |
Japan Hedged SmallCap Equity Fund | | | 1,603,138 | | | | 3,707,506 | | | | (176,433 | ) |
Notes to Financial Statements (continued)
WTAM and/or WisdomTree Investments (collectively herein, “WT”) may from time to time own shares of a Fund. As of and for the fiscal year ended March 31, 2022, WT held shares of and received distributions from the following Funds, which were purchased through an unaffiliated broker in ordinary brokerage transactions in the secondary market in which the Funds’ shares trade:
| | | | | | | | | | | | | | | | |
| | | | |
| | | At March 31, 2022 | | | | | | For the fiscal year ended
March 31, 2022 | |
| | | | |
| Fund | | Fund Shares
held by WT | | | Market Value
of Fund Shares
held by WT | | | | | | Dividends and
Distributions paid to
WT on Fund Shares
held by WT | |
International Hedged Quality Dividend Growth Fund | | | — | | | $ | — | | | | | | | $ | 15 | |
Japan Hedged Equity Fund | | | 20 | | | | 1,280 | | | | | | | | 43 | |
4. CAPITAL SHARE TRANSACTIONS
As of March 31, 2022, there were an unlimited number of $0.001 par value shares of beneficial interest authorized by the Trust. Shares are issued and redeemed by each Fund only in creation units or multiples thereof. Except when aggregated in creation units, shares of each Fund are not redeemable. Transactions in shares for each Fund are disclosed in detail in the Statements of Changes in Net Assets. The consideration for the purchase of creation units of a Fund generally consists of the in-kind contribution of a basket of securities and/or an amount of cash. Investors purchasing and redeeming creation units may be charged a purchase transaction fee and a redemption transaction fee to offset transfer and other transaction costs associated with the issuance and redemption of creation units.
5. INVESTMENT PORTFOLIO TRANSACTIONS
Purchases and sales of investments (excluding purchases and sales resulting from in-kind capital share transactions and short-term investments) and the cost of purchases and the proceeds from sales resulting from in-kind capital share transactions (excluding short-term investments) for the fiscal year ended March 31, 2022 are shown in the following table. Realized gains and losses on sales resulting from in-kind capital share redemptions, as shown on the Statements of Operations, are not recognized by the Funds for tax purposes.
| | | | | | | | | | | | | | | | |
| | | | |
| | | | | | | | | In-kind Capital Share Transactions | |
| | | | |
| Fund | | Purchases | | | Sales | | | Purchases | | | Sales | |
Europe Hedged Equity Fund | | $ | 802,026,333 | | | $ | 684,492,776 | | | $ | 50,884,092 | | | $ | 157,541,629 | |
Europe Hedged SmallCap Equity Fund | | | 32,755,905 | | | | 28,822,740 | | | | 23,092,190 | | | | — | |
Germany Hedged Equity Fund | | | 8,838,288 | | | | 7,160,379 | | | | — | | | | 4,880,820 | |
International Hedged Quality Dividend Growth Fund | | | 738,103,842 | | | | 642,997,201 | | | | 430,954,261 | | | | 242,249,315 | |
Japan Hedged Equity Fund | | | 600,650,317 | | | | 407,710,086 | | | | 860,421,182 | | | | 720,746,873 | |
Japan Hedged SmallCap Equity Fund | | | 16,523,798 | | | | 13,382,424 | | | | 13,732,739 | | | | 16,920,642 | |
6. FEDERAL INCOME TAXES
At March 31, 2022, the cost of investments (including securities on loan and derivatives) for Federal income tax purposes was as follows:
| | | | | | | | | | | | | | | | | | | | | | | | | | | | | | | | | | | | |
| | | | | |
| | | Investments in Long Securities | | | | | | Investments in Financial Derivatives1 | | | | |
| | | | | | | | | |
| Fund | | Tax Cost | | | Gross
Unrealized
Appreciation | | | Gross Unrealized
Depreciation | | | Net Unrealized
Appreciation/
(Depreciation) | | | | | | Gross
Unrealized
Appreciation | | | Gross
Unrealized
Depreciation | | | Net Unrealized
Appreciation/
(Depreciation) | | | Total Net
Unrealized
Appreciation/ (Depreciation) | |
Europe Hedged Equity Fund | | $ | 1,816,105,736 | | | $ | 326,429,287 | | | $ | (199,802,521 | ) | | $ | 126,626,766 | | | | | | | $ | — | | | $ | — | | | $ | — | | | $ | 126,626,766 | |
Europe Hedged SmallCap Equity Fund | | | 64,779,453 | | | | 4,551,140 | | | | (6,632,485 | ) | | | (2,081,345 | ) | | | | | | | — | | | | — | | | | — | | | | (2,081,345 | ) |
Germany Hedged Equity Fund | | | 25,474,946 | | | | 2,615,864 | | | | (2,912,230 | ) | | | (296,366 | ) | | | | | | | — | | | | — | | | | — | | | | (296,366 | ) |
International Hedged Quality Dividend Growth Fund | | | 1,094,766,073 | | | | 179,844,728 | | | | (88,966,579 | ) | | | 90,878,149 | | | | | | | | 48,093 | | | | (23,944 | ) | | | 24,149 | | | | 90,902,298 | |
Japan Hedged Equity Fund | | | 2,037,755,168 | | | | 143,047,551 | | | | (259,236,728 | ) | | | (116,189,177 | ) | | | | | | | — | | | | — | | | | — | | | | (116,189,177 | ) |
Japan Hedged SmallCap Equity Fund | | | 33,713,298 | | | | 489,943 | | | | (5,632,581 | ) | | | (5,142,638 | ) | | | | | | | — | | | | — | | | | — | | | | (5,142,638 | ) |
| | 1 | Certain financial derivatives may be considered section 1256 contracts under the Code. Each section 1256 contract held at the close of a taxable year shall be treated as sold for its fair market value on the last business day of such taxable year (and any realized gain and loss shall be taken into account for the taxable year). As such, the unrealized appreciation/(depreciation) for financial derivatives on a tax basis may not correspond to the unrealized appreciation/(depreciation) on a GAAP basis. The unrealized appreciation/(depreciation) for financial derivatives on a GAAP basis is located in the respective financial derivatives tables in each Fund’s Schedule of Investments. |
Notes to Financial Statements (continued)
At March 31, 2022, the components of total distributable earnings (loss) on a tax-basis were as follows:
| | | | | | | | | | | | | | | | | | | | |
| | | | | | |
| Fund | | Undistributed
Ordinary Income | | | Undistributed
Capital and Other
Losses | | | Net Unrealized
Appreciation/ (Depreciation) | | | Currency and
Other Unrealized
Appreciation/
(Depreciation) | | | Total Distributable
Earnings (Loss) | |
Europe Hedged Equity Fund | | $ | 188,127 | | | $ | (2,022,072,206 | ) | | $ | 126,626,766 | | | $ | (344,875 | ) | | $ | (1,895,602,188 | ) |
Europe Hedged SmallCap Equity Fund | | | 93,805 | | | | (18,544,114 | ) | | | (2,081,345 | ) | | | 10,574 | | | | (20,521,080 | ) |
Germany Hedged Equity Fund | | | 12,066 | | | | (31,814,657 | ) | | | (296,366 | ) | | | (12,229 | ) | | | (32,111,186 | ) |
International Hedged Quality Dividend Growth Fund | | | 2,919,654 | | | | 43,208 | | | | 90,902,298 | | | | 26,570 | | | | 93,891,730 | |
Japan Hedged Equity Fund | | | 22,187,864 | | | | (1,650,756,088 | ) | | | (116,189,177 | ) | | | 120,315 | | | | (1,744,637,086 | ) |
Japan Hedged SmallCap Equity Fund | | | 357,714 | | | | (21,494,836 | ) | | | (5,142,638 | ) | | | 446 | | | | (26,279,314 | ) |
The tax character of distributions paid during the fiscal years ended March 31, 2022 and March 31, 2021, was as follows:
| | | | | | | | |
| | | |
| | | Year Ended
March 31, 2022 | | | Year Ended
March 31, 2021 | |
| | |
| Fund | | Distributions Paid
from Ordinary
Income* | | | Distributions Paid
from Ordinary
Income* | |
Europe Hedged Equity Fund | | $ | 44,246,812 | | | $ | 53,199,944 | |
Europe Hedged SmallCap Equity Fund | | | 1,117,302 | | | | 1,413,257 | |
Germany Hedged Equity Fund | | | 1,209,360 | | | | 1,043,996 | |
International Hedged Quality Dividend Growth Fund | | | 34,880,873 | | | | 20,307,783 | |
Japan Hedged Equity Fund | | | 51,969,830 | | | | 43,598,753 | |
Japan Hedged SmallCap Equity Fund | | | 980,043 | | | | 1,037,117 | |
| | * | Includes short-term capital gains, if any. |
At March 31, 2022, for Federal tax purposes, the Funds have capital loss carryforwards available to offset future capital gains as indicated in the following table. The loss carryforward amounts do not have an expiration date and, therefore, can be carried forward indefinitely until utilized. To the extent that these loss carryforwards are utilized, capital gains so offset will not be distributed to shareholders.
| | | | | | | | | | | | |
| | | | |
| Fund | | Short-Term | | | Long-Term | | | Capital Loss
Available Total | |
Europe Hedged Equity Fund | | $ | 936,204,500 | | | $ | 1,085,867,706 | | | $ | 2,022,072,206 | |
Europe Hedged SmallCap Equity Fund | | | 10,346,009 | | | | 8,198,105 | | | | 18,544,114 | |
Germany Hedged Equity Fund | | | 15,336,235 | | | | 16,478,422 | | | | 31,814,657 | |
International Hedged Quality Dividend Growth Fund | | | — | | | | — | | | | — | |
Japan Hedged Equity Fund | | | 981,555,928 | | | | 669,200,160 | | | | 1,650,756,088 | |
Japan Hedged SmallCap Equity Fund | | | 12,085,981 | | | | 9,408,855 | | | | 21,494,836 | |
Capital losses incurred after October 31 (“post-October capital losses”) and late year ordinary losses incurred after December 31 within the taxable year are deemed to arise on the first business day of each Fund’s next taxable year. At March 31, 2022, the Funds did not have any post-October capital losses or late year ordinary losses to defer.
During the fiscal year ended March 31, 2022, the amount of capital loss carryforwards used to offset realized gains are shown in the following table:
| | | | |
| | |
| Fund | | Utilized
Capital Loss
Carryforward | |
Europe Hedged Equity Fund | | $ | 172,193,244 | |
Europe Hedged SmallCap Equity Fund | | | 7,308,553 | |
Germany Hedged Equity Fund | | | 1,953,593 | |
International Hedged Quality Dividend Growth Fund | | | 53,007,640 | |
Japan Hedged Equity Fund | | | 142,222,622 | |
Japan Hedged SmallCap Equity Fund | | | 2,099,896 | |
Notes to Financial Statements (continued)
At March 31, 2022, the effect of permanent “book/tax” reclassifications resulted in increases (decreases) to the components of net assets as shown in the following table. The differences are primarily due to redemptions-in-kind.
| | | | | | | | |
| | | |
| Fund | | Total Distributable
Earnings (Loss) | | | Paid-in Capital | |
Europe Hedged Equity Fund | | $ | (33,675,434 | ) | | $ | 33,675,434 | |
Europe Hedged SmallCap Equity Fund | | | — | | | | — | |
Germany Hedged Equity Fund | | | (806,978 | ) | | | 806,978 | |
International Hedged Quality Dividend Growth Fund | | | (75,964,414 | ) | | | 75,964,414 | |
Japan Hedged Equity Fund | | | (128,780,615 | ) | | | 128,780,615 | |
Japan Hedged SmallCap Equity Fund | | | (780,238 | ) | | | 780,238 | |
GAAP provides guidance on tax provisions that prescribe a minimum threshold for financial statement recognition of the benefit of a tax position taken or expected to be taken in a tax return. Foreign withholding taxes, as applicable, are accrued based on each Fund’s understanding of the tax rules and rates that exist in the foreign markets in which it invests. Foreign withholding taxes are accrued and applied to foreign income, net realized capital gains and net unrealized appreciation, as applicable, as the foreign income is earned or capital gains and unrealized appreciation are recorded. The dollar amount of applicable foreign withholding taxes on foreign income is included net in the Statements of Operations in “Less: Foreign withholding taxes,” the foreign capital gains tax applicable on the disposal of securities is included in the Statements of Operations in “Net realized gain (loss) from investment transactions” and the dollar amount of deferred foreign capital gains tax applicable on the unrealized appreciation on securities held is included in the Statements of Operations in “Net increase (decrease) in unrealized appreciation/depreciation from investment transactions”. The Funds record a foreign tax reclaim receivable on the ex-dividend date if the tax reclaim is “more likely than not” to be sustained assuming examination by tax authorities. This determination is based on, among other things, a jurisdiction’s legal obligation to pay reclaims as well as payment history and market convention. Foreign tax reclaims that have been recorded but not yet received are shown on the Statements of Assets and Liabilities in “Receivables: Foreign tax reclaims”.
As of and during the fiscal year or period ended March 31, 2022, the Funds did not have any liabilities for unrecognized tax benefits relating to uncertain income tax positions they have taken or expect to take in the future. If applicable, the Funds will recognize interest accrued related to unrecognized tax benefits in interest expense and penalties in “Other” expenses on the Statements of Operations. The Funds file tax returns with the Internal Revenue Service, the State of New York, and various other states. Specific to U.S. federal and state taxes, generally, each of the tax years in the four-year period ended March 31, 2022, remains subject to examination by taxing authorities. Specific to foreign countries in which the Funds invest, all open tax years remain subject to examination by taxing authorities in the respective jurisdictions.
As a result of several European Court of Justice (“ECJ”) court cases in certain countries across the European Union (“EU”), certain Funds have filed additional tax reclaims for previously withheld taxes on dividends earned in those countries (“ECJ tax reclaims”). These additional filings are subject to various administrative proceedings by the local jurisdictions’ tax authorities within the EU, as well as a number of related judicial proceedings. Income recognized, if any, for ECJ tax reclaims is reflected as “Other income” in the Statements of Operations and the cost to file these additional ECJ tax reclaims is reflected as “Other fees” in the Statements of Operations. When the ECJ tax reclaim is not “more likely than not” to be sustained assuming examination by tax authorities due to the uncertainty that exists as to the ultimate resolution of these proceedings, the likelihood of receipt of these ECJ tax reclaims, and the potential timing of payment, no amounts are reflected in the financial statements. At March 31, 2022, the Europe Hedged SmallCap Equity Fund recognized ECJ tax reclaim receivables of $20,812 in the Statements of Assets and Liabilities in “Other receivables” that were “more likely than not” to be sustained by tax authorities and the estimated cost of $6,244 to file for these reclaims is reflected in “Other liabilities” on the Statements of Assets and Liabilities. For U.S. income tax purposes, ECJ tax reclaims received by the Funds, if any, reduce the amounts of foreign taxes Fund shareholders can use as tax credits in their individual income tax returns. In the event that ECJ tax reclaims received by a Fund during the fiscal year exceed foreign withholding taxes paid, and a Fund previously passed foreign tax credits on to its shareholders, a Fund must either amend historic tax reporting to shareholders or enter into a closing agreement with the Internal Revenue Service in order to pay the associated tax liability on behalf of the respective Fund’s shareholders. During the fiscal year ended March 31, 2022, the ECJ tax reclaims received by the Funds did not exceed the foreign withholding taxes of the respective Funds.
7. ADDITIONAL INFORMATION
The respiratory disease caused by a novel coronavirus (“COVID-19”) has spread globally since 2019, resulting in a global pandemic and major disruption to global markets and economies. In an organized attempt to contain and mitigate the effects of COVID-19, governments and businesses world-wide took aggressive measures, including businesses canceling dividends to preserve cash, governments closing borders, restricting international and domestic travel, and the imposition of prolonged quarantines of large populations. COVID-19 has resulted in the disruption of and delays in the delivery of healthcare services and processes, the
Notes to Financial Statements (concluded)
cancellation of organized events and educational institutions, the disruption of production and supply chains, a decline in consumer demand for certain goods and services, and general concern and uncertainty, all of which have contributed to increased volatility in global markets. In recent months, however, the rapid COVID-19 vaccination rollout in the United States and certain other developed countries, coupled with the passage of stimulus programs in the U.S. and abroad, have resulted in a reversal of many of these trends including the re-opening of businesses, a reduction in quarantine requirements, increased consumer demand, and the resumption of certain in-person schooling, travel and events. Despite these positive trends, the prevalence of new COVID-19 variants, a failure to achieve herd immunity, or other unforeseen circumstances may result in the continued spread of the virus throughout unvaccinated populations or a resurgence in infections among vaccinated populations. As a result, it remains unclear if recent positive trends will continue in developed markets and whether such trends will spread world-wide to countries with limited access to vaccines that are still experiencing rising COVID-19 cases, hospitalizations and deaths.
The effects of COVID-19 have affected and are likely to continue to affect certain sectors and industries more dramatically than others, and the effects borne by some will negatively affect the value of the issuers in those sectors and industries, which may adversely affect the value of a Fund’s investments in those sectors or industries. It is also true that the speed at which global economies recover, or fail to recover, from the COVID-19 pandemic will affect certain sectors, industries, and issuers more dramatically than others, which in turn may adversely affect certain Fund investments.
COVID-19, and other epidemics and pandemics that may arise in the future, could adversely affect the economies of many nations, the global economy, individual companies and capital markets in ways that cannot be foreseen at the present time. In addition, the impact of infectious diseases in developing or emerging market countries may be greater due to limited health care resources, including access to COVID-19 vaccinations and treatments. Political, economic and social stresses caused by COVID-19 also may exacerbate other pre-existing political, social and economic risks in certain countries. The duration of COVID-19 and its effects cannot be determined fully at this time, but the effects could be present for an extended period of time. It is impossible to predict the effects on the Funds of these or similar events and market conditions in the future. However, it is possible that these or similar events and market conditions could have a significant and adverse effect on the NAV and/or risk profile of a Fund.
* * * * *
Russia’s military invasion of Ukraine initiated in February 2022 and the economic and diplomatic responses by the United States and other countries have led to increased volatility and uncertainty in the financial markets and could continue to adversely affect regional and global economies for the foreseeable future. In response to Russia’s actions, the governments of the United States, the European Union, the United Kingdom, and many other countries collectively imposed heavy and broad-ranging economic sanctions on certain Russian individuals, corporate and banking entities, and other industries and businesses. The sanctions restrict companies from doing business with Russia and Russian companies, prohibit transactions with the Russian central bank and other key Russian financial institutions and entities, ban Russian airlines and ships from using many other countries’ airspace and ports, respectively, and place a freeze on certain Russian assets. The sanctions also removed some Russian banks from the Society for Worldwide Interbank Financial Telecommunications (SWIFT), the electronic network that connects banks globally to facilitate cross-border payments. In addition, the United States has banned oil and other energy imports from Russia, and the United Kingdom made a commitment to phase out oil import from Russia by the end of 2022.
These sanctions, as well as other economic consequences related to the invasion, such as additional sanctions, boycotts or changes in consumer or purchaser preferences or cyberattacks on governments, companies or individuals, may further decrease the value and liquidity of certain Russian securities and securities of issuers in other countries that are subject to economic sanctions related to the invasion or otherwise adversely affected by the sanctions. To the extent a Fund has exposure to Russian investments or investments in countries affected by the invasion or the sanctions, the Fund’s ability to price, buy, sell, receive or deliver such investments may be impaired. In certain circumstances, such as when there is no market for a security or other means of valuing or disposing of a security, a Fund may determine to value the affected security at zero. In addition, any exposure a Fund may have to counterparties in Russia or in countries affected by the invasion could negatively affect the Fund’s portfolio. The extent and duration of Russia’s military actions and the repercussions of such actions are impossible to predict, but could result in continued significant market disruptions, including in the oil and natural gas markets, and may negatively affect global supply chains, inflation and global growth. Further, an escalation of the military conflict beyond Ukraine’s borders could result in significant, long-lasting damage to the economies of Eastern and Western Europe as well as the global economy. These and any related events could significantly and adversely affect a Fund’s performance and the value of an investment in the Fund, even in the absence of direct exposure to Russian issuers or issuers in other countries affected by the invasion.
Report of Independent Registered Public Accounting Firm
To the Shareholders of WisdomTree Europe Hedged Equity Fund, WisdomTree Europe Hedged SmallCap Equity Fund, WisdomTree Germany Hedged Equity Fund, WisdomTree International Hedged Quality Dividend Growth Fund, WisdomTree Japan Hedged Equity Fund and WisdomTree Japan Hedged SmallCap Equity Fund, and the Board of Trustees of WisdomTree Trust
Opinion on the Financial Statements
We have audited the accompanying statements of assets and liabilities of WisdomTree Europe Hedged Equity Fund, WisdomTree Europe Hedged SmallCap Equity Fund, WisdomTree Germany Hedged Equity Fund, WisdomTree International Hedged Quality Dividend Growth Fund, WisdomTree Japan Hedged Equity Fund and WisdomTree Japan Hedged SmallCap Equity Fund (collectively referred to as the “Funds”), (six of the funds constituting WisdomTree Trust (the “Trust”)), including the schedules of investments, as of March 31, 2022, and the related statements of operations for the year then ended, the statements of changes in net assets for each of the two years in the period then ended, the financial highlights for each of the five years in the period then ended and the related notes (collectively referred to as the “financial statements”). In our opinion, the financial statements present fairly, in all material respects, the financial position of each of the Funds (six of the funds constituting WisdomTree Trust) at March 31, 2022, the results of their operations for the year then ended, the changes in their net assets for each of the two years in the period then ended and their financial highlights for each of the five years in the period then ended, in conformity with U.S. generally accepted accounting principles.
Basis for Opinion
These financial statements are the responsibility of the Trust’s management. Our responsibility is to express an opinion on each of the Funds’ financial statements based on our audits. We are a public accounting firm registered with the Public Company Accounting Oversight Board (United States) (“PCAOB”) and are required to be independent with respect to the Trust in accordance with the U.S. federal securities laws and the applicable rules and regulations of the Securities and Exchange Commission and the PCAOB.
We conducted our audits in accordance with the standards of the PCAOB. Those standards require that we plan and perform the audit to obtain reasonable assurance about whether the financial statements are free of material misstatement, whether due to error or fraud. The Trust is not required to have, nor were we engaged to perform, an audit of the Trust’s internal control over financial reporting. As part of our audits, we are required to obtain an understanding of internal control over financial reporting, but not for the purpose of expressing an opinion on the effectiveness of the Trust’s internal control over financial reporting. Accordingly, we express no such opinion.
Our audits included performing procedures to assess the risks of material misstatement of the financial statements, whether due to error or fraud, and performing procedures that respond to those risks. Such procedures included examining, on a test basis, evidence regarding the amounts and disclosures in the financial statements. Our procedures included confirmation of securities owned as of March 31, 2022, by correspondence with the custodian and brokers or by other appropriate auditing procedures where replies from brokers were not received. Our audits also included evaluating the accounting principles used and significant estimates made by management, as well as evaluating the overall presentation of the financial statements. We believe that our audits provide a reasonable basis for our opinion.

We have served as the auditor of one or more WisdomTree investment companies since 2006.
New York, New York
May 25, 2022
Liquidity Risk Management Program (unaudited)
The Funds adopted a liquidity risk management program (the “Program”) pursuant to the requirements of Rule 22e-4 (the “Rule”) under the Investment Company Act of 1940, as amended. The Rule requires registered open-end funds, including exchange-traded funds such as the Funds, to establish liquidity risk management programs in order to effectively manage fund liquidity and shareholder redemptions. The Rule is designed to mitigate the risk that a Fund could not meet redemption requests without significantly diluting the interest of remaining investors. The Board has appointed WisdomTree Asset Management, Inc., the investment advisor to the Funds, as the Program Administrator for each Fund’s Program.
The Rule requires the Funds to assess, manage and review their liquidity risk at least annually considering applicable factors such as investment strategy and liquidity during normal and foreseeable stressed conditions, including whether the strategy is appropriate for an open-ended fund and whether the Fund has a relatively concentrated portfolio or large positions in particular issuers. The Funds must also assess their use of borrowings and derivatives, short-term and long-term cash flow projections in normal and stressed conditions, holdings of cash and cash equivalents, and borrowing arrangements and other funding sources.
The Rule also requires the Funds to classify their investments into one of four liquidity categories: highly liquid, moderately liquid, less liquid or illiquid based on the number of days a Fund expects it would take to liquidate the investment, and to review these classifications at least monthly or more often under certain conditions. The periods range from three or fewer business days for a highly liquid investment to greater than seven calendar days for settlement of a less liquid investment. Illiquid investments are those a Fund does not expect to be able to sell or dispose of within seven calendar days without significantly changing the market value of the investment. A Fund is prohibited from acquiring an investment if, after the acquisition, its holdings of illiquid assets will exceed 15% of its net assets. In addition, if a Fund permits redemptions in-kind, the Rule requires the Fund to establish redemption in-kind policies and procedures governing how and when it will engage in such redemptions.
Pursuant to the Rule’s requirements, the Program has been reviewed and approved by the Fund’s Board. Furthermore, the Board has received a written report prepared by the Program Administrator that addresses the operation of the Program, assesses its adequacy and effectiveness and describes any material changes made to the Program. The Program Administrator has monitored the Fund’s liquidity risk and the liquidity classifications of the securities held by the Fund and has determined that the Program is operating effectively.
During the period from January 1, 2021 to December 31, 2021, there were no material changes to the Program and no material liquidity events that impacted the Funds. During the period, the Funds held sufficient highly liquid assets to meet fund redemptions.
Under normal expected foreseeable Fund redemption forecasts and foreseeable stressed Fund redemption forecasts, the Program Administrator believes that the Funds maintain sufficient highly liquid assets to meet Fund redemptions.
Trustees and Officers Information (unaudited)
| | | | | | | | | | |
Name
and Year of Birth
of Trustee/Officer | | Position(s) Held with the Trust, Term of Office and Length of Time Served | | Principal Occupation(s) During Past 5 Years | | Number of Portfolios
in Fund Complex
Overseen by Trustee/
Officer+ | | | Other Directorships Held by Trustee |
| Trustees Who Are Interested Persons of the Trust |
| | | | |
Jonathan Steinberg
(1964) | | Trustee, 2005 – present; President, 2005-present | | Chief Executive Officer, WisdomTree Investments, Inc. and WisdomTree Asset Management since 2005; President, WisdomTree Investments, Inc. and WisdomTree Asset Management from 2012 to 2019. | | | 77 | | | Director, WisdomTree Investments, Inc. and WisdomTree Asset Management. |
| Trustees Who Are Not Interested Persons of the Trust |
| | | | |
David G. Chrencik*
(1948) | | Trustee, 2014-present | | Chief Financial Officer of Sarus Indochina Select LP (hedge fund) since 2012; Chief Financial Officer of GeoGreen BioFuels, Inc. (biodiesel fuel producer) from 2010 to 2014; Audit Partner at PricewaterhouseCoopers LLP (public accounting firm) from 1972 to 2009 (includes positions prior to becoming Audit Partner and predecessor firms). | | | 77 | | | Trustee, Vericimetry Funds (2011 to 2014). |
| | | | |
Joel Goldberg**, ***
(1945) | | Trustee, 2012-present | | Attorney, Partner at Stroock & Stroock & Lavan LLP from 2010 to 2018; Attorney, Partner at Willkie Farr & Gallagher LLP from 2006 to 2010. | | | 77 | | | Director, Better Business Bureau (Metropolitan New York, Long Island and the Mid-Hudson Region). |
| | | | |
Toni Massaro***
(1955) | | Trustee, 2006-present | | Dean Emerita at the University of Arizona James E. Rogers College of Law (“Rogers College of Law”) since 2009 (distinguished Emerita in July 2009); Dean of the Rogers College of Law from 1999 to 2009; Regents’ Professor since 2006; Milton O. Riepe Chair in Constitutional Law since 1997; Professor at the Rogers College of Law since 1990. | | | 77 | | | None |
| | | | |
Melinda A. Raso Kirstein**** (1955) | | Trustee, 2014-present | | Retired since 2004, Merrill Lynch Investment Management, Vice President; Senior Portfolio Manager, Fixed Income Management; Director, Tax Exempt Fund Management. | | | 77 | | | Associate Alumnae of Douglass College, Chair of Investment Committee. |
| | | | |
Victor Ugolyn
(1947) | | Trustee, 2006-present; Chairman of the Board, 2006-present | | Private Investor, from 2005 to present; President and Chief Executive Officer of William D. Witter, Inc. from 2005 to 2006; Consultant to AXA Enterprise in 2004; Chairman, President and Chief Executive Officer of Enterprise Capital Management (subsidiary of The MONY Group, Inc.) and Enterprise Group of Funds, Chairman of MONY Securities Corporation, and Chairman of the Fund Board of Enterprise Group of Funds from 1991 to 2004. | | | 77 | | | None |
Trustees and Officers Information (unaudited) (concluded)
| | | | | | | | | | |
Name
and Year of Birth
of Trustee/Officer | | Position(s) Held with the Trust, Term of Office and Length of Time Served | | Principal Occupation(s) During Past 5 Years | | Number of Portfolios
in Fund Complex
Overseen by Trustee/
Officer+ | | | Other Directorships Held by Trustee |
| Officers of the Trust |
| | | | |
Jonathan Steinberg***** (1964) | | President, 2005- present; Trustee, 2005-present | | Chief Executive Officer, WisdomTree Investments, Inc. and WisdomTree Asset Management since 2005; President, WisdomTree Investments, Inc. and WisdomTree Asset Management from 2012 to 2019. | | | 77 | | | None |
| | | | |
David Castano***** (1971) | | Treasurer, 2013-present | | Head of Fund Accounting & Administration, WisdomTree Asset Management, since 2020; Director of Fund Accounting & Administration, WisdomTree Asset Management, 2011 to 2020. | | | 77 | | | None |
| | | | |
Terry Jane Feld***** (1960) | | Chief Compliance Officer, 2012-present | | Head of Compliance, WisdomTree Asset Management since 2022; Chief Compliance Officer, WisdomTree Asset Management since 2012. | | | 77 | | | None |
| | | | |
Joanne Antico***** (1975) | | Chief Legal Officer and Secretary, 2021-present | | General Counsel, WisdomTree Asset Management since 2021; Assistant General Counsel, WisdomTree Asset Management, 2016 to 2021; Executive Director and Assistant Secretary, Morgan Stanley Investment Management Inc., 2005 to 2016. | | | 77 | | | None |
| | | | |
TJ Darnowski***** (1984) | | Assistant Secretary, 2021-present | | Senior Investment Management Paralegal, WisdomTree Asset Management since 2021; Senior Legal Administrator, Ultimus Fund Solutions, 2019-2021; Assistant Vice President, State Street Bank & Trust Company, 2010 to 2019. | | | 77 | | | None |
| | | | |
Clint Martin***** (1977) | | Assistant Treasurer, 2015-present | | Director of Fund Accounting & Administration, WisdomTree Asset Management, since 2020; Fund Manager, Fund Accounting & Administration, WisdomTree Asset Management, 2012 to 2020. | | | 77 | | | None |
| * | Chair of the Audit Committee. |
| ** | Chair of the Contracts Review Committee. |
| *** | Co-Chair of the Governance, Nominating and Compliance Committee. |
| **** | Chair of the Investment Committee. |
| ***** | Elected by and serves at the pleasure of the Board. |
Supplemental Information (unaudited)
Federal Income Tax Information
The following Federal tax information related to the Funds’ fiscal year ended March 31, 2022, is provided for information purposes only and should not be used for reporting to federal or state revenue agencies. Federal tax information for the calendar year will be reported to you on Form 1099-DIV in January 2023.
Certain dividends paid by the Funds may be subject to a maximum tax rate of 15%, as provided by the Jobs and Growth Tax Relief Reconciliation Act of 2003. Of the distributions paid during the fiscal year ended March 31, 2022, the following represents the maximum amount of ordinary income distributions that may be considered qualified dividend income:
| | | | |
| | |
| Fund | | Qualified Dividend
Income | |
Europe Hedged Equity Fund | | $ | 40,186,944 | |
Europe Hedged SmallCap Equity Fund | | | 1,030,792 | |
Germany Hedged Equity Fund | | | 1,209,360 | |
International Hedged Quality Dividend Growth Fund | | | 31,818,254 | |
Japan Hedged Equity Fund | | | 51,969,830 | |
Japan Hedged SmallCap Equity Fund | | | 775,739 | |
The Funds intend to elect to pass through to shareholders the credit for taxes paid to foreign countries during the fiscal year March 31, 2022. The gross foreign source income and foreign taxes paid are as follows:
| | | | | | | | |
| | | |
| Fund | | Gross Foreign Income | | | Foreign
Taxes Paid | |
Europe Hedged Equity Fund | | $ | 41,327,299 | | | $ | 3,065,059 | |
Europe Hedged SmallCap Equity Fund | | | 1,223,989 | | | | 101,464 | |
Germany Hedged Equity Fund | | | 1,013,408 | | | | 119,652 | |
International Hedged Quality Dividend Growth Fund | | | 31,822,654 | | | | 1,660,212 | |
Japan Hedged Equity Fund | | | 51,873,299 | | | | 5,314,897 | |
Japan Hedged SmallCap Equity Fund | | | 850,067 | | | | 87,362 | |
The following represents the percentage of dividends paid during the fiscal year ended March 31, 2022, that qualify for the 70% dividends received deduction for corporate shareholders:
| | | | |
| | |
| Fund | | Dividends-Received
Deduction | |
Europe Hedged Equity Fund | | | — | |
Europe Hedged SmallCap Equity Fund | | | — | |
Germany Hedged Equity Fund | | | — | |
International Hedged Quality Dividend Growth Fund | | | 0.02 | % |
Japan Hedged Equity Fund | | | — | |
Japan Hedged SmallCap Equity Fund | | | — | |
General Information (unaudited)
Proxy Voting Policies, Procedures and Record
A complete copy of the Proxy Voting Policy may be obtained upon request, at no charge, by calling 1-866-909-WISE (9473) or writing to: WisdomTree Trust, c/o Foreside Fund Services, LLC, Three Canal Plaza Suite 100, Portland, ME, 04101.
The Trust is required to disclose annually the Funds’ complete proxy voting record on Form N-PX covering the most recent
12-month period ended June 30 and to file Form N-PX with the SEC no later than August 31 of each year. The current Form N-PX for the Funds is available at no charge upon request by calling 1-866-909-WISE (9473) or through the Trust’s website at www.wisdomtree.com. The Funds’ Form N-PX is also available on the SEC’s website at www.sec.gov.
Shareholder Reports and Quarterly Portfolio Disclosure
The Funds file their complete schedule of portfolio holdings with the SEC for their first and third fiscal quarters as an exhibit to their reports on Form N-PORT. Copies of the filings are available, without charge, on the SEC’s website at www.sec.gov and are also available by calling the Trust at 1-866-909-WISE (9473). Copies of the filings may also be obtained, after paying a duplicating fee, by electronic request at the following E-mail address: publicinfo@sec.gov.
Information about each Fund’s portfolio holdings is available daily, without charge, at www.wisdomtree.com.
The Statement of Additional Information (“SAI”) has additional information about the Funds’ Trustees and Officers and is available without charge upon request. Contact your financial representative for a free prospectus or SAI.
Frequency Distribution of Discounts & Premiums
Information about differences between the per share net asset value of each Fund and the market trading price of shares of each Fund are available, without charge, at www.wisdomtree.com.
The WisdomTree Funds are exchange traded funds (“ETFs”) registered with the United States Securities and Exchange Commission as separate series (“Funds”) of WisdomTree Trust (“Trust”). WisdomTree Asset Management, Inc., a wholly owned subsidiary of WisdomTree Investments, Inc., serves as the investment adviser to the Trust. None of the WisdomTree entities are affiliated with Foreside Fund Services, LLC, the Funds’ distributor. WisdomTree Investments, its affiliates and their independent providers are not liable for any informational errors, incompleteness, delays, or for any actions taken in reliance on information contained herein.
There are risks associated with investing including possible loss of principal. Foreign investing involves special risks, such as risk of loss from currency fluctuation or political or economic uncertainty. Investments in real estate involve additional special risks, such as credit risk, interest rate fluctuations and the effect of varied economic conditions. Funds that focus their investments in one country or region may be significantly impacted by events and developments associated with the region which can adversely affect performance. Funds focusing on a single sector and/or smaller companies generally experience greater price volatility. Investments in emerging, offshore or frontier markets are generally less liquid and less efficient than investments in developed markets and are subject to additional risks, such as risks of adverse governmental regulation and intervention or political developments. Investments in currency involve additional special risks, such as credit risk and interest rate fluctuations. Derivative investments can be volatile and these investments may be less liquid than other securities, and more sensitive to the effect of varied economic conditions. As these Funds can have a high concentration in some issuers the Funds can be adversely impacted by changes affecting such issuers. Due to the investment strategy of certain Funds they may make higher capital gain distributions than other ETFs. Please read the Fund’s prospectus for specific details regarding the Fund’s risk profile.
Indexes are unmanaged and you cannot invest directly in an index.
Transactions in Fund shares will result in brokerage commissions and will generate tax consequences. Shares may be sold through brokerage accounts, but may be redeemed from the Funds only by Authorized Participants in large creation unit sizes of shares.
This report is intended for the Funds’ shareholders. It may not be distributed to prospective investors unless it is preceded or accompanied by the current prospectus.
Scan the QR code with your
smartphone camera to

learn more at
WisdomTree.com
WisdomTree Fund shares are distributed by Foreside Fund Services, LLC, in the U.S. only.
WTGM-6335


WisdomTree Trust
Annual Report
March 31, 2022
WisdomTree Europe Quality Dividend Growth Fund (EUDG)
WisdomTree Europe SmallCap Dividend Fund (DFE)
WisdomTree International AI Enhanced Value Fund (AIVI)
(formerly, WisdomTree International Dividend ex-Financials Fund (DOO))
WisdomTree International Equity Fund (DWM)
WisdomTree International High Dividend Fund (DTH)
WisdomTree International LargeCap Dividend Fund (DOL)
WisdomTree International MidCap Dividend Fund (DIM)
WisdomTree International Multifactor Fund (DWMF)
WisdomTree International Quality Dividend Growth Fund (IQDG)
WisdomTree International SmallCap Dividend Fund (DLS)
WisdomTree Japan SmallCap Dividend Fund (DFJ)
Table of Contents
“WisdomTree” is a registered mark of WisdomTree Investments, Inc. and is licensed for use by the WisdomTree Trust.
Market Environment Overview
(unaudited)
Developed international equity markets, as measured by the MSCI EAFE Index, were roughly flat for the 12-month fiscal period ending March 31, 2022 (the “period”), returning only 1.16% in U.S. dollar (“USD”) terms.
International currency market performance was mixed during the period, although the USD broadly strengthened relative to a basket of global currencies. The euro (“EUR”) steadily weakened against the USD during the period, as the European region generally saw slower economic growth than the U.S. Although not in Europe, this effect was even more pronounced in the Japanese yen (“JPY”), which was being suppressed by the Bank of Japan to stimulate economic growth while the rest of the global economy was overheating. The JPY weakened slightly for most of the period, though it sold off considerably in March 2022, the final month of the period. The British pound sterling fluctuated during the period but also weakened versus the USD, alongside the JPY and EUR.
Developed international equities increased their value for most of the period as the global economy continued its recovery from the COVID-19 pandemic that began in 2020. Vaccine accessibility established confidence in global markets as regional economies steadily began to reopen, promoting a revival in cyclical sectors that had been suppressed the prior year. The pace of economic growth improved during 2021, along with the inflation rates around the world, amid a global backdrop of accommodative policy. However, several headwinds in the first quarter of 2022 forced international equities to give up most of their gains from the previous nine months.
During the second quarter of 2021, markets gradually moved higher, with the MSCI EAFE Index returning 5.17% in USD terms. This was mainly due to the improved outlook for economic growth amid vaccine accessibility. The developed international economic region has significant concentration in cyclical sectors tied to overall levels of economic growth, so the improved economic outlook contributed positively to performance.
The third quarter of 2021 was more tempered than the previous quarter. The MSCI EAFE Index was flat during the quarter in USD terms, and early summertime optimism faded as new and potentially more infectious COVID-19 variants appeared and spread throughout the world. This ignited fear of renewed “lockdowns”, raised questions of vaccine efficacy, and threatened the ongoing economic recovery.
However, investors’ concerns quickly abated during the fourth quarter of 2021. Fears of systemic impacts from the downturn in the Chinese real estate markets briefly sent markets into negative territory, but they finished 2021 strong once their contagion concerns were allayed. Developed international markets ultimately finished the quarter in positive territory, returning 2.69% on a USD basis.
With 2021 in rearview, investors began 2022 with several concerns that led to risk-off sentiments in the first quarter of 2022. At the forefront were concerns about runaway inflation, and the expectation that global central banks would intervene with restrictive monetary policy actions to temper rising inflation. Interest rates around the world rose quickly as bonds sold-off, and the U.S. Federal Reserve raised its target federal funds rate for the first time since slashing it to 0% at the onset of the pandemic in 2020.
Inflationary and interest rate concerns temporarily took a backseat halfway through the first quarter of 2022, as geopolitical tensions between Russia and Ukraine escalated into war. Investor risk-on sentiment deteriorated, and equities declined for several weeks as markets assessed the developments and prospects for resolution.
As a result, international equities sold off in the first quarter of 2022, owing to the near certainty of several upcoming interest rate hikes amid a tightening cycle and geopolitical tensions between Russia and Ukraine. The MSCI EAFE Index fell nearly 6% in dollar terms, although it regained some ground from its -15% low on March 8, 2022.
Many of these risk factors are expected to continue and global financial market performance is likely to be dependent on developments in the war between Russia and Ukraine, economic data, and central bank activity.
Each WisdomTree Fund’s performance as set forth in “Management’s Discussion of Funds’ Performance” in the pages that follow should also be viewed in light of the foregoing market environment.
Information about Performance and Shareholder Expense Examples (unaudited)
Performance
The performance tables on the following pages are provided for comparative purposes and represent the period noted. Each Fund’s per share net asset value (“NAV”) is the value of one share of the Fund and is calculated by dividing the value of total assets less total liabilities by the number of shares outstanding. The NAV return is based on the NAV of the Fund and the market price return is based on the market price per share of the Fund. The price used to calculate market price returns is the midpoint of the bid and ask price for Fund shares as of the close of trading on the exchange where Fund shares are listed. NAV and market price returns assume that dividends and capital gain distributions have been reinvested in the Fund at NAV and market price, respectively. As with other exchange traded funds (“ETFs”), NAV returns and market price returns may differ because of factors such as the supply and demand for Fund shares and investors’ assessments of the underlying value of a Fund’s portfolio securities.
Fund shares are bought and sold at market price (not NAV) and are not individually redeemed from a Fund. Fund NAV returns are calculated using a Fund’s daily 4:00 p.m. eastern time NAV. Market price returns reflect the midpoint of the bid and ask price as of the close of trading on the exchange where Fund shares are listed. Market price returns do not represent the returns you would receive if you traded shares at other times. The returns do not reflect the deduction of taxes that a shareholder would pay on Fund distributions or on the redemption of Fund shares. Total returns for a period of less than one year are cumulative.
Performance is historical and does not guarantee future results. Current performance may be lower or higher than quoted. Investment returns and the principal value of an investment will fluctuate so that an investor’s shares, when redeemed, may be worth more or less than their original cost. For the most recent month-end performance information visit www.wisdomtree.com.
An index is a statistical measure of a specified financial market or sector. An index does not actually hold a portfolio of securities, incur expenses or pay any transaction costs. Therefore, index returns do not reflect deductions for fees or expenses and an index is not available for direct investment. In comparison, the Funds’ performance is negatively impacted by these deductions. Fund returns do not reflect brokerage commissions or taxes on transactions in Fund shares or taxes that a shareholder would pay on Fund distributions. Past performance is no guarantee of future results.
Shareholder Expense Examples
Each Fund’s performance table is accompanied by a shareholder expense example. As a shareholder of a WisdomTree Fund, you incur two types of cost: (1) transaction costs, including brokerage commissions on purchases and sales of your Fund shares and (2) ongoing costs, including management fees and other Fund expenses. The examples are intended to help you understand your ongoing costs (in dollars and cents) of investing in a Fund and to compare these costs with the ongoing costs of investing in other funds.
The examples are based on an investment of $1,000 invested at the beginning of the period and held for the entire period from October 1, 2021 to March 31, 2022. Except where noted, expenses are calculated using each Fund’s annualized expense ratio (after the effect of contractual or voluntary fee waivers, if any), multiplied by the average account value for the period, multiplied by 182/365 (to reflect the one-half year period). The annualized expense ratio does not include acquired fund fees and expenses (“AFFEs”), which are fees and expenses incurred indirectly by a Fund through its investments in certain underlying investment companies.
Actual expenses
The first line in the shareholder expense example table shown on the following pages provides information about actual account values and actual expenses. You may use the information in this line, together with the amount you invested, to estimate the expenses that you paid over the period. Simply divide your account value by $1,000 (for example, an $8,600 account value divided by $1,000 = 8.6), then multiply the result by the number in the first line for your Fund under the heading entitled “Expenses Paid During the Period” to estimate the expenses you paid on your account during the period.
Hypothetical example for comparison purposes
The second line in the shareholder expense example table shown on the following pages provides information about hypothetical account values and hypothetical expenses based on the Fund’s actual expense ratio and an assumed rate of return of 5% per year before expenses, which is not the Fund’s actual return. The hypothetical account values and expenses may not be used to estimate the actual ending account balance or expenses you paid for the period. You may use this information to compare the ongoing costs of investing in your Fund and other funds. To do so, compare this 5% hypothetical example with the 5% hypothetical examples that appear in the shareholder reports of the other funds.
Please note that the expenses shown in the table are meant to highlight your ongoing costs only and do not reflect any transactional costs, such as brokerage commissions paid on purchases and sales of Fund shares. Therefore, the second line in the table is useful in comparing ongoing Fund costs only and will not help you determine the relative total costs of owning different funds. In addition, if these transactional costs were included, your costs would have been higher.
Management’s Discussion of Funds’ Performance
as of March 31, 2022 (unaudited)
WisdomTree Europe Quality Dividend Growth Fund (EUDG)
Sector Breakdown†
| | | | |
| |
| Sector | | % of Net Assets | |
Industrials | | | 20.1% | |
Health Care | | | 19.0% | |
Consumer Staples | | | 19.0% | |
Materials | | | 16.0% | |
Consumer Discretionary | | | 12.2% | |
Information Technology | | | 4.2% | |
Financials | | | 3.4% | |
Communication Services | | | 2.3% | |
Energy | | | 1.8% | |
Utilities | | | 0.8% | |
Real Estate | | | 0.3% | |
Other Assets less Liabilities‡ | | | 0.9% | |
Total | | | 100.0% | |
| † | The Fund’s sector breakdown is expressed as a percentage of net assets and may change over time. In addition, a sector may be comprised of several industries. It does not include derivatives (if any). |
| ‡ | Other assets less liabilities may include investment of cash collateral for securities on loan and/or receivables/payables on derivatives (if any). |
Top Ten Holdings*
| | | | |
| |
| Description | | % of Net Assets | |
Nestle SA, Registered Shares | | | 6.9% | |
Rio Tinto PLC | | | 5.7% | |
Roche Holding AG | | | 5.6% | |
GlaxoSmithKline PLC | | | 5.0% | |
LVMH Moet Hennessy Louis Vuitton SE | | | 4.6% | |
Anglo American PLC | | | 3.7% | |
Unilever PLC | | | 3.5% | |
Novo Nordisk A/S, Class B | | | 3.3% | |
L’Oreal SA | | | 2.8% | |
Siemens AG, Registered Shares | | | 2.5% | |
| * | The ten largest holdings are subject to change, and there are no guarantees the Fund will remain invested in any particular company. Excludes derivatives and investment of cash collateral for securities on loan (if any). |
The WisdomTree Europe Quality Dividend Growth Fund (the “Fund”) seeks to track the price and yield performance, before fees and expenses, of the WisdomTree Europe Quality Dividend Growth Index (the “Index”). In seeking to track the Index, the Fund invests in dividend-paying companies with growth characteristics in the European equity market. The Fund generally uses a representative sampling strategy to achieve its investment objective, meaning it generally will invest in a sample of securities in the Index.
The Fund returned 4.02% at net asset value (“NAV”) for the fiscal year ended March 31, 2022 (for more complete performance information please see the table below). The Fund benefited from its positions in the Materials, Health Care and Information Technology sectors, due both to allocation and stock selection effects within the latter two and mainly stock selection within Materials. Positions in the Energy, Consumer Staples and Communication Services sectors detracted from performance for the Fund, mainly due to stock selection effects. When analyzing performance by country, exposures within Spain and France were the main detractors from performance largely attributable to stock selection. Germany and Netherlands were top performance contributors primarily due to stock selection effects.
Shareholder Expense Example (for the six-month period ended March 31, 2022)
| | | | | | | | | | | | | | | | |
| | | | | |
| | | Beginning
Account Value | | | Ending
Account Value | | | Annualized
Expense Ratio1 | | | Expenses Paid
During the
Period1 | |
Actual | | $ | 1,000.00 | | | $ | 988.10 | | | | 0.59 | % | | $ | 2.92 | |
Hypothetical (5% return before expenses) | | $ | 1,000.00 | | | $ | 1,021.99 | | | | 0.59 | % | | $ | 2.97 | |
| 1 | Included in the expense ratio are “Other fees” described in Note 6 which are not annualized. Without these expenses, the expense ratio would have been 0.58% and the actual and hypothetical expenses paid during the period would have been $2.87 and $2.92, respectively. |
Performance
| | | | | | | | | | | | | | | | |
| | |
| | | Average Annual Total Return | |
| | | | |
| | | 1 Year | | | 3 Year | | | 5 Year | | | Since Inception1 | |
Fund NAV Returns | | | 4.02 | % | | | 10.80 | % | | | 9.01 | % | | | 5.30 | % |
Fund Market Price Returns | | | 3.43 | % | | | 10.66 | % | | | 8.86 | % | | | 5.17 | % |
WisdomTree Europe Quality Dividend Growth Index | | | 4.59 | % | | | 11.34 | % | | | 9.59 | % | | | 5.82 | % |
MSCI Europe Index | | | 3.51 | % | | | 8.23 | % | | | 6.92 | % | | | 3.39 | % |
| 1 | Total returns are calculated based on the commencement of Fund trading on the NYSE Arca, Inc. on May 7, 2014. |
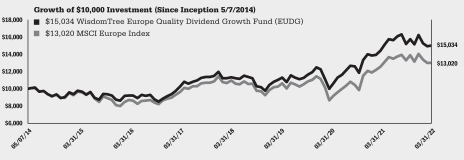
Performance is historical and does not guarantee future results. The returns do not reflect the deduction of taxes that a shareholder would pay on Fund distributions or on the redemption of Fund shares.
Management’s Discussion of Funds’ Performance
as of March 31, 2022 (unaudited)
WisdomTree Europe SmallCap Dividend Fund (DFE)
Sector Breakdown†
| | | | |
| |
| Sector | | % of Net Assets | |
Industrials | | | 24.7% | |
Financials | | | 18.4% | |
Consumer Discretionary | | | 12.2% | |
Materials | | | 8.4% | |
Real Estate | | | 7.8% | |
Information Technology | | | 6.8% | |
Consumer Staples | | | 5.0% | |
Utilities | | | 4.5% | |
Communication Services | | | 4.3% | |
Energy | | | 3.8% | |
Health Care | | | 3.2% | |
Investment Company | | | 0.4% | |
Other Assets less Liabilities‡ | | | 0.5% | |
Total | | | 100.0% | |
| † | The Fund’s sector breakdown is expressed as a percentage of net assets and may change over time. In addition, a sector may be comprised of several industries. It does not include derivatives (if any). |
| ‡ | Other assets less liabilities may include investment of cash collateral for securities on loan and/or receivables/payables on derivatives (if any). |
Top Ten Holdings*
| | | | |
| |
| Description | | % of Net Assets | |
PostNL NV | | | 3.3 | % |
Drax Group PLC | | | 1.8 | % |
BFF Bank SpA | | | 1.7 | % |
Diversified Energy Co. PLC | | | 1.7 | % |
Ferrexpo PLC | | | 1.5 | % |
Alm Brand A/S | | | 1.3 | % |
Bilfinger SE | | | 1.2 | % |
Anima Holding SpA | | | 1.2 | % |
Sonae SGPS SA | | | 1.2 | % |
TGS ASA | | | 1.2 | % |
| * | The ten largest holdings are subject to change, and there are no guarantees the Fund will remain invested in any particular company. Excludes derivatives and investment of cash collateral for securities on loan (if any). |
The WisdomTree Europe SmallCap Dividend Fund (the “Fund”) seeks to track the price and yield performance, before fees and expenses, of the WisdomTree Europe SmallCap Dividend Index (the “Index”). In seeking to track the Index, the Fund invests in dividend-paying small-cap companies in the European equity market. The Fund generally uses a representative sampling strategy to achieve its investment objective, meaning it generally will invest in a sample of securities in the Index.
The Fund returned 0.18% at net asset value (“NAV”) for the fiscal year ended March 31, 2022 (for more complete performance information please see the table below). The Fund benefited from its positions in Health Care, Consumer Discretionary and Information Technology, mainly due to stock selection within each sector. Positions in the Materials, Financials and Real Estate sectors detracted from performance for the Fund, due to stock selection effects in Materials and Financials, and allocation effects within Real Estate. When analyzing performance by country, exposures within Norway and Italy were the main detractors from performance, owing to poor stock selection. Germany and Switzerland were top performance contributors due to strong stock selection effects.
Shareholder Expense Example (for the six-month period ended March 31, 2022)
| | | | | | | | | | | | | | | | |
| | | | | |
| | | Beginning
Account Value | | | Ending
Account Value | | | Annualized Net
Expense
Ratio1 | | | Expenses Paid
During the
Period1 | |
Actual | | $ | 1,000.00 | | | $ | 946.90 | | | | 0.73 | % | | $ | 3.54 | |
Hypothetical (5% return before expenses) | | $ | 1,000.00 | | | $ | 1021.29 | | | | 0.73 | % | | $ | 3.68 | |
| 1 | Included in the expense ratio are “Other fees” described in Note 6 which are not annualized. Without these expenses, the expense ratio would have been 0.58% and the actual and hypothetical expenses paid during the period would have been $2.82 and $2.92, respectively. |
Performance
| | | | | | | | | | | | | | | | |
| | |
| | | Average Annual Total Return | |
| | | | |
| | | 1 Year | | | 3 Year | | | 5 Year | | | 10 Year | |
Fund NAV Returns | | | 0.18 | % | | | 8.54 | % | | | 6.31 | % | | | 9.50 | % |
Fund Market Price Returns | | | -0.95 | % | | | 8.13 | % | | | 6.06 | % | | | 9.27 | % |
WisdomTree Europe SmallCap Dividend Index | | | 0.59 | % | | | 9.18 | % | | | 6.78 | % | | | 10.20 | % |
MSCI Europe Small Cap Index | | | -3.55 | % | | | 10.04 | % | | | 8.39 | % | | | 9.58 | % |
MSCI Europe Index | | | 3.51 | % | | | 8.23 | % | | | 6.92 | % | | | 6.27 | % |
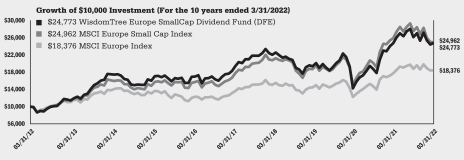
Performance is historical and does not guarantee future results. The returns do not reflect the deduction of taxes that a shareholder would pay on Fund distributions or on the redemption of Fund shares.
Management’s Discussion of Funds’ Performance
as of March 31, 2022 (unaudited)
WisdomTree International AI Enhanced Value Fund (AIVI)
(formerly, WisdomTree International Dividend ex-Financials Fund (DOO))
Sector Breakdown†
| | | | |
| |
| Sector | | % of Net Assets | |
Financials | | | 27.0% | |
Industrials | | | 14.5% | |
Real Estate | | | 10.1% | |
Health Care | | | 10.0% | |
Consumer Staples | | | 8.5% | |
Utilities | | | 8.2% | |
Materials | | | 7.0% | |
Communication Services | | | 5.5% | |
Consumer Discretionary | | | 5.0% | |
Energy | | | 2.1% | |
Information Technology | | | 0.8% | |
Investment Company | | | 0.1% | |
Other Assets less Liabilities‡ | | | 1.2% | |
Total | | | 100.0% | |
| † | The Fund’s sector breakdown is expressed as a percentage of net assets and may change over time. In addition, a sector may be comprised of several industries. It does not include derivatives (if any). |
| ‡ | Other assets less liabilities may include investment of cash collateral for securities on loan and/or receivables/payables on derivatives (if any). |
Top Ten Holdings*
| | | | |
| |
| Description | | % of Net Assets | |
Allianz SE, Registered Shares | | | 3.6% | |
Enagas SA | | | 3.5% | |
M&G PLC | | | 3.1% | |
Industrivarden AB, Class C | | | 3.1% | |
Novartis AG, Registered Shares | | | 3.1% | |
Henkel AG & Co. KGaA | | | 2.9% | |
Publicis Groupe SA | | | 2.5% | |
Swiss Re AG | | | 2.3% | |
Aurizon Holdings Ltd. | | | 2.2% | |
Aroundtown SA | | | 2.1% | |
| * | The ten largest holdings are subject to change, and there are no guarantees the Fund will remain invested in any particular company. Excludes derivatives and investment of cash collateral for securities on loan (if any). |
The WisdomTree International AI Enhanced Value Fund (the “Fund”) seeks income and capital appreciation by investing primarily in equity securities selected from a universe of developed market equities, excluding the United States and Canada, that exhibit value characteristics based on the selection results of a proprietary, quantitative artificial intelligence (“AI”) model developed by Voya Investment Management Co., LLC, the Fund’s sub-adviser. Prior to January 18, 2022, Fund performance reflects the investment objective of the Fund when it was the WisdomTree International Dividend ex-Financials Fund and tracked the price and yield performance, before fees and expenses, of the WisdomTree International Dividend ex-Financials Index (the “Former Index”). In seeking to track the Former Index, the Fund invested in high-dividend-yielding companies in the developed world excluding the U.S. and Canada, and excluding the financials sector.
The Fund returned 0.30% at net asset value (“NAV”) for the fiscal year ended March 31, 2022 (for more complete performance information please see the table below). Lower relative weight to the Consumer Discretionary sector and higher relative weight to the Industrials and the Utilities sectors benefited performance. Stock selection within these sectors as well as in Information Technology, Healthcare, and Communication Services benefited performance of the Fund as well. The Fund also benefited from overweight exposure to China and positive security selection within Chinese equities. Higher relative weight to high dividend paying companies also benefited the performance of the Fund.
Shareholder Expense Example (for the six-month period ended March 31, 2022)
| | | | | | | | | | | | | | | | |
| | | | | |
| | | Beginning
Account Value | | | Ending
Account Value | �� | | Annualized Net
Expense Ratio | | | Expenses Paid
During the
Period | |
Actual | | $ | 1,000.00 | | | $ | 1,000.00 | | | | 0.58 | % | | $ | 2.89 | |
Hypothetical (5% return before expenses) | | $ | 1,000.00 | | | $ | 1,022.04 | | | | 0.58 | % | | $ | 2.92 | |
Performance
| | | | | | | | | | | | | | | | |
| | |
| | | Average Annual Total Return | |
| | | | |
| | | 1 Year | | | 3 Year | | | 5 Year | | | 10 Year | |
Fund NAV Returns1 | | | 0.30 | % | | | 4.02 | % | | | 4.79 | % | | | 4.07 | % |
Fund Market Price Returns1 | | | -0.66 | % | | | 3.69 | % | | | 4.57 | % | | | 3.92 | % |
MSCI EAFE Value Index | | | 3.55 | % | | | 5.24 | % | | | 4.18 | % | | | 4.87 | % |
| 1 | The Fund’s investment objective changed effective January 18, 2022. Prior to January 18, 2022, the Fund’s investment objective sought to track the price and yield performance, before fees and expenses, of the the WisdomTree International Dividend ex-Financials Index. |
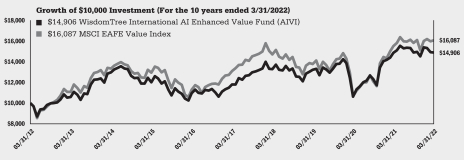
Performance is historical and does not guarantee future results. The returns do not reflect the deduction of taxes that a shareholder would pay on Fund distributions or on the redemption of Fund shares.
Management’s Discussion of Funds’ Performance
as of March 31, 2022 (unaudited)
WisdomTree International Equity Fund (DWM)
Sector Breakdown†
| | | | |
| |
| Sector | | % of Net Assets | |
Financials | | | 22.1% | |
Industrials | | | 13.0% | |
Materials | | | 12.9% | |
Consumer Staples | | | 9.2% | |
Health Care | | | 9.2% | |
Consumer Discretionary | | | 7.8% | |
Communication Services | | | 7.0% | |
Utilities | | | 6.1% | |
Energy | | | 4.3% | |
Real Estate | | | 3.9% | |
Information Technology | | | 3.6% | |
Other Assets less Liabilities‡ | | | 0.9% | |
Total | | | 100.0% | |
| † | The Fund’s sector breakdown is expressed as a percentage of net assets and may change over time. In addition, a sector may be comprised of several industries. It does not include derivatives (if any). |
| ‡ | Other assets less liabilities may include investment of cash collateral for securities on loan and/or receivables/payables on derivatives (if any). |
Top Ten Holdings*
| | | | |
| |
| Description | | % of Net Assets | |
BHP Group Ltd. | | | 3.4% | |
Nestle SA, Registered Shares | | | 2.1% | |
Rio Tinto PLC | | | 1.7% | |
Novartis AG, Registered Shares | | | 1.3% | |
Toyota Motor Corp. | | | 1.2% | |
Roche Holding AG | | | 1.2% | |
Commonwealth Bank of Australia | | | 1.1% | |
Shell PLC | | | 1.0% | |
AXA SA | | | 1.0% | |
GlaxoSmithKline PLC | | | 0.9% | |
| * | The ten largest holdings are subject to change, and there are no guarantees the Fund will remain invested in any particular company. Excludes derivatives and investment of cash collateral for securities on loan (if any). |
The WisdomTree International Equity Fund (the “Fund”) seeks to track the price and yield performance, before fees and expenses, of the WisdomTree International Equity Index (the “Index”). In seeking to track the Index, the Fund invests in dividend-paying companies in the developed world excluding the U.S. and Canada. The Fund generally uses a representative sampling strategy to achieve its investment objective, meaning it generally will invest in a sample of securities in the Index.
The Fund returned 4.62% at net asset value (“NAV”) for the fiscal year ended March 31, 2022 (for more complete performance information please see the table below). The Fund benefited from its positions in Materials, Industrials and Consumer Discretionary, due to combination of allocation and stock selection effects within each of those sectors. Positions in the Consumer Staples, Real Estate and Utilities sectors detracted from performance for the Fund, due to combination of allocation and stock selection effects, though their overall impacts were modest. When analyzing performance by country, exposures within France and Spain were the largest detractors on performance, however, the overall impact was minimal. Japan and Australia were top performance contributors due to stock selection effects in Japan and allocation effects in Australia.
Shareholder Expense Example (for the six-month period ended March 31, 2022)
| | | | | | | | | | | | | | | | |
| | | | | |
| | | Beginning
Account Value | | | Ending
Account Value | | | Annualized Net
Expense Ratio | | | Expenses Paid
During the
Period | |
Actual | | $ | 1,000.00 | | | $ | 1,015.90 | | | | 0.48 | % | | $ | 2.41 | |
Hypothetical (5% return before expenses) | | $ | 1,000.00 | | | $ | 1,022.54 | | | | 0.48 | % | | $ | 2.42 | |
Performance
| | | | | | | | | | | | | | | | |
| | |
| | | Average Annual Total Return | |
| | | | |
| | | 1 Year | | | 3 Year | | | 5 Year | | | 10 Year | |
Fund NAV Returns | | | 4.62 | % | | | 5.17 | % | | | 4.90 | % | | | 5.47 | % |
Fund Market Price Returns | | | 4.01 | % | | | 4.92 | % | | | 4.69 | % | | | 5.31 | % |
WisdomTree International Equity Index | | | 4.98 | % | | | 5.45 | % | | | 5.18 | % | | | 5.70 | % |
MSCI EAFE Index | | | 1.16 | % | | | 7.78 | % | | | 6.72 | % | | | 6.27 | % |
MSCI EAFE Value Index | | | 3.55 | % | | | 5.24 | % | | | 4.18 | % | | | 4.87 | % |
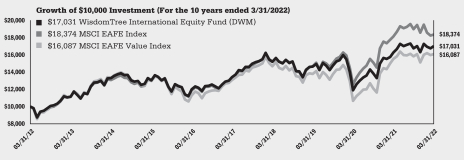
Performance is historical and does not guarantee future results. The returns do not reflect the deduction of taxes that a shareholder would pay on Fund distributions or on the redemption of Fund shares.
Management’s Discussion of Funds’ Performance
as of March 31, 2022 (unaudited)
WisdomTree International High Dividend Fund (DTH)
Sector Breakdown†
| | | | |
| |
| Sector | | % of Net Assets | |
Financials | | | 23.5% | |
Materials | | | 18.5% | |
Communication Services | | | 12.1% | |
Utilities | | | 9.7% | |
Health Care | | | 7.8% | |
Industrials | | | 7.4% | |
Energy | | | 5.5% | |
Consumer Staples | | | 5.4% | |
Real Estate | | | 4.9% | |
Consumer Discretionary | | | 2.7% | |
Information Technology | | | 0.9% | |
Investment Company | | | 0.4% | |
Other Assets less Liabilities‡ | | | 1.2% | |
Total | | | 100.0% | |
| † | The Fund’s sector breakdown is expressed as a percentage of net assets and may change over time. In addition, a sector may be comprised of several industries. It does not include derivatives (if any). |
| ‡ | Other assets less liabilities may include investment of cash collateral for securities on loan and/or receivables/payables on derivatives (if any). |
Top Ten Holdings*
| | | | |
| |
| Description | | % of Net Assets | |
BHP Group Ltd. | | | 6.6% | |
Rio Tinto PLC | | | 3.3% | |
Novartis AG, Registered Shares | | | 2.6% | |
Nippon Telegraph & Telephone Corp. | | | 1.9% | |
GlaxoSmithKline PLC | | | 1.9% | |
Fortescue Metals Group Ltd. | | | 1.8% | |
Sanofi | | | 1.5% | |
SoftBank Corp. | | | 1.5% | |
Commonwealth Bank of Australia | | | 1.5% | |
Anglo American PLC | | | 1.4% | |
| * | The ten largest holdings are subject to change, and there are no guarantees the Fund will remain invested in any particular company. Excludes derivatives and investment of cash collateral for securities on loan (if any). |
The WisdomTree International High Dividend Fund (the “Fund”) seeks to track the price and yield performance, before fees and expenses, of the WisdomTree International High Dividend Index (the “Index”). In seeking to track the Index, the Fund invests in high-dividend-yielding companies in the developed world excluding U.S. and Canada. The Fund generally uses a representative sampling strategy to achieve its investment objective, meaning it generally will invest in a sample of securities in the Index.
The Fund returned 6.61% at net asset value (“NAV”) for the fiscal year ended March 31, 2022 (for more complete performance information please see the table below). The Fund benefited from its positions in Materials, Industrials and Communication Services, due to combination of allocation and stock selection effects within each of those sectors. Positions in the Health Care, Consumer Staples and Real Estate sectors negatively impacted performance, mainly due to stock selection. When analyzing performance by country, exposures within Switzerland and France were the largest detractors from performance, owing to stock selection effects. Japan and Australia were top performance contributors primarily due to stock selection effects in Japan and allocation effects in Australia.
Shareholder Expense Example (for the six-month period ended March 31, 2022)
| | | | | | | | | | | | | | | | |
| | | | | |
| | | Beginning
Account Value | | | Ending
Account Value | | | Annualized Net
Expense
Ratio1 | | | Expenses Paid
During the
Period1 | |
Actual | | $ | 1,000.00 | | | $ | 1,065.10 | | | | 0.59 | % | | $ | 3.04 | |
Hypothetical (5% return before expenses) | | $ | 1,000.00 | | | $ | 1,021.99 | | | | 0.59 | % | | $ | 2.97 | |
| 1 | Included in the expense ratio are “Other fees” described in Note 6 which are not annualized. Without these expenses, the expense ratio would have been 0.58% and the actual and hypothetical expenses paid during the period would have been $2.99 and $2.92, respectively. |
Performance
| | | | | | | | | | | | | | | | |
| | |
| | | Average Annual Total Return | |
| | | | |
| | | 1 Year | | | 3 Year | | | 5 Year | | | 10 Year | |
Fund NAV Returns | | | 6.61 | % | | | 4.25 | % | | | 4.18 | % | | | 4.85 | % |
Fund Market Price Returns | | | 6.07 | % | | | 4.11 | % | | | 4.01 | % | | | 4.73 | % |
WisdomTree International High Dividend Index | | | 6.93 | % | | | 4.62 | % | | | 4.45 | % | | | 5.16 | % |
MSCI EAFE Value Index | | | 3.55 | % | | | 5.24 | % | | | 4.18 | % | | | 4.87 | % |
MSCI EAFE Index | | | 1.16 | % | | | 7.78 | % | | | 6.72 | % | | | 6.27 | % |
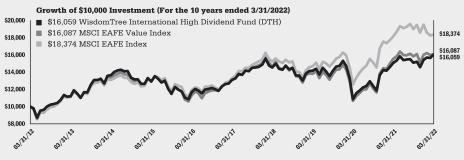
Performance is historical and does not guarantee future results. The returns do not reflect the deduction of taxes that a shareholder would pay on Fund distributions or on the redemption of Fund shares.
Management’s Discussion of Funds’ Performance
as of March 31, 2022 (unaudited)
WisdomTree International LargeCap Dividend Fund (DOL)
Sector Breakdown†
| | | | |
| |
| Sector | | % of Net Assets | |
Financials | | | 23.7% | |
Materials | | | 13.5% | |
Health Care | | | 11.4% | |
Consumer Staples | | | 10.4% | |
Industrials | | | 10.0% | |
Communication Services | | | 7.6% | |
Consumer Discretionary | | | 7.4% | |
Utilities | | | 5.7% | |
Energy | | | 4.7% | |
Information Technology | | | 3.0% | |
Real Estate | | | 1.7% | |
Other Assets less Liabilities‡ | | | 0.9% | |
Total | | | 100.0% | |
| † | The Fund’s sector breakdown is expressed as a percentage of net assets and may change over time. In addition, a sector may be comprised of several industries. It does not include derivatives (if any). |
| ‡ | Other assets less liabilities may include investment of cash collateral for securities on loan and/or receivables/payables on derivatives (if any). |
Top Ten Holdings*
| | | | |
| |
| Description | | % of Net Assets | |
BHP Group Ltd. | | | 4.8% | |
Nestle SA, Registered Shares | | | 2.9% | |
Rio Tinto PLC | | | 2.4% | |
Novartis AG, Registered Shares | | | 1.9% | |
Toyota Motor Corp. | | | 1.7% | |
Roche Holding AG | | | 1.6% | |
Commonwealth Bank of Australia | | | 1.6% | |
Shell PLC | | | 1.5% | |
AXA SA | | | 1.4% | |
Nippon Telegraph & Telephone Corp. | | | 1.4% | |
| * | The ten largest holdings are subject to change, and there are no guarantees the Fund will remain invested in any particular company. Excludes derivatives and investment of cash collateral for securities on loan (if any). |
The WisdomTree International LargeCap Dividend Fund (the “Fund”) seeks to track the price and yield performance, before fees and expenses, of the WisdomTree International LargeCap Dividend Index (the “Index”). In seeking to track the Index, the Fund invests in dividend-paying large-cap companies in the developed world excluding the U.S. and Canada. The Fund generally uses a representative sampling strategy to achieve its investment objective, meaning it generally will invest in a sample of securities in the Index.
The Fund returned 7.27% at net asset value (“NAV”) for the fiscal year ended March 31, 2022 (for more complete performance information please see the table below). The Fund benefited from its positions in Materials, Industrials and Financials, owing primarily to stock selection effects within each of these sectors. Positions in the Real Estate, Utilities and Consumer Staples sectors detracted from performance, due to stock selection effects. When analyzing performance by country, exposures within Spain and Sweden were the largest detractors from performance though their impacts were negligible. Japan and United Kingdom were top performance contributors primarily due to stock selection effects.
Shareholder Expense Example (for the six-month period ended March 31, 2022)
| | | | | | | | | | | | | | | | |
| | | | | |
| | | Beginning
Account Value | | | Ending
Account Value | | | Annualized Net
Expense
Ratio1 | | | Expenses Paid
During the
Period1 | |
Actual | | $ | 1,000.00 | | | $ | 1,040.90 | | | | 0.49 | % | | $ | 2.49 | |
Hypothetical (5% return before expenses) | | $ | 1,000.00 | | | $ | 1,022.49 | | | | 0.49 | % | | $ | 2.47 | |
| 1 | Included in the expense ratio are “Other fees” described in Note 6 which are not annualized. Without these expenses, the expense ratio would have been 0.48% and the actual and hypothetical expenses paid during the period would have been $2.44 and $2.42, respectively. |
Performance
| | | | | | | | | | | | | | | | |
| | |
| | | Average Annual Total Return | |
| | | | |
| | | 1 Year | | | 3 Year | | | 5 Year | | | 10 Year | |
Fund NAV Returns | | | 7.27 | % | | | 5.44 | % | | | 5.13 | % | | | 5.09 | % |
Fund Market Price Returns | | | 6.54 | % | | | 5.19 | % | | | 4.99 | % | | | 4.96 | % |
WisdomTree International LargeCap Dividend Index | | | 7.53 | % | | | 5.70 | % | | | 5.37 | % | | | 5.37 | % |
MSCI EAFE Index | | | 1.16 | % | | | 7.78 | % | | | 6.72 | % | | | 6.27 | % |
MSCI EAFE Value Index | | | 3.55 | % | | | 5.24 | % | | | 4.18 | % | | | 4.87 | % |
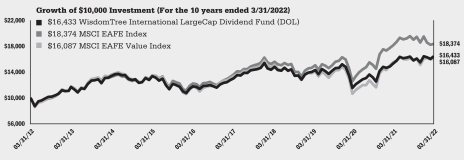
Performance is historical and does not guarantee future results. The returns do not reflect the deduction of taxes that a shareholder would pay on Fund distributions or on the redemption of Fund shares.
Management’s Discussion of Funds’ Performance
as of March 31, 2022 (unaudited)
WisdomTree International MidCap Dividend Fund (DIM)
Sector Breakdown†
| | | | |
| |
| Sector | | % of Net Assets | |
Financials | | | 18.9% | |
Industrials | | | 18.7% | |
Materials | | | 11.2% | |
Real Estate | | | 9.6% | |
Utilities | | | 8.6% | |
Consumer Discretionary | | | 8.1% | |
Communication Services | | | 6.2% | |
Consumer Staples | | | 5.9% | |
Information Technology | | | 4.6% | |
Energy | | | 4.0% | |
Health Care | | | 3.4% | |
Other Assets less Liabilities‡ | | | 0.8% | |
Total | | | 100.0% | |
| † | The Fund’s sector breakdown is expressed as a percentage of net assets and may change over time. In addition, a sector may be comprised of several industries. It does not include derivatives (if any). |
| ‡ | Other assets less liabilities may include investment of cash collateral for securities on loan and/or receivables/payables on derivatives (if any). |
Top Ten Holdings*
| | | | |
| |
| Description | | % of Net Assets | |
Power Assets Holdings Ltd. | | | 1.0% | |
Admiral Group PLC | | | 1.0% | |
Koninklijke KPN NV | | | 0.9% | |
Terna – Rete Elettrica Nazionale | | | 0.9% | |
Nippon Yusen KK | | | 0.8% | |
Sompo Holdings, Inc. | | | 0.8% | |
Mitsui OSK Lines Ltd. | | | 0.8% | |
Yara International ASA | | | 0.7% | |
Suncorp Group Ltd. | | | 0.7% | |
ENEOS Holdings, Inc. | | | 0.7% | |
| * | The ten largest holdings are subject to change, and there are no guarantees the Fund will remain invested in any particular company. Excludes derivatives and investment of cash collateral for securities on loan (if any). |
The WisdomTree International MidCap Dividend Fund (the “Fund”) seeks to track the price and yield performance, before fees and expenses, of the WisdomTree International MidCap Dividend Index (the “Index”). In seeking to track the Index, the Fund invests in dividend-paying mid-cap companies in the developed world excluding the U.S. and Canada. The Fund generally uses a representative sampling strategy to achieve its investment objective, meaning it generally will invest in a sample of securities in the Index.
The Fund returned -0.13% at net asset value (“NAV”) for the fiscal year ended March 31, 2022 (for more complete performance information please see the table below). The Fund benefited from its positions in Industrials, Consumer Discretionary and Utilities, due to a combination of allocation and stock selection effects. Positions in the Financials, Health Care and Materials sectors detracted from performance, mainly due to poor stock selection effects. When analyzing performance by country, exposures within the United Kingdom and Switzerland were the largest detractors from performance, owing to weak stock selection effects. Japan and Germany were top performance contributors almost entirely due to stock selection.
Shareholder Expense Example (for the six-month period ended March 31, 2022)
| | | | | | | | | | | | | | | | |
| | | | | |
| | | Beginning
Account Value | | | Ending
Account Value | | | Annualized
Expense Ratio1 | | | Expenses Paid
During the
Period1 | |
Actual | | $ | 1,000.00 | | | $ | 970.20 | | | | 0.59 | % | | $ | 2.90 | |
Hypothetical (5% return before expenses) | | $ | 1,000.00 | | | $ | 1,021.99 | | | | 0.59 | % | | $ | 2.97 | |
| 1 | Included in the expense ratio are “Other fees” described in Note 6 which are not annualized. Without these expenses, the expense ratio would have been 0.58% and the actual and hypothetical expenses paid during the period would have been $2.85 and $2.92, respectively. |
Performance
| | | | | | | | | | | | | | | | |
| | |
| | | Average Annual Total Return | |
| | | | |
| | | 1 Year | | | 3 Year | | | 5 Year | | | 10 Year | |
Fund NAV Returns | | | -0.13 | % | | | 4.77 | % | | | 4.75 | % | | | 6.25 | % |
Fund Market Price Returns | | | -0.79 | % | | | 4.43 | % | | | 4.50 | % | | | 6.16 | % |
WisdomTree International MidCap Dividend Index | | | 0.03 | % | | | 5.26 | % | | | 5.24 | % | | | 6.66 | % |
MSCI EAFE Mid Cap Index | | | -4.23 | % | | | 6.93 | % | | | 6.25 | % | | | 6.93 | % |
MSCI EAFE Mid Cap Value Index | | | -2.24 | % | | | 3.98 | % | | | 4.62 | % | | | 6.54 | % |
MSCI EAFE Index | | | 1.16 | % | | | 7.78 | % | | | 6.72 | % | | | 6.27 | % |
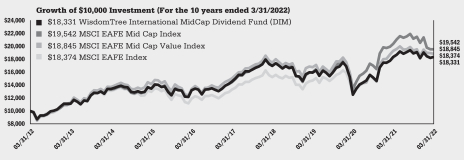
Performance is historical and does not guarantee future results. The returns do not reflect the deduction of taxes that a shareholder would pay on Fund distributions or on the redemption of Fund shares.
Management’s Discussion of Funds’ Performance
as of March 31, 2022 (unaudited)
WisdomTree International Multifactor Fund (DWMF)
Sector Breakdown†
| | | | |
| |
| Sector | | % of Net Assets | |
Financials | | | 15.6% | |
Health Care | | | 15.3% | |
Consumer Staples | | | 13.3% | |
Industrials | | | 13.0% | |
Utilities | | | 7.8% | |
Consumer Discretionary | | | 6.9% | |
Communication Services | | | 6.5% | |
Energy | | | 5.9% | |
Materials | | | 5.8% | |
Information Technology | | | 4.9% | |
Real Estate | | | 4.0% | |
Other Assets less Liabilities‡ | | | 1.0% | |
Total | | | 100.0% | |
| † | The Fund’s sector breakdown is expressed as a percentage of net assets and may change over time. In addition, a sector may be comprised of several industries. It does not include derivatives (if any). |
| ‡ | Other assets less liabilities may include investment of cash collateral for securities on loan and/or receivables/payables on derivatives (if any). |
Top Ten Holdings*
| | | | |
| |
| Description | | % of Net Assets | |
Aviva PLC | | | 1.8% | |
La Francaise des Jeux SAEM | | | 1.4% | |
Ipsen SA | | | 1.3% | |
Sanofi | | | 1.2% | |
United Overseas Bank Ltd. | | | 1.2% | |
GlaxoSmithKline PLC | | | 1.2% | |
Kingfisher PLC | | | 1.2% | |
Roche Holding AG | | | 1.2% | |
Givaudan SA, Registered Shares | | | 1.2% | |
Novartis AG, Registered Shares | | | 1.1% | |
| * | The ten largest holdings are subject to change, and there are no guarantees the Fund will remain invested in any particular company. Excludes derivatives and investment of cash collateral for securities on loan (if any). |
The WisdomTree International Multifactor Fund (the “Fund”) seeks capital appreciation by investing primarily in equity securities of developed countries, excluding the U.S. and Canada, with the highest composite scores based on two fundamental factors, value and quality measures, and two technical factors, momentum and correlation. The Fund seeks to manage its currency risk by dynamically hedging currency fluctuations in the relative value of the applicable international currencies against the U.S. dollar, ranging from a 0% to 100% hedge.
The Fund returned 3.03% at net asset value (“NAV”) for the fiscal year ended March 31, 2022 (for more complete performance information please see the table below). The Fund benefited from its positions in Industrials, Health Care, and Communication Services, primarily due to selection effects within these sectors. Information Technology, Energy, and Materials detracted from performance due to a combination of allocation and selection effects. When analyzing performance by market capitalization, the Fund’s exposure to Large Cap securities was additive during the fiscal year, while its position in Mid Caps detracted from performance. The Fund’s use of foreign currency contracts contributed positively to Fund performance as the U.S. dollar strengthened overall against various international currencies, which served as a tailwind to the Fund’s dynamic currency hedge strategy.
Shareholder Expense Example (for the six-month period ended March 31, 2022)
| | | | | | | | | | | | | | | | |
| | | | | |
| | | Beginning
Account Value | | | Ending
Account Value | | | Annualized
Expense Ratio1 | | | Expenses Paid
During the
Period1 | |
Actual | | $ | 1,000.00 | | | $ | 983.40 | | | | 0.39 | % | | $ | 1.93 | |
Hypothetical (5% return before expenses) | | $ | 1,000.00 | | | $ | 1,022.99 | | | | 0.39 | % | | $ | 1.97 | |
| 1 | Included in the expense ratio are “Other fees” described in Note 6 which are not annualized. Without these expenses, the expense ratio would have been 0.38% and the actual and hypothetical expenses paid during the period would have been $1.88 and $1.92, respectively. |
Performance
| | | | | | | | | | | | |
| | |
| | | Average Annual Total Return | |
| | | |
| | | 1 Year | | | 3 Year | | | Since Inception1 | |
Fund NAV Returns | | | 3.03 | % | | | 3.75 | % | | | 3.41 | % |
Fund Market Price Returns | | | 2.26 | % | | | 3.37 | % | | | 3.29 | % |
MSCI EAFE Local Currency Index | | | 6.21 | % | | | 8.23 | % | | | 6.21 | % |
MSCI EAFE Index | | | 1.16 | % | | | 7.78 | % | | | 5.70 | % |
| 1 | Total returns are calculated based on the commencement of Fund trading on the NYSE Arca, Inc. on August 10, 2018. |
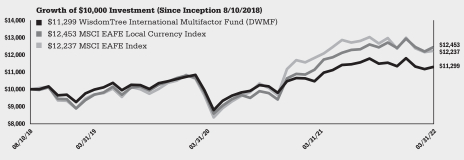
Performance is historical and does not guarantee future results. The returns do not reflect the deduction of taxes that a shareholder would pay on Fund distributions or on the redemption of Fund shares.
Management’s Discussion of Funds’ Performance
as of March 31, 2022 (unaudited)
WisdomTree International Quality Dividend Growth Fund (IQDG)
Sector Breakdown†
| | | | |
| |
| Sector | | % of Net Assets | |
Materials | | | 21.2% | |
Health Care | | | 19.5% | |
Industrials | | | 18.8% | |
Consumer Discretionary | | | 16.8% | |
Information Technology | | | 11.2% | |
Consumer Staples | | | 6.2% | |
Financials | | | 2.2% | |
Energy | | | 1.9% | |
Communication Services | | | 1.2% | |
Real Estate | | | 0.2% | |
Utilities | | | 0.0% | * |
Other Assets less Liabilities‡ | | | 0.8% | |
Total | | | 100.0% | |
| † | The Fund’s sector breakdown is expressed as a percentage of net assets and may change over time. In addition, a sector may be comprised of several industries. It does not include derivatives (if any). |
| ‡ | Other assets less liabilities may include investment of cash collateral for securities on loan and/or receivables/payables on derivatives (if any). |
| * | Represents less than 0.1%. |
Top Ten Holdings*
| | | | |
| |
| Description | | % of Net Assets | |
BHP Group Ltd. | | | 5.8% | |
Anglo American PLC | | | 5.6% | |
Novo Nordisk A/S, Class B | | | 5.1% | |
Roche Holding AG | | | 5.0% | |
Rio Tinto PLC | | | 4.9% | |
LVMH Moet Hennessy Louis Vuitton SE | | | 4.8% | |
Tokyo Electron Ltd. | | | 2.9% | |
Diageo PLC | | | 2.9% | |
Industria de Diseno Textil SA | | | 2.6% | |
Deutsche Post AG, Registered Shares | | | 2.5% | |
| * | The ten largest holdings are subject to change, and there are no guarantees the Fund will remain invested in any particular company. Excludes derivatives and investment of cash collateral for securities on loan (if any). |
The WisdomTree International Quality Dividend Growth Fund (the “Fund”) seeks to track the price and yield performance, before fees and expenses, of the WisdomTree International Quality Dividend Growth Index (the “Index”). In seeking to track the Index, the Fund invests in dividend-paying companies with growth characteristics in the developed world excluding the U.S. and Canada. The Fund generally uses a representative sampling strategy to achieve its investment objective, meaning it generally will invest in a sample of securities in the Index.
The Fund returned 2.46% at net asset value (“NAV”) for the fiscal year ended March 31, 2022 (for more complete performance information please see the table below). The Fund benefited from its positions in Materials, Health Care and Information Technology, mainly due to stock selection effects within each of these sectors. Positions in the Financials, Energy and Consumer Staples sectors detracted from performance for the Fund, mainly due to stock selection effects, especially within Financials. When analyzing performance by country, exposures within Spain and Australia were the largest detractors, due to poor stock selection. The United Kingdom and Germany were top performance contributors primarily due to allocation and stock selection effects.
Shareholder Expense Example (for the six-month period ended March 31, 2022)
| | | | | | | | | | | | | | | | |
| | | | | |
| | | Beginning
Account Value | | | Ending
Account Value | | | Annualized
Expense Ratio | | | Expenses Paid
During the
Period | |
Actual | | $ | 1,000.00 | | | $ | 975.20 | | | | 0.42 | % | | $ | 2.07 | |
Hypothetical (5% return before expenses) | | $ | 1,000.00 | | | $ | 1,022.84 | | | | 0.42 | % | | $ | 2.12 | |
Performance
| | | | | | | | | | | | | | | | |
| | |
| | | Average Annual Total Return | |
| | | | |
| | | 1 Year | | | 3 Year | | | 5 Year | | | Since Inception1 | |
Fund NAV Returns | | | 2.46 | % | | | 11.52 | % | | | 9.42 | % | | | 9.06 | % |
Fund Market Price Returns | | | 1.13 | % | | | 11.01 | % | | | 9.13 | % | | | 8.95 | % |
WisdomTree International Quality Dividend Growth Index | | | 3.28 | % | | | 12.01 | % | | | 9.83 | % | | | 9.48 | % |
MSCI EAFE Index | | | 1.16 | % | | | 7.78 | % | | | 6.72 | % | | | 8.02 | % |
| 1 | Total returns are calculated based on the commencement of Fund trading on the Cboe BZX Exchange, Inc. on April 7, 2016. |
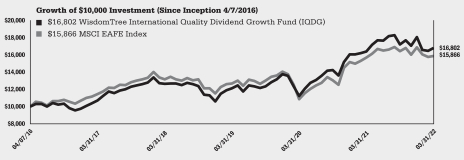
Performance is historical and does not guarantee future results. The returns do not reflect the deduction of taxes that a shareholder would pay on Fund distributions or on the redemption of Fund shares.
Management’s Discussion of Funds’ Performance
as of March 31, 2022 (unaudited)
WisdomTree International SmallCap Dividend Fund (DLS)
Sector Breakdown†
| | | | |
| |
| Sector | | % of Net Assets | |
Industrials | | | 22.1% | |
Financials | | | 15.3% | |
Materials | | | 12.0% | |
Consumer Discretionary | | | 10.8% | |
Real Estate | | | 10.3% | |
Consumer Staples | | | 6.9% | |
Information Technology | | | 6.9% | |
Communication Services | | | 4.2% | |
Health Care | | | 3.9% | |
Utilities | | | 3.5% | |
Energy | | | 2.4% | |
Investment Company | | | 0.6% | |
Other Assets less Liabilities‡ | | | 1.1% | |
Total | | | 100.0% | |
| † | The Fund’s sector breakdown is expressed as a percentage of net assets and may change over time. In addition, a sector may be comprised of several industries. It does not include derivatives (if any). |
| ‡ | Other assets less liabilities may include investment of cash collateral for securities on loan and/or receivables/payables on derivatives (if any). |
Top Ten Holdings*
| | | | |
| |
| Description | | % of Net Assets | |
PostNL NV | | | 0.9% | |
Ferrexpo PLC | | | 0.9% | |
Cia de Distribucion Integral Logista Holdings SA | | | 0.7% | |
NetLink NBN Trust | | | 0.7% | |
Drax Group PLC | | | 0.7% | |
Metropole Television SA | | | 0.6% | |
Diversified Energy Co. PLC | | | 0.6% | |
Metcash Ltd. | | | 0.6% | |
Hutchison Port Holdings Trust | | | 0.6% | |
Peab AB, Class B | | | 0.6% | |
| * | The ten largest holdings are subject to change, and there are no guarantees the Fund will remain invested in any particular company. Excludes derivatives and investment of cash collateral for securities on loan (if any). |
The WisdomTree International SmallCap Dividend Fund (the “Fund”) seeks to track the price and yield performance, before fees and expenses, of the WisdomTree International SmallCap Dividend Index (the “Index”). In seeking to track the Index, the Fund invests in dividend-paying small-cap companies in the developed world excluding the U.S. and Canada. The Fund generally uses a representative sampling strategy to achieve its investment objective, meaning it generally will invest in a sample of securities in the Index.
The Fund returned -0.79% at net asset value (“NAV”) for the fiscal year ended March 31, 2022 (for more complete performance information please see the table below). The Fund benefited from its positions in Consumer Discretionary, Utilities and Information Technology, due to stock selection effects within each of those sectors. Positions in the Materials, Financials and Industrials sectors detracted from performance, due to stock selection effects. When analyzing performance by country, exposures within Italy and Australia were the largest detractors from performance, owing to stock selection effects. Japan and Israel were top performance contributors due to positive stock selection in the former and strong allocation effects in the latter.
Shareholder Expense Example (for the six-month period ended March 31, 2022)
| | | | | | | | | | | | | | | | |
| | | | | |
| | | Beginning
Account Value | | | Ending
Account Value | | | Annualized Net
Expense
Ratio1 | | | Expenses Paid
During the
Period1 | |
Actual | | $ | 1,000.00 | | | $ | 940.10 | | | | 0.60 | % | | $ | 2.90 | |
Hypothetical (5% return before expenses) | | $ | 1,000.00 | | | $ | 1,021.94 | | | | 0.60 | % | | $ | 3.02 | |
| 1 | Included in the expense ratio are “Other fees” described in Note 6 which are not annualized. Without these expenses, the expense ratio would have been 0.58% and the actual and hypothetical expenses paid during the period would have been $2.81 and $2.92, respectively. |
Performance
| | | | | | | | | | | | | | | | |
| | |
| | | Average Annual Total Return | |
| | | | |
| | | 1 Year | | | 3 Year | | | 5 Year | | | 10 Year | |
Fund NAV Returns | | | -0.79 | % | | | 5.17 | % | | | 4.56 | % | | | 6.98 | % |
Fund Market Price Returns | | | -1.83 | % | | | 4.81 | % | | | 4.26 | % | | | 6.81 | % |
WisdomTree International SmallCap Dividend Index | | | -0.02 | % | | | 6.45 | % | | | 5.47 | % | | | 7.74 | % |
MSCI EAFE Small Cap Index | | | -3.63 | % | | | 8.51 | % | | | 7.42 | % | | | 8.30 | % |
MSCI EAFE Small Cap Value Index | | | -0.67 | % | | | 6.96 | % | | | 5.78 | % | | | 7.51 | % |
MSCI EAFE Index | | | 1.16 | % | | | 7.78 | % | | | 6.72 | % | | | 6.27 | % |
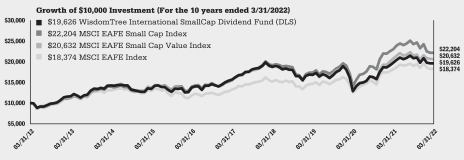
Performance is historical and does not guarantee future results. The returns do not reflect the deduction of taxes that a shareholder would pay on Fund distributions or on the redemption of Fund shares.
Management’s Discussion of Funds’ Performance
as of March 31, 2022 (unaudited)
WisdomTree Japan SmallCap Dividend Fund (DFJ)
Sector Breakdown†
| | | | |
| |
| Sector | | % of Net Assets | |
Industrials | | | 24.6% | |
Consumer Discretionary | | | 15.5% | |
Materials | | | 15.0% | |
Financials | | | 13.1% | |
Information Technology | | | 11.7% | |
Consumer Staples | | | 6.8% | |
Health Care | | | 3.9% | |
Communication Services | | | 2.3% | |
Utilities | | | 2.1% | |
Real Estate | | | 1.9% | |
Energy | | | 1.2% | |
Investment Company | | | 0.2% | |
Other Assets less Liabilities‡ | | | 1.7% | |
Total | | | 100.0% | |
| † | The Fund’s sector breakdown is expressed as a percentage of net assets and may change over time. In addition, a sector may be comprised of several industries. It does not include derivatives (if any). |
| ‡ | Other assets less liabilities may include investment of cash collateral for securities on loan and/or receivables/payables on derivatives (if any). |
Top Ten Holdings*
| | | | |
| |
| Description | | % of Net Assets | |
Nishimatsu Construction Co. Ltd. | | | 0.8% | |
Electric Power Development Co. Ltd. | | | 0.8% | |
Aozora Bank Ltd. | | | 0.7% | |
Mebuki Financial Group, Inc. | | | 0.7% | |
Konica Minolta, Inc. | | | 0.7% | |
Toyo Seikan Group Holdings Ltd. | | | 0.6% | |
Seven Bank Ltd. | | | 0.6% | |
H.U. Group Holdings, Inc. | | | 0.6% | |
Sankyo Co. Ltd. | | | 0.5% | |
K’s Holdings Corp. | | | 0.5% | |
| * | The ten largest holdings are subject to change, and there are no guarantees the Fund will remain invested in any particular company. Excludes derivatives and investment of cash collateral for securities on loan (if any). |
The WisdomTree Japan SmallCap Dividend Fund (the “Fund”) seeks to track the price and yield performance, before fees and expenses, of the WisdomTree Japan SmallCap Dividend Index (the “Index”). In seeking to track the Index, the Fund invests in dividend-paying small-cap companies in the Japanese equity market. The Fund generally uses a representative sampling strategy to achieve its investment objective, meaning it generally will invest in a sample of securities in the Index.
The Fund returned -10.62% at net asset value (“NAV”) for the fiscal year ended March 31, 2022 (for more complete performance information please see the table below). The Fund benefited from its positions in Materials, Information Technology and Consumer Staples, due to stock selection effects within each of those sectors. Positions in the Real Estate, Consumer Discretionary and Industrials sectors detracted from performance due to stock selection effects in Consumer Discretionary and Industrials and allocation effects within Real Estate. When analyzing performance by dividend yield attribution, only the 3rd quintile of companies detracted from performance as a result of poor stock selection. The companies within the 1st quintile and the Fund’s lack of exposure to those with zero dividend yield were top performance contributors due to overweighting the former and underweighting the latter.
Shareholder Expense Example (for the six-month period ended March 31, 2022)
| | | | | | | | | | | | | | | | |
| | | | | |
| | | Beginning
Account Value | | | Ending
Account Value | | | Annualized Net
Expense Ratio | | | Expenses Paid
During the
Period | |
Actual | | $ | 1,000.00 | | | $ | 873.30 | | | | 0.58 | % | | $ | 2.71 | |
Hypothetical (5% return before expenses) | | $ | 1,000.00 | | | $ | 1,022.04 | | | | 0.58 | % | | $ | 2.92 | |
Performance
| | | | | | | | | | | | | | | | |
| | |
| | | Average Annual Total Return | |
| | | | |
| | | 1 Year | | | 3 Year | | | 5 Year | | | 10 Year | |
Fund NAV Returns | | | -10.62 | % | | | 1.64 | % | | | 2.17 | % | | | 5.98 | % |
Fund Market Price Returns | | | -11.89 | % | | | 1.23 | % | | | 1.89 | % | | | 5.83 | % |
WisdomTree Japan SmallCap Dividend Index | | | -10.55 | % | | | 1.90 | % | | | 2.74 | % | | | 6.57 | % |
MSCI Japan Small Cap Index | | | -12.27 | % | | | 2.47 | % | | | 3.55 | % | | | 6.68 | % |
MSCI Japan Index | | | -6.47 | % | | | 6.84 | % | | | 6.10 | % | | | 6.46 | % |
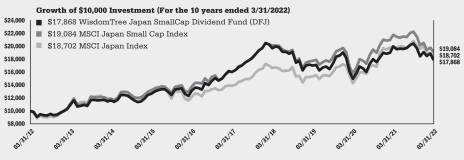
Performance is historical and does not guarantee future results. The returns do not reflect the deduction of taxes that a shareholder would pay on Fund distributions or on the redemption of Fund shares.
Description of Terms and Indexes (unaudited)
Below are descriptions of certain terms and of each Index referenced in this report:
Allocation Effect measures an investment manager’s ability to effectively allocate a portfolio’s assets to various segments. A segment refers to assets or securities that are grouped within a certain classification such as sectors, industries, or countries. The allocation effect determines whether the overweighting or underweighting of segments relative to a benchmark contributes positively or negatively to the overall portfolio return. Positive allocation occurs when the portfolio is overweighted in a segment that outperforms the benchmark and underweighted in a segment that underperforms the benchmark. Negative allocation occurs when the portfolio is overweighted in a segment that underperforms the benchmark and underweighted in a segment that outperforms the benchmark.
Growth is generally characterized by higher price levels relative to fundamentals, such as dividends or earnings. Price levels are higher because investors are willing to pay more due to their expectations of future improvements in these fundamentals.
The MSCI EAFE Index is a market cap-weighted index composed of companies representative of the developed market structure of developed countries in Europe, Australasia and Japan.
The MSCI EAFE Local Currency Index is a free float-adjusted market capitalization weighted index that is designed to measure developed market equity performance, excluding the U.S. and Canada, calculated in local currency.
The MSCI EAFE Mid Cap Index is a free float-adjusted market capitalization index that is designed to measure the performance of mid-capitalization equities in the developed markets, excluding the U.S. and Canada.
The MSCI EAFE Mid Cap Value Index captures mid cap securities exhibiting overall value style characteristics across Developed Markets countries, excluding the US and Canada.
The MSCI EAFE Small Cap Index is a free float-adjusted market capitalization equity index that is designed to measure the performance of small-cap stocks within the developed equity market, excluding the U.S. and Canada.
The MSCI EAFE Small Cap Value Index captures small cap securities exhibiting overall value style characteristics across Developed Markets countries, excluding the US and Canada.
The MSCI EAFE Value Index is a free float-adjusted market capitalization index that is designed to measure the performance of the “value” stocks within the developed equity market, excluding the U.S. and Canada.
The MSCI Europe Index is a free float-adjusted market capitalization index that is designed to measure the performance of large- and mid-cap stocks within developed market European countries.
The MSCI Europe Small Cap Index is a free float-adjusted market capitalization index that is designed to measure the performance of “small” stocks within developed market European countries.
The MSCI Japan Small Cap Index is a free float-adjusted market capitalization index that is designed to measure the performance of small cap stocks within Japan.
The MSCI Japan Index is a free float-adjusted market capitalization index that is designed to measure the performance of the Japanese equity market.
Quality is generally characterized by higher efficiency and profitability. Typical measures include earnings, return-on-equity, return on assets, operating profitability as well as others. This term is also related to the quality factor, which associates these stock characteristics with excess returns vs. the market over time.
Return-on-Equity (ROE) measures a corporation’s profitability by revealing how much profit a company generates with the money shareholders have invested.
Risk-on and Risk-off refers to investors’ appetites for risk which rise and fall over time. During periods when risk is perceived as low, the risk-on risk-off theory states that
Description of Terms and Indexes (unaudited) (continued)
investors tend to engage in higher-risk investments (i.e., “Risk-on”). When risk is perceived to be high, investors have the tendency to gravitate toward lower-risk investments (i.e., “Risk-off”).
Selection Effect measures an investment manager’s ability to select securities within a given segment relative to a benchmark. The over or underperformance of the portfolio is weighted by the benchmark weight, therefore, selection is not affected by the investment manager’s allocation to the segment. The weight of the segment in the portfolio determines the size of the effect—the larger the segment, the larger the effect is, positive or negative. A positive selection effect occurs when the portfolio return is greater than the benchmark return. Thus, the investment manager made good decisions in selecting securities that, as a whole, outperformed similar securities in the benchmark. A negative selection effect occurs when the portfolio return is less than the benchmark return. Thus, the investment manager made poor decisions in selecting securities that, as a whole, underperformed similar securities in the benchmark.
The WisdomTree Europe Quality Dividend Growth Index is a fundamentally weighted index that measures the performance of dividend-paying common stocks with growth characteristics selected from the WisdomTree International Equity Index.
The WisdomTree Europe SmallCap Dividend Index is a fundamentally weighted index that measures the performance of the small-capitalization segment of the European dividend-paying market.
The WisdomTree International Dividend ex-Financials Index measures the performance of high dividend-yielding international stocks outside the financial sector.
The WisdomTree International Equity Index is a fundamentally weighted Index that measures the performance of dividend-paying companies in the industrialized world, excluding Canada and the United States.
The WisdomTree International High Dividend Index is comprised of companies with high dividend yields selected from the WisdomTree International Equity Index.
The WisdomTree International LargeCap Dividend Index is comprised of the large-capitalization segment of the dividend-paying market in the industrialized world outside the U.S. and Canada.
The WisdomTree International MidCap Dividend Index is comprised of the mid-capitalization segment of the dividend-paying market in the industrialized world outside the U.S. and Canada.
The WisdomTree International Quality Dividend Growth Index is a fundamentally weighted index designed to provide exposure to dividend paying developed market companies.
The WisdomTree International SmallCap Dividend Index is comprised of the small-capitalization segment of the dividend-paying market in the industrialized world outside the U.S. and Canada.
The WisdomTree Japan SmallCap Dividend Index is comprised of dividend-paying small-capitalization companies in Japan.
The Global Industry Classification Standard (“GICS”) was developed by and is the exclusive property and a service mark of MSCI Inc. (“MSCI”) and Standard & Poor’s (“S&P”), a division of The McGraw-Hill Companies, Inc. and is licensed for use by WisdomTree Investments, Inc. Neither MSCI, S&P nor any other party involved in making or compiling the GICS or any GICS classifications makes any express or implied warranties or representations with respect to such standard or classification (or the results to be obtained by the use thereof), and all such parties hereby expressly disclaim all warranties of originality, accuracy, completeness, merchantability and fitness for a particular purpose with respect to any such standard or classification. Without limiting any of the foregoing, in no event shall MSCI, S&P, any of their affiliates or any third party involved in making or compiling the GICS or any GICS classifications have any liability for any direct, indirect, special, punitive, consequential or any other damages (including lost profits) even if notified of the possibility of such damages.
Description of Terms and Indexes (unaudited) (concluded)
Neither MSCI nor any other party involved in or related to compiling, computing or creating the MSCI data makes any express or implied warranties or representations with respect to such data (or the results to be obtained by the use thereof), and all such parties hereby expressly disclaim all warranties of originality, accuracy, completeness, merchantability or fitness for a particular purpose with respect to any such data. Without limiting any of the foregoing, in no event shall MSCI, any of its affiliates or any third party involved in or related to compiling, computing or creating the data have any liability for any direct, indirect, special, punitive, consequential or any other damages (including lost profits) even if notified of the possibility of such damages. No further distribution or dissemination of the MSCI data is permitted without MSCI’s express written consent.
WisdomTree Investments, Inc. and WisdomTree Asset Management, Inc. (together, “WisdomTree”) and the Funds make no representation or warranty, express or implied, to the owners of shares of the Funds or any member of the public regarding the advisability of investing in securities generally or in the Funds particularly or the ability of the underlying Indexes to track the performance of their underlying securities. WisdomTree Investments is the licensor of certain trademarks, service marks and trade names of the Funds. WisdomTree Investments has no obligation to take the needs of the Funds or the owners of shares of the Funds into consideration in determining, composing, or calculating the underlying WisdomTree Indexes of the applicable Funds. WisdomTree Investments is not responsible for, and has not participated in, the determination of the timing of, prices of, or quantities of shares of the Funds to be issued or in the determination or calculation of the equation by which the shares of the Funds are redeemable. WisdomTree and the Funds do not guarantee the accuracy, completeness, or performance of the underlying Indexes or the data included therein and shall have no liability in connection with the underlying Indexes or their calculation.
Index performance information assumes the reinvestment of dividends and excludes management fees, transaction costs and expenses. You cannot directly invest in an index.
* * * * * *
Abbreviations used in the schedules of investments and related tables included in this report are as follows:
| | | | | | |
| | |
| Currency abbreviations: | | | | |
| AUD | | Australian dollar | | JPY | | Japanese yen |
| CAD | | Canadian dollar | | NOK | | Norwegian krone |
| CHF | | Swiss franc | | NZD | | New Zealand dollar |
| DKK | | Danish krone | | SEK | | Swedish krona |
| EUR | | Euro | | SGD | | Singapore dollar |
| GBP | | British pound | | USD | | U.S. dollar |
| HKD | | Hong Kong dollar | | | | |
| | |
| Other abbreviations: | | | | |
| ADR | | American Depositary Receipt |
| CVA | | Certificaten Van Aandelen (Certificate of Stock) |
| RSP | | Risparmio Italian Savings Shares |
Schedule of Investments
WisdomTree Europe Quality Dividend Growth Fund (EUDG)
March 31, 2022
| | | | | | | | |
| Investments | | Shares | | | Value | |
| | |
| COMMON STOCKS – 99.1% | | | | | | | | |
| | |
| Austria – 1.1% | | | | | | | | |
| | |
Andritz AG | | | 1,472 | | | $ | 68,756 | |
| | |
OMV AG | | | 9,806 | | | | 473,413 | |
| | |
S&T AG(a) | | | 1,182 | | | | 22,318 | |
| | |
Telekom Austria AG* | | | 17,000 | | | | 132,405 | |
| | |
Wienerberger AG | | | 2,246 | | | | 68,473 | |
| | | | | | | | |
| Total Austria | | | | | | | 765,365 | |
| | |
| Belgium – 0.1% | | | | | | | | |
| | |
Melexis NV | | | 845 | | | | 78,976 | |
| | |
| Denmark – 6.3% | | | | | | | | |
| | |
AP Moller – Maersk A/S, Class B | | | 96 | | | | 292,508 | |
| | |
Carlsberg A/S, Class B | | | 1,914 | | | | 237,627 | |
| | |
Coloplast A/S, Class B | | | 2,980 | | | | 456,672 | |
| | |
DSV A/S | | | 406 | | | | 78,979 | |
| | |
H. Lundbeck A/S | | | 2,750 | | | | 64,026 | |
| | |
Novo Nordisk A/S, Class B | | | 21,319 | | | | 2,388,177 | |
| | |
Novozymes A/S, Class B | | | 2,361 | | | | 163,513 | |
| | |
Orsted A/S(b) | | | 4,613 | | | | 585,962 | |
| | |
Royal Unibrew A/S | | | 813 | | | | 76,906 | |
| | |
Scandinavian Tobacco Group A/S, Class A(b) | | | 4,122 | | | | 88,663 | |
| | |
SimCorp A/S | | | 297 | | | | 22,080 | |
| | |
Vestas Wind Systems A/S | | | 4,071 | | | | 121,636 | |
| | | | | | | | |
| Total Denmark | | | | | | | 4,576,749 | |
| | |
| Finland – 3.6% | | | | | | | | |
| | |
Elisa Oyj | | | 5,414 | | | | 329,025 | |
| | |
Kesko Oyj, Class A | | | 3,808 | | | | 99,145 | |
| | |
Kesko Oyj, Class B | | | 5,402 | | | | 150,324 | |
| | |
Kone Oyj, Class B | | | 7,619 | | | | 403,434 | |
| | |
Metso Outotec Oyj | | | 12,109 | | | | 103,527 | |
| | |
Neste Oyj | | | 10,499 | | | | 484,558 | |
| | |
Nokian Renkaat Oyj | | | 3,865 | | | | 63,538 | |
| | |
Orion Oyj, Class B | | | 3,772 | | | | 172,703 | |
| | |
Tokmanni Group Corp. | | | 2,281 | | | | 38,196 | |
| | |
UPM-Kymmene Oyj(a) | | | 19,532 | | | | 644,580 | |
| | |
Valmet Oyj(a) | | | 2,827 | | | | 88,733 | |
| | | | | | | | |
| Total Finland | | | | | | | 2,577,763 | |
| | |
| France – 16.9% | | | | | | | | |
| | |
Arkema SA | | | 1,463 | | | | 177,024 | |
| | |
BioMerieux | | | 648 | | | | 69,749 | |
| | |
Bureau Veritas SA | | | 4,026 | | | | 116,199 | |
| | |
Capgemini SE | | | 1,568 | | | | 353,289 | |
| | |
Cie de Saint-Gobain | | | 7,168 | | | | 432,829 | |
| | |
Cie Generale des Etablissements Michelin SCA | | | 2,687 | | | | 367,583 | |
| | |
Eiffage SA | | | 2,018 | | | | 209,354 | |
| | |
Hermes International | | | 316 | | | | 454,088 | |
| | |
IPSOS | | | 1,101 | | | | 55,371 | |
| | |
Kering SA | | | 1,348 | | | | 863,465 | |
| | |
L’Oreal SA | | | 5,009 | | | | 2,027,833 | |
| | |
La Francaise des Jeux SAEM(b) | | | 3,562 | | | | 142,519 | |
| | |
Legrand SA | | | 2,542 | | | | 244,314 | |
| | |
LVMH Moet Hennessy Louis Vuitton SE | | | 4,646 | | | | 3,356,991 | |
| | |
Remy Cointreau SA | | | 501 | | | | 104,241 | |
| | |
Safran SA | | | 1,021 | | | | 121,849 | |
| | |
Sartorius Stedim Biotech | | | 125 | | | | 51,808 | |
| | |
Schneider Electric SE | | | 6,295 | | | | 1,065,749 | |
| | |
SEB SA | | | 874 | | | | 123,113 | |
| | |
Sopra Steria Group SACA | | | 283 | | | | 53,183 | |
| | |
Teleperformance | | | 292 | | | | 112,511 | |
| | |
Television Francaise 1 | | | 10,674 | | | | 104,631 | |
| | |
Thales SA | | | 3,082 | | | | 390,756 | |
| | |
Trigano SA | | | 581 | | | | 85,331 | |
| | |
Verallia SA(b) | | | 3,181 | | | | 76,237 | |
| | |
Vinci SA | | | 10,578 | | | | 1,094,457 | |
| | | | | | | | |
| Total France | | | | | | | 12,254,474 | |
| | |
| Germany – 8.3% | | | | | | | | |
| | |
adidas AG | | | 1,860 | | | | 438,533 | |
| | |
Aurubis AG | | | 787 | | | | 94,965 | |
| | |
Bechtle AG | | | 966 | | | | 55,031 | |
| | |
Brenntag SE | | | 1,710 | | | | 139,539 | |
| | |
Carl Zeiss Meditec AG, Bearer Shares | | | 406 | | | | 66,383 | |
| | |
Covestro AG(b) | | | 3,965 | | | | 202,230 | |
| | |
Dermapharm Holding SE | | | 459 | | | | 29,468 | |
| | |
Deutsche Post AG, Registered Shares | | | 18,451 | | | | 894,060 | |
| | |
Fielmann AG | | | 1,854 | | | | 101,905 | |
| | |
Hapag-Lloyd AG(b) | | | 2,044 | | | | 720,030 | |
| | |
Infineon Technologies AG | | | 6,548 | | | | 225,745 | |
| | |
Instone Real Estate Group SE(b) | | | 924 | | | | 17,416 | |
| | |
Knorr-Bremse AG | | | 1,508 | | | | 116,847 | |
| | |
ProSiebenSat.1 Media SE | | | 7,018 | | | | 90,502 | |
| | |
Siemens AG, Registered Shares | | | 12,685 | | | | 1,773,561 | |
| | |
Siemens Healthineers AG(b) | | | 13,380 | | | | 837,260 | |
| | |
Symrise AG | | | 1,083 | | | | 131,164 | |
| | |
Varta AG(a) | | | 471 | | | | 47,113 | |
| | |
VERBIO Vereinigte BioEnergie AG | | | 265 | | | | 20,669 | |
| | | | | | | | |
| Total Germany | | | | | | | 6,002,421 | |
| | |
| Ireland – 1.0% | | | | | | | | |
| | |
CRH PLC | | | 16,330 | | | | 660,464 | |
| | |
Kingspan Group PLC | | | 550 | | | | 54,489 | |
| | | | | | | | |
| Total Ireland | | | | | | | 714,953 | |
| | |
| Italy – 1.8% | | | | | | | | |
| | |
Amplifon SpA | | | 1,317 | | | | 59,406 | |
| | |
Anima Holding SpA(b) | | | 18,503 | | | | 84,038 | |
| | |
BFF Bank SpA(b) | | | 19,928 | | | | 149,334 | |
| | |
Buzzi Unicem SpA | | | 2,798 | | | | 52,473 | |
| | |
Davide Campari-Milano NV | | | 5,541 | | | | 65,074 | |
| | |
De’ Longhi SpA | | | 2,209 | | | | 60,807 | |
| | |
DiaSorin SpA | | | 288 | | | | 45,471 | |
| | |
Ferrari NV | | | 741 | | | | 163,823 | |
| | |
GVS SpA(b) | | | 1,433 | | | | 13,138 | |
| | |
Moncler SpA | | | 1,869 | | | | 105,516 | |
| | |
Pirelli & C. SpA(b) | | | 14,688 | | | | 80,585 | |
| | |
RAI Way SpA(b) | | | 13,635 | | | | 86,019 | |
| | |
Recordati Industria Chimica e Farmaceutica SpA | | | 3,524 | | | | 178,953 | |
See Notes to Financial Statements.
Schedule of Investments (continued)
WisdomTree Europe Quality Dividend Growth Fund (EUDG)
March 31, 2022
| | | | | | | | |
| Investments | | Shares | | | Value | |
| | |
Technogym SpA(b) | | | 4,550 | | | $ | 36,400 | |
| | |
Telecom Italia SpA(a) | | | 392,905 | | | | 145,795 | |
| | | | | | | | |
| Total Italy | | | | | | | 1,326,832 | |
| | |
| Netherlands – 4.8% | | | | | | | | |
| | |
ASM International NV | | | 320 | | | | 118,244 | |
| | |
ASML Holding NV | | | 1,465 | | | | 994,320 | |
| | |
BE Semiconductor Industries NV | | | 1,645 | | | | 142,508 | |
| | |
Euronext NV(b) | | | 1,391 | | | | 127,994 | |
| | |
EXOR NV | | | 1,177 | | | | 91,016 | |
| | |
Heineken NV | | | 5,231 | | | | 503,919 | |
| | |
IMCD NV | | | 260 | | | | 44,912 | |
| | |
Koninklijke KPN NV | | | 181,138 | | | | 633,450 | |
| | |
Randstad NV(a) | | | 5,795 | | | | 352,308 | |
| | |
RHI Magnesita NV | | | 1,801 | | | | 57,765 | |
| | |
Signify NV(b) | | | 2,606 | | | | 123,029 | |
| | |
Wolters Kluwer NV | | | 2,640 | | | | 283,694 | |
| | | | | | | | |
| Total Netherlands | | | | | | | 3,473,159 | |
| | |
| Norway – 2.2% | | | | | | | | |
| | |
AF Gruppen ASA | | | 4,103 | | | | 93,847 | |
| | |
Aker BP ASA(a) | | | 9,023 | | | | 341,149 | |
| | |
Atea ASA* | | | 3,854 | | | | 58,268 | |
| | |
Kongsberg Gruppen ASA | | | 3,720 | | | | 149,328 | |
| | |
Mowi ASA | | | 3,632 | | | | 98,858 | |
| | |
Norsk Hydro ASA | | | 34,161 | | | | 336,375 | |
| | |
Yara International ASA | | | 10,282 | | | | 519,744 | |
| | | | | | | | |
| Total Norway | | | | | | | 1,597,569 | |
| | |
| Portugal – 0.4% | | | | | | | | |
| | |
Altri SGPS SA | | | 10,159 | | | | 68,499 | |
| | |
Jeronimo Martins SGPS SA | | | 8,504 | | | | 205,609 | |
| | | | | | | | |
| Total Portugal | | | | | | | 274,108 | |
| | |
| Spain – 3.7% | | | | | | | | |
| | |
Acerinox SA | | | 10,151 | | | | 112,719 | |
| | |
Banco Bilbao Vizcaya Argentaria SA(a) | | | 143,198 | | | | 830,106 | |
| | |
Cie Automotive SA | | | 2,320 | | | | 53,331 | |
| | |
Faes Farma SA | | | 24,288 | | | | 99,394 | |
| | |
Fluidra SA | | | 1,991 | | | | 58,262 | |
| | |
Grifols SA(a) | | | 6,028 | | | | 110,532 | |
| | |
Industria de Diseno Textil SA | | | 60,877 | | | | 1,339,795 | |
| | |
Viscofan SA | | | 1,074 | | | | 64,290 | |
| | | | | | | | |
| Total Spain | | | | | | | 2,668,429 | |
| | |
| Sweden – 5.3% | | | | | | | | |
| | |
AAK AB | | | 3,631 | | | | 68,183 | |
| | |
Alfa Laval AB | | | 4,274 | | | | 149,187 | |
| | |
Assa Abloy AB, Class B | | | 10,065 | | | | 275,293 | |
| | |
Atlas Copco AB, Class A | | | 6,841 | | | | 360,937 | |
| | |
Atlas Copco AB, Class B | | | 3,476 | | | | 160,197 | |
| | |
Axfood AB | | | 6,860 | | | | 225,393 | |
| | |
Bilia AB, Class A | | | 4,085 | | | | 58,956 | |
| | |
Catena AB | | | 792 | | | | 48,356 | |
| | |
Dustin Group AB(b) | | | 2,938 | | | | 25,473 | |
| | |
Elekta AB, Class B(a) | | | 7,656 | | | | 60,973 | |
| | |
Epiroc AB, Class A | | | 6,703 | | | | 145,433 | |
| | |
Epiroc AB, Class B | | | 2,087 | | | | 38,193 | |
| | |
EQT AB | | | 4,661 | | | | 186,102 | |
| | |
Evolution AB(b) | | | 862 | | | | 89,545 | |
| | |
Hexagon AB, Class B | | | 15,396 | | | | 219,308 | |
| | |
Hexpol AB | | | 7,566 | | | | 74,983 | |
| | |
Husqvarna AB, Class B | | | 9,020 | | | | 95,490 | |
| | |
Indutrade AB | | | 2,333 | | | | 59,656 | |
| | |
JM AB(a) | | | 2,527 | | | | 81,346 | |
| | |
Mycronic AB | | | 1,729 | | | | 32,653 | |
| | |
Nibe Industrier AB, Class B | | | 3,416 | | | | 38,506 | |
| | |
Nordnet AB publ | | | 2,171 | | | | 39,602 | |
| | |
Paradox Interactive AB(a) | | | 1,250 | | | | 24,103 | |
| | |
Samhallsbyggnadsbolaget i Norden AB(a) | | | 21,494 | | | | 97,444 | |
| | |
Sandvik AB | | | 15,434 | | | | 332,879 | |
| | |
SKF AB, Class B(a) | | | 7,956 | | | | 131,428 | |
| | |
Thule Group AB(b) | | | 1,365 | | | | 54,926 | |
| | |
Volvo AB, Class A | | | 8,955 | | | | 173,923 | |
| | |
Volvo AB, Class B | | | 27,099 | | | | 513,518 | |
| | | | | | | | |
| Total Sweden | | | | | | | 3,861,986 | |
| | |
| Switzerland – 17.9% | | | | | | | | |
| | |
Adecco Group AG, Registered Shares | | | 5,262 | | | | 240,214 | |
| | |
Coca-Cola HBC AG* | | | 6,963 | | | | 146,639 | |
| | |
EMS-Chemie Holding AG, Registered Shares | | | 375 | | | | 367,359 | |
| | |
Geberit AG, Registered Shares | | | 339 | | | | 210,786 | |
| | |
Kuehne + Nagel International AG, Registered Shares | | | 1,159 | | | | 331,359 | |
| | |
Logitech International SA, Registered Shares | | | 1,681 | | | | 126,406 | |
| | |
Nestle SA, Registered Shares | | | 37,998 | | | | 4,963,173 | |
| | |
Partners Group Holding AG | | | 401 | | | | 502,639 | |
| | |
Roche Holding AG | | | 10,175 | | | | 4,051,756 | |
| | |
Roche Holding AG, Bearer Shares | | | 2,123 | | | | 934,328 | |
| | |
Schindler Holding AG, Participation Certificate | | | 354 | | | | 76,551 | |
| | |
Schindler Holding AG, Registered Shares | | | 729 | | | | 156,772 | |
| | |
SFS Group AG | | | 471 | | | | 65,922 | |
| | |
Sonova Holding AG, Registered Shares | | | 476 | | | | 200,486 | |
| | |
STMicroelectronics NV | | | 4,297 | | | | 189,378 | |
| | |
Straumann Holding AG, Registered Shares | | | 38 | | | | 61,382 | |
| | |
Temenos AG, Registered Shares | | | 489 | | | | 47,293 | |
| | |
VAT Group AG(b) | | | 218 | | | | 83,954 | |
| | |
Vifor Pharma AG* | | | 938 | | | | 167,928 | |
| | | | | | | | |
| Total Switzerland | | | | | | | 12,924,325 | |
| | |
| United Kingdom – 25.7% | | | | | | | | |
| | |
abrdn PLC | | | 74,182 | | | | 209,897 | |
| | |
Alpha FX Group PLC | | | 917 | | | | 24,993 | |
| | |
Anglo American PLC | | | 51,056 | | | | 2,670,430 | |
| | |
Antofagasta PLC | | | 21,629 | | | | 476,434 | |
| | |
Ashmore Group PLC | | | 20,923 | | | | 64,077 | |
| | |
Ashtead Group PLC | | | 1,683 | | | | 107,096 | |
| | |
Avast PLC(b) | | | 12,156 | | | | 90,589 | |
| | |
Bellway PLC | | | 2,007 | | | | 64,266 | |
| | |
Britvic PLC | | | 6,799 | | | | 72,242 | |
| | |
Burberry Group PLC | | | 5,291 | | | | 116,617 | |
| | |
Clipper Logistics PLC | | | 3,056 | | | | 35,489 | |
See Notes to Financial Statements.
Schedule of Investments (concluded)
WisdomTree Europe Quality Dividend Growth Fund (EUDG)
March 31, 2022
| | | | | | | | |
| Investments | | Shares | | | Value | |
| | |
Computacenter PLC | | | 1,887 | | | $ | 73,095 | |
| | |
Croda International PLC | | | 971 | | | | 100,743 | |
| | |
Diageo PLC | | | 27,476 | | | | 1,397,671 | |
| | |
Dunelm Group PLC | | | 3,561 | | | | 51,153 | |
| | |
Electrocomponents PLC | | | 3,820 | | | | 54,521 | |
| | |
Ferrexpo PLC | | | 42,667 | | | | 104,771 | |
| | |
Fresnillo PLC | | | 11,379 | | | | 109,969 | |
| | |
Games Workshop Group PLC | | | 329 | | | | 31,470 | |
| | |
GlaxoSmithKline PLC | | | 165,810 | | | | 3,596,065 | |
| | |
Halma PLC | | | 1,667 | | | | 55,091 | |
| | |
Hargreaves Lansdown PLC | | | 7,918 | | | | 105,086 | |
| | |
Hikma Pharmaceuticals PLC | | | 2,345 | | | | 63,634 | |
| | |
Howden Joinery Group PLC | | | 4,436 | | | | 44,845 | |
| | |
Impax Asset Management Group PLC | | | 1,548 | | | | 20,178 | |
| | |
Intertek Group PLC | | | 1,513 | | | | 104,067 | |
| | |
Mondi PLC | | | 8,685 | | | | 170,555 | |
| | |
RELX PLC | | | 17,123 | | | | 537,247 | |
| | |
Rentokil Initial PLC | | | 11,054 | | | | 76,555 | |
| | |
Rightmove PLC | | | 7,387 | | | | 61,547 | |
| | |
Rio Tinto PLC | | | 51,076 | | | | 4,089,426 | |
| | |
Rotork PLC | | | 11,665 | | | | 50,131 | |
| | |
Savills PLC | | | 2,157 | | | | 31,638 | |
| | |
Softcat PLC | | | 2,354 | | | | 52,814 | |
| | |
Spirax-Sarco Engineering PLC | | | 406 | | | | 67,007 | |
| | |
Synthomer PLC | | | 9,228 | | | | 37,131 | |
| | |
Taylor Wimpey PLC | | | 118,874 | | | | 204,566 | |
| | |
Tesco PLC | | | 167,022 | | | | 606,950 | |
| | |
TI Fluid Systems PLC(b) | | | 10,846 | | | | 27,304 | |
| | |
Unilever PLC | | | 55,724 | | | | 2,534,900 | |
| | |
Victrex PLC | | | 2,108 | | | | 50,792 | |
| | |
Vistry Group PLC | | | 4,815 | | | | 59,694 | |
| | |
Vivo Energy PLC(b) | | | 33,614 | | | | 60,456 | |
| | | | | | | | |
| Total United Kingdom | | | | | | | 18,563,202 | |
TOTAL COMMON STOCKS
(Cost: $67,970,081) | | | | | | | 71,660,311 | |
|
| INVESTMENT OF CASH COLLATERAL FOR SECURITIES LOANED – 2.2% | |
| | |
| United States – 2.2% | | | | | | | | |
| | |
State Street Navigator Securities Lending Government Money Market Portfolio, 0.25%(c) | | | | | | | | |
| (Cost: $1,594,908) | | | 1,594,908 | | | | 1,594,908 | |
| |
TOTAL INVESTMENTS IN SECURITIES – 101.3%
(Cost: $69,564,989) | | | | 73,255,219 | |
| |
Other Assets less Liabilities – (1.3)% | | | | (908,865 | ) |
| | | | | | | | |
| NET ASSETS – 100.0% | | | $ | 72,346,354 | |
| * | Non-income producing security. |
| (a) | Security, or portion thereof, was on loan at March 31, 2022 (See Note 2). At March 31, 2022, the total market value of the Fund’s securities on loan identified in the Schedule of Investments was $2,416,370 and the total market value of the collateral held by the Fund was $2,584,005. The total market value of the collateral includes non-cash U.S. Government securities collateral having a value of $989,097. |
| (b) | This security is exempt from registration under rule 144A of the Securities Act of 1933. This security may be sold in transactions that are exempt from registration, normally to qualified institutional buyers. |
| (c) | Rate shown represents annualized 7-day yield as of March 31, 2022. |
The following is a summary of the fair valuations according to the inputs used as of March 31, 2022 in valuing the Fund’s investments (See Note 2 — Fair Value Measurement):
| | | | | | | | | | | | | | | | |
| | | | |
| | | Quoted
Prices in
Active
Markets
(Level 1) | | | Other
Significant
Observable
Inputs
(Level 2) | | | Significant
Unobservable
Inputs
(Level 3) | | | Total | |
Assets: | | | | | | | | | | | | | | | | |
Investments in Securities | | | | | | | | | | | | | | | | |
Common Stocks | | $ | 71,660,311 | | | $ | — | | | $ | — | | | $ | 71,660,311 | |
Investment of Cash Collateral for Securities Loaned | | | — | | | | 1,594,908 | | | | — | | | | 1,594,908 | |
Total Investments in Securities | | $ | 71,660,311 | | | $ | 1,594,908 | | | $ | — | | | $ | 73,255,219 | |
See Notes to Financial Statements.
Schedule of Investments
WisdomTree Europe SmallCap Dividend Fund (DFE)
March 31, 2022
| | | | | | | | |
| Investments | | Shares | | | Value | |
| | |
| COMMON STOCKS – 99.1% | | | | | | | | |
| | |
| Austria – 1.4% | | | | | | | | |
| | |
AT&S Austria Technologie & Systemtechnik AG | | | 16,103 | | | $ | 903,017 | |
| | |
POLYTEC Holding AG(a) | | | 44,994 | | | | 333,917 | |
| | |
S IMMO AG | | | 54,798 | | | | 1,350,508 | |
| | |
S&T AG(a) | | | 30,285 | | | | 571,832 | |
| | |
Semperit AG Holding(a) | | | 27,940 | | | | 707,239 | |
| | |
Zumtobel Group AG | | | 37,135 | | | | 302,863 | |
| | | | | | | | |
| Total Austria | | | | | | | 4,169,376 | |
| | |
| Belgium – 2.7% | | | | | | | | |
| | |
Befimmo SA | | | 45,324 | | | | 2,390,371 | |
| | |
Bekaert SA | | | 64,506 | | | | 2,546,492 | |
| | |
Deceuninck NV(a) | | | 96,842 | | | | 294,161 | |
| | |
Fagron | | | 33,755 | | | | 620,450 | |
| | |
Ion Beam Applications | | | 18,748 | | | | 363,798 | |
| | |
Recticel SA | | | 29,603 | | | | 711,456 | |
| | |
Xior Student Housing NV | | | 18,370 | | | | 1,034,233 | |
| | | | | | | | |
| Total Belgium | | | | | | | 7,960,961 | |
| | |
| Denmark – 5.2% | | | | | | | | |
| | |
Alm Brand A/S | | | 2,280,460 | | | | 3,943,267 | |
| | |
Cementir Holding NV | | | 123,155 | | | | 940,015 | |
| | |
Chemometec A/S | | | 3,752 | | | | 463,293 | |
| | |
D/S Norden A/S | | | 75,423 | | | | 2,667,025 | |
| | |
FLSmidth & Co. A/S | | | 16,109 | | | | 427,703 | |
| | |
Huscompagniet A/S | | | 18,235 | | | | 318,584 | |
| | |
Matas A/S | | | 22,046 | | | | 317,565 | |
| | |
Per Aarsleff Holding A/S | | | 15,501 | | | | 605,168 | |
| | |
Scandinavian Tobacco Group A/S, Class A(b) | | | 114,723 | | | | 2,467,660 | |
| | |
Spar Nord Bank A/S | | | 108,943 | | | | 1,448,695 | |
| | |
Sydbank A/S | | | 53,174 | | | | 1,835,739 | |
| | | | | | | | |
| Total Denmark | | | | | | | 15,434,714 | |
| | |
| Finland – 4.1% | | | | | | | | |
| | |
Aktia Bank Oyj | | | 83,795 | | | | 1,016,256 | |
| | |
Caverion Oyj | | | 73,462 | | | | 426,261 | |
| | |
Kamux Corp. | | | 23,994 | | | | 299,807 | |
| | |
Kemira Oyj(a) | | | 177,817 | | | | 2,348,457 | |
| | |
Lassila & Tikanoja Oyj(a) | | | 35,376 | | | | 425,887 | |
| | |
Musti Group Oyj | | | 12,632 | | | | 336,758 | |
| | |
Oma Saastopankki Oyj | | | 26,051 | | | | 523,191 | |
| | |
Revenio Group Oyj | | | 5,558 | | | | 295,724 | |
| | |
Rovio Entertainment Oyj(a)(b) | | | 59,736 | | | | 504,804 | |
| | |
Suominen Oyj(a) | | | 63,761 | | | | 251,496 | |
| | |
Talenom Oyj | | | 17,091 | | | | 186,930 | |
| | |
Terveystalo Oyj(a)(b) | | | 80,812 | | | | 1,010,650 | |
| | |
Tokmanni Group Corp. | | | 116,352 | | | | 1,948,359 | |
| | |
Uponor Oyj | | | 66,535 | | | | 1,358,454 | |
| | |
Verkkokauppa.com Oyj(a) | | | 64,034 | | | | 341,632 | |
| | |
YIT Oyj(a) | | | 224,769 | | | | 857,806 | |
| | | | | | | | |
| Total Finland | | | | | | | 12,132,472 | |
| | |
| France – 4.8% | | | | | | | | |
| | |
AKWEL | | | 18,677 | | | | 415,619 | |
| | |
Albioma SA | | | 25,871 | | | | 1,269,435 | |
| | |
Chargeurs SA | | | 50,082 | | | | 1,134,535 | |
| | |
Coface SA | | | 219,658 | | | | 2,671,320 | |
| | |
Fnac Darty SA | | | 15,897 | | | | 823,544 | |
| | |
Groupe SFPI | | | 87,424 | | | | 289,872 | |
| | |
IPSOS | | | 50,690 | | | | 2,549,291 | |
| | |
Kaufman & Broad SA | | | 23,362 | | | | 781,112 | |
| | |
Lectra | | | 9,562 | | | | 458,548 | |
| | |
Maisons du Monde SA(a)(b) | | | 22,614 | | | | 437,306 | |
| | |
Mersen SA | | | 15,462 | | | | 578,048 | |
| | |
Quadient SA | | | 28,518 | | | | 540,689 | |
| | |
Television Francaise 1 | | | 217,339 | | | | 2,130,454 | |
| | | | | | | | |
| Total France | | | | | | | 14,079,773 | |
| | |
| Germany – 7.7% | | | | | | | | |
| | |
Aareal Bank AG | | | 29,850 | | | | 946,559 | |
| | |
AURELIUS Equity Opportunities SE & Co. KGaA | | | 41,195 | | | | 1,154,141 | |
| | |
Bilfinger SE | | | 94,146 | | | | 3,620,214 | |
| | |
CANCOM SE | | | 17,239 | | | | 1,083,725 | |
| | |
CropEnergies AG | | | 94,269 | | | | 1,252,368 | |
| | |
Deutsche Pfandbriefbank AG(b) | | | 111,462 | | | | 1,371,022 | |
| | |
DIC Asset AG | | | 59,477 | | | | 958,906 | |
| | |
Eckert & Ziegler Strahlen – und Medizintechnik AG | | | 3,660 | | | | 237,008 | |
| | |
Encavis AG | | | 79,029 | | | | 1,671,580 | |
| | |
GFT Technologies SE | | | 7,923 | | | | 365,844 | |
| | |
GRENKE AG | | | 12,287 | | | | 345,880 | |
| | |
Hamborner REIT AG | | | 109,578 | | | | 1,167,769 | |
| | |
Hamburger Hafen und Logistik AG | | | 60,171 | | | | 1,081,231 | |
| | |
Hensoldt AG | | | 32,937 | | | | 971,155 | |
| | |
Hornbach Holding AG & Co. KGaA | | | 10,094 | | | | 1,281,468 | |
| | |
Instone Real Estate Group SE(b) | | | 26,654 | | | | 502,383 | |
| | |
Jenoptik AG | | | 15,463 | | | | 472,791 | |
| | |
JOST Werke AG(b) | | | 10,205 | | | | 414,443 | |
| | |
MLP SE | | | 44,877 | | | | 362,010 | |
| | |
Mutares SE & Co. KGaA | | | 28,345 | | | | 704,876 | |
| | |
NORMA Group SE | | | 20,248 | | | | 587,104 | |
| | |
PATRIZIA AG | | | 37,928 | | | | 719,942 | |
| | |
Wacker Neuson SE | | | 51,501 | | | | 1,164,389 | |
| | |
Wuestenrot & Wuerttembergische AG | | | 16,935 | | | | 344,068 | |
| | | | | | | | |
| Total Germany | | | | | | | 22,780,876 | |
| | |
| Ireland – 0.9% | | | | | | | | |
| | |
Hibernia REIT PLC | | | 784,094 | | | | 1,409,834 | |
| | |
Kenmare Resources PLC | | | 86,585 | | | | 526,690 | |
| | |
Origin Enterprises PLC | | | 101,719 | | | | 452,711 | |
| | |
Uniphar PLC | | | 67,558 | | | | 283,385 | |
| | | | | | | | |
| Total Ireland | | | | | | | 2,672,620 | |
| | |
| Italy – 10.9% | | | | | | | | |
| | |
Alerion Cleanpower SpA(a) | | | 23,339 | | | | 784,238 | |
| | |
Anima Holding SpA(b) | | | 758,343 | | | | 3,444,271 | |
| | |
Ascopiave SpA | | | 89,439 | | | | 342,827 | |
| | |
Avio SpA(a) | | | 26,993 | | | | 319,559 | |
| | |
Banca IFIS SpA | | | 55,271 | | | | 1,148,154 | |
| | |
Banca Popolare di Sondrio SPA(a) | | | 347,129 | | | | 1,436,015 | |
| | |
BFF Bank SpA(b) | | | 668,405 | | | | 5,008,826 | |
| | |
Cairo Communication SpA | | | 156,723 | | | | 391,478 | |
See Notes to Financial Statements.
Schedule of Investments (continued)
WisdomTree Europe SmallCap Dividend Fund (DFE)
March 31, 2022
| | | | | | | | |
| Investments | | Shares | | | Value | |
| | |
Credito Emiliano SpA | | | 292,777 | | | $ | 1,948,035 | |
| | |
Danieli & C. Officine Meccaniche SpA, RSP | | | 28,843 | | | | 462,769 | |
| | |
Datalogic SpA | | | 21,386 | | | | 236,167 | |
| | |
doValue SpA*(a)(b) | | | 80,300 | | | | 686,176 | |
| | |
El.En. SpA | | | 24,459 | | | | 393,519 | |
| | |
Emak SpA | | | 196,442 | | | | 307,748 | |
| | |
Esprinet SpA | | | 78,848 | | | | 843,965 | |
| | |
Falck Renewables SpA | | | 77,243 | | | | 758,030 | |
| | |
Gruppo MutuiOnline SpA | | | 17,592 | | | | 634,189 | |
| | |
GVS SpA(b) | | | 63,855 | | | | 585,438 | |
| | |
La Doria SpA | | | 48,983 | | | | 897,086 | |
| | |
Maire Tecnimont SpA(a) | | | 348,271 | | | | 1,214,437 | |
| | |
MARR SpA | | | 38,285 | | | | 639,393 | |
| | |
Piaggio & C. SpA | | | 634,340 | | | | 1,811,079 | |
| | |
RAI Way SpA(b) | | | 264,420 | | | | 1,668,154 | |
| | |
Salcef SpA | | | 60,904 | | | | 1,362,074 | |
| | |
Sanlorenzo SpA | | | 15,540 | | | | 635,429 | |
| | |
SOL SpA | | | 45,561 | | | | 836,442 | |
| | |
Technogym SpA(a)(b) | | | 146,522 | | | | 1,172,170 | |
| | |
Tinexta SpA | | | 9,952 | | | | 293,659 | |
| | |
Unieuro SpA(a)(b) | | | 78,600 | | | | 1,543,569 | |
| | |
Zignago Vetro SpA | | | 29,280 | | | | 387,031 | |
| | | | | | | | |
| Total Italy | | | | | | | 32,191,927 | |
| | |
| Netherlands – 6.5% | | | | | | | | |
| | |
AMG Advanced Metallurgical Group NV | | | 7,274 | | | | 316,776 | |
| | |
Brunel International NV | | | 38,422 | | | | 470,253 | |
| | |
Eurocommercial Properties NV | | | 41,871 | | | | 1,157,474 | |
| | |
Heijmans NV, CVA | | | 72,251 | | | | 1,194,597 | |
| | |
Ordina NV | | | 326,110 | | | | 1,690,864 | |
| | |
PostNL NV(a) | | | 2,535,974 | | | | 9,762,917 | |
| | |
RHI Magnesita NV | | | 60,569 | | | | 1,942,666 | |
| | |
TKH Group NV, CVA | | | 30,280 | | | | 1,704,767 | |
| | |
Wereldhave NV(a) | | | 52,045 | | | | 1,022,653 | |
| | | | | | | | |
| Total Netherlands | | | | | | | 19,262,967 | |
| | |
| Norway – 5.5% | | | | | | | | |
| | |
ABG Sundal Collier Holding ASA | | | 705,222 | | | | 687,156 | |
| | |
Atea ASA* | | | 93,843 | | | | 1,418,806 | |
| | |
Austevoll Seafood ASA | | | 145,858 | | | | 2,280,282 | |
| | |
Bonheur ASA | | | 17,026 | | | | 697,085 | |
| | |
Borregaard ASA | | | 59,262 | | | | 1,181,987 | |
| | |
Europris ASA(b) | | | 262,270 | | | | 1,694,677 | |
| | |
Kid ASA(b) | | | 52,564 | | | | 619,178 | |
| | |
Kitron ASA(a) | | | 317,076 | | | | 730,682 | |
| | |
Komplett Bank ASA*(a) | | | 377,110 | | | | 323,459 | |
| | |
Multiconsult ASA(b) | | | 33,946 | | | | 549,332 | |
| | |
Selvaag Bolig ASA | | | 62,120 | | | | 355,215 | |
| | |
SpareBank 1 Nord Norge | | | 63,201 | | | | 776,279 | |
| | |
SpareBank 1 SMN | | | 59,170 | | | | 955,490 | |
| | |
Sparebanken Vest | | | 42,737 | | | | 503,421 | |
| | |
TGS ASA | | | 226,832 | | | | 3,413,894 | |
| | | | | | | | |
| Total Norway | | | | | | | 16,186,943 | |
| | |
| Peru – 0.1% | | | | | | | | |
| | |
Hochschild Mining PLC | | | 274,571 | | | | 465,269 | |
|
| Portugal – 2.1% | |
| | |
Altri SGPS SA | | | 306,473 | | | | 2,066,444 | |
| | |
Corticeira Amorim SGPS SA | | | 32,483 | | | | 363,591 | |
| | |
CTT – Correios de Portugal SA(a) | | | 90,969 | | | | 456,487 | |
| | |
Sonae SGPS SA | | | 2,967,558 | | | | 3,440,532 | |
| | | | | | | | |
| Total Portugal | | | | | | | 6,327,054 | |
| | |
| Spain – 3.5% | | | | | | | | |
| | |
Aedas Homes SA(b) | | | 83,419 | | | | 2,134,772 | |
| | |
Applus Services SA | | | 91,485 | | | | 761,904 | |
| | |
Audax Renovables SA(a) | | | 251,016 | | | | 359,171 | |
| | |
ContourGlobal PLC(b) | | | 303,253 | | | | 763,420 | |
| | |
Faes Farma SA | | | 298,700 | | | | 1,222,378 | |
| | |
Linea Directa Aseguradora SA Cia de Seguros y Reaseguros(a) | | | 736,901 | | | | 1,143,779 | |
| | |
Neinor Homes SA*(b) | | | 105,055 | | | | 1,390,985 | |
| | |
Pharma Mar SA(a) | | | 5,254 | | | | 399,974 | |
| | |
Sacyr SA(a) | | | 851,547 | | | | 2,076,863 | |
| | | | | | | | |
| Total Spain | | | | | | | 10,253,246 | |
| | |
| Sweden – 12.5% | | | | | | | | |
| | |
AcadeMedia AB(b) | | | 104,478 | | | | 581,841 | |
| | |
Akelius Residential Property AB, Class D | | | 361,341 | | | | 742,981 | |
| | |
Alimak Group AB(b) | | | 32,412 | | | | 367,267 | |
| | |
Ambea AB(b) | | | 63,071 | | | | 324,038 | |
| | |
Beijer Alma AB(a) | | | 38,729 | | | | 905,951 | |
| | |
Bergman & Beving AB | | | 28,550 | | | | 433,179 | |
| | |
Bilia AB, Class A | | | 139,014 | | | | 2,006,286 | |
| | |
BioGaia AB, Class B | | | 4,384 | | | | 263,433 | |
| | |
Biotage AB | | | 11,918 | | | | 281,600 | |
| | |
Bonava AB, Class B | | | 118,175 | | | | 750,054 | |
| | |
Bufab AB | | | 13,935 | | | | 503,905 | |
| | |
Byggmax Group AB | | | 110,246 | | | | 824,532 | |
| | |
Catena AB | | | 28,799 | | | | 1,758,335 | |
| | |
Clas Ohlson AB, Class B | | | 139,468 | | | | 1,604,285 | |
| | |
Cloetta AB, Class B | | | 277,926 | | | | 767,626 | |
| | |
Coor Service Management Holding AB(b) | | | 122,628 | | | | 996,746 | |
| | |
Dios Fastigheter AB | | | 191,537 | | | | 2,104,576 | |
| | |
Dustin Group AB(b) | | | 81,036 | | | | 702,589 | |
| | |
Eolus Vind AB, Class B(a) | | | 10,867 | | | | 113,108 | |
| | |
Fagerhult AB | | | 63,759 | | | | 344,129 | |
| | |
Ferronordic AB | | | 18,496 | | | | 115,111 | |
| | |
G5 Entertainment AB(a) | | | 4,422 | | | | 99,169 | |
| | |
GARO AB | | | 7,107 | | | | 117,746 | |
| | |
Granges AB | | | 40,130 | | | | 399,173 | |
| | |
HMS Networks AB | | | 9,812 | | | | 465,363 | |
| | |
Instalco AB | | | 50,600 | | | | 384,628 | |
| | |
Inwido AB | | | 83,840 | | | | 1,343,146 | |
| | |
JM AB(a) | | | 82,371 | | | | 2,651,598 | |
| | |
Karnov Group AB | | | 63,966 | | | | 410,452 | |
| | |
KNOW IT AB | | | 14,777 | | | | 496,298 | |
| | |
Lagercrantz Group AB, Class B | | | 65,867 | | | | 754,834 | |
| | |
LeoVegas AB(a)(b) | | | 206,846 | | | | 841,198 | |
| | |
Lindab International AB | | | 52,898 | | | | 1,367,944 | |
| | |
Loomis AB | | | 65,725 | | | | 1,820,248 | |
See Notes to Financial Statements.
Schedule of Investments (continued)
WisdomTree Europe SmallCap Dividend Fund (DFE)
March 31, 2022
| | | | | | | | |
| Investments | | Shares | | | Value | |
| | |
Midsona AB, Class B | | | 67,080 | | | $ | 199,382 | |
| | |
MIPS AB | | | 4,847 | | | | 457,686 | |
| | |
Munters Group AB(b) | | | 66,267 | | | | 413,840 | |
| | |
Mycronic AB | | | 47,266 | | | | 892,634 | |
| | |
NCC AB, Class B | | | 109,139 | | | | 1,569,267 | |
| | |
Nobia AB | | | 203,499 | | | | 907,507 | |
| | |
Nordic Waterproofing Holding AB(a) | | | 28,573 | | | | 519,375 | |
| | |
Paradox Interactive AB(a) | | | 28,197 | | | | 543,705 | |
| | |
Platzer Fastigheter Holding AB, Class B | | | 58,480 | | | | 730,420 | |
| | |
Pricer AB, Class B(a) | | | 155,102 | | | | 325,536 | |
| | |
Ratos AB, Class B | | | 157,031 | | | | 822,949 | |
| | |
Rottneros AB | | | 271,575 | | | | 325,795 | |
| | |
Scandi Standard AB | | | 70,712 | | | | 270,498 | |
| | |
Troax Group AB | | | 17,185 | | | | 453,625 | |
| | |
Vitec Software Group AB, Class B | | | 5,699 | | | | 298,116 | |
| | |
Volati AB | | | 29,494 | | | | 481,682 | |
| | | | | | | | |
| Total Sweden | | | | | | | 36,855,386 | |
| | |
| Switzerland – 3.5% | | | | | | | | |
| | |
Arbonia AG | | | 80,280 | | | | 1,580,737 | |
| | |
Comet Holding AG, Registered Shares | | | 1,605 | | | | 468,288 | |
| | |
EFG International AG* | | | 87,034 | | | | 680,951 | |
| | |
Huber + Suhner AG, Registered Shares | | | 16,990 | | | | 1,600,688 | |
| | |
Landis + Gyr Group AG* | | | 34,699 | | | | 2,213,346 | |
| | |
Mobilezone Holding AG, Registered Shares | | | 100,342 | | | | 1,783,858 | |
| | |
Valiant Holding AG, Registered Shares | | | 15,547 | | | | 1,618,476 | |
| | |
Zehnder Group AG | | | 6,150 | | | | 535,974 | |
| | | | | | | | |
| Total Switzerland | | | | | | | 10,482,318 | |
| | |
| United Kingdom – 27.7% | | | | | | | | |
| | |
AJ Bell PLC | | | 190,838 | | | | 763,852 | |
| | |
Alliance Pharma PLC | | | 376,367 | | | | 569,875 | |
| | |
Anglo Asian Mining PLC | | | 149,366 | | | | 182,896 | |
| | |
Bloomsbury Publishing PLC | | | 81,858 | | | | 456,980 | |
| | |
Bodycote PLC | | | 120,731 | | | | 1,005,425 | |
| | |
Brewin Dolphin Holdings PLC | | | 339,210 | | | | 2,286,700 | |
| | |
CareTech Holdings PLC | | | 107,037 | | | | 975,238 | |
| | |
Central Asia Metals PLC | | | 413,854 | | | | 1,296,865 | |
| | |
Chemring Group PLC | | | 107,794 | | | | 461,972 | |
| | |
Chesnara PLC | | | 150,537 | | | | 601,551 | |
| | |
Clarkson PLC | | | 24,459 | | | | 1,191,546 | |
| | |
Clinigen Group PLC | | | 41,482 | | | | 504,664 | |
| | |
Clipper Logistics PLC | | | 40,301 | | | | 468,010 | |
| | |
CLS Holdings PLC | | | 264,114 | | | | 698,969 | |
| | |
Coats Group PLC | | | 859,752 | | | | 868,239 | |
| | |
Concentric AB | | | 18,300 | | | | 402,547 | |
| | |
Craneware PLC | | | 11,304 | | | | 248,553 | |
| | |
Currys PLC | | | 706,912 | | | | 846,057 | |
| | |
Devro PLC | | | 270,625 | | | | 744,706 | |
| | |
DiscoverIE Group PLC | | | 23,788 | | | | 246,805 | |
| | |
Diversified Energy Co. PLC | | | 3,139,650 | | | | 4,902,713 | |
| | |
Dole PLC | | | 1 | | | | 12 | |
| | |
Domino’s Pizza Group PLC | | | 373,072 | | | | 1,859,704 | |
| | |
Drax Group PLC | | | 521,236 | | | | 5,394,205 | |
| | |
EMIS Group PLC | | | 65,960 | | | | 1,158,529 | |
| | |
Essentra PLC | | | 145,217 | | | | 602,280 | |
| | |
Euromoney Institutional Investor PLC | | | 45,982 | | | | 598,157 | |
| | |
FDM Group Holdings PLC | | | 107,997 | | | | 1,510,104 | |
| | |
Ferrexpo PLC | | | 1,770,757 | | | | 4,348,188 | |
| | |
Forterra PLC(b) | | | 136,356 | | | | 417,415 | |
| | |
Galliford Try Holdings PLC | | | 117,780 | | | | 275,724 | |
| | |
Gamma Communications PLC | | | 16,786 | | | | 299,252 | |
| | |
Gateley Holdings PLC | | | 85,166 | | | | 225,389 | |
| | |
GB Group PLC | | | 37,021 | | | | 269,065 | |
| | |
Genuit Group PLC | | | 83,496 | | | | 540,331 | |
| | |
Halfords Group PLC | | | 91,808 | | | | 297,362 | |
| | |
Harworth Group PLC | | | 150,977 | | | | 353,835 | |
| | |
Headlam Group PLC | | | 59,208 | | | | 296,234 | |
| | |
Helical PLC | | | 82,556 | | | | 446,746 | |
| | |
Hill & Smith Holdings PLC | | | 49,320 | | | | 955,876 | |
| | |
Hilton Food Group PLC | | | 73,920 | | | | 1,206,852 | |
| | |
Hunting PLC | | | 154,116 | | | | 609,765 | |
| | |
Ibstock PLC(b) | | | 211,629 | | | | 488,737 | |
| | |
IG Design Group PLC(a) | | | 104,587 | | | | 92,262 | |
| | |
Impax Asset Management Group PLC | | | 48,409 | | | | 631,004 | |
| | |
IntegraFin Holdings PLC | | | 136,077 | | | | 754,288 | |
| | |
International Personal Finance PLC | | | 109,543 | | | | 148,845 | |
| | |
Jadestone Energy PLC(a) | | | 212,005 | | | | 260,714 | |
| | |
James Fisher & Sons PLC* | | | 24,367 | | | | 111,007 | |
| | |
James Halstead PLC(a) | | | 109,496 | | | | 333,028 | |
| | |
Jupiter Fund Management PLC | | | 951,991 | | | | 2,589,606 | |
| | |
Keller Group PLC | | | 62,030 | | | | 681,143 | |
| | |
Liontrust Asset Management PLC | | | 36,473 | | | | 611,803 | |
| | |
LSL Property Services PLC | | | 36,236 | | | | 185,115 | |
| | |
Luceco PLC(b) | | | 83,656 | | | | 224,697 | |
| | |
Marshalls PLC | | | 64,052 | | | | 574,315 | |
| | |
Mattioli Woods PLC | | | 56,256 | | | | 588,852 | |
| | |
MJ Gleeson PLC | | | 33,559 | | | | 260,694 | |
| | |
Moneysupermarket.com Group PLC | | | 714,823 | | | | 1,788,227 | |
| | |
Morgan Advanced Materials PLC | | | 143,406 | | | | 585,328 | |
| | |
Morgan Sindall Group PLC | | | 54,124 | | | | 1,720,987 | |
| | |
Mortgage Advice Bureau Holdings Ltd. | | | 33,318 | | | | 500,097 | |
| | |
NCC Group PLC | | | 153,641 | | | | 369,384 | |
| | |
Next Fifteen Communications Group PLC | | | 30,239 | | | | 533,510 | |
| | |
Norcros PLC | | | 81,742 | | | | 277,674 | |
| | |
Numis Corp. PLC | | | 94,189 | | | | 318,716 | |
| | |
Oxford Instruments PLC | | | 16,157 | | | | 448,863 | |
| | |
Pan African Resources PLC(a) | | | 2,646,890 | | | | 780,647 | |
| | |
Paragon Banking Group PLC | | | 252,975 | | | | 1,665,398 | |
| | |
PayPoint PLC | | | 110,706 | | | | 848,330 | |
| | |
Polar Capital Holdings PLC | | | 173,525 | | | | 1,418,810 | |
| | |
Premier Foods PLC | | | 206,764 | | | | 310,349 | |
| | |
Premier Miton Group PLC | | | 156,552 | | | | 311,248 | |
| | |
PZ Cussons PLC | | | 308,915 | | | | 795,570 | |
| | |
Reach PLC | | | 165,693 | | | | 399,669 | |
| | |
Record PLC | | | 191,989 | | | | 179,476 | |
| | |
Redde Northgate PLC | | | 374,918 | | | | 2,132,507 | |
| | |
Renew Holdings PLC | | | 59,171 | | | | 532,888 | |
| | |
Robert Walters PLC | | | 42,387 | | | | 390,662 | |
See Notes to Financial Statements.
Schedule of Investments (continued)
WisdomTree Europe SmallCap Dividend Fund (DFE)
March 31, 2022
| | | | | | | | |
| Investments | | Shares | | | Value | |
| | |
Sabre Insurance Group PLC(b) | | | 514,081 | | | $ | 1,570,327 | |
| | |
Serco Group PLC | | | 562,052 | | | | 1,066,378 | |
| | |
Serica Energy PLC | | | 162,540 | | | | 852,823 | |
| | |
Smart Metering Systems PLC | | | 95,944 | | | | 996,702 | |
| | |
Spirent Communications PLC | | | 251,342 | | | | 787,612 | |
| | |
SThree PLC | | | 83,665 | | | | 455,502 | |
| | |
TBC Bank Group PLC | | | 44,797 | | | | 648,802 | |
| | |
Telecom Plus PLC | | | 92,077 | | | | 1,854,868 | |
| | |
TI Fluid Systems PLC(b) | | | 377,031 | | | | 949,151 | |
| | |
TT Electronics PLC | | | 134,609 | | | | 364,214 | |
| | |
Tyman PLC | | | 162,778 | | | | 681,543 | |
| | |
UP Global Sourcing Holdings PLC(a) | | | 96,302 | | | | 166,737 | |
| | |
Vesuvius PLC | | | 293,959 | | | | 1,322,133 | |
| | |
Vitec Group PLC | | | 22,472 | | | | 399,435 | |
| | |
Volex PLC(a) | | | 54,877 | | | | 192,195 | |
| | |
Watkin Jones PLC | | | 291,799 | | | | 983,545 | |
| | |
Wincanton PLC | | | 135,598 | | | | 689,146 | |
| | |
Workspace Group PLC | | | 103,345 | | | | 932,074 | |
| | |
XPS Pensions Group PLC | | | 299,995 | | | | 489,786 | |
| | |
YouGov PLC | | | 17,765 | | | | 320,447 | |
| | | | | | | | |
| Total United Kingdom | | | | | | | 81,957,058 | |
TOTAL COMMON STOCKS
(Cost: $296,815,151) | | | | | | | 293,212,960 | |
| | |
| EXCHANGE-TRADED FUND – 0.4% | | | | | | | | |
| | |
| United States – 0.4% | | | | | | | | |
| |
WisdomTree International MidCap Dividend Fund(c) | | | | | |
| (Cost: $1,150,589) | | | 17,769 | | | | 1,141,154 | |
|
| INVESTMENT OF CASH COLLATERAL FOR SECURITIES LOANED – 4.6% | |
| | |
| United States – 4.6% | | | | | | | | |
| |
State Street Navigator Securities Lending
Government Money Market Portfolio, 0.25%(d) | | | | | |
| (Cost: $13,466,722) | | | 13,466,722 | | | | 13,466,722 | |
| |
TOTAL INVESTMENTS IN SECURITIES – 104.1%
(Cost: $311,432,462) | | | | 307,820,836 | |
| |
Other Assets less Liabilities – (4.1)% | | | | (12,015,144 | ) |
| | | | | | | | |
| NET ASSETS – 100.0% | | | $ | 295,805,692 | |
| * | Non-income producing security. |
| (a) | Security, or portion thereof, was on loan at March 31, 2022 (See Note 2). At March 31, 2022, the total market value of the Fund’s securities on loan identified in the Schedule of Investments was $25,439,370 and the total market value of the collateral held by the Fund was $27,414,325. The total market value of the collateral includes non-cash U.S. Government securities collateral having a value of $13,947,603. |
| (b) | This security is exempt from registration under rule 144A of the Securities Act of 1933. This security may be sold in transactions that are exempt from registration, normally to qualified institutional buyers. |
| (c) | Affiliated holding. See “Investment in Affiliates” supplementary table included in this Schedule of Investments for additional information. |
| (d) | Rate shown represents annualized 7-day yield as of March 31, 2022. |
Affiliated holdings are investments in entities in which the Fund owns 5% or more of the outstanding voting securities or are investments in entities which are under common ownership or control. Investments in affiliates during the fiscal year ended March 31, 2022 were as follows:
| | | | | | | | | | | | | | | | | | | | | | | | | | | | |
| Affiliate | | Value at
3/31/2021 | | | Purchases/
Additions | | | Sales/
Reductions | | | Realized
Gain/
(Loss) | | | Change in
Unrealized
Appreciation/
Depreciation | | | Value at
3/31/2022 | | | Dividend
Income | |
WisdomTree International MidCap Dividend Fund | | $ | 629,963 | | | $ | 4,752,320 | | | $ | 4,214,989 | | | $ | 18,320 | | | $ | (44,460 | ) | | $ | 1,141,154 | | | $ | 38,856 | |
| | | | | | | | | | | | | | | | | | | | | | | | | | | | |
|
| FINANCIAL DERIVATIVE INSTRUMENTS | |
|
| FOREIGN CURRENCY CONTRACTS (OTC – OVER THE COUNTER) | |
| | | | | |
| Counterparty | | Settlement
Date | | | Amount and
Description of
Currency to
be Purchased | | | Amount and
Description of
Currency to
be Sold | | | Unrealized
Appreciation | | | Unrealized
Depreciation | |
Bank of America NA | | | 4/4/2022 | | | | 29,759 | | | | USD | | | | 200,000 | | | | DKK | | | $ | — | | | $ | (157 | ) |
Bank of America NA | | | 4/4/2022 | | | | 265,611 | | | | USD | | | | 240,000 | | | | EUR | | | | — | | | | (1,426 | ) |
Bank of Montreal | | | 4/4/2022 | | | | 56,867 | | | | USD | | | | 500,000 | | | | NOK | | | | — | | | | (315 | ) |
Deutsche Bank AG | | | 4/1/2022 | | | | 50,000 | | | | SEK | | | | 4,049 | | | | GBP | | | | 34 | | | | — | |
JP Morgan Chase Bank NA | | | 4/4/2022 | | | | 952,438 | | | | USD | | | | 856,000 | | | | EUR | | | | 9 | | | | — | |
| | | | | | | | | | | | | | | | | | | | | | | $ | 43 | | | $ | (1,898 | ) |
See Notes to Financial Statements.
Schedule of Investments (concluded)
WisdomTree Europe SmallCap Dividend Fund (DFE)
March 31, 2022
The following is a summary of the fair valuations according to the inputs used as of March 31, 2022 in valuing the Fund’s investments (See Note 2 – Fair Value Measurement):
| | | | | | | | | | | | | | | | |
| | | | |
| | | Quoted
Prices in
Active
Markets
(Level 1) | | | Other
Significant
Observable
Inputs
(Level 2) | | | Significant
Unobservable
Inputs
(Level 3) | | | Total | |
Assets: | | | | | | | | | | | | | | | | |
Investments in Securities | | | | | | | | | | | | | | | | |
Common Stocks | | $ | 293,212,960 | | | $ | — | | | $ | — | | | $ | 293,212,960 | |
Exchange-Traded Fund | | | 1,141,154 | | | | — | | | | — | | | | 1,141,154 | |
Investment of Cash Collateral for Securities Loaned | | | — | | | | 13,466,722 | | | | — | | | | 13,466,722 | |
Total Investments in Securities | | $ | 294,354,114 | | | $ | 13,466,722 | | | $ | — | | | $ | 307,820,836 | |
Financial Derivative Instruments | | | | | | | | | | | | | | | | |
Foreign Currency Contracts1 | | $ | — | | | $ | 43 | | | $ | — | | | $ | 43 | |
Liabilities: | | | | | | | | | | | | | | | | |
Financial Derivative Instruments | | | | | | | | | | | | | | | | |
Foreign Currency Contracts1 | | $ | — | | | $ | (1,898 | ) | | $ | — | | | $ | (1,898 | ) |
Total – Net | | $ | 294,354,114 | | | $ | 13,464,867 | | | $ | — | | | $ | 307,818,981 | |
| 1 | Amount shown represents the unrealized appreciation (depreciation) on the financial instrument. |
See Notes to Financial Statements.
Schedule of Investments
WisdomTree International AI Enhanced Value Fund (AIVI)
March 31, 2022
| | | | | | | | |
| Investments | | Shares | | | Value | |
| | |
| COMMON STOCKS – 95.8% | | | | | | | | |
| | |
| Australia – 7.7% | | | | | | | | |
| | |
APA Group | | | 45,247 | | | $ | 362,548 | |
| | |
Aurizon Holdings Ltd. | | | 971,006 | | | | 2,690,662 | |
| | |
Insurance Australia Group Ltd. | | | 202,328 | | | | 665,489 | |
| | |
Lendlease Corp. Ltd.(a) | | | 43,285 | | | | 364,054 | |
| | |
Origin Energy Ltd. | | | 178,297 | | | | 834,148 | |
| | |
Sonic Healthcare Ltd. | | | 11,612 | | | | 309,387 | |
| | |
Suncorp Group Ltd. | | | 170,772 | | | | 1,426,042 | |
| | |
Tabcorp Holdings Ltd. | | | 302,056 | | | | 1,211,266 | |
| | |
Transurban Group | | | 147,265 | | | | 1,498,476 | |
| | | | | | | | |
| Total Australia | | | | | | | 9,362,072 | |
| | |
| Austria – 0.7% | | | | | | | | |
| | |
Raiffeisen Bank International AG | | | 59,503 | | | | 857,368 | |
| | |
| Belgium – 0.2% | | | | | | | | |
| | |
Groupe Bruxelles Lambert SA | | | 2,874 | | | | 300,973 | |
| | |
| Finland – 1.7% | | | | | | | | |
| | |
Sampo Oyj, Class A | | | 41,639 | | | | 2,056,109 | |
| | |
| France – 6.4% | | | | | | | | |
| | |
AXA SA(a) | | | 35,112 | | | | 1,037,825 | |
| | |
Cie de Saint-Gobain | | | 12,814 | | | | 773,755 | |
| | |
Faurecia SE(a) | | | 8,918 | | | | 234,670 | |
| | |
Orange SA | | | 24,322 | | | | 289,670 | |
| | |
Publicis Groupe SA | | | 50,337 | | | | 3,094,973 | |
| | |
Renault SA* | | | 68,507 | | | | 1,819,856 | |
| | |
Valeo | | | 27,244 | | | | 507,895 | |
| | | | | | | | |
| Total France | | | | | | | 7,758,644 | |
| | |
| Germany – 10.3% | | | | | | | | |
| | |
Allianz SE, Registered Shares | | | 18,163 | | | | 4,376,273 | |
| | |
Aroundtown SA | | | 435,815 | | | | 2,518,621 | |
| | |
Beiersdorf AG | | | 3,038 | | | | 321,798 | |
| | |
Continental AG* | | | 16,039 | | | | 1,167,115 | |
| | |
Deutsche Post AG, Registered Shares | | | 6,481 | | | | 314,043 | |
| | |
Fresenius SE & Co. KGaA | | | 41,949 | | | | 1,556,363 | |
| | |
HeidelbergCement AG | | | 29,492 | | | | 1,695,186 | |
| | |
LEG Immobilien SE | | | 2,372 | | | | 272,498 | |
| | |
Telefonica Deutschland Holding AG | | | 116,221 | | | | 319,275 | |
| | | | | | | | |
| Total Germany | | | | | | | 12,541,172 | |
| | |
| Hong Kong – 6.5% | | | | | | | | |
| | |
CK Infrastructure Holdings Ltd. | | | 53,000 | | | | 354,962 | |
| | |
Hang Lung Properties Ltd. | | | 380,000 | | | | 766,657 | |
| | |
Henderson Land Development Co. Ltd. | | | 150,000 | | | | 624,409 | |
| | |
HK Electric Investments & HK Electric Investments Ltd. | | | 1,443,500 | | | | 1,410,064 | |
| | |
Hongkong Land Holdings Ltd. | | | 60,400 | | | | 295,960 | |
| | |
MTR Corp. Ltd. | | | 142,500 | | | | 770,600 | |
| | |
New World Development Co. Ltd. | | | 87,000 | | | | 353,826 | |
| | |
Power Assets Holdings Ltd. | | | 51,500 | | | | 335,709 | |
| | |
Sino Land Co. Ltd. | | | 368,000 | | | | 477,422 | |
| | |
Sun Hung Kai Properties Ltd. | | | 62,500 | | | | 746,993 | |
| | |
Swire Pacific Ltd., Class A | | | 215,000 | | | | 1,315,027 | |
| | |
Swire Properties Ltd. | | | 160,000 | | | | 397,579 | |
| | | | | | | | |
| Total Hong Kong | | | | | | | 7,849,208 | |
| | |
| Israel – 0.8% | | | | | | | | |
| | |
Check Point Software Technologies Ltd.* | | | 2,671 | | | | 369,293 | |
| | |
Teva Pharmaceutical Industries Ltd., ADR* | | | 59,816 | | | | 561,672 | |
| | | | | | | | |
| Total Israel | | | | | | | 930,965 | |
| | |
| Italy – 0.3% | | | | | | | | |
| | |
Terna – Rete Elettrica Nazionale | | | 35,111 | | | | 304,170 | |
| | |
| Japan – 19.5% | | | | | | | | |
| | |
Asahi Group Holdings Ltd. | | | 28,800 | | | | 1,058,511 | |
| | |
Hino Motors Ltd.(a) | | | 127,300 | | | | 755,147 | |
| | |
Hoshizaki Corp. | | | 4,000 | | | | 277,158 | |
| | |
Hulic Co. Ltd. | | | 33,700 | | | | 305,695 | |
| | |
Japan Post Insurance Co. Ltd. | | | 34,600 | | | | 608,903 | |
| | |
Kao Corp. | | | 6,200 | | | | 256,684 | |
| | |
Keio Corp.(a) | | | 12,800 | | | | 504,618 | |
| | |
Keisei Electric Railway Co. Ltd. | | | 12,300 | | | | 346,072 | |
| | |
Kirin Holdings Co. Ltd. | | | 37,700 | | | | 568,101 | |
| | |
Komatsu Ltd. | | | 79,400 | | | | 1,925,225 | |
| | |
Lixil Corp. | | | 45,400 | | | | 856,568 | |
| | |
Mitsubishi Electric Corp. | | | 91,500 | | | | 1,062,945 | |
| | |
Mitsubishi Gas Chemical Co., Inc. | | | 88,100 | | | | 1,510,493 | |
| | |
Mitsubishi HC Capital, Inc. | | | 279,600 | | | | 1,313,055 | |
| | |
Mitsubishi Heavy Industries Ltd. | | | 16,800 | | | | 556,424 | |
| | |
Mitsui & Co. Ltd. | | | 16,000 | | | | 438,706 | |
| | |
Nisshin Seifun Group, Inc. | | | 22,300 | | | | 313,440 | |
| | |
Nomura Real Estate Holdings, Inc. | | | 36,800 | | | | 889,264 | |
| | |
Otsuka Corp. | | | 17,300 | | | | 619,308 | |
| | |
Otsuka Holdings Co. Ltd. | | | 18,700 | | | | 652,016 | |
| | |
Rinnai Corp. | | | 3,500 | | | | 264,428 | |
| | |
Santen Pharmaceutical Co. Ltd. | | | 36,300 | | | | 366,963 | |
| | |
Secom Co. Ltd. | | | 4,400 | | | | 321,476 | |
| | |
Shimizu Corp.(a) | | | 48,800 | | | | 295,514 | |
| | |
SoftBank Corp. | | | 24,800 | | | | 291,777 | |
| | |
Sompo Holdings, Inc. | | | 13,500 | | | | 598,505 | |
| | |
Sumitomo Corp. | | | 75,400 | | | | 1,316,355 | |
| | |
Sumitomo Dainippon Pharma Co. Ltd.(a) | | | 28,000 | | | | 278,674 | |
| | |
Sumitomo Mitsui Trust Holdings, Inc. | | | 9,000 | | | | 296,676 | |
| | |
Sumitomo Realty & Development Co. Ltd. | | | 18,600 | | | | 519,344 | |
| | |
Taisei Corp. | | | 10,000 | | | | 291,246 | |
| | |
Taisho Pharmaceutical Holdings Co. Ltd. | | | 13,000 | | | | 608,363 | |
| | |
Takeda Pharmaceutical Co. Ltd. | | | 61,600 | | | | 1,775,298 | |
| | |
Tosoh Corp. | | | 109,600 | | | | 1,638,018 | |
| | | | | | | | |
| Total Japan | | | | | | | 23,680,970 | |
| | |
| Netherlands – 1.0% | | | | | | | | |
| | |
Koninklijke Philips NV | | | 9,288 | | | | 286,570 | |
| | |
NN Group NV | | | 13,000 | | | | 663,340 | |
| | |
Wolters Kluwer NV | | | 2,819 | | | | 302,929 | |
| | | | | | | | |
| Total Netherlands | | | | | | | 1,252,839 | |
| | |
| New Zealand – 0.3% | | | | | | | | |
| | |
Spark New Zealand Ltd. | | | 103,857 | | | | 330,849 | |
| | |
| Norway – 1.1% | | | | | | | | |
| | |
DNB Bank ASA | | | 14,469 | | | | 331,112 | |
| | |
Gjensidige Forsikring ASA | | | 29,782 | | | | 744,891 | |
See Notes to Financial Statements.
Schedule of Investments (continued)
WisdomTree International AI Enhanced Value Fund (AIVI)
March 31, 2022
| | | | | | | | |
| Investments | | Shares | | | Value | |
| | |
Norsk Hydro ASA | | | 29,781 | | | $ | 293,246 | |
| | | | | | | | |
| Total Norway | | | | | | | 1,369,249 | |
| | |
| Singapore – 1.8% | | | | | | | | |
| | |
City Developments Ltd. | | | 262,400 | | | | 1,525,908 | |
| | |
UOL Group Ltd. | | | 117,100 | | | | 609,143 | |
| | | | | | | | |
| Total Singapore | | | | | | | 2,135,051 | |
| | |
| Spain – 6.1% | | | | | | | | |
| | |
ACS Actividades de Construccion y Servicios SA(a) | | | 16,549 | | | | 451,125 | |
| | |
Enagas SA(a) | | | 192,501 | | | | 4,315,854 | |
| | |
Red Electrica Corp. SA | | | 81,518 | | | | 1,687,946 | |
| | |
Repsol SA | | | 70,522 | | | | 935,632 | |
| | | | | | | | |
| Total Spain | | | | | | | 7,390,557 | |
| | |
| Sweden – 6.8% | | | | | | | | |
| | |
Essity AB, Class B(a) | | | 12,059 | | | | 287,519 | |
| | |
Industrivarden AB, Class C | | | 131,393 | | | | 3,720,691 | |
| | |
Securitas AB, Class B | | | 38,465 | | | | 439,363 | |
| | |
Svenska Handelsbanken AB, Class A | | | 180,759 | | | | 1,685,512 | |
| | |
Swedbank AB, Class A(a) | | | 18,651 | | | | 282,185 | |
| | |
Tele2 AB, Class B | | | 124,836 | | | | 1,906,149 | |
| | | | | | | | |
| Total Sweden | | | | | | | 8,321,419 | |
| | |
| Switzerland – 8.2% | | | | | | | | |
| | |
Baloise Holding AG, Registered Shares | | | 1,929 | | | | 346,078 | |
| | |
Geberit AG, Registered Shares | | | 1,380 | | | | 858,067 | |
| | |
Holcim Ltd., Registered Shares* | | | 39,528 | | | | 1,945,366 | |
| | |
Novartis AG, Registered Shares | | | 42,137 | | | | 3,720,327 | |
| | |
Swiss Prime Site AG, Registered Shares | | | 3,351 | | | | 332,278 | |
| | |
Swiss Re AG(a) | | | 29,513 | | | | 2,826,064 | |
| | | | | | | | |
| Total Switzerland | | | | | | | 10,028,180 | |
| | |
| United Kingdom – 16.4% | | | | | | | | |
| | |
Anglo American PLC | | | 16,544 | | | | 865,316 | |
| | |
Barratt Developments PLC | | | 83,364 | | | | 573,393 | |
| | |
British American Tobacco PLC | | | 42,576 | | | | 1,790,764 | |
| | |
CK Hutchison Holdings Ltd. | | | 83,500 | | | | 613,610 | |
| | |
GlaxoSmithKline PLC | | | 93,740 | | | | 2,033,021 | |
| | |
Imperial Brands PLC | | | 80,789 | | | | 1,713,103 | |
| | |
J. Sainsbury PLC | | | 137,551 | | | | 457,656 | |
| | |
Johnson Matthey PLC | | | 24,538 | | | | 606,905 | |
| | |
M&G PLC | | | 1,294,848 | | | | 3,771,155 | |
| | |
Pearson PLC | | | 39,803 | | | | 393,364 | |
| | |
Phoenix Group Holdings PLC | | | 190,355 | | | | 1,538,874 | |
| | |
Prudential PLC | | | 100,952 | | | | 1,507,296 | |
| | |
Schroders PLC | | | 45,273 | | | | 1,925,958 | |
| | |
Shell PLC | | | 57,240 | | | | 1,589,073 | |
| | |
United Utilities Group PLC | | | 20,123 | | | | 297,936 | |
| | |
Whitbread PLC* | | | 8,108 | | | | 304,996 | |
| | | | | | | | |
| Total United Kingdom | | | | | | | 19,982,420 | |
TOTAL COMMON STOCKS
(Cost: $124,027,795) | | | | | | | 116,452,215 | |
| | |
| PREFERRED STOCK – 2.9% | | | | | | | | |
| | |
| Germany – 2.9% | | | | | | | | |
Henkel AG & Co. KGaA
(Cost: $5,000,124) | | | 53,066 | | | | 3,582,784 | |
| | |
| EXCHANGE-TRADED FUND – 0.1% | | | | | | | | |
| | |
| United States – 0.1% | | | | | | | | |
iShares MSCI EAFE Value ETF(a)
(Cost: $113,044) | | | 2,366 | | | | 118,915 | |
|
| INVESTMENT OF CASH COLLATERAL FOR SECURITIES LOANED – 2.4% | |
| | |
| United States – 2.4% | | | | | | | | |
| | |
State Street Navigator Securities Lending Government Money Market Portfolio, 0.25%(b) | | | | | | | | |
| (Cost: $2,906,969) | | | 2,906,969 | | | | 2,906,969 | |
| |
TOTAL INVESTMENTS IN SECURITIES – 101.2%
(Cost: $132,047,932) | | | | 123,060,883 | |
| |
Other Assets less Liabilities – (1.2)% | | | | (1,479,044 | ) |
| | | | | | | | |
| NET ASSETS – 100.0% | | | $ | 121,581,839 | |
| * | Non-income producing security. |
| (a) | Security, or portion thereof, was on loan at March 31, 2022 (See Note 2). At March 31, 2022, the total market value of the Fund’s securities on loan identified in the Schedule of Investments was $7,864,166. The Fund also had securities on loan having a total market value of $205,764 that were sold and pending settlement. The total market value of the collateral held by the Fund was $8,641,140. The total market value of the collateral includes non-cash U.S. Government securities collateral having a value of $5,734,171. |
| (b) | Rate shown represents annualized 7-day yield as of March 31, 2022. |
Affiliated holdings are investments in entities in which the Fund owns 5% or more of the outstanding voting securities or are investments in entities which are under common ownership or control. Investments in affiliates during the fiscal year ended March 31, 2022 were as follows:
| | | | | | | | | | | | | | | | | | | | | | | | | | | | |
| Affiliate | | Value at
3/31/2021 | | | Purchases/
Additions | | | Sales/
Reductions | | | Realized
Gain/
(Loss) | | | Change in
Unrealized
Appreciation/
Depreciation | | | Value at
3/31/2022 | | | Dividend
Income | |
WisdomTree International LargeCap Dividend Fund^ | | $ | 249,429 | | | $ | 1,976,681 | | | $ | 2,219,326 | | | $ | 42,685 | | | $ | (49,469 | ) | | $ | — | | | $ | 25,790 | |
| ^ | As of March 31, 2022, the Fund did not hold a position in this affiliate. |
See Notes to Financial Statements.
Schedule of Investments (concluded)
WisdomTree International AI Enhanced Value Fund (AIVI)
March 31, 2022
| | | | | | | | | | | | | | | | | | | | | | | | | | | | |
|
| FINANCIAL DERIVATIVE INSTRUMENTS | |
|
| FOREIGN CURRENCY CONTRACTS (OTC – OVER THE COUNTER) | |
| | | | | |
| Counterparty | | Settlement
Date | | | Amount and
Description of
Currency to
be Purchased | | | Amount and
Description of
Currency to
be Sold | | | Unrealized
Appreciation | | | Unrealized
Depreciation | |
Brown Brothers, Harriman | | | 4/4/2022 | | | | 3,324 | | | | USD | | | | 3,000 | | | | EUR | | | $ | — | | | $ | (14 | ) |
Brown Brothers, Harriman | | | 4/4/2022 | | | | 9,958 | | | | USD | | | | 78,000 | | | | HKD | | | | — | | | | (2 | ) |
Brown Brothers, Harriman | | | 4/4/2022 | | | | 5,362 | | | | USD | | | | 47,000 | | | | NOK | | | | — | | | | (13 | ) |
Brown Brothers, Harriman | | | 4/4/2022 | | | | 82,147 | | | | USD | | | | 769,000 | | | | SEK | | | | — | | | | (369 | ) |
State Street Bank and Trust | | | 4/4/2022 | | | | 135,670 | | | | USD | | | | 181,000 | | | | AUD | | | | — | | | | (252 | ) |
| | | | | | | | | | | | | | | | | | | | | | | $ | — | | | $ | (650 | ) |
The following is a summary of the fair valuations according to the inputs used as of March 31, 2022 in valuing the Fund’s investments (See Note 2 — Fair Value Measurement):
| | | | | | | | | | | | | | | | |
| | | | |
| | | Quoted
Prices in
Active
Markets
(Level 1) | | | Other
Significant
Observable
Inputs
(Level 2) | | | Significant
Unobservable
Inputs
(Level 3) | | | Total | |
Assets: | | | | | | | | | | | | | | | | |
Investments in Securities | | | | | | | | | | | | | | | | |
Common Stocks | | $ | 116,452,215 | | | $ | — | | | $ | — | | | $ | 116,452,215 | |
Preferred Stock | | | 3,582,784 | | | | — | | | | — | | | | 3,582,784 | |
Exchange-Traded Fund | | | 118,915 | | | | — | | | | — | | | | 118,915 | |
Investment of Cash Collateral for Securities Loaned | | | — | | | | 2,906,969 | | | | — | | | | 2,906,969 | |
Total Investments in Securities | | $ | 120,153,914 | | | $ | 2,906,969 | | | $ | — | | | $ | 123,060,883 | |
Liabilities: | | | | | | | | | | | | | | | | |
Financial Derivative Instruments | | | | | | | | | | | | | | | | |
Foreign Currency Contracts1 | | $ | — | | | $ | (650 | ) | | $ | — | | | $ | (650 | ) |
Total – Net | | $ | 120,153,914 | | | $ | 2,906,319 | | | $ | — | | | $ | 123,060,233 | |
| 1 | Amount shown represents the unrealized appreciation (depreciation) on the financial instrument. |
See Notes to Financial Statements.
Schedule of Investments
WisdomTree International Equity Fund (DWM)
March 31, 2022
| | | | | | | | |
| Investments | | Shares | | | Value | |
| | |
| COMMON STOCKS – 99.1% | | | | | | | | |
| | |
| Australia – 11.5% | | | | | | | | |
| | |
Adairs Ltd.(a) | | | 46,243 | | | $ | 104,179 | |
| | |
Alumina Ltd. | | | 190,653 | | | | 287,773 | |
| | |
Ampol Ltd. | | | 10,953 | | | | 252,019 | |
| | |
APA Group(a) | | | 63,457 | | | | 508,458 | |
| | |
ASX Ltd.(a) | | | 9,933 | | | | 610,161 | |
| | |
Atlas Arteria Ltd. | | | 60,822 | | | | 299,166 | |
| | |
AUB Group Ltd.(a) | | | 4,621 | | | | 79,189 | |
| | |
Aurizon Holdings Ltd. | | | 108,310 | | | | 300,127 | |
| | |
Austal Ltd. | | | 180,978 | | | | 256,861 | |
| | |
Australia & New Zealand Banking Group Ltd. | | | 118,563 | | | | 2,457,362 | |
| | |
Australian Finance Group Ltd. | | | 136,599 | | | | 220,545 | |
| | |
Autosports Group Ltd.(a) | | | 123,865 | | | | 185,103 | |
| | |
Bank of Queensland Ltd.(a) | | | 51,066 | | | | 332,861 | |
| | |
Bapcor Ltd. | | | 22,638 | | | | 108,800 | |
| | |
Bell Financial Group Ltd.(a) | | | 227,771 | | | | 221,503 | |
| | |
Bendigo & Adelaide Bank Ltd.(a) | | | 71,227 | | | | 550,390 | |
| | |
BHP Group Ltd. | | | 559,992 | | | | 21,762,213 | |
| | |
Brambles Ltd. | | | 33,015 | | | | 245,695 | |
| | |
Brickworks Ltd. | | | 10,277 | | | | 187,999 | |
| | |
carsales.com Ltd. | | | 20,906 | | | | 328,431 | |
| | |
Charter Hall Group | | | 27,259 | | | | 337,962 | |
| | |
Coles Group Ltd. | | | 52,644 | | | | 708,036 | |
| | |
Commonwealth Bank of Australia | | | 85,653 | | | | 6,803,243 | |
| | |
Costa Group Holdings Ltd. | | | 87,857 | | | | 209,804 | |
| | |
Cromwell Property Group | | | 532,493 | | | | 331,897 | |
| | |
CSL Ltd. | | | 5,212 | | | | 1,049,526 | |
| | |
Dexus | | | 76,533 | | | | 629,323 | |
| | |
Dusk Group Ltd.(a) | | | 64,821 | | | | 125,587 | |
| | |
Elders Ltd. | | | 23,937 | | | | 238,894 | |
| | |
Fortescue Metals Group Ltd. | | | 382,756 | | | | 5,938,315 | |
| | |
Goodman Group | | | 53,931 | | | | 927,033 | |
| | |
GPT Group | | | 94,030 | | | | 365,769 | |
| | |
Growthpoint Properties Australia Ltd. | | | 99,148 | | | | 326,858 | |
| | |
GUD Holdings Ltd.(a) | | | 37,522 | | | | 326,855 | |
| | |
Harvey Norman Holdings Ltd.(a) | | | 130,824 | | | | 525,596 | |
| | |
Healius Ltd. | | | 32,806 | | | | 108,397 | |
| | |
Inghams Group Ltd.(a) | | | 70,006 | | | | 160,867 | |
| | |
Insurance Australia Group Ltd.(a) | | | 88,705 | | | | 291,765 | |
| | |
IVE Group Ltd. | | | 97,048 | | | | 155,231 | |
| | |
JB Hi-Fi Ltd.(a) | | | 11,368 | | | | 462,865 | |
| | |
Latitude Group Holdings Ltd. | | | 172,072 | | | | 235,176 | |
| | |
Lendlease Corp. Ltd.(a) | | | 22,559 | | | | 189,736 | |
| | |
Liberty Financial Group Ltd. | | | 63,870 | | | | 249,408 | |
| | |
MA Financial Group Ltd.(a) | | | 8,774 | | | | 53,040 | |
| | |
Macquarie Group Ltd. | | | 10,540 | | | | 1,608,884 | |
| | |
Magellan Financial Group Ltd.(a) | | | 16,481 | | | | 197,280 | |
| | |
Medibank Pvt Ltd. | | | 153,090 | | | | 354,086 | |
| | |
Metcash Ltd.(a) | | | 74,433 | | | | 253,765 | |
| | |
Mineral Resources Ltd. | | | 18,648 | | | | 738,136 | |
| | |
Mirvac Group | | | 223,585 | | | | 418,074 | |
| | |
Monadelphous Group Ltd.(a) | | | 22,744 | | | | 187,022 | |
| | |
National Australia Bank Ltd. | | | 142,729 | | | | 3,467,348 | |
| | |
Navigator Global Investments Ltd. | | | 182,256 | | | | 223,090 | |
| | |
Newcrest Mining Ltd. | | | 9,493 | | | | 190,623 | |
| | |
Nine Entertainment Co. Holdings Ltd. | | | 113,892 | | | | 254,016 | |
| | |
NRW Holdings Ltd. | | | 128,422 | | | | 207,343 | |
| | |
OZ Minerals Ltd. | | | 20,061 | | | | 401,778 | |
| | |
Pendal Group Ltd. | | | 47,169 | | | | 164,710 | |
| | |
QBE Insurance Group Ltd. | | | 45,435 | | | | 392,373 | |
| | |
Qube Holdings Ltd. | | | 90,878 | | | | 213,606 | |
| | |
Resimac Group Ltd.(a) | | | 117,408 | | | | 154,293 | |
| | |
Sandfire Resources Ltd. | | | 35,343 | | | | 150,752 | |
| | |
Santos Ltd. | | | 40,904 | | | | 237,748 | |
| | |
Scentre Group | | | 163,615 | | | | 374,743 | |
| | |
Seven Group Holdings Ltd. | | | 15,671 | | | | 249,602 | |
| | |
SG Fleet Group Ltd. | | | 85,319 | | | | 153,128 | |
| | |
Sims Ltd. | | | 13,017 | | | | 210,751 | |
| | |
SmartGroup Corp. Ltd. | | | 30,033 | | | | 192,830 | |
| | |
Sonic Healthcare Ltd. | | | 15,786 | | | | 420,597 | |
| | |
Stockland | | | 174,587 | | | | 559,823 | |
| | |
Suncorp Group Ltd. | | | 81,081 | | | | 677,072 | |
| | |
Tabcorp Holdings Ltd. | | | 89,003 | | | | 356,908 | |
| | |
Telstra Corp. Ltd. | | | 773,819 | | | | 2,301,153 | |
| | |
Transurban Group | | | 52,192 | | | | 531,073 | |
| | |
Vicinity Centres | | | 261,671 | | | | 366,476 | |
| | |
Viva Energy Group Ltd.(b) | | | 48,639 | | | | 85,835 | |
| | |
Washington H Soul Pattinson & Co. Ltd. | | | 11,850 | | | | 254,682 | |
| | |
Wesfarmers Ltd. | | | 54,896 | | | | 2,078,109 | |
| | |
Westpac Banking Corp. | | | 121,322 | | | | 2,208,427 | |
| | |
Woodside Petroleum Ltd. | | | 17,625 | | | | 424,859 | |
| | |
Woolworths Group Ltd. | | | 43,238 | | | | 1,209,816 | |
| | |
Worley Ltd. | | | 44,650 | | | | 432,871 | |
| | | | | | | | |
| Total Australia | | | | | | | 72,953,700 | |
| | |
| Austria – 0.6% | | | | | | | | |
| | |
Andritz AG | | | 5,332 | | | | 249,053 | |
| | |
BAWAG Group AG*(b) | | | 9,573 | | | | 489,538 | |
| | |
Oesterreichische Post AG(a) | | | 9,129 | | | | 327,068 | |
| | |
OMV AG | | | 21,649 | | | | 1,045,168 | |
| | |
Semperit AG Holding | | | 3,354 | | | | 84,899 | |
| | |
Strabag SE, Bearer Shares | | | 16,554 | | | | 667,682 | |
| | |
Telekom Austria AG*(a) | | | 67,566 | | | | 526,241 | |
| | |
Vienna Insurance Group AG Wiener Versicherung Gruppe | | | 6,472 | | | | 168,865 | |
| | |
Voestalpine AG | | | 5,887 | | | | 176,986 | |
| | |
Wienerberger AG | | | 1,719 | | | | 52,407 | |
| | | | | | | | |
| Total Austria | | | | | | | 3,787,907 | |
| | |
| Belgium – 0.7% | | | | | | | | |
| | |
Ackermans & van Haaren NV | | | 673 | | | | 126,699 | |
| | |
Aedifica SA | | | 2,351 | | | | 298,206 | |
| | |
Anheuser-Busch InBev SA/NV | | | 18,544 | | | | 1,119,546 | |
| | |
Befimmo SA | | | 8,892 | | | | 468,961 | |
| | |
Cofinimmo SA | | | 2,051 | | | | 301,230 | |
| | |
KBC Group NV | | | 1,471 | | | | 107,008 | |
| | |
Proximus SADP | | | 18,806 | | | | 352,578 | |
| | |
Solvay SA(a) | | | 3,662 | | | | 364,507 | |
See Notes to Financial Statements.
Schedule of Investments (continued)
WisdomTree International Equity Fund (DWM)
March 31, 2022
| | | | | | | | |
| Investments | | Shares | | | Value | |
| | |
Telenet Group Holding NV | | | 19,014 | | | $ | 618,176 | |
| | |
UCB SA | | | 3,860 | | | | 465,774 | |
| | |
Warehouses De Pauw CVA | | | 9,978 | | | | 434,089 | |
| | | | | | | | |
| Total Belgium | | | | | | | 4,656,774 | |
| | |
| China – 1.6% | | | | | | | | |
| | |
Beijing Enterprises Holdings Ltd. | | | 67,000 | | | | 212,599 | |
| | |
Beijing Tong Ren Tang Chinese Medicine Co. Ltd.(a) | | | 97,000 | | | | 134,512 | |
| | |
BOC Hong Kong Holdings Ltd. | | | 527,444 | | | | 2,000,292 | |
| | |
China Everbright Environment Group Ltd. | | | 186,000 | | | | 112,578 | |
| | |
China Merchants Port Holdings Co. Ltd. | | | 218,000 | | | | 395,281 | |
| | |
China Power International Development Ltd. | | | 961,000 | | | | 511,705 | |
| | |
China Resources Pharmaceutical Group Ltd.(b) | | | 442,000 | | | | 230,273 | |
| | |
China Resources Power Holdings Co. Ltd. | | | 286,000 | | | | 538,300 | |
| | |
China South City Holdings Ltd.(a) | | | 2,658,000 | | | | 234,188 | |
| | |
China Taiping Insurance Holdings Co. Ltd. | | | 122,400 | | | | 149,886 | |
| | |
CITIC Ltd. | | | 1,921,000 | | | | 2,136,516 | |
| | |
CSPC Pharmaceutical Group Ltd. | | | 331,280 | | | | 382,829 | |
| | |
Guangdong Investment Ltd. | | | 218,000 | | | | 298,409 | |
| | |
Lenovo Group Ltd.(a) | | | 737,003 | | | | 801,806 | |
| | |
MECOM Power and Construction Ltd.(a) | | | 74,000 | | | | 34,017 | |
| | |
Poly Property Group Co. Ltd.(a) | | | 1,350,000 | | | | 341,318 | |
| | |
Shoucheng Holdings Ltd.(a) | | | 644,000 | | | | 95,390 | |
| | |
Shougang Fushan Resources Group Ltd. | | | 851,238 | | | | 334,782 | |
| | |
Sino-Ocean Group Holding Ltd. | | | 700,500 | | | | 149,377 | |
| | |
Wharf Holdings Ltd. | | | 28,000 | | | | 85,451 | |
| | |
Wilmar International Ltd. | | | 240,700 | | | | 837,697 | |
| | | | | | | | |
| Total China | | | | | | | 10,017,206 | |
| | |
| Denmark – 1.5% | | | | | | | | |
| | |
Alm Brand A/S | | | 70,269 | | | | 121,506 | |
| | |
Alten SA | | | 818 | | | | 125,145 | |
| | |
AP Moller – Maersk A/S, Class B | | | 200 | | | | 609,392 | |
| | |
Carlsberg A/S, Class B | | | 2,288 | | | | 284,060 | |
| | |
Coloplast A/S, Class B | | | 5,215 | | | | 799,175 | |
| | |
Danske Bank A/S | | | 10,325 | | | | 173,902 | |
| | |
DSV A/S | | | 1,510 | | | | 293,740 | |
| | |
Novo Nordisk A/S, Class B | | | 40,361 | | | | 4,521,282 | |
| | |
Novozymes A/S, Class B | | | 4,865 | | | | 336,930 | |
| | |
Orsted A/S(b) | | | 4,653 | | | | 591,043 | |
| | |
Rockwool International A/S, Class B | | | 511 | | | | 170,605 | |
| | |
Royal Unibrew A/S | | | 1,955 | | | | 184,933 | |
| | |
Scandinavian Tobacco Group A/S, Class A(b) | | | 19,826 | | | | 426,452 | |
| | |
Topdanmark A/S | | | 3,078 | | | | 173,298 | |
| | |
Tryg A/S | | | 21,480 | | | | 527,735 | |
| | |
Vestas Wind Systems A/S | | | 9,696 | | | | 289,704 | |
| | | | | | | | |
| Total Denmark | | | | | | | 9,628,902 | |
| | |
| Finland – 1.9% | | | | | | | | |
| | |
Anora Group Oyj | | | 17,812 | | | | 174,403 | |
| | |
Cargotec Oyj, Class B | | | 5,377 | | | | 206,643 | |
| | |
Elisa Oyj | | | 11,965 | | | | 727,149 | |
| | |
Fortum Oyj | | | 61,420 | | | | 1,129,643 | |
| | |
Kesko Oyj, Class B | | | 19,075 | | | | 530,807 | |
| | |
Kone Oyj, Class B | | | 15,594 | | | | 825,718 | |
| | |
Konecranes Oyj(a) | | | 7,386 | | | | 229,858 | |
| | |
Metsa Board Oyj, Class B(a) | | | 30,757 | | | | 314,156 | |
| | |
Neste Oyj | | | 17,343 | | | | 800,427 | |
| | |
Nokian Renkaat Oyj | | | 5,720 | | | | 94,033 | |
| | |
Nordea Bank Abp(a) | | | 415,791 | | | | 4,341,102 | |
| | |
Orion Oyj, Class B | | | 6,277 | | | | 287,396 | |
| | |
Sampo Oyj, Class A | | | 26,160 | | | | 1,291,766 | |
| | |
UPM-Kymmene Oyj(a) | | | 28,660 | | | | 945,815 | |
| | |
Valmet Oyj(a) | | | 11,337 | | | | 355,844 | |
| | | | | | | | |
| Total Finland | | | | | | | 12,254,760 | |
| | |
| France – 9.5% | | | | | | | | |
| | |
Air Liquide SA | | | 14,478 | | | | 2,560,034 | |
| | |
ALD SA(b) | | | 35,233 | | | | 471,992 | |
| | |
Amundi SA(b) | | | 5,511 | | | | 381,399 | |
| | |
Arkema SA | | | 2,823 | | | | 341,585 | |
| | |
AXA SA | | | 212,370 | | | | 6,277,138 | |
| | |
BNP Paribas SA | | | 55,971 | | | | 3,234,000 | |
| | |
Bollore SE | | | 63,925 | | | | 338,134 | |
| | |
Bouygues SA | | | 21,412 | | | | 753,555 | |
| | |
Bureau Veritas SA | | | 10,986 | | | | 317,080 | |
| | |
Capgemini SE | | | 3,284 | | | | 739,924 | |
| | |
Carrefour SA | | | 17,216 | | | | 376,308 | |
| | |
Chargeurs SA | | | 6,640 | | | | 150,420 | |
| | |
Cie de Saint-Gobain | | | 14,218 | | | | 858,533 | |
| | |
Cie Generale des Etablissements Michelin SCA | | | 4,013 | | | | 548,980 | |
| | |
Cie Plastic Omnium SA | | | 6,955 | | | | 127,685 | |
| | |
Coface SA | | | 12,214 | | | | 148,538 | |
| | |
Covivio(a) | | | 3,406 | | | | 273,388 | |
| | |
Credit Agricole SA | | | 201,119 | | | | 2,436,016 | |
| | |
Danone SA | | | 22,159 | | | | 1,233,501 | |
| | |
Dassault Systemes SE | | | 9,124 | | | | 453,939 | |
| | |
Edenred | | | 4,990 | | | | 249,401 | |
| | |
Eiffage SA | | | 3,998 | | | | 414,767 | |
| | |
Electricite de France SA(a) | | | 58,924 | | | | 559,504 | |
| | |
Engie SA(a) | | | 130,293 | | | | 1,730,078 | |
| | |
EssilorLuxottica SA | | | 5,180 | | | | 958,475 | |
| | |
Eutelsat Communications SA | | | 23,982 | | | | 262,673 | |
| | |
Faurecia SE(a) | | | 4,284 | | | | 112,730 | |
| | |
Gecina SA | | | 4,236 | | | | 538,717 | |
| | |
Hermes International | | | 625 | | | | 898,117 | |
| | |
ICADE | | | 3,651 | | | | 237,034 | |
| | |
Imerys SA | | | 7,641 | | | | 331,569 | |
| | |
Ipsen SA | | | 2,818 | | | | 355,246 | |
| | |
IPSOS | | | 3,255 | | | | 163,700 | |
| | |
Kering SA | | | 1,980 | | | | 1,268,294 | |
| | |
Klepierre SA*(a) | | | 14,592 | | | | 392,581 | |
| | |
L’Oreal SA | | | 9,535 | | | | 3,860,128 | |
| | |
La Francaise des Jeux SAEM(b) | | | 5,810 | | | | 232,463 | |
| | |
Legrand SA | | | 5,243 | | | | 503,909 | |
| | |
LVMH Moet Hennessy Louis Vuitton SE | | | 8,084 | | | | 5,841,135 | |
| | |
Metropole Television SA | | | 20,184 | | | | 401,544 | |
| | |
Nexans SA | | | 468 | | | | 44,287 | |
| | |
Nexity SA | | | 6,450 | | | | 228,933 | |
| | |
Orange SA | | | 271,766 | | | | 3,236,681 | |
See Notes to Financial Statements.
Schedule of Investments (continued)
WisdomTree International Equity Fund (DWM)
March 31, 2022
| | | | | | | | |
| Investments | | Shares | | | Value | |
| | |
Pernod Ricard SA | | | 5,046 | | | $ | 1,118,957 | |
| | |
Publicis Groupe SA | | | 9,603 | | | | 590,441 | |
| | |
Remy Cointreau SA | | | 872 | | | | 181,433 | |
| | |
Rexel SA* | | | 12,581 | | | | 271,986 | |
| | |
Sanofi | | | 49,420 | | | | 5,086,864 | |
| | |
Schneider Electric SE | | | 17,867 | | | | 3,024,899 | |
| | |
SEB SA | | | 2,152 | | | | 303,134 | |
| | |
Societe Generale SA | | | 14,183 | | | | 385,996 | |
| | |
Sopra Steria Group SACA | | | 763 | | | | 143,388 | |
| | |
SPIE SA | | | 10,900 | | | | 260,507 | |
| | |
Television Francaise 1(a) | | | 32,392 | | | | 317,521 | |
| | |
Thales SA | | | 4,558 | | | | 577,893 | |
| | |
Trigano SA | | | 895 | | | | 131,449 | |
| | |
Valeo | | | 5,871 | | | | 109,450 | |
| | |
Veolia Environnement SA | | | 26,518 | | | | 858,308 | |
| | |
Verallia SA(b) | | | 7,289 | | | | 174,692 | |
| | |
Vinci SA | | | 16,875 | | | | 1,745,978 | |
| | |
Wendel SE | | | 2,853 | | | | 293,949 | |
| | | | | | | | |
| Total France | | | | | | | 60,420,960 | |
| | |
| Germany – 7.4% | | | | | | | | |
| | |
adidas AG | | | 2,009 | | | | 473,663 | |
| | |
Allianz SE, Registered Shares | | | 21,646 | | | | 5,215,483 | |
| | |
AURELIUS Equity Opportunities SE & Co. KGaA | | | 3,558 | | | | 99,683 | |
| | |
Aurubis AG | | | 2,056 | | | | 248,091 | |
| | |
BASF SE | | | 46,460 | | | | 2,675,668 | |
| | |
Bayer AG, Registered Shares | | | 38,866 | | | | 2,685,469 | |
| | |
Bayerische Motoren Werke AG | | | 16,240 | | | | 1,420,258 | |
| | |
Beiersdorf AG | | | 1,144 | | | | 121,177 | |
| | |
Bilfinger SE | | | 4,851 | | | | 186,536 | |
| | |
Brenntag SE | | | 6,924 | | | | 565,011 | |
| | |
Covestro AG(b) | | | 3,953 | | | | 201,618 | |
| | |
Deutsche Boerse AG | | | 4,843 | | | | 878,336 | |
| | |
Deutsche Pfandbriefbank AG(b) | | | 18,962 | | | | 233,239 | |
| | |
Deutsche Post AG, Registered Shares | | | 52,315 | | | | 2,534,971 | |
| | |
Deutsche Telekom AG, Registered Shares | | | 204,794 | | | | 3,858,195 | |
| | |
Deutsche Wohnen SE, Bearer Shares | | | 12,472 | | | | 421,860 | |
| | |
DWS Group GmbH & Co. KGaA(b) | | | 3,352 | | | | 124,047 | |
| | |
E.ON SE | | | 199,665 | | | | 2,341,982 | |
| | |
Evonik Industries AG | | | 10,888 | | | | 305,044 | |
| | |
Fielmann AG | | | 3,393 | | | | 186,496 | |
| | |
Freenet AG | | | 9,886 | | | | 267,292 | |
| | |
Fresenius SE & Co. KGaA | | | 8,064 | | | | 299,185 | |
| | |
Hannover Rueck SE | | | 5,537 | | | | 950,911 | |
| | |
Hapag-Lloyd AG(b) | | | 5,140 | | | | 1,810,642 | |
| | |
HeidelbergCement AG | | | 4,085 | | | | 234,804 | |
| | |
Henkel AG & Co. KGaA | | | 3,399 | | | | 226,725 | |
| | |
Hochtief AG | | | 3,783 | | | | 257,600 | |
| | |
Hornbach Holding AG & Co. KGaA | | | 1,081 | | | | 137,237 | |
| | |
Infineon Technologies AG | | | 13,935 | | | | 480,416 | |
| | |
Knorr-Bremse AG | | | 61 | | | | 4,727 | |
| | |
LANXESS AG | | | 3,824 | | | | 169,723 | |
| | |
LEG Immobilien SE | | | 3,972 | | | | 456,308 | |
| | |
Mercedes-Benz Group AG, Registered Shares | | | 24,361 | | | | 1,729,587 | |
| | |
Merck KGaA | | | 2,094 | | | | 442,330 | |
| | |
METRO AG* | | | 34,039 | | | | 305,488 | |
| | |
Muenchener Rueckversicherungs – Gesellschaft AG in Muenchen, Registered Shares | | | 6,655 | | | | 1,799,339 | |
| | |
Mutares SE & Co. KGaA | | | 3,332 | | | | 82,859 | |
| | |
RWE AG | | | 19,416 | | | | 853,975 | |
| | |
SAP SE | | | 20,686 | | | | 2,327,407 | |
| | |
Siemens AG, Registered Shares | | | 23,602 | | | | 3,299,929 | |
| | |
Siemens Healthineers AG(b) | | | 19,828 | | | | 1,240,746 | |
| | |
Suedzucker AG | | | 7,227 | | | | 94,081 | |
| | |
Symrise AG | | | 2,611 | | | | 316,223 | |
| | |
Talanx AG | | | 15,777 | | | | 702,522 | |
| | |
Telefonica Deutschland Holding AG | | | 154,862 | | | | 425,427 | |
| | |
Traton SE(a) | | | 16,841 | | | | 316,112 | |
| | |
United Internet AG, Registered Shares | | | 6,413 | | | | 222,483 | |
| | |
Vantage Towers AG | | | 4,515 | | | | 161,208 | |
| | |
Volkswagen AG | | | 5,578 | | | | 1,403,879 | |
| | |
Vonovia SE | | | 19,228 | | | | 905,182 | |
| | |
Wacker Neuson SE | | | 1,295 | | | | 29,279 | |
| | | | | | | | |
| Total Germany | | | | | | | 46,730,453 | |
| | |
| Hong Kong – 2.8% | | | | | | | | |
| | |
AIA Group Ltd. | | | 217,965 | | | | 2,294,764 | |
| | |
BOCOM International Holdings Co. Ltd. | | | 752,000 | | | | 109,467 | |
| | |
CLP Holdings Ltd. | | | 154,000 | | | | 1,501,379 | |
| | |
Dah Sing Banking Group Ltd. | | | 364,800 | | | | 324,209 | |
| | |
Fortune Real Estate Investment Trust | | | 331,000 | | | | 297,973 | |
| | |
Hang Lung Properties Ltd. | | | 151,000 | | | | 304,645 | |
| | |
Hang Seng Bank Ltd. | | | 129,600 | | | | 2,502,173 | |
| | |
Henderson Land Development Co. Ltd. | | | 233,859 | | | | 973,492 | |
| | |
Hong Kong & China Gas Co. Ltd. | | | 445,570 | | | | 539,937 | |
| | |
Hong Kong Exchanges & Clearing Ltd. | | | 29,429 | | | | 1,395,655 | |
| | |
Hutchison Port Holdings Trust | | | 1,182,400 | | | | 289,688 | |
| | |
Hysan Development Co. Ltd. | | | 74,000 | | | | 216,385 | |
| | |
Kowloon Development Co. Ltd. | | | 304,000 | | | | 407,590 | |
| | |
Link REIT | | | 103,700 | | | | 887,185 | |
| | |
MTR Corp. Ltd. | | | 148,553 | | | | 803,333 | |
| | |
Power Assets Holdings Ltd. | | | 171,500 | | | | 1,117,945 | |
| | |
Singamas Container Holdings Ltd. | | | 1,148,000 | | | | 168,578 | |
| | |
Sino Land Co. Ltd. | | | 176,400 | | | | 228,851 | |
| | |
Sun Hung Kai Properties Ltd. | | | 123,500 | | | | 1,476,058 | |
| | |
Swire Pacific Ltd., Class A | | | 22,000 | | | | 134,561 | |
| | |
Swire Pacific Ltd., Class B | | | 407,500 | | | | 411,069 | |
| | |
Swire Properties Ltd. | | | 183,000 | | | | 454,731 | |
| | |
Techtronic Industries Co. Ltd. | | | 32,000 | | | | 518,528 | |
| | |
Vitasoy International Holdings Ltd.(a) | | | 120,000 | | | | 227,699 | |
| | | | | | | | |
| Total Hong Kong | | | | | | | 17,585,895 | |
| | |
| Indonesia – 0.1% | | | | | | | | |
| | |
Bumitama Agri Ltd.(a) | | | 713,000 | | | | 400,399 | |
| | |
| Ireland – 0.3% | | | | | | | | |
| | |
CRH PLC | | | 22,781 | | | | 921,374 | |
| | |
Glanbia PLC | | | 15,019 | | | | 175,297 | |
| | |
Kerry Group PLC, Class A | | | 1,564 | | | | 175,933 | |
| | |
Smurfit Kappa Group PLC | | | 12,646 | | | | 569,155 | |
| | | | | | | | |
| Total Ireland | | | | | | | 1,841,759 | |
See Notes to Financial Statements.
Schedule of Investments (continued)
WisdomTree International Equity Fund (DWM)
March 31, 2022
| | | | | | | | |
| Investments | | Shares | | | Value | |
| | |
| Israel – 0.5% | | | | | | | | |
| | |
Bank Hapoalim BM | | | 50,175 | | | $ | 499,195 | |
| | |
Bank Leumi Le-Israel BM | | | 52,528 | | | | 568,529 | |
| | |
Elbit Systems Ltd. | | | 1,859 | | | | 407,771 | |
| | |
ICL Group Ltd. | | | 58,231 | | | | 697,586 | |
| | |
Meitav Dash Investments Ltd. | | | 40,820 | | | | 221,288 | |
| | |
Mizrahi Tefahot Bank Ltd. | | | 10,682 | | | | 419,079 | |
| | |
Strauss Group Ltd. | | | 8,071 | | | | 241,074 | |
| | | | | | | | |
| Total Israel | | | | | | | 3,054,522 | |
| | |
| Italy – 3.8% | | | | | | | | |
| | |
A2A SpA(a) | | | 285,451 | | | | 493,720 | |
| | |
ACEA SpA | | | 22,622 | | | | 419,590 | |
| | |
Amplifon SpA(a) | | | 465 | | | | 20,975 | |
| | |
Anima Holding SpA(b) | | | 58,906 | | | | 267,542 | |
| | |
Assicurazioni Generali SpA(a) | | | 118,920 | | | | 2,748,211 | |
| | |
Banca Mediolanum SpA | | | 39,529 | | | | 341,124 | |
| | |
Banco BPM SpA | | | 68,072 | | | | 203,741 | |
| | |
BPER Banca(a) | | | 98,571 | | | | 174,328 | |
| | |
Credito Emiliano SpA | | | 36,128 | | | | 240,383 | |
| | |
DiaSorin SpA | | | 326 | | | | 51,471 | |
| | |
Enel SpA | | | 523,528 | | | | 3,534,632 | |
| | |
Eni SpA | | | 187,184 | | | | 2,768,746 | |
| | |
ERG SpA | | | 10,775 | | | | 361,582 | |
| | |
Ferrari NV | | | 2,436 | | | | 538,560 | |
| | |
Hera SpA | | | 139,821 | | | | 520,544 | |
| | |
Infrastrutture Wireless Italiane SpA(a)(b) | | | 47,749 | | | | 540,045 | |
| | |
Intesa Sanpaolo SpA | | | 1,377,729 | | | | 3,193,861 | |
| | |
Iren SpA | | | 160,696 | | | | 429,831 | |
| | |
Italgas SpA | | | 105,710 | | | | 685,009 | |
| | |
Mediobanca Banca di Credito Finanziario SpA | | | 82,034 | | | | 841,557 | |
| | |
Piaggio & C. SpA | | | 97,295 | | | | 277,783 | |
| | |
Poste Italiane SpA(b) | | | 71,601 | | | | 822,162 | |
| | |
Recordati Industria Chimica e Farmaceutica SpA | | | 9,086 | | | | 461,399 | |
| | |
Snam SpA(a) | | | 243,331 | | | | 1,416,524 | |
| | |
Telecom Italia SpA(a) | | | 1,073,100 | | | | 398,194 | |
| | |
Terna – Rete Elettrica Nazionale(a) | | | 99,310 | | | | 860,332 | |
| | |
UniCredit SpA | | | 22,559 | | | | 247,363 | |
| | |
Unieuro SpA(a)(b) | | | 6,641 | | | | 130,418 | |
| | |
Unipol Gruppo SpA | | | 28,163 | | | | 156,051 | |
| | |
UnipolSai Assicurazioni SpA(a) | | | 321,604 | | | | 961,139 | |
| | | | | | | | |
| Total Italy | | | | | | | 24,106,817 | |
| | |
| Japan – 20.6% | | | | | | | | |
| | |
Acom Co. Ltd. | | | 69,800 | | | | 183,450 | |
| | |
Advantest Corp.(a) | | | 5,100 | | | | 406,319 | |
| | |
Aeon Co. Ltd. | | | 13,300 | | | | 285,943 | |
| | |
Aeon Delight Co. Ltd. | | | 13,000 | | | | 326,138 | |
| | |
Aeon Mall Co. Ltd. | | | 8,700 | | | | 116,621 | |
| | |
AGC, Inc. | | | 10,600 | | | | 428,367 | |
| | |
Air Water, Inc.(a) | | | 13,400 | | | | 189,891 | |
| | |
Aisin Corp. | | | 8,900 | | | | 307,605 | |
| | |
Ajinomoto Co., Inc. | | | 10,300 | | | | 294,892 | |
| | |
Amada Co. Ltd. | | | 19,200 | | | | 171,475 | |
| | |
Aozora Bank Ltd.(a) | | | 18,700 | | | | 398,882 | |
| | |
Asahi Group Holdings Ltd. | | | 15,000 | | | | 551,308 | |
| | |
Asahi Holdings, Inc.(a) | | | 6,000 | | | | 111,967 | |
| | |
Asahi Kasei Corp. | | | 41,300 | | | | 361,534 | |
| | |
Astellas Pharma, Inc. | | | 52,400 | | | | 825,017 | |
| | |
Avex, Inc.(a) | | | 26,800 | | | | 294,552 | |
| | |
Azbil Corp. | | | 3,600 | | | | 121,310 | |
| | |
Bandai Namco Holdings, Inc. | | | 5,500 | | | | 421,059 | |
| | |
Benesse Holdings, Inc. | | | 10,200 | | | | 188,831 | |
| | |
BML, Inc. | | | 4,600 | | | | 117,108 | |
| | |
Bridgestone Corp. | | | 25,300 | | | | 991,781 | |
| | |
Canon, Inc. | | | 43,500 | | | | 1,072,671 | |
| | |
Casio Computer Co. Ltd.(a) | | | 14,100 | | | | 163,566 | |
| | |
Chiba Bank Ltd.(a) | | | 23,600 | | | | 140,968 | |
| | |
Chubu Electric Power Co., Inc.(a) | | | 14,400 | | | | 149,843 | |
| | |
Chugai Pharmaceutical Co. Ltd. | | | 27,400 | | | | 924,884 | |
| | |
Citizen Watch Co. Ltd.(a) | | | 45,500 | | | | 195,308 | |
| | |
CKD Corp.(a) | | | 6,100 | | | | 94,735 | |
| | |
Concordia Financial Group Ltd. | | | 115,200 | | | | 434,699 | |
| | |
Cosmo Energy Holdings Co. Ltd. | | | 8,400 | | | | 182,014 | |
| | |
Credit Saison Co. Ltd.(a) | | | 14,800 | | | | 158,883 | |
| | |
Dai Nippon Printing Co. Ltd. | | | 13,000 | | | | 308,251 | |
| | |
Dai-ichi Life Holdings, Inc. | | | 43,533 | | | | 896,305 | |
| | |
Daicel Corp.(a) | | | 29,200 | | | | 196,551 | |
| | |
Daido Steel Co. Ltd. | | | 5,400 | | | | 164,169 | |
| | |
Daiichikosho Co. Ltd. | | | 6,600 | | | | 189,232 | |
| | |
Daikin Industries Ltd. | | | 3,200 | | | | 590,830 | |
| | |
Daishi Hokuetsu Financial Group, Inc. | | | 15,500 | | | | 319,897 | |
| | |
Daito Trust Construction Co. Ltd. | | | 4,400 | | | | 470,904 | |
| | |
Daiwa House Industry Co. Ltd. | | | 23,100 | | | | 609,212 | |
| | |
Daiwa Securities Group, Inc.(a) | | | 66,800 | | | | 381,235 | |
| | |
DCM Holdings Co. Ltd. | | | 33,000 | | | | 286,566 | |
| | |
Denka Co. Ltd. | | | 3,100 | | | | 86,838 | |
| | |
Denso Corp. | | | 17,100 | | | | 1,107,361 | |
| | |
Dentsu Group, Inc. | | | 7,000 | | | | 289,516 | |
| | |
DIC Corp. | | | 4,400 | | | | 90,882 | |
| | |
Dowa Holdings Co. Ltd. | | | 4,300 | | | | 198,748 | |
| | |
Electric Power Development Co. Ltd. | | | 30,300 | | | | 436,370 | |
| | |
ENEOS Holdings, Inc. | | | 188,500 | | | | 711,291 | |
| | |
EXEO Group, Inc. | | | 16,700 | | | | 311,091 | |
| | |
FANUC Corp. | | | 3,700 | | | | 659,827 | |
| | |
Fast Retailing Co. Ltd. | | | 800 | | | | 415,176 | |
| | |
Fuji Electric Co. Ltd. | | | 7,600 | | | | 385,714 | |
| | |
FUJIFILM Holdings Corp. | | | 9,700 | | | | 599,542 | |
| | |
Fujitec Co. Ltd.(a) | | | 8,800 | | | | 228,383 | |
| | |
Fujitsu Ltd. | | | 3,100 | | | | 470,332 | |
| | |
Fukuoka Financial Group, Inc. | | | 24,200 | | | | 473,333 | |
| | |
Furukawa Battery Co. Ltd.(a) | | | 6,400 | | | | 67,704 | |
| | |
Furuya Metal Co. Ltd. | | | 100 | | | | 8,519 | |
| | |
GMO Financial Holdings, Inc.(a) | | | 18,700 | | | | 126,798 | |
| | |
GMO Internet, Inc. | | | 6,500 | | | | 150,056 | |
| | |
GS Yuasa Corp.(a) | | | 13,800 | | | | 266,165 | |
| | |
H.U. Group Holdings, Inc. | | | 10,700 | | | | 256,095 | |
| | |
Hachijuni Bank Ltd.(a) | | | 104,100 | | | | 349,073 | |
| | |
Hakuhodo DY Holdings, Inc. | | | 16,900 | | | | 215,123 | |
See Notes to Financial Statements.
Schedule of Investments (continued)
WisdomTree International Equity Fund (DWM)
March 31, 2022
| | | | | | | | |
| Investments | | Shares | | | Value | |
| | |
Hankyu Hanshin Holdings, Inc. | | | 13,700 | | | $ | 400,136 | |
| | |
Haseko Corp. | | | 28,700 | | | | 332,695 | |
| | |
Heiwa Corp.(a) | | | 20,300 | | | | 304,730 | |
| | |
Hioki EE Corp.(a) | | | 800 | | | | 46,468 | |
| | |
Hirose Electric Co. Ltd. | | | 2,100 | | | | 309,009 | |
| | |
Hitachi Ltd. | | | 21,700 | | | | 1,102,208 | |
| | |
Hokkaido Electric Power Co., Inc. | | | 74,100 | | | | 295,484 | |
| | |
Honda Motor Co. Ltd. | | | 53,800 | | | | 1,545,628 | |
| | |
Hoya Corp. | | | 3,800 | | | | 439,250 | |
| | |
Idemitsu Kosan Co. Ltd. | | | 20,751 | | | | 577,010 | |
| | |
Iida Group Holdings Co. Ltd.(a) | | | 7,200 | | | | 125,462 | |
| | |
Iino Kaiun Kaisha Ltd. | | | 40,700 | | | | 276,978 | |
| | |
Information Services International-Dentsu Ltd. | | | 2,600 | | | | 83,757 | |
| | |
INFRONEER Holdings, Inc.(a) | | | 26,900 | | | | 230,936 | |
| | |
Inpex Corp. | | | 76,300 | | | | 905,228 | |
| | |
Isetan Mitsukoshi Holdings Ltd. | | | 18,700 | | | | 148,984 | |
| | |
Isuzu Motors Ltd. | | | 20,300 | | | | 265,593 | |
| | |
ITOCHU Corp. | | | 73,900 | | | | 2,523,103 | |
| | |
IwaiCosmo Holdings, Inc.(a) | | | 27,700 | | | | 303,987 | |
| | |
Iwatani Corp. | | | 2,600 | | | | 110,748 | |
| | |
Izumi Co. Ltd. | | | 9,400 | | | | 249,376 | |
| | |
Jaccs Co. Ltd. | | | 6,800 | | | | 172,556 | |
| | |
Japan Exchange Group, Inc. | | | 15,200 | | | | 286,280 | |
| | |
Japan Post Holdings Co. Ltd. | | | 239,900 | | | | 1,775,705 | |
| | |
Japan Post Insurance Co. Ltd. | | | 19,100 | | | | 336,129 | |
| | |
Japan Tobacco, Inc. | | | 189,744 | | | | 3,263,362 | |
| | |
JFE Holdings, Inc. | | | 17,100 | | | | 242,746 | |
| | |
JSR Corp.(a) | | | 9,300 | | | | 278,138 | |
| | |
JTEKT Corp. | | | 18,000 | | | | 142,962 | |
| | |
Kajima Corp. | | | 18,200 | | | | 223,573 | |
| | |
Kaneka Corp. | | | 7,500 | | | | 219,053 | |
| | |
Kansai Electric Power Co., Inc. | | | 29,000 | | | | 274,529 | |
| | |
Kao Corp. | | | 5,800 | | | | 240,124 | |
| | |
KDDI Corp. | | | 128,400 | | | | 4,236,803 | |
| | |
Keyence Corp. | | | 1,100 | | | | 518,847 | |
| | |
Kirin Holdings Co. Ltd. | | | 16,700 | | | | 251,652 | |
| | |
Kobe Steel Ltd.(a) | | | 29,800 | | | | 145,102 | |
| | |
Koito Manufacturing Co. Ltd. | | | 1,000 | | | | 40,989 | |
| | |
Komatsu Ltd. | | | 14,400 | | | | 349,159 | |
| | |
Kubota Corp. | | | 29,800 | | | | 565,433 | |
| | |
Kyowa Kirin Co. Ltd. | | | 13,000 | | | | 305,038 | |
| | |
Kyudenko Corp. | | | 10,000 | | | | 236,128 | |
| | |
Kyushu Railway Co. | | | 13,900 | | | | 287,104 | |
| | |
Lawson, Inc. | | | 8,600 | | | | 331,246 | |
| | |
Lixil Corp. | | | 14,400 | | | | 271,687 | |
| | |
Makita Corp. | | | 5,100 | | | | 165,343 | |
| | |
Marubeni Corp. | | | 95,100 | | | | 1,117,303 | |
| | |
Maruichi Steel Tube Ltd. | | | 16,100 | | | | 366,105 | |
| | |
Matsui Securities Co. Ltd.(a) | | | 53,900 | | | | 358,371 | |
| | |
Medipal Holdings Corp. | | | 16,900 | | | | 280,564 | |
| | |
Mitsubishi Chemical Holdings Corp. | | | 64,400 | | | | 433,543 | |
| | |
Mitsubishi Corp. | | | 67,600 | | | | 2,562,534 | |
| | |
Mitsubishi Electric Corp. | | | 61,300 | | | | 712,115 | |
| | |
Mitsubishi Estate Co. Ltd. | | | 17,900 | | | | 268,260 | |
| | |
Mitsubishi Gas Chemical Co., Inc. | | | 13,100 | | | | 224,602 | |
| | |
Mitsubishi HC Capital, Inc. | | | 126,990 | | | | 596,369 | |
| | |
Mitsubishi Heavy Industries Ltd. | | | 8,200 | | | | 271,588 | |
| | |
Mitsubishi Materials Corp. | | | 19,500 | | | | 344,292 | |
| | |
Mitsubishi UFJ Financial Group, Inc. | | | 546,500 | | | | 3,423,307 | |
| | |
Mitsui Chemicals, Inc. | | | 13,100 | | | | 333,504 | |
| | |
Mitsui Fudosan Co. Ltd. | | | 13,100 | | | | 282,777 | |
| | |
Mitsui High-Tec, Inc. | | | 200 | | | | 20,515 | |
| | |
Mitsui Mining & Smelting Co. Ltd. | | | 5,900 | | | | 163,085 | |
| | |
Mitsui OSK Lines Ltd.(a) | | | 34,800 | | | | 980,564 | |
| | |
Mizuho Financial Group, Inc. | | | 125,730 | | | | 1,623,225 | |
| | |
Mizuho Medy Co. Ltd.(a) | | | 200 | | | | 3,299 | |
| | |
MS&AD Insurance Group Holdings, Inc. | | | 34,730 | | | | 1,138,257 | |
| | |
Murata Manufacturing Co. Ltd. | | | 15,200 | | | | 1,016,506 | |
| | |
Musashi Seimitsu Industry Co. Ltd.(a) | | | 6,200 | | | | 77,235 | |
| | |
Nabtesco Corp. | | | 5,000 | | | | 134,295 | |
| | |
NEC Corp. | | | 8,800 | | | | 373,388 | |
| | |
NGK Insulators Ltd. | | | 14,400 | | | | 207,977 | |
| | |
NHK Spring Co. Ltd. | | | 30,700 | | | | 223,848 | |
| | |
Nichirei Corp. | | | 7,700 | | | | 150,289 | |
| | |
Nidec Corp. | | | 4,200 | | | | 337,315 | |
| | |
Nintendo Co. Ltd. | | | 4,800 | | | | 2,438,855 | |
| | |
Nippon Denko Co. Ltd. | | | 57,100 | | | | 159,480 | |
| | |
Nippon Electric Glass Co. Ltd. | | | 14,600 | | | | 326,703 | |
| | |
Nippon Express Holdings, Inc. | | | 5,400 | | | | 374,608 | |
| | |
Nippon Gas Co. Ltd.(a) | | | 19,000 | | | | 233,401 | |
| | |
Nippon Kayaku Co. Ltd.(a) | | | 19,700 | | | | 188,438 | |
| | |
Nippon Light Metal Holdings Co. Ltd.(a) | | | 20,600 | | | | 290,734 | |
| | |
Nippon Shinyaku Co. Ltd. | | | 500 | | | | 34,315 | |
| | |
Nippon Steel Corp. | | | 25,600 | | | | 457,900 | |
| | |
Nippon Steel Trading Corp. | | | 5,800 | | | | 253,743 | |
| | |
Nippon Telegraph & Telephone Corp. | | | 203,200 | | | | 5,934,863 | |
| | |
Nippon Yusen KK(a) | | | 12,600 | | | | 1,117,001 | |
| | |
Nishimatsu Construction Co. Ltd.(a) | | | 8,800 | | | | 266,084 | |
| | |
Nisshinbo Holdings, Inc. | | | 34,500 | | | | 302,150 | |
| | |
Nissin Electric Co. Ltd. | | | 27,600 | | | | 335,634 | |
| | |
Nissin Foods Holdings Co. Ltd. | | | 3,100 | | | | 218,884 | |
| | |
Nitto Denko Corp. | | | 1,200 | | | | 87,201 | |
| | |
Noevir Holdings Co. Ltd.(a) | | | 6,900 | | | | 281,116 | |
| | |
NOF Corp. | | | 4,300 | | | | 177,846 | |
| | |
Nomura Real Estate Holdings, Inc. | | | 10,800 | | | | 260,980 | |
| | |
Nomura Research Institute Ltd. | | | 10,900 | | | | 361,013 | |
| | |
NTT Data Corp. | | | 26,700 | | | | 531,910 | |
| | |
Oji Holdings Corp.(a) | | | 55,800 | | | | 279,057 | |
| | |
Okamura Corp. | | | 15,000 | | | | 149,784 | |
| | |
Olympus Corp. | | | 8,800 | | | | 169,584 | |
| | |
Omron Corp. | | | 4,600 | | | | 311,303 | |
| | |
Oracle Corp. | | | 4,300 | | | | 301,133 | |
| | |
Orient Corp.(a) | | | 37,600 | | | | 38,413 | |
| | |
Osaka Gas Co. Ltd. | | | 9,200 | | | | 158,570 | |
| | |
Otsuka Holdings Co. Ltd. | | | 7,200 | | | | 251,043 | |
| | |
PALTAC Corp. | | | 4,900 | | | | 183,687 | |
| | |
Panasonic Corp. | | | 64,600 | | | | 632,561 | |
| | |
Penta-Ocean Construction Co. Ltd. | | | 30,800 | | | | 155,554 | |
See Notes to Financial Statements.
Schedule of Investments (continued)
WisdomTree International Equity Fund (DWM)
March 31, 2022
| | | | | | | | |
| Investments | | Shares | | | Value | |
| | |
Pigeon Corp. | | | 16,400 | | | $ | 290,910 | |
| | |
Pola Orbis Holdings, Inc. | | | 1,400 | | | | 18,444 | |
| | |
Recruit Holdings Co. Ltd. | | | 9,200 | | | | 410,371 | |
| | |
Resona Holdings, Inc. | | | 92,000 | | | | 397,258 | |
| | |
Sanwa Holdings Corp. | | | 19,900 | | | | 203,960 | |
| | |
SBI Holdings, Inc. | | | 13,000 | | | | 332,029 | |
| | |
SCREEN Holdings Co. Ltd.(a) | | | 1,700 | | | | 173,116 | |
| | |
Scroll Corp.(a) | | | 20,600 | | | | 141,378 | |
| | |
SCSK Corp. | | | 18,100 | | | | 313,311 | |
| | |
Secom Co. Ltd. | | | 3,900 | | | | 284,945 | |
| | |
Sega Sammy Holdings, Inc. | | | 16,000 | | | | 278,542 | |
| | |
Seiko Epson Corp.(a) | | | 27,400 | | | | 415,600 | |
| | |
Sekisui Chemical Co. Ltd. | | | 21,600 | | | | 313,033 | |
| | |
Sekisui House Ltd. | | | 28,100 | | | | 548,919 | |
| | |
Senko Group Holdings Co. Ltd. | | | 39,500 | | | | 292,243 | |
| | |
Seven & I Holdings Co. Ltd. | | | 20,700 | | | | 991,383 | |
| | |
Sharp Corp.(a) | | | 21,300 | | | | 201,637 | |
| | |
Shikoku Electric Power Co., Inc. | | | 51,900 | | | | 336,949 | |
| | |
Shimamura Co. Ltd. | | | 1,900 | | | | 170,159 | |
| | |
Shimano, Inc. | | | 1,300 | | | | 301,557 | |
| | |
Shin-Etsu Chemical Co. Ltd. | | | 6,600 | | | | 1,021,743 | |
| | |
Shinsei Bank Ltd. | | | 10,800 | | | | 199,049 | |
| | |
Shionogi & Co. Ltd. | | | 8,800 | | | | 545,944 | |
| | |
Shizuoka Bank Ltd. | | | 53,100 | | | | 377,551 | |
| | |
SMC Corp. | | | 600 | | | | 340,301 | |
| | |
SoftBank Corp. | | | 449,300 | | | | 5,286,100 | |
| | |
SoftBank Group Corp. | | | 10,100 | | | | 462,582 | |
| | |
Sompo Holdings, Inc. | | | 17,100 | | | | 758,106 | |
| | |
Sony Group Corp. | | | 8,100 | | | | 849,541 | |
| | |
Stanley Electric Co. Ltd. | | | 9,800 | | | | 187,643 | |
| | |
Subaru Corp. | | | 5,500 | | | | 88,272 | |
| | |
Sumitomo Bakelite Co. Ltd. | | | 1,300 | | | | 53,446 | |
| | |
Sumitomo Chemical Co. Ltd. | | | 74,600 | | | | 345,419 | |
| | |
Sumitomo Corp. | | | 53,400 | | | | 932,273 | |
| | |
Sumitomo Dainippon Pharma Co. Ltd. | | | 16,100 | | | | 160,237 | |
| | |
Sumitomo Electric Industries Ltd. | | | 24,300 | | | | 292,701 | |
| | |
Sumitomo Forestry Co. Ltd. | | | 9,900 | | | | 176,834 | |
| | |
Sumitomo Heavy Industries Ltd. | | | 10,500 | | | | 243,782 | |
| | |
Sumitomo Metal Mining Co. Ltd. | | | 15,200 | | | | 771,803 | |
| | |
Sumitomo Mitsui Financial Group, Inc. | | | 68,100 | | | | 2,192,105 | |
| | |
Sumitomo Mitsui Trust Holdings, Inc. | | | 7,907 | | | | 260,646 | |
| | |
Sumitomo Realty & Development Co. Ltd. | | | 8,300 | | | | 231,750 | |
| | |
Sumitomo Rubber Industries Ltd. | | | 18,900 | | | | 175,024 | |
| | |
Sundrug Co. Ltd. | | | 10,800 | | | | 264,717 | |
| | |
Suntory Beverage & Food Ltd. | | | 5,400 | | | | 207,324 | |
| | |
Suzuki Motor Corp. | | | 10,600 | | | | 367,932 | |
| | |
Sysmex Corp. | | | 3,300 | | | | 242,603 | |
| | |
T&D Holdings, Inc. | | | 23,400 | | | | 322,154 | |
| | |
Taiheiyo Cement Corp.(a) | | | 13,500 | | | | 224,564 | |
| | |
Taisei Corp. | | | 14,400 | | | | 419,394 | |
| | |
Takashimaya Co. Ltd.(a) | | | 24,200 | | | | 231,682 | |
| | |
Takeda Pharmaceutical Co. Ltd. | | | 90,400 | | | | 2,605,307 | |
| | |
Teijin Ltd. | | | 28,400 | | | | 318,922 | |
| | |
Terumo Corp. | | | 7,300 | | | | 223,977 | |
| | |
TIS, Inc. | | | 10,600 | | | | 251,256 | |
| | |
Toda Corp.(a) | | | 58,200 | | | | 355,314 | |
| | |
Toho Co. Ltd. | | | 1,900 | | | | 72,556 | |
| | |
Tokio Marine Holdings, Inc. | | | 28,000 | | | | 1,644,358 | |
| | |
Tokuyama Corp.(a) | | | 16,400 | | | | 232,133 | |
| | |
Tokyo Electron Ltd. | | | 5,100 | | | | 2,657,672 | |
| | |
Tokyo Ohka Kogyo Co. Ltd. | | | 1,200 | | | | 72,766 | |
| | |
Tokyo Seimitsu Co. Ltd. | | | 5,300 | | | | 213,092 | |
| | |
Tokyo Steel Manufacturing Co. Ltd.(a) | | | 5,900 | | | | 56,582 | |
| | |
Tokyo Tatemono Co. Ltd. | | | 1,600 | | | | 24,176 | |
| | |
Tokyu Corp.(a) | | | 13,800 | | | | 181,006 | |
| | |
Toshiba Corp. | | | 9,500 | | | | 363,955 | |
| | |
Tosoh Corp. | | | 18,700 | | | | 279,479 | |
| | |
TOTO Ltd. | | | 4,000 | | | | 162,801 | |
| | |
Toyo Seikan Group Holdings Ltd. | | | 20,500 | | | | 237,471 | |
| | |
Toyo Suisan Kaisha Ltd. | | | 5,500 | | | | 198,023 | |
| | |
Toyo Tire Corp.(a) | | | 7,000 | | | | 90,142 | |
| | |
Toyoda Gosei Co. Ltd. | | | 15,000 | | | | 250,381 | |
| | |
Toyota Boshoku Corp. | | | 6,200 | | | | 102,265 | |
| | |
Toyota Motor Corp. | | | 420,150 | | | | 7,693,375 | |
| | |
Toyota Tsusho Corp. | | | 13,800 | | | | 575,308 | |
| | |
Trend Micro, Inc. | | | 7,400 | | | | 436,531 | |
| | |
Tsuruha Holdings, Inc. | | | 2,900 | | | | 185,409 | |
| | |
Ube Industries Ltd.(a) | | | 14,300 | | | | 235,280 | |
| | |
Ulvac, Inc. | | | 1,800 | | | | 93,429 | |
| | |
USS Co. Ltd. | | | 20,400 | | | | 346,065 | |
| | |
Wacom Co. Ltd.(a) | | | 29,300 | | | | 227,641 | |
| | |
Workman Co. Ltd.(a) | | | 2,500 | | | | 103,193 | |
| | |
Yakult Honsha Co. Ltd.(a) | | | 3,700 | | | | 198,756 | |
| | |
Yamaguchi Financial Group, Inc. | | | 62,400 | | | | 349,594 | |
| | |
Yamaha Motor Co. Ltd. | | | 18,000 | | | | 408,717 | |
| | |
Yamato Holdings Co. Ltd.(a) | | | 13,700 | | | | 258,819 | |
| | |
Yaskawa Electric Corp. | | | 2,400 | | | | 95,209 | |
| | |
Yokogawa Electric Corp. | | | 10,600 | | | | 183,311 | |
| | |
Yokohama Rubber Co. Ltd. | | | 13,900 | | | | 193,770 | |
| | | | | | | | |
| Total Japan | | | | | | | 130,780,755 | |
| | |
| Netherlands – 2.2% | | | | | | | | |
| | |
Aalberts NV | | | 6,085 | | | | 319,431 | |
| | |
Aegon NV(a) | | | 19,876 | | | | 106,196 | |
| | |
Akzo Nobel NV | | | 6,480 | | | | 563,964 | |
| | |
ASM International NV | | | 909 | | | | 335,886 | |
| | |
ASML Holding NV | | | 2,957 | | | | 2,006,965 | |
| | |
ASR Nederland NV | | | 13,404 | | | | 629,817 | |
| | |
Boskalis Westminster | | | 6,183 | | | | 223,722 | |
| | |
Eurocommercial Properties NV | | | 4,654 | | | | 128,654 | |
| | |
Euronext NV(b) | | | 3,008 | | | | 276,785 | |
| | |
Heijmans NV, CVA | | | 18,150 | | | | 300,092 | |
| | |
Heineken Holding NV | | | 3,370 | | | | 266,599 | |
| | |
Heineken NV | | | 4,958 | | | | 477,620 | |
| | |
ING Groep NV | | | 128,623 | | | | 1,361,142 | |
| | |
Koninklijke Ahold Delhaize NV | | | 40,592 | | | | 1,314,970 | |
| | |
Koninklijke DSM NV(a) | | | 3,636 | | | | 657,409 | |
| | |
Koninklijke KPN NV | | | 246,712 | | | | 862,767 | |
| | |
Koninklijke Philips NV | | | 17,881 | | | | 551,697 | |
See Notes to Financial Statements.
Schedule of Investments (continued)
WisdomTree International Equity Fund (DWM)
March 31, 2022
| | | | | | | | |
| Investments | | Shares | | | Value | |
| | |
NN Group NV | | | 26,908 | | | $ | 1,373,011 | |
| | |
Ordina NV | | | 55,357 | | | | 287,023 | |
| | |
PostNL NV | | | 69,720 | | | | 268,406 | |
| | |
Randstad NV(a) | | | 7,068 | | | | 429,701 | |
| | |
RHI Magnesita NV | | | 3,984 | | | | 127,781 | |
| | |
SBM Offshore NV(a) | | | 16,566 | | | | 265,700 | |
| | |
Signify NV(b) | | | 4,782 | | | | 225,757 | |
| | |
Wolters Kluwer NV | | | 7,862 | | | | 844,849 | |
| | | | | | | | |
| Total Netherlands | | | | | | | 14,205,944 | |
| | |
| Norway – 2.1% | | | | | | | | |
| | |
AF Gruppen ASA | | | 16,378 | | | | 374,611 | |
| | |
Aker ASA, Class A | | | 4,073 | | | | 377,302 | |
| | |
Aker BP ASA(a) | | | 8,545 | | | | 323,076 | |
| | |
Atea ASA* | | | 7,753 | | | | 117,217 | |
| | |
Austevoll Seafood ASA | | | 15,450 | | | | 241,539 | |
| | |
DNB Bank ASA | | | 55,909 | | | | 1,279,436 | |
| | |
Entra ASA(b) | | | 14,786 | | | | 298,798 | |
| | |
Equinor ASA | | | 112,326 | | | | 4,254,617 | |
| | |
Gjensidige Forsikring ASA(a) | | | 32,824 | | | | 820,975 | |
| | |
Hunter Group ASA* | | | 828,420 | | | | 265,276 | |
| | |
Kid ASA(b) | | | 14,077 | | | | 165,820 | |
| | |
Leroy Seafood Group ASA | | | 30,914 | | | | 286,796 | |
| | |
Multiconsult ASA(b) | | | 6,764 | | | | 109,459 | |
| | |
Norsk Hydro ASA | | | 29,310 | | | | 288,608 | |
| | |
Orkla ASA | | | 23,709 | | | | 212,470 | |
| | |
Salmar ASA | | | 2,672 | | | | 213,418 | |
| | |
Selvaag Bolig ASA | | | 56,229 | | | | 321,529 | |
| | |
SpareBank 1 SR-Bank ASA | | | 12,896 | | | | 198,071 | |
| | |
Telenor ASA | | | 129,965 | | | | 1,883,928 | |
| | |
Veidekke ASA | | | 20,303 | | | | 284,205 | |
| | |
Yara International ASA | | | 13,826 | | | | 698,890 | |
| | | | | | | | |
| Total Norway | | | | | | | 13,016,041 | |
| | |
| Peru – 0.0% | | | | | | | | |
| | |
Hochschild Mining PLC | | | 106,099 | | | | 179,788 | |
| | |
| Portugal – 0.3% | | | | | | | | |
| | |
EDP – Energias de Portugal SA | | | 158,972 | | | | 789,770 | |
| | |
Galp Energia SGPS SA | | | 34,102 | | | | 436,921 | |
| | |
Jeronimo Martins SGPS SA | | | 19,025 | | | | 459,984 | |
| | |
REN – Redes Energeticas Nacionais SGPS SA | | | 139,510 | | | | 442,394 | |
| | |
Sonae SGPS SA | | | 81,210 | | | | 94,153 | |
| | | | | | | | |
| Total Portugal | | | | | | | 2,223,222 | |
| | |
| Singapore – 1.8% | | | | | | | | |
| | |
Bukit Sembawang Estates Ltd. | | | 92,300 | | | | 341,688 | |
| | |
DBS Group Holdings Ltd. | | | 122,476 | | | | 3,242,557 | |
| | |
Genting Singapore Ltd. | | | 372,000 | | | | 224,022 | |
| | |
Ho Bee Land Ltd. | | | 148,500 | | | | 320,405 | |
| | |
Jardine Cycle & Carriage Ltd.(a) | | | 15,955 | | | | 295,085 | |
| | |
Jiutian Chemical Group Ltd.(a) | | | 1,128,000 | | | | 72,513 | |
| | |
NetLink NBN Trust | | | 646,600 | | | | 465,833 | |
| | |
Olam Group Ltd.(a) | | | 143,000 | | | | 184,912 | |
| | |
Oversea-Chinese Banking Corp. Ltd. | | | 211,195 | | | | 1,931,942 | |
| | |
Raffles Medical Group Ltd.(a) | | | 251,100 | | | | 217,081 | |
| | |
Riverstone Holdings Ltd. | | | 268,400 | | | | 196,340 | |
| | |
Sembcorp Industries Ltd. | | | 118,800 | | | | 234,378 | |
| | |
Singapore Exchange Ltd. | | | 66,400 | | | | 489,163 | |
| | |
Singapore Technologies Engineering Ltd. | | | 156,100 | | | | 475,215 | |
| | |
Singapore Telecommunications Ltd. | | | 348,700 | | | | 680,214 | |
| | |
United Overseas Bank Ltd. | | | 97,501 | | | | 2,306,855 | |
| | | | | | | | |
| Total Singapore | | | | | | | 11,678,203 | |
| | |
| Spain – 2.5% | | | | | | | | |
| | |
Acciona SA(a) | | | 2,278 | | | | 439,756 | |
| | |
Acerinox SA | | | 11,565 | | | | 128,421 | |
| | |
Banco Bilbao Vizcaya Argentaria SA(a) | | | 237,190 | | | | 1,374,969 | |
| | |
Banco Santander SA | | | 242,041 | | | | 834,852 | |
| | |
CaixaBank SA(a) | | | 105,079 | | | | 359,751 | |
| | |
Cie Automotive SA | | | 10,331 | | | | 237,482 | |
| | |
EDP Renovaveis SA | | | 10,003 | | | | 259,771 | |
| | |
Enagas SA(a) | | | 10,271 | | | | 230,275 | |
| | |
Faes Farma SA | | | 94,088 | | | | 385,039 | |
| | |
Ferrovial SA | | | 20,598 | | | | 553,020 | |
| | |
Fomento de Construcciones y Contratas SA | | | 30,774 | | | | 371,854 | |
| | |
Grupo Catalana Occidente SA | | | 8,185 | | | | 253,176 | |
| | |
Iberdrola SA | | | 266,862 | | | | 2,945,487 | |
| | |
Industria de Diseno Textil SA | | | 70,439 | | | | 1,550,237 | |
| | |
Inmobiliaria Colonial Socimi SA | | | 24,123 | | | | 221,166 | |
| | |
Linea Directa Aseguradora SA Cia de Seguros y Reaseguros(a) | | | 90,661 | | | | 140,719 | |
| | |
Mapfre SA | | | 219,838 | | | | 464,745 | |
| | |
Metrovacesa SA(a)(b) | | | 43,810 | | | | 373,876 | |
| | |
Naturgy Energy Group SA(a) | | | 73,323 | | | | 2,215,790 | |
| | |
Red Electrica Corp. SA | | | 24,678 | | | | 510,993 | |
| | |
Repsol SA | | | 78,050 | | | | 1,035,508 | |
| | |
Sacyr SA(a) | | | 43,035 | | | | 104,959 | |
| | |
Unicaja Banco SA(b) | | | 122,278 | | | | 128,298 | |
| | |
Viscofan SA | | | 6,654 | | | | 398,312 | |
| | |
Zardoya Otis SA | | | 22,988 | | | | 180,322 | |
| | | | | | | | |
| Total Spain | | | | | | | 15,698,778 | |
| | |
| Sweden – 2.8% | | | | | | | | |
| | |
Assa Abloy AB, Class B | | | 19,615 | | | | 536,501 | |
| | |
Atlas Copco AB, Class A | | | 20,967 | | | | 1,106,238 | |
| | |
Atlas Copco AB, Class B | | | 11,418 | | | | 526,217 | |
| | |
Axfood AB(a) | | | 15,699 | | | | 515,809 | |
| | |
BillerudKorsnas AB | | | 17,478 | | | | 262,093 | |
| | |
Boliden AB | | | 10,036 | | | | 514,863 | |
| | |
Castellum AB(a) | | | 18,278 | | | | 457,568 | |
| | |
Clas Ohlson AB, Class B | | | 21,860 | | | | 251,453 | |
| | |
Electrolux AB, Class B(a) | | | 11,754 | | | | 180,483 | |
| | |
Epiroc AB, Class A | | | 20,669 | | | | 448,449 | |
| | |
EQT AB | | | 13,476 | | | | 538,062 | |
| | |
Essity AB, Class B(a) | | | 22,932 | | | | 546,762 | |
| | |
Evolution AB(b) | | | 2,571 | | | | 267,076 | |
| | |
Fabege AB(a) | | | 14,227 | | | | 212,961 | |
| | |
Hexagon AB, Class B | | | 7,937 | | | | 113,058 | |
| | |
Intrum AB | | | 8,807 | | | | 240,885 | |
| | |
Investment AB Latour, Class B | | | 9,121 | | | | 294,592 | |
See Notes to Financial Statements.
Schedule of Investments (continued)
WisdomTree International Equity Fund (DWM)
March 31, 2022
| | | | | | | | |
| Investments | | Shares | | | Value | |
| | |
LeoVegas AB(b) | | | 62,542 | | | $ | 254,345 | |
| | |
Lindab International AB | | | 2,004 | | | | 51,824 | |
| | |
Loomis AB | | | 10,322 | | | | 285,867 | |
| | |
Lundin Energy AB(a) | | | 23,080 | | | | 988,888 | |
| | |
Mycronic AB | | | 7,387 | | | | 139,506 | |
| | |
Peab AB, Class B | | | 29,982 | | | | 304,987 | |
| | |
Saab AB, Class B | | | 6,194 | | | | 227,172 | |
| | |
Samhallsbyggnadsbolaget i Norden AB, Class D(a) | | | 19,552 | | | | 57,779 | |
| | |
Sandvik AB(a) | | | 23,381 | | | | 504,279 | |
| | |
Securitas AB, Class B | | | 16,145 | | | | 184,415 | |
| | |
Skandinaviska Enskilda Banken AB, Class A | | | 90,176 | | | | 991,323 | |
| | |
Skanska AB, Class B(a) | | | 12,850 | | | | 291,488 | |
| | |
SKF AB, Class B(a) | | | 14,428 | | | | 238,341 | |
| | |
Svenska Cellulosa AB SCA, Class B(a) | | | 13,563 | | | | 266,984 | |
| | |
Svenska Handelsbanken AB, Class A(a) | | | 90,987 | | | | 848,421 | |
| | |
Swedbank AB, Class A(a) | | | 18,741 | | | | 283,546 | |
| | |
Swedish Match AB | | | 74,982 | | | | 570,286 | |
| | |
Tele2 AB, Class B(a) | | | 61,096 | | | | 932,888 | |
| | |
Telefonaktiebolaget LM Ericsson, Class B(a) | | | 74,291 | | | | 687,953 | |
| | |
Telia Co. AB(a) | | | 216,763 | | | | 877,807 | |
| | |
Trelleborg AB, Class B | | | 17,384 | | | | 408,513 | |
| | |
Volvo AB, Class A | | | 17,500 | | | | 339,882 | |
| | |
Volvo AB, Class B(a) | | | 36,468 | | | | 691,058 | |
| | |
Wihlborgs Fastigheter AB | | | 13,653 | | | | 289,046 | |
| | | | | | | | |
| Total Sweden | | | | | | | 17,729,668 | |
| | |
| Switzerland – 9.1% | | | | | | | | |
| | |
ABB Ltd., Registered Shares | | | 76,462 | | | | 2,506,774 | |
| | |
Adecco Group AG, Registered Shares | | | 6,136 | | | | 280,112 | |
| | |
Baloise Holding AG, Registered Shares | | | 3,069 | | | | 550,602 | |
| | |
Banque Cantonale Vaudoise, Registered Shares | | | 1,502 | | | | 130,900 | |
| | |
BKW AG | | | 2,537 | | | | 319,796 | |
| | |
Cie Financiere Richemont SA, Class A, Registered Shares | | | 9,128 | | | | 1,170,447 | |
| | |
Coca-Cola HBC AG* | | | 14,013 | | | | 295,111 | |
| | |
EMS-Chemie Holding AG, Registered Shares | | | 881 | | | | 863,050 | |
| | |
Geberit AG, Registered Shares | | | 1,036 | | | | 644,172 | |
| | |
Helvetia Holding AG, Registered Shares | | | 68 | | | | 8,919 | |
| | |
Holcim Ltd., Registered Shares* | | | 23,659 | | | | 1,164,375 | |
| | |
Julius Baer Group Ltd. | | | 5,262 | | | | 308,086 | |
| | |
Kuehne + Nagel International AG, Registered Shares | | | 3,821 | | | | 1,092,426 | |
| | |
Logitech International SA, Registered Shares(a) | | | 4,486 | | | | 337,334 | |
| | |
Lonza Group AG, Registered Shares | | | 655 | | | | 478,447 | |
| | |
Nestle SA, Registered Shares | | | 103,533 | | | | 13,523,137 | |
| | |
Novartis AG, Registered Shares | | | 95,370 | | | | 8,420,334 | |
| | |
Partners Group Holding AG | | | 873 | | | | 1,094,274 | |
| | |
Roche Holding AG | | | 19,039 | | | | 7,581,463 | |
| | |
Roche Holding AG, Bearer Shares | | | 4,473 | | | | 1,968,558 | |
| | |
Schindler Holding AG, Participation Certificate | | | 1,767 | | | | 382,106 | |
| | |
Schindler Holding AG, Registered Shares | | | 39 | | | | 8,387 | |
| | |
SFS Group AG | | | 1,912 | | | | 267,607 | |
| | |
SGS SA, Registered Shares | | | 403 | | | | 1,128,094 | |
| | |
Sika AG, Registered Shares | | | 2,459 | | | | 821,404 | |
| | |
Sulzer AG, Registered Shares(a) | | | 3,905 | | | | 326,318 | |
| | |
Swatch Group AG, Bearer Shares | | | 1,477 | | | | 423,238 | |
| | |
Swiss Life Holding AG, Registered Shares | | | 1,896 | | | | 1,224,236 | |
| | |
Swiss Prime Site AG, Registered Shares | | | 5,388 | | | | 534,262 | |
| | |
Swisscom AG, Registered Shares(a) | | | 3,583 | | | | 2,160,897 | |
| | |
UBS Group AG, Registered Shares | | | 95,029 | | | | 1,873,731 | |
| | |
VAT Group AG(b) | | | 559 | | | | 215,278 | |
| | |
Vontobel Holding AG, Registered Shares | | | 3,638 | | | | 308,948 | |
| | |
Zurich Insurance Group AG | | | 10,930 | | | | 5,425,508 | |
| | | | | | | | |
| Total Switzerland | | | | | | | 57,838,331 | |
| | |
| United Kingdom – 15.5% | | | | | | | | |
| | |
abrdn PLC | | | 119,002 | | | | 336,714 | |
| | |
Admiral Group PLC | | | 33,891 | | | | 1,143,677 | |
| | |
Airtel Africa PLC(b) | | | 284,628 | | | | 522,784 | |
| | |
Anglo American PLC | | | 87,539 | | | | 4,578,635 | |
| | |
Antofagasta PLC | | | 36,469 | | | | 803,323 | |
| | |
Ashmore Group PLC | | | 59,278 | | | | 181,541 | |
| | |
Ashtead Group PLC | | | 8,299 | | | | 528,096 | |
| | |
Assura PLC | | | 359,256 | | | | 316,447 | |
| | |
AstraZeneca PLC | | | 38,602 | | | | 5,149,624 | |
| | |
Avast PLC(b) | | | 39,299 | | | | 292,866 | |
| | |
Aviva PLC | | | 274,029 | | | | 1,631,179 | |
| | |
BAE Systems PLC | | | 198,521 | | | | 1,875,160 | |
| | |
Barclays PLC | | | 206,827 | | | | 403,849 | |
| | |
Barratt Developments PLC | | | 43,257 | | | | 297,530 | |
| | |
Bellway PLC | | | 3,764 | | | | 120,527 | |
| | |
Big Yellow Group PLC | | | 11,860 | | | | 239,854 | |
| | |
BP PLC | | | 844,659 | | | | 4,174,345 | |
| | |
Britvic PLC | | | 22,206 | | | | 235,947 | |
| | |
Bunzl PLC | | | 14,827 | | | | 579,412 | |
| | |
Burberry Group PLC | | | 7,512 | | | | 165,570 | |
| | |
Cazoo Group Ltd.* | | | 7,508 | | | | 20,722 | |
| | |
Central Asia Metals PLC | | | 98,735 | | | | 309,399 | |
| | |
Clarkson PLC | | | 2,387 | | | | 116,285 | |
| | |
Close Brothers Group PLC | | | 23,374 | | | | 366,535 | |
| | |
Coca-Cola Europacific Partners PLC | | | 9,772 | | | | 484,928 | |
| | |
ConvaTec Group PLC(b) | | | 99,741 | | | | 283,135 | |
| | |
Cranswick PLC | | | 7,744 | | | | 359,312 | |
| | |
Croda International PLC | | | 3,167 | | | | 328,583 | |
| | |
Currys PLC | | | 106,875 | | | | 127,912 | |
| | |
DCC PLC | | | 3,357 | | | | 261,929 | |
| | |
Derwent London PLC | | | 3,461 | | | | 146,232 | |
| | |
Diageo PLC | | | 73,248 | | | | 3,726,037 | |
| | |
Direct Line Insurance Group PLC | | | 125,193 | | | | 453,462 | |
| | |
Diversified Energy Co. PLC | | | 199,322 | | | | 311,251 | |
| | |
Domino’s Pizza Group PLC | | | 41,736 | | | | 208,047 | |
| | |
DS Smith PLC | | | 33,024 | | | | 140,052 | |
| | |
Ferrexpo PLC | | | 91,309 | | | | 224,214 | |
| | |
Fresnillo PLC | | | 16,919 | | | | 163,509 | |
| | |
Games Workshop Group PLC | | | 880 | | | | 84,176 | |
| | |
Genus PLC | | | 184 | | | | 6,837 | |
| | |
GlaxoSmithKline PLC | | | 276,365 | | | | 5,993,767 | |
| | |
Hargreaves Lansdown PLC | | | 9,559 | | | | 126,865 | |
| | |
HSBC Holdings PLC | | | 772,020 | | | | 5,340,589 | |
| | |
IMI PLC | | | 18,217 | | | | 326,921 | |
| | |
Imperial Brands PLC | | | 123,737 | | | | 2,623,801 | |
See Notes to Financial Statements.
Schedule of Investments (continued)
WisdomTree International Equity Fund (DWM)
March 31, 2022
| | | | | | | | |
| Investments | | Shares | | | Value | |
| | |
Intertek Group PLC | | | 3,641 | | | $ | 250,435 | |
| | |
J. Sainsbury PLC | | | 98,468 | | | | 327,620 | |
| | |
Johnson Matthey PLC | | | 7,538 | | | | 186,439 | |
| | |
Jupiter Fund Management PLC | | | 68,507 | | | | 186,353 | |
| | |
Kingfisher PLC | | | 67,132 | | | | 225,746 | |
| | |
Land Securities Group PLC | | | 34,978 | | | | 361,799 | |
| | |
Legal & General Group PLC | | | 301,678 | | | | 1,080,396 | |
| | |
Linde PLC | | | 7,883 | | | | 2,547,982 | |
| | |
Lloyds Banking Group PLC | | | 1,781,460 | | | | 1,103,703 | |
| | |
London Stock Exchange Group PLC | | | 3,672 | | | | 385,135 | |
| | |
Londonmetric Property PLC | | | 67,944 | | | | 246,727 | |
| | |
Mondi PLC | | | 15,561 | | | | 305,584 | |
| | |
Morgan Sindall Group PLC | | | 5,102 | | | | 162,229 | |
| | |
National Grid PLC | | | 180,662 | | | | 2,788,773 | |
| | |
NatWest Group PLC | | | 288,053 | | | | 818,833 | |
| | |
OSB Group PLC | | | 31,914 | | | | 238,041 | |
| | |
Pan African Resources PLC(a) | | | 1,186,763 | | | | 350,012 | |
| | |
Paragon Banking Group PLC | | | 35,140 | | | | 231,335 | |
| | |
Pearson PLC | | | 21,848 | | | | 215,919 | |
| | |
QinetiQ Group PLC | | | 67,753 | | | | 271,546 | |
| | |
Reckitt Benckiser Group PLC | | | 21,497 | | | | 1,650,691 | |
| | |
Redde Northgate PLC | | | 39,028 | | | | 221,989 | |
| | |
Redrow PLC | | | 14,476 | | | | 99,645 | |
| | |
RELX PLC | | | 51,087 | | | | 1,602,895 | |
| | |
Rightmove PLC | | | 8,179 | | | | 68,145 | |
| | |
Rio Tinto PLC | | | 166,951 | | | | 13,688,034 | |
| | |
Royal Mail PLC | | | 37,511 | | | | 162,489 | |
| | |
RWS Holdings PLC | | | 20,396 | | | | 99,361 | |
| | |
Sabre Insurance Group PLC(b) | | | 125,371 | | | | 382,962 | |
| | |
Sage Group PLC | | | 48,808 | | | | 450,613 | |
| | |
Schroders PLC | | | 15,883 | | | | 675,678 | |
| | |
Segro PLC | | | 33,656 | | | | 596,234 | |
| | |
Serco Group PLC | | | 117,683 | | | | 223,279 | |
| | |
Severn Trent PLC | | | 9,770 | | | | 395,944 | |
| | |
Shell PLC | | | 238,297 | | | | 6,615,500 | |
| | |
Smith & Nephew PLC | | | 22,296 | | | | 358,144 | |
| | |
Smiths Group PLC | | | 15,376 | | | | 294,056 | |
| | |
Spectris PLC | | | 7,209 | | | | 246,690 | |
| | |
Spirent Communications PLC | | | 43,399 | | | | 135,996 | |
| | |
SSE PLC | | | 80,129 | | | | 1,844,700 | |
| | |
St. James’s Place PLC | | | 875 | | | | 16,688 | |
| | |
Standard Chartered PLC | | | 81,272 | | | | 545,949 | |
| | |
Tate & Lyle PLC | | | 55,228 | | | | 532,426 | |
| | |
Taylor Wimpey PLC | | | 202,697 | | | | 348,814 | |
| | |
TBC Bank Group PLC | | | 1,366 | | | | 19,784 | |
| | |
Telecom Plus PLC | | | 17,206 | | | | 346,611 | |
| | |
Tesco PLC | | | 237,634 | | | | 863,551 | |
| | |
TI Fluid Systems PLC(b) | | | 48,407 | | | | 121,861 | |
| | |
Tyman PLC | | | 42,106 | | | | 176,296 | |
| | |
Ultra Electronics Holdings PLC | | | 2,285 | | | | 100,004 | |
| | |
Unilever PLC | | | 102,648 | | | | 4,669,486 | |
| | |
Unite Group PLC | | | 4,940 | | | | 75,319 | |
| | |
United Utilities Group PLC | | | 64,926 | | | | 961,277 | |
| | |
Vesuvius PLC | | | 54,944 | | | | 247,120 | |
| | |
Victrex PLC | | | 3,945 | | | | 95,054 | |
| | |
Vivo Energy PLC(b) | | | 143,615 | | | | 258,298 | |
| | |
Weir Group PLC | | | 2,961 | | | | 63,976 | |
| | |
Wincanton PLC | | | 49,086 | | | | 249,468 | |
| | |
Workspace Group PLC | | | 21,780 | | | | 196,435 | |
| | | | | | | | |
| Total United Kingdom | | | | | | | 98,097,649 | |
TOTAL COMMON STOCKS
(Cost: $523,510,615) | | | | | | | 628,888,433 | |
|
| INVESTMENT OF CASH COLLATERAL FOR SECURITIES LOANED – 3.4% | |
| | |
| United States – 3.4% | | | | | | | | |
| | |
State Street Navigator Securities Lending Government Money Market Portfolio, 0.25%(c) | | | | | | | | |
| (Cost: $21,556,486) | | | 21,556,486 | | | | 21,556,486 | |
| |
TOTAL INVESTMENTS IN SECURITIES – 102.5%
(Cost: $545,067,101) | | | | 650,444,919 | |
| |
Other Assets less Liabilities – (2.5)% | | | | (16,016,572 | ) |
| | | | | | | | |
| NET ASSETS – 100.0% | | | $ | 634,428,347 | |
| * | Non-income producing security. |
| (a) | Security, or portion thereof, was on loan at March 31, 2022 (See Note 2). At March 31, 2022, the total market value of the Fund’s securities on loan identified in the Schedule of Investments was $37,387,164 and the total market value of the collateral held by the Fund was $39,751,724. The total market value of the collateral includes non-cash U.S. Government securities collateral having a value of $18,195,238. |
| (b) | This security is exempt from registration under rule 144A of the Securities Act of 1933. This security may be sold in transactions that are exempt from registration, normally to qualified institutional buyers. |
| (c) | Rate shown represents annualized 7-day yield as of March 31, 2022. |
Affiliated holdings are investments in entities in which the Fund owns 5% or more of the outstanding voting securities or are investments in entities which are under common ownership or control. Investments in affiliates during the fiscal year ended March 31, 2022 were as follows:
| | | | | | | | | | | | | | | | | | | | | | | | | | | | |
| | | | | | | |
| Affiliate | | Value at
3/31/2021 | | | Purchases/
Additions | | | Sales/
Reductions | | | Realized
Gain/
(Loss) | | | Change in
Unrealized
Appreciation/
Depreciation | | | Value at
3/31/2022 | | | Dividend
Income | |
WisdomTree International AI Enhanced Value Fund^ | | $ | 676,441 | | | $ | 3,121,336 | | | $ | 3,726,800 | | | $ | (78,048 | ) | | $ | 7,071 | | | $ | — | | | $ | 54,077 | |
| ^ | As of March 31, 2022, the Fund did not hold a position in this affiliate. |
See Notes to Financial Statements.
Schedule of Investments (concluded)
WisdomTree International Equity Fund (DWM)
March 31, 2022
| | | | | | | | | | | | | | | | | | | | | | | | | | | | |
|
| FINANCIAL DERIVATIVE INSTRUMENTS | |
|
| FOREIGN CURRENCY CONTRACTS (OTC – OVER THE COUNTER) | |
| | | | | |
| Counterparty | | Settlement
Date | | | Amount and
Description of
Currency to
be Purchased | | | Amount and
Description of
Currency to
be Sold | | | Unrealized
Appreciation | | | Unrealized
Depreciation | |
Bank of Montreal | | | 4/1/2022 | | | | 6,000 | | | | CHF | | | | 8,131 | | | | CAD | | | $ | 10 | | | $ | — | |
The following is a summary of the fair valuations according to the inputs used as of March 31, 2022 in valuing the Fund’s investments (See Note 2 — Fair Value Measurement):
| | | | | | | | | | | | | | | | |
| | | | |
| | | Quoted
Prices in
Active
Markets
(Level 1) | | | Other
Significant
Observable
Inputs
(Level 2) | | | Significant
Unobservable
Inputs
(Level 3) | | | Total | |
Assets: | | | | | | | | | | | | | | | | |
Investments in Securities | | | | | | | | | | | | | | | | |
Common Stocks | | $ | 628,888,433 | | | $ | — | | | $ | — | | | $ | 628,888,433 | |
Investment of Cash Collateral for Securities Loaned | | | — | | | | 21,556,486 | | | | — | | | | 21,556,486 | |
Total Investments in Securities | | $ | 628,888,433 | | | $ | 21,556,486 | | | $ | — | | | $ | 650,444,919 | |
Financial Derivative Instruments | | | | | | | | | | | | | | | | |
Foreign Currency Contracts1 | | $ | — | | | $ | 10 | | | $ | — | | | $ | 10 | |
Total – Net | | $ | 628,888,433 | | | $ | 21,556,496 | | | $ | — | | | $ | 650,444,929 | |
| 1 | Amount shown represents the unrealized appreciation (depreciation) on the financial instrument. |
See Notes to Financial Statements.
Schedule of Investments
WisdomTree International High Dividend Fund (DTH)
March 31, 2022
| | | | | | | | |
| Investments | | Shares | | | Value | |
| | |
| COMMON STOCKS – 98.4% | | | | | | | | |
| | |
| Australia – 16.3% | | | | | | | | |
| | |
Accent Group Ltd. | | | 26,284 | | | $ | 33,555 | |
| | |
Adairs Ltd.(a) | | | 25,713 | | | | 57,927 | |
| | |
Adbri Ltd. | | | 30,600 | | | | 69,627 | |
| | |
Alumina Ltd. | | | 79,795 | | | | 120,443 | |
| | |
APA Group(a) | | | 45,000 | | | | 360,569 | |
| | |
Atlas Arteria Ltd. | | | 27,231 | | | | 133,942 | |
| | |
Aurizon Holdings Ltd. | | | 86,304 | | | | 239,149 | |
| | |
Australia & New Zealand Banking Group Ltd. | | | 44,578 | | | | 923,933 | |
| | |
Bendigo & Adelaide Bank Ltd.(a) | | | 20,587 | | | | 159,081 | |
| | |
BHP Group Ltd. | | | 341,173 | | | | 13,258,546 | |
| | |
Coles Group Ltd. | | | 41,276 | | | | 555,142 | |
| | |
Commonwealth Bank of Australia | | | 37,288 | | | | 2,961,710 | |
| | |
Cromwell Property Group(a) | | | 222,007 | | | | 138,374 | |
| | |
CSR Ltd. | | | 23,691 | | | | 109,413 | |
| | |
Dexus | | | 42,411 | | | | 348,741 | |
| | |
Downer EDI Ltd. | | | 15,042 | | | | 60,884 | |
| | |
Evolution Mining Ltd. | | | 28,930 | | | | 95,590 | |
| | |
Fortescue Metals Group Ltd. | | | 233,252 | | | | 3,618,817 | |
| | |
GPT Group | | | 84,023 | | | | 326,843 | |
| | |
Growthpoint Properties Australia Ltd. | | | 48,873 | | | | 161,118 | |
| | |
Harvey Norman Holdings Ltd.(a) | | | 51,146 | | | | 205,483 | |
| | |
Inghams Group Ltd.(a) | | | 31,950 | | | | 73,418 | |
| | |
Insignia Financial Ltd.(a) | | | 14,531 | | | | 40,375 | |
| | |
Insurance Australia Group Ltd.(a) | | | 37,553 | | | | 123,518 | |
| | |
IRESS Ltd. | | | 5,815 | | | | 52,139 | |
| | |
JB Hi-Fi Ltd.(a) | | | 4,207 | | | | 171,294 | |
| | |
Magellan Financial Group Ltd.(a) | | | 3,858 | | | | 46,181 | |
| | |
Medibank Pvt Ltd. | | | 58,746 | | | | 135,875 | |
| | |
Metcash Ltd.(a) | | | 37,394 | | | | 127,488 | |
| | |
Mineral Resources Ltd. | | | 11,837 | | | | 468,539 | |
| | |
Mirvac Group | | | 71,227 | | | | 133,185 | |
| | |
National Australia Bank Ltd. | | | 64,630 | | | | 1,570,071 | |
| | |
New Hope Corp. Ltd.(a) | | | 36,867 | | | | 94,130 | |
| | |
Newcrest Mining Ltd. | | | 15,049 | | | | 302,190 | |
| | |
NIB Holdings Ltd. | | | 13,901 | | | | 66,392 | |
| | |
Nick Scali Ltd. | | | 4,394 | | | | 37,451 | |
| | |
Nickel Mines Ltd. | | | 67,936 | | | | 64,536 | |
| | |
Nine Entertainment Co. Holdings Ltd. | | | 41,891 | | | | 93,430 | |
| | |
NRW Holdings Ltd. | | | 41,675 | | | | 67,286 | |
| | |
Orora Ltd. | | | 46,102 | | | | 124,979 | |
| | |
Pendal Group Ltd. | | | 16,588 | | | | 57,924 | |
| | |
Platinum Asset Management Ltd. | | | 39,431 | | | | 65,440 | |
| | |
Sandfire Resources Ltd. | | | 16,050 | | | | 68,460 | |
| | |
Scentre Group | | | 134,743 | | | | 308,615 | |
| | |
SmartGroup Corp. Ltd. | | | 14,872 | | | | 95,487 | |
| | |
Stockland | | | 69,953 | | | | 224,308 | |
| | |
Suncorp Group Ltd. | | | 43,277 | | | | 361,387 | |
| | |
Super Retail Group Ltd.(a) | | | 9,774 | | | | 75,747 | |
| | |
Telstra Corp. Ltd. | | | 451,766 | | | | 1,343,444 | |
| | |
Vicinity Centres | | | 151,572 | | | | 212,280 | |
| | |
Wesfarmers Ltd. | | | 31,239 | | | | 1,182,564 | |
| | |
Westpac Banking Corp. | | | 52,473 | | | | 955,167 | |
| | |
Worley Ltd. | | | 13,162 | | | | 127,602 | |
| | | | | | | | |
| Total Australia | | | | | | | 32,809,789 | |
| | |
| Austria – 0.7% | | | | | | | | |
| | |
BAWAG Group AG*(b) | | | 4,793 | | | | 245,102 | |
| | |
Oesterreichische Post AG(a) | | | 2,864 | | | | 102,609 | |
| | |
OMV AG | | | 10,133 | | | | 489,200 | |
| | |
Semperit AG Holding | | | 1,597 | | | | 40,424 | |
| | |
Strabag SE, Bearer Shares | | | 9,613 | | | | 387,727 | |
| | |
Telekom Austria AG* | | | 27,351 | | | | 213,025 | |
| | | | | | | | |
| Total Austria | | | | | | | 1,478,087 | |
| | |
| Belgium – 0.6% | | | | | | | | |
| | |
Aedifica SA | | | 739 | | | | 93,736 | |
| | |
Cofinimmo SA | | | 1,183 | | | | 173,747 | |
| | |
Econocom Group SA/NV | | | 16,365 | | | | 73,380 | |
| | |
Etablissements Franz Colruyt NV | | | 2,972 | | | | 124,005 | |
| | |
Proximus SADP | | | 17,939 | | | | 336,323 | |
| | |
Solvay SA(a) | | | 2,278 | | | | 226,747 | |
| | |
Telenet Group Holding NV | | | 8,492 | | | | 276,089 | |
| | | | | | | | |
| Total Belgium | | | | | | | 1,304,027 | |
| | |
| China – 2.4% | | | | | | | | |
| | |
Beijing Enterprises Holdings Ltd. | | | 38,000 | | | | 120,579 | |
| | |
BOC Hong Kong Holdings Ltd. | | | 247,047 | | | | 936,907 | |
| | |
China Everbright Environment Group Ltd. | | | 230,000 | | | | 139,209 | |
| | |
China Merchants Port Holdings Co. Ltd. | | | 198,000 | | | | 359,016 | |
| | |
China Power International Development Ltd. | | | 259,000 | | | | 137,910 | |
| | |
China Taiping Insurance Holdings Co. Ltd. | | | 46,000 | | | | 56,330 | |
| | |
CITIC Ltd. | | | 1,222,000 | | | | 1,359,095 | |
| | |
CITIC Telecom International Holdings Ltd. | | | 434,000 | | | | 159,604 | |
| | |
Guangdong Investment Ltd. | | | 240,000 | | | | 328,523 | |
| | |
Lenovo Group Ltd.(a) | | | 338,000 | | | | 367,720 | |
| | |
Shoucheng Holdings Ltd. | | | 384,000 | | | | 56,879 | |
| | |
Shougang Fushan Resources Group Ltd. | | | 356,838 | | | | 140,340 | |
| | |
Sino-Ocean Group Holding Ltd. | | | 537,500 | | | | 114,619 | |
| | |
Wilmar International Ltd. | | | 116,800 | | | | 406,493 | |
| | |
Yanlord Land Group Ltd. | | | 141,700 | | | | 129,832 | |
| | | | | | | | |
| Total China | | | | | | | 4,813,056 | |
| | |
| Denmark – 0.3% | | | | | | | | |
| | |
Alm Brand A/S | | | 29,273 | | | | 50,617 | |
| | |
D/S Norden A/S | | | 2,598 | | | | 91,868 | |
| | |
Scandinavian Tobacco Group A/S, Class A(b) | | | 5,294 | | | | 113,872 | |
| | |
Topdanmark A/S | | | 1,427 | | | | 80,343 | |
| | |
Tryg A/S | | | 13,609 | | | | 334,355 | |
| | | | | | | | |
| Total Denmark | | | | | | | 671,055 | |
| | |
| Finland – 2.2% | | | | | | | | |
| | |
Elisa Oyj | | | 5,903 | | | | 358,743 | |
| | |
Fortum Oyj | | | 34,687 | | | | 637,967 | |
| | |
Kemira Oyj(a) | | | 7,797 | | | | 102,976 | |
| | |
Nokian Renkaat Oyj | | | 5,385 | | | | 88,526 | |
| | |
Nordea Bank Abp(a) | | | 180,706 | | | | 1,886,677 | |
| | |
Orion Oyj, Class B(a) | | | 3,231 | | | | 147,933 | |
| | |
Sampo Oyj, Class A | | | 9,642 | | | | 476,117 | |
| | |
Sanoma Oyj | | | 6,913 | | | | 98,608 | |
See Notes to Financial Statements.
Schedule of Investments (continued)
WisdomTree International High Dividend Fund (DTH)
March 31, 2022
| | | | | | | | |
| Investments | | Shares | | | Value | |
| | |
TietoEVRY Oyj(a) | | | 3,805 | | | $ | 102,200 | |
| | |
UPM-Kymmene Oyj(a) | | | 15,111 | | | | 498,681 | |
| | | | | | | | |
| Total Finland | | | | | | | 4,398,428 | |
| | |
| France – 7.7% | | | | | | | | |
| | |
ALD SA(b) | | | 20,470 | | | | 274,222 | |
| | |
Amundi SA(b) | | | 3,413 | | | | 236,203 | |
| | |
AXA SA(a) | | | 92,509 | | | | 2,734,340 | |
| | |
BNP Paribas SA | | | 24,513 | | | | 1,416,359 | |
| | |
Bouygues SA(a) | | | 11,908 | | | | 419,080 | |
| | |
Chargeurs SA | | | 2,787 | | | | 63,136 | |
| | |
Covivio(a) | | | 2,813 | | | | 225,790 | |
| | |
Credit Agricole SA | | | 81,754 | | | | 990,230 | |
| | |
Danone SA | | | 14,757 | | | | 821,462 | |
| | |
Eiffage SA | | | 2,271 | | | | 235,602 | |
| | |
Engie SA | | | 67,885 | | | | 901,402 | |
| | |
Eutelsat Communications SA | | | 11,721 | | | | 128,379 | |
| | |
Gecina SA | | | 2,065 | | | | 262,618 | |
| | |
ICADE | | | 2,736 | | | | 177,630 | |
| | |
Imerys SA | | | 2,884 | | | | 125,146 | |
| | |
Klepierre SA*(a) | | | 8,277 | | | | 222,683 | |
| | |
Metropole Television SA | | | 11,017 | | | | 219,174 | |
| | |
Nexity SA | | | 3,800 | | | | 134,876 | |
| | |
Orange SA | | | 157,945 | | | | 1,881,095 | |
| | |
Publicis Groupe SA | | | 8,267 | | | | 508,297 | |
| | |
Rubis SCA | | | 5,099 | | | | 151,310 | |
| | |
Sanofi | | | 29,896 | | | | 3,077,233 | |
| | |
Societe BIC SA | | | 2,554 | | | | 129,923 | |
| | |
Television Francaise 1 | | | 11,105 | | | | 108,856 | |
| | |
Trigano SA | | | 593 | | | | 87,094 | |
| | |
Verallia SA(b) | | | 4,022 | | | | 96,393 | |
| | | | | | | | |
| Total France | | | | | | | 15,628,533 | |
| | |
| Germany – 6.4% | | | | | | | | |
| | |
Allianz SE, Registered Shares | | | 8,576 | | | | 2,066,339 | |
| | |
BASF SE | | | 29,638 | | | | 1,706,876 | |
| | |
Bayer AG, Registered Shares | | | 25,408 | | | | 1,755,581 | |
| | |
Bilfinger SE | | | 2,891 | | | | 111,168 | |
| | |
Deutsche Telekom AG, Registered Shares | | | 112,779 | | | | 2,124,688 | |
| | |
DWS Group GmbH & Co. KGaA(b) | | | 4,812 | | | | 178,076 | |
| | |
E.ON SE | | | 104,183 | | | | 1,222,021 | |
| | |
Evonik Industries AG | | | 12,735 | | | | 356,791 | |
| | |
Freenet AG | | | 9,542 | | | | 257,991 | |
| | |
Hannover Rueck SE | | | 2,334 | | | | 400,835 | |
| | |
HeidelbergCement AG | | | 4,261 | | | | 244,920 | |
| | |
Hochtief AG | | | 2,721 | | | | 185,284 | |
| | |
METRO AG* | | | 21,881 | | | | 196,374 | |
| | |
Muenchener Rueckversicherungs—Gesellschaft AG in Muenchen, Registered Shares | | | 2,352 | | | | 635,920 | |
| | |
TAG Immobilien AG | | | 3,423 | | | | 78,267 | |
| | |
Talanx AG | | | 5,057 | | | | 225,179 | |
| | |
Telefonica Deutschland Holding AG | | | 149,695 | | | | 411,232 | |
| | |
Vonovia SE | | | 15,081 | | | | 709,957 | |
| | | | | | | | |
| Total Germany | | | | | | | 12,867,499 | |
| | |
| Hong Kong – 3.3% | | | | | | | | |
| | |
Bank of East Asia Ltd. | | | 60,600 | | | | 95,178 | |
| | |
CLP Holdings Ltd. | | | 99,000 | | | | 965,172 | |
| | |
Fortune Real Estate Investment Trust | | | 116,000 | | | | 104,426 | |
| | |
Hang Lung Group Ltd. | | | 57,000 | | | | 121,112 | |
| | |
Hang Lung Properties Ltd. | | | 113,000 | | | | 227,980 | |
| | |
Hang Seng Bank Ltd. | | | 48,318 | | | | 932,870 | |
| | |
Henderson Land Development Co. Ltd. | | | 166,220 | | | | 691,929 | |
| | |
Hutchison Port Holdings Trust | | | 504,823 | | | | 123,682 | |
| | |
Hysan Development Co. Ltd. | | | 30,000 | | | | 87,724 | |
| | |
Kowloon Development Co. Ltd. | | | 112,000 | | | | 150,165 | |
| | |
Link REIT | | | 50,000 | | | | 427,765 | |
| | |
Power Assets Holdings Ltd. | | | 128,518 | | | | 837,761 | |
| | |
Singamas Container Holdings Ltd. | | | 410,000 | | | | 60,206 | |
| | |
Sino Land Co. Ltd. | | | 224,000 | | | | 290,605 | |
| | |
Sun Hung Kai Properties Ltd. | | | 87,000 | | | | 1,039,814 | |
| | |
Swire Pacific Ltd., Class B | | | 80,000 | | | | 80,701 | |
| | |
Swire Properties Ltd. | | | 156,400 | | | | 388,634 | |
| | | | | | | | |
| Total Hong Kong | | | | | | | 6,625,724 | |
| | |
| Israel – 0.2% | | | | | | | | |
| | |
Ashtrom Group Ltd. | | | 4,592 | | | | 136,008 | |
| | |
Delek Automotive Systems Ltd. | | | 9,400 | | | | 145,127 | |
| | |
Gazit-Globe Ltd. | | | 8,672 | | | | 79,050 | |
| | |
Phoenix Holdings Ltd. | | | 6,790 | | | | 89,470 | |
| | | | | | | | |
| Total Israel | | | | | | | 449,655 | |
| | |
| Italy – 5.2% | | | | | | | | |
| | |
A2A SpA | | | 112,227 | | | | 194,109 | |
| | |
ACEA SpA | | | 7,158 | | | | 132,766 | |
| | |
Anima Holding SpA(b) | | | 22,382 | | | | 101,655 | |
| | |
Assicurazioni Generali SpA(a) | | | 55,126 | | | | 1,273,948 | |
| | |
Azimut Holding SpA | | | 3,465 | | | | 81,463 | |
| | |
Banca Mediolanum SpA | | | 28,072 | | | | 242,253 | |
| | |
BFF Bank SpA(b) | | | 12,064 | | | | 90,404 | |
| | |
Enel SpA | | | 315,791 | | | | 2,132,082 | |
| | |
Eni SpA | | | 121,525 | | | | 1,797,546 | |
| | |
Esprinet SpA | | | 4,338 | | | | 46,433 | |
| | |
Intesa Sanpaolo SpA | | | 579,366 | | | | 1,343,090 | |
| | |
Iren SpA | | | 47,909 | | | | 128,148 | |
| | |
Italgas SpA | | | 42,080 | | | | 272,682 | |
| | |
Mediobanca Banca di Credito Finanziario SpA | | | 23,924 | | | | 245,428 | |
| | |
Poste Italiane SpA(b) | | | 22,291 | | | | 255,957 | |
| | |
Snam SpA(a) | | | 167,574 | | | | 975,513 | |
| | |
Terna—Rete Elettrica Nazionale(a) | | | 82,344 | | | | 713,354 | |
| | |
Unieuro SpA(a)(b) | | | 3,368 | | | | 66,142 | |
| | |
Unipol Gruppo SpA | | | 17,596 | | | | 97,499 | |
| | |
UnipolSai Assicurazioni SpA(a) | | | 108,602 | | | | 324,566 | |
| | | | | | | | |
| Total Italy | | | | | | | 10,515,038 | |
| | |
| Japan – 17.8% | | | | | | | | |
| | |
Aisin Corp. | | | 8,100 | | | | 279,955 | |
| | |
Akita Bank Ltd. | | | 4,400 | | | | 60,975 | |
| | |
Aozora Bank Ltd.(a) | | | 5,500 | | | | 117,318 | |
| | |
Asahi Holdings, Inc.(a) | | | 3,800 | | | | 70,912 | |
| | |
Avex, Inc.(a) | | | 7,900 | | | | 86,827 | |
See Notes to Financial Statements.
Schedule of Investments (continued)
WisdomTree International High Dividend Fund (DTH)
March 31, 2022
| | | | | | | | |
| Investments | | Shares | | | Value | |
| | |
Bank of Saga Ltd. | | | 7,000 | | | $ | 84,317 | |
| | |
Canon, Inc. | | | 27,300 | | | | 673,194 | |
| | |
Chubu Electric Power Co., Inc.(a) | | | 23,400 | | | | 243,495 | |
| | |
Chugoku Electric Power Co., Inc.(a) | | | 16,900 | | | | 117,935 | |
| | |
Concordia Financial Group Ltd. | | | 32,700 | | | | 123,391 | |
| | |
Cosmo Energy Holdings Co. Ltd. | | | 3,800 | | | | 82,340 | |
| | |
Daito Trust Construction Co. Ltd. | | | 1,500 | | | | 160,536 | |
| | |
Daiwa House Industry Co. Ltd. | | | 14,200 | | | | 374,494 | |
| | |
Daiwa Securities Group, Inc.(a) | | | 48,300 | | | | 275,653 | |
| | |
Daiwabo Holdings Co. Ltd. | | | 3,500 | | | | 47,551 | |
| | |
Denka Co. Ltd. | | | 3,100 | | | | 86,838 | |
| | |
Electric Power Development Co. Ltd. | | | 8,300 | | | | 119,534 | |
| | |
ENEOS Holdings, Inc. | | | 153,800 | | | | 580,353 | |
| | |
FIDEA Holdings Co. Ltd.(a) | | | 6,400 | | | | 67,124 | |
| | |
Forum Engineering, Inc.(a) | | | 8,400 | | | | 56,404 | |
| | |
Fukuoka Financial Group, Inc. | | | 6,900 | | | | 134,959 | |
| | |
H.U. Group Holdings, Inc. | | | 5,500 | | | | 131,637 | |
| | |
Haseko Corp. | | | 13,000 | | | | 150,698 | |
| | |
Hulic Co. Ltd. | | | 13,500 | | | | 122,459 | |
| | |
Idemitsu Kosan Co. Ltd.(a) | | | 11,700 | | | | 325,335 | |
| | |
Inpex Corp. | | | 30,400 | | | | 360,667 | |
| | |
Isuzu Motors Ltd. | | | 17,200 | | | | 225,035 | |
| | |
Japan Post Holdings Co. Ltd. | | | 99,000 | | | | 732,784 | |
| | |
Japan Post Insurance Co. Ltd. | | | 13,000 | | | | 228,779 | |
| | |
Japan Tobacco, Inc. | | | 123,500 | | | | 2,124,047 | |
| | |
JFE Holdings, Inc. | | | 14,400 | | | | 204,418 | |
| | |
K’s Holdings Corp.(a) | | | 10,100 | | | | 105,098 | |
| | |
Kajima Corp. | | | 18,100 | | | | 222,345 | |
| | |
Kansai Electric Power Co., Inc. | | | 31,300 | | | | 296,302 | |
| | |
KDDI Corp. | | | 73,200 | | | | 2,415,374 | |
| | |
Ki-Star Real Estate Co. Ltd.(a) | | | 700 | | | | 30,393 | |
| | |
Konica Minolta, Inc.(a) | | | 17,700 | | | | 75,248 | |
| | |
Kuraray Co. Ltd. | | | 13,900 | | | | 121,049 | |
| | |
Kyushu Electric Power Co., Inc. | | | 18,000 | | | | 121,162 | |
| | |
Kyushu Railway Co. | | | 4,100 | | | | 84,685 | |
| | |
Marubeni Corp. | | | 49,000 | | | | 575,687 | |
| | |
Mitsubishi Corp. | | | 36,876 | | | | 1,397,870 | |
| | |
Mitsubishi Gas Chemical Co., Inc. | | | 6,000 | | | | 102,871 | |
| | |
Mitsubishi HC Capital, Inc. | | | 37,700 | | | | 177,046 | |
| | |
Mitsubishi Heavy Industries Ltd. | | | 9,600 | | | | 317,957 | |
| | |
Mitsubishi Materials Corp. | | | 6,000 | | | | 105,936 | |
| | |
Mitsubishi UFJ Financial Group, Inc. | | | 253,200 | | | | 1,586,059 | |
| | |
Mitsui OSK Lines Ltd.(a) | | | 22,200 | | | | 625,532 | |
| | |
Mizuho Financial Group, Inc. | | | 60,360 | | | | 779,272 | |
| | |
MS&AD Insurance Group Holdings, Inc. | | | 12,900 | | | | 422,791 | |
| | |
Neturen Co. Ltd.(a) | | | 11,300 | | | | 55,022 | |
| | |
NGK Spark Plug Co. Ltd. | | | 8,500 | | | | 138,451 | |
| | |
Nikko Co. Ltd.(a) | | | 23,600 | | | | 118,024 | |
| | |
Nintendo Co. Ltd. | | | 2,900 | | | | 1,473,475 | |
| | |
Nippon Electric Glass Co. Ltd. | | | 3,200 | | | | 71,606 | |
| | |
Nippon Telegraph & Telephone Corp. | | | 128,600 | | | | 3,756,021 | |
| | |
Nippon Yusen KK(a) | | | 7,800 | | | | 691,477 | |
| | |
Nishimatsu Construction Co. Ltd.(a) | | | 5,700 | | | | 172,350 | |
| | |
Nittoc Construction Co. Ltd.(a) | | | 18,000 | | | | 104,255 | |
| | |
NS United Kaiun Kaisha Ltd. | | | 900 | | | | 31,217 | |
| | |
Resona Holdings, Inc. | | | 67,400 | | | | 291,035 | |
| | |
SBI Holdings, Inc. | | | 3,900 | | | | 99,609 | |
| | |
Scroll Corp.(a) | | | 8,200 | | | | 56,277 | |
| | |
Sekisui House Ltd. | | | 18,200 | | | | 355,528 | |
| | |
Shimizu Corp.(a) | | | 24,200 | | | | 146,546 | |
| | |
SoftBank Corp. | | | 260,700 | | | | 3,067,185 | |
| | |
Sojitz Corp.(a) | | | 6,780 | | | | 112,670 | |
| | |
Sompo Holdings, Inc. | | | 11,100 | | | | 492,104 | |
| | |
Sumitomo Chemical Co. Ltd. | | | 36,200 | | | | 167,616 | |
| | |
Sumitomo Corp. | | | 38,600 | | | | 673,890 | |
| | |
Sumitomo Metal Mining Co. Ltd. | | | 8,000 | | | | 406,212 | |
| | |
Sumitomo Mitsui Financial Group, Inc. | | | 32,900 | | | | 1,059,034 | |
| | |
Sumitomo Mitsui Trust Holdings, Inc. | | | 8,600 | | | | 283,490 | |
| | |
Sumitomo Rubber Industries Ltd. | | | 13,500 | | | | 125,018 | |
| | |
T&D Holdings, Inc. | | | 10,200 | | | | 140,426 | |
| | |
Taisei Corp. | | | 7,000 | | | | 203,872 | |
| | |
Takeda Pharmaceutical Co. Ltd.(a) | | | 59,100 | | | | 1,703,249 | |
| | |
Tama Home Co. Ltd. | | | 2,600 | | | | 54,710 | |
| | |
Teijin Ltd. | | | 8,800 | | | | 98,821 | |
| | |
Tekken Corp.(a) | | | 6,600 | | | | 99,999 | |
| | |
Tokio Marine Holdings, Inc. | | | 11,600 | | | | 681,234 | |
| | |
Tosoh Corp. | | | 8,900 | | | | 133,014 | |
| | |
Toyo Seikan Group Holdings Ltd. | | | 8,300 | | | | 96,147 | |
| | |
Yahagi Construction Co. Ltd.(a) | | | 10,600 | | | | 70,041 | |
| | |
YAMADA Consulting Group Co. Ltd.(a) | | | 6,500 | | | | 63,246 | |
| | |
Yamada Holdings Co. Ltd. | | | 36,200 | | | | 113,335 | |
| | |
Yamaha Motor Co. Ltd. | | | 11,900 | | | | 270,207 | |
| | |
Yamanashi Chuo Bank Ltd. | | | 8,800 | | | | 69,022 | |
| | |
Yokohama Rubber Co. Ltd. | | | 8,200 | | | | 114,310 | |
| | | | | | | | |
| Total Japan | | | | 35,872,386 | |
|
| Netherlands – 1.6% | |
| | |
ASR Nederland NV | | | 3,505 | | | | 164,690 | |
| | |
ING Groep NV | | | 60,261 | | | | 637,707 | |
| | |
Koninklijke KPN NV | | | 188,926 | | | | 660,686 | |
| | |
Koninklijke Vopak NV | | | 3,632 | | | | 118,688 | |
| | |
NN Group NV | | | 10,803 | | | | 551,235 | |
| | |
Ordina NV | | | 19,670 | | | | 101,988 | |
| | |
PostNL NV(a) | | | 50,113 | | | | 192,924 | |
| | |
Randstad NV(a) | | | 5,963 | | | | 362,522 | |
| | |
RHI Magnesita NV | | | 1,907 | | | | 61,164 | |
| | |
SBM Offshore NV(a) | | | 7,286 | | | | 116,859 | |
| | |
Signify NV(b) | | | 3,964 | | | | 187,140 | |
| | | | | | | | |
| Total Netherlands | | | | | | | 3,155,603 | |
| | |
| Norway – 2.1% | | | | | | | | |
| | |
ABG Sundal Collier Holding ASA | | | 83,560 | | | | 81,419 | |
| | |
AF Gruppen ASA | | | 7,344 | | | | 167,978 | |
| | |
Aker BP ASA | | | 8,706 | | | | 329,163 | |
| | |
Atea ASA* | | | 2,132 | | | | 32,234 | |
| | |
Austevoll Seafood ASA | | | 4,311 | | | | 67,396 | |
| | |
DNB Bank ASA | | | 26,808 | | | | 613,481 | |
| | |
Gjensidige Forsikring ASA(a) | | | 11,995 | | | | 300,012 | |
| | |
Kid ASA(b) | | | 7,163 | | | | 84,377 | |
See Notes to Financial Statements.
Schedule of Investments (continued)
WisdomTree International High Dividend Fund (DTH)
March 31, 2022
| | | | | | | | |
| Investments | | Shares | | | Value | |
| | |
Kongsberg Gruppen ASA | | | 5,051 | | | $ | 202,756 | |
| | |
Orkla ASA | | | 21,836 | | | | 195,685 | |
| | |
Salmar ASA | | | 2,088 | | | | 166,773 | |
| | |
Storebrand ASA(a) | | | 6,098 | | | | 61,580 | |
| | |
Telenor ASA | | | 82,222 | | | | 1,191,862 | |
| | |
TGS ASA | | | 8,587 | | | | 129,237 | |
| | |
Veidekke ASA | | | 8,794 | | | | 123,100 | |
| | |
Yara International ASA | | | 10,588 | | | | 535,212 | |
| | | | | | | | |
| Total Norway | | | | | | | 4,282,265 | |
| | |
| Portugal – 0.6% | | | | | | | | |
| | |
EDP – Energias de Portugal SA | | | 95,104 | | | | 472,475 | |
| | |
Galp Energia SGPS SA | | | 29,998 | | | | 384,340 | |
| | |
Navigator Co. SA | | | 25,086 | | | | 94,342 | |
| | |
REN – Redes Energeticas Nacionais SGPS SA | | | 46,118 | | | | 146,243 | |
| | |
Sonae SGPS SA | | | 67,832 | | | | 78,643 | |
| | | | | | | | |
| Total Portugal | | | | | | | 1,176,043 | |
| | |
| Singapore – 2.1% | | | | | | | | |
| | |
Bukit Sembawang Estates Ltd. | | | 30,700 | | | | 113,649 | |
| | |
Hour Glass Ltd. | | | 43,000 | | | | 74,031 | |
| | |
Jardine Cycle & Carriage Ltd. | | | 6,400 | | | | 118,367 | |
| | |
Keppel Corp. Ltd. | | | 34,200 | | | | 162,237 | |
| | |
Keppel Infrastructure Trust | | | 362,921 | | | | 150,172 | |
| | |
NetLink NBN Trust | | | 226,800 | | | | 163,395 | |
| | |
Olam Group Ltd. | | | 125,400 | | | | 162,153 | |
| | |
Oversea-Chinese Banking Corp. Ltd. | | | 98,992 | | | | 905,546 | |
| | |
Propnex Ltd. | | | 53,000 | | | | 73,625 | |
| | |
Riverstone Holdings Ltd. | | | 121,200 | | | | 88,660 | |
| | |
Sembcorp Industries Ltd.(a) | | | 31,900 | | | | 62,935 | |
| | |
Sheng Siong Group Ltd.(a) | | | 115,300 | | | | 129,498 | |
| | |
Singapore Exchange Ltd. | | | 8,600 | | | | 63,355 | |
| | |
Singapore Technologies Engineering Ltd. | | | 109,700 | | | | 333,960 | |
| | |
Singapore Telecommunications Ltd. | | | 292,000 | | | | 569,747 | |
| | |
United Overseas Bank Ltd. | | | 39,500 | | | | 934,562 | |
| | |
Venture Corp. Ltd.(a) | | | 5,700 | | | | 74,001 | |
| | | | | | | | |
| Total Singapore | | | | | | | 4,179,893 | |
| | |
| Spain – 2.7% | | | | | | | | |
| | |
Acerinox SA | | | 10,967 | | | | 121,780 | |
| | |
Aedas Homes SA(b) | | | 2,857 | | | | 73,113 | |
| | |
Bankinter SA | | | 14,098 | | | | 83,513 | |
| | |
Cia de Distribucion Integral Logista Holdings SA(a) | | | 10,347 | | | | 191,109 | |
| | |
ContourGlobal PLC(b) | | | 40,521 | | | | 102,009 | |
| | |
Ebro Foods SA(a) | | | 6,156 | | | | 109,181 | |
| | |
Enagas SA(a) | | | 10,707 | | | | 240,050 | |
| | |
Fomento de Construcciones y Contratas SA | | | 11,828 | | | | 142,922 | |
| | |
Iberdrola SA | | | 172,074 | | | | 1,899,265 | |
| | |
Mapfre SA | | | 92,872 | | | | 196,335 | |
| | |
Naturgy Energy Group SA(a) | | | 38,640 | | | | 1,167,685 | |
| | |
Prosegur Cash SA(a)(b) | | | 109,684 | | | | 72,126 | |
| | |
Red Electrica Corp. SA | | | 17,601 | | | | 364,454 | |
| | |
Repsol SA | | | 46,671 | | | | 619,195 | |
| | |
Zardoya Otis SA | | | 17,623 | | | | 138,238 | |
| | | | | | | | |
| Total Spain | | | | | | | 5,520,975 | |
| | |
| Sweden – 1.6% | | | | | | | | |
| | |
Axfood AB(a) | | | 8,576 | | | | 281,775 | |
| | |
Bilia AB, Class A | | | 3,230 | | | | 46,616 | |
| | |
Electrolux AB, Class B(a) | | | 7,868 | | | | 120,814 | |
| | |
Intrum AB | | | 3,816 | | | | 104,373 | |
| | |
JM AB(a) | | | 2,365 | | | | 76,131 | |
| | |
Lundin Energy AB(a) | | | 11,497 | | | | 492,602 | |
| | |
Peab AB, Class B | | | 13,730 | | | | 139,666 | |
| | |
Skandinaviska Enskilda Banken AB, Class A(a) | | | 45,037 | | | | 495,101 | |
| | |
Svenska Handelsbanken AB, Class A(a) | | | 38,536 | | | | 359,334 | |
| | |
Tele2 AB, Class B(a) | | | 29,233 | | | | 446,365 | |
| | |
Telia Co. AB(a) | | | 150,828 | | | | 610,796 | |
| | | | | | | | |
| Total Sweden | | | | | | | 3,173,573 | |
| | |
| Switzerland – 5.8% | | | | | | | | |
| | |
Adecco Group AG, Registered Shares | | | 5,281 | | | | 241,081 | |
| | |
Allreal Holding AG, Registered Shares | | | 611 | | | | 131,595 | |
| | |
Baloise Holding AG, Registered Shares | | | 1,168 | | | | 209,548 | |
| | |
Banque Cantonale Vaudoise, Registered Shares | | | 2,303 | | | | 200,707 | |
| | |
Clariant AG, Registered Shares*(a) | | | 9,355 | | | | 163,566 | |
| | |
Helvetia Holding AG, Registered Shares | | | 1,360 | | | | 178,378 | |
| | |
Holcim Ltd., Registered Shares* | | | 16,576 | | | | 815,786 | |
| | |
Landis + Gyr Group AG* | | | 1,074 | | | | 68,507 | |
| | |
Novartis AG, Registered Shares | | | 58,350 | | | | 5,151,793 | |
| | |
OC Oerlikon Corp. AG, Registered Shares | | | 13,190 | | | | 106,065 | |
| | |
PSP Swiss Property AG, Registered Shares | | | 1,704 | | | | 225,163 | |
| | |
Sulzer AG, Registered Shares(a) | | | 1,065 | | | | 88,996 | |
| | |
Swiss Life Holding AG, Registered Shares | | | 531 | | | | 342,864 | |
| | |
Swiss Prime Site AG, Registered Shares | | | 1,928 | | | | 191,176 | |
| | |
Swisscom AG, Registered Shares(a) | | | 1,922 | | | | 1,159,152 | |
| | |
Zurich Insurance Group AG | | | 4,733 | | | | 2,349,399 | |
| | | | | | | | |
| Total Switzerland | | | | | | | 11,623,776 | |
| | |
| United Kingdom – 18.8% | | | | | | | | |
| | |
abrdn PLC | | | 55,383 | | | | 156,705 | |
| | |
Admiral Group PLC | | | 15,278 | | | | 515,568 | |
| | |
Airtel Africa PLC(b) | | | 68,319 | | | | 125,483 | |
| | |
Anglo American PLC | | | 53,308 | | | | 2,788,218 | |
| | |
Antofagasta PLC | | | 23,738 | | | | 522,890 | |
| | |
Ashmore Group PLC | | | 26,746 | | | | 81,910 | |
| | |
Assura PLC | | | 124,252 | | | | 109,446 | |
| | |
Aviva PLC | | | 129,229 | | | | 769,246 | |
| | |
BAE Systems PLC | | | 128,178 | | | | 1,210,725 | |
| | |
Barratt Developments PLC | | | 27,805 | | | | 191,248 | |
| | |
BP PLC | | | 536,982 | | | | 2,653,791 | |
| | |
Close Brothers Group PLC | | | 6,878 | | | | 107,856 | |
| | |
Direct Line Insurance Group PLC | | | 45,742 | | | | 165,682 | |
| | |
Diversified Energy Co. PLC | | | 109,050 | | | | 170,287 | |
| | |
Drax Group PLC | | | 13,016 | | | | 134,701 | |
| | |
Ferrexpo PLC | | | 72,303 | | | | 177,544 | |
| | |
GlaxoSmithKline PLC | | | 173,020 | | | | 3,752,435 | |
| | |
Hargreaves Lansdown PLC | | | 6,357 | | | | 84,369 | |
| | |
HSBC Holdings PLC | | | 319,921 | | | | 2,213,112 | |
| | |
Imperial Brands PLC | | | 75,389 | | | | 1,598,598 | |
| | |
Investec PLC | | | 15,107 | | | | 100,169 | |
See Notes to Financial Statements.
Schedule of Investments (continued)
WisdomTree International High Dividend Fund (DTH)
March 31, 2022
| | | | | | | | |
| Investments | | Shares | | | Value | |
| | |
J. Sainsbury PLC | | | 44,310 | | | $ | 147,427 | |
| | |
Jupiter Fund Management PLC | | | 32,768 | | | | 89,135 | |
| | |
Kingfisher PLC | | | 42,210 | | | | 141,941 | |
| | |
Land Securities Group PLC | | | 21,593 | | | | 223,349 | |
| | |
Legal & General Group PLC | | | 154,724 | | | | 554,111 | |
| | |
Londonmetric Property PLC | | | 43,147 | | | | 156,681 | |
| | |
Moneysupermarket.com Group PLC | | | 31,800 | | | | 79,552 | |
| | |
National Grid PLC | | | 120,256 | | | | 1,856,321 | |
| | |
OSB Group PLC | | | 17,144 | | | | 127,874 | |
| | |
Redde Northgate PLC | | | 19,534 | | | | 111,108 | |
| | |
Redrow PLC | | | 11,549 | | | | 79,497 | |
| | |
Rio Tinto PLC | | | 104,596 | | | | 8,581,271 | |
| | |
Severn Trent PLC | | | 6,374 | | | | 258,316 | |
| | |
Shell PLC | | | 78,482 | | | | 2,178,784 | |
| | |
SSE PLC | | | 48,052 | | | | 1,106,236 | |
| | |
St. James’s Place PLC | | | 7,196 | | | | 137,240 | |
| | |
Synthomer PLC | | | 18,155 | | | | 73,050 | |
| | |
Tate & Lyle PLC | | | 22,936 | | | | 221,115 | |
| | |
Taylor Wimpey PLC | | | 118,051 | | | | 203,149 | |
| | |
Tesco PLC | | | 169,233 | | | | 614,985 | |
| | |
Unilever PLC | | | 58,462 | | | | 2,659,452 | |
| | |
United Utilities Group PLC | | | 28,267 | | | | 418,514 | |
| | |
Vistry Group PLC | | | 5,182 | | | | 64,244 | |
| | |
Vivo Energy PLC(b) | | | 82,429 | | | | 148,252 | |
| | | | | | | | |
| Total United Kingdom | | | | | | | 37,861,587 | |
TOTAL COMMON STOCKS
(Cost: $183,065,919) | | | | | | | 198,406,992 | |
| | |
| RIGHTS – 0.0% | | | | | | | | |
| | |
| Austria – 0.0% | | | | | | | | |
CA Immobilien Anlagen AG*†
(Cost: $0) | | | 2,826 | | | | 0 | |
| | |
| EXCHANGE-TRADED FUND – 0.4% | | | | | | | | |
| | |
| United States – 0.4% | | | | | | | | |
| |
WisdomTree International LargeCap Dividend Fund(c) | | | | | |
| (Cost: $860,270) | | | 18,144 | | | | 882,052 | |
|
| INVESTMENT OF CASH COLLATERAL FOR SECURITIES LOANED – 3.7% | |
| | |
| United States – 3.7% | | | | | | | | |
| | |
State Street Navigator Securities Lending Government Money Market Portfolio, 0.25%(d) | | | | | | | | |
| (Cost: $7,485,308) | | | 7,485,308 | | | | 7,485,308 | |
| |
TOTAL INVESTMENTS IN SECURITIES – 102.5%
(Cost: $191,411,497) | | | | 206,774,352 | |
| |
Other Assets less Liabilities – (2.5)% | | | | (5,140,162 | ) |
| | | | | | | | |
| NET ASSETS – 100.0% | | | $ | 201,634,190 | |
| * | Non-income producing security. |
| † | Security is being fair valued using significant unobservable inputs by a pricing committee under the direction of the Board of Trustees. The aggregate value of fair valued securities is $0, which represents 0.0% of net assets. |
| (a) | Security, or portion thereof, was on loan at March 31, 2022 (See Note 2). At March 31, 2022, the total market value of the Fund’s securities on loan identified in the Schedule of Investments was $11,102,120 and the total market value of the collateral held by the Fund was $11,713,181. The total market value of the collateral includes non-cash U.S. Government securities collateral having a value of $4,227,873. |
| (b) | This security is exempt from registration under rule 144A of the Securities Act of 1933. This security may be sold in transactions that are exempt from registration, normally to qualified institutional buyers. |
| (c) | Affiliated holding. See “Investment in Affiliates” supplementary table included in this Schedule of Investments for additional information. |
| (d) | Rate shown represents annualized 7-day yield as of March 31, 2022. |
Affiliated holdings are investments in entities in which the Fund owns 5% or more of the outstanding voting securities or are investments in entities which are under common ownership or control. Investments in affiliates during the fiscal year ended March 31, 2022 were as follows:
| | | | | | | | | | | | | | | | | | | | | | | | | | | | |
| | | | | | | |
| Affiliate | | Value at
3/31/2021 | | | Purchases/
Additions | | | Sales/
Reductions | | | Realized
Gain/
(Loss) | | | Change in
Unrealized
Appreciation/
Depreciation | | | Value at
3/31/2022 | | | Dividend
Income | |
WisdomTree International LargeCap Dividend Fund | | $ | 548,318 | | | $ | 4,250,546 | | | $ | 3,899,760 | | | $ | (35,032 | ) | | $ | 17,980 | | | $ | 882,052 | | | $ | 52,756 | |
| | | | | | | | | | | | | | | | | | | | | | | | | | | | |
|
| FINANCIAL DERIVATIVE INSTRUMENTS | |
|
| FOREIGN CURRENCY CONTRACTS (OTC – OVER THE COUNTER) | |
| | | | | |
| Counterparty | | Settlement
Date | | | Amount and
Description of
Currency to be
Purchased | | | Amount and
Description of
Currency to be
Sold | | | Unrealized
Appreciation | | | Unrealized
Depreciation | |
Goldman Sachs | | | 4/1/2022 | | | | 1,737,836 | | | | HKD | | | | 222,030 | | | | USD | | | $ | — | | | $ | (124 | ) |
JP Morgan Chase Bank NA | | | 4/4/2022 | | | | 877,051 | | | | HKD | | | | 111,993 | | | | USD | | | | — | | | | (1 | ) |
| | | | | | | | | | | | | | | | | | | | | | | $ | — | | | $ | (125 | ) |
See Notes to Financial Statements.
Schedule of Investments (concluded)
WisdomTree International High Dividend Fund (DTH)
March 31, 2022
The following is a summary of the fair valuations according to the inputs used as of March 31, 2022 in valuing the Fund’s investments (See Note 2 — Fair Value Measurement):
| | | | | | | | | | | | | | | | |
| | | | |
| | | Quoted
Prices in
Active
Markets
(Level 1) | | | Other
Significant
Observable
Inputs
(Level 2) | | | Significant
Unobservable
Inputs
(Level 3) | | | Total | |
Assets: | | | | | | | | | | | | | | | | |
Investments in Securities | | | | | | | | | | | | | | | | |
Common Stocks | | $ | 198,406,992 | | | $ | — | | | $ | — | | | $ | 198,406,992 | |
Rights | | | — | | | | — | | | | 0 | * | | | 0 | |
Exchange-Traded Fund | | | 882,052 | | | | — | | | | — | | | | 882,052 | |
Investment of Cash Collateral for Securities Loaned | | | — | | | | 7,485,308 | | | | — | | | | 7,485,308 | |
Total Investments in Securities | | $ | 199,289,044 | | | $ | 7,485,308 | | | $ | 0 | | | $ | 206,774,352 | |
Liabilities: | | | | | | | | | | | | | | | | |
Financial Derivative Instruments | | | | | | | | | | | | | | | | |
Foreign Currency Contracts1 | | $ | — | | | $ | (125 | ) | | $ | — | | | $ | (125 | ) |
Total – Net | | $ | 199,289,044 | | | $ | 7,485,183 | | | $ | 0 | | | $ | 206,774,227 | |
| * | Security is being fair valued using significant unobservable inputs by the Pricing Committee. |
| 1 | Amount shown represents the unrealized appreciation (depreciation) on the financial instrument. |
See Notes to Financial Statements.
Schedule of Investments
WisdomTree International LargeCap Dividend Fund (DOL)
March 31, 2022
| | | | | | | | |
| Investments | | Shares | | | Value | |
| | |
| COMMON STOCKS – 99.1% | | | | | | | | |
| | |
| Australia – 11.9% | | | | | | | | |
| | |
Australia & New Zealand Banking Group Ltd. | | | 82,429 | | | $ | 1,708,441 | |
| | |
BHP Group Ltd. | | | 470,453 | | | | 18,282,580 | |
| | |
Coles Group Ltd. | | | 60,694 | | | | 816,305 | |
| | |
Commonwealth Bank of Australia | | | 74,571 | | | | 5,923,022 | |
| | |
CSL Ltd. | | | 4,075 | | | | 820,571 | |
| | |
Fortescue Metals Group Ltd. | | | 319,902 | | | | 4,963,159 | |
| | |
Goodman Group | | | 38,137 | | | | 655,546 | |
| | |
Macquarie Group Ltd. | | | 7,461 | | | | 1,138,888 | |
| | |
National Australia Bank Ltd. | | | 133,047 | | | | 3,232,141 | |
| | |
Telstra Corp. Ltd. | | | 639,304 | | | | 1,901,137 | |
| | |
Transurban Group | | | 69,138 | | | | 703,505 | |
| | |
Wesfarmers Ltd. | | | 44,335 | | | | 1,678,318 | |
| | |
Westpac Banking Corp. | | | 108,024 | | | | 1,966,363 | |
| | |
Woodside Petroleum Ltd. | | | 16,474 | | | | 397,114 | |
| | |
Woolworths Group Ltd. | | | 43,496 | | | | 1,217,035 | |
| | | | | | | | |
| Total Australia | | | | | | | 45,404,125 | |
| | |
| Austria – 0.2% | | | | | | | | |
| | |
OMV AG | | | 15,098 | | | | 728,900 | |
| | |
| Belgium – 0.3% | | | | | | | | |
| | |
Anheuser-Busch InBev SA/NV | | | 15,660 | | | | 945,432 | |
| | |
UCB SA | | | 2,509 | | | | 302,753 | |
| | | | | | | | |
| Total Belgium | | | | | | | 1,248,185 | |
| | |
| China – 1.2% | | | | | | | | |
| | |
BOC Hong Kong Holdings Ltd. | | | 460,634 | | | | 1,746,920 | |
| | |
China Resources Beer Holdings Co. Ltd. | | | 22,000 | | | | 134,982 | |
| | |
CITIC Ltd. | | | 1,710,000 | | | | 1,901,844 | |
| | |
Wilmar International Ltd. | | | 180,800 | | | | 629,230 | |
| | | | | | | | |
| Total China | | | | | | | 4,412,976 | |
| | |
| Denmark – 1.5% | | | | | | | | |
| | |
AP Moller – Maersk A/S, Class B | | | 209 | | | | 636,815 | |
| | |
Carlsberg A/S, Class B | | | 2,238 | | | | 277,852 | |
| | |
Coloplast A/S, Class B | | | 3,588 | | | | 549,845 | |
| | |
Novo Nordisk A/S, Class B | | | 32,079 | | | | 3,593,524 | |
| | |
Orsted A/S(a) | | | 4,810 | | | | 610,985 | |
| | |
Vestas Wind Systems A/S | | | 5,883 | | | | 175,777 | |
| | | | | | | | |
| Total Denmark | | | | | | | 5,844,798 | |
| | |
| Finland – 1.9% | | | | | | | | |
| | |
Fortum Oyj | | | 48,370 | | | | 889,626 | |
| | |
Kone Oyj, Class B | | | 12,219 | | | | 647,009 | |
| | |
Neste Oyj | | | 10,817 | | | | 499,234 | |
| | |
Nordea Bank Abp(b) | | | 359,105 | | | | 3,749,267 | |
| | |
Sampo Oyj, Class A | | | 18,205 | | | | 898,952 | |
| | |
UPM-Kymmene Oyj(b) | | | 20,375 | | | | 672,400 | |
| | | | | | | | |
| Total Finland | | | | | | | 7,356,488 | |
| | |
| France – 11.5% | | | | | | | | |
| | |
Air Liquide SA | | | 11,521 | | | | 2,037,171 | |
| | |
Amundi SA(a) | | | 7,268 | | | | 502,995 | |
| | |
AXA SA | | | 186,434 | | | | 5,510,533 | |
| | |
BNP Paribas SA | | | 50,560 | | | | 2,921,353 | |
| | |
Capgemini SE | | | 2,851 | | | | 642,364 | |
| | |
Cie de Saint-Gobain | | | 16,103 | | | | 972,356 | |
| | |
Cie Generale des Etablissements Michelin SCA | | | 4,355 | | | | 595,765 | |
| | |
Credit Agricole SA | | | 167,425 | | | | 2,027,904 | |
| | |
Danone SA | | | 19,467 | | | | 1,083,648 | |
| | |
Electricite de France SA(b) | | | 46,236 | | | | 439,027 | |
| | |
Engie SA | | | 94,890 | | | | 1,259,984 | |
| | |
EssilorLuxottica SA | | | 5,257 | | | | 972,722 | |
| | |
Hermes International | | | 507 | | | | 728,553 | |
| | |
Kering SA | | | 1,380 | | | | 883,963 | |
| | |
L’Oreal SA | | | 7,738 | | | | 3,132,635 | |
| | |
Legrand SA | | | 6,015 | | | | 578,106 | |
| | |
LVMH Moet Hennessy Louis Vuitton SE | | | 7,008 | | | | 5,063,666 | |
| | |
Orange SA | | | 220,879 | | | | 2,630,627 | |
| | |
Pernod Ricard SA | | | 3,525 | | | | 781,673 | |
| | |
Publicis Groupe SA | | | 12,691 | | | | 780,307 | |
| | |
Safran SA | | | 1,677 | | | | 200,138 | |
| | |
Sanofi | | | 41,837 | | | | 4,306,336 | |
| | |
Schneider Electric SE | | | 14,013 | | | | 2,372,413 | |
| | |
Societe Generale SA | | | 14,964 | | | | 407,252 | |
| | |
Thales SA | | | 5,016 | | | | 635,961 | |
| | |
Veolia Environnement SA | | | 22,539 | | | | 729,520 | |
| | |
Vinci SA | | | 15,917 | | | | 1,646,858 | |
| | | | | | | | |
| Total France | | | | | | | 43,843,830 | |
| | |
| Germany – 8.6% | | | | | | | | |
| | |
adidas AG | | | 1,973 | | | | 465,175 | |
| | |
Allianz SE, Registered Shares | | | 17,189 | | | | 4,141,594 | |
| | |
BASF SE | | | 41,976 | | | | 2,417,431 | |
| | |
Bayer AG, Registered Shares | | | 35,189 | | | | 2,431,405 | |
| | |
Bayerische Motoren Werke AG | | | 11,525 | | | | 1,007,911 | |
| | |
Deutsche Boerse AG | | | 2,893 | | | | 524,680 | |
| | |
Deutsche Post AG, Registered Shares | | | 40,859 | | | | 1,979,860 | |
| | |
Deutsche Telekom AG, Registered Shares | | | 161,837 | | | | 3,048,911 | |
| | |
Deutsche Wohnen SE, Bearer Shares | | | 7,043 | | | | 238,226 | |
| | |
E.ON SE | | | 152,931 | | | | 1,793,813 | |
| | |
Fresenius SE & Co. KGaA | | | 10,287 | | | | 381,661 | |
| | |
Hannover Rueck SE | | | 4,683 | | | | 804,247 | |
| | |
Hapag-Lloyd AG(a) | | | 4,472 | | | | 1,575,329 | |
| | |
Henkel AG & Co. KGaA | | | 7,235 | | | | 482,599 | |
| | |
Knorr-Bremse AG | | | 2,560 | | | | 198,362 | |
| | |
Mercedes-Benz Group AG, Registered Shares | | | 23,070 | | | | 1,637,929 | |
| | |
Merck KGaA | | | 1,348 | | | | 284,747 | |
| | |
Muenchener Rueckversicherungs – Gesellschaft AG in Muenchen, Registered Shares | | | 4,863 | | | | 1,314,829 | |
| | |
RWE AG | | | 14,979 | | | | 658,822 | |
| | |
SAP SE | | | 16,126 | | | | 1,814,356 | |
| | |
Siemens AG, Registered Shares | | | 18,554 | | | | 2,594,139 | |
| | |
Siemens Healthineers AG(a) | | | 13,930 | | | | 871,676 | |
| | |
Vantage Towers AG | | | 11,131 | | | | 397,432 | |
| | |
Volkswagen AG | | | 4,176 | | | | 1,051,022 | |
| | |
Vonovia SE | | | 17,255 | | | | 812,300 | |
| | | | | | | | |
| Total Germany | | | | | | | 32,928,456 | |
See Notes to Financial Statements.
Schedule of Investments (continued)
WisdomTree International LargeCap Dividend Fund (DOL)
March 31, 2022
| | | | | | | | |
| Investments | | Shares | | | Value | |
| | |
| Hong Kong – 2.8% | | | | | | | | |
| | |
AIA Group Ltd. | | | 162,604 | | | $ | 1,711,916 | |
| | |
CLP Holdings Ltd. | | | 131,000 | | | | 1,277,147 | |
| | |
Hang Seng Bank Ltd. | | | 101,618 | | | | 1,961,928 | |
| | |
Henderson Land Development Co. Ltd. | | | 263,219 | | | | 1,095,710 | |
| | |
Hong Kong & China Gas Co. Ltd. | | | 497,925 | | | | 603,380 | |
| | |
Hong Kong Exchanges & Clearing Ltd. | | | 21,024 | | | | 997,052 | |
| | |
Link REIT | | | 81,100 | | | | 693,835 | |
| | |
MTR Corp. Ltd. | | | 86,438 | | | | 467,432 | |
| | |
Sun Hung Kai Properties Ltd. | | | 125,942 | | | | 1,505,244 | |
| | |
Techtronic Industries Co. Ltd. | | | 16,500 | | | | 267,366 | |
| | | | | | | | |
| Total Hong Kong | | | | | | | 10,581,010 | |
| | |
| Ireland – 0.2% | | | | | | | | |
| | |
CRH PLC | | | 17,314 | | | | 700,262 | |
| | |
| Italy – 3.5% | | | | | | | | |
| | |
Assicurazioni Generali SpA(b) | | | 113,683 | | | | 2,627,185 | |
| | |
Enel SpA | | | 449,479 | | | | 3,034,685 | |
| | |
Eni SpA | | | 174,314 | | | | 2,578,378 | |
| | |
Intesa Sanpaolo SpA | | | 1,194,296 | | | | 2,768,625 | |
| | |
Moncler SpA | | | 3,204 | | | | 180,885 | |
| | |
Poste Italiane SpA(a) | | | 47,174 | | | | 541,678 | |
| | |
Snam SpA(b) | | | 238,365 | | | | 1,387,615 | |
| | |
UniCredit SpA | | | 22,153 | | | | 242,911 | |
| | | | | | | | |
| Total Italy | | | | | | | 13,361,962 | |
| | |
| Japan – 17.1% | | | | | | | | |
| | |
Advantest Corp.(b) | | | 4,100 | | | | 326,649 | |
| | |
Aeon Co. Ltd.(b) | | | 15,045 | | | | 323,460 | |
| | |
Asahi Group Holdings Ltd. | | | 10,835 | | | | 398,228 | |
| | |
Astellas Pharma, Inc. | | | 41,600 | | | | 654,975 | |
| | |
Bridgestone Corp. | | | 20,455 | | | | 801,853 | |
| | |
Canon, Inc. | | | 38,236 | | | | 942,866 | |
| | |
Chugai Pharmaceutical Co. Ltd. | | | 21,900 | | | | 739,232 | |
| | |
Dai-ichi Life Holdings, Inc. | | | 7,100 | | | | 146,182 | |
| | |
Daikin Industries Ltd. | | | 1,900 | | | | 350,805 | |
| | |
Daiwa House Industry Co. Ltd. | | | 19,400 | | | | 511,633 | |
| | |
Denso Corp. | | | 13,000 | | | | 841,854 | |
| | |
FANUC Corp. | | | 3,375 | | | | 601,869 | |
| | |
Fast Retailing Co. Ltd. | | | 700 | | | | 363,279 | |
| | |
FUJIFILM Holdings Corp. | | | 9,000 | | | | 556,276 | |
| | |
Fujitsu Ltd. | | | 2,200 | | | | 333,784 | |
| | |
Hitachi Ltd. | | | 14,400 | | | | 731,419 | |
| | |
Honda Motor Co. Ltd. | | | 52,500 | | | | 1,508,280 | |
| | |
Hoya Corp. | | | 2,800 | | | | 323,658 | |
| | |
ITOCHU Corp. | | | 63,300 | | | | 2,161,196 | |
| | |
Japan Post Holdings Co. Ltd. | | | 195,900 | | | | 1,450,023 | |
| | |
Japan Tobacco, Inc. | | | 171,509 | | | | 2,949,743 | |
| | |
Kao Corp. | | | 12,500 | | | | 517,508 | |
| | |
KDDI Corp. | | | 102,280 | | | | 3,374,924 | |
| | |
Keyence Corp. | | | 700 | | | | 330,175 | |
| | |
Kirin Holdings Co. Ltd. | | | 30,300 | | | | 456,591 | |
| | |
Komatsu Ltd. | | | 18,867 | | | | 457,471 | |
| | |
Kyowa Kirin Co. Ltd. | | | 7,000 | | | | 164,251 | |
| | |
Lasertec Corp. | | | 500 | | | | 85,623 | |
| | |
Mitsubishi Corp. | | | 50,305 | | | | 1,906,927 | |
| | |
Mitsubishi Electric Corp. | | | 51,581 | | | | 599,211 | |
| | |
Mitsubishi UFJ Financial Group, Inc. | | | 499,400 | | | | 3,128,270 | |
| | |
Mitsui Fudosan Co. Ltd. | | | 16,500 | | | | 356,169 | |
| | |
Mizuho Financial Group, Inc. | | | 119,814 | | | | 1,546,847 | |
| | |
MS&AD Insurance Group Holdings, Inc. | | | 26,400 | | | | 865,246 | |
| | |
Murata Manufacturing Co. Ltd. | | | 13,410 | | | | 896,799 | |
| | |
Nidec Corp. | | | 2,900 | | | | 232,908 | |
| | |
Nintendo Co. Ltd. | | | 4,400 | | | | 2,235,617 | |
| | |
Nippon Steel Corp. | | | 27,500 | | | | 491,885 | |
| | |
Nippon Telegraph & Telephone Corp. | | | 178,004 | | | | 5,198,963 | |
| | |
NTT Data Corp. | | | 16,400 | | | | 326,716 | |
| | |
Olympus Corp. | | | 9,300 | | | | 179,219 | |
| | |
Omron Corp. | | | 2,200 | | | | 148,884 | |
| | |
Otsuka Holdings Co. Ltd. | | | 12,700 | | | | 442,813 | |
| | |
Panasonic Corp. | | | 37,984 | | | | 371,938 | |
| | |
Recruit Holdings Co. Ltd. | | | 5,500 | | | | 245,331 | |
| | |
Seven & I Holdings Co. Ltd. | | | 17,900 | | | | 857,283 | |
| | |
SG Holdings Co. Ltd. | | | 10,100 | | | | 192,389 | |
| | |
Shimano, Inc. | | | 900 | | | | 208,770 | |
| | |
Shin-Etsu Chemical Co. Ltd. | | | 5,700 | | | | 882,414 | |
| | |
Shionogi & Co. Ltd. | | | 4,600 | | | | 285,380 | |
| | |
SMC Corp. | | | 650 | | | | 368,659 | |
| | |
SoftBank Corp. | | | 362,700 | | | | 4,267,235 | |
| | |
SoftBank Group Corp. | | | 10,280 | | | | 470,826 | |
| | |
Sony Group Corp. | | | 5,300 | | | | 555,872 | |
| | |
Sumitomo Corp. | | | 51,210 | | | | 894,039 | |
| | |
Sumitomo Mitsui Financial Group, Inc. | | | 50,894 | | | | 1,638,252 | |
| | |
Suzuki Motor Corp. | | | 9,317 | | | | 323,399 | |
| | |
Takeda Pharmaceutical Co. Ltd. | | | 81,100 | | | | 2,337,284 | |
| | |
Tokio Marine Holdings, Inc. | | | 22,300 | | | | 1,309,614 | |
| | |
Tokyo Electron Ltd. | | | 4,050 | | | | 2,110,505 | |
| | |
Toshiba Corp. | | | 9,700 | | | | 371,617 | |
| | |
Toyota Motor Corp. | | | 362,265 | | | | 6,633,441 | |
| | | | | | | | |
| Total Japan | | | | | | | 65,284,529 | |
| | |
| Netherlands – 1.9% | | | | | | | | |
| | |
ASM International NV | | | 479 | | | | 176,996 | |
| | |
ASML Holding NV | | | 2,282 | | | | 1,548,831 | |
| | |
Heineken NV | | | 5,772 | | | | 556,035 | |
| | |
ING Groep NV | | | 125,951 | | | | 1,332,866 | |
| | |
Koninklijke Ahold Delhaize NV | | | 28,203 | | | | 913,631 | |
| | |
Koninklijke DSM NV(b) | | | 2,276 | | | | 411,514 | |
| | |
Koninklijke Philips NV | | | 17,560 | | | | 541,793 | |
| | |
NN Group NV | | | 21,832 | | | | 1,114,003 | |
| | |
Wolters Kluwer NV | | | 6,845 | | | | 735,562 | |
| | | | | | | | |
| Total Netherlands | | | | | | | 7,331,231 | |
| | |
| Norway – 1.6% | | | | | | | | |
| | |
DNB Bank ASA | | | 54,510 | | | | 1,247,421 | |
| | |
Equinor ASA | | | 85,833 | | | | 3,251,131 | |
| | |
Telenor ASA | | | 118,079 | | | | 1,711,633 | |
| | | | | | | | |
| Total Norway | | | | | | | 6,210,185 | |
| | |
| Portugal – 0.2% | | | | | | | | |
| | |
EDP – Energias de Portugal SA | | | 141,712 | | | | 704,023 | |
See Notes to Financial Statements.
Schedule of Investments (continued)
WisdomTree International LargeCap Dividend Fund (DOL)
March 31, 2022
| | | | | | | | |
| Investments | | Shares | | | Value | |
| | |
| Singapore – 1.8% | | | | | | | | |
| | |
DBS Group Holdings Ltd. | | | 94,334 | | | $ | 2,497,497 | |
| | |
Oversea-Chinese Banking Corp. Ltd. | | | 204,612 | | | | 1,871,723 | |
| | |
Singapore Telecommunications Ltd. | | | 353,700 | | | | 689,968 | |
| | |
United Overseas Bank Ltd. | | | 82,886 | | | | 1,961,067 | |
| | | | | | | | |
| Total Singapore | | | | | | | 7,020,255 | |
| | |
| Spain – 2.3% | | | | | | | | |
| | |
Banco Bilbao Vizcaya Argentaria SA(b) | | | 217,083 | | | | 1,258,410 | |
| | |
Banco Santander SA | | | 224,195 | | | | 773,297 | |
| | |
Ferrovial SA | | | 10,701 | | | | 287,303 | |
| | |
Iberdrola SA | | | 242,045 | | | | 2,671,569 | |
| | |
Industria de Diseno Textil SA | | | 62,597 | | | | 1,377,649 | |
| | |
Naturgy Energy Group SA(b) | | | 55,645 | | | | 1,681,569 | |
| | |
Repsol SA | | | 69,691 | | | | 924,607 | |
| | | | | | | | |
| Total Spain | | | | | | | 8,974,404 | |
| | |
| Sweden – 1.9% | | | | | | | | |
| | |
Assa Abloy AB, Class B | | | 22,604 | | | | 618,254 | |
| | |
Atlas Copco AB, Class A | | | 8,254 | | | | 435,489 | |
| | |
Atlas Copco AB, Class B | | | 7,221 | | | | 332,792 | |
| | |
Epiroc AB, Class A | | | 8,927 | | | | 193,686 | |
| | |
EQT AB(b) | | | 6,946 | | | | 277,336 | |
| | |
Essity AB, Class B(b) | | | 15,324 | | | | 365,366 | |
| | |
Evolution AB(a) | | | 432 | | | | 44,876 | |
| | |
Hexagon AB, Class B | | | 27,259 | | | | 388,290 | |
| | |
Investment AB Latour, Class B(b) | | | 5,874 | | | | 189,720 | |
| | |
Nibe Industrier AB, Class B | | | 5,681 | | | | 64,037 | |
| | |
Sandvik AB | | | 23,164 | | | | 499,599 | |
| | |
Skandinaviska Enskilda Banken AB, Class A(b) | | | 85,863 | | | | 943,909 | |
| | |
Svenska Handelsbanken AB, Class A | | | 70,142 | | | | 654,049 | |
| | |
Swedbank AB, Class A(b) | | | 15,342 | | | | 232,120 | |
| | |
Telefonaktiebolaget LM Ericsson, Class B(b) | | | 64,457 | | | | 596,888 | |
| | |
Telia Co. AB(b) | | | 105,537 | | | | 427,384 | |
| | |
Volvo AB, Class B(b) | | | 42,510 | | | | 805,553 | |
| | | | | | | | |
| Total Sweden | | | | | | | 7,069,348 | |
| | |
| Switzerland – 11.1% | | | | | | | | |
| | |
ABB Ltd., Registered Shares | | | 71,799 | | | | 2,353,899 | |
| | |
Cie Financiere Richemont SA, Class A, Registered Shares | | | 8,073 | | | | 1,035,169 | |
| | |
EMS-Chemie Holding AG, Registered Shares | | | 625 | | | | 612,266 | |
| | |
Geberit AG, Registered Shares | | | 878 | | | | 545,929 | |
| | |
Holcim Ltd., Registered Shares* | | | 21,802 | | | | 1,072,983 | |
| | |
Kuehne + Nagel International AG, Registered Shares | | | 2,785 | | | | 796,233 | |
| | |
Nestle SA, Registered Shares | | | 85,322 | | | | 11,144,476 | |
| | |
Novartis AG, Registered Shares | | | 80,976 | | | | 7,149,470 | |
| | |
Partners Group Holding AG | | | 637 | | | | 798,456 | |
| | |
Roche Holding AG | | | 15,207 | | | | 6,055,534 | |
| | |
Roche Holding AG, Bearer Shares(b) | | | 3,434 | | | | 1,511,296 | |
| | |
SGS SA, Registered Shares | | | 154 | | | | 431,083 | |
| | |
Sika AG, Registered Shares | | | 1,756 | | | | 586,574 | |
| | |
Sonova Holding AG, Registered Shares | | | 656 | | | | 276,301 | |
| | |
Swisscom AG, Registered Shares | | | 2,766 | | | | 1,668,166 | |
| | |
UBS Group AG, Registered Shares | | | 67,580 | | | | 1,332,507 | |
| | |
Zurich Insurance Group AG | | | 9,749 | | | | 4,839,275 | |
| | | | | | | | |
| Total Switzerland | | | | | | | 42,209,617 | |
| | |
| United Kingdom – 17.6% | | | | | | | | |
| | |
Anglo American PLC | | | 74,091 | | | | 3,875,251 | |
| | |
Antofagasta PLC | | | 32,059 | | | | 706,182 | |
| | |
Ashtead Group PLC | | | 4,385 | | | | 279,034 | |
| | |
AstraZeneca PLC | | | 30,748 | | | | 4,101,876 | |
| | |
Aviva PLC | | | 265,891 | | | | 1,582,737 | |
| | |
BAE Systems PLC | | | 179,632 | | | | 1,696,741 | |
| | |
Barclays PLC | | | 217,231 | | | | 424,164 | |
| | |
BP PLC | | | 743,281 | | | | 3,673,330 | |
| | |
CNH Industrial NV | | | 15,019 | | | | 240,553 | |
| | |
Coca-Cola Europacific Partners PLC | | | 8,082 | | | | 401,063 | |
| | |
Diageo PLC | | | 60,716 | | | | 3,088,550 | |
| | |
GlaxoSmithKline PLC | | | 237,991 | | | | 5,161,517 | |
| | |
HSBC Holdings PLC | | | 637,892 | | | | 4,412,734 | |
| | |
Imperial Brands PLC | | | 106,536 | | | | 2,259,059 | |
| | |
Legal & General Group PLC | | | 317,753 | | | | 1,137,965 | |
| | |
Linde PLC | | | 6,027 | | | | 1,948,077 | |
| | |
Lloyds Banking Group PLC | | | 1,541,931 | | | | 955,303 | |
| | |
London Stock Exchange Group PLC | | | 4,616 | | | | 484,146 | |
| | |
National Grid PLC | | | 167,279 | | | | 2,582,187 | |
| | |
NatWest Group PLC | | | 255,425 | | | | 726,084 | |
| | |
Reckitt Benckiser Group PLC | | | 18,681 | | | | 1,434,459 | |
| | |
RELX PLC | | | 36,894 | | | | 1,157,578 | |
| | |
Rio Tinto PLC | | | 145,324 | | | | 11,924,865 | |
| | |
Segro PLC | | | 29,347 | | | | 519,898 | |
| | |
Shell PLC | | | 206,434 | | | | 5,730,933 | |
| | |
SSE PLC | | | 67,645 | | | | 1,557,298 | |
| | |
Standard Chartered PLC | | | 48,107 | | | | 323,161 | |
| | |
Tesco PLC | | | 246,997 | | | | 897,576 | |
| | |
Unilever PLC | | | 82,015 | | | | 3,730,885 | |
| | | | | | | | |
| Total United Kingdom | | | | | | | 67,013,206 | |
TOTAL COMMON STOCKS
(Cost: $312,343,463) | | | | | | | 378,227,790 | |
|
| INVESTMENT OF CASH COLLATERAL FOR SECURITIES LOANED – 2.4% | |
| | |
| United States – 2.4% | | | | | | | | |
| | |
State Street Navigator Securities Lending Government Money Market Portfolio, 0.25%(c) | | | | | | | | |
| (Cost: $9,140,440) | | | 9,140,440 | | | | 9,140,440 | |
| |
TOTAL INVESTMENTS IN SECURITIES – 101.5%
(Cost: $321,483,903) | | | | 387,368,230 | |
| |
Other Assets less Liabilities – (1.5)% | | | | (5,561,237 | ) |
| | | | | | | | |
| NET ASSETS – 100.0% | | | $ | 381,806,993 | |
| * | Non-income producing security. |
| (a) | This security is exempt from registration under rule 144A of the Securities Act of 1933. This security may be sold in transactions that are exempt from registration, normally to qualified institutional buyers. |
| (b) | Security, or portion thereof, was on loan at March 31, 2022 (See Note 2). At March 31, 2022, the total market value of the Fund’s securities on loan identified in the Schedule of Investments was $11,166,656 and the total market value of the collateral held by the Fund was $12,025,602. The total market value of the collateral includes non-cash U.S. Government securities collateral having a value of $2,885,162. |
| (c) | Rate shown represents annualized 7-day yield as of March 31, 2022. |
See Notes to Financial Statements.
Schedule of Investments (concluded)
WisdomTree International LargeCap Dividend Fund (DOL)
March 31, 2022
Affiliated holdings are investments in entities in which the Fund owns 5% or more of the outstanding voting securities or are investments in entities which are under common ownership or control. Investments in affiliates during the fiscal year ended March 31, 2022 were as follows:
| | | | | | | | | | | | | | | | | | | | | | | | | | | | |
| | | | | | | |
| Affiliate | | Value at
3/31/2021 | | | Purchases/
Additions | | | Sales/
Reductions | | | Realized
Gain/
(Loss) | | | Change in
Unrealized
Appreciation/
Depreciation | | | Value at
3/31/2022 | | | Dividend
Income | |
WisdomTree International MidCap Dividend Fund^ | | $ | — | | | $ | 3,627,605 | | | $ | 3,617,097 | | | $ | (10,508 | ) | | $ | — | | | $ | — | | | $ | 32,483 | |
| ^ | As of March 31, 2022, the Fund did not hold a position in this affiliate. |
The following is a summary of the fair valuations according to the inputs used as of March 31, 2022 in valuing the Fund’s investments (See Note 2 — Fair Value Measurement):
| | | | | | | | | | | | | | | | |
| | | | |
| | | Quoted
Prices in
Active
Markets
(Level 1) | | | Other
Significant
Observable
Inputs
(Level 2) | | | Significant
Unobservable
Inputs
(Level 3) | | | Total | |
Assets: | | | | | | | | | | | | | | | | |
Investments in Securities | | | | | | | | | | | | | | | | |
Common Stocks | | $ | 378,227,790 | | | $ | — | | | $ | — | | | $ | 378,227,790 | |
Investment of Cash Collateral for Securities Loaned | | | — | | | | 9,140,440 | | | | — | | | | 9,140,440 | |
Total Investments in Securities | | $ | 378,227,790 | | | $ | 9,140,440 | | | $ | — | | | $ | 387,368,230 | |
See Notes to Financial Statements.
Schedule of Investments
WisdomTree International MidCap Dividend Fund (DIM)
March 31, 2022
| | | | | | | | |
| Investments | | Shares | | | Value | |
|
| COMMON STOCKS – 99.2% | |
|
| Australia – 11.2% | |
| | |
ALS Ltd. | | | 14,496 | | | $ | 145,869 | |
| | |
Alumina Ltd. | | | 127,784 | | | | 192,878 | |
| | |
Ampol Ltd. | | | 6,480 | | | | 149,099 | |
| | |
Ansell Ltd.(a) | | | 4,550 | | | | 88,051 | |
| | |
APA Group(a) | | | 69,386 | | | | 555,965 | |
| | |
ASX Ltd.(a) | | | 5,793 | | | | 355,851 | |
| | |
Atlas Arteria Ltd. | | | 49,517 | | | | 243,560 | |
| | |
Aurizon Holdings Ltd. | | | 157,619 | | | | 436,763 | |
| | |
Bank of Queensland Ltd. | | | 32,372 | | | | 211,009 | |
| | |
Bendigo & Adelaide Bank Ltd. | | | 48,092 | | | | 371,620 | |
| | |
BlueScope Steel Ltd. | | | 7,407 | | | | 116,029 | |
| | |
Brambles Ltd. | | | 46,851 | | | | 348,661 | |
| | |
carsales.com Ltd. | | | 7,535 | | | | 118,374 | |
| | |
Challenger Ltd. | | | 20,929 | | | | 106,087 | |
| | |
Charter Hall Group | | | 17,377 | | | | 215,443 | |
| | |
Cleanaway Waste Management Ltd. | | | 46,195 | | | | 106,846 | |
| | |
Cochlear Ltd. | | | 929 | | | | 157,197 | |
| | |
Computershare Ltd. | | | 14,144 | | | | 262,349 | |
| | |
Dexus | | | 78,279 | | | | 643,680 | |
| | |
Domino’s Pizza Enterprises Ltd.(a) | | | 2,145 | | | | 141,508 | |
| | |
Downer EDI Ltd. | | | 26,062 | | | | 105,489 | |
| | |
Evolution Mining Ltd. | | | 67,978 | | | | 224,611 | |
| | |
GPT Group | | | 144,755 | | | | 563,085 | |
| | |
Harvey Norman Holdings Ltd.(a) | | | 91,108 | | | | 366,034 | |
| | |
IGO Ltd. | | | 8,310 | | | | 87,740 | |
| | |
Insurance Australia Group Ltd.(a) | | | 107,378 | | | | 353,183 | |
| | |
JB Hi-Fi Ltd.(a) | | | 7,338 | | | | 298,778 | |
| | |
Lendlease Corp. Ltd.(a) | | | 18,609 | | | | 156,514 | |
| | |
Magellan Financial Group Ltd.(a) | | | 13,351 | | | | 159,813 | |
| | |
Medibank Pvt Ltd. | | | 162,350 | | | | 375,503 | |
| | |
Mineral Resources Ltd. | | | 21,084 | | | | 834,559 | |
| | |
Mirvac Group | | | 142,197 | | | | 265,889 | |
| | |
Newcrest Mining Ltd. | | | 25,808 | | | | 518,235 | |
| | |
Nine Entertainment Co. Holdings Ltd. | | | 74,644 | | | | 166,480 | |
| | |
OZ Minerals Ltd. | | | 6,740 | | | | 134,988 | |
| | |
Premier Investments Ltd. | | | 6,858 | | | | 141,625 | |
| | |
QBE Insurance Group Ltd. | | | 15,112 | | | | 130,506 | |
| | |
Qube Holdings Ltd. | | | 82,007 | | | | 192,755 | |
| | |
Ramsay Health Care Ltd. | | | 5,322 | | | | 260,376 | |
| | |
REA Group Ltd. | | | 1,682 | | | | 171,112 | |
| | |
Reece Ltd. | | | 7,354 | | | | 105,259 | |
| | |
Santos Ltd. | | | 44,881 | | | | 260,864 | |
| | |
Scentre Group | | | 238,346 | | | | 545,907 | |
| | |
Seven Group Holdings Ltd. | | | 8,306 | | | | 132,295 | |
| | |
Sonic Healthcare Ltd. | | | 18,193 | | | | 484,729 | |
| | |
South32 Ltd. | | | 85,785 | | | | 323,390 | |
| | |
Steadfast Group Ltd. | | | 39,834 | | | | 142,986 | |
| | |
Stockland | | | 126,193 | | | | 404,645 | |
| | |
Suncorp Group Ltd. | | | 112,915 | | | | 942,904 | |
| | |
Tabcorp Holdings Ltd.(a) | | | 107,277 | | | | 430,188 | |
| | |
Treasury Wine Estates Ltd. | | | 18,889 | | | | 164,259 | |
| | |
Vicinity Centres | | | 269,201 | | | | 377,022 | |
| | |
Washington H Soul Pattinson & Co. Ltd.(a) | | | 5,761 | | | | 123,816 | |
| | |
Worley Ltd. | | | 25,987 | | | | 251,938 | |
| | | | | | | | |
| Total Australia | | | | 15,164,316 | |
|
| Austria – 1.3% | |
| | |
Andritz AG | | | 3,453 | | | | 161,286 | |
| | |
BAWAG Group AG*(b) | | | 12,513 | | | | 639,882 | |
| | |
CA Immobilien Anlagen AG | | | 4,363 | | | | 136,168 | |
| | |
EVN AG | | | 5,519 | | | | 143,079 | |
| | |
Raiffeisen Bank International AG | | | 7,484 | | | | 107,836 | |
| | |
Telekom Austria AG* | | | 26,868 | | | | 209,263 | |
| | |
Vienna Insurance Group AG Wiener Versicherung Gruppe | | | 5,014 | | | | 130,824 | |
| | |
Voestalpine AG | | | 4,292 | | | | 129,034 | |
| | |
Wienerberger AG | | | 4,370 | | | | 133,226 | |
| | | | | | | | |
| Total Austria | | | | 1,790,598 | |
|
| Belgium – 2.3% | |
| | |
Ackermans & van Haaren NV | | | 638 | | | | 120,110 | |
| | |
Aedifica SA | | | 1,405 | | | | 178,213 | |
| | |
Cofinimmo SA | | | 1,982 | | | | 291,096 | |
| | |
D’ieteren Group | | | 724 | | | | 123,331 | |
| | |
Elia Group SA/NV | | | 1,717 | | | | 264,020 | |
| | |
Etablissements Franz Colruyt NV | | | 4,685 | | | | 195,479 | |
| | |
Melexis NV | | | 1,143 | | | | 106,828 | |
| | |
Proximus SADP | | | 24,721 | | | | 463,473 | |
| | |
Solvay SA(a) | | | 3,960 | | | | 394,169 | |
| | |
Telenet Group Holding NV | | | 15,195 | | | | 494,015 | |
| | |
Umicore SA | | | 4,555 | | | | 199,481 | |
| | |
Warehouses De Pauw CVA | | | 6,503 | | | | 282,911 | |
| | | | | | | | |
| Total Belgium | | | | 3,113,126 | |
|
| China – 2.8% | |
| | |
Beijing Enterprises Holdings Ltd. | | | 46,700 | | | | 148,185 | |
| | |
BYD Electronic International Co. Ltd.(a) | | | 29,500 | | | | 59,517 | |
| | |
China Everbright Environment Group Ltd. | | | 426,407 | | | | 258,085 | |
| | |
China Merchants Port Holdings Co. Ltd. | | | 350,000 | | | | 634,625 | |
| | |
China Power International Development Ltd. | | | 493,000 | | | | 262,509 | |
| | |
China Resources Pharmaceutical Group Ltd.(b) | | | 324,000 | | | | 168,797 | |
| | |
China Resources Power Holdings Co. Ltd. | | | 194,000 | | | | 365,140 | |
| | |
China Taiping Insurance Holdings Co. Ltd. | | | 127,800 | | | | 156,498 | |
| | |
CSPC Pharmaceutical Group Ltd. | | | 274,000 | | | | 316,636 | |
| | |
Fosun International Ltd. | | | 209,500 | | | | 228,188 | |
| | |
Guangdong Investment Ltd. | | | 426,208 | | | | 583,414 | |
| | |
Lenovo Group Ltd.(a) | | | 492,000 | | | | 535,261 | |
| | |
Wharf Holdings Ltd. | | | 51,000 | | | | 155,643 | |
| | | | | | | | |
| Total China | | | | 3,872,498 | |
|
| Denmark – 1.4% | |
| | |
Danske Bank A/S | | | 17,370 | | | | 292,559 | |
| | |
H. Lundbeck A/S | | | 3,489 | | | | 81,232 | |
| | |
Novozymes A/S, Class B | | | 3,058 | | | | 211,785 | |
| | |
Royal Unibrew A/S | | | 1,742 | | | | 164,784 | |
| | |
Topdanmark A/S | | | 3,848 | | | | 216,651 | |
| | |
Tryg A/S | | | 36,059 | | | | 885,921 | |
| | | | | | | | |
| Total Denmark | | | | 1,852,932 | |
See Notes to Financial Statements.
Schedule of Investments (continued)
WisdomTree International MidCap Dividend Fund (DIM)
March 31, 2022
| | | | | | | | |
| Investments | | Shares | | | Value | |
|
| Finland – 2.1% | |
| | |
Elisa Oyj | | | 10,128 | | | $ | 615,509 | |
| | |
Huhtamaki Oyj | | | 2,499 | | | | 87,809 | |
| | |
Kesko Oyj, Class A | | | 4,566 | | | | 118,880 | |
| | |
Kesko Oyj, Class B | | | 12,969 | | | | 360,893 | |
| | |
Kojamo Oyj(a) | | | 5,255 | | | | 127,347 | |
| | |
Konecranes Oyj | | | 2,361 | | | | 73,476 | |
| | |
Metsa Board Oyj, Class B | | | 11,258 | | | | 114,991 | |
| | |
Metso Outotec Oyj | | | 21,312 | | | | 182,209 | |
| | |
Nokian Renkaat Oyj | | | 8,739 | | | | 143,664 | |
| | |
Orion Oyj, Class B(a) | | | 4,693 | | | | 214,872 | |
| | |
Stora Enso Oyj, Class R | | | 13,468 | | | | 266,961 | |
| | |
TietoEVRY Oyj(a) | | | 6,249 | | | | 167,844 | |
| | |
Valmet Oyj(a) | | | 7,023 | | | | 220,437 | |
| | |
Wartsila Oyj Abp | | | 11,071 | | | | 102,315 | |
| | | | | | | | |
| Total Finland | | | | 2,797,207 | |
|
| France – 5.5% | |
| | |
ALD SA(b) | | | 33,912 | | | | 454,296 | |
| | |
Arkema SA | | | 2,726 | | | | 329,848 | |
| | |
BioMerieux | | | 949 | | | | 102,148 | |
| | |
Bouygues SA | | | 20,491 | | | | 721,142 | |
| | |
Bureau Veritas SA | | | 10,734 | | | | 309,806 | |
| | |
Carrefour SA | | | 27,063 | | | | 591,544 | |
| | |
Cie Plastic Omnium SA | | | 3,980 | | | | 73,068 | |
| | |
Covivio(a) | | | 5,317 | | | | 426,777 | |
| | |
Edenred | | | 5,367 | | | | 268,244 | |
| | |
Eiffage SA | | | 3,535 | | | | 366,733 | |
| | |
Eurazeo SE | | | 2,930 | | | | 249,069 | |
| | |
Eutelsat Communications SA | | | 19,592 | | | | 214,590 | |
| | |
Faurecia SE(a) | | | 3,588 | | | | 94,415 | |
| | |
Gecina SA | | | 3,638 | | | | 462,666 | |
| | |
ICADE | | | 4,947 | | | | 321,175 | |
| | |
Imerys SA | | | 2,953 | | | | 128,141 | |
| | |
Ipsen SA | | | 959 | | | | 120,895 | |
| | |
Klepierre SA*(a) | | | 15,326 | | | | 412,329 | |
| | |
La Francaise des Jeux SAEM(b) | | | 6,969 | | | | 278,836 | |
| | |
Remy Cointreau SA | | | 676 | | | | 140,652 | |
| | |
Rexel SA* | | | 13,964 | | | | 301,885 | |
| | |
Rothschild & Co. | | | 2,334 | | | | 93,100 | |
| | |
Rubis SCA | | | 7,205 | | | | 213,804 | |
| | |
SEB SA | | | 1,102 | | | | 155,229 | |
| | |
SPIE SA | | | 5,970 | | | | 142,681 | |
| | |
Trigano SA | | | 764 | | | | 112,209 | |
| | |
Valeo | | | 3,474 | | | | 64,764 | |
| | |
Verallia SA(b) | | | 6,236 | | | | 149,455 | |
| | |
Wendel SE | | | 1,983 | | | | 204,311 | |
| | | | | | | | |
| Total France | | | | 7,503,812 | |
|
| Germany – 5.1% | |
| | |
alstria office REIT AG | | | 8,153 | | | | 111,669 | |
| | |
Aurubis AG | | | 1,118 | | | | 134,906 | |
| | |
Bechtle AG | | | 1,577 | | | | 89,838 | |
| | |
Brenntag SE | | | 4,635 | | | | 378,224 | |
| | |
Covestro AG(b) | | | 5,105 | | | | 260,375 | |
| | |
Dermapharm Holding SE | | | 1,359 | | | | 87,248 | |
| | |
DWS Group GmbH & Co. KGaA(b) | | | 10,212 | | | | 377,913 | |
| | |
Evonik Industries AG | | | 20,858 | | | | 584,369 | |
| | |
Fielmann AG | | | 2,228 | | | | 122,462 | |
| | |
Freenet AG | | | 15,475 | | | | 418,404 | |
| | |
GEA Group AG | | | 6,153 | | | | 255,429 | |
| | |
HeidelbergCement AG | | | 7,464 | | | | 429,027 | |
| | |
Hella GmbH & Co. KGaA | | | 1,913 | | | | 123,964 | |
| | |
Hochtief AG | | | 4,347 | | | | 296,005 | |
| | |
LANXESS AG | | | 1,938 | | | | 86,015 | |
| | |
LEG Immobilien SE | | | 2,237 | | | | 256,989 | |
| | |
METRO AG* | | | 37,817 | | | | 339,394 | |
| | |
ProSiebenSat.1 Media SE | | | 15,893 | | | | 204,950 | |
| | |
Rheinmetall AG | | | 1,287 | | | | 275,084 | |
| | |
Scout24 SE(b) | | | 2,077 | | | | 120,171 | |
| | |
Stroeer SE & Co. KGaA | | | 2,063 | | | | 143,692 | |
| | |
TAG Immobilien AG | | | 5,421 | | | | 123,951 | |
| | |
Talanx AG | | | 10,081 | | | | 448,889 | |
| | |
Telefonica Deutschland Holding AG | | | 252,006 | | | | 692,294 | |
| | |
Traton SE | | | 6,142 | | | | 115,288 | |
| | |
United Internet AG, Registered Shares | | | 4,314 | | | | 149,663 | |
| | |
Varta AG(a) | | | 906 | | | | 90,625 | |
| | |
Wacker Chemie AG | | | 1,180 | | | | 203,175 | |
| | | | | | | | |
| Total Germany | | | | 6,920,013 | |
|
| Hong Kong – 2.8% | |
| | |
Bank of East Asia Ltd. | | | 163,180 | | | | 256,290 | |
| | |
Hang Lung Group Ltd. | | | 65,000 | | | | 138,111 | |
| | |
Hang Lung Properties Ltd. | | | 208,000 | | | | 419,644 | |
| | |
Hysan Development Co. Ltd. | | | 62,000 | | | | 181,296 | |
| | |
Power Assets Holdings Ltd. | | | 210,500 | | | | 1,372,172 | |
| | |
Sino Land Co. Ltd. | | | 403,046 | | | | 522,888 | |
| | |
Swire Pacific Ltd., Class A | | | 42,000 | | | | 256,889 | |
| | |
Swire Properties Ltd. | | | 290,000 | | | | 720,612 | |
| | | | | | | | |
| Total Hong Kong | | | | 3,867,902 | |
|
| Ireland – 0.3% | |
| | |
Glanbia PLC | | | 9,503 | | | | 110,916 | |
| | |
Smurfit Kappa Group PLC | | | 7,580 | | | | 341,151 | |
| | | | | | | | |
| Total Ireland | | | | 452,067 | |
|
| Israel – 1.2% | |
| | |
Azrieli Group Ltd. | | | 2,340 | | | | 206,631 | |
| | |
Bank Hapoalim BM | | | 23,525 | | | | 234,052 | |
| | |
Bank Leumi Le-Israel BM | | | 25,210 | | | | 272,857 | |
| | |
Elbit Systems Ltd. | | | 585 | | | | 128,320 | |
| | |
First International Bank of Israel Ltd. | | | 1,799 | | | | 77,851 | |
| | |
ICL Group Ltd. | | | 27,439 | | | | 328,709 | |
| | |
Mizrahi Tefahot Bank Ltd. | | | 7,293 | | | | 286,121 | |
| | |
Strauss Group Ltd. | | | 3,651 | | | | 109,052 | |
| | | | | | | | |
| Total Israel | | | | 1,643,593 | |
|
| Italy – 5.1% | |
| | |
A2A SpA | | | 233,498 | | | | 403,862 | |
| | |
ACEA SpA | | | 10,232 | | | | 189,782 | |
| | |
Azimut Holding SpA | | | 10,937 | | | | 257,132 | |
See Notes to Financial Statements.
Schedule of Investments (continued)
WisdomTree International MidCap Dividend Fund (DIM)
March 31, 2022
| | | | | | | | |
| Investments | | Shares | | | Value | |
| | |
Banca Mediolanum SpA | | | 70,409 | | | $ | 607,610 | |
| | |
Banco BPM SpA | | | 39,766 | | | | 119,021 | |
| | |
BPER Banca(a) | | | 30,832 | | | | 54,528 | |
| | |
Brembo SpA | | | 6,947 | | | | 78,223 | |
| | |
De’ Longhi SpA | | | 2,905 | | | | 79,966 | |
| | |
DiaSorin SpA | | | 403 | | | | 63,628 | |
| | |
ERG SpA | | | 5,116 | | | | 171,680 | |
| | |
Hera SpA | | | 92,257 | | | | 343,466 | |
| | |
Infrastrutture Wireless Italiane SpA(a)(b) | | | 37,152 | | | | 420,193 | |
| | |
Iren SpA | | | 82,170 | | | | 219,789 | |
| | |
Italgas SpA | | | 64,522 | | | | 418,107 | |
| | |
Mediobanca Banca di Credito Finanziario SpA | | | 62,838 | | | | 644,632 | |
| | |
Pirelli & C. SpA(b) | | | 15,581 | | | | 85,485 | |
| | |
Prysmian SpA | | | 4,537 | | | | 156,289 | |
| | |
Recordati Industria Chimica e Farmaceutica SpA | | | 5,243 | | | | 266,247 | |
| | |
Telecom Italia SpA(a) | | | 532,473 | | | | 197,584 | |
| | |
Terna – Rete Elettrica Nazionale(a) | | | 138,409 | | | | 1,199,050 | |
| | |
Unipol Gruppo SpA | | | 42,168 | | | | 233,653 | |
| | |
UnipolSai Assicurazioni SpA(a) | | | 230,811 | | | | 689,797 | |
| | | | | | | | |
| Total Italy | | | | 6,899,724 | |
|
| Japan – 25.5% | |
| | |
ABC-Mart, Inc. | | | 3,178 | | | | 120,836 | |
| | |
Acom Co. Ltd. | | | 34,100 | | | | 89,622 | |
| | |
Aeon Mall Co. Ltd. | | | 7,800 | | | | 104,557 | |
| | |
AGC, Inc. | | | 9,128 | | | | 368,880 | |
| | |
Air Water, Inc. | | | 7,700 | | | | 109,116 | |
| | |
Aisin Corp. | | | 11,700 | | | | 404,379 | |
| | |
Ajinomoto Co., Inc. | | | 13,700 | | | | 392,235 | |
| | |
Amada Co. Ltd. | | | 13,500 | | | | 120,569 | |
| | |
Asahi Kasei Corp. | | | 42,800 | | | | 374,665 | |
| | |
Azbil Corp. | | | 2,500 | | | | 84,243 | |
| | |
Brother Industries Ltd. | | | 8,500 | | | | 156,659 | |
| | |
Canon Marketing Japan, Inc. | | | 4,800 | | | | 99,777 | |
| | |
Capcom Co. Ltd. | | | 4,300 | | | | 105,149 | |
| | |
Casio Computer Co. Ltd.(a) | | | 8,800 | | | | 102,084 | |
| | |
Chiba Bank Ltd.(a) | | | 30,200 | | | | 180,391 | |
| | |
Chubu Electric Power Co., Inc.(a) | | | 27,900 | | | | 290,321 | |
| | |
Chugoku Electric Power Co., Inc.(a) | | | 27,400 | | | | 191,207 | |
| | |
COMSYS Holdings Corp.(a) | | | 5,400 | | | | 118,700 | |
| | |
Concordia Financial Group Ltd. | | | 47,300 | | | | 178,483 | |
| | |
Dai Nippon Printing Co. Ltd. | | | 9,479 | | | | 224,763 | |
| | |
Daifuku Co. Ltd. | | | 1,300 | | | | 94,146 | |
| | |
Daito Trust Construction Co. Ltd. | | | 2,620 | | | | 280,402 | |
| | |
Daiwa Securities Group, Inc.(a) | | | 101,000 | | | | 576,418 | |
| | |
Denka Co. Ltd. | | | 3,800 | | | | 106,447 | |
| | |
Dentsu Group, Inc. | | | 6,100 | | | | 252,293 | |
| | |
Disco Corp. | | | 1,000 | | | | 283,419 | |
| | |
Ebara Corp. | | | 3,100 | | | | 174,698 | |
| | |
ENEOS Holdings, Inc. | | | 243,300 | | | | 918,075 | |
| | |
Fuji Electric Co. Ltd. | | | 3,575 | | | | 181,438 | |
| | |
Fukuoka Financial Group, Inc. | | | 8,900 | | | | 174,077 | |
| | |
Hakuhodo DY Holdings, Inc. | | | 10,300 | | | | 131,110 | |
| | |
Hamamatsu Photonics KK | | | 2,400 | | | | 129,516 | |
| | |
Hankyu Hanshin Holdings, Inc. | | | 6,100 | | | | 178,163 | |
| | |
Haseko Corp. | | | 15,400 | | | | 178,519 | |
| | |
Hino Motors Ltd.(a) | | | 9,300 | | | | 55,168 | |
| | |
Hirose Electric Co. Ltd. | | | 875 | | | | 128,754 | |
| | |
Hoshizaki Corp. | | | 1,200 | | | | 83,147 | |
| | |
Hulic Co. Ltd. | | | 29,500 | | | | 267,596 | |
| | |
Idemitsu Kosan Co. Ltd. | | | 19,866 | | | | 552,402 | |
| | |
Iida Group Holdings Co. Ltd.(a) | | | 10,200 | | | | 177,738 | |
| | |
Inpex Corp. | | | 51,000 | | | | 605,067 | |
| | |
Isuzu Motors Ltd. | | | 26,500 | | | | 346,711 | |
| | |
Itochu Techno-Solutions Corp.(a) | | | 5,700 | | | | 147,460 | |
| | |
Japan Exchange Group, Inc. | | | 12,600 | | | | 237,311 | |
| | |
Japan Post Insurance Co. Ltd. | | | 28,200 | | | | 496,274 | |
| | |
JFE Holdings, Inc. | | | 25,600 | | | | 363,409 | |
| | |
JSR Corp.(a) | | | 5,600 | | | | 167,481 | |
| | |
Kajima Corp. | | | 20,876 | | | | 256,446 | |
| | |
Kakaku.com, Inc.(a) | | | 2,400 | | | | 54,515 | |
| | |
Kansai Electric Power Co., Inc. | | | 42,200 | | | | 399,488 | |
| | |
Kansai Paint Co. Ltd. | | | 5,200 | | | | 84,528 | |
| | |
Kikkoman Corp. | | | 1,600 | | | | 107,172 | |
| | |
Kobayashi Pharmaceutical Co. Ltd. | | | 800 | | | | 64,725 | |
| | |
Koei Tecmo Holdings Co. Ltd.(a) | | | 3,510 | | | | 116,108 | |
| | |
Koito Manufacturing Co. Ltd. | | | 2,000 | | | | 81,977 | |
| | |
Konami Holdings Corp.(a) | | | 2,500 | | | | 159,629 | |
| | |
Kuraray Co. Ltd. | | | 11,200 | | | | 97,536 | |
| | |
Kurita Water Industries Ltd.(a) | | | 2,700 | | | | 101,104 | |
| | |
Kyushu Electric Power Co., Inc. | | | 24,100 | | | | 162,222 | |
| | |
Kyushu Railway Co. | | | 7,600 | | | | 156,978 | |
| | |
Lawson, Inc. | | | 3,900 | | | | 150,216 | |
| | |
Lixil Corp. | | | 9,700 | | | | 183,011 | |
| | |
Makita Corp. | | | 3,900 | | | | 126,439 | |
| | |
Marubeni Corp. | | | 74,400 | | | | 874,104 | |
| | |
MatsukiyoCocokara & Co. | | | 1,600 | | | | 57,145 | |
| | |
McDonald’s Holdings Co. Japan Ltd. | | | 1,500 | | | | 62,657 | |
| | |
Medipal Holdings Corp. | | | 8,000 | | | | 132,812 | |
| | |
MEIJI Holdings Co. Ltd. | | | 4,200 | | | | 228,729 | |
| | |
MINEBEA MITSUMI, Inc. | | | 6,500 | | | | 144,272 | |
| | |
MISUMI Group, Inc. | | | 2,900 | | | | 87,567 | |
| | |
Mitsubishi Chemical Holdings Corp. | | | 35,600 | | | | 239,660 | |
| | |
Mitsubishi Gas Chemical Co., Inc. | | | 8,900 | | | | 152,592 | |
| | |
Mitsubishi HC Capital, Inc. | | | 69,920 | | | | 328,358 | |
| | |
Mitsubishi Heavy Industries Ltd. | | | 14,600 | | | | 483,559 | |
| | |
Mitsui Chemicals, Inc. | | | 7,000 | | | | 178,208 | |
| | |
Mitsui OSK Lines Ltd.(a) | | | 36,900 | | | | 1,039,736 | |
| | |
Nabtesco Corp. | | | 3,100 | | | | 83,263 | |
| | |
NEC Corp. | | | 5,000 | | | | 212,152 | |
| | |
NGK Insulators Ltd. | | | 9,900 | | | | 142,984 | |
| | |
NGK Spark Plug Co. Ltd. | | | 9,000 | | | | 146,595 | |
| | |
NH Foods Ltd. | | | 3,400 | | | | 116,251 | |
| | |
Nikon Corp.(a) | | | 9,800 | | | | 106,094 | |
| | |
Nippon Express Holdings, Inc. | | | 1,600 | | | | 110,995 | |
| | |
Nippon Sanso Holdings Corp. | | | 7,500 | | | | 144,037 | |
| | |
Nippon Yusen KK | | | 12,800 | | | | 1,134,731 | |
| | |
Nissan Chemical Corp. | | | 3,000 | | | | 178,702 | |
See Notes to Financial Statements.
Schedule of Investments (continued)
WisdomTree International MidCap Dividend Fund (DIM)
March 31, 2022
| | | | | | | | |
| Investments | | Shares | | | Value | |
| | |
Nisshin Seifun Group, Inc. | | | 9,000 | | | $ | 126,501 | |
| | |
Nissin Foods Holdings Co. Ltd. | | | 1,900 | | | | 134,155 | |
| | |
Nitto Denko Corp. | | | 4,400 | | | | 319,736 | |
| | |
NOF Corp. | | | 1,300 | | | | 53,767 | |
| | |
Nomura Real Estate Holdings, Inc. | | | 6,868 | | | | 165,964 | |
| | |
Oji Holdings Corp. | | | 20,862 | | | | 104,332 | |
| | |
Ono Pharmaceutical Co. Ltd. | | | 15,000 | | | | 378,908 | |
| | |
Open House Group Co. Ltd. | | | 2,600 | | | | 116,103 | |
| | |
Oracle Corp. | | | 2,200 | | | | 154,068 | |
| | |
Osaka Gas Co. Ltd. | | | 22,200 | | | | 382,636 | |
| | |
Otsuka Corp. | | | 4,800 | | | | 171,831 | |
| | |
Pan Pacific International Holdings Corp. | | | 5,300 | | | | 85,761 | |
| | |
Persol Holdings Co. Ltd. | | | 4,000 | | | | 91,090 | |
| | |
Pola Orbis Holdings, Inc. | | | 4,700 | | | | 61,918 | |
| | |
Resona Holdings, Inc. | | | 115,200 | | | | 497,436 | |
| | |
Rohm Co. Ltd. | | | 2,100 | | | | 165,924 | |
| | |
Ryohin Keikaku Co. Ltd. | | | 6,200 | | | | 73,097 | |
| | |
Sanwa Holdings Corp. | | | 11,200 | | | | 114,791 | |
| | |
SBI Holdings, Inc. | | | 10,900 | | | | 278,393 | |
| | |
SCSK Corp. | | | 9,000 | | | | 155,790 | |
| | |
Sega Sammy Holdings, Inc. | | | 8,800 | | | | 153,198 | |
| | |
Seiko Epson Corp.(a) | | | 13,400 | | | | 203,249 | |
| | |
Sekisui Chemical Co. Ltd. | | | 15,300 | | | | 221,732 | |
| | |
Sekisui House Ltd. | | | 26,900 | | | | 525,478 | |
| | |
Sharp Corp.(a) | | | 15,300 | | | | 144,838 | |
| | |
Shimadzu Corp. | | | 4,200 | | | | 146,546 | |
| | |
Shimamura Co. Ltd. | | | 1,200 | | | | 107,469 | |
| | |
Shimizu Corp.(a) | | | 27,000 | | | | 163,502 | |
| | |
Shinko Electric Industries Co. Ltd. | | | 2,300 | | | | 110,855 | |
| | |
Shizuoka Bank Ltd. | | | 23,400 | | | | 166,379 | |
| | |
Showa Denko KK | | | 4,900 | | | | 98,101 | |
| | |
Sojitz Corp.(a) | | | 9,580 | | | | 159,200 | |
| | |
Sompo Holdings, Inc. | | | 23,600 | | | | 1,046,275 | |
| | |
Square Enix Holdings Co. Ltd. | | | 1,800 | | | | 80,527 | |
| | |
Stanley Electric Co. Ltd. | | | 4,200 | | | | 80,419 | |
| | |
Subaru Corp. | | | 20,400 | | | | 327,408 | |
| | |
Sumitomo Chemical Co. Ltd. | | | 58,800 | | | | 272,260 | |
| | |
Sumitomo Dainippon Pharma Co. Ltd. | | | 7,290 | | | | 72,555 | |
| | |
Sumitomo Electric Industries Ltd. | | | 23,112 | | | | 278,391 | |
| | |
Sumitomo Forestry Co. Ltd. | | | 6,700 | | | | 119,675 | |
| | |
Sumitomo Heavy Industries Ltd. | | | 4,800 | | | | 111,443 | |
| | |
Sumitomo Metal Mining Co. Ltd. | | | 12,000 | | | | 609,318 | |
| | |
Sumitomo Mitsui Trust Holdings, Inc. | | | 16,300 | | | | 537,313 | |
| | |
Sumitomo Rubber Industries Ltd. | | | 18,100 | | | | 167,616 | |
| | |
Sundrug Co. Ltd. | | | 5,000 | | | | 122,554 | |
| | |
Suntory Beverage & Food Ltd. | | | 6,400 | | | | 245,718 | |
| | |
T&D Holdings, Inc. | | | 22,351 | | | | 307,712 | |
| | |
Taisei Corp. | | | 7,575 | | | | 220,619 | |
| | |
Taiyo Yuden Co. Ltd.(a) | | | 2,400 | | | | 109,743 | |
| | |
TDK Corp. | | | 6,600 | | | | 242,521 | |
| | |
TIS, Inc. | | | 5,600 | | | | 132,739 | |
| | |
Tokyo Century Corp.(a) | | | 2,700 | | | | 100,437 | |
| | |
Tokyo Gas Co. Ltd.(a) | | | 16,000 | | | | 294,229 | |
| | |
Tokyo Tatemono Co. Ltd. | | | 8,800 | | | | 132,970 | |
| | |
Tokyu Corp.(a) | | | 8,200 | | | | 107,554 | |
| | |
Tokyu Fudosan Holdings Corp. | | | 21,800 | | | | 121,056 | |
| | |
Toray Industries, Inc. | | | 29,300 | | | | 154,207 | |
| | |
Tosoh Corp. | | | 12,600 | | | | 188,312 | |
| | |
TOTO Ltd. | | | 3,200 | | | | 130,241 | |
| | |
Toyo Suisan Kaisha Ltd. | | | 3,000 | | | | 108,012 | |
| | |
Toyota Boshoku Corp. | | | 9,400 | | | | 155,047 | |
| | |
Toyota Tsusho Corp. | | | 9,900 | | | | 412,721 | |
| | |
Trend Micro, Inc. | | | 4,530 | | | | 267,228 | |
| | |
Tsuruha Holdings, Inc. | | | 1,000 | | | | 63,934 | |
| | |
USS Co. Ltd. | | | 12,700 | | | | 215,442 | |
| | |
Yakult Honsha Co. Ltd.(a) | | | 2,200 | | | | 118,179 | |
| | |
Yamada Holdings Co. Ltd. | | | 52,100 | | | | 163,114 | |
| | |
Yamaha Corp. | | | 2,500 | | | | 110,196 | |
| | |
Yamaha Motor Co. Ltd. | | | 19,360 | | | | 439,598 | |
| | |
Yamato Holdings Co. Ltd.(a) | | | 9,100 | | | | 171,916 | |
| | |
Yaskawa Electric Corp. | | | 2,900 | | | | 115,044 | |
| | |
Yokogawa Electric Corp. | | | 2,000 | | | | 34,587 | |
| | |
Yokohama Rubber Co. Ltd. | | | 9,200 | | | | 128,250 | |
| | |
Zeon Corp. | | | 5,900 | | | | 66,304 | |
| | |
ZOZO, Inc. | | | 4,200 | | | | 113,673 | |
| | | | | | | | |
| Total Japan | | | | 34,620,977 | |
|
| Netherlands – 3.2% | |
| | |
Aalberts NV | | | 2,140 | | | | 112,339 | |
| | |
Aegon NV(a) | | | 70,580 | | | | 377,105 | |
| | |
Arcadis NV | | | 2,167 | | | | 98,615 | |
| | |
ASR Nederland NV | | | 8,270 | | | | 388,584 | |
| | |
BE Semiconductor Industries NV | | | 3,281 | | | | 284,236 | |
| | |
Boskalis Westminster | | | 3,014 | | | | 109,057 | |
| | |
CTP NV(b) | | | 4,400 | | | | 74,414 | |
| | |
Euronext NV(b) | | | 2,078 | | | | 191,210 | |
| | |
IMCD NV(a) | | | 711 | | | | 122,817 | |
| | |
Koninklijke KPN NV | | | 351,077 | | | | 1,227,737 | |
| | |
Koninklijke Vopak NV | | | 4,730 | | | | 154,570 | |
| | |
Randstad NV(a) | | | 11,118 | | | | 675,921 | |
| | |
SBM Offshore NV(a) | | | 11,282 | | | | 180,950 | |
| | |
Signify NV(b) | | | 6,809 | | | | 321,451 | |
| | | | | | | | |
| Total Netherlands | | | | 4,319,006 | |
|
| Norway – 3.5% | |
| | |
Aker ASA, Class A | | | 1,509 | | | | 139,786 | |
| | |
Aker BP ASA | | | 17,120 | | | | 647,286 | |
| | |
Entra ASA(b) | | | 5,619 | | | | 113,550 | |
| | |
Gjensidige Forsikring ASA | | | 27,530 | | | | 688,565 | |
| | |
Kongsberg Gruppen ASA | | | 8,350 | | | | 335,184 | |
| | |
Leroy Seafood Group ASA | | | 19,227 | | | | 178,373 | |
| | |
Mowi ASA | | | 4,575 | | | | 124,525 | |
| | |
Norsk Hydro ASA | | | 63,963 | | | | 629,828 | |
| | |
Orkla ASA | | | 36,217 | | | | 324,561 | |
| | |
Salmar ASA | | | 3,858 | | | | 308,146 | |
| | |
SpareBank 1 SR-Bank ASA | | | 10,380 | | | | 159,427 | |
| | |
Storebrand ASA(a) | | | 18,286 | | | | 184,659 | |
| | |
Yara International ASA | | | 19,100 | | | | 965,485 | |
| | | | | | | | |
| Total Norway | | | | 4,799,375 | |
See Notes to Financial Statements.
Schedule of Investments (continued)
WisdomTree International MidCap Dividend Fund (DIM)
March 31, 2022
| | | | | | | | |
| Investments | | Shares | | | Value | |
|
| Portugal – 0.8% | |
| | |
Galp Energia SGPS SA | | | 54,320 | | | $ | 695,957 | |
| | |
Jeronimo Martins SGPS SA | | | 15,732 | | | | 380,367 | |
| | | | | | | | |
| Total Portugal | | | | 1,076,324 | |
|
| Singapore – 1.5% | |
| | |
Genting Singapore Ltd. | | | 254,400 | | | | 153,202 | |
| | |
Jardine Cycle & Carriage Ltd. | | | 13,611 | | | | 251,733 | |
| | |
Keppel Corp. Ltd. | | | 64,600 | | | | 306,449 | |
| | |
Olam Group Ltd.(a) | | | 181,800 | | | | 235,083 | |
| | |
Singapore Exchange Ltd. | | | 41,200 | | | | 303,517 | |
| | |
Singapore Technologies Engineering Ltd. | | | 184,900 | | | | 562,891 | |
| | |
UOL Group Ltd. | | | 18,500 | | | | 96,235 | |
| | |
Venture Corp. Ltd.(a) | | | 11,300 | | | | 146,703 | |
| | | | | | | | |
| Total Singapore | | | | 2,055,813 | |
|
| Spain – 2.8% | |
| | |
Acciona SA(a) | | | 2,232 | | | | 430,876 | |
| | |
Acerinox SA | | | 18,583 | | | | 206,350 | |
| | |
Bankinter SA | | | 42,205 | | | | 250,012 | |
| | |
Cie Automotive SA | | | 3,088 | | | | 70,985 | |
| | |
Enagas SA(a) | | | 22,089 | | | | 495,233 | |
| | |
Fluidra SA(a) | | | 5,696 | | | | 166,680 | |
| | |
Fomento de Construcciones y Contratas SA | | | 16,916 | | | | 204,403 | |
| | |
Grifols SA(a) | | | 10,359 | | | | 189,948 | |
| | |
Grupo Catalana Occidente SA | | | 3,686 | | | | 114,014 | |
| | |
Inmobiliaria Colonial Socimi SA | | | 19,165 | | | | 175,709 | |
| | |
Mapfre SA | | | 235,594 | | | | 498,054 | |
| | |
Red Electrica Corp. SA | | | 32,710 | | | | 677,307 | |
| | |
Viscofan SA | | | 2,585 | | | | 154,740 | |
| | |
Zardoya Otis SA | | | 22,094 | | | | 173,309 | |
| | | | | | | | |
| Total Spain | | | | 3,807,620 | |
|
| Sweden – 5.1% | |
| | |
AAK AB | | | 4,205 | | | | 78,962 | |
| | |
Alfa Laval AB | | | 7,363 | | | | 257,011 | |
| | |
Axfood AB | | | 12,734 | | | | 418,391 | |
| | |
BillerudKorsnas AB | | | 7,196 | | | | 107,908 | |
| | |
Boliden AB | | | 8,088 | | | | 414,927 | |
| | |
Castellum AB(a) | | | 14,783 | | | | 370,075 | |
| | |
Dometic Group AB(a)(b) | | | 8,603 | | | | 75,198 | |
| | |
Electrolux AB, Class B(a) | | | 12,610 | | | | 193,627 | |
| | |
Elekta AB, Class B | | | 10,224 | | | | 81,424 | |
| | |
Fabege AB(a) | | | 10,181 | | | | 152,397 | |
| | |
Getinge AB, Class B | | | 4,312 | | | | 174,434 | |
| | |
Hexpol AB | | | 12,796 | | | | 126,815 | |
| | |
Holmen AB, Class B(a) | | | 2,756 | | | | 155,967 | |
| | |
Husqvarna AB, Class B | | | 10,698 | | | | 113,255 | |
| | |
Indutrade AB | | | 4,871 | | | | 124,553 | |
| | |
Intrum AB | | | 6,462 | | | | 176,746 | |
| | |
Lifco AB, Class B | | | 5,080 | | | | 131,314 | |
| | |
Lundin Energy AB(a) | | | 21,115 | | | | 904,696 | |
| | |
Saab AB, Class B | | | 2,865 | | | | 105,077 | |
| | |
Sagax AB, Class B | | | 3,344 | | | | 102,982 | |
| | |
Samhallsbyggnadsbolaget i Norden AB(a) | | | 28,012 | | | | 126,994 | |
| | |
Securitas AB, Class B | | | 11,293 | | | | 128,993 | |
| | |
Skanska AB, Class B(a) | | | 11,966 | | | | 271,435 | |
| | |
SKF AB, Class B(a) | | | 14,732 | | | | 243,362 | |
| | |
Svenska Cellulosa AB SCA, Class B(a) | | | 10,704 | | | | 210,705 | |
| | |
Swedish Match AB | | | 49,589 | | | | 377,156 | |
| | |
Tele2 AB, Class B | | | 52,151 | | | | 796,305 | |
| | |
Thule Group AB(a)(b) | | | 2,904 | | | | 116,853 | |
| | |
Trelleborg AB, Class B | | | 11,631 | | | | 273,321 | |
| | |
Wihlborgs Fastigheter AB | | | 5,218 | | | | 110,470 | |
| | | | | | | | |
| Total Sweden | | | | 6,921,353 | |
|
| Switzerland – 5.0% | |
| | |
Adecco Group AG, Registered Shares | | | 9,540 | | | | 435,507 | |
| | |
Allreal Holding AG, Registered Shares | | | 477 | | | | 102,735 | |
| | |
Baloise Holding AG, Registered Shares | | | 2,072 | | | | 371,733 | |
| | |
Banque Cantonale Vaudoise, Registered Shares | | | 4,755 | | | | 414,399 | |
| | |
BKW AG | | | 1,872 | | | | 235,971 | |
| | |
Clariant AG, Registered Shares*(a) | | | 14,240 | | | | 248,978 | |
| | |
Coca-Cola HBC AG* | | | 14,197 | | | | 298,986 | |
| | |
DKSH Holding AG | | | 2,299 | | | | 194,238 | |
| | |
Galenica AG(b) | | | 2,634 | | | | 203,936 | |
| | |
Helvetia Holding AG, Registered Shares | | | 2,584 | | | | 338,918 | |
| | |
Julius Baer Group Ltd. | | | 9,599 | | | | 562,015 | |
| | |
Logitech International SA, Registered Shares | | | 2,103 | | | | 158,139 | |
| | |
OC Oerlikon Corp. AG, Registered Shares | | | 15,357 | | | | 123,490 | |
| | |
PSP Swiss Property AG, Registered Shares | | | 2,456 | | | | 324,531 | |
| | |
SFS Group AG | | | 1,081 | | | | 151,299 | |
| | |
SIG Combibloc Group AG* | | | 8,847 | | | | 224,960 | |
| | |
Stadler Rail AG(a) | | | 2,486 | | | | 96,874 | |
| | |
Sulzer AG, Registered Shares(a) | | | 1,395 | | | | 116,572 | |
| | |
Swatch Group AG, Bearer Shares | | | 426 | | | | 122,071 | |
| | |
Swatch Group AG, Registered Shares | | | 2,023 | | | | 110,795 | |
| | |
Swiss Life Holding AG, Registered Shares | | | 1,383 | | | | 892,995 | |
| | |
Swiss Prime Site AG, Registered Shares | | | 2,910 | | | | 288,549 | |
| | |
Temenos AG, Registered Shares | | | 727 | | | | 70,310 | |
| | |
VAT Group AG(b) | | | 628 | | | | 241,851 | |
| | |
Vifor Pharma AG* | | | 1,323 | | | | 236,853 | |
| | |
Vontobel Holding AG, Registered Shares | | | 2,007 | | | | 170,440 | |
| | | | | | | | |
| Total Switzerland | | | | 6,737,145 | |
|
| United Kingdom – 10.7% | |
| | |
abrdn PLC | | | 135,227 | | | | 382,622 | |
| | |
Admiral Group PLC | | | 39,253 | | | | 1,324,622 | |
| | |
Airtel Africa PLC(b) | | | 134,736 | | | | 247,473 | |
| | |
Ashmore Group PLC | | | 41,570 | | | | 127,309 | |
| | |
Auto Trader Group PLC(b) | | | 8,594 | | | | 71,603 | |
| | |
Avast PLC(b) | | | 25,259 | | | | 188,236 | |
| | |
Barratt Developments PLC | | | 49,290 | | | | 339,026 | |
| | |
Bellway PLC | | | 3,462 | | | | 110,857 | |
| | |
Big Yellow Group PLC | | | 7,254 | | | | 146,703 | |
| | |
British Land Co. PLC(a) | | | 31,502 | | | | 219,995 | |
| | |
Britvic PLC | | | 10,668 | | | | 113,351 | |
| | |
Bunzl PLC | | | 11,158 | | | | 436,034 | |
| | |
Burberry Group PLC | | | 9,963 | | | | 219,592 | |
| | |
Cazoo Group Ltd.* | | | 3,724 | | | | 10,278 | |
| | |
Close Brothers Group PLC | | | 11,239 | | | | 176,242 | |
See Notes to Financial Statements.
Schedule of Investments (concluded)
WisdomTree International MidCap Dividend Fund (DIM)
March 31, 2022
| | | | | | | | |
| Investments | | Shares | | | Value | |
| | |
Computacenter PLC | | | 4,189 | | | $ | 162,265 | |
| | |
ConvaTec Group PLC(b) | | | 55,140 | | | | 156,526 | |
| | |
DCC PLC | | | 2,519 | | | | 196,544 | |
| | |
Dechra Pharmaceuticals PLC | | | 2,169 | | | | 115,832 | |
| | |
Derwent London PLC | | | 2,777 | | | | 117,332 | |
| | |
Diploma PLC | | | 2,085 | | | | 72,309 | |
| | |
Direct Line Insurance Group PLC | | | 111,502 | | | | 403,872 | |
| | |
DS Smith PLC | | | 47,931 | | | | 203,272 | |
| | |
Dunelm Group PLC(a) | | | 5,998 | | | | 86,159 | |
| | |
Electrocomponents PLC | | | 12,719 | | | | 181,532 | |
| | |
Fresnillo PLC | | | 22,252 | | | | 215,048 | |
| | |
Grafton Group PLC | | | 7,067 | | | | 91,419 | |
| | |
Halma PLC | | | 3,253 | | | | 107,505 | |
| | |
Hargreaves Lansdown PLC | | | 16,639 | | | | 220,830 | |
| | |
Hikma Pharmaceuticals PLC | | | 4,657 | | | | 126,373 | |
| | |
HomeServe PLC | | | 13,052 | | | | 144,869 | |
| | |
Howden Joinery Group PLC | | | 14,284 | | | | 144,400 | |
| | |
IMI PLC | | | 7,327 | | | | 131,490 | |
| | |
Inchcape PLC | | | 11,545 | | | | 101,845 | |
| | |
Intertek Group PLC | | | 3,970 | | | | 273,064 | |
| | |
Investec PLC | | | 31,401 | | | | 208,209 | |
| | |
J. Sainsbury PLC | | | 90,563 | | | | 301,319 | |
| | |
Johnson Matthey PLC | | | 5,985 | | | | 148,029 | |
| | |
Kingfisher PLC | | | 78,504 | | | | 263,987 | |
| | |
Land Securities Group PLC | | | 38,842 | | | | 401,766 | |
| | |
Mondi PLC | | | 15,173 | | | | 297,965 | |
| | |
OSB Group PLC | | | 27,917 | | | | 208,228 | |
| | |
Pearson PLC | | | 28,382 | | | | 280,493 | |
| | |
Pennon Group PLC | | | 7,830 | | | | 110,826 | |
| | |
Redrow PLC | | | 14,251 | | | | 98,096 | |
| | |
Rentokil Initial PLC | | | 26,944 | | | | 186,603 | |
| | |
Rightmove PLC | | | 13,860 | | | | 115,478 | |
| | |
Rotork PLC | | | 23,216 | | | | 99,772 | |
| | |
Royal Mail PLC | | | 39,777 | | | | 172,305 | |
| | |
Sage Group PLC | | | 28,734 | | | | 265,283 | |
| | |
Schroders PLC | | | 11,805 | | | | 502,196 | |
| | |
Severn Trent PLC | | | 10,360 | | | | 419,855 | |
| | |
Smith & Nephew PLC | | | 20,980 | | | | 337,005 | |
| | |
Smiths Group PLC | | | 11,292 | | | | 215,952 | |
| | |
Softcat PLC | | | 5,702 | | | | 127,929 | |
| | |
Spectris PLC | | | 4,706 | | | | 161,038 | |
| | |
Spirax-Sarco Engineering PLC | | | 1,195 | | | | 197,225 | |
| | |
St. James’s Place PLC | | | 20,111 | | | | 383,551 | |
| | |
Tate & Lyle PLC | | | 34,674 | | | | 334,275 | |
| | |
Taylor Wimpey PLC | | | 213,862 | | | | 368,027 | |
| | |
Unite Group PLC | | | 8,479 | | | | 129,278 | |
| | |
United Utilities Group PLC | | | 47,695 | | | | 706,160 | |
| | |
Vistry Group PLC | | | 8,923 | | | | 110,624 | |
| | | | | | | | |
| Total United Kingdom | | | | 14,517,903 | |
TOTAL COMMON STOCKS (Cost: $131,188,248) | | | | 134,733,304 | |
|
| RIGHTS – 0.0% | |
|
| Austria – 0.0% | |
| | |
CA Immobilien Anlagen AG*†
(Cost: $0) | | | 5,953 | | | | 0 | |
|
| INVESTMENT OF CASH COLLATERAL FOR SECURITIES LOANED – 7.1% | |
|
| United States – 7.1% | |
| | |
State Street Navigator Securities Lending Government Money Market Portfolio, 0.25%(c) | | | | | | | | |
| | |
| (Cost: $9,649,155) | | | 9,649,155 | | | | 9,649,155 | |
| |
TOTAL INVESTMENTS IN SECURITIES – 106.3% (Cost: $140,837,403) | | | | 144,382,459 | |
| |
Other Assets less Liabilities – (6.3)% | | | | (8,529,717 | ) |
| | | | | | | | |
| NET ASSETS – 100.0% | | | $ | 135,852,742 | |
| * | Non-income producing security. |
| † | Security is being fair valued using significant unobservable inputs by a pricing committee under the direction of the Board of Trustees. The aggregate value of fair valued securities is $0, which represents 0.0% of net assets. |
| (a) | Security, or portion thereof, was on loan at March 31, 2022 (See Note 2). At March 31, 2022, the total market value of the Fund’s securities on loan identified in the Schedule of Investments was $15,604,390 and the total market value of the collateral held by the Fund was $16,489,692. The total market value of the collateral includes non-cash U.S. Government securities collateral having a value of $6,840,537. |
| (b) | This security is exempt from registration under rule 144A of the Securities Act of 1933. This security may be sold in transactions that are exempt from registration, normally to qualified institutional buyers. |
| (c) | Rate shown represents annualized 7-day yield as of March 31, 2022. |
The following is a summary of the fair valuations according to the inputs used as of March 31, 2022 in valuing the Fund’s investments (See Note 2 — Fair Value Measurement):
| | | | | | | | | | | | | | | | |
| | | | |
| | | Quoted
Prices in
Active
Markets
(Level 1) | | | Other
Significant
Observable
Inputs
(Level 2) | | | Significant
Unobservable
Inputs
(Level 3) | | | Total | |
Assets: | | | | | | | | | | | | | | | | |
Investments in Securities | | | | | | | | | | | | | | | | |
Common Stocks | | $ | 134,733,304 | | | $ | — | | | $ | — | | | $ | 134,733,304 | |
Rights | | | — | | | | — | | | | 0 | * | | | 0 | |
Investment of Cash Collateral for Securities Loaned | | | — | | | | 9,649,155 | | | | — | | | | 9,649,155 | |
Total Investments in Securities | | $ | 134,733,304 | | | $ | 9,649,155 | | | $ | 0 | | | $ | 144,382,459 | |
| * | Security is being fair valued using significant unobservable inputs by the Pricing Committee. |
See Notes to Financial Statements.
Schedule of Investments
WisdomTree International Multifactor Fund (DWMF)
March 31, 2022
| | | | | | | | |
| Investments | | Shares | | | Value | |
|
| COMMON STOCKS – 99.0% | |
|
| Australia – 10.1% | |
| | |
Ampol Ltd. | | | 6,512 | | | $ | 149,835 | |
| | |
APA Group(a) | | | 4,257 | | | | 34,110 | |
| | |
Aristocrat Leisure Ltd. | | | 4,754 | | | | 131,019 | |
| | |
Aurizon Holdings Ltd. | | | 29,405 | | | | 81,481 | |
| | |
Australia & New Zealand Banking Group Ltd. | | | 10,269 | | | | 212,837 | |
| | |
BHP Group Ltd.(a) | | | 1,578 | | | | 61,324 | |
| | |
BlueScope Steel Ltd. | | | 2,027 | | | | 31,752 | |
| | |
Brambles Ltd. | | | 10,659 | | | | 79,323 | |
| | |
Coles Group Ltd. | | | 8,118 | | | | 109,183 | |
| | |
Commonwealth Bank of Australia | | | 2,448 | | | | 194,440 | |
| | |
Computershare Ltd. | | | 5,947 | | | | 110,308 | |
| | |
Fortescue Metals Group Ltd. | | | 5,000 | | | | 77,573 | |
| | |
Macquarie Group Ltd. | | | 1,301 | | | | 198,592 | |
| | |
Medibank Pvt Ltd. | | | 101,747 | | | | 235,333 | |
| | |
QBE Insurance Group Ltd. | | | 17,305 | | | | 149,445 | |
| | |
Ramsay Health Care Ltd. | | | 2,724 | | | | 133,270 | |
| | |
Sonic Healthcare Ltd. | | | 5,416 | | | | 144,302 | |
| | |
South32 Ltd. | | | 8,228 | | | | 31,018 | |
| | |
Suncorp Group Ltd. | | | 22,737 | | | | 189,867 | |
| | |
Tabcorp Holdings Ltd.(a) | | | 42,870 | | | | 171,912 | |
| | |
Telstra Corp. Ltd. | | | 54,159 | | | | 161,056 | |
| | |
Transurban Group | | | 5,729 | | | | 58,295 | |
| | |
Wesfarmers Ltd. | | | 4,181 | | | | 158,273 | |
| | |
Westpac Banking Corp.(a) | | | 11,190 | | | | 203,692 | |
| | |
Woodside Petroleum Ltd. | | | 5,394 | | | | 130,025 | |
| | |
Woolworths Group Ltd. | | | 2,705 | | | | 75,687 | |
| | | | | | | | |
| Total Australia | | | | 3,313,952 | |
|
| Belgium – 0.8% | |
| | |
Elia Group SA/NV | | | 315 | | | | 48,437 | |
| | |
Proximus SADP | | | 1,777 | | | | 33,316 | |
| | |
UCB SA | | | 1,552 | | | | 187,275 | |
| | | | | | | | |
| Total Belgium | | | | 269,028 | |
|
| China – 0.2% | |
| | |
SITC International Holdings Co. Ltd. | | | 7,000 | | | | 24,804 | |
| | |
Xinyi Glass Holdings Ltd. | | | 13,000 | | | | 31,540 | |
| | | | | | | | |
| Total China | | | | 56,344 | |
|
| Denmark – 0.6% | |
| | |
AP Moller – Maersk A/S, Class B | | | 66 | | | | 201,099 | |
|
| France – 10.1% | |
| | |
BioMerieux | | | 3,464 | | | | 372,857 | |
| | |
Carrefour SA | | | 13,752 | | | | 300,591 | |
| | |
Electricite de France SA(a) | | | 21,750 | | | | 206,524 | |
| | |
Engie SA | | | 23,340 | | | | 309,917 | |
| | |
Ipsen SA | | | 3,369 | | | | 424,707 | |
| | |
La Francaise des Jeux SAEM(b) | | | 11,839 | | | | 473,689 | |
| | |
Orange SA | | | 22,200 | | | | 264,398 | |
| | |
Sanofi | | | 3,844 | | | | 395,668 | |
| | |
Thales SA | | | 2,171 | | | | 275,254 | |
| | |
Veolia Environnement SA | | | 8,628 | | | | 279,263 | |
| | | | | | | | |
| Total France | | | | 3,302,868 | |
|
| Germany – 4.5% | |
| | |
Beiersdorf AG | | | 2,593 | | | | 274,662 | |
| | |
Deutsche Post AG, Registered Shares | | | 4,184 | | | | 202,740 | |
| | |
E.ON SE | | | 20,726 | | | | 243,107 | |
| | |
GEA Group AG | | | 5,496 | | | | 228,155 | |
| | |
LEG Immobilien SE | | | 1,944 | | | | 223,329 | |
| | |
Merck KGaA | | | 1,498 | | | | 316,432 | |
| | | | | | | | |
| Total Germany | | | | 1,488,425 | |
|
| Hong Kong – 3.2% | |
| | |
CK Asset Holdings Ltd. | | | 13,500 | | | | 92,570 | |
| | |
CK Infrastructure Holdings Ltd. | | | 14,500 | | | | 97,112 | |
| | |
CLP Holdings Ltd. | | | 14,000 | | | | 136,489 | |
| | |
Hong Kong & China Gas Co. Ltd. | | | 90,000 | | | | 109,061 | |
| | |
Hongkong Land Holdings Ltd. | | | 15,000 | | | | 73,500 | |
| | |
Jardine Matheson Holdings Ltd. | | | 1,700 | | | | 93,500 | |
| | |
MTR Corp. Ltd. | | | 21,500 | | | | 116,266 | |
| | |
Power Assets Holdings Ltd. | | | 19,500 | | | | 127,113 | |
| | |
Sino Land Co. Ltd. | | | 76,000 | | | | 98,598 | |
| | |
Swire Properties Ltd. | | | 38,000 | | | | 94,425 | |
| | | | | | | | |
| Total Hong Kong | | | | 1,038,634 | |
|
| Ireland – 0.2% | |
| | |
Kerry Group PLC, Class A | | | 578 | | | | 65,019 | |
|
| Israel – 1.8% | |
| | |
Check Point Software Technologies Ltd.* | | | 2,324 | | | | 321,316 | |
| | |
Teva Pharmaceutical Industries Ltd., ADR* | | | 26,954 | | | | 253,098 | |
| | | | | | | | |
| Total Israel | | | | 574,414 | |
|
| Italy – 0.5% | |
| | |
DiaSorin SpA | | | 525 | | | | 82,890 | |
| | |
Snam SpA(a) | | | 15,718 | | | | 91,500 | |
| | | | | | | | |
| Total Italy | | | | 174,390 | |
|
| Japan – 23.9% | |
| | |
AGC, Inc. | | | 1,500 | | | | 60,618 | |
| | |
Aisin Corp. | | | 3,100 | | | | 107,143 | |
| | |
Ajinomoto Co., Inc. | | | 3,500 | | | | 100,206 | |
| | |
Canon, Inc. | | | 1,600 | | | | 39,455 | |
| | |
Chubu Electric Power Co., Inc. | | | 9,600 | | | | 99,895 | |
| | |
CyberAgent, Inc.(a) | | | 2,600 | | | | 32,689 | |
| | |
Dai Nippon Printing Co. Ltd. | | | 1,200 | | | | 28,454 | |
| | |
Dai-ichi Life Holdings, Inc. | | | 9,700 | | | | 199,714 | |
| | |
Daito Trust Construction Co. Ltd. | | | 300 | | | | 32,107 | |
| | |
Daiwa House Industry Co. Ltd. | | | 1,100 | | | | 29,010 | |
| | |
Daiwa Securities Group, Inc. | | | 40,200 | | | | 229,426 | |
| | |
Dentsu Group, Inc. | | | 800 | | | | 33,088 | |
| | |
ENEOS Holdings, Inc. | | | 58,400 | | | | 220,368 | |
| | |
Fujitsu Ltd. | | | 700 | | | | 106,204 | |
| | |
Hitachi Metals Ltd.*(a) | | | 6,500 | | | | 109,302 | |
| | |
Idemitsu Kosan Co. Ltd. | | | 7,200 | | | | 200,206 | |
| | |
Inpex Corp. | | | 14,200 | | | | 168,470 | |
| | |
ITOCHU Corp. | | | 3,500 | | | | 119,497 | |
| | |
Itochu Techno-Solutions Corp. | | | 5,500 | | | | 142,286 | |
| | |
Japan Post Holdings Co. Ltd. | | | 31,200 | | | | 230,938 | |
| | |
Japan Post Insurance Co. Ltd. | | | 13,400 | | | | 235,818 | |
See Notes to Financial Statements.
Schedule of Investments (continued)
WisdomTree International Multifactor Fund (DWMF)
March 31, 2022
| | | | | | | | |
| Investments | | Shares | | | Value | |
| | |
Japan Tobacco, Inc. | | | 6,200 | | | $ | 106,632 | |
| | |
Kajima Corp. | | | 2,300 | | | | 28,254 | |
| | |
Kansai Electric Power Co., Inc. | | | 9,300 | | | | 88,039 | |
| | |
Kao Corp. | | | 700 | | | | 28,980 | |
| | |
KDDI Corp. | | | 4,000 | | | | 131,988 | |
| | |
Kirin Holdings Co. Ltd. | | | 4,200 | | | | 63,290 | |
| | |
Lawson, Inc. | | | 1,700 | | | | 65,479 | |
| | |
Marubeni Corp. | | | 2,900 | | | | 34,071 | |
| | |
McDonald’s Holdings Co. Japan Ltd. | | | 4,500 | | | | 187,971 | |
| | |
Medipal Holdings Corp. | | | 2,700 | | | | 44,824 | |
| | |
MEIJI Holdings Co. Ltd. | | | 1,600 | | | | 87,135 | |
| | |
Mitsubishi Chemical Holdings Corp. | | | 9,500 | | | | 63,954 | |
| | |
Mitsubishi Corp. | | | 2,000 | | | | 75,815 | |
| | |
Mitsubishi Electric Corp. | | | 5,300 | | | | 61,569 | |
| | |
Mitsubishi UFJ Financial Group, Inc. | | | 37,900 | | | | 237,408 | |
| | |
Mizuho Financial Group, Inc. | | | 19,000 | | | | 245,298 | |
| | |
MS&AD Insurance Group Holdings, Inc. | | | 7,200 | | | | 235,976 | |
| | |
NGK Insulators Ltd. | | | 2,200 | | | | 31,774 | |
| | |
Nintendo Co. Ltd. | | | 200 | | | | 101,619 | |
| | |
Nippon Sanso Holdings Corp. | | | 2,900 | | | | 55,694 | |
| | |
Nippon Shinyaku Co. Ltd. | | | 1,300 | | | | 89,219 | |
| | |
Nippon Steel Corp. | | | 2,000 | | | | 35,773 | |
| | |
Nippon Telegraph & Telephone Corp. | | | 4,800 | | | | 140,194 | |
| | |
Nippon Yusen KK | | | 1,900 | | | | 168,437 | |
| | |
Nisshin Seifun Group, Inc. | | | 2,300 | | | | 32,328 | |
| | |
Nissin Foods Holdings Co. Ltd. | | | 1,200 | | | | 84,729 | |
| | |
NTT Data Corp. | | | 2,200 | | | | 43,828 | |
| | |
Oji Holdings Corp. | | | 13,600 | | | | 68,014 | |
| | |
Olympus Corp. | | | 2,500 | | | | 48,177 | |
| | |
Ono Pharmaceutical Co. Ltd. | | | 5,200 | | | | 131,355 | |
| | |
Open House Group Co. Ltd. | | | 1,600 | | | | 71,448 | |
| | |
Oracle Corp. | | | 400 | | | | 28,012 | |
| | |
Osaka Gas Co. Ltd. | | | 5,400 | | | | 93,074 | |
| | |
Otsuka Holdings Co. Ltd. | | | 1,500 | | | | 52,301 | |
| | |
Resona Holdings, Inc. | | | 51,500 | | | | 222,378 | |
| | |
Ryohin Keikaku Co. Ltd. | | | 6,800 | | | | 80,171 | |
| | |
SCSK Corp. | | | 6,300 | | | | 109,053 | |
| | |
Secom Co. Ltd. | | | 400 | | | | 29,225 | |
| | |
Seiko Epson Corp. | | | 2,200 | | | | 33,369 | |
| | |
SG Holdings Co. Ltd. | | | 3,600 | | | | 68,574 | |
| | |
SoftBank Corp. | | | 7,700 | | | | 90,592 | |
| | |
Sohgo Security Services Co. Ltd. | | | 1,800 | | | | 59,320 | |
| | |
Sompo Holdings, Inc. | | | 6,000 | | | | 266,002 | |
| | |
Sumitomo Chemical Co. Ltd. | | | 14,400 | | | | 66,676 | |
| | |
Sumitomo Metal Mining Co. Ltd. | | | 700 | | | | 35,544 | |
| | |
Suntory Beverage & Food Ltd. | | | 1,400 | | | | 53,751 | |
| | |
Takeda Pharmaceutical Co. Ltd.(a) | | | 4,200 | | | | 121,043 | |
| | |
TIS, Inc. | | | 6,100 | | | | 144,591 | |
| | |
Tokio Marine Holdings, Inc. | | | 4,600 | | | | 270,145 | |
| | |
Tokyo Gas Co. Ltd. | | | 5,300 | | | | 97,463 | |
| | |
Toshiba Corp. | | | 800 | | | | 30,649 | |
| | |
Tosoh Corp. | | | 4,900 | | | | 73,233 | |
| | |
Toyo Suisan Kaisha Ltd. | | | 2,200 | | | | 79,209 | |
| | |
Trend Micro, Inc. | | | 2,700 | | | | 159,275 | |
| | |
USS Co. Ltd. | | | 8,900 | | | | 150,979 | |
| | |
Yamato Holdings Co. Ltd.(a) | | | 1,800 | | | | 34,005 | |
| | | | | | | | |
| Total Japan | | | | 7,862,800 | |
|
| Luxembourg – 1.0% | |
| | |
Eurofins Scientific SE | | | 3,190 | | | | 319,122 | |
|
| Netherlands – 3.9% | |
| | |
Koninklijke Ahold Delhaize NV | | | 10,317 | | | | 334,217 | |
| | |
Koninklijke KPN NV | | | 85,649 | | | | 299,520 | |
| | |
QIAGEN NV* | | | 7,018 | | | | 347,716 | |
| | |
Wolters Kluwer NV | | | 2,847 | | | | 305,938 | |
| | | | | | | | |
| Total Netherlands | | | | 1,287,391 | |
|
| New Zealand – 0.5% | |
| | |
Fisher & Paykel Healthcare Corp. Ltd. | | | 4,267 | | | | 72,269 | |
| | |
Spark New Zealand Ltd. | | | 32,342 | | | | 103,029 | |
| | | | | | | | |
| Total New Zealand | | | | 175,298 | |
|
| Norway – 2.6% | |
| | |
Aker BP ASA(a) | | | 7,030 | | | | 265,796 | |
| | |
Equinor ASA | | | 8,289 | | | | 313,966 | |
| | |
Orkla ASA | | | 17,814 | �� | | | 159,641 | |
| | |
Telenor ASA | | | 7,263 | | | | 105,282 | |
| | | | | | | | |
| Total Norway | | | | 844,685 | |
|
| Poland – 0.7% | |
| | |
InPost SA* | | | 37,868 | | | | 242,691 | |
|
| Portugal – 0.5% | |
| | |
Jeronimo Martins SGPS SA | | | 6,978 | | | | 168,713 | |
|
| Russia – 0.0% | |
| | |
Evraz PLC† | | | 17,300 | | | | 0 | |
|
| Singapore – 3.0% | |
| | |
City Developments Ltd. | | | 13,000 | | | | 75,598 | |
| | |
Keppel Corp. Ltd. | | | 13,700 | | | | 64,990 | |
| | |
Singapore Exchange Ltd. | | | 49,800 | | | | 366,872 | |
| | |
United Overseas Bank Ltd. | | | 16,500 | | | | 390,387 | |
| | |
UOL Group Ltd. | | | 19,100 | | | | 99,356 | |
| | | | | | | | |
| Total Singapore | | | | 997,203 | |
|
| Spain – 1.9% | |
| | |
Enagas SA | | | 3,689 | | | | 82,707 | |
| | |
Endesa SA | | | 2,288 | | | | 50,342 | |
| | |
Red Electrica Corp. SA | | | 5,034 | | | | 104,236 | |
| | |
Repsol SA | | | 23,471 | | | | 311,395 | |
| | |
Telefonica SA | | | 16,080 | | | | 78,517 | |
| | | | | | | | |
| Total Spain | | | | 627,197 | |
|
| Sweden – 2.6% | |
| | |
Essity AB, Class B | | | 7,378 | | | | 175,912 | |
| | |
Getinge AB, Class B | | | 878 | | | | 35,518 | |
| | |
Lundin Energy AB | | | 4,274 | | | | 183,124 | |
| | |
Securitas AB, Class B(a) | | | 6,220 | | | | 71,047 | |
| | |
Swedish Match AB(a) | | | 25,222 | | | | 191,830 | |
| | |
Tele2 AB, Class B(a) | | | 5,242 | | | | 80,041 | |
See Notes to Financial Statements.
Schedule of Investments (continued)
WisdomTree International Multifactor Fund (DWMF)
March 31, 2022
| | | | | | | | |
| Investments | | Shares | | | Value | |
| | |
Telefonaktiebolaget LM Ericsson, Class B | | | 11,931 | | | $ | 110,484 | |
| | | | | | | | |
| Total Sweden | | | | 847,956 | |
|
| Switzerland – 10.2% | |
| | |
Barry Callebaut AG, Registered Shares | | | 109 | | | | 257,028 | |
| | |
Geberit AG, Registered Shares | | | 359 | | | | 223,222 | |
| | |
Givaudan SA, Registered Shares | | | 91 | | | | 378,437 | |
| | |
Glencore PLC* | | | 51,306 | | | | 337,760 | |
| | |
Kuehne + Nagel International AG, Registered Shares | | | 911 | | | | 260,456 | |
| | |
Nestle SA, Registered Shares | | | 2,302 | | | | 300,680 | |
| | |
Novartis AG, Registered Shares | | | 4,273 | | | | 377,268 | |
| | |
Roche Holding AG | | | 955 | | | | 380,288 | |
| | |
Sonova Holding AG, Registered Shares | | | 739 | | | | 311,259 | |
| | |
Swiss Prime Site AG, Registered Shares | | | 2,535 | | | | 251,365 | |
| | |
Swisscom AG, Registered Shares | | | 467 | | | | 281,646 | |
| | | | | | | | |
| Total Switzerland | | | | 3,359,409 | |
|
| United Kingdom – 16.2% | |
| | |
Aviva PLC | | | 100,788 | | | | 599,948 | |
| | |
BAE Systems PLC | | | 28,890 | | | | 272,885 | |
| | |
British American Tobacco PLC | | | 6,253 | | | | 263,004 | |
| | |
Bunzl PLC | | | 6,640 | | | | 259,479 | |
| | |
CK Hutchison Holdings Ltd. | | | 16,000 | | | | 117,578 | |
| | |
DCC PLC | | | 3,163 | | | | 246,792 | |
| | |
Entain PLC* | | | 17,056 | | | | 369,077 | |
| | |
GlaxoSmithKline PLC | | | 17,877 | | | | 387,714 | |
| | |
Imperial Brands PLC | | | 12,372 | | | | 262,344 | |
| | |
J. Sainsbury PLC | | | 69,967 | | | | 232,793 | |
| | |
Kingfisher PLC | | | 113,522 | | | | 381,743 | |
| | |
National Grid PLC | | | 17,049 | | | | 263,176 | |
| | |
Rio Tinto PLC | | | 5,801 | | | | 481,344 | |
| | |
Sage Group PLC | | | 26,958 | | | | 248,886 | |
| | |
Segro PLC | | | 14,556 | | | | 257,867 | |
| | |
Tesco PLC | | | 67,709 | | | | 246,052 | |
| | |
Unilever PLC | | | 5,711 | | | | 259,795 | |
| | |
Vodafone Group PLC | | | 115,873 | | | | 190,461 | |
| | | | | | | | |
| Total United Kingdom | | | | 5,340,938 | |
TOTAL COMMON STOCKS (Cost: $30,694,823) | | | | 32,557,576 | |
|
| INVESTMENT OF CASH COLLATERAL FOR SECURITIES LOANED – 1.2% | |
|
| United States – 1.2% | |
| | |
State Street Navigator Securities Lending Government Money Market Portfolio, 0.25%(c) | | | | | | | | |
| | |
| (Cost: $395,563) | | | 395,563 | | | | 395,563 | |
| |
TOTAL INVESTMENTS IN SECURITIES – 100.2% (Cost: $31,090,386) | | | | 32,953,139 | |
| |
Other Assets less Liabilities – (0.2)% | | | | (66,730 | ) |
| | | | | | | | |
| NET ASSETS – 100.0% | | | $ | 32,886,409 | |
| * | Non-income producing security. |
| † | Security is being fair valued using significant unobservable inputs by a pricing committee under the direction of the Board of Trustees. The aggregate value of fair valued securities is $0, which represents 0.0% of net assets. |
| (a) | Security, or portion thereof, was on loan at March 31, 2022 (See Note 2). At March 31, 2022, the total market value of the Fund’s securities on loan identified in the Schedule of Investments was $1,235,414 and the total market value of the collateral held by the Fund was $1,305,984. The total market value of the collateral includes non-cash U.S. Government securities collateral having a value of $910,421. |
| (b) | This security is exempt from registration under rule 144A of the Securities Act of 1933. This security may be sold in transactions that are exempt from registration, normally to qualified institutional buyers. |
| (c) | Rate shown represents annualized 7-day yield as of March 31, 2022. |
| | | | | | | | | | | | | | | | | | | | | | | | | | | | |
|
| FINANCIAL DERIVATIVE INSTRUMENTS | |
|
| FOREIGN CURRENCY CONTRACTS (OTC – OVER THE COUNTER) | |
| | | | | |
| Counterparty | | Settlement
Date | | | Amount and
Description of
Currency to
be Purchased | | | Amount and
Description of
Currency to
be Sold | | | Unrealized
Appreciation | | | Unrealized
Depreciation | |
Bank of America NA | | | 4/6/2022 | | | | 5,480,953 | | | | USD | | | | 631,866,240 | | | | JPY | | | $ | 274,887 | | | $ | — | |
Barclays Bank PLC | | | 4/1/2022 | | | | 2,500 | | | | CHF | | | | 3,614 | | | | AUD | | | | 3 | | | | — | |
Barclays Bank PLC | | | 4/6/2022 | | | | 537,641 | | | | USD | | | | 5,333,392 | | | | SEK | | | | — | | | | (34,666 | ) |
Goldman Sachs | | | 4/6/2022 | | | | 16,237 | | | | AUD | | | | 12,180 | | | | USD | | | | 13 | | | | — | |
Goldman Sachs | | | 4/6/2022 | | | | 9,640 | | | | CHF | | | | 10,359 | | | | USD | | | | 117 | | | | — | |
Goldman Sachs | | | 4/6/2022 | | | | 4,008 | | | | DKK | | | | 592 | | | | USD | | | | 8 | | | | — | |
Goldman Sachs | | | 4/6/2022 | | | | 446,321 | | | | EUR | | | | 489,828 | | | | USD | | | | 6,798 | | | | — | |
Goldman Sachs | | | 4/6/2022 | | | | 20,386 | | | | EUR | | | | 22,399 | | | | USD | | | | 285 | | | | — | |
Goldman Sachs | | | 4/6/2022 | | | | 9,720 | | | | GBP | | | | 12,824 | | | | USD | | | | — | | | | (26 | ) |
Goldman Sachs | | | 4/6/2022 | | | | 2,443,912 | | | | JPY | | | | 20,039 | | | | USD | | | | 97 | | | | — | |
Goldman Sachs | | | 4/6/2022 | | | | 16,908 | | | | NOK | | | | 1,958 | | | | USD | | | | — | | | | (24 | ) |
Goldman Sachs | | | 4/6/2022 | | | | 496 | | | | NZD | | | | 345 | | | | USD | | | | 0 | ^ | | | — | |
Goldman Sachs | | | 4/6/2022 | | | | 18,530 | | | | SEK | | | | 1,965 | | | | USD | | | | 23 | | | | — | |
Goldman Sachs | | | 4/6/2022 | | | | 2,361 | | | | SGD | | | | 1,738 | | | | USD | | | | 6 | | | | — | |
HSBC Holdings PLC | | | 4/6/2022 | | | | 3,331,288 | | | | USD | | | | 4,535,545 | | | | AUD | | | | — | | | | (74,752 | ) |
HSBC Holdings PLC | | | 4/6/2022 | | | | 161,932 | | | | USD | | | | 1,101,701 | | | | DKK | | | | — | | | | (2,870 | ) |
HSBC Holdings PLC | | | 4/6/2022 | | | | 3,507,469 | | | | USD | | | | 2,648,703 | | | | GBP | | | | 20,115 | | | | — | |
HSBC Holdings PLC | | | 4/6/2022 | | | | 94,402 | | | | USD | | | | 138,379 | | | | NZD | | | | — | | | | (1,846 | ) |
HSBC Holdings PLC | | | 4/6/2022 | | | | 475,212 | | | | USD | | | | 647,111 | | | | SGD | | | | — | | | | (2,937 | ) |
See Notes to Financial Statements.
Schedule of Investments (concluded)
WisdomTree International Multifactor Fund (DWMF)
March 31, 2022
| | | | | | | | | | | | | | | | | | | | | | | | | | | | |
|
| FINANCIAL DERIVATIVE INSTRUMENTS | |
|
| FOREIGN CURRENCY CONTRACTS (OTC – OVER THE COUNTER) | |
| | | | | |
| Counterparty | | Settlement
Date | | | Amount and
Description of
Currency to
be Purchased | | | Amount and
Description of
Currency to
be Sold | | | Unrealized
Appreciation | | | Unrealized
Depreciation | |
Morgan Stanley & Co. International | | | 4/6/2022 | | | | 6,126,402 | | | | USD | | | | 5,604,008 | | | | EUR | | | $ | — | | | $ | (109,242 | ) |
UBS AG | | | 4/6/2022 | | | | 2,833,355 | | | | USD | | | | 2,603,270 | | | | CHF | | | | 4,306 | | | | — | |
UBS AG | | | 4/6/2022 | | | | 535,507 | | | | USD | | | | 4,823,504 | | | | NOK | | | | — | | | | (16,116 | ) |
| | | | | | | | | | | | | | | | | | | | | | | $ | 306,658 | | | $ | (242,479 | ) |
| ^ | Amount represents less than $1. |
The following is a summary of the fair valuations according to the inputs used as of March 31, 2022 in valuing the Fund’s investments (See Note 2 — Fair Value Measurement):
| | | | | | | | | | | | | | | | |
| | | | |
| | | Quoted
Prices in
Active
Markets
(Level 1) | | | Other
Significant
Observable
Inputs
(Level 2) | | | Significant
Unobservable
Inputs
(Level 3) | | | Total | |
Assets: | | | | | | | | | | | | | | | | |
Investments in Securities | | | | | | | | | | | | | | | | |
Common Stocks | | | | | | | | | | | | | | | | |
Russia | | $ | — | | | $ | — | | | $ | 0 | * | | $ | 0 | |
Other | | | 32,557,576 | | | | — | | | | — | | | | 32,557,576 | |
Investment of Cash Collateral for Securities Loaned | | | — | | | | 395,563 | | | | — | | | | 395,563 | |
Total Investments in Securities | | $ | 32,557,576 | | | $ | 395,563 | | | $ | 0 | | | $ | 32,953,139 | |
Financial Derivative Instruments | | | | | | | | | | | | |
Foreign Currency Contracts1 | | $ | — | | | $ | 306,658 | | | $ | — | | | $ | 306,658 | |
Liabilities: | | | | | | | | | | | | |
Financial Derivative Instruments | | | | | | | | | | | | | | | | |
Foreign Currency Contracts1 | | $ | — | | | $ | (242,479 | ) | | $ | — | | | $ | (242,479 | ) |
Total – Net | | $ | 32,557,576 | | | $ | 459,742 | | | $ | 0 | | | $ | 33,017,318 | |
| * | Security is being fair valued using significant unobservable inputs by the Pricing Committee. |
| 1 | Amount shown represents the unrealized appreciation (depreciation) on the financial instrument. |
See Notes to Financial Statements.
Schedule of Investments
WisdomTree International Quality Dividend Growth Fund (IQDG)
March 31, 2022
| | | | | | | | |
| Investments | | Shares | | | Value | |
|
| COMMON STOCKS – 99.2% | |
|
| Australia – 10.4% | |
| | |
ARB Corp. Ltd. | | | 5,163 | | | $ | 161,057 | |
| | |
Aristocrat Leisure Ltd. | | | 15,173 | | | | 418,166 | |
| | |
Beach Energy Ltd.(a) | | | 72,627 | | | | 84,809 | |
| | |
BHP Group Ltd. | | | 558,919 | | | | 21,720,515 | |
| | |
Breville Group Ltd.(a) | | | 7,141 | | | | 147,148 | |
| | |
carsales.com Ltd. | | | 37,651 | | | | 591,492 | |
| | |
Cochlear Ltd. | | | 5,550 | | | | 939,124 | |
| | |
Codan Ltd. | | | 2,926 | | | | 16,084 | |
| | |
Coles Group Ltd. | | | 312,778 | | | | 4,206,711 | |
| | |
CSL Ltd. | | | 31,901 | | | | 6,423,814 | |
| | |
Domino’s Pizza Enterprises Ltd. | | | 7,679 | | | | 506,591 | |
| | |
Eagers Automotive Ltd. | | | 45,114 | | | | 483,783 | |
| | |
Evolution Mining Ltd. | | | 383,193 | | | | 1,266,138 | |
| | |
Netwealth Group Ltd. | | | 21,909 | | | | 246,459 | |
| | |
OZ Minerals Ltd. | | | 27,805 | | | | 556,874 | |
| | |
REA Group Ltd. | | | 6,836 | | | | 695,434 | |
| | |
Technology One Ltd. | | | 27,401 | | | | 236,221 | |
| | |
WiseTech Global Ltd. | | | 2,404 | | | | 92,214 | |
| | | | | | | | |
| Total Australia | | | | 38,792,634 | |
|
| Belgium – 0.1% | |
| | |
Melexis NV | | | 5,649 | | | | 527,970 | |
|
| China – 1.2% | |
| | |
Beijing Tong Ren Tang Chinese Medicine Co. Ltd. | | | 186,000 | | | | 257,931 | |
| | |
BYD Electronic International Co. Ltd.(a) | | | 179,000 | | | | 361,136 | |
| | |
China Nonferrous Mining Corp. Ltd. | | | 657,000 | | | | 330,538 | |
| | |
Lenovo Group Ltd.(a) | | | 3,090,000 | | | | 3,361,698 | |
| | | | | | | | |
| Total China | | | | 4,311,303 | |
|
| Denmark – 7.7% | |
| | |
Alten SA | | | 2,296 | | | | 351,264 | |
| | |
AP Moller – Maersk A/S, Class B | | | 1,010 | | | | 3,077,430 | |
| | |
Coloplast A/S, Class B | | | 24,316 | | | | 3,726,318 | |
| | |
DSV A/S | | | 1,924 | | | | 374,275 | |
| | |
GN Store Nord A/S | | | 4,816 | | | | 239,671 | |
| | |
Netcompany Group A/S(b) | | | 768 | | | | 51,305 | |
| | |
Novo Nordisk A/S, Class B | | | 169,023 | | | | 18,934,136 | |
| | |
Royal Unibrew A/S | | | 5,757 | | | | 544,583 | |
| | |
SimCorp A/S | | | 3,806 | | | | 282,944 | |
| | |
Vestas Wind Systems A/S | | | 41,876 | | | | 1,251,203 | |
| | | | | | | | |
| Total Denmark | | | | 28,833,129 | |
|
| Finland – 2.4% | |
| | |
Kesko Oyj, Class A | | | 19,661 | | | | 511,894 | |
| | |
Kesko Oyj, Class B | | | 50,807 | | | | 1,413,826 | |
| | |
Neste Oyj | | | 83,374 | | | | 3,847,938 | |
| | |
Nokian Renkaat Oyj | | | 32,401 | | | | 532,653 | |
| | |
Orion Oyj, Class B | | | 33,704 | | | | 1,543,157 | |
| | |
Tokmanni Group Corp. | | | 17,748 | | | | 297,197 | |
| | |
Uponor Oyj | | | 5,682 | | | | 116,010 | |
| | |
Valmet Oyj(a) | | | 19,120 | | | | 600,136 | |
| | | | | | | | |
| Total Finland | | | | 8,862,811 | |
|
| France – 10.1% | |
| | |
Arkema SA | | | 12,337 | | | | 1,492,786 | |
| | |
BioMerieux | | | 5,725 | | | | 616,226 | |
| | |
Bureau Veritas SA | | | 45,991 | | | | 1,327,399 | |
| | |
Cie Generale des Etablissements Michelin SCA | | | 20,323 | | | | 2,780,194 | |
| | |
Hermes International | | | 2,493 | | | | 3,582,411 | |
| | |
Kering SA | | | 9,406 | | | | 6,025,039 | |
| | |
La Francaise des Jeux SAEM(b) | | | 24,915 | | | | 996,872 | |
| | |
LVMH Moet Hennessy Louis Vuitton SE | | | 24,922 | | | | 18,007,518 | |
| | |
Sartorius Stedim Biotech | | | 52 | | | | 21,552 | |
| | |
SEB SA | | | 7,502 | | | | 1,056,743 | |
| | |
Teleperformance | | | 2,830 | | | | 1,090,429 | |
| | |
Trigano SA | | | 1,568 | | | | 230,292 | |
| | |
Verallia SA(b) | | | 23,370 | | | | 560,097 | |
| | | | | | | | |
| Total France | | | | 37,787,558 | |
|
| Germany – 6.6% | |
| | |
adidas AG | | | 13,009 | | | | 3,067,140 | |
| | |
Covestro AG(b) | | | 31,067 | | | | 1,584,538 | |
| | |
Dermapharm Holding SE | | | 5,865 | | | | 376,533 | |
| | |
Deutsche Post AG, Registered Shares | | | 192,525 | | | | 9,328,976 | |
| | |
Eckert & Ziegler Strahlen – und Medizintechnik AG | | | 1,481 | | | | 95,904 | |
| | |
Fielmann AG | | | 13,337 | | | | 733,067 | |
| | |
Hamburger Hafen und Logistik AG | | | 16,267 | | | | 292,307 | |
| | |
Hapag-Lloyd AG(b) | | | 20,552 | | | | 7,239,752 | |
| | |
Instone Real Estate Group SE(b) | | | 8,571 | | | | 161,549 | |
| | |
Knorr-Bremse AG | | | 10,649 | | | | 825,137 | |
| | |
Nemetschek SE | | | 3,232 | | | | 315,736 | |
| | |
Varta AG(a) | | | 4,805 | | | | 480,631 | |
| | |
VERBIO Vereinigte BioEnergie AG | | | 2,034 | | | | 158,645 | |
| | | | | | | | |
| Total Germany | | | | 24,659,915 | |
|
| Hong Kong – 0.6% | |
| | |
Techtronic Industries Co. Ltd. | | | 103,500 | | | | 1,677,114 | |
| | |
Vitasoy International Holdings Ltd. | | | 370,000 | | | | 702,071 | |
| | | | | | | | |
| Total Hong Kong | | | | 2,379,185 | |
|
| Ireland – 0.1% | |
| | |
Kingspan Group PLC | | | 5,058 | | | | 501,098 | |
|
| Israel – 0.7% | |
| | |
Altshuler Shaham Provident Funds & Pension Ltd. | | | 43,975 | | | | 206,698 | |
| | |
AudioCodes Ltd. | | | 3,906 | | | | 98,775 | |
| | |
Delek Automotive Systems Ltd. | | | 66,731 | | | | 1,030,266 | |
| | |
Hilan Ltd. | | | 3,038 | | | | 188,397 | |
| | |
Matrix IT Ltd. | | | 13,806 | | | | 361,238 | |
| | |
One Software Technologies Ltd. | | | 11,890 | | | | 206,969 | |
| | |
Strauss Group Ltd. | | | 19,473 | | | | 581,642 | |
| | | | | | | | |
| Total Israel | | | | 2,673,985 | |
|
| Italy – 1.5% | |
| | |
Amplifon SpA(a) | | | 7,646 | | | | 344,887 | |
| | |
Carel Industries SpA(b) | | | 4,398 | | | | 113,772 | |
| | |
De’ Longhi SpA | | | 16,048 | | | | 441,753 | |
| | |
DiaSorin SpA | | | 1,952 | | | | 308,192 | |
| | |
Ferrari NV | | | 6,101 | | | | 1,348,831 | |
| | |
Gruppo MutuiOnline SpA | | | 4,234 | | | | 152,635 | |
See Notes to Financial Statements.
Schedule of Investments (continued)
WisdomTree International Quality Dividend Growth Fund (IQDG)
March 31, 2022
| | | | | | | | |
| Investments | | Shares | | | Value | |
| | |
GVS SpA(b) | | | 2,801 | | | $ | 25,680 | |
| | |
Interpump Group SpA | | | 3,202 | | | | 162,816 | |
| | |
Moncler SpA | | | 11,804 | | | | 666,405 | |
| | |
RAI Way SpA(b) | | | 122,169 | | | | 770,731 | |
| | |
Recordati Industria Chimica e Farmaceutica SpA | | | 20,157 | | | | 1,023,600 | |
| | |
Reply SpA | | | 775 | | | | 129,345 | |
| | |
Technogym SpA(b) | | | 30,808 | | | | 246,463 | |
| | | | | | | | |
| Total Italy | | | | 5,735,110 | |
|
| Japan – 12.3% | |
| | |
Anritsu Corp.(a) | | | 35,800 | | | | 458,063 | |
| | |
Asahi Holdings, Inc. | | | 15,500 | | | | 289,248 | |
| | |
Astellas Pharma, Inc. | | | 320,900 | | | | 5,052,440 | |
| | |
BayCurrent Consulting, Inc. | | | 300 | | | | 110,731 | |
| | |
Benefit One, Inc. | | | 3,600 | | | | 76,820 | |
| | |
BML, Inc. | | | 12,700 | | | | 323,320 | |
| | |
Capcom Co. Ltd. | | | 23,600 | | | | 577,094 | |
| | |
Cosmos Pharmaceutical Corp. | | | 1,100 | | | | 134,402 | |
| | |
Cybozu, Inc.(a) | | | 1,400 | | | | 16,091 | |
| | |
Daiwabo Holdings Co. Ltd. | | | 26,700 | | | | 362,746 | |
| | |
Digital Arts, Inc. | | | 1,200 | | | | 73,359 | |
| | |
Disco Corp. | | | 5,200 | | | | 1,473,780 | |
| | |
eGuarantee, Inc. | | | 8,100 | | | | 136,874 | |
| | |
Elecom Co. Ltd. | | | 35,900 | | | | 435,385 | |
| | |
en Japan, Inc. | | | 3,000 | | | | 72,964 | |
| | |
Fast Retailing Co. Ltd. | | | 3,900 | | | | 2,023,984 | |
| | |
Fujimi, Inc. | | | 3,100 | | | | 171,633 | |
| | |
Funai Soken Holdings, Inc. | | | 15,300 | | | | 278,457 | |
| | |
Future Corp. | | | 15,700 | | | | 225,588 | |
| | |
Goldwin, Inc. | | | 3,400 | | | | 173,957 | |
| | |
Haseko Corp. | | | 107,700 | | | | 1,248,477 | |
| | |
Hoya Corp. | | | 14,700 | | | | 1,699,205 | |
| | |
IR Japan Holdings Ltd.(a) | | | 900 | | | | 32,292 | |
| | |
Japan Elevator Service Holdings Co. Ltd.(a) | | | 3,000 | | | | 39,522 | |
| | |
Japan Material Co. Ltd. | | | 4,500 | | | | 64,511 | |
| | |
JCR Pharmaceuticals Co. Ltd. | | | 8,000 | | | | 148,762 | |
| | |
JCU Corp. | | | 2,100 | | | | 71,802 | |
| | |
JINS Holdings, Inc. | | | 1,700 | | | | 80,816 | |
| | |
Justsystems Corp. | | | 3,500 | | | | 166,962 | |
| | |
Kakaku.com, Inc.(a) | | | 15,300 | | | | 347,535 | |
| | |
Keyence Corp. | | | 4,300 | | | | 2,028,218 | |
| | |
KH Neochem Co. Ltd. | | | 12,500 | | | | 284,346 | |
| | |
Kobe Bussan Co. Ltd.(a) | | | 5,500 | | | | 171,061 | |
| | |
Koei Tecmo Holdings Co. Ltd.(a) | | | 20,500 | | | | 678,126 | |
| | |
Lasertec Corp. | | | 1,700 | | | | 291,118 | |
| | |
M3, Inc.(a) | | | 7,600 | | | | 279,830 | |
| | |
MCJ Co. Ltd. | | | 34,700 | | | | 266,164 | |
| | |
Meitec Corp. | | | 7,300 | | | | 399,959 | |
| | |
Milbon Co. Ltd. | | | 2,300 | | | | 103,843 | |
| | |
MonotaRO Co. Ltd. | | | 18,200 | | | | 394,964 | |
| | |
Nihon M&A Center Holdings, Inc. | | | 7,300 | | | | 103,869 | |
| | |
Nippon Shinyaku Co. Ltd. | | | 6,100 | | | | 418,645 | |
| | |
Nissan Chemical Corp. | | | 14,000 | | | | 833,944 | |
| | |
Nojima Corp. | | | 14,900 | | | | 284,435 | |
| | |
Nomura Research Institute Ltd. | | | 33,200 | | | | 1,099,600 | |
| | |
NSD Co. Ltd. | | | 14,800 | | | | 267,284 | |
| | |
Olympus Corp. | | | 44,000 | | | | 847,918 | |
| | |
Otsuka Corp. | | | 33,900 | | | | 1,213,557 | |
| | |
Outsourcing, Inc. | | | 3,873 | | | | 40,557 | |
| | |
Pasona Group, Inc. | | | 2,200 | | | | 44,680 | |
| | |
Pilot Corp. | | | 14,400 | | | | 624,049 | |
| | |
Recruit Holdings Co. Ltd. | | | 40,100 | | | | 1,788,683 | |
| | |
Shionogi & Co. Ltd. | | | 36,400 | | | | 2,258,225 | |
| | |
Shoei Co. Ltd. | | | 1,500 | | | | 56,663 | |
| | |
Solasto Corp. | | | 16,200 | | | | 131,869 | |
| | |
Sysmex Corp. | | | 6,300 | | | | 463,151 | |
| | |
Taiyo Yuden Co. Ltd.(a) | | | 7,900 | | | | 361,236 | |
| | |
TechnoPro Holdings, Inc. | | | 14,500 | | | | 397,817 | |
| | |
Toei Animation Co. Ltd.(a) | | | 800 | | | �� | 67,032 | |
| | |
Tokyo Electron Ltd. | | | 20,800 | | | | 10,839,135 | |
| | |
Trend Micro, Inc. | | | 26,500 | | | | 1,563,254 | |
| | |
UT Group Co. Ltd. | | | 2,700 | | | | 69,071 | |
| | |
ValueCommerce Co. Ltd. | | | 1,600 | | | | 49,236 | |
| | |
Wacom Co. Ltd.(a) | | | 41,200 | | | | 320,096 | |
| | |
West Holdings Corp.(a) | | | 2,000 | | | | 79,753 | |
| | |
ZOZO, Inc. | | | 19,400 | | | | 525,059 | |
| | | | | | | | |
| Total Japan | | | | 46,013,267 | |
|
| Netherlands – 3.9% | |
| | |
ASM International NV | | | 3,304 | | | | 1,220,865 | |
| | |
ASML Holding NV | | | 12,078 | | | | 8,197,540 | |
| | |
BE Semiconductor Industries NV | | | 13,545 | | | | 1,173,416 | |
| | |
IMCD NV | | | 224 | | | | 38,693 | |
| | |
Randstad NV(a) | | | 49,944 | | | | 3,036,356 | |
| | |
Signify NV(b) | | | 19,498 | | | | 920,496 | |
| | | | | | | | |
| Total Netherlands | | | | 14,587,366 | |
|
| Norway – 1.0% | |
| | |
AF Gruppen ASA | | | 29,232 | | | | 668,619 | |
| | |
Aker BP ASA(a) | | | 74,139 | | | | 2,803,105 | |
| | |
Tomra Systems ASA | | | 4,099 | | | | 211,560 | |
| | | | | | | | |
| Total Norway | | | | 3,683,284 | |
|
| Portugal – 0.5% | |
| | |
Altri SGPS SA | | | 76,202 | | | | 513,804 | |
| | |
Jeronimo Martins SGPS SA | | | 60,543 | | | | 1,463,802 | |
| | | | | | | | |
| Total Portugal | | | | 1,977,606 | |
|
| Singapore – 0.7% | |
| | |
iFAST Corp. Ltd.(a) | | | 13,500 | | | | 60,450 | |
| | |
Japfa Ltd.(a) | | | 476,900 | | | | 244,907 | |
| | |
Sheng Siong Group Ltd. | | | 857,100 | | | | 962,642 | |
| | |
Singapore Exchange Ltd. | | | 160,700 | | | | 1,183,862 | |
| | | | | | | | |
| Total Singapore | | | | 2,451,861 | |
|
| Spain – 2.8% | |
| | |
Cie Automotive SA | | | 21,604 | | | | 496,619 | |
| | |
Faes Farma SA | | | 23,692 | | | | 96,955 | |
| | |
Industria de Diseno Textil SA | | | 434,090 | | | | 9,553,549 | |
| | |
Laboratorios Farmaceuticos Rovi SA | | | 3,172 | | | | 237,171 | |
| | | | | | | | |
| Total Spain | | | | 10,384,294 | |
See Notes to Financial Statements.
Schedule of Investments (continued)
WisdomTree International Quality Dividend Growth Fund (IQDG)
March 31, 2022
| | | | | | | | |
| Investments | | Shares | | | Value | |
|
| Sweden – 6.0% | |
| | |
AddLife AB, Class B | | | 1,078 | | | $ | 30,445 | |
| | |
AddTech AB, Class B | | | 2,806 | | | | 54,799 | |
| | |
Assa Abloy AB, Class B | | | 104,399 | | | | 2,855,474 | |
| | |
Atlas Copco AB, Class A | | | 58,455 | | | | 3,084,139 | |
| | |
Atlas Copco AB, Class B | | | 45,920 | | | | 2,116,299 | |
| | |
Beijer Alma AB | | | 5,643 | | | | 132,001 | |
| | |
Beijer Ref AB | | | 20,421 | | | | 375,578 | |
| | |
Bilia AB, Class A | | | 26,132 | | | | 377,144 | |
| | |
Epiroc AB, Class A | | | 58,677 | | | | 1,273,096 | |
| | |
Epiroc AB, Class B | | | 27,460 | | | | 502,533 | |
| | |
EQT AB | | | 35,273 | | | | 1,408,361 | |
| | |
Evolution AB(b) | | | 7,338 | | | | 762,272 | |
| | |
Hexpol AB | | | 52,427 | | | | 519,578 | |
| | |
Husqvarna AB, Class B(a) | | | 66,309 | | | | 701,981 | |
| | |
Indutrade AB | | | 16,421 | | | | 419,890 | |
| | |
Instalco AB | | | 8,256 | | | | 62,757 | |
| | |
JM AB | | | 15,656 | | | | 503,981 | |
| | |
Lifco AB, Class B | | | 14,054 | | | | 363,286 | |
| | |
Mycronic AB | | | 13,986 | | | | 264,130 | |
| | |
Nibe Industrier AB, Class B | | | 26,368 | | | | 297,225 | |
| | |
Nolato AB, Class B | | | 14,828 | | | | 111,376 | |
| | |
Nordnet AB publ | | | 15,885 | | | | 289,767 | |
| | |
Paradox Interactive AB(a) | | | 10,641 | | | | 205,184 | |
| | |
Samhallsbyggnadsbolaget i Norden AB(a) | | | 137,860 | | | | 624,996 | |
| | |
Sandvik AB | | | 155,600 | | | | 3,355,967 | |
| | |
SKF AB, Class B(a) | | | 84,407 | | | | 1,394,345 | |
| | |
Thule Group AB(a)(b) | | | 9,236 | | | | 371,644 | |
| | | | | | | | |
| Total Sweden | | | | 22,458,248 | |
|
| Switzerland – 11.3% | |
| | |
Coca-Cola HBC AG* | | | 49,960 | | | | 1,052,149 | |
| | |
EMS-Chemie Holding AG, Registered Shares | | | 3,030 | | | | 2,968,264 | |
| | |
Kuehne + Nagel International AG, Registered Shares | | | 10,231 | | | | 2,925,049 | |
| | |
Logitech International SA, Registered Shares | | | 8,131 | | | | 611,427 | |
| | |
Partners Group Holding AG | | | 3,233 | | | | 4,052,448 | |
| | |
Roche Holding AG | | | 46,603 | | | | 18,557,641 | |
| | |
Roche Holding AG, Bearer Shares | | | 11,177 | | | | 4,918,973 | |
| | |
Schindler Holding AG, Participation Certificate | | | 1,942 | | | | 419,949 | |
| | |
Schindler Holding AG, Registered Shares | | | 9,033 | | | | 1,942,549 | |
| | |
SFS Group AG | | | 3,433 | | | | 480,489 | |
| | |
Sonova Holding AG, Registered Shares | | | 3,661 | | | | 1,541,976 | |
| | |
STMicroelectronics NV | | | 21,887 | | | | 964,606 | |
| | |
Straumann Holding AG, Registered Shares | | | 264 | | | | 426,445 | |
| | |
Temenos AG, Registered Shares | | | 5,007 | | | | 484,241 | |
| | |
VAT Group AG(b) | | | 1,860 | | | | 716,310 | |
| | | | | | | | |
| Total Switzerland | | | | 42,062,516 | |
|
| United Kingdom – 19.3% | |
| | |
AJ Bell PLC | | | 76,994 | | | | 308,178 | |
| | |
Anglo American PLC | | | 401,142 | | | | 20,981,307 | |
| | |
Antofagasta PLC | | | 175,719 | | | | 3,870,661 | |
| | |
Ashtead Group PLC | | | 19,034 | | | | 1,211,204 | |
| | |
Auto Trader Group PLC(b) | | | 35,714 | | | | 297,561 | |
| | |
Bellway PLC | | | 13,807 | | | | 442,113 | |
| | |
Burberry Group PLC | | | 34,026 | | | | 749,958 | |
| | |
Computacenter PLC | | | 13,333 | | | | 516,465 | |
| | |
Cranswick PLC | | | 3,453 | | | | 160,215 | |
| | |
Croda International PLC | | | 7,155 | | | | 742,346 | |
| | |
Diageo PLC | | | 209,707 | | | | 10,667,542 | |
| | |
Dunelm Group PLC | | | 25,018 | | | | 359,375 | |
| | |
Electrocomponents PLC | | | 22,113 | | | | 315,608 | |
| | |
EMIS Group PLC | | | 6,859 | | | | 120,472 | |
| | |
Ferrexpo PLC | | | 301,073 | | | | 739,301 | |
| | |
Fevertree Drinks PLC | | | 4,134 | | | | 97,485 | |
| | |
Fresnillo PLC | | | 100,011 | | | | 966,528 | |
| | |
Games Workshop Group PLC | | | 851 | | | | 81,402 | |
| | |
Hikma Pharmaceuticals PLC | | | 21,866 | | | | 593,359 | |
| | |
Howden Joinery Group PLC | | | 31,561 | | | | 319,058 | |
| | |
IMI PLC | | | 30,415 | | | | 545,826 | |
| | |
Intertek Group PLC | | | 6,651 | | | | 457,468 | |
| | |
James Halstead PLC(a) | | | 50,627 | | | | 153,980 | |
| | |
Kainos Group PLC | | | 3,915 | | | | 68,196 | |
| | |
Polar Capital Holdings PLC | | | 38,792 | | | | 317,179 | |
| | |
RELX PLC | | | 170,929 | | | | 5,363,031 | |
| | |
Rightmove PLC | | | 32,049 | | | | 267,025 | |
| | |
Rio Tinto PLC | | | 230,071 | | | | 18,420,753 | |
| | |
Softcat PLC | | | 12,523 | | | | 280,963 | |
| | |
Spirax-Sarco Engineering PLC | | | 2,636 | | | | 435,051 | |
| | |
Synthomer PLC | | | 32,992 | | | | 132,749 | |
| | |
Taylor Wimpey PLC | | | 779,035 | | | | 1,340,612 | |
| | |
Victrex PLC | | | 9,620 | | | | 231,791 | |
| | |
Vivo Energy PLC(b) | | | 213,883 | | | | 384,678 | |
| | | | | | | | |
| Total United Kingdom | | | | 71,939,440 | |
TOTAL COMMON STOCKS (Cost: $363,727,321) | | | | 370,622,580 | |
|
| INVESTMENT OF CASH COLLATERAL FOR SECURITIES LOANED – 2.1% | |
|
| United States – 2.1% | |
| | |
State Street Navigator Securities Lending Government Money Market Portfolio, 0.25%(c)
| | | | | | | | |
| (Cost: $7,811,502) | | | 7,811,502 | | | | 7,811,502 | |
| |
TOTAL INVESTMENTS IN SECURITIES – 101.3% (Cost: $371,538,823) | | | | 378,434,082 | |
| |
Other Assets less Liabilities – (1.3)% | | | | (4,694,372 | ) |
| | | | | | | | |
| NET ASSETS – 100.0% | | | $ | 373,739,710 | |
| * | Non-income producing security. |
| (a) | Security, or portion thereof, was on loan at March 31, 2022 (See Note 2). At March 31, 2022, the total market value of the Fund’s securities on loan identified in the Schedule of Investments was $15,950,630 and the total market value of the collateral held by the Fund was $16,874,059. The total market value of the collateral includes non-cash U.S. Government securities collateral having a value of $9,062,557. |
| (b) | This security is exempt from registration under rule 144A of the Securities Act of 1933. This security may be sold in transactions that are exempt from registration, normally to qualified institutional buyers. |
| (c) | Rate shown represents annualized 7-day yield as of March 31, 2022. |
See Notes to Financial Statements.
Schedule of Investments (concluded)
WisdomTree International Quality Dividend Growth Fund (IQDG)
March 31, 2022
The following is a summary of the fair valuations according to the inputs used as of March 31, 2022 in valuing the Fund’s investments (See Note 2 — Fair Value Measurement):
| | | | | | | | | | | | | | | | |
| | | | |
| | | Quoted
Prices in
Active
Markets
(Level 1) | | | Other
Significant
Observable
Inputs
(Level 2) | | | Significant
Unobservable
Inputs
(Level 3) | | | Total | |
Assets: | | | | | | | | | | | | | | | | |
Investments in Securities | | | | | | | | | | | | | | | | |
Common Stocks | | $ | 370,622,580 | | | $ | — | | | $ | — | | | $ | 370,622,580 | |
Investment of Cash Collateral for Securities Loaned | | | — | | | | 7,811,502 | | | | — | | | | 7,811,502 | |
Total Investments in Securities | | $ | 370,622,580 | | | $ | 7,811,502 | | | $ | — | | | $ | 378,434,082 | |
See Notes to Financial Statements.
Schedule of Investments
WisdomTree International SmallCap Dividend Fund (DLS)
March 31, 2022
| | | | | | | | |
| Investments | | Shares | | | Value | |
|
| COMMON STOCKS – 98.3% | |
|
| Australia – 13.3% | |
| | |
Accent Group Ltd. | | | 1,106,089 | | | $ | 1,412,049 | |
| | |
Adairs Ltd.(a) | | | 670,903 | | | | 1,511,443 | |
| | |
Adbri Ltd. | | | 1,256,230 | | | | 2,858,398 | |
| | |
ARB Corp. Ltd. | | | 84,759 | | | | 2,644,011 | |
| | |
AUB Group Ltd. | | | 131,768 | | | | 2,258,065 | |
| | |
Austal Ltd. | | | 629,048 | | | | 892,805 | |
| | |
Australian Finance Group Ltd. | | | 887,297 | | | | 1,432,578 | |
| | |
Autosports Group Ltd.(a) | | | 419,371 | | | | 626,704 | |
| | |
Bapcor Ltd. | | | 415,611 | | | | 1,997,459 | |
| | |
Beach Energy Ltd. | | | 1,376,552 | | | | 1,607,437 | |
| | |
Beacon Lighting Group Ltd.(a) | | | 678,830 | | | | 1,422,251 | |
| | |
Bega Cheese Ltd. | | | 281,071 | | | | 1,015,248 | |
| | |
Bell Financial Group Ltd. | | | 1,244,331 | | | | 1,210,087 | |
| | |
Breville Group Ltd.(a) | | | 69,138 | | | | 1,424,662 | |
| | |
Brickworks Ltd. | | | 160,166 | | | | 2,929,938 | |
| | |
Cardno Ltd.(a) | | | 84,316 | | | | 106,056 | |
| | |
Centuria Capital Group | | | 1,679,306 | | | | 3,631,894 | |
| | |
Codan Ltd. | | | 174,750 | | | | 960,592 | |
| | |
Collins Foods Ltd. | | | 136,956 | | | | 1,088,122 | |
| | |
Costa Group Holdings Ltd. | | | 648,356 | | | | 1,548,287 | |
| | |
Credit Corp. Group Ltd.(a) | | | 67,750 | | | | 1,539,025 | |
| | |
Cromwell Property Group | | | 8,002,592 | | | | 4,987,922 | |
| | |
CSR Ltd. | | | 1,177,555 | | | | 5,438,351 | |
| | |
Dicker Data Ltd.(a) | | | 193,035 | | | | 2,114,960 | |
| | |
Eagers Automotive Ltd.(a) | | | 334,370 | | | | 3,585,638 | |
| | |
Elders Ltd. | | | 301,935 | | | | 3,013,348 | |
| | |
Fleetwood Ltd.(a) | | | 272,724 | | | | 366,596 | |
| | |
Genworth Mortgage Insurance Australia Ltd. | | | 254,939 | | | | 551,366 | |
| | |
GrainCorp Ltd., Class A | | | 265,763 | | | | 1,696,385 | |
| | |
Growthpoint Properties Australia Ltd. | | | 2,208,193 | | | | 7,279,682 | |
| | |
GUD Holdings Ltd. | | | 193,360 | | | | 1,684,362 | |
| | |
GWA Group Ltd. | | | 654,359 | | | | 1,223,563 | |
| | |
Healius Ltd. | | | 826,362 | | | | 2,730,448 | |
| | |
Home Consortium Ltd.(a) | | | 267,947 | | | | 1,388,382 | |
| | |
HT&E Ltd.(a) | | | 464,757 | | | | 668,353 | |
| | |
Iluka Resources Ltd. | | | 343,641 | | | | 2,913,465 | |
| | |
Ingenia Communities Group | | | 423,401 | | | | 1,608,842 | |
| | |
Inghams Group Ltd.(a) | | | 1,080,488 | | | | 2,482,860 | |
| | |
Insignia Financial Ltd. | | | 1,082,970 | | | | 3,009,047 | |
| | |
Integral Diagnostics Ltd.(a) | | | 335,526 | | | | 990,215 | |
| | |
InvoCare Ltd. | | | 153,657 | | | | 1,383,510 | |
| | |
IPH Ltd. | | | 350,504 | | | | 2,097,791 | |
| | |
IRESS Ltd. | | | 326,217 | | | | 2,924,973 | |
| | |
Kelsian Group Ltd. | | | 232,496 | | | | 1,230,879 | |
| | |
Lovisa Holdings Ltd. | | | 91,000 | | | | 1,279,258 | |
| | |
MA Financial Group Ltd.(a) | | | 233,091 | | | | 1,409,069 | |
| | |
Macmahon Holdings Ltd. | | | 3,116,081 | | | | 456,304 | |
| | |
McMillan Shakespeare Ltd. | | | 235,340 | | | | 2,120,742 | |
| | |
Metcash Ltd. | | | 2,226,910 | | | | 7,592,231 | |
| | |
Monadelphous Group Ltd. | | | 189,194 | | | | 1,555,723 | |
| | |
Monash IVF Group Ltd. | | | 1,341,251 | | | | 1,198,582 | |
| | |
MyState Ltd. | | | 354,921 | | | | 1,329,974 | |
| | |
Navigator Global Investments Ltd. | | | 528,894 | | | | 647,392 | |
| | |
Netwealth Group Ltd. | | | 121,565 | | | | 1,367,512 | |
| | |
New Hope Corp. Ltd.(a) | | | 1,928,103 | | | | 4,922,889 | |
| | |
NIB Holdings Ltd. | | | 1,049,578 | | | | 5,012,827 | |
| | |
Nick Scali Ltd.(a) | | | 165,653 | | | | 1,411,907 | |
| | |
Nickel Mines Ltd. | | | 4,096,749 | | | | 3,891,713 | |
| | |
NRW Holdings Ltd. | | | 1,038,716 | | | | 1,677,051 | |
| | |
Omni Bridgeway Ltd.* | | | 283,404 | | | | 808,724 | |
| | |
Orora Ltd. | | | 2,328,428 | | | | 6,312,202 | |
| | |
Pact Group Holdings Ltd. | | | 608,863 | | | | 1,065,336 | |
| | |
Pendal Group Ltd. | | | 1,345,050 | | | | 4,696,802 | |
| | |
Perpetual Ltd. | | | 115,824 | | | | 3,022,486 | |
| | |
Pinnacle Investment Management Group Ltd. | | | 232,351 | | | | 1,849,530 | |
| | |
Platinum Asset Management Ltd. | | | 1,898,472 | | | | 3,150,702 | |
| | |
Reliance Worldwide Corp. Ltd. | | | 1,258,476 | | | | 4,025,923 | |
| | |
Resimac Group Ltd.(a) | | | 940,369 | | | | 1,235,797 | |
| | |
Sandfire Resources Ltd. | | | 861,116 | | | | 3,673,000 | |
| | |
Sims Ltd. | | | 361,032 | | | | 5,845,280 | |
| | |
SmartGroup Corp. Ltd. | | | 382,969 | | | | 2,458,899 | |
| | |
SRG Global Ltd. | | | 1,306,123 | | | | 632,637 | |
| | |
Super Retail Group Ltd. | | | 617,648 | | | | 4,786,649 | |
| | |
Tassal Group Ltd. | | | 444,761 | | | | 1,199,035 | |
| | |
Technology One Ltd. | | | 272,584 | | | | 2,349,920 | |
| | |
United Malt Group Ltd. | | | 212,760 | | | | 603,938 | |
| | |
Virtus Health Ltd.(a) | | | 311,512 | | | | 1,883,135 | |
| | |
Viva Energy Group Ltd.(b) | | | 1,275,432 | | | | 2,250,796 | |
| | | | | | | | |
| Total Australia | | | | 177,212,014 | |
|
| Austria – 1.2% | |
| | |
AT&S Austria Technologie & Systemtechnik AG | | | 29,610 | | | | 1,660,457 | |
| | |
Oesterreichische Post AG(a) | | | 190,428 | | | | 6,822,528 | |
| | |
POLYTEC Holding AG(a) | | | 62,763 | | | | 465,788 | |
| | |
S IMMO AG | | | 84,578 | | | | 2,084,442 | |
| | |
S&T AG(a) | | | 54,101 | | | | 1,021,518 | |
| | |
Semperit AG Holding | | | 71,530 | | | | 1,810,624 | |
| | |
UNIQA Insurance Group AG | | | 306,638 | | | | 2,453,090 | |
| | | | | | | | |
| Total Austria | | | | 16,318,447 | |
|
| Belgium – 1.3% | |
| | |
Befimmo SA | | | 71,424 | | | | 3,766,875 | |
| | |
Bekaert SA | | | 107,856 | | | | 4,257,813 | |
| | |
Deceuninck NV(a) | | | 148,352 | | | | 450,624 | |
| | |
Econocom Group SA/NV | | | 507,934 | | | | 2,277,566 | |
| | |
Intervest Offices & Warehouses NV | | | 86,784 | | | | 2,640,923 | |
| | |
Ion Beam Applications | | | 21,221 | | | | 411,786 | |
| | |
TINC Comm VA(a) | | | 71,676 | | | | 1,079,819 | |
| | |
Xior Student Housing NV | | | 43,047 | | | | 2,423,551 | |
| | | | | | | | |
| Total Belgium | | | | 17,308,957 | |
|
| China – 3.7% | |
| | |
Beijing Tong Ren Tang Chinese Medicine Co. Ltd. | | | 1,407,000 | | | | 1,951,122 | |
| | |
China Nonferrous Mining Corp. Ltd.(a) | | | 8,244,000 | | | | 4,147,580 | |
| | |
China South City Holdings Ltd. | | | 18,162,200 | | | | 1,600,214 | |
See Notes to Financial Statements.
Schedule of Investments (continued)
WisdomTree International SmallCap Dividend Fund (DLS)
March 31, 2022
| | | | | | | | |
| Investments | | Shares | | | Value | |
| | |
China Traditional Chinese Medicine Holdings Co. Ltd. | | | 4,312,000 | | | $ | 2,257,476 | |
| | |
CITIC Telecom International Holdings Ltd. | | | 11,763,822 | | | | 4,326,150 | |
| | |
CPMC Holdings Ltd. | | | 3,071,009 | | | | 1,627,383 | |
| | |
Genertec Universal Medical Group Co. Ltd.(b) | | | 4,468,200 | | | | 2,944,035 | |
| | |
Poly Property Group Co. Ltd.(a) | | | 9,061,600 | | | | 2,291,030 | |
| | |
Shanghai Industrial Holdings Ltd. | | | 3,304,000 | | | | 4,961,442 | |
| | |
Shoucheng Holdings Ltd.(a) | | | 13,488,000 | | | | 1,997,865 | |
| | |
Shougang Fushan Resources Group Ltd. | | | 17,073,612 | | | | 6,714,856 | |
| | |
Simcere Pharmaceutical Group Ltd.(a)(b) | | | 2,636,000 | | | | 3,561,162 | |
| | |
Sino-Ocean Group Holding Ltd. | | | 27,512,000 | | | | 5,866,772 | |
| | |
Yanlord Land Group Ltd. | | | 4,237,400 | | | | 3,882,496 | |
| | |
Zensun Enterprises Ltd. | | | 2,024,000 | | | | 956,253 | |
| | | | | | | | |
| Total China | | | | 49,085,836 | |
|
| Denmark – 1.8% | |
| | |
Alm Brand A/S | | | 2,850,174 | | | | 4,928,390 | |
| | |
Cementir Holding NV | | | 170,702 | | | | 1,302,931 | |
| | |
Chemometec A/S | | | 9,007 | | | | 1,112,175 | |
| | |
D/S Norden A/S | | | 104,168 | | | | 3,683,474 | |
| | |
FLSmidth & Co. A/S | | | 27,309 | | | | 725,070 | |
| | |
Per Aarsleff Holding A/S | | | 17,153 | | | | 669,663 | |
| | |
Scandinavian Tobacco Group A/S, Class A(b) | | | 281,538 | | | | 6,055,803 | |
| | |
Spar Nord Bank A/S | | | 157,898 | | | | 2,099,686 | |
| | |
Sydbank A/S | | | 78,989 | | | | 2,726,957 | |
| | | | | | | | |
| Total Denmark | | | | 23,304,149 | |
|
| Finland – 2.0% | |
| | |
Aktia Bank Oyj | | | 211,510 | | | | 2,565,170 | |
| | |
Anora Group Oyj | | | 238,012 | | | | 2,330,452 | |
| | |
Cargotec Oyj, Class B | | | 62,788 | | | | 2,413,002 | |
| | |
Fiskars Oyj Abp | | | 92,299 | | | | 2,207,975 | |
| | |
Kemira Oyj(a) | | | 268,132 | | | | 3,541,262 | |
| | |
Lassila & Tikanoja Oyj(a) | | | 75,710 | | | | 911,463 | |
| | |
Oma Saastopankki Oyj | | | 45,428 | | | | 912,346 | |
| | |
Raisio Oyj, Class V | | | 298,665 | | | | 887,267 | |
| | |
Sanoma Oyj | | | 152,084 | | | | 2,169,353 | |
| | |
Terveystalo Oyj(b) | | | 144,348 | | | | 1,805,243 | |
| | |
Tokmanni Group Corp. | | | 162,985 | | | | 2,729,247 | |
| | |
Uponor Oyj | | | 126,646 | | | | 2,585,748 | |
| | |
Verkkokauppa.com Oyj(a) | | | 127,406 | | | | 679,731 | |
| | |
YIT Oyj(a) | | | 248,048 | | | | 946,648 | |
| | | | | | | | |
| Total Finland | | | | 26,684,907 | |
|
| France – 3.3% | |
| | |
ABC Arbitrage | | | 112,319 | | | | 928,540 | |
| | |
Albioma SA | | | 44,151 | | | | 2,166,396 | |
| | |
Chargeurs SA | | | 68,095 | | | | 1,542,594 | |
| | |
Coface SA | | | 284,093 | | | | 3,454,931 | |
| | |
Fnac Darty SA | | | 23,526 | | | | 1,218,764 | |
| | |
Groupe SFPI | | | 151,096 | | | | 500,989 | |
| | |
IPSOS | | | 76,290 | | | | 3,836,761 | |
| | |
Kaufman & Broad SA | | | 48,757 | | | | 1,630,197 | |
| | |
Metropole Television SA | | | 413,038 | | | | 8,217,055 | |
| | |
Nexity SA | | | 189,790 | | | | 6,736,320 | |
| | |
Quadient SA | | | 40,151 | | | | 761,245 | |
| | |
Societe BIC SA | | | 103,883 | | | | 5,284,567 | |
| | |
Television Francaise 1(a) | | | 493,979 | | | | 4,842,204 | |
| | |
Vicat SA | | | 74,618 | | | | 2,552,980 | |
| | | | | | | | |
| Total France | | | | 43,673,543 | |
|
| Germany – 2.5% | |
| | |
7C Solarparken AG | | | 40,781 | | | | 201,465 | |
| | |
Aareal Bank AG | | | 44,243 | | | | 1,402,969 | |
| | |
AURELIUS Equity Opportunities SE & Co. KGaA | | | 58,679 | | | | 1,643,982 | |
| | |
Bilfinger SE | | | 119,451 | | | | 4,593,273 | |
| | |
CANCOM SE | | | 28,595 | | | | 1,797,617 | |
| | |
CropEnergies AG | | | 127,402 | | | | 1,692,541 | |
| | |
Deutsche Pfandbriefbank AG(b) | | | 165,749 | | | | 2,038,771 | |
| | |
DIC Asset AG | | | 174,073 | | | | 2,806,458 | |
| | |
Encavis AG | | | 124,143 | | | | 2,625,808 | |
| | |
Hamborner REIT AG | | | 232,216 | | | | 2,474,718 | |
| | |
Hamburger Hafen und Logistik AG | | | 84,488 | | | | 1,518,190 | |
| | |
Hornbach Holding AG & Co. KGaA | | | 14,182 | | | | 1,800,453 | |
| | |
Instone Real Estate Group SE(b) | | | 52,495 | | | | 989,441 | |
| | |
MLP SE | | | 177,807 | | | | 1,434,318 | |
| | |
Mutares SE & Co. KGaA | | | 66,157 | | | | 1,645,175 | |
| | |
NORMA Group SE | | | 33,182 | | | | 962,134 | |
| | |
PATRIZIA AG | | | 65,845 | | | | 1,249,858 | |
| | |
Wacker Neuson SE | | | 76,701 | | | | 1,734,137 | |
| | |
Wuestenrot & Wuerttembergische AG | | | 30,711 | | | | 623,955 | |
| | | | | | | | |
| Total Germany | | | | 33,235,263 | |
|
| Hong Kong – 2.0% | |
| | |
Dah Sing Banking Group Ltd. | | | 2,783,200 | | | | 2,473,513 | |
| | |
Dah Sing Financial Holdings Ltd. | | | 589,829 | | | | 1,920,556 | |
| | |
Fortune Real Estate Investment Trust | | | 5,561,000 | | | | 5,006,136 | |
| | |
Hutchison Port Holdings Trust | | | 30,786,500 | | | | 7,542,693 | |
| | |
Kowloon Development Co. Ltd. | | | 2,092,000 | | | | 2,804,862 | |
| | |
Nissin Foods Co. Ltd. | | | 2,044,000 | | | | 1,432,893 | |
| | |
Singamas Container Holdings Ltd. | | | 12,502,000 | | | | 1,835,853 | |
| | |
Sun Hung Kai & Co. Ltd. | | | 2,091,000 | | | | 1,065,338 | |
| | |
Vitasoy International Holdings Ltd.(a) | | | 1,066,000 | | | | 2,022,724 | |
| | | | | | | | |
| Total Hong Kong | | | | 26,104,568 | |
|
| Indonesia – 0.2% | |
| | |
Bumitama Agri Ltd.(a) | | | 1,870,300 | | | | 1,050,303 | |
| | |
First Resources Ltd. | | | 1,379,400 | | | | 2,089,460 | |
| | | | | | | | |
| Total Indonesia | | | | 3,139,763 | |
|
| Ireland – 0.3% | |
| | |
Hibernia REIT PLC | | | 1,316,447 | | | | 2,367,028 | |
| | |
Kenmare Resources PLC | | | 185,027 | | | | 1,125,506 | |
| | |
Origin Enterprises PLC | | | 43,933 | | | | 195,528 | |
| | | | | | | | |
| Total Ireland | | | | 3,688,062 | |
|
| Israel – 4.6% | |
| | |
Altshuler Shaham Provident Funds & Pension Ltd. | | | 217,907 | | | | 1,024,240 | |
| | |
Ashtrom Group Ltd. | | | 182,190 | | | | 5,396,179 | |
| | |
Carasso Motors Ltd. | | | 220,799 | | | | 1,591,344 | |
| | |
Delek Automotive Systems Ltd. | | | 275,574 | | | | 4,254,612 | |
See Notes to Financial Statements.
Schedule of Investments (continued)
WisdomTree International SmallCap Dividend Fund (DLS)
March 31, 2022
| | | | | | | | |
| Investments | | Shares | | | Value | |
| | |
Elco Ltd. | | | 20,592 | | | $ | 1,761,572 | |
| | |
Electra Real Estate Ltd. | | | 39,903 | | | | 761,236 | |
| | |
Energix-Renewable Energies Ltd. | | | 516,116 | | | | 1,981,174 | |
| | |
FIBI Holdings Ltd. | | | 44,056 | | | | 2,134,292 | |
| | |
Gav-Yam Lands Corp. Ltd. | | | 333,426 | | | | 3,933,722 | |
| | |
Gazit-Globe Ltd. | | | 296,761 | | | | 2,705,140 | |
| | |
Harel Insurance Investments & Financial Services Ltd. | | | 303,186 | | | | 3,714,711 | |
| | |
IDI Insurance Co. Ltd. | | | 58,293 | | | | 1,981,916 | |
| | |
Magic Software Enterprises Ltd. | | | 65,002 | | | | 1,143,709 | |
| | |
Matrix IT Ltd. | | | 87,498 | | | | 2,289,411 | |
| | |
Max Stock Ltd. | | | 305,463 | | | | 813,611 | |
| | |
Maytronics Ltd. | | | 84,131 | | | | 1,649,808 | |
| | |
Mega Or Holdings Ltd. | | | 44,184 | | | | 1,734,823 | |
| | |
Meitav Dash Investments Ltd. | | | 206,309 | | | | 1,118,416 | |
| | |
Menora Mivtachim Holdings Ltd.* | | | 70,520 | | | | 1,745,736 | |
| | |
Mivne Real Estate KD Ltd. | | | 760,212 | | | | 2,977,720 | |
| | |
Nawi Brothers Ltd. | | | 139,500 | | | | 1,343,309 | |
| | |
One Software Technologies Ltd. | | | 87,583 | | | | 1,524,555 | |
| | |
Palram Industries 1990 Ltd. | | | 77,389 | | | | 1,100,967 | |
| | |
Phoenix Holdings Ltd. | | | 428,197 | | | | 5,642,204 | |
| | |
Rami Levy Chain Stores Hashikma Marketing 2006 Ltd. | | | 29,861 | | | | 2,386,073 | |
| | |
Shapir Engineering and Industry Ltd. | | | 245,622 | | | | 2,443,713 | |
| | |
Shufersal Ltd. | | | 239,943 | | | | 2,177,438 | |
| | | | | | | | |
| Total Israel | | | | 61,331,631 | |
|
| Italy – 3.7% | |
| | |
Alerion Cleanpower SpA(a) | | | 36,660 | | | | 1,231,851 | |
| | |
Anima Holding SpA(b) | | | 1,055,595 | | | | 4,794,342 | |
| | |
Ascopiave SpA(a) | | | 144,303 | | | | 553,125 | |
| | |
Banca IFIS SpA | | | 87,402 | | | | 1,815,617 | |
| | |
Banca Popolare di Sondrio SPA(a) | | | 501,730 | | | | 2,075,574 | |
| | |
BFF Bank SpA(b) | | | 936,329 | | | | 7,016,568 | |
| | |
Cairo Communication SpA | | | 206,877 | | | | 516,758 | |
| | |
Credito Emiliano SpA | | | 447,538 | | | | 2,977,761 | |
| | |
doValue SpA*(a)(b) | | | 121,322 | | | | 1,036,715 | |
| | |
Esprinet SpA(a) | | | 110,068 | | | | 1,178,134 | |
| | |
Falck Renewables SpA | | | 139,550 | | | | 1,369,484 | |
| | |
Gruppo MutuiOnline SpA | | | 31,187 | | | | 1,124,287 | |
| | |
GVS SpA(b) | | | 106,892 | | | | 980,011 | |
| | |
La Doria SpA | | | 71,383 | | | | 1,307,324 | |
| | |
Maire Tecnimont SpA(a) | | | 548,490 | | | | 1,912,610 | |
| | |
MARR SpA | | | 61,919 | | | | 1,034,102 | |
| | |
Piaggio & C. SpA | | | 795,161 | | | | 2,270,233 | |
| | |
RAI Way SpA(b) | | | 507,927 | | | | 3,204,373 | |
| | |
Salcef SpA | | | 92,085 | | | | 2,059,414 | |
| | |
Sanlorenzo SpA(a) | | | 30,862 | | | | 1,261,944 | |
| | |
Sesa SpA | | | 8,365 | | | | 1,386,791 | |
| | |
SOL SpA | | | 75,194 | | | | 1,380,466 | |
| | |
Technogym SpA(a)(b) | | | 205,449 | | | | 1,643,583 | |
| | |
Unieuro SpA(a)(b) | | | 103,503 | | | | 2,032,621 | |
| | |
Webuild SpA(a) | | | 1,173,273 | | | | 2,103,068 | |
| | |
Zignago Vetro SpA | | | 91,458 | | | | 1,208,918 | |
| | | | | | | | |
| Total Italy | | | | 49,475,674 | |
|
| Japan – 25.4% | |
| | |
&Do Holdings Co. Ltd. | | | 50,200 | | | | 397,464 | |
| | |
A&D Co. Ltd.(a) | | | 58,200 | | | | 464,161 | |
| | |
Achilles Corp.(a) | | | 18,800 | | | | 196,093 | |
| | |
ADEKA Corp. | | | 96,301 | | | | 2,145,400 | |
| | |
Advance Create Co. Ltd. | | | 63,400 | | | | 496,753 | |
| | |
Aeon Delight Co. Ltd. | | | 62,100 | | | | 1,557,936 | |
| | |
Aeon Fantasy Co. Ltd.(a) | | | 47,600 | | | | 754,541 | |
| | |
AEON Financial Service Co. Ltd. | | | 136,500 | | | | 1,368,655 | |
| | |
Aica Kogyo Co. Ltd. | | | 63,700 | | | | 1,568,686 | |
| | |
Airport Facilities Co. Ltd.(a) | | | 176,000 | | | | 785,928 | |
| | |
Aisan Industry Co. Ltd.(a) | | | 96,800 | | | | 582,196 | |
| | |
AIT Corp.(a) | | | 83,900 | | | | 1,054,150 | |
| | |
Akatsuki, Inc. | | | 24,700 | | | | 591,375 | |
| | |
Alinco, Inc.(a) | | | 60,800 | | | | 434,304 | |
| | |
Alleanza Holdings Co. Ltd.(a) | | | 55,600 | | | | 446,174 | |
| | |
Alps Logistics Co. Ltd.(a) | | | 57,000 | | | | 504,371 | |
| | |
Amano Corp. | | | 69,600 | | | | 1,259,825 | |
| | |
Amuse, Inc.(a) | | | 42,500 | | | | 684,902 | |
| | |
Anest Iwata Corp. | | | 99,800 | | | | 682,463 | |
| | |
Anritsu Corp.(a) | | | 93,800 | | | | 1,200,176 | |
| | |
Aomori Bank Ltd.(a) | | | 36,200 | | | | 562,200 | |
| | |
Aozora Bank Ltd.(a) | | | 139,500 | | | | 2,975,617 | |
| | |
Arakawa Chemical Industries Ltd.(a) | | | 23,700 | | | | 208,540 | |
| | |
ARTERIA Networks Corp. | | | 102,400 | | | | 1,106,890 | |
| | |
Asahi Co. Ltd. | | | 61,100 | | | | 668,010 | |
| | |
Asahi Holdings, Inc.(a) | | | 95,000 | | | | 1,772,812 | |
| | |
Asahi Net, Inc. | | | 133,200 | | | | 645,286 | |
| | |
Asahi Yukizai Corp.(a) | | | 38,900 | | | | 643,232 | |
| | |
Asante, Inc.(a) | | | 58,700 | | | | 705,609 | |
| | |
Asia Pile Holdings Corp. | | | 19,400 | | | | 68,250 | |
| | |
Autobacs Seven Co. Ltd. | | | 126,203 | | | | 1,398,501 | |
| | |
Avantia Co. Ltd.(a) | | | 19,100 | | | | 132,972 | |
| | |
Avex, Inc.(a) | | | 135,100 | | | | 1,484,848 | |
| | |
Bando Chemical Industries Ltd.(a) | | | 94,900 | | | | 690,395 | |
| | |
Bank of Iwate Ltd. | | | 31,500 | | | | 479,605 | |
| | |
Bank of the Ryukyus Ltd. | | | 53,600 | | | | 351,960 | |
| | |
Baroque Japan Ltd.(a) | | | 93,500 | | | | 602,406 | |
| | |
Benesse Holdings, Inc. | | | 69,900 | | | | 1,294,050 | |
| | |
BML, Inc. | | | 45,100 | | | | 1,148,169 | |
| | |
Broadleaf Co. Ltd. | | | 182,200 | | | | 553,918 | |
| | |
Bunka Shutter Co. Ltd. | | | 129,800 | | | | 1,052,302 | |
| | |
Cawachi Ltd. | | | 36,300 | | | | 672,017 | |
| | |
Central Security Patrols Co. Ltd.(a) | | | 33,700 | | | | 695,518 | |
| | |
Chilled & Frozen Logistics Holdings Co. Ltd.(a) | | | 39,500 | | | | 391,827 | |
| | |
Chiyoda Co. Ltd. | | | 75,600 | | | | 458,427 | |
| | |
Chori Co. Ltd. | | | 30,600 | | | | 443,464 | |
| | |
Chugoku Bank Ltd. | | | 152,300 | | | | 1,097,940 | |
| | |
Chukyo Bank Ltd. | | | 71,800 | | | | 945,897 | |
| | |
Cleanup Corp. | | | 86,900 | | | | 379,460 | |
| | |
CONEXIO Corp.(a) | | | 82,900 | | | | 959,625 | |
| | |
Cosel Co. Ltd. | | | 68,200 | | | | 452,325 | |
| | |
Cosmo Energy Holdings Co. Ltd. | | | 98,400 | | | | 2,132,169 | |
| | |
Credit Saison Co. Ltd. | | | 146,100 | | | | 1,568,431 | |
See Notes to Financial Statements.
Schedule of Investments (continued)
WisdomTree International SmallCap Dividend Fund (DLS)
March 31, 2022
| | | | | | | | |
| Investments | | Shares | | | Value | |
| | |
Cresco Ltd.(a) | | | 53,300 | | | $ | 863,339 | |
| | |
CTI Engineering Co. Ltd. | | | 30,000 | | | | 562,801 | |
| | |
CTS Co. Ltd.(a) | | | 126,600 | | | | 877,204 | |
| | |
Cybernet Systems Co. Ltd.(a) | | | 112,400 | | | | 687,133 | |
| | |
Dai Nippon Toryo Co. Ltd.(a) | | | 13,400 | | | | 86,555 | |
| | |
Daicel Corp.(a) | | | 277,600 | | | | 1,868,582 | |
| | |
Daido Metal Co. Ltd. | | | 83,300 | | | | 391,879 | |
| | |
Daido Steel Co. Ltd. | | | 25,991 | | | | 790,169 | |
| | |
Daiichikosho Co. Ltd. | | | 49,300 | | | | 1,413,504 | |
| | |
Daiken Medical Co. Ltd.(a) | | | 162,800 | | | | 684,062 | |
| | |
Daikoku Denki Co. Ltd. | | | 35,800 | | | | 357,779 | |
| | |
Dainichiseika Color & Chemicals Manufacturing Co. Ltd. | | | 24,000 | | | | 407,333 | |
| | |
Daishi Hokuetsu Financial Group, Inc. | | | 55,440 | | | | 1,144,199 | |
| | |
Daiwabo Holdings Co. Ltd. | | | 107,500 | | | | 1,460,494 | |
| | |
DCM Holdings Co. Ltd. | | | 113,700 | | | | 987,352 | |
| | |
Denyo Co. Ltd.(a) | | | 33,100 | | | | 446,151 | |
| | |
Dexerials Corp. | | | 82,900 | | | | 2,284,659 | |
| | |
DIC Corp. | | | 76,200 | | | | 1,573,911 | |
| | |
DKS Co. Ltd. | | | 15,300 | | | | 347,787 | |
| | |
Dowa Holdings Co. Ltd. | | | 37,400 | | | | 1,728,643 | |
| | |
Ebara Jitsugyo Co. Ltd. | | | 23,500 | | | | 475,712 | |
| | |
EDION Corp.(a) | | | 110,500 | | | | 1,033,306 | |
| | |
Ehime Bank Ltd.(a) | | | 39,700 | | | | 305,498 | |
| | |
Electric Power Development Co. Ltd. | | | 174,500 | | | | 2,513,088 | |
| | |
Elematec Corp. | | | 56,300 | | | | 484,261 | |
| | |
Eslead Corp.(a) | | | 19,100 | | | | 263,584 | |
| | |
ESPEC Corp. | | | 47,800 | | | | 775,039 | |
| | |
EXEO Group, Inc. | | | 101,000 | | | | 1,881,450 | |
| | |
Ezaki Glico Co. Ltd. | | | 43,000 | | | | 1,317,899 | |
| | |
FALCO HOLDINGS Co. Ltd.(a) | | | 52,100 | | | | 861,501 | |
| | |
Feed One Co. Ltd.(a) | | | 59,900 | | | | 330,653 | |
| | |
First Bank of Toyama Ltd.(a) | | | 93,900 | | | | 244,469 | |
| | |
First Juken Co. Ltd.(a) | | | 42,100 | | | | 429,064 | |
| | |
FJ Next Holdings Co. Ltd.(a) | | | 40,300 | | | | 328,377 | |
| | |
France Bed Holdings Co. Ltd. | | | 132,300 | | | | 942,859 | |
| | |
Fudo Tetra Corp.(a) | | | 46,200 | | | | 579,332 | |
| | |
Fuji Co. Ltd.(a) | | | 49,000 | | | | 932,564 | |
| | |
Fuji Corp. Ltd.(a) | | | 68,900 | | | | 350,248 | |
| | |
Fuji Oil Holdings, Inc. | | | 63,700 | | | | 1,039,143 | |
| | |
Fuji Pharma Co. Ltd. | | | 58,100 | | | | 470,544 | |
| | |
Fujibo Holdings, Inc. | | | 16,700 | | | | 476,062 | |
| | |
Fujimi, Inc. | | | 27,441 | | | | 1,519,287 | |
| | |
Fujitec Co. Ltd.(a) | | | 75,200 | | | | 1,951,637 | |
| | |
FuKoKu Co. Ltd.(a) | | | 54,100 | | | | 412,742 | |
| | |
Fukui Bank Ltd.(a) | | | 46,300 | | | | 537,862 | |
| | |
Furukawa Battery Co. Ltd.(a) | | | 27,800 | | | | 294,090 | |
| | |
Furuno Electric Co. Ltd.(a) | | | 75,700 | | | | 632,419 | |
| | |
Furyu Corp.(a) | | | 43,700 | | | | 398,206 | |
| | |
Futaba Industrial Co. Ltd.(a) | | | 77,300 | | | | 231,820 | |
| | |
Fuyo General Lease Co. Ltd. | | | 27,800 | | | | 1,601,005 | |
| | |
G-Tekt Corp.(a) | | | 36,600 | | | | 385,073 | |
| | |
Gecoss Corp.(a) | | | 13,200 | | | | 87,329 | |
| | |
Glory Ltd.(a) | | | 59,477 | | | | 1,015,335 | |
| | |
GMO Financial Holdings, Inc.(a) | | | 175,800 | | | | 1,192,036 | |
| | |
GMO Internet, Inc. | | | 59,200 | | | | 1,366,660 | |
| | |
GS Yuasa Corp.(a) | | | 74,900 | | | | 1,444,621 | |
| | |
Gunma Bank Ltd.(a) | | | 436,200 | | | | 1,272,213 | |
| | |
H-One Co. Ltd. | | | 40,800 | | | | 204,378 | |
| | |
H.U. Group Holdings, Inc. | | | 96,900 | | | | 2,319,213 | |
| | |
Hachijuni Bank Ltd.(a) | | | 462,300 | | | | 1,550,205 | |
| | |
Hagiwara Electric Holdings Co. Ltd.(a) | | | 21,100 | | | | 351,160 | |
| | |
Hakudo Co. Ltd.(a) | | | 30,600 | | | | 650,951 | |
| | |
Hakuto Co. Ltd.(a) | | | 52,600 | | | | 1,062,618 | |
| | |
Halows Co. Ltd. | | | 28,400 | | | | 708,976 | |
| | |
Happinet Corp. | | | 54,300 | | | | 675,535 | |
| | |
Hazama Ando Corp. | | | 196,900 | | | | 1,466,510 | |
| | |
Heiwa Corp.(a) | | | 92,619 | | | | 1,390,334 | |
| | |
Hinokiya Group Co. Ltd.(a) | | | 32,300 | | | | 626,440 | |
| | |
Hochiki Corp. | | | 72,100 | | | | 733,029 | |
| | |
Hokkaido Electric Power Co., Inc. | | | 243,600 | | | | 971,389 | |
| | |
Hokkaido Gas Co. Ltd. | | | 12,900 | | | | 156,447 | |
| | |
Hokuetsu Industries Co. Ltd. | | | 65,700 | | | | 473,094 | |
| | |
Hokuhoku Financial Group, Inc. | | | 129,000 | | | | 949,100 | |
| | |
Honeys Holdings Co. Ltd. | | | 53,900 | | | | 464,062 | |
| | |
I-PEX, Inc. | | | 23,200 | | | | 280,598 | |
| | |
Ichikoh Industries Ltd. | | | 114,500 | | | | 388,663 | |
| | |
ID Holdings Corp.(a) | | | 99,600 | | | | 694,225 | |
| | |
IJTT Co. Ltd. | | | 51,300 | | | | 227,390 | |
| | |
Inaba Denki Sangyo Co. Ltd. | | | 68,900 | | | | 1,410,073 | |
| | |
Inabata & Co. Ltd.(a) | | | 106,000 | | | | 1,801,672 | |
| | |
Inageya Co. Ltd.(a) | | | 71,500 | | | | 795,263 | |
| | |
Ines Corp.(a) | | | 62,200 | | | | 835,825 | |
| | |
INFRONEER Holdings, Inc.(a) | | | 217,688 | | | | 1,868,844 | |
| | |
Innotech Corp. | | | 54,800 | | | | 624,867 | |
| | |
Ishihara Sangyo Kaisha Ltd. | | | 52,800 | | | | 468,512 | |
| | |
Itfor, Inc. | | | 113,100 | | | | 733,345 | |
| | |
Itochu Enex Co. Ltd. | | | 165,301 | | | | 1,398,675 | |
| | |
Itoham Yonekyu Holdings, Inc. | | | 380,100 | | | | 2,032,419 | |
| | |
Itoki Corp.(a) | | | 124,000 | | | | 354,505 | |
| | |
IwaiCosmo Holdings, Inc. | | | 74,100 | | | | 813,192 | |
| | |
Iwaki Co. Ltd. | | | 53,800 | | | | 484,920 | |
| | |
Iyo Bank Ltd. | | | 251,800 | | | | 1,244,737 | |
| | |
Izumi Co. Ltd. | | | 50,300 | | | | 1,334,426 | |
| | |
J. Front Retailing Co. Ltd. | | | 211,600 | | | | 1,738,127 | |
| | |
JAC Recruitment Co. Ltd. | | | 79,000 | | | | 1,206,072 | |
| | |
Jaccs Co. Ltd. | | | 44,400 | | | | 1,126,690 | |
| | |
Japan Transcity Corp.(a) | | | 132,100 | | | | 658,459 | |
| | |
JBCC Holdings, Inc.(a) | | | 63,400 | | | | 810,684 | |
| | |
JK Holdings Co. Ltd.(a) | | | 67,300 | | | | 666,485 | |
| | |
JM Holdings Co. Ltd. | | | 49,300 | | | | 708,783 | |
| | |
Juki Corp.(a) | | | 54,000 | | | | 373,273 | |
| | |
JVCKenwood Corp. | | | 234,100 | | | | 343,315 | |
| | |
K’s Holdings Corp. | | | 177,200 | | | | 1,843,902 | |
| | |
Kagome Co. Ltd. | | | 34,500 | | | | 886,838 | |
| | |
Kaken Pharmaceutical Co. Ltd. | | | 47,700 | | | | 1,528,758 | |
| | |
Kamei Corp. | | | 27,000 | | | | 224,231 | |
| | |
Kamigumi Co. Ltd. | | | 90,000 | | | | 1,631,308 | |
See Notes to Financial Statements.
Schedule of Investments (continued)
WisdomTree International SmallCap Dividend Fund (DLS)
March 31, 2022
| | | | | | | | |
| Investments | | Shares | | | Value | |
| | |
Kanaden Corp. | | | 44,100 | | | $ | 360,067 | |
| | |
Kandenko Co. Ltd. | | | 170,900 | | | | 1,174,299 | |
| | |
Kaneka Corp. | | | 64,400 | | | | 1,880,931 | |
| | |
Kanematsu Corp. | | | 115,800 | | | | 1,280,359 | |
| | |
Ki-Star Real Estate Co. Ltd.(a) | | | 18,900 | | | | 820,622 | |
| | |
King Jim Co. Ltd.(a) | | | 73,900 | | | | 557,104 | |
| | |
Kintetsu World Express, Inc. | | | 67,900 | | | | 1,753,792 | |
| | |
Kito Corp.(a) | | | 57,700 | | | | 843,811 | |
| | |
Koatsu Gas Kogyo Co. Ltd. | | | 75,800 | | | | 412,802 | |
| | |
Kobe Steel Ltd. | | | 254,900 | | | | 1,241,161 | |
| | |
Kojima Co. Ltd.(a) | | | 94,800 | | | | 449,104 | |
| | |
Kokusai Pulp & Paper Co. Ltd. | | | 196,600 | | | | 515,088 | |
| | |
Komatsu Matere Co. Ltd.(a) | | | 103,800 | | | | 1,202,412 | |
| | |
Konaka Co. Ltd.(a) | | | 126,000 | | | | 349,841 | |
| | |
Konica Minolta, Inc.(a) | | | 585,700 | | | | 2,489,979 | |
| | |
Kumagai Gumi Co. Ltd. | | | 51,100 | | | | 1,140,935 | |
| | |
Kurabo Industries Ltd.(a) | | | 20,395 | | | | 295,234 | |
| | |
Kyokuyo Co. Ltd.(a) | | | 24,000 | | | | 658,455 | |
| | |
KYORIN Holdings, Inc. | | | 88,490 | | | | 1,295,545 | |
| | |
Kyosan Electric Manufacturing Co. Ltd. | | | 143,300 | | | | 515,939 | |
| | |
Kyowa Leather Cloth Co. Ltd.(a) | | | 42,100 | | | | 226,152 | |
| | |
Kyudenko Corp. | | | 59,700 | | | | 1,409,682 | |
| | |
Kyushu Financial Group, Inc. | | | 393,600 | | | | 1,300,380 | |
| | |
LAC Co. Ltd. | | | 104,300 | | | | 789,715 | |
| | |
LEC, Inc.(a) | | | 60,400 | | | | 437,916 | |
| | |
Lintec Corp. | | | 103,230 | | | | 2,067,577 | |
| | |
Macnica Fuji Electronics Holdings, Inc. | | | 70,400 | | | | 1,532,414 | |
| | |
Marudai Food Co. Ltd.(a) | | | 54,200 | | | | 661,340 | |
| | |
Maruichi Steel Tube Ltd. | | | 70,600 | | | | 1,605,405 | |
| | |
Matsui Securities Co. Ltd.(a) | | | 197,940 | | | | 1,316,067 | |
| | |
Maxell Ltd. | | | 61,900 | | | | 613,008 | |
| | |
Mebuki Financial Group, Inc. | | | 1,153,100 | | | | 2,432,079 | |
| | |
Meisei Industrial Co. Ltd.(a) | | | 69,100 | | | | 392,824 | |
| | |
Meitec Corp. | | | 28,500 | | | | 1,561,483 | |
| | |
Meiwa Estate Co. Ltd.(a) | | | 20,800 | | | | 103,507 | |
| | |
Ministop Co. Ltd. | | | 67,500 | | | | 806,941 | |
| | |
Mirait Holdings Corp. | | | 105,100 | | | | 1,687,661 | |
| | |
Mitsubishi Logistics Corp.(a) | | | 61,600 | | | | 1,542,855 | |
| | |
Mitsubishi Materials Corp. | | | 94,000 | | | | 1,659,666 | |
| | |
Mitsui Matsushima Holdings Co. Ltd.(a) | | | 43,600 | | | | 686,464 | |
| | |
Mitsui Mining & Smelting Co. Ltd. | | | 36,664 | | | | 1,013,452 | |
| | |
Mizuho Leasing Co. Ltd.(a) | | | 46,600 | | | | 1,142,588 | |
| | |
Morinaga & Co. Ltd. | | | 42,100 | | | | 1,321,532 | |
| | |
Nafco Co. Ltd.(a) | | | 19,600 | | | | 274,521 | |
| | |
Nagase & Co. Ltd. | | | 103,600 | | | | 1,554,320 | |
| | |
Nakanishi, Inc. | | | 63,700 | | | | 1,185,043 | |
| | |
NEC Networks & System Integration Corp. | | | 96,300 | | | | 1,417,028 | |
| | |
NET One Systems Co. Ltd. | | | 45,800 | | | | 1,079,578 | |
| | |
Neturen Co. Ltd. | | | 52,500 | | | | 255,633 | |
| | |
NHK Spring Co. Ltd. | | | 175,300 | | | | 1,278,192 | |
| | |
Nichias Corp. | | | 67,800 | | | | 1,411,581 | |
| | |
Nichiban Co. Ltd. | | | 51,300 | | | | 718,517 | |
| | |
Nihon Chouzai Co. Ltd. | | | 42,500 | | | | 465,705 | |
| | |
Nihon Flush Co. Ltd.(a) | | | 68,600 | | | | 557,278 | |
| | |
Nihon Nohyaku Co. Ltd. | | | 100,700 | | | | 506,922 | |
| | |
Nihon Tokushu Toryo Co. Ltd. | | | 30,600 | | | | 211,269 | |
| | |
Nihon Unisys Ltd. | | | 67,700 | | | | 1,737,471 | |
| | |
Nikko Co. Ltd.(a) | | | 76,300 | | | | 381,579 | |
| | |
Nikkon Holdings Co. Ltd. | | | 60,700 | | | | 1,022,711 | |
| | |
Nippon Air Conditioning Services Co. Ltd. | | | 86,800 | | | | 566,390 | |
| | |
Nippon Aqua Co. Ltd. | | | 149,200 | | | | 807,616 | |
| | |
Nippon Carbide Industries Co., Inc. | | | 34,300 | | | | 391,112 | |
| | |
Nippon Chemical Industrial Co. Ltd.(a) | | | 16,100 | | | | 320,077 | |
| | |
Nippon Concrete Industries Co. Ltd.(a) | | | 114,800 | | | | 275,236 | |
| | |
Nippon Electric Glass Co. Ltd. | | | 77,100 | | | | 1,725,261 | |
| | |
Nippon Gas Co. Ltd.(a) | | | 104,600 | | | | 1,284,932 | |
| | |
Nippon Kayaku Co. Ltd.(a) | | | 185,399 | | | | 1,773,415 | |
| | |
Nippon Koei Co. Ltd. | | | 29,800 | | | | 736,560 | |
| | |
Nippon Light Metal Holdings Co. Ltd.(a) | | | 70,500 | | | | 994,987 | |
| | |
Nippon Paper Industries Co. Ltd.(a) | | | 82,738 | | | | 708,258 | |
| | |
Nippon Seisen Co. Ltd.(a) | | | 13,200 | | | | 483,955 | |
| | |
Nippon Shokubai Co. Ltd. | | | 27,600 | | | | 1,212,012 | |
| | |
Nippon Steel Trading Corp. | | | 40,673 | | | | 1,779,391 | |
| | |
Nippon Systemware Co. Ltd. | | | 39,800 | | | | 718,449 | |
| | |
Nippon Thompson Co. Ltd. | | | 124,500 | | | | 554,929 | |
| | |
Nipro Corp. | | | 148,500 | | | | 1,252,844 | |
| | |
Nishi-Nippon Financial Holdings, Inc. | | | 155,400 | | | | 969,209 | |
| | |
Nishimatsu Construction Co. Ltd.(a) | | | 121,300 | | | | 3,667,732 | |
| | |
Nissei Plastic Industrial Co. Ltd.(a) | | | 46,700 | | | | 388,221 | |
| | |
Nisshinbo Holdings, Inc. | | | 159,492 | | | | 1,396,828 | |
| | |
Nissin Corp.(a) | | | 31,000 | | | | 417,335 | |
| | |
Nissin Electric Co. Ltd. | | | 132,700 | | | | 1,613,719 | |
| | |
Noevir Holdings Co. Ltd.(a) | | | 39,200 | | | | 1,597,067 | |
| | |
NOK Corp. | | | 111,900 | | | | 1,057,461 | |
| | |
NS Tool Co. Ltd. | | | 61,700 | | | | 737,096 | |
| | |
Okabe Co. Ltd. | | | 58,100 | | | | 330,290 | |
| | |
Okamura Corp. | | | 134,300 | | | | 1,341,064 | |
| | |
Okinawa Cellular Telephone Co. | | | 40,400 | | | | 1,640,964 | |
| | |
Okumura Corp. | | | 52,300 | | | | 1,279,761 | |
| | |
Okura Industrial Co. Ltd.(a) | | | 22,000 | | | | 329,705 | |
| | |
Okuwa Co. Ltd. | | | 96,000 | | | | 728,453 | |
| | |
Orient Corp.(a) | | | 1,136,600 | | | | 1,161,181 | |
| | |
Oriental Shiraishi Corp. | | | 204,000 | | | | 398,336 | |
| | |
Osaki Electric Co. Ltd.(a) | | | 87,400 | | | | 336,999 | |
| | |
PALTAC Corp. | | | 27,600 | | | | 1,034,645 | |
| | |
PC Depot Corp.(a) | | | 114,900 | | | | 286,836 | |
| | |
Penta-Ocean Construction Co. Ltd. | | | 219,600 | | | | 1,109,082 | |
| | |
Pigeon Corp. | | | 94,800 | | | | 1,681,602 | |
| | |
Plenus Co. Ltd. | | | 23,800 | | | | 394,134 | |
| | |
Press Kogyo Co. Ltd. | | | 73,700 | | | | 229,525 | |
| | |
Pronexus, Inc. | | | 64,600 | | | | 564,169 | |
| | |
PS Mitsubishi Construction Co. Ltd.(a) | | | 98,600 | | | | 475,230 | |
| | |
Quick Co. Ltd. | | | 53,900 | | | | 703,420 | |
| | |
Raito Kogyo Co. Ltd. | | | 84,500 | | | | 1,359,658 | |
| | |
Rengo Co. Ltd. | | | 211,300 | | | | 1,361,373 | |
| | |
Retail Partners Co. Ltd.(a) | | | 55,700 | | | | 658,992 | |
| | |
Ricoh Leasing Co. Ltd.(a) | | | 47,700 | | | | 1,308,680 | |
| | |
Riken Corp. | | | 12,500 | | | | 251,596 | |
See Notes to Financial Statements.
Schedule of Investments (continued)
WisdomTree International SmallCap Dividend Fund (DLS)
March 31, 2022
| | | | | | | | |
| Investments | | Shares | | | Value | |
| | |
Riken Technos Corp.(a) | | | 123,000 | | | $ | 463,118 | |
| | |
Roland Corp. | | | 30,300 | | | | 1,007,296 | |
| | |
Roland DG Corp. | | | 21,000 | | | | 584,799 | |
| | |
Ryoden Corp.(a) | | | 44,500 | | | | 624,742 | |
| | |
Ryosan Co. Ltd.(a) | | | 39,100 | | | | 707,746 | |
| | |
Sakai Chemical Industry Co. Ltd. | | | 35,600 | | | | 569,600 | |
| | |
Sala Corp. | | | 72,800 | | | | 383,268 | |
| | |
SAMTY Co. Ltd. | | | 68,300 | | | | 1,237,981 | |
| | |
Sanei Architecture Planning Co. Ltd.(a) | | | 26,300 | | | | 345,177 | |
| | |
Sanki Engineering Co. Ltd. | | | 102,100 | | | | 1,175,990 | |
| | |
Sankyo Co. Ltd. | | | 72,700 | | | | 2,033,504 | |
| | |
Sanoh Industrial Co. Ltd.(a) | | | 56,200 | | | | 324,119 | |
| | |
Sansei Technologies, Inc.(a) | | | 52,600 | | | | 318,092 | |
| | |
Sanshin Electronics Co. Ltd.(a) | | | 37,000 | | | | 489,878 | |
| | |
Sanyo Trading Co. Ltd.(a) | | | 69,500 | | | | 565,162 | |
| | |
Sato Shoji Corp.(a) | | | 46,500 | | | | 441,726 | |
| | |
Sawai Group Holdings Co. Ltd. | | | 34,800 | | | | 1,278,748 | |
| | |
Scala, Inc. | | | 56,900 | | | | 353,940 | |
| | |
Seika Corp.(a) | | | 38,300 | | | | 504,566 | |
| | |
Seino Holdings Co. Ltd. | | | 98,100 | | | | 900,378 | |
| | |
Sekisui Kasei Co. Ltd.(a) | | | 42,800 | | | | 154,098 | |
| | |
Senko Group Holdings Co. Ltd. | | | 170,700 | | | | 1,262,934 | |
| | |
Seria Co. Ltd. | | | 38,700 | | | | 884,161 | |
| | |
Seven Bank Ltd.(a) | | | 1,395,700 | | | | 2,748,278 | |
| | |
Shibaura Mechatronics Corp.(a) | | | 13,800 | | | | 980,070 | |
| | |
Shikoku Electric Power Co., Inc. | | | 237,900 | | | | 1,544,512 | |
| | |
Shinnihon Corp. | | | 56,900 | | | | 341,752 | |
| | |
Shinnihonseiyaku Co. Ltd. | | | 29,200 | | | | 348,115 | |
| | |
Shinsho Corp. | | | 19,100 | | | | 560,214 | |
| | |
Ship Healthcare Holdings, Inc. | | | 55,900 | | | | 915,586 | |
| | |
SHO-BOND Holdings Co. Ltd. | | | 55,900 | | | | 2,454,764 | |
| | |
Sinfonia Technology Co. Ltd. | | | 47,000 | | | | 515,790 | |
| | |
SKY Perfect JSAT Holdings, Inc. | | | 298,600 | | | | 1,018,500 | |
| | |
Space Co. Ltd.(a) | | | 56,900 | | | | 450,981 | |
| | |
ST Corp. | | | 57,500 | | | | 723,399 | |
| | |
St. Marc Holdings Co. Ltd. | | | 66,800 | | | | 854,710 | |
| | |
Starzen Co. Ltd. | | | 42,200 | | | | 695,366 | |
| | |
Stella Chemifa Corp. | | | 23,800 | | | | 509,041 | |
| | |
Studio Alice Co. Ltd. | | | 36,300 | | | | 652,278 | |
| | |
Sumitomo Bakelite Co. Ltd. | | | 44,100 | | | | 1,813,050 | |
| | |
Sumitomo Osaka Cement Co. Ltd. | | | 34,100 | | | | 943,984 | |
| | |
Sumitomo Riko Co. Ltd. | | | 89,300 | | | | 442,178 | |
| | |
Sumitomo Seika Chemicals Co. Ltd. | | | 15,900 | | | | 405,442 | |
| | |
Sun Frontier Fudousan Co. Ltd. | | | 159,700 | | | | 1,381,545 | |
| | |
Suncall Corp.(a) | | | 31,300 | | | | 127,650 | |
| | |
T-Gaia Corp. | | | 61,200 | | | | 825,412 | |
| | |
Tachi-S Co. Ltd.(a) | | | 47,500 | | | | 389,392 | |
| | |
Tachibana Eletech Co. Ltd. | | | 30,800 | | | | 417,941 | |
| | |
Taiheiyo Cement Corp.(a) | | | 69,600 | | | | 1,157,754 | |
| | |
Taiho Kogyo Co. Ltd.(a) | | | 29,800 | | | | 173,337 | |
| | |
Taiyo Holdings Co. Ltd. | | | 24,600 | | | | 658,702 | |
| | |
Takaoka Toko Co. Ltd. | | | 32,800 | | | | 399,680 | |
| | |
Takara & Co. Ltd.(a) | | | 20,600 | | | | 334,013 | |
| | |
Takara Holdings, Inc. | | | 104,500 | | | | 947,926 | |
| | |
Takashimaya Co. Ltd.(a) | | | 149,500 | | | | 1,431,258 | |
| | |
Tama Home Co. Ltd. | | | 50,700 | | | | 1,066,841 | |
| | |
Tatsuta Electric Wire and Cable Co. Ltd.(a) | | | 109,400 | | | | 416,419 | |
| | |
Tayca Corp. | | | 48,200 | | | | 512,677 | |
| | |
TDC Soft, Inc.(a) | | | 76,400 | | | | 735,202 | |
| | |
Teijin Ltd. | | | 133,700 | | | | 1,501,406 | |
| | |
Teikoku Electric Manufacturing Co. Ltd. | | | 48,500 | | | | 628,952 | |
| | |
Toa Corp. | | | 83,300 | | | | 466,686 | |
| | |
Tobishima Corp. | | | 19,600 | | | | 166,650 | |
| | |
Toda Corp.(a) | | | 364,700 | | | | 2,226,510 | |
| | |
Toho Bank Ltd.(a) | | | 275,500 | | | | 465,314 | |
| | |
Tokai Carbon Co. Ltd. | | | 135,300 | | | | 1,283,051 | |
| | |
TOKAI Holdings Corp. | | | 169,800 | | | | 1,205,912 | |
| | |
Tokai Rika Co. Ltd. | | | 78,222 | | | | 969,921 | |
| | |
Tokai Tokyo Financial Holdings, Inc. | | | 353,300 | | | | 1,173,058 | |
| | |
Tokuyama Corp. | | | 60,100 | | | | 850,684 | |
| | |
Tokyo Energy & Systems, Inc. | | | 69,000 | | | | 553,137 | |
| | |
Tokyo Ohka Kogyo Co. Ltd. | | | 26,100 | | | | 1,582,665 | |
| | |
Tokyo Sangyo Co. Ltd.(a) | | | 88,600 | | | | 528,498 | |
| | |
Tokyo Seimitsu Co. Ltd. | | | 41,200 | | | | 1,656,486 | |
| | |
Tokyo Tekko Co. Ltd.(a) | | | 10,100 | | | | 111,090 | |
| | |
Tomoku Co. Ltd.(a) | | | 3,800 | | | | 49,811 | |
| | |
TOMONY Holdings, Inc.(a) | | | 169,100 | | | | 456,971 | |
| | |
Topre Corp. | | | 36,400 | | | | 352,379 | |
| | |
Torishima Pump Manufacturing Co. Ltd. | | | 59,300 | | | | 501,271 | |
| | |
Tow Co. Ltd.(a) | | | 235,700 | | | | 617,529 | |
| | |
Toyo Ink SC Holdings Co. Ltd. | | | 58,500 | | | | 917,203 | |
| | |
Toyo Kanetsu KK(a) | | | 11,200 | | | | 226,261 | |
| | |
Toyo Seikan Group Holdings Ltd. | | | 194,400 | | | | 2,251,917 | |
| | |
Toyo Tire Corp.(a) | | | 104,200 | | | | 1,341,830 | |
| | |
Toyoda Gosei Co. Ltd. | | | 88,200 | | | | 1,472,241 | |
| | |
TPR Co. Ltd.(a) | | | 32,300 | | | | 346,219 | |
| | |
Transaction Co. Ltd. | | | 74,200 | | | | 607,661 | |
| | |
TS Tech Co. Ltd. | | | 94,800 | | | | 1,073,944 | |
| | |
Tsumura & Co. | | | 50,801 | | | | 1,339,347 | |
| | |
Tsurumi Manufacturing Co. Ltd. | | | 53,000 | | | | 794,290 | |
| | |
Ube Industries Ltd.(a) | | | 103,800 | | | | 1,707,836 | |
| | |
Uchida Yoko Co. Ltd. | | | 18,900 | | | | 756,779 | |
| | |
Ulvac, Inc. | | | 27,400 | | | | 1,422,204 | |
| | |
UNITED, Inc.(a) | | | 46,200 | | | | 709,130 | |
| | |
V Technology Co. Ltd.(a) | | | 18,200 | | | | 494,830 | |
| | |
Vertex Corp.(a) | | | 32,700 | | | | 776,987 | |
| | |
Vital KSK Holdings, Inc. | | | 125,200 | | | | 758,163 | |
| | |
Wakachiku Construction Co. Ltd.(a) | | | 47,400 | | | | 762,696 | |
| | |
Wakita & Co. Ltd. | | | 67,900 | | | | 559,423 | |
| | |
Warabeya Nichiyo Holdings Co. Ltd. | | | 35,500 | | | | 520,033 | |
| | |
Xebio Holdings Co. Ltd. | | | 86,400 | | | | 674,116 | |
| | |
Yahagi Construction Co. Ltd. | | | 70,900 | | | | 468,480 | |
| | |
YAMADA Consulting Group Co. Ltd.(a) | | | 47,200 | | | | 459,264 | |
| | |
Yamae Group Holdings Co. Ltd. | | | 56,800 | | | | 482,946 | |
| | |
Yamagata Bank Ltd. | | | 56,800 | | | | 405,731 | |
| | |
Yamaguchi Financial Group, Inc. | | | 241,100 | | | | 1,350,756 | |
| | |
Yellow Hat Ltd. | | | 85,100 | | | | 1,102,181 | |
| | |
Yokorei Co. Ltd. | | | 72,000 | | | | 508,375 | |
See Notes to Financial Statements.
Schedule of Investments (continued)
WisdomTree International SmallCap Dividend Fund (DLS)
March 31, 2022
| | | | | | | | |
| Investments | | Shares | | | Value | |
| | |
Yorozu Corp.(a) | | | 33,100 | | | $ | 242,438 | |
| | |
Yotai Refractories Co. Ltd. | | | 49,300 | | | | 511,380 | |
| | |
Yurtec Corp. | | | 73,700 | | | | 420,189 | |
| | |
Yushin Precision Equipment Co. Ltd. | | | 95,300 | | | | 527,634 | |
| | | | | | | | |
| Total Japan | | | | 337,397,836 | |
|
| Netherlands – 2.0% | |
| | |
Brunel International NV | | | 98,904 | | | | 1,210,501 | |
| | |
Corbion NV | | | 36,446 | | | | 1,261,157 | |
| | |
Eurocommercial Properties NV | | | 61,435 | | | | 1,698,297 | |
| | |
Heijmans NV, CVA | | | 82,677 | | | | 1,366,980 | |
| | |
Ordina NV | | | 417,459 | | | | 2,164,504 | |
| | |
PostNL NV(a) | | | 3,164,952 | | | | 12,184,337 | |
| | |
RHI Magnesita NV | | | 80,250 | | | | 2,573,907 | |
| | |
TKH Group NV, CVA(a) | | | 42,183 | | | | 2,374,907 | |
| | |
Wereldhave NV(a) | | | 70,871 | | | | 1,392,573 | |
| | | | | | | | |
| Total Netherlands | | | | 26,227,163 | |
|
| Norway – 3.2% | |
| | |
ABG Sundal Collier Holding ASA | | | 2,424,919 | | | | 2,362,799 | |
| | |
AF Gruppen ASA | | | 64,516 | | | | 1,475,663 | |
| | |
Atea ASA* | | | 170,981 | | | | 2,585,051 | |
| | |
Austevoll Seafood ASA | | | 261,909 | | | | 4,094,575 | |
| | |
Bonheur ASA | | | 30,256 | | | | 1,238,752 | |
| | |
Borregaard ASA | | | 83,813 | | | | 1,671,659 | |
| | |
Bouvet ASA | | | 205,652 | | | | 1,646,345 | |
| | |
Europris ASA(b) | | | 372,320 | | | | 2,405,773 | |
| | |
Hunter Group ASA* | | | 5,046,382 | | | | 1,615,950 | |
| | |
Kid ASA(b) | | | 175,181 | | | | 2,063,546 | |
| | |
Kitron ASA(a) | | | 486,267 | | | | 1,120,572 | |
| | |
Multiconsult ASA(b) | | | 82,567 | | | | 1,336,143 | |
| | |
Pareto Bank ASA | | | 114,244 | | | | 858,398 | |
| | |
Protector Forsikring ASA | | | 150,933 | | | | 2,098,977 | |
| | |
Selvaag Bolig ASA | | | 227,566 | | | | 1,301,269 | |
| | |
SpareBank 1 Nord Norge | | | 89,692 | | | | 1,101,661 | |
| | |
Sparebank 1 Oestlandet | | | 120,850 | | | | 1,934,927 | |
| | |
SpareBank 1 SMN | | | 75,933 | | | | 1,226,182 | |
| | |
Sparebanken Vest | | | 127,045 | | | | 1,496,527 | |
| | |
TGS ASA | | | 279,765 | | | | 4,210,553 | |
| | |
Veidekke ASA | | | 374,148 | | | | 5,237,387 | |
| | | | | | | | |
| Total Norway | | | | 43,082,709 | |
|
| Peru – 0.1% | |
| | |
Hochschild Mining PLC | | | 619,326 | | | | 1,049,466 | |
|
| Portugal – 1.5% | |
| | |
Altri SGPS SA(a) | | | 421,293 | | | | 2,840,636 | |
| | |
Corticeira Amorim SGPS SA | | | 110,016 | | | | 1,231,438 | |
| | |
Navigator Co. SA | | | 1,351,188 | | | | 5,081,491 | |
| | |
REN – Redes Energeticas Nacionais SGPS SA | | | 1,667,341 | | | | 5,287,227 | |
| | |
Sonae SGPS SA | | | 4,610,009 | | | | 5,344,759 | |
| | | | | | | | |
| Total Portugal | | | | 19,785,551 | |
|
| Singapore – 3.8% | |
| | |
Best World International Ltd.*†(a) | | | 428,340 | | | | 228,120 | |
| | |
Bukit Sembawang Estates Ltd. | | | 711,500 | | | | 2,633,920 | |
| | |
China Sunsine Chemical Holdings Ltd. | | | 750,100 | | | | 257,728 | |
| | |
Civmec Ltd.(a) | | | 1,280,000 | | | | 605,313 | |
| | |
ComfortDelGro Corp. Ltd. | | | 2,112,200 | | | | 2,325,472 | |
| | |
CSE Global Ltd.(a) | | | 1,899,200 | | | | 666,583 | |
| | |
Hong Fok Corp. Ltd.* | | | 468,700 | | | | 299,572 | |
| | |
Hong Leong Asia Ltd. | | | 588,800 | | | | 358,932 | |
| | |
Hour Glass Ltd. | | | 1,689,700 | | | | 2,909,078 | |
| | |
Keppel Infrastructure Trust(a) | | | 14,794,882 | | | | 6,121,945 | |
| | |
NetLink NBN Trust(a) | | | 12,706,000 | | | | 9,153,840 | |
| | |
Propnex Ltd. | | | 1,416,800 | | | | 1,968,141 | |
| | |
Q&M Dental Group Singapore Ltd.(a) | | | 3,373,000 | | | | 1,320,937 | |
| | |
Raffles Medical Group Ltd.(a) | | | 2,046,800 | | | | 1,769,502 | |
| | |
Riverstone Holdings Ltd.(a) | | | 6,132,600 | | | | 4,486,108 | |
| | |
Sembcorp Industries Ltd.(a) | | | 2,275,800 | | | | 4,489,885 | |
| | |
Sheng Siong Group Ltd.(a) | | | 4,117,000 | | | | 4,623,963 | |
| | |
Singapore Post Ltd.(a) | | | 1,862,700 | | | | 894,636 | |
| | |
StarHub Ltd.(a) | | | 3,231,700 | | | | 3,080,425 | |
| | |
Tuan Sing Holdings Ltd. | | | 1,409,000 | | | | 426,859 | |
| | |
UMS Holdings Ltd.(a) | | | 1,613,998 | | | | 1,466,891 | |
| | |
Wing Tai Holdings Ltd.(a) | | | 810,500 | | | | 1,072,003 | |
| | | | | | | | |
| Total Singapore | | | | 51,159,853 | |
|
| Spain – 2.8% | |
| | |
Aedas Homes SA(b) | | | 117,315 | | | | 3,002,203 | |
| | |
Almirall SA | | | 132,219 | | | | 1,696,219 | |
| | |
Applus Services SA | | | 142,327 | | | | 1,185,326 | |
| | |
Cia de Distribucion Integral Logista Holdings SA | | | 538,259 | | | | 9,941,641 | |
| | |
ContourGlobal PLC(b) | | | 744,339 | | | | 1,873,826 | |
| | |
Ebro Foods SA(a) | | | 207,097 | | | | 3,672,999 | |
| | |
Faes Farma SA | | | 760,492 | | | | 3,112,182 | |
| | |
Linea Directa Aseguradora SA Cia de Seguros y Reaseguros | | | 1,930,030 | | | | 2,995,690 | |
| | |
Miquel y Costas & Miquel SA | | | 28,892 | | | | 402,476 | |
| | |
Neinor Homes SA*(b) | | | 151,331 | | | | 2,003,704 | |
| | |
Prosegur Cash SA(a)(b) | | | 1,996,573 | | | | 1,312,899 | |
| | |
Prosegur Cia de Seguridad SA | | | 1,171,074 | | | | 2,569,508 | |
| | |
Sacyr SA(a) | | | 1,101,420 | | | | 2,686,286 | |
| | |
Unicaja Banco SA(b) | | | 1,342,745 | | | | 1,408,847 | |
| | | | | | | | |
| Total Spain | | | | 37,863,806 | |
|
| Sweden – 4.6% | |
| | |
AcadeMedia AB(b) | | | 194,950 | | | | 1,085,682 | |
| | |
Akelius Residential Property AB, Class D(a) | | | 363,515 | | | | 747,451 | |
| | |
Atrium Ljungberg AB, Class B | | | 154,278 | | | | 3,186,741 | |
| | |
Beijer Alma AB(a) | | | 67,041 | | | | 1,568,227 | |
| | |
Bilia AB, Class A | | | 194,589 | | | | 2,808,359 | |
| | |
Bonava AB, Class B | | | 150,965 | | | | 958,171 | |
| | |
Bravida Holding AB(b) | | | 190,150 | | | | 2,213,799 | |
| | |
Bufab AB | | | 29,816 | | | | 1,078,180 | |
| | |
Byggmax Group AB | | | 163,314 | | | | 1,221,429 | |
| | |
Catena AB | | | 46,802 | | | | 2,857,516 | |
| | |
Clas Ohlson AB, Class B | | | 173,231 | | | | 1,992,657 | |
| | |
Cloetta AB, Class B | | | 435,179 | | | | 1,201,956 | |
| | |
Coor Service Management Holding AB(b) | | | 189,720 | | | | 1,542,083 | |
| | |
Dios Fastigheter AB | | | 302,494 | | | | 3,323,753 | |
See Notes to Financial Statements.
Schedule of Investments (continued)
WisdomTree International SmallCap Dividend Fund (DLS)
March 31, 2022
| | | | | | | | |
| Investments | | Shares | | | Value | |
| | |
Dustin Group AB(b) | | | 126,327 | | | $ | 1,095,266 | |
| | |
Elanders AB, Class B | | | 56,465 | | | | 830,065 | |
| | |
Ferronordic AB | | | 31,552 | | | | 196,366 | |
| | |
Inwido AB | | | 122,142 | | | | 1,956,757 | |
| | |
JM AB(a) | | | 108,377 | | | | 3,488,755 | |
| | |
KNOW IT AB | | | 28,432 | | | | 954,913 | |
| | |
Lagercrantz Group AB, Class B | | | 138,693 | | | | 1,589,417 | |
| | |
LeoVegas AB(b) | | | 330,624 | | | | 1,344,577 | |
| | |
Lindab International AB | | | 79,973 | | | | 2,068,105 | |
| | |
Loomis AB | | | 88,038 | | | | 2,438,205 | |
| | |
Mycronic AB | | | 72,997 | | | | 1,378,573 | |
| | |
NCC AB, Class B | | | 131,746 | | | | 1,894,324 | |
| | |
Nobia AB | | | 274,317 | | | | 1,223,321 | |
| | |
Nolato AB, Class B | | | 187,742 | | | | 1,410,170 | |
| | |
Nordic Waterproofing Holding AB | | | 50,174 | | | | 912,020 | |
| | |
Peab AB, Class B | | | 735,237 | | | | 7,479,072 | |
| | |
Platzer Fastigheter Holding AB, Class B | | | 139,390 | | | | 1,740,991 | |
| | |
Ratos AB, Class B | | | 279,446 | | | | 1,464,487 | |
| | |
Scandi Standard AB | | | 85,339 | | | | 326,452 | |
| | |
Troax Group AB | | | 39,628 | | | | 1,046,042 | |
| | |
Volati AB | | | 54,421 | | | | 888,778 | |
| | | | | | | | |
| Total Sweden | | | | 61,512,660 | |
|
| Switzerland – 1.4% | |
| | |
Arbonia AG | | | 125,432 | | | | 2,469,794 | |
| | |
EFG International AG* | | | 275,933 | | | | 2,158,889 | |
| | |
Huber + Suhner AG, Registered Shares | | | 24,470 | | | | 2,305,405 | |
| | |
Landis + Gyr Group AG* | | | 47,200 | | | | 3,010,747 | |
| | |
Mobilezone Holding AG, Registered Shares | | | 134,414 | | | | 2,389,582 | |
| | |
Swissquote Group Holding SA, Registered Shares | | | 9,790 | | | | 1,791,509 | |
| | |
Valiant Holding AG, Registered Shares | | | 29,126 | | | | 3,032,079 | |
| | |
Zehnder Group AG | | | 12,142 | | | | 1,058,178 | |
| | | | | | | | |
| Total Switzerland | | | | 18,216,183 | |
|
| United Kingdom – 13.6% | |
| | |
AJ Bell PLC | | | 270,884 | | | | 1,084,245 | |
| | |
Alliance Pharma PLC | | | 775,304 | | | | 1,173,925 | |
| | |
Assura PLC | | | 4,432,696 | | | | 3,904,492 | |
| | |
Balfour Beatty PLC | | | 471,377 | | | | 1,595,042 | |
| | |
Bodycote PLC | | | 216,454 | | | | 1,802,589 | |
| | |
Brewin Dolphin Holdings PLC | | | 780,347 | | | | 5,260,515 | |
| | |
CareTech Holdings PLC | | | 211,739 | | | | 1,929,201 | |
| | |
Central Asia Metals PLC | | | 716,123 | | | | 2,244,063 | |
| | |
Chesnara PLC | | | 373,455 | | | | 1,492,339 | |
| | |
Clarkson PLC | | | 43,540 | | | | 2,121,098 | |
| | |
CLS Holdings PLC | | | 626,982 | | | | 1,659,287 | |
| | |
Coats Group PLC | | | 1,559,582 | | | | 1,574,977 | |
| | |
Cohort PLC | | | 60,064 | | | | 359,038 | |
| | |
Cranswick PLC | | | 71,354 | | | | 3,310,737 | |
| | |
Currys PLC | | | 1,160,346 | | | | 1,388,743 | |
| | |
Devro PLC | | | 514,555 | | | | 1,415,952 | |
| | |
Diversified Energy Co. PLC | | | 5,249,573 | | | | 8,197,458 | |
| | |
Domino’s Pizza Group PLC | | | 668,938 | | | | 3,334,548 | |
| | |
Drax Group PLC | | | 881,152 | | | | 9,118,930 | |
| | |
EMIS Group PLC | | | 132,442 | | | | 2,326,227 | |
| | |
Epwin Group PLC | | | 341,349 | | | | 404,494 | |
| | |
Essentra PLC | | | 243,892 | | | | 1,011,530 | |
| | |
Euromoney Institutional Investor PLC | | | 105,681 | | | | 1,374,752 | |
| | |
FDM Group Holdings PLC | | | 199,290 | | | | 2,786,638 | |
| | |
Ferrexpo PLC | | | 4,750,053 | | | | 11,664,008 | |
| | |
Forterra PLC(b) | | | 310,762 | | | | 951,308 | |
| | |
Gateley Holdings PLC | | | 302,262 | | | | 799,927 | |
| | |
GB Group PLC | | | 98,285 | | | | 714,327 | |
| | |
Genuit Group PLC | | | 160,151 | | | | 1,036,391 | |
| | |
Great Portland Estates PLC | | | 211,650 | | | | 1,984,124 | |
| | |
Henry Boot PLC | | | 151,319 | | | | 629,580 | |
| | |
Hill & Smith Holdings PLC | | | 91,593 | | | | 1,775,173 | |
| | |
Hilton Food Group PLC | | | 138,981 | | | | 2,269,069 | |
| | |
Hunting PLC | | | 253,955 | | | | 1,004,782 | |
| | |
Ibstock PLC(b) | | | 385,278 | | | | 889,763 | |
| | |
IG Design Group PLC(a) | | | 161,092 | | | | 142,108 | |
| | |
Impax Asset Management Group PLC | | | 109,599 | | | | 1,428,605 | |
| | |
IntegraFin Holdings PLC | | | 256,844 | | | | 1,423,712 | |
| | |
James Fisher & Sons PLC* | | | 60,581 | | | | 275,983 | |
| | |
James Halstead PLC(a) | | | 395,424 | | | | 1,202,667 | |
| | |
Jupiter Fund Management PLC | | | 1,471,893 | | | | 4,003,843 | |
| | |
Keller Group PLC | | | 136,297 | | | | 1,496,659 | |
| | |
Liontrust Asset Management PLC | | | 74,664 | | | | 1,252,423 | |
| | |
Londonmetric Property PLC | | | 1,882,885 | | | | 6,837,362 | |
| | |
Marshalls PLC | | | 126,488 | | | | 1,134,141 | |
| | |
Mattioli Woods PLC | | | 79,718 | | | | 834,438 | |
| | |
MJ Gleeson PLC | | | 92,117 | | | | 715,587 | |
| | |
Moneysupermarket.com Group PLC | | | 1,176,183 | | | | 2,942,382 | |
| | |
Morgan Advanced Materials PLC | | | 287,334 | | | | 1,172,787 | |
| | |
Morgan Sindall Group PLC | | | 93,067 | | | | 2,959,262 | |
| | |
Mortgage Advice Bureau Holdings Ltd. | | | 76,311 | | | | 1,145,414 | |
| | |
NCC Group PLC | | | 420,947 | | | | 1,012,042 | |
| | |
Next Fifteen Communications Group PLC | | | 76,682 | | | | 1,352,909 | |
| | |
Numis Corp. PLC | | | 254,176 | | | | 860,079 | |
| | |
Oxford Instruments PLC | | | 37,469 | | | | 1,040,938 | |
| | |
Pagegroup PLC | | | 126,422 | | | | 819,617 | |
| | |
Pan African Resources PLC(a) | | | 5,363,580 | | | | 1,581,879 | |
| | |
Paragon Banking Group PLC | | | 432,022 | | | | 2,844,110 | |
| | |
PayPoint PLC | | | 227,320 | | | | 1,741,932 | |
| | |
Polar Capital Holdings PLC | | | 318,859 | | | | 2,607,119 | |
| | |
Premier Miton Group PLC | | | 314,821 | | | | 625,909 | |
| | |
PZ Cussons PLC | | | 512,071 | | | | 1,318,771 | |
| | |
QinetiQ Group PLC | | | 630,854 | | | | 2,528,390 | |
| | |
Reach PLC | | | 316,342 | | | | 763,050 | |
| | |
Redde Northgate PLC | | | 629,523 | | | | 3,580,683 | |
| | |
Renew Holdings PLC | | | 126,611 | | | | 1,140,245 | |
| | |
Sabre Insurance Group PLC(b) | | | 800,129 | | | | 2,444,097 | |
| | |
Safestore Holdings PLC | | | 250,753 | | | | 4,424,064 | |
| | |
Savills PLC | | | 171,303 | | | | 2,512,584 | |
| | |
Serco Group PLC | | | 920,795 | | | | 1,747,018 | |
| | |
Serica Energy PLC | | | 458,681 | | | | 2,406,631 | |
| | |
Smart Metering Systems PLC | | | 178,816 | | | | 1,857,607 | |
| | |
Spirent Communications PLC | | | 535,125 | | | | 1,676,883 | |
See Notes to Financial Statements.
Schedule of Investments (continued)
WisdomTree International SmallCap Dividend Fund (DLS)
March 31, 2022
| | | | | | | | |
| Investments | | Shares | | | Value | |
| | |
SThree PLC | | | 197,860 | | | $ | 1,077,219 | |
| | |
Synthomer PLC | | | 950,737 | | | | 3,825,465 | |
| | |
TBC Bank Group PLC | | | 85,154 | | | | 1,233,299 | |
| | |
Telecom Plus PLC | | | 160,256 | | | | 3,228,317 | |
| | |
TI Fluid Systems PLC(b) | | | 647,601 | | | | 1,630,294 | |
| | |
Tyman PLC | | | 305,354 | | | | 1,278,502 | |
| | |
Vesuvius PLC | | | 475,705 | | | | 2,139,568 | |
| | |
Victrex PLC | | | 93,907 | | | | 2,262,661 | |
| | |
Vivo Energy PLC(b) | | | 2,597,928 | | | | 4,672,489 | |
| | |
Watkin Jones PLC | | | 539,410 | | | | 1,818,149 | |
| | |
Wincanton PLC | | | 247,267 | | | | 1,256,678 | |
| | |
Workspace Group PLC | | | 186,295 | | | | 1,680,205 | |
| | |
XPS Pensions Group PLC | | | 531,150 | | | | 867,180 | |
| | | | | | | | |
| Total United Kingdom | | | | 181,413,228 | |
TOTAL COMMON STOCKS (Cost: $1,297,843,944) | | | | 1,308,271,269 | |
|
| EXCHANGE-TRADED FUNDS – 0.6% | |
|
| United States – 0.6% | |
| | |
WisdomTree Europe SmallCap Dividend Fund(a)(c) | | | 66,209 | | | | 4,449,907 | |
| | |
WisdomTree Japan SmallCap Dividend Fund(c) | | | 51,708 | | | | 3,408,074 | |
TOTAL EXCHANGE-TRADED FUNDS (Cost: $8,085,881) | | | | 7,857,981 | |
|
| INVESTMENT OF CASH COLLATERAL FOR SECURITIES LOANED – 4.7% | |
|
| United States – 4.7% | |
| |
State Street Navigator Securities Lending
Government Money Market Portfolio, 0.25%(d) | | | | | |
| (Cost: $62,685,810) | | | 62,685,810 | | | | 62,685,810 | |
| |
TOTAL INVESTMENTS IN SECURITIES – 103.6% (Cost: $1,368,615,635) | | | | 1,378,815,060 | |
| |
Other Assets less Liabilities – (3.6)% | | | | (48,452,386 | ) |
| | | | | | | | |
| NET ASSETS – 100.0% | | | $ | 1,330,362,674 | |
| * | Non-income producing security. |
| † | Security is being fair valued using significant unobservable inputs by a pricing committee under the direction of the Board of Trustees. The aggregate value of fair valued securities is $228,120, which represents 0.02% of net assets. |
| (a) | Security, or portion thereof, was on loan at March 31, 2022 (See Note 2). At March 31, 2022, the total market value of the Fund’s securities on loan identified in the Schedule of Investments was $126,323,648 and the total market value of the collateral held by the Fund was $136,141,210. The total market value of the collateral includes non-cash U.S. Government securities collateral having a value of $73,455,400. |
| (b) | This security is exempt from registration under rule 144A of the Securities Act of 1933. This security may be sold in transactions that are exempt from registration, normally to qualified institutional buyers. |
| (c) | Affiliated holding. See “Investment in Affiliates” supplementary table included in this Schedule of Investments for additional information. |
| (d) | Rate shown represents annualized 7-day yield as of March 31, 2022. |
Affiliated holdings are investments in entities in which the Fund owns 5% or more of the outstanding voting securities or are investments in entities which are under common ownership or control. Investments in affiliates during the fiscal year ended March 31, 2022 were as follows:
| | | | | | | | | | | | | | | | | | | | | | | | | | | | |
| | | | | | | |
| Affiliate | | Value at
3/31/2021 | | | Purchases/
Additions | | | Sales/
Reductions | | | Realized
Gain/(Loss) | | | Change in
Unrealized
Appreciation/
Depreciation | | | Value at
3/31/2022 | | | Dividend
Income | |
WisdomTree Europe SmallCap Dividend Fund | | $ | 1,759,247 | | | $ | 12,641,000 | | | $ | 10,010,784 | | | $ | 319,192 | | | $ | (258,748 | ) | | $ | 4,449,907 | | | $ | 80,179 | |
WisdomTree Japan SmallCap Dividend Fund | | | 1,441,447 | | | | 10,144,065 | | | | 7,823,341 | | | | (113,317 | ) | | | (240,780 | ) | | | 3,408,074 | | | | 67,058 | |
Total | | $ | 3,200,694 | | | $ | 22,785,065 | | | $ | 17,834,125 | | | $ | 205,875 | | | $ | (499,528 | ) | | $ | 7,857,981 | | | $ | 147,237 | |
| | | | | | | | | | | | | | | | | | | | | | | | | | | | |
|
| FINANCIAL DERIVATIVE INSTRUMENTS | |
|
| FOREIGN CURRENCY CONTRACTS (OTC – OVER THE COUNTER) | |
| | | | | |
| Counterparty | | Settlement
Date | | | Amount and
Description of
Currency to
be Purchased | | | Amount and
Description of
Currency to
be Sold | | | Unrealized
Appreciation | | | Unrealized
Depreciation | |
Goldman Sachs | | | 4/1/2022 | | | | 826,694 | | | | USD | | | | 1,100,000 | | | | AUD | | | $ | 649 | | | $ | — | |
HSBC Holdings PLC | | | 4/1/2022 | | | | 446,120 | | | | USD | | | | 400,000 | | | | EUR | | | | 1,060 | | | | — | |
| | | | | | | | | | | | | | | | | | | | | | | $ | 1,709 | | | $ | — | |
See Notes to Financial Statements.
Schedule of Investments (concluded)
WisdomTree International SmallCap Dividend Fund (DLS)
March 31, 2022
The following is a summary of the fair valuations according to the inputs used as of March 31, 2022 in valuing the Fund’s investments (See Note 2 — Fair Value Measurement):
| | | | | | | | | | | | | | | | |
| | | | |
| | | Quoted
Prices in
Active
Markets
(Level 1) | | | Other
Significant
Observable
Inputs
(Level 2) | | | Significant
Unobservable
Inputs
(Level 3) | | | Total | |
Assets: | | | | | | | | | | | | | | | | |
Investments in Securities | | | | | | | | | | | | | | | | |
Common Stocks | |
Japan | | $ | 336,835,636 | | | $ | 562,200 | | | $ | — | | | $ | 337,397,836 | |
Singapore | | | 50,931,733 | | | | — | | | | 228,120 | * | | | 51,159,853 | |
Other | | | 919,713,580 | | | | — | | | | — | | | | 919,713,580 | |
Exchange-Traded Funds | | | 7,857,981 | | | | — | | | | — | | | | 7,857,981 | |
Investment of Cash Collateral for Securities Loaned | | | — | | | | 62,685,810 | | | | — | | | | 62,685,810 | |
Total Investments in Securities | | $ | 1,315,338,930 | | | $ | 63,248,010 | | | $ | 228,120 | | | $ | 1,378,815,060 | |
Financial Derivative Instruments | | | | | | | | | | | | |
Foreign Currency Contracts1 | | $ | — | | | $ | 1,709 | | | $ | — | | | $ | 1,709 | |
Total – Net | | $ | 1,315,338,930 | | | $ | 63,249,719 | | | $ | 228,120 | | | $ | 1,378,816,769 | |
| * | Securities are being fair valued using significant unobservable inputs by the Pricing Committee. |
| 1 | Amount shown represents the unrealized appreciation (depreciation) on the financial instrument. |
See Notes to Financial Statements.
Schedule of Investments
WisdomTree Japan SmallCap Dividend Fund (DFJ)
March 31, 2022
| | | | | | | | |
| Investments | | Shares | | | Value | |
|
| COMMON STOCKS – 98.1% | |
|
| Japan – 98.1% | |
|
| Air Freight & Logistics – 0.7% | |
| | |
AIT Corp.(a) | | | 17,300 | | | $ | 217,363 | |
| | |
Kintetsu World Express, Inc. | | | 27,000 | | | | 697,384 | |
| | |
Konoike Transport Co. Ltd. | | | 9,700 | | | | 92,305 | |
| | |
Maruwa Unyu Kikan Co. Ltd. | | | 14,600 | | | | 135,084 | |
| | |
Mitsui-Soko Holdings Co. Ltd. | | | 11,800 | | | | 244,118 | |
| | |
SBS Holdings, Inc. | | | 6,900 | | | | 190,159 | |
| | | | | | | | |
| Total Air Freight & Logistics | | | | 1,576,413 | |
|
| Auto Components – 3.8% | |
| | |
Aisan Industry Co. Ltd. | | | 36,400 | | | | 218,925 | |
| | |
Daikyonishikawa Corp. | | | 26,900 | | | | 119,679 | |
| | |
Eagle Industry Co. Ltd.(a) | | | 41,600 | | | | 334,514 | |
| | |
Exedy Corp. | | | 17,125 | | | | 222,219 | |
| | |
FCC Co. Ltd. | | | 22,400 | | | | 247,853 | |
| | |
FuKoKu Co. Ltd. | | | 19,300 | | | | 147,245 | |
| | |
Furukawa Battery Co. Ltd.(a) | | | 12,000 | | | | 126,945 | |
| | |
Futaba Industrial Co. Ltd. | | | 19,200 | | | | 57,580 | |
| | |
G-Tekt Corp. | | | 18,200 | | | | 191,484 | |
| | |
H-One Co. Ltd. | | | 26,800 | | | | 134,248 | |
| | |
IJTT Co. Ltd. | | | 21,600 | | | | 95,743 | |
| | |
KYB Corp. | | | 13,500 | | | | 330,896 | |
| | |
Musashi Seimitsu Industry Co. Ltd.(a) | | | 23,200 | | | | 289,009 | |
| | |
NHK Spring Co. Ltd. | | | 87,300 | | | | 636,544 | |
| | |
Nihon Tokushu Toryo Co. Ltd. | | | 17,800 | | | | 122,895 | |
| | |
NOK Corp. | | | 65,200 | | | | 616,143 | |
| | |
Pacific Industrial Co. Ltd. | | | 26,800 | | | | 209,322 | |
| | |
Press Kogyo Co. Ltd. | | | 75,800 | | | | 236,065 | |
| | |
Riken Corp. | | | 7,300 | | | | 146,932 | |
| | |
Sanoh Industrial Co. Ltd.(a) | | | 18,400 | | | | 106,117 | |
| | |
Shoei Co. Ltd. | | | 7,700 | | | | 290,871 | |
| | |
Sumitomo Riko Co. Ltd. | | | 20,800 | | | | 102,993 | |
| | |
Tachi-S Co. Ltd. | | | 15,300 | | | | 125,425 | |
| | |
Taiho Kogyo Co. Ltd.(a) | | | 13,900 | | | | 80,852 | |
| | |
Tokai Rika Co. Ltd. | | | 44,958 | | | | 557,461 | |
| | |
Topre Corp. | | | 7,500 | | | | 72,606 | |
| | |
Toyo Tire Corp. | | | 47,900 | | | | 616,830 | |
| | |
Toyoda Gosei Co. Ltd. | | | 50,700 | | | | 846,288 | |
| | |
TPR Co. Ltd. | | | 9,700 | | | | 103,973 | |
| | |
TS Tech Co. Ltd. | | | 54,700 | | | | 619,671 | |
| | |
Yorozu Corp.(a) | | | 12,800 | | | | 93,752 | |
| | | | | | | | |
| Total Auto Components | | | | 8,101,080 | |
|
| Automobiles – 0.1% | |
| | |
Nissan Shatai Co. Ltd. | | | 37,800 | | | | 173,156 | |
|
| Banks – 8.4% | |
| | |
77 Bank Ltd. | | | 43,800 | | | | 558,619 | |
| | |
Aichi Bank Ltd. | | | 9,700 | | | | 362,826 | |
| | |
Akita Bank Ltd. | | | 16,600 | | | | 230,041 | |
| | |
Aomori Bank Ltd.(a) | | | 11,362 | | | | 176,456 | |
| | |
Aozora Bank Ltd.(a) | | | 73,600 | | | | 1,569,931 | |
| | |
Awa Bank Ltd. | | | 13,175 | | | | 235,657 | |
| | |
Bank of Iwate Ltd. | | | 11,900 | | | | 181,184 | |
| | |
Bank of Nagoya Ltd. | | | 4,769 | | | | 113,591 | |
| | |
Bank of Saga Ltd. | | | 20,700 | | | | 249,338 | |
| | |
Bank of the Ryukyus Ltd. | | | 32,408 | | | | 212,805 | |
| | |
Chugoku Bank Ltd. | | | 72,300 | | | | 521,215 | |
| | |
Chukyo Bank Ltd. | | | 13,000 | | | | 171,263 | |
| | |
Daishi Hokuetsu Financial Group, Inc. | | | 22,455 | | | | 463,438 | |
| | |
Ehime Bank Ltd. | | | 27,799 | | | | 213,918 | |
| | |
FIDEA Holdings Co. Ltd.(a) | | | 16,880 | | | | 177,040 | |
| | |
Fukui Bank Ltd.(a) | | | 15,448 | | | | 179,458 | |
| | |
Gunma Bank Ltd.(a) | | | 177,900 | | | | 518,860 | |
| | |
Hachijuni Bank Ltd. | | | 240,900 | | | | 807,796 | |
| | |
Hokkoku Financial Holdings, Inc.(a) | | | 2,662 | | | | 67,112 | |
| | |
Hokuhoku Financial Group, Inc. | | | 54,200 | | | | 398,769 | |
| | |
Hyakugo Bank Ltd. | | | 78,100 | | | | 215,559 | |
| | |
Hyakujushi Bank Ltd. | | | 6,400 | | | | 87,478 | |
| | |
Iyo Bank Ltd. | | | 99,400 | | | | 491,370 | |
| | |
Juroku Financial Group, Inc. | | | 16,900 | | | | 302,285 | |
| | |
Keiyo Bank Ltd. | | | 86,542 | | | | 352,942 | |
| | |
Kiyo Bank Ltd. | | | 23,690 | | | | 268,958 | |
| | |
Kyushu Financial Group, Inc. | | | 193,600 | | | | 639,618 | |
| | |
Mebuki Financial Group, Inc. | | | 706,200 | | | | 1,489,493 | |
| | |
Miyazaki Bank Ltd. | | | 14,300 | | | | 243,056 | |
| | |
Musashino Bank Ltd.(a) | | | 12,300 | | | | 178,154 | |
| | |
Nanto Bank Ltd. | | | 13,600 | | | | 221,634 | |
| | |
Nishi-Nippon Financial Holdings, Inc. | | | 69,100 | | | | 430,968 | |
| | |
North Pacific Bank Ltd. | | | 224,515 | | | | 443,943 | |
| | |
Ogaki Kyoritsu Bank Ltd. | | | 22,142 | | | | 347,340 | |
| | |
Oita Bank Ltd.(a) | | | 11,900 | | | | 187,949 | |
| | |
Okinawa Financial Group, Inc. | | | 11,380 | | | | 192,581 | |
| | |
San ju San Financial Group, Inc. | | | 23,600 | | | | 286,991 | |
| | |
San-In Godo Bank Ltd. | | | 60,800 | | | | 314,081 | |
| | |
Senshu Ikeda Holdings, Inc.(a) | | | 206,240 | | | | 293,961 | |
| | |
Seven Bank Ltd.(a) | | | 662,100 | | | | 1,303,744 | |
| | |
Shiga Bank Ltd. | | | 15,184 | | | | 276,596 | |
| | |
Shikoku Bank Ltd.(a) | | | 43,800 | | | | 269,566 | |
| | |
Suruga Bank Ltd. | | | 34,500 | | | | 116,255 | |
| | |
Toho Bank Ltd. | | | 133,500 | | | | 225,479 | |
| | |
Tokyo Kiraboshi Financial Group, Inc.(a) | | | 12,900 | | | | 186,419 | |
| | |
TOMONY Holdings, Inc. | | | 38,777 | | | | 104,790 | |
| | |
Towa Bank Ltd. | | | 14,100 | | | | 62,615 | |
| | |
Yamagata Bank Ltd. | | | 2,300 | | | | 16,429 | |
| | |
Yamaguchi Financial Group, Inc. | | | 142,600 | | | | 798,912 | |
| | |
Yamanashi Chuo Bank Ltd. | | | 25,700 | | | | 201,577 | |
| | | | | | | | |
| Total Banks | | | | 17,960,060 | |
|
| Beverages – 0.3% | |
| | |
Sapporo Holdings Ltd. | | | 14,898 | | | | 283,169 | |
| | |
Takara Holdings, Inc. | | | 34,811 | | | | 315,773 | |
| | | | | | | | |
| Total Beverages | | | | 598,942 | |
|
| Biotechnology – 0.0% | |
| | |
Pharma Foods International Co. Ltd.(a) | | | 3,300 | | | | 53,887 | |
|
| Building Products – 1.5% | |
| | |
Aica Kogyo Co. Ltd. | | | 22,715 | | | | 559,383 | |
| | |
Bunka Shutter Co. Ltd. | | | 55,400 | | | | 449,134 | |
See Notes to Financial Statements.
Schedule of Investments (continued)
WisdomTree Japan SmallCap Dividend Fund (DFJ)
March 31, 2022
| | | | | | | | |
| Investments | | Shares | | | Value | |
| | |
Central Glass Co. Ltd. | | | 20,386 | | | $ | 350,530 | |
| | |
Nichias Corp. | | | 22,513 | | | | 468,715 | |
| | |
Nichiha Corp. | | | 11,800 | | | | 244,021 | |
| | |
Noritz Corp. | | | 15,800 | | | | 191,097 | |
| | |
Shin Nippon Air Technologies Co. Ltd.(a) | | | 10,000 | | | | 158,929 | |
| | |
Sinko Industries Ltd.(a) | | | 10,100 | | | | 143,792 | |
| | |
Takara Standard Co. Ltd. | | | 22,531 | | | | 235,566 | |
| | |
Takasago Thermal Engineering Co. Ltd. | | | 22,172 | | | | 316,939 | |
| | | | | | | | |
| Total Building Products | | | | 3,118,106 | |
|
| Capital Markets – 2.2% | |
| | |
GMO Financial Holdings, Inc.(a) | | | 85,400 | | | | 579,067 | |
| | |
Ichiyoshi Securities Co. Ltd.(a) | | | 48,688 | | | | 248,304 | |
| | |
IwaiCosmo Holdings, Inc. | | | 43,400 | | | | 476,283 | |
| | |
Kyokuto Securities Co. Ltd.(a) | | | 42,300 | | | | 255,455 | |
| | |
Marusan Securities Co. Ltd.(a) | | | 46,700 | | | | 191,609 | |
| | |
Matsui Securities Co. Ltd.(a) | | | 160,200 | | | | 1,065,140 | |
| | |
Mito Securities Co. Ltd.(a) | | | 75,800 | | | | 171,740 | |
| | |
Monex Group, Inc.(a) | | | 52,594 | | | | 284,257 | |
| | |
Morningstar Japan KK | | | 56,844 | | | | 274,444 | |
| | |
Okasan Securities Group, Inc. | | | 109,800 | | | | 334,715 | |
| | |
Sparx Group Co. Ltd.(a) | | | 99,200 | | | | 223,941 | |
| | |
Tokai Tokyo Financial Holdings, Inc. | | | 185,600 | | | | 616,245 | |
| | | | | | | | |
| Total Capital Markets | | | | 4,721,200 | |
|
| Chemicals – 9.0% | |
| | |
ADEKA Corp. | | | 40,125 | | | | 893,907 | |
| | |
Asahi Yukizai Corp. | | | 7,000 | | | | 115,749 | |
| | |
Chugoku Marine Paints Ltd.(a) | | | 30,500 | | | | 227,164 | |
| | |
CI Takiron Corp. | | | 48,500 | | | | 217,775 | |
| | |
Daicel Corp. | | | 141,500 | | | | 952,466 | |
| | |
Dainichiseika Color & Chemicals Manufacturing Co. Ltd. | | | 5,142 | | | | 87,271 | |
| | |
DIC Corp. | | | 40,000 | | | | 826,200 | |
| | |
DKS Co. Ltd. | | | 4,600 | | | | 104,564 | |
| | |
Fujimi, Inc. | | | 12,000 | | | | 664,387 | |
| | |
Fujimori Kogyo Co. Ltd. | | | 4,900 | | | | 150,987 | |
| | |
Fuso Chemical Co. Ltd. | | | 5,100 | | | | 189,504 | |
| | |
Ishihara Sangyo Kaisha Ltd. | | | 9,100 | | | | 80,747 | |
| | |
JCU Corp. | | | 4,800 | | | | 164,119 | |
| | |
JSP Corp.(a) | | | 6,423 | | | | 81,336 | |
| | |
Kaneka Corp. | | | 30,600 | | | | 893,734 | |
| | |
KeePer Technical Laboratory Co. Ltd.(a) | | | 3,300 | | | | 67,699 | |
| | |
KH Neochem Co. Ltd. | | | 9,700 | | | | 220,653 | |
| | |
Konishi Co. Ltd. | | | 14,300 | | | | 184,383 | |
| | |
Kumiai Chemical Industry Co. Ltd. | | | 28,524 | | | | 207,981 | |
| | |
Kureha Corp. | | | 6,264 | | | | 506,281 | |
| | |
Kyowa Leather Cloth Co. Ltd.(a) | | | 27,000 | | | | 145,038 | |
| | |
Lintec Corp. | | | 45,965 | | | | 920,625 | |
| | |
MEC Co. Ltd. | | | 3,700 | | | | 102,884 | |
| | |
Nihon Nohyaku Co. Ltd.(a) | | | 39,500 | | | | 198,842 | |
| | |
Nihon Parkerizing Co. Ltd. | | | 34,100 | | | | 261,843 | |
| | |
Nippon Chemical Industrial Co. Ltd.(a) | | | 3,900 | | | | 77,534 | |
| | |
Nippon Kayaku Co. Ltd. | | | 84,900 | | | | 812,102 | |
| | |
Nippon Pillar Packing Co. Ltd. | | | 12,400 | | | | 314,661 | |
| | |
Nippon Shokubai Co. Ltd. | | | 9,800 | | | | 430,352 | |
| | |
Nippon Soda Co. Ltd. | | | 13,918 | | | | 386,436 | |
| | |
Okamoto Industries, Inc. | | | 7,287 | | | | 234,445 | |
| | |
Okura Industrial Co. Ltd. | | | 8,700 | | | | 130,384 | |
| | |
Osaka Organic Chemical Industry Ltd. | | | 4,600 | | | | 116,161 | |
| | |
Osaka Soda Co. Ltd. | | | 8,700 | | | | 223,996 | |
| | |
Riken Technos Corp. | | | 53,800 | | | | 202,567 | |
| | |
Sakata INX Corp. | | | 25,000 | | | | 199,176 | |
| | |
Sanyo Chemical Industries Ltd. | | | 9,235 | | | | 383,476 | |
| | |
Sekisui Kasei Co. Ltd.(a) | | | 37,900 | | | | 136,456 | |
| | |
Shikoku Chemicals Corp. | | | 12,100 | | | | 133,586 | |
| | |
Shin-Etsu Polymer Co. Ltd. | | | 23,400 | | | | 218,239 | |
| | |
Stella Chemifa Corp. | | | 6,000 | | | | 128,330 | |
| | |
Sumitomo Bakelite Co. Ltd. | | | 17,718 | | | | 728,427 | |
| | |
Sumitomo Seika Chemicals Co. Ltd. | | | 4,500 | | | | 114,748 | |
| | |
T Hasegawa Co. Ltd. | | | 11,400 | | | | 244,859 | |
| | |
Taiyo Holdings Co. Ltd. | | | 17,082 | | | | 457,397 | |
| | |
Takasago International Corp.(a) | | | 8,800 | | | | 199,092 | |
| | |
Tayca Corp. | | | 13,900 | | | | 147,847 | |
| | |
Teijin Ltd. | | | 85,200 | | | | 956,767 | |
| | |
Tokai Carbon Co. Ltd. | | | 56,400 | | | | 534,842 | |
| | |
Tokuyama Corp. | | | 32,900 | | | | 465,682 | |
| | |
Tokyo Ohka Kogyo Co. Ltd. | | | 10,900 | | | | 660,960 | |
| | |
Toyo Ink SC Holdings Co. Ltd. | | | 36,602 | | | | 573,871 | |
| | |
Toyobo Co. Ltd.(a) | | | 35,153 | | | | 316,558 | |
| | |
Ube Industries Ltd. | | | 51,393 | | | | 845,576 | |
| | |
Valqua Ltd. | | | 11,237 | | | | 246,172 | |
| | | | | | | | |
| Total Chemicals | | | | 19,086,838 | |
|
| Commercial Services & Supplies – 1.5% | |
| | |
Aeon Delight Co. Ltd. | | | 23,100 | | | | 579,522 | |
| | |
Daiseki Co. Ltd. | | | 5,888 | | | | 224,120 | |
| | |
Itoki Corp. | | | 47,000 | | | | 134,369 | |
| | |
Japan Elevator Service Holdings Co. Ltd. | | | 5,000 | | | | 65,870 | |
| | |
King Jim Co. Ltd.(a) | | | 27,100 | | | | 204,297 | |
| | |
Matsuda Sangyo Co. Ltd.(a) | | | 5,600 | | | | 114,238 | |
| | |
Nippon Air Conditioning Services Co. Ltd. | | | 32,000 | | | | 208,807 | |
| | |
Nippon Kanzai Co. Ltd. | | | 15,400 | | | | 358,435 | |
| | |
Nippon Parking Development Co. Ltd. | | | 162,400 | | | | 206,052 | |
| | |
Okamura Corp. | | | 50,376 | | | | 503,034 | |
| | |
Pilot Corp. | | | 6,800 | | | | 294,690 | |
| | |
Sato Holdings Corp. | | | 10,838 | | | | 153,495 | |
| | |
Studio Alice Co. Ltd. | | | 8,700 | | | | 156,331 | |
| | | | | | | | |
| Total Commercial Services & Supplies | | | | 3,203,260 | |
|
| Communications Equipment – 0.1% | |
| | |
Uniden Holdings Corp.(a) | | | 8,100 | | | | 229,903 | |
|
| Construction & Engineering – 7.5% | |
| | |
Asanuma Corp.(a) | | | 8,700 | | | | 357,677 | |
| | |
Dai-Dan Co. Ltd.(a) | | | 12,600 | | | | 217,898 | |
| | |
Daiho Corp.(a) | | | 7,000 | | | | 261,257 | |
| | |
EXEO Group, Inc. | | | 43,200 | | | | 804,739 | |
| | |
Fudo Tetra Corp. | | | 13,700 | | | | 171,793 | |
| | |
Hazama Ando Corp. | | | 90,400 | | | | 673,299 | |
| | |
INFRONEER Holdings, Inc.(a) | | | 86,173 | | | | 739,792 | |
See Notes to Financial Statements.
Schedule of Investments (continued)
WisdomTree Japan SmallCap Dividend Fund (DFJ)
March 31, 2022
| | | | | | | | |
| Investments | | Shares | | | Value | |
| | |
JDC Corp.(a) | | | 48,800 | | | $ | 221,937 | |
| | |
Kandenko Co. Ltd. | | | 65,738 | | | | 451,703 | |
| | |
Kumagai Gumi Co. Ltd. | | | 23,200 | | | | 517,998 | |
| | |
Kyudenko Corp. | | | 22,790 | | | | 538,135 | |
| | |
Meisei Industrial Co. Ltd. | | | 37,600 | | | | 213,751 | |
| | |
Mirait Holdings Corp. | | | 39,500 | | | | 634,278 | |
| | |
Nippon Densetsu Kogyo Co. Ltd. | | | 16,700 | | | | 217,805 | |
| | |
Nishimatsu Construction Co. Ltd. | | | 57,707 | | | | 1,744,879 | |
| | |
Nittoc Construction Co. Ltd. | | | 50,900 | | | | 294,811 | |
| | |
Okumura Corp. | | | 26,670 | | | | 652,605 | |
| | |
Penta-Ocean Construction Co. Ltd. | | | 95,993 | | | | 484,809 | |
| | |
PS Mitsubishi Construction Co. Ltd. | | | 33,500 | | | | 161,462 | |
| | |
Raito Kogyo Co. Ltd. | | | 25,800 | | | | 415,138 | |
| | |
Raiznext Corp. | | | 28,900 | | | | 255,249 | |
| | |
Sanki Engineering Co. Ltd. | | | 40,800 | | | | 469,935 | |
| | |
Seikitokyu Kogyo Co. Ltd.(a) | | | 40,100 | | | | 246,464 | |
| | |
Shinnihon Corp. | | | 21,400 | | | | 128,532 | |
| | |
SHO-BOND Holdings Co. Ltd. | | | 21,800 | | | | 957,314 | |
| | |
Sumitomo Densetsu Co. Ltd. | | | 15,600 | | | | 286,230 | |
| | |
Sumitomo Mitsui Construction Co. Ltd. | | | 44,060 | | | | 151,374 | |
| | |
Taihei Dengyo Kaisha Ltd. | | | 12,200 | | | | 265,762 | |
| | |
Taikisha Ltd. | | | 11,865 | | | | 297,664 | |
| | |
Takamatsu Construction Group Co. Ltd. | | | 14,900 | | | | 252,886 | |
| | |
Tekken Corp. | | | 12,100 | | | | 183,332 | |
| | |
Tess Holdings Co. Ltd. | | | 3,900 | | | | 50,929 | |
| | |
Toa Corp.(a) | | | 9,700 | | | | 199,394 | |
| | |
Toda Corp.(a) | | | 156,349 | | | | 954,518 | |
| | |
Tokyo Energy & Systems, Inc. | | | 300 | | | | 2,405 | |
| | |
Tokyu Construction Co. Ltd. | | | 38,100 | | | | 210,943 | |
| | |
Totetsu Kogyo Co. Ltd. | | | 11,979 | | | | 223,838 | |
| | |
Toyo Construction Co. Ltd.* | | | 61,600 | | | | 393,327 | |
| | |
Yahagi Construction Co. Ltd. | | | 30,500 | | | | 201,532 | |
| | |
Yokogawa Bridge Holdings Corp. | | | 20,700 | | | | 331,200 | |
| | |
Yurtec Corp. | | | 32,700 | | | | 186,434 | |
| | | | | | | | |
| Total Construction & Engineering | | | | 16,025,028 | |
|
| Construction Materials – 0.9% | |
| | |
Krosaki Harima Corp. | | | 5,000 | | | | 170,134 | |
| | |
Mitani Sekisan Co. Ltd.(a) | | | 2,200 | | | | 120,717 | |
| | |
Shinagawa Refractories Co. Ltd.(a) | | | 6,000 | | | | 187,600 | |
| | |
Sumitomo Osaka Cement Co. Ltd. | | | 17,740 | | | | 491,093 | |
| | |
Taiheiyo Cement Corp. | | | 41,900 | | | | 696,981 | |
| | |
Vertex Corp.(a) | | | 5,300 | | | | 125,934 | |
| | |
Yotai Refractories Co. Ltd. | | | 9,300 | | | | 96,467 | |
| | | | | | | | |
| Total Construction Materials | | | | 1,888,926 | |
|
| Consumer Finance – 1.1% | |
| | |
AEON Financial Service Co. Ltd. | | | 60,000 | | | | 601,607 | |
| | |
Credit Saison Co. Ltd. | | | 71,900 | | | | 771,870 | |
| | |
Jaccs Co. Ltd. | | | 18,700 | | | | 474,529 | |
| | |
Orient Corp.(a) | | | 392,700 | | | | 401,193 | |
| | |
Premium Group Co. Ltd. | | | 4,100 | | | | 136,638 | |
| | | | | | | | |
| Total Consumer Finance | | | | 2,385,837 | |
|
| Containers & Packaging – 1.0% | |
| | |
Fuji Seal International, Inc. | | | 8,010 | | | | 111,068 | |
| | |
Pack Corp. | | | 6,600 | | | | 139,912 | |
| | |
Rengo Co. Ltd. | | | 95,100 | | | | 612,714 | |
| | |
Toyo Seikan Group Holdings Ltd. | | | 116,200 | | | | 1,346,053 | |
| | | | | | | | |
| Total Containers & Packaging | | | | 2,209,747 | |
|
| Distributors – 0.6% | |
| | |
Arata Corp. | | | 6,700 | | | | 201,207 | |
| | |
Doshisha Co. Ltd. | | | 14,400 | | | | 177,842 | |
| | |
Happinet Corp. | | | 20,800 | | | | 258,768 | |
| | |
PALTAC Corp. | | | 11,900 | | | | 446,097 | |
| | |
Yamae Group Holdings Co. Ltd. | | | 12,700 | | | | 107,983 | |
| | | | | | | | |
| Total Distributors | | | | 1,191,897 | |
|
| Diversified Consumer Services – 0.4% | |
| | |
Asante, Inc.(a) | | | 11,300 | | | | 135,833 | |
| | |
Benesse Holdings, Inc. | | | 27,400 | | | | 507,253 | |
| | |
Riso Kyoiku Co. Ltd. | | | 39,800 | | | | 124,605 | |
| | |
Tokyo Individualized Educational Institute, Inc. | | | 26,800 | | | | 133,807 | |
| | | | | | | | |
| Total Diversified Consumer Services | | | | 901,498 | |
|
| Diversified Financial Services – 1.2% | |
| | |
eGuarantee, Inc. | | | 4,900 | | | | 82,800 | |
| | |
Financial Products Group Co. Ltd. | | | 32,000 | | | | 227,526 | |
| | |
Fuyo General Lease Co. Ltd. | | | 13,100 | | | | 754,431 | |
| | |
Japan Securities Finance Co. Ltd.(a) | | | 42,000 | | | | 318,698 | |
| | |
Mizuho Leasing Co. Ltd.(a) | | | 18,700 | | | | 458,506 | |
| | |
NEC Capital Solutions Ltd. | | | 11,600 | | | | 198,407 | |
| | |
Ricoh Leasing Co. Ltd.(a) | | | 18,600 | | | | 510,303 | |
| | | | | | | | |
| Total Diversified Financial Services | | | | 2,550,671 | |
|
| Diversified Telecommunication Services – 0.2% | |
| | |
ARTERIA Networks Corp. | | | 35,600 | | | | 384,817 | |
| | |
Usen-Next Holdings Co. Ltd. | | | 4,100 | | | | 86,172 | |
| | | | | | | | |
| Total Diversified Telecommunication Services | | | | 470,989 | |
|
| Electric Utilities – 0.7% | |
| | |
Hokkaido Electric Power Co., Inc. | | | 130,100 | | | | 518,792 | |
| | |
Okinawa Electric Power Co., Inc. | | | 27,181 | | | | 308,593 | |
| | |
Shikoku Electric Power Co., Inc. | | | 92,900 | | | | 603,132 | |
| | | | | | | | |
| Total Electric Utilities | | | | 1,430,517 | |
|
| Electrical Equipment – 1.6% | |
| | |
Daihen Corp. | | | 10,200 | | | | 355,477 | |
| | |
Furukawa Electric Co. Ltd. | | | 16,600 | | | | 297,603 | |
| | |
GS Yuasa Corp.(a) | | | 25,200 | | | | 486,041 | |
| | |
Idec Corp. | | | 8,936 | | | | 189,432 | |
| | |
Mabuchi Motor Co. Ltd. | | | 5,100 | | | | 160,721 | |
| | |
Nippon Carbon Co. Ltd. | | | 7,000 | | | | 241,648 | |
| | |
Nippon Seisen Co. Ltd. | | | 4,300 | | | | 157,652 | |
| | |
Nissin Electric Co. Ltd. | | | 43,865 | | | | 533,427 | |
| | |
Nitto Kogyo Corp. | | | 22,900 | | | | 297,346 | |
| | |
Sanyo Denki Co. Ltd. | | | 2,800 | | | | 113,615 | |
| | |
Sinfonia Technology Co. Ltd. | | | 14,500 | | | | 159,127 | |
| | |
SWCC Showa Holdings Co. Ltd. | | | 5,100 | | | | 78,953 | |
| | |
Takaoka Toko Co. Ltd. | | | 11,900 | | | | 145,006 | |
See Notes to Financial Statements.
Schedule of Investments (continued)
WisdomTree Japan SmallCap Dividend Fund (DFJ)
March 31, 2022
| | | | | | | | |
| Investments | | Shares | | | Value | |
| | |
Tatsuta Electric Wire and Cable Co. Ltd. | | | 38,400 | | | $ | 146,165 | |
| | | | | | | | |
| Total Electrical Equipment | | | | 3,362,213 | |
|
| Electronic Equipment, Instruments & Components – 4.8% | |
| | |
A&D Co. Ltd.(a) | | | 12,600 | | | | 100,489 | |
| | |
Ai Holdings Corp. | | | 14,300 | | | | 201,820 | |
| | |
Amano Corp. | | | 25,535 | | | | 462,207 | |
| | |
Anritsu Corp.(a) | | | 37,300 | | | | 477,256 | |
| | |
Canon Electronics, Inc. | | | 14,500 | | | | 191,621 | |
| | |
Citizen Watch Co. Ltd.(a) | | | 91,800 | | | | 394,050 | |
| | |
CONEXIO Corp. | | | 20,600 | | | | 238,459 | |
| | |
Daiwabo Holdings Co. Ltd. | | | 56,595 | | | | 768,899 | |
| | |
Dexerials Corp. | | | 30,700 | | | | 846,068 | |
| | |
Elematec Corp. | | | 21,854 | | | | 187,976 | |
| | |
ESPEC Corp. | | | 9,200 | | | | 149,171 | |
| | |
Furuno Electric Co. Ltd. | | | 27,700 | | | | 231,413 | |
| | |
Hakuto Co. Ltd.(a) | | | 14,934 | | | | 301,694 | |
| | |
Hioki EE Corp.(a) | | | 3,500 | | | | 203,296 | |
| | |
I-PEX, Inc. | | | 5,900 | | | | 71,359 | |
| | |
Innotech Corp. | | | 14,600 | | | | 166,479 | |
| | |
Iriso Electronics Co. Ltd.(a) | | | 3,300 | | | | 90,809 | |
| | |
Japan Aviation Electronics Industry Ltd. | | | 21,500 | | | | 352,680 | |
| | |
Kaga Electronics Co. Ltd. | | | 12,200 | | | | 327,176 | |
| | |
Koa Corp.(a) | | | 9,400 | | | | 111,290 | |
| | |
Macnica Fuji Electronics Holdings, Inc. | | | 26,500 | | | | 576,832 | |
| | |
Meiko Electronics Co. Ltd. | | | 4,600 | | | | 153,681 | |
| | |
Nichicon Corp. | | | 24,300 | | | | 235,242 | |
| | |
Nippon Ceramic Co. Ltd. | | | 7,400 | | | | 149,067 | |
| | |
Nippon Electric Glass Co. Ltd. | | | 43,800 | | | | 980,110 | |
| | |
Nippon Signal Co. Ltd.(a) | | | 33,300 | | | | 241,982 | |
| | |
Nissha Co. Ltd.(a) | | | 12,800 | | | | 153,231 | |
| | |
Nohmi Bosai Ltd. | | | 12,591 | | | | 202,701 | |
| | |
Optex Group Co. Ltd.(a) | | | 12,100 | | | | 172,864 | |
| | |
Restar Holdings Corp. | | | 15,800 | | | | 257,356 | |
| | |
Riken Keiki Co. Ltd.(a) | | | 500 | | | | 20,185 | |
| | |
Ryoden Corp. | | | 15,361 | | | | 215,655 | |
| | |
Ryosan Co. Ltd. | | | 5,000 | | | | 90,505 | |
| | |
Sanshin Electronics Co. Ltd. | | | 10,500 | | | | 139,020 | |
| | |
Siix Corp.(a) | | | 17,800 | | | | 156,039 | |
| | |
Tachibana Eletech Co. Ltd. | | | 1,100 | | | | 14,926 | |
| | |
Tokyo Electron Device Ltd.(a) | | | 5,100 | | | | 218,917 | |
| | |
Topcon Corp. | | | 14,000 | | | | 180,515 | |
| | |
V Technology Co. Ltd. | | | 5,300 | | | | 144,099 | |
| | |
Yokowo Co. Ltd.(a) | | | 5,700 | | | | 121,537 | |
| | | | | | | | |
| Total Electronic Equipment, Instruments & Components | | | | 10,298,676 | |
|
| Energy Equipment & Services – 0.1% | |
| | |
Modec, Inc. | | | 13,700 | | | | 143,913 | |
| | |
Toyo Kanetsu KK | | | 9,000 | | | | 181,817 | |
| | | | | | | | |
| Total Energy Equipment & Services | | | | 325,730 | |
|
| Entertainment – 0.8% | |
| | |
Akatsuki, Inc. | | | 5,600 | | | | 134,077 | |
| | |
Avex, Inc.(a) | | | 70,299 | | | | 772,638 | |
| | |
Daiichikosho Co. Ltd. | | | 18,300 | | | | 524,688 | |
| | |
Marvelous, Inc. | | | 42,000 | | | | 249,837 | |
| | | | | | | | |
| Total Entertainment | | | | 1,681,240 | |
|
| Food & Staples Retailing – 2.2% | |
| | |
Aeon Hokkaido Corp.(a) | | | 18,200 | | | | 168,542 | |
| | |
Ain Holdings, Inc. | | | 3,500 | | | | 183,399 | |
| | |
Arcs Co. Ltd. | | | 20,894 | | | | 364,257 | |
| | |
Axial Retailing, Inc. | | | 8,100 | | | | 213,553 | |
| | |
Belc Co. Ltd.(a) | | | 4,900 | | | | 219,213 | |
| | |
Cawachi Ltd. | | | 10,000 | | | | 185,129 | |
| | |
Create SD Holdings Co. Ltd. | | | 10,400 | | | | 275,477 | |
| | |
G-7 Holdings, Inc.(a) | | | 17,100 | | | | 233,025 | |
| | |
Heiwado Co. Ltd. | | | 17,863 | | | | 279,038 | |
| | |
Kato Sangyo Co. Ltd. | | | 12,916 | | | | 337,332 | |
| | |
Life Corp. | | | 8,200 | | | | 212,811 | |
| | |
Mitsubishi Shokuhin Co. Ltd. | | | 13,200 | | | | 327,349 | |
| | |
Okuwa Co. Ltd. | | | 21,600 | | | | 163,902 | |
| | |
Qol Holdings Co. Ltd. | | | 8,800 | | | | 84,610 | |
| | |
Retail Partners Co. Ltd. | | | 13,600 | | | | 160,903 | |
| | |
San-A Co. Ltd. | | | 7,100 | | | | 241,883 | |
| | |
United Super Markets Holdings, Inc.(a) | | | 30,700 | | | | 266,594 | |
| | |
Valor Holdings Co. Ltd. | | | 15,391 | | | | 268,193 | |
| | |
Yaoko Co. Ltd. | | | 5,800 | | | | 317,298 | |
| | |
Yokorei Co. Ltd. | | | 35,400 | | | | 249,951 | |
| | | | | | | | |
| Total Food & Staples Retailing | | | | 4,752,459 | |
|
| Food Products – 3.3% | |
| | |
Ariake Japan Co. Ltd. | | | 4,428 | | | | 189,341 | |
| | |
Ezaki Glico Co. Ltd. | | | 15,600 | | | | 478,122 | |
| | |
Fuji Oil Holdings, Inc. | | | 19,700 | | | | 321,368 | |
| | |
Fujicco Co. Ltd.(a) | | | 15,200 | | | | 241,572 | |
| | |
Hokuto Corp.(a) | | | 21,191 | | | | 332,771 | |
| | |
Itoham Yonekyu Holdings, Inc. | | | 172,900 | | | | 924,507 | |
| | |
J-Oil Mills, Inc.(a) | | | 16,400 | | | | 217,135 | |
| | |
Kagome Co. Ltd. | | | 15,800 | | | | 406,146 | |
| | |
Kameda Seika Co. Ltd.(a) | | | 4,000 | | | | 130,999 | |
| | |
Kyokuyo Co. Ltd. | | | 8,700 | | | | 238,690 | |
| | |
Maruha Nichiro Corp. | | | 8,432 | | | | 166,521 | |
| | |
Megmilk Snow Brand Co. Ltd.(a) | | | 17,300 | | | | 282,216 | |
| | |
Mitsui DM Sugar Holdings Co. Ltd. | | | 4,698 | | | | 74,433 | |
| | |
Morinaga & Co. Ltd. | | | 14,087 | | | | 442,195 | |
| | |
Nippn Corp. | | | 22,583 | | | | 309,417 | |
| | |
Nippon Suisan Kaisha Ltd. | | | 59,800 | | | | 269,993 | |
| | |
Nisshin Oillio Group Ltd. | | | 13,900 | | | | 326,271 | |
| | |
Prima Meat Packers Ltd. | | | 14,000 | | | | 253,990 | |
| | |
Riken Vitamin Co. Ltd. | | | 13,400 | | | | 185,144 | |
| | |
S Foods, Inc. | | | 9,400 | | | | 254,023 | |
| | |
Sakata Seed Corp. | | | 11,000 | | | | 336,231 | |
| | |
Showa Sangyo Co. Ltd.(a) | | | 11,300 | | | | 243,736 | |
| | |
Starzen Co. Ltd. | | | 14,300 | | | | 235,633 | |
| | |
Warabeya Nichiyo Holdings Co. Ltd. | | | 7,400 | | | | 108,401 | |
| | |
Yukiguni Maitake Co. Ltd. | | | 17,800 | | | | 167,331 | |
| | | | | | | | |
| Total Food Products | | | | 7,136,186 | |
See Notes to Financial Statements.
Schedule of Investments (continued)
WisdomTree Japan SmallCap Dividend Fund (DFJ)
March 31, 2022
| | | | | | | | |
| Investments | | Shares | | | Value | |
|
| Gas Utilities – 0.6% | |
| | |
Hokkaido Gas Co. Ltd. | | | 13,600 | | | $ | 164,937 | |
| | |
Nippon Gas Co. Ltd.(a) | | | 50,000 | | | | 614,212 | |
| | |
Saibu Gas Holdings Co. Ltd. | | | 15,800 | | | | 259,699 | |
| | |
Shizuoka Gas Co. Ltd. | | | 21,392 | | | | 149,986 | |
| | | | | | | | |
| Total Gas Utilities | | | | 1,188,834 | |
|
| Health Care Equipment & Supplies – 1.1% | |
| | |
Eiken Chemical Co. Ltd. | | | 14,370 | | | | 204,465 | |
| | |
Hogy Medical Co. Ltd. | | | 10,400 | | | | 277,619 | |
| | |
Japan Lifeline Co. Ltd.(a) | | | 14,200 | | | | 120,151 | |
| | |
Mani, Inc. | | | 17,400 | | | | 210,449 | |
| | |
Mizuho Medy Co. Ltd.(a) | | | 4,300 | | | | 70,926 | |
| | |
Nagaileben Co. Ltd. | | | 14,326 | | | | 235,944 | |
| | |
Nakanishi, Inc. | | | 22,600 | | | | 420,439 | |
| | |
Nipro Corp. | | | 62,400 | | | | 526,448 | |
| | |
Paramount Bed Holdings Co. Ltd. | | | 20,042 | | | | 329,423 | |
| | | | | | | | |
| Total Health Care Equipment & Supplies | | | | 2,395,864 | |
|
| Health Care Providers & Services – 1.2% | |
| | |
BML, Inc. | | | 17,400 | | | | 442,974 | |
| | |
FALCO HOLDINGS Co. Ltd.(a) | | | 8,200 | | | | 135,591 | |
| | |
France Bed Holdings Co. Ltd. | | | 27,200 | | | | 193,846 | |
| | |
H.U. Group Holdings, Inc. | | | 52,400 | | | | 1,254,146 | |
| | |
Ship Healthcare Holdings, Inc. | | | 19,314 | | | | 316,344 | |
| | |
Solasto Corp. | | | 18,500 | | | | 150,591 | |
| | |
Tokai Corp. | | | 9,400 | | | | 133,517 | |
| | | | | | | | |
| Total Health Care Providers & Services | | | | 2,627,009 | |
|
| Hotels, Restaurants & Leisure – 1.9% | |
| | |
Aeon Fantasy Co. Ltd. | | | 6,100 | | | | 96,695 | |
| | |
Arcland Service Holdings Co. Ltd. | | | 8,200 | | | | 147,482 | |
| | |
Doutor Nichires Holdings Co. Ltd. | | | 11,800 | | | | 148,065 | |
| | |
Heiwa Corp. | | | 47,500 | | | | 713,038 | |
| | |
Hiday Hidaka Corp. | | | 6,698 | | | | 98,945 | |
| | |
Ichibanya Co. Ltd.(a) | | | 7,336 | | | | 279,539 | |
| | |
KFC Holdings Japan Ltd. | | | 8,800 | | | | 206,052 | |
| | |
KOMEDA Holdings Co. Ltd. | | | 21,800 | | | | 365,683 | |
| | |
Kura Sushi, Inc.(a) | | | 3,300 | | | | 91,353 | |
| | |
Monogatari Corp. | | | 1,300 | | | | 62,336 | |
| | |
MOS Food Services, Inc.(a) | | | 6,400 | | | | 152,387 | |
| | |
Ohsho Food Service Corp.(a) | | | 8,100 | | | | 400,412 | |
| | |
Plenus Co. Ltd. | | | 27,900 | | | | 462,031 | |
| | |
Resorttrust, Inc. | | | 18,908 | | | | 326,051 | |
| | |
Round One Corp. | | | 17,600 | | | | 195,757 | |
| | |
Saizeriya Co. Ltd. | | | 2,800 | | | | 62,056 | |
| | |
Tokyotokeiba Co. Ltd. | | | 4,742 | | | | 170,341 | |
| | | | | | | | |
| Total Hotels, Restaurants & Leisure | | | | 3,978,223 | |
|
| Household Durables – 1.9% | |
| | |
&Do Holdings Co. Ltd. | | | 4,900 | | | | 38,796 | |
| | |
Cleanup Corp. | | | 38,000 | | | | 165,932 | |
| | |
ES-Con Japan Ltd.(a) | | | 61,000 | | | | 410,101 | |
| | |
FJ Next Holdings Co. Ltd.(a) | | | 35,200 | | | | 286,820 | |
| | |
Fuji Corp. Ltd. | | | 35,900 | | | | 182,495 | |
| | |
Fujitsu General Ltd. | | | 15,800 | | | | 311,118 | |
| | |
Hinokiya Group Co. Ltd.(a) | | | 12,800 | | | | 248,249 | |
| | |
Hoosiers Holdings | | | 26,000 | | | | 139,666 | |
| | |
JVCKenwood Corp. | | | 92,900 | | | | 136,241 | |
| | |
Ki-Star Real Estate Co. Ltd. | | | 10,500 | | | | 455,901 | |
| | |
LEC, Inc.(a) | | | 21,300 | | | | 154,431 | |
| | |
Pressance Corp. | | | 15,288 | | | | 230,123 | |
| | |
Sanei Architecture Planning Co. Ltd. | | | 12,400 | | | | 162,745 | |
| | |
Sangetsu Corp. | | | 23,500 | | | | 296,037 | |
| | |
Tama Home Co. Ltd. | | | 23,800 | | | | 500,805 | |
| | |
Tamron Co. Ltd. | | | 7,966 | | | | 156,268 | |
| | |
Zojirushi Corp.(a) | | | 18,200 | | | | 217,725 | |
| | | | | | | | |
| Total Household Durables | | | | 4,093,453 | |
|
| Household Products – 0.5% | |
| | |
Earth Corp. | | | 4,900 | | | | 225,269 | |
| | |
Pigeon Corp. | | | 45,500 | | | | 807,098 | |
| | | | | | | | |
| Total Household Products | | | | 1,032,367 | |
|
| Independent Power & Renewable Electricity Producers – 0.9% | |
| | |
Electric Power Development Co. Ltd. | | | 111,600 | | | | 1,607,224 | |
| | |
eRex Co. Ltd.(a) | | | 7,900 | | | | 112,732 | |
| | |
West Holdings Corp.(a) | | | 5,047 | | | | 201,256 | |
| | | | | | | | |
| Total Independent Power & Renewable Electricity Producers | | | | 1,921,212 | |
|
| Industrial Conglomerates – 0.6% | |
| | |
Nisshinbo Holdings, Inc. | | | 72,200 | | | | 632,326 | |
| | |
Noritsu Koki Co. Ltd.(a) | | | 5,100 | | | | 98,324 | |
| | |
TOKAI Holdings Corp. | | | 84,900 | | | | 602,956 | |
| | | | | | | | |
| Total Industrial Conglomerates | | | | 1,333,606 | |
|
| Insurance – 0.1% | |
| | |
Advance Create Co. Ltd. | | | 14,200 | | | | 111,260 | |
|
| Interactive Media & Services – 0.1% | |
| | |
Dip Corp.(a) | | | 10,600 | | | | 293,438 | |
|
| Internet & Direct Marketing Retail – 0.4% | |
| | |
ASKUL Corp. | | | 20,330 | | | | 268,666 | |
| | |
Aucnet, Inc.(a) | | | 7,200 | | | | 94,735 | |
| | |
Belluna Co. Ltd.(a) | | | 29,484 | | | | 176,357 | |
| | |
Scroll Corp.(a) | | | 32,000 | | | | 219,617 | |
| | | | | | | | |
| Total Internet & Direct Marketing Retail | | | | 759,375 | |
|
| IT Services – 3.3% | |
| | |
Bell System24 Holdings, Inc. | | | 29,000 | | | | 328,527 | |
| | |
Comture Corp. | | | 4,500 | | | | 114,933 | |
| | |
Digital Garage, Inc. | | | 4,000 | | | | 151,596 | |
| | |
DTS Corp. | | | 16,582 | | | | 365,863 | |
| | |
Future Corp. | | | 20,000 | | | | 287,374 | |
| | |
GMO GlobalSign Holdings KK(a) | | | 2,000 | | | | 102,327 | |
| | |
GMO Internet, Inc. | | | 22,872 | | | | 528,011 | |
| | |
Ines Corp. | | | 10,400 | | | | 139,752 | |
| | |
Infocom Corp. | | | 12,900 | | | | 225,106 | |
| | |
Information Services International-Dentsu Ltd. | | | 10,600 | | | | 341,471 | |
| | |
JBCC Holdings, Inc. | | | 14,500 | | | | 185,409 | |
| | |
Kanematsu Electronics Ltd. | | | 13,500 | | | | 426,550 | |
| | |
Mitsubishi Research Institute, Inc. | | | 5,800 | | | | 191,143 | |
| | |
NEC Networks & System Integration Corp. | | | 35,737 | | | | 525,860 | |
See Notes to Financial Statements.
Schedule of Investments (continued)
WisdomTree Japan SmallCap Dividend Fund (DFJ)
March 31, 2022
| | | | | | | | |
| Investments | | Shares | | | Value | |
| | |
NET One Systems Co. Ltd. | | | 21,400 | | | $ | 504,432 | |
| | |
Nihon Unisys Ltd. | | | 31,100 | | | | 798,159 | |
| | |
NSD Co. Ltd. | | | 25,300 | | | | 456,911 | |
| | |
Relia, Inc. | | | 32,600 | | | | 285,779 | |
| | |
SB Technology Corp.(a) | | | 5,200 | | | | 108,520 | |
| | |
TDC Soft, Inc. | | | 13,500 | | | | 129,911 | |
| | |
TKC Corp. | | | 12,900 | | | | 352,857 | |
| | |
Transcosmos, Inc. | | | 13,100 | | | | 344,297 | |
| | |
Uchida Yoko Co. Ltd. | | | 3,000 | | | | 120,123 | |
| | | | | | | | |
| Total IT Services | | | | 7,014,911 | |
|
| Leisure Products – 1.1% | |
| | |
Daikoku Denki Co. Ltd. | | | 11,900 | | | | 118,927 | |
| | |
Furyu Corp. | | | 9,400 | | | | 85,655 | |
| | |
GLOBERIDE, Inc.(a) | | | 4,100 | | | | 97,893 | |
| | |
Mizuno Corp. | | | 6,123 | | | | 106,494 | |
| | |
Roland Corp. | | | 14,800 | | | | 492,012 | |
| | |
Sankyo Co. Ltd. | | | 40,200 | | | | 1,124,441 | |
| | |
Tomy Co. Ltd. | | | 22,400 | | | | 225,338 | |
| | | | | | | | |
| Total Leisure Products | | | | 2,250,760 | |
|
| Machinery – 4.6% | |
| | |
Aichi Corp. | | | 44,200 | | | | 321,190 | |
| | |
Aida Engineering Ltd. | | | 17,900 | | | | 155,883 | |
| | |
Alinco, Inc.(a) | | | 23,300 | | | | 166,435 | |
| | |
Bando Chemical Industries Ltd. | | | 36,900 | | | | 268,446 | |
| | |
CKD Corp.(a) | | | 11,941 | | | | 185,448 | |
| | |
DMG Mori Co. Ltd. | | | 14,800 | | | | 204,121 | |
| | |
Ebara Jitsugyo Co. Ltd. | | | 6,800 | | | | 137,653 | |
| | |
Fujitec Co. Ltd.(a) | | | 27,561 | | | | 715,280 | |
| | |
Fukushima Galilei Co. Ltd. | | | 3,300 | | | | 104,540 | |
| | |
Furukawa Co. Ltd. | | | 15,800 | | | | 167,796 | |
| | |
Giken Ltd. | | | 5,300 | | | | 162,220 | |
| | |
Glory Ltd.(a) | | | 22,400 | | | | 382,392 | |
| | |
Hitachi Zosen Corp. | | | 28,800 | | | | 177,012 | |
| | |
Japan Steel Works Ltd. | | | 10,404 | | | | 327,442 | |
| | |
Juki Corp. | | | 11,800 | | | | 81,567 | |
| | |
Kito Corp. | | | 11,600 | | | | 169,640 | |
| | |
Kitz Corp. | | | 17,689 | | | | 100,122 | |
| | |
Kyokuto Kaihatsu Kogyo Co. Ltd. | | | 16,380 | | | | 187,316 | |
| | |
Meidensha Corp.(a) | | | 11,700 | | | | 244,941 | |
| | |
METAWATER Co. Ltd. | | | 14,700 | | | | 242,467 | |
| | |
Mitsubishi Logisnext Co. Ltd. | | | 10,600 | | | | 81,394 | |
| | |
Mitsuboshi Belting Ltd. | | | 13,046 | | | | 217,872 | |
| | |
Morita Holdings Corp. | | | 19,305 | | | | 196,589 | |
| | |
Nachi-Fujikoshi Corp. | | | 3,300 | | | | 113,920 | |
| | |
Nikko Co. Ltd.(a) | | | 50,200 | | | | 251,052 | |
| | |
Nippon Thompson Co. Ltd. | | | 18,800 | | | | 83,796 | |
| | |
Nissei ASB Machine Co. Ltd. | | | 5,200 | | | | 133,454 | |
| | |
Nitta Corp. | | | 6,900 | | | | 157,130 | |
| | |
Nomura Micro Science Co. Ltd.(a) | | | 2,800 | | | | 98,159 | |
| | |
Noritake Co. Ltd. | | | 3,600 | | | | 132,284 | |
| | |
Obara Group, Inc.(a) | | | 8,079 | | | | 198,888 | |
| | |
Oiles Corp.(a) | | | 15,600 | | | | 194,719 | |
| | |
OKUMA Corp. | | | 3,570 | | | | 150,006 | |
| | |
Organo Corp. | | | 2,500 | | | | 208,651 | |
| | |
OSG Corp. | | | 13,400 | | | | 207,445 | |
| | |
Shibaura Machine Co. Ltd. | | | 10,461 | | | | 294,761 | |
| | |
Shibuya Corp. | | | 7,500 | | | | 150,711 | |
| | |
Shinmaywa Industries Ltd. | | | 23,785 | | | | 177,346 | |
| | |
Sodick Co. Ltd. | | | 25,900 | | | | 167,510 | |
| | |
Star Micronics Co. Ltd. | | | 22,634 | | | | 287,179 | |
| | |
Takeuchi Manufacturing Co. Ltd. | | | 10,300 | | | | 224,203 | |
| | |
Tocalo Co. Ltd. | | | 22,500 | | | | 252,111 | |
| | |
Torishima Pump Manufacturing Co. Ltd. | | | 22,800 | | | | 192,732 | |
| | |
Tsubaki Nakashima Co. Ltd. | | | 13,400 | | | | 106,758 | |
| | |
Tsubakimoto Chain Co. | | | 10,545 | | | | 265,417 | |
| | |
Tsugami Corp. | | | 11,400 | | | | 124,919 | |
| | |
Union Tool Co. | | | 4,800 | | | | 150,673 | |
| | |
YAMABIKO Corp. | | | 19,200 | | | | 236,648 | |
| | |
Yushin Precision Equipment Co. Ltd. | | | 27,200 | | | | 150,594 | |
| | | | | | | | |
| Total Machinery | | | | 9,708,832 | |
|
| Marine – 0.4% | |
| | |
Iino Kaiun Kaisha Ltd. | | | 64,400 | | | | 438,265 | |
| | |
Japan Transcity Corp. | | | 25,600 | | | | 127,604 | |
| | |
NS United Kaiun Kaisha Ltd. | | | 10,500 | | | | 364,202 | |
| | | | | | | | |
| Total Marine | | | | 930,071 | |
|
| Media – 0.9% | |
| | |
Carta Holdings, Inc.(a) | | | 10,100 | | | | 199,878 | |
| | |
Digital Holdings, Inc.(a) | | | 7,100 | | | | 81,720 | |
| | |
Intage Holdings, Inc. | | | 16,500 | | | | 233,413 | |
| | |
Proto Corp. | | | 11,400 | | | | 97,117 | |
| | |
SKY Perfect JSAT Holdings, Inc. | | | 165,200 | | | | 563,484 | |
| | |
TV Tokyo Holdings Corp. | | | 14,700 | | | | 241,013 | |
| | |
ValueCommerce Co. Ltd. | | | 4,300 | | | | 132,321 | |
| | |
Wowow, Inc. | | | 11,200 | | | | 148,103 | |
| | |
Zenrin Co. Ltd. | | | 23,380 | | | | 192,048 | |
| | | | | | | | |
| Total Media | | | | 1,889,097 | |
|
| Metals & Mining – 3.6% | |
| | |
Aichi Steel Corp. | | | 7,300 | | | | 144,526 | |
| | |
Asahi Holdings, Inc.(a) | | | 41,600 | | | | 776,305 | |
| | |
Daido Steel Co. Ltd. | | | 11,300 | | | | 343,539 | |
| | |
Daiki Aluminium Industry Co. Ltd.(a) | | | 18,300 | | �� | | 237,466 | |
| | |
Dowa Holdings Co. Ltd. | | | 14,900 | | | | 688,684 | |
| | |
Hakudo Co. Ltd. | | | 7,600 | | | | 161,674 | |
| | |
Kobe Steel Ltd. | | | 132,200 | | | | 643,709 | |
| | |
Kurimoto Ltd. | | | 8,300 | | | | 107,361 | |
| | |
Kyoei Steel Ltd.(a) | | | 22,414 | | | | 247,270 | |
| | |
Maruichi Steel Tube Ltd. | | | 39,200 | | | | 891,386 | |
| | |
Mitsubishi Materials Corp. | | | 55,600 | | | | 981,675 | |
| | |
Mitsui Mining & Smelting Co. Ltd. | | | 18,200 | | | | 503,077 | |
| | |
Neturen Co. Ltd. | | | 24,100 | | | | 117,348 | |
| | |
Nippon Denko Co. Ltd. | | | 67,000 | | | | 187,131 | |
| | |
Nippon Light Metal Holdings Co. Ltd. | | | 42,000 | | | | 592,758 | |
| | |
Nippon Yakin Kogyo Co. Ltd.(a) | | | 7,800 | | | | 180,581 | |
| | |
Nittetsu Mining Co. Ltd. | | | 2,400 | | | | 139,996 | |
| | |
Sanyo Special Steel Co. Ltd.(a) | | | 17,800 | | | | 311,344 | |
See Notes to Financial Statements.
Schedule of Investments (continued)
WisdomTree Japan SmallCap Dividend Fund (DFJ)
March 31, 2022
| | | | | | | | |
| Investments | | Shares | | | Value | |
| | |
Toho Titanium Co. Ltd. | | | 10,800 | | | $ | 129,467 | |
| | |
Toho Zinc Co. Ltd.(a) | | | 2,800 | | | | 67,961 | |
| | |
Tokyo Steel Manufacturing Co. Ltd. | | | 24,300 | | | | 233,040 | |
| | |
Tokyo Tekko Co. Ltd.(a) | | | 5,600 | | | | 61,594 | |
| | | | | | | | |
| Total Metals & Mining | | | | 7,747,892 | |
|
| Multiline Retail – 1.3% | |
| | |
H2O Retailing Corp.(a) | | | 46,500 | | | | 324,494 | |
| | |
Izumi Co. Ltd. | | | 22,400 | | | | 594,257 | |
| | |
J. Front Retailing Co. Ltd. | | | 109,100 | | | | 896,171 | |
| | |
Mr. Max Holdings Ltd. | | | 29,800 | | | | 143,384 | |
| | |
Seria Co. Ltd. | | | 15,200 | | | | 347,268 | |
| | |
Takashimaya Co. Ltd. | | | 46,000 | | | | 440,387 | |
| | | | | | | | |
| Total Multiline Retail | | | | 2,745,961 | |
|
| Oil, Gas & Consumable Fuels – 1.0% | |
| | |
Cosmo Energy Holdings Co. Ltd. | | | 51,100 | | | | 1,107,254 | |
| | |
Itochu Enex Co. Ltd. | | | 63,781 | | | | 539,675 | |
| | |
Nippon Coke & Engineering Co. Ltd.(a) | | | 152,600 | | | | 181,046 | |
| | |
Sala Corp. | | | 38,000 | | | | 200,058 | |
| | |
San-Ai Oil Co. Ltd. | | | 18,116 | | | | 140,152 | |
| | | | | | | | |
| Total Oil, Gas & Consumable Fuels | | | | 2,168,185 | |
|
| Paper & Forest Products – 0.5% | |
| | |
Daiken Corp. | | | 12,800 | | | | 229,055 | |
| | |
Hokuetsu Corp.(a) | | | 67,032 | | | | 383,829 | |
| | |
Nippon Paper Industries Co. Ltd.(a) | | | 54,900 | | | | 469,958 | |
| | | | | | | | |
| Total Paper & Forest Products | | | | 1,082,842 | |
|
| Personal Products – 0.4% | |
| | |
Milbon Co. Ltd. | | | 4,200 | | | | 189,627 | |
| | |
Noevir Holdings Co. Ltd. | | | 16,100 | | | | 655,938 | |
| | |
Shinnihonseiyaku Co. Ltd. | | | 7,200 | | | | 85,837 | |
| | | | | | | | |
| Total Personal Products | | | | 931,402 | |
|
| Pharmaceuticals – 1.5% | |
| | |
Astena Holdings Co. Ltd. | | | 31,200 | | | | 114,389 | |
| | |
Kaken Pharmaceutical Co. Ltd. | | | 18,500 | | | | 592,915 | |
| | |
KYORIN Holdings, Inc. | | | 29,285 | | | | 428,749 | |
| | |
Mochida Pharmaceutical Co. Ltd. | | | 16,422 | | | | 505,344 | |
| | |
Sawai Group Holdings Co. Ltd. | | | 14,124 | | | | 518,995 | |
| | |
Seikagaku Corp. | | | 10,000 | | | | 72,091 | |
| | |
Towa Pharmaceutical Co. Ltd. | | | 13,700 | | | | 310,176 | |
| | |
Tsumura & Co. | | | 18,100 | | | | 477,199 | |
| | |
ZERIA Pharmaceutical Co. Ltd.(a) | | | 14,500 | | | | 227,460 | |
| | | | | | | | |
| Total Pharmaceuticals | | | | 3,247,318 | |
|
| Professional Services – 1.4% | |
| | |
Altech Corp. | | | 12,360 | | | | 191,548 | |
| | |
en Japan, Inc. | | | 4,900 | | | | 119,174 | |
| | |
Forum Engineering, Inc.(a) | | | 23,200 | | | | 155,782 | |
| | |
FULLCAST Holdings Co. Ltd. | | | 8,500 | | | | 183,551 | |
| | |
Funai Soken Holdings, Inc. | | | 9,810 | | | | 178,540 | |
| | |
IR Japan Holdings Ltd.(a) | | | 1,800 | | | | 64,585 | |
| | |
JAC Recruitment Co. Ltd. | | | 26,800 | | | | 409,148 | |
| | |
LIKE, Inc.(a) | | | 8,000 | | | | 135,250 | |
| | |
Link and Motivation, Inc.(a) | | | 11,700 | | | | 52,535 | |
| | |
Meitec Corp. | | | 10,100 | | | | 553,368 | |
| | |
Nomura Co. Ltd. | | | 30,000 | | | | 226,900 | |
| | |
Outsourcing, Inc. | | | 6,700 | | | | 70,160 | |
| | |
Pasona Group, Inc. | | | 6,200 | | | | 125,916 | |
| | |
Tanseisha Co. Ltd. | | | 13,300 | | | | 87,553 | |
| | |
UT Group Co. Ltd. | | | 4,100 | | | | 104,886 | |
| | |
World Holdings Co. Ltd.(a) | | | 7,500 | | | | 145,211 | |
| | |
YAMADA Consulting Group Co. Ltd. | | | 11,100 | | | | 108,005 | |
| | | | | | | | |
| Total Professional Services | | | | 2,912,112 | |
|
| Real Estate Management & Development – 1.9% | |
| | |
Aoyama Zaisan Networks Co. Ltd.(a) | | | 12,600 | | | | 128,102 | |
| | |
CRE, Inc. | | | 7,200 | | | | 106,302 | |
| | |
Daibiru Corp.*(a) | | | 21,400 | | | | 387,007 | |
| | |
Dear Life Co. Ltd.(a) | | | 41,600 | | | | 181,652 | |
| | |
Goldcrest Co. Ltd. | | | 17,800 | | | | 247,257 | |
| | |
Heiwa Real Estate Co. Ltd.(a) | | | 11,968 | | | | 389,977 | |
| | |
Ichigo, Inc. | | | 133,300 | | | | 345,949 | |
| | |
Katitas Co. Ltd. | | | 8,500 | | | | 236,704 | |
| | |
Keihanshin Building Co. Ltd. | | | 18,000 | | | | 222,303 | |
| | |
SAMTY Co. Ltd. | | | 26,500 | | | | 480,330 | |
| | |
Shinoken Group Co. Ltd. | | | 25,300 | | | | 213,864 | |
| | |
Starts Corp., Inc. | | | 15,400 | | | | 304,384 | |
| | |
Sun Frontier Fudousan Co. Ltd. | | | 57,300 | | | | 495,695 | |
| | |
Takara Leben Co. Ltd. | | | 95,400 | | | | 235,012 | |
| | | | | | | | |
| Total Real Estate Management & Development | | | | 3,974,538 | |
|
| Road & Rail – 1.2% | |
| | |
Alps Logistics Co. Ltd. | | | 16,400 | | | | 145,117 | |
| | |
Fukuyama Transporting Co. Ltd.(a) | | | 6,911 | | | | 207,828 | |
| | |
Hamakyorex Co. Ltd. | | | 5,400 | | | | 127,643 | |
| | |
Maruzen Showa Unyu Co. Ltd.(a) | | | 6,000 | | | | 156,457 | |
| | |
Nankai Electric Railway Co. Ltd. | | | 15,800 | | | | 307,604 | |
| | |
Nikkon Holdings Co. Ltd. | | | 24,660 | | | | 415,487 | |
| | |
Nishi-Nippon Railroad Co. Ltd.(a) | | | 9,000 | | | | 198,945 | |
| | |
Sakai Moving Service Co. Ltd. | | | 3,300 | | | | 115,007 | |
| | |
Seino Holdings Co. Ltd. | | | 46,600 | | | | 427,703 | |
| | |
Senko Group Holdings Co. Ltd. | | | 75,656 | | | | 559,745 | |
| | | | | | | | |
| Total Road & Rail | | | | 2,661,536 | |
|
| Semiconductors & Semiconductor Equipment – 1.2% | |
| | |
Ferrotec Holdings Corp. | | | 4,600 | | | | 104,260 | |
| | |
Furuya Metal Co. Ltd. | | | 1,200 | | | | 102,229 | |
| | |
Japan Material Co. Ltd. | | | 13,300 | | | | 190,665 | |
| | |
MegaChips Corp. | | | 3,000 | | | | 93,429 | |
| | |
Micronics Japan Co. Ltd. | | | 9,100 | | | | 125,507 | |
| | |
Mimasu Semiconductor Industry Co. Ltd. | | | 5,827 | | | | 123,093 | |
| | |
Mitsui High-Tec, Inc. | | | 2,500 | | | | 256,437 | |
| | |
Optorun Co. Ltd. | | | 11,700 | | | | 202,913 | |
| | |
Shibaura Mechatronics Corp. | | | 1,600 | | | | 113,631 | |
| | |
Tokyo Seimitsu Co. Ltd. | | | 14,900 | | | | 599,069 | |
| | |
Ulvac, Inc. | | | 9,400 | | | | 487,909 | |
| | |
Yamaichi Electronics Co. Ltd.(a) | | | 12,700 | | | | 196,399 | |
| | | | | | | | |
| Total Semiconductors & Semiconductor Equipment | | | | 2,595,541 | |
See Notes to Financial Statements.
Schedule of Investments (continued)
WisdomTree Japan SmallCap Dividend Fund (DFJ)
March 31, 2022
| | | | | | | | |
| Investments | | Shares | | | Value | |
|
| Software – 0.8% | |
| | |
Broadleaf Co. Ltd. | | | 300 | | | $ | 912 | |
| | |
Computer Engineering & Consulting Ltd. | | | 18,100 | | | | 191,476 | |
| | |
Cresco Ltd. | | | 10,200 | | | | 165,217 | |
| | |
Cybernet Systems Co. Ltd.(a) | | | 25,400 | | | | 155,277 | |
| | |
Fuji Soft, Inc. | | | 3,900 | | | | 197,932 | |
| | |
Fukui Computer Holdings, Inc.(a) | | | 3,600 | | | | 96,395 | |
| | |
Miroku Jyoho Service Co. Ltd. | | | 12,100 | | | | 141,960 | |
| | |
Scala, Inc. | | | 14,700 | | | | 91,440 | |
| | |
SRA Holdings(a) | | | 15,000 | | | | 343,440 | |
| | |
Systena Corp.(a) | | | 54,200 | | | | 192,463 | |
| | |
WingArc1st, Inc. | | | 3,500 | | | | 40,919 | |
| | | | | | | | |
| Total Software | | | | 1,617,431 | |
|
| Specialty Retail – 3.3% | |
| | |
Adastria Co. Ltd. | | | 15,800 | | | | 249,546 | |
| | |
Alleanza Holdings Co. Ltd. | | | 20,100 | | | | 161,297 | |
| | |
Alpen Co. Ltd. | | | 8,700 | | | | 146,726 | |
| | |
Arcland Sakamoto Co. Ltd.(a) | | | 9,416 | | | | 117,530 | |
| | |
Asahi Co. Ltd. | | | 15,700 | | | | 171,649 | |
| | |
Autobacs Seven Co. Ltd. | | | 61,400 | | | | 680,395 | |
| | |
Bic Camera, Inc.(a) | | | 28,500 | | | | 254,064 | |
| | |
Chiyoda Co. Ltd. | | | 4,091 | | | | 24,807 | |
| | |
DCM Holdings Co. Ltd. | | | 55,945 | | | | 485,817 | |
| | |
EDION Corp.(a) | | | 56,539 | | | | 528,707 | |
| | |
Honeys Holdings Co. Ltd. | | | 19,900 | | | | 171,333 | |
| | |
IDOM, Inc. | | | 13,500 | | | | 80,972 | |
| | |
JINS Holdings, Inc. | | | 2,100 | | | | 99,831 | |
| | |
Joshin Denki Co. Ltd. | | | 12,500 | | | | 197,940 | |
| | |
Joyful Honda Co. Ltd. | | | 21,000 | | | | 259,526 | |
| | |
K’s Holdings Corp. | | | 106,800 | | | | 1,111,336 | |
| | |
Kohnan Shoji Co. Ltd. | | | 7,800 | | | | 224,601 | |
| | |
Kojima Co. Ltd. | | | 17,900 | | | | 84,799 | |
| | |
Komeri Co. Ltd. | | | 10,837 | | | | 234,731 | |
| | |
Nafco Co. Ltd.(a) | | | 13,800 | | | | 193,285 | |
| | |
Nextage Co. Ltd. | | | 4,800 | | | | 87,755 | |
| | |
Nojima Corp. | | | 10,100 | | | | 192,805 | |
| | |
PAL GROUP Holdings Co. Ltd. | | | 10,500 | | | | 134,262 | |
| | |
PC Depot Corp.(a) | | | 11,900 | | | | 29,707 | |
| | |
T-Gaia Corp. | | | 26,800 | | | | 361,455 | |
| | |
VT Holdings Co. Ltd.(a) | | | 57,600 | | | | 211,655 | |
| | |
Xebio Holdings Co. Ltd. | | | 12,700 | | | | 99,089 | |
| | |
Yellow Hat Ltd. | | | 29,400 | | | | 380,777 | |
| | | | | | | | |
| Total Specialty Retail | | | | 6,976,397 | |
|
| Technology Hardware, Storage & Peripherals – 1.5% | |
| | |
Eizo Corp. | | | 8,700 | | | | 257,326 | |
| | |
Elecom Co. Ltd. | | | 26,900 | | | | 326,235 | |
| | |
Konica Minolta, Inc.(a) | | | 335,800 | | | | 1,427,582 | |
| | |
MCJ Co. Ltd. | | | 33,900 | | | | 260,028 | |
| | |
Riso Kagaku Corp. | | | 9,700 | | | | 158,557 | |
| | |
Roland DG Corp. | | | 5,100 | | | | 142,023 | |
| | |
Toshiba TEC Corp. | | | 6,700 | | | | 271,312 | |
| | |
Wacom Co. Ltd.(a) | | | 40,811 | | | | 317,073 | |
| | | | | | | | |
| Total Technology Hardware, Storage & Peripherals | | | | 3,160,136 | |
|
| Textiles, Apparel & Luxury Goods – 0.9% | |
| | |
Baroque Japan Ltd.(a) | | | 19,900 | | | | 128,213 | |
| | |
Fujibo Holdings, Inc. | | | 4,900 | | | | 139,683 | |
| | |
Gunze Ltd. | | | 7,183 | | | | 221,630 | |
| | |
Japan Wool Textile Co. Ltd. | | | 32,625 | | | | 239,765 | |
| | |
Kurabo Industries Ltd. | | | 13,476 | | | | 195,076 | |
| | |
Onward Holdings Co. Ltd.(a) | | | 66,033 | | | | 139,274 | |
| | |
Seiko Holdings Corp. | | | 11,400 | | | | 215,461 | |
| | |
Seiren Co. Ltd.(a) | | | 13,411 | | | | 245,735 | |
| | |
Wacoal Holdings Corp. | | | 12,900 | | | | 195,772 | |
| | |
Yondoshi Holdings, Inc. | | | 18,600 | | | | 251,320 | |
| | | | | | | | |
| Total Textiles, Apparel & Luxury Goods | | | | 1,971,929 | |
|
| Thrifts & Mortgage Finance – 0.1% | |
| | |
Aruhi Corp.(a) | | | 22,500 | | | | 184,820 | |
|
| Trading Companies & Distributors – 3.0% | |
| | |
Advan Group Co. Ltd. | | | 22,900 | | | | 169,804 | |
| | |
Alconix Corp. | | | 10,600 | | | | 122,178 | |
| | |
Chori Co. Ltd. | | | 12,200 | | | | 176,806 | |
| | |
Daiichi Jitsugyo Co. Ltd. | | | 4,000 | | | | 140,721 | |
| | |
Hanwa Co. Ltd. | | | 8,022 | | | | 214,140 | |
| | |
Inaba Denki Sangyo Co. Ltd. | | | 24,288 | | | | 497,066 | |
| | |
Inabata & Co. Ltd.(a) | | | 48,241 | | | | 819,948 | |
| | |
Kamei Corp. | | | 17,400 | | | | 144,504 | |
| | |
Kanamoto Co. Ltd. | | | 13,928 | | | | 229,733 | |
| | |
Kanematsu Corp. | | | 39,600 | | | | 437,843 | |
| | |
Kokusai Pulp & Paper Co. Ltd. | | | 46,500 | | | | 121,829 | |
| | |
Nagase & Co. Ltd. | | | 36,804 | | | | 552,174 | |
| | |
Nichiden Corp. | | | 8,400 | | | | 149,280 | |
| | |
Nippon Steel Trading Corp. | | | 18,500 | | | | 809,351 | |
| | |
Nishio Rent All Co. Ltd. | | | 8,500 | | | | 195,877 | |
| | |
Onoken Co. Ltd.(a) | | | 24,100 | | | | 306,177 | |
| | |
Sanyo Trading Co. Ltd.(a) | | | 21,600 | | | | 175,647 | |
| | |
Sato Shoji Corp.(a) | | | 13,500 | | | | 128,243 | |
| | |
Shinsho Corp. | | | 6,300 | | | | 184,783 | |
| | |
Trusco Nakayama Corp. | | | 10,200 | | | | 201,605 | |
| | |
Wakita & Co. Ltd. | | | 23,200 | | | | 191,143 | |
| | |
Yamazen Corp.(a) | | | 23,806 | | | | 185,152 | |
| | |
Yuasa Trading Co. Ltd. | | | 9,400 | | | | 224,284 | |
| | | | | | | | |
| Total Trading Companies & Distributors | | | | 6,378,288 | |
|
| Transportation Infrastructure – 0.6% | |
| | |
Kamigumi Co. Ltd. | | | 34,400 | | | | 623,522 | |
| | |
Mitsubishi Logistics Corp. | | | 21,900 | | | | 548,515 | |
| | |
Nissin Corp. | | | 11,100 | | | | 149,433 | |
| | | | | | | | |
| Total Transportation Infrastructure | | | | 1,321,470 | |
|
| Wireless Telecommunication Services – 0.3% | |
| | |
Okinawa Cellular Telephone Co. | | | 14,900 | | | | 605,207 | |
TOTAL COMMON STOCKS (Cost: $251,434,729) | | | | 209,245,776 | |
|
| EXCHANGE-TRADED FUND – 0.2% | |
|
| United States – 0.2% | |
| | |
WisdomTree Japan Hedged Equity Fund(a)(b)
(Cost: $373,558) | | | 5,946 | | | | 380,663 | |
See Notes to Financial Statements.
Schedule of Investments (concluded)
WisdomTree Japan SmallCap Dividend Fund (DFJ)
March 31, 2022
| | | | | | | | |
| Investments | | Shares | | | Value | |
|
| INVESTMENT OF CASH COLLATERAL FOR SECURITIES LOANED – 7.3% | |
|
| United States – 7.3% | |
| | |
State Street Navigator Securities Lending Government Money Market Portfolio, 0.25%(c) | | | | | | | | |
| (Cost: $15,529,924) | | | 15,529,924 | | | $ | 15,529,924 | |
| |
TOTAL INVESTMENTS IN SECURITIES – 105.6% (Cost: $267,338,211) | | | | 225,156,363 | |
| |
Other Assets less Liabilities – (5.6)% | | | | (12,008,010 | ) |
| | | | | | | | |
| NET ASSETS – 100.0% | | | $ | 213,148,353 | |
| * | Non-income producing security. |
| (a) | Security, or portion thereof, was on loan at March 31, 2022 (See Note 2). At March 31, 2022, the total market value of the Fund’s securities on loan identified in the Schedule of Investments was $27,816,238 and the total market value of the collateral held by the Fund was $29,602,983. The total market value of the collateral includes non-cash U.S. Government securities collateral having a value of $14,073,059. |
| (b) | Affiliated holding. See “Investment in Affiliates” supplementary table included in this Schedule of Investments for additional information. |
| (c) | Rate shown represents annualized 7-day yield as of March 31, 2022. |
Affiliated holdings are investments in entities in which the Fund owns 5% or more of the outstanding voting securities or are investments in entities which are under common ownership or control. Investments in affiliates during the fiscal year ended March 31, 2022 were as follows:
| | | | | | | | | | | | | | | | | | | | | | | | | | | | |
| | | | | | | |
| Affiliate | | Value at
3/31/2021 | | | Purchases/
Additions | | | Sales/
Reductions | | | Realized
Gain/(Loss) | | | Change in
Unrealized
Appreciation/
Depreciation | | | Value at
3/31/2022 | | | Dividend
Income | |
WisdomTree Japan Hedged Equity Fund | | $ | 572,793 | | | $ | 1,360,751 | | | $ | 1,558,417 | | | $ | 23,041 | | | $ | (17,505 | ) | | $ | 380,663 | | | $ | 9,785 | |
| | | | | | | | | | | | | | | | | | | | | | | | | | | | |
|
| FINANCIAL DERIVATIVE INSTRUMENTS | |
|
| FOREIGN CURRENCY CONTRACTS (OTC – OVER THE COUNTER) | |
| | | | | |
| Counterparty | | Settlement
Date | | | Amount and
Description of
Currency to
be Purchased | | | Amount and
Description of
Currency to
be Sold | | | Unrealized
Appreciation | | | Unrealized
Depreciation | |
UBS AG | | | 4/1/2022 | | | | 164,074 | | | | USD | | | | 20,000,000 | | | | JPY | | | $ | — | | | $ | (704 | ) |
The following is a summary of the fair valuations according to the inputs used as of March 31, 2022 in valuing the Fund’s investments (See Note 2 — Fair Value Measurement):
| | | | | | | | | | | | | | | | |
| | | | |
| | | Quoted
Prices in
Active
Markets
(Level 1) | | | Other
Significant
Observable
Inputs
(Level 2) | | | Significant
Unobservable
Inputs
(Level 3) | | | Total | |
Assets: | | | | | | | | | | | | | | | | |
Investments in Securities | | | | | | | | | | | | | | | | |
Common Stocks | |
Banks | | $ | 17,783,604 | | | $ | 176,456 | | | $ | — | | | $ | 17,960,060 | |
Other | | | 191,285,716 | | | | — | | | | — | | | | 191,285,716 | |
Exchange-Traded Fund | | | 380,663 | | | | — | | | | — | | | | 380,663 | |
Investment of Cash Collateral for Securities Loaned | | | — | | | | 15,529,924 | | | | — | | | | 15,529,924 | |
Total Investments in Securities | | $ | 209,449,983 | | | $ | 15,706,380 | | | $ | — | | | $ | 225,156,363 | |
Liabilities: | | | | | | | | | | | | |
Financial Derivative Instruments | | | | | | | | | | | | | | | | |
Foreign Currency Contracts1 | | $ | — | | | $ | (704 | ) | | $ | — | | | $ | (704 | ) |
Total – Net | | $ | 209,449,983 | | | $ | 15,705,676 | | | $ | — | | | $ | 225,155,659 | |
| 1 | Amount shown represents the unrealized appreciation (depreciation) on the financial instrument. |
See Notes to Financial Statements.
Statements of Assets and Liabilities
WisdomTree Trust
March 31, 2022
| | | | | | | | | | | | | | | | | | | | |
| | | WisdomTree
Europe Quality
Dividend
Growth Fund | | | WisdomTree
Europe SmallCap
Dividend Fund | | | WisdomTree
International
AI Enhanced
Value Fund | | | WisdomTree
International
Equity Fund | | | WisdomTree
International
High Dividend
Fund | |
ASSETS: | |
| | | | | |
Investments, at cost | | $ | 69,564,989 | | | $ | 310,281,873 | | | $ | 132,047,932 | | | $ | 545,067,101 | | | $ | 190,551,227 | |
| | | | | |
Investment in affiliates, at cost (Note 3) | | | — | | | | 1,150,589 | | | | — | | | | — | | | | 860,270 | |
| | | | | |
Foreign currency, at cost | | | 9,950 | | | | 356,500 | | | | 458,857 | | | | 290,086 | | | | 262,695 | |
Investments in securities, at value1,2 (Note 2) | | | 73,255,219 | | | | 306,679,682 | | | | 123,060,883 | | | | 650,444,919 | | | | 205,892,300 | |
| | | | | |
Investment in affiliates, at value (Note 3) | | | — | | | | 1,141,154 | | | | — | | | | — | | | | 882,052 | |
| | | | | |
Cash | | | 66,170 | | | | 4,273 | | | | — | | | | 172,916 | | | | 69,739 | |
| | | | | |
Foreign currency, at value | | | 9,965 | | | | 356,180 | | | | 459,358 | | | | 290,532 | | | | 262,547 | |
| | | | | |
Unrealized appreciation on foreign currency contracts | | | — | | | | 43 | | | | — | | | | 10 | | | | — | |
|
Receivables: | |
| | | | | |
Investment securities sold3 | | | — | | | | 943,795 | | | | 243,839 | | | | 151,239 | | | | — | |
| | | | | |
Capital shares sold | | | 1,593,648 | | | | — | | | | — | | | | — | | | | 6,012,070 | |
| | | | | |
Dividends | | | 450,763 | | | | 543,380 | | | | 900,098 | | | | 3,820,350 | | | | 1,658,517 | |
| | | | | |
Securities lending income | | | 860 | | | | 25,843 | | | | 6,474 | | | | 55,289 | | | | 20,980 | |
| | | | | |
Foreign tax reclaims | | | 190,338 | | | | 1,281,247 | | | | 180,604 | | | | 1,294,670 | | | | 359,114 | |
| | | | | |
Other (Note 6) | | | — | | | | 92,651 | | | | — | | | | — | | | | — | |
Total Assets | | | 75,566,963 | | | | 311,068,248 | | | | 124,851,256 | | | | 656,229,925 | | | | 215,157,319 | |
LIABILITIES: | |
| | | | | |
Due to custodian | | | — | | | | — | | | | 302,393 | | | | — | | | | — | |
| | | | | |
Unrealized depreciation on foreign currency contracts | | | — | | | | 1,898 | | | | 650 | | | | — | | | | 125 | |
|
Payables: | |
| | | | | |
Cash collateral received for securities loaned (Note 2) | | | 1,594,908 | | | | 13,466,722 | | | | 2,906,969 | | | | 21,556,486 | | | | 7,485,308 | |
| | | | | |
Investment securities purchased | | | 1,591,648 | | | | 1,147,344 | | | | — | | | | — | | | | 5,943,781 | |
| | | | | |
Advisory fees (Note 3) | | | 33,797 | | | | 139,428 | | | | 58,956 | | | | 242,866 | | | | 93,206 | |
| | | | | |
Service fees (Note 2) | | | 256 | | | | 1,057 | | | | 449 | | | | 2,226 | | | | 709 | |
| | | | | |
Other (Note 6) | | | — | | | | 506,107 | | | | — | | | | — | | | | — | |
Total Liabilities | | | 3,220,609 | | | | 15,262,556 | | | | 3,269,417 | | | | 21,801,578 | | | | 13,523,129 | |
NET ASSETS | | $ | 72,346,354 | | | $ | 295,805,692 | | | $ | 121,581,839 | | | $ | 634,428,347 | | | $ | 201,634,190 | |
NET ASSETS: | |
| | | | | |
Paid-in capital | | $ | 74,372,242 | | | $ | 559,387,408 | | | $ | 188,824,633 | | | $ | 696,823,268 | | | $ | 266,165,206 | |
| | | | | |
Total distributable earnings (loss) | | | (2,025,888 | ) | | | (263,581,716 | ) | | | (67,242,794 | ) | | | (62,394,921 | ) | | | (64,531,016 | ) |
NET ASSETS | | $ | 72,346,354 | | | $ | 295,805,692 | | | $ | 121,581,839 | | | $ | 634,428,347 | | | $ | 201,634,190 | |
Outstanding beneficial interest shares of $0.001 par value (unlimited number of shares authorized) | | | 2,300,000 | | | | 4,350,000 | | | | 3,000,000 | | | | 11,950,000 | | | | 5,050,000 | |
Net asset value per share | | $ | 31.45 | | | $ | 68.00 | | | $ | 40.53 | | | $ | 53.09 | | | $ | 39.93 | |
1 Includes market value of securities out on loan of: | | $ | 2,416,370 | | | $ | 25,439,370 | | | $ | 7,864,166 | | | $ | 37,387,164 | | | $ | 11,102,120 | |
2 Investments in securities include investment of cash collateral for securities loaned (see Schedule of Investments for additional information). | |
3 Includes market value of securities out on loan, which were sold and pending settlement, of: | | | — | | | | — | | | $ | 205,764 | | | | — | | | | — | |
See Notes to Financial Statements.
Statements of Assets and Liabilities (continued)
WisdomTree Trust
March 31, 2022
| | | | | | | | | | | | | | | | | | | | |
| | | WisdomTree
International
LargeCap
Dividend Fund | | | WisdomTree
International
MidCap
Dividend Fund | | | WisdomTree
International
Multifactor
Fund | | | WisdomTree
International
Quality Dividend
Growth Fund | | | WisdomTree
International
SmallCap
Dividend Fund | |
ASSETS: | |
| | | | | |
Investments, at cost | | $ | 321,483,903 | | | $ | 140,837,403 | | | $ | 31,090,386 | | | $ | 371,538,823 | | | $ | 1,360,529,754 | |
| | | | | |
Investment in affiliates, at cost (Note 3) | | | — | | | | — | | | | — | | | | — | | | | 8,085,881 | |
| | | | | |
Foreign currency, at cost | | | 217,142 | | | | 180,719 | | | | 29,041 | | | | 197,423 | | | | 1,266,970 | |
Investments in securities, at value1,2 (Note 2) | | | 387,368,230 | | | | 144,382,459 | | | | 32,953,139 | | | | 378,434,082 | | | | 1,370,957,079 | |
| | | | | |
Investment in affiliates, at value (Note 3) | | | — | | | | — | | | | — | | | | — | | | | 7,857,981 | |
| | | | | |
Cash | | | 15,183 | | | | 8,785 | | | | 15,945 | | | | 233,708 | | | | 34,725 | |
| | | | | |
Foreign currency, at value | | | 217,032 | | | | 181,013 | | | | 29,044 | | | | 197,266 | | | | 1,268,952 | |
| | | | | |
Unrealized appreciation on foreign currency contracts | | | — | | | | — | | | | 306,658 | | | | — | | | | 1,709 | |
|
Receivables: | |
| | | | | |
Investment securities sold | | | — | | | | — | | | | — | | | | 8,993,482 | | | | 2,406,240 | |
| | | | | |
Dividends | | | 2,308,335 | | | | 812,410 | | | | 169,960 | | | | 2,586,146 | | | | 8,625,924 | |
| | | | | |
Securities lending income | | | 41,259 | | | | 5,965 | | | | — | | | | 6,094 | | | | 79,762 | |
| | | | | |
Foreign tax reclaims | | | 1,148,952 | | | | 176,795 | | | | 60,206 | | | | 439,346 | | | | 2,458,980 | |
Total Assets | | | 391,098,991 | | | | 145,567,427 | | | | 33,534,952 | | | | 390,890,124 | | | | 1,393,691,352 | |
LIABILITIES: | |
| | | | | |
Unrealized depreciation on foreign currency contracts | | | — | | | | — | | | | 242,479 | | | | — | | | | — | |
|
Payables: | |
| | | | | |
Cash collateral received for securities loaned (Note 2) | | | 9,140,440 | | | | 9,649,155 | | | | 395,563 | | | | 7,811,502 | | | | 62,685,810 | |
| | | | | |
Capital shares redeemed | | | — | | | | — | | | | — | | | | 9,205,406 | | | | — | |
| | | | | |
Advisory fees (Note 3) | | | 150,181 | | | | 65,036 | | | | 10,381 | | | | 132,123 | | | | 638,013 | |
| | | | | |
Service fees (Note 2) | | | 1,377 | | | | 494 | | | | 120 | | | | 1,383 | | | | 4,855 | |
Total Liabilities | | | 9,291,998 | | | | 9,714,685 | | | | 648,543 | | | | 17,150,414 | | | | 63,328,678 | |
NET ASSETS | | $ | 381,806,993 | | | $ | 135,852,742 | | | $ | 32,886,409 | | | $ | 373,739,710 | | | $ | 1,330,362,674 | |
NET ASSETS: | |
| | | | | |
Paid-in capital | | $ | 421,624,170 | | | $ | 161,244,128 | | | $ | 33,798,354 | | | $ | 374,423,803 | | | $ | 1,542,181,498 | |
| | | | | |
Total distributable earnings (loss) | | | (39,817,177 | ) | | | (25,391,386 | ) | | | (911,945 | ) | | | (684,093 | ) | | | (211,818,824 | ) |
NET ASSETS | | $ | 381,806,993 | | | $ | 135,852,742 | | | $ | 32,886,409 | | | $ | 373,739,710 | | | $ | 1,330,362,674 | |
Outstanding beneficial interest shares of $0.001 par value (unlimited number of shares authorized) | | | 7,800,000 | | | | 2,100,000 | | | | 1,300,000 | | | | 10,150,000 | | | | 19,200,000 | |
Net asset value per share | | $ | 48.95 | | | $ | 64.69 | | | $ | 25.30 | | | $ | 36.82 | | | $ | 69.29 | |
1 Includes market value of securities out on loan of: | | $ | 11,166,656 | | | $ | 15,604,390 | | | $ | 1,235,414 | | | $ | 15,950,630 | | | $ | 126,323,648 | |
2 Investments in securities include investment of cash collateral for securities loaned (see Schedule of Investments for additional information). | |
See Notes to Financial Statements.
Statements of Assets and Liabilities (concluded)
WisdomTree Trust
March 31, 2022
| | | | |
| | | WisdomTree
Japan SmallCap
Dividend Fund | |
ASSETS: | |
| |
Investments, at cost | | $ | 266,964,653 | |
| |
Investment in affiliates, at cost (Note 3) | | | 373,558 | |
| |
Foreign currency, at cost | | | 349,097 | |
| |
Investments in securities, at value1,2 (Note 2) | | | 224,775,700 | |
| |
Investment in affiliates, at value (Note 3) | | | 380,663 | |
| |
Cash | | | 35,024 | |
| |
Foreign currency, at value | | | 346,027 | |
|
Receivables: | |
| |
Dividends | | | 3,243,279 | |
| |
Securities lending income | | | 5,393 | |
Total Assets | | | 228,786,086 | |
LIABILITIES: | |
| |
Unrealized depreciation on foreign currency contracts | | | 704 | |
|
Payables: | |
| |
Cash collateral received for securities loaned (Note 2) | | | 15,529,924 | |
| |
Advisory fees (Note 3) | | | 106,298 | |
| |
Service fees (Note 2) | | | 807 | |
Total Liabilities | | | 15,637,733 | |
NET ASSETS | | $ | 213,148,353 | |
NET ASSETS: | |
| |
Paid-in capital | | $ | 351,765,679 | |
| |
Total distributable earnings (loss) | | | (138,617,326 | ) |
NET ASSETS | | $ | 213,148,353 | |
Outstanding beneficial interest shares of $0.001 par value (unlimited number of shares authorized) | | | 3,200,000 | |
Net asset value per share | | $ | 66.61 | |
1 Includes market value of securities out on loan of: | | $ | 27,816,238 | |
2 Investments in securities include investment of cash collateral for securities loaned (see Schedule of Investments for additional information). | |
See Notes to Financial Statements.
Statements of Operations
WisdomTree Trust
For the Year Ended March 31, 2022
| | | | | | | | | | | | | | | | | | | | |
| | | WisdomTree
Europe Quality
Dividend
Growth Fund | | | WisdomTree
Europe SmallCap
Dividend Fund | | | WisdomTree
International
AI Enhanced
Value Fund | | | WisdomTree
International
Equity Fund | | | WisdomTree
International
High Dividend
Fund | |
INVESTMENT INCOME: | |
| | | | | |
Dividends | | $ | 2,408,360 | | | $ | 11,057,398 | | | $ | 8,260,362 | | | $ | 26,131,617 | | | $ | 10,066,542 | |
| | | | | |
Dividends from affiliates (Note 3) | | | — | | | | 38,856 | | | | 25,790 | | | | 54,077 | | | | 52,756 | |
| | | | | |
Non-cash dividends | | | 66,103 | | | | 28,958 | | | | 93,325 | | | | 628,520 | | | | 238,043 | |
| | | | | |
Other income (Note 6) | | | 14,935 | | | | 1,731,316 | | | | 1,547 | | | | 18,694 | | | | 49,429 | |
| | | | | |
Securities lending income, net (Note 2) | | | 24,128 | | | | 295,886 | | | | 74,992 | | | | 235,693 | | | | 69,601 | |
| | | | | |
Less: | | | | | | | | | | | | | | | | | | | | |
| | | | | |
Foreign withholding taxes on dividends | | | (195,574 | ) | | | (1,216,576 | ) | | | (474,118 | ) | | | (2,030,050 | ) | | | (696,523 | ) |
| | | | | |
IRS closing agreement fee (Note 6) | | | — | | | | (478,312 | ) | | | — | | | | — | | | | — | |
Total investment income | | | 2,317,952 | | | | 11,457,526 | | | | 7,981,898 | | | | 25,038,551 | | | | 9,779,848 | |
EXPENSES: | |
| | | | | |
Advisory fees (Note 3) | | | 348,976 | | | | 1,898,200 | | | | 825,283 | | | | 2,957,792 | | | | 1,053,151 | |
| | | | | |
Service fees (Note 2) | | | 2,646 | | | | 14,401 | | | | 6,260 | | | | 27,113 | | | | 7,989 | |
| | | | | |
Other fees (Note 6) | | | 4,246 | | | | 478,225 | | | | 471 | | | | 5,137 | | | | 13,477 | |
Total expenses | | | 355,868 | | | | 2,390,826 | | | | 832,014 | | | | 2,990,042 | | | | 1,074,617 | |
Expense waivers (Note 3) | | | — | | | | (1,392 | ) | | | (612 | ) | | | (1,120 | ) | | | (2,110 | ) |
Net expenses | | | 355,868 | | | | 2,389,434 | | | | 831,402 | | | | 2,988,922 | | | | 1,072,507 | |
Net investment income | | | 1,962,084 | | | | 9,068,092 | | | | 7,150,496 | | | | 22,049,629 | | | | 8,707,341 | |
NET REALIZED AND UNREALIZED GAIN (LOSS) ON INVESTMENTS: | |
|
Net realized gain (loss) from: | |
| | | | | |
Investment transactions | | | 1,594,916 | | | | 46,208,686 | | | | (10,494,711 | ) | | | (4,333,897 | ) | | | 848,667 | |
| | | | | |
Investment transactions in affiliates (Note 3) | | | — | | | | 18,320 | | | | 42,685 | | | | (78,048 | ) | | | (35,032 | ) |
| | | | | |
In-kind redemptions | | | — | | | | 3,250,037 | | | | 23,235,255 | | | | 10,351,062 | | | | 1,610,765 | |
| | | | | |
Futures contracts | | | — | | | | (40,770 | ) | | | — | | | | — | | | | — | |
| | | | | |
Foreign currency contracts | | | (1,801 | ) | | | (26,241 | ) | | | (147,728 | ) | | | 103,107 | | | | 48,198 | |
| | | | | |
Foreign currency related transactions | | | (7,108 | ) | | | (206,892 | ) | | | 112,633 | | | | (82,875 | ) | | | (50,491 | ) |
Net realized gain | | | 1,586,007 | | | | 49,203,140 | | | | 12,748,134 | | | | 5,959,349 | | | | 2,422,107 | |
Net increase (decrease) in unrealized appreciation/depreciation: | |
| | | | | |
Investment transactions | | | (2,618,434 | ) | | | (56,894,725 | ) | | | (18,571,678 | ) | | | 453,333 | | | | 656,219 | |
| | | | | |
Investment transactions in affiliates (Note 3) | | | — | | | | (44,460 | ) | | | (49,469 | ) | | | 7,071 | | | | 17,980 | |
| | | | | |
Foreign currency contracts | | | — | | | | (1,228 | ) | | | (558 | ) | | | 289 | | | | 31 | |
| | | | | |
Translation of assets and liabilities denominated in foreign currencies | | | (2,533 | ) | | | (70,217 | ) | | | (4,531 | ) | | | (44,986 | ) | | | (13,417 | ) |
Net increase (decrease) in unrealized appreciation/depreciation | | | (2,620,967 | ) | | | (57,010,630 | ) | | | (18,626,236 | ) | | | 415,707 | | | | 660,813 | |
Net realized and unrealized gain (loss) on investments | | | (1,034,960 | ) | | | (7,807,490 | ) | | | (5,878,102 | ) | | | 6,375,056 | | | | 3,082,920 | |
NET INCREASE IN NET ASSETS RESULTING FROM OPERATIONS | | $ | 927,124 | | | $ | 1,260,602 | | | $ | 1,272,394 | | | $ | 28,424,685 | | | $ | 11,790,261 | |
See Notes to Financial Statements.
Statements of Operations (continued)
WisdomTree Trust
For the Year Ended March 31, 2022
| | | | | | | | | | | | | | | | | | | | |
| | | WisdomTree
International
LargeCap
Dividend Fund | | | WisdomTree
International
MidCap
Dividend Fund | | | WisdomTree
International
Multifactor
Fund | | | WisdomTree
International
Quality Dividend
Growth Fund | | | WisdomTree
International
SmallCap
Dividend Fund | |
INVESTMENT INCOME: | |
| | | | | |
Dividends | | $ | 15,781,019 | | | $ | 6,418,460 | | | $ | 1,127,348 | | | $ | 11,177,863 | | | $ | 55,339,382 | |
| | | | | |
Dividends from affiliates (Note 3) | | | 32,483 | | | | — | | | | — | | | | — | | | | 147,237 | |
| | | | | |
Non-cash dividends | | | 291,189 | | | | 275,375 | | | | 194,357 | | | | 5,752 | | | | 245,830 | |
| | | | | |
Other income (Note 6) | | | 47,506 | | | | 29,874 | | | | 4,230 | | | | — | | | | 1,157,323 | |
| | | | | |
Securities lending income, net (Note 2) | | | 143,601 | | | | 50,806 | | | | 12,600 | | | | 39,576 | | | | 962,786 | |
| | | | | |
Less: Foreign withholding taxes on dividends | | | (1,190,220 | ) | | | (512,995 | ) | | | (91,531 | ) | | | (549,211 | ) | | | (4,932,359 | ) |
Total investment income | | | 15,105,578 | | | | 6,261,520 | | | | 1,247,004 | | | | 10,673,980 | | | | 52,920,199 | |
EXPENSES: | |
| | | | | |
Advisory fees (Note 3) | | | 1,760,954 | | | | 836,764 | | | | 139,581 | | | | 1,250,884 | | | | 8,334,301 | |
| | | | | |
Service fees (Note 2) | | | 16,142 | | | | 6,348 | | | | 1,616 | | | | 13,105 | | | | 63,225 | |
| | | | | |
Other fees (Note 6) | | | 12,698 | | | | 8,533 | | | | 1,210 | | | | — | | | | 335,085 | |
Total expenses | | | 1,789,794 | | | | 851,645 | | | | 142,407 | | | | 1,263,989 | | | | 8,732,611 | |
Expense waivers (Note 3) | | | (1,412 | ) | | | — | | | | — | | | | — | | | | (14,469 | ) |
Net expenses | | | 1,788,382 | | | | 851,645 | | | | 142,407 | | | | 1,263,989 | | | | 8,718,142 | |
Net investment income | | | 13,317,196 | | | | 5,409,875 | | | | 1,104,597 | | | | 9,409,991 | | | | 44,202,057 | |
NET REALIZED AND UNREALIZED GAIN (LOSS) ON INVESTMENTS: | |
|
Net realized gain (loss) from: | |
| | | | | |
Investment transactions | | | 2,246,569 | | | | 4,868,992 | | | | 122,321 | | | | (2,631,628 | ) | | | (16,777,810 | ) |
| | | | | |
Investment transactions in affiliates (Note 3) | | | (10,508 | ) | | | — | | | | — | | | | — | | | | 205,875 | |
| | | | | |
In-kind redemptions | | | 2,424,295 | | | | 765,503 | | | | 685,797 | | | | 11,769,563 | | | | 168,573,437 | |
| | | | | |
Futures contracts | | | — | | | | — | | | | — | | | | — | | | | 123,276 | |
| | | | | |
Foreign currency contracts | | | 69,599 | | | | 2,201 | | | | 1,460,164 | | | | 33,299 | | | | 127,775 | |
| | | | | |
Foreign currency related transactions | | | (81,436 | ) | | | (4,659 | ) | | | 8,575 | | | | (73,246 | ) | | | (393,157 | ) |
Net realized gain | | | 4,648,519 | | | | 5,632,037 | | | | 2,276,857 | | | | 9,097,988 | | | | 151,859,396 | |
Net increase (decrease) in unrealized appreciation/depreciation: | | | | | | | | | | | | | | | | | | | | |
| | | | | |
Investment transactions | | | 7,278,337 | | | | (10,861,131 | ) | | | (1,877,462 | ) | | | (21,804,673 | ) | | | (201,688,534 | ) |
| | | | | |
Investment transactions in affiliates (Note 3) | | | — | | | | — | | | | — | | | | — | | | | (499,528 | ) |
| | | | | |
Foreign currency contracts | | | — | | | | — | | | | (282,698 | ) | | | — | | | | (66 | ) |
| | | | | |
Translation of assets and liabilities denominated in foreign currencies | | | (3,924 | ) | | | (3,051 | ) | | | 1,064 | | | | 16,277 | | | | (69,046 | ) |
Net increase (decrease) in unrealized appreciation/depreciation | | | 7,274,413 | | | | (10,864,182 | ) | | | (2,159,096 | ) | | | (21,788,396 | ) | | | (202,257,174 | ) |
Net realized and unrealized gain (loss) on investments | | | 11,922,932 | | | | (5,232,145 | ) | | | 117,761 | | | | (12,690,408 | ) | | | (50,397,778 | ) |
NET INCREASE (DECREASE) IN NET ASSETS RESULTING FROM OPERATIONS | | $ | 25,240,128 | | | $ | 177,730 | | | $ | 1,222,358 | | | $ | (3,280,417 | ) | | $ | (6,195,721 | ) |
See Notes to Financial Statements.
Statements of Operations (concluded)
WisdomTree Trust
For the Year Ended March 31, 2022
| | | | |
| | | WisdomTree
Japan SmallCap
Dividend Fund | |
INVESTMENT INCOME: | | | | |
| |
Dividends | | $ | 7,127,593 | |
| |
Dividends from affiliates (Note 3) | | | 9,785 | |
| |
Securities lending income, net (Note 2) | | | 47,183 | |
| |
Less: Foreign withholding taxes on dividends | | | (712,799 | ) |
Total investment income | | | 6,471,762 | |
EXPENSES: | |
| |
Advisory fees (Note 3) | | | 1,285,764 | |
| |
Service fees (Note 2) | | | 9,754 | |
Total expenses | | | 1,295,518 | |
Expense waivers (Note 3) | | | (545 | ) |
Net expenses | | | 1,294,973 | |
Net investment income | | | 5,176,789 | |
NET REALIZED AND UNREALIZED GAIN (LOSS) ON INVESTMENTS: | |
|
Net realized gain (loss) from: | |
| |
Investment transactions | | | (2,401,668 | ) |
| |
Investment transactions in affiliates (Note 3) | | | 23,041 | |
| |
In-kind redemptions | | | 1,979,887 | |
| |
Foreign currency contracts | | | 5,732 | |
| |
Foreign currency related transactions | | | (64,138 | ) |
Net realized loss | | | (457,146 | ) |
Net increase (decrease) in unrealized appreciation/depreciation: | |
| |
Investment transactions | | | (29,528,699 | ) |
| |
Investment transactions in affiliates (Note 3) | | | (17,505 | ) |
| |
Foreign currency contracts | | | (704 | ) |
| |
Translation of assets and liabilities denominated in foreign currencies | | | 12,136 | |
Net decrease in unrealized appreciation/depreciation | | | (29,534,772 | ) |
Net realized and unrealized loss on investments | | | (29,991,918 | ) |
NET DECREASE IN NET ASSETS RESULTING FROM OPERATIONS | | $ | (24,815,129 | ) |
See Notes to Financial Statements.
Statements of Changes in Net Assets
WisdomTree Trust
| | | | | | | | | | | | | | | | | | | | | | | | |
| | | |
| | | WisdomTree Europe Quality Dividend Growth Fund | | | WisdomTree Europe SmallCap Dividend Fund | | | WisdomTree International AI Enhanced Value Fund | |
| | | | | | |
| | | For the
Year Ended
March 31, 2022 | | | For the Year Ended
March 31, 2021 | | | For the Year Ended
March 31, 2022 | | | For the Year Ended
March 31, 2021 | | | For the Year Ended
March 31, 2022 | | | For the Year Ended
March 31, 2021 | |
INCREASE (DECREASE) IN NET ASSETS RESULTING FROM OPERATIONS: | |
| | | | | | |
Net investment income | | $ | 1,962,084 | | | $ | 820,555 | | | $ | 9,068,092 | | | $ | 7,372,415 | | | $ | 7,150,496 | | | $ | 5,424,734 | |
| | | | | | |
Net realized gain (loss) on investments, futures contracts, foreign currency contracts and foreign currency related transactions | | | 1,586,007 | | | | (239,556 | ) | | | 49,203,140 | | | | (53,060,466 | ) | | | 12,748,134 | | | | (18,254,097 | ) |
| | | | | | |
Net increase (decrease) in unrealized appreciation/depreciation on investments, foreign currency contracts and translation of assets and liabilities denominated in foreign currencies | | | (2,620,967 | ) | | | 10,913,286 | | | | (57,010,630 | ) | | | 213,654,157 | | | | (18,626,236 | ) | | | 54,197,622 | |
Net increase in net assets resulting from operations | | | 927,124 | | | | 11,494,285 | | | | 1,260,602 | | | | 167,966,106 | | | | 1,272,394 | | | | 41,368,259 | |
DISTRIBUTIONS TO SHAREHOLDERS: | |
| | | | | | |
Distributable earnings | | | (1,969,811 | ) | | | (828,773 | ) | | | (8,828,002 | ) | | | (7,149,556 | ) | | | (7,009,725 | ) | | | (5,359,954 | ) |
CAPITAL SHARE TRANSACTIONS: | |
| | | | | | |
Net proceeds from sale of shares | | | 26,532,909 | | | | 13,027,760 | | | | 11,158,363 | | | | — | | | | 86,530,850 | | | | 10,968,590 | |
| | | | | | |
Cost of shares redeemed | | | — | | | | (2,287,610 | ) | | | (18,012,335 | ) | | | (170,820,367 | ) | | | (103,559,834 | ) | | | (8,689,913 | ) |
Net increase (decrease) in net assets resulting from capital share transactions | | | 26,532,909 | | | | 10,740,150 | | | | (6,853,972 | ) | | | (170,820,367 | ) | | | (17,028,984 | ) | | | 2,278,677 | |
Net Increase (Decrease) in Net Assets | | | 25,490,222 | | | | 21,405,662 | | | | (14,421,372 | ) | | | (10,003,817 | ) | | | (22,766,315 | ) | | | 38,286,982 | |
NET ASSETS: | |
| | | | | | |
Beginning of year | | $ | 46,856,132 | | | $ | 25,450,470 | | | $ | 310,227,064 | | | $ | 320,230,881 | | | $ | 144,348,154 | | | $ | 106,061,172 | |
| | | | | | |
End of year | | $ | 72,346,354 | | | $ | 46,856,132 | | | $ | 295,805,692 | | | $ | 310,227,064 | | | $ | 121,581,839 | | | $ | 144,348,154 | |
SHARES CREATED AND REDEEMED: | |
| | | | | | |
Shares outstanding, beginning of year | | | 1,500,000 | | | | 1,150,000 | | | | 4,450,000 | | | | 7,800,000 | | | | 3,400,000 | | | | 3,350,000 | |
| | | | | | |
Shares created | | | 800,000 | | | | 450,000 | | | | 150,000 | | | | — | | | | 2,000,000 | | | | 300,000 | |
| | | | | | |
Shares redeemed | | | — | | | | (100,000 | ) | | | (250,000 | ) | | | (3,350,000 | ) | | | (2,400,000 | ) | | | (250,000 | ) |
Shares outstanding, end of year | | | 2,300,000 | | | | 1,500,000 | | | | 4,350,000 | | | | 4,450,000 | | | | 3,000,000 | | | | 3,400,000 | |
See Notes to Financial Statements.
Statements of Changes in Net Assets (continued)
WisdomTree Trust
| | | | | | | | | | | | | | | | | | | | | | | | |
| | | |
| | | WisdomTree International Equity Fund | | | WisdomTree International High
Dividend Fund | | | WisdomTree International LargeCap
Dividend Fund | |
| | | | | | |
| | | For the Year Ended
March 31, 2022 | | | For the Year Ended
March 31, 2021 | | | For the Year Ended
March 31, 2022 | | | For the Year Ended
March 31, 2021 | | | For the Year Ended
March 31, 2022 | | | For the Year Ended
March 31, 2021 | |
INCREASE (DECREASE) IN NET ASSETS RESULTING FROM OPERATIONS: | |
| | | | | | |
Net investment income | | $ | 22,049,629 | | | $ | 18,365,088 | | | $ | 8,707,341 | | | $ | 7,741,073 | | | $ | 13,317,196 | | | $ | 11,482,700 | |
| | | | | | |
Net realized gain (loss) on investments, foreign currency contracts and foreign currency related transactions | | | 5,959,349 | | | | (51,932,857 | ) | | | 2,422,107 | | | | (33,380,026 | ) | | | 4,648,519 | | | | (45,575,900 | ) |
| | | | | | |
Net increase in unrealized appreciation/depreciation on investments, foreign currency contracts and translation of assets and liabilities denominated in foreign currencies | | | 415,707 | | | | 218,558,249 | | | | 660,813 | | | | 82,656,425 | | | | 7,274,413 | | | | 131,333,175 | |
Net increase in net assets resulting from operations | | | 28,424,685 | | | | 184,990,480 | | | | 11,790,261 | | | | 57,017,472 | | | | 25,240,128 | | | | 97,239,975 | |
DISTRIBUTIONS TO SHAREHOLDERS: | |
| | | | | | |
Distributable earnings | | | (22,558,337 | ) | | | (18,281,531 | ) | | | (8,671,887 | ) | | | (7,456,513 | ) | | | (13,525,175 | ) | | | (11,449,209 | ) |
CAPITAL SHARE TRANSACTIONS: | |
| | | | | | |
Net proceeds from sale of shares | | | 64,690,387 | | | | 4,792,891 | | | | 21,973,614 | | | | 7,623,205 | | | | 24,586,877 | | | | — | |
| | | | | | |
Cost of shares redeemed | | | (38,753,146 | ) | | | (149,786,802 | ) | | | (6,142,830 | ) | | | (48,734,895 | ) | | | (7,211,803 | ) | | | (60,695,563 | ) |
Net increase (decrease) in net assets resulting from capital share transactions | | | 25,937,241 | | | | (144,993,911 | ) | | | 15,830,784 | | | | (41,111,690 | ) | | | 17,375,074 | | | | (60,695,563 | ) |
Net Increase in Net Assets | | | 31,803,589 | | | | 21,715,038 | | | | 18,949,158 | | | | 8,449,269 | | | | 29,090,027 | | | | 25,095,203 | |
NET ASSETS: | |
| | | | | | |
Beginning of year | | $ | 602,624,758 | | | $ | 580,909,720 | | | $ | 182,685,032 | | | $ | 174,235,763 | | | $ | 352,716,966 | | | $ | 327,621,763 | |
| | | | | | |
End of year | | $ | 634,428,347 | | | $ | 602,624,758 | | | $ | 201,634,190 | | | $ | 182,685,032 | | | $ | 381,806,993 | | | $ | 352,716,966 | |
SHARES CREATED AND REDEEMED: | |
| | | | | | |
Shares outstanding, beginning of year | | | 11,450,000 | | | | 14,650,000 | | | | 4,650,000 | | | | 5,900,000 | | | | 7,450,000 | | | | 8,900,000 | |
| | | | | | |
Shares created | | | 1,250,000 | | | | 100,000 | | | | 550,000 | | | | 200,000 | | | | 500,000 | | | | — | |
| | | | | | |
Shares redeemed | | | (750,000 | ) | | | (3,300,000 | ) | | | (150,000 | ) | | | (1,450,000 | ) | | | (150,000 | ) | | | (1,450,000 | ) |
Shares outstanding, end of year | | | 11,950,000 | | | | 11,450,000 | | | | 5,050,000 | | | | 4,650,000 | | | | 7,800,000 | | | | 7,450,000 | |
See Notes to Financial Statements.
Statements of Changes in Net Assets (continued)
WisdomTree Trust
| | | | | | | | | | | | | | | | | | | | | | | | |
| | | |
| | | WisdomTree International MidCap
Dividend Fund | | | WisdomTree International
Multifactor Fund | | | WisdomTree International Quality
Dividend Growth Fund | |
| | | | | | |
| | | For the Year Ended
March 31, 2022 | | | For the Year Ended
March 31, 2021 | | | For the Year Ended
March 31, 2022 | | | For the Year Ended
March 31, 2021 | | | For the Year Ended
March 31, 2022 | | | For the Year Ended
March 31, 2021 | |
INCREASE (DECREASE) IN NET ASSETS RESULTING FROM OPERATIONS: | |
| | | | | | |
Net investment income | | $ | 5,409,875 | | | $ | 4,207,045 | | | $ | 1,104,597 | | | $ | 1,047,145 | | | $ | 9,409,991 | | | $ | 3,807,514 | |
| | | | | | |
Net realized gain on investments, foreign currency contracts and foreign currency related transactions | | | 5,632,037 | | | | 246,722 | | | | 2,276,857 | | | | 2,213,654 | | | | 9,097,988 | | | | 5,706,481 | |
| | | | | | |
Net increase (decrease) in unrealized appreciation/depreciation on investments, foreign currency contracts and translation of assets and liabilities denominated in foreign currencies | | | (10,864,182 | ) | | | 57,471,320 | | | | (2,159,096 | ) | | | 5,685,459 | | | | (21,788,396 | ) | | | 38,714,663 | |
Net increase (decrease) in net assets resulting from operations | | | 177,730 | | | | 61,925,087 | | | | 1,222,358 | | | | 8,946,258 | | | | (3,280,417 | ) | | | 48,228,658 | |
DISTRIBUTIONS TO SHAREHOLDERS: | |
| | | | | | |
Distributable earnings | | | (5,307,913 | ) | | | (4,319,792 | ) | | | (1,281,800 | ) | | | (1,004,586 | ) | | | (8,948,267 | ) | | | (3,650,231 | ) |
CAPITAL SHARE TRANSACTIONS: | |
| | | | | | |
Net proceeds from sale of shares | | | — | | | | — | | | | — | | | | 13,784,134 | | | | 236,774,497 | | | | 97,332,082 | |
| | | | | | |
Cost of shares redeemed | | | (3,421,536 | ) | | | (82,613,821 | ) | | | (5,192,465 | ) | | | (16,995,212 | ) | | | (41,113,302 | ) | | | (20,154,625 | ) |
Net increase (decrease) in net assets resulting from capital share transactions | | | (3,421,536 | ) | | | (82,613,821 | ) | | | (5,192,465 | ) | | | (3,211,078 | ) | | | 195,661,195 | | | | 77,177,457 | |
Net Increase (Decrease) in Net Assets | | | (8,551,719 | ) | | | (25,008,526 | ) | | | (5,251,907 | ) | | | 4,730,594 | | | | 183,432,511 | | | | 121,755,884 | |
NET ASSETS: | |
| | | | | | |
Beginning of year | | $ | 144,404,461 | | | $ | 169,412,987 | | | $ | 38,138,316 | | | $ | 33,407,722 | | | $ | 190,307,199 | | | $ | 68,551,315 | |
| | | | | | |
End of year | | $ | 135,852,742 | | | $ | 144,404,461 | | | $ | 32,886,409 | | | $ | 38,138,316 | | | $ | 373,739,710 | | | $ | 190,307,199 | |
SHARES CREATED AND REDEEMED: | |
| | | | | | |
Shares outstanding, beginning of year | | | 2,150,000 | | | | 3,600,000 | | | | 1,500,000 | | | | 1,600,000 | | | | 5,150,000 | | | | 2,650,000 | |
| | | | | | |
Shares created | | | — | | | | — | | | | — | | | | 600,000 | | | | 6,050,000 | | | | 3,100,000 | |
| | | | | | |
Shares redeemed | | | (50,000 | ) | | | (1,450,000 | ) | | | (200,000 | ) | | | (700,000 | ) | | | (1,050,000 | ) | | | (600,000 | ) |
Shares outstanding, end of year | | | 2,100,000 | | | | 2,150,000 | | | | 1,300,000 | | | | 1,500,000 | | | | 10,150,000 | | | | 5,150,000 | |
See Notes to Financial Statements.
Statements of Changes in Net Assets (concluded)
WisdomTree Trust
| | | | | | | | | | | | | | | | |
| | |
| | | WisdomTree International SmallCap
Dividend Fund | | | WisdomTree Japan SmallCap Dividend Fund | |
| | | | |
| | | For the Year Ended
March 31, 2022 | | | For the Year Ended
March 31, 2021 | | | For the Year Ended
March 31, 2022 | | | For the Year Ended
March 31, 2021 | |
INCREASE (DECREASE) IN NET ASSETS RESULTING FROM OPERATIONS: | |
| | | | |
Net investment income | | $ | 44,202,057 | | | $ | 33,397,978 | | | $ | 5,176,789 | | | $ | 3,791,440 | |
| | | | |
Net realized gain (loss) on investments, futures contracts, foreign currency contracts and foreign currency related transactions | | | 151,859,396 | | | | (40,625,800 | ) | | | (457,146 | ) | | | (840,712 | ) |
| | | | |
Net increase (decrease) in unrealized appreciation/depreciation on investments, foreign currency contracts and translation of assets and liabilities denominated in foreign currencies | | | (202,257,174 | ) | | | 562,247,872 | | | | (29,534,772 | ) | | | 60,817,334 | |
Net increase (decrease) in net assets resulting from operations | | | (6,195,721 | ) | | | 555,020,050 | | | | (24,815,129 | ) | | | 63,768,062 | |
DISTRIBUTIONS TO SHAREHOLDERS: | |
| | | | |
Distributable earnings | | | (47,038,894 | ) | | | (35,298,828 | ) | | | (4,540,106 | ) | | | (5,773,349 | ) |
CAPITAL SHARE TRANSACTIONS: | |
| | | | |
Net proceeds from sale of shares | | | 381,404,109 | | | | — | | | | 70,804,885 | | | | 7,761,522 | |
| | | | |
Cost of shares redeemed | | | (401,325,182 | ) | | | (277,642,196 | ) | | | (18,441,877 | ) | | | (113,118,986 | ) |
Net increase (decrease) in net assets resulting from capital share transactions | | | (19,921,073 | ) | | | (277,642,196 | ) | | | 52,363,008 | | | | (105,357,464 | ) |
Net Increase (Decrease) in Net Assets | | | (73,155,688 | ) | | | 242,079,026 | | | | 23,007,773 | | | | (47,362,751 | ) |
NET ASSETS: | |
| | | | |
Beginning of year | | $ | 1,403,518,362 | | | $ | 1,161,439,336 | | | $ | 190,140,580 | | | $ | 237,503,331 | |
| | | | |
End of year | | $ | 1,330,362,674 | | | $ | 1,403,518,362 | | | $ | 213,148,353 | | | $ | 190,140,580 | |
SHARES CREATED AND REDEEMED: | |
| | | | |
Shares outstanding, beginning of year | | | 19,450,000 | | | | 24,050,000 | | | | 2,500,000 | | | | 4,050,000 | |
| | | | |
Shares created | | | 5,050,000 | | | | — | | | | 950,000 | | | | 100,000 | |
| | | | |
Shares redeemed | | | (5,300,000 | ) | | | (4,600,000 | ) | | | (250,000 | ) | | | (1,650,000 | ) |
Shares outstanding, end of year | | | 19,200,000 | | | | 19,450,000 | | | | 3,200,000 | | | | 2,500,000 | |
See Notes to Financial Statements.
Financial Highlights
WisdomTree Trust
Selected data for a share of beneficial interest outstanding throughout the period is presented below:
| | | | | | | | | | | | | | | | | | | | |
WisdomTree Europe Quality Dividend Growth
Fund | | For the
Year Ended
March 31, 2022 | | | For the
Year Ended
March 31, 2021 | | | For the
Year Ended
March 31, 2020 | | | For the
Period Ended
March 31, 2019 | | | For the
Period Ended
March 31, 2018 | |
Net asset value, beginning of year | | $ | 31.24 | | | $ | 22.13 | | | $ | 25.06 | | | $ | 26.24 | | | $ | 23.17 | |
Investment operations: | | | | | | | | | | | | | | | | | | | | |
| | | | | |
Net investment income1 | | | 1.08 | | | | 0.66 | | | | 0.62 | | | | 0.61 | | | | 0.53 | |
| | | | | |
Net realized and unrealized gain (loss) | | | 0.21 | ^ | | | 9.10 | | | | (2.93 | ) | | | (1.05 | ) | | | 2.94 | |
Total from investment operations | | | 1.29 | ^ | | | 9.76 | | | | (2.31 | ) | | | (0.44 | ) | | | 3.47 | |
Dividends to shareholders: | | | | | | | | | | | | | | | | | | | | |
| | | | | |
Net investment income | | | (1.08 | ) | | | (0.65 | ) | | | (0.62 | ) | | | (0.74 | ) | | | (0.40 | ) |
Net asset value, end of year | | $ | 31.45 | | | $ | 31.24 | | | $ | 22.13 | | | $ | 25.06 | | | $ | 26.24 | |
| | | | | |
TOTAL RETURN2 | | | 4.02 | % | | | 44.43 | % | | | (9.46 | )% | | | (1.62 | )% | | | 15.03 | % |
RATIOS/SUPPLEMENTAL DATA: | | | | | | | | | | | | | | | | | | | | |
| | | | | |
Net assets, end of year (000’s omitted) | | $ | 72,346 | | | $ | 46,856 | | | $ | 25,450 | | | $ | 41,342 | | | $ | 72,163 | |
| | | | | |
Ratios to average net assets of: | | | | | | | | | | | | | | | | | | | | |
| | | | | |
Expenses | | | 0.59 | %3 | | | 0.58 | % | | | 0.58 | % | | | 0.58 | % | | | 0.58 | % |
| | | | | |
Net investment income | | | 3.26 | % | | | 2.37 | % | | | 2.42 | % | | | 2.41 | % | | | 2.02 | % |
Portfolio turnover rate4 | | | 53 | % | | | 61 | % | | | 43 | % | | | 42 | % | | | 18 | % |
| | | | | | | | | | | | | | | | | | | | |
| WisdomTree Europe SmallCap Dividend Fund | | For the
Year Ended
March 31, 2022 | | | For the
Year Ended
March 31, 2021 | | | For the
Year Ended
March 31, 2020 | | | For the
Year Ended
March 31, 2019 | | | For the
Year Ended
March 31, 2018 | |
Net asset value, beginning of year | | $ | 69.71 | | | $ | 41.06 | | | $ | 58.54 | | | $ | 69.55 | | | $ | 59.16 | |
Investment operations: | | | | | | | | | | | | | | | | | | | | |
| | | | | |
Net investment income1 | | | 2.03 | | | | 1.31 | | | | 2.43 | | | | 2.57 | | | | 1.88 | |
| | | | | |
Net realized and unrealized gain (loss) | | | (1.79 | ) | | | 28.62 | | | | (17.41 | ) | | | (10.87 | ) | | | 10.39 | |
Total from investment operations | | | 0.24 | | | | 29.93 | | | | (14.98 | ) | | | (8.30 | ) | | | 12.27 | |
Dividends to shareholders: | | | | | | | | | | | | | | | | | | | | |
| | | | | |
Net investment income | | | (1.95 | ) | | | (1.28 | ) | | | (2.50 | ) | | | (2.71 | ) | | | (1.88 | ) |
Net asset value, end of year | | $ | 68.00 | | | $ | 69.71 | | | $ | 41.06 | | | $ | 58.54 | | | $ | 69.55 | |
| | | | | |
TOTAL RETURN2 | | | 0.18 | % | | | 73.76 | % | | | (26.54 | )% | | | (12.19 | )% | | | 20.94 | % |
RATIOS/SUPPLEMENTAL DATA: | | | | | | | | | | | | | | | | | | | | |
| | | | | |
Net assets, end of year (000’s omitted) | | $ | 295,806 | | | $ | 310,227 | | | $ | 320,231 | | | $ | 667,402 | | | $ | 1,224,082 | |
| | | | | |
Ratios to average net assets5 of: | | | | | | | | | | | | | | | | | | | | |
| | | | | |
Expenses6 | | | 0.73 | %3 | | | 0.58 | % | | | 0.58 | % | | | 0.58 | % | | | 0.58 | % |
| | | | | |
Net investment income | | | 2.77 | % | | | 2.39 | % | | | 4.15 | % | | | 4.06 | % | | | 2.76 | % |
Portfolio turnover rate4 | | | 68 | % | | | 92 | % | | | 50 | % | | | 52 | % | | | 33 | % |
| ^ | The amount per share does not correspond with the amount reported within the Statements of Changes due to the timing of capital share transactions of Fund shares and fluctuating market values during the fiscal year. |
| 1 | Based on average shares outstanding. |
| 2 | Total return is calculated assuming an initial investment made at the net asset value at the beginning of the period, reinvestment of all dividends and distributions at net asset value during the period and redemption on the last day of the period. For the periods in which the investment advisor waived advisory fees for the WisdomTree Europe SmallCap Dividend Fund, the total return would have been lower if certain expenses had not been waived (Notes 2 and 3). |
| 3 | Included in the expense ratio are “Other fees” described in Note 6. Without these expenses, the expense ratio would have been 0.58%. |
| 4 | Portfolio turnover rate excludes the value of the portfolio securities received or delivered as a result of in-kind creations or redemptions of the Fund’s capital shares. Short-term securities with maturities less than or equal to 365 days are excluded from the portfolio turnover calculation. |
| 5 | The ratios to average net assets do not include net investment income (loss) or expenses of other funds in which the Fund invests. |
| 6 | The expense ratio includes investment advisory fee waivers. Without these investment advisory fee waivers, the expense ratio would have been unchanged. |
See Notes to Financial Statements.
Financial Highlights (continued)
WisdomTree Trust
Selected data for a share of beneficial interest outstanding throughout the period is presented below:
| | | | | | | | | | | | | | | | | | | | |
WisdomTree International AI
Enhanced Value Fund | | For the
Year Ended
March 31, 2022^ | | | For the
Year Ended
March 31, 2021^ | | | For the
Year Ended
March 31, 2020^ | | | For the
Year Ended
March 31, 2019^ | | | For the
Year Ended
March 31, 2018^ | |
Net asset value, beginning of year | | $ | 42.46 | | | $ | 31.66 | | | $ | 41.19 | | | $ | 43.18 | | | $ | 39.72 | |
Investment operations: | | | | | | | | | | | | | | | | | | | | |
| | | | | |
Net investment income1 | | | 2.14 | | | | 1.64 | | | | 1.69 | | | | 1.74 | | | | 1.58 | |
| | | | | |
Net realized and unrealized gain (loss) | | | (1.98 | ) | | | 10.78 | | | | (9.52 | ) | | | (1.98 | ) | | | 3.45 | |
Total from investment operations | | | 0.16 | | | | 12.42 | | | | (7.83 | ) | | | (0.24 | ) | | | 5.03 | |
Dividends to shareholders: | | | | | | | | | | | | | | | | | | | | |
| | | | | |
Net investment income | | | (2.09 | ) | | | (1.62 | ) | | | (1.70 | ) | | | (1.75 | ) | | | (1.57 | ) |
Net asset value, end of year | | $ | 40.53 | | | $ | 42.46 | | | $ | 31.66 | | | $ | 41.19 | | | $ | 43.18 | |
| | | | | |
TOTAL RETURN2 | | | 0.30 | % | | | 39.87 | % | | | (19.77 | )% | | | (0.49 | )% | | | 12.84 | % |
RATIOS/SUPPLEMENTAL DATA: | | | | | | | | | | | | | | | | | | | | |
| | | | | |
Net assets, end of year (000’s omitted) | | $ | 121,582 | | | $ | 144,348 | | | $ | 106,061 | | | $ | 179,189 | | | $ | 198,646 | |
| | | | | |
Ratios to average net assets3 of: | | | | | | | | | | | | | | | | | | | | |
| | | | | |
Expenses4 | | | 0.58 | %5 | | | 0.58 | % | | | 0.58 | % | | | 0.58 | % | | | 0.58 | % |
| | | | | |
Net investment income | | | 5.03 | % | | | 4.34 | % | | | 4.17 | % | | | 4.17 | % | | | 3.73 | % |
Portfolio turnover rate6 | | | 99 | %8,9 | | | 61 | % | | | 45 | % | | | 41 | % | | | 35 | % |
| | | | | | | | | | | | | | | | | | | | |
WisdomTree International Equity
Fund | | For the
Year Ended
March 31, 2022 | | | For the
Year Ended
March 31, 2021 | | | For the
Year Ended
March 31, 2020 | | | For the
Year Ended
March 31, 2019 | | | For the
Year Ended
March 31, 2018 | |
Net asset value, beginning of year | | $ | 52.63 | | | $ | 39.65 | | | $ | 50.59 | | | $ | 54.63 | | | $ | 49.57 | |
Investment operations: | | | | | | | | | | | | | | | | | | | | |
| | | | | |
Net investment income1 | | | 1.94 | | | | 1.47 | | | | 1.69 | | | | 1.86 | | | | 1.70 | |
| | | | | |
Net realized and unrealized gain (loss) | | | 0.50 | | | | 12.99 | | | | (10.88 | ) | | | (3.98 | ) | | | 4.98 | |
Total from investment operations | | | 2.44 | | | | 14.46 | | | | (9.19 | ) | | | (2.12 | ) | | | 6.68 | |
Dividends to shareholders: | | | | | | | | | | | | | | | | | | | | |
| | | | | |
Net investment income | | | (1.98 | ) | | | (1.48 | ) | | | (1.75 | ) | | | (1.92 | ) | | | (1.62 | ) |
Net asset value, end of year | | $ | 53.09 | | | $ | 52.63 | | | $ | 39.65 | | | $ | 50.59 | | | $ | 54.63 | |
| | | | | |
TOTAL RETURN2 | | | 4.62 | % | | | 36.92 | % | | | (18.80 | )% | | | (3.89 | )% | | | 13.61 | % |
RATIOS/SUPPLEMENTAL DATA: | | | | | | | | | | | | | | | | | | | | |
| | | | | |
Net assets, end of year (000’s omitted) | | $ | 634,428 | | | $ | 602,625 | | | $ | 580,910 | | | $ | 837,260 | | | $ | 914,993 | |
| | | | | |
Ratios to average net assets3 of: | | | | | | | | | | | | | | | | | | | | |
| | | | | |
Expenses4 | | | 0.49 | %7 | | | 0.48 | % | | | 0.48 | % | | | 0.48 | % | | | 0.48 | % |
| | | | | |
Net investment income | | | 3.58 | % | | | 3.13 | % | | | 3.36 | % | | | 3.59 | % | | | 3.15 | % |
Portfolio turnover rate6 | | | 31 | % | | | 47 | % | | | 23 | % | | | 15 | % | | | 19 | % |
| ^ | The information reflects the investment objective and strategy of the WisdomTree International Dividend ex-Financials Fund through January 17, 2022 and the investment objective and strategy of the WisdomTree International AI Enhanced Value Fund thereafter. |
| 1 | Based on average shares outstanding. |
| 2 | Total return is calculated assuming an initial investment made at the net asset value at the beginning of the period, reinvestment of all dividends and distributions at net asset value during the period and redemption on the last day of the period. For the periods in which the investment advisor waived advisory fees, the total return would have been lower if certain expenses had not been waived (Notes 2 and 3). |
| 3 | The ratios to average net assets do not include net investment income (loss) or expenses of other funds in which the Fund invests. |
| 4 | The expense ratio includes investment advisory fee waivers. Without these investment advisory fee waivers, the expense ratio would have been unchanged. |
| 5 | Included in the expense ratio are “Other fees” described in Note 6. Without these expenses, the expense ratio would have been unchanged. |
| 6 | Portfolio turnover rate excludes the value of the portfolio securities received or delivered as a result of in-kind creations or redemptions of the Fund’s capital shares. Short-term securities with maturities less than or equal to 365 days are excluded from the portfolio turnover calculation. |
| 7 | Included in the expense ratio are “Other fees” described in Note 6. Without these expenses, the expense ratio would have been 0.48%. |
| 8 | The increase in the portfolio turnover rate was primarily a result of the change in investment objective and strategy on January 18, 2022. |
| 9 | On January 7, 2022, Voya Investment Management Co., LLC replaced Mellon Investments Corporation as sub-advisor to the Fund. |
See Notes to Financial Statements.
Financial Highlights (continued)
WisdomTree Trust
Selected data for a share of beneficial interest outstanding throughout the period is presented below:
| | | | | | | | | | | | | | | | | | | | |
WisdomTree International High
Dividend Fund | | For the
Year Ended
March 31, 2022 | | | For the
Year Ended
March 31, 2021 | | | For the
Year Ended
March 31, 2020 | | | For the
Year Ended
March 31, 2019 | | | For the
Year Ended
March 31, 2018 | |
Net asset value, beginning of year | | $ | 39.29 | | | $ | 29.53 | | | $ | 40.30 | | | $ | 43.25 | | | $ | 40.39 | |
Investment operations: | | | | | | | | | | | | | | | | | | | | |
| | | | | |
Net investment income1 | | | 1.90 | | | | 1.54 | | | | 1.65 | | | | 1.78 | | | | 1.66 | |
| | | | | |
Net realized and unrealized gain (loss) | | | 0.63 | | | | 9.73 | | | | (10.75 | ) | | | (2.89 | ) | | | 2.79 | |
Total from investment operations | | | 2.53 | | | | 11.27 | | | | (9.10 | ) | | | (1.11 | ) | | | 4.45 | |
Dividends to shareholders: | | | | | | | | | | | | | | | | | | | | |
| | | | | |
Net investment income | | | (1.89 | ) | | | (1.51 | ) | | | (1.67 | ) | | | (1.84 | ) | | | (1.59 | ) |
Net asset value, end of year | | $ | 39.93 | | | $ | 39.29 | | | $ | 29.53 | | | $ | 40.30 | | | $ | 43.25 | |
| | | | | |
TOTAL RETURN2 | | | 6.61 | % | | | 38.88 | % | | | (23.48 | )% | | | (2.53 | )% | | | 11.12 | % |
RATIOS/SUPPLEMENTAL DATA: | | | | | | | | | | | | | | | | | | | | |
| | | | | |
Net assets, end of year (000’s omitted) | | $ | 201,634 | | | $ | 182,685 | | | $ | 174,236 | | | $ | 251,852 | | | $ | 335,180 | |
| | | | | |
Ratios to average net assets3 of: | | | | | | | | | | | | | | | | | | | | |
| | | | | |
Expenses4 | | | 0.59 | %5 | | | 0.58 | % | | | 0.58 | % | | | 0.58 | % | | | 0.58 | % |
| | | | | |
Net investment income | | | 4.80 | % | | | 4.43 | % | | | 4.18 | % | | | 4.32 | % | | | 3.83 | % |
Portfolio turnover rate6 | | | 40 | % | | | 57 | % | | | 34 | % | | | 24 | % | | | 26 | % |
| | | | | | | | | | | | | | | | | | | | |
WisdomTree International
LargeCap Dividend Fund | | For the
Year Ended
March 31, 2022 | | | For the
Year Ended
March 31, 2021 | | | For the
Year Ended
March 31, 2020 | | | For the
Year Ended
March 31, 2019 | | | For the
Year Ended
March 31, 2018 | |
Net asset value, beginning of year | | $ | 47.34 | | | $ | 36.81 | | | $ | 46.37 | | | $ | 49.48 | | | $ | 45.45 | |
Investment operations: | | | | | | | | | | | | | | | | | | | | |
| | | | | |
Net investment income1 | | | 1.79 | | | | 1.42 | | | | 1.56 | | | | 1.81 | | | | 1.62 | |
| | | | | |
Net realized and unrealized gain (loss) | | | 1.63 | | | | 10.55 | | | | (9.52 | ) | | | (3.09 | ) | | | 3.97 | |
Total from investment operations | | | 3.42 | | | | 11.97 | | | | (7.96 | ) | | | (1.28 | ) | | | 5.59 | |
Dividends to shareholders: | | | | | | | | | | | | | | | | | | | | |
| | | | | |
Net investment income | | | (1.81 | ) | | | (1.44 | ) | | | (1.60 | ) | | | (1.83 | ) | | | (1.56 | ) |
Net asset value, end of year | | $ | 48.95 | | | $ | 47.34 | | | $ | 36.81 | | | $ | 46.37 | | | $ | 49.48 | |
| | | | | |
TOTAL RETURN2 | | | 7.27 | % | | | 32.91 | % | | | (17.78 | )% | | | (2.55 | )% | | | 12.41 | % |
RATIOS/SUPPLEMENTAL DATA: | | | | | | | | | | | | | | | | | | | | |
| | | | | |
Net assets, end of year (000’s omitted) | | $ | 381,807 | | | $ | 352,717 | | | $ | 327,622 | | | $ | 389,510 | | | $ | 442,860 | |
| | | | | |
Ratios to average net assets3 of: | | | | | | | | | | | | | | | | | | | | |
| | | | | |
Expenses4 | | | 0.49 | %7 | | | 0.48 | % | | | 0.48 | % | | | 0.48 | % | | | 0.48 | % |
| | | | | |
Net investment income | | | 3.63 | % | | | 3.33 | % | | | 3.38 | % | | | 3.83 | % | | | 3.30 | % |
Portfolio turnover rate6 | | | 30 | % | | | 38 | % | | | 14 | % | | | 14 | % | | | 16 | % |
| 1 | Based on average shares outstanding. |
| 2 | Total return is calculated assuming an initial investment made at the net asset value at the beginning of the period, reinvestment of all dividends and distributions at net asset value during the period and redemption on the last day of the period. For the periods in which the investment advisor waived advisory fees, the total return would have been lower if certain expenses had not been waived (Notes 2 and 3). |
| 3 | The ratios to average net assets do not include net investment income (loss) or expenses of other funds in which the Fund invests. |
| 4 | The expense ratio includes investment advisory fee waivers. Without these investment advisory fee waivers, the expense ratio would have been unchanged. |
| 5 | Included in the expense ratio are “Other fees” described in Note 6. Without these expenses, the expense ratio would have been 0.58%. |
| 6 | Portfolio turnover rate excludes the value of the portfolio securities received or delivered as a result of in-kind creations or redemptions of the Fund’s capital shares. Short-term securities with maturities less than or equal to 365 days are excluded from the portfolio turnover calculation. |
| 7 | Included in the expense ratio are “Other fees” described in Note 6. Without these expenses, the expense ratio would have been 0.48%. |
See Notes to Financial Statements.
Financial Highlights (continued)
WisdomTree Trust
Selected data for a share of beneficial interest outstanding throughout the period is presented below:
| | | | | | | | | | | | | | | | | | | | |
WisdomTree International MidCap Dividend
Fund | | For the
Year Ended
March 31, 2022 | | | For the
Year Ended
March 31, 2021 | | | For the
Year Ended
March 31, 2020 | | | For the
Year Ended
March 31, 2019 | | | For the
Year Ended
March 31, 2018 | |
Net asset value, beginning of year | | $ | 67.16 | | | $ | 47.06 | | | $ | 61.98 | | | $ | 68.12 | | | $ | 59.88 | |
Investment operations: | | | | | | | | | | | | | | | | | | | | |
| | | | | |
Net investment income1 | | | 2.54 | | | | 1.51 | | | | 2.03 | | | | 2.00 | | | | 1.84 | |
| | | | | |
Net realized and unrealized gain (loss) | | | (2.53 | ) | | | 20.12 | | | | (14.87 | ) | | | (6.17 | ) | | | 8.17 | |
Total from investment operations | | | 0.01 | | | | 21.63 | | | | (12.84 | ) | | | (4.17 | ) | | | 10.01 | |
Dividends to shareholders: | | | | | | | | | | | | | | | | | | | | |
| | | | | |
Net investment income | | | (2.48 | ) | | | (1.53 | ) | | | (2.08 | ) | | | (1.97 | ) | | | (1.77 | ) |
Net asset value, end of year | | $ | 64.69 | | | $ | 67.16 | | | $ | 47.06 | | | $ | 61.98 | | | $ | 68.12 | |
| | | | | |
TOTAL RETURN2 | | | (0.13 | )% | | | 46.54 | % | | | (21.43 | )% | | | (6.16 | )% | | | 16.87 | % |
RATIOS/SUPPLEMENTAL DATA: | | | | | | | | | | | | | | | | | | | | |
| | | | | |
Net assets, end of year (000’s omitted) | | $ | 135,853 | | | $ | 144,404 | | | $ | 169,413 | | | $ | 278,924 | | | $ | 286,089 | |
| | | | | |
Ratios to average net assets of: | | | | | | | | | | | | | | | | | | | | |
| | | | | |
Expenses | | | 0.59 | %3 | | | 0.58 | % | | | 0.58 | % | | | 0.58 | %4,5 | | | 0.58 | %4,5 |
| | | | | |
Net investment income | | | 3.75 | % | | | 2.63 | % | | | 3.30 | % | | | 3.12 | %4 | | | 2.76 | %4 |
Portfolio turnover rate6 | | | 44 | % | | | 62 | % | | | 33 | % | | | 28 | % | | | 23 | % |
| | | | | | | | | | | | | | | | | | | | |
| WisdomTree International Multifactor Fund | | | | | For the
Year Ended
March 31, 2022 | | | For the
Year Ended
March 31, 2021 | | | For the
Year Ended
March 31, 2020 | | | For the Period
August 10, 2018*
through
March 31, 2019 | |
Net asset value, beginning of period | | | | | | $ | 25.43 | | | $ | 20.88 | | | $ | 24.72 | | | $ | 24.75 | |
Investment operations: | | | | | | | | | | | | | | | | | | | | |
| | | | | |
Net investment income1 | | | | | | | 0.79 | | | | 0.59 | | | | 0.75 | | | | 0.55 | |
| | | | | |
Net realized and unrealized gain (loss) | | | | | | | 0.00 | 7 | | | 4.53 | | | | (3.88 | ) | | | (0.27 | ) |
Total from investment operations | | | | | | | 0.79 | | | | 5.12 | | | | (3.13 | ) | | | 0.28 | |
Dividends to shareholders: | | | | | | | | | | | | | | | | | | | | |
| | | | | |
Net investment income | | | | | | | (0.92 | ) | | | (0.57 | ) | | | (0.71 | ) | | | (0.31 | ) |
Net asset value, end of period | | | | | | $ | 25.30 | | | $ | 25.43 | | | $ | 20.88 | | | $ | 24.72 | |
| | | | | |
TOTAL RETURN2 | | | | | | | 3.03 | % | | | 24.70 | % | | | (13.08 | )% | | | 1.18 | % |
RATIOS/SUPPLEMENTAL DATA: | | | | | | | | | | | | | | | | | | | | |
| | | | | |
Net assets, end of period (000’s omitted) | | | | | | $ | 32,886 | | | $ | 38,138 | | | $ | 33,408 | | | $ | 19,778 | |
| | | | | |
Ratios to average net assets of: | | | | | | | | | | | | | | | | | | | | |
| | | | | |
Expenses | | | | | | | 0.39 | %8 | | | 0.38 | % | | | 0.38 | %4,5 | | | 0.38 | %9 |
| | | | | |
Net investment income | | | | | | | 3.01 | % | | | 2.47 | % | | | 3.04 | %4 | | | 3.61 | %9 |
Portfolio turnover rate6 | | | | | | | 105 | % | | | 123 | % | | | 132 | % | | | 114 | % |
| * | Commencement of operations. The commencement of operations date is considered to be the date that the Fund began trading in the secondary market. |
| 1 | Based on average shares outstanding. |
| 2 | Total return is calculated assuming an initial investment made at the net asset value at the beginning of the period, reinvestment of all dividends and distributions at net asset value during the period and redemption on the last day of the period. Total return calculated for a period of less than one year is not annualized. For the periods in which the investment advisor waived advisory fees, the total return would have been lower if certain expenses had not been waived (Notes 2 and 3). |
| 3 | Included in the expense ratio are “Other fees” described in Note 6. Without these expenses, the expense ratio would have been 0.58%. |
| 4 | The ratios to average net assets do not include net investment income (loss) or expenses of other funds in which the Fund invests. |
| 5 | The expense ratio includes investment advisory fee waivers. Without these investment advisory fee waivers, the expense ratio would have been unchanged. |
| 6 | Portfolio turnover rate excludes the value of the portfolio securities received or delivered as a result of in-kind creations or redemptions of the Fund’s capital shares. Short-term securities with maturities less than or equal to 365 days are excluded from the portfolio turnover calculation. |
| 7 | Amount represents less than $0.005. |
| 8 | Included in the expense ratio are “Other fees” described in Note 6. Without these expenses, the expense ratio would have been 0.38%. |
See Notes to Financial Statements.
Financial Highlights (continued)
WisdomTree Trust
Selected data for a share of beneficial interest outstanding throughout the period is presented below:
| | | | | | | | | | | | | | | | | | | | |
WisdomTree International Quality
Dividend Growth Fund | | For the
Year Ended
March 31, 2022 | | | For the
Year Ended
March 31, 2021 | | | For the
Year Ended
March 31, 2020 | | | For the
Period Ended
March 31, 2019 | | | For the
Period Ended
March 31, 2018 | |
Net asset value, beginning of year | | $ | 36.95 | | | $ | 25.87 | | | $ | 28.62 | | | $ | 30.50 | | | $ | 26.14 | |
Investment operations: | | | | | | | | | | | | | | | | | | | | |
| | | | | |
Net investment income1 | | | 1.22 | | | | 0.91 | | | | 0.70 | | | | 0.58 | | | | 0.65 | |
| | | | | |
Net realized and unrealized gain (loss) | | | (0.27 | )^ | | | 10.98 | | | | (2.77 | ) | | | (1.95 | ) | | | 4.12 | |
Total from investment operations | | | 0.95 | ^ | | | 11.89 | | | | (2.07 | ) | | | (1.37 | ) | | | 4.77 | |
Dividends to shareholders: | | | | | | | | | | | | | | | | | | | | |
| | | | | |
Net investment income | | | (1.08 | ) | | | (0.81 | ) | | | (0.68 | ) | | | (0.51 | ) | | | (0.41 | ) |
Net asset value, end of year | | $ | 36.82 | | | $ | 36.95 | | | $ | 25.87 | | | $ | 28.62 | | | $ | 30.50 | |
| | | | | |
TOTAL RETURN2 | | | 2.46 | % | | | 46.22 | % | | | (7.43 | )% | | | (4.43 | )% | | | 18.33 | % |
RATIOS/SUPPLEMENTAL DATA: | | | | | | | | | | | | | | | | | | | | |
| | | | | |
Net assets, end of year (000’s omitted) | | $ | 373,740 | | | $ | 190,307 | | | $ | 68,551 | | | $ | 71,541 | | | $ | 24,396 | |
| | | | | |
Ratios to average net assets of: | | | | | | | | | | | | | | | | | | | | |
| | | | | |
Expenses, net of expense waivers | | | 0.42 | % | | | 0.41 | %3 | | | 0.38 | %4 | | | 0.38 | %4 | | | 0.38 | %4 |
| | | | | |
Expenses, prior to expense waivers | | | 0.42 | % | | | 0.44 | % | | | 0.48 | % | | | 0.48 | % | | | 0.48 | % |
| | | | | |
Net investment income | | | 3.16 | % | | | 2.73 | % | | | 2.38 | % | | | 2.05 | % | | | 2.18 | % |
Portfolio turnover rate5 | | | 63 | % | | | 66 | % | | | 51 | % | | | 55 | % | | | 39 | % |
| | | | | | | | | | | | | | | | | | | | |
WisdomTree International
SmallCap Dividend Fund | | For the
Year Ended
March 31, 2022 | | | For the
Year Ended
March 31, 2021 | | | For the
Year Ended
March 31, 2020 | | | For the
Year Ended
March 31, 2019 | | | For the
Year Ended
March 31, 2018 | |
Net asset value, beginning of year | | $ | 72.16 | | | $ | 48.29 | | | $ | 65.74 | | | $ | 75.80 | | | $ | 65.18 | |
Investment operations: | | | | | | | | | | | | | | | | | | | | |
| | | | | |
Net investment income1 | | | 2.27 | | | | 1.55 | | | | 2.36 | | | | 2.19 | | | | 2.07 | |
| | | | | |
Net realized and unrealized gain (loss) | | | (2.72 | ) | | | 23.97 | | | | (17.32 | ) | | | (10.01 | ) | | | 10.76 | |
Total from investment operations | | | (0.45 | ) | | | 25.52 | | | | (14.96 | ) | | | (7.82 | ) | | | 12.83 | |
Dividends to shareholders: | | | | | | | | | | | | | | | | | | | | |
| | | | | |
Net investment income | | | (2.42 | ) | | | (1.65 | ) | | | (2.49 | ) | | | (2.24 | ) | | | (2.21 | ) |
Net asset value, end of year | | $ | 69.29 | | | $ | 72.16 | | | $ | 48.29 | | | $ | 65.74 | | | $ | 75.80 | |
| | | | | |
TOTAL RETURN2 | | | (0.79 | )% | | | 53.46 | % | | | (23.58 | )% | | | (10.41 | )% | | | 19.91 | % |
RATIOS/SUPPLEMENTAL DATA: | | | | | | | | | | | | | | | | | | | | |
| | | | | |
Net assets, end of year (000’s omitted) | | $ | 1,330,363 | | | $ | 1,403,518 | | | $ | 1,161,439 | | | $ | 1,673,095 | | | $ | 1,940,467 | |
| | | | | |
Ratios to average net assets6 of: | | | | | | | | | | | | | | | | | | | | |
| | | | | |
Expenses7 | | | 0.61 | %8 | | | 0.58 | % | | | 0.58 | % | | | 0.58 | % | | �� | 0.58 | % |
| | | | | |
Net investment income | | | 3.08 | % | | | 2.54 | % | | | 3.63 | % | | | 3.15 | % | | | 2.83 | % |
Portfolio turnover rate5 | | | 55 | % | | | 74 | % | | | 50 | % | | | 35 | % | | | 28 | % |
| ^ | The amount per share does not correspond with the amount reported within the Statements of Changes due to the timing of capital share transactions of Fund shares and fluctuating market values during the fiscal year. |
| 1 | Based on average shares outstanding. |
| 2 | Total return is calculated assuming an initial investment made at the net asset value at the beginning of the period, reinvestment of all dividends and distributions at net asset value during the period and redemption on the last day of the period. For the periods in which the investment advisor waived advisory fees, the total return would have been lower if certain expenses had not been waived (Notes 2 and 3). |
| 3 | The investment advisor had contractually agreed to limit the advisory fee to 0.38% through July 31, 2020. On July 31, 2020, the contractual waiver expired and the advisory fee was permanently reduced to 0.42%. |
| 4 | Effective April 7, 2016, the investment advisor contractually agreed to limit the advisory fee to 0.38% through July 31, 2020, unless earlier terminated by the Board of Trustees of the Trust. |
| 5 | Portfolio turnover rate excludes the value of the portfolio securities received or delivered as a result of in-kind creations or redemptions of the Fund’s capital shares. Short-term securities with maturities less than or equal to 365 days are excluded from the portfolio turnover calculation. |
| 6 | The ratios to average net assets do not include net investment income (loss) or expenses of other funds in which the Fund invests. |
| 7 | The expense ratio includes investment advisory fee waivers. Without these investment advisory fee waivers, the expense ratio would have been unchanged. |
| 8 | Included in the expense ratio are “Other fees” described in Note 6. Without these expenses, the expense ratio would have been 0.58%. |
See Notes to Financial Statements.
Financial Highlights (concluded)
WisdomTree Trust
Selected data for a share of beneficial interest outstanding throughout the period is presented below:
| | | | | | | | | | | | | | | | | | | | |
| WisdomTree Japan SmallCap Dividend Fund | | For the
Year Ended
March 31, 2022 | | | For the
Year Ended
March 31, 2021 | | | For the
Year Ended
March 31, 2020 | | | For the
Year Ended
March 31, 2019 | | | For the
Year Ended
March 31, 2018 | |
Net asset value, beginning of year | | $ | 76.06 | | | $ | 58.64 | | | $ | 68.10 | | | $ | 80.93 | | | $ | 66.48 | |
Investment operations: | | | | | | | | | | | | | | | | | | | | |
| | | | | |
Net investment income1 | | | 1.71 | | | | 1.17 | | | | 1.14 | | | | 1.00 | | | | 1.47 | |
| | | | | |
Net realized and unrealized gain (loss) | | | (9.68 | ) | | | 18.13 | | | | (8.95 | ) | | | (12.61 | ) | | | 14.27 | |
Total from investment operations | | | (7.97 | ) | | | 19.30 | | | | (7.81 | ) | | | (11.61 | ) | | | 15.74 | |
Dividends to shareholders: | | | | | | | | | | | | | | | | | | | | |
| | | | | |
Net investment income | | | (1.48 | ) | | | (1.88 | ) | | | (1.65 | ) | | | (1.22 | ) | | | (1.29 | ) |
Net asset value, end of year | | $ | 66.61 | | | $ | 76.06 | | | $ | 58.64 | | | $ | 68.10 | | | $ | 80.93 | |
| | | | | |
TOTAL RETURN2 | | | (10.62 | )% | | | 33.27 | % | | | (11.85 | )% | | | (14.38 | )% | | | 23.84 | % |
RATIOS/SUPPLEMENTAL DATA: | | | | | | | | | | | | | | | | | | | | |
| | | | | |
Net assets, end of year (000’s omitted) | | $ | 213,148 | | | $ | 190,141 | | | $ | 237,503 | | | $ | 616,294 | | | $ | 1,100,591 | |
| | | | | |
Ratios to average net assets3 of: | | | | | | | | | | | | | | | | | | | | |
| | | | | |
Expenses4 | | | 0.58 | % | | | 0.58 | % | | | 0.58 | % | | | 0.58 | % | | | 0.58 | % |
| | | | | |
Net investment income | | | 2.34 | % | | | 1.73 | % | | | 1.67 | % | | | 1.35 | % | | | 1.94 | % |
Portfolio turnover rate5 | | | 36 | % | | | 43 | % | | | 38 | % | | | 42 | % | | | 18 | % |
| 1 | Based on average shares outstanding. |
| 2 | Total return is calculated assuming an initial investment made at the net asset value at the beginning of the period, reinvestment of all dividends and distributions at net asset value during the period and redemption on the last day of the period. For the periods in which the investment advisor waived advisory fees, the total return would have been lower if certain expenses had not been waived (Notes 2 and 3). |
| 3 | The ratios to average net assets do not include net investment income (loss) or expenses of other funds in which the Fund invests. |
| 4 | The expense ratio includes investment advisory fee waivers. Without these investment advisory fee waivers, the expense ratio would have been unchanged. |
| 5 | Portfolio turnover rate excludes the value of the portfolio securities received or delivered as a result of in-kind creations or redemptions of the Fund’s capital shares. Short-term securities with maturities less than or equal to 365 days are excluded from the portfolio turnover calculation. |
See Notes to Financial Statements.
Notes to Financial Statements
1. ORGANIZATION
WisdomTree Trust (the “Trust”) is registered under the Investment Company Act of 1940, as amended (the “1940 Act”), as an open-end management investment company. The Trust was established as a Delaware statutory trust on December 15, 2005 and is authorized to have multiple series of portfolios (each a “Fund”, collectively, the “Funds”). These notes relate only to the Funds listed below. In accordance with Accounting Standards Codification Topic 946, Financial Services-Investment Companies, each Fund listed below qualifies as an investment company and is applying the accounting and reporting guidance for investment companies.
| | | | |
| | |
| Fund | | Commencement
of Operations | |
WisdomTree Europe Quality Dividend Growth Fund (“Europe Quality Dividend Growth Fund”) | | | May 7, 2014 | |
WisdomTree Europe SmallCap Dividend Fund (“Europe SmallCap Dividend Fund”) | | | June 16, 2006 | |
WisdomTree International AI Enhanced Value Fund (“International AI Enhanced Value Fund”)
(formerly, WisdomTree International Dividend ex-Financials Fund (DOO)) | | | June 16, 2006 | |
WisdomTree International Equity Fund (“International Equity Fund”) | | | June 16, 2006 | |
WisdomTree International High Dividend Fund (“International High Dividend Fund”) | | | June 16, 2006 | |
WisdomTree International LargeCap Dividend Fund (“International LargeCap Dividend Fund”) | | | June 16, 2006 | |
WisdomTree International MidCap Dividend Fund (“International MidCap Dividend Fund”) | | | June 16, 2006 | |
WisdomTree International Multifactor Fund (“International Multifactor Fund”) | | | August 10, 2018 | |
WisdomTree International Quality Dividend Growth Fund (“International Quality Dividend Growth Fund”) | | | April 7, 2016 | |
WisdomTree International SmallCap Dividend Fund (“International SmallCap Dividend Fund”) | | | June 16, 2006 | |
WisdomTree Japan SmallCap Dividend Fund (“Japan SmallCap Dividend Fund”) | | | June 16, 2006 | |
Each Fund, except for the International AI Enhanced Value Fund and International Multifactor Fund, seeks to track the price and yield performance, before fees and expenses, of a particular index (“Index”) developed by WisdomTree Investments, Inc. (“WisdomTree Investments”). Effective January 18, 2022, the International AI Enhanced Value Fund is actively managed using a model-based approach seeking income and capital appreciation. Prior to January 18, 2022, the International AI Enhanced Value Fund was known as the WisdomTree International Dividend ex-Financials Fund which was a passively managed fund that sought to track the price and yield performance, before fees and expenses, of an index developed by WisdomTree Investments. The International Multifactor Fund is actively managed using a model-based approach seeking capital appreciation. WisdomTree Investments is the parent company of WisdomTree Asset Management, Inc. (“WTAM”), the investment adviser to each Fund and the Trust. “WisdomTree” is a registered trademark of WisdomTree Investments and has been licensed for use by the Trust. Each Fund described herein is considered to be non-diversified as defined under the 1940 Act.
In the normal course of business, the Funds may enter into contracts that contain a variety of representations or that provide indemnification for certain liabilities. The Funds’ maximum exposure under these arrangements is unknown, as this would involve future claims that may be made against the Funds that have not yet occurred. However, the Funds have not had prior claims or losses pursuant to these contracts and believes such exposure to be remote.
2. SIGNIFICANT ACCOUNTING POLICIES
The Financial Accounting Standards Board (“FASB”) Accounting Standards Codification (the “Codification”) is the exclusive reference of authoritative U.S. generally accepted accounting principles (“GAAP”) recognized by the FASB to be applied by nongovernmental entities. Rules and interpretive releases of the Securities and Exchange Commission (“SEC”) under authority of federal laws are also sources of authoritative GAAP for SEC registrants.
The following is a summary of significant accounting policies followed by the Funds:
Use of Estimates — The preparation of financial statements in conformity with GAAP, requires management to make certain estimates and assumptions that affect the reported amounts of assets and liabilities and disclosure of contingent assets and liabilities at the date of the financial statements and the reported amounts of increases and decreases in the net assets from operations during the reporting period. Actual results could differ from those estimates.
Investment Valuation — The net asset value (“NAV”) of each Fund’s shares is calculated each day a Fund is open for business as of the regularly scheduled close of regular trading on the New York Stock Exchange, normally 4:00 p.m. Eastern time (the “NAV Calculation Time”). NAV per share is calculated by dividing a Fund’s net assets by the number of Fund shares outstanding. Each Fund issues and redeems shares at NAV only in large blocks of shares known as creation units, which only certain institutions (e.g., broker-dealers) may purchase or redeem. Shares of each Fund are listed on a national securities exchange and trade at market prices. Most investors will buy and sell shares in the secondary market through brokers. Because Fund shares trade at market prices rather than NAV, shares may trade at a price greater than NAV or less than NAV. In calculating each Fund’s NAV, investments are valued under policies approved by the Board of Trustees of the Trust (the “Board of Trustees”). Equity securities (including preferred stock) traded on any recognized U.S. or non-U.S. exchange are valued at the last sale price or official closing price on the exchange on which they are principally traded. Unlisted equity securities (including preferred stock) are valued at the last sale
Notes to Financial Statements (continued)
price or, if no sale price is available, at the mean between the highest bid and lowest ask price. Each Fund may invest in money market funds which are valued at their NAV per share and exchange-traded funds (“ETFs” or “ETF”) or exchange-traded notes (“ETNs” or “ETN”) which are valued at their last sale or official closing price on the exchange on which they are principally traded or at their NAV per share in instances where the ETF or ETN has not traded on its principal exchange. Foreign currency contracts that settle within two business days after the trade date (“Spot Contracts”) and foreign currency contracts having a settlement period greater than two business days after the trade date (“Forward Contracts”) are valued daily using WM/Reuters closing spot and forward rates, respectively, as of 4:00 p.m. London time. Futures contracts generally are valued at the settlement price, the price at which a futures contract settles once a given trading day has ended, on the primary exchange on which they trade.
In certain instances, such as when reliable market valuations are not readily available, a Fund’s investments, which include derivatives, will be fair valued in accordance with the Fund’s pricing policy. The Board of Trustees has established a pricing committee (the “Pricing Committee”) which is comprised of senior representatives of WTAM and which reports to the Board of Trustees on a quarterly basis. In the event that a financial instrument cannot be valued based upon a price from the exchange or system on which it is principally traded, independent pricing service provider or broker-dealer quotation, or such prices are deemed to not reflect current market value, the Pricing Committee may value the financial instrument in good faith under the policies and procedures approved by the Board of Trustees based on current facts and circumstances. Securities that may be valued using “fair value” pricing may include, but are not limited to, securities for which there are no current market quotations, securities whose issuer is in default or bankruptcy, securities subject to corporate actions (such as mergers or reorganizations), securities subject to non-U.S. investment limits or currency controls, and securities affected by “significant events.” An example of a significant event is an event occurring after the close of the market in which a security trades but before a Fund’s next NAV Calculation Time that may materially affect the value of a Fund’s investment (e.g., government action, natural disaster, or significant market fluctuation). When fair value pricing is employed, the prices of securities used by a Fund to calculate its NAV may differ from quoted or published prices for the same securities.
Fair Value Measurement — In accordance with Codification Topic 820 (“ASC 820”), Fair Value Measurements and Disclosures, fair value is defined as the price that would be received to sell an asset or paid to transfer a liability in an orderly transaction between market participants at the measurement date. The Pricing Committee will perform other procedures (consistent with GAAP) to value an investment when a market quote is not available. ASC 820 established a three-tier hierarchy of inputs to be used when determining fair value measurements for disclosure purposes. Inputs refer broadly to the assumptions that market participants would use in pricing the asset or liability, including assumptions about risk — for example, the risk inherent in a particular valuation technique used to measure fair value (such as a pricing model) and/or the risk inherent in the inputs to the valuation technique. Inputs may be observable or unobservable. Observable inputs reflect the assumptions market participants would use in pricing the asset or liability. Observable inputs are based on market data obtained from sources independent of the reporting entity. Unobservable inputs reflect the reporting entity’s own assumptions about the assumptions market participants would use in pricing the asset or liability. Unobservable inputs are based on the best information available in the circumstances. The three-tier hierarchy of inputs is summarized in the three broad levels listed below:
Level 1 – quoted prices in active markets for identical securities
Level 2 – other significant observable inputs (including quoted prices for similar securities, interest rates,
prepayment speeds, credit risk, etc.)
Level 3 – significant unobservable inputs (including each Fund’s assumptions in determining the fair value of
investments)
The inputs or methodology used for valuation are not necessarily an indication of the risk associated with investing in those investments.
Investments that use Level 2 or Level 3 inputs may include, but are not limited to: (i) an unlisted security related to corporate actions; (ii) a restricted security (e.g., one that may not be publicly sold without registration under the Securities Act of 1933, as amended); (iii) a security whose trading has been suspended (either due to events affecting the issuer of the security specifically or events affecting the primary trading exchange more broadly) or which has been de-listed from its primary trading exchange; (iv) a security that is thinly traded; (v) a security in default or bankruptcy proceedings for which there is no current market quotation or market activity; (vi) a security affected by currency controls or restrictions; and (vii) a security affected by a significant event (e.g., an event that occurs after the close of the markets in which the security is traded but before the time as of which a Fund’s NAV is computed and that may materially affect the value of the Fund’s investments).
The valuation techniques and significant inputs used in determining the fair market value measurements for Level 2 and Level 3 positions are as follows:
Financial instruments are generally valued by independent pricing service providers that use broker-dealer quotations, reported trades or valuation estimates from their internal pricing models. Depending on the type of financial instrument, the independent
Notes to Financial Statements (continued)
pricing service providers’ internal pricing models may use inputs that are observable such as issuer details (e.g., credit rating, debt ranking, coupon date, maturity date, etc.), interest rates, yield curves, prepayment speeds, credit risks/spreads, default rates and quoted prices for similar assets. Financial instruments that use similar valuation techniques and observable inputs as described above and have an appropriate level of market activity are categorized as Level 2 of the fair value hierarchy, otherwise a Level 3 fair value classification is appropriate. Over-the-counter financial derivative instruments derive their value from underlying asset prices, indices, reference rates, and other inputs or a combination of these factors. These instruments are normally valued on the basis of broker-dealer quotations or prices obtained from independent pricing service providers. Depending on the product and the terms of the transaction, the value of the financial derivative instruments can be estimated by an independent pricing service provider using a series of techniques including simulation pricing models. The pricing models may use inputs that are observed from actively quoted markets such as issuer details, indices, credit risks/spreads, interest rates, yield curves, default and exchange rates. Derivative contracts that use similar valuation techniques and observable inputs as described above and have an appropriate level of market activity are categorized as Level 2 of the fair value hierarchy, otherwise a Level 3 fair value classification is appropriate.
Determination of a fair value by the Pricing Committee may include significant unobservable inputs and therefore such financial instruments would be reflected as a Level 3 of the fair value hierarchy. The Pricing Committee may employ a market-based valuation approach which may use, among other potential considerations, related or comparable securities, recent transactions, market multiples, and other relevant information to determine fair value. The Pricing Committee may also use an income-based valuation approach in which anticipated future cash flows of the financial instrument are discounted to calculate fair value.
The summary of fair valuations according to the inputs used in valuing each Fund’s assets as of the measurement date is included in a “Fair Valuation Summary” supplementary table in each applicable Fund’s Schedule of Investments.
During the fiscal year ended March 31, 2022, there were no significant transfers into or out of Level 3 of the fair value hierarchy.
Derivatives and Hedging Disclosure — Codification Topic 815 (“ASC 815”), Derivatives and Hedging, requires qualitative disclosures about objectives and strategies for using derivatives, quantitative disclosures about fair value amounts as well as gains and losses on derivative instruments, and disclosures about credit-risk-related contingent features in derivative agreements. The Funds have invested in derivatives, specifically foreign currency contracts and equity futures contracts during the fiscal year ended March 31, 2022 and open positions in such derivatives as of March 31, 2022 are detailed in each Fund’s Schedule of Investments. All of the derivative instruments disclosed and described herein are subject to risk. Risks may arise upon entering into foreign currency contracts from potential inability of a counterparty to meet the terms of their contracts and from unanticipated movements in the value of the foreign currencies relative to the U.S. dollar or each other. The Funds’ derivative agreements may also contain credit-risk related contingent features which include, but are not limited to, a percentage decline in the Funds’ NAV over a specified time period. If an event occurred at March 31, 2022 that triggered a contingent feature, the counterparty to the agreement may require the Funds to post additional collateral or terminate the derivative positions and demand payment. Any collateral posted with respect to the derivative positions would be used to offset or reduce the payment. The maximum exposure to derivatives agreements with credit-risk related contingent features would be the total value of derivatives in net liability positions for each Fund, as disclosed in the table included in Note 2 — Master Netting Arrangements. Information with respect to the amounts and types of collateral received and/or posted for derivative instruments as of March 31, 2022, if any, is reflected as a footnote within each Fund’s Schedule of Investments.
As of March 31, 2022, the effects of such derivative instruments on each Fund’s financial position as reflected in the Statements of Assets and Liabilities are presented in the summary below:
| | | | | | | | | | | | |
| | | |
| | | Asset Derivatives | | | Liability Derivatives | |
| | | | |
| Fund | | Balance Sheet Location | | Value | | | Balance Sheet Location | | Value | |
Europe SmallCap Dividend Fund | | | | | | | | | | | | |
Foreign currency risk | | Unrealized appreciation on
foreign currency contracts | | $ | 43 | | | Unrealized depreciation on
foreign currency contracts | | $ | 1,898 | |
International AI Enhanced Value Fund | | | | | | | | | | | | |
Foreign currency risk | | Unrealized appreciation on
foreign currency contracts | | | — | | | Unrealized depreciation on
foreign currency contracts | | | 650 | |
International Equity Fund | | | | | | | | | | | | |
Foreign currency risk | | Unrealized appreciation on
foreign currency contracts | | | 10 | | | Unrealized depreciation on
foreign currency contracts | | | — | |
International High Dividend Fund | | | | | | | | | | | | |
Foreign currency risk | | Unrealized appreciation on
foreign currency contracts | | | — | | | Unrealized depreciation on
foreign currency contracts | | | 125 | |
Notes to Financial Statements (continued)
| | | | | | | | | | | | |
| | | |
| | | Asset Derivatives | | | Liability Derivatives | |
| | | | |
| Fund | | Balance Sheet Location | | Value | | | Balance Sheet Location | | Value | |
International Multifactor Fund | | | | | | | | | | | | |
Foreign currency risk | | Unrealized appreciation on
foreign currency contracts | | $ | 306,658 | | | Unrealized depreciation on
foreign currency contracts | | $ | 242,479 | |
International SmallCap Dividend Fund | | | | | | | | | | | | |
Foreign currency risk | | Unrealized appreciation on
foreign currency contracts | | | 1,709 | | | Unrealized depreciation on
foreign currency contracts | | | — | |
Japan SmallCap Dividend Fund | | | | | | | | | | | | |
Foreign currency risk | | Unrealized appreciation onforeign currency contracts | | | — | | | Unrealized depreciation on
foreign currency contracts | | | 704 | |
For the fiscal year ended March 31, 2022, the effects of derivative instruments on each applicable Fund’s financial performance as reflected in the Statements of Operations are presented in the summary below:
| | | | | | | | |
| | | |
| Fund | | Amount of Realized Gain
or (Loss) on Derivatives
Recognized1 | | | Change in Unrealized
Appreciation or
(Depreciation) on
Derivatives Recognized2 | |
Europe Quality Dividend Growth Fund | | | | | | | | |
Foreign currency risk | | $ | (1,801 | ) | | $ | — | |
Europe SmallCap Dividend Fund | | | | | | | | |
Equity risk | | | (40,770 | ) | | | — | |
Foreign currency risk | | | (26,241 | ) | | | (1,228 | ) |
International AI Enhanced Value Fund | | | | | | | | |
Foreign currency risk | | | (147,728 | ) | | | (558 | ) |
International Equity Fund | | | | | | | | |
Foreign currency risk | | | 103,107 | | | | 289 | |
International High Dividend Fund | | | | | | | | |
Foreign currency risk | | | 48,198 | | | | 31 | |
International LargeCap Dividend Fund | | | | | | | | |
Foreign currency risk | | | 69,599 | | | | — | |
International MidCap Dividend Fund | | | | | | | | |
Foreign currency risk | | | 2,201 | | | | — | |
International Multifactor Fund | | | | | | | | |
Foreign currency risk | | | 1,460,164 | | | | (282,698 | ) |
International Quality Dividend Growth Fund | | | | | | | | |
Foreign currency risk | | | 33,299 | | | | — | |
International SmallCap Dividend Fund | | | | | | | | |
Equity risk | | | 123,276 | | | | — | |
Foreign currency risk | | | 127,775 | | | | (66 | ) |
Japan SmallCap Dividend Fund | | | | | | | | |
Foreign currency risk | | | 5,732 | | | | (704 | ) |
| | 1 | Realized gains (losses) on derivatives are located on the Statements of Operations as follows: |
| | |
Equity risk | | Net realized gain (loss) from futures contracts |
Foreign currency risk | | Net realized gain (loss) from foreign currency contracts |
| | 2 | Change in unrealized appreciation (depreciation) is located on the Statements of Operations as follows: |
| | |
Foreign currency risk | | Net increase (decrease) in unrealized appreciation/depreciation from foreign currency contracts |
During the fiscal year ended March 31, 2022, the volume of derivative activity (based on the average of month-end balances, except where footnoted) for each Fund was as follows:
| | | | | | | | | | | | |
| | |
| | | Average Notional | |
| | | |
| Fund | | Foreign currency
contracts
(to deliver
USD) | | | Foreign currency
contracts
(to receive
USD) | | | Futures
contracts
(long) | |
Europe Quality Dividend Growth Fund | | | | | | | | | | | | |
Foreign currency risk | | $ | 201,023 | | | $ | 15,117 | | | $ | — | |
Notes to Financial Statements (continued)
| | | | | | | | | | | | |
| | |
| | | Average Notional | |
| | | |
| Fund | | Foreign currency
contracts
(to deliver
USD) | | | Foreign currency
contracts
(to receive
USD) | | | Futures
contracts
(long) | |
Europe SmallCap Dividend Fund | | | | | | | | | | | | |
Equity risk1 | | $ | — | | | $ | — | | | $ | 212,503 | |
Foreign currency risk | | | 255,858 | | | | 144,387 | | | | — | |
International AI Enhanced Value Fund | | | | | | | | | | | | |
Foreign currency risk | | | — | | | | 40,575 | | | | — | |
International Equity Fund | | | | | | | | | | | | |
Foreign currency risk | | | 95,392 | | | | 88,680 | | | | — | |
International High Dividend Fund | | | | | | | | | | | | |
Foreign currency risk | | | 77,933 | | | | 50,093 | | | | — | |
International LargeCap Dividend Fund | | | | | | | | | | | | |
Foreign currency risk | | | 19,500 | | | | 108,213 | | | | — | |
International MidCap Dividend Fund | | | | | | | | | | | | |
Foreign currency risk1 | | | 862,807 | | | | 1,321,025 | | | | — | |
International Multifactor Fund | | | | | | | | | | | | |
Foreign currency risk | | | 3,702,977 | | | | 27,542,649 | | | | — | |
International Quality Dividend Growth Fund | | | | | | | | | | | | |
Foreign currency risk | | | 72,181 | | | | 7,225 | | | | — | |
International SmallCap Dividend Fund | | | | | | | | | | | | |
Equity risk1 | | | — | | | | — | | | | 1,386,864 | |
Foreign currency risk | | | 257,885 | | | | 701,279 | | | | — | |
Japan SmallCap Dividend Fund | | | | | | | | | | | | |
Foreign currency risk | | | — | | | | 56,524 | | | | — | |
| | 1 | The volume of derivative activity for the period is based on intra-month balances. |
Investment Transactions and Investment Income — Investment transactions are recorded as of the date that the securities are purchased or sold (trade date). Realized gains and losses on sales of portfolio securities are calculated using the identified-cost method. Dividend income (less foreign taxes withheld, if any) is recognized on the ex-dividend date or as soon as practicable (with respect to foreign dividends) after the existence of a dividend declaration has been determined. Non-cash dividend income is recognized on the ex-dividend date, or as soon as practicable (with respect to foreign dividends) after the existence of a dividend declaration has been determined, at the fair value of securities to be received. On each measurement date, the Funds evaluate the collectability of receivable balances. Generally, the Funds will write-off dividend receivable balances that are canceled by the issuer as of the date that the dividend receivable cancellation notification was publicly made available or when it becomes probable that dividends will not be collected and the amount of uncollectable dividends can be reasonably estimated. Income earned from securities lending activities (i.e., securities lending income), net of fees payable to the securities borrower and/or securities lending agent, is accrued daily.
Foreign Currency Translation — The accounting records of the Funds are maintained in U.S. dollars. Foreign currencies, as well as investment securities and other assets and liabilities denominated in foreign currencies, are translated into U.S. dollars using exchange rates prevailing on the respective dates of such transactions that are deemed appropriate by WTAM. Realized and unrealized foreign exchange gains and losses on investments are included as a component of “net realized gain (loss) from investment transactions” and “net increase (decrease) in unrealized appreciation/depreciation from investment transactions”, respectively, on the Statements of Operations. Realized and unrealized foreign exchange gains or losses from foreign currency contracts are included in “net realized gain (loss) from foreign currency contracts” and “net increase (decrease) in unrealized appreciation/depreciation from foreign currency contracts”, respectively, on the Statements of Operations. Realized and unrealized foreign exchange gains or losses arising from sales of foreign currencies, currency gains or losses recognized between the trade and settlement dates on investment transactions, and the difference between the amounts of dividends and foreign withholding taxes recorded on the Funds’ books and the U.S. dollar equivalent of the amounts actually received or paid are included in “net realized gain (loss) from foreign currency related transactions” and/or “net increase (decrease) in unrealized appreciation/depreciation from translation of assets and liabilities denominated in foreign currencies” in the Statements of Operations. Certain foreign exchange gains and losses included in realized and unrealized gains or losses are included in, or are a reduction of, ordinary income in accordance with U.S. Federal income tax regulations.
Expenses — Under the investment advisory agreement for each Fund, except for Funds that commenced operations on or after March 26, 2013, WTAM has agreed to pay all expenses of the Trust, except for: (i) brokerage expenses and other expenses (such as stamp taxes) connected with the execution of portfolio transactions or in connection with creation and redemption transactions;
Notes to Financial Statements (continued)
(ii) legal fees or expenses in connection with any arbitration, litigation or pending or threatened arbitration or litigation, including any settlements in connection therewith; (iii) compensation and expenses of trustees who are not interested persons of the Funds (“Independent Trustees”); (iv) compensation and expenses of counsel to the Independent Trustees; (v) compensation and expenses of the Trust’s Chief Compliance Officer (“CCO”); (vi) extraordinary expenses; (vii) distribution fees and expenses paid by the Trust under any distribution plan adopted pursuant to Rule 12b-1 under the 1940 Act; and (viii) the advisory fee payable to WTAM.
Under the investment advisory agreement for Funds that commenced operations on or after March 26, 2013, WTAM has agreed to pay all expenses of the Trust, except for: (i) brokerage expenses and other fees, charges, taxes, levies or expenses (such as stamp taxes) incurred in connection with the execution of portfolio transactions or in connection with creation and redemption transactions (including without limitation any fees, charges, taxes, levies or expenses related to the purchase or sale of an amount of any currency, or the patriation or repatriation of any security or other asset, related to the execution of portfolio transactions or any creation or redemption transactions); (ii) legal fees or expenses in connection with any arbitration, litigation or pending or threatened arbitration or litigation, including any settlements in connection therewith; (iii) compensation and expenses of each Independent Trustee; (iv) compensation and expenses of counsel to the Independent Trustees; (v) compensation and expenses of the Trust’s CCO; (vi) extraordinary expenses (in each case as determined by a majority of the Independent Trustees); (vii) distribution fees and expenses paid by the Trust under any distribution plan adopted pursuant to Rule 12b-1 under the 1940 Act; (viii) interest and taxes of any kind or nature (including, but not limited to, income, excise, transfer and withholding taxes); (ix) fees and expenses related to the provision of securities lending services; and (x) the advisory fee payable to WTAM.
Acquired fund fees and expenses (“AFFEs”) (which are fees and expenses incurred indirectly by a Fund through its investments in certain underlying investment companies) are not operating expenses of the Funds and are not paid by WTAM.
Pursuant to a separate contractual arrangement, WTAM arranges for the provision of CCO services with respect to each Fund, and is liable and responsible for, and administers, payments to the CCO, the Independent Trustees and counsel to the Independent Trustees. WTAM receives a fee, as shown on the Statements of Operations under “Service fees”, of up to 0.0044% per annum of each Fund’s average daily net assets for providing such services and paying such expenses. WTAM provides CCO services to the Trust.
Foreign Currency Contracts — The Funds may enter into foreign currency contracts to facilitate local securities settlements or to protect against currency exposure. The Funds, other than the International Multifactor Fund, do not expect to engage in currency transactions for the purpose of hedging against currency exposures of the Fund’s assets that are denominated in one or more foreign currencies. The Funds may not enter into such contracts for speculative purposes. During the fiscal year ended March 31, 2022, the Funds, except for the International Multifactor Fund, utilized foreign currency contracts primarily to facilitate foreign security settlements. The International Multifactor Fund utilized foreign currency contracts primarily to offset applicable international currency exposure from certain positions in international equities. A foreign currency contract involves an obligation to purchase or sell a specific currency at a future date, which may be any fixed number of days from the date of the contract agreed upon by the parties, at a price set at the time of the contract. These contracts are principally traded in the inter-bank market conducted directly between currency traders (usually large, commercial banks) and their customers. A foreign currency contract generally does not require an initial margin deposit and no commissions are charged at any stage for trades. However, if a Fund is in an unrealized loss position on a foreign currency contract, it may be required to pledge collateral (or additional collateral) to the counterparty. If a Fund is in an unrealized gain position on a foreign currency contract, it may receive collateral from the counterparty. In the event of a default or inability of counterparties to meet the terms of their contracts, the non-defaulting party generally has the right to liquidate the collateral and apply the proceeds in satisfaction of the contract terms.
Risks may arise upon entering into foreign currency contracts from the potential inability of counterparties to meet the terms of their contracts and from unanticipated movements in the value of foreign currencies relative to the U.S. dollar or each other.
Fluctuations in the value of open foreign currency contracts are recorded for book purposes as unrealized gains or losses on foreign currency contracts by the Funds and are included in “net increase (decrease) in unrealized appreciation/depreciation from foreign currency contracts” on the Statements of Operations. Realized gains and losses on foreign currency contracts include net gains or losses recognized by the Funds on contracts which have settled are included in “net realized gain (loss)” from foreign currency contracts on the Statements of Operations.
Futures Contracts — The Europe SmallCap Dividend Fund and International SmallCap Dividend Fund utilized equity futures contracts on a temporary basis during the period to obtain market exposure consistent with their investment objective during each Fund’s annual portfolio rebalance. When a Fund purchases a listed futures contract, it agrees to purchase a specified reference asset (e.g., commodity, currency or U.S. Treasury security) at a specified future date. When a Fund sells a listed futures contract, it agrees to sell a specified reference asset (e.g., commodity, currency or U.S. Treasury security) at a specified future date. The price at which the purchase and sale will take place is fixed when the Fund enters into the contract. The exchange clearing corporation is the ultimate counterparty for all exchange-listed contracts, so credit risk is limited to the creditworthiness of the exchange clearing corporation.
Notes to Financial Statements (continued)
Upon entering into a futures contract, a Fund is required to deliver to a broker an amount of cash and/or U.S. government securities equal to a certain percentage of the contract amount. This amount is known as the “initial margin”. Cash deposited as initial margin, if any, is shown as “Deposits at broker for futures contracts” in the Statement of Assets and Liabilities, and U.S. government securities deposited as initial margin, if any, are designated in the Schedule of Investments. Subsequent payments, known as “variation margin”, generally are made or received by the Fund each day or at other agreed-upon time periods depending on the fluctuations in the value of the underlying futures contracts, except that in the case of certain futures contracts, variation margin payments may be made or received when the futures contract expires. Variation margin is recorded for financial statement purposes on a daily basis as an unrealized gain or loss on futures until the financial futures contract is closed, at which time the net gain or loss is reclassified to realized gain or loss on futures. When a Fund purchases or sells a futures contract, the Fund is required to “cover” its position in order to limit the risk associated with the use of leverage and other related risks. To cover its position, a Fund will segregate assets consisting of, or take other measures with respect to, cash or liquid securities that, when added to any amounts deposited with a futures commission merchant as margin, will “cover” its position in a manner consistent with the 1940 Act or the rules and SEC interpretations thereunder. This will function as a practical limit on the amount of leverage which a Fund may undertake and on the potential increase in the speculative character of a Fund’s outstanding portfolio securities.
As of March 31, 2022, there were no open futures contracts in the Funds.
Securities Lending — Each Fund may lend portfolio securities to certain creditworthy borrowers, including the Funds’ securities lending agent. It is the Funds’ policy that, at origination, all loans are secured by collateral of at least 102% of the value of U.S. securities loaned and 105% of the value of foreign securities loaned. Collateral in the form of cash and/or securities issued or guaranteed by the U.S. government or its agencies, equivalent to at least 100% of the market value of securities, is maintained at all times. The cash collateral can be invested in certain money market mutual funds which also have exposure to the fluctuations of the market. The values of the investments of cash collateral for securities on loan along with the obligations to return such collateral are included on the Statements of Assets and Liabilities. The total value of securities received as collateral for securities on loan is included in a footnote following each Schedule of Investments, but is not included within the Statements of Assets and Liabilities because the receiving Fund does not have the right to sell or repledge the securities received as collateral. As compensation for lending its securities, each Fund retains all or a portion of the interest received on investment of cash collateral or receives a fee from the borrower (net of any fee rebates paid to the borrower). The lending agent receives a portion of the income earned by the Funds in connection with the lending program. The net securities lending income earned by the Funds is disclosed on the Statements of Operations. The dividend income earned on the securities loaned is accounted for in the same manner as other dividend income. The borrower pays to the Funds an amount equal to any dividends or interest received on loaned securities. Dividends received while a security is out on loan are not considered Qualified Dividend Income (“QDI”) under the specific criteria issued by the Internal Revenue Service and are subject to taxation at the shareholder’s ordinary income tax rate instead of the lower long-term capital gains tax rate. Lending portfolio securities could result in a loss or delay in recovering each Fund’s securities if the borrower defaults. In the event of a borrower default with respect to the failure to return to each Fund some or all of the securities loaned, the securities lending agent shall indemnify each Fund against the failure of the borrower if the value of the collateral received is insufficient to cover the market value of the securities loaned.
Master Netting Arrangements — Codification Topic 210 (“ASC 210”), Balance Sheet, requires disclosures generally intended to (i) help investors and other financial statement users to better assess the effect or potential effect of offsetting arrangements on a company’s financial position, (ii) improve transparency in the reporting of how companies mitigate credit risk, and (iii) facilitate comparisons between those entities that prepare their financial statements on the basis of GAAP and those entities that prepare their financial statements on the basis of international financial reporting standards. ASC 210 requires entities to disclose (i) gross and net information about both instruments and transactions eligible for offset in the financial statements, and (ii) instruments and transactions subject to an agreement similar to a master netting agreement. ASC 210 is limited in scope to the following financial instruments, to the extent they are offset in the financial statements or subject to an enforceable master netting arrangement or similar agreement: (i) recognized derivative instruments accounted for under ASC 815 (Derivatives and Hedging); (ii) repurchase agreements and reverse repurchase agreements; and (iii) securities borrowing and securities lending transactions.
In order to better define its contractual rights and to secure rights that will help a Fund mitigate its counterparty risk, a Fund enters into an International Swaps and Derivatives Association, Inc. Master Agreement (“ISDA Master Agreement”) with its counterparties. An ISDA Master Agreement is a bilateral agreement between a Fund and a counterparty that governs over-the-counter derivatives (“OTC”), such as foreign currency contracts, and typically contains, among other things, collateral posting terms, netting and rights of set-off provisions in the event of a default and/or termination event. Under an ISDA Master Agreement, a Fund may, under certain circumstances, offset with the counterparty certain derivative financial instruments’ payables and receivables to create a single net payment. The provisions of the ISDA Master Agreement typically permit a single net payment in the event of a default (close-out netting) or similar event, including the bankruptcy or insolvency of the counterparty.
Notes to Financial Statements (continued)
Collateral requirements generally differ by type of derivative. Collateral terms are contract-specific for OTC derivatives (e.g., foreign currency contracts, options and certain swaps). Generally, for transactions traded under an ISDA Master Agreement, the collateral requirements are calculated by netting the marked to market amount for each transaction under such agreement and comparing that amount to the value of any collateral currently pledged by a Fund and the counterparty. Generally, the amount of collateral due from or to a counterparty must exceed a minimum transfer amount threshold before a transfer is required to be made. To the extent amounts due to a Fund from its derivatives counterparties are not fully collateralized, contractually or otherwise, the Fund bears the risk of loss from a counterparty’s non-performance.
The Funds’ securities lending activities are governed by a Securities Lending Authorization Agreement (“Lending Agreement”) between the Funds and the lending agent. The Lending Agreement authorizes the lending agent to lend qualifying U.S. and foreign securities held by a Fund to approved borrowers (each a “Borrower”). To mitigate borrower risk, a Fund typically receives from a Borrower collateral in the form of U.S. dollar cash and/or securities issued or guaranteed by the U.S. government or its agencies in excess of the market value of the securities loaned. Under the provisions of the Lending Agreement, a Fund shall have, as to the collateral, all of the rights and remedies of a secured party under applicable law. A Fund is exposed to risk of loss if a Borrower defaults on its obligation to return borrowed securities and the value of the collateral a Fund received is insufficient to cover the market value of the securities loaned. Also, the lending agent is permitted to invest the cash collateral it receives from a Borrower into a money market fund which is subject to market fluctuation. Therefore, a Fund is exposed to risk of loss if the value of invested cash collateral is insufficient to satisfy the Fund’s obligation to return the full amount owed to such Borrower.
For financial reporting purposes, the Funds elect to not offset assets and liabilities subject to an ISDA Master Agreement or Lending Agreement, if any, in the Statements of Assets and Liabilities. Therefore, all qualifying transactions are presented on a gross basis in the Statements of Assets and Liabilities. As of March 31, 2022, the impact of netting of assets and liabilities and the offsetting of collateral pledged or received based on contractual netting/set-off provisions in the ISDA Master Agreement and the Lending Agreement are detailed in the following table:
| | | | | | | | | | | | | | | | | | | | | | | | | | | | | | | | |
| | | |
| | | Assets | | | Liabilities | |
| | | | | | |
| | | Gross Amounts
in the
Statements of Assets and
Liabilities | | | Gross Amounts Not Offset
in the Statements of
Assets and Liabilities | | | | | | Gross Amounts
in the
Statements of Assets and
Liabilities | | | Gross Amounts Not Offset
in the Statements of
Assets and Liabilities | | | | |
| Fund | | Financial
Instruments | | | Collateral
Received | | | Net Amount | | | Financial
Instruments | | | Collateral
Posted | | | Net Amount | |
Europe Quality Dividend Growth Fund | | | | | | | | | | | | | | | | | | | | | | | | | | | | | | | | |
Securities Lending | | $ | 2,416,370 | | | $ | — | | | $ | (2,416,370 | )1 | | $ | — | | | $ | — | | | $ | — | | | $ | — | | | $ | — | |
Europe SmallCap Dividend Fund | | | | | | | | | | | | | | | | | | | | | | | | | | | | | | | | |
Securities Lending | | | 25,439,370 | | | | — | | | | (25,439,370 | )1 | | | — | | | | — | | | | — | | | | — | | | | — | |
Foreign Currency Contracts | | | 43 | | | | — | | | | — | | | | 43 | | | | 1,898 | | | | — | | | | — | | | | 1,898 | |
International AI Enhanced Value Fund | | | | | | | | | | | | | | | | | | | | | | | | | | | | | | | | |
Securities Lending | | | 8,069,930 | | | | — | | | | (8,069,930 | )1 | | | — | | | | — | | | | — | | | | — | | | | — | |
Foreign Currency Contracts | | | — | | | | — | | | | — | | | | — | | | | 650 | | | | — | | | | — | | | | 650 | |
International Equity Fund | | | | | | | | | | | | | | | | | | | | | | | | | | | | | | | | |
Securities Lending | | | 37,387,164 | | | | — | | | | (37,387,164 | )1 | | | — | | | | — | | | | — | | | | — | | | | — | |
Foreign Currency Contracts | | | 10 | | | | — | | | | — | | | | 10 | | | | — | | | | — | | | | — | | | | — | |
International High Dividend Fund | | | | | | | | | | | | | | | | | | | | | | | | | | | | | | | | |
Securities Lending | | | 11,102,120 | | | | — | | | | (11,102,120 | )1 | | | — | | | | — | | | | — | | | | — | | | | — | |
Foreign Currency Contracts | | | — | | | | — | | | | — | | | | — | | | | 125 | | | | — | | | | — | | | | 125 | |
International LargeCap Dividend Fund | | | | | | | | | | | | | | | | | | | | | | | | | | | | | | | | |
Securities Lending | | | 11,166,656 | | | | — | | | | (11,166,656 | )1 | | | — | | | | — | | | | — | | | | — | | | | — | |
International MidCap Dividend Fund | | | | | | | | | | | | | | | | | | | | | | | | | | | | | | | | |
Securities Lending | | | 15,604,390 | | | | — | | | | (15,604,390 | )1 | | | — | | | | — | | | | — | | | | — | | | | — | |
International Multifactor Fund | | | | | | | | | | | | | | | | | | | | | | | | | | | | | | | | |
Securities Lending | | | 1,235,414 | | | | — | | | | (1,235,414 | )1 | | | — | | | | — | | | | — | | | | — | | | | — | |
Foreign Currency Contracts | | | 306,658 | | | | (24,474 | ) | | | — | | | | 282,184 | | | | 242,479 | | | | (24,474 | ) | | | — | | | | 218,005 | |
International Quality Dividend Growth Fund | | | | | | | | | | | | | | | | | | | | | | | | | | | | | | | | |
Securities Lending | | | 15,950,630 | | | | — | | | | (15,950,630 | )1 | | | — | | | | — | | | | — | | | | — | | | | — | |
International SmallCap Dividend Fund | | | | | | | | | | | | | | | | | | | | | | | | | | | | | | | | |
Securities Lending | | | 126,323,648 | | | | — | | | | (126,323,648 | )1 | | | — | | | | — | | | | — | | | | — | | | | — | |
Foreign Currency Contracts | | | 1,709 | | | | — | | | | — | | | | 1,709 | | | | — | | | | — | | | | — | | | | — | |
Notes to Financial Statements (continued)
| | | | | | | | | | | | | | | | | | | | | | | | | | | | | | | | |
| | | |
| | | Assets | | | Liabilities | |
| | | | | | |
| | | Gross Amounts
in the
Statements of Assets and
Liabilities | | | Gross Amounts Not Offset
in the Statements of
Assets and Liabilities | | | | | | Gross Amounts
in the
Statements of Assets and
Liabilities | | | Gross Amounts Not Offset
in the Statements of
Assets and Liabilities | | | | |
| Fund | | Financial
Instruments | | | Collateral
Received | | | Net Amount | | | Financial
Instruments | | | Collateral
Posted | | | Net Amount | |
Japan SmallCap Dividend Fund | | | | | | | | | | | | | | | | | | | | | | | | | | | | | | | | |
Securities Lending | | $ | 27,816,238 | | | $ | — | | | $ | (27,816,238 | )1 | | $ | — | | | $ | — | | | $ | — | | | $ | — | | | $ | — | |
Foreign Currency Contracts | | | — | | | | — | | | | — | | | | — | | | | 704 | | | | — | | | | — | | | | 704 | |
| | 1 | The amount of collateral presented has been limited such that the net amount by counterparty cannot be less than zero. |
Short-Term Investments — Each Fund may invest a portion of its assets in high-quality money market instruments on an ongoing basis to provide liquidity or for other reasons. The instruments include short-term obligations issued by the U.S. government, its agencies, non-U.S. government agencies, negotiable certificates of deposit (“CDs”), fixed time deposits and bankers’ acceptances of U.S. and foreign banks and similar institutions, commercial papers, repurchase agreements and money market funds. CDs are short-term negotiable obligations of commercial banks. Time deposits are non-negotiable deposits maintained in banking institutions for specified periods of time at stated interest rates. Banker’s acceptances are time drafts drawn on commercial banks by borrowers, usually in connection with international transactions.
Tax Information and Dividends and Distributions to Shareholders — It is each Fund’s policy to comply with all requirements of the Internal Revenue Code of 1986, as amended (the “Code”). A portion of the Code, known as subchapter M (“Subchapter M”), addresses the ways by which investment companies and investment trusts may pass income through to shareholders in order to avoid double taxation. Each Fund intends to qualify for and to elect treatment as a separate Regulated Investment Company (“RIC”) under Subchapter M of the Code so that it will not be subject to federal income tax on income and gains that are timely distributed to Fund shareholders. Accordingly, no provision for U.S. federal income taxes is required. In order to qualify for the special tax treatment accorded to RICs and their shareholders, each Fund must, among other things, distribute with respect to each taxable year an amount equal to or greater than the sum of 90% of its investment company taxable income and 90% of its net tax-exempt interest income. There can be no guarantee that a Fund will pay dividends. Taxable net realized gains from investment transactions, reduced by capital loss carryforwards, if any, are declared and distributed to shareholders at least annually. The capital loss carryforward amount, if any, is available to offset future net capital gains. The Funds may occasionally be required to make supplemental distributions at some other time during the year. The Trust reserves the right to declare special distributions if, in its reasonable discretion, such action is necessary or advisable to preserve the status of each Fund as a RIC or to avoid imposition of income or excise taxes on undistributed income. Dividends and distributions to shareholders are recorded on the ex-dividend date. The amount of dividends and distributions from net investment income and net realized capital gains is determined in accordance with the requirements of the Code and the U.S. Treasury regulations. These book/tax differences are either considered temporary or permanent in nature. To the extent these differences are permanent in nature, such amounts are reclassified within the components of net assets based on their Federal tax basis treatment; temporary differences do not require reclassification. Dividends and distributions that exceed earnings and profit for tax purposes are reported for tax purposes as a return of capital.
3. ADVISORY FEES AND OTHER TRANSACTIONS WITH AFFILIATES
WTAM has overall responsibility for the general management and administration of the Trust. WTAM provides an investment program for each Fund. WTAM has arranged for Mellon Investments Corporation (“Mellon”) to provide sub-advisory services to the Funds, except for the International AI Enhanced Value Fund. Prior to January 7, 2022, sub-advisory services for the International AI Enhanced Value Fund were provided by Mellon and thereafter by Voya IM. Mellon and Voya IM are compensated by WTAM at no additional cost to the Funds. WTAM also arranges for transfer agency, custody, fund accounting, fund administration, securities lending and all other non-distribution related services necessary for the Funds to operate, which are generally under separate agreements entered into between the Trust on behalf of the Funds and the applicable service provider. Under the investment advisory agreement for each Fund, WTAM agrees to pay all expenses of the Funds, except for certain expenses described in Note 2.
Pursuant to a separate contractual arrangement, as also described in Note 2, WTAM arranges for the provision of CCO services with respect to each Fund, and is liable and responsible for, and administers, payments to the CCO, the Independent Trustees and counsel to the Independent Trustees in exchange for a fee, accrued daily and paid monthly in arrears, of up to 0.0044% per annum of each Fund’s average daily net assets.
Notes to Financial Statements (continued)
WTAM expects to receive annual advisory fees from each Fund, based on a percentage of the Fund’s average daily net assets, as shown in the following table:
| | | | |
| | |
| Fund | | Advisory Fee Rate | |
Europe Quality Dividend Growth Fund | | | 0.58 | % |
Europe SmallCap Dividend Fund | | | 0.58 | % |
International AI Enhanced Value Fund | | | 0.58 | % |
International Equity Fund | | | 0.48 | % |
International High Dividend Fund | | | 0.58 | % |
International LargeCap Dividend Fund | | | 0.48 | % |
International MidCap Dividend Fund | | | 0.58 | % |
International Multifactor Fund | | | 0.38 | % |
International Quality Dividend Growth Fund | | | 0.42 | % |
International SmallCap Dividend Fund | | | 0.58 | % |
Japan SmallCap Dividend Fund | | | 0.58 | % |
Affiliated holdings are investments in entities in which the Fund owns 5% or more of the outstanding voting securities or are investments in entities which are under common ownership or control. Transactions in shares of affiliated ETFs for the fiscal year ended March 31, 2022, as applicable, are included in an “Investment in Affiliates” supplementary table in each applicable Fund’s Schedule of Investments. For these transactions, WTAM voluntarily waives a portion of the advisory fees, that it would otherwise charge, in an amount equal to the indirect AFFE (which are fees and expenses incurred indirectly by a Fund through its investments in certain underlying investment companies) attributable to each Fund’s investment in affiliated ETFs. The dollar amount of advisory fees waived during the period for the Funds, if any, are included in the Statement of Operations in “Expense waivers”.
During the fiscal year ended March 31, 2022, certain Funds engaged in purchase and sale transactions with funds that have a common investment adviser, WTAM. These interfund purchase and sale transactions were effected in accordance with Rule 17a-7 under the 1940 Act. For the fiscal year ended March 31, 2022, the cost of purchases, proceeds from sales and the net realized gain or loss recognized upon the disposal of securities resulting from interfund transactions are shown in the following table:
| | | | | | | | | | | | | | | | |
| | | | |
| Fund | | Purchases | | | Sales | | | | | | Net Realized
Gain/Loss | |
Europe Quality Dividend Growth Fund | | $ | 8,339,663 | | | $ | 7,115,198 | | | | | | | $ | 227,920 | |
Europe SmallCap Dividend Fund | | | 9,166,401 | | | | 9,961,768 | | | | | | | | 781,795 | |
International Equity Fund | | | 15,722,597 | | | | 32,235,589 | | | | | | | | 204,917 | |
International High Dividend Fund | | | 8,959,583 | | | | 6,144,343 | | | | | | | | 408,580 | |
International LargeCap Dividend Fund | | | 9,245,261 | | | | 19,241,729 | | | | | | | | 2,306,979 | |
International MidCap Dividend Fund | | | 11,412,285 | | | | 10,719,715 | | | | | | | | 1,566,131 | |
International Quality Dividend Growth Fund | | | 13,212,695 | | | | 12,743,621 | | | | | | | | (1,439,004 | ) |
International SmallCap Dividend Fund | | | 25,372,389 | | | | 31,398,017 | | | | | | | | (3,373,494 | ) |
Japan SmallCap Dividend Fund | | | 9,751,725 | | | | 23,376,923 | | | | | | | | 813,700 | |
WTAM and/or WisdomTree Investments (collectively herein, “WT”) may from time to time own shares of a Fund. As of and for the fiscal year ended March 31, 2022, WT held shares of and received distributions from the following Funds, which were purchased through an unaffiliated broker in ordinary brokerage transactions in the secondary market in which the Funds’ shares trade:
| | | | | | | | | | | | |
| | | |
| | | At March 31, 2022 | | | For the fiscal year ended
March 31, 2022 | |
| | | |
| Fund | | Fund Shares
held by WT | | | Market Value of Fund Shares
held by WT | | | Dividends and
Distributions paid to
WT on
Fund Shares
held by WT | |
Europe Quality Dividend Growth Fund | | | 86 | | | $ | 2,690 | | | $ | 90 | |
Europe SmallCap Dividend Fund | | | — | | | | — | | | | 8 | |
International Equity Fund | | | 81 | | | | 4,273 | | | | 185 | |
International High Dividend Fund | | | — | | | | — | | | | 31 | |
International MidCap Dividend Fund | | | — | | | | — | | | | 22 | |
Notes to Financial Statements (continued)
| | | | | | | | | | | | |
| | | |
| | | At March 31, 2022 | | | For the fiscal year ended
March 31, 2022 | |
| | | |
| Fund | | Fund Shares
held by WT | | | Market Value of Fund Shares
held by WT | | | Dividends and
Distributions paid to
WT on
Fund Shares
held by WT | |
International Multifactor Fund | | | 412 | | | $ | 10,366 | | | $ | 402 | |
International Quality Dividend Growth Fund | | | 306 | | | | 11,166 | | | | 318 | |
International SmallCap Dividend Fund | | | 466 | | | | 31,986 | | | | 1,046 | |
4. CAPITAL SHARE TRANSACTIONS
As of March 31, 2022, there were an unlimited number of $0.001 par value shares of beneficial interest authorized by the Trust. Shares are issued and redeemed by each Fund only in creation units or multiples thereof. Except when aggregated in creation units, shares of each Fund are not redeemable. Transactions in shares for each Fund are disclosed in detail in the Statements of Changes in Net Assets. The consideration for the purchase of creation units of a Fund generally consists of the in-kind contribution of a basket of securities and/or an amount of cash. Investors purchasing and redeeming creation units may be charged a purchase transaction fee and a redemption transaction fee to offset transfer and other transaction costs associated with the issuance and redemption of creation units.
5. INVESTMENT PORTFOLIO TRANSACTIONS
Purchases and sales of investments (excluding purchases and sales resulting from in-kind capital share transactions and short-term investments) and the cost of purchases and the proceeds from sales resulting from in-kind capital share transactions (excluding short-term investments) for the fiscal year ended March 31, 2022 are shown in the following table. Realized gains and losses on sales resulting from in-kind capital share redemptions, as shown on the Statements of Operations, are not recognized by the Funds for tax purposes.
| | | | | | | | | | | | | | | | |
| | | | |
| | | | | | | | | In-kind Capital Share Transactions | |
| | | | |
| Fund | | Purchases | | | Sales | | | Purchases | | | Sales | |
Europe Quality Dividend Growth Fund | | $ | 31,883,699 | | | $ | 32,096,105 | | | $ | 26,490,112 | | | $ | — | |
Europe SmallCap Dividend Fund | | | 228,865,081 | | | | 219,500,101 | | | | 7,388,248 | | | | 17,981,509 | |
International AI Enhanced Value Fund | | | 139,061,728 | | | | 137,040,367 | | | | 84,270,239 | | | | 103,106,556 | |
International Equity Fund | | | 200,360,378 | | | | 188,648,648 | | | | 51,267,847 | | | | 36,767,654 | |
International High Dividend Fund | | | 75,115,437 | | | | 72,410,560 | | | | 18,911,243 | | | | 6,069,106 | |
International LargeCap Dividend Fund | | | 111,106,063 | | | | 108,355,531 | | | | 20,604,910 | | | | 6,900,152 | |
International MidCap Dividend Fund | | | 63,512,320 | | | | 62,604,280 | | | | — | | | | 3,391,722 | |
International Multifactor Fund | | | 39,457,630 | | | | 38,217,676 | | | | — | | | | 5,132,459 | |
International Quality Dividend Growth Fund | | | 200,735,771 | | | | 187,023,320 | | | | 222,806,291 | | | | 41,535,754 | |
International SmallCap Dividend Fund | | | 841,789,155 | | | | 781,768,914 | | | | 333,871,624 | | | | 405,506,564 | |
Japan SmallCap Dividend Fund | | | 78,084,533 | | | | 79,149,302 | | | | 71,411,698 | | | | 18,568,861 | |
6. FEDERAL INCOME TAXES
At March 31, 2022, the cost of investments (including securities on loan and derivatives) for Federal income tax purposes was as follows:
| | | | | | | | | | | | | | | | | | | | | | | | | | | | | | | | | | | | |
| | | | | |
| | | Investments in Long Securities | | | | | | Investments in Financial Derivatives1 | | | | |
| | | | | | | | | |
| Fund | | Tax Cost | | | Gross
Unrealized
Appreciation | | | Gross Unrealized
Depreciation | | | Net Unrealized
Appreciation/
(Depreciation) | | | | | | Gross
Unrealized
Appreciation | | | Gross
Unrealized
Depreciation | | | Net Unrealized Appreciation/ (Depreciation) | | | Total Net
Unrealized
Appreciation/ (Depreciation) | |
Europe Quality Dividend Growth Fund | | $ | 69,587,428 | | | $ | 8,098,005 | | | $ | (4,430,214 | ) | | $ | 3,667,791 | | | | | | | $ | — | | | $ | — | | | $ | — | | | $ | 3,667,791 | |
Europe SmallCap Dividend Fund | | | 311,432,974 | | | | 30,182,690 | | | | (33,794,828 | ) | | | (3,612,138 | ) | | | | | | | 43 | | | | (1,898 | ) | | | (1,855 | ) | | | (3,613,993 | ) |
International AI Enhanced Value Fund | | | 132,175,469 | | | | 2,007,483 | | | | (11,122,069 | ) | | | (9,114,586 | ) | | | | | | | — | | | | (650 | ) | | | (650 | ) | | | (9,115,236 | ) |
Notes to Financial Statements (continued)
| | | | | | | | | | | | | | | | | | | | | | | | | | | | | | | | | | | | |
| | | | | |
| | | Investments in Long Securities | | | | | | Investments in Financial Derivatives1 | | | | |
| | | | | | | | | |
| Fund | | Tax Cost | | | Gross
Unrealized
Appreciation | | | Gross Unrealized
Depreciation | | | Net Unrealized
Appreciation/
(Depreciation) | | | | | | Gross
Unrealized
Appreciation | | | Gross
Unrealized
Depreciation | | | Net Unrealized Appreciation/ (Depreciation) | | | Total Net
Unrealized
Appreciation/ (Depreciation) | |
International Equity Fund | | $ | 547,643,353 | | | $ | 127,032,418 | | | $ | (24,230,852 | ) | | $ | 102,801,566 | | | | | | | $ | 10 | | | $ | — | | | $ | 10 | | | $ | 102,801,576 | |
International High Dividend Fund | | | 191,662,071 | | | | 25,369,261 | | | | (10,256,980 | ) | | | 15,112,281 | | | | | | | | — | | | | (125 | ) | | | (125 | ) | | | 15,112,156 | |
International LargeCap Dividend Fund | | | 322,358,810 | | | | 80,036,049 | | | | (15,026,629 | ) | | | 65,009,420 | | | | | | | | — | | | | — | | | | — | | | | 65,009,420 | |
International MidCap Dividend Fund | | | 141,126,477 | | | | 14,723,203 | | | | (11,467,221 | ) | | | 3,255,982 | | | | | | | | — | | | | — | | | | — | | | | 3,255,982 | |
International Multifactor Fund | | | 31,151,904 | | | | 3,018,615 | | | | (1,217,380 | ) | | | 1,801,235 | | | | | | | | 9 | | | | (2,937 | ) | | | (2,928 | ) | | | 1,798,307 | |
International Quality Dividend Growth Fund | | | 373,604,971 | | | | 36,202,068 | | | | (31,372,957 | ) | | | 4,829,111 | | | | | | | | — | | | | — | | | | — | | | | 4,829,111 | |
International SmallCap Dividend Fund | | | 1,376,746,328 | | | | 129,365,531 | | | | (127,296,799 | ) | | | 2,068,732 | | | | | | | | 1,709 | | | | — | | | | 1,709 | | | | 2,070,441 | |
Japan SmallCap Dividend Fund | | | 267,825,496 | | | | 6,661,974 | | | | (49,331,107 | ) | | | (42,669,133 | ) | | | | | | | — | | | | (704 | ) | | | (704 | ) | | | (42,669,837 | ) |
| | 1 | Certain financial derivatives may be considered section 1256 contracts under the Code. Each section 1256 contract held at the close of a taxable year shall be treated as sold for its fair market value on the last business day of such taxable year (and any realized gain and loss shall be taken into account for the taxable year). As such, the unrealized appreciation/(depreciation) for financial derivatives on a tax basis may not correspond to the unrealized appreciation/(depreciation) on a GAAP basis. The unrealized appreciation/(depreciation) for financial derivatives on a GAAP basis is located in the respective financial derivatives tables in each Fund’s Schedule of Investments. |
At March 31, 2022, the components of total distributable earnings (loss) on a tax-basis were as follows:
| | | | | | | | | | | | | | | | | | | | |
| | | | | | |
| Fund | | Undistributed
Ordinary Income | | | Undistributed
Capital and Other
Losses | | | Net Unrealized
Appreciation/ (Depreciation) | | | Currency and
Other Unrealized
Appreciation/
(Depreciation) | | | Total Distributable
Earnings (Loss) | |
Europe Quality Dividend Growth Fund | | $ | 118,118 | | | $ | (5,812,234 | ) | | $ | 3,667,791 | | | $ | 437 | | | $ | (2,025,888 | ) |
Europe SmallCap Dividend Fund | | | 1,721,329 | | | | (261,662,051 | ) | | | (3,613,993 | ) | | | (40,600 | ) | | | (263,595,315 | )1 |
International AI Enhanced Value Fund | | | 699,355 | | | | (58,825,268 | ) | | | (9,115,236 | ) | | | (1,645 | ) | | | (67,242,794 | ) |
International Equity Fund | | | 2,743,406 | | | | (167,949,165 | ) | | | 102,801,576 | | | | 9,262 | | | | (62,394,921 | ) |
International High Dividend Fund | | | 1,039,060 | | | | (80,682,630 | ) | | | 15,112,156 | | | | 398 | | | | (64,531,016 | ) |
International LargeCap Dividend Fund | | | 1,326,584 | | | | (106,169,571 | ) | | | 65,009,420 | | | | 16,390 | | | | (39,817,177 | ) |
International MidCap Dividend Fund | | | 897,569 | | | | (29,545,709 | ) | | | 3,255,982 | | | | 772 | | | | (25,391,386 | ) |
International Multifactor Fund | | | 122,827 | | | | (2,834,549 | ) | | | 1,798,307 | | | | 1,470 | | | | (911,945 | ) |
International Quality Dividend Growth Fund | | | 964,169 | | | | (6,480,916 | ) | | | 4,829,111 | | | | 3,543 | | | | (684,093 | ) |
International SmallCap Dividend Fund | | | 10,989,654 | | | | (224,830,974 | ) | | | 2,070,441 | | | | (47,945 | ) | | | (211,818,824 | ) |
Japan SmallCap Dividend Fund | | | 3,186,255 | | | | (99,136,377 | ) | | | (42,669,837 | ) | | | 2,633 | | | | (138,617,326 | ) |
| | 1 | The total distributable earnings (loss) reported herein differs from the amount shown on the Statement of Assets and Liabilities due to the treatment of certain income/expense items that have been recognized for GAAP but disallowed for tax purposes. |
The tax character of distributions paid during the fiscal years ended March 31, 2022 and March 31, 2021, was as follows:
| | | | | | | | |
| | | |
| | | Year Ended March 31, 2022 | | | Year Ended March 31, 2021 | |
| | |
| Fund | | Distributions Paid
from Ordinary
Income* | | | Distributions Paid
from Ordinary
Income* | |
Europe Quality Dividend Growth Fund | | $ | 1,969,811 | | | $ | 828,773 | |
Europe SmallCap Dividend Fund | | | 8,828,002 | | | | 7,149,556 | |
International AI Enhanced Value Fund | | | 7,009,725 | | | | 5,359,954 | |
International Equity Fund | | | 22,558,337 | | | | 18,281,531 | |
International High Dividend Fund | | | 8,671,887 | | | | 7,456,513 | |
International LargeCap Dividend Fund | | | 13,525,175 | | | | 11,449,209 | |
International MidCap Dividend Fund | | | 5,307,913 | | | | 4,319,792 | |
International Multifactor Fund | | | 1,281,800 | | | | 1,004,586 | |
International Quality Dividend Growth Fund | | | 8,948,267 | | | | 3,650,231 | |
International SmallCap Dividend Fund | | | 47,038,894 | | | | 35,298,828 | |
Japan SmallCap Dividend Fund | | | 4,540,106 | | | | 5,773,349 | |
| | * | Includes short-term capital gains, if any. |
Notes to Financial Statements (continued)
At March 31, 2022, for Federal tax purposes, the Funds have capital loss carryforwards available to offset future capital gains as indicated in the following table. The loss carryforward amounts do not have an expiration date and, therefore, can be carried forward indefinitely until utilized. To the extent that these loss carryforwards are utilized, capital gains so offset will not be distributed to shareholders.
| | | | | | | | | | | | |
| | | | |
| Fund | | Short-Term | | | Long-Term | | | Capital Loss
Available Total | |
Europe Quality Dividend Growth Fund | | $ | 2,489,471 | | | $ | 3,322,763 | | | $ | 5,812,234 | |
Europe SmallCap Dividend Fund | | | 69,775,545 | | | | 191,886,506 | | | | 261,662,051 | |
International AI Enhanced Value Fund | | | 16,196,041 | | | | 42,629,227 | | | | 58,825,268 | |
International Equity Fund | | | 18,836,159 | | | | 149,113,006 | | | | 167,949,165 | |
International High Dividend Fund | | | 6,053,461 | | | | 74,629,169 | | | | 80,682,630 | |
International LargeCap Dividend Fund | | | 11,688,834 | | | | 94,480,737 | | | | 106,169,571 | |
International MidCap Dividend Fund | | | 2,487,120 | | | | 27,058,589 | | | | 29,545,709 | |
International Multifactor Fund | | | 2,834,549 | | | | — | | | | 2,834,549 | |
International Quality Dividend Growth Fund | | | 2,063,366 | | | | 4,417,550 | | | | 6,480,916 | |
International SmallCap Dividend Fund | | | 119,055,753 | | | | 105,775,221 | | | | 224,830,974 | |
Japan SmallCap Dividend Fund | | | 68,333,285 | | | | 30,803,092 | | | | 99,136,377 | |
Capital losses incurred after October 31 (“post-October capital losses”) and late year ordinary losses incurred after December 31 within the taxable year are deemed to arise on the first business day of each Fund’s next taxable year. At March 31, 2022, the Funds did not have any post-October capital losses or late year ordinary losses to defer.
During the fiscal year ended March 31, 2022, the amount of capital loss carryforwards used to offset realized gains are shown in the following table:
| | | | |
| | |
| Fund | | Utilized Capital
Loss Carryforward | |
Europe Quality Dividend Growth Fund | | $ | 1,561,034 | |
Europe SmallCap Dividend Fund | | | 45,494,756 | |
International AI Enhanced Value Fund | | | — | |
International Equity Fund | | | — | |
International High Dividend Fund | | | 528,431 | |
International LargeCap Dividend Fund | | | 1,808,230 | |
International MidCap Dividend Fund | | | 4,559,434 | |
International Multifactor Fund | | | 1,194,841 | |
International Quality Dividend Growth Fund | | | — | |
International SmallCap Dividend Fund | | | — | |
Japan SmallCap Dividend Fund | | | — | |
At March 31, 2022, the effect of permanent “book/tax” reclassifications resulted in increases (decreases) to the components of net assets as shown in the following table. The differences are primarily due to redemptions-in-kind.
| | | | | | | | |
| | | |
| Fund | | Total
Distributable
Earnings (Loss) | | | Paid-in Capital | |
Europe Quality Dividend Growth Fund | | $ | — | | | $ | — | |
Europe SmallCap Dividend Fund | | | (3,183,056 | ) | | | 3,183,056 | |
International AI Enhanced Value Fund | | | (23,045,890 | ) | | | 23,045,890 | |
International Equity Fund | | | (10,143,568 | ) | | | 10,143,568 | |
International High Dividend Fund | | | (1,584,048 | ) | | | 1,584,048 | |
International LargeCap Dividend Fund | | | (2,290,135 | ) | | | 2,290,135 | |
International MidCap Dividend Fund | | | (750,740 | ) | | | 750,740 | |
International Multifactor Fund | | | (675,733 | ) | | | 675,733 | |
International Quality Dividend Growth Fund | | | (11,746,946 | ) | | | 11,746,946 | |
International SmallCap Dividend Fund | | | (166,085,593 | ) | | | 166,085,593 | |
Japan SmallCap Dividend Fund | | | (1,848,936 | ) | | | 1,848,936 | |
Notes to Financial Statements (continued)
GAAP provides guidance on tax provisions that prescribe a minimum threshold for financial statement recognition of the benefit of a tax position taken or expected to be taken in a tax return. Foreign withholding taxes, as applicable, are accrued based on each Fund’s understanding of the tax rules and rates that exist in the foreign markets in which it invests. Foreign withholding taxes are accrued and applied to foreign income, net realized capital gains and net unrealized appreciation, as applicable, as the foreign income is earned or capital gains and unrealized appreciation are recorded. The dollar amount of applicable foreign withholding taxes on foreign income is included net in the Statements of Operations in “Less: Foreign withholding taxes,” the foreign capital gains tax applicable on the disposal of securities is included in the Statements of Operations in “Net realized gain (loss) from investment transactions” and the dollar amount of deferred foreign capital gains tax applicable on the unrealized appreciation on securities held is included in the Statements of Operations in “Net increase (decrease) in unrealized appreciation/depreciation from investment transactions”. The Funds record a foreign tax reclaim receivable on the ex-dividend date if the tax reclaim is “more likely than not” to be sustained assuming examination by tax authorities. This determination is based on, among other things, a jurisdiction’s legal obligation to pay reclaims as well as payment history and market convention. Foreign tax reclaims that have been recorded but not yet received are shown on the Statements of Assets and Liabilities in “Receivables: Foreign tax reclaims”.
As of and during the fiscal year ended March 31, 2022, the Funds did not have any liabilities for unrecognized tax benefits relating to uncertain income tax positions they have taken or expect to take in the future. If applicable, the Funds will recognize interest accrued related to unrecognized tax benefits in interest expense and penalties in “Other” expenses on the Statements of Operations. The Funds file tax returns with the Internal Revenue Service, the State of New York, and various other states. Specific to U.S. federal and state taxes, generally, each of the tax years in the four-year period ended March 31, 2022, remains subject to examination by taxing authorities. Specific to foreign countries in which the Funds invest, all open tax years remain subject to examination by taxing authorities in the respective jurisdictions.
As a result of several European Court of Justice (“ECJ”) court cases in certain countries across the European Union (“EU”), certain Funds have filed additional tax reclaims for previously withheld taxes on dividends earned in those countries (“ECJ tax reclaims”). These additional filings are subject to various administrative proceedings by the local jurisdictions’ tax authorities within the EU, as well as a number of related judicial proceedings. Income recognized, if any, for ECJ tax reclaims is reflected as “Other income” in the Statements of Operations and the cost to file these additional ECJ tax reclaims is reflected as “Other fees” in the Statements of Operations. When the ECJ tax reclaim is not “more likely than not” to be sustained assuming examination by tax authorities due to the uncertainty that exists as to the ultimate resolution of these proceedings, the likelihood of receipt of these ECJ tax reclaims, and the potential timing of payment, no amounts are reflected in the financial statements. At March 31, 2022, the Europe SmallCap Dividend Fund recognized ECJ tax reclaim receivables of $92,651 in the Statements of Assets and Liabilities in “Other receivables” that were “more likely than not” to be sustained by tax authorities and the estimated cost of $27,795 to file for these reclaims is reflected in “Other liabilities” on the Statements of Assets and Liabilities. For U.S. income tax purposes, ECJ tax reclaims received by the Funds, if any, reduce the amounts of foreign taxes Fund shareholders can use as tax credits in their individual income tax returns. In the event that ECJ tax reclaims received by a Fund during the fiscal year exceed foreign withholding taxes paid, and a Fund previously passed foreign tax credits on to its shareholders, a Fund must either amend historic tax reporting to shareholders or enter into a closing agreement with the Internal Revenue Service in order to pay the associated tax liability on behalf of the respective Fund’s shareholders. During the fiscal year ended March 31, 2022, the ECJ tax reclaims received by the Funds, except for the Europe SmallCap Dividend Fund, did not exceed the foreign withholding taxes of the respective Funds. During the fiscal year ended March 31, 2022, the Europe SmallCap Dividend Fund received ECJ tax reclaims in excess of its foreign withholding taxes during the fiscal year. The Europe SmallCap Dividend Fund expects to enter into a closing agreement with the Internal Revenue Service and has recognized estimated closing agreement fees of $478,312 which are shown on the Statements of Operations in “Investment Income: Less IRS closing agreement fee”.
7. ADDITIONAL INFORMATION
The respiratory disease caused by a novel coronavirus (“COVID-19”) has spread globally since 2019, resulting in a global pandemic and major disruption to global markets and economies. In an organized attempt to contain and mitigate the effects of COVID-19, governments and businesses world-wide took aggressive measures, including businesses canceling dividends to preserve cash, governments closing borders, restricting international and domestic travel, and the imposition of prolonged quarantines of large populations. COVID-19 has resulted in the disruption of and delays in the delivery of healthcare services and processes, the cancellation of organized events and educational institutions, the disruption of production and supply chains, a decline in consumer demand for certain goods and services, and general concern and uncertainty, all of which have contributed to increased volatility in global markets. In recent months, however, the rapid COVID-19 vaccination rollout in the United States and certain other developed countries, coupled with the passage of stimulus programs in the U.S. and abroad, have resulted in a reversal of many of these trends including the re-opening of businesses, a reduction in quarantine requirements, increased consumer demand, and the resumption of certain in-person schooling, travel and events. Despite these positive trends, the prevalence of new COVID-19 variants, a failure to achieve herd immunity, or other unforeseen circumstances may result in the continued spread of the virus throughout unvaccinated
Notes to Financial Statements (concluded)
populations or a resurgence in infections among vaccinated populations. As a result, it remains unclear if recent positive trends will continue in developed markets and whether such trends will spread world-wide to countries with limited access to vaccines that are still experiencing rising COVID-19 cases, hospitalizations and deaths.
The effects of COVID-19 have affected and are likely to continue to affect certain sectors and industries more dramatically than others, and the effects borne by some will negatively affect the value of the issuers in those sectors and industries, which may adversely affect the value of a Fund’s investments in those sectors or industries. It is also true that the speed at which global economies recover, or fail to recover, from the COVID-19 pandemic will affect certain sectors, industries, and issuers more dramatically than others, which in turn may adversely affect certain Fund investments.
COVID-19, and other epidemics and pandemics that may arise in the future, could adversely affect the economies of many nations, the global economy, individual companies and capital markets in ways that cannot be foreseen at the present time. In addition, the impact of infectious diseases in developing or emerging market countries may be greater due to limited health care resources, including access to COVID-19 vaccinations and treatments. Political, economic and social stresses caused by COVID-19 also may exacerbate other pre-existing political, social and economic risks in certain countries. The duration of COVID-19 and its effects cannot be determined fully at this time, but the effects could be present for an extended period of time. It is impossible to predict the effects on the Funds of these or similar events and market conditions in the future. However, it is possible that these or similar events and market conditions could have a significant and adverse effect on the NAV and/or risk profile of a Fund.
* * * * *
Russia’s military invasion of Ukraine initiated in February 2022 and the economic and diplomatic responses by the United States and other countries have led to increased volatility and uncertainty in the financial markets and could continue to adversely affect regional and global economies for the foreseeable future. In response to Russia’s actions, the governments of the United States, the European Union, the United Kingdom, and many other countries collectively imposed heavy and broad-ranging economic sanctions on certain Russian individuals, corporate and banking entities, and other industries and businesses. The sanctions restrict companies from doing business with Russia and Russian companies, prohibit transactions with the Russian central bank and other key Russian financial institutions and entities, ban Russian airlines and ships from using many other countries’ airspace and ports, respectively, and place a freeze on certain Russian assets. The sanctions also removed some Russian banks from the Society for Worldwide Interbank Financial Telecommunications (SWIFT), the electronic network that connects banks globally to facilitate cross-border payments. In addition, the United States has banned oil and other energy imports from Russia, and the United Kingdom made a commitment to phase out oil import from Russia by the end of 2022.
These sanctions, as well as other economic consequences related to the invasion, such as additional sanctions, boycotts or changes in consumer or purchaser preferences or cyberattacks on governments, companies or individuals, may further decrease the value and liquidity of certain Russian securities and securities of issuers in other countries that are subject to economic sanctions related to the invasion or otherwise adversely affected by the sanctions. To the extent a Fund has exposure to Russian investments or investments in countries affected by the invasion or the sanctions, the Fund’s ability to price, buy, sell, receive or deliver such investments may be impaired. In certain circumstances, such as when there is no market for a security or other means of valuing or disposing of a security, a Fund may determine to value the affected security at zero. In addition, any exposure a Fund may have to counterparties in Russia or in countries affected by the invasion could negatively affect the Fund’s portfolio. The extent and duration of Russia’s military actions and the repercussions of such actions are impossible to predict, but could result in continued significant market disruptions, including in the oil and natural gas markets, and may negatively affect global supply chains, inflation and global growth. Further, an escalation of the military conflict beyond Ukraine’s borders could result in significant, long-lasting damage to the economies of Eastern and Western Europe as well as the global economy. These and any related events could significantly and adversely affect a Fund’s performance and the value of an investment in the Fund, even in the absence of direct exposure to Russian issuers or issuers in other countries affected by the invasion.
Report of Independent Registered Public Accounting Firm
To the Shareholders of WisdomTree Europe Quality Dividend Growth Fund, WisdomTree Europe SmallCap Dividend Fund, WisdomTree International Al Enhanced Value Fund (formerly, WisdomTree International Dividend ex-Financials Fund), WisdomTree International Equity Fund, WisdomTree International High Dividend Fund, WisdomTree International LargeCap Dividend Fund, WisdomTree International MidCap Dividend Fund, WisdomTree International Multifactor Fund, WisdomTree International Quality Dividend Growth Fund, WisdomTree International SmallCap Dividend Fund and WisdomTree Japan SmallCap Dividend Fund and the Board of Trustees of WisdomTree Trust
Opinion on the Financial Statements
We have audited the accompanying statements of assets and liabilities of WisdomTree Europe Quality Dividend Growth Fund, WisdomTree Europe SmallCap Dividend Fund, WisdomTree International Al Enhanced Value Fund (formerly, WisdomTree International Dividend ex-Financials Fund), WisdomTree International Equity Fund, WisdomTree International High Dividend Fund, WisdomTree International LargeCap Dividend Fund, WisdomTree International MidCap Dividend Fund, WisdomTree International Multifactor Fund, WisdomTree International Quality Dividend Growth Fund, WisdomTree International SmallCap Dividend Fund and WisdomTree Japan SmallCap Dividend Fund (collectively referred to as the “Funds”), (eleven of the funds constituting WisdomTree Trust (the “Trust”)), including the schedules of investments, as of March 31, 2022, and the related statements of operations and changes in net assets, and the financial highlights for each of the periods indicated in the table below and the related notes (collectively referred to as the “financial statements”). In our opinion, the financial statements present fairly, in all material respects, the financial position of each of the Funds (eleven of the funds constituting WisdomTree Trust) at March 31, 2022, and the results of their operations, changes in net assets and financial highlights for each of the periods indicated in the table below, in conformity with U.S. generally accepted accounting principles.
| | | | | | |
| | | | |
| Individual fund constituting the WisdomTree Trust | | Statement of
operations | | Statements of changes
in net assets | | Financial highlights |
WisdomTree Europe Quality Dividend Growth Fund WisdomTree Europe SmallCap Dividend Fund WisdomTree International Al Enhanced Value Fund (formerly, WisdomTree International Dividend ex-Financials Fund) WisdomTree International Equity Fund WisdomTree International High Dividend Fund WisdomTree International LargeCap Dividend Fund WisdomTree International MidCap Dividend Fund WisdomTree International Quality Dividend Growth Fund WisdomTree International SmallCap Dividend Fund WisdomTree Japan SmallCap Dividend Fund | | For the year ended March 31, 2022 | | For each of the two years in the period ended March 31, 2022 | | For each of the five years in the period ended March 31, 2022 |
WisdomTree International Multifactor Fund | | For the year ended March 31, 2022 | | For each of the two years in the period ended March 31, 2022 | | For each of the three years in the period ended March 31, 2022 and the period from August 10, 2018 (commencement of operations) through March 31, 2019 |
Basis for Opinion
These financial statements are the responsibility of the Trust’s management. Our responsibility is to express an opinion on each of the Funds’ financial statements based on our audits. We are a public accounting firm registered with the Public Company Accounting Oversight Board (United States) (“PCAOB”) and are required to be independent with respect to the Trust in accordance with the U.S. federal securities laws and the applicable rules and regulations of the Securities and Exchange Commission and the PCAOB.
We conducted our audits in accordance with the standards of the PCAOB. Those standards require that we plan and perform the audit to obtain reasonable assurance about whether the financial statements are free of material misstatement, whether due to error or fraud. The Trust is not required to have, nor were we engaged to perform, an audit of the Trust’s internal control over financial reporting. As part of our audits, we are required to obtain an understanding of internal control over financial reporting, but not for the purpose of expressing an opinion on the effectiveness of the Trust’s internal control over financial reporting. Accordingly, we express no such opinion.
Our audits included performing procedures to assess the risks of material misstatement of the financial statements, whether due to error or fraud, and performing procedures that respond to those risks. Such procedures included examining, on a test basis, evidence regarding the amounts and disclosures in the financial statements. Our procedures included confirmation of securities owned as of March 31, 2022, by correspondence with the custodian and brokers or by other appropriate auditing procedures where
Report of Independent Registered Public Accounting Firm (concluded)
replies from brokers were not received. Our audits also included evaluating the accounting principles used and significant estimates made by management, as well as evaluating the overall presentation of the financial statements. We believe that our audits provide a reasonable basis for our opinion.

We have served as the auditor of one or more WisdomTree investment companies since 2006.
New York, New York
May 25, 2022
Approval of Investment Advisory and Sub-Advisory Agreements (unaudited)
Consideration of the Approval of Sub-Advisory Agreement
WisdomTree International AI Enhanced Value Fund (the “Fund”)
At a meeting of the Board of Trustees (the “Board”) of the WisdomTree Trust (the “Trust”) held on September 27-28, 2021, the Trustees (the “Trustees”), including those Trustees who are not “interested persons” (as defined in the Investment Company Act of 1940, as amended) of the Trust (the “Independent Trustees”), considered the approval of the Sub-Advisory Agreement (the “Agreement”), pursuant to which Voya Investment Management Co., LLC (“Voya”) will coordinate the investment and reinvestment of the assets of the Fund. Management discussed with the Board its proposal to terminate Mellon Investments Corporation as the sub-adviser to the Fund and to appoint Voya as the Fund’s sub-adviser. Management noted that Voya currently serves as the sub-adviser to certain other series of the Trust.
In considering whether to approve the Agreement, the Trustees considered and discussed information and analysis provided by WisdomTree Asset Management, Inc. (“WTAM”). The Independent Trustees were assisted in their review by independent legal counsel and met with counsel in executive session separate from WTAM representatives and Voya. In considering the approval of the Agreement, the Board considered all factors that it believed to be relevant, including those discussed below. The Board did not identify any one factor as dispositive, and each Trustee may have attributed different weights to the factors considered.
Analysis of Nature, Extent, and Quality of Services to be Provided to the Fund. The Board considered information provided to them at the meeting and in previous presentations throughout the year from WTAM representatives regarding the nature, extent, and quality of the services provided to the WisdomTree funds, recognizing Voya’s operational capabilities and resources. The Board also considered WTAM’s favorable assessment of the nature and quality of the sub-advisory services expected to be provided to the Fund by Voya and WTAM’s recommendation to engage Voya.
Based on review of this information and the other factors considered at the meeting, the Board concluded that the nature, extent and quality of services to be provided by Voya under the Agreement are adequate and appropriate and supported the Board’s approval of the Agreement.
Comparative Analysis of the Fund’s Performance, Advisory Fees and Fund Expenses. Because Voya would be a newly-appointed sub-adviser for the Fund, the Board could not consider Voya’s investment performance in managing the Fund’s portfolio as a factor in evaluating the Agreement during the meeting. The Board discussed the portfolio management team and the investment strategies to be employed in the management of the Fund’s assets. The Board noted the reputation and experience of Voya.
The Board considered the proposed fees to be paid under the Agreement, noting that Voya’s fee would be paid by WTAM (out of its fee paid by the Fund), and not the Fund, and thus would not impact the fees paid by the Fund. The Board considered the fee to be paid to Voya in relation to the fee to be paid to WTAM by the Fund and the respective services to be provided by Voya and WTAM. Based on this review, the Board concluded that the fees to be paid to Voya supported the Board’s approval of the Agreement.
Analysis of Profitability and Economies of Scale. The Board recognized that, because Voya’s fee would be paid by WTAM, and not the Fund, an analysis of profitability and economies of scale was more appropriate in the context of the Board’s consideration of the investment advisory agreement between the Trust and WTAM. Accordingly, the Board did not consider Voya’s profitability to be relevant to its deliberations with respect to approval of the Agreement. The Board considered potential benefits to Voya from acting as sub-adviser to the Fund.
* * * * * *
In evaluating the Agreement, the Board considered the conclusions and determinations discussed above and also relied on its knowledge, gained through meetings and other interactions with WTAM and Voya, of other funds sub-advised by Voya. In light of the foregoing, the Board, including a majority of the Independent Trustees, determined to approve the Agreement.
Liquidity Risk Management Program (unaudited)
The Funds adopted a liquidity risk management program (the “Program”) pursuant to the requirements of Rule 22e-4 (the “Rule”) under the Investment Company Act of 1940, as amended. The Rule requires registered open-end funds, including exchange-traded funds such as the Funds, to establish liquidity risk management programs in order to effectively manage fund liquidity and shareholder redemptions. The Rule is designed to mitigate the risk that a Fund could not meet redemption requests without significantly diluting the interest of remaining investors. The Board has appointed WisdomTree Asset Management, Inc., the investment advisor to the Funds, as the Program Administrator for each Fund’s Program.
The Rule requires the Funds to assess, manage and review their liquidity risk at least annually considering applicable factors such as investment strategy and liquidity during normal and foreseeable stressed conditions, including whether the strategy is appropriate for an open-ended fund and whether the Fund has a relatively concentrated portfolio or large positions in particular issuers. The Funds must also assess their use of borrowings and derivatives, short-term and long-term cash flow projections in normal and stressed conditions, holdings of cash and cash equivalents, and borrowing arrangements and other funding sources.
The Rule also requires the Funds to classify their investments into one of four liquidity categories: highly liquid, moderately liquid, less liquid or illiquid based on the number of days a Fund expects it would take to liquidate the investment, and to review these classifications at least monthly or more often under certain conditions. The periods range from three or fewer business days for a highly liquid investment to greater than seven calendar days for settlement of a less liquid investment. Illiquid investments are those a Fund does not expect to be able to sell or dispose of within seven calendar days without significantly changing the market value of the investment. A Fund is prohibited from acquiring an investment if, after the acquisition, its holdings of illiquid assets will exceed 15% of its net assets. In addition, if a Fund permits redemptions in-kind, the Rule requires the Fund to establish redemption in-kind policies and procedures governing how and when it will engage in such redemptions.
Pursuant to the Rule’s requirements, the Program has been reviewed and approved by the Fund’s Board. Furthermore, the Board has received a written report prepared by the Program Administrator that addresses the operation of the Program, assesses its adequacy and effectiveness and describes any material changes made to the Program. The Program Administrator has monitored the Fund’s liquidity risk and the liquidity classifications of the securities held by the Fund and has determined that the Program is operating effectively.
During the period from January 1, 2021 to December 31, 2021, there were no material changes to the Program and no material liquidity events that impacted the Funds. During the period, the Funds held sufficient highly liquid assets to meet fund redemptions.
Under normal expected foreseeable Fund redemption forecasts and foreseeable stressed Fund redemption forecasts, the Program Administrator believes that the Funds maintain sufficient highly liquid assets to meet Fund redemptions.
Trustees and Officers Information (unaudited)
| | | | | | | | | | |
Name
and Year of Birth
of Trustee/Officer | | Position(s) Held with the Trust, Term of Office and Length
of Time Served | | Principal Occupation(s) During Past 5 Years | | Number of Portfolios
in Fund Complex
Overseen by Trustee/
Officer+ | | | Other Directorships Held by Trustee |
| Trustees Who Are Interested Persons of the Trust |
| | | | |
Jonathan Steinberg
(1964) | | Trustee, 2005-present; President, 2005-present | | Chief Executive Officer, WisdomTree Investments, Inc. and WisdomTree Asset Management since 2005; President, WisdomTree Investments, Inc. and WisdomTree Asset Management from 2012 to 2019. | | | 77 | | | Director, WisdomTree Investments, Inc. and WisdomTree Asset Management. |
| Trustees Who Are Not Interested Persons of the Trust |
| | | | |
David G. Chrencik*
(1948) | | Trustee, 2014-present | | Chief Financial Officer of Sarus Indochina Select LP (hedge fund) since 2012; Chief Financial Officer of GeoGreen BioFuels, Inc. (biodiesel fuel producer) from 2010 to 2014; Audit Partner at PricewaterhouseCoopers LLP (public accounting firm) from 1972 to 2009 (includes positions prior to becoming Audit Partner and predecessor firms). | | | 77 | | | Trustee, Vericimetry Funds (2011 to 2014). |
| | | | |
Joel Goldberg**, ***
(1945) | | Trustee, 2012-present | | Attorney, Partner at Stroock & Stroock & Lavan LLP from 2010 to 2018; Attorney, Partner at Willkie Farr & Gallagher LLP from 2006 to 2010. | | | 77 | | | Director, Better Business Bureau (Metropolitan New York, Long Island and the Mid-Hudson Region). |
| | | | |
Toni Massaro***
(1955) | | Trustee, 2006-present | | Dean Emerita at the University of Arizona James E. Rogers College of Law (“Rogers College of Law”) since 2009 (distinguished Emerita in July 2009); Dean of the Rogers College of Law from 1999 to 2009; Regents’ Professor since 2006; Milton O. Riepe Chair in Constitutional Law since 1997; Professor at the Rogers College of Law since 1990. | | | 77 | | | None |
| | | | |
Melinda A. Raso Kirstein**** (1955) | | Trustee, 2014-present | | Retired since 2004, Merrill Lynch Investment Management, Vice President; Senior Portfolio Manager, Fixed Income Management; Director, Tax Exempt Fund Management. | | | 77 | | | Associate Alumnae of Douglass College, Chair of Investment Committee. |
| | | | |
Victor Ugolyn
(1947) | | Trustee, 2006-present; Chairman of the Board, 2006-present | | Private Investor, from 2005 to present; President and Chief Executive Officer of William D. Witter, Inc. from 2005 to 2006; Consultant to AXA Enterprise in 2004; Chairman, President and Chief Executive Officer of Enterprise Capital Management (subsidiary of The MONY Group, Inc.) and Enterprise Group of Funds, Chairman of MONY Securities Corporation, and Chairman of the Fund Board of Enterprise Group of Funds from 1991 to 2004. | | | 77 | | | None |
Trustees and Officers Information (unaudited) (concluded)
| | | | | | | | | | |
Name
and Year of Birth
of Trustee/Officer | | Position(s) Held with the Trust, Term of Office and Length
of Time Served | | Principal Occupation(s) During Past 5 Years | | Number of Portfolios
in Fund Complex
Overseen by Trustee/
Officer+ | | | Other Directorships Held by Trustee |
| Officers of the Trust |
| | | | |
Jonathan Steinberg***** (1964) | | President, 2005- present; Trustee, 2005-present | | Chief Executive Officer, WisdomTree Investments, Inc. and WisdomTree Asset Management since 2005; President, WisdomTree Investments, Inc. and WisdomTree Asset Management from 2012 to 2019. | | | 77 | | | None |
| | | | |
David Castano***** (1971) | | Treasurer, 2013-present | | Head of Fund Accounting & Administration, WisdomTree Asset Management, since 2020; Director of Fund Accounting & Administration, WisdomTree Asset Management, 2011 to 2020. | | | 77 | | | None |
| | | | |
Terry Jane Feld***** (1960) | | Chief Compliance Officer, 2012-present | | Head of Compliance, WisdomTree Asset Management since 2022; Chief Compliance Officer, WisdomTree Asset Management since 2012. | | | 77 | | | None |
| | | | |
Joanne Antico***** (1975) | | Chief Legal Officer and Secretary, 2021-present | | General Counsel, WisdomTree Asset Management since 2021; Assistant General Counsel, WisdomTree Asset Management, 2016 to 2021; Executive Director and Assistant Secretary, Morgan Stanley Investment Management Inc., 2005 to 2016. | | | 77 | | | None |
| | | | |
TJ Darnowski***** (1984) | | Assistant Secretary, 2021-present | | Senior Investment Management Paralegal, WisdomTree Asset Management since 2021; Senior Legal Administrator, Ultimus Fund Solutions, 2019-2021; Assistant Vice President, State Street Bank & Trust Company, 2010 to 2019. | | | 77 | | | None |
| | | | |
Clint Martin***** (1977) | | Assistant Treasurer, 2015-present | | Director of Fund Accounting & Administration, WisdomTree Asset Management, since 2020; Fund Manager, Fund Accounting & Administration, WisdomTree Asset Management, 2012 to 2020. | | | 77 | | | None |
| * | Chair of the Audit Committee. |
| ** | Chair of the Contracts Review Committee. |
| *** | Co-Chair of the Governance, Nominating and Compliance Committee. |
| **** | Chair of the Investment Committee. |
| ***** | Elected by and serves at the pleasure of the Board. |
Supplemental Information (unaudited)
Federal Income Tax Information
The following Federal tax information related to the Funds’ fiscal year ended March 31, 2022, is provided for information purposes only and should not be used for reporting to federal or state revenue agencies. Federal tax information for the calendar year will be reported to you on Form 1099-DIV in January 2023.
Certain dividends paid by the Funds may be subject to a maximum tax rate of 15%, as provided by the Jobs and Growth Tax Relief Reconciliation Act of 2003. Of the distributions paid during the fiscal year ended March 31, 2022, the following represents the maximum amount of ordinary income distributions that may be considered qualified dividend income:
| | | | |
| | |
| Fund | | Qualified Dividend
Income | |
Europe Quality Dividend Growth Fund | | $ | 1,969,811 | |
Europe SmallCap Dividend Fund | | | 8,828,002 | |
International AI Enhanced Value Fund | | | 3,840,142 | |
International Equity Fund | | | 20,173,693 | |
International High Dividend Fund | | | 7,521,680 | |
International LargeCap Dividend Fund | | | 13,108,316 | |
International MidCap Dividend Fund | | | 3,731,847 | |
International Multifactor Fund | | | 1,068,410 | |
International Quality Dividend Growth Fund | | | 8,948,267 | |
International SmallCap Dividend Fund | | | 40,727,839 | |
Japan SmallCap Dividend Fund | | | 4,540,106 | |
The Funds intend to elect to pass through to shareholders the credit for taxes paid to foreign countries during the fiscal year ended March 31, 2022. The gross foreign source income and foreign taxes paid are as follows:
| | | | | | | | |
| | | |
| Fund | | Gross Foreign
Income | | | Foreign
Taxes Paid | |
Europe Quality Dividend Growth Fund | | $ | 2,122,902 | | | $ | 148,099 | |
Europe SmallCap Dividend Fund | | | 8,664,045 | | | | — | |
International AI Enhanced Value Fund | | | 7,522,700 | | | | 204,176 | |
International Equity Fund | | | 23,833,463 | | | | 1,481,716 | |
International High Dividend Fund | | | 9,299,058 | | | | 415,498 | |
International LargeCap Dividend Fund | | | 14,330,910 | | | | 857,403 | |
International MidCap Dividend Fund | | | 5,851,746 | | | | 321,945 | |
International Multifactor Fund | | | 1,180,540 | | | | 64,431 | |
International Quality Dividend Growth Fund | | | 9,920,163 | | | | 481,262 | |
International SmallCap Dividend Fund | | | 47,285,442 | | | | 3,071,028 | |
Japan SmallCap Dividend Fund | | | 5,842,836 | | | | 623,169 | |
The following represents the percentage of dividends paid during the fiscal year ended March 31, 2022, that qualify for the 70% dividends received deduction for corporate shareholders:
| | | | |
| | |
| Fund | | Dividends-Received
Deduction | |
Europe Quality Dividend Growth Fund | | | 0.01 | % |
Europe SmallCap Dividend Fund | | | 0.43 | % |
International AI Enhanced Value Fund | | | — | |
International Equity Fund | | | 0.01 | % |
International High Dividend Fund | | | 0.01 | % |
International LargeCap Dividend Fund | | | — | |
International MidCap Dividend Fund | | | — | |
International Multifactor Fund | | | — | |
International Quality Dividend Growth Fund | | | — | |
International SmallCap Dividend Fund | | | 0.26 | % |
Japan SmallCap Dividend Fund | | | — | |
General Information (unaudited)
Proxy Voting Policies, Procedures and Record
A complete copy of the Proxy Voting Policy may be obtained upon request, at no charge, by calling 1-866-909-WISE (9473) or writing to: WisdomTree Trust, c/o Foreside Fund Services, LLC, Three Canal Plaza Suite 100, Portland, ME, 04101.
The Trust is required to disclose annually the Funds’ complete proxy voting record on Form N-PX covering the most recent
12-month period ended June 30 and to file Form N-PX with the SEC no later than August 31 of each year. The current Form N-PX for the Funds is available at no charge upon request by calling 1-866-909-WISE (9473) or through the Trust’s website at www.wisdomtree.com. The Funds’ Form N-PX is also available on the SEC’s website at www.sec.gov.
Shareholder Reports and Quarterly Portfolio Disclosure
The Funds file their complete schedule of portfolio holdings with the SEC for their first and third fiscal quarters as an exhibit to their reports on Form N-PORT. Copies of the filings are available, without charge, on the SEC’s website at www.sec.gov and are also available by calling the Trust at 1-866-909-WISE (9473). Copies of the filings may also be obtained, after paying a duplicating fee, by electronic request at the following E-mail address: publicinfo@sec.gov.
Information about each Fund’s portfolio holdings is available daily, without charge, at www.wisdomtree.com.
The Statement of Additional Information (“SAI”) has additional information about the Funds’ Trustees and Officers and is available without charge upon request. Contact your financial representative for a free prospectus or SAI.
Frequency Distribution of Discounts & Premiums
Information about differences between the per share net asset value of each Fund and the market trading price of shares of each Fund are available, without charge, at www.wisdomtree.com.
The WisdomTree Funds are exchange traded funds (“ETFs”) registered with the United States Securities and Exchange Commission as separate series (“Funds”) of WisdomTree Trust (“Trust”). WisdomTree Asset Management, Inc., a wholly owned subsidiary of WisdomTree Investments, Inc., serves as the investment adviser to the Trust. None of the WisdomTree entities are affiliated with Foreside Fund Services, LLC, the Funds’ distributor. WisdomTree Investments, its affiliates and their independent providers are not liable for any informational errors, incompleteness, delays, or for any actions taken in reliance on information contained herein.
There are risks associated with investing including possible loss of principal. Foreign investing involves special risks, such as risk of loss from currency fluctuation or political or economic uncertainty. Investments in real estate involve additional special risks, such as credit risk, interest rate fluctuations and the effect of varied economic conditions. Funds that focus their investments in one country or region may be significantly impacted by events and developments associated with the region which can adversely affect performance. Funds focusing on a single sector and/or smaller companies generally experience greater price volatility. Investments in emerging, offshore or frontier markets are generally less liquid and less efficient than investments in developed markets and are subject to additional risks, such as risks of adverse governmental regulation and intervention or political developments. Investments in currency involve additional special risks, such as credit risk and interest rate fluctuations. Derivative investments can be volatile and these investments may be less liquid than other securities, and more sensitive to the effect of varied economic conditions. As these Funds can have a high concentration in some issuers the Funds can be adversely impacted by changes affecting such issuers. Due to the investment strategy of certain Funds they may make higher capital gain distributions than other ETFs. Please read the Fund’s prospectus for specific details regarding the Fund’s risk profile.
Indexes are unmanaged and you cannot invest directly in an index.
Transactions in Fund shares will result in brokerage commissions and will generate tax consequences. Shares may be sold through brokerage accounts, but may be redeemed from the Funds only by Authorized Participants in large creation unit sizes of shares.
This report is intended for the Funds’ shareholders. It may not be distributed to prospective investors unless it is preceded or accompanied by the current prospectus.
Scan the QR code with your
smartphone camera to

learn more at
WisdomTree.com
WisdomTree Fund shares are distributed by Foreside Fund Services, LLC, in the U.S. only.
WTGM-6334
| | (a) | The registrant, as of the end of the period covered by this report, has adopted a code of ethics that applies to the registrant’s principal executive officer, principal financial officer, principal accounting officer or controller, or persons performing similar functions, regardless of whether these individuals are employed by the registrant or a third party. |
| | (c) | There have been no amendments, during the period covered by this report, to a provision of the code of ethics that applies to the registrant’s principal executive officer, principal financial officer, principal accounting officer or controller, or persons performing similar functions, regardless of whether these individuals are employed by the registrant or a third party, and that relates to any element of the code of ethics description. |
| | (d) | The registrant has not granted any waivers, including an implicit waiver, from a provision of the code of ethics that applies to the registrant’s principal executive officer, principal financial officer, principal accounting officer or controller, or persons performing similar functions, regardless of whether these individuals are employed by the registrant or a third party, that relates to one or more of the items set forth in paragraph (b) of this item’s instructions. |
| | (f) | The code of ethics is attached hereto as exhibit 13(a)(1). |
| Item 3. | Audit Committee Financial Expert. |
The registrant’s Board of Trustees has determined that the registrant has one audit committee financial expert, as that term is defined under Item 3(b) and 3(c), serving on its audit committee. The audit committee financial expert serving on the registrant’s audit committee is David Chrencik, who is an independent trustee of the registrant, as that term is defined under Item 3(a) (2).
| Item 4. | Principal Accountant Fees and Services. |
Audit Fees
| | (a) | The aggregate fees billed for each of the last two fiscal years for professional services rendered by the principal accountant for the audit of the registrant’s annual financial statements or services that are normally provided by the accountant in connection with statutory and regulatory filings or engagements for those fiscal years were $1,062,666 for 2022 and $1,021,526 for 2021. |
Audit-Related Fees
| | (b) | The aggregate fees billed for each of the last two fiscal years for assurance and related services by the principal accountant that are reasonably related to the performance of the audit of the registrant’s financial statements and are not reported under paragraph (a) of this Item were $0 for 2022 and $0 for 2021. |
Tax Fees
| | (c) | The aggregate fees billed for each of the last two fiscal years for professional services rendered by the principal accountant for service fees for analysis of potential Passive Foreign Investment Companies, tax compliance, tax advice, and tax planning were $574,052 for 2022 and $553,295 for 2021. |
All Other Fees
| | (d) | The aggregate fees billed for each of the last two fiscal years for products and services provided by the principal accountant, other than the services reported in paragraphs (a) through (c) of this Item were $0 for 2022 and $0 for 2021. |
| | (e)(1) | Disclose the audit committee’s pre-approval policies and procedures described in paragraph (c)(7) of Rule 2-01 of Regulation S-X. |
Per Rule-01(c) (7) (A), the registrant’s audit committee charter provides that the audit committee shall select and approve in advance the retention of independent accountants to annually audit and provide their opinion on the registrant’s financial statements. The audit committee must also approve prior to appointment the engagement of the principal accountant to provide other audit services to the registrant or to provide non-audit services to the registrant, its investment adviser, or any entity controlling, controlled by, or under common control with its investment adviser (“adviser/affiliate”) that provides ongoing services to the registrant, if the engagement by the investment adviser or adviser affiliate relates directly to the operations and financial reporting of the registrant. The audit committee must also, prior to appointment of the engagement of the principal accountant, review and approve the fees proposed to be charged to the registrant by the auditors for each audit and non-audit service. The audit committee must also consider whether non-audit services provided by the registrant’s principal accountant to the registrant’s investment adviser, or adviser/affiliate that provides ongoing services to the registrant are compatible with maintaining the auditor’s independence.
| | (e)(2) | The registrant’s audit committee has approved 100% of services described in each of Items 4(b) through (d) pursuant to paragraph (c)(7)(i)(C) of Rule 2-01 of Regulation S-X. |
| | (f) | The percentage of hours expended on the principal accountant’s engagement to audit the registrant’s financial statements for the most recent fiscal year that were attributed to work performed by persons other than the principal accountant’s full-time, permanent employees was 0%. |
| | (g) | The aggregate non-audit fees billed by the registrant’s accountant for services rendered to the registrant, and rendered to the registrant’s investment adviser (not including any sub-adviser whose role is primarily portfolio management and is subcontracted with or overseen by another investment adviser), and any entity controlling, controlled by, or under common control with the adviser that provides ongoing services to the registrant for each of the last two fiscal years of the registrant was $574,052 for 2022 and $553,295 for 2021. |
| Item 5. | Audit Committee of Listed Registrants. |
The registrant is an issuer as defined in Rule 10A-3 under the Securities Exchange Act of 1934, as amended (the “Exchange Act”) and has a separately-designated standing audit committee established in accordance with Section 3(a)(58)A of the Exchange Act. The registrant’s audit committee members are David Chrencik, Melinda Raso Kirstein and Victor Ugolyn.
| (a) | Schedule of Investments in securities of unaffiliated issuers as of the close of the reporting period is included as part of the report to shareholders filed under Item 1 of this form. |
| Item 7. | Disclosure of Proxy Voting Policies and Procedures for Closed-End Management Investment Companies. |
Not applicable.
| Item 8. | Portfolio Managers of Closed-End Management Investment Companies. |
Not applicable.
| Item 9. | Purchases of Equity Securities by Closed-End Management Investment Company and Affiliated Purchasers. |
Not applicable.
| Item 10. | Submission of Matters to a Vote of Security Holders. |
There have been no material changes to the procedures by which the shareholders may recommend nominees to the registrant’s board of trustees, where those changes were implemented after the registrant last provided disclosure in response to the requirements of Item 407(c)(2)(iv) of Regulation S-K (17 CFR 229.407) (as required by Item 22(b)(15) of Schedule 14A (17 CFR 240.14a-101)), or this Item.
| Item 11. | Controls and Procedures. |
| | (a) | The registrant’s principal executive and principal financial officers, or persons performing similar functions, have concluded that the registrant’s disclosure controls and procedures (as defined in Rule 30a-3(c) under the Investment Company Act of 1940, as amended (the “1940 Act”) (17 CFR 270.30a-3(c))) are effective, as of a date within 90 days of the filing date of the report that includes the disclosure required by this paragraph, based on their evaluation of these controls and procedures required by Rule 30a-3(b) under the 1940 Act (17 CFR 270.30a-3(b)) and Rules 13a-15(b) or 15d-15(b) under the Securities Exchange Act of 1934, as amended (17 CFR 240.13a-15(b) or 240.15d-15(b)). |
| | (b) | There were no changes in the registrant’s internal control over financial reporting (as defined in Rule 30a-3(d) under the 1940 Act (17 CFR 270.30a-3(d)) that occurred during the period covered by this report that has materially affected, or is reasonably likely to materially affect, the registrant’s internal control over financial reporting. |
| Item 12. | Disclosure of Securities Lending Activities for Closed-End Management Investment Companies. |
Not applicable.
SIGNATURES
Pursuant to the requirements of the Securities Exchange Act of 1934 and the Investment Company Act of 1940, the registrant has duly caused this report to be signed on its behalf by the undersigned, thereunto duly authorized.
| | |
| (Registrant) | | WisdomTree Trust |
| |
| By (Signature and Title) | | /s/ Jonathan Steinberg |
| | Jonathan L. Steinberg, President |
| | (principal executive officer) |
Date: June 3, 2022
Pursuant to the requirements of the Securities Exchange Act of 1934 and the Investment Company Act of 1940, this report has been signed below by the following persons on behalf of the registrant and in the capacities and on the dates indicated.
| | |
| By (Signature and Title) | | /s/ Jonathan Steinberg |
| | Jonathan L. Steinberg, President |
| | (principal executive officer) |
| |
| Date: June 3, 2022 | | |
| |
| By (Signature and Title) | | /s/ David Castano |
| | David Castano, Treasurer |
| | (principal financial officer) |
Date: June 3, 2022