UNITED STATES
SECURITIES AND EXCHANGE COMMISSION
Washington, D.C. 20549
FORM N-CSR
CERTIFIED SHAREHOLDER REPORT OF REGISTERED
MANAGEMENT INVESTMENT COMPANIES
Investment Company Act file number 811-21864
WisdomTree Trust
(Exact name of registrant as specified in charter)
250 West 34th Street, 3rd Floor
New York, NY 10167
(Address of principal executive offices) (Zip code)
The Corporation Trust Company
1209 Orange Street
Wilmington, DE 19801
(Name and address of agent for service)
Registrant’s telephone number, including area code: (866) 909-9473
Date of fiscal year end: June 30
Date of reporting period: June 30, 2022
Form N-CSR is to be used by management investment companies to file reports with the Commission not later than 10 days after the transmission to stockholders of any report that is required to be transmitted to stockholders under Rule 30e-1 under the Investment Company Act of 1940 (17 CFR 270.30e-1). The Commission may use the information provided on Form N-CSR in its regulatory, disclosure review, inspection, and policymaking roles.
A registrant is required to disclose the information specified by Form N-CSR, and the Commission will make this information public. A registrant is not required to respond to the collection of information contained in Form N-CSR unless the Form displays a currently valid Office of Management and Budget (“OMB”) control number. Please direct comments concerning the accuracy of the information collection burden estimate and any suggestions for reducing the burden to Secretary, Securities and Exchange Commission, 100 F Street, NE, Washington, DC 20549. The OMB has reviewed this collection of information under the clearance requirements of 44 U.S.C. § 3507.
Item 1. Reports to Stockholders.
| | (a) | The Reports to Shareholders are attached hereto. |


WisdomTree Trust
Annual Report
June 30, 2022
International Equity ETFs:
WisdomTree Dynamic Currency Hedged International Equity Fund (DDWM)
WisdomTree Dynamic Currency Hedged International SmallCap Equity Fund (DDLS)
WisdomTree Emerging Markets ESG Fund (RESE)
WisdomTree International ESG Fund (RESD)
Fixed Income ETFs:
WisdomTree U.S. Corporate Bond Fund (WFIG)
WisdomTree U.S. High Yield Corporate Bond Fund (WFHY)
WisdomTree U.S. Short-Term Corporate Bond Fund (SFIG)
Efficient Core ETFs:
WisdomTree Emerging Markets Efficient Core Fund (NTSE)
WisdomTree International Efficient Core Fund (NTSI)
WisdomTree U.S. Efficient Core Fund (NTSX)
Megatrends ETFs:
WisdomTree Artificial Intelligence and Innovation Fund (WTAI)
WisdomTree Battery Value Chain and Innovation Fund (WBAT)
WisdomTree BioRevolution Fund (WDNA)
WisdomTree Cloud Computing Fund (WCLD)
WisdomTree Cybersecurity Fund (WCBR)
Table of Contents
“WisdomTree” is a registered mark of WisdomTree Investments, Inc. and is licensed for use by the WisdomTree Trust.
Market Environment Overview
(unaudited)
U.S. Markets
U.S. equity markets, as measured by the S&P 500 Index (“S&P 500”), returned -10.62% in U.S. dollar terms for the 12-month fiscal period ending June 30, 2022 (the “fiscal period”).
Vaccine accessibility and relatively benign flareups of the novel coronavirus (“COVID-19”) established confidence in markets early on in the fiscal period as the U.S. economy steadily continued its recovery rally. Economic growth remained robust during the latter half of 2021, although inflation rates began to accelerate amid a backdrop of accommodative monetary policy. U.S. real gross domestic product (“GDP”) grew 5.7%, while inflation increased nearly 7% year-over-year during 2021.
During the third quarter of 2021, U.S. markets initially moved higher as vaccines became accessible for most demographics. Shortly thereafter, flareups of new strains with unknown contagiousness and severity soured market sentiment. The S&P 500 managed to stay positive for the quarter, increasing about 0.5%, while small cap equities, as proxied by the Russell 2000 Index (“Russell 2000”), declined about -4.3%. However, the economic recovery slowly continued despite the decline in sentiment, as real GDP grew 2.3% during the quarter.
During the fourth quarter of 2021, markets regained momentum. The U.S. economy continued to grow and the ongoing monetary policy support from the U.S. Federal Reserve (the “Fed”) helped support markets. The S&P 500 returned over 11% to finish the 2021 calendar year, while small caps fluctuated but managed to increase overall by 2.1%. As 2021 concluded, investors acknowledged that the economy had recovered quickly and efficiently, but feared that 2022 would likely see the end of the accommodative monetary policies that helped support equity markets. The U.S. unemployment rate fell below 4% by the end of the 2021 calendar year, coming very close to pre-pandemic lows, and real GDP grew nearly 7% during the quarter. However, inflation rates continued to accelerate as well.
Entering the first quarter of 2022, several concerns led to risk-off sentiments among investors. At the forefront were concerns about runaway inflation, and the expectation that the Fed would have to quickly intervene with restrictive monetary policy actions to tame it. Interest rates rose quickly as bonds sold off, and the Fed raised its target federal funds rate for the first time since slashing it to 0% at the onset of the COVID-19 pandemic in 2020.
However, inflationary and interest rate concerns temporarily took a backseat halfway through the first quarter of 2022, as geopolitical tensions between Russia and Ukraine escalated into war. Investor risk-on sentiment deteriorated, and equities tumbled for several weeks as markets assessed the developments and prospects for a resolution. As a result, U.S. equities sold off during the quarter, owing to the near certainty of several upcoming interest rate hikes amid a tightening cycle and geopolitical tensions between Russia and Ukraine. Though the unemployment rate continued to fall, declining to 3.6%, while the rate of inflation increased to 8.5% year-over-year and real GDP fell by -1.6%. During the first quarter of 2022, the S&P 500 declined -4.6% while small caps declined over -7.5%.
During the second quarter of 2022, market sentiment grew even more pessimistic. Each of the S&P 500 and Russell 2000 fell about 16-17% amid ongoing concerns about inflation data and expected impacts to corporate earnings in the near future. Monthly inflation readings in the 8-9% range loomed over markets, which proved that the Fed’s initial interest rate hikes did little to alleviate price pressures, and more frequent and aggressive rate hikes would be needed. Because of this, markets began to fear that interest rates would have to be raised to a level that would likely tip the economy into recession, which amplified fears and exacerbated market declines. Estimates for real GDP data for the quarter are expected to be very low or perhaps even negative, the latter of which would be the second straight quarter of real GDP declines and may signal a technical recession.
Market Environment Overview
(unaudited) (continued)
Many of these risk factors remain paramount, and U.S. financial market performance will be heavily dependent on developments in economic data, commodity prices, and upcoming central bank activity.
Fixed Income
During the fiscal period, U.S. fixed income performance was volatile amid a rapidly transforming economic landscape and changes in investor risk sentiment. The Bloomberg U.S. Aggregate Bond Index, a gauge of the broad U.S. fixed income market, fell about -10.3% during the fiscal period, with nearly the entire decline occurring in the first six months of 2022 amid a rising interest rate environment and record inflation. U.S. Treasury yields, a barometer for domestic interest rates due to its relationship with the Fed funds rate at the short end of the yield curve and future economic growth prospects at the long end, rose while the slope and shape changed throughout the year. Yields on shorter-dated U.S. Treasuries began the period near 0%, commensurate with the Fed’s prevailing monetary policy activity, but finished the fiscal period closer to 3% as U.S. Treasury investors estimated the extent of future rate hikes needed to subdue the highest inflation in four decades. Longer-dated U.S. Treasury yields rose as well, though the 10-year U.S. Treasury yield varied during the period as the market contemplated the possibility that the Fed would have to raise rates high enough to combat historic inflation which could potentially tip the U.S. economy into a recession. The 10-year U.S. Treasury yield began the fiscal period at 1.46%, rose as high as 3.49%, and then fell to 2.98% to conclude the fiscal period. At times, the 10-year U.S. Treasury yield fell below that of shorter-dated rates as well, such as the 2-year U.S. Treasury yield, which caused the yield curve to invert. Typically, an inverted yield curve for a prolonged period is regarded as a recessionary indicator. Bearish economic sentiment weighed on riskier fixed income investments as well, with high yield credit, as proxied by the Bloomberg U.S. Corporate High Yield Index, falling nearly -13% during the fiscal period, as high yield spreads began to climb to their highest level since the early stages of the COVID-19 pandemic of 2020.
International Markets
International equity markets, as measured by the MSCI EAFE Index, a broad measure of equity performance for the developed world outside the U.S. and Canada, declined nearly -18% for the fiscal period.
Currency markets suffered throughout the fiscal period, as all Group of Ten (“G10”) currencies weakened relative to a strong U.S. dollar. The European euro steadily weakened during the fiscal period, as the European region generally experienced slower economic growth than the U.S. and had less of a need for interest rate hikes during the near-term that likely would have helped the struggling currency. Although not in Europe, this effect was even more pronounced in the Japanese yen, which was being suppressed by the Bank of Japan in its attempt to stimulate economic growth through low interest rates while the rest of the global economy was overheating. The Japanese yen weakened slightly for most of the fiscal period, though it sold off considerably during the latter half of the fiscal period to become one of the worst performing currencies. The British pound also weakened versus the U.S. dollar, alongside the Japanese yen, European euro and others.
During the third quarter of 2021, international equities changed directions a few times but finished flat, declining only -0.45% in U.S. dollar terms. Early summertime optimism faded as new and potentially more infectious COVID-19 variants appeared and spread throughout the world. This stoked fear of renewed “lockdowns”, questions of vaccine efficacy, and threatened the ongoing economic recovery.
But investors’ concerns eventually abated during the fourth quarter of 2021. Fears of systemic impacts from the troubles in Chinese real estate markets briefly sent markets into negative territory, but they finished 2021 stronger once their contagion concerns were allayed. International equities ultimately finished the quarter in positive territory, returning 2.69% in U.S. dollar terms.
Market Environment Overview
(unaudited) (concluded)
Overall, international equities remained relatively flat for the first half of the fiscal period. Though the pace of economic growth improved during 2021, along with the inflation rates around the world amid a global backdrop of accommodative monetary policy, international equities could not catch a strong tailwind and finished 2021 with modest returns.
Entering calendar year 2022, several headwinds weighed on investor sentiment and led to steep declines in international equity markets. At the forefront were concerns about runaway inflation and the expectation that global central banks would have to quickly intervene with restrictive monetary policy actions to tame it. Interest rates around the world rose quickly as bonds sold off, and the Fed kickstarted the global rate hike campaign by raising its target federal funds rate for the first time since slashing it to 0% during the onset of the COVID-19 pandemic in 2020.
Similar to U.S. equities, inflationary and interest rate concerns temporarily took a backseat halfway through the first quarter of 2022, as geopolitical tensions between Russia and Ukraine escalated into war. Investor risk-on sentiment deteriorated and international equities tumbled for several weeks as markets assessed the developments and prospects for a resolution. Meanwhile, a global commodity shortage materialized and exacerbated inflationary pressures in developed regions such as Europe, due to its dependency on Russian energy imports despite coordinated global sanctions and energy embargoes against Russia for its role in the war with Ukraine. As a result, international equities sold off in the first quarter of 2022, owing to the near certainty of several upcoming interest rate hikes amid a tightening cycle, energy supply uncertainty, and indefinite conflict between Russia and Ukraine. International equities declined nearly -6% in U.S. dollar terms, regaining some ground after reaching a -15% low in early March 2022.
During the second quarter of 2022, many of these same fears and sentiments persisted and, in some cases, worsened. During the second quarter of 2022, international equities, as measured by the MSCI EAFE Index, declined over -14.5% in U.S. dollar terms amid the ongoing conflict with Russia and Ukraine, inflationary pressures showing no signs of abating, and an anticipated impact to global corporate earnings. From a central bank standpoint, both the Bank of Japan and European Central Bank have maintained low interest rates so far, with the former reaffirming this accommodative monetary policy stance while the latter is beginning to consider interest rate hikes as a tightening tool.
Many of these risk factors remain paramount, and international equity market performance will be heavily dependent on developments in the war between Russia and Ukraine, economic data, energy pressure abatement, and upcoming central bank activity. International equity markets may also strengthen if global risk sentiment improves and investors determine this fiscal period’s selloff has been overdone.
Each WisdomTree Fund’s performance as set forth in “Management’s Discussion of Funds’ Performance” in the pages that follow should also be viewed in light of the foregoing market environment.
Information about Performance and Shareholder Expense Examples (unaudited)
Performance
The performance tables on the following pages are provided for comparative purposes and represent the period noted. Each Fund’s per share net asset value (“NAV”) is the value of one share of the Fund and is calculated by dividing the value of total assets less total liabilities by the number of shares outstanding. The NAV return is based on the NAV of the Fund and the market price return is based on the market price per share of the Fund. The price used to calculate market price returns is the midpoint of the bid and ask price for Fund shares as of the close of trading on the exchange where Fund shares are listed. NAV and market price returns assume that dividends and capital gain distributions have been reinvested in the Fund at NAV and market price, respectively. As with other exchange traded funds (“ETFs”), NAV returns and market price returns may differ because of factors such as the supply and demand for Fund shares and investors’ assessments of the underlying value of a Fund’s portfolio securities.
Fund shares are bought and sold at market price (not NAV) and are not individually redeemed from a Fund. Fund NAV returns are calculated using a Fund’s daily 4:00 p.m. eastern time NAV. Market price returns reflect the midpoint of the bid and ask price as of the close of trading on the exchange where Fund shares are listed. Market price returns do not represent the returns you would receive if you traded shares at other times. The returns do not reflect the deduction of taxes that a shareholder would pay on Fund distributions or on the redemption of Fund shares. Total returns for a period of less than one year are cumulative.
Performance is historical and does not guarantee future results. Current performance may be lower or higher than quoted. Investment returns and the principal value of an investment will fluctuate so that an investor’s shares, when redeemed, may be worth more or less than their original cost. For the most recent month-end performance information visit www.wisdomtree.com.
An index is a statistical measure of a specified financial market or sector. An index does not actually hold a portfolio of securities, incur expenses or pay any transaction costs. Therefore, index returns do not reflect deductions for fees or expenses and an index is not available for direct investment. In comparison, the Funds’ performance is negatively impacted by these deductions. Fund returns do not reflect brokerage commissions or taxes on transactions in Fund shares or taxes that a shareholder would pay on Fund distributions. Past performance is no guarantee of future results.
Shareholder Expense Examples
Each Fund’s performance table is accompanied by a shareholder expense example. As a shareholder of a WisdomTree Fund, you incur two types of cost: (1) transaction costs, including brokerage commissions on purchases and sales of your Fund shares and (2) ongoing costs, including management fees and other Fund expenses. The examples are intended to help you understand your ongoing costs (in dollars and cents) of investing in a Fund and to compare these costs with the ongoing costs of investing in other funds.
The examples are based on an investment of $1,000 invested at the beginning of the period and held for the entire period from January 1, 2022 to June 30, 2022. Except where noted, expenses are calculated using each Fund’s annualized expense ratio (after the effect of contractual or voluntary fee waivers, if any), multiplied by the average account value for the period, multiplied by 181/365 (to reflect the one-half year period). The annualized expense ratio does not include acquired fund fees and expenses (“AFFEs”), which are fees and expenses incurred indirectly by a Fund through its investments in certain underlying investment companies.
Actual expenses
The first line in the shareholder expense example table shown on the following pages provides information about actual account values and actual expenses. You may use the information in this line, together with the amount you invested, to estimate the expenses that you paid over the period. Simply divide your account value by $1,000 (for example, an $8,600 account value divided by $1,000 = 8.6), then multiply the result by the number in the first line for your Fund under the heading entitled “Expenses Paid During the Period” to estimate the expenses you paid on your account during the period.
Hypothetical example for comparison purposes
The second line in the shareholder expense example table shown on the following pages provides information about hypothetical account values and hypothetical expenses based on the Fund’s actual expense ratio and an assumed rate of return of 5% per year before expenses, which is not the Fund’s actual return. The hypothetical account values and expenses may not be used to estimate the actual ending account balance or expenses you paid for the period. You may use this information to compare the ongoing costs of investing in your Fund and other funds. To do so, compare this 5% hypothetical example with the 5% hypothetical examples that appear in the shareholder reports of the other funds.
Please note that the expenses shown in the table are meant to highlight your ongoing costs only and do not reflect any transactional costs, such as brokerage commissions paid on purchases and sales of Fund shares. Therefore, the second line in the table is useful in comparing ongoing Fund costs only and will not help you determine the relative total costs of owning different funds. In addition, if these transactional costs were included, your costs would have been higher.
Management’s Discussion of Funds’ Performance
as of June 30, 2022 (unaudited)
WisdomTree Dynamic Currency Hedged International Equity Fund (DDWM)
Sector Breakdown†
| | | | |
| |
| Sector | | % of Net Assets | |
Financials | | | 21.5% | |
Industrials | | | 12.6% | |
Materials | | | 11.5% | |
Consumer Staples | | | 9.7% | |
Health Care | | | 9.7% | |
Consumer Discretionary | | | 7.7% | |
Communication Services | | | 7.5% | |
Utilities | | | 6.2% | |
Energy | | | 5.1% | |
Real Estate | | | 3.7% | |
Information Technology | | | 3.3% | |
Other Assets less Liabilities‡ | | | 1.5% | |
Total | | | 100% | |
| † | The Fund’s sector breakdown is expressed as a percentage of net assets and may change over time. In addition, a sector may be comprised of several industries. It does not include derivatives (if any). |
| ‡ | Other assets less liabilities may include investment of cash collateral for securities on loan and/or receivables/payables on derivatives (if any). |
Top Ten Holdings*
| | | | |
| |
| Description | | % of Net Assets | |
BHP Group Ltd. | | | 2.9% | |
Nestle SA, Registered Shares | | | 2.1% | |
Rio Tinto Ltd. | | | 1.5% | |
Novartis AG, Registered Shares | | | 1.5% | |
Toyota Motor Corp. | | | 1.2% | |
GSK PLC | | | 1.1% | |
Shell PLC | | | 1.1% | |
Nippon Telegraph & Telephone Corp. | | | 1.1% | |
Roche Holding AG | | | 1.1% | |
Commonwealth Bank of Australia | | | 1.0% | |
| * | The ten largest holdings are subject to change, and there are no guarantees the Fund will remain invested in any particular company. Excludes derivatives and investment of cash collateral for securities on loan (if any). |
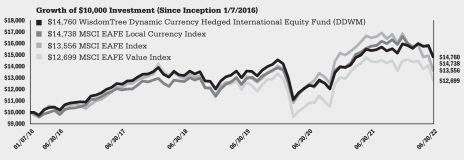
The WisdomTree Dynamic Currency Hedged International Equity Fund (the “Fund”) seeks to track the price and yield performance, before fees and expenses, of the WisdomTree Dynamic Currency Hedged International Equity Index (the “Index”). In seeking to track the Index, the Fund invests in dividend-paying companies in the industrialized world outside the U.S. and Canada while at the same time dynamically hedging exposure to fluctuations of the value of the applicable foreign currencies relative to the U.S. dollar. The Fund generally uses a representative sampling strategy to achieve its investment objective, meaning it generally will invest in a sample of securities in the Index.
The Fund returned -4.12% at net asset value (“NAV”) for the fiscal year ended June 30, 2022 (for more complete performance information please see the table below). Despite the negative performance for the fiscal year, all sectors were positive relative contributors to performance due to the Fund’s emphasis on dividend investing in an environment where value investing outperformed the broader market’s decline. The Fund benefitted from positions in the Information Technology, Industrials, and Financials sectors, all of which were primarily due to stock selection effects during a strong period for value investing. The least positive contributor was the Energy sector, due to both stock selection and allocation impacts. Fund performance was also aided by currency movements during the fiscal year. Amid record inflation readings throughout developed equity markets, each of the G10 currencies weakened against the U.S. dollar, which strengthened rapidly as investors expected the Fed to hike interest rates to quell the overheating economy. During the fiscal year, the Fund utilized foreign exchange contracts to dynamically hedge its foreign currency exposures. The Fund was nearly entirely hedged against movements in the Australian dollar, Swiss franc, and Japanese yen during the fiscal year, and more than two-thirds hedged against the European euro and British pound. Overall, the Fund’s use of foreign exchange contracts contributed to Fund performance as each of these currencies weakened relative to the U.S. dollar.
Shareholder Expense Example (for the six-month period ended June 30, 2022)
| | | | | | | | | | | | | | | | |
| | | | | |
| | | Beginning
Account Value | | | Ending
Account Value | | | Annualized
Expense Ratio | | | Expenses Paid
During the
Period | |
Actual | | $ | 1,000.00 | | | $ | 925.00 | | | | 0.40 | % | | $ | 1.91 | |
Hypothetical (5% return before expenses) | | $ | 1,000.00 | | | $ | 1,022.81 | | | | 0.40 | % | | $ | 2.01 | |
| | | | | | | | | | | | | | | | |
Performance | |
| | |
| | | Average Annual Total Return | |
| | | | |
| | | 1 Year | | | 3 Year | | | 5 Year | | | Since Inception1 | |
Fund NAV Returns | | | -4.12 | % | | | 2.74 | % | | | 3.47 | % | | | 6.19 | % |
Fund Market Price Returns | | | -3.99 | % | | | 2.79 | % | | | 3.49 | % | | | 6.32 | % |
WisdomTree Dynamic Currency Hedged International Equity Index | | | -4.08 | % | | | 3.02 | % | | | 3.70 | % | | | 6.37 | % |
MSCI EAFE Local Currency Index | | | -6.59 | % | | | 4.37 | % | | | 4.27 | % | | | 6.17 | % |
MSCI EAFE Index | | | -17.77 | % | | | 1.07 | % | | | 2.20 | % | | | 4.81 | % |
MSCI EAFE Value Index | | | -11.95 | % | | | 0.18 | % | | | 0.52 | % | | | 3.75 | % |
| 1 | Total returns are calculated based on the commencement of Fund trading on the Cboe BZX Exchange, Inc. on January 7, 2016. |
Performance is historical and does not guarantee future results. The returns do not reflect the deduction of taxes that a shareholder would pay on Fund distributions or on the redemption of Fund shares.
Management’s Discussion of Funds’ Performance
as of June 30, 2022 (unaudited)
WisdomTree Dynamic Currency Hedged International SmallCap Equity Fund (DDLS)
Sector Breakdown†
| | | | |
| |
| Sector | | % of Net Assets | |
Industrials | | | 22.1% | |
Financials | | | 15.3% | |
Materials | | | 11.7% | |
Consumer Discretionary | | | 10.8% | |
Real Estate | | | 9.4% | |
Consumer Staples | | | 7.3% | |
Information Technology | | | 7.0% | |
Communication Services | | | 4.4% | |
Utilities | | | 3.9% | |
Health Care | | | 3.9% | |
Energy | | | 2.7% | |
Other Assets less Liabilities‡ | | | 1.5% | |
Total | | | 100.0% | |
| † | The Fund’s sector breakdown is expressed as a percentage of net assets and may change over time. In addition, a sector may be comprised of several industries. It does not include derivatives (if any). |
| ‡ | Other assets less liabilities may include investment of cash collateral for securities on loan and/or receivables/payables on derivatives (if any). |
Top Ten Holdings*
| | | | |
| |
| Description | | % of Net Assets | |
Cia de Distribucion Integral Logista Holdings SA | | | 1.0% | |
PostNL NV | | | 0.9% | |
NetLink NBN Trust | | | 0.7% | |
Ferrexpo PLC | | | 0.7% | |
Diversified Energy Co. PLC | | | 0.7% | |
Metcash Ltd. | | | 0.7% | |
Hutchison Port Holdings Trust | | | 0.6% | |
Shougang Fushan Resources Group Ltd. | | | 0.6% | |
Drax Group PLC | | | 0.6% | |
BFF Bank SpA | | | 0.5% | |
| * | The ten largest holdings are subject to change, and there are no guarantees the Fund will remain invested in any particular company. Excludes derivatives and investment of cash collateral for securities on loan (if any). |
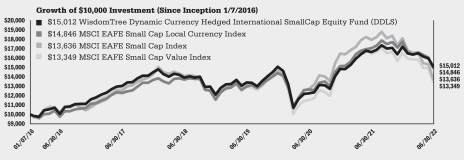
The WisdomTree Dynamic Currency Hedged International SmallCap Equity Fund (the “Fund”) seeks to track the price and yield performance, before fees and expenses, of the WisdomTree Dynamic Currency Hedged International SmallCap Equity Index (the “Index”). In seeking to track the Index, the Fund invests in the small-capitalization segment of dividend-paying companies in the industrialized world outside the U.S. and Canada while at the same time dynamically hedging exposure to fluctuations of the value of the applicable foreign currencies relative to the U.S. dollar. The Fund generally uses a representative sampling strategy to achieve its investment objective, meaning it generally will invest in a sample of securities in the Index.
The Fund returned -9.78% at net asset value (“NAV”) for the fiscal year ended June 30, 2022 (for more complete performance information please see the table below). Despite the negative performance for the fiscal year, all sectors were positive relative contributors to performance due to the Fund’s emphasis on dividend investing in an environment where value investing outperformed the broader market’s decline. The Fund benefitted from positions in the Information Technology, Industrials, and Consumer Discretionary sectors, all of which were primarily due to stock selection effects during a strong period for value investing. The least positive contributor was the Energy sector, again due to stock selection. Fund performance was also aided by currency movements during the fiscal year. Amid record inflation readings throughout developed equity markets, each of the G10 currencies weakened against the U.S. dollar, which strengthened rapidly as investors expected the Fed to hike interest rates to quell the overheating economy. During the fiscal year, the Fund utilized foreign exchange contracts to dynamically hedge its foreign currency exposures. The Fund was nearly entirely hedged against movements in the Australian dollar, Swiss franc, and Japanese yen during the fiscal year, and more than two-thirds hedged against the European euro and British pound. Overall, the Fund’s use of foreign exchange contracts contributed to Fund performance as each of these currencies weakened relative to the U.S. dollar.
Shareholder Expense Example (for the six-month period ended June 30, 2022)
| | | | | | | | | | | | | | | | |
| | | | | |
| | | Beginning
Account Value | | | Ending
Account Value | | | Annualized
Expense Ratio | | | Expenses Paid
During the
Period | |
Actual | | $ | 1,000.00 | | | $ | 873.10 | | | | 0.48 | % | | $ | 2.23 | |
Hypothetical (5% return before expenses) | | $ | 1,000.00 | | | $ | 1,022.41 | | | | 0.48 | % | | $ | 2.41 | |
Performance
| | | | | | | | | | | | | | | | |
| | |
| | | Average Annual Total Return | |
| | | | |
| | | 1 Year | | | 3 Year | | | 5 Year | | | Since Inception1 | |
Fund NAV Returns | | | -9.78 | % | | | 3.89 | % | | | 2.88 | % | | | 6.47 | % |
Fund Market Price Returns | | | -8.78 | % | | | 4.26 | % | | | 2.93 | % | | | 6.73 | % |
WisdomTree Dynamic Currency Hedged International SmallCap Equity Index | | | -9.70 | % | | | 4.18 | % | | | 3.27 | % | | | 6.88 | % |
MSCI EAFE Small Cap Local Currency Index | | | -12.93 | % | | | 4.63 | % | | | 3.89 | % | | | 6.29 | % |
MSCI EAFE Small Cap Index | | | -23.98 | % | | | 1.12 | % | | | 1.72 | % | | | 4.90 | % |
MSCI EAFE Small Cap Value Index | | | -18.90 | % | | | 0.81 | % | | | 0.83 | % | | | 4.56 | % |
| 1 | Total returns are calculated based on the commencement of Fund trading on the Cboe BZX Exchange, Inc. on January 7, 2016. |
Performance is historical and does not guarantee future results. The returns do not reflect the deduction of taxes that a shareholder would pay on Fund distributions or on the redemption of Fund shares.
Management’s Discussion of Funds’ Performance
as of June 30, 2022 (unaudited)
WisdomTree Emerging Markets ESG Fund (RESE)
| | | | |
| |
| Sector | | % of Net Assets | |
Information Technology | | | 22.1% | |
Financials | | | 21.0% | |
Consumer Discretionary | | | 18.2% | |
Consumer Staples | | | 9.0% | |
Materials | | | 8.8% | |
Communication Services | | | 7.8% | |
Industrials | | | 6.1% | |
Health Care | | | 4.2% | |
Utilities | | | 2.3% | |
Other Assets less Liabilities‡ | | | 0.5% | |
Total | | | 100.0% | |
| † | The Fund’s sector breakdown is expressed as a percentage of net assets and may change over time. In addition, a sector may be comprised of several industries. It does not include derivatives (if any). |
| ‡ | Other assets less liabilities may include investment of cash collateral for securities on loan and/or receivables/payables on derivatives (if any). |
| | | | |
| |
| Description | | % of Net Assets | |
Taiwan Semiconductor Manufacturing Co. Ltd. | | | 6.8% | |
Tencent Holdings Ltd. | | | 4.8% | |
Samsung Electronics Co. Ltd. | | | 3.6% | |
Alibaba Group Holding Ltd. | | | 3.5% | |
Infosys Ltd. | | | 1.2% | |
BYD Co. Ltd., Class H | | | 1.2% | |
Ping An Insurance Group Co. of China Ltd., Class H | | | 1.0% | |
Housing Development Finance Corp. Ltd. | | | 1.0% | |
ICICI Bank Ltd. | | | 0.9% | |
America Movil SAB de CV, Series L | | | 0.8% | |
| * | The ten largest holdings are subject to change, and there are no guarantees the Fund will remain invested in any particular company. Excludes derivatives and investment of cash collateral for securities on loan (if any). |
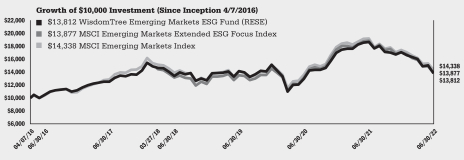
The WisdomTree Emerging Markets ESG Fund (the “Fund”) is actively managed using a model-based approach seeking capital appreciation. The Fund seeks to achieve its investment objective by investing primarily in equity securities of issuers in emerging markets that exhibit certain characteristics believed to be indicative of positive future returns as well as incorporating favorable environmental, social, and governance (“ESG”) characteristics.
The Fund returned -25.99% at net asset value (“NAV”) for the fiscal year ended June 30, 2022 (for more complete performance information please see the table below). During what was a challenging fiscal year for risk assets and emerging markets in particular, the Fund managed to benefit from positions in the Consumer Discretionary, Communication Services, and Health Care sectors, all of which were primarily due to stock selection effects. A lack of exposure to the Energy sector was a significant detractor in an environment when global energy prices significantly increased due to supply chain issues and global sanctions against Russia due to its war with Ukraine. The Materials and Financials sectors also weighed on the Fund’s performance, owing to stock selection impacts in both.
Shareholder Expense Example (for the six-month period ended June 30, 2022)
| | | | | | | | | | | | | | | | |
| | | | | |
| | | Beginning
Account Value | | | Ending
Account Value | | | Annualized
Expense Ratio | | | Expenses Paid
During the
Period | |
Actual | | $ | 1,000.00 | | | $ | 807.80 | | | | 0.32 | % | | $ | 1.43 | |
Hypothetical (5% return before expenses) | | $ | 1,000.00 | | | $ | 1,023.21 | | | | 0.32 | % | | $ | 1.61 | |
Performance
| | | | | | | | | | | | | | | | |
| | |
| | | Average Annual Total Return | |
| | | | |
| | | 1 Year | | | 3 Year | | | 5 Year | | | Since Inception1 | |
Fund NAV Returns2 | | | -25.99 | % | | | -0.76 | % | | | 1.95 | % | | | 5.32 | % |
Fund Market Price Returns2 | | | -25.03 | % | | | -0.54 | % | | | 1.97 | % | | | 5.50 | % |
MSCI Emerging Markets Extended ESG Focus Index3 | | | -26.42 | % | | | 0.84 | % | | | N/A | | | | N/A | |
MSCI Emerging Markets Index | | | -25.28 | % | | | 0.57 | % | | | 2.18 | % | | | 5.95 | % |
| 1 | Total returns are calculated based on the commencement of Fund trading on the Cboe BZX Exchange, Inc. on April 7, 2016. |
| 2 | The Fund’s objectives and strategies changed effective March 16, 2020. Prior to March 16, 2020, Fund performance reflects the investment objective of the Fund when it was the WisdomTree Emerging Markets Dividend Fund (DVEM) and tracked the performance, before fees and expenses, of the WisdomTree Emerging Markets Dividend Index. |
| 3 | The MSCI Emerging Markets Extended ESG Focus Index began on March 27, 2018, and the line graph for the Index begins at the same value as the Fund on that date. |
Performance is historical and does not guarantee future results. The returns do not reflect the deduction of taxes that a shareholder would pay on Fund distributions or on the redemption of Fund shares.
Management’s Discussion of Funds’ Performance
as of June 30, 2022 (unaudited)
WisdomTree International ESG Fund (RESD)
| | | | |
| |
| Sector | | % of Net Assets | |
Health Care | | | 17.0% | |
Financials | | | 15.7% | |
Industrials | | | 14.3% | |
Consumer Staples | | | 14.0% | |
Information Technology | | | 10.2% | |
Materials | | | 10.2% | |
Consumer Discretionary | | | 9.1% | |
Utilities | | | 4.7% | |
Communication Services | | | 4.1% | |
Other Assets less Liabilities‡ | | | 0.7% | |
Total | | | 100.0% | |
| † | The Fund’s sector breakdown is expressed as a percentage of net assets and may change over time. In addition, a sector may be comprised of several industries. It does not include derivatives (if any). |
| ‡ | Other assets less liabilities may include investment of cash collateral for securities on loan and/or receivables/payables on derivatives (if any). |
| | | | |
Top Ten Holdings* | |
| |
| Description | | % of Net Assets | |
Nestle SA, Registered Shares | | | 3.0% | |
Novo Nordisk A/S, Class B | | | 2.0% | |
Roche Holding AG | | | 2.0% | |
Novartis AG, Registered Shares | | | 1.6% | |
SAP SE | | | 1.3% | |
Unilever PLC | | | 1.3% | |
Commonwealth Bank of Australia | | | 1.2% | |
Diageo PLC | | | 1.1% | |
Sanofi | | | 1.1% | |
GSK PLC | | | 1.1% | |
| * | The ten largest holdings are subject to change, and there are no guarantees the Fund will remain invested in any particular company. Excludes derivatives and investment of cash collateral for securities on loan (if any). |
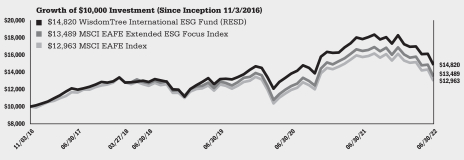
The WisdomTree International ESG Fund (the “Fund”) is actively managed using a model-based approach seeking capital appreciation. The Fund seeks to achieve its investment objective by investing primarily in equity securities of issuers in developed markets excluding the U.S. and Canada that exhibit certain characteristics believed to be indicative of positive future returns as well as incorporating favorable environmental, social, and governance (“ESG”) characteristics.
The Fund returned -16.85% at net asset value (“NAV”) for the fiscal year ended June 30, 2022 (for more complete performance information please see the table below). Despite the negative performance for the fiscal year, the Fund benefitted from positions in the Communication Services, Information Technology, and Health Care sectors, all of which were primarily due to stock selection effects. A lack of exposure to the Energy sector was a significant detractor in an environment when global energy prices significantly increased due to supply chain issues and global sanctions against Russia due to its war with Ukraine. The Materials sector also detracted from the Fund’s performance due stock selection effects.
Shareholder Expense Example (for the six-month period ended June 30, 2022)
| | | | | | | | | | | | | | | | |
| | | | | |
| | | Beginning
Account Value | | | Ending
Account Value | | | Annualized
Expense Ratio | | | Expenses Paid
During the
Period | |
Actual | | $ | 1,000.00 | | | $ | 810.90 | | | | 0.30 | % | | $ | 1.35 | |
Hypothetical (5% return before expenses) | | $ | 1,000.00 | | | $ | 1,023.31 | | | | 0.30 | % | | $ | 1.51 | |
Performance
| | | | | | | | | | | | | | | | |
| | |
| | | Average Annual Total Return | |
| | | | |
| | | 1 Year | | | 3 Year | | | 5 Year | | | Since Inception1 | |
Fund NAV Returns2 | | | -16.85 | % | | | 3.99 | % | | | 4.38 | % | | | 7.20 | % |
Fund Market Price Returns2 | | | -16.80 | % | | | 4.02 | % | | | 4.44 | % | | | 7.24 | % |
MSCI EAFE Extended ESG Focus Index3 | | | -17.99 | % | | | 1.56 | % | | | N/A | | | | N/A | |
MSCI EAFE Index | | | -17.77 | % | | | 1.07 | % | | | 2.20 | % | | | 4.69 | % |
| 1 | Total returns are calculated based on the commencement of Fund trading on the Cboe BZX Exchange, Inc. on November 3, 2016. |
| 2 | The Fund’s objective and strategy changed effective March 16, 2020. Prior to March 16, 2020, Fund performance reflects the investment objective of the Fund when it was the WisdomTree Dynamic Currency Hedged International Quality Dividend Growth Fund (DHDG) and tracked the performance, before fees and expenses, of the WisdomTree Dynamic Currency Hedged International Quality Dividend Growth Index. |
| 3 | The MSCI EAFE Extended ESG Focus Index began on March 27, 2018, and the line graph for the Index begins at the same value as the Fund on that date. |
Performance is historical and does not guarantee future results. The returns do not reflect the deduction of taxes that a shareholder would pay on Fund distributions or on the redemption of Fund shares.
Management’s Discussion of Funds’ Performance
as of June 30, 2022 (unaudited)
WisdomTree U.S. Corporate Bond Fund (WFIG)
Sector Breakdown†
| | | | |
| |
| Sector | | % of Net Assets | |
Financials | | | 28.2% | |
Health Care | | | 15.6% | |
Information Technology | | | 11.5% | |
Utilities | | | 7.6% | |
Communication Services | | | 7.4% | |
Consumer Discretionary | | | 6.8% | |
Industrials | | | 6.7% | |
Consumer Staples | | | 6.3% | |
Energy | | | 3.6% | |
Materials | | | 2.9% | |
Real Estate | | | 1.8% | |
U.S. Government Obligations | | | 0.1% | |
Other Assets less Liabilities‡ | | | 1.5% | |
Total | | | 100.0% | |
| † | The Fund’s sector breakdown is expressed as a percentage of net assets and may change over time. In addition, a sector may be comprised of several industries. It does not include derivatives (if any). |
| ‡ | Other assets less liabilities may include investment of cash collateral for securities on loan and/or receivables/payables on derivatives (if any). |
| | | | |
|
| Top Ten Holdings* | |
| |
| Description | | % of Net Assets | |
JPMorgan Chase & Co.,
3.63%, 12/1/27 | | | 1.6% | |
Morgan Stanley,
5.00%, 11/24/25 | | | 1.2% | |
Oracle Corp.,
5.38%, 7/15/40 | | | 1.1% | |
Oracle Corp.,
2.88%, 3/25/31 | | | 1.1% | |
Citigroup, Inc.,
4.30%, 11/20/26 | | | 1.1% | |
Bank of America Corp.,
1.90%, 7/23/31 | | | 1.0% | |
VMware, Inc.,
1.40%, 8/15/26 | | | 0.9% | |
Wells Fargo & Co.,
1.65%, 6/2/24 | | | 0.9% | |
Dow Chemical Co.,
2.10%, 11/15/30 | | | 0.9% | |
Constellation Brands, Inc.,
2.25%, 8/1/31 | | | 0.8% | |
| * | The ten largest holdings are subject to change, and there are no guarantees the Fund will remain invested in any particular company. Excludes derivatives and investment of cash collateral for securities on loan (if any). |
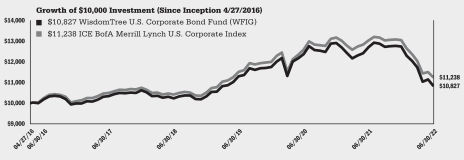
The WisdomTree U.S. Corporate Bond Fund (the “Fund”) seeks to track the price and yield performance, before fees and expenses, of the WisdomTree U.S. Corporate Bond Index (the “Index”). In seeking to track the Index, the Fund primarily invests in issuers in the U.S. investment grade corporate bond market that are deemed to exhibit favorable fundamentals and opportunities for income. The Fund generally uses a representative sampling strategy to achieve its investment objective, meaning it generally will invest in a sample of securities in the Index.
The Fund returned -14.83% at net asset value (“NAV”) for the fiscal year ended June 30, 2022 (for more complete performance information please see the table below). During the fiscal year, the Fund did not benefit from a full allocation into corporate bonds when compared to a broad aggregate U.S. bond universe that includes other asset classes like U.S. Treasury bonds, agency debt, and securitized debt. Corporate bonds, in the face of recessionary and inflation driven fears, lagged the broad U.S. aggregate bond market. The Fund concentrates nearly 100% of its weight in debt issued by public corporations and these securities benefit in performance when credit spreads (the difference in yield between U.S. Treasury bonds and another debt security with the same maturity but of lesser quality) tighten. Investment grade corporate bond credit spreads widened consistently by 84% over the fiscal year (0.86% credit spread at the beginning of the fiscal year versus 1.58% credit spread at the end of the fiscal year). Asset classes that are typically described as “risk-on”, like corporate debt, have continued to generate negative performance as the global markets grappled with rampant inflation, global supply chain concerns, global pressures on energy, and lockdowns in China because of the impacts of the COVID-19 pandemic. The Fund’s largest sector weights were in more cyclical sectors like Financials and Utilities, which have generally performed better during this inflation driven markets as compared to the growth-oriented sectors like Technology and Consumer Services. Intermediate levels of duration risk was another significant detractor for the Fund during a period of rising interest rates over the fiscal year. The Fund’s quality screening approach of screening out potential at-risk issuers helped alleviate some performance volatility and downgrade risk.
Shareholder Expense Example (for the six-month period ended June 30, 2022)
| | | | | | | | | | | | | | | | |
| | | | | |
| | | Beginning
Account Value | | | Ending
Account Value | | | Annualized
Expense Ratio | | | Expenses Paid
During the
Period | |
Actual | | $ | 1,000.00 | | | $ | 850.00 | | | | 0.18 | % | | $ | 0.83 | |
Hypothetical (5% return before expenses) | | $ | 1,000.00 | | | $ | 1,023.90 | | | | 0.18 | % | | $ | 0.90 | |
| | | | | | | | | | | | | | | | |
| Performance | |
| |
| | |
| | | Average Annual Total Return | |
| | | | |
| | | 1 Year | | | 3 Year | | | 5 Year | | | Since Inception1 | |
Fund NAV Returns | | | -14.83 | % | | | -1.40 | % | | | 0.92 | % | | | 1.29 | % |
Fund Market Price Returns | | | -14.96 | % | | | -1.49 | % | | | 1.05 | % | | | 1.27 | % |
WisdomTree U.S. Corporate Bond Index | | | -14.73 | % | | | -1.20 | % | | | 1.15 | % | | | 1.61 | % |
ICE BofA Merrill Lynch U.S. Corporate Index | | | -13.83 | % | | | -0.81 | % | | | 1.39 | % | | | 1.91 | % |
| 1 | Total returns are calculated based on the commencement of Fund trading on the Cboe BZX Exchange, Inc. on April 27, 2016. |
Performance is historical and does not guarantee future results. The returns do not reflect the deduction of taxes that a shareholder would pay on Fund distributions or on the redemption of Fund shares.
Management’s Discussion of Funds’ Performance
as of June 30, 2022 (unaudited)
WisdomTree U.S. High Yield Corporate Bond Fund (WFHY)
Sector Breakdown†
| | | | |
| |
| Sector | | % of Net Assets | |
Consumer Discretionary | | | 16.4% | |
Communication Services | | | 16.2% | |
Energy | | | 11.7% | |
Health Care | | | 10.2% | |
Industrials | | | 8.9% | |
Financials | | | 7.9% | |
Information Technology | | | 6.5% | |
Consumer Staples | | | 6.4% | |
Real Estate | | | 5.9% | |
Materials | | | 4.7% | |
Utilities | | | 2.2% | |
Other Assets less Liabilities‡ | | | 3.0% | |
Total | | | 100.0% | |
| † | The Fund’s sector breakdown is expressed as a percentage of net assets and may change over time. In addition, a sector may be comprised of several industries. It does not include derivatives (if any). |
| ‡ | Other assets less liabilities may include investment of cash collateral for securities on loan and/or receivables/payables on derivatives (if any). |
Top Ten Holdings*
| | | | |
| |
| Description | | % of Net Assets | |
Uniti Group LP / Uniti Fiber Holdings, Inc. / CSL Capital LLC,
7.88%, 2/15/25 | | | 1.1% | |
Ford Motor Co.,
5.29%, 12/8/46 | | | 0.8% | |
DISH DBS Corp.,
7.75%, 7/1/26 | | | 0.8% | |
Frontier Communications Holdings LLC,
5.00%, 5/1/28 | | | 0.7% | |
Nationstar Mortgage Holdings, Inc.,
6.00%, 1/15/27 | | | 0.7% | |
CSC Holdings LLC,
5.38%, 2/1/28 | | | 0.7% | |
Charter Communications Operating LLC / Charter Communications Operating Capital,
3.70%, 4/1/51 | | | 0.7% | |
Frontier Communications Holdings LLC,
5.88%, 11/1/29 | | | 0.7% | |
MPH Acquisition Holdings LLC, 5.75%, 11/1/28 | | | 0.7% | |
Genesis Energy LP / Genesis Energy Finance Corp., 7.75%, 2/1/28 | | | 0.6% | |
| * | The ten largest holdings are subject to change, and there are no guarantees the Fund will remain invested in any particular company. Excludes derivatives and investment of cash collateral for securities on loan (if any). |
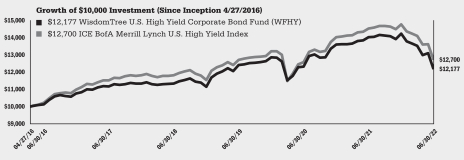
The WisdomTree U.S. High Yield Corporate Bond Fund (the “Fund”) seeks to track the price and yield performance, before fees and expenses, of the WisdomTree U.S. High Yield Corporate Bond Index (the “Index”). In seeking to track the Index, the Fund primarily invests in issuers in the U.S. non-investment grade corporate bond (“junk bond” or “high yield”) market that are deemed to exhibit favorable fundamentals and opportunities for income. The Fund generally uses a representative sampling strategy to achieve its investment objective, meaning it generally will invest in a sample of securities in the Index.
The Fund returned -13.16% at net asset value (“NAV”) for the fiscal year ended June 30, 2022 (for more complete performance information please see the table below). During the fiscal year, the Fund did not benefit from a full allocation into high yield corporate bonds when compared to a broad aggregate U.S. bond universe that includes other asset classes like U.S. Treasury bonds, agency debt, and securitized debt. Corporate bonds, in the face of recessionary and inflation driven fears, lagged the broad U.S. aggregate bond market. The Fund concentrates nearly 100% of its weight in debt issued by high yield public corporations and these securities benefit in performance when credit spreads (the difference in yield between U.S. Treasury bonds and another debt security with the same maturity but of lesser quality) tighten. High yield corporate bond credit spreads widened consistently by 85% over the fiscal year (3.04% credit spread at the beginning of the fiscal year versus 5.62% credit spread at the end of the fiscal year). Asset classes that are typically described as “risk-on”, like high yield corporate debt, have continued to generate negative performance as the global markets grappled with rampant inflation, global supply chain concerns, global pressures on energy, and lockdowns in China because of the impacts of the COVID-19 pandemic. One of the driving factors to performance for the Fund came from one of its larger sector weights in Energy, as the energy and commodities sectors broadly have seen relatively better performance over the fiscal year when compared to other sectors. Offsetting much of this was the negative performance impacts due to higher interest rates, which have risen in aggregate over the entire fiscal year. However, high yield corporate bonds tend to be less interest rate sensitive than their investment grade counterparts as they carry with them far less duration risk in the aggregate. The Fund’s quality screening approach of screening out potential at-risk issuers helped alleviate some performance volatility and default risk. In addition, the Fund was underweight to the lowest quality high yield bonds, mainly bonds rated CCC-rated and below, which had worse performance when compared to higher quality high yield securities.
Shareholder Expense Example (for the six-month period ended June 30, 2022)
| | | | | | | | | | | | | | | | |
| | | | | |
| | | Beginning
Account Value | | | Ending
Account Value | | | Annualized
Expense Ratio | | | Expenses Paid
During the
Period | |
Actual | | $ | 1,000.00 | | | $ | 855.70 | | | | 0.38 | % | | $ | 1.75 | |
Hypothetical (5% return before expenses) | | $ | 1,000.00 | | | $ | 1,022.91 | | | | 0.38 | % | | $ | 1.91 | |
Performance
| | | | | | | | | | | | | | | | |
| | |
| | | Average Annual Total Return | |
| | | | |
| | | 1 Year | | | 3 Year | | | 5 Year | | | Since Inception1 | |
Fund NAV Returns | | | -13.16 | % | | | -0.62 | % | | | 1.74 | % | | | 3.24 | % |
Fund Market Price Returns | | | -13.01 | % | | | -0.45 | % | | | 2.19 | % | | | 3.31 | % |
WisdomTree U.S. High Yield Corporate Bond Index | | | -13.22 | % | | | -0.41 | % | | | 2.05 | % | | | 3.85 | % |
ICE BofA Merrill Lynch U.S. High Yield Index | | | -12.66 | % | | | -0.04 | % | | | 1.95 | % | | | 3.94 | % |
| 1 | Total returns are calculated based on the commencement of Fund trading on the Cboe BZX Exchange, Inc. on April 27, 2016. |
Performance is historical and does not guarantee future results. The returns do not reflect the deduction of taxes that a shareholder would pay on Fund distributions or on the redemption of Fund shares.
Management’s Discussion of Funds’ Performance
as of June 30, 2022 (unaudited)
WisdomTree U.S. Short-Term Corporate Bond Fund (SFIG)
Sector Breakdown†
| | | | |
| |
| Sector | | % of Net Assets | |
Financials | | | 39.1% | |
Information Technology | | | 11.8% | |
Health Care | | | 11.1% | |
Consumer Discretionary | | | 7.1% | |
Industrials | | | 6.5% | |
Consumer Staples | | | 6.0% | |
Utilities | | | 6.0% | |
Communication Services | | | 5.7% | |
Energy | | | 3.1% | |
Real Estate | | | 1.4% | |
Materials | | | 0.8% | |
U.S. Government Obligations | | | 0.1% | |
Other Assets less Liabilities‡ | | | 1.3% | |
Total | | | 100.0% | |
| † | The Fund’s sector breakdown is expressed as a percentage of net assets and may change over time. In addition, a sector may be comprised of several industries. It does not include derivatives (if any). |
| ‡ | Other assets less liabilities may include investment of cash collateral for securities on loan and/or receivables/payables on derivatives (if any). |
Top Ten Holdings*
| | | | |
| |
| Description | | % of Net Assets | |
Oracle Corp.,
1.65%, 3/25/26 | | | 1.4% | |
Capital One Financial Corp.,
4.20%, 10/29/25 | | | 1.3% | |
Magallanes, Inc.,
3.64%, 3/15/25 | | | 1.0% | |
Morgan Stanley,
3.70%, 10/23/24 | | | 1.0% | |
Citigroup, Inc.,
3.20%, 10/21/26 | | | 0.9% | |
Dell International LLC / EMC Corp.,
6.02%, 6/15/26 | | | 0.8% | |
Bank of America Corp.,
1.66%, 3/11/27 | | | 0.8% | |
JPMorgan Chase & Co.,
3.22%, 3/1/25 | | | 0.8% | |
Bank of America Corp.,
3.46%, 3/15/25 | | | 0.8% | |
JPMorgan Chase & Co.,
2.08%, 4/22/26 | | | 0.8% | |
| * | The ten largest holdings are subject to change, and there are no guarantees the Fund will remain invested in any particular company. Excludes derivatives and investment of cash collateral for securities on loan (if any). |
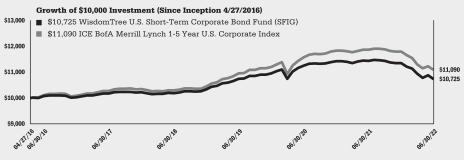
The WisdomTree U.S. Short-Term Corporate Bond Fund (the “Fund”) seeks to track the price and yield performance, before fees and expenses, of the WisdomTree U.S. Short-Term Corporate Bond Index (the “Index”). In seeking to track the Index, the Fund primarily invests in issuers in the short-term U.S. investment grade corporate bond market that are deemed to exhibit favorable fundamentals and opportunities for income. The Fund generally uses a representative sampling strategy to achieve its investment objective, meaning it generally will invest in a sample of securities in the Index.
The Fund returned -6.18% at net asset value (“NAV”) for the fiscal year ended June 30, 2022 (for more complete performance information please see the table below). During the fiscal year, the Fund did not benefit from a full allocation into corporate bonds when compared to a broad aggregate U.S. bond universe that includes other asset classes like U.S. Treasury bonds, agency debt, and securitized debt. Corporate bonds, in the face of recessionary and inflation driven fears, lagged the broad U.S. aggregate bond market. The Fund concentrates nearly 100% of its weight in debt issued by public corporations and these securities benefit in performance when credit spreads (the difference in yield between U.S. Treasury bonds and another debt security with the same maturity but of lesser quality) tighten. Investment grade corporate bond credit spreads widened consistently by 84% over the fiscal year (0.86% credit spread at the beginning of the fiscal year versus 1.58% credit spread at the end of the fiscal year). Asset classes that are typically described as “risk-on”, like corporate debt, have continued to generate negative performance as the global markets grappled with rampant inflation, global supply chain concerns, global pressures on energy, and lockdowns in China because of the impacts of the COVID-19 pandemic. The Fund’s largest sector weights were in more cyclical sectors like Financials and Utilities, which have generally performed better during inflation driven markets as compared to the growth-oriented sectors like Technology and Consumer Services. Intermediate levels of duration risk was another significant detractor from the Fund’s performance during a period of rising interest rates over the fiscal year. However, given that the Fund is targeting shorter term maturities, performance showed relative improvement when compared to longer-term bonds. The Fund’s quality screening approach of screening out potential at-risk issuers helped alleviate some performance volatility and downgrade risk.
Shareholder Expense Example (for the six-month period ended June 30, 2022)
| | | | | | | | | | | | | | | | |
| | | | | |
| | | Beginning
Account Value | | | Ending
Account Value | | | Annualized
Expense Ratio | | | Expenses Paid
During the
Period | |
Actual | | $ | 1,000.00 | | | $ | 944.90 | | | | 0.18 | % | | $ | 0.87 | |
Hypothetical (5% return before expenses) | | $ | 1,000.00 | | | $ | 1,023.90 | | | | 0.18 | % | | $ | 0.90 | |
Performance
| | | | | | | | | | | | | | | | |
| | |
| | | Average Annual Total Return | |
| | | | |
| | | 1 Year | | | 3 Year | | | 5 Year | | | Since Inception1 | |
Fund NAV Returns | | | -6.18 | % | | | -0.05 | % | | | 1.07 | % | | | 1.14 | % |
Fund Market Price Returns | | | -6.23 | % | | | -0.09 | % | | | 1.18 | % | | | 1.08 | % |
WisdomTree U.S. Short-Term Corporate Bond Index | | | -5.97 | % | | | 0.28 | % | | | 1.41 | % | | | 1.54 | % |
ICE BofA Merrill Lynch 1-5 year U.S. Corporate Index | | | -6.52 | % | | | 0.41 | % | | | 1.54 | % | | | 1.69 | % |
| 1 | Total returns are calculated based on the commencement of Fund trading on the Cboe BZX Exchange, Inc. on April 27, 2016. |
Performance is historical and does not guarantee future results. The returns do not reflect the deduction of taxes that a shareholder would pay on Fund distributions or on the redemption of Fund shares.
Management’s Discussion of Funds’ Performance
as of June 30, 2022 (unaudited)
WisdomTree Emerging Markets Efficient Core Fund (NTSE)
Sector Breakdown†
| | | | |
| |
| Sector | | % of Net Assets | |
Information Technology | | | 19.7% | |
Financials | | | 18.2% | |
Consumer Discretionary | | | 15.3% | |
Communication Services | | | 9.9% | |
Materials | | | 7.2% | |
Consumer Staples | | | 5.5% | |
Energy | | | 4.5% | |
Industrials | | | 3.1% | |
Health Care | | | 3.0% | |
Utilities | | | 1.9% | |
Real Estate | | | 1.5% | |
Other Assets less Liabilities‡ | | | 10.2% | |
Total | | | 100.0% | |
| † | The Fund’s sector breakdown is expressed as a percentage of net assets and may change over time. In addition, a sector may be comprised of several industries. It does not include derivatives (if any). |
| ‡ | Other assets less liabilities may include investment of cash collateral for securities on loan and/or receivables/payables on derivatives (if any). |
Top Ten Holdings*
| | | | |
| |
| Description | | % of Net Assets | |
Taiwan Semiconductor Manufacturing Co. Ltd. | | | 6.7% | |
Tencent Holdings Ltd. | | | 4.7% | |
Samsung Electronics Co. Ltd. | | | 4.3% | |
Alibaba Group Holding Ltd. | | | 4.0% | |
Reliance Industries Ltd. | | | 1.8% | |
Meituan, Class B | | | 1.7% | |
Naspers Ltd., Class N | | | 1.3% | |
Infosys Ltd. | | | 1.2% | |
China Construction Bank Corp., Class H | | | 1.2% | |
Vale SA | | | 1.2% | |
| * | The ten largest holdings are subject to change, and there are no guarantees the Fund will remain invested in any particular company. Excludes derivatives and investment of cash collateral for securities on loan (if any). |
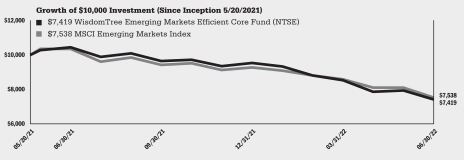
The WisdomTree Emerging Markets Efficient Core Fund (the “Fund”) is actively managed using a model-based approach seeking total return. The Fund seeks to achieve its investment objective by primarily investing in emerging markets equity securities and U.S. Treasury futures contracts. Under normal circumstances, the Fund will invest approximately 90% of its net assets in emerging market equity securities and the notional exposure to the U.S. Treasury futures contracts’ positions will represent approximately 60% of the Fund’s net assets.
The Fund returned -29.06% at net asset value (“NAV”) for the fiscal year ended June 30, 2022 (for more complete performance information please see the table below). The Fund’s positions in equities and its exposure to fixed income both detracted from performance. Over the course of the fiscal year, emerging market equities generally underperformed as concerns about geopolitical risk in China and Russia weighed on investor sentiment. Emerging market currencies generally depreciated against the U.S. dollar during the fiscal year. The Fund utilized derivatives contracts to obtain broad-based fixed income exposure, employing U.S. Treasury futures contracts, which had negative performance during the fiscal year as U.S. interest rates increased. The enhanced exposure compared to traditional 60% equity and 40% bond portfolios magnified the Fund’s returns and resulted in the overall negative performance of the Fund.
Shareholder Expense Example (for the six-month period ended June 30, 2022)
| | | | | | | | | | | | | | | | |
| | | | | |
| | | Beginning
Account Value | | | Ending
Account Value | | | Annualized Net
Expense Ratio | | | Expenses Paid
During the
Period | |
Actual | | $ | 1,000.00 | | | $ | 778.10 | | | | 0.32 | % | | $ | 1.41 | |
Hypothetical (5% return before expenses) | | $ | 1,000.00 | | | $ | 1,023.21 | | | | 0.32 | % | | $ | 1.61 | |
Performance
| | | | | | | | |
| | |
| | | Average Annual Total Return | |
| | |
| | | 1 Year | | | Since Inception1 | |
Fund NAV Returns | | | -29.06 | % | | | -23.49 | % |
Fund Market Price Returns | | | -29.43 | % | | | -23.57 | % |
MSCI Emerging Markets Index | | | -27.20 | % | | | -22.39 | % |
| 1 | Total returns are calculated based on the commencement of Fund trading on the NYSE Arca, Inc. on May 20, 2021. |
Performance is historical and does not guarantee future results. The returns do not reflect the deduction of taxes that a shareholder would pay on Fund distributions or on the redemption of Fund shares.
Management’s Discussion of Funds’ Performance
as of June 30, 2022 (unaudited)
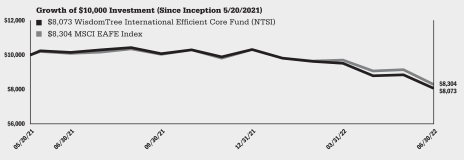
WisdomTree International Efficient Core Fund (NTSI)
Sector Breakdown†
| | | | |
| |
| Sector | | % of Net Assets | |
Financials | | | 15.9% | |
Health Care | | | 13.3% | |
Industrials | | | 12.8% | |
Consumer Discretionary | | | 10.5% | |
Consumer Staples | | | 10.1% | |
Information Technology | | | 7.0% | |
Materials | | | 6.9% | |
Communication Services | | | 4.4% | |
Energy | | | 4.3% | |
Utilities | | | 2.7% | |
Real Estate | | | 1.5% | |
Other Assets less Liabilities‡ | | | 10.6% | |
Total | | | 100.0% | |
| † | The Fund’s sector breakdown is expressed as a percentage of net assets and may change over time. In addition, a sector may be comprised of several industries. It does not include derivatives (if any). |
| ‡ | Other assets less liabilities may include investment of cash collateral for securities on loan and/or receivables/payables on derivatives (if any). |
Top Ten Holdings*
| | | | |
| |
| Description | | % of Net Assets | |
Nestle SA, Registered Shares | | | 2.4% | |
Roche Holding AG | | | 1.7% | |
ASML Holding NV | | | 1.5% | |
Shell PLC | | | 1.5% | |
Toyota Motor Corp. | | | 1.4% | |
Novo Nordisk A/S, Class B | | | 1.4% | |
Novartis AG, Registered Shares | | | 1.3% | |
LVMH Moet Hennessy Louis Vuitton SE | | | 1.3% | |
AstraZeneca PLC | | | 1.2% | |
BHP Group Ltd. | | | 1.0% | |
| * | The ten largest holdings are subject to change, and there are no guarantees the Fund will remain invested in any particular company. Excludes derivatives and investment of cash collateral for securities on loan (if any). |
The WisdomTree International Efficient Core Fund (the “Fund”) is actively managed using a model-based approach seeking total return. The Fund seeks to achieve its investment objective by primarily investing in international equity securities and U.S. Treasury futures contracts. Under normal circumstances, the Fund will invest approximately 90% of its net assets in international equity securities and the notional exposure to the U.S. Treasury futures contracts’ positions will represent approximately 60% of the Fund’s net assets.
The Fund returned -20.44% at net asset value (“NAV”) for the fiscal year ended June 30, 2022 (for more complete performance information please see the table below). The Fund’s positions in equities and exposure to fixed income both detracted from performance. Over the course of the fiscal year, international equities generally underperformed as investors grappled with high levels of inflation and Russia’s invasion of Ukraine. Developed market currencies generally depreciated against the U.S. dollar during the fiscal year. The Fund utilized derivatives contracts to obtain broad-based fixed income exposure, through use of U.S. Treasury futures contracts, which had negative performance during the fiscal year as U.S. interest rates increased. The enhanced exposure compared to traditional 60% equity and 40% bond portfolios magnified the Fund’s returns and resulted in the overall negative performance of the Fund.
Shareholder Expense Example (for the six-month period ended June 30, 2022)
| | | | | | | | | | | | | | | | |
| | | | | |
| | | Beginning
Account Value | | | Ending
Account Value | | | Annualized
Expense Ratio | | | Expenses Paid
During the
Period | |
Actual | | $ | 1,000.00 | | | $ | 781.90 | | | | 0.26 | % | | $ | 1.15 | |
Hypothetical (5% return before expenses) | | $ | 1,000.00 | | | $ | 1,023.51 | | | | 0.26 | % | | $ | 1.30 | |
Performance
| | | | | | | | |
| | |
| | | Average Annual Total Return | |
| | |
| | | 1 Year | | | Since Inception1 | |
Fund NAV Returns | | | -20.44 | % | | | -17.45 | % |
Fund Market Price Returns | | | -20.70 | % | | | -17.37 | % |
MSCI EAFE Index | | | -17.77 | % | | | -15.35 | % |
| 1 | Total returns are calculated based on the commencement of Fund trading on the NYSE Arca, Inc. on May 20, 2021. |
Performance is historical and does not guarantee future results. The returns do not reflect the deduction of taxes that a shareholder would pay on Fund distributions or on the redemption of Fund shares.
Management’s Discussion of Funds’ Performance
as of June 30, 2022 (unaudited)
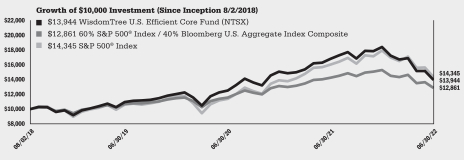
WisdomTree U.S. Efficient Core Fund (NTSX)
Sector Breakdown†
| | | | |
| |
| Sector | | % of Net Assets | |
Information Technology | | | 24.8% | |
Health Care | | | 13.4% | |
Financials | | | 9.7% | |
Consumer Discretionary | | | 9.5% | |
Communication Services | | | 7.8% | |
Industrials | | | 6.9% | |
Consumer Staples | | | 6.1% | |
Energy | | | 3.9% | |
Real Estate | | | 2.6% | |
Utilities | | | 2.5% | |
Materials | | | 2.2% | |
Other Assets less Liabilities‡ | | | 10.6% | |
Total | | | 100.0% | |
| † | The Fund’s sector breakdown is expressed as a percentage of net assets and may change over time. In addition, a sector may be comprised of several industries. It does not include derivatives (if any). |
| ‡ | Other assets less liabilities may include investment of cash collateral for securities on loan and/or receivables/payables on derivatives (if any). |
Top Ten Holdings*
| | | | |
| |
| Description | | % of Net Assets | |
Apple, Inc. | | | 6.0% | |
Microsoft Corp. | | | 5.4% | |
Amazon.com, Inc. | | | 2.7% | |
Alphabet, Inc., Class A | | | 1.7% | |
Alphabet, Inc., Class C | | | 1.7% | |
Tesla, Inc. | | | 1.6% | |
UnitedHealth Group, Inc. | | | 1.3% | |
Johnson & Johnson | | | 1.3% | |
Exxon Mobil Corp. | | | 1.0% | |
NVIDIA Corp. | | | 1.0% | |
| * | The ten largest holdings are subject to change, and there are no guarantees the Fund will remain invested in any particular company. Excludes derivatives and investment of cash collateral for securities on loan (if any). |
The WisdomTree U.S. Efficient Core Fund (the “Fund”) is actively managed using a model-based approach seeking total return. The Fund seeks to achieve its investment objective by investing in large-capitalization U.S. equity securities and U.S. Treasury futures contracts. Under normal circumstances, the Fund will invest approximately 90% of its net assets in U.S. equity securities and the notional exposure to the U.S. Treasury futures contracts’ positions will represent approximately 60% of the Fund’s net assets.
The Fund returned -16.95% at net asset value (“NAV”) for the fiscal year ended June 30, 2022 (for more complete performance information please see the table below). The Fund’s positions in equities and exposure to fixed income both detracted from performance. Over the course of the fiscal year, U.S. equities generally underperformed as investors grappled with the impact that rate hikes from the U.S. Federal Reserve would have on the market. The Fund utilized derivatives contracts to obtain broad-based fixed income exposure, through use of U.S. Treasury futures contracts, which had negative performance during the fiscal year as U.S. interest rates increased. The enhanced exposure compared to traditional 60% equity and 40% bond portfolios magnified the Fund’s returns and resulted in the overall negative performance of the Fund.
Shareholder Expense Example (for the six-month period ended June 30, 2022)
| | | | | | | | | | | | | | | | |
| | | | | |
| | | Beginning
Account Value | | | Ending
Account Value | | | Annualized
Expense Ratio | | | Expenses Paid
During the
Period | |
Actual | | $ | 1,000.00 | | | $ | 757.80 | | | | 0.20 | % | | $ | 0.87 | |
Hypothetical (5% return before expenses) | | $ | 1,000.00 | | | $ | 1,023.80 | | | | 0.20 | % | | $ | 1.00 | |
Performance
| | | | | | | | | | | | |
| | |
| | | Average Annual Total Return | |
| | | |
| | | 1 Year | | | 3 Year | | | Since Inception1 | |
Fund NAV Returns | | | -16.95 | % | | | 8.35 | % | | | 8.87 | % |
Fund Market Price Returns | | | -17.38 | % | | | 8.23 | % | | | 8.77 | % |
60% S&P 500® Index / 40% Bloomberg U.S. Aggregate Index Composite | | | -9.80 | % | | | 6.35 | % | | | 6.64 | % |
S&P 500® Index | | | -10.62 | % | | | 10.60 | % | | | 9.66 | % |
| 1 | Total returns are calculated based on the commencement of Fund trading on the NYSE Arca, Inc. on August 2, 2018. |
Performance is historical and does not guarantee future results. The returns do not reflect the deduction of taxes that a shareholder would pay on Fund distributions or on the redemption of Fund shares.
Management’s Discussion of Funds’ Performance
as of June 30, 2022 (unaudited)
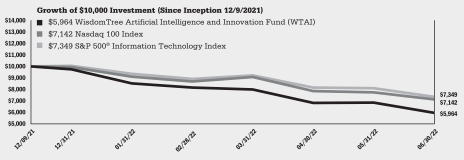
WisdomTree Artificial Intelligence and Innovation Fund (WTAI)
Sector Breakdown†
| | | | |
| |
| Sector | | % of Net Assets | |
Information Technology | | | 73.2% | |
Consumer Discretionary | | | 11.9% | |
Industrials | | | 5.9% | |
Communication Services | | | 5.5% | |
Health Care | | | 2.5% | |
Financials | | | 0.8% | |
Other Assets less Liabilities‡ | | | 0.2% | |
Total | | | 100.0% | |
| † | The Fund’s sector breakdown is expressed as a percentage of net assets and may change over time. In addition, a sector may be comprised of several industries. It does not include derivatives (if any). |
| ‡ | Other assets less liabilities may include investment of cash collateral for securities on loan and/or receivables/payables on derivatives (if any). |
Top Ten Holdings*
| | | | |
| |
| Description | | % of Net Assets | |
PROS Holdings, Inc. | | | 2.5% | |
Macronix International Co. Ltd. | | | 2.2% | |
BrainChip Holdings Ltd. | | | 2.2% | |
Synopsys, Inc. | | | 2.1% | |
Denso Corp. | | | 2.1% | |
FANUC Corp. | | | 2.1% | |
Cadence Design Systems, Inc. | | | 2.0% | |
PKSHA Technology, Inc. | | | 2.0% | |
QUALCOMM, Inc. | | | 2.0% | |
ON Semiconductor Corp. | | | 1.9% | |
| * | The ten largest holdings are subject to change, and there are no guarantees the Fund will remain invested in any particular company. Excludes derivatives and investment of cash collateral for securities on loan (if any). |
The WisdomTree Artificial Intelligence and Innovation Fund (the “Fund”) seeks to track the price and yield performance, before fees and expenses, of the WisdomTree Artificial Intelligence & Innovation Index (the “Index”). In seeking to track the Index, the Fund primarily invests in equity securities of exchange-listed companies globally, including developed countries and emerging markets throughout the world, which are primarily involved in the investment theme of “Artificial Intelligence and Innovation”. Artificial intelligence refers to the application of computer systems or robotics to perform tasks that typically require human intelligence, discernment and adaption, such as decision-making, reasoning, learning from past experiences, visual perception, and speech recognition. Innovation refers to those companies that introduce a new, creative, or different (i.e., “innovative”) technologically enabled product or service in seeking to potentially change an industry landscape, as well as companies that service those innovative technologies. The Fund generally uses a representative sampling strategy to achieve its investment objective, meaning it generally will invest in a sample of the securities in the Index whose risk, return and other characteristics resemble the risk, return and other characteristics of the Index as a whole.
The Fund returned -40.36% at net asset value (“NAV”) for the fiscal period ended June 30, 2022 (for more complete performance information please see the table below). During the fiscal period, the Fund’s performance was negatively impacted by its majority allocation to the Information Technology sector, as the Fund concentrates on artificial intelligence and related innovative technologies. The Fund’s lack of exposure to the Energy, Consumer Staples, and Utilities sectors detracted from performance. Security selection within the Financials sector was another detractor, but the underweight allocation to Communication Services sector contributed to the Fund’s performance. The Fund’s exposure to companies with small- and mid-market capitalizations was an additional driver of negative relative performance.
Shareholder Expense Example (for the six-month period ended June 30, 2022)
| | | | | | | | | | | | | | | | |
| | | | | |
| | | Beginning
Account Value | | | Ending
Account Value | | | Annualized
Expense Ratio | | | Expenses Paid
During the
Period | |
Actual | | $ | 1,000.00 | | | $ | 611.90 | | | | 0.45 | % | | $ | 1.80 | |
Hypothetical (5% return before expenses) | | $ | 1,000.00 | | | $ | 1,022.56 | | | | 0.45 | % | | $ | 2.26 | |
Performance
| | | | |
| | |
| | | Cumulative Total Return | |
| |
| | | Since Inception1 | |
Fund NAV Returns | | | -40.36 | % |
Fund Market Price Returns | | | -40.17 | % |
WisdomTree Artificial Intelligence & Innovation Index | | | -40.29 | % |
Nasdaq 100 Index | | | -28.58 | % |
S&P 500® Information Technology Index | | | -26.51 | % |
| 1 | Total returns are calculated based on the commencement of Fund trading on the Cboe BZX Exchange, Inc. on December 9, 2021. |
Performance is historical and does not guarantee future results. The returns do not reflect the deduction of taxes that a shareholder would pay on Fund distributions or on the redemption of Fund shares.
Management’s Discussion of Funds’ Performance
as of June 30, 2022 (unaudited)
WisdomTree Battery Value Chain and Innovation Fund (WBAT)
Sector Breakdown†
| | | | |
| |
| Sector | | % of Net Assets | |
Materials | | | 40.0% | |
Industrials | | | 36.5% | |
Consumer Discretionary | | | 8.7% | |
Information Technology | | | 8.0% | |
Utilities | | | 3.6% | |
Energy | | | 2.3% | |
Health Care | | | 0.5% | |
Other Assets less Liabilities‡ | | | 0.4% | |
Total | | | 100.0% | |
| † | The Fund’s sector breakdown is expressed as a percentage of net assets and may change over time. In addition, a sector may be comprised of several industries. It does not include derivatives (if any). |
| ‡ | Other assets less liabilities may include investment of cash collateral for securities on loan and/or receivables/payables on derivatives (if any). |
Top Ten Holdings*
| | | | |
| |
| Description | | % of Net Assets | |
TDK Corp. | | | 3.4% | |
Contemporary Amperex Technology Co. Ltd., Class A | | | 3.2% | |
Ganfeng Lithium Co. Ltd., Class A | | | 3.2% | |
Camel Group Co. Ltd., Class A | | | 3.2% | |
NARI Technology Co. Ltd., Class A | | | 2.9% | |
BASF SE | | | 2.9% | |
Umicore SA | | | 2.9% | |
Alfen Beheer BV | | | 2.8% | |
Vale Indonesia Tbk PT | | | 2.8% | |
Ningbo Ronbay New Energy Technology Co. Ltd., Class A | | | 2.5% | |
| * | The ten largest holdings are subject to change, and there are no guarantees the Fund will remain invested in any particular company. Excludes derivatives and investment of cash collateral for securities on loan (if any). |
The WisdomTree Battery Value Chain and Innovation Fund (the “Fund”) seeks to track the price and yield performance, before fees and expenses, of the WisdomTree Battery Value Chain and Innovation Index (the “Index”). In seeking to track the Index, the Fund invests in companies primarily involved in battery and energy storage solutions that meet the index eligibility requirements. The Fund generally uses a representative sampling strategy to achieve its investment objective, meaning it generally will invest in a sample of the securities in the index whose risk, return and other characteristics resemble the risk, return and other characteristics of the Index as a whole.
The Fund had less than six months of operating history at the end of the reporting period and therefore no discussion of Fund performance or comparative performance information is shown in this shareholder report. Comparative performance information for the most recent month-end is available at www.wisdomtree.com.
Shareholder Expense Example (for the six-month period1 ended June 30, 2022)
| | | | | | | | | | | | | | | | |
| | | | | |
| | | Beginning
Account Value | | | Ending
Account Value | | | Annualized
Expense Ratio | | | Expenses Paid
During the
Period | |
Actual1 | | $ | 1,000.00 | | | $ | 858.00 | | | | 0.45 | % | | $ | 1.53 | |
Hypothetical (5% return before expenses) | | $ | 1,000.00 | | | $ | 1,022.56 | | | | 0.45 | % | | $ | 2.26 | |
| 1 | Fund commenced operations on February 17, 2022. Actual expenses are calculated using the Fund’s annualized expense ratio, multiplied by the average account value for the period, multiplied by 134/365 (to reflect the period since commencement of operations). |
Management’s Discussion of Funds’ Performance
as of June 30, 2022 (unaudited)
WisdomTree BioRevolution Fund (WDNA)
Sector Breakdown†
| | | | |
| |
| Sector | | % of Net Assets | |
Health Care | | | 81.8% | |
Materials | | | 9.5% | |
Consumer Staples | | | 5.4% | |
Energy | | | 3.2% | |
Other Assets less Liabilities‡ | | | 0.1% | |
Total | | | 100.0% | |
| † | The Fund’s sector breakdown is expressed as a percentage of net assets and may change over time. In addition, a sector may be comprised of several industries. It does not include derivatives (if any). |
| ‡ | Other assets less liabilities may include investment of cash collateral for securities on loan and/or receivables/payables on derivatives (if any). |
Top Ten Holdings*
| | | | |
| |
| Description | | % of Net Assets | |
AstraZeneca PLC, ADR | | | 3.0% | |
Eli Lilly & Co. | | | 3.0% | |
Pfizer, Inc. | | | 2.3% | |
Vertex Pharmaceuticals, Inc. | | | 2.3% | |
Thermo Fisher Scientific, Inc. | | | 2.0% | |
GSK PLC | | | 1.9% | |
Merck & Co., Inc. | | | 1.9% | |
PerkinElmer, Inc. | | | 1.9% | |
Archer-Daniels-Midland Co. | | | 1.9% | |
Johnson & Johnson | | | 1.8% | |
| * | The ten largest holdings are subject to change, and there are no guarantees the Fund will remain invested in any particular company. Excludes derivatives and investment of cash collateral for securities on loan (if any). |
The WisdomTree BioRevolution Fund (the “Fund”) seeks to track the price and yield performance, before fees and expenses, of the WisdomTree BioRevolution Index (the “Index”). In seeking to track the Index, the Fund primarily invests in equity securities of exchange-listed companies globally that will be significantly transformed by advancements in genetics and biotechnology. The Fund generally uses a representative sampling strategy to achieve its investment objective, meaning it generally will invest in a sample of the securities in the Index whose risk, return and other characteristics resemble the risk, return and other characteristics of the Index as a whole.
The Fund returned -34.79% at net asset value (“NAV”) for the fiscal year ended June 30, 2022 (for more complete performance information please see the table below). The Fund’s overweight allocation to the Biotechnology sub-industry was the biggest driver of negative performance in the fiscal year. Exposure to lower market capitalization companies was an additional driver of negative relative performance. The Fund’s lack of exposure to the Communication Services and Consumer Discretionary sectors was a modest benefit to Fund performance over the fiscal year.
Shareholder Expense Example (for the six-month period ended June 30, 2022)
| | | | | | | | | | | | | | | | |
| | | | | |
| | | Beginning
Account Value | | | Ending
Account Value | | | Annualized
Expense Ratio | | | Expenses Paid
During the
Period | |
Actual | | $ | 1,000.00 | | | $ | 735.30 | | | | 0.45 | % | | $ | 1.94 | |
Hypothetical (5% return before expenses) | | $ | 1,000.00 | | | $ | 1,022.56 | | | | 0.45 | % | | $ | 2.26 | |
Performance
| | | | | | | | |
| | |
| | | Average Annual Total Return | |
| | |
| | | 1 Year | | | Since Inception1 | |
Fund NAV Returns | | | -34.79 | % | | | -28.74 | % |
Fund Market Price Returns | | | -34.93 | % | | | -28.78 | % |
WisdomTree BioRevolution Index | | | -34.51 | % | | | -28.42 | % |
S&P Biotechnology Select Industry Index | | | -44.72 | % | | | -38.87 | % |
S&P 500® Health Care Index | | | 1.73 | % | | | 5.49 | % |
| 1 | Total returns are calculated based on the commencement of Fund trading on the Cboe BZX Exchange, Inc. on June 3, 2021. |
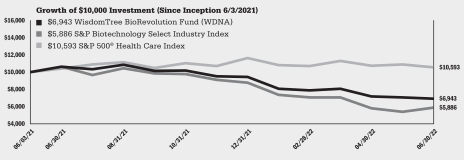
Performance is historical and does not guarantee future results. The returns do not reflect the deduction of taxes that a shareholder would pay on Fund distributions or on the redemption of Fund shares.
Management’s Discussion of Funds’ Performance
as of June 30, 2022 (unaudited)
WisdomTree Cloud Computing Fund (WCLD)
Sector Breakdown†
| | | | |
| |
| Sector | | % of Net Assets | |
Information Technology | | | 91.2% | |
Health Care | | | 3.8% | |
Communication Services | | | 2.9% | |
Consumer Discretionary | | | 2.1% | |
Other Assets less Liabilities‡ | | | 0.0% | * |
Total | | | 100.0% | |
| † | The Fund’s sector breakdown is expressed as a percentage of net assets and may change over time. In addition, a sector may be comprised of several industries. It does not include derivatives (if any). |
| ‡ | Other assets less liabilities may include investment of cash collateral for securities on loan and/or receivables/payables on derivatives (if any). |
| * | Represents less than 0.1%. |
Top Ten Holdings*
| | | | |
| |
| Description | | % of Net Assets | |
Sprout Social, Inc., Class A | | | 2.1% | |
Qualys, Inc. | | | 2.1% | |
2U, Inc. | | | 2.1% | |
Definitive Healthcare Corp. | | | 2.0% | |
Crowdstrike Holdings, Inc., Class A | | | 2.0% | |
Tenable Holdings, Inc. | | | 1.9% | |
Box, Inc., Class A | | | 1.9% | |
Blackline, Inc. | | | 1.8% | |
Dropbox, Inc., Class A | | | 1.8% | |
Paycom Software, Inc. | | | 1.7% | |
| * | The ten largest holdings are subject to change, and there are no guarantees the Fund will remain invested in any particular company. Excludes derivatives and investment of cash collateral for securities on loan (if any). |
The WisdomTree Cloud Computing Fund (the “Fund”) seeks to track the price and yield performance, before fees and expenses, of the Bessemer Venture Partners (“BVP”) Nasdaq Emerging Cloud Index (the “Index”). In seeking to track the Index, the Fund invests in emerging public companies primarily involved in providing cloud computing software and services to their customers, which derive the majority of their revenues from business-oriented software products, as determined by BVP. The Fund generally uses a representative sampling strategy to achieve its investment objective, meaning it generally will invest in a sample of securities in the Index.
The Fund returned -49.85% at net asset value (“NAV”) for the fiscal year ended June 30, 2022 (for more complete performance information please see the table below). During the fiscal year, the Fund’s performance was negatively impacted by its allocation to the Information Technology sector, as the Fund concentrates nearly 100% of its weight in companies within the cloud computing industry. The Fund’s lack of exposure to the Energy, Consumer Staples, and Utilities sectors also detracted from performance. The Fund’s exposure to companies with smaller market capitalizations was an additional driver of negative relative performance. The Fund’s methodology also results in allocations to companies that are not yet profitable. In aggregate, unprofitable companies have not performed well during the fiscal year as the market environment was more favorable toward value-oriented investments.
Shareholder Expense Example (for the six-month period ended June 30, 2022)
| | | | | | | | | | | | | | | | |
| | | | | |
| | | Beginning
Account Value | | | Ending
Account Value | | | Annualized
Expense Ratio | | | Expenses Paid
During the
Period | |
Actual | | $ | 1,000.00 | | | $ | 540.40 | | | | 0.45 | % | | $ | 1.72 | |
Hypothetical (5% return before expenses) | | $ | 1,000.00 | | | $ | 1,022.56 | | | | 0.45 | % | | $ | 2.26 | |
Performance
| | | | | | | | |
| | |
| | | Average Annual Total Return | |
| | |
| | | 1 Year | | | Since Inception1 | |
Fund NAV Returns | | | -49.85 | % | | | 4.05 | % |
Fund Market Price Returns | | | -50.04 | % | | | 3.99 | % |
BVP Nasdaq Emerging Cloud Index | | | -49.69 | % | | | 4.45 | % |
S&P 500® Information Technology Index | | | -13.56 | % | | | 18.28 | % |
S&P 500® Growth Index | | | -16.41 | % | | | 11.63 | % |
| 1 | Total returns are calculated based on the commencement of Fund trading on the NASDAQ on September 6, 2019. |
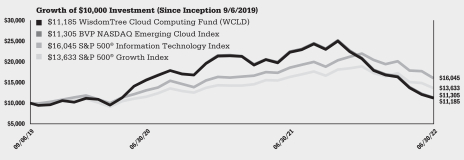
Performance is historical and does not guarantee future results. The returns do not reflect the deduction of taxes that a shareholder would pay on Fund distributions or on the redemption of Fund shares.
Management’s Discussion of Funds’ Performance
as of June 30, 2022 (unaudited)
WisdomTree Cybersecurity Fund (WCBR)
Country Breakdown†
| | | | |
| |
| Country | | % of Net Assets | |
United States | | | 83.6% | |
Israel | | | 4.7% | |
Japan | | | 3.7% | |
United Kingdom | | | 3.5% | |
South Korea | | | 3.1% | |
Canada | | | 1.1% | |
Other Assets less Liabilities‡ | | | 0.3% | |
Total | | | 100.0% | |
| † | The Fund’s country breakdown may change over time. It does not include derivatives (if any). |
| ‡ | Other assets less liabilities may include investment of cash collateral for securities on loan and/or receivables/payables on derivatives (if any). |
Top Ten Holdings*
| | | | |
| |
| Description | | % of Net Assets | |
Sailpoint Technologies Holdings, Inc. | | | 6.2% | |
Palo Alto Networks, Inc. | | | 5.3% | |
Crowdstrike Holdings, Inc., Class A | | | 5.1% | |
Fortinet, Inc. | | | 4.4% | |
ForgeRock, Inc., Class A | | | 4.4% | |
Datadog, Inc., Class A | | | 4.4% | |
Ping Identity Holding Corp. | | | 4.3% | |
Elastic NV | | | 4.1% | |
HashiCorp, Inc., Class A | | | 3.8% | |
Tenable Holdings, Inc. | | | 3.8% | |
| * | The ten largest holdings are subject to change, and there are no guarantees the Fund will remain invested in any particular company. Excludes derivatives and investment of cash collateral for securities on loan (if any). |
The WisdomTree Cybersecurity Fund (the “Fund”) seeks to track the price and yield performance, before fees and expenses, of the WisdomTree Team8 Cybersecurity Index (the “Index”). In seeking to track the Index, the Fund invests in equity securities of exchange-listed companies globally, which are primarily involved in cybersecurity and security-oriented technology that generate a meaningful part of their revenue from security protocols that prevent intrusion and attacks to systems, networks, applications, computers, and mobile devices and are experiencing revenue growth.
The Fund returned -26.79% at net asset value (“NAV”) for the fiscal year ended June 30, 2022 (for more complete performance information please see the table below). The Fund concentrates 100% of its weight in Information Technology sector stocks that participate in the cybersecurity industry. Exposure to the Information Technology sector was the biggest detractor from performance during the fiscal year as cyclical sectors like Energy, Consumer Staples, and Utilities outperformed. A lack of exposure to the Communication Services and Consumer Discretionary sectors were modestly relative positive contributors to Fund performance over the fiscal year. The Fund’s methodology also results in allocations to companies that are not yet profitable. In aggregate, unprofitable companies have not performed well during the fiscal year as the market environment was more favorable toward value-oriented investments.
Shareholder Expense Example (for the six-month period ended June 30, 2022)
| | | | | | | | | | | | | | | | |
| | | | | |
| | | Beginning
Account Value | | | Ending
Account Value | | | Annualized
Expense Ratio | | | Expenses Paid
During the
Period | |
Actual | | $ | 1,000.00 | | | $ | 682.60 | | | | 0.45 | % | | $ | 1.88 | |
Hypothetical (5% return before expenses) | | $ | 1,000.00 | | | $ | 1,022.56 | | | | 0.45 | % | | $ | 2.26 | |
Performance
| | | | | | | | |
| | |
| | | Average Annual Total Return | |
| | |
| | | 1 Year | | | Since Inception1 | |
Fund NAV Returns | | | -26.79 | % | | | -19.09 | % |
Fund Market Price Returns | | | -27.05 | % | | | -19.15 | % |
WisdomTree Team8 Cybersecurity Index | | | -26.53 | % | | | -18.73 | % |
S&P 500® Information Technology Index | | | -13.56 | % | | | -1.90 | % |
S&P 500® Growth Index | | | -16.41 | % | | | -3.74 | % |
| 1 | Total returns are calculated based on the commencement of Fund trading on the NASDAQ on January 28, 2021. |
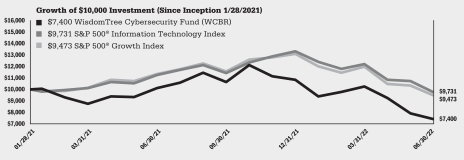
Performance is historical and does not guarantee future results. The returns do not reflect the deduction of taxes that a shareholder would pay on Fund distributions or on the redemption of Fund shares.
Description of Terms and Indexes (unaudited)
Below are descriptions of certain terms and of each Index referenced in this report:
The 60% S&P 500® Index/40% Bloomberg U.S. Aggregate Index Composite represents a 60% weight to the S&P 500® Index and a 40% weight to the Bloomberg U.S. Aggregate Index. The Bloomberg U.S. Aggregate Index measures the performance of the U.S. investment-grade bond market.
The BVP Nasdaq Emerging Cloud Index is an equally weighted index that is designed to track the performance of emerging public companies primarily involved in providing cloud software and services to their customers.
Cloud computing is a term used to describe the delivery, through the Internet, of computing services, which can include servers, storage, databases, networking, software, analytics, and intelligence.
The ICE BofA Merrill Lynch U.S. Corporate Index tracks the performance of U.S. dollar
denominated investment grade corporate debt publicly issued in the U.S.
The ICE BofA Merrill Lynch U.S. High Yield Index tracks the performance of U.S. dollar
denominated high yield corporate debt securities issued in the U.S.
The ICE BofA Merrill Lynch 1-5 Year U.S. Corporate Index is a subset of the ICE BofA Merrill Lynch U.S. Corporate Index including all securities with a remaining term to final maturity less than 5 years.
The MSCI EAFE Extended ESG Focus Index is designed to maximize exposure to positive environmental, social and governance (ESG) factors while exhibiting risk and return characteristics similar to those of the MSCIEAFE Index, its parent index.
The MSCI EAFE Index is a market cap-weighted index composed of companies
representative of the developed market structure of developed countries in Europe,
Australasia and Japan.
The MSCI EAFE Local Currency Index is a free float-adjusted market capitalization
weighted index that is designed to measure developed market equity performance, excluding the U.S. and Canada, in local currency.
The MSCI EAFE Small Cap Index is a free float-adjusted market capitalization equity index that is designed to measure the performance of small-cap stocks within the developed equity market, excluding the U.S. and Canada.
The MSCI EAFE Small Cap Local Currency Index is a free float-adjusted market capitalization equity index that is designed to measure the performance of small-cap stocks within the developed equity market, excluding the U.S. and Canada, in local currency.
The MSCI EAFE Small Cap Value Index captures small cap securities exhibiting overall value style characteristics across Developed Markets countries, excluding the U.S. and Canada.
The MSCI EAFE Value Index is a free float-adjusted market capitalization index that is designed to measure the performance of “value” stocks within the developed equity market, excluding the U.S. and Canada.
The MSCI Emerging Markets Extended ESG Focus Index is designed to maximize exposure to positive environmental, social and governance (ESG) factors while exhibiting risk and return characteristics similar to those of the MSCI Emerging Markets Index, its parent index.
The MSCI Emerging Markets Index is a free float-adjusted market capitalization index
that is designed to measure emerging markets equity performance.
The MSCI Extended ESG Focus Indexes (the “Indexes”) are designed to maximize their exposure to positive environmental, social and governance (ESG) factors while exhibiting risk and return characteristics similar to those of the underlying market capitalization weighted index.
Description of Terms and Indexes (unaudited) (continued)
The NASDAQ 100 Index is a large-cap growth index that includes 100 of the largest domestic and international non-financial companies listed on the Nasdaq Stock Market based on market capitalization.
The S&P 500® Growth Index measures the performance of the large-capitalization growth sector of the U.S. equity market.
The S&P 500® Health Care Index is a capitalization weighted index that measures the performance of the members of the GICS Healthcare sector within the S&P 500 Index.
The S&P 500® Index is a capitalization-weighted index of 500 stocks selected by the Standard & Poor’s Index Committee designed to represent the performance of the
leading industries in the United States economy.
The S&P 500® Information Technology Index comprises companies included in the S&P 500® that are classified as members of the GICS® information technology sector.
The S&P Biotechnology Select Industry Index is designed to measure the performance of stocks from the S&P Total Market index that are classified in the GICS biotechnology sub-industry.
The WisdomTree Artificial Intelligence & Innovation Index is designed to measure the performance of companies primarily involved in artificial intelligence and innovation.
The WisdomTree Battery Value Chain and Innovation Index is designed to track the performance of companies primarily involved in battery and energy storage solutions that meet Index eligibility requirements. Battery and energy storage solutions can be defined as technology that captures electric energy in chemical form.
The WisdomTree BioRevolution Index is designed to track performance of companies that will be significantly transformed by advancements in genetics and biotechnology that meet index eligibility requirements.
The WisdomTree Dynamic Currency Hedged International Equity Index is a fundamentally weighted index that measures the performance of dividend-paying companies in the industrialized world, excluding Canada and the United States. To hedge the impact of changes to the value of foreign currencies relative to the U.S. dollar, a currency hedge ratio (ranging from 0% to 100%) is applied monthly using a rules-based process that combines momentum, value, and interest rate signals.
The WisdomTree Dynamic Currency Hedged International SmallCap Equity Index is a fundamentally weighted index that measures the performance of the small-capitalization segment of the dividend-paying market in the industrialized world, excluding Canada and the United States. To hedge the impact of changes to the value of foreign currencies relative to the U.S. dollar, a currency hedge ratio (ranging from 0% to 100%) is applied monthly using a rules-based process that combines momentum, value, and interest rate signals.
The WisdomTree Team8 Cybersecurity Index is designed to track the performance of companies primarily involved in providing cybersecurity-oriented products that meet index eligibility requirements.
The WisdomTree U.S. Corporate Bond Index is a rule-based alternatively weighted index designed to capture the performance of selected issuers in the U.S. investment grade corporate bond market that are deemed to have attractive fundamental and income characteristics. The Index employs a multi-step process, which screens on fundamentals to identify bonds with favorable characteristics and then tilts to those which offer attractive income characteristics. The Index is comprised of U.S. corporate bonds of public issuers domiciled in the United States. To be eligible for inclusion in the Index, debt securities must have fixed coupons with at least $350 million in par amount outstanding and a remaining maturity of at least one year. Component securities must be rated investment grade.
Description of Terms and Indexes (unaudited) (continued)
The WisdomTree U.S. High Yield Corporate Bond Index is a rule-based alternatively weighted index designed to capture the performance of selected issuers in the U.S. high yield corporate bond market that are deemed to have attractive fundamental and income characteristics. The Index employs a multi-step process, which screens on fundamentals to identify bonds with favorable characteristics and then tilts to those which offer attractive income characteristics. The Index is comprised of U.S. corporate bonds of public issuers domiciled in the United States. To be eligible for inclusion in the Index, debt securities must have fixed coupons with at least $500 million in par amount outstanding and a remaining maturity of at least one year. Component securities must be rated non-investment grade by at least one rating agency.
The WisdomTree U.S. Short-Term Corporate Bond Index is a rule-based alternatively weighted index designed to capture the performance of selected issuers in the U.S.investment-grade corporate bond market that are deemed to have attractive fundamental and income characteristics. The Index employs a multi-step process, which screens on fundamentals to identify bonds with favorable characteristics and then tilts to those which offer attractive income characteristics. The Index is comprised of U.S. corporate bonds of public issuers domiciled in the United States. To be eligible for inclusion in the Index, debt securities must have fixed coupons with at least $350 million in par amount outstanding and a remaining maturity of at least one year but not more than five years. Component securities must be rated investment grade.
The Global Industry Classification Standard (“GICS”) was developed by and is the exclusive property and a service mark of MSCI Inc. (“MSCI”) and Standard & Poor’s (“S&P”), a division of The McGraw-Hill Companies, Inc. and is licensed for use by WisdomTree Investments, Inc. Neither MSCI, S&P nor any other party involved in making or compiling the GICS or any GICS
classifications makes any express or implied warranties or representations with respect to such standard or classification (or the results to be obtained by the use thereof), and all such parties hereby expressly disclaim all warranties of originality, accuracy, completeness, merchantability and fitness for a particular purpose with respect to any such standard or classification. Without limiting any of the foregoing, in no event shall MSCI, S&P, any of their affiliates or any third party involved in making or compiling the GICS or any GICS classifications have any liability for any direct, indirect, special, punitive, consequential or any other damages (including lost profits) even if notified of the possibility of such damages.
Neither MSCI nor any other party involved in or related to compiling, computing or creating the MSCI data makes any express or implied warranties or representations with respect to such data (or the results to be obtained by the use thereof), and all such parties hereby expressly disclaim all warranties of originality, accuracy, completeness, merchantability or fitness for a particular purpose with respect to any such data. Without limiting any of the foregoing, in no event shall MSCI, any of its affiliates or any third party involved in or related to compiling, computing or creating the data have any liability for any direct, indirect, special, punitive, consequential or any other damages (including lost profits) even if notified of the possibility of such damages. No further distribution or dissemination of the MSCI data is permitted without MSCI’s express written consent.
THE INFORMATION SET FORTH IN THE BVP NASDAQ EMERGING CLOUD INDEX IS NOT INTENDED TO BE, AND SHALL NOT BE REGARDED OR CONSTRUED AS, A RECOMMENDATION FOR A TRANSACTION OR INVESTMENT OR FINANCIAL, TAX, INVESTMENT OR OTHER ADVICE OF ANY KIND BY BESSEMER VENTURE PARTNERS. BESSEMER VENTURE PARTNERS DOES NOT PROVIDE INVESTMENT ADVICE TO WISDOMTREE OR THE FUND, IS NOT AN INVESTMENT ADVISER TO THE FUND AND IS NOT RESPONSIBLE FOR THE PERFORMANCE OF THE FUND.THE FUND IS NOT ISSUED, SPONSORED, ENDORSED OR PROMOTED BY BESSEMER VENTURE PARTNERS. BESSEMER VENTURE PARTNERS MAKES NO WARRANTY OR REPRESENTATION REGARDING THE QUALITY, ACCURACY OR COMPLETENESS OF THE BVP NASDAQ EMERGING CLOUD INDEX, INDEX VALUES OR ANY INDEX RELATED DATA INCLUDED HEREIN, PROVIDED HEREWITH OR DERIVED THEREFROM AND ASSUMES NO LIABILITY IN CONNECTION WITH ITS USE. BESSEMER VENTURE PARTNERS AND/OR POOLED INVESTMENT VEHICLES WHICH IT MANAGES, AND INDIVIDUALS AND ENTITIES
Description of Terms and Indexes (unaudited) (concluded)
AFFILIATED WITH SUCH VEHICLES, MAY PURCHASE, SELL OR HOLD SECURITIES OF ISSUERS THAT ARE CONSTITUENTS OF THE BVP NASDAQ EMERGING CLOUD INDEX FROM TIME TO TIME AND AT ANY TIME, INCLUDING IN ADVANCE OF OR FOLLOWING AN ISSUER BEING ADDED TO OR REMOVED FROM THE BVP NASDAQ EMERGING CLOUD INDEX.
Nasdaq® and the BVP Nasdaq Emerging Cloud Index are registered trademarks and service marks of Nasdaq, Inc. (which with its affiliates is referred to as the “Corporations”) and are licensed for use by WisdomTree. The fund has not been passed on by the Corporations as to its legality or suitability. The fund is not issued, endorsed, sold, or promoted by the Corporations. THE CORPORATIONS MAKE NO WARRANTIES AND BEAR NO LIABILITY WITH RESPECT TO THE FUND.
WisdomTree Investments, Inc. and WisdomTree Asset Management, Inc. (together, “WisdomTree”) and the Funds make no representation or warranty, express or implied, to the owners of shares of the Funds or any member of the public regarding the advisability of investing in securities generally or in the Funds particularly or the ability of the underlying Indexes to track the performance of their underlying securities. WisdomTree Investments is the licensor of certain trademarks, service marks and trade names of the Funds. WisdomTree Investments has no obligation to take the needs of the Funds or the owners of shares of the Funds into consideration in determining, composing, or calculating the underlying WisdomTree Indexes of the applicable Funds. WisdomTree Investments is not responsible for, and has not participated in, the determination of the timing of, prices of, or quantities of shares of the Funds to be issued or in the determination or calculation of the equation by which the shares of the Funds are redeemable. WisdomTree and the Funds do not guarantee the accuracy, completeness, or performance of the underlying Indexes or the data included therein and shall have no liability in connection with the underlying Indexes or their calculation.
Index performance information assumes the reinvestment of dividends and excludes
management fees, transaction costs and expenses. You cannot directly invest in an index.
* * * * * *
Abbreviations used in the schedules of investments and related tables included in this report are as follows:
| | | | | | | | | | |
|
| CURRENCY ABBREVIATIONS: |
| AUD | | Australian dollar | | GBP | | British pound | | SEK | | Swedish krona |
| BRL | | Brazilian real | | ILS | | Israeli new shekel | | SGD | | Singapore dollar |
| CHF | | Swiss franc | | JPY | | Japanese yen | | TWD | | New Taiwan dollar |
| CLP | | Chilean peso | | KRW | | South Korean won | | USD | | U.S. dollar |
| DKK | | Danish krone | | MYR | | Malaysian ringgit | | | | |
| EUR | | Euro | | NOK | | Norwegian krone | | | | |
|
| OTHER ABBREVIATIONS: |
| ADR | | American Depositary Receipt |
| CVA | | Certificaten Van Aandelen (Certificate of Stock) |
| GDR | | Global Depositary Receipt |
| NVDR | | Non-Voting Depositary Receipt |
| RSP | | Risparmio Italian Savings Shares |
Schedule of Investments
WisdomTree Dynamic Currency Hedged International Equity Fund (DDWM)
June 30, 2022
| | | | | | | | |
| Investments | | Shares | | | Value | |
| COMMON STOCKS – 98.5% | |
|
| Australia – 12.7% | |
| | |
Accent Group Ltd. | | | 9,902 | | | $ | 8,443 | |
| | |
Adairs Ltd.(a) | | | 6,612 | | | | 8,684 | |
| | |
Adbri Ltd. | | | 14,515 | | | | 24,155 | |
| | |
Ampol Ltd. | | | 3,331 | | | | 78,406 | |
| | |
Ansell Ltd. | | | 2,615 | | | | 39,992 | |
| | |
APA Group | | | 18,852 | | | | 146,100 | |
| | |
ASX Ltd. | | | 2,312 | | | | 129,906 | |
| | |
Aurizon Holdings Ltd. | | | 39,542 | | | | 103,326 | |
| | |
Australia & New Zealand Banking Group Ltd. | | | 33,794 | | | | 511,943 | |
| | |
Bank of Queensland Ltd.(a) | | | 20,379 | | | | 93,471 | |
| | |
Beach Energy Ltd. | | | 31,328 | | | | 37,161 | |
| | |
Bell Financial Group Ltd. | | | 67,749 | | | | 44,957 | |
| | |
Bendigo & Adelaide Bank Ltd. | | | 20,781 | | | | 129,611 | |
| | |
BHP Group Ltd. | | | 172,625 | | | | 4,896,606 | |
| | |
Brambles Ltd. | | | 10,693 | | | | 78,751 | |
| | |
Brickworks Ltd. | | | 1,928 | | | | 24,580 | |
| | |
Cardno Ltd. | | | 1,588 | | | | 1,758 | |
| | |
Centuria Capital Group | | | 7,239 | | | | 9,010 | |
| | |
Cleanaway Waste Management Ltd. | | | 26,320 | | | | 45,609 | |
| | |
Cochlear Ltd. | | | 233 | | | | 31,836 | |
| | |
Coles Group Ltd. | | | 17,722 | | | | 217,042 | |
| | |
Commonwealth Bank of Australia | | | 26,708 | | | | 1,659,897 | |
| | |
Computershare Ltd. | | | 10,113 | | | | 171,352 | |
| | |
Cromwell Property Group(a) | | | 191,680 | | | | 99,516 | |
| | |
CSL Ltd. | | | 1,527 | | | | 282,524 | |
| | |
CSR Ltd. | | | 13,999 | | | | 39,083 | |
| | |
Dexus(a) | | | 21,387 | | | | 130,596 | |
| | |
Dicker Data Ltd.(a) | | | 2,809 | | | | 21,325 | |
| | |
Downer EDI Ltd. | | | 13,469 | | | | 46,773 | |
| | |
Dusk Group Ltd. | | | 883 | | | | 1,014 | |
| | |
Eagers Automotive Ltd. | | | 3,586 | | | | 23,969 | |
| | |
Evolution Mining Ltd. | | | 18,157 | | | | 29,716 | |
| | |
Fortescue Metals Group Ltd. | | | 116,488 | | | | 1,404,205 | |
| | |
Goodman Group(a) | | | 14,360 | | | | 176,164 | |
| | |
GPT Group | | | 34,108 | | | | 98,977 | |
| | |
Growthpoint Properties Australia Ltd.(a) | | | 41,680 | | | | 97,735 | |
| | |
Harvey Norman Holdings Ltd.(a) | | | 36,135 | | | | 92,187 | |
| | |
Healius Ltd. | | | 9,942 | | | | 25,090 | |
| | |
HT&E Ltd. | | | 14,796 | | | | 11,395 | |
| | |
Iluka Resources Ltd. | | | 3,877 | | | | 25,167 | |
| | |
Inghams Group Ltd. | | | 13,934 | | | | 24,721 | |
| | |
Insignia Financial Ltd. | | | 13,849 | | | | 25,618 | |
| | |
Insurance Australia Group Ltd. | | | 34,050 | | | | 102,087 | |
| | |
IRESS Ltd. | | | 7,187 | | | | 56,884 | |
| | |
IVE Group Ltd. | | | 9,928 | | | | 11,742 | |
| | |
JB Hi-Fi Ltd.(a) | | | 3,037 | | | | 80,320 | |
| | |
Lendlease Corp. Ltd. | | | 10,444 | | | | 65,426 | |
| | |
Lovisa Holdings Ltd. | | | 2,073 | | | | 19,686 | |
| | |
Macmahon Holdings Ltd. | | | 298,710 | | | | 27,730 | |
| | |
Macquarie Group Ltd. | | | 3,008 | | | | 340,281 | |
| | |
Magellan Financial Group Ltd.(a) | | | 3,131 | | | | 27,817 | |
| | |
Medibank Pvt Ltd. | | | 46,074 | | | | 102,969 | |
Metcash Ltd.(a) | | | 42,958 | | | | 125,250 | |
| | |
Mineral Resources Ltd. | | | 6,079 | | | | 201,780 | |
| | |
Mirvac Group(a) | | | 62,939 | | | | 85,478 | |
| | |
MyState Ltd. | | | 7,475 | | | | 20,972 | |
| | |
National Australia Bank Ltd. | | | 43,945 | | | | 827,693 | |
| | |
New Hope Corp. Ltd.(a) | | | 10,926 | | | | 25,996 | |
| | |
Newcrest Mining Ltd. | | | 6,226 | | | | 89,437 | |
| | |
NIB Holdings Ltd. | | | 11,606 | | | | 58,899 | |
| | |
Nick Scali Ltd.(a) | | | 1,689 | | | | 9,594 | |
| | |
NRW Holdings Ltd. | | | 19,996 | | | | 23,307 | |
| | |
Orora Ltd. | | | 35,877 | | | | 90,049 | |
| | |
Pendal Group Ltd.(a) | | | 15,078 | | | | 45,828 | |
| | |
Platinum Asset Management Ltd. | | | 16,571 | | | | 19,827 | |
| | |
QBE Insurance Group Ltd. | | | 9,693 | | | | 80,985 | |
| | |
Ramsay Health Care Ltd. | | | 2,477 | | | | 124,750 | |
| | |
Reliance Worldwide Corp. Ltd. | | | 19,449 | | | | 54,031 | |
| | |
Resimac Group Ltd.(a) | | | 44,131 | | | | 34,899 | |
| | |
Rio Tinto Ltd. | | | 52,095 | | | | 3,226,628 | |
| | |
Sandfire Resources Ltd. | | | 19,171 | | | | 58,664 | |
| | |
Santos Ltd. | | | 22,626 | | | | 115,446 | |
| | |
Scentre Group | | | 46,845 | | | | 83,432 | |
| | |
Seven Group Holdings Ltd. | | | 7,125 | | | | 81,381 | |
| | |
Sigma Healthcare Ltd.(a) | | | 9,633 | | | | 3,842 | |
| | |
Sims Ltd. | | | 5,940 | | | | 56,000 | |
| | |
Sonic Healthcare Ltd. | | | 5,525 | | | | 125,414 | |
| | |
South32 Ltd. | | | 53,471 | | | | 144,871 | |
| | |
Southern Cross Media Group Ltd. | | | 12,808 | | | | 8,763 | |
| | |
Stockland(a) | | | 48,347 | | | | 120,017 | |
| | |
Suncorp Group Ltd. | | | 27,367 | | | | 206,632 | |
| | |
Super Retail Group Ltd.(a) | | | 12,636 | | | | 73,771 | |
| | |
Tabcorp Holdings Ltd. | | | 36,835 | | | | 26,976 | |
| | |
Telstra Corp. Ltd. | | | 212,269 | | | | 561,972 | |
| | |
Ten Sixty Four Ltd. | | | 2,047 | | | | 971 | |
| | |
Transurban Group | | | 29,685 | | | | 293,537 | |
| | |
Vicinity Centres | | | 71,182 | | | | 89,820 | |
| | |
Wesfarmers Ltd. | | | 16,743 | | | | 482,524 | |
| | |
Westpac Banking Corp. | | | 36,426 | | | | 488,443 | |
| | |
Woodside Energy Group Ltd. | | | 38,898 | | | | 851,663 | |
| | |
Woolworths Group Ltd. | | | 13,643 | | | | 333,985 | |
| | |
Worley Ltd. | | | 6,932 | | | | 67,879 | |
| | | | | | | | |
| Total Australia | | | | 21,404,719 | |
| Austria – 0.7% | |
| | |
BAWAG Group AG(b) | | | 4,205 | | | | 176,548 | |
| | |
Erste Group Bank AG | | | 2,183 | | | | 55,230 | |
| | |
Oesterreichische Post AG(a) | | | 2,994 | | | | 85,138 | |
| | |
OMV AG | | | 6,175 | | | | 288,955 | |
| | |
POLYTEC Holding AG(a) | | | 6,443 | | | | 40,415 | |
| | |
Raiffeisen Bank International AG | | | 1,839 | | | | 19,880 | |
| | |
S IMMO AG | | | 1,067 | | | | 25,378 | |
| | |
Semperit AG Holding(a) | | | 1,452 | | | | 28,022 | |
| | |
Strabag SE, Bearer Shares* | | | 6,804 | | | | 288,442 | |
| | |
Telekom Austria AG* | | | 19,180 | | | | 127,328 | |
| | |
UNIQA Insurance Group AG | | | 3,525 | | | | 24,838 | |
| | | | | | | | |
| Total Austria | | | | 1,160,174 | |
See Notes to Financial Statements.
Schedule of Investments (continued)
WisdomTree Dynamic Currency Hedged International Equity Fund (DDWM)
June 30, 2022
| | | | | | | | |
| Investments | | Shares | | | Value | |
|
| Belgium – 0.7% | |
| | |
Anheuser-Busch InBev SA/NV | | | 5,734 | | | $ | 307,883 | |
| | |
Bekaert SA | | | 2,561 | | | | 83,160 | |
| | |
Cofinimmo SA | | | 1,088 | | | | 117,840 | |
| | |
Econocom Group SA/NV | | | 13,181 | | | | 46,025 | |
| | |
Etablissements Franz Colruyt NV | | | 1,698 | | | | 46,066 | |
| | |
KBC Group NV | | | 1,235 | | | | 69,127 | |
| | |
Proximus SADP | | | 8,206 | | | | 120,663 | |
| | |
Solvay SA | | | 1,417 | | | | 114,542 | |
| | |
Telenet Group Holding NV | | | 6,242 | | | | 129,274 | |
| | |
UCB SA | | | 970 | | | | 81,776 | |
| | |
Warehouses De Pauw CVA | | | 2,798 | | | | 87,755 | |
| | | | | | | | |
| Total Belgium | | | | 1,204,111 | |
|
| China – 1.7% | |
| | |
Beijing Enterprises Holdings Ltd. | | | 16,000 | | | | 56,888 | |
| | |
BOC Hong Kong Holdings Ltd. | | | 161,500 | | | | 638,019 | |
| | |
China Everbright Environment Group Ltd. | | | 114,666 | | | | 67,657 | |
| | |
China Merchants Port Holdings Co. Ltd. | | | 90,000 | | | | 153,002 | |
| | |
China Nonferrous Mining Corp. Ltd. | | | 81,000 | | | | 37,367 | |
| | |
China Power International Development Ltd. | | | 163,000 | | | | 103,447 | |
| | |
China Resources Pharmaceutical Group Ltd.(b) | | | 124,000 | | | | 84,226 | |
| | |
China Resources Power Holdings Co. Ltd. | | | 48,000 | | | | 99,096 | |
| | |
China Taiping Insurance Holdings Co. Ltd. | | | 50,000 | | | | 61,680 | |
| | |
CITIC Ltd. | | | 593,000 | | | | 600,788 | |
| | |
CSPC Pharmaceutical Group Ltd. | | | 66,320 | | | | 65,839 | |
| | |
Fosun International Ltd. | | | 42,500 | | | | 39,267 | |
| | |
Guangdong Investment Ltd. | | | 136,000 | | | | 143,852 | |
| | |
Lenovo Group Ltd. | | | 176,000 | | | | 164,405 | |
| | |
Shanghai Industrial Holdings Ltd. | | | 39,000 | | | | 56,361 | |
| | |
Shoucheng Holdings Ltd. | | | 200,000 | | | | 30,075 | |
| | |
Shougang Fushan Resources Group Ltd. | | | 240,000 | | | | 99,708 | |
| | |
Simcere Pharmaceutical Group Ltd.(b) | | | 28,000 | | | | 30,687 | |
| | |
Sino-Ocean Group Holding Ltd. | | | 277,000 | | | | 46,949 | |
| | |
Wilmar International Ltd. | | | 71,100 | | | | 206,398 | |
| | |
Zensun Enterprises Ltd.*(a) | | | 75,000 | | | | 29,629 | |
| | | | | | | | |
| Total China | | | | 2,815,340 | |
|
| Denmark – 1.5% | |
| | |
Alm Brand A/S | | | 19,884 | | | | 29,099 | |
| | |
AP Moller — Maersk A/S, Class B | | | 75 | | | | 174,549 | |
| | |
Carlsberg A/S, Class B | | | 646 | | | | 82,097 | |
| | |
Coloplast A/S, Class B | | | 1,446 | | | | 164,331 | |
| | |
D/S Norden A/S | | | 737 | | | | 25,488 | |
| | |
Danske Bank A/S* | | | 7,934 | | | | 111,871 | |
| | |
DSV A/S | | | 305 | | | | 42,500 | |
| | |
Novo Nordisk A/S, Class B | | | 11,507 | | | | 1,273,424 | |
| | |
Novozymes A/S, Class B | | | 1,480 | | | | 88,633 | |
| | |
Orsted A/S(b) | | | 1,512 | | | | 157,697 | |
| | |
Royal Unibrew A/S | | | 825 | | | | 72,881 | |
| | |
Scandinavian Tobacco Group A/S, Class A(b) | | | 4,209 | | | | 82,129 | |
| | |
Sydbank A/S | | | 802 | | | | 24,488 | |
| | |
Topdanmark A/S | | | 640 | | | | 33,236 | |
| | |
Tryg A/S | | | 8,663 | | | | 194,065 | |
| | |
Vestas Wind Systems A/S | | | 2,087 | | | | 43,979 | |
| | | | | | | | |
| Total Denmark | | | | 2,600,467 | |
| Finland – 1.9% | |
| | |
Aktia Bank Oyj | | | 2,630 | | | | 25,131 | |
| | |
Anora Group Oyj | | | 3,066 | | | | 24,809 | |
| | |
Elisa Oyj | | | 3,402 | | | | 190,706 | |
| | |
Fiskars Oyj Abp | | | 3,144 | | | | 58,967 | |
| | |
Fortum Oyj | | | 17,782 | | | | 266,119 | |
| | |
Huhtamaki Oyj | | | 861 | | | | 34,025 | |
| | |
Kesko Oyj, Class B | | | 5,403 | | | | 127,149 | |
| | |
Kone Oyj, Class B | | | 5,330 | | | | 252,757 | |
| | |
Konecranes Oyj | | | 988 | | | | 22,951 | |
| | |
Neste Oyj | | | 4,942 | | | | 218,238 | |
| | |
Nokian Renkaat Oyj | | | 2,986 | | | | 32,560 | |
| | |
Nordea Bank Abp | | | 124,145 | | | | 1,090,330 | |
| | |
Orion Oyj, Class B | | | 2,349 | | | | 104,615 | |
| | |
Sampo Oyj, Class A | | | 6,958 | | | | 302,027 | |
| | |
Stora Enso Oyj, Class R | | | 5,721 | | | | 89,506 | |
| | |
UPM-Kymmene Oyj | | | 7,503 | | | | 227,555 | |
| | |
Uponor Oyj | | | 3,395 | | | | 46,744 | |
| | |
Valmet Oyj | | | 3,507 | | | | 85,830 | |
| | | | | | | | |
| Total Finland | | | | 3,200,019 | |
| France – 9.1% | |
| | |
Air Liquide SA | | | 4,782 | | | | 640,516 | |
| | |
Albioma SA | | | 487 | | | | 25,396 | |
| | |
ALD SA(b) | | | 11,184 | | | | 130,018 | |
| | |
Amundi SA(b) | | | 1,394 | | | | 76,074 | |
| | |
Arkema SA | | | 802 | | | | 71,201 | |
| | |
AXA SA | | | 65,864 | | | | 1,491,454 | |
| | |
BNP Paribas SA | | | 17,887 | | | | 848,324 | |
| | |
Bollore SE | | | 21,089 | | | | 97,450 | |
| | |
Bouygues SA | | | 5,750 | | | | 176,493 | |
| | |
Bureau Veritas SA | | | 4,636 | | | | 118,502 | |
| | |
Capgemini SE | | | 1,001 | | | | 171,050 | |
| | |
Carrefour SA(a) | | | 7,270 | | | | 128,333 | |
| | |
Chargeurs SA | | | 637 | | | | 9,836 | |
| | |
Cie de Saint-Gobain | | | 5,501 | | | | 235,475 | |
| | |
Cie Generale des Etablissements Michelin SCA(a) | | | 5,679 | | | | 154,216 | |
| | |
Cie Plastic Omnium SA | | | 2,159 | | | | 37,310 | |
| | |
Coface SA | | | 1,240 | | | | 12,918 | |
| | |
Covivio | | | 1,328 | | | | 73,514 | |
| | |
Credit Agricole SA(a) | | | 56,749 | | | | 517,995 | |
| | |
Danone SA | | | 7,222 | | | | 402,126 | |
| | |
Dassault Systemes SE | | | 2,558 | | | | 93,907 | |
| | |
Edenred | | | 1,874 | | | | 88,104 | |
| | |
Eiffage SA | | | 1,774 | | | | 159,275 | |
| | |
Electricite de France SA | | | 15,275 | | | | 124,656 | |
| | |
Engie SA | | | 32,782 | | | | 375,826 | |
| | |
EssilorLuxottica SA | | | 1,742 | | | | 260,246 | |
| | |
Eurazeo SE | | | 933 | | | | 57,646 | |
| | |
Eutelsat Communications SA | | | 7,187 | | | | 80,697 | |
| | |
Gecina SA | | | 1,176 | | | | 109,421 | |
| | |
Hermes International | | | 204 | | | | 227,561 | |
| | |
ICADE | | | 1,718 | | | | 83,590 | |
| | |
Ipsen SA | | | 260 | | | | 24,477 | |
See Notes to Financial Statements.
Schedule of Investments (continued)
WisdomTree Dynamic Currency Hedged International Equity Fund (DDWM)
June 30, 2022
| | | | | | | | |
| Investments | | Shares | | | Value | |
| | |
Kering SA | | | 509 | | | $ | 260,799 | |
| | |
Klepierre SA | | | 4,208 | | | | 80,770 | |
| | |
L’Oreal SA | | | 2,732 | | | | 940,536 | |
| | |
La Francaise des Jeux SAEM(b) | | | 2,800 | | | | 96,658 | |
| | |
Legrand SA | | | 1,802 | | | | 132,740 | |
| | |
LVMH Moet Hennessy Louis Vuitton SE | | | 2,513 | | | | 1,528,251 | |
| | |
Metropole Television SA | | | 5,840 | | | | 86,025 | |
| | |
Nexans SA | | | 309 | | | | 23,889 | |
| | |
Nexity SA | | | 2,367 | | | | 63,102 | |
| | |
Orange SA | | | 76,862 | | | | 901,587 | |
| | |
Pernod Ricard SA | | | 1,441 | | | | 264,088 | |
| | |
Publicis Groupe SA* | | | 4,171 | | | | 203,464 | |
| | |
Remy Cointreau SA | | | 170 | | | | 29,627 | |
| | |
Rexel SA | | | 4,955 | | | | 76,019 | |
| | |
Rothschild & Co. | | | 407 | | | | 13,722 | |
| | |
Rubis SCA | | | 2,200 | | | | 51,244 | |
| | |
Sanofi | | | 14,983 | | | | 1,509,067 | |
| | |
Schneider Electric SE | | | 4,880 | | | | 575,993 | |
| | |
SEB SA | | | 502 | | | | 48,047 | |
| | |
Societe BIC SA | | | 1,229 | | | | 67,070 | |
| | |
Societe Generale SA | | | 4,650 | | | | 101,553 | |
| | |
Teleperformance | | | 258 | | | | 79,111 | |
| | |
Television Francaise 1 | | | 5,801 | | | | 40,967 | |
| | |
Thales SA | | | 1,654 | | | | 202,400 | |
| | |
Trigano SA | | | 488 | | | | 47,651 | |
| | |
Valeo | | | 1,756 | | | | 33,825 | |
| | |
Veolia Environnement SA*(a) | | | 7,427 | | | | 180,837 | |
| | |
Verallia SA(b) | | | 1,942 | | | | 46,249 | |
| | |
Vinci SA | | | 5,277 | | | | 468,711 | |
| | |
Wendel SE | | | 956 | | | | 79,706 | |
| | | | | | | | |
| Total France | | | | 15,337,315 | |
|
| Germany – 7.0% | |
| | |
adidas AG | | | 625 | | | | 110,269 | |
| | |
Allianz SE, Registered Shares | | | 6,154 | | | | 1,171,705 | |
| | |
BASF SE | | | 14,580 | | | | 632,951 | |
| | |
Bayer AG, Registered Shares | | | 12,780 | | | | 757,827 | |
| | |
Bayerische Motoren Werke AG | | | 4,626 | | | | 355,271 | |
| | |
Beiersdorf AG | | | 952 | | | | 97,019 | |
| | |
Bilfinger SE | | | 1,237 | | | | 36,055 | |
| | |
Brenntag SE | | | 1,811 | | | | 117,574 | |
| | |
Covestro AG(b) | | | 1,763 | | | | 60,786 | |
| | |
Dermapharm Holding SE | | | 511 | | | | 25,376 | |
| | |
Deutsche Boerse AG | | | 1,160 | | | | 193,550 | |
| | |
Deutsche Post AG, Registered Shares | | | 14,921 | | | | 557,514 | |
| | |
Deutsche Telekom AG, Registered Shares | | | 58,040 | | | | 1,149,604 | |
| | |
Deutsche Wohnen SE, Bearer Shares | | | 2,426 | | | | 55,646 | |
| | |
DIC Asset AG | | | 2,088 | | | | 23,008 | |
| | |
DWS Group GmbH & Co. KGaA(b) | | | 2,998 | | | | 78,231 | |
| | |
E.ON SE | | | 56,804 | | | | 475,561 | |
| | |
Encavis AG | | | 1,329 | | | | 24,280 | |
| | |
Evonik Industries AG | | | 5,497 | | | | 117,006 | |
| | |
Freenet AG | | | 6,908 | | | | 170,944 | |
| | |
Fresenius SE & Co. KGaA | | | 3,252 | | | | 98,254 | |
| | |
GEA Group AG | | | 1,901 | | | | 65,366 | |
| | |
Hannover Rueck SE | | | 1,585 | | | | 229,500 | |
| | |
Hapag-Lloyd AG(b) | | | 1,647 | | | | 425,298 | |
| | |
HeidelbergCement AG | | | 2,040 | | | | 97,764 | |
| | |
Hella GmbH & Co. KGaA | | | 1,078 | | | | 72,522 | |
| | |
Henkel AG & Co. KGaA | | | 2,006 | | | | 122,475 | |
| | |
Hochtief AG | | | 1,957 | | | | 95,034 | |
| | |
Infineon Technologies AG | | | 3,967 | | | | 95,761 | |
| | |
Knorr-Bremse AG | | | 936 | | | | 53,252 | |
| | |
LEG Immobilien SE | | | 987 | | | | 81,641 | |
| | |
Mercedes-Benz Group AG, Registered Shares | | | 7,827 | | | | 451,851 | |
| | |
Merck KGaA | | | 566 | | | | 95,268 | |
| | |
METRO AG* | | | 9,742 | | | | 81,987 | |
| | |
Muenchener Rueckversicherungs — Gesellschaft AG in Muenchen, Registered Shares | | | 1,826 | | | | 427,996 | |
| | |
ProSiebenSat.1 Media SE | | | 6,555 | | | | 60,374 | |
| | |
Rheinmetall AG | | | 701 | | | | 161,449 | |
| | |
RWE AG | | | 5,131 | | | | 188,176 | |
| | |
SAP SE | | | 5,900 | | | | 536,198 | |
| | |
Siemens AG, Registered Shares | | | 6,730 | | | | 683,113 | |
| | |
Siemens Healthineers AG(b) | | | 5,663 | | | | 287,079 | |
| | |
Software AG | | | 748 | | | | 24,727 | |
| | |
Stroeer SE & Co. KGaA | | | 1,614 | | | | 72,388 | |
| | |
Suedzucker AG | | | 1,603 | | | | 25,775 | |
| | |
TAG Immobilien AG | | | 1,885 | | | | 21,461 | |
| | |
Talanx AG* | | | 4,073 | | | | 154,655 | |
| | |
Telefonica Deutschland Holding AG | | | 70,225 | | | | 201,162 | |
| | |
Traton SE | | | 3,964 | | | | 57,852 | |
| | |
Vantage Towers AG | | | 3,341 | | | | 92,910 | |
| | |
Volkswagen AG | | | 1,542 | | | | 280,341 | |
| | |
Vonovia SE | | | 5,501 | | | | 169,080 | |
| | | | | | | | |
| Total Germany | | | | 11,720,886 | |
|
| Hong Kong – 3.1% | |
| | |
AIA Group Ltd. | | | 63,000 | | | | 682,832 | |
| | |
Bank of East Asia Ltd. | | | 44,349 | | | | 62,395 | |
| | |
CLP Holdings Ltd. | | | 50,500 | | | | 418,959 | |
| | |
Dah Sing Banking Group Ltd. | | | 31,200 | | | | 25,248 | |
| | |
Hang Lung Group Ltd. | | | 56,000 | | | | 105,621 | |
| | |
Hang Lung Properties Ltd. | | | 73,000 | | | | 138,428 | |
| | |
Hang Seng Bank Ltd. | | | 34,300 | | | | 605,401 | |
| | |
Henderson Land Development Co. Ltd. | | | 82,000 | | | | 307,228 | |
| | |
Hong Kong & China Gas Co. Ltd. | | | 174,816 | | | | 188,251 | |
| | |
Hong Kong Exchanges & Clearing Ltd. | | | 8,759 | | | | 430,865 | |
| | |
Hutchison Port Holdings Trust | | | 340,900 | | | | 80,111 | |
| | |
Hysan Development Co. Ltd. | | | 30,000 | | | | 90,417 | |
| | |
Link REIT | | | 26,700 | | | | 217,766 | |
| | |
MTR Corp. Ltd. | | | 60,643 | | | | 316,857 | |
| | |
Power Assets Holdings Ltd. | | | 60,000 | | | | 377,344 | |
| | |
Singamas Container Holdings Ltd. | | | 30,000 | | | | 4,550 | |
| | |
Sino Land Co. Ltd. | | | 100,000 | | | | 147,573 | |
| | |
Sun Hung Kai Properties Ltd. | | | 43,000 | | | | 507,981 | |
| | |
Swire Pacific Ltd., Class A | | | 17,500 | | | | 104,260 | |
| | |
Swire Pacific Ltd., Class B | | | 50,000 | | | | 49,892 | |
| | |
Swire Properties Ltd. | | | 77,800 | | | | 193,138 | |
| | |
Techtronic Industries Co. Ltd. | | | 8,500 | | | | 88,662 | |
| | | | | | | | |
| Total Hong Kong | | | | 5,143,779 | |
See Notes to Financial Statements.
Schedule of Investments (continued)
WisdomTree Dynamic Currency Hedged International Equity Fund (DDWM)
June 30, 2022
| | | | | | | | |
| Investments | | Shares | | | Value | |
|
| Ireland – 0.3% | |
| | |
CRH PLC | | | 6,810 | | | $ | 234,944 | |
| | |
Kerry Group PLC, Class A | | | 596 | | | | 56,913 | |
| | |
Kingspan Group PLC | | | 404 | | | | 24,243 | |
| | |
Smurfit Kappa Group PLC(a) | | | 3,594 | | | | 120,536 | |
| | | | | | | | |
| Total Ireland | | | | 436,636 | |
|
| Israel – 0.4% | |
| | |
Azrieli Group Ltd. | | | 1,422 | | | | 99,235 | |
| | |
Bank Hapoalim BM | | | 14,191 | | | | 118,159 | |
| | |
Bank Leumi Le-Israel BM | | | 14,835 | | | | 131,527 | |
| | |
Carasso Motors Ltd. | | | 4,883 | | | | 23,745 | |
| | |
G City Ltd. | | | 9,730 | | | | 55,232 | |
| | |
ICL Group Ltd. | | | 13,683 | | | | 123,814 | |
| | |
Mizrahi Tefahot Bank Ltd. | | | 2,784 | | | | 91,815 | |
| | |
Shapir Engineering and Industry Ltd. | | | 3,003 | | | | 24,438 | |
| | |
Tiv Taam Holdings 1 Ltd. | | | 24,215 | | | | 49,700 | |
| | |
Victory Supermarket Chain Ltd.* | | | 1,654 | | | | 24,422 | |
| | | | | | | | |
| Total Israel | | | | 742,087 | |
|
| Italy – 3.5% | |
| | |
A2A SpA | | | 91,300 | | | | 115,685 | |
| | |
ACEA SpA | | | 6,382 | | | | 94,143 | |
| | |
Alerion Cleanpower SpA(a) | | | 642 | | | | 20,874 | |
| | |
Anima Holding SpA(a)(b) | | | 19,303 | | | | 70,591 | |
| | |
Assicurazioni Generali SpA | | | 37,754 | | | | 600,929 | |
| | |
Azimut Holding SpA | | | 3,639 | | | | 63,096 | |
| | |
Banca Mediolanum SpA | | | 20,385 | | | | 133,794 | |
| | |
Banco BPM SpA | | | 14,418 | | | | 40,939 | |
| | |
BFF Bank SpA(b) | | | 8,593 | | | | 57,630 | |
| | |
BPER Banca | | | 24,230 | | | | 39,707 | |
| | |
Buzzi Unicem SpA | | | 1,495 | | | | 24,398 | |
| | |
De’ Longhi SpA | | | 1,299 | | | | 24,092 | |
| | |
DiaSorin SpA | | | 191 | | | | 25,000 | |
| | |
Enel SpA | | | 154,135 | | | | 841,153 | |
| | |
Eni SpA | | | 59,940 | | | | 709,861 | |
| | |
ERG SpA | | | 2,841 | | | | 88,034 | |
| | |
Esprinet SpA(a) | | | 1,396 | | | | 9,975 | |
| | |
Ferrari NV | | | 509 | | | | 93,230 | |
| | |
Hera SpA | | | 26,450 | | | | 76,320 | |
| | |
Infrastrutture Wireless Italiane SpA(b) | | | 14,631 | | | | 148,126 | |
| | |
Intesa Sanpaolo SpA | | | 407,620 | | | | 758,540 | |
| | |
Iren SpA* | | | 45,676 | | | | 99,515 | |
| | |
Italgas SpA(a) | | | 19,825 | | | | 115,133 | |
| | |
Mediobanca Banca di Credito Finanziario SpA | | | 22,161 | | | | 191,323 | |
| | |
Piaggio & C. SpA | | | 10,402 | | | | 24,294 | |
| | |
Poste Italiane SpA(b) | | | 20,447 | | | | 190,506 | |
| | |
Recordati Industria Chimica e Farmaceutica SpA | | | 2,056 | | | | 89,223 | |
| | |
Snam SpA | | | 72,225 | | | | 377,463 | |
| | |
Telecom Italia SpA* | | | 168,183 | | | | 43,904 | |
| | |
Terna – Rete Elettrica Nazionale | | | 35,469 | | | | 277,663 | |
| | |
UniCredit SpA | | | 6,658 | | | | 63,098 | |
| | |
Unieuro SpA(a)(b) | | | 1,631 | | | | 25,270 | |
| | |
Unipol Gruppo SpA | | | 22,579 | | | | 102,352 | |
| | |
UnipolSai Assicurazioni SpA(a) | | | 73,320 | | | | 175,074 | |
| | |
Webuild SpA(a) | | | 17,481 | | | | 27,029 | |
| | | | | | | | |
| Total Italy | | | | 5,837,964 | |
|
| Japan – 21.5% | |
| | |
&Do Holdings Co. Ltd.* | | | 5,600 | | | | 33,842 | |
| | |
Advan Group Co. Ltd. | | | 7,200 | | | | 41,868 | |
| | |
Advantest Corp. | | | 1,500 | | | | 80,159 | |
| | |
Aeon Co. Ltd. | | | 4,400 | | | | 76,240 | |
| | |
AEON Financial Service Co. Ltd. | | | 7,500 | | | | 70,553 | |
| | |
AGC, Inc.(a) | | | 2,600 | | | | 91,289 | |
| | |
Aica Kogyo Co. Ltd. | | | 1,300 | | | | 27,099 | |
| | |
Aichi Steel Corp. | | | 1,100 | | | | 16,874 | |
| | |
Aisin Corp. | | | 3,100 | | | | 95,837 | |
| | |
Ajinomoto Co., Inc. | | | 4,500 | | | | 109,308 | |
| | |
Akatsuki, Inc.(a) | | | 600 | | | | 12,017 | |
| | |
Akita Bank Ltd. | | | 1,500 | | | | 18,284 | |
| | |
Aruhi Corp. | | | 4,300 | | | | 32,031 | |
| | |
Asahi Group Holdings Ltd. | | | 3,700 | | | | 121,059 | |
| | |
Asahi Holdings, Inc. | | | 3,800 | | | | 59,606 | |
| | |
Asahi Kasei Corp. | | | 15,900 | | | | 121,250 | |
| | |
Asahi Net, Inc. | | | 6,600 | | | | 28,177 | |
| | |
Astellas Pharma, Inc. | | | 15,300 | | | | 238,191 | |
| | |
Autobacs Seven Co. Ltd. | | | 2,500 | | | | 25,726 | |
| | |
Avex, Inc. | | | 2,400 | | | | 23,814 | |
| | |
Azbil Corp. | | | 1,000 | | | | 26,241 | |
| | |
Bandai Namco Holdings, Inc. | | | 1,100 | | | | 77,560 | |
| | |
Bank of Iwate Ltd. | | | 2,700 | | | | 39,907 | |
| | |
Bank of Nagoya Ltd. | | | 2,200 | | | | 50,444 | |
| | |
BayCurrent Consulting, Inc. | | | 100 | | | | 26,572 | |
| | |
BIPROGY, Inc. | | | 2,000 | | | | 39,748 | |
| | |
Bridgestone Corp.(a) | | | 7,600 | | | | 276,913 | |
| | |
Brother Industries Ltd. | | | 3,100 | | | | 54,422 | |
| | |
Calbee, Inc. | | | 1,300 | | | | 26,181 | |
| | |
Canon, Inc.(a) | | | 14,100 | | | | 320,183 | |
| | |
Cawachi Ltd. | | | 1,600 | | | | 25,239 | |
| | |
Central Security Patrols Co. Ltd. | | | 1,900 | | | | 37,915 | |
| | |
Chiba Bank Ltd. | | | 16,300 | | | | 88,906 | |
| | |
Chubu Electric Power Co., Inc. | | | 10,800 | | | | 108,592 | |
| | |
Chugai Pharmaceutical Co. Ltd. | | | 8,800 | | | | 224,769 | |
| | |
Chugoku Electric Power Co., Inc. | | | 7,500 | | | | 48,195 | |
| | |
Chukyo Bank Ltd. | | | 3,000 | | | | 37,253 | |
| | |
Concordia Financial Group Ltd. | | | 25,900 | | | | 89,603 | |
| | |
Cosmo Energy Holdings Co. Ltd. | | | 3,300 | | | | 91,333 | |
| | |
Cybernet Systems Co. Ltd. | | | 4,900 | | | | 28,854 | |
| | |
Dai Nippon Printing Co. Ltd. | | | 3,700 | | | | 79,689 | |
| | |
Dai-ichi Life Holdings, Inc. | | | 12,300 | | | | 227,250 | |
| | |
Daifuku Co. Ltd. | | | 700 | | | | 39,984 | |
| | |
Daiken Medical Co. Ltd.(a) | | | 12,000 | | | | 43,016 | |
| | |
Daikin Industries Ltd. | | | 700 | | | | 112,068 | |
| | |
Daikyonishikawa Corp.(a) | | | 7,400 | | | | 28,379 | |
| | |
Daito Trust Construction Co. Ltd. | | | 900 | | | | 77,575 | |
| | |
Daiwa House Industry Co. Ltd. | | | 8,000 | | | | 186,199 | |
| | |
Daiwa Securities Group, Inc. | | | 29,100 | | | | 129,805 | |
| | |
Daiwabo Holdings Co. Ltd. | | | 2,300 | | | | 29,949 | |
| | |
Denso Corp. | | | 4,300 | | | | 228,143 | |
| | |
Dentsu Group, Inc.(a) | | | 1,700 | | | | 50,992 | |
| | |
Digital Holdings, Inc.(a) | | | 700 | | | | 6,291 | |
See Notes to Financial Statements.
Schedule of Investments (continued)
WisdomTree Dynamic Currency Hedged International Equity Fund (DDWM)
June 30, 2022
| | | | | | | | |
| Investments | | Shares | | | Value | |
| | |
Disco Corp. | | | 400 | | | $ | 94,807 | |
| | |
Ebara Corp. | | | 800 | | | | 29,914 | |
| | |
Ehime Bank Ltd. | | | 3,400 | | | | 22,499 | |
| | |
Electric Power Development Co. Ltd. | | | 4,700 | | | | 77,633 | |
| | |
ENEOS Holdings, Inc. | | | 73,400 | | | | 277,543 | |
| | |
FANUC Corp. | | | 1,200 | | | | 187,612 | |
| | |
Fast Retailing Co. Ltd. | | | 300 | | | | 156,961 | |
| | |
FIDEA Holdings Co. Ltd. | | | 1,500 | | | | 14,199 | |
| | |
Fuji Electric Co. Ltd. | | | 1,500 | | | | 62,051 | |
| | |
Fujicco Co. Ltd.(a) | | | 4,600 | | | | 67,516 | |
| | |
FUJIFILM Holdings Corp. | | | 3,200 | | | | 171,430 | |
| | |
Fujimi, Inc. | | | 800 | | | | 33,506 | |
| | |
Fujitec Co. Ltd. | | | 1,200 | | | | 26,543 | |
| | |
Fujitsu Ltd. | | | 700 | | | | 87,413 | |
| | |
Fukui Bank Ltd. | | | 2,900 | | | | 28,775 | |
| | |
Fukuoka Financial Group, Inc. | | | 6,700 | | | | 120,531 | |
| | |
Furukawa Co. Ltd. | | | 4,700 | | | | 41,446 | |
| | |
Futaba Industrial Co. Ltd. | | | 1,500 | | | | 4,240 | |
| | |
GMO Financial Holdings, Inc.(a) | | | 12,100 | | | | 69,204 | |
| | |
Gunma Bank Ltd. | | | 9,200 | | | | 25,936 | |
| | |
H-One Co. Ltd. | | | 1,600 | | | | 7,019 | |
| | |
H.U. Group Holdings, Inc. | | | 3,100 | | | | 67,292 | |
| | |
Hagiwara Electric Holdings Co. Ltd. | | | 1,600 | | | | 23,731 | |
| | |
Hakudo Co. Ltd. | | | 900 | | | | 15,349 | |
| | |
Hamamatsu Photonics KK | | | 700 | | | | 27,154 | |
| | |
Hankyu Hanshin Holdings, Inc. | | | 1,100 | | | | 29,958 | |
| | |
Haseko Corp. | | | 9,200 | | | | 107,606 | |
| | |
Hazama Ando Corp. | | | 4,200 | | | | 26,062 | |
| | |
Hitachi Ltd. | | | 4,900 | | | | 232,205 | |
| | |
Hitachi Transport System Ltd. | | | 500 | | | | 31,504 | |
| | |
Hokkaido Gas Co. Ltd. | | | 2,700 | | | | 33,329 | |
| | |
Hokkoku Financial Holdings, Inc. | | | 900 | | | | 30,540 | |
| | |
Honda Motor Co. Ltd. | | | 18,600 | | | | 450,847 | |
| | |
Hoya Corp. | | | 1,200 | | | | 102,330 | |
| | |
Hulic Co. Ltd. | | | 9,300 | | | | 71,878 | |
| | |
Hyakujushi Bank Ltd. | | | 1,300 | | | | 16,200 | |
| | |
Ichinen Holdings Co. Ltd. | | | 3,200 | | | | 28,807 | |
| | |
Idemitsu Kosan Co. Ltd. | | | 4,500 | | | | 108,314 | |
| | |
IHI Corp. | | | 1,000 | | | | 26,720 | |
| | |
Iida Group Holdings Co. Ltd. | | | 3,200 | | | | 49,205 | |
| | |
Inpex Corp. | | | 20,300 | | | | 219,653 | |
| | |
Internet Initiative Japan, Inc. | | | 800 | | | | 27,942 | |
| | |
Isuzu Motors Ltd. | | | 8,600 | | | | 95,018 | |
| | |
ITOCHU Corp. | | | 23,000 | | | | 620,816 | |
| | |
Itochu Techno-Solutions Corp. | | | 1,400 | | | | 34,264 | |
| | |
J-Oil Mills, Inc.(a) | | | 4,700 | | | | 55,630 | |
| | |
J. Front Retailing Co. Ltd. | | | 7,600 | | | | 64,893 | |
| | |
Japan Exchange Group, Inc. | | | 4,100 | | | | 59,091 | |
| | |
Japan Post Holdings Co. Ltd. | | | 70,800 | | | | 505,041 | |
| | |
Japan Post Insurance Co. Ltd. | | | 8,500 | | | | 135,832 | |
| | |
Japan Property Management Center Co. Ltd. | | | 2,700 | | | | 20,490 | |
| | |
Japan Tobacco, Inc.(a) | | | 61,900 | | | | 1,068,915 | |
| | |
JDC Corp.(a) | | | 9,300 | | | | 35,734 | |
| | |
JFE Holdings, Inc. | | | 7,000 | | | | 73,682 | |
| | |
JM Holdings Co. Ltd. | | | 1,700 | | | | 19,871 | |
| | |
JSR Corp. | | | 2,500 | | | | 64,775 | |
| | |
Kajima Corp. | | | 8,700 | | | | 99,709 | |
| | |
Kaken Pharmaceutical Co. Ltd. | | | 1,000 | | | | 28,081 | |
| | |
Kansai Electric Power Co., Inc. | | | 14,300 | | | | 141,469 | |
| | |
Kao Corp.(a) | | | 3,800 | | | | 153,057 | |
| | |
KDDI Corp. | | | 37,200 | | | | 1,174,420 | |
| | |
Keiyo Bank Ltd. | | | 22,000 | | | | 77,244 | |
| | |
Keyence Corp. | | | 330 | | | | 112,660 | |
| | |
Ki-Star Real Estate Co. Ltd. | | | 100 | | | | 3,460 | |
| | |
Kikkoman Corp. | | | 800 | | | | 42,398 | |
| | |
Kirin Holdings Co. Ltd.(a) | | | 11,500 | | | | 180,937 | |
| | |
Kisoji Co. Ltd.(a) | | | 4,400 | | | | 70,702 | |
| | |
Kobayashi Pharmaceutical Co. Ltd. | | | 500 | | | | 30,768 | |
| | |
Kobe Steel Ltd. | | | 4,300 | | | | 19,529 | |
| | |
Koito Manufacturing Co. Ltd. | | | 800 | | | | 25,351 | |
| | |
Komatsu Ltd. | | | 8,300 | | | | 183,772 | |
| | |
Konami Holdings Corp. | | | 600 | | | | 33,168 | |
| | |
Kubota Corp.(a) | | | 8,100 | | | | 120,855 | |
| | |
Kuraray Co. Ltd.(a) | | | 7,700 | | | | 62,063 | |
| | |
Kyowa Kirin Co. Ltd. | | | 3,200 | | | | 71,841 | |
| | |
Kyushu Electric Power Co., Inc. | | | 14,000 | | | | 89,861 | |
| | |
Kyushu Railway Co. | | | 2,900 | | | | 60,367 | |
| | |
Lawson, Inc. | | | 1,400 | | | | 46,579 | |
| | |
LEC, Inc. | | | 2,500 | | | | 11,777 | |
| | |
LIFULL Co. Ltd. | | | 16,700 | | | | 20,037 | |
| | |
LIKE, Inc. | | | 500 | | | | 8,494 | |
| | |
Lixil Corp. | | | 3,300 | | | | 61,698 | |
| | |
Makita Corp. | | | 1,400 | | | | 34,852 | |
| | |
Marubeni Corp. | | | 25,800 | | | | 232,448 | |
| | |
Marvelous, Inc. | | | 7,700 | | | | 38,088 | |
| | |
Matsui Securities Co. Ltd. | | | 10,000 | | | | 59,254 | |
| | |
MatsukiyoCocokara & Co. | | | 600 | | | | 24,246 | |
| | |
Mebuki Financial Group, Inc. | | | 45,500 | | | | 89,423 | |
| | |
MEIJI Holdings Co. Ltd. | | | 1,900 | | | | 93,143 | |
| | |
Mie Kotsu Group Holdings, Inc. | | | 9,400 | | | | 34,111 | |
| | |
MINEBEA MITSUMI, Inc. | | | 3,100 | | | | 52,711 | |
| | |
Ministop Co. Ltd. | | | 3,100 | | | | 33,383 | |
| | |
MISUMI Group, Inc. | | | 1,200 | | | | 25,262 | |
| | |
Mitsubishi Chemical Holdings Corp. | | | 13,400 | | | | 72,694 | |
| | |
Mitsubishi Corp. | | | 19,700 | | | | 585,395 | |
| | |
Mitsubishi Electric Corp. | | | 19,800 | | | | 211,474 | |
| | |
Mitsubishi Estate Co. Ltd. | | | 10,500 | | | | 152,181 | |
| | |
Mitsubishi Gas Chemical Co., Inc. | | | 3,200 | | | | 46,049 | |
| | |
Mitsubishi HC Capital, Inc. | | | 25,900 | | | | 119,343 | |
| | |
Mitsubishi Heavy Industries Ltd. | | | 4,000 | | | | 139,708 | |
| | |
Mitsubishi Materials Corp. | | | 4,200 | | | | 60,038 | |
| | |
Mitsubishi UFJ Financial Group, Inc. | | | 181,700 | | | | 975,540 | |
| | |
Mitsui Chemicals, Inc. | | | 2,300 | | | | 48,927 | |
| | |
Mitsui Fudosan Co. Ltd. | | | 5,300 | | | | 113,818 | |
| | |
Mitsui OSK Lines Ltd.(a) | | | 11,100 | | | | 253,693 | |
| | |
Miyazaki Bank Ltd. | | | 1,100 | | | | 16,939 | |
| | |
Mizuho Financial Group, Inc. | | | 41,350 | | | | 469,641 | |
| | |
Mizuho Medy Co. Ltd.(a) | | | 300 | | | | 5,622 | |
See Notes to Financial Statements.
Schedule of Investments (continued)
WisdomTree Dynamic Currency Hedged International Equity Fund (DDWM)
June 30, 2022
| | | | | | | | |
| Investments | | Shares | | | Value | |
| | |
MS&AD Insurance Group Holdings, Inc. | | | 9,000 | | | $ | 275,455 | |
| | |
Murata Manufacturing Co. Ltd. | | | 4,800 | | | | 261,314 | |
| | |
Nabtesco Corp.(a) | | | 1,400 | | | | 32,667 | |
| | |
NEC Capital Solutions Ltd. | | | 800 | | | | 12,007 | |
| | |
NEC Corp. | | | 1,700 | | | | 65,945 | |
| | |
NET One Systems Co. Ltd. | | | 2,000 | | | | 44,165 | |
| | |
NGK Insulators Ltd. | | | 4,400 | | | | 59,204 | |
| | |
NGK Spark Plug Co. Ltd. | | | 3,600 | | | | 65,267 | |
| | |
NH Foods Ltd. | | | 900 | | | | 28,122 | |
| | |
NHK Spring Co. Ltd. | | | 3,800 | | | | 24,978 | |
| | |
Nidec Corp. | | | 1,100 | | | | 67,852 | |
| | |
Nihon Chouzai Co. Ltd. | | | 2,100 | | | | 20,342 | |
| | |
Nihon Flush Co. Ltd.(a) | | | 1,500 | | | | 11,008 | |
| | |
Nihon Tokushu Toryo Co. Ltd. | | | 1,500 | | | | 11,118 | |
| | |
Nintendo Co. Ltd. | | | 1,500 | | | | 647,897 | |
| | |
Nippon Aqua Co. Ltd. | | | 3,300 | | | | 14,234 | |
| | |
Nippon Carbon Co. Ltd. | | | 1,500 | | | | 44,054 | |
| | |
Nippon Electric Glass Co. Ltd.(a) | | | 2,300 | | | | 43,967 | |
| | |
Nippon Express Holdings, Inc. | | | 1,200 | | | | 65,099 | |
| | |
Nippon Gas Co. Ltd. | | | 2,800 | | | | 39,654 | |
| | |
Nippon Sanso Holdings Corp. | | | 1,700 | | | | 27,066 | |
| | |
Nippon Shinyaku Co. Ltd. | | | 500 | | | | 30,363 | |
| | |
Nippon Steel Corp. | | | 9,200 | | | | 128,599 | |
| | |
Nippon Telegraph & Telephone Corp. | | | 65,100 | | | | 1,866,914 | |
| | |
Nippon Yusen KK | | | 3,800 | | | | 259,291 | |
| | |
Nishimatsu Construction Co. Ltd. | | | 3,000 | | | | 89,765 | |
| | |
Nissan Chemical Corp. | | | 1,100 | | | | 50,605 | |
| | |
Nisshinbo Holdings, Inc. | | | 3,300 | | | | 24,801 | |
| | |
Nissin Foods Holdings Co. Ltd. | | | 900 | | | | 62,074 | |
| | |
Nitori Holdings Co. Ltd. | | | 400 | | | | 37,967 | |
| | |
Nitto Denko Corp. | | | 1,700 | | | | 109,867 | |
| | |
NOF Corp. | | | 1,900 | | | | 70,347 | |
| | |
Nomura Real Estate Holdings, Inc. | | | 3,300 | | | | 80,766 | |
| | |
Nomura Research Institute Ltd. | | | 3,000 | | | | 79,717 | |
| | |
NTT Data Corp. | | | 6,400 | | | | 88,377 | |
| | |
Oita Bank Ltd. | | | 1,700 | | | | 23,375 | |
| | |
Oji Holdings Corp. | | | 8,900 | | | | 38,521 | |
| | |
Okinawa Cellular Telephone Co. | | | 700 | | | | 27,875 | |
| | |
Okinawa Financial Group, Inc. | | | 1,800 | | | | 29,016 | |
| | |
Okumura Corp. | | | 1,200 | | | | 26,631 | |
| | |
Okuwa Co. Ltd.(a) | | | 900 | | | | 5,598 | |
| | |
Olympus Corp. | | | 2,700 | | | | 54,187 | |
| | |
Omron Corp. | | | 1,100 | | | | 55,796 | |
| | |
Ono Pharmaceutical Co. Ltd. | | | 4,600 | | | | 117,899 | |
| | |
Open House Group Co. Ltd. | | | 1,300 | | | | 51,673 | |
| | |
Oracle Corp. | | | 600 | | | | 34,714 | |
| | |
Osaka Gas Co. Ltd. | | | 6,700 | | | | 128,028 | |
| | |
Otsuka Holdings Co. Ltd. | | | 4,800 | | | | 170,229 | |
| | |
Panasonic Holdings Corp. | | | 16,500 | | | | 133,173 | |
| | |
Pigeon Corp.(a) | | | 2,500 | | | | 34,246 | |
| | |
Pola Orbis Holdings, Inc.(a) | | | 2,700 | | | | 33,210 | |
| | |
Premium Group Co. Ltd. | | | 200 | | | | 5,734 | |
| | |
Procrea Holdings, Inc. | | | 3,200 | | | | 45,814 | |
| | |
Recruit Holdings Co. Ltd. | | | 2,200 | | | | 64,694 | |
| | |
Resona Holdings, Inc. | | | 34,300 | | | | 128,283 | |
| | |
Rohm Co. Ltd. | | | 700 | | | | 48,743 | |
| | |
Roland Corp. | | | 700 | | | | 20,791 | |
| | |
Sala Corp. | | | 8,000 | | | | 41,515 | |
| | |
Sanoh Industrial Co. Ltd.(a) | | | 800 | | | | 3,851 | |
| | |
Sanshin Electronics Co. Ltd. | | | 1,200 | | | | 13,559 | |
| | |
SBI Holdings, Inc. | | | 3,300 | | | | 64,492 | |
| | |
Scala, Inc.(a) | | | 3,500 | | | | 18,575 | |
| | |
Scroll Corp.(a) | | | 3,000 | | | | 20,095 | |
| | |
SCSK Corp. | | | 8,700 | | | | 147,033 | |
| | |
Secom Co. Ltd. | | | 2,000 | | | | 123,411 | |
| | |
Sega Sammy Holdings, Inc. | | | 5,600 | | | | 89,778 | |
| | |
Seikagaku Corp. | | | 4,600 | | | | 27,629 | |
| | |
Seiko Epson Corp. | | | 4,500 | | | | 63,597 | |
| | |
Sekisui Chemical Co. Ltd. | | | 8,600 | | | | 117,553 | |
| | |
Sekisui House Ltd. | | | 10,700 | | | | 187,174 | |
| | |
Senshu Ikeda Holdings, Inc. | | | 8,300 | | | | 12,219 | |
| | |
Seven & I Holdings Co. Ltd. | | | 5,400 | | | | 209,354 | |
| | |
Seven Bank Ltd. | | | 17,700 | | | | 33,744 | |
| | |
SG Holdings Co. Ltd. | | | 3,700 | | | | 62,341 | |
| | |
Shikoku Electric Power Co., Inc. | | | 4,500 | | | | 26,201 | |
| | |
Shimadzu Corp. | | | 2,200 | | | | 69,471 | |
| | |
Shimamura Co. Ltd. | | | 800 | | | | 70,134 | |
| | |
Shimano, Inc. | | | 300 | | | | 50,613 | |
| | |
Shimizu Corp. | | | 12,300 | | | | 67,903 | |
| | |
Shin-Etsu Chemical Co. Ltd. | | | 2,000 | | | | 225,240 | |
| | |
Shinko Electric Industries Co. Ltd. | | | 1,000 | | | | 25,763 | |
| | |
Shinnihon Corp. | | | 2,000 | | | | 10,408 | |
| | |
Shionogi & Co. Ltd. | | | 1,600 | | | | 80,733 | |
| | |
Shiseido Co. Ltd.(a) | | | 1,100 | | | | 44,096 | |
| | |
Shizuoka Bank Ltd. | | | 5,500 | | | | 32,995 | |
| | |
SKY Perfect JSAT Holdings, Inc. | | | 6,700 | | | | 26,631 | |
| | |
SMC Corp. | | | 200 | | | | 89,021 | |
| | |
Sodick Co. Ltd. | | | 4,000 | | | | 23,967 | |
| | |
SoftBank Corp. | | | 132,400 | | | | 1,468,187 | |
| | |
SoftBank Group Corp. | | | 3,500 | | | | 134,868 | |
| | |
Sojitz Corp. | | | 4,780 | | | | 67,590 | |
| | |
Sompo Holdings, Inc. | | | 7,700 | | | | 339,105 | |
| | |
Sony Group Corp. | | | 1,800 | | | | 147,002 | |
| | |
Square Enix Holdings Co. Ltd. | | | 900 | | | | 39,815 | |
| | |
Stanley Electric Co. Ltd. | | | 1,600 | | | | 26,240 | |
| | |
Subaru Corp. | | | 7,000 | | | | 124,254 | |
| | |
SUMCO Corp. | | | 2,000 | | | | 25,895 | |
| | |
Sumitomo Bakelite Co. Ltd. | | | 900 | | | | 26,929 | |
| | |
Sumitomo Chemical Co. Ltd. | | | 20,600 | | | | 80,517 | |
| | |
Sumitomo Corp. | | | 16,300 | | | | 222,804 | |
| | |
Sumitomo Electric Industries Ltd. | | | 7,200 | | | | 79,444 | |
| | |
Sumitomo Forestry Co. Ltd.(a) | | | 2,500 | | | | 35,387 | |
| | |
Sumitomo Heavy Industries Ltd. | | | 3,000 | | | | 66,137 | |
| | |
Sumitomo Metal Mining Co. Ltd. | | | 3,700 | | | | 115,748 | |
| | |
Sumitomo Mitsui Financial Group, Inc. | | | 23,200 | | | | 688,546 | |
| | |
Sumitomo Mitsui Trust Holdings, Inc. | | | 4,400 | | | | 135,380 | |
| | |
Sumitomo Pharma Co. Ltd. | | | 3,200 | | | | 25,698 | |
| | |
Sumitomo Realty & Development Co. Ltd. | | | 3,000 | | | | 79,121 | |
See Notes to Financial Statements.
Schedule of Investments (continued)
WisdomTree Dynamic Currency Hedged International Equity Fund (DDWM)
June 30, 2022
| | | | | | | | |
| Investments | | Shares | | | Value | |
| | |
Sumitomo Rubber Industries Ltd.(a) | | | 9,900 | | | $ | 84,458 | |
| | |
Suncall Corp. | | | 2,400 | | | | 10,829 | |
| | |
Suntory Beverage & Food Ltd. | | | 2,900 | | | | 109,506 | |
| | |
Suzuki Motor Corp. | | | 3,000 | | | | 94,159 | |
| | |
Sysmex Corp. | | | 600 | | | | 36,065 | |
| | |
T&D Holdings, Inc. | | | 6,700 | �� | | | 80,091 | |
| | |
Tachi-S Co. Ltd. | | | 1,000 | | | | 8,060 | |
| | |
Taihei Dengyo Kaisha Ltd. | | | 1,800 | | | | 39,099 | |
| | |
Taiheiyo Cement Corp. | | | 1,800 | | | | 26,830 | |
| | |
Taiho Kogyo Co. Ltd.(a) | | | 1,900 | | | | 9,342 | |
| | |
Taisei Corp. | | | 3,300 | | | | 102,628 | |
| | |
Takeda Pharmaceutical Co. Ltd. | | | 28,700 | | | | 806,570 | |
| | |
Tama Home Co. Ltd.(a) | | | 900 | | | | 16,231 | |
| | |
TDK Corp. | | | 2,200 | | | | 67,852 | |
| | |
Terumo Corp. | | | 2,500 | | | | 75,227 | |
| | |
Toho Bank Ltd. | | | 20,500 | | | | 31,386 | |
| | |
Toho Co. Ltd. | | | 800 | | | | 28,884 | |
| | |
Toho Gas Co. Ltd. | | | 1,500 | | | | 36,160 | |
| | |
Toho Zinc Co. Ltd.(a) | | | 500 | | | | 7,906 | |
| | |
Tokai Carbon Co. Ltd. | | | 3,500 | | | | 26,639 | |
| | |
TOKAI Holdings Corp. | | | 4,000 | | | | 26,116 | |
| | |
Tokio Marine Holdings, Inc. | | | 7,900 | | | | 459,561 | |
| | |
Tokyo Electron Device Ltd. | | | 300 | | | | 11,306 | |
| | |
Tokyo Electron Ltd. | | | 1,400 | | | | 456,516 | |
| | |
Tokyo Gas Co. Ltd. | | | 4,400 | | | | 90,912 | |
| | |
Tokyo Tekko Co. Ltd.(a) | | | 1,200 | | | | 10,847 | |
| | |
Tokyu Fudosan Holdings Corp. | | | 13,600 | | | | 71,476 | |
| | |
TOMONY Holdings, Inc. | | | 10,700 | | | | 24,573 | |
| | |
Toray Industries, Inc. | | | 15,200 | | | | 85,166 | |
| | |
Toshiba Corp. | | | 3,100 | | | | 125,844 | |
| | |
Tosoh Corp. | | | 4,600 | | | | 57,054 | |
| | |
TOTO Ltd. | | | 1,200 | | | | 39,572 | |
| | |
Towa Bank Ltd. | | | 7,000 | | | | 26,536 | |
| | |
Toyo Kanetsu KK | | | 200 | | | | 3,898 | |
| | |
Toyo Seikan Group Holdings Ltd. | | | 4,600 | | | | 48,047 | |
| | |
Toyo Suisan Kaisha Ltd. | | | 1,300 | | | | 50,620 | |
| | |
Toyo Tire Corp. | | | 2,100 | | | | 26,185 | |
| | |
Toyota Boshoku Corp. | | | 3,600 | | | | 53,395 | |
| | |
Toyota Motor Corp. | | | 130,770 | | | | 2,021,398 | |
| | |
Toyota Tsusho Corp. | | | 2,800 | | | | 91,303 | |
| | |
TPR Co. Ltd. | | | 2,800 | | | | 24,773 | |
| | |
Trend Micro, Inc. | | | 1,800 | | | | 87,711 | |
| | |
Tsurumi Manufacturing Co. Ltd. | | | 1,800 | | | | 24,631 | |
| | |
TV Tokyo Holdings Corp. | | | 3,000 | | | | 43,061 | |
| | |
Unicharm Corp.(a) | | | 2,500 | | | | 83,545 | |
| | |
USS Co. Ltd. | | | 7,200 | | | | 124,492 | |
| | |
V Technology Co. Ltd.(a) | | | 800 | | | | 16,447 | |
| | |
Vital KSK Holdings, Inc. | | | 7,000 | | | | 35,656 | |
| | |
Wakita & Co. Ltd. | | | 3,000 | | | | 26,388 | |
| | |
Yakult Honsha Co. Ltd. | | | 1,200 | | | | 69,162 | |
| | |
YAMABIKO Corp.(a) | | | 2,400 | | | | 20,227 | |
| | |
Yamada Holdings Co. Ltd. | | | 23,700 | | | | 85,132 | |
| | |
Yamagata Bank Ltd. | | | 7,200 | | | | 47,645 | |
| | |
Yamaha Corp. | | | 1,100 | | | | 45,342 | |
| | |
Yamaha Motor Co. Ltd.(a) | | | 7,000 | | | | 128,092 | |
| | |
Yamanashi Chuo Bank Ltd. | | | 3,400 | | | | 28,430 | |
| | |
Yamato Holdings Co. Ltd. | | | 3,400 | | | | 54,308 | |
| | |
Yokohama Rubber Co. Ltd.(a) | | | 3,300 | | | | 44,622 | |
| | |
Yokorei Co. Ltd. | | | 3,800 | | | | 24,614 | |
| | |
Yorozu Corp.(a) | | | 600 | | | | 3,913 | |
| | |
Zeon Corp. | | | 3,900 | | | | 37,721 | |
| | | | | | | | |
| Total Japan | | | | 36,048,150 | |
|
| Netherlands – 2.1% | |
| | |
Aalberts NV | | | 700 | | | | 27,216 | |
| | |
Aegon NV | | | 12,132 | | | | 52,357 | |
| | |
Akzo Nobel NV | | | 1,715 | | | | 112,274 | |
| | |
Arcadis NV | | | 761 | | | | 25,538 | |
| | |
ASM International NV | | | 317 | | | | 79,074 | |
| | |
ASML Holding NV | | | 844 | | | | 402,224 | |
| | |
ASR Nederland NV | | | 3,729 | | | | 150,365 | |
| | |
BE Semiconductor Industries NV | | | 874 | | | | 41,912 | |
| | |
CTP NV(b) | | | 2,117 | | | | 24,345 | |
| | |
Euronext NV(b) | | | 443 | | | | 36,078 | |
| | |
Heineken Holding NV | | | 1,201 | | | | 87,200 | |
| | |
Heineken NV | | | 1,681 | | | | 152,894 | |
| | |
ING Groep NV | | | 41,589 | | | | 410,053 | |
| | |
Koninklijke Ahold Delhaize NV | | | 10,785 | | | | 280,301 | |
| | |
Koninklijke DSM NV | | | 1,051 | | | | 150,641 | |
| | |
Koninklijke KPN NV | | | 88,367 | | | | 314,196 | |
| | |
Koninklijke Philips NV | | | 5,819 | | | | 125,046 | |
| | |
Koninklijke Vopak NV | | | 1,799 | | | | 45,289 | |
| | |
NN Group NV | | | 7,108 | | | | 322,062 | |
| | |
Ordina NV | | | 5,045 | | | | 25,106 | |
| | |
PostNL NV(a) | | | 27,519 | | | | 83,288 | |
| | |
Randstad NV(a) | | | 2,728 | | | | 131,762 | |
| | |
RHI Magnesita NV | | | 1,931 | | | | 46,691 | |
| | |
SBM Offshore NV | | | 2,322 | | | | 31,400 | |
| | |
Signify NV(b) | | | 2,327 | | | | 76,948 | |
| | |
Wolters Kluwer NV | | | 2,213 | | �� | | 214,145 | |
| | | | | | | | |
| Total Netherlands | | | | 3,448,405 | |
|
| Norway – 2.0% | |
| | |
ABG Sundal Collier Holding ASA | | | 16,547 | | | | 9,865 | |
| | |
AF Gruppen ASA | | | 5,434 | | | | 86,682 | |
| | |
Aker ASA, Class A | | | 849 | | | | 64,966 | |
| | |
Aker BP ASA(a) | | | 3,389 | | | | 117,349 | |
| | |
Austevoll Seafood ASA | | | 6,427 | | | | 75,005 | |
| | |
Bouvet ASA | | | 4,211 | | | | 25,105 | |
| | |
DNB Bank ASA | | | 16,548 | | | | 295,711 | |
| | |
Equinor ASA | | | 31,398 | | | | 1,088,629 | |
| | |
Gjensidige Forsikring ASA | | | 8,720 | | | | 176,081 | |
| | |
Hunter Group ASA* | | | 62,696 | | | | 21,735 | |
| | |
Kid ASA(b) | | | 2,658 | | | | 22,411 | |
| | |
Komplett Bank ASA* | | | 22,850 | | | | 13,900 | |
| | |
Kongsberg Gruppen ASA | | | 3,329 | | | | 118,944 | |
| | |
Leroy Seafood Group ASA | | | 4,674 | | | | 33,092 | |
| | |
Mowi ASA | | | 1,365 | | | | 30,962 | |
| | |
Norsk Hydro ASA | | | 20,392 | | | | 113,851 | |
See Notes to Financial Statements.
Schedule of Investments (continued)
WisdomTree Dynamic Currency Hedged International Equity Fund (DDWM)
June 30, 2022
| | | | | | | | |
| Investments | | Shares | | | Value | |
| | |
Orkla ASA | | | 18,213 | | | $ | 145,118 | |
| | |
Pareto Bank ASA | | | 7,691 | | | | 36,782 | |
| | |
Storebrand ASA | | | 8,852 | | | | 62,808 | |
| | |
Telenor ASA | | | 40,174 | | | | 532,685 | |
| | |
TGS ASA | | | 3,745 | | | | 52,424 | |
| | |
Veidekke ASA | | | 8,592 | | | | 77,834 | |
| | |
Yara International ASA | | | 5,590 | | | | 232,885 | |
| | | | | | | | |
| Total Norway | | | | 3,434,824 | |
|
| Portugal – 0.3% | |
| | |
EDP – Energias de Portugal SA | | | 52,925 | | | | 246,331 | |
| | |
Galp Energia SGPS SA | | | 18,080 | | | | 211,416 | |
| | |
Jeronimo Martins SGPS SA | | | 4,706 | | | | 102,038 | |
| | | | | | | | |
| Total Portugal | | | | 559,785 | |
|
| Singapore – 1.9% | |
| | |
China Aviation Oil Singapore Corp. Ltd. | | | 31,700 | | | | 19,931 | |
| | |
ComfortDelGro Corp. Ltd. | | | 25,500 | | | | 25,652 | |
| | |
DBS Group Holdings Ltd. | | | 35,063 | | | | 747,769 | |
| | |
Hour Glass Ltd. | | | 13,100 | | | | 21,838 | |
| | |
Jardine Cycle & Carriage Ltd. | | | 4,600 | | | | 93,507 | |
| | |
Keppel Corp. Ltd. | | | 39,000 | | | | 181,871 | |
| | |
NetLink NBN Trust | | | 194,500 | �� | | | 135,564 | |
| | |
Olam Group Ltd. | | | 82,400 | | | | 89,996 | |
| | | | | | | | |
| | | | | | | | |
| | |
Oversea-Chinese Banking Corp. Ltd. | | | 70,001 | | | | 572,905 | |
| | |
Propnex Ltd. | | | 13,100 | | | | 14,402 | |
| | |
Riverstone Holdings Ltd. | | | 79,700 | | | | 42,378 | |
| | |
Sembcorp Industries Ltd. | | | 42,500 | | | | 87,034 | |
| | |
Sheng Siong Group Ltd. | | | 30,800 | | | | 33,639 | |
| | |
Singapore Exchange Ltd. | | | 14,000 | | | | 95,164 | |
| | |
Singapore Technologies Engineering Ltd. | | | 56,300 | | | | 165,053 | |
| | |
Singapore Telecommunications Ltd. | | | 144,400 | | | | 262,508 | |
| | |
United Overseas Bank Ltd. | | | 27,628 | | | | 521,115 | |
| | |
Venture Corp. Ltd. | | | 9,400 | | | | 112,325 | |
| | | | | | | | |
| Total Singapore | | | | 3,222,651 | |
|
| Spain – 2.7% | |
| | |
Acciona SA(a) | | | 615 | | | | 112,838 | |
| | |
Acerinox SA* | | | 7,336 | | | | 70,835 | |
| | |
Aedas Homes SA(b) | | | 2,281 | | | | 50,794 | |
| | |
Banco Bilbao Vizcaya Argentaria SA | | | 70,397 | | | | 318,710 | |
| | |
Banco Santander SA | | | 63,856 | | | | 179,446 | |
| | |
CaixaBank SA | | | 31,647 | | | | 109,744 | |
| | |
Cia de Distribucion Integral Logista Holdings SA | | | 7,672 | | | | 149,666 | |
| | |
ContourGlobal PLC(b) | | | 26,256 | | | | 80,195 | |
| | |
EDP Renovaveis SA | | | 3,238 | | | | 76,234 | |
| | |
Enagas SA(a) | | | 5,374 | | | | 118,376 | |
| | |
Ferrovial SA | | | 5,911 | | | | 149,486 | |
| | |
Fomento de Construcciones y Contratas SA | | | 7,692 | | | | 75,832 | |
| | |
Grupo Catalana Occidente SA | | | 4,013 | | | | 124,813 | |
| | |
Iberdrola SA | | | 81,987 | | | | 848,219 | |
| | |
Industria de Diseno Textil SA | | | 22,404 | | | | 505,687 | |
| | |
Inmobiliaria Colonial Socimi SA | | | 8,914 | | | | 56,893 | |
| | |
Linea Directa Aseguradora SA Cia de Seguros y Reaseguros(a) | | | 66,258 | | | | 87,141 | |
| | |
Mapfre SA | | | 89,118 | | | | 156,709 | |
| | |
Metrovacesa SA(b) | | | 8,173 | | | | 57,846 | |
| | |
Naturgy Energy Group SA | | | 19,982 | | | | 573,853 | |
| | |
Neinor Homes SA(b) | | | 2,002 | | | | 25,032 | |
| | |
Prosegur Cash SA(a)(b) | | | 58,895 | | | | 38,298 | |
| | |
Prosegur Cia de Seguridad SA | | | 14,244 | | | | 25,077 | |
| | |
Red Electrica Corp. SA(a) | | | 7,872 | | | | 148,342 | |
| | |
Repsol SA(a) | | | 21,737 | | | | 319,285 | |
| | |
Viscofan SA | | | 2,192 | | | | 120,310 | |
| | | | | | | | |
| Total Spain | | | | 4,579,661 | |
|
| Sweden – 2.6% | |
| | |
AAK AB | | | 1,563 | | | | 25,457 | |
| | |
Alfa Laval AB | | | 2,256 | | | | 54,290 | |
| | |
Assa Abloy AB, Class B | | | 7,676 | | | | 162,772 | |
| | |
Atlas Copco AB, Class A | | | 19,742 | | | | 184,119 | |
| | |
Atlas Copco AB, Class B* | | | 11,473 | | | | 95,771 | |
| | |
Atrium Ljungberg AB, Class B | | | 1,804 | | | | 23,590 | |
| | |
Axfood AB | | | 5,464 | | | | 156,923 | |
| | |
Boliden AB* | | | 2,500 | | | | 79,374 | |
| | |
Castellum AB(a) | | | 4,318 | | | | 55,390 | |
| | |
Clas Ohlson AB, Class B | | | 2,457 | | | | 25,367 | |
| | |
Dios Fastigheter AB | | | 3,435 | | | | 23,816 | |
| | |
Elekta AB, Class B(a) | | | 9,315 | | | | 64,231 | |
| | |
Epiroc AB, Class A | | | 5,976 | | | | 92,112 | |
| | |
EQT AB | | | 3,641 | | | | 74,402 | |
| | |
Essity AB, Class B | | | 5,391 | | | | 140,517 | |
| | |
Evolution AB(b) | | | 733 | | | | 66,530 | |
| | |
Fabege AB | | | 7,189 | | | | 67,755 | |
| | |
FastPartner AB, Class A | | | 4,205 | | | | 24,293 | |
| | |
Hexagon AB, Class B | | | 9,364 | | | | 97,090 | |
| | |
Hexpol AB | | | 9,837 | | | | 83,564 | |
| | |
Hufvudstaden AB, Class A | | | 2,168 | | | | 23,907 | |
| | |
Intrum AB | | | 1,657 | | | | 31,556 | |
| | |
Investment AB Latour, Class B | | | 3,224 | | | | 63,647 | |
| | |
JM AB | | | 1,411 | | | | 23,311 | |
| | |
L E Lundbergforetagen AB, Class B | | | 605 | | | | 24,554 | |
| | |
Loomis AB | | | 1,023 | | | | 24,838 | |
| | |
Lundin Energy AB(a) | | | 6,865 | | | | 4,683 | |
| | |
Lundin Energy MergerCo AB*(a) | | | 6,580 | | | | 267,734 | |
| | |
Nordic Paper Holding AB | | | 6,136 | | | | 23,652 | |
| | |
Peab AB, Class B | | | 11,937 | | | | 69,660 | |
| | |
Saab AB, Class B | | | 1,533 | | | | 63,220 | |
| | |
Sandvik AB | | | 7,745 | | | | 125,350 | |
| | |
Scandi Standard AB* | | | 12,667 | | | | 45,118 | |
| | |
Securitas AB, Class B | | | 7,593 | | | | 65,294 | |
| | |
Skandinaviska Enskilda Banken AB, Class A | | | 27,187 | | | | 266,367 | |
| | |
Skanska AB, Class B | | | 6,533 | | | | 99,964 | |
| | |
SKF AB, Class B | | | 4,286 | | | | 62,947 | |
| | |
Svenska Cellulosa AB SCA, Class B | | | 3,104 | | | | 46,284 | |
| | |
Svenska Handelsbanken AB, Class A | | | 16,161 | | | | 137,869 | |
| | |
Svenska Handelsbanken AB, Class B(a) | | | 4,059 | | | | 39,848 | |
| | |
Swedbank AB, Class A | | | 6,117 | | | | 77,183 | |
| | |
Swedish Match AB | | | 16,077 | | | | 163,478 | |
| | |
Tele2 AB, Class B | | | 15,752 | | | | 179,080 | |
| | |
Telefonaktiebolaget LM Ericsson, Class B | | | 21,501 | | | | 160,029 | |
See Notes to Financial Statements.
Schedule of Investments (continued)
WisdomTree Dynamic Currency Hedged International Equity Fund (DDWM)
June 30, 2022
| | | | | | | | |
| Investments | | Shares | | | Value | |
| | |
Telia Co. AB | | | 63,448 | | | $ | 242,588 | |
| | |
Trelleborg AB, Class B | | | 5,675 | | | | 114,138 | |
| | |
Volvo AB, Class A | | | 8,364 | | | | 134,348 | |
| | |
Volvo AB, Class B | | | 15,211 | | | | 235,096 | |
| | | | | | | | |
| Total Sweden | | | | 4,413,106 | |
|
| Switzerland – 9.2% | |
| | |
ABB Ltd., Registered Shares | | | 24,557 | | | | 653,075 | |
| | |
Adecco Group AG, Registered Shares | | | 2,565 | | | | 86,916 | |
| | |
Alcon, Inc. | | | 368 | | | | 25,631 | |
| | |
Baloise Holding AG, Registered Shares | | | 749 | | | | 121,971 | |
| | |
Banque Cantonale Vaudoise, Registered Shares(a) | | | 1,301 | | | | 101,786 | |
| | |
BKW AG | | | 755 | | | | 78,627 | |
| | |
Cie Financiere Richemont SA, Class A, Registered Shares | | | 2,951 | | | | 313,333 | |
| | |
Clariant AG, Registered Shares* | | | 5,216 | | | | 99,051 | |
| | |
Coca-Cola HBC AG* | | | 4,278 | | | | 94,661 | |
| | |
DKSH Holding AG | | | 1,235 | | | | 101,654 | |
| | |
EMS-Chemie Holding AG, Registered Shares | | | 232 | | | | 172,179 | |
| | |
Geberit AG, Registered Shares | | | 255 | | | | 122,206 | |
| | |
Helvetia Holding AG, Registered Shares | | | 762 | | | | 88,907 | |
| | |
Holcim AG, Registered Shares | | | 8,177 | | | | 348,912 | |
| | |
Julius Baer Group Ltd. | | | 2,546 | | | | 117,121 | |
| | |
Kuehne + Nagel International AG, Registered Shares | | | 969 | | | | 228,750 | |
| | |
Landis + Gyr Group AG*(a) | | | 868 | | | | 45,379 | |
| | |
Logitech International SA, Registered Shares(a) | | | 762 | | | | 39,694 | |
| | |
Lonza Group AG, Registered Shares | | | 133 | | | | 70,713 | |
| | |
Mobilezone Holding AG, Registered Shares | | | 3,831 | | | | 66,668 | |
| | |
Nestle SA, Registered Shares | | | 30,656 | | | | 3,568,501 | |
| | |
Novartis AG, Registered Shares | | | 29,091 | | | | 2,456,789 | |
| | |
Partners Group Holding AG | | | 247 | | | | 221,935 | |
| | |
PSP Swiss Property AG, Registered Shares | | | 841 | | | | 93,293 | |
| | |
Roche Holding AG | | | 5,424 | | | | 1,804,789 | |
| | |
Roche Holding AG, Bearer Shares | | | 1,239 | | | | 476,782 | |
| | |
Schindler Holding AG, Registered Shares | | | 623 | | | | 111,669 | |
| | |
SGS SA, Registered Shares | | | 107 | | | | 244,211 | |
| | |
SIG Group AG | | | 3,095 | | | | 67,955 | |
| | |
Sika AG, Registered Shares | | | 616 | | | | 141,557 | |
| | |
Sonova Holding AG, Registered Shares | | | 260 | | | | 82,561 | |
| | |
STMicroelectronics NV | | | 1,562 | | | | 48,965 | |
| | |
Sulzer AG, Registered Shares | | | 1,167 | | | | 72,286 | |
| | |
Swatch Group AG, Registered Shares | | | 1,801 | | | | 79,840 | |
| | |
Swiss Life Holding AG, Registered Shares | | | 524 | | | | 254,515 | |
| | |
Swiss Prime Site AG, Registered Shares | | | 1,515 | | | | 132,534 | |
| | |
Swisscom AG, Registered Shares | | | 931 | | | | 512,884 | |
| | |
Temenos AG, Registered Shares | | | 291 | | | | 24,810 | |
| | |
UBS Group AG, Registered Shares | | | 26,070 | | | | 419,092 | |
| | |
VAT Group AG(b) | | | 250 | | | | 59,435 | |
| | |
Vontobel Holding AG, Registered Shares | | | 476 | | | | 33,363 | |
| | |
Zurich Insurance Group AG | | | 3,557 | | | | 1,542,661 | |
| | | | | | | | |
| Total Switzerland | | | | 15,427,661 | |
|
| United Kingdom – 13.6% | |
| | |
abrdn PLC | | | 35,794 | | | | 69,487 | |
| | |
Admiral Group PLC | | | 11,136 | | | | 303,481 | |
| | |
Airtel Africa PLC(b) | | | 64,160 | | | | 105,347 | |
| | |
Anglo American PLC | | | 26,917 | | | | 960,086 | |
| | |
Antofagasta PLC | | | 12,516 | | | | 175,561 | |
| | |
Ashmore Group PLC(a) | | | 27,252 | | | | 73,407 | |
| | |
Ashtead Group PLC | | | 2,370 | | | | 98,983 | |
| | |
AstraZeneca PLC | | | 11,065 | | | | 1,451,292 | |
| | |
Auto Trader Group PLC(b) | | | 3,779 | | | | 25,471 | |
| | |
Aviva PLC* | | | 61,768 | | | | 301,032 | |
| | |
BAE Systems PLC | | | 62,975 | | | | 634,937 | |
| | |
Barclays PLC | | | 57,331 | | | | 106,611 | |
| | |
Barratt Developments PLC | | | 15,632 | | | | 86,834 | |
| | |
Bellway PLC | | | 2,678 | | | | 69,794 | |
| | |
Big Yellow Group PLC | | | 5,865 | | | | 93,451 | |
| | |
BP PLC | | | 263,632 | | | | 1,243,212 | |
| | |
British Land Co. PLC | | | 20,256 | | | | 109,986 | |
| | |
Bunzl PLC | | | 5,314 | | | | 175,473 | |
| | |
Burberry Group PLC | | | 3,768 | | | | 75,093 | |
| | |
Central Asia Metals PLC | | | 18,698 | | | | 50,298 | |
| | |
Close Brothers Group PLC | | | 6,721 | | | | 83,664 | |
| | |
CNH Industrial NV | | | 4,490 | | | | 51,729 | |
| | |
Coca-Cola Europacific Partners PLC | | | 2,683 | | | | 137,386 | |
| | |
Computacenter PLC | | | 3,219 | | | | 91,947 | |
| | |
ConvaTec Group PLC(b) | | | 27,737 | | | | 75,590 | |
| | |
Croda International PLC | | | 855 | | | | 67,202 | |
| | |
DCC PLC | | | 1,057 | | | | 65,442 | |
| | |
Diageo PLC | | | 22,085 | | | | 946,920 | |
| | |
Diploma PLC | | | 922 | | | | 24,947 | |
| | |
Direct Line Insurance Group PLC | | | 47,177 | | | | 144,209 | |
| | |
Diversified Energy Co. PLC | | | 45,470 | | | | 61,516 | |
| | |
Domino’s Pizza Group PLC | | | 16,640 | | | | 56,422 | |
| | |
Drax Group PLC | | | 12,410 | | | | 96,909 | |
| | |
DS Smith PLC | | | 18,969 | | | | 63,881 | |
| | |
FDM Group Holdings PLC | | | 2,378 | | | | 24,519 | |
| | |
Ferrexpo PLC | | | 32,037 | | | | 50,696 | |
| | |
Fresnillo PLC | | | 8,977 | | | | 83,597 | |
| | |
Grafton Group PLC | | | 4,682 | | | | 44,169 | |
| | |
Grainger PLC | | | 7,119 | | | | 24,312 | |
| | |
GSK PLC | | | 88,584 | | | | 1,899,447 | |
| | |
H&T Group PLC | | | 2,718 | | | | 10,563 | |
| | |
Hargreaves Lansdown PLC(a) | | | 5,321 | | | | 50,908 | |
| | |
Hikma Pharmaceuticals PLC | | | 3,516 | | | | 69,067 | |
| | |
HomeServe PLC | | | 5,063 | | | | 72,063 | |
| | |
HSBC Holdings PLC | | | 223,408 | | | | 1,453,178 | |
| | |
Hunting PLC | | | 3,831 | | | | 10,050 | |
| | |
IMI PLC | | | 5,197 | | | | 74,034 | |
| | |
Imperial Brands PLC | | | 36,923 | | | | 823,283 | |
| | |
Inchcape PLC | | | 8,729 | | | | 73,730 | |
| | |
Intertek Group PLC | | | 1,152 | | | | 58,844 | |
| | |
Investec PLC | | | 12,335 | | | | 66,632 | |
| | |
J. Sainsbury PLC | | | 30,749 | | | | 76,180 | |
| | |
James Fisher & Sons PLC* | | | 1,608 | | | | 5,683 | |
| | |
Johnson Matthey PLC | | | 2,035 | | | | 47,587 | |
| | |
Jupiter Fund Management PLC | | | 8,645 | | | | 15,549 | |
See Notes to Financial Statements.
Schedule of Investments (continued)
WisdomTree Dynamic Currency Hedged International Equity Fund (DDWM)
June 30, 2022
| | | | | | | | |
| Investments | | Shares | | | Value | |
| | |
Kingfisher PLC | | | 25,952 | | | $ | 76,997 | |
| | |
Land Securities Group PLC | | | 17,628 | | | | 142,151 | |
| | |
Legal & General Group PLC | | | 101,508 | | | | 295,247 | |
| | |
Linde PLC* | | | 2,250 | | | | 644,402 | |
| | |
Lloyds Banking Group PLC | | | 457,769 | | | | 235,217 | |
| | |
London Stock Exchange Group PLC | | | 1,512 | | | | 140,143 | |
| | |
Mondi PLC | | | 5,060 | | | | 89,411 | |
| | |
Moneysupermarket.com Group PLC | | | 35,500 | | | | 75,060 | |
| | |
Morgan Sindall Group PLC | | | 1,770 | | | | 39,165 | |
| | |
National Grid PLC | | | 60,813 | | | | 776,948 | |
| | |
NatWest Group PLC | | | 82,827 | | | | 219,586 | |
| | |
OSB Group PLC | | | 16,882 | | | | 98,452 | |
| | |
Pan African Resources PLC | | | 22,547 | | | | 5,682 | |
| | |
Pearson PLC | | | 5,790 | | | | 52,723 | |
| | |
Pets at Home Group PLC | | | 6,945 | | | | 25,910 | |
| | |
Polar Capital Holdings PLC | | | 3,938 | | | | 24,391 | |
| | |
Reach PLC | | | 4,076 | | | | 4,965 | |
| | |
Reckitt Benckiser Group PLC | | | 6,486 | | | | 486,006 | |
| | |
Redde Northgate PLC | | | 7,273 | | | | 29,766 | |
| | |
Redrow PLC | | | 7,104 | | | | 42,257 | |
| | |
RELX PLC | | | 14,551 | | | | 393,367 | |
| | |
Rotork PLC | | | 22,803 | | | | 66,630 | |
| | |
Royal Mail PLC | | | 15,153 | | | | 49,632 | |
| | |
Sabre Insurance Group PLC(b) | | | 9,939 | | | | 24,805 | |
| | |
Sage Group PLC | | | 9,877 | | | | 76,145 | |
| | |
Savills PLC | | | 1,857 | | | | 22,823 | |
| | |
Schroders PLC | | | 4,055 | | | | 131,585 | |
| | |
Segro PLC | | | 9,826 | | | | 116,563 | |
| | |
Serco Group PLC | | | 11,745 | | | | 24,847 | |
| | |
Severn Trent PLC | | | 3,385 | | | | 111,776 | |
| | |
Shell PLC | | | 73,138 | | | | 1,895,471 | |
| | |
Smith & Nephew PLC | | | 6,270 | | | | 87,378 | |
| | |
Smiths Group PLC | | | 4,287 | | | | 72,863 | |
| | |
SSE PLC | | | 23,670 | | | | 464,536 | |
| | |
St. James’s Place PLC | | | 6,686 | | | | 89,521 | |
| | |
Standard Chartered PLC | | | 24,021 | | | | 180,460 | |
| | |
Synthomer PLC | | | 10,235 | | | | 27,967 | |
| | |
Tate & Lyle PLC | | | 15,911 | | | | 144,807 | |
| | |
Taylor Wimpey PLC | | | 95,704 | | | | 135,580 | |
| | |
TBC Bank Group PLC | | | 2,181 | | | | 33,480 | |
| | |
Tesco PLC | | | 71,735 | | | | 222,588 | |
| | |
Unilever PLC | | | 29,376 | | | | 1,327,492 | |
| | |
United Utilities Group PLC | | | 18,452 | | | | 228,572 | |
| | |
UP Global Sourcing Holdings PLC | | | 949 | | | | 1,360 | |
| | |
Vesuvius PLC | | | 6,593 | | | | 24,341 | |
| | |
Victrex PLC | | | 1,191 | | | | 25,732 | |
| | |
Vivo Energy PLC(b) | | | 57,463 | | | | 101,888 | |
| | | | | | | | |
| Total United Kingdom | | | | 22,798,379 | |
TOTAL COMMON STOCKS
(Cost: $174,617,019) | | | | | | | 165,536,119 | |
|
| RIGHTS – 0.0% | |
|
| Spain – 0.0% | |
| | |
Fomento de Construcciones y Contratas SA,
expiring 7/7/22*
| | | | | | | | |
| (Cost: $3,102) | | | 7,362 | | | | 2,640 | |
|
| INVESTMENT OF CASH COLLATERAL FOR SECURITIES LOANED – 2.7% | |
|
| United States – 2.7% | |
| |
State Street Navigator Securities Lending
Government Money Market Portfolio, 1.56%(c) | | | | | |
| (Cost: $4,556,691) | | | 4,556,691 | | | | 4,556,691 | |
| |
TOTAL INVESTMENTS IN SECURITIES – 101.2%
(Cost: $179,176,812) | | | | 170,095,450 | |
| |
Other Assets less Liabilities – (1.2)% | | | | (2,024,967 | ) |
| | | | | | | | |
| NET ASSETS – 100.0% | | | $ | 168,070,483 | |
| * | Non-income producing security. |
| (a) | Security, or portion thereof, was on loan at June 30, 2022 (See Note 2). At June 30, 2022, the total market value of the Fund’s securities on loan identified in the Schedule of Investments was $6,762,760 and the total market value of the collateral held by the Fund was $6,967,821. The total market value of the collateral includes non-cash U.S. Government securities collateral having a value of $2,411,130. |
| (b) | This security is exempt from registration under rule 144A of the Securities Act of 1933. This security may be sold in transactions that are exempt from registration, normally to qualified institutional buyers. |
| (c) | Rate shown represents annualized 7-day yield as of June 30, 2022. |
| | | | | | | | | | | | | | | | | | | | | | | | | | | | |
|
| FINANCIAL DERIVATIVE INSTRUMENTS | |
|
| FOREIGN CURRENCY CONTRACTS (OTC – OVER THE COUNTER) | |
| | | | | |
| Counterparty | | Settlement
Date | | | Amount and
Description of
Currency to
be Purchased | | | Amount and
Description of
Currency to
be Sold | | | Unrealized
Appreciation | | | Unrealized
Depreciation | |
Bank of America NA | | | 7/6/2022 | | | | 6,425,478 | | | | AUD | | | | 4,418,544 | | | | USD | | | $ | — | | | $ | (54 | ) |
Bank of America NA | | | 7/6/2022 | | | | 3,897,841 | | | | CHF | | | | 4,071,550 | | | | USD | | | | 168 | | | | — | |
Bank of America NA | | | 7/6/2022 | | | | 3,102,349 | | | | DKK | | | | 436,124 | | | | USD | | | | 34 | | | | — | |
Bank of America NA | | | 7/6/2022 | | | | 8,473,066 | | | | EUR | | | | 8,858,294 | | | | USD | | | | 429 | | | | — | |
Bank of America NA | | | 7/6/2022 | | | | 4,608,345 | | | | GBP | | | | 5,596,688 | | | | USD | | | | — | | | | (24 | ) |
Bank of America NA | | | 7/6/2022 | | | | 356,160 | | | | ILS | | | | 101,699 | | | | USD | | | | 2 | | | | — | |
Bank of America NA | | | 7/6/2022 | | | | 860,337,486 | | | | JPY | | | | 6,332,856 | | | | USD | | | | 248 | | | | — | |
Bank of America NA | | | 7/6/2022 | | | | 9,207,216 | | | | NOK | | | | 931,942 | | | | USD | | | | — | | | | (2 | ) |
Bank of America NA | | | 7/6/2022 | | | | 13,423,914 | | | | SEK | | | | 1,310,002 | | | | USD | | | | 22 | | | | — | |
Bank of America NA | | | 7/6/2022 | | | | 625,356 | | | | SGD | | | | 449,353 | | | | USD | | | | — | | | | (7 | ) |
See Notes to Financial Statements.
Schedule of Investments (continued)
WisdomTree Dynamic Currency Hedged International Equity Fund (DDWM)
June 30, 2022
| | | | | | | | | | | | | | | | | | | | | | | | | | | | |
|
| FINANCIAL DERIVATIVE INSTRUMENTS | |
|
| FOREIGN CURRENCY CONTRACTS (OTC – OVER THE COUNTER) | |
| | | | | |
| Counterparty | | Settlement
Date | | | Amount and
Description of
Currency to
be Purchased | | | Amount and
Description of
Currency to
be Sold | | | Unrealized
Appreciation | | | Unrealized
Depreciation | |
Bank of America NA | | | 7/6/2022 | | | | 4,289,097 | | | | USD | | | | 5,976,153 | | | | AUD | | | $ | 179,586 | | | $ | — | |
Bank of America NA | | | 7/6/2022 | | | | 3,952,269 | | | | USD | | | | 3,781,752 | | | | CHF | | | | 1,818 | | | | — | |
Bank of America NA | | | 7/6/2022 | | | | 423,347 | | | | USD | | | | 2,935,296 | | | | DKK | | | | 10,675 | | | | — | |
Bank of America NA | | | 7/6/2022 | | | | 8,598,779 | | | | USD | | | | 8,013,475 | | | | EUR | | | | 220,566 | | | | — | |
Bank of America NA | | | 7/6/2022 | | | | 5,432,727 | | | | USD | | | | 4,310,084 | | | | GBP | | | | 198,291 | | | | — | |
Bank of America NA | | | 7/6/2022 | | | | 98,720 | | | | USD | | | | 328,313 | | | | ILS | | | | 4,970 | | | | — | |
Bank of America NA | | | 7/6/2022 | | | | 6,147,327 | | | | USD | | | | 789,813,490 | | | | JPY | | | | 333,363 | | | | — | |
Bank of America NA | | | 7/6/2022 | | | | 904,639 | | | | USD | | | | 8,502,468 | | | | NOK | | | | 44,033 | | | | — | |
Bank of America NA | | | 7/6/2022 | | | | 1,271,624 | | | | USD | | | | 12,428,095 | | | | SEK | | | | 58,780 | | | | — | |
Bank of America NA | | | 7/6/2022 | | | | 436,189 | | | | USD | | | | 598,035 | | | | SGD | | | | 6,474 | | | | — | |
Bank of America NA | | | 8/3/2022 | | | | 440,882 | | | | USD | | | | 3,130,463 | | | | DKK | | | | — | | | | (56 | ) |
Bank of America NA | | | 8/3/2022 | | | | 8,153,025 | | | | USD | | | | 7,784,224 | | | | EUR | | | | — | | | | (572 | ) |
Bank of America NA | | | 8/3/2022 | | | | 5,324,524 | | | | USD | | | | 4,382,223 | | | | GBP | | | | — | | | | (131 | ) |
Bank of America NA | | | 8/3/2022 | | | | 100,782 | | | | USD | | | | 352,455 | | | | ILS | | | | — | | | | (10 | ) |
Bank of America NA | | | 8/3/2022 | | | | 6,077,377 | | | | USD | | | | 824,283,758 | | | | JPY | | | | — | | | | (487 | ) |
Bank of America NA | | | 8/3/2022 | | | | 784,893 | | | | USD | | | | 7,750,898 | | | | NOK | | | | — | | | | (51 | ) |
Bank of America NA | | | 8/3/2022 | | | | 1,124,611 | | | | USD | | | | 11,514,360 | | | | SEK | | | | — | | | | (152 | ) |
Bank of America NA | | | 8/3/2022 | | | | 438,197 | | | | USD | | | | 609,837 | | | | SGD | | | | — | | | | (8 | ) |
Bank of America NA | | | 8/4/2022 | | | | 4,118,236 | | | | USD | | | | 5,987,610 | | | | AUD | | | | — | | | | (77 | ) |
Bank of America NA | | | 8/4/2022 | | | | 3,931,397 | | | | USD | | | | 3,757,043 | | | | CHF | | | | — | | | | (293 | ) |
Bank of Montreal | | | 7/5/2022 | | | | 275,000 | | | | CHF | | | | 287,961 | | | | USD | | | | — | | | | (710 | ) |
Barclays Bank PLC | | | 7/6/2022 | | | | 6,425,336 | | | | AUD | | | | 4,418,543 | | | | USD | | | | — | | | | (150 | ) |
Barclays Bank PLC | | | 7/6/2022 | | | | 3,897,595 | | | | CHF | | | | 4,071,548 | | | | USD | | | | — | | | | (87 | ) |
Barclays Bank PLC | | | 7/6/2022 | | | | 3,102,168 | | | | DKK | | | | 436,123 | | | | USD | | | | 10 | | | | — | |
Barclays Bank PLC | | | 7/6/2022 | | | | 8,472,570 | | | | EUR | | | | 8,858,292 | | | | USD | | | | — | | | | (88 | ) |
Barclays Bank PLC | | | 7/6/2022 | | | | 4,608,270 | | | | GBP | | | | 5,596,689 | | | | USD | | | | — | | | | (116 | ) |
Barclays Bank PLC | | | 7/6/2022 | | | | 356,058 | | | | ILS | | | | 101,699 | | | | USD | | | | — | | | | (27 | ) |
Barclays Bank PLC | | | 7/6/2022 | | | | 860,293,020 | | | | JPY | | | | 6,332,855 | | | | USD | | | | — | | | | (78 | ) |
Barclays Bank PLC | | | 7/6/2022 | | | | 9,207,010 | | | | NOK | | | | 931,940 | | | | USD | | | | — | | | | (21 | ) |
Barclays Bank PLC | | | 7/6/2022 | | | | 13,423,379 | | | | SEK | | | | 1,310,001 | | | | USD | | | | — | | | | (29 | ) |
Barclays Bank PLC | | | 7/6/2022 | | | | 625,352 | | | | SGD | | | | 449,354 | | | | USD | | | | — | | | | (10 | ) |
Barclays Bank PLC | | | 8/3/2022 | | | | 440,880 | | | | USD | | | | 3,130,136 | | | | DKK | | | | — | | | | (12 | ) |
Barclays Bank PLC | | | 8/3/2022 | | | | 8,153,023 | | | | USD | | | | 7,783,791 | | | | EUR | | | | — | | | | (121 | ) |
Barclays Bank PLC | | | 8/3/2022 | | | | 5,324,522 | | | | USD | | | | 4,382,186 | | | | GBP | | | | — | | | | (87 | ) |
Barclays Bank PLC | | | 8/3/2022 | | | | 100,780 | | | | USD | | | | 352,498 | | | | ILS | | | | — | | | | (25 | ) |
Barclays Bank PLC | | | 8/3/2022 | | | | 6,077,378 | | | | USD | | | | 824,238,313 | | | | JPY | | | | — | | | | (150 | ) |
Barclays Bank PLC | | | 8/3/2022 | | | | 784,893 | | | | USD | | | | 7,750,741 | | | | NOK | | | | — | | | | (35 | ) |
Barclays Bank PLC | | | 8/3/2022 | | | | 1,124,610 | | | | USD | | | | 11,513,247 | | | | SEK | | | | — | | | | (45 | ) |
Barclays Bank PLC | | | 8/3/2022 | | | | 438,196 | | | | USD | | | | 609,830 | | | | SGD | | | | — | | | | (5 | ) |
Barclays Bank PLC | | | 8/4/2022 | | | | 4,118,236 | | | | USD | | | | 5,987,636 | | | | AUD | | | | — | | | | (94 | ) |
Barclays Bank PLC | | | 8/4/2022 | | | | 3,931,396 | | | | USD | | | | 3,756,866 | | | | CHF | | | | — | | | | (108 | ) |
Citibank NA | | | 7/6/2022 | | | | 328,561 | | | | AUD | | | | 228,143 | | | | USD | | | | — | | | | (2,207 | ) |
Citibank NA | | | 7/6/2022 | | | | 200,640 | | | | CHF | | | | 210,227 | | | | USD | | | | — | | | | (637 | ) |
Citibank NA | | | 7/6/2022 | | | | 158,814 | | | | DKK | | | | 22,518 | | | | USD | | | | — | | | | (190 | ) |
Citibank NA | | | 7/6/2022 | | | | 433,537 | | | | EUR | | | | 457,382 | | | | USD | | | | — | | | | (4,113 | ) |
Citibank NA | | | 7/6/2022 | | | | 235,099 | | | | GBP | | | | 288,975 | | | | USD | | | | — | | | | (3,456 | ) |
Citibank NA | | | 7/6/2022 | | | | 17,911 | | | | ILS | | | | 5,251 | | | | USD | | | | — | | | | (137 | ) |
Citibank NA | | | 7/6/2022 | | | | 44,194,871 | | | | JPY | | | | 326,986 | | | | USD | | | | — | | | | (1,659 | ) |
Citibank NA | | | 7/6/2022 | | | | 474,928 | | | | NOK | | | | 48,119 | | | | USD | | | | — | | | | (48 | ) |
Citibank NA | | | 7/6/2022 | | | | 684,875 | | | | SEK | | | | 67,640 | | | | USD | | | | — | | | | (804 | ) |
Citibank NA | | | 7/6/2022 | | | | 32,184 | | | | SGD | | | | 23,202 | | | | USD | | | | — | | | | (77 | ) |
Goldman Sachs | | | 7/5/2022 | | | | 155,000 | | | | ILS | | | | 44,378 | | | | USD | | | | — | | | | (119 | ) |
Goldman Sachs | | | 7/6/2022 | | | | 4,289,097 | | | | USD | | | | 5,976,228 | | | | AUD | | | | 179,534 | | | | — | |
Goldman Sachs | | | 7/6/2022 | | | | 3,952,267 | | | | USD | | | | 3,781,494 | | | | CHF | | | | 2,087 | | | | — | |
Goldman Sachs | | | 7/6/2022 | | | | 423,346 | | | | USD | | | | 2,935,219 | | | | DKK | | | | 10,685 | | | | — | |
See Notes to Financial Statements.
Schedule of Investments (continued)
WisdomTree Dynamic Currency Hedged International Equity Fund (DDWM)
June 30, 2022
| | | | | | | | | | | | | | | | | | | | | | | | | | | | |
|
| FINANCIAL DERIVATIVE INSTRUMENTS | |
|
| FOREIGN CURRENCY CONTRACTS (OTC – OVER THE COUNTER) | |
| | | | | |
| Counterparty | | Settlement
Date | | | Amount and
Description of
Currency to
be Purchased | | | Amount and
Description of
Currency to
be Sold | | | Unrealized
Appreciation | | | Unrealized
Depreciation | |
Goldman Sachs | | | 7/6/2022 | | | | 8,598,779 | | | | USD | | | | 8,013,251 | | | | EUR | | | $ | 220,801 | | | $ | — | |
Goldman Sachs | | | 7/6/2022 | | | | 5,432,725 | | | | USD | | | | 4,309,983 | | | | GBP | | | | 198,411 | | | | — | |
Goldman Sachs | | | 7/6/2022 | | | | 98,719 | | | | USD | | | | 328,282 | | | | ILS | | | | 4,978 | | | | — | |
Goldman Sachs | | | 7/6/2022 | | | | 6,147,328 | | | | USD | | | | 789,803,783 | | | | JPY | | | | 333,435 | | | | — | |
Goldman Sachs | | | 7/6/2022 | | | | 904,639 | | | | USD | | | | 8,502,380 | | | | NOK | | | | 44,042 | | | | — | |
Goldman Sachs | | | 7/6/2022 | | | | 1,271,623 | | | | USD | | | | 12,427,385 | | | | SEK | | | | 58,849 | | | | — | |
Goldman Sachs | | | 7/6/2022 | | | | 436,189 | | | | USD | | | | 598,056 | | | | SGD | | | | 6,459 | | | | — | |
JP Morgan Chase Bank NA | | | 7/6/2022 | | | | 6,425,431 | | | | AUD | | | | 4,418,544 | | | | USD | | | | — | | | | (86 | ) |
JP Morgan Chase Bank NA | | | 7/6/2022 | | | | 3,897,634 | | | | CHF | | | | 4,071,550 | | | | USD | | | | — | | | | (49 | ) |
JP Morgan Chase Bank NA | | | 7/6/2022 | | | | 3,102,126 | | | | DKK | | | | 436,124 | | | | USD | | | | 3 | | | | — | |
JP Morgan Chase Bank NA | | | 7/6/2022 | | | | 8,472,580 | | | | EUR | | | | 8,858,294 | | | | USD | | | | — | | | | (80 | ) |
JP Morgan Chase Bank NA | | | 7/6/2022 | | | | 4,608,334 | | | | GBP | | | | 5,596,688 | | | | USD | | | | — | | | | (38 | ) |
JP Morgan Chase Bank NA | | | 7/6/2022 | | | | 356,153 | | | | ILS | | | | 101,699 | | | | USD | | | | 0 | ^ | | | — | |
JP Morgan Chase Bank NA | | | 7/6/2022 | | | | 860,292,522 | | | | JPY | | | | 6,332,856 | | | | USD | | | | — | | | | (83 | ) |
JP Morgan Chase Bank NA | | | 7/6/2022 | | | | 9,207,147 | | | | NOK | | | | 931,942 | | | | USD | | | | — | | | | (9 | ) |
JP Morgan Chase Bank NA | | | 7/6/2022 | | | | 13,423,407 | | | | SEK | | | | 1,310,002 | | | | USD | | | | — | | | | (27 | ) |
JP Morgan Chase Bank NA | | | 7/6/2022 | | | | 625,357 | | | | SGD | | | | 449,353 | | | | USD | | | | — | | | | (6 | ) |
JP Morgan Chase Bank NA | | | 7/6/2022 | | | | 4,289,097 | | | | USD | | | | 5,976,028 | | | | AUD | | | | 179,671 | | | | — | |
JP Morgan Chase Bank NA | | | 7/6/2022 | | | | 745,930 | | | | USD | | | | 1,084,596 | | | | AUD | | | | 106 | | | | — | |
JP Morgan Chase Bank NA | | | 7/6/2022 | | | | 3,952,269 | | | | USD | | | | 3,781,511 | | | | CHF | | | | 2,070 | | | | — | |
JP Morgan Chase Bank NA | | | 7/6/2022 | | | | 687,351 | | | | USD | | | | 654,737 | | | | CHF | | | | 3,407 | | | | — | |
JP Morgan Chase Bank NA | | | 7/6/2022 | | | | 423,347 | | | | USD | | | | 2,935,198 | | | | DKK | | | | 10,689 | | | | — | |
JP Morgan Chase Bank NA | | | 7/6/2022 | | | | 73,626 | | | | USD | | | | 522,591 | | | | DKK | | | | 155 | | | | — | |
JP Morgan Chase Bank NA | | | 7/6/2022 | | | | 8,598,779 | | | | USD | | | | 8,013,146 | | | | EUR | | | | 220,910 | | | | — | |
JP Morgan Chase Bank NA | | | 7/6/2022 | | | | 1,495,440 | | | | USD | | | | 1,426,726 | | | | EUR | | | | 3,776 | | | | — | |
JP Morgan Chase Bank NA | | | 7/6/2022 | | | | 5,432,727 | | | | USD | | | | 4,310,043 | | | | GBP | | | | 198,341 | | | | — | |
JP Morgan Chase Bank NA | | | 7/6/2022 | | | | 944,822 | | | | USD | | | | 779,402 | | | | GBP | | | | — | | | | (1,733 | ) |
JP Morgan Chase Bank NA | | | 7/6/2022 | | | | 98,720 | | | | USD | | | | 328,325 | | | | ILS | | | | 4,967 | | | | — | |
JP Morgan Chase Bank NA | | | 7/6/2022 | | | | 17,168 | | | | USD | | | | 59,379 | | | | ILS | | | | 212 | | | | — | |
JP Morgan Chase Bank NA | | | 7/6/2022 | | | | 6,147,327 | | | | USD | | | | 789,786,442 | | | | JPY | | | | 333,562 | | | | — | |
JP Morgan Chase Bank NA | | | 7/6/2022 | | | | 1,069,100 | | | | USD | | | | 146,252,238 | | | | JPY | | | | — | | | | (7,490 | ) |
JP Morgan Chase Bank NA | | | 7/6/2022 | | | | 904,639 | | | | USD | | | | 8,502,280 | | | | NOK | | | | 44,052 | | | | — | |
JP Morgan Chase Bank NA | | | 7/6/2022 | | | | 157,329 | | | | USD | | | | 1,551,695 | | | | NOK | | | | 269 | | | | — | |
JP Morgan Chase Bank NA | | | 7/6/2022 | | | | 1,271,624 | | | | USD | | | | 12,427,427 | | | | SEK | | | | 58,846 | | | | — | |
JP Morgan Chase Bank NA | | | 7/6/2022 | | | | 221,152 | | | | USD | | | | 2,255,502 | | | | SEK | | | | 1,040 | | | | — | |
JP Morgan Chase Bank NA | | | 7/6/2022 | | | | 436,189 | | | | USD | | | | 598,033 | | | | SGD | | | | 6,475 | | | | — | |
JP Morgan Chase Bank NA | | | 7/6/2022 | | | | 75,859 | | | | USD | | | | 105,586 | | | | SGD | | | | — | | | | (10 | ) |
JP Morgan Chase Bank NA | | | 8/3/2022 | | | | 440,882 | | | | USD | | | | 3,130,215 | | | | DKK | | | | — | | | | (21 | ) |
JP Morgan Chase Bank NA | | | 8/3/2022 | | | | 8,153,025 | | | | USD | | | | 7,783,800 | | | | EUR | | | | — | | | | (129 | ) |
JP Morgan Chase Bank NA | | | 8/3/2022 | | | | 5,324,524 | | | | USD | | | | 4,382,162 | | | | GBP | | | | — | | | | (56 | ) |
JP Morgan Chase Bank NA | | | 8/3/2022 | | | | 100,782 | | | | USD | | | | 352,441 | | | | ILS | | | | — | | | | (6 | ) |
JP Morgan Chase Bank NA | | | 8/3/2022 | | | | 6,077,377 | | | | USD | | | | 824,236,962 | | | | JPY | | | | — | | | | (141 | ) |
JP Morgan Chase Bank NA | | | 8/3/2022 | | | | 784,893 | | | | USD | | | | 7,750,613 | | | | NOK | | | | — | | | | (22 | ) |
JP Morgan Chase Bank NA | | | 8/3/2022 | | | | 1,124,611 | | | | USD | | | | 11,513,347 | | | | SEK | | | | — | | | | (54 | ) |
JP Morgan Chase Bank NA | | | 8/3/2022 | | | | 438,197 | | | | USD | | | | 609,824 | | | | SGD | | | | 1 | | | | — | |
JP Morgan Chase Bank NA | | | 8/4/2022 | | | | 4,118,236 | | | | USD | | | | 5,987,584 | | | | AUD | | | | — | | | | (59 | ) |
JP Morgan Chase Bank NA | | | 8/4/2022 | | | | 3,931,397 | | | | USD | | | | 3,756,839 | | | | CHF | | | | — | | | | (80 | ) |
UBS AG | | | 7/5/2022 | | | | 250,000 | | | | EUR | | | | 262,048 | | | | USD | | | | — | | | | (686 | ) |
UBS AG | | | 7/6/2022 | | | | 6,425,412 | | | | AUD | | | | 4,418,544 | | | | USD | | | | — | | | | (99 | ) |
UBS AG | | | 7/6/2022 | | | | 3,897,617 | | | | CHF | | | | 4,071,550 | | | | USD | | | | — | | | | (66 | ) |
UBS AG | | | 7/6/2022 | | | | 3,102,109 | | | | DKK | | | | 436,124 | | | | USD | | | | 0 | ^ | | | — | |
UBS AG | | | 7/6/2022 | | | | 8,472,539 | | | | EUR | | | | 8,858,294 | | | | USD | | | | — | | | | (122 | ) |
UBS AG | | | 7/6/2022 | | | | 4,608,311 | | | | GBP | | | | 5,596,688 | | | | USD | | | | — | | | | (66 | ) |
UBS AG | | | 7/6/2022 | | | | 356,151 | | | | ILS | | | | 101,699 | | | | USD | | | | 0 | ^ | | | — | |
UBS AG | | | 7/6/2022 | | | | 860,290,623 | | | | JPY | | | | 6,332,856 | | | | USD | | | | — | | | | (97 | ) |
See Notes to Financial Statements.
Schedule of Investments (concluded)
WisdomTree Dynamic Currency Hedged International Equity Fund (DDWM)
June 30, 2022
| | | | | | | | | | | | | | | | | | | | | | | | | | | | |
|
| FINANCIAL DERIVATIVE INSTRUMENTS | |
|
| FOREIGN CURRENCY CONTRACTS (OTC – OVER THE COUNTER) | |
| | | | | |
| Counterparty | | Settlement
Date | | | Amount and
Description of
Currency to
be Purchased | | | Amount and
Description of
Currency to
be Sold | | | Unrealized
Appreciation | | | Unrealized
Depreciation | |
UBS AG | | | 7/6/2022 | | | | 9,207,102 | | | | NOK | | | | 931,942 | | | | USD | | | $ | — | | | $ | (14 | ) |
UBS AG | | | 7/6/2022 | | | | 13,423,326 | | | | SEK | | | | 1,310,002 | | | | USD | | | | — | | | | (35 | ) |
UBS AG | | | 7/6/2022 | | | | 625,354 | | | | SGD | | | | 449,353 | | | | USD | | | | — | | | | (8 | ) |
UBS AG | | | 7/6/2022 | | | | 4,289,097 | | | | USD | | | | 5,976,111 | | | | AUD | | | | 179,614 | | | | — | |
UBS AG | | | 7/6/2022 | | | | 3,952,269 | | | | USD | | | | 3,781,582 | | | | CHF | | | | 1,996 | | | | — | |
UBS AG | | | 7/6/2022 | | | | 423,347 | | | | USD | | | | 2,935,141 | | | | DKK | | | | 10,696 | | | | — | |
UBS AG | | | 7/6/2022 | | | | 8,598,779 | | | | USD | | | | 8,013,072 | | | | EUR | | | | 220,988 | | | | — | |
UBS AG | | | 7/6/2022 | | | | 5,432,727 | | | | USD | | | | 4,310,091 | | | | GBP | | | | 198,283 | | | | — | |
UBS AG | | | 7/6/2022 | | | | 98,720 | | �� | | USD | | | | 328,305 | | | | ILS | | | | 4,973 | | | | — | |
UBS AG | | | 7/6/2022 | | | | 6,147,327 | | | | USD | | | | 789,785,827 | | | | JPY | | | | 333,567 | | | | — | |
UBS AG | | | 7/6/2022 | | | | 904,639 | | | | USD | | | | 8,502,069 | | | | NOK | | | | 44,073 | | | | — | |
UBS AG | | | 7/6/2022 | | | | 1,271,624 | | | | USD | | | | 12,427,775 | | | | SEK | | | | 58,812 | | | | — | |
UBS AG | | | 7/6/2022 | | | | 436,189 | | | | USD | | | | 598,034 | | | | SGD | | | | 6,475 | | | | — | |
UBS AG | | | 8/3/2022 | | | | 440,882 | | | | USD | | | | 3,130,100 | | | | DKK | | | | — | | | | (5 | ) |
UBS AG | | | 8/3/2022 | | | | 8,153,025 | | | | USD | | | | 7,783,748 | | | | EUR | | | | — | | | | (74 | ) |
UBS AG | | | 8/3/2022 | | | | 5,324,524 | | | | USD | | | | 4,382,216 | | | | GBP | | | | — | | | | (122 | ) |
UBS AG | | | 8/3/2022 | | | | 100,782 | | | | USD | | | | 352,429 | | | | ILS | | | | — | | | | (3 | ) |
UBS AG | | | 8/3/2022 | | | | 6,077,377 | | | | USD | | | | 824,232,708 | | | | JPY | | | | — | | | | (110 | ) |
UBS AG | | | 8/3/2022 | | | | 784,893 | | | | USD | | | | 7,750,517 | | | | NOK | | | | — | | | | (12 | ) |
UBS AG | | | 8/3/2022 | | | | 1,124,611 | | | | USD | | | | 11,513,821 | | | | SEK | | | | — | | | | (100 | ) |
UBS AG | | | 8/3/2022 | | | | 438,197 | | | | USD | | | | 609,849 | | | | SGD | | | | — | | | | (17 | ) |
UBS AG | | | 8/4/2022 | | | | 4,118,236 | | | | USD | | | | 5,987,575 | | | | AUD | | | | — | | | | (53 | ) |
UBS AG | | | 8/4/2022 | | | | 3,931,397 | | | | USD | | | | 3,756,863 | | | | CHF | | | | — | | | | (104 | ) |
| | | | | | | | | | | | | | | | | | | | | | | $ | 4,246,779 | | | $ | (29,341 | ) |
| ^ | Amount represents less than $1. |
The following is a summary of the fair valuations according to the inputs used as of June 30, 2022 in valuing the Fund’s investments (See Note 2 – Fair Value Measurement):
| | | | | | | | | | | | | | | | |
| | | | |
| | | Quoted
Prices in
Active
Markets
(Level 1) | | | Other
Significant
Observable
Inputs
(Level 2) | | | Significant
Unobservable
Inputs
(Level 3) | | | Total | |
Assets: | | | | | | | | | | | | | | | | |
Investments in Securities | | | | | | | | | | | | | | | | |
Common Stocks | | | | | | | | | | | | | | | | |
Sweden | | $ | 4,145,372 | | | $ | 267,734 | | | $ | — | | | $ | 4,413,106 | |
Other | | | 161,123,013 | | | | — | | | | — | | | | 161,123,013 | |
Rights | | | 2,640 | | | | — | | | | — | | | | 2,640 | |
Investment of Cash Collateral for Securities Loaned | | | — | | | | 4,556,691 | | | | — | | | | 4,556,691 | |
Total Investments in Securities | | $ | 165,271,025 | | | $ | 4,824,425 | | | $ | — | | | $ | 170,095,450 | |
Financial Derivative Instruments | | | | | | | | | | | | | | | | |
Foreign Currency Contracts1 | | $ | — | | | $ | 4,246,779 | | | $ | — | | | $ | 4,246,779 | |
Liabilities: | | | | | | | | | | | | | | | | |
Financial Derivative Instruments | | | | | | | | | | | | | | | | |
Foreign Currency Contracts1 | | $ | — | | | $ | (29,341 | ) | | $ | — | | | $ | (29,341 | ) |
Total – Net | | $ | 165,271,025 | | | $ | 9,041,863 | | | $ | — | | | $ | 174,312,888 | |
| 1 | Amount shown represents the unrealized appreciation (depreciation) on the financial instrument. |
See Notes to Financial Statements.
Schedule of Investments
WisdomTree Dynamic Currency Hedged International SmallCap Equity Fund (DDLS)
June 30, 2022
| | | | | | | | |
| Investments | | Shares | | | Value | |
|
| COMMON STOCKS – 98.5% | |
|
| Australia – 12.2% | |
| | |
Accent Group Ltd. | | | 61,786 | | | $ | 52,684 | |
| | |
Adairs Ltd.(a) | | | 37,881 | | | | 49,753 | |
| | |
Adbri Ltd. | | | 58,498 | | | | 97,347 | |
| | |
ARB Corp. Ltd. | | | 3,707 | | | | 71,987 | |
| | |
AUB Group Ltd.(a) | | | 6,092 | | | | 74,064 | |
| | |
Austal Ltd. | | | 35,971 | | | | 44,524 | |
| | |
Australian Finance Group Ltd. | | | 47,033 | | | | 48,837 | |
| | |
Autosports Group Ltd.(a) | | | 24,117 | | | | 25,208 | |
| | |
Baby Bunting Group Ltd.(a) | | | 12,060 | | | | 33,836 | |
| | |
Bapcor Ltd. | | | 18,924 | | | | 79,120 | |
| | |
Beach Energy Ltd. | | | 68,378 | | | | 81,110 | |
| | |
Beacon Lighting Group Ltd. | | | 34,341 | | | | 42,152 | |
| | |
Bega Cheese Ltd. | | | 12,814 | | | | 33,660 | |
| | |
Bravura Solutions Ltd. | | | 28,999 | | | | 28,217 | |
| | |
Breville Group Ltd.(a) | | | 3,227 | | | | 39,921 | |
| | |
Brickworks Ltd. | | | 8,541 | | | | 108,889 | |
| | |
Capitol Health Ltd. | | | 149,878 | | | | 28,858 | |
| | |
Cardno Ltd. | | | 8,903 | | | | 9,857 | |
| | |
Centuria Capital Group | | | 79,645 | | | | 99,130 | |
| | |
Codan Ltd.(a) | | | 10,120 | | | | 48,435 | |
| | |
Collins Foods Ltd. | | | 3,842 | | | | 26,182 | |
| | |
Costa Group Holdings Ltd. | | | 31,301 | | | | 61,559 | |
| | |
Credit Corp. Group Ltd.(a) | | | 3,218 | | | | 44,877 | |
| | |
Cromwell Property Group(a) | | | 438,556 | | | | 227,688 | |
| | |
CSR Ltd. | | | 60,939 | | | | 170,133 | |
| | |
Dicker Data Ltd.(a) | | | 9,917 | | | | 75,286 | |
| | |
Domain Holdings Australia Ltd. | | | 15,978 | | | | 33,072 | |
| | |
Dusk Group Ltd. | | | 27,020 | | | | 31,029 | |
| | |
Eagers Automotive Ltd.(a) | | | 16,360 | | | | 109,350 | |
| | |
Elders Ltd. | | | 14,878 | | | | 128,806 | |
| | |
Genworth Mortgage Insurance Australia Ltd. | | | 22,432 | | | | 35,478 | |
| | |
GrainCorp Ltd., Class A | | | 13,440 | | | | 87,892 | |
| | |
Growthpoint Properties Australia Ltd.(a) | | | 115,725 | | | | 271,362 | |
| | |
GUD Holdings Ltd. | | | 10,780 | | | | 59,229 | |
| | |
GWA Group Ltd. | | | 30,292 | | | | 40,931 | |
| | |
Hansen Technologies Ltd. | | | 9,200 | | | | 32,897 | |
| | |
Healius Ltd. | | | 34,506 | | | | 87,082 | |
| | |
Home Consortium Ltd. | | | 11,237 | | | | 34,849 | |
| | |
Iluka Resources Ltd. | | | 15,023 | | | | 97,521 | |
| | |
Infomedia Ltd.(a) | | | 37,682 | | | | 43,273 | |
| | |
Ingenia Communities Group | | | 17,629 | | | | 48,248 | |
| | |
Inghams Group Ltd.(a) | | | 50,287 | | | | 89,216 | |
| | |
Insignia Financial Ltd. | | | 54,939 | | | | 101,625 | |
| | |
Integral Diagnostics Ltd. | | | 12,410 | | | | 25,857 | |
| | |
InvoCare Ltd.(a) | | | 4,127 | | | | 29,685 | |
| | |
IPH Ltd. | | | 16,598 | | | | 93,135 | |
| | |
IRESS Ltd. | | | 15,865 | | | | 125,569 | |
| | |
IVE Group Ltd. | | | 31,470 | | | | 37,221 | |
| | |
Johns Lyng Group Ltd. | | | 7,541 | | | | 29,765 | |
| | |
Jumbo Interactive Ltd. | | | 3,713 | | | | 36,307 | |
| | |
Kelsian Group Ltd.(a) | | | 10,593 | | | | 41,520 | |
| | |
Lovisa Holdings Ltd. | | | 4,876 | | | | 46,305 | |
| | |
MA Financial Group Ltd.(a) | | | 8,531 | | | | 26,399 | |
| | |
McMillan Shakespeare Ltd. | | | 11,804 | | | | 79,060 | |
| | |
Metcash Ltd.(a) | | | 130,375 | | | | 380,126 | |
| | |
Monadelphous Group Ltd.(a) | | | 8,683 | | | | 59,410 | |
| | |
Monash IVF Group Ltd. | | | 78,109 | | | | 50,489 | |
| | |
Money3 Corp. Ltd. | | | 22,213 | | | | 29,939 | |
| | |
MyState Ltd. | | | 21,008 | | | | 58,940 | |
| | |
Navigator Global Investments Ltd.(a) | | | 42,592 | | | | 36,464 | |
| | |
Netwealth Group Ltd. | | | 6,285 | | | | 52,554 | |
| | |
New Hope Corp. Ltd.(a) | | | 94,265 | | | | 224,282 | |
| | |
NIB Holdings Ltd. | | | 52,846 | | | | 268,186 | |
| | |
Nick Scali Ltd.(a) | | | 8,646 | | | | 49,109 | |
| | |
NRW Holdings Ltd. | | | 49,196 | | | | 57,341 | |
| | |
Omni Bridgeway Ltd.* | | | 8,035 | | | | 19,615 | |
| | |
Orora Ltd. | | | 122,130 | | | | 306,537 | |
| | |
Pact Group Holdings Ltd. | | | 31,865 | | | | 39,551 | |
| | |
Pendal Group Ltd.(a) | | | 68,998 | | | | 209,713 | |
| | |
Perpetual Ltd. | | | 5,634 | | | | 111,887 | |
| | |
Pinnacle Investment Management Group Ltd.(a) | | | 11,999 | | | | 58,005 | |
| | |
Platinum Asset Management Ltd.(a) | | | 98,923 | | | | 118,362 | |
| | |
PSC Insurance Group Ltd. | | | 23,167 | | | | 65,953 | |
| | |
Ramelius Resources Ltd. | | | 42,993 | | | | 25,721 | |
| | |
Regis Healthcare Ltd. | | | 31,964 | | | | 40,663 | |
| | |
Reliance Worldwide Corp. Ltd. | | | 65,022 | | | | 180,638 | |
| | |
Resimac Group Ltd.(a) | | | 55,266 | | | | 43,704 | |
| | |
Sandfire Resources Ltd. | | | 46,413 | | | | 142,026 | |
| | |
Sims Ltd. | | | 19,025 | | | | 179,362 | |
| | |
SmartGroup Corp. Ltd. | | | 19,230 | | | | 80,796 | |
| | |
Super Retail Group Ltd.(a) | | | 32,600 | | | | 190,324 | |
| | |
Tassal Group Ltd. | | | 21,659 | | | | 71,341 | |
| | |
Technology One Ltd. | | | 12,077 | | | | 88,944 | |
| | |
United Malt Group Ltd. | | | 13,344 | | | | 30,005 | |
| | |
Virtus Health Ltd. | | | 15,105 | | | | 82,057 | |
| | |
Viva Energy Group Ltd.(b) | | | 62,985 | | | | 125,171 | |
| | | | | | | | |
| Total Australia | | | | 7,083,212 | |
|
| Austria – 1.2% | |
| | |
AT&S Austria Technologie & Systemtechnik AG | | | 1,130 | | | | 60,249 | |
| | |
Kontron AG | | | 2,023 | | | | 29,736 | |
| | |
Oesterreichische Post AG(a) | | | 9,727 | | | | 276,599 | |
| | |
POLYTEC Holding AG(a) | | | 5,943 | | | | 37,279 | |
| | |
S IMMO AG | | | 4,105 | | | | 97,633 | |
| | |
Semperit AG Holding(a) | | | 3,755 | | | | 72,468 | |
| | |
UNIQA Insurance Group AG | | | 13,116 | | | | 92,420 | |
| | |
Zumtobel Group AG | | | 3,846 | | | | 28,146 | |
| | | | | | | | |
| Total Austria | | | | 694,530 | |
|
| Belgium – 1.4% | |
| | |
Befimmo SA | | | 3,859 | | | | 190,423 | |
| | |
Bekaert SA | | | 5,237 | | | | 170,054 | |
| | |
Deceuninck NV(a) | | | 6,660 | | | | 15,387 | |
| | |
Econocom Group SA/NV | | | 23,567 | | | | 82,291 | |
| | |
Fagron | | | 2,057 | | | | 33,204 | |
| | |
Intervest Offices & Warehouses NV | | | 5,144 | | | | 134,445 | |
| | |
Ion Beam Applications | | | 1,661 | | | | 27,020 | |
See Notes to Financial Statements.
Schedule of Investments (continued)
WisdomTree Dynamic Currency Hedged International SmallCap Equity Fund (DDLS)
June 30, 2022
| | | | | | | | |
| Investments | | Shares | | | Value | |
| | |
Recticel SA | | | 2,193 | | | $ | 32,648 | |
| | |
TINC Comm VA | | | 4,904 | | | | 67,470 | |
| | |
Xior Student Housing NV | | | 1,839 | | | | 79,883 | |
| | | | | | | | |
| Total Belgium | | | | 832,825 | |
|
| China – 4.1% | |
| | |
Beijing Tong Ren Tang Chinese Medicine Co. Ltd. | | | 44,300 | | | | 71,472 | |
| | |
China Nonferrous Mining Corp. Ltd.(a) | | | 406,000 | | | | 187,298 | |
| | |
China South City Holdings Ltd.(a) | | | 870,000 | | | | 73,175 | |
| | |
China Traditional Chinese Medicine Holdings Co. Ltd. | | | 202,000 | | | | 124,851 | |
| | |
CITIC Telecom International Holdings Ltd. | | | 887,678 | | | | 294,122 | |
| | |
CPMC Holdings Ltd. | | | 157,900 | | | | 68,417 | |
| | |
Genertec Universal Medical Group Co. Ltd.(b) | | | 195,800 | | | | 119,522 | |
| | |
Poly Property Group Co. Ltd. | | | 515,000 | | | | 124,042 | |
| | |
Shanghai Industrial Holdings Ltd. | | | 185,000 | | | | 267,352 | |
| | |
Shoucheng Holdings Ltd. | | | 682,000 | | | | 102,557 | |
| | |
Shougang Fushan Resources Group Ltd. | | | 863,885 | | | | 358,899 | |
| | |
Simcere Pharmaceutical Group Ltd.(b) | | | 126,000 | | | | 138,092 | |
| | |
Sino-Ocean Group Holding Ltd. | | | 1,438,500 | | | | 243,815 | |
| | |
Yanlord Land Group Ltd. | | | 249,609 | | | | 190,117 | |
| | |
Zensun Enterprises Ltd.*(a) | | | 90,000 | | | | 35,555 | |
| | | | | | | | |
| Total China | | | | 2,399,286 | |
|
| Denmark – 1.8% | |
| | |
Alm Brand A/S | | | 148,109 | | | | 216,749 | |
| | |
Cementir Holding NV | | | 8,752 | | | | 56,637 | |
| | |
Chemometec A/S | | | 330 | | | | 35,119 | |
| | |
D/S Norden A/S | | | 5,034 | | | | 174,090 | |
| | |
FLSmidth & Co. A/S | | | 993 | | | | 24,353 | |
| | |
Huscompagniet A/S | | | 1,867 | | | | 16,535 | |
| | |
Matas A/S | | | 2,293 | | | | 23,870 | |
| | |
Per Aarsleff Holding A/S | | | 956 | | | | 28,492 | |
| | |
Scandinavian Tobacco Group A/S, Class A(b) | | | 14,632 | | | | 285,509 | |
| | |
Spar Nord Bank A/S | | | 7,276 | | | | 76,817 | |
| | |
Sydbank A/S | | | 3,537 | | | | 107,999 | |
| | | | | | | | |
| Total Denmark | | | | 1,046,170 | |
|
| Finland – 2.0% | |
| | |
Aktia Bank Oyj | | | 10,202 | | | | 97,484 | |
| | |
Anora Group Oyj | | | 11,496 | | | | 93,023 | |
| | |
Cargotec Oyj, Class B | | | 3,401 | | | | 89,174 | |
| | |
Caverion Oyj | | | 6,854 | | | | 31,636 | |
| | |
Fiskars Oyj Abp | | | 4,767 | | | | 89,407 | |
| | |
Kemira Oyj | | | 13,228 | | | | 161,249 | |
| | |
Lassila & Tikanoja Oyj(a) | | | 3,660 | | | | 41,095 | |
| | |
Musti Group Oyj* | | | 1,386 | | | | 24,691 | |
| | |
Oma Saastopankki Oyj | | | 2,060 | | | | 44,365 | |
| | |
Raisio Oyj, Class V | | | 11,726 | | | | 23,782 | |
| | |
Sanoma Oyj | | | 6,508 | | | | 90,490 | |
| | |
Taaleri Oyj | | | 4,383 | | | | 44,585 | |
| | |
Terveystalo Oyj(b) | | | 6,355 | | | | 67,900 | |
| | |
Tokmanni Group Corp. | | | 7,792 | | | | 91,481 | |
| | |
Uponor Oyj | | | 5,742 | | | | 79,059 | |
| | |
Verkkokauppa.com Oyj(a) | | | 6,967 | | | | 29,572 | |
| | |
YIT Oyj | | | 13,863 | | | $ | 46,088 | |
| | | | | | | | |
| Total Finland | | | | 1,145,081 | |
|
| France – 3.2% | |
| | |
ABC Arbitrage | | | 5,295 | | | | 38,860 | |
| | |
AKWEL | | | 1,788 | | | | 29,946 | |
| | |
Albioma SA | | | 1,822 | | | | 95,012 | |
| | |
Chargeurs SA(a) | | | 3,644 | | | | 56,268 | |
| | |
Coface SA | | | 14,387 | | | | 149,882 | |
| | |
Fnac Darty SA | | | 1,164 | | | | 49,212 | |
| | |
IPSOS(a) | | | 3,393 | | | | 160,689 | |
| | |
Kaufman & Broad SA | | | 2,635 | | | | 71,624 | |
| | |
Maisons du Monde SA(a)(b) | | | 1,430 | | | | 14,202 | |
| | |
Mersen SA | | | 1,442 | | | | 42,889 | |
| | |
Metropole Television SA | | | 21,189 | | | | 312,122 | |
| | |
Nexity SA | | | 9,332 | | | | 248,782 | |
| | |
Quadient SA | | | 2,004 | | | | 34,108 | |
| | |
Societe BIC SA | | | 5,405 | | | | 294,964 | |
| | |
Television Francaise 1(a) | | | 23,419 | | | | 165,385 | |
| | |
Vicat SA | | | 3,831 | | | | 105,335 | |
| | | | | | | | |
| Total France | | | | 1,869,280 | |
|
| Germany – 2.4% | |
| | |
7C Solarparken AG | | | 11,334 | | | | 55,217 | |
| | |
Aareal Bank AG* | | | 2,045 | | | | 61,102 | |
| | |
AIXTRON SE | | | 1,738 | | | | 43,935 | |
| | |
AURELIUS Equity Opportunities SE & Co. KGaA | | | 2,566 | | | | 54,457 | |
| | |
Bilfinger SE | | | 6,193 | | | | 180,508 | |
| | |
CANCOM SE | | | 1,126 | | | | 37,787 | |
| | |
CropEnergies AG | | | 6,084 | | | | 80,779 | |
| | |
Deutsche Pfandbriefbank AG(b) | | | 7,462 | | | | 66,934 | |
| | |
DIC Asset AG | | | 7,458 | | | | 82,180 | |
| | |
Eckert & Ziegler Strahlen – und Medizintechnik AG | | | 375 | | | | 14,278 | |
| | |
Encavis AG | | | 5,647 | | | | 103,166 | |
| | |
GRENKE AG | | | 790 | | | | 19,293 | |
| | |
Hamborner REIT AG | | | 12,052 | | | | 107,602 | |
| | |
Hamburger Hafen und Logistik AG | | | 3,622 | | | | 51,119 | |
| | |
Hensoldt AG | | | 2,277 | | | | 57,370 | |
| | |
Hornbach Holding AG & Co. KGaA | | | 712 | | | | 58,358 | |
| | |
Instone Real Estate Group SE(b) | | | 1,729 | | | | 20,462 | |
| | |
Jenoptik AG | | | 1,108 | | | | 24,650 | |
| | |
JOST Werke AG(b) | | | 702 | | | | 26,127 | |
| | |
MLP SE | | | 6,333 | | | | 37,871 | |
| | |
Mutares SE & Co. KGaA | | | 3,180 | | | | 54,788 | |
| | |
NORMA Group SE | | | 1,819 | | | | 40,506 | |
| | |
PATRIZIA AG | | | 2,689 | | | | 31,711 | |
| | |
Wacker Neuson SE | | | 3,360 | | | | 57,925 | |
| | |
Wuestenrot & Wuerttembergische AG | | | 2,007 | | | | 35,418 | |
| | | | | | | | |
| Total Germany | | | | 1,403,543 | |
|
| Hong Kong – 2.1% | |
| | |
Dah Sing Banking Group Ltd. | | | 119,200 | | | | 96,460 | |
| | |
Dah Sing Financial Holdings Ltd. | | | 31,200 | | | | 88,865 | |
| | |
Fortune Real Estate Investment Trust | | | 269,000 | | | | 222,825 | |
| | |
Hutchison Port Holdings Trust | | | 1,597,800 | | | | 375,483 | |
| | |
Kowloon Development Co. Ltd. | | | 114,000 | | | | 140,921 | |
See Notes to Financial Statements.
Schedule of Investments (continued)
WisdomTree Dynamic Currency Hedged International SmallCap Equity Fund (DDLS)
June 30, 2022
| | | | | | | | |
| Investments | | Shares | | | Value | |
| | |
Nissin Foods Co. Ltd. | | | 74,000 | | | $ | 49,510 | |
| | |
Singamas Container Holdings Ltd. | | | 624,000 | | | | 94,630 | |
| | |
Sun Hung Kai & Co. Ltd. | | | 114,000 | | | | 53,318 | |
| | |
Vitasoy International Holdings Ltd.* | | | 48,000 | | | | 83,926 | |
| | | | | | | | |
| Total Hong Kong | | | | 1,205,938 | |
|
| Indonesia – 0.5% | |
| | |
Bumitama Agri Ltd. | | | 115,300 | | | | 55,094 | |
| | |
First Resources Ltd. | | | 62,727 | | | | 73,468 | |
| | |
Nickel Industries Ltd. | | | 209,310 | | | | 140,334 | |
| | | | | | | | |
| Total Indonesia | | | | 268,896 | |
|
| Ireland – 0.2% | |
| | |
Kenmare Resources PLC | | | 9,891 | | | | 51,893 | |
| | |
Origin Enterprises PLC | | | 11,153 | | | | 47,922 | |
| | | | | | | | |
| Total Ireland | | | | 99,815 | |
|
| Israel – 4.2% | |
| | |
Altshuler Shaham Penn Ltd. | | | 8,763 | | | | 23,135 | |
| | |
Arad Ltd. | | | 2,600 | | | | 31,411 | |
| | |
Ashtrom Group Ltd. | | | 9,058 | | | | 198,843 | |
| | |
Carasso Motors Ltd. | | | 12,600 | | | | 61,270 | |
| | |
Delek Automotive Systems Ltd. | | | 14,632 | | | | 158,764 | |
| | |
Elco Ltd. | | | 731 | | | | 46,922 | |
| | |
Electra Real Estate Ltd. | | | 2,410 | | | | 33,719 | |
| | |
Energix-Renewable Energies Ltd. | | | 22,734 | | | | 68,615 | |
| | |
FIBI Holdings Ltd. | | | 1,634 | | | | 68,306 | |
| | |
G City Ltd. | | | 15,541 | | | | 88,219 | |
| | |
Gav-Yam Lands Corp. Ltd. | | | 15,720 | | | | 130,172 | |
| | |
Harel Insurance Investments & Financial Services Ltd. | | | 15,580 | | | | 151,345 | |
| | |
IDI Insurance Co. Ltd. | | | 2,748 | | | | 71,404 | |
| | |
Israel Land Development – Urban Renewal Ltd. | | | 2,816 | | | | 43,026 | |
| | |
Magic Software Enterprises Ltd. | | | 2,568 | | | | 44,788 | |
| | |
Matrix IT Ltd. | | | 3,876 | | | | 89,613 | |
| | |
Max Stock Ltd.* | | | 16,468 | | | | 32,478 | |
| | |
Maytronics Ltd. | | | 3,829 | | | | 53,732 | |
| | |
Mediterranean Towers Ltd. | | | 11,239 | | | | 30,420 | |
| | |
Mega Or Holdings Ltd. | | | 2,218 | | | | 66,499 | |
| | |
Meitav Dash Investments Ltd. | | | 11,054 | | | | 53,216 | |
| | |
Menora Mivtachim Holdings Ltd.* | | | 3,493 | | | | 63,953 | |
| | |
Mivne Real Estate KD Ltd. | | | 44,893 | | | | 130,238 | |
| | |
Nawi Brothers Ltd. | | | 7,495 | | | | 57,740 | |
| | |
One Software Technologies Ltd. | | | 3,529 | | | | 55,512 | |
| | |
Palram Industries 1990 Ltd. | | | 4,008 | | | | 48,181 | |
| | |
Phoenix Holdings Ltd. | | | 21,530 | | | | 211,848 | |
| | |
Rami Levy Chain Stores Hashikma Marketing 2006 Ltd. | | | 1,709 | | | | 121,801 | |
| | |
Shapir Engineering and Industry Ltd. | | | 11,410 | | | | 92,853 | |
| | |
Shufersal Ltd. | | | 12,220 | | | | 79,905 | |
| | |
Tiv Taam Holdings 1 Ltd. | | | 11,354 | | | | 23,304 | |
| | |
Victory Supermarket Chain Ltd.* | | | 1,867 | | | | 27,567 | |
| | | | | | | | |
| Total Israel | | | | 2,458,799 | |
|
| Italy – 3.5% | |
| | |
Alerion Cleanpower SpA(a) | | | 1,792 | | | | 58,264 | |
| | |
Anima Holding SpA(b) | | | 58,933 | | | | 215,517 | |
| | |
Ascopiave SpA | | | 14,191 | | | | 42,802 | |
| | |
Banca IFIS SpA | | | 4,343 | | | | 61,341 | |
| | |
Banca Popolare di Sondrio SpA | | | 23,360 | | | | 80,250 | |
| | |
BFF Bank SpA(b) | | | 47,301 | | | | 317,227 | |
| | |
Carel Industries SpA(b) | | | 1,550 | | | | 30,724 | |
| | |
Credito Emiliano SpA | | | 23,004 | | | | 126,260 | |
| | |
Danieli & C. Officine Meccaniche SpA, RSP | | | 2,851 | | | | 40,000 | |
| | |
doValue SpA(b) | | | 5,594 | | | | 32,926 | |
| | |
El.En. SpA | | | 1,988 | | | | 25,668 | |
| | |
Emak SpA | | | 21,055 | | | | 26,194 | |
| | |
Esprinet SpA | | | 5,824 | | | | 41,616 | |
| | |
Gruppo MutuiOnline SpA | | | 1,222 | | | | 30,814 | |
| | |
GVS SpA*(a)(b) | | | 5,316 | | | | 43,238 | |
| | |
Maire Tecnimont SpA(a) | | | 23,251 | | | | 66,603 | |
| | |
MARR SpA | | | 2,200 | | | | 30,268 | |
| | |
Piaggio & C. SpA | | | 40,828 | | | | 95,355 | |
| | |
RAI Way SpA(b) | | | 25,893 | | | | 138,056 | |
| | |
Salcef Group SpA | | | 4,447 | | | | 77,175 | |
| | |
Sanlorenzo SpA | | | 1,282 | | | | 43,023 | |
| | |
Sesa SpA | | | 325 | | | | 41,248 | |
| | |
SOL SpA | | | 3,440 | | | | 59,268 | |
| | |
Technogym SpA(a)(b) | | | 10,659 | | | | 69,312 | |
| | |
Tinexta SpA | | | 987 | | | | 22,969 | |
| | |
Unieuro SpA(a)(b) | | | 5,388 | | | | 83,479 | |
| | |
Webuild SpA(a) | | | 55,738 | | | | 86,183 | |
| | |
Zignago Vetro SpA | | | 4,482 | | | | 54,448 | |
| | | | | | | | |
| Total Italy | | | | 2,040,228 | |
|
| Japan – 27.2% | |
| | |
77 Bank Ltd. | | | 4,435 | | | | 59,251 | |
| | |
ADEKA Corp. | | | 4,400 | | | | 75,884 | |
| | |
Advan Group Co. Ltd. | | | 5,000 | | | | 29,075 | |
| | |
Aeon Delight Co. Ltd. | | | 3,000 | | | | 65,518 | |
| | |
AEON Financial Service Co. Ltd. | | | 5,600 | | | | 52,680 | |
| | |
Aica Kogyo Co. Ltd. | | | 2,900 | | | | 60,453 | |
| | |
Aichi Bank Ltd. | | | 900 | | | | 35,045 | |
| | |
Aichi Corp. | | | 7,400 | | | | 46,735 | |
| | |
Alleanza Holdings Co. Ltd.(a) | | | 5,400 | | | | 40,861 | |
| | |
Amano Corp. | | | 2,800 | | | | 48,331 | |
| | |
Anritsu Corp. | | | 3,500 | | | | 37,820 | |
| | |
Aozora Bank Ltd. | | | 6,000 | | | | 116,462 | |
| | |
Arcs Co. Ltd. | | | 3,300 | | | | 48,605 | |
| | |
ARTERIA Networks Corp. | | | 6,300 | | | | 56,668 | |
| | |
Asahi Holdings, Inc. | | | 4,000 | | | | 62,743 | |
| | |
Asanuma Corp. | | | 1,100 | | | | 43,399 | |
| | |
Autobacs Seven Co. Ltd. | | | 5,400 | | | | 55,568 | |
| | |
Avex, Inc. | | | 6,300 | | | | 62,511 | |
| | |
Awa Bank Ltd. | | | 2,770 | | | | 41,207 | |
| | |
Bando Chemical Industries Ltd. | | | 8,200 | | | | 55,590 | |
| | |
Bank of Nagoya Ltd. | | | 1,649 | | | | 37,810 | |
| | |
Bank of Saga Ltd. | | | 5,700 | | | | 61,718 | |
| | |
Bell System24 Holdings, Inc. | | | 3,401 | | | | 34,672 | |
| | |
Benesse Holdings, Inc. | | | 2,700 | | | | 43,663 | |
| | |
Bic Camera, Inc.(a) | | | 4,500 | | | | 38,821 | |
| | |
BIPROGY, Inc. | | | 3,000 | | | | 59,622 | |
See Notes to Financial Statements.
Schedule of Investments (continued)
WisdomTree Dynamic Currency Hedged International SmallCap Equity Fund (DDLS)
June 30, 2022
| | | | | | | | |
| Investments | | Shares | | | Value | |
| | |
BML, Inc. | | | 1,600 | | | $ | 41,515 | |
| | |
Bunka Shutter Co. Ltd. | | | 6,600 | | | | 48,484 | |
| | |
Central Glass Co. Ltd. | | | 2,500 | | | | 56,770 | |
| | |
Chugoku Bank Ltd. | | | 6,800 | | | | 49,202 | |
| | |
Chukyo Bank Ltd. | | | 2,400 | | | | 29,802 | |
| | |
Citizen Watch Co. Ltd. | | | 8,400 | | | | 34,130 | |
| | |
Computer Engineering & Consulting Ltd. | | | 3,800 | | | | 31,999 | |
| | |
CONEXIO Corp.(a) | | | 3,900 | | | | 38,123 | |
| | |
Cosmo Energy Holdings Co. Ltd. | | | 4,319 | | | | 119,535 | |
| | |
Credit Saison Co. Ltd. | | | 6,100 | | | | 70,000 | |
| | |
Dai-Dan Co. Ltd. | | | 1,800 | | | | 27,996 | |
| | |
Daicel Corp. | | | 11,500 | | | | 71,021 | |
| | |
Daido Steel Co. Ltd. | | | 1,200 | | | | 30,871 | |
| | |
Daihen Corp. | | | 1,437 | | | | 44,320 | |
| | |
Daiichikosho Co. Ltd. | | | 2,800 | | | | 81,410 | |
| | |
Daiki Aluminium Industry Co. Ltd. | | | 2,900 | | | | 25,552 | |
| | |
Dainichiseika Color & Chemicals Manufacturing Co. Ltd. | | | 2,600 | | | | 33,434 | |
| | |
Daishi Hokuetsu Financial Group, Inc. | | | 2,800 | | | | 51,690 | |
| | |
Daiwabo Holdings Co. Ltd. | | | 4,900 | | | | 63,804 | |
| | |
DCM Holdings Co. Ltd. | | | 5,400 | | | | 41,259 | |
| | |
Denyo Co. Ltd. | | | 2,995 | | | | 35,052 | |
| | |
Dexerials Corp. | | | 3,100 | | | | 82,489 | |
| | |
DIC Corp.(a) | | | 3,300 | | | | 58,419 | |
| | |
Digital Garage, Inc. | | | 800 | | | | 21,611 | |
| | |
Dip Corp. | | | 941 | | | | 26,009 | |
| | |
DKS Co. Ltd. | | | 1,600 | | | | 25,215 | |
| | |
DMG Mori Co. Ltd. | | | 2,700 | | | | 33,389 | |
| | |
Dowa Holdings Co. Ltd. | | | 1,400 | | | | 46,424 | |
| | |
DTS Corp. | | | 2,800 | | | | 62,140 | |
| | |
DyDo Group Holdings, Inc.(a) | | | 700 | | | | 25,917 | |
| | |
Eagle Industry Co. Ltd. | | | 4,600 | | | | 33,182 | |
| | |
EDION Corp.(a) | | | 5,400 | | | | 50,600 | |
| | |
Eizo Corp. | | | 900 | | | | 24,975 | |
| | |
Elecom Co. Ltd.(a) | | | 3,300 | | | | 37,019 | |
| | |
Electric Power Development Co. Ltd. | | | 9,300 | | | | 153,614 | |
| | |
ES-Con Japan Ltd.(a) | | | 7,700 | | | | 43,359 | |
| | |
ESPEC Corp. | | | 3,000 | | | | 38,136 | |
| | |
Exedy Corp. | | | 3,130 | | | | 39,651 | |
| | |
EXEO Group, Inc. | | | 3,700 | | | | 57,820 | |
| | |
Ezaki Glico Co. Ltd.(a) | | | 1,300 | | | | 37,558 | |
| | |
France Bed Holdings Co. Ltd. | | | 8,600 | | | | 57,416 | |
| | |
Fuji Co. Ltd.(a) | | | 900 | | | | 14,018 | |
| | |
Fuji Oil Holdings, Inc. | | | 2,900 | | | | 45,724 | |
| | |
Fujimi, Inc. | | | 1,100 | | | | 46,071 | |
| | |
Fujimori Kogyo Co. Ltd. | | | 900 | | | | 23,021 | |
| | |
Fujitec Co. Ltd. | | | 3,000 | | | | 66,357 | |
| | |
Fujitsu General Ltd. | | | 2,600 | | | | 51,462 | |
| | |
Furukawa Electric Co. Ltd. | | | 1,600 | | | | 26,240 | |
| | |
Furuno Electric Co. Ltd.(a) | | | 4,800 | | | | 35,685 | |
| | |
Fuyo General Lease Co. Ltd. | | | 1,100 | | | | 62,346 | |
| | |
G-7 Holdings, Inc.(a) | | | 2,800 | | | | 29,576 | |
| | |
Glory Ltd. | | | 3,600 | | | | 54,270 | |
| | |
GMO Financial Holdings, Inc.(a) | | | 7,600 | | | | 43,467 | |
| | |
GMO Internet, Inc. | | | 2,800 | | | | 47,939 | |
| | |
GS Yuasa Corp. | | | 3,051 | | | | 47,678 | |
| | |
Gunma Bank Ltd. | | | 19,287 | | | | 54,374 | |
| | |
H.U. Group Holdings, Inc. | | | 4,400 | | | | 95,511 | |
| | |
H2O Retailing Corp. | | | 6,600 | | | | 51,059 | |
| | |
Hachijuni Bank Ltd. | | | 21,800 | | | | 80,233 | |
| | |
Hanwa Co. Ltd. | | | 1,039 | | | | 21,712 | |
| | |
Hazama Ando Corp. | | | 8,100 | | | | 50,262 | |
| | |
Heiwa Corp. | | | 4,049 | | | | 59,995 | |
| | |
Heiwa Real Estate Co. Ltd. | | | 1,300 | | | | 37,223 | |
| | |
Hiday Hidaka Corp. | | | 3,200 | | | | 48,593 | |
| | |
Hokkaido Electric Power Co., Inc. | | | 12,800 | | | | 46,638 | |
| | |
Hokuetsu Corp. | | | 7,100 | | | | 36,583 | |
| | |
Hokuhoku Financial Group, Inc. | | | 6,906 | | | | 42,599 | |
| | |
Hokuto Corp. | | | 3,700 | | | | 52,645 | |
| | |
Ichigo, Inc. | | | 19,200 | | | | 44,235 | |
| | |
Ichiyoshi Securities Co. Ltd.(a) | | | 9,300 | | | | 44,427 | |
| | |
Iino Kaiun Kaisha Ltd. | | | 6,700 | | | | 33,733 | |
| | |
Inaba Denki Sangyo Co. Ltd. | | | 2,800 | | | | 54,926 | |
| | |
Inabata & Co. Ltd. | | | 4,500 | | | | 73,402 | |
| | |
Information Services International-Dentsu Ltd. | | | 1,100 | | | | 32,509 | |
| | |
INFRONEER Holdings, Inc. | | | 8,223 | | | | 58,409 | |
| | |
Itochu Enex Co. Ltd. | | | 5,100 | | | | 39,567 | |
| | |
Itoham Yonekyu Holdings, Inc. | | | 14,600 | | | | 74,260 | |
| | |
IwaiCosmo Holdings, Inc.(a) | | | 5,400 | | | | 49,884 | |
| | |
Iyo Bank Ltd. | | | 11,300 | | | | 55,396 | |
| | |
Izumi Co. Ltd. | | | 2,700 | | | | 60,715 | |
| | |
J. Front Retailing Co. Ltd. | | | 9,500 | | | | 81,116 | |
| | |
JAC Recruitment Co. Ltd. | | | 3,800 | | | | 48,614 | |
| | |
Jaccs Co. Ltd. | | | 2,300 | | | | 56,800 | |
| | |
Japan Aviation Electronics Industry Ltd. | | | 2,900 | | | | 43,610 | |
| | |
Japan Securities Finance Co. Ltd.(a) | | | 7,000 | | | | 43,951 | |
| | |
Japan Steel Works Ltd. | | | 1,500 | | | | 32,549 | |
| | |
JCU Corp. | | | 700 | | | | 17,441 | |
| | |
K’s Holdings Corp. | | | 9,500 | | | | 92,444 | |
| | |
Kagome Co. Ltd. | | | 2,600 | | | | 63,347 | |
| | |
Kaken Pharmaceutical Co. Ltd. | | | 1,400 | | | | 39,314 | |
| | |
Kamei Corp. | | | 4,800 | | | | 37,134 | |
| | |
Kamigumi Co. Ltd. | | | 3,800 | | | | 73,396 | |
| | |
Kandenko Co. Ltd. | | | 7,278 | | | | 45,322 | |
| | |
Kaneka Corp. | | | 3,100 | | | | 76,214 | |
| | |
Kanematsu Corp. | | | 4,100 | | | | 40,410 | |
| | |
Kanematsu Electronics Ltd. | | | 1,500 | | | | 44,496 | |
| | |
Kanto Denka Kogyo Co. Ltd. | | | 4,700 | | | | 30,548 | |
| | |
Katitas Co. Ltd. | | | 1,200 | | | | 25,810 | |
| | |
Kato Sangyo Co. Ltd. | | | 2,648 | | | | 63,444 | |
| | |
Keiyo Bank Ltd. | | | 12,600 | | | | 44,240 | |
| | |
KFC Holdings Japan Ltd. | | | 900 | | | | 18,834 | |
| | |
Ki-Star Real Estate Co. Ltd.(a) | | | 900 | | | | 31,136 | |
| | |
Kintetsu World Express, Inc. | | | 2,700 | | | | 82,875 | |
| | |
Kisoji Co. Ltd.(a) | | | 3,100 | | | | 49,813 | |
| | |
Kobe Steel Ltd. | | | 14,400 | | | | 65,399 | |
| | |
Kohnan Shoji Co. Ltd. | | | 900 | | | | 24,246 | |
| | |
KOMEDA Holdings Co. Ltd. | | | 3,000 | | | | 50,812 | |
See Notes to Financial Statements.
Schedule of Investments (continued)
WisdomTree Dynamic Currency Hedged International SmallCap Equity Fund (DDLS)
June 30, 2022
| | | | | | | | |
| Investments | | Shares | | | Value | |
| | |
Konica Minolta, Inc. | | | 27,100 | | | $ | 90,363 | |
| | |
Kumagai Gumi Co. Ltd. | | | 2,700 | | | | 54,674 | |
| | |
Kurabo Industries Ltd. | | | 3,763 | | | | 53,791 | |
| | |
Kureha Corp. | | | 600 | | | | 42,266 | |
| | |
KYB Corp. | | | 1,400 | | | | 31,894 | |
| | |
Kyoei Steel Ltd. | | | 3,500 | | | | 35,604 | |
| | |
Kyokuto Securities Co. Ltd. | | | 9,500 | | | | 48,250 | |
| | |
Kyokuyo Co. Ltd. | | | 3,300 | | | | 83,924 | |
| | |
KYORIN Holdings, Inc. | | | 3,373 | | | | 44,045 | |
| | |
Kyudenko Corp. | | | 2,700 | | | | 54,535 | |
| | |
Kyushu Financial Group, Inc. | | | 16,600 | | | | 47,409 | |
| | |
Lintec Corp. | | | 4,000 | | | | 67,690 | |
| | |
Macnica Fuji Electronics Holdings, Inc. | | | 3,000 | | | | 57,745 | |
| | |
Maeda Kosen Co. Ltd. | | | 1,100 | | | | 23,797 | |
| | |
Maruichi Steel Tube Ltd. | | | 4,000 | | | | 84,443 | |
| | |
Marusan Securities Co. Ltd.(a) | | | 10,700 | | | | 38,514 | |
| | |
Maruzen Showa Unyu Co. Ltd. | | | 1,200 | | | | 26,985 | |
| | |
Marvelous, Inc. | | | 7,900 | | | | 39,077 | |
| | |
Matsui Securities Co. Ltd. | | | 12,500 | | | | 74,068 | |
| | |
MCJ Co. Ltd. | | | 3,600 | | | | 23,266 | |
| | |
Mebuki Financial Group, Inc. | | | 59,700 | | | | 117,330 | |
| | |
Meitec Corp. | | | 3,200 | | | | 51,514 | |
| | |
Mie Kotsu Group Holdings, Inc. | | | 10,500 | | | | 38,103 | |
| | |
Mirait Holdings Corp. | | | 3,900 | | | | 45,845 | |
| | |
Miroku Jyoho Service Co. Ltd. | | | 3,400 | | | | 29,782 | |
| | |
Mitsubishi Logistics Corp. | | | 2,900 | | | | 69,269 | |
| | |
Mitsubishi Materials Corp. | | | 4,600 | | | | 65,755 | |
| | |
Mitsui Mining & Smelting Co. Ltd. | | | 2,200 | | | | 51,334 | |
| | |
Mizuho Leasing Co. Ltd. | | | 1,600 | | | | 36,568 | |
| | |
Mochida Pharmaceutical Co. Ltd. | | | 1,800 | | | | 43,259 | |
| | |
Modec, Inc.* | | | 2,600 | | | | 22,392 | |
| | |
Monex Group, Inc.(a) | | | 4,500 | | | | 13,978 | |
| | |
Morinaga & Co. Ltd. | | | 1,400 | | | | 44,827 | |
| | |
Morita Holdings Corp. | | | 4,000 | | | | 38,865 | |
| | |
Morningstar Japan KK | | | 11,697 | | | | 43,997 | |
| | |
Musashi Seimitsu Industry Co. Ltd. | | | 3,100 | | | | 31,740 | |
| | |
Musashino Bank Ltd. | | | 3,400 | | | | 44,673 | |
| | |
Nafco Co. Ltd.(a) | | | 3,100 | | | | 35,871 | |
| | |
Nagase & Co. Ltd. | | | 3,800 | | | | 52,138 | |
| | |
Nakanishi, Inc. | | | 2,917 | | | | 51,381 | |
| | |
NEC Networks & System Integration Corp. | | | 3,800 | | | | 51,299 | |
| | |
NET One Systems Co. Ltd. | | | 2,800 | | | | 61,831 | |
| | |
NHK Spring Co. Ltd. | | | 8,700 | | | | 57,187 | |
| | |
Nichias Corp. | | | 2,974 | | | | 49,386 | |
| | |
Nichiden Corp.(a) | | | 2,700 | | | | 37,602 | |
| | |
Nichiha Corp. | | | 1,500 | | | | 29,149 | |
| | |
Nihon Chouzai Co. Ltd. | | | 3,800 | | | | 36,810 | |
| | |
Nihon Parkerizing Co. Ltd. | | | 4,840 | | | | 31,743 | |
| | |
Nikkon Holdings Co. Ltd. | | | 3,100 | | | | 49,082 | |
| | |
Nippon Densetsu Kogyo Co. Ltd. | | | 3,100 | | | | 40,115 | |
| | |
Nippon Electric Glass Co. Ltd.(a) | | | 4,000 | | | | 76,464 | |
| | |
Nippon Gas Co. Ltd. | | | 4,300 | | | | 60,897 | |
| | |
Nippon Kanzai Co. Ltd. | | | 3,000 | | | | 57,282 | |
| | |
Nippon Kayaku Co. Ltd. | | | 7,900 | | | | 63,849 | |
| | |
Nippon Light Metal Holdings Co. Ltd. | | | 4,300 | | | | 47,287 | |
| | |
Nippon Paper Industries Co. Ltd. | | | 4,200 | | | | 29,741 | |
| | |
Nippon Parking Development Co. Ltd. | | | 41,600 | | | | 52,055 | |
| | |
Nippon Shokubai Co. Ltd. | | | 1,100 | | | | 42,509 | |
| | |
Nippon Signal Co. Ltd.(a) | | | 7,000 | | | | 50,650 | |
| | |
Nippon Soda Co. Ltd. | | | 1,400 | | | | 44,982 | |
| | |
Nippon Steel Trading Corp. | | | 1,700 | | | | 63,693 | |
| | |
Nippon Suisan Kaisha Ltd. | | | 7,600 | | | | 32,055 | |
| | |
Nipro Corp. | | | 5,100 | | | | 40,055 | |
| | |
Nishi-Nippon Financial Holdings, Inc. | | | 8,900 | | | | 49,133 | |
| | |
Nishimatsu Construction Co. Ltd. | | | 5,250 | | | | 157,088 | |
| | |
Nissan Shatai Co. Ltd. | | | 8,000 | | | | 33,801 | |
| | |
Nisshinbo Holdings, Inc.(a) | | | 7,750 | | | | 58,244 | |
| | |
Nissin Electric Co. Ltd. | | | 5,500 | | | | 61,820 | |
| | |
Nitto Kogyo Corp. | | | 2,700 | | | | 46,645 | |
| | |
Nittoc Construction Co. Ltd. | | | 10,700 | | | | 64,505 | |
| | |
Noevir Holdings Co. Ltd. | | | 1,473 | | | | 62,452 | |
| | |
NOK Corp. | | | 6,400 | | | | 52,008 | |
| | |
Nomura Co. Ltd. | | | 6,258 | | | | 42,839 | |
| | |
North Pacific Bank Ltd. | | | 23,000 | | | | 37,753 | |
| | |
NS United Kaiun Kaisha Ltd.(a) | | | 1,000 | | | | 27,125 | |
| | |
NSD Co. Ltd. | | | 3,200 | | | | 55,706 | |
| | |
Ogaki Kyoritsu Bank Ltd. | | | 3,100 | | | | 39,316 | |
| | |
Ohsho Food Service Corp. | | | 772 | | | | 39,721 | |
| | |
Okamura Corp. | | | 5,400 | | | | 48,175 | |
| | |
Okasan Securities Group, Inc.(a) | | | 16,300 | | | | 40,554 | |
| | |
Okinawa Cellular Telephone Co. | | | 1,300 | | | | 51,768 | |
| | |
Okinawa Electric Power Co., Inc.(a) | | | 3,570 | | | | 34,477 | |
| | |
Okinawa Financial Group, Inc. | | | 2,142 | | | | 34,529 | |
| | |
Okumura Corp. | | | 2,890 | | | | 64,137 | |
| | |
Okuwa Co. Ltd.(a) | | | 6,700 | | | | 41,673 | |
| | |
Onoken Co. Ltd.(a) | | | 3,800 | | | | 39,131 | |
| | |
Optorun Co. Ltd. | | | 2,300 | | | | 30,474 | |
| | |
Orient Corp. | | | 40,000 | | | | 37,687 | |
| | |
Osaki Electric Co. Ltd. | | | 10,500 | | | | 37,717 | |
| | |
Pack Corp.(a) | | | 1,500 | | | | 24,798 | |
| | |
PAL GROUP Holdings Co. Ltd. | | | 2,290 | | | | 30,324 | |
| | |
PALTAC Corp. | | | 1,000 | | | | 30,915 | |
| | |
Paramount Bed Holdings Co. Ltd. | | | 3,000 | | | | 48,625 | |
| | |
Penta-Ocean Construction Co. Ltd. | | | 8,600 | | | | 46,338 | |
| | |
Pigeon Corp.(a) | | | 4,100 | | | | 56,164 | |
| | |
Plenus Co. Ltd. | | | 3,200 | | | | 46,991 | |
| | |
Pressance Corp.(a) | | | 2,686 | | | | 29,854 | |
| | |
Prima Meat Packers Ltd. | | | 2,657 | | | | 44,533 | |
| | |
Raito Kogyo Co. Ltd. | | | 3,100 | | | | 42,351 | |
| | |
Raiznext Corp. | | | 4,100 | | | | 34,525 | |
| | |
Relia, Inc. | | | 3,900 | | | | 30,717 | |
| | |
Rengo Co. Ltd. | | | 8,450 | | | | 45,778 | |
| | |
Resorttrust, Inc. | | | 2,700 | | | | 44,121 | |
| | |
Restar Holdings Corp.(a) | | | 3,054 | | | | 42,869 | |
| | |
Ricoh Leasing Co. Ltd. | | | 1,500 | | | | 38,589 | |
| | |
Riken Keiki Co. Ltd.(a) | | | 500 | | | | 13,231 | |
| | |
Roland Corp. | | | 1,400 | | | | 41,581 | |
| | |
Ryoden Corp. | | | 3,900 | | | | 45,501 | |
See Notes to Financial Statements.
Schedule of Investments (continued)
WisdomTree Dynamic Currency Hedged International SmallCap Equity Fund (DDLS)
June 30, 2022
| | | | | | | | |
| Investments | | Shares | | | Value | |
| | |
Ryosan Co. Ltd. | | | 2,600 | | | $ | 41,951 | |
| | |
Sakata Seed Corp. | | | 1,000 | | | | 33,676 | |
| | |
Sala Corp. | | | 7,400 | | | | 38,401 | |
| | |
SAMTY Co. Ltd.(a) | | | 4,100 | | | | 60,841 | |
| | |
San ju San Financial Group, Inc. | | | 3,700 | | | | 37,965 | |
| | |
San-In Godo Bank Ltd. | | | 8,300 | | | | 39,956 | |
| | |
Sangetsu Corp. | | | 4,300 | | | | 49,313 | |
| | |
Sanki Engineering Co. Ltd. | | | 4,400 | | | | 49,747 | |
| | |
Sankyo Co. Ltd. | | | 3,900 | | | | 117,843 | |
| | |
Sanyo Chemical Industries Ltd. | | | 800 | | | | 28,000 | |
| | |
Sanyo Special Steel Co. Ltd. | | | 3,000 | | | | 43,392 | |
| | |
Sapporo Holdings Ltd. | | | 2,700 | | | | 59,821 | |
| | |
Sawai Group Holdings Co. Ltd. | | | 1,100 | | | | 33,319 | |
| | |
SBS Holdings, Inc. | | | 800 | | | | 16,047 | |
| | |
Seikitokyu Kogyo Co. Ltd. | | | 7,500 | | | | 44,882 | |
| | |
Seiko Holdings Corp. | | | 2,200 | | | | 46,929 | |
| | |
Seino Holdings Co. Ltd. | | | 4,800 | | | | 38,370 | |
| | |
Seiren Co. Ltd.(a) | | | 1,600 | | | | 23,778 | |
| | |
Senko Group Holdings Co. Ltd. | | | 7,580 | | | | 48,988 | |
| | |
Senshu Ikeda Holdings, Inc. | | | 30,900 | | | | 45,490 | |
| | |
Seria Co. Ltd. | | | 1,700 | | | | 30,157 | |
| | |
Seven Bank Ltd. | | | 56,500 | | | | 107,714 | |
| | |
Shikoku Electric Power Co., Inc. | | | 8,300 | | | | 48,326 | |
| | |
Shin Nippon Air Technologies Co. Ltd. | | | 3,000 | | | | 40,632 | |
| | |
Shinmaywa Industries Ltd. | | | 4,500 | | | | 35,773 | |
| | |
Ship Healthcare Holdings, Inc. | | | 2,600 | | | | 46,180 | |
| | |
SHO-BOND Holdings Co. Ltd. | | | 2,600 | | | | 114,254 | |
| | |
Shoei Co. Ltd. | | | 800 | | | | 31,269 | |
| | |
Sinfonia Technology Co. Ltd. | | | 3,400 | | | | 33,486 | |
| | |
Sinko Industries Ltd. | | | 2,400 | | | | 28,866 | |
| | |
SKY Perfect JSAT Holdings, Inc. | | | 12,600 | | | | 50,083 | |
| | |
SRA Holdings | | | 3,300 | | | | 67,334 | |
| | |
ST Corp. | | | 4,100 | | | | 45,450 | |
| | |
St. Marc Holdings Co. Ltd. | | | 4,000 | | | | 46,609 | |
| | |
Stella Chemifa Corp. | | | 2,900 | | | | 50,932 | |
| | |
Sumitomo Bakelite Co. Ltd. | | | 1,600 | | | | 47,875 | |
| | |
Sumitomo Densetsu Co. Ltd. | | | 2,900 | | | | 55,372 | |
| | |
Sumitomo Osaka Cement Co. Ltd.(a) | | | 1,500 | | | | 37,154 | |
| | |
Sumitomo Seika Chemicals Co. Ltd. | | | 1,625 | | | | 34,544 | |
| | |
Sun Frontier Fudousan Co. Ltd. | | | 9,000 | | | | 74,064 | |
| | |
Systena Corp. | | | 7,500 | | | | 21,751 | |
| | |
T-Gaia Corp. | | | 3,200 | | | | 38,111 | |
| | |
Tachibana Eletech Co. Ltd. | | | 3,300 | | | | 36,946 | |
| | |
Taihei Dengyo Kaisha Ltd. | | | 3,000 | | | | 65,165 | |
| | |
Taiheiyo Cement Corp. | | | 3,500 | | | | 52,170 | |
| | |
Taikisha Ltd. | | | 1,300 | | | | 30,429 | |
| | |
Taiyo Holdings Co. Ltd. | | | 1,600 | | | | 33,530 | |
| | |
Takamatsu Construction Group Co. Ltd. | | | 2,600 | | | | 39,482 | |
| | |
Takara Holdings, Inc. | | | 4,400 | | | | 32,549 | |
| | |
Takara Standard Co. Ltd. | | | 3,200 | | | | 29,443 | |
| | |
Takasago International Corp.(a) | | | 2,200 | | | | 39,416 | |
| | |
Takasago Thermal Engineering Co. Ltd. | | | 2,700 | | | | 32,017 | |
| | |
Takashimaya Co. Ltd.(a) | | | 5,700 | | | | 55,802 | |
| | |
Tama Home Co. Ltd.(a) | | | 2,900 | | | | 52,298 | |
| | |
Tatsuta Electric Wire and Cable Co. Ltd.(a) | | | 10,900 | | | | 36,827 | |
| | |
Teijin Ltd. | | | 6,900 | | | | 71,765 | |
| | |
TKC Corp. | | | 1,500 | | | | 36,325 | |
| | |
Toda Corp. | | | 14,504 | | | | 76,868 | |
| | |
Tokai Carbon Co. Ltd.(a) | | | 6,500 | | | | 49,472 | |
| | |
TOKAI Holdings Corp. | | | 7,900 | | | | 51,579 | |
| | |
Tokai Rika Co. Ltd. | | | 5,300 | | | | 57,738 | |
| | |
Tokai Tokyo Financial Holdings, Inc. | | | 18,018 | | | | 49,072 | |
| | |
Tokuyama Corp. | | | 3,300 | | | | 41,926 | |
| | |
Tokyo Ohka Kogyo Co. Ltd.(a) | | | 900 | | | | 43,988 | |
| | |
Tokyo Sangyo Co. Ltd.(a) | | | 12,800 | | | | 66,801 | |
| | |
Tokyo Seimitsu Co. Ltd. | | | 1,500 | | | | 49,244 | |
| | |
Tokyu Construction Co. Ltd. | | | 5,100 | | | | 23,913 | |
| | |
Totetsu Kogyo Co. Ltd. | | | 2,345 | | | | 41,824 | |
| | |
Towa Pharmaceutical Co. Ltd. | | | 1,200 | | | | 21,756 | |
| | |
Toyo Construction Co. Ltd. | | | 7,000 | | | | 45,806 | |
| | |
Toyo Ink SC Holdings Co. Ltd.(a) | | | 3,328 | | | | 46,593 | |
| | |
Toyo Seikan Group Holdings Ltd. | | | 9,500 | | | | 99,227 | |
| | |
Toyo Tire Corp. | | | 4,600 | | | | 57,358 | |
| | |
Toyobo Co. Ltd. | | | 4,400 | | | | 32,452 | |
| | |
Toyoda Gosei Co. Ltd. | | | 5,100 | | | | 80,448 | |
| | |
Transcosmos, Inc. | | | 1,500 | | | | 38,479 | |
| | |
TS Tech Co. Ltd. | | | 4,400 | | | | 45,569 | |
| | |
Tsubakimoto Chain Co. | | | 2,356 | | | | 52,633 | |
| | |
Tsumura & Co. | | | 1,413 | | | | 31,670 | |
| | |
UBE Corp. | | | 4,300 | | | | 63,841 | |
| | |
Ulvac, Inc.(a) | | | 1,100 | | | | 37,408 | |
| | |
Wowow, Inc. | | | 2,800 | | | | 30,998 | |
| | |
Yamaguchi Financial Group, Inc. | | | 12,200 | | | | 66,812 | |
| | |
Yaoko Co. Ltd. | | | 600 | | | | 26,896 | |
| | |
Yellow Hat Ltd. | | | 3,800 | | | | 48,054 | |
| | |
Yokogawa Bridge Holdings Corp. | | | 3,000 | | | | 43,127 | |
| | |
Yokorei Co. Ltd. | | | 8,100 | | | | 52,468 | |
| | |
Yorozu Corp.(a) | | | 5,600 | | | | 36,521 | |
| | |
Zenrin Co. Ltd.(a) | | | 5,600 | | | | 38,046 | |
| | | | | | | | |
| Total Japan | | | | 15,828,046 | |
|
| Malaysia – 0.0% | |
| | |
Frencken Group Ltd. | | | 35,200 | | | | 28,075 | |
|
| Netherlands – 1.9% | |
| | |
Brunel International NV | | | 5,135 | | | | 55,724 | |
| | |
Corbion NV | | | 1,612 | | | | 48,637 | |
| | |
Eurocommercial Properties NV | | | 3,266 | | | | 70,132 | |
| | |
Heijmans NV, CVA | | | 4,546 | | | | 50,568 | |
| | |
Ordina NV | | | 22,536 | | | | 112,147 | |
| | |
PostNL NV(a) | | | 179,333 | | | | 542,765 | |
| | |
RHI Magnesita NV | | | 3,927 | | | | 94,954 | |
| | |
TKH Group NV, CVA | | | 1,915 | | | | 72,233 | |
| | |
Wereldhave NV(a) | | | 3,194 | | | | 47,917 | |
| | | | | | | | |
| Total Netherlands | | | | 1,095,077 | |
|
| Norway – 2.9% | |
| | |
ABG Sundal Collier Holding ASA | | | 134,289 | | | | 80,059 | |
| | |
AF Gruppen ASA(a) | | | 4,164 | | | | 66,423 | |
| | |
American Shipping Co. ASA* | | | 10,668 | | | | 44,271 | |
See Notes to Financial Statements.
Schedule of Investments (continued)
WisdomTree Dynamic Currency Hedged International SmallCap Equity Fund (DDLS)
June 30, 2022
| | | | | | | | |
| Investments | | Shares | | | Value | |
| | |
Atea ASA* | | | 7,267 | | | $ | 75,320 | |
| | |
Austevoll Seafood ASA | | | 13,515 | | | | 157,725 | |
| | |
Bonheur ASA | | | 1,279 | | | | 46,281 | |
| | |
Borregaard ASA | | | 3,827 | | | | 62,055 | |
| | |
Bouvet ASA | | | 10,429 | | | | 62,174 | |
| | |
Europris ASA(b) | | | 20,074 | | | | 93,383 | |
| | |
Hunter Group ASA* | | | 251,612 | | | | 87,226 | |
| | |
Kid ASA(b) | | | 9,154 | | | | 77,181 | |
| | |
Kitron ASA(a) | | | 26,885 | | | | 47,730 | |
| | |
Multiconsult ASA(b) | | | 4,416 | | | | 57,660 | |
| | |
Norway Royal Salmon ASA* | | | 23 | | | | 584 | |
| | |
Pareto Bank ASA | | | 8,690 | | | | 41,560 | |
| | |
Protector Forsikring ASA | | | 8,656 | | | | 89,716 | |
| | |
Selvaag Bolig ASA | | | 11,572 | | | | 41,639 | |
| | |
SpareBank 1 Nord Norge | | | 4,533 | | | | 40,147 | |
| | |
Sparebank 1 Oestlandet | | | 3,608 | | | | 42,800 | |
| | |
SpareBank 1 SMN | | | 2,234 | | | | 26,185 | |
| | |
Sparebanken Vest | | | 5,235 | | | | 46,205 | |
| | |
TGS ASA | | | 15,198 | | | | 212,747 | |
| | |
Veidekke ASA | | | 19,403 | | | | 175,770 | |
| | | | | | | | |
| Total Norway | | | | 1,674,841 | |
|
| Peru – 0.1% | |
| | |
Hochschild Mining PLC | | | 25,219 | | | | 29,555 | |
|
| Portugal – 1.8% | |
| | |
Altri SGPS SA | | | 20,831 | | | | 138,724 | |
| | |
Corticeira Amorim SGPS SA | | | 4,453 | | | | 49,161 | |
| | |
CTT – Correios de Portugal SA(a) | | | 8,871 | | | | 28,935 | |
| | |
Greenvolt-Energias Renovaveis SA* | | | 923 | | | | 7,092 | |
| | |
Navigator Co. SA | | | 69,460 | | | | 278,559 | |
| | |
REN – Redes Energeticas Nacionais SGPS SA | | | 93,122 | | | | 279,894 | |
| | |
Sonae SGPS SA | | | 233,138 | | | | 285,413 | |
| | | | | | | | |
| Total Portugal | | | | 1,067,778 | |
|
| Singapore – 4.2% | |
| | |
AEM Holdings Ltd. | | | 14,900 | | | | 44,324 | |
| | |
Best World International Ltd.*† | | | 3,997 | | | | 2,070 | |
| | |
Bukit Sembawang Estates Ltd. | | | 36,400 | | | | 129,206 | |
| | |
China Aviation Oil Singapore Corp. Ltd. | | | 48,034 | | | | 30,200 | |
| | |
Civmec Ltd. | | | 66,300 | | | | 28,584 | |
| | |
ComfortDelGro Corp. Ltd. | | | 103,700 | | | | 104,318 | |
| | |
CSE Global Ltd.(a) | | | 174,200 | | | | 58,204 | |
| | |
Geo Energy Resources Ltd. | | | 150,600 | | | | 39,498 | |
| | |
Hour Glass Ltd. | | | 88,100 | | | | 146,865 | |
| | |
Japfa Ltd. | | | 88,600 | | | | 37,880 | |
| | |
Keppel Infrastructure Trust | | | 716,391 | | | | 293,413 | |
| | |
NetLink NBN Trust | | | 614,200 | | | | 428,091 | |
| | |
OUE Ltd. | | | 49,700 | | | | 45,711 | |
| | |
Propnex Ltd. | | | 71,000 | | | | 78,056 | |
| | |
Q&M Dental Group Singapore Ltd. | | | 150,500 | | | | 48,663 | |
| | |
Raffles Medical Group Ltd. | | | 74,200 | | | | 59,714 | |
| | |
Riverstone Holdings Ltd. | | | 315,400 | | | | 167,706 | |
| | |
Sembcorp Industries Ltd. | | | 115,800 | | | | 237,142 | |
| | |
Sheng Siong Group Ltd. | | | 202,200 | | | | 220,841 | |
| | |
Singapore Post Ltd. | | | 100,400 | | | | 46,892 | |
| | |
StarHub Ltd. | | | 140,400 | | | | 124,087 | |
| | |
UMS Holdings Ltd. | | | 63,425 | | | | 50,587 | |
| | | | | | | | |
| Total Singapore | | | | 2,422,052 | |
|
| Spain – 3.2% | |
| | |
Aedas Homes SA(b) | | | 5,760 | | | | 128,264 | |
| | |
Almirall SA | | | 5,594 | | | | 61,874 | |
| | |
Applus Services SA | | | 7,054 | | | | 48,672 | |
| | |
Audax Renovables SA(a) | | | 20,134 | | | | 23,912 | |
| | |
Cia de Distribucion Integral Logista Holdings SA | | | 28,658 | | | | 559,063 | |
| | |
ContourGlobal PLC(b) | | | 39,863 | | | | 121,755 | |
| | |
Ebro Foods SA(a) | | | 10,775 | | | | 181,362 | |
| | |
Faes Farma SA | | | 37,315 | | | | 151,363 | |
| | |
Linea Directa Aseguradora SA Cia de Seguros y Reaseguros(a) | | | 81,881 | | | | 107,688 | |
| | |
Neinor Homes SA(a)(b) | | | 7,926 | | | | 99,103 | |
| | |
Prosegur Cash SA(a)(b) | | | 105,889 | | | | 68,856 | |
| | |
Prosegur Cia de Seguridad SA | | | 55,589 | | | | 97,867 | |
| | |
Sacyr SA(a) | | | 54,873 | | | | 131,600 | |
| | |
Unicaja Banco SA(b) | | | 71,838 | | | | 70,109 | |
| | | | | | | | |
| Total Spain | | | | 1,851,488 | |
|
| Sweden – 4.1% | |
| | |
AcadeMedia AB(b) | | | 7,759 | | | | 34,512 | |
| | |
Akelius Residential Property AB, Class D(a) | | | 28,164 | | | | 54,589 | |
| | |
Alimak Group AB(b) | | | 2,875 | | | | 21,715 | |
| | |
Atrium Ljungberg AB, Class B | | | 7,330 | | | | 95,851 | |
| | |
Beijer Alma AB | | | 3,552 | | | | 58,371 | |
| | |
Bergman & Beving AB | | | 2,449 | | | | 25,572 | |
| | |
Bilia AB, Class A | | | 9,356 | | | | 134,487 | |
| | |
Bonava AB, Class B | | | 6,079 | | | | 17,619 | |
| | |
Bravida Holding AB(b) | | | 8,667 | | | | 75,359 | |
| | |
Bufab AB | | | 1,330 | | | | 34,394 | |
| | |
Byggmax Group AB | | | 8,276 | | | | 42,885 | |
| | |
Catena AB | | | 2,024 | | | | 73,317 | |
| | |
Clas Ohlson AB, Class B | | | 9,650 | | | | 99,632 | |
| | |
Coor Service Management Holding AB(b) | | | 8,371 | | | | 65,555 | |
| | |
Dios Fastigheter AB | | | 15,441 | | | | 107,060 | |
| | |
Dustin Group AB(b) | | | 6,339 | | | | 36,250 | |
| | |
Elanders AB, Class B | | | 2,573 | | | | 29,930 | |
| | |
Fagerhult AB | | | 4,016 | | | | 17,812 | |
| | |
Ferronordic AB* | | | 3,247 | | | | 10,013 | |
| | |
Granges AB | | | 3,231 | | | | 24,120 | |
| | |
HMS Networks AB | | | 1,038 | | | | 44,225 | |
| | |
Instalco AB(a) | | | 4,111 | | | | 16,970 | |
| | |
Inwido AB | | | 5,437 | | | | 59,849 | |
| | |
JM AB | | | 5,438 | | | | 89,843 | |
| | |
KNOW IT AB | | | 1,156 | | | | 32,218 | |
| | |
Lagercrantz Group AB, Class B | | | 5,705 | | | | 46,125 | |
| | |
LeoVegas AB(b) | | | 13,313 | | | | 78,599 | |
| | |
Lindab International AB | | | 3,490 | | | | 50,507 | |
| | |
Loomis AB | | | 4,213 | | | | 102,289 | |
| | |
MIPS AB | | | 483 | | | | 21,036 | |
| | |
Munters Group AB(b) | | | 5,327 | | | | 30,696 | |
| | |
Mycronic AB | | | 3,510 | | | | 49,289 | |
| | |
NCC AB, Class B | | | 5,942 | | | | 59,667 | |
| | |
Nobia AB | | | 15,823 | | | | 42,308 | |
See Notes to Financial Statements.
Schedule of Investments (continued)
WisdomTree Dynamic Currency Hedged International SmallCap Equity Fund (DDLS)
June 30, 2022
| | | | | | | | |
| Investments | | Shares | | | Value | |
| | |
Nolato AB, Class B | | | 7,499 | | | $ | 40,249 | |
| | |
Nordic Paper Holding AB | | | 11,324 | | | | 43,650 | |
| | |
Nordic Waterproofing Holding AB | | | 2,178 | | | | 29,798 | |
| | |
Peab AB, Class B | | | 37,906 | | | | 221,205 | |
| | |
Platzer Fastigheter Holding AB, Class B | | | 5,794 | | | | 37,430 | |
| | | | | | | | |
| | |
Pricer AB, Class B | | | 16,923 | | | | 25,432 | |
| | |
Ratos AB, Class B | | | 10,929 | | | | 46,415 | |
| | |
Rottneros AB | | | 31,259 | | | | 36,483 | |
| | |
Scandi Standard AB* | | | 7,389 | | | | 26,319 | |
| | |
Tethys Oil AB | | | 6,030 | | | | 37,366 | |
| | |
Troax Group AB | | | 1,810 | | | | 31,263 | |
| | |
Volati AB | | | 2,333 | | | | 28,914 | |
| | | | | | | | |
| Total Sweden | | | | 2,387,188 | |
|
| Switzerland – 1.3% | |
| | |
Arbonia AG | | | 5,221 | | | | 69,588 | |
| | |
Comet Holding AG, Registered Shares | | | 127 | | | | 19,952 | |
| | |
EFG International AG* | | | 15,156 | | | | 111,135 | |
| | |
Huber + Suhner AG, Registered Shares | | | 1,052 | | | | 83,733 | |
| | |
Landis + Gyr Group AG*(a) | | | 2,184 | | | | 114,179 | |
| | |
Mobilezone Holding AG, Registered Shares | | | 7,151 | | | | 124,443 | |
| | |
Swissquote Group Holding SA, Registered Shares | | | 449 | | | | 45,423 | |
| | |
Valiant Holding AG, Registered Shares | | | 1,740 | | | | 152,490 | |
| | |
Zehnder Group AG | | | 474 | | | | 27,974 | |
| | | | | | | | |
| Total Switzerland | | | | 748,917 | |
|
| United Kingdom – 13.0% | |
| | |
AJ Bell PLC(a) | | | 15,405 | | | | 50,251 | |
| | |
Alliance Pharma PLC | | | 39,377 | | | | 54,612 | |
| | |
Assura PLC | | | 224,382 | | | | 178,215 | |
| | |
Balfour Beatty PLC | | | 24,129 | | | | 74,489 | |
| | |
Begbies Traynor Group PLC | | | 21,084 | | | | 36,411 | |
| | |
Bloomsbury Publishing PLC | | | 8,987 | | | | 41,310 | |
| | |
Bodycote PLC | | | 11,960 | | | | 76,473 | |
| | |
Brewin Dolphin Holdings PLC* | | | 38,100 | | | | 236,905 | |
| | |
CareTech Holdings PLC* | | | 8,799 | | | | 79,183 | |
| | |
Central Asia Metals PLC | | | 39,107 | | | | 105,198 | |
| | |
Chemring Group PLC | | | 9,405 | | | | 35,979 | |
| | |
Chesnara PLC | | | 26,413 | | | | 89,977 | |
| | |
Clarkson PLC | | | 2,142 | | | | 78,301 | |
| | |
CLS Holdings PLC | | | 33,411 | | | | 82,166 | |
| | |
Coats Group PLC | | | 79,224 | | | | 59,941 | |
| | |
Concentric AB | | | 1,370 | | | | 23,583 | |
| | |
Craneware PLC | | | 1,101 | | | | 24,603 | |
| | |
Cranswick PLC | | | 3,458 | | | | 128,759 | |
| | |
Currys PLC | | | 57,901 | | | | 47,886 | |
| | |
Devro PLC | | | 26,992 | | | | 60,119 | |
| | |
DiscoverIE Group PLC | | | 2,724 | | | | 20,511 | |
| | |
Diversified Energy Co. PLC | | | 281,639 | | | | 381,029 | |
| | |
Domino’s Pizza Group PLC | | | 30,846 | | | | 104,591 | |
| | |
Drax Group PLC | | | 45,119 | | | | 352,330 | |
| | |
EMIS Group PLC | | | 5,202 | | | | 117,759 | |
| | |
Essentra PLC | | | 13,081 | | | | 39,477 | |
| | |
Euromoney Institutional Investor PLC | | | 4,057 | | | | 66,219 | |
| | |
FDM Group Holdings PLC | | | 8,924 | | | | 92,013 | |
| | |
Ferrexpo PLC | | | 247,368 | | | | 391,442 | |
| | |
Forterra PLC(b) | | | 14,447 | | | | 46,933 | |
| | |
Galliford Try Holdings PLC | | | 17,186 | | | | 35,482 | |
| | |
Gamma Communications PLC | | | 1,738 | | | | 22,711 | |
| | |
Gateley Holdings PLC | | | 18,185 | | | | 44,280 | |
| | |
GB Group PLC | | | 4,218 | | | | 20,388 | |
| | |
Genuit Group PLC | | | 7,474 | | | | 34,719 | |
| | |
Great Portland Estates PLC | | | 9,467 | | | | 65,879 | |
| | |
Halfords Group PLC | | | 7,525 | | | | 13,059 | |
| | |
Helical PLC | | | 8,364 | | | | 38,040 | |
| | |
Hill & Smith Holdings PLC | | | 4,623 | | | | 65,015 | |
| | |
Hilton Food Group PLC | | | 6,396 | | | | 79,385 | |
| | |
Ibstock PLC(b) | | | 19,349 | | | | 38,890 | |
| | |
IG Design Group PLC*(a) | | | 8,043 | | | | 8,303 | |
| | |
Impax Asset Management Group PLC | | | 5,421 | | | | 39,896 | |
| | |
IntegraFin Holdings PLC | | | 11,410 | | | | 31,150 | |
| | |
James Halstead PLC(a) | | | 16,232 | | | | 40,017 | |
| | |
Jupiter Fund Management PLC | | | 80,891 | | | | 145,491 | |
| | |
Keller Group PLC | | | 5,595 | | | | 49,195 | |
| | |
Liontrust Asset Management PLC | | | 4,096 | | | | 45,416 | |
| | |
Londonmetric Property PLC | | | 99,487 | | | | 275,957 | |
| | |
Luceco PLC(b) | | | 9,544 | | | | 12,031 | |
| | |
Marshalls PLC | | | 5,993 | | | | 32,606 | |
| | |
MJ Gleeson PLC | | | 5,493 | | | | 34,289 | |
| | |
Moneysupermarket.com Group PLC | | | 60,429 | | | | 127,769 | |
| | |
Morgan Advanced Materials PLC | | | 15,385 | | | | 51,382 | |
| | |
Morgan Sindall Group PLC | | | 4,463 | | | | 98,754 | |
| | |
Mortgage Advice Bureau Holdings Ltd. | | | 3,044 | | | | 33,271 | |
| | |
NCC Group PLC(a) | | | 14,385 | | | | 32,704 | |
| | |
Next Fifteen Communications Group PLC(a) | | | 3,410 | | | | 37,271 | |
| | |
Norcros PLC | | | 8,281 | | | | 23,332 | |
| | |
Numis Corp. PLC | | | 10,180 | | | | 31,031 | |
| | |
Oxford Instruments PLC | | | 1,600 | | | | 38,396 | |
| | |
Pagegroup PLC | | | 5,277 | | | | 25,609 | |
| | |
Pan African Resources PLC | | | 262,660 | | | | 66,190 | |
| | |
Paragon Banking Group PLC | | | 21,225 | | | | 126,151 | |
| | |
PayPoint PLC | | | 11,090 | | | | 75,692 | |
| | |
Polar Capital Holdings PLC | | | 16,241 | | | | 100,592 | |
| | |
PZ Cussons PLC | | | 26,644 | | | | 63,680 | |
| | |
QinetiQ Group PLC | | | 31,357 | | | | 139,988 | |
| | |
Reach PLC | | | 14,058 | | | | 17,124 | |
| | |
Redde Northgate PLC | | | 32,034 | | | | 131,105 | |
| | |
Renew Holdings PLC | | | 6,220 | | | | 48,345 | |
| | |
Robert Walters PLC | | | 5,150 | | | | 29,396 | |
| | |
Sabre Insurance Group PLC(b) | | | 44,961 | | | | 112,209 | |
| | |
Safestore Holdings PLC | | | 12,161 | | | | 156,698 | |
| | |
Savills PLC | | | 8,085 | | | | 99,367 | |
| | |
Serco Group PLC | | | 46,386 | | | | 98,133 | |
| | |
Serica Energy PLC | | | 13,818 | | | | 47,827 | |
| | |
Smart Metering Systems PLC | | | 8,687 | | | | 86,404 | |
| | |
Spirent Communications PLC | | | 23,043 | | | | 69,570 | |
| | |
SThree PLC | | | 8,133 | | | | 35,212 | |
| | |
Synthomer PLC | | | 49,353 | | | | 134,858 | |
| | |
TBC Bank Group PLC | | | 4,336 | | | | 66,560 | |
See Notes to Financial Statements.
Schedule of Investments (continued)
WisdomTree Dynamic Currency Hedged International SmallCap Equity Fund (DDLS)
June 30, 2022
| | | | | | | | |
| Investments | | Shares | | | Value | |
| | |
Telecom Plus PLC | | | 8,067 | | | $ | 191,629 | |
| | |
TI Fluid Systems PLC(a)(b) | | | 32,882 | | | | 60,380 | |
| | |
TT Electronics PLC | | | 14,014 | | | | 29,852 | |
| | |
Tyman PLC | | | 11,824 | | | | 34,248 | |
| | |
Vesuvius PLC | | | 26,560 | | | | 98,058 | |
| | |
Victrex PLC | | | 4,480 | | | | 96,791 | |
| | |
VIDENDUM PLC | | | 2,251 | | | | 35,866 | |
| | |
Vivo Energy PLC(b) | | | 137,829 | | | | 244,384 | |
| | |
Watkin Jones PLC | | | 28,437 | | | | 75,978 | |
| | |
Wincanton PLC | | | 12,866 | | | | 54,219 | |
| | |
Workspace Group PLC | | | 8,916 | | | | 60,204 | |
| | |
XPS Pensions Group PLC | | | 26,376 | | | | 41,642 | |
| | | | | | | | |
| Total United Kingdom | | | | 7,576,735 | |
TOTAL COMMON STOCKS (Cost: $66,376,379) | | | | 57,257,355 | |
|
| RIGHTS – 0.0% | |
|
| Portugal – 0.0% | |
| | |
Greenvolt-Energias Renovaveis SA,
expiring 7/4/22*† | | | | | | | | |
| (Cost: $0) | | | 922 | | | | 0 | |
|
| INVESTMENT OF CASH COLLATERAL FOR SECURITIES LOANED – 4.2% | |
|
| United States – 4.2% | |
| | |
State Street Navigator Securities Lending Government Money Market Portfolio, 1.56%(c) | | | | | | | | |
| (Cost: $2,406,651) | | | 2,406,651 | | | | 2,406,651 | |
| |
TOTAL INVESTMENTS IN SECURITIES – 102.7% (Cost: $68,783,030) | | | | 59,664,006 | |
| |
Other Assets less Liabilities – (2.7)% | | | | (1,545,734 | ) |
| | | | | | | | |
| NET ASSETS – 100.0% | | | $ | 58,118,272 | |
| * | Non-income producing security. |
| † | Security is being fair valued using significant unobservable inputs by a pricing committee under the direction of the Board of Trustees. The aggregate value of fair valued securities is $2,070, which represents 0.0% of net assets. |
| (a) | Security, or portion thereof, was on loan at June 30, 2022 (See Note 2). At June 30, 2022, the total market value of the Fund’s securities on loan identified in the Schedule of Investments was $5,221,005 and the total market value of the collateral held by the Fund was $5,664,509. The total market value of the collateral includes non-cash U.S. Government securities collateral having a value of $3,257,858. |
| (b) | This security is exempt from registration under rule 144A of the Securities Act of 1933. This security may be sold in transactions that are exempt from registration, normally to qualified institutional buyers. |
| (c) | Rate shown represents annualized 7-day yield as of June 30, 2022. |
| | | | | | | | | | | | | | | | | | | | | | | | | | | | |
|
| FINANCIAL DERIVATIVE INSTRUMENTS | |
|
| FOREIGN CURRENCY CONTRACTS (OTC – OVER THE COUNTER) | |
| | | | | |
| Counterparty | | Settlement
Date | | | Amount and
Description of
Currency to be
Purchased | | | Amount and
Description of
Currency to be Sold | | | Unrealized
Appreciation | | | Unrealized
Depreciation | |
Bank of America NA | | | 7/6/2022 | | | | 2,419,172 | | | | AUD | | | | 1,663,568 | | | | USD | | | $ | — | | | $ | (20 | ) |
Bank of America NA | | | 7/6/2022 | | | | 188,704 | | | | CHF | | | | 197,114 | | | | USD | | | | 8 | | | | — | |
Bank of America NA | | | 7/6/2022 | | | | 1,300,112 | | | | DKK | | | | 182,768 | | | | USD | | | | 14 | | | | — | |
Bank of America NA | | | 7/6/2022 | | | | 2,083,027 | | | | EUR | | | | 2,177,732 | | | | USD | | | | 105 | | | | — | |
Bank of America NA | | | 7/6/2022 | | | | 1,507,191 | | | | GBP | | | | 1,830,435 | | | | USD | | | | — | | | | (8 | ) |
Bank of America NA | | | 7/6/2022 | | | | 1,137,709 | | | | ILS | | | | 324,865 | | | | USD | | | | 8 | | | | — | |
Bank of America NA | | | 7/6/2022 | | | | 367,198,296 | | | | JPY | | | | 2,702,909 | | | | USD | | | | 106 | | | | — | |
Bank of America NA | | | 7/6/2022 | | | | 4,632,407 | | | | NOK | | | | 468,886 | | | | USD | | | | — | | | | (1 | ) |
Bank of America NA | | | 7/6/2022 | | | | 5,780,400 | | | | SEK | | | | 564,093 | | | | USD | | | | 10 | | | | — | |
Bank of America NA | | | 7/6/2022 | | | | 494,461 | | | | SGD | | | | 355,298 | | | | USD | | | | — | | | | (5 | ) |
Bank of America NA | | | 7/6/2022 | | | | 1,566,773 | | | | USD | | | | 2,183,041 | | | | AUD | | | | 65,601 | | | | — | |
Bank of America NA | | | 7/6/2022 | | | | 185,645 | | | | USD | | | | 177,636 | | | | CHF | | | | 85 | | | | — | |
Bank of America NA | | | 7/6/2022 | | | | 172,134 | | | | USD | | | | 1,193,499 | | | | DKK | | | | 4,340 | | | | — | |
Bank of America NA | | | 7/6/2022 | | | | 2,051,020 | | | | USD | | | | 1,911,411 | | | | EUR | | | | 52,610 | | | | — | |
Bank of America NA | | | 7/6/2022 | | | | 1,723,931 | | | | USD | | | | 1,367,690 | | | | GBP | | | | 62,922 | | | | — | |
Bank of America NA | | | 7/6/2022 | | | | 305,962 | | | | USD | | | | 1,017,538 | | | | ILS | | | | 15,404 | | | | — | |
Bank of America NA | | | 7/6/2022 | | | | 2,545,640 | | | | USD | | | | 327,065,863 | | | | JPY | | | | 138,047 | | | | — | |
Bank of America NA | | | 7/6/2022 | | | | 441,604 | | | | USD | | | | 4,150,522 | | | | NOK | | | | 21,495 | | | | — | |
Bank of America NA | | | 7/6/2022 | | | | 531,271 | | | | USD | | | | 5,192,326 | | | | SEK | | | | 24,558 | | | | — | |
Bank of America NA | | | 7/6/2022 | | | | 334,625 | | | | USD | | | | 458,786 | | | | SGD | | | | 4,967 | | | | — | |
Bank of America NA | | | 8/3/2022 | | | | 166,668 | | | | USD | | | | 1,183,419 | | | | DKK | | | | — | | | | (21 | ) |
Bank of America NA | | | 8/3/2022 | | | | 2,048,027 | | | | USD | | | | 1,955,385 | | | | EUR | | | | — | | | | (144 | ) |
Bank of America NA | | | 8/3/2022 | | | | 1,706,605 | | | | USD | | | | 1,404,581 | | | | GBP | | | | — | | | | (42 | ) |
Bank of America NA | | | 8/3/2022 | | | | 327,383 | | | | USD | | | | 1,144,923 | | | | ILS | | | | — | | | | (33 | ) |
Bank of America NA | | | 8/3/2022 | | | | 2,679,247 | | | | USD | | | | 363,390,289 | | | | JPY | | | | — | | | | (215 | ) |
Bank of America NA | | | 8/3/2022 | | | | 359,753 | | | | USD | | | | 3,552,598 | | | | NOK | | | | — | | | | (23 | ) |
Bank of America NA | | | 8/3/2022 | | | | 501,503 | | | | USD | | | | 5,134,652 | | | | SEK | | | | — | | | | (68 | ) |
Bank of America NA | | | 8/3/2022 | | | | 355,600 | | | | USD | | | | 494,887 | | | | SGD | | | | — | | | | (7 | ) |
See Notes to Financial Statements.
Schedule of Investments (continued)
WisdomTree Dynamic Currency Hedged International SmallCap Equity Fund (DDLS)
June 30, 2022
| | | | | | | | | | | | | | | | | | | | | | | | | | | | |
|
| FINANCIAL DERIVATIVE INSTRUMENTS | |
|
| FOREIGN CURRENCY CONTRACTS (OTC — OVER THE COUNTER) | |
| | | | | |
| Counterparty | | Settlement
Date | | | Amount and
Description of
Currency to be
Purchased | | | Amount and
Description of
Currency to be Sold | | | Unrealized
Appreciation | | | Unrealized
Depreciation | |
Bank of America NA | | | 8/4/2022 | | | | 1,521,266 | | | | USD | | | | 2,211,808 | | | | AUD | | | $ | — | | | $ | (28 | ) |
Bank of America NA | | | 8/4/2022 | | | | 192,933 | | | | USD | | | | 184,377 | | | | CHF | | | | — | | | | (14 | ) |
Barclays Bank PLC | | | 7/6/2022 | | | | 2,419,117 | | | | AUD | | | | 1,663,566 | | | | USD | | | | — | | | | (57 | ) |
Barclays Bank PLC | | | 7/6/2022 | | | | 188,693 | | | | CHF | | | | 197,115 | | | | USD | | | | — | | | | (4 | ) |
Barclays Bank PLC | | | 7/6/2022 | | | | 1,300,039 | | | | DKK | | | | 182,768 | | | | USD | | | | 4 | | | | — | |
Barclays Bank PLC | | | 7/6/2022 | | | | 2,082,905 | | | | EUR | | | | 2,177,731 | | | | USD | | | | — | | | | (22 | ) |
Barclays Bank PLC | | | 7/6/2022 | | | | 1,507,165 | | | | GBP | | | | 1,830,434 | | | | USD | | | | — | | | | (38 | ) |
Barclays Bank PLC | | | 7/6/2022 | | | | 1,137,377 | | | | ILS | | | | 324,863 | | | | USD | | | | — | | | | (85 | ) |
Barclays Bank PLC | | | 7/6/2022 | | | | 367,179,376 | | | | JPY | | | | 2,702,909 | | | | USD | | | | — | | | | (33 | ) |
Barclays Bank PLC | | | 7/6/2022 | | | | 4,632,303 | | | | NOK | | | | 468,885 | | | | USD | | | | — | | | | (11 | ) |
Barclays Bank PLC | | | 7/6/2022 | | | | 5,780,154 | | | | SEK | | | | 564,091 | | | | USD | | | | — | | | | (12 | ) |
Barclays Bank PLC | | | 7/6/2022 | | | | 494,456 | | | | SGD | | | | 355,297 | | | | USD | | | | — | | | | (8 | ) |
Barclays Bank PLC | | | 8/3/2022 | | | | 166,669 | | | | USD | | | | 1,183,308 | | | | DKK | | | | — | | | | (4 | ) |
Barclays Bank PLC | | | 8/3/2022 | | | | 2,048,025 | | | | USD | | | | 1,955,275 | | | | EUR | | | | — | | | | (30 | ) |
Barclays Bank PLC | | | 8/3/2022 | | | | 1,706,606 | | | | USD | | | | 1,404,570 | | | | GBP | | | | — | | | | (28 | ) |
Barclays Bank PLC | | | 8/3/2022 | | | | 327,382 | | | | USD | | | | 1,145,083 | | | | ILS | | | | — | | | | (80 | ) |
Barclays Bank PLC | | | 8/3/2022 | | | | 2,679,247 | | | | USD | | | | 363,370,195 | | | | JPY | | | | — | | | | (66 | ) |
Barclays Bank PLC | | | 8/3/2022 | | | | 359,753 | | | | USD | | | | 3,552,526 | | | | NOK | | | | — | | | | (16 | ) |
Barclays Bank PLC | | | 8/3/2022 | | | | 501,502 | | | | USD | | | | 5,134,150 | | | | SEK | | | | — | | | | (20 | ) |
Barclays Bank PLC | | | 8/3/2022 | | | | 355,599 | | | | USD | | | | 494,881 | | | | SGD | | | | — | | | | (4 | ) |
Barclays Bank PLC | | | 8/4/2022 | | | | 1,521,264 | | | | USD | | | | 2,211,815 | | | | AUD | | | | — | | | | (35 | ) |
Barclays Bank PLC | | | 8/4/2022 | | | | 192,933 | | | | USD | | | | 184,368 | | | | CHF | | | | — | | | | (5 | ) |
Citibank NA | | | 7/6/2022 | | | | 194,533 | | | | AUD | | | | 135,078 | | | | USD | | | | — | | | | (1,307 | ) |
Citibank NA | | | 7/6/2022 | | | | 15,275 | | | | CHF | | | | 16,005 | | | | USD | | | | — | | | | (49 | ) |
Citibank NA | | | 7/6/2022 | | | | 104,663 | | | | DKK | | | | 14,840 | | | | USD | | | | — | | | | (125 | ) |
Citibank NA | | | 7/6/2022 | | | | 167,608 | | | | EUR | | | | 176,827 | | | | USD | | | | — | | | | (1,590 | ) |
Citibank NA | | | 7/6/2022 | | | | 120,917 | | | | GBP | | | | 148,627 | | | | USD | | | | — | | | | (1,778 | ) |
Citibank NA | | | 7/6/2022 | | | | 89,974 | | | | ILS | | | | 26,378 | | | | USD | | | | — | | | | (686 | ) |
Citibank NA | | | 7/6/2022 | | | | 29,663,192 | | | | JPY | | | | 219,470 | | | | USD | | | | — | | | | (1,114 | ) |
Citibank NA | | | 7/6/2022 | | | | 375,765 | | | | NOK | | | | 38,072 | | | | USD | | | | — | | | | (38 | ) |
Citibank NA | | | 7/6/2022 | | | | 463,769 | | | | SEK | | | | 45,803 | | | | USD | | | | — | | | | (544 | ) |
Citibank NA | | | 7/6/2022 | | | | 40,018 | | | | SGD | | | | 28,850 | | | | USD | | | | — | | | | (95 | ) |
Goldman Sachs | | | 7/1/2022 | | | | 300,000 | | | | AUD | | | | 206,298 | | | | USD | | | | — | | | | (3 | ) |
Goldman Sachs | | | 7/1/2022 | | | | 10,000 | | | | CHF | | | | 10,444 | | | | USD | | | | 2 | | | | — | |
Goldman Sachs | | | 7/1/2022 | | | | 265,000 | | | | DKK | | | | 37,246 | | | | USD | | | | 8 | | | | — | |
Goldman Sachs | | | 7/1/2022 | | | | 155,000 | | | | EUR | | | | 162,007 | | | | USD | | | | 37 | | | | — | |
Goldman Sachs | | | 7/1/2022 | | | | 120,000 | | | | GBP | | | | 145,734 | | | | USD | | | | — | | | | (0 | )^ |
Goldman Sachs | | | 7/1/2022 | | | | 47,300,000 | | | | JPY | | | | 348,092 | | | | USD | | | | 74 | | | | — | |
Goldman Sachs | | | 7/1/2022 | | | | 440,000 | | | | NOK | | | | 44,535 | | | | USD | | | | 1 | | | | — | |
Goldman Sachs | | | 7/1/2022 | | | | 924,000 | | | | SEK | | | | 90,157 | | | | USD | | | | 12 | | | | — | |
Goldman Sachs | | | 7/1/2022 | | | | 27,000 | | | | SGD | | | | 19,404 | | | | USD | | | | — | | | | (3 | ) |
Goldman Sachs | | | 7/6/2022 | | | | 1,566,771 | | | | USD | | | | 2,183,066 | | | | AUD | | | | 65,582 | | | | — | |
Goldman Sachs | | | 7/6/2022 | | | | 174,086 | | | | USD | | | | 244,354 | | | | AUD | | | | 6,055 | | | | — | |
Goldman Sachs | | | 7/6/2022 | | | | 185,646 | | | | USD | | | | 177,624 | | | | CHF | | | | 98 | | | | — | |
Goldman Sachs | | | 7/6/2022 | | | | 20,627 | | | | USD | | | | 20,172 | | | | CHF | | | | — | | | | (445 | ) |
Goldman Sachs | | | 7/6/2022 | | | | 172,132 | | | | USD | | | | 1,193,457 | | | | DKK | | | | 4,344 | | | | — | |
Goldman Sachs | | | 7/6/2022 | | | | 19,126 | | | | USD | | | | 133,427 | | | | DKK | | | | 368 | | | | — | |
Goldman Sachs | | | 7/6/2022 | | | | 2,051,021 | | | | USD | | | | 1,911,358 | | | | EUR | | | | 52,666 | | | | — | |
Goldman Sachs | | | 7/6/2022 | | | | 227,891 | | | | USD | | | | 213,703 | | | | EUR | | | | 4,461 | | | | — | |
Goldman Sachs | | | 7/6/2022 | | | | 1,723,929 | | | | USD | | | | 1,367,657 | | | | GBP | | | | 62,960 | | | | — | |
Goldman Sachs | | | 7/6/2022 | | | | 191,548 | | | | USD | | | | 152,719 | | | | GBP | | | | 6,077 | | | | — | |
Goldman Sachs | | | 7/6/2022 | | | | 305,962 | | | | USD | | | | 1,017,451 | | | | ILS | | | | 15,429 | | | | — | |
Goldman Sachs | | | 7/6/2022 | | | | 33,996 | | | | USD | | | | 114,008 | | | | ILS | | | | 1,441 | | | | — | |
Goldman Sachs | | | 7/6/2022 | | | | 2,545,639 | | | | USD | | | | 327,061,662 | | | | JPY | | | | 138,077 | | | | — | |
See Notes to Financial Statements.
Schedule of Investments (continued)
WisdomTree Dynamic Currency Hedged International SmallCap Equity Fund (DDLS)
June 30, 2022
| | | | | | | | | | | | | | | | | | | | | | | | | | | | |
|
| FINANCIAL DERIVATIVE INSTRUMENTS | |
|
| FOREIGN CURRENCY CONTRACTS (OTC — OVER THE COUNTER) | |
| | | | | |
| Counterparty | | Settlement
Date | | | Amount and
Description of
Currency to be
Purchased | | | Amount and
Description of
Currency to be Sold | | | Unrealized
Appreciation | | | Unrealized
Depreciation | |
Goldman Sachs | | | 7/6/2022 | | | | 282,849 | | | | USD | | | | 37,945,268 | | | | JPY | | | $ | 3,527 | | | $ | — | |
Goldman Sachs | | | 7/6/2022 | | | | 441,602 | | | | USD | | | | 4,150,460 | | | | NOK | | | | 21,499 | | | | — | |
Goldman Sachs | | | 7/6/2022 | | | | 49,067 | | | | USD | | | | 468,678 | | | | NOK | | | | 1,628 | | | | — | |
Goldman Sachs | | | 7/6/2022 | | | | 531,270 | | | | USD | | | | 5,192,024 | | | | SEK | | | | 24,586 | | | | — | |
Goldman Sachs | | | 7/6/2022 | | | | 59,030 | | | | USD | | | | 582,968 | | | | SEK | | | | 2,139 | | | | — | |
Goldman Sachs | | | 7/6/2022 | | | | 334,625 | | | | USD | | | | 458,802 | | | | SGD | | | | 4,955 | | | | — | |
Goldman Sachs | | | 7/6/2022 | | | | 37,180 | | | | USD | | | | 51,303 | | | | SGD | | | | 317 | | | | — | |
JP Morgan Chase Bank NA | | | 7/6/2022 | | | | 2,419,155 | | | | AUD | | | | 1,663,568 | | | | USD | | | | — | | | | (32 | ) |
JP Morgan Chase Bank NA | | | 7/6/2022 | | | | 188,694 | | | | CHF | | | | 197,114 | | | | USD | | | | — | | | | (2 | ) |
JP Morgan Chase Bank NA | | | 7/6/2022 | | | | 1,300,019 | | | | DKK | | | | 182,768 | | | | USD | | | | 1 | | | | — | |
JP Morgan Chase Bank NA | | | 7/6/2022 | | | | 2,082,908 | | | | EUR | | | | 2,177,732 | | | | USD | | | | — | | | | (20 | ) |
JP Morgan Chase Bank NA | | | 7/6/2022 | | | | 1,507,187 | | | | GBP | | | | 1,830,435 | | | | USD | | | | — | | | | (12 | ) |
JP Morgan Chase Bank NA | | | 7/6/2022 | | | | 1,137,686 | | | | ILS | | | | 324,865 | | | | USD | | | | 1 | | | | — | |
JP Morgan Chase Bank NA | | | 7/6/2022 | | | | 367,179,105 | | | | JPY | | | | 2,702,909 | | | | USD | | | | — | | | | (35 | ) |
JP Morgan Chase Bank NA | | | 7/6/2022 | | | | 4,632,372 | | | | NOK | | | | 468,886 | | | | USD | | | | — | | | | (5 | ) |
JP Morgan Chase Bank NA | | | 7/6/2022 | | | | 5,780,182 | | | | SEK | | | | 564,093 | | | | USD | | | | — | | | | (12 | ) |
JP Morgan Chase Bank NA | | | 7/6/2022 | | | | 494,462 | | | | SGD | | | | 355,298 | | | | USD | | | | — | | | | (5 | ) |
JP Morgan Chase Bank NA | | | 7/6/2022 | | | | 1,566,773 | | | | USD | | | | 2,182,996 | | | | AUD | | | | 65,632 | | | | — | |
JP Morgan Chase Bank NA | | | 7/6/2022 | | | | 348,172 | | | | USD | | | | 506,249 | | | | AUD | | | | 49 | | | | — | |
JP Morgan Chase Bank NA | | | 7/6/2022 | | | | 185,645 | | | | USD | | | | 177,624 | | | | CHF | | | | 97 | | | | — | |
JP Morgan Chase Bank NA | | | 7/6/2022 | | | | 41,254 | | | | USD | | | | 39,297 | | | | CHF | | | | 204 | | | | — | |
JP Morgan Chase Bank NA | | | 7/6/2022 | | | | 172,134 | | | | USD | | | | 1,193,459 | | | | DKK | | | | 4,346 | | | | — | |
JP Morgan Chase Bank NA | | | 7/6/2022 | | | | 38,252 | | | | USD | | | | 271,509 | | | | DKK | | | | 81 | | | | — | |
JP Morgan Chase Bank NA | | | 7/6/2022 | | | | 2,051,020 | | | | USD | | | | 1,911,332 | | | | EUR | | | | 52,692 | | | | — | |
JP Morgan Chase Bank NA | | | 7/6/2022 | | | | 455,782 | | | | USD | | | | 434,839 | | | | EUR | | | | 1,151 | | | | — | |
JP Morgan Chase Bank NA | | | 7/6/2022 | | | | 1,723,931 | | | | USD | | | | 1,367,677 | | | | GBP | | | | 62,938 | | | | — | |
JP Morgan Chase Bank NA | | | 7/6/2022 | | | | 383,096 | | | | USD | | | | 316,023 | | | | GBP | | | | — | | | | (703 | ) |
JP Morgan Chase Bank NA | | | 7/6/2022 | | | | 305,962 | | | | USD | | | | 1,017,575 | | | | ILS | | | | 15,394 | | | | — | |
JP Morgan Chase Bank NA | | | 7/6/2022 | | | | 67,992 | | | | USD | | | | 235,164 | | | | ILS | | | | 841 | | | | — | |
JP Morgan Chase Bank NA | | | 7/6/2022 | | | | 2,545,640 | | | | USD | | | | 327,054,662 | | | | JPY | | | | 138,130 | | | | — | |
JP Morgan Chase Bank NA | | | 7/6/2022 | | | | 565,698 | | | | USD | | | | 77,387,146 | | | | JPY | | | | — | | | | (3,963 | ) |
JP Morgan Chase Bank NA | | | 7/6/2022 | | | | 441,604 | | | | USD | | | | 4,150,430 | | | | NOK | | | | 21,504 | | | | — | |
JP Morgan Chase Bank NA | | | 7/6/2022 | | | | 98,134 | | | | USD | | | | 967,870 | | | | NOK | | | | 168 | | | | — | |
JP Morgan Chase Bank NA | | | 7/6/2022 | | | | 531,271 | | | | USD | | | | 5,192,047 | | | | SEK | | | | 24,585 | | | | — | |
JP Morgan Chase Bank NA | | | 7/6/2022 | | | | 118,060 | | | | USD | | | | 1,204,080 | | | | SEK | | | | 555 | | | | — | |
JP Morgan Chase Bank NA | | | 7/6/2022 | | | | 334,625 | | | | USD | | | | 458,785 | | | | SGD | | | | 4,968 | | | | — | |
JP Morgan Chase Bank NA | | | 7/6/2022 | | | | 74,361 | | | | USD | | | | 103,501 | | | | SGD | | | | — | | | | (9 | ) |
JP Morgan Chase Bank NA | | | 8/3/2022 | | | | 166,668 | | | | USD | | | | 1,183,325 | | | | DKK | | | | — | | | | (8 | ) |
JP Morgan Chase Bank NA | | | 8/3/2022 | | | | 2,048,027 | | | | USD | | | | 1,955,278 | | | | EUR | | | | — | | | | (32 | ) |
JP Morgan Chase Bank NA | | | 8/3/2022 | | | | 1,706,605 | | | | USD | | | | 1,404,561 | | | | GBP | | | | — | | | | (18 | ) |
JP Morgan Chase Bank NA | | | 8/3/2022 | | | | 327,383 | | | | USD | | | | 1,144,880 | | | | ILS | | | | — | | | | (21 | ) |
JP Morgan Chase Bank NA | | | 8/3/2022 | | | | 2,679,247 | | | | USD | | | | 363,369,659 | | | | JPY | | | | — | | | | (62 | ) |
JP Morgan Chase Bank NA | | | 8/3/2022 | | | | 359,753 | | | | USD | | | | 3,552,467 | | | | NOK | | | | — | | | | (10 | ) |
JP Morgan Chase Bank NA | | | 8/3/2022 | | | | 501,503 | | | | USD | | | | 5,134,200 | | | | SEK | | | | — | | | | (24 | ) |
JP Morgan Chase Bank NA | | | 8/3/2022 | | | | 355,600 | | | | USD | | | | 494,876 | | | | SGD | | | | 1 | | | | — | |
JP Morgan Chase Bank NA | | | 8/4/2022 | | | | 1,521,266 | | | | USD | | | | 2,211,798 | | | | AUD | | | | — | | | | (22 | ) |
JP Morgan Chase Bank NA | | | 8/4/2022 | | | | 192,933 | | | | USD | | | | 184,367 | | | | CHF | | | | — | | | | (4 | ) |
UBS AG | | | 7/6/2022 | | | | 2,419,148 | | | | AUD | | | | 1,663,568 | | | | USD | | | | — | | | | (37 | ) |
UBS AG | | | 7/6/2022 | | | | 188,693 | | | | CHF | | | | 197,114 | | | | USD | | | | — | | | | (3 | ) |
UBS AG | | | 7/6/2022 | | | | 1,300,011 | | | | DKK | | | | 182,768 | | | | USD | | | | 0 | ^ | | | — | |
UBS AG | | | 7/6/2022 | | | | 2,082,898 | | | | EUR | | | | 2,177,732 | | | | USD | | | | — | | | | (30 | ) |
UBS AG | | | 7/6/2022 | | | | 1,507,180 | | | | GBP | | | | 1,830,435 | | | | USD | | | | — | | | | (22 | ) |
UBS AG | | | 7/6/2022 | | | | 1,137,682 | | | | ILS | | | | 324,865 | | | | USD | | | | 0 | ^ | | | — | |
UBS AG | | | 7/6/2022 | | | | 367,178,294 | | | | JPY | | | | 2,702,909 | | | | USD | | | | — | | | | (41 | ) |
See Notes to Financial Statements.
Schedule of Investments (concluded)
WisdomTree Dynamic Currency Hedged International SmallCap Equity Fund (DDLS)
June 30, 2022
| | | | | | | | | | | | | | | | | | | | | | | | | | | | |
|
| FINANCIAL DERIVATIVE INSTRUMENTS | |
|
| FOREIGN CURRENCY CONTRACTS (OTC – OVER THE COUNTER) | |
| | | | | |
| Counterparty | | Settlement
Date | | | Amount and
Description of
Currency to be
Purchased | | | Amount and
Description of
Currency to be Sold | | | Unrealized
Appreciation | | | Unrealized
Depreciation | |
UBS AG | | | 7/6/2022 | | | | 4,632,350 | | | | NOK | | | | 468,886 | | | | USD | | | $ | — | | | $ | (7 | ) |
UBS AG | | | 7/6/2022 | | | | 5,780,147 | | | | SEK | | | | 564,093 | | | | USD | | | | — | | | | (15 | ) |
UBS AG | | | 7/6/2022 | | | | 494,459 | | | | SGD | | | | 355,298 | | | | USD | | | | — | | | | (7 | ) |
UBS AG | | | 7/6/2022 | | | | 1,566,773 | | | | USD | | | | 2,183,026 | | | | AUD | | | | 65,612 | | | | — | |
UBS AG | | | 7/6/2022 | | | | 185,645 | | | | USD | | | | 177,628 | | | | CHF | | | | 94 | | | | — | |
UBS AG | | | 7/6/2022 | | | | 172,134 | | | | USD | | | | 1,193,436 | | | | DKK | | | | 4,349 | | | | — | |
UBS AG | | | 7/6/2022 | | | | 2,051,020 | | | | USD | | | | 1,911,314 | | | | EUR | | | | 52,711 | | | | — | |
UBS AG | | | 7/6/2022 | | | | 1,723,931 | | | | USD | | | | 1,367,692 | | | | GBP | | | | 62,920 | | | | — | |
UBS AG | | | 7/6/2022 | | | | 305,962 | | | | USD | | | | 1,017,513 | | | | ILS | | | | 15,411 | | | | — | |
UBS AG | | | 7/6/2022 | | | | 2,545,640 | | | | USD | | | | 327,054,408 | | | | JPY | | | | 138,132 | | | | — | |
UBS AG | | | 7/6/2022 | | | | 441,604 | | | | USD | | | | 4,150,327 | | | | NOK | | | | 21,515 | | | | — | |
UBS AG | | | 7/6/2022 | | | | 531,271 | | | | USD | | | | 5,192,192 | | | | SEK | | | | 24,571 | | | | — | |
UBS AG | | | 7/6/2022 | | | | 334,625 | | | | USD | | | | 458,786 | | | | SGD | | | | 4,967 | | | | — | |
UBS AG | | | 8/3/2022 | | | | 166,668 | | | | USD | | | | 1,183,281 | | | | DKK | | | | — | | | | (2 | ) |
UBS AG | | | 8/3/2022 | | | | 2,048,027 | | | | USD | | | | 1,955,265 | | | | EUR | | | | — | | | | (19 | ) |
UBS AG | | | 8/3/2022 | | | | 1,706,605 | | | | USD | | | | 1,404,578 | | | | GBP | | | | — | | | | (39 | ) |
UBS AG | | | 8/3/2022 | | | | 327,383 | | | | USD | | | | 1,144,839 | | | | ILS | | | | — | | | | (9 | ) |
UBS AG | | | 8/3/2022 | | | | 2,679,247 | | | | USD | | | | 363,367,783 | | | | JPY | | | | — | | | | (49 | ) |
UBS AG | | | 8/3/2022 | | | | 359,753 | | | | USD | | | | 3,552,423 | | | | NOK | | | | — | | | | (6 | ) |
UBS AG | | | 8/3/2022 | | | | 501,503 | | | | USD | | | | 5,134,412 | | | | SEK | | | | — | | | | (45 | ) |
UBS AG | | | 8/3/2022 | | | | 355,600 | | | | USD | | | | 494,897 | | | | SGD | | | | — | | | | (14 | ) |
UBS AG | | | 8/4/2022 | | | | 1,521,266 | | | | USD | | | | 2,211,795 | | | | AUD | | | | — | | | | (19 | ) |
UBS AG | | | 8/4/2022 | | | | 192,933 | | | | USD | | | | 184,368 | | | | CHF | | | | — | | | | (5 | ) |
| | | | | | | | | | | | | | | | | | | | | | | $ | 1,590,247 | | | $ | (14,332 | ) |
| ^ | Amount represents less than $1. |
The following is a summary of the fair valuations according to the inputs used as of June 30, 2022 in valuing the Fund’s investments (See Note 2 – Fair Value Measurement):
| | | | | | | | | | | | | | | | |
| | | | |
| | | Quoted
Prices in
Active
Markets
(Level 1) | | | Other
Significant
Observable
Inputs
(Level 2) | | | Significant
Unobservable
Inputs
(Level 3) | | | Total | |
Assets: | | | | | | | | | | | | |
Investments in Securities | | | | | | | | | | | | | | | | |
Common Stocks | |
Singapore | | $ | 2,419,982 | | | $ | — | | | $ | 2,070 | * | | $ | 2,422,052 | |
Other | | | 54,835,303 | | | | — | | | | — | | | | 54,835,303 | |
Rights | | | — | | | | — | | | | 0 | * | | | 0 | |
Investment of Cash Collateral for Securities Loaned | | | — | | | | 2,406,651 | | | | — | | | | 2,406,651 | |
Total Investments in Securities | | $ | 57,255,285 | | | $ | 2,406,651 | | | $ | 2,070 | | | $ | 59,664,006 | |
Financial Derivative Instruments | | | | | | | | | | | | | | | | |
Foreign Currency Contracts1 | | $ | — | | | $ | 1,590,247 | | | $ | — | | | $ | 1,590,247 | |
Liabilities: | | | | | | | | | | | | |
Financial Derivative Instruments | | | | | | | | | | | | | | | | |
Foreign Currency Contracts1 | | $ | — | | | $ | (14,332 | ) | | $ | — | | | $ | (14,332 | ) |
Total – Net | | $ | 57,255,285 | | | $ | 3,982,566 | | | $ | 2,070 | | | $ | 61,239,921 | |
| * Securities | are being fair valued using significant unobservable inputs by the Pricing Committee. |
| 1 Amount | shown represents the unrealized appreciation (depreciation) on the financial instrument. |
See Notes to Financial Statements.
Schedule of Investments
WisdomTree Emerging Markets ESG Fund (RESE)
June 30, 2022
| | | | | | | | |
| Investments | | Shares | | | Value | |
|
| COMMON STOCKS – 97.2% | |
|
| Brazil – 3.9% | |
| | |
Ambev SA | | | 50,737 | | | $ | 130,009 | |
| | |
B3 SA – Brasil Bolsa Balcao | | | 63,654 | | | | 133,408 | |
| | |
Banco Santander Brasil SA | | | 12,039 | | | | 66,325 | |
| | |
CCR SA | | | 40,710 | | | | 97,543 | |
| | |
Cia Siderurgica Nacional SA | | | 7,957 | | | | 23,493 | |
| | |
Energisa SA | | | 9,448 | | | | 72,900 | |
| | |
Equatorial Energia SA | | | 14,792 | | | | 64,605 | |
| | |
Localiza Rent a Car SA | | | 7,929 | | | | 79,465 | |
| | |
Lojas Renner SA | | | 13,864 | | | | 59,969 | |
| | |
Magazine Luiza SA | | | 37,314 | | | | 16,697 | |
| | |
Raia Drogasil SA | | | 7,789 | | | | 28,597 | |
| | |
Suzano SA | | | 7,904 | | | | 75,104 | |
| | |
Telefonica Brasil SA | | | 12,030 | | | | 108,258 | |
| | |
TOTVS SA | | | 9,686 | | | | 43,082 | |
| | | | | | | | |
| Total Brazil | | | | 999,455 | |
|
| Chile – 0.4% | |
| | |
Banco Santander Chile | | | 1,527,416 | | | | 60,405 | |
| | |
Cia Cervecerias Unidas SA | | | 6,681 | | | | 41,361 | |
| | | | | | | | |
| Total Chile | | | | 101,766 | |
|
| China – 30.7% | |
| | |
360 DigiTech, Inc., ADR | | | 4,248 | | | | 73,490 | |
| | |
3SBio, Inc.*(a) | | | 81,500 | | | | 64,810 | |
| | |
Alibaba Group Holding Ltd.* | | | 61,700 | | | | 879,862 | |
| | |
ANTA Sports Products Ltd. | | | 10,600 | | | | 130,221 | |
| | |
Avary Holding Shenzhen Co. Ltd., Class A | | | 12,500 | | | | 56,327 | |
| | |
Beijing Roborock Technology Co. Ltd., Class A* | | | 200 | | | | 18,397 | |
| | |
Beijing Sinnet Technology Co. Ltd., Class A | | | 16,200 | | | | 25,179 | |
| | |
Beijing Yuanliu Hongyuan Electronic Technology Co. Ltd., Class A | | | 2,600 | | | | 52,095 | |
| | |
BOE Technology Group Co. Ltd., Class A | | | 36,800 | | | | 21,627 | |
| | |
BYD Co. Ltd., Class H | | | 7,500 | | | | 300,117 | |
| | |
CanSino Biologics, Inc., Class H*(a)(b) | | | 4,000 | | | | 40,959 | |
| | |
Chengtun Mining Group Co. Ltd., Class A* | | | 36,600 | | | | 42,364 | |
| | |
China Conch Venture Holdings Ltd. | | | 33,500 | | | | 73,003 | |
| | |
China Education Group Holdings Ltd. | | | 48,000 | | | | 47,468 | |
| | |
China Feihe Ltd.(a) | | | 111,000 | | | | 127,594 | |
| | |
China Hongqiao Group Ltd.(b) | | | 47,500 | | | | 53,693 | |
| | |
China Medical System Holdings Ltd. | | | 64,000 | | | | 99,830 | |
| | |
China Meidong Auto Holdings Ltd.(b) | | | 22,000 | | | | 69,250 | |
| | |
China Minsheng Banking Corp. Ltd., Class H(b) | | | 260,300 | | | | 92,882 | |
| | |
Chongqing Zhifei Biological Products Co. Ltd., Class A | | | 3,200 | | | | 52,986 | |
| | |
Dali Foods Group Co. Ltd.(a) | | | 183,700 | | | | 97,621 | |
| | |
Daqo New Energy Corp., ADR* | | | 712 | | | | 50,823 | |
| | |
Dongyue Group Ltd. | | | 25,000 | | | | 31,286 | |
| | |
ENN Energy Holdings Ltd. | | | 9,700 | | | | 159,340 | |
| | |
Fuyao Glass Industry Group Co. Ltd., Class H(a) | | | 10,800 | | | | 54,778 | |
| | |
Geely Automobile Holdings Ltd. | | | 55,000 | | | | 125,042 | |
| | |
GOME Retail Holdings Ltd.*(b) | | | 581,000 | | | | 28,136 | |
| | |
Great Wall Motor Co. Ltd., Class H | | | 63,000 | | | | 129,582 | |
| | |
Haidilao International Holding Ltd.*(a)(b) | | | 27,000 | | | | 62,967 | |
| | |
Haier Smart Home Co. Ltd., Class H | | | 10,400 | | | | 38,502 | |
| | |
Haitian International Holdings Ltd. | | | 38,000 | | | | 97,095 | |
| | |
Hengan International Group Co. Ltd. | | | 16,600 | | | | 77,955 | |
| | |
Huazhu Group Ltd., ADR | | | 951 | | | | 36,233 | |
| | |
Inner Mongolia Yuan Xing Energy Co. Ltd., Class A* | | | 18,400 | | | | 28,845 | |
| | |
JD.com, Inc., Class A* | | | 6,164 | | | | 198,582 | |
| | |
Jiangsu Yuyue Medical Equipment & Supply Co. Ltd., Class A | | | 10,900 | | | | 41,719 | |
| | |
Jiumaojiu International Holdings Ltd.(a)(b) | | | 34,000 | | | | 90,341 | |
| | |
Jointown Pharmaceutical Group Co. Ltd., Class A | | | 26,700 | | | | 47,433 | |
| | |
Kingboard Holdings Ltd. | | | 13,500 | | | | 51,096 | |
| | |
Lee & Man Paper Manufacturing Ltd. | | | 108,000 | | | | 46,382 | |
| | |
Li Auto, Inc., ADR* | | | 1,056 | | | | 40,455 | |
| | |
Li Ning Co. Ltd. | | | 21,000 | | | | 194,560 | |
| | |
LONGi Green Energy Technology Co. Ltd., Class A | | | 2,900 | | | | 28,822 | |
| | |
Lufax Holding Ltd., ADR | | | 4,886 | | | | 29,316 | |
| | |
Ming Yang Smart Energy Group Ltd., Class A | | | 12,600 | | | | 63,524 | |
| | |
Minth Group Ltd. | | | 20,000 | | | | 54,543 | |
| | |
Pinduoduo, Inc., ADR* | | | 568 | | | | 35,102 | |
| | |
Ping An Healthcare and Technology Co. Ltd.*(a) | | | 11,800 | | | | 34,963 | |
| | |
Ping An Insurance Group Co. of China Ltd., Class H | | | 37,500 | | | | 254,956 | |
| | |
Satellite Chemical Co. Ltd., Class A | | | 4,900 | | | | 18,893 | |
| | |
Shandong Weigao Group Medical Polymer Co. Ltd., Class H | | | 64,000 | | | | 74,383 | |
| | |
Shanghai Fosun Pharmaceutical Group Co. Ltd., Class H | | | 10,500 | | | | 38,872 | |
| | |
Shenzhou International Group Holdings Ltd. | | | 2,400 | | | | 29,071 | |
| | |
Sichuan Hebang Biotechnology Co. Ltd., Class A* | | | 55,300 | | | | 35,139 | |
| | |
Sino Biopharmaceutical Ltd. | | | 147,000 | | | | 93,105 | |
| | |
TAL Education Group, ADR* | | | 12,419 | | | | 60,481 | |
| | |
TBEA Co. Ltd., Class A | | | 8,300 | | | | 33,910 | |
| | |
TCL Technology Group Corp., Class A | | | 55,700 | | | | 39,796 | |
| | |
Tencent Holdings Ltd. | | | 26,800 | | | | 1,210,396 | |
| | |
Tingyi Cayman Islands Holding Corp. | | | 66,000 | | | | 113,043 | |
| | |
Tongcheng Travel Holdings Ltd.* | | | 46,800 | | | | 100,674 | |
| | |
Tongwei Co. Ltd., Class A | | | 3,900 | | | | 34,822 | |
| | |
Topsports International Holdings Ltd.(a) | | | 69,000 | | | | 62,696 | |
| | |
Trina Solar Co. Ltd., Class A | | | 4,725 | | | | 45,987 | |
| | |
Trip.com Group Ltd., ADR* | | | 3,832 | | | | 105,188 | |
| | |
Uni-President China Holdings Ltd. | | | 105,000 | | | | 90,054 | |
| | |
Vipshop Holdings Ltd., ADR* | | | 8,309 | | | | 82,176 | |
| | |
Want Want China Holdings Ltd. | | | 165,600 | | | | 143,928 | |
| | |
WUS Printed Circuit Kunshan Co. Ltd., Class A | | | 25,100 | | | | 55,260 | |
| | |
Xinjiang Goldwind Science & Technology Co. Ltd., Class H | | | 42,000 | | | | 78,573 | |
| | |
Xinyi Solar Holdings Ltd. | | | 63,952 | | | | 98,777 | |
| | |
Yadea Group Holdings Ltd.(a) | | | 66,000 | | | | 129,192 | |
| | |
Yum China Holdings, Inc. | | | 3,147 | | | | 152,629 | |
| | |
Zhefu Holding Group Co. Ltd., Class A | | | 125,510 | | | | 89,674 | |
| | |
ZhongAn Online P&C Insurance Co. Ltd., Class H*(a)(b) | | | 26,300 | | | | 85,634 | |
| | |
Zhongsheng Group Holdings Ltd. | | | 11,500 | | | | 81,117 | |
| | |
Zhuzhou Kibing Group Co. Ltd., Class A | | | 29,800 | | | | 56,673 | |
| | |
Zibo Qixiang Tengda Chemical Co. Ltd., Class A* | | | 24,200 | | | | 29,274 | |
| | | | | | | | |
| Total China | | | | 7,821,570 | |
See Notes to Financial Statements.
Schedule of Investments (continued)
WisdomTree Emerging Markets ESG Fund (RESE)
June 30, 2022
| | | | | | | | |
| Investments | | Shares | | | Value | |
|
| Hong Kong – 0.6% | |
| | |
Kingboard Laminates Holdings Ltd. | | | 41,500 | | | $ | 51,195 | |
| | |
Vinda International Holdings Ltd.(b) | | | 44,000 | | | | 112,706 | |
| | | | | | | | |
| Total Hong Kong | | | | 163,901 | |
|
| India – 15.1% | |
| | |
Adani Green Energy Ltd.* | | | 4,582 | | | | 111,956 | |
| | |
Adani Total Gas Ltd.* | | | 4,069 | | | | 123,292 | |
| | |
Ambuja Cements Ltd. | | | 25,603 | | | | 117,685 | |
| | |
Asian Paints Ltd. | | | 4,534 | | | | 154,738 | |
| | |
Axis Bank Ltd.* | | | 16,377 | | | | 132,057 | |
| | |
Bajaj Auto Ltd. | | | 1,841 | | | | 86,408 | |
| | |
Bajaj Finserv Ltd. | | | 387 | | | | 53,570 | |
| | |
Balkrishna Industries Ltd. | | | 1,374 | | | | 37,392 | |
| | |
Bandhan Bank Ltd.(a) | | | 9,361 | | | | 31,234 | |
| | |
Berger Paints India Ltd. | | | 4,740 | | | | 34,110 | |
| | |
Cipla Ltd. | | | 6,635 | | | | 77,060 | |
| | |
Colgate-Palmolive India Ltd. | | | 4,205 | | | | 79,169 | |
| | |
Dabur India Ltd. | | | 9,841 | | | | 61,802 | |
| | |
Divi’s Laboratories Ltd. | | | 1,402 | | | | 64,451 | |
| | |
Dr. Reddy’s Laboratories Ltd. | | | 1,710 | | | | 95,139 | |
| | |
Godrej Consumer Products Ltd.* | | | 7,714 | | | | 73,997 | |
| | |
Grasim Industries Ltd. | | | 4,178 | | | | 69,874 | |
| | |
Havells India Ltd. | | | 5,308 | | | | 73,814 | |
| | |
HCL Technologies Ltd. | | | 9,398 | | | | 115,820 | |
| | |
HDFC Asset Management Co. Ltd.(a) | | | 1,594 | | | | 36,177 | |
| | |
HDFC Life Insurance Co. Ltd.(a) | | | 4,863 | | | | 33,868 | |
| | |
Hero MotoCorp Ltd. | | | 2,332 | | | | 80,311 | |
| | |
Housing Development Finance Corp. Ltd. | | | 9,006 | | | | 247,563 | |
| | |
ICICI Bank Ltd. | | | 25,853 | | | | 231,514 | |
| | |
ICICI Lombard General Insurance Co. Ltd.(a) | | | 3,642 | | | | 51,695 | |
| | |
ICICI Prudential Life Insurance Co. Ltd.(a) | | | 6,317 | | | | 39,115 | |
| | |
Indus Towers Ltd. | | | 19,483 | | | | 51,586 | |
| | |
Infosys Ltd. | | | 17,090 | | | | 316,362 | |
| | |
JSW Steel Ltd. | | | 9,778 | | | | 69,894 | |
| | |
Kotak Mahindra Bank Ltd. | | | 4,908 | | | | 103,234 | |
| | |
Marico Ltd. | | | 17,455 | | | | 105,628 | |
| | |
Maruti Suzuki India Ltd. | | | 990 | | | | 106,189 | |
| | |
Mphasis Ltd. | | | 1,222 | | | | 35,498 | |
| | |
Muthoot Finance Ltd. | | | 3,014 | | | | 37,261 | |
| | |
Nestle India Ltd. | | | 435 | | | | 96,229 | |
| | |
Page Industries Ltd. | | | 93 | | | | 47,301 | |
| | |
PI Industries Ltd. | | | 934 | | | | 30,271 | |
| | |
Piramal Enterprises Ltd. | | | 3,097 | | | | 64,930 | |
| | |
Samvardhana Motherson International Ltd. | | | 15,570 | | | | 23,294 | |
| | |
Shriram Transport Finance Co. Ltd. | | | 3,368 | | | | 54,647 | |
| | |
SRF Ltd. | | | 960 | | | | 27,378 | |
| | |
Tech Mahindra Ltd. | | | 8,123 | | | | 102,859 | |
| | |
Torrent Pharmaceuticals Ltd. | | | 1,907 | | | | 69,068 | |
| | |
UltraTech Cement Ltd. | | | 1,564 | | | | 111,049 | |
| | |
Wipro Ltd. | | | 16,590 | | | | 87,401 | |
| | | | | | | | |
| Total India | | | | 3,853,890 | |
|
| Indonesia – 1.7% | |
| | |
Bank Central Asia Tbk PT | | | 400,000 | | | | 194,664 | |
| | |
Barito Pacific Tbk PT | | | 444,800 | | | | 22,542 | |
| | |
Indocement Tunggal Prakarsa Tbk PT | | | 67,500 | | | | 42,931 | |
| | |
Indofood CBP Sukses Makmur Tbk PT | | | 53,400 | | | | 34,232 | |
| | |
Indofood Sukses Makmur Tbk PT | | | 73,900 | | | | 34,972 | |
| | |
Kalbe Farma Tbk PT | | | 681,200 | | | | 75,905 | |
| | |
Merdeka Copper Gold Tbk PT* | | | 97,600 | | | | 26,140 | |
| | | | | | | | |
| Total Indonesia | | | | 431,386 | |
|
| Malaysia – 1.7% | |
| | |
HAP Seng Consolidated Bhd | | | 21,000 | | | | 33,972 | |
| | |
Hartalega Holdings Bhd | | | 62,000 | | | | 43,045 | |
| | |
Hong Leong Bank Bhd | | | 21,900 | | | | 101,662 | |
| | |
Hong Leong Financial Group Bhd | | | 17,900 | | | | 75,133 | |
| | |
Nestle Malaysia Bhd | | | 3,600 | | | | 108,306 | |
| | |
Westports Holdings Bhd | | | 76,500 | | | | 61,616 | |
| | | | | | | | |
| Total Malaysia | | | | 423,734 | |
|
| Mexico – 4.1% | |
| | |
America Movil SAB de CV, Series L | | | 206,646 | | | | 210,479 | |
| | |
Arca Continental SAB de CV | | | 18,468 | | | | 121,285 | |
| | |
Cemex SAB de CV, Series CPO* | | | 225,683 | | | | 87,585 | |
| | |
Coca-Cola Femsa SAB de CV | | | 19,999 | | | | 110,365 | |
| | |
Gruma SAB de CV, Class B(b) | | | 2,384 | | | | 26,297 | |
| | |
Grupo Aeroportuario del Sureste SAB de CV, Class B | | | 2,615 | | | | 51,226 | |
| | |
Grupo Bimbo SAB de CV, Series A | | | 45,345 | | | | 146,919 | |
| | |
Grupo Financiero Banorte SAB de CV, Class O | | | 27,438 | | | | 152,545 | |
| | |
Industrias Penoles SAB de CV | | | 6,345 | | | | 58,557 | |
| | |
Kimberly-Clark de Mexico SAB de CV, Class A(b) | | | 56,803 | | | | 76,664 | |
| | | | | | | | |
| Total Mexico | | | | 1,041,922 | |
|
| Philippines – 0.7% | |
| | |
Globe Telecom, Inc. | | | 1,775 | | | | 73,215 | |
| | |
Jollibee Foods Corp. | | | 7,870 | | | | 29,141 | |
| | |
PLDT, Inc. | | | 2,220 | | | | 67,829 | |
| | | | | | | | |
| Total Philippines | | | | 170,185 | |
|
| Poland – 0.3% | |
| | |
Orange Polska SA* | | | 62,867 | | | | 87,676 | |
|
| Russia – 0.0% | |
| | |
Novolipetsk Steel PJSC, GDR† | | | 2,772 | | | | 0 | |
| | |
PhosAgro PJSC, GDR†(c) | | | 3,402 | | | | 0 | |
| | |
Polyus PJSC, GDR†(c) | | | 871 | | | | 0 | |
| | |
TCS Group Holding PLC, GDR*†(c) | | | 872 | | | | 0 | |
| | |
X5 Retail Group NV, GDR†(c) | | | 2,404 | | | | 0 | |
| | | | | | | | |
| Total Russia | | | | 0 | |
|
| South Africa – 5.4% | |
| | |
Absa Group Ltd. | | | 9,069 | | | | 85,583 | |
| | |
Anglo American Platinum Ltd. | | | 1,096 | | | | 95,334 | |
| | |
AngloGold Ashanti Ltd. | | | 5,488 | | | | 82,083 | |
| | |
Aspen Pharmacare Holdings Ltd. | | | 9,138 | | | | 77,555 | |
See Notes to Financial Statements.
Schedule of Investments (continued)
WisdomTree Emerging Markets ESG Fund (RESE)
June 30, 2022
| | | | | | | | |
| Investments | | Shares | | | Value | |
| | |
Clicks Group Ltd. | | | 4,947 | | | $ | 82,531 | |
| | |
FirstRand Ltd. | | | 43,435 | | | | 165,362 | |
| | |
Gold Fields Ltd. | | | 11,964 | | | | 111,735 | |
| | |
Harmony Gold Mining Co. Ltd. | | | 10,001 | | | | 31,726 | |
| | |
Impala Platinum Holdings Ltd. | | | 8,927 | | | | 98,705 | |
| | |
Mr. Price Group Ltd. | | | 4,852 | | | | 52,532 | |
| | |
Nedbank Group Ltd. | | | 6,834 | | | | 86,459 | |
| | |
Pepkor Holdings Ltd.(a) | | | 23,767 | | | | 27,738 | |
| | |
Sibanye Stillwater Ltd. | | | 19,121 | | | | 47,468 | |
| | |
Standard Bank Group Ltd. | | | 12,243 | | | | 115,962 | |
| | |
Vodacom Group Ltd. | | | 11,426 | | | | 91,457 | |
| | |
Woolworths Holdings Ltd. | | | 33,671 | | | | 111,500 | |
| | | | | | | | |
| Total South Africa | | | | 1,363,730 | |
|
| South Korea – 13.7% | |
| | |
CJ CheilJedang Corp. | | | 332 | | | | 96,910 | |
| | |
Coway Co. Ltd. | | | 1,445 | | | | 71,115 | |
| | |
DB Insurance Co. Ltd. | | | 2,252 | | | | 106,321 | |
| | |
Doosan Enerbility Co. Ltd.* | | | 4,215 | | | | 62,978 | |
| | |
GS Engineering & Construction Corp. | | | 2,862 | | | | 69,544 | |
| | |
Hana Financial Group, Inc. | | | 4,037 | | | | 122,347 | |
| | |
Hankook Tire & Technology Co. Ltd. | | | 2,340 | | | | 59,383 | |
| | |
Hanon Systems | | | 2,746 | | | | 21,255 | |
| | |
Hanwha Solutions Corp.* | | | 1,817 | | | | 53,038 | |
| | |
HLB, Inc.* | | | 801 | | | | 21,839 | |
| | |
Hyundai Engineering & Construction Co. Ltd. | | | 2,326 | | | | 74,076 | |
| | |
Hyundai Glovis Co. Ltd. | | | 661 | | | | 91,381 | |
| | |
Hyundai Steel Co. | | | 2,530 | | | | 62,548 | |
| | |
KB Financial Group, Inc. | | | 3,655 | | | | 135,542 | |
| | |
Korea Investment Holdings Co. Ltd. | | | 455 | | | | 21,622 | |
| | |
Korea Zinc Co. Ltd. | | | 74 | | | | 27,784 | |
| | |
LG Chem Ltd. | | | 338 | | | | 134,325 | |
| | |
LG Display Co. Ltd. | | | 5,024 | | | | 56,299 | |
| | |
LG Electronics, Inc. | | | 1,366 | | | | 92,897 | |
| | |
LG Innotek Co. Ltd. | | | 332 | | | | 87,577 | |
| | |
LG Uplus Corp. | | | 3,920 | | | | 38,493 | |
| | |
Lotte Chemical Corp. | | | 378 | | | | 52,403 | |
| | |
Meritz Financial Group, Inc. | | | 2,058 | | | | 40,973 | |
| | |
Meritz Fire & Marine Insurance Co. Ltd. | | | 925 | | | | 23,617 | |
| | |
Meritz Securities Co. Ltd. | | | 19,020 | | | | 66,506 | |
| | |
Mirae Asset Securities Co. Ltd. | | | 7,819 | | | | 39,866 | |
| | |
NH Investment & Securities Co. Ltd. | | | 5,789 | | | | 40,350 | |
| | |
Pan Ocean Co. Ltd. | | | 4,430 | | | | 20,267 | |
| | |
Samsung Electro-Mechanics Co. Ltd. | | | 680 | | | | 68,346 | |
| | |
Samsung Electronics Co. Ltd. | | | 20,833 | | | | 914,573 | |
| | |
Samsung Engineering Co. Ltd.* | | | 4,821 | | | | 80,016 | |
| | |
Samsung Fire & Marine Insurance Co. Ltd. | | | 593 | | | | 91,800 | |
| | |
Samsung Life Insurance Co. Ltd. | | | 1,483 | | | | 71,500 | |
| | |
Samsung SDS Co. Ltd. | | | 467 | | | | 46,758 | |
| | |
Samsung Securities Co. Ltd. | | | 2,148 | | | | 55,338 | |
| | |
Shinhan Financial Group Co. Ltd. | | | 4,755 | | | | 135,684 | |
| | |
SK Chemicals Co. Ltd. | | | 437 | | | | 30,998 | |
| | |
SK Hynix, Inc. | | | 2,758 | | | | 193,298 | |
| | | | | | | | |
| Total South Korea | | | | 3,479,567 | |
|
| Taiwan – 17.7% | |
| | |
Acer, Inc. | | | 62,000 | | | | 45,249 | |
| | |
Advantech Co. Ltd. | | | 5,499 | | | | 63,990 | |
| | |
ASE Technology Holding Co. Ltd. | | | 16,000 | | | | 41,112 | |
| | |
Asia Cement Corp. | | | 20,000 | | | | 29,462 | |
| | |
Asustek Computer, Inc. | | | 3,000 | | | | 31,328 | |
| | |
AUO Corp. | | | 54,000 | | | | 29,603 | |
| | |
Catcher Technology Co. Ltd. | | | 6,000 | | | | 33,397 | |
| | |
Cathay Financial Holding Co. Ltd. | | | 71,714 | | | | 122,765 | |
| | |
Chailease Holding Co. Ltd. | | | 14,658 | | | | 102,786 | |
| | |
Cheng Shin Rubber Industry Co. Ltd. | | | 23,000 | | | | 27,383 | |
| | |
China Development Financial Holding Corp. | | | 235,114 | | | | 116,238 | |
| | |
Compal Electronics, Inc. | | | 41,000 | | | | 31,370 | |
| | |
CTBC Financial Holding Co. Ltd. | | | 146,720 | | | | 123,856 | |
| | |
Delta Electronics, Inc. | | | 10,000 | | | | 74,495 | |
| | |
E Ink Holdings, Inc.* | | | 7,000 | | | | 44,378 | |
| | |
E.Sun Financial Holding Co. Ltd. | | | 96,772 | | | | 94,385 | |
| | |
Eclat Textile Co. Ltd. | | | 2,000 | | | | 27,948 | |
| | |
Evergreen Marine Corp. Taiwan Ltd. | | | 37,000 | | | | 105,275 | |
| | |
Far Eastern New Century Corp. | | | 42,000 | | | | 44,919 | |
| | |
Feng TAY Enterprise Co. Ltd. | | | 8,200 | | | | 48,400 | |
| | |
Fubon Financial Holding Co. Ltd. | | | 67,392 | | | | 135,539 | |
| | |
Giant Manufacturing Co. Ltd. | | | 4,000 | | | | 32,287 | |
| | |
Hiwin Technologies Corp. | | | 4,000 | | | | 32,085 | |
| | |
Hon Hai Precision Industry Co. Ltd. | | | 47,880 | | | | 175,523 | |
| | |
Hotai Motor Co. Ltd. | | | 1,000 | | | | 20,381 | |
| | |
Innolux Corp. | | | 88,000 | | | | 35,811 | |
| | |
Inventec Corp. | | | 31,000 | | | | 26,221 | |
| | |
Lite-On Technology Corp. | | | 15,014 | | | | 29,237 | |
| | |
MediaTek, Inc. | | | 7,000 | | | | 153,262 | |
| | |
Micro-Star International Co. Ltd. | | | 9,000 | | | | 34,355 | |
| | |
momo.com, Inc. | | | 1,200 | | | | 25,749 | |
| | |
Nan Ya Printed Circuit Board Corp. | | | 2,000 | | | | 17,522 | |
| | |
Nanya Technology Corp. | | | 9,000 | | | | 14,953 | |
| | |
Nien Made Enterprise Co. Ltd. | | | 3,000 | | | | 29,563 | |
| | |
Novatek Microelectronics Corp. | | | 2,000 | | | | 20,314 | |
| | |
Pegatron Corp. | | | 14,000 | | | | 26,838 | |
| | |
Quanta Computer, Inc. | | | 19,000 | | | | 50,993 | |
| | |
Realtek Semiconductor Corp. | | | 5,000 | | | | 61,042 | |
| | |
Shanghai Commercial & Savings Bank Ltd. | | | 25,000 | | | | 44,647 | |
| | |
Shin Kong Financial Holding Co. Ltd. | | | 110,297 | | | | 32,495 | |
| | |
SinoPac Financial Holdings Co. Ltd. | | | 118,000 | | | | 66,672 | |
| | |
Synnex Technology International Corp. | | | 27,150 | | | | 48,578 | |
| | |
Taishin Financial Holding Co. Ltd. | | | 94,998 | | | | 52,078 | |
| | |
Taiwan Semiconductor Manufacturing Co. Ltd. | | | 108,000 | | | | 1,728,959 | |
| | |
Unimicron Technology Corp. | | | 6,000 | | | | 31,984 | |
| | |
United Microelectronics Corp. | | | 64,000 | | | | 84,269 | |
| | |
Vanguard International Semiconductor Corp. | | | 10,000 | | | | 25,829 | |
| | |
Voltronic Power Technology Corp. | | | 1,000 | | | | 48,598 | |
| | |
Wan Hai Lines Ltd. | | | 5,600 | | | | 22,412 | |
| | |
Winbond Electronics Corp. | | | 24,000 | | | | 17,516 | |
| | |
Wiwynn Corp. | | | 1,000 | | | | 23,442 | |
| | |
WPG Holdings Ltd. | | | 14,000 | | | | 25,944 | |
See Notes to Financial Statements.
Schedule of Investments (continued)
WisdomTree Emerging Markets ESG Fund (RESE)
June 30, 2022
| | | | | | | | |
| Investments | | Shares | | | Value | |
| | |
Yuanta Financial Holding Co. Ltd. | | | 154,120 | | | $ | 102,113 | |
| | | | | | | | |
| Total Taiwan | | | | | | | 4,515,550 | |
| | |
| Thailand – 1.0% | | | | | | | | |
| | |
Asset World Corp. PCL, NVDR* | | | 183,100 | | | | 25,273 | |
| | |
Energy Absolute PCL, NVDR | | | 17,800 | | | | 41,032 | |
| | |
Home Product Center PCL, NVDR | | | 56,900 | | | | 20,439 | |
| | |
Indorama Ventures PCL, NVDR | | | 47,100 | | | | 62,614 | |
| | |
Muangthai Capital PCL, NVDR | | | 19,500 | | | | 23,579 | |
| | |
Srisawad Corp. PCL, NVDR | | | 15,700 | | | | 21,537 | |
| | |
Thai Union Group PCL, NVDR | | | 102,400 | | | | 49,527 | |
| | | | | | | | |
| Total Thailand | | | | | | | 244,001 | |
| | |
| Turkey – 0.2% | | | | | | | | |
| | |
Turkcell Iletisim Hizmetleri AS | | | 60,810 | | | | 59,002 | |
TOTAL COMMON STOCKS
(Cost: $23,778,390) | | | | | | | 24,757,335 | |
|
| PREFERRED STOCKS – 2.3% | |
|
| Brazil – 2.3% | |
| | |
Alpargatas SA | | | 5,743 | | | | 21,020 | |
| | |
Banco Bradesco SA | | | 53,089 | | | | 174,613 | |
| | |
Braskem SA, Class A | | | 7,680 | | | | 54,691 | |
| | |
Gerdau SA | | | 8,311 | | | | 35,520 | |
| | |
Itau Unibanco Holding SA | | | 43,906 | | | | 190,335 | |
Itausa SA | | | 71,776 | | | | 114,470 | |
TOTAL PREFERRED STOCKS
(Cost: $711,082) | | | | | | | 590,649 | |
|
| INVESTMENT OF CASH COLLATERAL FOR SECURITIES LOANED – 0.9% | |
|
| United States – 0.9% | |
| | |
State Street Navigator Securities Lending
Government Money Market Portfolio, 1.56%(d)
| | | | | | | | |
| (Cost: $224,927) | | | 224,927 | | | $ | 224,927 | |
| |
TOTAL INVESTMENTS IN SECURITIES – 100.4% (Cost: $24,714,399) | | | | 25,572,911 | |
| |
Other Assets less Liabilities – (0.4)% | | | | (91,826 | ) |
| | | | | |
| NET ASSETS – 100.0% | | | $ | 25,481,085 | |
| * | Non-income producing security. |
| † | Security is being fair valued using significant unobservable inputs by a pricing committee under the direction of the Board of Trustees. The aggregate value of fair valued securities is $0, which represents 0.0% of net assets. |
| (a) | This security is exempt from registration under rule 144A of the Securities Act of 1933. This security may be sold in transactions that are exempt from registration, normally to qualified institutional buyers. |
| (b) | Security, or portion thereof, was on loan at June 30, 2022 (See Note 2). At June 30, 2022, the total market value of the Fund’s securities on loan identified in the Schedule of Investments was $601,144 and the total market value of the collateral held by the Fund was $679,135. The total market value of the collateral includes non-cash U.S. Government securities collateral having a value of $454,208. |
| (c) | This security is exempt from registration under Regulation S of the Securities Act of 1933, which exempts from registration securities offered and sold outside the United States. This security may not be offered or sold in the United States except pursuant to an exemption from, or in a transaction not subject to, the registration requirements of the Securities Act of 1933. |
| (d) | Rate shown represents annualized 7-day yield as of June 30, 2022. |
The following is a summary of the fair valuations according to the inputs used as of June 30, 2022 in valuing the Fund’s investments (See Note 2 – Fair Value Measurement):
| | | | | | | | | | | | | | | | |
| | | | |
| | | Quoted
Prices in
Active Markets
(Level 1) | | | Other
Significant
Observable
Inputs
(Level 2) | | | Significant
Unobservable
Inputs
(Level 3) | | | Total | |
Assets: | | | | | | | | | | | | | | | | |
Investments in Securities | | | | | | | | | | | | | | | | |
Common Stocks | | | | | | | | | | | | | | | | |
Russia | | $ | — | | | $ | — | | | $ | 0 | * | | $ | 0 | |
Other | | | 24,757,335 | | | | — | | | | — | | | | 24,757,335 | |
Preferred Stocks | | | 590,649 | | | | — | | | | — | | | | 590,649 | |
Investment of Cash Collateral for Securities Loaned | | | — | | | | 224,927 | | | | — | | | | 224,927 | |
Total Investments in Securities | | $ | 25,347,984 | | | $ | 224,927 | | | $ | 0 | | | $ | 25,572,911 | |
| * | Securities are being fair valued using significant unobservable inputs by the Pricing Committee. |
See Notes to Financial Statements.
Schedule of Investments (concluded)
WisdomTree Emerging Markets ESG Fund (RESE)
June 30, 2022
| | | | |
The following is a reconciliation of assets in which significant unobservable inputs (Level 3) were used in determining fair value: | |
| | |
| | | Common Stocks | |
| |
| | | Russia | |
Balance as of June 30, 2021 | | $ | — | |
Realized gain (loss) | | | 14,774 | |
Change in unrealized appreciation (depreciation) | | | (376,874 | ) |
Purchases | | | 148,738 | |
Sales | | | (89,366 | ) |
Transfers into Level 3(1) | | | 302,728 | |
Transfers out of Level 3 | | | — | |
Balance as of June 30, 2022 | | $ | 0 | |
Net change in unrealized appreciation (depreciation) from investments still held as of June 30, 2022 is: | | $ | (376,874 | ) |
| | (1) | Transferred into Level 3 because of a lack of observable market data, resulting from a decrease in market activity for the securities. |
See Notes to Financial Statements.
Schedule of Investments
WisdomTree International ESG Fund (RESD)
June 30, 2022
| | | | | | | | |
| Investments | | Shares | | | Value | |
|
| COMMON STOCKS – 98.9% | |
|
| Australia – 8.9% | |
| | |
APA Group | | | 2,862 | | | $ | 22,180 | |
| | |
Australia & New Zealand Banking Group Ltd. | | | 4,027 | | | | 61,005 | |
| | |
BlueScope Steel Ltd. | | | 942 | | | | 10,299 | |
| | |
Brambles Ltd. | | | 6,379 | | | | 46,980 | |
| | |
Commonwealth Bank of Australia | | | 1,492 | | | | 92,727 | |
| | |
Computershare Ltd. | | | 1,799 | | | | 30,482 | |
| | |
CSL Ltd. | | | 42 | | | | 7,771 | |
| | |
Fortescue Metals Group Ltd. | | | 2,267 | | | | 27,327 | |
| | |
Macquarie Group Ltd. | | | 443 | | | | 50,114 | |
| | |
Medibank Pvt Ltd. | | | 10,945 | | | | 24,461 | |
| | |
Mineral Resources Ltd. | | | 407 | | | | 13,509 | |
| | |
National Australia Bank Ltd.(a) | | | 3,965 | | | | 74,680 | |
| | |
QBE Insurance Group Ltd. | | | 4,240 | | | | 35,425 | |
| | |
Ramsay Health Care Ltd. | | | 270 | | | | 13,598 | |
| | |
Sonic Healthcare Ltd. | | | 689 | | | | 15,640 | |
| | |
Suncorp Group Ltd. | | | 4,200 | | | | 31,712 | |
| | |
Transurban Group | | | 5,026 | | | | 49,699 | |
| | |
Westpac Banking Corp.(a) | | | 3,956 | | | | 53,047 | |
| | | | | | | | |
| Total Australia | | | | | | | 660,656 | |
| | |
| Belgium – 0.9% | | | | | | | | |
| | |
Elia Group SA/NV | | | 173 | | | | 24,453 | |
| | |
UCB SA | | | 196 | | | | 16,524 | |
| | |
Umicore SA | | | 698 | | | | 24,314 | |
| | | | | | | | |
| Total Belgium | | | | | | | 65,291 | |
| | |
| China – 0.6% | | | | | | | | |
| | |
SITC International Holdings Co. Ltd. | | | 6,000 | | | | 16,975 | |
| | |
Wilmar International Ltd. | | | 2,300 | | | | 6,676 | |
| | |
Xinyi Glass Holdings Ltd. | | | 8,000 | | | | 19,187 | |
| | | | | | | | |
| Total China | | | | | | | 42,838 | |
| | |
| Denmark – 3.5% | | | | | | | | |
| | |
AP Moller - Maersk A/S, Class B | | | 10 | | | | 23,273 | |
| | |
Chr Hansen Holding A/S | | | 316 | | | | 22,949 | |
| | |
Coloplast A/S, Class B | | | 199 | | | | 22,616 | |
| | |
Demant A/S* | | | 218 | | | | 8,161 | |
| | |
Novo Nordisk A/S, Class B | | | 1,356 | | | | 150,062 | |
| | |
Novozymes A/S, Class B | | | 562 | | | | 33,657 | |
| | | | | | | | |
| Total Denmark | | | | | | | 260,718 | |
| | |
| Finland – 1.7% | | | | | | | | |
| | |
Nokia Oyj* | | | 12,190 | | | | 56,577 | |
| | |
Nordea Bank Abp | | | 5,403 | | | | 47,453 | |
| | |
Orion Oyj, Class B | | | 482 | | | | 21,467 | |
| | | | | | | | |
| Total Finland | | | | | | | 125,497 | |
| | |
| France – 8.3% | | | | | | | | |
| | |
Arkema SA | | | 203 | | | | 18,022 | |
| | |
BioMerieux | | | 190 | | | | 18,513 | |
| | |
Bouygues SA | | | 1,072 | | | | 32,904 | |
| | |
Bureau Veritas SA(a) | | | 1,500 | | | | 38,342 | |
| | |
Capgemini SE | | | 294 | | | | 50,238 | |
| | |
Cie Generale des Etablissements Michelin SCA | | | 1,432 | | | | 38,887 | |
| | |
Danone SA | | | 831 | | | | 46,271 | |
| | |
Ipsen SA | | | 293 | | | | 27,584 | |
| | |
L’Oreal SA | | | 217 | | | | 74,706 | |
| | |
La Francaise des Jeux SAEM(b) | | | 806 | | | | 27,824 | |
| | |
Orange SA | | | 4,289 | | | | 50,310 | |
| | |
Orpea SA*(a) | | | 303 | | | | 7,362 | |
| | |
Pernod Ricard SA | | | 228 | | | | 41,785 | |
| | |
Sanofi | | | 827 | | | | 83,294 | |
| | |
Sartorius Stedim Biotech | | | 57 | | | | 17,835 | |
| | |
Sodexo SA | | | 604 | | | | 42,345 | |
| | | | | | | | |
| Total France | | | | | | | 616,222 | |
| | |
| Germany – 7.0% | | | | | | | | |
| | |
Bayer AG, Registered Shares | | | 705 | | | | 41,805 | |
| | |
Bayerische Motoren Werke AG | | | 615 | | | | 47,231 | |
| | |
Beiersdorf AG | | | 305 | | | | 31,083 | |
| | |
Covestro AG(b) | | | 558 | | | | 19,239 | |
| | |
Deutsche Post AG, Registered Shares | | | 1,592 | | | | 59,484 | |
| | |
Evonik Industries AG | | | 1,298 | | | | 27,628 | |
| | |
Fresenius Medical Care AG & Co. KGaA | | | 317 | | | | 15,785 | |
| | |
Fresenius SE & Co. KGaA | | | 238 | | | | 7,191 | |
| | |
GEA Group AG | | | 854 | | | | 29,365 | |
| | |
HeidelbergCement AG | | | 487 | | | | 23,339 | |
| | |
LANXESS AG | | | 617 | | | | 22,048 | |
| | |
Merck KGaA | | | 243 | | | | 40,901 | |
| | |
Muenchener Rueckversicherungs – Gesellschaft AG in Muenchen, Registered Shares | | | 264 | | | | 61,879 | |
| | |
SAP SE | | | 1,064 | | | | 96,697 | |
| | | | | | | | |
| Total Germany | | | | | | | 523,675 | |
| | |
| Hong Kong – 1.2% | | | | | | | | |
| | |
Hang Seng Bank Ltd. | | | 2,300 | | | | 40,595 | |
| | |
MTR Corp. Ltd. | | | 8,000 | | | | 41,800 | |
| | |
WH Group Ltd.(b) | | | 10,500 | | | | 8,109 | |
| | | | | | | | |
| Total Hong Kong | | | | | | | 90,504 | |
| | |
| Ireland – 0.6% | | | | | | | | |
| | |
CRH PLC | | | 1,209 | | | | 41,710 | |
| | |
| Israel – 0.3% | | | | | | | | |
| | |
Check Point Software Technologies Ltd.* | | | 178 | | | | 21,677 | |
| | |
| Italy – 2.0% | | | | | | | | |
| | |
Amplifon SpA | | | 242 | | | | 7,400 | |
| | |
Assicurazioni Generali SpA | | | 3,180 | | | | 50,616 | |
| | |
DiaSorin SpA | | | 62 | | | | 8,115 | |
| | |
Recordati Industria Chimica e Farmaceutica SpA | | | 169 | | | | 7,334 | |
| | |
Snam SpA | | | 6,426 | | | | 33,584 | |
| | |
Terna - Rete Elettrica Nazionale | | | 5,798 | | | | 45,389 | |
| | | | | | | | |
| Total Italy | | | | | | | 152,438 | |
| | |
| Japan – 25.7% | | | | | | | | |
| | |
Advantest Corp. | | | 400 | | | | 21,376 | |
| | |
AGC, Inc. | | | 700 | | | | 24,578 | |
| | |
Aisin Corp. | | | 400 | | | | 12,366 | |
| | |
Ajinomoto Co., Inc. | | | 1,500 | | | | 36,436 | |
| | |
Asahi Group Holdings Ltd. | | | 400 | | | | 13,087 | |
| | |
Asahi Kasei Corp. | | | 1,700 | | | | 12,964 | |
| | |
Astellas Pharma, Inc. | | | 2,200 | | | | 34,250 | |
| | |
Bandai Namco Holdings, Inc. | | | 100 | | | | 7,051 | |
| | |
Canon, Inc.(a) | | | 1,500 | | | | 34,062 | |
See Notes to Financial Statements.
Schedule of Investments (continued)
WisdomTree International ESG Fund (RESD)
June 30, 2022
| | | | | | | | |
| Investments | | Shares | | | Value | |
| | |
Chugai Pharmaceutical Co. Ltd. | | | 700 | | | $ | 17,879 | |
| | |
Dai Nippon Printing Co. Ltd. | | | 1,200 | | | | 25,845 | |
| | |
Dai-ichi Life Holdings, Inc. | | | 1,500 | | | | 27,713 | |
| | |
Daiichi Sankyo Co. Ltd. | | | 300 | | | | 7,590 | |
| | |
Daiwa Securities Group, Inc. | | | 5,600 | | | | 24,980 | |
| | |
Eisai Co. Ltd. | | | 200 | | | | 8,428 | |
| | |
Fuji Electric Co. Ltd. | | | 700 | | | | 28,957 | |
| | |
FUJIFILM Holdings Corp. | | | 700 | | | | 37,500 | |
| | |
Fujitsu Ltd. | | | 400 | | | | 49,950 | |
| | |
Hitachi Construction Machinery Co. Ltd. | | | 700 | | | | 15,483 | |
| | |
Hitachi Metals Ltd.* | | | 600 | | | | 9,067 | |
| | |
Honda Motor Co. Ltd. | | | 1,700 | | | | 41,206 | |
| | |
Itochu Techno-Solutions Corp. | | | 800 | | | | 19,580 | |
| | |
Japan Post Holdings Co. Ltd. | | | 1,600 | | | | 11,413 | |
| | |
Japan Post Insurance Co. Ltd. | | | 600 | | | | 9,588 | |
| | |
Kajima Corp. | | | 1,200 | | | | 13,753 | |
| | |
Kao Corp. | | | 800 | | | | 32,223 | |
| | |
Kirin Holdings Co. Ltd. | | | 600 | | | | 9,440 | |
| | |
Kyowa Kirin Co. Ltd. | | | 400 | | | | 8,980 | |
| | |
Lixil Corp. | | | 1,200 | | | | 22,436 | |
| | |
Mazda Motor Corp. | | | 3,900 | | | | 31,865 | |
| | |
McDonald’s Holdings Co. Japan Ltd. | | | 300 | | | | 10,909 | |
| | |
Medipal Holdings Corp. | | | 700 | | | | 9,862 | |
| | |
MEIJI Holdings Co. Ltd. | | | 300 | | | | 14,707 | |
| | |
Mitsubishi Chemical Holdings Corp. | | | 1,400 | | | | 7,595 | |
| | |
Mitsubishi Gas Chemical Co., Inc. | | | 700 | | | | 10,073 | |
| | |
Mitsubishi UFJ Financial Group, Inc. | | | 10,400 | | | | 55,837 | |
| | |
Mitsui Chemicals, Inc. | | | 400 | | | | 8,509 | |
| | |
Mizuho Financial Group, Inc. | | | 2,600 | | | | 29,530 | |
| | |
MS&AD Insurance Group Holdings, Inc. | | | 1,100 | | | | 33,667 | |
| | |
NEC Corp. | | | 1,100 | | | | 42,671 | |
| | |
NGK Insulators Ltd. | | | 900 | | | | 12,110 | |
| | |
Nippon Sanso Holdings Corp. | | | 500 | | | | 7,961 | |
| | |
Nippon Shinyaku Co. Ltd. | | | 100 | | | | 6,073 | |
| | |
Nippon Telegraph & Telephone Corp. | | | 2,000 | | | | 57,355 | |
| | |
Nissan Chemical Corp. | | | 100 | | | | 4,600 | |
| | |
Nisshin Seifun Group, Inc. | | | 700 | | | | 8,182 | |
| | |
Nissin Foods Holdings Co. Ltd. | | | 100 | | | | 6,897 | |
| | |
Nitto Denko Corp. | | | 400 | | | | 25,851 | |
| | |
Nomura Holdings, Inc. | | | 7,800 | | | | 28,472 | |
| | |
Nomura Research Institute Ltd. | | | 1,300 | | | | 34,544 | |
| | |
NTT Data Corp. | | | 2,100 | | | | 28,999 | |
| | |
Obayashi Corp.(a) | | | 3,100 | | | | 22,476 | |
| | |
Oji Holdings Corp. | | | 2,100 | | | | 9,089 | |
| | |
Olympus Corp. | | | 1,100 | | | | 22,076 | |
| | |
Ono Pharmaceutical Co. Ltd. | | | 600 | | | | 15,378 | |
| | |
Oracle Corp. | | | 100 | | | | 5,786 | |
| | |
Otsuka Holdings Co. Ltd. | | | 300 | | | | 10,639 | |
| | |
Panasonic Holdings Corp. | | | 3,500 | | | | 28,249 | |
| | |
Pola Orbis Holdings, Inc. | | | 700 | | | | 8,610 | |
| | |
Ryohin Keikaku Co. Ltd. | | | 700 | | | | 7,126 | |
| | |
Santen Pharmaceutical Co. Ltd. | | | 1,100 | | | | 8,615 | |
| | |
SCSK Corp. | | | 1,900 | | | | 32,111 | |
| | |
Secom Co. Ltd. | | | 300 | | | | 18,512 | |
| | |
Seiko Epson Corp. | | | 1,600 | | | | 22,612 | |
| | |
Sekisui Chemical Co. Ltd. | | | 1,900 | | | | 25,971 | |
| | |
Sekisui House Ltd. | | | 1,600 | | | | 27,989 | |
| | |
SG Holdings Co. Ltd. | | | 700 | | | | 11,794 | |
| | |
Sharp Corp. | | | 1,800 | | | | 13,899 | |
| | |
Shimizu Corp. | | | 1,800 | | | | 9,937 | |
| | |
Shin-Etsu Chemical Co. Ltd. | | | 200 | | | | 22,524 | |
| | |
Shionogi & Co. Ltd. | | | 200 | | | | 10,092 | |
| | |
Shiseido Co. Ltd. | | | 200 | | | | 8,017 | |
| | |
Sohgo Security Services Co. Ltd. | | | 300 | | | | 8,325 | |
| | |
Sompo Holdings, Inc. | | | 700 | | | | 30,828 | |
| | |
Sumitomo Metal Mining Co. Ltd. | | | 200 | | | | 6,257 | |
| | |
Sumitomo Mitsui Financial Group, Inc. | | | 1,300 | | | | 38,582 | |
| | |
Sumitomo Mitsui Trust Holdings, Inc. | | | 700 | | | | 21,538 | |
| | |
Sumitomo Pharma Co. Ltd. | | | 1,000 | | | | 8,031 | |
| | |
Suntory Beverage & Food Ltd. | | | 500 | | | | 18,880 | |
| | |
Sysmex Corp. | | | 400 | | | | 24,043 | |
| | |
Taisei Corp. | | | 400 | | | | 12,440 | |
| | |
Takeda Pharmaceutical Co. Ltd. | | | 1,100 | | | | 30,914 | |
| | |
Terumo Corp. | | | 300 | | | | 9,027 | |
| | |
TIS, Inc. | | | 600 | | | | 15,701 | |
| | |
Tokio Marine Holdings, Inc. | | | 800 | | | | 46,538 | |
| | |
Tokyo Electron Ltd. | | | 100 | | | | 32,608 | |
| | |
Tokyo Gas Co. Ltd. | | | 2,000 | | | | 41,323 | |
| | |
Tosoh Corp. | | | 900 | | | | 11,163 | |
| | |
TOTO Ltd. | | | 800 | | | | 26,381 | |
| | |
Toyo Suisan Kaisha Ltd. | | | 600 | | | | 23,363 | |
| | |
Trend Micro, Inc. | | | 200 | | | | 9,746 | |
| | |
Unicharm Corp.(a) | | | 500 | | | | 16,709 | |
| | |
USS Co. Ltd. | | | 500 | | | | 8,645 | |
| | |
Yakult Honsha Co. Ltd. | | | 200 | | | | 11,527 | |
| | |
Yamaha Motor Co. Ltd. | | | 1,100 | | | | 20,129 | |
| | |
Yamato Holdings Co. Ltd. | | | 500 | | | | 7,986 | |
| | | | | | | | |
| Total Japan | | | | | | | 1,916,636 | |
| | |
| Netherlands – 3.9% | | | | | | | | |
| | |
Akzo Nobel NV | | | 418 | | | | 27,365 | |
| | |
Heineken Holding NV | | | 341 | | | | 24,759 | |
| | |
Heineken NV | | | 266 | | | | 24,194 | |
| | |
Koninklijke DSM NV | | | 265 | | | | 37,982 | |
| | |
Koninklijke KPN NV | | | 13,460 | | | | 47,858 | |
| | |
Koninklijke Philips NV | | | 1,300 | | | | 27,936 | |
| | |
NN Group NV | | | 19 | | | | 861 | |
| | |
QIAGEN NV* | | | 228 | | | | 10,655 | |
| | |
Randstad NV | | | 784 | | | | 37,867 | |
| | |
Wolters Kluwer NV | | | 545 | | | | 52,738 | |
| | | | | | | | |
| Total Netherlands | | | | | | | 292,215 | |
| | |
| Norway – 0.8% | | | | | | | | |
| | |
Orkla ASA | | | 2,807 | | | | 22,366 | |
| | |
Telenor ASA | | | 2,900 | | | | 38,452 | |
| | | | | | | | |
| Total Norway | | | | | | | 60,818 | |
| | |
| Singapore – 1.2% | | | | | | | | |
| | |
Genting Singapore Ltd. | | | 40,900 | | | | 21,160 | |
| | |
Keppel Corp. Ltd. | | | 8,900 | | | | 41,504 | |
See Notes to Financial Statements.
Schedule of Investments (continued)
WisdomTree International ESG Fund (RESD)
June 30, 2022
| | | | | | | | |
| Investments | | Shares | | | Value | |
| | |
Singapore Exchange Ltd. | | | 3,800 | | | $ | 25,830 | |
| | | | | | | | |
| Total Singapore | | | | | | | 88,494 | |
| | |
| Spain – 3.6% | | | | | | | | |
| | |
Banco Bilbao Vizcaya Argentaria SA | | | 11,987 | | | | 54,269 | |
| | |
Enagas SA(a) | | | 1,553 | | | | 34,209 | |
| | |
Grifols SA(a) | | | 1,210 | | | | 22,814 | |
| | |
Industria de Diseno Textil SA | | | 2,532 | | | | 57,150 | |
| | |
Red Electrica Corp. SA | | | 2,252 | | | | 42,437 | |
| | |
Telefonica SA | | | 11,868 | | | | 60,325 | |
| | | | | | | | |
| Total Spain | | | | | | | 271,204 | |
| | |
| Sweden – 2.2% | | | | | | | | |
| | |
Essity AB, Class B | | | 931 | | | | 24,267 | |
| | |
Getinge AB, Class B | | | 543 | | | | 12,526 | |
| | |
H & M Hennes & Mauritz AB, Class B(a) | | | 3,522 | | | | 41,986 | |
| | |
Securitas AB, Class B | | | 2,481 | | | | 21,335 | |
| | |
Svenska Cellulosa AB SCA, Class B | | | 1,399 | | | | 20,860 | |
| | |
Telefonaktiebolaget LM Ericsson, Class B | | | 5,516 | | | | 41,055 | |
| | | | | | | | |
| Total Sweden | | | | | | | 162,029 | |
| | |
| Switzerland – 12.8% | | | | | | | | |
| | |
Alcon, Inc. | | | 126 | | | | 8,776 | |
| | |
Barry Callebaut AG, Registered Shares | | | 3 | | | | 6,675 | |
| | |
Clariant AG, Registered Shares* | | | 1,466 | | | | 27,839 | |
| | |
Coca-Cola HBC AG* | | | 1,446 | | | | 31,996 | |
| | |
EMS-Chemie Holding AG, Registered Shares | | | 12 | | | | 8,906 | |
| | |
Geberit AG, Registered Shares | | | 89 | | | | 42,652 | |
| | |
Givaudan SA, Registered Shares | | | 15 | | | | 52,598 | |
| | |
Kuehne + Nagel International AG, Registered Shares | | | 154 | | | | 36,355 | |
| | |
Nestle SA, Registered Shares | | | 1,901 | | | | 221,285 | |
| | |
Novartis AG, Registered Shares | | | 1,436 | | | | 121,273 | |
| | |
Roche Holding AG | | | 449 | | | | 149,401 | |
| | |
Sika AG, Registered Shares | | | 142 | | | | 32,632 | |
| | |
Sonova Holding AG, Registered Shares | | | 96 | | | | 30,484 | |
| | |
STMicroelectronics NV | | | 1,462 | | | | 45,853 | |
| | |
Swiss Re AG | | | 692 | | | | 53,475 | |
| | |
Swisscom AG, Registered Shares | | | 90 | | | | 49,581 | |
| | |
Temenos AG, Registered Shares | | | 363 | | | | 30,948 | |
| | | | | | | | |
| Total Switzerland | | | | | | | 950,729 | |
| | |
| United Kingdom – 13.7% | | | | | | | | |
| | |
Anglo American PLC | | | 1,275 | | | | 45,477 | |
| | |
Antofagasta PLC | | | 1,301 | | | | 18,249 | |
| | |
Associated British Foods PLC | | | 590 | | | | 11,307 | |
| | |
AstraZeneca PLC | | | 101 | | | | 13,247 | |
| | |
Barclays PLC | | | 29,885 | | | | 55,573 | |
| | |
Bunzl PLC | | | 1,135 | | | | 37,479 | |
| | |
Compass Group PLC | | | 2,372 | | | | 48,395 | |
| | |
Croda International PLC | | | 415 | | | | 32,619 | |
| | |
Diageo PLC | | | 1,973 | | | | 84,595 | |
| | |
Experian PLC | | | 1,870 | | | | 54,641 | |
| | |
Ferguson PLC | | | 402 | | | | 44,857 | |
| | |
GSK PLC | | | 3,742 | | | | 80,237 | |
| | |
Hikma Pharmaceuticals PLC | | | 404 | | | | 7,936 | |
| | |
Johnson Matthey PLC | | | 1,459 | | | | 34,117 | |
| | |
Kingfisher PLC | | | 14,385 | | | | 42,679 | |
| | |
National Grid PLC | | | 5,336 | | | | 68,173 | |
| | |
Next PLC | | | 484 | | | | 34,445 | |
| | |
Reckitt Benckiser Group PLC | | | 693 | | | | 51,927 | |
| | |
RELX PLC | | | 2,788 | | | | 75,370 | |
| | |
Smith & Nephew PLC | | | 511 | | | | 7,121 | |
| | |
SSE PLC | | | 2,090 | | | | 41,017 | |
| | |
Taylor Wimpey PLC | | | 27,834 | | | | 39,431 | |
| | |
Unilever PLC | | | 2,091 | | | | 94,492 | |
| | | | | | | | |
| Total United Kingdom | | | | | | | 1,023,384 | |
TOTAL COMMON STOCKS
(Cost: $7,593,507) | | | | | | | 7,366,735 | |
| | |
| PREFERRED STOCK – 0.4% | | | | | | | | |
| | |
| Germany – 0.4% | | | | | | | | |
| | |
Henkel AG & Co. KGaA | | | | | | | | |
| (Cost: $35,957) | | | 464 | | | | 28,513 | |
|
| INVESTMENT OF CASH COLLATERAL FOR SECURITIES LOANED – 2.7% | |
| | |
| United States – 2.7% | | | | | | | | |
| | |
State Street Navigator Securities Lending Government Money Market Portfolio, 1.56%(c) | | | | | | | | |
| (Cost: $203,121) | | | 203,121 | | | | 203,121 | |
| |
TOTAL INVESTMENTS IN SECURITIES – 102.0%
(Cost: $7,832,585) | | | | 7,598,369 | |
| |
Other Assets less Liabilities – (2.0)% | | | | (151,734 | ) |
| | | | | | | | |
| NET ASSETS – 100.0% | | | $ | 7,446,635 | |
| * | Non-income producing security. |
| (a) | Security, or portion thereof, was on loan at June 30, 2022 (See Note 2). At June 30, 2022, the total market value of the Fund’s securities on loan identified in the Schedule of Investments was $292,233 and the total market value of the collateral held by the Fund was $322,466. The total market value of the collateral includes non-cash U.S. Government securities collateral having a value of $119,345. |
| (b) | This security is exempt from registration under rule 144A of the Securities Act of 1933. This security may be sold in transactions that are exempt from registration, normally to qualified institutional buyers. |
| (c) | Rate shown represents annualized 7-day yield as of June 30, 2022. |
| | | | | | | | | | | | | | | | | | | | | | | | | | | | |
|
| FINANCIAL DERIVATIVE INSTRUMENTS | |
|
| FOREIGN CURRENCY CONTRACTS (OTC – OVER THE COUNTER) | |
| | | | | |
| Counterparty | | Settlement Date | | | Amount and
Description of Currency to
be Purchased | | | Amount and
Description of Currency to be
Sold | | | Unrealized
Appreciation | | | Unrealized
Depreciation | |
Bank of Montreal | | | 7/5/2022 | | | | 706 | | | | USD | | | | 95,768 | | | | JPY | | | $ | 1 | | | $ | — | |
See Notes to Financial Statements.
Schedule of Investments (concluded)
WisdomTree International ESG Fund (RESD)
June 30, 2022
The following is a summary of the fair valuations according to the inputs used as of June 30, 2022 in valuing the Fund’s investments (See Note 2 — Fair Value Measurement):
| | | | | | | | | | | | | | | | |
| | | | |
| | | Quoted
Prices in
Active
Markets
(Level 1) | | | Other
Significant
Observable
Inputs
(Level 2) | | | Significant
Unobservable
Inputs
(Level 3) | | | Total | |
Assets: | | | | | | | | | |
Investments in Securities | | | | |
Common Stocks | | $ | 7,366,735 | | | $ | — | | | $ | — | | | $ | 7,366,735 | |
Preferred Stock | | | 28,513 | | | | — | | | | — | | | | 28,513 | |
Investment of Cash Collateral for Securities Loaned | | | — | | | | 203,121 | | | | — | | | | 203,121 | |
Total Investments in Securities | | $ | 7,395,248 | | | $ | 203,121 | | | $ | — | | | $ | 7,598,369 | |
Financial Derivative Instruments | | | | |
Foreign Currency Contracts1 | | $ | — | | | $ | 1 | | | $ | — | | | $ | 1 | |
Total – Net | | $ | 7,395,248 | | | $ | 203,122 | | | $ | — | | | $ | 7,598,370 | |
| 1 | Amount shown represents the unrealized appreciation (depreciation) on the financial instrument. |
See Notes to Financial Statements.
Schedule of Investments
WisdomTree U.S. Corporate Bond Fund (WFIG)
June 30, 2022
| | | | | | | | |
| Investments | | Principal
Amount | | | Value | |
| | | | | | | | |
| | | | | | | | |
|
| U.S. CORPORATE BONDS – 95.5% | |
|
| United States – 95.5% | |
| | |
3M Co. | | | | | | | | |
3.38%, 3/1/29(a) | | $ | 7,000 | | | $ | 6,740 | |
3.13%, 9/19/46 | | | 27,000 | | | | 21,330 | |
| | |
Abbott Laboratories
2.95%, 3/15/25 | | | 29,000 | | | | 28,643 | |
4.90%, 11/30/46 | | | 9,000 | | | | 9,499 | |
| | |
AbbVie, Inc.
2.60%, 11/21/24 | | | 93,000 | | | | 90,127 | |
3.80%, 3/15/25 | | | 89,000 | | | | 88,413 | |
3.60%, 5/14/25 | | | 112,000 | | | | 110,578 | |
3.20%, 5/14/26 | | | 90,000 | | | | 86,693 | |
3.20%, 11/21/29 | | | 133,000 | | | | 122,373 | |
4.50%, 5/14/35 | | | 49,000 | | | | 47,582 | |
4.30%, 5/14/36 | | | 46,000 | | | | 43,294 | |
4.45%, 5/14/46 | | | 38,000 | | | | 34,526 | |
4.88%, 11/14/48 | | | 20,000 | | | | 19,335 | |
| | |
Aetna, Inc.
6.63%, 6/15/36 | | | 240,000 | | | | 271,778 | |
| | |
Alexandria Real Estate Equities, Inc.
3.95%, 1/15/28 | | | 63,000 | | | | 61,105 | |
| | |
Ally Financial, Inc.
5.80%, 5/1/25 | | | 68,000 | | | | 69,618 | |
| | |
Amazon.com, Inc.
4.05%, 8/22/47 | | | 35,000 | | | | 32,967 | |
4.25%, 8/22/57 | | | 50,000 | | | | 47,028 | |
2.70%, 6/3/60 | | | 64,000 | | | | 43,414 | |
| | |
Amcor Finance USA, Inc.
3.63%, 4/28/26 | | | 270,000 | | | | 259,627 | |
| | |
Ameren Corp.
3.50%, 1/15/31 | | | 44,000 | | | | 40,372 | |
| | |
Ameren Illinois Co.
1.55%, 11/15/30 | | | 310,000 | | | | 252,994 | |
| | |
American Express Co.
2.50%, 8/1/22 | | | 56,000 | | | | 56,000 | |
3.63%, 12/5/24 | | | 17,000 | | | | 16,921 | |
| | |
American Honda Finance Corp.
1.30%, 9/9/26 | | | 60,000 | | | | 54,190 | |
| | |
American Water Capital Corp.
2.95%, 9/1/27 | | | 29,000 | | | | 27,273 | |
4.30%, 12/1/42 | | | 58,000 | | | | 53,847 | |
| | |
Amgen, Inc.
1.90%, 2/21/25 | | | 239,000 | | | | 228,482 | |
2.20%, 2/21/27 | | | 105,000 | | | | 96,575 | |
| | |
Amphenol Corp.
2.80%, 2/15/30 | | | 22,000 | | | | 19,172 | |
| | |
Aon Corp.
8.21%, 1/1/27 | | | 100,000 | | | | 107,001 | |
| | |
Aon Corp. / Aon Global Holdings PLC
2.60%, 12/2/31 | | | 220,000 | | | | 186,201 | |
| | |
Appalachian Power Co.
7.00%, 4/1/38 | | | 185,000 | | | | 215,481 | |
| | |
Apple, Inc.
3.85%, 5/4/43 | | | 13,000 | | | | 11,997 | |
| | |
Applied Materials, Inc.
5.85%, 6/15/41 | | | 14,000 | | | | 15,990 | |
| | |
AutoNation, Inc.
3.50%, 11/15/24 | | | 260,000 | | | | 252,161 | |
| | |
AvalonBay Communities, Inc.
4.20%, 12/15/23 | | | 12,000 | | | | 12,051 | |
| | |
Bank of America Corp.
4.13%, 1/22/24 | | | 55,000 | | | | 55,632 | |
4.20%, 8/26/24 | | | 325,000 | | | | 325,913 | |
4.45%, 3/3/26 | | | 47,000 | | | | 46,911 | |
1.73%, 7/22/27, (1.734% fixed rate until 7/22/26; Secured Overnight Financing Rate + 0.96% thereafter)(b) | | | 243,000 | | | | 216,671 | |
3.25%, 10/21/27 | | | 95,000 | | | | 89,677 | |
4.18%, 11/25/27, Series L | | | 30,000 | | | | 29,205 | |
3.42%, 12/20/28, (3.419% fixed rate until 12/20/27; 3-month U.S. dollar London Interbank Offered Rate + 1.04% thereafter)(b)(d) | | | 174,000 | | | | 162,138 | |
3.19%, 7/23/30, (3.194% fixed rate until 7/23/29; 3-month U.S. dollar London Interbank Offered Rate + 1.18% thereafter)(b)(d) | | | 178,000 | | | | 159,595 | |
2.50%, 2/13/31, (2.496% fixed rate until 2/13/30; 3-month U.S. dollar London Interbank Offered Rate + 0.99% thereafter)(b)(d) | | | 240,000 | | | | 203,326 | |
2.59%, 4/29/31, (2.592% fixed rate until 4/29/30; Secured Overnight Financing Rate + 2.15% thereafter)(b) | | | 236,000 | | | | 200,581 | |
1.90%, 7/23/31, (1.898% fixed rate until 7/23/30; Secured Overnight Financing Rate + 1.53% thereafter)(b) | | | 504,000 | | | | 403,790 | |
5.00%, 1/21/44 | | | 121,000 | | | | 118,667 | |
4.08%, 3/20/51, (4.083% fixed rate until 3/20/50; 3-month U.S. dollar London Interbank Offered Rate + 3.15% thereafter)(b)(d) | | | 60,000 | | | | 51,790 | |
| | |
Baxter International, Inc.
2.60%, 8/15/26 | | | 240,000 | | | | 225,041 | |
1.73%, 4/1/31 | | | 30,000 | | | | 23,662 | |
2.54%, 2/1/32 | | | 96,000 | | | | 81,039 | |
| | |
Becton Dickinson and Co.
3.79%, 5/20/50 | | | 108,000 | | | | 89,396 | |
| | |
Berkshire Hathaway Energy Co.
3.75%, 11/15/23 | | | 44,000 | | | | 44,287 | |
6.13%, 4/1/36 | | | 30,000 | | | | 33,149 | |
3.80%, 7/15/48 | | | 47,000 | | | | 39,653 | |
| | |
Biogen, Inc.
3.25%, 2/15/51 | | | 83,000 | | | | 58,294 | |
| | |
Boardwalk Pipelines LP
5.95%, 6/1/26 | | | 60,000 | | | | 62,255 | |
| | |
Booking Holdings, Inc.
3.55%, 3/15/28 | | | 27,000 | | | | 26,047 | |
| | |
BorgWarner, Inc.
4.38%, 3/15/45 | | | 30,000 | | | | 24,337 | |
| | |
Boston Scientific Corp.
4.70%, 3/1/49 | | | 12,000 | | | | 11,497 | |
| | |
Brighthouse Financial, Inc.
5.63%, 5/15/30 | | | 240,000 | | | | 233,378 | |
4.70%, 6/22/47 | | | 8,000 | | | | 6,388 | |
See Notes to Financial Statements.
Schedule of Investments (continued)
WisdomTree U.S. Corporate Bond Fund (WFIG)
June 30, 2022
| | | | | | | | |
| Investments | | Principal
Amount | | | Value | |
| | |
Bristol-Myers Squibb Co.
0.75%, 11/13/25 | | $ | 240,000 | | | $ | 218,957 | |
4.35%, 11/15/47 | | | 11,000 | | | | 10,527 | |
4.25%, 10/26/49 | | | 58,000 | | | | 54,646 | |
3.90%, 3/15/62 | | | 100,000 | | | | 86,356 | |
| | |
Broadcom Corp. / Broadcom Cayman Finance Ltd.
3.88%, 1/15/27 | | | 154,000 | | | | 148,570 | |
| | |
Broadcom, Inc.
3.46%, 9/15/26(a) | | | 16,000 | | | | 15,370 | |
2.45%, 2/15/31(c) | | | 55,000 | | | | 44,239 | |
4.30%, 11/15/32 | | | 43,000 | | | | 39,171 | |
3.42%, 4/15/33(c) | | | 78,000 | | | | 64,557 | |
3.47%, 4/15/34(c) | | | 171,000 | | | | 139,279 | |
4.93%, 5/15/37(c) | | | 307,000 | | | | 276,014 | |
| | |
Broadridge Financial Solutions, Inc.
3.40%, 6/27/26 | | | 25,000 | | | | 24,194 | |
| | |
Brown & Brown, Inc.
4.20%, 3/17/32 | | | 270,000 | | | | 246,518 | |
| | |
Burlington Northern Santa Fe LLC
3.75%, 4/1/24 | | | 15,000 | | | | 15,105 | |
5.05%, 3/1/41 | | | 25,000 | | | | 25,661 | |
5.40%, 6/1/41 | | | 19,000 | | | | 20,220 | |
4.45%, 3/15/43 | | | 38,000 | | | | 36,260 | |
4.15%, 4/1/45 | | | 9,000 | | | | 8,232 | |
| | |
Capital One Financial Corp.
3.75%, 7/28/26 | | | 136,000 | | | | 130,223 | |
3.80%, 1/31/28 | | | 281,000 | | | | 264,989 | |
| | |
Cardinal Health, Inc.
4.90%, 9/15/45 | | | 44,000 | | | | 40,179 | |
| | |
Carrier Global Corp.
3.38%, 4/5/40 | | | 310,000 | | | | 243,648 | |
| | |
Caterpillar Financial Services Corp.
2.85%, 5/17/24 | | | 46,000 | | | | 45,615 | |
| | |
Charles Schwab Corp.
1.15%, 5/13/26 | | | 114,000 | | | | 102,983 | |
| | |
Chubb Corp.
6.50%, 5/15/38, Series 1 | | | 18,000 | | | | 21,197 | |
| | |
Cigna Corp.
4.50%, 2/25/26 | | | 54,000 | | | | 54,761 | |
4.38%, 10/15/28 | | | 63,000 | | | | 62,510 | |
4.80%, 7/15/46 | | | 132,000 | | | | 125,907 | |
3.88%, 10/15/47 | | | 18,000 | | | | 14,888 | |
4.90%, 12/15/48 | | | 94,000 | | | | 90,332 | |
| | |
Cisco Systems, Inc.
5.50%, 1/15/40 | | | 35,000 | | | | 38,384 | |
| | |
Citigroup, Inc.
5.50%, 9/13/25 | | | 84,000 | | | | 86,484 | |
4.30%, 11/20/26 | | | 441,000 | | | | 435,880 | |
4.45%, 9/29/27 | | | 116,000 | | | | 114,160 | |
4.41%, 3/31/31, (4.412% fixed rate until 3/31/30; Secured Overnight Financing Rate + 3.914% thereafter)(b) | | | 97,000 | | | | 92,945 | |
2.56%, 5/1/32, (2.561% fixed rate until 5/1/31; Secured Overnight Financing Rate + 1.167% thereafter)(b) | | | 48,000 | | | | 39,613 | |
6.63%, 6/15/32 | | | 150,000 | | | | 164,223 | |
3.06%, 1/25/33, (3.057% fixed rate until 1/25/32; Secured Overnight Financing Rate + 1.351% thereafter)(b) | | | 51,000 | | | | 43,353 | |
8.13%, 7/15/39 | | | 106,000 | | | | 139,425 | |
5.88%, 1/30/42 | | | 83,000 | | | | 88,818 | |
4.65%, 7/23/48 | | | 93,000 | | | | 86,833 | |
| | |
CNA Financial Corp.
4.50%, 3/1/26 | | | 18,000 | | | | 18,067 | |
| | |
Coca-Cola Co.
1.45%, 6/1/27 | | | 67,000 | | | | 60,685 | |
| | |
Comcast Corp.
3.38%, 2/15/25 | | | 19,000 | | | | 18,869 | |
3.38%, 8/15/25 | | | 10,000 | | | | 9,887 | |
3.15%, 2/15/28 | | | 4,000 | | | | 3,814 | |
4.15%, 10/15/28 | | | 28,000 | | | | 27,947 | |
4.25%, 10/15/30 | | | 78,000 | | | | 76,968 | |
1.50%, 2/15/31(a) | | | 284,000 | | | | 228,444 | |
4.25%, 1/15/33 | | | 191,000 | | | | 187,948 | |
4.00%, 8/15/47 | | | 104,000 | | | | 90,661 | |
3.97%, 11/1/47 | | | 35,000 | | | | 30,318 | |
2.94%, 11/1/56 | | | 39,000 | | | | 27,122 | |
2.99%, 11/1/63 | | | 58,000 | | | | 39,668 | |
| | |
Commonwealth Edison Co.
3.65%, 6/15/46 | | | 31,000 | | | | 26,338 | |
| | |
Conagra Brands, Inc.
4.30%, 5/1/24 | | | 61,000 | | | | 61,260 | |
7.00%, 10/1/28 | | | 33,000 | | | | 35,594 | |
5.40%, 11/1/48 | | | 42,000 | | | | 39,743 | |
| | |
Connecticut Light and Power Co.
4.30%, 4/15/44 | | | 30,000 | | | | 28,071 | |
| | |
Consolidated Edison Co. of New York, Inc.
6.75%, 4/1/38, Series 08-B | | | 98,000 | | | | 114,956 | |
4.20%, 3/15/42, Series 12-A | | | 40,000 | | | | 35,372 | |
3.95%, 3/1/43 | | | 37,000 | | | | 31,998 | |
3.85%, 6/15/46 | | | 25,000 | | | | 21,242 | |
4.50%, 5/15/58 | | | 5,000 | | | | 4,511 | |
| | |
Constellation Brands, Inc.
2.25%, 8/1/31 | | | 410,000 | | | | 332,723 | |
3.75%, 5/1/50 | | | 38,000 | | | | 30,382 | |
| | |
Corning, Inc.
4.38%, 11/15/57 | | | 59,000 | | | | 48,975 | |
5.45%, 11/15/79 | | | 10,000 | | | | 9,049 | |
| | |
CSX Corp.
3.80%, 3/1/28 | | | 50,000 | | | | 48,933 | |
6.00%, 10/1/36 | | | 7,000 | | | | 7,763 | |
4.25%, 11/1/66 | | | 15,000 | | | | 12,826 | |
| | |
CVS Health Corp.
3.38%, 8/12/24 | | | 83,000 | | | | 82,672 | |
3.88%, 7/20/25 | | | 134,000 | | | | 133,496 | |
4.30%, 3/25/28 | | | 59,000 | | | | 58,482 | |
4.78%, 3/25/38 | | | 117,000 | | | | 110,868 | |
2.70%, 8/21/40 | | | 101,000 | | | | 72,895 | |
5.13%, 7/20/45 | | | 56,000 | | | | 54,134 | |
5.05%, 3/25/48 | | | 145,000 | | | | 138,943 | |
| | |
D.R. Horton, Inc.
2.60%, 10/15/25 | | | 40,000 | | | | 37,692 | |
1.30%, 10/15/26 | | | 240,000 | | | | 207,470 | |
| | |
Dell International LLC / EMC Corp.
6.02%, 6/15/26 | | | 209,000 | | | | 216,842 | |
5.30%, 10/1/29 | | | 220,000 | | | | 217,111 | |
3.38%, 12/15/41(c) | | | 120,000 | | | | 85,951 | |
See Notes to Financial Statements.
Schedule of Investments (continued)
WisdomTree U.S. Corporate Bond Fund (WFIG)
June 30, 2022
| | | | | | | | |
| Investments | | Principal
Amount | | | Value | |
| | |
Devon Energy Corp.
4.75%, 5/15/42 | | $ | 130,000 | | | $ | 117,966 | |
| | |
Diamondback Energy, Inc.
3.13%, 3/24/31 | | | 290,000 | | | | 252,677 | |
| | |
Discover Financial Services
3.85%, 11/21/22 | | | 32,000 | | | | 32,114 | |
3.95%, 11/6/24 | | | 132,000 | | | | 130,342 | |
| | |
Discovery Communications LLC
3.90%, 11/15/24 | | | 140,000 | | | | 137,946 | |
4.00%, 9/15/55 | | | 34,000 | | | | 23,823 | |
| | |
Dollar General Corp.
3.88%, 4/15/27 | | | 9,000 | | | | 8,840 | |
| | |
Dominion Energy South Carolina, Inc.
5.10%, 6/1/65 | | | 33,000 | | | | 33,077 | |
| | |
Dominion Energy, Inc.
3.07%, 8/15/24(b) | | | 10,000 | | | | 9,774 | |
4.90%, 8/1/41, Series C | | | 18,000 | | | | 17,313 | |
| | |
Dow Chemical Co.
2.10%, 11/15/30(a) | | | 420,000 | | | | 346,777 | |
| | |
Duke Energy Carolinas LLC
3.95%, 11/15/28 | | | 35,000 | | | | 34,587 | |
6.05%, 4/15/38(a) | | | 84,000 | | | | 94,153 | |
3.95%, 3/15/48 | | | 40,000 | | | | 35,297 | |
| | |
Duke Energy Florida LLC
4.20%, 7/15/48 | | | 13,000 | | | | 11,732 | |
| | |
Duke Energy Florida Project Finance LLC
2.54%, 9/1/29, Series 2026 | | | 50,000 | | | | 47,114 | |
| | |
Duke Energy Ohio, Inc.
3.70%, 6/15/46 | | | 36,000 | | | | 30,240 | |
| | |
Duke Energy Progress LLC
3.45%, 3/15/29 | | | 63,000 | | | | 59,997 | |
3.70%, 10/15/46 | | | 37,000 | | | | 31,710 | |
| | |
Eastern Gas Transmission & Storage, Inc.
4.80%, 11/1/43(c) | | | 10,000 | | | | 9,422 | |
| | |
Eastman Chemical Co.
3.60%, 8/15/22 | | | 3,000 | | | | 3,000 | |
| | |
eBay, Inc.
4.00%, 7/15/42 | | | 82,000 | | | | 69,877 | |
| | |
Elevance Health, Inc.
3.30%, 1/15/23 | | | 23,000 | | | | 23,013 | |
3.65%, 12/1/27 | | | 73,000 | | | | 71,101 | |
4.10%, 3/1/28 | | | 48,000 | | | | 47,525 | |
4.63%, 5/15/42 | | | 15,000 | | | | 14,265 | |
4.65%, 1/15/43 | | | 40,000 | | | | 38,167 | |
4.38%, 12/1/47 | | | 60,000 | | | | 55,596 | |
| | |
Enterprise Products Operating LLC
2.80%, 1/31/30 | | | 252,000 | | | | 220,946 | |
3.95%, 1/31/60 | | | 19,000 | | | | 14,983 | |
| | |
EOG Resources, Inc.
3.90%, 4/1/35 | | | 18,000 | | | | 16,787 | |
| | |
Essential Utilities, Inc.
4.28%, 5/1/49 | | | 32,000 | | | | 28,124 | |
| | |
Evergy, Inc.
2.90%, 9/15/29 | | | 30,000 | | | | 26,521 | |
| | |
Exelon Corp.
3.40%, 4/15/26 | | | 71,000 | | | | 68,977 | |
5.10%, 6/15/45 | | | 60,000 | | | | 59,596 | |
4.45%, 4/15/46 | | | 40,000 | | | | 36,156 | |
| | |
Exxon Mobil Corp.
2.02%, 8/16/24(a) | | | 11,000 | | | | 10,743 | |
2.71%, 3/6/25 | | | 77,000 | | | | 75,478 | |
| | |
Fifth Third Bancorp
3.95%, 3/14/28(a) | | | 27,000 | | | | 26,278 | |
8.25%, 3/1/38 | | | 25,000 | | | | 32,234 | |
| | |
Fiserv, Inc.
3.80%, 10/1/23 | | | 33,000 | | | | 33,086 | |
2.75%, 7/1/24 | | | 51,000 | | | | 49,794 | |
3.50%, 7/1/29 | | | 89,000 | | | | 81,206 | |
| | |
Florida Power & Light Co.
4.13%, 6/1/48 | | | 79,000 | | | | 74,363 | |
| | |
Fortune Brands Home & Security, Inc.
3.25%, 9/15/29 | | | 290,000 | | | | 251,018 | |
| | |
Fox Corp.
3.50%, 4/8/30 | | | 151,000 | | | | 137,250 | |
| | |
General Mills, Inc.
4.00%, 4/17/25 | | | 35,000 | | | | 35,014 | |
4.20%, 4/17/28 | | | 18,000 | | | | 17,854 | |
3.00%, 2/1/51(a) | | | 24,000 | | | | 17,483 | |
| | |
Gilead Sciences, Inc.
3.70%, 4/1/24 | | | 10,000 | | | | 10,016 | |
3.65%, 3/1/26 | | | 90,000 | | | | 88,682 | |
4.60%, 9/1/35 | | | 60,000 | | | | 59,515 | |
4.80%, 4/1/44 | | | 16,000 | | | | 15,533 | |
4.50%, 2/1/45 | | | 52,000 | | | | 48,218 | |
4.15%, 3/1/47 | | | 8,000 | | | | 7,082 | |
| | |
Global Payments, Inc.
1.20%, 3/1/26 | | | 290,000 | | | | 255,977 | |
2.90%, 5/15/30 | | | 85,000 | | | | 71,696 | |
| | |
GSK Consumer Healthcare Capital U.S. LLC
3.38%, 3/24/29(c) | | | 320,000 | | | | 299,747 | |
| | |
Hartford Financial Services Group, Inc.
6.10%, 10/1/41 | | | 7,000 | | | | 7,653 | |
| | |
Hasbro, Inc.
3.50%, 9/15/27 | | | 55,000 | | | | 51,963 | |
| | |
HCA, Inc.
5.25%, 6/15/26 | | | 85,000 | | | | 84,621 | |
4.50%, 2/15/27 | | | 200,000 | | | | 192,564 | |
4.13%, 6/15/29 | | | 136,000 | | | | 124,216 | |
5.25%, 6/15/49 | | | 57,000 | | | | 49,270 | |
| | |
Healthpeak Properties, Inc.
3.50%, 7/15/29 | | | 45,000 | | | | 41,603 | |
| | |
Home Depot, Inc.
2.13%, 9/15/26 | | | 23,000 | | | | 21,783 | |
2.95%, 6/15/29 | | | 37,000 | | | | 34,625 | |
4.88%, 2/15/44 | | | 34,000 | | | | 34,638 | |
4.40%, 3/15/45 | | | 63,000 | | | | 60,406 | |
4.50%, 12/6/48 | | | 9,000 | | | | 8,806 | |
| | |
Honeywell International, Inc.
5.70%, 3/15/37 | | | 4,000 | | | | 4,553 | |
| | |
HP, Inc.
1.45%, 6/17/26 | | | 170,000 | | | | 150,662 | |
2.65%, 6/17/31 | | | 130,000 | | | | 104,525 | |
6.00%, 9/15/41(a) | | | 83,000 | | | | 84,086 | |
| | |
Humana, Inc.
3.13%, 8/15/29 | | | 53,000 | | | | 47,970 | |
See Notes to Financial Statements.
Schedule of Investments (continued)
WisdomTree U.S. Corporate Bond Fund (WFIG)
June 30, 2022
| | | | | | | | |
| Investments | | Principal
Amount | | | Value | |
| | |
Indiana Michigan Power Co.
4.55%, 3/15/46, Series K | | $ | 26,000 | | | $ | 24,172 | |
| | |
Intel Corp.
3.10%, 7/29/22 | | | 10,000 | | | | 10,009 | |
2.88%, 5/11/24 | | | 3,000 | | | | 2,992 | |
3.25%, 11/15/49 | | | 165,000 | | | | 129,187 | |
4.95%, 3/25/60(a) | | | 40,000 | | | | 40,749 | |
| | |
Intercontinental Exchange, Inc.
4.60%, 3/15/33 | | | 70,000 | | | | 69,635 | |
3.00%, 6/15/50 | | | 56,000 | | | | 40,919 | |
3.00%, 9/15/60 | | | 50,000 | | | | 33,920 | |
| | |
International Business Machines Corp.
3.30%, 5/15/26 | | | 100,000 | | | | 97,708 | |
3.50%, 5/15/29 | | | 100,000 | | | | 94,760 | |
1.95%, 5/15/30 | | | 250,000 | | | | 210,205 | |
4.15%, 5/15/39 | | | 100,000 | | | | 90,227 | |
4.00%, 6/20/42 | | | 24,000 | | | | 20,832 | |
| | |
International Flavors & Fragrances, Inc.
5.00%, 9/26/48 | | | 10,000 | | | | 9,359 | |
| | |
International Paper Co.
5.00%, 9/15/35 | | | 40,000 | | | | 40,540 | |
4.80%, 6/15/44 | | | 3,000 | | | | 2,791 | |
4.40%, 8/15/47 | | | 100,000 | | | | 89,355 | |
4.35%, 8/15/48(a) | | | 9,000 | | | | 8,004 | |
| | |
Interpublic Group of Cos., Inc.
4.65%, 10/1/28 | | | 22,000 | | | | 21,787 | |
| | |
Jefferies Group LLC / Jefferies Group Capital Finance, Inc.
4.85%, 1/15/27 | | | 141,000 | | | | 140,674 | |
| | |
Johnson & Johnson
2.90%, 1/15/28 | | | 30,000 | | | | 29,021 | |
4.38%, 12/5/33 | | | 26,000 | | | | 26,906 | |
| | |
JPMorgan Chase & Co.
3.63%, 12/1/27 | | | 660,000 | | | | 634,399 | |
4.57%, 6/14/30, (4.565% fixed rate until 6/14/29; Secured Overnight Financing Rate + 1.75% thereafter)(b) | | | 51,000 | | | | 50,162 | |
4.49%, 3/24/31, (4.493% fixed rate until 3/24/30; Secured Overnight Financing Rate + 3.79% thereafter)(b) | | | 80,000 | | | | 78,303 | |
2.58%, 4/22/32, (2.58% fixed rate until 4/22/31; Secured Overnight Financing Rate + 1.25% thereafter)(b) | | | 52,000 | | | | 43,820 | |
6.40%, 5/15/38 | | | 111,000 | | | | 126,685 | |
3.11%, 4/22/41, (3.109% fixed rate until 4/22/40; Secured Overnight Financing Rate + 2.46% thereafter)(b) | | | 115,000 | | | | 89,616 | |
2.53%, 11/19/41, (2.525% fixed rate until 11/19/40; Secured Overnight Financing Rate + 1.51% thereafter)(b) | | | 60,000 | | | | 42,878 | |
5.63%, 8/16/43 | | | 16,000 | | | | 16,784 | |
4.85%, 2/1/44 | | | 23,000 | | | | 22,626 | |
4.95%, 6/1/45 | | | 187,000 | | | | 178,875 | |
3.96%, 11/15/48, (3.964% fixed rate until 11/15/47; 3-month U.S. dollar London Interbank Offered Rate + 1.38% thereafter)(b)(d) | | | 124,000 | | | | 105,995 | |
3.11%, 4/22/51, (3.109% fixed rate until 4/22/50; Secured Overnight Financing Rate + 2.44% thereafter)(b) | | | 177,000 | | | | 130,672 | |
3.33%, 4/22/52, (3.328% fixed rate until 4/22/51; Secured Overnight Financing Rate + 1.58% thereafter)(b) | | | 28,000 | | | | 21,438 | |
| | |
Kansas City Southern
4.20%, 11/15/69 | | | 42,000 | | | | 34,737 | |
| | |
Keurig Dr. Pepper, Inc.
3.40%, 11/15/25 | | | 320,000 | | | | 312,966 | |
3.80%, 5/1/50 | | | 43,000 | | | | 34,243 | |
4.50%, 4/15/52 | | | 20,000 | | | | 17,647 | |
| | |
Kilroy Realty LP
4.38%, 10/1/25 | | | 250,000 | | | | 247,240 | |
| | |
Kimberly-Clark Corp.
3.10%, 3/26/30 | | | 7,000 | | | | 6,578 | |
5.30%, 3/1/41 | | | 22,000 | | | | 23,288 | |
| | |
Kimco Realty Corp.
2.80%, 10/1/26 | | | 280,000 | | | | 262,724 | |
| | |
KLA Corp.
3.30%, 3/1/50(a) | | | 22,000 | | | | 17,487 | |
| | |
Kroger Co.
4.00%, 2/1/24 | | | 50,000 | | | | 50,302 | |
2.65%, 10/15/26 | | | 44,000 | | | | 41,255 | |
3.70%, 8/1/27(a) | | | 17,000 | | | | 16,561 | |
5.15%, 8/1/43 | | | 2,000 | | | | 1,972 | |
4.45%, 2/1/47 | | | 22,000 | | | | 19,985 | |
Laboratory Corp. of America Holdings
1.55%, 6/1/26 | | | 300,000 | | | | 268,872 | |
4.70%, 2/1/45 | | | 15,000 | | | | 13,394 | |
| | |
Lam Research Corp.
3.80%, 3/15/25 | | | 4,000 | | | | 4,005 | |
| | |
Lincoln National Corp.
3.80%, 3/1/28 | | | 25,000 | | | | 23,982 | |
| | |
Lockheed Martin Corp.
4.50%, 5/15/36 | | | 31,000 | | | | 31,016 | |
4.70%, 5/15/46 | | | 18,000 | | | | 18,244 | |
| | |
Lowe’s Cos., Inc.
2.50%, 4/15/26 | | | 230,000 | | | | 217,900 | |
1.30%, 4/15/28 | | | 60,000 | | | | 50,805 | |
4.05%, 5/3/47 | | | 116,000 | | | | 97,329 | |
4.45%, 4/1/62 | | | 140,000 | | | | 119,846 | |
| | |
LYB International Finance III LLC
4.20%, 5/1/50 | | | 30,000 | | | | 24,468 | |
| | |
Magallanes, Inc.
5.39%, 3/15/62(c) | | | 390,000 | | | | 327,530 | |
| | |
Magellan Midstream Partners LP
5.15%, 10/15/43 | | | 9,000 | | | | 8,357 | |
| | |
Marathon Oil Corp.
5.20%, 6/1/45 | | | 100,000 | | | | 92,131 | |
| | |
Marriott International, Inc.
5.75%, 5/1/25, Series EE | | | 85,000 | | | | 88,238 | |
| | |
Marsh & McLennan Cos., Inc.
3.88%, 3/15/24 | | | 64,000 | | | | 64,152 | |
| | |
Martin Marietta Materials, Inc.
2.40%, 7/15/31 | | | 70,000 | | | | 57,235 | |
| | |
McDonald’s Corp.
1.45%, 9/1/25 | | | 310,000 | | | | 289,097 | |
3.50%, 3/1/27 | | | 27,000 | | | | 26,462 | |
3.80%, 4/1/28 | | | 29,000 | | | | 28,509 | |
See Notes to Financial Statements.
Schedule of Investments (continued)
WisdomTree U.S. Corporate Bond Fund (WFIG)
June 30, 2022
| | | | | | | | |
| Investments | | Principal
Amount | | | Value | |
| | | | | | | | |
6.30%, 3/1/38 | | $ | 32,000 | | | $ | 36,652 | |
4.60%, 5/26/45 | | | 10,000 | | | | 9,468 | |
4.45%, 3/1/47 | | | 10,000 | | | | 9,320 | |
3.63%, 9/1/49 | | | 14,000 | | | | 11,516 | |
| | |
Merck & Co., Inc.
3.60%, 9/15/42 | | | 16,000 | | | | 14,050 | |
3.70%, 2/10/45 | | | 28,000 | | | | 24,646 | |
4.00%, 3/7/49 | | | 23,000 | | | | 21,356 | |
| | |
MetLife, Inc.
4.60%, 5/13/46 | | | 96,000 | | | | 93,617 | |
| | |
Micron Technology, Inc.
5.33%, 2/6/29 | | | 78,000 | | | | 77,938 | |
| | |
Microsoft Corp.
2.88%, 2/6/24 | | | 37,000 | | | | 36,966 | |
| | |
MidAmerican Energy Co.
3.65%, 8/1/48 | | | 40,000 | | | | 33,860 | |
| | |
Mondelez International, Inc.
2.75%, 4/13/30 | | | 300,000 | | | | 263,769 | |
| | |
Moody’s Corp.
2.63%, 1/15/23 | | | 54,000 | | | | 53,863 | |
| | |
Morgan Stanley
4.10%, 5/22/23 | | | 34,000 | | | | 34,170 | |
3.88%, 4/29/24, Series F | | | 33,000 | | | | 33,102 | |
5.00%, 11/24/25 | | | 460,000 | | | | 468,423 | |
3.95%, 4/23/27 | | | 244,000 | | | | 236,792 | |
4.43%, 1/23/30, (4.431% fixed rate until 1/23/29; 3-month U.S. dollar London Interbank Offered Rate + 1.628% thereafter)(b)(d) | | | 123,000 | | | | 119,560 | |
7.25%, 4/1/32 | | | 234,000 | | | | 276,632 | |
2.24%, 7/21/32, (2.239% fixed rate until 7/21/31; Secured Overnight Financing Rate + 1.178% thereafter)(b) | | | 197,000 | | | | 160,135 | |
6.38%, 7/24/42 | | | 80,000 | | | | 91,842 | |
4.30%, 1/27/45 | | | 66,000 | | | | 59,488 | |
5.60%, 3/24/51, (5.597% fixed rate until 3/24/50; Secured Overnight Financing Rate + 4.84% thereafter)(b) | | | 58,000 | | | | 62,900 | |
| | |
Mosaic Co.
5.45%, 11/15/33 | | | 20,000 | | | | 20,779 | |
| | |
Motorola Solutions, Inc.
4.60%, 5/23/29 | | | 50,000 | | | | 47,777 | |
| | |
National Fuel Gas Co.
3.75%, 3/1/23 | | | 30,000 | | | | 30,020 | |
| | |
Newmont Corp.
2.25%, 10/1/30 | | | 220,000 | | | | 183,143 | |
6.25%, 10/1/39 | | | 28,000 | | | | 30,831 | |
| | |
NextEra Energy Capital Holdings, Inc.
2.25%, 6/1/30 | | | 75,000 | | | | 63,037 | |
4.80%, 12/1/77, (4.80% fixed rate until 12/1/27; 3-month U.S. dollar London Interbank Offered Rate + 2.409% thereafter)(b)(d) | | | 90,000 | | | | 74,786 | |
3.80%, 3/15/82, (3.80% fixed rate until 3/15/27; 5-year Constant Maturity Treasury Rate + 2.547% thereafter)(b) | | | 20,000 | | | | 15,960 | |
| | | | | | | | |
| | |
NIKE, Inc.
3.38%, 11/1/46 | | | 39,000 | | | | 33,525 | |
| | |
Norfolk Southern Corp.
3.95%, 10/1/42 | | | 64,000 | | | | 56,253 | |
4.15%, 2/28/48 | | | 31,000 | | | | 27,828 | |
5.10%, 8/1/2118 | | | 12,000 | | | | 10,945 | |
| | |
Northrop Grumman Corp.
4.03%, 10/15/47 | | | 81,000 | | | | 72,085 | |
5.25%, 5/1/50 | | | 47,000 | | | | 49,868 | |
| | |
NSTAR Electric Co.
3.20%, 5/15/27 | | | 71,000 | | | | 68,690 | |
| | |
O’Reilly Automotive, Inc.
3.60%, 9/1/27 | | | 56,000 | | | | 54,168 | |
| | |
Omega Healthcare Investors, Inc.
5.25%, 1/15/26 | | | 20,000 | | | | 19,824 | |
3.63%, 10/1/29 | | | 330,000 | | | | 279,196 | |
| | |
Oracle Corp.
2.65%, 7/15/26 | | | 140,000 | | | | 129,191 | |
2.88%, 3/25/31 | | | 556,000 | | | | 458,322 | |
4.30%, 7/8/34 | | | 3,000 | | | | 2,635 | |
3.85%, 7/15/36 | | | 20,000 | | | | 16,096 | |
5.38%, 7/15/40 | | | 509,000 | | | | 463,974 | |
4.38%, 5/15/55 | | | 28,000 | | | | 21,131 | |
4.10%, 3/25/61 | | | 35,000 | | | | 25,098 | |
| | |
Owens Corning
4.30%, 7/15/47(a) | | | 7,000 | | | | 5,749 | |
| | |
Owl Rock Capital Corp.
3.75%, 7/22/25 | | | 210,000 | | | | 194,764 | |
| | |
PacifiCorp
6.00%, 1/15/39 | | | 99,000 | | | | 109,279 | |
| | |
Paramount Global
4.00%, 1/15/26 | | | 28,000 | | | | 27,390 | |
2.90%, 1/15/27 | | | 46,000 | | | | 42,400 | |
3.38%, 2/15/28 | | | 23,000 | | | | 21,146 | |
7.88%, 7/30/30 | | | 58,000 | | | | 66,550 | |
6.88%, 4/30/36 | | | 42,000 | | | | 43,878 | |
| | |
Parker-Hannifin Corp.
3.25%, 3/1/27(a) | | | 67,000 | | | | 64,029 | |
4.45%, 11/21/44 | | | 11,000 | | | | 9,882 | |
| | |
PepsiCo, Inc.
2.63%, 7/29/29 | | | 10,000 | | | | 9,270 | |
| | |
PerkinElmer, Inc.
0.85%, 9/15/24 | | | 290,000 | | | | 269,291 | |
| | |
Pfizer, Inc.
4.10%, 9/15/38 | | | 80,000 | | | | 77,402 | |
| | |
Philip Morris International, Inc.
2.88%, 5/1/24 | | | 5,000 | | | | 4,944 | |
2.75%, 2/25/26 | | | 40,000 | | | | 38,238 | |
3.13%, 8/17/27 | | | 20,000 | | | | 18,794 | |
3.13%, 3/2/28 | | | 100,000 | | | | 91,498 | |
4.38%, 11/15/41 | | | 50,000 | | | | 41,853 | |
| | |
Phillips 66
3.70%, 4/6/23 | | | 53,000 | | | | 53,075 | |
3.55%, 10/1/26(c) | | | 167,000 | | | | 162,688 | |
| | |
Pinnacle West Capital Corp.
1.30%, 6/15/25 | | | 10,000 | | | | 9,167 | |
See Notes to Financial Statements.
Schedule of Investments (continued)
WisdomTree U.S. Corporate Bond Fund (WFIG)
June 30, 2022
| | | | | | | | |
| Investments | | Principal
Amount | | | Value | |
| | |
Progress Energy, Inc.
7.75%, 3/1/31 | | $ | 70,000 | | | $ | 82,113 | |
6.00%, 12/1/39 | | | 62,000 | | | | 65,769 | |
| | |
Prudential Financial, Inc. | | | | | | | | |
5.38%, 5/15/45, (5.375% fixed rate until 5/15/25; 3-month U.S. dollar London Interbank Offered Rate + 3.031% thereafter)(b)(d) | | | 150,000 | | | | 143,962 | |
| | |
Public Service Electric and Gas Co.
3.60%, 12/1/47 | | | 62,000 | | | | 52,782 | |
| | |
Quest Diagnostics, Inc.
2.95%, 6/30/30 | | | 39,000 | | | | 34,403 | |
| | |
Raytheon Technologies Corp.
1.90%, 9/1/31 | | | 150,000 | | | | 123,085 | |
4.15%, 5/15/45 | | | 51,000 | | | | 45,552 | |
4.63%, 11/16/48 | | | 105,000 | | | | 102,658 | |
| | |
Realty Income Corp.
2.20%, 6/15/28 | | | 330,000 | | | | 290,763 | |
| | |
Republic Services, Inc.
3.20%, 3/15/25 | | | 3,000 | | | | 2,952 | |
2.90%, 7/1/26(a) | | | 100,000 | | | | 95,590 | |
| | |
Roper Technologies, Inc.
4.20%, 9/15/28 | | | 78,000 | | | | 76,532 | |
| | |
Royalty Pharma PLC
3.30%, 9/2/40 | | | 290,000 | | | | 214,701 | |
3.55%, 9/2/50 | | | 140,000 | | | | 97,852 | |
| | |
S&P Global, Inc.
1.25%, 8/15/30 | | | 320,000 | | | | 253,987 | |
2.30%, 8/15/60 | | | 70,000 | | | | 43,183 | |
| | |
Sempra Energy
6.00%, 10/15/39 | | | 159,000 | | | | 168,301 | |
| | |
Sherwin-Williams Co.
3.45%, 8/1/25 | | | 37,000 | | | | 36,461 | |
4.50%, 6/1/47 | | | 32,000 | | | | 28,371 | |
3.80%, 8/15/49 | | | 28,000 | | | | 22,531 | |
| | |
Southern Co.
3.25%, 7/1/26 | | | 227,000 | | | | 217,859 | |
4.25%, 7/1/36 | | | 7,000 | | | | 6,435 | |
4.40%, 7/1/46 | | | 100,000 | | | | 87,279 | |
| | |
Southern Power Co.
4.15%, 12/1/25 | | | 7,000 | | | | 7,016 | |
4.95%, 12/15/46, Series F | | | 100,000 | | | | 92,816 | |
| | |
Stanley Black & Decker, Inc.
4.25%, 11/15/28 | | | 57,000 | | | | 57,076 | |
| | |
Starbucks Corp.
4.00%, 11/15/28(a) | | | 50,000 | | | | 48,900 | |
| | |
State Street Corp.
3.10%, 5/15/23 | | | 21,000 | | | | 20,951 | |
2.65%, 5/19/26 | | | 50,000 | | | | 47,877 | |
| | |
Steel Dynamics, Inc.
5.00%, 12/15/26 | | | 46,000 | | | | 45,577 | |
| | |
Stryker Corp.
4.63%, 3/15/46 | | | 52,000 | | | | 49,769 | |
| | |
Synchrony Financial
4.38%, 3/19/24 | | | 33,000 | | | | 32,807 | |
| | |
Take-Two Interactive Software, Inc.
4.00%, 4/14/32 | | | 100,000 | | | | 94,040 | |
| | |
Target Corp.
2.50%, 4/15/26(a) | | | 37,000 | | | | 35,538 | |
| | |
TD SYNNEX Corp.
1.75%, 8/9/26(c) | | | 290,000 | | | | 256,145 | |
| | |
Teledyne Technologies, Inc.
1.60%, 4/1/26 | | | 290,000 | | | | 260,434 | |
| | |
Textron, Inc.
4.30%, 3/1/24 | | | 43,000 | | | | 43,225 | |
| | |
Thermo Fisher Scientific, Inc.
1.75%, 10/15/28 | | | 60,000 | | | | 52,537 | |
2.00%, 10/15/31 | | | 260,000 | | | | 218,286 | |
| | |
Toyota Motor Credit Corp.
0.80%, 10/16/25 | | | 130,000 | | | | 118,392 | |
1.13%, 6/18/26 | | | 150,000 | | | | 135,567 | |
1.90%, 9/12/31 | | | 100,000 | | | | 82,469 | |
| | |
Travelers Cos., Inc.
6.75%, 6/20/36 | | | 19,000 | | | | 23,014 | |
| | |
TWDC Enterprises 18 Corp.
3.00%, 2/13/26 | | | 55,000 | | | | 53,547 | |
7.00%, 3/1/32, Series B | | | 35,000 | | | | 41,642 | |
| | |
Tyson Foods, Inc.
3.95%, 8/15/24 | | | 18,000 | | | | 17,986 | |
4.88%, 8/15/34 | | | 62,000 | | | | 62,761 | |
| | |
U.S. Bancorp
3.00%, 7/30/29 | | | 50,000 | | | | 45,553 | |
| | |
Union Pacific Corp.
3.75%, 3/15/24 | | | 10,000 | | | | 10,036 | |
4.00%, 4/15/47 | | | 81,000 | | | | 72,662 | |
3.84%, 3/20/60 | | | 42,000 | | | | 35,162 | |
2.97%, 9/16/62 | | | 63,000 | | | | 43,790 | |
3.80%, 4/6/71 | | | 10,000 | | | | 8,063 | |
| | |
United Parcel Service, Inc.
6.20%, 1/15/38 | | | 6,000 | | | | 7,006 | |
5.30%, 4/1/50 | | | 30,000 | | | | 33,084 | |
| | |
UnitedHealth Group, Inc.
2.75%, 2/15/23 | | | 26,000 | | | | 25,956 | |
2.88%, 3/15/23 | | | 39,000 | | | | 38,979 | |
3.75%, 7/15/25 | | | 49,000 | | | | 49,065 | |
3.38%, 4/15/27 | | | 70,000 | | | | 68,780 | |
4.63%, 7/15/35 | | | 27,000 | | | | 27,485 | |
3.50%, 8/15/39 | | | 43,000 | | | | 37,586 | |
4.25%, 4/15/47 | | | 31,000 | | | | 29,199 | |
4.25%, 6/15/48 | | | 38,000 | | | | 35,627 | |
| | |
Valero Energy Corp.
7.50%, 4/15/32 | | | 70,000 | | | | 81,117 | |
4.00%, 6/1/52 | | | 150,000 | | | | 119,616 | |
| | |
Valero Energy Partners LP
4.50%, 3/15/28 | | | 170,000 | | | | 167,907 | |
| | |
Verizon Communications, Inc.
0.85%, 11/20/25 | | | 350,000 | | | | 317,579 | |
1.45%, 3/20/26 | | | 45,000 | | | | 41,221 | |
4.33%, 9/21/28 | | | 122,000 | | | | 121,461 | |
4.02%, 12/3/29 | | | 127,000 | | | | 123,289 | |
2.36%, 3/15/32 | | | 99,000 | | | | 82,177 | |
4.50%, 8/10/33 | | | 82,000 | | | | 80,096 | |
4.40%, 11/1/34 | | | 49,000 | | | | 47,065 | |
4.81%, 3/15/39 | | | 156,000 | | | | 154,006 | |
See Notes to Financial Statements.
Schedule of Investments (continued)
WisdomTree U.S. Corporate Bond Fund (WFIG)
June 30, 2022
| | | | | | | | |
| Investments | | Principal
Amount | | | Value | |
3.85%, 11/1/42 | | $ | 9,000 | | | $ | 7,660 | |
4.00%, 3/22/50 | | | 42,000 | | | | 36,307 | |
2.99%, 10/30/56 | | | 58,000 | | | | 40,399 | |
3.00%, 11/20/60 | | | 140,000 | | | | 95,537 | |
| | |
Virginia Electric and Power Co.
3.80%, 4/1/28, Series A | | | 50,000 | | | | 48,903 | |
2.30%, 11/15/31 | | | 100,000 | | | | 85,032 | |
8.88%, 11/15/38 | | | 118,000 | | | | 167,081 | |
| | |
VMware, Inc.
1.40%, 8/15/26 | | | 408,000 | | | | 361,443 | |
| | |
Walgreens Boots Alliance, Inc.
4.10%, 4/15/50(a) | | | 64,000 | | | | 50,612 | |
| | |
Walt Disney Co.
2.00%, 9/1/29 | | | 6,000 | | | | 5,162 | |
3.50%, 5/13/40 | | | 105,000 | | | | 89,706 | |
5.40%, 10/1/43 | | | 35,000 | | | | 36,950 | |
2.75%, 9/1/49 | | | 50,000 | | | | 35,976 | |
3.60%, 1/13/51 | | | 54,000 | | | | 45,138 | |
WEC Energy Group, Inc.
1.80%, 10/15/30 | | | 70,000 | | | | 56,399 | |
| | |
Wells Fargo & Co.
4.13%, 8/15/23 | | | 255,000 | | | | 256,874 | |
1.65%, 6/2/24, (1.654% fixed rate until 6/2/23; Secured Overnight Financing Rate + 1.60% thereafter)(b) | | | 367,000 | | | | 358,559 | |
3.00%, 2/19/25 | | | 39,000 | | | | 38,160 | |
3.55%, 9/29/25 | | | 84,000 | | | | 82,550 | |
4.30%, 7/22/27 | | | 45,000 | | | | 44,501 | |
2.39%, 6/2/28, (2.393% fixed rate until 6/2/27; Secured Overnight Financing Rate + 2.10% thereafter)(b) | | | 176,000 | | | | 157,770 | |
5.38%, 11/2/43 | | | 64,000 | | | | 63,206 | |
5.61%, 1/15/44 | | | 107,000 | | | | 107,915 | |
4.75%, 12/7/46 | | | 50,000 | | | | 45,722 | |
Westlake Corp.
3.60%, 8/15/26 | | | 70,000 | | | | 68,221 | |
3.38%, 8/15/61 | | | 240,000 | | | | 162,996 | |
| | |
Weyerhaeuser Co.
7.38%, 3/15/32 | | | 31,000 | | | | 35,905 | |
| | |
Wyeth LLC
6.50%, 2/1/34 | | | 87,000 | | | | 104,122 | |
| | |
Xcel Energy, Inc.
3.30%, 6/1/25 | | | 117,000 | | | | 115,030 | |
Xylem, Inc.
4.38%, 11/1/46 | | | 20,000 | | | | 18,221 | |
| | |
Zoetis, Inc.
3.00%, 9/12/27 | | | 38,000 | | | | 35,885 | |
TOTAL U.S. CORPORATE BONDS (Cost: $44,143,441) | | | | 38,867,437 | |
|
| FOREIGN CORPORATE BONDS – 2.9% | |
|
| Canada – 0.1% | |
| | |
Barrick North America Finance LLC
5.75%, 5/1/43 | | | 33,000 | | | | 34,444 | |
|
| Germany – 0.5% | |
| | |
Deutsche Bank AG | | | | | | | | |
3.96%, 11/26/25, (3.961% fixed rate until 11/26/24; Secured Overnight Financing Rate + 2.581% thereafter)(b) | | | 215,000 | | | | 208,432 | |
|
| Switzerland – 0.1% | |
| | |
Novartis Capital Corp.
3.00%, 11/20/25 | | | 33,000 | | | | 32,577 | |
|
| United Kingdom – 2.2% | |
BAT Capital Corp.
4.70%, 4/2/27 | | | 250,000 | | | | 244,465 | |
| | |
Diageo Investment Corp.
4.25%, 5/11/42 | | | 12,000 | | | | 11,370 | |
| | |
GlaxoSmithKline Capital, Inc.
2.80%, 3/18/23 | | | 10,000 | | | | 10,018 | |
3.88%, 5/15/28(a) | | | 12,000 | | | | 11,956 | |
6.38%, 5/15/38 | | | 10,000 | | | | 11,981 | |
| | |
RELX Capital, Inc.
4.00%, 3/18/29 | | | 17,000 | | | | 16,457 | |
| | |
Reynolds American, Inc.
4.45%, 6/12/25 | | | 90,000 | | | | 89,686 | |
5.70%, 8/15/35 | | | 169,000 | | | | 158,186 | |
5.85%, 8/15/45 | | | 102,000 | | | | 86,768 | |
| | |
Unilever Capital Corp.
1.38%, 9/14/30 | | | 100,000 | | | | 81,426 | |
2.63%, 8/12/51, Series 30Y | | | 220,000 | | | | 159,689 | |
| | | | | | | | |
| Total United Kingdom | | | | 882,002 | |
TOTAL FOREIGN CORPORATE BONDS (Cost: $1,314,929) | | | | 1,157,455 | |
|
| U.S. GOVERNMENT OBLIGATIONS – 0.1% | |
|
| U.S. Treasury Note – 0.1% | |
| | |
U.S. Treasury Note
2.88%, 5/15/32 (Cost: $37,267) | | | 38,500 | | | | 38,076 | |
| | |
| | | Shares | | | | |
|
| INVESTMENT OF CASH COLLATERAL FOR SECURITIES LOANED – 1.0% | |
|
| United States – 1.0% | |
| | |
State Street Navigator Securities Lending Government Money Market Portfolio, 1.56%(e) | | | | | | | | |
| (Cost: $398,348) | | | 398,348 | | | | 398,348 | |
| |
TOTAL INVESTMENTS IN SECURITIES – 99.5% (Cost: $45,893,985) | | | | 40,461,316 | |
| |
Other Assets less Liabilities – 0.5% | | | | 223,261 | |
| | | | | |
| NET ASSETS – 100.0% | | | $ | 40,684,577 | |
| (a) | Security, or portion thereof, was on loan at June 30, 2022 (See Note 2). At June 30, 2022, the total market value of the Fund’s securities on loan identified in the Schedule of Investments was $643,606 and the total market value of the collateral held by the Fund was $665,672. The total market value of the collateral includes non-cash U.S. Government securities collateral having a value of $267,324. |
| (b) | Rate shown reflects the accrual rate as of June 30, 2022 on securities with variable or step rates. |
| (c) | This security is exempt from registration under rule 144A of the Securities Act of 1933. This security may be sold in transactions that are exempt from registration, normally to qualified institutional buyers. |
| (d) | The London Interbank Offered Rate (“LIBOR”) is being phased out completely by June 30, 2023. There remains uncertainty regarding the nature of any replacement rate and the impact of a transition away from LIBOR on the Fund’s investments. |
| (e) | Rate shown represents annualized 7-day yield as of June 30, 2022. |
See Notes to Financial Statements.
Schedule of Investments (concluded)
WisdomTree U.S. Corporate Bond Fund (WFIG)
June 30, 2022
The following is a summary of the fair valuations according to the inputs used as of June 30, 2022 in valuing the Fund’s investments (See Note 2 — Fair Value Measurement):
| | | | | | | | | | | | | | | | |
| | | | |
| | | Quoted
Prices in
Active
Markets
(Level 1) | | | Other Significant
Observable Inputs
(Level 2) | | | Significant
Unobservable
Inputs
(Level 3) | | | Total | |
Assets: | | | | | | | | | | | | |
Investments in Securities | | | | |
U.S. Corporate Bonds | | $ | — | | | $ | 38,867,437 | | | $ | — | | | $ | 38,867,437 | |
Foreign Corporate Bonds | | | — | | | | 1,157,455 | | | | — | | | | 1,157,455 | |
U.S. Government Obligations | | | — | | | | 38,076 | | | | — | | | | 38,076 | |
Investment of Cash Collateral for Securities Loaned | | | — | | | | 398,348 | | | | — | | | | 398,348 | |
Total Investments in Securities | | $ | — | | | $ | 40,461,316 | | | $ | — | | | $ | 40,461,316 | |
See Notes to Financial Statements.
Schedule of Investments
WisdomTree U.S. High Yield Corporate Bond Fund (WFHY)
June 30, 2022
| | | | | | | | |
| Investments | | Principal
Amount | | | Value | |
|
| U.S. CORPORATE BONDS – 96.0% | |
|
| United States – 96.0% | |
| | |
ACCO Brands Corp.
4.25%, 3/15/29(a) | | $ | 299,000 | | | $ | 245,805 | |
| | |
AdaptHealth LLC
4.63%, 8/1/29(a) | | | 569,000 | | | | 468,128 | |
| | |
ADT Security Corp.
4.88%, 7/15/32(a) | | | 755,000 | | | | 603,200 | |
| | |
Adtalem Global Education, Inc.
5.50%, 3/1/28(a) | | | 252,000 | | | | 226,359 | |
| | |
AECOM
5.13%, 3/15/27 | | | 269,000 | | | | 254,506 | |
| | |
Albertsons Cos., Inc. / Safeway, Inc. / New Albertsons LP / Albertsons LLC
4.63%, 1/15/27(a) | | | 1,000,000 | | | | 895,300 | |
3.50%, 3/15/29(a) | | | 881,000 | | | | 713,566 | |
4.88%, 2/15/30(a) | | | 1,000,000 | | | | 854,370 | |
| | |
Allison Transmission, Inc.
5.88%, 6/1/29(a) | | | 649,000 | | | | 605,452 | |
| | |
AMC Networks, Inc.
4.75%, 8/1/25 | | | 377,000 | | | | 351,172 | |
| | |
American Axle & Manufacturing, Inc.
5.00%, 10/1/29(b) | | | 280,000 | | | | 225,714 | |
| | |
American Finance Trust, Inc. / American Finance Operating Partner LP
4.50%, 9/30/28(a) | | | 342,000 | | | | 271,254 | |
| | |
AmeriGas Partners LP / AmeriGas Finance Corp.
5.50%, 5/20/25 | | | 200,000 | | | | 189,118 | |
5.75%, 5/20/27 | | | 478,000 | | | | 440,864 | |
| | |
Amkor Technology, Inc.
6.63%, 9/15/27(a) | | | 247,000 | | | | 234,383 | |
| | |
Antero Midstream Partners LP / Antero Midstream Finance Corp.
5.75%, 1/15/28(a) | | | 900,000 | | | | 821,997 | |
| | |
Antero Resources Corp.
7.63%, 2/1/29(a) | | | 546,000 | | | | 558,138 | |
| | |
Apache Corp.
5.10%, 9/1/40 | | | 389,000 | | | | 329,121 | |
| | |
Apollo Commercial Real Estate Finance, Inc.
4.63%, 6/15/29(a) | | | 353,000 | | | | 266,790 | |
| | |
APX Group, Inc.
5.75%, 7/15/29(a)(b) | | | 310,000 | | | | 241,124 | |
| | |
Aramark Services, Inc.
6.38%, 5/1/25(a) | | | 740,000 | | | | 725,674 | |
5.00%, 2/1/28(a)(b) | | | 610,000 | | | | 558,022 | |
| | |
Archrock Partners LP / Archrock Partners Finance Corp.
6.88%, 4/1/27(a) | | | 564,000 | | | | 514,481 | |
6.25%, 4/1/28(a) | | | 159,000 | | | | 140,615 | |
| | |
Asbury Automotive Group, Inc.
5.00%, 2/15/32(a) | | | 620,000 | | | | 507,575 | |
| | |
ASGN, Inc.
4.63%, 5/15/28(a) | | | 232,000 | | | | 199,940 | |
| | |
Audacy Capital Corp.
6.75%, 3/31/29(a)(b) | | | 418,000 | | | | 224,349 | |
| | |
Avantor Funding, Inc.
4.63%, 7/15/28(a) | | | 318,000 | | | | 291,374 | |
| | |
Avient Corp.
5.75%, 5/15/25(a) | | | 135,000 | | | | 130,418 | |
| | |
Axalta Coating Systems LLC
3.38%, 2/15/29(a)(b) | | | 354,000 | | | | 289,437 | |
| | |
B&G Foods, Inc.
5.25%, 4/1/25 | | | 612,000 | | | | 564,956 | |
5.25%, 9/15/27 | | | 341,000 | | | | 295,534 | |
| | |
Ball Corp.
4.00%, 11/15/23 | | | 124,000 | | | | 122,926 | |
5.25%, 7/1/25 | | | 347,000 | | | | 347,944 | |
2.88%, 8/15/30 | | | 330,000 | | | | 267,402 | |
| | |
Bath & Body Works, Inc.
5.25%, 2/1/28 | | | 186,000 | | | | 157,023 | |
6.63%, 10/1/30(a) | | | 200,000 | | | | 172,926 | |
6.75%, 7/1/36 | | | 322,000 | | | | 258,064 | |
| | |
Bausch Health Americas, Inc.
9.25%, 4/1/26(a) | | | 921,000 | | | | 660,016 | |
| | |
Berry Global, Inc.
4.50%, 2/15/26(a)(b) | | | 232,000 | | | | 216,052 | |
5.63%, 7/15/27(a) | | | 9,000 | | | | 8,630 | |
| | |
Black Knight InfoServ LLC
3.63%, 9/1/28(a) | | | 186,000 | | | | 161,654 | |
| | |
Block, Inc.
3.50%, 6/1/31(a)(b) | | | 244,000 | | | | 196,144 | |
| | |
Booz Allen Hamilton, Inc.
3.88%, 9/1/28(a) | | | 284,000 | | | | 251,519 | |
| | |
Boyd Gaming Corp.
4.75%, 12/1/27 | | | 400,000 | | | | 362,476 | |
4.75%, 6/15/31(a) | | | 170,000 | | | | 143,990 | |
| | |
Brink’s Co.
4.63%, 10/15/27(a) | | | 50,000 | | | | 44,616 | |
| | |
Brookfield Property REIT, Inc. / BPR Cumulus LLC / BPR Nimbus LLC / GGSI Sellco LLC
5.75%, 5/15/26(a) | | | 423,000 | | | | 385,641 | |
| | |
Builders FirstSource, Inc.
5.00%, 3/1/30(a) | | | 243,000 | | | | 206,744 | |
4.25%, 2/1/32(a) | | | 262,000 | | | | 201,072 | |
| | |
Cable One, Inc.
4.00%, 11/15/30(a)(b) | | | 240,000 | | | | 197,431 | |
| | |
Catalent Pharma Solutions, Inc.
3.13%, 2/15/29(a) | | | 250,000 | | | | 206,545 | |
| | |
CCO Holdings LLC / CCO Holdings Capital Corp.
5.13%, 5/1/27(a) | | | 134,000 | | | | 126,587 | |
5.00%, 2/1/28(a) | | | 370,000 | | | | 340,677 | |
5.38%, 6/1/29(a) | | | 192,000 | | | | 175,169 | |
4.75%, 3/1/30(a) | | | 460,000 | | | | 394,004 | |
4.50%, 8/15/30(a) | | | 820,000 | | | | 686,069 | |
4.25%, 2/1/31(a) | | | 10,000 | | | | 8,226 | |
4.50%, 5/1/32 | | | 213,000 | | | | 172,617 | |
| | |
CDI Escrow Issuer, Inc.
5.75%, 4/1/30(a) | | | 250,000 | | | | 227,755 | |
| | |
CDK Global, Inc.
4.88%, 6/1/27 | | | 311,000 | | | | 309,193 | |
| | |
CDW LLC / CDW Finance Corp.
4.25%, 4/1/28 | | | 285,000 | | | | 258,888 | |
See Notes to Financial Statements.
Schedule of Investments (continued)
WisdomTree U.S. High Yield Corporate Bond Fund (WFHY)
June 30, 2022
| | | | | | | | |
| Investments | | Principal
Amount | | | Value | |
| | |
Centene Corp.
4.63%, 12/15/29 | | $ | 900,000 | | | $ | 840,276 | |
3.00%, 10/15/30 | | | 1,133,000 | | | | 940,073 | |
| | |
Central Garden & Pet Co.
4.13%, 10/15/30 | | | 100,000 | | | | 82,962 | |
| | |
CF Industries, Inc.
5.15%, 3/15/34 | | | 248,000 | | | | 242,938 | |
| | |
Change Healthcare Holdings LLC / Change Healthcare Finance, Inc.
5.75%, 3/1/25(a) | | | 462,000 | | | | 450,958 | |
| | |
Charles River Laboratories International, Inc.
4.25%, 5/1/28(a) | | | 410,000 | | | | 369,102 | |
| | |
Charter Communications Operating LLC / Charter Communications Operating Capital
3.70%, 4/1/51 | | | 1,743,000 | | | | 1,187,018 | |
| | |
Chemours Co.
5.38%, 5/15/27(b) | | | 698,000 | | | | 630,427 | |
4.63%, 11/15/29(a) | | | 396,000 | | | | 312,195 | |
| | |
Cheniere Energy, Inc.
4.63%, 10/15/28 | | | 400,000 | | | | 362,440 | |
| | |
Chesapeake Energy Corp.
6.75%, 4/15/29(a) | | | 104,000 | | | | 100,912 | |
| | |
CHS / Community Health Systems, Inc.
8.00%, 3/15/26(a) | | | 408,000 | | | | 371,819 | |
5.63%, 3/15/27(a) | | | 250,000 | | | | 211,808 | |
8.00%, 12/15/27(a)(b) | | | 426,000 | | | | 387,681 | |
6.88%, 4/15/29(a)(b) | | | 511,000 | | | | 327,209 | |
6.13%, 4/1/30(a) | | | 250,000 | | | | 153,405 | |
5.25%, 5/15/30(a) | | | 750,000 | | | | 573,412 | |
4.75%, 2/15/31(a) | | | 1,308,000 | | | | 968,116 | |
| | |
Churchill Downs, Inc.
5.50%, 4/1/27(a) | | | 430,000 | | | | 409,928 | |
| | |
Cinemark USA, Inc.
5.25%, 7/15/28(a)(b) | | | 522,000 | | | | 419,667 | |
| | |
Clarivate Science Holdings Corp.
4.88%, 7/1/29(a)(b) | | | 480,000 | | | | 394,411 | |
| | |
Clean Harbors, Inc.
4.88%, 7/15/27(a) | | | 167,000 | | | | 152,995 | |
| | |
Clear Channel Outdoor Holdings, Inc.
7.75%, 4/15/28(a)(b) | | | 1,170,000 | | | | 852,684 | |
| | |
Clearway Energy Operating LLC
4.75%, 3/15/28(a) | | | 176,000 | | | | 159,669 | |
3.75%, 2/15/31(a) | | | 176,000 | | | | 142,968 | |
| | |
Cleveland-Cliffs, Inc.
6.75%, 3/15/26(a) | | | 200,000 | | | | 198,734 | |
4.63%, 3/1/29(a)(b) | | | 464,000 | | | | 409,963 | |
4.88%, 3/1/31(a)(b) | | | 328,000 | | | | 289,339 | |
| | |
CNX Resources Corp.
7.25%, 3/14/27(a) | | | 470,000 | | | | 462,292 | |
| | |
Coinbase Global, Inc.
3.63%, 10/1/31(a) | | | 1,000,000 | | | | 561,850 | |
| | |
CommScope Technologies LLC
6.00%, 6/15/25(a) | | | 888,000 | | | | 769,221 | |
5.00%, 3/15/27(a) | | | 797,000 | | | | 594,849 | |
| | |
CommScope, Inc.
6.00%, 3/1/26(a) | | | 335,000 | | | | 309,486 | |
8.25%, 3/1/27(a) | | | 717,000 | | | | 571,800 | |
7.13%, 7/1/28(a)(b) | | | 1,131,000 | | | | 861,008 | |
| | |
Compass Minerals International, Inc.
6.75%, 12/1/27(a) | | | 393,000 | | | | 356,129 | |
| | |
Comstock Resources, Inc.
5.88%, 1/15/30(a) | | | 820,000 | | | | 711,366 | |
| | |
Conduent Business Services LLC / Conduent State & Local Solutions, Inc.
6.00%, 11/1/29(a) | | | 380,000 | | | | 317,505 | |
| | |
Consolidated Communications, Inc.
6.50%, 10/1/28(a) | | | 497,000 | | | | 423,369 | |
| | |
Continental Resources, Inc.
4.38%, 1/15/28 | | | 371,000 | | | | 349,222 | |
| | |
CoreCivic, Inc.
8.25%, 4/15/26 | | | 400,000 | | | | 390,548 | |
| | |
Cornerstone Building Brands, Inc.
6.13%, 1/15/29(a) | | | 317,000 | | | | 205,993 | |
| | |
Coty, Inc.
5.00%, 4/15/26(a) | | | 350,000 | | | | 321,979 | |
6.50%, 4/15/26(a)(b) | | | 301,000 | | | | 277,648 | |
| | |
CQP Holdco LP / BIP-V Chinook Holdco LLC
5.50%, 6/15/31(a) | | | 440,000 | | | | 376,662 | |
| | |
Crestwood Midstream Partners LP / Crestwood Midstream Finance Corp.
5.75%, 4/1/25 | | | 596,000 | | | | 563,321 | |
| | |
Crown Americas LLC / Crown Americas Capital Corp. VI
4.75%, 2/1/26 | | | 50,000 | | | | 47,702 | |
| | |
CSC Holdings LLC
5.50%, 4/15/27(a) | | | 200,000 | | | | 181,686 | |
5.38%, 2/1/28(a) | | | 1,394,000 | | | | 1,223,026 | |
7.50%, 4/1/28(a) | | | 850,000 | | | | 718,097 | |
6.50%, 2/1/29(a) | | | 300,000 | | | | 273,294 | |
5.75%, 1/15/30(a) | | | 500,000 | | | | 364,165 | |
| | |
Curo Group Holdings Corp.
7.50%, 8/1/28(a) | | | 185,000 | | | | 116,465 | |
| | |
DaVita, Inc.
4.63%, 6/1/30(a) | | | 1,305,000 | | | | 1,018,318 | |
3.75%, 2/15/31(a) | | | 382,000 | | | | 274,322 | |
| | |
Delta Air Lines, Inc.
3.80%, 4/19/23 | | | 265,000 | | | | 263,871 | |
3.75%, 10/28/29 | | | 158,000 | | | | 125,098 | |
| | |
Deluxe Corp.
8.00%, 6/1/29(a) | | | 205,000 | | | | 168,203 | |
| | |
Diamond Sports Group LLC / Diamond Sports Finance Co.
5.38%, 8/15/26(a) | | | 1,369,000 | | | | 351,053 | |
6.63%, 8/15/27(a) | | | 1,498,000 | | | | 181,333 | |
| | |
DISH DBS Corp.
5.88%, 7/15/22 | | | 4,000 | | | | 4,002 | |
5.00%, 3/15/23 | | | 514,000 | | | | 493,039 | |
5.88%, 11/15/24 | | | 540,000 | | | | 458,606 | |
7.75%, 7/1/26 | | | 1,739,000 | | | | 1,351,533 | |
5.13%, 6/1/29 | | | 1,642,000 | | | | 999,732 | |
| | |
Diversified Healthcare Trust
4.75%, 2/15/28 | | | 317,000 | | | | 234,073 | |
4.38%, 3/1/31(b) | | | 896,000 | | | | 610,337 | |
See Notes to Financial Statements.
Schedule of Investments (continued)
WisdomTree U.S. High Yield Corporate Bond Fund (WFHY)
June 30, 2022
| | | | | | | | |
| Investments | | Principal
Amount | | | Value | |
| | |
Dycom Industries, Inc.
4.50%, 4/15/29(a) | | $ | 220,000 | | | $ | 192,881 | |
| | |
Edgewell Personal Care Co.
4.13%, 4/1/29(a) | | | 110,000 | | | | 91,586 | |
| | |
Element Solutions, Inc.
3.88%, 9/1/28(a) | | | 321,000 | | | | 266,064 | |
| | |
Encompass Health Corp.
4.50%, 2/1/28 | | | 707,000 | | | | 609,314 | |
| | |
Energizer Holdings, Inc.
4.75%, 6/15/28(a) | | | 441,000 | | | | 351,336 | |
4.38%, 3/31/29(a) | | | 423,000 | | | | 324,982 | |
| | |
EnLink Midstream LLC
5.63%, 1/15/28(a) | | | 240,000 | | | | 221,582 | |
| | |
EnLink Midstream Partners LP
5.45%, 6/1/47 | | | 290,000 | | | | 206,393 | |
| | |
EQM Midstream Partners LP
6.00%, 7/1/25(a) | | | 416,000 | | | | 400,429 | |
6.50%, 7/1/27(a) | | | 500,000 | | | | 466,205 | |
5.50%, 7/15/28 | | | 1,097,000 | | | | 955,268 | |
4.75%, 1/15/31(a)(b) | | | 596,000 | | | | 476,216 | |
6.50%, 7/15/48 | | | 123,000 | | | | 91,907 | |
| | |
Ferrellgas LP / Ferrellgas Finance Corp.
5.88%, 4/1/29(a) | | | 900,000 | | | | 736,542 | |
| | |
Fertitta Entertainment LLC / Fertitta Entertainment Finance Co., Inc.
4.63%, 1/15/29(a) | | | 300,000 | | | | 256,104 | |
6.75%, 1/15/30(a)(b) | | | 750,000 | | | | 576,682 | |
| | |
Fluor Corp.
4.25%, 9/15/28(b) | | | 267,000 | | | | 233,644 | |
| | |
Ford Motor Co.
4.35%, 12/8/26(b) | | | 385,000 | | | | 357,176 | |
9.63%, 4/22/30 | | | 223,000 | | | | 252,231 | |
3.25%, 2/12/32 | | | 400,000 | | | | 299,608 | |
4.75%, 1/15/43 | | | 301,000 | | | | 214,923 | |
5.29%, 12/8/46 | | | 1,758,000 | | | | 1,353,133 | |
| | |
Ford Motor Credit Co. LLC
3.35%, 11/1/22 | | | 200,000 | | | | 199,880 | |
4.54%, 8/1/26 | | | 150,000 | | | | 137,664 | |
4.00%, 11/13/30 | | | 350,000 | | | | 284,217 | |
| | |
Freeport-McMoRan, Inc.
3.88%, 3/15/23 | | | 351,000 | | | | 351,713 | |
5.25%, 9/1/29 | | | 490,000 | | | | 468,553 | |
5.40%, 11/14/34 | | | 134,000 | | | | 131,024 | |
5.45%, 3/15/43 | | | 264,000 | | | | 244,575 | |
| | |
Frontier Communications Holdings LLC
5.00%, 5/1/28(a) | | | 1,500,000 | | | | 1,283,355 | |
5.88%, 11/1/29 | | | 1,500,000 | | | | 1,160,025 | |
6.00%, 1/15/30(a)(b) | | | 1,000,000 | | | | 773,940 | |
| | |
Gap, Inc.
3.88%, 10/1/31(a)(b) | | | 383,000 | | | | 266,832 | |
| | |
Gartner, Inc.
3.75%, 10/1/30(a) | | | 302,000 | | | | 261,245 | |
| | |
Gates Global LLC / Gates Corp.
6.25%, 1/15/26(a) | | | 286,000 | | | | 266,738 | |
| | |
Genesis Energy LP / Genesis Energy Finance Corp.
7.75%, 2/1/28 | | | 1,265,000 | | | | 1,095,300 | |
| | |
GLP Capital LP / GLP Financing II, Inc.
5.38%, 4/15/26 | | | 280,000 | | | | 274,324 | |
4.00%, 1/15/31 | | | 388,000 | | | | 337,075 | |
| | |
Go Daddy Operating Co. LLC / GD Finance Co., Inc.
3.50%, 3/1/29(a) | | | 350,000 | | | | 295,494 | |
| | |
Goodyear Tire & Rubber Co.
5.00%, 5/31/26(b) | | | 400,000 | | | | 371,652 | |
4.88%, 3/15/27(b) | | | 50,000 | | | | 44,813 | |
5.25%, 7/15/31(b) | | | 1,032,000 | | | | 837,262 | |
| | |
GrafTech Finance, Inc.
4.63%, 12/15/28(a) | | | 207,000 | | | | 173,025 | |
| | |
Gray Escrow II, Inc.
5.38%, 11/15/31(a) | | | 930,000 | | | | 745,795 | |
| | |
Gray Television, Inc.
5.88%, 7/15/26(a) | | | 618,000 | | | | 579,857 | |
7.00%, 5/15/27(a) | | | 308,000 | | | | 297,238 | |
| | |
Griffon Corp.
5.75%, 3/1/28 | | | 529,000 | | | | 480,708 | |
| | |
Group 1 Automotive, Inc.
4.00%, 8/15/28(a) | | | 303,000 | | | | 257,605 | |
| | |
Hanesbrands, Inc.
4.88%, 5/15/26(a) | | | 428,000 | | | | 397,141 | |
| | |
HCA, Inc.
5.88%, 2/1/29 | | | 202,000 | | | | 202,386 | |
3.50%, 9/1/30 | | | 548,000 | | | | 467,767 | |
| | |
Hilton Domestic Operating Co., Inc.
5.38%, 5/1/25(a) | | | 371,000 | | | | 365,109 | |
5.75%, 5/1/28(a) | | | 439,000 | | | | 419,350 | |
| | |
Hilton Grand Vacations Borrower Escrow LLC / Hilton Grand Vacations Borrower Escrow, Inc.
4.88%, 7/1/31(a) | | | 544,000 | | | | 416,388 | |
| | |
Hilton Worldwide Finance LLC / Hilton Worldwide Finance Corp.
4.88%, 4/1/27 | | | 535,000 | | | | 505,842 | |
| | |
HLF Financing Sarl LLC / Herbalife International, Inc.
4.88%, 6/1/29(a) | | | 349,000 | | | | 241,267 | |
| | |
Holly Energy Partners LP / Holly Energy Finance Corp.
5.00%, 2/1/28(a) | | | 247,000 | | | | 212,153 | |
| | |
Hologic, Inc.
3.25%, 2/15/29(a) | | | 158,000 | | | | 135,280 | |
| | |
Horizon Therapeutics USA, Inc.
5.50%, 8/1/27(a) | | | 250,000 | | | | 241,317 | |
| | |
Hughes Satellite Systems Corp.
5.25%, 8/1/26 | | | 129,000 | | | | 119,491 | |
6.63%, 8/1/26 | | | 397,000 | | | | 347,871 | |
| | |
Huntsman International LLC
4.50%, 5/1/29 | | | 120,000 | | | | 113,123 | |
| | |
iHeartCommunications, Inc.
8.38%, 5/1/27(b) | | | 1,157,774 | | | | 927,308 | |
4.75%, 1/15/28(a)(b) | | | 441,000 | | | | 363,799 | |
| | |
Ingevity Corp.
3.88%, 11/1/28(a)(b) | | | 246,000 | | | | 206,345 | |
See Notes to Financial Statements.
Schedule of Investments (continued)
WisdomTree U.S. High Yield Corporate Bond Fund (WFHY)
June 30, 2022
| | | | | | | | |
| Investments | | Principal
Amount | | | Value | |
| | |
IQVIA, Inc.
5.00%, 5/15/27(a) | | $ | 200,000 | | | $ | 189,402 | |
| | |
Iron Mountain, Inc.
4.88%, 9/15/27(a) | | | 344,000 | | | | 311,822 | |
5.25%, 3/15/28(a) | | | 469,000 | | | | 421,486 | |
4.88%, 9/15/29(a) | | | 475,000 | | | | 398,382 | |
5.63%, 7/15/32(a) | | | 499,000 | | | | 423,372 | |
| | |
iStar, Inc.
4.25%, 8/1/25 | | | 160,000 | | | | 148,280 | |
| | |
Kaiser Aluminum Corp.
4.50%, 6/1/31(a) | | | 513,000 | | | | 393,943 | |
| | |
KAR Auction Services, Inc.
5.13%, 6/1/25(a)(b) | | | 504,000 | | | | 474,456 | |
| | |
Kennedy-Wilson, Inc.
5.00%, 3/1/31 | | | 678,000 | | | | 537,098 | |
| | |
KFC Holding Co. / Pizza Hut Holdings LLC / Taco Bell of America LLC
4.75%, 6/1/27(a) | | | 113,000 | | | | 108,737 | |
| | |
Koppers, Inc.
6.00%, 2/15/25(a) | | | 270,000 | | | | 252,288 | |
| | |
Ladder Capital Finance Holdings LLLP / Ladder Capital Finance Corp.
4.25%, 2/1/27(a) | | | 320,000 | | | | 259,565 | |
| | |
Lamar Media Corp.
4.00%, 2/15/30 | | | 328,000 | | | | 278,256 | |
3.63%, 1/15/31 | | | 50,000 | | | | 41,085 | |
| | |
Lamb Weston Holdings, Inc.
4.88%, 5/15/28(a) | | | 56,000 | | | | 52,775 | |
4.38%, 1/31/32(a) | | | 570,000 | | | | 496,208 | |
| | |
Level 3 Financing, Inc.
5.38%, 5/1/25 | | | 350,000 | | | | 340,291 | |
4.25%, 7/1/28(a) | | | 417,000 | | | | 334,530 | |
3.63%, 1/15/29(a) | | | 952,000 | | | | 731,821 | |
| | |
Lions Gate Capital Holdings LLC
5.50%, 4/15/29(a) | | | 382,000 | | | | 298,426 | |
| | |
Lithia Motors, Inc.
4.38%, 1/15/31(a) | | | 68,000 | | | | 58,418 | |
| | |
Live Nation Entertainment, Inc.
4.75%, 10/15/27(a)(b) | | | 800,000 | | | | 713,120 | |
3.75%, 1/15/28(a) | | | 500,000 | | | | 433,345 | |
| | |
LPL Holdings, Inc.
4.00%, 3/15/29(a) | | | 104,000 | | | | 89,579 | |
| | |
Lumen Technologies, Inc.
6.75%, 12/1/23, Series W | | | 524,000 | | | | 520,804 | |
7.50%, 4/1/24, Series Y | | | 292,000 | | | | 289,982 | |
5.63%, 4/1/25 | | | 391,000 | | | | 371,403 | |
5.13%, 12/15/26(a) | | | 1,261,000 | | | | 1,063,893 | |
| | |
Macy’s Retail Holdings LLC
5.88%, 4/1/29(a) | | | 270,000 | | | | 230,329 | |
| | |
Marriott Ownership Resorts, Inc.
6.13%, 9/15/25(a) | | | 288,000 | | | | 286,332 | |
| | |
Masonite International Corp.
5.38%, 2/1/28(a) | | | 231,000 | | | | 210,171 | |
| | |
Match Group Holdings II LLC
3.63%, 10/1/31(a)(b) | | | 186,000 | | | | 146,851 | |
| | |
Mattel, Inc.
5.88%, 12/15/27(a) | | | 220,000 | | | | 215,233 | |
| | |
MGM Resorts International
6.75%, 5/1/25 | | | 585,000 | | | | 576,991 | |
4.63%, 9/1/26 | | | 146,000 | | | | 129,775 | |
5.50%, 4/15/27 | | | 731,000 | | | | 660,539 | |
4.75%, 10/15/28 | | | 77,000 | | | | 64,905 | |
| | |
Michaels Cos., Inc.
7.88%, 5/1/29(a) | | | 999,000 | | | | 663,566 | |
| | |
Midwest Gaming Borrower LLC / Midwest Gaming Finance Corp.
4.88%, 5/1/29(a) | | | 446,000 | | | | 364,690 | |
| | |
ModivCare Escrow Issuer, Inc.
5.00%, 10/1/29(a) | | | 452,000 | | | | 365,804 | |
| | |
Molina Healthcare, Inc.
3.88%, 11/15/30(a) | | | 550,000 | | | | 470,580 | |
3.88%, 5/15/32(a) | | | 264,000 | | | | 222,285 | |
| | |
MPH Acquisition Holdings LLC
5.75%, 11/1/28(a)(b) | | | 1,379,000 | | | | 1,146,514 | |
| | |
MPT Operating Partnership LP / MPT Finance Corp.
5.25%, 8/1/26 | | | 212,000 | | | | 201,148 | |
5.00%, 10/15/27 | | | 251,000 | | | | 230,483 | |
4.63%, 8/1/29 | | | 189,000 | | | | 167,148 | |
| | |
MSCI, Inc.
4.00%, 11/15/29(a)(b) | | | 359,000 | | | | 319,241 | |
| | |
Murphy Oil USA, Inc.
4.75%, 9/15/29 | | | 92,000 | | | | 83,143 | |
3.75%, 2/15/31(a) | | | 154,000 | | | | 131,441 | |
| | |
Nabors Industries, Inc.
7.38%, 5/15/27(a) | | | 700,000 | | | | 662,200 | |
| | |
Nationstar Mortgage Holdings, Inc.
6.00%, 1/15/27(a) | | | 1,440,000 | | | | 1,252,224 | |
| | |
Navient Corp.
5.50%, 1/25/23 | | | 450,000 | | | | 447,430 | |
6.13%, 3/25/24 | | | 639,000 | | | | 606,788 | |
6.75%, 6/25/25 | | | 77,000 | | | | 70,440 | |
6.75%, 6/15/26 | | | 261,000 | | | | 231,215 | |
5.00%, 3/15/27 | | | 47,000 | | | | 38,827 | |
4.88%, 3/15/28 | | | 280,000 | | | | 218,999 | |
| | |
NCR Corp.
5.00%, 10/1/28(a) | | | 731,000 | | | | 624,515 | |
5.13%, 4/15/29(a) | | | 410,000 | | | | 348,279 | |
| | |
Newell Brands, Inc.
4.10%, 4/1/23 | | | 15,000 | | | | 14,890 | |
4.45%, 4/1/26 | | | 159,000 | | | | 151,510 | |
5.75%, 4/1/46 | | | 286,000 | | | | 232,083 | |
| | |
Newmark Group, Inc.
6.13%, 11/15/23 | | | 135,000 | | | | 135,012 | |
| | |
News Corp.
3.88%, 5/15/29(a) | | | 300,000 | | | | 260,508 | |
| | |
Nexstar Media, Inc.
5.63%, 7/15/27(a) | | | 600,000 | | | | 554,880 | |
4.75%, 11/1/28(a) | | | 340,000 | | | | 297,296 | |
| | |
NextEra Energy Operating Partners LP
4.25%, 9/15/24(a) | | | 7,000 | | | | 6,754 | |
3.88%, 10/15/26(a) | | | 281,000 | | | | 256,910 | |
| | |
Nielsen Finance LLC / Nielsen Finance Co.
5.88%, 10/1/30(a) | | | 250,000 | | | | 229,953 | |
4.75%, 7/15/31(a) | | | 478,000 | | | | 431,605 | |
See Notes to Financial Statements.
Schedule of Investments (continued)
WisdomTree U.S. High Yield Corporate Bond Fund (WFHY)
June 30, 2022
| | | | | | | | |
| Investments | | Principal
Amount | | | Value | |
| | |
Nordstrom, Inc.
5.00%, 1/15/44(b) | | $ | 665,000 | | | $ | 475,016 | |
| | |
NortonLifeLock, Inc.
5.00%, 4/15/25(a) | | | 351,000 | | | | 343,369 | |
| | |
NRG Energy, Inc.
3.88%, 2/15/32(a) | | | 900,000 | | | | 715,203 | |
| | |
NuStar Logistics LP
5.63%, 4/28/27 | | | 495,000 | | | | 441,787 | |
6.38%, 10/1/30 | | | 460,000 | | | | 402,091 | |
| | |
Occidental Petroleum Corp.
2.90%, 8/15/24 | | | 550,000 | | | | 531,998 | |
3.40%, 4/15/26 | | | 371,000 | | | | 340,322 | |
3.50%, 8/15/29(b) | | | 600,000 | | | | 536,430 | |
6.63%, 9/1/30 | | | 300,000 | | | | 309,306 | |
7.50%, 5/1/31 | | | 216,000 | | | | 233,058 | |
6.45%, 9/15/36 | | | 193,000 | | | | 201,226 | |
4.40%, 8/15/49 | | | 621,000 | | | | 499,110 | |
| | |
Olin Corp.
5.13%, 9/15/27 | | | 503,000 | | | | 465,169 | |
| | |
ON Semiconductor Corp.
3.88%, 9/1/28(a) | | | 200,000 | | | | 176,900 | |
| | |
OneMain Finance Corp.
5.63%, 3/15/23 | | | 411,000 | | | | 407,749 | |
6.13%, 3/15/24 | | | 353,000 | | | | 337,892 | |
6.88%, 3/15/25 | | | 575,000 | | | | 544,099 | |
7.13%, 3/15/26 | | | 61,000 | | | | 56,926 | |
6.63%, 1/15/28 | | | 300,000 | | | | 268,776 | |
5.38%, 11/15/29 | | | 465,000 | | | | 377,733 | |
4.00%, 9/15/30 | | | 894,000 | | | | 662,973 | |
| | |
Organon & Co. / Organon Foreign Debt Co-Issuer BV
5.13%, 4/30/31(a) | | | 1,000,000 | | | | 864,180 | |
| | |
Outfront Media Capital LLC / Outfront Media Capital Corp.
4.63%, 3/15/30(a) | | | 736,000 | | | | 592,524 | |
| | |
Owens & Minor, Inc.
4.50%, 3/31/29(a)(b) | | | 223,000 | | | | 182,318 | |
6.63%, 4/1/30(a) | | | 400,000 | | | | 365,116 | |
| | |
Owens-Brockway Glass Container, Inc.
5.88%, 8/15/23(a) | | | 641,000 | | | | 635,116 | |
| | |
Pactiv Evergreen Group Issuer LLC / Pactiv Evergreen Group Issuer, Inc.
4.38%, 10/15/28(a) | | | 742,000 | | | | 631,531 | |
| | |
Par Pharmaceutical, Inc.
7.50%, 4/1/27(a) | | | 1,255,000 | | | | 955,344 | |
| | |
Paramount Global | | | | | | | | |
6.25%, 2/28/57, (6.25% fixed rate until 2/28/27; 3-month U.S. dollar London Interbank Offered Rate + 3.899% thereafter)(c)(d) | | | 115,000 | | | | 100,848 | |
6.38%, 3/30/62, (6.375% fixed rate until 3/30/27; 5-year Constant Maturity Treasury Rate + 3.999% thereafter)(c) | | | 600,000 | | | | 536,166 | |
| | |
Park Intermediate Holdings LLC / PK Domestic Property LLC / PK Finance Co-Issuer, Inc.
5.88%, 10/1/28(a) | | | 605,000 | | | | 553,164 | |
| | |
Party City Holdings, Inc.
8.75%, 2/15/26(a) | | | 486,000 | | | | 327,773 | |
| | |
Patterson-UTI Energy, Inc.
3.95%, 2/1/28 | | | 219,000 | | | | 183,259 | |
| | |
PBF Holding Co. LLC / PBF Finance Corp.
9.25%, 5/15/25(a) | | | 449,000 | | | | 470,386 | |
7.25%, 6/15/25 | | | 729,000 | | | | 682,162 | |
6.00%, 2/15/28 | | | 496,000 | | | | 420,866 | |
| | |
PBF Logistics LP / PBF Logistics Finance Corp. 6.88%, 5/15/23 | | | 407,000 | | | | 403,109 | |
| | |
Performance Food Group, Inc.
5.50%, 10/15/27(a) | | | 446,000 | | | | 413,665 | |
4.25%, 8/1/29(a) | | | 150,000 | | | | 125,471 | |
| | |
Pilgrim’s Pride Corp.
5.88%, 9/30/27(a) | | | 223,000 | | | | 213,605 | |
4.25%, 4/15/31(a) | | | 170,000 | | | | 141,991 | |
| | |
Plantronics, Inc.
4.75%, 3/1/29(a) | | | 290,000 | | | | 289,458 | |
| | |
Post Holdings, Inc.
5.63%, 1/15/28(a) | | | 246,000 | | | | 233,653 | |
5.50%, 12/15/29(a) | | | 189,000 | | | | 169,588 | |
4.63%, 4/15/30(a) | | | 738,000 | | | | 623,219 | |
4.50%, 9/15/31(a) | | | 1,029,000 | | | | 846,713 | |
| | |
Premier Entertainment Sub LLC / Premier Entertainment Finance Corp.
5.88%, 9/1/31(a) | | | 813,000 | | | | 564,759 | |
| | |
Prestige Brands, Inc.
3.75%, 4/1/31(a) | | | 269,000 | | | | 223,248 | |
| | |
Prime Security Services Borrower LLC / Prime Finance, Inc.
5.25%, 4/15/24(a) | | | 415,000 | | | | 407,609 | |
5.75%, 4/15/26(a) | | | 715,000 | | | | 671,206 | |
6.25%, 1/15/28(a) | | | 759,000 | | | | 638,251 | |
| | |
PROG Holdings, Inc.
6.00%, 11/15/29(a) | | | 438,000 | | | | 331,781 | |
| | |
QVC, Inc.
4.45%, 2/15/25 | | | 179,000 | | | | 160,137 | |
4.75%, 2/15/27 | | | 338,000 | | | | 270,414 | |
| | |
Rackspace Technology Global, Inc.
3.50%, 2/15/28(a)(b) | | | 578,000 | | | | 453,551 | |
| | |
Radian Group, Inc.
6.63%, 3/15/25 | | | 181,000 | | | | 178,301 | |
| | |
Realogy Group LLC / Realogy Co-Issuer Corp.
5.75%, 1/15/29(a) | | | 368,000 | | | | 281,465 | |
5.25%, 4/15/30(a) | | | 700,000 | | | | 518,742 | |
| | |
RHP Hotel Properties LP / RHP Finance Corp.
4.75%, 10/15/27 | | | 204,000 | | | | 181,417 | |
4.50%, 2/15/29(a) | | | 376,000 | | | | 319,021 | |
| | |
Rite Aid Corp.
8.00%, 11/15/26(a)(b) | | | 960,000 | | | | 747,840 | |
| | |
RLJ Lodging Trust LP
4.00%, 9/15/29(a) | | | 365,000 | | | | 302,658 | |
| | |
Sabra Health Care LP
3.20%, 12/1/31 | | | 723,000 | | | | 574,792 | |
| | |
Sally Holdings LLC / Sally Capital, Inc.
5.63%, 12/1/25 | | | 151,000 | | | | 142,182 | |
See Notes to Financial Statements.
Schedule of Investments (continued)
WisdomTree U.S. High Yield Corporate Bond Fund (WFHY)
June 30, 2022
| | | | | | | | |
| Investments | | Principal
Amount | | | Value | |
| | |
Scientific Games International, Inc.
7.00%, 5/15/28(a) | | $ | 250,000 | | | $ | 236,293 | |
7.25%, 11/15/29(a)(b) | | | 200,000 | | | | 189,476 | |
| | |
Scotts Miracle-Gro Co.
4.00%, 4/1/31 | | | 193,000 | | | | 146,091 | |
| | |
Scripps Escrow II, Inc.
5.38%, 1/15/31(a) | | | 662,000 | | | | 529,209 | |
| | |
SeaWorld Parks & Entertainment, Inc.
5.25%, 8/15/29(a)(b) | | | 437,000 | | | | 370,847 | |
| | |
Select Medical Corp.
6.25%, 8/15/26(a)(b) | | | 302,000 | | | | 282,844 | |
| | |
Sensata Technologies, Inc.
3.75%, 2/15/31(a) | | | 283,000 | | | | 227,478 | |
| | |
Service Corp. International
4.63%, 12/15/27 | | | 205,000 | | | | 193,067 | |
5.13%, 6/1/29 | | | 78,000 | | | | 73,700 | |
3.38%, 8/15/30 | | | 338,000 | | | | 279,303 | |
| | |
Service Properties Trust
4.35%, 10/1/24 | | | 828,000 | | | | 673,561 | |
| | |
Silgan Holdings, Inc.
4.13%, 2/1/28 | | | 102,000 | | | | 91,684 | |
| | |
Sinclair Television Group, Inc.
5.50%, 3/1/30(a)(b) | | | 600,000 | | | | 446,688 | |
4.13%, 12/1/30(a) | | | 160,000 | | | | 127,098 | |
| | |
Sirius XM Radio, Inc.
5.00%, 8/1/27(a) | | | 88,000 | | | | 81,729 | |
5.50%, 7/1/29(a) | | | 885,000 | | | | 814,041 | |
4.13%, 7/1/30(a) | | | 810,000 | | | | 677,006 | |
3.88%, 9/1/31(a) | | | 1,010,000 | | | | 805,202 | |
| | |
Six Flags Entertainment Corp.
5.50%, 4/15/27(a)(b) | | | 124,000 | | | | 112,658 | |
| | |
Six Flags Theme Parks, Inc.
7.00%, 7/1/25(a) | | | 37,000 | | | | 37,582 | |
| | |
Skyworks Solutions, Inc.
3.00%, 6/1/31 | | | 520,000 | | | | 425,012 | |
| | |
Sonic Automotive, Inc.
4.88%, 11/15/31(a)(b) | | | 555,000 | | | | 419,624 | |
| | |
Southwestern Energy Co.
5.38%, 3/15/30 | | | 500,000 | | | | 460,465 | |
| | |
Spectrum Brands, Inc.
5.75%, 7/15/25 | | | 100,000 | | | | 99,003 | |
3.88%, 3/15/31(a) | | | 236,000 | | | | 190,584 | |
| | |
Spirit AeroSystems, Inc.
5.50%, 1/15/25(a) | | | 238,000 | | | | 222,185 | |
7.50%, 4/15/25(a) | | | 410,000 | | | | 384,162 | |
4.60%, 6/15/28 | | | 518,000 | | | | 387,044 | |
| | |
Sprint Corp.
7.88%, 9/15/23 | | | 72,000 | | | | 74,430 | |
7.13%, 6/15/24 | | | 279,000 | | | | 287,272 | |
7.63%, 2/15/25 | | | 200,000 | | | | 209,002 | |
7.63%, 3/1/26 | | | 250,000 | | | | 264,005 | |
| | |
SS&C Technologies, Inc.
5.50%, 9/30/27(a) | | | 434,000 | | | | 408,858 | |
| | |
Stagwell Global LLC
5.63%, 8/15/29(a) | | | 640,000 | | | | 515,629 | |
| | |
Station Casinos LLC
4.50%, 2/15/28(a) | | | 200,000 | | | | 169,214 | |
4.63%, 12/1/31(a) | | | 368,000 | | | | 287,846 | |
| | |
Summit Midstream Holdings LLC / Summit Midstream Finance Corp.
8.50%, 10/15/26(a) | | | 512,000 | | | | 461,896 | |
| | |
SunCoke Energy, Inc.
4.88%, 6/30/29(a) | | | 220,000 | | | | 179,584 | |
| | |
Sunoco LP / Sunoco Finance Corp.
4.50%, 4/30/30(a) | | | 180,000 | | | | 146,768 | |
| | |
Surgery Center Holdings, Inc.
10.00%, 4/15/27(a)(b) | | | 117,000 | | | | 114,723 | |
| | |
Syneos Health, Inc.
3.63%, 1/15/29(a) | | | 150,000 | | | | 127,944 | |
| | |
T-Mobile USA, Inc.
2.88%, 2/15/31 | | | 415,000 | | | | 344,699 | |
| | |
Talos Production, Inc.
12.00%, 1/15/26 | | | 143,000 | | | | 149,209 | |
| | |
Taylor Morrison Communities, Inc.
5.13%, 8/1/30(a) | | | 230,000 | | | | 191,627 | |
| | |
TEGNA, Inc.
4.63%, 3/15/28 | | | 313,000 | | | | 293,068 | |
5.00%, 9/15/29 | | | 230,000 | | | | 217,713 | |
| | |
Teleflex, Inc.
4.63%, 11/15/27 | | | 238,000 | | | | 223,173 | |
| | |
Tempur Sealy International, Inc.
4.00%, 4/15/29(a)(b) | | | 120,000 | | | | 96,930 | |
3.88%, 10/15/31(a) | | | 450,000 | | | | 337,774 | |
| | |
Tenet Healthcare Corp.
6.75%, 6/15/23 | | | 941,000 | | | | 973,822 | |
4.63%, 7/15/24 | | | 51,000 | | | | 49,039 | |
4.63%, 9/1/24(a) | | | 664,000 | | | | 637,892 | |
4.88%, 1/1/26(a) | | | 815,000 | | | | 754,095 | |
6.25%, 2/1/27(a) | | | 415,000 | | | | 384,597 | |
6.13%, 10/1/28(a) | | | 1,150,000 | | | | 991,794 | |
| | |
Tenneco, Inc.
5.00%, 7/15/26 | | | 110,000 | | | | 102,923 | |
| | |
Terex Corp.
5.00%, 5/15/29(a) | | | 334,000 | | | | 287,995 | |
| | |
TerraForm Power Operating LLC
5.00%, 1/31/28(a) | | | 417,000 | | | | 378,915 | |
| | |
Time Warner Cable LLC
4.50%, 9/15/42 | | | 121,000 | | | | 95,211 | |
| | |
TopBuild Corp.
4.13%, 2/15/32(a) | | | 230,000 | | | | 181,463 | |
| | |
Townsquare Media, Inc.
6.88%, 2/1/26(a)(b) | | | 432,000 | | | | 390,757 | |
| | |
TransDigm, Inc.
6.25%, 3/15/26(a) | | | 936,000 | | | | 905,271 | |
6.38%, 6/15/26 | | | 519,000 | | | | 486,708 | |
4.88%, 5/1/29 | | | 1,288,000 | | | | 1,049,334 | |
| | |
Transocean, Inc.
11.50%, 1/30/27(a) | | | 768,000 | | | | 720,868 | |
8.00%, 2/1/27(a) | | | 373,000 | | | | 251,182 | |
| | |
Travel + Leisure Co.
6.63%, 7/31/26(a) | | | 230,000 | | | | 220,126 | |
See Notes to Financial Statements.
Schedule of Investments (continued)
WisdomTree U.S. High Yield Corporate Bond Fund (WFHY)
June 30, 2022
| | | | | | | | |
| Investments | | Principal
Amount | | | Value | |
| | |
TreeHouse Foods, Inc.
4.00%, 9/1/28(b) | | $ | 345,000 | | | $ | 281,927 | |
| | |
TriNet Group, Inc.
3.50%, 3/1/29(a) | | | 187,000 | | | | 154,153 | |
| | |
Tronox, Inc.
4.63%, 3/15/29(a) | | | 625,000 | | | | 505,625 | |
| | |
TTM Technologies, Inc.
4.00%, 3/1/29(a)(b) | | | 233,000 | | | | 196,412 | |
| | |
Tutor Perini Corp.
6.88%, 5/1/25(a)(b) | | | 439,000 | | | | 359,572 | |
| | |
Twitter, Inc.
3.88%, 12/15/27(a)(b) | | | 187,000 | | | | 176,674 | |
| | |
U.S. Foods, Inc.
6.25%, 4/15/25(a) | | | 397,000 | | | | 396,234 | |
4.75%, 2/15/29(a) | | | 430,000 | | | | 376,108 | |
| | |
Under Armour, Inc.
3.25%, 6/15/26 | | | 116,000 | | | | 101,318 | |
| | |
United Natural Foods, Inc.
6.75%, 10/15/28(a)(b) | | | 250,000 | | | | 234,450 | |
| | |
United Rentals North America, Inc.
5.50%, 5/15/27 | | | 389,000 | | | | 382,099 | |
4.88%, 1/15/28 | | | 323,000 | | | | 306,152 | |
5.25%, 1/15/30 | | | 105,000 | | | | 97,900 | |
| | |
Uniti Group LP / Uniti Fiber Holdings, Inc. / CSL Capital LLC
7.88%, 2/15/25(a) | | | 2,000,000 | | | | 1,931,540 | |
| | |
Univar Solutions USA, Inc.
5.13%, 12/1/27(a) | | | 148,000 | | | | 138,263 | |
| | |
Urban One, Inc.
7.38%, 2/1/28(a) | | | 507,000 | | | | 434,940 | |
| | |
USA Compression Partners LP / USA Compression Finance Corp.
6.88%, 4/1/26 | | | 430,000 | | | | 391,661 | |
| | |
Vail Resorts, Inc.
6.25%, 5/15/25(a) | | | 217,000 | | | | 217,176 | |
| | |
Valvoline, Inc.
4.25%, 2/15/30(a) | | | 296,000 | | | | 247,290 | |
3.63%, 6/15/31(a) | | | 182,000 | | | | 146,286 | |
| | |
Vector Group Ltd.
5.75%, 2/1/29(a) | | | 826,000 | | | | 688,289 | |
| | |
Victors Merger Corp.
6.38%, 5/15/29(a)(b) | | | 411,000 | | | | 259,571 | |
| | |
Vista Outdoor, Inc.
4.50%, 3/15/29(a) | | | 284,000 | | | | 215,408 | |
| | |
Vistra Operations Co. LLC
5.63%, 2/15/27(a) | | | 1,009,000 | | | | 950,306 | |
| | |
Vontier Corp.
2.95%, 4/1/31 | | | 650,000 | | | | 508,449 | |
| | |
W&T Offshore, Inc.
9.75%, 11/1/23(a) | | | 429,000 | | | | 409,777 | |
| | |
WESCO Distribution, Inc.
7.13%, 6/15/25(a) | | | 916,000 | | | | 914,699 | |
| | |
Western Digital Corp.
4.75%, 2/15/26 | | | 230,000 | | | | 220,393 | |
2.85%, 2/1/29 | | | 500,000 | | | | 407,795 | |
| | |
Western Midstream Operating LP
3.95%, 6/1/25 | | | 749,000 | | | | 707,753 | |
4.65%, 7/1/26 | | | 220,000 | | | | 207,297 | |
4.55%, 2/1/30 | | | 356,000 | | | | 309,485 | |
| | |
Westinghouse Air Brake Technologies Corp.
4.95%, 9/15/28 | | | 262,000 | | | | 252,214 | |
| | |
Williams Scotsman International, Inc.
4.63%, 8/15/28(a) | | | 285,000 | | | | 246,491 | |
| | |
WW International, Inc.
4.50%, 4/15/29(a)(b) | | | 195,000 | | | | 130,014 | |
| | |
Xerox Corp.
4.63%, 3/15/23 | | | 61,000 | | | | 60,929 | |
| | |
Xerox Holdings Corp.
5.50%, 8/15/28(a)(b) | | | 681,000 | | | | 573,259 | |
| | |
Yum! Brands, Inc.
4.75%, 1/15/30(a) | | | 20,000 | | | | 18,189 | |
3.63%, 3/15/31 | | | 290,000 | | | | 245,775 | |
| | |
Ziff Davis, Inc.
4.63%, 10/15/30(a) | | | 287,000 | | | | 245,864 | |
TOTAL U.S. CORPORATE BONDS (Cost: $193,895,738) | | | | | | | 164,410,815 | |
|
| FOREIGN CORPORATE BONDS – 1.0% | |
|
| Canada – 0.4% | |
| | |
Open Text Holdings, Inc.
4.13%, 2/15/30(a) | | | 340,000 | | | | 290,612 | |
4.13%, 12/1/31(a) | | | 262,000 | | | | 219,278 | |
| | |
Primo Water Holdings, Inc.
4.38%, 4/30/29(a) | | | 300,000 | | | | 245,532 | |
| | | | | | | | |
| Total Canada | | | | 755,422 | |
|
| Germany – 0.6% | |
| | |
Deutsche Bank AG | | | | | | | | |
5.88%, 7/8/31, (5.88% fixed rate until 4/8/30; Secured Overnight Financing Rate + 5.438% thereafter)(c) | | | 395,000 | | | | 361,678 | |
3.73%, 1/14/32, (3.729% fixed rate until 10/14/30; Secured Overnight Financing Rate + 2.757% thereafter)(c) | | | 210,000 | | | | 157,712 | |
3.74%, 1/7/33, (3.742% fixed rate until 10/7/31; Secured Overnight Financing Rate + 2.257% thereafter)(c) | | | 600,000 | | | | 444,948 | |
| | | | | | | | |
| Total Germany | | | | | | | 964,338 | |
TOTAL FOREIGN CORPORATE BONDS (Cost: $2,017,455) | | | | | | | 1,719,760 | |
| | |
| | | Shares | | | | |
|
| INVESTMENT OF CASH COLLATERAL FOR SECURITIES LOANED – 11.0% | |
| | |
| United States – 11.0% | | | | | | | | |
State Street Navigator Securities Lending Government Money Market Portfolio, 1.56%(e) (Cost: $18,791,313) | | | 18,791,313 | | | | 18,791,313 | |
| |
TOTAL INVESTMENTS IN SECURITIES – 108.0% (Cost: $214,704,506) | | | | 184,921,888 | |
| |
Other Assets less Liabilities – (8.0)% | | | | (13,626,588 | ) |
| | | | | | | | |
| NET ASSETS – 100.0% | | | $ | 171,295,300 | |
| (a) | This security is exempt from registration under rule 144A of the Securities Act of 1933. This security may be sold in transactions that are exempt from registration, normally to qualified institutional buyers. |
See Notes to Financial Statements.
Schedule of Investments (concluded)
WisdomTree U.S. High Yield Corporate Bond Fund (WFHY)
June 30, 2022
| (b) | Security, or portion thereof, was on loan at June 30, 2022 (See Note 2). At June 30, 2022, the total market value of the Fund’s securities on loan identified in the Schedule of Investments was $18,352,831 and the total market value of the collateral held by the Fund was $19,045,514. The total market value of the collateral includes non-cash U.S. Government securities collateral having a value of $254,201. |
| (c) | Rate shown reflects the accrual rate as of June 30, 2022 on securities with variable or step rates. |
| (d) | The London Interbank Offered Rate (“LIBOR”) is being phased out completely by June 30, 2023. There remains uncertainty regarding the nature of any replacement rate and the impact of a transition away from LIBOR on the Fund’s investments. |
| (e) | Rate shown represents annualized 7-day yield as of June 30, 2022. |
The following is a summary of the fair valuations according to the inputs used as of June 30, 2022 in valuing the Fund’s investments (See Note 2 – Fair Value Measurement):
| | | | | | | | | | | | | | | | |
| | | | |
| | | Quoted
Prices in
Active
Markets
(Level 1) | | | Other
Significant
Observable
Inputs
(Level 2) | | | Significant
Unobservable
Inputs
(Level 3) | | | Total | |
Assets: | | | | | | | | | | | | | | | | |
Investments in Securities | | | | | | | | | | | | | | | | |
U.S. Corporate Bonds | | $ | — | | | $ | 164,410,815 | | | $ | — | | | $ | 164,410,815 | |
Foreign Corporate Bonds | | | — | | | | 1,719,760 | | | | — | | | | 1,719,760 | |
Investment of Cash Collateral for Securities Loaned | | | — | | | | 18,791,313 | | | | — | | | | 18,791,313 | |
Total Investments in Securities | | $ | — | | | $ | 184,921,888 | | | $ | — | | | $ | 184,921,888 | |
See Notes to Financial Statements.
Schedule of Investments
WisdomTree U.S. Short-Term Corporate Bond Fund (SFIG)
June 30, 2022
| | | | | | | | |
| Investments | | Principal
Amount | | | Value | |
| | | | | | | | |
| U.S. CORPORATE BONDS – 94.1% | |
| United States – 94.1% | |
| | |
3M Co.
2.65%, 4/15/25 | | $ | 9,000 | | | $ | 8,795 | |
| | |
Abbott Laboratories
3.40%, 11/30/23 | | | 51,000 | | | | 51,234 | |
| | |
AbbVie, Inc.
2.85%, 5/14/23 | | | 139,000 | | | | 138,419 | |
2.60%, 11/21/24 | | | 223,000 | | | | 216,112 | |
3.60%, 5/14/25 | | | 74,000 | | | | 73,060 | |
2.95%, 11/21/26 | | | 179,000 | | | | 169,744 | |
| | |
Aetna, Inc.
2.80%, 6/15/23 | | | 156,000 | | | | 154,114 | |
| | |
Affiliated Managers Group, Inc.
3.50%, 8/1/25 | | | 39,000 | | | | 38,654 | |
| | |
Aflac, Inc.
3.63%, 11/15/24 | | | 46,000 | | | | 46,146 | |
| | |
Aircastle Ltd.
4.13%, 5/1/24 | | | 63,000 | | | | 61,399 | |
| | |
Alexandria Real Estate Equities, Inc.
3.45%, 4/30/25 | | | 9,000 | | | | 8,863 | |
| | |
Allegion U.S. Holding Co., Inc.
3.20%, 10/1/24 | | | 50,000 | | | | 48,666 | |
| | |
Ally Financial, Inc.
3.88%, 5/21/24 | | | 156,000 | | | | 154,544 | |
4.63%, 3/30/25 | | | 62,000 | | | | 61,721 | |
5.80%, 5/1/25 | | | 53,000 | | | | 54,261 | |
| | |
Altria Group, Inc.
4.00%, 1/31/24 | | | 10,000 | | | | 10,030 | |
4.40%, 2/14/26 | | | 136,000 | | | | 133,171 | |
| | |
Amazon.com, Inc.
3.80%, 12/5/24 | | | 9,000 | | | | 9,114 | |
| | |
Amcor Finance USA, Inc.
3.63%, 4/28/26 | | | 160,000 | | | | 153,853 | |
| | |
American Express Co.
3.40%, 2/22/24 | | | 79,000 | | | | 78,834 | |
3.00%, 10/30/24 | | | 43,000 | | | | 42,242 | |
3.63%, 12/5/24 | | | 60,000 | | | | 59,720 | |
1.65%, 11/4/26 | | | 280,000 | | | | 253,996 | |
| | |
American Honda Finance Corp.
2.15%, 9/10/24 | | | 179,000 | | | | 173,532 | |
1.20%, 7/8/25 | | | 75,000 | | | | 69,306 | |
| | |
American International Group, Inc.
2.50%, 6/30/25 | | | 54,000 | | | | 51,538 | |
| | |
American Water Capital Corp.
3.40%, 3/1/25 | | | 40,000 | | | | 39,558 | |
| | |
Amgen, Inc.
3.63%, 5/22/24 | | | 153,000 | | | | 152,804 | |
2.20%, 2/21/27 | | | 64,000 | | | | 58,865 | |
| | |
Amphenol Corp.
3.20%, 4/1/24 | | | 25,000 | | | | 24,805 | |
| | |
Aon Corp. / Aon Global Holdings PLC
2.85%, 5/28/27 | | | 210,000 | | | | 197,024 | |
| | |
Apple, Inc.
2.85%, 5/11/24 | | | 136,000 | | | | 135,234 | |
| | |
AutoZone, Inc.
3.13%, 4/21/26 | | | 76,000 | | | | 73,278 | |
| | |
AvalonBay Communities, Inc.
4.20%, 12/15/23 | | | 77,000 | | | | 77,330 | |
| | |
Avangrid, Inc.
3.20%, 4/15/25 | | | 66,000 | | | | 64,178 | |
| | | | | | | | |
| | |
Bank of America Corp.
4.13%, 1/22/24 | | | 19,000 | | | | 19,218 | |
0.81%, 10/24/24, (0.81% fixed rate until 10/24/23; Secured Overnight Financing Rate + 0.74% thereafter)(a) | | | 70,000 | | | | 66,810 | |
4.00%, 1/22/25 | | | 15,000 | | | | 14,951 | |
3.46%, 3/15/25, (3.458% fixed rate until 3/15/24; 3-month U.S. dollar London Interbank Offered Rate + 0.97% thereafter)(a)(d) | | | 353,000 | | | | 348,549 | |
3.95%, 4/21/25, Series L | | | 93,000 | | | | 91,977 | |
3.09%, 10/1/25, (3.093% fixed rate until 10/1/24; 3-month U.S. dollar London Interbank Offered Rate + 1.09% thereafter)(a)(d) | | | 161,000 | | | | 156,176 | |
3.37%, 1/23/26, (3.366% fixed rate until 1/23/25; 3-month U.S. dollar London Interbank Offered Rate + 0.81% thereafter)(a)(d) | | | 283,000 | | | | 274,094 | |
4.45%, 3/3/26 | | | 94,000 | | | | 93,821 | |
3.50%, 4/19/26 | | | 57,000 | | | | 55,575 | |
1.32%, 6/19/26, (1.319% fixed rate until 6/19/25; Secured Overnight Financing Rate + 1.15% thereafter)(a) | | | 188,000 | | | | 171,069 | |
4.25%, 10/22/26 | | | 74,000 | | | | 73,030 | |
1.20%, 10/24/26, (1.197% fixed rate until 10/24/25; Secured Overnight Financing Rate + 1.01% thereafter)(a) | | | 166,000 | | | | 148,862 | |
1.66%, 3/11/27, Series N, (1.658% fixed rate until 3/11/26; Secured Overnight Financing Rate + 0.91% thereafter)(a) | | | 400,000 | | | | 359,936 | |
| | |
BankUnited, Inc.
4.88%, 11/17/25 | | | 38,000 | | | | 38,385 | |
| | |
Baxter International, Inc.
1.32%, 11/29/24 | | | 121,000 | | | | 113,686 | |
1.92%, 2/1/27 | | | 61,000 | | | | 54,681 | |
| | |
Becton Dickinson and Co.
3.36%, 6/6/24 | | | 33,000 | | | | 32,670 | |
3.73%, 12/15/24 | | | 73,000 | | | | 72,649 | |
| | |
Biogen, Inc.
4.05%, 9/15/25 | | | 280,000 | | | | 277,379 | |
| | |
Boardwalk Pipelines LP
4.95%, 12/15/24 | | | 103,000 | | | | 103,869 | |
5.95%, 6/1/26 | | | 120,000 | | | | 124,511 | |
| | |
Boeing Co.
4.88%, 5/1/25 | | | 107,000 | | | | 106,634 | |
| | |
Boston Scientific Corp.
3.45%, 3/1/24 | | | 25,000 | | | | 24,967 | |
| | |
Bristol-Myers Squibb Co.
0.75%, 11/13/25(b) | | | 300,000 | | | | 273,696 | |
| | |
Broadcom Corp. / Broadcom Cayman Finance Ltd.
3.88%, 1/15/27 | | | 174,000 | | | | 167,865 | |
| | |
Broadcom, Inc.
3.15%, 11/15/25 | | | 34,000 | | | | 32,781 | |
3.46%, 9/15/26(b) | | | 54,000 | | | | 51,873 | |
See Notes to Financial Statements.
Schedule of Investments (continued)
WisdomTree U.S. Short-Term Corporate Bond Fund (SFIG)
June 30, 2022
| | | | | | | | |
| Investments | | Principal
Amount | | | Value | |
4.11%, 9/15/28 | | $ | 68,000 | | | $ | 64,602 | |
| | |
Broadridge Financial Solutions, Inc.
3.40%, 6/27/26 | | | 46,000 | | | | 44,517 | |
| | |
Bunge Ltd. Finance Corp.
1.63%, 8/17/25 | | | 280,000 | | | | 258,118 | |
| | | | | | | | |
| | | | | | | | |
| | |
Burlington Northern Santa Fe LLC
3.40%, 9/1/24 | | | 9,000 | | | | 9,022 | |
| | |
Capital One Financial Corp.
3.90%, 1/29/24 | | | 200,000 | | | | 200,054 | |
3.30%, 10/30/24 | | | 102,000 | | | | 99,674 | |
4.25%, 4/30/25 | | | 90,000 | | | | 89,981 | |
4.20%, 10/29/25 | | | 576,000 | | | | 568,230 | |
3.75%, 7/28/26 | | | 103,000 | | | | 98,625 | |
| | |
Carrier Global Corp.
2.24%, 2/15/25 | | | 142,000 | | | | 134,934 | |
2.49%, 2/15/27 | | | 302,000 | | | | 276,001 | |
| | |
Caterpillar Financial Services Corp.
2.15%, 11/8/24(b) | | | 9,000 | | | | 8,742 | |
0.80%, 11/13/25 | | | 156,000 | | | | 141,890 | |
| | |
Celanese U.S. Holdings LLC
3.50%, 5/8/24 | | | 20,000 | | | | 19,752 | |
1.40%, 8/5/26 | | | 64,000 | | | | 55,135 | |
| | |
Charles Schwab Corp.
4.20%, 3/24/25 | | | 48,000 | | | | 48,776 | |
3.63%, 4/1/25 | | | 60,000 | | | | 59,939 | |
| | |
Chevron Corp.
2.90%, 3/3/24 | | | 132,000 | | | | 131,645 | |
| | |
Chubb INA Holdings, Inc.
3.35%, 5/15/24(b) | | | 30,000 | | | | 29,930 | |
| | |
Cigna Corp.
3.25%, 4/15/25 | | | 114,000 | | | | 111,873 | |
4.13%, 11/15/25 | | | 81,000 | | | | 81,269 | |
4.50%, 2/25/26 | | | 134,000 | | | | 135,888 | |
| | |
Cintas Corp. No. 2
3.70%, 4/1/27 | | | 80,000 | | | | 79,084 | |
| | |
Cisco Systems, Inc.
2.20%, 9/20/23 | | | 51,000 | | | | 50,565 | |
| | |
Citigroup, Inc.
3.75%, 6/16/24 | | | 99,000 | | | | 99,572 | |
4.00%, 8/5/24(b) | | | 56,000 | | | | 56,000 | |
0.78%, 10/30/24, (0.776% fixed rate until 10/30/23; Secured Overnight Financing Rate + 0.686% thereafter)(a) | | | 122,000 | | | | 116,412 | |
3.35%, 4/24/25, (3.352% fixed rate until 4/24/24; 3-month U.S. dollar London Interbank Offered Rate + 0.897% thereafter)(a)(d) | | | 91,000 | | | | 89,286 | |
3.30%, 4/27/25 | | | 150,000 | | | | 147,898 | |
0.98%, 5/1/25, (0.981% fixed rate until 5/1/24; Secured Overnight Financing Rate + 0.669% thereafter)(a) | | | 72,000 | | | | 67,470 | |
4.40%, 6/10/25 | | | 273,000 | | | | 272,899 | |
5.50%, 9/13/25 | | | 228,000 | | | | 234,742 | |
1.28%, 11/3/25, (1.281% fixed rate until 11/3/24; Secured Overnight Financing Rate + 0.528% thereafter)(a) | | | 183,000 | | | | 170,267 | |
4.60%, 3/9/26 | | | 87,000 | | | | 87,300 | |
3.11%, 4/8/26, (3.106% fixed rate until 4/8/25; Secured Overnight Financing Rate + 2.842% thereafter)(a) | | | 199,000 | | | | 191,464 | |
3.40%, 5/1/26 | | | 98,000 | | | | 94,904 | |
3.20%, 10/21/26 | | | 385,000 | | | | 366,693 | |
4.30%, 11/20/26 | | | 48,000 | | | | 47,443 | |
| | | | | | | | |
| | | | | | | | |
1.12%, 1/28/27, (1.122% fixed rate until 1/28/26; Secured Overnight Financing Rate + 0.765% thereafter)(a) | | | 104,000 | | | | 91,951 | |
| | |
Citizens Financial Group, Inc.
2.85%, 7/27/26(b) | | | 260,000 | | | | 243,872 | |
| | |
Comcast Corp.
3.70%, 4/15/24 | | | 9,000 | | | | 9,029 | |
3.38%, 8/15/25 | | | 68,000 | | | | 67,234 | |
3.95%, 10/15/25 | | | 135,000 | | | | 135,724 | |
3.15%, 3/1/26 | | | 273,000 | | | | 266,388 | |
| | |
Comerica, Inc.
3.70%, 7/31/23 | | | 50,000 | | | | 49,990 | |
| | |
Conagra Brands, Inc.
4.60%, 11/1/25 | | | 73,000 | | | | 73,410 | |
| | |
Constellation Brands, Inc.
4.40%, 11/15/25 | | | 290,000 | | | | 291,853 | |
4.35%, 5/9/27 | | | 75,000 | | | | 74,580 | |
| | |
CSX Corp.
3.35%, 11/1/25(b) | | | 180,000 | | | | 177,012 | |
2.60%, 11/1/26 | | | 70,000 | | | | 65,941 | |
| | |
CVS Health Corp.
2.63%, 8/15/24 | | | 196,000 | | | | 191,813 | |
2.88%, 6/1/26 | | | 80,000 | | | | 76,300 | |
| | |
D.R. Horton, Inc.
2.50%, 10/15/24 | | | 78,000 | | | | 74,592 | |
2.60%, 10/15/25 | | | 25,000 | | | | 23,557 | |
| | |
Dell International LLC / EMC Corp.
6.02%, 6/15/26 | | | 348,000 | | | | 361,057 | |
4.90%, 10/1/26 | | | 93,000 | | | | 93,148 | |
| | |
Delmarva Power & Light Co.
3.50%, 11/15/23 | | | 100,000 | | | | 100,467 | |
| | |
Devon Energy Corp.
5.85%, 12/15/25 | | | 160,000 | | | | 166,941 | |
| | |
Discover Bank
3.45%, 7/27/26 | | | 260,000 | | | | 246,134 | |
| | |
Discover Financial Services
3.95%, 11/6/24 | | | 50,000 | | | | 49,372 | |
3.75%, 3/4/25 | | | 114,000 | | | | 112,395 | |
4.50%, 1/30/26 | | | 116,000 | | | | 113,811 | |
4.10%, 2/9/27 | | | 57,000 | | | | 54,661 | |
| | |
Discovery Communications LLC
3.80%, 3/13/24 | | | 45,000 | | | | 44,786 | |
3.95%, 6/15/25(b) | | | 100,000 | | | | 97,863 | |
4.90%, 3/11/26 | | | 244,000 | | | | 244,669 | |
| | |
Dollar General Corp.
4.15%, 11/1/25 | | | 230,000 | | | | 230,582 | |
| | |
Dominion Energy, Inc.
3.30%, 3/15/25, Series A | | | 109,000 | | | | 106,893 | |
1.45%, 4/15/26, Series A | | | 260,000 | | | | 235,279 | |
| | |
DTE Energy Co.
2.53%, 10/1/24, Series C | | | 26,000 | | | | 25,169 | |
See Notes to Financial Statements.
Schedule of Investments (continued)
WisdomTree U.S. Short-Term Corporate Bond Fund (SFIG)
June 30, 2022
| | | | | | | | |
| Investments | | Principal
Amount | | | Value | |
| | |
Duke Energy Corp.
3.95%, 10/15/23 | | $ | 63,000 | | | $ | 63,293 | |
2.65%, 9/1/26 | | | 60,000 | | | | 56,384 | |
| | |
eBay, Inc.
1.90%, 3/11/25 | | | 35,000 | | | | 32,933 | |
1.40%, 5/10/26 | | | 280,000 | | | | 252,053 | |
| | |
Elevance Health, Inc.
3.50%, 8/15/24 | | | 121,000 | | | | 120,568 | |
| | | | | | | | |
3.35%, 12/1/24 | | | 9,000 | | | | 8,891 | |
| | |
Entergy Arkansas LLC
3.50%, 4/1/26 | | | 50,000 | | | | 49,360 | |
| | |
Entergy Corp.
0.90%, 9/15/25 | | | 310,000 | | | | 279,679 | |
| | |
Entergy Louisiana LLC
2.40%, 10/1/26 | | | 130,000 | | | | 120,786 | |
| | |
Enterprise Products Operating LLC
3.90%, 2/15/24 | | | 78,000 | | | | 77,942 | |
3.75%, 2/15/25 | | | 93,000 | | | | 92,129 | |
| | |
Equitable Holdings, Inc.
3.90%, 4/20/23 | | | 61,000 | | | | 61,304 | |
| | |
Evergy Kansas Central, Inc.
2.55%, 7/1/26 | | | 62,000 | | | | 58,937 | |
| | |
Evergy, Inc.
2.45%, 9/15/24 | | | 36,000 | | | | 34,681 | |
| | |
Eversource Energy
3.80%, 12/1/23, Series N(b) | | | 43,000 | | | | 43,092 | |
| | |
Exxon Mobil Corp.
2.71%, 3/6/25(b) | | | 143,000 | | | | 140,174 | |
| | |
Fidelity National Information Services, Inc.
1.15%, 3/1/26 | | | 42,000 | | | | 37,278 | |
| | |
Fifth Third Bancorp
2.38%, 1/28/25 | | | 50,000 | | | | 47,932 | |
| | |
Fifth Third Bank NA
3.85%, 3/15/26 | | | 200,000 | | | | 196,234 | |
| | |
Fiserv, Inc.
3.80%, 10/1/23 | | | 135,000 | | | | 135,354 | |
2.75%, 7/1/24 | | | 82,000 | | | | 80,061 | |
| | |
Florida Power & Light Co.
2.85%, 4/1/25(b) | | | 97,000 | | | | 95,432 | |
| | |
FMC Corp.
3.20%, 10/1/26 | | | 250,000 | | | | 238,212 | |
| | |
Fortune Brands Home & Security, Inc.
4.00%, 9/21/23 | | | 51,000 | | | | 51,197 | |
| | |
Fox Corp.
3.05%, 4/7/25 | | | 47,000 | | | | 45,582 | |
| | |
General Dynamics Corp.
3.38%, 5/15/23 | | | 78,000 | | | | 78,239 | |
2.38%, 11/15/24 | | | 9,000 | | | | 8,771 | |
3.25%, 4/1/25(b) | | | 9,000 | | | | 8,933 | |
| | |
General Mills, Inc.
4.00%, 4/17/25 | | | 75,000 | | | | 75,030 | |
| | |
Georgia Power Co.
2.10%, 7/30/23, Series A | | | 71,000 | | | | 69,977 | |
2.20%, 9/15/24, Series A | | | 82,000 | | | | 79,295 | |
| | |
Gilead Sciences, Inc.
3.50%, 2/1/25 | | | 283,000 | | | | 280,051 | |
| | |
Global Payments, Inc.
2.65%, 2/15/25 | | | 68,000 | | | | 64,890 | |
1.20%, 3/1/26 | | | 310,000 | | | | 273,631 | |
4.80%, 4/1/26 | | | 43,000 | | | | 43,054 | |
| | |
Goldman Sachs BDC, Inc.
2.88%, 1/15/26(b) | | | 81,000 | | | | 73,275 | |
| | |
HCA, Inc.
5.00%, 3/15/24 | | | 111,000 | | | | 111,527 | |
5.25%, 4/15/25 | | | 28,000 | | | | 28,082 | |
| | | | | | | | |
5.25%, 6/15/26 | | | 94,000 | | | | 93,581 | |
4.50%, 2/15/27 | | | 75,000 | | | | 72,211 | |
| | |
Hershey Co.
3.38%, 5/15/23 | | | 85,000 | | | | 85,341 | |
| | |
Hewlett Packard Enterprise Co.
1.45%, 4/1/24 | | | 81,000 | | | | 78,027 | |
1.75%, 4/1/26 | | | 270,000 | | | | 247,020 | |
| | |
Home Depot, Inc.
2.13%, 9/15/26(b) | | | 270,000 | | | | 255,709 | |
| | |
Honeywell International, Inc.
1.35%, 6/1/25 | | | 56,000 | | | | 52,830 | |
| | |
HP, Inc.
2.20%, 6/17/25 | | | 54,000 | | | | 51,046 | |
1.45%, 6/17/26 | | | 50,000 | | | | 44,312 | |
| | |
Humana, Inc.
1.35%, 2/3/27 | | | 340,000 | | | | 297,830 | |
| | |
Huntington Bancshares, Inc.
4.00%, 5/15/25 | | | 9,000 | | | | 8,968 | |
| | |
Huntington Ingalls Industries, Inc.
3.84%, 5/1/25 | | | 250,000 | | | | 244,475 | |
| | |
Illumina, Inc.
0.55%, 3/23/23 | | | 49,000 | | | | 47,996 | |
| | |
Intel Corp.
2.88%, 5/11/24 | | | 97,000 | | | | 96,741 | |
2.60%, 5/19/26(b) | | | 250,000 | | | | 242,165 | |
| | |
International Business Machines Corp.
3.00%, 5/15/24 | | | 100,000 | | | | 99,239 | |
3.45%, 2/19/26 | | | 200,000 | | | | 197,564 | |
3.30%, 5/15/26 | | | 200,000 | | | | 195,416 | |
| | |
Interpublic Group of Cos., Inc.
4.20%, 4/15/24 | | | 10,000 | | | | 10,013 | |
| | |
Interstate Power and Light Co.
3.25%, 12/1/24 | | | 9,000 | | | | 8,907 | |
| | |
J.M. Smucker Co.
3.50%, 3/15/25 | | | 57,000 | | | | 56,280 | |
| | |
JPMorgan Chase & Co.
3.88%, 2/1/24 | | | 71,000 | | | | 71,485 | |
3.88%, 9/10/24 | | | 109,000 | | | | 108,821 | |
0.65%, 9/16/24, (0.653% fixed rate until 9/16/23; 3-month Secured Overnight Financing Rate + 0.60% thereafter)(a) | | | 50,000 | | | | 47,998 | |
4.02%, 12/5/24, (4.023% fixed rate until 12/5/23; 3-month U.S. dollar London Interbank Offered Rate + 1.00% thereafter)(a)(d) | | | 84,000 | | | | 83,739 | |
3.13%, 1/23/25 | | | 38,000 | | | | 37,487 | |
3.22%, 3/1/25, (3.22% fixed rate until 3/1/24; 3-month U.S. dollar London Interbank Offered Rate + 1.155% thereafter)(a)(d) | | | 359,000 | | | | 352,962 | |
See Notes to Financial Statements.
Schedule of Investments (continued)
WisdomTree U.S. Short-Term Corporate Bond Fund (SFIG)
June 30, 2022
| | | | | | | | |
| Investments | | Principal
Amount | | | Value | |
0.82%, 6/1/25, (0.824% fixed rate until 6/1/24; Secured Overnight Financing Rate + 0.54% thereafter)(a) | | $ | 200,000 | | | $ | 187,222 | |
3.90%, 7/15/25 | | | 138,000 | | | | 138,697 | |
2.01%, 3/13/26, (2.005% fixed rate until 3/13/25; 3-month Secured Overnight Financing Rate + 1.585% thereafter)(a) | | | 154,000 | | | | 144,216 | |
3.30%, 4/1/26 | | | 112,000 | | | | 108,855 | |
2.08%, 4/22/26, (2.083% fixed rate until 4/22/25; Secured Overnight Financing Rate + 1.85% thereafter)(a) | | | 360,000 | | | | 337,532 | |
| | | | | | | | |
3.20%, 6/15/26 | | | 46,000 | | | | 44,647 | |
2.95%, 10/1/26 | | | 54,000 | | | | 51,585 | |
1.05%, 11/19/26, (1.045% fixed rate until 11/19/25; Secured Overnight Financing Rate + 0.80% thereafter)(a) | | | 209,000 | | | | 186,142 | |
4.13%, 12/15/26 | | | 59,000 | | | | 58,638 | |
3.96%, 1/29/27, (3.96% fixed rate until 1/29/26; 3-month U.S. dollar London Interbank Offered Rate + 1.245% thereafter)(a)(d) | | | 75,000 | | | | 73,485 | |
1.04%, 2/4/27, (1.04% fixed rate until 2/4/26; 3-month Secured Overnight Financing Rate + 0.695% thereafter)(a) | | | 68,000 | | | | 60,177 | |
| | |
Juniper Networks, Inc.
1.20%, 12/10/25 | | | 48,000 | | | | 43,018 | |
| | |
Kellogg Co.
2.65%, 12/1/23 | | | 37,000 | | | | 36,670 | |
| | |
Keysight Technologies, Inc.
4.55%, 10/30/24(b) | | | 58,000 | | | | 58,920 | |
| | |
Kilroy Realty LP
4.38%, 10/1/25 | | | 230,000 | | | | 227,461 | |
| | |
KLA Corp.
4.65%, 11/1/24 | | | 45,000 | | | | 45,738 | |
| | |
Kraft Heinz Foods Co.
3.00%, 6/1/26 | | | 20,000 | | | | 18,907 | |
| | |
Kroger Co.
3.85%, 8/1/23 | | | 80,000 | | | | 80,374 | |
| | |
L3Harris Technologies, Inc.
3.85%, 6/15/23 | | | 98,000 | | | | 97,913 | |
| | |
Laboratory Corp. of America Holdings
3.60%, 2/1/25 | | | 18,000 | | | | 17,750 | |
| | |
Leidos, Inc.
2.95%, 5/15/23 | | | 107,000 | | | | 105,960 | |
| | |
Lennar Corp.
4.75%, 5/30/25 | | | 179,000 | | | | 179,797 | |
| | |
Lennox International, Inc.
3.00%, 11/15/23 | | | 35,000 | | | | 34,667 | |
| | |
Lincoln National Corp.
4.00%, 9/1/23 | | | 74,000 | | | | 74,537 | |
| | |
Lowe’s Cos., Inc.
2.50%, 4/15/26 | | | 196,000 | | | | 185,688 | |
| | |
Magallanes, Inc.
3.64%, 3/15/25(c) | | | 430,000 | | | | 417,504 | |
| | |
Marriott International, Inc.
5.75%, 5/1/25, Series EE | | | 37,000 | | | | 38,410 | |
3.75%, 10/1/25 | | | 16,000 | | | | 15,723 | |
| | |
Marsh & McLennan Cos., Inc.
3.88%, 3/15/24 | | | 67,000 | | | | 67,159 | |
3.50%, 3/10/25 | | | 21,000 | | | | 20,763 | |
| | |
Marvell Technology, Inc.
1.65%, 4/15/26 | | | 227,000 | | | | 203,717 | |
| | |
McCormick & Co., Inc.
0.90%, 2/15/26 | | | 270,000 | | | | 239,711 | |
| | |
McDonald’s Corp.
3.25%, 6/10/24(b) | | | 60,000 | | | | 59,894 | |
3.38%, 5/26/25 | | | 21,000 | | | | 20,826 | |
3.70%, 1/30/26 | | | 270,000 | | | | 270,089 | |
| | |
Merck & Co., Inc.
2.80%, 5/18/23 | | | 81,000 | | | | 80,857 | |
| | | | | | | | |
| | |
Micron Technology, Inc.
4.19%, 2/15/27 | | | 56,000 | | | | 54,784 | |
| | |
Mid-America Apartments LP
3.75%, 6/15/24(b) | | | 50,000 | | | | 49,851 | |
| | |
MidAmerican Energy Co.
3.50%, 10/15/24 | | | 36,000 | | | | 36,024 | |
| | |
Mondelez International, Inc.
1.50%, 5/4/25 | | | 69,000 | | | | 64,498 | |
| | |
Morgan Stanley | | | | | | | | |
3.74%, 4/24/24, (3.737% fixed rate until 4/24/23; 3-month U.S. dollar London Interbank Offered Rate + 0.847% thereafter)(a)(d) | | | 100,000 | | | | 99,738 | |
3.70%, 10/23/24 | | | 417,000 | | | | 416,254 | |
0.79%, 5/30/25, (0.79% fixed rate until 5/30/24; Secured Overnight Financing Rate + 0.525% thereafter)(a) | | | 50,000 | | | | 46,591 | |
2.72%, 7/22/25, (2.72% fixed rate until 7/22/24; Secured Overnight Financing Rate + 1.152% thereafter)(a) | | | 293,000 | | | | 282,833 | |
4.00%, 7/23/25 | | | 100,000 | | | | 100,059 | |
0.86%, 10/21/25, Series I, (0.864% fixed rate until 10/21/24; Secured Overnight Financing Rate + 0.745% thereafter)(a) | | | 187,000 | | | | 172,642 | |
5.00%, 11/24/25 | | | 131,000 | | | | 133,399 | |
3.88%, 1/27/26 | | | 205,000 | | | | 202,317 | |
2.19%, 4/28/26, (2.188% fixed rate until 4/28/25; Secured Overnight Financing Rate + 1.99% thereafter)(a) | | | 289,000 | | | | 271,229 | |
3.13%, 7/27/26 | | | 99,000 | | | | 94,514 | |
4.35%, 9/8/26 | | | 110,000 | | | | 108,982 | |
0.99%, 12/10/26, (0.985% fixed rate until 12/10/25; Secured Overnight Financing Rate + 0.72% thereafter)(a) | | | 92,000 | | | | 81,633 | |
3.63%, 1/20/27 | | | 114,000 | | | | 110,720 | |
| | |
MPLX LP
4.50%, 7/15/23 | | | 47,000 | | | | 47,121 | |
4.00%, 2/15/25 | | | 68,000 | | | | 67,106 | |
| | |
National Fuel Gas Co.
5.20%, 7/15/25 | | | 88,000 | | | | 89,108 | |
| | |
NetApp, Inc.
3.30%, 9/29/24 | | | 34,000 | | | | 33,460 | |
1.88%, 6/22/25 | | | 54,000 | | | | 50,386 | |
| | |
NextEra Energy Capital Holdings, Inc.
1.88%, 1/15/27 | | | 62,000 | | | | 55,943 | |
See Notes to Financial Statements.
Schedule of Investments (continued)
WisdomTree U.S. Short-Term Corporate Bond Fund (SFIG)
June 30, 2022
| | | | | | | | |
| Investments | | Principal
Amount | | | Value | |
| | |
Norfolk Southern Corp.
3.85%, 1/15/24 | | $ | 12,000 | | | $ | 12,046 | |
| | |
Northern States Power Co.
2.60%, 5/15/23 | | | 54,000 | | | | 53,654 | |
| | |
Northern Trust Corp.
3.95%, 10/30/25 | | | 52,000 | | | | 52,244 | |
| | |
Northrop Grumman Corp.
3.25%, 8/1/23 | | | 130,000 | | | | 130,005 | |
| | |
Nucor Corp.
2.00%, 6/1/25 | | | 10,000 | | | | 9,435 | |
| | |
Old Republic International Corp.
4.88%, 10/1/24 | | | 67,000 | | | | 68,044 | |
| | |
Omega Healthcare Investors, Inc.
4.38%, 8/1/23 | | | 10,000 | | | | 10,022 | |
4.95%, 4/1/24 | | | 50,000 | | | | 50,206 | |
5.25%, 1/15/26 | | | 118,000 | | | | 116,964 | |
| | | | | | | | |
| | |
Omnicom Group, Inc. / Omnicom Capital, Inc. 3.65%, 11/1/24 | | | 36,000 | | | | 35,735 | |
3.60%, 4/15/26 | | | 95,000 | | | | 92,444 | |
| | |
Oracle Corp.
3.63%, 7/15/23 | | | 166,000 | | | | 165,872 | |
2.95%, 11/15/24 | | | 48,000 | | | | 46,615 | |
2.50%, 4/1/25 | | | 215,000 | | | | 204,310 | |
2.95%, 5/15/25 | | | 142,000 | | | | 136,199 | |
1.65%, 3/25/26 | | | 650,000 | | | | 582,491 | |
2.65%, 7/15/26 | | | 194,000 | | | | 179,021 | |
| | |
Otis Worldwide Corp.
2.06%, 4/5/25 | | | 123,000 | | | | 116,495 | |
| | |
Owens Corning
4.20%, 12/1/24 | | | 70,000 | | | | 69,931 | |
| | |
Owl Rock Capital Corp.
3.75%, 7/22/25 | | | 30,000 | | | | 27,823 | |
3.40%, 7/15/26 | | | 216,000 | | | | 190,592 | |
| | |
Packaging Corp. of America
3.65%, 9/15/24 | | | 9,000 | | | | 8,945 | |
| | |
Paramount Global
4.75%, 5/15/25 | | | 63,000 | | | | 63,680 | |
| | |
Parker-Hannifin Corp.
2.70%, 6/14/24 | | | 67,000 | | | | 65,527 | |
| | |
PECO Energy Co.
3.15%, 10/15/25 | | | 9,000 | | | | 8,877 | |
| | |
PepsiCo, Inc.
3.50%, 7/17/25 | | | 18,000 | | | | 18,090 | |
2.85%, 2/24/26 | | | 18,000 | | | | 17,696 | |
| | |
PerkinElmer, Inc.
0.85%, 9/15/24 | | | 270,000 | | | | 250,719 | |
| | |
Pfizer, Inc.
3.40%, 5/15/24 | | | 75,000 | | | | 75,448 | |
| | |
Philip Morris International, Inc.
3.25%, 11/10/24 | | | 67,000 | | | | 66,209 | |
1.50%, 5/1/25 | | | 79,000 | | | | 74,010 | |
0.88%, 5/1/26 | | | 260,000 | | | | 230,441 | |
| | |
Phillips 66
3.61%, 2/15/25(c) | | | 57,000 | | | | 56,406 | |
| | |
Pioneer Natural Resources Co.
0.55%, 5/15/23 | | | 16,000 | | | | 15,601 | |
| | |
PNC Bank NA
2.50%, 8/27/24 | | | 162,000 | | | | 157,931 | |
| | |
PNC Financial Services Group, Inc.
3.50%, 1/23/24 | | | 30,000 | | | | 30,019 | |
| | |
Procter & Gamble Co.
0.55%, 10/29/25 | | | 10,000 | | | | 9,211 | |
| | |
Public Service Electric and Gas Co.
3.00%, 5/15/25(b) | | | 33,000 | | | | 32,373 | |
0.95%, 3/15/26 | | | 10,000 | | | | 9,090 | |
| | |
Public Service Enterprise Group, Inc.
2.88%, 6/15/24 | | | 82,000 | | | | 80,385 | |
0.80%, 8/15/25 | | | 36,000 | | | | 32,592 | |
| | |
QUALCOMM, Inc.
3.45%, 5/20/25(b) | | | 93,000 | | | | 92,999 | |
| | |
Ralph Lauren Corp.
3.75%, 9/15/25 | | | 36,000 | | | | 35,900 | |
| | |
Raytheon Technologies Corp.
3.95%, 8/16/25 | | | 124,000 | | | | 124,578 | |
| | |
Realty Income Corp.
3.88%, 4/15/25 | | | 24,000 | | | | 23,933 | |
| | | | | | | | |
4.13%, 10/15/26 | | | 120,000 | | | | 119,543 | |
| | |
Reliance Steel & Aluminum Co.
4.50%, 4/15/23 | | | 35,000 | | | | 35,118 | |
| | |
Republic Services, Inc.
0.88%, 11/15/25 | | | 65,000 | | | | 58,731 | |
| | |
Roper Technologies, Inc.
3.65%, 9/15/23 | | | 73,000 | | | | 73,111 | |
1.00%, 9/15/25 | | | 16,000 | | | | 14,476 | |
| | |
Royalty Pharma PLC
1.20%, 9/2/25 | | | 26,000 | | | | 23,300 | |
| | |
S&P Global, Inc.
2.95%, 1/22/27(b) | | | 50,000 | | | | 48,130 | |
| | |
Salesforce, Inc.
3.25%, 4/11/23 | | | 35,000 | | | | 35,100 | |
| | |
Sherwin-Williams Co.
3.13%, 6/1/24(b) | | | 9,000 | | | | 8,935 | |
| | |
SITE Centers Corp.
4.25%, 2/1/26 | | | 190,000 | | | | 186,470 | |
| | |
Southern Co.
3.25%, 7/1/26 | | | 177,000 | | | | 169,872 | |
| | |
Southern Co. Gas Capital Corp.
3.25%, 6/15/26(b) | | | 180,000 | | | | 173,081 | |
| | |
Southwest Airlines Co.
5.25%, 5/4/25 | | | 70,000 | | | | 71,487 | |
| | |
Southwestern Electric Power Co.
1.65%, 3/15/26, Series N | | | 121,000 | | | | 110,406 | |
| | |
Starbucks Corp.
3.85%, 10/1/23 | | | 17,000 | | | | 17,138 | |
| | |
State Street Corp.
3.70%, 11/20/23 | | | 28,000 | | | | 28,234 | |
3.55%, 8/18/25(b) | | | 79,000 | | | | 78,657 | |
| | |
Stifel Financial Corp.
4.25%, 7/18/24 | | | 7,000 | | | | 7,032 | |
| | |
Stryker Corp.
3.38%, 5/15/24(b) | | | 24,000 | | | | 23,883 | |
| | |
Synchrony Financial
4.25%, 8/15/24 | | | 162,000 | | | | 161,297 | |
3.70%, 8/4/26 | | | 228,000 | | | | 211,411 | |
See Notes to Financial Statements.
Schedule of Investments (continued)
WisdomTree U.S. Short-Term Corporate Bond Fund (SFIG)
June 30, 2022
| | | | | | | | |
| Investments | | Principal
Amount | | | Value | |
| | |
Target Corp.
2.25%, 4/15/25 | | $ | 54,000 | | | $ | 52,199 | |
| | |
TCI Communications, Inc.
7.88%, 2/15/26 | | | 180,000 | | | | 202,468 | |
| | |
TD SYNNEX Corp.
1.75%, 8/9/26(c) | | | 125,000 | | | | 110,407 | |
| | |
Textron, Inc.
4.30%, 3/1/24 | | | 77,000 | | | | 77,403 | |
| | |
TJX Cos., Inc.
2.50%, 5/15/23 | | | 42,000 | | | | 41,787 | |
| | |
Toyota Motor Credit Corp.
2.00%, 10/7/24 | | | 27,000 | | | | 26,127 | |
3.00%, 4/1/25 | | | 221,000 | | | | 217,468 | |
0.80%, 10/16/25 | | | 360,000 | | | | 327,856 | |
| | |
Truist Bank
3.20%, 4/1/24 | | | 46,000 | | | | 45,833 | |
| | |
Truist Financial Corp.
2.50%, 8/1/24 | | | 65,000 | | | | 63,482 | |
4.00%, 5/1/25 | | | 54,000 | | | | 54,147 | |
3.70%, 6/5/25(b) | | | 101,000 | | | | 100,648 | |
1.20%, 8/5/25 | | | 82,000 | | | | 75,536 | |
| | | | | | | | |
| | |
TWDC Enterprises 18 Corp.
3.15%, 9/17/25 | | | 80,000 | | | | 78,790 | |
1.85%, 7/30/26 | | | 320,000 | | | | 295,946 | |
| | |
Tyson Foods, Inc.
3.95%, 8/15/24 | | | 14,000 | | | | 13,989 | |
4.00%, 3/1/26 | | | 45,000 | | | | 44,688 | |
| | |
U.S. Bancorp
3.95%, 11/17/25 | | | 23,000 | | | | 23,132 | |
| | |
Union Electric Co.
3.50%, 4/15/24 | | | 94,000 | | | | 94,126 | |
| | |
Union Pacific Corp.
3.50%, 6/8/23 | | | 80,000 | | | | 79,986 | |
3.15%, 3/1/24(b) | | | 54,000 | | | | 53,677 | |
| | |
United Parcel Service, Inc.
2.50%, 4/1/23 | | | 83,000 | | | | 82,919 | |
| | |
UnitedHealth Group, Inc.
3.50%, 6/15/23 | | | 130,000 | | | | 130,450 | |
2.38%, 8/15/24 | | | 104,000 | | | | 102,032 | |
| | |
Universal Health Services, Inc.
1.65%, 9/1/26(c) | | | 260,000 | | | | 225,597 | |
| | |
Valero Energy Corp.
2.85%, 4/15/25 | | | 90,000 | | | | 87,060 | |
3.40%, 9/15/26 | | | 230,000 | | | | 221,897 | |
| | |
Verizon Communications, Inc.
3.50%, 11/1/24 | | | 140,000 | | | | 139,849 | |
3.38%, 2/15/25 | | | 46,000 | | | | 45,720 | |
1.45%, 3/20/26 | | | 106,000 | | | | 97,099 | |
2.63%, 8/15/26 | | | 101,000 | | | | 95,540 | |
1.68%, 10/30/30 | | | 100,000 | | | | 80,563 | |
| | |
VF Corp.
2.40%, 4/23/25 | | | 34,000 | | | | 32,689 | |
| | |
Virginia Electric and Power Co.
3.45%, 2/15/24(b) | | | 92,000 | | | | 91,897 | |
| | |
VMware, Inc.
1.40%, 8/15/26 | | | 342,000 | | | | 302,974 | |
| | |
Vornado Realty LP
2.15%, 6/1/26 | | | 82,000 | | | | 73,098 | |
| | |
Walgreens Boots Alliance, Inc.
3.45%, 6/1/26 | | | 76,000 | | | | 73,963 | |
| | |
Walt Disney Co.
3.35%, 3/24/25 | | | 46,000 | | | | 45,660 | |
| | |
WEC Energy Group, Inc.
0.80%, 3/15/24 | | | 10,000 | | | | 9,513 | |
3.55%, 6/15/25 | | | 26,000 | | | | 25,615 | |
| | |
Wells Fargo & Co.
4.48%, 1/16/24 | | | 200,000 | | | | 202,436 | |
3.75%, 1/24/24 | | | 233,000 | | | | 233,485 | |
3.30%, 9/9/24 | | | 146,000 | | | | 144,349 | |
3.00%, 2/19/25 | | | 86,000 | | | | 84,147 | |
3.55%, 9/29/25 | | | 138,000 | | | | 135,618 | |
2.41%, 10/30/25, (2.406% fixed rate until 10/30/24; Secured Overnight Financing Rate + 1.087% thereafter)(a) | | | 145,000 | | | | 138,371 | |
2.16%, 2/11/26, (2.164% fixed rate until 2/11/25; 3-month U.S. dollar London Interbank Offered Rate + 0.75% thereafter)(a)(d) | | | 100,000 | | | | 94,187 | |
2.19%, 4/30/26, (2.188% fixed rate until 4/30/25; Secured Overnight Financing Rate + 2.00% thereafter)(a) | | | 192,000 | | | | 180,117 | |
3.00%, 10/23/26 | | | 135,000 | | | | 127,497 | |
| | |
Western Union Co.
2.85%, 1/10/25 | | | 57,000 | | | | 54,792 | |
| | |
Whirlpool Corp.
3.70%, 5/1/25 | | | 41,000 | | | | 40,955 | |
| | |
WRKCo, Inc.
3.75%, 3/15/25(b) | | | 89,000 | | | | 88,161 | |
| | |
Xcel Energy, Inc.
3.30%, 6/1/25 | | | 14,000 | | | | 13,764 | |
| | | | | | | | |
Xilinx, Inc.
2.95%, 6/1/24(b) | | | 30,000 | | | | 29,800 | |
TOTAL U.S. CORPORATE BONDS (Cost: $42,000,229) | | | | | | | 40,233,503 | |
|
| FOREIGN CORPORATE BONDS – 4.5% | |
|
| Germany – 1.7% | |
| | |
Deutsche Bank AG
0.90%, 5/28/24 | | | 50,000 | | | | 46,940 | |
3.70%, 5/30/24(b) | | | 100,000 | | | | 98,605 | |
3.96%, 11/26/25, (3.961% fixed rate until 11/26/24; Secured Overnight Financing Rate + 2.581% thereafter)(a) | | | 150,000 | | | | 145,417 | |
4.10%, 1/13/26(b) | | | 129,000 | | | | 127,764 | |
1.69%, 3/19/26 | | | 200,000 | | | | 179,484 | |
2.13%, 11/24/26, (2.129% fixed rate until 11/24/25; Secured Overnight Financing Rate + 1.87% thereafter)(a) | | | 150,000 | | | | 133,575 | |
| | | | | | | | |
| Total Germany | | | | | | | 731,785 | |
| | |
| Switzerland – 0.5% | | | | | | | | |
| | |
Novartis Capital Corp.
2.00%, 2/14/27 | | | 250,000 | | | | 232,863 | |
| | |
| United Kingdom – 2.3% | | | | | | | | |
| | |
Astrazeneca Finance LLC
1.20%, 5/28/26 | | | 280,000 | | | | 253,212 | |
See Notes to Financial Statements.
Schedule of Investments (concluded)
WisdomTree U.S. Short-Term Corporate Bond Fund (SFIG)
June 30, 2022
| | | | | | | | |
| Investments | | Principal
Amount | | | Value | |
| | |
BAT Capital Corp.
3.22%, 8/15/24 | | $ | 235,000 | | | $ | 228,857 | |
2.79%, 9/6/24 | | | 50,000 | | | | 48,312 | |
3.22%, 9/6/26 | | | 62,000 | | | | 57,920 | |
| | |
GlaxoSmithKline Capital, Inc.
3.38%, 5/15/23(b) | | | 56,000 | | | | 56,267 | |
| | |
Reynolds American, Inc.
4.85%, 9/15/23 | | | 107,000 | | | | 108,082 | |
4.45%, 6/12/25 | | | 137,000 | | | | 136,522 | |
| | |
Unilever Capital Corp.
2.00%, 7/28/26 | | | 100,000 | | | | 94,248 | |
| | | | | | | | |
| Total United Kingdom | | | | | | | 983,420 | |
TOTAL FOREIGN CORPORATE BONDS (Cost: $2,034,977) | | | | | | | 1,948,068 | |
|
| U.S. GOVERNMENT OBLIGATIONS – 0.1% | |
|
| U.S. Treasury Note – 0.1% | |
| | |
U.S. Treasury Note
2.63%, 5/31/27 | | | | | | | | |
| (Cost: $29,572) | | | 30,000 | | | | 29,436 | |
|
| INVESTMENT OF CASH COLLATERAL FOR SECURITIES LOANED – 3.3% | |
|
| United States – 3.3% | |
| | |
State Street Navigator Securities Lending
Government Money Market Portfolio, 1.56%(e) | | | | | | | | |
| (Cost: $1,408,510) | | | 1,408,510 | | | | 1,408,510 | |
| |
TOTAL INVESTMENTS IN SECURITIES – 102.0% (Cost: $45,473,288) | | | | 43,619,517 | |
| |
Other Assets less Liabilities – (2.0)% | | | | (862,708 | ) |
| | | | | | | | |
| NET ASSETS – 100.0% | | | $ | 42,756,809 | |
| (a) | Rate shown reflects the accrual rate as of June 30, 2022 on securities with variable or step rates. |
| (b) | Security, or portion thereof, was on loan at June 30, 2022 (See Note 2). At June 30, 2022, the total market value of the Fund’s securities on loan identified in the Schedule of Investments was $1,661,467 and the total market value of the collateral held by the Fund was $1,708,467. The total market value of the collateral includes non-cash U.S. Government securities collateral having a value of $299,957. |
| (c) | This security is exempt from registration under rule 144A of the Securities Act of 1933. This security may be sold in transactions that are exempt from registration, normally to qualified institutional buyers. |
| (d) | The London Interbank Offered Rate (“LIBOR”) is being phased out completely by June 30, 2023. There remains uncertainty regarding the nature of any replacement rate and the impact of a transition away from LIBOR on the Fund’s investments. |
| (e) | Rate shown represents annualized 7-day yield as of June 30, 2022. |
The following is a summary of the fair valuations according to the inputs used as of June 30, 2022 in valuing the Fund’s investments (See Note 2 – Fair Value Measurement):
| | | | | | | | | | | | | | | | |
| | | | |
| | | Quoted
Prices in
Active
Markets
(Level 1) | | | Other
Significant
Observable
Inputs
(Level 2) | | | Significant
Unobservable
Inputs
(Level 3) | | | Total | |
Assets: | | | | | | | | | |
Investments in Securities | | | | |
U.S. Corporate Bonds | | $ | — | | | $ | 40,233,503 | | | $ | — | | | $ | 40,233,503 | |
Foreign Corporate Bonds | | | — | | | | 1,948,068 | | | | — | | | | 1,948,068 | |
U.S. Government Obligations | | | — | | | | 29,436 | | | | — | | | | 29,436 | |
Investment of Cash Collateral for Securities Loaned | | | — | | | | 1,408,510 | | | | — | | | | 1,408,510 | |
Total Investments in Securities | | $ | — | | | $ | 43,619,517 | | | $ | — | | | $ | 43,619,517 | |
See Notes to Financial Statements.
Schedule of Investments
WisdomTree Emerging Markets Efficient Core Fund (NTSE)
June 30, 2022
| | | | | | | | |
| Investments | | Shares | | | Value | |
| | | | | | | | |
| | |
| COMMON STOCKS – 87.5% | | | | | | | | |
|
| Brazil – 3.5% | |
| | |
Ambev SA | | | 34,603 | | | $ | 88,667 | |
| | |
B3 SA – Brasil Bolsa Balcao | | | 54,489 | | | | 114,199 | |
| | |
Banco Santander Brasil SA | | | 3,387 | | | | 18,660 | |
| | |
CCR SA | | | 10,168 | | | | 24,363 | |
| | |
Centrais Eletricas Brasileiras SA | | | 3,387 | | | | 29,923 | |
| | |
Cosan SA | | | 10,168 | | | | 35,388 | |
| | |
Equatorial Energia SA | | | 6,774 | | | | 29,586 | |
| | |
Getnet Adquirencia e Servicos para Meios de Pagamento SA | | | 859 | | | | 703 | |
| | |
Hapvida Participacoes e Investimentos SA(a) | | | 37,818 | | | | 39,558 | |
| | |
JBS SA | | | 10,168 | | | | 61,423 | |
| | |
Klabin SA | | | 6,774 | | | | 26,166 | |
| | |
Localiza Rent a Car SA | | | 3,693 | | | | 37,012 | |
| | |
Lojas Renner SA | | | 11,743 | | | | 50,794 | |
| | |
Magazine Luiza SA | | | 33,884 | | | | 15,162 | |
| | |
Natura & Co. Holding SA | | | 5,096 | | | | 13,077 | |
| | |
Raia Drogasil SA | | | 1,256 | | | | 4,611 | |
| | |
Rumo SA | | | 10,168 | | | | 31,052 | |
| | |
Suzano SA | | | 6,774 | | | | 64,366 | |
| | |
Telefonica Brasil SA | | | 5,537 | | | | 49,828 | |
| | |
Vale SA | | | 27,150 | | | | 397,480 | |
| | |
Via SA* | | | 10,168 | | | | 3,733 | |
| | |
Vibra Energia SA | | | 6,774 | | | | 21,645 | |
| | |
WEG SA | | | 11,140 | | | | 56,345 | |
| | | | | | | | |
| Total Brazil | | | | | | | 1,213,741 | |
|
| Chile – 0.5% | |
| | |
Banco de Chile | | | 384,362 | | | | 34,257 | |
| | |
Banco de Credito e Inversiones SA | | | 583 | | | | 16,716 | |
| | |
Banco Santander Chile | | | 623,695 | | | | 24,665 | |
| | |
Cencosud SA | | | 22,088 | | | | 27,537 | |
| | |
Empresas CMPC SA | | | 2,849 | | | | 4,638 | |
| | |
Empresas COPEC SA | | | 3,028 | | | | 21,881 | |
| | |
Enel Americas SA | | | 293,398 | | | | 27,277 | |
| | |
Falabella SA | | | 4,350 | | | | 9,983 | |
| | | | | | | | |
| Total Chile | | | | | | | 166,954 | |
|
| China – 31.4% | |
| | |
Agricultural Bank of China Ltd., Class H | | | 257,000 | | | | 96,945 | |
| | |
Airtac International Group | | | 1,000 | | | | 33,329 | |
| | |
Alibaba Group Holding Ltd.* | | | 95,500 | | | | 1,361,860 | |
| | |
Anhui Conch Cement Co. Ltd., Class H | | | 10,500 | | | | 45,495 | |
| | |
ANTA Sports Products Ltd. | | | 8,200 | | | | 100,737 | |
| | |
Baidu, Inc., ADR* | | | 1,715 | | | | 255,072 | |
| | |
Bank of China Ltd., Class H | | | 476,000 | | | | 189,867 | |
| | |
Bank of Communications Co. Ltd., Class H | | | 114,000 | | | | 78,741 | |
| | |
BeiGene Ltd., ADR* | | | 289 | | | | 46,775 | |
| | |
Bilibili, Inc., ADR* | | | 222 | | | | 5,683 | |
| | |
BYD Co. Ltd., Class H | | | 4,000 | | | | 160,062 | |
| | |
China Conch Venture Holdings Ltd. | | | 15,500 | | | | 33,777 | |
| | |
China Construction Bank Corp., Class H | | | 600,000 | | | | 402,959 | |
| | |
China Everbright Bank Co. Ltd., Class H | | | 45,000 | | | | 14,566 | |
| | |
China International Capital Corp. Ltd., Class H(a) | | | 18,000 | | | | 38,354 | |
| | | | | | | | |
| | |
China Life Insurance Co. Ltd., Class H | | | 45,000 | | | | 78,336 | |
| | |
China Longyuan Power Group Corp. Ltd., Class H | | | 18,000 | | | | 34,775 | |
| | |
China Mengniu Dairy Co. Ltd.* | | | 24,000 | | | | 119,741 | |
| | |
China Merchants Bank Co. Ltd., Class H | | | 35,500 | | | | 237,513 | |
| | |
China Minsheng Banking Corp. Ltd., Class H | | | 22,500 | | | | 8,029 | |
| | |
China Overseas Land & Investment Ltd. | | | 28,000 | | | | 88,493 | |
| | |
China Pacific Insurance Group Co. Ltd., Class H | | | 30,000 | | | | 73,328 | |
| | |
China Petroleum & Chemical Corp., Class H | | | 144,000 | | | | 64,779 | |
| | |
China Resources Land Ltd. | | | 16,000 | | | | 74,628 | |
| | |
China Shenhua Energy Co. Ltd., Class H | | | 32,000 | | | | 91,755 | |
| | |
China Taiping Insurance Holdings Co. Ltd. | | | 13,800 | | | | 17,024 | |
| | |
China Tower Corp. Ltd., Class H(a) | | | 276,000 | | | | 35,525 | |
| | |
China Yangtze Power Co. Ltd., Class A | | | 18,300 | | | | 63,109 | |
| | |
CITIC Ltd. | | | 62,000 | | | | 62,814 | |
| | |
CITIC Securities Co. Ltd., Class H | | | 27,500 | | | | 61,470 | |
| | |
CMOC Group Ltd., Class H | | | 12,000 | | | | 6,698 | |
| | |
Contemporary Amperex Technology Co. Ltd., Class A | | | 400 | | | | 31,861 | |
| | |
COSCO Shipping Holdings Co. Ltd., Class H* | | | 33,800 | | | | 47,209 | |
| | |
Country Garden Holdings Co. Ltd. | | | 103,000 | | | | 63,793 | |
| | |
Country Garden Services Holdings Co. Ltd. | | | 8,000 | | | | 35,632 | |
| | |
CSPC Pharmaceutical Group Ltd. | | | 84,000 | | | | 83,390 | |
| | |
Daqo New Energy Corp., ADR* | | | 620 | | | | 44,256 | |
| | |
ENN Energy Holdings Ltd. | | | 6,300 | | | | 103,489 | |
| | |
Foshan Haitian Flavouring & Food Co. Ltd., Class A | | | 2,440 | | | | 32,887 | |
| | |
Fosun International Ltd. | | | 10,000 | | | | 9,239 | |
| | |
Fuyao Glass Industry Group Co. Ltd., Class H(a) | | | 6,800 | | | | 34,490 | |
| | |
GDS Holdings Ltd., ADR* | | | 612 | | | | 43,777 | |
| | |
Geely Automobile Holdings Ltd. | | | 43,000 | | | | 97,760 | |
| | |
GF Securities Co. Ltd., Class H | | | 27,600 | | | | 36,509 | |
| | |
Great Wall Motor Co. Ltd., Class H | | | 20,500 | | | | 42,165 | |
| | |
Haier Smart Home Co. Ltd., Class H | | | 16,200 | | | | 59,974 | |
| | |
Haitong Securities Co. Ltd., Class H | | | 27,600 | | | | 20,260 | |
| | |
Hangzhou Tigermed Consulting Co. Ltd., Class H(a) | | | 1,100 | | | | 12,715 | |
| | |
Huatai Securities Co. Ltd., Class H(a) | | | 22,800 | | | | 33,821 | |
| | |
Huazhu Group Ltd., ADR | | | 1,503 | | | | 57,264 | |
| | |
Industrial & Commercial Bank of China Ltd., Class H | | | 403,000 | | | | 239,326 | |
| | |
iQIYI, Inc., ADR* | | | 1,707 | | | | 7,169 | |
| | |
JD Health International, Inc.*(a) | | | 3,450 | | | | 27,061 | |
| | |
JD.com, Inc., ADR | | | 5,600 | | | | 359,632 | |
| | |
JD.com, Inc., Class A* | | | 1,738 | | | | 55,992 | |
| | |
JOYY, Inc., ADR | | | 620 | | | | 18,513 | |
| | |
Kingdee International Software Group Co. Ltd.* | | | 4,000 | | | | 9,379 | |
| | |
Kweichow Moutai Co. Ltd., Class A | | | 300 | | | | 91,510 | |
| | |
Lenovo Group Ltd. | | | 60,000 | | | | 56,047 | |
| | |
Li Auto, Inc., ADR* | | | 1,736 | | | | 66,506 | |
| | |
Li Ning Co. Ltd. | | | 14,000 | | | | 129,706 | |
| | |
Longfor Group Holdings Ltd.(a) | | | 13,000 | | | | 61,381 | |
| | |
LONGi Green Energy Technology Co. Ltd., Class A | | | 3,172 | | | | 31,525 | |
| | |
Luzhou Laojiao Co. Ltd., Class A | | | 1,100 | | | | 40,451 | |
| | |
Meituan, Class B*(a) | | | 23,200 | | | | 574,165 | |
| | |
NetEase, Inc., ADR | | | 2,856 | | | | 266,636 | |
| | |
New China Life Insurance Co. Ltd., Class H | | | 11,400 | | | | 32,034 | |
| | |
NIO, Inc., ADR* | | | 8,659 | | | | 188,074 | |
| | |
People’s Insurance Co. Group of China Ltd., Class H | | | 69,000 | | | | 21,104 | |
See Notes to Financial Statements.
Schedule of Investments (continued)
WisdomTree Emerging Markets Efficient Core Fund (NTSE)
June 30, 2022
| | | | | | | | |
| Investments | | Shares | | | Value | |
| | | | | | | | |
| | |
PetroChina Co. Ltd., Class H | | | 140,000 | | | $ | 66,727 | |
| | |
PICC Property & Casualty Co. Ltd., Class H | | | 64,000 | | | | 66,553 | |
| | |
Pinduoduo, Inc., ADR* | | | 2,780 | | | | 171,804 | |
| | |
Ping An Bank Co. Ltd., Class A* | | | 17,600 | | | | 39,326 | |
| | |
Ping An Healthcare and Technology Co. Ltd.*(a) | | | 4,500 | | | | 13,333 | |
| | |
Ping An Insurance Group Co. of China Ltd., Class H | | | 40,000 | | | | 271,953 | |
| | |
Postal Savings Bank of China Co. Ltd., Class H(a) | | | 97,000 | | | | 77,012 | |
| | |
SF Holding Co. Ltd., Class A | | | 5,600 | | | | 46,618 | |
| | |
Shenzhou International Group Holdings Ltd. | | | 5,700 | | | | 69,044 | |
| | |
Shimao Group Holdings Ltd.† | | | 9,500 | | | | 2,724 | |
| | |
Smoore International Holdings Ltd.(a) | | | 5,000 | | | | 15,420 | |
| | |
Sunac China Holdings Ltd.† | | | 19,000 | | | | 4,843 | |
| | |
Sunny Optical Technology Group Co. Ltd. | | | 5,000 | | | | 81,497 | |
| | |
Tencent Holdings Ltd. | | | 35,700 | | | | 1,612,356 | |
| | |
Tencent Music Entertainment Group, ADR* | | | 3,932 | | | | 19,739 | |
| | |
Trip.com Group Ltd., ADR* | | | 3,614 | | | | 99,204 | |
| | |
Want Want China Holdings Ltd. | | | 53,000 | | | | 46,064 | |
| | |
Weibo Corp., ADR* | | | 839 | | | | 19,406 | |
| | |
Weichai Power Co. Ltd., Class H | | | 16,000 | | | | 25,406 | |
| | |
Wuliangye Yibin Co. Ltd., Class A | | | 2,600 | | | | 78,312 | |
| | |
WuXi AppTec Co. Ltd., Class H(a) | | | 2,940 | | | | 39,153 | |
| | |
Wuxi Biologics Cayman, Inc.*(a) | | | 22,500 | | | | 205,876 | |
| | |
Xiaomi Corp., Class B*(a) | | | 101,200 | | | | 175,911 | |
| | |
Xinyi Solar Holdings Ltd. | | | 38,026 | | | | 58,733 | |
| | |
XPeng, Inc., ADR* | | | 1,337 | | | | 42,436 | |
| | |
Yum China Holdings, Inc. | | | 2,321 | | | | 112,569 | |
| | |
Zai Lab Ltd., ADR* | | | 741 | | | | 25,698 | |
| | |
Zijin Mining Group Co. Ltd., Class H | | | 40,000 | | | | 48,987 | |
| | |
Zoomlion Heavy Industry Science and Technology Co. Ltd., Class H | | | 40,000 | | | | 21,359 | |
| | |
ZTE Corp., Class H | | | 14,000 | | | | 32,614 | |
| | |
ZTO Express Cayman, Inc., ADR | | | 2,046 | | | | 56,163 | |
| | | | | | | | |
| Total China | | | | 10,795,781 | |
|
| Czech Republic – 0.2% | |
| | |
CEZ AS | | | 1,343 | | | | 60,338 | |
|
| Hungary – 0.2% | |
| | |
MOL Hungarian Oil & Gas PLC | | | 407 | | | | 3,129 | |
| | |
OTP Bank Nyrt | | | 1,255 | | | | 27,849 | |
| | |
Richter Gedeon Nyrt | | | 1,482 | | | | 26,669 | |
| | | | | | | | |
| Total Hungary | | | | 57,647 | |
|
| India – 12.9% | |
| | |
Adani Green Energy Ltd.* | | | 2,064 | | | | 50,431 | |
| | |
Adani Ports & Special Economic Zone Ltd. | | | 5,084 | | | | 43,264 | |
| | |
Ambuja Cements Ltd. | | | 8,434 | | | | 38,767 | |
| | |
Apollo Hospitals Enterprise Ltd. | | | 760 | | | | 35,449 | |
| | |
Asian Paints Ltd. | | | 2,068 | | | | 70,577 | |
| | |
Aurobindo Pharma Ltd. | | | 2,369 | | | | 15,392 | |
| | |
Avenue Supermarts Ltd.*(a) | | | 1,472 | | | | 63,488 | |
| | |
Axis Bank Ltd.* | | | 14,539 | | | | 117,236 | |
| | |
Bajaj Finance Ltd. | | | 1,809 | | | | 123,708 | |
| | |
Bandhan Bank Ltd.(a) | | | 9,678 | | | | 32,292 | |
| | |
Bharti Airtel Ltd.* | | | 16,391 | | | | 142,164 | |
| | | | | | | | |
| | |
Britannia Industries Ltd. | | | 449 | | | | 19,708 | |
| | |
Cipla Ltd. | | | 2,035 | | | | 23,635 | |
| | |
Divi’s Laboratories Ltd. | | | 736 | | | | 33,834 | |
| | |
Dr. Reddy’s Laboratories Ltd. | | | 773 | | | | 43,007 | |
| | |
GAIL India Ltd. | | | 3,625 | | | | 6,206 | |
| | |
Godrej Consumer Products Ltd.* | | | 3,387 | | | | 32,490 | |
| | |
Grasim Industries Ltd. | | | 2,640 | | | | 44,152 | |
| | |
HCL Technologies Ltd. | | | 7,633 | | | | 94,068 | |
| | |
HDFC Life Insurance Co. Ltd.(a) | | | 1,586 | | | | 11,046 | |
| | |
Hindalco Industries Ltd. | | | 13,555 | | | | 58,127 | |
| | |
Hindustan Unilever Ltd. | | | 5,280 | | | | 149,135 | |
| | |
Housing Development Finance Corp. Ltd. | | | 10,555 | | | | 290,143 | |
| | |
ICICI Bank Ltd. | | | 32,714 | | | | 292,954 | |
| | |
ICICI Lombard General Insurance Co. Ltd.(a) | | | 171 | | | | 2,427 | |
| | |
Infosys Ltd. | | | 22,221 | | | | 411,344 | |
| | |
ITC Ltd. | | | 31,419 | | | | 108,811 | |
| | |
JSW Steel Ltd. | | | 8,471 | | | | 60,551 | |
| | |
Kotak Mahindra Bank Ltd. | | | 2,858 | | | | 60,115 | |
| | |
Larsen & Toubro Ltd. | | | 5,215 | | | | 102,900 | |
| | |
Lupin Ltd. | | | 1,999 | | | | 15,465 | |
| | |
Mahindra & Mahindra Ltd. | | | 6,414 | | | | 88,784 | |
| | |
Marico Ltd. | | | 3,387 | | | | 20,496 | |
| | |
Maruti Suzuki India Ltd. | | | 892 | | | | 95,678 | |
| | |
NTPC Ltd. | | | 24,833 | | | | 44,935 | |
| | |
Oil & Natural Gas Corp. Ltd. | | | 15,626 | | | | 29,987 | |
| | |
Power Grid Corp. of India Ltd. | | | 20,567 | | | | 55,186 | |
| | |
Reliance Industries Ltd.* | | | 18,320 | | | | 602,138 | |
| | |
Samvardhana Motherson International Ltd. | | | 7,827 | | | | 11,710 | |
| | |
SBI Life Insurance Co. Ltd.(a) | | | 2,986 | | | | 40,896 | |
| | |
Shriram Transport Finance Co. Ltd. | | | 2,271 | | | | 36,848 | |
| | |
State Bank of India | | | 10,562 | | | | 62,311 | |
| | |
Sun Pharmaceutical Industries Ltd. | | | 7,800 | | | | 82,037 | |
| | |
Tata Consultancy Services Ltd. | | | 5,899 | | | | 244,042 | |
| | |
Tata Consumer Products Ltd. | | | 5,084 | | | | 45,473 | |
| | |
Tata Motors Ltd.* | | | 12,362 | | | | 64,461 | |
| | |
Tata Steel Ltd. | | | 4,003 | | | | 43,949 | |
| | |
Tech Mahindra Ltd. | | | 5,084 | | | | 64,377 | |
| | |
Titan Co. Ltd. | | | 1,697 | | | | 41,714 | |
| | |
UltraTech Cement Ltd. | | | 848 | | | | 60,211 | |
| | |
UPL Ltd. | | | 2,011 | | | | 16,104 | |
| | |
Vedanta Ltd. | | | 15,206 | | | | 42,938 | |
| | |
Wipro Ltd. | | | 6,774 | | | | 35,687 | |
| | | | | | | | |
| Total India | | | | 4,422,848 | |
|
| Indonesia – 1.7% | |
| | |
Astra International Tbk PT | | | 186,200 | | | | 82,804 | |
| | |
Bank Central Asia Tbk PT | | | 333,500 | | | | 162,301 | |
| | |
Bank Mandiri Persero Tbk PT | | | 180,400 | | | | 95,967 | |
| | |
Bank Rakyat Indonesia Persero Tbk PT | | | 376,500 | | | | 104,882 | |
| | |
Charoen Pokphand Indonesia Tbk PT | | | 95,300 | | | | 38,382 | |
| | |
Telkom Indonesia Persero Tbk PT | | | 293,600 | | | | 78,832 | |
| | |
Unilever Indonesia Tbk PT | | | 105,900 | | | | 33,908 | |
| | | | | | | | |
| Total Indonesia | | | | 597,076 | |
See Notes to Financial Statements.
Schedule of Investments (continued)
WisdomTree Emerging Markets Efficient Core Fund (NTSE)
June 30, 2022
| | | | | | | | |
| Investments | | Shares | | | Value | |
| | | | | | | | |
|
| Luxembourg – 0.1% | |
| | |
Reinet Investments SCA | | | 1,152 | | | $ | 20,097 | |
|
| Malaysia – 1.1% | |
| | |
CIMB Group Holdings Bhd | | | 60,743 | | | | 68,358 | |
| | |
Dialog Group Bhd | | | 20,000 | | | | 9,665 | |
| | |
Hartalega Holdings Bhd | | | 20,000 | | | | 13,886 | |
| | |
Hong Leong Bank Bhd | | | 4,500 | | | | 20,890 | |
| | |
IHH Healthcare Bhd | | | 28,800 | | | | 42,146 | |
| | |
Malayan Banking Bhd | | | 3,150 | | | | 6,139 | |
| | |
Petronas Chemicals Group Bhd | | | 24,500 | | | | 50,028 | |
| | |
Petronas Gas Bhd | | | 12,200 | | | | 45,506 | |
| | |
Press Metal Aluminium Holdings Bhd | | | 29,200 | | | | 31,535 | |
| | |
Public Bank Bhd | | | 78,800 | | | | 78,130 | |
| | |
Tenaga Nasional Bhd | | | 11,400 | | | | 20,640 | |
| | |
Top Glove Corp. Bhd | | | 19,500 | | | | 4,601 | |
| | | | | | | | |
| Total Malaysia | | | | 391,524 | |
|
| Mexico – 2.6% | |
| | |
America Movil SAB de CV, Series L | | | 238,729 | | | | 243,157 | |
| | |
Cemex SAB de CV, Series CPO* | | | 93,884 | | | | 36,435 | |
| | |
Fibra Uno Administracion SA de CV | | | 23,716 | | | | 23,545 | |
| | |
Fomento Economico Mexicano SAB de CV | | | 14,826 | | | | 99,762 | |
| | |
Grupo Aeroportuario del Pacifico SAB de CV, Class B | | | 2,243 | | | | 31,139 | |
| | |
Grupo Aeroportuario del Sureste SAB de CV, Class B | | | 2,035 | | | | 39,864 | |
| | |
Grupo Bimbo SAB de CV, Series A | | | 16,942 | | | | 54,893 | |
| | |
Grupo Financiero Banorte SAB de CV, Class O | | | 17,787 | | | | 98,889 | |
| | |
Grupo Mexico SAB de CV, Series B | | | 18,632 | | | | 76,899 | |
| | |
Grupo Televisa SAB, Series CPO | | | 20,329 | | | | 33,261 | |
| | |
Wal-Mart de Mexico SAB de CV | | | 43,200 | | | | 148,448 | |
| | | | | | | | |
| Total Mexico | | | | 886,292 | |
|
| Philippines – 0.6% | |
| | |
AC Energy Corp. | | | 8,730 | | | | 1,277 | |
| | |
Ayala Corp. | | | 2,910 | | | | 31,754 | |
| | |
Ayala Land, Inc. | | | 109,800 | | | | 50,922 | |
| | |
Bank of the Philippine Islands | | | 16,630 | | | | 25,647 | |
| | |
BDO Unibank, Inc. | | | 16,140 | | | | 32,436 | |
| | |
JG Summit Holdings, Inc. | | | 29,370 | | | | 26,013 | |
| | |
SM Investments Corp. | | | 20 | | | | 284 | |
| | |
SM Prime Holdings, Inc. | | | 67,400 | | | | 44,803 | |
| | | | | | | | |
| Total Philippines | | | | 213,136 | |
|
| Poland – 0.5% | |
| | |
Allegro.eu SA*(a) | | | 2,582 | | | | 13,694 | |
| | |
Bank Polska Kasa Opieki SA | | | 1,733 | | | | 31,431 | |
| | |
CD Projekt SA | | | 476 | | | | 10,130 | |
| | |
Dino Polska SA*(a) | | | 74 | | | | 5,251 | |
| | |
KGHM Polska Miedz SA | | | 1,389 | | | | 36,734 | |
| | |
Polski Koncern Naftowy Orlen SA | | | 2,211 | | | | 33,697 | |
| | |
Powszechna Kasa Oszczednosci Bank Polski SA* | | | 3,213 | | | | 20,011 | |
| | |
Powszechny Zaklad Ubezpieczen SA | | | 5,305 | | | | 35,376 | |
| | | | | | | | |
| Total Poland | | | | 186,324 | |
| | | | | | | | |
|
| Russia – 0.0% | |
| | |
Gazprom PJSC, ADR† | | | 49,510 | | | | 0 | |
| | |
Lukoil PJSC, ADR† | | | 2,998 | | | | 0 | |
| | |
Magnit PJSC, GDR†(b) | | | 4,515 | | | | 0 | |
| | |
MMC Norilsk Nickel PJSC, ADR† | | | 3,678 | | | | 0 | |
| | |
Mobile TeleSystems PJSC, ADR† | | | 2,887 | | | | 0 | |
| | |
Novatek PJSC, GDR†(b) | | | 696 | | | | 0 | |
| | |
Novolipetsk Steel PJSC, GDR† | | | 1,290 | | | | 0 | |
| | |
Polymetal International PLC | | | 2,011 | | | | 4,421 | |
| | |
Polyus PJSC, GDR†(b) | | | 652 | | | | 0 | |
| | |
Rosneft Oil Co. PJSC, GDR†(b) | | | 4,594 | | | | 0 | |
| | |
Sberbank of Russia PJSC, ADR*† | | | 21,191 | | | | 0 | |
| | |
Severstal PAO, GDR†(b) | | | 2,080 | | | | 0 | |
| | |
Surgutneftegas PJSC, ADR† | | | 11,296 | | | | 0 | |
| | |
Tatneft PJSC, ADR† | | | 2,035 | | | | 0 | |
| | |
TCS Group Holding PLC, GDR*†(b) | | | 430 | | | | 0 | |
| | |
X5 Retail Group NV, GDR†(b) | | | 1,673 | | | | 0 | |
| | |
Yandex NV, Class A*† | | | 2,324 | | | | 0 | |
| | | | | | | | |
| Total Russia | | | | | | | 4,421 | |
| | |
| South Africa – 4.9% | | | | | | | | |
| | |
Absa Group Ltd. | | | 6,367 | | | | 60,085 | |
| | |
Anglo American Platinum Ltd. | | | 580 | | | | 50,450 | |
| | |
AngloGold Ashanti Ltd. | | | 3,725 | | | | 55,714 | |
| | |
Aspen Pharmacare Holdings Ltd. | | | 4,384 | | | | 37,207 | |
| | |
Bid Corp. Ltd. | | | 1,651 | | | | 30,920 | |
| | |
Bidvest Group Ltd. | | | 2,849 | | | | 36,449 | |
| | |
Capitec Bank Holdings Ltd. | | | 387 | | | | 46,823 | |
| | |
Clicks Group Ltd. | | | 654 | | | | 10,911 | |
| | |
Discovery Ltd.* | | | 3,908 | | | | 30,558 | |
| | |
Exxaro Resources Ltd. | | | 1,604 | | | | 19,404 | |
| | |
FirstRand Ltd. | | | 23,737 | | | | 90,369 | |
| | |
Gold Fields Ltd. | | | 5,662 | | | | 52,879 | |
| | |
Growthpoint Properties Ltd. | | | 34,967 | | | | 26,360 | |
| | |
Impala Platinum Holdings Ltd. | | | 4,096 | | | | 45,289 | |
| | |
Mr. Price Group Ltd. | | | 2,756 | | | | 29,839 | |
| | |
MTN Group Ltd. | | | 12,112 | | | | 97,621 | |
| | |
MultiChoice Group | | | 3,363 | | | | 23,773 | |
| | |
Naspers Ltd., Class N | | | 3,049 | | | | 440,664 | |
| | |
Nedbank Group Ltd. | | | 4,246 | | | | 53,717 | |
| | |
Northam Platinum Holdings Ltd.* | | | 4,270 | | | | 44,646 | |
| | |
Old Mutual Ltd. | | | 49,919 | | | | 33,609 | |
| | |
Remgro Ltd. | | | 5,015 | | | | 39,768 | |
| | |
Sanlam Ltd. | | | 14,431 | | | | 46,572 | |
| | |
Sasol Ltd.* | | | 4,424 | | | | 100,370 | |
| | |
Shoprite Holdings Ltd. | | | 5,456 | | | | 65,902 | |
| | |
Sibanye Stillwater Ltd. | �� | | 6,343 | | | | 15,747 | |
| | |
Standard Bank Group Ltd. | | | 3,220 | | | | 30,499 | |
| | |
Vodacom Group Ltd. | | | 5,391 | | | | 43,151 | |
| | |
Woolworths Holdings Ltd. | | | 9,192 | | | | 30,439 | |
| | | | | | | | |
| Total South Africa | | | | | | | 1,689,735 | |
| | |
| South Korea – 10.5% | | | | | | | | |
| | |
Amorepacific Corp. | | | 314 | | | | 31,439 | |
| | |
Celltrion Healthcare Co. Ltd. | | | 636 | | | | 33,602 | |
See Notes to Financial Statements.
Schedule of Investments (continued)
WisdomTree Emerging Markets Efficient Core Fund (NTSE)
June 30, 2022
| | | | | | | | |
| Investments | | Shares | | | Value | |
| | | | | | | | |
| | |
Celltrion, Inc. | | | 553 | | | $ | 76,025 | |
| | |
CJ CheilJedang Corp. | | | 45 | | | | 13,135 | |
| | |
Coway Co. Ltd. | | | 287 | | | | 14,124 | |
| | |
E-Mart, Inc. | | | 114 | | | | 9,263 | |
| | |
Hana Financial Group, Inc. | | | 1,873 | | | | 56,764 | |
| | |
Hankook Tire & Technology Co. Ltd. | | | 591 | | | | 14,998 | |
| | |
Hanon Systems | | | 1,511 | | | | 11,696 | |
| | |
Hanwha Solutions Corp.* | | | 990 | | | | 28,898 | |
| | |
HLB, Inc.* | | | 790 | | | | 21,539 | |
| | |
Hyundai Engineering & Construction Co. Ltd. | | | 814 | | | | 25,923 | |
| | |
Hyundai Glovis Co. Ltd. | | | 114 | | | | 15,760 | |
| | |
Hyundai Motor Co. | | | 981 | | | | 136,376 | |
| | |
Hyundai Steel Co. | | | 476 | | | | 11,768 | |
| | |
Kakao Corp. | | | 194 | | | | 10,444 | |
| | |
KB Financial Group, Inc. | | | 1,993 | | | | 73,909 | |
| | |
Kia Corp. | | | 1,567 | | | | 93,291 | |
| | |
Korea Electric Power Corp.* | | | 1,535 | | | | 26,659 | |
| | |
Korea Investment Holdings Co. Ltd. | | | 306 | | | | 14,541 | |
| | |
Korea Shipbuilding & Offshore Engineering Co. Ltd.* | | | 407 | | | | 29,434 | |
| | |
Korean Air Lines Co. Ltd.* | | | 1,059 | | | | 20,554 | |
| | |
KT&G Corp. | | | 545 | | | | 34,503 | |
| | |
Kumho Petrochemical Co. Ltd. | | | 176 | | | | 18,842 | |
| | |
LG Chem Ltd. | | | 297 | | | | 118,031 | |
| | |
LG Display Co. Ltd. | | | 2,473 | | | | 27,713 | |
| | |
LG Electronics, Inc. | | | 581 | | | | 39,512 | |
| | |
LG H&H Co. Ltd. | | | 48 | | | | 25,139 | |
| | |
Lotte Chemical Corp. | | | 69 | | | | 9,566 | |
| | |
NAVER Corp. | | | 669 | | | | 123,660 | |
| | |
NCSoft Corp. | | | 111 | | | | 29,879 | |
| | |
Orion Corp. | | | 158 | | | | 12,655 | |
| | |
POSCO Chemical Co. Ltd. | | | 190 | | | | 15,658 | |
| | |
POSCO Holdings, Inc. | | | 366 | | | | 64,974 | |
| | |
S-Oil Corp. | | | 389 | | | | 31,158 | |
| | |
Samsung Biologics Co. Ltd.*(a) | | | 98 | | | | 59,627 | |
| | |
Samsung Electro-Mechanics Co. Ltd. | | | 461 | | | | 46,334 | |
| | |
Samsung Electronics Co. Ltd. | | | 33,909 | | | | 1,488,611 | |
| | |
Samsung Fire & Marine Insurance Co. Ltd. | | | 176 | | | | 27,246 | |
| | |
Samsung Heavy Industries Co. Ltd.* | | | 3,656 | | | | 17,092 | |
| | |
Samsung Life Insurance Co. Ltd. | | | 306 | | | | 14,753 | |
| | |
Samsung SDI Co. Ltd. | | | 345 | | | | 141,359 | |
| | |
Samsung SDS Co. Ltd. | | | 192 | | | | 19,224 | |
| | |
Shinhan Financial Group Co. Ltd. | | | 2,711 | | | | 77,359 | |
| | |
SK Hynix, Inc. | | | 3,536 | | | | 247,825 | |
| | |
SK Innovation Co. Ltd.* | | | 289 | | | | 42,736 | |
| | |
SK Square Co. Ltd.* | | | 136 | | | | 4,090 | |
| | |
SK Telecom Co. Ltd. | | | 475 | | | | 19,023 | |
| | |
SK, Inc. | | | 314 | | | | 51,995 | |
| | |
Yuhan Corp. | | | 315 | | | | 13,586 | |
| | | | | | | | |
| Total South Korea | | | | | | | 3,592,292 | |
| | |
| Taiwan – 14.6% | | | | | | | | |
| | |
Acer, Inc. | | | 43,000 | | | | 31,382 | |
| | |
ASE Technology Holding Co. Ltd. | | | 26,000 | | | | 66,807 | |
| | |
Asia Cement Corp. | | | 4,000 | | | | 5,892 | |
| | |
AUO Corp. | | | 41,000 | | | | 22,476 | |
| | | | | | | | |
| | |
Cathay Financial Holding Co. Ltd. | | | 53,000 | | | | 90,729 | |
| | |
Chang Hwa Commercial Bank Ltd. | | | 15,030 | | | | 8,770 | |
| | |
Cheng Shin Rubber Industry Co. Ltd. | | | 12,000 | | | | 14,287 | |
| | |
China Development Financial Holding Corp. | | | 88,000 | | | | 43,507 | |
| | |
China Steel Corp. | | | 78,000 | | | | 74,633 | |
| | |
Chunghwa Telecom Co. Ltd. | | | 24,000 | | | | 98,475 | |
| | |
Compal Electronics, Inc. | | | 45,000 | | | | 34,431 | |
| | |
CTBC Financial Holding Co. Ltd. | | | 141,000 | | | | 119,027 | |
| | |
Delta Electronics, Inc. | | | 8,000 | | | | 59,596 | |
| | |
E.Sun Financial Holding Co. Ltd. | | | 96,305 | | | | 93,929 | |
| | |
Evergreen Marine Corp. Taiwan Ltd. | | | 9,000 | | | | 25,608 | |
| | |
Far EasTone Telecommunications Co. Ltd. | | | 8,000 | | | | 22,493 | |
| | |
First Financial Holding Co. Ltd. | | | 69,040 | | | | 60,835 | |
| | |
Formosa Chemicals & Fibre Corp. | | | 23,000 | | | | 57,783 | |
| | |
Formosa Petrochemical Corp. | | | 8,000 | | | | 25,238 | |
| | |
Formosa Plastics Corp. | | | 26,000 | | | | 94,876 | |
| | |
Fubon Financial Holding Co. Ltd. | | | 46,276 | | | | 93,070 | |
| | |
Giant Manufacturing Co. Ltd. | | | 1,000 | | | | 8,072 | |
| | |
Hon Hai Precision Industry Co. Ltd. | | | 80,000 | | | | 293,272 | |
| | |
Hua Nan Financial Holdings Co. Ltd. | | | 115,105 | | | | 87,490 | |
| | |
Innolux Corp. | | | 40,000 | | | | 16,278 | |
| | |
Largan Precision Co. Ltd. | | | 1,000 | | | | 58,015 | |
| | |
Lite-On Technology Corp. | | | 23,000 | | | | 44,788 | |
| | |
MediaTek, Inc. | | | 9,000 | | | | 197,050 | |
| | |
Mega Financial Holding Co. Ltd. | | | 90,000 | | | | 106,849 | |
| | |
Nan Ya Plastics Corp. | | | 43,000 | | | | 120,033 | |
| | |
Nanya Technology Corp. | | | 12,000 | | | | 19,937 | |
| | |
Novatek Microelectronics Corp. | | | 1,000 | | | | 10,157 | |
| | |
Quanta Computer, Inc. | | | 32,000 | | | | 85,883 | |
| | |
SinoPac Financial Holdings Co. Ltd. | | | 114,000 | | | | 64,412 | |
| | |
Taishin Financial Holding Co. Ltd. | | | 69,090 | | | | 37,875 | |
| | |
Taiwan Cement Corp. | | | 30,000 | | | | 39,854 | |
| | |
Taiwan Cooperative Financial Holding Co. Ltd. | | | 59,100 | | | | 53,369 | |
| | |
Taiwan Mobile Co. Ltd. | | | 14,000 | | | | 50,852 | |
| | |
Taiwan Semiconductor Manufacturing Co. Ltd. | | | 143,000 | | | | 2,289,270 | |
| | |
Uni-President Enterprises Corp. | | | 45,000 | | | | 101,401 | |
| | |
Unimicron Technology Corp. | | | 4,000 | | | | 21,323 | |
| | |
United Microelectronics Corp. | | | 77,000 | | | | 101,386 | |
| | |
Winbond Electronics Corp. | | | 31,000 | | | | 22,624 | |
| | |
Yuanta Financial Holding Co. Ltd. | | | 71,000 | | | | 47,041 | |
| | | | | | | | |
| Total Taiwan | | | | | | | 5,021,075 | |
| | |
| Thailand – 2.1% | | | | | | | | |
| | |
Advanced Info Service PCL, NVDR | | | 11,400 | | | | 62,715 | |
| | |
Airports of Thailand PCL, NVDR* | | | 26,000 | | | | 52,213 | |
| | |
Bangkok Dusit Medical Services PCL, NVDR | | | 47,500 | | | | 33,588 | |
| | |
Central Pattana PCL, NVDR | | | 31,400 | | | | 54,176 | |
| | |
Charoen Pokphand Foods PCL, NVDR | | | 40,700 | | | | 29,931 | |
| | |
CP ALL PCL, NVDR | | | 26,900 | | | | 45,651 | |
| | |
Delta Electronics Thailand PCL, NVDR | | | 2,000 | | | | 18,837 | |
| | |
Energy Absolute PCL, NVDR | | | 21,000 | | | | 48,409 | |
| | |
Gulf Energy Development PCL, NVDR | | | 9,100 | | | | 11,969 | |
| | |
Home Product Center PCL, NVDR | | | 65,200 | | | | 23,421 | |
| | |
Intouch Holdings PCL, NVDR | | | 5,600 | | | | 10,850 | |
| | |
Kasikornbank PCL, NVDR | | | 8,400 | | | | 35,757 | |
See Notes to Financial Statements.
Schedule of Investments (continued)
WisdomTree Emerging Markets Efficient Core Fund (NTSE)
June 30, 2022
| | | | | | | | |
| Investments | | Shares | | | Value | |
| | | | | | | | |
| | |
Minor International PCL, NVDR* | | | 33,800 | | | $ | 32,505 | |
| | |
PTT Exploration & Production PCL, NVDR | | | 6,900 | | | | 31,128 | |
| | |
PTT Global Chemical PCL, NVDR | | | 17,600 | | | | 22,650 | |
| | |
PTT Oil & Retail Business PCL, NVDR | | | 47,600 | | | | 34,332 | |
| | |
PTT PCL, NVDR | | | 88,300 | | | | 84,916 | |
| | |
SCB X PCL | | | 3,500 | | | | 10,296 | |
| | |
Siam Cement PCL, NVDR | | | 6,900 | | | | 72,991 | |
| | | | | | | | |
| Total Thailand | | | | | | | 716,335 | |
| | |
| Turkey – 0.1% | | | | | | | | |
| | |
BIM Birlesik Magazalar AS | | | 4,948 | | | | 23,960 | |
TOTAL COMMON STOCKS
(Cost: $36,968,887) | | | | | | | 30,059,576 | |
| | |
| PREFERRED STOCKS – 2.3% | | | | | | | | |
| | |
| Brazil – 2.1% | | | | | | | | |
| | |
Banco Bradesco SA | | | 46,160 | | | | 151,823 | |
| | |
Gerdau SA | | | 10,168 | | | | 43,457 | |
| | |
Itau Unibanco Holding SA | | | 32,376 | | | | 140,352 | |
| | |
Itausa SA | | | 39,144 | | | | 62,428 | |
| | |
Petroleo Brasileiro SA | | | 62,804 | | | | 335,430 | |
| | | | | | | | |
| Total Brazil | | | | | | | 733,490 | |
| | | | | | | | |
| | |
| Chile – 0.2% | | | | | | | | |
| Sociedad Quimica y Minera de Chile SA, Class B | | | 597 | | | | 48,748 | |
TOTAL PREFERRED STOCKS (Cost: $769,334) | | | | | | | 782,238 | |
| |
TOTAL INVESTMENTS IN SECURITIES – 89.8% (Cost: $37,738,221) | | | | 30,841,814 | |
| | |
Other Assets less Liabilities —10.2% | | | | | | | 3,509,718 | |
| | | | | | | | |
| NET ASSETS – 100.0% | | | $ | 34,351,532 | |
| * | Non-income producing security. |
| † | Security is being fair valued using significant unobservable inputs by a pricing committee under the direction of the Board of Trustees. The aggregate value of fair valued securities is $7,567, which represents 0.02% of net assets. |
| (a) | This security is exempt from registration under rule 144A of the Securities Act of 1933. This security may be sold in transactions that are exempt from registration, normally to qualified institutional buyers. |
| (b) | This security is exempt from registration under Regulation S of the Securities Act of 1933, which exempts from registration securities offered and sold outside the United States. This security may not be offered or sold in the United States except pursuant to an exemption from, or in a transaction not subject to, the registration requirements of the Securities Act of 1933. |
Affiliated holdings are investments in entities in which the Fund owns 5% or more of the outstanding voting securities or are investments in entities which are under common ownership or control. Investments in affiliates during the fiscal year ended June 30, 2022 were as follows:
| | | | | | | | | | | | | | | | | | | | | | | | | | | | |
| | | | | | | | |
| Affiliate | | Value at
6/30/2021 | | | Purchases/
Additions | | | Sales/
Reductions | | | Realized
Gain/(Loss) | | | Change in
Unrealized
Appreciation/ Depreciation | | | Value at
6/30/2022 | | | Dividend
Income | |
WisdomTree India Earnings Fund^ | | $ | 67,314 | | | $ | 88,347 | | | $ | 167,852 | | | $ | 14,075 | | | $ | (1,884 | ) | | $ | — | | | $ | 237 | |
| ^ | As of June 30, 2022, the Fund did not hold a position in this affiliate. |
| | | | | | | | | | | | | | | | | | | | | | | | | | | | |
|
| FINANCIAL DERIVATIVE INSTRUMENTS | |
|
| FOREIGN CURRENCY CONTRACTS (OTC – OVER THE COUNTER) | |
| | | | | |
| Counterparty | | Settlement
Date | | | Amount and
Description of
Currency to
be Purchased | | | Amount and
Description of
Currency to
be Sold | | | Unrealized
Appreciation | | | Unrealized
Depreciation | |
Credit Suisse International | | | 7/5/2022 | | | | 303,451 | | | | USD | | | | 393,636,914 | | | | KRW | | | $ | 280 | | | $ | — | |
HSBC Holdings PLC | | | 7/1/2022 | | | | 32,480 | | | | USD | | | | 142,941 | | | | MYR | | | | 48 | | | | — | |
JP Morgan Chase Bank NA | | | 7/1/2022 | | | | 163,919 | | | | USD | | | | 857,322 | | | | BRL | | | | — | | | | (22 | ) |
JP Morgan Chase Bank NA | | | 7/1/2022 | | | | 396,321 | | | | USD | | | | 11,759,240 | | | | TWD | | | | 833 | | | | — | |
State Street Bank and Trust | | | 7/1/2022 | | | | 18,183 | | | | USD | | | | 17,053,761 | | | | CLP | | | | — | | | | (20 | ) |
| | | | | | | | | | | | | | | | | | | | | | | $ | 1,161 | | | $ | (42 | ) |
| | | | | | | | | | | | | | | | |
|
| FUTURES CONTRACTS (EXCHANGE-TRADED) | |
| | | | |
| Long Exposure | | Contracts | | | Expiration
Date | | | Notional
Value | | | Unrealized
Depreciation | |
2 Year U.S. Treasury Note | | | 21 | | | | 9/30/22 | | | $ | 4,410,328 | | | $ | (25,617 | ) |
5 Year U.S. Treasury Note | | | 39 | | | | 9/30/22 | | | | 4,377,750 | | | | (41,029 | ) |
10 Year U.S. Treasury Note | | | 37 | | | | 9/21/22 | | | | 4,385,656 | | | | (58,188 | ) |
U.S. Treasury Long Bond | | | 32 | | | | 9/21/22 | | | | 4,436,000 | | | | (64,259 | ) |
Ultra 10 Year U.S. Treasury Note | | | 34 | | | | 9/21/22 | | | | 4,330,750 | | | | (68,627 | ) |
| | | | | | | | | | | $ | 21,940,484 | | | $ | (257,720 | ) |
See Notes to Financial Statements.
Schedule of Investments (concluded)
WisdomTree Emerging Markets Efficient Core Fund (NTSE)
June 30, 2022
The following is a summary of the fair valuations according to the inputs used as of June 30, 2022 in valuing the Fund’s investments (See Note 2 – Fair Value Measurement):
| | | | | | | | | | | | | | | | |
| | | | |
| | | Quoted Prices in Active Markets
(Level 1) | | | Other
Significant
Observable
Inputs
(Level 2) | | | Significant
Unobservable
Inputs
(Level 3) | | | Total | |
Assets: | | | | | | | | | |
Investments in Securities | | | | |
Common Stocks | | | | | | | | | | | | | | | | |
China | | $ | 10,788,214 | | | $ | — | | | $ | 7,567 | * | | $ | 10,795,781 | |
Russia | | | 4,421 | | | | — | | | | 0 | * | | | 4,421 | |
Other | | | 19,259,374 | | | | — | | | | — | | | | 19,259,374 | |
Preferred Stocks | | | 782,238 | | | | — | | | | — | | | | 782,238 | |
Total Investments in Securities | | $ | 30,834,247 | | | $ | — | | | $ | 7,567 | | | $ | 30,841,814 | |
Financial Derivative Instruments | | | | |
Foreign Currency Contracts1 | | $ | — | | | $ | 1,161 | | | $ | — | | | $ | 1,161 | |
Liabilities: | | | | | | | | | |
Financial Derivative Instruments | | | | |
Foreign Currency Contracts1 | | $ | — | | | $ | (42 | ) | | $ | — | | | $ | (42 | ) |
Futures Contracts1 | | | (257,720 | ) | | | — | | | | — | | | | (257,720 | ) |
Total – Net | | $ | 30,576,527 | | | $ | 1,119 | | | $ | 7,567 | | | $ | 30,585,213 | |
| * | Securities are being fair valued using significant unobservable inputs by the Pricing Committee. |
| 1 | Amount shown represents the unrealized appreciation (depreciation) on the financial instrument. |
The following is a reconciliation of assets in which significant unobservable inputs (Level 3) were used in determining fair value:
| | | | | | | | |
| | |
| | | Common Stocks | |
| | |
| | | China | | | Russia | |
Balance as of June 30, 2021 | | $ | — | | | $ | — | |
Realized gain (loss) | | | (3,929 | ) | | | (36,316 | ) |
Change in unrealized appreciation (depreciation) | | | (27,013 | ) | | | (1,943,155 | ) |
Purchases | | | 41,294 | | | | 2,528,556 | |
Sales | | | (2,785 | ) | | | (630,284 | ) |
Transfers into Level 3(1) | | | — | | | | 81,199 | |
Transfers out of Level 3 | | | — | | | | — | |
Balance as of June 30, 2022 | | $ | 7,567 | | | $ | 0 | |
Net change in unrealized appreciation (depreciation) from investments still held as of June 30, 2022 is: | | $ | (27,013 | ) | | $ | (1,943,155 | ) |
| (1) | Transferred into Level 3 because of a lack of observable market data, resulting from a decrease in market activity for the securities. |
See Notes to Financial Statements.
Schedule of Investments
WisdomTree International Efficient Core Fund (NTSI)
June 30, 2022
| | | | | | | | |
| Investments | | Shares | | | Value | |
|
| COMMON STOCKS – 88.9% | |
|
| Australia – 7.0% | |
| | |
Aristocrat Leisure Ltd. | | | 3,626 | | | $ | 85,724 | |
| | |
ASX Ltd. | | | 1,519 | | | | 85,349 | |
| | |
Australia & New Zealand Banking Group Ltd. | | | 15,616 | | | | 236,566 | |
| | |
BHP Group Ltd. | | | 27,271 | | | | 773,557 | |
| | |
Brambles Ltd. | | | 8,036 | | | | 59,183 | |
| | |
Cochlear Ltd. | | | 34 | | | | 4,646 | |
| | |
Coles Group Ltd. | | | 7,252 | | | | 88,816 | |
| | |
Commonwealth Bank of Australia | | | 9,702 | | | | 602,977 | |
| | |
CSL Ltd. | | | 2,558 | | | | 473,279 | |
| | |
Dexus | | | 1,176 | | | | 7,181 | |
| | |
Fortescue Metals Group Ltd. | | | 8,820 | | | | 106,321 | |
| | |
Goodman Group | | | 9,877 | | | | 121,168 | |
| | |
Insurance Australia Group Ltd. | | | 17,003 | | | | 50,978 | |
| | |
Lottery Corp. Ltd.* | | | 10,339 | | | | 32,135 | |
| | |
Macquarie Group Ltd. | | | 1,887 | | | | 213,467 | |
| | |
National Australia Bank Ltd. | | | 18,099 | | | | 340,890 | |
| | |
Newcrest Mining Ltd. | | | 4,215 | | | | 60,549 | |
| | |
Northern Star Resources Ltd. | | | 7,301 | | | | 34,340 | |
| | |
QBE Insurance Group Ltd. | | | 9,849 | | | | 82,288 | |
| | |
Ramsay Health Care Ltd. | | | 980 | | | | 49,356 | |
| | |
Rio Tinto Ltd. | | | 8,035 | | | | 499,314 | |
| | |
Santos Ltd. | | | 4,655 | | | | 23,751 | |
| | |
Scentre Group | | | 14,223 | | | | 25,331 | |
| | |
Sonic Healthcare Ltd. | | | 3,479 | | | | 78,971 | |
| | |
South32 Ltd. | | | 26,362 | | | | 71,424 | |
| | |
Stockland | | | 4,862 | | | | 12,070 | |
Tabcorp Holdings Ltd. | | | 10,339 | | | | 7,572 | |
| | |
Telstra Corp. Ltd. | | | 35,721 | | | | 94,570 | |
| | |
Transurban Group | | | 15,043 | | | | 148,751 | |
| | |
Wesfarmers Ltd. | | | 6,811 | | | | 196,289 | |
| | |
Westpac Banking Corp. | | | 20,090 | | | | 269,390 | |
| | |
Woodside Energy Group Ltd. | | | 9,333 | | | | 204,344 | |
| | |
Woolworths Group Ltd. | | | 7,694 | | | | 188,352 | |
| | | | | | | | |
Total Australia | | | | 5,328,899 | |
|
| Austria – 0.1% | |
| | |
Erste Group Bank AG | | | 1,649 | | | | 41,720 | |
| | |
| Belgium – 0.6% | | | | | | | | |
| | |
Ageas SA/NV | | | 980 | | | | 43,010 | |
| | |
Anheuser-Busch InBev SA/NV | | | 4,361 | | | | 234,161 | |
| | |
KBC Group NV | | | 1,470 | | | | 82,281 | |
| | |
Solvay SA | | | 245 | | | | 19,804 | |
| | |
UCB SA | | | 588 | | | | 49,572 | |
| | |
Umicore SA | | | 1,406 | | | | 48,977 | |
| | | | | | | | |
| Total Belgium | | | | | | | 477,805 | |
| | |
| China – 0.5% | | | | | | | | |
| | |
BOC Hong Kong Holdings Ltd. | | | 27,500 | | | | 108,641 | |
| | |
Prosus NV* | | | 2,865 | | | | 187,141 | |
| | |
WH Group Ltd.(a) | | | 92,500 | | | | 71,435 | |
| | | | | | | | |
| Total China | | | | | | | 367,217 | |
| | |
| Denmark – 2.7% | | | | | | | | |
| | |
Ambu A/S, Class B | | | 1,323 | | | | 12,818 | |
| | |
AP Moller - Maersk A/S, Class B | | | 49 | | | | 114,038 | |
| | |
Carlsberg A/S, Class B | | | 315 | | | | 40,032 | |
| | |
Chr Hansen Holding A/S | | | 588 | | | | 42,703 | |
| | |
Coloplast A/S, Class B | | | 812 | | | | 92,280 | |
| | |
Danske Bank A/S* | | | 1,326 | | | | 18,697 | |
| | |
DSV A/S | | | 1,274 | | | | 177,524 | |
| | |
Genmab A/S* | | | 343 | | | | 110,760 | |
| | |
GN Store Nord A/S | | | 931 | | | | 32,550 | |
| | |
Novo Nordisk A/S, Class B | | | 9,424 | | | | 1,042,908 | |
| | |
Novozymes A/S, Class B | | | 1,176 | | | | 70,428 | |
| | |
Orsted A/S(a) | | | 1,138 | | | | 118,690 | |
| | |
Pandora A/S | | | 539 | | | | 33,833 | |
| | |
Vestas Wind Systems A/S | | | 5,453 | | | | 114,911 | |
| | | | | | | | |
| Total Denmark | | | | | | | 2,022,172 | |
| | |
| Finland – 1.1% | | | | | | | | |
| | |
Elisa Oyj | | | 549 | | | | 30,775 | |
| | |
Fortum Oyj | | | 2,426 | | | | 36,307 | |
| | |
Kesko Oyj, Class B | | | 2,009 | | | | 47,278 | |
| | |
Kone Oyj, Class B | | | 2,303 | | | | 109,212 | |
| | |
Neste Oyj | | | 2,548 | | | | 112,519 | |
| | |
Nokia Oyj* | | | 34,930 | | | | 162,120 | |
| | |
Nordea Bank Abp | | | 17,489 | | | | 153,601 | |
| | |
Sampo Oyj, Class A | | | 2,009 | | | | 87,205 | |
| | |
Stora Enso Oyj, Class R | | | 2,208 | | | | 34,544 | |
| | |
UPM-Kymmene Oyj | | | 2,107 | | | | 63,902 | |
| | | | | | | | |
| Total Finland | | | | | | | 837,463 | |
| | |
| France – 10.2% | | | | | | | | |
| | |
Air Liquide SA | | | 2,963 | | | | 396,873 | |
| | |
Airbus SE* | | | 3,479 | | | | 336,252 | |
| | |
Alstom SA | | | 1,693 | | | | 38,213 | |
| | |
Arkema SA | | | 98 | | | | 8,700 | |
| | |
Atos SE* | | | 490 | | | | 6,549 | |
| | |
AXA SA | | | 10,878 | | | | 246,326 | |
| | |
BNP Paribas SA | | | 5,929 | | | | 281,194 | |
| | |
Bouygues SA | | | 487 | | | | 14,948 | |
| | |
Bureau Veritas SA | | | 441 | | | | 11,273 | |
| | |
Capgemini SE | | | 1,053 | | | | 179,935 | |
| | |
Carrefour SA | | | 1,672 | | | | 29,515 | |
| | |
Cie de Saint-Gobain | | | 3,087 | | | | 132,142 | |
| | |
Cie Generale des Etablissements Michelin SCA | | | 2,940 | | | | 79,837 | |
| | |
Credit Agricole SA | | | 4,213 | | | | 38,456 | |
| | |
Danone SA | | | 3,332 | | | | 185,528 | |
| | |
Dassault Systemes SE | | | 4,288 | | | | 157,417 | |
| | |
Edenred | | | 1,078 | | | | 50,681 | |
| | |
Eiffage SA | | | 149 | | | | 13,378 | |
| | |
Engie SA | | | 11,169 | | | | 128,046 | |
| | |
EssilorLuxottica SA | | | 1,496 | | | | 223,495 | |
| | |
Hermes International | | | 168 | | | | 187,403 | |
| | |
Kering SA | | | 441 | | | | 225,957 | |
| | |
L’Oreal SA | | | 1,474 | | | | 507,449 | |
| | |
Legrand SA | | | 1,568 | | | | 115,503 | |
| | |
LVMH Moet Hennessy Louis Vuitton SE | | | 1,568 | | | | 953,561 | |
| | |
Orange SA | | | 6,714 | | | | 78,755 | |
| | |
Pernod Ricard SA | | | 1,225 | | | | 224,503 | |
| | |
Publicis Groupe SA* | | | 1,127 | | | | 54,976 | |
See Notes to Financial Statements.
Schedule of Investments (continued)
WisdomTree International Efficient Core Fund (NTSI)
June 30, 2022
| | | | | | | | |
| Investments | | Shares | | | Value | |
| | |
Renault SA* | | | 1,203 | | | $ | 29,920 | |
| | |
Safran SA | | | 2,036 | | | | 200,529 | |
| | |
Sanofi | | | 6,125 | | | | 616,902 | |
| | |
Sartorius Stedim Biotech | | | 147 | | | | 45,997 | |
| | |
Schneider Electric SE | | | 3,230 | | | | 381,241 | |
| | |
Societe Generale SA | | | 4,217 | | | | 92,097 | |
| | |
Sodexo SA | | | 392 | | | | 27,482 | |
| | |
Teleperformance | | | 343 | | | | 105,174 | |
| | |
Thales SA | | | 441 | | | | 53,965 | |
| | |
TotalEnergies SE | | | 14,408 | | | | 758,715 | |
| | |
Unibail-Rodamco-Westfield* | | | 829 | | | | 42,164 | |
| | |
Valeo | | | 1,497 | | | | 28,836 | |
| | |
Veolia Environnement SA* | | | 2,744 | | | | 66,812 | |
| | |
Vinci SA | | | 3,061 | | | | 271,882 | |
| | |
Vivendi SE | | | 4,655 | | | | 47,186 | |
| | |
Worldline SA*(a) | | | 1,492 | | | | 55,186 | |
| | | | | | | | |
| Total France | | | | 7,730,953 | |
|
| Germany – 6.8% | |
| | |
adidas AG | | | 1,127 | | | | 198,837 | |
| | |
Allianz SE, Registered Shares | | | 2,477 | | | | 471,614 | |
| | |
BASF SE | | | 5,194 | | | | 225,483 | |
| | |
Bayer AG, Registered Shares | | | 5,266 | | | | 312,263 | |
| | |
Bayerische Motoren Werke AG | | | 1,356 | | | | 104,139 | |
| | |
Beiersdorf AG | | | 539 | | | | 54,930 | |
| | |
Brenntag SE | | | 735 | | | | 47,718 | |
| | |
Continental AG | | | 539 | | | | 37,473 | |
| | |
Covestro AG(a) | | | 1,323 | | | | 45,616 | |
| | |
Daimler Truck Holding AG* | | | 512 | | | | 13,334 | |
| | |
Delivery Hero SE*(a) | | | 751 | | | | 28,084 | |
| | |
Deutsche Bank AG, Registered Shares | | | 10,780 | | | | 93,743 | |
| | |
Deutsche Boerse AG | | | 1,156 | | | | 192,883 | |
| | |
Deutsche Post AG, Registered Shares | | | 6,125 | | | | 228,857 | |
| | |
Deutsche Telekom AG, Registered Shares | | | 18,677 | | | | 369,937 | |
| | |
Deutsche Wohnen SE, Bearer Shares | | | 1,372 | | | | 31,470 | |
| | |
E.ON SE | | | 8,575 | | | | 71,790 | |
| | |
Fresenius Medical Care AG & Co. KGaA | | | 898 | | | | 44,716 | |
| | |
Fresenius SE & Co. KGaA | | | 2,058 | | | | 62,179 | |
| | |
Hannover Rueck SE | | | 197 | | | | 28,525 | |
| | |
HeidelbergCement AG | | | 689 | | | | 33,019 | |
| | |
HelloFresh SE* | | | 980 | | | | 31,607 | |
| | |
Infineon Technologies AG | | | 10,093 | | | | 243,639 | |
| | |
Knorr-Bremse AG | | | 343 | | | | 19,514 | |
| | |
Mercedes-Benz Group AG, Registered Shares | | | 4,312 | | | | 248,931 | |
| | |
Merck KGaA | | | 856 | | | | 144,080 | |
| | |
MTU Aero Engines AG | | | 343 | | | | 62,287 | |
| | |
Muenchener Rueckversicherungs – Gesellschaft AG in Muenchen, Registered Shares | | | 784 | | | | 183,762 | |
| | |
Puma SE | | | 588 | | | | 38,629 | |
| | |
RWE AG | | | 4,455 | | | | 163,384 | |
| | |
SAP SE | | | 6,009 | | | | 546,104 | |
| | |
Scout24 SE(a) | | | 980 | | | | 50,192 | |
| | |
Siemens AG, Registered Shares | | | 4,542 | | | | 461,025 | |
| | |
Siemens Energy AG* | | | 2,516 | | | | 36,785 | |
| | |
Siemens Healthineers AG(a) | | | 1,547 | | | | 78,423 | |
| | |
Symrise AG | | | 637 | | | | 69,159 | |
| | |
Vonovia SE | | | 2,901 | | | | 89,166 | |
| | |
Zalando SE*(a) | | | 1,071 | | | | 27,947 | |
| | | | | | | | |
| Total Germany | | | | 5,191,244 | |
|
| Hong Kong – 2.3% | |
| | |
AIA Group Ltd. | | | 68,600 | | | | 743,528 | |
| | |
CK Asset Holdings Ltd. | | | 16,500 | | | | 116,701 | |
| | |
CLP Holdings Ltd. | | | 12,000 | | | | 99,555 | |
| | |
Hang Seng Bank Ltd. | | | 6,500 | | | | 114,726 | |
| | |
Hong Kong & China Gas Co. Ltd. | | | 73,100 | | | | 78,718 | |
| | |
Hong Kong Exchanges & Clearing Ltd. | | | 5,000 | | | | 245,956 | |
| | |
Link REIT | | | 16,000 | | | | 130,497 | |
| | |
MTR Corp. Ltd. | | | 11,500 | | | | 60,087 | |
| | |
Power Assets Holdings Ltd. | | | 11,500 | | | | 72,324 | |
| | |
Techtronic Industries Co. Ltd. | | | 10,000 | | | | 104,308 | |
| | | | | | | | |
| Total Hong Kong | | | | 1,766,400 | |
|
| Ireland – 0.5% | |
| | |
CRH PLC | | | 4,064 | | | | 140,207 | |
| | |
Flutter Entertainment PLC* | | | 1,075 | | | | 108,430 | |
| | |
Kerry Group PLC, Class A | | | 633 | | | | 60,446 | |
| | |
Kingspan Group PLC | | | 945 | | | | 56,708 | |
| | |
Smurfit Kappa Group PLC | | | 689 | | | | 23,108 | |
| | | | | | | | |
| Total Ireland | | | | 388,899 | |
|
| Israel – 0.4% | |
| | |
Bank Hapoalim BM | | | 6,321 | | | | 52,631 | |
| | |
Bank Leumi Le-Israel BM | | | 8,996 | | | | 79,759 | |
| | |
Check Point Software Technologies Ltd.* | | | 513 | | | | 62,473 | |
| | |
Nice Ltd.* | | | 492 | | | | 94,195 | |
| | |
Teva Pharmaceutical Industries Ltd., ADR* | | | 281 | | | | 2,113 | |
| | |
Wix.com Ltd.* | | | 282 | | | | 18,485 | |
| | | | | | | | |
| Total Israel | | | | 309,656 | |
|
| Italy – 1.6% | |
| | |
Assicurazioni Generali SpA | | | 5,588 | | | | 88,944 | |
| | |
Atlantia SpA* | | | 2,743 | | | | 64,178 | |
| | |
Enel SpA | | | 47,105 | | | | 257,064 | |
| | |
Eni SpA | | | 13,722 | | | | 162,508 | |
| | |
Ferrari NV | | | 691 | | | | 126,566 | |
| | |
FinecoBank Banca Fineco SpA | | | 4,410 | | | | 52,651 | |
| | |
Intesa Sanpaolo SpA | | | 89,439 | | | | 166,437 | |
| | |
Moncler SpA | | | 1,323 | | | | 56,612 | |
| | |
Nexi SpA*(a) | | | 3,291 | | | | 27,194 | |
| | |
Prysmian SpA | | | 1,421 | | | | 38,937 | |
| | |
Snam SpA | | | 2,744 | | | | 14,341 | |
| | |
Telecom Italia SpA* | | | 48,257 | | | | 12,597 | |
| | |
Terna – Rete Elettrica Nazionale | | | 3,637 | | | | 28,472 | |
| | |
UniCredit SpA | | | 10,682 | | | | 101,233 | |
| | | | | | | | |
| Total Italy | | | | 1,197,734 | |
|
| Japan – 20.2% | |
| | |
Aeon Co. Ltd. | | | 4,900 | | | | 84,904 | |
| | |
Ajinomoto Co., Inc. | | | 4,900 | | | | 119,024 | |
| | |
Asahi Group Holdings Ltd. | | | 4,500 | | | | 147,234 | |
| | |
Asahi Kasei Corp. | | | 14,700 | | | | 112,099 | |
See Notes to Financial Statements.
Schedule of Investments (continued)
WisdomTree International Efficient Core Fund (NTSI)
June 30, 2022
| | | | | | | | |
| Investments | | Shares | | | Value | |
| | |
Astellas Pharma, Inc. | | | 16,100 | | | $ | 250,646 | |
| | |
Bridgestone Corp. | | | 4,900 | | | | 178,536 | |
| | |
Canon, Inc. | | | 8,800 | | | | 199,831 | |
| | |
Chugai Pharmaceutical Co. Ltd. | | | 4,900 | | | | 125,156 | |
| | |
Dai-ichi Life Holdings, Inc. | | | 9,800 | | | | 181,061 | |
| | |
Daiichi Sankyo Co. Ltd. | | | 11,800 | | | | 298,529 | |
| | |
Daikin Industries Ltd. | | | 1,100 | | | | 176,107 | |
| | |
Daiwa House Industry Co. Ltd. | | | 4,100 | | | | 95,427 | |
| | |
FANUC Corp. | | | 600 | | | | 93,806 | |
| | |
Hitachi Ltd. | | | 4,900 | | | | 232,205 | |
| | |
Honda Motor Co. Ltd. | | | 9,800 | | | | 237,543 | |
| | |
Hoya Corp. | | | 1,700 | | | | 144,967 | |
| | |
ITOCHU Corp. | | | 9,300 | | | | 251,026 | |
| | |
Japan Exchange Group, Inc. | | | 4,900 | | | | 70,621 | |
| | |
Japan Post Holdings Co. Ltd. | | | 24,500 | | | | 174,767 | |
| | |
Japan Tobacco, Inc. | | | 9,800 | | | | 169,230 | |
| | |
Kao Corp. | | | 4,900 | | | | 197,363 | |
| | |
KDDI Corp. | | | 9,800 | | | | 309,390 | |
| | |
Keyence Corp. | | | 900 | | | | 307,254 | |
| | |
Kirin Holdings Co. Ltd. | | | 9,800 | | | | 154,190 | |
| | |
Komatsu Ltd. | | | 8,200 | | | | 181,558 | |
| | |
Kubota Corp. | | | 9,600 | | | | 143,235 | |
| | |
Kyowa Kirin Co. Ltd. | | | 4,400 | | | | 98,782 | |
| | |
M3, Inc. | | | 3,900 | | | | 111,900 | |
| | |
Marubeni Corp. | | | 16,200 | | | | 145,956 | |
| | |
MINEBEA MITSUMI, Inc. | | | 4,900 | | | | 83,317 | |
| | |
MISUMI Group, Inc. | | | 4,700 | | | | 98,944 | |
| | |
Mitsubishi Chemical Holdings Corp. | | | 19,600 | | | | 106,328 | |
| | |
Mitsubishi Corp. | | | 9,800 | | | | 291,212 | |
| | |
Mitsubishi Electric Corp. | | | 19,600 | | | | 209,338 | |
| | |
Mitsubishi Estate Co. Ltd. | | | 12,100 | | | | 175,370 | |
| | |
Mitsubishi Heavy Industries Ltd. | | | 2,800 | | | | 97,795 | |
| | |
Mitsubishi UFJ Financial Group, Inc. | | | 98,000 | | | | 526,158 | |
| | |
Mitsui Fudosan Co. Ltd. | | | 7,800 | | | | 167,506 | |
| | |
Mizuho Financial Group, Inc. | | | 19,400 | | | | 220,339 | |
| | |
Murata Manufacturing Co. Ltd. | | | 4,900 | | | | 266,758 | |
| | |
Nexon Co. Ltd. | | | 4,000 | | | | 81,793 | |
| | |
Nidec Corp. | | | 300 | | | | 18,505 | |
| | |
Nihon M&A Center Holdings, Inc. | | | 3,800 | | | | 40,362 | |
| | |
Nintendo Co. Ltd. | | | 600 | | | | 259,159 | |
| | |
Nippon Paint Holdings Co. Ltd. | | | 7,500 | | | | 55,813 | |
| | |
Nippon Steel Corp. | | | 7,900 | | | | 110,427 | |
| | |
Nippon Telegraph & Telephone Corp. | | | 6,600 | | | | 189,272 | |
| | |
Nissan Motor Co. Ltd. | | | 22,600 | | | | 87,868 | |
| | |
Nomura Holdings, Inc. | | | 41,000 | | | | 149,659 | |
| | |
Nomura Research Institute Ltd. | | | 2,300 | | | | 61,117 | |
| | |
NTT Data Corp. | | | 7,200 | | | | 99,424 | |
| | |
Odakyu Electric Railway Co. Ltd. | | | 4,900 | | | | 65,824 | |
| | |
Olympus Corp. | | | 9,400 | | | | 188,650 | |
| | |
Ono Pharmaceutical Co. Ltd. | | | 3,300 | | | | 84,580 | |
| | |
Otsuka Holdings Co. Ltd. | | | 3,600 | | | | 127,671 | |
| | |
Pan Pacific International Holdings Corp. | | | 3,700 | | | | 58,964 | |
| | |
Panasonic Holdings Corp. | | | 20,100 | | | | 162,229 | |
| | |
Rakuten Group, Inc. | | | 12,000 | | | | 54,058 | |
| | |
Recruit Holdings Co. Ltd. | | | 9,800 | | | | 288,182 | |
| | |
Renesas Electronics Corp.* | | | 12,700 | | | | 115,263 | |
| | |
Resona Holdings, Inc. | | | 22,300 | | | | 83,402 | |
| | |
Sekisui House Ltd. | | | 9,200 | | | | 160,935 | |
| | |
Seven & I Holdings Co. Ltd. | | | 4,900 | | | | 189,969 | |
| | |
Shimadzu Corp. | | | 2,800 | | | | 88,418 | |
| | |
Shin-Etsu Chemical Co. Ltd. | | | 1,200 | | | | 135,144 | |
| | |
Shiseido Co. Ltd. | | | 100 | | | | 4,009 | |
| | |
SoftBank Corp. | | | 24,500 | | | | 271,681 | |
| | |
SoftBank Group Corp. | | | 9,800 | | | | 377,631 | |
| | |
Sompo Holdings, Inc. | | | 3,100 | | | | 136,523 | |
| | |
Sony Group Corp. | | | 8,200 | | | | 669,677 | |
| | |
Subaru Corp. | | | 5,200 | | | | 92,303 | |
| | |
Sumitomo Chemical Co. Ltd. | | | 29,400 | | | | 114,912 | |
| | |
Sumitomo Corp. | | | 11,500 | | | | 157,193 | |
| | |
Sumitomo Electric Industries Ltd. | | | 9,800 | | | | 108,131 | |
| | |
Sumitomo Mitsui Financial Group, Inc. | | | 9,800 | | | | 290,851 | |
| | |
Sumitomo Mitsui Trust Holdings, Inc. | | | 4,200 | | | | 129,226 | |
| | |
Sumitomo Realty & Development Co. Ltd. | | | 3,500 | | | | 92,308 | |
| | |
Suzuki Motor Corp. | | | 3,600 | | | | 112,991 | |
| | |
Takeda Pharmaceutical Co. Ltd. | | | 9,800 | | | | 275,414 | |
| | |
Terumo Corp. | | | 4,900 | | | | 147,445 | |
| | |
Tokio Marine Holdings, Inc. | | | 3,100 | | | | 180,334 | |
| | |
Tokyo Electron Ltd. | | | 900 | | | | 293,475 | |
| | |
Tokyo Gas Co. Ltd. | | | 4,500 | | | | 92,978 | |
| | |
Toray Industries, Inc. | | | 15,700 | | | | 87,968 | |
| | |
Toshiba Corp. | | | 3,300 | | | | 133,963 | |
| | |
Toyota Motor Corp. | | | 67,700 | | | | 1,046,483 | |
| | |
Unicharm Corp. | | | 4,000 | | | | 133,672 | |
| | |
Yamato Holdings Co. Ltd. | | | 4,900 | | | | 78,267 | |
| | |
Z Holdings Corp. | | | 26,600 | | | | 77,614 | |
| | | | | | | | |
| Total Japan | | | | | | | 15,297,149 | |
| | |
| Luxembourg – 0.2% | | | | | | | | |
| | |
ArcelorMittal SA | | | 3,332 | | | | 74,929 | |
| | |
Eurofins Scientific SE | | | 735 | | | | 57,692 | |
| | | | | | | | |
| Total Luxembourg | | | | | | | 132,621 | |
| | |
| Macau – 0.1% | | | | | | | | |
| | |
Sands China Ltd.* | | | 24,000 | | | | 57,255 | |
|
| Netherlands – 3.4% | |
| | |
Adyen NV*(a) | | | 98 | | | | 142,206 | |
| | |
Aegon NV | | | 7,376 | | | | 31,832 | |
| | |
Akzo Nobel NV | | | 931 | | | | 60,949 | |
| | |
Argenx SE* | | | 238 | | | | 88,952 | |
| | |
ASM International NV | | | 395 | | | | 98,530 | |
| | |
ASML Holding NV | | | 2,417 | | | | 1,151,866 | |
| | |
EXOR NV | | | 233 | | | | 14,489 | |
| | |
Heineken NV | | | 1,274 | | | | 115,876 | |
| | |
ING Groep NV | | | 20,185 | | | | 199,017 | |
| | |
Just Eat Takeaway.com NV*(a) | | | 784 | | | | 12,349 | |
| | |
Koninklijke Ahold Delhaize NV | | | 6,079 | | | | 157,992 | |
| | |
Koninklijke DSM NV | | | 946 | | | | 135,591 | |
| | |
Koninklijke KPN NV | | | 17,542 | | | | 62,372 | |
| | |
Koninklijke Philips NV | | | 5,382 | | | | 115,655 | |
See Notes to Financial Statements.
Schedule of Investments (continued)
WisdomTree International Efficient Core Fund (NTSI)
June 30, 2022
| | | | | | | | |
| Investments | | Shares | | | Value | |
| | |
QIAGEN NV* | | | 931 | | | $ | 43,507 | |
| | |
Randstad NV | | | 294 | | | | 14,200 | |
| | |
Wolters Kluwer NV | | | 1,078 | | | | 104,315 | |
| | | | | | | | |
| Total Netherlands | | | | | | | 2,549,698 | |
|
| New Zealand – 0.1% | |
| | |
Xero Ltd.* | | | 1,176 | | | | 62,236 | |
|
| Norway – 0.6% | |
| | |
DNB Bank ASA | | | 4,261 | | | | 76,144 | |
| | |
Equinor ASA | | | 5,831 | | | | 202,172 | |
| | |
Mowi ASA | | | 2,695 | | | | 61,130 | |
| | |
Norsk Hydro ASA | | | 7,791 | | | | 43,498 | |
| | |
Telenor ASA | | | 1,960 | | | | 25,989 | |
| | |
Yara International ASA | | | 689 | | | | 28,704 | |
| | | | | | | | |
| Total Norway | | | | 437,637 | |
|
| Portugal – 0.1% | |
| | |
EDP - Energias de Portugal SA | | | 20,305 | | | | 94,506 | |
|
| Singapore – 0.8% | |
| | |
DBS Group Holdings Ltd. | | | 12,200 | | | | 260,182 | |
| | |
Oversea-Chinese Banking Corp. Ltd. | | | 19,600 | | | | 160,411 | |
| | |
Singapore Telecommunications Ltd. | | | 62,700 | | | | 113,984 | |
| | |
United Overseas Bank Ltd. | | | 4,900 | | | | 92,423 | |
| | | | | | | | |
| Total Singapore | | | | 627,000 | |
|
| Spain – 2.2% | |
| | |
ACS Actividades de Construccion y Servicios SA | | | 1,595 | | | | 38,569 | |
| | |
Aena SME SA*(a) | | | 441 | | | | 55,901 | |
| | |
Amadeus IT Group SA* | | | 2,789 | | | | 155,002 | |
| | |
Banco Bilbao Vizcaya Argentaria SA | | | 36,456 | | | | 165,048 | |
| | |
Banco Santander SA | | | 66,210 | | | | 186,061 | |
| | |
CaixaBank SA | | | 15,435 | | | | 53,525 | |
| | |
Cellnex Telecom SA(a) | | | 2,008 | | | | 77,736 | |
| | |
Endesa SA | | | 1,127 | | | | 21,208 | |
| | |
Ferrovial SA | | | 2,525 | | | | 63,856 | |
| | |
Grifols SA | | | 1,127 | | | | 21,249 | |
| | |
Iberdrola SA | | | 37,080 | | | | 383,621 | |
| | |
Industria de Diseno Textil SA | | | 6,272 | | | | 141,567 | |
| | |
Repsol SA | | | 7,937 | | | | 116,583 | |
| | |
Siemens Gamesa Renewable Energy SA* | | | 1,503 | | | | 28,142 | |
| | |
Telefonica SA | | | 25,387 | | | | 129,042 | |
| | | | | | | | |
| Total Spain | | | | 1,637,110 | |
|
| Sweden – 2.2% | |
| | |
Alfa Laval AB | | | 1,960 | | | | 47,167 | |
| | |
Assa Abloy AB, Class B | | | 5,903 | | | | 125,175 | |
| | |
Atlas Copco AB, Class A | | | 25,480 | | | | 237,633 | |
| | |
Boliden AB* | | | 1,518 | | | | 48,196 | |
| | |
Epiroc AB, Class A | | | 6,149 | | | | 94,779 | |
| | |
EQT AB | | | 1,519 | | | | 31,040 | |
| | |
Essity AB, Class B | | | 2,744 | | | | 71,523 | |
| | |
Evolution AB(a) | | | 1,029 | | | | 93,397 | |
| | |
H & M Hennes & Mauritz AB, Class B | | | 4,998 | | | | 59,581 | |
| | |
Hexagon AB, Class B | | | 13,961 | | | | 144,754 | |
| | |
Kinnevik AB, Class B* | | | 1,862 | | | | 29,945 | |
| | |
Nibe Industrier AB, Class B | | | 8,085 | | | | 60,594 | |
| | |
Sandvik AB | | | 7,252 | | | | 117,371 | |
| | |
Skandinaviska Enskilda Banken AB, Class A | | | 3,431 | | | | 33,616 | |
| | |
Skanska AB, Class B | | | 931 | | | | 14,246 | |
| | |
SKF AB, Class B | | | 2,450 | | | | 35,982 | |
| | |
Svenska Cellulosa AB SCA, Class B | | | 3,773 | | | | 56,259 | |
| | |
Svenska Handelsbanken AB, Class A | | | 4,609 | | | | 39,319 | |
| | |
Swedbank AB, Class A | | | 2,547 | | | | 32,138 | |
| | |
Swedish Match AB | | | 6,223 | | | | 63,278 | |
| | |
Telefonaktiebolaget LM Ericsson, Class B | | | 15,805 | | | | 117,634 | |
| | |
Telia Co. AB | | | 3,626 | | | | 13,864 | |
| | |
Volvo AB, Class B | | | 9,408 | | | | 145,406 | |
| | | | | | | | |
| Total Sweden | | | | 1,712,897 | |
|
| Switzerland – 10.5% | |
| | |
ABB Ltd., Registered Shares | | | 12,280 | | | | 326,577 | |
| | |
Adecco Group AG, Registered Shares | | | 634 | | | | 21,483 | |
| | |
Alcon, Inc. | | | 3,038 | | | | 211,599 | |
| | |
Cie Financiere Richemont SA, Class A, Registered Shares | | | 3,034 | | | | 322,146 | |
| | |
Credit Suisse Group AG, Registered Shares | | | 10,723 | | | | 60,708 | |
| | |
Geberit AG, Registered Shares | | | 294 | | | | 140,896 | |
| | |
Givaudan SA, Registered Shares | | | 49 | | | | 171,821 | |
| | |
Glencore PLC* | | | 58,653 | | | | 317,050 | |
| | |
Holcim AG, Registered Shares | | | 1,960 | | | | 83,633 | |
| | |
Julius Baer Group Ltd. | | | 686 | | | | 31,557 | |
| | |
Kuehne + Nagel International AG, Registered Shares | | | 370 | | | | 87,345 | |
| | |
Logitech International SA, Registered Shares | | | 1,291 | | | | 67,250 | |
| | |
Lonza Group AG, Registered Shares | | | 436 | | | | 231,811 | |
| | |
Nestle SA, Registered Shares | | | 15,872 | | | | 1,847,575 | |
| | |
Novartis AG, Registered Shares | | | 11,760 | | | | 993,154 | |
| | |
Partners Group Holding AG | | | 147 | | | | 132,083 | |
| | |
Roche Holding AG | | | 3,940 | | | | 1,311,001 | |
| | |
Schindler Holding AG, Participation Certificate | | | 490 | | | | 89,110 | |
| | |
Sika AG, Registered Shares | | | 931 | | | | 213,945 | |
| | |
Sonova Holding AG, Registered Shares | | | 387 | | | | 122,889 | |
| | |
STMicroelectronics NV | | | 5,989 | | | | 187,836 | |
| | |
Straumann Holding AG, Registered Shares | | | 490 | | | | 58,681 | |
| | |
Swatch Group AG, Bearer Shares | | | 245 | | | | 57,965 | |
| | |
Swiss Life Holding AG, Registered Shares | | | 98 | | | | 47,600 | |
| | |
Swiss Re AG | | | 1,274 | | | | 98,449 | |
| | |
Swisscom AG, Registered Shares | | | 149 | | | | 82,083 | |
| | |
Temenos AG, Registered Shares | | | 490 | | | | 41,776 | |
| | |
UBS Group AG, Registered Shares | | | 16,121 | | | | 259,155 | |
| | |
Zurich Insurance Group AG | | | 784 | | | | 340,019 | |
| | | | | | | | |
| Total Switzerland | | | | 7,957,197 | |
|
| United Kingdom – 14.5% | |
| | |
abrdn PLC | | | 8,840 | | | | 17,161 | |
| | |
Admiral Group PLC | | | 826 | | | | 22,510 | |
| | |
Anglo American PLC | | | 7,252 | | | | 258,667 | |
| | |
Antofagasta PLC | | | 2,059 | | | | 28,881 | |
| | |
Ashtead Group PLC | | | 2,631 | | | | 109,884 | |
| | |
Associated British Foods PLC | | | 1,442 | | | | 27,635 | |
| | |
AstraZeneca PLC | | | 7,203 | | | | 944,750 | |
| | |
Aviva PLC* | | | 12,579 | | | | 61,305 | |
| | |
BAE Systems PLC | | | 16,366 | | | | 165,008 | |
| | |
Barclays PLC | | | 94,484 | | | | 175,699 | |
See Notes to Financial Statements.
Schedule of Investments (continued)
WisdomTree International Efficient Core Fund (NTSI)
june 31, 2022
| | | | | | | | |
| Investments | | Shares | | | Value | |
| | |
Barratt Developments PLC | | | 6,079 | | | $ | 33,768 | |
| | |
BP PLC | | | 116,522 | | | | 549,484 | |
| | |
British American Tobacco PLC | | | 12,467 | | | | 532,872 | |
| | |
BT Group PLC | | | 54,349 | | | | 122,966 | |
| | |
Bunzl PLC | | | 1,862 | | | | 61,485 | |
| | |
Burberry Group PLC | | | 2,058 | | | | 41,014 | |
| | |
CK Hutchison Holdings Ltd. | | | 19,000 | | | | 128,451 | |
| | |
CNH Industrial NV | | | 6,587 | | | | 75,888 | |
| | |
Coca-Cola Europacific Partners PLC | | | 784 | | | | 40,462 | |
| | |
Compass Group PLC | | | 11,319 | | | | 230,939 | |
| | |
Croda International PLC | | | 931 | | | | 73,176 | |
| | |
DCC PLC | | | 464 | | | | 28,727 | |
| | |
Diageo PLC | | | 13,524 | | | | 579,857 | |
| | |
Entain PLC* | | | 3,969 | | | | 60,011 | |
| | |
Experian PLC | | | 5,684 | | | | 166,085 | |
| | |
Ferguson PLC | | | 1,271 | | | | 141,823 | |
| | |
GSK PLC | | | 26,362 | | | | 565,263 | |
| | |
Halma PLC | | | 2,721 | | | | 66,388 | |
| | |
HSBC Holdings PLC | | | 110,756 | | | | 720,423 | |
| | |
Informa PLC* | | | 9,408 | | | | 60,418 | |
| | |
InterContinental Hotels Group PLC | | | 980 | | | | 51,772 | |
| | |
Intertek Group PLC | | | 931 | | | | 47,555 | |
| | |
James Hardie Industries PLC | | | 3,332 | | | | 72,793 | |
| | |
Johnson Matthey PLC | | | 1,029 | | | | 24,062 | |
| | |
Kingfisher PLC | | | 10,829 | | | | 32,129 | |
| | |
Legal & General Group PLC | | | 37,143 | | | | 108,034 | |
| | |
Lloyds Banking Group PLC | | | 377,594 | | | | 194,021 | |
| | |
London Stock Exchange Group PLC | | | 1,695 | | | | 157,104 | |
| | |
Melrose Industries PLC | | | 22,394 | | | | 40,713 | |
| | |
Mondi PLC | | | 2,398 | | | | 42,373 | |
| | |
National Grid PLC | | | 18,966 | | | | 242,310 | |
| | |
NatWest Group PLC | | | 16,075 | | | | 42,617 | |
| | |
Next PLC | | | 637 | | | | 45,333 | |
| | |
Ocado Group PLC* | | | 3,185 | | | | 30,217 | |
| | |
Pearson PLC | | | 4,018 | | | | 36,588 | |
| | |
Persimmon PLC | | | 1,566 | | | | 35,431 | |
| | |
Prudential PLC | | | 15,802 | | | | 194,978 | |
| | |
Reckitt Benckiser Group PLC | | | 4,148 | | | | 310,816 | |
| | |
RELX PLC | | | 10,584 | | | | 286,124 | |
| | |
Rentokil Initial PLC | | | 9,457 | | | | 54,508 | |
| | |
Rolls-Royce Holdings PLC* | | | 50,654 | | | | 51,028 | |
| | |
Sage Group PLC | | | 7,700 | | | | 59,362 | |
| | |
Segro PLC | | | 4,685 | | | | 55,577 | |
| | |
Shell PLC | | | 43,117 | | | | 1,117,436 | |
| | |
Smith & Nephew PLC | | | 6,125 | | | | 85,357 | |
| | |
Smiths Group PLC | | | 2,005 | | | | 34,077 | |
| | |
Spirax-Sarco Engineering PLC | | | 441 | | | | 52,904 | |
| | |
SSE PLC | | | 5,341 | | | | 104,820 | |
| | |
St. James’s Place PLC | | | 3,479 | | | | 46,581 | |
| | |
Standard Chartered PLC | | | 13,981 | | | | 105,034 | |
| | |
Taylor Wimpey PLC | | | 18,914 | | | | 26,795 | |
| | |
Tesco PLC | | | 38,266 | | | | 118,736 | |
| | |
Unilever PLC | | | 14,867 | | | | 671,835 | |
| | |
United Utilities Group PLC | | | 637 | | | | 7,891 | |
| | |
Vodafone Group PLC | | | 148,691 | | | | 228,720 | |
| | |
Whitbread PLC* | | | 1,225 | | | | 36,865 | |
| | |
WPP PLC | | | 6,861 | | | | 68,708 | |
| | | | | | | | |
| Total United Kingdom | | | | 11,012,204 | |
|
| United States – 0.2% | |
| | |
Stellantis NV | | | 11,234 | | | | 138,492 | |
TOTAL COMMON STOCKS (Cost: $85,907,120) | | | | 67,376,164 | |
|
| PREFERRED STOCKS – 0.5% | |
|
| Germany – 0.5% | |
| | |
Henkel AG & Co. KGaA | | | 1,519 | | | | 93,345 | |
| | |
Porsche Automobil Holding SE | | | 735 | | | | 48,502 | |
| | |
Sartorius AG | | | 245 | | | | 85,395 | |
| Volkswagen AG | | | 1,274 | | | | 169,711 | |
TOTAL PREFERRED STOCKS (Cost: $632,900) | | | | 396,953 | |
| |
TOTAL INVESTMENTS IN SECURITIES – 89.4% (Cost: $86,540,020) | | | | 67,773,117 | |
| |
Other Assets less Liabilities – 10.6% | | | | 7,994,061 | |
| | | | | | | | |
| NET ASSETS – 100.0% | | | $ | 75,767,178 | |
| * | Non-income producing security. |
| (a) | This security is exempt from registration under rule 144A of the Securities Act of 1933. This security may be sold in transactions that are exempt from registration, normally to qualified institutional buyers. |
| | | | | | | | | | | | | | | | | | | | | | | | | | | | |
|
| FINANCIAL DERIVATIVE INSTRUMENTS | |
|
| FOREIGN CURRENCY CONTRACTS (OTC – OVER THE COUNTER) | |
| | | | | |
| Counterparty | | Settlement
Date | | | Amount and Description of
Currency to be Purchased | | | Amount and
Description of
Currency to be Sold | | | Unrealized
Appreciation | | | Unrealized
Depreciation | |
Barclays Bank PLC | | | 7/5/2022 | | | | 18,329 | | | | USD | | | | 130,000 | | | | DKK | | | $ | 53 | | | $ | — | |
Deutsche Bank AG | | | 7/1/2022 | | | | 37,813 | | | | USD | | | | 36,081 | | | | CHF | | | | 125 | | | | — | |
Deutsche Bank AG | | | 7/5/2022 | | | | 55,297 | | | | USD | | | | 7,500,000 | | | | JPY | | | | 92 | | | | — | |
Goldman Sachs | | | 7/5/2022 | | | | 27,644 | | | | USD | | | | 40,000 | | | | AUD | | | | 138 | | | | — | |
Morgan Stanley & Co. International | | | 7/5/2022 | | | | 24,354 | | | | USD | | | | 20,000 | | | | GBP | | | | 65 | | | | — | |
Standard Chartered Bank | | | 7/5/2022 | | | | 27,263 | | | | USD | | | | 26,000 | | | | EUR | | | | 81 | | | | — | |
| | | | | | | | | | | | | | | | | | | | | | | $ | 554 | | | $ | — | |
See Notes to Financial Statements.
Schedule of Investments (concluded)
WisdomTree International Efficient Core Fund (NTSI)
June 30, 2022
| | | | | | | | | | | | |
| | | | | |
| FUTURES CONTRACTS (EXCHANGE-TRADED) | | | | | | | | | | |
| | | | |
| Long Exposure | | Contracts | | Expiration
Date | | Notional
Value | | | Unrealized
Depreciation | |
2 Year U.S. Treasury Note | | 43 | | 9/30/22 | | $ | 9,030,672 | | | $ | (52,181 | ) |
5 Year U.S. Treasury Note | | 80 | | 9/30/22 | | | 8,980,000 | | | | (84,183 | ) |
10 Year U.S. Treasury Note | | 77 | | 9/21/22 | | | 9,126,906 | | | | (119,104 | ) |
U.S. Treasury Long Bond | | 65 | | 9/21/22 | | | 9,010,625 | | | | (124,356 | ) |
Ultra 10 Year U.S. Treasury Note | | 72 | | 9/21/22 | | | 9,171,000 | | | | (141,683 | ) |
| | | | | | | $ | 45,319,203 | | | $ | (521,507 | ) |
The following is a summary of the fair valuations according to the inputs used as of June 30, 2022 in valuing the Fund’s investments (See Note 2 – Fair Value Measurement):
| | | | | | | | | | | | | | | | |
| | | | |
| | | Quoted
Prices in
Active
Markets
(Level 1) | | | Other
Significant
Observable
Inputs
(Level 2) | | | Significant
Unobservable
Inputs
(Level 3) | | | Total | |
Assets: | | | | | | | | | | | | | | | | |
Investments in Securities | | | | | | | | | | | | | | | | |
Common Stocks | | $ | 67,376,164 | | | $ | — | | | $ | — | | | $ | 67,376,164 | |
Preferred Stocks | | | 396,953 | | | | — | | | | — | | | | 396,953 | |
Total Investments in Securities | | $ | 67,773,117 | | | $ | — | | | $ | — | | | $ | 67,773,117 | |
Financial Derivative Instruments | | | | | | | | | | | | | | | | |
Foreign Currency Contracts1 | | $ | — | | | $ | 554 | | | $ | — | | | $ | 554 | |
Liabilities: | | | | | | | | | | | | | | | | |
Financial Derivative Instruments | | | | | | | | | | | | | | | | |
Futures Contracts1 | | $ | (521,507 | ) | | $ | — | | | $ | — | | | $ | (521,507 | ) |
Total – Net | | $ | 67,251,610 | | | $ | 554 | | | $ | — | | | $ | 67,252,164 | |
| 1 | Amount shown represents the unrealized appreciation (depreciation) on the financial instrument. |
See Notes to Financial Statements.
Schedule of Investments
WisdomTree U.S. Efficient Core Fund (NTSX)
June 30, 2022
| | | | | | | | |
| Investments | | Shares | | | Value | |
| COMMON STOCKS – 89.4% | |
| Argentina – 0.1% | |
|
| Internet & Direct Marketing Retail – 0.1% | |
| | |
MercadoLibre, Inc.* | | | 726 | | | $ | 462,367 | |
|
| China – 0.2% | |
|
| Hotels, Restaurants & Leisure – 0.1% | |
| | |
Yum China Holdings, Inc. | | | 7,519 | | | | 364,672 | |
|
| Semiconductors & Semiconductor Equipment – 0.1% | |
| | |
NXP Semiconductors NV | | | 4,507 | | | | 667,171 | |
| Total China | | | | 1,031,843 | |
|
| Ireland – 0.1% | |
|
| Technology Hardware, Storage & Peripherals – 0.1% | |
| | |
Seagate Technology Holdings PLC | | | 4,195 | | | | 299,691 | |
|
| Israel – 0.0% | |
|
| Software – 0.0% | |
| | |
Check Point Software Technologies Ltd.* | | | 1,974 | | | | 240,394 | |
|
| Russia – 0.0% | |
|
| Interactive Media & Services – 0.0% | |
| | |
Yandex NV, Class A*† | | | 6,719 | | | | 0 | |
|
| South Korea – 0.0% | |
|
| Internet & Direct Marketing Retail – 0.0% | |
| | |
Coupang, Inc.* | | | 19,452 | | | | 248,013 | |
|
| United Kingdom – 0.4% | |
|
| Chemicals – 0.4% | |
| | |
Linde PLC | | | 9,990 | | | | 2,872,424 | |
|
| United States – 88.6% | |
|
| Aerospace & Defense – 1.5% | |
| | |
Boeing Co.* | | | 11,542 | | | | 1,578,022 | |
| | |
General Dynamics Corp. | | | 4,608 | | | | 1,019,520 | |
| | |
Howmet Aerospace, Inc. | | | 7,145 | | | | 224,710 | |
| | |
L3Harris Technologies, Inc. | | | 3,547 | | | | 857,310 | |
| | |
Lockheed Martin Corp. | | | 5,011 | | | | 2,154,530 | |
| | |
Northrop Grumman Corp. | | | 2,830 | | | | 1,354,353 | |
| | |
Raytheon Technologies Corp. | | | 29,543 | | | | 2,839,378 | |
| | |
TransDigm Group, Inc.* | | | 894 | | | | 479,783 | |
| | | | | | | | |
| Total Aerospace & Defense | | | | 10,507,606 | |
|
| Air Freight & Logistics – 0.6% | |
| | |
C.H. Robinson Worldwide, Inc. | | | 2,240 | | | | 227,069 | |
| | |
Expeditors International of Washington, Inc. | | | 3,046 | | | | 296,863 | |
| | |
FedEx Corp. | | | 4,381 | | | | 993,217 | |
United Parcel Service, Inc., Class B | | | 14,225 | | | | 2,596,631 | |
| | | | | | | | |
| Total Air Freight & Logistics | | | | 4,113,780 | |
|
| Airlines – 0.1% | |
| | |
Delta Air Lines, Inc.* | | | 12,571 | | | | 364,182 | |
| | |
Southwest Airlines Co.* | | | 10,173 | | | | 367,448 | |
| | |
United Airlines Holdings, Inc.* | | | 5,359 | | | | 189,816 | |
| | | | | | | | |
| Total Airlines | | | | 921,446 | |
|
| Auto Components – 0.1% | |
| | |
Aptiv PLC* | | | 5,366 | | | | 477,950 | |
|
| Automobiles - 1.9% | |
| | |
Ford Motor Co. | | | 73,936 | | | | 822,908 | |
| | |
General Motors Co.* | | | 24,020 | | | | 762,875 | |
| | |
Lucid Group, Inc.*(a) | | | 11,530 | | | | 197,855 | |
| | |
Rivian Automotive, Inc., Class A* | | | 7,463 | | | | 192,098 | |
| | |
Tesla, Inc.* | | | 16,813 | | | | 11,322,210 | |
| | | | | | | | |
| Total Automobiles | | | | 13,297,946 | |
|
| Banks – 3.2% | |
| | |
Bank of America Corp. | | | 136,153 | | | | 4,238,443 | |
| | |
Citigroup, Inc. | | | 38,705 | | | | 1,780,043 | |
| | |
Citizens Financial Group, Inc. | | | 7,260 | | | | 259,110 | |
| | |
Fifth Third Bancorp | | | 11,741 | | | | 394,498 | |
| | |
First Republic Bank | | | 3,351 | | | | 483,214 | |
| | |
Huntington Bancshares, Inc. | | | 25,977 | | | | 312,503 | |
| | |
JPMorgan Chase & Co. | | | 57,685 | | | | 6,495,908 | |
| | |
KeyCorp | | | 15,186 | | | | 261,655 | |
| | |
M&T Bank Corp. | | | 2,221 | | | | 354,005 | |
| | |
PNC Financial Services Group, Inc. | | | 8,293 | | | | 1,308,387 | |
| | |
Regions Financial Corp. | | | 15,839 | | | | 296,981 | |
| | |
Signature Bank | | | 1,097 | | | | 196,593 | |
| | |
SVB Financial Group* | | | 1,090 | | | | 430,539 | |
| | |
Truist Financial Corp. | | | 26,561 | | | | 1,259,788 | |
| | |
U.S. Bancorp | | | 26,501 | | | | 1,219,576 | |
| | |
Wells Fargo & Co. | | | 75,300 | | | | 2,949,501 | |
| | | | | | | | |
| Total Banks | | | | 22,240,744 | |
|
| Beverages – 1.7% | |
| | |
Brown-Forman Corp., Class B | | | 6,322 | | | | 443,552 | |
| | |
Coca-Cola Co. | | | 77,522 | | | | 4,876,909 | |
| | |
Constellation Brands, Inc., Class A | | | 3,008 | | | | 701,044 | |
| | |
Keurig Dr. Pepper, Inc. | | | 16,820 | | | | 595,260 | |
| | |
Monster Beverage Corp.* | | | 7,562 | | | | 700,997 | |
| | |
PepsiCo, Inc. | | | 26,673 | | | | 4,445,322 | |
| | | | | | | | |
| Total Beverages | | | | 11,763,084 | |
|
| Biotechnology – 2.1% | |
| | |
AbbVie, Inc. | | | 34,808 | | | | 5,331,193 | |
| | |
Alnylam Pharmaceuticals, Inc.* | | | 1,671 | | | | 243,715 | |
| | |
Amgen, Inc. | | | 10,131 | | | | 2,464,872 | |
| | |
Biogen, Inc.* | | | 2,442 | | | | 498,021 | |
| | |
Gilead Sciences, Inc. | | | 20,207 | | | | 1,248,995 | |
| | |
Horizon Therapeutics PLC* | | | 4,210 | | | | 335,790 | |
| | |
Incyte Corp.* | | | 4,376 | | | | 332,445 | |
| | |
Moderna, Inc.* | | | 6,968 | | | | 995,379 | |
| | |
Regeneron Pharmaceuticals, Inc.* | | | 1,797 | | | | 1,062,261 | |
| | |
Seagen, Inc.* | | | 3,202 | | | | 566,562 | |
| | |
Vertex Pharmaceuticals, Inc.* | | | 4,681 | | | | 1,319,059 | |
| | | | | | | | |
| Total Biotechnology | | | | 14,398,292 | |
|
| Building Products – 0.2% | |
| | |
Carrier Global Corp. | | | 11,421 | | | | 407,273 | |
| | |
Johnson Controls International PLC | | | 12,439 | | | | 595,579 | |
| | |
Trane Technologies PLC | | | 4,127 | | | | 535,974 | |
| | | | | | | | |
| Total Building Products | | | | 1,538,826 | |
|
| Capital Markets – 2.7% | |
| | |
Ameriprise Financial, Inc. | | | 2,076 | | | | 493,424 | |
| | |
Bank of New York Mellon Corp. | | | 14,856 | | | | 619,644 | |
See Notes to Financial Statements.
Schedule of Investments (continued)
WisdomTree U.S. Efficient Core Fund (NTSX)
June 30, 2022
| | | | | | | | |
| Investments | | Shares | | | Value | |
| | |
BlackRock, Inc. | | | 2,637 | | | $ | 1,606,038 | |
| | |
Blackstone, Inc. | | | 13,712 | | | | 1,250,946 | |
| | |
Charles Schwab Corp. | | | 28,371 | | | | 1,792,480 | |
| | |
CME Group, Inc. | | | 6,505 | | | | 1,331,574 | |
| | |
Coinbase Global, Inc., Class A* | | | 2,712 | | | | 127,518 | |
| | |
FactSet Research Systems, Inc. | | | 722 | | | | 277,660 | |
| | |
Goldman Sachs Group, Inc. | | | 6,485 | | | | 1,926,175 | |
| | |
Intercontinental Exchange, Inc. | | | 11,210 | | | | 1,054,188 | |
| | |
KKR & Co., Inc. | | | 11,320 | | | | 524,003 | |
| | |
LPL Financial Holdings, Inc. | | | 1,613 | | | | 297,566 | |
| | |
Moody’s Corp. | | | 3,131 | | | | 851,538 | |
| | |
Morgan Stanley | | | 27,766 | | | | 2,111,882 | |
| | |
MSCI, Inc. | | | 1,397 | | | | 575,774 | |
| | |
Nasdaq, Inc. | | | 2,062 | | | | 314,537 | |
| | |
Northern Trust Corp. | | | 3,938 | | | | 379,938 | |
| | |
Raymond James Financial, Inc. | | | 3,723 | | | | 332,873 | |
| | |
S&P Global, Inc. | | | 6,831 | | | | 2,302,457 | |
| | |
State Street Corp. | | | 6,702 | | | | 413,178 | |
| | |
T. Rowe Price Group, Inc. | | | 3,839 | | | | 436,149 | |
| | | | | | | | |
| Total Capital Markets | | | | 19,019,542 | |
|
| Chemicals – 1.1% | |
| | |
Air Products and Chemicals, Inc. | | | 4,121 | | | | 991,018 | |
| | |
Albemarle Corp. | | | 2,337 | | | | 488,386 | |
| | |
Celanese Corp. | | | 1,875 | | | | 220,519 | |
| | |
CF Industries Holdings, Inc. | | | 3,433 | | | | 294,311 | |
| | |
Corteva, Inc. | | | 14,356 | | | | 777,234 | |
| | |
Dow, Inc. | | | 14,482 | | | | 747,416 | |
| | |
DuPont de Nemours, Inc. | | | 10,140 | | | | 563,581 | |
| | |
Ecolab, Inc. | | | 4,966 | | | | 763,572 | |
| | |
FMC Corp. | | | 2,492 | | | | 266,669 | |
| | |
International Flavors & Fragrances, Inc. | | | 4,451 | | | | 530,203 | |
| | |
LyondellBasell Industries NV, Class A | | | 4,319 | | | | 377,740 | |
| | |
Mosaic Co. | | | 6,583 | | | | 310,915 | |
| | |
PPG Industries, Inc. | | | 4,350 | | | | 497,379 | |
| | |
Sherwin-Williams Co. | | | 4,785 | | | | 1,071,410 | |
| | | | | | | | |
| Total Chemicals | | | | 7,900,353 | |
|
| Commercial Services & Supplies – 0.5% | |
| | |
Cintas Corp. | | | 1,820 | | | | 679,825 | |
| | |
Copart, Inc.* | | | 4,378 | | | | 475,713 | |
| | |
Republic Services, Inc. | | | 4,019 | | | | 525,966 | |
| | |
Waste Connections, Inc. | | | 4,427 | | | | 548,771 | |
| | |
Waste Management, Inc. | | | 7,471 | | | | 1,142,914 | |
| | | | | | | | |
| Total Commercial Services & Supplies | | | | 3,373,189 | |
|
| Communications Equipment – 0.6% | |
| | |
Arista Networks, Inc.* | | | 4,980 | | | | 466,825 | |
| | |
Cisco Systems, Inc. | | | 77,958 | | | | 3,324,129 | |
| | |
Motorola Solutions, Inc. | | | 2,943 | | | | 616,853 | |
| | | | | | | | |
| Total Communications Equipment | | | | 4,407,807 | |
|
| Construction & Engineering – 0.0% | |
| Quanta Services, Inc. | | | 2,692 | | | | 337,415 | |
|
| Construction Materials – 0.1% | |
| | |
Martin Marietta Materials, Inc. | | | 1,045 | | | | 312,706 | |
| | |
Vulcan Materials Co. | | | 2,378 | | | | 337,914 | |
| | | | | | | | |
| Total Construction Materials | | | | 650,620 | |
|
| Consumer Finance – 0.5% | |
| | |
Ally Financial, Inc. | | | 6,463 | | | | 216,575 | |
| | |
American Express Co. | | | 11,915 | | | | 1,651,657 | |
| | |
Capital One Financial Corp. | | | 7,596 | | | | 791,427 | |
| | |
Discover Financial Services | | | 4,925 | | | | 465,807 | |
| | |
Synchrony Financial | | | 8,301 | | | | 229,274 | |
| | | | | | | | |
| Total Consumer Finance | | | | 3,354,740 | |
|
| Containers & Packaging – 0.2% | |
| | |
Amcor PLC | | | 28,133 | | | | 349,693 | |
| | |
Ball Corp. | | | 5,744 | | | | 395,015 | |
| | |
Crown Holdings, Inc. | | | 2,347 | | | | 216,323 | |
| | |
International Paper Co. | | | 6,353 | | | | 265,746 | |
| | |
Packaging Corp. of America | | | 1,661 | | | | 228,387 | |
| | | | | | | | |
| Total Containers & Packaging | | | | 1,455,164 | |
|
| Distributors – 0.1% | |
| | |
Genuine Parts Co. | | | 2,577 | | | | 342,741 | |
| | |
LKQ Corp. | | | 5,296 | | | | 259,981 | |
| | |
Pool Corp. | | | 766 | | | | 269,042 | |
| | | | | | | | |
| Total Distributors | | | | 871,764 | |
|
| Diversified Financial Services – 1.4% | |
| | |
Apollo Global Management, Inc. | | | 9,668 | | | | 468,705 | |
| | |
Berkshire Hathaway, Inc., Class A* | | | 7 | | | | 2,862,650 | |
| | |
Berkshire Hathaway, Inc., Class B* | | | 23,479 | | | | 6,410,236 | |
| | | | | | | | |
| Total Diversified Financial Services | | | | 9,741,591 | |
|
| Diversified Telecommunication Services – 1.0% | |
| | |
AT&T, Inc. | | | 131,113 | | | | 2,748,129 | |
| | |
Verizon Communications, Inc. | | | 82,483 | | | | 4,186,012 | |
| | | | | | | | |
| Total Diversified Telecommunication Services | | | | 6,934,141 | |
|
| Electric Utilities – 1.6% | |
| | |
Alliant Energy Corp. | | | 4,179 | | | | 244,931 | |
| | |
American Electric Power Co., Inc. | | | 8,700 | | | | 834,678 | |
| | |
Duke Energy Corp. | | | 15,075 | | | | 1,616,191 | |
| | |
Edison International | | | 6,651 | | | | 420,609 | |
| | |
Entergy Corp. | | | 3,569 | | | | 402,012 | |
| | |
Evergy, Inc. | | | 4,518 | | | | 294,800 | |
| | |
Eversource Energy | | | 6,211 | | | | 524,643 | |
| | |
Exelon Corp. | | | 17,307 | | | | 784,353 | |
| | |
FirstEnergy Corp. | | | 10,875 | | | | 417,491 | |
| | |
NextEra Energy, Inc. | | | 38,760 | | | | 3,002,350 | |
| | |
PG&E Corp.* | | | 26,658 | | | | 266,047 | |
| | |
PPL Corp. | | | 13,541 | | | | 367,367 | |
| | |
Southern Co. | | | 20,883 | | | | 1,489,167 | |
| | |
Xcel Energy, Inc. | | | 9,916 | | | | 701,656 | |
| | | | | | | | |
| Total Electric Utilities | | | | 11,366,295 | |
|
| Electrical Equipment – 0.5% | |
| | |
AMETEK, Inc. | | | 4,376 | | | | 480,879 | |
| | |
Eaton Corp. PLC | | | 7,831 | | | | 986,628 | |
| | |
Emerson Electric Co. | | | 11,803 | | | | 938,810 | |
| | |
Generac Holdings, Inc.* | | | 1,148 | | | | 241,746 | |
See Notes to Financial Statements.
Schedule of Investments (continued)
WisdomTree U.S. Efficient Core Fund (NTSX)
June 30, 2022
| | | | | | | | |
| Investments | | Shares | | | Value | |
| | |
Plug Power, Inc.*(a) | | | 9,992 | | | $ | 165,567 | |
| | |
Rockwell Automation, Inc. | | | 2,152 | | | | 428,915 | |
| | | | | | | | |
| Total Electrical Equipment | | | | 3,242,545 | |
|
| Electronic Equipment, Instruments & Components – 0.5% | |
| | |
Amphenol Corp., Class A | | | 10,316 | | | | 664,144 | |
| | |
CDW Corp. | | | 2,513 | | | | 395,948 | |
| | |
Corning, Inc. | | | 14,834 | | | | 467,419 | |
| | |
Keysight Technologies, Inc.* | | | 3,387 | | | | 466,898 | |
| | |
TE Connectivity Ltd. | | | 6,046 | | | | 684,105 | |
| | |
Teledyne Technologies, Inc.* | | | 725 | | | | 271,955 | |
| | |
Trimble, Inc.* | | | 4,312 | | | | 251,088 | |
| | |
Zebra Technologies Corp., Class A* | | | 926 | | | | 272,198 | |
| | | | | | | | |
| Total Electronic Equipment, Instruments & Components | | | | 3,473,755 | |
|
| Energy Equipment & Services – 0.3% | |
| | |
Baker Hughes Co. | | | 13,661 | | | | 394,393 | |
| | |
Halliburton Co. | | | 16,684 | | | | 523,210 | |
| | |
Schlumberger NV | | | 26,482 | | | | 946,997 | |
| | | | | | | | |
| Total Energy Equipment & Services | | | | 1,864,600 | |
|
| Entertainment – 1.1% | |
| | |
Activision Blizzard, Inc. | | | 14,593 | | | | 1,136,211 | |
| | |
Electronic Arts, Inc. | | | 4,981 | | | | 605,939 | |
| | |
Live Nation Entertainment, Inc.* | | | 2,829 | | | | 233,619 | |
| | |
Netflix, Inc.* | | | 7,971 | | | | 1,393,889 | |
| | |
ROBLOX Corp., Class A* | | | 7,044 | | | | 231,466 | |
| | |
Roku, Inc.* | | | 2,090 | | | | 171,672 | |
| | |
Spotify Technology SA* | | | 2,020 | | | | 189,536 | |
| | |
Take-Two Interactive Software, Inc.* | | | 1,965 | | | | 240,771 | |
| | |
Walt Disney Co.* | | | 35,877 | | | | 3,386,789 | |
| | | | | | | | |
| Total Entertainment | | | | 7,589,892 | |
|
| Equity Real Estate Investment Trusts (REITs) – 2.5% | |
| | |
Alexandria Real Estate Equities, Inc. | | | 2,860 | | | | 414,786 | |
| | |
American Tower Corp. | | | 8,976 | | | | 2,294,176 | |
| | |
AvalonBay Communities, Inc. | | | 2,594 | | | | 503,884 | |
| | |
Boston Properties, Inc. | | | 2,454 | | | | 218,357 | |
| | |
Camden Property Trust | | | 1,530 | | | | 205,754 | |
| | |
Crown Castle International Corp. | | | 8,060 | | | | 1,357,143 | |
| | |
Digital Realty Trust, Inc. | | | 4,965 | | | | 644,606 | |
| | |
Duke Realty Corp. | | | 6,658 | | | | 365,857 | |
| | |
Equinix, Inc. | | | 1,682 | | | | 1,105,108 | |
| | |
Equity Residential | | | 5,772 | | | | 416,854 | |
| | |
Essex Property Trust, Inc. | | | 1,213 | | | | 317,212 | |
| | |
Extra Space Storage, Inc. | | | 2,438 | | | | 414,752 | |
| | |
Healthpeak Properties, Inc. | | | 9,865 | | | | 255,602 | |
| | |
Host Hotels & Resorts, Inc. | | | 14,157 | | | | 221,982 | |
| | |
Invitation Homes, Inc. | | | 11,981 | | | | 426,284 | |
| | |
Iron Mountain, Inc. | | | 5,089 | | | | 247,783 | |
| | |
Kimco Realty Corp. | | | 10,793 | | | | 213,377 | |
| | |
Mid-America Apartment Communities, Inc. | | | 1,737 | | | | 303,402 | |
| | |
Prologis, Inc. | | | 13,721 | | | | 1,614,276 | |
| | |
Public Storage | | | 2,843 | | | | 888,921 | |
| | |
Realty Income Corp. | | | 11,073 | | | | 755,843 | |
| | |
SBA Communications Corp. | | | 2,042 | | | | 653,542 | |
| | |
Simon Property Group, Inc. | | | 6,011 | | | | 570,564 | |
| | |
Sun Communities, Inc. | | | 2,165 | | | | 345,014 | |
| | |
UDR, Inc. | | | 5,468 | | | | 251,747 | |
| | |
Ventas, Inc. | | | 6,977 | | | | 358,827 | |
| | |
VICI Properties, Inc. | | | 17,880 | | | | 532,645 | |
| | |
W.P. Carey, Inc. | | | 3,959 | | | | 328,043 | |
| | |
Welltower, Inc. | | | 8,102 | | | | 667,200 | |
| | |
Weyerhaeuser Co. | | | 12,673 | | | | 419,730 | |
| | | | | | | | |
| Total Equity Real Estate Investment Trusts (REITs) | | | | 17,313,271 | |
|
| Food & Staples Retailing – 1.4% | |
| | |
Costco Wholesale Corp. | | | 8,591 | | | | 4,117,494 | |
| | |
Kroger Co. | | | 11,921 | | | | 564,221 | |
| | |
Sysco Corp. | | | 9,853 | | | | 834,648 | |
| | |
Walgreens Boots Alliance, Inc. | | | 14,315 | | | | 542,539 | |
| | |
Walmart, Inc. | | | 28,692 | | | | 3,488,373 | |
| | | | | | | | |
| Total Food & Staples Retailing | | | | 9,547,275 | |
|
| Food Products – 0.9% | |
| | |
Archer-Daniels-Midland Co. | | | 9,524 | | | | 739,062 | |
| | |
Bunge Ltd. | | | 2,369 | | | | 214,845 | |
| | |
Conagra Brands, Inc. | | | 9,129 | | | | 312,577 | |
| | |
General Mills, Inc. | | | 10,568 | | | | 797,356 | |
| | |
Hershey Co. | | | 2,659 | | | | 572,110 | |
| | |
Hormel Foods Corp. | | | 6,044 | | | | 286,244 | |
| | |
J.M. Smucker Co. | | | 2,132 | | | | 272,917 | |
| | |
Kellogg Co. | | | 4,376 | | | | 312,184 | |
| | |
Kraft Heinz Co. | | | 14,055 | | | | 536,058 | |
| | |
McCormick & Co., Inc., Non-Voting Shares | | | 3,838 | | | | 319,514 | |
| | |
Mondelez International, Inc., Class A | | | 27,290 | | | | 1,694,436 | |
| | |
Tyson Foods, Inc., Class A | | | 5,522 | | | | 475,223 | |
| | | | | | | | |
| Total Food Products | | | | 6,532,526 | |
|
| Gas Utilities – 0.0% | |
| Atmos Energy Corp. | | | 2,536 | | | | 284,286 | |
|
| Health Care Equipment & Supplies – 2.3% | |
| | |
Abbott Laboratories | | | 34,259 | | | | 3,722,240 | |
| | |
Align Technology, Inc.* | | | 1,507 | | | | 356,662 | |
| | |
Baxter International, Inc. | | | 8,775 | | | | 563,618 | |
| | |
Becton Dickinson and Co. | | | 4,928 | | | | 1,214,900 | |
| | |
Boston Scientific Corp.* | | | 26,592 | | | | 991,084 | |
| | |
Cooper Cos., Inc. | | | 873 | | | | 273,354 | |
| | |
Dexcom, Inc.* | | | 7,440 | | | | 554,503 | |
| | |
Edwards Lifesciences Corp.* | | | 11,824 | | | | 1,124,344 | |
| | |
Hologic, Inc.* | | | 3,868 | | | | 268,052 | |
| | |
IDEXX Laboratories, Inc.* | | | 1,434 | | | | 502,947 | |
| | |
Intuitive Surgical, Inc.* | | | 6,621 | | | | 1,328,901 | |
| | |
Medtronic PLC | | | 26,426 | | | | 2,371,733 | |
| | |
ResMed, Inc. | | | 2,560 | | | | 536,653 | |
| | |
STERIS PLC | | | 1,739 | | | | 358,495 | |
| | |
Stryker Corp. | | | 6,690 | | | | 1,330,842 | |
| | |
Teleflex, Inc. | | | 790 | | | | 194,222 | |
| | |
Zimmer Biomet Holdings, Inc. | | | 3,657 | | | | 384,204 | |
| | | | | | | | |
| Total Health Care Equipment & Supplies | | | | 16,076,754 | |
See Notes to Financial Statements.
Schedule of Investments (continued)
WisdomTree U.S. Efficient Core Fund (NTSX)
June 30, 2022
| | | | | | | | |
| Investments | | Shares | | | Value | |
|
| Health Care Providers & Services – 3.0% | |
| | |
AmerisourceBergen Corp. | | | 2,855 | | | $ | 403,925 | |
| | |
Cardinal Health, Inc. | | | 4,923 | | | | 257,325 | |
| | |
Centene Corp.* | | | 10,078 | | | | 852,700 | |
| | |
Cigna Corp. | | | 5,922 | | | | 1,560,566 | |
| | |
CVS Health Corp. | | | 25,096 | | | | 2,325,395 | |
| | |
Elevance Health, Inc. | | | 4,765 | | | | 2,299,494 | |
| | |
HCA Healthcare, Inc. | | | 4,154 | | | | 698,121 | |
| | |
Humana, Inc. | | | 2,137 | | | | 1,000,266 | |
| | |
Laboratory Corp. of America Holdings | | | 1,778 | | | | 416,692 | |
| | |
McKesson Corp. | | | 2,764 | | | | 901,644 | |
| | |
Molina Healthcare, Inc.* | | | 923 | | | | 258,080 | |
| | |
Quest Diagnostics, Inc. | | | 2,009 | | | | 267,157 | |
| | |
UnitedHealth Group, Inc. | | | 18,271 | | | | 9,384,534 | |
| | | | | | | | |
| Total Health Care Providers & Services | | | | 20,625,899 | |
|
| Health Care Technology – 0.1% | |
| | |
Veeva Systems, Inc., Class A* | | | 2,365 | | | | 468,365 | |
|
| Hotels, Restaurants & Leisure – 1.6% | |
| | |
Airbnb, Inc., Class A* | | | 5,494 | | | | 489,405 | |
| | |
Booking Holdings, Inc.* | | | 806 | | | | 1,409,686 | |
| | |
Caesars Entertainment, Inc.* | | | 3,309 | | | | 126,735 | |
| | |
Carnival Corp.*(a) | | | 15,978 | | | | 138,210 | |
| | |
Chipotle Mexican Grill, Inc.* | | | 534 | | | | 698,077 | |
| | |
Domino’s Pizza, Inc. | | | 635 | | | | 247,466 | |
| | |
Expedia Group, Inc.* | | | 2,784 | | | | 264,007 | |
| | |
Hilton Worldwide Holdings, Inc. | | | 5,039 | | | | 561,546 | |
| | |
Las Vegas Sands Corp.* | | | 6,916 | | | | 232,308 | |
| | |
Marriott International, Inc., Class A | | | 5,808 | | | | 789,946 | |
| | |
McDonald’s Corp. | | | 14,390 | | | | 3,552,603 | |
| | |
MGM Resorts International | | | 7,844 | | | | 227,084 | |
| | |
Royal Caribbean Cruises Ltd.* | | | 3,569 | | | | 124,594 | |
| | |
Starbucks Corp. | | | 22,119 | | | | 1,689,670 | |
| | |
Yum! Brands, Inc. | | | 4,322 | | | | 490,590 | |
| | | | | | | | |
| Total Hotels, Restaurants & Leisure | | | | 11,041,927 | |
|
| Household Durables – 0.2% | |
| | |
D.R. Horton, Inc. | | | 6,198 | | | | 410,246 | |
| | |
Garmin Ltd. | | | 2,873 | | | | 282,272 | |
| | |
Lennar Corp., Class A | | | 4,013 | | | | 283,197 | |
| | |
NVR, Inc.* | | | 66 | | | | 264,273 | |
| | | | | | | | |
| Total Household Durables | | | | 1,239,988 | |
| | |
| Household Products – 1.4% | | | | | | | | |
| | |
Church & Dwight Co., Inc. | | | 4,283 | | | | 396,863 | |
| | |
Clorox Co. | | | 2,327 | | | | 328,060 | |
| | |
Colgate-Palmolive Co. | | | 15,631 | | | | 1,252,668 | |
| | |
Kimberly-Clark Corp. | | | 5,887 | | | | 795,628 | |
| | |
Procter & Gamble Co. | | | 46,544 | | | | 6,692,562 | |
| | | | | | | | |
| Total Household Products | | | | 9,465,781 | |
|
| Independent Power & Renewable Electricity Producers – 0.0% | |
| | |
AES Corp. | | | 11,089 | | | | 232,980 | |
|
| Industrial Conglomerates – 0.7% | |
| | |
3M Co. | | | 11,256 | | | | 1,456,639 | |
| | |
General Electric Co. | | | 18,361 | | | | 1,169,045 | |
| | |
Honeywell International, Inc. | | | 13,548 | | | | 2,354,778 | |
| | | | | | | | |
| Total Industrial Conglomerates | | | | 4,980,462 | |
|
| Insurance – 1.9% | |
| | |
Aflac, Inc. | | | 11,804 | | | | 653,115 | |
| | |
Allstate Corp. | | | 5,486 | | | | 695,241 | |
| | |
American International Group, Inc. | | | 14,569 | | | | 744,913 | |
| | |
Aon PLC, Class A | | | 4,187 | | | | 1,129,150 | |
| | |
Arch Capital Group Ltd.* | | | 6,645 | | | | 302,281 | |
| | |
Arthur J Gallagher & Co. | | | 3,862 | | | | 629,661 | |
| | |
Brown & Brown, Inc. | | | 4,666 | | | | 272,214 | |
| | |
Chubb Ltd. | | | 7,902 | | | | 1,553,375 | |
| | |
Cincinnati Financial Corp. | | | 2,612 | | | | 310,776 | |
| | |
Fidelity National Financial, Inc. | | | 5,389 | | | | 199,177 | |
| | |
Hartford Financial Services Group, Inc. | | | 5,214 | | | | 341,152 | |
| | |
Markel Corp.* | | | 267 | | | | 345,298 | |
| | |
Marsh & McLennan Cos., Inc. | | | 8,928 | | | | 1,386,072 | |
| | |
MetLife, Inc. | | | 13,658 | | | | 857,586 | |
| | |
Principal Financial Group, Inc. | | | 4,516 | | | | 301,624 | |
| | |
Progressive Corp. | | | 11,489 | | | | 1,335,826 | |
| | |
Prudential Financial, Inc. | | | 6,905 | | | | 660,670 | |
| | |
Travelers Cos., Inc. | | | 4,125 | | | | 697,661 | |
| | |
W.R. Berkley Corp. | | | 4,380 | | | | 298,979 | |
| | |
Willis Towers Watson PLC | | | 2,182 | | | | 430,705 | |
| | | | | | | | |
| Total Insurance | | | | 13,145,476 | |
|
| Interactive Media & Services – 4.6% | |
| | |
Alphabet, Inc., Class A* | | | 5,467 | | | | 11,914,014 | |
| | |
Alphabet, Inc., Class C* | | | 5,418 | | | | 11,851,604 | |
| | |
Match Group, Inc.* | | | 5,681 | | | | 395,909 | |
| | |
Meta Platforms, Inc., Class A* | | | 42,827 | | | | 6,905,854 | |
| | |
Pinterest, Inc., Class A* | | | 10,951 | | | | 198,870 | |
| | |
Snap, Inc., Class A* | | | 22,625 | | | | 297,066 | |
| | |
Twitter, Inc.* | | | 15,789 | | | | 590,351 | |
| | |
ZoomInfo Technologies, Inc., Class A* | | | 5,353 | | | | 177,934 | |
| | | | | | | | |
| Total Interactive Media & Services | | | | 32,331,602 | |
|
| Internet & Direct Marketing Retail – 2.9% | |
| | |
Amazon.com, Inc.* | | | 179,587 | | | | 19,073,935 | |
| | |
DoorDash, Inc., Class A* | | | 3,767 | | | | 241,729 | |
| | |
eBay, Inc. | | | 11,358 | | | | 473,288 | |
| | |
Etsy, Inc.* | | | 2,030 | | | | 148,616 | |
| | | | | | | | |
| Total Internet & Direct Marketing Retail | | | | 19,937,568 | |
|
| IT Services – 4.3% | |
| | |
Accenture PLC, Class A | | | 12,823 | | | | 3,560,306 | |
| | |
Akamai Technologies, Inc.* | | | 3,043 | | | | 277,917 | |
| | |
Automatic Data Processing, Inc. | | | 8,296 | | | | 1,742,492 | |
| | |
Block, Inc.* | | | 10,040 | | | | 617,058 | |
| | |
Broadridge Financial Solutions, Inc. | | | 1,967 | | | | 280,396 | |
| | |
Cloudflare, Inc., Class A* | | | 3,555 | | | | 155,531 | |
| | |
Cognizant Technology Solutions Corp., Class A | | | 10,401 | | | | 701,964 | |
| | |
EPAM Systems, Inc.* | | | 1,037 | | | | 305,687 | |
| | |
Fidelity National Information Services, Inc. | | | 11,276 | | | | 1,033,671 | |
| | |
Fiserv, Inc.* | | | 11,086 | | | | 986,321 | |
| | |
FleetCor Technologies, Inc.* | | | 1,255 | | | | 263,688 | |
Schedule of Investments (continued)
WisdomTree U.S. Efficient Core Fund (NTSX)
June 30, 2022
| | | | | | | | |
| Investments | | Shares | | | Value | |
| | |
Gartner, Inc.* | | | 1,512 | | | $ | 365,647 | |
| | |
Global Payments, Inc. | | | 5,342 | | | | 591,039 | |
| | |
International Business Machines Corp. | | | 17,794 | | | | 2,512,335 | |
| | |
Jack Henry & Associates, Inc. | | | 1,363 | | | | 245,367 | |
| | |
MasterCard, Inc., Class A | | | 16,994 | | | | 5,361,267 | |
| | |
MongoDB, Inc.* | | | 902 | | | | 234,069 | |
| | |
Okta, Inc.* | | | 2,595 | | | | 234,588 | |
| | |
Paychex, Inc. | | | 6,028 | | | | 686,408 | |
| | |
PayPal Holdings, Inc.* | | | 22,008 | | | | 1,537,039 | |
| | |
Snowflake, Inc., Class A* | | | 5,631 | | | | 783,047 | |
| | |
SS&C Technologies Holdings, Inc. | | | 4,065 | | | | 236,055 | |
| | |
Twilio, Inc., Class A* | | | 2,596 | | | | 217,571 | |
| | |
VeriSign, Inc.* | | | 1,759 | | | | 294,333 | |
| | |
Visa, Inc., Class A | | | 32,680 | | | | 6,434,365 | |
| | | | | | | | |
| Total IT Services | | | | 29,658,161 | |
|
| Life Sciences Tools & Services – 1.6% | |
| | |
Agilent Technologies, Inc. | | | 5,120 | | | | 608,102 | |
| | |
Avantor, Inc.* | | | 10,019 | | | | 311,591 | |
| | |
Bio-Techne Corp. | | | 693 | | | | 240,221 | |
| | |
Charles River Laboratories International, Inc.* | | | 867 | | | | 185,512 | |
| | |
Danaher Corp. | | | 13,058 | | | | 3,310,464 | |
| | |
Illumina, Inc.* | | | 2,771 | | | | 510,862 | |
| | |
IQVIA Holdings, Inc.* | | | 3,547 | | | | 769,664 | |
| | |
Mettler-Toledo International, Inc.* | | | 386 | | | | 443,425 | |
| | |
PerkinElmer, Inc. | | | 1,943 | | | | 276,333 | |
| | |
Thermo Fisher Scientific, Inc. | | | 7,714 | | | | 4,190,862 | |
| | |
Waters Corp.* | | | 965 | | | | 319,396 | |
| | |
West Pharmaceutical Services, Inc. | | | 1,273 | | | | 384,917 | |
| | | | | | | | |
| Total Life Sciences Tools & Services | | | | 11,551,349 | |
|
| Machinery – 1.3% | |
| | |
Caterpillar, Inc. | | | 10,595 | | | | 1,893,962 | |
| | |
Cummins, Inc. | | | 2,566 | | | | 496,598 | |
| | |
Deere & Co. | | | 5,512 | | | | 1,650,679 | |
| | |
Dover Corp. | | | 2,708 | | | | 328,534 | |
| | |
Fortive Corp. | | | 6,781 | | | | 368,751 | |
| | |
IDEX Corp. | | | 1,312 | | | | 238,299 | |
| | |
Illinois Tool Works, Inc. | | | 5,332 | | | | 971,757 | |
| | |
Ingersoll Rand, Inc. | | | 5,932 | | | | 249,618 | |
| | |
Otis Worldwide Corp. | | | 8,284 | | | | 585,430 | |
| | |
PACCAR, Inc. | | | 6,919 | | | | 569,710 | |
| | |
Parker-Hannifin Corp. | | | 2,534 | | | | 623,491 | |
| | |
Stanley Black & Decker, Inc. | | | 3,245 | | | | 340,271 | |
| | |
Westinghouse Air Brake Technologies Corp. | | | 3,712 | | | | 304,681 | |
| | |
Xylem, Inc. | | | 3,443 | | | | 269,174 | |
| | | | | | | | |
| Total Machinery | | | | 8,890,955 | |
|
| Media – 0.8% | |
| | |
Charter Communications, Inc., Class A* | | | 2,190 | | | | 1,026,081 | |
| | |
Comcast Corp., Class A | | | 89,080 | | | | 3,495,499 | |
| | |
Liberty Broadband Corp., Class C* | | | 2,663 | | | | 307,949 | |
| | |
Omnicom Group, Inc. | | | 3,808 | | | | 242,227 | |
| | |
Paramount Global, Class B | | | 10,821 | | | | 267,062 | |
| | | | | | | | |
| Total Media | | | | 5,338,818 | |
|
| Metals & Mining – 0.4% | |
| | |
Alcoa Corp. | | | 3,460 | | | | 157,707 | |
| | |
Cleveland-Cliffs, Inc.* | | | 8,339 | | | | 128,170 | |
| | |
Freeport-McMoRan, Inc. | | | 25,061 | | | | 733,285 | |
| | |
Newmont Corp. | | | 14,657 | | | | 874,583 | |
| | |
Nucor Corp. | | | 4,350 | | | | 454,184 | |
| | |
Steel Dynamics, Inc. | | | 3,135 | | | | 207,380 | |
| | | | | | | | |
| Total Metals & Mining | | | | 2,555,309 | |
|
| Multi-Utilities – 0.7% | |
| | |
Ameren Corp. | | | 3,611 | | | | 326,290 | |
| | |
CenterPoint Energy, Inc. | | | 10,645 | | | | 314,879 | |
| | |
CMS Energy Corp. | | | 4,578 | | | | 309,015 | |
| | |
Consolidated Edison, Inc. | | | 6,266 | | | | 595,897 | |
| | |
Dominion Energy, Inc. | | | 15,989 | | | | 1,276,082 | |
| | |
DTE Energy Co. | | | 3,275 | | | | 415,106 | |
| | |
Public Service Enterprise Group, Inc. | | | 9,113 | | | | 576,671 | |
| | |
Sempra Energy | | | 5,186 | | | | 779,300 | |
| | |
WEC Energy Group, Inc. | | | 5,775 | | | | 581,196 | |
| | | | | | | | |
| Total Multi-Utilities | | | | 5,174,436 | |
|
| Multiline Retail – 0.4% | |
| | |
Dollar General Corp. | | | 3,820 | | | | 937,581 | |
| | |
Dollar Tree, Inc.* | | | 3,959 | | | | 617,010 | |
| | |
Target Corp. | | | 8,592 | | | | 1,213,448 | |
| | | | | | | | |
| Total Multiline Retail | | | | 2,768,039 | |
|
| Oil, Gas & Consumable Fuels – 3.6% | |
| | |
Cheniere Energy, Inc. | | | 4,998 | | | | 664,884 | |
| | |
Chevron Corp. | | | 38,236 | | | | 5,535,808 | |
| | |
ConocoPhillips | | | 25,026 | | | | 2,247,585 | |
| | |
Coterra Energy, Inc. | | | 13,136 | | | | 338,777 | |
| | |
Devon Energy Corp. | | | 11,817 | | | | 651,235 | |
| | |
Diamondback Energy, Inc. | | | 3,209 | | | | 388,770 | |
| | |
EOG Resources, Inc. | | | 9,456 | | | | 1,044,321 | |
| | |
Exxon Mobil Corp. | | | 82,549 | | | | 7,069,496 | |
| | |
Hess Corp. | | | 4,717 | | | | 499,719 | |
| | |
Kinder Morgan, Inc. | | | 39,942 | | | | 669,428 | |
| | |
Marathon Oil Corp. | | | 12,947 | | | | 291,049 | |
| | |
Marathon Petroleum Corp. | | | 10,239 | | | | 841,748 | |
| | |
Occidental Petroleum Corp. | | | 18,531 | | | | 1,091,105 | |
| | |
ONEOK, Inc. | | | 7,865 | | | | 436,508 | |
| | |
Phillips 66 | | | 9,554 | | | | 783,333 | |
| | |
Pioneer Natural Resources Co. | | | 4,488 | | | | 1,001,183 | |
| | |
Targa Resources Corp. | | | 4,342 | | | | 259,087 | |
| | |
Valero Energy Corp. | | | 7,619 | | | | 809,747 | |
| | |
Williams Cos., Inc. | | | 22,759 | | | | 710,308 | |
| | | | | | | | |
| Total Oil, Gas & Consumable Fuels | | | | 25,334,091 | |
|
| Personal Products – 0.2% | |
| | |
Estee Lauder Cos., Inc., Class A | | | 4,634 | | | | 1,180,141 | |
|
| Pharmaceuticals – 4.3% | |
| | |
Bristol-Myers Squibb Co. | | | 39,797 | | | | 3,064,369 | |
| | |
Catalent, Inc.* | | | 2,904 | | | | 311,570 | |
| | |
Eli Lilly & Co. | | | 15,557 | | | | 5,044,046 | |
| | |
Johnson & Johnson | | | 51,085 | | | | 9,068,098 | |
| | |
Merck & Co., Inc. | | | 49,732 | | | | 4,534,067 | |
See Notes to Financial Statements.
Schedule of Investments (continued)
WisdomTree U.S. Efficient Core Fund (NTSX)
June 30, 2022
| | | | | | | | |
| Investments | | Shares | | | Value | |
| | |
Pfizer, Inc. | | | 109,952 | | | $ | 5,764,783 | |
| | |
Royalty Pharma PLC, Class A | | | 7,642 | | | | 321,270 | |
| | |
Viatris, Inc. | | | 21,961 | | | | 229,932 | |
| | |
Zoetis, Inc. | | | 8,965 | | | | 1,540,994 | |
| | | | | | | | |
| Total Pharmaceuticals | | | | 29,879,129 | |
|
| Professional Services – 0.3% | |
| | |
CoStar Group, Inc.* | | | 7,297 | | | | 440,812 | |
| | |
Equifax, Inc. | | | 2,376 | | | | 434,285 | |
| | |
Jacobs Engineering Group, Inc. | | | 2,295 | | | | 291,763 | |
| | |
Leidos Holdings, Inc. | | | 2,398 | | | | 241,503 | |
| | |
TransUnion | | | 3,086 | | | | 246,849 | |
| | |
Verisk Analytics, Inc. | | | 3,174 | | | | 549,388 | |
| | | | | | | | |
| Total Professional Services | | | | 2,204,600 | |
|
| Real Estate Management & Development – 0.1% | |
| | |
CBRE Group, Inc., Class A* | | | 6,231 | | | | 458,664 | |
|
| Road & Rail – 0.9% | |
| | |
CSX Corp. | | | 37,068 | | | | 1,077,196 | |
| | |
JB Hunt Transport Services, Inc. | | | 1,562 | | | | 245,968 | |
| | |
Norfolk Southern Corp. | | | 5,140 | | | | 1,168,271 | |
| | |
Old Dominion Freight Line, Inc. | | | 1,710 | | | | 438,239 | |
| | |
Uber Technologies, Inc.* | | | 38,179 | | | | 781,142 | |
| | |
Union Pacific Corp. | | | 12,374 | | | | 2,639,127 | |
| | | | | | | | |
| Total Road & Rail | | | | 6,349,943 | |
|
| Semiconductors & Semiconductor Equipment – 4.3% | |
| | |
Advanced Micro Devices, Inc.* | | | 32,122 | | | | 2,456,369 | |
| | |
Analog Devices, Inc. | | | 10,397 | | | | 1,518,898 | |
| | |
Applied Materials, Inc. | | | 16,638 | | | | 1,513,725 | |
| | |
Broadcom, Inc. | | | 6,198 | | | | 3,011,050 | |
| | |
Enphase Energy, Inc.* | | | 2,355 | | | | 459,790 | |
| | |
Entegris, Inc. | | | 2,144 | | | | 197,527 | |
| | |
Intel Corp. | | | 75,291 | | | | 2,816,636 | |
| | |
KLA Corp. | | | 2,704 | | | | 862,792 | |
| | |
Lam Research Corp. | | | 2,633 | | | | 1,122,053 | |
| | |
Marvell Technology, Inc. | | | 14,235 | | | | 619,650 | |
| | |
Microchip Technology, Inc. | | | 10,341 | | | | 600,605 | |
| | |
Micron Technology, Inc. | | | 20,993 | | | | 1,160,493 | |
| | |
Monolithic Power Systems, Inc. | | | 813 | | | | 312,225 | |
| | |
NVIDIA Corp. | | | 45,936 | | | | 6,963,438 | |
| | |
ON Semiconductor Corp.* | | | 7,901 | | | | 397,499 | |
| | |
QUALCOMM, Inc. | | | 21,870 | | | | 2,793,674 | |
| | |
Skyworks Solutions, Inc. | | | 2,951 | | | | 273,381 | |
| | |
SolarEdge Technologies, Inc.* | | | 1,119 | | | | 306,248 | |
| | |
Teradyne, Inc. | | | 3,065 | | | | 274,471 | |
| | |
Texas Instruments, Inc. | | | 17,268 | | | | 2,653,228 | |
| | | | | | | | |
| Total Semiconductors & Semiconductor Equipment | | | | 30,313,752 | |
|
| Software – 8.7% | |
| | |
Adobe, Inc.* | | | 8,876 | | | | 3,249,149 | |
| | |
ANSYS, Inc.* | | | 1,522 | | | | 364,199 | |
| | |
Atlassian Corp. PLC, Class A* | | | 2,264 | | | | 424,274 | |
| | |
Autodesk, Inc.* | | | 4,337 | | | | 745,790 | |
| | |
Bill.com Holdings, Inc.* | | | 1,772 | | | | 194,814 | |
| | |
Cadence Design Systems, Inc.* | | | 5,135 | | | | 770,404 | |
| | |
Crowdstrike Holdings, Inc., Class A* | | | 4,089 | | | | 689,242 | |
| | |
Datadog, Inc., Class A* | | | 4,669 | | | | 444,676 | |
| | |
DocuSign, Inc.* | | | 3,173 | | | | 182,067 | |
| | |
Fortinet, Inc.* | | | 11,805 | | | | 667,927 | |
| | |
HubSpot, Inc.* | | | 792 | | | | 238,115 | |
| | |
Intuit, Inc. | | | 4,965 | | | | 1,913,710 | |
| | |
Microsoft Corp. | | | 146,487 | | | | 37,622,256 | |
| | |
NortonLifeLock, Inc. | | | 9,138 | | | | 200,670 | |
| | |
Oracle Corp. | | | 30,176 | | | | 2,108,397 | |
| | |
Palantir Technologies, Inc., Class A* | | | 32,778 | | | | 297,296 | |
| | |
Palo Alto Networks, Inc.* | | | 1,934 | | | | 955,280 | |
| | |
Paycom Software, Inc.* | | | 949 | | | | 265,834 | |
| | |
Roper Technologies, Inc. | | | 1,860 | | | | 734,049 | |
| | |
Salesforce, Inc.* | | | 18,228 | | | | 3,008,349 | |
| | |
ServiceNow, Inc.* | | | 3,717 | | | | 1,767,508 | |
| | |
Splunk, Inc.* | | | 3,081 | | | | 272,545 | |
| | |
Synopsys, Inc.* | | | 2,701 | | | | 820,294 | |
| | |
Trade Desk, Inc., Class A* | | | 7,976 | | | | 334,115 | |
| | |
Tyler Technologies, Inc.* | | | 773 | | | | 257,007 | |
| | |
Unity Software, Inc.*(a) | | | 3,492 | | | | 128,575 | |
| | |
VMware, Inc., Class A | | | 4,042 | | | | 460,707 | |
| | |
Workday, Inc., Class A* | | | 3,833 | | | | 535,010 | |
| | |
Zoom Video Communications, Inc., Class A* | | | 3,302 | | | | 356,517 | |
| | |
Zscaler, Inc.* | | | 1,603 | | | | 239,664 | |
| | | | | | | | |
| Total Software | | | | 60,248,440 | |
|
| Specialty Retail – 1.8% | |
| | |
AutoZone, Inc.* | | | 342 | | | | 734,999 | |
| | |
Best Buy Co., Inc. | | | 3,731 | | | | 243,224 | |
| | |
CarMax, Inc.* | | | 3,019 | | | | 273,159 | |
| | |
Home Depot, Inc. | | | 20,074 | | | | 5,505,696 | |
| | |
Lowe’s Cos., Inc. | | | 13,067 | | | | 2,282,413 | |
| | |
O’Reilly Automotive, Inc.* | | | 1,235 | | | | 780,223 | |
| | |
Ross Stores, Inc. | | | 5,694 | | | | 399,890 | |
| | |
TJX Cos., Inc. | | | 23,262 | | | | 1,299,183 | |
| | |
Tractor Supply Co. | | | 2,078 | | | | 402,820 | |
| | |
Ulta Beauty, Inc.* | | | 969 | | | | 373,530 | |
| | | | | | | | |
| Total Specialty Retail | | | | 12,295,137 | |
|
| Technology Hardware, Storage & Peripherals – 6.2% | |
| | |
Apple, Inc. | | | 302,951 | | | | 41,419,461 | |
| | |
Dell Technologies, Inc., Class C | | | 5,991 | | | | 276,844 | |
| | |
Hewlett Packard Enterprise Co. | | | 23,851 | | | | 316,264 | |
| | |
HP, Inc. | | | 19,102 | | | | 626,163 | |
| | |
NetApp, Inc. | | | 3,399 | | | | 221,751 | |
| | |
Western Digital Corp.* | | | 6,047 | | | | 271,087 | |
| | | | | | | | |
| Total Technology Hardware, Storage & Peripherals | | | | 43,131,570 | |
|
| Textiles, Apparel & Luxury Goods – 0.5% | |
| | |
lululemon athletica, Inc.* | | | 1,878 | | | | 511,962 | |
| | |
NIKE, Inc., Class B | | | 25,340 | | | | 2,589,748 | |
| | |
VF Corp. | | | 5,215 | | | | 230,346 | |
| | | | | | | | |
| Total Textiles, Apparel & Luxury Goods | | | | 3,332,056 | |
See Notes to Financial Statements.
Schedule of Investments (continued)
WisdomTree U.S. Efficient Core Fund (NTSX)
June 30, 2022
| | | | | | | | |
| Investments | | Shares | | | Value | |
|
| Tobacco – 0.6% | |
| | |
Altria Group, Inc. | | | 33,617 | | | $ | 1,404,182 | |
| | |
Philip Morris International, Inc. | | | 28,984 | | | | 2,861,880 | |
| | | | | | | | |
| Total Tobacco | | | | 4,266,062 | |
|
| Trading Companies & Distributors – 0.2% | |
| | |
Fastenal Co. | | | 10,608 | | | | 529,551 | |
| | |
United Rentals, Inc.* | | | 1,348 | | | | 327,443 | |
| | |
W.W. Grainger, Inc. | | | 913 | | | | 414,895 | |
| | | | | | | | |
| Total Trading Companies & Distributors | | | | 1,271,889 | |
|
| Water Utilities – 0.1% | |
| | |
American Water Works Co., Inc. | | | 3,649 | | | | 542,862 | |
|
| Wireless Telecommunication Services – 0.2% | |
| | |
T-Mobile US, Inc.* | | | 12,999 | | | | 1,748,885 | |
| Total United States | | | | 616,561,535 | |
| |
| TOTAL COMMON STOCKS | | | | | |
| (Cost: $672,074,071) | | | | 621,716,267 | |
|
| INVESTMENT OF CASH COLLATERAL FOR SECURITIES LOANED – 0.0% | |
|
| United States – 0.0% | |
| | |
State Street Navigator Securities Lending Government Money Market Portfolio, 1.56%(b) | | | | | | | | |
| (Cost: $184,192) | | | 184,192 | | | $ | 184,192 | |
| |
TOTAL INVESTMENTS IN SECURITIES – 89.4% (Cost: $672,258,263) | | | | 621,900,459 | |
| |
Other Assets less Liabilities – 10.6% | | | | 73,704,607 | |
| | | | | | | | |
| NET ASSETS – 100.0% | | | $ | 695,605,066 | |
| * | Non-income producing security. |
| † | Security is being fair valued using significant unobservable inputs by a pricing committee under the direction of the Board of Trustees. The aggregate value of fair valued securities is $0, which represents 0.0% of net assets. |
| (a) | Security, or portion thereof, was on loan at June 30, 2022 (See Note 2). At June 30, 2022, the total market value of the Fund’s securities on loan identified in the Schedule of Investments was $567,142 and the total market value of the collateral held by the Fund was $600,933. The total market value of the collateral includes non-cash U.S. Government and U.S. Government Agencies securities collateral having a value of $416,741. |
| (b) | Rate shown represents annualized 7-day yield as of June 30, 2022. |
| | | | | | | | | | | | | | | | |
| | | | |
| FINANCIAL DERIVATIVE INSTRUMENTS | | | | | | | | | | | | |
| | | | |
| FUTURES CONTRACTS (EXCHANGE-TRADED) | | | | | | | | | | | | |
| | | | |
| Long Exposure | | Contracts | | | Expiration
Date | | | Notional
Value | | | Unrealized
Depreciation | |
2 Year U.S. Treasury Note | | | 385 | | | | 9/30/22 | | | $ | 80,856,016 | | | $ | (468,279 | ) |
5 Year U.S. Treasury Note | | | 728 | | | | 9/30/22 | | | | 81,718,000 | | | | (771,472 | ) |
10 Year U.S. Treasury Note | | | 694 | | | | 9/21/22 | | | | 82,260,688 | | | | (1,084,971 | ) |
U.S. Treasury Long Bond | | | 598 | | | | 9/21/22 | | | | 82,897,750 | | | | (1,155,307 | ) |
Ultra 10 Year U.S. Treasury Note | | | 650 | | | | 9/21/22 | | | | 82,793,750 | | | | (1,279,280 | ) |
| | | | | | | | | | | $ | 410,526,204 | | | $ | (4,759,309 | ) |
The following is a summary of the fair valuations according to the inputs used as of June 30, 2022 in valuing the Fund’s investments (See Note 2 – Fair Value Measurement):
| | | | | | | | | | | | | | | | |
| | | | |
| | | Quoted Prices in Active Markets
(Level 1) | | | Other
Significant
Observable
Inputs
(Level 2) | | | Significant
Unobservable
Inputs
(Level 3) | | | Total | |
Assets: | | | | | | | | | |
Investments in Securities | | | | |
Common Stocks | | | | | | | | | | | | | | | | |
Interactive Media & Services | | $ | 32,331,602 | | | $ | — | | | $ | 0 | * | | $ | 32,331,602 | |
Other | | | 589,384,665 | | | | — | | | | — | | | | 589,384,665 | |
Investment of Cash Collateral for Securities Loaned | | | — | | | | 184,192 | | | | — | | | | 184,192 | |
Total Investments in Securities | | $ | 621,716,267 | | | $ | 184,192 | | | $ | 0 | | | $ | 621,900,459 | |
Liabilities: | | | | | | | | | | | | | | | | |
Financial Derivative Instruments | | | | | | | | | | | | | | | | |
Futures Contracts1 | | $ | (4,759,309 | ) | | $ | — | | | $ | — | | | $ | (4,759,309 | ) |
Total – Net | | $ | 616,956,958 | | | $ | 184,192 | | | $ | 0 | | | $ | 617,141,150 | |
| * | Securities are being fair valued using significant unobservable inputs by the Pricing Committee. |
| 1 | Amount shown represents the unrealized appreciation (depreciation) on the financial instrument. |
See Notes to Financial Statements.
Schedule of Investments (concluded)
WisdomTree U.S. Efficient Core Fund (NTSX)
June 30, 2022
| | | | |
The following is a reconciliation of assets in which significant unobservable inputs (Level 3) were used in determining fair value: | |
| | |
| | | Common Stocks | |
| | Russia | |
Balance as of June 30, 2021 | | $ | — | |
Realized gain (loss) | | | 9,787 | |
Change in unrealized appreciation (depreciation) | | | (489,799 | ) |
Purchases | | | 249,731 | |
Sales | | | (46,281 | ) |
Transfers into Level 3(1) | | | 276,562 | |
Transfers out of Level 3 | | | — | |
| Balance as of June 30, 2022 | | $ | 0 | |
Net change in unrealized appreciation (depreciation) from investments still held as of June 30, 2022 is: | | $ | (489,799 | ) |
| | (1) | Transferred into Level 3 because of a lack of observable market data, resulting from a decrease in market activity for the securities. |
Schedule of Investments
WisdomTree Artificial Intelligence and Innovation Fund (WTAI)
June 30, 2022
| | | | | | | | |
| Investments | | Shares | | | Value | |
|
| COMMON STOCKS – 99.8% | |
|
| Australia – 3.4% | |
|
| IT Services – 1.2% | |
| | |
Appen Ltd. | | | 2,376 | | | $ | 9,166 | |
|
| Software – 2.2% | |
| | |
BrainChip Holdings Ltd.* | | | 29,977 | | | | 16,491 | |
| Total Australia | | | | 25,657 | |
|
| Canada – 3.7% | |
|
| Machinery – 1.8% | |
| | |
ATS Automation Tooling Systems, Inc.* | | | 500 | | | | 13,702 | |
|
| Software – 1.9% | |
| | |
Kinaxis, Inc.* | | | 128 | | | | 13,789 | |
| Total Canada | | | | 27,491 | |
|
| China – 8.7% | |
|
| Auto Components – 1.5% | |
| | |
Nexteer Automotive Group Ltd. | | | 16,000 | | | | 11,500 | |
|
| Automobiles – 1.3% | |
| | |
NIO, Inc., ADR* | | | 455 | | | | 9,883 | |
|
| Interactive Media & Services – 3.0% | |
| | |
Baidu, Inc., ADR* | | | 89 | | | | 13,237 | |
| | |
Tencent Holdings Ltd. | | | 200 | | | | 9,033 | |
| | | | | | | | |
| Total Interactive Media & Services | | | | 22,270 | |
|
| Internet & Direct Marketing Retail – 1.3% | |
| | |
Alibaba Group Holding Ltd., ADR* | | | 86 | | | | 9,776 | |
|
| Semiconductors & Semiconductor Equipment – 1.6% | |
| | |
NXP Semiconductors NV | | | 78 | | | | 11,546 | |
| Total China | | | | 64,975 | |
|
| France – 1.9% | |
|
| Auto Components – 1.9% | |
| | |
Valeo | | | 742 | | | | 14,293 | |
|
| Israel – 1.7% | |
|
| Health Care Equipment & Supplies – 0.7% | |
| | |
Nano-X Imaging Ltd.* | | | 463 | | | | 5,232 | |
|
| Technology Hardware, Storage & Peripherals – 1.0% | |
| | |
Nano Dimension Ltd., ADR* | | | 2,469 | | | | 7,753 | |
| Total Israel | | | | 12,985 | |
|
| Italy – 0.4% | |
|
| Software – 0.4% | |
| | |
Kaleyra, Inc.* | | | 1,533 | | | | 3,127 | |
|
| Japan – 10.8% | |
|
| Auto Components – 2.1% | |
| | |
Denso Corp. | | | 300 | | | | 15,917 | |
| | | | | | | | |
|
| Electronic Equipment, Instruments & Components – 1.4% | |
| | |
Omron Corp. | | | 200 | | | | 10,145 | |
|
| Machinery – 2.1% | |
| | |
FANUC Corp. | | | 100 | | | | 15,634 | |
|
| Software – 4.2% | |
| | |
AI inside, Inc.* | | | 300 | | | | 8,192 | |
| | |
Appier Group, Inc.* | | | 1,400 | | | | 8,770 | |
| | |
PKSHA Technology, Inc.* | | | 1,100 | | | | 14,971 | |
| | | | | | | | |
| Total Software | | | | 31,933 | |
|
| Wireless Telecommunication Services – 1.0% | |
| | |
SoftBank Group Corp. | | | 200 | | | | 7,707 | |
| Total Japan | | | | 81,336 | |
|
| Netherlands – 1.3% | |
|
| Semiconductors & Semiconductor Equipment – 1.3% | |
| | |
ASML Holding NV, Registered shares | | | 20 | | | | 9,518 | |
|
| South Korea – 4.8% | |
|
| Semiconductors & Semiconductor Equipment – 1.9% | |
| | |
SK Hynix, Inc. | | | 201 | | | | 14,087 | |
|
| Software – 1.1% | |
| | |
Alchera, Inc.* | | | 789 | | | | 7,930 | |
|
| Technology Hardware, Storage & Peripherals – 1.8% | |
| | |
Samsung Electronics Co. Ltd. | | | 316 | | | | 13,873 | |
| Total South Korea | | | | 35,890 | |
|
| Sweden – 2.0% | |
|
| Electronic Equipment, Instruments & Components – 2.0% | |
| | |
Hexagon AB, Class B | | | 1,257 | | | | 13,033 | |
| | |
Smart Eye AB* | | | 349 | | | | 2,062 | |
| | | | | | | | |
| Total Electronic Equipment, Instruments & Components | | | | 15,095 | |
|
| Switzerland – 1.4% | |
|
| Semiconductors & Semiconductor Equipment – 1.4% | |
| | |
STMicroelectronics NV | | | 343 | | | | 10,758 | |
|
| Taiwan – 6.9% | |
|
| Semiconductors & Semiconductor Equipment – 6.9% | |
| | |
Alchip Technologies Ltd. | | | 500 | | | | 11,670 | |
| | |
Macronix International Co. Ltd. | | | 14,000 | | | | 16,715 | |
| | |
Nanya Technology Corp. | | | 7,000 | | | | 11,630 | |
| | |
Taiwan Semiconductor Manufacturing Co. Ltd., ADR | | | 148 | | | | 12,099 | |
| | | | | | | | |
| Total Semiconductors & Semiconductor Equipment | | | | 52,114 | |
|
| United Kingdom – 1.3% | |
|
| Software – 1.3% | |
| | |
Darktrace PLC* | | | 2,753 | | | | 9,850 | |
|
| United States – 51.5% | |
|
| Auto Components – 1.0% | |
| | |
Luminar Technologies, Inc.* | | | 1,218 | | | | 7,223 | |
|
| Automobiles – 1.6% | |
| | |
Tesla, Inc.* | | | 18 | | | | 12,122 | |
|
| Biotechnology – 0.9% | |
| | |
Recursion Pharmaceuticals, Inc., Class A* | | | 808 | | | | 6,577 | |
|
| Consumer Finance – 0.3% | |
| | |
Upstart Holdings, Inc.* | | | 84 | | | | 2,656 | |
|
| Electrical Equipment – 0.5% | |
| | |
Stem, Inc.* | | | 540 | | | | 3,866 | |
|
| Electronic Equipment, Instruments & Components – 1.4% | |
| | |
Cognex Corp. | | | 257 | | | | 10,928 | |
See Notes to Financial Statements.
Schedule of Investments (continued)
WisdomTree Artificial Intelligence and Innovation Fund (WTAI)
June 30, 2022
| | | | | | | | |
| Investments | | Shares | | | Value | |
|
| Insurance – 0.5% | |
| | |
Lemonade, Inc.* | | | 197 | | | $ | 3,597 | |
|
| Interactive Media & Services – 1.4% | |
| | |
Alphabet, Inc., Class A* | | | 5 | | | | 10,896 | |
|
| Internet & Direct Marketing Retail – 1.1% | |
| | |
Amazon.com, Inc.* | | | 80 | | | | 8,497 | |
|
| IT Services – 3.0% | |
| | |
Grid Dynamics Holdings, Inc.* | | | 625 | | | | 10,512 | |
| | |
Snowflake, Inc., Class A* | | | 47 | | | | 6,536 | |
| | |
Twilio, Inc., Class A* | | | 65 | | | | 5,448 | |
| | | | | | | | |
| Total IT Services | | | | 22,496 | |
|
| Life Sciences Tools & Services – 1.0% | |
| | |
Illumina, Inc.* | | | 39 | | | | 7,190 | |
|
| Machinery – 1.5% | |
| | |
Deere & Co. | | | 38 | | | | 11,380 | |
|
| Semiconductors & Semiconductor Equipment – 16.4% | |
| | |
Advanced Micro Devices, Inc.* | | | 126 | | | | 9,635 | |
| | |
Analog Devices, Inc. | | | 98 | | | | 14,317 | |
| | |
Ceva, Inc.* | | | 269 | | | | 9,028 | |
| | |
GLOBALFOUNDRIES, Inc.* | | | 234 | | | | 9,439 | |
| | |
Lattice Semiconductor Corp.* | | | 212 | | | | 10,282 | |
| | |
Marvell Technology, Inc. | | | 248 | | | | 10,795 | |
| | |
NVIDIA Corp. | | | 62 | | | | 9,399 | |
| | |
ON Semiconductor Corp.* | | | 289 | | | | 14,540 | |
| | |
QUALCOMM, Inc. | | | 117 | | | | 14,946 | |
| | |
Teradyne, Inc. | | | 122 | | | | 10,925 | |
| | |
Wolfspeed, Inc.* | | | 158 | | | | 10,025 | |
| | | | | | | | |
| Total Semiconductors & Semiconductor Equipment | | | | 123,331 | |
|
| Software – 19.1% | |
| | |
ANSYS, Inc.* | | | 31 | | | | 7,418 | |
| | |
Appian Corp.* | | | 155 | | | | 7,341 | |
| | |
Autodesk, Inc.* | | | 43 | | | | 7,394 | |
| | |
C3.ai, Inc., Class A* | | | 382 | | | | 6,975 | |
| | |
Cadence Design Systems, Inc.* | | | 102 | | | | 15,303 | |
| | |
Cerence, Inc.* | | | 178 | | | | 4,491 | |
| | |
Crowdstrike Holdings, Inc., Class A* | | | 79 | | | | 13,316 | |
| | |
CS Disco, Inc.* | | | 285 | | | | 5,141 | |
| | |
Dynatrace, Inc.* | | | 259 | | | | 10,215 | |
| | |
Microsoft Corp. | | | 41 | | | | 10,530 | |
| | |
Pegasystems, Inc. | | | 207 | | | | 9,903 | |
| | |
PROS Holdings, Inc.* | | | 716 | | | | 18,781 | |
| | |
Synopsys, Inc.* | | | 53 | | | | 16,096 | |
| | |
UiPath, Inc., Class A* | | | 334 | | | | 6,076 | |
| | |
Veritone, Inc.* | | | 678 | | | | 4,427 | |
| | | | | | | | |
| Total Software | | | | 143,407 | |
|
| Technology Hardware, Storage & Peripherals – 1.8% | |
| | |
Apple, Inc. | | | 98 | | | | 13,398 | |
| Total United States | | | | 387,564 | |
| |
TOTAL INVESTMENTS IN SECURITIES – 99.8% (Cost: $1,175,982) | | | | 750,653 | |
| |
Other Assets less Liabilities – 0.2% | | | | 1,370 | |
| | | | | | | | |
| NET ASSETS – 100.0% | | | $ | 752,023 | |
| * | Non-income producing security. |
| | | | | | | | | | | | | | | | | | | | | | | | | | | | |
|
| FINANCIAL DERIVATIVE INSTRUMENTS | |
|
| FOREIGN CURRENCY CONTRACTS (OTC - OVER THE COUNTER) | |
| | | | | |
| Counterparty | | Settlement
Date | | | Amount and
Description of
Currency to
be Purchased | | | Amount and
Description of
Currency to
be Sold | | | Unrealized
Appreciation | | | Unrealized
Depreciation | |
Bank of America NA | | | 7/1/2022 | | | | 500 | | | | EUR | | | | 522 | | | | USD | | | $ | 1 | | | $ | — | |
Morgan Stanley & Co. International | | | 7/1/2022 | | | | 267 | | | | EUR | | | | 38,000 | | | | JPY | | | | — | | | | (1 | ) |
UBS AG | | | 7/5/2022 | | | | 147 | | | | USD | | | | 20,000 | | | | JPY | | | | 0 | ^ | | | — | |
| | | | | | | | | | | | | | | | | | | | | | | $ | 1 | | | $ | (1 | ) |
| ^ | Amount represents less than $1. |
See Notes to Financial Statements.
Schedule of Investments (concluded)
WisdomTree Artificial Intelligence and Innovation Fund (WTAI)
June 30, 2022
The following is a summary of the fair valuations according to the inputs used as of June 30, 2022 in valuing the Fund’s investments (See Note 2 - Fair Value Measurement):
| | | | | | | | | | | | | | | | |
| | | | |
| | | Quoted
Prices in Active Markets
(Level 1) | | | Other
Significant
Observable
Inputs
(Level 2) | | | Significant
Unobservable
Inputs
(Level 3) | | | Total | |
Assets: | | | | | | | | | |
Investments in Securities | | | | |
Common Stocks | | $ | 750,653 | | | $ | — | | | $ | — | | | $ | 750,653 | |
Total Investments in Securities | | $ | 750,653 | | | $ | — | | | $ | — | | | $ | 750,653 | |
Financial Derivative Instruments | | | | |
Foreign Currency Contracts1 | | $ | — | | | $ | 1 | | | $ | — | | | $ | 1 | |
| |
Liabilities: | | | | |
Financial Derivative Instruments | | | | |
Foreign Currency Contracts1 | | $ | — | | | $ | (1 | ) | | $ | — | | | $ | (1 | ) |
Total – Net | | $ | 750,653 | | | $ | 0 | | | $ | — | | | $ | 750,653 | |
| 1 | Amount shown represents the unrealized appreciation (depreciation) on the financial instrument. |
See Notes to Financial Statements.
Schedule of Investments
WisdomTree Battery Value Chain and Innovation Fund (WBAT)
June 30, 2022
| | | | | | | | |
| Investments | | Shares | | | Value | |
|
| COMMON STOCKS – 99.6% | |
| | |
| Australia – 4.5% | | | | | | | | |
| | |
| Metals & Mining – 4.5% | | | | | | | | |
| | |
Allkem Ltd.* | | | 5,281 | | | $ | 37,441 | |
| | |
IGO Ltd. | | | 1,054 | | | | 7,204 | |
| | |
Mincor Resources NL* | | | 8,056 | | | | 9,251 | |
| | |
Mineral Resources Ltd. | | | 108 | | | | 3,585 | |
| | |
South32 Ltd. | | | 1,084 | | | | 2,937 | |
| | |
Syrah Resources Ltd.* | | | 20,219 | | | | 17,171 | |
| | | | | | | | |
| Total Metals & Mining | | | | 77,589 | |
| | |
| Belgium – 2.9% | | | | | | | | |
| | |
| Chemicals – 2.9% | | | | | | | | |
| | |
Umicore SA | | | 1,461 | | | | 50,893 | |
| | |
| Brazil – 0.2% | | | | | | | | |
| | |
| Metals & Mining – 0.2% | | | | | | | | |
| | |
Vale SA | | | 233 | | | | 3,411 | |
| | |
| Canada – 0.2% | | | | | | | | |
| | |
| Metals & Mining – 0.2% | | | | | | | | |
| | |
Lundin Mining Corp. | | | 479 | | | | 3,030 | |
| | |
| Chile – 2.0% | | | | | | | | |
| | |
| Chemicals – 2.0% | | | | | | | | |
| | |
Sociedad Quimica y Minera de Chile SA, ADR | | | 418 | | | | 34,916 | |
| | |
| China – 31.4% | | | | | | | | |
| | |
| Chemicals – 10.6% | | | | | | | | |
| | |
Do-Fluoride New Materials Co. Ltd., Class A | | | 2,100 | | | | 15,320 | |
| | |
Guangzhou Tinci Materials Technology Co. Ltd., Class A | | | 1,900 | | | | 17,588 | |
| | |
Ningbo Shanshan Co. Ltd., Class A | | | 3,600 | | | | 15,959 | |
| | |
Shandong Shida Shenghua Chemical Group Co. Ltd., Class A | | | 300 | | | | 6,504 | |
| | |
Shanghai Putailai New Energy Technology Co. Ltd., Class A | | | 2,200 | | | | 27,696 | |
| | |
Shenzhen Capchem Technology Co. Ltd., Class A | | | 2,640 | | | | 20,697 | |
| | |
Shenzhen Dynanonic Co. Ltd., Class A | | | 300 | | | | 18,288 | |
| | |
Sichuan Yahua Industrial Group Co. Ltd., Class A | | | 6,600 | | | | 32,143 | |
| | |
Yunnan Energy New Material Co. Ltd., Class A | | | 800 | | | | 29,886 | |
| | | | | | | | |
| Total Chemicals | | | | 184,081 | |
| | |
| Construction & Engineering – 0.6% | | | | | | | | |
| | |
China Energy Engineering Corp. Ltd., Class H | | | 74,000 | | | | 10,279 | |
| | |
| Electrical Equipment – 14.7% | | | | | | | | |
| | |
Beijing Easpring Material Technology Co. Ltd., Class A | | | 800 | | | | 10,780 | |
| | |
Camel Group Co. Ltd., Class A* | | | 33,200 | | | | 55,117 | |
| | |
Contemporary Amperex Technology Co. Ltd., Class A | | | 700 | | | | 55,756 | |
| | |
East Group Co. Ltd., Class A* | | | 15,600 | | | | 18,895 | |
| | |
Jiangxi Special Electric Motor Co. Ltd., Class A* | | | 5,700 | | | | 21,289 | |
| | |
NARI Technology Co. Ltd., Class A | | | 12,720 | | | | 51,228 | |
| | |
Ningbo Ronbay New Energy Technology Co. Ltd., Class A | | | 2,220 | | | | 42,862 | |
| | | | | | | | |
| Total Electrical Equipment | | | | 255,927 | |
| | |
| Energy Equipment & Services – 0.3% | | | | | | | | |
| | |
Cangzhou Mingzhu Plastic Co. Ltd., Class A | | | 5,500 | | | | 5,103 | |
| | |
| Metals & Mining – 4.5% | | | | | | | | |
| | |
China Nonferrous Mining Corp. Ltd. | | | 16,000 | | | | 7,381 | |
| | |
Ganfeng Lithium Co. Ltd., Class A | | | 2,500 | | | | 55,450 | |
| | |
Jinchuan Group International Resources Co. Ltd. | | | 32,000 | | | | 4,200 | |
| | |
Nanjing Hanrui Cobalt Co. Ltd., Class A | | | 600 | | | | 5,184 | |
| | |
Xiamen Tungsten Co. Ltd., Class A | | | 2,000 | | | | 6,450 | |
| | | | | | | | |
| Total Metals & Mining | | | | 78,665 | |
| | |
| Pharmaceuticals – 0.4% | | | | | | | | |
| | |
Zhejiang NHU Co. Ltd., Class A | | | 2,280 | | | | 7,757 | |
| | |
| Semiconductors & Semiconductor Equipment – 0.3% | | | | | | | | |
| | |
NXP Semiconductors NV | | | 30 | | | | 4,441 | |
| Total China | | | | 546,253 | |
| | |
| Finland – 1.1% | | | | | | | | |
| | |
| Machinery – 1.1% | | | | | | | | |
| | |
Wartsila Oyj Abp | | | 2,535 | | | | 19,691 | |
| | |
| France – 3.6% | | | | | | | | |
| | |
| Aerospace & Defense – 0.9% | | | | | | | | |
| | |
Airbus SE* | | | 161 | | | | 15,561 | |
| | |
| Automobiles – 0.5% | | | | | | | | |
| | |
Renault SA* | | | 359 | | | | 8,929 | |
| | |
| Electric Utilities – 0.8% | | | | | | | | |
| | |
Electricite de France SA | | | 1,702 | | | | 13,890 | |
| | |
| Metals & Mining – 0.4% | | | | | | | | |
| | |
Eramet SA | | | 55 | | | | 5,701 | |
| | |
| Multi-Utilities – 1.0% | | | | | | | | |
| | |
Engie SA | | | 1,549 | | | | 17,758 | |
| Total France | | | | 61,839 | |
| | |
| Germany – 8.4% | | | | | | | | |
| | |
| Automobiles – 1.7% | | | | | | | | |
| | |
Bayerische Motoren Werke AG | | | 332 | | | | 25,497 | |
| | |
Mercedes-Benz Group AG, Registered Shares | | | 74 | | | | 4,272 | |
| Total Automobiles | | | | 29,769 | |
|
| Chemicals – 2.9% | |
| | |
BASF SE | | | 1,176 | | | | 51,053 | |
|
| Electrical Equipment – 1.5% | |
| | |
SFC Energy AG* | | | 523 | | | | 13,095 | |
| | |
SGL Carbon SE* | | | 2,002 | | | | 12,527 | |
| | | | | | | | |
| Total Electrical Equipment | | | | 25,622 | |
|
| Industrial Conglomerates – 0.9% | |
| | |
Siemens AG, Registered Shares | | | 147 | | | | 14,921 | |
|
| Multi-Utilities – 1.2% | |
| | |
E.ON SE | | | 2,515 | | | | 21,055 | |
|
| Semiconductors & Semiconductor Equipment – 0.2% | |
| | |
Infineon Technologies AG | | | 135 | | | | 3,259 | |
| Total Germany | | | | 145,679 | |
|
| Indonesia – 3.5% | |
|
| Metals & Mining – 3.5% | |
| | |
Aneka Tambang Tbk | | | 42,100 | | | | 5,087 | |
| | |
Nickel Industries Ltd. | | | 9,621 | | | | 6,450 | |
See Notes to Financial Statements.
Schedule of Investments (continued)
WisdomTree Battery Value Chain and Innovation Fund (WBAT)
June 30, 2022
| | | | | | | | |
| Investments | | Shares | | | Value | |
| | |
Vale Indonesia Tbk PT* | | | 128,000 | | | $ | 48,545 | |
| | | | | | | | |
| Total Metals & Mining | | | | 60,082 | |
|
| Japan – 16.7% | |
|
| Auto Components – 0.3% | |
| | |
Denso Corp. | | | 100 | | | | 5,306 | |
|
| Automobiles – 1.8% | |
| | |
Honda Motor Co. Ltd., ADR | | | 205 | | | | 4,951 | |
| | |
Nissan Motor Co. Ltd. | | | 5,200 | | | | 20,217 | |
| | |
Toyota Motor Corp. | | | 400 | | | | 6,183 | |
| | | | | | | | |
| Total Automobiles | | | | 31,351 | |
|
| Building Products – 0.5% | |
| | |
Central Glass Co. Ltd. | | | 400 | | | | 9,083 | |
|
| Chemicals – 3.6% | |
| | |
Asahi Kasei Corp. | | | 1,500 | | | | 11,439 | |
| | |
Showa Denko KK | | | 400 | | | | 6,789 | |
| | |
Tanaka Chemical Corp.* | | | 800 | | | | 6,548 | |
| | |
W-Scope Corp.* | | | 2,300 | | | | 38,448 | |
| | | | | | | | |
| Total Chemicals | | | | 63,224 | |
|
| Electrical Equipment – 1.9% | |
| | |
Fujikura Ltd. | | | 1,000 | | | | 5,661 | |
| | |
GS Yuasa Corp. | | | 1,200 | | | | 18,752 | |
| | |
Nippon Carbon Co. Ltd. | | | 300 | | | | 8,811 | |
| | | | | | | | |
| Total Electrical Equipment | | | | 33,224 | |
|
| Electronic Equipment, Instruments & Components – 3.7% | |
| | |
Iriso Electronics Co. Ltd. | | | 200 | | | | 4,733 | |
| | |
TDK Corp. | | | 1,900 | | | | 58,599 | |
| | | | | | | | |
| Total Electronic Equipment, Instruments & Components | | | | 63,332 | |
|
| Household Durables – 0.2% | |
| | |
Panasonic Holdings Corp. | | | 500 | | | | 4,036 | |
|
| Industrial Conglomerates – 0.5% | |
| | |
Toshiba Corp. | | | 200 | | | | 8,119 | |
|
| Machinery – 0.6% | |
| | |
Mitsubishi Heavy Industries Ltd. | | | 300 | | | | 10,478 | |
|
| Metals & Mining – 1.6% | |
| | |
Nippon Denko Co. Ltd. | | | 9,700 | | | | 24,776 | |
| | |
Sumitomo Metal Mining Co. Ltd. | | | 100 | | | | 3,128 | |
| | | | | | | | |
| Total Metals & Mining | | | | 27,904 | |
|
| Oil, Gas & Consumable Fuels – 2.0% | |
| | |
Iwatani Corp. | | | 900 | | | | 34,647 | |
| Total Japan | | | | 290,704 | |
|
| Netherlands – 2.8% | |
|
| Electrical Equipment – 2.8% | |
| | |
Alfen Beheer BV*(a) | | | 528 | | | | 48,664 | |
|
| Russia – 0.0% | |
|
| Metals & Mining – 0.0% | |
| | |
MMC Norilsk Nickel PJSC, ADR† | | | 342 | | | | 0 | |
|
| South Africa – 0.2% | |
|
| Metals & Mining – 0.2% | |
| | |
African Rainbow Minerals Ltd. | | | 213 | | | | 2,779 | |
|
| South Korea – 5.0% | |
|
| Automobiles – 0.3% | |
| | |
Hyundai Motor Co. | | | 33 | | | | 4,587 | |
|
| Chemicals – 2.0% | |
| | |
LG Chem Ltd. | | | 54 | | | | 21,460 | |
| | |
Soulbrain Co. Ltd. | | | 72 | | | | 12,677 | |
| | | | | | | | |
| Total Chemicals | | | | 34,137 | |
|
| Electrical Equipment – 1.6% | |
| | |
Ecopro BM Co. Ltd. | | | 136 | | | | 11,889 | |
| | |
Hyundai Electric & Energy System Co. Ltd.* | | | 216 | | | | 4,217 | |
| | |
LS Electric Co. Ltd. | | | 260 | | | | 11,534 | |
| | | | | | | | |
| Total Electrical Equipment | | | | 27,640 | |
|
| Electronic Equipment, Instruments & Components – 1.1% | |
| | |
Samsung SDI Co. Ltd. | | | 49 | | | | 20,077 | |
| Total South Korea | | | | 86,441 | |
|
| Sweden – 0.4% | |
|
| Machinery – 0.2% | |
| | |
Volvo AB, Class B | | | 283 | | | | 4,374 | |
|
| Metals & Mining – 0.2% | |
| | |
Boliden AB* | | | 104 | | | | 3,302 | |
| Total Sweden | | | | | | | 7,676 | |
|
| Taiwan – 1.5% | |
|
| Electronic Equipment, Instruments & Components – 1.5% | |
| | |
Simplo Technology Co. Ltd.* | | | 3,000 | | | | 25,678 | |
|
| United Kingdom – 1.6% | |
|
| Aerospace & Defense – 1.0% | |
| | |
Rolls-Royce Holdings PLC* | | | 17,398 | | | | 17,527 | |
|
| Chemicals – 0.6% | |
| | |
Johnson Matthey PLC | | | 443 | | | | 10,359 | |
| Total United Kingdom | | | | | | | 27,886 | |
|
| United States – 13.6% | |
|
| Aerospace & Defense – 1.5% | |
| | |
Boeing Co.* | | | 71 | | | | 9,707 | |
| | |
Lockheed Martin Corp. | | | 40 | | | | 17,198 | |
| | | | | | | | |
| Total Aerospace & Defense | | | | | | | 26,905 | |
|
| Auto Components – 2.4% | |
| | |
Solid Power, Inc.* | | | 7,771 | | | | 41,808 | |
|
| Automobiles – 1.5% | |
| | |
General Motors Co.* | | | 225 | | | | 7,146 | |
| | |
Tesla, Inc.* | | | 28 | | | | 18,856 | |
| | | | | | | | |
| Total Automobiles | | | | | | | 26,002 | |
|
| Construction & Engineering – 0.5% | |
| | |
Primoris Services Corp. | | | 441 | | | | 9,596 | |
|
| Electrical Equipment – 4.2% | |
| | |
EnerSys | | | 698 | | | | 41,154 | |
| | |
GrafTech International Ltd. | | | 692 | | | | 4,893 | |
See Notes to Financial Statements.
Schedule of Investments (concluded)
WisdomTree Battery Value Chain and Innovation Fund (WBAT)
June 30, 2022
| | | | | | | | |
| Investments | | Shares | | | Value | |
| | |
SES AI Corp.* | | | 6,640 | | | $ | 26,095 | |
| | | | | | | | |
| Total Electrical Equipment | | | | | | | 72,142 | |
|
| Electronic Equipment, Instruments & Components – 0.6% | |
| | |
Amphenol Corp., Class A | | | 77 | | | | 4,957 | |
| | |
Belden, Inc. | | | 98 | | | | 5,221 | |
| | | | | | | | |
| Total Electronic Equipment, Instruments & Components | | | | | | | 10,178 | |
|
| Independent Power & Renewable Electricity Producers – 0.6% | |
| | |
AES Corp. | | | 493 | | | | 10,358 | |
|
| Industrial Conglomerates – 0.4% | |
| | |
General Electric Co. | | | 114 | | | | 7,258 | |
|
| Machinery – 1.0% | |
| | |
Caterpillar, Inc. | | | 74 | | | | 13,228 | |
| | |
ITT, Inc. | | | 52 | | | | 3,497 | |
| | | | | | | | |
| Total Machinery | | | | | | | 16,725 | |
|
| Metals & Mining – 0.2% | |
| | |
Steel Dynamics, Inc. | | | 60 | | | | 3,969 | |
|
| Semiconductors & Semiconductor Equipment – 0.7% | |
| | |
QUALCOMM, Inc. | | | 59 | | | | 7,537 | |
| | |
Texas Instruments, Inc. | | | 30 | | | | 4,609 | |
| | | | | | | | |
| Total Semiconductors & Semiconductor Equipment | | | | | | | 12,146 | |
| Total United States | | | | | | | 237,087 | |
| |
TOTAL INVESTMENTS IN SECURITIES – 99.6% (Cost: $1,886,223) | | | | 1,730,298 | |
| |
Other Assets less Liabilities – 0.4% | | | | 6,838 | |
| | | | | | | | |
| NET ASSETS – 100.0% | | | $ | 1,737,136 | |
| * | Non-income producing security. |
| † | Security is being fair valued using significant unobservable inputs by a pricing committee under the direction of the Board of Trustees. The aggregate value of fair valued securities is $0, which represents 0.0% of net assets. |
| (a) | This security is exempt from registration under rule 144A of the Securities Act of 1933. This security may be sold in transactions that are exempt from registration, normally to qualified institutional buyers. |
| | | | | | | | | | | | | | | | | | | | | | | | | | | | |
|
| FINANCIAL DERIVATIVE INSTRUMENTS | |
|
| FOREIGN CURRENCY CONTRACTS (OTC – OVER THE COUNTER) | |
| | | | | |
| Counterparty | | Settlement
Date | | | Amount and
Description of
Currency to
be Purchased | | | Amount and
Description of
Currency to
be Sold | | | Unrealized
Appreciation | | | Unrealized
Depreciation | |
Deutsche Bank AG | | | 7/5/2022 | | | | 885 | | | | USD | | | | 120,000 | | | | JPY | | | $ | 2 | | | $ | — | |
Goldman Sachs | | | 7/5/2022 | | | | 553 | | | | USD | | | | 800 | | | | AUD | | | | 3 | | | | — | |
State Street Bank and Trust | | | 7/1/2022 | | | | 269,000 | | | | TWD | | | | 9,050 | | | | USD | | | | — | | | | (3 | ) |
| | | | | | | | | | | | | | | | | | | | | | | $ | 5 | | | $ | (3 | ) |
The following is a summary of the fair valuations according to the inputs used as of June 30, 2022 in valuing the Fund’s investments (See Note 2 – Fair Value Measurement):
| | | | | | | | | | | | | | | | |
| | | | |
| | | Quoted
Prices in
Active
Markets
(Level 1) | | | Other
Significant
Observable
Inputs
(Level 2) | | | Significant
Unobservable
Inputs
(Level 3) | | | Total | |
Assets: | | | | | | | | | | | | |
Investments in Securities | | | | | | | | | | | | | | | | |
Common Stocks | | | | | | | | | | | | | | | | |
Metals & Mining | | $ | 266,432 | | | $ | — | | | $ | 0 | * | | $ | 266,432 | |
Other | | | 1,463,866 | | | | — | | | | — | | | | 1,463,866 | |
Total Investments in Securities | | $ | 1,730,298 | | | $ | — | | | $ | 0 | | | $ | 1,730,298 | |
Financial Derivative Instruments | | | | | | | | | | | | | | | | |
Foreign Currency Contracts1 | | $ | — | | | $ | 5 | | | $ | — | | | $ | 5 | |
Liabilities: | | | | | | | | | | | | |
Financial Derivative Instruments | | | | | | | | | | | | | | | | |
Foreign Currency Contracts1 | | $ | — | | | $ | (3 | ) | | $ | — | | | $ | (3 | ) |
Total – Net | | $ | 1,730,298 | | | $ | 2 | | | $ | 0 | | | $ | 1,730,300 | |
| * | Securities are being fair valued using significant unobservable inputs by the Pricing Committee. |
| 1 | Amount shown represents the unrealized appreciation (depreciation) on the financial instrument. |
See Notes to Financial Statements.
Schedule of Investments
WisdomTree BioRevolution Fund (WDNA)
June 30, 2022
| | | | | | | | |
| Investments | | Shares | | | Value | |
|
| COMMON STOCKS – 99.9% | |
|
| Canada – 0.7% | |
|
| Chemicals – 0.7% | |
| | |
Nutrien Ltd. | | | 416 | | | $ | 33,151 | |
|
| Denmark – 3.6% | |
|
| Biotechnology – 1.1% | |
| | |
Genmab A/S, ADR* | | | 1,600 | | | | 51,984 | |
|
| Chemicals – 2.5% | |
| | |
Chr Hansen Holding A/S | | | 649 | | | | 47,133 | |
| | |
Novozymes A/S, Class B | | | 1,181 | | | | 70,727 | |
| | | | | | | | |
| Total Chemicals | | | | 117,860 | |
| Total Denmark | | | | 169,844 | |
|
| Germany – 4.6% | |
|
| Biotechnology – 1.3% | |
| | |
BioNTech SE, ADR | | | 368 | | | | 54,869 | |
| | |
CureVac NV* | | | 615 | | | | 8,370 | |
| | | | | | | | |
| Total Biotechnology | | | | 63,239 | |
|
| Life Sciences Tools & Services – 0.8% | |
| | |
Evotec SE* | | | 1,517 | | | | 36,477 | |
|
| Oil, Gas & Consumable Fuels – 1.3% | |
| | |
VERBIO Vereinigte BioEnergie AG | | | 1,224 | | | | 61,422 | |
|
| Pharmaceuticals – 1.2% | |
| | |
Bayer AG, Registered Shares | | | 929 | | | | 55,088 | |
| Total Germany | | | | 216,226 | |
|
| Japan – 2.5% | |
|
| Biotechnology – 1.0% | |
| | |
Takara Bio, Inc. | | | 3,500 | | | | 49,567 | |
|
| Pharmaceuticals – 1.5% | |
| | |
Takeda Pharmaceutical Co. Ltd. | | | 2,500 | | | | 70,259 | |
| Total Japan | | | | 119,826 | |
|
| Netherlands – 2.2% | |
|
| Biotechnology – 0.5% | |
| | |
uniQure NV* | | | 1,346 | | | | 25,090 | |
|
| Life Sciences Tools & Services – 1.7% | |
| | |
QIAGEN NV* | | | 1,655 | | | | 78,116 | |
| Total Netherlands | | | | 103,206 | |
|
| Norway – 0.4% | |
|
| Chemicals – 0.4% | |
| | |
Borregaard ASA | | | 1,138 | | | | 18,453 | |
|
| Sweden – 1.0% | |
|
| Biotechnology – 0.8% | |
| | |
Vitrolife AB | | | 1,626 | | | | 37,320 | |
|
| Life Sciences Tools & Services – 0.2% | |
| | |
BICO Group AB, Class B* | | | 926 | | | | 8,017 | |
| Total Sweden | | | | 45,337 | |
|
| Switzerland – 1.7% | |
|
| Biotechnology – 0.5% | |
| | |
CRISPR Therapeutics AG* | | | 373 | | | | 22,667 | |
|
| Pharmaceuticals – 1.2% | |
| | |
Novartis AG, Registered Shares | | | 677 | | | | 57,174 | |
| Total Switzerland | | | | 79,841 | |
|
| United Kingdom – 6.0% | |
|
| Biotechnology – 0.7% | |
| | |
Genus PLC | | | 1,114 | | | | 33,931 | |
|
| Life Sciences Tools & Services – 0.3% | |
| | |
Oxford Nanopore Technologies PLC* | | | 3,728 | | | | 12,518 | |
|
| Pharmaceuticals – 5.0% | |
| | |
AstraZeneca PLC, ADR | | | 2,143 | | | | 141,588 | |
| | |
GSK PLC | | | 4,262 | | | | 91,387 | |
| | | | | | | | |
| Total Pharmaceuticals | | | | 232,975 | |
| Total United Kingdom | | | | 279,424 | |
|
| United States – 77.2% | |
|
| Biotechnology – 36.6% | |
| | |
2seventy bio, Inc.* | | | 583 | | | | 7,696 | |
| | |
Agenus, Inc.* | | | 17,795 | | | | 34,522 | |
| | |
Agios Pharmaceuticals, Inc.* | | | 1,212 | | | | 26,870 | |
| | |
Allogene Therapeutics, Inc.* | | | 3,906 | | | | 44,528 | |
| | |
Alnylam Pharmaceuticals, Inc.* | | | 394 | | | | 57,465 | |
| | |
Amgen, Inc. | | | 339 | | | | 82,479 | |
| | |
Amicus Therapeutics, Inc.* | | | 5,133 | | | | 55,128 | |
| | |
Arcturus Therapeutics Holdings, Inc.* | | | 1,387 | | | | 21,831 | |
| | |
Arrowhead Pharmaceuticals, Inc.* | | | 593 | | | | 20,880 | |
| | |
Beam Therapeutics, Inc.* | | | 606 | | | | 23,458 | |
| | |
Biogen, Inc.* | | | 291 | | | | 59,347 | |
| | |
BioMarin Pharmaceutical, Inc.* | | | 747 | | | | 61,904 | |
| | |
Blueprint Medicines Corp.* | | | 763 | | | | 38,539 | |
| | |
Bridgebio Pharma, Inc.* | | | 1,098 | | | | 9,970 | |
| | |
Editas Medicine, Inc.* | | | 1,134 | | | | 13,415 | |
| | |
Exact Sciences Corp.* | | | 433 | | | | 17,056 | |
| | |
Fate Therapeutics, Inc.* | | | 475 | | | | 11,770 | |
| | |
Generation Bio Co.* | | | 1,590 | | | | 10,430 | |
| | |
Geron Corp.* | | | 23,523 | | | | 36,461 | |
| | |
Gilead Sciences, Inc. | | | 1,256 | | | | 77,633 | |
| | |
Gossamer Bio, Inc.* | | | 6,857 | | | | 57,393 | |
| | |
Inovio Pharmaceuticals, Inc.* | | | 9,524 | | | | 16,477 | |
| | |
Intellia Therapeutics, Inc.* | | | 311 | | | | 16,097 | |
| | |
Ionis Pharmaceuticals, Inc.* | | | 1,002 | | | | 37,094 | |
| | |
Iovance Biotherapeutics, Inc.* | | | 1,386 | | | | 15,301 | |
| | |
MacroGenics, Inc.* | | | 1,408 | | | | 4,154 | |
| | |
Mirati Therapeutics, Inc.* | | | 237 | | | | 15,910 | |
| | |
Moderna, Inc.* | | | 284 | | | | 40,569 | |
| | |
Myriad Genetics, Inc.* | | | 2,133 | | | | 38,757 | |
| | |
Natera, Inc.* | | | 579 | | | | 20,520 | |
| | |
Novavax, Inc.* | | | 241 | | | | 12,395 | |
| | |
Precigen, Inc.* | | | 7,643 | | | | 10,242 | |
| | |
Regeneron Pharmaceuticals, Inc.* | | | 134 | | | | 79,211 | |
| | |
REGENXBIO, Inc.* | | | 2,330 | | | | 57,551 | |
| | |
Rocket Pharmaceuticals, Inc.* | | | 853 | | | | 11,737 | |
| | |
Sana Biotechnology, Inc.* | | | 4,262 | | | | 27,405 | |
| | |
Sangamo Therapeutics, Inc.* | | | 5,604 | | | | 23,201 | |
| | |
Sarepta Therapeutics, Inc.* | | | 799 | | | | 59,893 | |
| | |
Seagen, Inc.* | | | 440 | | | | 77,854 | |
| | |
Sorrento Therapeutics, Inc.* | | | 5,406 | | | | 10,866 | |
| | |
Stoke Therapeutics, Inc.* | | | 2,181 | | | | 28,811 | |
See Notes to Financial Statements.
Schedule of Investments (concluded)
WisdomTree BioRevolution Fund (WDNA)
June 30, 2022
| | | | | | | | |
| Investments | | Shares | | | Value | |
| | |
Turning Point Therapeutics, Inc.* | | | 673 | | | $ | 50,643 | |
| | |
Twist Bioscience Corp.* | | | 355 | | | | 12,411 | |
| | |
Ultragenyx Pharmaceutical, Inc.* | | | 562 | | | | 33,529 | |
| | |
United Therapeutics Corp.* | | | 84 | | | | 19,794 | |
| | |
Vaxart, Inc.* | | | 5,344 | | | | 18,704 | |
| | |
VBI Vaccines, Inc.* | | | 12,803 | | | | 10,351 | |
| | |
Veracyte, Inc.* | | | 1,913 | | | | 38,069 | |
| | |
Vericel Corp.* | | | 914 | | | | 23,014 | |
| | |
Vertex Pharmaceuticals, Inc.* | | | 380 | | | | 107,080 | |
| | |
Verve Therapeutics, Inc.* | | | 1,762 | | | | 26,923 | |
| | | | | | | | |
| Total Biotechnology | | | | 1,713,338 | |
|
| Chemicals – 5.8% | |
| | |
Amyris, Inc.* | | | 4,277 | | | | 7,913 | |
| | |
Corteva, Inc. | | | 1,544 | | | | 83,592 | |
| | |
Dow, Inc. | | | 1,199 | | | | 61,880 | |
| | |
DuPont de Nemours, Inc. | | | 719 | | | | 39,962 | |
| | |
FMC Corp. | | | 691 | | | | 73,944 | |
| | |
Ginkgo Bioworks Holdings, Inc.* | | | 2,656 | | | | 6,321 | |
| | | | | | | | |
| Total Chemicals | | | | 273,612 | |
|
| Food Products – 5.4% | |
| | |
Archer-Daniels-Midland Co. | | | 1,158 | | | | 89,861 | |
| | |
Benson Hill, Inc.* | | | 7,711 | | | | 21,128 | |
| | |
Beyond Meat, Inc.* | | | 447 | | | | 10,701 | |
| | |
Darling Ingredients, Inc.* | | | 1,076 | | | | 64,345 | |
| | |
Tyson Foods, Inc., Class A | | | 763 | | | | 65,664 | |
| | | | | | | | |
| Total Food Products | | | | 251,699 | |
|
| Health Care Providers & Services – 1.6% | |
| | |
Invitae Corp.* | | | 1,679 | | | | 4,097 | |
| | |
Laboratory Corp. of America Holdings | | | 302 | | | | 70,776 | |
| | | | | | | | |
| Total Health Care Providers & Services | | | | 74,873 | |
|
| Life Sciences Tools & Services – 13.5% | |
| | |
10X Genomics, Inc., Class A* | | | 276 | | | | 12,489 | |
| | |
Agilent Technologies, Inc. | | | 608 | | | | 72,212 | |
| | |
Berkeley Lights, Inc.* | | | 4,098 | | | | 20,367 | |
| | |
Bio-Rad Laboratories, Inc., Class A* | | | 96 | | | | 47,520 | |
| | |
Bio-Techne Corp. | | | 181 | | | | 62,742 | |
| | |
Codexis, Inc.* | | | 1,004 | | | | 10,502 | |
| | |
Danaher Corp. | | | 323 | | | | 81,887 | |
| | |
Illumina, Inc.* | | | 204 | | | | 37,609 | |
| | |
NanoString Technologies, Inc.* | | | 765 | | | | 9,715 | |
| | |
NeoGenomics, Inc.* | | | 1,819 | | | | 14,825 | |
| | |
Pacific Biosciences of California, Inc.* | | | 1,136 | | | | 5,021 | |
| | |
PerkinElmer, Inc. | | | 632 | | | | 89,883 | |
| | |
Personalis, Inc.* | | | 2,411 | | | | 8,318 | |
| | |
Repligen Corp.* | | | 425 | | | | 69,020 | |
| | |
Thermo Fisher Scientific, Inc. | | | 170 | | | | 92,358 | |
| | | | | | | | |
| Total Life Sciences Tools & Services | | | | 634,468 | |
|
| Oil, Gas & Consumable Fuels – 2.0% | |
| | |
Alto Ingredients, Inc.* | | | 9,931 | | | | 36,844 | |
| | |
Green Plains, Inc.* | | | 1,986 | | | | 53,960 | |
| | | | | | | | |
| Total Oil, Gas & Consumable Fuels | | | | 90,804 | |
|
| Pharmaceuticals – 12.3% | |
| | |
Catalent, Inc.* | | | 740 | | | | 79,395 | |
| | |
Eli Lilly & Co. | | | 427 | | | | 138,446 | |
| | |
Johnson & Johnson | | | 482 | | | | 85,560 | |
| | |
Merck & Co., Inc. | | | 991 | | | | 90,350 | |
| | |
Pfizer, Inc. | | | 2,068 | | | | 108,425 | |
| | |
Zoetis, Inc. | | | 443 | | | | 76,147 | |
| | | | | | | | |
| Total Pharmaceuticals | | | | 578,323 | |
| Total United States | | | | 3,617,117 | |
| |
TOTAL INVESTMENTS IN SECURITIES – 99.9% (Cost: $5,897,514) | | | | 4,682,425 | |
| |
Other Assets less Liabilities – 0.1% | | | | 5,330 | |
| | | | | | | | |
| NET ASSETS – 100.0% | | | $ | 4,687,755 | |
* Non-income producing security.
The following is a summary of the fair valuations according to the inputs used as of June 30, 2022 in valuing the Fund’s investments (See Note 2 – Fair Value Measurement):
| | | | | | | | | | | | | | | | |
| | | | |
| | | Quoted
Prices in
Active
Markets
(Level 1) | | | Other
Significant
Observable
Inputs
(Level 2) | | | Significant
Unobservable
Inputs
(Level 3) | | | Total | |
Assets: | | | | | | | | | |
Investments in Securities | | | | | | | | | |
Common Stocks | | $ | 4,682,425 | | | $ | — | | | $ | — | | | $ | 4,682,425 | |
Total Investments in Securities | | $ | 4,682,425 | | | $ | — | | | $ | — | | | $ | 4,682,425 | |
See Notes to Financial Statements.
Schedule of Investments
WisdomTree Cloud Computing Fund (WCLD)
June 30, 2022
| | | | | | | | |
| Investments | | Shares | | | Value | |
|
| COMMON STOCKS – 100.0% | |
|
| Brazil – 0.8% | |
|
| Interactive Media & Services – 0.8% | |
| | |
VTEX, Class A* | | | 1,596,910 | | | $ | 4,918,483 | |
|
| Canada – 0.9% | |
|
| IT Services – 0.9% | |
| | |
Shopify, Inc., Class A* | | | 185,734 | | | | 5,802,330 | |
|
| China – 1.4% | |
|
| Software – 1.4% | |
| | |
Agora, Inc., ADR* | | | 1,358,333 | | | | 8,924,248 | |
|
| Israel – 3.1% | |
|
| IT Services – 1.4% | |
| | |
Wix.com Ltd.* | | | 137,326 | | | | 9,001,719 | |
|
| Software – 1.7% | |
| | |
JFrog Ltd.* | | | 502,482 | | | | 10,587,296 | |
| Total Israel | | | | | | | 19,589,015 | |
|
| United States – 93.8% | |
|
| Diversified Consumer Services – 2.1% | |
| | |
2U, Inc.*(a) | | | 1,236,849 | | | | 12,949,809 | |
|
| Health Care Technology – 3.7% | |
| | |
Definitive Healthcare Corp.*(a) | | | 556,968 | | | | 12,771,276 | |
| | |
Veeva Systems, Inc., Class A* | | | 54,832 | | | | 10,858,929 | |
| | | | | | | | |
| Total Health Care Technology | | | | | | | 23,630,205 | |
|
| Interactive Media & Services – 2.2% | |
| | |
Vimeo, Inc.* | | | 967,596 | | | | 5,824,928 | |
| | |
ZoomInfo Technologies, Inc., Class A* | | | 233,946 | | | | 7,776,365 | |
| | | | | | | | |
| Total Interactive Media & Services | | | | | | | 13,601,293 | |
|
| IT Services – 11.9% | |
| | |
BigCommerce Holdings, Inc., Series 1*(a) | | | 480,286 | | | | 7,780,633 | |
| | |
Block, Inc.* | | | 124,232 | | | | 7,635,299 | |
| | |
Cloudflare, Inc., Class A* | | | 127,072 | | | | 5,559,400 | |
| | |
DigitalOcean Holdings, Inc.*(a) | | | 234,270 | | | | 9,689,407 | |
| | |
Fastly, Inc., Class A*(a) | | | 649,342 | | | | 7,538,861 | |
| | |
Okta, Inc.* | | | 73,928 | | | | 6,683,091 | |
| | |
PayPal Holdings, Inc.* | | | 119,192 | | | | 8,324,369 | |
| | |
Snowflake, Inc., Class A* | | | 44,454 | | | | 6,181,773 | |
| | |
Squarespace, Inc., Class A*(a) | | | 434,007 | | | | 9,079,427 | |
| | |
Twilio, Inc., Class A* | | | 77,106 | | | | 6,462,254 | |
| | | | | | | | |
| Total IT Services | | | | | | | 74,934,514 | |
|
| Software – 73.9% | |
| | |
Adobe, Inc.* | | | 26,886 | | | | 9,841,889 | |
| | |
Amplitude, Inc., Class A*(a) | | | 592,133 | | | | 8,461,581 | |
| | |
Appfolio, Inc., Class A* | | | 105,139 | | | | 9,529,799 | |
| | |
Asana, Inc., Class A*(a) | | | 191,871 | | | | 3,373,092 | |
| | |
Atlassian Corp. PLC, Class A* | | | 39,719 | | | | 7,443,341 | |
| | |
Avalara, Inc.* | | | 131,298 | | | | 9,269,639 | |
| | |
Bill.com Holdings, Inc.* | | | 54,356 | | | | 5,975,899 | |
| | |
Blackline, Inc.* | | | 170,674 | | | | 11,366,888 | |
| | |
Blend Labs, Inc., Class A*(a) | | | 1,325,902 | | | | 3,129,129 | |
| | |
Box, Inc., Class A* | | | 470,220 | | | | 11,821,331 | |
| | |
C3.ai, Inc., Class A* | | | 575,462 | | | | 10,507,936 | |
| | |
Clearwater Analytics Holdings, Inc., Class A* | | | 663,810 | | | | 7,992,272 | |
| | |
Confluent, Inc., Class A*(a) | | | 258,762 | | | | 6,013,629 | |
| | |
Coupa Software, Inc.* | | | 105,186 | | | | 6,006,121 | |
| | |
Crowdstrike Holdings, Inc., Class A* | | | 74,103 | | | | 12,490,802 | |
| | |
CS Disco, Inc.*(a) | | | 373,967 | | | | 6,746,365 | |
| | |
Datadog, Inc., Class A* | | | 77,172 | | | | 7,349,861 | |
| | |
DocuSign, Inc.* | | | 110,722 | | | | 6,353,228 | |
| | |
Domo, Inc., Class B* | | | 288,504 | | | | 8,020,411 | |
| | |
Dropbox, Inc., Class A* | | | 535,164 | | | | 11,233,092 | |
| | |
Elastic NV* | | | 150,840 | | | | 10,207,343 | |
| | |
Enfusion, Inc., Class A* | | | 786,544 | | | | 8,030,614 | |
| | |
Everbridge, Inc.* | | | 268,670 | | | | 7,493,206 | |
| | |
Freshworks, Inc., Class A*(a) | | | 646,581 | | | | 8,502,540 | |
| | |
Gitlab, Inc., Class A* | | | 199,605 | | | | 10,607,010 | |
| | |
HubSpot, Inc.* | | | 24,617 | | | | 7,401,101 | |
| | |
Monday.com Ltd.* | | | 62,786 | | | | 6,477,004 | |
| | |
nCino, Inc.*(a) | | | 287,491 | | | | 8,889,222 | |
| | |
New Relic, Inc.* | | | 183,456 | | | | 9,181,973 | |
| | |
Olo, Inc., Class A*(a) | | | 745,494 | | | | 7,358,026 | |
| | |
PagerDuty, Inc.*(a) | | | 386,143 | | | | 9,568,624 | |
| | |
Paycom Software, Inc.* | | | 38,893 | | | | 10,894,707 | |
| | |
Paylocity Holding Corp.* | | | 61,969 | | | | 10,808,633 | |
| | |
Procore Technologies, Inc.* | | | 191,348 | | | | 8,685,286 | |
| | |
Q2 Holdings, Inc.* | | | 197,893 | | | | 7,632,733 | |
| | |
Qualtrics International, Inc., Class A* | | | 422,417 | | | | 5,284,437 | |
| | |
Qualys, Inc.* | | | 103,571 | | | | 13,064,446 | |
| | |
RingCentral, Inc., Class A* | | | 83,205 | | | | 4,348,293 | |
| | |
Riskified Ltd., Class A*(a) | | | 1,698,510 | | | | 7,541,384 | |
| | |
Salesforce, Inc.* | | | 63,169 | | | | 10,425,412 | |
| | |
SentinelOne, Inc., Class A* | | | 312,825 | | | | 7,298,207 | |
| | |
ServiceNow, Inc.* | | | 22,449 | | | | 10,674,948 | |
| | |
Smartsheet, Inc., Class A* | | | 220,325 | | | | 6,924,815 | |
| | |
Sprinklr, Inc., Class A*(a) | | | 1,007,721 | | | | 10,188,059 | |
| | |
Sprout Social, Inc., Class A* | | | 231,847 | | | | 13,463,355 | |
| | |
Sumo Logic, Inc.* | | | 1,053,838 | | | | 7,893,247 | |
| | |
Tenable Holdings, Inc.* | | | 262,173 | | | | 11,905,276 | |
| | |
UiPath, Inc., Class A* | | | 320,850 | | | | 5,836,261 | |
| | |
Workday, Inc., Class A* | | | 57,837 | | | | 8,072,888 | |
| | |
Workiva, Inc.* | | | 118,449 | | | | 7,816,449 | |
| | |
Yext, Inc.* | | | 1,651,934 | | | | 7,896,244 | |
| | |
Zendesk, Inc.* | | | 103,723 | | | | 7,682,763 | |
| | |
Zoom Video Communications, Inc., Class A* | | | 96,732 | | | | 10,444,154 | |
| | |
Zscaler, Inc.* | | | 48,054 | | | | 7,184,554 | |
| | |
Zuora, Inc., Class A*(a) | | | 843,188 | | | | 7,546,533 | |
| | | | | | | | |
| Total Software | | | | | | | 466,156,052 | |
| Total United States | | | | | | | 591,271,873 | |
TOTAL COMMON STOCKS (Cost: $1,127,563,577) | | | | 630,505,949 | |
See Notes to Financial Statements.
Schedule of Investments (concluded)
WisdomTree Cloud Computing Fund (WCLD)
June 30, 2022
| | | | | | | | |
| Investments | | Shares | | | Value | |
|
| INVESTMENT OF CASH COLLATERAL FOR SECURITIES LOANED – 4.4% | |
|
| United States – 4.4% | |
| | |
State Street Navigator Securities Lending
Government Money Market Portfolio, 1.56%(b) | | | | | | | | |
| (Cost: $28,111,122) | | | 28,111,122 | | | $ | 28,111,122 | |
| |
TOTAL INVESTMENTS IN SECURITIES – 104.4% (Cost: $1,155,674,699) | | | | 658,617,071 | |
| |
Other Assets less Liabilities – (4.4)% | | | | (27,966,515 | ) |
| | | | | | | | |
| NET ASSETS – 100.0% | | | $ | 630,650,556 | |
| * | Non-income producing security. |
| (a) | Security, or portion thereof, was on loan at June 30, 2022 (See Note 2). At June 30, 2022, the total market value of the Fund’s securities on loan identified in the Schedule of Investments was $53,091,540 and the total market value of the collateral held by the Fund was $55,629,011. The total market value of the collateral includes non-cash U.S. Government securities collateral having a value of $27,517,889. |
| (b) | Rate shown represents annualized 7-day yield as of June 30, 2022. |
The following is a summary of the fair valuations according to the inputs used as of June 30, 2022 in valuing the Fund’s investments (See Note 2 – Fair Value Measurement):
| | | | | | | | | | | | | | | | |
| | | | |
| | | Quoted Prices in Active Markets
(Level 1) | | | Other
Significant
Observable
Inputs
(Level 2) | | | Significant
Unobservable
Inputs
(Level 3) | | | Total | |
Assets: | | | | | | | | | | | | | | | | |
Investments in Securities | | | | | | | | | | | | | | | | |
Common Stocks | | $ | 630,505,949 | | | $ | — | | | $ | — | | | $ | 630,505,949 | |
Investment of Cash Collateral for Securities Loaned | | | — | | | | 28,111,122 | | | | — | | | | 28,111,122 | |
Total Investments in Securities | | $ | 630,505,949 | | | $ | 28,111,122 | | | $ | — | | | $ | 658,617,071 | |
See Notes to Financial Statements.
Schedule of Investments
WisdomTree Cybersecurity Fund (WCBR)
June 30, 2022
| | | | | | | | |
| Investments | | Shares | | | Value | |
|
| COMMON STOCKS – 99.7% | |
|
| Canada – 1.1% | |
|
| Software – 1.1% | |
| | |
Absolute Software Corp. | | | 41,737 | | | $ | 359,146 | |
|
| Israel – 4.7% | |
|
| Communications Equipment – 2.2% | |
| | |
Radware Ltd.* | | | 33,471 | | | | 725,317 | |
|
| Software – 2.5% | |
| | |
Tufin Software Technologies Ltd.*(a) | | | 63,749 | | | | 800,687 | |
| Total Israel | | | | 1,526,004 | |
|
| Japan – 3.7% | |
|
| Software – 3.7% | |
| | |
Trend Micro, Inc. | | | 24,800 | | | | 1,208,465 | |
|
| South Korea – 3.1% | |
|
| Software – 3.1% | |
| | |
Ahnlab, Inc. | | | 15,264 | | | | 1,015,719 | |
|
| United Kingdom – 3.5% | |
|
| Software �� 3.5% | |
| | |
Darktrace PLC*(a) | | | 325,665 | | | | 1,165,154 | |
|
| United States – 83.6% | |
|
| IT Services – 13.4% | |
| | |
Akamai Technologies, Inc.* | | | 13,137 | | | | 1,199,802 | |
| | |
Cloudflare, Inc., Class A* | | | 21,498 | | | | 940,538 | |
| | |
Fastly, Inc., Class A*(a) | | | 97,487 | | | | 1,131,824 | |
| | |
Okta, Inc.* | | | 12,400 | | | | 1,120,960 | |
| | | | | | | | |
| Total IT Services | | | | 4,393,124 | |
|
| Software – 70.2% | |
| | |
Crowdstrike Holdings, Inc., Class A* | | | 9,998 | | | | 1,685,263 | |
| | |
CyberArk Software Ltd.* | | | 7,154 | | | | 915,426 | |
| | |
Datadog, Inc., Class A* | | | 15,000 | | | | 1,428,600 | |
| | |
Elastic NV* | | | 19,923 | | | | 1,348,189 | |
| | |
ForgeRock, Inc., Class A* | | | 67,345 | | | | 1,442,530 | |
| | |
Fortinet, Inc.* | | | 25,598 | | | | 1,448,335 | |
| | |
HashiCorp, Inc., Class A*(a) | | | 42,718 | | | | 1,257,618 | |
| | |
Palo Alto Networks, Inc.* | | | 3,486 | | | | 1,721,875 | |
| | |
Ping Identity Holding Corp.* | | | 77,864 | | | | 1,412,453 | |
| | |
Qualys, Inc.* | | | 8,394 | | | | 1,058,819 | |
| | |
Rapid7, Inc.* | | | 18,591 | | | | 1,241,879 | |
| | |
Sailpoint Technologies Holdings, Inc.* | | | 32,633 | | | | 2,045,436 | |
| | |
SentinelOne, Inc., Class A* | | | 43,610 | | | | 1,017,421 | |
| | |
Splunk, Inc.* | | | 8,821 | | | | 780,306 | |
| | |
Sumo Logic, Inc.* | | | 146,779 | | | | 1,099,375 | |
| | |
Tenable Holdings, Inc.* | | | 27,451 | | | | 1,246,550 | |
| | |
Varonis Systems, Inc.* | | | 26,680 | | | | 782,257 | |
| | |
Zscaler, Inc.* | | | 7,135 | | | | 1,066,754 | |
| | | | | | | | |
| Total Software | | | | 22,999,086 | |
| Total United States | | | | 27,392,210 | |
TOTAL COMMON STOCKS (Cost: $48,105,009) | | | | 32,666,698 | |
|
| INVESTMENT OF CASH COLLATERAL FOR SECURITIES LOANED – 3.7% | |
|
| United States – 3.7% | |
| | |
State Street Navigator Securities Lending Government Money Market Portfolio, 1.56%(b)
| | | | | | | | |
| (Cost: $1,201,992) | | | 1,201,992 | | | | 1,201,992 | |
| |
TOTAL INVESTMENTS IN SECURITIES – 103.4% (Cost: $49,307,001) | | | | 33,868,690 | |
| |
Other Assets less Liabilities – (3.4)% | | | | (1,106,779 | ) |
| | | | | | | | |
| NET ASSETS – 100.0% | | | $ | 32,761,911 | |
| * | Non-income producing security. |
| (a) | Security, or portion thereof, was on loan at June 30, 2022 (See Note 2). At June 30, 2022, the total market value of the Fund’s securities on loan identified in the Schedule of Investments was $3,145,726 and the total market value of the collateral held by the Fund was $3,518,567. The total market value of the collateral includes non-cash U.S. Government securities collateral having a value of $2,316,575. |
| (b) | Rate shown represents annualized 7-day yield as of June 30, 2022. |
| | | | | | | | | | | | | | | | |
|
| FAIR VALUATION SUMMARY | |
The following is a summary of the fair valuations according to the inputs used as of June 30, 2022 in valuing the Fund’s investments (See Note 2 – Fair Value Measurement): | |
| | | | |
| | | Quoted
Prices in
Active
Markets
(Level 1) | | | Other
Significant
Observable
Inputs
(Level 2) | | | Significant
Unobservable
Inputs
(Level 3) | | | Total | |
Assets: | | | | | | | | | |
Investments in Securities | | | | |
Common Stocks | | $ | 32,666,698 | | | $ | — | | | $ | — | | | $ | 32,666,698 | |
Investment of Cash Collateral for Securities Loaned | | | — | | | | 1,201,992 | | | | — | | | | 1,201,992 | |
Total Investments in Securities | | $ | 32,666,698 | | | $ | 1,201,992 | | | $ | — | | | $ | 33,868,690 | |
See Notes to Financial Statements.
Statements of Assets and Liabilities
WisdomTree Trust
June 30, 2022
| | | | | | | | | | | | | | | | | | | | |
| | | WisdomTree
Dynamic
Currency
Hedged
International
Equity Fund | | | WisdomTree
Dynamic
Currency
Hedged
International
SmallCap
Equity Fund | | | WisdomTree
Emerging
Markets ESG Fund | | | WisdomTree
International
ESG Fund | | | WisdomTree
U.S. Corporate
Bond Fund | |
ASSETS: | |
| | | | | |
Investments, at cost | | $ | 179,176,812 | | | $ | 68,783,030 | | | $ | 24,714,399 | | | $ | 7,832,585 | | | $ | 45,893,985 | |
| | | | | |
Foreign currency, at cost | | | 500,876 | | | | 423,193 | | | | 16,400 | | | | 6,319 | | | | — | |
Investments in securities, at value1,2 (Note 2) | | | 170,095,450 | | | | 59,664,006 | | | | 25,572,911 | | | | 7,598,369 | | | | 40,461,316 | |
| | | | | |
Cash | | | 694,024 | | | | 123,641 | | | | 3,612 | | | | 1,624 | | | | 234,521 | |
| | | | | |
Foreign currency, at value | | | 501,212 | | | | 422,973 | | | | 16,336 | | | | 6,335 | | | | — | |
| | | | | |
Unrealized appreciation on foreign currency contracts | | | 4,246,779 | | | | 1,590,247 | | | | — | | | | 1 | | | | — | |
|
Receivables: | |
| | | | | |
Investment securities sold | | | 9,875 | | | | — | | | | — | | | | — | | | | — | |
| | | | | |
Capital shares sold | | | 6,069,704 | | | | 2,703,016 | | | | — | | | | — | | | | — | |
| | | | | |
Dividends | | | 311,001 | | | | 167,280 | | | | 145,277 | | | | 16,152 | | | | — | |
| | | | | |
Securities lending income | | | 6,959 | | | | 2,256 | | | | 546 | | | | 117 | | | | 456 | |
| | | | | |
Interest | | | — | | | | — | | | | — | | | | — | | | | 392,839 | |
| | | | | |
Foreign tax reclaims | | | 453,788 | | | | 71,099 | | | | 617 | | | | 29,104 | | | | — | |
| | | | | |
Other (Note 6) | | | 17,685 | | | | 2,225 | | | | — | | | | — | | | | — | |
Total Assets | | | 182,406,477 | | | | 64,746,743 | | | | 25,739,299 | | | | 7,651,702 | | | | 41,089,132 | |
LIABILITIES: | |
| | | | | |
Unrealized depreciation on foreign currency contracts | | | 29,341 | | | | 14,332 | | | | — | | | | — | | | | — | |
|
Payables: | |
| | | | | |
Cash collateral received for securities loaned (Note 2) | | | 4,556,691 | | | | 2,406,651 | | | | 224,927 | | | | 203,121 | | | | 398,348 | |
| | | | | |
Investment securities purchased | | | 9,688,785 | | | | 4,184,113 | | | | — | | | | — | | | | — | |
| | | | | |
Advisory fees (Note 3) | | | 55,264 | | | | 22,501 | | | | 6,999 | | | | 1,918 | | | | 6,059 | |
| | | | | |
Service fees (Note 2) | | | 608 | | | | 206 | | | | 96 | | | | 28 | | | | 148 | |
| | | | | |
Foreign capital gains tax | | | — | | | | — | | | | 26,192 | | | | — | | | | — | |
| | | | | |
Other (Note 6) | | | 5,305 | | | | 668 | | | | — | | | | — | | | | — | |
| | | | | | | | | | | | | | | | | | | | |
Total Liabilities | | | 14,335,994 | | | | 6,628,471 | | | | 258,214 | | | | 205,067 | | | | 404,555 | |
NET ASSETS | | $ | 168,070,483 | | | $ | 58,118,272 | | | $ | 25,481,085 | | | $ | 7,446,635 | | | $ | 40,684,577 | |
NET ASSETS: | |
| | | | | |
Paid-in capital | | $ | 208,928,322 | | | $ | 70,120,434 | | | $ | 34,385,735 | | | $ | 10,973,650 | | | $ | 48,593,258 | |
| | | | | |
Total distributable earnings (loss) | | | (40,857,839 | ) | | | (12,002,162 | ) | | | (8,904,650 | ) | | | (3,527,015 | ) | | | (7,908,681 | ) |
NET ASSETS | | $ | 168,070,483 | | | $ | 58,118,272 | | | $ | 25,481,085 | | | $ | 7,446,635 | | | $ | 40,684,577 | |
Outstanding beneficial interest shares of $0.001 par value (unlimited number of shares authorized) | | | 6,050,000 | | | | 1,950,000 | | | | 900,000 | | | | 300,000 | | | | 900,000 | |
Net asset value per share | | $ | 27.78 | | | $ | 29.80 | | | $ | 28.31 | | | $ | 24.82 | | | $ | 45.21 | |
1 Includes market value of securities out on loan of: | | $ | 6,762,760 | | | $ | 5,221,005 | | | $ | 601,144 | | | $ | 292,233 | | | $ | 643,606 | |
2 Investments in securities include investment of cash collateral for securities loaned (see Schedule of Investments for additional information). |
See Notes to Financial Statements.
Statements of Assets and Liabilities (continued)
WisdomTree Trust
June 30, 2022
| | | | | | | | | | | | | | | | | | | | | | |
| | | WisdomTree
U.S. High Yield
Corporate Bond
Fund | | | WisdomTree
U.S. Short-
Term
Corporate
Bond Fund | | | WisdomTree
Emerging
Markets
Efficient Core
Fund | | | WisdomTree
International
Efficient Core
Fund | | | WisdomTree U.S.
Efficient Core
Fund | |
ASSETS: | |
| | | | | |
Investments, at cost | | $ | 214,704,506 | | | $ | 45,473,288 | | | $ | 37,738,221 | | | $ | 86,540,020 | | | $ | 672,258,263 | |
| | | | | |
Foreign currency, at cost | | | — | | | | — | | | | 66,740 | | | | 261,431 | | | | — | |
Investments in securities, at value1,2 (Note 2) | | | 184,921,888 | | | | 43,619,517 | | | | 30,841,814 | | | | 67,773,117 | | | | 621,900,459 | |
| | | | | |
Cash | | | 2,098,553 | | | | 212,710 | | | | 3,086,035 | | | | 7,455,826 | | | | 63,474,097 | |
| | | | | |
Deposits at broker for futures contracts | | | — | | | | — | | | | 391,135 | | | | 887,579 | | | | 6,751,985 | |
| | | | | |
Foreign currency, at value | | | — | | | | — | | | | 65,482 | | | | 259,766 | | | | — | |
| | | | | |
Unrealized appreciation on foreign currency contracts | | | — | | | | — | | | | 1,161 | | | | 554 | | | | — | |
|
Receivables: | |
| | | | | |
Investment securities sold | | | 38,295 | | | | — | | | | 2,485,241 | | | | 9,712,316 | | | | — | |
| | | | | |
Capital shares sold | | | — | | | | — | | | | 3,493 | | | | 610 | | | | — | |
| | | | | |
Dividends | | | — | | | | — | | | | 192,069 | | | | 119,287 | | | | 477,035 | |
| | | | | |
Securities lending income | | | 8,528 | | | | 2,064 | | | | — | | | | — | | | | 1,644 | |
| | | | | |
Interest | | | 3,075,514 | | | | 337,468 | | | | — | | | | — | | | | — | |
| | | | | |
Foreign tax reclaims | | | — | | | | — | | | | 1,250 | | | | 134,017 | | | | — | |
| | | | | |
Net variation margin on futures contracts | | | — | | | | — | | | | 176,682 | | | | 363,334 | | | | 3,305,688 | |
Total Assets | | | 190,142,778 | | | | 44,171,759 | | | | 37,244,362 | | | | 86,706,406 | | | | 695,910,908 | |
LIABILITIES: | |
| | | | | |
Unrealized depreciation on foreign currency contracts | | | — | | | | — | | | | 42 | | | | — | | | | — | |
|
Payables: | |
| | | | | |
Cash collateral received for securities loaned (Note 2) | | | 18,791,313 | | | | 1,408,510 | | | | — | | | | — | | | | 184,192 | |
| | | | | |
Capital shares redeemed | | | — | | | | — | | | | 2,882,624 | | | | 10,917,685 | | | | — | |
| | | | | |
Advisory fees (Note 3) | | | 55,522 | | | | 6,286 | | | | 10,026 | | | | 21,184 | | | | 119,031 | |
| | | | | |
Service fees (Note 2) | | | 643 | | | | 154 | | | | 138 | | | | 359 | | | | 2,619 | |
Total Liabilities | | | 18,847,478 | | | | 1,414,950 | | | | 2,892,830 | | | | 10,939,228 | | | | 305,842 | |
NET ASSETS | | $ | 171,295,300 | | | $ | 42,756,809 | | | $ | 34,351,532 | | | $ | 75,767,178 | | | $ | 695,605,066 | |
NET ASSETS: | |
| | | | | |
Paid-in capital | | $ | 202,497,528 | | | $ | 45,406,207 | | | $ | 44,068,880 | | | $ | 101,675,197 | | | $ | 823,047,946 | |
| | | | | |
Total distributable earnings (loss) | | | (31,202,228 | ) | | | (2,649,398 | ) | | | (9,717,348 | ) | | | (25,908,019 | ) | | | (127,442,880 | ) |
NET ASSETS | | $ | 171,295,300 | | | $ | 42,756,809 | | | $ | 34,351,532 | | | $ | 75,767,178 | | | $ | 695,605,066 | |
Outstanding beneficial interest shares of $0.001 par value (unlimited number of shares authorized) | | | 3,900,000 | | | | 900,000 | | | | 1,200,000 | | | | 2,450,000 | | | | 20,850,000 | |
Net asset value per share | | $ | 43.92 | | | $ | 47.51 | | | $ | 28.63 | | | $ | 30.93 | | | $ | 33.36 | |
1 Includes market value of securities out on loan of: | | $ | 18,352,831 | | | $ | 1,661,467 | | | | — | | | | — | | | $ | 567,142 | |
2 Investments in securities include investment of cash collateral for securities loaned (see Schedule of Investments for additional information). | |
See Notes to Financial Statements.
Statements of Assets and Liabilities (concluded)
WisdomTree Trust
June 30, 2022
| | | | | | | | | | | | | | | | | | | | |
| | | WisdomTree
Artificial
Intelligence
and
Innovation Fund | | | WisdomTree
Battery Value
Chain and
Innovation
Fund | | | WisdomTree
BioRevolution
Fund | | | WisdomTree Cloud
Computing Fund | | | WisdomTree
Cybersecurity
Fund | |
ASSETS: | |
| | | | | |
Investments, at cost | | $ | 1,175,982 | | | $ | 1,886,223 | | | $ | 5,897,514 | | | $ | 1,155,674,699 | | | $ | 49,307,001 | |
| | | | | |
Foreign currency, at cost | | | 958 | | | | 3,605 | | | | 1,489 | | | | — | | | | 9,214 | |
Investments in securities, at value1,2 (Note 2) | | | 750,653 | | | | 1,730,298 | | | | 4,682,425 | | | | 658,617,071 | | | | 33,868,690 | |
| | | | | |
Cash | | | 1,621 | | | | 9,807 | | | | 2,792 | | | | 305,590 | | | | 77,428 | |
| | | | | |
Foreign currency, at value | | | 935 | | | | 3,589 | | | | 1,492 | | | | — | | | | 9,161 | |
| | | | | |
Unrealized appreciation on foreign currency contracts | | | 1 | | | | 5 | | | | — | | | | — | | | | — | |
|
Receivables: | |
| | | | | |
Investment securities sold | | | — | | | | — | | | | — | | | | 6,471,564 | | | | — | |
| | | | | |
Dividends | | | 1,003 | | | | 2,113 | | | | 1,952 | | | | — | | | | 193 | |
| | | | | |
Securities lending income | | | — | | | | — | | | | — | | | | 8,783 | | | | 18,935 | |
| | | | | |
Foreign tax reclaims | | | 95 | | | | 755 | | | | 743 | | | | — | | | | 2,189 | |
Total Assets | | | 754,308 | | | | 1,746,567 | | | | 4,689,404 | | | | 665,403,008 | | | | 33,976,596 | |
LIABILITIES: | |
| | | | | |
Unrealized depreciation on foreign currency contracts | | | 1 | | | | 3 | | | | — | | | | — | | | | — | |
|
Payables: | |
| | | | | |
Cash collateral received for securities loaned (Note 2) | | | — | | | | — | | | | — | | | | 28,111,122 | | | | 1,201,992 | |
| | | | | |
Investment securities purchased | | | 1,983 | | | | 8,751 | | | | — | | | | — | | | | — | |
| | | | | |
Capital shares redeemed | | | — | | | | — | | | | — | | | | 6,397,780 | | | | — | |
| | | | | |
Advisory fees (Note 3) | | | 298 | | | | 670 | | | | 1,633 | | | | 241,192 | | | | 12,570 | |
| | | | | |
Service fees (Note 2) | | | 3 | | | | 7 | | | | 16 | | | | 2,358 | | | | 123 | |
Total Liabilities | | | 2,285 | | | | 9,431 | | | | 1,649 | | | | 34,752,452 | | | | 1,214,685 | |
NET ASSETS | | $ | 752,023 | | | $ | 1,737,136 | | | $ | 4,687,755 | | | $ | 630,650,556 | | | $ | 32,761,911 | |
NET ASSETS: | |
| | | | | |
Paid-in capital | | $ | 1,249,999 | | | $ | 2,000,003 | | | $ | 6,105,922 | | | $ | 1,269,926,052 | | | $ | 49,066,639 | |
| | | | | |
Total distributable earnings (loss) | | | (497,976 | ) | | | (262,867 | ) | | | (1,418,167 | ) | | | (639,275,496 | ) | | | (16,304,728 | ) |
NET ASSETS | | $ | 752,023 | | | $ | 1,737,136 | | | $ | 4,687,755 | | | $ | 630,650,556 | | | $ | 32,761,911 | |
Outstanding beneficial interest shares of $0.001 par value (unlimited number of shares authorized) | | | 50,000 | | | | 50,000 | | | | 270,000 | | | | 22,500,000 | | | | 1,840,000 | |
Net asset value per share | | $ | 15.04 | | | $ | 34.74 | | | $ | 17.36 | | | $ | 28.03 | | | $ | 17.81 | |
1 Includes market value of securities out on loan of: | | | — | | | | — | | | | — | | | $ | 53,091,540 | | | $ | 3,145,726 | |
2 Investments in securities include investment of cash collateral for securities loaned (see Schedule of Investments for additional information). | |
See Notes to Financial Statements.
Statements of Operations
WisdomTree Trust
For the Year Ended June 30, 2022
| | | | | | | | | | | | | | | | | | | | |
| | | WisdomTree
Dynamic Currency Hedged
International Equity Fund | | | WisdomTree
Dynamic Currency Hedged
International
SmallCap Equity Fund | | | WisdomTree
Emerging Markets ESG Fund | | | WisdomTree
International ESG Fund | | | WisdomTree
U.S.
Corporate
Bond Fund | |
INVESTMENT INCOME: | |
| | | | | |
Dividends | | $ | 7,659,806 | | | $ | 2,333,115 | | | $ | 973,813 | | | $ | 284,846 | | | $ | — | |
| | | | | |
Interest | | | — | | | | — | | | | 1,390 | | | | — | | | | 1,204,351 | |
| | | | | |
Non-cash dividends | | | 724,758 | | | | 55,405 | | | | 80,265 | | | | 4,030 | | | | — | |
| | | | | |
Other income (Note 6) | | | 55,945 | | | | 6,452 | | | | — | | | | — | | | | — | |
| | | | | |
Securities lending income, net (Note 2) | | | 66,530 | | | | 24,868 | | | | 5,400 | | | | 2,061 | | | | 6,863 | |
| | | | | |
Less: Foreign withholding taxes on dividends | | | (628,892 | ) | | | (225,445 | ) | | | (115,707 | ) | | | (29,513 | ) | | | — | |
Total investment income | | | 7,878,147 | | | | 2,194,395 | | | | 945,161 | | | | 261,424 | | | | 1,211,214 | |
EXPENSES: | |
| | | | | |
Advisory fees (Note 3) | | | 653,042 | | | | 231,387 | | | | 94,352 | | | | 24,041 | | | | 83,635 | |
| | | | | |
Service fees (Note 2) | | | 7,183 | | | | 2,121 | | | | 1,297 | | | | 353 | | | | 2,044 | |
| | | | | |
Other fees (Note 6) | | | 15,956 | | | | 1,906 | | | | — | | | | — | | | | — | |
Total expenses | | | 676,181 | | | | 235,414 | | | | 95,649 | | | | 24,394 | | | | 85,679 | |
Net investment income | | | 7,201,966 | | | | 1,958,981 | | | | 849,512 | | | | 237,030 | | | | 1,125,535 | |
NET REALIZED AND UNREALIZED GAIN (LOSS) ON INVESTMENTS: | |
|
Net realized gain (loss) from: | |
| | | | | |
Investment transactions1 | | | (1,285,675 | ) | | | (804,893 | ) | | | (496,163 | ) | | | (30,827 | ) | | | (2,428,696 | ) |
| | | | | |
In-kind redemptions | | | 5,032,796 | | | | 4,317,441 | | | | 298,940 | | | | — | | | | — | |
| | | | | |
Futures contracts | | | — | | | | 3,195 | | | | — | | | | — | | | | — | |
| | | | | |
Foreign currency contracts | | | 12,127,972 | | | | 3,785,890 | | | | (12,381 | ) | | | 2,980 | | | | — | |
| | | | | |
Foreign currency related transactions | | | (129,910 | ) | | | (48,697 | ) | | | 30 | | | | (7,138 | ) | | | — | |
Net realized gain (loss) | | | 15,745,183 | | | | 7,252,936 | | | | (209,574 | ) | | | (34,985 | ) | | | (2,428,696 | ) |
Net increase (decrease) in unrealized appreciation/depreciation: | |
| | | | | |
Investment transactions2 | | | (32,427,454 | ) | | | (16,023,070 | ) | | | (9,318,885 | ) | | | (1,694,591 | ) | | | (5,842,676 | ) |
| | | | | |
Foreign currency contracts | | | 2,545,957 | | | | 1,178,053 | | | | — | | | | 1 | | | | — | |
| | | | | |
Translation of assets and liabilities denominated in foreign currencies | | | (32,205 | ) | | | (6,668 | ) | | | (1,390 | ) | | | (1,407 | ) | | | — | |
Net decrease in unrealized appreciation/depreciation | | | (29,913,702 | ) | | | (14,851,685 | ) | | | (9,320,275 | ) | | | (1,695,997 | ) | | | (5,842,676 | ) |
Net realized and unrealized loss on investments | | | (14,168,519 | ) | | | (7,598,749 | ) | | | (9,529,849 | ) | | | (1,730,982 | ) | | | (8,271,372 | ) |
NET DECREASE IN NET ASSETS RESULTING FROM OPERATIONS | | $ | (6,966,553 | ) | | $ | (5,639,768 | ) | | $ | (8,680,337 | ) | | $ | (1,493,952 | ) | | $ | (7,145,837 | ) |
1 Net of foreign capital gains tax of: | | | — | | | | — | | | $ | 29,338 | | | | — | | | | — | |
2 Includes net increase (decrease) in accrued foreign capital gain taxes of: | | | — | | | | — | | | $ | (80,403 | ) | | | — | | | | — | |
See Notes to Financial Statements.
Statements of Operations (continued)
WisdomTree Trust
For the Year Ended June 30, 2022
| | | | | | | | | | | | | | | | | | | | |
| | | WisdomTree U.S. High Yield
Corporate Bond Fund | | | WisdomTree U.S. Short- Term
Corporate
Bond Fund | | | WisdomTree
Emerging Markets Efficient Core Fund | | | WisdomTree
International
Efficient Core Fund | | | WisdomTree U.S. Efficient Core Fund | |
INVESTMENT INCOME: | | | | | | | | | | | | | | | | | | | | |
| | | | | |
Dividends | | $ | — | | | $ | — | | | $ | 641,525 | | | $ | 2,363,582 | | | $ | 9,906,977 | |
| | | | | |
Dividends from affiliates (Note 3) | | | — | | | | — | | | | 237 | | | | — | | | | — | |
| | | | | |
Interest | | | 8,698,672 | | | | 589,410 | | | | — | | | | — | | | | 666 | |
| | | | | |
Non-cash dividends | | | — | | | | — | | | | 1,251 | | | | 33,131 | | | | 14,087 | |
| | | | | |
Securities lending income, net (Note 2) | | | 40,185 | | | | 8,655 | | | | — | | | | — | | | | 20,452 | |
| | | | | |
Less: Foreign withholding taxes on dividends | | | — | | | | — | | | | (64,197 | ) | | | (220,684 | ) | | | (2,546 | ) |
Total investment income | | | 8,738,857 | | | | 598,065 | | | | 578,816 | | | | 2,176,029 | | | | 9,939,636 | |
EXPENSES: | |
| | | | | |
Advisory fees (Note 3) | | | 700,555 | | | | 69,782 | | | | 65,206 | | | | 158,719 | | | | 1,579,485 | |
| | | | | |
Service fees (Note 2) | | | 8,112 | | | | 1,706 | | | | 897 | | | | 2,686 | | | | 34,749 | |
Total expenses | | | 708,667 | | | | 71,488 | | | | 66,103 | | | | 161,405 | | | | 1,614,234 | |
Expense waivers (Note 3) | | | — | | | | — | | | | (480 | ) | | | — | | | | — | |
Net expenses | | | 708,667 | | | | 71,488 | | | | 65,623 | | | | 161,405 | | | | 1,614,234 | |
Net investment income | | | 8,030,190 | | | | 526,577 | | | | 513,193 | | | | 2,014,624 | | | | 8,325,402 | |
NET REALIZED AND UNREALIZED GAIN (LOSS) ON INVESTMENTS: | |
| | | | | |
Net realized gain (loss) from: | | | | | | | | | | | | | | | | | | | | |
| | | | | |
Investment transactions | | | (1,193,179 | ) | | | (808,823 | ) | | | (1,198,740 | ) | | | (1,295,697 | ) | | | (15,361,662 | ) |
| | | | | |
Investment transactions in affiliates (Note 3) | | | — | | | | — | | | | 14,075 | | | | — | | | | — | |
| | | | | |
In-kind redemptions | | | 405,063 | | | | — | | | | (366,718 | ) | | | (2,251,178 | ) | | | 66,470,929 | |
| | | | | |
Futures contracts | | | — | | | | — | | | | (1,580,114 | ) | | | (5,344,771 | ) | | | (45,041,558 | ) |
| | | | | |
Foreign currency contracts | | | — | | | | — | | | | (111,168 | ) | | | (11,890 | ) | | | (6 | ) |
| | | | | |
Foreign currency related transactions | | | — | | | | — | | | | 44,169 | | | | (25,032 | ) | | | 15 | |
Net realized gain (loss) | | | (788,116 | ) | | | (808,823 | ) | | | (3,198,496 | ) | | | (8,928,568 | ) | | | 6,067,718 | |
Net increase (decrease) in unrealized appreciation/depreciation: | | | | | | | | | | | | | | | | | | | | |
| | | | | |
Investment transactions | | | (33,528,082 | ) | | | (2,297,744 | ) | | | (6,947,125 | ) | | | (18,752,483 | ) | | | (182,866,280 | ) |
| | | | | |
Investment transactions in affiliates (Note 3) | | | — | | | | — | | | | (1,884 | ) | | | — | | | | — | |
| | | | | |
Futures contracts | | | — | | | | — | | | | (273,200 | ) | | | (532,484 | ) | | | (7,341,122 | ) |
| | | | | |
Foreign currency contracts | | | — | | | | — | | | | 1,119 | | | | 554 | | | | — | |
| | | | | |
Translation of assets and liabilities denominated in foreign currencies | | | — | | | | — | | | | (4,833 | ) | | | (7,277 | ) | | | — | |
Net decrease in unrealized appreciation/depreciation | | | (33,528,082 | ) | | | (2,297,744 | ) | | | (7,225,923 | ) | | | (19,291,690 | ) | | | (190,207,402 | ) |
Net realized and unrealized loss on investments | | | (34,316,198 | ) | | | (3,106,567 | ) | | | (10,424,419 | ) | | | (28,220,258 | ) | | | (184,139,684 | ) |
NET DECREASE IN NET ASSETS RESULTING FROM OPERATIONS | | $ | (26,286,008 | ) | | $ | (2,579,990 | ) | | $ | (9,911,226 | ) | | $ | (26,205,634 | ) | | $ | (175,814,282 | ) |
See Notes to Financial Statements.
Statements of Operations (concluded)
WisdomTree Trust
For the Year or Period Ended June 30, 2022
| | | | | | | | | | | | | | | | | | | | |
| | | WisdomTree
Artificial
Intelligence
and Innovation
Fund1 | | | WisdomTree
Battery Value
Chain and
Innovation
Fund2 | | | WisdomTree
BioRevolution
Fund | | | WisdomTree
Cloud Computing
Fund | | | WisdomTree
Cybersecurity
Fund | |
INVESTMENT INCOME: | |
| | | | | |
Dividends | | $ | 4,529 | | | $ | 15,088 | | | $ | 29,304 | | | $ | — | | | $ | 291,977 | |
| | | | | |
Non-cash dividends | | | — | | | | 666 | | | | — | | | | — | | | | — | |
| | | | | |
Securities lending income, net (Note 2) | | | — | | | | — | | | | — | | | | 168,979 | | | | 67,775 | |
| | | | | |
Less: Foreign withholding taxes on dividends | | | (586 | ) | | | (1,749 | ) | | | (1,252 | ) | | | — | | | | (5,882 | ) |
Total investment income | | | 3,943 | | | | 14,005 | | | | 28,052 | | | | 168,979 | | | | 353,870 | |
EXPENSES: | |
| | | | | |
Advisory fees (Note 3) | | | 2,480 | | | | 3,125 | | | | 15,433 | | | | 4,761,664 | | | | 168,970 | |
| | | | | |
Service fees (Note 2) | | | 24 | | | | 31 | | | | 151 | | | | 46,558 | | | | 1,652 | |
Total expenses | | | 2,504 | | | | 3,156 | | | | 15,584 | | | | 4,808,222 | | | | 170,622 | |
Net investment income (loss) | | | 1,439 | | | | 10,849 | | | | 12,468 | | | | (4,639,243 | ) | | | 183,248 | |
NET REALIZED AND UNREALIZED GAIN (LOSS) ON INVESTMENTS: | |
|
Net realized gain (loss) from: | |
| | | | | |
Investment transactions | | | (73,521 | ) | | | (117,030 | ) | | | (210,391 | ) | | | (153,599,228 | ) | | | (482,294 | ) |
| | | | | |
In-kind redemptions | | | — | | | | — | | | | — | | | | 143,412,428 | | | | 1,768,139 | |
| | | | | |
Foreign currency contracts | | | 258 | | | | (3,944 | ) | | | (648 | ) | | | — | | | | (23,733 | ) |
| | | | | |
Foreign currency related transactions | | | (798 | ) | | | 3,216 | | | | 300 | | | | — | | | | 22,694 | |
Net realized gain (loss) | | | (74,061 | ) | | | (117,758 | ) | | | (210,739 | ) | | | (10,186,800 | ) | | | 1,284,806 | |
Net increase (decrease) in unrealized appreciation/depreciation: | |
| | | | | |
Investment transactions | | | (425,329 | ) | | | (155,925 | ) | | | (1,315,892 | ) | | | (595,077,204 | ) | | | (16,324,950 | ) |
| | | | | |
Foreign currency contracts | | | 0 | 3 | | | 2 | | | | — | | | | — | | | | (21 | ) |
| | | | | |
Translation of assets and liabilities denominated in foreign currencies | | | (25 | ) | | | (35 | ) | | | (40 | ) | | | — | | | | (457 | ) |
Net decrease in unrealized appreciation/depreciation | | | (425,354 | ) | | | (155,958 | ) | | | (1,315,932 | ) | | | (595,077,204 | ) | | | (16,325,428 | ) |
Net realized and unrealized loss on investments | | | (499,415 | ) | | | (273,716 | ) | | | (1,526,671 | ) | | | (605,264,004 | ) | | | (15,040,622 | ) |
NET DECREASE IN NET ASSETS RESULTING FROM OPERATIONS | | $ | (497,976 | ) | | $ | (262,867 | ) | | $ | (1,514,203 | ) | | $ | (609,903,247 | ) | | $ | (14,857,374 | ) |
| 1 | For the period December 9, 2021 (commencement of operations) through June 30, 2022. |
| 2 | For the period February 17, 2022 (commencement of operations) through June 30, 2022. |
| 3 | Amount represents less than $1. |
See Notes to Financial Statements.
Statements of Changes in Net Assets
WisdomTree Trust
| | | | | | | | | | | | | | | | | | | | | | | | |
| | | |
| | | WisdomTree Dynamic Currency Hedged International Equity Fund | | | WisdomTree Dynamic Currency
Hedged International SmallCap
Equity Fund | | | WisdomTree Emerging Markets ESG Fund | |
| | | | | | |
| | | For the Year Ended June 30, 2022 | | | For the Year Ended June 30, 2021 | | | For the Year Ended June 30, 2022 | | | For the Year Ended
June 30, 2021 | | | For the Year Ended
June 30, 2022 | | | For the Year Ended June 30, 2021 | |
INCREASE (DECREASE) IN NET ASSETS RESULTING FROM OPERATIONS: | | | | | | | | | | | | | |
| | | | | | |
Net investment income | | $ | 7,201,966 | | | $ | 5,069,975 | | | $ | 1,958,981 | | | $ | 1,104,430 | | | $ | 849,512 | | | $ | 621,876 | |
| | | | | | |
Net realized gain (loss) on investments, futures contracts, foreign currency contracts and foreign currency related transactions | | | 15,745,183 | | | | (13,911,409 | ) | | | 7,252,936 | | | | (1,823,424 | ) | | | (209,574 | ) | | | 5,032,282 | |
| | | | | | |
Net increase (decrease) in unrealized appreciation/depreciation on investments, foreign currency contracts and translation of assets and liabilities denominated in foreign currencies | | | (29,913,702 | ) | | | 42,916,984 | | | | (14,851,685 | ) | | | 12,323,707 | | | | (9,320,275 | ) | | | 7,069,078 | |
Net increase (decrease) in net assets resulting from operations | | | (6,966,553 | ) | | | 34,075,550 | | | | (5,639,768 | ) | | | 11,604,713 | | | | (8,680,337 | ) | | | 12,723,236 | |
DISTRIBUTIONS TO SHAREHOLDERS: | | | | | |
| | | | | | |
Distributable earnings | | | (8,333,400 | ) | | | (5,826,707 | ) | | | (2,160,473 | ) | | | (1,376,310 | ) | | | (813,816 | ) | | | (678,548 | ) |
CAPITAL SHARE TRANSACTIONS: | |
| | | | | | |
Net proceeds from sale of shares | | | 46,532,186 | | | | 7,730,083 | | | | 35,211,942 | | | | — | | | | 3,157,366 | | | | — | |
| | | | | | |
Cost of shares redeemed | | | (24,821,425 | ) | | | (72,463,771 | ) | | | (10,629,801 | ) | | | (6,907,300 | ) | | | (3,585,905 | ) | | | (10,123,196 | ) |
Net increase (decrease) in net assets resulting from capital share transactions | | | 21,710,761 | | | | (64,733,688 | ) | | | 24,582,141 | | | | (6,907,300 | ) | | | (428,539 | ) | | | (10,123,196 | ) |
Net Increase (Decrease) in Net Assets | | | 6,410,808 | | | | (36,484,845 | ) | | | 16,781,900 | | | | 3,321,103 | | | | (9,922,692 | ) | | | 1,921,492 | |
NET ASSETS: | |
| | | | | | |
Beginning of year | | $ | 161,659,675 | | | $ | 198,144,520 | | | $ | 41,336,372 | | | $ | 38,015,269 | | | $ | 35,403,777 | | | $ | 33,482,285 | |
| | | | | | |
End of year | | $ | 168,070,483 | | | $ | 161,659,675 | | | $ | 58,118,272 | | | $ | 41,336,372 | | | $ | 25,481,085 | | | $ | 35,403,777 | |
SHARES CREATED AND REDEEMED: | |
| | | | | | |
Shares outstanding, beginning of year | | | 5,300,000 | | | | 7,800,000 | | | | 1,200,000 | | | | 1,450,000 | | | | 900,000 | | | | 1,200,000 | |
| | | | | | |
Shares created | | | 1,550,000 | | | | 250,000 | | | | 1,050,000 | | | | — | | | | 100,000 | | | | — | |
| | | | | | |
Shares redeemed | | | (800,000 | ) | | | (2,750,000 | ) | | | (300,000 | ) | | | (250,000 | ) | | | (100,000 | ) | | | (300,000 | ) |
Shares outstanding, end of year | | | 6,050,000 | | | | 5,300,000 | | | | 1,950,000 | | | | 1,200,000 | | | | 900,000 | | | | 900,000 | |
See Notes to Financial Statements.
Statements of Changes in Net Assets (continued)
WisdomTree Trust
| | | | | | | | | | | | | | | | | | | | | | | | |
| | | |
| | | WisdomTree International ESG Fund | | | WisdomTree U.S. Corporate Bond Fund | | | WisdomTree U.S. High Yield Corporate
Bond Fund | |
| | | | | | |
| | | For the Year
Ended
June 30,
2022 | | | For the Year
Ended June 30,
2021 | | | For the Year
Ended
June 30, 2022 | | | For the Year
Ended June 30,
2021 | | | For the Year
Ended June 30,
2022 | | | For the Year
Ended June 30,
2021 | |
INCREASE (DECREASE) IN NET ASSETS RESULTING FROM OPERATIONS: | | | | | | | | | | | | | |
| | | | | | |
Net investment income | | $ | 237,030 | | | $ | 264,869 | | | $ | 1,125,535 | | | $ | 1,064,372 | | | $ | 8,030,190 | | | $ | 5,188,130 | |
| | | | | | |
Net realized gain (loss) on investments, foreign currency contracts and foreign currency related transactions | | | (34,985 | ) | | | 4,957,506 | | | | (2,428,696 | ) | | | 582,562 | | | | (788,116 | ) | | | 2,280,595 | |
| | | | | | |
Net increase (decrease) in unrealized appreciation/depreciation on investments, foreign currency contracts and translation of assets and liabilities denominated in foreign currencies | | | (1,695,997 | ) | | | (1,064,241 | ) | | | (5,842,676 | ) | | | (644,650 | ) | | | (33,528,082 | ) | | | 5,486,180 | |
Net increase (decrease) in net assets resulting from operations | | | (1,493,952 | ) | | | 4,158,134 | | | | (7,145,837 | ) | | | 1,002,284 | | | | (26,286,008 | ) | | | 12,954,905 | |
DISTRIBUTIONS TO SHAREHOLDERS: | |
| | | | | | |
Distributable earnings | | | (238,020 | ) | | | (320,460 | ) | | | (1,197,666 | ) | | | (1,241,380 | ) | | | (7,906,350 | ) | | | (5,187,250 | ) |
CAPITAL SHARE TRANSACTIONS: | |
| | | | | | |
Net proceeds from sale of shares | | | 1,484,583 | | | | — | | | | — | | | | 22,168,592 | | | | 82,422,563 | | | | 129,194,909 | |
| | | | | | |
Cost of shares redeemed | | | — | | | | (14,506,297 | ) | | | — | | | | (10,978,661 | ) | | | (35,293,904 | ) | | | (41,686,889 | ) |
Net increase (decrease) in net assets resulting from capital share transactions | | | 1,484,583 | | | | (14,506,297 | ) | | | — | | | | 11,189,931 | | | | 47,128,659 | | | | 87,508,020 | |
Net Increase (Decrease) in Net Assets | | | (247,389 | ) | | | (10,668,623 | ) | | | (8,343,503 | ) | | | 10,950,835 | | | | 12,936,301 | | | | 95,275,675 | |
NET ASSETS: | |
| | | | | | |
Beginning of year | | $ | 7,694,024 | | | $ | 18,362,647 | | | $ | 49,028,080 | | | $ | 38,077,245 | | | $ | 158,358,999 | | | $ | 63,083,324 | |
| | | | | | |
End of year | | $ | 7,446,635 | | | $ | 7,694,024 | | | $ | 40,684,577 | | | $ | 49,028,080 | | | $ | 171,295,300 | | | $ | 158,358,999 | |
SHARES CREATED AND REDEEMED: | |
| | | | | | |
Shares outstanding, beginning of year | | | 250,000 | | | | 750,000 | | | | 900,000 | | | | 700,000 | | | | 3,000,000 | | | | 1,300,000 | |
| | | | | | |
Shares created | | | 50,000 | | | | — | | | | — | | | | 400,000 | | | | 1,600,000 | | | | 2,500,000 | |
| | | | | | |
Shares redeemed | | | — | | | | (500,000 | ) | | | — | | | | (200,000 | ) | | | (700,000 | ) | | | (800,000 | ) |
Shares outstanding, end of year | | | 300,000 | | | | 250,000 | | | | 900,000 | | | | 900,000 | | | | 3,900,000 | | | | 3,000,000 | |
See Notes to Financial Statements.
Statements of Changes in Net Assets (continued)
WisdomTree Trust
| | | | | | | | | | | | | | | | | | | | | | | | |
| | | |
| | | WisdomTree U.S. Short-Term Corporate Bond Fund | | | WisdomTree Emerging Markets Efficient Core Fund | | | WisdomTree International Efficient Core Fund | |
| | | | | | |
| | | For the Year Ended
June 30, 2022 | | | For the Year Ended
June 30, 2021 | | | For the Year Ended
June 30, 2022 | | | For the Period
May 20, 2021*
through June 30, 2021 | | | For the Year
Ended June 30,
2022 | | | For the Period
May 20, 2021*
through June
30, 2021 | |
INCREASE (DECREASE) IN NET ASSETS RESULTING FROM OPERATIONS: | |
| | | | | | |
Net investment income | | $ | 526,577 | | | $ | 428,070 | | | $ | 513,193 | | | $ | 6,326 | | | $ | 2,014,624 | | | $ | 4,509 | |
| | | | | | |
Net realized gain (loss) on investments, futures contracts, foreign currency contracts and foreign currency related transactions | | | (808,823 | ) | | | 235,153 | | | | (3,198,496 | ) | | | 3,913 | | | | (8,928,568 | ) | | | (84 | ) |
| | | | | | |
Net increase (decrease) in unrealized appreciation/depreciation on investments, futures contracts, foreign currency contracts and translation of assets and liabilities denominated in foreign currencies | | | (2,297,744 | ) | | | (245,808 | ) | | | (7,225,923 | ) | | | 68,084 | | | | (19,291,690 | ) | | | (3,534 | ) |
Net increase (decrease) in net assets resulting from operations | | | (2,579,990 | ) | | | 417,415 | | | | (9,911,226 | ) | | | 78,323 | | | | (26,205,634 | ) | | | 891 | |
DISTRIBUTIONS TO SHAREHOLDERS: | |
| | | | | | |
Distributable earnings | | | (651,248 | ) | | | (521,988 | ) | | | (378,458 | ) | | | (3,000 | ) | | | (1,971,331 | ) | | | (2,000 | ) |
CAPITAL SHARE TRANSACTIONS: | |
| | | | | | |
Net proceeds from sale of shares | | | 15,102,248 | | | | 10,358,506 | | | | 51,468,255 | | | | 2,000,000 | | | | 157,472,630 | | | | 2,000,000 | |
| | | | | | |
Cost of shares redeemed | | | — | | | | — | | | | (8,902,363 | ) | | | (119 | ) | | | (55,527,380 | ) | | | (118 | ) |
Net increase in net assets resulting from capital share transactions | | | 15,102,248 | | | | 10,358,506 | | | | 42,565,892 | | | | 1,999,881 | | | | 101,945,250 | | | | 1,999,882 | |
Net Increase in Net Assets | | | 11,871,010 | | | | 10,253,933 | | | | 32,276,208 | | | | 2,075,204 | | | | 73,768,285 | | | | 1,998,773 | |
NET ASSETS: | |
| | | | | | |
Beginning of period | | $ | 30,885,799 | | | $ | 20,631,866 | | | $ | 2,075,324 | | | $ | 120 | | | $ | 1,998,893 | | | $ | 120 | |
| | | | | | |
End of period | | $ | 42,756,809 | | | $ | 30,885,799 | | | $ | 34,351,532 | | | $ | 2,075,324 | | | $ | 75,767,178 | | | $ | 1,998,893 | |
SHARES CREATED AND REDEEMED: | |
| | | | | | |
Shares outstanding, beginning of period | | | 600,000 | | | | 400,000 | | | | 50,000 | | | | 3 | | | | 50,000 | | | | 3 | |
| | | | | | |
Shares created | | | 300,000 | | | | 200,000 | | | | 1,450,000 | | | | 50,000 | | | | 4,050,000 | | | | 50,000 | |
| | | | | | |
Shares redeemed | | | — | | | | — | | | | (300,000 | ) | | | (3 | ) | | | (1,650,000 | ) | | | (3 | ) |
Shares outstanding, end of period | | | 900,000 | | | | 600,000 | | | | 1,200,000 | | | | 50,000 | | | | 2,450,000 | | | | 50,000 | |
| * | Commencement of operations. The commencement of operations date is considered to be the date that the Fund began trading in the secondary market. |
See Notes to Financial Statements.
Statements of Changes in Net Assets (continued)
WisdomTree Trust
| | | | | | | | | | | | | | | | |
| | | |
| | | WisdomTree U.S. Efficient Core Fund | | | WisdomTree Artificial Intelligence and Innovation Fund | | | WisdomTree Battery Value Chain and Innovation Fund | |
| | | | |
| | | For the Year
Ended June 30, 2022 | | | For the Year
Ended June 30, 2021 | | | For the Period December 9, 2021* through June 30, 2022 | | | For the Period
February 17,
2022* through
June 30, 2022 | |
INCREASE (DECREASE) IN NET ASSETS RESULTING FROM OPERATIONS: | |
| | | | |
Net investment income | | $ | 8,325,402 | | | $ | 4,443,974 | | | $ | 1,439 | | | | 10,849 | |
| | | | |
Net realized gain (loss) on investments, futures contracts, foreign currency contracts and foreign currency related transactions | | | 6,067,718 | | | | (6,770,600 | ) | | | (74,061 | ) | | | (117,758 | ) |
| | | | |
Net increase (decrease) in unrealized appreciation/depreciation on investments, futures contracts, foreign currency contracts and translation of assets and liabilities denominated in foreign currencies | | | (190,207,402 | ) | | | 111,302,431 | | | | (425,354 | ) | | | (155,958 | ) |
Net increase (decrease) in net assets resulting from operations | | | (175,814,282 | ) | | | 108,975,805 | | | | (497,976 | ) | | | (262,867 | ) |
DISTRIBUTIONS TO SHAREHOLDERS: | |
| | | | |
Distributable earnings | | | (8,163,536 | ) | | | (4,558,343 | ) | | | — | | | | — | |
CAPITAL SHARE TRANSACTIONS: | |
| | | | |
Net proceeds from sale of shares | | | 543,539,352 | | | | 192,382,346 | | | | 1,250,000 | | | | 2,000,000 | |
| | | | |
Cost of shares redeemed | | | (183,240,518 | ) | | | (16,194,891 | ) | | | (101 | ) | | | (117 | ) |
| | | | |
Net increase in net assets resulting from capital share transactions | | | 360,298,834 | | | | 176,187,455 | | | | 1,249,899 | | | | 1,999,883 | |
Net Increase in Net Assets | | | 176,321,016 | | | | 280,604,917 | | | | 751,923 | | | | 1,737,016 | |
NET ASSETS: | |
| | | | |
Beginning of period | | $ | 519,284,050 | | | $ | 238,679,133 | | | $ | 100 | | | | 120 | |
| | | | |
End of period | | $ | 695,605,066 | | | $ | 519,284,050 | | | $ | 752,023 | | | | 1,737,136 | |
SHARES CREATED AND REDEEMED: | |
| | | | |
Shares outstanding, beginning of period | | | 12,800,000 | | | | 7,800,000 | | | | 4 | | | | 3 | |
| | | | |
Shares created | | | 12,750,000 | | | | 5,450,000 | | | | 50,000 | | | | 50,000 | |
| | | | |
Shares redeemed | | | (4,700,000 | ) | | | (450,000 | ) | | | (4 | ) | | | (3 | ) |
Shares outstanding, end of period | | | 20,850,000 | | | | 12,800,000 | | | | 50,000 | | | | 50,000 | |
| * | Commencement of operations. The commencement of operations date is considered to be the date that the Fund began trading in the secondary market. |
See Notes to Financial Statements.
Statements of Changes in Net Assets (concluded)
WisdomTree Trust
| | | | | | | | | | | | | | | | | | | | | | | | |
| | | |
| | | WisdomTree BioRevolution Fund | | | WisdomTree Cloud Computing Fund | | | WisdomTree Cybersecurity Fund | |
| | | | | | |
| | | For the Year Ended June 30, 2022 | | | For the Period
June 3, 2021*
through June 30, 2021 | | | For the Year Ended June 30, 2022 | | | For the Year Ended June 30, 2021 | | | For the Year Ended June 30, 2022 | | | For the Period
January 28, 2021*
through June 30, 2021 | |
INCREASE (DECREASE) IN NET ASSETS RESULTING FROM OPERATIONS: | | | | | | | | | | | | | |
| | | | | | |
Net investment income (loss) | | $ | 12,468 | | | $ | (112 | ) | | $ | (4,639,243 | ) | | $ | (4,511,983 | ) | | $ | 183,248 | | | $ | (10,713 | ) |
| | | | | | |
Net realized gain (loss) on investments, foreign currency contracts and foreign currency related transactions | | | (210,739 | ) | | | (231 | ) | | | (10,186,800 | ) | | | 255,254,863 | | | | 1,284,806 | | | | (390,587 | ) |
| | | | | | |
Net increase (decrease) in unrealized appreciation/depreciation on investments and translation of assets and liabilities denominated in foreign currencies | | | (1,315,932 | ) | | | 100,803 | | | | (595,077,204 | ) | | | 47,066,707 | | | | (16,325,428 | ) | | | 886,660 | |
Net increase (decrease) in net assets resulting from operations | | | (1,514,203 | ) | | | 100,460 | | | | (609,903,247 | ) | | | 297,809,587 | | | | (14,857,374 | ) | | | 485,360 | |
DISTRIBUTIONS TO SHAREHOLDERS: | |
| | | | | | |
Distributable earnings | | | (4,424 | ) | | | — | | | | — | | | | — | | | | (177,112 | ) | | | — | |
CAPITAL SHARE TRANSACTIONS: | |
| | | | | | |
Net proceeds from sale of shares | | | 3,541,300 | | | | 2,564,622 | | | | 874,468,867 | | | | 1,791,135,471 | | | | 33,409,139 | | | | 26,389,247 | |
| | | | | | |
Cost of shares redeemed | | | — | | | | (100 | ) | | | (910,956,909 | ) | | | (1,232,674,591 | ) | | | (12,487,363 | ) | | | (86 | ) |
Net increase (decrease) in net assets resulting from capital share transactions | | | 3,541,300 | | | | 2,564,522 | | | | (36,488,042 | ) | | | 558,460,880 | | | | 20,921,776 | | | | 26,389,161 | |
Net Increase (Decrease) in Net Assets | | | 2,022,673 | | | | 2,664,982 | | | | (646,391,289 | ) | | | 856,270,467 | | | | 5,887,290 | | | | 26,874,521 | |
NET ASSETS: | |
| | | | | | |
Beginning of period | | $ | 2,665,082 | | | $ | 100 | | | $ | 1,277,041,845 | | | $ | 420,771,378 | | | $ | 26,874,621 | | | $ | 100 | |
| | | | | | |
End of period | | $ | 4,687,755 | | | $ | 2,665,082 | | | $ | 630,650,556 | | | $ | 1,277,041,845 | | | $ | 32,761,911 | | | $ | 26,874,621 | |
SHARES CREATED AND REDEEMED: | |
| | | | | | |
Shares outstanding, beginning of period | | | 100,000 | | | | 4 | | | | 22,850,000 | | | | 10,800,004 | | | | 1,100,000 | | | | 4 | |
| | | | | | |
Shares created | | | 170,000 | | | | 100,000 | | | | 20,350,000 | | | | 37,050,000 | | | | 1,290,000 | | | | 1,100,000 | |
| | | | | | |
Shares redeemed | | | — | | | | (4 | ) | | | (20,700,000 | ) | | | (25,000,004 | ) | | | (550,000 | ) | | | (4 | ) |
Shares outstanding, end of period | | | 270,000 | | | | 100,000 | | | | 22,500,000 | | | | 22,850,000 | | | | 1,840,000 | | | | 1,100,000 | |
* Commencement of operations. The commencement of operations date is considered to be the date that the Fund began trading in the secondary market. | |
See Notes to Financial Statements.
Financial Highlights
WisdomTree Trust
Selected data for a share of beneficial interest outstanding throughout the period is presented below:
| | | | | | | | | | | | | | | | | | | | |
| | | | | | |
WisdomTree Dynamic Currency Hedged
International Equity Fund | | For the
Year Ended
June 30, 2022 | | | For the
Year Ended
June 30, 2021 | | | For the
Year Ended
June 30, 2020 | | | For the
Year Ended
June 30, 2019 | | | For the
Year Ended
June 30, 2018 | |
Net asset value, beginning of year | | $ | 30.50 | | | $ | 25.40 | | | $ | 28.84 | | | $ | 28.96 | | | $ | 28.27 | |
Investment operations: | |
| | | | | |
Net investment income1 | | | 1.34 | | | | 0.91 | | | | 0.80 | | | | 1.04 | | | | 1.00 | |
| | | | | |
Net realized and unrealized gain (loss) | | | (2.54 | ) | | | 5.27 | | | | (3.44 | ) | | | (0.17 | ) | | | 0.70 | |
Total from investment operations | | | (1.20 | ) | | | 6.18 | | | | (2.64 | ) | | | 0.87 | | | | 1.70 | |
Dividends to shareholders: | |
| | | | | |
Net investment income | | | (1.52 | ) | | | (1.08 | ) | | | (0.80 | ) | | | (0.99 | ) | | | (1.01 | ) |
Net asset value, end of year | | $ | 27.78 | | | $ | 30.50 | | | $ | 25.40 | | | $ | 28.84 | | | $ | 28.96 | |
| | | | | |
TOTAL RETURN2 | | | (4.12 | )% | | | 24.76 | % | | | (9.34 | )%3 | | | 3.11 | % | | | 6.04 | % |
RATIOS/SUPPLEMENTAL DATA: | |
| | | | | |
Net assets, end of year (000’s omitted) | | $ | 168,070 | | | $ | 161,660 | | | $ | 198,145 | | | $ | 252,362 | | | $ | 262,129 | |
|
Ratios to average net assets of: | |
| | | | | |
Expenses, net of expense waivers | | | 0.41 | %4 | | | 0.39 | % | | | 0.35 | % | | | 0.35 | % | | | 0.35 | % |
| | | | | |
Expenses, prior to expense waivers | | | 0.41 | %4 | | | 0.40 | % | | | 0.40 | % | | | 0.40 | % | | | 0.40 | % |
| | | | | |
Net investment income | | | 4.41 | % | | | 3.26 | % | | | 2.87 | % | | | 3.68 | % | | | 3.33 | % |
Portfolio turnover rate5 | | | 35 | % | | | 38 | % | | | 17 | % | | | 26 | % | | | 15 | % |
| | | | | | | | | | | | | | | | | | | | |
| | | | | | |
WisdomTree Dynamic Currency Hedged
International SmallCap Equity Fund | | For the
Year Ended
June 30, 2022 | | | For the
Year Ended
June 30, 2021 | | | For the
Year Ended
June 30, 2020 | | | For the
Year Ended
June 30, 2019 | | | For the
Year Ended
June 30, 2018 | |
Net asset value, beginning of year | | $ | 34.45 | | | $ | 26.22 | | | $ | 29.60 | | | $ | 31.50 | | | $ | 30.12 | |
Investment operations: | |
| | | | | |
Net investment income1 | | | 1.37 | | | | 0.88 | | | | 0.88 | | | | 1.12 | | | | 1.11 | |
| | | | | |
Net realized and unrealized gain (loss) | | | (4.65 | ) | | | 8.46 | | | | (3.39 | ) | | | (2.29 | ) | | | 0.92 | |
Total from investment operations | | | (3.28 | ) | | | 9.34 | | | | (2.51 | ) | | | (1.17 | ) | | | 2.03 | |
Dividends to shareholders: | |
| | | | | |
Net investment income | | | (1.37 | ) | | | (1.11 | ) | | | (0.87 | ) | | | (0.73 | ) | | | (0.65 | ) |
Net asset value, end of year | | $ | 29.80 | | | $ | 34.45 | | | $ | 26.22 | | | $ | 29.60 | | | $ | 31.50 | |
| | | | | |
TOTAL RETURN2 | | | (9.78 | )% | | | 36.12 | % | | | (8.70 | )%6 | | | (3.70 | )% | | | 6.73 | % |
RATIOS/SUPPLEMENTAL DATA: | |
| | | | | |
Net assets, end of year (000’s omitted) | | $ | 58,118 | | | $ | 41,336 | | | $ | 38,015 | | | $ | 34,041 | | | $ | 17,327 | |
|
Ratios to average net assets of: | |
| | | | | |
Expenses, net of expense waivers | | | 0.49 | %7 | | | 0.47 | % | | | 0.43 | % | | | 0.43 | % | | | 0.43 | % |
| | | | | |
Expenses, prior to expense waivers | | | 0.49 | %7 | | | 0.48 | % | | | 0.48 | % | | | 0.48 | % | | | 0.48 | % |
| | | | | |
Net investment income | | | 4.06 | % | | | 2.86 | % | | | 3.08 | % | | | 3.77 | % | | | 3.41 | % |
Portfolio turnover rate5 | | | 48 | % | | | 60 | % | | | 25 | % | | | 55 | % | | | 95 | % |
| 1 | Based on average shares outstanding. |
| 2 | Total return is calculated assuming an initial investment made at the net asset value at the beginning of the period, reinvestment of all dividends and distributions at net asset value during the period and redemption on the last day of the period. For the periods in which the investment advisor waived advisory fees, the total return would have been lower if certain expenses had not been waived (Notes 2 and 3). |
| 3 | Includes a voluntary reimbursement from the sub-advisor for investment losses on certain foreign exchange transactions during the period. Excluding this voluntary reimbursement, total return would have been 0.11% lower. |
| 4 | Included in the expense ratio are “Other fees” described in Note 6. Without these expenses, the expense ratio would have been 0.40%. |
| 5 | Portfolio turnover rate excludes the value of the portfolio securities received or delivered as a result of in-kind creations or redemptions of the Fund’s capital shares. Short-term securities with maturities less than or equal to 365 days are excluded from the portfolio turnover calculation. |
| 6 | Includes a voluntary reimbursement from the sub-advisor for investment losses on certain foreign exchange transactions during the period. Excluding this voluntary reimbursement, total return would have been 0.14% lower. |
| 7 | Included in the expense ratio are “Other fees” described in Note 6. Without these expenses, the expense ratio would have been 0.48%. |
See Notes to Financial Statements.
Financial Highlights (continued)
WisdomTree Trust
Selected data for a share of beneficial interest outstanding throughout the period is presented below:
| | | | | | | | | | | | | | | | | | | | |
| | | | | | |
WisdomTree Emerging Markets ESG
Fund | | For the
Year Ended
June 30, 2022 | | | For the
Year Ended
June 30, 2021 | | | For the
Year Ended
June 30, 20201 | | | For the
Year Ended
June 30, 2019 | | | For the
Year Ended
June 30, 2018 | |
Net asset value, beginning of year | | $ | 39.34 | | | $ | 27.90 | | | $ | 31.47 | | | $ | 30.95 | | | $ | 29.71 | |
Investment operations: | | | | | | | | | | | | | | | | | | | | |
| | | | | |
Net investment income2 | | | 0.99 | | | | 0.62 | | | | 0.93 | | | | 1.21 | | | | 0.96 | |
| | | | | |
Net realized and unrealized gain (loss) | | | (11.07 | ) | | | 11.50 | | | | (3.44 | ) | | | 0.38 | | | | 1.14 | |
Total from investment operations | | | (10.08 | ) | | | 12.12 | | | | (2.51 | ) | | | 1.59 | | | | 2.10 | |
Dividends to shareholders: | | | | | | | | | | | | | | | | | | | | |
| | | | | |
Net investment income | | | (0.95 | ) | | | (0.68 | ) | | | (1.06 | ) | | | (1.07 | ) | | | (0.86 | ) |
Net asset value, end of year | | $ | 28.31 | | | $ | 39.34 | | | $ | 27.90 | | | $ | 31.47 | | | $ | 30.95 | |
| | | | | |
TOTAL RETURN3 | | | (25.99 | )% | | | 43.82 | % | | | (8.19 | )% | | | 5.25 | % | | | 7.05 | %4 |
RATIOS/SUPPLEMENTAL DATA: | | | | | | | | | | | | | | | | | | | | |
| | | | | |
Net assets, end of year (000’s omitted) | | $ | 25,481 | | | $ | 35,404 | | | $ | 33,482 | | | $ | 50,353 | | | $ | 34,042 | |
| | | | | |
Ratios to average net assets of: | | | | | | | | | | | | | | | | | | | | |
| | | | | |
Expenses | | | 0.32 | % | | | 0.32 | %5,6 | | | 0.32 | % | | | 0.32 | % | | | 0.32 | % |
| | | | | |
Net investment income | | | 2.88 | % | | | 1.79 | %5 | | | 3.13 | % | | | 3.97 | % | | | 2.91 | % |
Portfolio turnover rate7 | | | 57 | % | | | 69 | % | | | 130 | %1 | | | 26 | % | | | 22 | % |
| | | | | | | | | | | | | | | | | | | | |
| | | | | | |
| WisdomTree International ESG Fund | | For the
Year Ended
June 30, 2022 | | | For the
Year Ended
June 30, 2021 | | | For the
Year Ended
June 30, 20208 | | | For the
Year Ended
June 30, 2019 | | | For the
Year Ended
June 30, 2018 | |
Net asset value, beginning of year | | $ | 30.78 | | | $ | 24.48 | | | $ | 23.96 | | | $ | 24.67 | | | $ | 23.31 | |
Investment operations: | | | | | | | | | | | | | | | | | | | | |
| | | | | |
Net investment income2 | | | 0.87 | | | | 0.51 | | | | 0.46 | | | | 0.49 | | | | 0.71 | |
| | | | | |
Net realized and unrealized gain (loss) | | | (5.98 | ) | | | 6.52 | | | | 0.73 | 9 | | | 0.02 | | | | 1.03 | |
Total from investment operations | | | (5.11 | ) | | | 7.03 | | | | 1.19 | | | | 0.51 | | | | 1.74 | |
Dividends and distributions to shareholders: | | | | | | | | | | | | | | | | | | | | |
| | | | | |
Net investment income | | | (0.85 | ) | | | (0.73 | ) | | | (0.50 | ) | | | (0.29 | ) | | | (0.21 | ) |
| | | | | |
Capital gains | | | – | | | | – | | | | (0.17 | ) | | | (0.93 | ) | | | (0.17 | ) |
Total dividends and distributions to shareholders | | | (0.85 | ) | | | (0.73 | ) | | | (0.67 | ) | | | (1.22 | ) | | | (0.38 | ) |
Net asset value, end of year | | $ | 24.82 | | | $ | 30.78 | | | $ | 24.48 | | | $ | 23.96 | | | $ | 24.67 | |
| | | | | |
TOTAL RETURN3 | | | (16.85 | )% | | | 28.94 | % | | | 4.88 | % | | | 2.56 | % | | | 7.44 | % |
RATIOS/SUPPLEMENTAL DATA: | | | | | | | | | | | | | | | | | | | | |
| | | | | |
Net assets, end of year (000’s omitted) | | $ | 7,447 | | | $ | 7,694 | | | $ | 18,363 | | | $ | 28,749 | | | $ | 19,736 | |
| | | | | |
Ratios to average net assets of: | | | | | | | | | | | | | | | | | | | | |
| | | | | |
Expenses, net of expense waivers | | | 0.30 | % | | | 0.30 | % | | | 0.15 | %5 | | | 0.10 | %5 | | | 0.10 | %5 |
| | | | | |
Expenses, prior to expense waivers | | | 0.30 | % | | | 0.30 | % | | | 0.52 | %5 | | | 0.58 | %5 | | | 0.58 | %5 |
| | | | | |
Net investment income | | | 2.96 | % | | | 1.86 | % | | | 1.89 | %5 | | | 2.10 | %5 | | | 2.87 | %5 |
Portfolio turnover rate7 | | | 87 | % | | | 80 | % | | | 112 | %8 | | | 6 | % | | | 4 | % |
| 1 | The information reflects the investment objective and strategy of the WisdomTree Emerging Markets Dividend Fund through March 15, 2020 and the investment objective and strategy of the WisdomTree Emerging Markets ESG Fund thereafter. The increase in the portfolio turnover rate was primarily a result of the aforementioned investment objective and strategy change. |
| 2 | Based on average shares outstanding. |
| 3 | Total return is calculated assuming an initial investment made at the net asset value at the beginning of the period, reinvestment of all dividends and distributions at net asset value during the period and redemption on the last day of the period. For the periods in which the investment advisor waived advisory fees, the total return would have been lower if certain expenses had not been waived (Notes 2 and 3). |
| 4 | Includes a reimbursement from the sub-advisor for an operational error. Excluding the reimbursement, total return would have been unchanged. |
| 5 | The ratios to average net assets do not include net investment income (loss) or expenses of other funds in which the Fund invests. |
| 6 | The expense ratio includes investment advisory fee waivers. Without these investment advisory fee waivers, the expense ratio would have been unchanged. |
| 7 | Portfolio turnover rate excludes the value of the portfolio securities received or delivered as a result of in-kind creations or redemptions of the Fund’s capital shares. Short-term securities with maturities less than or equal to 365 days are excluded from the portfolio turnover calculation. |
| 8 | The information reflects the investment objective and strategy of the WisdomTree Dynamic Currency Hedged International Quality Dividend Growth Fund through March 15, 2020 and the investment objective and strategy of the WisdomTree International ESG Fund thereafter. The increase in the portfolio turnover rate was primarily a result of the aforementioned investment objective and strategy change. |
| 9 | The amount of net realized and unrealized gain per share does not correspond with the amounts reported within the Statements of Changes due to the timing of capital share transactions of Fund shares and fluctuating market values during the fiscal year ended. |
See Notes to Financial Statements.
Financial Highlights (continued)
WisdomTree Trust
Selected data for a share of beneficial interest outstanding throughout the period is presented below:
| | | | | | | | | | | | | | | | | | | | |
| | | | | | |
| WisdomTree U.S. Corporate Bond Fund | | For the
Year Ended
June 30, 2022 | | | For the
Year Ended
June 30, 2021 | | | For the
Year Ended
June 30, 2020 | | | For the
Year Ended
June 30, 2019 | | | For the
Year Ended
June 30, 2018 | |
Net asset value, beginning of year | | $ | 54.48 | | | $ | 54.40 | | | $ | 51.09 | | | $ | 47.79 | | | $ | 49.88 | |
Investment operations: | |
| | | | | |
Net investment income1 | | | 1.25 | | | | 1.23 | | | | 1.42 | | | | 1.59 | | | | 1.49 | |
| | | | | |
Net realized and unrealized gain (loss) | | | (9.18 | ) | | | 0.25 | 2 | | | 3.37 | | | | 3.28 | | | | (2.02 | ) |
Total from investment operations | | | (7.93 | ) | | | 1.48 | | | | 4.79 | | | | 4.87 | | | | (0.53 | ) |
Dividends and distributions to shareholders: | |
| | | | | |
Net investment income | | | (1.24 | ) | | | (1.21 | ) | | | (1.48 | ) | | | (1.57 | ) | | | (1.56 | ) |
| | | | | |
Capital gains | | | (0.10 | ) | | | (0.19 | ) | | | – | | | | – | | | | – | |
Total dividends and distributions to shareholders | | | (1.34 | ) | | | (1.40 | ) | | | (1.48 | ) | | | (1.57 | ) | | | (1.56 | ) |
Net asset value, end of year | | $ | 45.21 | | | $ | 54.48 | | | $ | 54.40 | | | $ | 51.09 | | | $ | 47.79 | |
| | | | | |
TOTAL RETURN3 | | | (14.83 | )% | | | 2.75 | % | | | 9.54 | % | | | 10.44 | % | | | (1.11 | )% |
RATIOS/SUPPLEMENTAL DATA: | |
| | | | | |
Net assets, end of year (000’s omitted) | | $ | 40,685 | | | $ | 49,028 | | | $ | 38,077 | | | $ | 5,109 | | | $ | 4,779 | |
|
Ratios to average net assets of: | |
| | | | | |
Expenses, net of expense waivers | | | 0.18 | % | | | 0.18 | %4 | | | 0.18 | % | | | 0.18 | % | | | 0.18 | % |
| | | | | |
Expenses, prior to expense waivers | | | 0.18 | % | | | 0.21 | % | | | 0.28 | % | | | 0.28 | % | | | 0.28 | % |
| | | | | |
Net investment income | | | 2.42 | % | | | 2.27 | % | | | 2.71 | % | | | 3.29 | % | | | 3.02 | % |
Portfolio turnover rate5 | | | 52 | % | | | 36 | % | | | 25 | % | | | 22 | % | | | 21 | % |
| | | | | | | | | | | | | | | | | | | | |
| | | | | | |
WisdomTree U.S. High Yield Corporate
Bond Fund | | For the
Year Ended
June 30, 2022 | | | For the
Year Ended
June 30, 2021 | | | For the
Year Ended
June 30, 2020 | | | For the
Year Ended
June 30, 2019 | | | For the
Year Ended
June 30, 2018 | |
Net asset value, beginning of year | | $ | 52.79 | | | $ | 48.53 | | | $ | 51.51 | | | $ | 49.77 | | | $ | 52.29 | |
Investment operations: | |
| | | | | |
Net investment income1 | | | 2.20 | | | | 2.32 | | | | 2.64 | | | | 2.84 | | | | 2.91 | |
| | | | | |
Net realized and unrealized gain (loss) | | | (8.92 | ) | | | 4.28 | | | | (3.00 | ) | | | 1.69 | | | | (2.14 | ) |
Total from investment operations | | | (6.72 | ) | | | 6.60 | | | | (0.36 | ) | | | 4.53 | | | | 0.77 | |
Dividends and distributions to shareholders: | |
| | | | | |
Net investment income | | | (2.15 | ) | | | (2.34 | ) | | | (2.62 | ) | | | (2.75 | ) | | | (2.89 | ) |
| | | | | |
Capital gains | | | – | | | | – | | | | – | | | | (0.04 | ) | | | (0.40 | ) |
| | | | | |
Tax return of capital | | | – | | | | – | | | | (0.00 | )6 | | | – | | | | – | |
Total dividends and distributions to shareholders | | | (2.15 | ) | | | (2.34 | ) | | | (2.62 | ) | | | (2.79 | ) | | | (3.29 | ) |
Net asset value, end of year | | $ | 43.92 | | | $ | 52.79 | | | $ | 48.53 | | | $ | 51.51 | | | $ | 49.77 | |
| | | | | |
TOTAL RETURN3 | | | (13.16 | )% | | | 13.84 | % | | | (0.72 | )% | | | 9.43 | % | | | 1.49 | % |
RATIOS/SUPPLEMENTAL DATA: | |
| | | | | |
Net assets, end of year (000’s omitted) | | $ | 171,295 | | | $ | 158,359 | | | $ | 63,083 | | | $ | 15,453 | | | $ | 4,977 | |
|
Ratios to average net assets of: | |
| | | | | |
Expenses, net of expense waivers | | | 0.38 | % | | | 0.38 | %7 | | | 0.38 | % | | | 0.38 | % | | | 0.38 | % |
| | | | | |
Expenses, prior to expense waivers | | | 0.38 | % | | | 0.41 | % | | | 0.48 | % | | | 0.48 | % | | | 0.48 | % |
| | | | | |
Net investment income | | | 4.36 | % | | | 4.51 | % | | | 5.32 | % | | | 5.68 | % | | | 5.67 | % |
Portfolio turnover rate5 | | | 24 | % | | | 21 | % | | | 22 | % | | | 14 | % | | | 35 | % |
| 1 | Based on average shares outstanding. |
| 2 | The amount of net realized and unrealized gain per share does not correspond with the amounts reported within the Statements of Changes due to the timing of capital share transactions of Fund shares and fluctuating market values during the fiscal year ended. |
| 3 | Total return is calculated assuming an initial investment made at the net asset value at the beginning of the period, reinvestment of all dividends and distributions at net asset value during the period and redemption on the last day of the period. For the periods in which the investment advisor waived advisory fees, the total return would have been lower if certain expenses had not been waived (Notes 2 and 3). |
| 4 | The investment advisor had contractually agreed to limit the advisory fee to 0.18% through October 31, 2020. On October 31, 2020, the contractual waiver expired and the advisory fee was permanently reduced to 0.18%. |
| 5 | Portfolio turnover rate excludes the value of the portfolio securities received or delivered as a result of in-kind creations or redemptions of the Fund’s capital shares. Short-term securities with maturities less than or equal to 365 days are excluded from the portfolio turnover calculation. |
| 6 | Amount represents less than $0.005. |
| 7 | The investment advisor had contractually agreed to limit the advisory fee to 0.38% through October 31, 2020. On October 31, 2020, the contractual waiver expired and the advisory fee was permanently reduced to 0.38%. |
See Notes to Financial Statements.
Financial Highlights (continued)
WisdomTree Trust
Selected data for a share of beneficial interest outstanding throughout the period is presented below:
| | | | | | | | | | | | | | | | | | | | |
| | | | | | |
WisdomTree U.S. Short-Term Corporate
Bond Fund | | For the
Year Ended
June 30, 2022 | | | For the
Year Ended
June 30, 2021 | | | For the
Year Ended
June 30, 2020 | | | For the
Year Ended
June 30, 2019 | | | For the
Year Ended
June 30, 2018 | |
Net asset value, beginning of year | | $ | 51.48 | | | $ | 51.58 | | | $ | 50.43 | | | $ | 49.03 | | | $ | 49.94 | |
Investment operations: | |
| | | | | |
Net investment income1 | | | 0.68 | | | | 0.75 | | | | 1.23 | | | | 1.24 | | | | 0.98 | |
| | | | | |
Net realized and unrealized gain (loss) | | | (3.82 | ) | | | 0.06 | 2 | | | 1.13 | 2 | | | 1.39 | | | | (0.88 | ) |
Total from investment operations | | | (3.14 | ) | | | 0.81 | | | | 2.36 | | | | 2.63 | | | | 0.10 | |
Dividends and distributions to shareholders: | |
| | | | | |
Net investment income | | | (0.62 | ) | | | (0.75 | ) | | | (1.21 | ) | | | (1.23 | ) | | | (1.01 | ) |
| | | | | |
Capital gains | | | (0.21 | ) | | | (0.16 | ) | | | – | | | | – | | | | – | |
Total dividends and distributions to shareholders | | | (0.83 | ) | | | (0.91 | ) | | | (1.21 | ) | | | (1.23 | ) | | | (1.01 | ) |
Net asset value, end of year | | $ | 47.51 | | | $ | 51.48 | | | $ | 51.58 | | | $ | 50.43 | | | $ | 49.03 | |
| | | | | |
TOTAL RETURN3 | | | (6.18 | )% | | | 1.59 | % | | | 4.75 | % | | | 5.44 | % | | | 0.19 | % |
RATIOS/SUPPLEMENTAL DATA: | |
| | | | | |
Net assets, end of year (000’s omitted) | | $ | 42,757 | | | $ | 30,886 | | | $ | 20,632 | | | $ | 5,043 | | | $ | 4,903 | |
|
Ratios to average net assets of: | |
| | | | | |
Expenses, net of expense waivers | | | 0.18 | % | | | 0.18 | %4 | | | 0.18 | % | | | 0.18 | % | | | 0.18 | % |
| | | | | |
Expenses, prior to expense waivers | | | 0.18 | % | | | 0.21 | % | | | 0.28 | % | | | 0.28 | % | | | 0.28 | % |
| | | | | |
Net investment income | | | 1.36 | % | | | 1.46 | % | | | 2.43 | % | | | 2.50 | % | | | 1.98 | % |
Portfolio turnover rate5 | | | 55 | % | | | 47 | % | | | 43 | % | | | 28 | % | | | 41 | % |
| | | | | | | | | | | | | | | | |
| | | |
| WisdomTree Emerging Markets Efficient Core Fund | | For the
Year Ended
June 30, 2022 | | | For the Period
May 20, 2021*
through
June 30, 2021 | |
Net asset value, beginning of period | | $ | 41.51 | | | $ | 39.75 | |
Investment operations: | |
| | |
Net investment income1 | | | 0.82 | | | | 0.13 | |
| | |
Net realized and unrealized gain (loss) | | | (12.71 | ) | | | 1.69 | |
Total from investment operations | | | (11.89 | ) | | | 1.82 | |
Dividends and distributions to shareholders: | |
| | |
Net investment income | | | (0.73 | ) | | | (0.06 | ) |
| | |
Capital gains | | | (0.26 | ) | | | – | |
Total dividends and distributions to shareholders | | | (0.99 | ) | | | (0.06 | ) |
Net asset value, end of period | | $ | 28.63 | | | $ | 41.51 | |
| | |
TOTAL RETURN3 | | | (29.06 | )% | | | 4.58 | % |
RATIOS/SUPPLEMENTAL DATA: | |
| | |
Net assets, end of period (000’s omitted) | | $ | 34,352 | | | $ | 2,075 | |
|
Ratios to average net assets of: | |
| | |
Expenses, net of expense waivers | | | 0.32 | %6 | | | 0.31 | %6,7 |
| | |
Expenses, prior to expense waivers | | | 0.32 | %6 | | | 0.32 | %6,7 |
| | |
Net investment income | | | 2.52 | %6 | | | 2.68 | %6,7 |
Portfolio turnover rate5 | | | 102 | % | | | 3 | % |
| * | Commencement of operations. The commencement of operations date is considered to be the date that the Fund began trading in the secondary market. |
| 1 | Based on average shares outstanding. |
| 2 | The amount of net realized and unrealized gain per share does not correspond with the amounts reported within the Statements of Changes due to the timing of capital share transactions of Fund shares and fluctuating market values during the fiscal year ended. |
| 3 | Total return is calculated assuming an initial investment made at the net asset value at the beginning of the period, reinvestment of all dividends and distributions at net asset value during the period and redemption on the last day of the period. Total return calculated for a period of less than one year is not annualized. For the periods in which the investment advisor waived advisory fees, the total return would have been lower if certain expenses had not been waived (Notes 2 and 3). |
| 4 | The investment advisor had contractually agreed to limit the advisory fee to 0.18% through October 31, 2020. On October 31, 2020, the contractual waiver expired and the advisory fee was permanently reduced to 0.18%. |
| 5 | Portfolio turnover rate excludes the value of the portfolio securities received or delivered as a result of in-kind creations or redemptions of the Fund’s capital shares. Short-term securities with maturities less than or equal to 365 days are excluded from the portfolio turnover calculation. |
| 6 | The ratios to average net assets do not include net investment income (loss) or expenses of other funds in which the Fund invests. |
See Notes to Financial Statements.
Financial Highlights (continued)
WisdomTree Trust
Selected data for a share of beneficial interest outstanding throughout the period is presented below:
| | | | | | | | |
| WisdomTree International Efficient Core Fund | | For the
Year Ended
June 30, 2022 | | | For the Period
May 20, 2021*
through
June 30, 2021 | |
Net asset value, beginning of period | | $ | 39.98 | | | $ | 39.43 | |
Investment operations: | | | | | | | | |
| | |
Net investment income1 | | | 1.19 | | | | 0.09 | |
| | |
Net realized and unrealized gain (loss) | | | (9.26 | ) | | | 0.50 | 2 |
Total from investment operations | | | (8.07 | ) | | | 0.59 | |
Dividends and distributions to shareholders: | | | | | | | | |
| | |
Net investment income | | | (0.96 | ) | | | (0.04 | ) |
| | |
Capital gains | | | (0.02 | ) | | | – | |
Total dividends and distributions to shareholders | | | (0.98 | ) | | | (0.04 | ) |
Net asset value, end of period | | $ | 30.93 | | | $ | 39.98 | |
| | |
TOTAL RETURN3 | | | (20.44 | )% | | | 1.50 | % |
RATIOS/SUPPLEMENTAL DATA: | | | | | | | | |
| | |
Net assets, end of period (000’s omitted) | | $ | 75,767 | | | $ | 1,999 | |
| | |
Ratios to average net assets of: | | | | | | | | |
| | |
Expenses | | | 0.26 | % | | | 0.26 | %4 |
| | |
Net investment income | | | 3.30 | % | | | 1.94 | %4 |
Portfolio turnover rate5 | | | 13 | % | | | 0 | % |
| | | | | | | | | | | | | | | | |
| | | | | |
| WisdomTree U.S. Efficient Core Fund | | For the
Year Ended
June 30, 2022 | | | For the
Year Ended
June 30, 2021 | | | For the
Year Ended
June 30, 2020 | | | For the Period
August 2, 2018*
through
June 30, 2019 | |
Net asset value, beginning of period | | $ | 40.57 | | | $ | 30.60 | | | $ | 27.14 | | | $ | 25.08 | |
Investment operations: | |
| | | | |
Net investment income1 | | | 0.42 | | | | 0.41 | | | | 0.45 | | | | 0.38 | |
| | | | |
Net realized and unrealized gain (loss) | | | (7.23 | ) | | | 9.95 | | | | 3.39 | | | | 2.01 | |
Total from investment operations | | | (6.81 | ) | | | 10.36 | | | | 3.84 | | | | 2.39 | |
Dividends and distributions to shareholders: | |
| | | | |
Net investment income | | | (0.40 | ) | | | (0.37 | ) | | | (0.27 | ) | | | (0.33 | ) |
| | | | |
Capital gains | | | – | | | | (0.02 | ) | | | (0.11 | ) | | | – | |
Total dividends and distributions to shareholders | | | (0.40 | ) | | | (0.39 | ) | | | (0.38 | ) | | | (0.33 | ) |
Net asset value, end of period | | $ | 33.36 | | | $ | 40.57 | | | $ | 30.60 | | | $ | 27.14 | |
| | | | |
TOTAL RETURN3 | | | (16.95 | )% | | | 34.04 | % | | | 14.25 | % | | | 9.64 | % |
RATIOS/SUPPLEMENTAL DATA: | |
| | | | |
Net assets, end of period (000’s omitted) | | $ | 695,605 | | | $ | 519,284 | | | $ | 238,679 | | | $ | 5,428 | |
|
Ratios to average net assets of: | |
| | | | |
Expenses | | | 0.20 | % | | | 0.20 | % | | | 0.20 | % | | | 0.20 | %4 |
| | | | |
Net investment income | | | 1.05 | % | | | 1.12 | % | | | 1.57 | % | | | 1.68 | %4 |
Portfolio turnover rate5 | | | 7 | % | | | 9 | % | | | 13 | % | | | 11 | % |
| * | Commencement of operations. The commencement of operations date is considered to be the date that the Fund began trading in the secondary market. |
| 1 | Based on average shares outstanding. |
| 2 | The amount of net realized and unrealized gain per share does not correspond with the amounts reported within the Statements of Changes due to the timing of capital share transactions of Fund shares and fluctuating market values during the fiscal year ended. |
| 3 | Total return is calculated assuming an initial investment made at the net asset value at the beginning of the period, reinvestment of all dividends and distributions at net asset value during the period and redemption on the last day of the period. Total return calculated for a period of less than one year is not annualized. |
| 5 | Portfolio turnover rate is not annualized for fiscal periods less than one year and excludes the value of the portfolio securities received or delivered as a result of in-kind creations or redemptions of the Fund’s capital shares. Short-term securities with maturities less than or equal to 365 days are excluded from the portfolio turnover calculation. |
See Notes to Financial Statements.
Financial Highlights (continued)
WisdomTree Trust
Selected data for a share of beneficial interest outstanding throughout the period is presented below:
| | | | |
| WisdomTree Artificial Intelligence and Innovation Fund | | For the Period
December 9, 2021*
through
June 30, 2022 | |
Net asset value, beginning of period | | $ | 25.22 | |
Investment operations: | | | | |
| |
Net investment income1 | | | 0.03 | |
| |
Net realized and unrealized loss | | | (10.21 | ) |
Total from investment operations | | | (10.18 | ) |
Net asset value, end of period | | $ | 15.04 | |
| |
TOTAL RETURN2 | | | (40.36 | )% |
RATIOS/SUPPLEMENTAL DATA: | | | | |
| |
Net assets, end of period (000’s omitted) | | $ | 752 | |
| |
Ratios to average net assets of: | | | | |
| |
Expenses | | | 0.45 | %3 |
| |
Net investment income | | | 0.26 | %3 |
Portfolio turnover rate4 | | | 11 | % |
| | | | |
| | |
| WisdomTree Battery Value Chain and Innovation Fund | | For the Period
February 17, 2022*
through
June 30, 2022 | |
Net asset value, beginning of period | | $ | 40.49 | |
Investment operations: | | | | |
| |
Net investment income1 | | | 0.22 | |
| |
Net realized and unrealized gain | | | (5.97 | ) |
Total from investment operations | | | (5.75 | ) |
Net asset value, end of period | | $ | 34.74 | |
| |
TOTAL RETURN2 | | | (14.20 | )% |
RATIOS/SUPPLEMENTAL DATA: | | | | |
| |
Net assets, end of period (000’s omitted) | | $ | 1,737 | |
| |
Ratios to average net assets of: | | | | |
| |
Expenses | | | 0.45 | %3 |
| |
Net investment income | | | 1.56 | %3 |
Portfolio turnover rate4 | | | 48 | % |
| * | Commencement of operations. The commencement of operations date is considered to be the date that the Fund began trading in the secondary market. |
| 1 | Based on average shares outstanding. |
| 2 | Total return is calculated assuming an initial investment made at the net asset value at the beginning of the period, reinvestment of all dividends and distributions at net asset value during the period and redemption on the last day of the period. Total return calculated for a period of less than one year is not annualized. |
| 4 | Portfolio turnover rate is not annualized for fiscal periods less than one year and excludes the value of the portfolio securities received or delivered as a result of in-kind creations or redemptions of the Fund’s capital shares. Short-term securities with maturities less than or equal to 365 days are excluded from the portfolio turnover calculation. |
See Notes to Financial Statements.
Financial Highlights (continued)
WisdomTree Trust
Selected data for a share of beneficial interest outstanding throughout the period is presented below:
| | | | | | | | |
| WisdomTree BioRevolution Fund | | For the
Year Ended
June 30, 2022 | | | For the Period
June 3, 2021*
through
June 30, 2021 | |
Net asset value, beginning of period | | $ | 26.65 | | | $ | 25.03 | |
Investment operations: | |
| | |
Net investment income (loss)1 | | | 0.08 | | | | (0.00 | )2 |
| | |
Net realized and unrealized gain (loss) | | | (9.34 | ) | | | 1.62 | |
Total from investment operations | | | (9.26 | ) | | | 1.62 | |
Dividends to shareholders: | |
| | |
Net investment income | | | (0.03 | ) | | | – | |
Net asset value, end of period | | $ | 17.36 | | | $ | 26.65 | |
| | |
TOTAL RETURN3 | | | (34.79 | )% | | | 6.47 | % |
RATIOS/SUPPLEMENTAL DATA: | |
| | |
Net assets, end of period (000’s omitted) | | $ | 4,688 | | | $ | 2,665 | |
|
Ratios to average net assets of: | |
| | |
Expenses | | | 0.45 | % | | | 0.45 | %4 |
| | |
Net investment income (loss) | | | 0.36 | % | | | (0.07 | )%4 |
Portfolio turnover rate5 | | | 17 | % | | | 0 | % |
| | | | | | | | | | | | |
| WisdomTree Cloud Computing Fund | | For the
Year Ended
June 30, 2022 | | | For the
Year Ended
June 30, 2021 | | | For the Period
September 6,
2019*
through
June 30, 2020 | |
Net asset value, beginning of period | | $ | 55.89 | | | $ | 38.96 | | | $ | 25.06 | |
Investment operations: | | | | | |
| | | |
Net investment loss1 | | | (0.21 | ) | | | (0.22 | ) | | | (0.11 | ) |
| | | |
Net realized and unrealized gain (loss) | | | (27.65 | ) | | | 17.15 | | | | 14.01 | |
Total from investment operations | | | (27.86 | ) | | | 16.93 | | | | 13.90 | |
Net asset value, end of period | | $ | 28.03 | | | $ | 55.89 | | | $ | 38.96 | |
| | | |
TOTAL RETURN3 | | | (49.85 | )% | | | 43.45 | % | | | 55.47 | % |
| |
RATIOS/SUPPLEMENTAL DATA: | | | | | |
| | | |
Net assets, end of period (000’s omitted) | | $ | 630,651 | | | $ | 1,277,042 | | | $ | 420,771 | |
| |
Ratios to average net assets of: | | | | | |
| | | |
Expenses | | | 0.45 | % | | | 0.45 | % | | | 0.45 | %4 |
| | | |
Net investment loss | | | (0.44 | )% | | | (0.44 | )% | | | (0.43 | )%4 |
Portfolio turnover rate5 | | | 50 | % | | | 40 | % | | | 8 | % |
| * | Commencement of operations. The commencement of operations date is considered to be the date that the Fund began trading in the secondary market. |
| 1 | Based on average shares outstanding. |
| 2 | Amount represents less than $0.005. |
| 3 | Total return is calculated assuming an initial investment made at the net asset value at the beginning of the period, reinvestment of all dividends and distributions at net asset value during the period and redemption on the last day of the period. Total return calculated for a period of less than one year is not annualized. |
| 5 | Portfolio turnover rate is not annualized for fiscal periods less than one year and excludes the value of the portfolio securities received or delivered as a result of in-kind creations or redemptions of the Fund’s capital shares. Short-term securities with maturities less than or equal to 365 days are excluded from the portfolio turnover calculation. |
See Notes to Financial Statements.
Financial Highlights (concluded)
WisdomTree Trust
Selected data for a share of beneficial interest outstanding throughout the period is presented below:
| | | | | | | | |
| WisdomTree Cybersecurity Fund | | For the
Year Ended
June 30, 2022 | | | For the Period
January 28, 2021*
through
June 30, 2021 | |
Net asset value, beginning of period | | $ | 24.43 | | | $ | 24.17 | |
Investment operations: | |
| | |
Net investment income (loss)1 | | | 0.12 | | | | (0.01 | ) |
| | |
Net realized and unrealized gain (loss) | | | (6.63 | ) | | | 0.27 | |
Total from investment operations | | | (6.51 | ) | | | 0.26 | |
Dividends to shareholders: | |
| | |
Net investment income | | | (0.11 | ) | | | – | |
Net asset value, end of period | | $ | 17.81 | | | $ | 24.43 | |
| | |
TOTAL RETURN2 | | | (26.79 | )% | | | 1.08 | % |
RATIOS/SUPPLEMENTAL DATA: | |
| | |
Net assets, end of period (000’s omitted) | | $ | 32,762 | | | $ | 26,875 | |
|
Ratios to average net assets of: | |
| | |
Expenses | | | 0.45 | % | | | 0.45 | %3 |
| | |
Net investment income (loss) | | | 0.49 | % | | | (0.16 | )%3 |
Portfolio turnover rate4 | | | 56 | % | | | 18 | % |
| * | Commencement of operations. The commencement of operations date is considered to be the date that the Fund began trading in the secondary market. |
| 1 | Based on average shares outstanding. |
| 2 | Total return is calculated assuming an initial investment made at the net asset value at the beginning of the period, reinvestment of all dividends and distributions at net asset value during the period and redemption on the last day of the period. Total return calculated for a period of less than one year is not annualized. |
| 4 | Portfolio turnover rate is not annualized for fiscal periods less than one year and excludes the value of the portfolio securities received or delivered as a result of in-kind creations or redemptions of the Fund’s capital shares. Short-term securities with maturities less than or equal to 365 days are excluded from the portfolio turnover calculation. |
See Notes to Financial Statements.
Notes to Financial Statements
1. ORGANIZATION
WisdomTree Trust (the “Trust”) is registered under the Investment Company Act of 1940, as amended (the “1940 Act”), as an open-end management investment company. The Trust was established as a Delaware statutory trust on December 15, 2005 and is authorized to have multiple series of portfolios (each a “Fund”, collectively, the “Funds”). These notes relate only to the Funds listed below. In accordance with Accounting Standards Codification Topic 946, Financial Services-Investment Companies, each Fund listed below qualifies as an investment company and is applying the accounting and reporting guidance for investment companies.
| | | | |
| | |
| Fund | | Commencement
of Operations | |
WisdomTree Dynamic Currency Hedged International Equity Fund (“Dynamic Currency Hedged International Equity Fund” and also referred to herein as “Currency Hedged Equity Fund”) | | | January 7, 2016 | |
WisdomTree Dynamic Currency Hedged International SmallCap Equity Fund (“Dynamic Currency Hedged International SmallCap Equity Fund” and also referred to herein as “Currency Hedged Equity Fund”) | | | January 7, 2016 | |
WisdomTree Emerging Markets ESG Fund (“Emerging Markets ESG Fund”) | | | April 7, 2016 | |
WisdomTree International ESG Fund (“International ESG Fund”) | | | November 3, 2016 | |
WisdomTree U.S. Corporate Bond Fund (“U.S. Corporate Bond Fund”) | | | April 27, 2016 | |
WisdomTree U.S. High Yield Corporate Bond Fund (“U.S. High Yield Corporate Bond Fund”) | | | April 27, 2016 | |
WisdomTree U.S. Short-Term Corporate Bond Fund (“U.S. Short-Term Corporate Bond Fund”) | | | April 27, 2016 | |
WisdomTree Emerging Markets Efficient Core Fund (“Emerging Markets Efficient Core Fund”) | | | May 20, 2021 | |
WisdomTree International Efficient Core Fund (“International Efficient Core Fund”) | | | May 20, 2021 | |
WisdomTree U.S. Efficient Core Fund (“U.S. Efficient Core Fund”) | | | August 2, 2018 | |
WisdomTree Artificial Intelligence and Innovation Fund (“Artificial Intelligence and Innovation Fund”) | | | December 9, 2021 | |
WisdomTree Battery Value Chain and Innovation Fund (“Battery Value Chain and Innovation Fund”) | | | February 17, 2022 | |
WisdomTree BioRevolution Fund (“BioRevolution Fund”) | | | June 3, 2021 | |
WisdomTree Cloud Computing Fund (“Cloud Computing Fund”) | | | September 6, 2019 | |
WisdomTree Cybersecurity Fund (“Cybersecurity Fund”) | | | January 28, 2021 | |
Each Fund, except the Emerging Markets ESG Fund, International ESG Fund, Emerging Markets Efficient Core Fund, International Efficient Core Fund and U.S. Efficient Core Fund, seeks to track the price and yield performance, before fees and expenses, of a particular index (“Index”) developed by WisdomTree Investments, Inc. (“WisdomTree Investments”) or an Index developed by a third party. The Emerging Markets ESG Fund, International ESG Fund, Emerging Markets Efficient Core Fund, International Efficient Core Fund and U.S. Efficient Core Fund are actively managed using a model-based approach. WisdomTree Investments is the parent company of WisdomTree Asset Management, Inc. (“WTAM”), the investment adviser to each Fund and the Trust. “WisdomTree” is a registered trademark of WisdomTree Investments and has been licensed for use by the Trust. Each Fund described herein is considered to be non-diversified as defined under the 1940 Act.
In the normal course of business, the Funds may enter into contracts that contain a variety of representations or that provide indemnification for certain liabilities. The Funds’ maximum exposure under these arrangements is unknown, as this would involve future claims that may be made against the Funds that have not yet occurred. However, the Funds have not had prior claims or losses pursuant to these contracts and believes such exposure to be remote.
2. SIGNIFICANT ACCOUNTING POLICIES
The Financial Accounting Standards Board (“FASB”) Accounting Standards Codification (the “Codification”) is the exclusive reference of authoritative U.S. generally accepted accounting principles (“GAAP”) recognized by the FASB to be applied by nongovernmental entities. Rules and interpretive releases of the Securities and Exchange Commission (“SEC”) under authority of federal laws are also sources of authoritative GAAP for SEC registrants.
The following is a summary of significant accounting policies followed by the Funds:
Use of Estimates — The preparation of financial statements in conformity with GAAP, requires management to make certain estimates and assumptions that affect the reported amounts of assets and liabilities and disclosure of contingent assets and liabilities at the date of the financial statements and the reported amounts of increases and decreases in the net assets from operations during the reporting period. Actual results could differ from those estimates.
Investment Valuation — The net asset value (“NAV”) of each Fund’s shares is calculated each day a Fund is open for business as of the regularly scheduled close of regular trading on the New York Stock Exchange, normally 4:00 p.m. Eastern time (the “NAV Calculation Time”). NAV per share is calculated by dividing a Fund’s net assets by the number of Fund shares outstanding. Each Fund issues and redeems shares at NAV only in large blocks of shares known as creation units, which only certain institutions (e.g., broker-dealers) may purchase or redeem. Shares of each Fund are listed on a national securities exchange and trade at market
Notes to Financial Statements (continued)
prices. Most investors will buy and sell shares in the secondary market through brokers. Because Fund shares trade at market prices rather than NAV, shares may trade at a price greater than NAV or less than NAV. In calculating each Fund’s NAV, investments are valued under policies approved by the Board of Trustees of the Trust (the “Board of Trustees”). Equity securities (including preferred stock) traded on any recognized U.S. or non-U.S. exchange are valued at the last sale price or official closing price on the exchange on which they are principally traded. Unlisted equity securities (including preferred stock) are valued at the last sale price or, if no sale price is available, at the mean between the highest bid and lowest ask price. Each Fund may invest in money market funds which are valued at their NAV per share and exchange-traded funds (“ETFs” or “ETF”) or exchange-traded notes (“ETNs” or “ETN”) which are valued at their last sale or official closing price on the exchange on which they are principally traded or at their NAV per share in instances where the ETF or ETN has not traded on its principal exchange. Fixed income securities (including short-term debt securities with remaining maturities of 60 days or less) generally are valued at current market quotations or mean prices obtained from broker-dealers or independent pricing service providers. Broker-dealers or independent pricing service providers, in determining the value of securities, may consider such factors as recent transactions, indications from yields and quoted prices from broker-dealers on similar securities, and market sentiment for the type of security. U.S. fixed income securities may be valued as of the announced closing time for such securities on any day that the Securities Industry and Financial Markets Association announces an early closing time. Foreign currency contracts that settle within two business days after the trade date (“Spot Contracts”) and foreign currency contracts having a settlement period greater than two business days after the trade date (“Forward Contracts”) are valued daily using WM/Reuters closing spot and forward rates, respectively, as of 4:00 p.m. London time. Futures contracts generally are valued at the settlement price, the price at which a futures contract settles once a given trading day has ended, on the primary exchange on which they trade.
In certain instances, such as when reliable market valuations are not readily available, a Fund’s investments, which include derivatives, will be fair valued in accordance with the Fund’s pricing policy. The Board of Trustees has established a pricing committee (the “Pricing Committee”) which is comprised of senior representatives of WTAM and which reports to the Board of Trustees on a quarterly basis. In the event that a financial instrument cannot be valued based upon a price from the exchange or system on which it is principally traded, independent pricing service provider or broker-dealer quotation, or such prices are deemed to not reflect current market value, the Pricing Committee may value the financial instrument in good faith under the policies and procedures approved by the Board of Trustees based on current facts and circumstances. Securities that may be valued using “fair value” pricing may include, but are not limited to, securities for which there are no current market quotations, securities whose issuer is in default or bankruptcy, securities subject to corporate actions (such as mergers or reorganizations), securities subject to non-U.S. investment limits or currency controls, and securities affected by “significant events.” An example of a significant event is an event occurring after the close of the market in which a security trades but before a Fund’s next NAV Calculation Time that may materially affect the value of a Fund’s investment (e.g., government action, natural disaster, or significant market fluctuation). When fair value pricing is employed, the prices of securities used by a Fund to calculate its NAV may differ from quoted or published prices for the same securities.
Fair Value Measurement — In accordance with Codification Topic 820 (“ASC 820”), Fair Value Measurements and Disclosures, fair value is defined as the price that would be received to sell an asset or paid to transfer a liability in an orderly transaction between market participants at the measurement date. The Pricing Committee will perform other procedures (consistent with GAAP) to value an investment when a market quote is not available. ASC 820 established a three-tier hierarchy of inputs to be used when determining fair value measurements for disclosure purposes. Inputs refer broadly to the assumptions that market participants would use in pricing the asset or liability, including assumptions about risk — for example, the risk inherent in a particular valuation technique used to measure fair value (such as a pricing model) and/or the risk inherent in the inputs to the valuation technique. Inputs may be observable or unobservable. Observable inputs reflect the assumptions market participants would use in pricing the asset or liability. Observable inputs are based on market data obtained from sources independent of the reporting entity. Unobservable inputs reflect the reporting entity’s own assumptions about the assumptions market participants would use in pricing the asset or liability. Unobservable inputs are based on the best information available in the circumstances. The three-tier hierarchy of inputs is summarized in the three broad levels listed below:
Level 1 – quoted prices in active markets for identical securities
Level 2 – other significant observable inputs (including quoted prices for similar securities, interest rates, prepayment speeds, credit risk, etc.)
Level 3 – significant unobservable inputs (including each Fund’s assumptions in determining the fair value of investments)
The inputs or methodology used for valuation are not necessarily an indication of the risk associated with investing in those investments.
Investments that use Level 2 or Level 3 inputs may include, but are not limited to: (i) an unlisted security related to corporate actions; (ii) a restricted security (e.g., one that may not be publicly sold without registration under the Securities Act of 1933, as amended); (iii) a security whose trading has been suspended (either due to events affecting the issuer of the security specifically or events affecting the primary trading exchange more broadly) or which has been de-listed from its primary trading exchange; (iv) a
Notes to Financial Statements (continued)
security that is thinly traded; (v) a security in default or bankruptcy proceedings for which there is no current market quotation or market activity; (vi) a security affected by currency controls or restrictions; and (vii) a security affected by a significant event (e.g., an event that occurs after the close of the markets in which the security is traded but before the time as of which a Fund’s NAV is computed and that may materially affect the value of the Fund’s investments).
The valuation techniques and significant inputs used in determining the fair market value measurements for Level 2 and Level 3 positions are as follows:
Financial instruments are generally valued by independent pricing service providers that use broker-dealer quotations, reported trades or valuation estimates from their internal pricing models. Depending on the type of financial instrument, the independent pricing service providers’ internal pricing models may use inputs that are observable such as issuer details (e.g., credit rating, debt ranking, coupon date, maturity date, etc.), interest rates, yield curves, prepayment speeds, credit risks/spreads, default rates and quoted prices for similar assets. Financial instruments that use similar valuation techniques and observable inputs as described above and have an appropriate level of market activity are categorized as Level 2 of the fair value hierarchy, otherwise a Level 3 fair value classification is appropriate. Over-the-counter financial derivative instruments derive their value from underlying asset prices, indices, reference rates, and other inputs or a combination of these factors. These instruments are normally valued on the basis of broker-dealer quotations or prices obtained from independent pricing service providers. Depending on the product and the terms of the transaction, the value of the financial derivative instruments can be estimated by an independent pricing service provider using a series of techniques including simulation pricing models. The pricing models may use inputs that are observed from actively quoted markets such as issuer details, indices, credit risks/spreads, interest rates, yield curves, default and exchange rates. Derivative contracts that use similar valuation techniques and observable inputs as described above and have an appropriate level of market activity are categorized as Level 2 of the fair value hierarchy, otherwise a Level 3 fair value classification is appropriate.
Determination of a fair value by the Pricing Committee may include significant unobservable inputs and therefore such financial instruments would be reflected as a Level 3 of the fair value hierarchy. The Pricing Committee may employ a market-based valuation approach which may use, among other potential considerations, related or comparable securities, recent transactions, market multiples, and other relevant information to determine fair value. The Pricing Committee may also use an income-based valuation approach in which anticipated future cash flows of the financial instrument are discounted to calculate fair value.
The summary of fair valuations according to the inputs used in valuing each Fund’s assets as of the measurement date and significant transfers into or out of Level 3 of the fair value hierarchy during the fiscal year or period ended June 30, 2022, if any, are included in a “Fair Valuation Summary” supplementary table in each applicable Fund’s Schedule of Investments.
Derivatives and Hedging Disclosure — Codification Topic 815 (“ASC 815”), Derivatives and Hedging, requires qualitative disclosures about objectives and strategies for using derivatives, quantitative disclosures about fair value amounts as well as gains and losses on derivative instruments, and disclosures about credit-risk-related contingent features in derivative agreements. The Funds have invested in derivatives, specifically foreign currency contracts, equity futures contracts and interest rate futures contracts during the fiscal year or period ended June 30, 2022 and open positions in such derivatives as of June 30, 2022 are detailed in each Fund’s Schedule of Investments. All of the derivative instruments disclosed and described herein are subject to credit risk. Credit risk is where the financial condition of an issuer of a security or instrument may cause it to default or become unable to pay interest or principal due on the security or where the counterparty to a derivative contract might default on its obligations. The maximum exposure to derivatives agreements with credit risk would be the total value of derivatives in net liability positions for each Fund, as disclosed in the table included in Note 2 — Master Netting Arrangements. Information with respect to the amounts and types of collateral received and/or posted for derivative instruments as of June 30, 2022, if any, is reflected as a footnote within each Fund’s Schedule of Investments.
As of June 30, 2022, the effects of such derivative instruments on each Fund’s financial position as reflected in the Statements of Assets and Liabilities are presented in the summary below:
| | | | | | | | | | | | |
| | | |
| | | Asset Derivatives | | | Liability Derivatives | |
| | | | |
| Fund | | Balance Sheet Location | | Value | | | Balance Sheet Location | | Value | |
Dynamic Currency Hedged International Equity Fund | |
Foreign currency risk | | Unrealized appreciation on
foreign currency contracts | | $ | 4,246,779 | | | Unrealized depreciation on
foreign currency contracts | | $ | 29,341 | |
Dynamic Currency Hedged International SmallCap Equity Fund | |
Foreign currency risk | | Unrealized appreciation on
foreign currency contracts | | | 1,590,247 | | | Unrealized depreciation on
foreign currency contracts | | | 14,332 | |
Notes to Financial Statements (continued)
| | | | | | | | | | | | |
| | | |
| | | Asset Derivatives | | | Liability Derivatives | |
| | | | |
| Fund | | Balance Sheet Location | | Value | | | Balance Sheet Location | | Value | |
International ESG Fund | |
Foreign currency risk | | Unrealized appreciation on
foreign currency contracts | | | 1 | | | Unrealized depreciation on
foreign currency contracts | | | — | |
Emerging Markets Efficient Core Fund | |
Foreign currency risk | | Unrealized appreciation on
foreign currency contracts | | | 1,161 | | | Unrealized depreciation on
foreign currency contracts | | | 42 | |
Interest rate risk | | Unrealized appreciation on
futures contracts* | | | — | | | Unrealized depreciation on
futures contracts* | | | 257,720 | |
International Efficient Core Fund | |
Foreign currency risk | | Unrealized appreciation on
foreign currency contracts | | | 554 | | | Unrealized depreciation on
foreign currency contracts | | | — | |
Interest rate risk | | Unrealized appreciation on
futures contracts* | | | — | | | Unrealized depreciation on
futures contracts* | | | 521,507 | |
U.S. Efficient Core Fund | |
Interest rate risk | | Unrealized appreciation on
futures contracts* | | | — | | | Unrealized depreciation on
futures contracts* | | | 4,759,309 | |
Artificial Intelligence and Innovation Fund | |
Foreign currency risk | | Unrealized appreciation on
foreign currency contracts | | | 1 | | | Unrealized depreciation on
foreign currency contracts | | | 1 | |
Battery Value Chain and Innovation Fund | |
Foreign currency risk | | Unrealized appreciation on
foreign currency contracts | | | 5 | | | Unrealized depreciation on
foreign currency contracts | | | 3 | |
| | * | Includes cumulative appreciation (depreciation) of futures contracts as reported in each Fund’s Schedule of Investments. Only current day’s variation margin is reported within the Statements of Assets and Liabilities. Please see Note 2 (Futures Contracts) on page 137 for additional information regarding balance sheet location of balances associated with futures contracts |
For the fiscal year or period ended June 30, 2022, the effects of derivative instruments on each applicable Fund’s financial performance as reflected in the Statements of Operations are presented in the summary below:
| | | | | | | | |
| | | |
| Fund | | Amount of Realized Gain
or (Loss) on Derivatives
Recognized1 | | | Change in Unrealized
Appreciation or
(Depreciation) on
Derivatives Recognized2 | |
Dynamic Currency Hedged International Equity Fund | |
Foreign currency risk | | $ | 12,127,972 | | | $ | 2,545,957 | |
Dynamic Currency Hedged International SmallCap Equity Fund | |
Equity risk | | | 3,195 | | | | — | |
Foreign currency risk | | | 3,785,890 | | | | 1,178,053 | |
Emerging Markets ESG Fund | |
Foreign currency risk | | | (12,381 | ) | | | — | |
International ESG Fund | |
Foreign currency risk | | | 2,980 | | | | 1 | |
Emerging Markets Efficient Core Fund | |
Equity risk | | | 8,748 | | | | 106 | |
Foreign currency risk | | | (111,168 | ) | | | 1,119 | |
Interest rate risk | | | (1,588,862 | ) | | | (273,306 | ) |
International Efficient Core Fund | |
Foreign currency risk | | | (11,890 | ) | | | 554 | |
Interest rate risk | | | (5,344,771 | ) | | | (532,484 | ) |
U.S. Efficient Core Fund | |
Foreign currency risk | | | (6 | ) | | | — | |
Interest rate risk | | | (45,041,558 | ) | | | (7,341,122 | ) |
Artificial Intelligence and Innovation Fund3 | |
Foreign currency risk | | | 258 | | | | 0 | 4 |
Notes to Financial Statements (continued)
| | | | | | | | |
| | | |
| Fund | | Amount of Realized Gain
or (Loss) on Derivatives
Recognized1 | | | Change in Unrealized
Appreciation or
(Depreciation) on
Derivatives Recognized2 | |
Battery Value Chain and Innovation Fund5 | |
Foreign currency risk | | | (3,944 | ) | | | 2 | |
BioRevolution Fund | |
Foreign currency risk | | | (648 | ) | | | — | |
Cybersecurity Fund | |
Foreign currency risk | | | (23,733 | ) | | | (21 | ) |
| | 1 | Realized gains (losses) on derivatives are located on the Statements of Operations as follows: |
| | |
Equity risk | | Net realized gain (loss) from futures contracts |
Foreign currency risk | | Net realized gain (loss) from foreign currency contracts |
Interest rate risk | | Net realized gain (loss) from futures contracts |
| | 2 | Change in unrealized appreciation (depreciation) is located on the Statements of Operations as follows: |
| | |
Equity risk | | Net increase (decrease) in unrealized appreciation/depreciation from futures contracts |
Foreign currency risk | | Net increase (decrease) in unrealized appreciation/depreciation from foreign currency contracts |
Interest rate risk | | Net increase (decrease) in unrealized appreciation/depreciation from futures contracts |
| | 3 | For the period December 9, 2021 (commencement of operations) through June 30, 2022. |
| | 4 | Amount represents less than $1. |
| | 5 | For the period February 17, 2022 (commencement of operations) through June 30, 2022. |
During the fiscal year or period ended June 30, 2022, the volume of derivative activity (based on the average of month-end balances, except where footnoted) for each Fund was as follows:
| | | | | | | | | | | | |
| | |
| | | Average Notional | |
| | | |
| Fund | | Foreign currency
contracts
(to deliver USD) | | | Foreign currency
contracts
(to receive USD) | | | Futures
contracts
(long) | |
Dynamic Currency Hedged International Equity Fund | |
Foreign currency risk | | $ | 113,264,813 | | | $ | 227,099,814 | | | $ | — | |
Dynamic Currency Hedged International SmallCap Equity Fund | |
Equity risk1 | | | — | | | | — | | | | 36,260 | |
Foreign currency risk | | | 32,994,219 | | | | 64,847,032 | | | | — | |
Emerging Markets ESG Fund | |
Foreign currency risk | | | — | | | | 5,121 | | | | — | |
International ESG Fund | |
Foreign currency risk1 | | | 8,101 | | | | 33,191 | | | | — | |
Emerging Markets Efficient Core Fund | |
Equity risk | | | — | | | | — | | | | 28,576 | |
Foreign currency risk | | | 861,314 | | | | 432,262 | | | | — | |
Interest rate risk | | | — | | | | — | | | | 12,892,503 | |
International Efficient Core Fund | |
Foreign currency risk | | | 246,951 | | | | 92,707 | | | | — | |
Interest rate risk | | | | | | | — | | | | 36,718,325 | |
U.S. Efficient Core Fund | |
Foreign currency risk1 | | | — | | | | 240 | | | | — | |
Interest rate risk | | | — | | | | — | | | | 469,367,280 | |
Artificial Intelligence and Innovation Fund2 | |
Foreign currency risk | | | 100 | | | | 35 | | | | — | |
Battery Value Chain and Innovation Fund3 | |
Foreign currency risk | | | 1,508 | | | | 889 | | | | — | |
BioRevolution Fund | |
Foreign currency risk1 | | | 8,540 | | | | 1,264 | | | | — | |
Cybersecurity Fund | |
Foreign currency risk1 | | | 198,353 | | | | 43,233 | | | | — | |
| | 1 | The volume of derivative activity for the period is based on intra-month balances. |
| | 2 | For the period December 9, 2021 (commencement of operations) through June 30, 2022. |
| | 3 | For the period February 17, 2022 (commencement of operations) through June 30, 2022. |
Notes to Financial Statements (continued)
Investment Transactions and Investment Income — Investment transactions are recorded as of the date that the securities are purchased or sold (trade date). Realized gains and losses on sales of portfolio securities are calculated using the identified-cost method. Dividend income (less foreign taxes withheld, if any) is recognized on the ex-dividend date or, with respect to foreign dividends, as soon as practicable after the existence of a dividend declaration has been determined. Non-cash dividend income is recognized at the fair value of securities received on the ex-dividend date or as soon as practicable after the existence of a dividend declaration has been determined. On each measurement date, the Funds evaluate the collectability of receivable balances. Generally, the Funds will write-off dividend receivable balances that are canceled by the issuer as of the date that the dividend receivable cancellation notification was publicly made available or when it becomes probable that dividends will not be collected and the amount of uncollectable dividends can be reasonably estimated. In addition, the Funds generally will write-off interest receivable balances in default by the issuer as of the date any applicable interest payment grace period or forbearance period expires or as of the date any interest payment cancellation notification was publicly made available or when it becomes probable that interest will not be collected and the amount of uncollectable interest can be reasonably estimated. Interest income (including amortization of premiums and accretion of discounts), less any foreign taxes withheld, is accrued daily. Generally, amortization of premiums and accretion of discounts are recognized daily using the effective interest method (also known as the scientific amortization method). Income earned from securities lending activities (i.e., securities lending income), net of fees payable to the securities borrower and/or securities lending agent, is accrued daily.
Foreign Currency Translation — The accounting records of the Funds are maintained in U.S. dollars. Foreign currencies, as well as investment securities and other assets and liabilities denominated in foreign currencies, are translated into U.S. dollars using exchange rates prevailing on the respective dates of such transactions that are deemed appropriate by WTAM. Realized and unrealized foreign exchange gains and losses on investments are included as a component of “net realized gain (loss) from investment transactions” and “net increase (decrease) in unrealized appreciation/depreciation from investment transactions”, respectively, on the Statements of Operations. Realized and unrealized foreign exchange gains or losses from foreign currency contracts are included in “net realized gain (loss) from foreign currency contracts” and “net increase (decrease) in unrealized appreciation/depreciation from foreign currency contracts”, respectively, on the Statements of Operations. Realized and unrealized foreign exchange gains or losses arising from sales of foreign currencies, currency gains or losses recognized between the trade and settlement dates on investment transactions, and the difference between the amounts of dividends and foreign withholding taxes recorded on the Funds’ books and the U.S. dollar equivalent of the amounts actually received or paid are included in “net realized gain (loss) from foreign currency related transactions” and/or “net increase (decrease) in unrealized appreciation/depreciation from translation of assets and liabilities denominated in foreign currencies” in the Statements of Operations. Certain foreign exchange gains and losses included in realized and unrealized gains or losses are included in, or are a reduction of, ordinary income in accordance with U.S. Federal income tax regulations.
Expenses — Under the investment advisory agreement for each Fund, WTAM has agreed to pay all expenses of the Trust, except for: (i) brokerage expenses and other fees, charges, taxes, levies or expenses (such as stamp taxes) incurred in connection with the execution of portfolio transactions or in connection with creation and redemption transactions (including without limitation any fees, charges, taxes, levies or expenses related to the purchase or sale of an amount of any currency, or the patriation or repatriation of any security or other asset, related to the execution of portfolio transactions or any creation or redemption transactions); (ii) legal fees or expenses in connection with any arbitration, litigation or pending or threatened arbitration or litigation, including any settlements in connection therewith; (iii) compensation and expenses of trustees who are not interested persons of the Funds (“Independent Trustees”); (iv) compensation and expenses of counsel to the Independent Trustees; (v) compensation and expenses of the Trust’s Chief Compliance Officer (“CCO”); (vi) extraordinary expenses (in each case as determined by a majority of the Independent Trustees); (vii) distribution fees and expenses paid by the Trust under any distribution plan adopted pursuant to Rule 12b-1 under the 1940 Act; (viii) interest and taxes of any kind or nature (including, but not limited to, income, excise, transfer and withholding taxes); (ix) fees and expenses related to the provision of securities lending services; and (x) the advisory fee payable to WTAM.
Acquired fund fees and expenses (“AFFEs”) (which are fees and expenses incurred indirectly by a Fund through its investments in certain underlying investment companies) are not operating expenses of the Funds and are not paid by WTAM.
Pursuant to a separate contractual arrangement, WTAM arranges for the provision of CCO services with respect to each Fund, and is liable and responsible for, and administers, payments to the CCO, the Independent Trustees and counsel to the Independent Trustees. WTAM receives a fee, as shown on the Statements of Operations under “Service fees”, of up to 0.0044% per annum of each Fund’s average daily net assets for providing such services and paying such expenses. WTAM provides CCO services to the Trust.
Foreign Currency Contracts — The Funds may enter into foreign currency contracts to facilitate local securities settlements or to protect against currency exposure. The Funds, other than the Currency Hedged Equity Funds, do not expect to engage in currency transactions for the purpose of hedging against currency exposures of the Fund’s assets that are denominated in one or more foreign
Notes to Financial Statements (continued)
currencies. The Funds may not enter into such contracts for speculative purposes. During the fiscal year or period ended June 30, 2022, the Funds, except for the Currency Hedged Equity Funds, utilized foreign currency contracts primarily to facilitate foreign security settlements. The Currency Hedged Equity Funds utilized foreign currency contracts primarily to dynamically offset applicable international currency exposure from positions in international equities. A foreign currency contract involves an obligation to purchase or sell a specific currency at a future date, which may be any fixed number of days from the date of the contract agreed upon by the parties, at a price set at the time of the contract. These contracts are principally traded in the inter-bank market conducted directly between currency traders (usually large, commercial banks) and their customers. A foreign currency contract generally does not require an initial margin deposit and no commissions are charged at any stage for trades.
Risks may arise upon entering into foreign currency contracts from the potential inability of counterparties to meet the terms of their contracts and from unanticipated movements in the value of foreign currencies relative to the U.S. dollar or each other.
Fluctuations in the value of open foreign currency contracts are recorded for book purposes as unrealized gains or losses on foreign currency contracts by the Funds and are included in “net increase (decrease) in unrealized appreciation/depreciation from foreign currency contracts” on the Statements of Operations. Realized gains and losses on foreign currency contracts include net gains or losses recognized by the Funds on contracts which have settled are included in “net realized gain (loss)” from foreign currency contracts on the Statements of Operations.
Futures Contracts — The Dynamic Currency Hedged International SmallCap Equity Fund utilized equity futures contracts on a temporary basis during the period to obtain market exposure consistent with its investment objective during the Fund’s quarterly portfolio rebalance. The Emerging Markets Efficient Core Fund utilized futures contracts to obtain long exposure to equity futures contracts and U.S. Treasury obligations consistent with its investment strategy. The International Efficient Core Fund and U.S. Efficient Core Fund primarily utilized futures contracts to obtain long exposure to U.S. Treasury obligations consistent with their investment strategy. When a Fund purchases a listed futures contract, it agrees to purchase a specified reference asset (e.g., equity, currency or U.S. Treasury security) at a specified future date. When a Fund sells a listed futures contract, it agrees to sell a specified reference asset (e.g., equity, currency or U.S. Treasury security) at a specified future date. The price at which the purchase and sale will take place is fixed when the Fund enters into the contract. The exchange clearing corporation is the ultimate counterparty for all exchange-listed contracts, so credit risk is limited to the creditworthiness of the exchange clearing corporation.
Upon entering into a futures contract, a Fund is required to deliver to a broker an amount of cash and/or U.S. government securities equal to a certain percentage of the contract amount. This amount is known as the “initial margin”. Cash deposited as initial margin, if any, is shown as “Deposits at broker for futures contracts” in the Statement of Assets and Liabilities, and U.S. government securities deposited, if any, are designated in the Schedule of Investments. Subsequent payments, known as “variation margin”, generally are made or received by the Fund each day or at other agreed-upon time periods depending on the fluctuations in the value of the underlying futures contracts, except that in the case of certain futures contracts, variation margin payments may be made or received when the futures contract expires. Variation margin is recorded for financial statement purposes on a daily basis as an unrealized gain or loss on futures until the financial futures contract is closed, at which time the net gain or loss is reclassified to realized gain or loss on futures. The current one-day variation margin on open futures contracts is shown on the Statements of Assets and Liabilities as either a receivable or a payable for “Net variation margin on futures contracts”. The variation margins received or paid by the Funds on both open and closed futures contracts are shown in the Statements of Assets and Liabilities, in whole or in part, as a component of, or an offset to, “Deposits at broker for futures contracts”. Deposits at broker utilized for futures contract margin requirements generally are restricted from withdrawal. When a Fund purchases or sells a futures contract, the Fund is required to “cover” its position in order to limit the risk associated with the use of leverage and other related risks. To cover its position, a Fund will segregate assets consisting of, or take other measures with respect to, cash or liquid securities that, when added to any amounts deposited with a futures commission merchant as margin, will “cover” its position in a manner consistent with the 1940 Act or the rules and SEC interpretations thereunder. This will function as a practical limit on the amount of leverage which a Fund may undertake and on the potential increase in the speculative character of a Fund’s outstanding portfolio securities. Please see Note 7 “Recent Regulatory Update” for information on new regulations governing the use of derivatives by the Funds.
Securities Lending — Each Fund may lend portfolio securities to certain creditworthy borrowers, including the Funds’ securities lending agent. It is the Funds’ policy that, at origination, all loans are secured by collateral of at least 102% of the value of U.S. securities loaned and 105% of the value of foreign securities loaned. Collateral in the form of cash and/or securities issued or guaranteed by the U.S. government or its agencies, equivalent to at least 100% of the market value of securities, is maintained at all times. The cash collateral can be invested in certain money market mutual funds which also have exposure to the fluctuations of the market. The values of the investments of cash collateral for securities on loan along with the obligations to return such collateral are included on the Statements of Assets and Liabilities. The total value of securities received as collateral for securities on loan is
Notes to Financial Statements (continued)
included in a footnote following each Schedule of Investments, but is not included within the Statements of Assets and Liabilities because the receiving Fund does not have the right to sell or repledge the securities received as collateral. As compensation for lending its securities, each Fund retains all or a portion of the interest received on investment of cash collateral or receives a fee from the borrower (net of any fee rebates paid to the borrower). The lending agent receives a portion of the income earned by the Funds in connection with the lending program. The net securities lending income earned by the Funds is disclosed on the Statements of Operations. The dividend and interest income earned on the securities loaned is accounted for in the same manner as other dividend and interest income. The borrower pays to the Funds an amount equal to any dividends or interest received on loaned securities. Dividends received while a security is out on loan are not considered Qualified Dividend Income (“QDI”) under the specific criteria issued by the Internal Revenue Service and are subject to taxation at the shareholder’s ordinary income tax rate instead of the lower long-term capital gains tax rate. Lending portfolio securities could result in a loss or delay in recovering each Fund’s securities if the borrower defaults. In the event of a borrower default with respect to the failure to return to each Fund some or all of the securities loaned, the securities lending agent shall indemnify each Fund against the failure of the borrower if the value of the collateral received is insufficient to cover the market value of the securities loaned.
Master Netting Arrangements — Codification Topic 210 (“ASC 210”), Balance Sheet, requires disclosures generally intended to (i) help investors and other financial statement users to better assess the effect or potential effect of offsetting arrangements on a company’s financial position, (ii) improve transparency in the reporting of how companies mitigate credit risk, and (iii) facilitate comparisons between those entities that prepare their financial statements on the basis of GAAP and those entities that prepare their financial statements on the basis of international financial reporting standards. ASC 210 requires entities to disclose (i) gross and net information about both instruments and transactions eligible for offset in the financial statements, and (ii) instruments and transactions subject to an agreement similar to a master netting agreement. ASC 210 is limited in scope to the following financial instruments, to the extent they are offset in the financial statements or subject to an enforceable master netting arrangement or similar agreement: (i) recognized derivative instruments accounted for under ASC 815 (Derivatives and Hedging); (ii) repurchase agreements and reverse repurchase agreements; and (iii) securities borrowing and securities lending transactions.
In order to better define its contractual rights and to secure rights that will help a Fund mitigate its counterparty risk, a Fund enters into an International Swaps and Derivatives Association, Inc. Master Agreement (“ISDA Master Agreement”) with its counterparties. An ISDA Master Agreement is a bilateral agreement between a Fund and a counterparty that governs over-the-counter derivatives (“OTC”), such as foreign currency contracts, and typically contains, among other things, collateral posting terms, netting and rights of set-off provisions in the event of a default and/or termination event. Under an ISDA Master Agreement, a Fund may, under certain circumstances, offset with the counterparty certain derivative financial instruments’ payables and receivables to create a single net payment. The provisions of the ISDA Master Agreement typically permit a single net payment in the event of a default (close-out netting) or similar event, including the bankruptcy or insolvency of the counterparty.
Collateral requirements generally differ by type of derivative. Collateral terms are contract-specific for OTC derivatives (e.g., foreign currency contracts, options and certain swaps). To the extent amounts due to a Fund from its derivatives counterparties are not fully collateralized, contractually or otherwise, the Fund bears the risk of loss from a counterparty’s non-performance.
The Funds’ securities lending activities are governed by a Securities Lending Authorization Agreement (“Lending Agreement”) between the Funds and the lending agent. The Lending Agreement authorizes the lending agent to lend qualifying U.S. and foreign securities held by a Fund to approved borrowers (each a “Borrower”). To mitigate borrower risk, a Fund typically receives from a Borrower collateral in the form of U.S. dollar cash and/or securities issued or guaranteed by the U.S. government or its agencies in excess of the market value of the securities loaned. Under the provisions of the Lending Agreement, a Fund shall have, as to the collateral, all of the rights and remedies of a secured party under applicable law. A Fund is exposed to risk of loss if a Borrower defaults on its obligation to return borrowed securities and the value of the collateral a Fund received is insufficient to cover the market value of the securities loaned. Also, the lending agent is permitted to invest the cash collateral it receives from a Borrower into a money market fund which is subject to market fluctuation. Therefore, a Fund is exposed to risk of loss if the value of invested cash collateral is insufficient to satisfy the Fund’s obligation to return the full amount owed to such Borrower.
Each Fund’s futures contracts are all exchange traded and are not subject to master netting arrangements. Therefore, all futures contracts are excluded from the netting table herein.
For financial reporting purposes, the Funds elect to not offset assets and liabilities subject to an ISDA Master Agreement or Lending Agreement, if any, in the Statements of Assets and Liabilities. Therefore, all qualifying transactions are presented on a gross basis in
Notes to Financial Statements (continued)
the Statements of Assets and Liabilities. As of June 30, 2022, the impact of netting of assets and liabilities and the offsetting of collateral pledged or received based on contractual netting/set-off provisions in the ISDA Master Agreement and the Lending Agreement are detailed in the following table:
| | | | | | | | | | | | | | | | | | | | | | | | | | | | | | | | |
| | | |
| | | Assets | | | Liabilities | |
| | | | | | |
| | | Gross Amounts
in the
Statements of Assets and
Liabilities | | | Gross Amounts Not Offset
in the Statements of
Assets and Liabilities | | | Net Amount | | | Gross Amounts
in the
Statements of Assets and
Liabilities | | | Gross Amounts Not Offset
in the Statements of
Assets and Liabilities | | | | |
| Fund | | Financial
Instruments | | | Collateral
Received | | | Financial
Instruments | | | Collateral
Posted | | | Net Amount | |
Dynamic Currency Hedged International Equity Fund | | | | | | | | | | | | | | | | | | | | | | | | | | | | | | | | |
Securities Lending | | $ | 6,762,760 | | | $ | — | | | $ | (6,762,760 | )1 | | $ | — | | | $ | — | | | $ | — | | | $ | — | | | $ | — | |
Foreign Currency Contracts | | | 4,246,779 | | | | (14,025 | ) | | | — | | | | 4,232,754 | | | | 29,341 | | | | (14,025 | ) | | | — | | | | 15,316 | |
Dynamic Currency Hedged International SmallCap Equity Fund | | | | | | | | | | | | | | | | | | | | | | | | | | | | | | | | |
Securities Lending | | | 5,221,005 | | | | — | | | | (5,221,005 | )1 | | | — | | | | — | | | | — | | | | — | | | | — | |
Foreign Currency Contracts | | | 1,590,247 | | | | (6,452 | ) | | | — | | | | 1,583,795 | | | | 14,332 | | | | (6,452 | ) | | | — | | | | 7,880 | |
Emerging Markets ESG Fund | | | | | | | | | | | | | | | | | | | | | | | | | | | | | | | | |
Securities Lending | | | 601,144 | | | | — | | | | (601,144 | )1 | | | — | | | | — | | | | — | | | | — | | | | — | |
International ESG Fund | | | | | | | | | | | | | | | | | | | | | | | | | | | | | | | | |
Securities Lending | | | 292,233 | | | | — | | | | (292,233 | )1 | | | — | | | | — | | | | — | | | | — | | | | — | |
Foreign Currency Contracts | | | 1 | | | | — | | | | — | | | | 1 | | | | — | | | | — | | | | — | | | | — | |
U.S. Corporate Bond Fund | | | | | | | | | | | | | | | | | | | | | | | | | | | | | | | | |
Securities Lending | | | 643,606 | | | | — | | | | (643,606 | )1 | | | — | | | | — | | | | — | | | | — | | | | — | |
U.S. High Yield Corporate Bond Fund | | | | | | | | | | | | | | | | | | | | | | | | | | | | | | | | |
Securities Lending | | | 18,352,831 | | | | — | | | | (18,352,831 | )1 | | | — | | | | — | | | | — | | | | — | | | | — | |
U.S. Short-Term Corporate Bond Fund | | | | | | | | | | | | | | | | | | | | | | | | | | | | | | | | |
Securities Lending | | | 1,661,467 | | | | — | | | | (1,661,467 | )1 | | | — | | | | — | | | | — | | | | — | | | | — | |
Emerging Markets Efficient Core Fund | | | | | | | | | | | | | | | | | | | | | | | | | | | | | | | | |
Foreign Currency Contracts | | | 1,161 | | | | (22 | ) | | | — | | | | 1,139 | | | | 42 | | | | (22 | ) | | | — | | | | 20 | |
International Efficient Core Fund | | | | | | | | | | | | | | | | | | | | | | | | | | | | | | | | |
Foreign Currency Contracts | | | 554 | | | | — | | | | — | | | | 554 | | | | — | | | | — | | | | — | | | | — | |
U.S. Efficient Core Fund | | | | | | | | | | | | | | | | | | | | | | | | | | | | | | | | |
Securities Lending | | | 567,142 | | | | — | | | | (567,142 | )1 | | | — | | | | — | | | | — | | | | — | | | | — | |
Artificial Intelligence and Innovation Fund | | | | | | | | | | | | | | | | | | | | | | | | | | | | | | | | |
Foreign Currency Contracts | | | 1 | | | | — | | | | — | | | | 1 | | | | 1 | | | | — | | | | — | | | | 1 | |
Battery Value Chain and Innovation Fund | | | | | | | | | | | | | | | | | | | | | | | | | | | | | | | | |
Foreign Currency Contracts | | | 5 | | | | — | | | | — | | | | 5 | | | | 3 | | | | — | | | | — | | | | 3 | |
Cloud Computing Fund | | | | | | | | | | | | | | | | | | | | | | | | | | | | | | | | |
Securities Lending | | | 53,091,540 | | | | — | | | | (53,091,540 | )1 | | | — | | | | — | | | | — | | | | — | | | | — | |
Cybersecurity Fund | | | | | | | | | | | | | | | | | | | | | | | | | | | | | | | | |
Securities Lending | | | 3,145,726 | | | | — | | | | (3,145,726 | )1 | | | — | | | | — | | | | — | | | | — | | | | — | |
| | 1The | amount of collateral presented has been limited such that the net amount by counterparty cannot be less than zero. |
Short-Term Investments — Each Fund may invest a portion of its assets in high-quality money market instruments on an ongoing basis to provide liquidity or for other reasons. The instruments include short-term obligations issued by the U.S. government, its agencies, non-U.S. government agencies, negotiable certificates of deposit (“CDs”), fixed time deposits and bankers’ acceptances of U.S. and foreign banks and similar institutions, commercial papers, repurchase agreements and money market funds. CDs are short-term negotiable obligations of commercial banks. Time deposits are non-negotiable deposits maintained in banking institutions for specified periods of time at stated interest rates. Banker’s acceptances are time drafts drawn on commercial banks by borrowers, usually in connection with international transactions.
Emerging Markets Investments — Investments in securities listed and traded in emerging markets are subject to additional risks that may not be present for U.S. investments or investments in more developed non-U.S. markets. Such risks may include: (i) greater market volatility; (ii) lower trading volume; (iii) greater social, political and economic uncertainty; (iv) governmental controls on foreign investments and limitations on repatriation of invested capital; (v) the risk that companies may be held to lower disclosure, corporate governance, auditing and financial reporting standards than companies in more developed markets; and (vi) the risk that there may be less protection of property rights than in other countries. Emerging markets are generally less liquid and less efficient than developed securities markets.
Notes to Financial Statements (continued)
Tax Information and Dividends and Distributions to Shareholders — It is each Fund’s policy to comply with all requirements of the Internal Revenue Code of 1986, as amended (the “Code”). A portion of the Code, known as subchapter M (“Subchapter M”), addresses the ways by which investment companies and investment trusts may pass income through to shareholders in order to avoid double taxation. Each Fund intends to qualify for and to elect treatment as a separate Regulated Investment Company (“RIC”) under Subchapter M of the Code so that it will not be subject to federal income tax on income and gains that are timely distributed to Fund shareholders. Accordingly, no provision for U.S. federal income taxes is required. In order to qualify for the special tax treatment accorded to RICs and their shareholders, each Fund must, among other things, distribute with respect to each taxable year an amount equal to or greater than the sum of 90% of its investment company taxable income and 90% of its net tax-exempt interest income. There can be no guarantee that a Fund will pay dividends. Taxable net realized gains from investment transactions, reduced by capital loss carryforwards, if any, are declared and distributed to shareholders at least annually. The capital loss carryforward amount, if any, is available to offset future net capital gains. The Funds may occasionally be required to make supplemental distributions at some other time during the year. The Trust reserves the right to declare special distributions if, in its reasonable discretion, such action is necessary or advisable to preserve the status of each Fund as a RIC or to avoid imposition of income or excise taxes on undistributed income. Dividends and distributions to shareholders are recorded on the ex-dividend date. The amount of dividends and distributions from net investment income and net realized capital gains is determined in accordance with the requirements of the Code and the U.S. Treasury regulations. These book/tax differences are either considered temporary or permanent in nature. To the extent these differences are permanent in nature, such amounts are reclassified within the components of net assets based on their Federal tax basis treatment; temporary differences do not require reclassification. Dividends and distributions that exceed earnings and profit for tax purposes are reported for tax purposes as a return of capital.
3. ADVISORY FEES AND OTHER TRANSACTIONS WITH AFFILIATES
WTAM has overall responsibility for the general management and administration of the Trust. WTAM provides an investment program for each Fund. WTAM has arranged for Mellon Investments Corporation (“Mellon”) to provide sub-advisory services to the Funds, except for U.S. Corporate Bond Fund, U.S. High Yield Corporate Bond Fund and U.S. Short-Term Corporate Bond Fund which are sub-advised by Voya Investment Management Co., LLC (“Voya IM”). Mellon and Voya IM are compensated by WTAM at no additional cost to the Funds. WTAM also arranges for transfer agency, custody, fund accounting, fund administration, securities lending and all other non-distribution related services necessary for the Funds to operate, which are generally under separate agreements entered into between the Trust on behalf of the Funds and the applicable service provider. Under the investment advisory agreement for each Fund, WTAM agrees to pay all expenses of the Funds, except for certain expenses described in Note 2.
Pursuant to a separate contractual arrangement, as also described in Note 2, WTAM arranges for the provision of CCO services with respect to each Fund, and is liable and responsible for, and administers, payments to the CCO, the Independent Trustees and counsel to the Independent Trustees in exchange for a fee, accrued daily and paid monthly in arrears, of up to 0.0044% per annum of each Fund’s average daily net assets.
WTAM expects to receive annual advisory fees from each Fund, based on a percentage of the Fund’s average daily net assets, as shown in the following table:
| | | | |
| | |
| Fund | | Advisory Fee Rate | |
Dynamic Currency Hedged International Equity Fund | | | 0.40 | % |
Dynamic Currency Hedged International SmallCap Equity Fund | | | 0.48 | % |
Emerging Markets ESG Fund | | | 0.32 | % |
International ESG Fund | | | 0.30 | % |
U.S. Corporate Bond Fund | | | 0.18 | % |
U.S. High Yield Corporate Bond Fund | | | 0.38 | % |
U.S. Short-Term Corporate Bond Fund | | | 0.18 | % |
Emerging Markets Efficient Core Fund | | | 0.32 | % |
International Efficient Core Fund | | | 0.26 | % |
U.S. Efficient Core Fund | | | 0.20 | % |
Artificial Intelligence and Innovation Fund1 | | | 0.45 | % |
Battery Value Chain and Innovation Fund2 | | | 0.45 | % |
BioRevolution Fund | | | 0.45 | % |
Cloud Computing Fund | | | 0.45 | % |
Cybersecurity Fund | | | 0.45 | % |
| | 1 | Since the commencement of operations on December 9, 2021. |
| | 2 | Since the commencement of operations on February 17, 2022. |
Notes to Financial Statements (continued)
Affiliated holdings are investments in entities in which the Fund owns 5% or more of the outstanding voting securities or are investments in entities which are under common ownership or control. Transactions in shares of affiliated ETFs for the fiscal year ended June 30, 2022, as applicable, are included in an “Investment in Affiliates” supplementary table in each applicable Fund’s Schedule of Investments. For these transactions, WTAM voluntarily waives a portion of the advisory fees, that it would otherwise charge, in an amount equal to the indirect AFFE (which are fees and expenses incurred indirectly by a Fund through its investments in certain underlying investment companies) attributable to each Fund’s investment in affiliated ETFs. The dollar amount of advisory fees waived during the period for the Funds, if any, are included in the Statement of Operations in “Expense waivers”.
During the fiscal year ended June 30, 2022, certain Funds engaged in purchase and sale transactions with funds that have a common investment adviser, WTAM. These interfund purchase and sale transactions were effected in accordance with Rule 17a-7 under the 1940 Act. For the fiscal year ended June 30, 2022, the cost of purchases, proceeds from sales and the net realized gain or loss recognized upon the disposal of securities resulting from interfund transactions are shown in the following table:
| | | | | | | | | | | | |
| | | | |
| Fund | | Purchases | | | Sales | | | Net Realized
Gain/(Loss) | |
Dynamic Currency Hedged International Equity Fund | | $ | 5,754,779 | | | $ | 8,730,082 | | | $ | 327,730 | |
Dynamic Currency Hedged International SmallCap Equity Fund | | | 1,536,028 | | | | 1,344,540 | | | | (58,196 | ) |
WTAM and/or WisdomTree Investments (collectively herein, “WT”) may from time to time own shares of a Fund. As of and for the fiscal year or period ended June 30, 2022, WT held shares of and received distributions from the following Funds, which were purchased through an unaffiliated broker in ordinary brokerage transactions in the secondary market in which the Funds’ shares trade:
| | | | | | | | | | | | | | | | |
| | | | |
| | | At June 30, 2022 | | | | | | For the Fiscal Year Ended
June 30, 2022 | |
| | | | |
| Fund | | Fund Shares
held by WT | | | Market Value of
Fund Shares
held by WT | | | | | | Dividends and Distributions
paid to WT on
Fund Shares
held by WT | |
Dynamic Currency Hedged International Equity Fund | | | 667 | | | $ | 18,643 | | | | | | | $ | 1,032 | |
International ESG Fund | | | 324 | | | | 8,064 | | | | | | | | 274 | |
U.S. Corporate Bond Fund | | | 18,000 | | | | 813,031 | | | | | | | | 23,967 | |
U.S. High Yield Corporate Bond Fund | | | 478 | | | | 21,032 | | | | | | | | 993 | |
U.S. Short-Term Corporate Bond Fund | | | 58,349 | | | | 2,771,461 | | | | | | | | 48,136 | |
Emerging Markets Efficient Core Fund | | | 40 | | | | 1,138 | | | | | | | | 6 | |
International Efficient Core Fund | | | 188 | | | | 5,818 | | | | | | | | 92 | |
U.S. Efficient Core Fund | | | 399 | | | | 13,303 | | | | | | | | 84 | |
Cloud Computing Fund | | | 78 | | | | 2,186 | | | | | | | | — | |
Cybersecurity Fund | | | 134 | | | | 2,383 | | | | | | | | 8 | |
During the fiscal period ended June 30, 2022, in connection with the organization of the Artificial Intelligence and Innovation Fund and the Battery Value Chain and Innovation Fund, for each newly launched fund, WTAM contributed $100 in exchange for 4 shares in the Artificial Intelligence and Innovation Fund, and contributed $120 in exchange for 3 shares in the Battery Value Chain and Innovation Fund. Prior to June 30, 2022, WTAM redeemed the aforementioned shares as follows: 4 shares of the Artificial Intelligence and Innovation Fund for proceeds of $101 and 3 shares of the Battery Value Chain and Innovation Fund for proceeds of $117.
4. CAPITAL SHARE TRANSACTIONS
As of June 30, 2022, there were an unlimited number of $0.001 par value shares of beneficial interest authorized by the Trust. Shares are issued and redeemed by each Fund only in creation units or multiples thereof. Except when aggregated in creation units, shares of each Fund are not redeemable. Transactions in shares for each Fund are disclosed in detail in the Statements of Changes in Net Assets. The consideration for the purchase of creation units of a Fund generally consists of the in-kind contribution of a basket of securities and/or an amount of cash. Investors purchasing and redeeming creation units may be charged a purchase transaction fee and a redemption transaction fee to offset transfer and other transaction costs associated with the issuance and redemption of creation units.
5. INVESTMENT PORTFOLIO TRANSACTIONS
Purchases and sales of investments (excluding purchases and sales resulting from in-kind capital share transactions and short-term investments) and the cost of purchases and the proceeds from sales resulting from in-kind capital share transactions (excluding
Notes to Financial Statements (continued)
short-term investments) for the fiscal year or period ended June 30, 2022 are shown in the following table. Realized gains and losses on sales resulting from in-kind capital share redemptions, as shown on the Statements of Operations, are not recognized by the Funds for tax purposes.
| | | | | | | | | | | | | | | | |
| | | | |
| | | | | | | | | In-kind Capital Share Transactions | |
| | | | |
| Fund | | Purchases | | | Sales | | | Purchases | | | Sales | |
Dynamic Currency Hedged International Equity Fund | | $ | 75,677,843 | | | $ | 55,920,551 | | | $ | 37,860,703 | | | $ | 23,065,862 | |
Dynamic Currency Hedged International SmallCap Equity Fund | | | 31,653,907 | | | | 23,407,827 | | | | 31,268,226 | | | | 10,231,863 | |
Emerging Markets ESG Fund | | | 17,415,421 | | | | 16,990,186 | | | | 514,536 | | | | 1,418,720 | |
International ESG Fund | | | 6,989,255 | | | | 6,950,636 | | | | 1,435,371 | | | | — | |
U.S. Corporate Bond Fund | | | 24,211,781 | | | | 23,689,239 | | | | — | | | | — | |
U.S. High Yield Corporate Bond Fund | | | 45,025,349 | | | | 43,409,811 | | | | 80,686,588 | | | | 34,274,299 | |
U.S. Short-Term Corporate Bond Fund | | | 21,455,794 | | | | 20,846,951 | | | | 14,830,769 | | | | — | |
Emerging Markets Efficient Core Fund | | | 47,877,104 | | | | 20,253,789 | | | | 13,299,998 | | | | 3,384,442 | |
International Efficient Core Fund | | | 7,752,355 | | | | 6,944,698 | | | | 137,324,098 | | | | 49,886,575 | |
U.S. Efficient Core Fund | | | 48,188,599 | | | | 83,715,056 | | | | 489,167,076 | | | | 165,509,367 | |
Artificial Intelligence and Innovation Fund1 | | | 1,355,671 | | | | 106,168 | | | | — | | | | — | |
Battery Value Chain and Innovation Fund2 | | | 2,910,764 | | | | 906,417 | | | | — | | | | — | |
BioRevolution Fund | | | 662,570 | | | | 606,975 | | | | 3,542,104 | | | | — | |
Cloud Computing Fund | | | 530,149,603 | | | | 533,240,670 | | | | 787,619,713 | | | | 824,506,634 | |
Cybersecurity Fund | | | 21,395,959 | | | | 21,197,447 | | | | 33,058,706 | | | | 12,408,395 | |
| | 1 | For the period December 9, 2021 (commencement of operations) through June 30, 2022. |
| | 2 | For the period February 17, 2022 (commencement of operations) through June 30, 2022. |
6. FEDERAL INCOME TAXES
At June 30, 2022, the cost of investments (including securities on loan and derivatives) for Federal income tax purposes was as follows:
| | | | | | | | | | | | | | | | | | | | | | | | | | | | | | | | | | | | |
| | | | | |
| | | Investments in Long Securities | | | | | | Investments in Financial Derivatives1 | | | | |
| | | | | | | | | |
| Fund | | Tax Cost | | | Gross
Unrealized
Appreciation | | | Gross Unrealized
Depreciation | | | Net Unrealized
Appreciation/ (Depreciation) | | | | | | Gross
Unrealized
Appreciation | | | Gross
Unrealized
Depreciation | | | Net Unrealized
Appreciation/ (Depreciation) | | | Total Net
Unrealized
Appreciation/ (Depreciation) | |
Dynamic Currency Hedged International Equity Fund | | $ | 179,909,458 | | | $ | 8,861,473 | | | $ | (18,675,481 | ) | | $ | (9,814,008 | ) | | | | | | $ | 25,886 | | | $ | (1,665 | ) | | $ | 24,221 | | | $ | (9,789,787 | ) |
Dynamic Currency Hedged International SmallCap Equity Fund | | | 69,222,835 | | | | 2,017,949 | | | | (11,576,778 | ) | | | (9,558,829 | ) | | | | | | | 20,306 | | | | (159 | ) | | | 20,147 | | | | (9,538,682 | ) |
Emerging Markets ESG Fund | | | 25,052,381 | | | | 3,629,087 | | | | (3,108,557 | ) | | | 520,530 | | | | | | | | — | | | | — | | | | — | | | | 520,530 | |
International ESG Fund | | | 7,855,257 | | | | 389,214 | | | | (646,102 | ) | | | (256,888 | ) | | | | | | | 1 | | | | — | | | | 1 | | | | (256,887 | ) |
U.S. Corporate Bond Fund | | | 45,893,985 | | | | 1,710 | | | | (5,434,379 | ) | | | (5,432,669 | ) | | | | | | | — | | | | — | | | | — | | | | (5,432,669 | ) |
U.S. High Yield Corporate Bond Fund | | | 214,704,506 | | | | 255,191 | | | | (30,037,809 | ) | | | (29,782,618 | ) | | | | | | | — | | | | — | | | | — | | | | (29,782,618 | ) |
U.S. Short-Term Corporate Bond Fund | | | 45,483,087 | | | | 10,769 | | | | (1,874,339 | ) | | | (1,863,570 | ) | | | | | | | — | | | | — | | | | — | | | | (1,863,570 | ) |
Emerging Markets Efficient Core Fund | | | 37,934,996 | | | | 441,805 | | | | (7,534,987 | ) | | | (7,093,182 | ) | | | | | | | 881 | | | | (42 | ) | | | 839 | | | | (7,092,343 | ) |
International Efficient Core Fund | | | 86,554,346 | | | | 373,295 | | | | (19,154,524 | ) | | | (18,781,229 | ) | | | | | | | 554 | | | | — | | | | 554 | | | | (18,780,675 | ) |
U.S. Efficient Core Fund | | | 672,409,011 | | | | 34,379,231 | | | | (84,887,783 | ) | | | (50,508,552 | ) | | | | | | | — | | | | — | | | | — | | | | (50,508,552 | ) |
Artificial Intelligence and Innovation Fund | | | 1,175,982 | | | | 3,533 | | | | (428,862 | ) | | | (425,329 | ) | | | | | | | — | | | | — | | | | — | | | | (425,329 | ) |
Battery Value Chain and Innovation Fund | | | 1,886,783 | | | | 109,042 | | | | (265,527 | ) | | | (156,485 | ) | | | | | | | 5 | | | | (3 | ) | | | 2 | | | | (156,483 | ) |
BioRevolution Fund | | | 5,898,306 | | | | 178,166 | | | | (1,394,047 | ) | | | (1,215,881 | ) | | | | | | | — | | | | — | | | | — | | | | (1,215,881 | ) |
Cloud Computing Fund | | | 1,188,818,087 | | | | 1,749,126 | | | | (531,950,142 | ) | | | (530,201,016 | ) | | | | | | | — | | | | — | | | | — | | | | (530,201,016 | ) |
Cybersecurity Fund | | | 49,527,634 | | | | 1,155,130 | | | | (16,814,074 | ) | | | (15,658,944 | ) | | | | | | | — | | | | — | | | | — | | | | (15,658,944 | ) |
| | 1 | Certain financial derivatives may be considered section 1256 contracts under the Code. Each section 1256 contract held at the close of a taxable year shall be treated as sold for its fair market value on the last business day of such taxable year (and any realized gain and loss shall be taken into account for the taxable year). As such, the unrealized appreciation/(depreciation) for financial derivatives on a tax basis may not correspond to the unrealized appreciation/(depreciation) on a GAAP basis. The unrealized appreciation/(depreciation) for financial derivatives on a GAAP basis is located in the respective financial derivatives tables in each Fund’s Schedule of Investments. |
Notes to Financial Statements (continued)
At June 30, 2022, the components of total distributable earnings (loss) on a tax-basis were as follows:
| | | | | | | | | | | | | | | | | | | | |
| | | | | | |
| Fund | | Undistributed
Ordinary Income | | | Undistributed Capital
and Other Losses | | | Net Unrealized
Appreciation/
(Depreciation) | | | Currency and Other
Unrealized
Appreciation/
(Depreciation) | | | Total Distributable
Earnings (Loss) | |
Dynamic Currency Hedged International Equity Fund | | $ | 138,876 | | | $ | (31,192,196 | ) | | $ | (9,814,008 | ) | | $ | 9,489 | | | $
| (40,857,839
| )
|
Dynamic Currency Hedged International SmallCap Equity Fund | | | 160,892 | | | | (2,618,349 | ) | | | (9,558,829 | ) | | | 14,124 | | | | (12,002,162 | ) |
Emerging Markets ESG Fund | | | 268,167 | | | | (9,666,488 | ) | | | 520,530 | | | | (26,859 | ) | | | (8,904,650 | ) |
International ESG Fund | | | 10,749 | | | | (3,280,221 | ) | | | (256,888 | ) | | | (655 | ) | | | (3,527,015 | ) |
U.S. Corporate Bond Fund | | | 27,392 | | | | (2,503,404 | ) | | | (5,432,669 | ) | | | — | | | | (7,908,681 | ) |
U.S. High Yield Corporate Bond Fund | | | 124,720 | | | | (1,544,330 | ) | | | (29,782,618 | ) | | | — | | | | (31,202,228 | ) |
U.S. Short-Term Corporate Bond Fund | | | 43,952 | | | | (829,780 | ) | | | (1,863,570 | ) | | | — | | | | (2,649,398 | ) |
Emerging Markets Efficient Core Fund | | | 150,061 | | | | (2,770,235 | ) | | | (7,093,182 | ) | | | (3,992 | ) | | | (9,717,348 | ) |
International Efficient Core Fund | | | 28,594 | | | | (7,148,570 | ) | | | (18,781,229 | ) | | | (6,814 | ) | | | (25,908,019 | ) |
U.S. Efficient Core Fund | | | 440,856 | | | | (77,375,185 | ) | | | (50,508,552 | ) | | | 1 | | | | (127,442,880 | ) |
Artificial Intelligence and Innovation Fund | | | 899 | | | | (73,521 | ) | | | (425,329 | ) | | | (25 | ) | | | (497,976 | ) |
Battery Value Chain and Innovation Fund | | | 10,154 | | | | (116,503 | ) | | | (156,485 | ) | | | (33 | ) | | | (262,867 | ) |
BioRevolution Fund | | | 7,692 | | | | (209,938 | ) | | | (1,215,881 | ) | | | (40 | ) | | | (1,418,167 | ) |
Cloud Computing Fund | | | — | | | | (109,074,480 | ) | | | (530,201,016 | ) | | | — | | | | (639,275,496 | ) |
Cybersecurity Fund | | | 7,183 | | | | (652,510 | ) | | | (15,658,944 | ) | | | (457 | ) | | | (16,304,728 | ) |
The tax character of distributions paid during the fiscal years or periods ended June 30, 2022 and June 30, 2021, was as follows:
| | | | | | | | | | | | | | | | |
| | | |
| | | Year or Period Ended June 30, 2022 | | | Year Ended June 30, 2021 | |
| | | | |
| Fund | | Distributions Paid
from Ordinary
Income* | | | Distributions Paid
from Long-Term
Capital Gains | | | Distributions Paid
from Ordinary
Income* | | | Distributions Paid
from Long-Term
Capital Gains | |
Dynamic Currency Hedged International Equity Fund | | $ | 8,333,400 | | | $ | — | | | $ | 5,826,707 | | | $ | — | |
Dynamic Currency Hedged International SmallCap Equity Fund | | | 2,160,473 | | | | — | | | | 1,376,310 | | | | — | |
Emerging Markets ESG Fund | | | 813,816 | | | | — | | | | 678,548 | | | | — | |
International ESG Fund | | | 238,020 | | | | — | | | | 320,460 | | | | — | |
U.S. Corporate Bond Fund | | | 1,111,508 | | | | 86,158 | | | | 1,207,970 | | | | 33,410 | |
U.S. High Yield Corporate Bond Fund | | | 7,906,350 | | | | — | | | | 5,187,250 | | | | — | |
U.S. Short-Term Corporate Bond Fund | | | 563,903 | | | | 87,345 | | | | 491,556 | | | | 30,432 | |
Emerging Markets Efficient Core Fund | | | 367,111 | | | | 11,347 | | | | 3,000 | 1 | | | — | 1 |
International Efficient Core Fund | | | 1,964,754 | | | | 6,577 | | | | 2,000 | 1 | | | — | 1 |
U.S. Efficient Core Fund | | | 8,163,536 | | | | — | | | | 4,308,424 | | | | 249,919 | |
Artificial Intelligence and Innovation Fund2 | | | — | | | | — | | | | — | | | | — | |
Battery Value Chain and Innovation Fund3 | | | — | | | | — | | | | — | | | | — | |
BioRevolution Fund | | | 4,424 | | | | — | | | | — | 4 | | | — | 4 |
Cloud Computing Fund | | | — | | | | — | | | | — | | | | — | |
Cybersecurity Fund | | | 177,112 | | | | — | | | | — | 5 | | | — | 5 |
| | * | Includes short-term capital gains, if any. |
| | 1 | For the period May 20, 2021 (commencement of operations) through June 30, 2021. |
| | 2 | For the period December 9, 2021 (commencement of operations) through June 30, 2022. |
| | 3 | For the period February 17, 2022 (commencement of operations) through June 30, 2022. |
| | 4 | For the period June 3, 2021 (commencement of operations) through June 30, 2021. |
| | 5 | For the period January 28, 2021 (commencement of operations) through June 30, 2021. |
At June 30, 2022, for Federal tax purposes, the Funds have capital loss carryforwards available to offset future capital gains as indicated in the table. The loss carryforward amounts do not have an expiration date and, therefore, can be carried forward indefinitely until utilized. To the extent that these loss carryforwards are utilized, capital gains so offset will not be distributed to shareholders.
Notes to Financial Statements (continued)
| | | | | | | | | | | | |
| | | | |
| Fund | | Short-Term | | | Long-Term | | | Capital Loss
Available Total | |
Dynamic Currency Hedged International Equity Fund | | $ | 1,141,173 | | | $ | 30,051,023 | | | $ | 31,192,196 | |
Dynamic Currency Hedged International SmallCap Equity Fund | | | 1,800,526 | | | | 817,823 | | | | 2,618,349 | |
Emerging Markets ESG Fund | | | 7,819,230 | | | | 1,847,258 | | | | 9,666,488 | |
International ESG Fund | | | 571,751 | | | | 2,708,470 | | | | 3,280,221 | |
U.S. Corporate Bond Fund | | | — | | | | — | | | | — | |
U.S. High Yield Corporate Bond Fund | | | 816,343 | | | | 727,987 | | | | 1,544,330 | |
U.S. Short-Term Corporate Bond Fund | | | — | | | | — | | | | — | |
Emerging Markets Efficient Core Fund | | | — | | | | — | | | | — | |
International Efficient Core Fund | | | 3,577,018 | | | | 3,571,552 | | | | 7,148,570 | |
U.S. Efficient Core Fund | | | 39,036,354 | | | | 38,338,831 | | | | 77,375,185 | |
Artificial Intelligence and Innovation Fund | | | 73,521 | | | | — | | | | 73,521 | |
Battery Value Chain and Innovation Fund | | | 116,483 | | | | 20 | | | | 116,503 | |
BioRevolution Fund | | | 114,847 | | | | 95,091 | | | | 209,938 | |
Cloud Computing Fund | | | 81,720,335 | | | | 25,645,029 | | | | 107,365,364 | |
Cybersecurity Fund | | | 448,654 | | | | 203,856 | | | | 652,510 | |
Capital losses incurred after October 31 (“post-October capital losses”) and late year ordinary losses incurred after December 31 within the taxable year are deemed to arise on the first business day of each Fund’s next taxable year.
During the fiscal year or period ended June 30, 2022, the following Funds incurred and will elect to defer post-October capital losses and late year ordinary losses as follows:
| | | | | | | | | | | | |
| | | | |
| Fund | | Short-Term Post-October
Capital Losses | | | Long-Term Post-October
Capital Losses | | | Late Year
Ordinary Loss | |
Dynamic Currency Hedged International Equity Fund | | $ | — | | | | — | | | $ | — | |
Dynamic Currency Hedged International SmallCap Equity Fund | | | — | | | | — | | | | — | |
Emerging Markets ESG Fund | | | — | | | | — | | | | — | |
International ESG Fund | | | — | | | | — | | | | — | |
U.S. Corporate Bond Fund | | | 353,159 | | | | 2,150,246 | | | | — | |
U.S. High Yield Corporate Bond Fund | | | — | | | | — | | | | — | |
U.S. Short-Term Corporate Bond Fund | | | 431,848 | | | | 397,932 | | | | — | |
Emerging Markets Efficient Core Fund | | | 1,643,192 | | | | 1,127,043 | | | | — | |
International Efficient Core Fund | | | — | | | | — | | | | — | |
U.S. Efficient Core Fund | | | — | | | | — | | | | — | |
Artificial Intelligence and Innovation Fund1 | | | — | | | | — | | | | — | |
Battery Value Chain and Innovation Fund2 | | | — | | | | — | | | | — | |
BioRevolution Fund | | | — | | | | — | | | | — | |
Cloud Computing Fund | | | — | | | | — | | | | 1,709,116 | |
Cybersecurity Fund | | | — | | | | — | | | | — | |
| | 1 | For the period December 9, 2021 (commencement of operations) through June 30, 2022. |
| | 2 | For the period February 17, 2022 (commencement of operations) through June 30, 2022. |
During the fiscal year or period ended June 30, 2022, the amount of capital loss carryforwards used to offset realized gains are shown in the following table:
| | | | |
| | |
| Fund | | Utilized
Capital Loss
Carryforward | |
Dynamic Currency Hedged International Equity Fund | | $ | 13,367,023 | |
Dynamic Currency Hedged International SmallCap Equity Fund | | | 4,388,905 | |
Emerging Markets ESG Fund | | | — | |
International ESG Fund | | | — | |
U.S. Corporate Bond Fund | | | — | |
U.S. High Yield Corporate Bond Fund | | | — | |
U.S. Short-Term Corporate Bond Fund | | | — | |
Notes to Financial Statements (continued)
| | | | |
| | |
| Fund | | Utilized
Capital Loss
Carryforward | |
Emerging Markets Efficient Core Fund | | $ | — | |
International Efficient Core Fund | | | — | |
U.S. Efficient Core Fund | | | — | |
Artificial Intelligence and Innovation Fund1 | | | — | |
Battery Value Chain and Innovation Fund2 | | | — | |
BioRevolution Fund | | | — | |
Cloud Computing Fund | | | — | |
Cybersecurity Fund | | | — | |
| | 1 | For the period December 9, 2021 (commencement of operations) through June 30, 2022. |
| | 2 | For the period February 17, 2022 (commencement of operations) through June 30, 2022. |
At June 30, 2022, the effect of permanent “book/tax” reclassifications resulted in increases (decreases) to the components of net assets as shown in the following table. The differences are primarily due to redemptions-in-kind and net operating losses.
| | | | | | | | |
| | | |
| Fund | | Total Distributable
Earnings (Loss) | | | Paid-in Capital | |
Dynamic Currency Hedged International Equity Fund | | $ | (4,855,933 | ) | | $ | 4,855,933 | |
Dynamic Currency Hedged International SmallCap Equity Fund | | | (4,255,563 | ) | | | 4,255,563 | |
Emerging Markets ESG Fund | | | (293,501 | ) | | | 293,501 | |
International ESG Fund | | | — | | | | — | |
U.S. Corporate Bond Fund | | | — | | | | — | |
U.S. High Yield Corporate Bond Fund | | | (405,063 | ) | | | 405,063 | |
U.S. Short-Term Corporate Bond Fund | | | — | | | | — | |
Emerging Markets Efficient Core Fund | | | 497,013 | | | | (497,013 | ) |
International Efficient Core Fund | | | 2,270,055 | | | | (2,270,055 | ) |
U.S. Efficient Core Fund | | | (66,290,363 | ) | | | 66,290,363 | |
Artificial Intelligence and Innovation Fund | | | — | | | | — | |
Battery Value Chain and Innovation Fund | | | — | | | | — | |
BioRevolution Fund | | | — | | | | — | |
Cloud Computing Fund | | | (111,362,354 | ) | | | 111,362,354 | |
Cybersecurity Fund | | | (1,766,480 | ) | | | 1,766,480 | |
GAAP provides guidance on tax provisions that prescribe a minimum threshold for financial statement recognition of the benefit of a tax position taken or expected to be taken in a tax return. Foreign withholding taxes, as applicable, are accrued based on each Fund’s understanding of the tax rules and rates that exist in the foreign markets in which it invests. Foreign withholding taxes are accrued and applied to foreign income, net realized capital gains and net unrealized appreciation, as applicable, as the foreign income is earned or capital gains and unrealized appreciation are recorded. The dollar amount of applicable foreign withholding taxes on foreign income is included net in the Statements of Operations in “Less: Foreign withholding taxes,” the foreign capital gains tax applicable on the disposal of securities is included in the Statements of Operations in “Net realized gain (loss) from investment transactions” and the dollar amount of deferred foreign capital gains tax applicable on the unrealized appreciation on securities held is included in the Statements of Operations in “Net increase (decrease) in unrealized appreciation/depreciation from investment transactions”. The Funds record a foreign tax reclaim receivable on the ex-dividend date if the tax reclaim is “more likely than not” to be sustained assuming examination by tax authorities. This determination is based on, among other things, a jurisdiction’s legal obligation to pay reclaims as well as payment history and market convention. Foreign tax reclaims that have been recorded but not yet received are shown on the Statements of Assets and Liabilities in “Receivables: Foreign tax reclaims”.
As of and during the fiscal year or period ended June 30, 2022, the Funds did not have any liabilities for unrecognized tax benefits relating to uncertain income tax positions they have taken or expect to take in the future. If applicable, the Funds will recognize interest accrued related to unrecognized tax benefits in interest expense and penalties in “Other” expenses on the Statements of Operations. The Funds file tax returns with the Internal Revenue Service, the State of New York, and various other states. Specific to U.S. federal and state taxes, generally, each of the tax years in the four-year period ended June 30, 2022, remains subject to examination by taxing authorities. Specific to foreign countries in which the Funds invest, all open tax years remain subject to examination by taxing authorities in the respective jurisdictions.
Notes to Financial Statements (continued)
As a result of several European Court of Justice (“ECJ”) court cases in certain countries across the European Union (“EU”), certain Funds have filed additional tax reclaims for previously withheld taxes on dividends earned in those countries (“ECJ tax reclaims”). These additional filings are subject to various administrative proceedings by the local jurisdictions’ tax authorities within the EU, as well as a number of related judicial proceedings. Income recognized, if any, for ECJ tax reclaims is reflected as “Other income” in the Statements of Operations and the cost to file these additional ECJ tax reclaims is reflected as “Other fees” in the Statements of Operations. When the ECJ tax reclaim is not “more likely than not” to be sustained assuming examination by tax authorities due to the uncertainty that exists as to the ultimate resolution of these proceedings, the likelihood of receipt of these ECJ tax reclaims, and the potential timing of payment, no amounts are reflected in the financial statements. At June 30, 2022, the Dynamic Currency Hedged International Equity Fund and the Dynamic Currency Hedged International SmallCap Equity Fund recognized ECJ tax reclaim receivables of $17,685 and $2,225, respectively, in the Statements of Assets and Liabilities in “Other receivables” that were “more likely than not” to be sustained by tax authorities and the estimated cost of $5,305 and $668, respectively, to file for these reclaims is reflected in “Other liabilities” on the Statements of Assets and Liabilities. For U.S. income tax purposes, ECJ tax reclaims received by the Funds, if any, reduce the amounts of foreign taxes Fund shareholders can use as tax credits in their individual tax returns. In the event that ECJ tax reclaims received by a Fund during the fiscal year exceed foreign withholding taxes paid, and a Fund previously passed foreign tax credits on to its shareholders, a Fund must either amend historic tax reporting to shareholders or enter into a closing agreement with the Internal Revenue Service in order to pay the associated tax liability on behalf of the respective Fund’s shareholders. During the fiscal period ended June 30, 2022, the ECJ tax reclaims received by the Funds did not exceed the foreign withholding taxes of the respective Funds.
7. RECENT REGULATORY UPDATE
On August 19, 2022, the Funds will be required to comply with new regulations adopted by the SEC governing the use of derivatives by registered investment companies (“Rule 18f-4”). Rule 18f-4 imposes limits on the amount of derivatives a fund can enter into, eliminates the asset segregation framework currently used by the Funds to comply with Section 18 of the 1940 Act, and requires funds, whose use of derivatives is greater than a limited specified amount, to establish and maintain a comprehensive derivatives risk management program and appoint a derivatives risk manager. WTAM anticipates Rule 18f-4 will not have a material impact on the Funds.
8. RECENT ACCOUNTING PRONOUNCEMENT
In June 2022, the FASB issued Accounting Standards Update No. 2022-03 (“ASU 2022-03”) Fair Value Measurement (Topic 820) — Fair Value Measurement of Equity Securities Subject to Contractual Sale Restrictions. The amendments in ASU 2022-03 clarify that a contractual restriction on the sale of an equity security is not considered part of the unit of account of the equity security and, therefore, is not considered in measuring fair value. The amendments also clarify that an entity cannot, as a separate unit of account, recognize and measure a contractual sale restriction. The amendments in ASU 2022-03 also require the following disclosures for equity securities subject to contractual sale restrictions: (i) the fair value of equity securities subject to contractual sale restrictions reflected in the balance sheet, (ii) the nature and remaining duration of the restriction(s), and (iii) the circumstances that could cause a lapse in the restriction(s). The amendments in ASU 2022-03 are effective for fiscal years beginning after December 15, 2023, and interim periods within those fiscal years for public business entities (early adoption is also permitted). WTAM is currently evaluating the impact that the adoption of ASU 2022-03 will have on the Trust’s financial statements and related disclosures.
9. ADDITIONAL INFORMATION
The respiratory disease caused by a novel coronavirus (“COVID-19”) has spread globally since 2019, resulting in a global pandemic and major disruption to global markets and economies. In an organized attempt to contain and mitigate the effects of COVID-19, governments and businesses world-wide took aggressive measures, including businesses canceling dividends to preserve cash, governments closing borders, restricting international and domestic travel, and the imposition of prolonged quarantines of large populations. COVID-19 has resulted in the disruption of and delays in the delivery of healthcare services and processes, the cancellation of organized events and educational institutions, the disruption of production and supply chains, a decline in consumer demand for certain goods and services, and general concern and uncertainty, all of which have contributed to increased volatility in global markets. In recent months, however, the rapid COVID-19 vaccination rollout in the United States and certain other developed countries, coupled with the passage of stimulus programs in the U.S. and abroad, have resulted in a reversal of many of these trends including the re-opening of businesses, a reduction in quarantine requirements, increased consumer demand, and the resumption of certain in-person schooling, travel and events. Despite these positive trends, the prevalence of new COVID-19 variants, a failure to achieve herd immunity, or other unforeseen circumstances may result in the continued spread of the virus throughout unvaccinated populations or a resurgence in infections among vaccinated populations. As a result, it remains unclear if recent positive trends will continue in developed markets and whether such trends will spread world-wide to countries with limited access to vaccines that are still experiencing rising COVID-19 cases, hospitalizations and deaths.
The effects of COVID-19 have affected and are likely to continue to affect certain sectors and industries more dramatically than others, and the effects borne by some will negatively affect the value of the issuers in those sectors and industries, which may
Notes to Financial Statements (concluded)
adversely affect the value of a Fund’s investments in those sectors or industries. It is also true that the speed at which global economies recover, or fail to recover, from the COVID-19 pandemic will affect certain sectors, industries, and issuers more dramatically than others, which in turn may adversely affect certain Fund investments.
COVID-19, and other epidemics and pandemics that may arise in the future, could adversely affect the economies of many nations, the global economy, individual companies and capital markets in ways that cannot be foreseen at the present time. In addition, the impact of infectious diseases in developing or emerging market countries may be greater due to limited health care resources, including access to COVID-19 vaccinations and treatments. Political, economic and social stresses caused by COVID-19 also may exacerbate other pre-existing political, social and economic risks in certain countries. The duration of COVID-19 and its effects cannot be determined fully at this time, but the effects could be present for an extended period of time. It is impossible to predict the effects on the Funds of these or similar events and market conditions in the future. However, it is possible that these or similar events and market conditions could have a significant and adverse effect on the NAV and/or risk profile of a Fund.
* * * * *
Russia’s military invasion of Ukraine initiated in February 2022 and the economic and diplomatic responses by the United States and other countries have led to increased volatility and uncertainty in the financial markets and could continue to adversely affect regional and global economies for the foreseeable future. In response to Russia’s actions, the governments of the United States, the European Union, the United Kingdom, and many other countries collectively imposed heavy and broad-ranging economic sanctions on certain Russian individuals, corporate and banking entities, and other industries and businesses. The sanctions restrict companies from doing business with Russia and Russian companies, prohibit transactions with the Russian central bank and other key Russian financial institutions and entities, ban Russian airlines and ships from using many other countries’ airspace and ports, respectively, and place a freeze on certain Russian assets. The sanctions also removed some Russian banks from the Society for Worldwide Interbank Financial Telecommunications (SWIFT), the electronic network that connects banks globally to facilitate cross-border payments. In addition, the United States has banned oil and other energy imports from Russia, and the United Kingdom made a commitment to phase out oil import from Russia by the end of 2022.
These sanctions, as well as other economic consequences related to the invasion, such as additional sanctions, boycotts or changes in consumer or purchaser preferences or cyberattacks on governments, companies or individuals, may further decrease the value and liquidity of certain Russian securities and securities of issuers in other countries that are subject to economic sanctions related to the invasion or otherwise adversely affected by the sanctions. To the extent a Fund has exposure to Russian investments or investments in countries affected by the invasion or the sanctions, the Fund’s ability to price, buy, sell, receive or deliver such investments may be impaired. In certain circumstances, such as when there is no market for a security or other means of valuing or disposing of a security, a Fund may determine to value the affected security at zero. In addition, any exposure a Fund may have to counterparties in Russia or in countries affected by the invasion could negatively affect the Fund’s portfolio. The extent and duration of Russia’s military actions and the repercussions of such actions are impossible to predict, but could result in continued significant market disruptions, including in the oil and natural gas markets, and may negatively affect global supply chains, inflation and global growth. Further, an escalation of the military conflict beyond Ukraine’s borders could result in significant, long-lasting damage to the economies of Eastern and Western Europe as well as the global economy. These and any related events could significantly and adversely affect a Fund’s performance and the value of an investment in the Fund, even in the absence of direct exposure to Russian issuers or issuers in other countries affected by the invasion.
Report of Independent Registered Public Accounting Firm
To the Shareholders of WisdomTree Dynamic Currency Hedged International Equity Fund, WisdomTree Dynamic Currency Hedged International SmallCap Equity Fund, WisdomTree Emerging Markets ESG Fund, WisdomTree International ESG Fund, WisdomTree U.S. Corporate Bond Fund, WisdomTree U.S. High Yield Corporate Bond Fund, WisdomTree U.S. Short-Term Corporate Bond Fund, WisdomTree Emerging Markets Efficient Core Fund, WisdomTree International Efficient Core Fund, WisdomTree U.S. Efficient Core Fund, WisdomTree Artificial Intelligence and Innovation Fund, WisdomTree Battery Value Chain and Innovation Fund, WisdomTree BioRevolution Fund, WisdomTree Cloud Computing Fund, and WisdomTree Cybersecurity Fund, and the Board of Trustees of WisdomTree Trust
Opinion on the Financial Statements
We have audited the accompanying statements of assets and liabilities of WisdomTree Dynamic Currency Hedged International Equity Fund, WisdomTree Dynamic Currency Hedged International SmallCap Equity Fund, WisdomTree Emerging Markets ESG Fund, WisdomTree International ESG Fund, WisdomTree U.S. Corporate Bond Fund, WisdomTree U.S. High Yield Corporate Bond Fund, WisdomTree U.S. Short-Term Corporate Bond Fund, WisdomTree Emerging Markets Efficient Core Fund, WisdomTree International Efficient Core Fund, WisdomTree U.S. Efficient Core Fund, WisdomTree Artificial Intelligence and Innovation Fund, WisdomTree Battery Value Chain and Innovation Fund, WisdomTree BioRevolution Fund, WisdomTree Cloud Computing Fund, and WisdomTree Cybersecurity Fund (collectively referred to as the “Funds”), (fifteen of the funds constituting WisdomTree Trust (the “Trust”)), including the schedules of investments, as of June 30, 2022, and the related statements of operations and changes in net assets, and the financial highlights for each of the periods indicated in the table below and the related notes (collectively referred to as the “financial statements”). In our opinion, the financial statements present fairly, in all material respects, the financial position of each of the Funds (fifteen of the funds constituting WisdomTree Trust) at June 30, 2022, and the results of their operations, changes in net assets and financial highlights for each of the periods indicated in the table below, in conformity with U.S. generally accepted accounting principles.
| | | | | | |
| | | | |
| Individual fund constituting the WisdomTree Trust | | Statement of operations | | Statements of changes in
net assets | | Financial highlights |
WisdomTree Dynamic Currency Hedged International Equity Fund WisdomTree Dynamic Currency Hedged International SmallCap Equity Fund WisdomTree Emerging Markets ESG Fund WisdomTree U.S. Corporate Bond Fund WisdomTree U.S. High Yield Corporate Bond Fund WisdomTree U.S. Short-Term Corporate Bond Fund WisdomTree International ESG Fund | | For the year ended June 30, 2022 | | For each of the two years in the period ended June 30, 2022 | | For each of the five years in the period ended June 30, 2022 |
WisdomTree U.S. Efficient Core Fund | | For the year ended June 30, 2022 | | For each of the two years in the period ended June 30, 2022 | | For each of the three years in the period ended June 30, 2022 and the period from August 2, 2018 (commencement of operations) through June 30, 2019 |
WisdomTree Cloud Computing Fund | | For the year ended June 30, 2022 | | For each of the two years in the period ended June 30, 2022 | | For each of the two years in the period ended June 30, 2022 and the period from September 6, 2019 (commencement of operations) through June 30, 2020 |
WisdomTree Cybersecurity Fund | | For the year ended June 30, 2022 | | For the year ended June 30, 2022 and the period from January 28, 2021 (commencement of operations) through June 30, 2021 |
WisdomTree Emerging Markets Efficient Core Fund WisdomTree International Efficient Core Fund | | For the year ended June 30, 2022 | | For the year ended June 30, 2022 and the period from May 20, 2021 (commencement of operations) through June 30, 2021 |
WisdomTree BioRevolution Fund | | For the year ended June 30, 2022 | | For the year ended June 30, 2022 and the period from June 3, 2021 (commencement of operations) through June 30, 2021 |
WisdomTree Artificial Intelligence and Innovation Fund | | For the period from December 9, 2021 (commencement of operations) through June 30, 2022 |
WisdomTree Battery Value Chain and Innovation Fund | | For the period from February 17, 2022 (commencement of operations) through June 30, 2022 |
Basis for Opinion
These financial statements are the responsibility of the Trust’s management. Our responsibility is to express an opinion on each of the Funds’ financial statements based on our audits. We are a public accounting firm registered with the Public Company Accounting Oversight Board (United States) (“PCAOB”) and are required to be independent with respect to the Trust in accordance with the U.S. federal securities laws and the applicable rules and regulations of the Securities and Exchange Commission and the PCAOB.
Report of Independent Registered Public Accounting Firm (concluded)
We conducted our audits in accordance with the standards of the PCAOB. Those standards require that we plan and perform the audit to obtain reasonable assurance about whether the financial statements are free of material misstatement, whether due to error or fraud. The Trust is not required to have, nor were we engaged to perform, an audit of the Trust’s internal control over financial reporting. As part of our audits, we are required to obtain an understanding of internal control over financial reporting, but not for the purpose of expressing an opinion on the effectiveness of the Trust’s internal control over financial reporting. Accordingly, we express no such opinion.
Our audits included performing procedures to assess the risks of material misstatement of the financial statements, whether due to error or fraud, and performing procedures that respond to those risks. Such procedures included examining, on a test basis, evidence regarding the amounts and disclosures in the financial statements. Our procedures included confirmation of securities owned as of June 30, 2022, by correspondence with the custodian and brokers or by other appropriate auditing procedures where replies from brokers were not received. Our audits also included evaluating the accounting principles used and significant estimates made by management, as well as evaluating the overall presentation of the financial statements. We believe that our audits provide a reasonable basis for our opinion.
We have served as the auditor of one or more WisdomTree investment companies since 2006.
New York, New York
August 25, 2022
Approval of Investment Advisory and Sub-Advisory Agreements (unaudited)
Consideration of the Approval of Investment Advisory and Sub-Advisory Agreements
WisdomTree Battery Value Chain and Innovation Fund (the “Fund”)
At a meeting of the Board of Trustees (the “Board”) of the WisdomTree Trust (the “Trust”) held on May 25, 2021, the Trustees (the “Trustees”), including those Trustees who are not “interested persons” (as defined in the Investment Company Act of 1940, as amended) of the Trust (the “Independent Trustees”), considered the approval of the Investment Advisory Agreement (the “Advisory Agreement”), pursuant to which WisdomTree Asset Management, Inc. (“WTAM”) will provide the Fund with investment advisory services, and the Sub-Advisory Agreement (together with the Advisory Agreement, the “Agreements”), pursuant to which Mellon Investments Corporation (the “Sub-Adviser”) will coordinate the investment and reinvestment of the assets of the Fund.
In considering whether to approve the Agreements, the Trustees considered and discussed information and analysis provided by WTAM and Broadridge Financial Solutions, Inc. (“Broadridge”), an independent provider of investment company data. The Trustees noted that representatives from WTAM presented preliminary information to the Trustees regarding the Fund’s proposed investment objective and principal investment strategies and risks at a meeting of the Board held on March 24-25, 2021. The Independent Trustees were assisted in their review by independent legal counsel and met with counsel in executive session separate from WTAM representatives and the Sub-Adviser. In considering the approval of the Agreements, the Board considered all factors that it believed to be relevant, including those discussed below. The Board did not identify any one factor as dispositive, and each Trustee may have attributed different weights to the factors considered.
Analysis of Nature, Extent, and Quality of Services to be Provided to the Fund. The Board considered information provided to them at the meeting and in previous presentations throughout the year from WTAM representatives regarding the nature, extent, and quality of the services provided to the WisdomTree funds, recognizing WTAM’s and the Sub-Adviser’s operational capabilities and resources. It was noted that the Fund would be passively managed. The Board noted WTAM’s belief that shareholders will invest in the Fund on the strength of WTAM’s industry standing and reputation and with the expectation that WTAM will have a continuing role in providing advisory services to the Fund. The Board also noted the extensive responsibilities that WTAM will have as investment adviser to the Fund, including: the selection of, and supervisory responsibilities and activities over, the Sub-Adviser, including oversight of the Sub-Adviser’s adherence to the Fund’s investment strategy and restrictions, monitoring of the Sub-Adviser’s buying and selling of securities and derivatives transactions, review of Sub-Adviser performance, review of proxies voted by the Sub-Adviser and oversight of, and the provision of consultation to, the Sub-Adviser with respect to the creation of custom creation or redemption baskets for authorized participants; oversight of the daily valuation of the Fund’s portfolio holdings; oversight of general Fund compliance with federal and state laws; and implementation of Board directives as they relate to the Fund. The Board also considered research support available to, and management capabilities of, the Fund’s management personnel and that WTAM will provide oversight of day-to-day Fund operations, including fund accounting, tax matters, administration, compliance and legal assistance in meeting disclosure and regulatory requirements.
Based on review of this information and the other factors considered at the meeting, the Board concluded that the nature, extent and quality of services to be provided by WTAM and the Sub-Adviser under the Advisory Agreement and Sub-Advisory Agreement, respectively, are adequate and appropriate and supported the Board’s approval of the Agreements.
Comparative Analysis of the Fund’s Performance, Advisory Fees and Fund Expenses. As the Fund had not yet commenced operations, the Board was not able to review the Fund’s performance. The Board discussed with WTAM representatives the portfolio management team and the investment strategies to be employed in the management of the Fund’s assets. The Board noted the reputation and experience of WTAM and the Sub-Adviser.
The Board considered the fees to be paid to WTAM by the Fund. The Board examined the fee to be paid by the Fund in light of fees paid to other investment advisers by comparable funds and the method of computing the Fund’s fee. The Board also considered the fee to be paid to the Sub-Adviser in relation to the fee to be paid to WTAM by the Fund and the respective services to be provided by the Sub-Adviser and WTAM. The Board also noted the Sub-Adviser’s fee will be paid by WTAM (out of its fee paid by the Fund) and not by the Fund. The Board considered the meaningful differences in the services that WTAM will provide to the Fund as compared to the Sub-Adviser. Specifically, they noted that the role of the Sub-Adviser in making investment recommendations with respect to the Fund, which is passively managed and tracks an index, is a rules-based function, with oversight by WTAM in seeking to ensure compliance with such rules. The Board also considered the entrepreneurial and expense risk to be borne by WTAM that is associated with the Fund’s unitary fee structure, which includes minimum fees (such as those to the Sub-Adviser), regardless of whether the asset size of the Fund grows to a sufficient size. Based on this review, the Board concluded that the fees to be paid to WTAM and the Sub-Adviser supported the Board’s approval of the Agreements.
Analysis of Profitability and Economies of Scale. As the Fund had not yet commenced operations, WTAM representatives were not able to review the dollar amount of expenses allocated and profit received by WTAM, or any economies of scale. The Board considered potential benefits to WTAM and the Sub-Adviser from acting as investment adviser and sub-adviser, respectively. The Board also considered the uncertainty of the estimated asset levels and the renewal requirements for advisory agreements and their
Approval of Investment Advisory and Sub-Advisory Agreements (unaudited) (concluded)
ability to review the advisory fees annually after the initial term of the Agreements. The Board determined that because the Fund had not yet commenced operations, economies of scale were not a factor, but, to the extent in the future it were determined that material economies of scale had not been shared with the Fund, the Board would seek to have those economies of scale shared with the Fund in connection with future renewals.
* * * * * *
In evaluating the Agreements, the Board considered the conclusions and determinations discussed above and also relied on its knowledge, gained through meetings and other interactions with WTAM and the Sub-Adviser, of other funds advised by WTAM and the Sub-Adviser. In light of the foregoing, the Board, including a majority of the Independent Trustees, determined to approve the Agreements.
Liquidity Risk Management Program (unaudited)
The Funds adopted a liquidity risk management program (the “Program”) pursuant to the requirements of Rule 22e-4 (the “Rule”) under the Investment Company Act of 1940, as amended. The Rule requires registered open-end funds, including exchange-traded funds such as the Funds, to establish liquidity risk management programs in order to effectively manage fund liquidity and shareholder redemptions. The Rule is designed to mitigate the risk that a Fund could not meet redemption requests without significantly diluting the interest of remaining investors. The Board has appointed WisdomTree Asset Management, Inc., the investment advisor to the Funds, as the Program Administrator for each Fund’s Program.
The Rule requires the Funds to assess, manage and review their liquidity risk at least annually considering applicable factors such as investment strategy and liquidity during normal and foreseeable stressed conditions, including whether the strategy is appropriate for an open-ended fund and whether the Fund has a relatively concentrated portfolio or large positions in particular issuers. The Funds must also assess their use of borrowings and derivatives, short-term and long-term cash flow projections in normal and stressed conditions, holdings of cash and cash equivalents, and borrowing arrangements and other funding sources.
The Rule also requires the Funds to classify their investments into one of four liquidity categories: highly liquid, moderately liquid, less liquid or illiquid based on the number of days a Fund expects it would take to liquidate the investment, and to review these classifications at least monthly or more often under certain conditions. The periods range from three or fewer business days for a highly liquid investment to greater than seven calendar days for settlement of a less liquid investment. Illiquid investments are those a Fund does not expect to be able to sell or dispose of within seven calendar days without significantly changing the market value of the investment. A Fund is prohibited from acquiring an investment if, after the acquisition, its holdings of illiquid assets will exceed 15% of its net assets. In addition, if a Fund permits redemptions in-kind, the Rule requires the Fund to establish redemption in-kind policies and procedures governing how and when it will engage in such redemptions.
Pursuant to the Rule’s requirements, the Program has been reviewed and approved by the Fund’s Board. Furthermore, the Board has received a written report prepared by the Program Administrator that addresses the operation of the Program, assesses its adequacy and effectiveness and describes any material changes made to the Program. The Program Administrator has monitored the Fund’s liquidity risk and the liquidity classifications of the securities held by the Fund and has determined that the Program is operating effectively.
During the period from January 1, 2021 to December 31, 2021, there were no material changes to the Program and no material liquidity events that impacted the Funds. During the period, the Funds held sufficient highly liquid assets to meet fund redemptions.
Under normal expected foreseeable Fund redemption forecasts and foreseeable stressed Fund redemption forecasts, the Program Administrator believes that the Funds maintain sufficient highly liquid assets to meet Fund redemptions.
Trustees and Officers Information (unaudited)
| | | | | | | | | | |
Name
and Year of Birth
of Trustee/Officer | | Position(s) Held with the Trust, Term of Office and Length of
Time Served | | Principal Occupation(s)
During Past 5 Years | | Number of Portfolios
in Fund Complex
Overseen by Trustee/
Officer+ | | | Other
Directorships Held by Trustee/
Officer |
| Trustees Who Are Interested Persons of the Trust |
Jonathan Steinberg
(1964) | | Trustee, 2005-present; President, 2005-present | | Chief Executive Officer, WisdomTree Investments and WisdomTree Asset Management since 2005; President, WisdomTree Investments and WisdomTree Asset Management from 2012 to 2019. | | | 77 | | | Director, WisdomTree Investments and WisdomTree Asset Management. |
|
| Trustees Who Are Not Interested Persons of the Trust |
| | | | |
David G. Chrencik*
(1948) | | Trustee, 2014-present | | Chief Financial Officer of Sarus Indochina Select LP (hedge fund) since 2012; Chief Financial Officer of GeoGreen BioFuels, Inc. (biodiesel fuel producer) from 2010 to 2014; Audit Partner at PricewaterhouseCoopers LLP (public accounting firm) from 1972 to 2009 (includes positions prior to becoming Audit Partner and predecessor firms). | | | 77 | | | None |
| | | | |
Joel Goldberg**, ***
(1945) | | Trustee, 2012-present | | Attorney, Partner at Stroock & Stroock & Lavan LLP from 2010 to 2018; Attorney, Partner at Willkie Farr & Gallagher LLP from 2006 to 2010. | | | 77 | | | Director, Better Business Bureau (Metropolitan New York, Long Island and the Mid-Hudson Region). |
| | | | |
Toni Massaro***
(1955) | | Trustee, 2006-present | | Dean Emerita at the University of Arizona James E. Rogers College of Law (“Rogers College of Law”) since 2009 (distinguished Emerita in July 2009); Dean of the Rogers College of Law from 1999 to 2009; Regents’ Professor since 2006; Milton O. Riepe Chair in Constitutional Law since 1997; Professor at the Rogers College of Law since 1990. | | | 77 | | | None |
| | | | |
Melinda A. Raso Kirstein**** (1955) | | Trustee, 2014-present | | Retired since 2004, Merrill Lynch Investment Management, Vice President; Senior Portfolio Manager, Fixed Income Management; Director, Tax Exempt Fund Management. | | | 77 | | | Associate Alumnae of Douglass College, Chair of Investment Committee. |
| | | | |
Victor Ugolyn
(1947) | | Trustee, 2006-present; Chairman of the Board, 2006-present | | Private Investor, from 2005 to present; President and Chief Executive Officer of William D. Witter, Inc. from 2005 to 2006; Consultant to AXA Enterprise in 2004; Chairman, President and Chief Executive Officer of Enterprise Capital Management (subsidiary of The MONY Group, Inc.) and Enterprise Group of Funds, Chairman of MONY Securities Corporation, and Chairman of the Fund Board of Enterprise Group of Funds from 1991 to 2004. | | | 77 | | | None |
Trustees and Officers Information (unaudited) (concluded)
| | | | | | | | | | |
Name
and Year of Birth
of Trustee/Officer | | Position(s) Held with the Trust, Term of Office and Length of
Time Served | | Principal Occupation(s)
During Past 5 Years | | Number of Portfolios
in Fund Complex
Overseen by Trustee/
Officer+ | | | Other
Directorships Held by Trustee/
Officer |
|
| Officers of the Trust |
| | | | |
Jonathan Steinberg*****
(1964) | | President, 2005- present; Trustee, 2005-present | | Chief Executive Officer, WisdomTree Investments and WisdomTree Asset Management since 2005; President, WisdomTree Investments and WisdomTree Asset Management from 2012 to 2019. | | | 77 | | | None |
| | | | |
David Castano*****
(1971) | | Treasurer, 2013-present | | Head of Fund Accounting & Administration, WisdomTree Asset Management, since 2020; Director of Fund Accounting & Administration, WisdomTree Asset Management, 2011 to 2020. | | | 77 | | | None |
| | | | |
Terry Jane Feld*****
(1960) | | Chief Compliance Officer, 2012-present | | Head of U.S. Compliance, WisdomTree Asset Management since 2022; Chief Compliance Officer WisdomTree Asset Management since 2012. | | | 77 | | | None |
| | | | |
Joanne Antico*****
(1975) | | Chief Legal Officer and Secretary, 2021-present | | General Counsel, WisdomTree Asset Management since 2021; Assistant General Counsel, WisdomTree Asset Management 2016 to 2021; Executive Director and Assistant Secretary, Morgan Stanley Investment Management Inc., 2005 to 2016. | | | 77 | | | None |
| | | | |
TJ Darnowski*****
(1984) | | Assistant Secretary, 2021-present | | Senior Investment Management Paralegal, WisdomTree Asset Management since 2021; Senior Legal Administrator, Ultimus Fund Solutions, 2019-2021; Assistant Vice President, State Street Bank & Trust Company, 2010 to 2019. | | | 77 | | | None |
| | | | |
Clint Martin*****
(1977) | | Assistant Treasurer, 2015-present | | Director of Fund Accounting & Administration, WisdomTree Asset Management, since 2020; Fund Manager, Fund Accounting & Administration, WisdomTree Asset Management, 2012 to 2020. | | | 77 | | | None |
| | | | |
Angela Borreggine*****
(1964) | | Assistant Secretary, 2022- present | | Assistant General Counsel, WisdomTree Asset Management since 2022; Vice President and Senior Counsel, Virtus Investment Partners, 2021-2022; Director, Senior Counsel, Allianz Global Investors, 2007-2021. | | | 77 | | | None |
| * | Chair of the Audit Committee. |
| ** | Chair of the Contracts Review Committee. |
| *** | Co-Chair of the Governance, Nominating and Compliance Committee. |
| **** | Chair of the Investment Committee. |
| ***** | Elected by and serves at the pleasure of the Board. |
Supplemental Information (unaudited)
Federal Income Tax Information
The following Federal tax information related to the Funds’ fiscal year or period ended June 30, 2022, is provided for information purposes only and should not be used for reporting to federal or state revenue agencies. Federal tax information for the calendar year will be reported to you on Form 1099-DIV in January 2023.
Certain dividends paid by the Funds may be subject to a maximum tax rate of 15%, as provided by the Jobs and Growth Tax Relief Reconciliation Act of 2003. Of the distributions paid during the fiscal year or period ended June 30, 2022, the following represents the maximum amount of ordinary income distributions that may be considered qualified dividend income:
| | | | |
| | |
| Fund | | Qualified Dividend
Income | |
Dynamic Currency Hedged International Equity Fund | | $ | 6,488,567 | |
Dynamic Currency Hedged International SmallCap Equity Fund | | | 1,728,500 | |
Emerging Markets ESG Fund | | | 436,099 | |
International ESG Fund | | | 277,534 | |
U.S. Corporate Bond Fund | | | — | |
U.S. High Yield Corporate Bond Fund | | | — | |
U.S. Short-Term Corporate Bond Fund | | | — | |
Emerging Markets Efficient Core Fund | | | 275,630 | |
International Efficient Core Fund | | | 2,214,642 | |
U.S. Efficient Core Fund | | | 8,163,536 | |
Artificial Intelligence and Innovation Fund1 | | | — | |
Battery Value Chain and Innovation Fund2 | | | — | |
BioRevolution Fund | | | — | |
Cloud Computing Fund | | | — | |
Cybersecurity Fund | | | 177,112 | |
| | 1 | For the period December 9, 2021 (commencement of operations) through June 30, 2022. |
| | 2 | For the period February 17, 2022 (commencement of operations) through June 30, 2022. |
The Funds designate the following amount of ordinary income distributions paid during the fiscal year or period ended June 30, 2022 from qualified short-term gains and qualified interest income:
| | | | | | | | |
| | | |
| Fund | | Qualified Short-
Term Gains | | | Qualified Interest
Income | |
Dynamic Currency Hedged International Equity Fund | | | 0.00 | % | | | 0.00 | % |
Dynamic Currency Hedged International SmallCap Equity Fund | | | 0.00 | % | | | 0.00 | % |
Emerging Markets ESG Fund | | | 0.00 | % | | | 0.00 | % |
International ESG Fund | | | 0.00 | % | | | 0.00 | % |
U.S. Corporate Bond Fund | | | 0.00 | % | | | 100.00 | % |
U.S. High Yield Corporate Bond Fund | | | 0.00 | % | | | 100.00 | % |
U.S. Short-Term Corporate Bond Fund | | | 100.00 | % | | | 100.00 | % |
Emerging Markets Efficient Core Fund | |
| 100.00
| %
| | | 0.00 | % |
International Efficient Core Fund | |
| 100.00
| %
| | | 0.00 | % |
U.S. Efficient Core Fund | | | 0.00 | % | | | 0.00 | % |
Artificial Intelligence and Innovation Fund1 | | | 0.00 | % | | | 0.00 | % |
Battery Value Chain and Innovation Fund2 | | | 0.00 | % | | | 0.00 | % |
BioRevolution Fund | | | 0.00 | % | | | 0.00 | % |
Cloud Computing Fund | | | 0.00 | % | | | 0.00 | % |
Cybersecurity Fund | | | 0.00 | % | | | 0.00 | % |
| | 1 | For the period December 9, 2021 (commencement of operations) through June 30, 2022. |
| | 2 | For the period February 17, 2022 (commencement of operations) through June 30, 2022. |
Supplemental Information (unaudited) (concluded)
The following represents the percentage of dividends paid during the fiscal year or period ended June 30, 2022, that qualify for the 70% dividends received deduction for corporate shareholders:
| | | | |
| | |
| Fund | | Dividends-Received
Deduction | |
Dynamic Currency Hedged International Equity Fund | | | — | |
Dynamic Currency Hedged International SmallCap Equity Fund | | | — | |
Emerging Markets ESG Fund | | | 0.15 | % |
International ESG Fund | | | — | |
U.S. Corporate Bond Fund | | | — | |
U.S. High Yield Corporate Bond Fund | | | — | |
U.S. Short-Term Corporate Bond Fund | | | — | |
Emerging Markets Efficient Core Fund | | | 0.12 | % |
International Efficient Core Fund | | | — | |
U.S. Efficient Core Fund | | | 100.00 | % |
Artificial Intelligence and Innovation Fund1 | | | — | |
Battery Value Chain and Innovation Fund2 | | | — | |
BioRevolution Fund | | | — | |
Cloud Computing Fund | | | — | |
Cybersecurity Fund | | | 100.00 | % |
| | 1 | For the period December 9, 2021 (commencement of operations) through June 30, 2022. |
| | 2 | For the period February 17, 2022 (commencement of operations) through June 30, 2022. |
The Funds intend to elect to pass through to shareholders the credit for taxes paid to foreign countries during the fiscal year or period ended June 30, 2022. The gross foreign source income and foreign taxes paid are as follows:
| | | | | | | | |
| | | |
| Fund | | Gross Foreign
Income | | | Foreign
Taxes Paid | |
Dynamic Currency Hedged International Equity Fund | | $ | 7,725,642 | | | $ | 412,453 | |
Dynamic Currency Hedged International SmallCap Equity Fund | | | 2,155,128 | | | | 184,867 | |
Emerging Markets ESG Fund | | | 957,862 | | | | 135,604 | |
International ESG Fund | | | 264,473 | | | | 29,441 | |
U.S. Corporate Bond Fund | | | — | | | | — | |
U.S. High Yield Corporate Bond Fund | | | — | | | | — | |
U.S. Short-Term Corporate Bond Fund | | | — | | | | — | |
Emerging Markets Efficient Core Fund | | | 576,611 | | | | 62,149 | |
International Efficient Core Fund | | | 2,235,237 | | | | 219,824 | |
U.S. Efficient Core Fund | | | — | | | | — | |
Artificial Intelligence and Innovation Fund1 | | | — | | | | — | |
Battery Value Chain and Innovation Fund2 | | | 11,686 | | | | 1,749 | |
BioRevolution Fund | | | — | | | | — | |
Cloud Computing Fund | | | — | | | | — | |
Cybersecurity Fund | | | — | | | | — | |
| | 1 | For the period December 9, 2021 (commencement of operations) through June 30, 2022. |
| | 2 | For the period February 17, 2022 (commencement of operations) through June 30, 2022. |
General Information (unaudited)
Proxy Voting Policies, Procedures and Record
A complete copy of the Proxy Voting Policy may be obtained upon request, at no charge, by calling 1-866-909-WISE (9473) or writing to: WisdomTree Trust, c/o Foreside Fund Services, LLC, Three Canal Plaza Suite 100, Portland, ME, 04101.
The Trust is required to disclose annually the Funds’ complete proxy voting record on Form N-PX covering the most recent 12-month period ended June 30 and to file Form N-PX with the SEC no later than August 31 of each year. The current Form N-PX for the Funds is available at no charge upon request by calling 1-866-909-WISE (9473) or through the Trust’s website at www.wisdomtree.com. The Funds’ Form N-PX is also available on the SEC’s website at www.sec.gov.
Shareholder Reports and Quarterly Portfolio Disclosure
The Funds file their complete schedule of portfolio holdings with the SEC for their first and third fiscal quarters as an exhibit to their reports on Form N-PORT. Copies of the filings are available, without charge, on the SEC’s website at www.sec.gov and are also available by calling the Trust at 1-866-909-WISE (9473). Copies of the filings may also be obtained, after paying a duplicating fee, by electronic request at the following E-mail address: publicinfo@sec.gov.
Information about each Fund’s portfolio holdings is available daily, without charge, at www.wisdomtree.com.
The Statement of Additional Information (“SAI”) has additional information about the Funds’ Trustees and Officers and is available without charge upon request. Contact your financial representative for a free prospectus or SAI.
Frequency Distribution of Discounts & Premiums
Information about differences between the per share net asset value of each Fund and the market trading price of shares of each Fund are available, without charge, at www.wisdomtree.com.
The WisdomTree Funds are exchange traded funds (“ETFs”) registered with the United States Securities and Exchange Commission as separate series (“Funds”) of WisdomTree Trust (“Trust”). WisdomTree Asset Management, Inc., a wholly owned subsidiary of WisdomTree Investments, Inc., serves as the investment adviser to the Trust. None of the WisdomTree entities are affiliated with Foreside Fund Services, LLC, the Funds’ distributor. WisdomTree Investments, its affiliates and their independent providers are not liable for any informational errors, incompleteness, delays, or for any actions taken in reliance on information contained herein.
There are risks associated with investing including possible loss of principal. Foreign investing involves special risks, such as risk of loss from currency fluctuation or political or economic uncertainty. Investments in real estate involve additional special risks, such as credit risk, interest rate fluctuations and the effect of varied economic conditions. Funds that focus their investments in one country or region may be significantly impacted by events and developments associated with the region which can adversely affect performance. Funds focusing on a single sector and/or smaller companies generally experience greater price volatility. Investments in emerging, offshore or frontier markets are generally less liquid and less efficient than investments in developed markets and are subject to additional risks, such as risks of adverse governmental regulation and intervention or political developments. Fixed income investments are subject to interest rate risk; their value will normally decline as interest rates rise. In addition, when interest rates fall income may decline. Fixed income investments are also subject to credit risk, the risk that the issuer of a bond will fail to pay interest and principal in a timely manner, or that negative perceptions of the issuer’s ability to make such payments will cause the price of that bond to decline. High-yield or “junk” bonds have lower credit ratings and involve a greater risk to principal. While the Fixed Income Funds attempt to limit credit and counterparty exposure, the value of an investment in the Funds may change quickly and without warning in response to issuer or counterparty defaults and changes in the credit ratings of the Fund’s portfolio investments. Investments in currency involve additional special risks, such as credit risk and interest rate fluctuations. Derivative investments can be volatile and these investments may be less liquid than other securities, and more sensitive to the effect of varied economic conditions. As these Funds can have a high concentration in some issuers the Funds can be adversely impacted by changes affecting such issuers. Due to the investment strategy of certain Funds they may make higher capital gain distributions than other ETFs. Please read the Fund’s prospectus for specific details regarding the Fund’s risk profile.
Indexes are unmanaged and you cannot invest directly in an index.
Transactions in Fund shares will result in brokerage commissions and will generate tax consequences. Shares may be sold through brokerage accounts, but may be redeemed from the Funds only by Authorized Participants in large creation unit sizes of shares.
This report is intended for the Funds’ shareholders. It may not be distributed to prospective investors unless it is preceded or accompanied by the current prospectus.
Scan the QR code with your
smartphone camera to

learn more at
WisdomTree.com
WisdomTree Fund shares are distributed by Foreside Fund Services, LLC, in the U.S.
WTGM-6670
Item 2. Code of Ethics.
| | (a) | The registrant, as of the end of the period covered by this report, has adopted a code of ethics that applies to the registrant’s principal executive officer, principal financial officer, principal accounting officer or controller, or persons performing similar functions, regardless of whether these individuals are employed by the registrant or a third party. |
| | (c) | There have been no amendments, during the period covered by this report, to a provision of the code of ethics that applies to the registrant’s principal executive officer, principal financial officer, principal accounting officer or controller, or persons performing similar functions, regardless of whether these individuals are employed by the registrant or a third party, and that relates to any element of the code of ethics description. |
| | (d) | The registrant has not granted any waivers, including an implicit waiver, from a provision of the code of ethics that applies to the registrant’s principal executive officer, principal financial officer, principal accounting officer or controller, or persons performing similar functions, regardless of whether these individuals are employed by the registrant or a third party, that relates to one or more of the items set forth in paragraph (b) of this item’s instructions. |
| | (f) | The code of ethics is attached hereto as exhibit 13(a)(1). |
Item 3. Audit Committee Financial Expert.
The registrant’s Board of Trustees has determined that the registrant has one audit committee financial expert, as that term is defined under Item 3(b) and 3(c), serving on its audit committee. The audit committee financial expert serving on the registrant’s audit committee is David Chrencik, who is an independent trustee of the registrant, as that term is defined under Item 3(a) (2).
Item 4. Principal Accountant Fees and Services.
Audit Fees
| | (a) | The aggregate fees billed for each of the last two fiscal years for professional services rendered by the principal accountant for the audit of the registrant’s annual financial statements or services that are normally provided by the accountant in connection with statutory and regulatory filings or engagements for those fiscal years were $350,253 for 2022 and $290,308 for 2021. |
Audit-Related Fees
| | (b) | The aggregate fees billed for each of the last two fiscal years for assurance and related services by the principal accountant that are reasonably related to the performance of the audit of the registrant’s financial statements and are not reported under paragraph (a) of this Item were $ 0 for 2022 and $0 for 2021. |
Tax Fees
| | (c) | The aggregate fees billed for each of the last two fiscal years for professional services rendered by the principal accountant for tax compliance, tax advice, and tax planning were $130,790 for 2022 and $111,854 for 2021. |
All Other Fees
| | (d) | The aggregate fees billed for each of the last two fiscal years for products and services provided by the principal accountant, other than the services reported in paragraphs (a) through (c) of this Item were $0 for 2022 and $0 for 2021. |
| | (e)(1) | Disclose the audit committee’s pre-approval policies and procedures described in paragraph (c)(7) of Rule 2-01 of Regulation S-X. |
Per Rule 2-01(c) (7) (A), the registrant’s audit committee charter provides that the audit committee shall select and approve in advance the retention of independent accountants to annually audit and provide their opinion on the registrant’s financial statements. The audit committee must also approve prior to appointment the engagement of the principal accountant to provide other audit services to the registrant or to provide non-audit services to the registrant, its investment adviser, or any entity controlling, controlled by, or under common control with its investment adviser (“adviser/affiliate”) that provides ongoing services to the registrant, if the engagement by the investment adviser or adviser affiliate relates directly to the operations and financial reporting of the registrant. The audit committee must also, prior to appointment of the engagement of the principal accountant, review and approve the fees proposed to be charged to the registrant by the auditors for each audit and non-audit service. The audit committee must also consider whether non-audit services provided by the registrant’s principal accountant to the registrant’s investment adviser, or adviser/affiliate that provides ongoing services to the registrant are compatible with maintaining the auditor’s independence.
| | (e)(2) | The registrant’s audit committee has approved 100% of services described in each of Items 4(b) through (d) pursuant to paragraph (c)(7)(i)(C) of Rule 2-01 of Regulation S-X. |
| | (f) | The percentage of hours expended on the principal accountant’s engagement to audit the registrant’s financial statements for the most recent fiscal year that were attributed to work performed by persons other than the principal accountant’s full-time, permanent employees was 0%. |
| | (g) | The aggregate non-audit fees billed by the registrant’s accountant for services rendered to the registrant, and rendered to the registrant’s investment adviser (not including any sub-adviser whose role is primarily portfolio management and is subcontracted with or overseen by another investment adviser), and any entity controlling, controlled by, or under common control with the adviser that provides ongoing services to the registrant for each of the last two fiscal years of the registrant was $130,790 for 2022 and $111,854 for 2021. |
Item 5. Audit Committee of Listed Registrants.
The registrant is an issuer as defined in Rule 10A-3 under the Securities Exchange Act of 1934, as amended (the “Exchange Act”) and has a separately-designated standing audit committee established in accordance with Section 3(a)(58)A of the Exchange Act. The registrant’s audit committee members are David Chrencik, Melinda Raso Kirstein and Victor Ugolyn.
Item 6. Investments.
| (a) | Schedule of Investments in securities of unaffiliated issuers as of the close of the reporting period is included as part of the report to shareholders filed under Item 1 of this form. |
Item 7. Disclosure of Proxy Voting Policies and Procedures for Closed-End Management Investment Companies.
Not applicable.
Item 8. Portfolio Managers of Closed-End Management Investment Companies.
Not applicable.
Item 9. Purchases of Equity Securities by Closed-End Management Investment Company and Affiliated Purchasers.
Not applicable.
Item 10. Submission of Matters to a Vote of Security Holders.
There have been no material changes to the procedures by which the shareholders may recommend nominees to the registrant’s board of trustees, where those changes were implemented after the registrant last provided disclosure in response to the requirements of Item 407(c)(2)(iv) of Regulation S-K (17 CFR 229.407) (as required by Item 22(b)(15) of Schedule 14A (17 CFR 240.14a-101)), or this Item.
Item 11. Controls and Procedures.
| | (a) | The registrant’s principal executive and principal financial officers, or persons performing similar functions, have concluded that the registrant’s disclosure controls and procedures (as defined in Rule 30a-3(c) under the Investment Company Act of 1940, as amended (the “1940 Act”) (17 CFR 270.30a-3(c))) are effective, as of a date within 90 days of the filing date of the report that includes the disclosure required by this paragraph, based on their evaluation of these controls and procedures required by Rule 30a-3(b) under the 1940 Act (17 CFR 270.30a-3(b)) and Rules 13a-15(b) or 15d-15(b) under the Securities Exchange Act of 1934, as amended (17 CFR 240.13a-15(b) or 240.15d-15(b)). |
| | (b) | There were no changes in the registrant’s internal control over financial reporting (as defined in Rule 30a-3(d) under the 1940 Act (17 CFR 270.30a-3(d)) that occurred during the period covered by this report that has materially affected, or is reasonably likely to materially affect, the registrant’s internal control over financial reporting. |
Item 12. Disclosure of Securities Lending Activities for Closed-End Management Investment Companies.
Not applicable.
Item 13. Exhibits.
SIGNATURES
Pursuant to the requirements of the Securities Exchange Act of 1934 and the Investment Company Act of 1940, the registrant has duly caused this report to be signed on its behalf by the undersigned, thereunto duly authorized.
| | |
| (Registrant) | | WisdomTree Trust |
| |
| By (Signature and Title) | | /s/ Jonathan Steinberg |
| | Jonathan L. Steinberg, President |
| | (principal executive officer) |
Date: September 1, 2022
Pursuant to the requirements of the Securities Exchange Act of 1934 and the Investment Company Act of 1940, this report has been signed below by the following persons on behalf of the registrant and in the capacities and on the dates indicated.
| | |
| By (Signature and Title) | | /s/ Jonathan Steinberg |
| | Jonathan L. Steinberg, President |
| | (principal executive officer) |
| |
| Date: September 1, 2022 | | |
| |
| By (Signature and Title) | | /s/ David Castano |
| | David Castano, Treasurer |
| | (principal financial officer) |
| |
| Date: September 1, 2022 | | |