UNITED STATES
SECURITIES AND EXCHANGE COMMISSION
Washington, D.C. 20549
FORM N-CSR
CERTIFIED SHAREHOLDER REPORT OF REGISTERED
MANAGEMENT INVESTMENT COMPANIES
Investment Company Act file number | 811-21852 |
|
Columbia Funds Series Trust II |
(Exact name of registrant as specified in charter) |
|
50606 Ameriprise Financial Center
Minneapolis, MN | | 55474 |
(Address of principal executive offices) | | (Zip code) |
|
Ryan Larrenaga
c/o Columbia Management Investment Advisers, LLC
225 Franklin Street
Boston, MA 02110 |
(Name and address of agent for service) |
|
Registrant’s telephone number, including area code: | (800) 345-6611 | |
|
Date of fiscal year end: | May 31 | |
|
Date of reporting period: | November 30, 2014 | |
| | | | | | | | |
Form N-CSR is to be used by management investment companies to file reports with the Commission not later than 10 days after the transmission to stockholders of any report that is required to be transmitted to stockholders under Rule 30e-1 under the Investment Company Act of 1940 (17 CFR 270.30e-1). The Commission may use the information provided on Form N-CSR in its regulatory, disclosure review, inspection, and policymaking roles.
A registrant is required to disclose the information specified by Form N-CSR, and the Commission will make this information public. A registrant is not required to respond to the collection of information contained in Form N-CSR unless the Form displays a currently valid Office of Management and Budget (“OMB”) control number. Please direct comments concerning the accuracy of the information collection burden estimate and any suggestions for reducing the burden to Secretary, Securities and Exchange Commission, 450 Fifth Street, NW, Washington, DC 20549-0609. The OMB has reviewed this collection of information under the clearance requirements of 44 U.S.C. § 3507.
Item 1. Reports to Stockholders.
Semiannual Report
November 30, 2014

Active Portfolios® Multi-Manager Value Fund
Not FDIC insured • No bank guarantee • May lose value

About Columbia Management
Backed by more than 100 years of experience, Columbia Management is one of the nation's largest asset managers. At the heart of our success — and, most importantly, that of our investors — are some of the most talented professionals in the industry, brought together by a unique way of working.
It starts with carefully selected, specialized investment teams. While each team brings a diverse and innovative range of skills, all are grounded by a common set of core beliefs. All possess a solid conviction in the power of proprietary, bottom-up research. All look not only at generating returns, but also at the likely consistency of those returns and the risks required to achieve them. And while our culture encourages teams to operate independently and question established thinking, a rigorous investment oversight process ensures that each team stays true to its clearly articulated investment process. At Columbia Management, reaching our performance goals matters, and the way we reach them matters just as much.
Columbia funds are distributed by Columbia Management Investment Distributors, Inc., member FINRA, and managed by Columbia Management Investment Advisers, LLC.
© 2015 Columbia Management Investment Advisers, LLC. All rights reserved.
Not part of the shareholder report
Note: Effective January 1, 2015, Christopher O. Petersen will serve as the President of the Columbia Funds, replacing J. Kevin Connaughton. Mr. Petersen has served as a Fund officer since 2007.
Dear Shareholders,
People invest for different reasons, though typically based on a desire for one or more outcomes, e.g., generating an appropriate income stream in retirement, navigating a changing interest rate environment, maximizing after-tax returns, growing assets to achieve financial goals, or easing the impact of volatile markets. Achieving these desired outcomes can be particularly challenging given the unpredictability of complex global markets. To continue to effectively deliver solutions that help clients achieve desired outcomes, an asset manager must have the resources and investment framework to meaningfully embody a global perspective.
With this in mind, I thought it important to highlight excerpts from a piece written by Jeffrey L. Knight, Global Head of Investment Solutions and Asset Allocation, in which he touches on some of these issues emphasizing the importance of maintaining a diversified portfolio with the flexibility to adapt to changing market conditions.
I encourage you to read the article in its entirety. To access the full article and for other insights on current market events and investment opportunities, please visit the Columbia Management blog at columbiamanagement.com/blog.
On behalf of the Funds, I want to acknowledge the contributions of J. Kevin Connaughton and to thank him for his years of trusted, dedicated service. He has worked tirelessly as an advocate for shareholders and a leader of the Columbia Funds. In taking on this new role, I look forward to continuing the work of Mr. Connaughton, helping build on the strong foundation of the Columbia Funds.
Thank you for your confidence. We look forward to continuing to serve your investment needs for many years to come.
Best regards,

Christopher O. Petersen
President, Columbia Funds
Excerpts from:
2015 Outlook: Same song, slightly different arrangement
By Jeffrey L. Knight, Global Head of Investment Solutions and Asset Allocation
Jeffrey L. Knight, CFA, is global head of investment solutions and asset allocation for Columbia Management Investment Advisers, LLC. Mr. Knight leads a team of six portfolio managers responsible for our broad suite of multi-asset strategies including capital allocation, risk allocation, absolute return and total return funds.
What's different in 2015?
As stationary as market conditions have felt lately, circumstances are always evolving. For 2015, while the essential elements of our outlook remain in place, we highlight two important changes in the market environment:
> The relative value of global equities vs. global bonds actually improved during 2014.
> Monetary policy around the globe has become desynchronized, with the U.S. Federal Reserve (the Fed) contemplating rate hikes, while the European Central Bank (ECB) and the Bank of Japan (BOJ) intensify their monetary stimulus programs.
In our view, while equities will most likely continue to dominate, the complex interactions of today's conditions elevate the role of dynamic risk management. We argue that investors will need a cross-asset surveillance methodology to detect tactical threats.
President's Message (continued)
Monetary policies diverge
The Fed has given strong signals that economic growth in the United States has reached self-sustaining momentum and no longer needs unconventional efforts to support the expansion. The withdrawal and suspension of large-scale asset purchases was only the first step in the evolution toward policy normalization. In 2015, we expect to see a change in forward guidance and, most likely, the first interest rate increase in years.
These actions stand in stark contrast with the direction of the monetary policies of other central banks as they double down on efforts to support growth and avoid deflation. The Bank of Japan has announced its intention to increase both qualitative and quantitative easing on an enormous scale, expanding purchases of Japanese government bonds (JGBs), exchange-traded funds and real estate investment trusts. They intend to coordinate this with government pension investment fund purchases by shifting into riskier assets through sales of JGBs.
With evidence of deterioration on both the economic and inflation front, the European Central Bank (ECB) also plans to take bolder actions. These include increased purchases of asset-backed securities and covered bonds in both the primary and secondary market, together with the long-term refinancing operations that will steer the ECB's balance sheet higher by €1 trillion.
The latest to jump on the bandwagon was the People's Bank of China (PBOC), which cut its benchmark interest rate for the first time in over two years to support private sector investment, as targeted liquidity injections have had minimal effect on sinking economic growth.
Investment strategy for 2015
We remain convinced that relative value favors stocks over bonds, even though stocks outperformed in 2014. Therefore, you will hear the same recommendation from us for 2015. Equities remain the most important asset class for generating returns.
Within equities, the currency-based advantage of U.S. stocks is offset somewhat by the valuation advantage from overseas equities, notably in Japan. Indeed, economic growth in Japan and Europe are essential ingredients for equities to continue to perform well. If Japanese and European stocks cannot produce gains, then the global economy will probably be stuck in a near recessionary funk.
Devising a strategy to manage risk and stabilize portfolio values in the event that equities do not perform well remains complicated. Bond yields are low enough that they are not likely to offer powerful diversification benefits. We affirm our recommendation for three additional sources of portfolio stability:
> Non-traditional diversifiers, such as liquid alternatives, alternative beta exposures and absolute return strategies
> Explicit downside hedges, such as put options (with emphasis on managing the related expense)
> Flexibility and a methodology for active risk reduction when appropriate (Our cross-asset methodologies should prove valuable in this regard.)
Our overall stance for investment strategy will likely remain in place until the valuation advantage for equities has been priced away, or until the healing process for the global economy reverses.
Please visit columbiamanagement.com/blog to read the entire article.
Investors should consider the investment objectives, risks, charges and expenses of a mutual fund carefully before investing. For a free prospectus and, if available, a summary prospectus, which contains this and other important information about a fund, visit columbiamanagement.com. The prospectus should be read carefully before investing.
The views expressed are as of December 2014, may change as market or other conditions change, and may differ from views expressed by other Columbia Management Investment Advisers, LLC (CMIA) associates or affiliates. Actual investments or investment decisions made by CMIA and its affiliates, whether for its own account or on behalf of clients, will not necessarily reflect the views expressed. This information is not intended to provide investment advice and does not account for individual investor circumstances. Investment decisions should always be made based on an investor's specific financial needs, objectives, goals, time horizon and risk tolerance. Asset classes described may not be suitable for all investors. Past performance does not guarantee future results, and no forecast should be considered a guarantee either. Since economic and market change frequently, there can be no assurance that the trends described here will continue or that the forecasts are accurate.
Diversification does not assure a profit or protect against loss.
Columbia Funds are distributed by Columbia Management Investment Distributors, Inc., member FINRA, and managed by Columbia Management Investment Advisers, LLC.
© 2015 Columbia Management Investment Advisers, LLC. All rights reserved
Active Portfolios® Multi-Manager Value Fund
Performance Overview | | | 4 | | |
Portfolio Overview | | | 5 | | |
Understanding Your Fund's Expenses | | | 6 | | |
Portfolio of Investments | | | 7 | | |
Statement of Assets and Liabilities | | | 16 | | |
Statement of Operations | | | 17 | | |
Statement of Changes in Net Assets | | | 18 | | |
Financial Highlights | | | 19 | | |
Notes to Financial Statements | | | 20 | | |
Important Information About This Report | | | 25 | | |
Fund Investment Manager
Columbia Management Investment
Advisers, LLC
225 Franklin Street
Boston, MA 02110
Fund Distributor
Columbia Management Investment
Distributors, Inc.
225 Franklin Street
Boston, MA 02110
Fund Transfer Agent
Columbia Management Investment
Services Corp.
P.O. Box 8081
Boston, MA 02266-8081
For more information about any of the funds, please visit columbiamanagement.com or call 800.345.6611. Customer Service Representatives are available to answer your questions Monday through Friday from 8 a.m. to 7 p.m. Eastern time.
The views expressed in this report reflect the current views of the respective parties. These views are not guarantees of future performance and involve certain risks, uncertainties and assumptions that are difficult to predict, so actual outcomes and results may differ significantly from the views expressed. These views are subject to change at any time based upon economic, market or other conditions and the respective parties disclaim any responsibility to update such views. These views may not be relied on as investment advice and, because investment decisions for a Columbia Fund are based on numerous factors, may not be relied on as an indication of trading intent on behalf of any particular Columbia Fund. References to specific securities should not be construed as a recommendation or investment advice.
Active Portfolios® Multi-Manager Value Fund
Performance Overview
(Unaudited)
Performance Summary
> Active Portfolios® Multi-Manager Value Fund (the Fund) Class A shares returned 4.81% for the six-month period that ended November 30, 2014.
> The Fund underperformed its benchmark, the Russell 1000 Value Index, which returned 6.86% during the same time period.
Average Annual Total Returns (%) (for period ended November 30, 2014)
| | | Inception | | 6 Months
cumulative | | 1 Year | | Life | |
Class A | | 04/20/12 | | | 4.81 | | | | 13.38 | | | | 16.71 | | |
Russell 1000 Value Index | | | | | | | 6.86 | | | | 15.62 | | | | 20.22 | | |
All results shown assume reinvestment of distributions during the period. Returns do not reflect the deduction of taxes that a shareholder may pay on Fund distributions or on the redemption of Fund shares. Performance results reflect the effect of any fee waivers or reimbursements of Fund expenses by Columbia Management Investment Advisers, LLC and/or any of its affiliates. Absent these fee waivers or expense reimbursement arrangements, performance results would have been lower.
The performance information shown represents past performance and is not a guarantee of future results. The investment return and principal value of your investment will fluctuate so that your shares, when redeemed, may be worth more or less than their original cost. Current performance may be lower or higher than the performance information shown. You may obtain performance information current to the most recent month-end by contacting your financial intermediary, visiting columbiamanagement.com or calling 800.345.6611.
The Russell 1000 Value Index, an unmanaged index, measures the performance of those stocks in the Russell 1000 Index with lower price-to-book ratios and lower forecasted growth values.
Indices are not available for investment, are not professionally managed and do not reflect sales charges, fees, brokerage commissions, taxes or other expenses of investing. Securities in the Fund may not match those in an index.
Semiannual Report 2014
4
Active Portfolios® Multi-Manager Value Fund
Portfolio Overview
(Unaudited)
Top Ten Holdings (%)
(at November 30, 2014) | |
Pfizer, Inc. | | | 3.5 | | |
Cisco Systems, Inc. | | | 3.2 | | |
Chevron Corp. | | | 2.9 | | |
Altria Group, Inc. | | | 2.7 | | |
Intel Corp. | | | 2.7 | | |
Johnson & Johnson | | | 2.6 | | |
Procter & Gamble Co. (The) | | | 2.5 | | |
AT&T, Inc. | | | 2.4 | | |
Microsoft Corp. | | | 2.3 | | |
General Electric Co. | | | 2.0 | | |
Percentages indicated are based upon total investments (excluding Money Market Funds).
For further detail about these holdings, please refer to the section entitled "Portfolio of Investments."
Fund holdings are as of the date given, are subject to change at any time, and are not recommendations to buy or sell any security.
Portfolio Breakdown (%)
(at November 30, 2014) | |
Common Stocks | | | 94.1 | | |
Consumer Discretionary | | | 6.5 | | |
Consumer Staples | | | 14.4 | | |
Energy | | | 13.2 | | |
Financials | | | 10.6 | | |
Health Care | | | 13.5 | | |
Industrials | | | 8.0 | | |
Information Technology | | | 13.0 | | |
Materials | | | 2.5 | | |
Telecommunication Services | | | 7.0 | | |
Utilities | | | 5.4 | | |
Equity-Linked Notes | | | 5.0 | | |
Money Market Funds | | | 0.9 | | |
Total | | | 100.0 | | |
Percentages indicated are based upon total investments. The Fund's portfolio composition is subject to change.
Portfolio Management
Columbia Management Investment
Advisers, LLC
Steve Schroll
Paul Stocking
Dean Ramos, CFA
Dimensional Fund Advisors, L.P.
Joseph Chi, CFA
Jed Fogdall
Henry Gray
Bhanu Singh
Morningstar Style BoxTM

The Morningstar Style BoxTM is based on a fund's portfolio holdings. For equity funds, the vertical axis shows the market capitalization of the stocks owned, and the horizontal axis shows investment style (value, blend, or growth). Information shown is based on the most recent data provided by Morningstar.
© 2015 Morningstar, Inc. All rights reserved. The Morningstar information contained herein: (1) is proprietary to Morningstar and/or its content providers; (2) may not be copied or distributed; and (3) is not warranted to be accurate, complete or timely. Neither Morningstar nor its content providers are responsible for any damages or losses arising from any use of this information.
Semiannual Report 2014
5
Active Portfolios® Multi-Manager Value Fund
Understanding Your Fund's Expenses
(Unaudited)
As an investor, you incur two types of costs. There are transaction costs, which generally include sales charges on purchases and may include redemption fees. There are also ongoing costs, which generally include management fees, distribution and/or service fees, and other fund expenses. The following information is intended to help you understand your ongoing costs (in dollars) of investing in the Fund and to help you compare these costs with the ongoing costs of investing in other mutual funds.
Analyzing Your Fund's Expenses
To illustrate these ongoing costs, we have provided examples and calculated the expenses paid by investors in the Fund during the period. The actual and hypothetical information in the table is based on an initial investment of $1,000 at the beginning of the period indicated and held for the entire period. Expense information is calculated two ways and each method provides you with different information. The amount listed in the "Actual" column is calculated using the Fund's actual operating expenses and total return for the period. You may use the Actual information, together with the amount invested, to estimate the expenses that you paid over the period. Simply divide your account value by $1,000 (for example, an $8,600 account value divided by $1,000 = 8.6), then multiply the results by the expenses paid during the period under the "Actual" column. The amount listed in the "Hypothetical" column assumes a 5% annual rate of return before expenses (which is not the Fund's actual return) and then applies the Fund's actual expense ratio for the period to the hypothetical return. You should not use the hypothetical account values and expenses to estimate either your actual account balance at the end of the period or the expenses you paid during the period. See "Compare With Other Funds" below for details on how to use the hypothetical data.
Compare With Other Funds
Since all mutual funds are required to include the same hypothetical calculations about expenses in shareholder reports, you can use this information to compare the ongoing cost of investing in the Fund with other funds. To do so, compare the hypothetical example with the 5% hypothetical examples that appear in the shareholder reports of other funds. As you compare hypothetical examples of other funds, it is important to note that hypothetical examples are meant to highlight the ongoing costs of investing in a fund only and do not reflect any transaction costs, such as sales charges, or redemption or exchange fees. Therefore, the hypothetical calculations are useful in comparing ongoing costs only, and will not help you determine the relative total costs of owning different funds. If transaction costs were included in these calculations, your costs would be higher.
June 1, 2014 – November 30, 2014
| | | Account Value at the Beginning
of the Period ($) | | Account Value at the End of the
Period ($) | | Expenses Paid During the
Period ($) | | Fund's Annualized
Expense Ratio (%) | |
| | | Actual | | Hypothetical | | Actual | | Hypothetical | | Actual | | Hypothetical | | Actual | |
Class A | | | 1,000.00 | | | | 1,000.00 | | | | 1,048.10 | | | | 1,019.45 | | | | 5.62 | | | | 5.54 | | | | 1.10 | | |
Expenses paid during the period are equal to the annualized expense ratio for each class as indicated above, multiplied by the average account value over the period and then multiplied by the number of days in the Fund's most recent fiscal half year and divided by 365.
Expenses do not include fees and expenses incurred indirectly by the Fund from its investment in underlying funds, including affiliated and non-affiliated pooled investment vehicles, such as mutual funds and exchange-traded funds.
Had Columbia Management Investment Advisers, LLC and/or certain of its affiliates not waived/reimbursed certain fees and expenses, account value at the end of the period would have been reduced.
Semiannual Report 2014
6
Active Portfolios® Multi-Manager Value Fund
Portfolio of Investments
November 30, 2014 (Unaudited)
(Percentages represent value of investments compared to net assets)
Common Stocks 94.0%
Issuer | | Shares | | Value ($) | |
Consumer Discretionary 6.5% | |
Auto Components 0.2% | |
Autoliv, Inc. | | | 19,797 | | | | 1,959,111 | | |
Lear Corp. | | | 16,548 | | | | 1,587,119 | | |
TRW Automotive Holdings Corp.(a) | | | 7,750 | | | | 801,350 | | |
Total | | | | | 4,347,580 | | |
Automobiles 0.4% | |
Ford Motor Co. | | | 130,889 | | | | 2,058,884 | | |
General Motors Co. | | | 163,580 | | | | 5,468,479 | | |
Total | | | | | 7,527,363 | | |
Diversified Consumer Services 0.1% | |
Graham Holdings Co., Class B | | | 1,042 | | | | 924,765 | | |
Service Corp. International | | | 53,334 | | | | 1,205,348 | | |
Total | | | | | 2,130,113 | | |
Hotels, Restaurants & Leisure 0.4% | |
Carnival Corp. | | | 16,135 | | | | 712,522 | | |
Hyatt Hotels Corp., Class A(a) | | | 3,693 | | | | 217,629 | | |
MGM Resorts International(a) | | | 127,235 | | | | 2,902,230 | | |
Royal Caribbean Cruises Ltd. | | | 36,895 | | | | 2,720,637 | | |
Total | | | | | 6,553,018 | | |
Household Durables 1.0% | |
D.R. Horton, Inc. | | | 54,249 | | | | 1,382,807 | | |
Leggett & Platt, Inc. | | | 263,310 | | | | 11,082,718 | | |
Lennar Corp., Class A | | | 27,362 | | | | 1,292,581 | | |
Lennar Corp., Class B | | | 1,697 | | | | 64,214 | | |
Mohawk Industries, Inc.(a) | | | 10,171 | | | | 1,562,164 | | |
PulteGroup, Inc. | | | 38,177 | | | | 825,769 | | |
Toll Brothers, Inc.(a) | | | 14,870 | | | | 520,301 | | |
Whirlpool Corp. | | | 5,100 | | | | 949,467 | | |
Total | | | | | 17,680,021 | | |
Internet & Catalog Retail 0.3% | |
Lands' End, Inc.(a) | | | 1,670 | | | | 79,458 | | |
Liberty Interactive Corp., Class A(a) | | | 124,253 | | | | 3,621,975 | | |
Liberty TripAdvisor Holdings, Inc., Class A(a) | | | 659 | | | | 17,272 | | |
Liberty Ventures, Inc., Class A(a) | | | 24,918 | | | | 912,996 | | |
Total | | | | | 4,631,701 | | |
Media 3.4% | |
Comcast Corp. | | | 59,114 | | | | 3,358,266 | | |
Comcast Corp., Class A | | | 381,671 | | | | 21,770,514 | | |
Common Stocks (continued)
Issuer | | Shares | | Value ($) | |
Gannett Co., Inc. | | | 17,511 | | | | 569,983 | | |
Liberty Broadband Corp. Class A(a) | | | 4,176 | | | | 229,012 | | |
Liberty Broadband Corp. Class C(a) | | | 7,928 | | | | 431,283 | | |
Liberty Global PLC, Class C(a) | | | 27,543 | | | | 1,374,947 | | |
Liberty Media Corp., Class A(a) | | | 16,707 | | | | 614,316 | | |
Liberty Media Corp., Class C(a) | | | 31,714 | | | | 1,158,512 | | |
Madison Square Garden Co. (The),
Class A(a) | | | 10,614 | | | | 775,247 | | |
News Corp., Class A(a) | | | 31,805 | | | | 493,614 | | |
News Corp., Class B(a) | | | 14,504 | | | | 218,285 | | |
Pearson PLC | | | 618,210 | | | | 11,887,075 | | |
Regal Entertainment Group, Class A | | | 271,127 | | | | 6,260,322 | | |
Time Warner, Inc. | | | 132,146 | | | | 11,248,268 | | |
Time, Inc. | | | 148 | | | | 3,543 | | |
Total | | | | | 60,393,187 | | |
Multiline Retail 0.4% | |
Dillard's, Inc., Class A | | | 10,044 | | | | 1,183,987 | | |
Kohl's Corp. | | | 53,883 | | | | 3,212,504 | | |
Target Corp. | | | 40,388 | | | | 2,988,712 | | |
Total | | | | | 7,385,203 | | |
Specialty Retail 0.2% | |
Foot Locker, Inc. | | | 36,923 | | | | 2,115,319 | | |
GameStop Corp., Class A | | | 14,272 | | | | 539,624 | | |
Penske Automotive Group, Inc. | | | 22,093 | | | | 1,046,104 | | |
Staples, Inc. | | | 16,102 | | | | 226,394 | | |
Total | | | | | 3,927,441 | | |
Textiles, Apparel & Luxury Goods 0.1% | |
PVH Corp. | | | 13,692 | | | | 1,740,801 | | |
Total Consumer Discretionary | | | | | 116,316,428 | | |
Consumer Staples 14.3% | |
Beverages 2.4% | |
Anheuser-Busch InBev NV | | | 95,805 | | | | 11,252,901 | | |
Coca-Cola Co. (The) | | | 423,716 | | | | 18,995,188 | | |
Molson Coors Brewing Co., Class B | | | 13,364 | | | | 1,033,706 | | |
PepsiCo, Inc. | | | 85,610 | | | | 8,569,561 | | |
SABMiller PLC | | | 48,214 | | | | 2,684,057 | | |
Total | | | | | 42,535,413 | | |
The accompanying Notes to Financial Statements are an integral part of this statement.
Semiannual Report 2014
7
Active Portfolios® Multi-Manager Value Fund
Portfolio of Investments (continued)
November 30, 2014 (Unaudited)
Common Stocks (continued)
Issuer | | Shares | | Value ($) | |
Food & Staples Retailing 1.8% | |
CVS Health Corp. | | | 172,058 | | | | 15,719,219 | | |
Safeway, Inc. | | | 60,717 | | | | 2,115,380 | | |
SYSCO Corp. | | | 224,698 | | | | 9,046,342 | | |
Wesfarmers Ltd. | | | 134,345 | | | | 4,734,886 | | |
Total | | | | | 31,615,827 | | |
Food Products 1.6% | |
Archer-Daniels-Midland Co. | | | 55,187 | | | | 2,907,251 | | |
Bunge Ltd. | | | 24,761 | | | | 2,247,556 | | |
ConAgra Foods, Inc. | | | 105,784 | | | | 3,863,232 | | |
Ingredion, Inc. | | | 19,294 | | | | 1,605,840 | | |
JM Smucker Co. (The) | | | 22,005 | | | | 2,257,053 | | |
Kraft Foods Group, Inc. | | | 71,044 | | | | 4,274,717 | | |
Mondelez International, Inc., Class A | | | 101,457 | | | | 3,977,114 | | |
Tyson Foods, Inc., Class A | | | 69,985 | | | | 2,963,165 | | |
Unilever PLC | | | 118,555 | | | | 5,011,048 | | |
Total | | | | | 29,106,976 | | |
Household Products 3.2% | |
Energizer Holdings, Inc. | | | 15,755 | | | | 2,048,465 | | |
Kimberly-Clark Corp. | | | 93,536 | | | | 10,905,362 | | |
Procter & Gamble Co. (The) | | | 490,096 | | | | 44,319,382 | | |
Total | | | | | 57,273,209 | | |
Tobacco 5.3% | |
Altria Group, Inc. | | | 948,312 | | | | 47,662,161 | | |
British American Tobacco PLC | | | 183,441 | | | | 10,872,562 | | |
Imperial Tobacco Group PLC | | | 244,547 | | | | 11,306,677 | | |
Lorillard, Inc. | | | 205,155 | | | | 12,953,487 | | |
Philip Morris International, Inc. | | | 156,477 | | | | 13,602,546 | | |
Total | | | | | 96,397,433 | | |
Total Consumer Staples | | | | | 256,928,858 | | |
Energy 13.2% | |
Energy Equipment & Services 0.8% | |
Baker Hughes, Inc. | | | 37,375 | | | | 2,130,375 | | |
Helmerich & Payne, Inc. | | | 26,960 | | | | 1,875,068 | | |
Nabors Industries Ltd. | | | 74,271 | | | | 974,436 | | |
National Oilwell Varco, Inc. | | | 37,758 | | | | 2,531,296 | | |
Noble Corp. PLC | | | 63,763 | | | | 1,147,096 | | |
Superior Energy Services, Inc. | | | 26,753 | | | | 516,601 | | |
Common Stocks (continued)
Issuer | | Shares | | Value ($) | |
Transocean Ltd. | | | 116,525 | | | | 2,448,190 | | |
Weatherford International PLC(a) | | | 193,599 | | | | 2,536,147 | | |
Total | | | | | 14,159,209 | | |
Oil, Gas & Consumable Fuels 12.4% | |
Anadarko Petroleum Corp. | | | 74,615 | | | | 5,905,777 | | |
Apache Corp. | | | 53,458 | | | | 3,426,123 | | |
| BP PLC, ADR | | | 145,590 | | | | 5,724,599 | | |
Chesapeake Energy Corp. | | | 139,842 | | | | 2,833,199 | | |
Chevron Corp. | | | 473,421 | | | | 51,541,344 | | |
Cimarex Energy Co. | | | 21,851 | | | | 2,293,262 | | |
ConocoPhillips | | | 547,396 | | | | 36,166,454 | | |
Denbury Resources, Inc. | | | 61,512 | | | | 508,089 | | |
Devon Energy Corp. | | | 50,299 | | | | 2,966,132 | | |
Exxon Mobil Corp. | | | 266,615 | | | | 24,139,322 | | |
Hess Corp. | | | 38,224 | | | | 2,787,676 | | |
HollyFrontier Corp. | | | 47,840 | | | | 1,952,829 | | |
Kinder Morgan, Inc. | | | 56,473 | | | | 2,335,159 | | |
Marathon Oil Corp. | | | 87,645 | | | | 2,534,693 | | |
Marathon Petroleum Corp. | | | 39,477 | | | | 3,556,483 | | |
Newfield Exploration Co.(a) | | | 3,114 | | | | 84,794 | | |
Occidental Petroleum Corp. | | | 373,630 | | | | 29,804,465 | | |
Phillips 66 | | | 23,886 | | | | 1,744,156 | | |
QEP Resources, Inc. | | | 45,111 | | | | 922,069 | | |
Royal Dutch Shell PLC, Class A | | | 373,250 | | | | 12,432,824 | | |
Spectra Energy Corp. | | | 195,270 | | | | 7,396,828 | | |
Suncor Energy, Inc. | | | 103,106 | | | | 3,257,119 | | |
Tesoro Corp. | | | 33,424 | | | | 2,560,947 | | |
Total SA | | | 200,234 | | | | 11,201,655 | | |
Valero Energy Corp. | | | 72,281 | | | | 3,513,579 | | |
Whiting Petroleum Corp.(a) | | | 29,856 | | | | 1,247,085 | | |
WPX Energy, Inc.(a) | | | 16,843 | | | | 228,560 | | |
Total | | | | | 223,065,222 | | |
Total Energy | | | | | 237,224,431 | | |
Financials 10.6% | |
Banks 6.1% | |
Bank of America Corp. | | | 527,310 | | | | 8,985,362 | | |
Bank of Montreal | | | 204,283 | | | | 15,053,614 | | |
BB&T Corp. | | | 59,125 | | | | 2,222,509 | | |
BOK Financial Corp. | | | 5,990 | | | | 386,056 | | |
The accompanying Notes to Financial Statements are an integral part of this statement.
Semiannual Report 2014
8
Active Portfolios® Multi-Manager Value Fund
Portfolio of Investments (continued)
November 30, 2014 (Unaudited)
Common Stocks (continued)
Issuer | | Shares | | Value ($) | |
CIT Group, Inc. | | | 33,577 | | | | 1,638,558 | | |
Citigroup, Inc. | | | 144,695 | | | | 7,809,189 | | |
Comerica, Inc. | | | 15,342 | | | | 715,091 | | |
Fifth Third Bancorp | | | 74,048 | | | | 1,489,846 | | |
Huntington Bancshares, Inc. | | | 139,319 | | | | 1,408,515 | | |
JPMorgan Chase & Co. | | | 589,539 | | | | 35,466,666 | | |
KeyCorp | �� | | 75,208 | | | | 1,015,308 | | |
M&T Bank Corp. | | | 21,846 | | | | 2,753,033 | | |
PNC Financial Services Group, Inc. (The) | | | 44,630 | | | | 3,903,786 | | |
Regions Financial Corp. | | | 232,084 | | | | 2,337,086 | | |
SunTrust Banks, Inc. | | | 22,482 | | | | 883,318 | | |
Wells Fargo & Co. | | | 413,128 | | | | 22,507,213 | | |
Zions Bancorporation | | | 27,834 | | | | 781,022 | | |
Total | | | | | 109,356,172 | | |
Capital Markets 1.3% | |
Bank of New York Mellon Corp. (The) | | | 96,332 | | | | 3,856,170 | | |
BlackRock, Inc. | | | 24,533 | | | | 8,809,310 | | |
E*TRADE Financial Corp.(a) | | | 34,069 | | | | 777,114 | | |
Goldman Sachs Group, Inc. (The) | | | 36,679 | | | | 6,910,690 | | |
Legg Mason, Inc. | | | 10,118 | | | | 574,196 | | |
Morgan Stanley | | | 61,376 | | | | 2,159,208 | | |
State Street Corp. | | | 9,206 | | | | 706,376 | | |
Total | | | | | 23,793,064 | | |
Consumer Finance 0.3% | |
Capital One Financial Corp. | | | 63,234 | | | | 5,261,069 | | |
Diversified Financial Services 0.1% | |
CME Group, Inc. | | | 13,361 | | | | 1,130,875 | | |
Intercontinental Exchange, Inc. | | | 1,647 | | | | 372,205 | | |
Leucadia National Corp. | | | 30,575 | | | | 707,200 | | |
NASDAQ OMX Group, Inc. (The) | | | 14,055 | | | | 631,210 | | |
Total | | | | | 2,841,490 | | |
Insurance 2.7% | |
ACE Ltd. | | | 24,176 | | | | 2,764,284 | | |
Aflac, Inc. | | | 14,386 | | | | 859,276 | | |
Alleghany Corp.(a) | | | 1,406 | | | | 641,895 | | |
Allied World Assurance Co. Holdings AG | | | 465 | | | | 17,531 | | |
Allstate Corp. (The) | | | 57,225 | | | | 3,899,884 | | |
American Financial Group, Inc. | | | 11,946 | | | | 721,419 | | |
American International Group, Inc. | | | 90,528 | | | | 4,960,934 | | |
Arch Capital Group Ltd.(a) | | | 11,201 | | | | 642,041 | | |
Common Stocks (continued)
Issuer | | Shares | | Value ($) | |
Assurant, Inc. | | | 12,198 | | | | 824,463 | | |
Assured Guaranty Ltd. | | | 16,363 | | | | 418,238 | | |
Axis Capital Holdings Ltd. | | | 9,588 | | | | 479,879 | | |
Chubb Corp. (The) | | | 16,284 | | | | 1,678,066 | | |
Cincinnati Financial Corp. | | | 26,553 | | | | 1,352,875 | | |
CNA Financial Corp. | | | 3,492 | | | | 135,210 | | |
Everest Re Group Ltd. | | | 8,464 | | | | 1,484,501 | | |
Genworth Financial, Inc., Class A(a) | | | 41,456 | | | | 376,835 | | |
Hartford Financial Services Group, Inc. (The) | | | 119,608 | | | | 4,939,810 | | |
HCC Insurance Holdings, Inc. | | | 16,809 | | | | 892,054 | | |
Lincoln National Corp. | | | 22,004 | | | | 1,246,087 | | |
Loews Corp. | | | 16,462 | | | | 685,478 | | |
Markel Corp.(a) | | | 1,172 | | | | 816,626 | | |
MetLife, Inc. | | | 40,163 | | | | 2,233,464 | | |
Old Republic International Corp. | | | 43,614 | | | | 659,880 | | |
PartnerRe Ltd. | | | 4,461 | | | | 519,751 | | |
Principal Financial Group, Inc. | | | 49,380 | | | | 2,630,473 | | |
Protective Life Corp. | | | 13,180 | | | | 918,778 | | |
Prudential Financial, Inc. | | | 19,333 | | | | 1,642,918 | | |
Reinsurance Group of America, Inc. | | | 4,895 | | | | 419,599 | | |
RenaissanceRe Holdings Ltd. | | | 7,450 | | | | 729,504 | | |
Travelers Companies, Inc. (The) | | | 45,804 | | | | 4,784,228 | | |
Unum Group | | | 43,810 | | | | 1,455,368 | | |
Validus Holdings Ltd. | | | 6,795 | | | | 281,993 | | |
WR Berkley Corp. | | | 33,984 | | | | 1,775,324 | | |
XL Group PLC | | | 23,721 | | | | 842,570 | | |
Total | | | | | 48,731,236 | | |
Thrifts & Mortgage Finance 0.1% | |
New York Community Bancorp, Inc. | | | 73,955 | | | | 1,175,145 | | |
People's United Financial, Inc. | | | 26,655 | | | | 393,961 | | |
Total | | | | | 1,569,106 | | |
Total Financials | | | | | 191,552,137 | | |
Health Care 13.5% | |
Health Care Equipment & Supplies 0.2% | |
Boston Scientific Corp.(a) | | | 103,448 | | | | 1,331,376 | | |
CareFusion Corp.(a) | | | 17,726 | | | | 1,048,848 | | |
Hologic, Inc.(a) | | | 24,109 | | | | 646,121 | | |
Teleflex, Inc. | | | 6,902 | | | | 822,373 | | |
Total | | | | | 3,848,718 | | |
The accompanying Notes to Financial Statements are an integral part of this statement.
Semiannual Report 2014
9
Active Portfolios® Multi-Manager Value Fund
Portfolio of Investments (continued)
November 30, 2014 (Unaudited)
Common Stocks (continued)
Issuer | | Shares | | Value ($) | |
Health Care Providers & Services 2.2% | |
Aetna, Inc. | | | 48,878 | | | | 4,264,117 | | |
CIGNA Corp. | | | 5,925 | | | | 609,623 | | |
Community Health Systems, Inc.(a) | | | 23,897 | | | | 1,125,071 | | |
Express Scripts Holding Co.(a) | | | 104,505 | | | | 8,689,591 | | |
Humana, Inc. | | | 39,232 | | | | 5,412,839 | | |
Mednax, Inc.(a) | | | 8,437 | | | | 552,286 | | |
Omnicare, Inc. | | | 17,275 | | | | 1,214,778 | | |
Quest Diagnostics, Inc. | | | 36,593 | | | | 2,389,889 | | |
UnitedHealth Group, Inc. | | | 126,662 | | | | 12,492,673 | | |
Universal Health Services, Inc., Class B | | | 3,138 | | | | 328,297 | | |
WellPoint, Inc. | | | 24,778 | | | | 3,169,354 | | |
Total | | | | | 40,248,518 | | |
Life Sciences Tools & Services 0.2% | |
Bio-Rad Laboratories, Inc., Class A(a) | | | 800 | | | | 95,032 | | |
Thermo Fisher Scientific, Inc. | | | 21,569 | | | | 2,788,656 | | |
Total | | | | | 2,883,688 | | |
Pharmaceuticals 10.9% | |
AbbVie, Inc. | | | 314,227 | | | | 21,744,508 | | |
AstraZeneca PLC, ADR | | | 72,648 | | | | 5,388,302 | | |
Bristol-Myers Squibb Co. | | | 216,484 | | | | 12,783,380 | | |
Eli Lilly & Co. | | | 184,001 | | | | 12,534,148 | | |
Johnson & Johnson | | | 431,374 | | | | 46,696,236 | | |
Mallinckrodt PLC(a) | | | 1,530 | | | | 141,097 | | |
Merck & Co., Inc. | | | 330,857 | | | | 19,983,763 | | |
Novartis AG, ADR | | | 71,193 | | | | 6,880,803 | | |
Pfizer, Inc. | | | 2,028,239 | | | | 63,179,645 | | |
Roche Holding AG, Genusschein Shares | | | 22,301 | | | | 6,679,337 | | |
Total | | | | | 196,011,219 | | |
Total Health Care | | | | | 242,992,143 | | |
Industrials 8.0% | |
Aerospace & Defense 2.1% | |
BAE Systems PLC | | | 748,722 | | | | 5,626,481 | | |
L-3 Communications Holdings, Inc. | | | 22,751 | | | | 2,834,775 | | |
Lockheed Martin Corp. | | | 153,391 | | | | 29,383,580 | | |
Textron, Inc. | | | 14,507 | | | | 628,443 | | |
Total | | | | | 38,473,279 | | |
Common Stocks (continued)
Issuer | | Shares | | Value ($) | |
Air Freight & Logistics 0.4% | |
FedEx Corp. | | | 38,512 | | | | 6,862,068 | | |
Airlines 0.4% | |
Alaska Air Group, Inc. | | | 1,914 | | | | 112,984 | | |
Southwest Airlines Co. | | | 189,320 | | | | 7,917,362 | | |
Total | | | | | 8,030,346 | | |
Building Products 0.1% | |
Owens Corning | | | 29,621 | | | | 1,031,996 | | |
Commercial Services & Supplies 0.8% | |
ADT Corp. (The) | | | 17,945 | | | | 626,998 | | |
KAR Auction Services, Inc. | | | 34,933 | | | | 1,210,429 | | |
Republic Services, Inc. | | | 90,608 | | | | 3,588,983 | | |
RR Donnelley & Sons Co. | | | 413,355 | | | | 6,960,898 | | |
Waste Connections, Inc. | | | 28,770 | | | | 1,358,232 | | |
Total | | | | | 13,745,540 | | |
Construction & Engineering 0.1% | |
AECOM Technology Corp.(a) | | | 4,843 | | | | 155,024 | | |
Jacobs Engineering Group, Inc.(a) | | | 22,103 | | | | 1,026,684 | | |
Quanta Services, Inc.(a) | | | 35,623 | | | | 1,086,502 | | |
Total | | | | | 2,268,210 | | |
Electrical Equipment 0.2% | |
Eaton Corp. PLC | | | 40,026 | | | | 2,714,964 | | |
Industrial Conglomerates 2.3% | |
Danaher Corp. | | | 1,308 | | | | 109,296 | | |
General Electric Co. | | | 1,377,698 | | | | 36,495,220 | | |
Siemens AG, Registered Shares | | | 45,480 | | | | 5,381,499 | | |
Total | | | | | 41,986,015 | | |
Machinery 0.6% | |
AGCO Corp. | | | 24,498 | | | | 1,033,571 | | |
Ingersoll-Rand PLC | | | 6,160 | | | | 388,449 | | |
Joy Global, Inc. | | | 25,674 | | | | 1,259,053 | | |
Oshkosh Corp. | | | 21,887 | | | | 993,670 | | |
Pentair PLC | | | 21,244 | | | | 1,374,699 | | |
SPX Corp. | | | 4,413 | | | | 395,802 | | |
Stanley Black & Decker, Inc. | | | 29,675 | | | | 2,802,507 | | |
Timken Co. (The) | | | 13,752 | | | | 588,448 | | |
Trinity Industries, Inc. | | | 39,298 | | | | 1,259,894 | | |
Total | | | | | 10,096,093 | | |
The accompanying Notes to Financial Statements are an integral part of this statement.
Semiannual Report 2014
10
Active Portfolios® Multi-Manager Value Fund
Portfolio of Investments (continued)
November 30, 2014 (Unaudited)
Common Stocks (continued)
Issuer | | Shares | | Value ($) | |
Marine —% | |
Kirby Corp.(a) | | | 4,365 | | | | 419,651 | | |
Professional Services —% | |
Manpowergroup, Inc. | | | 7,324 | | | | 489,683 | | |
Road & Rail 0.9% | |
Avis Budget Group, Inc.(a) | | | 26,977 | | | | 1,622,667 | | |
CSX Corp. | | | 136,477 | | | | 4,980,046 | | |
Genesee & Wyoming, Inc., Class A(a) | | | 8,697 | | | | 857,437 | | |
Hertz Global Holdings, Inc.(a) | | | 112,975 | | | | 2,682,026 | | |
Norfolk Southern Corp. | | | 40,393 | | | | 4,509,474 | | |
Ryder System, Inc. | | | 13,234 | | | | 1,264,112 | | |
Union Pacific Corp. | | | 5,144 | | | | 600,665 | | |
Total | | | | | 16,516,427 | | |
Trading Companies & Distributors 0.1% | |
Air Lease Corp. | | | 7,269 | | | | 276,440 | | |
Veritiv Corp.(a) | | | 1,015 | | | | 51,004 | | |
WESCO International, Inc.(a) | | | 11,121 | | | | 916,259 | | |
Total | | | | | 1,243,703 | | |
Total Industrials | | | | | 143,877,975 | | |
Information Technology 13.0% | |
Communications Equipment 3.3% | |
Brocade Communications Systems, Inc. | | | 74,473 | | | | 842,289 | | |
Cisco Systems, Inc. | | | 2,071,887 | | | | 57,266,957 | | |
EchoStar Corp., Class A(a) | | | 3,561 | | | | 191,867 | | |
Juniper Networks, Inc. | | | 42,357 | | | | 938,631 | | |
Total | | | | | 59,239,744 | | |
Electronic Equipment, Instruments & Components 0.2% | |
Arrow Electronics, Inc.(a) | | | 25,349 | | | | 1,481,395 | | |
Avnet, Inc. | | | 23,078 | | | | 1,010,586 | | |
Corning, Inc. | | | 60,692 | | | | 1,275,746 | | |
Ingram Micro, Inc., Class A(a) | | | 25,858 | | | | 709,285 | | |
Jabil Circuit, Inc. | | | 2,798 | | | | 58,058 | | |
Total | | | | | 4,535,070 | | |
IT Services 0.9% | |
Amdocs Ltd. | | | 27,252 | | | | 1,328,399 | | |
Computer Sciences Corp. | | | 29,967 | | | | 1,899,309 | | |
Fidelity National Information Services, Inc. | | | 71,601 | | | | 4,381,265 | | |
Paychex, Inc. | | | 98,391 | | | | 4,664,717 | | |
Xerox Corp. | | | 309,778 | | | | 4,324,501 | | |
Total | | | | | 16,598,191 | | |
Common Stocks (continued)
Issuer | | Shares | | Value ($) | |
Semiconductors & Semiconductor Equipment 4.2% | |
Analog Devices, Inc. | | | 73,317 | | | | 4,006,041 | | |
Broadcom Corp., Class A | | | 71,096 | | | | 3,066,371 | | |
First Solar, Inc.(a) | | | 16,681 | | | | 814,033 | | |
Intel Corp. | | | 1,274,522 | | | | 47,475,945 | | |
Lam Research Corp. | | | 13,621 | | | | 1,125,639 | | |
Marvell Technology Group Ltd. | | | 41,275 | | | | 591,058 | | |
Maxim Integrated Products, Inc. | | | 85,925 | | | | 2,540,802 | | |
Microchip Technology, Inc. | | | 294,888 | | | | 13,314,193 | | |
NVIDIA Corp. | | | 95,372 | | | | 1,999,951 | | |
Teradyne, Inc. | | | 19,091 | | | | 378,956 | | |
Total | | | | | 75,312,989 | | |
Software 2.5% | |
Activision Blizzard, Inc. | | | 122,188 | | | | 2,645,370 | | |
CA, Inc. | | | 10,738 | | | | 334,489 | | |
Microsoft Corp. | | | 871,049 | | | | 41,644,853 | | |
Synopsys, Inc.(a) | | | 17,745 | | | | 769,955 | | |
Total | | | | | 45,394,667 | | |
Technology Hardware, Storage & Peripherals 1.9% | |
Apple, Inc. | | | 93,738 | | | | 11,148,260 | | |
EMC Corp. | | | 258,902 | | | | 7,857,676 | | |
Hewlett-Packard Co. | | | 285,576 | | | | 11,154,599 | | |
Seagate Technology PLC | | | 53,274 | | | | 3,521,944 | | |
Total | | | | | 33,682,479 | | |
Total Information Technology | | | | | 234,763,140 | | |
Materials 2.5% | |
Chemicals 0.9% | |
Ashland, Inc. | | | 19,504 | | | | 2,224,431 | | |
CF Industries Holdings, Inc. | | | 14,421 | | | | 3,866,991 | | |
LyondellBasell Industries NV, Class A | | | 120,852 | | | | 9,530,389 | | |
Mosaic Co. (The) | | | 25,629 | | | | 1,173,039 | | |
Rockwood Holdings, Inc. | | | 986 | | | | 76,859 | | |
Total | | | | | 16,871,709 | | |
Construction Materials —% | |
Vulcan Materials Co. | | | 10,903 | | | | 720,688 | | |
Containers & Packaging 0.2% | |
Bemis Co., Inc. | | | 25,902 | | | | 1,034,526 | | |
MeadWestvaco Corp. | | | 29,839 | | | | 1,336,787 | | |
The accompanying Notes to Financial Statements are an integral part of this statement.
Semiannual Report 2014
11
Active Portfolios® Multi-Manager Value Fund
Portfolio of Investments (continued)
November 30, 2014 (Unaudited)
Common Stocks (continued)
Issuer | | Shares | | Value ($) | |
Rock-Tenn Co., Class A | | | 36,118 | | | | 2,051,864 | | |
Sonoco Products Co. | | | 2,487 | | | | 104,504 | | |
Total | | | | | 4,527,681 | | |
Metals & Mining 1.2% | |
Alcoa, Inc. | | | 184,733 | | | | 3,194,034 | | |
Allegheny Technologies, Inc. | | | 1,267 | | | | 42,685 | | |
BHP Billiton Ltd. | | | 187,261 | | | | 4,855,662 | | |
Freeport-McMoRan, Inc. | | | 143,252 | | | | 3,846,316 | | |
Newmont Mining Corp. | | | 39,019 | | | | 717,950 | | |
Nucor Corp. | | | 53,380 | | | | 2,862,769 | | |
Reliance Steel & Aluminum Co. | | | 12,974 | | | | 829,558 | | |
Rio Tinto PLC | | | 50,331 | | | | 2,352,614 | | |
Steel Dynamics, Inc. | | | 37,238 | | | | 839,344 | | |
TimkenSteel Corp. | | | 3,973 | | | | 141,518 | | |
United States Steel Corp. | | | 36,401 | | | | 1,213,973 | | |
Total | | | | | 20,896,423 | | |
Paper & Forest Products 0.2% | |
International Paper Co. | | | 53,134 | | | | 2,859,672 | | |
Total Materials | | | | | 45,876,173 | | |
Telecommunication Services 7.0% | |
Diversified Telecommunication Services 6.4% | |
AT&T, Inc. | | | 1,193,756 | | | | 42,235,087 | | |
BCE, Inc. | | | 149,277 | | | | 7,015,431 | | |
BCE, Inc. | | | 168,639 | | | | 7,912,542 | | |
CenturyLink, Inc. | | | 493,662 | | | | 20,126,600 | | |
Frontier Communications Corp. | | | 251,510 | | | | 1,773,145 | | |
Orange SA | | | 357,091 | | | | 6,289,612 | | |
Telstra Corp., Ltd. | | | 1,330,842 | | | | 6,439,672 | | |
Verizon Communications, Inc. | | | 425,962 | | | | 21,549,418 | | |
Windstream Holdings, Inc. | | | 149,987 | | | | 1,516,369 | | |
Total | | | | | 114,857,876 | | |
Wireless Telecommunication Services 0.6% | |
Sprint Corp.(a) | | | 92,759 | | | | 474,926 | | |
T-Mobile USA, Inc.(a) | | | 11,176 | | | | 326,227 | | |
United States Cellular Corp.(a) | | | 3,857 | | | | 148,456 | | |
Vodafone Group PLC | | | 973,285 | | | | 3,556,674 | | |
Vodafone Group PLC, ADR | | | 192,779 | | | | 7,046,073 | | |
Total | | | | | 11,552,356 | | |
Total Telecommunication Services | | | | | 126,410,232 | | |
Common Stocks (continued)
Issuer | | Shares | | Value ($) | |
Utilities 5.4% | |
Electric Utilities 2.9% | |
American Electric Power Co., Inc. | | | 85,516 | | | | 4,921,446 | | |
Duke Energy Corp. | | | 272,200 | | | | 22,020,980 | | |
Endesa SA | | | 81,552 | | | | 1,576,354 | | |
PPL Corp. | | | 191,408 | | | | 6,800,726 | | |
Southern Co. (The) | | | 121,611 | | | | 5,768,010 | | |
Terna Rete Elettrica Nazionale SpA | | | 1,413,788 | | | | 6,827,974 | | |
Xcel Energy, Inc. | | | 134,944 | | | | 4,579,999 | | |
Total | | | | | 52,495,489 | | |
Gas Utilities 0.1% | |
UGI Corp. | | | 43,207 | | | | 1,629,336 | | |
Independent Power and Renewable Electricity Producers 0.1% | |
Calpine Corp.(a) | | | 36,503 | | | | 838,109 | | |
NRG Energy, Inc. | | | 42,444 | | | | 1,326,799 | | |
Total | | | | | 2,164,908 | | |
Multi-Utilities 2.3% | |
Ameren Corp. | | | 132,907 | | | | 5,729,621 | | |
CMS Energy Corp. | | | 65,283 | | | | 2,160,867 | | |
DTE Energy Co. | | | 32,112 | | | | 2,615,844 | | |
National Grid PLC | | | 633,384 | | | | 9,200,914 | | |
PG&E Corp. | | | 121,363 | | | | 6,128,831 | | |
Public Service Enterprise Group, Inc. | | | 98,281 | | | | 4,106,180 | | |
SCANA Corp. | | | 49,917 | | | | 2,846,767 | | |
Sempra Energy | | | 75,615 | | | | 8,448,464 | | |
Total | | | | | 41,237,488 | | |
Total Utilities | | | | | 97,527,221 | | |
Total Common Stocks
(Cost: $1,508,827,377) | | | | | 1,693,468,738 | | |
Equity-Linked Notes 5.0%
Issuer | | Coupon
Rate | | Shares | | Value ($) | |
Deutsche Bank AG
Senior Unsecured
(linked to common stock of Merck & Co.)(b)
12/15/14 | | | 15.230 | % | | | 326,720 | | | | 19,639,139 | | |
Goldman Sachs Group, Inc. (The)(b)
Senior Unsecured
(linked to common stock of Apple, Inc.)
03/11/15 | | | 7.000 | % | | | 270,760 | | | | 30,951,117 | | |
(linked to common stock of Dow Chemical Co. (The))
02/13/15 | | | 7.000 | % | | | 345,330 | | | | 16,812,405 | | |
The accompanying Notes to Financial Statements are an integral part of this statement.
Semiannual Report 2014
12
Active Portfolios® Multi-Manager Value Fund
Portfolio of Investments (continued)
November 30, 2014 (Unaudited)
Equity-Linked Notes (continued)
Issuer | | Coupon
Rate | | Shares | | Value ($) | |
JPMorgan Chase & Co.(b)
Senior Unsecured
(linked to common stock of Delta Air Lines, Inc.)
12/23/14 | | | 8.260 | % | | | 99,700 | | | | 4,414,716 | | |
(linked to common stock of KKR & Co., LLP)
01/20/15 | | | 12.300 | % | | | 153,214 | | | | 3,474,893 | | |
(linked to common stock of Suncor Energy, Inc.)
01/20/15 | | | 10.600 | % | | | 14,550 | | | | 462,399 | | |
(linked to common stock of United Continental Holdings, Inc.)
12/23/14 | | | 12.580 | % | | | 98,300 | | | | 5,564,763 | | |
UBS AG
Senior Unsecured
(linked to common stock of Blackstone Group LP (The))(b)
02/26/15 | | | 8.960 | % | | | 251,740 | | | | 8,393,012 | | |
Total Equity-Linked Notes
(Cost: $86,862,847) | | | | | | | 89,712,444 | | |
Money Market Funds 0.9%
| | | Shares | | Value ($) | |
Columbia Short-Term Cash Fund,
0.104%(c)(d) | | | 16,823,286 | | | | 16,823,286 | | |
Total Money Market Funds
(Cost: $16,823,286) | | | | | 16,823,286 | | |
Total Investments
(Cost: $1,612,513,510) | | | | | 1,800,004,468 | | |
Other Assets & Liabilities, Net | | | | | 2,219,462 | | |
Net Assets | | | | | 1,802,223,930 | | |
Notes to Portfolio of Investments
(a) Non-income producing.
(b) Security exempt from registration pursuant to Rule 144A under the Securities Act of 1933. This security may be resold in transactions exempt from registration, normally to qualified institutional buyers. At November 30, 2014, the value of these securities amounted to $89,712,444 or 4.98% of net assets.
(c) The rate shown is the seven-day current annualized yield at November 30, 2014.
(d) As defined in the Investment Company Act of 1940, an affiliated company is one in which the Fund owns 5% or more of the company's outstanding voting securities, or a company which is under common ownership or control with the Fund. Holdings and transactions in these affiliated companies during the period ended November 30, 2014, are as follows:
Issuer | | Beginning
Cost ($) | | Purchase
Cost ($) | | Proceeds
From Sales ($) | | Ending
Cost ($) | | Dividends —
Affiliated
Issuers ($) | | Value ($) | |
Columbia Short-Term Cash Fund | | | 22,254,774 | | | | 298,825,402 | | | | (304,256,890 | ) | | | 16,823,286 | | | | 14,552 | | | | 16,823,286 | | |
Abbreviation Legend
ADR American Depositary Receipt
The accompanying Notes to Financial Statements are an integral part of this statement.
Semiannual Report 2014
13
Active Portfolios® Multi-Manager Value Fund
Portfolio of Investments (continued)
November 30, 2014 (Unaudited)
Fair Value Measurements
Generally accepted accounting principles (GAAP) require disclosure regarding the inputs and valuation techniques used to measure fair value and any changes in valuation inputs or techniques. In addition, investments shall be disclosed by major category.
The Fund categorizes its fair value measurements according to a three-level hierarchy that maximizes the use of observable inputs and minimizes the use of unobservable inputs by prioritizing that the most observable input be used when available. Observable inputs are those that market participants would use in pricing an investment based on market data obtained from sources independent of the reporting entity. Unobservable inputs are those that reflect the Fund's assumptions about the information market participants would use in pricing an investment. An investment's level within the fair value hierarchy is based on the lowest level of any input that is deemed significant to the asset or liability's fair value measurement. The input levels are not necessarily an indication of the risk or liquidity associated with investments at that level. For example, certain U.S. government securities are generally high quality and liquid, however, they are reflected as Level 2 because the inputs used to determine fair value may not always be quoted prices in an active market.
Fair value inputs are summarized in the three broad levels listed below:
> Level 1 — Valuations based on quoted prices for investments in active markets that the Fund has the ability to access at the measurement date (including NAV for open-end mutual funds). Valuation adjustments are not applied to Level 1 investments.
> Level 2 — Valuations based on other significant observable inputs (including quoted prices for similar securities, interest rates, prepayment speeds, credit risks, etc.).
> Level 3 — Valuations based on significant unobservable inputs (including the Fund's own assumptions and judgment in determining the fair value of investments).
Inputs that are used in determining fair value of an investment may include price information, credit data, volatility statistics, and other factors. These inputs can be either observable or unobservable. The availability of observable inputs can vary between investments, and is affected by various factors such as the type of investment, and the volume and level of activity for that investment or similar investments in the marketplace. The inputs will be considered by the Investment Manager, along with any other relevant factors in the calculation of an investment's fair value. The Fund uses prices and inputs that are current as of the measurement date, which may include periods of market dislocations. During these periods, the availability of prices and inputs may be reduced for many investments. This condition could cause an investment to be reclassified between the various levels within the hierarchy.
Foreign equity securities actively traded in markets where there is a significant delay in the local close relative to the New York Stock Exchange (NYSE) are classified as Level 2. The values of these securities may include an adjustment to reflect the impact of significant market movements following the close of local trading, as described in Note 2 to the financial statements — Security Valuation.
Investments falling into the Level 3 category are primarily supported by quoted prices from brokers and dealers participating in the market for those investments. However, these may be classified as Level 3 investments due to lack of market transparency and corroboration to support these quoted prices. Additionally, valuation models may be used as the pricing source for any remaining investments classified as Level 3. These models may rely on one or more significant unobservable inputs and/or significant assumptions by the Investment Manager. Inputs used in valuations may include, but are not limited to, financial statement analysis, capital account balances, discount rates and estimated cash flows, and comparable company data.
Under the direction of the Fund's Board of Trustees (the Board), the Investment Manager's Valuation Committee (the Committee) is responsible for overseeing the valuation procedures approved by the Board. The Committee consists of voting and non-voting members from various groups within the Investment Manager's organization, including operations and accounting, trading and investments, compliance, risk management and legal.
The Committee meets at least monthly to review and approve valuation matters, which may include a description of specific valuation determinations, data regarding pricing information received from approved pricing vendors and brokers and the results of Board-approved valuation control policies and procedures (the Policies). The Policies address, among other things, instances when market quotations are or are not readily available, including recommendations of third party pricing vendors and a determination of appropriate pricing methodologies; events that require specific valuation determinations and assessment of fair value techniques; securities with a potential for stale pricing, including those that are illiquid, restricted, or in default; and the effectiveness of third party pricing vendors, including periodic reviews of vendors. The Committee meets more frequently, as needed, to discuss additional valuation matters, which may include the need to review back-testing results, review time-sensitive information or approve related valuation actions. The Committee reports to the Board, with members of the Committee meeting with the Board at each of its regularly scheduled meetings to discuss valuation matters and actions during the period, similar to those described earlier.
For investments categorized as Level 3, the Committee monitors information similar to that described above, which may include: (i) data specific to the issuer or comparable issuers, (ii) general market or specific sector news and (iii) quoted prices and specific or similar security transactions. The Committee considers this data and any changes from prior periods in order to assess the reasonableness of observable and unobservable inputs, any assumptions or internal models used to value those securities and changes in fair value. This data is also used to corroborate, when available, information received from approved pricing vendors and brokers. Various factors impact the frequency of monitoring this information (which may occur as often as daily). However, the Committee may determine that changes to inputs, assumptions and models are not required as a result of the monitoring procedures performed.
The accompanying Notes to Financial Statements are an integral part of this statement.
Semiannual Report 2014
14
Active Portfolios® Multi-Manager Value Fund
Portfolio of Investments (continued)
November 30, 2014 (Unaudited)
Fair Value Measurements (continued)
The following table is a summary of the inputs used to value the Fund's investments at November 30, 2014:
Description | | Level 1
Quoted Prices in Active
Markets for Identical
Assets ($) | | Level 2
Other Significant
Observable Inputs ($) | | Level 3
Significant
Unobservable Inputs ($) | | Total ($) | |
Equity Securities | |
Common Stocks | |
Consumer Discretionary | | | 104,429,353 | | | | 11,887,075 | | | | — | | | | 116,316,428 | | |
Consumer Staples | | | 211,066,726 | | | | 45,862,132 | | | | — | | | | 256,928,858 | | |
Energy | | | 213,589,952 | | | | 23,634,479 | | | | — | | | | 237,224,431 | | |
Financials | | | 191,552,137 | | | | — | | | | — | | | | 191,552,137 | | |
Health Care | | | 236,312,806 | | | | 6,679,337 | | | | — | | | | 242,992,143 | | |
Industrials | | | 132,869,994 | | | | 11,007,981 | | | | — | | | | 143,877,975 | | |
Information Technology | | | 234,763,140 | | | | — | | | | — | | | | 234,763,140 | | |
Materials | | | 38,667,897 | | | | 7,208,276 | | | | — | | | | 45,876,173 | | |
Telecommunication Services | | | 110,124,274 | | | | 16,285,958 | | | | — | | | | 126,410,232 | | |
Utilities | | | 79,921,979 | | | | 17,605,242 | | | | — | | | | 97,527,221 | | |
Total Equity Securities | | | 1,553,298,258 | | | | 140,170,480 | | | | — | | | | 1,693,468,738 | | |
Other | |
Equity-Linked Notes | | | — | | | | 89,712,444 | | | | — | | | | 89,712,444 | | |
Total Other | | | — | | | | 89,712,444 | | | | — | | | | 89,712,444 | | |
Mutual Funds | |
Money Market Funds | | | 16,823,286 | | | | — | | | | — | | | | 16,823,286 | | |
Total Mutual Funds | | | 16,823,286 | | | | — | | | | — | | | | 16,823,286 | | |
Total | | | 1,570,121,544 | | | | 229,882,924 | | | | — | | | | 1,800,004,468 | | |
See the Portfolio of Investments for all investment classifications not indicated in the table.
The Fund's assets assigned to the Level 2 input category are generally valued using the market approach, in which a security's value is determined through reference to prices and information from market transactions for similar or identical assets. These assets include certain foreign securities for which a third party statistical pricing service may be employed for purposes of fair market valuation. The model utilized by such third party statistical pricing service takes into account a security's correlation to available market data including, but not limited to, intraday index, ADR, and ETF movements.
There were no transfers of financial assets between levels during the period.
The accompanying Notes to Financial Statements are an integral part of this statement.
Semiannual Report 2014
15
Active Portfolios® Multi-Manager Value Fund
Statement of Assets and Liabilities
November 30, 2014 (Unaudited)
Assets | |
Investments, at value | |
Unaffiliated issuers (identified cost $1,595,690,224) | | $ | 1,783,181,182 | | |
Affiliated issuers (identified cost $16,823,286) | | | 16,823,286 | | |
Total investments (identified cost $1,612,513,510) | | | 1,800,004,468 | | |
Foreign currency (identified cost $97,962) | | | 97,952 | | |
Receivable for: | |
Investments sold | | | 1,783,201 | | |
Capital shares sold | | | 3,628,270 | | |
Dividends | | | 5,728,149 | | |
Reclaims | | | 184,309 | | |
Expense reimbursement due from Investment Manager | | | 2,211 | | |
Prepaid expenses | | | 7,065 | | |
Total assets | | | 1,811,435,625 | | |
Liabilities | |
Disbursements in excess of cash | | | 812,982 | | |
Payable for: | |
Investments purchased | | | 5,126,606 | | |
Capital shares purchased | | | 2,791,190 | | |
Investment management fees | | | 59,518 | | |
Distribution and/or service fees | | | 24,861 | | |
Transfer agent fees | | | 253,307 | | |
Administration fees | | | 5,383 | | |
Compensation of board members | | | 21,439 | | |
Other expenses | | | 116,409 | | |
Total liabilities | | | 9,211,695 | | |
Net assets applicable to outstanding capital stock | | $ | 1,802,223,930 | | |
Represented by | |
Paid-in capital | | $ | 1,515,892,433 | | |
Undistributed net investment income | | | 7,498,412 | | |
Accumulated net realized gain | | | 91,364,475 | | |
Unrealized appreciation (depreciation) on: | |
Investments | | | 187,490,958 | | |
Foreign currency translations | | | (22,348 | ) | |
Total — representing net assets applicable to outstanding capital stock | | $ | 1,802,223,930 | | |
Class A | |
Net assets | | $ | 1,802,223,930 | | |
Shares outstanding | | | 138,637,290 | | |
Net asset value per share | | $ | 13.00 | | |
The accompanying Notes to Financial Statements are an integral part of this statement.
Semiannual Report 2014
16
Active Portfolios® Multi-Manager Value Fund
Statement of Operations
Six Months Ended November 30, 2014 (Unaudited)
Net investment income | |
Income: | |
Dividends — unaffiliated issuers | | $ | 26,753,742 | | |
Dividends — affiliated issuers | | | 14,552 | | |
Interest | | | 2,123,329 | | |
Foreign taxes withheld | | | (570,697 | ) | |
Total income | | | 28,320,926 | | |
Expenses: | |
Investment management fees | | | 5,291,297 | | |
Distribution and/or service fees | |
Class A | | | 2,202,283 | | |
Transfer agent fees | |
Class A | | | 1,689,929 | | |
Administration fees | | | 477,854 | | |
Compensation of board members | | | 15,770 | | |
Custodian fees | | | 20,294 | | |
Printing and postage fees | | | 123,430 | | |
Registration fees | | | 91,812 | | |
Professional fees | | | 20,162 | | |
Other | | | 13,271 | | |
Total expenses | | | 9,946,102 | | |
Fees waived or expenses reimbursed by Investment Manager and its affiliates | | | (290,850 | ) | |
Total net expenses | | | 9,655,252 | | |
Net investment income | | | 18,665,674 | | |
Realized and unrealized gain (loss) — net | |
Net realized gain (loss) on: | |
Investments | | | 41,694,843 | | |
Foreign currency translations | | | (95,729 | ) | |
Net realized gain | | | 41,599,114 | | |
Net change in unrealized appreciation (depreciation) on: | |
Investments | | | 23,374,090 | | |
Foreign currency translations | | | (17,944 | ) | |
Net change in unrealized appreciation | | | 23,356,146 | | |
Net realized and unrealized gain | | | 64,955,260 | | |
Net increase in net assets resulting from operations | | $ | 83,620,934 | | |
The accompanying Notes to Financial Statements are an integral part of this statement.
Semiannual Report 2014
17
Active Portfolios® Multi-Manager Value Fund
Statement of Changes in Net Assets
| | | Six Months Ended
November 30, 2014
(Unaudited) | | Year Ended
May 31,
2014 | |
Operations | |
Net investment income | | $ | 18,665,674 | | | $ | 23,904,073 | | |
Net realized gain | | | 41,599,114 | | | | 126,928,690 | | |
Net change in unrealized appreciation | | | 23,356,146 | | | | 53,682,840 | | |
Net increase in net assets resulting from operations | | | 83,620,934 | | | | 204,515,603 | | |
Distributions to shareholders | |
Net investment income | |
Class A | | | (18,166,443 | ) | | | (18,761,924 | ) | |
Net realized gains | |
Class A | | | — | | | | (90,982,487 | ) | |
Total distributions to shareholders | | | (18,166,443 | ) | | | (109,744,411 | ) | |
Increase (decrease) in net assets from capital stock activity | | | (16,181,063 | ) | | | 907,244,652 | | |
Total increase in net assets | | | 49,273,428 | | | | 1,002,015,844 | | |
Net assets at beginning of period | | | 1,752,950,502 | | | | 750,934,658 | | |
Net assets at end of period | | $ | 1,802,223,930 | | | $ | 1,752,950,502 | | |
Undistributed net investment income | | $ | 7,498,412 | | | $ | 6,999,181 | | |
| | | Six Months Ended November 30, 2014
(Unaudited) | | Year Ended May 31, 2014 | |
| | | Shares | | Dollars ($) | | Shares | | Dollars ($) | |
Capital stock activity | |
Class A shares | |
Subscriptions | | | 13,723,087 | | | | 172,682,413 | | | | 92,115,130 | | | | 1,093,668,735 | | |
Distributions reinvested | | | 1,412,699 | | | | 18,166,409 | | | | 9,527,929 | | | | 109,741,649 | | |
Redemptions | | | (16,401,858 | ) | | | (207,029,885 | ) | | | (24,350,459 | ) | | | (296,165,732 | ) | |
Net increase (decrease) | | | (1,266,072 | ) | | | (16,181,063 | ) | | | 77,292,600 | | | | 907,244,652 | | |
Total net increase (decrease) | | | (1,266,072 | ) | | | (16,181,063 | ) | | | 77,292,600 | | | | 907,244,652 | | |
The accompanying Notes to Financial Statements are an integral part of this statement.
Semiannual Report 2014
18
Active Portfolios® Multi-Manager Value Fund
The following table is intended to help you understand the Fund's financial performance. Certain information reflects financial results for a single share of a class held for the periods shown. Per share net investment income (loss) amounts are calculated based on average shares outstanding during the period. Total return assumes reinvestment of all dividends and distributions, if any. Total return does not reflect payment of sales charges, if any. Total return and portfolio turnover are not annualized for periods of less than one year. The portfolio turnover rate is calculated without regard to purchase and sales transactions of short-term instruments and certain derivatives, if any. If such transactions were included, the Fund's portfolio turnover rate may be higher.
| | | Six Months Ended
November 30, 2014 | | Year Ended May 31, | |
Class A | | (Unaudited) | | 2014 | | 2013 | | 2012(a) | |
Per share data | |
Net asset value, beginning of period | | $ | 12.53 | | | $ | 11.99 | | | $ | 9.49 | | | $ | 10.00 | | |
Income from investment operations: | |
Net investment income | | | 0.13 | | | | 0.25 | | | | 0.18 | | | | 0.02 | | |
Net realized and unrealized gain (loss) | | | 0.47 | | | | 1.67 | | | | 2.50 | | | | (0.53 | ) | |
Total from investment operations | | | 0.60 | | | | 1.92 | | | | 2.68 | | | | (0.51 | ) | |
Less distributions to shareholders: | |
Net investment income | | | (0.13 | ) | | | (0.20 | ) | | | (0.18 | ) | | | — | | |
Net realized gains | | | — | | | | (1.18 | ) | | | — | | | | — | | |
Total distributions to shareholders | | | (0.13 | ) | | | (1.38 | ) | | | (0.18 | ) | | | — | | |
Net asset value, end of period | | $ | 13.00 | | | $ | 12.53 | | | $ | 11.99 | | | $ | 9.49 | | |
Total return | | | 4.81 | % | | | 17.18 | % | | | 28.49 | % | | | (5.10 | %) | |
Ratios to average net assets(b) | |
Total gross expenses | | | 1.13 | %(c) | | | 1.20 | %(d) | | | 1.24 | % | | | 1.38 | %(c) | |
Total net expenses(e) | | | 1.10 | %(c) | | | 1.08 | %(d) | | | 1.08 | % | | | 1.08 | %(c) | |
Net investment income | | | 2.12 | %(c) | | | 2.05 | % | | | 1.70 | % | | | 2.46 | %(c) | |
Supplemental data | |
Net assets, end of period (in thousands) | | $ | 1,802,224 | | | $ | 1,752,951 | | | $ | 750,935 | | | $ | 576,769 | | |
Portfolio turnover | | | 26 | % | | | 99 | % | | | 55 | % | | | 3 | % | |
Notes to Financial Highlights
(a) Based on operations from April 20, 2012 (commencement of operations) through the stated period end.
(b) In addition to the fees and expenses that the Fund bears directly, the Fund indirectly bears a pro rata share of the fees and expenses of any other funds in which it invests. Such indirect expenses are not included in the Fund's reported expense ratios.
(c) Annualized.
(d) Ratios include line of credit interest expense which is less than 0.01%.
(e) Total net expenses include the impact of certain fee waivers/expense reimbursements made by the Investment Manager and certain of its affiliates, if applicable.
The accompanying Notes to Financial Statements are an integral part of this statement.
Semiannual Report 2014
19
Active Portfolios® Multi-Manager Value Fund
Notes to Financial Statements
November 30, 2014 (Unaudited)
Note 1. Organization
Active Portfolios® Multi-Manager Value Fund (the Fund), a series of Columbia Funds Series Trust II (the Trust), is a diversified fund. The Trust is registered under the Investment Company Act of 1940, as amended (the 1940 Act), as an open-end management investment company organized as a Massachusetts business trust.
Fund Shares
The Trust may issue an unlimited number of shares (without par value). The Fund only offers Class A shares that are available only to certain eligible investors through certain wrap fee programs sponsored and/or managed by Ameriprise Financial, Inc. (Ameriprise Financial) or its affiliates.
Class A shares are not subject to any front-end sales charge or contingent deferred sales charge.
Note 2. Summary of Significant Accounting Policies
Basis of Preparation
The Fund is an investment company that applies the accounting and reporting guidance in the Financial Accounting Standards Board (FASB) Accounting Standards Codification Topic 946, Financial Services — Investment Companies (ASC 946). The financial statements are prepared in accordance with U.S. generally accepted accounting principles (GAAP) which requires management to make certain estimates and assumptions that affect the reported amounts of assets and liabilities, the disclosure of contingent assets and liabilities at the date of the financial statements and the reported amounts of income and expenses during the reporting period. Actual results could differ from those estimates.
The following is a summary of significant accounting policies followed by the Fund in the preparation of its financial statements.
Security Valuation
All equity securities are valued at the close of business of the New York Stock Exchange (NYSE). Equity securities are valued at the last quoted sales price on the principal exchange or market on which they trade, except for securities traded on the NASDAQ Stock Market, which are valued at the NASDAQ official close price. Unlisted securities or listed securities for which there were no sales during the day are valued at the mean of the latest quoted bid and ask prices on such exchanges or markets.
Debt securities generally are valued by pricing services approved by the Board of Trustees (the Board) based upon
market transactions for normal, institutional-size trading units of similar securities. The services may use various pricing techniques that take into account, as applicable, factors such as yield, quality, coupon rate, maturity, type of issue, trading characteristics and other data, as well as broker quotes. Debt securities for which quotations are readily available may also be valued based upon an over-the-counter or exchange bid quotation.
Foreign equity securities are valued based on quotations from the principal market in which such securities are traded. If any foreign security prices are not readily available as a result of limited share activity, the securities are valued at the mean of the latest quoted bid and ask prices on such exchanges or markets. Foreign currency exchange rates are generally determined at 4:00 p.m. Eastern (U.S.) time. Many securities markets and exchanges outside the U.S. close prior to the close of the NYSE; therefore, the closing prices for securities in such markets or on such exchanges may not fully reflect events that occur after such close but before the close of the NYSE. In those situations, foreign securities will be fair valued pursuant to a policy adopted by the Board, including, if available, utilizing a third party pricing service to determine these fair values. The third party pricing service takes into account multiple factors, including, but not limited to, movements in the U.S. securities markets, certain depositary receipts, futures contracts and foreign exchange rates that have occurred subsequent to the close of the foreign exchange or market, to determine a good faith estimate that reasonably reflects the current market conditions as of the close of the NYSE. The fair value of a security is likely to be different from the quoted or published price, if available.
Investments in open-end investment companies, including money market funds, are valued at their net asset value.
Investments for which market quotations are not readily available, or that have quotations which management believes are not reliable, are valued at fair value as determined in good faith under procedures established by and under the general supervision of the Board. If a security or class of securities (such as foreign securities) is valued at fair value, such value is likely to be different from the quoted or published price for the security.
The determination of fair value often requires significant judgment. To determine fair value, management may use assumptions including but not limited to future cash flows and estimated risk premiums. Multiple inputs from various sources may be used to determine fair value.
Semiannual Report 2014
20
Active Portfolios® Multi-Manager Value Fund
Notes to Financial Statements (continued)
November 30, 2014 (Unaudited)
Foreign Currency Transactions and Translations
The values of all assets and liabilities denominated in foreign currencies are generally translated into U.S. dollars at exchange rates determined at the close of the NYSE. Net realized and unrealized gains (losses) on foreign currency transactions and translations include gains (losses) arising from the fluctuation in exchange rates between trade and settlement dates on securities transactions, gains (losses) arising from the disposition of foreign currency and currency gains (losses) between the accrual and payment dates on dividends, interest income and foreign withholding taxes.
For financial statement purposes, the Fund does not distinguish that portion of gains (losses) on investments which is due to changes in foreign exchange rates from that which is due to changes in market prices of the investments. Such fluctuations are included with the net realized and unrealized gains (losses) on investments in the Statement of Operations.
Equity-Linked Notes
The Fund may invest in equity-linked notes (ELNs). An ELN is a debt instrument whose value is based on the value of a single equity security, basket of equity securities or an index of equity securities (each, an Underlying Equity). An ELN typically provides interest income, thereby offering a yield advantage over investing directly in an Underlying Equity. However, the holder of an ELN may have limited or no benefit from any appreciation in the Underlying Equity, but is exposed to various risks, including, without limitation, volatility, issuer and market risk. The Fund may purchase ELNs that trade on a securities exchange or those that trade on the over-the-counter markets, including securities offered and sold under Rule 144A of the Securities Act of 1933, as amended. The Fund may also purchase an ELN in a privately negotiated transaction with the issuer of the ELN (or its broker-dealer affiliate).
Security Transactions
Security transactions are accounted for on the trade date. Cost is determined and gains (losses) are based upon the specific identification method for both financial statement and federal income tax purposes.
Income Recognition
Corporate actions and dividend income are generally recorded net of any non-reclaimable tax withholdings, on the ex-dividend date or upon receipt of ex-dividend notification in the case of certain foreign securities.
Interest income is recorded on an accrual basis. Market premiums and discounts, including original issue discounts, are
amortized and accreted, respectively, over the expected life of the security on all debt securities, unless otherwise noted.
The Fund may place a debt security on non-accrual status and reduce related interest income when it becomes probable that the interest will not be collected and the amount of uncollectible interest can be reasonably estimated. A defaulted debt security is removed from non-accrual status when the issuer resumes interest payments or when collectability of interest is reasonably assured.
The Fund may receive distributions from holdings in business development companies (BDCs), exchange-traded funds (ETFs), other regulated investment companies (RICs), and real estate investment trusts (REITs), which report information on the character of their distributions annually. These distributions are allocated to dividend income, capital gain and return of capital based on actual information reported. To the extent actual information has not yet been reported by the REITs, estimates for return of capital are made by the Fund's management. Return of capital is recorded as a reduction of the cost basis of securities held. If the Fund no longer owns the applicable securities, return of capital is recorded as a realized gain. Management's estimates are subsequently adjusted when the actual character of the distributions is disclosed by the REITs, which could result in a proportionate change in return of capital to shareholders. No estimates are made for the BDCs, ETFs, and RICs.
Awards from class action litigation are recorded as a reduction of cost basis if the Fund still owns the applicable securities on the payment date. If the Fund no longer owns the applicable securities, the proceeds are recorded as realized gains.
Expenses
General expenses of the Trust are allocated to the Fund and other funds of the Trust based upon relative net assets or other expense allocation methodologies determined by the nature of the expense. Expenses directly attributable to the Fund are charged to the Fund.
Federal Income Tax Status
The Fund intends to qualify each year as a regulated investment company under Subchapter M of the Internal Revenue Code, as amended, and will distribute substantially all of its taxable income (including net short-term capital gains), if any, for its tax year, and as such will not be subject to federal income taxes. In addition, the Fund intends to distribute in each calendar year substantially all of its net investment income, capital gains and certain other amounts, if any, such that the Fund should not be subject to federal excise tax. Therefore, no federal income or excise tax provision is recorded.
Semiannual Report 2014
21
Active Portfolios® Multi-Manager Value Fund
Notes to Financial Statements (continued)
November 30, 2014 (Unaudited)
Foreign Taxes
The Fund may be subject to foreign taxes on income, gains on investments or currency repatriation, a portion of which may be recoverable. The Fund will accrue such taxes and recoveries, as applicable, based upon its current interpretation of tax rules and regulations that exist in the markets in which it invests.
Realized gains in certain countries may be subject to foreign taxes at the Fund level, based on statutory rates. The Fund accrues for such foreign taxes on realized and unrealized gains at the appropriate rate for each jurisdiction, as applicable. The amount, if any, is disclosed as a liability on the Statement of Assets and Liabilities.
Distributions to Shareholders
Distributions from net investment income, if any, are declared and paid each calendar quarter. Net realized capital gains, if any, are distributed at least annually. Income distributions and capital gain distributions are determined in accordance with federal income tax regulations, which may differ from GAAP.
Guarantees and Indemnifications
Under the Trust's organizational documents and, in some cases, by contract, its officers and trustees are indemnified against certain liabilities arising out of the performance of their duties to the Trust or its funds. In addition, certain of the Fund's contracts with its service providers contain general indemnification clauses. The Fund's maximum exposure under these arrangements is unknown since the amount of any future claims that may be made against the Fund cannot be determined, and the Fund has no historical basis for predicting the likelihood of any such claims.
Note 3. Fees and Compensation Paid to Affiliates
Investment Management Fees
Under an Investment Management Services Agreement, Columbia Management Investment Advisers, LLC (the Investment Manager), a wholly-owned subsidiary of Ameriprise Financial, Inc. (Ameriprise Financial), is responsible for the ultimate oversight of investments made by the Fund. The Fund's subadviser (see Subadvisory Agreement below) shares the responsibility for the day-to-day portfolio management of the Fund with the Investment Manager. The investment management fee is an annual fee that is equal to a percentage of the Fund's average daily net assets that declines from 0.66% to 0.49% as the Fund's net assets increase. The annualized effective investment management fee rate for the six months ended November 30, 2014 was 0.60% of the Fund's average daily net assets.
Subadvisory Agreement
The Investment Manager has entered into a Subadvisory Agreement with Dimensional Fund Advisors, L.P. (DFA) to subadvise a portion of the assets of the Fund. The Investment Manager compensates DFA to manage the investment of a portion of the Fund's assets.
Administration Fees
Under an Administrative Services Agreement, the Investment Manager also serves as the Fund Administrator. The Fund pays the Fund Administrator an annual fee for administration and accounting services equal to a percentage of the Fund's average daily net assets that declines from 0.06% to 0.03% as the Fund's net assets increase. The annualized effective administration fee rate for the six months ended November 30, 2014 was 0.05% of the Fund's average daily net assets.
Other Expenses
Other expenses are for, among other things, miscellaneous expenses of the Fund or the Board, including payments to a company providing limited administrative services to the Fund and the Board. That company's expenses include boardroom and office expense, employee compensation, employee health and retirement benefits, and certain other expenses. For the six months ended November 30, 2014, other expenses paid by the Fund to this company were $1,808.
Compensation of Board Members
Board members are compensated for their services to the Fund as disclosed in the Statement of Operations. Under a Deferred Compensation Plan (the Plan), the Board members who are not "interested persons" of the Fund, as defined under the 1940 Act, may elect to defer payment of up to 100% of their compensation. Deferred amounts are treated as though equivalent dollar amounts had been invested in shares of certain funds managed by the Investment Manager. The Fund's liability for these amounts is adjusted for market value changes and remains in the Fund until distributed in accordance with the Plan.
Transfer Agent Fees
Under a Transfer and Dividend Disbursing Agent Agreement, Columbia Management Investment Services Corp. (the Transfer Agent), an affiliate of the Investment Manager and a wholly-owned subsidiary of Ameriprise Financial, is responsible for providing transfer agency services to the Fund. The Transfer Agent has contracted with Boston Financial Data Services (BFDS) to serve as sub-transfer agent.
Effective November 1, 2014, the Transfer Agent receives a monthly transfer agency fee based on the number or the average value of accounts, depending on the type of account. Prior to November 1, 2014, the Transfer Agent received a
Semiannual Report 2014
22
Active Portfolios® Multi-Manager Value Fund
Notes to Financial Statements (continued)
November 30, 2014 (Unaudited)
monthly account-based service fee based on the number of open accounts. In addition, the Transfer Agent also receives sub-transfer agency fees based on a percentage of the average aggregate value of the Fund's shares maintained in omnibus accounts (other than omnibus accounts for which American Enterprise Investment Services Inc. is the broker of record or accounts where the beneficial shareholder is a customer of Ameriprise Financial Services, Inc., which receive a per account fee). The Transfer Agent pays the fees of BFDS for services as sub-transfer agent and is not entitled to reimbursement for such fees from the Fund (with the exception of out-of-pocket fees).
The Transfer Agent also receives compensation from the Fund for various shareholder services and reimbursements for certain out-of-pocket fees.
For the six months ended November 30, 2014, the Fund's annualized effective transfer agent fee rates as a percentage of average daily net assets for Class A shares as 0.19%.
Distribution and Service Fees
The Fund has an agreement with Columbia Management Investment Distributors, Inc. (the Distributor), an affiliate of the Investment Manager and a wholly-owned subsidiary of Ameriprise Financial, for distribution and shareholder services. The Board has approved, and the Fund has adopted, distribution and shareholder service plans (the Plans) applicable to certain share classes, which set the distribution and service fees for the Fund. These fees are calculated daily and are intended to compensate the Distributor and/or eligible selling and/or servicing agents for selling shares of the Fund and providing services to investors.
The Fund may pay distribution and service fees up to a maximum annual rate of 0.25% of the Fund's average daily net assets attributable to Class A shares (comprised of up to 0.25% for distribution services and up to 0.25% for shareholder liaison services).
Expenses Waived/Reimbursed by the Investment Manager and its Affiliates
The Fund's expense ratio is subject to an expense reimbursement arrangement pursuant to which fees will be waived and/or expenses reimbursed (excluding certain fees and expenses described below), so that the Fund's net operating expenses, after giving effect to fees waived/expenses reimbursed and any balance credits and/or overdraft charges from the Fund's custodian, do not exceed the annual rates of:
| | | Voluntary
Expense Cap
Effective
October 1, 2014 | | Contractual
Expense Cap
Prior to
October 1, 2014 | |
Class A | | | 1.13 | % | | | 1.08 | % | |
The voluntary expense cap arrangement may be revised or discontinued at any time. Under the arrangements, the following fees and expenses are excluded from the waiver/reimbursement commitment, and therefore will be paid by the Fund, if applicable: taxes (including foreign transaction taxes), expenses associated with investments in affiliated and non-affiliated pooled investment vehicles (including mutual funds and exchange-traded funds), transaction costs and brokerage commissions, costs related to any securities lending program, dividend expenses associated with securities sold short, inverse floater program fees and expenses, transaction charges and interest on borrowed money, interest and extraordinary expenses.
Note 4. Federal Tax Information
The timing and character of income and capital gain distributions are determined in accordance with income tax regulations, which may differ from GAAP because of temporary or permanent book to tax differences.
At November 30, 2014, the cost of investments for federal income tax purposes was approximately $1,612,514,000 and the aggregate gross approximate unrealized appreciation and depreciation based on that cost was:
Unrealized appreciation | | $ | 224,439,000 | | |
Unrealized depreciation | | | (36,949,000 | ) | |
Net unrealized appreciation | | $ | 187,490,000 | | |
Management of the Fund has concluded that there are no significant uncertain tax positions in the Fund that would require recognition in the financial statements. However, management's conclusion may be subject to review and adjustment at a later date based on factors including, but not limited to, new tax laws, regulations, and administrative interpretations (including relevant court decisions). Generally, the Fund's federal tax returns for the prior three fiscal years remain subject to examination by the Internal Revenue Service.
Note 5. Portfolio Information
The cost of purchases and proceeds from sales of securities, excluding short-term obligations and certain derivatives, if any, aggregated to $456,868,698 and $456,304,677, respectively, for the six months ended November 30, 2014. The amount of purchase and sale activity impacts the portfolio turnover rate reported in the Financial Highlights.
Note 6. Affiliated Money Market Fund
The Fund invests in Columbia Short-Term Cash Fund, an affiliated money market fund established for the exclusive use by the Fund and other affiliated funds. The income earned by
Semiannual Report 2014
23
Active Portfolios® Multi-Manager Value Fund
Notes to Financial Statements (continued)
November 30, 2014 (Unaudited)
the Fund from such investments is included as Dividends — affiliated issuers in the Statement of Operations. As an investing fund, the Fund indirectly bears its proportionate share of the expenses of Columbia Short-Term Cash Fund.
Note 7. Shareholder Concentration
Affiliated shareholders of record owned 100.0% of the outstanding shares of the Fund in one or more accounts. Subscription and redemption activity by concentrated accounts may have a significant effect on the operations of the Fund.
Note 8. Line of Credit
The Fund has entered into a revolving credit facility with a syndicate of banks led by JPMorgan Chase Bank N.A. (JPMorgan) whereby the Fund may borrow for the temporary funding of shareholder redemptions or for other temporary or emergency purposes. The credit facility agreement, as amended, which is a collective agreement between the Fund and certain other funds managed by the Investment Manager, severally and not jointly, permits collective borrowings up to $500 million. Interest is charged to each participating fund based on its borrowings at a rate equal to the higher of (i) the overnight federal funds rate plus 1.00% or (ii) the one-month LIBOR rate plus 1.00%. Each borrowing under the credit facility matures no later than 60 days after the date of borrowing. The Fund also pays a commitment fee equal to its pro rata share of the amount of the credit facility at a rate of 0.075% per annum. The commitment fee is included in other expenses in the Statement of Operations.
Effective December 9, 2014, the Fund extended its revolving credit facility with JPMorgan. The credit facility agreement, as amended, permits collective borrowings up to $550 million under the same terms and interest rates as described above.
The Fund had no borrowings during the six months ended November 30, 2014.
Note 9. Subsequent Events
Management has evaluated the events and transactions that have occurred through the date the financial statements were issued. Other than as noted in Note 8 above, there were no items requiring adjustment of the financial statements or additional disclosure.
Note 10. Information Regarding Pending and Settled Legal Proceedings
In December 2005, without admitting or denying the allegations, American Express Financial Corporation (AEFC, which is now known as Ameriprise Financial, Inc. (Ameriprise Financial)) entered into settlement agreements with the Securities and Exchange Commission (SEC) and Minnesota
Department of Commerce (MDOC) related to market timing activities. As a result, AEFC was censured and ordered to cease and desist from committing or causing any violations of certain provisions of the Investment Advisers Act of 1940, the Investment Company Act of 1940, and various Minnesota laws. AEFC agreed to pay disgorgement of $10 million and civil money penalties of $7 million. AEFC also agreed to retain an independent distribution consultant to assist in developing a plan for distribution of all disgorgement and civil penalties ordered by the SEC in accordance with various undertakings detailed at www.sec.gov/litigation/admin/ia-2451.pdf. Ameriprise Financial and its affiliates have cooperated with the SEC and the MDOC in these legal proceedings, and have made regular reports to the Funds' Boards of Trustees.
Ameriprise Financial and certain of its affiliates have historically been involved in a number of legal, arbitration and regulatory proceedings, including routine litigation, class actions, and governmental actions, concerning matters arising in connection with the conduct of their business activities. Ameriprise Financial believes that the Funds are not currently the subject of, and that neither Ameriprise Financial nor any of its affiliates are the subject of, any pending legal, arbitration or regulatory proceedings that are likely to have a material adverse effect on the Funds or the ability of Ameriprise Financial or its affiliates to perform under their contracts with the Funds. Ameriprise Financial is required to make quarterly (10-Q), annual (10-K) and, as necessary, 8-K filings with the Securities and Exchange Commission on legal and regulatory matters that relate to Ameriprise Financial and its affiliates. Copies of these filings may be obtained by accessing the SEC website at www.sec.gov.
There can be no assurance that these matters, or the adverse publicity associated with them, will not result in increased fund redemptions, reduced sale of fund shares or other adverse consequences to the Funds. Further, although we believe proceedings are not likely to have a material adverse effect on the Funds or the ability of Ameriprise Financial or its affiliates to perform under their contracts with the Funds, these proceedings are subject to uncertainties and, as such, we are unable to estimate the possible loss or range of loss that may result. An adverse outcome in one or more of these proceedings could result in adverse judgments, settlements, fines, penalties or other relief that could have a material adverse effect on the consolidated financial condition or results of operations of Ameriprise Financial.
Semiannual Report 2014
24
Active Portfolios® Multi-Manager Value Fund
Important Information About This Report
Each fund mails one shareholder report to each shareholder address. If you would like more than one report, please call shareholder services at 800.345.6611 and additional reports will be sent to you.
The policy of the Board is to vote the proxies of the companies in which each fund holds investments consistent with the procedures as stated in the Statement of Additional Information (SAI). You may obtain a copy of the SAI without charge by calling 800.345.6611; contacting your financial intermediary; visiting columbiamanagement.com; or searching the website of the Securities and Exchange Commission (SEC) at sec.gov. Information regarding how each fund voted proxies relating to portfolio securities is filed with the SEC by August 31 for the most recent 12-month period ending June 30 of that year, and is available without charge by visiting columbiamanagement.com; or searching the website of the SEC at sec.gov.
Each fund files a complete schedule of portfolio holdings with the SEC for the first and third quarters of each fiscal year on Form N-Q. Each fund's Form N-Q is available on the SEC's website at sec.gov and may be reviewed and copied at the SEC's Public Reference Room in Washington, D.C. Information on the operation of the Public Reference Room may be obtained by calling 800.SEC.0330. Each fund's complete schedule of portfolio holdings, as filed on Form N-Q, can also be obtained without charge, upon request, by calling 800.345.6611.
Semiannual Report 2014
25

Active Portfolios® Multi-Manager Value Fund
P.O. Box 8081
Boston, MA 02266-8081
columbiamanagement.com
This information is for use with concurrent or prior delivery of a fund prospectus. Please read and consider the investment objectives, risks, charges and expenses for any fund carefully before investing. For a prospectus and, if available, a summary prospectus, which contains this and other important information about the Fund, go to columbiamanagement.com. The Fund is distributed by Columbia Management Investment Distributors, Inc., member FINRA, and managed by Columbia Management Investment Advisers, LLC.
© 2015 Columbia Management Investment Advisers, LLC. All rights reserved.
SAR116_05_E01_(01/15)
Semiannual Report
November 30, 2014

Columbia Absolute Return Emerging Markets Macro Fund
Not FDIC insured • No bank guarantee • May lose value
About Columbia Management
Backed by more than 100 years of experience, Columbia Management is one of the nation's largest asset managers. At the heart of our success — and, most importantly, that of our investors — are some of the most talented professionals in the industry, brought together by a unique way of working.
It starts with carefully selected, specialized investment teams. While each team brings a diverse and innovative range of skills, all are grounded by a common set of core beliefs. All possess a solid conviction in the power of proprietary, bottom-up research. All look not only at generating returns, but also at the likely consistency of those returns and the risks required to achieve them. And while our culture encourages teams to operate independently and question established thinking, a rigorous investment oversight process ensures that each team stays true to its clearly articulated investment process. At Columbia Management, reaching our performance goals matters, and the way we reach them matters just as much.
Columbia funds are distributed by Columbia Management Investment Distributors, Inc., member FINRA, and managed by Columbia Management Investment Advisers, LLC.
© 2015 Columbia Management Investment Advisers, LLC. All rights reserved.
Not part of the shareholder report
Connect with Columbia Management
Get the market insight you need from our investment experts
Investor insight
Stay informed with economic and market commentary, investment videos, white papers, mutual fund commentary and more at columbiamanagement.com.
 Columbia Management investor
(e-newsletter)
Read our award-winning* shareholder newsletter. Our quarterly newsletter is available online and provides timely and relevant content about economic trends, fund news, service enhancements and changes. Sign up to receive the newsletter electronically at columbiamanagement.com/newsletter.
 Investment videos
Watch and discover what our thought leaders are saying about financial markets and the economy. For an analysis of current events and trends that may affect your investments, visit our online video library at blog.columbiamanagement.com/publications.
 Social media
Columbia Management offers you multiple ways to access our market commentary and investment insights.
> Perspectives blog at columbiamanagement.com
Read timely posts by our investment team, including our chief investment officer, chief economist and portfolio managers.
> Twitter.com/ColumbiaMgmt
Follow us on Twitter for quick, up-to-the-minute comments on market news and more.
> Youtube.com/columbiamanagement
View our commentaries on the economy, markets and current investment opportunities.
> Linkedin.com/company/columbia-management
Connect with us on LinkedIn for updates from our thought leaders.


*Columbia Management investor was awarded top honors in the Mutual Fund Education Alliance STAR Awards competition for excellence in mutual fund marketing and communications. Materials in the competition were evaluated on educational value, message comprehension, effective design and objectives.
Not part of the shareholder report
Subscribe to Columbia Management
Get market insight and fund updates delivered to you
Email subscription center
Visit the Columbia Management email subscription center at columbiamanagement.com/subscribe to register for economic and market commentary, product and service updates, white papers and more.
> Columbia Management investor
Quarterly newsletter featuring the latest macro- and micro-economic trends, investment themes, products, service changes and other items of interest to Columbia Management investors
> Investment Strategy Outlook
Quarterly publication featuring the Columbia Management Asset Allocation Team's perspective on global economic investment conditions and markets
> MarketTrack
Quarterly publication featuring more than 40 charts and graphs that highlight the current state of the economy and markets; includes straightforward insight on current investment opportunities
> White papers
Frequent articles that delve deep into a variety of investment topics
> Mutual fund updates
Quarterly portfolio manager commentary and fund fact sheets available for Columbia funds. (Not all funds have a commentary.)
Register today by visiting columbiamanagement.com/subscribe 

Not part of the shareholder report
Note: Effective January 1, 2015, Christopher O. Petersen will serve as the President of the Columbia Funds, replacing J. Kevin Connaughton. Mr. Petersen has served as a Fund officer since 2007.
Dear Shareholders,
People invest for different reasons, though typically based on a desire for one or more outcomes, e.g., generating an appropriate income stream in retirement, navigating a changing interest rate environment, maximizing after-tax returns, growing assets to achieve financial goals, or easing the impact of volatile markets. Achieving these desired outcomes can be particularly challenging given the unpredictability of complex global markets. To continue to effectively deliver solutions that help clients achieve desired outcomes, an asset manager must have the resources and investment framework to meaningfully embody a global perspective.
With this in mind, I thought it important to highlight excerpts from a piece written by Jeffrey L. Knight, Global Head of Investment Solutions and Asset Allocation, in which he touches on some of these issues emphasizing the importance of maintaining a diversified portfolio with the flexibility to adapt to changing market conditions.
I encourage you to read the article in its entirety. To access the full article and for other insights on current market events and investment opportunities, please visit the Columbia Management blog at columbiamanagement.com/blog.
On behalf of the Funds, I want to acknowledge the contributions of J. Kevin Connaughton and to thank him for his years of trusted, dedicated service. He has worked tirelessly as an advocate for shareholders and a leader of the Columbia Funds. In taking on this new role, I look forward to continuing the work of Mr. Connaughton, helping build on the strong foundation of the Columbia Funds.
Thank you for your confidence. We look forward to continuing to serve your investment needs for many years to come.
Best regards,

Christopher O. Petersen
President, Columbia Funds
Excerpts from:
2015 Outlook: Same song, slightly different arrangement
By Jeffrey L. Knight, Global Head of Investment Solutions and Asset Allocation
Jeffrey L. Knight, CFA, is global head of investment solutions and asset allocation for Columbia Management Investment Advisers, LLC. Mr. Knight leads a team of six portfolio managers responsible for our broad suite of multi-asset strategies including capital allocation, risk allocation, absolute return and total return funds.
What's different in 2015?
As stationary as market conditions have felt lately, circumstances are always evolving. For 2015, while the essential elements of our outlook remain in place, we highlight two important changes in the market environment:
> The relative value of global equities vs. global bonds actually improved during 2014.
> Monetary policy around the globe has become desynchronized, with the U.S. Federal Reserve (the Fed) contemplating rate hikes, while the European Central Bank (ECB) and the Bank of Japan (BOJ) intensify their monetary stimulus programs.
In our view, while equities will most likely continue to dominate, the complex interactions of today's conditions elevate the role of dynamic risk management. We argue that investors will need a cross-asset surveillance methodology to detect tactical threats.
President's Message (continued)
Monetary policies diverge
The Fed has given strong signals that economic growth in the United States has reached self-sustaining momentum and no longer needs unconventional efforts to support the expansion. The withdrawal and suspension of large-scale asset purchases was only the first step in the evolution toward policy normalization. In 2015, we expect to see a change in forward guidance and, most likely, the first interest rate increase in years.
These actions stand in stark contrast with the direction of the monetary policies of other central banks as they double down on efforts to support growth and avoid deflation. The Bank of Japan has announced its intention to increase both qualitative and quantitative easing on an enormous scale, expanding purchases of Japanese government bonds (JGBs), exchange-traded funds and real estate investment trusts. They intend to coordinate this with government pension investment fund purchases by shifting into riskier assets through sales of JGBs.
With evidence of deterioration on both the economic and inflation front, the European Central Bank (ECB) also plans to take bolder actions. These include increased purchases of asset-backed securities and covered bonds in both the primary and secondary market, together with the long-term refinancing operations that will steer the ECB's balance sheet higher by €1 trillion.
The latest to jump on the bandwagon was the People's Bank of China (PBOC), which cut its benchmark interest rate for the first time in over two years to support private sector investment, as targeted liquidity injections have had minimal effect on sinking economic growth.
Investment strategy for 2015
We remain convinced that relative value favors stocks over bonds, even though stocks outperformed in 2014. Therefore, you will hear the same recommendation from us for 2015. Equities remain the most important asset class for generating returns.
Within equities, the currency-based advantage of U.S. stocks is offset somewhat by the valuation advantage from overseas equities, notably in Japan. Indeed, economic growth in Japan and Europe are essential ingredients for equities to continue to perform well. If Japanese and European stocks cannot produce gains, then the global economy will probably be stuck in a near recessionary funk.
Devising a strategy to manage risk and stabilize portfolio values in the event that equities do not perform well remains complicated. Bond yields are low enough that they are not likely to offer powerful diversification benefits. We affirm our recommendation for three additional sources of portfolio stability:
> Non-traditional diversifiers, such as liquid alternatives, alternative beta exposures and absolute return strategies
> Explicit downside hedges, such as put options (with emphasis on managing the related expense)
> Flexibility and a methodology for active risk reduction when appropriate (Our cross-asset methodologies should prove valuable in this regard.)
Our overall stance for investment strategy will likely remain in place until the valuation advantage for equities has been priced away, or until the healing process for the global economy reverses.
Please visit columbiamanagement.com/blog to read the entire article.
Investors should consider the investment objectives, risks, charges and expenses of a mutual fund carefully before investing. For a free prospectus and, if available, a summary prospectus, which contains this and other important information about a fund, visit columbiamanagement.com. The prospectus should be read carefully before investing.
The views expressed are as of December 2014, may change as market or other conditions change, and may differ from views expressed by other Columbia Management Investment Advisers, LLC (CMIA) associates or affiliates. Actual investments or investment decisions made by CMIA and its affiliates, whether for its own account or on behalf of clients, will not necessarily reflect the views expressed. This information is not intended to provide investment advice and does not account for individual investor circumstances. Investment decisions should always be made based on an investor's specific financial needs, objectives, goals, time horizon and risk tolerance. Asset classes described may not be suitable for all investors. Past performance does not guarantee future results, and no forecast should be considered a guarantee either. Since economic and market change frequently, there can be no assurance that the trends described here will continue or that the forecasts are accurate.
Diversification does not assure a profit or protect against loss.
Columbia Funds are distributed by Columbia Management Investment Distributors, Inc., member FINRA, and managed by Columbia Management Investment Advisers, LLC.
© 2015 Columbia Management Investment Advisers, LLC. All rights reserved
Columbia Absolute Return Emerging Markets Macro Fund
Performance Overview | | | 4 | | |
Portfolio Overview | | | 5 | | |
Understanding Your Fund's Expenses | | | 7 | | |
Portfolio of Investments | | | 8 | | |
Statement of Assets and Liabilities | | | 14 | | |
Statement of Operations | | | 16 | | |
Statement of Changes in Net Assets | | | 17 | | |
Financial Highlights | | | 19 | | |
Notes to Financial Statements | | | 27 | | |
Important Information About This Report | | | 39 | | |
Fund Investment Manager
Columbia Management Investment
Advisers, LLC
225 Franklin Street
Boston, MA 02110
Fund Distributor
Columbia Management Investment
Distributors, Inc.
225 Franklin Street
Boston, MA 02110
Fund Transfer Agent
Columbia Management Investment
Services Corp.
P.O. Box 8081
Boston, MA 02266-8081
For more information about any of the funds, please visit columbiamanagement.com or call 800.345.6611. Customer Service Representatives are available to answer your questions Monday through Friday from 8 a.m. to 7 p.m. Eastern time.
The views expressed in this report reflect the current views of the respective parties. These views are not guarantees of future performance and involve certain risks, uncertainties and assumptions that are difficult to predict, so actual outcomes and results may differ significantly from the views expressed. These views are subject to change at any time based upon economic, market or other conditions and the respective parties disclaim any responsibility to update such views. These views may not be relied on as investment advice and, because investment decisions for a Columbia Fund are based on numerous factors, may not be relied on as an indication of trading intent on behalf of any particular Columbia Fund. References to specific securities should not be construed as a recommendation or investment advice.
Columbia Absolute Return Emerging Markets Macro Fund
Performance Overview
(Unaudited)
Performance Summary
> Columbia Absolute Return Emerging Markets Macro Fund (the Fund) Class A shares returned -2.39% excluding sales charges for the six-month period that ended November 30, 2014.
> The Fund underperformed its benchmarks, the Citigroup 3-Month U.S. Treasury Bill Index, which returned 0.01% and the 1 Month USD LIBOR, which returned 0.08% for the same time period.
> On January 28, 2015 the Fund's Board of Trustees approved a Plan of Liquidation and Termination (the Plan) pursuant to which the Fund will be liquidated and terminated. Effective at the open of business on February 2, 2015, the Fund is no longer open to new investors. Under the terms of the Plan, it is anticipated that the Fund will be liquidated on or about March 6, 2015, at which time the Fund's shareholders will receive a liquidation distribution in an amount equal to the net asset value of their Fund shares. Shareholders of the Fund may also redeem their investment in the Fund or exchange their Fund shares for shares of another Columbia Fund at any time prior to the date of liquidation.
Average Annual Total Returns (%) (for period ended November 30, 2014)
| | | Inception | | 6 Months
cumulative | | 1 Year | | Life | |
Class A | | 04/07/11 | | | | | | | |
Excluding sales charges | | | | | -2.39 | | | | 0.04 | | | | 0.87 | | |
Including sales charges | | | | | -7.97 | | | | -5.74 | | | | -0.75 | | |
Class B | | 04/07/11 | | | | | | | |
Excluding sales charges | | | | | -2.79 | | | | -0.65 | | | | 0.11 | | |
Including sales charges | | | | | -7.65 | | | | -5.51 | | | | -0.70 | | |
Class C | | 04/07/11 | | | | | | | |
Excluding sales charges | | | | | -2.81 | | | | -0.76 | | | | 0.07 | | |
Including sales charges | | | | | -3.78 | | | | -1.73 | | | | 0.07 | | |
Class I | | 04/07/11 | | | -2.27 | | | | 0.39 | | | | 1.26 | | |
Class R | | 04/07/11 | | | -2.58 | | | | -0.23 | | | | 0.60 | | |
Class R5* | | 11/08/12 | | | -2.28 | | | | 0.45 | | | | 1.11 | | |
Class W | | 04/07/11 | | | -2.48 | | | | 0.03 | | | | 0.83 | | |
Class Z | | 04/07/11 | | | -2.26 | | | | 0.29 | | | | 1.11 | | |
Citigroup 3-Month U.S. Treasury Bill Index | | | | | 0.01 | | | | 0.04 | | | | 0.05 | | |
| 1 Month USD LIBOR | | | | | 0.08 | | | | 0.16 | | | | 0.20 | | |
Returns for Class A are shown with and without the maximum initial sales charge of 5.75%. Returns for Class B are shown with and without the applicable contingent deferred sales charge (CDSC) of 5.00% in the first year, declining to 1.00% in the sixth year and eliminated thereafter. Returns for Class C are shown with and without the 1.00% CDSC for the first year only. The Fund's other classes are not subject to sales charges and have limited eligibility. Please see the Fund's prospectus for details. Performance for different share classes will vary based on differences in sales charges and fees associated with each class. All results shown assume reinvestment of distributions during the period. Returns do not reflect the deduction of taxes that a shareholder may pay on Fund distributions or on the redemption of Fund shares. Performance results reflect the effect of any fee waivers or reimbursements of Fund expenses by Columbia Management Investment Advisers, LLC and/or any of its affiliates. Absent these fee waivers or expense reimbursement arrangements, performance results would have been lower.
The performance information shown represents past performance and is not a guarantee of future results. The investment return and principal value of your investment will fluctuate so that your shares, when redeemed, may be worth more or less than their original cost. Current performance may be lower or higher than the performance information shown. You may obtain performance information current to the most recent month-end by contacting your financial intermediary, visiting columbiamanagement.com or calling 800.345.6611.
*The returns shown for periods prior to the share class inception date (including returns for the Life of the Fund, if shown, which are since Fund inception) include the returns of the Fund's oldest share class. Since the Fund launched more than one share class at its inception, Class A shares were used. These returns are adjusted to reflect any higher class-related operating expenses of the newer share classes, as applicable. Please visit columbiamanagement.com/investment-products/mutual-funds/appended-performance for more information.
The Citigroup 3-Month U.S. Treasury Bill Index, an unmanaged index, is representative of the performance of three-month Treasury bills.
The 1 Month USD LIBOR is the average interest rate at which a selection of banks in London lend U.S. dollar funds from one another with a maturity of one month. The LIBOR interest rates are used by banks as the base rate in setting the level of their savings, mortgage and loan interest rates.
Indices are not available for investment, are not professionally managed and do not reflect sales charges, fees, brokerage commissions, taxes or other expenses of investing. Securities in the Fund may not match those in an index.
Semiannual Report 2014
4
Columbia Absolute Return Emerging Markets Macro Fund
Portfolio Overview
(Unaudited)
Sector Allocation (%)
(at November 30, 2014) | |
Sovereign | | | 47.1 | | |
| USD denominated | | | 26.5 | | |
non-USD denominated | | | 20.6 | | |
Quasi Sovereign | | | 23.5 | | |
Short-Term Investments Segregated in Connection with Open
Derivatives Contracts(a) | | | 29.4 | | |
Total | | | 100.0 | | |
Percentages indicated are based upon total investments. The Fund's portfolio composition is subject to change.
(a) Includes investments in Money Market Funds (amounting to $21.2 million) which have been segregated to cover obligations related to the Fund's investment in derivatives which provides exposure to multiple markets. For a description of the Fund's investments in derivatives, see Investments in Derivatives following the Portfolio of Investments, and Note 2 to the financial statements.
Foreign Debt Percentages by Country (%)
at November 30, 2014 | |
China | | | 15.3 | | |
Brazil | | | 10.3 | | |
Russian Federation | | | 6.8 | | |
Peru | | | 6.1 | | |
Singapore | | | 5.5 | | |
Georgia | | | 4.9 | | |
Mexico | | | 4.7 | | |
Panama | | | 4.3 | | |
Dominican Republic | | | 4.0 | | |
Chile | | | 3.5 | | |
Venezuela | | | 3.5 | | |
Ivory Coast | | | 3.4 | | |
Zambia | | | 3.4 | | |
Hungary | | | 3.0 | | |
Indonesia | | | 2.5 | | |
Qatar | | | 2.0 | | |
Croatia | | | 1.7 | | |
Trinidad and Tobago | | | 1.7 | | |
Romania | | | 1.6 | | |
South Korea | | | 1.5 | | |
Guatemala | | | 1.5 | | |
Morocco | | | 1.4 | | |
United Arab Emirates | | | 1.4 | | |
Colombia | | | 1.2 | | |
Greece | | | 0.0 | (a) | |
Turkey | | | (3.7 | ) | |
Percentages indicated are based upon Fund net assets and include market value of credit default swaps valued at notional but do not include investments in forward foreign currency contracts. The Fund's portfolio composition is subject to change.
Foreign debt exposure is defined as exposure to foreign debt, through bond or derivative investments, issued in a currency different from the currency that the sovereign entity can produce (print) itself.
(a) Rounds to zero.
Portfolio Management
Henry Stipp, PhD
Jim Carlen, CFA
Semiannual Report 2014
5
Columbia Absolute Return Emerging Markets Macro Fund
Portfolio Overview (continued)
(Unaudited)
Quality Breakdown (%)
(at November 30, 2014) | |
AAA rating | | | 7.9 | | |
AA rating | | | 10.2 | | |
A rating | | | 8.8 | | |
BBB rating | | | 36.2 | | |
BB rating | | | 16.2 | | |
B rating | | | 15.7 | | |
CCC rating | | | 5.0 | | |
Total | | | 100.0 | | |
Percentages indicated are based upon total fixed income securities (excluding Money Market Funds).
Bond ratings apply to the underlying holdings of the Fund and not the Fund itself and are divided into categories ranging from highest to lowest credit quality, determined by using the middle rating of Moody's, S&P and Fitch, after dropping the highest and lowest available ratings. When ratings are available from only two rating agencies, the lower rating is used. When a rating is available from only one rating agency, that rating is used. When a bond is not rated by any rating agency, it is designated as "Not rated". Credit quality ratings assigned by a rating agency are subjective opinions, not statements of fact, and are subject to change, including daily. The ratings assigned by credit rating agencies are but one of the considerations that the Investment Manager and/or Fund's subadviser incorporates into its credit analysis process, along with such other country-specific factors as the direction and stance of fiscal policy, balance of payment trends and commodity prices, the level and structure of public debt as well as political stability and commitment to strong macroeconomic policies.
Notional Market Value (in USD) of
Forward Foreign Currency Contracts Exposure as a % of Net Assets
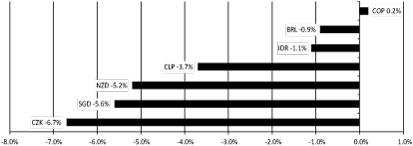
BRL Brazilian Real
CLP Chilean Peso
COP Colombian Peso
CZK Czech Koruna
IDR Indonesian Rupiah
NZD New Zealand Dollar
SGD Singapore Dollar
Semiannual Report 2014
6
Columbia Absolute Return Emerging Markets Macro Fund
Understanding Your Fund's Expenses
(Unaudited)
As an investor, you incur two types of costs. There are transaction costs, which generally include sales charges on purchases and may include redemption fees. There are also ongoing costs, which generally include management fees, distribution and/or service fees, and other fund expenses. The following information is intended to help you understand your ongoing costs (in dollars) of investing in the Fund and to help you compare these costs with the ongoing costs of investing in other mutual funds.
Analyzing Your Fund's Expenses
To illustrate these ongoing costs, we have provided examples and calculated the expenses paid by investors in each share class of the Fund during the period. The actual and hypothetical information in the table is based on an initial investment of $1,000 at the beginning of the period indicated and held for the entire period. Expense information is calculated two ways and each method provides you with different information. The amount listed in the "Actual" column is calculated using the Fund's actual operating expenses and total return for the period. You may use the Actual information, together with the amount invested, to estimate the expenses that you paid over the period. Simply divide your account value by $1,000 (for example, an $8,600 account value divided by $1,000 = 8.6), then multiply the results by the expenses paid during the period under the "Actual" column. The amount listed in the "Hypothetical" column assumes a 5% annual rate of return before expenses (which is not the Fund's actual return) and then applies the Fund's actual expense ratio for the period to the hypothetical return. You should not use the hypothetical account values and expenses to estimate either your actual account balance at the end of the period or the expenses you paid during the period. See "Compare With Other Funds" below for details on how to use the hypothetical data.
Compare With Other Funds
Since all mutual funds are required to include the same hypothetical calculations about expenses in shareholder reports, you can use this information to compare the ongoing cost of investing in the Fund with other funds. To do so, compare the hypothetical example with the 5% hypothetical examples that appear in the shareholder reports of other funds. As you compare hypothetical examples of other funds, it is important to note that hypothetical examples are meant to highlight the ongoing costs of investing in a fund only and do not reflect any transaction costs, such as sales charges, or redemption or exchange fees. Therefore, the hypothetical calculations are useful in comparing ongoing costs only, and will not help you determine the relative total costs of owning different funds. If transaction costs were included in these calculations, your costs would be higher.
June 1, 2014 – November 30, 2014
| | | Account Value at the Beginning
of the Period ($) | | Account Value at the End of the
Period ($) | | Expenses Paid During the
Period ($) | | Fund's Annualized
Expense Ratio (%) | |
| | | Actual | | Hypothetical | | Actual | | Hypothetical | | Actual | | Hypothetical | | Actual | |
Class A | | | 1,000.00 | | | | 1,000.00 | | | | 976.10 | | | | 1,017.10 | | | | 7.73 | | | | 7.90 | | | | 1.57 | | |
Class B | | | 1,000.00 | | | | 1,000.00 | | | | 972.10 | | | | 1,013.31 | | | | 11.46 | | | | 11.70 | | | | 2.33 | | |
Class C | | | 1,000.00 | | | | 1,000.00 | | | | 971.90 | | | | 1,013.31 | | | | 11.45 | | | | 11.70 | | | | 2.33 | | |
Class I | | | 1,000.00 | | | | 1,000.00 | | | | 977.30 | | | | 1,019.30 | | | | 5.57 | | | | 5.69 | | | | 1.13 | | |
Class R | | | 1,000.00 | | | | 1,000.00 | | | | 974.20 | | | | 1,015.81 | | | | 9.01 | | | | 9.20 | | | | 1.83 | | |
Class R5 | | | 1,000.00 | | | | 1,000.00 | | | | 977.20 | | | | 1,019.05 | | | | 5.82 | | | | 5.94 | | | | 1.18 | | |
Class W | | | 1,000.00 | | | | 1,000.00 | | | | 975.20 | | | | 1,017.25 | | | | 7.58 | | | | 7.75 | | | | 1.54 | | |
Class Z | | | 1,000.00 | | | | 1,000.00 | | | | 977.40 | | | | 1,018.30 | | | | 6.56 | | | | 6.69 | | | | 1.33 | | |
Expenses paid during the period are equal to the annualized expense ratio for each class as indicated above, multiplied by the average account value over the period and then multiplied by the number of days in the Fund's most recent fiscal half year and divided by 365.
Expenses do not include fees and expenses incurred indirectly by the Fund from its investment in underlying funds, including affiliated and non-affiliated pooled investment vehicles, such as mutual funds and exchange-traded funds.
Had Columbia Management Investment Advisers, LLC and/or certain of its affiliates not waived/reimbursed certain fees and expenses, account value at the end of the period would have been reduced.
Columbia Management Investment Advisers, LLC and/or certain of its affiliates have contractually agreed to waive certain fees and/or to reimburse certain expenses until September 30, 2015, unless sooner terminated at the sole discretion of the Fund's Board, such that net expenses (excluding fees and expenses of acquired funds) will not exceed 1.68% for Class A, 2.43% for Class B, 2.43% for Class C, 1.23% for Class I, 1.93% for Class R, 1.28% for Class R5, 1.68% for Class W and 1.43% for Class Z. Any amounts waived will not be reimbursed by the Fund. This change was effective October 1, 2014. If this change had been in place for the entire six month period ended November 30, 2014, the actual expenses paid would have been $8.28 for Class A, $11.95 for Class B, $11.95 for Class C, $6.06 for Class I, $9.50 for Class R, $6.31 for Class R5, $8.27 for Class W and $7.05 for Class Z; and the hypothetical expenses paid would have been $8.45 for Class A, $12.19 for Class B, $12.19 for Class C, $6.19 for Class I, $9.70 for Class R, $6.44 for Class R5, $8.45 for Class W and $7.19 for Class Z.
Semiannual Report 2014
7
Columbia Absolute Return Emerging Markets Macro Fund
Portfolio of Investments
November 30, 2014 (Unaudited)
(Percentages represent value of investments compared to net assets)
Inflation-Indexed Bonds(a) 6.6%
Issuer | | Coupon
Rate | | Principal
Amount ($) | | Value ($) | |
Brazil 2.5% | |
Brazil Notas do Tesouro Nacional
05/15/45 | | | 6.000 | % | | BRL | | | | | 4,478,810 | | | | 1,800,669 | | |
Mexico 4.1% | |
Mexican Udibonos
11/15/40 | | | 4.000 | % | | MXN | | | | | 38,695,014 | | | | 3,047,015 | | |
Total Inflation-Indexed Bonds
(Cost: $5,471,487) | | | | | | | | | 4,847,684 | | |
Foreign Government Obligations(a)(b) 62.5%
Brazil 1.7% | |
Brazilian Government International Bond
Senior Unsecured
01/05/23 | | | 2.625 | % | | | | | | | 1,350,000 | | | | 1,246,725 | | |
Chile 3.5% | |
Chile Government International Bond
Senior Unsecured
08/05/20 | | | 5.500 | % | | CLP | | | | | 1,500,000,000 | | | | 2,605,496 | | |
Colombia 6.9% | |
Colombia Government International Bond
Senior Unsecured
07/12/21 | | | 4.375 | % | | | | | | | 1,700,000 | | | | 1,813,050 | | |
03/21/23 | | | 4.375 | % | | COP | | | | | 2,650,000,000 | | | | 1,088,991 | | |
06/28/27 | | | 9.850 | % | | COP | | | | | 1,840,000,000 | | | | 1,084,406 | | |
Empresa de Energia de Bogota SA ESP
Senior Unsecured(c)
11/10/21 | | | 6.125 | % | | | | | | | 1,000,000 | | | | 1,071,808 | | |
Total | | | | | | | | | 5,058,255 | | |
Croatia 1.7% | |
Croatia Government International Bond
Senior Unsecured
11/05/19 | | | 6.750 | % | | | | | | | 1,145,000 | | | | 1,278,106 | | |
Dominican Republic 4.0% | |
Dominican Republic International Bond
Senior Unsecured(c)
05/06/21 | | | 7.500 | % | | | | | | | 2,600,000 | | | | 2,930,076 | | |
Georgia 4.9% | |
Georgian Railway JSC
Senior Unsecured
07/11/22 | | | 7.750 | % | | | | | | | 3,300,000 | | | | 3,646,500 | | |
Foreign Government Obligations(a)(b) (continued)
Issuer | | Coupon
Rate | | Principal
Amount ($) | | Value ($) | |
Greece —% | |
Hellenic Republic Government Bond
Senior Unsecured(d)
10/15/42 | | | 0.000 | % | | EUR | | | | | 1,417,500 | | | | 13,501 | | |
Guatemala 1.5% | |
Guatemala Government Bond
Senior Unsecured(c)
06/06/22 | | | 5.750 | % | | | | | | | 1,000,000 | | | | 1,097,500 | | |
Hungary 3.0% | |
MFB Hungarian Development Bank
10/21/20 | | | 6.250 | % | | | | | | | 2,000,000 | | | | 2,227,500 | | |
Indonesia 2.5% | |
Indonesia Treasury Bond
Senior Unsecured
09/15/16 | | | 7.375 | % | | IDR | | | | | 9,600,000,000 | | | | 788,138 | | |
PT Perusahaan Listrik Negara
Senior Unsecured(c)
11/22/21 | | | 5.500 | % | | | | | | | 1,000,000 | | | | 1,074,360 | | |
Total | | | | | | | | | 1,862,498 | | |
Ivory Coast 3.4% | |
Ivory Coast Government International Bond(c)
Senior Unsecured
07/23/24 | | | 5.375 | % | | | | | | | 1,310,000 | | | | 1,269,063 | | |
Ivory Coast Government International Bond(d)
Senior Unsecured
12/31/32 | | | 5.750 | % | | | | | | | 1,310,000 | | | | 1,270,962 | | |
Total | | | | | | | | | 2,540,025 | | |
Mexico 0.6% | |
Mexican Bonos
12/15/16 | | | 7.250 | % | | MXN | | | | | 5,671,000 | | | | 436,133 | | |
Morocco 1.4% | |
Morocco Government International Bond
Senior Unsecured(c)
12/11/22 | | | 4.250 | % | | | | | | | 1,000,000 | | | | 1,025,000 | | |
Qatar 2.0% | |
Qatar Government International Bond
Senior Unsecured
04/09/19 | | | 6.550 | % | | | | | | | 1,250,000 | | | | 1,490,625 | | |
Romania 1.6% | |
Romanian Government International Bond
Senior Unsecured(c)
02/07/22 | | | 6.750 | % | | | | | 1,000,000 | | | | 1,202,500 | | |
The accompanying Notes to Financial Statements are an integral part of this statement.
Semiannual Report 2014
8
Columbia Absolute Return Emerging Markets Macro Fund
Portfolio of Investments (continued)
November 30, 2014 (Unaudited)
Foreign Government Obligations(a)(b) (continued)
Issuer | | Coupon
Rate | | Principal
Amount ($) | | Value ($) | |
Russian Federation 6.8% | |
Russian Foreign Bond — Eurobond
Senior Unsecured(c)
04/04/17 | | | 3.250 | % | | | | | | | 2,000,000 | | | | 1,992,500 | | |
Sberbank of Russia Via SB Capital SA
Senior Unsecured(c)
02/07/17 | | | 4.950 | % | | | | | | | 3,000,000 | | | | 2,985,000 | | |
Total | | | | | | | | | 4,977,500 | | |
Singapore 5.5% | |
Singapore Government Bond
Senior Unsecured
03/01/27 | | | 3.500 | % | | SGD | | | | | 4,700,000 | | | | 4,028,078 | | |
South Korea 1.5% | |
Export-Import Bank of Korea
Senior Unsecured
11/20/15 | | | 1.250 | % | | | | | | | 1,100,000 | | | | 1,105,400 | | |
Trinidad and Tobago 1.7% | |
Petroleum Co. of Trinidad & Tobago Ltd.
Senior Unsecured(c)
08/14/19 | | | 9.750 | % | | | | | | | 1,000,000 | | | | 1,236,000 | | |
United Arab Emirates 1.4% | |
Abu Dhabi National Energy Co.
Senior Unsecured(c)
01/12/23 | | | 3.625 | % | | | | | 1,000,000 | | | | 1,007,500 | | |
Foreign Government Obligations(a)(b) (continued)
Issuer | | Coupon
Rate | | Principal
Amount ($) | | Value ($) | |
Venezuela 3.5% | |
Petroleos de Venezuela SA
11/02/17 | | | 8.500 | % | | | | | | | 3,660,000 | | | | 2,562,000 | | |
Zambia 3.4% | |
Zambia Government International Bond
Senior Unsecured
04/14/24 | | | 8.500 | % | | | | | | | 2,200,000 | | | | 2,480,500 | | |
Total Foreign Government Obligations
(Cost: $47,790,350) | | | | | | | | | 46,057,418 | | |
Money Market Funds 28.8%
| | | Shares | | Value ($) | |
Columbia Short-Term Cash Fund,
0.104%(e)(f) | | | 21,170,582 | | | | 21,170,582 | | |
Total Money Market Funds
(Cost: $21,170,582) | | | | | 21,170,582 | | |
Total Investments
(Cost: $74,432,419) | | | | | 72,075,684 | | |
Other Assets & Liabilities, Net | | | | | 1,536,072 | | |
Net Assets | | | | | 73,611,756 | | |
Investments in Derivatives
Forward Foreign Currency Exchange Contracts Open at November 30, 2014
Counterparty | | Exchange Date | | Currency to
be Delivered | | Currency to
be Received | | Unrealized
Appreciation ($) | | Unrealized
Depreciation ($) | |
J.P. Morgan Securities, Inc.
| | 01/09/15
| | | 5,405,000
SGD | | | | 4,141,115
USD | | | | —
| | | | (2,067
| ) | |
Morgan Stanley
| | 01/13/15
| | | 109,000,000
CZK | | | | 4,941,473
USD | | | | 34,196
| | | | —
| | |
Standard Chartered Bank
| | 12/22/14
| | | 1,600,000,000
CLP | | | | 2,696,553
USD | | | | 72,371
| | | | —
| | |
Standard Chartered Bank
| | 12/22/14
| | | 119,980
USD | | | | 255,000,000
COP | | | | —
| | | | (5,237
| ) | |
Standard Chartered Bank
| | 01/14/15
| | | 9,715,000,000
IDR | | | | 798,274
USD | | | | 10,679
| | | | —
| | |
State Street Bank
| | 12/08/14
| | | 1,590,000
BRL | | | | 641,828
USD | | | | 25,095
| | | | —
| | |
UBS Securities | | 01/13/15 | | | 4,800,000
NZD | | | | 3,791,136
USD | | | | 42,125
| | | | —
| | |
Total | | | | | | | | | 184,466 | | | | (7,304 | ) | |
The accompanying Notes to Financial Statements are an integral part of this statement.
Semiannual Report 2014
9
Columbia Absolute Return Emerging Markets Macro Fund
Portfolio of Investments (continued)
November 30, 2014 (Unaudited)
Futures Contracts Outstanding at November 30, 2014
At November 30, 2014, cash totaling $216,300 was pledged as collateral to cover initial margin requirements on open futures contracts.
Short Futures Contracts Outstanding
Contract Description | | Number of
Contracts | | Trading
Currency | | Notional
Market
Value ($) | | Expiration
Date | | Unrealized
Appreciation ($) | | Unrealized
Depreciation ($) | |
US 5YR NOTE | | | (79 | ) | | USD | | | | | (9,439,883 | ) | | 03/2015 | | | — | | | | (46,911 | ) | |
US 10YR NOTE | | | (121 | ) | | USD | | | | | (15,372,672 | ) | | 03/2015 | | | — | | | | (119,131 | ) | |
Total | | | | | | | | | | | — | | | | (166,042 | ) | |
Credit Default Swap Contracts Outstanding at November 30, 2014
Buy Protection
Counterparty | | Reference
Entity | | Expiration
Date | | Pay Fixed
Rate (%) | | Notional
Amount ($) | | Market
Value ($) | | Unamortized
Premium
(Paid)
Received ($) | | Periodic
Payments
Receivable
(Payable) ($) | | Unrealized
Appreciation ($) | | Unrealized
Depreciation ($) | |
Citigroup Global
Markets Limited | | Republic of
Turkey | | 12/20/15
| | | 1.000
| | | | 2,700,000
| | | | (12,926
| ) | | | (33,592
| ) | | | (5,100
| ) | | | —
| | | | (51,618
| ) | |
Goldman Sachs
International | | Republic of
Colombia | | 09/20/19
| | | 1.000
| | | | 6,400,000
| | | | (17,540
| ) | | | 61,780
| | | | (12,089
| ) | | | 32,151
| | | | —
| | |
Total | | | | | | | | | | | | | | | | | 32,151 | | | | (51,618 | ) | |
Credit Default Swap Contracts Outstanding at November 30, 2014
Sell Protection
Counterparty | | Reference
Entity | | Expiration
Date | | Receive
Fixed
Rate (%) | | Implied
Credit
Spread
(%)** | | Notional
Amount ($) | | Market
Value ($) | | Unamortized
Premium
(Paid)
Received ($) | | Periodic
Payments
Receivable
(Payable) ($) | | Unrealized
Appreciation ($) | | Unrealized
Depreciation ($) | |
Barclays
| | Federative
Republic of
Brazil | | 03/20/18
| | | 1.000
| | | | 1.064
| | | | 2,260,000
| | | | (4,733
| ) | | | 14,301
| | | | 4,269
| | | | 13,837
| | | | —
| | |
Citibank
| | Federative
Republic of
Brazil | | 12/20/17
| | | 1.000
| | | | 0.989
| | | | 2,200,000
| | | | 735
| | | | 7,753
| | | | 4,156
| | | | 12,644
| | | | —
| | |
Citibank
| | People's
Republic of
China | | 12/20/16
| | | 1.000
| | | | 0.313
| | | | 1,500,000
| | | | 21,331
| | | | 12,309
| | | | 2,833
| | | | 36,473
| | | | —
| | |
Citibank
| | Republic of
Colombia | | 12/20/17
| | | 1.000
| | | | 0.620
| | | | 2,200,000
| | | | 25,419
| | | | 1,944
| | | | 4,156
| | | | 31,519
| | | | —
| | |
Citibank
| | Republic of
Panama | | 12/20/17
| | | 1.000
| | | | 0.570
| | | | 3,200,000
| | | | 41,898
| | | | 1,886
| | | | 6,044
| | | | 49,828
| | | | —
| | |
Citibank
| | Republic of
Peru | | 09/20/16
| | | 1.000
| | | | 0.459
| | | | 1,500,000
| | | | 14,797
| | | | 15,284
| | | | 2,833
| | | | 32,914
| | | | —
| | |
Citibank
| | Republic of
Peru | | 09/20/16
| | | 1.000
| | | | 0.459
| | | | 3,000,000
| | | | 29,594
| | | | 12,905
| | | | 5,667
| | | | 48,166
| | | | —
| | |
Citibank
New York
| | People's
Republic of
China | | 12/20/16
| | | 1.000
| | | | 0.313
| | | | 9,700,000
| | | | 137,940
| | | | 108,968
| | | | 18,322
| | | | 265,230
| | | | —
| | |
Total | | | | | | | | | | | | | | | | | | | 490,611 | | | | — | | |
**Implied credit spreads, represented in absolute terms, utilized in determining the market value of credit default swap agreements on corporate or sovereign issues as of period end serve as an indicator of the current status of the payment/performance risk and
The accompanying Notes to Financial Statements are an integral part of this statement.
Semiannual Report 2014
10
Columbia Absolute Return Emerging Markets Macro Fund
Portfolio of Investments (continued)
November 30, 2014 (Unaudited)
Credit Default Swap Contracts Outstanding at November 30, 2014
Sell Protection (continued)
represent the likelihood or risk of default for the credit derivative. The implied credit spread of a particular referenced entity reflects the cost of buying/selling protection and may include upfront payments required to be made to enter into the agreement. Wider credit spreads represent adeterioration of the referenced entity's credit soundness and a greater likelihood or risk of default or other credit event occurring as defined under the terms of the agreement.
Notes to Portfolio of Investments
(a) Principal amounts are denominated in United States Dollars unless otherwise noted.
(b) Principal and interest may not be guaranteed by the government.
(c) Security exempt from registration pursuant to Rule 144A under the Securities Act of 1933. This security may be resold in transactions exempt from registration, normally to qualified institutional buyers. At November 30, 2014, the value of these securities amounted to $16,891,307 or 22.95% of net assets.
(d) Variable rate security.
(e) The rate shown is the seven-day current annualized yield at November 30, 2014.
(f) As defined in the Investment Company Act of 1940, an affiliated company is one in which the Fund owns 5% or more of the company's outstanding voting securities, or a company which is under common ownership or control with the Fund. Holdings and transactions in these affiliated companies during the period ended November 30, 2014, are as follows:
Issuer | | Beginning
Cost ($) | | Purchase
Cost ($) | | Proceeds
From Sales ($) | | Ending
Cost ($) | | Dividends —
Affiliated
Issuers ($) | | Value ($) | |
Columbia Short-Term Cash Fund | | | 49,891,427 | | | | 45,779,290 | | | | (74,500,135 | ) | | | 21,170,582 | | | | 25,124 | | | | 21,170,582 | | |
Currency Legend
BRL Brazilian Real
CLP Chilean Peso
COP Colombian Peso
CZK Czech Koruna
EUR Euro
IDR Indonesian Rupiah
MXN Mexican Peso
NZD New Zealand Dollar
SGD Singapore Dollar
USD US Dollar
Fair Value Measurements
Generally accepted accounting principles (GAAP) require disclosure regarding the inputs and valuation techniques used to measure fair value and any changes in valuation inputs or techniques. In addition, investments shall be disclosed by major category.
The Fund categorizes its fair value measurements according to a three-level hierarchy that maximizes the use of observable inputs and minimizes the use of unobservable inputs by prioritizing that the most observable input be used when available. Observable inputs are those that market participants would use in pricing an investment based on market data obtained from sources independent of the reporting entity. Unobservable inputs are those that reflect the Fund's assumptions about the information market participants would use in pricing an investment. An investment's level within the fair value hierarchy is based on the lowest level of any input that is deemed significant to the asset or liability's fair value measurement. The input levels are not necessarily an indication of the risk or liquidity associated with investments at that level. For example, certain U.S. government securities are generally high quality and liquid, however, they are reflected as Level 2 because the inputs used to determine fair value may not always be quoted prices in an active market.
The accompanying Notes to Financial Statements are an integral part of this statement.
Semiannual Report 2014
11
Columbia Absolute Return Emerging Markets Macro Fund
Portfolio of Investments (continued)
November 30, 2014 (Unaudited)
Fair Value Measurements (continued)
Fair value inputs are summarized in the three broad levels listed below:
> Level 1 — Valuations based on quoted prices for investments in active markets that the Fund has the ability to access at the measurement date (including NAV for open-end mutual funds). Valuation adjustments are not applied to Level 1 investments.
> Level 2 — Valuations based on other significant observable inputs (including quoted prices for similar securities, interest rates, prepayment speeds, credit risks, etc.).
> Level 3 — Valuations based on significant unobservable inputs (including the Fund's own assumptions and judgment in determining the fair value of investments).
Inputs that are used in determining fair value of an investment may include price information, credit data, volatility statistics, and other factors. These inputs can be either observable or unobservable. The availability of observable inputs can vary between investments, and is affected by various factors such as the type of investment, and the volume and level of activity for that investment or similar investments in the marketplace. The inputs will be considered by the Investment Manager, along with any other relevant factors in the calculation of an investment's fair value. The Fund uses prices and inputs that are current as of the measurement date, which may include periods of market dislocations. During these periods, the availability of prices and inputs may be reduced for many investments. This condition could cause an investment to be reclassified between the various levels within the hierarchy.
Investments falling into the Level 3 category are primarily supported by quoted prices from brokers and dealers participating in the market for those investments. However, these may be classified as Level 3 investments due to lack of market transparency and corroboration to support these quoted prices. Additionally, valuation models may be used as the pricing source for any remaining investments classified as Level 3. These models may rely on one or more significant unobservable inputs and/or significant assumptions by the Investment Manager. Inputs used in valuations may include, but are not limited to, financial statement analysis, capital account balances, discount rates and estimated cash flows, and comparable company data.
Under the direction of the Fund's Board of Trustees (the Board), the Investment Manager's Valuation Committee (the Committee) is responsible for overseeing the valuation procedures approved by the Board. The Committee consists of voting and non-voting members from various groups within the Investment Manager's organization, including operations and accounting, trading and investments, compliance, risk management and legal.
The Committee meets at least monthly to review and approve valuation matters, which may include a description of specific valuation determinations, data regarding pricing information received from approved pricing vendors and brokers and the results of Board-approved valuation control policies and procedures (the Policies). The Policies address, among other things, instances when market quotations are or are not readily available, including recommendations of third party pricing vendors and a determination of appropriate pricing methodologies; events that require specific valuation determinations and assessment of fair value techniques; securities with a potential for stale pricing, including those that are illiquid, restricted, or in default; and the effectiveness of third party pricing vendors, including periodic reviews of vendors. The Committee meets more frequently, as needed, to discuss additional valuation matters, which may include the need to review back-testing results, review time-sensitive information or approve related valuation actions. The Committee reports to the Board, with members of the Committee meeting with the Board at each of its regularly scheduled meetings to discuss valuation matters and actions during the period, similar to those described earlier.
For investments categorized as Level 3, the Committee monitors information similar to that described above, which may include: (i) data specific to the issuer or comparable issuers, (ii) general market or specific sector news and (iii) quoted prices and specific or similar security transactions. The Committee considers this data and any changes from prior periods in order to assess the reasonableness of observable and unobservable inputs, any assumptions or internal models used to value those securities and changes in fair value. This data is also used to corroborate, when available, information received from approved pricing vendors and brokers. Various factors impact the frequency of monitoring this information (which may occur as often as daily). However, the Committee may determine that changes to inputs, assumptions and models are not required as a result of the monitoring procedures performed.
The accompanying Notes to Financial Statements are an integral part of this statement.
Semiannual Report 2014
12
Columbia Absolute Return Emerging Markets Macro Fund
Portfolio of Investments (continued)
November 30, 2014 (Unaudited)
Fair Value Measurements (continued)
The following table is a summary of the inputs used to value the Fund's investments at November 30, 2014:
Description | | Level 1
Quoted Prices in Active
Markets for Identical
Assets ($) | | Level 2
Other Significant
Observable Inputs ($) | | Level 3
Significant
Unobservable Inputs ($) | | Total ($) | |
Bonds | |
Inflation-Indexed Bonds | | | — | | | | 4,847,684 | | | | — | | | | 4,847,684 | | |
Foreign Government Obligations | | | — | | | | 46,057,418 | | | | — | | | | 46,057,418 | | |
Total Bonds | | | — | | | | 50,905,102 | | | | — | | | | 50,905,102 | | |
Mutual Funds | |
Money Market Funds | | | 21,170,582 | | | | — | | | | — | | | | 21,170,582 | | |
Total Mutual Funds | | | 21,170,582 | | | | — | | | | — | | | | 21,170,582 | | |
Investments in Securities | | | 21,170,582 | | | | 50,905,102 | | | | — | | | | 72,075,684 | | |
Derivatives | |
Assets | |
Forward Foreign Currency
Exchange Contracts | | | — | | | | 184,466 | | | | — | | | | 184,466 | | |
Swap Contracts | | | — | | | | 522,762 | | | | — | | | | 522,762 | | |
Liabilities | |
Forward Foreign Currency
Exchange Contracts | | | — | | | | (7,304 | ) | | | — | | | | (7,304 | ) | |
Futures Contracts | | | (166,042 | ) | | | — | | | | — | | | | (166,042 | ) | |
Swap Contracts | | | — | | | | (51,618 | ) | | | — | | | | (51,618 | ) | |
Total | | | 21,004,540 | | | | 51,553,408 | | | | — | | | | 72,557,948 | | |
See the Portfolio of Investments for all investment classifications not indicated in the table.
The Fund's assets assigned to the Level 2 input category are generally valued using the market approach, in which a security's value is determined through reference to prices and information from market transactions for similar or identical assets.
There were no transfers of financial assets between levels during the period.
Derivative instruments are valued at unrealized appreciation (depreciation).
The accompanying Notes to Financial Statements are an integral part of this statement.
Semiannual Report 2014
13
Columbia Absolute Return Emerging Markets Macro Fund
Statement of Assets and Liabilities
November 30, 2014 (Unaudited)
Assets | |
Investments, at value | |
Unaffiliated issuers (identified cost $53,261,837) | | $ | 50,905,102 | | |
Affiliated issuers (identified cost $21,170,582) | | | 21,170,582 | | |
Total investments (identified cost $74,432,419) | | | 72,075,684 | | |
Foreign currency (identified cost $195,589) | | | 189,369 | | |
Margin deposits | | | 216,300 | | |
Unrealized appreciation on forward foreign currency exchange contracts | | | 184,466 | | |
Unrealized appreciation on swap contracts | | | 522,762 | | |
Premiums paid on outstanding swap contracts | | | 33,592 | | |
Receivable for: | |
Investments sold | | | 106,776 | | |
Capital shares sold | | | 15,113 | | |
Dividends | | | 1,865 | | |
Interest | | | 659,257 | | |
Reclaims | | | 48,308 | | |
Expense reimbursement due from Investment Manager | | | 373 | | |
Prepaid expenses | | | 2,357 | | |
Total assets | | | 74,056,222 | | |
Liabilities | |
Unrealized depreciation on forward foreign currency exchange contracts | | | 7,304 | | |
Unrealized depreciation on swap contracts | | | 51,618 | | |
Premiums received on outstanding swap contracts | | | 237,130 | | |
Payable for: | |
Capital shares purchased | | | 2,618 | | |
Variation margin | | | 53,860 | | |
Investment management fees | | | 3,722 | | |
Distribution and/or service fees | | | 8 | | |
Transfer agent fees | | | 18,675 | | |
Administration fees | | | 324 | | |
Compensation of board members | | | 14,332 | | |
Accounting fees | | | 22,915 | | |
Other expenses | | | 31,960 | | |
Total liabilities | | | 444,466 | | |
Net assets applicable to outstanding capital stock | | $ | 73,611,756 | | |
Represented by | |
Paid-in capital | | $ | 75,977,809 | | |
Undistributed net investment income | | | 388,910 | | |
Accumulated net realized loss | | | (857,446 | ) | |
Unrealized appreciation (depreciation) on: | |
Investments | | | (2,356,735 | ) | |
Foreign currency translations | | | (23,046 | ) | |
Forward foreign currency exchange contracts | | | 177,162 | | |
Futures contracts | | | (166,042 | ) | |
Swap contracts | | | 471,144 | | |
Total — representing net assets applicable to outstanding capital stock | | $ | 73,611,756 | | |
The accompanying Notes to Financial Statements are an integral part of this statement.
Semiannual Report 2014
14
Columbia Absolute Return Emerging Markets Macro Fund
Statement of Assets and Liabilities (continued)
November 30, 2014 (Unaudited)
Class A | |
Net assets | | $ | 195,467 | | |
Shares outstanding | | | 19,906 | | |
Net asset value per share | | $ | 9.82 | | |
Maximum offering price per share(a) | | $ | 10.42 | | |
Class B | |
Net assets | | $ | 9,849 | | |
Shares outstanding | | | 1,009 | | |
Net asset value per share | | $ | 9.76 | | |
Class C | |
Net assets | | $ | 9,929 | | |
Shares outstanding | | | 1,026 | | |
Net asset value per share | | $ | 9.68 | | |
Class I | |
Net assets | | $ | 73,027,315 | | |
Shares outstanding | | | 7,388,332 | | |
Net asset value per share | | $ | 9.88 | | |
Class R | |
Net assets | | $ | 9,887 | | |
Shares outstanding | | | 1,008 | | |
Net asset value per share | | $ | 9.81 | | |
Class R5 | |
Net assets | | $ | 9,923 | | |
Shares outstanding | | | 1,005 | | |
Net asset value per share | | $ | 9.87 | | |
Class W | |
Net assets | | $ | 275,473 | | |
Shares outstanding | | | 28,063 | | |
Net asset value per share | | $ | 9.82 | | |
Class Z | |
Net assets | | $ | 73,913 | | |
Shares outstanding | | | 7,427 | | |
Net asset value per share | | $ | 9.95 | | |
(a) The maximum offering price per share is calculated by dividing the net asset value per share by 1.0 minus the maximum sales charge of 5.75%.
The accompanying Notes to Financial Statements are an integral part of this statement.
Semiannual Report 2014
15
Columbia Absolute Return Emerging Markets Macro Fund
Statement of Operations
Six Months Ended November 30, 2014 (Unaudited)
Net investment income | |
Income: | |
Dividends — affiliated issuers | | $ | 25,124 | | |
Interest | | | 1,268,226 | | |
Foreign taxes withheld | | | (14,359 | ) | |
Total income | | | 1,278,991 | | |
Expenses: | |
Investment management fees | | | 506,456 | | |
Distribution and/or service fees | |
Class A | | | 280 | | |
Class B | | | 50 | | |
Class C | | | 51 | | |
Class R | | | 25 | | |
Class W | | | 44,599 | | |
Transfer agent fees | |
Class A | | | 1,092 | | |
Class B | | | 48 | | |
Class C | | | 48 | | |
Class R | | | 48 | | |
Class R5 | | | 3 | | |
Class W | | | 164,778 | | |
Class Z | | | 339 | | |
Administration fees | | | 44,040 | | |
Compensation of board members | | | 6,145 | | |
Custodian fees | | | 6,511 | | |
Printing and postage fees | | | 28,308 | | |
Registration fees | | | 44,860 | | |
Professional fees | | | 21,558 | | |
Other | | | 9,906 | | |
Total expenses | | | 879,145 | | |
Fees waived or expenses reimbursed by Investment Manager and its affiliates | | | (183,497 | ) | |
Total net expenses | | | 695,648 | | |
Net investment income | | | 583,343 | | |
Realized and unrealized gain (loss) — net | |
Net realized gain (loss) on: | |
Investments | | | (112,835 | ) | |
Foreign currency translations | | | (253,619 | ) | |
Forward foreign currency exchange contracts | | | 201,620 | | |
Futures contracts | | | (174,058 | ) | |
Swap contracts | | | 141,257 | | |
Net realized loss | | | (197,635 | ) | |
Net change in unrealized appreciation (depreciation) on: | |
Investments | | | (2,659,617 | ) | |
Foreign currency translations | | | (120,395 | ) | |
Forward foreign currency exchange contracts | | | 116,876 | | |
Futures contracts | | | (166,042 | ) | |
Swap contracts | | | (64,644 | ) | |
Net change in unrealized depreciation | | | (2,893,822 | ) | |
Net realized and unrealized loss | | | (3,091,457 | ) | |
Net decrease in net assets from operations | | $ | (2,508,114 | ) | |
The accompanying Notes to Financial Statements are an integral part of this statement.
Semiannual Report 2014
16
Columbia Absolute Return Emerging Markets Macro Fund
Statement of Changes in Net Assets
| | | Six Months Ended
November 30, 2014
(Unaudited) | | Year Ended
May 31,
2014 | |
Operations | |
Net investment income | | $ | 583,343 | | | $ | 858,944 | | |
Net realized loss | | | (197,635 | ) | | | (169,452 | ) | |
Net change in unrealized depreciation | | | (2,893,822 | ) | | | (222,534 | ) | |
Net increase (decrease) in net assets resulting from operations | | | (2,508,114 | ) | | | 466,958 | | |
Distributions to shareholders | |
Net investment income | |
Class A | | | — | | | | (9,996 | ) | |
Class B | | | — | | | | (54 | ) | |
Class C | | | — | | | | (318 | ) | |
Class I | | | — | | | | (2,456,096 | ) | |
Class R | | | — | | | | (67 | ) | |
Class R5 | | | — | | | | (80 | ) | |
Class W | | | — | | | | (954,624 | ) | |
Class Z | | | — | | | | (1,051 | ) | |
Total distributions to shareholders | | | — | | | | (3,422,286 | ) | |
Decrease in net assets from capital stock activity | | | (26,227,372 | ) | | | (8,763,080 | ) | |
Total decrease in net assets | | | (28,735,486 | ) | | | (11,718,408 | ) | |
Net assets at beginning of period | | | 102,347,242 | | | | 114,065,650 | | |
Net assets at end of period | | $ | 73,611,756 | | | $ | 102,347,242 | | |
Undistributed (excess of distributions over) net investment income | | $ | 388,910 | | | $ | (194,433 | ) | |
The accompanying Notes to Financial Statements are an integral part of this statement.
Semiannual Report 2014
17
Columbia Absolute Return Emerging Markets Macro Fund
Statement of Changes in Net Assets (continued)
| | | Six Months Ended November 30, 2014
(Unaudited) | | Year Ended May 31, 2014 | |
| | | Shares | | Dollars ($) | | Shares | | Dollars ($) | |
Capital stock activity | |
Class A shares | |
Subscriptions | | | 1,669 | | | | 16,519 | | | | 7,417 | | | | 74,468 | | |
Distributions reinvested | | | — | | | | — | | | | 1,008 | | | | 9,922 | | |
Redemptions | | | (11,169 | ) | | | (111,615 | ) | | | (23,239 | ) | | | (233,605 | ) | |
Net decrease | | | (9,500 | ) | | | (95,096 | ) | | | (14,814 | ) | | | (149,215 | ) | |
Class B shares | |
Subscriptions | | | — | | | | — | | | | 759 | | | | 7,500 | | |
Net increase | | | — | | | | — | | | | 759 | | | | 7,500 | | |
Class C shares | |
Subscriptions | | | — | | | | — | | | | 776 | | | | 7,595 | | |
Distributions reinvested | | | — | | | | — | | | | 27 | | | | 264 | | |
Redemptions | | | — | | | | — | | | | (2,340 | ) | | | (23,307 | ) | |
Net decrease | | | — | | | | — | | | | (1,537 | ) | | | (15,448 | ) | |
Class I shares | |
Subscriptions | | | 26,205 | | | | 261,242 | | | | 695,384 | | | | 7,114,991 | | |
Distributions reinvested | | | — | | | | — | | | | 248,836 | | | | 2,456,011 | | |
Redemptions | | | (56,427 | ) | | | (576,207 | ) | | | (808,831 | ) | | | (8,211,402 | ) | |
Net increase (decrease) | | | (30,222 | ) | | | (314,965 | ) | | | 135,389 | | | | 1,359,600 | | |
Class R shares | |
Subscriptions | | | — | | | | — | | | | 758 | | | | 7,500 | | |
Net increase | | | — | | | | — | | | | 758 | | | | 7,500 | | |
Class R5 shares | |
Subscriptions | | | — | | | | — | | | | 766 | | | | 7,600 | | |
Net increase | | | — | | | | — | | | | 766 | | | | 7,600 | | |
Class W shares | |
Subscriptions | | | 2,884,021 | | | | 28,946,021 | | | | 861,754 | | | | 8,696,325 | | |
Distributions reinvested | | | — | | | | — | | | | 96,909 | | | | 954,550 | | |
Redemptions | | | (5,535,588 | ) | | | (54,770,412 | ) | | | (1,955,606 | ) | | | (19,690,729 | ) | |
Net decrease | | | (2,651,567 | ) | | | (25,824,391 | ) | | | (996,943 | ) | | | (10,039,854 | ) | |
Class Z shares | |
Subscriptions | | | 694 | | | | 7,080 | | | | 5,972 | | | | 60,233 | | |
Distributions reinvested | | | — | | | | — | | | | 98 | | | | 971 | | |
Redemptions | | | — | | | | — | | | | (192 | ) | | | (1,967 | ) | |
Net increase | | | 694 | | | | 7,080 | | | | 5,878 | | | | 59,237 | | |
Total net decrease | | | (2,690,595 | ) | | | (26,227,372 | ) | | | (869,744 | ) | | | (8,763,080 | ) | |
The accompanying Notes to Financial Statements are an integral part of this statement.
Semiannual Report 2014
18
Columbia Absolute Return Emerging Markets Macro Fund
The following tables are intended to help you understand the Fund's financial performance. Certain information reflects financial results for a single share of a class held for the periods shown. Per share net investment income (loss) amounts are calculated based on average shares outstanding during the period. Total return assumes reinvestment of all dividends and distributions, if any. Total return does not reflect payment of sales charges, if any. Total return and portfolio turnover are not annualized for periods of less than one year. The portfolio turnover rate is calculated without regard to purchase and sales transactions of short-term instruments and certain derivatives, if any. If such transactions were included, the Fund's portfolio turnover rate may be higher.
| | | Six Months Ended
November 30, 2014 | |
Year Ended May 31, | |
Class A | | (Unaudited) | | 2014 | | 2013 | | 2012 | | 2011(a) | |
Per share data | |
Net asset value, beginning of period | | $ | 10.06 | | | $ | 10.33 | | | $ | 9.99 | | | $ | 10.01 | | | $ | 10.00 | | |
Income from investment operations: | |
Net investment income (loss) | | | 0.04 | | | | 0.05 | | | | 0.04 | | | | 0.12 | | | | (0.00 | )(b) | |
Net realized and unrealized gain (loss) | | | (0.28 | ) | | | (0.03 | ) | | | 0.38 | | | | (0.01 | ) | | | 0.01 | | |
Total from investment operations | | | (0.24 | ) | | | 0.02 | | | | 0.42 | | | | 0.11 | | | | 0.01 | | |
Less distributions to shareholders: | |
Net investment income | | | — | | | | (0.29 | ) | | | (0.08 | ) | | | (0.13 | ) | | | — | | |
Total distributions to shareholders | | | — | | | | (0.29 | ) | | | (0.08 | ) | | | (0.13 | ) | | | — | | |
Net asset value, end of period | | $ | 9.82 | | | $ | 10.06 | | | $ | 10.33 | | | $ | 9.99 | | | $ | 10.01 | | |
Total return | | | (2.39 | %) | | | 0.30 | % | | | 4.19 | % | | | 1.09 | % | | | 0.10 | % | |
Ratios to average net assets(c) | |
Total gross expenses | | | 2.45 | %(d) | | | 2.59 | % | | | 2.46 | % | | | 1.79 | % | | | 7.31 | %(d) | |
Total net expenses(e) | | | 1.57 | %(d) | | | 1.51 | % | | | 1.48 | % | | | 1.48 | % | | | 1.45 | %(d) | |
Net investment income (loss) | | | 0.81 | %(d) | | | 0.47 | % | | | 0.43 | % | | | 1.16 | % | | | (0.24 | %)(d) | |
Supplemental data | |
Net assets, end of period (in thousands) | | $ | 195 | | | $ | 296 | | | $ | 457 | | | $ | 238 | | | $ | 3 | | |
Portfolio turnover | | | 26 | % | | | 15 | % | | | 1 | % | | | 285 | % | | | 5 | % | |
Notes to Financial Highlights
(a) Based on operations from April 7, 2011 (commencement of operations) through the stated period end.
(b) Rounds to zero.
(c) In addition to the fees and expenses that the Fund bears directly, the Fund indirectly bears a pro rata share of the fees and expenses of any other funds in which it invests. Such indirect expenses are not included in the Fund's reported expense ratios.
(d) Annualized.
(e) Total net expenses include the impact of certain fee waivers/expense reimbursements made by the Investment Manager and certain of its affiliates, if applicable.
The accompanying Notes to Financial Statements are an integral part of this statement.
Semiannual Report 2014
19
Columbia Absolute Return Emerging Markets Macro Fund
Financial Highlights (continued)
| | | Six Months Ended
November 30, 2014 | |
Year Ended May 31, | |
Class B | | (Unaudited) | | 2014 | | 2013 | | 2012 | | 2011(a) | |
Per share data | |
Net asset value, beginning of period | | $ | 10.04 | | | $ | 10.30 | | | $ | 9.96 | | | $ | 10.00 | | | $ | 10.00 | | |
Income from investment operations: | |
Net investment income (loss) | | | 0.01 | | | | (0.02 | ) | | | (0.03 | ) | | | 0.08 | | | | (0.01 | ) | |
Net realized and unrealized gain (loss) | | | (0.29 | ) | | | (0.02 | ) | | | 0.37 | | | | (0.05 | ) | | | 0.01 | | |
Total from investment operations | | | (0.28 | ) | | | (0.04 | ) | | | 0.34 | | | | 0.03 | | | | — | | |
Less distributions to shareholders: | |
Net investment income | | | — | | | | (0.22 | ) | | | — | | | | (0.07 | ) | | | — | | |
Total distributions to shareholders | | | — | | | | (0.22 | ) | | | — | | | | (0.07 | ) | | | — | | |
Net asset value, end of period | | $ | 9.76 | | | $ | 10.04 | | | $ | 10.30 | | | $ | 9.96 | | | $ | 10.00 | | |
Total return | | | (2.79 | %) | | | (0.38 | %) | | | 3.41 | % | | | 0.26 | % | | | 0.00 | % | |
Ratios to average net assets(b) | |
Total gross expenses | | | 3.20 | %(c) | | | 3.37 | % | | | 3.19 | % | | | 2.95 | % | | | 8.00 | %(c) | |
Total net expenses(d) | | | 2.33 | %(c) | | | 2.27 | % | | | 2.23 | % | | | 2.23 | % | | | 2.21 | %(c) | |
Net investment income (loss) | | | 0.12 | %(c) | | | (0.24 | %) | | | (0.25 | %) | | | 0.76 | % | | | (0.93 | %)(c) | |
Supplemental data | |
Net assets, end of period (in thousands) | | $ | 10 | | | $ | 10 | | | $ | 3 | | | $ | 2 | | | $ | 2 | | |
Portfolio turnover | | | 26 | % | | | 15 | % | | | 1 | % | | | 285 | % | | | 5 | % | |
Notes to Financial Highlights
(a) Based on operations from April 7, 2011 (commencement of operations) through the stated period end.
(b) In addition to the fees and expenses that the Fund bears directly, the Fund indirectly bears a pro rata share of the fees and expenses of any other funds in which it invests. Such indirect expenses are not included in the Fund's reported expense ratios.
(c) Annualized.
(d) Total net expenses include the impact of certain fee waivers/expense reimbursements made by the Investment Manager and certain of its affiliates, if applicable.
The accompanying Notes to Financial Statements are an integral part of this statement.
Semiannual Report 2014
20
Columbia Absolute Return Emerging Markets Macro Fund
Financial Highlights (continued)
| | | Six Months Ended
November 30, 2014 | |
Year Ended May 31, | |
Class C | | (Unaudited) | | 2014 | | 2013 | | 2012 | | 2011(a) | |
Per share data | |
Net asset value, beginning of period | | $ | 9.96 | | | $ | 10.23 | | | $ | 9.96 | | | $ | 10.00 | | | $ | 10.00 | | |
Income from investment operations: | |
Net investment income (loss) | | | 0.01 | | | | (0.03 | ) | | | (0.04 | ) | | | 0.08 | | | | (0.01 | ) | |
Net realized and unrealized gain (loss) | | | (0.29 | ) | | | (0.02 | ) | | | 0.38 | | | | (0.05 | ) | | | 0.01 | | |
Total from investment operations | | | (0.28 | ) | | | (0.05 | ) | | | 0.34 | | | | 0.03 | | | | — | | |
Less distributions to shareholders: | |
Net investment income | | | — | | | | (0.22 | ) | | | (0.07 | ) | | | (0.07 | ) | | | — | | |
Total distributions to shareholders | | | — | | | | (0.22 | ) | | | (0.07 | ) | | | (0.07 | ) | | | — | | |
Net asset value, end of period | | $ | 9.68 | | | $ | 9.96 | | | $ | 10.23 | | | $ | 9.96 | | | $ | 10.00 | | |
Total return | | | (2.81 | %) | | | (0.49 | %) | | | 3.40 | % | | | 0.26 | % | | | 0.00 | % | |
Ratios to average net assets(b) | |
Total gross expenses | | | 3.19 | %(c) | | | 3.30 | % | | | 3.21 | % | | | 2.95 | % | | | 8.00 | %(c) | |
Total net expenses(d) | | | 2.33 | %(c) | | | 2.26 | % | | | 2.23 | % | | | 2.23 | % | | | 2.21 | %(c) | |
Net investment income (loss) | | | 0.12 | %(c) | | | (0.29 | %) | | | (0.34 | %) | | | 0.76 | % | | | (0.93 | %)(c) | |
Supplemental data | |
Net assets, end of period (in thousands) | | $ | 10 | | | $ | 10 | | | $ | 26 | | | $ | 2 | | | $ | 2 | | |
Portfolio turnover | | | 26 | % | | | 15 | % | | | 1 | % | | | 285 | % | | | 5 | % | |
Notes to Financial Highlights
(a) Based on operations from April 7, 2011 (commencement of operations) through the stated period end.
(b) In addition to the fees and expenses that the Fund bears directly, the Fund indirectly bears a pro rata share of the fees and expenses of any other funds in which it invests. Such indirect expenses are not included in the Fund's reported expense ratios.
(c) Annualized.
(d) Total net expenses include the impact of certain fee waivers/expense reimbursements made by the Investment Manager and certain of its affiliates, if applicable.
The accompanying Notes to Financial Statements are an integral part of this statement.
Semiannual Report 2014
21
Columbia Absolute Return Emerging Markets Macro Fund
Financial Highlights (continued)
| | | Six Months Ended
November 30, 2014 | |
Year Ended May 31, | |
Class I | | (Unaudited) | | 2014 | | 2013 | | 2012 | | 2011(a) | |
Per share data | |
Net asset value, beginning of period | | $ | 10.11 | | | $ | 10.38 | | | $ | 10.01 | | | $ | 10.01 | | | $ | 10.00 | | |
Income from investment operations: | |
Net investment income | | | 0.07 | | | | 0.09 | | | | 0.09 | | | | 0.15 | | | | 0.00 | (b) | |
Net realized and unrealized gain (loss) | | | (0.30 | ) | | | (0.02 | ) | | | 0.39 | | | | (0.01 | ) | | | 0.01 | | |
Total from investment operations | | | (0.23 | ) | | | 0.07 | | | | 0.48 | | | | 0.14 | | | | 0.01 | | |
Less distributions to shareholders: | |
Net investment income | | | — | | | | (0.34 | ) | | | (0.11 | ) | | | (0.14 | ) | | | — | | |
Total distributions to shareholders | | | — | | | | (0.34 | ) | | | (0.11 | ) | | | (0.14 | ) | | | — | | |
Net asset value, end of period | | $ | 9.88 | | | $ | 10.11 | | | $ | 10.38 | | | $ | 10.01 | | | $ | 10.01 | | |
Total return | | | (2.27 | %) | | | 0.75 | % | | | 4.74 | % | | | 1.40 | % | | | 0.10 | % | |
Ratios to average net assets(c) | |
Total gross expenses | | | 1.23 | %(d) | | | 1.28 | % | | | 1.21 | % | | | 1.10 | % | | | 6.95 | %(d) | |
Total net expenses(e) | | | 1.13 | %(d) | | | 1.06 | % | | | 1.05 | % | | | 1.10 | % | | | 1.16 | %(d) | |
Net investment income | | | 1.32 | %(d) | | | 0.92 | % | | | 0.88 | % | | | 1.51 | % | | | 0.11 | %(d) | |
Supplemental data | |
Net assets, end of period (in thousands) | | $ | 73,027 | | | $ | 74,971 | | | $ | 75,567 | | | $ | 73,788 | | | $ | 15,003 | | |
Portfolio turnover | | | 26 | % | | | 15 | % | | | 1 | % | | | 285 | % | | | 5 | % | |
Notes to Financial Highlights
(a) Based on operations from April 7, 2011 (commencement of operations) through the stated period end.
(b) Rounds to zero.
(c) In addition to the fees and expenses that the Fund bears directly, the Fund indirectly bears a pro rata share of the fees and expenses of any other funds in which it invests. Such indirect expenses are not included in the Fund's reported expense ratios.
(d) Annualized.
(e) Total net expenses include the impact of certain fee waivers/expense reimbursements made by the Investment Manager and certain of its affiliates, if applicable.
The accompanying Notes to Financial Statements are an integral part of this statement.
Semiannual Report 2014
22
Columbia Absolute Return Emerging Markets Macro Fund
Financial Highlights (continued)
| | | Six Months Ended
November 30, 2014 | |
Year Ended May 31, | |
Class R | | (Unaudited) | | 2014 | | 2013 | | 2012 | | 2011(a) | |
Per share data | |
Net asset value, beginning of period | | $ | 10.07 | | | $ | 10.33 | | | $ | 9.98 | | | $ | 10.00 | | | $ | 10.00 | | |
Income from investment operations: | |
Net investment income (loss) | | | 0.03 | | | | 0.03 | | | | 0.02 | | | | 0.13 | | | | (0.01 | ) | |
Net realized and unrealized gain (loss) | | | (0.29 | ) | | | (0.02 | ) | | | 0.37 | | | | (0.05 | ) | | | 0.01 | | |
Total from investment operations | | | (0.26 | ) | | | 0.01 | | | | 0.39 | | | | 0.08 | | | | — | | |
Less distributions to shareholders: | |
Net investment income | | | — | | | | (0.27 | ) | | | (0.04 | ) | | | (0.10 | ) | | | — | | |
Total distributions to shareholders | | | — | | | | (0.27 | ) | | | (0.04 | ) | | | (0.10 | ) | | | — | | |
Net asset value, end of period | | $ | 9.81 | | | $ | 10.07 | | | $ | 10.33 | | | $ | 9.98 | | | $ | 10.00 | | |
Total return | | | (2.58 | %) | | | 0.13 | % | | | 3.93 | % | | | 0.81 | % | | | 0.00 | % | |
Ratios to average net assets(b) | |
Total gross expenses | | | 2.70 | %(c) | | | 2.87 | % | | | 2.68 | % | | | 2.64 | % | | | 7.54 | %(c) | |
Total net expenses(d) | | | 1.83 | %(c) | | | 1.77 | % | | | 1.73 | % | | | 1.73 | % | | | 1.73 | %(c) | |
Net investment income (loss) | | | 0.64 | %(c) | | | 0.26 | % | | | 0.24 | % | | | 1.26 | % | | | (0.46 | %)(c) | |
Supplemental data | |
Net assets, end of period (in thousands) | | $ | 10 | | | $ | 10 | | | $ | 3 | | | $ | 2 | | | $ | 3 | | |
Portfolio turnover | | | 26 | % | | | 15 | % | | | 1 | % | | | 285 | % | | | 5 | % | |
Notes to Financial Highlights
(a) Based on operations from April 7, 2011 (commencement of operations) through the stated period end.
(b) In addition to the fees and expenses that the Fund bears directly, the Fund indirectly bears a pro rata share of the fees and expenses of any other funds in which it invests. Such indirect expenses are not included in the Fund's reported expense ratios.
(c) Annualized.
(d) Total net expenses include the impact of certain fee waivers/expense reimbursements made by the Investment Manager and certain of its affiliates, if applicable.
The accompanying Notes to Financial Statements are an integral part of this statement.
Semiannual Report 2014
23
Columbia Absolute Return Emerging Markets Macro Fund
Financial Highlights (continued)
| | | Six Months Ended
November 30, 2014 | |
Year Ended May 31, | |
Class R5 | | (Unaudited) | | 2014 | | 2013(a) | |
Per share data | |
Net asset value, beginning of period | | $ | 10.10 | | | $ | 10.37 | | | $ | 10.47 | | |
Income from investment operations: | |
Net investment income | | | 0.06 | | | | 0.08 | | | | 0.05 | | |
Net realized and unrealized loss | | | (0.29 | ) | | | (0.01 | ) | | | (0.05 | )(b) | |
Total from investment operations | | | (0.23 | ) | | | 0.07 | | | | — | | |
Less distributions to shareholders: | |
Net investment income | | | — | | | | (0.34 | ) | | | (0.10 | ) | |
Total distributions to shareholders | | | — | | | | (0.34 | ) | | | (0.10 | ) | |
Net asset value, end of period | | $ | 9.87 | | | $ | 10.10 | | | $ | 10.37 | | |
Total return | | | (2.28 | %) | | | 0.71 | % | | | 0.04 | % | |
Ratios to average net assets(c) | |
Total gross expenses | | | 1.29 | %(d) | | | 1.32 | % | | | 1.28 | %(d) | |
Total net expenses(e) | | | 1.18 | %(d) | | | 1.12 | % | | | 1.08 | %(d) | |
Net investment income | | | 1.27 | %(d) | | | 0.83 | % | | | 0.79 | %(d) | |
Supplemental data | |
Net assets, end of period (in thousands) | | $ | 10 | | | $ | 10 | | | $ | 2 | | |
Portfolio turnover | | | 26 | % | | | 15 | % | | | 1 | % | |
Notes to Financial Highlights
(a) Based on operations from November 8, 2012 (commencement of operations) through the stated period end.
(b) Calculation of the net gain (loss) per share (both realized and unrealized) does not correlate to the aggregate realized and unrealized gain (loss) presented in the Statement of Operations due to the timing of subscriptions and redemptions of Fund shares in relation to fluctuations in the market value of the portfolio.
(c) In addition to the fees and expenses that the Fund bears directly, the Fund indirectly bears a pro rata share of the fees and expenses of any other funds in which it invests. Such indirect expenses are not included in the Fund's reported expense ratios.
(d) Annualized.
(e) Total net expenses include the impact of certain fee waivers/expense reimbursements made by the Investment Manager and certain of its affiliates, if applicable.
The accompanying Notes to Financial Statements are an integral part of this statement.
Semiannual Report 2014
24
Columbia Absolute Return Emerging Markets Macro Fund
Financial Highlights (continued)
| | | Six Months Ended
November 30, 2014 | |
Year Ended May 31, | |
Class W | | (Unaudited) | | 2014 | | 2013 | | 2012 | | 2011(a) | |
Per share data | |
Net asset value, beginning of period | | $ | 10.07 | | | $ | 10.34 | | | $ | 9.97 | | | $ | 10.01 | | | $ | 10.00 | | |
Income from investment operations: | |
Net investment income (loss) | | | 0.03 | | | | 0.05 | | | | 0.05 | | | | 0.12 | | | | (0.00 | )(b) | |
Net realized and unrealized gain (loss) | | | (0.28 | ) | | | (0.03 | ) | | | 0.38 | | | | (0.03 | ) | | | 0.01 | | |
Total from investment operations | | | (0.25 | ) | | | 0.02 | | | | 0.43 | | | | 0.09 | | | | 0.01 | | |
Less distributions to shareholders: | |
Net investment income | | | — | | | | (0.29 | ) | | | (0.06 | ) | | | (0.13 | ) | | | — | | |
Total distributions to shareholders | | | — | | | | (0.29 | ) | | | (0.06 | ) | | | (0.13 | ) | | | — | | |
Net asset value, end of period | | $ | 9.82 | | | $ | 10.07 | | | $ | 10.34 | | | $ | 9.97 | | | $ | 10.01 | | |
Total return | | | (2.48 | %) | | | 0.29 | % | | | 4.31 | % | | | 0.92 | % | | | 0.10 | % | |
Ratios to average net assets(c) | |
Total gross expenses | | | 2.35 | %(d) | | | 2.58 | % | | | 2.45 | % | | | 1.88 | % | | | 7.27 | %(d) | |
Total net expenses(e) | | | 1.54 | %(d) | | | 1.51 | % | | | 1.48 | % | | | 1.48 | % | | | 1.48 | %(d) | |
Net investment income (loss) | | | 0.52 | %(d) | | | 0.47 | % | | | 0.45 | % | | | 1.18 | % | | | (0.20 | %)(d) | |
Supplemental data | |
Net assets, end of period (in thousands) | | $ | 275 | | | $ | 26,972 | | | $ | 37,999 | | | $ | 31,699 | | | $ | 3 | | |
Portfolio turnover | | | 26 | % | | | 15 | % | | | 1 | % | | | 285 | % | | | 5 | % | |
Notes to Financial Highlights
(a) Based on operations from April 7, 2011 (commencement of operations) through the stated period end.
(b) Rounds to zero.
(c) In addition to the fees and expenses that the Fund bears directly, the Fund indirectly bears a pro rata share of the fees and expenses of any other funds in which it invests. Such indirect expenses are not included in the Fund's reported expense ratios.
(d) Annualized.
(e) Total net expenses include the impact of certain fee waivers/expense reimbursements made by the Investment Manager and certain of its affiliates, if applicable.
The accompanying Notes to Financial Statements are an integral part of this statement.
Semiannual Report 2014
25
Columbia Absolute Return Emerging Markets Macro Fund
Financial Highlights (continued)
| | | Six Months Ended
November 30, 2014 | |
Year Ended May 31, | |
Class Z | | (Unaudited) | | 2014 | | 2013 | | 2012 | | 2011(a) | |
Per share data | |
Net asset value, beginning of period | | $ | 10.18 | | | $ | 10.45 | | | $ | 10.00 | | | $ | 10.01 | | | $ | 10.00 | | |
Income from investment operations: | |
Net investment income (loss) | | | 0.06 | | | | 0.07 | | | | 0.09 | | | | 0.17 | | | | (0.01 | ) | |
Net realized and unrealized gain (loss) | | | (0.29 | ) | | | (0.02 | ) | | | 0.36 | | | | (0.04 | ) | | | 0.02 | | |
Total from investment operations | | | (0.23 | ) | | | 0.05 | | | | 0.45 | | | | 0.13 | | | | 0.01 | | |
Less distributions to shareholders: | |
Net investment income | | | — | | | | (0.32 | ) | | | — | | | | (0.14 | ) | | | — | | |
Total distributions to shareholders | | | — | | | | (0.32 | ) | | | — | | | | (0.14 | ) | | | — | | |
Net asset value, end of period | | $ | 9.95 | | | $ | 10.18 | | | $ | 10.45 | | | $ | 10.00 | | | $ | 10.01 | | |
Total return | | | (2.26 | %) | | | 0.55 | % | | | 4.50 | % | | | 1.27 | % | | | 0.10 | % | |
Ratios to average net assets(b) | |
Total gross expenses | | | 2.18 | %(c) | | | 2.34 | % | | | 2.18 | % | | | 1.75 | % | | | 12.46 | %(c) | |
Total net expenses(d) | | | 1.33 | %(c) | | | 1.27 | % | | | 1.23 | % | | | 1.23 | % | | | 1.21 | %(c) | |
Net investment income (loss) | | | 1.14 | %(c) | | | 0.72 | % | | | 0.82 | % | | | 1.71 | % | | | (0.40 | %)(c) | |
Supplemental data | |
Net assets, end of period (in thousands) | | $ | 74 | | | $ | 69 | | | $ | 9 | | | $ | 44 | | | $ | 17,532 | | |
Portfolio turnover | | | 26 | % | | | 15 | % | | | 1 | % | | | 285 | % | | | 5 | % | |
Notes to Financial Highlights
(a) Based on operations from April 7, 2011 (commencement of operations) through the stated period end.
(b) In addition to the fees and expenses that the Fund bears directly, the Fund indirectly bears a pro rata share of the fees and expenses of any other funds in which it invests. Such indirect expenses are not included in the Fund's reported expense ratios.
(c) Annualized.
(d) Total net expenses include the impact of certain fee waivers/expense reimbursements made by the Investment Manager and certain of its affiliates, if applicable.
The accompanying Notes to Financial Statements are an integral part of this statement.
Semiannual Report 2014
26
Columbia Absolute Return Emerging Markets Macro Fund
Notes to Financial Statements
November 30, 2014 (Unaudited)
Note 1. Organization
Columbia Absolute Return Emerging Markets Macro Fund (the Fund), a series of Columbia Funds Series Trust II (the Trust), is a non-diversified fund. The Trust is registered under the Investment Company Act of 1940, as amended (the 1940 Act), as an open-end management investment company organized as a Massachusetts business trust.
Fund Shares
The Trust may issue an unlimited number of shares (without par value). The Fund offers Class A, Class B, Class C, Class I, Class R, Class R5, Class W and Class Z shares. Although all share classes generally have identical voting, dividend and liquidation rights, each share class votes separately when required by the Trust's organizational documents or by law. Different share classes pay different distribution amounts to the extent the expenses of such share classes differ, and distributions in liquidation will be proportional to the net asset value of each share class. Each share class has its own expense structure and sales charges.
Class A shares are subject to a maximum front-end sales charge of 5.75% based on the initial investment amount. Class A shares purchased without an initial sales charge in accounts aggregating $1 million to $50 million at the time of purchase are subject to a contingent deferred sales charge (CDSC) if the shares are sold within 18 months of purchase, charged as follows: 1.00% CDSC if redeemed within 12 months of purchase, and 0.50% CDSC if redeemed more than 12, but less than 18, months after purchase.
Class B shares may be subject to a maximum CDSC of 5.00% based upon the holding period after purchase. Class B shares will generally convert to Class A shares eight years after purchase. The Fund no longer accepts investments by new or existing investors in the Fund's Class B shares, except in connection with the reinvestment of any dividend and/or capital gain distributions in Class B shares of the Fund and exchanges by existing Class B shareholders of certain other funds within the Columbia Family of Funds.
Class C shares are subject to a 1.00% CDSC on shares redeemed within one year of purchase.
Class I shares are not subject to sales charges and are available only to the Columbia Family of Funds.
Class R shares are not subject to sales charges and are generally available only to certain retirement plans and other investors as described in the Fund's prospectus.
Class R5 shares are not subject to sales charges and are generally available only to investors purchasing through authorized investment professionals and omnibus retirement plans.
Class W shares are not subject to sales charges and are available only to investors purchasing through authorized investment programs managed by investment professionals, including discretionary managed account programs.
Class Z shares are not subject to sales charges and are available only to eligible investors, which are subject to different investment minimums as described in the Fund's prospectus.
Note 2. Summary of Significant Accounting Policies
Basis of Preparation
The Fund is an investment company that applies the accounting and reporting guidance in the Financial Accounting Standards Board (FASB) Accounting Standards Codification Topic 946, Financial Services — Investment Companies (ASC 946). The financial statements are prepared in accordance with U.S. generally accepted accounting principles (GAAP) which requires management to make certain estimates and assumptions that affect the reported amounts of assets and liabilities, the disclosure of contingent assets and liabilities at the date of the financial statements and the reported amounts of income and expenses during the reporting period. Actual results could differ from those estimates.
The following is a summary of significant accounting policies followed by the Fund in the preparation of its financial statements.
Security Valuation
Debt securities generally are valued by pricing services approved by the Board of Trustees (the Board) based upon market transactions for normal, institutional-size trading units of similar securities. The services may use various pricing techniques that take into account, as applicable, factors such as yield, quality, coupon rate, maturity, type of issue, trading characteristics and other data, as well as broker quotes. Debt securities for which quotations are readily available may also be valued based upon an over-the-counter or exchange bid quotation.
Investments in open-end investment companies, including money market funds, are valued at their net asset value.
Forward foreign currency exchange contracts are marked-to-market based upon foreign currency exchange rates provided by a pricing service.
Futures and options on futures contracts are valued based upon the settlement price established each day by the board of trade or exchange on which they are traded.
Semiannual Report 2014
27
Columbia Absolute Return Emerging Markets Macro Fund
Notes to Financial Statements (continued)
November 30, 2014 (Unaudited)
Swap transactions are valued through an independent pricing service or broker, or if neither is available, through an internal model based upon observable inputs.
Investments for which market quotations are not readily available, or that have quotations which management believes are not reliable, are valued at fair value as determined in good faith under procedures established by and under the general supervision of the Board. If a security or class of securities (such as foreign securities) is valued at fair value, such value is likely to be different from the quoted or published price for the security.
The determination of fair value often requires significant judgment. To determine fair value, management may use assumptions including but not limited to future cash flows and estimated risk premiums. Multiple inputs from various sources may be used to determine fair value.
Foreign Currency Transactions and Translations
The values of all assets and liabilities denominated in foreign currencies are generally translated into U.S. dollars at exchange rates determined at the close of the NYSE. Net realized and unrealized gains (losses) on foreign currency transactions and translations include gains (losses) arising from the fluctuation in exchange rates between trade and settlement dates on securities transactions, gains (losses) arising from the disposition of foreign currency and currency gains (losses) between the accrual and payment dates on dividends, interest income and foreign withholding taxes.
For financial statement purposes, the Fund does not distinguish that portion of gains (losses) on investments which is due to changes in foreign exchange rates from that which is due to changes in market prices of the investments. Such fluctuations are included with the net realized and unrealized gains (losses) on investments in the Statement of Operations.
Derivative Instruments
The Fund invests in certain derivative instruments, as detailed below, to meet its investment objectives. Derivatives are instruments whose values depend on, or are derived from, in whole or in part, the value of one or more other assets, such as securities, currencies, commodities or indices. Derivative instruments may be used to increase investment flexibility (including to maintain cash reserves while maintaining exposure to certain other assets), for risk management (hedging) purposes, to facilitate trading, to reduce transaction costs and to pursue higher investment returns. The Fund may also use derivative instruments to mitigate certain investment risks, such as foreign currency exchange rate risk, interest rate risk and credit risk. Derivatives may involve various risks, including the potential inability of the counterparty to fulfill
its obligation under the terms of the contract, the potential for an illiquid secondary market (making it difficult for the Fund to sell, including at favorable prices) and the potential for market movements which may expose the Fund to gains or losses in excess of the amount shown in the Statement of Assets and Liabilities. The notional amounts of derivative instruments, if applicable, are not recorded in the financial statements.
A derivative instrument may suffer a marked-to-market loss if the value of the contract decreases due to an unfavorable change in the market rates or values of the underlying instrument. Losses can also occur if the counterparty does not perform under the contract. The Fund's risk of loss from counterparty credit risk on over-the-counter derivatives is generally limited to the aggregate unrealized gain netted against any collateral held by the Fund and the amount of any variation margin held by the counterparty. With exchange-traded or centrally cleared derivatives, there is reduced counterparty credit risk to the Fund since the exchange's clearinghouse, as counterparty to such instruments, guarantees against a possible default. The clearinghouse stands between the buyer and the seller of the contract; therefore, the counterparty credit risk is failure of the clearinghouse. However, credit risk still exists in exchange-traded or centrally cleared derivatives with respect to initial and variation margin that is held in a broker's customer account. While brokers are required to segregate customer margin from their own assets, in the event that a broker becomes insolvent or goes into bankruptcy and at that time there is a shortfall in the aggregate amount of margin held by the broker for all its clients, U.S. bankruptcy laws will typically allocate that shortfall on a pro-rata basis across all the broker's customers (including the Fund), potentially resulting in losses to the Fund.
In order to better define its contractual rights and to secure rights that will help the Fund mitigate its counterparty risk, the Fund may enter into an International Swaps and Derivatives Association, Inc. Master Agreement (ISDA Master Agreement) or similar agreement with its derivative contract counterparties. An ISDA Master Agreement is an agreement between the Fund and a counterparty that governs over-the-counter derivatives and forward foreign currency exchange contracts and typically contains, among other things, collateral posting terms and netting provisions in the event of a default and/or termination event. Under an ISDA Master Agreement, the Fund may, under certain circumstances, offset with the counterparty certain derivative instrument's payables and/or receivables with collateral held and/or posted and create one single net payment. The provisions of the ISDA Master Agreement typically permit a single net payment in the event of default (close-out netting) including the bankruptcy or
Semiannual Report 2014
28
Columbia Absolute Return Emerging Markets Macro Fund
Notes to Financial Statements (continued)
November 30, 2014 (Unaudited)
insolvency of the counterparty. Note, however, that bankruptcy or insolvency laws of a particular jurisdiction may impose restrictions on or prohibitions against the right of offset in bankruptcy, insolvency or other events.
Collateral (margin) requirements differ by type of derivative. Margin requirements are established by the exchange or clearinghouse for exchange-traded and centrally cleared derivatives. Brokers can ask for margin in excess of the minimum in certain circumstances. Collateral terms are contract specific for over-the-counter derivatives. For over-the-counter derivatives traded under an ISDA Master Agreement, the collateral requirements are typically calculated by netting the marked-to-market amount for each transaction under such agreement and comparing that amount to the value of any variation margin currently pledged by the Fund and/or the counterparty. Generally, the amount of collateral due from or to a party has to exceed a minimum transfer amount threshold (e.g., $500,000) before a transfer has to be made. To the extent amounts due to the Fund from its counterparties are not fully collateralized, contractually or otherwise, the Fund bears the risk of loss from counterparty nonperformance. The Fund attempts to mitigate counterparty risk by only entering into agreements with counterparties that it believes have the financial resources to honor their obligations and by monitoring the financial stability of those counterparties.
Certain ISDA Master Agreements allow counterparties to over-the-counter derivatives to terminate derivative contracts prior to maturity in the event the Fund's net assets decline by a stated percentage over a specified time period or if the Fund fails to meet the terms of the ISDA Master Agreement, which would cause the Fund to accelerate payment of any net liability owed to the counterparty. The Fund also has termination rights if the counterparty fails to meet the terms of the ISDA Master Agreement. In addition to considering counterparty credit risk, the Fund would consider terminating the derivative contracts based on whether termination would result in a net liability owed from the counterparty.
For financial reporting purposes, the Fund does not offset derivative assets and derivative liabilities that are subject to netting arrangements in the Statement of Assets and Liabilities.
Forward Foreign Currency Exchange Contracts
Forward foreign currency exchange contracts are over-the-counter agreements between two parties to buy and sell a currency at a set price on a future date. The Fund utilized forward foreign currency exchange contracts to hedge the currency exposure associated with some or all of the Fund's securities, to shift foreign currency exposure back to U.S. dollars and to shift investment exposure from one currency to
another. These instruments may be used for other purposes in future periods.
The values of forward foreign currency exchange contracts fluctuate daily with changes in foreign currency exchange rates. Changes in the value of these contracts are recorded as unrealized appreciation or depreciation until the contract is exercised or has expired. The Fund will realize a gain or loss when the forward foreign currency exchange contract is closed or expires.
The use of forward foreign currency exchange contracts does not eliminate fluctuations in the prices of the Fund's portfolio securities. The risks of forward foreign currency exchange contracts include movement in the values of the foreign currencies relative to the U.S. dollar (or other foreign currencies) and the possibility that counterparties will not complete their contractual obligations, which may be in excess of the amount reflected, if any, in the Statement of Assets and Liabilities.
Futures Contracts
Futures contracts are exchange traded and represent commitments for the future purchase or sale of an asset at a specified price on a specified date. The Fund bought and sold futures contracts to manage the duration and yield curve exposure of the Fund versus the benchmark and to manage exposure to movements in interest rates. These instruments may be used for other purposes in future periods. Upon entering into futures contracts, the Fund bears risks that it may not achieve the anticipated benefits of the futures contracts and may realize a loss. Additional risks include counterparty credit risk, the possibility of an illiquid market, and that a change in the value of the contract or option may not correlate with changes in the value of the underlying asset.
Upon entering into a futures contract, the Fund pledges cash or securities with the broker in an amount sufficient to meet the initial margin requirement. The initial margin deposit must be maintained at an established level over the life of the contract. Cash deposited as initial margin is recorded in the Statement of Assets and Liabilities as margin deposits. Securities deposited as initial margin are designated in the Portfolio of Investments. Subsequent payments (variation margin) are made or received by the Fund each day. The variation margin payments are equal to the daily change in the contract value and are recorded as variation margin receivable or payable and are offset in unrealized gains or losses. The Fund recognizes a realized gain or loss when the contract is closed or expires. Futures contracts involve, to varying degrees, risk of loss in excess of the variation margin disclosed in the Statement of Assets and Liabilities.
Semiannual Report 2014
29
Columbia Absolute Return Emerging Markets Macro Fund
Notes to Financial Statements (continued)
November 30, 2014 (Unaudited)
Swap Contracts
Swap contracts are privately negotiated in the over-the-counter market and may be entered into as a bilateral contract or centrally cleared (centrally cleared swap contract). In a centrally cleared swap contract, immediately following execution of the swap contract with a broker, the swap contract is novated to a central counterparty (the CCP) and the CCP becomes the Fund's counterparty to the centrally cleared swap contract. The Fund is required to deposit initial margin with the broker in the form of cash or securities in an amount that varies depending on the size and risk profile of the particular swap contract. Securities deposited as initial margin are designated in the Portfolio of Investments and cash deposited is recorded in the Statement of Assets and Liabilities as margin deposits. Unlike a bilateral swap contract, for centrally cleared swap contracts, the Fund has minimal credit exposure to the counterparty because the CCP stands between the Fund and the counterparty. Swap contracts are marked-to-market daily and changes in value are recorded as unrealized appreciation (depreciation). The daily change in valuation of centrally cleared swap contracts, if any, is recorded as a receivable or payable for variation margin in the Statement of Assets and Liabilities.
Credit Default Swap Contracts
The Fund entered into credit default swap contracts to increase or decrease its credit exposure to a single issuer of debt securities, increase or decrease its credit exposure to a specific debt security or a basket of debt securities as a protection buyer to reduce overall credit exposure. Additionally, credit default swap contracts were used to hedge the Fund's exposure on a debt security that it owns or in lieu of selling such debt security. These instruments may be used for other purposes in future periods. Credit default swap contracts are agreements in which one party pays fixed periodic payments to a counterparty in consideration for a guarantee from the counterparty to make a specific payment should a specified credit event(s) take place. Although specified credit events are contract specific, credit events are generally defined as bankruptcy, failure to pay, restructuring, obligation acceleration, obligation default, or repudiation/moratorium.
As the purchaser of a credit default swap contract, the Fund purchases protection by paying a periodic interest rate on the notional amount to the counterparty. The interest amount is accrued daily as a component of unrealized appreciation (depreciation) and is recorded as a realized loss upon payment. If a credit event as specified in the contract occurs, the Fund may have the option either to deliver the reference obligation to the seller in exchange for a cash payment of its par amount, or to receive a net cash settlement equal to the par amount less
an agreed-upon value of the reference obligation as of the date of the credit event. The difference between the value of the obligation or cash delivered and the notional amount received will be recorded as a realized gain (loss).
As the seller of a credit default swap contract, the Fund sells protection to a buyer and will generally receive a periodic interest rate on the notional amount. The interest amount is accrued daily as a component of unrealized appreciation (depreciation) and is recorded as a realized gain upon receipt of the payment. If a credit event as specified in the contract with the counterparty occurs, the Fund may either be required to accept the reference obligation from the buyer in exchange for a cash payment of its notional amount, or to pay the buyer a net cash settlement equal to the notional amount less an agreed-upon value of the reference obligation (recovery value) as of the date of the credit event. The difference between the value of the obligation or cash received and the notional amount paid will be recorded as a realized gain (loss). The maximum potential amount of undiscounted future payments the Fund could be required to make as the seller of protection under a credit default swap contract is equal to the notional amount of the reference obligation. These potential amounts may be partially offset by any recovery values of the respective reference obligations or premiums received upon entering into the agreement. The notional amounts and market values of all credit default swap contracts in which the Fund is the seller of protection, if any, are disclosed in the Credit Default Swap Contracts Outstanding schedule following the Portfolio of Investments. These potential amounts may be partially offset by any recovery values of the respective reference obligations or premiums received upon entering into the agreement.
As a protection seller, the Fund bears the risk of loss from the credit events specified in the contract with the counterparty. For credit default swap contracts on credit indices, quoted market prices and resulting market values serve as an indicator of the current status of the payment/performance risk. Increasing market values, in absolute terms when compared to the notional amount of the swap, represent a deterioration of the reference entity's credit soundness and a greater likelihood or risk of default or other credit event occurring as defined under the terms of the contract.
Any premium paid or received by the Fund upon entering into a credit default swap contract is recorded as an asset or liability, respectively, and amortized daily as a component of realized gain (loss) in the Statement of Operations. Credit default swap contracts are valued daily, and the change in value is recorded as unrealized appreciation (depreciation) until the termination of the swap, at which time a realized gain (loss) is recorded.
Semiannual Report 2014
30
Columbia Absolute Return Emerging Markets Macro Fund
Notes to Financial Statements (continued)
November 30, 2014 (Unaudited)
Credit default swap contracts can involve greater risks than if a fund had invested in the reference obligation directly since, in addition to general market risks, credit default swaps are subject to counterparty credit risk, leverage risk, hedging risk,
correlation risk and liquidity risk. The Fund will enter into credit default swap transactions only with counterparties that meet certain standards of creditworthiness.
Offsetting of Derivative Assets and Derivative Liabilities
The following tables present the Fund's gross and net amount of assets and liabilities available for offset under netting arrangements as well as any related collateral received or pledged by the Fund as of November 30, 2014:
| | | | | | | | Gross Amounts Not Offset in
the Statement of Assets and Liabilities | | | |
| | Gross
Amounts of
Recognized
Assets ($) | | Gross Amounts
Offset in the
Statement of
Assets and
Liabilities ($) | | Net Amounts of
Assets
Presented in the
Statement of
Assets and
Liabilities ($) | | Financial
Instruments ($)(a) | | Cash
Collateral
Received ($) | | Securities
Collateral
Received ($) | | Net
Amount ($)(b) | |
Asset Derivatives: | |
Forward Foreign Currency
Exchange Contracts | | | 184,466 | | | | — | | | | 184,466 | | | | 5,237 | | | | — | | | | — | | | | 179,229 | | |
Over-the-Counter
Swap Contracts(c) | | | 297,699 | | | | — | | | | 297,699 | | | | — | | | | — | | | | — | | | | 297,699 | | |
Total asset derivatives | | | 482,165 | | | | — | | | | 482,165 | | | | 5,237 | | | | — | | | | — | | | | 476,928 | | |
| | | | | | | | Gross Amounts Not Offset in
the Statement of Assets and Liabilities | | | |
| | Gross
Amounts of
Recognized
Liabilities ($) | | Gross Amounts
Offset in the
Statement of
Assets and
Liabilities ($) | | Net Amounts of
Liabilities
Presented in the
Statement of
Assets and
Liabilities ($) | | Financial
Instruments ($)(d) | | Cash
Collateral
Pledged ($) | | Securities
Collateral
Pledged ($) | | Net
Amount($)(e) | |
Liability Derivatives: | |
Forward Foreign Currency
Exchange Contracts | | | 7,304 | | | | — | | | | 7,304 | | | | 5,237 | | | | — | | | | — | | | | 2,067 | | |
Over-the-Counter
Swap Contracts(c) | | | 30,093 | | | | — | | | | 30,093 | | | | — | | | | — | | | | — | | | | 30,093 | | |
Total liability derivatives | | | 37,397 | | | | — | | | | 37,397 | | | | 5,237 | | | | — | | | | — | | | | 32,160 | | |
(a) Represents the amount of assets that could be offset by liabilities with the same counterparty under master netting or similar agreements that management elects not to offset on the Statement of Assets and Liabilities.
(b) Represents the net amount due from counterparties in the event of default.
(c) Over-the-Counter Swap Contracts are presented at market value plus periodic payments receivable (payable), which is comprised of unrealized appreciation, unrealized depreciation, premiums paid and premiums received.
(d) Represents the amount of liabilities that could be offset by assets with the same counterparty under master netting or similar agreements that management elects not to offset on the Statement of Assets and Liabilities.
(e) Represents the net amount due to counterparties in the event of default.
Effects of Derivative Transactions in the Financial Statements
The following tables are intended to provide additional information about the effect of derivatives on the financial statements of the Fund, including: the fair value of derivatives by risk category and the location of those fair values in the
Statement of Assets and Liabilities; and the impact of derivative transactions over the period in the Statement of Operations, including realized gains or losses and unrealized gains or losses. The derivative schedules following the Portfolio of Investments present additional information regarding derivative instruments outstanding at the end of the period, if any.
Semiannual Report 2014
31
Columbia Absolute Return Emerging Markets Macro Fund
Notes to Financial Statements (continued)
November 30, 2014 (Unaudited)
The following table is a summary of the fair value of derivative instruments (not considered to be hedging instruments for accounting disclosure purposes) at November 30, 2014:
Asset Derivatives | |
Risk Exposure
Category | | Statement of Assets and
Liabilities Location | | Fair Value ($) | |
Credit risk
| | Net assets — unrealized
appreciation on swap
contracts | | | 522,762
| * | |
Credit risk
| | Premiums paid on
outstanding swap
contracts | | | 33,592
| | |
Foreign exchange
risk
| | Unrealized appreciation on
forward foreign currency
exchange contracts | | | 184,466
| | |
Total | | | | | 740,820 | | |
Liability Derivatives | |
Risk Exposure
Category | | Statement of Assets and
Liabilities Location | | Fair Value ($) | |
Credit risk
| | Net assets — unrealized
depreciation on swap
contracts | | | 51,618
| * | |
Credit risk
| | Premiums received on
outstanding swap
contracts | | | 237,130
| | |
Foreign exchange
risk
| | Unrealized depreciation on
forward foreign currency
exchange contracts | | | 7,304
| | |
Interest rate risk
| | Net assets — unrealized
depreciation on futures
contracts | | | 166,042
| * | |
Total | | | | | 462,094 | | |
The following table indicates the effect of derivative instruments (not considered to be hedging instruments for accounting disclosure purposes) in the Statement of Operations for the six months ended November 30, 2014:
Amount of Realized Gain (Loss) on Derivatives Recognized in Income | |
| Risk Exposure Category | | Forward Foreign
Currency Exchange
Contracts ($) | | Futures
Contracts ($) | | Swap
Contracts ($) | | Total ($) | |
Credit risk | | | — | | | | — | | | | 141,257 | | | | 141,257 | | |
Foreign exchange risk | | | 201,620 | | | | — | | | | — | | | | 201,620 | | |
Interest rate risk | | | — | | | | (174,058 | ) | | | — | | | | (174,058 | ) | |
Total | | | 201,620 | | | | (174,058 | ) | | | 141,257 | | | | 168,819 | | |
Change in Unrealized Appreciation (Depreciation) on Derivatives Recognized in Income | |
| Risk Exposure Category | | Forward Foreign
Currency Exchange
Contracts ($) | | Futures
Contracts ($) | | Swap
Contracts ($) | | Total ($) | |
Credit risk | | | — | | | | — | | | | (64,644 | ) | | | (64,644 | ) | |
Foreign exchange risk | | | 116,876 | | | | — | | | | — | | | | 116,876 | | |
Interest rate risk | | | — | | | | (166,042 | ) | | | — | | | | (166,042 | ) | |
Total | | | 116,876 | | | | (166,042 | ) | | | (64,644 | ) | | | (113,810 | ) | |
The following table is a summary of the average outstanding volume by derivative instrument for the six months ended November 30, 2014:
Derivative Instrument | | Average Notional Amounts ($)* | |
Futures contracts — Short | | | 25,195,825 | | |
Credit default swap
contracts — buy protection | | | 9,100,000 | | |
Credit default swap
contracts — sell protection | | | 25,560,000 | | |
Derivative Instrument | | Average Unrealized
Appreciation ($)* | | Average Unrealized
Depreciation ($)* | |
Forward foreign currency
exchange contracts | | | 243,248
| | | | (108,617
| ) | |
*Based on the ending quarterly outstanding amounts for the six months ended November 30, 2014.
Treasury Inflation Protected Securities
The Fund may invest in treasury inflation protected securities (TIPS). The principal amount of TIPS is adjusted periodically and is increased for inflation or decreased for deflation based on a monthly published index. These adjustments are recorded as interest income in the Statement of Operations. Coupon
Semiannual Report 2014
32
Columbia Absolute Return Emerging Markets Macro Fund
Notes to Financial Statements (continued)
November 30, 2014 (Unaudited)
payments are based on the adjusted principal at the time the interest is paid.
Security Transactions
Security transactions are accounted for on the trade date. Cost is determined and gains (losses) are based upon the specific identification method for both financial statement and federal income tax purposes.
Income Recognition
Interest income is recorded on an accrual basis. Market premiums and discounts, including original issue discounts, are amortized and accreted, respectively, over the expected life of the security on all debt securities, unless otherwise noted.
The Fund may place a debt security on non-accrual status and reduce related interest income when it becomes probable that the interest will not be collected and the amount of uncollectible interest can be reasonably estimated. A defaulted debt security is removed from non-accrual status when the issuer resumes interest payments or when collectability of interest is reasonably assured.
Dividend income is recorded on the ex-dividend date.
Expenses
General expenses of the Trust are allocated to the Fund and other funds of the Trust based upon relative net assets or other expense allocation methodologies determined by the nature of the expense. Expenses directly attributable to the Fund are charged to the Fund. Expenses directly attributable to a specific class of shares are charged to that share class.
Determination of Class Net Asset Value
All income, expenses (other than class-specific expenses, which are charged to that share class, as shown in the Statement of Operations) and realized and unrealized gains (losses) are allocated to each class of the Fund on a daily basis, based on the relative net assets of each class, for purposes of determining the net asset value of each class.
Federal Income Tax Status
The Fund intends to qualify each year as a regulated investment company under Subchapter M of the Internal Revenue Code, as amended, and will distribute substantially all of its taxable income (including net short-term capital gains), if any, for its tax year, and as such will not be subject to federal income taxes. In addition, the Fund intends to distribute in each calendar year substantially all of its net investment income, capital gains and certain other amounts, if any, such that the Fund should not be subject to federal excise tax. Therefore, no federal income or excise tax provision is recorded.
Foreign Taxes
The Fund may be subject to foreign taxes on income, gains on investments or currency repatriation, a portion of which may be recoverable. The Fund will accrue such taxes and recoveries, as applicable, based upon its current interpretation of tax rules and regulations that exist in the markets in which it invests.
Realized gains in certain countries may be subject to foreign taxes at the Fund level, based on statutory rates. The Fund accrues for such foreign taxes on realized and unrealized gains at the appropriate rate for each jurisdiction, as applicable. The amount, if any, is disclosed as a liability on the Statement of Assets and Liabilities.
Distributions to Shareholders
Distributions from net investment income, if any, are declared and paid annually. Net realized capital gains, if any, are distributed along with the income distribution. Income distributions and capital gain distributions are determined in accordance with federal income tax regulations, which may differ from GAAP.
Guarantees and Indemnifications
Under the Trust's organizational documents and, in some cases, by contract, its officers and trustees are indemnified against certain liabilities arising out of the performance of their duties to the Trust or its funds. In addition, certain of the Fund's contracts with its service providers contain general indemnification clauses. The Fund's maximum exposure under these arrangements is unknown since the amount of any future claims that may be made against the Fund cannot be determined, and the Fund has no historical basis for predicting the likelihood of any such claims.
Note 3. Fees and Compensation Paid to Affiliates
Investment Management Fees
Under an Investment Management Services Agreement, Columbia Management Investment Advisers, LLC (the Investment Manager), a wholly-owned subsidiary of Ameriprise Financial, Inc. (Ameriprise Financial), determines which securities will be purchased, held or sold. The investment management fee is an annual fee that is equal to a percentage of the Fund's average daily net assets that declines from 0.92% to 0.80% as the Fund's net assets increase. The annualized effective investment management fee rate for the six months ended November 30, 2014 was 0.92% of the Fund's average daily net assets.
Semiannual Report 2014
33
Columbia Absolute Return Emerging Markets Macro Fund
Notes to Financial Statements (continued)
November 30, 2014 (Unaudited)
The Investment Manager has entered into a personnel-sharing arrangement with its affiliate, Threadneedle Investments (Threadneedle). Threadneedle, like the Investment Manager, is a wholly-owned subsidiary of Ameriprise Financial and is an SEC-registered investment adviser. Pursuant to this arrangement, certain employees of Threadneedle serve as "associated persons" of the Investment Manager and, in this capacity, subject to the oversight and supervision of the Investment Manager and consistent with the investment objectives, policies and limitations set forth in the Fund's prospectus and Statement of Additional Information (SAI), may provide research and related services, and discretionary investment management services (including acting as portfolio managers) to the Fund on behalf of the Investment Manager.
Administration Fees
Under an Administrative Services Agreement, the Investment Manager also serves as the Fund Administrator. The Fund pays the Fund Administrator an annual fee for administration and accounting services equal to a percentage of the Fund's average daily net assets that declines from 0.08% to 0.05% as the Fund's net assets increase. The annualized effective administration fee rate for the six months ended November 30, 2014 was 0.08% of the Fund's average daily net assets.
Other Expenses
Other expenses are for, among other things, miscellaneous expenses of the Fund or the Board, including payments to a company providing limited administrative services to the Fund and the Board. That company's expenses include boardroom and office expense, employee compensation, employee health and retirement benefits, and certain other expenses. For the six months ended November 30, 2014, other expenses paid by the Fund to this company were $629.
Compensation of Board Members
Board members are compensated for their services to the Fund as disclosed in the Statement of Operations. Under a Deferred Compensation Plan (the Plan), the Board members who are not "interested persons" of the Fund, as defined under the 1940 Act, may elect to defer payment of up to 100% of their compensation. Deferred amounts are treated as though equivalent dollar amounts had been invested in shares of certain funds managed by the Investment Manager. The Fund's liability for these amounts is adjusted for market value changes and remains in the Fund until distributed in accordance with the Plan.
Transfer Agent Fees
Under a Transfer and Dividend Disbursing Agent Agreement, Columbia Management Investment Services Corp. (the
Transfer Agent), an affiliate of the Investment Manager and a wholly-owned subsidiary of Ameriprise Financial, is responsible for providing transfer agency services to the Fund. The Transfer Agent has contracted with Boston Financial Data Services (BFDS) to serve as sub-transfer agent.
Effective November 1, 2014, the Transfer Agent receives a monthly transfer agency fee based on the number or the average value of accounts, depending on the type of account. Prior to November 1, 2014, the Transfer Agent received a monthly account-based service fee based on the number of open accounts. In addition, the Transfer Agent also receives sub-transfer agency fees based on a percentage of the average aggregate value of the Fund's shares maintained in omnibus accounts (other than omnibus accounts for which American Enterprise Investment Services Inc. is the broker of record or accounts where the beneficial shareholder is a customer of Ameriprise Financial Services, Inc., which receive a per account fee). The Transfer Agent pays the fees of BFDS for services as sub-transfer agent and is not entitled to reimbursement for such fees from the Fund (with the exception of out-of-pocket fees).
The Transfer Agent also receives compensation from the Fund for various shareholder services and reimbursements for certain out-of-pocket fees. Class I shares do not pay transfer agent fees. Total transfer agent fees for Class R5 shares are subject to an annual limitation of not more than 0.05% of the average daily net assets attributable to Class R5 shares.
For the six months ended November 30, 2014, the Fund's annualized effective transfer agent fee rates as a percentage of average daily net assets of each class were as follows:
Class A | | | 0.97 | % | |
Class B | | | 0.96 | | |
Class C | | | 0.96 | | |
Class R | | | 0.96 | | |
Class R5 | | | 0.05 | | |
Class W | | | 0.92 | | |
Class Z | | | 0.95 | | |
An annual minimum account balance fee of $20 may apply to certain accounts with a value below the applicable share class's initial minimum investment requirements to reduce the impact of small accounts on transfer agent fees. These minimum account balance fees are remitted to the Fund and recorded as part of expense reductions in the Statement of Operations. For the six months ended November 30, 2014, no minimum account balance fees were charged by the Fund.
Semiannual Report 2014
34
Columbia Absolute Return Emerging Markets Macro Fund
Notes to Financial Statements (continued)
November 30, 2014 (Unaudited)
Distribution Fees
The Fund has an agreement with Columbia Management Investment Distributors, Inc. (the Distributor), an affiliate of the Investment Manager and a wholly-owned subsidiary of Ameriprise Financial, for distribution and shareholder services. Under a Plan and Agreement of Distribution, the Fund pays a fee at an annual rate of up to 0.25% of the Fund's average daily net assets attributable to Class A and Class W shares, a fee at an annual rate of up to 0.50% of the Fund's average daily net assets attributable to Class R shares (of which up to 0.25% may be used for shareholder services) and a fee at an annual rate of up to 1.00% of the Fund's average daily net assets attributable to Class B and Class C shares. For Class B and Class C shares, of the 1.00% fee, up to 0.75% is reimbursed for distribution expenses.
The amount of distribution expenses incurred by the Distributor and not yet reimbursed (unreimbursed expense) was approximately $24,000 for Class C shares. This amount is based on the most recent information available as of September 30, 2014, and may be recovered from future payments under the distribution plan or CDSCs. To the extent the unreimbursed expense has been fully recovered, the distribution fee is reduced.
Sales Charges
Sales charges, including front-end charges and CDSCs, received by the Distributor for distributing Fund shares were $89 for Class A shares for the six months ended November 30, 2014.
Expenses Waived/Reimbursed by the Investment Manager and its Affiliates
The Investment Manager and certain of its affiliates have contractually agreed to waive fees and/or reimburse expenses (excluding certain fees and expenses described below) for the periods disclosed below, unless sooner terminated at the sole discretion of the Board, so that the Fund's net operating expenses, after giving effect to fees waived/expenses reimbursed and any balance credits and/or overdraft charges
from the Fund's custodian, do not exceed the following annual rates as a percentage of the class' average daily net assets:
| | | October 1, 2014
through
September 30, 2015 | | Prior to
October 1, 2014 | |
Class A | | | 1.68 | % | | | 1.53 | % | |
Class B | | | 2.43 | | | | 2.28 | | |
Class C | | | 2.43 | | | | 2.28 | | |
Class I | | | 1.23 | | | | 1.08 | | |
Class R | | | 1.93 | | | | 1.78 | | |
Class R5 | | | 1.28 | | | | 1.13 | | |
Class W | | | 1.68 | | | | 1.53 | | |
Class Z | | | 1.43 | | | | 1.28 | | |
Under the agreement governing these fee waivers and/or expense reimbursement arrangements, the following fees and expenses are excluded from the waiver/reimbursement commitment, and therefore will be paid by the Fund, if applicable: taxes (including foreign transaction taxes), expenses associated with investments in affiliated and non-affiliated pooled investment vehicles (including mutual funds and exchange-traded funds), transaction costs and brokerage commissions, costs related to any securities lending program, dividend expenses associated with securities sold short, inverse floater program fees and expenses, transaction charges and interest on borrowed money, interest, extraordinary expenses and any other expenses the exclusion of which is specifically approved by the Board. This agreement may be modified or amended only with approval from all parties.
Note 4. Federal Tax Information
The timing and character of income and capital gain distributions are determined in accordance with income tax regulations, which may differ from GAAP because of temporary or permanent book to tax differences.
At November 30, 2014, the cost of investments for federal income tax purposes was approximately $74,432,000 and the aggregate gross approximate unrealized appreciation and depreciation based on that cost was:
Unrealized appreciation | | $ | 844,000 | | |
Unrealized depreciation | | | (3,200,000 | ) | |
Net unrealized depreciation | | $ | (2,356,000 | ) | |
Semiannual Report 2014
35
Columbia Absolute Return Emerging Markets Macro Fund
Notes to Financial Statements (continued)
November 30, 2014 (Unaudited)
The following capital loss carryforwards, determined as of May 31, 2014, may be available to reduce taxable income arising from future net realized gains on investments, if any, to the extent permitted by the Internal Revenue Code:
Year of Expiration | | Amount ($) | |
No expiration — short-term | | | 659,811 | | |
Total | | | 659,811 | | |
Management of the Fund has concluded that there are no significant uncertain tax positions in the Fund that would require recognition in the financial statements. However, management's conclusion may be subject to review and adjustment at a later date based on factors including, but not limited to, new tax laws, regulations, and administrative interpretations (including relevant court decisions). Generally, the Fund's federal tax returns for the prior three fiscal years remain subject to examination by the Internal Revenue Service.
Note 5. Portfolio Information
The cost of purchases and proceeds from sales of securities, excluding short-term obligations and certain derivatives, if any, aggregated to $25,541,060 and $13,104,548, respectively, for the six months ended November 30, 2014. The amount of purchase and sale activity impacts the portfolio turnover rate reported in the Financial Highlights.
Note 6. Affiliated Money Market Fund
The Fund significantly invests in Columbia Short-Term Cash Fund, an affiliated money market fund established for the exclusive use by the Fund and other affiliated funds. The income earned by the Fund from such investments is included as Dividends — affiliated issuers in the Statement of Operations. As an investing fund, the Fund indirectly bears its proportionate share of the expenses of Columbia Short-Term Cash Fund.
Note 7. Shareholder Concentration
At November 30, 2014, affiliated shareholders of record owned 99.9% of the outstanding shares of the Fund in one or more accounts. Subscription and redemption activity by concentrated accounts may have a significant effect on the operations of the Fund.
Note 8. Line of Credit
The Fund has entered into a revolving credit facility with a syndicate of banks led by JPMorgan Chase Bank N.A. (JPMorgan) whereby the Fund may borrow for the temporary funding of shareholder redemptions or for other temporary or emergency purposes. The credit facility agreement, as amended, which is a collective agreement between the Fund
and certain other funds managed by the Investment Manager, severally and not jointly, permits collective borrowings up to $500 million. Interest is charged to each participating fund based on its borrowings at a rate equal to the higher of (i) the overnight federal funds rate plus 1.00% or (ii) the one-month LIBOR rate plus 1.00%. Each borrowing under the credit facility matures no later than 60 days after the date of borrowing. The Fund also pays a commitment fee equal to its pro rata share of the amount of the credit facility at a rate of 0.075% per annum. The commitment fee is included in other expenses in the Statement of Operations.
Effective December 9, 2014, the Fund extended its revolving credit facility with JPMorgan. The credit facility agreement, as amended, permits collective borrowings up to $550 million under the same terms and interest rates as described above.
The Fund had no borrowings during the six months ended November 30, 2014.
Note 9. Significant Risks
Derivatives Risk
Losses involving derivative instruments may be substantial, because a relatively small price movement in the underlying security(ies) instrument, commodity, currency or index may result in a substantial loss for the Fund. In addition to the potential for increased losses, the use of derivative instruments may lead to increased volatility within the Fund. Derivatives will typically increase the Fund's exposure to principal risks to which it is otherwise exposed, and may expose the Fund to additional risks, including correlation risk, counterparty risk, hedging risk, leverage risk and liquidity risk.
Credit Risk
Credit risk is the risk that the value of debt securities in the Fund's portfolio may decline because the issuer may default and fail to pay interest or repay principal when due. Rating agencies assign credit ratings to debt securities to indicate their credit risk. Lower rated or unrated debt securities held by the Fund may present increased credit risk as compared to higher-rated debt securities.
Interest Rate Risk
Interest rate risk is the risk of losses attributable to changes in interest rates. In general, if prevailing interest rates rise, the values of debt securities tend to fall, and if interest rates fall, the values of debt securities tend to rise. Actions by governments and central banking authorities can result in increases in interest rates. Increasing interest rates may negatively affect the value of debt securities held by the Fund, resulting in a negative impact on the Fund's performance and net asset value per share. In general, the longer the maturity or
Semiannual Report 2014
36
Columbia Absolute Return Emerging Markets Macro Fund
Notes to Financial Statements (continued)
November 30, 2014 (Unaudited)
duration of a debt security, the greater its sensitivity to changes in interest rates.
Liquidity Risk
Liquidity risk is the risk associated with a lack of marketability of investments which may make it difficult to sell the investment at a desirable time or price. Changing regulatory, market or other conditions or environments (for example, the interest rate or credit environments) may adversely affect the liquidity of the Fund's investments. The Fund may have to accept a lower selling price for the holding, sell other investments, or forego another, more appealing investment opportunity. Generally, the less liquid the market at the time the Fund sells a portfolio investment, the greater the risk of loss or decline of value to the Fund. A less liquid market can lead to an increase in Fund redemptions, which may negatively impact Fund performance and net asset value per share, including, for example, if the Fund is forced to sell securities in a down market.
Foreign Securities and Emerging Market Countries Risk
Investing in foreign securities may include certain risks and considerations not typically associated with investing in U.S. securities, such as fluctuating currency values and changing local and regional economic, political and social conditions, which may result in greater market volatility. In addition, certain foreign securities may not be as liquid as U.S. securities. Investing in emerging markets may accentuate these risks. These countries are also more likely to experience high levels of inflation, deflation or currency devaluation which could hurt their economies and securities markets.
High-Yield Securities Risk
Securities rated below investment grade (commonly called "high-yield" or "junk" bonds) and unrated securities of comparable quality expose the Fund to a greater risk of loss of principal and income than a fund that invests solely or primarily in investment grade securities. In addition, these investments have greater price fluctuations, are less liquid and are more likely to experience a default than higher-rated securities. High-yield securities are considered to be predominantly speculative with respect to the issuer's capacity to pay interest and repay principal.
Non-Diversification Risk
A non-diversified fund is permitted to invest a greater percentage of its total assets in fewer issuers than a diversified fund. The Fund may, therefore, have a greater risk of loss from a few issuers than a similar fund that invests more broadly.
Note 10. Subsequent Events
Management has evaluated the events and transactions that have occurred through the date the financial statements were issued. Other than as noted below and in Note 8 above, there were no items requiring adjustment of the financial statements or additional disclosure.
On January 28, 2015 the Fund's Board of Trustees approved a Plan of Liquidation and Termination (the Plan) pursuant to which the Fund will be liquidated and terminated. Effective at the open of business on February 2, 2015, the Fund is no longer open to new investors. Under the terms of the Plan, it is anticipated that the Fund will be liquidated on or about March 6, 2015, at which time the Fund's shareholders will receive a liquidation distribution in an amount equal to the net asset value of their Fund shares. Shareholders of the Fund may also redeem their investment in the Fund or exchange their Fund shares for shares of another Columbia Fund at any time prior to the date of liquidation.
Note 11. Information Regarding Pending and Settled Legal Proceedings
In December 2005, without admitting or denying the allegations, American Express Financial Corporation (AEFC, which is now known as Ameriprise Financial, Inc. (Ameriprise Financial)) entered into settlement agreements with the Securities and Exchange Commission (SEC) and Minnesota Department of Commerce (MDOC) related to market timing activities. As a result, AEFC was censured and ordered to cease and desist from committing or causing any violations of certain provisions of the Investment Advisers Act of 1940, the Investment Company Act of 1940, and various Minnesota laws. AEFC agreed to pay disgorgement of $10 million and civil money penalties of $7 million. AEFC also agreed to retain an independent distribution consultant to assist in developing a plan for distribution of all disgorgement and civil penalties ordered by the SEC in accordance with various undertakings detailed at www.sec.gov/litigation/admin/ia-2451.pdf. Ameriprise Financial and its affiliates have cooperated with the SEC and the MDOC in these legal proceedings, and have made regular reports to the Funds' Boards of Trustees.
Ameriprise Financial and certain of its affiliates have historically been involved in a number of legal, arbitration and regulatory proceedings, including routine litigation, class actions, and governmental actions, concerning matters arising in connection with the conduct of their business activities. Ameriprise Financial believes that the Funds are not currently the subject of, and that neither Ameriprise Financial nor any of its affiliates are the subject of, any pending legal, arbitration or regulatory proceedings that are likely to have a material
Semiannual Report 2014
37
Columbia Absolute Return Emerging Markets Macro Fund
Notes to Financial Statements (continued)
November 30, 2014 (Unaudited)
adverse effect on the Funds or the ability of Ameriprise Financial or its affiliates to perform under their contracts with the Funds. Ameriprise Financial is required to make quarterly (10-Q), annual (10-K) and, as necessary, 8-K filings with the Securities and Exchange Commission on legal and regulatory matters that relate to Ameriprise Financial and its affiliates. Copies of these filings may be obtained by accessing the SEC website at www.sec.gov.
There can be no assurance that these matters, or the adverse publicity associated with them, will not result in increased fund redemptions, reduced sale of fund shares or other adverse consequences to the Funds. Further, although we believe proceedings are not likely to have a material adverse effect on the Funds or the ability of Ameriprise Financial or its affiliates to perform under their contracts with the Funds, these proceedings are subject to uncertainties and, as such, we are unable to estimate the possible loss or range of loss that may result. An adverse outcome in one or more of these proceedings could result in adverse judgments, settlements, fines, penalties or other relief that could have a material adverse effect on the consolidated financial condition or results of operations of Ameriprise Financial.
Semiannual Report 2014
38
Columbia Absolute Return Emerging Markets Macro Fund
Important Information About This Report
Each fund mails one shareholder report to each shareholder address. If you would like more than one report, please call shareholder services at 800.345.6611 and additional reports will be sent to you.
The policy of the Board is to vote the proxies of the companies in which each fund holds investments consistent with the procedures as stated in the Statement of Additional Information (SAI). You may obtain a copy of the SAI without charge by calling 800.345.6611; contacting your financial intermediary; visiting columbiamanagement.com; or searching the website of the Securities and Exchange Commission (SEC) at sec.gov. Information regarding how each fund voted proxies relating to portfolio securities is filed with the SEC by August 31 for the most recent 12-month period ending June 30 of that year, and is available without charge by visiting columbiamanagement.com; or searching the website of the SEC at sec.gov.
Each fund files a complete schedule of portfolio holdings with the SEC for the first and third quarters of each fiscal year on Form N-Q. Each fund's Form N-Q is available on the SEC's website at sec.gov and may be reviewed and copied at the SEC's Public Reference Room in Washington, D.C. Information on the operation of the Public Reference Room may be obtained by calling 800.SEC.0330. Each fund's complete schedule of portfolio holdings, as filed on Form N-Q, can also be obtained without charge, upon request, by calling 800.345.6611.
Semiannual Report 2014
39

Columbia Absolute Return Emerging Markets Macro Fund
P.O. Box 8081
Boston, MA 02266-8081
columbiamanagement.com
This information is for use with concurrent or prior delivery of a fund prospectus. Please read and consider the investment objectives, risks, charges and expenses for any fund carefully before investing. For a prospectus and, if available, a summary prospectus, which contains this and other important information about the Fund, go to columbiamanagement.com. The Fund is distributed by Columbia Management Investment Distributors, Inc., member FINRA, and managed by Columbia Management Investment Advisers, LLC.
© 2015 Columbia Management Investment Advisers, LLC. All rights reserved.
SAR105_05_E01_(01/15)
Semiannual Report
November 30, 2014

Columbia High Yield Bond Fund
Not FDIC insured • No bank guarantee • May lose value
About Columbia Management
Backed by more than 100 years of experience, Columbia Management is one of the nation's largest asset managers. At the heart of our success — and, most importantly, that of our investors — are some of the most talented professionals in the industry, brought together by a unique way of working.
It starts with carefully selected, specialized investment teams. While each team brings a diverse and innovative range of skills, all are grounded by a common set of core beliefs. All possess a solid conviction in the power of proprietary, bottom-up research. All look not only at generating returns, but also at the likely consistency of those returns and the risks required to achieve them. And while our culture encourages teams to operate independently and question established thinking, a rigorous investment oversight process ensures that each team stays true to its clearly articulated investment process. At Columbia Management, reaching our performance goals matters, and the way we reach them matters just as much.
Columbia funds are distributed by Columbia Management Investment Distributors, Inc., member FINRA, and managed by Columbia Management Investment Advisers, LLC.
© 2015 Columbia Management Investment Advisers, LLC. All rights reserved.
Not part of the shareholder report
Connect with Columbia Management
Get the market insight you need from our investment experts
Investor insight
Stay informed with economic and market commentary, investment videos, white papers, mutual fund commentary and more at columbiamanagement.com.
Columbia Management investor
(e-newsletter)
Read our award-winning* shareholder newsletter. Our quarterly newsletter is available online and provides timely and relevant content about economic trends, fund news, service enhancements and changes. Sign up to receive the newsletter electronically at columbiamanagement.com/newsletter.
Investment videos
Watch and discover what our thought leaders are saying about financial markets and the economy. For an analysis of current events and trends that may affect your investments, visit our online video library at blog.columbiamanagement.com/publications.
Social media
Columbia Management offers you multiple ways to access our market commentary and investment insights.
> Perspectives blog at columbiamanagement.com
Read timely posts by our investment team, including our chief investment officer, chief economist and portfolio managers.
> Twitter.com/ColumbiaMgmt
Follow us on Twitter for quick, up-to-the-minute comments on market news and more.
> Youtube.com/columbiamanagement
View our commentaries on the economy, markets and current investment opportunities.
> Linkedin.com/company/columbia-management
Connect with us on LinkedIn for updates from our thought leaders.
*Columbia Management investor was awarded top honors in the Mutual Fund Education Alliance STAR Awards competition for excellence in mutual fund marketing and communications. Materials in the competition were evaluated on educational value, message comprehension, effective design and objectives.
Not part of the shareholder report
Subscribe to Columbia Management
Get market insight and fund updates delivered to you
Email subscription center
Visit the Columbia Management email subscription center at columbiamanagement.com/subscribe to register for economic and market commentary, product and service updates, white papers and more.
> Columbia Management investor
Quarterly newsletter featuring the latest macro- and micro-economic trends, investment themes, products, service changes and other items of interest to Columbia Management investors
> Investment Strategy Outlook
Quarterly publication featuring the Columbia Management Asset Allocation Team's perspective on global economic investment conditions and markets
> MarketTrack
Quarterly publication featuring more than 40 charts and graphs that highlight the current state of the economy and markets; includes straightforward insight on current investment opportunities
> White papers
Frequent articles that delve deep into a variety of investment topics
> Mutual fund updates
Quarterly portfolio manager commentary and fund fact sheets available for Columbia funds. (Not all funds have a commentary.)
Register today by visiting columbiamanagement.com/subscribe
Not part of the shareholder report
Note: Effective January 1, 2015, Christopher O. Petersen will serve as the President of the Columbia Funds, replacing J. Kevin Connaughton. Mr. Petersen has served as a Fund officer since 2007.
Dear Shareholders,
People invest for different reasons, though typically based on a desire for one or more outcomes, e.g., generating an appropriate income stream in retirement, navigating a changing interest rate environment, maximizing after-tax returns, growing assets to achieve financial goals, or easing the impact of volatile markets. Achieving these desired outcomes can be particularly challenging given the unpredictability of complex global markets. To continue to effectively deliver solutions that help clients achieve desired outcomes, an asset manager must have the resources and investment framework to meaningfully embody a global perspective.
With this in mind, I thought it important to highlight excerpts from a piece written by Jeffrey L. Knight, Global Head of Investment Solutions and Asset Allocation, in which he touches on some of these issues emphasizing the importance of maintaining a diversified portfolio with the flexibility to adapt to changing market conditions.
I encourage you to read the article in its entirety. To access the full article and for other insights on current market events and investment opportunities, please visit the Columbia Management blog at columbiamanagement.com/blog.
On behalf of the Funds, I want to acknowledge the contributions of J. Kevin Connaughton and to thank him for his years of trusted, dedicated service. He has worked tirelessly as an advocate for shareholders and a leader of the Columbia Funds. In taking on this new role, I look forward to continuing the work of Mr. Connaughton, helping build on the strong foundation of the Columbia Funds.
Thank you for your confidence. We look forward to continuing to serve your investment needs for many years to come.
Best regards,

Christopher O. Petersen
President, Columbia Funds
Excerpts from:
2015 Outlook: Same song, slightly different arrangement
By Jeffrey L. Knight, Global Head of Investment Solutions and Asset Allocation
Jeffrey L. Knight, CFA, is global head of investment solutions and asset allocation for Columbia Management Investment Advisers, LLC. Mr. Knight leads a team of six portfolio managers responsible for our broad suite of multi-asset strategies including capital allocation, risk allocation, absolute return and total return funds.
What's different in 2015?
As stationary as market conditions have felt lately, circumstances are always evolving. For 2015, while the essential elements of our outlook remain in place, we highlight two important changes in the market environment:
> The relative value of global equities vs. global bonds actually improved during 2014.
> Monetary policy around the globe has become desynchronized, with the U.S. Federal Reserve (the Fed) contemplating rate hikes, while the European Central Bank (ECB) and the Bank of Japan (BOJ) intensify their monetary stimulus programs.
In our view, while equities will most likely continue to dominate, the complex interactions of today's conditions elevate the role of dynamic risk management. We argue that investors will need a cross-asset surveillance methodology to detect tactical threats.
President's Message (continued)
Monetary policies diverge
The Fed has given strong signals that economic growth in the United States has reached self-sustaining momentum and no longer needs unconventional efforts to support the expansion. The withdrawal and suspension of large-scale asset purchases was only the first step in the evolution toward policy normalization. In 2015, we expect to see a change in forward guidance and, most likely, the first interest rate increase in years.
These actions stand in stark contrast with the direction of the monetary policies of other central banks as they double down on efforts to support growth and avoid deflation. The Bank of Japan has announced its intention to increase both qualitative and quantitative easing on an enormous scale, expanding purchases of Japanese government bonds (JGBs), exchange-traded funds and real estate investment trusts. They intend to coordinate this with government pension investment fund purchases by shifting into riskier assets through sales of JGBs.
With evidence of deterioration on both the economic and inflation front, the European Central Bank (ECB) also plans to take bolder actions. These include increased purchases of asset-backed securities and covered bonds in both the primary and secondary market, together with the long-term refinancing operations that will steer the ECB's balance sheet higher by €1 trillion.
The latest to jump on the bandwagon was the People's Bank of China (PBOC), which cut its benchmark interest rate for the first time in over two years to support private sector investment, as targeted liquidity injections have had minimal effect on sinking economic growth.
Investment strategy for 2015
We remain convinced that relative value favors stocks over bonds, even though stocks outperformed in 2014. Therefore, you will hear the same recommendation from us for 2015. Equities remain the most important asset class for generating returns.
Within equities, the currency-based advantage of U.S. stocks is offset somewhat by the valuation advantage from overseas equities, notably in Japan. Indeed, economic growth in Japan and Europe are essential ingredients for equities to continue to perform well. If Japanese and European stocks cannot produce gains, then the global economy will probably be stuck in a near recessionary funk.
Devising a strategy to manage risk and stabilize portfolio values in the event that equities do not perform well remains complicated. Bond yields are low enough that they are not likely to offer powerful diversification benefits. We affirm our recommendation for three additional sources of portfolio stability:
> Non-traditional diversifiers, such as liquid alternatives, alternative beta exposures and absolute return strategies
> Explicit downside hedges, such as put options (with emphasis on managing the related expense)
> Flexibility and a methodology for active risk reduction when appropriate (Our cross-asset methodologies should prove valuable in this regard.)
Our overall stance for investment strategy will likely remain in place until the valuation advantage for equities has been priced away, or until the healing process for the global economy reverses.
Please visit columbiamanagement.com/blog to read the entire article.
Investors should consider the investment objectives, risks, charges and expenses of a mutual fund carefully before investing. For a free prospectus and, if available, a summary prospectus, which contains this and other important information about a fund, visit columbiamanagement.com. The prospectus should be read carefully before investing.
The views expressed are as of December 2014, may change as market or other conditions change, and may differ from views expressed by other Columbia Management Investment Advisers, LLC (CMIA) associates or affiliates. Actual investments or investment decisions made by CMIA and its affiliates, whether for its own account or on behalf of clients, will not necessarily reflect the views expressed. This information is not intended to provide investment advice and does not account for individual investor circumstances. Investment decisions should always be made based on an investor's specific financial needs, objectives, goals, time horizon and risk tolerance. Asset classes described may not be suitable for all investors. Past performance does not guarantee future results, and no forecast should be considered a guarantee either. Since economic and market change frequently, there can be no assurance that the trends described here will continue or that the forecasts are accurate.
Diversification does not assure a profit or protect against loss.
Columbia Funds are distributed by Columbia Management Investment Distributors, Inc., member FINRA, and managed by Columbia Management Investment Advisers, LLC.
© 2015 Columbia Management Investment Advisers, LLC. All rights reserved
Columbia High Yield Bond Fund
Performance Overview | | | 4 | | |
Portfolio Overview | | | 5 | | |
Understanding Your Fund's Expenses | | | 6 | | |
Portfolio of Investments | | | 7 | | |
Statement of Assets and Liabilities | | | 21 | | |
Statement of Operations | | | 23 | | |
Statement of Changes in Net Assets | | | 24 | | |
Financial Highlights | | | 27 | | |
Notes to Financial Statements | | | 38 | | |
Important Information About This Report | | | 47 | | |
Fund Investment Manager
Columbia Management Investment
Advisers, LLC
225 Franklin Street
Boston, MA 02110
Fund Distributor
Columbia Management Investment
Distributors, Inc.
225 Franklin Street
Boston, MA 02110
Fund Transfer Agent
Columbia Management Investment
Services Corp.
P.O. Box 8081
Boston, MA 02266-8081
For more information about any of the funds, please visit columbiamanagement.com or call 800.345.6611. Customer Service Representatives are available to answer your questions Monday through Friday from 8 a.m. to 7 p.m. Eastern time.
The views expressed in this report reflect the current views of the respective parties. These views are not guarantees of future performance and involve certain risks, uncertainties and assumptions that are difficult to predict, so actual outcomes and results may differ significantly from the views expressed. These views are subject to change at any time based upon economic, market or other conditions and the respective parties disclaim any responsibility to update such views. These views may not be relied on as investment advice and, because investment decisions for a Columbia Fund are based on numerous factors, may not be relied on as an indication of trading intent on behalf of any particular Columbia Fund. References to specific securities should not be construed as a recommendation or investment advice.
Columbia High Yield Bond Fund
Performance Overview
(Unaudited)
Performance Summary
> Columbia High Yield Bond Fund (the Fund) Class A shares returned 0.10% excluding sales charges for the six-month period that ended November 30, 2014.
> The Fund outperformed its benchmark, the Bank of America Merrill Lynch (BofAML) U.S. Cash Pay High Yield Constrained Index, which returned -0.64% for the same time period.
Average Annual Total Returns (%) (for period ended November 30, 2014)
| | | Inception | | 6 Months
cumulative | | 1 Year | | 5 Years | | 10 Years | |
Class A | | 12/08/83 | | | | | | | | | | | | | | | | | |
Excluding sales charges | | | | | | | 0.10 | | | | 4.83 | | | | 9.34 | | | | 7.47 | | |
Including sales charges | | | | | | | -4.61 | | | | -0.19 | | | | 8.28 | | | | 6.93 | | |
Class B | | 03/20/95 | | | | | | | | | | | | | | | | | |
Excluding sales charges | | | | | | | -0.28 | | | | 4.05 | | | | 8.52 | | | | 6.66 | | |
Including sales charges | | | | | | | -5.16 | | | | -0.93 | | | | 8.23 | | | | 6.66 | | |
Class C | | 06/26/00 | | | | | | | | | | | | | | | | | |
Excluding sales charges | | | | | | | -0.24 | | | | 4.18 | | | | 8.51 | | | | 6.65 | | |
Including sales charges | | | | | | | -1.22 | | | | 3.18 | | | | 8.51 | | | | 6.65 | | |
Class I | | 03/04/04 | | | 0.63 | | | | 5.26 | | | | 9.78 | | | | 7.85 | | |
Class K | | 03/20/95 | | | 0.15 | | | | 4.95 | | | | 9.45 | | | | 7.61 | | |
Class R* | | 12/11/06 | | | -0.02 | | | | 4.57 | | | | 9.04 | | | | 7.17 | | |
Class R4* | | 12/11/06 | | | 0.24 | | | | 5.10 | | | | 9.34 | | | | 7.48 | | |
Class R5* | | 12/11/06 | | | -0.06 | | | | 4.86 | | | | 9.65 | | | | 7.72 | | |
Class W* | | 12/01/06 | | | 0.08 | | | | 4.82 | | | | 9.35 | | | | 7.39 | | |
Class Y* | | 11/08/12 | | | 0.30 | | | | 5.25 | | | | 9.52 | | | | 7.56 | | |
Class Z* | | 09/27/10 | | | 0.22 | | | | 5.09 | | | | 9.56 | | | | 7.58 | | |
BofAML U.S. Cash Pay High Yield Constrained Index | | | | | | | -0.64 | | | | 4.56 | | | | 9.80 | | | | 7.85 | | |
Returns for Class A are shown with and without the maximum initial sales charge of 4.75%. Returns for Class B are shown with and without the applicable contingent deferred sales charge (CDSC) of 5.00% in the first year, declining to 1.00% in the sixth year and eliminated thereafter. Returns for Class C are shown with and without the 1.00% CDSC for the first year only. The Fund's other classes are not subject to sales charges and have limited eligibility. Please see the Fund's prospectus for details. Performance for different share classes will vary based on differences in sales charges and fees associated with each class. All results shown assume reinvestment of distributions during the period. Returns do not reflect the deduction of taxes that a shareholder may pay on Fund distributions or on the redemption of Fund shares. Performance results reflect the effect of any fee waivers or reimbursements of Fund expenses by Columbia Management Investment Advisers, LLC and/or any of its affiliates. Absent these fee waivers or expense reimbursement arrangements, performance results would have been lower.
The performance information shown represents past performance and is not a guarantee of future results. The investment return and principal value of your investment will fluctuate so that your shares, when redeemed, may be worth more or less than their original cost. Current performance may be lower or higher than the performance information shown. You may obtain performance information current to the most recent month-end by contacting your financial intermediary, visiting columbiamanagement.com or calling 800.345.6611.
*The returns shown for periods prior to the share class inception date (including returns for the Life of the Fund, if shown, which are since Fund inception) include the returns of the Fund's oldest share class. These returns are adjusted to reflect any higher class-related operating expenses of the newer share classes, as applicable. Please visit columbiamanagement.com/investment-products/mutual-funds/appended-performance for more information.
The BofAML U.S. Cash Pay High Yield Constrained Index tracks the performance of U.S. dollar-denominated below investment grade corporate debt, currently in a coupon paying period that is publicly issued in the U.S. domestic market.
Indices are not available for investment, are not professionally managed and do not reflect sales charges, fees, brokerage commissions, taxes or other expenses of investing. Securities in the Fund may not match those in an index.
Semiannual Report 2014
4
Columbia High Yield Bond Fund
Portfolio Overview
(Unaudited)
Portfolio Breakdown (%)
(at November 30, 2014) | |
Common Stocks | | | 0.0 | (a) | |
Financials | | | 0.0 | (a) | |
Corporate Bonds & Notes | | | 95.8 | | |
Limited Partnerships | | | 0.0 | (a) | |
Money Market Funds | | | 1.9 | | |
Municipal Bonds | | | 0.1 | | |
Senior Loans | | | 2.2 | | |
Total | | | 100.0 | | |
Percentages indicated are based upon total investments. The Fund's portfolio composition is subject to change.
(a) Rounds to zero.
Quality Breakdown (%)
(at November 30, 2014) | |
BBB rating | | | 1.7 | | |
BB rating | | | 42.5 | | |
B rating | | | 41.8 | | |
CCC rating | | | 12.3 | | |
Not rated | | | 1.7 | | |
Total | | | 100.0 | | |
Percentages indicated are based upon total fixed income securities (excluding Money Market Funds).
Bond ratings apply to the underlying holdings of the Fund and not the Fund itself and are divided into categories ranging from highest to lowest credit quality, determined by using the average rating of Moody's, S&P and Fitch. When ratings are available from only two rating agencies, the average of the two rating is used. When a rating is available from only one rating agency, that rating is used. When a bond is not rated by any rating agency, it is designated as "Not rated". Credit quality ratings assigned by a rating agency are subjective opinions, not statements of fact, and are subject to change, including daily. The ratings assigned by credit rating agencies are but one of the considerations that the Investment Manager and/or Fund's subadviser incorporates into its credit analysis process, along with such other issuer-specific factors as cash flows, capital structure and leverage ratios, ability to de-leverage (repay) through free cash flow, quality of management, market positioning and access to capital, as well as such security-specific factors as the terms of the security (e.g., interest rate, and time to maturity) and the amount and type of any collateral.
Portfolio Management
Jennifer Ponce de Leon
Brian Lavin, CFA
Semiannual Report 2014
5
Columbia High Yield Bond Fund
Understanding Your Fund's Expenses
(Unaudited)
As an investor, you incur two types of costs. There are transaction costs, which generally include sales charges on purchases and may include redemption fees. There are also ongoing costs, which generally include management fees, distribution and/or service fees, and other fund expenses. The following information is intended to help you understand your ongoing costs (in dollars) of investing in the Fund and to help you compare these costs with the ongoing costs of investing in other mutual funds.
Analyzing Your Fund's Expenses
To illustrate these ongoing costs, we have provided examples and calculated the expenses paid by investors in each share class of the Fund during the period. The actual and hypothetical information in the table is based on an initial investment of $1,000 at the beginning of the period indicated and held for the entire period. Expense information is calculated two ways and each method provides you with different information. The amount listed in the "Actual" column is calculated using the Fund's actual operating expenses and total return for the period. You may use the Actual information, together with the amount invested, to estimate the expenses that you paid over the period. Simply divide your account value by $1,000 (for example, an $8,600 account value divided by $1,000 = 8.6), then multiply the results by the expenses paid during the period under the "Actual" column. The amount listed in the "Hypothetical" column assumes a 5% annual rate of return before expenses (which is not the Fund's actual return) and then applies the Fund's actual expense ratio for the period to the hypothetical return. You should not use the hypothetical account values and expenses to estimate either your actual account balance at the end of the period or the expenses you paid during the period. See "Compare With Other Funds" below for details on how to use the hypothetical data.
Compare With Other Funds
Since all mutual funds are required to include the same hypothetical calculations about expenses in shareholder reports, you can use this information to compare the ongoing cost of investing in the Fund with other funds. To do so, compare the hypothetical example with the 5% hypothetical examples that appear in the shareholder reports of other funds. As you compare hypothetical examples of other funds, it is important to note that hypothetical examples are meant to highlight the ongoing costs of investing in a fund only and do not reflect any transaction costs, such as sales charges, or redemption or exchange fees. Therefore, the hypothetical calculations are useful in comparing ongoing costs only, and will not help you determine the relative total costs of owning different funds. If transaction costs were included in these calculations, your costs would be higher.
June 1, 2014 – November 30, 2014
| | | Account Value at the Beginning
of the Period ($) | | Account Value at the End of the
Period ($) | | Expenses Paid During the
Period ($) | | Fund's Annualized
Expense Ratio (%) | |
| | | Actual | | Hypothetical | | Actual | | Hypothetical | | Actual | | Hypothetical | | Actual | |
Class A | | | 1,000.00 | | | | 1,000.00 | | | | 1,001.00 | | | | 1,019.60 | | | | 5.34 | | | | 5.39 | | | | 1.07 | | |
Class B | | | 1,000.00 | | | | 1,000.00 | | | | 997.20 | | | | 1,015.91 | | | | 9.01 | | | | 9.10 | | | | 1.81 | | |
Class C | | | 1,000.00 | | | | 1,000.00 | | | | 997.60 | | | | 1,016.40 | | | | 8.52 | | | | 8.60 | | | | 1.71 | | |
Class I | | | 1,000.00 | | | | 1,000.00 | | | | 1,006.30 | | | | 1,021.69 | | | | 3.25 | | | | 3.28 | | | | 0.65 | | |
Class K | | | 1,000.00 | | | | 1,000.00 | | | | 1,001.50 | | | | 1,020.19 | | | | 4.74 | | | | 4.78 | | | | 0.95 | | |
Class R | | | 1,000.00 | | | | 1,000.00 | | | | 999.80 | | | | 1,018.35 | | | | 6.58 | | | | 6.64 | | | | 1.32 | | |
Class R4 | | | 1,000.00 | | | | 1,000.00 | | | | 1,002.40 | | | | 1,020.84 | | | | 4.09 | | | | 4.13 | | | | 0.82 | | |
Class R5 | | | 1,000.00 | | | | 1,000.00 | | | | 999.40 | | | | 1,021.39 | | | | 3.54 | | | | 3.58 | | | | 0.71 | | |
Class W | | | 1,000.00 | | | | 1,000.00 | | | | 1,000.80 | | | | 1,019.60 | | | | 5.34 | | | | 5.39 | | | | 1.07 | | |
Class Y | | | 1,000.00 | | | | 1,000.00 | | | | 1,003.00 | | | | 1,021.69 | | | | 3.25 | | | | 3.28 | | | | 0.65 | | |
Class Z | | | 1,000.00 | | | | 1,000.00 | | | | 1,002.20 | | | | 1,020.84 | | | | 4.09 | | | | 4.13 | | | | 0.82 | | |
Expenses paid during the period are equal to the annualized expense ratio for each class as indicated above, multiplied by the average account value over the period and then multiplied by the number of days in the Fund's most recent fiscal half year and divided by 365.
Expenses do not include fees and expenses incurred indirectly by the Fund from its investment in underlying funds, including affiliated and non-affiliated pooled investment vehicles, such as mutual funds and exchange-traded funds.
Had Columbia Management Investment Advisers, LLC and/or certain of its affiliates not waived/reimbursed certain fees and expenses, account value at the end of the period would have been reduced.
Semiannual Report 2014
6
Columbia High Yield Bond Fund
Portfolio of Investments
November 30, 2014 (Unaudited)
(Percentages represent value of investments compared to net assets)
Corporate Bonds & Notes 93.4%
Issuer | | Coupon
Rate | | Principal
Amount ($) | | Value ($) | |
Aerospace & Defense 0.8% | |
Bombardier, Inc.(a)
Senior Unsecured
03/15/20 | | | 7.750 | % | | | 2,332,000 | | | | 2,565,200 | | |
10/15/22 | | | 6.000 | % | | | 3,496,000 | | | | 3,553,509 | | |
01/15/23 | | | 6.125 | % | | | 2,078,000 | | | | 2,137,743 | | |
Huntington Ingalls Industries, Inc.(a)(b)
12/15/21 | | | 5.000 | % | | | 1,025,000 | | | | 1,041,656 | | |
TransDigm, Inc.
07/15/21 | | | 7.500 | % | | | 2,535,000 | | | | 2,718,787 | | |
07/15/22 | | | 6.000 | % | | | 903,000 | | | | 912,030 | | |
07/15/24 | | | 6.500 | % | | | 2,138,000 | | | | 2,180,760 | | |
Total | | | | | | | 15,109,685 | | |
Automotive 2.2% | |
Allison Transmission, Inc.(a)
05/15/19 | | | 7.125 | % | | | 4,538,000 | | | | 4,753,555 | | |
American Axle & Manufacturing, Inc.
03/15/21 | | | 6.250 | % | | | 3,464,000 | | | | 3,663,180 | | |
Chrysler Group LLC/Co-Issuer, Inc.
Secured
06/15/21 | | | 8.250 | % | | | 5,104,000 | | | | 5,690,960 | | |
Gates Global LLC/Co.(a)
07/15/22 | | | 6.000 | % | | | 3,518,000 | | | | 3,421,255 | | |
General Motors Co.
Senior Unsecured
10/02/23 | | | 4.875 | % | | | 8,605,000 | | | | 9,121,300 | | |
General Motors Financial Co., Inc.
09/25/21 | | | 4.375 | % | | | 3,318,000 | | | | 3,438,278 | | |
Jaguar Land Rover Automotive PLC(a)
11/15/19 | | | 4.250 | % | | | 1,982,000 | | | | 2,016,685 | | |
Schaeffler Finance BV(a)
Senior Secured
05/15/21 | | | 4.250 | % | | | 1,774,000 | | | | 1,738,520 | | |
05/15/21 | | | 4.750 | % | | | 3,449,000 | | | | 3,440,377 | | |
Schaeffler Holding Finance BV(a)
Senior Secured PIK
08/15/18 | | | 6.875 | % | | | 2,634,000 | | | | 2,755,823 | | |
11/15/19 | | | 6.250 | % | | | 3,478,000 | | | | 3,638,857 | | |
Total | | | | | | | 43,678,790 | | |
Banking 2.6% | |
Ally Financial, Inc.
03/15/20 | | | 8.000 | % | | | 21,794,000 | | | | 25,825,890 | | |
Senior Unsecured
09/30/24 | | | 5.125 | % | | | 5,452,000 | | | | 5,561,040 | | |
Royal Bank of Scotland Group PLC
Subordinated Notes
05/28/24 | | | 5.125 | % | | | 8,152,000 | | | | 8,312,228 | | |
Corporate Bonds & Notes (continued)
Issuer | | Coupon
Rate | | Principal
Amount ($) | | Value ($) | |
Royal Bank of Scotland PLC (The)
Subordinated Notes(c)
03/16/22 | | | 9.500 | % | | | 1,230,000 | | | | 1,408,658 | | |
Synovus Financial Corp.
Senior Unsecured
02/15/19 | | | 7.875 | % | | | 8,045,000 | | | | 9,070,737 | | |
Subordinated Notes
06/15/17 | | | 5.125 | % | | | 1,628,000 | | | | 1,664,630 | | |
Total | | | | | | | 51,843,183 | | |
Brokerage/Asset Managers/Exchanges 0.6% | |
E*TRADE Financial Corp.
Senior Unsecured
11/15/19 | | | 6.375 | % | | | 7,066,000 | | | | 7,560,620 | | |
11/15/22 | | | 5.375 | % | | | 4,767,000 | | | | 4,814,670 | | |
Total | | | | | | | 12,375,290 | | |
Building Materials 1.9% | |
Allegion US Holding Co., Inc.
10/01/21 | | | 5.750 | % | | | 1,688,000 | | | | 1,772,400 | | |
American Builders & Contractors Supply Co., Inc.
Senior Unsecured(a)
04/15/21 | | | 5.625 | % | | | 6,753,000 | | | | 6,820,530 | | |
Building Materials Corp. of America
Senior Unsecured(a)
11/15/24 | | | 5.375 | % | | | 5,546,000 | | | | 5,546,000 | | |
Gibraltar Industries, Inc.
02/01/21 | | | 6.250 | % | | | 1,557,000 | | | | 1,599,818 | | |
HD Supply, Inc.
07/15/20 | | | 7.500 | % | | | 9,109,000 | | | | 9,609,995 | | |
07/15/20 | | | 11.500 | % | | | 2,860,000 | | | | 3,317,600 | | |
HD Supply, Inc.(a)(b)
Senior Secured
12/15/21 | | | 5.250 | % | | | 3,465,000 | | | | 3,538,631 | | |
Nortek, Inc.
04/15/21 | | | 8.500 | % | | | 4,798,000 | | | | 5,157,850 | | |
Total | | | | | | | 37,362,824 | | |
Cable and Satellite 6.9% | |
CCO Holdings LLC/Capital Corp.
03/15/21 | | | 5.250 | % | | | 8,753,000 | | | | 8,807,706 | | |
04/30/21 | | | 6.500 | % | | | 3,992,000 | | | | 4,201,580 | | |
01/31/22 | | | 6.625 | % | | | 1,594,000 | | | | 1,695,618 | | |
09/30/22 | | | 5.250 | % | | | 706,000 | | | | 702,470 | | |
CCOH Safari LLC
12/01/22 | | | 5.500 | % | | | 2,974,000 | | | | 3,007,457 | | |
12/01/24 | | | 5.750 | % | | | 12,823,000 | | | | 12,903,144 | | |
CSC Holdings LLC
Senior Unsecured
02/15/19 | | | 8.625 | % | | | 4,838,000 | | | | 5,630,222 | | |
The accompanying Notes to Financial Statements are an integral part of this statement.
Semiannual Report 2014
7
Columbia High Yield Bond Fund
Portfolio of Investments (continued)
November 30, 2014 (Unaudited)
Corporate Bonds & Notes (continued)
Issuer | | Coupon
Rate | | Principal
Amount ($) | | Value ($) | |
CSC Holdings, Inc.
Senior Unsecured
11/15/21 | | | 6.750 | % | | | 7,260,000 | | | | 8,022,300 | | |
Cequel Communications Holdings I LLC/Capital Corp.(a)
Senior Unsecured
09/15/20 | | | 6.375 | % | | | 6,588,000 | | | | 6,835,050 | | |
12/15/21 | | | 5.125 | % | | | 4,097,000 | | | | 3,953,605 | | |
DISH DBS Corp.
09/01/19 | | | 7.875 | % | | | 2,518,000 | | | | 2,876,815 | | |
06/01/21 | | | 6.750 | % | | | 11,284,000 | | | | 12,257,245 | | |
07/15/22 | | | 5.875 | % | | | 1,308,000 | | | | 1,352,309 | | |
DISH DBS Corp.(a)
11/15/24 | | | 5.875 | % | | | 1,050,000 | | | | 1,057,875 | | |
DigitalGlobe, Inc.(a)
02/01/21 | | | 5.250 | % | | | 4,050,000 | | | | 3,888,000 | | |
Hughes Satellite Systems Corp.
06/15/21 | | | 7.625 | % | | | 6,725,000 | | | | 7,464,750 | | |
Intelsat Jackson Holdings SA
10/15/20 | | | 7.250 | % | | | 3,575,000 | | | | 3,793,969 | | |
Senior Unsecured
04/01/21 | | | 7.500 | % | | | 4,480,000 | | | | 4,804,800 | | |
Intelsat Luxembourg SA
06/01/21 | | | 7.750 | % | | | 1,736,000 | | | | 1,798,930 | | |
06/01/23 | | | 8.125 | % | | | 4,876,000 | | | | 5,095,420 | | |
Mediacom Broadband LLC/Corp.
04/15/21 | | | 5.500 | % | | | 702,000 | | | | 712,530 | | |
Numericable-SFR(a)
Senior Secured
05/15/19 | | | 4.875 | % | | | 3,325,000 | | | | 3,287,594 | | |
05/15/22 | | | 6.000 | % | | | 8,271,000 | | | | 8,401,434 | | |
Quebecor Media, Inc.
Senior Unsecured
01/15/23 | | | 5.750 | % | | | 6,364,000 | | | | 6,523,100 | | |
Unitymedia Hessen GmbH & Co. KG NRW
Senior Secured(a)
01/15/23 | | | 5.500 | % | | | 1,972,000 | | | | 2,050,880 | | |
Unitymedia KabelBW GmbH(a)
01/15/25 | | | 6.125 | % | | | 5,232,000 | | | | 5,473,980 | | |
Videotron Ltd.
07/15/22 | | | 5.000 | % | | | 3,578,000 | | | | 3,676,395 | | |
Videotron Ltd.(a)
06/15/24 | | | 5.375 | % | | | 2,137,000 | | | | 2,185,082 | | |
Virgin Media Finance PLC(a)
10/15/24 | | | 6.000 | % | | | 1,618,000 | | | | 1,694,855 | | |
Virgin Media Secured Finance PLC
Senior Secured(a)
04/15/21 | | | 5.375 | % | | | 1,805,000 | | | | 1,859,150 | | |
Total | | | | | | | 136,014,265 | | |
Corporate Bonds & Notes (continued)
Issuer | | Coupon
Rate | | Principal
Amount ($) | | Value ($) | |
Chemicals 3.0% | |
Axalta Coating Systems Dutch Holding B BV/U.S.
Holdings, Inc.(a)
05/01/21 | | | 7.375 | % | | | 5,083,000 | | | | 5,496,248 | | |
Celanese U.S. Holdings LLC
06/15/21 | | | 5.875 | % | | | 3,280,000 | | | | 3,534,200 | | |
Eco Services Operations LLC/Finance Corp.
Senior Unsecured(a)
11/01/22 | | | 8.500 | % | | | 1,848,000 | | | | 1,912,680 | | |
Huntsman International LLC
03/15/21 | | | 8.625 | % | | | 490,000 | | | | 531,650 | | |
Huntsman International LLC(a)
11/15/22 | | | 5.125 | % | | | 3,424,000 | | | | 3,424,000 | | |
INEOS Group Holdings SA(a)
08/15/18 | | | 6.125 | % | | | 975,000 | | | | 959,254 | | |
02/15/19 | | | 5.875 | % | | | 4,876,000 | | | | 4,741,910 | | |
JM Huber Corp.
Senior Unsecured(a)
11/01/19 | | | 9.875 | % | | | 4,940,000 | | | | 5,434,000 | | |
NOVA Chemicals Corp.(a)
Senior Unsecured
08/01/23 | | | 5.250 | % | | | 1,190,000 | | | | 1,246,525 | | |
05/01/25 | | | 5.000 | % | | | 6,585,000 | | | | 6,807,243 | | |
PQ Corp.
Secured(a)
05/01/18 | | | 8.750 | % | | | 19,069,000 | | | | 20,022,450 | | |
WR Grace & Co.(a)
10/01/21 | | | 5.125 | % | | | 2,794,000 | | | | 2,898,775 | | |
10/01/24 | | | 5.625 | % | | | 2,024,000 | | | | 2,137,850 | | |
Total | | | | | | | 59,146,785 | | |
Construction Machinery 1.5% | |
Ashtead Capital, Inc.(a)
Secured
07/15/22 | | | 6.500 | % | | | 2,337,000 | | | | 2,512,275 | | |
10/01/24 | | | 5.625 | % | | | 2,325,000 | | | | 2,429,625 | | |
CNH Industrial Capital LLC
Senior Unsecured(a)
07/15/19 | | | 3.375 | % | | | 1,430,000 | | | | 1,379,950 | | |
Columbus McKinnon Corp.
02/01/19 | | | 7.875 | % | | | 2,136,000 | | | | 2,232,120 | | |
H&E Equipment Services, Inc.
09/01/22 | | | 7.000 | % | | | 3,938,000 | | | | 4,184,125 | | |
United Rentals North America, Inc.
05/15/20 | | | 7.375 | % | | | 3,182,000 | | | | 3,436,560 | | |
04/15/22 | | | 7.625 | % | | | 3,460,000 | | | | 3,823,300 | | |
06/15/23 | | | 6.125 | % | | | 4,581,000 | | | | 4,844,407 | | |
The accompanying Notes to Financial Statements are an integral part of this statement.
Semiannual Report 2014
8
Columbia High Yield Bond Fund
Portfolio of Investments (continued)
November 30, 2014 (Unaudited)
Corporate Bonds & Notes (continued)
Issuer | | Coupon
Rate | | Principal
Amount ($) | | Value ($) | |
Secured
07/15/18 | | | 5.750 | % | | | 744,000 | | | | 777,480 | | |
Senior Unsecured
02/01/21 | | | 8.250 | % | | | 2,760,000 | | | | 3,001,500 | | |
Total | | | | | | | 28,621,342 | | |
Consumer Cyclical Services 1.4% | |
ADT Corp. (The)
Senior Unsecured
07/15/22 | | | 3.500 | % | | | 3,676,000 | | | | 3,216,500 | | |
APX Group, Inc.
12/01/20 | | | 8.750 | % | | | 6,746,000 | | | | 5,936,480 | | |
Senior Secured
12/01/19 | | | 6.375 | % | | | 9,541,000 | | | | 9,135,507 | | |
IHS, Inc.(a)
11/01/22 | | | 5.000 | % | | | 5,377,000 | | | | 5,457,655 | | |
Monitronics International, Inc.
04/01/20 | | | 9.125 | % | | | 4,428,000 | | | | 4,389,255 | | |
Total | | | | | | | 28,135,397 | | |
Consumer Products 1.7% | |
Serta Simmons Holdings LLC
Senior Unsecured(a)
10/01/20 | | | 8.125 | % | | | 7,566,000 | | | | 8,038,875 | | |
Spectrum Brands, Inc.
03/15/20 | | | 6.750 | % | | | 4,535,000 | | | | 4,790,094 | | |
11/15/20 | | | 6.375 | % | | | 4,769,000 | | | | 5,019,373 | | |
11/15/22 | | | 6.625 | % | | | 2,456,000 | | | | 2,615,640 | | |
Springs Industries, Inc.
Senior Secured
06/01/21 | | | 6.250 | % | | | 6,188,000 | | | | 6,033,300 | | |
Tempur Sealy International, Inc.
12/15/20 | | | 6.875 | % | | | 7,429,000 | | | | 7,967,602 | | |
Total | | | | | | | 34,464,884 | | |
Diversified Manufacturing 1.2% | |
Amsted Industries, Inc.(a)
03/15/22 | | | 5.000 | % | | | 4,033,000 | | | | 3,972,505 | | |
09/15/24 | | | 5.375 | % | | | 4,504,000 | | | | 4,458,960 | | |
Entegris, Inc.(a)
04/01/22 | | | 6.000 | % | | | 5,733,000 | | | | 5,921,042 | | |
Hamilton Sundstrand Corp.
Senior Unsecured(a)
12/15/20 | | | 7.750 | % | | | 9,112,000 | | | | 9,203,120 | | |
Total | | | | | | | 23,555,627 | | |
Electric 1.3% | |
AES Corp. (The)
Senior Unsecured
07/01/21 | | | 7.375 | % | | | 6,751,000 | | | | 7,729,895 | | |
Corporate Bonds & Notes (continued)
Issuer | | Coupon
Rate | | Principal
Amount ($) | | Value ($) | |
Calpine Corp.
Senior Secured(a)
01/15/22 | | | 6.000 | % | | | 6,846,000 | | | | 7,308,105 | | |
NRG Energy, Inc.
07/15/22 | | | 6.250 | % | | | 8,788,000 | | | | 9,029,670 | | |
NRG Yield Operating LLC(a)
08/15/24 | | | 5.375 | % | | | 2,005,000 | | | | 2,035,075 | | |
Total | | | | | | | 26,102,745 | | |
Environmental 0.2% | |
Clean Harbors, Inc.
08/01/20 | | | 5.250 | % | | | 3,957,000 | | | | 3,996,570 | | |
Finance Companies 5.1% | |
AerCap Ireland Capital Ltd./Global Aviation Trust(a)
05/15/21 | | | 4.500 | % | | | 14,557,000 | | | | 14,738,962 | | |
Senior Unsecured
10/01/21 | | | 5.000 | % | | | 6,376,000 | | | | 6,631,040 | | |
Aviation Capital Group Corp.
Senior Unsecured(a)
04/06/21 | | | 6.750 | % | | | 262,000 | | | | 298,680 | | |
CIT Group, Inc.
Senior Unsecured
05/15/20 | | | 5.375 | % | | | 4,897,000 | | | | 5,203,062 | | |
CIT Group, Inc.(a)
Senior Secured
04/01/18 | | | 6.625 | % | | | 5,360,000 | | | | 5,842,400 | | |
Senior Unsecured
02/15/19 | | | 5.500 | % | | | 4,115,000 | | | | 4,351,613 | | |
International Lease Finance Corp.
Senior Unsecured
09/01/17 | | | 8.875 | % | | | 6,420,000 | | | | 7,342,875 | | |
05/15/19 | | | 6.250 | % | | | 4,809,000 | | | | 5,253,832 | | |
12/15/20 | | | 8.250 | % | | | 2,425,000 | | | | 2,940,313 | | |
04/15/21 | | | 4.625 | % | | | 3,743,000 | | | | 3,808,503 | | |
01/15/22 | | | 8.625 | % | | | 719,000 | | | | 891,560 | | |
Navient Corp.
Senior Unsecured
10/26/20 | | | 5.000 | % | | | 857,000 | | | | 852,715 | | |
01/25/22 | | | 7.250 | % | | | 4,381,000 | | | | 4,808,148 | | |
03/25/24 | | | 6.125 | % | | | 3,617,000 | | | | 3,617,000 | | |
10/25/24 | | | 5.875 | % | | | 8,487,000 | | | | 8,253,607 | | |
Provident Funding Associates LP/Finance Corp.(a)
06/15/21 | | | 6.750 | % | | | 6,421,000 | | | | 6,348,764 | | |
Senior Unsecured
02/15/19 | | | 10.125 | % | | | 1,182,000 | | | | 1,252,920 | | |
Springleaf Finance Corp.
12/15/17 | | | 6.900 | % | | | 2,959,000 | | | | 3,254,900 | | |
06/01/20 | | | 6.000 | % | | | 2,772,000 | | | | 2,862,090 | | |
10/01/21 | | | 7.750 | % | | | 3,223,000 | | | | 3,625,875 | | |
10/01/23 | | | 8.250 | % | | | 2,221,000 | | | | 2,520,835 | | |
The accompanying Notes to Financial Statements are an integral part of this statement.
Semiannual Report 2014
9
Columbia High Yield Bond Fund
Portfolio of Investments (continued)
November 30, 2014 (Unaudited)
Corporate Bonds & Notes (continued)
Issuer | | Coupon
Rate | | Principal
Amount ($) | | Value ($) | |
iStar Financial, Inc
Senior Unsecured
07/01/19 | | | 5.000 | % | | | 5,845,000 | | | | 5,728,100 | | |
Total | | | | | | | 100,427,794 | | |
Food and Beverage 1.3% | |
B&G Foods, Inc.
06/01/21 | | | 4.625 | % | | | 7,291,000 | | | | 7,017,588 | | |
Constellation Brands, Inc.
11/15/19 | | | 3.875 | % | | | 1,345,000 | | | | 1,370,017 | | |
11/15/24 | | | 4.750 | % | | | 3,445,000 | | | | 3,513,900 | | |
Darling Ingredients, Inc.
01/15/22 | | | 5.375 | % | | | 3,277,000 | | | | 3,309,770 | | |
Diamond Foods, Inc.(a)
03/15/19 | | | 7.000 | % | | | 1,564,000 | | | | 1,610,920 | | |
Pinnacle Foods Finance LLC/Corp.
05/01/21 | | | 4.875 | % | | | 863,000 | | | | 854,370 | | |
Post Holdings, Inc.(a)
12/15/22 | | | 6.000 | % | | | 2,342,000 | | | | 2,207,335 | | |
WhiteWave Foods Co. (The)
10/01/22 | | | 5.375 | % | | | 4,946,000 | | | | 5,193,300 | | |
Total | | | | | | | 25,077,200 | | |
Gaming 4.1% | |
GLP Capital LP/Financing II, Inc.
11/01/20 | | | 4.875 | % | | | 3,965,000 | | | | 4,034,388 | | |
11/01/23 | | | 5.375 | % | | | 715,000 | | | | 732,875 | | |
MGM Resorts International
03/01/18 | | | 11.375 | % | | | 7,001,000 | | | | 8,418,702 | | |
10/01/20 | | | 6.750 | % | | | 3,344,000 | | | | 3,603,160 | | |
12/15/21 | | | 6.625 | % | | | 6,129,000 | | | | 6,542,707 | | |
03/15/23 | | | 6.000 | % | | | 10,105,000 | | | | 10,256,575 | | |
Penn National Gaming, Inc.
Senior Unsecured
11/01/21 | | | 5.875 | % | | | 4,236,000 | | | | 3,992,430 | | |
Pinnacle Entertainment, Inc.
08/01/21 | | | 6.375 | % | | | 5,101,000 | | | | 5,317,793 | | |
SGMS Escrow Corp.
Senior Unsecured(a)
12/01/22 | | | 10.000 | % | | | 13,747,000 | | | | 12,853,445 | | |
Scientific Games International, Inc.
Senior Secured(a)
01/01/22 | | | 7.000 | % | | | 8,878,000 | | | | 8,933,487 | | |
Seminole Tribe of Florida, Inc.(a)
Senior Secured
10/01/20 | | | 6.535 | % | | | 4,795,000 | | | | 5,154,625 | | |
Senior Unsecured
10/01/20 | | | 7.804 | % | | | 2,440,000 | | | | 2,660,332 | | |
Corporate Bonds & Notes (continued)
Issuer | | Coupon
Rate | | Principal
Amount ($) | | Value ($) | |
SugarHouse HSP Gaming LP/Finance Corp.
Senior Secured(a)
06/01/21 | | | 6.375 | % | | | 3,767,000 | | | | 3,559,815 | | |
Tunica-Biloxi Gaming Authority
Senior Unsecured(a)(d)
11/15/15 | | | 9.000 | % | | | 8,862,000 | | | | 5,250,735 | | |
Total | | | | | | | 81,311,069 | | |
Health Care 9.0% | |
Acadia Healthcare Co., Inc.
07/01/22 | | | 5.125 | % | | | 1,334,000 | | | | 1,337,335 | | |
Amsurg Corp.(a)
07/15/22 | | | 5.625 | % | | | 3,850,000 | | | | 3,946,250 | | |
Biomet, Inc.
08/01/20 | | | 6.500 | % | | | 1,004,000 | | | | 1,074,902 | | |
CHS/Community Health Systems, Inc.
11/15/19 | | | 8.000 | % | | | 4,374,000 | | | | 4,680,180 | | |
02/01/22 | | | 6.875 | % | | | 14,354,000 | | | | 15,197,297 | | |
Senior Secured
08/15/18 | | | 5.125 | % | | | 5,993,000 | | | | 6,165,299 | | |
08/01/21 | | | 5.125 | % | | | 1,410,000 | | | | 1,448,775 | | |
Catamaran Corp.
03/15/21 | | | 4.750 | % | | | 1,402,000 | | | | 1,400,248 | | |
ConvaTec Finance International SA
Senior Unsecured PIK(a)
01/15/19 | | | 8.250 | % | | | 3,056,000 | | | | 3,101,840 | | |
ConvaTec Healthcare E SA
Senior Unsecured(a)
12/15/18 | | | 10.500 | % | | | 10,197,000 | | | | 10,796,074 | | |
DaVita HealthCare Partners, Inc.
08/15/22 | | | 5.750 | % | | | 9,431,000 | | | | 9,961,494 | | |
07/15/24 | | | 5.125 | % | | | 1,949,000 | | | | 1,998,943 | | |
Emdeon, Inc.
12/31/19 | | | 11.000 | % | | | 5,255,000 | | | | 5,793,638 | | |
Fresenius Medical Care U.S. Finance II, Inc.(a)
07/31/19 | | | 5.625 | % | | | 1,737,000 | | | | 1,867,275 | | |
01/31/22 | | | 5.875 | % | | | 3,632,000 | | | | 3,931,640 | | |
10/15/24 | | | 4.750 | % | | | 2,883,000 | | | | 2,890,208 | | |
Fresenius Medical Care U.S. Finance, Inc.(a)
09/15/18 | | | 6.500 | % | | | 710,000 | | | | 777,450 | | |
HCA, Inc.
02/15/22 | | | 7.500 | % | | | 7,598,000 | | | | 8,699,710 | | |
Senior Secured
03/15/19 | | | 3.750 | % | | | 3,962,000 | | | | 3,946,647 | | |
02/15/20 | | | 6.500 | % | | | 13,874,000 | | | | 15,348,112 | | |
04/15/25 | | | 5.250 | % | | | 6,176,000 | | | | 6,361,280 | | |
IMS Health, Inc.
Senior Unsecured(a)
11/01/20 | | | 6.000 | % | | | 3,394,000 | | | | 3,487,335 | | |
Kinetic Concepts, Inc./KCI U.S.A., Inc.
Secured
11/01/18 | | | 10.500 | % | | | 2,883,000 | | | | 3,192,923 | | |
The accompanying Notes to Financial Statements are an integral part of this statement.
Semiannual Report 2014
10
Columbia High Yield Bond Fund
Portfolio of Investments (continued)
November 30, 2014 (Unaudited)
Corporate Bonds & Notes (continued)
Issuer | | Coupon
Rate | | Principal
Amount ($) | | Value ($) | |
LifePoint Hospitals, Inc.
12/01/21 | | | 5.500 | % | | | 5,427,000 | | | | 5,630,513 | | |
MPH Acquisition Holdings LLC(a)
04/01/22 | | | 6.625 | % | | | 5,117,000 | | | | 5,347,265 | | |
Omnicare, Inc.
Senior Unsecured
12/01/22 | | | 4.750 | % | | | 2,938,000 | | | | 2,982,070 | | |
12/01/24 | | | 5.000 | % | | | 1,240,000 | | | | 1,264,800 | | |
Physio-Control International, Inc.
Senior Secured(a)
01/15/19 | | | 9.875 | % | | | 4,348,000 | | | | 4,663,230 | | |
STHI Holding Corp.
Secured(a)
03/15/18 | | | 8.000 | % | | | 2,198,000 | | | | 2,313,395 | | |
Teleflex, Inc.(a)
06/15/24 | | | 5.250 | % | | | 418,000 | | | | 420,090 | | |
Tenet Healthcare Corp.
Senior Secured
10/01/20 | | | 6.000 | % | | | 2,684,000 | | | | 2,855,105 | | |
04/01/21 | | | 4.500 | % | | | 11,975,000 | | | | 11,765,437 | | |
Senior Unsecured
04/01/22 | | | 8.125 | % | | | 14,379,000 | | | | 16,068,532 | | |
Universal Health Services, Inc.
Senior Secured(a)
08/01/22 | | | 4.750 | % | | | 7,203,000 | | | | 7,275,030 | | |
Total | | | | | | | 177,990,322 | | |
Healthcare Insurance 0.1% | |
Centene Corp.
Senior Unsecured
05/15/22 | | | 4.750 | % | | | 2,367,000 | | | | 2,390,670 | | |
Home Construction 1.1% | |
Meritage Homes Corp.
03/01/18 | | | 4.500 | % | | | 3,265,000 | | | | 3,281,325 | | |
04/15/20 | | | 7.150 | % | | | 1,217,000 | | | | 1,326,530 | | |
04/01/22 | | | 7.000 | % | | | 3,328,000 | | | | 3,619,200 | | |
Shea Homes LP/Funding Corp.
Senior Secured
05/15/19 | | | 8.625 | % | | | 3,674,000 | | | | 3,894,440 | | |
Standard Pacific Corp.
11/15/24 | | | 5.875 | % | | | 1,628,000 | | | | 1,636,140 | | |
Taylor Morrison Communities, Inc./Monarch, Inc.(a)
04/15/21 | | | 5.250 | % | | | 4,823,000 | | | | 4,847,115 | | |
03/01/24 | | | 5.625 | % | | | 2,745,000 | | | | 2,703,825 | | |
Total | | | | | | | 21,308,575 | | |
Independent Energy 8.9% | |
Antero Resources Corp.(a)
12/01/22 | | | 5.125 | % | | | 9,846,000 | | | | 9,550,620 | | |
Corporate Bonds & Notes (continued)
Issuer | | Coupon
Rate | | Principal
Amount ($) | | Value ($) | |
Antero Resources Finance Corp.
11/01/21 | | | 5.375 | % | | | 2,789,000 | | | | 2,754,138 | | |
Chesapeake Energy Corp.
08/15/20 | | | 6.625 | % | | | 15,198,000 | | | | 16,641,810 | | |
02/15/21 | | | 6.125 | % | | | 5,614,000 | | | | 6,077,155 | | |
03/15/23 | | | 5.750 | % | | | 3,736,000 | | | | 3,960,160 | | |
Cimarex Energy Co.
06/01/24 | | | 4.375 | % | | | 1,644,000 | | | | 1,623,450 | | |
Comstock Resources, Inc.
06/15/20 | | | 9.500 | % | | | 6,349,000 | | | | 6,269,637 | | |
Concho Resources, Inc.
01/15/21 | | | 7.000 | % | | | 5,066,000 | | | | 5,230,645 | | |
01/15/22 | | | 6.500 | % | | | 965,000 | | | | 996,363 | | |
10/01/22 | | | 5.500 | % | | | 3,987,000 | | | | 4,066,740 | | |
04/01/23 | | | 5.500 | % | | | 6,473,000 | | | | 6,375,905 | | |
EP Energy LLC/Everest Acquisition Finance, Inc.
05/01/20 | | | 9.375 | % | | | 7,893,000 | | | | 8,573,771 | | |
09/01/22 | | | 7.750 | % | | | 1,720,000 | | | | 1,754,400 | | |
Kodiak Oil & Gas Corp.
01/15/21 | | | 5.500 | % | | | 6,443,000 | | | | 6,491,322 | | |
02/01/22 | | | 5.500 | % | | | 13,545,000 | | | | 13,206,375 | | |
Laredo Petroleum, Inc.
02/15/19 | | | 9.500 | % | | | 13,113,000 | | | | 13,637,520 | | |
01/15/22 | | | 5.625 | % | | | 4,928,000 | | | | 4,656,960 | | |
05/01/22 | | | 7.375 | % | | | 3,662,000 | | | | 3,698,620 | | |
Oasis Petroleum, Inc.
02/01/19 | | | 7.250 | % | | | 5,921,000 | | | | 5,565,740 | | |
11/01/21 | | | 6.500 | % | | | 7,008,000 | | | | 6,780,240 | | |
03/15/22 | | | 6.875 | % | | | 5,227,000 | | | | 4,913,380 | | |
01/15/23 | | | 6.875 | % | | | 5,992,000 | | | | 5,632,480 | | |
Parsley Energy LLC/Finance Corp.
Senior Unsecured(a)
02/15/22 | | | 7.500 | % | | | 9,500,000 | | | | 9,274,375 | | |
RKI Exploration & Production LLC/Finance Corp.(a)
08/01/21 | | | 8.500 | % | | | 2,987,000 | | | | 2,837,650 | | |
RSP Permian, Inc.(a)
10/01/22 | | | 6.625 | % | | | 2,051,000 | | | | 1,994,598 | | |
Range Resources Corp.
03/15/23 | | | 5.000 | % | | | 8,720,000 | | | | 8,670,950 | | |
SM Energy Co.
Senior Unsecured
01/15/24 | | | 5.000 | % | | | 2,904,000 | | | | 2,664,420 | | |
SM Energy Co.(a)
Senior Unsecured
11/15/22 | | | 6.125 | % | | | 3,746,000 | | | | 3,764,730 | | |
Whiting Petroleum Corp.
03/15/21 | | | 5.750 | % | | | 7,319,000 | | | | 7,392,190 | | |
Total | | | | | | | 175,056,344 | | |
The accompanying Notes to Financial Statements are an integral part of this statement.
Semiannual Report 2014
11
Columbia High Yield Bond Fund
Portfolio of Investments (continued)
November 30, 2014 (Unaudited)
Corporate Bonds & Notes (continued)
Issuer | | Coupon
Rate | | Principal
Amount ($) | | Value ($) | |
Leisure 1.5% | |
AMC Entertainment, Inc.
12/01/20 | | | 9.750 | % | | | 2,071,000 | | | | 2,293,633 | | |
Activision Blizzard, Inc.(a)
09/15/21 | | | 5.625 | % | | | 13,967,001 | | | | 14,909,773 | | |
09/15/23 | | | 6.125 | % | | | 5,108,000 | | | | 5,554,950 | | |
Cedar Fair LP/Canada's Wonderland Co./Magnum
Management Corp.
03/15/21 | | | 5.250 | % | | | 3,840,000 | | | | 3,859,200 | | |
Cinemark USA, Inc.
12/15/22 | | | 5.125 | % | | | 1,043,000 | | | | 1,022,140 | | |
06/01/23 | | | 4.875 | % | | | 1,204,000 | | | | 1,146,810 | | |
Six Flags, Inc., Escrow(a)(e)(f)(g)(h)
06/01/44 | | | 0.000 | % | | | 950,000 | | | | — | | |
United Artists Theatre Circuit, Inc.(g)(h)
1995-A Pass-Through Certificates
07/01/15 | | | 9.300 | % | | | 1,144,107 | | | | 1,144,107 | | |
07/01/15 | | | 9.300 | % | | | 368,623 | | | | 368,623 | | |
Total | | | | | | | 30,299,236 | | |
Lodging 1.6% | |
Choice Hotels International, Inc.
07/01/22 | | | 5.750 | % | | | 2,939,000 | | | | 3,144,730 | | |
Hilton Worldwide Finance/Corp.(a)
10/15/21 | | | 5.625 | % | | | 19,132,000 | | | | 20,088,600 | | |
Playa Resorts Holding BV(a)
08/15/20 | | | 8.000 | % | | | 8,546,000 | | | | 8,823,745 | | |
Total | | | | | | | 32,057,075 | | |
Media and Entertainment 4.7% | |
AMC Networks, Inc.
07/15/21 | | | 7.750 | % | | | 3,870,000 | | | | 4,227,975 | | |
12/15/22 | | | 4.750 | % | | | 12,944,000 | | | | 12,782,200 | | |
CBS Outdoor Americas Capital LLC/Corp.(a)
02/15/22 | | | 5.250 | % | | | 990,000 | | | | 1,014,750 | | |
02/15/24 | | | 5.625 | % | | | 990,000 | | | | 1,020,938 | | |
03/15/25 | | | 5.875 | % | | | 8,267,000 | | | | 8,556,345 | | |
Clear Channel Worldwide Holdings, Inc.
03/15/20 | | | 7.625 | % | | | 11,401,000 | | | | 11,868,441 | | |
Senior Unsecured
11/15/22 | | | 6.500 | % | | | 4,149,000 | | | | 4,303,758 | | |
11/15/22 | | | 6.500 | % | | | 4,217,000 | | | | 4,396,222 | | |
Lamar Media Corp.
01/15/24 | | | 5.375 | % | | | 1,883,000 | | | | 1,944,198 | | |
MDC Partners, Inc.(a)
04/01/20 | | | 6.750 | % | | | 7,466,000 | | | | 7,708,645 | | |
Nielsen Finance LLC/Co.
10/01/20 | | | 4.500 | % | | | 5,879,000 | | | | 5,915,744 | | |
Corporate Bonds & Notes (continued)
Issuer | | Coupon
Rate | | Principal
Amount ($) | | Value ($) | |
Univision Communications, Inc.(a)
Senior Secured
11/01/20 | | | 7.875 | % | | | 7,474,000 | | | | 8,071,920 | | |
09/15/22 | | | 6.750 | % | | | 1,583,000 | | | | 1,741,300 | | |
05/15/23 | | | 5.125 | % | | | 5,289,000 | | | | 5,540,227 | | |
iHeartCommunications, Inc. PIK
02/01/21 | | | 14.000 | % | | | 5,830,244 | | | | 4,780,800 | | |
iHeartCommunications, Inc.
Senior Secured
03/01/21 | | | 9.000 | % | | | 9,444,000 | | | | 9,207,900 | | |
Total | | | | | | | 93,081,363 | | |
Metals 1.0% | |
ArcelorMittal
Senior Unsecured
03/01/21 | | | 6.000 | % | | | 4,487,000 | | | | 4,716,959 | | |
02/25/22 | | | 6.750 | % | | | 3,726,000 | | | | 4,030,787 | | |
Constellium NV(a)
05/15/24 | | | 5.750 | % | | | 1,686,000 | | | | 1,618,560 | | |
FMG Resources August 2006 Proprietary Ltd.(a)
11/01/19 | | | 8.250 | % | | | 5,794,000 | | | | 5,420,287 | | |
Peabody Energy Corp.
11/15/18 | | | 6.000 | % | | | 4,817,000 | | | | 4,588,192 | | |
Total | | | | | | | 20,374,785 | | |
Midstream 5.6% | |
Blue Racer Midstream LLC/Finance Corp.(a)
11/15/22 | | | 6.125 | % | | | 5,665,000 | | | | 5,721,650 | | |
Hiland Partners LP/Finance Corp.(a)
10/01/20 | | | 7.250 | % | | | 15,717,000 | | | | 16,424,265 | | |
05/15/22 | | | 5.500 | % | | | 1,945,000 | | | | 1,840,456 | | |
Kinder Morgan, Inc.
Senior Unsecured
09/15/20 | | | 6.500 | % | | | 17,105,000 | | | | 19,682,742 | | |
MarkWest Energy Partners LP/Finance Corp.
06/15/22 | | | 6.250 | % | | | 4,686,000 | | | | 4,973,017 | | |
02/15/23 | | | 5.500 | % | | | 7,508,000 | | | | 7,695,700 | | |
07/15/23 | | | 4.500 | % | | | 4,078,000 | | | | 3,976,050 | | |
Markwest Energy Partners LP/Finance Corp.
12/01/24 | | | 4.875 | % | | | 8,601,000 | | | | 8,471,985 | | |
Regency Energy Partners LP/Finance Corp.
07/15/21 | | | 6.500 | % | | | 9,657,000 | | | | 10,043,280 | | |
03/01/22 | | | 5.875 | % | | | 1,823,000 | | | | 1,877,690 | | |
10/01/22 | | | 5.000 | % | | | 4,593,000 | | | | 4,501,140 | | |
11/01/23 | | | 4.500 | % | | | 1,400,000 | | | | 1,316,000 | | |
Sabine Pass Liquefaction LLC
Senior Secured
02/01/21 | | | 5.625 | % | | | 5,606,000 | | | | 5,732,135 | | |
04/15/23 | | | 5.625 | % | | | 1,091,000 | | | | 1,112,820 | | |
05/15/24 | | | 5.750 | % | | | 548,000 | | | | 554,165 | | |
The accompanying Notes to Financial Statements are an integral part of this statement.
Semiannual Report 2014
12
Columbia High Yield Bond Fund
Portfolio of Investments (continued)
November 30, 2014 (Unaudited)
Corporate Bonds & Notes (continued)
Issuer | | Coupon
Rate | | Principal
Amount ($) | | Value ($) | |
Targa Resources Partners LP/Finance Corp.
05/01/23 | | | 5.250 | % | | | 256,000 | | | | 261,120 | | |
11/15/23 | | | 4.250 | % | | | 2,581,000 | | | | 2,464,855 | | |
Targa Resources Partners LP/Finance Corp.(a)
11/15/19 | | | 4.125 | % | | | 2,572,000 | | | | 2,572,000 | | |
Tesoro Logistics LP/Finance Corp.(a)
Senior Unsecured
10/15/19 | | | 5.500 | % | | | 1,319,000 | | | | 1,342,083 | | |
10/15/22 | | | 6.250 | % | | | 9,894,000 | | | | 10,091,880 | | |
Total | | | | | | | 110,655,033 | | |
Other Financial Institutions 0.4% | |
Icahn Enterprises LP/Finance Corp.
08/01/20 | | | 6.000 | % | | | 4,161,000 | | | | 4,332,433 | | |
02/01/22 | | | 5.875 | % | | | 3,387,000 | | | | 3,454,740 | | |
Total | | | | | | | 7,787,173 | | |
Other Industry 0.3% | |
CB Richard Ellis Services, Inc.
03/15/25 | | | 5.250 | % | | | 5,964,000 | | | | 6,187,650 | | |
Other REIT 0.4% | |
CyrusOne LP/Finance Corp.
11/15/22 | | | 6.375 | % | | | 7,242,000 | | | | 7,839,465 | | |
Packaging 2.7% | |
Ardagh Packaging Finance PLC/Holdings USA, Inc.(a)
01/31/21 | | | 6.750 | % | | | 3,308,000 | | | | 3,374,160 | | |
Berry Plastics Corp.
Secured
05/15/22 | | | 5.500 | % | | | 5,183,000 | | | | 5,208,915 | | |
Beverage Packaging Holdings (Luxembourg) II SA(a)
06/15/17 | | | 6.000 | % | | | 912,000 | | | | 909,720 | | |
Plastipak Holdings, Inc.
Senior Unsecured(a)
10/01/21 | | | 6.500 | % | | | 7,538,000 | | | | 7,575,690 | | |
Reynolds Group Issuer, Inc./LLC
04/15/19 | | | 9.000 | % | | | 1,310,000 | | | | 1,365,675 | | |
08/15/19 | | | 9.875 | % | | | 4,619,000 | | | | 4,976,972 | | |
02/15/21 | | | 8.250 | % | �� | | 5,239,000 | | | | 5,468,206 | | |
Senior Secured
10/15/20 | | | 5.750 | % | | | 9,785,000 | | | | 10,066,319 | | |
Sealed Air Corp.(a)
09/15/21 | | | 8.375 | % | | | 4,130,000 | | | | 4,646,250 | | |
Signode Industrial Group Luxembourg SA/US, Inc.
Senior Unsecured(a)
05/01/22 | | | 6.375 | % | | | 9,038,000 | | | | 8,857,240 | | |
Total | | | | | | | 52,449,147 | | |
Corporate Bonds & Notes (continued)
Issuer | | Coupon
Rate | | Principal
Amount ($) | | Value ($) | |
Paper —% | |
Graphic Packaging International, Inc.
04/15/21 | | | 4.750 | % | | | 726,000 | | | | 728,723 | | |
Pharmaceuticals 2.0% | |
Grifols Worldwide Operations Ltd.
Senior Unsecured(a)
04/01/22 | | | 5.250 | % | | | 4,858,000 | | | | 5,003,740 | | |
Jaguar Holding Co. I
Senior Unsecured PIK(a)
10/15/17 | | | 9.375 | % | | | 3,043,000 | | | | 3,103,860 | | |
Jaguar Holding Co. II/Merger Sub, Inc.
Senior Unsecured(a)
12/01/19 | | | 9.500 | % | | | 4,155,000 | | | | 4,466,625 | | |
Salix Pharmaceuticals Ltd.(a)
01/15/21 | | | 6.000 | % | | | 1,196,000 | | | | 1,219,920 | | |
Valeant Pharmaceuticals International, Inc.(a)
08/15/18 | | | 6.750 | % | | | 3,674,000 | | | | 3,926,587 | | |
10/15/20 | | | 6.375 | % | | | 11,546,000 | | | | 12,007,840 | | |
07/15/21 | | | 7.500 | % | | | 5,249,000 | | | | 5,668,920 | | |
12/01/21 | | | 5.625 | % | | | 3,362,000 | | | | 3,395,620 | | |
Total | | | | | | | 38,793,112 | | |
Property & Casualty 0.7% | |
HUB International Ltd.
Senior Unsecured(a)
10/01/21 | | | 7.875 | % | | | 11,331,000 | | | | 11,755,912 | | |
Hub Holdings LLC/Finance, Inc.
Senior Unsecured PIK(a)
07/15/19 | | | 8.125 | % | | | 1,245,000 | | | | 1,241,888 | | |
Total | | | | | | | 12,997,800 | | |
Railroads 0.4% | |
Florida East Coast Holdings Corp.(a)
05/01/20 | | | 9.750 | % | | | 3,079,000 | | | | 3,102,093 | | |
Senior Secured
05/01/19 | | | 6.750 | % | | | 4,578,000 | | | | 4,681,005 | | |
Total | | | | | | | 7,783,098 | | |
Restaurants 0.2% | |
BC ULC/New Red Finance Inc.
Secured(a)
04/01/22 | | | 6.000 | % | | | 4,725,000 | | | | 4,843,125 | | |
Retailers 1.2% | |
Asbury Automotive Group, Inc.(a)(b)
12/15/24 | | | 6.000 | % | | | 2,724,000 | | | | 2,764,860 | | |
Group 1 Automotive, Inc.(a)
06/01/22 | | | 5.000 | % | | | 2,107,000 | | | | 2,080,663 | | |
The accompanying Notes to Financial Statements are an integral part of this statement.
Semiannual Report 2014
13
Columbia High Yield Bond Fund
Portfolio of Investments (continued)
November 30, 2014 (Unaudited)
Corporate Bonds & Notes (continued)
Issuer | | Coupon
Rate | | Principal
Amount ($) | | Value ($) | |
J. Crew Group, Inc.
Senior Unsecured PIK(a)
05/01/19 | | | 7.750 | % | | | 1,050,000 | | | | 992,250 | | |
L Brands, Inc.
04/01/21 | | | 6.625 | % | | | 2,492,000 | | | | 2,809,730 | | |
Michaels Stores, Inc.(a)
12/15/20 | | | 5.875 | % | | | 2,179,000 | | | | 2,200,790 | | |
Neiman Marcus Group Ltd. LLC(a)
10/15/21 | | | 8.000 | % | | | 1,900,000 | | | | 2,023,500 | | |
Penske Automotive Group, Inc.
12/01/24 | | | 5.375 | % | | | 2,955,000 | | | | 2,962,388 | | |
Rite Aid Corp.
03/15/20 | | | 9.250 | % | | | 4,687,000 | | | | 5,167,417 | | |
06/15/21 | | | 6.750 | % | | | 1,250,000 | | | | 1,309,375 | | |
Senior Unsecured
02/15/27 | | | 7.700 | % | | | 1,993,000 | | | | 2,202,265 | | |
Total | | | | | | | 24,513,238 | | |
Technology 5.1% | |
Alliance Data Systems Corp.(a)
04/01/20 | | | 6.375 | % | | | 3,999,000 | | | | 4,163,959 | | |
08/01/22 | | | 5.375 | % | | | 8,825,000 | | | | 8,847,062 | | |
Ancestry.com, Inc.
12/15/20 | | | 11.000 | % | | | 1,296,000 | | | | 1,458,000 | | |
Ancestry.com, Inc.(a)
Senior Unsecured PIK
10/15/18 | | | 9.625 | % | | | 1,656,000 | | | | 1,651,860 | | |
Audatex North America, Inc.(a)
06/15/21 | | | 6.000 | % | | | 2,036,000 | | | | 2,112,350 | | |
11/01/23 | | | 6.125 | % | | | 4,874,000 | | | | 5,056,775 | | |
Equinix, Inc.
Senior Unsecured
04/01/20 | | | 4.875 | % | | | 2,523,000 | | | | 2,529,308 | | |
01/01/22 | | | 5.375 | % | | | 3,067,000 | | | | 3,082,335 | | |
04/01/23 | | | 5.375 | % | | | 9,350,000 | | | | 9,385,062 | | |
First Data Corp.
01/15/21 | | | 12.625 | % | | | 6,815,000 | | | | 8,109,850 | | |
06/15/21 | | | 10.625 | % | | | 986,000 | | | | 1,124,040 | | |
First Data Corp.(a)
Secured
01/15/21 | | | 8.250 | % | | | 7,288,000 | | | | 7,798,160 | | |
Senior Secured
06/15/19 | | | 7.375 | % | | | 5,694,000 | | | | 5,992,935 | | |
08/15/20 | | | 8.875 | % | | | 1,084,000 | | | | 1,165,300 | | |
11/01/20 | | | 6.750 | % | | | 4,949,000 | | | | 5,270,685 | | |
Goodman Networks, Inc.
Senior Secured
07/01/18 | | | 12.125 | % | | | 2,920,000 | | | | 3,102,500 | | |
MSCI, Inc.(a)
11/15/24 | | | 5.250 | % | | | 5,011,000 | | | | 5,198,912 | | |
Corporate Bonds & Notes (continued)
Issuer | | Coupon
Rate | | Principal
Amount ($) | | Value ($) | |
NCR Corp.
12/15/23 | | | 6.375 | % | | | 1,820,000 | | | | 1,892,800 | | |
NXP BV/Funding LLC(a)
02/15/21 | | | 5.750 | % | | | 8,495,000 | | | | 8,983,462 | | |
Nuance Communications, Inc.(a)
08/15/20 | | | 5.375 | % | | | 3,933,000 | | | | 3,962,498 | | |
Qualitytech LP/Finance Corp.(a)
08/01/22 | | | 5.875 | % | | | 294,000 | | | | 292,530 | | |
VeriSign, Inc.
Senior Unsecured
05/01/23 | | | 4.625 | % | | | 3,743,000 | | | | 3,677,498 | | |
Zebra Technologies Corp.
Senior Unsecured(a)
10/15/22 | | | 7.250 | % | | | 5,848,000 | | | | 6,250,050 | | |
Total | | | | | | | 101,107,931 | | |
Transportation Services 0.5% | |
Hertz Corp. (The)
10/15/20 | | | 5.875 | % | | | 1,898,000 | | | | 1,916,980 | | |
01/15/21 | | | 7.375 | % | | | 996,000 | | | | 1,050,780 | | |
10/15/22 | | | 6.250 | % | | | 5,932,000 | | | | 6,006,150 | | |
Total | | | | | | | 8,973,910 | | |
Wireless 5.8% | |
Altice SA
Senior Secured(a)
05/15/22 | | | 7.750 | % | | | 5,890,000 | | | | 6,088,787 | | |
Crown Castle International Corp.
Senior Unsecured
04/15/22 | | | 4.875 | % | | | 1,994,000 | | | | 1,994,000 | | |
01/15/23 | | | 5.250 | % | | | 10,475,000 | | | | 10,658,312 | | |
SBA Communications Corp.
Senior Unsecured(a)
07/15/22 | | | 4.875 | % | | | 2,543,000 | | | | 2,473,068 | | |
SBA Telecommunications, Inc.
07/15/20 | | | 5.750 | % | | | 8,109,000 | | | | 8,352,270 | | |
Sprint Communications, Inc.
Senior Unsecured
08/15/20 | | | 7.000 | % | | | 766,000 | | | | 785,150 | | |
11/15/21 | | | 11.500 | % | | | 4,050,000 | | | | 5,032,125 | | |
Sprint Communications, Inc.(a)
11/15/18 | | | 9.000 | % | | | 18,977,000 | | | | 21,965,877 | | |
03/01/20 | | | 7.000 | % | | | 2,555,000 | | | | 2,812,097 | | |
Sprint Corp.
09/15/21 | | | 7.250 | % | | | 4,383,000 | | | | 4,470,660 | | |
09/15/23 | | | 7.875 | % | | | 3,733,000 | | | | 3,910,317 | | |
06/15/24 | | | 7.125 | % | | | 2,918,000 | | | | 2,885,173 | | |
T-Mobile USA, Inc.
04/28/21 | | | 6.633 | % | | | 6,228,000 | | | | 6,414,840 | | |
01/15/22 | | | 6.125 | % | | | 2,417,000 | | | | 2,459,298 | | |
The accompanying Notes to Financial Statements are an integral part of this statement.
Semiannual Report 2014
14
Columbia High Yield Bond Fund
Portfolio of Investments (continued)
November 30, 2014 (Unaudited)
Corporate Bonds & Notes (continued)
Issuer | | Coupon
Rate | | Principal
Amount ($) | | Value ($) | |
04/28/22 | | | 6.731 | % | | | 1,126,000 | | | | 1,165,410 | | |
03/01/23 | | | 6.000 | % | | | 5,291,000 | | | | 5,370,365 | | |
04/01/23 | | | 6.625 | % | | | 4,656,000 | | | | 4,830,600 | | |
01/15/24 | | | 6.500 | % | | | 2,417,000 | | | | 2,471,383 | | |
03/01/25 | | | 6.375 | % | | | 1,324,000 | | | | 1,343,860 | | |
Wind Acquisition Finance SA(a)
04/23/21 | | | 7.375 | % | | | 4,756,000 | | | | 4,577,650 | | |
Senior Secured
04/30/20 | | | 6.500 | % | | | 6,048,000 | | | | 6,259,680 | | |
07/15/20 | | | 4.750 | % | | | 8,653,000 | | | | 8,328,512 | | |
Total | | | | | | | 114,649,434 | | |
Wirelines 4.4% | |
CenturyLink, Inc.
Senior Unsecured
06/15/21 | | | 6.450 | % | | | 9,793,000 | | | | 10,674,370 | | |
03/15/22 | | | 5.800 | % | | | 1,706,000 | | | | 1,791,300 | | |
12/01/23 | | | 6.750 | % | | | 2,362,000 | | | | 2,621,820 | | |
Frontier Communications Corp.
Senior Unsecured
03/15/19 | | | 7.125 | % | | | 1,309,000 | | | | 1,433,355 | | |
07/01/21 | | | 9.250 | % | | | 2,492,000 | | | | 2,921,870 | | |
09/15/21 | | | 6.250 | % | | | 822,000 | | | | 839,509 | | |
04/15/22 | | | 8.750 | % | | | 3,150,000 | | | | 3,622,500 | | |
04/15/24 | | | 7.625 | % | | | 4,048,000 | | | | 4,280,760 | | |
01/15/25 | | | 6.875 | % | | | 11,803,000 | | | | 11,862,015 | | |
Level 3 Communications, Inc.
Senior Unsecured(a)(b)
12/01/22 | | | 5.750 | % | | | 3,994,000 | | | | 4,013,970 | | |
Level 3 Escrow II, Inc.(a)
08/15/22 | | | 5.375 | % | | | 6,190,000 | | | | 6,267,375 | | |
Level 3 Financing, Inc.
06/01/20 | | | 7.000 | % | | | 4,765,000 | | | | 5,086,637 | | |
07/15/20 | | | 8.625 | % | | | 2,550,000 | | | | 2,773,125 | | |
01/15/21 | | | 6.125 | % | | | 2,848,000 | | | | 2,969,040 | | |
Telecom Italia Capital SA
06/18/19 | | | 7.175 | % | | | 6,050,000 | | | | 6,897,000 | | |
Telecom Italia SpA
Senior Unsecured(a)
05/30/24 | | | 5.303 | % | | | 3,017,000 | | | | 3,065,903 | | |
Windstream Corp.
09/01/18 | | | 8.125 | % | | | 1,565,000 | | | | 1,633,469 | | |
10/15/20 | | | 7.750 | % | | | 2,572,000 | | | | 2,699,314 | | |
10/01/21 | | | 7.750 | % | | | 2,120,000 | | | | 2,218,050 | | |
08/01/23 | | | 6.375 | % | | | 600,000 | | | | 579,000 | | |
Zayo Group LLC/Capital, Inc.
07/01/20 | | | 10.125 | % | | | 1,907,000 | | | | 2,145,375 | | |
Senior Secured
01/01/20 | | | 8.125 | % | | | 5,224,000 | | | | 5,576,620 | | |
Total | | | | | | | 85,972,377 | | |
Total Corporate Bonds & Notes
(Cost: $1,801,380,390) | | | | | | | 1,845,063,036 | | |
Municipal Bonds 0.1%
Issue
Description | | Coupon
Rate | | Principal
Amount ($) | | Value ($) | |
California 0.1% | |
Cabazon Band Mission Indians
Revenue Bonds
Mortgage Notes
Series 2004(a)(d)(g)(i)
10/01/13 | | | 13.000 | % | | | 3,250,000 | | | | 1,651,260 | | |
Total Municipal Bonds
(Cost: $3,250,000) | | | | | | | 1,651,260 | | |
Senior Loans 2.2%
Borrower | | Weighted
Average
Coupon | | Principal
Amount ($) | | Value ($) | |
Chemicals 0.3% | |
PQ Corp.
Term Loan(c)(j)
08/07/17 | | | 4.000 | % | | | 4,450,077 | | | | 4,423,377 | | |
Solenis International LP/Holdings 3 LLC
1st Lien Term Loan(c)(j)
07/31/21 | | | 4.250 | % | | | 1,321,000 | | | | 1,302,017 | | |
Total | | | | | | | 5,725,394 | | |
Health Care 1.4% | |
American Renal Holdings, Inc.
2nd Lien Term Loan(c)(j)
03/20/20 | | | 8.500 | % | | | 7,462,000 | | | | 7,350,070 | | |
U.S. Renal Care, Inc.(c)(j)
1st Lien Tranche B-2 Term Loan
07/03/19 | | | 4.250 | % | | | 7,424,134 | | | | 7,424,134 | | |
2nd Lien Term Loan
01/03/20 | | | 10.250 | % | | | 5,065,000 | | | | 5,090,325 | | |
2nd Lien Tranche B-1 Term Loan
01/03/20 | | | 8.500 | % | | | 1,996,001 | | | | 1,998,496 | | |
United Surgical Partners International, Inc.
Tranche B Term Loan(c)(j)
04/03/19 | | | 4.750 | % | | | 5,243,679 | | | | 5,241,477 | | |
Total | | | | | | | 27,104,502 | | |
Lodging 0.1% | |
Four Seasons Holdings, Inc.
2nd Lien Term Loan(c)(j)
12/28/20 | | | 6.250 | % | | | 1,250,000 | | | | 1,256,250 | | |
Technology 0.4% | |
Applied Systems, Inc.(c)(j)
1st Lien Term Loan
01/25/21 | | | 4.250 | % | | | 565,725 | | | | 562,896 | | |
2nd Lien Term Loan
01/24/22 | | | 7.500 | % | | | 666,000 | | | | 666,553 | | |
The accompanying Notes to Financial Statements are an integral part of this statement.
Semiannual Report 2014
15
Columbia High Yield Bond Fund
Portfolio of Investments (continued)
November 30, 2014 (Unaudited)
Senior Loans (continued)
Borrower | | Weighted
Average
Coupon | | Principal
Amount ($) | | Value ($) | |
First Data Corp.
Term Loan(c)(j)
03/23/18 | | | 3.653 | % | | | 2,235,000 | | | | 2,205,677 | | |
TIBCO Software, Inc.
Tranche B Term Loan(b)(c)(j)
11/04/20 | | | 6.500 | % | | | 5,436,000 | | | | 5,322,768 | | |
Total | | | | | | | 8,757,894 | | |
Total Senior Loans
(Cost: $42,616,936) | | | | | | | 42,844,040 | | |
Common Stocks —%
Issuer | | | | Shares | | Value ($) | |
Financials —% | |
Diversified Financial Services —% | |
Fairlane Management Corp.(e)(g)(h)(k) | | | | | 50,004 | | | | — | | |
Total Financials | | | | | | | | | | | — | | |
Total Common Stocks
(Cost: $—) | | | | | | | — | | |
Limited Partnerships —%
Issuer | | | | Shares | | Value ($) | |
Financials —% | |
Diversified Financial Services —% | |
Varde Fund V LP(g)(h)(k) | | | | | 25,000,000 | | | | 64,675 | | |
Total Financials | | | | | | | | | | | 64,675 | | |
Total Limited Partnerships
(Cost: $—) | | | | | | | 64,675 | | |
Money Market Funds 1.9%
| | | Shares | | Value ($) | |
Columbia Short-Term Cash Fund,
0.104%(l)(m) | | | 37,162,500 | | | | 37,162,500 | | |
Total Money Market Funds
(Cost: $37,162,500) | | | | | 37,162,500 | | |
Total Investments
(Cost: $1,884,409,826) | | | | | 1,926,785,511 | | |
Other Assets & Liabilities, Net | | | | | 48,360,368 | | |
Net Assets | | | | | 1,975,145,879 | | |
Investments in Derivatives
Futures Contracts Outstanding at November 30, 2014
At November 30, 2014, cash totaling $260,400 was pledged as collateral to cover initial margin requirements on open futures contracts.
Short Futures Contracts Outstanding
Contract Description | | Number of
Contracts | | Trading
Currency | | Notional
Market
Value ($) | | Expiration
Date | | Unrealized
Appreciation ($) | | Unrealized
Depreciation ($) | |
US 10YR NOTE | | | (217 | ) | | USD | | | | | (27,569,173 | ) | | 03/2015 | | | — | | | | (213,460 | ) | |
Notes to Portfolio of Investments
(a) Security exempt from registration pursuant to Rule 144A under the Securities Act of 1933. This security may be resold in transactions exempt from registration, normally to qualified institutional buyers. At November 30, 2014, the value of these securities amounted to $725,094,385 or 36.71% of net assets.
(b) Represents a security purchased on a when-issued or delayed delivery basis.
(c) Variable rate security.
(d) Represents securities that have defaulted on payment of interest. The Fund has stopped accruing interest on these securities. At November 30, 2014, the value of these securities amounted to $6,901,995, which represents 0.35% of net assets.
(e) Negligible market value.
(f) Zero coupon bond.
The accompanying Notes to Financial Statements are an integral part of this statement.
Semiannual Report 2014
16
Columbia High Yield Bond Fund
Portfolio of Investments (continued)
November 30, 2014 (Unaudited)
Notes to Portfolio of Investments (continued)
(g) Identifies securities considered by the Investment Manager to be illiquid as to their marketability. The aggregate value of such securities at November 30, 2014 was $3,228,665, which represents 0.16% of net assets. Information concerning such security holdings at November 30, 2014 is as follows:
Security Description | | Acquisition Dates | | Cost ($) | |
Cabazon Band Mission Indians
Revenue Bonds
Mortgage Notes
Series 2004
10/01/13 13.000% | | 10/04/2004 | | | 3,250,000 | | |
Fairlane Management Corp. | | 09/23/2002 | | | — | | |
Six Flags, Inc., Escrow
06/01/44 0.000% | | 05/07/2010 | | | — | | |
United Artists Theatre Circuit, Inc.
1995-A Pass-Through Certificates
07/01/15 9.300% | | 12/06/2001 | | | 360,183 | | |
United Artists Theatre Circuit, Inc.
1995-A Pass-Through Certificates
07/01/15 9.300% | | 04/03/2002 | | | 1,136,744 | | |
Varde Fund V LP | | 04/27/2000 - 06/19/2000 | | | — | * | |
*The original cost for this position was $25,000,000. From September 29, 2004 through May 7, 2005, $25,000,000 was returned to the Fund in the form of return of capital.
(h) Represents fair value as determined in good faith under procedures approved by the Board of Trustees. At November 30, 2014, the value of these securities amounted to $1,577,405, which represents 0.08% of net assets.
(i) Municipal obligations include debt obligations issued by or on behalf of territories, possessions, or sovereign nations within the territorial boundaries of the United States. At November 30, 2014, the value of these securities amounted to $1,651,260 or 0.08% of net assets.
(j) Senior loans have rates of interest that float periodically based primarily on the London Interbank Offered Rate ("LIBOR") and other short-term rates. The interest rate shown reflects the weighted average coupon as of November 30, 2014. The interest rate shown for senior loans purchased on a when-issued or delayed delivery basis, if any, reflects an estimated average coupon. Remaining maturities of senior loans may be less than the stated maturities shown as a result of contractual or optional prepayments by the borrower. Such prepayments cannot be predicted.
(k) Non-income producing.
(l) The rate shown is the seven-day current annualized yield at November 30, 2014.
(m) As defined in the Investment Company Act of 1940, an affiliated company is one in which the Fund owns 5% or more of the company's outstanding voting securities, or a company which is under common ownership or control with the Fund. Holdings and transactions in these affiliated companies during the period ended November 30, 2014, are as follows:
Issuer | | Beginning
Cost ($) | | Purchase
Cost ($) | | Proceeds
From Sales ($) | | Ending
Cost ($) | | Dividends —
Affiliated
Issuers ($) | | Value ($) | |
Columbia Short-Term Cash Fund | | | 68,543,128 | | | | 527,290,986 | | | | (558,671,614 | ) | | | 37,162,500 | | | | 35,243 | | | | 37,162,500 | | |
Abbreviation Legend
PIK Payment-in-Kind
Currency Legend
USD US Dollar
The accompanying Notes to Financial Statements are an integral part of this statement.
Semiannual Report 2014
17
Columbia High Yield Bond Fund
Portfolio of Investments (continued)
November 30, 2014 (Unaudited)
Fair Value Measurements
Generally accepted accounting principles (GAAP) require disclosure regarding the inputs and valuation techniques used to measure fair value and any changes in valuation inputs or techniques. In addition, investments shall be disclosed by major category.
The Fund categorizes its fair value measurements according to a three-level hierarchy that maximizes the use of observable inputs and minimizes the use of unobservable inputs by prioritizing that the most observable input be used when available. Observable inputs are those that market participants would use in pricing an investment based on market data obtained from sources independent of the reporting entity. Unobservable inputs are those that reflect the Fund's assumptions about the information market participants would use in pricing an investment. An investment's level within the fair value hierarchy is based on the lowest level of any input that is deemed significant to the asset or liability's fair value measurement. The input levels are not necessarily an indication of the risk or liquidity associated with investments at that level. For example, certain U.S. government securities are generally high quality and liquid, however, they are reflected as Level 2 because the inputs used to determine fair value may not always be quoted prices in an active market.
Fair value inputs are summarized in the three broad levels listed below:
> Level 1 — Valuations based on quoted prices for investments in active markets that the Fund has the ability to access at the measurement date (including NAV for open-end mutual funds). Valuation adjustments are not applied to Level 1 investments.
> Level 2 — Valuations based on other significant observable inputs (including quoted prices for similar securities, interest rates, prepayment speeds, credit risks, etc.).
> Level 3 — Valuations based on significant unobservable inputs (including the Fund's own assumptions and judgment in determining the fair value of investments).
Inputs that are used in determining fair value of an investment may include price information, credit data, volatility statistics, and other factors. These inputs can be either observable or unobservable. The availability of observable inputs can vary between investments, and is affected by various factors such as the type of investment, and the volume and level of activity for that investment or similar investments in the marketplace. The inputs will be considered by the Investment Manager, along with any other relevant factors in the calculation of an investment's fair value. The Fund uses prices and inputs that are current as of the measurement date, which may include periods of market dislocations. During these periods, the availability of prices and inputs may be reduced for many investments. This condition could cause an investment to be reclassified between the various levels within the hierarchy.
Investments falling into the Level 3 category are primarily supported by quoted prices from brokers and dealers participating in the market for those investments. However, these may be classified as Level 3 investments due to lack of market transparency and corroboration to support these quoted prices. Additionally, valuation models may be used as the pricing source for any remaining investments classified as Level 3. These models may rely on one or more significant unobservable inputs and/or significant assumptions by the Investment Manager. Inputs used in valuations may include, but are not limited to, financial statement analysis, capital account balances, discount rates and estimated cash flows, and comparable company data.
Under the direction of the Fund's Board of Trustees (the Board), the Investment Manager's Valuation Committee (the Committee) is responsible for overseeing the valuation procedures approved by the Board. The Committee consists of voting and non-voting members from various groups within the Investment Manager's organization, including operations and accounting, trading and investments, compliance, risk management and legal.
The Committee meets at least monthly to review and approve valuation matters, which may include a description of specific valuation determinations, data regarding pricing information received from approved pricing vendors and brokers and the results of Board-approved valuation control policies and procedures (the Policies). The Policies address, among other things, instances when market quotations are or are not readily available, including recommendations of third party pricing vendors and a determination of appropriate pricing methodologies; events that require specific valuation determinations and assessment of fair value techniques; securities with a potential for stale pricing, including those that are illiquid, restricted, or in default; and the effectiveness of third party pricing vendors, including periodic reviews of vendors. The Committee meets more frequently, as needed, to discuss additional valuation matters, which may include the need to review back-testing results, review time-sensitive information or approve related valuation actions. The Committee reports to the Board, with members of the Committee meeting with the Board at each of its regularly scheduled meetings to discuss valuation matters and actions during the period, similar to those described earlier.
For investments categorized as Level 3, the Committee monitors information similar to that described above, which may include: (i) data specific to the issuer or comparable issuers, (ii) general market or specific sector news and (iii) quoted prices and specific or similar security transactions. The Committee considers this data and any changes from prior periods in order to assess the reasonableness of observable and unobservable inputs, any assumptions or internal models used to value those securities and changes in fair value. This data is also used to corroborate, when available, information received from approved pricing vendors and brokers. Various factors impact the frequency of monitoring this information (which may occur as often as daily). However, the Committee may determine that changes to inputs, assumptions and models are not required as a result of the monitoring procedures performed.
The accompanying Notes to Financial Statements are an integral part of this statement.
Semiannual Report 2014
18
Columbia High Yield Bond Fund
Portfolio of Investments (continued)
November 30, 2014 (Unaudited)
Fair Value Measurements (continued)
The following table is a summary of the inputs used to value the Fund's investments at November 30, 2014:
Description | | Level 1
Quoted Prices in Active
Markets for Identical
Assets ($) | |
Level 2
Other Significant
Observable Inputs ($) | |
Level 3
Significant
Unobservable Inputs ($) | |
Total ($) | |
Bonds | |
Corporate Bonds & Notes | |
Leisure | | | — | | | | 28,786,506 | | | | 1,512,730 | | | | 30,299,236 | | |
All other industries | | | — | | | | 1,814,763,800 | | | | — | | | | 1,814,763,800 | | |
Municipal Bonds | | | — | | | | 1,651,260 | | | | — | | | | 1,651,260 | | |
Total Bonds | | | — | | | | 1,845,201,566 | | | | 1,512,730 | | | | 1,846,714,296 | | |
Equity Securities | |
Common Stocks | |
Financials | | | — | | | | — | | | | 0 | (a) | | | 0 | (a) | |
Total Equity Securities | | | — | | | | — | | | | 0 | (a) | | | 0 | (a) | |
Other | |
Senior Loans | |
Health Care | | | — | | | | 14,590,043 | | | | 12,514,459 | | | | 27,104,502 | | |
Lodging | | | — | | | | — | | | | 1,256,250 | | | | 1,256,250 | | |
All other industries | | | — | | | | 14,483,288 | | | | — | | | | 14,483,288 | | |
Limited Partnerships | | | — | | | | — | | | | 64,675 | | | | 64,675 | | |
Total Other | | | — | | | | 29,073,331 | | | | 13,835,384 | | | | 42,908,715 | | |
Mutual Funds | |
Money Market Funds | | | 37,162,500 | | | | — | | | | — | | | | 37,162,500 | | |
Total Mutual Funds | | | 37,162,500 | | | | — | | | | — | | | | 37,162,500 | | |
Investments in Securities | | | 37,162,500 | | | | 1,874,274,897 | | | | 15,348,114 | | | | 1,926,785,511 | | |
Derivatives | |
Liabilities | |
Futures Contracts | | | (213,460 | ) | | | — | | | | — | | | | (213,460 | ) | |
Total | | | 36,949,040 | | | | 1,874,274,897 | | | | 15,348,114 | | | | 1,926,572,051 | | |
(a) Rounds to zero.
See the Portfolio of Investments for all investment classifications not indicated in the table.
The Fund's assets assigned to the Level 2 input category are generally valued using the market approach, in which a security's value is determined through reference to prices and information from market transactions for similar or identical assets.
There were no transfers of financial assets between Levels 1 and 2 during the period.
Derivative instruments are valued at unrealized appreciation (depreciation).
The Fund does not hold any significant investments with unobservable inputs which are categorized as Level 3.
The Fund's assets assigned to the Level 3 category are valued utilizing the valuation technique deemed the most appropriate in the circumstances.
The accompanying Notes to Financial Statements are an integral part of this statement.
Semiannual Report 2014
19
Columbia High Yield Bond Fund
Portfolio of Investments (continued)
November 30, 2014 (Unaudited)
Fair Value Measurements (continued)
Corporate bonds classified as Level 3 securities are valued using the market approach. To determine fair value for these securities, management considered various factors which may have included, but were not limited to, estimated cash flows of the securities, discount rates observed in the market for similar assets as well as observed yields on securities management deemed comparable. Significant increases (decreases) to any of these inputs would result in a significantly lower (higher) fair value measurement. Generally, a change in observable yields on comparable securities would result in a directionally similar change to discount rates.
Certain common stock classified as Level 3 are valued using an income approach. To determine fair value for these securities, management considered estimates of future distributions related to the potential actions of the respective company's restructuring. Significant increases (decreases) to any of these inputs would result in a significantly lower (higher) fair value measurement.
Certain senior loans classified as Level 3 securities are valued using the market approach and utilize single market quotations from broker dealers which may have included, but were not limited to, observable transactions for identical or similar assets in the market and the distressed nature of the security. The appropriateness of fair values for these securities is monitored on an ongoing basis which may include results of back testing, manual price reviews and other control procedures. Significant increases (decreases) to any of these inputs would result in a significantly lower (higher) fair value measurement.
Limited partnership securities classified as Level 3 are valued using a market approach. To determine fair value for these securities, management considered various factors which may have included, but were not limited to, the Fund's pro-rata interest in the limited partnership's capital balance, estimated earnings of the respective company, and the position of the security within the respective company's capital structure. Significant increases (decreases) to any of these inputs would result in a significantly lower (higher) fair value measurement. Generally, a change in the fund's pro-rata interest would result in a change to the limited partnership's capital balance.
Financial Assets were transferred from Level 2 to Level 3 due to utilizing a single market quotation from a broker dealer. As a result, as of period end, management determined to value the security(s) under procedures established by and under the general supervision of the Board of Trustees.
Transfers In | | Transfers Out | |
Level 2 ($) | | Level 3 ($) | | Level 2 ($) | | Level 3 ($) | |
| | — | | | | 7,470,957 | | | | 7,470,957 | | | | — | | |
Transfers in and/or out of Level 3 are determined based on the fair value at the beginning of the period for security positions held throughout the period.
The accompanying Notes to Financial Statements are an integral part of this statement.
Semiannual Report 2014
20
Columbia High Yield Bond Fund
Statement of Assets and Liabilities
November 30, 2014 (Unaudited)
Assets | |
Investments, at value | |
Unaffiliated issuers (identified cost $1,847,247,326) | | $ | 1,889,623,011 | | |
Affiliated issuers (identified cost $37,162,500) | | | 37,162,500 | | |
Total investments (identified cost $1,884,409,826) | | | 1,926,785,511 | | |
Cash | | | 24,594 | | |
Margin deposits | | | 260,400 | | |
Receivable for: | |
Investments sold | | | 41,183,396 | | |
Capital shares sold | | | 7,398,480 | | |
Dividends | | | 4,831 | | |
Interest | | | 28,064,361 | | |
Reclaims | | | 54,619 | | |
Prepaid expenses | | | 7,291 | | |
Trustees' deferred compensation plan | | | 80,436 | | |
Other assets | | | 22,822 | | |
Total assets | | | 2,003,886,741 | | |
Liabilities | |
Payable for: | |
Investments purchased | | | 1,282,016 | | |
Investments purchased on a delayed delivery basis | | | 16,372,200 | | |
Capital shares purchased | | | 2,232,854 | | |
Dividend distributions to shareholders | | | 8,120,329 | | |
Variation margin | | | 67,813 | | |
Investment management fees | | | 60,850 | | |
Distribution and/or service fees | | | 24,218 | | |
Transfer agent fees | | | 202,061 | | |
Administration fees | | | 6,907 | | |
Plan administration fees | | | 11,677 | | |
Compensation of board members | | | 104,107 | | |
Other expenses | | | 175,394 | | |
Trustees' deferred compensation plan | | | 80,436 | | |
Total liabilities | | | 28,740,862 | | |
Net assets applicable to outstanding capital stock | | $ | 1,975,145,879 | | |
Represented by | |
Paid-in capital | | $ | 2,105,392,426 | | |
Excess of distributions over net investment income | | | (698,036 | ) | |
Accumulated net realized loss | | | (171,710,736 | ) | |
Unrealized appreciation (depreciation) on: | |
Investments | | | 42,375,685 | | |
Futures contracts | | | (213,460 | ) | |
Total — representing net assets applicable to outstanding capital stock | | $ | 1,975,145,879 | | |
The accompanying Notes to Financial Statements are an integral part of this statement.
Semiannual Report 2014
21
Columbia High Yield Bond Fund
Statement of Assets and Liabilities (continued)
November 30, 2014 (Unaudited)
Class A | |
Net assets | | $ | 1,235,716,708 | | |
Shares outstanding | | | 415,758,149 | | |
Net asset value per share | | $ | 2.97 | | |
Maximum offering price per share(a) | | $ | 3.12 | | |
Class B | |
Net assets | | $ | 12,028,532 | | |
Shares outstanding | | | 4,048,579 | | |
Net asset value per share | | $ | 2.97 | | |
Class C | |
Net assets | | $ | 91,963,576 | | |
Shares outstanding | | | 31,148,754 | | |
Net asset value per share | | $ | 2.95 | | |
Class I | |
Net assets | | $ | 253,992,567 | | |
Shares outstanding | | | 85,577,885 | | |
Net asset value per share | | $ | 2.97 | | |
Class K | |
Net assets | | $ | 58,654,401 | | |
Shares outstanding | | | 19,715,878 | | |
Net asset value per share | | $ | 2.97 | | |
Class R | |
Net assets | | $ | 18,058,431 | | |
Shares outstanding | | | 6,057,089 | | |
Net asset value per share | | $ | 2.98 | | |
Class R4 | |
Net assets | | $ | 11,205,345 | | |
Shares outstanding | | | 3,749,210 | | |
Net asset value per share | | $ | 2.99 | | |
Class R5 | |
Net assets | | $ | 27,320,907 | | |
Shares outstanding | | | 9,219,680 | | |
Net asset value per share | | $ | 2.96 | | |
Class W | |
Net assets | | $ | 79,294,686 | | |
Shares outstanding | | | 26,885,511 | | |
Net asset value per share | | $ | 2.95 | | |
Class Y | |
Net assets | | $ | 6,584,978 | | |
Shares outstanding | | | 2,220,934 | | |
Net asset value per share | | $ | 2.96 | | |
Class Z | |
Net assets | | $ | 180,325,748 | | |
Shares outstanding | | | 60,744,314 | | |
Net asset value per share | | $ | 2.97 | | |
(a) The maximum offering price per share is calculated by dividing the net asset value per share by 1.0 minus the maximum sales charge of 4.75%.
The accompanying Notes to Financial Statements are an integral part of this statement.
Semiannual Report 2014
22
Columbia High Yield Bond Fund
Statement of Operations
Six Months Ended November 30, 2014 (Unaudited)
Net investment income | |
Income: | |
Dividends — affiliated issuers | | $ | 35,243 | | |
Interest | | | 58,348,388 | | |
Total income | | | 58,383,631 | | |
Expenses: | |
Investment management fees | | | 5,582,541 | | |
Distribution and/or service fees | |
Class A | | | 1,611,970 | | |
Class B | | | 68,798 | | |
Class C | | | 456,592 | | |
Class R | | | 45,927 | | |
Class W | | | 97,593 | | |
Transfer agent fees | |
Class A | | | 1,053,374 | | |
Class B | | | 11,228 | | |
Class C | | | 74,590 | | |
Class K | | | 13,680 | | |
Class R | | | 15,020 | | |
Class R4 | | | 8,726 | | |
Class R5 | | | 7,264 | | |
Class W | | | 63,905 | | |
Class Z | | | 142,961 | | |
Administration fees | | | 633,557 | | |
Plan administration fees | |
Class K | | | 68,401 | | |
Compensation of board members | | | 21,704 | | |
Custodian fees | | | 20,550 | | |
Printing and postage fees | | | 102,349 | | |
Registration fees | | | 74,729 | | |
Professional fees | | | 29,000 | | |
Other | | | 21,277 | | |
Total expenses | | | 10,225,736 | | |
Fees waived by Distributor — Class C | | | (47,055 | ) | |
Expense reductions | | | (4,244 | ) | |
Total net expenses | | | 10,174,437 | | |
Net investment income | | | 48,209,194 | | |
Realized and unrealized gain (loss) — net | |
Net realized gain (loss) on: | |
Investments | | | 16,280,489 | | |
Futures contracts | | | (376,260 | ) | |
Swap contracts | | | 624,729 | | |
Net realized gain | | | 16,528,958 | | |
Net change in unrealized appreciation (depreciation) on: | |
Investments | | | (62,141,636 | ) | |
Futures contracts | | | (245,961 | ) | |
Net change in unrealized depreciation | | | (62,387,597 | ) | |
Net realized and unrealized loss | | | (45,858,639 | ) | |
Net increase in net assets resulting from operations | | $ | 2,350,555 | | |
The accompanying Notes to Financial Statements are an integral part of this statement.
Semiannual Report 2014
23
Columbia High Yield Bond Fund
Statement of Changes in Net Assets
| | | Six Months Ended
November 30, 2014
(Unaudited) | | Year Ended
May 31,
2014 | |
Operations | |
Net investment income | | $ | 48,209,194 | | | $ | 104,028,485 | | |
Net realized gain | | | 16,528,958 | | | | 15,947,480 | | |
Net change in unrealized appreciation (depreciation) | | | (62,387,597 | ) | | | 3,470,887 | | |
Net increase in net assets resulting from operations | | | 2,350,555 | | | | 123,446,852 | | |
Distributions to shareholders | |
Net investment income | |
Class A | | | (31,326,840 | ) | | | (72,091,221 | ) | |
Class B | | | (282,003 | ) | | | (907,706 | ) | |
Class C | | | (1,924,112 | ) | | | (4,498,323 | ) | |
Class I | | | (5,817,685 | ) | | | (9,955,980 | ) | |
Class K | | | (1,362,705 | ) | | | (2,954,790 | ) | |
Class R | | | (423,299 | ) | | | (845,333 | ) | |
Class R4 | | | (272,925 | ) | | | (547,776 | ) | |
Class R5 | | | (773,117 | ) | | | (725,714 | ) | |
Class W | | | (1,896,652 | ) | | | (3,480,615 | ) | |
Class Y | | | (173,602 | ) | | | (192,644 | ) | |
Class Z | | | (4,482,433 | ) | | | (8,307,105 | ) | |
Total distributions to shareholders | | | (48,735,373 | ) | | | (104,507,207 | ) | |
Increase (decrease) in net assets from capital stock activity | | | 16,022,958 | | | | (14,905,980 | ) | |
Total increase (decrease) in net assets | | | (30,361,860 | ) | | | 4,033,665 | | |
Net assets at beginning of period | | | 2,005,507,739 | | | | 2,001,474,074 | | |
Net assets at end of period | | $ | 1,975,145,879 | | | $ | 2,005,507,739 | | |
Excess of distributions over net investment income | | $ | (698,036 | ) | | $ | (171,857 | ) | |
The accompanying Notes to Financial Statements are an integral part of this statement.
Semiannual Report 2014
24
Columbia High Yield Bond Fund
Statement of Changes in Net Assets (continued)
| | | Six Months Ended November 30, 2014
(Unaudited) | | Year Ended May 31, 2014 | |
| | | Shares | | Dollars ($) | | Shares | | Dollars ($) | |
Capital stock activity | |
Class A shares | |
Subscriptions(a) | | | 32,070,235 | | | | 96,617,402 | | | | 72,008,579 | | | | 214,600,887 | | |
Distributions reinvested | | | 8,665,635 | | | | 25,999,873 | | | | 19,939,602 | | | | 59,449,128 | | |
Redemptions | | | (71,730,739 | ) | | | (214,945,077 | ) | | | (129,447,082 | ) | | | (385,190,744 | ) | |
Net decrease | | | (30,994,869 | ) | | | (92,327,802 | ) | | | (37,498,901 | ) | | | (111,140,729 | ) | |
Class B shares | |
Subscriptions | | | 93,554 | | | | 281,533 | | | | 451,098 | | | | 1,344,548 | | |
Distributions reinvested | | | 86,315 | | | | 258,915 | | | | 277,690 | | | | 826,428 | | |
Redemptions(a) | | | (1,283,230 | ) | | | (3,850,994 | ) | | | (4,630,935 | ) | | | (13,770,725 | ) | |
Net decrease | | | (1,103,361 | ) | | | (3,310,546 | ) | | | (3,902,147 | ) | | | (11,599,749 | ) | |
Class C shares | |
Subscriptions | | | 4,821,660 | | | | 14,383,140 | | | | 8,827,287 | | | | 26,151,165 | | |
Distributions reinvested | | | 552,012 | | | | 1,645,238 | | | | 1,278,800 | | | | 3,788,371 | | |
Redemptions | | | (6,588,918 | ) | | | (19,675,251 | ) | | | (10,349,367 | ) | | | (30,513,456 | ) | |
Net decrease | | | (1,215,246 | ) | | | (3,646,873 | ) | | | (243,280 | ) | | | (573,920 | ) | |
Class I shares | |
Subscriptions | | | 21,027,730 | | | | 62,358,943 | | | | 22,796,389 | | | | 67,243,135 | | |
Distributions reinvested | | | 1,941,635 | | | | 5,817,420 | | | | 3,340,414 | | | | 9,955,379 | | |
Redemptions | | | (747,491 | ) | | | (2,226,384 | ) | | | (312,045 | ) | | | (932,892 | ) | |
Net increase | | | 22,221,874 | | | | 65,949,979 | | | | 25,824,758 | | | | 76,265,622 | | |
Class K shares | |
Subscriptions | | | 5,641,392 | | | | 16,884,307 | | | | 2,283,085 | | | | 6,865,495 | | |
Distributions reinvested | | | 453,764 | | | | 1,362,471 | | | | 989,958 | | | | 2,953,764 | | |
Redemptions | | | (4,239,550 | ) | | | (12,837,859 | ) | | | (6,105,532 | ) | | | (18,105,190 | ) | |
Net increase (decrease) | | | 1,855,606 | | | | 5,408,919 | | | | (2,832,489 | ) | | | (8,285,931 | ) | |
Class R shares | |
Subscriptions | | | 960,620 | | | | 2,891,764 | | | | 3,189,252 | | | | 9,529,959 | | |
Distributions reinvested | | | 101,905 | | | | 306,512 | | | | 203,883 | | | | 610,385 | | |
Redemptions | | | (1,165,650 | ) | | | (3,508,170 | ) | | | (1,858,997 | ) | | | (5,568,728 | ) | |
Net increase (decrease) | | | (103,125 | ) | | | (309,894 | ) | | | 1,534,138 | | | | 4,571,616 | | |
Class R4 shares | |
Subscriptions | | | 935,822 | | | | 2,836,619 | | | | 1,295,724 | | | | 3,883,467 | | |
Distributions reinvested | | | 90,460 | | | | 272,925 | | | | 182,472 | | | | 547,437 | | |
Redemptions | | | (672,597 | ) | | | (2,023,594 | ) | | | (1,541,919 | ) | | | (4,617,558 | ) | |
Net increase (decrease) | | | 353,685 | | | | 1,085,950 | | | | (63,723 | ) | | | (186,654 | ) | |
The accompanying Notes to Financial Statements are an integral part of this statement.
Semiannual Report 2014
25
Columbia High Yield Bond Fund
Statement of Changes in Net Assets (continued)
| | | Six Months Ended November 30, 2014
(Unaudited) | | Year Ended May 31, 2014 | |
| | | Shares | | Dollars ($) | | Shares | | Dollars ($) | |
Capital stock activity (continued) | |
Class R5 shares | |
Subscriptions | | | 30,330,867 | | | | 91,295,499 | | | | 3,894,340 | | | | 11,615,583 | | |
Distributions reinvested | | | 259,183 | | | | 773,098 | | | | 240,630 | | | | 718,306 | | |
Redemptions | | | (26,494,358 | ) | | | (78,452,878 | ) | | | (4,035,787 | ) | | | (11,954,329 | ) | |
Net increase | | | 4,095,692 | | | | 13,615,719 | | | | 99,183 | | | | 379,560 | | |
Class W shares | |
Subscriptions | | | 3,912,037 | | | | 11,587,239 | | | | 16,241,285 | | | | 48,140,991 | | |
Distributions reinvested | | | 636,897 | | | | 1,896,408 | | | | 1,173,557 | | | | 3,480,307 | | |
Redemptions | | | (2,701,527 | ) | | | (8,048,867 | ) | | | (9,453,173 | ) | | | (28,027,953 | ) | |
Net increase | | | 1,847,407 | | | | 5,434,780 | | | | 7,961,669 | | | | 23,593,345 | | |
Class Y shares | |
Subscriptions | | | 621,857 | | | | 1,865,404 | | | | 3,242,085 | | | | 9,632,898 | | |
Distributions reinvested | | | 57,918 | | | | 173,339 | | | | 61,181 | | | | 183,039 | | |
Redemptions | | | (467,735 | ) | | | (1,404,026 | ) | | | (1,295,228 | ) | | | (3,826,856 | ) | |
Net increase | | | 212,040 | | | | 634,717 | | | | 2,008,038 | | | | 5,989,081 | | |
Class Z shares | |
Subscriptions | | | 29,094,420 | | | | 87,826,416 | | | | 27,962,967 | | | | 82,847,086 | | |
Distributions reinvested | | | 583,996 | | | | 1,751,914 | | | | 1,399,606 | | | | 4,172,706 | | |
Redemptions | | | (22,059,594 | ) | | | (66,090,321 | ) | | | (27,356,376 | ) | | | (80,938,013 | ) | |
Net increase | | | 7,618,822 | | | | 23,488,009 | | | | 2,006,197 | | | | 6,081,779 | | |
Total net increase (decrease) | | | 4,788,525 | | | | 16,022,958 | | | | (5,106,557 | ) | | | (14,905,980 | ) | |
(a) Includes conversions of Class B shares to Class A shares, if any.
The accompanying Notes to Financial Statements are an integral part of this statement.
Semiannual Report 2014
26
Columbia High Yield Bond Fund
The following tables are intended to help you understand the Fund's financial performance. Certain information reflects financial results for a single share of a class held for the periods shown. Per share net investment income (loss) amounts are calculated based on average shares outstanding during the period. Total return assumes reinvestment of all dividends and distributions, if any. Total return does not reflect payment of sales charges, if any. Total return and portfolio turnover are not annualized for periods of less than one year. The portfolio turnover rate is calculated without regard to purchase and sales transactions of short-term instruments and certain derivatives, if any. If such transactions were included, the Fund's portfolio turnover rate may be higher.
| | | Six Months Ended
November 30, 2014 | | Year Ended May 31, | |
Class A | | (Unaudited) | | 2014 | | 2013 | | 2012 | | 2011 | | 2010 | |
Per share data | |
Net asset value, beginning
of period | | $ | 3.04 | | | $ | 3.01 | | | $ | 2.78 | | | $ | 2.86 | | | $ | 2.61 | | | $ | 2.30 | | |
Income from investment operations: | |
Net investment income | | | 0.07 | | | | 0.16 | | | | 0.17 | | | | 0.18 | | | | 0.20 | | | | 0.20 | | |
Net realized and unrealized
gain (loss) | | | (0.07 | ) | | | 0.03 | | | | 0.23 | | | | (0.07 | ) | | | 0.25 | | | | 0.31 | | |
Total from investment operations | | | — | | | | 0.19 | | | | 0.40 | | | | 0.11 | | | | 0.45 | | | | 0.51 | | |
Less distributions to shareholders: | |
Net investment income | | | (0.07 | ) | | | (0.16 | ) | | | (0.17 | ) | | | (0.19 | ) | | | (0.20 | ) | | | (0.20 | ) | |
Net realized gains | | | — | | | | — | | | | — | | | | (0.00 | )(a) | | | — | | | | — | | |
Total distributions to shareholders | | | (0.07 | ) | | | (0.16 | ) | | | (0.17 | ) | | | (0.19 | ) | | | (0.20 | ) | | | (0.20 | ) | |
Proceeds from regulatory
settlements | | | — | | | | — | | | | — | | | | 0.00 | (a) | | | — | | | | 0.00 | (a) | |
Net asset value, end of period | | $ | 2.97 | | | $ | 3.04 | | | $ | 3.01 | | | $ | 2.78 | | | $ | 2.86 | | | $ | 2.61 | | |
Total return | | | 0.10 | % | | | 6.55 | % | | | 14.55 | % | | | 3.99 | %(b) | | | 17.61 | % | | | 22.80 | %(c) | |
Ratios to average net assets(d) | |
Total gross expenses | | | 1.07 | %(e) | | | 1.07 | % | | | 1.08 | % | | | 1.08 | % | | | 1.08 | % | | | 1.09 | % | |
Total net expenses(f) | | | 1.07 | %(e)(g) | | | 1.07 | %(g) | | | 1.07 | %(g) | | | 1.04 | %(g) | | | 1.06 | % | | | 1.03 | % | |
Net investment income | | | 4.81 | %(e) | | | 5.36 | % | | | 5.72 | % | | | 6.54 | % | | | 7.16 | % | | | 7.95 | % | |
Supplemental data | |
Net assets, end of period
(in thousands) | | $ | 1,235,717 | | | $ | 1,357,909 | | | $ | 1,457,415 | | | $ | 1,170,173 | | | $ | 1,339,628 | | | $ | 1,192,636 | | |
Portfolio turnover | | | 33 | % | | | 63 | % | | | 81 | % | | | 76 | % | | | 96 | % | | | 94 | % | |
Notes to Financial Highlights
(a) Rounds to zero.
(b) The Fund received proceeds from regulatory settlements. Had the Fund not received these proceeds, the total return would have been lower by 0.08%.
(c) The Fund received proceeds from regulatory settlements. Had the Fund not received these proceeds, the total return would have been lower by 0.01%.
(d) In addition to the fees and expenses that the Fund bears directly, the Fund indirectly bears a pro rata share of the fees and expenses of any other funds in which it invests. Such indirect expenses are not included in the Fund's reported expense ratios.
(e) Annualized.
(f) Total net expenses include the impact of certain fee waivers/expense reimbursements made by the Investment Manager and certain of its affiliates, if applicable.
(g) The benefits derived from expense reductions had an impact of less than 0.01%.
The accompanying Notes to Financial Statements are an integral part of this statement.
Semiannual Report 2014
27
Columbia High Yield Bond Fund
Financial Highlights (continued)
| | | Six Months Ended
November 30, 2014 | | Year Ended May 31, | |
Class B | | (Unaudited) | | 2014 | | 2013 | | 2012 | | 2011 | | 2010 | |
Per share data | |
Net asset value, beginning of period | | $ | 3.04 | | | $ | 3.01 | | | $ | 2.78 | | | $ | 2.86 | | | $ | 2.61 | | | $ | 2.30 | | |
Income from investment operations: | |
Net investment income | | | 0.06 | | | | 0.14 | | | | 0.15 | | | | 0.16 | | | | 0.18 | | | | 0.18 | | |
Net realized and unrealized gain (loss) | | | (0.07 | ) | | | 0.03 | | | | 0.22 | | | | (0.07 | ) | | | 0.25 | | | | 0.31 | | |
Total from investment operations | | | (0.01 | ) | | | 0.17 | | | | 0.37 | | | | 0.09 | | | | 0.43 | | | | 0.49 | | |
Less distributions to shareholders: | |
Net investment income | | | (0.06 | ) | | | (0.14 | ) | | | (0.14 | ) | | | (0.17 | ) | | | (0.18 | ) | | | (0.18 | ) | |
Net realized gains | | | — | | | | — | | | | — | | | | (0.00 | )(a) | | | — | | | | — | | |
Total distributions to shareholders | | | (0.06 | ) | | | (0.14 | ) | | | (0.14 | ) | | | (0.17 | ) | | | (0.18 | ) | | | (0.18 | ) | |
Proceeds from regulatory settlements | | | — | | | | — | | | | — | | | | 0.00 | (a) | | | — | | | | 0.00 | (a) | |
Net asset value, end of period | | $ | 2.97 | | | $ | 3.04 | | | $ | 3.01 | | | $ | 2.78 | | | $ | 2.86 | | | $ | 2.61 | | |
Total return | | | (0.28 | %) | | | 5.75 | % | | | 13.69 | % | | | 3.20 | %(b) | | | 16.71 | % | | | 21.88 | %(c) | |
Ratios to average net assets(d) | |
Total gross expenses | | | 1.81 | %(e) | | | 1.82 | % | | | 1.82 | % | | | 1.84 | % | | | 1.84 | % | | | 1.85 | % | |
Total net expenses(f) | | | 1.81 | %(e)(g) | | | 1.82 | %(g) | | | 1.82 | %(g) | | | 1.79 | %(g) | | | 1.82 | % | | | 1.79 | % | |
Net investment income | | | 4.06 | %(e) | | | 4.63 | % | | | 4.99 | % | | | 5.77 | % | | | 6.45 | % | | | 7.19 | % | |
Supplemental data | |
Net assets, end of period (in thousands) | | $ | 12,029 | | | $ | 15,652 | | | $ | 27,239 | | | $ | 34,361 | | | $ | 62,820 | | | $ | 91,104 | | |
Portfolio turnover | | | 33 | % | | | 63 | % | | | 81 | % | | | 76 | % | | | 96 | % | | | 94 | % | |
Notes to Financial Highlights
(a) Rounds to zero.
(b) The Fund received proceeds from regulatory settlements. Had the Fund not received these proceeds, the total return would have been lower by 0.08%.
(c) The Fund received proceeds from regulatory settlements. Had the Fund not received these proceeds, the total return would have been lower by 0.01%.
(d) In addition to the fees and expenses that the Fund bears directly, the Fund indirectly bears a pro rata share of the fees and expenses of any other funds in which it invests. Such indirect expenses are not included in the Fund's reported expense ratios.
(e) Annualized.
(f) Total net expenses include the impact of certain fee waivers/expense reimbursements made by the Investment Manager and certain of its affiliates, if applicable.
(g) The benefits derived from expense reductions had an impact of less than 0.01%.
The accompanying Notes to Financial Statements are an integral part of this statement.
Semiannual Report 2014
28
Columbia High Yield Bond Fund
Financial Highlights (continued)
| | | Six Months Ended
November 30, 2014 | | Year Ended May 31, | |
Class C | | (Unaudited) | | 2014 | | 2013 | | 2012 | | 2011 | | 2010 | |
Per share data | |
Net asset value, beginning of period | | $ | 3.02 | | | $ | 2.99 | | | $ | 2.76 | | | $ | 2.84 | | | $ | 2.59 | | | $ | 2.28 | | |
Income from investment operations: | |
Net investment income | | | 0.06 | | | | 0.14 | | | | 0.15 | | | | 0.16 | | | | 0.18 | | | | 0.18 | | |
Net realized and unrealized gain (loss) | | | (0.07 | ) | | | 0.03 | | | | 0.22 | | | | (0.08 | ) | | | 0.25 | | | | 0.31 | | |
Total from investment operations | | | (0.01 | ) | | | 0.17 | | | | 0.37 | | | | 0.08 | | | | 0.43 | | | | 0.49 | | |
Less distributions to shareholders: | |
Net investment income | | | (0.06 | ) | | | (0.14 | ) | | | (0.14 | ) | | | (0.16 | ) | | | (0.18 | ) | | | (0.18 | ) | |
Net realized gains | | | — | | | | — | | | | — | | | | (0.00 | )(a) | | | — | | | | — | | |
Total distributions to shareholders | | | (0.06 | ) | | | (0.14 | ) | | | (0.14 | ) | | | (0.16 | ) | | | (0.18 | ) | | | (0.18 | ) | |
Proceeds from regulatory settlements | | | — | | | | — | | | | — | | | | 0.00 | (a) | | | — | | | | 0.00 | (a) | |
Net asset value, end of period | | $ | 2.95 | | | $ | 3.02 | | | $ | 2.99 | | | $ | 2.76 | | | $ | 2.84 | | | $ | 2.59 | | |
Total return | | | (0.24 | %) | | | 5.92 | % | | | 13.78 | % | | | 3.20 | %(b) | | | 16.80 | % | | | 22.01 | %(c) | |
Ratios to average net assets(d) | |
Total gross expenses | | | 1.82 | %(e) | | | 1.82 | % | | | 1.83 | % | | | 1.83 | % | | | 1.84 | % | | | 1.85 | % | |
Total net expenses(f) | | | 1.71 | %(e)(g) | | | 1.67 | %(g) | | | 1.80 | %(g) | | | 1.79 | %(g) | | | 1.82 | % | | | 1.79 | % | |
Net investment income | | | 4.17 | %(e) | | | 4.76 | % | | | 4.98 | % | | | 5.79 | % | | | 6.42 | % | | | 7.14 | % | |
Supplemental data | |
Net assets, end of period (in thousands) | | $ | 91,964 | | | $ | 97,714 | | | $ | 97,487 | | | $ | 75,596 | | | $ | 76,237 | | | $ | 70,489 | | |
Portfolio turnover | | | 33 | % | | | 63 | % | | | 81 | % | | | 76 | % | | | 96 | % | | | 94 | % | |
Notes to Financial Highlights
(a) Rounds to zero.
(b) The Fund received proceeds from regulatory settlements. Had the Fund not received these proceeds, the total return would have been lower by 0.08%.
(c) The Fund received proceeds from regulatory settlements. Had the Fund not received these proceeds, the total return would have been lower by 0.01%.
(d) In addition to the fees and expenses that the Fund bears directly, the Fund indirectly bears a pro rata share of the fees and expenses of any other funds in which it invests. Such indirect expenses are not included in the Fund's reported expense ratios.
(e) Annualized.
(f) Total net expenses include the impact of certain fee waivers/expense reimbursements made by the Investment Manager and certain of its affiliates, if applicable.
(g) The benefits derived from expense reductions had an impact of less than 0.01%.
The accompanying Notes to Financial Statements are an integral part of this statement.
Semiannual Report 2014
29
Columbia High Yield Bond Fund
Financial Highlights (continued)
| | | Six Months Ended
November 30, 2014 | | Year Ended May 31, | |
Class I | | (Unaudited) | | 2014 | | 2013 | | 2012 | | 2011 | | 2010 | |
Per share data | |
Net asset value, beginning of period | | $ | 3.03 | | | $ | 3.00 | | | $ | 2.78 | | | $ | 2.86 | | | $ | 2.60 | | | $ | 2.29 | | |
Income from investment operations: | |
Net investment income | | | 0.08 | | | | 0.17 | | | | 0.18 | | | | 0.19 | | | | 0.21 | | | | 0.21 | | |
Net realized and unrealized gain (loss) | | | (0.06 | ) | | | 0.03 | | | | 0.22 | | | | (0.07 | ) | | | 0.26 | | | | 0.31 | | |
Total from investment operations | | | 0.02 | | | | 0.20 | | | | 0.40 | | | | 0.12 | | | | 0.47 | | | | 0.52 | | |
Less distributions to shareholders: | |
Net investment income | | | (0.08 | ) | | | (0.17 | ) | | | (0.18 | ) | | | (0.20 | ) | | | (0.21 | ) | | | (0.21 | ) | |
Net realized gains | | | — | | | | — | | | | — | | | | (0.00 | )(a) | | | — | | | | — | | |
Total distributions to shareholders | | | (0.08 | ) | | | (0.17 | ) | | | (0.18 | ) | | | (0.20 | ) | | | (0.21 | ) | | | (0.21 | ) | |
Proceeds from regulatory settlements | | | — | | | | — | | | | — | | | | 0.00 | (a) | | | — | | | | 0.00 | (a) | |
Net asset value, end of period | | $ | 2.97 | | | $ | 3.03 | | | $ | 3.00 | | | $ | 2.78 | | | $ | 2.86 | | | $ | 2.60 | | |
Total return | | | 0.63 | % | | | 6.99 | % | | | 14.64 | % | | | 4.38 | %(b) | | | 18.52 | % | | | 23.35 | %(c) | |
Ratios to average net assets(d) | |
Total gross expenses | | | 0.65 | %(e) | | | 0.66 | % | | | 0.66 | % | | | 0.66 | % | | | 0.68 | % | | | 0.68 | % | |
Total net expenses(f) | | | 0.65 | %(e) | | | 0.66 | % | | | 0.66 | % | | | 0.66 | % | | | 0.68 | % | | | 0.63 | % | |
Net investment income | | | 5.23 | %(e) | | | 5.76 | % | | | 6.15 | % | | | 6.91 | % | | | 7.53 | % | | | 8.36 | % | |
Supplemental data | |
Net assets, end of period (in thousands) | | $ | 253,993 | | | $ | 192,255 | | | $ | 112,742 | | | $ | 141,388 | | | $ | 132,684 | | | $ | 144,203 | | |
Portfolio turnover | | | 33 | % | | | 63 | % | | | 81 | % | | | 76 | % | | | 96 | % | | | 94 | % | |
Notes to Financial Highlights
(a) Rounds to zero.
(b) The Fund received proceeds from regulatory settlements. Had the Fund not received these proceeds, the total return would have been lower by 0.08%.
(c) The Fund received proceeds from regulatory settlements. Had the Fund not received these proceeds, the total return would have been lower by 0.01%.
(d) In addition to the fees and expenses that the Fund bears directly, the Fund indirectly bears a pro rata share of the fees and expenses of any other funds in which it invests. Such indirect expenses are not included in the Fund's reported expense ratios.
(e) Annualized.
(f) Total net expenses include the impact of certain fee waivers/expense reimbursements made by the Investment Manager and certain of its affiliates, if applicable.
The accompanying Notes to Financial Statements are an integral part of this statement.
Semiannual Report 2014
30
Columbia High Yield Bond Fund
Financial Highlights (continued)
| | | Six Months Ended
November 30, 2014 | | Year Ended May 31, | |
Class K | | (Unaudited) | | 2014 | | 2013 | | 2012 | | 2011 | | 2010 | |
Per share data | |
Net asset value, beginning of period | | $ | 3.04 | | | $ | 3.01 | | | $ | 2.79 | | | $ | 2.86 | | | $ | 2.61 | | | $ | 2.30 | | |
Income from investment operations: | |
Net investment income | | | 0.07 | | | | 0.16 | | | | 0.17 | | | | 0.18 | | | | 0.20 | | | | 0.21 | | |
Net realized and unrealized gain (loss) | | | (0.07 | ) | | | 0.03 | | | | 0.22 | | | | (0.06 | ) | | | 0.25 | | | | 0.30 | | |
Total from investment operations | | | — | | | | 0.19 | | | | 0.39 | | | | 0.12 | | | | 0.45 | | | | 0.51 | | |
Less distributions to shareholders: | |
Net investment income | | | (0.07 | ) | | | (0.16 | ) | | | (0.17 | ) | | | (0.19 | ) | | | (0.20 | ) | | | (0.20 | ) | |
Net realized gains | | | — | | | | — | | | | — | | | | (0.00 | )(a) | | | — | | | | — | | |
Total distributions to shareholders | | | (0.07 | ) | | | (0.16 | ) | | | (0.17 | ) | | | (0.19 | ) | | | (0.20 | ) | | | (0.20 | ) | |
Proceeds from regulatory settlements | | | — | | | | — | | | | — | | | | 0.00 | (a) | | | — | | | | 0.00 | (a) | |
Net asset value, end of period | | $ | 2.97 | | | $ | 3.04 | | | $ | 3.01 | | | $ | 2.79 | | | $ | 2.86 | | | $ | 2.61 | | |
Total return | | | 0.15 | % | | | 6.67 | % | | | 14.26 | % | | | 4.44 | %(b) | | | 17.74 | % | | | 22.92 | %(c) | |
Ratios to average net assets(d) | |
Total gross expenses | | | 0.95 | %(e) | | | 0.96 | % | | | 0.96 | % | | | 0.96 | % | | | 0.96 | % | | | 0.99 | % | |
Total net expenses(f) | | | 0.95 | %(e) | | | 0.96 | % | | | 0.96 | % | | | 0.96 | % | | | 0.96 | % | | | 0.93 | % | |
Net investment income | | | 4.93 | %(e) | | | 5.48 | % | | | 5.84 | % | | | 6.62 | % | | | 7.27 | % | | | 8.05 | % | |
Supplemental data | |
Net assets, end of period (in thousands) | | $ | 58,654 | | | $ | 54,345 | | | $ | 62,347 | | | $ | 63,276 | | | $ | 61,282 | | | $ | 43,406 | | |
Portfolio turnover | | | 33 | % | | | 63 | % | | | 81 | % | | | 76 | % | | | 96 | % | | | 94 | % | |
Notes to Financial Highlights
(a) Rounds to zero.
(b) The Fund received proceeds from regulatory settlements. Had the Fund not received these proceeds, the total return would have been lower by 0.08%.
(c) The Fund received proceeds from regulatory settlements. Had the Fund not received these proceeds, the total return would have been lower by 0.01%.
(d) In addition to the fees and expenses that the Fund bears directly, the Fund indirectly bears a pro rata share of the fees and expenses of any other funds in which it invests. Such indirect expenses are not included in the Fund's reported expense ratios.
(e) Annualized.
(f) Total net expenses include the impact of certain fee waivers/expense reimbursements made by the Investment Manager and certain of its affiliates, if applicable.
The accompanying Notes to Financial Statements are an integral part of this statement.
Semiannual Report 2014
31
Columbia High Yield Bond Fund
Financial Highlights (continued)
| | | Six Months Ended
November 30, 2014 | | Year Ended May 31, | |
Class R | | (Unaudited) | | 2014 | | 2013 | | 2012 | | 2011 | | 2010 | |
Per share data | |
Net asset value, beginning of period | | $ | 3.05 | | | $ | 3.02 | | | $ | 2.79 | | | $ | 2.87 | | | $ | 2.62 | | | $ | 2.30 | | |
Income from investment operations: | |
Net investment income | | | 0.07 | | | | 0.15 | | | | 0.16 | | | | 0.17 | | | | 0.19 | | | | 0.20 | | |
Net realized and unrealized gain (loss) | | | (0.07 | ) | | | 0.03 | | | | 0.23 | | | | (0.07 | ) | | | 0.25 | | | | 0.31 | | |
Total from investment operations | | | — | | | | 0.18 | | | | 0.39 | | | | 0.10 | | | | 0.44 | | | | 0.51 | | |
Less distributions to shareholders: | |
Net investment income | | | (0.07 | ) | | | (0.15 | ) | | | (0.16 | ) | | | (0.18 | ) | | | (0.19 | ) | | | (0.19 | ) | |
Net realized gains | | | — | | | | — | | | | — | | | | (0.00 | )(a) | | | — | | | | — | | |
Total distributions to shareholders | | | (0.07 | ) | | | (0.15 | ) | | | (0.16 | ) | | | (0.18 | ) | | | (0.19 | ) | | | (0.19 | ) | |
Proceeds from regulatory settlements | | | — | | | | — | | | | — | | | | 0.00 | (a) | | | — | | | | 0.00 | (a) | |
Net asset value, end of period | | $ | 2.98 | | | $ | 3.05 | | | $ | 3.02 | | | $ | 2.79 | | | $ | 2.87 | | | $ | 2.62 | | |
Total return | | | (0.02 | %) | | | 6.28 | % | | | 14.24 | % | | | 3.75 | %(b) | | | 17.23 | % | | | 22.79 | %(c) | |
Ratios to average net assets(d) | |
Total gross expenses | | | 1.32 | %(e) | | | 1.32 | % | | | 1.33 | % | | | 1.33 | % | | | 1.36 | % | | | 1.48 | % | |
Total net expenses(f) | | | 1.32 | %(e)(g) | | | 1.32 | %(g) | | | 1.32 | %(g) | | | 1.29 | %(g) | | | 1.35 | % | | | 1.43 | % | |
Net investment income | | | 4.56 | %(e) | | | 5.10 | % | | | 5.45 | % | | | 6.29 | % | | | 6.86 | % | | | 7.46 | % | |
Supplemental data | |
Net assets, end of period (in thousands) | | $ | 18,058 | | | $ | 18,782 | | | $ | 13,967 | | | $ | 7,582 | | | $ | 7,156 | | | $ | 5,690 | | |
Portfolio turnover | | | 33 | % | | | 63 | % | | | 81 | % | | | 76 | % | | | 96 | % | | | 94 | % | |
Notes to Financial Highlights
(a) Rounds to zero.
(b) The Fund received proceeds from regulatory settlements. Had the Fund not received these proceeds, the total return would have been lower by 0.08%.
(c) The Fund received proceeds from regulatory settlements. Had the Fund not received these proceeds, the total return would have been lower by 0.01%.
(d) In addition to the fees and expenses that the Fund bears directly, the Fund indirectly bears a pro rata share of the fees and expenses of any other funds in which it invests. Such indirect expenses are not included in the Fund's reported expense ratios.
(e) Annualized.
(f) Total net expenses include the impact of certain fee waivers/expense reimbursements made by the Investment Manager and certain of its affiliates, if applicable.
(g) The benefits derived from expense reductions had an impact of less than 0.01%.
The accompanying Notes to Financial Statements are an integral part of this statement.
Semiannual Report 2014
32
Columbia High Yield Bond Fund
Financial Highlights (continued)
| | | Six Months Ended
November 30, 2014 | | Year Ended May 31, | |
Class R4 | | (Unaudited) | | 2014 | | 2013 | | 2012 | | 2011 | | 2010 | |
Per share data | |
Net asset value, beginning of period | | $ | 3.06 | | | $ | 3.03 | | | $ | 2.80 | | | $ | 2.88 | | | $ | 2.62 | | | $ | 2.31 | | |
Income from investment operations: | |
Net investment income | | | 0.08 | | | | 0.17 | | | | 0.17 | | | | 0.18 | | | | 0.20 | | | | 0.20 | | |
Net realized and unrealized gain (loss) | | | (0.07 | ) | | | 0.03 | | | | 0.23 | | | | (0.08 | ) | | | 0.26 | | | | 0.31 | | |
Total from investment operations | | | 0.01 | | | | 0.20 | | | | 0.40 | | | | 0.10 | | | | 0.46 | | | | 0.51 | | |
Less distributions to shareholders: | |
Net investment income | | | (0.08 | ) | | | (0.17 | ) | | | (0.17 | ) | | | (0.18 | ) | | | (0.20 | ) | | | (0.20 | ) | |
Net realized gains | | | — | | | | — | | | | — | | | | (0.00 | )(a) | | | — | | | | — | | |
Total distributions to shareholders | | | (0.08 | ) | | | (0.17 | ) | | | (0.17 | ) | | | (0.18 | ) | | | (0.20 | ) | | | (0.20 | ) | |
Proceeds from regulatory settlements | | | — | | | | — | | | | — | | | | 0.00 | (a) | | | — | | | | 0.00 | (a) | |
Net asset value, end of period | | $ | 2.99 | | | $ | 3.06 | | | $ | 3.03 | | | $ | 2.80 | | | $ | 2.88 | | | $ | 2.62 | | |
Total return | | | 0.24 | % | | | 6.81 | % | | | 14.59 | % | | | 3.83 | %(b) | | | 17.81 | % | | | 22.56 | %(c) | |
Ratios to average net assets(d) | |
Total gross expenses | | | 0.82 | %(e) | | | 0.82 | % | | | 0.97 | % | | | 1.21 | % | | | 1.21 | % | | | 1.23 | % | |
Total net expenses(f) | | | 0.82 | %(e)(g) | | | 0.82 | %(g) | | | 0.97 | % | | | 1.21 | % | | | 1.21 | % | | | 1.18 | % | |
Net investment income | | | 5.06 | %(e) | | | 5.60 | % | | | 5.82 | % | | | 6.37 | % | | | 6.99 | % | | | 7.81 | % | |
Supplemental data | |
Net assets, end of period (in thousands) | | $ | 11,205 | | | $ | 10,379 | | | $ | 10,468 | | | $ | 8,176 | | | $ | 7,418 | | | $ | 4,003 | | |
Portfolio turnover | | | 33 | % | | | 63 | % | | | 81 | % | | | 76 | % | | | 96 | % | | | 94 | % | |
Notes to Financial Highlights
(a) Rounds to zero.
(b) The Fund received proceeds from regulatory settlements. Had the Fund not received these proceeds, the total return would have been lower by 0.08%.
(c) The Fund received proceeds from regulatory settlements. Had the Fund not received these proceeds, the total return would have been lower by 0.01%.
(d) In addition to the fees and expenses that the Fund bears directly, the Fund indirectly bears a pro rata share of the fees and expenses of any other funds in which it invests. Such indirect expenses are not included in the Fund's reported expense ratios.
(e) Annualized.
(f) Total net expenses include the impact of certain fee waivers/expense reimbursements made by the Investment Manager and certain of its affiliates, if applicable.
(g) The benefits derived from expense reductions had an impact of less than 0.01%.
The accompanying Notes to Financial Statements are an integral part of this statement.
Semiannual Report 2014
33
Columbia High Yield Bond Fund
Financial Highlights (continued)
| | | Six Months Ended
November 30, 2014 | | Year Ended May 31, | |
Class R5 | | (Unaudited) | | 2014 | | 2013 | | 2012 | | 2011 | | 2010 | |
Per share data | |
Net asset value, beginning of period | | $ | 3.04 | | | $ | 3.01 | | | $ | 2.78 | | | $ | 2.86 | | | $ | 2.61 | | | $ | 2.30 | | |
Income from investment operations: | |
Net investment income | | | 0.08 | | | | 0.17 | | | | 0.18 | | | | 0.19 | | | | 0.21 | | | | 0.21 | | |
Net realized and unrealized gain (loss) | | | (0.08 | ) | | | 0.03 | | | | 0.23 | | | | (0.07 | ) | | | 0.25 | | | | 0.31 | | |
Total from investment operations | | | — | | | | 0.20 | | | | 0.41 | | | | 0.12 | | | | 0.46 | | | | 0.52 | | |
Less distributions to shareholders: | |
Net investment income | | | (0.08 | ) | | | (0.17 | ) | | | (0.18 | ) | | | (0.20 | ) | | | (0.21 | ) | | | (0.21 | ) | |
Net realized gains | | | — | | | | — | | | | — | | | | (0.00 | )(a) | | | — | | | | — | | |
Total distributions to shareholders | | | (0.08 | ) | | | (0.17 | ) | | | (0.18 | ) | | | (0.20 | ) | | | (0.21 | ) | | | (0.21 | ) | |
Proceeds from regulatory settlements | | | — | | | | — | | | | — | | | | 0.00 | (a) | | | — | | | | 0.00 | (a) | |
Net asset value, end of period | | $ | 2.96 | | | $ | 3.04 | | | $ | 3.01 | | | $ | 2.78 | | | $ | 2.86 | | | $ | 2.61 | | |
Total return | | | (0.06 | %) | | | 6.93 | % | | | 14.96 | % | | | 4.32 | %(b) | | | 18.02 | % | | | 23.22 | %(c) | |
Ratios to average net assets(d) | |
Total gross expenses | | | 0.71 | %(e) | | | 0.71 | % | | | 0.71 | % | | | 0.71 | % | | | 0.73 | % | | | 0.73 | % | |
Total net expenses(f) | | | 0.71 | %(e) | | | 0.71 | % | | | 0.71 | % | | | 0.71 | % | | | 0.72 | % | | | 0.68 | % | |
Net investment income | | | 5.20 | %(e) | | | 5.71 | % | | | 6.06 | % | | | 6.76 | % | | | 7.48 | % | | | 8.18 | % | |
Supplemental data | |
Net assets, end of period (in thousands) | | $ | 27,321 | | | $ | 15,564 | | | $ | 15,124 | | | $ | 8,675 | | | $ | 11,384 | | | $ | 7,958 | | |
Portfolio turnover | | | 33 | % | | | 63 | % | | | 81 | % | | | 76 | % | | | 96 | % | | | 94 | % | |
Notes to Financial Highlights
(a) Rounds to zero.
(b) The Fund received proceeds from regulatory settlements. Had the Fund not received these proceeds, the total return would have been lower by 0.08%.
(c) The Fund received proceeds from regulatory settlements. Had the Fund not received these proceeds, the total return would have been lower by 0.01%.
(d) In addition to the fees and expenses that the Fund bears directly, the Fund indirectly bears a pro rata share of the fees and expenses of any other funds in which it invests. Such indirect expenses are not included in the Fund's reported expense ratios.
(e) Annualized.
(f) Total net expenses include the impact of certain fee waivers/expense reimbursements made by the Investment Manager and certain of its affiliates, if applicable.
The accompanying Notes to Financial Statements are an integral part of this statement.
Semiannual Report 2014
34
Columbia High Yield Bond Fund
Financial Highlights (continued)
| | | Six Months Ended
November 30, 2014 | | Year Ended May 31, | |
Class W | | (Unaudited) | | 2014 | | 2013 | | 2012 | | 2011 | | 2010 | |
Per share data | |
Net asset value, beginning of period | | $ | 3.02 | | | $ | 2.99 | | | $ | 2.76 | | | $ | 2.84 | | | $ | 2.59 | | | $ | 2.28 | | |
Income from investment operations: | |
Net investment income | | | 0.07 | | | | 0.16 | | | | 0.17 | | | | 0.18 | | | | 0.20 | | | | 0.20 | | |
Net realized and unrealized gain (loss) | | | (0.07 | ) | | | 0.03 | | | | 0.23 | | | | (0.07 | ) | | | 0.25 | | | | 0.31 | | |
Total from investment operations | | | — | | | | 0.19 | | | | 0.40 | | | | 0.11 | | | | 0.45 | | | | 0.51 | | |
Less distributions to shareholders: | |
Net investment income | | | (0.07 | ) | | | (0.16 | ) | | | (0.17 | ) | | | (0.19 | ) | | | (0.20 | ) | | | (0.20 | ) | |
Net realized gains | | | — | | | | — | | | | — | | | | (0.00 | )(a) | | | — | | | | — | | |
Total distributions to shareholders | | | (0.07 | ) | | | (0.16 | ) | | | (0.17 | ) | | | (0.19 | ) | | | (0.20 | ) | | | (0.20 | ) | |
Proceeds from regulatory settlements | | | — | | | | — | | | | — | | | | 0.00 | (a) | | | — | | | | 0.00 | (a) | |
Net asset value, end of period | | $ | 2.95 | | | $ | 3.02 | | | $ | 2.99 | | | $ | 2.76 | | | $ | 2.84 | | | $ | 2.59 | | |
Total return | | | 0.08 | % | | | 6.54 | % | | | 14.61 | % | | | 3.97 | %(b) | | | 17.65 | % | | | 22.82 | %(c) | |
Ratios to average net assets(d) | |
Total gross expenses | | | 1.07 | %(e) | | | 1.07 | % | | | 1.08 | % | | | 1.11 | % | | | 1.10 | % | | | 1.12 | % | |
Total net expenses(f) | | | 1.07 | %(e)(g) | | | 1.07 | %(g) | | | 1.07 | %(g) | | | 1.05 | %(g) | | | 1.09 | % | | | 1.08 | % | |
Net investment income | | | 4.81 | %(e) | | | 5.32 | % | | | 5.72 | % | | | 6.59 | % | | | 7.16 | % | | | 7.68 | % | |
Supplemental data | |
Net assets, end of period (in thousands) | | $ | 79,295 | | | $ | 75,524 | | | $ | 50,998 | | | $ | 44,832 | | | $ | 89,506 | | | $ | 100,227 | | |
Portfolio turnover | | | 33 | % | | | 63 | % | | | 81 | % | | | 76 | % | | | 96 | % | | | 94 | % | |
Notes to Financial Highlights
(a) Rounds to zero.
(b) The Fund received proceeds from regulatory settlements. Had the Fund not received these proceeds, the total return would have been lower by 0.08%.
(c) The Fund received proceeds from regulatory settlements. Had the Fund not received these proceeds, the total return would have been lower by 0.01%.
(d) In addition to the fees and expenses that the Fund bears directly, the Fund indirectly bears a pro rata share of the fees and expenses of any other funds in which it invests. Such indirect expenses are not included in the Fund's reported expense ratios.
(e) Annualized.
(f) Total net expenses include the impact of certain fee waivers/expense reimbursements made by the Investment Manager and certain of its affiliates, if applicable.
(g) The benefits derived from expense reductions had an impact of less than 0.01%.
The accompanying Notes to Financial Statements are an integral part of this statement.
Semiannual Report 2014
35
Columbia High Yield Bond Fund
Financial Highlights (continued)
| | | Six Months Ended
November 30, 2014 | | Year Ended May 31, | |
Class Y | | (Unaudited) | | 2014 | | 2013(a) | |
Per share data | |
Net asset value, beginning of period | | $ | 3.03 | | | $ | 3.00 | | | $ | 2.92 | | |
Income from investment operations: | |
Net investment income | | | 0.08 | | | | 0.17 | | | | 0.10 | | |
Net realized and unrealized gain (loss) | | | (0.07 | ) | | | 0.03 | | | | 0.08 | | |
Total from investment operations | | | 0.01 | | | | 0.20 | | | | 0.18 | | |
Less distributions to shareholders: | |
Net investment income | | | (0.08 | ) | | | (0.17 | ) | | | (0.10 | ) | |
Total distributions to shareholders | | | (0.08 | ) | | | (0.17 | ) | | | (0.10 | ) | |
Net asset value, end of period | | $ | 2.96 | | | $ | 3.03 | | | $ | 3.00 | | |
Total return | | | 0.30 | % | | | 6.98 | % | | | 6.16 | % | |
Ratios to average net assets(b) | |
Total gross expenses | | | 0.65 | %(c) | | | 0.66 | % | | | 0.58 | %(c) | |
Total net expenses(d) | | | 0.65 | %(c) | | | 0.66 | % | | | 0.58 | %(c) | |
Net investment income | | | 5.23 | %(c) | | | 5.71 | % | | | 6.06 | %(c) | |
Supplemental data | |
Net assets, end of period (in thousands) | | $ | 6,585 | | | $ | 6,091 | | | $ | 3 | | |
Portfolio turnover | | | 33 | % | | | 63 | % | | | 81 | % | |
Notes to Financial Highlights
(a) Based on operations from November 8, 2012 (commencement of operations) through the stated period end.
(b) In addition to the fees and expenses that the Fund bears directly, the Fund indirectly bears a pro rata share of the fees and expenses of any other funds in which it invests. Such indirect expenses are not included in the Fund's reported expense ratios.
(c) Annualized.
(d) Total net expenses include the impact of certain fee waivers/expense reimbursements made by the Investment Manager and certain of its affiliates, if applicable.
The accompanying Notes to Financial Statements are an integral part of this statement.
Semiannual Report 2014
36
Columbia High Yield Bond Fund
Financial Highlights (continued)
| | | Six Months Ended
November 30, 2014 | |
Year Ended May 31, | |
Class Z | | (Unaudited) | | 2014 | | 2013 | | 2012 | | 2011(a) | |
Per share data | |
Net asset value, beginning of period | | $ | 3.04 | | | $ | 3.01 | | | $ | 2.78 | | | $ | 2.85 | | | $ | 2.72 | | |
Income from investment operations: | |
Net investment income | | | 0.08 | | | | 0.17 | | | | 0.17 | | | | 0.18 | | | | 0.14 | | |
Net realized and unrealized gain (loss) | | | (0.07 | ) | | | 0.03 | | | | 0.23 | | | | (0.06 | ) | | | 0.12 | | |
Total from investment operations | | | 0.01 | | | | 0.20 | | | | 0.40 | | | | 0.12 | | | | 0.26 | | |
Less distributions to shareholders: | |
Net investment income | | | (0.08 | ) | | | (0.17 | ) | | | (0.17 | ) | | | (0.19 | ) | | | (0.13 | ) | |
Net realized gains | | | — | | | | — | | | | — | | | | (0.00 | )(b) | | | — | | |
Total distributions to shareholders | | | (0.08 | ) | | | (0.17 | ) | | | (0.17 | ) | | | (0.19 | ) | | | (0.13 | ) | |
Proceeds from regulatory settlements | | | — | | | | — | | | | — | | | | 0.00 | (b) | | | — | | |
Net asset value, end of period | | $ | 2.97 | | | $ | 3.04 | | | $ | 3.01 | | | $ | 2.78 | | | $ | 2.85 | | |
Total return | | | 0.22 | % | | | 6.81 | % | | | 14.84 | % | | | 4.59 | %(c) | | | 9.87 | % | |
Ratios to average net assets(d) | |
Total gross expenses | | | 0.82 | %(e) | | | 0.82 | % | | | 0.82 | % | | | 0.80 | % | | | 0.73 | %(e) | |
Total net expenses(f) | | | 0.82 | %(e)(g) | | | 0.82 | %(g) | | | 0.82 | %(g) | | | 0.78 | %(g) | | | 0.73 | %(e) | |
Net investment income | | | 5.06 | %(e) | | | 5.58 | % | | | 5.86 | % | | | 6.58 | % | | | 7.37 | %(e) | |
Supplemental data | |
Net assets, end of period (in thousands) | | $ | 180,326 | | | $ | 161,293 | | | $ | 153,684 | | | $ | 35,492 | | | $ | 12,526 | | |
Portfolio turnover | | | 33 | % | | | 63 | % | | | 81 | % | | | 76 | % | | | 96 | % | |
Notes to Financial Highlights
(a) Based on operations from September 27, 2010 (commencement of operations) through the stated period end.
(b) Rounds to zero.
(c) The Fund received proceeds from regulatory settlements. Had the Fund not received these proceeds, the total return would have been lower by 0.08%.
(d) In addition to the fees and expenses that the Fund bears directly, the Fund indirectly bears a pro rata share of the fees and expenses of any other funds in which it invests. Such indirect expenses are not included in the Fund's reported expense ratios.
(e) Annualized.
(f) Total net expenses include the impact of certain fee waivers/expense reimbursements made by the Investment Manager and certain of its affiliates, if applicable.
(g) The benefits derived from expense reductions had an impact of less than 0.01%.
The accompanying Notes to Financial Statements are an integral part of this statement.
Semiannual Report 2014
37
Columbia High Yield Bond Fund
Notes to Financial Statements
November 30, 2014 (Unaudited)
Note 1. Organization
Columbia High Yield Bond Fund (the Fund), a series of Columbia Funds Series Trust II (the Trust), is a diversified fund. The Trust is registered under the Investment Company Act of 1940, as amended (the 1940 Act), as an open-end management investment company organized as a Massachusetts business trust.
Fund Shares
The Trust may issue an unlimited number of shares (without par value). The Fund offers Class A, Class B, Class C, Class I, Class K, Class R, Class R4, Class R5, Class W, Class Y and Class Z shares. Although all share classes generally have identical voting, dividend and liquidation rights, each share class votes separately when required by the Trust's organizational documents or by law. Different share classes pay different distribution amounts to the extent the expenses of such share classes differ, and distributions in liquidation will be proportional to the net asset value of each share class. Each share class has its own expense structure and sales charges.
Class A shares are subject to a maximum front-end sales charge of 4.75% based on the initial investment amount. Class A shares purchased without an initial sales charge in accounts aggregating $1 million to $50 million at the time of purchase are subject to a contingent deferred sales charge (CDSC) if the shares are sold within 18 months of purchase, charged as follows: 1.00% CDSC if redeemed within 12 months of purchase, and 0.50% CDSC if redeemed more than 12, but less than 18, months after purchase.
Class B shares may be subject to a maximum CDSC of 5.00% based upon the holding period after purchase. Class B shares will generally convert to Class A shares eight years after purchase. The Fund no longer accepts investments by new or existing investors in the Fund's Class B shares, except in connection with the reinvestment of any dividend and/or capital gain distributions in Class B shares of the Fund and exchanges by existing Class B shareholders of certain other funds within the Columbia Family of Funds.
Class C shares are subject to a 1.00% CDSC on shares redeemed within one year of purchase.
Class I shares are not subject to sales charges and are available only to the Columbia Family of Funds.
Class K shares are not subject to sales charges, however this share class is closed to new investors.
Class R shares are not subject to sales charges and are generally available only to certain retirement plans and other investors as described in the Fund's prospectus.
Class R4 shares are not subject to sales charges and are generally available only to omnibus retirement plans and certain investors as described in the Fund's prospectus.
Class R5 shares are not subject to sales charges and are generally available only to investors purchasing through authorized investment professionals and omnibus retirement plans.
Class W shares are not subject to sales charges and are available only to investors purchasing through authorized investment programs managed by investment professionals, including discretionary managed account programs.
Class Y shares are not subject to sales charges and are generally available only to certain retirement plans as described in the Fund's prospectus.
Class Z shares are not subject to sales charges and are available only to eligible investors, which are subject to different investment minimums as described in the Fund's prospectus.
Note 2. Summary of Significant Accounting Policies
Basis of Preparation
The Fund is an investment company that applies the accounting and reporting guidance in the Financial Accounting Standards Board (FASB) Accounting Standards Codification Topic 946, Financial Services — Investment Companies (ASC 946). The financial statements are prepared in accordance with U.S. generally accepted accounting principles (GAAP) which requires management to make certain estimates and assumptions that affect the reported amounts of assets and liabilities, the disclosure of contingent assets and liabilities at the date of the financial statements and the reported amounts of income and expenses during the reporting period. Actual results could differ from those estimates.
The following is a summary of significant accounting policies followed by the Fund in the preparation of its financial statements.
Security Valuation
Debt securities generally are valued by pricing services approved by the Board of Trustees (the Board) based upon market transactions for normal, institutional-size trading units of similar securities. The services may use various pricing techniques that take into account, as applicable, factors such as yield, quality, coupon rate, maturity, type of issue, trading characteristics and other data, as well as broker quotes. Debt securities for which quotations are readily available may also
Semiannual Report 2014
38
Columbia High Yield Bond Fund
Notes to Financial Statements (continued)
November 30, 2014 (Unaudited)
be valued based upon an over-the-counter or exchange bid quotation.
All equity securities are valued at the close of business of the New York Stock Exchange (NYSE). Equity securities are valued at the last quoted sales price on the principal exchange or market on which they trade, except for securities traded on the NASDAQ Stock Market, which are valued at the NASDAQ official close price. Unlisted securities or listed securities for which there were no sales during the day are valued at the mean of the latest quoted bid and ask prices on such exchanges or markets.
Senior loan securities for which reliable market quotations are readily available are generally valued by pricing services at the average of the bids received.
Investments in open-end investment companies, including money market funds, are valued at their net asset value.
Futures and options on futures contracts are valued based upon the settlement price established each day by the board of trade or exchange on which they are traded.
Swap transactions are valued through an independent pricing service or broker, or if neither is available, through an internal model based upon observable inputs.
Investments for which market quotations are not readily available, or that have quotations which management believes are not reliable, are valued at fair value as determined in good faith under procedures established by and under the general supervision of the Board. If a security or class of securities (such as foreign securities) is valued at fair value, such value is likely to be different from the quoted or published price for the security.
The determination of fair value often requires significant judgment. To determine fair value, management may use assumptions including but not limited to future cash flows and estimated risk premiums. Multiple inputs from various sources may be used to determine fair value.
Derivative Instruments
The Fund invests in certain derivative instruments, as detailed below, to meet its investment objectives. Derivatives are instruments whose values depend on, or are derived from, in whole or in part, the value of one or more other assets, such as securities, currencies, commodities or indices. Derivative instruments may be used to increase investment flexibility (including to maintain cash reserves while maintaining exposure to certain other assets), for risk management (hedging) purposes, to facilitate trading, to reduce transaction costs and to pursue higher investment returns. The Fund may also use derivative instruments to mitigate certain investment
risks, such as foreign currency exchange rate risk, interest rate risk and credit risk. Derivatives may involve various risks, including the potential inability of the counterparty to fulfill its obligation under the terms of the contract, the potential for an illiquid secondary market (making it difficult for the Fund to sell, including at favorable prices) and the potential for market movements which may expose the Fund to gains or losses in excess of the amount shown in the Statement of Assets and Liabilities. The notional amounts of derivative instruments, if applicable, are not recorded in the financial statements.
A derivative instrument may suffer a marked-to-market loss if the value of the contract decreases due to an unfavorable change in the market rates or values of the underlying instrument. Losses can also occur if the counterparty does not perform under the contract. The Fund's risk of loss from counterparty credit risk on over-the-counter derivatives is generally limited to the aggregate unrealized gain netted against any collateral held by the Fund and the amount of any variation margin held by the counterparty. With exchange-traded or centrally cleared derivatives, there is reduced counterparty credit risk to the Fund since the exchange's clearinghouse, as counterparty to such instruments, guarantees against a possible default. The clearinghouse stands between the buyer and the seller of the contract; therefore, the counterparty credit risk is failure of the clearinghouse. However, credit risk still exists in exchange-traded or centrally cleared derivatives with respect to initial and variation margin that is held in a broker's customer account. While brokers are required to segregate customer margin from their own assets, in the event that a broker becomes insolvent or goes into bankruptcy and at that time there is a shortfall in the aggregate amount of margin held by the broker for all its clients, U.S. bankruptcy laws will typically allocate that shortfall on a pro-rata basis across all the broker's customers (including the Fund), potentially resulting in losses to the Fund.
In order to better define its contractual rights and to secure rights that will help the Fund mitigate its counterparty risk, the Fund may enter into an International Swaps and Derivatives Association, Inc. Master Agreement (ISDA Master Agreement) or similar agreement with its derivative contract counterparties. An ISDA Master Agreement is an agreement between the Fund and a counterparty that governs over-the-counter derivatives and forward foreign currency exchange contracts and typically contains, among other things, collateral posting terms and netting provisions in the event of a default and/or termination event. Under an ISDA Master Agreement, the Fund may, under certain circumstances, offset with the counterparty certain derivative instrument's payables and/or receivables with collateral held and/or posted and create one single net payment. The provisions of the ISDA
Semiannual Report 2014
39
Columbia High Yield Bond Fund
Notes to Financial Statements (continued)
November 30, 2014 (Unaudited)
Master Agreement typically permit a single net payment in the event of default (close-out netting) including the bankruptcy or insolvency of the counterparty. Note, however, that bankruptcy or insolvency laws of a particular jurisdiction may impose restrictions on or prohibitions against the right of offset in bankruptcy, insolvency or other events.
Collateral (margin) requirements differ by type of derivative. Margin requirements are established by the exchange or clearinghouse for exchange-traded and centrally cleared derivatives. Brokers can ask for margin in excess of the minimum in certain circumstances. Collateral terms are contract specific for over-the-counter derivatives. For over-the-counter derivatives traded under an ISDA Master Agreement, the collateral requirements are typically calculated by netting the marked-to-market amount for each transaction under such agreement and comparing that amount to the value of any variation margin currently pledged by the Fund and/or the counterparty. Generally, the amount of collateral due from or to a party has to exceed a minimum transfer amount threshold (e.g., $500,000) before a transfer has to be made. To the extent amounts due to the Fund from its counterparties are not fully collateralized, contractually or otherwise, the Fund bears the risk of loss from counterparty nonperformance. The Fund attempts to mitigate counterparty risk by only entering into agreements with counterparties that it believes have the financial resources to honor their obligations and by monitoring the financial stability of those counterparties.
Certain ISDA Master Agreements allow counterparties to over-the-counter derivatives to terminate derivative contracts prior to maturity in the event the Fund's net assets decline by a stated percentage over a specified time period or if the Fund fails to meet the terms of the ISDA Master Agreement, which would cause the Fund to accelerate payment of any net liability owed to the counterparty. The Fund also has termination rights if the counterparty fails to meet the terms of the ISDA Master Agreement. In addition to considering counterparty credit risk, the Fund would consider terminating the derivative contracts based on whether termination would result in a net liability owed from the counterparty.
For financial reporting purposes, the Fund does not offset derivative assets and derivative liabilities that are subject to netting arrangements in the Statement of Assets and Liabilities.
Futures Contracts
Futures contracts are exchange traded and represent commitments for the future purchase or sale of an asset at a specified price on a specified date. The Fund bought and sold futures contracts to manage the duration and yield curve exposure of the Fund versus the benchmark, manage exposure to movements in interest rates, and manage exposure to the securities market. These instruments may be used for other
purposes in future periods. Upon entering into futures contracts, the Fund bears risks that it may not achieve the anticipated benefits of the futures contracts and may realize a loss. Additional risks include counterparty credit risk, the possibility of an illiquid market, and that a change in the value of the contract or option may not correlate with changes in the value of the underlying asset.
Upon entering into a futures contract, the Fund pledges cash or securities with the broker in an amount sufficient to meet the initial margin requirement. The initial margin deposit must be maintained at an established level over the life of the contract. Cash deposited as initial margin is recorded in the Statement of Assets and Liabilities as margin deposits. Securities deposited as initial margin are designated in the Portfolio of Investments. Subsequent payments (variation margin) are made or received by the Fund each day. The variation margin payments are equal to the daily change in the contract value and are recorded as variation margin receivable or payable and are offset in unrealized gains or losses. The Fund recognizes a realized gain or loss when the contract is closed or expires. Futures contracts involve, to varying degrees, risk of loss in excess of the variation margin disclosed in the Statement of Assets and Liabilities.
Swap Contracts
Swap contracts are privately negotiated in the over-the-counter market and may be entered into as a bilateral contract or centrally cleared (centrally cleared swap contract). In a centrally cleared swap contract, immediately following execution of the swap contract with a broker, the swap contract is novated to a central counterparty (the CCP) and the CCP becomes the Fund's counterparty to the centrally cleared swap contract. The Fund is required to deposit initial margin with the broker in the form of cash or securities in an amount that varies depending on the size and risk profile of the particular swap contract. Securities deposited as initial margin are designated in the Portfolio of Investments and cash deposited is recorded in the Statement of Assets and Liabilities as margin deposits. Unlike a bilateral swap contract, for centrally cleared swap contracts, the Fund has minimal credit exposure to the counterparty because the CCP stands between the Fund and the counterparty. Swap contracts are marked-to-market daily and changes in value are recorded as unrealized appreciation (depreciation). The daily change in valuation of centrally cleared swap contracts, if any, is recorded as a receivable or payable for variation margin in the Statement of Assets and Liabilities.
Credit Default Swap Contracts
The Fund entered into credit default swap contracts to increase or decrease its credit exposure to an index and increase or decrease its credit exposure to a specific debt security or a
Semiannual Report 2014
40
Columbia High Yield Bond Fund
Notes to Financial Statements (continued)
November 30, 2014 (Unaudited)
basket of debt securities as a protection buyer to reduce overall credit exposure. These instruments may be used for other purposes in future periods. Credit default swap contracts are agreements in which one party pays fixed periodic payments to a counterparty in consideration for a guarantee from the counterparty to make a specific payment should a specified credit event(s) take place. Although specified credit events are contract specific, credit events are generally defined as bankruptcy, failure to pay, restructuring, obligation acceleration, obligation default, or repudiation/moratorium.
As the purchaser of a credit default swap contract, the Fund purchases protection by paying a periodic interest rate on the notional amount to the counterparty. The interest amount is accrued daily as a component of unrealized appreciation (depreciation) and is recorded as a realized loss upon payment. If a credit event as specified in the contract occurs, the Fund may have the option either to deliver the reference obligation to the seller in exchange for a cash payment of its par amount, or to receive a net cash settlement equal to the par amount less an agreed-upon value of the reference obligation as of the date of the credit event. The difference between the value of the obligation or cash delivered and the notional amount received will be recorded as a realized gain (loss).
Effects of Derivative Transactions in the Financial Statements
The following tables are intended to provide additional information about the effect of derivatives on the financial statements of the Fund, including: the fair value of derivatives by risk category and the location of those fair values in the Statement of Assets and Liabilities; and the impact of derivative transactions over the period in the Statement of Operations, including realized gains or losses and unrealized gains or losses. The derivative schedules following the Portfolio of Investments present additional information regarding derivative instruments outstanding at the end of the period, if any.
The following table is a summary of the fair value of derivative instruments (not considered to be hedging instruments for accounting disclosure purposes) at November 30, 2014:
Liability Derivatives | |
Risk Exposure
Category | | Statement of Assets and
Liabilities Location | | Fair Value ($) | |
Interest rate risk
| | Net assets — unrealized
depreciation on futures
contracts | | | 213,460
| * | |
*Includes cumulative appreciation (depreciation) as reported in the tables following the Portfolio of Investments. Only the current day's variation margin is reported in receivables or payables in the Statement of Assets and Liabilities.
The following table indicates the effect of derivative instruments (not considered to be hedging instruments for accounting disclosure purposes) in the Statement of Operations for the six months ended November 30, 2014:
Amount of Realized Gain (Loss) on Derivatives Recognized in Income | |
Risk Exposure
Category | | Futures
Contracts ($) | | Swap
Contracts ($) | | Total ($) | |
Credit risk | | | — | | | | 624,729 | | | | 624,729 | | |
Interest rate risk | | | (376,260 | ) | | | — | | | | (376,260 | ) | |
Total | | | (376,260 | ) | | | 624,729 | | | | 248,469 | | |
Change in Unrealized Appreciation (Depreciation) on
Derivatives Recognized in Income | |
Risk Exposure Category | | Futures Contracts ($) | |
Interest rate risk | | | (245,961 | ) | |
The following table is a summary of the average outstanding volume by derivative instrument for the six months ended November 30, 2014:
Derivative Instrument | | Average Notional Amounts ($)* | |
Futures contracts — Short | | | 27,809,196 | | |
*Based on the ending quarterly outstanding amounts for the six months ended November 30, 2014.
Investments in Senior Loans
The Fund may invest in senior loan assignments. When the Fund purchases an assignment of a senior loan, the Fund typically has direct rights against the borrower; provided, however, that the Fund's rights may be more limited than the lender from which it acquired the assignment and the Fund may be able to enforce its rights only through an administrative agent. Although certain senior loan assignments are secured by collateral, the Fund could experience delays or limitations in realizing such collateral or have its interest subordinated to other indebtedness of the obligor. In the event that the administrator or collateral agent of a loan becomes insolvent, enters into receivership or bankruptcy, the Fund may incur costs and delays in realizing payment or may suffer a loss of principal and/or interest. The risk of loss is greater for unsecured or subordinated loans. In addition, senior loan assignments are vulnerable to market, economic or other conditions or events that may reduce the demand for senior loan assignments and certain senior loan assignments which were liquid, when purchased, may become illiquid.
The Fund may enter into senior loan assignments where all or a portion of the loan may be unfunded. The Fund is obligated to fund these commitments at the borrower's discretion. These commitments are generally traded and priced in the same manner as other senior loan securities and are disclosed as unfunded senior loan commitments in the Fund's Portfolio of
Semiannual Report 2014
41
Columbia High Yield Bond Fund
Notes to Financial Statements (continued)
November 30, 2014 (Unaudited)
Investments. The Fund designates cash or liquid securities to cover these commitments.
Delayed Delivery Securities
The Fund may trade securities on other than normal settlement terms, including securities purchased or sold on a "when-issued" basis. This may increase risk to the Fund since the other party to the transaction may fail to deliver which could cause the Fund to subsequently invest at less advantageous prices. The Fund designates cash or liquid securities in an amount equal to the delayed delivery commitment.
Security Transactions
Security transactions are accounted for on the trade date. Cost is determined and gains (losses) are based upon the specific identification method for both financial statement and federal income tax purposes.
Trade date for senior loans purchased in the primary market is the date on which the loan is allocated. Trade date for senior loans purchased in the secondary market is the date on which the transaction is entered into.
Income Recognition
Interest income is recorded on an accrual basis. Market premiums and discounts, including original issue discounts, are amortized and accreted, respectively, over the expected life of the security on all debt securities, unless otherwise noted.
The Fund may place a debt security on non-accrual status and reduce related interest income when it becomes probable that the interest will not be collected and the amount of uncollectible interest can be reasonably estimated. A defaulted debt security is removed from non-accrual status when the issuer resumes interest payments or when collectability of interest is reasonably assured.
Corporate actions and dividend income are recorded on the ex-dividend date.
Awards from class action litigation are recorded as a reduction of cost basis if the Fund still owns the applicable securities on the payment date. If the Fund no longer owns the applicable securities, the proceeds are recorded as realized gains.
The value of additional securities received as an income payment is recorded as income and increases the cost basis of such securities.
The Fund may receive other income from senior loans, including amendment fees, consent fees and commitment fees. These fees are recorded as income when received by the Fund. These amounts are included in Interest Income in the Statement of Operations.
Expenses
General expenses of the Trust are allocated to the Fund and other funds of the Trust based upon relative net assets or other expense allocation methodologies determined by the nature of the expense. Expenses directly attributable to the Fund are charged to the Fund. Expenses directly attributable to a specific class of shares are charged to that share class.
Determination of Class Net Asset Value
All income, expenses (other than class-specific expenses, which are charged to that share class, as shown in the Statement of Operations) and realized and unrealized gains (losses) are allocated to each class of the Fund on a daily basis, based on the relative net assets of each class, for purposes of determining the net asset value of each class.
Federal Income Tax Status
The Fund intends to qualify each year as a regulated investment company under Subchapter M of the Internal Revenue Code, as amended, and will distribute substantially all of its taxable income (including net short-term capital gains), if any, for its tax year, and as such will not be subject to federal income taxes. In addition, the Fund intends to distribute in each calendar year substantially all of its net investment income, capital gains and certain other amounts, if any, such that the Fund should not be subject to federal excise tax. Therefore, no federal income or excise tax provision is recorded.
Distributions to Shareholders
Distributions from net investment income, if any, are declared daily and paid monthly. Net realized capital gains, if any, are distributed at least annually. Income distributions and capital gain distributions are determined in accordance with federal income tax regulations, which may differ from GAAP.
Guarantees and Indemnifications
Under the Trust's organizational documents and, in some cases, by contract, its officers and trustees are indemnified against certain liabilities arising out of the performance of their duties to the Trust or its funds. In addition, certain of the Fund's contracts with its service providers contain general indemnification clauses. The Fund's maximum exposure under these arrangements is unknown since the amount of any future claims that may be made against the Fund cannot be determined, and the Fund has no historical basis for predicting the likelihood of any such claims.
Semiannual Report 2014
42
Columbia High Yield Bond Fund
Notes to Financial Statements (continued)
November 30, 2014 (Unaudited)
Note 3. Fees and Compensation Paid to Affiliates
Investment Management Fees
Under an Investment Management Services Agreement, Columbia Management Investment Advisers, LLC (the Investment Manager), a wholly-owned subsidiary of Ameriprise Financial, Inc. (Ameriprise Financial), determines which securities will be purchased, held or sold. The investment management fee is an annual fee that is equal to a percentage of the Fund's average daily net assets that declines from 0.59% to 0.36% as the Fund's net assets increase. The annualized effective investment management fee rate for the six months ended November 30, 2014 was 0.56% of the Fund's average daily net assets.
Administration Fees
Under an Administrative Services Agreement, the Investment Manager also serves as the Fund Administrator. The Fund pays the Fund Administrator an annual fee for administration and accounting services equal to a percentage of the Fund's average daily net assets that declines from 0.07% to 0.04% as the Fund's net assets increase. The annualized effective administration fee rate for the six months ended November 30, 2014 was 0.06% of the Fund's average daily net assets.
Other Expenses
Other expenses are for, among other things, miscellaneous expenses of the Fund or the Board, including payments to a company providing limited administrative services to the Fund and the Board. That company's expenses include boardroom and office expense, employee compensation, employee health and retirement benefits, and certain other expenses. For the six months ended November 30, 2014, other expenses paid by the Fund to this company were $1,975.
Compensation of Board Members
Board members are compensated for their services to the Fund as disclosed in the Statement of Operations. Under a Deferred Compensation Plan (the Plan), the Board members who are not "interested persons" of the Fund, as defined under the 1940 Act, may elect to defer payment of up to 100% of their compensation. Deferred amounts are treated as though equivalent dollar amounts had been invested in shares of certain funds managed by the Investment Manager. The Fund's liability for these amounts is adjusted for market value changes and remains in the Fund until distributed in accordance with the Plan.
Transfer Agent Fees
Under a Transfer and Dividend Disbursing Agent Agreement, Columbia Management Investment Services Corp. (the Transfer Agent), an affiliate of the Investment Manager and a wholly-owned subsidiary of Ameriprise Financial, is responsible for providing transfer agency services to the Fund. The Transfer Agent has contracted with Boston Financial Data Services (BFDS) to serve as sub-transfer agent.
Effective November 1, 2014, the Transfer Agent receives a monthly transfer agency fee based on the number or the average value of accounts, depending on the type of account. Prior to November 1, 2014, the Transfer Agent received a monthly account-based service fee based on the number of open accounts. In addition, the Transfer Agent also receives sub-transfer agency fees based on a percentage of the average aggregate value of the Fund's shares maintained in omnibus accounts (other than omnibus accounts for which American Enterprise Investment Services Inc. is the broker of record or accounts where the beneficial shareholder is a customer of Ameriprise Financial Services, Inc., which receive a per account fee). The Transfer Agent pays the fees of BFDS for services as sub-transfer agent and is not entitled to reimbursement for such fees from the Fund (with the exception of out-of-pocket fees).
The Transfer Agent also receives compensation from the Fund for various shareholder services and reimbursements for certain out-of-pocket fees. Total transfer agent fees for Class K and Class R5 shares are subject to an annual limitation of not more than 0.05% of the average daily net assets attributable to each share class. Class I and Class Y shares are not subject to transfer agent fees.
For the six months ended November 30, 2014, the Fund's annualized effective transfer agent fee rates as a percentage of average daily net assets of each class were as follows:
Class A | | | 0.16 | % | |
Class B | | | 0.16 | | |
Class C | | | 0.16 | | |
Class K | | | 0.05 | | |
Class R | | | 0.16 | | |
Class R4 | | | 0.16 | | |
Class R5 | | | 0.05 | | |
Class W | | | 0.16 | | |
Class Z | | | 0.16 | | |
The Fund and certain other associated investment companies, have severally, but not jointly, guaranteed the performance and observance of all the terms and conditions of a lease entered into by Seligman Data Corp. (SDC), the former transfer agent,
Semiannual Report 2014
43
Columbia High Yield Bond Fund
Notes to Financial Statements (continued)
November 30, 2014 (Unaudited)
including the payment of rent by SDC (the Guaranty). SDC was the legacy Seligman funds' former transfer agent.
The lease and the Guaranty expire in January 2019. At November 30, 2014, the Fund's total potential future obligation over the life of the Guaranty is $119,781. The liability remaining at November 30, 2014 for non-recurring charges associated with the lease amounted to $63,277 and is recorded as a part of the payable for other expenses in the Statement of Assets and Liabilities.
An annual minimum account balance fee of $20 may apply to certain accounts with a value below the applicable share class's initial minimum investment requirements to reduce the impact of small accounts on transfer agent fees. These minimum account balance fees are remitted to the Fund and recorded as part of expense reductions in the Statement of Operations. For the six months ended November 30, 2014, these minimum account balance fees reduced total expenses of the Fund by $4,244.
Plan Administration Fees
Under a Plan Administration Services Agreement with the Transfer Agent, the Fund pays an annual fee at a rate of 0.25% of the Fund's average daily net assets attributable to Class K shares for the provision of various administrative, recordkeeping, communication and educational services.
Distribution Fees
The Fund has an agreement with Columbia Management Investment Distributors, Inc. (the Distributor), an affiliate of the Investment Manager and a wholly-owned subsidiary of Ameriprise Financial, for distribution and shareholder services. Under a Plan and Agreement of Distribution, the Fund pays a fee at an annual rate of up to 0.25% of the Fund's average daily net assets attributable to Class A and Class W shares, a fee at an annual rate of up to 0.50% of the Fund's average daily net assets attributable to Class R shares (of which up to 0.25% may be used for shareholder services) and a fee at an annual rate of up to 1.00% of the Fund's average daily net assets attributable to Class B and Class C shares. For Class B and Class C shares, of the 1.00% fee, up to 0.75% is reimbursed for distribution expenses. Prior to October 1, 2014, the Distributor voluntarily waived a portion of the distribution fee for Class C shares so that the distribution fee did not exceed 0.60% annually of the average daily net assets attributable to Class C shares.
The amount of distribution expenses incurred by the Distributor and not yet reimbursed (unreimbursed expense) was approximately $2,581,000 and $7,306,000 for Class B and Class C shares, respectively. These amounts are based on the most recent information available as of September 30, 2014,
and may be recovered from future payments under the distribution plan or CDSCs. To the extent the unreimbursed expense has been fully recovered, the distribution fee is reduced.
Sales Charges
Sales charges, including front-end charges and CDSCs, received by the Distributor for distributing Fund shares were $348,440 for Class A, $1,927 for Class B, and $1,737 for Class C shares for the six months ended November 30, 2014.
Expenses Waived/Reimbursed by the Investment Manager and its Affiliates
The Fund's expense ratio is subject to an expense reimbursement arrangement pursuant to which fees will be waived and/or expenses reimbursed (excluding certain fees and expenses described below), so that the Fund's net operating expenses, after giving effect to fees waived/expenses reimbursed and any balance credits and/or overdraft charges from the Fund's custodian, do not exceed the annual rates of:
| | | Voluntary
Expense Cap
Effective
October 1, 2014 | | Contractual
Expense Cap
Prior to
October 1, 2014 | |
Class A | | | 1.07 | % | | | 1.07 | % | |
Class B | | | 1.82 | | | | 1.82 | | |
Class C | | | 1.82 | | | | 1.82 | | |
Class I | | | 0.70 | | | | 0.70 | | |
Class K | | | 1.00 | | | | 1.00 | | |
Class R | | | 1.32 | | | | 1.32 | | |
Class R4 | | | 0.82 | | | | 0.82 | | |
Class R5 | | | 0.75 | | | | 0.75 | | |
Class W | | | 1.07 | | | | 1.07 | | |
Class Y | | | 0.70 | | | | 0.70 | | |
Class Z | | | 0.82 | | | | 0.82 | | |
The voluntary expense cap arrangement may be revised or discontinued at any time. Under the arrangements, the following fees and expenses are excluded from the waiver/reimbursement commitment, and therefore will be paid by the Fund, if applicable: taxes (including foreign transaction taxes), expenses associated with investments in affiliated and non-affiliated pooled investment vehicles (including mutual funds and exchange-traded funds), transaction costs and brokerage commissions, costs related to any securities lending program, dividend expenses associated with securities sold short, inverse floater program fees and expenses, transaction charges and interest on borrowed money, interest and extraordinary expenses.
Semiannual Report 2014
44
Columbia High Yield Bond Fund
Notes to Financial Statements (continued)
November 30, 2014 (Unaudited)
Note 4. Federal Tax Information
The timing and character of income and capital gain distributions are determined in accordance with income tax regulations, which may differ from GAAP because of temporary or permanent book to tax differences.
At November 30, 2014, the cost of investments for federal income tax purposes was approximately $1,884,410,000 and the aggregate gross approximate unrealized appreciation and depreciation based on that cost was:
Unrealized appreciation | | $ | 59,924,000 | | |
Unrealized depreciation | | | (17,548,000 | ) | |
Net unrealized appreciation | | $ | 42,376,000 | | |
The following capital loss carryforwards, determined as of May 31, 2014, may be available to reduce taxable income arising from future net realized gains on investments, if any, to the extent permitted by the Internal Revenue Code:
Year of Expiration | | Amount ($) | |
2016 | | | 14,236,782 | | |
2017 | | | 117,858,836 | | |
2018 | | | 55,132,247 | | |
Total | | | 187,227,865 | | |
Under current tax rules, regulated investment companies can elect to treat certain late-year ordinary losses incurred and post-October capital losses (capital losses realized after October 31) as arising on the first day of the following taxable year. The Fund has elected to treat post-October capital losses of $797,149 at May 31, 2014 as arising on June 1, 2014.
Management of the Fund has concluded that there are no significant uncertain tax positions in the Fund that would require recognition in the financial statements. However, management's conclusion may be subject to review and adjustment at a later date based on factors including, but not limited to, new tax laws, regulations, and administrative interpretations (including relevant court decisions). Generally, the Fund's federal tax returns for the prior three fiscal years remain subject to examination by the Internal Revenue Service.
Note 5. Portfolio Information
The cost of purchases and proceeds from sales of securities, excluding short-term obligations and certain derivatives, if any, aggregated to $665,925,995 and $631,838,740, respectively, for the six months ended November 30, 2014. The amount of purchase and sale activity impacts the portfolio turnover rate reported in the Financial Highlights.
Note 6. Affiliated Money Market Fund
The Fund invests in Columbia Short-Term Cash Fund, an affiliated money market fund established for the exclusive use
by the Fund and other affiliated funds. The income earned by the Fund from such investments is included as Dividends — affiliated issuers in the Statement of Operations. As an investing fund, the Fund indirectly bears its proportionate share of the expenses of Columbia Short-Term Cash Fund.
Note 7. Shareholder Concentration
At November 30, 2014, affiliated shareholders of record owned 68.1% of the outstanding shares of the Fund in one or more accounts. Subscription and redemption activity by concentrated accounts may have a significant effect on the operations of the Fund.
Note 8. Line of Credit
The Fund has entered into a revolving credit facility with a syndicate of banks led by JPMorgan Chase Bank N.A. (JPMorgan) whereby the Fund may borrow for the temporary funding of shareholder redemptions or for other temporary or emergency purposes. The credit facility agreement, as amended, which is a collective agreement between the Fund and certain other funds managed by the Investment Manager, severally and not jointly, permits collective borrowings up to $500 million. Interest is charged to each participating fund based on its borrowings at a rate equal to the higher of (i) the overnight federal funds rate plus 1.00% or (ii) the one-month LIBOR rate plus 1.00%. Each borrowing under the credit facility matures no later than 60 days after the date of borrowing. The Fund also pays a commitment fee equal to its pro rata share of the amount of the credit facility at a rate of 0.075% per annum. The commitment fee is included in other expenses in the Statement of Operations.
Effective December 9, 2014, the Fund extended its revolving credit facility with JPMorgan. The credit facility agreement, as amended, permits collective borrowings up to $550 million under the same terms and interest rates as described above.
The Fund had no borrowings during the six months ended November 30, 2014.
Note 9. Significant Risks
Credit Risk
Credit risk is the risk that the value of debt securities in the Fund's portfolio may decline because the issuer may default and fail to pay interest or repay principal when due. Rating agencies assign credit ratings to debt securities to indicate their credit risk. Lower rated or unrated debt securities held by the Fund may present increased credit risk as compared to higher-rated debt securities.
Interest Rate Risk
Interest rate risk is the risk of losses attributable to changes in interest rates. In general, if prevailing interest rates rise, the values of debt securities tend to fall, and if interest rates fall,
Semiannual Report 2014
45
Columbia High Yield Bond Fund
Notes to Financial Statements (continued)
November 30, 2014 (Unaudited)
the values of debt securities tend to rise. Actions by governments and central banking authorities can result in increases in interest rates. Increasing interest rates may negatively affect the value of debt securities held by the Fund, resulting in a negative impact on the Fund's performance and net asset value per share. In general, the longer the maturity or duration of a debt security, the greater its sensitivity to changes in interest rates.
Liquidity Risk
Liquidity risk is the risk associated with a lack of marketability of investments which may make it difficult to sell the investment at a desirable time or price. Changing regulatory, market or other conditions or environments (for example, the interest rate or credit environments) may adversely affect the liquidity of the Fund's investments. The Fund may have to accept a lower selling price for the holding, sell other investments, or forego another, more appealing investment opportunity. Generally, the less liquid the market at the time the Fund sells a portfolio investment, the greater the risk of loss or decline of value to the Fund. A less liquid market can lead to an increase in Fund redemptions, which may negatively impact Fund performance and net asset value per share, including, for example, if the Fund is forced to sell securities in a down market.
High-Yield Securities Risk
Securities rated below investment grade (commonly called "high-yield" or "junk" bonds) and unrated securities of comparable quality expose the Fund to a greater risk of loss of principal and income than a fund that invests solely or primarily in investment grade securities. In addition, these investments have greater price fluctuations, are less liquid and are more likely to experience a default than higher-rated securities. High-yield securities are considered to be predominantly speculative with respect to the issuer's capacity to pay interest and repay principal.
Note 10. Subsequent Events
Management has evaluated the events and transactions that have occurred through the date the financial statements were issued. Other than as noted in Note 8 above, there were no items requiring adjustment of the financial statements or additional disclosure.
Note 11. Information Regarding Pending and Settled Legal Proceedings
In December 2005, without admitting or denying the allegations, American Express Financial Corporation (AEFC, which is now known as Ameriprise Financial, Inc. (Ameriprise Financial)) entered into settlement agreements with the
Securities and Exchange Commission (SEC) and Minnesota Department of Commerce (MDOC) related to market timing activities. As a result, AEFC was censured and ordered to cease and desist from committing or causing any violations of certain provisions of the Investment Advisers Act of 1940, the Investment Company Act of 1940, and various Minnesota laws. AEFC agreed to pay disgorgement of $10 million and civil money penalties of $7 million. AEFC also agreed to retain an independent distribution consultant to assist in developing a plan for distribution of all disgorgement and civil penalties ordered by the SEC in accordance with various undertakings detailed at www.sec.gov/litigation/admin/ia-2451.pdf. Ameriprise Financial and its affiliates have cooperated with the SEC and the MDOC in these legal proceedings, and have made regular reports to the Funds' Boards of Trustees.
Ameriprise Financial and certain of its affiliates have historically been involved in a number of legal, arbitration and regulatory proceedings, including routine litigation, class actions, and governmental actions, concerning matters arising in connection with the conduct of their business activities. Ameriprise Financial believes that the Funds are not currently the subject of, and that neither Ameriprise Financial nor any of its affiliates are the subject of, any pending legal, arbitration or regulatory proceedings that are likely to have a material adverse effect on the Funds or the ability of Ameriprise Financial or its affiliates to perform under their contracts with the Funds. Ameriprise Financial is required to make quarterly (10-Q), annual (10-K) and, as necessary, 8-K filings with the Securities and Exchange Commission on legal and regulatory matters that relate to Ameriprise Financial and its affiliates. Copies of these filings may be obtained by accessing the SEC website at www.sec.gov.
There can be no assurance that these matters, or the adverse publicity associated with them, will not result in increased fund redemptions, reduced sale of fund shares or other adverse consequences to the Funds. Further, although we believe proceedings are not likely to have a material adverse effect on the Funds or the ability of Ameriprise Financial or its affiliates to perform under their contracts with the Funds, these proceedings are subject to uncertainties and, as such, we are unable to estimate the possible loss or range of loss that may result. An adverse outcome in one or more of these proceedings could result in adverse judgments, settlements, fines, penalties or other relief that could have a material adverse effect on the consolidated financial condition or results of operations of Ameriprise Financial.
Semiannual Report 2014
46
Columbia High Yield Bond Fund
Important Information About This Report
Each fund mails one shareholder report to each shareholder address. If you would like more than one report, please call shareholder services at 800.345.6611 and additional reports will be sent to you.
The policy of the Board is to vote the proxies of the companies in which each fund holds investments consistent with the procedures as stated in the Statement of Additional Information (SAI). You may obtain a copy of the SAI without charge by calling 800.345.6611; contacting your financial intermediary; visiting columbiamanagement.com; or searching the website of the Securities and Exchange Commission (SEC) at sec.gov. Information regarding how each fund voted proxies relating to portfolio securities is filed with the SEC by August 31 for the most recent 12-month period ending June 30 of that year, and is available without charge by visiting columbiamanagement.com; or searching the website of the SEC at sec.gov.
Each fund files a complete schedule of portfolio holdings with the SEC for the first and third quarters of each fiscal year on Form N-Q. Each fund's Form N-Q is available on the SEC's website at sec.gov and may be reviewed and copied at the SEC's Public Reference Room in Washington, D.C. Information on the operation of the Public Reference Room may be obtained by calling 800.SEC.0330. Each fund's complete schedule of portfolio holdings, as filed on Form N-Q, can also be obtained without charge, upon request, by calling 800.345.6611.
Semiannual Report 2014
47

Columbia High Yield Bond Fund
P.O. Box 8081
Boston, MA 02266-8081
columbiamanagement.com
This information is for use with concurrent or prior delivery of a fund prospectus. Please read and consider the investment objectives, risks, charges and expenses for any fund carefully before investing. For a prospectus and, if available, a summary prospectus, which contains this and other important information about the Fund, go to columbiamanagement.com. The Fund is distributed by Columbia Management Investment Distributors, Inc., member FINRA, and managed by Columbia Management Investment Advisers, LLC.
© 2015 Columbia Management Investment Advisers, LLC. All rights reserved.
SAR160_05_E01_(01/15)
Semiannual Report
November 30, 2014

Columbia Mortgage Opportunities Fund
Not FDIC insured • No bank guarantee • May lose value
About Columbia Management
Backed by more than 100 years of experience, Columbia Management is one of the nation's largest asset managers. At the heart of our success — and, most importantly, that of our investors — are some of the most talented professionals in the industry, brought together by a unique way of working.
It starts with carefully selected, specialized investment teams. While each team brings a diverse and innovative range of skills, all are grounded by a common set of core beliefs. All possess a solid conviction in the power of proprietary, bottom-up research. All look not only at generating returns, but also at the likely consistency of those returns and the risks required to achieve them. And while our culture encourages teams to operate independently and question established thinking, a rigorous investment oversight process ensures that each team stays true to its clearly articulated investment process. At Columbia Management, reaching our performance goals matters, and the way we reach them matters just as much.
Columbia funds are distributed by Columbia Management Investment Distributors, Inc., member FINRA, and managed by Columbia Management Investment Advisers, LLC.
© 2015 Columbia Management Investment Advisers, LLC. All rights reserved.
Not part of the shareholder report
Connect with Columbia Management
Get the market insight you need from our investment experts
Investor insight
Stay informed with economic and market commentary, investment videos, white papers, mutual fund commentary and more at columbiamanagement.com.
Columbia Management investor
(e-newsletter)
Read our award-winning* shareholder newsletter. Our quarterly newsletter is available online and provides timely and relevant content about economic trends, fund news, service enhancements and changes. Sign up to receive the newsletter electronically at columbiamanagement.com/newsletter.
Investment videos
Watch and discover what our thought leaders are saying about financial markets and the economy. For an analysis of current events and trends that may affect your investments, visit our online video library at blog.columbiamanagement.com/publications.
Social media
Columbia Management offers you multiple ways to access our market commentary and investment insights.
> Perspectives blog at columbiamanagement.com
Read timely posts by our investment team, including our chief investment officer, chief economist and portfolio managers.
> Twitter.com/ColumbiaMgmt
Follow us on Twitter for quick, up-to-the-minute comments on market news and more.
> Youtube.com/columbiamanagement
View our commentaries on the economy, markets and current investment opportunities.
> Linkedin.com/company/columbia-management
Connect with us on LinkedIn for updates from our thought leaders.
*Columbia Management investor was awarded top honors in the Mutual Fund Education Alliance STAR Awards competition for excellence in mutual fund marketing and communications. Materials in the competition were evaluated on educational value, message comprehension, effective design and objectives.
Not part of the shareholder report
Note: Effective January 1, 2015, Christopher O. Petersen will serve as the President of the Columbia Funds, replacing J. Kevin Connaughton. Mr. Petersen has served as a Fund officer since 2007.
Dear Shareholders,
People invest for different reasons, though typically based on a desire for one or more outcomes, e.g., generating an appropriate income stream in retirement, navigating a changing interest rate environment, maximizing after-tax returns, growing assets to achieve financial goals, or easing the impact of volatile markets. Achieving these desired outcomes can be particularly challenging given the unpredictability of complex global markets. To continue to effectively deliver solutions that help clients achieve desired outcomes, an asset manager must have the resources and investment framework to meaningfully embody a global perspective.
With this in mind, I thought it important to highlight excerpts from a piece written by Jeffrey L. Knight, Global Head of Investment Solutions and Asset Allocation, in which he touches on some of these issues emphasizing the importance of maintaining a diversified portfolio with the flexibility to adapt to changing market conditions.
I encourage you to read the article in its entirety. To access the full article and for other insights on current market events and investment opportunities, please visit the Columbia Management blog at columbiamanagement.com/blog.
On behalf of the Funds, I want to acknowledge the contributions of J. Kevin Connaughton and to thank him for his years of trusted, dedicated service. He has worked tirelessly as an advocate for shareholders and a leader of the Columbia Funds. In taking on this new role, I look forward to continuing the work of Mr. Connaughton, helping build on the strong foundation of the Columbia Funds.
Thank you for your confidence. We look forward to continuing to serve your investment needs for many years to come.
Best regards,

Christopher O. Petersen
President, Columbia Funds
Excerpts from:
2015 Outlook: Same song, slightly different arrangement
By Jeffrey L. Knight, Global Head of Investment Solutions and Asset Allocation
Jeffrey L. Knight, CFA, is global head of investment solutions and asset allocation for Columbia Management Investment Advisers, LLC. Mr. Knight leads a team of six portfolio managers responsible for our broad suite of multi-asset strategies including capital allocation, risk allocation, absolute return and total return funds.
What's different in 2015?
As stationary as market conditions have felt lately, circumstances are always evolving. For 2015, while the essential elements of our outlook remain in place, we highlight two important changes in the market environment:
> The relative value of global equities vs. global bonds actually improved during 2014.
> Monetary policy around the globe has become desynchronized, with the U.S. Federal Reserve (the Fed) contemplating rate hikes, while the European Central Bank (ECB) and the Bank of Japan (BOJ) intensify their monetary stimulus programs.
In our view, while equities will most likely continue to dominate, the complex interactions of today's conditions elevate the role of dynamic risk management. We argue that investors will need a cross-asset surveillance methodology to detect tactical threats.
President's Message (continued)
Monetary policies diverge
The Fed has given strong signals that economic growth in the United States has reached self-sustaining momentum and no longer needs unconventional efforts to support the expansion. The withdrawal and suspension of large-scale asset purchases was only the first step in the evolution toward policy normalization. In 2015, we expect to see a change in forward guidance and, most likely, the first interest rate increase in years.
These actions stand in stark contrast with the direction of the monetary policies of other central banks as they double down on efforts to support growth and avoid deflation. The Bank of Japan has announced its intention to increase both qualitative and quantitative easing on an enormous scale, expanding purchases of Japanese government bonds (JGBs), exchange-traded funds and real estate investment trusts. They intend to coordinate this with government pension investment fund purchases by shifting into riskier assets through sales of JGBs.
With evidence of deterioration on both the economic and inflation front, the European Central Bank (ECB) also plans to take bolder actions. These include increased purchases of asset-backed securities and covered bonds in both the primary and secondary market, together with the long-term refinancing operations that will steer the ECB's balance sheet higher by €1 trillion.
The latest to jump on the bandwagon was the People's Bank of China (PBOC), which cut its benchmark interest rate for the first time in over two years to support private sector investment, as targeted liquidity injections have had minimal effect on sinking economic growth.
Investment strategy for 2015
We remain convinced that relative value favors stocks over bonds, even though stocks outperformed in 2014. Therefore, you will hear the same recommendation from us for 2015. Equities remain the most important asset class for generating returns.
Within equities, the currency-based advantage of U.S. stocks is offset somewhat by the valuation advantage from overseas equities, notably in Japan. Indeed, economic growth in Japan and Europe are essential ingredients for equities to continue to perform well. If Japanese and European stocks cannot produce gains, then the global economy will probably be stuck in a near recessionary funk.
Devising a strategy to manage risk and stabilize portfolio values in the event that equities do not perform well remains complicated. Bond yields are low enough that they are not likely to offer powerful diversification benefits. We affirm our recommendation for three additional sources of portfolio stability:
> Non-traditional diversifiers, such as liquid alternatives, alternative beta exposures and absolute return strategies
> Explicit downside hedges, such as put options (with emphasis on managing the related expense)
> Flexibility and a methodology for active risk reduction when appropriate (Our cross-asset methodologies should prove valuable in this regard.)
Our overall stance for investment strategy will likely remain in place until the valuation advantage for equities has been priced away, or until the healing process for the global economy reverses.
Please visit columbiamanagement.com/blog to read the entire article.
Investors should consider the investment objectives, risks, charges and expenses of a mutual fund carefully before investing. For a free prospectus and, if available, a summary prospectus, which contains this and other important information about a fund, visit columbiamanagement.com. The prospectus should be read carefully before investing.
The views expressed are as of December 2014, may change as market or other conditions change, and may differ from views expressed by other Columbia Management Investment Advisers, LLC (CMIA) associates or affiliates. Actual investments or investment decisions made by CMIA and its affiliates, whether for its own account or on behalf of clients, will not necessarily reflect the views expressed. This information is not intended to provide investment advice and does not account for individual investor circumstances. Investment decisions should always be made based on an investor's specific financial needs, objectives, goals, time horizon and risk tolerance. Asset classes described may not be suitable for all investors. Past performance does not guarantee future results, and no forecast should be considered a guarantee either. Since economic and market change frequently, there can be no assurance that the trends described here will continue or that the forecasts are accurate.
Diversification does not assure a profit or protect against loss.
Columbia Funds are distributed by Columbia Management Investment Distributors, Inc., member FINRA, and managed by Columbia Management Investment Advisers, LLC.
© 2015 Columbia Management Investment Advisers, LLC. All rights reserved
Columbia Mortgage Opportunities Fund
Fund Investment Manager
Columbia Management Investment
Advisers, LLC
225 Franklin Street
Boston, MA 02110
Fund Distributor
Columbia Management Investment
Distributors, Inc.
225 Franklin Street
Boston, MA 02110
Fund Transfer Agent
Columbia Management Investment
Services Corp.
P.O. Box 8081
Boston, MA 02266-8081
For more information about any of the funds, please visit columbiamanagement.com or call 800.345.6611. Customer Service Representatives are available to answer your questions Monday through Friday from 8 a.m. to 7 p.m. Eastern time.
The views expressed in this report reflect the current views of the respective parties. These views are not guarantees of future performance and involve certain risks, uncertainties and assumptions that are difficult to predict, so actual outcomes and results may differ significantly from the views expressed. These views are subject to change at any time based upon economic, market or other conditions and the respective parties disclaim any responsibility to update such views. These views may not be relied on as investment advice and, because investment decisions for a Columbia Fund are based on numerous factors, may not be relied on as an indication of trading intent on behalf of any particular Columbia Fund. References to specific securities should not be construed as a recommendation or investment advice.
Performance Overview | | | 3 | | |
Portfolio Overview | | | 4 | | |
Understanding Your Fund's Expenses | | | 5 | | |
Portfolio of Investments | | | 6 | | |
Statement of Assets and Liabilities | | | 13 | | |
Statement of Operations | | | 15 | | |
Statement of Changes in Net Assets | | | 16 | | |
Financial Highlights | | | 18 | | |
Notes to Financial Statements | | | 25 | | |
Important Information About This Report | | | 35 | | |
Columbia Mortgage Opportunities Fund
Performance Overview
(Unaudited)
Performance Summary
> Columbia Mortgage Opportunities Fund (the Fund) Class A shares returned 2.24% excluding sales charges for the six-month period that ended November 30, 2014.
> The Fund outperformed its benchmark, the Citigroup 1-Month U.S. Treasury Bill Index, which returned 0.01% for the same time period.
Average Annual Total Returns (%) (for period ended November 30, 2014)
| | | Inception | | 6 Months
cumulative | | Life | |
Class A | | 04/30/14 | | | | | | | | | |
Excluding sales charges | | | | | | | 2.24 | | | | 2.53 | | |
Including sales charges | | | | | | | -2.62 | | | | -2.35 | | |
Class C | | 04/30/14 | | | | | | | | | |
Excluding sales charges | | | | | | | 1.85 | | | | 2.09 | | |
Including sales charges | | | | | | | 0.85 | | | | 1.09 | | |
Class I | | 04/30/14 | | | 2.44 | | | | 2.76 | | |
Class R4 | | 04/30/14 | | | 2.36 | | | | 2.67 | | |
Class R5 | | 04/30/14 | | | 2.41 | | | | 2.73 | | |
Class W | | 04/30/14 | | | 2.23 | | | | 2.53 | | |
Class Z | | 04/30/14 | | | 2.36 | | | | 2.67 | | |
Citigroup 1-Month U.S. Treasury Bill Index | | | | | | | 0.01 | | | | 0.01 | | |
Returns for Class A are shown with and without the maximum initial sales charge of 4.75%. Returns for Class C are shown with and without the 1.00% contingent deferred sales charge for the first year only. The Fund's other classes are not subject to sales charges and have limited eligibility. Please see the Fund's prospectus for details. Performance for different share classes will vary based on differences in sales charges and fees associated with each class. All results shown assume reinvestment of distributions during the period. Returns do not reflect the deduction of taxes that a shareholder may pay on Fund distributions or on the redemption of Fund shares. Performance results reflect the effect of any fee waivers or reimbursements of Fund expenses by Columbia Management Investment Advisers, LLC and/or any of its affiliates. Absent these fee waivers or expense reimbursement arrangements, performance results would have been lower.
The performance information shown represents past performance and is not a guarantee of future results. The investment return and principal value of your investment will fluctuate so that your shares, when redeemed, may be worth more or less than their original cost. Current performance may be lower or higher than the performance information shown. You may obtain performance information current to the most recent month-end by contacting your financial intermediary, visiting columbiamanagement.com or calling 800.345.6611.
The Citigroup 1-Month U.S. Treasury Bill Index is an unmanaged index that measures the rate of return for 30-day U.S. Treasury Bills.
Indices are not available for investment, are not professionally managed and do not reflect sales charges, fees, brokerage commissions, taxes or other expenses of investing. Securities in the Fund may not match those in an index.
Semiannual Report 2014
3
Columbia Mortgage Opportunities Fund
Portfolio Overview
(Unaudited)
Portfolio Management
Jason Callan
Tom Heuer, CPA, CFA
Portfolio Breakdown (%)
(at November 30, 2014) | |
Asset-Backed Securities — Non-Agency | | | 7.8 | | |
Commercial Mortgage-Backed Securities — Non-Agency | | | 21.5 | | |
Money Market Funds | | | 2.3 | | |
Options Purchased Puts | | | 0.8 | | |
Residential Mortgage-Backed Securities — Agency | | | 53.5 | | |
Residential Mortgage-Backed Securities — Non-Agency | | | 14.1 | | |
Total | | | 100.0 | | |
Percentages indicated are based upon total investments. The Fund's portfolio composition is subject to change.
Quality Breakdown (%)
(at November 30, 2014) | |
AAA rating | | | 56.3 | | |
BBB rating | | | 6.8 | | |
Non-investment grade | | | 5.4 | | |
Not rated | | | 31.5 | | |
Total | | | 100.0 | | |
Percentages indicated are based upon total fixed income securities (excluding Money Market Funds).
Bond ratings apply to the underlying holdings of the Fund and not the Fund itself and are divided into categories ranging from highest to lowest credit quality, determined by using the middle rating of Moody's, S&P and Fitch, after dropping the highest and lowest available ratings. When ratings are available from only two rating agencies, the lower rating is used. When a rating is available from only one rating agency, that rating is used. When a bond is not rated by any rating agency, it is designated as "Not rated". Credit quality ratings assigned by a rating agency are subjective opinions, not statements of fact, and are subject to change, including daily. The ratings assigned by credit rating agencies are but one of the considerations that the Investment Manager and/or Fund's subadviser incorporates into its credit analysis process, along with such other issuer-specific factors as cash flows, capital structure and leverage ratios, ability to de-leverage (repay) through free cash flow, quality of management, market positioning and access to capital, as well as such security-specific factors as the terms of the security (e.g., interest rate, and time to maturity) and the amount and type of any collateral.
Semiannual Report 2014
4
Columbia Mortgage Opportunities Fund
Understanding Your Fund's Expenses
(Unaudited)
As an investor, you incur two types of costs. There are transaction costs, which generally include sales charges on purchases and may include redemption fees. There are also ongoing costs, which generally include management fees, distribution and/or service fees, and other fund expenses. The following information is intended to help you understand your ongoing costs (in dollars) of investing in the Fund and to help you compare these costs with the ongoing costs of investing in other mutual funds.
Analyzing Your Fund's Expenses
To illustrate these ongoing costs, we have provided examples and calculated the expenses paid by investors in each share class of the Fund during the period. The actual and hypothetical information in the table is based on an initial investment of $1,000 at the beginning of the period indicated and held for the entire period. Expense information is calculated two ways and each method provides you with different information. The amount listed in the "Actual" column is calculated using the Fund's actual operating expenses and total return for the period. You may use the Actual information, together with the amount invested, to estimate the expenses that you paid over the period. Simply divide your account value by $1,000 (for example, an $8,600 account value divided by $1,000 = 8.6), then multiply the results by the expenses paid during the period under the "Actual" column. The amount listed in the "Hypothetical" column assumes a 5% annual rate of return before expenses (which is not the Fund's actual return) and then applies the Fund's actual expense ratio for the period to the hypothetical return. You should not use the hypothetical account values and expenses to estimate either your actual account balance at the end of the period or the expenses you paid during the period. See "Compare With Other Funds" below for details on how to use the hypothetical data.
Compare With Other Funds
Since all mutual funds are required to include the same hypothetical calculations about expenses in shareholder reports, you can use this information to compare the ongoing cost of investing in the Fund with other funds. To do so, compare the hypothetical example with the 5% hypothetical examples that appear in the shareholder reports of other funds. As you compare hypothetical examples of other funds, it is important to note that hypothetical examples are meant to highlight the ongoing costs of investing in a fund only and do not reflect any transaction costs, such as sales charges, or redemption or exchange fees. Therefore, the hypothetical calculations are useful in comparing ongoing costs only, and will not help you determine the relative total costs of owning different funds. If transaction costs were included in these calculations, your costs would be higher.
June 1, 2014 – November 30, 2014
| | | Account Value at the Beginning
of the Period ($) | | Account Value at the End of the
Period ($) | | Expenses Paid During the
Period ($) | | Fund's Annualized
Expense Ratio (%) | |
| | | Actual | | Hypothetical | | Actual | | Hypothetical | | Actual | | Hypothetical | | Actual | |
Class A | | | 1,000.00 | | | | 1,000.00 | | | | 1,022.40 | | | | 1,019.95 | | | | 5.04 | | | | 5.04 | | | | 1.00 | | |
Class C | | | 1,000.00 | | | | 1,000.00 | | | | 1,018.50 | | | | 1,016.21 | | | | 8.81 | | | | 8.80 | | | | 1.75 | | |
Class I | | | 1,000.00 | | | | 1,000.00 | | | | 1,024.40 | | | | 1,021.94 | | | | 3.03 | | | | 3.02 | | | | 0.60 | | |
Class R4 | | | 1,000.00 | | | | 1,000.00 | | | | 1,023.60 | | | | 1,021.19 | | | | 3.78 | | | | 3.78 | | | | 0.75 | | |
Class R5 | | | 1,000.00 | | | | 1,000.00 | | | | 1,024.10 | | | | 1,021.69 | | | | 3.28 | | | | 3.28 | | | | 0.65 | | |
Class W | | | 1,000.00 | | | | 1,000.00 | | | | 1,022.30 | | | | 1,019.95 | | | | 5.04 | | | | 5.04 | | | | 1.00 | | |
Class Z | | | 1,000.00 | | | | 1,000.00 | | | | 1,023.60 | | | | 1,021.19 | | | | 3.78 | | | | 3.78 | | | | 0.75 | | |
Expenses paid during the period are equal to the annualized expense ratio for each class as indicated above, multiplied by the average account value over the period and then multiplied by the number of days in the Fund's most recent fiscal half year and divided by 365.
Expenses do not include fees and expenses incurred indirectly by the Fund from its investment in underlying funds, including affiliated and non-affiliated pooled investment vehicles, such as mutual funds and exchange-traded funds.
Had Columbia Management Investment Advisers, LLC and/or certain of its affiliates not waived/reimbursed certain fees and expenses, account value at the end of the period would have been reduced.
Semiannual Report 2014
5
Columbia Mortgage Opportunities Fund
Portfolio of Investments
November 30, 2014 (Unaudited)
(Percentages represent value of investments compared to net assets)
Residential Mortgage-Backed Securities — Agency 87.5%
Issuer | | Coupon
Rate | | Principal
Amount ($) | | Value ($) | |
Federal Home Loan Mortgage Corp.(a)(b)(c)
CMO IO STRIPS Series 280 Class S1
09/15/42 | | | 5.845 | % | | | 4,434,761 | | | | 1,010,672 | | |
CMO IO Series 311 Class S1
08/15/43 | | | 5.795 | % | | | 43,961,323 | | | | 9,930,349 | | |
CMO IO Series 3922 Class SH
09/15/41 | | | 5.745 | % | | | 24,136,958 | | | | 4,116,669 | | |
CMO IO Series 4223 Class DS
12/15/38 | | | 5.945 | % | | | 3,680,748 | | | | 676,403 | | |
CMO IO Series 4286 Class NS
12/15/43 | | | 5.745 | % | | | 3,859,018 | | | | 938,704 | | |
CMO IO Series WS Class 3957
11/15/41 | | | 6.395 | % | | | 12,054,659 | | | | 2,170,909 | | |
Federal Home Loan Mortgage Corp.(b)(c)
CMO IO STRIPS Series 304 Class C67
12/15/42 | | | 4.500 | % | | | 13,687,331 | | | | 3,582,874 | | |
CMO IO Series 329 Class C5
06/15/43 | | | 3.500 | % | | | 1,901,913 | | | | 394,299 | | |
CMO IO Series 4215 Class IL
07/15/41 | | | 3.500 | % | | | 14,542,453 | | | | 2,300,156 | | |
Federal National Mortgage Association(a)(b)(c)
CMO IO Series 2013-124 Class SB
12/25/43 | | | 5.795 | % | | | 9,596,955 | | | | 2,286,891 | | |
CMO IO Series 2013-BS Class 54
06/25/43 | | | 5.995 | % | | | 9,258,751 | | | | 2,339,823 | | |
CMO IO Series 2013-SB Class 97
06/25/32 | | | 5.945 | % | | | 4,515,901 | | | | 812,662 | | |
Federal National Mortgage Association(b)(c)
CMO IO Series 2012-152 Class EI
07/25/31 | | | 3.000 | % | | | 19,350,767 | | | | 2,615,227 | | |
CMO IO Series 2012-96 Class CI
04/25/39 | | | 3.500 | % | | | 2,892,433 | | | | 456,590 | | |
CMO IO Series 2013-117 Class AI
04/25/36 | | | 3.500 | % | | | 7,123,166 | | | | 785,730 | | |
CMO IO Series 2013-118 Class AI
09/25/38 | | | 4.000 | % | | | 8,012,214 | | | | 1,244,496 | | |
CMO IO Series 2013-31 Class IH
02/25/43 | | | 3.500 | % | | | 16,728,157 | | | | 2,788,888 | | |
Federal National Mortgage Association(b)(d)
12/16/29 - 12/11/44 | | | 3.500 | % | | | 95,000,000 | | | | 99,783,396 | | |
Total Residential Mortgage-Backed
Securities — Agency
(Cost: $138,783,024) | | | | | | | 138,234,738 | | |
Residential Mortgage-Backed Securities — Non-Agency 23.1% | |
AJAX Mortgage Loan Trust
CMO Series 2014-B Class A(b)(e)
08/25/54 | | | 3.850 | % | | | 2,000,000 | | | | 2,000,000 | | |
Residential Mortgage-Backed Securities — Non-Agency (continued)
Issuer | | Coupon
Rate | | Principal
Amount ($) | | Value ($) | |
Citigroup Mortgage Loan Trust
CMO Series 2014-11 Class 5A2(a)(b)(e)(f)
11/25/36 | | | 25.541 | % | | | 1,589,159 | | | | 1,939,886 | | |
Credit Suisse Mortgage Capital Certificates(a)(b)(e)(f)
CMO Series 2014-RPL4 Class A1
08/25/62 | | | 3.625 | % | | | 2,000,000 | | | | 1,985,000 | | |
Credit Suisse Mortgage Capital Certificates(b)(e)
CMO Series 2010-9R Class 10A5
04/27/37 | | | 4.000 | % | | | 1,000,000 | | | | 1,003,835 | | |
CMO Series 2010-9R Class 7A5
05/27/37 | | | 4.000 | % | | | 1,000,000 | | | | 1,002,621 | | |
Series 2010-2A5 Class 9R
02/27/38 | | | 4.000 | % | | | 2,709,000 | | | | 2,593,976 | | |
Series 2010-9R Class 1A5
08/27/37 | | | 4.000 | % | | | 3,000,000 | | | | 2,784,180 | | |
Credit Suisse Securities (USA) LLC(b)(e)
CMO Series 2014-5R Class 5A2
07/27/37 | | | 3.250 | % | | | 3,662,699 | | | | 3,525,573 | | |
CMO Series 2014-5R Class 8A1
11/27/37 | | | 2.625 | % | | | 1,802,660 | | | | 1,751,113 | | |
CMO Series 2014-RPL1 Class A3
02/25/54 | | | 3.958 | % | | | 2,500,000 | | | | 2,472,845 | | |
Jefferies Resecuritization Trust
Series 2014-1A1 Class R1(b)(e)
12/27/37 | | | 4.000 | % | | | 2,759,995 | | | | 2,754,177 | | |
Morgan Stanley Re-Remic Trust
Series 2013-R8 Class 1B(a)(b)(e)
09/26/36 | | | 2.614 | % | | | 8,157,742 | | | | 7,990,508 | | |
New Residential Mortgage Loan Trust
CMO IO Series 2014-1A Class AIO(a)(b)(c)(e)
01/25/54 | | | 2.244 | % | | | 36,310,649 | | | | 2,640,837 | | |
VML LLC
CMO Series 2014-NPL1 Class A1(a)(b)(d)(e)
04/25/54 | | | 3.875 | % | | | 2,000,000 | | | | 2,000,000 | | |
Total Residential Mortgage-Backed
Securities — Non-Agency
(Cost: $35,541,137) | | | | | | | 36,444,551 | | |
Commercial Mortgage-Backed Securities — Non-Agency 35.1% | |
American Homes 4 Rent Trust(b)(e)
Series 2014-SFR2 Class E
10/17/36 | | | 6.231 | % | | | 5,000,000 | | | | 4,978,013 | | |
Series 2014-SFR3 Class E
12/17/36 | | | 6.418 | % | | | 3,000,000 | | | | 3,029,392 | | |
The accompanying Notes to Financial Statements are an integral part of this statement.
Semiannual Report 2014
6
Columbia Mortgage Opportunities Fund
Portfolio of Investments (continued)
November 30, 2014 (Unaudited)
Commercial Mortgage-Backed Securities — Non-Agency (continued)
Issuer | | Coupon
Rate | | Principal
Amount ($) | | Value ($) | |
American Homes 4 Rent(a)(b)(e)
Series 2014-F Class SFR1
06/17/31 | | | 3.500 | % | | | 3,250,000 | | | | 2,991,368 | | |
Series 2014-SFR1 Class E
06/17/31 | | | 2.750 | % | | | 7,000,000 | | | | 6,367,222 | | |
Aventura Mall Trust
Series 2013-AVM Class E(a)(b)(e)
12/05/32 | | | 3.867 | % | | | 5,000,000 | | | | 4,901,640 | | |
BHMS Mortgage Trust
Series 2014-ATLS Class DFX(a)(b)(e)
07/05/33 | | | 4.847 | % | | | 2,000,000 | | | | 2,021,730 | | |
Banc of America Merrill Lynch Re-Remic Trust
Series 2014-FRR7 Class B(a)(b)
10/26/44 | | | 2.405 | % | | | 2,000,000 | | | | 1,852,650 | | |
Citigroup/Deutsche Bank Commercial Mortgage Trust
Series 2007-AMFX Class CD4(a)(b)
12/11/49 | | | 5.366 | % | | | 1,000,000 | | | | 1,045,692 | | |
GS Mortgage Securities Trust
Series 2007-GG10 Class AM(a)(b)
08/10/45 | | | 5.990 | % | | | 2,500,000 | | | | 2,562,895 | | |
JPMorgan Chase Commercial Mortgage Securities Trust
Series 2006-LDP9 Class AM(b)
05/15/47 | | | 5.372 | % | | | 3,000,000 | | | | 3,121,395 | | |
ORES NPL LLC
Series 2013-LV2 Class A(b)(e)
09/25/25 | | | 3.081 | % | | | 526,440 | | | | 526,440 | | |
Rialto Capital Management LLC
Series 2014-LT5 Class B(b)(e)
05/15/24 | | | 5.000 | % | | | 3,000,000 | | | | 2,997,303 | | |
Rialto Real Estate Fund LLC
Series 2014-LT6 Class B(b)(e)
09/15/24 | | | 5.486 | % | | | 1,000,000 | | | | 1,005,529 | | |
Rialto Real Estate Fund LP
Series 2014-LT5 Class A(b)(e)
05/15/24 | | | 2.850 | % | | | 1,769,266 | | | | 1,769,119 | | |
VFC LLC(b)(e)
Series 2014-2 Class A
07/20/30 | | | 2.750 | % | | | 8,706,536 | | | | 8,706,859 | | |
Series 2014-2 Class B
07/20/30 | | | 5.500 | % | | | 3,000,000 | | | | 2,999,046 | | |
VNDO Mortgage Trust
Series 2013-PENN Class D(a)(b)(e)
12/13/29 | | | 4.079 | % | | | 4,500,000 | | | | 4,599,946 | | |
Total Commercial Mortgage-Backed
Securities — Non-Agency
(Cost: $56,015,215) | | | | | | | 55,476,239 | | |
Asset-Backed Securities — Non-Agency 12.8%
Issuer | | Coupon
Rate | | Principal
Amount ($) | | Value ($) | |
A Voce CLO Ltd.
Series 2014-1A Class C(a)(e)
07/15/26 | | | 3.734 | % | | | 1,000,000 | | | | 935,008 | | |
Carlyle Global Market Strategies CLO
Series 2014-C1 Class 3A(a)(e)
07/27/26 | | | 3.934 | % | | | 2,000,000 | | | | 1,921,708 | | |
GCAT LLC
Series 2014-2 Class A1(a)(e)
10/25/19 | | | 3.721 | % | | | 986,222 | | | | 981,159 | | |
Keuka Park CLO Ltd.
Series 2013-1A Class D(a)(e)
10/21/24 | | | 3.431 | % | | | 7,000,000 | | | | 6,642,867 | | |
New York Mortgage Trust Residential LLC(a)(e)
Series 2013-RP1A Class A
07/25/18 | | | 4.250 | % | | | 2,097,611 | | | | 2,108,099 | | |
Series 2013-RP2A Class A
09/25/18 | | | 4.600 | % | | | 1,916,717 | | | | 1,947,219 | | |
Selene Non-Performing Loans LLC
Series 2014-1A Class A(a)(e)
05/25/54 | | | 2.981 | % | | | 1,485,028 | | | | 1,472,080 | | |
Symphony CLO Ltd.
Series 2014-14A Class D2(a)(e)
07/14/26 | | | 3.830 | % | | | 3,000,000 | | | | 2,845,392 | | |
Truman Capital Mortgage Loan Trust
Series 2014-NPL2 Class A1(a)(e)
06/25/54 | | | 3.125 | % | | | 752,924 | | | | 752,066 | | |
Vericrest Opportunity Loan Transferee
Series 2014-3A Class A1(a)(e)
05/26/54 | | | 3.250 | % | | | 582,047 | | | | 581,254 | | |
Total Asset-Backed Securities — Non-Agency
(Cost: $20,303,533) | | | | | | | 20,186,852 | | |
Options Purchased Puts 1.3% | |
Issuer | | Notional ($)/
Contracts | | Exercise
Price ($) | | Expiration
Date | | Value ($) | |
OTC
5-Year
Interest
Rate
Swap(g) | | | 70,000,000 | | | | 3.25 | | | 08/18/17 | | | 1,263,423 | | |
OTC
5-Year
Interest
Rate
Swap(g) | | | 100,000,000 | | | | 2.50 | | | 10/30/15 | | | 818,610 | | |
Total Options Purchased Puts
(Cost: $3,066,500) | | | | | | | | | 2,082,033 | | |
The accompanying Notes to Financial Statements are an integral part of this statement.
Semiannual Report 2014
7
Columbia Mortgage Opportunities Fund
Portfolio of Investments (continued)
November 30, 2014 (Unaudited)
Money Market Funds 3.8%
| | |
Shares | |
Value ($) | |
Columbia Short-Term Cash Fund,
0.104%(h)(i) | | | 5,985,334 | | | | 5,985,334 | | |
Total Money Market Funds
(Cost: $5,985,334) | | | | | 5,985,334 | | |
Total Investments
(Cost: $259,694,743) | | | | | 258,409,747 | | |
Other Assets & Liabilities, Net | | | | | (100,496,767 | ) | |
Net Assets | | | | | 157,912,980 | | |
Investments in Derivatives
Futures Contracts Outstanding at November 30, 2014
At November 30, 2014, cash totaling $221,496 was pledged as collateral to cover initial margin requirements on open futures contracts.
Long Futures Contracts Outstanding
Contract Description | | Number of
Contracts | | Trading
Currency | | Notional
Market
Value ($) | | Expiration
Date | | Unrealized
Appreciation ($) | | Unrealized
Depreciation ($) | |
US 10YR NOTE | | | 68 | | | USD | | | | | 8,639,188 | | | 03/2015 | | | 70,707 | | | | — | | |
Short Futures Contracts Outstanding
Contract Description | | Number of
Contracts | | Trading
Currency | | Notional
Market
Value ($) | | Expiration
Date | | Unrealized
Appreciation ($) | | Unrealized
Depreciation ($) | |
US 2YR NOTE | | | (28 | ) | | USD | | | | | (6,135,938 | ) | | 03/2015 | | | — | | | | (7,047 | ) | |
US 5YR NOTE | | | (72 | ) | | USD | | | | | (8,603,438 | ) | | 03/2015 | | | — | | | | (42,754 | ) | |
Total | | | | | | | | | | | — | | | | (49,801 | ) | |
Notes to Portfolio of Investments
(a) Variable rate security.
(b) The maturity dates shown represent the original maturity of the underlying obligation. Actual maturity may vary based upon prepayment activity on these obligations. Unless otherwise noted, the coupon rates presented are fixed rates.
(c) Interest Only (IO) security. The actual effective yield of this security is different than the stated coupon rate.
(d) Represents a security purchased on a when-issued or delayed delivery basis.
(e) Security exempt from registration pursuant to Rule 144A under the Securities Act of 1933. This security may be resold in transactions exempt from registration, normally to qualified institutional buyers. At November 30, 2014, the value of these securities amounted to $103,525,010 or 65.56% of net assets.
(f) Represents fair value as determined in good faith under procedures approved by the Board of Trustees. At November 30, 2014, the value of these securities amounted to $3,924,886, which represents 2.49% of net assets.
The accompanying Notes to Financial Statements are an integral part of this statement.
Semiannual Report 2014
8
Columbia Mortgage Opportunities Fund
Portfolio of Investments (continued)
November 30, 2014 (Unaudited)
Notes to Portfolio of Investments (continued)
(g) Purchased swaption contracts outstanding at November 30, 2014:
At November 30, 2014, securities and cash totaling $2,243,000 were received from broker as collateral to cover open purchased swaption contracts.
Description | | Counterparty | | Floating Rate
Index | | Fund
Pay/Receive
Floating Rate | | Exercise
Rate (%) | | Expiration
Date | | Notional
Amount ($) | | Premium
Paid ($) | | Market
Value ($) | |
OTC 5-Year
Interest Rate Swap | | Barclays
| | 3-Month
USD LIBOR | | Receive | | | 3.250 | | | 8/22/2022 | | | 70,000,000 | | | | 1,851,500 | | | | 1,263,423 | | |
OTC 5-Year
Interest Rate Swap | | Morgan Stanley
| | 3-Month
USD LIBOR | | Receive | | | 2.500 | | | 11/3/2020 | | | 100,000,000 | | | | 1,215,000 | | | | 818,610 | | |
Total | | | | | | | | | | | | | | | | | 2,082,033 | | |
(h) The rate shown is the seven-day current annualized yield at November 30, 2014.
(i) As defined in the Investment Company Act of 1940, an affiliated company is one in which the Fund owns 5% or more of the company's outstanding voting securities, or a company which is under common ownership or control with the Fund. Holdings and transactions in these affiliated companies during the period ended November 30, 2014, are as follows:
Issuer | | Beginning
Cost ($) | | Purchase
Cost ($) | | Proceeds
From Sales ($) | | Ending
Cost ($) | | Dividends —
Affiliated
Issuers ($) | | Value ($) | |
Columbia Short-Term Cash Fund | | | 1,635,633 | | | | 122,506,005 | | | | (118,156,304 | ) | | | 5,985,334 | | | | 1,132 | | | | 5,985,334 | | |
Abbreviation Legend
CMO Collateralized Mortgage Obligation
STRIPS Separate Trading of Registered Interest and Principal Securities
Currency Legend
USD US Dollar
The accompanying Notes to Financial Statements are an integral part of this statement.
Semiannual Report 2014
9
Columbia Mortgage Opportunities Fund
Portfolio of Investments (continued)
November 30, 2014 (Unaudited)
Fair Value Measurements
Generally accepted accounting principles (GAAP) require disclosure regarding the inputs and valuation techniques used to measure fair value and any changes in valuation inputs or techniques. In addition, investments shall be disclosed by major category.
The Fund categorizes its fair value measurements according to a three-level hierarchy that maximizes the use of observable inputs and minimizes the use of unobservable inputs by prioritizing that the most observable input be used when available. Observable inputs are those that market participants would use in pricing an investment based on market data obtained from sources independent of the reporting entity. Unobservable inputs are those that reflect the Fund's assumptions about the information market participants would use in pricing an investment. An investment's level within the fair value hierarchy is based on the lowest level of any input that is deemed significant to the asset or liability's fair value measurement. The input levels are not necessarily an indication of the risk or liquidity associated with investments at that level. For example, certain U.S. government securities are generally high quality and liquid, however, they are reflected as Level 2 because the inputs used to determine fair value may not always be quoted prices in an active market.
Fair value inputs are summarized in the three broad levels listed below:
> Level 1 — Valuations based on quoted prices for investments in active markets that the Fund has the ability to access at the measurement date (including NAV for open-end mutual funds). Valuation adjustments are not applied to Level 1 investments.
> Level 2 — Valuations based on other significant observable inputs (including quoted prices for similar securities, interest rates, prepayment speeds, credit risks, etc.).
> Level 3 — Valuations based on significant unobservable inputs (including the Fund's own assumptions and judgment in determining the fair value of investments).
Inputs that are used in determining fair value of an investment may include price information, credit data, volatility statistics, and other factors. These inputs can be either observable or unobservable. The availability of observable inputs can vary between investments, and is affected by various factors such as the type of investment, and the volume and level of activity for that investment or similar investments in the marketplace. The inputs will be considered by the Investment Manager, along with any other relevant factors in the calculation of an investment's fair value. The Fund uses prices and inputs that are current as of the measurement date, which may include periods of market dislocations. During these periods, the availability of prices and inputs may be reduced for many investments. This condition could cause an investment to be reclassified between the various levels within the hierarchy.
Investments falling into the Level 3 category are primarily supported by quoted prices from brokers and dealers participating in the market for those investments. However, these may be classified as Level 3 investments due to lack of market transparency and corroboration to support these quoted prices. Additionally, valuation models may be used as the pricing source for any remaining investments classified as Level 3. These models may rely on one or more significant unobservable inputs and/or significant assumptions by the Investment Manager. Inputs used in valuations may include, but are not limited to, financial statement analysis, capital account balances, discount rates and estimated cash flows, and comparable company data.
Under the direction of the Fund's Board of Trustees (the Board), the Investment Manager's Valuation Committee (the Committee) is responsible for overseeing the valuation procedures approved by the Board. The Committee consists of voting and non-voting members from various groups within the Investment Manager's organization, including operations and accounting, trading and investments, compliance, risk management and legal.
The Committee meets at least monthly to review and approve valuation matters, which may include a description of specific valuation determinations, data regarding pricing information received from approved pricing vendors and brokers and the results of Board-approved valuation control policies and procedures (the Policies). The Policies address, among other things, instances when market quotations are or are not readily available, including recommendations of third party pricing vendors and a determination of appropriate pricing methodologies; events that require specific valuation determinations and assessment of fair value techniques; securities with a potential for stale pricing, including those that are illiquid, restricted, or in default; and the effectiveness of third party pricing vendors, including periodic reviews of vendors. The Committee meets more frequently, as needed, to discuss additional valuation matters, which may include the need to review back-testing results, review time-sensitive information or approve related valuation actions. The Committee reports to the Board, with members of the Committee meeting with the Board at each of its regularly scheduled meetings to discuss valuation matters and actions during the period, similar to those described earlier.
For investments categorized as Level 3, the Committee monitors information similar to that described above, which may include: (i) data specific to the issuer or comparable issuers, (ii) general market or specific sector news and (iii) quoted prices and specific or similar security transactions. The Committee considers this data and any changes from prior periods in order to assess the reasonableness of observable and unobservable inputs, any assumptions or internal models used to value those securities and changes in fair value. This data is also used to corroborate, when available, information received from approved pricing vendors and brokers. Various factors impact the frequency of monitoring this information (which may occur as often as daily). However, the Committee may determine that changes to inputs, assumptions and models are not required as a result of the monitoring procedures performed.
The accompanying Notes to Financial Statements are an integral part of this statement.
Semiannual Report 2014
10
Columbia Mortgage Opportunities Fund
Portfolio of Investments (continued)
November 30, 2014 (Unaudited)
Fair Value Measurements (continued)
The following table is a summary of the inputs used to value the Fund's investments at November 30, 2014:
Description | | Level 1
Quoted Prices in Active
Markets for Identical
Assets ($) | | Level 2
Other Significant
Observable Inputs ($) | | Level 3
Significant
Unobservable Inputs ($) | | Total ($) | |
Bonds | |
Residential Mortgage-Backed
Securities — Agency | | | — | | | | 138,234,738 | | | | — | | | | 138,234,738 | | |
Residential Mortgage-Backed
Securities — Non-Agency | | | — | | | | 18,056,311 | | | | 18,388,240 | | | | 36,444,551 | | |
Commercial Mortgage-Backed
Securities — Non-Agency | | | — | | | | 55,476,239 | | | | — | | | | 55,476,239 | | |
Asset-Backed Securities — Non-Agency | | | — | | | | 18,078,753 | | | | 2,108,099 | | | | 20,186,852 | | |
Total Bonds | | | — | | | | 229,846,041 | | | | 20,496,339 | | | | 250,342,380 | | |
Other | |
Options Purchased Puts | | | — | | | | 2,082,033 | | | | — | | | | 2,082,033 | | |
Total Other | | | — | | | | 2,082,033 | | | | — | | | | 2,082,033 | | |
Mutual Funds | |
Money Market Funds | | | 5,985,334 | | | | — | | | | — | | | | 5,985,334 | | |
Total Mutual Funds | | | 5,985,334 | | | | — | | | | — | | | | 5,985,334 | | |
Investments in Securities | | | 5,985,334 | | | | 231,928,074 | | | | 20,496,339 | | | | 258,409,747 | | |
Derivatives | |
Assets | |
Futures Contracts | | | 70,707 | | | | — | | | | — | | | | 70,707 | | |
Liabilities | |
Futures Contracts | | | (49,801 | ) | | | — | | | | — | | | | (49,801 | ) | |
Total | | | 6,006,240 | | | | 231,928,074 | | | | 20,496,339 | | | | 258,430,653 | | |
See the Portfolio of Investments for all investment classifications not indicated in the table.
The Fund's assets assigned to the Level 2 input category are generally valued using the market approach, in which a security's value is determined through reference to prices and information from market transactions for similar or identical assets.
There were no transfers of financial assets between Levels 1 and 2 during the period.
Futures contracts are valued at unrealized appreciation (depreciation).
The accompanying Notes to Financial Statements are an integral part of this statement.
Semiannual Report 2014
11
Columbia Mortgage Opportunities Fund
Portfolio of Investments (continued)
November 30, 2014 (Unaudited)
Fair Value Measurements (continued)
The following table is a reconciliation of Level 3 assets for which significant observable and/or unobservable inputs were used to determine fair value:
| | | Residential
Mortgage-Backed
Securities —
Non-Agency ($) | | Asset-Backed
Securities —
Non-Agency ($) | | Total ($) | |
Balance as of May 31, 2014 | | | 32,675,752 | | | | 8,276,749 | | | | 40,952,501 | | |
Accrued discounts/premiums | | | 5,683 | | | | (1,080 | ) | | | 4,603 | | |
Realized gain (loss) | | | — | | | | — | | | | — | | |
Change in unrealized appreciation (depreciation)(a) | | | 370,970 | | | | (956 | ) | | | 370,014 | | |
Sales | | | (9,992,655 | ) | | | (50,546 | ) | | | (10,043,201 | ) | |
Purchases | | | 7,924,887 | | | | (713,868 | ) | | | 7,211,019 | | |
Transfers into Level 3 | | | — | | | | — | | | | — | | |
Transfers out of Level 3 | | | (12,596,397 | ) | | | (5,402,200 | ) | | | (17,998,597 | ) | |
Balance as of November 30, 2014 | | | 18,388,240 | | | | 2,108,099 | | | | 20,496,339 | | |
(a) Change in unrealized appreciation (depreciation) relating to securities held at November 30, 2014 was $366,878, which is comprised of Residential Mortgage-Backed Securities — Non-Agency of $367,834 and Asset-Backed Securities — Non-Agency of $(956).
The Fund's assets assigned to the Level 3 category are valued utilizing the valuation technique deemed the most appropriate in the circumstances. Certain residential and asset backed securities classified as Level 3 securities are valued using the market approach and utilize single market quotations from broker dealers which may have included, but were not limited to, observable transactions for identical or similar assets in the market and the distressed nature of the security. The appropriateness of fair values for these securities is monitored on an ongoing basis which may include results of back testing, manual price reviews and other control procedures. Significant increases (decreases) to any of these inputs would result in a significantly lower (higher) fair value measurement.
Financial assets were transferred from Level 3 to Level 2 as observable market inputs were utilized and management determined that there was sufficient, reliable and observable market data to value these assets as of period end.
Transfers in and/or out of Level 3 are determined based on the fair value at the beginning of the period for security positions held throughout the period.
The accompanying Notes to Financial Statements are an integral part of this statement.
Semiannual Report 2014
12
Columbia Mortgage Opportunities Fund
Statement of Assets and Liabilities
November 30, 2014 (Unaudited)
Assets | |
Investments, at value | |
Unaffiliated issuers (identified cost $253,709,409) | | $ | 252,424,413 | | |
Affiliated issuers (identified cost $5,985,334) | | | 5,985,334 | | |
Total investments (identified cost $259,694,743) | | | 258,409,747 | | |
Cash | | | 10,012 | | |
Margin deposits | | | 221,496 | | |
Receivable for: | |
Capital shares sold | | | 4,218 | | |
Dividends | | | 196 | | |
Interest | | | 884,048 | | |
Variation margin | | | 22,003 | | |
Expense reimbursement due from Investment Manager | | | 2,547 | | |
Prepaid expenses | | | 2,584 | | |
Other assets | | | 48,822 | | |
Total assets | | | 259,605,673 | | |
Liabilities | |
Payable for: | |
Investments purchased on a delayed delivery basis | | | 101,570,486 | | |
Variation margin | | | 17,250 | | |
Investment management fees | | | 4,937 | | |
Distribution and/or service fees | | | 5 | | |
Transfer agent fees | | | 49 | | |
Administration fees | | | 693 | | |
Compensation of board members | | | 2,167 | | |
Other expenses | | | 97,106 | | |
Total liabilities | | | 101,692,693 | | |
Net assets applicable to outstanding capital stock | | $ | 157,912,980 | | |
Represented by | |
Paid-in capital | | $ | 156,534,804 | | |
Undistributed net investment income | | | 382,788 | | |
Accumulated net realized gain | | | 2,259,478 | | |
Unrealized appreciation (depreciation) on: | |
Investments | | | (1,284,996 | ) | |
Futures contracts | | | 20,906 | | |
Total — representing net assets applicable to outstanding capital stock | | $ | 157,912,980 | | |
The accompanying Notes to Financial Statements are an integral part of this statement.
Semiannual Report 2014
13
Columbia Mortgage Opportunities Fund
Statement of Assets and Liabilities (continued)
November 30, 2014 (Unaudited)
Class A | |
Net assets | | $ | 306,002 | | |
Shares outstanding | | | 30,211 | | |
Net asset value per share | | $ | 10.13 | | |
Maximum offering price per share(a) | | $ | 10.64 | | |
Class C | |
Net assets | | $ | 10,131 | | |
Shares outstanding | | | 1,000 | | |
Net asset value per share | | $ | 10.13 | | |
Class I | |
Net assets | | $ | 156,717,986 | | |
Shares outstanding | | | 15,469,029 | | |
Net asset value per share | | $ | 10.13 | | |
Class R4 | |
Net assets | | $ | 834,381 | | |
Shares outstanding | | | 82,334 | | |
Net asset value per share | | $ | 10.13 | | |
Class R5 | |
Net assets | | $ | 10,132 | | |
Shares outstanding | | | 1,000 | | |
Net asset value per share | | $ | 10.13 | | |
Class W | |
Net assets | | $ | 10,132 | | |
Shares outstanding | | | 1,000 | | |
Net asset value per share | | $ | 10.13 | | |
Class Z | |
Net assets | | $ | 24,216 | | |
Shares outstanding | | | 2,389 | | |
Net asset value per share(b) | | $ | 10.13 | | |
(a) The maximum offering price per share is calculated by dividing the net asset value per share by 1.0 minus the maximum sales charge of 4.75%.
(b) Net asset value per share rounds to this amount due to fractional shares outstanding.
The accompanying Notes to Financial Statements are an integral part of this statement.
Semiannual Report 2014
14
Columbia Mortgage Opportunities Fund
Statement of Operations
Six Months Ended November 30, 2014 (Unaudited)
Net investment income | |
Income: | |
Dividends — affiliated issuers | | $ | 1,132 | | |
Interest | | | 2,518,606 | | |
Total income | | | 2,519,738 | | |
Expenses: | |
Investment management fees | | | 371,506 | | |
Distribution and/or service fees | |
Class A | | | 210 | | |
Class C | | | 50 | | |
Class W | | | 13 | | |
Transfer agent fees | |
Class A | | | 138 | | |
Class C | | | 9 | | |
Class R4 | | | 31 | | |
Class R5 | | | 3 | | |
Class W | | | 9 | | |
Class Z | | | 17 | | |
Administration fees | | | 52,141 | | |
Compensation of board members | | | 5,649 | | |
Custodian fees | | | 13,711 | | |
Printing and postage fees | | | 22,822 | | |
Registration fees | | | 62,077 | | |
Professional fees | | | 20,051 | | |
Offering costs | | | 54,256 | | |
Other | | | 4,777 | | |
Total expenses | | | 607,470 | | |
Fees waived or expenses reimbursed by Investment Manager and its affiliates | | | (215,948 | ) | |
Total net expenses | | | 391,522 | | |
Net investment income | | | 2,128,216 | | |
Realized and unrealized gain (loss) — net | |
Net realized gain (loss) on: | |
Investments | | | (364,578 | ) | |
Futures contracts | | | 2,607,028 | | |
Net realized gain | | | 2,242,450 | | |
Net change in unrealized appreciation (depreciation) on: | |
Investments | | | (1,355,932 | ) | |
Futures contracts | | | 36,981 | | |
Net change in unrealized depreciation | | | (1,318,951 | ) | |
Net realized and unrealized gain | | | 923,499 | | |
Net increase in net assets resulting from operations | | $ | 3,051,715 | | |
The accompanying Notes to Financial Statements are an integral part of this statement.
Semiannual Report 2014
15
Columbia Mortgage Opportunities Fund
Statement of Changes in Net Assets
| | | Six Months Ended
November 30, 2014
(Unaudited) | | Year Ended
May 31, 2014(a) | |
Operations | |
Net investment income | | $ | 2,128,216 | | | $ | 180,318 | | |
Net realized gain | | | 2,242,450 | | | | 17,028 | | |
Net change in unrealized appreciation (depreciation) | | | (1,318,951 | ) | | | 54,861 | | |
Net increase in net assets resulting from operations | | | 3,051,715 | | | | 252,207 | | |
Distributions to shareholders | |
Net investment income | |
Class A | | | (2,336 | ) | | | (9 | ) | |
Class C | | | (75 | ) | | | (4 | ) | |
Class I | | | (1,815,163 | ) | | | (109,096 | ) | |
Class R4 | | | (2,146 | ) | | | (10 | ) | |
Class R5 | | | (130 | ) | | | (11 | ) | |
Class W | | | (113 | ) | | | (9 | ) | |
Class Z | | | (254 | ) | | | (13 | ) | |
Total distributions to shareholders | | | (1,820,217 | ) | | | (109,152 | ) | |
Increase in net assets from capital stock activity | | | 61,293,887 | | | | 95,174,540 | | |
Total increase in net assets | | | 62,525,385 | | | | 95,317,595 | | |
Net assets at beginning of period | | | 95,387,595 | | | | 70,000 | | |
Net assets at end of period | | $ | 157,912,980 | | | $ | 95,387,595 | | |
Undistributed net investment income | | $ | 382,788 | | | $ | 74,789 | | |
(a) Based on operations from April 30, 2014 (commencement of operations) through the stated period end.
The accompanying Notes to Financial Statements are an integral part of this statement.
Semiannual Report 2014
16
Columbia Mortgage Opportunities Fund
Statement of Changes in Net Assets (continued)
| | | Six Months Ended November 30, 2014
(Unaudited) | | Year Ended May 31, 2014(a) | |
| | | Shares | | Dollars ($) | | Shares | | Dollars ($) | |
Capital stock activity | |
Class A shares | |
Subscriptions | | | 28,994 | | | | 292,966 | | | | — | | | | — | | |
Distributions reinvested | | | 221 | | | | 2,223 | | | | — | | | | — | | |
Redemptions | | | (4 | ) | | | (34 | ) | | | — | | | | — | | |
Net increase | | | 29,211 | | | | 295,155 | | | | — | | | | — | | |
Class I shares | |
Subscriptions | | | 5,867,820 | | | | 59,278,062 | | | | 9,507,827 | | | | 95,128,172 | | |
Distributions reinvested | | | 180,122 | | | | 1,815,031 | | | | 10,887 | | | | 109,085 | | |
Redemptions | | | (92,119 | ) | | | (931,020 | ) | | | (6,508 | ) | | | (65,156 | ) | |
Net increase | | | 5,955,823 | | | | 60,162,073 | | | | 9,512,206 | | | | 95,172,101 | | |
Class R4 shares | |
Subscriptions | | | 81,153 | | | | 823,150 | | | | — | | | | — | | |
Distributions reinvested | | | 199 | | | | 2,021 | | | | — | | | | — | | |
Redemptions | | | (18 | ) | | | (125 | ) | | | — | | | | — | | |
Net increase | | | 81,334 | | | | 825,046 | | | | — | | | | — | | |
Class Z shares | |
Subscriptions | | | 1,142 | | | | 11,573 | | | | 243 | | | | 2,439 | | |
Distributions reinvested | | | 13 | | | | 128 | | | | — | | | | — | | |
Redemptions | | | (9 | ) | | | (88 | ) | | | — | | | | — | | |
Net increase | | | 1,146 | | | | 11,613 | | | | 243 | | | | 2,439 | | |
Total net increase | | | 6,067,514 | | | | 61,293,887 | | | | 9,512,449 | | | | 95,174,540 | | |
(a) Based on operations from April 30, 2014 (commencement of operations) through the stated period end.
The accompanying Notes to Financial Statements are an integral part of this statement.
Semiannual Report 2014
17
Columbia Mortgage Opportunities Fund
The following tables are intended to help you understand the Fund's financial performance. Certain information reflects financial results for a single share of a class held for the periods shown. Per share net investment income (loss) amounts are calculated based on average shares outstanding during the period. Total return assumes reinvestment of all dividends and distributions, if any. Total return does not reflect payment of sales charges, if any. Total return and portfolio turnover are not annualized for periods of less than one year. The portfolio turnover rate is calculated without regard to purchase and sales transactions of short-term instruments and certain derivatives, if any. If such transactions were included, the Fund's portfolio turnover rate may be higher.
Class A | | Six Months Ended
November 30, 2014
(Unaudited) | | Year Ended
May 31,
2014(a) | |
Per share data | |
Net asset value, beginning of period | | $ | 10.02 | | | $ | 10.00 | | |
Income from investment operations: | |
Net investment income | | | 0.16 | | | | 0.02 | | |
Net realized and unrealized gain | | | 0.06 | | | | 0.01 | | |
Total from investment operations | | | 0.22 | | | | 0.03 | | |
Less distributions to shareholders: | |
Net investment income | | | (0.11 | ) | | | (0.01 | ) | |
Total distributions to shareholders | | | (0.11 | ) | | | (0.01 | ) | |
Net asset value, end of period | | $ | 10.13 | | | $ | 10.02 | | |
Total return | | | 2.24 | % | | | 0.29 | % | |
Ratios to average net assets(b) | |
Total gross expenses | | | 1.36 | %(c) | | | 1.24 | %(c) | |
Total net expenses(d) | | | 1.00 | %(c) | | | 1.00 | %(c) | |
Net investment income | | | 3.18 | %(c) | | | 1.79 | %(c) | |
Supplemental data | |
Net assets, end of period (in thousands) | | $ | 306 | | | $ | 10 | | |
Portfolio turnover | | | 428 | %(e) | | | 56 | % | |
Notes to Financial Highlights
(a) Based on operations from April 30, 2014 (commencement of operations) through the stated period end.
(b) In addition to the fees and expenses that the Fund bears directly, the Fund indirectly bears a pro rata share of the fees and expenses of any other funds in which it invests. Such indirect expenses are not included in the Fund's reported expense ratios.
(c) Annualized.
(d) Total net expenses include the impact of certain fee waivers/expense reimbursements made by the Investment Manager and certain of its affiliates, if applicable.
(e) Includes mortgage dollar rolls. If mortgage dollar roll transactions were excluded, the portfolio turnover would have been 237% for the six months ended November 30, 2014.
The accompanying Notes to Financial Statements are an integral part of this statement.
Semiannual Report 2014
18
Columbia Mortgage Opportunities Fund
Financial Highlights (continued)
Class C | | Six Months Ended
November 30, 2014
(Unaudited) | | Year Ended
May 31,
2014(a) | |
Per share data | |
Net asset value, beginning of period | | $ | 10.02 | | | $ | 10.00 | | |
Income from investment operations: | |
Net investment income | | | 0.10 | | | | 0.01 | | |
Net realized and unrealized gain | | | 0.08 | | | | 0.01 | | |
Total from investment operations | | | 0.18 | | | | 0.02 | | |
Less distributions to shareholders: | |
Net investment income | | | (0.07 | ) | | | (0.00 | )(b) | |
Total distributions to shareholders | | | (0.07 | ) | | | (0.00 | )(b) | |
Redemption fees: | |
Net asset value, end of period | | $ | 10.13 | | | $ | 10.02 | | |
Total return | | | 1.85 | % | | | 0.24 | % | |
Ratios to average net assets(c) | |
Total gross expenses | | | 2.13 | %(d) | | | 2.05 | %(d) | |
Total net expenses(e) | | | 1.75 | %(d) | | | 1.75 | %(d) | |
Net investment income | | | 2.04 | %(d) | | | 1.05 | %(d) | |
Supplemental data | |
Net assets, end of period (in thousands) | | $ | 10 | | | $ | 10 | | |
Portfolio turnover | | | 428 | %(f) | | | 56 | % | |
Notes to Financial Highlights
(a) Based on operations from April 30, 2014 (commencement of operations) through the stated period end.
(b) Rounds to zero.
(c) In addition to the fees and expenses that the Fund bears directly, the Fund indirectly bears a pro rata share of the fees and expenses of any other funds in which it invests. Such indirect expenses are not included in the Fund's reported expense ratios.
(d) Annualized.
(e) Total net expenses include the impact of certain fee waivers/expense reimbursements made by the Investment Manager and certain of its affiliates, if applicable.
(f) Includes mortgage dollar rolls. If mortgage dollar roll transactions were excluded, the portfolio turnover would have been 237% for the six months ended November 30, 2014.
The accompanying Notes to Financial Statements are an integral part of this statement.
Semiannual Report 2014
19
Columbia Mortgage Opportunities Fund
Financial Highlights (continued)
Class I | | Six Months Ended
November 30, 2014
(Unaudited) | | Year Ended
May 31,
2014(a) | |
Per share data | |
Net asset value, beginning of period | | $ | 10.02 | | | $ | 10.00 | | |
Income from investment operations: | |
Net investment income | | | 0.16 | | | | 0.02 | | |
Net realized and unrealized gain | | | 0.08 | | | | 0.01 | | |
Total from investment operations | | | 0.24 | | | | 0.03 | | |
Less distributions to shareholders: | |
Net investment income | | | (0.13 | ) | | | (0.01 | ) | |
Total distributions to shareholders | | | (0.13 | ) | | | (0.01 | ) | |
Net asset value, end of period | | $ | 10.13 | | | $ | 10.02 | | |
Total return | | | 2.44 | % | | | 0.31 | % | |
Ratios to average net assets(b) | |
Total gross expenses | | | 0.93 | %(c) | | | 0.87 | %(c) | |
Total net expenses(d) | | | 0.60 | %(c) | | | 0.60 | %(c) | |
Net investment income | | | 3.27 | %(c) | | | 2.38 | %(c) | |
Supplemental data | |
Net assets, end of period (in thousands) | | $ | 156,718 | | | $ | 95,325 | | |
Portfolio turnover | | | 428 | %(e) | | | 56 | % | |
Notes to Financial Highlights
(a) Based on operations from April 30, 2014 (commencement of operations) through the stated period end.
(b) In addition to the fees and expenses that the Fund bears directly, the Fund indirectly bears a pro rata share of the fees and expenses of any other funds in which it invests. Such indirect expenses are not included in the Fund's reported expense ratios.
(c) Annualized.
(d) Total net expenses include the impact of certain fee waivers/expense reimbursements made by the Investment Manager and certain of its affiliates, if applicable.
(e) Includes mortgage dollar rolls. If mortgage dollar roll transactions were excluded, the portfolio turnover would have been 237% for the six months ended November 30, 2014.
The accompanying Notes to Financial Statements are an integral part of this statement.
Semiannual Report 2014
20
Columbia Mortgage Opportunities Fund
Financial Highlights (continued)
Class R4 | | Six Months Ended
November 30, 2014
(Unaudited) | | Year Ended
May 31,
2014(a) | |
Per share data | |
Net asset value, beginning of period | | $ | 10.02 | | | $ | 10.00 | | |
Income from investment operations: | |
Net investment income | | | 0.15 | | | | 0.02 | | |
Net realized and unrealized gain | | | 0.09 | | | | 0.01 | | |
Total from investment operations | | | 0.24 | | | | 0.03 | | |
Less distributions to shareholders: | |
Net investment income | | | (0.13 | ) | | | (0.01 | ) | |
Total distributions to shareholders | | | (0.13 | ) | | | (0.01 | ) | |
Net asset value, end of period | | $ | 10.13 | | | $ | 10.02 | | |
Total return | | | 2.36 | % | | | 0.30 | % | |
Ratios to average net assets(b) | |
Total gross expenses | | | 1.09 | %(c) | | | 1.05 | %(c) | |
Total net expenses(d) | | | 0.75 | %(c) | | | 0.75 | %(c) | |
Net investment income | | | 3.48 | %(c) | | | 2.04 | %(c) | |
Supplemental data | |
Net assets, end of period (in thousands) | | $ | 834 | | | $ | 10 | | |
Portfolio turnover | | | 428 | %(e) | | | 56 | % | |
Notes to Financial Highlights
(a) Based on operations from April 30, 2014 (commencement of operations) through the stated period end.
(b) In addition to the fees and expenses that the Fund bears directly, the Fund indirectly bears a pro rata share of the fees and expenses of any other funds in which it invests. Such indirect expenses are not included in the Fund's reported expense ratios.
(c) Annualized.
(d) Total net expenses include the impact of certain fee waivers/expense reimbursements made by the Investment Manager and certain of its affiliates, if applicable.
(e) Includes mortgage dollar rolls. If mortgage dollar roll transactions were excluded, the portfolio turnover would have been 237% for the six months ended November 30, 2014.
The accompanying Notes to Financial Statements are an integral part of this statement.
Semiannual Report 2014
21
Columbia Mortgage Opportunities Fund
Financial Highlights (continued)
Class R5 | | Six Months Ended
November 30, 2014
(Unaudited) | | Year Ended
May 31,
2014(a) | |
Per share data | |
Net asset value, beginning of period | | $ | 10.02 | | | $ | 10.00 | | |
Income from investment operations: | |
Net investment income | | | 0.16 | | | | 0.02 | | |
Net realized and unrealized gain | | | 0.08 | | | | 0.01 | | |
Total from investment operations | | | 0.24 | | | | 0.03 | | |
Less distributions to shareholders: | |
Net investment income | | | (0.13 | ) | | | (0.01 | ) | |
Total distributions to shareholders | | | (0.13 | ) | | | (0.01 | ) | |
Net asset value, end of period | | $ | 10.13 | | | $ | 10.02 | | |
Total return | | | 2.41 | % | | | 0.31 | % | |
Ratios to average net assets(b) | |
Total gross expenses | | | 0.99 | %(c) | | | 0.89 | %(c) | |
Total net expenses(d) | | | 0.65 | %(c) | | | 0.65 | %(c) | |
Net investment income | | | 3.14 | %(c) | | | 2.14 | %(c) | |
Supplemental data | |
Net assets, end of period (in thousands) | | $ | 10 | | | $ | 10 | | |
Portfolio turnover | | | 428 | %(e) | | | 56 | % | |
Notes to Financial Highlights
(a) Based on operations from April 30, 2014 (commencement of operations) through the stated period end.
(b) In addition to the fees and expenses that the Fund bears directly, the Fund indirectly bears a pro rata share of the fees and expenses of any other funds in which it invests. Such indirect expenses are not included in the Fund's reported expense ratios.
(c) Annualized.
(d) Total net expenses include the impact of certain fee waivers/expense reimbursements made by the Investment Manager and certain of its affiliates, if applicable.
(e) Includes mortgage dollar rolls. If mortgage dollar roll transactions were excluded, the portfolio turnover would have been 237% for the six months ended November 30, 2014.
The accompanying Notes to Financial Statements are an integral part of this statement.
Semiannual Report 2014
22
Columbia Mortgage Opportunities Fund
Financial Highlights (continued)
Class W | | Six Months Ended
November 30, 2014
(Unaudited) | | Year Ended
May 31,
2014(a) | |
Per share data | |
Net asset value, beginning of period | | $ | 10.02 | | | $ | 10.00 | | |
Income from investment operations: | |
Net investment income | | | 0.14 | | | | 0.02 | | |
Net realized and unrealized gain | | | 0.08 | | | | 0.01 | | |
Total from investment operations | | | 0.22 | | | | 0.03 | | |
Less distributions to shareholders: | |
Net investment income | | | (0.11 | ) | | | (0.01 | ) | |
Total distributions to shareholders | | | (0.11 | ) | | | (0.01 | ) | |
Net asset value, end of period | | $ | 10.13 | | | $ | 10.02 | | |
Total return | | | 2.23 | % | | | 0.29 | % | |
Ratios to average net assets(b) | |
Total gross expenses | | | 1.38 | %(c) | | | 1.30 | %(c) | |
Total net expenses(d) | | | 1.00 | %(c) | | | 1.00 | %(c) | |
Net investment income | | | 2.79 | %(c) | | | 1.79 | %(c) | |
Supplemental data | |
Net assets, end of period (in thousands) | | $ | 10 | | | $ | 10 | | |
Portfolio turnover | | | 428 | %(e) | | | 56 | % | |
Notes to Financial Highlights
(a) Based on operations from April 30, 2014 (commencement of operations) through the stated period end.
(b) In addition to the fees and expenses that the Fund bears directly, the Fund indirectly bears a pro rata share of the fees and expenses of any other funds in which it invests. Such indirect expenses are not included in the Fund's reported expense ratios.
(c) Annualized.
(d) Total net expenses include the impact of certain fee waivers/expense reimbursements made by the Investment Manager and certain of its affiliates, if applicable.
(e) Includes mortgage dollar rolls. If mortgage dollar roll transactions were excluded, the portfolio turnover would have been 237% for the six months ended November 30, 2014.
The accompanying Notes to Financial Statements are an integral part of this statement.
Semiannual Report 2014
23
Columbia Mortgage Opportunities Fund
Financial Highlights (continued)
Class Z | | Six Months Ended
November 30, 2014
(Unaudited) | | Year Ended
May 31,
2014(a) | |
Per share data | |
Net asset value, beginning of period | | $ | 10.02 | | | $ | 10.00 | | |
Income from investment operations: | |
Net investment income | | | 0.16 | | | | 0.02 | | |
Net realized and unrealized gain | | | 0.08 | | | | 0.01 | | |
Total from investment operations | | | 0.24 | | | | 0.03 | | |
Less distributions to shareholders: | |
Net investment income | | | (0.13 | ) | | | (0.01 | ) | |
Total distributions to shareholders | | | (0.13 | ) | | | (0.01 | ) | |
Net asset value, end of period | | $ | 10.13 | | | $ | 10.02 | | |
Total return | | | 2.36 | % | | | 0.30 | % | |
Ratios to average net assets(b) | |
Total gross expenses | | | 1.11 | %(c) | | | 1.08 | %(c) | |
Total net expenses(d) | | | 0.75 | %(c) | | | 0.75 | %(c) | |
Net investment income | | | 3.14 | %(c) | | | 2.21 | %(c) | |
Supplemental data | |
Net assets, end of period (in thousands) | | $ | 24 | | | $ | 12 | | |
Portfolio turnover | | | 428 | %(e) | | | 56 | % | |
Notes to Financial Highlights
(a) Based on operations from April 30, 2014 (commencement of operations) through the stated period end.
(b) In addition to the fees and expenses that the Fund bears directly, the Fund indirectly bears a pro rata share of the fees and expenses of any other funds in which it invests. Such indirect expenses are not included in the Fund's reported expense ratios.
(c) Annualized.
(d) Total net expenses include the impact of certain fee waivers/expense reimbursements made by the Investment Manager and certain of its affiliates, if applicable.
(e) Includes mortgage dollar rolls. If mortgage dollar roll transactions were excluded, the portfolio turnover would have been 237% for the six months ended November 30, 2014.
The accompanying Notes to Financial Statements are an integral part of this statement.
Semiannual Report 2014
24
Columbia Mortgage Opportunities Fund
Notes to Financial Statements
November 30, 2014 (Unaudited)
Note 1. Organization
Columbia Mortgage Opportunities Fund (the Fund), a series of Columbia Funds Series Trust II (the Trust), is a non-diversified fund. The Trust is registered under the Investment Company Act of 1940, as amended (the 1940 Act), as an open-end management investment company organized as a Massachusetts business trust.
Fund Shares
The Trust may issue an unlimited number of shares (without par value). The Fund offers Class A, Class C, Class I, Class R4, Class R5, Class W and Class Z shares. Although all share classes generally have identical voting, dividend and liquidation rights, each share class votes separately when required by the Trust's organizational documents or by law. Different share classes pay different distribution amounts to the extent the expenses of such share classes differ, and distributions in liquidation will be proportional to the net asset value of each share class. Each share class has its own expense structure and sales charges.
Class A shares are subject to a maximum front-end sales charge of 4.75% based on the initial investment amount. Class A shares purchased without an initial sales charge in accounts aggregating $1 million to $50 million at the time of purchase are subject to a contingent deferred sales charge (CDSC) if the shares are sold within 18 months of purchase, charged as follows: 1.00% CDSC if redeemed within 12 months of purchase, and 0.50% CDSC if redeemed more than 12, but less than 18, months after purchase.
Class C shares are subject to a 1.00% CDSC on shares redeemed within one year of purchase.
Class I shares are not subject to sales charges and are available only to the Columbia Family of Funds.
Class R4 shares are not subject to sales charges and are generally available only to omnibus retirement plans and certain investors as described in the Fund's prospectus.
Class R5 shares are not subject to sales charges and are generally available only to investors purchasing through authorized investment professionals and omnibus retirement plans.
Class W shares are not subject to sales charges and are available only to investors purchasing through authorized investment programs managed by investment professionals, including discretionary managed account programs.
Class Z shares are not subject to sales charges and are available only to eligible investors, which are subject to different investment minimums as described in the Fund's prospectus.
Note 2. Summary of Significant Accounting Policies
Basis of Preparation
The Fund is an investment company that applies the accounting and reporting guidance in the Financial Accounting Standards Board (FASB) Accounting Standards Codification Topic 946, Financial Services — Investment Companies (ASC 946). The financial statements are prepared in accordance with U.S. generally accepted accounting principles (GAAP) which requires management to make certain estimates and assumptions that affect the reported amounts of assets and liabilities, the disclosure of contingent assets and liabilities at the date of the financial statements and the reported amounts of income and expenses during the reporting period. Actual results could differ from those estimates.
The following is a summary of significant accounting policies followed by the Fund in the preparation of its financial statements.
Security Valuation
Debt securities generally are valued by pricing services approved by the Board of Trustees (the Board) based upon market transactions for normal, institutional-size trading units of similar securities. The services may use various pricing techniques that take into account, as applicable, factors such as yield, quality, coupon rate, maturity, type of issue, trading characteristics and other data, as well as broker quotes. Debt securities for which quotations are readily available may also be valued based upon an over-the-counter or exchange bid quotation.
Asset and mortgage-backed securities are generally valued by pricing services, which utilize pricing models that incorporate the securities' cash flow and loan performance data. These models also take into account available market data, including trades, market quotations, and benchmark yield curves for identical or similar securities. Factors used to identify similar securities may include, but are not limited to, issuer, collateral type, vintage, prepayment speeds, collateral performance, credit ratings, credit enhancement and expected life. Asset-backed securities for which quotations are readily available may also be valued based upon an over-the-counter or exchange bid quotation.
Investments in open-end investment companies, including money market funds, are valued at their net asset value.
Futures and options on futures contracts are valued based upon the settlement price established each day by the board of trade or exchange on which they are traded.
Semiannual Report 2014
25
Columbia Mortgage Opportunities Fund
Notes to Financial Statements (continued)
November 30, 2014 (Unaudited)
Option contracts are valued at the mean of the latest quoted bid and asked prices on their primary exchanges. Option contracts, including over-the-counter option contracts, with no readily available market value are valued using quotations obtained from independent brokers as of the close of the New York Stock Exchange (NYSE).
Investments for which market quotations are not readily available, or that have quotations which management believes are not reliable, are valued at fair value as determined in good faith under procedures established by and under the general supervision of the Board. If a security or class of securities (such as foreign securities) is valued at fair value, such value is likely to be different from the quoted or published price for the security.
The determination of fair value often requires significant judgment. To determine fair value, management may use assumptions including but not limited to future cash flows and estimated risk premiums. Multiple inputs from various sources may be used to determine fair value.
Derivative Instruments
The Fund invests in certain derivative instruments, as detailed below, to meet its investment objectives. Derivatives are instruments whose values depend on, or are derived from, in whole or in part, the value of one or more other assets, such as securities, currencies, commodities or indices. Derivative instruments may be used to increase investment flexibility (including to maintain cash reserves while maintaining exposure to certain other assets), for risk management (hedging) purposes, to facilitate trading, to reduce transaction costs and to pursue higher investment returns. The Fund may also use derivative instruments to mitigate certain investment risks, such as foreign currency exchange rate risk, interest rate risk and credit risk. Derivatives may involve various risks, including the potential inability of the counterparty to fulfill its obligation under the terms of the contract, the potential for an illiquid secondary market (making it difficult for the Fund to sell, including at favorable prices) and the potential for market movements which may expose the Fund to gains or losses in excess of the amount shown in the Statement of Assets and Liabilities. The notional amounts of derivative instruments, if applicable, are not recorded in the financial statements.
A derivative instrument may suffer a marked-to-market loss if the value of the contract decreases due to an unfavorable change in the market rates or values of the underlying instrument. Losses can also occur if the counterparty does not perform under the contract. The Fund's risk of loss from counterparty credit risk on over-the-counter derivatives is generally limited to the aggregate unrealized gain netted against any collateral held by the Fund and the amount of any
variation margin held by the counterparty. With exchange-traded or centrally cleared derivatives, there is reduced counterparty credit risk to the Fund since the exchange's clearinghouse, as counterparty to such instruments, guarantees against a possible default. The clearinghouse stands between the buyer and the seller of the contract; therefore, the counterparty credit risk is failure of the clearinghouse. However, credit risk still exists in exchange-traded or centrally cleared derivatives with respect to initial and variation margin that is held in a broker's customer account. While brokers are required to segregate customer margin from their own assets, in the event that a broker becomes insolvent or goes into bankruptcy and at that time there is a shortfall in the aggregate amount of margin held by the broker for all its clients, U.S. bankruptcy laws will typically allocate that shortfall on a pro-rata basis across all the broker's customers (including the Fund), potentially resulting in losses to the Fund.
In order to better define its contractual rights and to secure rights that will help the Fund mitigate its counterparty risk, the Fund may enter into an International Swaps and Derivatives Association, Inc. Master Agreement (ISDA Master Agreement) or similar agreement with its derivative contract counterparties. An ISDA Master Agreement is an agreement between the Fund and a counterparty that governs over-the-counter derivatives and forward foreign currency exchange contracts and typically contains, among other things, collateral posting terms and netting provisions in the event of a default and/or termination event. Under an ISDA Master Agreement, the Fund may, under certain circumstances, offset with the counterparty certain derivative instrument's payables and/or receivables with collateral held and/or posted and create one single net payment. The provisions of the ISDA Master Agreement typically permit a single net payment in the event of default (close-out netting) including the bankruptcy or insolvency of the counterparty. Note, however, that bankruptcy or insolvency laws of a particular jurisdiction may impose restrictions on or prohibitions against the right of offset in bankruptcy, insolvency or other events.
Collateral (margin) requirements differ by type of derivative. Margin requirements are established by the exchange or clearinghouse for exchange-traded and centrally cleared derivatives. Brokers can ask for margin in excess of the minimum in certain circumstances. Collateral terms are contract specific for over-the-counter derivatives. For over-the-counter derivatives traded under an ISDA Master Agreement, the collateral requirements are typically calculated by netting the marked-to-market amount for each transaction under such agreement and comparing that amount to the value of any variation margin currently pledged by the Fund and/or
Semiannual Report 2014
26
Columbia Mortgage Opportunities Fund
Notes to Financial Statements (continued)
November 30, 2014 (Unaudited)
the counterparty. Generally, the amount of collateral due from or to a party has to exceed a minimum transfer amount threshold (e.g., $500,000) before a transfer has to be made. To the extent amounts due to the Fund from its counterparties are not fully collateralized, contractually or otherwise, the Fund bears the risk of loss from counterparty nonperformance. The Fund attempts to mitigate counterparty risk by only entering into agreements with counterparties that it believes have the financial resources to honor their obligations and by monitoring the financial stability of those counterparties.
Certain ISDA Master Agreements allow counterparties to over-the-counter derivatives to terminate derivative contracts prior to maturity in the event the Fund's net assets decline by a stated percentage over a specified time period or if the Fund fails to meet the terms of the ISDA Master Agreement, which would cause the Fund to accelerate payment of any net liability owed to the counterparty. The Fund also has termination rights if the counterparty fails to meet the terms of the ISDA Master Agreement. In addition to considering counterparty credit risk, the Fund would consider terminating the derivative contracts based on whether termination would result in a net liability owed from the counterparty.
For financial reporting purposes, the Fund does not offset derivative assets and derivative liabilities that are subject to netting arrangements in the Statement of Assets and Liabilities.
Futures Contracts
Futures contracts are exchange traded and represent commitments for the future purchase or sale of an asset at a specified price on a specified date. The Fund bought and sold futures contracts to manage the duration and yield curve exposure of the Fund versus the benchmark and manage exposure to movements in interest rates. These instruments may be used for other purposes in future periods. Upon entering into futures contracts, the Fund bears risks that it may not achieve the anticipated benefits of the futures contracts and may realize a loss. Additional risks include counterparty credit risk, the possibility of an illiquid market, and that a change in the value of the contract or option may not correlate with changes in the value of the underlying asset.
Upon entering into a futures contract, the Fund pledges cash or securities with the broker in an amount sufficient to meet the initial margin requirement. The initial margin deposit must be maintained at an established level over the life of the contract. Cash deposited as initial margin is recorded in the Statement of Assets and Liabilities as margin deposits. Securities deposited as initial margin are designated in the Portfolio of Investments. Subsequent payments (variation margin) are made or received by the Fund each day. The
variation margin payments are equal to the daily change in the contract value and are recorded as variation margin receivable or payable and are offset in unrealized gains or losses. The Fund recognizes a realized gain or loss when the contract is closed or expires. Futures contracts involve, to varying degrees, risk of loss in excess of the variation margin disclosed in the Statement of Assets and Liabilities.
Interest Rate Swaption Contracts
Interest rate swaption contracts entered into by the Fund typically represent an option that gives the purchaser the right, but not the obligation, to enter into an interest rate swap contract on a future date. The Fund purchased or wrote interest rate swaption contracts to manage exposure to fluctuations in interest rates, to hedge the fair value of other Fund investments, and as part of an investment strategy. These instruments may be used for other purposes in future periods. Each interest rate swaption agreement will specify if the buyer is entitled to receive the fixed or floating rate if the interest rate is exercised. Changes in the value of a purchased interest rate swaption contracts are reported as unrealized appreciation or depreciation on investments in the Statement of Assets and Liabilities. Gain or loss is recognized in the Statement of Operations when the interest rate swaption contract is closed or expires.
When the Fund writes an interest rate swaption contract, the premium received is recorded as an asset and an amount equivalent to the premium is recorded as a liability in the Statement of Assets and Liabilities and is subsequently adjusted to reflect the current fair value of the interest rate swaption contract written. Premiums received from writing interest rate swaption contracts that expire unexercised are recorded by the Fund on the expiration date as realized gains from options written in the Statement of Operations. The difference between the premium and the amount paid on effecting a closing purchase transaction, including brokerage commissions, is also recorded as realized gain, or if the premium is less than the amount paid for the closing purchase, as realized loss. These amounts are reflected as net realized gain (loss) on options written in the Statement of Operations.
Semiannual Report 2014
27
Columbia Mortgage Opportunities Fund
Notes to Financial Statements (continued)
November 30, 2014 (Unaudited)
Offsetting of Derivative Assets and Derivative Liabilities
The following tables present the Fund's gross and net amount of assets and liabilities available for offset under netting arrangements as well as any related collateral received or pledged by the Fund as of November 30, 2014:
| |
| |
| |
| | Gross Amounts Not Offset in
the Statement of Assets and Liabilities | |
| |
| |
Gross
Amounts of
Recognized
Assets ($) | |
Gross Amounts
Offset in the
Statement of
Assets and
Liabilities ($) | | Net Amounts of
Assets
Presented in the
Statement of
Assets and
Liabilities ($) | |
Financial
Instruments ($)(a) | |
Cash
Collateral
Received ($) | |
Securities
Collateral
Received ($) | |
Net
Amount ($)(b) | |
Asset Derivatives: | |
Options Purchased Puts(c) | | | 2,082,033 | | | | — | | | | 2,082,033 | | | | — | | | | 818,610 | | | | 1,263,423 | | | | — | | |
(a) Represents the amount of assets that could be offset by liabilities with the same counterparty under master netting or similar agreements that management elects not to offset on the Statement of Assets and Liabilities.
(b) Represents the net amount due from counterparties in the event of default.
(c) Purchased options are included within investments at value on the Statement of Assets and Liabilities.
Effects of Derivative Transactions in the Financial Statements
The following tables are intended to provide additional information about the effect of derivatives on the financial statements of the Fund, including: the fair value of derivatives by risk category and the location of those fair values in the Statement of Assets and Liabilities; and the impact of derivative transactions over the period in the Statement of Operations, including realized gains or losses and unrealized gains or losses. The derivative schedules following the Portfolio of Investments present additional information regarding derivative instruments outstanding at the end of the period, if any.
The following table is a summary of the fair value of derivative instruments (not considered to be hedging instruments for accounting disclosure purposes) at November 30, 2014:
Asset Derivatives | |
Risk Exposure
Category | | Statement of Assets and
Liabilities Location | | Fair Value ($) | |
Interest rate
risk
| | Net assets — unrealized
appreciation on futures
contracts | | | 70,707
| * | |
Interest rate
risk
| | Investments at value —
unaffiliated issuers
(for purchased options) | | | 2,082,033
| | |
Total | | | | | 2,152,740 | | |
Liability Derivatives | |
Risk Exposure
Category | | Statement of Assets and
Liabilities Location | |
Fair Value ($) | |
Interest rate
risk
| | Net assets — unrealized
depreciation on futures
contracts | | | 49,801
| * | |
*Includes cumulative appreciation (depreciation) as reported in the tables following the Portfolio of Investments. Only the current day's variation margin is reported in receivables or payables in the Statement of Assets and Liabilities.
The following table indicates the effect of derivative instruments (not considered to be hedging instruments for accounting disclosure purposes) in the Statement of Operations for the six months ended November 30, 2014:
Amount of Realized Gain (Loss) on Derivatives Recognized in Income | |
Risk Exposure
Category | | Futures
Contracts ($) | | Options
Contracts
Written and
Purchased ($) | | Total ($) | |
Interest rate risk | | | 2,607,028 | | | | 212,543 | | | | 2,819,571 | | |
Change in Unrealized Appreciation (Depreciation) on Derivatives Recognized in Income | |
Risk Exposure
Category | | Futures
Contracts ($) | | Options
Contracts
Written and
Purchased ($) | | Total ($) | |
Interest rate risk | | | 36,981 | | | | (1,086,099 | ) | | | (1,049,118 | ) | |
Semiannual Report 2014
28
Columbia Mortgage Opportunities Fund
Notes to Financial Statements (continued)
November 30, 2014 (Unaudited)
The following table is a summary of the average outstanding volume by derivative instrument for the six months ended November 30, 2014:
Derivative Instrument | | Average notional amounts ($)* | |
Futures contracts — Long | | | 7,118,594 | | |
Futures contracts — Short | | | 49,894,806 | | |
Derivative Instrument | | Average market value ($)* | |
Options contracts — Purchased | | | 2,011,463 | | |
*Based on the ending quarterly outstanding amounts for the six months ended November 30, 2014.
Delayed Delivery Securities
The Fund may trade securities on other than normal settlement terms, including securities purchased or sold on a "when-issued" basis. This may increase risk to the Fund since the other party to the transaction may fail to deliver which could cause the Fund to subsequently invest at less advantageous prices. The Fund designates cash or liquid securities in an amount equal to the delayed delivery commitment.
Mortgage Dollar Roll Transactions
The Fund may enter into mortgage "dollar rolls" in which the Fund sells securities for delivery in the current month and simultaneously contracts with the same counterparty to repurchase similar but not identical securities (same type, coupon and maturity) on a specified future date. During the roll period, the Fund loses the right to receive principal and interest paid on the securities sold. However, the Fund will benefit because it receives negotiated amounts in the form of reductions of the purchase price for the future purchase plus the interest earned on the cash proceeds of the securities sold until the settlement date of the forward purchase. The Fund records the incremental difference between the forward purchase and sale of each forward roll as a realized gain or loss. Unless any realized gains exceed the income, capital appreciation, and gain or loss due to mortgage prepayments that would have been realized on the securities sold as part of the mortgage dollar roll, the use of this technique will diminish the investment performance of the Fund compared to what the performance would have been without the use of mortgage dollar rolls. All cash proceeds will be invested in instruments that are permissible investments for the Fund. The Fund identifies cash or liquid securities in an amount equal to the forward purchase price.
For financial reporting and tax purposes, the Fund treats "to be announced" mortgage dollar rolls as two separate transactions, one involving the purchase of a security and a separate transaction involving a sale. These transactions may increase the Fund's portfolio turnover rate. The Fund does not
currently enter into mortgage dollar rolls that are accounted for as financing transactions.
Mortgage dollar rolls involve the risk that the market value of the securities the Fund is obligated to repurchase may decline below the repurchase price, or that the counterparty may default on its obligations.
Interest Only Securities
The Fund may invest in Interest Only Securities (IOs). IOs are stripped securities entitled to receive all of the security's interest, but none of its principal. The Fund may also invest in stripped mortgage-backed securities. If the underlying obligations experience greater than anticipated prepayments of principal, the Fund may fail to fully recoup its initial investment in an IO. As a result of the prepayments the daily interest accrual factor is adjusted periodically (typically, each month) to reflect the paydown of principal. IOs are particularly sensitive to changes in interest rates and therefore subject to greater fluctuations in price than typical interest bearing debt securities. IOs are also subject to credit risk because the Fund may not receive all or part of the interest payments if the issuer or credit enhancer defaults on its obligation.
Security Transactions
Security transactions are accounted for on the trade date. Cost is determined and gains (losses) are based upon the specific identification method for both financial statement and federal income tax purposes.
Income Recognition
Interest income is recorded on an accrual basis. Market premiums and discounts, including original issue discounts, are amortized and accreted, respectively, over the expected life of the security on all debt securities, unless otherwise noted. The Fund classifies gains and losses realized on prepayments received on mortgage-backed securities as adjustments to interest income.
The Fund may place a debt security on non-accrual status and reduce related interest income when it becomes probable that the interest will not be collected and the amount of uncollectible interest can be reasonably estimated. A defaulted debt security is removed from non-accrual status when the issuer resumes interest payments or when collectability of interest is reasonably assured.
Dividend income is recorded on the ex-dividend date.
Expenses
General expenses of the Trust are allocated to the Fund and other funds of the Trust based upon relative net assets or other expense allocation methodologies determined by the nature of the expense. Expenses directly attributable to the Fund are
Semiannual Report 2014
29
Columbia Mortgage Opportunities Fund
Notes to Financial Statements (continued)
November 30, 2014 (Unaudited)
charged to the Fund. Expenses directly attributable to a specific class of shares are charged to that share class.
Determination of Class Net Asset Value
All income, expenses (other than class-specific expenses, which are charged to that share class, as shown in the Statement of Operations) and realized and unrealized gains (losses) are allocated to each class of the Fund on a daily basis, based on the relative net assets of each class, for purposes of determining the net asset value of each class.
Federal Income Tax Status
The Fund intends to qualify each year as a regulated investment company under Subchapter M of the Internal Revenue Code, as amended, and will distribute substantially all of its taxable income (including net short-term capital gains), if any, for its tax year, and as such will not be subject to federal income taxes. In addition, the Fund intends to distribute in each calendar year substantially all of its net investment income, capital gains and certain other amounts, if any, such that the Fund should not be subject to federal excise tax. Therefore, no federal income or excise tax provision is recorded.
Distributions to Shareholders
Distributions from net investment income, if any, are declared and paid monthly. Net realized capital gains, if any, are distributed at least annually. Income distributions and capital gain distributions are determined in accordance with federal income tax regulations, which may differ from GAAP.
Guarantees and Indemnifications
Under the Trust's organizational documents and, in some cases, by contract, its officers and trustees are indemnified against certain liabilities arising out of the performance of their duties to the Trust or its funds. In addition, certain of the Fund's contracts with its service providers contain general indemnification clauses. The Fund's maximum exposure under these arrangements is unknown since the amount of any future claims that may be made against the Fund cannot be determined, and the Fund has no historical basis for predicting the likelihood of any such claims.
Note 3. Fees and Compensation Paid to Affiliates
Investment Management Fees
Under an Investment Management Services Agreement, Columbia Management Investment Advisers, LLC (the Investment Manager), a wholly-owned subsidiary of Ameriprise Financial, Inc. (Ameriprise Financial), determines which securities will be purchased, held or sold. The investment management fee is an annual fee that is equal to a
percentage of the Fund's average daily net assets that declines from 0.570% to 0.485% as the Fund's net assets increase. The annualized effective investment management fee rate for the six months ended November 30, 2014 was 0.570% of the Fund's average daily net assets.
Administration Fees
Under an Administrative Services Agreement, the Investment Manager also serves as the Fund Administrator. The Fund pays the Fund Administrator an annual fee for administration and accounting services equal to a percentage of the Fund's average daily net assets that declines from 0.08% to 0.05% as the Fund's net assets increase. The annualized effective administration fee rate for the six months ended November 30, 2014 was 0.08% of the Fund's average daily net assets.
Other Expenses
Other expenses are for, among other things, miscellaneous expenses of the Fund or the Board, including payments to a company providing limited administrative services to the Fund and the Board. That company's expenses include boardroom and office expense, employee compensation, employee health and retirement benefits, and certain other expenses. For the six months ended November 30, 2014, other expenses paid by the Fund to this company were $634.
Offering Costs
Offering costs were incurred prior to the shares of the Fund being offered. Offering costs include, among other things, state registration filing fees and printing costs. The Fund amortizes offering costs over a period of 12 months from the commencement of operations.
Compensation of Board Members
Board members are compensated for their services to the Fund as disclosed in the Statement of Operations. Under a Deferred Compensation Plan (the Plan), the Board members who are not "interested persons" of the Fund, as defined under the 1940 Act, may elect to defer payment of up to 100% of their compensation. Deferred amounts are treated as though equivalent dollar amounts had been invested in shares of certain funds managed by the Investment Manager. The Fund's liability for these amounts is adjusted for market value changes and remains in the Fund until distributed in accordance with the Plan.
Transfer Agent Fees
Under a Transfer and Dividend Disbursing Agent Agreement, Columbia Management Investment Services Corp. (the Transfer Agent), an affiliate of the Investment Manager and a wholly-owned subsidiary of Ameriprise Financial, is responsible for providing transfer agency services to the Fund.
Semiannual Report 2014
30
Columbia Mortgage Opportunities Fund
Notes to Financial Statements (continued)
November 30, 2014 (Unaudited)
The Transfer Agent has contracted with Boston Financial Data Services (BFDS) to serve as sub-transfer agent.
Effective November 1, 2014, the Transfer Agent receives a monthly transfer agency fee based on the number or the average value of accounts, depending on the type of account. Prior to November 1, 2014, the Transfer Agent received a monthly account-based service fee based on the number of open accounts. In addition, the Transfer Agent also receives sub-transfer agency fees based on a percentage of the average aggregate value of the Fund's shares maintained in omnibus accounts (other than omnibus accounts for which American Enterprise Investment Services Inc. is the broker of record or accounts where the beneficial shareholder is a customer of Ameriprise Financial Services, Inc., which receive a per account fee). The Transfer Agent pays the fees of BFDS for services as sub-transfer agent and is not entitled to reimbursement for such fees from the Fund (with the exception of out-of-pocket fees).
The Transfer Agent also receives compensation from the Fund for various shareholder services and reimbursements for certain out-of-pocket fees. Class I shares do not pay transfer agent fees. Total transfer agent fees for Class R5 shares are subject to an annual limitation of not more than 0.05% of the average daily net assets attributable to Class R5 shares.
For the six months ended November 30, 2014, the Fund's annualized effective transfer agent fee rates as a percentage of average daily net assets of each class were as follows:
Class A | | | 0.16 | % | |
Class C | | | 0.19 | | |
Class R4 | | | 0.16 | | |
Class R5 | | | 0.05 | | |
Class W | | | 0.19 | | |
Class Z | | | 0.18 | | |
An annual minimum account balance fee of $20 may apply to certain accounts with a value below the applicable share class's initial minimum investment requirements to reduce the impact of small accounts on transfer agent fees. These minimum account balance fees are remitted to the Fund and recorded as part of expense reductions in the Statement of Operations. For the six months ended November 30, 2014, no minimum account balance fees were charged by the Fund.
Distribution Fees
The Fund has an agreement with Columbia Management Investment Distributors, Inc. (the Distributor), an affiliate of the Investment Manager and a wholly-owned subsidiary of Ameriprise Financial, for distribution and shareholder services. Under a Plan and Agreement of Distribution, the Fund pays a fee at an annual rate of up to 0.25% of the Fund's average daily net assets attributable to Class A and Class W
shares, and a fee at an annual rate of up to 1.00% of the Fund's average daily net assets attributable to Class C shares. For Class C shares, of the 1.00% fee, up to 0.75% is reimbursed for distribution expenses.
The amount of distribution expenses incurred by the Distributor and not yet reimbursed (unreimbursed expense) was approximately $0 for Class C shares. This amount is based on the most recent information available as of September 30, 2014, and may be recovered from future payments under the distribution plan or CDSCs. To the extent the unreimbursed expense has been fully recovered, the distribution fee is reduced.
Sales Charges
Sales charges, including front-end charges and CDSCs, received by the Distributor for distributing Fund shares were $427 for Class A shares for the six months ended November 30, 2014.
Expenses Waived/Reimbursed by the Investment Manager and its Affiliates
The Investment Manager and certain of its affiliates have contractually agreed to waive fees and/or reimburse expenses (excluding certain fees and expenses described below) for the period disclosed below, unless sooner terminated at the sole discretion of the Board, so that the Fund's net operating expenses, after giving effect to fees waived/expenses reimbursed and any balance credits and/or overdraft charges from the Fund's custodian, do not exceed the following annual rates as a percentage of the class' average daily net assets:
| | | Fee Rates
Contractual
through
September 30, 2015 | |
Class A | | | 1.00 | % | |
Class C | | | 1.75 | | |
Class I | | | 0.60 | | |
Class R4 | | | 0.75 | | |
Class R5 | | | 0.65 | | |
Class W | | | 1.00 | | |
Class Z | | | 0.75 | | |
Under the agreement governing these fee waivers and/or expense reimbursement arrangements, the following fees and expenses are excluded from the waiver/reimbursement commitment, and therefore will be paid by the Fund, if applicable: taxes (including foreign transaction taxes), expenses associated with investments in affiliated and non-affiliated pooled investment vehicles (including mutual funds and exchange-traded funds), transaction costs and brokerage commissions, costs related to any securities lending program, dividend expenses associated with securities sold
Semiannual Report 2014
31
Columbia Mortgage Opportunities Fund
Notes to Financial Statements (continued)
November 30, 2014 (Unaudited)
short, inverse floater program fees and expenses, transaction charges and interest on borrowed money, interest, extraordinary expenses and any other expenses the exclusion of which is specifically approved by the Board. This agreement may be modified or amended only with approval from all parties.
Note 4. Federal Tax Information
The timing and character of income and capital gain distributions are determined in accordance with income tax regulations, which may differ from GAAP because of temporary or permanent book to tax differences.
At November 30, 2014, the cost of investments for federal income tax purposes was approximately $259,695,000 and the aggregate gross approximate unrealized appreciation and depreciation based on that cost was:
Unrealized appreciation | | $ | 1,961,000 | | |
Unrealized depreciation | | | (3,246,000 | ) | |
Net unrealized depreciation | | $ | (1,285,000 | ) | |
Management of the Fund has concluded that there are no significant uncertain tax positions in the Fund that would require recognition in the financial statements. However, management's conclusion may be subject to review and adjustment at a later date based on factors including, but not limited to, new tax laws, regulations, and administrative interpretations (including relevant court decisions). Generally, the Fund's federal tax returns for the prior three fiscal years remain subject to examination by the Internal Revenue Service.
Note 5. Portfolio Information
The cost of purchases and proceeds from sales of securities, excluding short-term obligations and certain derivatives, if any, but including mortgage dollar rolls, aggregated to $877,080,415 and $724,234,328, respectively, for the six months ended November 30, 2014, of which $769,796,094 and $679,830,273, respectively, were U.S. government securities. The amount of purchase and sale activity impacts the portfolio turnover rate reported in the Financial Highlights.
Note 6. Affiliated Money Market Fund
The Fund invests in Columbia Short-Term Cash Fund, an affiliated money market fund established for the exclusive use by the Fund and other affiliated funds. The income earned by the Fund from such investments is included as Dividends — affiliated issuers in the Statement of Operations. As an investing fund, the Fund indirectly bears its proportionate share of the expenses of Columbia Short-Term Cash Fund.
Note 7. Shareholder Concentration
At November 30, 2014, affiliated shareholders of record owned 99.2% of the outstanding shares of the Fund in one or more accounts. Subscription and redemption activity by concentrated accounts may have a significant effect on the operations of the Fund.
Note 8. Line of Credit
Effective July 31, 2014, the Fund has entered into a revolving credit facility with a syndicate of banks led by JPMorgan Chase Bank N.A. (JPMorgan) whereby the Fund may borrow for the temporary funding of shareholder redemptions or for other temporary or emergency purposes. The credit facility agreement, as amended, which is a collective agreement between the Fund and certain other funds managed by the Investment Manager, severally and not jointly, permits collective borrowings up to $500 million. Interest is charged to each participating fund based on its borrowings at a rate equal to the higher of (i) the overnight federal funds rate plus 1.00% or (ii) the one-month LIBOR rate plus 1.00%. Each borrowing under the credit facility matures no later than 60 days after the date of borrowing. The Fund also pays a commitment fee equal to its pro rata share of the amount of the credit facility at a rate of 0.075% per annum. The commitment fee is included in other expenses in the Statement of Operations.
Effective December 9, 2014, the Fund extended its revolving credit facility with JPMorgan. The credit facility agreement, as amended, permits collective borrowings up to $550 million under the same terms and interest rates as described above.
The Fund had no borrowings during the six months ended November 30, 2014.
Note 9. Significant Risks
Credit Risk
Credit risk is the risk that the value of debt securities in the Fund's portfolio may decline because the issuer may default and fail to pay interest or repay principal when due. Rating agencies assign credit ratings to debt securities to indicate their credit risk. Lower rated or unrated debt securities held by the Fund may present increased credit risk as compared to higher-rated debt securities.
Interest Rate Risk
Interest rate risk is the risk of losses attributable to changes in interest rates. In general, if prevailing interest rates rise, the values of debt securities tend to fall, and if interest rates fall, the values of debt securities tend to rise. Actions by governments and central banking authorities can result in increases in interest rates. Increasing interest rates may negatively affect the value of debt securities held by the Fund, resulting in a negative impact on the Fund's performance and
Semiannual Report 2014
32
Columbia Mortgage Opportunities Fund
Notes to Financial Statements (continued)
November 30, 2014 (Unaudited)
net asset value per share. In general, the longer the maturity or duration of a debt security, the greater its sensitivity to changes in interest rates.
Liquidity Risk
Liquidity risk is the risk associated with a lack of marketability of investments which may make it difficult to sell the investment at a desirable time or price. Changing regulatory, market or other conditions or environments (for example, the interest rate or credit environments) may adversely affect the liquidity of the Fund's investments. The Fund may have to accept a lower selling price for the holding, sell other investments, or forego another, more appealing investment opportunity. Generally, the less liquid the market at the time the Fund sells a portfolio investment, the greater the risk of loss or decline of value to the Fund. A less liquid market can lead to an increase in Fund redemptions, which may negatively impact Fund performance and net asset value per share, including, for example, if the Fund is forced to sell securities in a down market.
High-Yield Securities Risk
Securities rated below investment grade (commonly called "high-yield" or "junk" bonds) and unrated securities of comparable quality expose the Fund to a greater risk of loss of principal and income than a fund that invests solely or primarily in investment grade securities. In addition, these investments have greater price fluctuations, are less liquid and are more likely to experience a default than higher-rated securities. High-yield securities are considered to be predominantly speculative with respect to the issuer's capacity to pay interest and repay principal.
Mortgage-Backed Securities Risk
The value of mortgage-backed securities may be affected by, among other things, changes in interest rates, factors concerning the interests in and structure of the issuer or the originator of the mortgages, the creditworthiness of the entities that provide any supporting letters of credit, surety bonds or other credit enhancements or the quality of underlying assets or the market's assessment thereof. Mortgage-backed securities are subject to prepayment risk, which is the possibility that the underlying mortgage may be refinanced or prepaid prior to maturity during periods of declining or low interest rates, causing the Fund to have to reinvest the money received in securities that have lower yields. In addition, the impact of prepayments on the value of mortgage-backed securities may be difficult to predict and may result in greater volatility.
Non-Diversification Risk
A non-diversified fund is permitted to invest a greater percentage of its total assets in fewer issuers than a diversified
fund. The Fund may, therefore, have a greater risk of loss from a few issuers than a similar fund that invests more broadly.
Note 10. Subsequent Events
Management has evaluated the events and transactions that have occurred through the date the financial statements were issued. Other than as noted in Note 8 above, there were no items requiring adjustment of the financial statements or additional disclosure.
Note 11. Information Regarding Pending and Settled Legal Proceedings
In December 2005, without admitting or denying the allegations, American Express Financial Corporation (AEFC, which is now known as Ameriprise Financial, Inc. (Ameriprise Financial)) entered into settlement agreements with the Securities and Exchange Commission (SEC) and Minnesota Department of Commerce (MDOC) related to market timing activities. As a result, AEFC was censured and ordered to cease and desist from committing or causing any violations of certain provisions of the Investment Advisers Act of 1940, the Investment Company Act of 1940, and various Minnesota laws. AEFC agreed to pay disgorgement of $10 million and civil money penalties of $7 million. AEFC also agreed to retain an independent distribution consultant to assist in developing a plan for distribution of all disgorgement and civil penalties ordered by the SEC in accordance with various undertakings detailed at www.sec.gov/litigation/admin/ia-2451.pdf. Ameriprise Financial and its affiliates have cooperated with the SEC and the MDOC in these legal proceedings, and have made regular reports to the Funds' Boards of Trustees.
Ameriprise Financial and certain of its affiliates have historically been involved in a number of legal, arbitration and regulatory proceedings, including routine litigation, class actions, and governmental actions, concerning matters arising in connection with the conduct of their business activities. Ameriprise Financial believes that the Funds are not currently the subject of, and that neither Ameriprise Financial nor any of its affiliates are the subject of, any pending legal, arbitration or regulatory proceedings that are likely to have a material adverse effect on the Funds or the ability of Ameriprise Financial or its affiliates to perform under their contracts with the Funds. Ameriprise Financial is required to make quarterly (10-Q), annual (10-K) and, as necessary, 8-K filings with the Securities and Exchange Commission on legal and regulatory matters that relate to Ameriprise Financial and its affiliates. Copies of these filings may be obtained by accessing the SEC website at www.sec.gov.
There can be no assurance that these matters, or the adverse publicity associated with them, will not result in increased fund redemptions, reduced sale of fund shares or other adverse
Semiannual Report 2014
33
Columbia Mortgage Opportunities Fund
Notes to Financial Statements (continued)
November 30, 2014 (Unaudited)
consequences to the Funds. Further, although we believe proceedings are not likely to have a material adverse effect on the Funds or the ability of Ameriprise Financial or its affiliates to perform under their contracts with the Funds, these proceedings are subject to uncertainties and, as such, we are unable to estimate the possible loss or range of loss that may result. An adverse outcome in one or more of these proceedings could result in adverse judgments, settlements, fines, penalties or other relief that could have a material adverse effect on the consolidated financial condition or results of operations of Ameriprise Financial.
Semiannual Report 2014
34
Columbia Mortgage Opportunities Fund
Important Information About This Report
Each fund mails one shareholder report to each shareholder address. If you would like more than one report, please call shareholder services at 800.345.6611 and additional reports will be sent to you.
The policy of the Board is to vote the proxies of the companies in which each fund holds investments consistent with the procedures as stated in the Statement of Additional Information (SAI). You may obtain a copy of the SAI without charge by calling 800.345.6611; contacting your financial intermediary; visiting columbiamanagement.com; or searching the website of the Securities and Exchange Commission (SEC) at sec.gov. Information regarding how each fund voted proxies relating to portfolio securities is filed with the SEC by August 31 for the most recent 12-month period ending June 30 of that year, and is available without charge by visiting columbiamanagement.com; or searching the website of the SEC at sec.gov.
Each fund files a complete schedule of portfolio holdings with the SEC for the first and third quarters of each fiscal year on Form N-Q. Each fund's Form N-Q is available on the SEC's website at sec.gov and may be reviewed and copied at the SEC's Public Reference Room in Washington, D.C. Information on the operation of the Public Reference Room may be obtained by calling 800.SEC.0330. Each fund's complete schedule of portfolio holdings, as filed on Form N-Q, can also be obtained without charge, upon request, by calling 800.345.6611.
Semiannual Report 2014
35

Columbia Mortgage Opportunities Fund
P.O. Box 8081
Boston, MA 02266-8081
columbiamanagement.com
This information is for use with concurrent or prior delivery of a fund prospectus. Please read and consider the investment objectives, risks, charges and expenses for any fund carefully before investing. For a prospectus and, if available, a summary prospectus, which contains this and other important information about the Fund, go to columbiamanagement.com. The Fund is distributed by Columbia Management Investment Distributors, Inc., member FINRA, and managed by Columbia Management Investment Advisers, LLC.
© 2015 Columbia Management Investment Advisers, LLC. All rights reserved.
SAR251_05_E01_(01/15)
Semiannual Report
November 30, 2014

Columbia Diversified Equity Income Fund
Not FDIC insured • No bank guarantee • May lose value
About Columbia Management
Backed by more than 100 years of experience, Columbia Management is one of the nation's largest asset managers. At the heart of our success — and, most importantly, that of our investors — are some of the most talented professionals in the industry, brought together by a unique way of working.
It starts with carefully selected, specialized investment teams. While each team brings a diverse and innovative range of skills, all are grounded by a common set of core beliefs. All possess a solid conviction in the power of proprietary, bottom-up research. All look not only at generating returns, but also at the likely consistency of those returns and the risks required to achieve them. And while our culture encourages teams to operate independently and question established thinking, a rigorous investment oversight process ensures that each team stays true to its clearly articulated investment process. At Columbia Management, reaching our performance goals matters, and the way we reach them matters just as much.
Columbia funds are distributed by Columbia Management Investment Distributors, Inc., member FINRA, and managed by Columbia Management Investment Advisers, LLC.
© 2015 Columbia Management Investment Advisers, LLC. All rights reserved.
Not part of the shareholder report
Connect with Columbia Management
Get the market insight you need from our investment experts
Investor insight
Stay informed with economic and market commentary, investment videos, white papers, mutual fund commentary and more at columbiamanagement.com.
Columbia Management investor
(e-newsletter)
Read our award-winning* shareholder newsletter. Our quarterly newsletter is available online and provides timely and relevant content about economic trends, fund news, service enhancements and changes. Sign up to receive the newsletter electronically at columbiamanagement.com/newsletter.
Investment videos
Watch and discover what our thought leaders are saying about financial markets and the economy. For an analysis of current events and trends that may affect your investments, visit our online video library at blog.columbiamanagement.com/publications.
Social media
Columbia Management offers you multiple ways to access our market commentary and investment insights.
> Perspectives blog at columbiamanagement.com
Read timely posts by our investment team, including our chief investment officer, chief economist and portfolio managers.
> Twitter.com/ColumbiaMgmt
Follow us on Twitter for quick, up-to-the-minute comments on market news and more.
> Youtube.com/columbiamanagement
View our commentaries on the economy, markets and current investment opportunities.
> Linkedin.com/company/columbia-management
Connect with us on LinkedIn for updates from our thought leaders.
*Columbia Management investor was awarded top honors in the Mutual Fund Education Alliance STAR Awards competition for excellence in mutual fund marketing and communications. Materials in the competition were evaluated on educational value, message comprehension, effective design and objectives.
Not part of the shareholder report
Subscribe to Columbia Management
Get market insight and fund updates delivered to you
Email subscription center
Visit the Columbia Management email subscription center at columbiamanagement.com/subscribe to register for economic and market commentary, product and service updates, white papers and more.
> Columbia Management investor
Quarterly newsletter featuring the latest macro- and micro-economic trends, investment themes, products, service changes and other items of interest to Columbia Management investors
> Investment Strategy Outlook
Quarterly publication featuring the Columbia Management Asset Allocation Team's perspective on global economic investment conditions and markets
> MarketTrack
Quarterly publication featuring more than 40 charts and graphs that highlight the current state of the economy and markets; includes straightforward insight on current investment opportunities
> White papers
Frequent articles that delve deep into a variety of investment topics
> Mutual fund updates
Quarterly portfolio manager commentary and fund fact sheets available for Columbia funds. (Not all funds have a commentary.)
Register today by visiting columbiamanagement.com/subscribe
Not part of the shareholder report
Note: Effective January 1, 2015, Christopher O. Petersen will serve as the President of the Columbia Funds, replacing J. Kevin Connaughton. Mr. Petersen has served as a Fund officer since 2007.
Dear Shareholders,
People invest for different reasons, though typically based on a desire for one or more outcomes, e.g., generating an appropriate income stream in retirement, navigating a changing interest rate environment, maximizing after-tax returns, growing assets to achieve financial goals, or easing the impact of volatile markets. Achieving these desired outcomes can be particularly challenging given the unpredictability of complex global markets. To continue to effectively deliver solutions that help clients achieve desired outcomes, an asset manager must have the resources and investment framework to meaningfully embody a global perspective.
With this in mind, I thought it important to highlight excerpts from a piece written by Jeffrey L. Knight, Global Head of Investment Solutions and Asset Allocation, in which he touches on some of these issues emphasizing the importance of maintaining a diversified portfolio with the flexibility to adapt to changing market conditions.
I encourage you to read the article in its entirety. To access the full article and for other insights on current market events and investment opportunities, please visit the Columbia Management blog at columbiamanagement.com/blog.
On behalf of the Funds, I want to acknowledge the contributions of J. Kevin Connaughton and to thank him for his years of trusted, dedicated service. He has worked tirelessly as an advocate for shareholders and a leader of the Columbia Funds. In taking on this new role, I look forward to continuing the work of Mr. Connaughton, helping build on the strong foundation of the Columbia Funds.
Thank you for your confidence. We look forward to continuing to serve your investment needs for many years to come.
Best regards,

Christopher O. Petersen
President, Columbia Funds
Excerpts from:
2015 Outlook: Same song, slightly different arrangement
By Jeffrey L. Knight, Global Head of Investment Solutions and Asset Allocation
Jeffrey L. Knight, CFA, is global head of investment solutions and asset allocation for Columbia Management Investment Advisers, LLC. Mr. Knight leads a team of six portfolio managers responsible for our broad suite of multi-asset strategies including capital allocation, risk allocation, absolute return and total return funds.
What's different in 2015?
As stationary as market conditions have felt lately, circumstances are always evolving. For 2015, while the essential elements of our outlook remain in place, we highlight two important changes in the market environment:
> The relative value of global equities vs. global bonds actually improved during 2014.
> Monetary policy around the globe has become desynchronized, with the U.S. Federal Reserve (the Fed) contemplating rate hikes, while the European Central Bank (ECB) and the Bank of Japan (BOJ) intensify their monetary stimulus programs.
In our view, while equities will most likely continue to dominate, the complex interactions of today's conditions elevate the role of dynamic risk management. We argue that investors will need a cross-asset surveillance methodology to detect tactical threats.
President's Message (continued)
Monetary policies diverge
The Fed has given strong signals that economic growth in the United States has reached self-sustaining momentum and no longer needs unconventional efforts to support the expansion. The withdrawal and suspension of large-scale asset purchases was only the first step in the evolution toward policy normalization. In 2015, we expect to see a change in forward guidance and, most likely, the first interest rate increase in years.
These actions stand in stark contrast with the direction of the monetary policies of other central banks as they double down on efforts to support growth and avoid deflation. The Bank of Japan has announced its intention to increase both qualitative and quantitative easing on an enormous scale, expanding purchases of Japanese government bonds (JGBs), exchange-traded funds and real estate investment trusts. They intend to coordinate this with government pension investment fund purchases by shifting into riskier assets through sales of JGBs.
With evidence of deterioration on both the economic and inflation front, the European Central Bank (ECB) also plans to take bolder actions. These include increased purchases of asset-backed securities and covered bonds in both the primary and secondary market, together with the long-term refinancing operations that will steer the ECB's balance sheet higher by €1 trillion.
The latest to jump on the bandwagon was the People's Bank of China (PBOC), which cut its benchmark interest rate for the first time in over two years to support private sector investment, as targeted liquidity injections have had minimal effect on sinking economic growth.
Investment strategy for 2015
We remain convinced that relative value favors stocks over bonds, even though stocks outperformed in 2014. Therefore, you will hear the same recommendation from us for 2015. Equities remain the most important asset class for generating returns.
Within equities, the currency-based advantage of U.S. stocks is offset somewhat by the valuation advantage from overseas equities, notably in Japan. Indeed, economic growth in Japan and Europe are essential ingredients for equities to continue to perform well. If Japanese and European stocks cannot produce gains, then the global economy will probably be stuck in a near recessionary funk.
Devising a strategy to manage risk and stabilize portfolio values in the event that equities do not perform well remains complicated. Bond yields are low enough that they are not likely to offer powerful diversification benefits. We affirm our recommendation for three additional sources of portfolio stability:
> Non-traditional diversifiers, such as liquid alternatives, alternative beta exposures and absolute return strategies
> Explicit downside hedges, such as put options (with emphasis on managing the related expense)
> Flexibility and a methodology for active risk reduction when appropriate (Our cross-asset methodologies should prove valuable in this regard.)
Our overall stance for investment strategy will likely remain in place until the valuation advantage for equities has been priced away, or until the healing process for the global economy reverses.
Please visit columbiamanagement.com/blog to read the entire article.
Investors should consider the investment objectives, risks, charges and expenses of a mutual fund carefully before investing. For a free prospectus and, if available, a summary prospectus, which contains this and other important information about a fund, visit columbiamanagement.com. The prospectus should be read carefully before investing.
The views expressed are as of December 2014, may change as market or other conditions change, and may differ from views expressed by other Columbia Management Investment Advisers, LLC (CMIA) associates or affiliates. Actual investments or investment decisions made by CMIA and its affiliates, whether for its own account or on behalf of clients, will not necessarily reflect the views expressed. This information is not intended to provide investment advice and does not account for individual investor circumstances. Investment decisions should always be made based on an investor's specific financial needs, objectives, goals, time horizon and risk tolerance. Asset classes described may not be suitable for all investors. Past performance does not guarantee future results, and no forecast should be considered a guarantee either. Since economic and market change frequently, there can be no assurance that the trends described here will continue or that the forecasts are accurate.
Diversification does not assure a profit or protect against loss.
Columbia Funds are distributed by Columbia Management Investment Distributors, Inc., member FINRA, and managed by Columbia Management Investment Advisers, LLC.
© 2015 Columbia Management Investment Advisers, LLC. All rights reserved
Columbia Diversified Equity Income Fund
Performance Overview | | | 4 | | |
Portfolio Overview | | | 5 | | |
Understanding Your Fund's Expenses | | | 6 | | |
Portfolio of Investments | | | 7 | | |
Statement of Assets and Liabilities | | | 12 | | |
Statement of Operations | | | 14 | | |
Statement of Changes in Net Assets | | | 15 | | |
Financial Highlights | | | 18 | | |
Notes to Financial Statements | | | 29 | | |
Important Information About This Report | | | 35 | | |
Fund Investment Manager
Columbia Management Investment
Advisers, LLC
225 Franklin Street
Boston, MA 02110
Fund Distributor
Columbia Management Investment
Distributors, Inc.
225 Franklin Street
Boston, MA 02110
Fund Transfer Agent
Columbia Management Investment
Services Corp.
P.O. Box 8081
Boston, MA 02266-8081
For more information about any of the funds, please visit columbiamanagement.com or call 800.345.6611. Customer Service Representatives are available to answer your questions Monday through Friday from 8 a.m. to 7 p.m. Eastern time.
The views expressed in this report reflect the current views of the respective parties. These views are not guarantees of future performance and involve certain risks, uncertainties and assumptions that are difficult to predict, so actual outcomes and results may differ significantly from the views expressed. These views are subject to change at any time based upon economic, market or other conditions and the respective parties disclaim any responsibility to update such views. These views may not be relied on as investment advice and, because investment decisions for a Columbia Fund are based on numerous factors, may not be relied on as an indication of trading intent on behalf of any particular Columbia Fund. References to specific securities should not be construed as a recommendation or investment advice.
Columbia Diversified Equity Income Fund
Performance Overview
(Unaudited)
Performance Summary
> Columbia Diversified Equity Income Fund (the Fund) Class A shares returned 6.69% excluding sales charges for the six month period that ended November 30, 2014.
> The Fund underperformed its benchmark, the Russell 1000 Value Index, which returned 6.86% for the same time period.
Average Annual Total Returns (%) (for period ended November 30, 2014)
| | | Inception | | 6 Months
cumulative | | 1 Year | | 5 Years | | 10 Years | |
Class A | | 10/15/90 | | | | | | | | | | | | | | | | | |
Excluding sales charges | | | | | | | 6.69 | | | | 13.94 | | | | 13.54 | | | | 7.82 | | |
Including sales charges | | | | | | | 0.56 | | | | 7.38 | | | | 12.19 | | | | 7.19 | | |
Class B | | 03/20/95 | | | | | | | | | | | | | | | | | |
Excluding sales charges | | | | | | | 6.36 | | | | 13.07 | | | | 12.68 | | | | 7.00 | | |
Including sales charges | | | | | | | 1.36 | | | | 8.07 | | | | 12.43 | | | | 7.00 | | |
Class C | | 06/26/00 | | | | | | | | | | | | | | | | | |
Excluding sales charges | | | | | | | 6.32 | | | | 13.06 | | | | 12.68 | | | | 7.00 | | |
Including sales charges | | | | | | | 5.32 | | | | 12.06 | | | | 12.68 | | | | 7.00 | | |
Class I | | 03/04/04 | | | 6.94 | | | | 14.37 | | | | 14.03 | | | | 8.28 | | |
Class K | | 03/20/95 | | | 6.76 | | | | 14.08 | | | | 13.70 | | | | 7.99 | | |
Class R* | | 12/11/06 | | | 6.53 | | | | 13.66 | | | | 13.24 | | | | 7.50 | | |
Class R4* | | 12/11/06 | | | 6.83 | | | | 14.23 | | | | 13.56 | | | | 7.78 | | |
Class R5* | | 12/11/06 | | | 6.89 | | | | 14.35 | | | | 13.99 | | | | 8.15 | | |
Class W* | | 12/01/06 | | | 6.68 | | | | 13.92 | | | | 13.55 | | | | 7.83 | | |
Class Y* | | 11/08/12 | | | 6.93 | | | | 14.38 | | | | 13.75 | | | | 7.92 | | |
Class Z* | | 09/27/10 | | | 6.83 | | | | 14.22 | | | | 13.79 | | | | 7.94 | | |
Russell 1000 Value Index | | | | | | | 6.86 | | | | 15.62 | | | | 15.69 | | | | 7.59 | | |
Returns for Class A are shown with and without the maximum initial sales charge of 5.75%. Returns for Class B are shown with and without the applicable contingent deferred sales charge (CDSC) of 5.00% in the first year, declining to 1.00% in the sixth year and eliminated thereafter. Returns for Class C are shown with and without the 1.00% CDSC for the first year only. The Fund's other classes are not subject to sales charges and have limited eligibility. Please see the Fund's prospectus for details. Performance for different share classes will vary based on differences in sales charges and fees associated with each class. All results shown assume reinvestment of distributions during the period. Returns do not reflect the deduction of taxes that a shareholder may pay on Fund distributions or on the redemption of Fund shares. Performance results reflect the effect of any fee waivers or reimbursements of Fund expenses by Columbia Management Investment Advisers, LLC and/or any of its affiliates. Absent these fee waivers or expense reimbursement arrangements, performance results would have been lower.
The performance information shown represents past performance and is not a guarantee of future results. The investment return and principal value of your investment will fluctuate so that your shares, when redeemed, may be worth more or less than their original cost. Current performance may be lower or higher than the performance information shown. You may obtain performance information current to the most recent month-end by contacting your financial intermediary, visiting columbiamanagement.com or calling 800.345.6611.
*The returns shown for periods prior to the share class inception date (including returns for the Life of the Fund, if shown, which are since Fund inception) include the returns of the Fund's oldest share class. These returns are adjusted to reflect any higher class-related operating expenses of the newer share classes, as applicable. Please visit columbiamanagement.com/investment-products/mutual-funds/appended-performance for more information.
The Russell 1000 Value Index, an unmanaged index, measures the performance of those stocks in the Russell 1000 Index with lower price-to-book ratios and lower forecasted growth values.
Indices are not available for investment, are not professionally managed and do not reflect sales charges, fees, brokerage commissions, taxes or other expenses of investing. Securities in the Fund may not match those in an index.
Semiannual Report 2014
4
Columbia Diversified Equity Income Fund
Portfolio Overview
(Unaudited)
Top Ten Holdings (%)
(at November 30, 2014) | |
Wells Fargo & Co. | | | 3.7 | | |
Berkshire Hathaway, Inc., Class B | | | 3.3 | | |
Citigroup, Inc. | | | 3.1 | | |
JPMorgan Chase & Co. | | | 3.0 | | |
General Electric Co. | | | 3.0 | | |
Merck & Co., Inc. | | | 2.6 | | |
Johnson & Johnson | | | 2.4 | | |
CVS Health Corp. | | | 2.3 | | |
Chevron Corp. | | | 2.3 | | |
Cisco Systems, Inc. | | | 2.3 | | |
Percentages indicated are based upon total investments (excluding Money Market Funds).
For further detail about these holdings, please refer to the section entitled "Portfolio of Investments."
Fund holdings are as of the date given, are subject to change at any time, and are not recommendations to buy or sell any security.
Portfolio Breakdown (%)
(at November 30, 2014) | |
Common Stocks | | | 97.8 | | |
Consumer Discretionary | | | 8.3 | | |
Consumer Staples | | | 7.5 | | |
Energy | | | 10.2 | | |
Financials | | | 27.7 | | |
Health Care | | | 14.4 | | |
Industrials | | | 11.1 | | |
Information Technology | | | 10.8 | | |
Materials | | | 1.8 | | |
Telecommunication Services | | | 2.0 | | |
Utilities | | | 4.0 | | |
Convertible Bonds | | | 0.2 | | |
Health Care | | | 0.2 | | |
Money Market Funds | | | 2.0 | | |
Total | | | 100.0 | | |
Percentages indicated are based upon total investments. The Fund's portfolio composition is subject to change.
Portfolio Management
Hugh Mullin, CFA
Russell Bloomfield, CFA, CAIA
Morningstar Style BoxTM
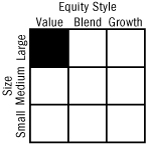
The Morningstar Style BoxTM is based on a fund's portfolio holdings. For equity funds, the vertical axis shows the market capitalization of the stocks owned, and the horizontal axis shows investment style (value, blend, or growth). Information shown is based on the most recent data provided by Morningstar.
© 2015 Morningstar, Inc. All rights reserved. The Morningstar information contained herein: (1) is proprietary to Morningstar and/or its content providers; (2) may not be copied or distributed; and (3) is not warranted to be accurate, complete or timely. Neither Morningstar nor its content providers are responsible for any damages or losses arising from any use of this information.
Semiannual Report 2014
5
Columbia Diversified Equity Income Fund
Understanding Your Fund's Expenses
(Unaudited)
As an investor, you incur two types of costs. There are transaction costs, which generally include sales charges on purchases and may include redemption fees. There are also ongoing costs, which generally include management fees, distribution and/or service fees, and other fund expenses. The following information is intended to help you understand your ongoing costs (in dollars) of investing in the Fund and to help you compare these costs with the ongoing costs of investing in other mutual funds.
Analyzing Your Fund's Expenses
To illustrate these ongoing costs, we have provided examples and calculated the expenses paid by investors in each share class of the Fund during the period. The actual and hypothetical information in the table is based on an initial investment of $1,000 at the beginning of the period indicated and held for the entire period. Expense information is calculated two ways and each method provides you with different information. The amount listed in the "Actual" column is calculated using the Fund's actual operating expenses and total return for the period. You may use the Actual information, together with the amount invested, to estimate the expenses that you paid over the period. Simply divide your account value by $1,000 (for example, an $8,600 account value divided by $1,000 = 8.6), then multiply the results by the expenses paid during the period under the "Actual" column. The amount listed in the "Hypothetical" column assumes a 5% annual rate of return before expenses (which is not the Fund's actual return) and then applies the Fund's actual expense ratio for the period to the hypothetical return. You should not use the hypothetical account values and expenses to estimate either your actual account balance at the end of the period or the expenses you paid during the period. See "Compare With Other Funds" below for details on how to use the hypothetical data.
Compare With Other Funds
Since all mutual funds are required to include the same hypothetical calculations about expenses in shareholder reports, you can use this information to compare the ongoing cost of investing in the Fund with other funds. To do so, compare the hypothetical example with the 5% hypothetical examples that appear in the shareholder reports of other funds. As you compare hypothetical examples of other funds, it is important to note that hypothetical examples are meant to highlight the ongoing costs of investing in a fund only and do not reflect any transaction costs, such as sales charges, or redemption or exchange fees. Therefore, the hypothetical calculations are useful in comparing ongoing costs only, and will not help you determine the relative total costs of owning different funds. If transaction costs were included in these calculations, your costs would be higher.
June 1, 2014 – November 30, 2014
| | | Account Value at the Beginning
of the Period ($) | | Account Value at the End of the
Period ($) | | Expenses Paid During the
Period ($) | | Fund's Annualized
Expense Ratio (%) | |
| | | Actual | | Hypothetical | | Actual | | Hypothetical | | Actual | | Hypothetical | | Actual | |
Class A | | | 1,000.00 | | | | 1,000.00 | | | | 1,066.90 | | | | 1,019.60 | | | | 5.51 | | | | 5.39 | | | | 1.07 | | |
Class B | | | 1,000.00 | | | | 1,000.00 | | | | 1,063.60 | | | | 1,015.86 | | | | 9.36 | | | | 9.15 | | | | 1.82 | | |
Class C | | | 1,000.00 | | | | 1,000.00 | | | | 1,063.20 | | | | 1,015.86 | | | | 9.36 | | | | 9.15 | | | | 1.82 | | |
Class I | | | 1,000.00 | | | | 1,000.00 | | | | 1,069.40 | | | | 1,021.89 | | | | 3.15 | | | | 3.07 | | | | 0.61 | | |
Class K | | | 1,000.00 | | | | 1,000.00 | | | | 1,067.60 | | | | 1,020.19 | | | | 4.90 | | | | 4.78 | | | | 0.95 | | |
Class R | | | 1,000.00 | | | | 1,000.00 | | | | 1,065.30 | | | | 1,018.35 | | | | 6.80 | | | | 6.64 | | | | 1.32 | | |
Class R4 | | | 1,000.00 | | | | 1,000.00 | | | | 1,068.30 | | | | 1,020.84 | | | | 4.23 | | | | 4.13 | | | | 0.82 | | |
Class R5 | | | 1,000.00 | | | | 1,000.00 | | | | 1,068.90 | | | | 1,021.44 | | | | 3.61 | | | | 3.53 | | | | 0.70 | | |
Class W | | | 1,000.00 | | | | 1,000.00 | | | | 1,066.80 | | | | 1,019.55 | | | | 5.57 | | | | 5.44 | | | | 1.08 | | |
Class Y | | | 1,000.00 | | | | 1,000.00 | | | | 1,069.30 | | | | 1,021.69 | | | | 3.35 | | | | 3.28 | | | | 0.65 | | |
Class Z | | | 1,000.00 | | | | 1,000.00 | | | | 1,068.30 | | | | 1,020.84 | | | | 4.23 | | | | 4.13 | | | | 0.82 | | |
Expenses paid during the period are equal to the annualized expense ratio for each class as indicated above, multiplied by the average account value over the period and then multiplied by the number of days in the Fund's most recent fiscal half year and divided by 365.
Expenses do not include fees and expenses incurred indirectly by the Fund from its investment in underlying funds, including affiliated and non-affiliated pooled investment vehicles, such as mutual funds and exchange-traded funds.
Had Columbia Management Investment Advisers, LLC and/or certain of its affiliates not waived/reimbursed certain fees and expenses, account value at the end of the period would have been reduced.
Semiannual Report 2014
6
Columbia Diversified Equity Income Fund
Portfolio of Investments
November 30, 2014 (Unaudited)
(Percentages represent value of investments compared to net assets)
Common Stocks 97.6%
Issuer | | Shares | | Value ($) | |
Consumer Discretionary 8.3% | |
Hotels, Restaurants & Leisure 1.8% | |
Las Vegas Sands Corp. | | | 325,520 | | | | 20,732,369 | | |
Starwood Hotels & Resorts
Worldwide, Inc. | | | 355,460 | | | | 28,081,340 | | |
Total | | | | | 48,813,709 | | |
Media 4.3% | |
Comcast Corp., Class A | | | 226,380 | | | | 12,912,715 | | |
DISH Network Corp., Class A(a) | | | 634,542 | | | | 50,388,980 | | |
Time Warner Cable, Inc. | | | 108,330 | | | | 16,171,503 | | |
Viacom, Inc., Class B | | | 245,510 | | | | 18,567,921 | | |
Walt Disney Co. (The) | | | 246,355 | | | | 22,790,301 | | |
Total | | | | | 120,831,420 | | |
Specialty Retail 2.2% | |
Foot Locker, Inc. | | | 372,350 | | | | 21,331,931 | | |
Home Depot, Inc. (The) | | | 293,850 | | | | 29,208,690 | | |
Urban Outfitters, Inc.(a) | | | 291,030 | | | | 9,406,090 | | |
Total | | | | | 59,946,711 | | |
Total Consumer Discretionary | | | | | 229,591,840 | | |
Consumer Staples 7.4% | |
Beverages 1.1% | |
Coca-Cola Enterprises, Inc. | | | 686,570 | | | | 30,167,886 | | |
Food & Staples Retailing 4.0% | |
CVS Health Corp. | | | 676,148 | | | | 61,772,881 | | |
Wal-Mart Stores, Inc. | | | 553,940 | | | | 48,491,908 | | |
Total | | | | | 110,264,789 | | |
Household Products 1.1% | |
Procter & Gamble Co. (The) | | | 351,766 | | | | 31,810,199 | | |
Tobacco 1.2% | |
Philip Morris International, Inc. | | | 390,730 | | | | 33,966,159 | | |
Total Consumer Staples | | | | | 206,209,033 | | |
Energy 10.1% | |
Oil, Gas & Consumable Fuels 10.1% | |
Anadarko Petroleum Corp. | | | 497,513 | | | | 39,378,154 | | |
Apache Corp. | | | 352,943 | | | | 22,620,117 | | |
| BP PLC, ADR | | | 915,028 | | | | 35,978,901 | | |
Chevron Corp. | | | 563,858 | | | | 61,387,220 | | |
ConocoPhillips | | | 672,736 | | | | 44,447,668 | | |
Common Stocks (continued)
Issuer | | Shares | | Value ($) | |
EOG Resources, Inc. | | | 304,760 | | | | 26,428,787 | | |
Exxon Mobil Corp. | | | 566,220 | | | | 51,265,559 | | |
Total | | | | | 281,506,406 | | |
Total Energy | | | | | 281,506,406 | | |
Financials 27.7% | |
Banks 12.3% | |
Citigroup, Inc. | | | 1,539,359 | | | | 83,079,205 | | |
East West Bancorp, Inc. | | | 203,420 | | | | 7,479,754 | | |
Fifth Third Bancorp | | | 1,708,728 | | | | 34,379,607 | | |
JPMorgan Chase & Co. | | | 1,365,866 | | | | 82,170,499 | | |
PNC Financial Services Group, Inc. (The) | | | 390,179 | | | | 34,128,957 | | |
Wells Fargo & Co. | | | 1,839,665 | | | | 100,224,949 | | |
Total | | | | | 341,462,971 | | |
Capital Markets 3.5% | |
Invesco Ltd. | | | 1,161,463 | | | | 46,876,647 | | |
Morgan Stanley | | | 1,424,172 | | | | 50,102,371 | | |
Total | | | | | 96,979,018 | | |
Consumer Finance 1.9% | |
Discover Financial Services | | | 792,125 | | | | 51,923,794 | | |
Diversified Financial Services 3.2% | |
Berkshire Hathaway, Inc., Class B(a) | | | 606,605 | | | | 90,196,097 | | |
Insurance 3.8% | |
ACE Ltd. | | | 341,028 | | | | 38,993,141 | | |
Marsh & McLennan Companies, Inc. | | | 453,980 | | | | 25,690,728 | | |
MetLife, Inc. | | | 730,903 | | | | 40,645,516 | | |
Total | | | | | 105,329,385 | | |
Real Estate Investment Trusts (REITs) 3.0% | |
Alexandria Real Estate Equities, Inc. | | | 317,362 | | | | 27,267,743 | | |
American Tower Corp. | | | 269,500 | | | | 28,300,195 | | |
Duke Realty Corp. | | | 1,389,690 | | | | 27,015,574 | | |
Total | | | | | 82,583,512 | | |
Total Financials | | | | | 768,474,777 | | |
Health Care 14.4% | |
Biotechnology 1.2% | |
Alkermes PLC(a) | | | 128,880 | | | | 7,090,978 | | |
Amgen, Inc. | | | 153,850 | | | | 25,432,943 | | |
Total | | | | | 32,523,921 | | |
The accompanying Notes to Financial Statements are an integral part of this statement.
Semiannual Report 2014
7
Columbia Diversified Equity Income Fund
Portfolio of Investments (continued)
November 30, 2014 (Unaudited)
Common Stocks (continued)
Issuer | | Shares | | Value ($) | |
Health Care Equipment & Supplies 3.5% | |
Covidien PLC | | | 522,190 | | | | 52,741,190 | | |
St. Jude Medical, Inc. | | | 651,326 | | | | 44,264,115 | | |
Total | | | | | 97,005,305 | | |
Health Care Providers & Services 3.9% | |
Aetna, Inc. | | | 552,432 | | | | 48,194,168 | | |
Cardinal Health, Inc. | | | 439,889 | | | | 36,154,477 | | |
CIGNA Corp. | | | 244,840 | | | | 25,191,587 | | |
Total | | | | | 109,540,232 | | |
Pharmaceuticals 5.8% | |
Jazz Pharmaceuticals PLC(a) | | | 127,624 | | | | 22,600,934 | | |
Johnson & Johnson | | | 610,308 | | | | 66,065,841 | | |
Merck & Co., Inc. | | | 1,190,064 | | | | 71,879,866 | | |
Total | | | | | 160,546,641 | | |
Total Health Care | | | | | 399,616,099 | | |
Industrials 11.1% | |
Aerospace & Defense 2.9% | |
Honeywell International, Inc. | | | 352,400 | | | | 34,912,268 | | |
Raytheon Co. | | | 430,199 | | | | 45,902,233 | | |
Total | | | | | 80,814,501 | | |
Airlines 1.5% | |
Delta Air Lines, Inc. | | | 863,468 | | | | 40,298,052 | | |
Electrical Equipment 1.2% | |
Eaton Corp. PLC | | | 501,210 | | | | 33,997,074 | | |
Industrial Conglomerates 2.9% | |
General Electric Co. | | | 3,037,929 | | | | 80,474,739 | | |
Machinery 1.7% | |
Ingersoll-Rand PLC | | | 340,955 | | | | 21,500,622 | | |
Parker-Hannifin Corp. | | | 204,144 | | | | 26,340,701 | | |
Total | | | | | 47,841,323 | | |
Road & Rail 0.9% | |
Union Pacific Corp. | | | 204,112 | | | | 23,834,158 | | |
Total Industrials | | | | | 307,259,847 | | |
Information Technology 10.8% | |
Communications Equipment 2.2% | |
Cisco Systems, Inc. | | | 2,213,173 | | | | 61,172,102 | | |
Common Stocks (continued)
Issuer | | Shares | | Value ($) | |
IT Services 0.7% | |
MasterCard, Inc., Class A | | | 227,340 | | | | 19,844,508 | | |
Semiconductors & Semiconductor Equipment 2.0% | |
Broadcom Corp., Class A | | | 689,020 | | | | 29,717,433 | | |
Intel Corp. | | | 681,410 | | | | 25,382,522 | | |
Total | | | | | 55,099,955 | | |
Software 3.3% | |
Activision Blizzard, Inc. | | | 1,137,360 | | | | 24,623,844 | | |
Microsoft Corp. | | | 1,001,070 | | | | 47,861,157 | | |
Oracle Corp. | | | 469,896 | | | | 19,928,289 | | |
Total | | | | | 92,413,290 | | |
Technology Hardware, Storage & Peripherals 2.6% | |
Apple, Inc. | | | 155,585 | | | | 18,503,724 | | |
EMC Corp. | | | 937,724 | | | | 28,459,923 | | |
Western Digital Corp. | | | 234,050 | | | | 24,170,344 | | |
Total | | | | | 71,133,991 | | |
Total Information Technology | | | | | 299,663,846 | | |
Materials 1.8% | |
Chemicals 1.0% | |
EI du Pont de Nemours & Co. | | | 388,700 | | | | 27,753,180 | | |
Metals & Mining 0.8% | |
Freeport-McMoRan, Inc. | | | 826,230 | | | | 22,184,276 | | |
Total Materials | | | | | 49,937,456 | | |
Telecommunication Services 2.0% | |
Diversified Telecommunication Services 1.0% | |
Verizon Communications, Inc. | | | 538,147 | | | | 27,224,857 | | |
Wireless Telecommunication Services 1.0% | |
Vodafone Group PLC, ADR | | | 775,345 | | | | 28,338,860 | | |
Total Telecommunication Services | | | | | 55,563,717 | | |
Utilities 4.0% | |
Electric Utilities 2.4% | |
Duke Energy Corp. | | | 267,297 | | | | 21,624,327 | | |
Edison International | | | 386,440 | | | | 24,562,126 | | |
NextEra Energy, Inc. | | | 201,948 | | | | 21,081,352 | | |
Total | | | | | 67,267,805 | | |
The accompanying Notes to Financial Statements are an integral part of this statement.
Semiannual Report 2014
8
Columbia Diversified Equity Income Fund
Portfolio of Investments (continued)
November 30, 2014 (Unaudited)
Common Stocks (continued)
Issuer | | Shares | | Value ($) | |
Multi-Utilities 1.6% | |
Ameren Corp. | | | 467,990 | | | | 20,175,049 | | |
Public Service Enterprise Group, Inc. | | | 549,200 | | | | 22,945,576 | | |
Total | | | | | 43,120,625 | | |
Total Utilities | | | | | 110,388,430 | | |
Total Common Stocks
(Cost: $2,143,428,608) | | | | | 2,708,211,451 | | |
Convertible Bonds 0.2% | |
Issuer | | Coupon
Rate | | Principal
Amount ($) | | Value ($) | |
Pharmaceuticals 0.2% | |
Acorda Therapeutics, Inc.
Senior Unsecured
06/15/21 | | | 1.750 | % | | | | | | | 6,100,000 | | | | 6,572,750 | | |
Total Convertible Bonds
(Cost: $6,525,554) | | | | | | | | | 6,572,750 | | |
Money Market Funds 2.0%
| | | Shares | | Value ($) | |
Columbia Short-Term Cash Fund,
0.104%(b)(c) | | | 55,666,991 | | | | 55,666,991 | | |
Total Money Market Funds
(Cost: $55,666,991) | | | | | 55,666,991 | | |
Total Investments
(Cost: $2,205,621,153) | | | | | 2,770,451,192 | | |
Other Assets & Liabilities, Net | | | | | 5,153,409 | | |
Net Assets | | | | | 2,775,604,601 | | |
Notes to Portfolio of Investments
(a) Non-income producing.
(b) The rate shown is the seven-day current annualized yield at November 30, 2014.
(c) As defined in the Investment Company Act of 1940, an affiliated company is one in which the Fund owns 5% or more of the company's outstanding voting securities, or a company which is under common ownership or control with the Fund. Holdings and transactions in these affiliated companies during the period ended November 30, 2014, are as follows:
Issuer | | Beginning
Cost ($) | | Purchase
Cost ($) | | Proceeds
From Sales ($) | | Ending
Cost ($) | | Dividends —
Affiliated
Issuers ($) | | Value ($) | |
Columbia Short-Term Cash Fund | | | 17,104,683 | | | | 294,011,816 | | | | (255,449,508 | ) | | | 55,666,991 | | | | 22,108 | | | | 55,666,991 | | |
Abbreviation Legend
ADR American Depositary Receipt
The accompanying Notes to Financial Statements are an integral part of this statement.
Semiannual Report 2014
9
Columbia Diversified Equity Income Fund
Portfolio of Investments (continued)
November 30, 2014 (Unaudited)
Fair Value Measurements
Generally accepted accounting principles (GAAP) require disclosure regarding the inputs and valuation techniques used to measure fair value and any changes in valuation inputs or techniques. In addition, investments shall be disclosed by major category.
The Fund categorizes its fair value measurements according to a three-level hierarchy that maximizes the use of observable inputs and minimizes the use of unobservable inputs by prioritizing that the most observable input be used when available. Observable inputs are those that market participants would use in pricing an investment based on market data obtained from sources independent of the reporting entity. Unobservable inputs are those that reflect the Fund's assumptions about the information market participants would use in pricing an investment. An investment's level within the fair value hierarchy is based on the lowest level of any input that is deemed significant to the asset or liability's fair value measurement. The input levels are not necessarily an indication of the risk or liquidity associated with investments at that level. For example, certain U.S. government securities are generally high quality and liquid, however, they are reflected as Level 2 because the inputs used to determine fair value may not always be quoted prices in an active market.
Fair value inputs are summarized in the three broad levels listed below:
> Level 1 — Valuations based on quoted prices for investments in active markets that the Fund has the ability to access at the measurement date (including NAV for open-end mutual funds). Valuation adjustments are not applied to Level 1 investments.
> Level 2 — Valuations based on other significant observable inputs (including quoted prices for similar securities, interest rates, prepayment speeds, credit risks, etc.).
> Level 3 — Valuations based on significant unobservable inputs (including the Fund's own assumptions and judgment in determining the fair value of investments).
Inputs that are used in determining fair value of an investment may include price information, credit data, volatility statistics, and other factors. These inputs can be either observable or unobservable. The availability of observable inputs can vary between investments, and is affected by various factors such as the type of investment, and the volume and level of activity for that investment or similar investments in the marketplace. The inputs will be considered by the Investment Manager, along with any other relevant factors in the calculation of an investment's fair value. The Fund uses prices and inputs that are current as of the measurement date, which may include periods of market dislocations. During these periods, the availability of prices and inputs may be reduced for many investments. This condition could cause an investment to be reclassified between the various levels within the hierarchy.
Investments falling into the Level 3 category are primarily supported by quoted prices from brokers and dealers participating in the market for those investments. However, these may be classified as Level 3 investments due to lack of market transparency and corroboration to support these quoted prices. Additionally, valuation models may be used as the pricing source for any remaining investments classified as Level 3. These models may rely on one or more significant unobservable inputs and/or significant assumptions by the Investment Manager. Inputs used in valuations may include, but are not limited to, financial statement analysis, capital account balances, discount rates and estimated cash flows, and comparable company data.
Under the direction of the Fund's Board of Trustees (the Board), the Investment Manager's Valuation Committee (the Committee) is responsible for overseeing the valuation procedures approved by the Board. The Committee consists of voting and non-voting members from various groups within the Investment Manager's organization, including operations and accounting, trading and investments, compliance, risk management and legal.
The Committee meets at least monthly to review and approve valuation matters, which may include a description of specific valuation determinations, data regarding pricing information received from approved pricing vendors and brokers and the results of Board-approved valuation control policies and procedures (the Policies). The Policies address, among other things, instances when market quotations are or are not readily available, including recommendations of third party pricing vendors and a determination of appropriate pricing methodologies; events that require specific valuation determinations and assessment of fair value techniques; securities with a potential for stale pricing, including those that are illiquid, restricted, or in default; and the effectiveness of third party pricing vendors, including periodic reviews of vendors. The Committee meets more frequently, as needed, to discuss additional valuation matters, which may include the need to review back-testing results, review time-sensitive information or approve related valuation actions. The Committee reports to the Board, with members of the Committee meeting with the Board at each of its regularly scheduled meetings to discuss valuation matters and actions during the period, similar to those described earlier.
For investments categorized as Level 3, the Committee monitors information similar to that described above, which may include: (i) data specific to the issuer or comparable issuers, (ii) general market or specific sector news and (iii) quoted prices and specific or similar security transactions. The Committee considers this data and any changes from prior periods in order to assess the reasonableness of observable and unobservable inputs, any assumptions or internal models used to value those securities and changes in fair value. This data is also used to corroborate, when available, information received from approved pricing vendors and brokers. Various factors impact the frequency of monitoring this information (which may occur as often as daily). However, the Committee may determine that changes to inputs, assumptions and models are not required as a result of the monitoring procedures performed.
The accompanying Notes to Financial Statements are an integral part of this statement.
Semiannual Report 2014
10
Columbia Diversified Equity Income Fund
Portfolio of Investments (continued)
November 30, 2014 (Unaudited)
Fair Value Measurements (continued)
The following table is a summary of the inputs used to value the Fund's investments at November 30, 2014:
Description | | Level 1
Quoted Prices in Active
Markets for Identical
Assets ($) | |
Level 2
Other Significant
Observable Inputs ($) | |
Level 3
Significant
Unobservable Inputs ($) | |
Total ($) | |
Equity Securities | |
Common Stocks | |
Consumer Discretionary | | | 229,591,840 | | | | — | | | | — | | | | 229,591,840 | | |
Consumer Staples | | | 206,209,033 | | | | — | | | | — | | | | 206,209,033 | | |
Energy | | | 281,506,406 | | | | — | | | | — | | | | 281,506,406 | | |
Financials | | | 768,474,777 | | | | — | | | | — | | | | 768,474,777 | | |
Health Care | | | 399,616,099 | | | | — | | | | — | | | | 399,616,099 | | |
Industrials | | | 307,259,847 | | | | — | | | | — | | | | 307,259,847 | | |
Information Technology | | | 299,663,846 | | | | — | | | | — | | | | 299,663,846 | | |
Materials | | | 49,937,456 | | | | — | | | | — | | | | 49,937,456 | | |
Telecommunication Services | | | 55,563,717 | | | | — | | | | — | | | | 55,563,717 | | |
Utilities | | | 110,388,430 | | | | — | | | | — | | | | 110,388,430 | | |
Total Equity Securities | | | 2,708,211,451 | | | | — | | | | — | | | | 2,708,211,451 | | |
Bonds | |
Convertible Bonds | | | — | | | | 6,572,750 | | | | — | | | | 6,572,750 | | |
Total Bonds | | | — | | | | 6,572,750 | | | | — | | | | 6,572,750 | | |
Mutual Funds | |
Money Market Funds | | | 55,666,991 | | | | — | | | | — | | | | 55,666,991 | | |
Total Mutual Funds | | | 55,666,991 | | | | — | | | | — | | | | 55,666,991 | | |
Total | | | 2,763,878,442 | | | | 6,572,750 | | | | — | | | | 2,770,451,192 | | |
See the Portfolio of Investments for all investment classifications not indicated in the table.
The Fund's assets assigned to the Level 2 input category are generally valued using the market approach, in which a security's value is determined through reference to prices and information from market transactions for similar or identical assets.
There were no transfers of financial assets between levels during the period.
The accompanying Notes to Financial Statements are an integral part of this statement.
Semiannual Report 2014
11
Columbia Diversified Equity Income Fund
Statement of Assets and Liabilities
November 30, 2014 (Unaudited)
Assets | |
Investments, at value | |
Unaffiliated issuers (identified cost $2,149,954,162) | | $ | 2,714,784,201 | | |
Affiliated issuers (identified cost $55,666,991) | | | 55,666,991 | | |
Total investments (identified cost $2,205,621,153) | | | 2,770,451,192 | | |
Receivable for: | |
Capital shares sold | | | 645,433 | | |
Dividends | | | 6,180,997 | | |
Interest | | | 46,258 | | |
Reclaims | | | 38,119 | | |
Prepaid expenses | | | 9,144 | | |
Other assets | | | 17,466 | | |
Total assets | | | 2,777,388,609 | | |
Liabilities | |
Payable for: | |
Capital shares purchased | | | 998,721 | | |
Investment management fees | | | 87,303 | | |
Distribution and/or service fees | | | 41,644 | | |
Transfer agent fees | | | 271,263 | | |
Administration fees | | | 8,055 | | |
Plan administration fees | | | 12,935 | | |
Compensation of board members | | | 223,117 | | |
Printing and postage fees | | | 98,526 | | |
Other expenses | | | 42,444 | | |
Total liabilities | | | 1,784,008 | | |
Net assets applicable to outstanding capital stock | | $ | 2,775,604,601 | | |
Represented by | |
Paid-in capital | | $ | 1,977,136,173 | | |
Undistributed net investment income | | | 4,973,786 | | |
Accumulated net realized gain | | | 228,664,603 | | |
Unrealized appreciation (depreciation) on: | |
Investments | | | 564,830,039 | | |
Total — representing net assets applicable to outstanding capital stock | | $ | 2,775,604,601 | | |
The accompanying Notes to Financial Statements are an integral part of this statement.
Semiannual Report 2014
12
Columbia Diversified Equity Income Fund
Statement of Assets and Liabilities (continued)
November 30, 2014 (Unaudited)
Class A | |
Net assets | | $ | 2,488,007,433 | | |
Shares outstanding | | | 164,591,639 | | |
Net asset value per share | | $ | 15.12 | | |
Maximum offering price per share(a) | | $ | 16.04 | | |
Class B | |
Net assets | | $ | 57,469,897 | | |
Shares outstanding | | | 3,792,126 | | |
Net asset value per share | | $ | 15.16 | | |
Class C | |
Net assets | | $ | 72,686,329 | | |
Shares outstanding | | | 4,820,331 | | |
Net asset value per share | | $ | 15.08 | | |
Class I | |
Net assets | | $ | 3,102 | | |
Shares outstanding | | | 205 | | |
Net asset value per share(b) | | $ | 15.10 | | |
Class K | |
Net assets | | $ | 65,798,357 | | |
Shares outstanding | | | 4,349,615 | | |
Net asset value per share | | $ | 15.13 | | |
Class R | |
Net assets | | $ | 7,735,966 | | |
Shares outstanding | | | 514,292 | | |
Net asset value per share | | $ | 15.04 | | |
Class R4 | |
Net assets | | $ | 12,534,574 | | |
Shares outstanding | | | 829,385 | | |
Net asset value per share | | $ | 15.11 | | |
Class R5 | |
Net assets | | $ | 29,013,041 | | |
Shares outstanding | | | 1,917,960 | | |
Net asset value per share | | $ | 15.13 | | |
Class W | |
Net assets | | $ | 2,894 | | |
Shares outstanding | | | 191 | | |
Net asset value per share(b) | | $ | 15.14 | | |
Class Y | |
Net assets | | $ | 21,656,130 | | |
Shares outstanding | | | 1,420,819 | | |
Net asset value per share | | $ | 15.24 | | |
Class Z | |
Net assets | | $ | 20,696,878 | | |
Shares outstanding | | | 1,370,184 | | |
Net asset value per share | | $ | 15.11 | | |
(a) The maximum offering price per share is calculated by dividing the net asset value per share by 1.0 minus the maximum sales charge of 5.75%.
(b) Net asset value per share rounds to this amount due to fractional shares outstanding.
The accompanying Notes to Financial Statements are an integral part of this statement.
Semiannual Report 2014
13
Columbia Diversified Equity Income Fund
Statement of Operations
Six Months Ended November 30, 2014 (Unaudited)
Net investment income | |
Income: | |
Dividends — unaffiliated issuers | | $ | 30,045,035 | | |
Dividends — affiliated issuers | | | 22,108 | | |
Interest | | | 3,122 | | |
Total income | | | 30,070,265 | | |
Expenses: | |
Investment management fees | | | 7,840,371 | | |
Distribution and/or service fees | |
Class A | | | 3,068,913 | | |
Class B | | | 318,473 | | |
Class C | | | 353,150 | | |
Class R | | | 20,224 | | |
Class W | | | 3 | | |
Transfer agent fees | |
Class A | | | 2,092,103 | | |
Class B | | | 54,418 | | |
Class C | | | 60,159 | | |
Class K | | | 16,475 | | |
Class R | | | 6,900 | | |
Class R4 | | | 10,607 | | |
Class R5 | | | 6,919 | | |
Class W | | | 3 | | |
Class Z | | | 15,291 | | |
Administration fees | | | 722,957 | | |
Plan administration fees | |
Class K | | | 82,375 | | |
Compensation of board members | | | 31,159 | | |
Custodian fees | | | 7,921 | | |
Printing and postage fees | | | 138,452 | | |
Registration fees | | | 69,904 | | |
Professional fees | | | 27,959 | | |
Other | | | 32,230 | | |
Total expenses | | | 14,976,966 | | |
Fees waived or expenses reimbursed by Investment Manager and its affiliates | | | (1 | ) | |
Expense reductions | | | (160 | ) | |
Total net expenses | | | 14,976,805 | | |
Net investment income | | | 15,093,460 | | |
Realized and unrealized gain (loss) — net | |
Net realized gain (loss) on: | |
Investments | | | 141,188,832 | | |
Net realized gain | | | 141,188,832 | | |
Net change in unrealized appreciation (depreciation) on: | |
Investments | | | 21,771,067 | | |
Net change in unrealized appreciation | | | 21,771,067 | | |
Net realized and unrealized gain | | | 162,959,899 | | |
Net increase in net assets resulting from operations | | $ | 178,053,359 | | |
The accompanying Notes to Financial Statements are an integral part of this statement.
Semiannual Report 2014
14
Columbia Diversified Equity Income Fund
Statement of Changes in Net Assets
| | | Six Months Ended
November 30, 2014
(Unaudited) | | Year Ended
May 31,
2014 | |
Operations | |
Net investment income | | $ | 15,093,460 | | | $ | 32,040,539 | | |
Net realized gain | | | 141,188,832 | | | | 514,452,520 | | |
Net change in unrealized appreciation (depreciation) | | | 21,771,067 | | | | (90,979,239 | ) | |
Net increase in net assets resulting from operations | | | 178,053,359 | | | | 455,513,820 | | |
Distributions to shareholders | |
Net investment income | |
Class A | | | (13,887,532 | ) | | | (30,928,741 | ) | |
Class B | | | (127,261 | ) | | | (488,450 | ) | |
Class C | | | (136,176 | ) | | | (340,695 | ) | |
Class I | | | (24 | ) | | | (595,238 | ) | |
Class K | | | (433,121 | ) | | | (1,663,128 | ) | |
Class R | | | (36,127 | ) | | | (89,299 | ) | |
Class R4 | | | (87,891 | ) | | | (266,142 | ) | |
Class R5 | | | (207,365 | ) | | | (848,547 | ) | |
Class W | | | (16 | ) | | | (60 | ) | |
Class Y | | | (157,935 | ) | | | (219,344 | ) | |
Class Z | | | (121,096 | ) | | | (456,152 | ) | |
Total distributions to shareholders | | | (15,194,544 | ) | | | (35,895,796 | ) | |
Decrease in net assets from capital stock activity | | | (136,684,787 | ) | | | (704,268,677 | ) | |
Total increase (decrease) in net assets | | | 26,174,028 | | | | (284,650,653 | ) | |
Net assets at beginning of period | | | 2,749,430,573 | | | | 3,034,081,226 | | |
Net assets at end of period | | $ | 2,775,604,601 | | | $ | 2,749,430,573 | | |
Undistributed net investment income | | $ | 4,973,786 | | | $ | 5,074,870 | | |
The accompanying Notes to Financial Statements are an integral part of this statement.
Semiannual Report 2014
15
Columbia Diversified Equity Income Fund
Statement of Changes in Net Assets (continued)
| | | Six Months Ended November 30, 2014
(Unaudited) | | Year Ended May 31, 2014 | |
| | | Shares | | Dollars ($) | | Shares | | Dollars ($) | |
Capital stock activity | |
Class A shares | |
Subscriptions(a) | | | 4,600,060 | | | | 67,358,125 | | | | 13,711,296 | | | | 178,654,020 | | |
Distributions reinvested | | | 920,227 | | | | 13,601,414 | | | | 2,385,650 | | | | 30,320,307 | | |
Redemptions | | | (13,227,049 | ) | | | (193,341,033 | ) | | | (45,679,682 | ) | | | (595,367,938 | ) | |
Net decrease | | | (7,706,762 | ) | | | (112,381,494 | ) | | | (29,582,736 | ) | | | (386,393,611 | ) | |
Class B shares | |
Subscriptions | | | 17,998 | | | | 263,668 | | | | 83,246 | | | | 1,085,638 | | |
Distributions reinvested | | | 8,552 | | | | 126,621 | | | | 38,677 | | | | 485,364 | | |
Redemptions(a) | | | (1,117,042 | ) | | | (16,263,077 | ) | | | (4,051,570 | ) | | | (53,086,018 | ) | |
Net decrease | | | (1,090,492 | ) | | | (15,872,788 | ) | | | (3,929,647 | ) | | | (51,515,016 | ) | |
Class C shares | |
Subscriptions | | | 225,434 | | | | 3,291,636 | | | | 611,348 | | | | 8,039,141 | | |
Distributions reinvested | | | 9,066 | | | | 133,651 | | | | 26,481 | | | | 334,472 | | |
Redemptions | | | (313,769 | ) | | | (4,574,317 | ) | | | (728,291 | ) | | | (9,579,858 | ) | |
Net decrease | | | (79,269 | ) | | | (1,149,030 | ) | | | (90,462 | ) | | | (1,206,245 | ) | |
Class I shares | |
Subscriptions | | | — | | | | — | | | | 24,487 | | | | 314,999 | | |
Distributions reinvested | | | — | | | | — | | | | 47,844 | | | | 595,058 | | |
Redemptions | | | — | | | | — | | | | (3,763,170 | ) | | | (51,346,011 | ) | |
Net increase (decrease) | | | — | | | | — | | | | (3,690,839 | ) | | | (50,435,954 | ) | |
Class K shares | |
Subscriptions | | | 286,886 | | | | 4,177,271 | | | | 1,117,455 | | | | 14,392,795 | | |
Distributions reinvested | | | 29,294 | | | | 433,121 | | | | 115,141 | | | | 1,439,442 | | |
Redemptions | | | (1,028,412 | ) | | | (15,041,024 | ) | | | (9,866,174 | ) | | | (128,436,026 | ) | |
Net decrease | | | (712,232 | ) | | | (10,430,632 | ) | | | (8,633,578 | ) | | | (112,603,789 | ) | |
Class R shares | |
Subscriptions | | | 40,284 | | | | 584,640 | | | | 122,628 | | | | 1,591,736 | | |
Distributions reinvested | | | 2,147 | | | | 31,626 | | | | 7,035 | | | | 88,722 | | |
Redemptions | | | (92,699 | ) | | | (1,325,003 | ) | | | (371,221 | ) | | | (4,826,391 | ) | |
Net decrease | | | (50,268 | ) | | | (708,737 | ) | | | (241,558 | ) | | | (3,145,933 | ) | |
Class R4 shares | |
Subscriptions | | | 83,848 | | | | 1,224,804 | | | | 484,229 | | | | 6,372,581 | | |
Distributions reinvested | | | 5,862 | | | | 86,596 | | | | 21,102 | | | | 266,077 | | |
Redemptions | | | (179,681 | ) | | | (2,619,719 | ) | | | (1,390,041 | ) | | | (18,154,935 | ) | |
Net decrease | | | (89,971 | ) | | | (1,308,319 | ) | | | (884,710 | ) | | | (11,516,277 | ) | |
The accompanying Notes to Financial Statements are an integral part of this statement.
Semiannual Report 2014
16
Columbia Diversified Equity Income Fund
Statement of Changes in Net Assets (continued)
| | | Six Months Ended November 30, 2014
(Unaudited) | | Year Ended May 31, 2014 | |
| | | Shares | | Dollars ($) | | Shares | | Dollars ($) | |
Capital stock activity (continued) | |
Class R5 shares | |
Subscriptions | | | 236,014 | | | | 3,433,177 | | | | 564,068 | | | | 7,314,754 | | |
Distributions reinvested | | | 14,007 | | | | 207,113 | | | | 68,338 | | | | 847,679 | | |
Redemptions | | | (186,350 | ) | | | (2,723,451 | ) | | | (5,547,066 | ) | | | (70,546,274 | ) | |
Net increase (decrease) | | | 63,671 | | | | 916,839 | | | | (4,914,660 | ) | | | (62,383,841 | ) | |
Class W shares | |
Redemptions | | | — | | | | — | | | | (170 | ) | | | (2,400 | ) | |
Net increase (decrease) | | | — | | | | — | | | | (170 | ) | | | (2,400 | ) | |
Class Y shares | |
Subscriptions | | | 72,089 | | | | 1,057,437 | | | | 1,573,008 | | | | 19,670,018 | | |
Distributions reinvested | | | 10,601 | | | | 157,914 | | | | 16,480 | | | | 219,291 | | |
Redemptions | | | (63,165 | ) | | | (926,739 | ) | | | (188,436 | ) | | | (2,486,021 | ) | |
Net increase | | | 19,525 | | | | 288,612 | | | | 1,401,052 | | | | 17,403,288 | | |
Class Z shares | |
Subscriptions | | | 584,021 | | | | 8,607,970 | | | | 429,296 | | | | 5,537,278 | | |
Distributions reinvested | | | 7,544 | | | | 111,483 | | | | 35,330 | | | | 435,359 | | |
Redemptions | | | (326,626 | ) | | | (4,758,691 | ) | | | (3,790,036 | ) | | | (48,441,536 | ) | |
Net increase (decrease) | | | 264,939 | | | | 3,960,762 | | | | (3,325,410 | ) | | | (42,468,899 | ) | |
Total net decrease | | | (9,380,859 | ) | | | (136,684,787 | ) | | | (53,892,718 | ) | | | (704,268,677 | ) | |
(a) Includes conversions of Class B shares to Class A shares, if any.
The accompanying Notes to Financial Statements are an integral part of this statement.
Semiannual Report 2014
17
Columbia Diversified Equity Income Fund
The accompanying Notes to Financial Statements are an integral part of this statement.
The following tables are intended to help you understand the Fund's financial performance. Certain information reflects financial results for a single share of a class held for the periods shown. Per share net investment income (loss) amounts are calculated based on average shares outstanding during the period. Total return assumes reinvestment of all dividends and distributions, if any. Total return does not reflect payment of sales charges, if any. Total return and portfolio turnover are not annualized for periods of less than one year. The portfolio turnover rate is calculated without regard to purchase and sales transactions of short-term instruments and certain derivatives, if any. If such transactions were included, the Fund's portfolio turnover rate may be higher.
| | | Six Months Ended
November 30, 2014 | | Year Ended May 31, | | Year Ended September 30, | |
Class A | | (Unaudited) | | 2014 | | 2013 | | 2012(a) | | 2011 | | 2010 | | 2009 | |
Per share data | |
Net asset value, beginning of period | | $ | 14.25 | | | $ | 12.29 | | | $ | 9.76 | | | $ | 8.53 | | | $ | 9.03 | | | $ | 8.31 | | | $ | 9.31 | | |
Income from investment operations: | |
Net investment income | | | 0.08 | | | | 0.15 | | | | 0.19 | | | | 0.11 | | | | 0.12 | | | | 0.12 | | | | 0.16 | | |
Net realized and unrealized gain (loss) | | | 0.87 | | | | 1.97 | | | | 2.55 | | | | 1.20 | | | | (0.49 | ) | | | 0.72 | | | | (1.02 | ) | |
Total from investment operations | | | 0.95 | | | | 2.12 | | | | 2.74 | | | | 1.31 | | | | (0.37 | ) | | | 0.84 | | | | (0.86 | ) | |
Less distributions to shareholders: | |
Net investment income | | | (0.08 | ) | | | (0.16 | ) | | | (0.21 | ) | | | (0.08 | ) | | | (0.13 | ) | | | (0.12 | ) | | | (0.14 | ) | |
Total distributions to shareholders | | | (0.08 | ) | | | (0.16 | ) | | | (0.21 | ) | | | (0.08 | ) | | | (0.13 | ) | | | (0.12 | ) | | | (0.14 | ) | |
Net asset value, end of period | | $ | 15.12 | | | $ | 14.25 | | | $ | 12.29 | | | $ | 9.76 | | | $ | 8.53 | | | $ | 9.03 | | | $ | 8.31 | | |
Total return | | | 6.69 | % | | | 17.45 | % | | | 28.46 | % | | | 15.31 | % | | | (4.32 | %) | | | 10.18 | % | | | (8.91 | %) | |
Ratios to average net assets(b) | |
Total gross expenses | | | 1.07 | %(c) | | | 1.09 | % | | | 1.14 | %(d) | | | 1.10 | %(c) | | | 1.13 | % | | | 1.12 | % | | | 0.99 | % | |
Total net expenses(e) | | | 1.07 | %(c)(f) | | | 1.08 | %(f) | | | 1.08 | %(d)(f) | | | 1.10 | %(c) | | | 1.13 | %(f) | | | 1.12 | % | | | 0.99 | % | |
Net investment income | | | 1.13 | %(c) | | | 1.16 | % | | | 1.77 | % | | | 1.66 | %(c) | | | 1.20 | % | | | 1.36 | % | | | 2.21 | % | |
Supplemental data | |
Net assets, end of period (in thousands) | | $ | 2,488,007 | | | $ | 2,454,495 | | | $ | 2,480,865 | | | $ | 2,320,419 | | | $ | 3,197,508 | | | $ | 3,516,017 | | | $ | 3,516,948 | | |
Portfolio turnover | | | 24 | % | | | 74 | % | | | 43 | % | | | 16 | % | | | 36 | % | | | 34 | % | | | 38 | % | |
Notes to Financial Highlights
(a) For the period from October 1, 2011 to May 31, 2012. During the period, the Fund's fiscal year end was changed from September 30 to May 31.
(b) In addition to the fees and expenses that the Fund bears directly, the Fund indirectly bears a pro rata share of the fees and expenses of any other funds in which it invests. Such indirect expenses are not included in the Fund's reported expense ratios.
(c) Annualized.
(d) Ratios include line of credit interest expense which is less than 0.01%.
(e) Total net expenses include the impact of certain fee waivers/expense reimbursements made by the Investment Manager and certain of its affiliates, if applicable.
(f) The benefits derived from expense reductions had an impact of less than 0.01%.
Semiannual Report 2014
18
Columbia Diversified Equity Income Fund
Financial Highlights (continued)
| | | Six Months Ended
November 30, 2014 | | Year Ended May 31, | | Year Ended September 30, | |
Class B | | (Unaudited) | | 2014 | | 2013 | | 2012(a) | | 2011 | | 2010 | | 2009 | |
Per share data | |
Net asset value, beginning of period | | $ | 14.28 | | | $ | 12.32 | | | $ | 9.79 | | | $ | 8.56 | | | $ | 9.05 | | | $ | 8.33 | | | $ | 9.32 | | |
Income from investment operations: | |
Net investment income | | | 0.03 | | | | 0.05 | | | | 0.11 | | | | 0.06 | | | | 0.04 | | | | 0.05 | | | | 0.10 | | |
Net realized and unrealized gain (loss) | | | 0.88 | | | | 1.98 | | | | 2.55 | | | | 1.21 | | | | (0.49 | ) | | | 0.72 | | | | (1.00 | ) | |
Total from investment operations | | | 0.91 | | | | 2.03 | | | | 2.66 | | | | 1.27 | | | | (0.45 | ) | | | 0.77 | | | | (0.90 | ) | |
Less distributions to
shareholders: | |
Net investment income | | | (0.03 | ) | | | (0.07 | ) | | | (0.13 | ) | | | (0.04 | ) | | | (0.04 | ) | | | (0.05 | ) | | | (0.09 | ) | |
Total distributions to shareholders | | | (0.03 | ) | | | (0.07 | ) | | | (0.13 | ) | | | (0.04 | ) | | | (0.04 | ) | | | (0.05 | ) | | | (0.09 | ) | |
Net asset value, end of period | | $ | 15.16 | | | $ | 14.28 | | | $ | 12.32 | | | $ | 9.79 | | | $ | 8.56 | | | $ | 9.05 | | | $ | 8.33 | | |
Total return | | | 6.36 | % | | | 16.54 | % | | | 27.38 | % | | | 14.82 | % | | | (5.01 | %) | | | 9.26 | % | | | (9.53 | %) | |
Ratios to average net assets(b) | |
Total gross expenses | | | 1.82 | %(c) | | | 1.84 | % | | | 1.88 | %(d) | | | 1.87 | %(c) | | | 1.88 | % | | | 1.89 | % | | | 1.76 | % | |
Total net expenses(e) | | | 1.82 | %(c)(f) | | | 1.83 | %(f) | | | 1.83 | %(d)(f) | | | 1.87 | %(c) | | | 1.88 | %(f) | | | 1.89 | % | | | 1.76 | % | |
Net investment income | | | 0.37 | %(c) | | | 0.39 | % | | | 1.03 | % | | | 0.93 | %(c) | | | 0.43 | % | | | 0.58 | % | | | 1.49 | % | |
Supplemental data | |
Net assets, end of period (in thousands) | | $ | 57,470 | | | $ | 69,741 | | | $ | 108,589 | | | $ | 138,560 | | | $ | 142,429 | | | $ | 246,456 | | | $ | 377,652 | | |
Portfolio turnover | | | 24 | % | | | 74 | % | | | 43 | % | | | 16 | % | | | 36 | % | | | 34 | % | | | 38 | % | |
Notes to Financial Highlights
(a) For the period from October 1, 2011 to May 31, 2012. During the period, the Fund's fiscal year end was changed from September 30 to May 31.
(b) In addition to the fees and expenses that the Fund bears directly, the Fund indirectly bears a pro rata share of the fees and expenses of any other funds in which it invests. Such indirect expenses are not included in the Fund's reported expense ratios.
(c) Annualized.
(d) Ratios include line of credit interest expense which is less than 0.01%.
(e) Total net expenses include the impact of certain fee waivers/expense reimbursements made by the Investment Manager and certain of its affiliates, if applicable.
(f) The benefits derived from expense reductions had an impact of less than 0.01%.
The accompanying Notes to Financial Statements are an integral part of this statement.
Semiannual Report 2014
19
Columbia Diversified Equity Income Fund
Financial Highlights (continued)
| | | Six Months Ended
November 30, 2014 | | Year Ended May 31, | | Year Ended September 30, | |
Class C | | (Unaudited) | | 2014 | | 2013 | | 2012(a) | | 2011 | | 2010 | | 2009 | |
Per share data | |
Net asset value, beginning of period | | $ | 14.21 | | | $ | 12.26 | | | $ | 9.74 | | | $ | 8.52 | | | $ | 9.02 | | | $ | 8.30 | | | $ | 9.30 | | |
Income from investment operations: | |
Net investment income | | | 0.03 | | | | 0.05 | | | | 0.11 | | | | 0.06 | | | | 0.04 | | | | 0.05 | | | | 0.10 | | |
Net realized and unrealized gain (loss) | | | 0.87 | | | | 1.97 | | | | 2.54 | | | | 1.20 | | | | (0.49 | ) | | | 0.73 | | | | (1.01 | ) | |
Total from investment operations | | | 0.90 | | | | 2.02 | | | | 2.65 | | | | 1.26 | | | | (0.45 | ) | | | 0.78 | | | | (0.91 | ) | |
Less distributions to shareholders: | |
Net investment income | | | (0.03 | ) | | | (0.07 | ) | | | (0.13 | ) | | | (0.04 | ) | | | (0.05 | ) | | | (0.06 | ) | | | (0.09 | ) | |
Total distributions to shareholders | | | (0.03 | ) | | | (0.07 | ) | | | (0.13 | ) | | | (0.04 | ) | | | (0.05 | ) | | | (0.06 | ) | | | (0.09 | ) | |
Net asset value, end of period | | $ | 15.08 | | | $ | 14.21 | | | $ | 12.26 | | | $ | 9.74 | | | $ | 8.52 | | | $ | 9.02 | | | $ | 8.30 | | |
Total return | | | 6.32 | % | | | 16.54 | % | | | 27.46 | % | | | 14.80 | % | | | (5.07 | %) | | | 9.37 | % | | | (9.61 | %) | |
Ratios to average net assets(b) | |
Total gross expenses | | | 1.82 | %(c) | | | 1.84 | % | | | 1.89 | %(d) | | | 1.85 | %(c) | | | 1.88 | % | | | 1.88 | % | | | 1.75 | % | |
Total net expenses(e) | | | 1.82 | %(c)(f) | | | 1.83 | %(f) | | | 1.83 | %(d)(f) | | | 1.85 | %(c) | | | 1.88 | %(f) | | | 1.88 | % | | | 1.75 | % | |
Net investment income | | | 0.38 | %(c) | | | 0.41 | % | | | 1.02 | % | | | 0.95 | %(c) | | | 0.44 | % | | | 0.60 | % | | | 1.46 | % | |
Supplemental data | |
Net assets, end of period (in thousands) | | $ | 72,686 | | | $ | 69,633 | | | $ | 61,178 | | | $ | 55,775 | | | $ | 54,238 | | | $ | 66,505 | | | $ | 72,372 | | |
Portfolio turnover | | | 24 | % | | | 74 | % | | | 43 | % | | | 16 | % | | | 36 | % | | | 34 | % | | | 38 | % | |
Notes to Financial Highlights
(a) For the period from October 1, 2011 to May 31, 2012. During the period, the Fund's fiscal year end was changed from September 30 to May 31.
(b) In addition to the fees and expenses that the Fund bears directly, the Fund indirectly bears a pro rata share of the fees and expenses of any other funds in which it invests. Such indirect expenses are not included in the Fund's reported expense ratios.
(c) Annualized.
(d) Ratios include line of credit interest expense which is less than 0.01%.
(e) Total net expenses include the impact of certain fee waivers/expense reimbursements made by the Investment Manager and certain of its affiliates, if applicable.
(f) The benefits derived from expense reductions had an impact of less than 0.01%.
The accompanying Notes to Financial Statements are an integral part of this statement.
Semiannual Report 2014
20
Columbia Diversified Equity Income Fund
Financial Highlights (continued)
| | | Six Months Ended
November 30, 2014 | | Year Ended May 31, | | Year Ended September 30, | |
Class I | | (Unaudited) | | 2014 | | 2013 | | 2012(a) | | 2011 | | 2010 | | 2009 | |
Per share data | |
Net asset value, beginning of period | | $ | 14.23 | | | $ | 12.28 | | | $ | 9.76 | | | $ | 8.52 | | | $ | 9.02 | | | $ | 8.30 | | | $ | 9.30 | | |
Income from investment operations: | |
Net investment income | | | 0.12 | | | | 0.19 | | | | 0.24 | | | | 0.14 | | | | 0.16 | | | | 0.16 | | | | 0.19 | | |
Net realized and unrealized gain (loss) | | | 0.86 | | | | 1.98 | | | | 2.54 | | | | 1.20 | | | | (0.49 | ) | | | 0.72 | | | | (1.01 | ) | |
Total from investment operations | | | 0.98 | | | | 2.17 | | | | 2.78 | | | | 1.34 | | | | (0.33 | ) | | | 0.88 | | | | (0.82 | ) | |
Less distributions to shareholders: | |
Net investment income | | | (0.11 | ) | | | (0.22 | ) | | | (0.26 | ) | | | (0.10 | ) | | | (0.17 | ) | | | (0.16 | ) | | | (0.18 | ) | |
Total distributions to shareholders | | | (0.11 | ) | | | (0.22 | ) | | | (0.26 | ) | | | (0.10 | ) | | | (0.17 | ) | | | (0.16 | ) | | | (0.18 | ) | |
Net asset value, end of period | | $ | 15.10 | | | $ | 14.23 | | | $ | 12.28 | | | $ | 9.76 | | | $ | 8.52 | | | $ | 9.02 | | | $ | 8.30 | | |
Total return | | | 6.94 | % | | | 17.90 | % | | | 28.92 | % | | | 15.76 | % | | | (3.88 | %) | | | 10.69 | % | | | (8.47 | %) | |
Ratios to average net assets(b) | |
Total gross expenses | | | 0.61 | %(c) | | | 0.63 | % | | | 0.66 | %(d) | | | 0.63 | %(c) | | | 0.67 | % | | | 0.67 | % | | | 0.50 | % | |
Total net expenses(e) | | | 0.61 | %(c) | | | 0.63 | % | | | 0.66 | %(d) | | | 0.63 | %(c) | | | 0.67 | % | | | 0.67 | % | | | 0.50 | % | |
Net investment income | | | 1.58 | %(c) | | | 1.46 | % | | | 2.19 | % | | | 2.13 | %(c) | | | 1.63 | % | | | 1.82 | % | | | 2.69 | % | |
Supplemental data | |
Net assets, end of period (in thousands) | | $ | 3 | | | $ | 3 | | | $ | 45,330 | | | $ | 39,849 | | | $ | 79,024 | | | $ | 213,083 | | | $ | 212,064 | | |
Portfolio turnover | | | 24 | % | | | 74 | % | | | 43 | % | | | 16 | % | | | 36 | % | | | 34 | % | | | 38 | % | |
Notes to Financial Highlights
(a) For the period from October 1, 2011 to May 31, 2012. During the period, the Fund's fiscal year end was changed from September 30 to May 31.
(b) In addition to the fees and expenses that the Fund bears directly, the Fund indirectly bears a pro rata share of the fees and expenses of any other funds in which it invests. Such indirect expenses are not included in the Fund's reported expense ratios.
(c) Annualized.
(d) Ratios include line of credit interest expense which is less than 0.01%.
(e) Total net expenses include the impact of certain fee waivers/expense reimbursements made by the Investment Manager and certain of its affiliates, if applicable.
The accompanying Notes to Financial Statements are an integral part of this statement.
Semiannual Report 2014
21
Columbia Diversified Equity Income Fund
Financial Highlights (continued)
| | | Six Months Ended
November 30, 2014 | | Year Ended May 31, | | Year Ended September 30, | |
Class K | | (Unaudited) | | 2014 | | 2013 | | 2012(a) | | 2011 | | 2010 | | 2009 | |
Per share data | |
Net asset value, beginning of period | | $ | 14.26 | | | $ | 12.30 | | | $ | 9.77 | | | $ | 8.53 | | | $ | 9.04 | | | $ | 8.32 | | | $ | 9.31 | | |
Income from investment operations: | |
Net investment income | | | 0.09 | | | | 0.16 | | | | 0.20 | | | | 0.12 | | | | 0.14 | | | | 0.13 | | | | 0.17 | | |
Net realized and unrealized gain (loss) | | | 0.87 | | | | 1.98 | | | | 2.56 | | | | 1.20 | | | | (0.50 | ) | | | 0.73 | | | | (1.00 | ) | |
Total from investment operations | | | 0.96 | | | | 2.14 | | | | 2.76 | | | | 1.32 | | | | (0.36 | ) | | | 0.86 | | | | (0.83 | ) | |
Less distributions to shareholders: | |
Net investment income | | | (0.09 | ) | | | (0.18 | ) | | | (0.23 | ) | | | (0.08 | ) | | | (0.15 | ) | | | (0.14 | ) | | | (0.16 | ) | |
Total distributions to shareholders | | | (0.09 | ) | | | (0.18 | ) | | | (0.23 | ) | | | (0.08 | ) | | | (0.15 | ) | | | (0.14 | ) | | | (0.16 | ) | |
Net asset value, end of period | | $ | 15.13 | | | $ | 14.26 | | | $ | 12.30 | | | $ | 9.77 | | | $ | 8.53 | | | $ | 9.04 | | | $ | 8.32 | | |
Total return | | | 6.76 | % | | | 17.60 | % | | | 28.61 | % | | | 15.51 | % | | | (4.23 | %) | | | 10.34 | % | | | (8.57 | %) | |
Ratios to average net assets(b) | |
Total gross expenses | | | 0.95 | %(c) | | | 0.94 | % | | | 0.94 | %(d) | | | 0.93 | %(c) | | | 0.97 | % | | | 0.97 | % | | | 0.80 | % | |
Total net expenses(e) | | | 0.95 | %(c) | | | 0.94 | % | | | 0.94 | %(d) | | | 0.93 | %(c) | | | 0.97 | % | | | 0.97 | % | | | 0.75 | % | |
Net investment income | | | 1.24 | %(c) | | | 1.24 | % | | | 1.88 | % | | | 1.87 | %(c) | | | 1.36 | % | | | 1.52 | % | | | 2.42 | % | |
Supplemental data | |
Net assets, end of period (in thousands) | | $ | 65,798 | | | $ | 72,165 | | | $ | 168,438 | | | $ | 202,741 | | | $ | 189,510 | | | $ | 217,779 | | | $ | 197,977 | | |
Portfolio turnover | | | 24 | % | | | 74 | % | | | 43 | % | | | 16 | % | | | 36 | % | | | 34 | % | | | 38 | % | |
Notes to Financial Highlights
(a) For the period from October 1, 2011 to May 31, 2012. During the period, the Fund's fiscal year end was changed from September 30 to May 31.
(b) In addition to the fees and expenses that the Fund bears directly, the Fund indirectly bears a pro rata share of the fees and expenses of any other funds in which it invests. Such indirect expenses are not included in the Fund's reported expense ratios.
(c) Annualized.
(d) Ratios include line of credit interest expense which is less than 0.01%.
(e) Total net expenses include the impact of certain fee waivers/expense reimbursements made by the Investment Manager and certain of its affiliates, if applicable.
The accompanying Notes to Financial Statements are an integral part of this statement.
Semiannual Report 2014
22
Columbia Diversified Equity Income Fund
Financial Highlights (continued)
| | | Six Months Ended
November 30, 2014 | | Year Ended May 31, | | Year Ended September 30, | |
Class R | | (Unaudited) | | 2014 | | 2013 | | 2012(a) | | 2011 | | 2010 | | 2009 | |
Per share data | |
Net asset value, beginning of period | | $ | 14.18 | | | $ | 12.23 | | | $ | 9.72 | | | $ | 8.50 | | | $ | 8.99 | | | $ | 8.28 | | | $ | 9.28 | | |
Income from investment operations: | |
Net investment income | | | 0.06 | | | | 0.12 | | | | 0.17 | | | | 0.09 | | | | 0.09 | | | | 0.09 | | | | 0.13 | | |
Net realized and unrealized gain (loss) | | | 0.86 | | | | 1.96 | | | | 2.53 | | | | 1.20 | | | | (0.48 | ) | | | 0.72 | | | | (1.01 | ) | |
Total from investment operations | | | 0.92 | | | | 2.08 | | | | 2.70 | | | | 1.29 | | | | (0.39 | ) | | | 0.81 | | | | (0.88 | ) | |
Less distributions to shareholders: | |
Net investment income | | | (0.06 | ) | | | (0.13 | ) | | | (0.19 | ) | | | (0.07 | ) | | | (0.10 | ) | | | (0.10 | ) | | | (0.12 | ) | |
Total distributions to shareholders | | | (0.06 | ) | | | (0.13 | ) | | | (0.19 | ) | | | (0.07 | ) | | | (0.10 | ) | | | (0.10 | ) | | | (0.12 | ) | |
Net asset value, end of period | | $ | 15.04 | | | $ | 14.18 | | | $ | 12.23 | | | $ | 9.72 | | | $ | 8.50 | | | $ | 8.99 | | | $ | 8.28 | | |
Total return | | | 6.53 | % | | | 17.16 | % | | | 28.05 | % | | | 15.14 | % | | | (4.46 | %) | | | 9.76 | % | | | (9.20 | %) | |
Ratios to average net assets(b) | |
Total gross expenses | | | 1.32 | %(c) | | | 1.34 | % | | | 1.39 | %(d) | | | 1.35 | %(c) | | | 1.38 | % | | | 1.46 | % | | | 1.30 | % | |
Total net expenses(e) | | | 1.32 | %(c)(f) | | | 1.33 | %(f) | | | 1.33 | %(d)(f) | | | 1.35 | %(c) | | | 1.38 | %(f) | | | 1.46 | % | | | 1.30 | % | |
Net investment income | | | 0.88 | %(c) | | | 0.90 | % | | | 1.53 | % | | | 1.46 | %(c) | | | 0.95 | % | | | 1.03 | % | | | 1.86 | % | |
Supplemental data | |
Net assets, end of period (in thousands) | | $ | 7,736 | | | $ | 8,004 | | | $ | 9,859 | | | $ | 10,976 | | | $ | 10,114 | | | $ | 10,506 | | | $ | 8,271 | | |
Portfolio turnover | | | 24 | % | | | 74 | % | | | 43 | % | | | 16 | % | | | 36 | % | | | 34 | % | | | 38 | % | |
Notes to Financial Highlights
(a) For the period from October 1, 2011 to May 31, 2012. During the period, the Fund's fiscal year end was changed from September 30 to May 31.
(b) In addition to the fees and expenses that the Fund bears directly, the Fund indirectly bears a pro rata share of the fees and expenses of any other funds in which it invests. Such indirect expenses are not included in the Fund's reported expense ratios.
(c) Annualized.
(d) Ratios include line of credit interest expense which is less than 0.01%.
(e) Total net expenses include the impact of certain fee waivers/expense reimbursements made by the Investment Manager and certain of its affiliates, if applicable.
(f) The benefits derived from expense reductions had an impact of less than 0.01%.
The accompanying Notes to Financial Statements are an integral part of this statement.
Semiannual Report 2014
23
Columbia Diversified Equity Income Fund
Financial Highlights (continued)
| | | Six Months Ended
November 30, 2014 | | Year Ended May 31, | | Year Ended September 30, | |
Class R4 | | (Unaudited) | | 2014 | | 2013 | | 2012(a) | | 2011 | | 2010 | | 2009 | |
Per share data | |
Net asset value, beginning of period | | $ | 14.24 | | | $ | 12.28 | | | $ | 9.75 | | | $ | 8.51 | | | $ | 9.02 | | | $ | 8.30 | | | $ | 9.30 | | |
Income from investment operations: | |
Net investment income | | | 0.10 | | | | 0.18 | | | | 0.20 | | | | 0.11 | | | | 0.11 | | | | 0.11 | | | | 0.15 | | |
Net realized and unrealized gain (loss) | | | 0.87 | | | | 1.97 | | | | 2.54 | | | | 1.20 | | | | (0.50 | ) | | | 0.72 | | | | (1.01 | ) | |
Total from investment operations | | | 0.97 | | | | 2.15 | | | | 2.74 | | | | 1.31 | | | | (0.39 | ) | | | 0.83 | | | | (0.86 | ) | |
Less distributions to shareholders: | |
Net investment income | | | (0.10 | ) | | | (0.19 | ) | | | (0.21 | ) | | | (0.07 | ) | | | (0.12 | ) | | | (0.11 | ) | | | (0.14 | ) | |
Total distributions to shareholders | | | (0.10 | ) | | | (0.19 | ) | | | (0.21 | ) | | | (0.07 | ) | | | (0.12 | ) | | | (0.11 | ) | | | (0.14 | ) | |
Net asset value, end of period | | $ | 15.11 | | | $ | 14.24 | | | $ | 12.28 | | | $ | 9.75 | | | $ | 8.51 | | | $ | 9.02 | | | $ | 8.30 | | |
Total return | | | 6.83 | % | | | 17.71 | % | | | 28.46 | % | | | 15.37 | % | | | (4.52 | %) | | | 10.09 | % | | | (8.95 | %) | |
Ratios to average net assets(b) | |
Total gross expenses | | | 0.82 | %(c) | | | 0.84 | % | | | 1.02 | %(d) | | | 1.18 | %(c) | | | 1.21 | % | | | 1.22 | % | | | 1.05 | % | |
Total net expenses(e) | | | 0.82 | %(c)(f) | | | 0.83 | %(f) | | | 0.99 | %(d) | | | 1.18 | %(c) | | | 1.21 | % | | | 1.22 | % | | | 1.05 | % | |
Net investment income | | | 1.38 | %(c) | | | 1.37 | % | | | 1.91 | % | | | 1.63 | %(c) | | | 1.06 | % | | | 1.26 | % | | | 2.13 | % | |
Supplemental data | |
Net assets, end of period (in thousands) | | $ | 12,535 | | | $ | 13,093 | | | $ | 22,154 | | | $ | 53,739 | | | $ | 53,617 | | | $ | 103,577 | | | $ | 110,248 | | |
Portfolio turnover | | | 24 | % | | | 74 | % | | | 43 | % | | | 16 | % | | | 36 | % | | | 34 | % | | | 38 | % | |
Notes to Financial Highlights
(a) For the period from October 1, 2011 to May 31, 2012. During the period, the Fund's fiscal year end was changed from September 30 to May 31.
(b) In addition to the fees and expenses that the Fund bears directly, the Fund indirectly bears a pro rata share of the fees and expenses of any other funds in which it invests. Such indirect expenses are not included in the Fund's reported expense ratios.
(c) Annualized.
(d) Ratios include line of credit interest expense which is less than 0.01%.
(e) Total net expenses include the impact of certain fee waivers/expense reimbursements made by the Investment Manager and certain of its affiliates, if applicable.
(f) The benefits derived from expense reductions had an impact of less than 0.01%.
The accompanying Notes to Financial Statements are an integral part of this statement.
Semiannual Report 2014
24
Columbia Diversified Equity Income Fund
Financial Highlights (continued)
| | | Six Months Ended
November 30, 2014 | | Year Ended May 31, | | Year Ended September 30, | |
Class R5 | | (Unaudited) | | 2014 | | 2013 | | 2012(a) | | 2011 | | 2010 | | 2009 | |
Per share data | |
Net asset value, beginning of period | | $ | 14.26 | | | $ | 12.30 | | | $ | 9.77 | | | $ | 8.53 | | | $ | 9.03 | | | $ | 8.31 | | | $ | 9.31 | | |
Income from investment operations: | |
Net investment income | | | 0.11 | | | | 0.19 | | | | 0.23 | | | | 0.14 | | | | 0.16 | | | | 0.15 | | | | 0.18 | | |
Net realized and unrealized gain (loss) | | | 0.87 | | | | 1.98 | | | | 2.55 | | | | 1.20 | | | | (0.49 | ) | | | 0.73 | | | | (1.00 | ) | |
Total from investment operations | | | 0.98 | | | | 2.17 | | | | 2.78 | | | | 1.34 | | | | (0.33 | ) | | | 0.88 | | | | (0.82 | ) | |
Less distributions to shareholders: | |
Net investment income | | | (0.11 | ) | | | (0.21 | ) | | | (0.25 | ) | | | (0.10 | ) | | | (0.17 | ) | | | (0.16 | ) | | | (0.18 | ) | |
Total distributions to shareholders | | | (0.11 | ) | | | (0.21 | ) | | | (0.25 | ) | | | (0.10 | ) | | | (0.17 | ) | | | (0.16 | ) | | | (0.18 | ) | |
Net asset value, end of period | | $ | 15.13 | | | $ | 14.26 | | | $ | 12.30 | | | $ | 9.77 | | | $ | 8.53 | | | $ | 9.03 | | | $ | 8.31 | | |
Total return | | | 6.89 | % | | | 17.89 | % | | | 28.95 | % | | | 15.65 | % | | | (3.87 | %) | | | 10.62 | % | | | (8.51 | %) | |
Ratios to average net assets(b) | |
Total gross expenses | | | 0.70 | %(c) | | | 0.69 | % | | | 0.70 | %(d) | | | 0.68 | %(c) | | | 0.72 | % | | | 0.72 | % | | | 0.55 | % | |
Total net expenses(e) | | | 0.70 | %(c) | | | 0.69 | % | | | 0.70 | %(d) | | | 0.68 | %(c) | | | 0.72 | % | | | 0.72 | % | | | 0.55 | % | |
Net investment income | | | 1.50 | %(c) | | | 1.48 | % | | | 2.14 | % | | | 2.11 | %(c) | | | 1.62 | % | | | 1.77 | % | | | 2.62 | % | |
Supplemental data | |
Net assets, end of period (in thousands) | | $ | 29,013 | | | $ | 26,434 | | | $ | 83,244 | | | $ | 57,805 | | | $ | 57,903 | | | $ | 60,156 | | | $ | 53,334 | | |
Portfolio turnover | | | 24 | % | | | 74 | % | | | 43 | % | | | 16 | % | | | 36 | % | | | 34 | % | | | 38 | % | |
Notes to Financial Highlights
(a) For the period from October 1, 2011 to May 31, 2012. During the period, the Fund's fiscal year end was changed from September 30 to May 31.
(b) In addition to the fees and expenses that the Fund bears directly, the Fund indirectly bears a pro rata share of the fees and expenses of any other funds in which it invests. Such indirect expenses are not included in the Fund's reported expense ratios.
(c) Annualized.
(d) Ratios include line of credit interest expense which is less than 0.01%.
(e) Total net expenses include the impact of certain fee waivers/expense reimbursements made by the Investment Manager and certain of its affiliates, if applicable.
The accompanying Notes to Financial Statements are an integral part of this statement.
Semiannual Report 2014
25
Columbia Diversified Equity Income Fund
Financial Highlights (continued)
| | | Six Months Ended
November 30, 2014 | | Year Ended May 31, | | Year Ended September 30, | |
Class W | | (Unaudited) | | 2014 | | 2013 | | 2012(a) | | 2011 | | 2010 | | 2009 | |
Per share data | |
Net asset value, beginning of period | | $ | 14.27 | | | $ | 12.31 | | | $ | 9.78 | | | $ | 8.55 | | | $ | 9.04 | | | $ | 8.32 | | | $ | 9.32 | | |
Income from investment operations: | |
Net investment income | | | 0.08 | | | | 0.16 | | | | 0.19 | | | | 0.11 | | | | 0.12 | | | | 0.12 | | | | 0.16 | | |
Net realized and unrealized gain (loss) | | | 0.87 | | | | 1.97 | | | | 2.55 | | | | 1.20 | | | | (0.48 | ) | | | 0.72 | | | | (1.01 | ) | |
Total from investment operations | | | 0.95 | | | | 2.13 | | | | 2.74 | | | | 1.31 | | | | (0.36 | ) | | | 0.84 | | | | (0.85 | ) | |
Less distributions to shareholders: | |
Net investment income | | | (0.08 | ) | | | (0.17 | ) | | | (0.21 | ) | | | (0.08 | ) | | | (0.13 | ) | | | (0.12 | ) | | | (0.15 | ) | |
Total distributions to shareholders | | | (0.08 | ) | | | (0.17 | ) | | | (0.21 | ) | | | (0.08 | ) | | | (0.13 | ) | | | (0.12 | ) | | | (0.15 | ) | |
Net asset value, end of period | | $ | 15.14 | | | $ | 14.27 | | | $ | 12.31 | | | $ | 9.78 | | | $ | 8.55 | | | $ | 9.04 | | | $ | 8.32 | | |
Total return | | | 6.68 | % | | | 17.44 | % | | | 28.38 | % | | | 15.32 | % | | | (4.20 | %) | | | 10.18 | % | | | (8.85 | %) | |
Ratios to average net assets(b) | |
Total gross expenses | | | 1.13 | %(c) | | | 1.07 | % | | | 1.11 | %(d) | | | 1.08 | %(c) | | | 1.10 | % | | | 1.09 | % | | | 0.91 | % | |
Total net expenses(e) | | | 1.08 | %(c)(f) | | | 1.07 | %(f) | | | 1.08 | %(d)(f) | | | 1.08 | %(c) | | | 1.10 | %(f) | | | 1.09 | % | | | 0.91 | % | |
Net investment income | | | 1.11 | %(c) | | | 1.19 | % | | | 1.77 | % | | | 1.73 | %(c) | | | 1.23 | % | | | 1.40 | % | | | 2.28 | % | |
Supplemental data | |
Net assets, end of period (in thousands) | | $ | 3 | | | $ | 3 | | | $ | 4 | | | $ | 4 | | | $ | 3 | | | $ | 3 | | | $ | 3 | | |
Portfolio turnover | | | 24 | % | | | 74 | % | | | 43 | % | | | 16 | % | | | 36 | % | | | 34 | % | | | 38 | % | |
Notes to Financial Highlights
(a) For the period from October 1, 2011 to May 31, 2012. During the period, the Fund's fiscal year end was changed from September 30 to May 31.
(b) In addition to the fees and expenses that the Fund bears directly, the Fund indirectly bears a pro rata share of the fees and expenses of any other funds in which it invests. Such indirect expenses are not included in the Fund's reported expense ratios.
(c) Annualized.
(d) Ratios include line of credit interest expense which is less than 0.01%.
(e) Total net expenses include the impact of certain fee waivers/expense reimbursements made by the Investment Manager and certain of its affiliates, if applicable.
(f) The benefits derived from expense reductions had an impact of less than 0.01%.
The accompanying Notes to Financial Statements are an integral part of this statement.
Semiannual Report 2014
26
Columbia Diversified Equity Income Fund
Financial Highlights (continued)
| | | Six Months Ended
November 30, 2014 | | Year Ended May 31, | |
Class Y | | (Unaudited) | | 2014 | | 2013(a) | |
Per share data | |
Net asset value, beginning of period | | $ | 14.36 | | | $ | 12.38 | | | $ | 10.33 | | |
Income from investment operations: | |
Net investment income | | | 0.11 | | | | 0.22 | | | | 0.14 | | |
Net realized and unrealized gain | | | 0.88 | | | | 1.98 | | | | 2.04 | | |
Total from investment operations | | | 0.99 | | | | 2.20 | | | | 2.18 | | |
Less distributions to shareholders: | |
Net investment income | | | (0.11 | ) | | | (0.22 | ) | | | (0.13 | ) | |
Total distributions to shareholders | | | (0.11 | ) | | | (0.22 | ) | | | (0.13 | ) | |
Net asset value, end of period | | $ | 15.24 | | | $ | 14.36 | | | $ | 12.38 | | |
Total return | | | 6.93 | % | | | 17.99 | % | | | 21.23 | % | |
Ratios to average net assets(b) | |
Total gross expenses | | | 0.65 | %(c) | | | 0.64 | % | | | 0.64 | %(c)(d) | |
Total net expenses(e) | | | 0.65 | %(c) | | | 0.64 | % | | | 0.64 | %(c)(d) | |
Net investment income | | | 1.55 | %(c) | | | 1.63 | % | | | 2.24 | %(c) | |
Supplemental data | |
Net assets, end of period (in thousands) | | $ | 21,656 | | | $ | 20,127 | | | $ | 3 | | |
Portfolio turnover | | | 24 | % | | | 74 | % | | | 43 | % | |
Notes to Financial Highlights
(a) Based on operations from November 8, 2012 (commencement of operations) through the stated period end.
(b) In addition to the fees and expenses that the Fund bears directly, the Fund indirectly bears a pro rata share of the fees and expenses of any other funds in which it invests. Such indirect expenses are not included in the Fund's reported expense ratios.
(c) Annualized.
(d) Ratios include line of credit interest expense which is less than 0.01%.
(e) Total net expenses include the impact of certain fee waivers/expense reimbursements made by the Investment Manager and certain of its affiliates, if applicable.
The accompanying Notes to Financial Statements are an integral part of this statement.
Semiannual Report 2014
27
Columbia Diversified Equity Income Fund
Financial Highlights (continued)
| | | Six Months Ended
November 30, 2014 | | Year Ended May 31, | | Year Ended September 30, | |
Class Z | | (Unaudited) | | 2014 | | 2013 | | 2012(a) | | 2011 | | 2010(b) | |
Per share data | |
Net asset value, beginning of period | | $ | 14.24 | | | $ | 12.28 | | | $ | 9.76 | | | $ | 8.52 | | | $ | 9.03 | | | $ | 9.02 | | |
Income from investment operations: | |
Net investment income | | | 0.10 | | | | 0.18 | | | | 0.22 | | | | 0.13 | | | | 0.17 | | | | 0.01 | | |
Net realized and unrealized gain (loss) | | | 0.87 | | | | 1.98 | | | | 2.54 | | | | 1.20 | | | | (0.52 | ) | | | — | | |
Total from investment operations | | | 0.97 | | | | 2.16 | | | | 2.76 | | | | 1.33 | | | | (0.35 | ) | | | 0.01 | | |
Less distributions to shareholders: | |
Net investment income | | | (0.10 | ) | | | (0.20 | ) | | | (0.24 | ) | | | (0.09 | ) | | | (0.16 | ) | | | — | | |
Total distributions to shareholders | | | (0.10 | ) | | | (0.20 | ) | | | (0.24 | ) | | | (0.09 | ) | | | (0.16 | ) | | | — | | |
Net asset value, end of period | | $ | 15.11 | | | $ | 14.24 | | | $ | 12.28 | | | $ | 9.76 | | | $ | 8.52 | | | $ | 9.03 | | |
Total return | | | 6.83 | % | | | 17.76 | % | | | 28.69 | % | | | 15.62 | % | | | (4.06 | %) | | | 0.11 | % | |
Ratios to average net assets(c) | |
Total gross expenses | | | 0.82 | %(d) | | | 0.84 | % | | | 0.89 | %(e) | | | 0.82 | %(d) | | | 0.87 | % | | | 1.02 | %(d) | |
Total net expenses(f) | | | 0.82 | %(d)(g) | | | 0.83 | %(g) | | | 0.83 | %(e)(g) | | | 0.82 | %(d) | | | 0.87 | %(g) | | | 1.02 | %(d) | |
Net investment income | | | 1.39 | %(d) | | | 1.37 | % | | | 2.03 | % | | | 2.00 | %(d) | | | 1.77 | % | | | 9.89 | %(d) | |
Supplemental data | |
Net assets, end of period (in thousands) | | $ | 20,697 | | | $ | 15,733 | | | $ | 54,418 | | | $ | 69,694 | | | $ | 58,213 | | | $ | 3 | | |
Portfolio turnover | | | 24 | % | | | 74 | % | | | 43 | % | | | 16 | % | | | 36 | % | | | 34 | % | |
Notes to Financial Highlights
(a) For the period from October 1, 2011 to May 31, 2012. During the period, the Fund's fiscal year end was changed from September 30 to May 31.
(b) Based on operations from September 27, 2010 (commencement of operations) through the stated period end.
(c) In addition to the fees and expenses that the Fund bears directly, the Fund indirectly bears a pro rata share of the fees and expenses of any other funds in which it invests. Such indirect expenses are not included in the Fund's reported expense ratios.
(d) Annualized.
(e) Ratios include line of credit interest expense which is less than 0.01%.
(f) Total net expenses include the impact of certain fee waivers/expense reimbursements made by the Investment Manager and certain of its affiliates, if applicable.
(g) The benefits derived from expense reductions had an impact of less than 0.01%.
The accompanying Notes to Financial Statements are an integral part of this statement.
Semiannual Report 2014
28
Columbia Diversified Equity Income Fund
Notes to Financial Statements
November 30, 2014 (Unaudited)
Note 1. Organization
Columbia Diversified Equity Income Fund (the Fund), a series of Columbia Funds Series Trust II (the Trust), is a diversified fund. The Trust is registered under the Investment Company Act of 1940, as amended (the 1940 Act), as an open-end management investment company organized as a Massachusetts business trust.
Fund Shares
The Trust may issue an unlimited number of shares (without par value). The Fund offers Class A, Class B, Class C, Class I, Class K, Class R, Class R4, Class R5, Class W, Class Y and Class Z shares. Although all share classes generally have identical voting, dividend and liquidation rights, each share class votes separately when required by the Trust's organizational documents or by law. Different share classes pay different distribution amounts to the extent the expenses of such share classes differ, and distributions in liquidation will be proportional to the net asset value of each share class. Each share class has its own expense structure and sales charges.
Class A shares are subject to a maximum front-end sales charge of 5.75% based on the initial investment amount. Class A shares purchased without an initial sales charge in accounts aggregating $1 million to $50 million at the time of purchase are subject to a contingent deferred sales charge (CDSC) if the shares are sold within 18 months of purchase, charged as follows: 1.00% CDSC if redeemed within 12 months of purchase, and 0.50% CDSC if redeemed more than 12, but less than 18, months after purchase.
Class B shares may be subject to a maximum CDSC of 5.00% based upon the holding period after purchase. Class B shares will generally convert to Class A shares eight years after purchase. The Fund no longer accepts investments by new or existing investors in the Fund's Class B shares, except in connection with the reinvestment of any dividend and/or capital gain distributions in Class B shares of the Fund and exchanges by existing Class B shareholders of certain other funds within the Columbia Family of Funds.
Class C shares are subject to a 1.00% CDSC on shares redeemed within one year of purchase.
Class I shares are not subject to sales charges and are available only to the Columbia Family of Funds.
Class K shares are not subject to sales charges, however this share class is closed to new investors.
Class R shares are not subject to sales charges and are generally available only to certain retirement plans and other investors as described in the Fund's prospectus.
Class R4 shares are not subject to sales charges and are generally available only to omnibus retirement plans and certain investors as described in the Fund's prospectus.
Class R5 shares are not subject to sales charges and are generally available only to investors purchasing through authorized investment professionals and omnibus retirement plans.
Class W shares are not subject to sales charges and are available only to investors purchasing through authorized investment programs managed by investment professionals, including discretionary managed account programs.
Class Y shares are not subject to sales charges and are generally available only to certain retirement plans as described in the Fund's prospectus.
Class Z shares are not subject to sales charges and are available only to eligible investors, which are subject to different investment minimums as described in the Fund's prospectus.
Note 2. Summary of Significant Accounting Policies
Basis of Preparation
The Fund is an investment company that applies the accounting and reporting guidance in the Financial Accounting Standards Board (FASB) Accounting Standards Codification Topic 946, Financial Services — Investment Companies (ASC 946). The financial statements are prepared in accordance with U.S. generally accepted accounting principles (GAAP) which requires management to make certain estimates and assumptions that affect the reported amounts of assets and liabilities, the disclosure of contingent assets and liabilities at the date of the financial statements and the reported amounts of income and expenses during the reporting period. Actual results could differ from those estimates.
The following is a summary of significant accounting policies followed by the Fund in the preparation of its financial statements.
Security Valuation
All equity securities are valued at the close of business of the New York Stock Exchange (NYSE). Equity securities are valued at the last quoted sales price on the principal exchange or market on which they trade, except for securities traded on the NASDAQ Stock Market, which are valued at the NASDAQ official close price. Unlisted securities or listed securities for which there were no sales during the day are
Semiannual Report 2014
29
Columbia Diversified Equity Income Fund
Notes to Financial Statements (continued)
November 30, 2014 (Unaudited)
valued at the mean of the latest quoted bid and ask prices on such exchanges or markets.
Debt securities generally are valued by pricing services approved by the Board of Trustees (the Board) based upon market transactions for normal, institutional-size trading units of similar securities. The services may use various pricing techniques that take into account, as applicable, factors such as yield, quality, coupon rate, maturity, type of issue, trading characteristics and other data, as well as broker quotes. Debt securities for which quotations are readily available may also be valued based upon an over-the-counter or exchange bid quotation.
Foreign equity securities are valued based on quotations from the principal market in which such securities are traded. If any foreign security prices are not readily available as a result of limited share activity, the securities are valued at the mean of the latest quoted bid and ask prices on such exchanges or markets. Foreign currency exchange rates are generally determined at 4:00 p.m. Eastern (U.S.) time. Many securities markets and exchanges outside the U.S. close prior to the close of the NYSE; therefore, the closing prices for securities in such markets or on such exchanges may not fully reflect events that occur after such close but before the close of the NYSE. In those situations, foreign securities will be fair valued pursuant to a policy adopted by the Board, including, if available, utilizing a third party pricing service to determine these fair values. The third party pricing service takes into account multiple factors, including, but not limited to, movements in the U.S. securities markets, certain depositary receipts, futures contracts and foreign exchange rates that have occurred subsequent to the close of the foreign exchange or market, to determine a good faith estimate that reasonably reflects the current market conditions as of the close of the NYSE. The fair value of a security is likely to be different from the quoted or published price, if available.
Investments in open-end investment companies, including money market funds, are valued at their net asset value.
Investments for which market quotations are not readily available, or that have quotations which management believes are not reliable, are valued at fair value as determined in good faith under procedures established by and under the general supervision of the Board. If a security or class of securities (such as foreign securities) is valued at fair value, such value is likely to be different from the quoted or published price for the security.
The determination of fair value often requires significant judgment. To determine fair value, management may use
assumptions including but not limited to future cash flows and estimated risk premiums. Multiple inputs from various sources may be used to determine fair value.
Security Transactions
Security transactions are accounted for on the trade date. Cost is determined and gains (losses) are based upon the specific identification method for both financial statement and federal income tax purposes.
Income Recognition
Corporate actions and dividend income are generally recorded net of any non-reclaimable tax withholdings, on the ex-dividend date or upon receipt of ex-dividend notification in the case of certain foreign securities.
Interest income is recorded on an accrual basis. Market premiums and discounts, including original issue discounts, are amortized and accreted, respectively, over the expected life of the security on all debt securities, unless otherwise noted.
The Fund may place a debt security on non-accrual status and reduce related interest income when it becomes probable that the interest will not be collected and the amount of uncollectible interest can be reasonably estimated. A defaulted debt security is removed from non-accrual status when the issuer resumes interest payments or when collectability of interest is reasonably assured.
The Fund may receive distributions from holdings in business development companies (BDCs), exchange-traded funds (ETFs), other regulated investment companies (RICs), and real estate investment trusts (REITs), which report information on the character of their distributions annually. These distributions are allocated to dividend income, capital gain and return of capital based on actual information reported. To the extent actual information has not yet been reported by the REITs, estimates for return of capital are made by the Fund's management. Return of capital is recorded as a reduction of the cost basis of securities held. If the Fund no longer owns the applicable securities, return of capital is recorded as a realized gain. Management's estimates are subsequently adjusted when the actual character of the distributions is disclosed by the REITs, which could result in a proportionate change in return of capital to shareholders. No estimates are made for the BDCs, ETFs, and RICs.
Awards from class action litigation are recorded as a reduction of cost basis if the Fund still owns the applicable securities on the payment date. If the Fund no longer owns the applicable securities, the proceeds are recorded as realized gains.
Semiannual Report 2014
30
Columbia Diversified Equity Income Fund
Notes to Financial Statements (continued)
November 30, 2014 (Unaudited)
Expenses
General expenses of the Trust are allocated to the Fund and other funds of the Trust based upon relative net assets or other expense allocation methodologies determined by the nature of the expense. Expenses directly attributable to the Fund are charged to the Fund. Expenses directly attributable to a specific class of shares are charged to that share class.
Determination of Class Net Asset Value
All income, expenses (other than class-specific expenses, which are charged to that share class, as shown in the Statement of Operations) and realized and unrealized gains (losses) are allocated to each class of the Fund on a daily basis, based on the relative net assets of each class, for purposes of determining the net asset value of each class.
Federal Income Tax Status
The Fund intends to qualify each year as a regulated investment company under Subchapter M of the Internal Revenue Code, as amended, and will distribute substantially all of its taxable income (including net short-term capital gains), if any, for its tax year, and as such will not be subject to federal income taxes. In addition, the Fund intends to distribute in each calendar year substantially all of its net investment income, capital gains and certain other amounts, if any, such that the Fund should not be subject to federal excise tax. Therefore, no federal income or excise tax provision is recorded.
Distributions to Shareholders
Distributions from net investment income, if any, are declared and paid each calendar quarter. Net realized capital gains, if any, are distributed at least annually. Income distributions and capital gain distributions are determined in accordance with federal income tax regulations, which may differ from GAAP.
Guarantees and Indemnifications
Under the Trust's organizational documents and, in some cases, by contract, its officers and trustees are indemnified against certain liabilities arising out of the performance of their duties to the Trust or its funds. In addition, certain of the Fund's contracts with its service providers contain general indemnification clauses. The Fund's maximum exposure under these arrangements is unknown since the amount of any future claims that may be made against the Fund cannot be determined, and the Fund has no historical basis for predicting the likelihood of any such claims.
Note 3. Fees and Compensation Paid to Affiliates
Investment Management Fees
Under an Investment Management Services Agreement, Columbia Management Investment Advisers, LLC (the Investment Manager), a wholly-owned subsidiary of Ameriprise Financial, Inc. (Ameriprise Financial), determines which securities will be purchased, held or sold. The investment management fee is an annual fee that is equal to a percentage of the Fund's average daily net assets that declines from 0.66% to 0.49% as the Fund's net assets increase. The annualized effective investment management fee rate for the six months ended November 30, 2014 was 0.57% of the Fund's average daily net assets.
Administration Fees
Under an Administrative Services Agreement, the Investment Manager also serves as the Fund Administrator. The Fund pays the Fund Administrator an annual fee for administration and accounting services equal to a percentage of the Fund's average daily net assets that declines from 0.06% to 0.03% as the Fund's net assets increase. The annualized effective administration fee rate for the six months ended November 30, 2014 was 0.05% of the Fund's average daily net assets.
Other Expenses
Other expenses are for, among other things, miscellaneous expenses of the Fund or the Board, including payments to a company providing limited administrative services to the Fund and the Board. That company's expenses include boardroom and office expense, employee compensation, employee health and retirement benefits, and certain other expenses. For the six months ended November 30, 2014, other expenses paid by the Fund to this company were $2,515.
Compensation of Board Members
Board members are compensated for their services to the Fund as disclosed in the Statement of Operations. Under a Deferred Compensation Plan (the Plan), the Board members who are not "interested persons" of the Fund, as defined under the 1940 Act, may elect to defer payment of up to 100% of their compensation. Deferred amounts are treated as though equivalent dollar amounts had been invested in shares of certain funds managed by the Investment Manager. The Fund's liability for these amounts is adjusted for market value changes and remains in the Fund until distributed in accordance with the Plan.
Semiannual Report 2014
31
Columbia Diversified Equity Income Fund
Notes to Financial Statements (continued)
November 30, 2014 (Unaudited)
Transfer Agent Fees
Under a Transfer and Dividend Disbursing Agent Agreement, Columbia Management Investment Services Corp. (the Transfer Agent), an affiliate of the Investment Manager and a wholly-owned subsidiary of Ameriprise Financial, is responsible for providing transfer agency services to the Fund. The Transfer Agent has contracted with Boston Financial Data Services (BFDS) to serve as sub-transfer agent.
Effective November 1, 2014, the Transfer Agent receives a monthly transfer agency fee based on the number or the average value of accounts, depending on the type of account. Prior to November 1, 2014, the Transfer Agent received a monthly account-based service fee based on the number of open accounts. In addition, the Transfer Agent also receives sub-transfer agency fees based on a percentage of the average aggregate value of the Fund's shares maintained in omnibus accounts (other than omnibus accounts for which American Enterprise Investment Services Inc. is the broker of record or accounts where the beneficial shareholder is a customer of Ameriprise Financial Services, Inc., which receive a per account fee). The Transfer Agent pays the fees of BFDS for services as sub-transfer agent and is not entitled to reimbursement for such fees from the Fund (with the exception of out-of-pocket fees).
The Transfer Agent also receives compensation from the Fund for various shareholder services and reimbursements for certain out-of-pocket fees. Total transfer agent fees for Class K and Class R5 shares are subject to an annual limitation of not more than 0.05% of the average daily net assets attributable to each share class. Class I and Class Y shares are not subject to transfer agent fees.
For the six months ended November 30, 2014, the Fund's annualized effective transfer agent fee rates as a percentage of average daily net assets of each class were as follows:
Class A | | | 0.17 | % | |
Class B | | | 0.17 | | |
Class C | | | 0.17 | | |
Class K | | | 0.05 | | |
Class R | | | 0.17 | | |
Class R4 | | | 0.17 | | |
Class R5 | | | 0.05 | | |
Class W | | | 0.23 | | |
Class Z | | | 0.17 | | |
An annual minimum account balance fee of $20 may apply to certain accounts with a value below the applicable share class's initial minimum investment requirements to reduce the impact of small accounts on transfer agent fees. These
minimum account balance fees are remitted to the Fund and recorded as part of expense reductions in the Statement of Operations. For the six months ended November 30, 2014, these minimum account balance fees reduced total expenses of the Fund by $160.
Plan Administration Fees
Under a Plan Administration Services Agreement with the Transfer Agent, the Fund pays an annual fee at a rate of 0.25% of the Fund's average daily net assets attributable to Class K shares for the provision of various administrative, recordkeeping, communication and educational services.
Distribution Fees
The Fund has an agreement with Columbia Management Investment Distributors, Inc. (the Distributor), an affiliate of the Investment Manager and a wholly-owned subsidiary of Ameriprise Financial, for distribution and shareholder services. Under a Plan and Agreement of Distribution, the Fund pays a fee at an annual rate of up to 0.25% of the Fund's average daily net assets attributable to Class A and Class W shares, a fee at an annual rate of up to 0.50% of the Fund's average daily net assets attributable to Class R shares (of which up to 0.25% may be used for shareholder services) and a fee at an annual rate of up to 1.00% of the Fund's average daily net assets attributable to Class B and Class C shares. For Class B and Class C shares, of the 1.00% fee, up to 0.75% is reimbursed for distribution expenses.
The amount of distribution expenses incurred by the Distributor and not yet reimbursed (unreimbursed expense) was approximately $8,137,000 and $633,000 for Class B and Class C shares, respectively. These amounts are based on the most recent information available as of September 30, 2014, and may be recovered from future payments under the distribution plan or CDSCs. To the extent the unreimbursed expense has been fully recovered, the distribution fee is reduced.
Sales Charges
Sales charges, including front-end charges and CDSCs, received by the Distributor for distributing Fund shares were $553,959 for Class A, $4,718 for Class B and $2,333 for Class C shares for the six months ended November 30, 2014.
Expenses Waived/Reimbursed by the Investment Manager and its Affiliates
The Fund's expense ratio is subject to an expense reimbursement arrangement pursuant to which fees will be waived and/or expenses reimbursed (excluding certain fees and expenses described below), so that the Fund's net operating expenses, after giving effect to fees waived/expenses
Semiannual Report 2014
32
Columbia Diversified Equity Income Fund
Notes to Financial Statements (continued)
November 30, 2014 (Unaudited)
reimbursed and any balance credits and/or overdraft charges from the Fund's custodian, do not exceed the annual rates of:
| | | Voluntary
Expense Cap
Effective
October 1, 2014 | | Contractual
Expense Cap
Prior to
October 1, 2014 | |
Class A | | | 1.13 | % | | | 1.08 | % | |
Class B | | | 1.88 | | | | 1.83 | | |
Class C | | | 1.88 | | | | 1.83 | | |
Class I | | | 0.75 | | | | 0.68 | | |
Class K | | | 1.05 | | | | 0.98 | | |
Class R | | | 1.38 | | | | 1.33 | | |
Class R4 | | | 0.88 | | | | 0.83 | | |
Class R5 | | | 0.80 | | | | 0.73 | | |
Class W | | | 1.13 | | | | 1.08 | | |
Class Y | | | 0.75 | | | | 0.68 | | |
Class Z | | | 0.88 | | | | 0.83 | | |
The voluntary expense cap arrangement may be revised or discontinued at any time. Under the arrangements, the following fees and expenses are excluded from the waiver/reimbursement commitment, and therefore will be paid by the Fund, if applicable: taxes (including foreign transaction taxes), expenses associated with investments in affiliated and non-affiliated pooled investment vehicles (including mutual funds and exchange-traded funds), transaction costs and brokerage commissions, costs related to any securities lending program, dividend expenses associated with securities sold short, inverse floater program fees and expenses, transaction charges and interest on borrowed money, interest and extraordinary expenses.
Note 4. Federal Tax Information
The timing and character of income and capital gain distributions are determined in accordance with income tax regulations, which may differ from GAAP because of temporary or permanent book to tax differences.
At November 30, 2014, the cost of investments for federal income tax purposes was approximately $2,205,621,000 and the aggregate gross approximate unrealized appreciation and depreciation based on that cost was:
Unrealized appreciation | | $ | 595,004,000 | | |
Unrealized depreciation | | | (30,174,000 | ) | |
Net unrealized appreciation | | $ | 564,830,000 | | |
Management of the Fund has concluded that there are no significant uncertain tax positions in the Fund that would require recognition in the financial statements. However, management's conclusion may be subject to review and adjustment at a later date based on factors including, but not
limited to, new tax laws, regulations, and administrative interpretations (including relevant court decisions). Generally, the Fund's federal tax returns for the prior three fiscal years remain subject to examination by the Internal Revenue Service.
Note 5. Portfolio Information
The cost of purchases and proceeds from sales of securities, excluding short-term obligations and certain derivatives, if any, aggregated to $638,829,930 and $812,998,429, respectively, for the six months ended November 30, 2014.The amount of purchase and sale activity impacts the portfolio turnover rate reported in the Financial Highlights.
Note 6. Affiliated Money Market Fund
The Fund invests in Columbia Short-Term Cash Fund, an affiliated money market fund established for the exclusive use by the Fund and other affiliated funds. The income earned by the Fund from such investments is included as Dividends — affiliated issuers in the Statement of Operations. As an investing fund, the Fund indirectly bears its proportionate share of the expenses of Columbia Short-Term Cash Fund.
Note 7. Shareholder Concentration
At November 30, 2014, affiliated shareholders of record owned 86.6% of the outstanding shares of the Fund in one or more accounts. Subscription and redemption activity by concentrated accounts may have a significant effect on the operations of the Fund.
Note 8. Line of Credit
The Fund has entered into a revolving credit facility with a syndicate of banks led by JPMorgan Chase Bank N.A. (JPMorgan) whereby the Fund may borrow for the temporary funding of shareholder redemptions or for other temporary or emergency purposes. The credit facility agreement, as amended, which is a collective agreement between the Fund and certain other funds managed by the Investment Manager, severally and not jointly, permits collective borrowings up to $500 million. Interest is charged to each participating fund based on its borrowings at a rate equal to the higher of (i) the overnight federal funds rate plus 1.00% or (ii) the one-month LIBOR rate plus 1.00%. Each borrowing under the credit facility matures no later than 60 days after the date of borrowing. The Fund also pays a commitment fee equal to its pro rata share of the amount of the credit facility at a rate of 0.075% per annum. The commitment fee is included in other expenses in the Statement of Operations.
Effective December 9, 2014, the Fund extended its revolving credit facility with JPMorgan. The credit facility agreement, as
Semiannual Report 2014
33
Columbia Diversified Equity Income Fund
Notes to Financial Statements (continued)
November 30, 2014 (Unaudited)
amended, permits collective borrowings up to $550 million under the same terms and interest rates as described above.
The Fund had no borrowings during the six months ended November 30, 2014.
Note 9. Significant Risks
Financial Sector Risk
Sector risk occurs when a fund invests a significant portion of its assets in securities of companies conducting business in a related group of industries within an economic sector. Companies in the same economic sector may be similarly affected by economic, regulatory, political or market events or conditions, making a fund more vulnerable to unfavorable developments in that economic sector than funds that invest more broadly. The Fund may be more susceptible to the particular risks that may affect companies in the financial sector than if it were invested in a wider variety of companies in unrelated sectors.
Note 10. Subsequent Events
Management has evaluated the events and transactions that have occurred through the date the financial statements were issued. Other than as noted in Note 8 above, there were no items requiring adjustment of the financial statements or additional disclosure.
Note 11. Information Regarding Pending and Settled Legal Proceedings
In December 2005, without admitting or denying the allegations, American Express Financial Corporation (AEFC, which is now known as Ameriprise Financial, Inc. (Ameriprise Financial)) entered into settlement agreements with the Securities and Exchange Commission (SEC) and Minnesota Department of Commerce (MDOC) related to market timing activities. As a result, AEFC was censured and ordered to cease and desist from committing or causing any violations of certain provisions of the Investment Advisers Act of 1940, the Investment Company Act of 1940, and various Minnesota laws. AEFC agreed to pay disgorgement of $10 million and civil money penalties of $7 million. AEFC also agreed to retain an independent distribution consultant to assist in developing a plan for distribution of all disgorgement and civil penalties ordered by the SEC in accordance with various undertakings detailed at www.sec.gov/litigation/admin/ia-2451.pdf. Ameriprise Financial and its affiliates have cooperated with the SEC and the MDOC in these legal proceedings, and have made regular reports to the Funds' Boards of Trustees.
Ameriprise Financial and certain of its affiliates have historically been involved in a number of legal, arbitration and regulatory proceedings, including routine litigation, class actions, and governmental actions, concerning matters arising in connection with the conduct of their business activities. Ameriprise Financial believes that the Funds are not currently the subject of, and that neither Ameriprise Financial nor any of its affiliates are the subject of, any pending legal, arbitration or regulatory proceedings that are likely to have a material adverse effect on the Funds or the ability of Ameriprise Financial or its affiliates to perform under their contracts with the Funds. Ameriprise Financial is required to make quarterly (10-Q), annual (10-K) and, as necessary, 8-K filings with the Securities and Exchange Commission on legal and regulatory matters that relate to Ameriprise Financial and its affiliates. Copies of these filings may be obtained by accessing the SEC website at www.sec.gov.
There can be no assurance that these matters, or the adverse publicity associated with them, will not result in increased fund redemptions, reduced sale of fund shares or other adverse consequences to the Funds. Further, although we believe proceedings are not likely to have a material adverse effect on the Funds or the ability of Ameriprise Financial or its affiliates to perform under their contracts with the Funds, these proceedings are subject to uncertainties and, as such, we are unable to estimate the possible loss or range of loss that may result. An adverse outcome in one or more of these proceedings could result in adverse judgments, settlements, fines, penalties or other relief that could have a material adverse effect on the consolidated financial condition or results of operations of Ameriprise Financial.
Semiannual Report 2014
34
Columbia Diversified Equity Income Fund
Important Information About This Report
Each fund mails one shareholder report to each shareholder address. If you would like more than one report, please call shareholder services at 800.345.6611 and additional reports will be sent to you.
The policy of the Board is to vote the proxies of the companies in which each fund holds investments consistent with the procedures as stated in the Statement of Additional Information (SAI). You may obtain a copy of the SAI without charge by calling 800.345.6611; contacting your financial intermediary; visiting columbiamanagement.com; or searching the website of the Securities and Exchange Commission (SEC) at sec.gov. Information regarding how each fund voted proxies relating to portfolio securities is filed with the SEC by August 31 for the most recent 12-month period ending June 30 of that year, and is available without charge by visiting columbiamanagement.com; or searching the website of the SEC at sec.gov.
Each fund files a complete schedule of portfolio holdings with the SEC for the first and third quarters of each fiscal year on Form N-Q. Each fund's Form N-Q is available on the SEC's website at sec.gov and may be reviewed and copied at the SEC's Public Reference Room in Washington, D.C. Information on the operation of the Public Reference Room may be obtained by calling 800.SEC.0330. Each fund's complete schedule of portfolio holdings, as filed on Form N-Q, can also be obtained without charge, upon request, by calling 800.345.6611.
Semiannual Report 2014
35

Columbia Diversified Equity Income Fund
P.O. Box 8081
Boston, MA 02266-8081
columbiamanagement.com
This information is for use with concurrent or prior delivery of a fund prospectus. Please read and consider the investment objectives, risks, charges and expenses for any fund carefully before investing. For a prospectus and, if available, a summary prospectus, which contains this and other important information about the Fund, go to columbiamanagement.com. The Fund is distributed by Columbia Management Investment Distributors, Inc., member FINRA, and managed by Columbia Management Investment Advisers, LLC.
© 2015 Columbia Management Investment Advisers, LLC. All rights reserved.
SAR138_05_E01_(01/15)
Semiannual Report
November 30, 2014

Columbia Dividend Opportunity Fund
Not FDIC insured • No bank guarantee • May lose value
About Columbia Management
Backed by more than 100 years of experience, Columbia Management is one of the nation's largest asset managers. At the heart of our success — and, most importantly, that of our investors — are some of the most talented professionals in the industry, brought together by a unique way of working.
It starts with carefully selected, specialized investment teams. While each team brings a diverse and innovative range of skills, all are grounded by a common set of core beliefs. All possess a solid conviction in the power of proprietary, bottom-up research. All look not only at generating returns, but also at the likely consistency of those returns and the risks required to achieve them. And while our culture encourages teams to operate independently and question established thinking, a rigorous investment oversight process ensures that each team stays true to its clearly articulated investment process. At Columbia Management, reaching our performance goals matters, and the way we reach them matters just as much.
Columbia funds are distributed by Columbia Management Investment Distributors, Inc., member FINRA, and managed by Columbia Management Investment Advisers, LLC.
© 2015 Columbia Management Investment Advisers, LLC. All rights reserved.
Not part of the shareholder report
Note: Effective January 1, 2015, Christopher O. Petersen will serve as the President of the Columbia Funds, replacing J. Kevin Connaughton. Mr. Petersen has served as a Fund officer since 2007.
Dear Shareholders,
People invest for different reasons, though typically based on a desire for one or more outcomes, e.g., generating an appropriate income stream in retirement, navigating a changing interest rate environment, maximizing after-tax returns, growing assets to achieve financial goals, or easing the impact of volatile markets. Achieving these desired outcomes can be particularly challenging given the unpredictability of complex global markets. To continue to effectively deliver solutions that help clients achieve desired outcomes, an asset manager must have the resources and investment framework to meaningfully embody a global perspective.
With this in mind, I thought it important to highlight excerpts from a piece written by Jeffrey L. Knight, Global Head of Investment Solutions and Asset Allocation, in which he touches on some of these issues emphasizing the importance of maintaining a diversified portfolio with the flexibility to adapt to changing market conditions.
I encourage you to read the article in its entirety. To access the full article and for other insights on current market events and investment opportunities, please visit the Columbia Management blog at columbiamanagement.com/blog.
On behalf of the Funds, I want to acknowledge the contributions of J. Kevin Connaughton and to thank him for his years of trusted, dedicated service. He has worked tirelessly as an advocate for shareholders and a leader of the Columbia Funds. In taking on this new role, I look forward to continuing the work of Mr. Connaughton, helping build on the strong foundation of the Columbia Funds.
Thank you for your confidence. We look forward to continuing to serve your investment needs for many years to come.
Best regards,

Christopher O. Petersen
President, Columbia Funds
Excerpts from:
2015 Outlook: Same song, slightly different arrangement
By Jeffrey L. Knight, Global Head of Investment Solutions and Asset Allocation
Jeffrey L. Knight, CFA, is global head of investment solutions and asset allocation for Columbia Management Investment Advisers, LLC. Mr. Knight leads a team of six portfolio managers responsible for our broad suite of multi-asset strategies including capital allocation, risk allocation, absolute return and total return funds.
What's different in 2015?
As stationary as market conditions have felt lately, circumstances are always evolving. For 2015, while the essential elements of our outlook remain in place, we highlight two important changes in the market environment:
> The relative value of global equities vs. global bonds actually improved during 2014.
> Monetary policy around the globe has become desynchronized, with the U.S. Federal Reserve (the Fed) contemplating rate hikes, while the European Central Bank (ECB) and the Bank of Japan (BOJ) intensify their monetary stimulus programs.
In our view, while equities will most likely continue to dominate, the complex interactions of today's conditions elevate the role of dynamic risk management. We argue that investors will need a cross-asset surveillance methodology to detect tactical threats.
President's Message (continued)
Monetary policies diverge
The Fed has given strong signals that economic growth in the United States has reached self-sustaining momentum and no longer needs unconventional efforts to support the expansion. The withdrawal and suspension of large-scale asset purchases was only the first step in the evolution toward policy normalization. In 2015, we expect to see a change in forward guidance and, most likely, the first interest rate increase in years.
These actions stand in stark contrast with the direction of the monetary policies of other central banks as they double down on efforts to support growth and avoid deflation. The Bank of Japan has announced its intention to increase both qualitative and quantitative easing on an enormous scale, expanding purchases of Japanese government bonds (JGBs), exchange-traded funds and real estate investment trusts. They intend to coordinate this with government pension investment fund purchases by shifting into riskier assets through sales of JGBs.
With evidence of deterioration on both the economic and inflation front, the European Central Bank (ECB) also plans to take bolder actions. These include increased purchases of asset-backed securities and covered bonds in both the primary and secondary market, together with the long-term refinancing operations that will steer the ECB's balance sheet higher by €1 trillion.
The latest to jump on the bandwagon was the People's Bank of China (PBOC), which cut its benchmark interest rate for the first time in over two years to support private sector investment, as targeted liquidity injections have had minimal effect on sinking economic growth.
Investment strategy for 2015
We remain convinced that relative value favors stocks over bonds, even though stocks outperformed in 2014. Therefore, you will hear the same recommendation from us for 2015. Equities remain the most important asset class for generating returns.
Within equities, the currency-based advantage of U.S. stocks is offset somewhat by the valuation advantage from overseas equities, notably in Japan. Indeed, economic growth in Japan and Europe are essential ingredients for equities to continue to perform well. If Japanese and European stocks cannot produce gains, then the global economy will probably be stuck in a near recessionary funk.
Devising a strategy to manage risk and stabilize portfolio values in the event that equities do not perform well remains complicated. Bond yields are low enough that they are not likely to offer powerful diversification benefits. We affirm our recommendation for three additional sources of portfolio stability:
> Non-traditional diversifiers, such as liquid alternatives, alternative beta exposures and absolute return strategies
> Explicit downside hedges, such as put options (with emphasis on managing the related expense)
> Flexibility and a methodology for active risk reduction when appropriate (Our cross-asset methodologies should prove valuable in this regard.)
Our overall stance for investment strategy will likely remain in place until the valuation advantage for equities has been priced away, or until the healing process for the global economy reverses.
Please visit columbiamanagement.com/blog to read the entire article.
Investors should consider the investment objectives, risks, charges and expenses of a mutual fund carefully before investing. For a free prospectus and, if available, a summary prospectus, which contains this and other important information about a fund, visit columbiamanagement.com. The prospectus should be read carefully before investing.
The views expressed are as of December 2014, may change as market or other conditions change, and may differ from views expressed by other Columbia Management Investment Advisers, LLC (CMIA) associates or affiliates. Actual investments or investment decisions made by CMIA and its affiliates, whether for its own account or on behalf of clients, will not necessarily reflect the views expressed. This information is not intended to provide investment advice and does not account for individual investor circumstances. Investment decisions should always be made based on an investor's specific financial needs, objectives, goals, time horizon and risk tolerance. Asset classes described may not be suitable for all investors. Past performance does not guarantee future results, and no forecast should be considered a guarantee either. Since economic and market change frequently, there can be no assurance that the trends described here will continue or that the forecasts are accurate.
Diversification does not assure a profit or protect against loss.
Columbia Funds are distributed by Columbia Management Investment Distributors, Inc., member FINRA, and managed by Columbia Management Investment Advisers, LLC.
© 2015 Columbia Management Investment Advisers, LLC. All rights reserved
Columbia Dividend Opportunity Fund
Performance Overview | | | 4 | | |
Portfolio Overview | | | 5 | | |
Understanding Your Fund's Expenses | | | 6 | | |
Portfolio of Investments | | | 7 | | |
Statement of Assets and Liabilities | | | 13 | | |
Statement of Operations | | | 15 | | |
Statement of Changes in Net Assets | | | 16 | | |
Financial Highlights | | | 19 | | |
Notes to Financial Statements | | | 30 | | |
Important Information About This Report | | | 37 | | |
Fund Investment Manager
Columbia Management Investment
Advisers, LLC
225 Franklin Street
Boston, MA 02110
Fund Distributor
Columbia Management Investment
Distributors, Inc.
225 Franklin Street
Boston, MA 02110
Fund Transfer Agent
Columbia Management Investment
Services Corp.
P.O. Box 8081
Boston, MA 02266-8081
For more information about any of the funds, please visit columbiamanagement.com or call 800.345.6611. Customer Service Representatives are available to answer your questions Monday through Friday from 8 a.m. to 7 p.m. Eastern time.
The views expressed in this report reflect the current views of the respective parties. These views are not guarantees of future performance and involve certain risks, uncertainties and assumptions that are difficult to predict, so actual outcomes and results may differ significantly from the views expressed. These views are subject to change at any time based upon economic, market or other conditions and the respective parties disclaim any responsibility to update such views. These views may not be relied on as investment advice and, because investment decisions for a Columbia Fund are based on numerous factors, may not be relied on as an indication of trading intent on behalf of any particular Columbia Fund. References to specific securities should not be construed as a recommendation or investment advice.
Columbia Dividend Opportunity Fund
Performance Overview
(Unaudited)
Performance Summary
> Columbia Dividend Opportunity Fund (the Fund) Class A shares returned 5.50% excluding sales charges for the six-month period that ended November 30, 2014.
> The Fund underperformed both of its benchmarks, the MSCI USA High Dividend Yield Index (Net), which returned 8.26% and the Russell 1000 Value Index, which returned 6.86% for the same time period.
Average Annual Total Returns (%) (for period ended November 30, 2014)
| | | Inception | | 6 Months
cumulative | | 1 Year | | 5 Years | | 10 Years | |
Class A | | 08/01/88 | | | | | | | | | | | | | | | | | |
Excluding sales charges | | | | | | | 5.50 | | | | 13.77 | | | | 15.25 | | | | 8.85 | | |
Including sales charges | | | | | | | -0.56 | | | | 7.26 | | | | 13.91 | | | | 8.20 | | |
Class B | | 03/20/95 | | | | | | | | | | | | | | | | | |
Excluding sales charges | | | | | | | 5.06 | | | | 12.94 | | | | 14.37 | | | | 8.01 | | |
Including sales charges | | | | | | | 0.06 | | | | 7.94 | | | | 14.14 | | | | 8.01 | | |
Class C | | 06/26/00 | | | | | | | | | | | | | | | | | |
Excluding sales charges | | | | | | | 5.01 | | | | 12.94 | | | | 14.38 | | | | 8.03 | | |
Including sales charges | | | | | | | 4.01 | | | | 11.94 | | | | 14.38 | | | | 8.03 | | |
Class I | | 03/04/04 | | | 5.59 | | | | 14.19 | | | | 15.72 | | | | 9.28 | | |
Class K | | 03/20/95 | | | 5.54 | | | | 13.84 | | | | 15.40 | | | | 9.05 | | |
Class R* | | 08/01/08 | | | 5.38 | | | | 13.50 | | | | 14.96 | | | | 8.56 | | |
Class R4* | | 11/08/12 | | | 5.56 | | | | 14.08 | | | | 15.36 | | | | 8.90 | | |
Class R5* | | 08/01/08 | | | 5.67 | | | | 14.22 | | | | 15.71 | | | | 9.11 | | |
Class W* | | 12/01/06 | | | 5.40 | | | | 13.76 | | | | 15.24 | | | | 8.82 | | |
Class Y* | | 11/08/12 | | | 5.63 | | | | 14.24 | | | | 15.44 | | | | 8.93 | | |
Class Z* | | 09/27/10 | | | 5.52 | | | | 14.01 | | | | 15.48 | | | | 8.95 | | |
MSCI USA High Dividend Yield Index (Net) | | | | | | | 8.26 | | | | 16.43 | | | | 16.11 | | | | 8.12 | | |
Russell 1000 Value Index | | | | | | | 6.86 | | | | 15.62 | | | | 15.69 | | | | 7.59 | | |
Returns for Class A are shown with and without the maximum initial sales charge of 5.75%. Returns for Class B are shown with and without the applicable contingent deferred sales charge (CDSC) of 5.00% in the first year, declining to 1.00% in the sixth year and eliminated thereafter. Returns for Class C are shown with and without the 1.00% CDSC for the first year only. The Fund's other classes are not subject to sales charges and have limited eligibility. Please see the Fund's prospectus for details. Performance for different share classes will vary based on differences in sales charges and fees associated with each class. All results shown assume reinvestment of distributions during the period. Returns do not reflect the deduction of taxes that a shareholder may pay on Fund distributions or on the redemption of Fund shares. Performance results reflect the effect of any fee waivers or reimbursements of Fund expenses by Columbia Management Investment Advisers, LLC and/or any of its affiliates. Absent these fee waivers or expense reimbursement arrangements, performance results would have been lower.
The performance information shown represents past performance and is not a guarantee of future results. The investment return and principal value of your investment will fluctuate so that your shares, when redeemed, may be worth more or less than their original cost. Current performance may be lower or higher than the performance information shown. You may obtain performance information current to the most recent month-end by contacting your financial intermediary, visiting columbiamanagement.com or calling 800.345.6611.
*The returns shown for periods prior to the share class inception date (including returns for the Life of the Fund, if shown, which are since Fund inception) include the returns of the Fund's oldest share class. These returns are adjusted to reflect any higher class-related operating expenses of the newer share classes, as applicable. Please visit columbiamanagement.com/investment-products/mutual-funds/appended-performance for more information.
The MSCI USA High Dividend Yield Index (Net) is composed of those securities in the MSCI USA Index that have higher-than-average dividend yield (e.g. 30% higher than that of the MSCI USA Index), a track record of consistent dividend payments and the capacity to sustain future dividend payments. The MSCI USA Index is a free float adjusted market capitalization index that is designed to measure large- and mid-cap U.S. equity market performance.
The Russell 1000 Value Index, an unmanaged index, measures the performance of those stocks in the Russell 1000 Index with lower price-to-book ratios and lower forecasted growth values.
Indices are not available for investment, are not professionally managed and do not reflect sales charges, fees, brokerage commissions, taxes (except the MSCI USA High Dividend Yield Index (Net), which reflects reinvested dividends net of withholding taxes) or other expenses of investing. Securities in the Fund may not match those in an index.
Semiannual Report 2014
4
Columbia Dividend Opportunity Fund
Portfolio Overview
(Unaudited)
Top Ten Holdings (%)
(at November 30, 2014) | |
Altria Group, Inc. | | | 4.5 | | |
Johnson & Johnson | | | 4.4 | | |
Procter & Gamble Co. (The) | | | 4.1 | | |
Microsoft Corp. | | | 3.9 | | |
Cisco Systems, Inc. | | | 3.8 | | |
Pfizer, Inc. | | | 3.4 | | |
Chevron Corp. | | | 2.6 | | |
Intel Corp. | | | 2.2 | | |
ConocoPhillips | | | 2.2 | | |
Lockheed Martin Corp. | | | 2.1 | | |
Percentages indicated are based upon total investments (excluding Money Market Funds).
For further detail about these holdings, please refer to the section entitled "Portfolio of Investments."
Fund holdings are as of the date given, are subject to change at any time, and are not recommendations to buy or sell any security.
Portfolio Breakdown (%)
(at November 30, 2014) | |
Common Stocks | | | 90.1 | | |
Consumer Discretionary | | | 3.1 | | |
Consumer Staples | | | 19.9 | | |
Energy | | | 10.4 | | |
Financials | | | 3.2 | | |
Health Care | | | 15.6 | | |
Industrials | | | 5.8 | | |
Information Technology | | | 13.3 | | |
Materials | | | 1.5 | | |
Telecommunication Services | | | 8.6 | | |
Utilities | | | 8.7 | | |
Equity-Linked Notes | | | 8.3 | | |
Money Market Funds | | | 1.6 | | |
Total | | | 100.0 | | |
Percentages indicated are based upon total investments. The Fund's portfolio composition is subject to change.
Portfolio Management
Steve Schroll
Paul Stocking
Dean Ramos, CFA
Morningstar Style BoxTM

The Morningstar Style BoxTM is based on a fund's portfolio holdings. For equity funds, the vertical axis shows the market capitalization of the stocks owned, and the horizontal axis shows investment style (value, blend, or growth). Information shown is based on the most recent data provided by Morningstar.
© 2015 Morningstar, Inc. All rights reserved. The Morningstar information contained herein: (1) is proprietary to Morningstar and/or its content providers; (2) may not be copied or distributed; and (3) is not warranted to be accurate, complete or timely. Neither Morningstar nor its content providers are responsible for any damages or losses arising from any use of this information.
Semiannual Report 2014
5
Columbia Dividend Opportunity Fund
Understanding Your Fund's Expenses
(Unaudited)
As an investor, you incur two types of costs. There are transaction costs, which generally include sales charges on purchases and may include redemption fees. There are also ongoing costs, which generally include management fees, distribution and/or service fees, and other fund expenses. The following information is intended to help you understand your ongoing costs (in dollars) of investing in the Fund and to help you compare these costs with the ongoing costs of investing in other mutual funds.
Analyzing Your Fund's Expenses
To illustrate these ongoing costs, we have provided examples and calculated the expenses paid by investors in each share class of the Fund during the period. The actual and hypothetical information in the table is based on an initial investment of $1,000 at the beginning of the period indicated and held for the entire period. Expense information is calculated two ways and each method provides you with different information. The amount listed in the "Actual" column is calculated using the Fund's actual operating expenses and total return for the period. You may use the Actual information, together with the amount invested, to estimate the expenses that you paid over the period. Simply divide your account value by $1,000 (for example, an $8,600 account value divided by $1,000 = 8.6), then multiply the results by the expenses paid during the period under the "Actual" column. The amount listed in the "Hypothetical" column assumes a 5% annual rate of return before expenses (which is not the Fund's actual return) and then applies the Fund's actual expense ratio for the period to the hypothetical return. You should not use the hypothetical account values and expenses to estimate either your actual account balance at the end of the period or the expenses you paid during the period. See "Compare With Other Funds" below for details on how to use the hypothetical data.
Compare With Other Funds
Since all mutual funds are required to include the same hypothetical calculations about expenses in shareholder reports, you can use this information to compare the ongoing cost of investing in the Fund with other funds. To do so, compare the hypothetical example with the 5% hypothetical examples that appear in the shareholder reports of other funds. As you compare hypothetical examples of other funds, it is important to note that hypothetical examples are meant to highlight the ongoing costs of investing in a fund only and do not reflect any transaction costs, such as sales charges, or redemption or exchange fees. Therefore, the hypothetical calculations are useful in comparing ongoing costs only, and will not help you determine the relative total costs of owning different funds. If transaction costs were included in these calculations, your costs would be higher.
June 1, 2014 – November 30, 2014
| | | Account Value at the Beginning
of the Period ($) | | Account Value at the End of the
Period ($) | | Expenses Paid During the
Period ($) | | Fund's Annualized
Expense Ratio (%) | |
| | | Actual | | Hypothetical | | Actual | | Hypothetical | | Actual | | Hypothetical | | Actual | |
Class A | | | 1,000.00 | | | | 1,000.00 | | | | 1,055.00 | | | | 1,019.95 | | | | 5.12 | | | | 5.04 | | | | 1.00 | | |
Class B | | | 1,000.00 | | | | 1,000.00 | | | | 1,050.60 | | | | 1,016.21 | | | | 8.95 | | | | 8.80 | | | | 1.75 | | |
Class C | | | 1,000.00 | | | | 1,000.00 | | | | 1,050.10 | | | | 1,016.21 | | | | 8.94 | | | | 8.80 | | | | 1.75 | | |
Class I | | | 1,000.00 | | | | 1,000.00 | | | | 1,055.90 | | | | 1,021.94 | | | | 3.08 | | | | 3.02 | | | | 0.60 | | |
Class K | | | 1,000.00 | | | | 1,000.00 | | | | 1,055.40 | | | | 1,020.44 | | | | 4.61 | | | | 4.53 | | | | 0.90 | | |
Class R | | | 1,000.00 | | | | 1,000.00 | | | | 1,053.80 | | | | 1,018.70 | | | | 6.40 | | | | 6.29 | | | | 1.25 | | |
Class R4 | | | 1,000.00 | | | | 1,000.00 | | | | 1,055.60 | | | | 1,021.19 | | | | 3.84 | | | | 3.78 | | | | 0.75 | | |
Class R5 | | | 1,000.00 | | | | 1,000.00 | | | | 1,056.70 | | | | 1,021.69 | | | | 3.33 | | | | 3.28 | | | | 0.65 | | |
Class W | | | 1,000.00 | | | | 1,000.00 | | | | 1,054.00 | | | | 1,019.95 | | | | 5.12 | | �� | | 5.04 | | | | 1.00 | | |
Class Y | | | 1,000.00 | | | | 1,000.00 | | | | 1,056.30 | | | | 1,021.94 | | | | 3.08 | | | | 3.02 | | | | 0.60 | | |
Class Z | | | 1,000.00 | | | | 1,000.00 | | | | 1,055.20 | | | | 1,021.19 | | | | 3.84 | | | | 3.78 | | | | 0.75 | | |
Expenses paid during the period are equal to the annualized expense ratio for each class as indicated above, multiplied by the average account value over the period and then multiplied by the number of days in the Fund's most recent fiscal half year and divided by 365.
Expenses do not include fees and expenses incurred indirectly by the Fund from its investment in underlying funds, including affiliated and non-affiliated pooled investment vehicles, such as mutual funds and exchange-traded funds.
Semiannual Report 2014
6
Columbia Dividend Opportunity Fund
Portfolio of Investments
November 30, 2014 (Unaudited)
(Percentages represent value of investments compared to net assets)
Common Stocks 90.1%
Issuer | | Shares | | Value ($) | |
Consumer Discretionary 3.1% | |
Household Durables 1.0% | |
Leggett & Platt, Inc. | | | 1,526,590 | | | | 64,254,173 | | |
Media 2.1% | |
Comcast Corp., Class A | | | 522,060 | | | | 29,778,302 | | |
National CineMedia, Inc. | | | 1,621,147 | | | | 22,955,442 | | |
Pearson PLC | | | 1,989,954 | | | | 38,263,265 | | |
Regal Entertainment Group, Class A | | | 1,947,366 | | | | 44,964,681 | | |
Total | | | | | 135,961,690 | | |
Total Consumer Discretionary | | | | | 200,215,863 | | |
Consumer Staples 19.9% | |
Beverages 3.8% | |
Anheuser-Busch InBev NV | | | 567,458 | | | | 66,651,516 | | |
Coca-Cola Co. (The) | | | 2,529,422 | | | | 113,393,988 | | |
PepsiCo, Inc. | | | 508,489 | | | | 50,899,749 | | |
SABMiller PLC | | | 281,624 | | | | 15,677,915 | | |
Total | | | | | 246,623,168 | | |
Food & Staples Retailing 1.3% | |
SYSCO Corp. | | | 1,333,973 | | | | 53,705,753 | | |
Wesfarmers Ltd. | | | 795,969 | | | | 28,053,347 | | |
Total | | | | | 81,759,100 | | |
Food Products 0.8% | |
Kraft Foods Group, Inc. | | | 421,971 | | | | 25,389,995 | | |
Unilever PLC | | | 700,800 | | | | 29,621,212 | | |
Total | | | | | 55,011,207 | | |
Household Products 5.1% | |
Kimberly-Clark Corp. | | | 555,569 | | | | 64,773,790 | | |
Procter & Gamble Co. (The) | | | 2,900,909 | | | | 262,329,201 | | |
Total | | | | | 327,102,991 | | |
Tobacco 8.9% | |
Altria Group, Inc. | | | 5,616,186 | | | | 282,269,508 | | |
British American Tobacco PLC | | | 1,093,388 | | | | 64,805,192 | | |
Imperial Tobacco Group PLC | | | 1,446,619 | | | | 66,884,705 | | |
Lorillard, Inc. | | | 1,214,546 | | | | 76,686,434 | | |
Philip Morris International, Inc. | | | 927,787 | | | | 80,652,524 | | |
Total | | | | | 571,298,363 | | |
Total Consumer Staples | | | | | 1,281,794,829 | | |
Common Stocks (continued)
Issuer | | Shares | | Value ($) | |
Energy 10.4% | |
Energy Equipment & Services 0.1% | |
Transocean Ltd. | | | 331,851 | | | | 6,972,189 | | |
Oil, Gas & Consumable Fuels 10.3% | |
| BP PLC, ADR | | | 850,386 | | | | 33,437,178 | | |
Chevron Corp. | | | 1,493,050 | | | | 162,548,353 | | |
ConocoPhillips | | | 2,097,748 | | | | 138,598,210 | | |
Enbridge Energy Management LLC(a)(b) | | | 1 | | | | 42 | | |
Kinder Morgan Management LLC(a)(c)(d)(e) | | | — | | | | — | | |
Newfield Exploration Co.(b) | | | 1 | | | | 27 | | |
Occidental Petroleum Corp. | | | 1,576,292 | | | | 125,740,813 | | |
Royal Dutch Shell PLC, Class A | | | 2,211,751 | | | | 73,672,636 | | |
Spectra Energy Corp. | | | 1,165,409 | | | | 44,145,693 | | |
Suncor Energy, Inc. | | | 602,242 | | | | 19,024,825 | | |
Total SA | | | 1,186,495 | | | | 66,375,878 | | |
Total | | | | | 663,543,655 | | |
Total Energy | | | | | 670,515,844 | | |
Financials 3.2% | |
Banks 2.0% | |
Bank of Montreal | | | 897,194 | | | | 66,114,226 | | |
JPMorgan Chase & Co. | | | 1,046,558 | | | | 62,960,929 | | |
Total | | | | | 129,075,155 | | |
Capital Markets 1.2% | |
BlackRock, Inc. | | | 145,126 | | | | 52,111,844 | | |
New Mountain Finance Corp. | | | 1,510,853 | | | | 22,798,772 | | |
Total | | | | | 74,910,616 | | |
Total Financials | | | | | 203,985,771 | | |
Health Care 15.6% | |
Pharmaceuticals 15.6% | |
AbbVie, Inc. | | | 1,884,287 | | | | 130,392,660 | | |
AstraZeneca PLC, ADR | | | 430,007 | | | | 31,893,619 | | |
Bristol-Myers Squibb Co. | | | 1,286,579 | | | | 75,972,490 | | |
Eli Lilly & Co. | | | 1,080,893 | | | | 73,630,431 | | |
Johnson & Johnson | | | 2,555,098 | | | | 276,589,359 | | |
Merck & Co., Inc. | | | 1,955,978 | | | | 118,141,071 | | |
Novartis AG, ADR | | | 427,173 | | | | 41,286,270 | | |
The accompanying Notes to Financial Statements are an integral part of this statement.
Semiannual Report 2014
7
Columbia Dividend Opportunity Fund
Portfolio of Investments (continued)
November 30, 2014 (Unaudited)
Common Stocks (continued)
Issuer | | Shares | | Value ($) | |
Pfizer, Inc. | | | 6,854,458 | | | | 213,516,367 | | |
Roche Holding AG, Genusschein Shares | | | 131,771 | | | | 39,466,523 | | |
Total | | | | | 1,000,888,790 | | |
Total Health Care | | | | | 1,000,888,790 | | |
Industrials 5.8% | |
Aerospace & Defense 2.6% | |
BAE Systems PLC | | | 4,426,190 | | | | 33,261,846 | | |
Lockheed Martin Corp. | | | 691,714 | | | | 132,504,734 | | |
Total | | | | | 165,766,580 | | |
Commercial Services & Supplies 1.0% | |
RR Donnelley & Sons Co. | | | 2,433,948 | | | | 40,987,684 | | |
West Corp. | | | 797,326 | | | | 24,908,464 | | |
Total | | | | | 65,896,148 | | |
Industrial Conglomerates 1.9% | |
General Electric Co. | | | 3,368,245 | | | | 89,224,810 | | |
Siemens AG, Registered Shares | | | 270,107 | | | | 31,960,874 | | |
Total | | | | | 121,185,684 | | |
Trading Companies & Distributors 0.3% | |
Fly Leasing Ltd., ADR | | | 1,302,431 | | | | 17,673,989 | | |
Total Industrials | | | | | 370,522,401 | | |
Information Technology 13.3% | |
Communications Equipment 3.7% | |
Cisco Systems, Inc. | | | 8,661,354 | | | | 239,399,825 | | |
IT Services 0.4% | |
Paychex, Inc. | | | 594,446 | | | | 28,182,685 | | |
Semiconductors & Semiconductor Equipment 4.0% | |
Analog Devices, Inc. | | | 454,261 | | | | 24,820,821 | | |
Intel Corp. | | | 3,722,134 | | | | 138,649,492 | | |
Maxim Integrated Products, Inc. | | | 510,099 | | | | 15,083,627 | | |
Microchip Technology, Inc. | | | 1,756,576 | | | | 79,309,406 | | |
Total | | | | | 257,863,346 | | |
Software 3.8% | |
Microsoft Corp. | | | 5,152,268 | | | | 246,329,933 | | |
Technology Hardware, Storage & Peripherals 1.4% | |
Apple, Inc. | | | 552,730 | | | | 65,736,179 | | |
Seagate Technology PLC | | | 316,721 | | | | 20,938,425 | | |
Total | | | | | 86,674,604 | | |
Total Information Technology | | | | | 858,450,393 | | |
Common Stocks (continued)
Issuer | | Shares | | Value ($) | |
Materials 1.5% | |
Chemicals 0.9% | |
LyondellBasell Industries NV, Class A | | | 717,538 | | | | 56,585,047 | | |
Metals & Mining 0.6% | |
BHP Billiton Ltd. | | | 1,090,330 | | | | 28,272,163 | | |
Rio Tinto PLC | | | 293,049 | | | | 13,697,943 | | |
Total | | | | | 41,970,106 | | |
Total Materials | | | | | 98,555,153 | | |
Telecommunication Services 8.6% | |
Diversified Telecommunication Services 7.6% | |
AT&T, Inc. | | | 2,715,687 | | | | 96,081,006 | | |
BCE, Inc. | | | 836,886 | | | | 39,330,349 | | |
BCE, Inc. | | | 1,054,445 | | | | 49,474,559 | | |
CenturyLink, Inc. | | | 2,558,216 | | | | 104,298,466 | | |
Orange SA | | | 2,155,176 | | | | 37,960,130 | | |
Telstra Corp., Ltd. | | | 8,086,112 | | | | 39,127,040 | | |
Verizon Communications, Inc. | | | 2,510,613 | | | | 127,011,912 | | |
Total | | | | | 493,283,462 | | |
Wireless Telecommunication Services 1.0% | |
Vodafone Group PLC | | | 5,778,032 | | | | 21,114,652 | | |
Vodafone Group PLC, ADR | | | 1,141,659 | | | | 41,727,637 | | |
Total | | | | | 62,842,289 | | |
Total Telecommunication Services | | | | | 556,125,751 | | |
Utilities 8.7% | |
Electric Utilities 4.9% | |
American Electric Power Co., Inc. | | | 506,552 | | | | 29,152,068 | | |
Duke Energy Corp. | | | 1,611,809 | | | | 130,395,348 | | |
Endesa SA | | | 483,054 | | | | 9,337,160 | | |
PPL Corp. | | | 1,132,016 | | | | 40,220,528 | | |
Southern Co. (The) | | | 720,853 | | | | 34,190,058 | | |
Terna Rete Elettrica Nazionale SpA | | | 8,330,680 | | | | 40,233,521 | | |
Xcel Energy, Inc. | | | 803,072 | | | | 27,256,264 | | |
Total | | | | | 310,784,947 | | |
Multi-Utilities 3.8% | |
Ameren Corp. | | | 793,655 | | | | 34,214,467 | | |
CMS Energy Corp. | | | 386,487 | | | | 12,792,720 | | |
DTE Energy Co. | | | 190,149 | | | | 15,489,538 | | |
National Grid PLC | | | 3,774,924 | | | | 54,836,799 | | |
The accompanying Notes to Financial Statements are an integral part of this statement.
Semiannual Report 2014
8
Columbia Dividend Opportunity Fund
Portfolio of Investments (continued)
November 30, 2014 (Unaudited)
Common Stocks (continued)
Issuer | | Shares | | Value ($) | |
PG&E Corp. | | | 717,601 | | | | 36,238,850 | | |
Public Service Enterprise Group, Inc. | | | 575,882 | | | | 24,060,350 | | |
SCANA Corp. | | | 296,344 | | | | 16,900,498 | | |
Sempra Energy | | | 455,146 | | | | 50,853,463 | | |
Total | | | | | 245,386,685 | | |
Total Utilities | | | | | 556,171,632 | | |
Total Common Stocks
(Cost: $4,992,489,670) | | | | | 5,797,226,427 | | |
Equity-Linked Notes 8.3%
Issuer | | Coupon
Rate | | Shares | | Value ($) | |
Deutsche Bank AG
Senior Unsecured
(linked to common stock of
Merck & Co.)(f)
12/15/14 | | | 15.230 | % | | | 1,953,970 | | | | 117,453,137 | | |
Goldman Sachs Group, Inc. (The)(f)
Senior Unsecured
(linked to common stock of
Apple, Inc.)
03/11/15 | | | 7.000 | % | | | 1,617,090 | | | | 184,852,792 | | |
(linked to common stock of
Dow Chemical Co. (The))
02/13/15 | | | 7.000 | % | | | 2,065,220 | | | | 100,545,318 | | |
JPMorgan Chase & Co.(f)
Senior Unsecured
(linked to common stock of
Delta Air Lines, Inc.)
12/23/14 | | | 8.260 | % | | | 596,000 | | | | 26,390,880 | | |
Equity-Linked Notes (continued)
Issuer | | Coupon
Rate | | Shares | | Value ($) | |
(linked to common stock of
KKR & Co., LLP)
01/20/15 | | | 12.300 | % | | | 916,292 | | | | 20,781,503 | | |
(linked to common stock of
Suncor Energy, Inc.)
01/20/15 | | | 10.600 | % | | | 87,235 | | | | 2,772,328 | | |
(linked to common stock of
United Continental
Holdings, Inc.)
12/23/14 | | | 12.580 | % | | | 587,500 | | | | 33,258,375 | | |
UBS AG
Senior Unsecured
(linked to common stock of
Blackstone Group LP (The))(f)
02/26/15 | | | 8.960 | % | | | 1,495,530 | | | | 49,860,970 | | |
Total Equity-Linked Notes
(Cost: $518,892,557) | | | | | | | 535,915,303 | | |
Money Market Funds 1.6%
| | | Shares | | Value ($) | |
Columbia Short-Term Cash Fund,
0.104%(g)(h) | | | 100,320,850 | | | | 100,320,850 | | |
Total Money Market Funds
(Cost: $100,320,850) | | | | | 100,320,850 | | |
Total Investments
(Cost: $5,611,703,077) | | | | | 6,433,462,580 | | |
Other Assets & Liabilities, Net | | | | | (466,899 | ) | |
Net Assets | | | | | 6,432,995,681 | | |
Notes to Portfolio of Investments
(a) Identifies securities considered by the Investment Manager to be illiquid as to their marketability. The aggregate value of such securities at November 30, 2014 was $42, which represents less than 0.01% of net assets. Information concerning such security holdings at November 30, 2014 is as follows:
Security Description | | Acquisition Dates | | Cost ($) | |
Enbridge Energy Management LLC | | 4/22/2009 | | | 11 | | |
Kinder Morgan Management LLC | | 11/18/2005 | | | — | | |
(b) Non-income producing.
(c) Negligible market value.
(d) Represents fair value as determined in good faith under procedures approved by the Board of Trustees. At November 30, 2014, the value of these securities amounted to $0.
(e) Represents fractional shares.
The accompanying Notes to Financial Statements are an integral part of this statement.
Semiannual Report 2014
9
Columbia Dividend Opportunity Fund
Portfolio of Investments (continued)
November 30, 2014 (Unaudited)
Notes to Portfolio of Investments (continued)
(f) Security exempt from registration pursuant to Rule 144A under the Securities Act of 1933. This security may be resold in transactions exempt from registration, normally to qualified institutional buyers. At November 30, 2014, the value of these securities amounted to $535,915,303 or 8.33% of net assets.
(g) The rate shown is the seven-day current annualized yield at November 30, 2014.
(h) As defined in the Investment Company Act of 1940, an affiliated company is one in which the Fund owns 5% or more of the company's outstanding voting securities, or a company which is under common ownership or control with the Fund. Holdings and transactions in these affiliated companies during the period ended November 30, 2014, are as follows:
Issuer | | Beginning
Cost ($) | | Purchase
Cost ($) | | Proceeds
From Sales ($) | | Ending
Cost ($) | | Dividends —
Affiliated
Issuers ($) | | Value ($) | |
Columbia Short-Term Cash Fund | | | 72,206,625 | | | | 1,447,176,161 | | | | (1,419,061,936 | ) | | | 100,320,850 | | | | 75,214 | | | | 100,320,850 | | |
Abbreviation Legend
ADR American Depositary Receipt
Fair Value Measurements
Generally accepted accounting principles (GAAP) require disclosure regarding the inputs and valuation techniques used to measure fair value and any changes in valuation inputs or techniques. In addition, investments shall be disclosed by major category.
The Fund categorizes its fair value measurements according to a three-level hierarchy that maximizes the use of observable inputs and minimizes the use of unobservable inputs by prioritizing that the most observable input be used when available. Observable inputs are those that market participants would use in pricing an investment based on market data obtained from sources independent of the reporting entity. Unobservable inputs are those that reflect the Fund's assumptions about the information market participants would use in pricing an investment. An investment's level within the fair value hierarchy is based on the lowest level of any input that is deemed significant to the asset or liability's fair value measurement. The input levels are not necessarily an indication of the risk or liquidity associated with investments at that level. For example, certain U.S. government securities are generally high quality and liquid, however, they are reflected as Level 2 because the inputs used to determine fair value may not always be quoted prices in an active market.
Fair value inputs are summarized in the three broad levels listed below:
> Level 1 — Valuations based on quoted prices for investments in active markets that the Fund has the ability to access at the measurement date (including NAV for open-end mutual funds). Valuation adjustments are not applied to Level 1 investments.
> Level 2 — Valuations based on other significant observable inputs (including quoted prices for similar securities, interest rates, prepayment speeds, credit risks, etc.).
> Level 3 — Valuations based on significant unobservable inputs (including the Fund's own assumptions and judgment in determining the fair value of investments).
Inputs that are used in determining fair value of an investment may include price information, credit data, volatility statistics, and other factors. These inputs can be either observable or unobservable. The availability of observable inputs can vary between investments, and is affected by various factors such as the type of investment, and the volume and level of activity for that investment or similar investments in the marketplace. The inputs will be considered by the Investment Manager, along with any other relevant factors in the calculation of an investment's fair value. The Fund uses prices and inputs that are current as of the measurement date, which may include periods of market dislocations. During these periods, the availability of prices and inputs may be reduced for many investments. This condition could cause an investment to be reclassified between the various levels within the hierarchy.
Foreign equity securities actively traded in markets where there is a significant delay in the local close relative to the New York Stock Exchange (NYSE) are classified as Level 2. The values of these securities may include an adjustment to reflect the impact of significant market movements following the close of local trading, as described in Note 2 to the financial statements — Security Valuation.
Investments falling into the Level 3 category are primarily supported by quoted prices from brokers and dealers participating in the market for those investments. However, these may be classified as Level 3 investments due to lack of market transparency and corroboration to support these quoted prices. Additionally, valuation models may be used as the pricing source for any remaining investments classified as Level 3. These models may rely on one or more significant unobservable inputs and/or significant assumptions by the Investment Manager. Inputs used in valuations may include, but are not limited to, financial statement analysis, capital account balances, discount rates and estimated cash flows, and comparable company data.
The accompanying Notes to Financial Statements are an integral part of this statement.
Semiannual Report 2014
10
Columbia Dividend Opportunity Fund
Portfolio of Investments (continued)
November 30, 2014 (Unaudited)
Fair Value Measurements (continued)
Under the direction of the Fund's Board of Trustees (the Board), the Investment Manager's Valuation Committee (the Committee) is responsible for overseeing the valuation procedures approved by the Board. The Committee consists of voting and non-voting members from various groups within the Investment Manager's organization, including operations and accounting, trading and investments, compliance, risk management and legal.
The Committee meets at least monthly to review and approve valuation matters, which may include a description of specific valuation determinations, data regarding pricing information received from approved pricing vendors and brokers and the results of Board-approved valuation control policies and procedures (the Policies). The Policies address, among other things, instances when market quotations are or are not readily available, including recommendations of third party pricing vendors and a determination of appropriate pricing methodologies; events that require specific valuation determinations and assessment of fair value techniques; securities with a potential for stale pricing, including those that are illiquid, restricted, or in default; and the effectiveness of third party pricing vendors, including periodic reviews of vendors. The Committee meets more frequently, as needed, to discuss additional valuation matters, which may include the need to review back-testing results, review time-sensitive information or approve related valuation actions. The Committee reports to the Board, with members of the Committee meeting with the Board at each of its regularly scheduled meetings to discuss valuation matters and actions during the period, similar to those described earlier.
For investments categorized as Level 3, the Committee monitors information similar to that described above, which may include: (i) data specific to the issuer or comparable issuers, (ii) general market or specific sector news and (iii) quoted prices and specific or similar security transactions. The Committee considers this data and any changes from prior periods in order to assess the reasonableness of observable and unobservable inputs, any assumptions or internal models used to value those securities and changes in fair value. This data is also used to corroborate, when available, information received from approved pricing vendors and brokers. Various factors impact the frequency of monitoring this information (which may occur as often as daily). However, the Committee may determine that changes to inputs, assumptions and models are not required as a result of the monitoring procedures performed.
The following table is a summary of the inputs used to value the Fund's investments at November 30, 2014:
Description | | Level 1
Quoted Prices in Active
Markets for Identical
Assets ($) | | Level 2
Other Significant
Observable Inputs ($) | | Level 3
Significant
Unobservable Inputs ($) | | Total ($) | |
Equity Securities | |
Common Stocks | |
Consumer Discretionary | | | 161,952,598 | | | | 38,263,265 | | | | — | | | | 200,215,863 | | |
Consumer Staples | | | 1,010,100,942 | | | | 271,693,887 | | | | — | | | | 1,281,794,829 | | |
Energy | | | 530,467,288 | | | | 140,048,556 | | | | — | (a) | | | 670,515,844 | | |
Financials | | | 203,985,771 | | | | — | | | | — | | | | 203,985,771 | | |
Health Care | | | 961,422,267 | | | | 39,466,523 | | | | — | | | | 1,000,888,790 | | |
Industrials | | | 305,299,681 | | | | 65,222,720 | | | | — | | | | 370,522,401 | | |
Information Technology | | | 858,450,393 | | | | — | | | | — | | | | 858,450,393 | | |
Materials | | | 56,585,047 | | | | 41,970,106 | | | | — | | | | 98,555,153 | | |
Telecommunication Services | | | 457,923,929 | | | | 98,201,822 | | | | — | | | | 556,125,751 | | |
Utilities | | | 451,764,152 | | | | 104,407,480 | | | | — | | | | 556,171,632 | | |
Total Equity Securities | | | 4,997,952,068 | | | | 799,274,359 | | | | — | (a) | | | 5,797,226,427 | | |
Other | |
Equity-Linked Notes | | | — | | | | 535,915,303 | | | | — | | | | 535,915,303 | | |
Total Other | | | — | | | | 535,915,303 | | | | — | | | | 535,915,303 | | |
Mutual Funds | |
Money Market Funds | | | 100,320,850 | | | | — | | | | — | | | | 100,320,850 | | |
Total Mutual Funds | | | 100,320,850 | | | | — | | | | — | | | | 100,320,850 | | |
Total | | | 5,098,272,918 | | | | 1,335,189,662 | | | | — | (a) | | | 6,433,462,580 | | |
(a) Negligible market value.
The accompanying Notes to Financial Statements are an integral part of this statement.
Semiannual Report 2014
11
Columbia Dividend Opportunity Fund
Portfolio of Investments (continued)
November 30, 2014 (Unaudited)
Fair Value Measurements (continued)
See the Portfolio of Investments for all investment classifications not indicated in the table.
The Fund's assets assigned to the Level 2 input category are generally valued using the market approach, in which a security's value is determined through reference to prices and information from market transactions for similar or identical assets. These assets include certain foreign securities for which a third party statistical pricing service may be employed for purposes of fair market valuation. The model utilized by such third party statistical pricing service takes into account a security's correlation to available market data including, but not limited to, intraday index, ADR, and ETF movements.
There were no transfers of financial assets between Levels 1 and 2 during the period.
The Fund does not hold any significant investments with unobservable inputs which are categorized as Level 3.
The Fund's assets assigned to the Level 3 category are valued utilizing the valuation technique deemed the most appropriate in the circumstances. Certain common stock classified as Level 3 are valued using an income approach. To determine fair value for these securities, management considered estimates of future distributions from the company assets or potential actions related to the respective company's restructuring. Significant increases (decreases) to any of these inputs would result in a significantly lower (higher) fair value measurement.
Financial Assets were transferred from Level 2 to Level 3 due to the utilization of unobservable market inputs. As a result, as of period end, management determined to value the security(s) under consistently applied procedures established by and under the general supervision of the Board of Trustees.
Transfers In | | Transfers Out | |
Level 2 ($) | | Level 3 ($) | | Level 2 ($) | | Level 3 ($) | |
| | — | | | | 2 | | | | 2 | | | | — | | |
Transfers in and/or out of Level 3 are determined based on the fair value at the beginning of the period for security positions held throughout the period.
The accompanying Notes to Financial Statements are an integral part of this statement.
Semiannual Report 2014
12
Columbia Dividend Opportunity Fund
Statement of Assets and Liabilities
November 30, 2014 (Unaudited)
Assets | |
Investments, at value | |
Unaffiliated issuers (identified cost $5,511,382,227) | | $ | 6,333,141,730 | | |
Affiliated issuers (identified cost $100,320,850) | | | 100,320,850 | | |
Total investments (identified cost $5,611,703,077) | | | 6,433,462,580 | | |
Cash | | | 8,589 | | |
Receivable for: | |
Capital shares sold | | | 4,373,480 | | |
Dividends | | | 23,530,620 | | |
Reclaims | | | 1,285,131 | | |
Prepaid expenses | | | 18,317 | | |
Other assets | | | 14,359 | | |
Total assets | | | 6,462,693,076 | | |
Liabilities | |
Payable for: | |
Investments purchased | | | 25,429,633 | | |
Capital shares purchased | | | 2,752,315 | | |
Investment management fees | | | 189,340 | | |
Distribution and/or service fees | | | 85,182 | | |
Transfer agent fees | | | 861,231 | | |
Administration fees | | | 16,203 | | |
Plan administration fees | | | 875 | | |
Compensation of board members | | | 150,704 | | |
Other expenses | | | 211,912 | | |
Total liabilities | | | 29,697,395 | | |
Net assets applicable to outstanding capital stock | | $ | 6,432,995,681 | | |
Represented by | |
Paid-in capital | | $ | 5,019,367,271 | | |
Undistributed net investment income | | | 35,454,803 | | |
Accumulated net realized gain | | | 556,509,196 | | |
Unrealized appreciation (depreciation) on: | |
Investments | | | 821,759,503 | | |
Foreign currency translations | | | (95,092 | ) | |
Total — representing net assets applicable to outstanding capital stock | | $ | 6,432,995,681 | | |
The accompanying Notes to Financial Statements are an integral part of this statement.
Semiannual Report 2014
13
Columbia Dividend Opportunity Fund
Statement of Assets and Liabilities (continued)
November 30, 2014 (Unaudited)
Class A | |
Net assets | | $ | 4,064,686,301 | | |
Shares outstanding | | | 366,009,336 | | |
Net asset value per share | | $ | 11.11 | | |
Maximum offering price per share(a) | | $ | 11.79 | | |
Class B | |
Net assets | | $ | 33,419,249 | | |
Shares outstanding | | | 3,035,331 | | |
Net asset value per share | | $ | 11.01 | | |
Class C | |
Net assets | | $ | 482,175,972 | | |
Shares outstanding | | | 44,149,377 | | |
Net asset value per share | | $ | 10.92 | | |
Class I | |
Net assets | | $ | 216,829,509 | | |
Shares outstanding | | | 19,441,415 | | |
Net asset value per share | | $ | 11.15 | | |
Class K | |
Net assets | | $ | 4,439,793 | | |
Shares outstanding | | | 398,244 | | |
Net asset value per share | | $ | 11.15 | | |
Class R | |
Net assets | | $ | 34,348,439 | | |
Shares outstanding | | | 3,095,606 | | |
Net asset value per share | | $ | 11.10 | | |
Class R4 | |
Net assets | | $ | 106,271,365 | | |
Shares outstanding | | | 9,448,015 | | |
Net asset value per share | | $ | 11.25 | | |
Class R5 | |
Net assets | | $ | 297,847,318 | | |
Shares outstanding | | | 26,692,015 | | |
Net asset value per share | | $ | 11.16 | | |
Class W | |
Net assets | | $ | 122,122 | | |
Shares outstanding | | | 10,983 | | |
Net asset value per share | | $ | 11.12 | | |
Class Y | |
Net assets | | $ | 65,201,997 | | |
Shares outstanding | | | 5,787,441 | | |
Net asset value per share | | $ | 11.27 | | |
Class Z | |
Net assets | | $ | 1,127,653,616 | | |
Shares outstanding | | | 101,211,618 | | |
Net asset value per share | | $ | 11.14 | | |
(a) The maximum offering price per share is calculated by dividing the net asset value per share by 1.0 minus the maximum sales charge of 5.75%.
The accompanying Notes to Financial Statements are an integral part of this statement.
Semiannual Report 2014
14
Columbia Dividend Opportunity Fund
Statement of Operations
Six Months Ended November 30, 2014 (Unaudited)
Net investment income | |
Income: | |
Dividends — unaffiliated issuers | | $ | 114,813,726 | | |
Dividends — affiliated issuers | | | 75,214 | | |
Interest | | | 12,581,351 | | |
Foreign taxes withheld | | | (3,267,731 | ) | |
Total income | | | 124,202,560 | | |
Expenses: | |
Investment management fees | | | 16,786,056 | | |
Distribution and/or service fees | |
Class A | | | 4,976,578 | | |
Class B | | | 179,864 | | |
Class C | | | 2,294,139 | | |
Class R | | | 82,358 | | |
Class W | | | 219 | | |
Transfer agent fees | |
Class A | | | 2,966,296 | | |
Class B | | | 26,790 | | |
Class C | | | 342,008 | | |
Class K | | | 1,008 | | |
Class R | | | 24,553 | | |
Class R4 | | | 68,631 | | |
Class R5 | | | 78,671 | | |
Class W | | | 130 | | |
Class Z | | | 793,870 | | |
Administration fees | | | 1,438,235 | | |
Plan administration fees | |
Class K | | | 5,346 | | |
Compensation of board members | | | 49,531 | | |
Custodian fees | | | 43,857 | | |
Printing and postage fees | | | 201,214 | | |
Registration fees | | | 138,580 | | |
Professional fees | | | 43,120 | | |
Other | | | 68,879 | | |
Total expenses | | | 30,609,933 | | |
Expense reductions | | | (60 | ) | |
Total net expenses | | | 30,609,873 | | |
Net investment income | | | 93,592,687 | | |
Realized and unrealized gain (loss) — net | |
Net realized gain (loss) on: | |
Investments | | | 243,395,596 | | |
Foreign currency translations | | | (468,247 | ) | |
Net realized gain | | | 242,927,349 | | |
Net change in unrealized appreciation (depreciation) on: | |
Investments | | | (1,523,614 | ) | |
Foreign currency translations | | | (69,725 | ) | |
Net change in unrealized depreciation | | | (1,593,339 | ) | |
Net realized and unrealized gain | | | 241,334,010 | | |
Net increase in net assets resulting from operations | | $ | 334,926,697 | | |
The accompanying Notes to Financial Statements are an integral part of this statement.
Semiannual Report 2014
15
Columbia Dividend Opportunity Fund
Statement of Changes in Net Assets
| | | Six Months Ended
November 30, 2014
(Unaudited) | | Year Ended
May 31,
2014 | |
Operations | |
Net investment income | | $ | 93,592,687 | | | $ | 166,878,841 | | |
Net realized gain | | | 242,927,349 | | | | 625,137,592 | | |
Net change in unrealized appreciation (depreciation) | | | (1,593,339 | ) | | | 173,417,780 | | |
Net increase in net assets resulting from operations | | | 334,926,697 | | | | 965,434,213 | | |
Distributions to shareholders | |
Net investment income | |
Class A | | | (52,955,701 | ) | | | (107,397,242 | ) | |
Class B | | | (350,690 | ) | | | (938,047 | ) | |
Class C | | | (4,421,026 | ) | | | (7,666,903 | ) | |
Class I | | | (3,157,903 | ) | | | (8,002,514 | ) | |
Class K | | | (59,137 | ) | | | (113,493 | ) | |
Class R | | | (390,230 | ) | | | (570,891 | ) | |
Class R4 | | | (1,273,517 | ) | | | (1,244,131 | ) | |
Class R5 | | | (5,017,922 | ) | | | (7,623,121 | ) | |
Class W | | | (2,512 | ) | | | (775,702 | ) | |
Class Y | | | (654,166 | ) | | | (839,687 | ) | |
Class Z | | | (15,289,951 | ) | | | (31,328,614 | ) | |
Net realized gains | |
Class A | | | — | | | | (192,539,299 | ) | |
Class B | | | — | | | | (2,141,190 | ) | |
Class C | | | — | | | | (19,198,060 | ) | |
Class I | | | — | | | | (9,044,764 | ) | |
Class K | | | — | | | | (182,448 | ) | |
Class R | | | — | | | | (1,162,986 | ) | |
Class R4 | | | — | | | | (2,549,539 | ) | |
Class R5 | | | — | | | | (12,996,935 | ) | |
Class W | | | — | | | | (15,949 | ) | |
Class Y | | | — | | | | (1,539,750 | ) | |
Class Z | | | — | | | | (50,252,924 | ) | |
Total distributions to shareholders | | | (83,572,755 | ) | | | (458,124,189 | ) | |
Decrease in net assets from capital stock activity | | | (6,880,082 | ) | | | (129,672,681 | ) | |
Total increase in net assets | | | 244,473,860 | | | | 377,637,343 | | |
Net assets at beginning of period | | | 6,188,521,821 | | | | 5,810,884,478 | | |
Net assets at end of period | | $ | 6,432,995,681 | | | $ | 6,188,521,821 | | |
Undistributed net investment income | | $ | 35,454,803 | | | $ | 25,434,871 | | |
The accompanying Notes to Financial Statements are an integral part of this statement.
Semiannual Report 2014
16
Columbia Dividend Opportunity Fund
Statement of Changes in Net Assets (continued)
| | | Six Months Ended November 30, 2014
(Unaudited) | | Year Ended May 31, 2014 | |
| | | Shares | | Dollars ($) | | Shares | | Dollars ($) | |
Capital stock activity | |
Class A shares | |
Subscriptions(a) | | | 27,408,585 | | | | 295,491,240 | | | | 107,456,138 | | | | 1,085,316,778 | | |
Distributions reinvested | | | 4,764,811 | | | | 51,596,676 | | | | 29,880,253 | | | | 293,889,247 | | |
Redemptions | | | (41,965,499 | ) | | | (452,074,372 | ) | | | (138,331,998 | ) | | | (1,395,305,489 | ) | |
Net decrease | | | (9,792,103 | ) | | | (104,986,456 | ) | | | (995,607 | ) | | | (16,099,464 | ) | |
Class B shares | |
Subscriptions | | | 55,208 | | | | 590,111 | | | | 344,191 | | | | 3,444,072 | | |
Distributions reinvested | | | 32,085 | | | | 344,797 | | | | 311,201 | | | | 3,036,016 | | |
Redemptions(a) | | | (757,497 | ) | | | (8,069,810 | ) | | | (2,425,936 | ) | | | (24,439,679 | ) | |
Net decrease | | | (670,204 | ) | | | (7,134,902 | ) | | | (1,770,544 | ) | | | (17,959,591 | ) | |
Class C shares | |
Subscriptions | | | 4,376,327 | | | | 46,352,512 | | | | 13,020,039 | | | | 129,675,626 | | |
Distributions reinvested | | | 369,234 | | | | 3,935,736 | | | | 2,461,417 | | | | 23,867,144 | | |
Redemptions | | | (3,020,706 | ) | | | (32,022,991 | ) | | | (5,411,061 | ) | | | (54,029,241 | ) | |
Net increase | | | 1,724,855 | | | | 18,265,257 | | | | 10,070,395 | | | | 99,513,529 | | |
Class I shares | |
Subscriptions | | | 362,464 | | | | 3,946,442 | | | | 1,118,817 | | | | 11,128,666 | | |
Distributions reinvested | | | 290,656 | | | | 3,157,859 | | | | 1,729,333 | | | | 17,046,034 | | |
Redemptions | | | (413,466 | ) | | | (4,480,021 | ) | | | (15,227,765 | ) | | | (160,404,863 | ) | |
Net increase (decrease) | | | 239,654 | | | | 2,624,280 | | | | (12,379,615 | ) | | | (132,230,163 | ) | |
Class K shares | |
Subscriptions | | | 29,619 | | | | 321,044 | | | | 61,695 | | | | 626,655 | | |
Distributions reinvested | | | 5,441 | | | | 59,136 | | | | 29,973 | | | | 295,941 | | |
Redemptions | | | (43,008 | ) | | | (465,447 | ) | | | (87,886 | ) | | | (897,169 | ) | |
Net increase (decrease) | | | (7,948 | ) | | | (85,267 | ) | | | 3,782 | | | | 25,427 | | |
Class R shares | |
Subscriptions | | | 737,490 | | | | 7,938,084 | | | | 1,541,177 | | | | 15,630,728 | | |
Distributions reinvested | | | 30,881 | | | | 334,309 | | | | 146,515 | | | | 1,442,462 | | |
Redemptions | | | (630,638 | ) | | | (6,797,721 | ) | | | (498,106 | ) | | | (5,056,135 | ) | |
Net increase | | | 137,733 | | | | 1,474,672 | | | | 1,189,586 | | | | 12,017,055 | | |
Class R4 shares | |
Subscriptions | | | 2,805,946 | | | | 30,354,498 | | | | 7,032,011 | | | | 72,134,128 | | |
Distributions reinvested | | | 116,068 | | | | 1,273,197 | | | | 379,751 | | | | 3,791,944 | | |
Redemptions | | | (830,492 | ) | | | (9,085,030 | ) | | | (1,283,886 | ) | | | (13,178,138 | ) | |
Net increase | | | 2,091,522 | | | | 22,542,665 | | | | 6,127,876 | | | | 62,747,934 | | |
The accompanying Notes to Financial Statements are an integral part of this statement.
Semiannual Report 2014
17
Columbia Dividend Opportunity Fund
Statement of Changes in Net Assets (continued)
| | | Six Months Ended November 30, 2014
(Unaudited) | | Year Ended May 31, 2014 | |
| | | Shares | | Dollars ($) | | Shares | | Dollars ($) | |
Capital stock activity (continued) | |
Class R5 shares | |
Subscriptions | | | 5,451,884 | | | | 58,719,015 | | | | 16,917,879 | | | | 172,147,740 | | |
Distributions reinvested | | | 400,887 | | | | 4,359,776 | | | | 1,829,882 | | | | 18,088,125 | | |
Redemptions | | | (8,098,705 | ) | | | (89,334,661 | ) | | | (9,201,091 | ) | | | (93,469,406 | ) | |
Net increase (decrease) | | | (2,245,934 | ) | | | (26,255,870 | ) | | | 9,546,670 | | | | 96,766,459 | | |
Class W shares | |
Subscriptions | | | 1 | | | | 7 | | | | 635,993 | | | | 6,380,217 | | |
Distributions reinvested | | | 228 | | | | 2,476 | | | | 81,373 | | | | 791,208 | | |
Redemptions | | | (8,092 | ) | | | (87,491 | ) | | | (13,731,919 | ) | | | (140,521,852 | ) | |
Net decrease | | | (7,863 | ) | | | (85,008 | ) | | | (13,014,553 | ) | | | (133,350,427 | ) | |
Class Y shares | |
Subscriptions | | | 2,487,875 | | | | 27,684,056 | | | | 3,496,329 | | | | 35,642,821 | | |
Distributions reinvested | | | 59,575 | | | | 654,166 | | | | 230,135 | | | | 2,303,105 | | |
Redemptions | | | (301,620 | ) | | | (3,289,190 | ) | | | (592,724 | ) | | | (6,103,477 | ) | |
Net increase | | | 2,245,830 | | | | 25,049,032 | | | | 3,133,740 | | | | 31,842,449 | | |
Class Z shares | |
Subscriptions | | | 16,883,796 | | | | 182,974,371 | | | | 24,022,144 | | | | 243,699,050 | | |
Distributions reinvested | | | 1,171,953 | | | | 12,728,847 | | | | 6,967,801 | | | | 68,717,653 | | |
Redemptions | | | (12,352,778 | ) | | | (133,991,703 | ) | | | (43,883,978 | ) | | | (445,362,592 | ) | |
Net increase (decrease) | | | 5,702,971 | | | | 61,711,515 | | | | (12,894,033 | ) | | | (132,945,889 | ) | |
Total net decrease | | | (581,487 | ) | | | (6,880,082 | ) | | | (10,982,303 | ) | | | (129,672,681 | ) | |
(a) Includes conversions of Class B shares to Class A shares, if any.
The accompanying Notes to Financial Statements are an integral part of this statement.
Semiannual Report 2014
18
Columbia Dividend Opportunity Fund
The following tables are intended to help you understand the Fund's financial performance. Certain information reflects financial results for a single share of a class held for the periods shown. Per share net investment income (loss) amounts are calculated based on average shares outstanding during the period. Total return assumes reinvestment of all dividends and distributions, if any. Total return does not reflect payment of sales charges, if any. Total return and portfolio turnover are not annualized for periods of less than one year. The portfolio turnover rate is calculated without regard to purchase and sales transactions of short-term instruments and certain derivatives, if any. If such transactions were included, the Fund's portfolio turnover rate may be higher.
| | | Six Months Ended
November 30, 2014 | | Year Ended May 31, | | Year Ended June 30, | |
Class A | | (Unaudited) | | 2014 | | 2013 | | 2012(a) | | 2011 | | 2010 | | 2009 | |
Per share data | |
Net asset value,
beginning of period | | $ | 10.67 | | | $ | 9.83 | | | $ | 8.14 | | | $ | 8.31 | | | $ | 6.31 | | | $ | 5.58 | | | $ | 7.72 | | |
Income from investment
operations: | |
Net investment income | | | 0.16 | | | | 0.28 | | | | 0.30 | | | | 0.26 | | | | 0.31 | | | | 0.23 | | | | 0.25 | | |
Net realized and
unrealized gain (loss) | | | 0.42 | | | | 1.34 | | | | 1.69 | | | | (0.22 | ) | | | 1.98 | | | | 0.76 | | | | (2.10 | ) | |
Total from investment
operations | | | 0.58 | | | | 1.62 | | | | 1.99 | | | | 0.04 | | | | 2.29 | | | | 0.99 | | | | (1.85 | ) | |
Less distributions to
shareholders: | |
Net investment income | | | (0.14 | ) | | | (0.28 | ) | | | (0.30 | ) | | | (0.21 | ) | | | (0.29 | ) | | | (0.26 | ) | | | (0.29 | ) | |
Net realized gains | | | — | | | | (0.50 | ) | | | — | | | | — | | | | — | | | | — | | | | — | | |
Total distributions to
shareholders | | | (0.14 | ) | | | (0.78 | ) | | | (0.30 | ) | | | (0.21 | ) | | | (0.29 | ) | | | (0.26 | ) | | | (0.29 | ) | |
Net asset value, end
of period | | $ | 11.11 | | | $ | 10.67 | | | $ | 9.83 | | | $ | 8.14 | | | $ | 8.31 | | | $ | 6.31 | | | $ | 5.58 | | |
Total return | | | 5.50 | % | | | 17.30 | % | | | 25.05 | % | | | 0.58 | % | | | 36.74 | % | | | 17.60 | % | | | (23.98 | %) | |
Ratios to average net assets(b) | |
Total gross expenses | | | 1.00 | %(c) | | | 1.01 | % | | | 1.05 | % | | | 1.08 | %(c) | | | 1.16 | % | | | 1.20 | % | | | 1.13 | % | |
Total net expenses(d) | | | 1.00 | %(c)(e) | | | 1.01 | %(e) | | | 1.05 | %(e) | | | 1.08 | %(c)(e) | | | 1.16 | % | | | 1.16 | % | | | 1.03 | % | |
Net investment income | | | 2.97 | %(c) | | | 2.75 | % | | | 3.32 | % | | | 3.49 | %(c) | | | 4.01 | % | | | 3.51 | % | | | 4.23 | % | |
Supplemental data | |
Net assets, end of period
(in thousands) | | $ | 4,064,686 | | | $ | 4,011,117 | | | $ | 3,705,617 | | | $ | 2,660,013 | | | $ | 1,630,280 | | | $ | 883,208 | | | $ | 793,421 | | |
Portfolio turnover | | | 39 | % | | | 73 | % | | | 62 | % | | | 28 | % | | | 105 | % | | | 23 | % | | | 21 | % | |
Notes to Financial Highlights
(a) For the period from July 1, 2011 to May 31, 2012. During the period, the Fund's fiscal year end was changed from June 30 to May 31.
(b) In addition to the fees and expenses that the Fund bears directly, the Fund indirectly bears a pro rata share of the fees and expenses of any other funds in which it invests. Such indirect expenses are not included in the Fund's reported expense ratios.
(c) Annualized.
(d) Total net expenses include the impact of certain fee waivers/expense reimbursements made by the Investment Manager and certain of its affiliates, if applicable.
(e) The benefits derived from expense reductions had an impact of less than 0.01%.
The accompanying Notes to Financial Statements are an integral part of this statement.
Semiannual Report 2014
19
Columbia Dividend Opportunity Fund
Financial Highlights (continued)
| | | Six Months Ended
November 30, 2014 | | Year Ended May 31, | | Year Ended June 30, | |
Class B | | (Unaudited) | | 2014 | | 2013 | | 2012(a) | | 2011 | | 2010 | | 2009 | |
Per share data | |
Net asset value, beginning
of period | | $ | 10.58 | | | $ | 9.76 | | | $ | 8.08 | | | $ | 8.26 | | | $ | 6.27 | | | $ | 5.54 | | | $ | 7.67 | | |
Income from investment operations: | |
Net investment income | | | 0.12 | | | | 0.20 | | | | 0.23 | | | | 0.20 | | | | 0.27 | | | | 0.18 | | | | 0.21 | | |
Net realized and unrealized
gain (loss) | | | 0.41 | | | | 1.32 | | | | 1.69 | | | | (0.22 | ) | | | 1.95 | | | | 0.76 | | | | (2.10 | ) | |
Total from investment operations | | | 0.53 | | | | 1.52 | | | | 1.92 | | | | (0.02 | ) | | | 2.22 | | | | 0.94 | | | | (1.89 | ) | |
Less distributions to shareholders: | |
Net investment income | | | (0.10 | ) | | | (0.20 | ) | | | (0.24 | ) | | | (0.16 | ) | | | (0.23 | ) | | | (0.21 | ) | | | (0.24 | ) | |
Net realized gains | | | — | | | | (0.50 | ) | | | — | | | | — | | | | — | | | | — | | | | — | | |
Total distributions to shareholders | | | (0.10 | ) | | | (0.70 | ) | | | (0.24 | ) | | | (0.16 | ) | | | (0.23 | ) | | | (0.21 | ) | | | (0.24 | ) | |
Net asset value, end of period | | $ | 11.01 | | | $ | 10.58 | | | $ | 9.76 | | | $ | 8.08 | | | $ | 8.26 | | | $ | 6.27 | | | $ | 5.54 | | |
Total return | | | 5.06 | % | | | 16.33 | % | | | 24.21 | % | | | (0.14 | %) | | | 35.72 | % | | | 16.79 | % | | | (24.60 | %) | |
Ratios to average net assets(b) | |
Total gross expenses | | | 1.75 | %(c) | | | 1.76 | % | | | 1.80 | % | | | 1.83 | %(c) | | | 1.92 | % | | | 1.96 | % | | | 1.89 | % | |
Total net expenses(d) | | | 1.75 | %(c)(e) | | | 1.76 | %(e) | | | 1.80 | %(e) | | | 1.83 | %(c)(e) | | | 1.91 | % | | | 1.92 | % | | | 1.79 | % | |
Net investment income | | | 2.20 | %(c) | | | 1.98 | % | | | 2.58 | % | | | 2.68 | %(c) | | | 3.50 | % | | | 2.73 | % | | | 3.45 | % | |
Supplemental data | |
Net assets, end of period
(in thousands) | | $ | 33,419 | | | $ | 39,217 | | | $ | 53,428 | | | $ | 56,776 | | | $ | 65,777 | | | $ | 68,145 | | | $ | 91,922 | | |
Portfolio turnover | | | 39 | % | | | 73 | % | | | 62 | % | | | 28 | % | | | 105 | % | | | 23 | % | | | 21 | % | |
Notes to Financial Highlights
(a) For the period from July 1, 2011 to May 31, 2012. During the period, the Fund's fiscal year end was changed from June 30 to May 31.
(b) In addition to the fees and expenses that the Fund bears directly, the Fund indirectly bears a pro rata share of the fees and expenses of any other funds in which it invests. Such indirect expenses are not included in the Fund's reported expense ratios.
(c) Annualized.
(d) Total net expenses include the impact of certain fee waivers/expense reimbursements made by the Investment Manager and certain of its affiliates, if applicable.
(e) The benefits derived from expense reductions had an impact of less than 0.01%.
The accompanying Notes to Financial Statements are an integral part of this statement.
Semiannual Report 2014
20
Columbia Dividend Opportunity Fund
Financial Highlights (continued)
| | | Six Months Ended
November 30, 2014 | | Year Ended May 31, | | Year Ended June 30, | |
Class C | | (Unaudited) | | 2014 | | 2013 | | 2012(a) | | 2011 | | 2010 | | 2009 | |
Per share data | |
Net asset value, beginning
of period | | $ | 10.50 | | | $ | 9.68 | | | $ | 8.02 | | | $ | 8.22 | | | $ | 6.25 | | | $ | 5.53 | | | $ | 7.65 | | |
Income from investment
operations: | |
Net investment income | | | 0.12 | | | | 0.20 | | | | 0.23 | | | | 0.20 | | | | 0.25 | | | | 0.18 | | | | 0.20 | | |
Net realized and unrealized
gain (loss) | | | 0.40 | | | | 1.32 | | | | 1.68 | | | | (0.23 | ) | | | 1.96 | | | | 0.76 | | | | (2.07 | ) | |
Total from investment
operations | | | 0.52 | | | | 1.52 | | | | 1.91 | | | | (0.03 | ) | | | 2.21 | | | | 0.94 | | | | (1.87 | ) | |
Less distributions to
shareholders: | |
Net investment income | | | (0.10 | ) | | | (0.20 | ) | | | (0.25 | ) | | | (0.17 | ) | | | (0.24 | ) | | | (0.22 | ) | | | (0.25 | ) | |
Net realized gains | | | — | | | | (0.50 | ) | | | — | | | | — | | | | — | | | | — | | | | — | | |
Total distributions to
shareholders | | | (0.10 | ) | | | (0.70 | ) | | | (0.25 | ) | | | (0.17 | ) | | | (0.24 | ) | | | (0.22 | ) | | | (0.25 | ) | |
Net asset value, end of period | | $ | 10.92 | | | $ | 10.50 | | | $ | 9.68 | | | $ | 8.02 | | | $ | 8.22 | | | $ | 6.25 | | | $ | 5.53 | | |
Total return | | | 5.01 | % | | | 16.46 | % | | | 24.25 | % | | | (0.25 | %) | | | 35.71 | % | | | 16.77 | % | | | (24.51 | %) | |
Ratios to average net assets(b) | |
Total gross expenses | | | 1.75 | %(c) | | | 1.76 | % | | | 1.80 | % | | | 1.84 | %(c) | | | 1.91 | % | | | 1.95 | % | | | 1.88 | % | |
Total net expenses(d) | | | 1.75 | %(c)(e) | | | 1.76 | %(e) | | | 1.80 | %(e) | | | 1.84 | %(c)(e) | | | 1.90 | % | | | 1.91 | % | | | 1.78 | % | |
Net investment income | | | 2.23 | %(c) | | | 2.06 | % | | | 2.56 | % | | | 2.76 | %(c) | | | 3.26 | % | | | 2.77 | % | | | 3.46 | % | |
Supplemental data | |
Net assets, end of period
(in thousands) | | $ | 482,176 | | | $ | 445,402 | | | $ | 313,275 | | | $ | 143,150 | | | $ | 52,281 | | | $ | 21,354 | | | $ | 14,770 | | |
Portfolio turnover | | | 39 | % | | | 73 | % | | | 62 | % | | | 28 | % | | | 105 | % | | | 23 | % | | | 21 | % | |
Notes to Financial Highlights
(a) For the period from July 1, 2011 to May 31, 2012. During the period, the Fund's fiscal year end was changed from June 30 to May 31.
(b) In addition to the fees and expenses that the Fund bears directly, the Fund indirectly bears a pro rata share of the fees and expenses of any other funds in which it invests. Such indirect expenses are not included in the Fund's reported expense ratios.
(c) Annualized.
(d) Total net expenses include the impact of certain fee waivers/expense reimbursements made by the Investment Manager and certain of its affiliates, if applicable.
(e) The benefits derived from expense reductions had an impact of less than 0.01%.
The accompanying Notes to Financial Statements are an integral part of this statement.
Semiannual Report 2014
21
Columbia Dividend Opportunity Fund
Financial Highlights (continued)
| | | Six Months Ended
November 30, 2014 | | Year Ended May 31, | | Year Ended June 30, | |
Class I | | (Unaudited) | | 2014 | | 2013 | | 2012(a) | | 2011 | | 2010 | | 2009 | |
Per share data | |
Net asset value, beginning
of period | | $ | 10.72 | | | $ | 9.87 | | | $ | 8.17 | | | $ | 8.34 | | | $ | 6.32 | | | $ | 5.59 | | | $ | 7.73 | | |
Income from investment
operations: | |
Net investment income | | | 0.18 | | | | 0.31 | | | | 0.34 | | | | 0.29 | | | | 0.35 | | | | 0.26 | | | | 0.27 | | |
Net realized and unrealized
gain (loss) | | | 0.41 | | | | 1.36 | | | | 1.70 | | | | (0.23 | ) | | | 1.99 | | | | 0.76 | | | | (2.10 | ) | |
Total from investment operations | | | 0.59 | | | | 1.67 | | | | 2.04 | | | | 0.06 | | | | 2.34 | | | | 1.02 | | | | (1.83 | ) | |
Less distributions to
shareholders: | |
Net investment income | | | (0.16 | ) | | | (0.32 | ) | | | (0.34 | ) | | | (0.23 | ) | | | (0.32 | ) | | | (0.29 | ) | | | (0.31 | ) | |
Net realized gains | | | — | | | | (0.50 | ) | | | — | | | | — | | | | — | | | | — | | | | — | | |
Total distributions to shareholders | | | (0.16 | ) | | | (0.82 | ) | | | (0.34 | ) | | | (0.23 | ) | | | (0.32 | ) | | | (0.29 | ) | | | (0.31 | ) | |
Net asset value, end of period | | $ | 11.15 | | | $ | 10.72 | | | $ | 9.87 | | | $ | 8.17 | | | $ | 8.34 | | | $ | 6.32 | | | $ | 5.59 | | |
Total return | | | 5.59 | % | | | 17.83 | % | | | 25.59 | % | | | 0.90 | % | | | 37.51 | % | | | 18.06 | % | | | (23.66 | %) | |
Ratios to average net assets(b) | |
Total gross expenses | | | 0.60 | %(c) | | | 0.60 | % | | | 0.62 | % | | | 0.66 | %(c) | | | 0.75 | % | | | 0.75 | % | | | 0.66 | % | |
Total net expenses(d) | | | 0.60 | %(c) | | | 0.60 | % | | | 0.62 | % | | | 0.66 | %(c) | | | 0.75 | % | | | 0.72 | % | | | 0.66 | % | |
Net investment income | | | 3.37 | %(c) | | | 3.08 | % | | | 3.76 | % | | | 3.90 | %(c) | | | 4.58 | % | | | 3.94 | % | | | 4.60 | % | |
Supplemental data | |
Net assets, end of period
(in thousands) | | $ | 216,830 | | | $ | 205,817 | | | $ | 311,786 | | | $ | 306,301 | | | $ | 232,481 | | | $ | 165,701 | | | $ | 158,905 | | |
Portfolio turnover | | | 39 | % | | | 73 | % | | | 62 | % | | | 28 | % | | | 105 | % | | | 23 | % | | | 21 | % | |
Notes to Financial Highlights
(a) For the period from July 1, 2011 to May 31, 2012. During the period, the Fund's fiscal year end was changed from June 30 to May 31.
(b) In addition to the fees and expenses that the Fund bears directly, the Fund indirectly bears a pro rata share of the fees and expenses of any other funds in which it invests. Such indirect expenses are not included in the Fund's reported expense ratios.
(c) Annualized.
(d) Total net expenses include the impact of certain fee waivers/expense reimbursements made by the Investment Manager and certain of its affiliates, if applicable.
The accompanying Notes to Financial Statements are an integral part of this statement.
Semiannual Report 2014
22
Columbia Dividend Opportunity Fund
Financial Highlights (continued)
| | | Six Months Ended
November 30, 2014 | | Year Ended May 31, | | Year Ended June 30, | |
Class K | | (Unaudited) | | 2014 | | 2013 | | 2012(a) | | 2011 | | 2010 | | 2009 | |
Per share data | |
Net asset value, beginning
of period | | $ | 10.71 | | | $ | 9.87 | | | $ | 8.17 | | | $ | 8.34 | | | $ | 6.33 | | | $ | 5.59 | | | $ | 7.74 | | |
Income from investment
operations: | |
Net investment income | | | 0.17 | | | | 0.29 | | | | 0.31 | | | | 0.27 | | | | 0.32 | | | | 0.24 | | | | 0.27 | | |
Net realized and unrealized
gain (loss) | | | 0.42 | | | | 1.34 | | | | 1.71 | | | | (0.23 | ) | | | 1.99 | | | | 0.77 | | | | (2.11 | ) | |
Total from investment operations | | | 0.59 | | | | 1.63 | | | | 2.02 | | | | 0.04 | | | | 2.31 | | | | 1.01 | | | | (1.84 | ) | |
Less distributions to
shareholders: | |
Net investment income | | | (0.15 | ) | | | (0.29 | ) | | | (0.32 | ) | | | (0.21 | ) | | | (0.30 | ) | | | (0.27 | ) | | | (0.31 | ) | |
Net realized gains | | | — | | | | (0.50 | ) | | | — | | | | — | | | | — | | | | — | | | | — | | |
Total distributions to shareholders | | | (0.15 | ) | | | (0.79 | ) | | | (0.32 | ) | | | (0.21 | ) | | | (0.30 | ) | | | (0.27 | ) | | | (0.31 | ) | |
Net asset value, end of period | | $ | 11.15 | | | $ | 10.71 | | | $ | 9.87 | | | $ | 8.17 | | | $ | 8.34 | | | $ | 6.33 | | | $ | 5.59 | | |
Total return | | | 5.54 | % | | | 17.37 | % | | | 25.25 | % | | | 0.68 | % | | | 36.95 | % | | | 17.90 | % | | | (23.86 | %) | |
Ratios to average net assets(b) | |
Total gross expenses | | | 0.90 | %(c) | | | 0.91 | % | | | 0.90 | % | | | 0.94 | %(c) | | | 1.01 | % | | | 1.06 | % | | | 0.96 | % | |
Total net expenses(d) | | | 0.90 | %(c) | | | 0.91 | % | | | 0.90 | % | | | 0.94 | %(c) | | | 1.01 | % | | | 1.02 | % | | | 0.75 | % | |
Net investment income | | | 3.08 | %(c) | | | 2.88 | % | | | 3.47 | % | | | 3.60 | %(c) | | | 4.05 | % | | | 3.65 | % | | | 4.50 | % | |
Supplemental data | |
Net assets, end of period
(in thousands) | | $ | 4,440 | | | $ | 4,352 | | | $ | 3,972 | | | $ | 3,656 | | | $ | 3,795 | | | $ | 1,456 | | | $ | 490 | | |
Portfolio turnover | | | 39 | % | | | 73 | % | | | 62 | % | | | 28 | % | | | 105 | % | | | 23 | % | | | 21 | % | |
Notes to Financial Highlights
(a) For the period from July 1, 2011 to May 31, 2012. During the period, the Fund's fiscal year end was changed from June 30 to May 31.
(b) In addition to the fees and expenses that the Fund bears directly, the Fund indirectly bears a pro rata share of the fees and expenses of any other funds in which it invests. Such indirect expenses are not included in the Fund's reported expense ratios.
(c) Annualized.
(d) Total net expenses include the impact of certain fee waivers/expense reimbursements made by the Investment Manager and certain of its affiliates, if applicable.
The accompanying Notes to Financial Statements are an integral part of this statement.
Semiannual Report 2014
23
Columbia Dividend Opportunity Fund
Financial Highlights (continued)
| | | Six Months Ended
November 30, 2014 | | Year Ended May 31, | | Year Ended June 30, | |
Class R | | (Unaudited) | | 2014 | | 2013 | | 2012(a) | | 2011 | | 2010 | | 2009(b) | |
Per share data | |
Net asset value, beginning
of period | | $ | 10.66 | | | $ | 9.83 | | | $ | 8.14 | | | $ | 8.33 | | | $ | 6.32 | | | $ | 5.59 | | | $ | 7.67 | | |
Income from investment
operations: | |
Net investment income | | | 0.15 | | | | 0.26 | | | | 0.28 | | | | 0.25 | | | | 0.29 | | | | 0.25 | | | | 0.23 | | |
Net realized and unrealized
gain (loss) | | | 0.42 | | | | 1.32 | | | | 1.70 | | | | (0.24 | ) | | | 1.99 | | | | 0.72 | | | | (2.03 | ) | |
Total from investment operations | | | 0.57 | | | | 1.58 | | | | 1.98 | | | | 0.01 | | | | 2.28 | | | | 0.97 | | | | (1.80 | ) | |
Less distributions to
shareholders: | |
Net investment income | | | (0.13 | ) | | | (0.25 | ) | | | (0.29 | ) | | | (0.20 | ) | | | (0.27 | ) | | | (0.24 | ) | | | (0.28 | ) | |
Net realized gains | | | — | | | | (0.50 | ) | | | — | | | | — | | | | — | | | | — | | | | — | | |
Total distributions to shareholders | | | (0.13 | ) | | | (0.75 | ) | | | (0.29 | ) | | | (0.20 | ) | | | (0.27 | ) | | | (0.24 | ) | | | (0.28 | ) | |
Net asset value, end of period | | $ | 11.10 | | | $ | 10.66 | | | $ | 9.83 | | | $ | 8.14 | | | $ | 8.33 | | | $ | 6.32 | | | $ | 5.59 | | |
Total return | | | 5.38 | % | | | 16.89 | % | | | 24.84 | % | | | 0.31 | % | | | 36.53 | % | | | 17.19 | % | | | (23.53 | %) | |
Ratios to average net assets(c) | |
Total gross expenses | | | 1.25 | %(d) | | | 1.26 | % | | | 1.30 | % | | | 1.32 | %(d) | | | 1.42 | % | | | 1.58 | % | | | 1.46 | %(d) | |
Total net expenses(e) | | | 1.25 | %(d)(f) | | | 1.26 | %(f) | | | 1.30 | %(f) | | | 1.32 | %(d)(f) | | | 1.42 | % | | | 1.51 | % | | | 1.33 | %(d) | |
Net investment income | | | 2.72 | %(d) | | | 2.61 | % | | | 3.05 | % | | | 3.36 | %(d) | | | 3.79 | % | | | 3.76 | % | | | 4.23 | %(d) | |
Supplemental data | |
Net assets, end of period
(in thousands) | | $ | 34,348 | | | $ | 31,544 | | | $ | 17,375 | | | $ | 5,365 | | | $ | 464 | | | $ | 196 | | | $ | 4 | | |
Portfolio turnover | | | 39 | % | | | 73 | % | | | 62 | % | | | 28 | % | | | 105 | % | | | 23 | % | | | 21 | % | |
Notes to Financial Highlights
(a) For the period from July 1, 2011 to May 31, 2012. During the period, the Fund's fiscal year end was changed from June 30 to May 31.
(b) Based on operations from August 1, 2008 (commencement of operations) through the stated period end.
(c) In addition to the fees and expenses that the Fund bears directly, the Fund indirectly bears a pro rata share of the fees and expenses of any other funds in which it invests. Such indirect expenses are not included in the Fund's reported expense ratios.
(d) Annualized.
(e) Total net expenses include the impact of certain fee waivers/expense reimbursements made by the Investment Manager and certain of its affiliates, if applicable.
(f) The benefits derived from expense reductions had an impact of less than 0.01%.
The accompanying Notes to Financial Statements are an integral part of this statement.
Semiannual Report 2014
24
Columbia Dividend Opportunity Fund
Financial Highlights (continued)
| | | Six Months Ended
November 30, 2014 | | Year Ended May 31, | |
Class R4 | | (Unaudited) | | 2014 | | 2013(a) | |
Per share data | |
Net asset value, beginning of period | | $ | 10.81 | | | $ | 9.95 | | | $ | 8.62 | | |
Income from investment operations: | |
Net investment income | | | 0.18 | | | | 0.33 | | | | 0.20 | | |
Net realized and unrealized gain | | | 0.42 | | | | 1.33 | | | | 1.31 | | |
Total from investment operations | | | 0.60 | | | | 1.66 | | | | 1.51 | | |
Less distributions to shareholders: | |
Net investment income | | | (0.16 | ) | | | (0.30 | ) | | | (0.18 | ) | |
Net realized gains | | | — | | | | (0.50 | ) | | | — | | |
Total distributions to shareholders | | | (0.16 | ) | | | (0.80 | ) | | | (0.18 | ) | |
Net asset value, end of period | | $ | 11.25 | | | $ | 10.81 | | | $ | 9.95 | | |
Total return | | | 5.56 | % | | | 17.57 | % | | | 17.71 | % | |
Ratios to average net assets(b) | |
Total gross expenses | | | 0.75 | %(c) | | | 0.77 | % | | | 0.83 | %(c) | |
Total net expenses(d) | | | 0.75 | %(c)(e) | | | 0.77 | %(e) | | | 0.83 | %(c) | |
Net investment income | | | 3.26 | %(c) | | | 3.23 | % | | | 3.64 | %(c) | |
Supplemental data | |
Net assets, end of period (in thousands) | | $ | 106,271 | | | $ | 79,510 | | | $ | 12,222 | | |
Portfolio turnover | | | 39 | % | | | 73 | % | | | 62 | % | |
Notes to Financial Highlights
(a) Based on operations from November 8, 2012 (commencement of operations) through the stated period end.
(b) In addition to the fees and expenses that the Fund bears directly, the Fund indirectly bears a pro rata share of the fees and expenses of any other funds in which it invests. Such indirect expenses are not included in the Fund's reported expense ratios.
(c) Annualized.
(d) Total net expenses include the impact of certain fee waivers/expense reimbursements made by the Investment Manager and certain of its affiliates, if applicable.
(e) The benefits derived from expense reductions had an impact of less than 0.01%.
The accompanying Notes to Financial Statements are an integral part of this statement.
Semiannual Report 2014
25
Columbia Dividend Opportunity Fund
Financial Highlights (continued)
| | | Six Months Ended
November 30, 2014 | | Year Ended May 31, | | Year Ended June 30, | |
Class R5 | | (Unaudited) | | 2014 | | 2013 | | 2012(a) | | 2011 | | 2010 | | 2009(b) | |
Per share data | |
Net asset value, beginning of period | | $ | 10.72 | �� | | $ | 9.88 | | | $ | 8.17 | | | $ | 8.34 | | | $ | 6.33 | | | $ | 5.59 | | | $ | 7.67 | | |
Income from investment operations: | |
Net investment income | | | 0.18 | | | | 0.32 | | | | 0.33 | | | | 0.29 | | | | 0.32 | | | | 0.28 | | | | 0.26 | | |
Net realized and unrealized
gain (loss) | | | 0.42 | | | | 1.34 | | | | 1.72 | | | | (0.23 | ) | | | 2.01 | | | | 0.75 | | | | (2.03 | ) | |
Total from investment operations | | | 0.60 | | | | 1.66 | | | | 2.05 | | | | 0.06 | | | | 2.33 | | | | 1.03 | | | | (1.77 | ) | |
Less distributions to shareholders: | |
Net investment income | | | (0.16 | ) | | | (0.32 | ) | | | (0.34 | ) | | | (0.23 | ) | | | (0.32 | ) | | | (0.29 | ) | | | (0.31 | ) | |
Net realized gains | | | — | | | | (0.50 | ) | | | — | | | | — | | | | — | | | | — | | | | — | | |
Total distributions to shareholders | | | (0.16 | ) | | | (0.82 | ) | | | (0.34 | ) | | | (0.23 | ) | | | (0.32 | ) | | | (0.29 | ) | | | (0.31 | ) | |
Net asset value, end of period | | $ | 11.16 | | | $ | 10.72 | | | $ | 9.88 | | | $ | 8.17 | | | $ | 8.34 | | | $ | 6.33 | | | $ | 5.59 | | |
Total return | | | 5.67 | % | | | 17.65 | % | | | 25.68 | % | | | 0.89 | % | | | 37.27 | % | | | 18.20 | % | | | (23.10 | %) | |
Ratios to average net assets(c) | |
Total gross expenses | | | 0.65 | %(d) | | | 0.65 | % | | | 0.66 | % | | | 0.67 | %(d) | | | 0.75 | % | | | 0.82 | % | | | 0.72 | %(d) | |
Total net expenses(e) | | | 0.65 | %(d) | | | 0.65 | % | | | 0.66 | % | | | 0.67 | %(d) | | | 0.75 | % | | | 0.78 | % | | | 0.72 | %(d) | |
Net investment income | | | 3.31 | %(d) | | | 3.19 | % | | | 3.52 | % | | | 3.88 | %(d) | | | 3.95 | % | | | 4.05 | % | | | 4.85 | %(d) | |
Supplemental data | |
Net assets, end of period
(in thousands) | | $ | 297,847 | | | $ | 310,352 | | | $ | 191,577 | | | $ | 30,819 | | | $ | 21,589 | | | $ | 968 | | | $ | 4 | | |
Portfolio turnover | | | 39 | % | | | 73 | % | | | 62 | % | | | 28 | % | | | 105 | % | | | 23 | % | | | 21 | % | |
Notes to Financial Highlights
(a) For the period from July 1, 2011 to May 31, 2012. During the period, the Fund's fiscal year end was changed from June 30 to May 31.
(b) Based on operations from August 1, 2008 (commencement of operations) through the stated period end.
(c) In addition to the fees and expenses that the Fund bears directly, the Fund indirectly bears a pro rata share of the fees and expenses of any other funds in which it invests. Such indirect expenses are not included in the Fund's reported expense ratios.
(d) Annualized.
(e) Total net expenses include the impact of certain fee waivers/expense reimbursements made by the Investment Manager and certain of its affiliates, if applicable.
The accompanying Notes to Financial Statements are an integral part of this statement.
Semiannual Report 2014
26
Columbia Dividend Opportunity Fund
Financial Highlights (continued)
| | | Six Months Ended
November 30, 2014 | | Year Ended May 31, | | Year Ended June 30, | |
Class W | | (Unaudited) | | 2014 | | 2013 | | 2012(a) | | 2011 | | 2010 | | 2009 | |
Per share data | |
Net asset value, beginning of period | | $ | 10.69 | | | $ | 9.85 | | | $ | 8.15 | | | $ | 8.33 | | | $ | 6.32 | | | $ | 5.59 | | | $ | 7.73 | | |
Income from investment operations: | |
Net investment income | | | 0.16 | | | | 0.24 | | | | 0.30 | | | | 0.25 | | | | 0.27 | | | | 0.23 | | | | 0.25 | | |
Net realized and unrealized gain (loss) | | | 0.41 | | | | 1.38 | | | | 1.71 | | | | (0.23 | ) | | | 2.04 | | | | 0.76 | | | | (2.10 | ) | |
Total from investment operations | | | 0.57 | | | | 1.62 | | | | 2.01 | | | | 0.02 | | | | 2.31 | | | | 0.99 | | | | (1.85 | ) | |
Less distributions to shareholders: | |
Net investment income | | | (0.14 | ) | | | (0.28 | ) | | | (0.31 | ) | | | (0.20 | ) | | | (0.30 | ) | | | (0.26 | ) | | | (0.29 | ) | |
Net realized gains | | | — | | | | (0.50 | ) | | | — | | | | — | | | | — | | | | — | | | | — | | |
Total distributions to shareholders | | | (0.14 | ) | | | (0.78 | ) | | | (0.31 | ) | | | (0.20 | ) | | | (0.30 | ) | | | (0.26 | ) | | | (0.29 | ) | |
Net asset value, end of period | | $ | 11.12 | | | $ | 10.69 | | | $ | 9.85 | | | $ | 8.15 | | | $ | 8.33 | | | $ | 6.32 | | | $ | 5.59 | | |
Total return | | | 5.40 | % | | | 17.28 | % | | | 25.19 | % | | | 0.38 | % | | | 36.95 | % | | | 17.55 | % | | | (24.01 | %) | |
Ratios to average net assets(b) | |
Total gross expenses | | | 1.00 | %(c) | | | 1.01 | % | | | 1.05 | % | | | 1.11 | %(c) | | | 1.14 | % | | | 1.18 | % | | | 1.09 | % | |
Total net expenses(d) | | | 1.00 | %(c)(e) | | | 1.01 | %(e) | | | 1.05 | %(e) | | | 1.11 | %(c)(e) | | | 1.14 | % | | | 1.18 | % | | | 1.09 | % | |
Net investment income | | | 2.88 | %(c) | | | 2.32 | % | | | 3.27 | % | | | 3.42 | %(c) | | | 3.36 | % | | | 3.49 | % | | | 4.18 | % | |
Supplemental data | |
Net assets, end of period
(in thousands) | | $ | 122 | | | $ | 201 | | | $ | 128,328 | | | $ | 18,330 | | | $ | 21,260 | | | $ | 4 | | | $ | 3 | | |
Portfolio turnover | | | 39 | % | | | 73 | % | | | 62 | % | | | 28 | % | | | 105 | % | | | 23 | % | | | 21 | % | |
Notes to Financial Highlights
(a) For the period from July 1, 2011 to May 31, 2012. During the period, the Fund's fiscal year end was changed from June 30 to May 31.
(b) In addition to the fees and expenses that the Fund bears directly, the Fund indirectly bears a pro rata share of the fees and expenses of any other funds in which it invests. Such indirect expenses are not included in the Fund's reported expense ratios.
(c) Annualized.
(d) Total net expenses include the impact of certain fee waivers/expense reimbursements made by the Investment Manager and certain of its affiliates, if applicable.
(e) The benefits derived from expense reductions had an impact of less than 0.01%.
The accompanying Notes to Financial Statements are an integral part of this statement.
Semiannual Report 2014
27
Columbia Dividend Opportunity Fund
Financial Highlights (continued)
| | | Six Months Ended
November 30, 2014 | | Year Ended May 31, | |
Class Y | | (Unaudited) | | 2014 | | 2013(a) | |
Per share data | |
Net asset value, beginning of period | | $ | 10.83 | | | $ | 9.96 | | | $ | 8.63 | | |
Income from investment operations: | |
Net investment income | | | 0.19 | | | | 0.34 | | | | 0.22 | | |
Net realized and unrealized gain | | | 0.41 | | | | 1.35 | | | | 1.29 | | |
Total from investment operations | | | 0.60 | | | | 1.69 | | | | 1.51 | | |
Less distributions to shareholders: | |
Net investment income | | | (0.16 | ) | | | (0.32 | ) | | | (0.18 | ) | |
Net realized gains | | | — | | | | (0.50 | ) | | | — | | |
Total distributions to shareholders | | | (0.16 | ) | | | (0.82 | ) | | | (0.18 | ) | |
Net asset value, end of period | | $ | 11.27 | | | $ | 10.83 | | | $ | 9.96 | | |
Total return | | | 5.63 | % | | | 17.84 | % | | | 17.73 | % | |
Ratios to average net assets(b) | |
Total gross expenses | | | 0.60 | %(c) | | | 0.61 | % | | | 0.71 | %(c) | |
Total net expenses(d) | | | 0.60 | %(c) | | | 0.61 | % | | | 0.71 | %(c) | |
Net investment income | | | 3.44 | %(c) | | | 3.29 | % | | | 4.13 | %(c) | |
Supplemental data | |
Net assets, end of period (in thousands) | | $ | 65,202 | | | $ | 38,342 | | | $ | 4,064 | | |
Portfolio turnover | | | 39 | % | | | 73 | % | | | 62 | % | |
Notes to Financial Highlights
(a) Based on operations from November 8, 2012 (commencement of operations) through the stated period end.
(b) In addition to the fees and expenses that the Fund bears directly, the Fund indirectly bears a pro rata share of the fees and expenses of any other funds in which it invests. Such indirect expenses are not included in the Fund's reported expense ratios.
(c) Annualized.
(d) Total net expenses include the impact of certain fee waivers/expense reimbursements made by the Investment Manager and certain of its affiliates, if applicable.
The accompanying Notes to Financial Statements are an integral part of this statement.
Semiannual Report 2014
28
Columbia Dividend Opportunity Fund
Financial Highlights (continued)
| | | Six Months Ended
November 30, 2014 | | Year Ended May 31, | | Year Ended
June 30, | |
Class Z | | (Unaudited) | | 2014 | | 2013 | | 2012(a) | | 2011(b) | |
Per share data | |
Net asset value, beginning of period | | $ | 10.71 | | | $ | 9.86 | | | $ | 8.16 | | | $ | 8.34 | | | $ | 7.20 | | |
Income from investment operations: | |
Net investment income | | | 0.17 | | | | 0.30 | | | | 0.32 | | | | 0.28 | | | | 0.24 | | |
Net realized and unrealized gain (loss) | | | 0.42 | | | | 1.35 | | | | 1.71 | | | | (0.24 | ) | | | 1.14 | | |
Total from investment operations | | | 0.59 | | | | 1.65 | | | | 2.03 | | | | 0.04 | | | | 1.38 | | |
Less distributions to shareholders: | |
Net investment income | | | (0.16 | ) | | | (0.30 | ) | | | (0.33 | ) | | | (0.22 | ) | | | (0.24 | ) | |
Net realized gains | | | — | | | | (0.50 | ) | | | — | | | | — | | | | — | | |
Total distributions to shareholders | | | (0.16 | ) | | | (0.80 | ) | | | (0.33 | ) | | | (0.22 | ) | | | (0.24 | ) | |
Net asset value, end of period | | $ | 11.14 | | | $ | 10.71 | | | $ | 9.86 | | | $ | 8.16 | | | $ | 8.34 | | |
Total return | | | 5.52 | % | | | 17.65 | % | | | 25.42 | % | | | 0.65 | % | | | 19.28 | % | |
Ratios to average net assets(c) | |
Total gross expenses | | | 0.75 | %(d) | | | 0.76 | % | | | 0.80 | % | | | 0.84 | %(d) | | | 0.87 | %(d) | |
Total net expenses(e) | | | 0.75 | %(d)(f) | | | 0.76 | %(f) | | | 0.80 | %(f) | | | 0.84 | %(d)(f) | | | 0.87 | %(d) | |
Net investment income | | | 3.23 | %(d) | | | 3.00 | % | | | 3.58 | % | | | 3.79 | %(d) | | | 3.98 | %(d) | |
Supplemental data | |
Net assets, end of period (in thousands) | | $ | 1,127,654 | | | $ | 1,022,666 | | | $ | 1,069,240 | | | $ | 671,036 | | | $ | 138,659 | | |
Portfolio turnover | | | 39 | % | | | 73 | % | | | 62 | % | | | 28 | % | | | 105 | % | |
Notes to Financial Highlights
(a) For the period from July 1, 2011 to May 31, 2012. During the period, the Fund's fiscal year end was changed from June 30 to May 31.
(b) Based on operations from September 27, 2010 (commencement of operations) through the stated period end.
(c) In addition to the fees and expenses that the Fund bears directly, the Fund indirectly bears a pro rata share of the fees and expenses of any other funds in which it invests. Such indirect expenses are not included in the Fund's reported expense ratios.
(d) Annualized.
(e) Total net expenses include the impact of certain fee waivers/expense reimbursements made by the Investment Manager and certain of its affiliates, if applicable.
(f) The benefits derived from expense reductions had an impact of less than 0.01%.
The accompanying Notes to Financial Statements are an integral part of this statement.
Semiannual Report 2014
29
Columbia Dividend Opportunity Fund
Notes to Financial Statements
November 30, 2014 (Unaudited)
Note 1. Organization
Columbia Dividend Opportunity Fund (the Fund), a series of Columbia Funds Series Trust II (the Trust), is a diversified fund. The Trust is registered under the Investment Company Act of 1940, as amended (the 1940 Act), as an open-end management investment company organized as a Massachusetts business trust.
Fund Shares
The Trust may issue an unlimited number of shares (without par value). The Fund offers Class A, Class B, Class C, Class I, Class K, Class R, Class R4, Class R5, Class W, Class Y and Class Z shares. Although all share classes generally have identical voting, dividend and liquidation rights, each share class votes separately when required by the Trust's organizational documents or by law. Different share classes pay different distribution amounts to the extent the expenses of such share classes differ, and distributions in liquidation will be proportional to the net asset value of each share class. Each share class has its own expense structure and sales charges.
Class A shares are subject to a maximum front-end sales charge of 5.75% based on the initial investment amount. Class A shares purchased without an initial sales charge in accounts aggregating $1 million to $50 million at the time of purchase are subject to a contingent deferred sales charge (CDSC) if the shares are sold within 18 months of purchase, charged as follows: 1.00% CDSC if redeemed within 12 months of purchase, and 0.50% CDSC if redeemed more than 12, but less than 18, months after purchase.
Class B shares may be subject to a maximum CDSC of 5.00% based upon the holding period after purchase. Class B shares will generally convert to Class A shares eight years after purchase. The Fund no longer accepts investments by new or existing investors in the Fund's Class B shares, except in connection with the reinvestment of any dividend and/or capital gain distributions in Class B shares of the Fund and exchanges by existing Class B shareholders of certain other funds within the Columbia Family of Funds.
Class C shares are subject to a 1.00% CDSC on shares redeemed within one year of purchase.
Class I shares are not subject to sales charges and are available only to the Columbia Family of Funds.
Class K shares are not subject to sales charges, however this share class is closed to new investors.
Class R shares are not subject to sales charges and are generally available only to certain retirement plans and other investors as described in the Fund's prospectus.
Class R4 shares are not subject to sales charges and are generally available only to omnibus retirement plans and certain investors as described in the Fund's prospectus.
Class R5 shares are not subject to sales charges and are generally available only to investors purchasing through authorized investment professionals and omnibus retirement plans.
Class W shares are not subject to sales charges and are available only to investors purchasing through authorized investment programs managed by investment professionals, including discretionary managed account programs.
Class Y shares are not subject to sales charges and are generally available only to certain retirement plans as described in the Fund's prospectus.
Class Z shares are not subject to sales charges and are available only to eligible investors, which are subject to different investment minimums as described in the Fund's prospectus.
Note 2. Summary of Significant Accounting Policies
Basis of Preparation
The Fund is an investment company that applies the accounting and reporting guidance in the Financial Accounting Standards Board (FASB) Accounting Standards Codification Topic 946, Financial Services — Investment Companies (ASC 946). The financial statements are prepared in accordance with U.S. generally accepted accounting principles (GAAP) which requires management to make certain estimates and assumptions that affect the reported amounts of assets and liabilities, the disclosure of contingent assets and liabilities at the date of the financial statements and the reported amounts of income and expenses during the reporting period. Actual results could differ from those estimates.
The following is a summary of significant accounting policies followed by the Fund in the preparation of its financial statements.
Security Valuation
All equity securities are valued at the close of business of the New York Stock Exchange (NYSE). Equity securities are valued at the last quoted sales price on the principal exchange or market on which they trade, except for securities traded on the NASDAQ Stock Market, which are valued at the NASDAQ official close price. Unlisted securities or listed securities for which there were no sales during the day are
Semiannual Report 2014
30
Columbia Dividend Opportunity Fund
Notes to Financial Statements (continued)
November 30, 2014 (Unaudited)
valued at the mean of the latest quoted bid and ask prices on such exchanges or markets.
Debt securities generally are valued by pricing services approved by the Board of Trustees (the Board) based upon market transactions for normal, institutional-size trading units of similar securities. The services may use various pricing techniques that take into account, as applicable, factors such as yield, quality, coupon rate, maturity, type of issue, trading characteristics and other data, as well as broker quotes. Debt securities for which quotations are readily available may also be valued based upon an over-the-counter or exchange bid quotation.
Foreign equity securities are valued based on quotations from the principal market in which such securities are traded. If any foreign security prices are not readily available as a result of limited share activity, the securities are valued at the mean of the latest quoted bid and ask prices on such exchanges or markets. Foreign currency exchange rates are generally determined at 4:00 p.m. Eastern (U.S.) time. Many securities markets and exchanges outside the U.S. close prior to the close of the NYSE; therefore, the closing prices for securities in such markets or on such exchanges may not fully reflect events that occur after such close but before the close of the NYSE. In those situations, foreign securities will be fair valued pursuant to a policy adopted by the Board of Trustees, including, if available, utilizing a third party pricing service to determine these fair values. The third party pricing service takes into account multiple factors, including, but not limited to, movements in the U.S. securities markets, certain depositary receipts, futures contracts and foreign exchange rates that have occurred subsequent to the close of the foreign exchange or market, to determine a good faith estimate that reasonably reflects the current market conditions as of the close of the NYSE. The fair value of a security is likely to be different from the quoted or published price, if available.
Investments in open-end investment companies, including money market funds, are valued at their net asset value.
Investments for which market quotations are not readily available, or that have quotations which management believes are not reliable, are valued at fair value as determined in good faith under procedures established by and under the general supervision of the Board. If a security or class of securities (such as foreign securities) is valued at fair value, such value is likely to be different from the quoted or published price for the security.
The determination of fair value often requires significant judgment. To determine fair value, management may use assumptions including but not limited to future cash flows and estimated risk premiums. Multiple inputs from various sources may be used to determine fair value.
Foreign Currency Transactions and Translations
The values of all assets and liabilities denominated in foreign currencies are generally translated into U.S. dollars at exchange rates determined at the close of the NYSE. Net realized and unrealized gains (losses) on foreign currency transactions and translations include gains (losses) arising from the fluctuation in exchange rates between trade and settlement dates on securities transactions, gains (losses) arising from the disposition of foreign currency and currency gains (losses) between the accrual and payment dates on dividends, interest income and foreign withholding taxes.
For financial statement purposes, the Fund does not distinguish that portion of gains (losses) on investments which is due to changes in foreign exchange rates from that which is due to changes in market prices of the investments. Such fluctuations are included with the net realized and unrealized gains (losses) on investments in the Statement of Operations.
Equity-Linked Notes
The Fund may invest in equity-linked notes (ELNs). An ELN is a debt instrument whose value is based on the value of a single equity security, basket of equity securities or an index of equity securities (each, an Underlying Equity). An ELN typically provides interest income, thereby offering a yield advantage over investing directly in an Underlying Equity. However, the holder of an ELN may have limited or no benefit from any appreciation in the Underlying Equity, but is exposed to various risks, including, without limitation, volatility, issuer and market risk. The Fund may purchase ELNs that trade on a securities exchange or those that trade on the over-the-counter markets, including securities offered and sold under Rule 144A of the Securities Act of 1933, as amended. The Fund may also purchase an ELN in a privately negotiated transaction with the issuer of the ELN (or its broker-dealer affiliate).
Security Transactions
Security transactions are accounted for on the trade date. Cost is determined and gains (losses) are based upon the specific identification method for both financial statement and federal income tax purposes.
Income Recognition
Interest income is recorded on an accrual basis. Market premiums and discounts, including original issue discounts, are amortized and accreted, respectively, over the expected life of the security on all debt securities, unless otherwise noted.
The Fund may place a debt security on non-accrual status and reduce related interest income when it becomes probable that the interest will not be collected and the amount of
Semiannual Report 2014
31
Columbia Dividend Opportunity Fund
Notes to Financial Statements (continued)
November 30, 2014 (Unaudited)
uncollectible interest can be reasonably estimated. A defaulted debt security is removed from non-accrual status when the issuer resumes interest payments or when collectability of interest is reasonably assured.
Corporate actions and dividend income are generally recorded net of any non-reclaimable tax withholdings, on the ex-dividend date or upon receipt of ex-dividend notification in the case of certain foreign securities.
Awards from class action litigation are recorded as a reduction of cost basis if the Fund still owns the applicable securities on the payment date. If the Fund no longer owns the applicable securities, the proceeds are recorded as realized gains.
Expenses
General expenses of the Trust are allocated to the Fund and other funds of the Trust based upon relative net assets or other expense allocation methodologies determined by the nature of the expense. Expenses directly attributable to the Fund are charged to the Fund. Expenses directly attributable to a specific class of shares are charged to that share class.
Determination of Class Net Asset Value
All income, expenses (other than class-specific expenses, which are charged to that share class, as shown in the Statement of Operations) and realized and unrealized gains (losses) are allocated to each class of the Fund on a daily basis, based on the relative net assets of each class, for purposes of determining the net asset value of each class.
Federal Income Tax Status
The Fund intends to qualify each year as a regulated investment company under Subchapter M of the Internal Revenue Code, as amended, and will distribute substantially all of its taxable income (including net short-term capital gains), if any, for its tax year, and as such will not be subject to federal income taxes. In addition, the Fund intends to distribute in each calendar year substantially all of its net investment income, capital gains and certain other amounts, if any, such that the Fund should not be subject to federal excise tax. Therefore, no federal income or excise tax provision is recorded.
Foreign Taxes
The Fund may be subject to foreign taxes on income, gains on investments or currency repatriation, a portion of which may be recoverable. The Fund will accrue such taxes and recoveries, as applicable, based upon its current interpretation of tax rules and regulations that exist in the markets in which it invests.
Realized gains in certain countries may be subject to foreign taxes at the Fund level, based on statutory rates. The Fund accrues for such foreign taxes on realized and unrealized gains at the appropriate rate for each jurisdiction, as applicable. The amount, if any, is disclosed as a liability on the Statement of Assets and Liabilities.
Distributions to Shareholders
Distributions from net investment income, if any, are declared and paid each calendar quarter. Net realized capital gains, if any, are distributed at least annually. Income distributions and capital gain distributions are determined in accordance with federal income tax regulations, which may differ from GAAP.
Guarantees and Indemnifications
Under the Trust's organizational documents and, in some cases, by contract, its officers and trustees are indemnified against certain liabilities arising out of the performance of their duties to the Trust or its funds. In addition, certain of the Fund's contracts with its service providers contain general indemnification clauses. The Fund's maximum exposure under these arrangements is unknown since the amount of any future claims that may be made against the Fund cannot be determined, and the Fund has no historical basis for predicting the likelihood of any such claims.
Note 3. Fees and Compensation Paid to Affiliates
Investment Management Fees
Under an Investment Management Services Agreement, Columbia Management Investment Advisers, LLC (the Investment Manager), a wholly-owned subsidiary of Ameriprise Financial, Inc. (Ameriprise Financial), determines which securities will be purchased, held or sold. The investment management fee is an annual fee that is equal to a percentage of the Fund's average daily net assets that declines from 0.66% to 0.49% as the Fund's net assets increase. The annualized effective investment management fee rate for the six months ended November 30, 2014 was 0.54% of the Fund's average daily net assets.
Administration Fees
Under an Administrative Services Agreement, the Investment Manager also serves as the Fund Administrator. The Fund pays the Fund Administrator an annual fee for administration and accounting services equal to a percentage of the Fund's average daily net assets that declines from 0.06% to 0.03% as the Fund's net assets increase. The annualized effective administration fee rate for the six months ended November 30, 2014 was 0.05% of the Fund's average daily net assets.
Semiannual Report 2014
32
Columbia Dividend Opportunity Fund
Notes to Financial Statements (continued)
November 30, 2014 (Unaudited)
Other Expenses
Other expenses are for, among other things, miscellaneous expenses of the Fund or the Board, including payments to a company providing limited administrative services to the Fund and the Board. That company's expenses include boardroom and office expense, employee compensation, employee health and retirement benefits, and certain other expenses. For the six months ended November 30, 2014, other expenses paid by the Fund to this company were $5,014.
Compensation of Board Members
Board members are compensated for their services to the Fund as disclosed in the Statement of Operations. Under a Deferred Compensation Plan (the Plan), the Board members who are not "interested persons" of the Fund, as defined under the 1940 Act, may elect to defer payment of up to 100% of their compensation. Deferred amounts are treated as though equivalent dollar amounts had been invested in shares of certain funds managed by the Investment Manager. The Fund's liability for these amounts is adjusted for market value changes and remains in the Fund until distributed in accordance with the Plan.
Transfer Agent Fees
Under a Transfer and Dividend Disbursing Agent Agreement, Columbia Management Investment Services Corp. (the Transfer Agent), an affiliate of the Investment Manager and a wholly-owned subsidiary of Ameriprise Financial, is responsible for providing transfer agency services to the Fund. The Transfer Agent has contracted with Boston Financial Data Services (BFDS) to serve as sub-transfer agent.
Effective November 1, 2014, the Transfer Agent receives a monthly transfer agency fee based on the number or the average value of accounts, depending on the type of account. Prior to November 1, 2014, the Transfer Agent received a monthly account-based service fee based on the number of open accounts. In addition, the Transfer Agent also receives sub-transfer agency fees based on a percentage of the average aggregate value of the Fund's shares maintained in omnibus accounts (other than omnibus accounts for which American Enterprise Investment Services Inc. is the broker of record or accounts where the beneficial shareholder is a customer of Ameriprise Financial Services, Inc., which receive a per account fee). The Transfer Agent pays the fees of BFDS for services as sub-transfer agent and is not entitled to reimbursement for such fees from the Fund (with the exception of out-of-pocket fees).
The Transfer Agent also receives compensation from the Fund for various shareholder services and reimbursements for certain out-of-pocket fees. Total transfer agent fees for Class K
and Class R5 shares are subject to an annual limitation of not more than 0.05% of the average daily net assets attributable to each share class. Class I and Class Y shares are not subject to transfer agent fees.
For the six months ended November 30, 2014, the Fund's annualized effective transfer agent fee rates as a percentage of average daily net assets of each class were as follows:
Class A | | | 0.15 | % | |
Class B | | | 0.15 | | |
Class C | | | 0.15 | | |
Class K | | | 0.05 | | |
Class R | | | 0.15 | | |
Class R4 | | | 0.15 | | |
Class R5 | | | 0.05 | | |
Class W | | | 0.15 | | |
Class Z | | | 0.15 | | |
An annual minimum account balance fee of $20 may apply to certain accounts with a value below the applicable share class's initial minimum investment requirements to reduce the impact of small accounts on transfer agent fees. These minimum account balance fees are remitted to the Fund and recorded as part of expense reductions in the Statement of Operations. For the six months ended November 30, 2014, these minimum account balance fees reduced total expenses of the Fund by $60.
Plan Administration Fees
Under a Plan Administration Services Agreement with the Transfer Agent, the Fund pays an annual fee at a rate of 0.25% of the Fund's average daily net assets attributable to Class K shares for the provision of various administrative, recordkeeping, communication and educational services.
Distribution Fees
The Fund has an agreement with Columbia Management Investment Distributors, Inc. (the Distributor), an affiliate of the Investment Manager and a wholly-owned subsidiary of Ameriprise Financial, for distribution and shareholder services. Under a Plan and Agreement of Distribution, the Fund pays a fee at an annual rate of up to 0.25% of the Fund's average daily net assets attributable to Class A and Class W shares, a fee at an annual rate of up to 0.50% of the Fund's average daily net assets attributable to Class R shares (of which up to 0.25% may be used for shareholder services) and a fee at an annual rate of up to 1.00% of the Fund's average daily net assets attributable to Class B and Class C shares. For Class B and Class C shares, of the 1.00% fee, up to 0.75% is reimbursed for distribution expenses.
Semiannual Report 2014
33
Columbia Dividend Opportunity Fund
Notes to Financial Statements (continued)
November 30, 2014 (Unaudited)
The amount of distribution expenses incurred by the Distributor and not yet reimbursed (unreimbursed expense) was approximately $3,307,000 and $1,154,000 for Class B and Class C shares, respectively. These amounts are based on the most recent information available as of September 30, 2014, and may be recovered from future payments under the distribution plan or CDSCs. To the extent the unreimbursed expense has been fully recovered, the distribution fee is reduced.
Sales Charges
Sales charges, including front-end charges and CDSCs, received by the Distributor for distributing Fund shares were $1,521,181 for Class A, $2,849 for Class B and $16,539 for Class C shares for the six months ended November 30, 2014.
Expenses Waived/Reimbursed by the Investment Manager and its Affiliates
The Fund's expense ratio is subject to an expense reimbursement arrangement pursuant to which fees will be waived and/or expenses reimbursed (excluding certain fees and expenses described below), so that the Fund's net operating expenses, after giving effect to fees waived/expenses reimbursed and any balance credits and/or overdraft charges from the Fund's custodian, do not exceed the annual rates of:
| | | Voluntary
Expense Cap
Effective
October 1, 2014 | | Contractual
Expense Cap
Prior to
October 1, 2014 | |
Class A | | | 1.13 | % | | | 1.16 | % | |
Class B | | | 1.88 | | | | 1.91 | | |
Class C | | | 1.88 | | | | 1.91 | | |
Class I | | | 0.77 | | | | 0.78 | | |
Class K | | | 1.07 | | | | 1.08 | | |
Class R | | | 1.38 | | | | 1.41 | | |
Class R4 | | | 0.88 | | | | 0.91 | | |
Class R5 | | | 0.82 | | | | 0.83 | | |
Class W | | | 1.13 | | | | 1.16 | | |
Class Y | | | 0.77 | | | | 0.78 | | |
Class Z | | | 0.88 | | | | 0.91 | | |
The voluntary expense cap arrangement may be revised or discontinued at any time. Under the arrangements, the following fees and expenses are excluded from the waiver/reimbursement commitment, and therefore will be paid by the Fund, if applicable: taxes (including foreign transaction taxes), expenses associated with investments in affiliated and non-affiliated pooled investment vehicles (including mutual funds and exchange-traded funds), transaction costs and brokerage commissions, costs related to any securities lending
program, dividend expenses associated with securities sold short, inverse floater program fees and expenses, transaction charges and interest on borrowed money, interest and extraordinary expenses.
Note 4. Federal Tax Information
The timing and character of income and capital gain distributions are determined in accordance with income tax regulations, which may differ from GAAP because of temporary or permanent book to tax differences.
At November 30, 2014, the cost of investments for federal income tax purposes was approximately $5,611,703,000 and the aggregate gross approximate unrealized appreciation and depreciation based on that cost was:
Unrealized appreciation | | $ | 941,800,000 | | |
Unrealized depreciation | | | (120,040,000 | ) | |
Net unrealized appreciation | | $ | 821,760,000 | | |
Management of the Fund has concluded that there are no significant uncertain tax positions in the Fund that would require recognition in the financial statements. However, management's conclusion may be subject to review and adjustment at a later date based on factors including, but not limited to, new tax laws, regulations, and administrative interpretations (including relevant court decisions). Generally, the Fund's federal tax returns for the prior three fiscal years remain subject to examination by the Internal Revenue Service.
Note 5. Portfolio Information
The cost of purchases and proceeds from sales of securities, excluding short-term obligations and certain derivatives, if any, aggregated to $2,452,715,300 and $2,408,733,638, respectively, for the six months ended November 30, 2014. The amount of purchase and sale activity impacts the portfolio turnover rate reported in the Financial Highlights.
Note 6. Redemption-in-Kind
Proceeds from the sales of securities for the Fund include the value of securities delivered through an in-kind redemption of certain fund shares. During the six months ended November 30, 2014, securities and other assets with a value of $58,340,324 were distributed to shareholders to satisfy their redemption requests. The net realized gain on these securities was $7,206,191, which is not taxable to remaining shareholders in the Fund.
Note 7. Affiliated Money Market Fund
The Fund invests in Columbia Short-Term Cash Fund, an affiliated money market fund established for the exclusive use
Semiannual Report 2014
34
Columbia Dividend Opportunity Fund
Notes to Financial Statements (continued)
November 30, 2014 (Unaudited)
by the Fund and other affiliated funds. The income earned by the Fund from such investments is included as Dividends — affiliated issuers in the Statement of Operations. As an investing fund, the Fund indirectly bears its proportionate share of the expenses of Columbia Short-Term Cash Fund.
Note 8. Shareholder Concentration
At November 30, 2014, one unaffiliated shareholder of record owned 11.3% of the outstanding shares of the Fund in one or more accounts. The Fund has no knowledge about whether any portion of those shares was owned beneficially. Affiliated shareholders of record owned 52.5% of the outstanding shares of the Fund in one or more accounts. Subscription and redemption activity by concentrated accounts may have a significant effect on the operations of the Fund.
Note 9. Line of Credit
The Fund has entered into a revolving credit facility with a syndicate of banks led by JPMorgan Chase Bank N.A. (JPMorgan) whereby the Fund may borrow for the temporary funding of shareholder redemptions or for other temporary or emergency purposes. The credit facility agreement, as amended, which is a collective agreement between the Fund and certain other funds managed by the Investment Manager, severally and not jointly, permits collective borrowings up to $500 million. Interest is charged to each participating fund based on its borrowings at a rate equal to the higher of (i) the overnight federal funds rate plus 1.00% or (ii) the one-month LIBOR rate plus 1.00%. Each borrowing under the credit facility matures no later than 60 days after the date of borrowing. The Fund also pays a commitment fee equal to its pro rata share of the amount of the credit facility at a rate of 0.075% per annum. The commitment fee is included in other expenses in the Statement of Operations.
Effective December 9, 2014, the Fund extended its revolving credit facility with JPMorgan. The credit facility agreement, as amended, permits collective borrowings up to $550 million under the same terms and interest rates as described above.
The Fund had no borrowings during the six months ended November 30, 2014.
Note 10. Subsequent Events
Management has evaluated the events and transactions that have occurred through the date the financial statements were issued. Other than as noted in Note 9 above, there were no items requiring adjustment of the financial statements or additional disclosure.
Note 11. Significant Risks
Foreign Securities and Emerging Market Countries Risk
Investing in foreign securities may include certain risks and considerations not typically associated with investing in U.S. securities, such as fluctuating currency values and changing local and regional economic, political and social conditions, which may result in greater market volatility. In addition, certain foreign securities may not be as liquid as U.S. securities. Investing in emerging markets may accentuate these risks. These countries are also more likely to experience high levels of inflation, deflation or currency devaluation which could hurt their economies and securities markets.
Note 12. Information Regarding Pending and Settled Legal Proceedings
In December 2005, without admitting or denying the allegations, American Express Financial Corporation (AEFC, which is now known as Ameriprise Financial, Inc. (Ameriprise Financial)) entered into settlement agreements with the Securities and Exchange Commission (SEC) and Minnesota Department of Commerce (MDOC) related to market timing activities. As a result, AEFC was censured and ordered to cease and desist from committing or causing any violations of certain provisions of the Investment Advisers Act of 1940, the Investment Company Act of 1940, and various Minnesota laws. AEFC agreed to pay disgorgement of $10 million and civil money penalties of $7 million. AEFC also agreed to retain an independent distribution consultant to assist in developing a plan for distribution of all disgorgement and civil penalties ordered by the SEC in accordance with various undertakings detailed at www.sec.gov/litigation/admin/ia-2451.pdf. Ameriprise Financial and its affiliates have cooperated with the SEC and the MDOC in these legal proceedings, and have made regular reports to the Funds' Boards of Trustees.
Ameriprise Financial and certain of its affiliates have historically been involved in a number of legal, arbitration and regulatory proceedings, including routine litigation, class actions, and governmental actions, concerning matters arising in connection with the conduct of their business activities. Ameriprise Financial believes that the Funds are not currently the subject of, and that neither Ameriprise Financial nor any of its affiliates are the subject of, any pending legal, arbitration or regulatory proceedings that are likely to have a material adverse effect on the Funds or the ability of Ameriprise Financial or its affiliates to perform under their contracts with the Funds. Ameriprise Financial is required to make quarterly (10-Q), annual (10-K) and, as necessary, 8-K filings with the Securities and Exchange Commission on legal and regulatory matters that
Semiannual Report 2014
35
Columbia Dividend Opportunity Fund
Notes to Financial Statements (continued)
November 30, 2014 (Unaudited)
relate to Ameriprise Financial and its affiliates. Copies of these filings may be obtained by accessing the SEC website at www.sec.gov.
There can be no assurance that these matters, or the adverse publicity associated with them, will not result in increased fund redemptions, reduced sale of fund shares or other adverse consequences to the Funds. Further, although we believe proceedings are not likely to have a material adverse effect on the Funds or the ability of Ameriprise Financial or its affiliates to perform under their contracts with the Funds, these proceedings are subject to uncertainties and, as such, we are unable to estimate the possible loss or range of loss that may result. An adverse outcome in one or more of these proceedings could result in adverse judgments, settlements, fines, penalties or other relief that could have a material adverse effect on the consolidated financial condition or results of operations of Ameriprise Financial.
Semiannual Report 2014
36
Columbia Dividend Opportunity Fund
Important Information About This Report
Each fund mails one shareholder report to each shareholder address. If you would like more than one report, please call shareholder services at 800.345.6611 and additional reports will be sent to you.
The policy of the Board is to vote the proxies of the companies in which each fund holds investments consistent with the procedures as stated in the Statement of Additional Information (SAI). You may obtain a copy of the SAI without charge by calling 800.345.6611; contacting your financial intermediary; visiting columbiamanagement.com; or searching the website of the Securities and Exchange Commission (SEC) at sec.gov. Information regarding how each fund voted proxies relating to portfolio securities is filed with the SEC by August 31 for the most recent 12-month period ending June 30 of that year, and is available without charge by visiting columbiamanagement.com; or searching the website of the SEC at sec.gov.
Each fund files a complete schedule of portfolio holdings with the SEC for the first and third quarters of each fiscal year on Form N-Q. Each fund's Form N-Q is available on the SEC's website at sec.gov and may be reviewed and copied at the SEC's Public Reference Room in Washington, D.C. Information on the operation of the Public Reference Room may be obtained by calling 800.SEC.0330. Each fund's complete schedule of portfolio holdings, as filed on Form N-Q, can also be obtained without charge, upon request, by calling 800.345.6611.
Semiannual Report 2014
37

Columbia Dividend Opportunity Fund
P.O. Box 8081
Boston, MA 02266-8081
columbiamanagement.com
This information is for use with concurrent or prior delivery of a fund prospectus. Please read and consider the investment objectives, risks, charges and expenses for any fund carefully before investing. For a prospectus and, if available, a summary prospectus, which contains this and other important information about the Fund, go to columbiamanagement.com. The Fund is distributed by Columbia Management Investment Distributors, Inc., member FINRA, and managed by Columbia Management Investment Advisers, LLC.
© 2015 Columbia Management Investment Advisers, LLC. All rights reserved.
SAR140_05_E01_(01/15)
Semiannual Report
November 30, 2014

Columbia Small/Mid Cap Value Fund
Not FDIC insured • No bank guarantee • May lose value
About Columbia Management
Backed by more than 100 years of experience, Columbia Management is one of the nation's largest asset managers. At the heart of our success — and, most importantly, that of our investors — are some of the most talented professionals in the industry, brought together by a unique way of working.
It starts with carefully selected, specialized investment teams. While each team brings a diverse and innovative range of skills, all are grounded by a common set of core beliefs. All possess a solid conviction in the power of proprietary, bottom-up research. All look not only at generating returns, but also at the likely consistency of those returns and the risks required to achieve them. And while our culture encourages teams to operate independently and question established thinking, a rigorous investment oversight process ensures that each team stays true to its clearly articulated investment process. At Columbia Management, reaching our performance goals matters, and the way we reach them matters just as much.
Columbia funds are distributed by Columbia Management Investment Distributors, Inc., member FINRA, and managed by Columbia Management Investment Advisers, LLC.
© 2015 Columbia Management Investment Advisers, LLC. All rights reserved.
Not part of the shareholder report
Connect with Columbia Management
Get the market insight you need from our investment experts
Investor insight
Stay informed with economic and market commentary, investment videos, white papers, mutual fund commentary and more at columbiamanagement.com.
Columbia Management investor
(e-newsletter)
Read our award-winning* shareholder newsletter. Our quarterly newsletter is available online and provides timely and relevant content about economic trends, fund news, service enhancements and changes. Sign up to receive the newsletter electronically at columbiamanagement.com/newsletter.
Investment videos
Watch and discover what our thought leaders are saying about financial markets and the economy. For an analysis of current events and trends that may affect your investments, visit our online video library at blog.columbiamanagement.com/publications.
Social media
Columbia Management offers you multiple ways to access our market commentary and investment insights.
> Perspectives blog at columbiamanagement.com
Read timely posts by our investment team, including our chief investment officer, chief economist and portfolio managers.
> Twitter.com/ColumbiaMgmt
Follow us on Twitter for quick, up-to-the-minute comments on market news and more.
> Youtube.com/columbiamanagement
View our commentaries on the economy, markets and current investment opportunities.
> Linkedin.com/company/columbia-management
Connect with us on LinkedIn for updates from our thought leaders.
*Columbia Management investor was awarded top honors in the Mutual Fund Education Alliance STAR Awards competition for excellence in mutual fund marketing and communications. Materials in the competition were evaluated on educational value, message comprehension, effective design and objectives.
Not part of the shareholder report
Note: Effective January 1, 2015, Christopher O. Petersen will serve as the President of the Columbia Funds, replacing J. Kevin Connaughton. Mr. Petersen has served as a Fund officer since 2007.
Dear Shareholders,
People invest for different reasons, though typically based on a desire for one or more outcomes, e.g., generating an appropriate income stream in retirement, navigating a changing interest rate environment, maximizing after-tax returns, growing assets to achieve financial goals, or easing the impact of volatile markets. Achieving these desired outcomes can be particularly challenging given the unpredictability of complex global markets. To continue to effectively deliver solutions that help clients achieve desired outcomes, an asset manager must have the resources and investment framework to meaningfully embody a global perspective.
With this in mind, I thought it important to highlight excerpts from a piece written by Jeffrey L. Knight, Global Head of Investment Solutions and Asset Allocation, in which he touches on some of these issues emphasizing the importance of maintaining a diversified portfolio with the flexibility to adapt to changing market conditions.
I encourage you to read the article in its entirety. To access the full article and for other insights on current market events and investment opportunities, please visit the Columbia Management blog at columbiamanagement.com/blog.
On behalf of the Funds, I want to acknowledge the contributions of J. Kevin Connaughton and to thank him for his years of trusted, dedicated service. He has worked tirelessly as an advocate for shareholders and a leader of the Columbia Funds. In taking on this new role, I look forward to continuing the work of Mr. Connaughton, helping build on the strong foundation of the Columbia Funds.
Thank you for your confidence. We look forward to continuing to serve your investment needs for many years to come.
Best regards,

Christopher O. Petersen
President, Columbia Funds
Excerpts from:
2015 Outlook: Same song, slightly different arrangement
By Jeffrey L. Knight, Global Head of Investment Solutions and Asset Allocation
Jeffrey L. Knight, CFA, is global head of investment solutions and asset allocation for Columbia Management Investment Advisers, LLC. Mr. Knight leads a team of six portfolio managers responsible for our broad suite of multi-asset strategies including capital allocation, risk allocation, absolute return and total return funds.
What's different in 2015?
As stationary as market conditions have felt lately, circumstances are always evolving. For 2015, while the essential elements of our outlook remain in place, we highlight two important changes in the market environment:
> The relative value of global equities vs. global bonds actually improved during 2014.
> Monetary policy around the globe has become desynchronized, with the U.S. Federal Reserve (the Fed) contemplating rate hikes, while the European Central Bank (ECB) and the Bank of Japan (BOJ) intensify their monetary stimulus programs.
In our view, while equities will most likely continue to dominate, the complex interactions of today's conditions elevate the role of dynamic risk management. We argue that investors will need a cross-asset surveillance methodology to detect tactical threats.
President's Message (continued)
Monetary policies diverge
The Fed has given strong signals that economic growth in the United States has reached self-sustaining momentum and no longer needs unconventional efforts to support the expansion. The withdrawal and suspension of large-scale asset purchases was only the first step in the evolution toward policy normalization. In 2015, we expect to see a change in forward guidance and, most likely, the first interest rate increase in years.
These actions stand in stark contrast with the direction of the monetary policies of other central banks as they double down on efforts to support growth and avoid deflation. The Bank of Japan has announced its intention to increase both qualitative and quantitative easing on an enormous scale, expanding purchases of Japanese government bonds (JGBs), exchange-traded funds and real estate investment trusts. They intend to coordinate this with government pension investment fund purchases by shifting into riskier assets through sales of JGBs.
With evidence of deterioration on both the economic and inflation front, the European Central Bank (ECB) also plans to take bolder actions. These include increased purchases of asset-backed securities and covered bonds in both the primary and secondary market, together with the long-term refinancing operations that will steer the ECB's balance sheet higher by €1 trillion.
The latest to jump on the bandwagon was the People's Bank of China (PBOC), which cut its benchmark interest rate for the first time in over two years to support private sector investment, as targeted liquidity injections have had minimal effect on sinking economic growth.
Investment strategy for 2015
We remain convinced that relative value favors stocks over bonds, even though stocks outperformed in 2014. Therefore, you will hear the same recommendation from us for 2015. Equities remain the most important asset class for generating returns.
Within equities, the currency-based advantage of U.S. stocks is offset somewhat by the valuation advantage from overseas equities, notably in Japan. Indeed, economic growth in Japan and Europe are essential ingredients for equities to continue to perform well. If Japanese and European stocks cannot produce gains, then the global economy will probably be stuck in a near recessionary funk.
Devising a strategy to manage risk and stabilize portfolio values in the event that equities do not perform well remains complicated. Bond yields are low enough that they are not likely to offer powerful diversification benefits. We affirm our recommendation for three additional sources of portfolio stability:
> Non-traditional diversifiers, such as liquid alternatives, alternative beta exposures and absolute return strategies
> Explicit downside hedges, such as put options (with emphasis on managing the related expense)
> Flexibility and a methodology for active risk reduction when appropriate (Our cross-asset methodologies should prove valuable in this regard.)
Our overall stance for investment strategy will likely remain in place until the valuation advantage for equities has been priced away, or until the healing process for the global economy reverses.
Please visit columbiamanagement.com/blog to read the entire article.
Investors should consider the investment objectives, risks, charges and expenses of a mutual fund carefully before investing. For a free prospectus and, if available, a summary prospectus, which contains this and other important information about a fund, visit columbiamanagement.com. The prospectus should be read carefully before investing.
The views expressed are as of December 2014, may change as market or other conditions change, and may differ from views expressed by other Columbia Management Investment Advisers, LLC (CMIA) associates or affiliates. Actual investments or investment decisions made by CMIA and its affiliates, whether for its own account or on behalf of clients, will not necessarily reflect the views expressed. This information is not intended to provide investment advice and does not account for individual investor circumstances. Investment decisions should always be made based on an investor's specific financial needs, objectives, goals, time horizon and risk tolerance. Asset classes described may not be suitable for all investors. Past performance does not guarantee future results, and no forecast should be considered a guarantee either. Since economic and market change frequently, there can be no assurance that the trends described here will continue or that the forecasts are accurate.
Diversification does not assure a profit or protect against loss.
Columbia Funds are distributed by Columbia Management Investment Distributors, Inc., member FINRA, and managed by Columbia Management Investment Advisers, LLC.
© 2015 Columbia Management Investment Advisers, LLC. All rights reserved
Columbia Small/Mid Cap Value Fund
Fund Investment Manager
Columbia Management Investment
Advisers, LLC
225 Franklin Street
Boston, MA 02110
Fund Distributor
Columbia Management Investment
Distributors, Inc.
225 Franklin Street
Boston, MA 02110
Fund Transfer Agent
Columbia Management Investment
Services Corp.
P.O. Box 8081
Boston, MA 02266-8081
For more information about any of the funds, please visit columbiamanagement.com or call 800.345.6611. Customer Service Representatives are available to answer your questions Monday through Friday from 8 a.m. to 7 p.m. Eastern time.
The views expressed in this report reflect the current views of the respective parties. These views are not guarantees of future performance and involve certain risks, uncertainties and assumptions that are difficult to predict, so actual outcomes and results may differ significantly from the views expressed. These views are subject to change at any time based upon economic, market or other conditions and the respective parties disclaim any responsibility to update such views. These views may not be relied on as investment advice and, because investment decisions for a Columbia Fund are based on numerous factors, may not be relied on as an indication of trading intent on behalf of any particular Columbia Fund. References to specific securities should not be construed as a recommendation or investment advice.
Performance Overview | | | 3 | | |
Portfolio Overview | | | 4 | | |
Understanding Your Fund's Expenses | | | 5 | | |
Portfolio of Investments | | | 6 | | |
Statement of Assets and Liabilities | | | 11 | | |
Statement of Operations | | | 14 | | |
Statement of Changes in Net Assets | | | 15 | | |
Financial Highlights | | | 18 | | |
Notes to Financial Statements | | | 29 | | |
Important Information About This Report | | | 35 | | |
Columbia Small/Mid Cap Value Fund
Performance Overview
(Unaudited)
Performance Summary
> Columbia Small/Mid Cap Value Fund (the Fund) Class A shares returned 2.22% excluding sales charges for the six-month period that ended November 30, 2014.
> The Fund outperformed its benchmark, the Russell 2500 Value Index, which returned 2.12% for the same time period.
> The Fund underperformed its former benchmark, the Russell Midcap Value Index, which returned 6.03% for the same time period.
Average Annual Total Returns (%) (for period ended November 30, 2014)
| | | Inception | | 6 Months
cumulative | | 1 Year | | 5 Years | | 10 Years | |
Class A | | 02/14/02 | | | | | | | | | |
Excluding sales charges | | | | | 2.22 | | | | 8.16 | | | | 14.64 | | | | 8.73 | | |
Including sales charges | | | | | -3.66 | | | | 1.93 | | | | 13.29 | | | | 8.08 | | |
Class B | | 02/14/02 | | | | | | | | | |
Excluding sales charges | | | | | 1.76 | | | | 7.31 | | | | 13.75 | | | | 7.91 | | |
Including sales charges | | | | | -3.24 | | | | 2.38 | | | | 13.51 | | | | 7.91 | | |
Class C | | 02/14/02 | | | | | | | | | |
Excluding sales charges | | | | | 1.86 | | | | 7.42 | | | | 13.79 | | | | 7.93 | | |
Including sales charges | | | | | 0.86 | | | | 6.43 | | | | 13.79 | | | | 7.93 | | |
Class I | | 03/04/04 | | | 2.45 | | | | 8.64 | | | | 15.14 | | | | 9.22 | | |
Class K | | 02/14/02 | | | 2.30 | | | | 8.27 | | | | 14.80 | | | | 8.91 | | |
Class R* | | 12/11/06 | | | 2.15 | | | | 7.91 | | | | 14.33 | | | | 8.43 | | |
Class R4* | | 12/11/06 | | | 2.32 | | | | 8.45 | | | | 14.68 | | | | 8.70 | | |
Class R5* | | 12/11/06 | | | 2.48 | | | | 8.58 | | | | 15.11 | | | | 9.08 | | |
Class W* | | 12/01/06 | | | 2.20 | | | | 8.12 | | | | 14.64 | | | | 8.75 | | |
Class Y* | | 06/13/13 | | | 2.51 | | | | 8.66 | | | | 14.80 | | | | 8.80 | | |
Class Z* | | 09/27/10 | | | 2.37 | | | | 8.46 | | | | 14.92 | | | | 8.86 | | |
Russell 2500 Value Index | | | | | 2.12 | | | | 8.11 | | | | 16.67 | | | | 8.09 | | |
Russell Midcap Value Index | | | | | 6.03 | | | | 17.02 | | | | 18.45 | | | | 9.76 | | |
Returns for Class A are shown with and without the maximum initial sales charge of 5.75%. Returns for Class B are shown with and without the applicable contingent deferred sales charge (CDSC) of 5.00% in the first year, declining to 1.00% in the sixth year and eliminated thereafter. Returns for Class C are shown with and without the 1.00% CDSC for the first year only. The Fund's other classes are not subject to sales charges and have limited eligibility. Please see the Fund's prospectus for details. Performance for different share classes will vary based on differences in sales charges and fees associated with each class. All results shown assume reinvestment of distributions during the period. Returns do not reflect the deduction of taxes that a shareholder may pay on Fund distributions or on the redemption of Fund shares. Performance results reflect the effect of any fee waivers or reimbursements of Fund expenses by Columbia Management Investment Advisers, LLC and/or any of its affiliates. Absent these fee waivers or expense reimbursement arrangements, performance results would have been lower.
The performance information shown represents past performance and is not a guarantee of future results. The investment return and principal value of your investment will fluctuate so that your shares, when redeemed, may be worth more or less than their original cost. Current performance may be lower or higher than the performance information shown. You may obtain performance information current to the most recent month-end by contacting your financial intermediary, visiting columbiamanagement.com or calling 800.345.6611.
*The returns shown for periods prior to the share class inception date (including returns for the Life of the Fund, if shown, which are since Fund inception) include the returns of the Fund's oldest share class. Since the Fund launched more than one share class at its inception, Class A shares were used. These returns are adjusted to reflect any higher class-related operating expenses of the newer share classes, as applicable. Please visit columbiamanagement.com/investment-products/mutual-funds/appended-performance for more information.
The Russell 2500 Value Index measures the performance of the small- to mid-cap value segment of the U.S. equity universe. It includes those Russell 2500 companies that are considered more value oriented relative to the overall market as defined by Russell's leading style methodology.
The Russell Midcap Value Index, an unmanaged index, measures the performance of those Russell Midcap Index companies with lower price-to-book ratios and forecasted growth values.
Effective July 7, 2014, the Fund compares its performance to that of the Russell 2500 Value Index. The investment manager believes that it provides a more appropriate basis for comparing the Fund's performance in light of the changes made to the Fund's name and principal investment strategies. Information on the both benchmarks will be included for a one year transition period. Thereafter, only the Russell 2500 Value Index will be included.
Indices are not available for investment, are not professionally managed and do not reflect sales charges, fees, brokerage commissions, taxes or other expenses of investing. Securities in the Fund may not match those in an index.
Semiannual Report 2014
3
Columbia Small/Mid Cap Value Fund
Portfolio Overview
(Unaudited)
Portfolio Management
Jarl Ginsberg, CFA, CAIA
Christian Stadlinger, PhD, CFA
David Hoffman
Morningstar Style BoxTM
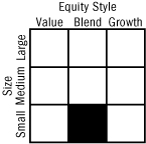
The Morningstar Style BoxTM is based on a fund's portfolio holdings. For equity funds, the vertical axis shows the market capitalization of the stocks owned, and the horizontal axis shows investment style (value, blend, or growth). Information shown is based on the most recent data provided by Morningstar.
© 2015 Morningstar, Inc. All rights reserved. The Morningstar information contained herein: (1) is proprietary to Morningstar and/or its content providers; (2) may not be copied or distributed; and (3) is not warranted to be accurate, complete or timely. Neither Morningstar nor its content providers are responsible for any damages or losses arising from any use of this information.
Top Ten Holdings (%)
(at November 30, 2014) | |
Assured Guaranty Ltd. | | | 1.5 | | |
Swift Transportation Co. | | | 1.5 | | |
United Continental Holdings, Inc. | | | 1.4 | | |
Alaska Air Group, Inc. | | | 1.4 | | |
Catalent, Inc. | | | 1.4 | | |
VCA, Inc. | | | 1.4 | | |
Southwest Gas Corp. | | | 1.4 | | |
Omnicare, Inc. | | | 1.3 | | |
EverBank Financial Corp. | | | 1.3 | | |
Zions Bancorporation | | | 1.3 | | |
Percentages indicated are based upon total investments (excluding Money Market Funds).
For further detail about these holdings, please refer to the section entitled "Portfolio of Investments."
Fund holdings are as of the date given, are subject to change at any time, and are not recommendations to buy or sell any security.
Portfolio Breakdown (%)
(at November 30, 2014) | |
Common Stocks | | | 95.6 | | |
Consumer Discretionary | | | 16.4 | | |
Consumer Staples | | | 1.2 | | |
Energy | | | 4.3 | | |
Financials | | | 31.2 | | |
Health Care | | | 8.9 | | |
Industrials | | | 12.0 | | |
Information Technology | | | 10.2 | | |
Materials | | | 6.6 | | |
Utilities | | | 4.8 | | |
Exchange-Traded Funds | | | 0.6 | | |
Limited Partnerships | | | 0.9 | | |
Money Market Funds | | | 2.9 | | |
Total | | | 100.0 | | |
Percentages indicated are based upon total investments. The Fund's portfolio composition is subject to change.
Semiannual Report 2014
4
Columbia Small/Mid Cap Value Fund
Understanding Your Fund's Expenses
(Unaudited)
As an investor, you incur two types of costs. There are transaction costs, which generally include sales charges on purchases and may include redemption fees. There are also ongoing costs, which generally include management fees, distribution and/or service fees, and other fund expenses. The following information is intended to help you understand your ongoing costs (in dollars) of investing in the Fund and to help you compare these costs with the ongoing costs of investing in other mutual funds.
Analyzing Your Fund's Expenses
To illustrate these ongoing costs, we have provided examples and calculated the expenses paid by investors in each share class of the Fund during the period. The actual and hypothetical information in the table is based on an initial investment of $1,000 at the beginning of the period indicated and held for the entire period. Expense information is calculated two ways and each method provides you with different information. The amount listed in the "Actual" column is calculated using the Fund's actual operating expenses and total return for the period. You may use the Actual information, together with the amount invested, to estimate the expenses that you paid over the period. Simply divide your account value by $1,000 (for example, an $8,600 account value divided by $1,000 = 8.6), then multiply the results by the expenses paid during the period under the "Actual" column. The amount listed in the "Hypothetical" column assumes a 5% annual rate of return before expenses (which is not the Fund's actual return) and then applies the Fund's actual expense ratio for the period to the hypothetical return. You should not use the hypothetical account values and expenses to estimate either your actual account balance at the end of the period or the expenses you paid during the period. See "Compare With Other Funds" below for details on how to use the hypothetical data.
Compare With Other Funds
Since all mutual funds are required to include the same hypothetical calculations about expenses in shareholder reports, you can use this information to compare the ongoing cost of investing in the Fund with other funds. To do so, compare the hypothetical example with the 5% hypothetical examples that appear in the shareholder reports of other funds. As you compare hypothetical examples of other funds, it is important to note that hypothetical examples are meant to highlight the ongoing costs of investing in a fund only and do not reflect any transaction costs, such as sales charges, or redemption or exchange fees. Therefore, the hypothetical calculations are useful in comparing ongoing costs only, and will not help you determine the relative total costs of owning different funds. If transaction costs were included in these calculations, your costs would be higher.
June 1, 2014 – November 30, 2014
| | | Account Value at the Beginning
of the Period ($) | | Account Value at the End of the
Period ($) | | Expenses Paid During the
Period ($) | | Fund's Annualized
Expense Ratio (%) | |
| | | Actual | | Hypothetical | | Actual | | Hypothetical | | Actual | | Hypothetical | | Actual | |
Class A | | | 1,000.00 | | | | 1,000.00 | | | | 1,022.20 | | | | 1,018.70 | | | | 6.30 | | | | 6.29 | | | | 1.25 | | |
Class B | | | 1,000.00 | | | | 1,000.00 | | | | 1,017.60 | | | | 1,014.96 | | | | 10.06 | | | | 10.05 | | | | 2.00 | | |
Class C | | | 1,000.00 | | | | 1,000.00 | | | | 1,018.60 | | | | 1,014.96 | | | | 10.07 | | | | 10.05 | | | | 2.00 | | |
Class I | | | 1,000.00 | | | | 1,000.00 | | | | 1,024.50 | | | | 1,020.94 | | | | 4.04 | | | | 4.03 | | | | 0.80 | | |
Class K | | | 1,000.00 | | | | 1,000.00 | | | | 1,023.00 | | | | 1,019.40 | | | | 5.60 | | | | 5.59 | | | | 1.11 | | |
Class R | | | 1,000.00 | | | | 1,000.00 | | | | 1,021.50 | | | | 1,017.45 | | | | 7.56 | | | | 7.54 | | | | 1.50 | | |
Class R4 | | | 1,000.00 | | | | 1,000.00 | | | | 1,023.20 | | | | 1,019.95 | | | | 5.04 | | | | 5.04 | | | | 1.00 | | |
Class R5 | | | 1,000.00 | | | | 1,000.00 | | | | 1,024.80 | | | | 1,020.64 | | | | 4.34 | | | | 4.33 | | | | 0.86 | | |
Class W | | | 1,000.00 | | | | 1,000.00 | | | | 1,022.00 | | | | 1,018.50 | | | | 6.50 | | | | 6.49 | | | | 1.29 | | |
Class Y | | | 1,000.00 | | | | 1,000.00 | | | | 1,025.10 | | | | 1,020.89 | | | | 4.09 | | | | 4.08 | | | | 0.81 | | |
Class Z | | | 1,000.00 | | | | 1,000.00 | | | | 1,023.70 | | | | 1,019.90 | | | | 5.10 | | | | 5.09 | | | | 1.01 | | |
Expenses paid during the period are equal to the annualized expense ratio for each class as indicated above, multiplied by the average account value over the period and then multiplied by the number of days in the Fund's most recent fiscal half year and divided by 365.
Expenses do not include fees and expenses incurred indirectly by the Fund from its investment in underlying funds, including affiliated and non-affiliated pooled investment vehicles, such as mutual funds and exchange-traded funds.
Semiannual Report 2014
5
Columbia Small/Mid Cap Value Fund
Portfolio of Investments
November 30, 2014 (Unaudited)
(Percentages represent value of investments compared to net assets)
Common Stocks 95.2%
Issuer | | Shares | | Value ($) | |
Consumer Discretionary 16.3% | |
Auto Components 2.6% | |
American Axle & Manufacturing
Holdings, Inc.(a) | | | 725,000 | | | | 15,471,500 | | |
Motorcar Parts of America, Inc.(a) | | | 150,000 | | | | 5,062,500 | | |
Tenneco, Inc.(a) | | | 220,000 | | | | 11,957,000 | | |
Total | | | | | 32,491,000 | | |
Diversified Consumer Services 1.9% | |
Houghton Mifflin Harcourt Co.(a) | | | 650,000 | | | | 12,493,000 | | |
Nord Anglia Education, Inc.(a) | | | 700,000 | | | | 11,585,000 | | |
Total | | | | | 24,078,000 | | |
Hotels, Restaurants & Leisure 2.9% | |
Dave & Buster's Entertainment, Inc.(a) | | | 260,000 | | | | 5,959,200 | | |
Del Frisco's Restaurant Group, Inc.(a) | | | 525,000 | | | | 11,665,500 | | |
Intrawest Resorts Holdings, Inc.(a) | | | 475,000 | | | | 5,092,000 | | |
Sonic Corp. | | | 505,000 | | | | 13,730,950 | | |
Total | | | | | 36,447,650 | | |
Household Durables 3.8% | |
D.R. Horton, Inc. | | | 500,000 | | | | 12,745,000 | | |
Helen of Troy Ltd.(a) | | | 223,000 | | | | 14,419,180 | | |
KB Home | | | 620,000 | | | | 10,893,400 | | |
Standard Pacific Corp.(a) | | | 1,375,000 | | | | 10,381,250 | | |
Total | | | | | 48,438,830 | | |
Multiline Retail 0.8% | |
JCPenney Co., Inc.(a) | | | 1,250,000 | | | | 10,012,500 | | |
Specialty Retail 4.3% | |
Best Buy Co., Inc. | | | 385,000 | | | | 15,172,850 | | |
Finish Line, Inc., Class A (The) | | | 420,000 | | | | 11,986,800 | | |
Neff Corp. Class A(a)(b) | | | 548,349 | | | | 8,088,148 | | |
Sonic Automotive, Inc., Class A | | | 485,000 | | | | 12,508,150 | | |
TravelCenters of America LLC(a) | | | 725,000 | | | | 6,778,750 | | |
Total | | | | | 54,534,698 | | |
Total Consumer Discretionary | | | | | 206,002,678 | | |
Consumer Staples 1.2% | |
Food Products 1.2% | |
TreeHouse Foods, Inc.(a) | | | 190,000 | | | | 15,380,500 | | |
Total Consumer Staples | | | | | 15,380,500 | | |
Common Stocks (continued)
Issuer | | Shares | | Value ($) | |
Energy 4.2% | |
Energy Equipment & Services 2.0% | |
Helix Energy Solutions Group, Inc.(a) | | | 485,000 | | | | 11,091,950 | | |
Nabors Industries Ltd. | | | 525,000 | | | | 6,888,000 | | |
Oil States International, Inc.(a) | | | 155,000 | | | | 7,726,750 | | |
Total | | | | | 25,706,700 | | |
Oil, Gas & Consumable Fuels 2.2% | |
Delek U.S. Holdings, Inc. | | | 315,000 | | | | 9,418,500 | | |
Goodrich Petroleum Corp.(a) | | | 925,000 | | | | 5,596,250 | | |
Gulfport Energy Corp.(a) | | | 115,000 | | | | 5,488,950 | | |
Whiting Petroleum Corp.(a) | | | 175,000 | | | | 7,309,750 | | |
Total | | | | | 27,813,450 | | |
Total Energy | | | | | 53,520,150 | | |
Financials 31.1% | |
Banks 9.3% | |
Comerica, Inc. | | | 310,000 | | | | 14,449,100 | | |
East West Bancorp, Inc. | | | 420,000 | | | | 15,443,400 | | |
Huntington Bancshares, Inc. | | | 1,500,000 | | | | 15,165,000 | | |
Prosperity Bancshares, Inc. | | | 240,000 | | | | 13,483,200 | | |
SVB Financial Group(a) | | | 145,000 | | | | 15,246,750 | | |
Texas Capital Bancshares, Inc.(a) | | | 225,000 | | | | 12,404,250 | | |
Umpqua Holdings Corp. | | | 875,000 | | | | 14,866,250 | | |
Zions Bancorporation | | | 560,000 | | | | 15,713,600 | | |
Total | | | | | 116,771,550 | | |
Capital Markets 2.4% | |
Affiliated Managers Group, Inc.(a) | | | 58,000 | | | | 11,808,220 | | |
E*TRADE Financial Corp.(a) | | | 340,000 | | | | 7,755,400 | | |
Medley Capital Corp. | | | 950,000 | | | | 10,602,000 | | |
Total | | | | | 30,165,620 | | |
Insurance 6.8% | |
American Equity Investment Life
Holding Co. | | | 500,000 | | | | 13,500,000 | | |
Amtrust Financial Services, Inc. | | | 250,000 | | | | 12,830,000 | | |
Assured Guaranty Ltd. | | | 725,000 | | | | 18,531,000 | | |
CNO Financial Group, Inc. | | | 725,000 | | | | 12,571,500 | | |
Hartford Financial Services Group, Inc. (The) | | | 380,000 | | | | 15,694,000 | | |
XL Group PLC | | | 360,000 | | | | 12,787,200 | | |
Total | | | | | 85,913,700 | | |
The accompanying Notes to Financial Statements are an integral part of this statement.
Semiannual Report 2014
6
Columbia Small/Mid Cap Value Fund
Portfolio of Investments (continued)
November 30, 2014 (Unaudited)
Common Stocks (continued)
Issuer | | Shares | | Value ($) | |
Real Estate Investment Trusts (REITs) 9.5% | |
Alexandria Real Estate Equities, Inc. | | | 120,000 | | | | 10,310,400 | | |
American Assets Trust, Inc. | | | 325,000 | | | | 12,772,500 | | |
CubeSmart | | | 675,000 | | | | 14,539,500 | | |
Geo Group, Inc. (The) | | | 340,000 | | | | 13,698,600 | | |
Highwoods Properties, Inc. | | | 320,000 | | | | 13,811,200 | | |
Kilroy Realty Corp. | | | 220,000 | | | | 15,109,600 | | |
National Health Investors, Inc. | | | 3,758 | | | | 249,080 | | |
PennyMac Mortgage Investment Trust | | | 85,359 | | | | 1,849,730 | | |
QTS Realty Trust Inc., Class A | | | 429,300 | | | | 13,960,836 | | |
RLJ Lodging Trust | | | 350,000 | | | | 11,525,500 | | |
Tanger Factory Outlet Centers, Inc. | | | 330,000 | | | | 12,071,400 | | |
Total | | | | | 119,898,346 | | |
Thrifts & Mortgage Finance 3.1% | |
EverBank Financial Corp. | | | 835,000 | | | | 15,731,400 | | |
MGIC Investment Corp.(a) | | | 1,150,000 | | | | 10,706,500 | | |
Radian Group, Inc. | | | 750,000 | | | | 12,787,500 | | |
Total | | | | | 39,225,400 | | |
Total Financials | | | | | 391,974,616 | | |
Health Care 8.9% | |
Health Care Equipment & Supplies 2.1% | |
Globus Medical, Inc., Class A(a) | | | 465,000 | | | | 10,713,600 | | |
Teleflex, Inc. | | | 130,000 | | | | 15,489,500 | | |
Total | | | | | 26,203,100 | | |
Health Care Providers & Services 5.5% | |
Healthways, Inc.(a) | | | 650,000 | | | | 10,127,000 | | |
Kindred Healthcare, Inc. | | | 755,000 | | | | 15,016,950 | | |
LifePoint Hospitals, Inc.(a) | | | 170,000 | | | | 11,762,300 | | |
Omnicare, Inc. | | | 225,000 | | | | 15,822,000 | | |
VCA, Inc.(a) | | | 350,000 | | | | 16,565,500 | | |
Total | | | | | 69,293,750 | | |
Pharmaceuticals 1.3% | |
Catalent, Inc.(a) | | | 580,000 | | | | 16,698,200 | | |
Total Health Care | | | | | 112,195,050 | | |
Industrials 12.0% | |
Airlines 3.1% | |
Alaska Air Group, Inc. | | | 295,000 | | | | 17,413,850 | | |
United Continental Holdings, Inc.(a) | | | 285,000 | | | | 17,450,550 | | |
Common Stocks (continued)
Issuer | | Shares | | Value ($) | |
Virgin America, Inc.(a) | | | 103,194 | | | | 3,888,350 | | |
Total | | | | | 38,752,750 | | |
Commercial Services & Supplies 2.2% | |
Deluxe Corp. | | | 255,000 | | | | 14,904,750 | | |
Steelcase, Inc., Class A | | | 740,000 | | | | 12,964,800 | | |
Total | | | | | 27,869,550 | | |
Construction & Engineering 0.9% | |
Tutor Perini Corp.(a) | | | 420,000 | | | | 10,605,000 | | |
Machinery 1.7% | |
Trinity Industries, Inc. | | | 292,000 | | | | 9,361,520 | | |
Wabash National Corp.(a) | | | 1,150,000 | | | | 12,408,500 | | |
Total | | | | | 21,770,020 | | |
Professional Services 1.6% | |
Towers Watson & Co. | | | 134,000 | | | | 15,136,640 | | |
TrueBlue, Inc.(a) | | | 230,000 | | | | 5,278,500 | | |
Total | | | | | 20,415,140 | | |
Road & Rail 1.4% | |
Swift Transportation Co.(a) | | | 610,000 | | | | 17,732,700 | | |
Trading Companies & Distributors 1.1% | |
United Rentals, Inc.(a) | | | 125,000 | | | | 14,163,750 | | |
Total Industrials | | | | | 151,308,910 | | |
Information Technology 10.1% | |
Communications Equipment 1.0% | |
F5 Networks, Inc.(a) | | | 100,000 | | | | 12,919,000 | | |
Internet Software & Services 1.1% | |
Endurance International Group
Holdings, Inc.(a) | | | 875,000 | | | | 14,542,500 | | |
IT Services 0.7% | |
Unisys Corp.(a) | | | 335,000 | | | | 8,951,200 | | |
Semiconductors & Semiconductor Equipment 5.3% | |
Fairchild Semiconductor
International, Inc.(a) | | | 670,000 | | | | 10,807,100 | | |
Integrated Device Technology, Inc.(a) | | | 725,000 | | | | 13,528,500 | | |
Kulicke & Soffa Industries, Inc.(a) | | | 1,050,000 | | | | 14,679,000 | | |
Skyworks Solutions, Inc. | | | 230,000 | | | | 15,518,100 | | |
SunEdison, Inc.(a) | | | 550,000 | | | | 11,907,500 | | |
Total | | | | | 66,440,200 | | |
The accompanying Notes to Financial Statements are an integral part of this statement.
Semiannual Report 2014
7
Columbia Small/Mid Cap Value Fund
Portfolio of Investments (continued)
November 30, 2014 (Unaudited)
Common Stocks (continued)
Issuer | | Shares | | Value ($) | |
Software 2.0% | |
Autodesk, Inc.(a) | | | 185,000 | | | | 11,470,000 | | |
Mentor Graphics Corp. | | | 600,000 | | | | 13,326,000 | | |
Total | | | | | 24,796,000 | | |
Total Information Technology | | | | | 127,648,900 | | |
Materials 6.6% | |
Chemicals 1.5% | |
Axiall Corp. | | | 260,000 | | | | 11,252,800 | | |
Orion Engineered Carbons SA(a) | | | 500,000 | | | | 8,490,000 | | |
Total | | | | | 19,742,800 | | |
Containers & Packaging 1.1% | |
Rock-Tenn Co., Class A | | | 240,000 | | | | 13,634,400 | | |
Metals & Mining 1.3% | |
Carpenter Technology Corp. | | | 155,000 | | | | 7,815,100 | | |
Constellium NV(a) | | | 525,000 | | | | 8,268,750 | | |
Total | | | | | 16,083,850 | | |
Paper & Forest Products 2.7% | |
Boise Cascade Co.(a) | | | 340,000 | | | | 12,134,600 | | |
Clearwater Paper Corp.(a) | | | 185,000 | | | | 12,258,100 | | |
KapStone Paper and Packaging Corp.(a) | | | 325,000 | | | | 9,707,750 | | |
Total | | | | | 34,100,450 | | |
Total Materials | | | | | 83,561,500 | | |
Utilities 4.8% | |
Electric Utilities 1.0% | |
UIL Holdings Corp. | | | 310,000 | | | | 12,338,000 | | |
Gas Utilities 2.6% | |
South Jersey Industries, Inc. | | | 275,000 | | | | 15,697,000 | | |
Southwest Gas Corp. | | | 285,000 | | | | 16,498,650 | | |
Total | | | | | 32,195,650 | | |
Common Stocks (continued)
Issuer | | Shares | | Value ($) | |
Independent Power and Renewable Electricity Producers 1.2% | |
NRG Energy, Inc. | | | 490,000 | | | | 15,317,400 | | |
Total Utilities | | | | | 59,851,050 | | |
Total Common Stocks
(Cost: $1,028,551,468) | | | | | 1,201,443,354 | | |
Exchange-Traded Funds 0.6%
| | | Shares | | Value ($) | |
SPDR S&P 500 ETF Trust | | | 35,000 | | | | 7,252,000 | | |
Total Exchange-Traded Funds
(Cost: $7,256,900) | | | | | 7,252,000 | | |
Limited Partnerships 1.0%
Issuer | | Shares | | Value ($) | |
Financials 1.0% | |
Capital Markets 1.0% | |
Lazard Ltd., Class A | | | 225,000 | | | | 11,592,000 | | |
Total Financials | | | | | 11,592,000 | | |
Total Limited Partnerships
(Cost: $7,585,565) | | | | | 11,592,000 | | |
Money Market Funds 2.9%
| | | Shares | | Value ($) | |
Columbia Short-Term Cash Fund,
0.104%(b)(c) | | | 37,111,846 | | | | 37,111,846 | | |
Total Money Market Funds
(Cost: $37,111,846) | | | | | 37,111,846 | | |
Total Investments
(Cost: $1,080,505,779) | | | | | 1,257,399,200 | | |
Other Assets & Liabilities, Net | | | | | 4,388,877 | | |
Net Assets | | | | | 1,261,788,077 | | |
The accompanying Notes to Financial Statements are an integral part of this statement.
Semiannual Report 2014
8
Columbia Small/Mid Cap Value Fund
Portfolio of Investments (continued)
November 30, 2014 (Unaudited)
Notes to Portfolio of Investments
(a) Non-income producing.
(b) As defined in the Investment Company Act of 1940, an affiliated company is one in which the Fund owns 5% or more of the company's outstanding voting securities, or a company which is under common ownership or control with the Fund. Holdings and transactions in these affiliated companies during the period ended November 30, 2014, are as follows:
Issuer | | Beginning
Cost ($) | | Purchase
Cost ($) | | Proceeds
From Sales ($) | | Ending
Cost ($) | | Dividends —
Affiliated
Issuers ($) | | Value ($) | |
Columbia Short-Term Cash Fund | | | 39,035,428 | | | | 267,778,801 | | | | (269,702,383 | ) | | | 37,111,846 | | | | 19,600 | | | | 37,111,846 | | |
Neff Corp. Class A* | | | — | | | | 8,225,235 | | | | — | | | | 8,225,235 | | | | — | | | | 8,088,148 | | |
Total | | | 39,035,428 | | | | 276,004,036 | | | | (269,702,383 | ) | | | 45,337,081 | | | | 19,600 | | | | 45,199,994 | | |
*Issuer was not an affiliate for the entire period ended November 30, 2014.
(c) The rate shown is the seven-day current annualized yield at November 30, 2014.
Fair Value Measurements
Generally accepted accounting principles (GAAP) require disclosure regarding the inputs and valuation techniques used to measure fair value and any changes in valuation inputs or techniques. In addition, investments shall be disclosed by major category.
The Fund categorizes its fair value measurements according to a three-level hierarchy that maximizes the use of observable inputs and minimizes the use of unobservable inputs by prioritizing that the most observable input be used when available. Observable inputs are those that market participants would use in pricing an investment based on market data obtained from sources independent of the reporting entity. Unobservable inputs are those that reflect the Fund's assumptions about the information market participants would use in pricing an investment. An investment's level within the fair value hierarchy is based on the lowest level of any input that is deemed significant to the asset or liability's fair value measurement. The input levels are not necessarily an indication of the risk or liquidity associated with investments at that level. For example, certain U.S. government securities are generally high quality and liquid, however, they are reflected as Level 2 because the inputs used to determine fair value may not always be quoted prices in an active market.
Fair value inputs are summarized in the three broad levels listed below:
> Level 1 — Valuations based on quoted prices for investments in active markets that the Fund has the ability to access at the measurement date (including NAV for open-end mutual funds). Valuation adjustments are not applied to Level 1 investments.
> Level 2 — Valuations based on other significant observable inputs (including quoted prices for similar securities, interest rates, prepayment speeds, credit risks, etc.).
> Level 3 — Valuations based on significant unobservable inputs (including the Fund's own assumptions and judgment in determining the fair value of investments).
Inputs that are used in determining fair value of an investment may include price information, credit data, volatility statistics, and other factors. These inputs can be either observable or unobservable. The availability of observable inputs can vary between investments, and is affected by various factors such as the type of investment, and the volume and level of activity for that investment or similar investments in the marketplace. The inputs will be considered by the Investment Manager, along with any other relevant factors in the calculation of an investment's fair value. The Fund uses prices and inputs that are current as of the measurement date, which may include periods of market dislocations. During these periods, the availability of prices and inputs may be reduced for many investments. This condition could cause an investment to be reclassified between the various levels within the hierarchy.
Investments falling into the Level 3 category are primarily supported by quoted prices from brokers and dealers participating in the market for those investments. However, these may be classified as Level 3 investments due to lack of market transparency and corroboration to support these quoted prices. Additionally, valuation models may be used as the pricing source for any remaining investments classified as Level 3. These models may rely on one or more significant unobservable inputs and/or significant assumptions by the Investment Manager. Inputs used in valuations may include, but are not limited to, financial statement analysis, capital account balances, discount rates and estimated cash flows, and comparable company data.
Under the direction of the Fund's Board of Trustees (the Board), the Investment Manager's Valuation Committee (the Committee) is responsible for overseeing the valuation procedures approved by the Board. The Committee consists of voting and non-voting members from various groups within the Investment Manager's organization, including operations and accounting, trading and investments, compliance, risk management and legal.
The Committee meets at least monthly to review and approve valuation matters, which may include a description of specific valuation determinations, data regarding pricing information received from approved pricing vendors and brokers and the results of Board-approved
The accompanying Notes to Financial Statements are an integral part of this statement.
Semiannual Report 2014
9
Columbia Small/Mid Cap Value Fund
Portfolio of Investments (continued)
November 30, 2014 (Unaudited)
Fair Value Measurements (continued)
valuation control policies and procedures (the Policies). The Policies address, among other things, instances when market quotations are or are not readily available, including recommendations of third party pricing vendors and a determination of appropriate pricing methodologies; events that require specific valuation determinations and assessment of fair value techniques; securities with a potential for stale pricing, including those that are illiquid, restricted, or in default; and the effectiveness of third party pricing vendors, including periodic reviews of vendors. The Committee meets more frequently, as needed, to discuss additional valuation matters, which may include the need to review back-testing results, review time-sensitive information or approve related valuation actions. The Committee reports to the Board, with members of the Committee meeting with the Board at each of its regularly scheduled meetings to discuss valuation matters and actions during the period, similar to those described earlier.
For investments categorized as Level 3, the Committee monitors information similar to that described above, which may include: (i) data specific to the issuer or comparable issuers, (ii) general market or specific sector news and (iii) quoted prices and specific or similar security transactions. The Committee considers this data and any changes from prior periods in order to assess the reasonableness of observable and unobservable inputs, any assumptions or internal models used to value those securities and changes in fair value. This data is also used to corroborate, when available, information received from approved pricing vendors and brokers. Various factors impact the frequency of monitoring this information (which may occur as often as daily). However, the Committee may determine that changes to inputs, assumptions and models are not required as a result of the monitoring procedures performed.
The following table is a summary of the inputs used to value the Fund's investments at November 30, 2014:
Description | | Level 1
Quoted Prices in Active
Markets for Identical
Assets ($) | | Level 2
Other Significant
Observable Inputs ($) | | Level 3
Significant
Unobservable Inputs ($) | |
Total ($) | |
Equity Securities | |
Common Stocks | |
Consumer Discretionary | | | 206,002,678 | | | | — | | | | — | | | | 206,002,678 | | |
Consumer Staples | | | 15,380,500 | | | | — | | | | — | | | | 15,380,500 | | |
Energy | | | 53,520,150 | | | | — | | | | — | | | | 53,520,150 | | |
Financials | | | 391,974,616 | | | | — | | | | — | | | | 391,974,616 | | |
Health Care | | | 112,195,050 | | | | — | | | | — | | | | 112,195,050 | | |
Industrials | | | 151,308,910 | | | | — | | | | — | | | | 151,308,910 | | |
Information Technology | | | 127,648,900 | | | | — | | | | — | | | | 127,648,900 | | |
Materials | | | 83,561,500 | | | | — | | | | — | | | | 83,561,500 | | |
Utilities | | | 59,851,050 | | | | — | | | | — | | | | 59,851,050 | | |
Exchange-Traded Funds | | | 7,252,000 | | | | — | | | | — | | | | 7,252,000 | | |
Total Equity Securities | | | 1,208,695,354 | | | | — | | | | — | | | | 1,208,695,354 | | |
Other | |
Limited Partnerships | | | 11,592,000 | | | | — | | | | — | | | | 11,592,000 | | |
Total Other | | | 11,592,000 | | | | — | | | | — | | | | 11,592,000 | | |
Mutual Funds | |
Money Market Funds | | | 37,111,846 | | | | — | | | | — | | | | 37,111,846 | | |
Total Mutual Funds | | | 37,111,846 | | | | — | | | | — | | | | 37,111,846 | | |
Total | | | 1,257,399,200 | | | | — | | | | — | | | | 1,257,399,200 | | |
See the Portfolio of Investments for all investment classifications not indicated in the table.
There were no transfers of financial assets between levels during the period.
The accompanying Notes to Financial Statements are an integral part of this statement.
Semiannual Report 2014
10
Columbia Small/Mid Cap Value Fund
Statement of Assets and Liabilities
November 30, 2014 (Unaudited)
Assets | |
Investments, at value | |
Unaffiliated issuers (identified cost $1,035,168,698) | | $ | 1,212,199,206 | | |
Affiliated issuers (identified cost $45,337,081) | | | 45,199,994 | | |
Total investments (identified cost $1,080,505,779) | | | 1,257,399,200 | | |
Cash | | | 6,750 | | |
Receivable for: | |
Investments sold | | | 11,469,572 | | |
Capital shares sold | | | 253,122 | | |
Dividends | | | 1,299,319 | | |
Prepaid expenses | | | 5,873 | | |
Other assets | | | 4,476 | | |
Total assets | | | 1,270,438,312 | | |
Liabilities | |
Payable for: | |
Investments purchased | | | 7,256,900 | | |
Capital shares purchased | | | 959,644 | | |
Investment management fees | | | 50,600 | | |
Distribution and/or service fees | | | 15,783 | | |
Transfer agent fees | | | 143,533 | | |
Administration fees | | | 3,911 | | |
Plan administration fees | | | 28,195 | | |
Compensation of board members | | | 113,802 | | |
Other expenses | | | 77,867 | | |
Total liabilities | | | 8,650,235 | | |
Net assets applicable to outstanding capital stock | | $ | 1,261,788,077 | | |
Represented by | |
Paid-in capital | | $ | 907,441,974 | | |
Excess of distributions over net investment income | | | (878,770 | ) | |
Accumulated net realized gain | | | 178,331,452 | | |
Unrealized appreciation (depreciation) on: | |
Investments — unaffiliated issuers | | | 177,030,508 | | |
Investments — affiliated issuers | | | (137,087 | ) | |
Total — representing net assets applicable to outstanding capital stock | | $ | 1,261,788,077 | | |
The accompanying Notes to Financial Statements are an integral part of this statement.
Semiannual Report 2014
11
Columbia Small/Mid Cap Value Fund
Statement of Assets and Liabilities (continued)
November 30, 2014 (Unaudited)
Class A | |
Net assets | | $ | 905,777,120 | | |
Shares outstanding | | | 81,968,872 | | |
Net asset value per share | | $ | 11.05 | | |
Maximum offering price per share(a) | | $ | 11.72 | | |
Class B | |
Net assets | | $ | 18,318,294 | | |
Shares outstanding | | | 1,762,298 | | |
Net asset value per share | | $ | 10.39 | | |
Class C | |
Net assets | | $ | 34,733,264 | | |
Shares outstanding | | | 3,344,364 | | |
Net asset value per share | | $ | 10.39 | | |
Class I | |
Net assets | | $ | 3,115 | | |
Shares outstanding | | | 276 | | |
Net asset value per share(b) | | $ | 11.28 | | |
Class K | |
Net assets | | $ | 140,895,502 | | |
Shares outstanding | | | 12,658,219 | | |
Net asset value per share | | $ | 11.13 | | |
Class R | |
Net assets | | $ | 10,067,970 | | |
Shares outstanding | | | 921,511 | | |
Net asset value per share | | $ | 10.93 | | |
Class R4 | |
Net assets | | $ | 23,695,474 | | |
Shares outstanding | | | 2,145,840 | | |
Net asset value per share | | $ | 11.04 | | |
Class R5 | |
Net assets | | $ | 86,969,145 | | |
Shares outstanding | | | 7,787,968 | | |
Net asset value per share | | $ | 11.17 | | |
Class W | |
Net assets | | $ | 2,704 | | |
Shares outstanding | | | 243 | | |
Net asset value per share | | $ | 11.13 | | |
Class Y | |
Net assets | | $ | 6,973,644 | | |
Shares outstanding | | | 631,638 | | |
Net asset value per share | | $ | 11.04 | | |
The accompanying Notes to Financial Statements are an integral part of this statement.
Semiannual Report 2014
12
Columbia Small/Mid Cap Value Fund
Statement of Assets and Liabilities (continued)
November 30, 2014 (Unaudited)
Class Z | |
Net assets | | $ | 34,351,845 | | |
Shares outstanding | | | 3,054,536 | | |
Net asset value per share | | $ | 11.25 | | |
(a) The maximum offering price per share is calculated by dividing the net asset value per share by 1.0 minus the maximum sales charge of 5.75%.
(b) Net asset value per share rounds to this amount due to fractional shares outstanding.
The accompanying Notes to Financial Statements are an integral part of this statement.
Semiannual Report 2014
13
Columbia Small/Mid Cap Value Fund
Statement of Operations
Six Months Ended November 30, 2014 (Unaudited)
Net investment income | |
Income: | |
Dividends — unaffiliated issuers | | $ | 8,841,377 | | |
Dividends — affiliated issuers | | | 19,600 | | |
Total income | | | 8,860,977 | | |
Expenses: | |
Investment management fees | | | 5,018,742 | | |
Distribution and/or service fees | |
Class A | | | 1,172,688 | | |
Class B | | | 106,635 | | |
Class C | | | 176,381 | | |
Class R | | | 27,593 | | |
Class W | | | 3 | | |
Transfer agent fees | |
Class A | | | 924,095 | | |
Class B | | | 21,034 | | |
Class C | | | 34,739 | | |
Class K | | | 36,463 | | |
Class R | | | 10,880 | | |
Class R4 | | | 25,233 | | |
Class R5 | | | 28,427 | | |
Class W | | | 3 | | |
Class Z | | | 32,319 | | |
Administration fees | | | 386,841 | | |
Plan administration fees | |
Class K | | | 182,316 | | |
Compensation of board members | | | 19,201 | | |
Custodian fees | | | 12,121 | | |
Printing and postage fees | | | 93,569 | | |
Registration fees | | | 74,922 | | |
Professional fees | | | 22,763 | | |
Other | | | 14,210 | | |
Total expenses | | | 8,421,178 | | |
Expense reductions | | | (60 | ) | |
Total net expenses | | | 8,421,118 | | |
Net investment income | | | 439,859 | | |
Realized and unrealized gain (loss) — net | |
Net realized gain (loss) on: | |
Investments | | | 26,307,667 | | |
Net realized gain | | | 26,307,667 | | |
Net change in unrealized appreciation (depreciation) on: | |
Investments — unaffiliated issuers | | | 3,291,557 | | |
Investments — affiliated issuers | | | (137,087 | ) | |
Net change in unrealized appreciation | | | 3,154,470 | | |
Net realized and unrealized gain | | | 29,462,137 | | |
Net increase in net assets resulting from operations | | $ | 29,901,996 | | |
The accompanying Notes to Financial Statements are an integral part of this statement.
Semiannual Report 2014
14
Columbia Small/Mid Cap Value Fund
Statement of Changes in Net Assets
| | | Six Months Ended
November 30, 2014
(Unaudited) | | Year Ended
May 31,
2014(a) | |
Operations | |
Net investment income | | $ | 439,859 | | | $ | 3,022,865 | | |
Net realized gain | | | 26,307,667 | | | | 472,710,377 | | |
Net change in unrealized appreciation (depreciation) | | | 3,154,470 | | | | (221,887,020 | ) | |
Net increase in net assets resulting from operations | | | 29,901,996 | | | | 253,846,222 | | |
Distributions to shareholders | |
Net investment income | |
Class A | | | — | | | | (9,760,341 | ) | |
Class B | | | — | | | | (188,593 | ) | |
Class C | | | — | | | | (219,396 | ) | |
Class I | | | — | | | | (1,084,703 | ) | |
Class K | | | — | | | | (1,861,253 | ) | |
Class R | | | — | | | | (107,709 | ) | |
Class R4 | | | — | | | | (337,511 | ) | |
Class R5 | | | — | | | | (3,167,030 | ) | |
Class W | | | — | | | | (57 | ) | |
Class Y | | | — | | | | (472,242 | ) | |
Class Z | | | — | | | | (497,630 | ) | |
Net realized gains | |
Class A | | | — | | | | (69,193,078 | ) | |
Class B | | | — | | | | (2,263,318 | ) | |
Class C | | | — | | | | (2,648,660 | ) | |
Class I | | | — | | | | (5,522,105 | ) | |
Class K | | | — | | | | (11,548,795 | ) | |
Class R | | | — | | | | (965,363 | ) | |
Class R4 | | | — | | | | (2,074,996 | ) | |
Class R5 | | | — | | | | (16,630,430 | ) | |
Class W | | | — | | | | (400 | ) | |
Class Y | | | — | | | | (2,524,550 | ) | |
Class Z | | | — | | | | (2,901,080 | ) | |
Total distributions to shareholders | | | — | | | | (133,969,240 | ) | |
Decrease in net assets from capital stock activity | | | (240,145,638 | ) | | | (321,503,772 | ) | |
Total decrease in net assets | | | (210,243,642 | ) | | | (201,626,790 | ) | |
Net assets at beginning of period | | | 1,472,031,719 | | | | 1,673,658,509 | | |
Net assets at end of period | | $ | 1,261,788,077 | | | $ | 1,472,031,719 | | |
Excess of distributions over net investment income | | $ | (878,770 | ) | | $ | (1,318,629 | ) | |
(a) Class Y shares are based on operations from June 13, 2013 (commencement of operations) through the stated period end.
The accompanying Notes to Financial Statements are an integral part of this statement.
Semiannual Report 2014
15
Columbia Small/Mid Cap Value Fund
Statement of Changes in Net Assets (continued)
| | | Six Months Ended November 30, 2014
(Unaudited) | | Year Ended May 31, 2014(a) | |
| | | Shares | | Dollars ($) | | Shares | | Dollars ($) | |
Capital stock activity | |
Class A shares | |
Subscriptions(b) | | | 1,644,211 | | | | 17,824,409 | | | | 7,719,881 | | | | 81,556,402 | | |
Distributions reinvested | | | — | | | | — | | | | 7,655,219 | | | | 78,083,234 | | |
Redemptions | | | (10,023,576 | ) | | | (108,651,304 | ) | | | (17,509,364 | ) | | | (184,628,857 | ) | |
Net decrease | | | (8,379,365 | ) | | | (90,826,895 | ) | | | (2,134,264 | ) | | | (24,989,221 | ) | |
Class B shares | |
Subscriptions | | | 11,542 | | | | 117,237 | | | | 51,752 | | | | 516,734 | | |
Distributions reinvested | | | — | | | | — | | | | 251,225 | | | | 2,429,346 | | |
Redemptions(b) | | | (638,303 | ) | | | (6,500,959 | ) | | | (1,938,909 | ) | | | (19,393,030 | ) | |
Net decrease | | | (626,761 | ) | | | (6,383,722 | ) | | | (1,635,932 | ) | | | (16,446,950 | ) | |
Class C shares | |
Subscriptions | | | 119,429 | | | | 1,224,745 | | | | 411,683 | | | | 4,114,931 | | |
Distributions reinvested | | | — | | | | — | | | | 286,754 | | | | 2,770,043 | | |
Redemptions | | | (317,285 | ) | | | (3,247,407 | ) | | | (506,602 | ) | | | (5,053,420 | ) | |
Net increase (decrease) | | | (197,856 | ) | | | (2,022,662 | ) | | | 191,835 | | | | 1,831,554 | | |
Class I shares | |
Subscriptions | | | 6,533 | | | | 71,191 | | | | 182,239 | | | | 2,000,712 | | |
Distributions reinvested | | | — | | | | — | | | | 636,996 | | | | 6,605,646 | | |
Redemptions | | | (7,350,096 | ) | | | (82,079,581 | ) | | | (3,247,139 | ) | | | (35,388,406 | ) | |
Net decrease | | | (7,343,563 | ) | | | (82,008,390 | ) | | | (2,427,904 | ) | | | (26,782,048 | ) | |
Class K shares | |
Subscriptions | | | 551,154 | | | | 6,049,373 | | | | 2,732,714 | | | | 28,911,315 | | |
Distributions reinvested | | | — | | | | — | | | | 1,306,894 | | | | 13,408,739 | | |
Redemptions | | | (2,191,972 | ) | | | (24,067,374 | ) | | | (9,695,132 | ) | | | (103,152,230 | ) | |
Net decrease | | | (1,640,818 | ) | | | (18,018,001 | ) | | | (5,655,524 | ) | | | (60,832,176 | ) | |
Class R shares | |
Subscriptions | | | 148,849 | | | | 1,575,988 | | | | 318,601 | | | | 3,327,797 | | |
Distributions reinvested | | | — | | | | — | | | | 104,018 | | | | 1,051,621 | | |
Redemptions | | | (371,829 | ) | | | (3,983,606 | ) | | | (543,044 | ) | | | (5,672,185 | ) | |
Net decrease | | | (222,980 | ) | | | (2,407,618 | ) | | | (120,425 | ) | | | (1,292,767 | ) | |
Class R4 shares | |
Subscriptions | | | 285,145 | | | | 3,107,440 | | | | 588,775 | | | | 6,202,352 | | |
Distributions reinvested | | | — | | | | — | | | | 237,218 | | | | 2,412,507 | | |
Redemptions | | | (542,632 | ) | | | (5,884,720 | ) | | | (1,315,116 | ) | | | (13,752,040 | ) | |
Net decrease | | | (257,487 | ) | | | (2,777,280 | ) | | | (489,123 | ) | | | (5,137,181 | ) | |
The accompanying Notes to Financial Statements are an integral part of this statement.
Semiannual Report 2014
16
Columbia Small/Mid Cap Value Fund
Statement of Changes in Net Assets (continued)
| | | Six Months Ended November 30, 2014
(Unaudited) | | Year Ended May 31, 2014(a) | |
| | | Shares | | Dollars ($) | | Shares | | Dollars ($) | |
Capital stock activity (continued) | |
Class R5 shares | |
Subscriptions | | | 975,532 | | | | 10,692,706 | | | | 4,153,207 | | | | 44,352,521 | | |
Distributions reinvested | | | — | | | | — | | | | 1,798,337 | | | | 18,468,926 | | |
Redemptions | | | (4,340,820 | ) | | | (47,904,566 | ) | | | (17,308,395 | ) | | | (182,577,597 | ) | |
Net decrease | | | (3,365,288 | ) | | | (37,211,860 | ) | | | (11,356,851 | ) | | | (119,756,150 | ) | |
Class W shares | |
Redemptions | | | — | | | | — | | | | (263 | ) | | | (2,901 | ) | |
Net decrease | | | — | | | | — | | | | (263 | ) | | | (2,901 | ) | |
Class Y shares | |
Subscriptions | | | 49,351 | | | | 533,348 | | | | 4,460,365 | | | | 46,830,747 | | |
Distributions reinvested | | | — | | | | — | | | | 295,227 | | | | 2,996,559 | | |
Redemptions | | | (70,280 | ) | | | (764,527 | ) | | | (4,103,025 | ) | | | (43,038,706 | ) | |
Net increase (decrease) | | | (20,929 | ) | | | (231,179 | ) | | | 652,567 | | | | 6,788,600 | | |
Class Z shares | |
Subscriptions | | | 688,250 | | | | 7,650,732 | | | | 4,012,037 | | | | 42,542,748 | | |
Distributions reinvested | | | — | | | | — | | | | 251,291 | | | | 2,603,380 | | |
Redemptions | | | (538,366 | ) | | | (5,908,763 | ) | | | (10,865,587 | ) | | | (120,030,660 | ) | |
Net increase (decrease) | | | 149,884 | | | | 1,741,969 | | | | (6,602,259 | ) | | | (74,884,532 | ) | |
Total net decrease | | | (21,905,163 | ) | | | (240,145,638 | ) | | | (29,578,143 | ) | | | (321,503,772 | ) | |
(a) Class Y shares are based on operations from June 13, 2013 (commencement of operations) through the stated period end.
(b) Includes conversions of Class B shares to Class A shares, if any.
The accompanying Notes to Financial Statements are an integral part of this statement.
Semiannual Report 2014
17
Columbia Small/Mid Cap Value Fund
The following tables are intended to help you understand the Fund's financial performance. Certain information reflects financial results for a single share of a class held for the periods shown. Per share net investment income (loss) amounts are calculated based on average shares outstanding during the period. Total return assumes reinvestment of all dividends and distributions, if any. Total return does not reflect payment of sales charges, if any. Total return and portfolio turnover are not annualized for periods of less than one year. The portfolio turnover rate is calculated without regard to purchase and sales transactions of short-term instruments and certain derivatives, if any. If such transactions were included, the Fund's portfolio turnover rate may be higher.
| | | Six Months Ended
November 30, 2014 | | Year Ended May 31, | | Year Ended September 30, | |
Class A | | (Unaudited) | | 2014 | | 2013 | | 2012(a) | | 2011 | | 2010 | | 2009 | |
Per share data | |
Net asset value,
beginning of period | | $ | 10.81 | | | $ | 10.08 | | | $ | 7.59 | | | $ | 6.44 | | | $ | 6.94 | | | $ | 6.15 | | | $ | 7.14 | | |
Income from investment
operations: | |
Net investment income | | | 0.00 | (b) | | | 0.01 | | | | 0.07 | | | | 0.03 | | | | 0.02 | | | | 0.04 | | | | 0.07 | | |
Net realized and
unrealized gain (loss) | | | 0.24 | | | | 1.62 | | | | 2.46 | | | | 1.12 | | | | (0.48 | ) | | | 0.83 | | | | (0.59 | ) | |
Total from investment
operations | | | 0.24 | | | | 1.63 | | | | 2.53 | | | | 1.15 | | | | (0.46 | ) | | | 0.87 | | | | (0.52 | ) | |
Less distributions to
shareholders: | |
Net investment income | | | — | | | | (0.11 | ) | | | (0.04 | ) | | | (0.00 | )(b) | | | (0.04 | ) | | | (0.08 | ) | | | (0.02 | ) | |
Net realized gains | | | — | | | | (0.79 | ) | | | — | | | | — | | | | — | | | | — | | | | (0.45 | ) | |
Total distributions to
shareholders | | | — | | | | (0.90 | ) | | | (0.04 | ) | | | (0.00 | )(b) | | | (0.04 | ) | | | (0.08 | ) | | | (0.47 | ) | |
Net asset value, end
of period | | $ | 11.05 | | | $ | 10.81 | | | $ | 10.08 | | | $ | 7.59 | | | $ | 6.44 | | | $ | 6.94 | | | $ | 6.15 | | |
Total return | | | 2.22 | % | | | 16.73 | % | | | 33.47 | % | | | 17.93 | % | | | (6.69 | %) | | | 14.28 | % | | | (4.97 | %) | |
Ratios to average
net assets(c) | |
Total gross expenses | | | 1.25 | %(d) | | | 1.26 | % | | | 1.31 | % | | | 1.29 | %(d) | | | 1.30 | % | | | 1.20 | % | | | 1.19 | % | |
Total net expenses(e) | | | 1.25 | %(d)(f) | | | 1.25 | %(f) | | | 1.23 | %(f) | | | 1.20 | %(d) | | | 1.29 | %(f) | | | 1.20 | % | | | 1.19 | % | |
Net investment income | | | 0.02 | %(d) | | | 0.10 | % | | | 0.81 | % | | | 0.55 | %(d) | | | 0.22 | % | | | 0.62 | % | | | 1.39 | % | |
Supplemental data | |
Net assets, end of period
(in thousands) | | $ | 905,777 | | | $ | 976,436 | | | $ | 932,556 | | | $ | 850,820 | | | $ | 882,934 | | | $ | 1,324,861 | | | $ | 1,351,336 | | |
Portfolio turnover | | | 25 | % | | | 110 | % | | | 40 | % | | | 28 | % | | | 46 | % | | | 50 | % | | | 42 | % | |
Notes to Financial Highlights
(a) For the period from October 1, 2011 to May 31, 2012. During the period, the Fund's fiscal year end was changed from September 30 to May 31.
(b) Rounds to zero.
(c) In addition to the fees and expenses that the Fund bears directly, the Fund indirectly bears a pro rata share of the fees and expenses of any other funds in which it invests. Such indirect expenses are not included in the Fund's reported expense ratios.
(d) Annualized.
(e) Total net expenses include the impact of certain fee waivers/expense reimbursements made by the Investment Manager and certain of its affiliates, if applicable.
(f) The benefits derived from expense reductions had an impact of less than 0.01%.
The accompanying Notes to Financial Statements are an integral part of this statement.
Semiannual Report 2014
18
Columbia Small/Mid Cap Value Fund
Financial Highlights (continued)
| | | Six Months Ended
November 30, 2014 | | Year Ended May 31, | | Year Ended September 30, | |
Class B | | (Unaudited) | | 2014 | | 2013 | | 2012(a) | | 2011 | | 2010 | | 2009 | |
Per share data | |
Net asset value, beginning
of period | | $ | 10.21 | | | $ | 9.60 | | | $ | 7.24 | | | $ | 6.17 | | | $ | 6.67 | | | $ | 5.90 | | | $ | 6.90 | | |
Income from investment
operations: | |
Net investment income (loss) | | | (0.04 | ) | | | (0.06 | ) | | | 0.01 | | | | (0.01 | ) | | | (0.04 | ) | | | (0.01 | ) | | | 0.03 | | |
Net realized and unrealized
gain (loss) | | | 0.22 | | | | 1.53 | | | | 2.35 | | | | 1.08 | | | | (0.46 | ) | | | 0.81 | | | | (0.58 | ) | |
Total from investment
operations | | | 0.18 | | | | 1.47 | | | | 2.36 | | | | 1.07 | | | | (0.50 | ) | | | 0.80 | | | | (0.55 | ) | |
Less distributions to
shareholders: | |
Net investment income | | | — | | | | (0.07 | ) | | | — | | | | — | | | | — | | | | (0.03 | ) | | | — | | |
Net realized gains | | | — | | | | (0.79 | ) | | | — | | | | — | | | | — | | | | — | | | | (0.45 | ) | |
Total distributions to
shareholders | | | — | | | | (0.86 | ) | | | — | | | | — | | | | — | | | | (0.03 | ) | | | (0.45 | ) | |
Net asset value, end of period | | $ | 10.39 | | | $ | 10.21 | | | $ | 9.60 | | | $ | 7.24 | | | $ | 6.17 | | | $ | 6.67 | | | $ | 5.90 | | |
Total return | | | 1.76 | % | | | 15.78 | % | | | 32.60 | % | | | 17.34 | % | | | (7.50 | %) | | | 13.65 | % | | | (5.88 | %) | |
Ratios to average net assets(b) | |
Total gross expenses | | | 2.00 | %(c) | | | 2.01 | % | | | 2.05 | % | | | 2.04 | %(c) | | | 2.04 | % | | | 1.97 | % | | | 1.96 | % | |
Total net expenses(d) | | | 2.00 | %(c)(e) | | | 2.00 | %(e) | | | 1.97 | %(e) | | | 1.95 | %(c) | | | 2.03 | %(e) | | | 1.97 | % | | | 1.96 | % | |
Net investment income (loss) | | | (0.73 | %)(c) | | | (0.65 | %) | | | 0.11 | % | | | (0.19 | %)(c) | | | (0.54 | %) | | | (0.18 | %) | | | 0.62 | % | |
Supplemental data | |
Net assets, end of period
(in thousands) | | $ | 18,318 | | | $ | 24,381 | | | $ | 38,621 | | | $ | 49,020 | | | $ | 49,737 | | | $ | 92,370 | | | $ | 104,322 | | |
Portfolio turnover | | | 25 | % | | | 110 | % | | | 40 | % | | | 28 | % | | | 46 | % | | | 50 | % | | | 42 | % | |
Notes to Financial Highlights
(a) For the period from October 1, 2011 to May 31, 2012. During the period, the Fund's fiscal year end was changed from September 30 to May 31.
(b) In addition to the fees and expenses that the Fund bears directly, the Fund indirectly bears a pro rata share of the fees and expenses of any other funds in which it invests. Such indirect expenses are not included in the Fund's reported expense ratios.
(c) Annualized.
(d) Total net expenses include the impact of certain fee waivers/expense reimbursements made by the Investment Manager and certain of its affiliates, if applicable.
(e) The benefits derived from expense reductions had an impact of less than 0.01%.
The accompanying Notes to Financial Statements are an integral part of this statement.
Semiannual Report 2014
19
Columbia Small/Mid Cap Value Fund
Financial Highlights (continued)
| | | Six Months Ended
November 30, 2014 | | Year Ended May 31, | | Year Ended September 30, | |
Class C | | (Unaudited) | | 2014 | | 2013 | | 2012(a) | | 2011 | | 2010 | | 2009 | |
Per share data | |
Net asset value, beginning
of period | | $ | 10.20 | | | $ | 9.59 | | | $ | 7.24 | | | $ | 6.17 | | | $ | 6.66 | | | $ | 5.91 | | | $ | 6.90 | | |
Income from investment
operations: | |
Net investment income (loss) | | | (0.04 | ) | | | (0.07 | ) | | | 0.01 | | | | (0.01 | ) | | | (0.04 | ) | | | (0.01 | ) | | | 0.03 | | |
Net realized and unrealized
gain (loss) | | | 0.23 | | | | 1.54 | | | | 2.34 | | | | 1.08 | | | | (0.45 | ) | | | 0.80 | | | | (0.57 | ) | |
Total from investment
operations | | | 0.19 | | | | 1.47 | | | | 2.35 | | | | 1.07 | | | | (0.49 | ) | | | 0.79 | | | | (0.54 | ) | |
Less distributions to
shareholders: | |
Net investment income | | | — | | | | (0.07 | ) | | | — | | | | — | | | | — | | | | (0.04 | ) | | | — | | |
Net realized gains | | | — | | | | (0.79 | ) | | | — | | | | — | | | | — | | | | — | | | | (0.45 | ) | |
Total distributions to
shareholders | | | — | | | | (0.86 | ) | | | — | | | | — | | | | — | | | | (0.04 | ) | | | (0.45 | ) | |
Net asset value, end of period | | $ | 10.39 | | | $ | 10.20 | | | $ | 9.59 | | | $ | 7.24 | | | $ | 6.17 | | | $ | 6.66 | | | $ | 5.91 | | |
Total return | | | 1.86 | % | | | 15.79 | % | | | 32.46 | % | | | 17.34 | % | | | (7.36 | %) | | | 13.49 | % | | | (5.74 | %) | |
Ratios to average net assets(b) | |
Total gross expenses | | | 2.00 | %(c) | | | 2.01 | % | | | 2.06 | % | | | 2.04 | %(c) | | | 2.05 | % | | | 1.96 | % | | | 1.95 | % | |
Total net expenses(d) | | | 2.00 | %(c)(e) | | | 2.00 | %(e) | | | 1.98 | %(e) | | | 1.95 | %(c) | | | 2.04 | %(e) | | | 1.96 | % | | | 1.95 | % | |
Net investment income (loss) | | | (0.73 | %)(c) | | | (0.66 | %) | | | 0.07 | % | | | (0.20 | %)(c) | | | (0.52 | %) | | | (0.13 | %) | | | 0.62 | % | |
Supplemental data | |
Net assets, end of period
(in thousands) | | $ | 34,733 | | | $ | 36,115 | | | $ | 32,119 | | | $ | 31,012 | | | $ | 34,731 | | | $ | 45,317 | | | $ | 41,952 | | |
Portfolio turnover | | | 25 | % | | | 110 | % | | | 40 | % | | | 28 | % | | | 46 | % | | | 50 | % | | | 42 | % | |
Notes to Financial Highlights
(a) For the period from October 1, 2011 to May 31, 2012. During the period, the Fund's fiscal year end was changed from September 30 to May 31.
(b) In addition to the fees and expenses that the Fund bears directly, the Fund indirectly bears a pro rata share of the fees and expenses of any other funds in which it invests. Such indirect expenses are not included in the Fund's reported expense ratios.
(c) Annualized.
(d) Total net expenses include the impact of certain fee waivers/expense reimbursements made by the Investment Manager and certain of its affiliates, if applicable.
(e) The benefits derived from expense reductions had an impact of less than 0.01%.
The accompanying Notes to Financial Statements are an integral part of this statement.
Semiannual Report 2014
20
Columbia Small/Mid Cap Value Fund
Financial Highlights (continued)
| | | Six Months Ended
November 30, 2014 | | Year Ended May 31, | | Year Ended September 30, | |
Class I | | (Unaudited) | | 2014 | | 2013 | | 2012(a) | | 2011 | | 2010 | | 2009 | |
Per share data | |
Net asset value, beginning
of period | | $ | 11.01 | | | $ | 10.25 | | | $ | 7.72 | | | $ | 6.56 | | | $ | 7.07 | | | $ | 6.25 | | | $ | 7.26 | | |
Income from investment
operations: | |
Net investment income | | | 0.02 | | | | 0.06 | | | | 0.11 | | | | 0.05 | | | | 0.06 | | | | 0.07 | | | | 0.09 | | |
Net realized and unrealized
gain (loss) | | | 0.25 | | | | 1.65 | | | | 2.50 | | | | 1.15 | | | | (0.49 | ) | | | 0.86 | | | | (0.60 | ) | |
Total from investment
operations | | | 0.27 | | | | 1.71 | | | | 2.61 | | | | 1.20 | | | | (0.43 | ) | | | 0.93 | | | | (0.51 | ) | |
Less distributions to
shareholders: | |
Net investment income | | | — | | | | (0.16 | ) | | | (0.08 | ) | | | (0.04 | ) | | | (0.08 | ) | | | (0.11 | ) | | | (0.05 | ) | |
Net realized gains | | | — | | | | (0.79 | ) | | | — | | | | — | | | | — | | | | — | | | | (0.45 | ) | |
Total distributions to
shareholders | | | — | | | | (0.95 | ) | | | (0.08 | ) | | | (0.04 | ) | | | (0.08 | ) | | | (0.11 | ) | | | (0.50 | ) | |
Net asset value, end of period | | $ | 11.28 | | | $ | 11.01 | | | $ | 10.25 | | | $ | 7.72 | | | $ | 6.56 | | | $ | 7.07 | | | $ | 6.25 | | |
Total return | | | 2.45 | % | | | 17.22 | % | | | 33.99 | % | | | 18.30 | % | | | (6.28 | %) | | | 15.06 | % | | | (4.60 | %) | |
Ratios to average net assets(b) | |
Total gross expenses | | | 0.80 | %(c) | | | 0.79 | % | | | 0.80 | % | | | 0.79 | %(c) | | | 0.82 | % | | | 0.73 | % | | | 0.67 | % | |
Total net expenses(d) | | | 0.80 | %(c) | | | 0.79 | % | | | 0.78 | % | | | 0.77 | %(c) | | | 0.82 | % | | | 0.73 | % | | | 0.67 | % | |
Net investment income | | | 0.36 | %(c) | | | 0.55 | % | | | 1.25 | % | | | 0.98 | %(c) | | | 0.72 | % | | | 1.05 | % | | | 1.83 | % | |
Supplemental data | |
Net assets, end of period
(in thousands) | | $ | 3 | | | $ | 80,862 | | | $ | 100,192 | | | $ | 84,959 | | | $ | 100,645 | | | $ | 117,621 | | | $ | 44,214 | | |
Portfolio turnover | | | 25 | % | | | 110 | % | | | 40 | % | | | 28 | % | | | 46 | % | | | 50 | % | | | 42 | % | |
Notes to Financial Highlights
(a) For the period from October 1, 2011 to May 31, 2012. During the period, the Fund's fiscal year end was changed from September 30 to May 31.
(b) In addition to the fees and expenses that the Fund bears directly, the Fund indirectly bears a pro rata share of the fees and expenses of any other funds in which it invests. Such indirect expenses are not included in the Fund's reported expense ratios.
(c) Annualized.
(d) Total net expenses include the impact of certain fee waivers/expense reimbursements made by the Investment Manager and certain of its affiliates, if applicable.
The accompanying Notes to Financial Statements are an integral part of this statement.
Semiannual Report 2014
21
Columbia Small/Mid Cap Value Fund
Financial Highlights (continued)
| | | Six Months Ended
November 30, 2014 | | Year Ended May 31, | | Year Ended September 30, | |
Class K | | (Unaudited) | | 2014 | | 2013 | | 2012(a) | | 2011 | | 2010 | | 2009 | |
Per share data | |
Net asset value,
beginning of period | | $ | 10.88 | | | $ | 10.14 | | | $ | 7.64 | | | $ | 6.48 | | | $ | 6.99 | | | $ | 6.19 | | | $ | 7.20 | | |
Income from investment
operations: | |
Net investment income | | | 0.01 | | | | 0.03 | | | | 0.08 | | | | 0.04 | | | | 0.03 | | | | 0.05 | | | | 0.08 | | |
Net realized and
unrealized gain (loss) | | | 0.24 | | | | 1.63 | | | | 2.47 | | | | 1.13 | | | | (0.48 | ) | | | 0.85 | | | | (0.60 | ) | |
Total from investment
operations | | | 0.25 | | | | 1.66 | | | | 2.55 | | | | 1.17 | | | | (0.45 | ) | | | 0.90 | | | | (0.52 | ) | |
Less distributions to
shareholders: | |
Net investment income | | | — | | | | (0.13 | ) | | | (0.05 | ) | | | (0.01 | ) | | | (0.06 | ) | | | (0.10 | ) | | | (0.04 | ) | |
Net realized gains | | | — | | | | (0.79 | ) | | | — | | | | — | | | | — | | | | — | | | | (0.45 | ) | |
Total distributions to
shareholders | | | — | | | | (0.92 | ) | | | (0.05 | ) | | | (0.01 | ) | | | (0.06 | ) | | | (0.10 | ) | | | (0.49 | ) | |
Net asset value, end
of period | | $ | 11.13 | | | $ | 10.88 | | | $ | 10.14 | | | $ | 7.64 | | | $ | 6.48 | | | $ | 6.99 | | | $ | 6.19 | | |
Total return | | | 2.30 | % | | | 16.90 | % | | | 33.53 | % | | | 18.15 | % | | | (6.59 | %) | | | 14.61 | % | | | (4.91 | %) | |
Ratios to average
net assets(b) | |
Total gross expenses | | | 1.11 | %(c) | | | 1.09 | % | | | 1.10 | % | | | 1.09 | %(c) | | | 1.12 | % | | | 1.03 | % | | | 0.97 | % | |
Total net expenses(d) | | | 1.11 | %(c) | | | 1.09 | % | | | 1.08 | % | | | 1.07 | %(c) | | | 1.12 | % | | | 1.03 | % | | | 0.97 | % | |
Net investment income | | | 0.17 | %(c) | | | 0.28 | % | | | 0.97 | % | | | 0.69 | %(c) | | | 0.38 | % | | | 0.80 | % | | | 1.55 | % | |
Supplemental data | |
Net assets, end of period
(in thousands) | | $ | 140,896 | | | $ | 155,551 | | | $ | 202,420 | | | $ | 241,253 | | | $ | 251,200 | | | $ | 389,349 | | | $ | 337,593 | | |
Portfolio turnover | | | 25 | % | | | 110 | % | | | 40 | % | | | 28 | % | | | 46 | % | | | 50 | % | | | 42 | % | |
Notes to Financial Highlights
(a) For the period from October 1, 2011 to May 31, 2012. During the period, the Fund's fiscal year end was changed from September 30 to May 31.
(b) In addition to the fees and expenses that the Fund bears directly, the Fund indirectly bears a pro rata share of the fees and expenses of any other funds in which it invests. Such indirect expenses are not included in the Fund's reported expense ratios.
(c) Annualized.
(d) Total net expenses include the impact of certain fee waivers/expense reimbursements made by the Investment Manager and certain of its affiliates, if applicable.
The accompanying Notes to Financial Statements are an integral part of this statement.
Semiannual Report 2014
22
Columbia Small/Mid Cap Value Fund
Financial Highlights (continued)
| | | Six Months Ended
November 30, 2014 | | Year Ended May 31, | | Year Ended September 30, | |
Class R | | (Unaudited) | | 2014 | | 2013 | | 2012(a) | | 2011 | | 2010 | | 2009 | |
Per share data | |
Net asset value, beginning
of period | | $ | 10.70 | | | $ | 9.99 | | | $ | 7.52 | | | $ | 6.39 | | | $ | 6.88 | | | $ | 6.11 | | | $ | 7.12 | | |
Income from investment
operations: | |
Net investment income (loss) | | | (0.01 | ) | | | (0.02 | ) | | | 0.05 | | | | 0.02 | | | | (0.00 | )(b) | | | 0.02 | | | | 0.05 | | |
Net realized and unrealized
gain (loss) | | | 0.24 | | | | 1.61 | | | | 2.43 | | | | 1.11 | | | | (0.46 | ) | | | 0.82 | | | | (0.58 | ) | |
Total from investment
operations | | | 0.23 | | | | 1.59 | | | | 2.48 | | | | 1.13 | | | | (0.46 | ) | | | 0.84 | | | | (0.53 | ) | |
Less distributions to
shareholders: | |
Net investment income | | | — | | | | (0.09 | ) | | | (0.01 | ) | | | — | | | | (0.03 | ) | | | (0.07 | ) | | | (0.03 | ) | |
Net realized gains | | | — | | | | (0.79 | ) | | | — | | | | — | | | | — | | | | — | | | | (0.45 | ) | |
Total distributions to
shareholders | | | — | | | | (0.88 | ) | | | (0.01 | ) | | | — | | | | (0.03 | ) | | | (0.07 | ) | | | (0.48 | ) | |
Net asset value, end of period | | $ | 10.93 | | | $ | 10.70 | | | $ | 9.99 | | | $ | 7.52 | | | $ | 6.39 | | | $ | 6.88 | | | $ | 6.11 | | |
Total return | | | 2.15 | % | | | 16.42 | % | | | 33.07 | % | | | 17.68 | % | | | (6.81 | %) | | | 13.85 | % | | | (5.25 | %) | |
Ratios to average net assets(c) | |
Total gross expenses | | | 1.50 | %(d) | | | 1.51 | % | | | 1.56 | % | | | 1.54 | %(d) | | | 1.55 | % | | | 1.53 | % | | | 1.47 | % | |
Total net expenses(e) | | | 1.50 | %(d)(f) | | | 1.50 | %(f) | | | 1.47 | %(f) | | | 1.45 | %(d) | | | 1.54 | %(f) | | | 1.53 | % | | | 1.47 | % | |
Net investment income (loss) | | | (0.23 | %)(d) | | | (0.15 | %) | | | 0.59 | % | | | 0.31 | %(d) | | | (0.01 | %) | | | 0.31 | % | | | 1.07 | % | |
Supplemental data | |
Net assets, end of period
(in thousands) | | $ | 10,068 | | | $ | 12,245 | | | $ | 12,641 | | | $ | 13,594 | | | $ | 14,799 | | | $ | 16,531 | | | $ | 15,827 | | |
Portfolio turnover | | | 25 | % | | | 110 | % | | | 40 | % | | | 28 | % | | | 46 | % | | | 50 | % | | | 42 | % | |
Notes to Financial Highlights
(a) For the period from October 1, 2011 to May 31, 2012. During the period, the Fund's fiscal year end was changed from September 30 to May 31.
(b) Rounds to zero.
(c) In addition to the fees and expenses that the Fund bears directly, the Fund indirectly bears a pro rata share of the fees and expenses of any other funds in which it invests. Such indirect expenses are not included in the Fund's reported expense ratios.
(d) Annualized.
(e) Total net expenses include the impact of certain fee waivers/expense reimbursements made by the Investment Manager and certain of its affiliates, if applicable.
(f) The benefits derived from expense reductions had an impact of less than 0.01%.
The accompanying Notes to Financial Statements are an integral part of this statement.
Semiannual Report 2014
23
Columbia Small/Mid Cap Value Fund
Financial Highlights (continued)
| | | Six Months Ended
November 30, 2014 | | Year Ended May 31, | | Year Ended September 30, | |
Class R4 | | (Unaudited) | | 2014 | | 2013 | | 2012(a) | | 2011 | | 2010 | | 2009 | |
Per share data | |
Net asset value, beginning
of period | | $ | 10.79 | | | $ | 10.06 | | | $ | 7.56 | | | $ | 6.41 | | | $ | 6.92 | | | $ | 6.14 | | | $ | 7.15 | | |
Income from investment
operations: | |
Net investment income | | | 0.01 | | | | 0.04 | | | | 0.08 | | | | 0.02 | | | | 0.01 | | | | 0.04 | | | | 0.06 | | |
Net realized and unrealized
gain (loss) | | | 0.24 | | | | 1.61 | | | | 2.45 | | | | 1.13 | | | | (0.48 | ) | | | 0.83 | | | | (0.59 | ) | |
Total from investment
operations | | | 0.25 | | | | 1.65 | | | | 2.53 | | | | 1.15 | | | | (0.47 | ) | | | 0.87 | | | | (0.53 | ) | |
Less distributions to
shareholders: | |
Net investment income | | | — | | | | (0.13 | ) | | | (0.03 | ) | | | — | | | | (0.04 | ) | | | (0.09 | ) | | | (0.03 | ) | |
Net realized gains | | | — | | | | (0.79 | ) | | | — | | | | — | | | | — | | | | — | | | | (0.45 | ) | |
Total distributions to
shareholders | | | — | | | | (0.92 | ) | | | (0.03 | ) | | | — | | | | (0.04 | ) | | | (0.09 | ) | | | (0.48 | ) | |
Net asset value, end of period | | $ | 11.04 | | | $ | 10.79 | | | $ | 10.06 | | | $ | 7.56 | | | $ | 6.41 | | | $ | 6.92 | | | $ | 6.14 | | |
Total return | | | 2.32 | % | | | 16.95 | % | | | 33.59 | % | | | 17.94 | % | | | (6.84 | %) | | | 14.22 | % | | | (5.07 | %) | |
Ratios to average net assets(b) | |
Total gross expenses | | | 1.00 | %(c) | | | 1.01 | % | | | 1.18 | % | | | 1.34 | %(c) | | | 1.37 | % | | | 1.29 | % | | | 1.22 | % | |
Total net expenses(d) | | | 1.00 | %(c)(e) | | | 1.00 | %(e) | | | 1.15 | % | | | 1.32 | %(c) | | | 1.37 | % | | | 1.29 | % | | | 1.22 | % | |
Net investment income | | | 0.27 | %(c) | | | 0.36 | % | | | 0.93 | % | | | 0.44 | %(c) | | | 0.16 | % | | | 0.55 | % | | | 1.30 | % | |
Supplemental data | |
Net assets, end of period
(in thousands) | | $ | 23,695 | | | $ | 25,924 | | | $ | 29,093 | | | $ | 46,639 | | | $ | 50,329 | | | $ | 67,911 | | | $ | 46,599 | | |
Portfolio turnover | | | 25 | % | | | 110 | % | | | 40 | % | | | 28 | % | | | 46 | % | | | 50 | % | | | 42 | % | |
Notes to Financial Highlights
(a) For the period from October 1, 2011 to May 31, 2012. During the period, the Fund's fiscal year end was changed from September 30 to May 31.
(b) In addition to the fees and expenses that the Fund bears directly, the Fund indirectly bears a pro rata share of the fees and expenses of any other funds in which it invests. Such indirect expenses are not included in the Fund's reported expense ratios.
(c) Annualized.
(d) Total net expenses include the impact of certain fee waivers/expense reimbursements made by the Investment Manager and certain of its affiliates, if applicable.
(e) The benefits derived from expense reductions had an impact of less than 0.01%.
The accompanying Notes to Financial Statements are an integral part of this statement.
Semiannual Report 2014
24
Columbia Small/Mid Cap Value Fund
Financial Highlights (continued)
| | | Six Months Ended
November 30, 2014 | | Year Ended May 31, | | Year Ended September 30, | |
Class R5 | | (Unaudited) | | 2014 | | 2013 | | 2012(a) | | 2011 | | 2010 | | 2009 | |
Per share data | |
Net asset value,
beginning of period | | $ | 10.90 | | | $ | 10.16 | | | $ | 7.65 | | | $ | 6.50 | | | $ | 7.01 | | | $ | 6.20 | | | $ | 7.21 | | |
Income from investment
operations: | |
Net investment income | | | 0.02 | | | | 0.06 | | | | 0.11 | | | | 0.05 | | | | 0.05 | | | | 0.07 | | | | 0.09 | | |
Net realized and
unrealized gain (loss) | | | 0.25 | | | | 1.62 | | | | 2.47 | | | | 1.13 | | | | (0.48 | ) | | | 0.85 | | | | (0.60 | ) | |
Total from investment
operations | | | 0.27 | | | | 1.68 | | | | 2.58 | | | | 1.18 | | | | (0.43 | ) | | | 0.92 | | | | (0.51 | ) | |
Less distributions to
shareholders: | |
Net investment income | | | — | | | | (0.15 | ) | | | (0.07 | ) | | | (0.03 | ) | | | (0.08 | ) | | | (0.11 | ) | | | (0.05 | ) | |
Net realized gains | | | — | | | | (0.79 | ) | | | — | | | | — | | | | — | | | | — | | | | (0.45 | ) | |
Total distributions to
shareholders | | | — | | | | (0.94 | ) | | | (0.07 | ) | | | (0.03 | ) | | | (0.08 | ) | | | (0.11 | ) | | | (0.50 | ) | |
Net asset value, end
of period | | $ | 11.17 | | | $ | 10.90 | | | $ | 10.16 | | | $ | 7.65 | | | $ | 6.50 | | | $ | 7.01 | | | $ | 6.20 | | |
Total return | | | 2.48 | % | | | 17.12 | % | | | 33.98 | % | | | 18.26 | % | | | (6.38 | %) | | | 14.97 | % | | | (4.65 | %) | |
Ratios to average
net assets(b) | |
Total gross expenses | | | 0.86 | %(c) | | | 0.84 | % | | | 0.85 | % | | | 0.84 | %(c) | | | 0.87 | % | | | 0.79 | % | | | 0.72 | % | |
Total net expenses(d) | | | 0.86 | %(c) | | | 0.84 | % | | | 0.83 | % | | | 0.82 | %(c) | | | 0.87 | % | | | 0.79 | % | | | 0.72 | % | |
Net investment income | | | 0.41 | %(c) | | | 0.53 | % | | | 1.22 | % | | | 0.94 | %(c) | | | 0.67 | % | | | 1.05 | % | | | 1.82 | % | |
Supplemental data | |
Net assets, end of period
(in thousands) | | $ | 86,969 | | | $ | 121,576 | | | $ | 228,714 | | | $ | 142,835 | | | $ | 119,293 | | | $ | 139,751 | | | $ | 133,143 | | |
Portfolio turnover | | | 25 | % | | | 110 | % | | | 40 | % | | | 28 | % | | | 46 | % | | | 50 | % | | | 42 | % | |
Notes to Financial Highlights
(a) For the period from October 1, 2011 to May 31, 2012. During the period, the Fund's fiscal year end was changed from September 30 to May 31.
(b) In addition to the fees and expenses that the Fund bears directly, the Fund indirectly bears a pro rata share of the fees and expenses of any other funds in which it invests. Such indirect expenses are not included in the Fund's reported expense ratios.
(c) Annualized.
(d) Total net expenses include the impact of certain fee waivers/expense reimbursements made by the Investment Manager and certain of its affiliates, if applicable.
The accompanying Notes to Financial Statements are an integral part of this statement.
Semiannual Report 2014
25
Columbia Small/Mid Cap Value Fund
Financial Highlights (continued)
| | | Six Months Ended
November 30, 2014 | | Year Ended May 31, | | Year Ended September 30, | |
Class W | | (Unaudited) | | 2014 | | 2013 | | 2012(a) | | 2011 | | 2010 | | 2009 | |
Per share data | |
Net asset value, beginning of period | | $ | 10.89 | | | $ | 10.15 | | | $ | 7.65 | | | $ | 6.49 | | | $ | 7.00 | | | $ | 6.20 | | | $ | 7.19 | | |
Income from investment operations: | |
Net investment income | | | (0.00 | )(b) | | | 0.01 | | | | 0.07 | | | | 0.03 | | | | 0.02 | | | | 0.04 | | | | 0.07 | | |
Net realized and unrealized gain (loss) | | | 0.24 | | | | 1.63 | | | | 2.47 | | | | 1.14 | | | | (0.48 | ) | | | 0.85 | | | | (0.59 | ) | |
Total from investment operations | | | 0.24 | | | | 1.64 | | | | 2.54 | | | | 1.17 | | | | (0.46 | ) | | | 0.89 | | | | (0.52 | ) | |
Less distributions to shareholders: | |
Net investment income | | | — | | | | (0.11 | ) | | | (0.04 | ) | | | (0.01 | ) | | | (0.05 | ) | | | (0.09 | ) | | | (0.02 | ) | |
Net realized gains | | | — | | | | (0.79 | ) | | | — | | | | — | | | | — | | | | — | | | | (0.45 | ) | |
Total distributions to shareholders | | | — | | | | (0.90 | ) | | | (0.04 | ) | | | (0.01 | ) | | | (0.05 | ) | | | (0.09 | ) | | | (0.47 | ) | |
Net asset value, end of period | | $ | 11.13 | | | $ | 10.89 | | | $ | 10.15 | | | $ | 7.65 | | | $ | 6.49 | | | $ | 7.00 | | | $ | 6.20 | | |
Total return | | | 2.20 | % | | | 16.73 | % | | | 33.37 | % | | | 18.03 | % | | | (6.69 | %) | | | 14.43 | % | | | (4.96 | %) | |
Ratios to average net assets(c) | |
Total gross expenses | | | 1.29 | %(d) | | | 1.24 | % | | | 1.28 | % | | | 1.26 | %(d) | | | 1.28 | % | | | 1.17 | % | | | 1.07 | % | |
Total net expenses(e) | | | 1.29 | %(d)(f) | | | 1.24 | %(f) | | | 1.22 | %(f) | | | 1.18 | %(d) | | | 1.28 | % | | | 1.17 | % | | | 1.07 | % | |
Net investment income (loss) | | | (0.02 | %)(d) | | | 0.14 | % | | | 0.80 | % | | | 0.57 | %(d) | | | 0.26 | % | | | 0.67 | % | | | 1.48 | % | |
Supplemental data | |
Net assets, end of period
(in thousands) | | $ | 3 | | | $ | 3 | | | $ | 5 | | | $ | 4 | | | $ | 3 | | | $ | 4 | | | $ | 3 | | |
Portfolio turnover | | | 25 | % | | | 110 | % | | | 40 | % | | | 28 | % | | | 46 | % | | | 50 | % | | | 42 | % | |
Notes to Financial Highlights
(a) For the period from October 1, 2011 to May 31, 2012. During the period, the Fund's fiscal year end was changed from September 30 to May 31.
(b) Rounds to zero.
(c) In addition to the fees and expenses that the Fund bears directly, the Fund indirectly bears a pro rata share of the fees and expenses of any other funds in which it invests. Such indirect expenses are not included in the Fund's reported expense ratios.
(d) Annualized.
(e) Total net expenses include the impact of certain fee waivers/expense reimbursements made by the Investment Manager and certain of its affiliates, if applicable.
(f) The benefits derived from expense reductions had an impact of less than 0.01%.
The accompanying Notes to Financial Statements are an integral part of this statement.
Semiannual Report 2014
26
Columbia Small/Mid Cap Value Fund
Financial Highlights (continued)
Class Y | | Six Months Ended
November 30, 2014
(Unaudited) | | Year Ended
May 31,
2014(a) | |
Per share data | |
Net asset value, beginning of period | | $ | 10.77 | | | $ | 10.08 | | |
Income from investment operations: | |
Net investment income | | | 0.03 | | | | 0.04 | | |
Net realized and unrealized gain | | | 0.24 | | | | 1.59 | | |
Total from investment operations | | | 0.27 | | | | 1.63 | | |
Less distributions to shareholders: | |
Net investment income | | | — | | | | (0.15 | ) | |
Net realized gains | | | — | | | | (0.79 | ) | |
Total distributions to shareholders | | | — | | | | (0.94 | ) | |
Net asset value, end of period | | $ | 11.04 | | | $ | 10.77 | | |
Total return | | | 2.51 | % | | | 16.73 | % | |
Ratios to average net assets(b) | |
Total gross expenses | | | 0.81 | %(c) | | | 0.79 | %(c) | |
Total net expenses(d) | | | 0.81 | %(c) | | | 0.78 | %(c) | |
Net investment income | | | 0.47 | %(c) | | | 0.37 | %(c) | |
Supplemental data | |
Net assets, end of period (in thousands) | | $ | 6,974 | | | $ | 7,031 | | |
Portfolio turnover | | | 25 | % | | | 110 | % | |
Notes to Financial Highlights
(a) Based on operations from June 13, 2013 (commencement of operations) through the stated period end.
(b) In addition to the fees and expenses that the Fund bears directly, the Fund indirectly bears a pro rata share of the fees and expenses of any other funds in which it invests. Such indirect expenses are not included in the Fund's reported expense ratios.
(c) Annualized.
(d) Total net expenses include the impact of certain fee waivers/expense reimbursements made by the Investment Manager and certain of its affiliates, if applicable.
The accompanying Notes to Financial Statements are an integral part of this statement.
Semiannual Report 2014
27
Columbia Small/Mid Cap Value Fund
Financial Highlights (continued)
| | | Six Months Ended
November 30, 2014 | | Year Ended May 31, | | Year Ended September 30, | |
Class Z | | (Unaudited) | | 2014 | | 2013 | | 2012(a) | | 2011 | | 2010(b) | |
Per share data | |
Net asset value, beginning of period | | $ | 10.99 | | | $ | 10.23 | | | $ | 7.71 | | | $ | 6.55 | | | $ | 7.07 | | | $ | 7.00 | | |
Income from investment operations: | |
Net investment income | | | 0.02 | | | | 0.04 | | | | 0.09 | | | | 0.04 | | | | 0.06 | | | | 0.00 | (c) | |
Net realized and unrealized gain (loss) | | | 0.24 | | | | 1.65 | | | | 2.50 | | | | 1.15 | | | | (0.50 | ) | | | 0.07 | | |
Total from investment operations | | | 0.26 | | | | 1.69 | | | | 2.59 | | | | 1.19 | | | | (0.44 | ) | | | 0.07 | | |
Less distributions to shareholders: | |
Net investment income | | | — | | | | (0.14 | ) | | | (0.07 | ) | | | (0.03 | ) | | | (0.08 | ) | | | — | | |
Net realized gains | | | — | | | | (0.79 | ) | | | — | | | | — | | | | — | | | | — | | |
Total distributions to shareholders | | | — | | | | (0.93 | ) | | | (0.07 | ) | | | (0.03 | ) | | | (0.08 | ) | | | — | | |
Net asset value, end of period | | $ | 11.25 | | | $ | 10.99 | | | $ | 10.23 | | | $ | 7.71 | | | $ | 6.55 | | | $ | 7.07 | | |
Total return | | | 2.37 | % | | | 17.04 | % | | | 33.70 | % | | | 18.18 | % | | | (6.42 | %) | | | 1.00 | % | |
Ratios to average net assets(d) | |
Total gross expenses | | | 1.01 | %(e) | | | 1.01 | % | | | 1.06 | % | | | 1.04 | %(e) | | | 1.07 | % | | | 1.01 | %(e) | |
Total net expenses(f) | | | 1.01 | %(e)(g) | | | 1.00 | %(g) | | | 0.97 | %(g) | | | 0.95 | %(e) | | | 1.06 | %(g) | | | 1.01 | %(e) | |
Net investment income | | | 0.27 | %(e) | | | 0.36 | % | | | 1.07 | % | | | 0.81 | %(e) | | | 0.80 | % | | | 4.49 | %(e) | |
Supplemental data | |
Net assets, end of period (in thousands) | | $ | 34,352 | | | $ | 31,909 | | | $ | 97,298 | | | $ | 141,202 | | | $ | 127,642 | | | $ | 3 | | |
Portfolio turnover | | | 25 | % | | | 110 | % | | | 40 | % | | | 28 | % | | | 46 | % | | | 50 | % | |
Notes to Financial Highlights
(a) For the period from October 1, 2011 to May 31, 2012. During the period, the Fund's fiscal year end was changed from September 30 to May 31.
(b) Based on operations from September 27, 2010 (commencement of operations) through the stated period end.
(c) Rounds to zero.
(d) In addition to the fees and expenses that the Fund bears directly, the Fund indirectly bears a pro rata share of the fees and expenses of any other funds in which it invests. Such indirect expenses are not included in the Fund's reported expense ratios.
(e) Annualized.
(f) Total net expenses include the impact of certain fee waivers/expense reimbursements made by the Investment Manager and certain of its affiliates, if applicable.
(g) The benefits derived from expense reductions had an impact of less than 0.01%.
The accompanying Notes to Financial Statements are an integral part of this statement.
Semiannual Report 2014
28
Columbia Small/Mid Cap Value Fund
Notes to Financial Statements
November 30, 2014 (Unaudited)
Note 1. Organization
Columbia Small/Mid Cap Value Fund (formerly known as Columbia Mid Cap Value Opportunity Fund) (the Fund), a series of Columbia Funds Series Trust II (the Trust), is a diversified fund. The Trust is registered under the Investment Company Act of 1940, as amended (the 1940 Act), as an open-end management investment company organized as a Massachusetts business trust. Effective July 7, 2014, Columbia Mid Cap Value Opportunity Fund was renamed Columbia Small/Mid Cap Value Fund.
Fund Shares
The Trust may issue an unlimited number of shares (without par value). The Fund offers Class A, Class B, Class C, Class I, Class K, Class R, Class R4, Class R5, Class W, Class Y and Class Z shares. Although all share classes generally have identical voting, dividend and liquidation rights, each share class votes separately when required by the Trust's organizational documents or by law. Different share classes pay different distribution amounts to the extent the expenses of such share classes differ, and distributions in liquidation will be proportional to the net asset value of each share class. Each share class has its own expense structure and sales charges.
Class A shares are subject to a maximum front-end sales charge of 5.75% based on the initial investment amount. Class A shares purchased without an initial sales charge in accounts aggregating $1 million to $50 million at the time of purchase are subject to a contingent deferred sales charge (CDSC) if the shares are sold within 18 months of purchase, charged as follows: 1.00% CDSC if redeemed within 12 months of purchase, and 0.50% CDSC if redeemed more than 12, but less than 18, months after purchase.
Class B shares may be subject to a maximum CDSC of 5.00% based upon the holding period after purchase. Class B shares will generally convert to Class A shares eight years after purchase. The Fund no longer accepts investments by new or existing investors in the Fund's Class B shares, except in connection with the reinvestment of any dividend and/or capital gain distributions in Class B shares of the Fund and exchanges by existing Class B shareholders of certain other funds within the Columbia Family of Funds.
Class C shares are subject to a 1.00% CDSC on shares redeemed within one year of purchase.
Class I shares are not subject to sales charges and are available only to the Columbia Family of Funds.
Class K shares are not subject to sales charges, however this share class is closed to new investors.
Class R shares are not subject to sales charges and are generally available only to certain retirement plans and other investors as described in the Fund's prospectus.
Class R4 shares are not subject to sales charges and are generally available only to omnibus retirement plans and certain investors as described in the Fund's prospectus.
Class R5 shares are not subject to sales charges and are generally available only to investors purchasing through authorized investment professionals and omnibus retirement plans.
Class W shares are not subject to sales charges and are available only to investors purchasing through authorized investment programs managed by investment professionals, including discretionary managed account programs.
Class Y shares are not subject to sales charges and are generally available only to certain retirement plans as described in the Fund's prospectus.
Class Z shares are not subject to sales charges and are available only to eligible investors, which are subject to different investment minimums as described in the Fund's prospectus.
Note 2. Summary of Significant Accounting Policies
Basis of Preparation
The Fund is an investment company that applies the accounting and reporting guidance in the Financial Accounting Standards Board (FASB) Accounting Standards Codification Topic 946, Financial Services — Investment Companies (ASC 946). The financial statements are prepared in accordance with U.S. generally accepted accounting principles (GAAP) which requires management to make certain estimates and assumptions that affect the reported amounts of assets and liabilities, the disclosure of contingent assets and liabilities at the date of the financial statements and the reported amounts of income and expenses during the reporting period. Actual results could differ from those estimates.
The following is a summary of significant accounting policies followed by the Fund in the preparation of its financial statements.
Security Valuation
All equity securities and exchange-traded funds (ETFs) are valued at the close of business of the New York Stock Exchange (NYSE). Equity securities and ETFs are valued at the last quoted sales price on the principal exchange or market on which they trade, except for securities traded on the
Semiannual Report 2014
29
Columbia Small/Mid Cap Value Fund
Notes to Financial Statements (continued)
November 30, 2014 (Unaudited)
NASDAQ Stock Market, which are valued at the NASDAQ official close price. Unlisted securities or listed securities for which there were no sales during the day are valued at the mean of the latest quoted bid and ask prices on such exchanges or markets.
Foreign equity securities are valued based on quotations from the principal market in which such securities are traded. If any foreign security prices are not readily available as a result of limited share activity, the securities are valued at the mean of the latest quoted bid and ask prices on such exchanges or markets. Foreign currency exchange rates are generally determined at 4:00 p.m. Eastern (U.S.) time. Many securities markets and exchanges outside the U.S. close prior to the close of the NYSE; therefore, the closing prices for securities in such markets or on such exchanges may not fully reflect events that occur after such close but before the close of the NYSE. In those situations, foreign securities will be fair valued pursuant to a policy adopted by the Board of Trustees (the Board), including, if available, utilizing a third party pricing service to determine these fair values. The third party pricing service takes into account multiple factors, including, but not limited to, movements in the U.S. securities markets, certain depositary receipts, futures contracts and foreign exchange rates that have occurred subsequent to the close of the foreign exchange or market, to determine a good faith estimate that reasonably reflects the current market conditions as of the close of the NYSE. The fair value of a security is likely to be different from the quoted or published price, if available.
Investments in open-end investment companies, including money market funds, are valued at their net asset value.
Investments for which market quotations are not readily available, or that have quotations which management believes are not reliable, are valued at fair value as determined in good faith under procedures established by and under the general supervision of the Board. If a security or class of securities (such as foreign securities) is valued at fair value, such value is likely to be different from the quoted or published price for the security.
The determination of fair value often requires significant judgment. To determine fair value, management may use assumptions including but not limited to future cash flows and estimated risk premiums. Multiple inputs from various sources may be used to determine fair value.
Security Transactions
Security transactions are accounted for on the trade date. Cost is determined and gains (losses) are based upon the specific
identification method for both financial statement and federal income tax purposes.
Income Recognition
Corporate actions and dividend income are recorded on the ex-dividend date.
The Fund may receive distributions from holdings in business development companies (BDCs), exchange-traded funds (ETFs), other regulated investment companies (RICs), and real estate investment trusts (REITs), which report information on the character of their distributions annually. These distributions are allocated to dividend income, capital gain and return of capital based on actual information reported. To the extent actual information has not yet been reported by the REITs, estimates for return of capital are made by the Fund's management. Return of capital is recorded as a reduction of the cost basis of securities held. If the Fund no longer owns the applicable securities, return of capital is recorded as a realized gain. Management's estimates are subsequently adjusted when the actual character of the distributions is disclosed by the REITs, which could result in a proportionate change in return of capital to shareholders. No estimates are made for the BDCs, ETFs, and RICs.
Awards from class action litigation are recorded as a reduction of cost basis if the Fund still owns the applicable securities on the payment date. If the Fund no longer owns the applicable securities, the proceeds are recorded as realized gains.
Expenses
General expenses of the Trust are allocated to the Fund and other funds of the Trust based upon relative net assets or other expense allocation methodologies determined by the nature of the expense. Expenses directly attributable to the Fund are charged to the Fund. Expenses directly attributable to a specific class of shares are charged to that share class.
Determination of Class Net Asset Value
All income, expenses (other than class-specific expenses, which are charged to that share class, as shown in the Statement of Operations) and realized and unrealized gains (losses) are allocated to each class of the Fund on a daily basis, based on the relative net assets of each class, for purposes of determining the net asset value of each class.
Federal Income Tax Status
The Fund intends to qualify each year as a regulated investment company under Subchapter M of the Internal Revenue Code, as amended, and will distribute substantially all of its taxable income (including net short-term capital gains), if any, for its tax year, and as such will not be subject to federal income taxes. In addition, the Fund intends to
Semiannual Report 2014
30
Columbia Small/Mid Cap Value Fund
Notes to Financial Statements (continued)
November 30, 2014 (Unaudited)
distribute in each calendar year substantially all of its net investment income, capital gains and certain other amounts, if any, such that the Fund should not be subject to federal excise tax. Therefore, no federal income or excise tax provision is recorded.
Distributions to Shareholders
Distributions from net investment income, if any, are declared and paid annually. Net realized capital gains, if any, are distributed along with the income distribution. Income distributions and capital gain distributions are determined in accordance with federal income tax regulations, which may differ from GAAP.
Guarantees and Indemnifications
Under the Trust's organizational documents and, in some cases, by contract, its officers and trustees are indemnified against certain liabilities arising out of the performance of their duties to the Trust or its funds. In addition, certain of the Fund's contracts with its service providers contain general indemnification clauses. The Fund's maximum exposure under these arrangements is unknown since the amount of any future claims that may be made against the Fund cannot be determined, and the Fund has no historical basis for predicting the likelihood of any such claims.
Note 3. Fees and Compensation Paid to Affiliates
Investment Management Fees
Under an Investment Management Services Agreement, Columbia Management Investment Advisers, LLC (the Investment Manager), a wholly-owned subsidiary of Ameriprise Financial, Inc. (Ameriprise Financial), determines which securities will be purchased, held or sold. The investment management fee is an annual fee that is equal to a percentage of the Fund's average daily net assets that declines from 0.76% to 0.62% as the Fund's net assets increase. The annualized effective investment management fee rate for the six months ended November 30, 2014 was 0.72% of the Fund's average daily net assets.
Administration Fees
Under an Administrative Services Agreement, the Investment Manager also serves as the Fund Administrator. The Fund pays the Fund Administrator an annual fee for administration and accounting services equal to a percentage of the Fund's average daily net assets that declines from 0.06% to 0.03% as the Fund's net assets increase. The annualized effective administration fee rate for the six months ended November 30, 2014 was 0.06% of the Fund's average daily net assets.
Other Expenses
Other expenses are for, among other things, miscellaneous expenses of the Fund or the Board, including payments to a company providing limited administrative services to the Fund and the Board. That company's expenses include boardroom and office expense, employee compensation, employee health and retirement benefits, and certain other expenses. For the six months ended November 30, 2014, other expenses paid by the Fund to this company were $1,571.
Compensation of Board Members
Board members are compensated for their services to the Fund as disclosed in the Statement of Operations. Under a Deferred Compensation Plan (the Plan), the Board members who are not "interested persons" of the Fund, as defined under the 1940 Act, may elect to defer payment of up to 100% of their compensation. Deferred amounts are treated as though equivalent dollar amounts had been invested in shares of certain funds managed by the Investment Manager. The Fund's liability for these amounts is adjusted for market value changes and remains in the Fund until distributed in accordance with the Plan.
Transfer Agent Fees
Under a Transfer and Dividend Disbursing Agent Agreement, Columbia Management Investment Services Corp. (the Transfer Agent), an affiliate of the Investment Manager and a wholly-owned subsidiary of Ameriprise Financial, is responsible for providing transfer agency services to the Fund. The Transfer Agent has contracted with Boston Financial Data Services (BFDS) to serve as sub-transfer agent.
Effective November 1, 2014, the Transfer Agent receives a monthly transfer agency fee based on the number or the average value of accounts, depending on the type of account. Prior to November 1, 2014, the Transfer Agent received a monthly account-based service fee based on the number of open accounts. In addition, the Transfer Agent also receives sub-transfer agency fees based on a percentage of the average aggregate value of the Fund's shares maintained in omnibus accounts (other than omnibus accounts for which American Enterprise Investment Services Inc. is the broker of record or accounts where the beneficial shareholder is a customer of Ameriprise Financial Services, Inc., which receive a per account fee). The Transfer Agent pays the fees of BFDS for services as sub-transfer agent and is not entitled to reimbursement for such fees from the Fund (with the exception of out-of-pocket fees).
The Transfer Agent also receives compensation from the Fund for various shareholder services and reimbursements for certain out-of-pocket fees. Total transfer agent fees for Class K
Semiannual Report 2014
31
Columbia Small/Mid Cap Value Fund
Notes to Financial Statements (continued)
November 30, 2014 (Unaudited)
and Class R5 shares are subject to an annual limitation of not more than 0.05% of the average daily net assets attributable to each share class. Class I and Class Y shares are not subject to transfer agent fees.
For the six months ended November 30, 2014, the Fund's annualized effective transfer agent fee rates as a percentage of average daily net assets of each class were as follows:
Class A | | | 0.20 | % | |
Class B | | | 0.20 | | |
Class C | | | 0.20 | | |
Class K | | | 0.05 | | |
Class R | | | 0.20 | | |
Class R4 | | | 0.20 | | |
Class R5 | | | 0.05 | | |
Class W | | | 0.24 | | |
Class Z | | | 0.20 | | |
An annual minimum account balance fee of $20 may apply to certain accounts with a value below the applicable share class's initial minimum investment requirements to reduce the impact of small accounts on transfer agent fees. These minimum account balance fees are remitted to the Fund and recorded as part of expense reductions in the Statement of Operations. For the six months ended November 30, 2014, these minimum account balance fees reduced total expenses of the Fund by $60.
Plan Administration Fees
Under a Plan Administration Services Agreement with the Transfer Agent, the Fund pays an annual fee at a rate of 0.25% of the Fund's average daily net assets attributable to Class K shares for the provision of various administrative, recordkeeping, communication and educational services.
Distribution Fees
The Fund has an agreement with Columbia Management Investment Distributors, Inc. (the Distributor), an affiliate of the Investment Manager and a wholly-owned subsidiary of Ameriprise Financial, for distribution and shareholder services. Under a Plan and Agreement of Distribution, the Fund pays a fee at an annual rate of up to 0.25% of the Fund's average daily net assets attributable to Class A and Class W shares, a fee at an annual rate of up to 0.50% of the Fund's average daily net assets attributable to Class R shares (of which up to 0.25% may be used for shareholder services) and a fee at an annual rate of up to 1.00% of the Fund's average daily net assets attributable to Class B and Class C shares. For Class B and Class C shares, of the 1.00% fee, up to 0.75% is reimbursed for distribution expenses.
The amount of distribution expenses incurred by the Distributor and not yet reimbursed (unreimbursed expense) was approximately $1,764,000 and $336,000 for Class B and Class C shares, respectively. These amounts are based on the most recent information available as of September 30, 2014, and may be recovered from future payments under the distribution plan or CDSCs. To the extent the unreimbursed expense has been fully recovered, the distribution fee is reduced.
Sales Charges
Sales charges, including front-end charges and CDSCs, received by the Distributor for distributing Fund shares were $131,255 for Class A, $1,926 for Class B and $498 for Class C shares for the six months ended November 30, 2014.
Expenses Waived/Reimbursed by the Investment Manager and its Affiliates
The Fund's expense ratio is subject to an expense reimbursement arrangement pursuant to which fees will be waived and/or expenses reimbursed (excluding certain fees and expenses described below), so that the Fund's net operating expenses, after giving effect to fees waived/expenses reimbursed and any balance credits and/or overdraft charges from the Fund's custodian, do not exceed the annual rates of:
| | | Voluntary
Expense Cap
Effective
October 1, 2014 | | Contractual
Expense Cap
Prior to
October 1, 2014 | |
Class A | | | 1.28 | % | | | 1.33 | % | |
Class B | | | 2.03 | | | | 2.08 | | |
Class C | | | 2.03 | | | | 2.08 | | |
Class I | | | 0.88 | | | | 0.89 | | |
Class K | | | 1.18 | | | | 1.19 | | |
Class R | | | 1.53 | | | | 1.58 | | |
Class R4 | | | 1.03 | | | | 1.08 | | |
Class R5 | | | 0.93 | | | | 0.94 | | |
Class W | | | 1.28 | | | | 1.33 | | |
Class Y | | | 0.88 | | | | 0.89 | | |
Class Z | | | 1.03 | | | | 1.08 | | |
The voluntary expense cap arrangement may be revised or discontinued at any time. Under the arrangements, the following fees and expenses are excluded from the waiver/reimbursement commitment, and therefore will be paid by the Fund, if applicable: taxes (including foreign transaction taxes), expenses associated with investments in affiliated and non-affiliated pooled investment vehicles (including mutual funds and exchange-traded funds), transaction costs and brokerage commissions, costs related to any securities lending
Semiannual Report 2014
32
Columbia Small/Mid Cap Value Fund
Notes to Financial Statements (continued)
November 30, 2014 (Unaudited)
program, dividend expenses associated with securities sold short, inverse floater program fees and expenses, transaction charges and interest on borrowed money, interest and extraordinary expenses.
Note 4. Federal Tax Information
The timing and character of income and capital gain distributions are determined in accordance with income tax regulations, which may differ from GAAP because of temporary or permanent book to tax differences.
At November 30, 2014, the cost of investments for federal income tax purposes was approximately $1,080,506,000 and the aggregate gross approximate unrealized appreciation and depreciation based on that cost was:
Unrealized appreciation | | $ | 214,195,000 | | |
Unrealized depreciation | | | (37,302,000 | ) | |
Net unrealized appreciation | | $ | 176,893,000 | | |
The following capital loss carryforwards, determined as of May 31, 2014, may be available to reduce taxable income arising from future net realized gains on investments, if any, to the extent permitted by the Internal Revenue Code:
Year of Expiration | | Amount ($) | |
2017 | | | 1,305,027 | | |
2018 | | | 9,944,538 | | |
Total | | | 11,249,565 | | |
Management of the Fund has concluded that there are no significant uncertain tax positions in the Fund that would require recognition in the financial statements. However, management's conclusion may be subject to review and adjustment at a later date based on factors including, but not limited to, new tax laws, regulations, and administrative interpretations (including relevant court decisions). Generally, the Fund's federal tax returns for the prior three fiscal years remain subject to examination by the Internal Revenue Service.
Note 5. Portfolio Information
The cost of purchases and proceeds from sales of securities, excluding short-term obligations and certain derivatives, if any, aggregated to $343,235,407 and $580,874,473, respectively, for the six months ended November 30, 2014. The amount of purchase and sale activity impacts the portfolio turnover rate reported in the Financial Highlights.
Note 6. Affiliated Money Market Fund
The Fund invests in Columbia Short-Term Cash Fund, an affiliated money market fund established for the exclusive use by the Fund and other affiliated funds. The income earned by the Fund from such investments is included as
Dividends — affiliated issuers in the Statement of Operations. As an investing fund, the Fund indirectly bears its proportionate share of the expenses of Columbia Short-Term Cash Fund.
Note 7. Shareholder Concentration
At November 30, 2014, affiliated shareholders of record owned 67.2% of the outstanding shares of the Fund in one or more accounts. Subscription and redemption activity by concentrated accounts may have a significant effect on the operations of the Fund.
Note 8. Line of Credit
The Fund has entered into a revolving credit facility with a syndicate of banks led by JPMorgan Chase Bank N.A. (JPMorgan) whereby the Fund may borrow for the temporary funding of shareholder redemptions or for other temporary or emergency purposes. The credit facility agreement, as amended, which is a collective agreement between the Fund and certain other funds managed by the Investment Manager, severally and not jointly, permits collective borrowings up to $500 million. Interest is charged to each participating fund based on its borrowings at a rate equal to the higher of (i) the overnight federal funds rate plus 1.00% or (ii) the one-month LIBOR rate plus 1.00%. Each borrowing under the credit facility matures no later than 60 days after the date of borrowing. The Fund also pays a commitment fee equal to its pro rata share of the amount of the credit facility at a rate of 0.075% per annum. The commitment fee is included in other expenses in the Statement of Operations.
Effective December 9, 2014, the Fund extended its revolving credit facility with JPMorgan. The credit facility agreement, as amended, permits collective borrowings up to $550 million under the same terms and interest rates as described above.
The Fund had no borrowings during the six months ended November 30, 2014.
Note 9. Significant Risks
Financial Sector Risk
Sector risk occurs when a fund invests a significant portion of its assets in securities of companies conducting business in a related group of industries within an economic sector. Companies in the same economic sector may be similarly affected by economic, regulatory, political or market events or conditions, making a fund more vulnerable to unfavorable developments in that economic sector than funds that invest more broadly. The Fund may be more susceptible to the particular risks that may affect companies in the financial sector than if it were invested in a wider variety of companies in unrelated sectors.
Semiannual Report 2014
33
Columbia Small/Mid Cap Value Fund
Notes to Financial Statements (continued)
November 30, 2014 (Unaudited)
Note 10. Subsequent Events
Management has evaluated the events and transactions that have occurred through the date the financial statements were issued. Other than as noted in Note 8 above, there were no items requiring adjustment of the financial statements or additional disclosure.
Note 11. Information Regarding Pending and Settled Legal Proceedings
In December 2005, without admitting or denying the allegations, American Express Financial Corporation (AEFC, which is now known as Ameriprise Financial, Inc. (Ameriprise Financial)) entered into settlement agreements with the Securities and Exchange Commission (SEC) and Minnesota Department of Commerce (MDOC) related to market timing activities. As a result, AEFC was censured and ordered to cease and desist from committing or causing any violations of certain provisions of the Investment Advisers Act of 1940, the Investment Company Act of 1940, and various Minnesota laws. AEFC agreed to pay disgorgement of $10 million and civil money penalties of $7 million. AEFC also agreed to retain an independent distribution consultant to assist in developing a plan for distribution of all disgorgement and civil penalties ordered by the SEC in accordance with various undertakings detailed at www.sec.gov/litigation/admin/ia-2451.pdf. Ameriprise Financial and its affiliates have cooperated with the SEC and the MDOC in these legal proceedings, and have made regular reports to the Funds' Boards of Trustees.
Ameriprise Financial and certain of its affiliates have historically been involved in a number of legal, arbitration and regulatory proceedings, including routine litigation, class actions, and governmental actions, concerning matters arising in connection with the conduct of their business activities. Ameriprise Financial believes that the Funds are not currently the subject of, and that neither Ameriprise Financial nor any of its affiliates are the subject of, any pending legal, arbitration or regulatory proceedings that are likely to have a material adverse effect on the Funds or the ability of Ameriprise Financial or its affiliates to perform under their contracts with the Funds. Ameriprise Financial is required to make quarterly (10-Q), annual (10-K) and, as necessary, 8-K filings with the Securities and Exchange Commission on legal and regulatory matters that relate to Ameriprise Financial and its affiliates. Copies of these filings may be obtained by accessing the SEC website at www.sec.gov.
There can be no assurance that these matters, or the adverse publicity associated with them, will not result in increased fund redemptions, reduced sale of fund shares or other adverse consequences to the Funds. Further, although we believe
proceedings are not likely to have a material adverse effect on the Funds or the ability of Ameriprise Financial or its affiliates to perform under their contracts with the Funds, these proceedings are subject to uncertainties and, as such, we are unable to estimate the possible loss or range of loss that may result. An adverse outcome in one or more of these proceedings could result in adverse judgments, settlements, fines, penalties or other relief that could have a material adverse effect on the consolidated financial condition or results of operations of Ameriprise Financial.
Semiannual Report 2014
34
Columbia Small/Mid Cap Value Fund
Important Information About This Report
Each fund mails one shareholder report to each shareholder address. If you would like more than one report, please call shareholder services at 800.345.6611 and additional reports will be sent to you.
The policy of the Board is to vote the proxies of the companies in which each fund holds investments consistent with the procedures as stated in the Statement of Additional Information (SAI). You may obtain a copy of the SAI without charge by calling 800.345.6611; contacting your financial intermediary; visiting columbiamanagement.com; or searching the website of the Securities and Exchange Commission (SEC) at sec.gov. Information regarding how each fund voted proxies relating to portfolio securities is filed with the SEC by August 31 for the most recent 12-month period ending June 30 of that year, and is available without charge by visiting columbiamanagement.com; or searching the website of the SEC at sec.gov.
Each fund files a complete schedule of portfolio holdings with the SEC for the first and third quarters of each fiscal year on Form N-Q. Each fund's Form N-Q is available on the SEC's website at sec.gov and may be reviewed and copied at the SEC's Public Reference Room in Washington, D.C. Information on the operation of the Public Reference Room may be obtained by calling 800.SEC.0330. Each fund's complete schedule of portfolio holdings, as filed on Form N-Q, can also be obtained without charge, upon request, by calling 800.345.6611.
Semiannual Report 2014
35

Columbia Small/Mid Cap Value Fund
P.O. Box 8081
Boston, MA 02266-8081
columbiamanagement.com
This information is for use with concurrent or prior delivery of a fund prospectus. Please read and consider the investment objectives, risks, charges and expenses for any fund carefully before investing. For a prospectus and, if available, a summary prospectus, which contains this and other important information about the Fund, go to columbiamanagement.com. The Fund is distributed by Columbia Management Investment Distributors, Inc., member FINRA, and managed by Columbia Management Investment Advisers, LLC.
© 2015 Columbia Management Investment Advisers, LLC. All rights reserved.
SAR198_05_E01_(01/15)
Semiannual Report
November 30, 2014

Columbia U.S. Government Mortgage Fund
Not FDIC insured • No bank guarantee • May lose value
About Columbia Management
Backed by more than 100 years of experience, Columbia Management is one of the nation's largest asset managers. At the heart of our success — and, most importantly, that of our investors — are some of the most talented professionals in the industry, brought together by a unique way of working.
It starts with carefully selected, specialized investment teams. While each team brings a diverse and innovative range of skills, all are grounded by a common set of core beliefs. All possess a solid conviction in the power of proprietary, bottom-up research. All look not only at generating returns, but also at the likely consistency of those returns and the risks required to achieve them. And while our culture encourages teams to operate independently and question established thinking, a rigorous investment oversight process ensures that each team stays true to its clearly articulated investment process. At Columbia Management, reaching our performance goals matters, and the way we reach them matters just as much.
Columbia funds are distributed by Columbia Management Investment Distributors, Inc., member FINRA, and managed by Columbia Management Investment Advisers, LLC.
© 2015 Columbia Management Investment Advisers, LLC. All rights reserved.
Not part of the shareholder report
Note: Effective January 1, 2015, Christopher O. Petersen will serve as the President of the Columbia Funds, replacing J. Kevin Connaughton. Mr. Petersen has served as a Fund officer since 2007.
Dear Shareholders,
People invest for different reasons, though typically based on a desire for one or more outcomes, e.g., generating an appropriate income stream in retirement, navigating a changing interest rate environment, maximizing after-tax returns, growing assets to achieve financial goals, or easing the impact of volatile markets. Achieving these desired outcomes can be particularly challenging given the unpredictability of complex global markets. To continue to effectively deliver solutions that help clients achieve desired outcomes, an asset manager must have the resources and investment framework to meaningfully embody a global perspective.
With this in mind, I thought it important to highlight excerpts from a piece written by Jeffrey L. Knight, Global Head of Investment Solutions and Asset Allocation, in which he touches on some of these issues emphasizing the importance of maintaining a diversified portfolio with the flexibility to adapt to changing market conditions.
I encourage you to read the article in its entirety. To access the full article and for other insights on current market events and investment opportunities, please visit the Columbia Management blog at columbiamanagement.com/blog.
On behalf of the Funds, I want to acknowledge the contributions of J. Kevin Connaughton and to thank him for his years of trusted, dedicated service. He has worked tirelessly as an advocate for shareholders and a leader of the Columbia Funds. In taking on this new role, I look forward to continuing the work of Mr. Connaughton, helping build on the strong foundation of the Columbia Funds.
Thank you for your confidence. We look forward to continuing to serve your investment needs for many years to come.
Best regards,

Christopher O. Petersen
President, Columbia Funds
Excerpts from:
2015 Outlook: Same song, slightly different arrangement
By Jeffrey L. Knight, Global Head of Investment Solutions and Asset Allocation
Jeffrey L. Knight, CFA, is global head of investment solutions and asset allocation for Columbia Management Investment Advisers, LLC. Mr. Knight leads a team of six portfolio managers responsible for our broad suite of multi-asset strategies including capital allocation, risk allocation, absolute return and total return funds.
What's different in 2015?
As stationary as market conditions have felt lately, circumstances are always evolving. For 2015, while the essential elements of our outlook remain in place, we highlight two important changes in the market environment:
> The relative value of global equities vs. global bonds actually improved during 2014.
> Monetary policy around the globe has become desynchronized, with the U.S. Federal Reserve (the Fed) contemplating rate hikes, while the European Central Bank (ECB) and the Bank of Japan (BOJ) intensify their monetary stimulus programs.
In our view, while equities will most likely continue to dominate, the complex interactions of today's conditions elevate the role of dynamic risk management. We argue that investors will need a cross-asset surveillance methodology to detect tactical threats.
President's Message (continued)
Monetary policies diverge
The Fed has given strong signals that economic growth in the United States has reached self-sustaining momentum and no longer needs unconventional efforts to support the expansion. The withdrawal and suspension of large-scale asset purchases was only the first step in the evolution toward policy normalization. In 2015, we expect to see a change in forward guidance and, most likely, the first interest rate increase in years.
These actions stand in stark contrast with the direction of the monetary policies of other central banks as they double down on efforts to support growth and avoid deflation. The Bank of Japan has announced its intention to increase both qualitative and quantitative easing on an enormous scale, expanding purchases of Japanese government bonds (JGBs), exchange-traded funds and real estate investment trusts. They intend to coordinate this with government pension investment fund purchases by shifting into riskier assets through sales of JGBs.
With evidence of deterioration on both the economic and inflation front, the European Central Bank (ECB) also plans to take bolder actions. These include increased purchases of asset-backed securities and covered bonds in both the primary and secondary market, together with the long-term refinancing operations that will steer the ECB's balance sheet higher by €1 trillion.
The latest to jump on the bandwagon was the People's Bank of China (PBOC), which cut its benchmark interest rate for the first time in over two years to support private sector investment, as targeted liquidity injections have had minimal effect on sinking economic growth.
Investment strategy for 2015
We remain convinced that relative value favors stocks over bonds, even though stocks outperformed in 2014. Therefore, you will hear the same recommendation from us for 2015. Equities remain the most important asset class for generating returns.
Within equities, the currency-based advantage of U.S. stocks is offset somewhat by the valuation advantage from overseas equities, notably in Japan. Indeed, economic growth in Japan and Europe are essential ingredients for equities to continue to perform well. If Japanese and European stocks cannot produce gains, then the global economy will probably be stuck in a near recessionary funk.
Devising a strategy to manage risk and stabilize portfolio values in the event that equities do not perform well remains complicated. Bond yields are low enough that they are not likely to offer powerful diversification benefits. We affirm our recommendation for three additional sources of portfolio stability:
> Non-traditional diversifiers, such as liquid alternatives, alternative beta exposures and absolute return strategies
> Explicit downside hedges, such as put options (with emphasis on managing the related expense)
> Flexibility and a methodology for active risk reduction when appropriate (Our cross-asset methodologies should prove valuable in this regard.)
Our overall stance for investment strategy will likely remain in place until the valuation advantage for equities has been priced away, or until the healing process for the global economy reverses.
Please visit columbiamanagement.com/blog to read the entire article.
Investors should consider the investment objectives, risks, charges and expenses of a mutual fund carefully before investing. For a free prospectus and, if available, a summary prospectus, which contains this and other important information about a fund, visit columbiamanagement.com. The prospectus should be read carefully before investing.
The views expressed are as of December 2014, may change as market or other conditions change, and may differ from views expressed by other Columbia Management Investment Advisers, LLC (CMIA) associates or affiliates. Actual investments or investment decisions made by CMIA and its affiliates, whether for its own account or on behalf of clients, will not necessarily reflect the views expressed. This information is not intended to provide investment advice and does not account for individual investor circumstances. Investment decisions should always be made based on an investor's specific financial needs, objectives, goals, time horizon and risk tolerance. Asset classes described may not be suitable for all investors. Past performance does not guarantee future results, and no forecast should be considered a guarantee either. Since economic and market change frequently, there can be no assurance that the trends described here will continue or that the forecasts are accurate.
Diversification does not assure a profit or protect against loss.
Columbia Funds are distributed by Columbia Management Investment Distributors, Inc., member FINRA, and managed by Columbia Management Investment Advisers, LLC.
© 2015 Columbia Management Investment Advisers, LLC. All rights reserved
Columbia U.S. Government Mortgage Fund
Performance Overview | | | 4 | | |
Portfolio Overview | | | 5 | | |
Understanding Your Fund's Expenses | | | 6 | | |
Portfolio of Investments | | | 7 | | |
Statement of Assets and Liabilities | | | 17 | | |
Statement of Operations | | | 19 | | |
Statement of Changes in Net Assets | | | 20 | | |
Financial Highlights | | | 23 | | |
Notes to Financial Statements | | | 33 | | |
Important Information About This Report | | | 45 | | |
Fund Investment Manager
Columbia Management Investment
Advisers, LLC
225 Franklin Street
Boston, MA 02110
Fund Distributor
Columbia Management Investment
Distributors, Inc.
225 Franklin Street
Boston, MA 02110
Fund Transfer Agent
Columbia Management Investment
Services Corp.
P.O. Box 8081
Boston, MA 02266-8081
For more information about any of the funds, please visit columbiamanagement.com or call 800.345.6611. Customer Service Representatives are available to answer your questions Monday through Friday from 8 a.m. to 7 p.m. Eastern time.
The views expressed in this report reflect the current views of the respective parties. These views are not guarantees of future performance and involve certain risks, uncertainties and assumptions that are difficult to predict, so actual outcomes and results may differ significantly from the views expressed. These views are subject to change at any time based upon economic, market or other conditions and the respective parties disclaim any responsibility to update such views. These views may not be relied on as investment advice and, because investment decisions for a Columbia Fund are based on numerous factors, may not be relied on as an indication of trading intent on behalf of any particular Columbia Fund. References to specific securities should not be construed as a recommendation or investment advice.
Columbia U.S. Government Mortgage Fund
Performance Overview
(Unaudited)
Performance Summary
> Columbia U.S. Government Mortgage Fund (the Fund) Class A shares returned 2.11% excluding sales charges for the six months ended November 30, 2014.
> The Fund slightly outperformed its benchmark, the Barclays U.S. Mortgage-Backed Securities Index, which returned 2.08% for the same time period.
Average Annual Total Returns (%) (for period ended November 30, 2014)
| | | Inception | | 6 Months
cumulative | | 1 Year | | 5 Years | | 10 Years | |
Class A | | 02/14/02 | | | | | | | | | | | | | | | | | |
Excluding sales charges | | | | | | | 2.11 | | | | 4.88 | | | | 5.67 | | | | 5.05 | | |
Including sales charges | | | | | | | -2.68 | | | | -0.08 | | | | 4.65 | | | | 4.53 | | |
Class B | | 02/14/02 | | | | | | | | | | | | | | | | | |
Excluding sales charges | | | | | | | 1.73 | | | | 4.11 | | | | 4.87 | | | | 4.26 | | |
Including sales charges | | | | | | | -3.27 | | | | -0.89 | | | | 4.54 | | | | 4.26 | | |
Class C | | 02/14/02 | | | | | | | | | | | | | | | | | |
Excluding sales charges | | | | | | | 1.73 | | | | 4.30 | | | | 4.91 | | | | 4.28 | | |
Including sales charges | | | | | | | 0.73 | | | | 3.30 | | | | 4.91 | | | | 4.28 | | |
Class I | | 03/04/04 | | | 2.31 | | | | 5.49 | | | | 6.06 | | | | 5.46 | | |
Class K | | 02/14/02 | | | 2.15 | | | | 4.97 | | | | 5.71 | | | | 5.35 | | |
Class R4* | | 11/08/12 | | | 2.24 | | | | 5.35 | | | | 5.77 | | | | 5.10 | | |
Class R5* | | 11/08/12 | | | 2.10 | | | | 5.24 | | | | 5.77 | | | | 5.10 | | |
Class W* | | 06/18/12 | | | 2.11 | | | | 5.07 | | | | 5.67 | | | | 5.02 | | |
Class Y* | | 10/01/14 | | | 2.18 | | | | 4.95 | | | | 5.68 | | | | 5.05 | | |
Class Z* | | 09/27/10 | | | 2.24 | | | | 5.35 | | | | 5.93 | | | | 5.18 | | |
Barclays U.S. Mortgage-Backed Securities Index | | | | | | | 2.08 | | | | 5.42 | | | | 3.40 | | | | 4.81 | | |
Returns for Class A are shown with and without the maximum initial sales charge of 4.75%. Returns for Class B are shown with and without the applicable contingent deferred sales charge (CDSC) of 5.00% in the first year, declining to 1.00% in the sixth year and eliminated thereafter. Returns for Class C are shown with and without the 1.00% CDSC for the first year only. The Fund's other classes are not subject to sales charges and have limited eligibility. Please see the Fund's prospectus for details. Performance for different share classes will vary based on differences in sales charges and fees associated with each class. All results shown assume reinvestment of distributions during the period. Returns do not reflect the deduction of taxes that a shareholder may pay on Fund distributions or on the redemption of Fund shares. Performance results reflect the effect of any fee waivers or reimbursements of Fund expenses by Columbia Management Investment Advisers, LLC and/or any of its affiliates. Absent these fee waivers or expense reimbursement arrangements, performance results would have been lower.
The performance information shown represents past performance and is not a guarantee of future results. The investment return and principal value of your investment will fluctuate so that your shares, when redeemed, may be worth more or less than their original cost. Current performance may be lower or higher than the performance information shown. You may obtain performance information current to the most recent month-end by contacting your financial intermediary, visiting columbiamanagement.com or calling 800.345.6611.
*The returns shown for periods prior to the share class inception date (including returns for the Life of the Fund, if shown, which are since Fund inception) include the returns of the Fund's oldest share class. Since the Fund launched more than one share class at its inception, Class A shares were used. These returns are adjusted to reflect any higher class-related operating expenses of the newer share classes, as applicable. Please visit columbiamanagement.com/investment-products/mutual-funds/appended-performance for more information.
The Barclays U.S. Mortgage-Backed Securities Index is composed of all mortgage-backed pass-through securities of Ginnie Mae (GNMA), Fannie Mae (FNMA), and Freddie Mac (FHLMC).
Indices are not available for investment, are not professionally managed and do not reflect sales charges, fees, brokerage commissions, taxes or other expenses of investing. Securities in the Fund may not match those in an index.
Semiannual Report 2014
4
Columbia U.S. Government Mortgage Fund
Portfolio Overview
(Unaudited)
Portfolio Breakdown (%)
(at November 30, 2014) | |
Asset-Backed Securities — Non-Agency | | | 4.3 | | |
Commercial Mortgage-Backed Securities — Agency | | | 5.9 | | |
Commercial Mortgage-Backed Securities — Non-Agency | | | 4.4 | | |
Money Market Funds | | | 0.7 | | |
Options Purchased Puts | | | 0.5 | | |
Residential Mortgage-Backed Securities — Agency | | | 71.9 | | |
Residential Mortgage-Backed Securities — Non-Agency | | | 9.2 | | |
Repurchase Agreements | | | 3.1 | | |
Total | | | 100.0 | | |
Percentages indicated are based upon total investments. The Fund's portfolio composition is subject to change.
Quality Breakdown (%)
(at November 30, 2014) | |
AAA rating | | | 81.5 | | |
AA rating | | | 0.9 | | |
A rating | | | 1.6 | | |
BBB rating | | | 1.2 | | |
Non-investment grade | | | 1.7 | | |
Not rated | | | 13.1 | | |
Total | | | 100.0 | | |
Percentages indicated are based upon total fixed income securities (excluding Money Market Funds).
Bond ratings apply to the underlying holdings of the Fund and not the Fund itself and are divided into categories ranging from highest to lowest credit quality, determined by using the middle rating of Moody's, S&P and Fitch, after dropping the highest and lowest available ratings. When ratings are available from only two rating agencies, the lower rating is used. When a rating is available from only one rating agency, that rating is used. When a bond is not rated by any rating agency, it is designated as "Not rated". Credit quality ratings assigned by a rating agency are subjective opinions, not statements of fact, and are subject to change, including daily. The ratings assigned by credit rating agencies are but one of the considerations that the Investment Manager and/or Fund's subadviser incorporates into its credit analysis process, along with such other issuer-specific factors as cash flows, capital structure and leverage ratios, ability to de-leverage (repay) through free cash flow, quality of management, market positioning and access to capital, as well as such security-specific factors as the terms of the security (e.g., interest rate, and time to maturity) and the amount and type of any collateral.
Portfolio Management
Jason Callan
Tom Heuer, CFA
Semiannual Report 2014
5
Columbia U.S. Government Mortgage Fund
Understanding Your Fund's Expenses
(Unaudited)
As an investor, you incur two types of costs. There are transaction costs, which generally include sales charges on purchases and may include redemption fees. There are also ongoing costs, which generally include management fees, distribution and/or service fees, and other fund expenses. The following information is intended to help you understand your ongoing costs (in dollars) of investing in the Fund and to help you compare these costs with the ongoing costs of investing in other mutual funds.
Analyzing Your Fund's Expenses
To illustrate these ongoing costs, we have provided examples and calculated the expenses paid by investors in each share class of the Fund during the period. The actual and hypothetical information in the table is based on an initial investment of $1,000 at the beginning of the period indicated and held for the entire period. Expense information is calculated two ways and each method provides you with different information. The amount listed in the "Actual" column is calculated using the Fund's actual operating expenses and total return for the period. You may use the Actual information, together with the amount invested, to estimate the expenses that you paid over the period. Simply divide your account value by $1,000 (for example, an $8,600 account value divided by $1,000 = 8.6), then multiply the results by the expenses paid during the period under the "Actual" column. The amount listed in the "Hypothetical" column assumes a 5% annual rate of return before expenses (which is not the Fund's actual return) and then applies the Fund's actual expense ratio for the period to the hypothetical return. You should not use the hypothetical account values and expenses to estimate either your actual account balance at the end of the period or the expenses you paid during the period. See "Compare With Other Funds" below for details on how to use the hypothetical data.
Compare With Other Funds
Since all mutual funds are required to include the same hypothetical calculations about expenses in shareholder reports, you can use this information to compare the ongoing cost of investing in the Fund with other funds. To do so, compare the hypothetical example with the 5% hypothetical examples that appear in the shareholder reports of other funds. As you compare hypothetical examples of other funds, it is important to note that hypothetical examples are meant to highlight the ongoing costs of investing in a fund only and do not reflect any transaction costs, such as sales charges, or redemption or exchange fees. Therefore, the hypothetical calculations are useful in comparing ongoing costs only, and will not help you determine the relative total costs of owning different funds. If transaction costs were included in these calculations, your costs would be higher.
June 1, 2014 – November 30, 2014
| | | Account Value at the Beginning
of the Period ($) | | Account Value at the End of the
Period ($) | | Expenses Paid During the
Period ($) | | Fund's Annualized
Expense Ratio (%) | |
| | | Actual | | Hypothetical | | Actual | | Hypothetical | | Actual | | Hypothetical | | Actual | |
Class A | | | 1,000.00 | | | | 1,000.00 | | | | 1,021.10 | | | | 1,020.59 | | | | 4.38 | | | | 4.38 | | | | 0.87 | | |
Class B | | | 1,000.00 | | | | 1,000.00 | | | | 1,017.30 | | | | 1,016.85 | | | | 8.15 | | | | 8.15 | | | | 1.62 | | |
Class C | | | 1,000.00 | | | | 1,000.00 | | | | 1,017.30 | | | | 1,016.85 | | | | 8.15 | | | | 8.15 | | | | 1.62 | | |
Class I | | | 1,000.00 | | | | 1,000.00 | | | | 1,023.10 | | | | 1,022.49 | | | | 2.47 | | | | 2.47 | | | | 0.49 | | |
Class K | | | 1,000.00 | | | | 1,000.00 | | | | 1,021.50 | | | | 1,020.99 | | | | 3.98 | | | | 3.98 | | | | 0.79 | | |
Class R4 | | | 1,000.00 | | | | 1,000.00 | | | | 1,022.40 | | | | 1,021.84 | | | | 3.13 | | | | 3.13 | | | | 0.62 | | |
Class R5 | | | 1,000.00 | | | | 1,000.00 | | | | 1,021.00 | | | | 1,022.24 | | | | 2.72 | | | | 2.72 | | | | 0.54 | | |
Class W | | | 1,000.00 | | | | 1,000.00 | | | | 1,021.10 | | | | 1,020.59 | | | | 4.38 | | | | 4.38 | | | | 0.87 | | |
Class Y | | | 1,000.00 | | | | 1,000.00 | | | | 1,015.20 | * | | | 1,022.44 | | | | 0.79 | * | | | 2.52 | | | | 0.50 | * | |
Class Z | | | 1,000.00 | | | | 1,000.00 | | | | 1,022.40 | | | | 1,021.84 | | | | 3.13 | | | | 3.13 | | | | 0.62 | | |
*Based on operations from October 1, 2014 (commencement of operations) through the stated period end.
Expenses paid during the period are equal to the annualized expense ratio for each class as indicated above, multiplied by the average account value over the period and then multiplied by the number of days in the Fund's most recent fiscal half year and divided by 365.
Expenses do not include fees and expenses incurred indirectly by the Fund from its investment in underlying funds, including affiliated and non-affiliated pooled investment vehicles, such as mutual funds and exchange-traded funds.
Had Columbia Management Investment Advisers, LLC and/or certain of its affiliates not waived/reimbursed certain fees and expenses, account value at the end of the period would have been reduced.
Semiannual Report 2014
6
Columbia U.S. Government Mortgage Fund
Portfolio of Investments
November 30, 2014 (Unaudited)
(Percentages represent value of investments compared to net assets)
Residential Mortgage-Backed Securities —
Agency 93.6%
Issuer | | Coupon
Rate | | Principal
Amount ($) | | Value ($) | |
Federal Home Loan Mortgage Corp.(a)
06/01/15 | | | 7.500 | % | | | 5,616 | | | | 5,690 | | |
12/01/16 - 08/01/34 | | | 6.500 | % | | | 892,780 | | | | 1,009,896 | | |
04/01/17 | | | 7.000 | % | | | 53,242 | | | | 55,605 | | |
10/01/17 - 06/01/31 | | | 8.000 | % | | | 172,907 | | | | 199,151 | | |
01/01/20 | | | 10.500 | % | | | 12,511 | | | | 12,593 | | |
10/01/24 - 04/01/40 | | | 5.000 | % | | | 22,239,516 | | | | 24,812,361 | | |
01/01/30 - 06/01/33 | | | 5.500 | % | | | 12,308,189 | | | | 13,784,979 | | |
04/01/33 - 11/01/37 | | | 6.000 | % | | | 4,685,895 | | | | 5,335,486 | | |
07/01/39 - 07/01/40 | | | 4.500 | % | | | 18,710,589 | | | | 20,595,576 | | |
04/01/41 - 08/01/44 | | | 4.000 | % | | | 33,363,767 | | | | 35,799,606 | | |
01/01/42 - 06/01/44 | | | 3.500 | % | | | 167,650,009 | | | | 174,927,603 | | |
Federal Home Loan Mortgage Corp.(a)(b)
CMO Series 4119 Class SP
10/15/42 | | | 2.483 | % | | | 5,313,239 | | | | 4,629,581 | | |
Federal Home Loan Mortgage Corp.(a)(b)(c)
CMO IO Series 3913 Class SW
09/15/40 | | | 6.445 | % | | | 9,038,203 | | | | 1,654,797 | | |
CMO IO STRIPS Series 280 Class S1
09/15/42 | | | 5.845 | % | | | 21,508,592 | | | | 4,901,759 | | |
CMO IO Series 2471 Class SI
03/15/32 | | | 7.795 | % | | | 68,243 | | | | 17,490 | | |
CMO IO Series 264 Class S1
07/15/42 | | | 5.795 | % | | | 21,360,934 | | | | 5,001,062 | | |
CMO IO Series 2957 Class SW
04/15/35 | | | 5.845 | % | | | 3,346,274 | | | | 614,275 | | |
CMO IO Series 311 Class S1
08/15/43 | | | 5.795 | % | | | 65,116,301 | | | | 14,709,010 | | |
CMO IO Series 318 Class S1
11/15/43 | | | 5.795 | % | | | 14,573,635 | | | | 3,320,037 | | |
CMO IO Series 3280 Class SI
02/15/37 | | | 6.285 | % | | | 2,708,898 | | | | 371,238 | | |
CMO IO Series 336 Class 30
08/15/44 | | | 5.895 | % | | | 14,511,699 | | | | 3,716,209 | | |
CMO IO Series 3453 Class W
12/15/32 | | | 7.247 | % | | | 10,086,451 | | | | 2,148,371 | | |
CMO IO Series 3630 Class AI
03/15/17 | | | 1.931 | % | | | 423,046 | | | | 12,829 | | |
CMO IO Series 3761 Class KS
06/15/40 | | | 5.845 | % | | | 3,040,100 | | | | 384,886 | | |
CMO IO Series 4068 Class GI
09/15/36 | | | 1.894 | % | | | 26,287,034 | | | | 2,126,863 | | |
CMO IO Series 4094 Class SY
08/15/42 | | | 5.925 | % | | | 21,965,523 | | | | 4,442,246 | | |
CMO IO Series 4107 Class KS
06/15/38 | | | 1.862 | % | | | 19,630,513 | | | | 1,495,513 | | |
CMO IO Series 4174 Class SB
05/15/39 | | | 6.045 | % | | | 22,041,517 | | | | 4,031,918 | | |
CMO IO Series 4223 Class DS
12/15/38 | | | 5.945 | % | | | 6,671,357 | | | | 1,225,981 | | |
CMO IO Series 4286 Class NS
12/15/43 | | | 5.745 | % | | | 7,718,037 | | | | 1,877,409 | | |
CMO IO Series AS Class 4183
04/15/39 | | | 5.995 | % | | | 10,216,256 | | | | 1,853,359 | | |
CMO IO Series ES Class 4175
06/15/38 | | | 5.995 | % | | | 10,855,443 | | | | 1,925,631 | | |
Residential Mortgage-Backed Securities —
Agency (continued)
Issuer | | Coupon
Rate | | Principal
Amount ($) | | Value ($) | |
Federal Home Loan Mortgage Corp.(a)(c)
CMO IO Series 304 Class C69
12/15/42 | | | 4.000 | % | | | 9,288,439 | | | | 2,132,451 | | |
CMO IO Series 329 Class C5
06/15/43 | | | 3.500 | % | | | 13,190,897 | | | | 2,734,700 | | |
CMO IO Series 3786 Class PI
12/15/37 | | | 4.500 | % | | | 7,018,784 | | | | 604,987 | | |
CMO IO Series 3800 Class HI
01/15/40 | | | 4.500 | % | | | 7,081,352 | | | | 1,096,108 | | |
CMO IO Series 3807 Class NI
11/15/35 | | | 4.500 | % | | | 21,538,801 | | | | 1,402,206 | | |
CMO IO Series 4098 Class AI
05/15/39 | | | 3.500 | % | | | 13,193,041 | | | | 2,256,761 | | |
CMO IO Series 4120 Class AI
11/15/39 | | | 3.500 | % | | | 15,157,695 | | | | 2,090,246 | | |
CMO IO Series 4121 Class IA
01/15/41 | | | 3.500 | % | | | 13,543,895 | | | | 2,766,059 | | |
CMO IO Series 4121 Class MI
10/15/42 | | | 4.000 | % | | | 8,945,733 | | | | 2,259,272 | | |
CMO IO Series 4122 Class JI
12/15/40 | | | 4.000 | % | | | 11,235,897 | | | | 1,991,390 | | |
CMO IO Series 4139 Class CI
05/15/42 | | | 3.500 | % | | | 8,851,945 | | | | 1,322,710 | | |
CMO IO Series 4147 Class CI
01/15/41 | | | 3.500 | % | | | 15,679,579 | | | | 2,775,044 | | |
CMO IO Series 4148 Class BI
02/15/41 | | | 4.000 | % | | | 11,506,371 | | | | 1,774,611 | | |
CMO IO Series 4177 Class IY
03/15/43 | | | 4.000 | % | | | 20,089,999 | | | | 4,810,687 | | |
CMO IO Series 4213 Class DI
06/15/38 | | | 3.500 | % | | | 19,873,800 | | | | 2,897,809 | | |
CMO IO Series 4215 Class IL
07/15/41 | | | 3.500 | % | | | 17,009,475 | | | | 2,690,361 | | |
Federal Home Loan Mortgage Corp.(a)(d)
12/11/44 | | | 4.000 | % | | | 9,500,000 | | | | 10,130,117 | | |
12/11/44 | | | 4.500 | % | | | 18,300,000 | | | | 19,867,651 | | |
Federal National Mortgage Association(a)
11/01/15 | | | 8.000 | % | | | 157 | | | | 158 | | |
08/01/16 - 10/01/37 | | | 6.500 | % | | | 12,082,393 | | | | 13,939,738 | | |
01/01/17 - 09/01/28 | | | 7.500 | % | | | 242,789 | | | | 273,796 | | |
11/01/22 - 09/01/38 | | | 6.000 | % | | | 10,270,835 | | | | 11,742,786 | | |
03/01/23 - 04/01/41 | | | 5.500 | % | | | 33,009,980 | | | | 37,365,282 | | |
06/01/25 - 09/01/41 | | | 4.500 | % | | | 139,146,185 | | | | 152,499,310 | | |
02/01/27 - 05/01/43 | | | 3.000 | % | | | 123,126,790 | | | | 125,893,896 | | |
05/01/27 | | | 2.500 | % | | | 20,997,165 | | | | 21,489,909 | | |
04/01/29 - 09/01/41 | | | 5.000 | % | | | 75,584,907 | | | | 84,153,782 | | |
10/01/31 | | | 9.500 | % | | | 87,941 | | | | 94,192 | | |
11/01/37 | | | 8.500 | % | | | 39,708 | | | | 45,751 | | |
11/01/40 - 10/01/44 | | | 4.000 | % | | | 96,769,989 | | | | 103,883,821 | | |
03/01/42 - 09/01/44 | | | 3.500 | % | | | 109,451,373 | | | | 114,547,553 | | |
Federal National Mortgage Association(a)(b)(c)
CMO IO Series 2003-117 Class KS
08/25/33 | | | 6.945 | % | | | 4,825,738 | | | | 419,499 | | |
CMO IO Series 2006-5 Class N1
08/25/34 | | | 1.933 | % | | | 19,677,341 | | | | 826,629 | | |
The accompanying Notes to Financial Statements are an integral part of this statement.
Semiannual Report 2014
7
Columbia U.S. Government Mortgage Fund
Portfolio of Investments (continued)
November 30, 2014 (Unaudited)
Residential Mortgage-Backed Securities —
Agency (continued)
Issuer | | Coupon
Rate | | Principal
Amount ($) | | Value ($) | |
CMO IO Series 2006-5 Class N2
02/25/35 | | | 1.976 | % | | | 75,053,290 | | | | 4,491,662 | | |
CMO IO Series 2007-5 Class SC
02/25/37 | | | 5.955 | % | | | 1,514,070 | | | | 217,027 | | |
CMO IO Series 2007-54 Class DI
06/25/37 | | | 5.945 | % | | | 23,271,035 | | | | 4,440,176 | | |
CMO IO Series 2012-80 Class DS
06/25/39 | | | 6.495 | % | | | 11,358,864 | | | | 2,185,825 | | |
CMO IO Series 2012-97 Class SB
09/25/42 | | | 5.845 | % | | | 11,927,489 | | | | 2,418,006 | | |
CMO IO Series 2013-13 Class SA
03/25/43 | | | 5.995 | % | | | 22,927,656 | | | | 5,368,357 | | |
CMO IO Series 2013-SB Class 97
06/25/32 | | | 5.945 | % | | | 16,443,041 | | | | 2,959,019 | | |
Federal National Mortgage Association(a)(c)
CMO IO STRIPS Series 417 Class C5
02/25/43 | | | 3.500 | % | | | 10,652,501 | | | | 2,230,992 | | |
CMO IO Series 2003-119 Class GI
12/25/33 | | | 4.500 | % | | | 138,722 | | | | 26,460 | | |
CMO IO Series 2012-118 Class BI
12/25/39 | | | 3.500 | % | | | 47,252,599 | | | | 7,756,112 | | |
CMO IO Series 2012-121 Class GI
08/25/39 | | | 3.500 | % | | | 15,119,498 | | | | 1,770,047 | | |
CMO IO Series 2012-129 Class IC
01/25/41 | | | 3.500 | % | | | 11,487,524 | | | | 1,591,444 | | |
CMO IO Series 2012-133 Class EI
07/25/31 | | | 3.500 | % | | | 9,092,231 | | | | 1,273,406 | | |
CMO IO Series 2012-134 Class AI
07/25/40 | | | 3.500 | % | | | 32,630,269 | | | | 5,609,829 | | |
CMO IO Series 2012-144 Class HI
07/25/42 | | | 3.500 | % | | | 7,910,273 | | | | 1,201,098 | | |
CMO IO Series 2012-96 Class CI
04/25/39 | | | 3.500 | % | | | 20,247,033 | | | | 3,196,128 | | |
CMO IO Series 2013-1 Class AI
02/25/43 | | | 3.500 | % | | | 8,174,883 | | | | 1,405,519 | | |
CMO IO Series 2013-1 Class BI
02/25/40 | | | 3.500 | % | | | 6,642,732 | | | | 927,498 | | |
CMO IO Series 2013-16 Class IO
01/25/40 | | | 3.500 | % | | | 21,800,110 | | | | 4,259,990 | | |
CMO IO Series 2013-41 Class IY
05/25/40 | | | 3.500 | % | | | 25,782,360 | | | | 4,474,196 | | |
CMO IO Series 2013-6 Class MI
02/25/40 | | | 3.500 | % | | | 12,119,640 | | | | 1,603,213 | | |
Federal National Mortgage Association(a)(d)
12/16/29 - 12/11/44 | | | 3.000 | % | | | 164,250,000 | | | | 167,120,501 | | |
12/16/29 - 12/11/44 | | | 3.500 | % | | | 152,750,000 | | | | 160,379,653 | | |
12/11/44 | | | 4.000 | % | | | 121,000,000 | | | | 129,186,400 | | |
12/11/44 | | | 4.500 | % | | | 66,000,000 | | | | 71,728,595 | | |
12/11/44 | | | 5.000 | % | | | 7,000,000 | | | | 7,761,250 | | |
Federal National Mortgage Association(a)(e)
08/01/38 | | | 5.500 | % | | | 5,901,982 | | | | 6,662,572 | | |
Government National Mortgage Association(a)
03/15/30 | | | 7.000 | % | | | 35,657 | | | | 36,101 | | |
12/15/31 - 02/15/32 | | | 6.500 | % | | | 251,770 | | | | 293,213 | | |
Residential Mortgage-Backed Securities —
Agency (continued)
Issuer | | Coupon
Rate | | Principal
Amount ($) | | Value ($) | |
12/15/32 - 11/20/41 | | | 6.000 | % | | | 12,137,947 | | | | 13,900,113 | | |
09/15/33 - 08/20/40 | | | 5.000 | % | | | 30,607,166 | | | | 34,162,390 | | |
Government National Mortgage Association(a)(c)
CMO IO Series 2012-121 Class PI
09/16/42 | | | 4.500 | % | | | 13,715,808 | | | | 2,629,167 | | |
CMO IO Series 2012-129 Class AI
08/20/37 | | | 3.000 | % | | | 18,031,288 | | | | 2,381,248 | | |
Vendee Mortgage Trust(a)(b)(c)
CMO IO Series 1998-1 Class 2IO
03/15/28 | | | 0.356 | % | | | 2,462,329 | | | | 20,256 | | |
CMO IO Series 1998-3 Class IO
03/15/29 | | | 0.143 | % | | | 3,002,624 | | | | 4,612 | | |
Total Residential Mortgage-Backed
Securities — Agency
(Cost: $1,699,091,735) | | | | | | | 1,725,450,357 | | |
Residential Mortgage-Backed Securities —
Non-Agency 11.9% | |
AJAX Mortgage Loan Trust
CMO Series 2014-B Class A(a)(f)
08/25/54 | | | 3.850 | % | | | 12,000,000 | | | | 12,000,000 | | |
ASG Resecuritization Trust(a)(b)(f)
CMO Series 2013-2 Class 1A60
12/28/35 | | | 2.231 | % | | | 4,989,397 | | | | 4,941,357 | | |
CMO Series 2013-2 Class 2A70
11/28/35 | | | 2.221 | % | | | 3,379,539 | | | | 3,292,735 | | |
Apollo Residential Mortgage Securitization Trust
CMO Series 2013-1 Class A(a)(f)
05/25/47 | | | 4.000 | % | | | 11,539,783 | | | | 11,892,000 | | |
BCAP LLC Trust(a)(b)(f)
07/26/36 | | | 2.617 | % | | | 5,721,582 | | | | 5,726,251 | | |
CMO Series 2010-RR12 Class 3A7
08/26/37 | | | 5.000 | % | | | 5,300,316 | | | | 5,449,187 | | |
CMO Series 2013-RR4 Class 2A1
05/26/47 | | | 2.895 | % | | | 3,479,214 | | | | 3,486,026 | | |
Series 2012-RR10 Class 2A1
09/26/36 | | | 2.618 | % | | | 7,314,380 | | | | 7,374,592 | | |
Series 2013-RR1 Class 10A1
10/26/36 | | | 3.000 | % | | | 8,678,769 | | | | 8,729,713 | | |
BNPP Mortgage Securities LLC Trust
CMO Series 2009-1 Class A1(a)(f)
08/27/37 | | | 6.000 | % | | | 1,425,562 | | | | 1,487,214 | | |
Bayview Opportunity Master Fund Trust IIB LP
CMO Series 2012-6NPL Class A(a)(b)(f)
01/28/33 | | | 2.981 | % | | | 1,991,951 | | | | 1,995,735 | | |
CAM Mortgage Trust
CMO Series 2014-2 Class A(a)(b)(f)
05/15/48 | | | 2.600 | % | | | 1,615,993 | | | | 1,615,948 | | |
The accompanying Notes to Financial Statements are an integral part of this statement.
Semiannual Report 2014
8
Columbia U.S. Government Mortgage Fund
Portfolio of Investments (continued)
November 30, 2014 (Unaudited)
Residential Mortgage-Backed Securities —
Non-Agency (continued)
Issuer | | Coupon
Rate | | Principal
Amount ($) | | Value ($) | |
Citigroup Mortgage Loan Trust, Inc.(a)(b)(f)
CMO Series 2009-11 Class 1A2
02/25/37 | | | 2.543 | % | | | 710,201 | | | | 590,602 | | |
CMO Series 2009-9 Class 1A3
04/25/34 | | | 2.615 | % | | | 2,489,441 | | | | 2,187,498 | | |
CMO Series 2010-7 Class 3A4
12/25/35 | | | 6.032 | % | | | 3,000,000 | | | | 3,017,302 | | |
CMO Series 2013-5 Class 3A1
08/25/37 | | | 2.564 | % | | | 8,861,812 | | | | 8,933,309 | | |
CMO Series 2013-7 Class 1A2
10/25/35 | | | 4.000 | % | | | 4,162,060 | | | | 4,058,362 | | |
CMO Series 2014-A Class B2
01/25/35 | | | 5.435 | % | | | 2,843,748 | | | | 2,936,224 | | |
Citigroup Mortgage Loan Trust, Inc.(a)(b)(f)(g)
CMO Series 2014-2 Class 2A3
04/25/36 | | | 4.750 | % | | | 4,682,189 | | | | 4,787,538 | | |
Credit Suisse Mortgage Capital Certificates(a)(b)
CMO Series 2012-6R Class 1A1
11/26/37 | | | 2.607 | % | | | 2,017,352 | | | | 1,997,220 | | |
Credit Suisse Mortgage Capital Certificates(a)(b)(f)
04/27/37 | | | 5.705 | % | | | 2,983,620 | | | | 3,106,974 | | |
CMO Series 2013-2R Class 1A5
05/27/36 | | | 4.334 | % | | | 5,818,000 | | | | 5,656,539 | | |
Series 2012-11 Class 3A2
06/29/47 | | �� | 1.154 | % | | | 9,499,870 | | | | 8,967,783 | | |
Credit Suisse Mortgage Capital Certificates(a)(b)(f)(g)
CMO Series 2014-RPL4 Class A1
08/25/62 | | | 3.625 | % | | | 5,000,000 | | | | 4,962,500 | | |
Credit Suisse Mortgage Capital Certificates(a)(f)
CMO Series 2009-12R Class 11A1
08/27/37 | | | 6.000 | % | | | 2,005,308 | | | | 2,058,660 | | |
CMO Series 2010-9R Class 10A5
04/27/37 | | | 4.000 | % | | | 5,000,000 | | | | 5,019,175 | | |
CMO Series 2010-9R Class 7A5
05/27/37 | | | 4.000 | % | | | 5,000,000 | | | | 5,013,105 | | |
Series 2010-2A5 Class 9R
02/27/38 | | | 4.000 | % | | | 2,000,000 | | | | 1,915,080 | | |
Credit Suisse Securities (USA) LLC(a)(b)(f)
02/25/54 | | | 3.067 | % | | | 16,814,479 | | | | 16,572,770 | | |
Credit Suisse Securities (USA) LLC(a)(f)
CMO Series 2014-5R Class 5A2
07/27/37 | | | 3.250 | % | | | 2,899,942 | | | | 2,791,372 | | |
CMO Series 2014-5R Class 8A1
11/27/37 | | | 2.625 | % | | | 5,791,947 | | | | 5,626,325 | | |
CMO Series 2014-RPL1 Class A3
02/25/54 | | | 3.958 | % | | | 5,500,000 | | | | 5,440,259 | | |
Deutsche Mortgage Securities, Inc. Mortgage Loan Trust
CMO Series 2003-1 Class 1A7(a)
04/25/33 | | | 5.500 | % | | | 452,035 | | | | 454,294 | | |
GCAT
Series 2013-RP1 Class A1(a)(b)(f)
06/25/18 | | | 3.500 | % | | | 6,033,019 | | | | 6,086,964 | | |
Residential Mortgage-Backed Securities —
Non-Agency (continued)
Issuer | | Coupon
Rate | | Principal
Amount ($) | | Value ($) | |
Jefferies Resecuritization Trust(a)(f)
CMO Series 2010-R4 Class 2A2
10/26/35 | | | 5.500 | % | | | 2,138,119 | | | | 2,224,756 | | |
Series 2014-1A1 Class R1
12/27/37 | | | 4.000 | % | | | 2,759,995 | | | | 2,754,177 | | |
Morgan Stanley Re-Remic Trust
Series 2013-R8 Class 1B(a)(b)(f)
09/26/36 | | | 2.614 | % | | | 5,027,535 | | | | 4,924,471 | | |
NRPL Trust(a)(b)(f)
Series 2013-1A Class A
08/25/57 | | | 4.000 | % | | | 12,962,474 | | | | 12,897,662 | | |
Series 2014-1A Class A1
05/01/48 | | | 3.250 | % | | | 4,839,105 | | | | 4,839,105 | | |
New Residential Mortgage Loan Trust
CMO IO Series 2014-1A Class AIO(a)(b)(c)(f)
01/25/54 | | | 2.244 | % | | | 77,932,609 | | | | 5,667,961 | | |
RBSSP Resecuritization Trust(a)(b)(f)
CMO Series 2009-12 Class 9A1
03/25/36 | | | 2.603 | % | | | 2,219,959 | | | | 2,190,718 | | |
CMO Series 2012-1 Class 5A2
12/27/35 | | | 5.253 | % | | | 5,534,879 | | | | 4,936,453 | | |
CMO Series 2012-5 Class 2A1
07/26/36 | | | 5.750 | % | | | 5,983,585 | | | | 6,409,915 | | |
VML LLC
CMO Series 2014-NPL1 Class A1(a)(b)(d)(f)
04/25/54 | | | 3.875 | % | | | 3,000,000 | | | | 3,000,000 | | |
Total Residential Mortgage-Backed
Securities — Non-Agency
(Cost: $215,239,619) | | | | | | | 220,015,831 | | |
Commercial Mortgage-Backed Securities — Agency 7.6% | |
Federal Home Loan Mortgage Corp. Multifamily Structured Pass-Through Certificates(a)
Series K025 Class A2
10/25/22 | | | 2.682 | % | | | 33,400,000 | | | | 33,785,169 | | |
Series K715 Class A2
01/25/21 | | | 2.856 | % | | | 30,000,000 | | | | 31,092,093 | | |
Federal Home Loan Mortgage Corp. Multifamily Structured Pass-Through Certificates(a)(b)
Series K029 Class A2
02/25/23 | | | 3.320 | % | | | 6,776,000 | | | | 7,148,456 | | |
Series K030 Class A2
04/25/23 | | | 3.250 | % | | | 18,500,000 | | | | 19,420,005 | | |
Series K031 Class A2
04/25/23 | | | 3.300 | % | | | 3,100,000 | | | | 3,269,818 | | |
Series K035 Class A2
08/25/23 | | | 3.458 | % | | | 5,000,000 | | | | 5,315,005 | | |
Series K714 Class A2
10/25/20 | | | 3.034 | % | | | 13,700,000 | | | | 14,350,018 | | |
The accompanying Notes to Financial Statements are an integral part of this statement.
Semiannual Report 2014
9
Columbia U.S. Government Mortgage Fund
Portfolio of Investments (continued)
November 30, 2014 (Unaudited)
Commercial Mortgage-Backed Securities —
Agency (continued)
Issuer | | Coupon
Rate | | Principal
Amount ($) | | Value ($) | |
Federal National Mortgage Association(a)
10/01/19 | | | 4.420 | % | | | 4,103,051 | | | | 4,542,935 | | |
10/01/19 | | | 4.430 | % | | | 4,660,471 | | | | 5,162,533 | | |
01/01/20 | | | 4.570 | % | | | 1,048,687 | | | | 1,170,804 | | |
01/01/20 | | | 4.600 | % | | | 1,726,820 | | | | 1,930,413 | | |
05/01/24 | | | 5.030 | % | | | 3,380,237 | | | | 4,000,172 | | |
Federal National Mortgage Association(a)(b)
Series 2013-M14 Class A2
10/25/23 | | | 3.329 | % | | | 9,000,000 | | | | 9,458,532 | | |
Total Commercial Mortgage-Backed
Securities — Agency
(Cost: $134,256,088) | | | | | | | 140,645,953 | | |
Commercial Mortgage-Backed Securities —
Non-Agency 5.8% | |
American Homes 4 Rent Trust
Series 2014-SFR2 Class D(a)(f)
10/17/36 | | | 5.149 | % | | | 3,000,000 | | | | 3,050,105 | | |
American Homes 4 Rent
Series 2014-SFR1 Class E(a)(b)(f)
06/17/31 | | | 2.750 | % | | | 10,250,000 | | | | 9,323,432 | | |
BHMS Mortgage Trust
Series 2014-ATLS Class DFX(a)(b)(f)
07/05/33 | | | 4.847 | % | | | 6,500,000 | | | | 6,570,623 | | |
Banc of America Merrill Lynch Commercial Mortgage
Securities Trust
Series 2013-DSNY Class F(a)(b)(f)
09/15/26 | | | 3.655 | % | | | 6,928,000 | | | | 6,961,016 | | |
Banc of America Merrill Lynch Re-Remic Trust(a)(b)
Series 2014-FRR7 Class A
10/26/44 | | | 2.405 | % | | | 5,000,000 | | | | 4,894,248 | | |
Series 2014-FRR7 Class B
10/26/44 | | | 2.405 | % | | | 2,000,000 | | | | 1,852,650 | | |
Citigroup/Deutsche Bank Commercial Mortgage Trust
Series 2007-AMFX Class CD4(a)(b)
12/11/49 | | | 5.366 | % | | | 8,200,000 | | | | 8,574,674 | | |
Commercial Mortgage Trust
Series 2013-RIA4 Class A1(a)(b)(f)
11/27/28 | | | 3.250 | % | | | 2,134,383 | | | | 2,148,273 | | |
GS Mortgage Securities Trust
Series 2007-GG10 Class AM(a)(b)
08/10/45 | | | 5.990 | % | | | 13,200,000 | | | | 13,532,086 | | |
JPMorgan Chase Commercial Mortgage
Securities Trust
Series 2006-LDP9 Class AM(a)
05/15/47 | | | 5.372 | % | | | 2,000,000 | | | | 2,080,930 | | |
Merrill Lynch Mortgage Investors Trust
CMO IO Series 1998-C3 Class IO(a)(b)(c)
12/15/30 | | | 1.070 | % | | | 313,027 | | | | 6,315 | | |
Commercial Mortgage-Backed Securities —
Non-Agency (continued)
Issuer | | Coupon
Rate | | Principal
Amount ($) | | Value ($) | |
ORES NPL LLC(a)(f)
Series 2013-LV2 Class A
09/25/25 | | | 3.081 | % | | | 2,854,743 | | | | 2,854,743 | | |
Series 2014-LV3 Class A
03/27/24 | | | 3.000 | % | | | 6,556,962 | | | | 6,557,126 | | |
Series 2014-LV3 Class B
03/27/24 | | | 6.000 | % | | | 4,800,000 | | | | 4,792,152 | | |
Rialto Capital Management LLC
Series 2014-LT5 Class B(a)(f)
05/15/24 | | | 5.000 | % | | | 7,412,000 | | | | 7,405,337 | | |
Rialto Real Estate Fund LLC
Series 2014-LT6 Class A(a)(f)
09/15/24 | | | 2.750 | % | | | 7,515,500 | | | | 7,517,935 | | |
Rialto Real Estate Fund LP(a)(f)
Series 2013-LT3 Class A
06/20/28 | | | 2.500 | % | | | 1,442,983 | | | | 1,442,983 | | |
Series 2014-LT5 Class A
05/15/24 | | | 2.850 | % | | | 6,318,806 | | | | 6,318,282 | | |
VFC LLC(a)(f)
Series 2014-2 Class A
07/20/30 | | | 2.750 | % | | | 5,223,922 | | | | 5,224,115 | | |
Series 2014-2 Class B
07/20/30 | | | 5.500 | % | | | 5,000,000 | | | | 4,998,410 | | |
Total Commercial Mortgage-Backed
Securities — Non-Agency
(Cost: $107,264,068) | | | | | | | 106,105,435 | | |
Asset-Backed Securities — Non-Agency 5.7% | |
A Voce CLO Ltd.
Series 2014-1A Class C(b)(f)
07/15/26 | | | 3.734 | % | | | 3,000,000 | | | | 2,805,024 | | |
ARES CLO Ltd.
Series 2014-1A Class B(b)(f)
04/17/26 | | | 3.028 | % | | | 3,250,000 | | | | 3,141,986 | | |
Apidos CDO XVII
Series 2014-17A Class A2A(b)(f)
04/17/26 | | | 2.278 | % | | | 6,500,000 | | | | 6,345,371 | | |
Carlyle Global Market Strategies CLO(b)(f)
Series 2013-1A Class B
02/14/25 | | | 3.333 | % | | | 6,300,000 | | | | 6,247,477 | | |
Series 2014-C1 Class 3A
07/27/26 | | | 3.934 | % | | | 1,500,000 | | | | 1,441,281 | | |
Dryden Senior Loan Fund
Series 2014-33A Class C(b)(f)
07/15/26 | | | 3.081 | % | | | 10,266,667 | | | | 9,974,005 | | |
GCAT LLC
Series 2014-2 Class A1(b)(f)
10/25/19 | | | 3.721 | % | | | 5,915,818 | | | | 5,885,447 | | |
The accompanying Notes to Financial Statements are an integral part of this statement.
Semiannual Report 2014
10
Columbia U.S. Government Mortgage Fund
Portfolio of Investments (continued)
November 30, 2014 (Unaudited)
Asset-Backed Securities — Non-Agency (continued)
Issuer | | Coupon
Rate | | Principal
Amount ($) | | Value ($) | |
GoldenTree Loan Opportunities VII Ltd.
Series 2013-7A Class B(b)(f)
04/25/25 | | | 1.984 | % | | | 8,000,000 | | | | 7,684,632 | | |
GoldenTree Loan Opportunities VIII Ltd.
Series 2014-8A Class D(b)(f)
04/19/26 | | | 3.851 | % | | | 5,000,000 | | | | 4,818,240 | | |
MASTR Asset-Backed Securities Trust
Series 2005-FRE1 Class A4(b)
10/25/35 | | | 0.405 | % | | | 32,136 | | | | 32,055 | | |
Morgan Stanley Resecuritization Trust
Series 2013-BSFC Class A(b)(f)(g)
07/06/38 | | | 2.654 | % | | | 2,794,769 | | | | 2,794,769 | | |
New York Mortgage Trust Residential LLC(b)(f)
Series 2013-RP1A Class A
07/25/18 | | | 4.250 | % | | | 11,044,622 | | | | 11,099,846 | | |
Series 2013-RP2A Class A
09/25/18 | | | 4.600 | % | | | 6,113,133 | | | | 6,210,414 | | |
Nomad CLO Ltd.
Series 2013-1A Class B(b)(f)
01/15/25 | | | 3.181 | % | | | 10,000,000 | | | | 9,688,950 | | |
OHA Credit Partners VIII Ltd.
Series 2013-8A Class B(b)(f)
04/20/25 | | | 1.881 | % | | | 4,500,000 | | | | 4,340,038 | | |
OZLM VII Ltd.
Series 2014-C Class 7A(b)(f)
07/17/26 | | | 3.855 | % | | | 2,000,000 | | | | 1,875,614 | | |
Selene Non-Performing Loans LLC
Series 2014-1A Class A(b)(f)
05/25/54 | | | 2.981 | % | | | 4,950,094 | | | | 4,906,934 | | |
Symphony CLO Ltd.
Series 2014-14A Class D2(b)(f)
07/14/26 | | | 3.830 | % | | | 7,500,000 | | | | 7,113,480 | | |
Truman Capital Mortgage Loan Trust
Series 2014-NPL2 Class A1(b)(f)
06/25/54 | | | 3.125 | % | | | 4,216,374 | | | | 4,211,567 | | |
Vericrest Opportunity Loan Transferee
Series 2014-3A Class A1(b)(f)
05/26/54 | | | 3.250 | % | | | 3,492,279 | | | | 3,487,526 | | |
Total Asset-Backed Securities — Non-Agency
(Cost: $105,237,017) | | | | | | | 104,104,656 | | |
Options Purchased Puts 0.7%
Issuer | | Notional ($)/
Contracts | | Exercise
Price ($) | | Expiration
Date | | Value ($) | |
Put — OTC
2-Year Interest
Rate Swap(h) | | | 100,000,000 | | | | 2.50 | | | 01/26/2015 | | | 10 | | |
Options Purchased Puts (continued)
Issuer | | Notional ($)/
Contracts | | Exercise
Price ($) | | Expiration
Date | | Value ($) | |
Put — OTC
3-Year Interest
Rate Swap(h) | | | 150,000,000 | | | | 2.25 | | | 03/06/2015 | | | 11,670 | | |
Put — OTC
3-Year Interest
Rate Swap(h) | | | 500,000,000 | | | | 2.25 | | | 11/02/2015 | | | 1,953,300 | | |
Put — OTC
3-Year Interest
Rate Swap(h) | | | 200,000,000 | | | | 1.75 | | | 02/11/2015 | | | 58,820 | | |
Put — OTC
5-Year
Rate Swap(h) | | | 150,000,000 | | | | 2.75 | | | 05/31/2017 | | | 3,744,495 | | |
Put — OTC
5-Year Interest
Rate Swap(h) | | | 100,000,000 | | | | 3.00 | | | 05/17/2017 | | | 1,980,170 | | |
Put — OTC
5-Year Interest
Rate Swap(h) | | | 130,000,000 | | | | 3.25 | | | 08/18/2017 | | | 2,346,357 | | |
Put — OTC
5-Year Interest
Rate Swap(h) | | | 244,000,000 | | | | 2.50 | | | 10/30/2015 | | | 1,997,408 | | |
Put — OTC
5-Year Interest
Rate Swap(h) | | | 50,000,000 | | | | 4.00 | | | 08/17/2017 | | | 464,635 | | |
Total Options Purchased Puts
(Cost: $25,119,100) | | | | | | | | | 12,556,865 | | |
Repurchase Agreements 4.1%
Issue
Description | | Effective
Yield | | Principal
Amount ($) | | Value ($) | |
Tri-Party TD Securities (USA) LLC
dated 11/28/14, matures 12/01/14,
repurchase price $75,000,688
(collateralized by U.S. Government
Agencies — total market value of
$76,500,000)
12/01/14 | | | 0.110 | % | | | 75,000,000 | | | | 75,000,000 | | |
Total Repurchase Agreements
(Cost: $75,000,000) | | | | | | | 75,000,000 | | |
The accompanying Notes to Financial Statements are an integral part of this statement.
Semiannual Report 2014
11
Columbia U.S. Government Mortgage Fund
Portfolio of Investments (continued)
November 30, 2014 (Unaudited)
Money Market Funds 0.9%
| | | Shares | | Value ($) | |
Columbia Short-Term Cash Fund,
0.104%(i)(j) | | | 17,371,548 | | | | 17,371,548 | | |
Total Money Market Funds
(Cost: $17,371,548) | | | | | 17,371,548 | | |
Total Investments
(Cost: $2,378,579,175) | | | | | 2,401,250,645 | | |
Other Assets & Liabilities, Net | | | | | (558,365,561 | ) | |
Net Assets | | | | | 1,842,885,084 | | |
Investments in Derivatives
Futures Contracts Outstanding at November 30, 2014
At November 30, 2014, securities totaling $4,153,839 were pledged as collateral to cover initial margin requirements on open futures contracts.
Long Futures Contracts Outstanding
Contract Description | | Number of
Contracts | | Trading
Currency | | Notional
Market
Value ($) | | Expiration
Date | | Unrealized
Appreciation ($) | | Unrealized
Depreciation ($) | |
US 5YR NOTE | | | 1,372 | | | USD | | | | | 163,943,285 | | | 03/2015 | | | 812,570 | | | | — | | |
US 10YR NOTE | | | 1,379 | | | USD | | | | | 175,197,647 | | | 03/2015 | | | 1,134,813 | | | | — | | |
Total | | | | | | | | | | | 1,947,383 | | | | — | | |
Short Futures Contracts Outstanding
Contract Description | | Number of
Contracts | | Trading
Currency | | Notional
Market
Value ($) | | Expiration
Date | | Unrealized
Appreciation ($) | | Unrealized
Depreciation ($) | |
US 2YR NOTE | | | (34 | ) | | USD | | | | | (7,450,781 | ) | | 03/2015 | | | — | | | | (8,557 | ) | |
US ULTRA T-BOND | | | (99 | ) | | USD | | | | | (15,920,438 | ) | | 03/2015 | | | — | | | | (307,203 | ) | |
Total | | | | | | | | | | | — | | | | (315,760 | ) | |
Total Return Swap Contracts Outstanding at November 30, 2014
Counterparty | | Fund Receives | | Fund Pays | | Expiration
Date | | Notional
Currency | | Notional
Amount ($) | | Unrealized
Appreciation ($) | | Unrealized
Depreciation ($) | |
Citibank
| | Total return based
on the Markit
IOS FN30.350.10
Index | | Floating rate
based on 1-month
USD LIBOR
| | 1/12/1941
| | USD |
| | | | 1,086,822
| | | | —
| | | | (52,163
| ) | |
JPMorgan Chase
Bank, London
Branch
| | Total return based
on the Markit
IOS FN30.400.10
Index | | Floating rate
based on 1-month
USD LIBOR
| | 1/12/1941
| | USD |
| | | | 976,519
| | | | —
| | | | (52,039
| ) | |
Total | | | | | | | | | | | | | — | | | | (104,202 | ) | |
The accompanying Notes to Financial Statements are an integral part of this statement.
Semiannual Report 2014
12
Columbia U.S. Government Mortgage Fund
Portfolio of Investments (continued)
November 30, 2014 (Unaudited)
Notes to Portfolio of Investments
Notes to Portfolio of Investments
(a) The maturity dates shown represent the original maturity of the underlying obligation. Actual maturity may vary based upon prepayment activity on these obligations. Unless otherwise noted, the coupon rates presented are fixed rates.
(b) Variable rate security.
(c) Interest Only (IO) security. The actual effective yield of this security is different than the stated coupon rate.
(d) Represents a security purchased on a when-issued or delayed delivery basis.
(e) This security, or a portion of this security, has been pledged as collateral in connection with open futures contracts. These values are denoted within the Investments in Derivatives section of the Portfolio of Investments.
(f) Security exempt from registration pursuant to Rule 144A under the Securities Act of 1933. This security may be resold in transactions exempt from registration, normally to qualified institutional buyers. At November 30, 2014, the value of these securities amounted to $396,801,450 or 21.53% of net assets.
(g) Represents fair value as determined in good faith under procedures approved by the Board of Trustees. At November 30, 2014, the value of these securities amounted to $12,544,807, which represents 0.68% of net assets.
(h) Purchased swaption contracts outstanding at November 30, 2014:
Purchased Swaption Contracts Outstanding at November 30, 2014
At November 30, 2014, securities and cash totaling $14,017,338 were received from broker as collateral to cover open purchased swaption contracts.
Description | | Counterparty | | Floating Rate
Index | | Fund
Pay/Receive
Floating Rate | | Exercise
Rate (%) | | Expiration
Date | | Notional
Amount ($) | | Premium
Paid ($) | | Market
Value ($) | |
Put — OTC 2-Year
Interest Rate Swap | | JPMorgan
| | 3-Month
USD LIBOR | | Receive
| | | 2.500
| | | 1/28/2017
| | | 100,000,000
| | | | 657,500
| | | | 10
| | |
Put — OTC 3-Year
Interest Rate Swap | | JPMorgan
| | 3-Month
USD LIBOR | | Receive
| | | 2.250
| | | 3/10/2018
| | | 150,000,000
| | | | 2,321,250
| | | | 11,670
| | |
Put — OTC 3-Year
Interest Rate Swap | | Morgan Stanley
| | 3-Month
USD LIBOR | | Receive
| | | 2.250
| | | 11/4/2018
| | | 500,000,000
| | | | 4,745,000
| | | | 1,953,300
| | |
Put — OTC 3-Year
Interest Rate Swap | | Citibank
| | 3-Month
USD LIBOR | | Receive
| | | 1.750
| | | 2/13/2018
| | | 200,000,000
| | | | 1,485,000
| | | | 58,820
| | |
Put — OTC 5-Year
Interest Rate Swap | | JPMorgan
| | 3-Month
USD LIBOR | | Receive
| | | 2.750
| | | 6/2/2022
| | | 150,000,000
| | | | 4,890,000
| | | | 3,744,495
| | |
Put — OTC 5-Year
Interest Rate Swap | | Morgan Stanley
| | 3-Month
USD LIBOR | | Receive
| | | 3.000
| | | 5/17/2022
| | | 100,000,000
| | | | 3,516,000
| | | | 1,980,170
| | |
Put — OTC 5-Year
Interest Rate Swap | | Barclays
| | 3-Month
USD LIBOR | | Receive
| | | 3.250
| | | 8/22/2022
| | | 130,000,000
| | | | 3,438,500
| | | | 2,346,357
| | |
Put — OTC 5-Year
Interest Rate Swap | | Morgan Stanley
| | 3-Month
USD LIBOR | | Receive
| | | 2.500
| | | 11/3/2020
| | | 244,000,000
| | | | 2,964,600
| | | | 1,997,408
| | |
Put — OTC 5-Year
Interest Rate Swap | | JPMorgan
| | 3-Month
USD LIBOR | | Receive
| | | 4.000
| | | 8/21/2022
| | | 50,000,000
| | | | 1,101,250
| | | | 464,635
| | |
Total | | | | | | | | | | | | | | | 25,119,100 | | | | 12,556,865 | | |
(i) The rate shown is the seven-day current annualized yield at November 30, 2014.
(j) As defined in the Investment Company Act of 1940, an affiliated company is one in which the Fund owns 5% or more of the company's outstanding voting securities, or a company which is under common ownership or control with the Fund. Holdings and transactions in these affiliated companies during the period ended November 30, 2014, are as follows:
Issuer | | Beginning
Cost ($) | | Purchase
Cost ($) | | Proceeds
From Sales ($) | | Ending
Cost ($) | | Dividends —
Affiliated
Issuers ($) | | Value ($) | |
Columbia Short-Term Cash Fund | | | 1,565,091 | | | | 218,322,477 | | | | (202,516,020 | ) | | | 17,371,548 | | | | 2,385 | | | | 17,371,548 | | |
The accompanying Notes to Financial Statements are an integral part of this statement.
Semiannual Report 2014
13
Columbia U.S. Government Mortgage Fund
Portfolio of Investments (continued)
November 30, 2014 (Unaudited)
Abbreviation Legend
CMO Collateralized Mortgage Obligation
STRIPS Separate Trading of Registered Interest and Principal Securities
Currency Legend
USD US Dollar
Fair Value Measurements
Generally accepted accounting principles (GAAP) require disclosure regarding the inputs and valuation techniques used to measure fair value and any changes in valuation inputs or techniques. In addition, investments shall be disclosed by major category.
The Fund categorizes its fair value measurements according to a three-level hierarchy that maximizes the use of observable inputs and minimizes the use of unobservable inputs by prioritizing that the most observable input be used when available. Observable inputs are those that market participants would use in pricing an investment based on market data obtained from sources independent of the reporting entity. Unobservable inputs are those that reflect the Fund's assumptions about the information market participants would use in pricing an investment. An investment's level within the fair value hierarchy is based on the lowest level of any input that is deemed significant to the asset or liability's fair value measurement. The input levels are not necessarily an indication of the risk or liquidity associated with investments at that level. For example, certain U.S. government securities are generally high quality and liquid, however, they are reflected as Level 2 because the inputs used to determine fair value may not always be quoted prices in an active market.
Fair value inputs are summarized in the three broad levels listed below:
> Level 1 — Valuations based on quoted prices for investments in active markets that the Fund has the ability to access at the measurement date (including NAV for open-end mutual funds). Valuation adjustments are not applied to Level 1 investments.
> Level 2 — Valuations based on other significant observable inputs (including quoted prices for similar securities, interest rates, prepayment speeds, credit risks, etc.).
> Level 3 — Valuations based on significant unobservable inputs (including the Fund's own assumptions and judgment in determining the fair value of investments).
Inputs that are used in determining fair value of an investment may include price information, credit data, volatility statistics, and other factors. These inputs can be either observable or unobservable. The availability of observable inputs can vary between investments, and is affected by various factors such as the type of investment, and the volume and level of activity for that investment or similar investments in the marketplace. The inputs will be considered by the Investment Manager, along with any other relevant factors in the calculation of an investment's fair value. The Fund uses prices and inputs that are current as of the measurement date, which may include periods of market dislocations. During these periods, the availability of prices and inputs may be reduced for many investments. This condition could cause an investment to be reclassified between the various levels within the hierarchy.
Investments falling into the Level 3 category are primarily supported by quoted prices from brokers and dealers participating in the market for those investments. However, these may be classified as Level 3 investments due to lack of market transparency and corroboration to support these quoted prices. Additionally, valuation models may be used as the pricing source for any remaining investments classified as Level 3. These models may rely on one or more significant unobservable inputs and/or significant assumptions by the Investment Manager. Inputs used in valuations may include, but are not limited to, financial statement analysis, capital account balances, discount rates and estimated cash flows, and comparable company data.
Under the direction of the Fund's Board of Trustees (the Board), the Investment Manager's Valuation Committee (the Committee) is responsible for overseeing the valuation procedures approved by the Board. The Committee consists of voting and non-voting members from various groups within the Investment Manager's organization, including operations and accounting, trading and investments, compliance, risk management and legal.
The Committee meets at least monthly to review and approve valuation matters, which may include a description of specific valuation determinations, data regarding pricing information received from approved pricing vendors and brokers and the results of Board-approved valuation control policies and procedures (the Policies). The Policies address, among other things, instances when market quotations are or are not readily available, including recommendations of third party pricing vendors and a determination of appropriate pricing methodologies; events that require specific valuation determinations and assessment of fair value techniques; securities with a potential for stale pricing, including those that are illiquid, restricted, or in default; and the effectiveness of third party pricing vendors, including periodic reviews of vendors. The Committee meets more frequently, as needed, to discuss additional valuation matters, which may include the need to review back-testing results, review time-sensitive information or approve related valuation actions. The Committee reports to the Board, with members of the Committee meeting with the Board at each of its regularly scheduled meetings to discuss valuation matters and actions during the period, similar to those described earlier.
The accompanying Notes to Financial Statements are an integral part of this statement.
Semiannual Report 2014
14
Columbia U.S. Government Mortgage Fund
Portfolio of Investments (continued)
November 30, 2014 (Unaudited)
Fair Value Measurements (continued)
For investments categorized as Level 3, the Committee monitors information similar to that described above, which may include: (i) data specific to the issuer or comparable issuers, (ii) general market or specific sector news and (iii) quoted prices and specific or similar security transactions. The Committee considers this data and any changes from prior periods in order to assess the reasonableness of observable and unobservable inputs, any assumptions or internal models used to value those securities and changes in fair value. This data is also used to corroborate, when available, information received from approved pricing vendors and brokers. Various factors impact the frequency of monitoring this information (which may occur as often as daily). However, the Committee may determine that changes to inputs, assumptions and models are not required as a result of the monitoring procedures performed.
The following table is a summary of the inputs used to value the Fund's investments at November 30, 2014:
Description | | Level 1
Quoted Prices in Active
Markets for Identical
Assets ($) | | Level 2
Other Significant
Observable Inputs ($) | | Level 3
Significant
Unobservable Inputs ($) | | Total ($) | |
Bonds | |
Residential Mortgage-Backed
Securities — Agency | | | — | | | | 1,725,450,357 | | | | — | | | | 1,725,450,357 | | |
Residential Mortgage-Backed
Securities — Non-Agency | | | — | | | | 121,326,093 | | | | 98,689,738 | | | | 220,015,831 | | |
Commercial Mortgage-Backed
Securities — Agency | | | — | | | | 140,645,953 | | | | — | | | | 140,645,953 | | |
Commercial Mortgage-Backed
Securities — Non-Agency | | | — | | | | 104,662,452 | | | | 1,442,983 | | | | 106,105,435 | | |
Asset-Backed Securities — Non-Agency | | | — | | | | 90,210,042 | | | | 13,894,614 | | | | 104,104,656 | | |
Total Bonds | | | — | | | | 2,182,294,897 | | | | 114,027,335 | | | | 2,296,322,232 | | |
Short-Term Securities | |
Repurchase Agreements | | | — | | | | 75,000,000 | | | | — | | | | 75,000,000 | | |
Total Short-Term Securities | | | — | | | | 75,000,000 | | | | — | | | | 75,000,000 | | |
Other | |
Options Purchased Puts | | | — | | | | 12,556,865 | | | | — | | | | 12,556,865 | | |
Total Other | | | — | | | | 12,556,865 | | | | — | | | | 12,556,865 | | |
Mutual Funds | |
Money Market Funds | | | 17,371,548 | | | | — | | | | — | | | | 17,371,548 | | |
Total Mutual Funds | | | 17,371,548 | | | | — | | | | — | | | | 17,371,548 | | |
Investments in Securities | | | 17,371,548 | | | | 2,269,851,762 | | | | 114,027,335 | | | | 2,401,250,645 | | |
Derivatives | |
Assets | |
Futures Contracts | | | 1,947,383 | | | | — | | | | — | | | | 1,947,383 | | |
Liabilities | |
Futures Contracts | | | (315,760 | ) | | | — | | | | — | | | | (315,760 | ) | |
Swap Contracts | | | — | | | | (104,202 | ) | | | — | | | | (104,202 | ) | |
Total | | | 19,003,171 | | | | 2,269,747,560 | | | | 114,027,335 | | | | 2,402,778,066 | | |
See the Portfolio of Investments for all investment classifications not indicated in the table.
The Fund's assets assigned to the Level 2 input category are generally valued using the market approach, in which a security's value is determined through reference to prices and information from market transactions for similar or identical assets.
The accompanying Notes to Financial Statements are an integral part of this statement.
Semiannual Report 2014
15
Columbia U.S. Government Mortgage Fund
Portfolio of Investments (continued)
November 30, 2014 (Unaudited)
Fair Value Measurements (continued)
There were no transfers of financial assets between Levels 1 and 2 during the period.
Futures contracts and swap contracts are valued at unrealized appreciation (depreciation).
The following table is a reconciliation of Level 3 assets for which significant observable and/or unobservable inputs were used to determine fair value:
| | | Residential
Mortgage-Backed
Securities —
Non-Agency ($) | | Commercial
Mortgage-Backed
Securities —
Non-Agency ($) | | Asset-Backed
Securities —
Non-Agency ($) | | Total ($) | |
Balance as of May 31, 2014 | | | 105,818,531 | | | | 5,783,840 | | | | 56,279,826 | | | | 167,882,197 | | |
Accrued discounts/premiums | | | (11,905 | ) | | | 5,165 | | | | 10,078 | | | | 3,338 | | |
Realized gain (loss) | | | — | | | | 165,825 | | | | 415,236 | | | | 581,061 | | |
Change in unrealized appreciation (depreciation)(a) | | | 34,799 | | | | (77,948 | ) | | | (590,688 | ) | | | (633,837 | ) | |
Sales | | | (17,611,490 | ) | | | (4,433,899 | ) | | | (29,624,700 | ) | | | (51,670,089 | ) | |
Purchases | | | 24,962,501 | | | | — | | | | 5,660,362 | | | | 30,622,863 | | |
Transfers into Level 3 | | | — | | | | — | | | | — | | | | — | | |
Transfers out of Level 3 | | | (14,502,698 | ) | | | — | | | | (18,255,500 | ) | | | (32,758,198 | ) | |
Balance as of November 30, 2014 | | | 98,689,738 | | | | 1,442,983 | | | | 13,894,614 | | | | 114,027,335 | | |
(a) Change in unrealized appreciation (depreciation) relating to securities held at November 30, 2014 was ($1,341), which is comprised of Residential Mortgage-Backed Securities — Non-Agency of $62,148 and Asset-Backed Securities — Non-Agency of ($63,489).
The Fund's assets assigned to the Level 3 category are valued utilizing the valuation technique deemed the most appropriate in the circumstances. Certain residential, commercial and asset backed securities classified as Level 3 are valued using the market approach and utilize single market quotations from broker dealers which may have included, but not limited to, the distressed nature of the security and observable transactions for similar assets in the market. Significant increases (decreases) to any of these inputs would result in a significantly lower (higher) fair value measurement.
Financial assets were transferred from Level 3 to Level 2 as observable market inputs were utilized and management's determination that there was sufficient, reliable and observable market data to value these assets as of period end.
Transfers in and/or out of Level 3 are determined based on the fair value at the beginning of the period for security positions held throughout the period.
The accompanying Notes to Financial Statements are an integral part of this statement.
Semiannual Report 2014
16
Columbia U.S. Government Mortgage Fund
Statement of Assets and Liabilities
November 30, 2014 (Unaudited)
Assets | |
Investments, at value | |
Unaffiliated issuers (identified cost $2,286,207,627) | | $ | 2,308,879,097 | | |
Repurchase agreements (identified cost $75,000,000) | | | 75,000,000 | | |
Affiliated issuers (identified cost $17,371,548) | | | 17,371,548 | | |
Total investments (identified cost $2,378,579,175) | | | 2,401,250,645 | | |
Receivable for: | |
Investments sold | | | 1,138 | | |
Investments sold on a delayed delivery basis | | | 78,361,545 | | |
Capital shares sold | | | 4,545,018 | | |
Dividends | | | 278 | | |
Interest | | | 7,271,955 | | |
Variation margin | | | 709,632 | | |
Expense reimbursement due from Investment Manager | | | 5,219 | | |
Prepaid expenses | | | 6,622 | | |
Trustees' deferred compensation plan | | | 87,325 | | |
Other assets | | | 16,879 | | |
Total assets | | | 2,492,256,256 | | |
Liabilities | |
Disbursements in excess of cash | | | 187,667 | | |
Unrealized depreciation on swap contracts | | | 104,202 | | |
Payable for: | |
Investments purchased | | | 462,213 | | |
Investments purchased on a delayed delivery basis | | | 643,749,780 | | |
Capital shares purchased | | | 630,699 | | |
Dividend distributions to shareholders | | | 3,605,323 | | |
Variation margin | | | 99,094 | | |
Investment management fees | | | 42,845 | | |
Distribution and/or service fees | | | 9,740 | | |
Transfer agent fees | | | 195,251 | | |
Administration fees | | | 6,453 | | |
Plan administration fees | | | 14 | | |
Compensation of board members | | | 104,828 | | |
Other expenses | | | 85,738 | | |
Trustees' deferred compensation plan | | | 87,325 | | |
Total liabilities | | | 649,371,172 | | |
Net assets applicable to outstanding capital stock | | $ | 1,842,885,084 | | |
Represented by | |
Paid-in capital | | $ | 1,852,862,839 | | |
Excess of distributions over net investment income | | | (5,252,703 | ) | |
Accumulated net realized loss | | | (28,923,943 | ) | |
Unrealized appreciation (depreciation) on: | |
Investments | | | 22,671,470 | | |
Futures contracts | | | 1,631,623 | | |
Swap contracts | | | (104,202 | ) | |
Total — representing net assets applicable to outstanding capital stock | | $ | 1,842,885,084 | | |
The accompanying Notes to Financial Statements are an integral part of this statement.
Semiannual Report 2014
17
Columbia U.S. Government Mortgage Fund
Statement of Assets and Liabilities (continued)
November 30, 2014 (Unaudited)
Class A | |
Net assets | | $ | 552,338,733 | | |
Shares outstanding | | | 99,875,429 | | |
Net asset value per share | | $ | 5.53 | | |
Maximum offering price per share(a) | | $ | 5.81 | | |
Class B | |
Net assets | | $ | 2,244,381 | | |
Shares outstanding | | | 405,595 | | |
Net asset value per share | | $ | 5.53 | | |
Class C | |
Net assets | | $ | 36,429,035 | | |
Shares outstanding | | | 6,576,957 | | |
Net asset value per share | | $ | 5.54 | | |
Class I | |
Net assets | | $ | 783,657,801 | | |
Shares outstanding | | | 141,785,592 | | |
Net asset value per share | | $ | 5.53 | | |
Class K | |
Net assets | | $ | 69,265 | | |
Shares outstanding | | | 12,547 | | |
Net asset value per share | | $ | 5.52 | | |
Class R4 | |
Net assets | | $ | 15,157,304 | | |
Shares outstanding | | | 2,742,349 | | |
Net asset value per share | | $ | 5.53 | | |
Class R5 | |
Net assets | | $ | 7,341,272 | | |
Shares outstanding | | | 1,328,967 | | |
Net asset value per share | | $ | 5.52 | | |
Class W | |
Net assets | | $ | 5,829,739 | | |
Shares outstanding | | | 1,052,676 | | |
Net asset value per share | | $ | 5.54 | | |
Class Y | |
Net assets | | $ | 10,109 | | |
Shares outstanding | | | 1,838 | | |
Net asset value per share | | $ | 5.50 | | |
Class Z | |
Net assets | | $ | 439,807,445 | | |
Shares outstanding | | | 79,586,073 | | |
Net asset value per share | | $ | 5.53 | | |
(a) The maximum offering price per share is calculated by dividing the net asset value per share by 1.0 minus the maximum sales charge of 4.75%.
The accompanying Notes to Financial Statements are an integral part of this statement.
Semiannual Report 2014
18
Columbia U.S. Government Mortgage Fund
Statement of Operations
Six Months Ended November 30, 2014 (Unaudited)
Net investment income | |
Income: | |
Dividends — affiliated issuers | | $ | 2,385 | | |
Interest | | | 28,252,153 | | |
Total income | | | 28,254,538 | | |
Expenses: | |
Investment management fees | | | 3,897,893 | | |
Distribution and/or service fees | |
Class A | | | 683,341 | | |
Class B | | | 12,280 | | |
Class C | | | 182,325 | | |
Class W | | | 7,901 | | |
Transfer agent fees | |
Class A | | | 506,924 | | |
Class B | | | 2,275 | | |
Class C | | | 33,808 | | |
Class K | | | 20 | | |
Class R4 | | | 7,643 | | |
Class R5 | | | 1,685 | | |
Class W | | | 5,841 | | |
Class Z | | | 407,649 | | |
Administration fees | | | 587,116 | | |
Plan administration fees | |
Class K | | | 98 | | |
Compensation of board members | | | 20,928 | | |
Custodian fees | | | 23,691 | | |
Printing and postage fees | | | 55,870 | | |
Registration fees | | | 67,479 | | |
Professional fees | | | 26,480 | | |
Other | | | 16,659 | | |
Total expenses | | | 6,547,906 | | |
Fees waived or expenses reimbursed by Investment Manager and its affiliates | | | (519,540 | ) | |
Expense reductions | | | (8,443 | ) | |
Total net expenses | | | 6,019,923 | | |
Net investment income | | | 22,234,615 | | |
Realized and unrealized gain (loss) — net | |
Net realized gain (loss) on: | |
Investments | | | 23,137,690 | | |
Futures contracts | | | 5,096,697 | | |
Swap contracts | | | (81,376 | ) | |
Net realized gain | | | 28,153,011 | | |
Net change in unrealized appreciation (depreciation) on: | |
Investments | | | (12,458,319 | ) | |
Forward sale commitments | | | 24,492 | | |
Futures contracts | | | 1,359,488 | | |
Options contracts written | | | 426,625 | | |
Swap contracts | | | (52,077 | ) | |
Net change in unrealized depreciation | | | (10,699,791 | ) | |
Net realized and unrealized gain | | | 17,453,220 | | |
Net increase in net assets resulting from operations | | $ | 39,687,835 | | |
The accompanying Notes to Financial Statements are an integral part of this statement.
Semiannual Report 2014
19
Columbia U.S. Government Mortgage Fund
Statement of Changes in Net Assets
| | | Six Months Ended
November 30, 2014(a)
(Unaudited) | | Year Ended
May 31,
2014 | |
Operations | |
Net investment income | | $ | 22,234,615 | | | $ | 47,001,440 | | |
Net realized gain (loss) | | | 28,153,011 | | | | (20,730,780 | ) | |
Net change in unrealized appreciation (depreciation) | | | (10,699,791 | ) | | | 5,897,462 | | |
Net increase in net assets resulting from operations | | | 39,687,835 | | | | 32,168,122 | | |
Distributions to shareholders | |
Net investment income | |
Class A | | | (6,518,614 | ) | | | (19,566,004 | ) | |
Class B | | | (20,103 | ) | | | (98,186 | ) | |
Class C | | | (298,054 | ) | | | (1,267,105 | ) | |
Class I | | | (10,879,723 | ) | | | (25,407,332 | ) | |
Class K | | | (966 | ) | | | (2,769 | ) | |
Class R4 | | | (107,771 | ) | | | (245,407 | ) | |
Class R5 | | | (91,173 | ) | | | (144,034 | ) | |
Class W | | | (76,031 | ) | | | (221,197 | ) | |
Class Y | | | (41 | ) | | | — | | |
Class Z | | | (5,792,566 | ) | | | (19,551,658 | ) | |
Net realized gains | |
Class A | | | — | | | | (1,790,881 | ) | |
Class B | | | — | | | | (11,629 | ) | |
Class C | | | — | | | | (150,208 | ) | |
Class I | | | — | | | | (1,967,681 | ) | |
Class K | | | — | | | | (246 | ) | |
Class R4 | | | — | | | | (28,012 | ) | |
Class R5 | | | — | | | | (10,299 | ) | |
Class W | | | — | | | | (20,953 | ) | |
Class Z | | | — | | | | (1,634,852 | ) | |
Total distributions to shareholders | | | (23,785,042 | ) | | | (72,118,453 | ) | |
Decrease in net assets from capital stock activity | | | (38,283,025 | ) | | | (586,296,268 | ) | |
Total decrease in net assets | | | (22,380,232 | ) | | | (626,246,599 | ) | |
Net assets at beginning of period | | | 1,865,265,316 | | | | 2,491,511,915 | | |
Net assets at end of period | | $ | 1,842,885,084 | | | $ | 1,865,265,316 | | |
Excess of distributions over net investment income | | $ | (5,252,703 | ) | | $ | (3,702,276 | ) | |
(a) Class Y shares are based on operations from October 1, 2014 (commencement of operations) through the stated period end.
The accompanying Notes to Financial Statements are an integral part of this statement.
Semiannual Report 2014
20
Columbia U.S. Government Mortgage Fund
Statement of Changes in Net Assets (continued)
| | | Six Months Ended November 30, 2014(a)
(Unaudited) | | Year Ended May 31, 2014 | |
| | | Shares | | Dollars ($) | | Shares | | Dollars ($) | |
Capital stock activity | |
Class A shares | |
Subscriptions(b) | | | 9,352,129 | | | | 51,199,307 | | | | 24,484,286 | | | | 133,264,990 | | |
Distributions reinvested | | | 983,109 | | | | 5,379,077 | | | | 3,346,156 | | | | 18,184,154 | | |
Redemptions | | | (12,700,140 | ) | | | (69,434,761 | ) | | | (56,779,079 | ) | | | (308,924,734 | ) | |
Net decrease | | | (2,364,902 | ) | | | (12,856,377 | ) | | | (28,948,637 | ) | | | (157,475,590 | ) | |
Class B shares | |
Subscriptions | | | 4,000 | | | | 21,948 | | | | 14,221 | | | | 77,700 | | |
Distributions reinvested | | | 2,627 | | | | 14,372 | | | | 15,305 | | | | 83,198 | | |
Redemptions(b) | | | (112,709 | ) | | | (615,867 | ) | | | (555,231 | ) | | | (3,024,148 | ) | |
Net decrease | | | (106,082 | ) | | | (579,547 | ) | | | (525,705 | ) | | | (2,863,250 | ) | |
Class C shares | |
Subscriptions | | | 731,450 | | | | 4,017,895 | | | | 2,043,964 | | | | 11,213,972 | | |
Distributions reinvested | | | 43,090 | | | | 236,159 | | | | 210,560 | | | | 1,145,783 | | |
Redemptions | | | (1,262,679 | ) | | | (6,911,015 | ) | | | (7,396,508 | ) | | | (40,314,718 | ) | |
Net decrease | | | (488,139 | ) | | | (2,656,961 | ) | | | (5,141,984 | ) | | | (27,954,963 | ) | |
Class I shares | |
Subscriptions | | | 12,815,354 | | | | 70,224,467 | | | | 36,560,349 | | | | 199,090,715 | | |
Distributions reinvested | | | 1,989,789 | | | | 10,879,582 | | | | 5,037,722 | | | | 27,374,599 | | |
Redemptions | | | (16,373,113 | ) | | | (89,643,484 | ) | | | (40,294,510 | ) | | | (219,683,319 | ) | |
Net increase (decrease) | | | (1,567,970 | ) | | | (8,539,435 | ) | | | 1,303,561 | | | | 6,781,995 | | |
Class K shares | |
Subscriptions | | | 58 | | | | 314 | | | | 1,546 | | | | 8,351 | | |
Distributions reinvested | | | 150 | | | | 821 | | | | 532 | | | | 2,884 | | |
Redemptions | | | (3,084 | ) | | | (16,742 | ) | | | (1,659 | ) | | | (8,960 | ) | |
Net increase (decrease) | | | (2,876 | ) | | | (15,607 | ) | | | 419 | | | | 2,275 | | |
Class R4 shares | |
Subscriptions | | | 1,921,001 | | | | 10,542,451 | | | | 2,547,375 | | | | 13,883,654 | | |
Distributions reinvested | | | 17,381 | | | | 95,095 | | | | 50,413 | | | | 273,287 | | |
Redemptions | | | (1,479,385 | ) | | | (8,075,413 | ) | | | (346,911 | ) | | | (1,878,873 | ) | |
Net increase | | | 458,997 | | | | 2,562,133 | | | | 2,250,877 | | | | 12,278,068 | | |
Class R5 shares | |
Subscriptions | | | 537,718 | | | | 2,933,962 | | | | 1,298,203 | | | | 7,052,090 | | |
Distributions reinvested | | | 16,683 | | | | 91,173 | | | | 28,256 | | | | 153,330 | | |
Redemptions | | | (236,988 | ) | | | (1,298,018 | ) | | | (405,916 | ) | | | (2,200,703 | ) | |
Net increase | | | 317,413 | | | | 1,727,117 | | | | 920,543 | | | | 5,004,717 | | |
The accompanying Notes to Financial Statements are an integral part of this statement.
Semiannual Report 2014
21
Columbia U.S. Government Mortgage Fund
Statement of Changes in Net Assets (continued)
| | | Six Months Ended November 30, 2014(a)
(Unaudited) | | Year Ended May 31, 2014 | |
| | | Shares | | Dollars ($) | | Shares | | Dollars ($) | |
Capital stock activity (continued) | |
Class W shares | |
Subscriptions | | | 100,536 | | | | 550,799 | | | | 648,286 | | | | 3,535,684 | | |
Distributions reinvested | | | 13,853 | | | | 75,911 | | | | 44,476 | | | | 242,027 | | |
Redemptions | | | (408,077 | ) | | | (2,232,547 | ) | | | (1,206,014 | ) | | | (6,631,138 | ) | |
Net decrease | | | (293,688 | ) | | | (1,605,837 | ) | | | (513,252 | ) | | | (2,853,427 | ) | |
Class Y shares | |
Subscriptions | | | 1,838 | | | | 10,000 | | | | — | | | | — | | |
Net increase | | | 1,838 | | | | 10,000 | | | | — | | | | — | | |
Class Z shares | |
Subscriptions | | | 11,880,363 | | | | 64,908,418 | | | | 24,644,604 | | | | 133,969,086 | | |
Distributions reinvested | | | 607,225 | | | | 3,320,693 | | | | 1,754,205 | | | | 9,530,247 | | |
Redemptions | | | (15,473,438 | ) | | | (84,557,622 | ) | | | (103,360,206 | ) | | | (562,715,426 | ) | |
Net decrease | | | (2,985,850 | ) | | | (16,328,511 | ) | | | (76,961,397 | ) | | | (419,216,093 | ) | |
Total net decrease | | | (7,031,259 | ) | | | (38,283,025 | ) | | | (107,615,575 | ) | | | (586,296,268 | ) | |
(a) Class Y shares are based on operations from October 1, 2014 (commencement of operations) through the stated period end.
(b) Includes conversions of Class B shares to Class A shares, if any.
The accompanying Notes to Financial Statements are an integral part of this statement.
Semiannual Report 2014
22
Columbia U.S. Government Mortgage Fund
The following tables are intended to help you understand the Fund's financial performance. Certain information reflects financial results for a single share of a class held for the periods shown. Per share net investment income (loss) amounts are calculated based on average shares outstanding during the period. Total return assumes reinvestment of all dividends and distributions, if any. Total return does not reflect payment of sales charges, if any. Total return and portfolio turnover are not annualized for periods of less than one year. The portfolio turnover rate is calculated without regard to purchase and sales transactions of short-term instruments and certain derivatives, if any. If such transactions were included, the Fund's portfolio turnover rate may be higher.
| | | Six Months Ended
November 30, 2014 | |
Year Ended May 31, | |
Class A | | (Unaudited) | | 2014 | | 2013 | | 2012 | | 2011 | | 2010 | |
Per share data | |
Net asset value, beginning of period | | $ | 5.48 | | | $ | 5.56 | | | $ | 5.63 | | | $ | 5.46 | | | $ | 5.16 | | | $ | 4.77 | | |
Income from investment operations: | |
Net investment income | | | 0.06 | | | | 0.12 | | | | 0.10 | | | | 0.16 | | | | 0.17 | | | | 0.25 | | |
Net realized and unrealized gain (loss) | | | 0.06 | | | | (0.01 | ) | | | 0.08 | | | | 0.19 | | | | 0.34 | | | | 0.37 | | |
Total from investment operations | | | 0.12 | | | | 0.11 | | | | 0.18 | | | | 0.35 | | | | 0.51 | | | | 0.62 | | |
Less distributions to shareholders: | |
Net investment income | | | (0.07 | ) | | | (0.17 | ) | | | (0.14 | ) | | | (0.16 | ) | | | (0.21 | ) | | | (0.23 | ) | |
Net realized gains | | | — | | | | (0.02 | ) | | | (0.11 | ) | | | (0.02 | ) | | | — | | | | — | | |
Total distributions to shareholders | | | (0.07 | ) | | | (0.19 | ) | | | (0.25 | ) | | | (0.18 | ) | | | (0.21 | ) | | | (0.23 | ) | |
Proceeds from regulatory settlements | | | — | | | | — | | | | — | | | | 0.00 | (a) | | | — | | | | — | | |
Net asset value, end of period | | $ | 5.53 | | | $ | 5.48 | | | $ | 5.56 | | | $ | 5.63 | | | $ | 5.46 | | | $ | 5.16 | | |
Total return | | | 2.11 | % | | | 2.13 | % | | | 3.28 | % | | | 6.55 | % | | | 10.10 | % | | | 13.32 | % | |
Ratios to average net assets(b) | |
Total gross expenses | | | 0.95 | %(c) | | | 0.95 | % | | | 0.94 | % | | | 0.92 | % | | | 0.98 | % | | | 1.09 | % | |
Total net expenses(d) | | | 0.87 | %(c)(e) | | | 0.86 | %(e) | | | 0.86 | %(e) | | | 0.85 | %(e) | | | 0.87 | % | | | 0.89 | % | |
Net investment income | | | 2.22 | %(c) | | | 2.23 | % | | | 1.81 | % | | | 2.83 | % | | | 3.16 | % | | | 4.98 | % | |
Supplemental data | |
Net assets, end of period (in thousands) | | $ | 552,339 | | | $ | 560,484 | | | $ | 729,893 | | | $ | 616,112 | | | $ | 519,454 | | | $ | 80,371 | | |
Portfolio turnover | | | 173 | %(f) | | | 413 | %(f) | | | 576 | %(f) | | | 545 | %(f) | | | 465 | %(f) | | | 519 | %(f) | |
Notes to Financial Highlights
(a) Rounds to zero.
(b) In addition to the fees and expenses that the Fund bears directly, the Fund indirectly bears a pro rata share of the fees and expenses of any other funds in which it invests. Such indirect expenses are not included in the Fund's reported expense ratios.
(c) Annualized.
(d) Total net expenses include the impact of certain fee waivers/expense reimbursements made by the Investment Manager and certain of its affiliates, if applicable.
(e) The benefits derived from expense reductions had an impact of less than 0.01%.
(f) Includes mortgage dollar rolls. If mortgage dollar roll transactions were excluded, the portfolio turnover would have been 17% for the six months ended November 30, 2014 and 116%, 164%, 285%, 253% and 246% for the years ended May 31, 2014, 2013, 2012, 2011 and 2010, respectively.
The accompanying Notes to Financial Statements are an integral part of this statement.
Semiannual Report 2014
23
Columbia U.S. Government Mortgage Fund
Financial Highlights (continued)
| | | Six Months Ended
November 30, 2014 | |
Year Ended May 31, | |
Class B | | (Unaudited) | | 2014 | | 2013 | | 2012 | | 2011 | | 2010 | |
Per share data | |
Net asset value, beginning of period | | $ | 5.48 | | | $ | 5.57 | | | $ | 5.64 | | | $ | 5.47 | | | $ | 5.16 | | | $ | 4.77 | | |
Income from investment operations: | |
Net investment income | | | 0.04 | | | | 0.08 | | | | 0.06 | | | | 0.12 | | | | 0.13 | | | | 0.21 | | |
Net realized and unrealized gain (loss) | | | 0.05 | | | | (0.02 | ) | | | 0.08 | | | | 0.19 | | | | 0.35 | | | | 0.37 | | |
Total from investment operations | | | 0.09 | | | | 0.06 | | | | 0.14 | | | | 0.31 | | | | 0.48 | | | | 0.58 | | |
Less distributions to shareholders: | |
Net investment income | | | (0.04 | ) | | | (0.13 | ) | | | (0.10 | ) | | | (0.12 | ) | | | (0.17 | ) | | | (0.19 | ) | |
Net realized gains | | | — | | | | (0.02 | ) | | | (0.11 | ) | | | (0.02 | ) | | | — | | | | — | | |
Total distributions to shareholders | | | (0.04 | ) | | | (0.15 | ) | | | (0.21 | ) | | | (0.14 | ) | | | (0.17 | ) | | | (0.19 | ) | |
Proceeds from regulatory settlements | | | — | | | | — | | | | — | | | | 0.00 | (a) | | | — | | | | — | | |
Net asset value, end of period | | $ | 5.53 | | | $ | 5.48 | | | $ | 5.57 | | | $ | 5.64 | | | $ | 5.47 | | | $ | 5.16 | | |
Total return | | | 1.73 | % | | | 1.19 | % | | | 2.51 | % | | | 5.73 | % | | | 9.45 | % | | | 12.46 | % | |
Ratios to average net assets(b) | |
Total gross expenses | | | 1.70 | %(c) | | | 1.70 | % | | | 1.68 | % | | | 1.68 | % | | | 1.81 | % | | | 1.85 | % | |
Total net expenses(d) | | | 1.62 | %(c)(e) | | | 1.61 | %(e) | | | 1.61 | %(e) | | | 1.60 | %(e) | | | 1.65 | % | | | 1.65 | % | |
Net investment income | | | 1.45 | %(c) | | | 1.47 | % | | | 1.07 | % | | | 2.09 | % | | | 2.43 | % | | | 4.18 | % | |
Supplemental data | |
Net assets, end of period (in thousands) | | $ | 2,244 | | | $ | 2,806 | | | $ | 5,775 | | | $ | 8,495 | | | $ | 16,024 | | | $ | 17,619 | | |
Portfolio turnover | | | 173 | %(f) | | | 413 | %(f) | | | 576 | %(f) | | | 545 | %(f) | | | 465 | %(f) | | | 519 | %(f) | |
Notes to Financial Highlights
(a) Rounds to zero.
(b) In addition to the fees and expenses that the Fund bears directly, the Fund indirectly bears a pro rata share of the fees and expenses of any other funds in which it invests. Such indirect expenses are not included in the Fund's reported expense ratios.
(c) Annualized.
(d) Total net expenses include the impact of certain fee waivers/expense reimbursements made by the Investment Manager and certain of its affiliates, if applicable.
(e) The benefits derived from expense reductions had an impact of less than 0.01%.
(f) Includes mortgage dollar rolls. If mortgage dollar roll transactions were excluded, the portfolio turnover would have been 17% for the six months ended November 30, 2014 and 116%, 164%, 285%, 253% and 246% for the years ended May 31, 2014, 2013, 2012, 2011 and 2010, respectively.
The accompanying Notes to Financial Statements are an integral part of this statement.
Semiannual Report 2014
24
Columbia U.S. Government Mortgage Fund
Financial Highlights (continued)
| | | Six Months Ended
November 30, 2014 | |
Year Ended May 31, | |
Class C | | (Unaudited) | | 2014 | | 2013 | | 2012 | | 2011 | | 2010 | |
Per share data | |
Net asset value, beginning of period | | $ | 5.49 | | | $ | 5.57 | | | $ | 5.64 | | | $ | 5.47 | | | $ | 5.16 | | | $ | 4.77 | | |
Income from investment operations: | |
Net investment income | | | 0.04 | | | | 0.08 | | | | 0.06 | | | | 0.11 | | | | 0.14 | | | | 0.21 | | |
Net realized and unrealized gain (loss) | | | 0.05 | | | | (0.01 | ) | | | 0.08 | | | | 0.20 | | | | 0.34 | | | | 0.37 | | |
Total from investment operations | | | 0.09 | | | | 0.07 | | | | 0.14 | | | | 0.31 | | | | 0.48 | | | | 0.58 | | |
Less distributions to shareholders: | |
Net investment income | | | (0.04 | ) | | | (0.13 | ) | | | (0.10 | ) | | | (0.12 | ) | | | (0.17 | ) | | | (0.19 | ) | |
Net realized gains | | | — | | | | (0.02 | ) | | | (0.11 | ) | | | (0.02 | ) | | | — | | | | — | | |
Total distributions to shareholders | | | (0.04 | ) | | | (0.15 | ) | | | (0.21 | ) | | | (0.14 | ) | | | (0.17 | ) | | | (0.19 | ) | |
Proceeds from regulatory settlements | | | — | | | | — | | | | — | | | | 0.00 | (a) | | | — | | | | — | | |
Net asset value, end of period | | $ | 5.54 | | | $ | 5.49 | | | $ | 5.57 | | | $ | 5.64 | | | $ | 5.47 | | | $ | 5.16 | | |
Total return | | | 1.73 | % | | | 1.37 | % | | | 2.50 | % | | | 5.73 | % | | | 9.46 | % | | | 12.47 | % | |
Ratios to average net assets(b) | |
Total gross expenses | | | 1.70 | %(c) | | | 1.70 | % | | | 1.69 | % | | | 1.67 | % | | | 1.79 | % | | | 1.85 | % | |
Total net expenses(d) | | | 1.62 | %(c)(e) | | | 1.61 | %(e) | | | 1.61 | %(e) | | | 1.60 | %(e) | | | 1.64 | % | | | 1.65 | % | |
Net investment income | | | 1.46 | %(c) | | | 1.49 | % | | | 1.00 | % | | | 2.03 | % | | | 2.55 | % | | | 4.27 | % | |
Supplemental data | |
Net assets, end of period (in thousands) | | $ | 36,429 | | | $ | 38,790 | | | $ | 68,017 | | | $ | 32,691 | | | $ | 14,661 | | | $ | 5,217 | | |
Portfolio turnover | | | 173 | %(f) | | | 413 | %(f) | | | 576 | %(f) | | | 545 | %(f) | | | 465 | %(f) | | | 519 | %(f) | |
Notes to Financial Highlights
(a) Rounds to zero.
(b) In addition to the fees and expenses that the Fund bears directly, the Fund indirectly bears a pro rata share of the fees and expenses of any other funds in which it invests. Such indirect expenses are not included in the Fund's reported expense ratios.
(c) Annualized.
(d) Total net expenses include the impact of certain fee waivers/expense reimbursements made by the Investment Manager and certain of its affiliates, if applicable.
(e) The benefits derived from expense reductions had an impact of less than 0.01%.
(f) Includes mortgage dollar rolls. If mortgage dollar roll transactions were excluded, the portfolio turnover would have been 17% for the six months ended November 30, 2014 and 116%, 164%, 285%, 253% and 246% for the years ended May 31, 2014, 2013, 2012, 2011 and 2010, respectively.
The accompanying Notes to Financial Statements are an integral part of this statement.
Semiannual Report 2014
25
Columbia U.S. Government Mortgage Fund
Financial Highlights (continued)
| | | Six Months Ended
November 30, 2014 | |
Year Ended May 31, | |
Class I | | (Unaudited) | | 2014 | | 2013 | | 2012 | | 2011 | | 2010 | |
Per share data | |
Net asset value, beginning of period | | $ | 5.48 | | | $ | 5.56 | | | $ | 5.63 | | | $ | 5.46 | | | $ | 5.15 | | | $ | 4.77 | | |
Income from investment operations: | |
Net investment income | | | 0.07 | | | | 0.14 | | | | 0.12 | | | | 0.17 | | | | 0.20 | | | | 0.26 | | |
Net realized and unrealized gain (loss) | | | 0.06 | | | | (0.01 | ) | | | 0.08 | | | | 0.20 | | | | 0.35 | | | | 0.37 | | |
Total from investment operations | | | 0.13 | | | | 0.13 | | | | 0.20 | | | | 0.37 | | | | 0.55 | | | | 0.63 | | |
Less distributions to shareholders: | |
Net investment income | | | (0.08 | ) | | | (0.19 | ) | | | (0.16 | ) | | | (0.18 | ) | | | (0.24 | ) | | | (0.25 | ) | |
Net realized gains | | | — | | | | (0.02 | ) | | | (0.11 | ) | | | (0.02 | ) | | | — | | | | — | | |
Total distributions to shareholders | | | (0.08 | ) | | | (0.21 | ) | | | (0.27 | ) | | | (0.20 | ) | | | (0.24 | ) | | | (0.25 | ) | |
Proceeds from regulatory settlements | | | — | | | | — | | | | — | | | | 0.00 | (a) | | | — | | | | — | | |
Net asset value, end of period | | $ | 5.53 | | | $ | 5.48 | | | $ | 5.56 | | | $ | 5.63 | | | $ | 5.46 | | | $ | 5.15 | | |
Total return | | | 2.31 | % | | | 2.52 | % | | | 3.65 | % | | | 6.90 | % | | | 10.76 | % | | | 13.58 | % | |
Ratios to average net assets(b) | |
Total gross expenses | | | 0.51 | %(c) | | | 0.51 | % | | | 0.51 | % | | | 0.52 | % | | | 0.62 | % | | | 0.62 | % | |
Total net expenses(d) | | | 0.49 | %(c) | | | 0.49 | % | | | 0.50 | % | | | 0.52 | % | | | 0.48 | % | | | 0.47 | % | |
Net investment income | | | 2.60 | %(c) | | | 2.60 | % | | | 2.17 | % | | | 3.12 | % | | | 3.76 | % | | | 5.33 | % | |
Supplemental data | |
Net assets, end of period (in thousands) | | $ | 783,658 | | | $ | 785,350 | | | $ | 789,766 | | | $ | 739,181 | | | $ | 221,198 | | | $ | 132,495 | | |
Portfolio turnover | | | 173 | %(e) | | | 413 | %(e) | | | 576 | %(e) | | | 545 | %(e) | | | 465 | %(e) | | | 519 | %(e) | |
Notes to Financial Highlights
(a) Rounds to zero.
(b) In addition to the fees and expenses that the Fund bears directly, the Fund indirectly bears a pro rata share of the fees and expenses of any other funds in which it invests. Such indirect expenses are not included in the Fund's reported expense ratios.
(c) Annualized.
(d) Total net expenses include the impact of certain fee waivers/expense reimbursements made by the Investment Manager and certain of its affiliates, if applicable.
(e) Includes mortgage dollar rolls. If mortgage dollar roll transactions were excluded, the portfolio turnover would have been 17% for the six months ended November 30, 2014 and 116%, 164%, 285%, 253% and 246% for the years ended May 31, 2014, 2013, 2012, 2011 and 2010, respectively.
The accompanying Notes to Financial Statements are an integral part of this statement.
Semiannual Report 2014
26
Columbia U.S. Government Mortgage Fund
Financial Highlights (continued)
| | | Six Months Ended
November 30, 2014 | |
Year Ended May 31, | |
Class K | | (Unaudited) | | 2014 | | 2013 | | 2012 | | 2011 | | 2010 | |
Per share data | |
Net asset value, beginning of period | | $ | 5.47 | | | $ | 5.55 | | | $ | 5.62 | | | $ | 5.46 | | | $ | 5.15 | | | $ | 4.77 | | |
Income from investment operations: | |
Net investment income | | | 0.06 | | | | 0.13 | | | | 0.11 | | | | 0.16 | | | | 0.19 | | | | 0.25 | | |
Net realized and unrealized gain (loss) | | | 0.06 | | | | (0.01 | ) | | | 0.08 | | | | 0.18 | | | | 0.34 | | | | 0.37 | | |
Total from investment operations | | | 0.12 | | | | 0.12 | | | | 0.19 | | | | 0.34 | | | | 0.53 | | | | 0.62 | | |
Less distributions to shareholders: | |
Net investment income | | | (0.07 | ) | | | (0.18 | ) | | | (0.15 | ) | | | (0.16 | ) | | | (0.22 | ) | | | (0.24 | ) | |
Net realized gains | | | — | | | | (0.02 | ) | | | (0.11 | ) | | | (0.02 | ) | | | — | | | | — | | |
Total distributions to shareholders | | | (0.07 | ) | | | (0.20 | ) | | | (0.26 | ) | | | (0.18 | ) | | | (0.22 | ) | | | (0.24 | ) | |
Proceeds from regulatory settlements | | | — | | | | — | | | | — | | | | 0.00 | (a) | | | — | | | | — | | |
Net asset value, end of period | | $ | 5.52 | | | $ | 5.47 | | | $ | 5.55 | | | $ | 5.62 | | | $ | 5.46 | | | $ | 5.15 | | |
Total return | | | 2.15 | % | | | 2.20 | % | | | 3.33 | % | | | 6.41 | % | | | 10.44 | % | | | 13.25 | % | |
Ratios to average net assets(b) | |
Total gross expenses | | | 0.81 | %(c) | | | 0.81 | % | | | 0.81 | % | | | 0.82 | % | | | 0.93 | % | | | 0.93 | % | |
Total net expenses(d) | | | 0.79 | %(c) | | | 0.79 | % | | | 0.80 | % | | | 0.80 | % | | | 0.78 | % | | | 0.77 | % | |
Net investment income | | | 2.27 | %(c) | | | 2.32 | % | | | 1.88 | % | | | 2.87 | % | | | 3.50 | % | | | 5.09 | % | |
Supplemental data | |
Net assets, end of period (in thousands) | | $ | 69 | | | $ | 84 | | | $ | 83 | | | $ | 80 | | | $ | 72 | | | $ | 85 | | |
Portfolio turnover | | | 173 | %(e) | | | 413 | %(e) | | | 576 | %(e) | | | 545 | %(e) | | | 465 | %(e) | | | 519 | %(e) | |
Notes to Financial Highlights
(a) Rounds to zero.
(b) In addition to the fees and expenses that the Fund bears directly, the Fund indirectly bears a pro rata share of the fees and expenses of any other funds in which it invests. Such indirect expenses are not included in the Fund's reported expense ratios.
(c) Annualized.
(d) Total net expenses include the impact of certain fee waivers/expense reimbursements made by the Investment Manager and certain of its affiliates, if applicable.
(e) Includes mortgage dollar rolls. If mortgage dollar roll transactions were excluded, the portfolio turnover would have been 17% for the six months ended November 30, 2014 and 116%, 164%, 285%, 253% and 246% for the years ended May 31, 2014, 2013, 2012, 2011 and 2010, respectively.
The accompanying Notes to Financial Statements are an integral part of this statement.
Semiannual Report 2014
27
Columbia U.S. Government Mortgage Fund
Financial Highlights (continued)
| | | Six Months Ended
November 30, 2014 | | Year Ended May 31, | |
Class R4 | | (Unaudited) | | 2014 | | 2013(a) | |
Per share data | |
Net asset value, beginning of period | | $ | 5.48 | | | $ | 5.56 | | | $ | 5.76 | | |
Income from investment operations: | |
Net investment income | | | 0.07 | | | | 0.14 | | | | 0.06 | | |
Net realized and unrealized gain (loss) | | | 0.05 | | | | (0.01 | ) | | | (0.06 | )(b) | |
Total from investment operations | | | 0.12 | | | | 0.13 | | | | — | | |
Less distributions to shareholders: | |
Net investment income | | | (0.07 | ) | | | (0.19 | ) | | | (0.09 | ) | |
Net realized gains | | | — | | | | (0.02 | ) | | | (0.11 | ) | |
Total distributions to shareholders | | | (0.07 | ) | | | (0.21 | ) | | | (0.20 | ) | |
Net asset value, end of period | | $ | 5.53 | | | $ | 5.48 | | | $ | 5.56 | | |
Total return | | | 2.24 | % | | | 2.40 | % | | | (0.01 | %) | |
Ratios to average net assets(c) | |
Total gross expenses | | | 0.70 | %(d) | | | 0.70 | % | | | 0.73 | %(d) | |
Total net expenses(e) | | | 0.62 | %(d)(f) | | | 0.61 | %(f) | | | 0.61 | %(d) | |
Net investment income | | | 2.57 | %(d) | | | 2.54 | % | | | 2.11 | %(d) | |
Supplemental data | |
Net assets, end of period (in thousands) | | $ | 15,157 | | | $ | 12,510 | | | $ | 181 | | |
Portfolio turnover | | | 173 | %(g) | | | 413 | %(g) | | | 576 | %(g) | |
Notes to Financial Highlights
(a) Based on operations from November 8, 2012 (commencement of operations) through the stated period end.
(b) Calculation of the net gain (loss) per share (both realized and unrealized) does not correlate to the aggregate realized and unrealized gain (loss) presented in the Statement of Operations due to the timing of subscriptions and redemptions of Fund shares in relation to fluctuations in the market value of the portfolio.
(c) In addition to the fees and expenses that the Fund bears directly, the Fund indirectly bears a pro rata share of the fees and expenses of any other funds in which it invests. Such indirect expenses are not included in the Fund's reported expense ratios.
(d) Annualized.
(e) Total net expenses include the impact of certain fee waivers/expense reimbursements made by the Investment Manager and certain of its affiliates, if applicable.
(f) The benefits derived from expense reductions had an impact of less than 0.01%.
(g) Includes mortgage dollar rolls. If mortgage dollar roll transactions were excluded, the portfolio turnover would have been 17% for the six months ended November 30, 2014 and 116% and 164% for the years ended May 31, 2014 and 2013, respectively.
The accompanying Notes to Financial Statements are an integral part of this statement.
Semiannual Report 2014
28
Columbia U.S. Government Mortgage Fund
Financial Highlights (continued)
| | | Six Months Ended
November 30, 2014 | | Year Ended May 31, | |
Class R5 | | (Unaudited) | | 2014 | | 2013(a) | |
Per share data | |
Net asset value, beginning of period | | $ | 5.48 | | | $ | 5.56 | | | $ | 5.76 | | |
Income from investment operations: | |
Net investment income | | | 0.07 | | | | 0.14 | | | | 0.07 | | |
Net realized and unrealized gain (loss) | | | 0.04 | | | | (0.01 | ) | | | (0.07 | )(b) | |
Total from investment operations | | | 0.11 | | | | 0.13 | | | | — | | |
Less distributions to shareholders: | |
Net investment income | | | (0.07 | ) | | | (0.19 | ) | | | (0.09 | ) | |
Net realized gains | | | — | | | | (0.02 | ) | | | (0.11 | ) | |
Total distributions to shareholders | | | (0.07 | ) | | | (0.21 | ) | | | (0.20 | ) | |
Net asset value, end of period | | $ | 5.52 | | | $ | 5.48 | | | $ | 5.56 | | |
Total return | | | 2.10 | % | | | 2.47 | % | | | 0.04 | % | |
Ratios to average net assets(c) | |
Total gross expenses | | | 0.56 | %(d) | | | 0.57 | % | | | 0.57 | %(d) | |
Total net expenses(e) | | | 0.54 | %(d) | | | 0.53 | % | | | 0.55 | %(d) | |
Net investment income | | | 2.58 | %(d) | | | 2.62 | % | | | 2.16 | %(d) | |
Supplemental data | |
Net assets, end of period (in thousands) | | $ | 7,341 | | | $ | 5,539 | | | $ | 506 | | |
Portfolio turnover | | | 173 | %(f) | | | 413 | %(f) | | | 576 | %(f) | |
Notes to Financial Highlights
(a) Based on operations from November 8, 2012 (commencement of operations) through the stated period end.
(b) Calculation of the net gain (loss) per share (both realized and unrealized) does not correlate to the aggregate realized and unrealized gain (loss) presented in the Statement of Operations due to the timing of subscriptions and redemptions of Fund shares in relation to fluctuations in the market value of the portfolio.
(c) In addition to the fees and expenses that the Fund bears directly, the Fund indirectly bears a pro rata share of the fees and expenses of any other funds in which it invests. Such indirect expenses are not included in the Fund's reported expense ratios.
(d) Annualized.
(e) Total net expenses include the impact of certain fee waivers/expense reimbursements made by the Investment Manager and certain of its affiliates, if applicable.
(f) Includes mortgage dollar rolls. If mortgage dollar roll transactions were excluded, the portfolio turnover would have been 17% for the six months ended November 30, 2014 and 116% and 164% for the years ended May 31, 2014 and 2013, respectively.
The accompanying Notes to Financial Statements are an integral part of this statement.
Semiannual Report 2014
29
Columbia U.S. Government Mortgage Fund
Financial Highlights (continued)
| | | Six Months Ended
November 30, 2014 | | Year Ended May 31, | |
Class W | | (Unaudited) | | 2014 | | 2013(a) | |
Per share data | |
Net asset value, beginning of period | | $ | 5.49 | | | $ | 5.58 | | | $ | 5.65 | | |
Income from investment operations: | |
Net investment income | | | 0.06 | | | | 0.12 | | | | 0.09 | | |
Net realized and unrealized gain (loss) | | | 0.06 | | | | (0.02 | ) | | | 0.09 | | |
Total from investment operations | | | 0.12 | | | | 0.10 | | | | 0.18 | | |
Less distributions to shareholders: | |
Net investment income | | | (0.07 | ) | | | (0.17 | ) | | | (0.14 | ) | |
Net realized gains | | | — | | | | (0.02 | ) | | | (0.11 | ) | |
Total distributions to shareholders | | | (0.07 | ) | | | (0.19 | ) | | | (0.25 | ) | |
Net asset value, end of period | | $ | 5.54 | | | $ | 5.49 | | | $ | 5.58 | | |
Total return | | | 2.11 | % | | | 1.94 | % | | | 3.15 | % | |
Ratios to average net assets(b) | |
Total gross expenses | | | 0.95 | %(c) | | | 0.95 | % | | | 0.94 | %(c) | |
Total net expenses(d) | | | 0.87 | %(c)(e) | | | 0.86 | %(e) | | | 0.86 | %(c) | |
Net investment income | | | 2.21 | %(c) | | | 2.22 | % | | | 1.75 | %(c) | |
Supplemental data | |
Net assets, end of period (in thousands) | | $ | 5,830 | | | $ | 7,393 | | | $ | 10,367 | | |
Portfolio turnover | | | 173 | %(f) | | | 413 | %(f) | | | 576 | %(f) | |
Notes to Financial Highlights
(a) Based on operations from June 18, 2012 (commencement of operations) through the stated period end.
(b) In addition to the fees and expenses that the Fund bears directly, the Fund indirectly bears a pro rata share of the fees and expenses of any other funds in which it invests. Such indirect expenses are not included in the Fund's reported expense ratios.
(c) Annualized.
(d) Total net expenses include the impact of certain fee waivers/expense reimbursements made by the Investment Manager and certain of its affiliates, if applicable.
(e) The benefits derived from expense reductions had an impact of less than 0.01%.
(f) Includes mortgage dollar rolls. If mortgage dollar roll transactions were excluded, the portfolio turnover would have been 17% for the six months ended November 30, 2014 and 116% and 164% for the years ended May 31, 2014 and 2013, respectively.
The accompanying Notes to Financial Statements are an integral part of this statement.
Semiannual Report 2014
30
Columbia U.S. Government Mortgage Fund
Financial Highlights (continued)
Class Y | | Six Months Ended
November 30, 2014(a)
(Unaudited) | |
Per share data | |
Net asset value, beginning of period | | $ | 5.44 | | |
Income from investment operations: | |
Net investment income | | | 0.02 | | |
Net realized and unrealized gain | | | 0.06 | | |
Total from investment operations | | | 0.08 | | |
Less distributions to shareholders: | |
Net investment income | | | (0.02 | ) | |
Total distributions to shareholders | | | (0.02 | ) | |
Net asset value, end of period | | $ | 5.50 | | |
Total return | | | 1.52 | % | |
Ratios to average net assets(b) | |
Total gross expenses | | | 0.53 | %(c) | |
Total net expenses(d) | | | 0.50 | %(c) | |
Net investment income | | | 2.78 | %(c) | |
Supplemental data | |
Net assets, end of period (in thousands) | | $ | 10 | | |
Portfolio turnover | | | 173 | %(e) | |
Notes to Financial Highlights
(a) Based on operations from October 1, 2014 (commencement of operations) through the stated period end.
(b) In addition to the fees and expenses that the Fund bears directly, the Fund indirectly bears a pro rata share of the fees and expenses of any other funds in which it invests. Such indirect expenses are not included in the Fund's reported expense ratios.
(c) Annualized.
(d) Total net expenses include the impact of certain fee waivers/expense reimbursements made by the Investment Manager and certain of its affiliates, if applicable.
(e) Includes mortgage dollar rolls. If mortgage dollar roll transactions were excluded, the portfolio turnover would have been 17% for the six months ended November 30, 2014.
The accompanying Notes to Financial Statements are an integral part of this statement.
Semiannual Report 2014
31
Columbia U.S. Government Mortgage Fund
Financial Highlights (continued)
| | | Six Months Ended
November 30, 2014 | |
Year Ended May 31, | |
Class Z | | (Unaudited) | | 2014 | | 2013 | | 2012 | | 2011(a) | |
Per share data | |
Net asset value, beginning of period | | $ | 5.48 | | | $ | 5.56 | | | $ | 5.63 | | | $ | 5.46 | | | $ | 5.27 | | |
Income from investment operations: | |
Net investment income | | | 0.07 | | | | 0.13 | | | | 0.11 | | | | 0.16 | | | | 0.11 | | |
Net realized and unrealized gain | | | 0.05 | | | | (0.00 | )(b) | | | 0.09 | | | | 0.21 | | | | 0.23 | | |
Total from investment operations | | | 0.12 | | | | 0.13 | | | | 0.20 | | | | 0.37 | | | | 0.34 | | |
Less distributions to shareholders: | |
Net investment income | | | (0.07 | ) | | | (0.19 | ) | | | (0.16 | ) | | | (0.18 | ) | | | (0.15 | ) | |
Net realized gains | | | — | | | | (0.02 | ) | | | (0.11 | ) | | | (0.02 | ) | | | — | | |
Total distributions to shareholders | | | (0.07 | ) | | | (0.21 | ) | | | (0.27 | ) | | | (0.20 | ) | | | (0.15 | ) | |
Proceeds from regulatory settlements | | | — | | | | — | | | | — | | | | 0.00 | (b) | | | — | | |
Net asset value, end of period | | $ | 5.53 | | | $ | 5.48 | | | $ | 5.56 | | | $ | 5.63 | | | $ | 5.46 | | |
Total return | | | 2.24 | % | | | 2.40 | % | | | 3.53 | % | | | 6.82 | % | | | 6.59 | % | |
Ratios to average net assets(c) | |
Total gross expenses | | | 0.70 | %(d) | | | 0.70 | % | | | 0.69 | % | | | 0.68 | % | | | 0.62 | %(d) | |
Total net expenses(e) | | | 0.62 | %(d)(f) | | | 0.61 | %(f) | | | 0.61 | %(f) | | | 0.61 | %(f) | | | 0.58 | %(d) | |
Net investment income | | | 2.47 | %(d) | | | 2.46 | % | | | 2.01 | % | | | 2.96 | % | | | 3.12 | %(d) | |
Supplemental data | |
Net assets, end of period (in thousands) | | $ | 439,807 | | | $ | 452,308 | | | $ | 886,922 | | | $ | 424,251 | | | $ | 51,912 | | |
Portfolio turnover | | | 173 | %(g) | | | 413 | %(g) | | | 576 | %(g) | | | 545 | %(g) | | | 465 | %(g) | |
Notes to Financial Highlights
(a) Based on operations from September 27, 2010 (commencement of operations) through the stated period end.
(b) Rounds to zero.
(c) In addition to the fees and expenses that the Fund bears directly, the Fund indirectly bears a pro rata share of the fees and expenses of any other funds in which it invests. Such indirect expenses are not included in the Fund's reported expense ratios.
(d) Annualized.
(e) Total net expenses include the impact of certain fee waivers/expense reimbursements made by the Investment Manager and certain of its affiliates, if applicable.
(f) The benefits derived from expense reductions had an impact of less than 0.01%.
(g) Includes mortgage dollar rolls. If mortgage dollar roll transactions were excluded, the portfolio turnover would have been 17% for the six months ended November 30, 2014 and 116%, 164%, 285% and 253% for the years ended May 31, 2014, 2013, 2012 and 2011, respectively.
The accompanying Notes to Financial Statements are an integral part of this statement.
Semiannual Report 2014
32
Columbia U.S. Government Mortgage Fund
Notes to Financial Statements
November 30, 2014 (Unaudited)
Note 1. Organization
Columbia U.S. Government Mortgage Fund (the Fund), a series of Columbia Funds Series Trust II (the Trust), is a diversified fund. The Trust is registered under the Investment Company Act of 1940, as amended (the 1940 Act), as an open-end management investment company organized as a Massachusetts business trust.
Fund Shares
The Trust may issue an unlimited number of shares (without par value). The Fund offers Class A, Class B, Class C, Class I, Class K, Class R4, Class R5, Class W, Class Y and Class Z shares. Although all share classes generally have identical voting, dividend and liquidation rights, each share class votes separately when required by the Trust's organizational documents or by law. Different share classes pay different distribution amounts to the extent the expenses of such share classes differ, and distributions in liquidation will be proportional to the net asset value of each share class. Each share class has its own expense structure and sales charges.
Class A shares are subject to a maximum front-end sales charge of 4.75% based on the initial investment amount. Class A shares purchased without an initial sales charge in accounts aggregating $1 million to $50 million at the time of purchase are subject to a contingent deferred sales charge (CDSC) if the shares are sold within 18 months of purchase, charged as follows: 1.00% CDSC if redeemed within 12 months of purchase, and 0.50% CDSC if redeemed more than 12, but less than 18, months after purchase.
Class B shares may be subject to a maximum CDSC of 5.00% based upon the holding period after purchase. Class B shares will generally convert to Class A shares eight years after purchase. The Fund no longer accepts investments by new or existing investors in the Fund's Class B shares, except in connection with the reinvestment of any dividend and/or capital gain distributions in Class B shares of the Fund and exchanges by existing Class B shareholders of certain other funds within the Columbia Family of Funds.
Class C shares are subject to a 1.00% CDSC on shares redeemed within one year of purchase.
Class I shares are not subject to sales charges and are available only to the Columbia Family of Funds.
Class K shares are not subject to sales charges, however this share class is closed to new investors.
Class R4 shares are not subject to sales charges and are generally available only to omnibus retirement plans and certain investors as described in the Fund's prospectus.
Class R5 shares are not subject to sales charges and are generally available only to investors purchasing through
authorized investment professionals and omnibus retirement plans.
Class W shares are not subject to sales charges and are available only to investors purchasing through authorized investment programs managed by investment professionals, including discretionary managed account programs.
Class Y shares are not subject to sales charges and are generally available only to certain retirement plans as described in the Fund's prospectus. Class Y shares commenced operations on October 1, 2014.
Class Z shares are not subject to sales charges and are available only to eligible investors, which are subject to different investment minimums as described in the Fund's prospectus.
Note 2. Summary of Significant Accounting Policies
Basis of Preparation
The Fund is an investment company that applies the accounting and reporting guidance in the Financial Accounting Standards Board (FASB) Accounting Standards Codification Topic 946, Financial Services — Investment Companies (ASC 946). The financial statements are prepared in accordance with U.S. generally accepted accounting principles (GAAP) which requires management to make certain estimates and assumptions that affect the reported amounts of assets and liabilities, the disclosure of contingent assets and liabilities at the date of the financial statements and the reported amounts of income and expenses during the reporting period. Actual results could differ from those estimates.
The following is a summary of significant accounting policies followed by the Fund in the preparation of its financial statements.
Security Valuation
Debt securities generally are valued by pricing services approved by the Board of Trustees (the Board) based upon market transactions for normal, institutional-size trading units of similar securities. The services may use various pricing techniques that take into account, as applicable, factors such as yield, quality, coupon rate, maturity, type of issue, trading characteristics and other data, as well as broker quotes. Debt securities for which quotations are readily available may also be valued based upon an over-the-counter or exchange bid quotation.
Asset and mortgage-backed securities are generally valued by pricing services, which utilize pricing models that incorporate
Semiannual Report 2014
33
Columbia U.S. Government Mortgage Fund
Notes to Financial Statements (continued)
November 30, 2014 (Unaudited)
the securities' cash flow and loan performance data. These models also take into account available market data, including trades, market quotations, and benchmark yield curves for identical or similar securities. Factors used to identify similar securities may include, but are not limited to, issuer, collateral type, vintage, prepayment speeds, collateral performance, credit ratings, credit enhancement and expected life. Asset-backed securities for which quotations are readily available may also be valued based upon an over-the-counter or exchange bid quotation.
Investments in open-end investment companies, including money market funds, are valued at their net asset value.
Futures and options on futures contracts are valued based upon the settlement price established each day by the board of trade or exchange on which they are traded.
Option contracts are valued at the mean of the latest quoted bid and asked prices on their primary exchanges. Option contracts, including over-the-counter option contracts, with no readily available market value are valued using quotations obtained from independent brokers as of the close of the New York Stock Exchange (NYSE).
Swap transactions are valued through an independent pricing service or broker, or if neither is available, through an internal model based upon observable inputs.
Investments for which market quotations are not readily available, or that have quotations which management believes are not reliable, are valued at fair value as determined in good faith under procedures established by and under the general supervision of the Board. If a security or class of securities (such as foreign securities) is valued at fair value, such value is likely to be different from the quoted or published price for the security.
The determination of fair value often requires significant judgment. To determine fair value, management may use assumptions including but not limited to future cash flows and estimated risk premiums. Multiple inputs from various sources may be used to determine fair value.
Derivative Instruments
The Fund invests in certain derivative instruments, as detailed below, to meet its investment objectives. Derivatives are instruments whose values depend on, or are derived from, in whole or in part, the value of one or more other assets, such as securities, currencies, commodities or indices. Derivative instruments may be used to increase investment flexibility (including to maintain cash reserves while maintaining exposure to certain other assets), for risk management (hedging) purposes, to facilitate trading, to reduce transaction costs and to pursue higher investment returns. The Fund may
also use derivative instruments to mitigate certain investment risks, such as foreign currency exchange rate risk, interest rate risk and credit risk. Derivatives may involve various risks, including the potential inability of the counterparty to fulfill its obligation under the terms of the contract, the potential for an illiquid secondary market (making it difficult for the Fund to sell, including at favorable prices) and the potential for market movements which may expose the Fund to gains or losses in excess of the amount shown in the Statement of Assets and Liabilities. The notional amounts of derivative instruments, if applicable, are not recorded in the financial statements.
A derivative instrument may suffer a marked-to-market loss if the value of the contract decreases due to an unfavorable change in the market rates or values of the underlying instrument. Losses can also occur if the counterparty does not perform under the contract. The Fund's risk of loss from counterparty credit risk on over-the-counter derivatives is generally limited to the aggregate unrealized gain netted against any collateral held by the Fund and the amount of any variation margin held by the counterparty. With exchange-traded or centrally cleared derivatives, there is reduced counterparty credit risk to the Fund since the exchange's clearinghouse, as counterparty to such instruments, guarantees against a possible default. The clearinghouse stands between the buyer and the seller of the contract; therefore, the counterparty credit risk is failure of the clearinghouse. However, credit risk still exists in exchange-traded or centrally cleared derivatives with respect to initial and variation margin that is held in a broker's customer account. While brokers are required to segregate customer margin from their own assets, in the event that a broker becomes insolvent or goes into bankruptcy and at that time there is a shortfall in the aggregate amount of margin held by the broker for all its clients, U.S. bankruptcy laws will typically allocate that shortfall on a pro-rata basis across all the broker's customers (including the Fund), potentially resulting in losses to the Fund.
In order to better define its contractual rights and to secure rights that will help the Fund mitigate its counterparty risk, the Fund may enter into an International Swaps and Derivatives Association, Inc. Master Agreement (ISDA Master Agreement) or similar agreement with its derivative contract counterparties. An ISDA Master Agreement is an agreement between the Fund and a counterparty that governs over-the-counter derivatives and forward foreign currency exchange contracts and typically contains, among other things, collateral posting terms and netting provisions in the event of a default and/or termination event. Under an ISDA Master Agreement, the Fund may, under certain circumstances, offset with the counterparty certain derivative instrument's payables and/or receivables with collateral held and/or posted and create one single net payment.
Semiannual Report 2014
34
Columbia U.S. Government Mortgage Fund
Notes to Financial Statements (continued)
November 30, 2014 (Unaudited)
The provisions of the ISDA Master Agreement typically permit a single net payment in the event of default (close-out netting) including the bankruptcy or insolvency of the counterparty. Note, however, that bankruptcy or insolvency laws of a particular jurisdiction may impose restrictions on or prohibitions against the right of offset in bankruptcy, insolvency or other events.
Collateral (margin) requirements differ by type of derivative. Margin requirements are established by the exchange or clearinghouse for exchange-traded and centrally cleared derivatives. Brokers can ask for margin in excess of the minimum in certain circumstances. Collateral terms are contract specific for over-the-counter derivatives. For over-the-counter derivatives traded under an ISDA Master Agreement, the collateral requirements are typically calculated by netting the marked-to-market amount for each transaction under such agreement and comparing that amount to the value of any variation margin currently pledged by the Fund and/or the counterparty. Generally, the amount of collateral due from or to a party has to exceed a minimum transfer amount threshold (e.g., $500,000) before a transfer has to be made. To the extent amounts due to the Fund from its counterparties are not fully collateralized, contractually or otherwise, the Fund bears the risk of loss from counterparty nonperformance. The Fund attempts to mitigate counterparty risk by only entering into agreements with counterparties that it believes have the financial resources to honor their obligations and by monitoring the financial stability of those counterparties.
Certain ISDA Master Agreements allow counterparties to over-the-counter derivatives to terminate derivative contracts prior to maturity in the event the Fund's net assets decline by a stated percentage over a specified time period or if the Fund fails to meet the terms of the ISDA Master Agreement, which would cause the Fund to accelerate payment of any net liability owed to the counterparty. The Fund also has termination rights if the counterparty fails to meet the terms of the ISDA Master Agreement. In addition to considering counterparty credit risk, the Fund would consider terminating the derivative contracts based on whether termination would result in a net liability owed from the counterparty.
For financial reporting purposes, the Fund does not offset derivative assets and derivative liabilities that are subject to netting arrangements in the Statement of Assets and Liabilities.
Futures Contracts
Futures contracts are exchange traded and represent commitments for the future purchase or sale of an asset at a specified price on a specified date. The Fund bought and sold futures contracts to manage the duration and yield curve
exposure of the Fund versus the benchmark and to manage exposure to movements in interest rates. These instruments may be used for other purposes in future periods. Upon entering into futures contracts, the Fund bears risks that it may not achieve the anticipated benefits of the futures contracts and may realize a loss. Additional risks include counterparty credit risk, the possibility of an illiquid market, and that a change in the value of the contract or option may not correlate with changes in the value of the underlying asset.
Upon entering into a futures contract, the Fund pledges cash or securities with the broker in an amount sufficient to meet the initial margin requirement. The initial margin deposit must be maintained at an established level over the life of the contract. Cash deposited as initial margin is recorded in the Statement of Assets and Liabilities as margin deposits. Securities deposited as initial margin are designated in the Portfolio of Investments. Subsequent payments (variation margin) are made or received by the Fund each day. The variation margin payments are equal to the daily change in the contract value and are recorded as variation margin receivable or payable and are offset in unrealized gains or losses. The Fund recognizes a realized gain or loss when the contract is closed or expires. Futures contracts involve, to varying degrees, risk of loss in excess of the variation margin disclosed in the Statement of Assets and Liabilities.
Options Contracts
Options are contracts which entitle the holder to purchase or sell securities or other identified assets at a specified price, or in the case of index option contracts, to receive or pay the difference between the index value and the strike price of the index option contract. Option contracts can be either exchange-traded or over-the-counter. The Fund purchased and wrote option contracts to protect gains. These instruments may be used for other purposes in future periods. Completion of transactions for option contracts traded in the over-the-counter market depends upon the performance of the other party. Cash collateral may be collected or posted by the Fund to secure certain over-the-counter option contract trades. Cash collateral held or posted by the Fund for such option contract trades must be returned to the counterparty or the Fund upon closure, exercise or expiration of the contract.
Options contracts purchased are recorded as investments. When the Fund writes an options contract, the premium received is recorded as an asset and an amount equivalent to the premium is recorded as a liability in the Statement of Assets and Liabilities and is subsequently adjusted to reflect the current fair value of the option written. Changes in the fair value of the written option are recorded as unrealized appreciation or depreciation until the contract is exercised or
Semiannual Report 2014
35
Columbia U.S. Government Mortgage Fund
Notes to Financial Statements (continued)
November 30, 2014 (Unaudited)
has expired. The Fund will realize a gain or loss when the option contract is closed or expires. When option contracts are exercised, the proceeds on sales for a written call or purchased put option contract, or the purchase cost for a written put or purchased call option contract, is adjusted by the amount of premium received or paid.
For over-the-counter options purchased, the Fund bears the risk of loss of the amount of the premiums paid plus the positive change in market values net of any collateral held by the Fund should the counterparty fail to perform under the contracts. Option contracts written by the Fund do not typically give rise to counterparty credit risk, as options written generally obligate the Fund and not the counterparty to perform. The risk in writing a call option contract is that the Fund gives up the opportunity for profit if the market price of the security increases above the strike price and the option contract is exercised. The risk in writing a put option contract is that the Fund may incur a loss if the market price of the security decreases below the strike price and the option contract is exercised. Exercise of a written option could result in the Fund purchasing or selling a security or foreign currency when it otherwise would not, or at a price different from the current market value. In purchasing and writing options, the Fund bears the risk of an unfavorable change in the value of the underlying instrument or the risk that the Fund may not be able to enter into a closing transaction due to an illiquid market.
Contracts and premiums associated with options contracts written for the six months ended November 30, 2014:
| | | Calls | |
| | | Contracts | | Premiums ($) | |
Balance at May 31, 2014 | | | 250,000,000 | | | | 150,000 | | |
Opened | | | — | | | | — | | |
Closed | | | — | | | | — | | |
Expired | | | 250,000,000 | | | | 150,000 | | |
Exercised | | | — | | | | — | | |
Balance at November 30, 2014 | | | — | | | | — | | |
Swap Contracts
Swap contracts are privately negotiated in the over-the-counter market and may be entered into as a bilateral contract or centrally cleared (centrally cleared swap contract). In a centrally cleared swap contract, immediately following execution of the swap contract with a broker, the swap contract is novated to a central counterparty (the CCP) and the CCP becomes the Fund's counterparty to the centrally cleared swap contract. The Fund is required to deposit initial margin with the broker in the form of cash or securities in an amount that
varies depending on the size and risk profile of the particular swap contract. Securities deposited as initial margin are designated in the Portfolio of Investments and cash deposited is recorded in the Statement of Assets and Liabilities as margin deposits. Unlike a bilateral swap contract, for centrally cleared swap contracts, the Fund has minimal credit exposure to the counterparty because the CCP stands between the Fund and the counterparty. Swap contracts are marked-to-market daily and changes in value are recorded as unrealized appreciation (depreciation). The daily change in valuation of centrally cleared swap contracts, if any, is recorded as a receivable or payable for variation margin in the Statement of Assets and Liabilities.
Interest Rate Swaption Contracts
Interest rate swaption contracts entered into by the Fund typically represent an option that gives the purchaser the right, but not the obligation, to enter into an interest rate swap contract on a future date. The Fund purchased or wrote interest rate swaption contracts to manage exposure to fluctuations in interest rates, to hedge the fair value of other Fund investments, and as part of an investment strategy. These instruments may be used for other purposes in future periods. Each interest rate swaption agreement will specify if the buyer is entitled to receive the fixed or floating rate if the interest rate is exercised. Changes in the value of a purchased interest rate swaption contracts are reported as unrealized appreciation or depreciation on investments in the Statement of Assets and Liabilities. Gain or loss is recognized in the Statement of Operations when the interest rate swaption contract is closed or expires.
When the Fund writes an interest rate swaption contract, the premium received is recorded as an asset and an amount equivalent to the premium is recorded as a liability in the Statement of Assets and Liabilities and is subsequently adjusted to reflect the current fair value of the interest rate swaption contract written. Premiums received from writing interest rate swaption contracts that expire unexercised are recorded by the Fund on the expiration date as realized gains from options written in the Statement of Operations. The difference between the premium and the amount paid on effecting a closing purchase transaction, including brokerage commissions, is also recorded as realized gain, or if the premium is less than the amount paid for the closing purchase, as realized loss. These amounts are reflected as net realized gain (loss) on options written in the Statement of Operations.
Total Return Swap Contracts
The Fund entered into total return swap contracts to obtain long or short exposure to the total return on a basket of
Semiannual Report 2014
36
Columbia U.S. Government Mortgage Fund
Notes to Financial Statements (continued)
November 30, 2014 (Unaudited)
reference securities in return for periodic payments based on a fixed or variable interest rate. These instruments may be used for other purposes in future periods. Total return swap contracts may be used to obtain exposure to an underlying reference security or market without owning, taking physical custody of, or short selling such security or securities in a market.
Total return swap contracts are valued daily, and the change in value is recorded as unrealized appreciation (depreciation) until the termination of the swap, at which time the Fund will realize a gain or (loss). Periodic payments received (or made) by the Fund over the term of the contract are recorded as realized gains (losses).
Total return swap contracts may be subject to liquidity risk, which exists when a particular swap contract is difficult to purchase or sell. It may not be possible for the Fund to initiate
a transaction or liquidate a position at an advantageous time or price, which may result in significant losses. Total return swap contracts are subject to the risk associated with the investment in the underlying reference instruments. The risk in the case of short total return swap contracts is unlimited based on the potential for unlimited increases in the market value of the underlying reference instruments. This risk may be offset if the Fund holds any of the underlying reference instruments. The risk in the case of long total return swap contracts is limited to the current notional amount of the total return swap contract.
Total return swap contracts are also subject to the risk of the counterparty not fulfilling its obligations under the contract (counterparty credit risk). The Fund attempts to mitigate counterparty credit risk by entering into total return swap contracts only with counterparties that meet prescribed levels of creditworthiness, as determined by the Investment Manager.
Offsetting of Derivative Assets and Derivative Liabilities
The following tables present the Fund's gross and net amount of assets and liabilities available for offset under netting arrangements as well as any related collateral received or pledged by the Fund as of November 30, 2014:
| | | | | | | | Gross Amounts Not Offset in
the Statement of Assets and Liabilities | |
| |
| | Gross
Amounts of
Recognized
Assets ($) | | Gross Amounts
Offset in the
Statement of
Assets and
Liabilities ($) | | Net Amounts of
Assets
Presented in the
Statement of
Assets and
Liabilities ($) | | Financial
Instruments ($)(a) | | Cash
Collateral
Received ($) | | Securities
Collateral
Received ($) | | Net
Amount ($)(b) | |
Asset Derivatives: | |
Options Purchased Puts(c) | | | 12,556,865 | | | | — | | | | 12,556,865 | | | | — | | | | 2,346,357 | | | | 10,210,508 | | | | — | | |
| | | | | | | | Gross Amounts Not Offset in
the Statement of Assets and Liabilities | | | |
| | Gross
Amounts of
Recognized
Liabilities ($) | | Gross Amounts
Offset in the
Statement of
Assets and
Liabilities ($) | | Net Amounts of
Liabilities
Presented in the
Statement of
Assets and
Liabilities ($) | | Financial
Instruments ($)(d) | | Cash
Collateral
Pledged ($) | | Securities
Collateral
Pledged ($) | | Net
Amount ($)(e) | |
Liability Derivatives: | |
Over-the-Counter
Swap Contracts(f) | | | 104,202 | | | | — | | | | 104,202 | | | | — | | | | — | | | | — | | | | 104,202 | | |
(a) Represents the amount of assets that could be offset by liabilities with the same counterparty under master netting or similar agreements that management elects not to offset on the Statement of Assets and Liabilities.
(b) Represents the net amount due from counterparties in the event of default.
(c) Purchased options are included within investments at value on the Statement of Assets and Liabilities.
(d) Represents the amount of liabilities that could be offset by assets with the same counterparty under master netting or similar agreements that management elects not to offset on the Statement of Assets and Liabilities.
(e) Represents the net amount due to counterparties in the event of default.
(f) Over-the-Counter Swap Contracts are presented at market value plus periodic payments receivable (payable), which is comprised of unrealized appreciation, unrealized depreciation, premiums paid and premiums received.
Semiannual Report 2014
37
Columbia U.S. Government Mortgage Fund
Notes to Financial Statements (continued)
November 30, 2014 (Unaudited)
Effects of Derivative Transactions in the Financial Statements
The following tables are intended to provide additional information about the effect of derivatives on the financial statements of the Fund, including: the fair value of derivatives by risk category and the location of those fair values in the Statement of Assets and Liabilities; and the impact of derivative transactions over the period in the Statement of Operations, including realized gains or losses and unrealized gains or losses. The derivative schedules following the Portfolio of Investments present additional information regarding derivative instruments outstanding at the end of the period, if any.
The following table is a summary of the fair value of derivative instruments (not considered to be hedging instruments for accounting disclosure purposes) at November 30, 2014:
Asset Derivatives | |
Risk Exposure
Category | | Statement of Assets and
Liabilities Location | | Fair Value ($) | |
Interest rate risk
| | Net assets — unrealized
appreciation on futures
contracts | | | 1,947,383
| * | |
Interest rate risk
| | Investments at value —
unaffiliated issuers (for
purchased options) | | | 12,556,865
| | |
Total | | | | | 14,504,248 | | |
Liability Derivatives | |
Risk Exposure
Category | | Statement of Assets and
Liabilities Location | |
Fair Value ($) | |
Interest rate risk
| | Net assets — unrealized
depreciation on futures
contracts | | | 315,760
| * | |
Interest rate risk
| | Net assets — unrealized
depreciation on swap
contracts | | | 104,202
| * | |
Total | | | | | 419,962 | | |
*Includes cumulative appreciation (depreciation) as reported in the tables following the Portfolio of Investments. Only the current day's variation margin is reported in receivables or payables in the Statement of Assets and Liabilities.
The following table indicates the effect of derivative instruments (not considered to be hedging instruments for accounting disclosure purposes) in the Statement of Operations for the six months ended November 30, 2014:
Amount of Realized Gain (Loss) on Derivatives Recognized in Income | |
Risk Exposure
Category | | Futures
Contracts ($) | | Options
Contracts
Written and
Purchased ($) | | Swap
Contracts ($) | | Total ($) | |
Interest
rate risk | | | 5,096,697 | | | | (2,340,448 | ) | | | (81,376 | ) | | | 2,674,873 | | |
Change in Unrealized Appreciation (Depreciation) on
Derivatives Recognized in Income | |
Risk Exposure
Category | | Futures
Contracts ($) | | Options
Contracts
Written and
Purchased ($) | | Swap
Contracts ($) | | Total ($) | |
Interest rate
risk | | | 1,359,488 | | | | (8,068,718 | ) | | | (52,077 | ) | | | (6,761,307 | ) | |
The following table is a summary of the average outstanding volume by derivative instrument for the six months ended November 30 , 2014:
Derivative Instrument | | | | Average Notional
Amounts ($)* | |
Futures contracts — Long | | | | | 236,696,365 | | |
Futures contracts — Short | | | | | 23,809,774 | | |
Derivative Instrument | | | | Average Market
Value ($)* | |
Options contracts —
Purchased | | | | | 16,133,165 | | |
Derivative Instrument | | Average Unrealized
Appreciation ($)* | | Average Unrealized
Depreciation ($)* | |
Total return swap contracts | | | — | | | | (79,538 | ) | |
*Based on the ending quarterly outstanding amounts for the six months ended November 30, 2014.
Repurchase Agreements
The Fund may engage in repurchase agreement transactions with institutions that management has determined are creditworthy. The Fund, through the custodian, receives delivery of the underlying securities collateralizing a repurchase agreement. Management is responsible for determining that the collateral is at least equal, at all times, to the value of the repurchase obligation including interest. A repurchase agreement transaction involves certain risks in the event of default or insolvency of the counterparty. These risks include possible delays in or restrictions on the Fund's ability to dispose of the underlying securities and a possible decline in the value of the underlying securities during the period while the Fund seeks to assert its rights.
Semiannual Report 2014
38
Columbia U.S. Government Mortgage Fund
Notes to Financial Statements (continued)
November 30, 2014 (Unaudited)
Offsetting of Financial Assets
The following table presents the Fund's gross and net amount of assets available for offset under a netting arrangement for repurchase agreements as well as the related collateral received by the Fund as of November 30, 2014:
| | | | | | | | Gross Amounts Not Offset in
the Statement of Assets and Liabilities | |
| |
| | Gross
Amounts of
Recognized
Assets ($) | | Gross Amounts
Offset in the
Statement of
Assets and
Liabilities ($) | | Net Amounts of
Assets
Presented in the
Statement of
Assets and
Liabilities ($) | | Financial
Instruments ($)(a) | | Cash
Collateral
Received ($) | | Securities
Collateral
Received ($) | | Net
Amount ($)(b) | |
Repurchase Agreements | | | 75,000,000 | | | | — | | | | 75,000,000 | | | | — | | | | — | | | | 75,000,000 | | | | — | | |
(a) Represents the amount of assets that could be offset by liabilities with the same counterparty under master netting or similar agreements that management elects not to offset on the Statement of Assets and Liabilities.
(b) Represents the net amount due from counterparties in the event of default.
Delayed Delivery Securities
The Fund may trade securities on other than normal settlement terms, including securities purchased or sold on a "when-issued" basis. This may increase risk to the Fund since the other party to the transaction may fail to deliver which could cause the Fund to subsequently invest at less advantageous prices. The Fund designates cash or liquid securities in an amount equal to the delayed delivery commitment.
Mortgage Dollar Roll Transactions
The Fund may enter into mortgage "dollar rolls" in which the Fund sells securities for delivery in the current month and simultaneously contracts with the same counterparty to repurchase similar but not identical securities (same type, coupon and maturity) on a specified future date. During the roll period, the Fund loses the right to receive principal and interest paid on the securities sold. However, the Fund will benefit because it receives negotiated amounts in the form of reductions of the purchase price for the future purchase plus the interest earned on the cash proceeds of the securities sold until the settlement date of the forward purchase. The Fund records the incremental difference between the forward purchase and sale of each forward roll as a realized gain or loss. Unless any realized gains exceed the income, capital appreciation, and gain or loss due to mortgage prepayments that would have been realized on the securities sold as part of the mortgage dollar roll, the use of this technique will diminish the investment performance of the Fund compared to what the performance would have been without the use of mortgage dollar rolls. All cash proceeds will be invested in instruments that are permissible investments for the Fund. The Fund identifies cash or liquid securities in an amount equal to the forward purchase price.
For financial reporting and tax purposes, the Fund treats "to be announced" mortgage dollar rolls as two separate
transactions, one involving the purchase of a security and a separate transaction involving a sale. These transactions may increase the Fund's portfolio turnover rate. The Fund does not currently enter into mortgage dollar rolls that are accounted for as financing transactions.
Mortgage dollar rolls involve the risk that the market value of the securities the Fund is obligated to repurchase may decline below the repurchase price, or that the counterparty may default on its obligations.
Stripped Securities
The Fund may invest in Interest Only (IO) and Principal Only (PO) stripped mortgage-backed securities. These securities are derivative multi-class mortgage securities structured so that one class receives most, if not all, of the principal from the underlying mortgage assets, while the other class receives most, if not all, of the interest and the remainder of the principal. If the underlying mortgage assets experience greater than anticipated prepayments of principal, the Fund may fail to fully recoup its initial investment in an IO security, therefore the daily interest accrual factor is adjusted each month to reflect the paydown of principal. The market value of these securities can be extremely volatile in response to changes in interest rates. Credit risk reflects the risk that the Fund may not receive all or part of its principal because the issuer or credit enhancer has defaulted on its obligation.
Security Transactions
Security transactions are accounted for on the trade date. Cost is determined and gains (losses) are based upon the specific identification method for both financial statement and federal income tax purposes.
Income Recognition
Interest income is recorded on an accrual basis. Market premiums and discounts, including original issue discounts,
Semiannual Report 2014
39
Columbia U.S. Government Mortgage Fund
Notes to Financial Statements (continued)
November 30, 2014 (Unaudited)
are amortized and accreted, respectively, over the expected life of the security on all debt securities, unless otherwise noted. The Fund classifies gains and losses realized on prepayments received on mortgage-backed securities as adjustments to interest income.
The Fund may place a debt security on non-accrual status and reduce related interest income when it becomes probable that the interest will not be collected and the amount of uncollectible interest can be reasonably estimated. A defaulted debt security is removed from non-accrual status when the issuer resumes interest payments or when collectability of interest is reasonably assured.
Dividend income is recorded on the ex-dividend date.
Expenses
General expenses of the Trust are allocated to the Fund and other funds of the Trust based upon relative net assets or other expense allocation methodologies determined by the nature of the expense. Expenses directly attributable to the Fund are charged to the Fund. Expenses directly attributable to a specific class of shares are charged to that share class.
Determination of Class Net Asset Value
All income, expenses (other than class-specific expenses, which are charged to that share class, as shown in the Statement of Operations) and realized and unrealized gains (losses) are allocated to each class of the Fund on a daily basis, based on the relative net assets of each class, for purposes of determining the net asset value of each class.
Federal Income Tax Status
The Fund intends to qualify each year as a regulated investment company under Subchapter M of the Internal Revenue Code, as amended, and will distribute substantially all of its taxable income (including net short-term capital gains), if any, for its tax year, and as such will not be subject to federal income taxes. In addition, the Fund intends to distribute in each calendar year substantially all of its net investment income, capital gains and certain other amounts, if any, such that the Fund should not be subject to federal excise tax. Therefore, no federal income or excise tax provision is recorded.
Distributions to Shareholders
Distributions from net investment income, if any, are declared daily and paid monthly. Net realized capital gains, if any, are distributed at least annually. Income distributions and capital gain distributions are determined in accordance with federal income tax regulations, which may differ from GAAP.
Guarantees and Indemnifications
Under the Trust's organizational documents and, in some cases, by contract, its officers and trustees are indemnified against certain liabilities arising out of the performance of their duties to the Trust or its funds. In addition, certain of the Fund's contracts with its service providers contain general indemnification clauses. The Fund's maximum exposure under these arrangements is unknown since the amount of any future claims that may be made against the Fund cannot be determined, and the Fund has no historical basis for predicting the likelihood of any such claims.
Note 3. Fees and Compensation Paid to Affiliates
Investment Management Fees
Under an Investment Management Services Agreement, Columbia Management Investment Advisers, LLC (the Investment Manager), a wholly-owned subsidiary of Ameriprise Financial, Inc. (Ameriprise Financial), determines which securities will be purchased, held or sold. The investment management fee is an annual fee that is equal to a percentage of the Fund's average daily net assets that declines from 0.43% to 0.30% as the Fund's net assets increase. The annualized effective investment management fee rate for the six months ended November 30, 2014 was 0.43% of the Fund's average daily net assets.
Administration Fees
Under an Administrative Services Agreement, the Investment Manager also serves as the Fund Administrator. The Fund pays the Fund Administrator an annual fee for administration and accounting services equal to a percentage of the Fund's average daily net assets that declines from 0.07% to 0.04% as the Fund's net assets increase. The annualized effective administration fee rate for the six months ended November 30, 2014 was 0.06% of the Fund's average daily net assets.
Other Expenses
Other expenses are for, among other things, miscellaneous expenses of the Fund or the Board, including payments to a company providing limited administrative services to the Fund and the Board. That company's expenses include boardroom and office expense, employee compensation, employee health and retirement benefits, and certain other expenses. For the six months ended November 30, 2014, other expenses paid by the Fund to this company were $1,870.
Compensation of Board Members
Board members are compensated for their services to the Fund as disclosed in the Statement of Operations. Under a Deferred Compensation Plan (the Plan), the Board members who are not "interested persons" of the Fund, as defined under the
Semiannual Report 2014
40
Columbia U.S. Government Mortgage Fund
Notes to Financial Statements (continued)
November 30, 2014 (Unaudited)
1940 Act, may elect to defer payment of up to 100% of their compensation. Deferred amounts are treated as though equivalent dollar amounts had been invested in shares of certain funds managed by the Investment Manager. The Fund's liability for these amounts is adjusted for market value changes and remains in the Fund until distributed in accordance with the Plan.
Transfer Agent Fees
Under a Transfer and Dividend Disbursing Agent Agreement, Columbia Management Investment Services Corp. (the Transfer Agent), an affiliate of the Investment Manager and a wholly-owned subsidiary of Ameriprise Financial, is responsible for providing transfer agency services to the Fund. The Transfer Agent has contracted with Boston Financial Data Services (BFDS) to serve as sub-transfer agent.
Effective November 1, 2014, the Transfer Agent receives a monthly transfer agency fee based on the number or the average value of accounts, depending on the type of account. Prior to November 1, 2014, the Transfer Agent received a monthly account-based service fee based on the number of open accounts. In addition, the Transfer Agent also receives sub-transfer agency fees based on a percentage of the average aggregate value of the Fund's shares maintained in omnibus accounts (other than omnibus accounts for which American Enterprise Investment Services Inc. is the broker of record or accounts where the beneficial shareholder is a customer of Ameriprise Financial Services, Inc., which receive a per account fee). The Transfer Agent pays the fees of BFDS for services as sub-transfer agent and is not entitled to reimbursement for such fees from the Fund (with the exception of out-of-pocket fees).
The Transfer Agent also receives compensation from the Fund for various shareholder services and reimbursements for certain out-of-pocket fees. Total transfer agent fees for Class K and Class R5 shares are subject to an annual limitation of not more than 0.05% of the average daily net assets attributable to each share class. Class I and Class Y shares are not subject to transfer agent fees.
For the six months ended November 30, 2014, the Fund's annualized effective transfer agent fee rates as a percentage of average daily net assets of each class were as follows:
Class A | | | 0.19 | % | |
Class B | | | 0.19 | | |
Class C | | | 0.19 | | |
Class K | | | 0.05 | | |
Class R4 | | | 0.19 | | |
Class R5 | | | 0.05 | | |
Class W | | | 0.18 | | |
Class Z | | | 0.19 | | |
An annual minimum account balance fee of $20 may apply to certain accounts with a value below the applicable share class's initial minimum investment requirements to reduce the impact of small accounts on transfer agent fees. These minimum account balance fees are remitted to the Fund and recorded as part of expense reductions in the Statement of Operations. For the six months ended November 30, 2014, these minimum account balance fees reduced total expenses of the Fund by $8,443.
Plan Administration Fees
Under a Plan Administration Services Agreement with the Transfer Agent, the Fund pays an annual fee at a rate of 0.25% of the Fund's average daily net assets attributable to Class K shares for the provision of various administrative, recordkeeping, communication and educational services.
Distribution Fees
The Fund has an agreement with Columbia Management Investment Distributors, Inc. (the Distributor), an affiliate of the Investment Manager and a wholly-owned subsidiary of Ameriprise Financial, for distribution and shareholder services. Under a Plan and Agreement of Distribution, the Fund pays a fee at an annual rate of up to 0.25% of the Fund's average daily net assets attributable to Class A and Class W shares and a fee at an annual rate of up to 1.00% of the Fund's average daily net assets attributable to Class B and Class C shares. For Class B and Class C shares, of the 1.00% fee, up to 0.75% is reimbursed for distribution expenses.
The amount of distribution expenses incurred by the Distributor and not yet reimbursed (unreimbursed expense) was approximately $733,000 and $150,000 for Class B and Class C shares, respectively. These amounts are based on the most recent information available as of September 30, 2014, and may be recovered from future payments under the distribution plan or CDSCs. To the extent the unreimbursed expense has been fully recovered, the distribution fee is reduced.
Sales Charges
Sales charges, including front-end charges and CDSCs, received by the Distributor for distributing Fund shares were $102,633 for Class A, $808 for Class B, and $450 for Class C shares for the six months ended November 30, 2014.
Expenses Waived/Reimbursed by the Investment Manager and its Affiliates
The Fund's expense ratio is subject to an expense reimbursement arrangement pursuant to which fees will be waived and/or expenses reimbursed (excluding certain fees and expenses described below), so that the Fund's net operating expenses, after giving effect to fees waived/expenses
Semiannual Report 2014
41
Columbia U.S. Government Mortgage Fund
Notes to Financial Statements (continued)
November 30, 2014 (Unaudited)
reimbursed and any balance credits and/or overdraft charges from the Fund's custodian, do not exceed the annual rates of:
| | | Voluntary
Expense Cap
Effective
October 1, 2014 | | Contractual
Expense Cap
Prior to
October 1, 2014 | |
Class A | | | 0.88 | % | | | 0.86 | % | |
Class B | | | 1.63 | | | | 1.61 | | |
Class C | | | 1.63 | | | | 1.61 | | |
Class I | | | 0.50 | | | | 0.48 | | |
Class K | | | 0.80 | | | | 0.78 | | |
Class R4 | | | 0.63 | | | | 0.61 | | |
Class R5 | | | 0.55 | | | | 0.53 | | |
Class W | | | 0.88 | | | | 0.86 | | |
Class Y | | | 0.50 | * | | | — | | |
Class Z | | | 0.63 | | | | 0.61 | | |
*Class Y shares commenced operations on October 1, 2014.
The voluntary expense cap arrangement may be revised or discontinued at any time. Under the arrangements, the following fees and expenses are excluded from the waiver/reimbursement commitment, and therefore will be paid by the Fund, if applicable: taxes (including foreign transaction taxes), expenses associated with investments in affiliated and non-affiliated pooled investment vehicles (including mutual funds and exchange-traded funds), transaction costs and brokerage commissions, costs related to any securities lending program, dividend expenses associated with securities sold short, inverse floater program fees and expenses, transaction charges and interest on borrowed money, interest and extraordinary expenses.
Note 4. Federal Tax Information
The timing and character of income and capital gain distributions are determined in accordance with income tax regulations, which may differ from GAAP because of temporary or permanent book to tax differences.
At November 30, 2014, the cost of investments for federal income tax purposes was approximately $2,378,579,000 and the aggregate gross approximate unrealized appreciation and depreciation based on that cost was:
Unrealized appreciation | | $ | 50,448,000 | | |
Unrealized depreciation | | | (27,777,000 | ) | |
Net unrealized appreciation | | $ | 22,671,000 | | |
The following capital loss carryforwards, determined as of May 31, 2014, may be available to reduce taxable income
arising from future net realized gains on investments, if any, to the extent permitted by the Internal Revenue Code:
Year of Expiration | | Amount ($) | |
| Unlimited short-term | | | 38,912,096 | | |
Management of the Fund has concluded that there are no significant uncertain tax positions in the Fund that would require recognition in the financial statements. However, management's conclusion may be subject to review and adjustment at a later date based on factors including, but not limited to, new tax laws, regulations, and administrative interpretations (including relevant court decisions). Generally, the Fund's federal tax returns for the prior three fiscal years remain subject to examination by the Internal Revenue Service.
Note 5. Portfolio Information
The cost of purchases and proceeds from sales of securities, excluding short-term obligations and certain derivatives, if any, but including mortgage dollar rolls, aggregated to $3,975,470,711 and $3,983,731,363, respectively, for the six months ended November 30, 2014, of which $4,544,635,721 and $4,472,428,755, respectively, were U.S. government securities. The amount of purchase and sale activity impacts the portfolio turnover rate reported in the Financial Highlights.
Note 6. Affiliated Money Market Fund
The Fund invests in Columbia Short-Term Cash Fund, an affiliated money market fund established for the exclusive use by the Fund and other affiliated funds. The income earned by the Fund from such investments is included as Dividends — affiliated issuers in the Statement of Operations. As an investing fund, the Fund indirectly bears its proportionate share of the expenses of Columbia Short-Term Cash Fund.
Note 7. Shareholder Concentration
At November 30, 2014, one unaffiliated shareholder of record owned 13.1% of the outstanding shares of the Fund in one or more accounts. The Fund has no knowledge about whether any portion of those shares was owned beneficially. Affiliated shareholders of record owned 56.1% of the outstanding shares of the Fund in one or more accounts. Subscription and redemption activity by concentrated accounts may have a significant effect on the operations of the Fund.
Note 8. Line of Credit
The Fund has entered into a revolving credit facility with a syndicate of banks led by JPMorgan Chase Bank N.A. (JPMorgan) whereby the Fund may borrow for the temporary funding of shareholder redemptions or for other temporary or
Semiannual Report 2014
42
Columbia U.S. Government Mortgage Fund
Notes to Financial Statements (continued)
November 30, 2014 (Unaudited)
emergency purposes. The credit facility agreement, as amended, which is a collective agreement between the Fund and certain other funds managed by the Investment Manager, severally and not jointly, permits collective borrowings up to $500 million. Interest is charged to each participating fund based on its borrowings at a rate equal to the higher of (i) the overnight federal funds rate plus 1.00% or (ii) the one-month LIBOR rate plus 1.00%. Each borrowing under the credit facility matures no later than 60 days after the date of borrowing. The Fund also pays a commitment fee equal to its pro rata share of the amount of the credit facility at a rate of 0.075% per annum. The commitment fee is included in other expenses in the Statement of Operations.
Effective December 9, 2014, the Fund extended its revolving credit facility with JPMorgan. The credit facility agreement, as amended, permits collective borrowings up to $550 million under the same terms and interest rates as described above.
The Fund had no borrowings during the six months ended November 30, 2014.
Note 9. Significant Risks
Credit Risk
Credit risk is the risk that the value of debt securities in the Fund's portfolio may decline because the issuer may default and fail to pay interest or repay principal when due. Rating agencies assign credit ratings to debt securities to indicate their credit risk. Lower rated or unrated debt securities held by the Fund may present increased credit risk as compared to higher-rated debt securities.
Interest Rate Risk
Interest rate risk is the risk of losses attributable to changes in interest rates. In general, if prevailing interest rates rise, the values of debt securities tend to fall, and if interest rates fall, the values of debt securities tend to rise. Actions by governments and central banking authorities can result in increases in interest rates. Increasing interest rates may negatively affect the value of debt securities held by the Fund, resulting in a negative impact on the Fund's performance and net asset value per share. In general, the longer the maturity or duration of a debt security, the greater its sensitivity to changes in interest rates.
Liquidity Risk
Liquidity risk is the risk associated with a lack of marketability of investments which may make it difficult to sell the investment at a desirable time or price. Changing regulatory, market or other conditions or environments (for example, the interest rate or credit environments) may adversely affect the liquidity of the Fund's investments. The Fund may have to accept a lower selling price for the holding,
sell other investments, or forego another, more appealing investment opportunity. Generally, the less liquid the market at the time the Fund sells a portfolio investment, the greater the risk of loss or decline of value to the Fund. A less liquid market can lead to an increase in Fund redemptions, which may negatively impact Fund performance and net asset value per share, including, for example, if the Fund is forced to sell securities in a down market.
Mortgage-Backed Securities Risk
The value of mortgage-backed securities may be affected by, among other things, changes in interest rates, factors concerning the interests in and structure of the issuer or the originator of the mortgages, the creditworthiness of the entities that provide any supporting letters of credit, surety bonds or other credit enhancements or the quality of underlying assets or the market's assessment thereof. Mortgage-backed securities are subject to prepayment risk, which is the possibility that the underlying mortgage may be refinanced or prepaid prior to maturity during periods of declining or low interest rates, causing the Fund to have to reinvest the money received in securities that have lower yields. In addition, the impact of prepayments on the value of mortgage-backed securities may be difficult to predict and may result in greater volatility.
Note 10. Subsequent Events
Management has evaluated the events and transactions that have occurred through the date the financial statements were issued. Other than as noted in Note 8 above, there were no items requiring adjustment of the financial statements or additional disclosure.
Note 11. Information Regarding Pending and Settled Legal Proceedings
In December 2005, without admitting or denying the allegations, American Express Financial Corporation (AEFC, which is now known as Ameriprise Financial, Inc. (Ameriprise Financial)) entered into settlement agreements with the Securities and Exchange Commission (SEC) and Minnesota Department of Commerce (MDOC) related to market timing activities. As a result, AEFC was censured and ordered to cease and desist from committing or causing any violations of certain provisions of the Investment Advisers Act of 1940, the Investment Company Act of 1940, and various Minnesota laws. AEFC agreed to pay disgorgement of $10 million and civil money penalties of $7 million. AEFC also agreed to retain an independent distribution consultant to assist in developing a plan for distribution of all disgorgement and civil penalties ordered by the SEC in accordance with various undertakings detailed at www.sec.gov/litigation/admin/ia-2451.pdf. Ameriprise Financial and its affiliates have cooperated with the
Semiannual Report 2014
43
Columbia U.S. Government Mortgage Fund
Notes to Financial Statements (continued)
November 30, 2014 (Unaudited)
SEC and the MDOC in these legal proceedings, and have made regular reports to the Funds' Boards of Trustees.
Ameriprise Financial and certain of its affiliates have historically been involved in a number of legal, arbitration and regulatory proceedings, including routine litigation, class actions, and governmental actions, concerning matters arising in connection with the conduct of their business activities. Ameriprise Financial believes that the Funds are not currently the subject of, and that neither Ameriprise Financial nor any of its affiliates are the subject of, any pending legal, arbitration or regulatory proceedings that are likely to have a material adverse effect on the Funds or the ability of Ameriprise Financial or its affiliates to perform under their contracts with the Funds. Ameriprise Financial is required to make quarterly (10-Q), annual (10-K) and, as necessary, 8-K filings with the Securities and Exchange Commission on legal and regulatory matters that relate to Ameriprise Financial and its affiliates. Copies of these filings may be obtained by accessing the SEC website at www.sec.gov.
There can be no assurance that these matters, or the adverse publicity associated with them, will not result in increased fund redemptions, reduced sale of fund shares or other adverse consequences to the Funds. Further, although we believe proceedings are not likely to have a material adverse effect on the Funds or the ability of Ameriprise Financial or its affiliates to perform under their contracts with the Funds, these proceedings are subject to uncertainties and, as such, we are unable to estimate the possible loss or range of loss that may result. An adverse outcome in one or more of these proceedings could result in adverse judgments, settlements, fines, penalties or other relief that could have a material adverse effect on the consolidated financial condition or results of operations of Ameriprise Financial.
Semiannual Report 2014
44
Columbia U.S. Government Mortgage Fund
Important Information About This Report
Each fund mails one shareholder report to each shareholder address. If you would like more than one report, please call shareholder services at 800.345.6611 and additional reports will be sent to you.
The policy of the Board is to vote the proxies of the companies in which each fund holds investments consistent with the procedures as stated in the Statement of Additional Information (SAI). You may obtain a copy of the SAI without charge by calling 800.345.6611; contacting your financial intermediary; visiting columbiamanagement.com; or searching the website of the Securities and Exchange Commission (SEC) at sec.gov. Information regarding how each fund voted proxies relating to portfolio securities is filed with the SEC by August 31 for the most recent 12-month period ending June 30 of that year, and is available without charge by visiting columbiamanagement.com; or searching the website of the SEC at sec.gov.
Each fund files a complete schedule of portfolio holdings with the SEC for the first and third quarters of each fiscal year on Form N-Q. Each fund's Form N-Q is available on the SEC's website at sec.gov and may be reviewed and copied at the SEC's Public Reference Room in Washington, D.C. Information on the operation of the Public Reference Room may be obtained by calling 800.SEC.0330. Each fund's complete schedule of portfolio holdings, as filed on Form N-Q, can also be obtained without charge, upon request, by calling 800.345.6611.
Semiannual Report 2014
45

Columbia U.S. Government Mortgage Fund
P.O. Box 8081
Boston, MA 02266-8081
columbiamanagement.com
This information is for use with concurrent or prior delivery of a fund prospectus. Please read and consider the investment objectives, risks, charges and expenses for any fund carefully before investing. For a prospectus and, if available, a summary prospectus, which contains this and other important information about the Fund, go to columbiamanagement.com. The Fund is distributed by Columbia Management Investment Distributors, Inc., member FINRA, and managed by Columbia Management Investment Advisers, LLC.
© 2015 Columbia Management Investment Advisers, LLC. All rights reserved.
SAR236_05_E01_(01/15)
Semiannual Report
November 30, 2014

Columbia Absolute Return Enhanced Multi-Strategy Fund
Not FDIC insured • No bank guarantee • May lose value
About Columbia Management
Backed by more than 100 years of experience, Columbia Management is one of the nation's largest asset managers. At the heart of our success — and, most importantly, that of our investors — are some of the most talented professionals in the industry, brought together by a unique way of working.
It starts with carefully selected, specialized investment teams. While each team brings a diverse and innovative range of skills, all are grounded by a common set of core beliefs. All possess a solid conviction in the power of proprietary, bottom-up research. All look not only at generating returns, but also at the likely consistency of those returns and the risks required to achieve them. And while our culture encourages teams to operate independently and question established thinking, a rigorous investment oversight process ensures that each team stays true to its clearly articulated investment process. At Columbia Management, reaching our performance goals matters, and the way we reach them matters just as much.
Columbia funds are distributed by Columbia Management Investment Distributors, Inc., member FINRA, and managed by Columbia Management Investment Advisers, LLC.
© 2015 Columbia Management Investment Advisers, LLC. All rights reserved.
Not part of the shareholder report
Note: Effective January 1, 2015, Christopher O. Petersen will serve as the President of the Columbia Funds, replacing J. Kevin Connaughton. Mr. Petersen has served as a Fund officer since 2007.
Dear Shareholders,
People invest for different reasons, though typically based on a desire for one or more outcomes, e.g., generating an appropriate income stream in retirement, navigating a changing interest rate environment, maximizing after-tax returns, growing assets to achieve financial goals, or easing the impact of volatile markets. Achieving these desired outcomes can be particularly challenging given the unpredictability of complex global markets. To continue to effectively deliver solutions that help clients achieve desired outcomes, an asset manager must have the resources and investment framework to meaningfully embody a global perspective.
With this in mind, I thought it important to highlight excerpts from a piece written by Jeffrey L. Knight, Global Head of Investment Solutions and Asset Allocation, in which he touches on some of these issues emphasizing the importance of maintaining a diversified portfolio with the flexibility to adapt to changing market conditions.
I encourage you to read the article in its entirety. To access the full article and for other insights on current market events and investment opportunities, please visit the Columbia Management blog at columbiamanagement.com/blog.
On behalf of the Funds, I want to acknowledge the contributions of J. Kevin Connaughton and to thank him for his years of trusted, dedicated service. He has worked tirelessly as an advocate for shareholders and a leader of the Columbia Funds. In taking on this new role, I look forward to continuing the work of Mr. Connaughton, helping build on the strong foundation of the Columbia Funds.
Thank you for your confidence. We look forward to continuing to serve your investment needs for many years to come.
Best regards,

Christopher O. Petersen
President, Columbia Funds
Excerpts from:
2015 Outlook: Same song, slightly different arrangement
By Jeffrey L. Knight, Global Head of Investment Solutions and Asset Allocation
Jeffrey L. Knight, CFA, is global head of investment solutions and asset allocation for Columbia Management Investment Advisers, LLC. Mr. Knight leads a team of six portfolio managers responsible for our broad suite of multi-asset strategies including capital allocation, risk allocation, absolute return and total return funds.
What's different in 2015?
As stationary as market conditions have felt lately, circumstances are always evolving. For 2015, while the essential elements of our outlook remain in place, we highlight two important changes in the market environment:
> The relative value of global equities vs. global bonds actually improved during 2014.
> Monetary policy around the globe has become desynchronized, with the U.S. Federal Reserve (the Fed) contemplating rate hikes, while the European Central Bank (ECB) and the Bank of Japan (BOJ) intensify their monetary stimulus programs.
In our view, while equities will most likely continue to dominate, the complex interactions of today's conditions elevate the role of dynamic risk management. We argue that investors will need a cross-asset surveillance methodology to detect tactical threats.
President's Message (continued)
Monetary policies diverge
The Fed has given strong signals that economic growth in the United States has reached self-sustaining momentum and no longer needs unconventional efforts to support the expansion. The withdrawal and suspension of large-scale asset purchases was only the first step in the evolution toward policy normalization. In 2015, we expect to see a change in forward guidance and, most likely, the first interest rate increase in years.
These actions stand in stark contrast with the direction of the monetary policies of other central banks as they double down on efforts to support growth and avoid deflation. The Bank of Japan has announced its intention to increase both qualitative and quantitative easing on an enormous scale, expanding purchases of Japanese government bonds (JGBs), exchange-traded funds and real estate investment trusts. They intend to coordinate this with government pension investment fund purchases by shifting into riskier assets through sales of JGBs.
With evidence of deterioration on both the economic and inflation front, the European Central Bank (ECB) also plans to take bolder actions. These include increased purchases of asset-backed securities and covered bonds in both the primary and secondary market, together with the long-term refinancing operations that will steer the ECB's balance sheet higher by €1 trillion.
The latest to jump on the bandwagon was the People's Bank of China (PBOC), which cut its benchmark interest rate for the first time in over two years to support private sector investment, as targeted liquidity injections have had minimal effect on sinking economic growth.
Investment strategy for 2015
We remain convinced that relative value favors stocks over bonds, even though stocks outperformed in 2014. Therefore, you will hear the same recommendation from us for 2015. Equities remain the most important asset class for generating returns.
Within equities, the currency-based advantage of U.S. stocks is offset somewhat by the valuation advantage from overseas equities, notably in Japan. Indeed, economic growth in Japan and Europe are essential ingredients for equities to continue to perform well. If Japanese and European stocks cannot produce gains, then the global economy will probably be stuck in a near recessionary funk.
Devising a strategy to manage risk and stabilize portfolio values in the event that equities do not perform well remains complicated. Bond yields are low enough that they are not likely to offer powerful diversification benefits. We affirm our recommendation for three additional sources of portfolio stability:
> Non-traditional diversifiers, such as liquid alternatives, alternative beta exposures and absolute return strategies
> Explicit downside hedges, such as put options (with emphasis on managing the related expense)
> Flexibility and a methodology for active risk reduction when appropriate (Our cross-asset methodologies should prove valuable in this regard.)
Our overall stance for investment strategy will likely remain in place until the valuation advantage for equities has been priced away, or until the healing process for the global economy reverses.
Please visit columbiamanagement.com/blog to read the entire article.
Investors should consider the investment objectives, risks, charges and expenses of a mutual fund carefully before investing. For a free prospectus and, if available, a summary prospectus, which contains this and other important information about a fund, visit columbiamanagement.com. The prospectus should be read carefully before investing.
The views expressed are as of December 2014, may change as market or other conditions change, and may differ from views expressed by other Columbia Management Investment Advisers, LLC (CMIA) associates or affiliates. Actual investments or investment decisions made by CMIA and its affiliates, whether for its own account or on behalf of clients, will not necessarily reflect the views expressed. This information is not intended to provide investment advice and does not account for individual investor circumstances. Investment decisions should always be made based on an investor's specific financial needs, objectives, goals, time horizon and risk tolerance. Asset classes described may not be suitable for all investors. Past performance does not guarantee future results, and no forecast should be considered a guarantee either. Since economic and market change frequently, there can be no assurance that the trends described here will continue or that the forecasts are accurate.
Diversification does not assure a profit or protect against loss.
Columbia Funds are distributed by Columbia Management Investment Distributors, Inc., member FINRA, and managed by Columbia Management Investment Advisers, LLC.
© 2015 Columbia Management Investment Advisers, LLC. All rights reserved
Columbia Absolute Return Enhanced Multi-Strategy Fund
Performance Overview | | | 4 | | |
Portfolio Overview | | | 5 | | |
Understanding Your Fund's Expenses | | | 7 | | |
Portfolio of Investments | | | 8 | | |
Statement of Assets and Liabilities | | | 22 | | |
Statement of Operations | | | 24 | | |
Statement of Changes in Net Assets | | | 25 | | |
Financial Highlights | | | 27 | | |
Notes to Financial Statements | | | 35 | | |
Important Information About This Report | | | 45 | | |
Fund Investment Manager
Columbia Management Investment
Advisers, LLC
225 Franklin Street
Boston, MA 02110
Fund Distributor
Columbia Management Investment
Distributors, Inc.
225 Franklin Street
Boston, MA 02110
Fund Transfer Agent
Columbia Management Investment
Services Corp.
P.O. Box 8081
Boston, MA 02266-8081
For more information about any of the funds, please visit columbiamanagement.com or call 800.345.6611. Customer Service Representatives are available to answer your questions Monday through Friday from 8 a.m. to 7 p.m. Eastern time.
The views expressed in this report reflect the current views of the respective parties. These views are not guarantees of future performance and involve certain risks, uncertainties and assumptions that are difficult to predict, so actual outcomes and results may differ significantly from the views expressed. These views are subject to change at any time based upon economic, market or other conditions and the respective parties disclaim any responsibility to update such views. These views may not be relied on as investment advice and, because investment decisions for a Columbia Fund are based on numerous factors, may not be relied on as an indication of trading intent on behalf of any particular Columbia Fund. References to specific securities should not be construed as a recommendation or investment advice.
Columbia Absolute Return Enhanced Multi-Strategy Fund
Performance Overview
(Unaudited)
Performance Summary
> Columbia Absolute Return Enhanced Multi-Strategy Fund (the Fund) Class A shares returned 0.94% excluding sales charges for the six-month period that ended November 30, 2014.
> During the same period, the Citigroup 3-Month U.S. Treasury Bill Index returned 0.01%, the S&P 500 Index, a broad measure of the U.S. equity market, returned 8.58% and the Barclays U.S. Aggregate Bond Index, a broad measure of the domestic fixed-income market, returned 1.92%.
> The Fund underperformed its Blended Index, which returned 5.89% for the same time period.
> On January 28, 2015 the Fund's Board of Trustees approved a Plan of Liquidation and Termination (the Plan) pursuant to which the Fund will be liquidated and terminated. Effective at the open of business on February 2, 2015, the Fund is no longer open to new investors. Under the terms of the Plan, it is anticipated that the Fund will be liquidated on or about March 6, 2015, at which time the Fund's shareholders will receive a liquidation distribution in an amount equal to the net asset value of their Fund shares. Shareholders of the Fund may also redeem their investment in the Fund or exchange their Fund shares for shares of another Columbia Fund at any time prior to the date of liquidation.
Average Annual Total Returns (%) (for period ended November 30, 2014)
| | | Inception | | 6 Months
cumulative | | 1 Year | | Life | |
Class A | | 03/31/11 | | | | | | | | | | | | | |
Excluding sales charges | | | | | | | 0.94 | | | | -3.94 | | | | -0.15 | | |
Including sales charges | | | | | | | -4.82 | | | | -9.49 | | | | -1.75 | | |
Class B | | 03/31/11 | | | | | | | | | | | | | |
Excluding sales charges | | | | | | | 0.53 | | | | -4.59 | | | | -0.90 | | |
Including sales charges | | | | | | | -4.47 | | | | -9.35 | | | | -1.70 | | |
Class C | | 03/31/11 | | | | | | | | | | | | | |
Excluding sales charges | | | | | | | 0.53 | | | | -4.59 | | | | -0.88 | | |
Including sales charges | | | | | | | -0.47 | | | | -5.55 | | | | -0.88 | | |
Class I | | 03/31/11 | | | 1.14 | | | | -3.56 | | | | 0.18 | | |
Class R | | 03/31/11 | | | 0.84 | | | | -4.07 | | | | -0.40 | | |
Class R5* | | 11/08/12 | | | 1.14 | | | | -3.63 | | | | 0.04 | | |
Class W | | 03/31/11 | | | 0.83 | | | | -4.05 | | | | -0.14 | | |
Class Z | | 03/31/11 | | | 1.04 | | | | -3.63 | | | | 0.11 | | |
Citigroup 3-Month U.S. Treasury Bill Index | | | | | | | 0.01 | | | | 0.04 | | | | 0.05 | | |
S&P 500 Index | | | | | | | 8.58 | | | | 16.86 | | | | 15.33 | | |
Barclays U.S. Aggregate Bond Index | | | | | | | 1.92 | | | | 5.27 | | | | 4.15 | | |
Blended Index | | | | | | | 5.89 | | | | 12.17 | | | | 10.93 | | |
Returns for Class A are shown with and without the maximum initial sales charge of 5.75%. Returns for Class B are shown with and without the applicable contingent deferred sales charge (CDSC) of 5.00% in the first year, declining to 1.00% in the sixth year and eliminated thereafter. Returns for Class C are shown with and without the 1.00% CDSC for the first year only. If they had, returns would be lower. The Fund's other classes are not subject to sales charges and have limited eligibility. Please see the Fund's prospectus for details. Performance for different share classes will vary based on differences in sales charges and fees associated with each class. All results shown assume reinvestment of distributions during the period. Returns do not reflect the deduction of taxes that a shareholder may pay on Fund distributions or on the redemption of Fund shares. The indices do not reflect the effects of sales charges, expenses and taxes. Performance results reflect the effect of any fee waivers or reimbursements of Fund expenses by Columbia Management Investment Advisers, LLC and/or any of its affiliates. Absent these fee waivers or expense reimbursement arrangements, performance results would have been lower.
The performance information shown represents past performance and is not a guarantee of future results. The investment return and principal value of your investment will fluctuate so that your shares, when redeemed, may be worth more or less than their original cost. Current performance may be lower or higher than the performance information shown. You may obtain performance information current to the most recent month-end by contacting your financial intermediary, visiting columbiamanagement.com or calling 800.345.6611.
*The returns shown for periods prior to the share class inception date (including returns for the Life of the Fund, if shown, which are since Fund inception) include the returns of the Fund's oldest share class. Since the Fund launched more than one share class at its inception, Class A shares were used. These returns are adjusted to reflect any higher class-related operating expenses of the newer share classes, as applicable. Please visit columbiamanagement.com/investment-products/mutual-funds/appended-performance for more information.
The Citigroup 3-Month U.S. Treasury Bill Index, an unmanaged index, is representative of the performance of three-month Treasury bills.
The S&P 500 Index, an unmanaged index, measures the performance of 500 widely held, large-capitalization U.S. stocks and is frequently used as a general measure of market performance.
The Barclays U.S. Aggregate Bond Index is a broad-based benchmark that measures the investment grade, U.S. dollar-denominated, fixed-rate taxable bond market, including Treasuries, government-related and corporate securities, mortgage-backed securities (agency fixed-rate and hybrid adjustable-rate mortgage passthroughs), asset-backed securities, and commercial mortgage-backed securities.
The Blended Index is comprised 60% of the S&P 500 Index and 40% of the Barclays U.S. Aggregate Bond Index.
Indices are not available for investment, are not professionally managed and do not reflect sales charges, fees, brokerage commissions, taxes or other expenses of investing. Securities in the Fund may not match those in an index.
Semiannual Report 2014
4
Columbia Absolute Return Enhanced Multi-Strategy Fund
Portfolio Overview
(Unaudited)
Top Ten Holdings (%) — Long Positions
(at November 30, 2014) | |
Goldman Sachs Group, Inc. (The) | | | 3.5 | | |
Comcast Corp., Class A | | | 3.5 | | |
Cubist Pharmaceuticals, Inc. | | | 3.3 | | |
Alexandria Real Estate Equities, Inc. | | | 3.2 | | |
Bluebird Bio, Inc. | | | 3.2 | | |
Activision Blizzard, Inc. | | | 2.7 | | |
Rockwell Automation, Inc. | | | 2.7 | | |
Nike, Inc., Class B | | | 2.6 | | |
DISH Network Corp., Class A | | | 2.6 | | |
Electronic Arts, Inc. | | | 2.5 | | |
Percentages indicated are based upon total long investments (excluding Money Market Funds).
Top Ten Holdings (%) — Short Positions
(at November 30, 2014) | |
Coach, Inc. | | | (3.5 | ) | |
Dick's Sporting Goods, Inc. | | | (3.4 | ) | |
Armstrong World Industries, Inc. | | | (2.8 | ) | |
Regeneron Pharmaceuticals, Inc. | | | (2.8 | ) | |
First Republic Bank | | | (2.8 | ) | |
Xerox Corp. | | | (2.7 | ) | |
Target Corp. | | | (2.4 | ) | |
Clorox Co. (The) | | | (2.4 | ) | |
Expeditors International of Washington, Inc. | | | (2.4 | ) | |
SAP SE, ADR | | | (2.4 | ) | |
Percentages indicated are based upon total short investments.
For further detail about these holdings, please refer to the section entitled "Portfolio of Investments."
Fund holdings are as of the date given, are subject to change at any time, and are not recommendations to buy or sell any security.
Portfolio Management
Todd White
Jeffrey Knight, CFA
Kent Peterson, PhD
Semiannual Report 2014
5
Columbia Absolute Return Enhanced Multi-Strategy Fund
Portfolio Overview (continued)
(Unaudited)
Portfolio Breakdown (%)
(at November 30, 2014) | |
| | | Long | | Short | | Net | |
Common Stocks | | | 36.4 | | | | (36.2 | ) | | | 0.2 | | |
Consumer Discretionary | | | 7.8 | | | | (7.8 | ) | | | 0.0 | | |
Consumer Staples | | | 2.1 | | | | (2.1 | ) | | | 0.0 | | |
Energy | | | 2.8 | | | | (2.7 | ) | | | 0.1 | | |
Financials | | | 5.2 | | | | (5.1 | ) | | | 0.1 | | |
Health Care | | | 5.8 | | | | (6.0 | ) | | | (0.2 | ) | |
Industrials | | | 3.9 | | | | (3.8 | ) | | | 0.1 | | |
Information Technology | | | 8.4 | | | | (8.3 | ) | | | 0.1 | | |
Materials | | | 0.4 | | | | (0.4 | ) | | | 0.0 | | |
Convertible Bonds | | | 0.0 | (a) | | | 0.0 | | | | 0.0 | (a) | |
Short-Term Investments Segregated in
Connection with Open Derivatives Contracts(b) | | | 99.8 | | | | 0.0 | | | | 99.8 | | |
Total | | | 136.2 | | | | (36.2 | ) | | | 100.0 | | |
Percentages indicated are based upon total investments. The Fund's portfolio composition is subject to change.
(a) Rounds to zero.
(b) Includes investments in Money Market Funds (amounting to $73.2 million) which have been segregated to cover obligations related to the Fund's investment in derivatives which provides exposure to multiple markets. For a description of the Fund's investments in derivatives, see Investments in Derivatives following the Portfolio of Investments, and Note 2 to the financial statements.
Semiannual Report 2014
6
Columbia Absolute Return Enhanced Multi-Strategy Fund
Understanding Your Fund's Expenses
(Unaudited)
As an investor, you incur two types of costs. There are transaction costs, which generally include sales charges on purchases and may include redemption fees. There are also ongoing costs, which generally include management fees, distribution and/or service fees, and other fund expenses. The following information is intended to help you understand your ongoing costs (in dollars) of investing in the Fund and to help you compare these costs with the ongoing costs of investing in other mutual funds.
Analyzing Your Fund's Expenses
To illustrate these ongoing costs, we have provided examples and calculated the expenses paid by investors in each share class of the Fund during the period. The actual and hypothetical information in the table is based on an initial investment of $1,000 at the beginning of the period indicated and held for the entire period. Expense information is calculated two ways and each method provides you with different information. The amount listed in the "Actual" column is calculated using the Fund's actual operating expenses and total return for the period. You may use the Actual information, together with the amount invested, to estimate the expenses that you paid over the period. Simply divide your account value by $1,000 (for example, an $8,600 account value divided by $1,000 = 8.6), then multiply the results by the expenses paid during the period under the "Actual" column. The amount listed in the "Hypothetical" column assumes a 5% annual rate of return before expenses (which is not the Fund's actual return) and then applies the Fund's actual expense ratio for the period to the hypothetical return. You should not use the hypothetical account values and expenses to estimate either your actual account balance at the end of the period or the expenses you paid during the period. See "Compare With Other Funds" below for details on how to use the hypothetical data.
Compare With Other Funds
Since all mutual funds are required to include the same hypothetical calculations about expenses in shareholder reports, you can use this information to compare the ongoing cost of investing in the Fund with other funds. To do so, compare the hypothetical example with the 5% hypothetical examples that appear in the shareholder reports of other funds. As you compare hypothetical examples of other funds, it is important to note that hypothetical examples are meant to highlight the ongoing costs of investing in a fund only and do not reflect any transaction costs, such as sales charges, or redemption or exchange fees. Therefore, the hypothetical calculations are useful in comparing ongoing costs only, and will not help you determine the relative total costs of owning different funds. If transaction costs were included in these calculations, your costs would be higher.
June 1, 2014 – November 30, 2014
| | | Account Value at the Beginning
of the Period ($) | | Account Value at the End of the
Period ($) | | Expenses Paid During the
Period ($) | | Fund's Annualized
Expense Ratio (%) | |
| | | Actual | | Hypothetical | | Actual | | Hypothetical | | Actual | | Hypothetical | | Actual | |
Class A | | | 1,000.00 | | | | 1,000.00 | | | | 1,009.40 | | | | 1,016.26 | | | | 8.72 | | | | 8.75 | | | | 1.74 | | |
Class B | | | 1,000.00 | | | | 1,000.00 | | | | 1,005.30 | | | | 1,012.42 | | | | 12.55 | | | | 12.59 | | | | 2.51 | | |
Class C | | | 1,000.00 | | | | 1,000.00 | | | | 1,005.30 | | | | 1,012.47 | | | | 12.50 | | | | 12.54 | | | | 2.50 | | |
Class I | | | 1,000.00 | | | | 1,000.00 | | | | 1,011.40 | | | | 1,017.85 | | | | 7.12 | | | | 7.14 | | | | 1.42 | | |
Class R | | | 1,000.00 | | | | 1,000.00 | | | | 1,008.40 | | | | 1,014.86 | | | | 10.11 | | | | 10.15 | | | | 2.02 | | |
Class R5 | | | 1,000.00 | | | | 1,000.00 | | | | 1,011.40 | | | | 1,017.70 | | | | 7.27 | | | | 7.29 | | | | 1.45 | | |
Class W | | | 1,000.00 | | | | 1,000.00 | | | | 1,008.30 | | | | 1,016.21 | | | | 8.76 | | | | 8.80 | | | | 1.75 | | |
Class Z | | | 1,000.00 | | | | 1,000.00 | | | | 1,010.40 | | | | 1,017.40 | | | | 7.57 | | | | 7.59 | | | | 1.51 | | |
Expenses paid during the period are equal to the annualized expense ratio for each class as indicated above, multiplied by the average account value over the period and then multiplied by the number of days in the Fund's most recent fiscal half year and divided by 365.
Expenses do not include fees and expenses incurred indirectly by the Fund from its investment in underlying funds, including affiliated and non-affiliated pooled investment vehicles, such as mutual funds and exchange-traded funds.
Had Columbia Management Investment Advisers, LLC and/or certain of its affiliates not waived/reimbursed certain fees and expenses, account value at the end of the period would have been reduced.
Semiannual Report 2014
7
Columbia Absolute Return Enhanced Multi-Strategy Fund
Portfolio of Investments
November 30, 2014 (Unaudited)
(Percentages represent value of investments compared to net assets)
Common Stocks 26.8%
Issuer | | Shares | | Value ($) | |
Consumer Discretionary 5.8% | |
Hotels, Restaurants & Leisure 0.4% | |
Hilton Worldwide Holdings, Inc.(a) | | | 16,730 | | | | 438,661 | | |
Internet & Catalog Retail 0.5% | |
Priceline Group, Inc. (The)(a)(b) | | | 400 | | | | 464,076 | | |
Media 2.3% | |
Cinemark Holdings, Inc.(b) | | | 11,765 | | | | 427,187 | | |
Comcast Corp., Class A(b) | | | 16,225 | | | | 925,474 | | |
DISH Network Corp., Class A(a)(b) | | | 8,738 | | | | 693,885 | | |
Viacom, Inc., Class B(b) | | | 3,848 | | | | 291,024 | | |
Total | | | | | 2,337,570 | | |
Specialty Retail 0.6% | |
Cabela's, Inc.(a)(b) | | | 10,815 | | | | 586,605 | | |
Textiles, Apparel & Luxury Goods 2.0% | |
Nike, Inc., Class B(b) | | | 7,135 | | | | 708,434 | | |
PVH Corp.(b) | | | 4,430 | | | | 563,230 | | |
VF Corp.(b) | | | 8,875 | | | | 667,134 | | |
Total | | | | | 1,938,798 | | |
Total Consumer Discretionary | | | | | 5,765,710 | | |
Consumer Staples 1.5% | |
Beverages 0.6% | |
Dr. Pepper Snapple Group, Inc.(b) | | | 8,530 | | | | 631,220 | | |
Food Products 0.6% | |
Archer-Daniels-Midland Co. | | | 11,820 | | | | 622,677 | | |
Personal Products 0.3% | |
Avon Products, Inc. | | | 26,915 | | | | 263,229 | | |
Total Consumer Staples | | | | | 1,517,126 | | |
Energy 2.1% | |
Energy Equipment & Services 0.5% | |
Halliburton Co.(b) | | | 12,370 | | | | 522,014 | | |
Oil, Gas & Consumable Fuels 1.6% | |
Anadarko Petroleum Corp.(b) | | | 5,105 | | | | 404,061 | | |
Cimarex Energy Co.(b) | | | 3,835 | | | | 402,483 | | |
ConocoPhillips(b) | | | 5,235 | | | | 345,876 | | |
EOG Resources, Inc.(b) | | | 4,655 | | | | 403,682 | | |
Total | | | | | 1,556,102 | | |
Total Energy | | | | | 2,078,116 | | |
Common Stocks (continued)
Issuer | | Shares | | Value ($) | |
Financials 3.8% | |
Capital Markets 1.5% | |
Goldman Sachs Group, Inc. (The)(b) | | | 4,945 | | | | 931,688 | | |
Invesco Ltd. | | | 14,295 | | | | 576,946 | | |
Total | | | | | 1,508,634 | | |
Consumer Finance 0.3% | |
American Express Co.(b) | | | 3,165 | | | | 292,509 | | |
Insurance 0.3% | |
MetLife, Inc. | | | 5,390 | | | | 299,738 | | |
Real Estate Investment Trusts (REITs) 1.2% | |
Alexandria Real Estate Equities, Inc.(b) | | | 10,055 | | | | 863,926 | | |
Duke Realty Corp.(b) | | | 15,170 | | | | 294,905 | | |
Total | | | | | 1,158,831 | | |
Real Estate Management & Development 0.5% | |
St. Joe Co. (The)(a) | | | 28,770 | | | | 534,834 | | |
Total Financials | | | | | 3,794,546 | | |
Health Care 4.3% | |
Biotechnology 3.5% | |
ARIAD Pharmaceuticals, Inc.(a) | | | 44,490 | | | | 316,324 | | |
Auspex Pharmaceuticals, Inc.(a)(b) | | | 17,090 | | | | 414,091 | | |
Bluebird Bio, Inc.(a) | | | 20,460 | | | | 843,566 | | |
Clovis Oncology, Inc.(a)(b) | | | 10,760 | | | | 511,961 | | |
Cubist Pharmaceuticals, Inc.(a)(b) | | | 11,570 | | | | 877,121 | | |
Vertex Pharmaceuticals, Inc.(a)(b) | | | 4,580 | | | | 539,890 | | |
Total | | | | | 3,502,953 | | |
Health Care Equipment & Supplies 0.4% | |
HeartWare International, Inc.(a)(b) | | | 4,705 | | | | 345,959 | | |
Pharmaceuticals 0.4% | |
AstraZeneca PLC, ADR | | | 5,785 | | | | 429,073 | | |
Total Health Care | | | | | 4,277,985 | | |
Industrials 2.9% | |
Airlines 1.3% | |
Alaska Air Group, Inc. | | | 10,690 | | | | 631,031 | | |
Delta Air Lines, Inc.(b) | | | 14,055 | | | | 655,947 | | |
Total | | | | | 1,286,978 | | |
Electrical Equipment 0.7% | |
Rockwell Automation, Inc.(b) | | | 6,270 | | | | 723,621 | | |
The accompanying Notes to Financial Statements are an integral part of this statement.
Semiannual Report 2014
8
Columbia Absolute Return Enhanced Multi-Strategy Fund
Portfolio of Investments (continued)
November 30, 2014 (Unaudited)
Common Stocks (continued)
Issuer | | Shares | | Value ($) | |
Machinery 0.3% | |
IDEX Corp.(b) | | | 3,640 | | | | 279,588 | | |
Road & Rail 0.6% | |
Norfolk Southern Corp.(b) | | | 5,380 | | | | 600,623 | | |
Total Industrials | | | | | 2,890,810 | | |
Information Technology 6.1% | |
Internet Software & Services 0.8% | |
Google, Inc., Class C(a)(b) | | | 1,015 | | | | 549,958 | | |
HomeAway, Inc.(a)(b) | | | 8,965 | | | | 281,142 | | |
Total | | | | | 831,100 | | |
Semiconductors & Semiconductor Equipment 1.2% | |
Broadcom Corp., Class A | | | 6,755 | | | | 291,343 | | |
TriQuint Semiconductor, Inc.(a) | | | 12,570 | | | | 306,331 | | |
Xilinx, Inc.(b) | | | 13,230 | | | | 601,171 | | |
Total | | | | | 1,198,845 | | |
Software 3.8% | |
Activision Blizzard, Inc.(b) | | | 33,855 | | | | 732,961 | | |
Autodesk, Inc.(a) | | | 7,485 | | | | 464,070 | | |
Check Point Software Technologies Ltd.(a)(b) | | | 6,769 | | | | 523,311 | | |
Electronic Arts, Inc.(a)(b) | | | 15,285 | | | | 671,470 | | |
Fortinet, Inc.(a)(b) | | | 10,860 | | | | 299,302 | | |
salesforce.com, Inc.(a)(b) | | | 10,175 | | | | 609,177 | | |
Tableau Software, Inc., Class A(a)(b) | | | 3,355 | | | | 281,418 | | |
VMware, Inc., Class A(a)(b) | | | 2,745 | | | | 241,450 | | |
Total | | | | | 3,823,159 | | |
Technology Hardware, Storage & Peripherals 0.3% | |
EMC Corp.(b) | | | 9,515 | | | | 288,780 | | |
Total Information Technology | | | | | 6,141,884 | | |
Materials 0.3% | |
Chemicals 0.3% | |
Monsanto Co.(b) | | | 2,395 | | | | 287,185 | | |
Total Materials | | | | | 287,185 | | |
Total Common Stocks
(Cost: $24,170,675) | | | | | 26,753,362 | | |
Convertible Bonds —%
Issuer | | Coupon
Rate | | Principal
Amount | | Value ($) | |
Metals —% | |
Patriot Coal Corp.
Senior Unsecured(c)(d)(e)
05/31/13 | | | 3.250 | % | | | 115,000 | | | | 11 | | |
Total Convertible Bonds
(Cost: $114,071) | | | | | | | 11 | | |
Money Market Funds 73.2%
| | | Shares | | Value ($) | |
Columbia Short-Term Cash Fund,
0.104%(f)(g) | | | 73,223,695 | | | | 73,223,695 | | |
Total Money Market Funds
(Cost: $73,223,695) | | | | | 73,223,695 | | |
Total Investments
(Cost: $97,508,441) | | | | | 99,977,068 | | |
Investments Sold Short (26.6)% | |
Common Stocks (26.6)% | |
Issuer | | Shares | | Value ($) | |
Consumer Discretionary (5.7)% | |
Hotels, Restaurants & Leisure (1.0)% | |
Choice Hotels International, Inc. | | | (8,200 | ) | | | (454,362 | ) | |
Panera Bread Co., Class A(a) | | | (3,270 | ) | | | (547,398 | ) | |
Total | | | | | (1,001,760 | ) | |
Internet & Catalog Retail (0.3)% | |
Groupon, Inc.(a) | | | (37,225 | ) | | | (280,304 | ) | |
Media (0.9)% | |
Grupo Televisa SAB, ADR | | | (7,883 | ) | | | (294,430 | ) | |
Regal Entertainment Group, Class A | | | (26,775 | ) | | | (618,235 | ) | |
Total | | | | | (912,665 | ) | |
Multiline Retail (0.6)% | |
Target Corp. | | | (8,675 | ) | | | (641,950 | ) | |
Specialty Retail (2.0)% | |
Dick's Sporting Goods, Inc. | | | (18,025 | ) | | | (912,245 | ) | |
Staples, Inc. | | | (32,685 | ) | | | (459,551 | ) | |
Ulta Salon Cosmetics & Fragrance, Inc.(a) | | | (4,595 | ) | | | (581,222 | ) | |
Total | | | | | (1,953,018 | ) | |
Textiles, Apparel & Luxury Goods (0.9)% | |
Coach, Inc. | | | (24,740 | ) | | | (918,349 | ) | |
Total Consumer Discretionary | | | | | (5,708,046 | ) | |
The accompanying Notes to Financial Statements are an integral part of this statement.
Semiannual Report 2014
9
Columbia Absolute Return Enhanced Multi-Strategy Fund
Portfolio of Investments (continued)
November 30, 2014 (Unaudited)
Investments Sold Short (continued)
Common Stocks (continued)
Issuer | | Shares | | Value ($) | |
Consumer Staples (1.5)% | |
Food & Staples Retailing (0.6)% | |
Sprouts Farmers Market, Inc.(a) | | | (19,070 | ) | | | (606,235 | ) | |
Household Products (0.9)% | |
Clorox Co. (The) | | | (6,315 | ) | | | (641,731 | ) | |
Colgate-Palmolive Co. | | | (4,095 | ) | | | (284,971 | ) | |
Total | | | | | (926,702 | ) | |
Total Consumer Staples | | | | | (1,532,937 | ) | |
Energy (2.0)% | |
Energy Equipment & Services (1.4)% | |
Rowan Companies PLC, Class A | | | (18,995 | ) | | | (413,521 | ) | |
SEACOR Holdings, Inc.(a) | | | (7,125 | ) | | | (506,872 | ) | |
Tidewater, Inc. | | | (13,380 | ) | | | (413,576 | ) | |
Total | | | | | (1,333,969 | ) | |
Oil, Gas & Consumable Fuels (0.6)% | |
Bill Barrett Corp.(a) | | | (23,405 | ) | | | (237,093 | ) | |
Pioneer Natural Resources Co. | | | (2,765 | ) | | | (396,031 | ) | |
Total | | | | | (633,124 | ) | |
Total Energy | | | | | (1,967,093 | ) | |
Financials (3.8)% | |
Banks (1.3)% | |
First Republic Bank | | | (14,455 | ) | | | (744,866 | ) | |
Westamerica Bancorporation | | | (11,600 | ) | | | (563,760 | ) | |
Total | | | | | (1,308,626 | ) | |
Capital Markets (0.3)% | |
SEI Investments Co. | | | (7,510 | ) | | | (297,621 | ) | |
Insurance (1.2)% | |
Progressive Corp. (The) | | | (21,175 | ) | | | (576,807 | ) | |
Travelers Companies, Inc. (The) | | | (2,815 | ) | | | (294,027 | ) | |
WR Berkley Corp. | | | (5,755 | ) | | | (300,641 | ) | |
Total | | | | | (1,171,475 | ) | |
Real Estate Investment Trusts (REITs) (1.0)% | |
American Homes 4 Rent, Class A | | | (24,740 | ) | | | (425,528 | ) | |
Healthcare Realty Trust, Inc. | | | (21,630 | ) | | | (571,249 | ) | |
Iron Mountain, Inc. | | | (307 | ) | | | (11,669 | ) | |
Total | | | | | (1,008,446 | ) | |
Total Financials | | | | | (3,786,168 | ) | |
Investments Sold Short (continued)
Common Stocks (continued)
Issuer | | Shares | | Value ($) | |
Health Care (4.4)% | |
Biotechnology (2.9)% | |
Agios Pharmaceuticals, Inc.(a) | | | (5,415 | ) | | | (545,886 | ) | |
Alexion Pharmaceuticals, Inc.(a) | | | (1,440 | ) | | | (280,656 | ) | |
Ironwood Pharmaceuticals, Inc.(a) | | | (45,090 | ) | | | (624,046 | ) | |
Regeneron Pharmaceuticals, Inc.(a) | | | (1,800 | ) | | | (748,998 | ) | |
Synageva Biopharma Corp.(a) | | | (4,010 | ) | | | (325,612 | ) | |
United Therapeutics Corp.(a) | | | (3,035 | ) | | | (402,350 | ) | |
Total | | | | | (2,927,548 | ) | |
Health Care Equipment & Supplies (0.6)% | |
Varian Medical Systems, Inc.(a) | | | (6,680 | ) | | | (591,247 | ) | |
Health Care Providers & Services (0.5)% | |
WellCare Health Plans, Inc.(a) | | | (5,875 | ) | | | (433,222 | ) | |
Pharmaceuticals (0.4)% | |
Eli Lilly & Co. | | | (6,145 | ) | | | (418,597 | ) | |
Total Health Care | | | | | (4,370,614 | ) | |
Industrials (2.8)% | |
Air Freight & Logistics (0.6)% | |
Expeditors International of Washington, Inc. | | | (13,705 | ) | | | (641,668 | ) | |
Building Products (0.7)% | |
Armstrong World Industries, Inc.(a) | | | (14,990 | ) | | | (750,999 | ) | |
Commercial Services & Supplies (0.3)% | |
Stericycle, Inc.(a) | | | (2,345 | ) | | | (302,318 | ) | |
Machinery (0.6)% | |
PACCAR, Inc. | | | (8,902 | ) | | | (596,612 | ) | |
Trading Companies & Distributors (0.6)% | |
Fastenal Co. | | | (12,390 | ) | | | (560,028 | ) | |
Total Industrials | | | | | (2,851,625 | ) | |
Information Technology (6.1)% | |
Electronic Equipment, Instruments & Components (1.0)% | |
Dolby Laboratories, Inc., Class A | | | (12,150 | ) | | | (539,217 | ) | |
Vishay Intertechnology, Inc. | | | (35,575 | ) | | | (493,425 | ) | |
Total | | | | | (1,032,642 | ) | |
Internet Software & Services (0.8)% | |
AOL, Inc.(a) | | | (6,460 | ) | | | (298,193 | ) | |
LinkedIn Corp., Class A(a) | | | (1,940 | ) | | | (438,964 | ) | |
Total | | | | | (737,157 | ) | |
The accompanying Notes to Financial Statements are an integral part of this statement.
Semiannual Report 2014
10
Columbia Absolute Return Enhanced Multi-Strategy Fund
Portfolio of Investments (continued)
November 30, 2014 (Unaudited)
Investments Sold Short (continued)
Common Stocks (continued)
Issuer | | Shares | | Value ($) | |
IT Services (0.7)% | |
Xerox Corp. | | | (51,810 | ) | | | (723,268 | ) | |
Semiconductors & Semiconductor Equipment (1.1)% | |
Analog Devices, Inc. | | | (5,515 | ) | | | (301,340 | ) | |
Intersil Corp., Class A | | | (40,295 | ) | | | (528,267 | ) | |
Silicon Laboratories, Inc.(a) | | | (6,195 | ) | | | (280,943 | ) | |
Total | | | | | (1,110,550 | ) | |
Software (1.5)% | |
Concur Technologies, Inc.(a) | | | (4,210 | ) | | | (542,290 | ) | |
SAP SE, ADR | | | (9,060 | ) | | | (637,099 | ) | |
Zynga, Inc., Class A(a) | | | (107,245 | ) | | | (278,837 | ) | |
Total | | | | | (1,458,226 | ) | |
Technology Hardware, Storage & Peripherals (1.0)% | |
Diebold, Inc. | | | (15,060 | ) | | | (544,871 | ) | |
Lexmark International, Inc., Class A | | | (11,131 | ) | | | (477,075 | ) | |
Total | | | | | (1,021,946 | ) | |
Total Information Technology | | | | | (6,083,789 | ) | |
Investments Sold Short (continued)
Common Stocks (continued)
Issuer | | Shares | | Value ($) | |
Materials (0.3)% | |
Chemicals (0.3)% | |
Air Products & Chemicals, Inc. | | | (2,050 | ) | | | (294,851 | ) | |
Total Materials | | | | | (294,851 | ) | |
Total Common Stocks
(Proceeds: $24,933,708) | | | | | (26,595,123 | ) | |
Total Investments Sold Short
(Proceeds: $24,933,708) | | | | | (26,595,123 | ) | |
Total Investments, Net of Investments Sold Short | | | | | 73,381,945 | | |
Other Assets & Liabilities, Net | | | | | 26,591,537 | | |
Net Assets | | | | | 99,973,482 | | |
Investments in Derivatives
Forward Foreign Currency Exchange Contracts Open at November 30, 2014
Counterparty | | Exchange Date | | Currency to
be Delivered | | Currency to
be Received | | Unrealized
Appreciation ($) | | Unrealized
Depreciation ($) | |
Barclays Bank PLC
| | 12/12/14
| | | 14,000,000
AUD | | | | 12,209,582
USD | | | | 305,614
| | | | —
| | |
Barclays Bank PLC
| | 12/12/14
| | | 1,000,000
CAD | | | | 891,554
USD | | | | 17,257
| | | | —
| | |
Barclays Bank PLC
| | 12/12/14
| | | 22,150,000
EUR | | | | 28,097,541
USD | | | | 553,648
| | | | —
| | |
Barclays Bank PLC
| | 12/12/14
| | | 4,765,500,000
JPY | | | | 44,391,968
USD | | | | 4,241,420
| | | | —
| | |
Barclays Bank PLC
| | 12/12/14
| | | 4,600,000
NOK | | | | 706,403
USD | | | | 50,945
| | | | —
| | |
Barclays Bank PLC
| | 12/12/14
| | | 14,900,000
NZD | | | | 11,652,471
USD | | | | —
| | | | (23,668
| ) | |
Barclays Bank PLC
| | 12/12/14
| | | 14,939,086
SEK | | | | 2,084,370
USD | | | | 80,835
| | | | —
| | |
Barclays Bank PLC
| | 12/12/14
| | | 2,700,000
SGD | | | | 2,122,642
USD | | | | 52,518
| | | | —
| | |
Barclays Bank PLC
| | 12/12/14
| | | 523,268
USD | | | | 600,000
AUD | | | | —
| | | | (13,098
| ) | |
The accompanying Notes to Financial Statements are an integral part of this statement.
Semiannual Report 2014
11
Columbia Absolute Return Enhanced Multi-Strategy Fund
Portfolio of Investments (continued)
November 30, 2014 (Unaudited)
Forward Foreign Currency Exchange Contracts Open at November 30, 2014 (continued)
Counterparty | | Exchange Date | | Currency to
be Delivered | | Currency to
be Received | | Unrealized
Appreciation ($) | | Unrealized
Depreciation ($) | |
Barclays Bank PLC
| | 12/12/14
| | | 6,909,544
USD | | | | 7,750,000
CAD | | | | —
| | | | (133,745
| ) | |
Barclays Bank PLC
| | 12/12/14
| | | 8,112,459
USD | | | | 7,725,000
CHF | | | | —
| | | | (116,419
| ) | |
Barclays Bank PLC
| | 12/12/14
| | | 761,107
USD | | | | 600,000
EUR | | | | —
| | | | (14,997
| ) | |
Barclays Bank PLC
| | 12/12/14
| | | 4,254,655
USD | | | | 2,650,000
GBP | | | | —
| | | | (115,584
| ) | |
Barclays Bank PLC
| | 12/12/14
| | | 184,443
USD | | | | 19,800,000
JPY | | | | —
| | | | (17,623
| ) | |
Barclays Bank PLC
| | 12/12/14
| | | 47,183,089
USD | | | | 307,250,000
NOK | | | | —
| | | | (3,402,798
| ) | |
Barclays Bank PLC
| | 12/12/14
| | | 391,023
USD | | | | 500,000
NZD | | | | 794
| | | | —
| | |
Barclays Bank PLC
| | 12/12/14
| | | 4,283,405
USD | | | | 30,700,000
SEK | | | | —
| | | | (166,116
| ) | |
Barclays Bank PLC
| | 12/12/14
| | | 49,331,761
USD | | | | 62,750,000
SGD | | | | —
| | | | (1,220,556
| ) | |
Citigroup Global Markets,Inc.
| | 12/12/14
| | | 600,000
AUD | | | | 523,434
USD | | | | 13,264
| | | | —
| | |
Citigroup Global Markets,Inc.
| | 12/12/14
| | | 18,600,000
CAD | | | | 16,588,037
USD | | | | 326,119
| | | | —
| | |
Citigroup Global Markets,Inc.
| | 12/12/14
| | | 900,000
CHF | | | | 945,418
USD | | | | 13,840
| | | | —
| | |
Citigroup Global Markets,Inc.
| | 12/12/14
| | | 1,800,000
GBP | | | | 2,889,864
USD | | | | 78,420
| | | | —
| | |
Citigroup Global Markets,Inc.
| | 12/12/14
| | | 1,070,000,000
JPY | | | | 9,971,019
USD | | | | 955,997
| | | | —
| | |
Citigroup Global Markets,Inc.
| | 12/12/14
| | | 224,400,000
NOK | | | | 34,468,458
USD | | | | 2,493,528
| | | | —
| | |
Citigroup Global Markets,Inc.
| | 12/12/14
| | | 26,400,000
NZD | | | | 20,653,512
USD | | | | —
| | | | (34,410
| ) | |
Citigroup Global Markets,Inc.
| | 12/12/14
| | | 2,854,411
SEK | | | | 398,410
USD | | | | 15,595
| | | | —
| | |
Citigroup Global Markets,Inc.
| | 12/12/14
| | | 15,179,586
USD | | | | 17,400,000
AUD | | | | —
| | | | (384,654
| ) | |
Citigroup Global Markets,Inc.
| | 12/12/14
| | | 267,549
USD | | | | 300,000
CAD | | | | —
| | | | (5,260
| ) | |
Citigroup Global Markets,Inc.
| | 12/12/14
| | | 19,538,636
USD | | | | 18,600,000
CHF | | | | —
| | | | (286,036
| ) | |
Citigroup Global Markets,Inc.
| | 12/12/14
| | | 8,880,410
USD | | | | 7,000,000
EUR | | | | —
| | | | (175,794
| ) | |
Citigroup Global Markets,Inc.
| | 12/12/14
| | | 13,549,692
USD | | | | 8,439,652
GBP | | | | —
| | | | (367,686
| ) | |
Citigroup Global Markets,Inc.
| | 12/12/14
| | | 1,075,219
USD | | | | 7,000,000
NOK | | | | —
| | | | (77,784
| ) | |
Citigroup Global Markets,Inc.
| | 12/12/14
| | | 1,228,012
USD | | | | 1,569,686
NZD | | | | 2,046
| | | | —
| | |
The accompanying Notes to Financial Statements are an integral part of this statement.
Semiannual Report 2014
12
Columbia Absolute Return Enhanced Multi-Strategy Fund
Portfolio of Investments (continued)
November 30, 2014 (Unaudited)
Forward Foreign Currency Exchange Contracts Open at November 30, 2014 (continued)
Counterparty | | Exchange Date | | Currency to
be Delivered | | Currency to
be Received | | Unrealized
Appreciation ($) | | Unrealized
Depreciation ($) | |
Citigroup Global Markets,Inc.
| | 12/12/14
| | | 7,299,881
USD | | | | 52,300,000
SEK | | | | —
| | | | (285,738
| ) | |
Citigroup Global Markets,Inc.
| | 12/12/14
| | | 88,572,428
USD | | | | 112,700,000
SGD | | | | —
| | | | (2,163,937
| ) | |
Credit Suisse Securities (USA) L.L.C.
| | 12/12/14
| | | 12,500,000
AUD | | | | 10,835,590
USD | | | | 207,046
| | | | —
| | |
Credit Suisse Securities (USA) L.L.C.
| | 12/12/14
| | | 8,700,000
CAD | | | | 7,737,040
USD | | | | 130,660
| | | | —
| | |
Credit Suisse Securities (USA) L.L.C.
| | 12/12/14
| | | 8,500,000
CHF | | | | 8,932,015
USD | | | | 133,784
| | | | —
| | |
Credit Suisse Securities (USA) L.L.C.
| | 12/12/14
| | | 6,600,000
EUR | | | | 8,382,774
USD | | | | 175,564
| | | | —
| | |
Credit Suisse Securities (USA) L.L.C.
| | 12/12/14
| | | 1,600,000
GBP | | | | 2,581,699
USD | | | | 82,638
| | | | —
| | |
Credit Suisse Securities (USA) L.L.C.
| | 12/12/14
| | | 31,800,000
JPY | | | | 269,549
USD | | | | 1,626
| | | | —
| | |
Credit Suisse Securities (USA) L.L.C.
| | 12/12/14
| | | 102,700,000
NOK | | | | 15,758,520
USD | | | | 1,124,717
| | | | —
| | |
Credit Suisse Securities (USA) L.L.C.
| | 12/12/14
| | | 21,800,000
SEK | | | | 2,929,378
USD | | | | 5,700
| | | | —
| | |
Credit Suisse Securities (USA) L.L.C.
| | 12/12/14
| | | 53,100,000
SGD | | | | 41,742,668
USD | | | | 1,030,239
| | | | —
| | |
Credit Suisse Securities (USA) L.L.C.
| | 12/12/14
| | | 709,611
USD | | | | 800,000
AUD | | | | —
| | | | (29,384
| ) | |
Credit Suisse Securities (USA) L.L.C.
| | 12/12/14
| | | 3,348,663
USD | | | | 3,200,000
CHF | | | | —
| | | | (36,389
| ) | |
Credit Suisse Securities (USA) L.L.C.
| | 12/12/14
| | | 2,008,566
USD | | | | 1,600,000
EUR | | | | —
| | | | (18,940
| ) | |
Credit Suisse Securities (USA) L.L.C.
| | 12/12/14
| | | 4,305,077
USD | | | | 2,700,000
GBP | | | | —
| | | | (87,911
| ) | |
Credit Suisse Securities (USA) L.L.C.
| | 12/12/14
| | | 6,107,828
USD | | | | 668,500,000
JPY | | | | —
| | | | (475,545
| ) | |
Credit Suisse Securities (USA) L.L.C.
| | 12/12/14
| | | 1,304,913
USD | | | | 8,800,000
NOK | | | | —
| | | | (50,994
| ) | |
Credit Suisse Securities (USA) L.L.C.
| | 12/12/14
| | | 548,144
USD | | | | 700,000
NZD | | | | 399
| | | | —
| | |
Credit Suisse Securities (USA) L.L.C.
| | 12/12/14
| | | 157,687
USD | | | | 200,000
NZD | | | | —
| | | | (960
| ) | |
Credit Suisse Securities (USA) L.L.C.
| | 12/12/14
| | | 6,427,378
USD | | | | 46,800,000
SEK | | | | —
| | | | (150,861
| ) | |
Credit Suisse Securities (USA) L.L.C.
| | 12/12/14
| | | 2,527,556
USD | | | | 3,300,000
SGD | | | | 2,595
| | | | —
| | |
Credit Suisse Securities (USA) L.L.C.
| | 12/12/14
| | | 691,191
USD | | | | 900,000
SGD | | | | —
| | | | (1,150
| ) | |
Deutsch Bank
| | 12/12/14
| | | 2,800,000
AUD | | | | 2,443,636
USD | | | | 62,842
| | | | —
| | |
Deutsch Bank
| | 12/12/14
| | | 1,200,000
CAD | | | | 1,070,732
USD | | | | 21,576
| | | | —
| | |
The accompanying Notes to Financial Statements are an integral part of this statement.
Semiannual Report 2014
13
Columbia Absolute Return Enhanced Multi-Strategy Fund
Portfolio of Investments (continued)
November 30, 2014 (Unaudited)
Forward Foreign Currency Exchange Contracts Open at November 30, 2014 (continued)
Counterparty | | Exchange Date | | Currency to
be Delivered | | Currency to
be Received | | Unrealized
Appreciation ($) | | Unrealized
Depreciation ($) | |
Deutsch Bank
| | 12/12/14
| | | 600,000
EUR | | | | 761,702
USD | | | | 15,592
| | | | —
| | |
Deutsch Bank
| | 12/12/14
| | | 132,000,000
JPY | | | | 1,230,200
USD | | | | 118,066
| | | | —
| | |
Deutsch Bank
| | 12/12/14
| | | 1,300,000
SGD | | | | 1,022,071
USD | | | | 25,345
| | | | —
| | |
Deutsch Bank
| | 12/12/14
| | | 523,636
USD | | | | 600,000
AUD | | | | —
| | | | (13,466
| ) | |
Deutsch Bank
| | 12/12/14
| | | 210,178
USD | | | | 200,000
CHF | | | | —
| | | | (3,160
| ) | |
Deutsch Bank
| | 12/12/14
| | | 2,537,166
USD | | | | 2,000,000
EUR | | | | —
| | | | (50,132
| ) | |
Deutsch Bank
| | 12/12/14
| | | 1,285,400
USD | | | | 800,000
GBP | | | | —
| | | | (35,869
| ) | |
Deutsch Bank
| | 12/12/14
| | | 265,142
USD | | | | 1,900,000
SEK | | | | —
| | | | (10,326
| ) | |
HSBC Securities (USA), Inc.
| | 12/12/14
| | | 19,600,000
CHF | | | | 20,593,643
USD | | | | 305,957
| | | | —
| | |
HSBC Securities (USA), Inc.
| | 12/12/14
| | | 10,939,652
GBP | | | | 17,568,753
USD | | | | 481,963
| | | | —
| | |
HSBC Securities (USA), Inc.
| | 12/12/14
| | | 1,500,000
SGD | | | | 1,179,245
USD | | | | 29,177
| | | | —
| | |
HSBC Securities (USA), Inc.
| | 12/12/14
| | | 9,950,946
USD | | | | 11,400,000
AUD | | | | —
| | | | (257,715
| ) | |
HSBC Securities (USA), Inc.
| | 12/12/14
| | | 4,015,348
USD | | | | 4,500,000
CAD | | | | —
| | | | (81,013
| ) | |
HSBC Securities (USA), Inc.
| | 12/12/14
| | | 18,280,512
USD | | | | 14,400,000
EUR | | | | —
| | | | (373,873
| ) | |
HSBC Securities (USA), Inc.
| | 12/12/14
| | | 27,228,669
USD | | | | 2,921,500,000
JPY | | | | —
| | | | (2,614,289
| ) | |
HSBC Securities (USA), Inc.
| | 12/12/14
| | | 7,916,500
USD | | | | 51,500,000
NOK | | | | —
| | | | (578,225
| ) | |
HSBC Securities (USA), Inc.
| | 12/12/14
| | | 16,362,610
USD | | | | 20,900,000
NZD | | | | 15,329
| | | | —
| | |
HSBC Securities (USA), Inc.
| | 12/12/14
| | | 32,809,315
USD | | | | 235,000,000
SEK | | | | —
| | | | (1,292,610
| ) | |
Morgan Stanley
| | 12/12/14
| | | 1,000,000
AUD | | | | 872,530
USD | | | | 22,246
| | | | —
| | |
Morgan Stanley
| | 12/12/14
| | | 5,500,000
CAD | | | | 4,905,452
USD | | | | 96,821
| | | | —
| | |
Morgan Stanley
| | 12/12/14
| | | 3,500,000
GBP | | | | 5,619,605
USD | | | | 152,908
| | | | —
| | |
Morgan Stanley
| | 12/12/14
| | | 600,000
NZD | | | | 469,489
USD | | | | —
| | | | (691
| ) | |
Morgan Stanley
| | 12/12/14
| | | 315,100
USD | | | | 300,000
CHF | | | | —
| | | | (4,574
| ) | |
Morgan Stanley
| | 12/12/14
| | | 7,155,241
USD | | | | 9,100,000
SGD | | | | —
| | | | (178,158
| ) | |
The accompanying Notes to Financial Statements are an integral part of this statement.
Semiannual Report 2014
14
Columbia Absolute Return Enhanced Multi-Strategy Fund
Portfolio of Investments (continued)
November 30, 2014 (Unaudited)
Forward Foreign Currency Exchange Contracts Open at November 30, 2014 (continued)
Counterparty | | Exchange Date | | Currency to
be Delivered | | Currency to
be Received | | Unrealized
Appreciation ($) | | Unrealized
Depreciation ($) | |
State Street Bank & Trust Company
| | 12/12/14
| | | 4,500,000
AUD | | | | 3,926,340
USD | | | | 100,065
| | | | —
| | |
State Street Bank & Trust Company
| | 12/12/14
| | | 1,000,000
EUR | | | | 1,268,750
USD | | | | 25,233
| | | | —
| | |
State Street Bank & Trust Company
| | 12/12/14
| | | 7,421,010
NZD | | | | 5,808,276
USD | | | | —
| | | | (7,075
| ) | |
State Street Bank & Trust Company
| | 12/12/14
| | | 8,829,038
USD | | | | 9,900,000
CAD | | | | —
| | | | (173,501
| ) | |
State Street Bank & Trust Company
| | 12/12/14
| | | 1,680,496
USD | | | | 1,600,000
CHF | | | | —
| | | | (24,358
| ) | |
State Street Bank & Trust Company
| | 12/12/14
| | | 9,474,633
USD | | | | 5,900,000
GBP | | | | —
| | | | (259,344
| ) | |
State Street Bank & Trust Company
| | 12/12/14
| | | 1,992,994
USD | | | | 213,900,000
JPY | | | | —
| | | | (190,832
| ) | |
UBS Securities
| | 12/12/14
| | | 3,614,990
AUD | | | | 3,149,886
USD | | | | 76,120
| | | | —
| | |
UBS Securities
| | 12/12/14
| | | 3,600,000
CAD | | | | 3,169,621
USD | | | | 22,153
| | | | —
| | |
UBS Securities
| | 12/12/14
| | | 3,825,000
CHF | | | | 3,988,881
USD | | | | 29,676
| | | | —
| | |
UBS Securities
| | 12/12/14
| | | 1,600,000
EUR | | | | 1,994,128
USD | | | | 4,501
| | | | —
| | |
UBS Securities
| | 12/12/14
| | | 5,850,000
GBP | | | | 9,388,524
USD | | | | 251,330
| | | | —
| | |
UBS Securities
| | 12/12/14
| | | 354,600,000
JPY | | | | 3,296,612
USD | | | | 309,017
| | | | —
| | |
UBS Securities
| | 12/12/14
| | | 79,336,197
NOK | | | | 12,070,473
USD | | | | 765,797
| | | | —
| | |
UBS Securities
| | 12/12/14
| | | 500,000
NZD | | | | 394,295
USD | | | | 2,478
| | | | —
| | |
UBS Securities
| | 12/12/14
| | | 1,648,676
NZD | | | | 1,289,413
USD | | | | —
| | | | (2,545
| ) | |
UBS Securities
| | 12/12/14
| | | 488,000,000
SEK | | | | 67,732,411
USD | | | | 2,284,956
| | | | —
| | |
UBS Securities
| | 12/12/14
| | | 123,050,000
SGD | | | | 96,727,848
USD | | | | 2,383,884
| | | | —
| | |
UBS Securities
| | 12/12/14
| | | 3,329,717
USD | | | | 3,814,990
AUD | | | | —
| | | | (85,895
| ) | |
UBS Securities
| | 12/12/14
| | | 14,036,583
USD | | | | 15,750,000
CAD | | | | —
| | | | (266,412
| ) | |
UBS Securities
| | 12/12/14
| | | 635,829
USD | | | | 600,000
CHF | | | | —
| | | | (14,777
| ) | |
UBS Securities
| | 12/12/14
| | | 3,367,543
USD | | | | 2,650,000
EUR | | | | —
| | | | (72,223
| ) | |
UBS Securities
| | 12/12/14
| | | 15,125,082
USD | | | | 9,500,000
GBP | | | | —
| | | | (286,905
| ) | |
UBS Securities
| | 12/12/14
| | | 18,118,667
USD | | | | 1,951,800,000
JPY | | | | —
| | | | (1,674,258
| ) | |
The accompanying Notes to Financial Statements are an integral part of this statement.
Semiannual Report 2014
15
Columbia Absolute Return Enhanced Multi-Strategy Fund
Portfolio of Investments (continued)
November 30, 2014 (Unaudited)
Forward Foreign Currency Exchange Contracts Open at November 30, 2014 (continued)
Counterparty | | Exchange Date | | Currency to
be Delivered | | Currency to
be Received | | Unrealized
Appreciation ($) | | Unrealized
Depreciation ($) | |
UBS Securities
| | 12/12/14
| | | 2,914,219
USD | | | | 19,800,000
NOK | | | | —
| | | | (92,901
| ) | |
UBS Securities
| | 12/12/14
| | | 22,289,565
USD | | | | 28,500,000
NZD | | | | 52,398
| | | | —
| | |
UBS Securities
| | 12/12/14
| | | 1,722,666
USD | | | | 2,200,000
NZD | | | | —
| | | | (7,083
| ) | |
UBS Securities
| | 12/12/14
| | | 2,758,175
USD | | | | 19,793,497
SEK | | | | —
| | | | (103,598
| ) | |
UBS Securities
| | 12/12/14
| | | 5,897,964
USD | | | | 7,600,000
SGD | | | | —
| | | | (70,948
| ) | |
Wells Fargo Bank
| | 12/12/14
| | | 1,400,000
AUD | | | | 1,220,660
USD | | | | 30,263
| | | | —
| | |
Wells Fargo Bank
| | 12/12/14
| | | 2,000,000
CAD | | | | 1,782,372
USD | | | | 33,779
| | | | —
| | |
Wells Fargo Bank
| | 12/12/14
| | | 15,200,000
NOK | | | | 2,335,408
USD | | | | 169,548
| | | | —
| | |
Wells Fargo Bank
| | 12/12/14
| | | 5,900,000
SGD | | | | 4,636,178
USD | | | | 112,575
| | | | —
| | |
Wells Fargo Bank
| | 12/12/14
| | | 1,903,950
USD | | | | 1,500,000
EUR | | | | —
| | | | (38,675
| ) | |
Wells Fargo Bank
| | 12/12/14
| | | 2,248,820
USD | | | | 1,400,000
GBP | | | | —
| | | | (62,141
| ) | |
Wells Fargo Bank
| | 12/12/14
| | | 5,573,373
USD | | | | 597,800,000
JPY | | | | —
| | | | (536,756
| ) | |
Wells Fargo Bank
| | 12/12/14
| | | 782,900
USD | | | | 1,000,000
NZD | | | | 733
| | | | —
| | |
Credit Suisse Securities (USA) L.L.C.
| | 12/17/14
| | | 5,064,000
CHF | | | | 6,310,453
USD | | | | 13,116
| | | | —
| | |
Credit Suisse Securities (USA) L.L.C.
| | 12/17/14
| | | 18,000
CHF | | | | 22,367
USD | | | | —
| | | | (17
| ) | |
Credit Suisse Securities (USA) L.L.C.
| | 12/17/14
| | | 2,524,276
USD | | | | 1,609,000
GBP | | | | —
| | | | (11,227
| ) | |
Credit Suisse Securities (USA) L.L.C.
| | 12/17/14
| | | 3,807,757
USD | | | | 4,817,000
NZD | | | | —
| | | | (35,082
| ) | |
HSBC Securities (USA), Inc.
| | 12/17/14
| | | 25,656,000
NOK | | | | 3,781,278
USD | | | | 126,199
| | | | —
| | |
HSBC Securities (USA), Inc.
| | 12/17/14
| | | 6,372,458
USD | | | | 747,082,000
JPY | | | | —
| | | | (77,459
| ) | |
UBS Securities
| | 12/17/14
| | | 2,444,000
CHF | | | | 2,534,875
USD | | | | 4,931
| | | | —
| | |
Total | | | | | | | | | 20,243,382 | | | | (19,446,150 | ) | |
The accompanying Notes to Financial Statements are an integral part of this statement.
Semiannual Report 2014
16
Columbia Absolute Return Enhanced Multi-Strategy Fund
Portfolio of Investments (continued)
November 30, 2014 (Unaudited)
Futures Contracts Outstanding at November 30, 2014
At November 30, 2014, cash totaling $2,172,433 was pledged as collateral to cover initial margin requirements on open futures contracts.
Long Futures Contracts Outstanding
Contract Description | | Number of
Contracts | | Trading
Currency | | Notional
Market
Value ($) | | Expiration
Date | | Unrealized
Appreciation ($) | | Unrealized
(Depreciation) ($) | |
| 10YR MINI | | | 395 | | | JPY | | | | | 48,891,294 | | | 12/2014 | | | 107,683 | | | | — | | |
| 3MO EUROYEN (TFX) | | | 16 | | | JPY | | | | | 3,364,023 | | | 06/2015 | | | 404 | | | | — | | |
| 90 DAY STERLING | | | 19 | | | GBP | | | | | 3,684,894 | | | 06/2015 | | | 13,562 | | | | — | | |
AUST 10YR BOND | | | 51 | | | AUD | | | | | 5,435,834 | | | 12/2014 | | | 110,420 | | | | — | | |
BANK ACCEPT | | | 84 | | | CAD | | | | | 18,126,847 | | | 06/2015 | | | 1,744 | | | | — | | |
CAC40 10 EURO | | | 13 | | | EUR | | | | | 708,505 | | | 12/2014 | | | 20,691 | | | | — | | |
CAN 10YR BOND | | | 11 | | | CAD | | | | | 1,324,906 | | | 03/2015 | | | 16,964 | | | | — | | |
CBOE VIX | | | 65 | | | USD | | | | | 1,153,750 | | | 04/2015 | | | 5,820 | | | | — | | |
CBOE VIX | | | 34 | | | USD | | | | | 569,500 | | | 02/2015 | | | — | | | | (89 | ) | |
CBOE VIX | | | 105 | | | USD | | | | | 1,806,000 | | | 03/2015 | | | 5,734 | | | | — | | |
| EURO STOXX 50 | | | 28 | | | EUR | | | | | 1,129,451 | | | 12/2014 | | | 42,615 | | | | — | | |
| EURO-BUND | | | 9 | | | EUR | | | | | 1,710,552 | | | 12/2014 | | | 40,308 | | | | — | | |
FTSE 100 INDEX | | | 41 | | | GBP | | | | | 4,310,666 | | | 12/2014 | | | 43,062 | | | | — | | |
FTSE/MIB INDEX | | | 20 | | | EUR | | | | | 2,491,377 | | | 12/2014 | | | 92,863 | | | | — | | |
HANG SENG INDEX | | | 1 | | | HKD | | | | | 154,605 | | | 12/2014 | | | 697 | | | | — | | |
IBEX 35 INDEX | | | 12 | | | EUR | | | | | 1,605,588 | | | 12/2014 | | | 62,869 | | | | — | | |
LONG GILT | | | 54 | | | GBP | | | | | 9,914,262 | | | 03/2015 | | | 77,122 | | | | — | | |
MSCI SING IX ETS | | | 61 | | | SGD | | | | | 3,527,677 | | | 12/2014 | | | 13,856 | | | | — | | |
OMXS30 INDEX | | | 92 | | | SEK | | | | | 1,807,229 | | | 12/2014 | | | 42,837 | | | | — | | |
S&P 500 | | | 1 | | | USD | | | | | 516,575 | | | 12/2014 | | | 13,272 | | | | — | | |
SPI 200 | | | 3 | | | AUD | | | | | 340,658 | | | 12/2014 | | | — | | | | (9,758 | ) | |
TOPIX INDEX | | | 2 | | | JPY | | | | | 237,628 | | | 12/2014 | | | 23,638 | | | | — | | |
US LONG BOND | | | 7 | | | USD | | | | | 998,375 | | | 03/2015 | | | 14,370 | | | | — | | |
Total | | | | | | | | | | | 750,531 | | | | (9,847 | ) | |
Short Futures Contracts Outstanding
Contract Description | | Number of
Contracts | | Trading
Currency | | Notional
Market
Value ($) | | Expiration
Date | | Unrealized
Appreciation ($) | | Unrealized
(Depreciation) ($) | |
| 3MO EURO EURIBOR | | | (11 | ) | | EUR | | | | | (3,416,923 | ) | | 06/2015 | | | — | | | | (707 | ) | |
3MO EURO SWISS FRANC | | | (98 | ) | | CHF | | | | | (25,383,648 | ) | | 06/2015 | | | — | | | | (5,502 | ) | |
| 3MO EUROYEN (TFX) | | | (69 | ) | | JPY | | | | | (14,507,350 | ) | | 06/2015 | | | — | | | | (1,915 | ) | |
CAN 10YR BOND | | | (1 | ) | | CAD | | | | | (120,446 | ) | | 03/2015 | | | — | | | | (1,201 | ) | |
CBOE VIX | | | (147 | ) | | USD | | | | | (2,182,950 | ) | | 12/2014 | | | 41,868 | | | | — | | |
CBOE VIX | | | (39 | ) | | USD | | | | | (622,050 | ) | | 01/2015 | | | — | | | | (7,052 | ) | |
The accompanying Notes to Financial Statements are an integral part of this statement.
Semiannual Report 2014
17
Columbia Absolute Return Enhanced Multi-Strategy Fund
Portfolio of Investments (continued)
November 30, 2014 (Unaudited)
Futures Contracts Outstanding at November 30, 2014
Short Futures Contracts Outstanding (continued)
Contract Description | | Number of
Contracts | | Trading
Currency | | Notional
Market
Value ($) | | Expiration
Date | | Unrealized
Appreciation ($) | | Unrealized
(Depreciation) ($) | |
| EURO$ 90 DAY | | | (152 | ) | | USD | | | | | (37,863,200 | ) | | 06/2015 | | | — | | | | (13,129 | ) | |
| EURO-BUND | | | (58 | ) | | EUR | | | | | (11,023,558 | ) | | 12/2014 | | | — | | | | (121,389 | ) | |
FTSE 100 INDEX | | | (4 | ) | | GBP | | | | | (420,553 | ) | | 12/2014 | | | — | | | | (17,187 | ) | |
HANG SENG INDEX | | | (1 | ) | | HKD | | | | | (154,605 | ) | | 12/2014 | | | — | | | | (706 | ) | |
S&P 500 | | | (1 | ) | | USD | | | | | (516,575 | ) | | 12/2014 | | | — | | | | (78 | ) | |
S&P/TSE 60 INDEX | | | (3 | ) | | CAD | | | | | (452,243 | ) | | 12/2014 | | | — | | | | (3,602 | ) | |
SPI 200 | | | (6 | ) | | AUD | | | | | (681,316 | ) | | 12/2014 | | | 2,165 | | | | — | | |
TOPIX INDEX | | | (5 | ) | | JPY | | | | | (594,070 | ) | | 12/2014 | | | — | | | | (9,528 | ) | |
US LONG BOND | | | (17 | ) | | USD | | | | | (2,424,625 | ) | | 03/2015 | | | — | | | | (28,722 | ) | |
Total | | | | | | | | | | | 44,033 | | | | (210,718 | ) | |
Notes to Portfolio of Investments
(a) Non-income producing.
(b) This security, or a portion of this security, was pledged as collateral for securities sold short. At November 30, 2014, total securities pledged was $18,895,340.
(c) Identifies securities considered by the Investment Manager to be illiquid as to their marketability. The aggregate value of such securities at November 30, 2014 was $11, which represents less than 0.01% of net assets. Information concerning such security holdings at November 30, 2014 is as follows:
Security Description | | Acquisition Dates | | Cost ($) | |
Patriot Coal Corp.
Senior Unsecured
05/31/2013 3.25% | | 05/16/2011 - 11/22/2011
| | | 114,071
| | |
(d) Represents fair value as determined in good faith under procedures approved by the Board of Trustees. At November 30, 2014, the value of these securities amounted to $11, which represents less than 0.01% of net assets.
(e) Represents securities that have defaulted on payment of interest. The Fund has stopped accruing interest on these securities. At November 30, 2014, the value of these securities amounted to $11, which represents less than 0.01% of net assets.
(f) The rate shown is the seven-day current annualized yield at November 30, 2014.
(g) As defined in the Investment Company Act of 1940, an affiliated company is one in which the Fund owns 5% or more of the company's outstanding voting securities, or a company which is under common ownership or control with the Fund. Holdings and transactions in these affiliated companies during the period ended November 30, 2014, are as follows:
Issuer | | Beginning
Cost ($) | | Purchase
Cost ($) | | Proceeds
From Sales ($) | | Ending
Cost ($) | | Dividends —
Affiliated
Issuers ($) | | Value ($) | |
Columbia Short-Term Cash Fund | | | 82,850,299 | | | | 74,412,431 | | | | (84,039,035 | ) | | | 73,223,695 | | | | 36,701 | | | | 73,223,695 | | |
Abbreviation Legend
ADR American Depositary Receipt
The accompanying Notes to Financial Statements are an integral part of this statement.
Semiannual Report 2014
18
Columbia Absolute Return Enhanced Multi-Strategy Fund
Portfolio of Investments (continued)
November 30, 2014 (Unaudited)
AUD Australian Dollar
CAD Canadian Dollar
CHF Swiss Franc
EUR Euro
GBP British Pound
HKD Hong Kong Dollar
JPY Japanese Yen
NOK Norwegian Krone
NZD New Zealand Dollar
SEK Swedish Krona
SGD Singapore Dollar
USD US Dollar
Fair Value Measurements
Generally accepted accounting principles (GAAP) require disclosure regarding the inputs and valuation techniques used to measure fair value and any changes in valuation inputs or techniques. In addition, investments shall be disclosed by major category.
The Fund categorizes its fair value measurements according to a three-level hierarchy that maximizes the use of observable inputs and minimizes the use of unobservable inputs by prioritizing that the most observable input be used when available. Observable inputs are those that market participants would use in pricing an investment based on market data obtained from sources independent of the reporting entity. Unobservable inputs are those that reflect the Fund's assumptions about the information market participants would use in pricing an investment. An investment's level within the fair value hierarchy is based on the lowest level of any input that is deemed significant to the asset or liability's fair value measurement. The input levels are not necessarily an indication of the risk or liquidity associated with investments at that level. For example, certain U.S. government securities are generally high quality and liquid, however, they are reflected as Level 2 because the inputs used to determine fair value may not always be quoted prices in an active market.
Fair value inputs are summarized in the three broad levels listed below:
> Level 1 — Valuations based on quoted prices for investments in active markets that the Fund has the ability to access at the measurement date (including NAV for open-end mutual funds). Valuation adjustments are not applied to Level 1 investments.
> Level 2 — Valuations based on other significant observable inputs (including quoted prices for similar securities, interest rates, prepayment speeds, credit risks, etc.).
> Level 3 — Valuations based on significant unobservable inputs (including the Fund's own assumptions and judgment in determining the fair value of investments).
Inputs that are used in determining fair value of an investment may include price information, credit data, volatility statistics, and other factors. These inputs can be either observable or unobservable. The availability of observable inputs can vary between investments, and is affected by various factors such as the type of investment, and the volume and level of activity for that investment or similar investments in the marketplace. The inputs will be considered by the Investment Manager, along with any other relevant factors in the calculation of an investment's fair value. The Fund uses prices and inputs that are current as of the measurement date, which may include periods of market dislocations. During these periods, the availability of prices and inputs may be reduced for many investments. This condition could cause an investment to be reclassified between the various levels within the hierarchy.
Investments falling into the Level 3 category are primarily supported by quoted prices from brokers and dealers participating in the market for those investments. However, these may be classified as Level 3 investments due to lack of market transparency and corroboration to support these quoted prices. Additionally, valuation models may be used as the pricing source for any remaining investments classified as Level 3. These models may rely on one or more significant unobservable inputs and/or significant assumptions by the Investment Manager. Inputs used in valuations may include, but are not limited to, financial statement analysis, capital account balances, discount rates and estimated cash flows, and comparable company data.
Under the direction of the Fund's Board of Trustees (the Board), the Investment Manager's Valuation Committee (the Committee) is responsible for overseeing the valuation procedures approved by the Board. The Committee consists of voting and non-voting members from various groups within the Investment Manager's organization, including operations and accounting, trading and investments, compliance, risk management and legal.
The accompanying Notes to Financial Statements are an integral part of this statement.
Semiannual Report 2014
19
Columbia Absolute Return Enhanced Multi-Strategy Fund
Portfolio of Investments (continued)
November 30, 2014 (Unaudited)
Fair Value Measurements (continued)
The Committee meets at least monthly to review and approve valuation matters, which may include a description of specific valuation determinations, data regarding pricing information received from approved pricing vendors and brokers and the results of Board-approved valuation control policies and procedures (the Policies). The Policies address, among other things, instances when market quotations are or are not readily available, including recommendations of third party pricing vendors and a determination of appropriate pricing methodologies; events that require specific valuation determinations and assessment of fair value techniques; securities with a potential for stale pricing, including those that are illiquid, restricted, or in default; and the effectiveness of third party pricing vendors, including periodic reviews of vendors. The Committee meets more frequently, as needed, to discuss additional valuation matters, which may include the need to review back-testing results, review time-sensitive information or approve related valuation actions. The Committee reports to the Board, with members of the Committee meeting with the Board at each of its regularly scheduled meetings to discuss valuation matters and actions during the period, similar to those described earlier.
For investments categorized as Level 3, the Committee monitors information similar to that described above, which may include: (i) data specific to the issuer or comparable issuers, (ii) general market or specific sector news and (iii) quoted prices and specific or similar security transactions. The Committee considers this data and any changes from prior periods in order to assess the reasonableness of observable and unobservable inputs, any assumptions or internal models used to value those securities and changes in fair value. This data is also used to corroborate, when available, information received from approved pricing vendors and brokers. Various factors impact the frequency of monitoring this information (which may occur as often as daily). However, the Committee may determine that changes to inputs, assumptions and models are not required as a result of the monitoring procedures performed.
The following table is a summary of the inputs used to value the Fund's investments at November 30, 2014:
Description | | Level 1
Quoted Prices in Active
Markets for Identical
Assets ($) | | Level 2
Other Significant
Observable Inputs ($) | | Level 3
Significant
Unobservable Inputs ($) | | Total ($) | |
Equity Securities | |
Common Stocks | |
Consumer Discretionary | | | 5,765,710 | | | | — | | | | — | | | | 5,765,710 | | |
Consumer Staples | | | 1,517,126 | | | | — | | | | — | | | | 1,517,126 | | |
Energy | | | 2,078,116 | | | | — | | | | — | | | | 2,078,116 | | |
Financials | | | 3,794,546 | | | | — | | | | — | | | | 3,794,546 | | |
Health Care | | | 4,277,985 | | | | — | | | | — | | | | 4,277,985 | | |
Industrials | | | 2,890,810 | | | | — | | | | — | | | | 2,890,810 | | |
Information Technology | | | 6,141,884 | | | | — | | | | — | | | | 6,141,884 | | |
Materials | | | 287,185 | | | | — | | | | — | | | | 287,185 | | |
Common Stocks — Investments
Sold Short | |
Consumer Discretionary | | | (5,708,046 | ) | | | — | | | | — | | | | (5,708,046 | ) | |
Consumer Staples | | | (1,532,937 | ) | | | — | | | | — | | | | (1,532,937 | ) | |
Energy | | | (1,967,093 | ) | | | — | | | | — | | | | (1,967,093 | ) | |
Financials | | | (3,786,168 | ) | | | — | | | | — | | | | (3,786,168 | ) | |
Health Care | | | (4,370,614 | ) | | | — | | | | — | | | | (4,370,614 | ) | |
Industrials | | | (2,851,625 | ) | | | — | | | | — | | | | (2,851,625 | ) | |
Information Technology | | | (6,083,789 | ) | | | — | | | | — | | | | (6,083,789 | ) | |
Materials | | | (294,851 | ) | | | — | | | | — | | | | (294,851 | ) | |
Total Equity Securities | | | 158,239 | | | | — | | | | — | | | | 158,239 | | |
Bonds | |
Convertible Bonds | | | — | | | | — | | | | 11 | | | | 11 | | |
Total Bonds | | | — | | | | — | | | | 11 | | | | 11 | | |
The accompanying Notes to Financial Statements are an integral part of this statement.
Semiannual Report 2014
20
Columbia Absolute Return Enhanced Multi-Strategy Fund
Portfolio of Investments (continued)
November 30, 2014 (Unaudited)
Fair Value Measurements (continued)
Description | | Level 1
Quoted Prices in Active
Markets for Identical
Assets ($) | | Level 2
Other Significant
Observable Inputs ($) | | Level 3
Significant
Unobservable Inputs ($) | | Total ($) | |
Mutual Funds | |
Money Market Funds | | | 73,223,695 | | | | — | | | | — | | | | 73,223,695 | | |
Total Mutual Funds | | | 73,223,695 | | | | — | | | | — | | | | 73,223,695 | | |
Investments in Securities | | | 73,381,934 | | | | — | | | | 11 | | | | 73,381,945 | | |
Derivatives | |
Assets | |
Forward Foreign Currency
Exchange Contracts | | | | | | | 20,243,382 | | | | — | | | | 20,243,382 | | |
Futures Contracts | | | 794,564 | | | | — | | | | — | | | | 794,564 | | |
Liabilities | |
Forward Foreign Currency
Exchange Contracts | | | | | (19,446,150 | ) | | | — | | | | (19,446,150 | ) | |
Futures Contracts | | | (220,565 | ) | | | — | | | | — | | | | (220,565 | ) | |
Total | | | 73,955,933 | | | | 797,232 | | | | 11 | | | | 74,753,176 | | |
See the Portfolio of Investments for all investment classifications not indicated in the table.
There were no transfers of financial assets between levels during the period.
Derivative instruments are valued at unrealized appreciation (depreciation).
The Fund's assets assigned to the Level 3 category are valued utilizing the valuation technique deemed the most appropriate in the circumstances. Certain convertible bonds classified as Level 3 are valued using an income approach. To determine fair value for these securities, management considered estimates of future distributions from the company assets or potential actions related to the respective company's restructuring. Significant increases (decreases) to any of these inputs would result in a significantly lower (higher) fair value measurement.
The accompanying Notes to Financial Statements are an integral part of this statement.
Semiannual Report 2014
21
Columbia Absolute Return Enhanced Multi-Strategy Fund
Statement of Assets and Liabilities
November 30, 2014 (Unaudited)
Assets | |
Investments, at value | |
Unaffiliated issuers (identified cost $24,284,746) | | $ | 26,753,373 | | |
Affiliated issuers (identified cost $73,223,695) | | | 73,223,695 | | |
Total investments (identified cost $97,508,441) | | | 99,977,068 | | |
Cash | | | 2,029 | | |
Cash collateral held at broker | | | 23,907,663 | | |
Margin deposits | | | 2,172,433 | | |
Unrealized appreciation on forward foreign currency exchange contracts | | | 20,243,382 | | |
Receivable for: | |
Investments sold | | | 15,097 | | |
Capital shares sold | | | 5,240 | | |
Dividends | | | 31,997 | | |
Variation margin | | | 156,237 | | |
Prepaid expenses | | | 2,402 | | |
Total assets | | | 146,513,548 | | |
Liabilities | |
Securities sold short, at value (proceeds $24,933,708) | | | 26,595,123 | | |
Unrealized depreciation on forward foreign currency exchange contracts | | | 19,446,150 | | |
Payable for: | |
Investments purchased | | | 17,188 | | |
Capital shares purchased | | | 143,822 | | |
Dividends and interest on securities sold short | | | 38,507 | | |
Variation margin | | | 210,495 | | |
Investment management fees | | | 5,027 | | |
Distribution and/or service fees | | | 357 | | |
Transfer agent fees | | | 3,247 | | |
Administration fees | | | 437 | | |
Compensation of board members | | | 14,671 | | |
Other expenses | | | 65,042 | | |
Total liabilities | | | 46,540,066 | | |
Net assets applicable to outstanding capital stock | | $ | 99,973,482 | | |
Represented by | |
Paid-in capital | | $ | 108,101,738 | | |
Excess of distributions over net investment income | | | (2,350,680 | ) | |
Accumulated net realized loss | | | (7,921,244 | ) | |
Unrealized appreciation (depreciation) on: | |
Investments | | | 2,468,627 | | |
Foreign currency translations | | | (34,775 | ) | |
Forward foreign currency exchange contracts | | | 797,232 | | |
Futures contracts | | | 573,999 | | |
Securities sold short | | | (1,661,415 | ) | |
Total — representing net assets applicable to outstanding capital stock | | $ | 99,973,482 | | |
The accompanying Notes to Financial Statements are an integral part of this statement.
Semiannual Report 2014
22
Columbia Absolute Return Enhanced Multi-Strategy Fund
Statement of Assets and Liabilities (continued)
November 30, 2014 (Unaudited)
Class A | |
Net assets | | $ | 17,953,003 | | |
Shares outstanding | | | 1,856,663 | | |
Net asset value per share | | $ | 9.67 | | |
Maximum offering price per share(a) | | $ | 10.26 | | |
Class B | |
Net assets | | $ | 83,149 | | |
Shares outstanding | | | 8,738 | | |
Net asset value per share | | $ | 9.52 | | |
Class C | |
Net assets | | $ | 1,882,828 | | |
Shares outstanding | | | 197,835 | | |
Net asset value per share | | $ | 9.52 | | |
Class I | |
Net assets | | $ | 78,143,211 | | |
Shares outstanding | | | 8,034,350 | | |
Net asset value per share | | $ | 9.73 | | |
Class R | |
Net assets | | $ | 15,954 | | |
Shares outstanding | | | 1,664 | | |
Net asset value per share | | $ | 9.59 | | |
Class R5 | |
Net assets | | $ | 2,435 | | |
Shares outstanding | | | 249 | | |
Net asset value per share(b) | | $ | 9.79 | | |
Class W | |
Net assets | | $ | 100,181 | | |
Shares outstanding | | | 10,356 | | |
Net asset value per share | | $ | 9.67 | | |
Class Z | |
Net assets | | $ | 1,792,721 | | |
Shares outstanding | | | 184,402 | | |
Net asset value per share | | $ | 9.72 | | |
(a) The maximum offering price per share is calculated by dividing the net asset value per share by 1.0 minus the maximum sales charge of 5.75%.
(b) Net asset value per share rounds to this amount due to fractional shares outstanding.
The accompanying Notes to Financial Statements are an integral part of this statement.
Semiannual Report 2014
23
Columbia Absolute Return Enhanced Multi-Strategy Fund
Statement of Operations
Six Months Ended November 30, 2014 (Unaudited)
Net investment income | |
Income: | |
Dividends — unaffiliated issuers | | $ | 210,677 | | |
Dividends — affiliated issuers | | | 36,701 | | |
Foreign taxes withheld | | | (399 | ) | |
Total income | | | 246,979 | | |
Expenses: | |
Investment management fees | | | 488,366 | | |
Distribution and/or service fees | |
Class A | | | 30,358 | | |
Class B | | | 425 | | |
Class C | | | 12,193 | | |
Class R | | | 35 | | |
Class W | | | 158 | | |
Transfer agent fees | |
Class A | | | 15,510 | | |
Class B | | | 55 | | |
Class C | | | 1,560 | | |
Class R | | | 9 | | |
Class R5 | | | 1 | | |
Class W | | | 81 | | |
Class Z | | | 1,243 | | |
Administration fees | | | 42,467 | | |
Compensation of board members | | | 6,458 | | |
Custodian fees | | | 32,512 | | |
Printing and postage fees | | | 12,539 | | |
Registration fees | | | 48,355 | | |
Professional fees | | | 19,583 | | |
Dividends and interest on securities sold short | | | 137,628 | | |
Other | | | 5,728 | | |
Total expenses | | | 855,264 | | |
Fees waived or expenses reimbursed by Investment Manager and its affiliates | | | (49,180 | ) | |
Total net expenses | | | 806,084 | | |
Net investment loss | | | (559,105 | ) | |
Realized and unrealized gain (loss) — net | |
Net realized gain (loss) on: | |
Investments | | | 8,950,510 | | |
Foreign currency translations | | | (119,880 | ) | |
Forward foreign currency exchange contracts | | | 633,642 | | |
Futures contracts | | | (1,567,362 | ) | |
Securities sold short | | | (715,945 | ) | |
Net realized gain | | | 7,180,965 | | |
Net change in unrealized appreciation (depreciation) on: | |
Investments | | | (5,661,820 | ) | |
Foreign currency translations | | | (31,997 | ) | |
Forward foreign currency exchange contracts | | | 1,141,932 | | |
Futures contracts | | | 422,308 | | |
Securities sold short | | | (1,475,799 | ) | |
Net change in unrealized depreciation | | | (5,605,376 | ) | |
Net realized and unrealized gain | | | 1,575,589 | | |
Net increase in net assets resulting from operations | | $ | 1,016,484 | | |
The accompanying Notes to Financial Statements are an integral part of this statement.
Semiannual Report 2014
24
Columbia Absolute Return Enhanced Multi-Strategy Fund
Statement of Changes in Net Assets
| | | Six Months Ended
November 30, 2014
(Unaudited) | | Year Ended
May 31,
2014 | |
Operations | |
Net investment loss | | $ | (559,105 | ) | | $ | (1,438,621 | ) | |
Net realized gain (loss) | | | 7,180,965 | | | | (12,128,794 | ) | |
Net change in unrealized appreciation (depreciation) | | | (5,605,376 | ) | | | 1,443,185 | | |
Net increase (decrease) in net assets resulting from operations | | | 1,016,484 | | | | (12,124,230 | ) | |
Distributions to shareholders | |
Net investment income | |
Class A | | | — | | | | (198,465 | ) | |
Class B | | | — | | | | (163 | ) | |
Class C | | | — | | | | (4,435 | ) | |
Class I | | | — | | | | (645,950 | ) | |
Class R | | | — | | | | (37 | ) | |
Class R5 | | | — | | | | (15 | ) | |
Class W | | | — | | | | (280,341 | ) | |
Class Z | | | — | | | | (22,402 | ) | |
Total distributions to shareholders | | | — | | | | (1,151,808 | ) | |
Increase (decrease) in net assets from capital stock activity | | | (15,614,129 | ) | | | 43,879,176 | | |
Total increase (decrease) in net assets | | | (14,597,645 | ) | | | 30,603,138 | | |
Net assets at beginning of period | | | 114,571,127 | | | | 83,967,989 | | |
Net assets at end of period | | $ | 99,973,482 | | | $ | 114,571,127 | | |
Excess of distributions over net investment income | | $ | (2,350,680 | ) | | $ | (1,791,575 | ) | |
The accompanying Notes to Financial Statements are an integral part of this statement.
Semiannual Report 2014
25
Columbia Absolute Return Enhanced Multi-Strategy Fund
Statement of Changes in Net Assets (continued)
| | | Six Months Ended November 30, 2014
(Unaudited) | | Year Ended May 31, 2014 | |
| | | Shares | | Dollars ($) | | Shares | | Dollars ($) | |
Capital stock activity | |
Class A shares | |
Subscriptions(a) | | | 81,828 | | | | 782,876 | | | | 1,290,048 | | | | 13,002,904 | | |
Distributions reinvested | | | — | | | | — | | | | 19,843 | | | | 198,433 | | |
Redemptions | | | (1,565,862 | ) | | | (14,979,142 | ) | | | (2,332,865 | ) | | | (22,930,108 | ) | |
Net decrease | | | (1,484,034 | ) | | | (14,196,266 | ) | | | (1,022,974 | ) | | | (9,728,771 | ) | |
Class B shares | |
Subscriptions | | | — | | | | — | | | | 8,500 | | | | 84,263 | | |
Distributions reinvested | | | — | | | | — | | | | 16 | | | | 160 | | |
Redemptions(a) | | | (4,174 | ) | | | (39,525 | ) | | | (6,364 | ) | | | (63,559 | ) | |
Net increase (decrease) | | | (4,174 | ) | | | (39,525 | ) | | | 2,152 | | | | 20,864 | | |
Class C shares | |
Subscriptions | | | 4,133 | | | | 39,082 | | | | 84,916 | | | | 843,680 | | |
Distributions reinvested | | | — | | | | — | | | | 447 | | | | 4,426 | | |
Redemptions | | | (111,694 | ) | | | (1,052,554 | ) | | | (187,071 | ) | | | (1,832,758 | ) | |
Net decrease | | | (107,561 | ) | | | (1,013,472 | ) | | | (101,708 | ) | | | (984,652 | ) | |
Class I shares | |
Subscriptions | | | 28,311 | | | | 272,280 | | | | 14,232,623 | | | | 144,527,436 | | |
Distributions reinvested | | | — | | | | — | | | | 64,465 | | | | 645,935 | | |
Redemptions | | | (60,217 | ) | | | (578,872 | ) | | | (9,264,723 | ) | | | (92,396,280 | ) | |
Net increase (decrease) | | | (31,906 | ) | | | (306,592 | ) | | | 5,032,365 | | | | 52,777,091 | | |
Class R shares | |
Subscriptions | | | 285 | | | | 2,712 | | | | 466 | | | | 4,590 | | |
Distributions reinvested | | | — | | | | — | | | | 3 | | | | 29 | | |
Redemptions | | | (2 | ) | | | (16 | ) | | | (20 | ) | | | (199 | ) | |
Net increase | | | 283 | | | | 2,696 | | | | 449 | | | | 4,420 | | |
Class W shares | |
Subscriptions | | | 116 | | | | 1,112 | | | | 7,310,311 | | | | 74,031,114 | | |
Distributions reinvested | | | — | | | | — | | | | 28,005 | | | | 280,331 | | |
Redemptions | | | (8,989 | ) | | | (86,198 | ) | | | (7,321,733 | ) | | | (70,925,822 | ) | |
Net increase (decrease) | | | (8,873 | ) | | | (85,086 | ) | | | 16,583 | | | | 3,385,623 | | |
Class Z shares | |
Subscriptions | | | 75,858 | | | | 730,605 | | | | 169,342 | | | | 1,716,552 | | |
Distributions reinvested | | | — | | | | — | | | | 1,840 | | | | 18,454 | | |
Redemptions | | | (73,529 | ) | | | (706,489 | ) | | | (337,804 | ) | | | (3,330,405 | ) | |
Net increase (decrease) | | | 2,329 | | | | 24,116 | | | | (166,622 | ) | | | (1,595,399 | ) | |
Total net increase (decrease) | | | (1,633,936 | ) | | | (15,614,129 | ) | | | 3,760,245 | | | | 43,879,176 | | |
(a) Includes conversions of Class B shares to Class A shares, if any.
The accompanying Notes to Financial Statements are an integral part of this statement.
Semiannual Report 2014
26
Columbia Absolute Return Enhanced Multi-Strategy Fund
The following tables are intended to help you understand the Fund's financial performance. Certain information reflects financial results for a single share of a class held for the periods shown. Per share net investment income (loss) amounts are calculated based on average shares outstanding during the period. Total return assumes reinvestment of all dividends and distributions, if any. Total return does not reflect payment of sales charges, if any. Total return and portfolio turnover are not annualized for periods of less than one year. The portfolio turnover rate is calculated without regard to purchase and sales transactions of short-term instruments and certain derivatives, if any. If such transactions were included, the Fund's portfolio turnover rate may be higher.
| | | Six Months Ended
November 30, 2014 | |
Year Ended May 31, | |
Class A | | (Unaudited) | | 2014 | | 2013 | | 2012 | | 2011(a) | |
Per share data | |
Net asset value, beginning of period | | $ | 9.58 | | | $ | 10.28 | | | $ | 10.01 | | | $ | 9.92 | | | $ | 10.00 | | |
Income from investment operations: | |
Net investment loss | | | (0.06 | ) | | | (0.10 | ) | | | (0.06 | ) | | | (0.06 | ) | | | (0.01 | ) | |
Net realized and unrealized gain (loss) | | | 0.15 | | | | (0.56 | ) | | | 0.56 | | | | 0.12 | | | | (0.07 | ) | |
Increase from payment by affiliate | | | — | | | | 0.00 | (b) | | | — | | | | 0.04 | | | | — | | |
Total from investment operations | | | 0.09 | | | | (0.66 | ) | | | 0.50 | | | | 0.10 | | | | (0.08 | ) | |
Less distributions to shareholders: | |
Net investment income | | | — | | | | (0.04 | ) | | | (0.23 | ) | | | — | | | | — | | |
Net realized gains | | | — | | | | — | | | | — | | | | (0.01 | ) | | | — | | |
Total distributions to shareholders | | | — | | | | (0.04 | ) | | | (0.23 | ) | | | (0.01 | ) | | | — | | |
Net asset value, end of period | | $ | 9.67 | | | $ | 9.58 | | | $ | 10.28 | | | $ | 10.01 | | | $ | 9.92 | | |
Total return | | | 0.94 | % | | | (6.41 | %)(c) | | | 5.08 | % | | | 1.00 | %(d) | | | (0.80 | %) | |
Ratios to average net assets(e) | |
Total gross expenses | | | 1.86 | %(f)(g) | | | 1.97 | %(f) | | | 2.15 | %(f) | | | 2.15 | %(f) | | | 5.76 | %(g) | |
Total net expenses(h) | | | 1.74 | %(f)(g) | | | 1.68 | %(f) | | | 1.77 | %(f) | | | 1.68 | %(f) | | | 1.47 | %(g) | |
Net investment loss | | | (1.27 | %)(g) | | | (1.00 | %) | | | (0.63 | %) | | | (0.57 | %) | | | (0.68 | %)(g) | |
Supplemental data | |
Net assets, end of period (in thousands) | | $ | 17,953 | | | $ | 32,008 | | | $ | 44,838 | | | $ | 55,582 | | | $ | 11,745 | | |
Portfolio turnover | | | 130 | % | | | 142 | % | | | 62 | % | | | 154 | % | | | 11 | % | |
Notes to Financial Highlights
(a) Based on operations from March 31, 2011 (commencement of operations) through the stated period end.
(b) Rounds to zero.
(c) The Fund received a payment from an affiliate. Had the Fund not received this payment, the total return would have been lower by 0.03%.
(d) The Fund received a payment from an affiliate. Had the Fund not received this payment, the total return would have been lower by 0.38%.
(e) In addition to the fees and expenses that the Fund bears directly, the Fund indirectly bears a pro rata share of the fees and expenses of any other funds in which it invests. Such indirect expenses are not included in the Fund's reported expense ratios.
(f) Ratios include dividends and interest on securities sold short. If dividends and interest on securities sold short had been excluded, expenses would have been lower by 0.24% for the six months ended November 30, 2014 and 0.17%, 0.29% and 0.20% for the years ended May 31, 2014, 2013 and 2012, respectively.
(g) Annualized.
(h) Total net expenses include the impact of certain fee waivers/expense reimbursements made by the Investment Manager and certain of its affiliates, if applicable.
The accompanying Notes to Financial Statements are an integral part of this statement.
Semiannual Report 2014
27
Columbia Absolute Return Enhanced Multi-Strategy Fund
Financial Highlights (continued)
| | | Six Months Ended
November 30, 2014 | |
Year Ended May 31, | |
Class B | | (Unaudited) | | 2014 | | 2013 | | 2012 | | 2011(a) | |
Per share data | |
Net asset value, beginning of period | | $ | 9.47 | | | $ | 10.20 | | | $ | 9.92 | | | $ | 9.90 | | | $ | 10.00 | | |
Income from investment operations: | |
Net investment loss | | | (0.10 | ) | | | (0.17 | ) | | | (0.14 | ) | | | (0.14 | ) | | | (0.02 | ) | |
Net realized and unrealized gain (loss) | | | 0.15 | | | | (0.55 | ) | | | 0.56 | | | | 0.13 | | | | (0.08 | ) | |
Increase from payment by affiliate | | | — | | | | 0.00 | (b) | | | — | | | | 0.04 | | | | — | | |
Total from investment operations | | | 0.05 | | | | (0.72 | ) | | | 0.42 | | | | 0.03 | | | | (0.10 | ) | |
Less distributions to shareholders: | |
Net investment income | | | — | | | | (0.01 | ) | | | (0.14 | ) | | | — | | | | — | | |
Net realized gains | | | — | | | | — | | | | — | | | | (0.01 | ) | | | — | | |
Total distributions to shareholders | | | — | | | | (0.01 | ) | | | (0.14 | ) | | | (0.01 | ) | | | — | | |
Net asset value, end of period | | $ | 9.52 | | | $ | 9.47 | | | $ | 10.20 | | | $ | 9.92 | | | $ | 9.90 | | |
Total return | | | 0.53 | % | | | (7.04 | %)(c) | | | 4.26 | % | | | 0.30 | %(d) | | | (1.00 | %) | |
Ratios to average net assets(e) | |
Total gross expenses | | | 2.62 | %(f)(g) | | | 2.75 | %(f) | | | 2.87 | %(f) | | | 2.92 | %(f) | | | 6.86 | %(g) | |
Total net expenses(h) | | | 2.51 | %(f)(g) | | | 2.43 | %(f) | | | 2.50 | %(f) | | | 2.42 | %(f) | | | 2.22 | %(g) | |
Net investment loss | | | (2.05 | %)(g) | | | (1.75 | %) | | | (1.40 | %) | | | (1.38 | %) | | | (1.36 | %)(g) | |
Supplemental data | |
Net assets, end of period (in thousands) | | $ | 83 | | | $ | 122 | | | $ | 110 | | | $ | 92 | | | $ | 28 | | |
Portfolio turnover | | | 130 | % | | | 142 | % | | | 62 | % | | | 154 | % | | | 11 | % | |
Notes to Financial Highlights
(a) Based on operations from March 31, 2011 (commencement of operations) through the stated period end.
(b) Rounds to zero.
(c) The Fund received a payment from an affiliate. Had the Fund not received this payment, the total return would have been lower by 0.03%.
(d) The Fund received a payment from an affiliate. Had the Fund not received this payment, the total return would have been lower by 0.38%.
(e) In addition to the fees and expenses that the Fund bears directly, the Fund indirectly bears a pro rata share of the fees and expenses of any other funds in which it invests. Such indirect expenses are not included in the Fund's reported expense ratios.
(f) Ratios include dividends and interest on securities sold short. If dividends and interest on securities sold short had been excluded, expenses would have been lower by 0.26% for the six months ended November 30, 2014 and 0.17%, 027% and 0.19% for the years ended May 31, 2014, 2013 and 2012, respectively.
(g) Annualized.
(h) Total net expenses include the impact of certain fee waivers/expense reimbursements made by the Investment Manager and certain of its affiliates, if applicable.
The accompanying Notes to Financial Statements are an integral part of this statement.
Semiannual Report 2014
28
Columbia Absolute Return Enhanced Multi-Strategy Fund
Financial Highlights (continued)
| | | Six Months Ended
November 30, 2014 | |
Year Ended May 31, | |
Class C | | (Unaudited) | | 2014 | | 2013 | | 2012 | | 2011(a) | |
Per share data | |
Net asset value, beginning of period | | $ | 9.47 | | | $ | 10.20 | | | $ | 9.93 | | | $ | 9.91 | | | $ | 10.00 | | |
Income from investment operations: | |
Net investment loss | | | (0.10 | ) | | | (0.17 | ) | | | (0.14 | ) | | | (0.13 | ) | | | (0.02 | ) | |
Net realized and unrealized gain (loss) | | | 0.15 | | | | (0.55 | ) | | | 0.56 | | | | 0.12 | | | | (0.07 | ) | |
Increase from payment by affiliate | | | — | | | | 0.00 | (b) | | | — | | | | 0.04 | | | | — | | |
Total from investment operations | | | 0.05 | | | | (0.72 | ) | | | 0.42 | | | | 0.03 | | | | (0.09 | ) | |
Less distributions to shareholders: | |
Net investment income | | | — | | | | (0.01 | ) | | | (0.15 | ) | | | — | | | | — | | |
Net realized gains | | | — | | | | — | | | | — | | | | (0.01 | ) | | | — | | |
Total distributions to shareholders | | | — | | | | (0.01 | ) | | | (0.15 | ) | | | (0.01 | ) | | | — | | |
Net asset value, end of period | | $ | 9.52 | | | $ | 9.47 | | | $ | 10.20 | | | $ | 9.93 | | | $ | 9.91 | | |
Total return | | | 0.53 | % | | | (7.05 | %)(c) | | | 4.24 | % | | | 0.30 | %(d) | | | (0.90 | %) | |
Ratios to average net assets(e) | |
Total gross expenses | | | 2.62 | %(f)(g) | | | 2.72 | %(f) | | | 2.91 | %(f) | | | 2.92 | %(f) | | | 6.73 | %(g) | |
Total net expenses(h) | | | 2.50 | %(f)(g) | | | 2.43 | %(f) | | | 2.52 | %(f) | | | 2.44 | %(f) | | | 2.22 | %(g) | |
Net investment loss | | | (2.02 | %)(g) | | | (1.75 | %) | | | (1.37 | %) | | | (1.31 | %) | | | (1.44 | %)(g) | |
Supplemental data | |
Net assets, end of period (in thousands) | | $ | 1,883 | | | $ | 2,891 | | | $ | 4,151 | | | $ | 5,637 | | | $ | 970 | | |
Portfolio turnover | | | 130 | % | | | 142 | % | | | 62 | % | | | 154 | % | | | 11 | % | |
Notes to Financial Highlights
(a) Based on operations from March 31, 2011 (commencement of operations) through the stated period end.
(b) Rounds to zero.
(c) The Fund received a payment from an affiliate. Had the Fund not received this payment, the total return would have been lower by 0.03%.
(d) The Fund received a payment from an affiliate. Had the Fund not received this payment, the total return would have been lower by 0.38%.
(e) In addition to the fees and expenses that the Fund bears directly, the Fund indirectly bears a pro rata share of the fees and expenses of any other funds in which it invests. Such indirect expenses are not included in the Fund's reported expense ratios.
(f) Ratios include dividends and interest on securities sold short. If dividends and interest on securities sold short had been excluded, expenses would have been lower by 0.24% for the six months ended November 30, 2014 and 0.17%, 0.29% and 0.21% for the years ended May 31, 2014, 2013 and 2012, respectively.
(g) Annualized.
(h) Total net expenses include the impact of certain fee waivers/expense reimbursements made by the Investment Manager and certain of its affiliates, if applicable.
The accompanying Notes to Financial Statements are an integral part of this statement.
Semiannual Report 2014
29
Columbia Absolute Return Enhanced Multi-Strategy Fund
Financial Highlights (continued)
| | | Six Months Ended
November 30, 2014 | |
Year Ended May 31, | |
Class I | | (Unaudited) | | 2014 | | 2013 | | 2012 | | 2011(a) | |
Per share data | |
Net asset value, beginning of period | | $ | 9.62 | | | $ | 10.30 | | | $ | 10.03 | | | $ | 9.92 | | | $ | 10.00 | | |
Income from investment operations: | |
Net investment loss | | | (0.05 | ) | | | (0.06 | ) | | | (0.02 | ) | | | (0.04 | ) | | | (0.01 | ) | |
Net realized and unrealized gain (loss) | | | 0.16 | | | | (0.56 | ) | | | 0.56 | | | | 0.12 | | | | (0.07 | ) | |
Increase from payment by affiliate | | | — | | | | 0.00 | (b) | | | — | | | | 0.04 | | | | — | | |
Total from investment operations | | | 0.11 | | | | (0.62 | ) | | | 0.54 | | | | 0.12 | | | | (0.08 | ) | |
Less distributions to shareholders: | |
Net investment income | | | — | | | | (0.06 | ) | | | (0.27 | ) | | | — | | | | — | | |
Net realized gains | | | — | | | | — | | | | — | | | | (0.01 | ) | | | — | | |
Total distributions to shareholders | | | — | | | | (0.06 | ) | | | (0.27 | ) | | | (0.01 | ) | | | — | | |
Net asset value, end of period | | $ | 9.73 | | | $ | 9.62 | | | $ | 10.30 | | | $ | 10.03 | | | $ | 9.92 | | |
Total return | | | 1.14 | % | | | (6.04 | %)(c) | | | 5.51 | % | | | 1.21 | %(d) | | | (0.80 | %) | |
Ratios to average net assets(e) | |
Total gross expenses | | | 1.50 | %(f)(g) | | | 1.34 | %(f) | | | 1.64 | %(f) | | | 1.53 | %(f) | | | 3.87 | %(g) | |
Total net expenses(h) | | | 1.42 | %(f)(g) | | | 1.30 | %(f) | | | 1.35 | %(f) | | | 1.32 | %(f) | | | 1.16 | %(g) | |
Net investment loss | | | (0.95 | %)(g) | | | (0.63 | %) | | | (0.21 | %) | | | (0.37 | %) | | | (0.48 | %)(g) | |
Supplemental data | |
Net assets, end of period (in thousands) | | $ | 78,143 | | | $ | 77,599 | | | $ | 31,239 | | | $ | 29,587 | | | $ | 27,767 | | |
Portfolio turnover | | | 130 | % | | | 142 | % | | | 62 | % | | | 154 | % | | | 11 | % | |
Notes to Financial Highlights
(a) Based on operations from March 31, 2011 (commencement of operations) through the stated period end.
(b) Rounds to zero.
(c) The Fund received a payment from an affiliate. Had the Fund not received this payment, the total return would have been lower by 0.03%.
(d) The Fund received a payment from an affiliate. Had the Fund not received this payment, the total return would have been lower by 0.38%.
(e) In addition to the fees and expenses that the Fund bears directly, the Fund indirectly bears a pro rata share of the fees and expenses of any other funds in which it invests. Such indirect expenses are not included in the Fund's reported expense ratios.
(f) Ratios include dividends and interest on securities sold short. If dividends and interest on securities sold short had been excluded, expenses would have been lower by 0.27% for the six months ended November 30, 2014 and 0.16%, 0.29% and 0.16% for the years ended May 31, 2014, 2013 and 2012, respectively.
(g) Annualized.
(h) Total net expenses include the impact of certain fee waivers/expense reimbursements made by the Investment Manager and certain of its affiliates, if applicable.
The accompanying Notes to Financial Statements are an integral part of this statement.
Semiannual Report 2014
30
Columbia Absolute Return Enhanced Multi-Strategy Fund
Financial Highlights (continued)
| | | Six Months Ended
November 30, 2014 | |
Year Ended May 31, | |
Class R | | (Unaudited) | | 2014 | | 2013 | | 2012 | | 2011(a) | |
Per share data | |
Net asset value, beginning of period | | $ | 9.51 | | | $ | 10.21 | | | $ | 9.98 | | | $ | 9.91 | | | $ | 10.00 | | |
Income from investment operations: | |
Net investment loss | | | (0.07 | ) | | | (0.12 | ) | | | (0.09 | ) | | | (0.09 | ) | | | (0.02 | ) | |
Net realized and unrealized gain (loss) | | | 0.15 | | | | (0.55 | ) | | | 0.55 | | | | 0.13 | | | | (0.07 | ) | |
Increase from payment by affiliate | | | — | | | | 0.00 | (b) | | | — | | | | 0.04 | | | | — | | |
Total from investment operations | | | 0.08 | | | | (0.67 | ) | | | 0.46 | | | | 0.08 | | | | (0.09 | ) | |
Less distributions to shareholders: | |
Net investment income | | | — | | | | (0.03 | ) | | | (0.23 | ) | | | — | | | | — | | |
Net realized gains | | | — | | | | — | | | | — | | | | (0.01 | ) | | | — | | |
Total distributions to shareholders | | | — | | | | (0.03 | ) | | | (0.23 | ) | | | (0.01 | ) | | | — | | |
Net asset value, end of period | | $ | 9.59 | | | $ | 9.51 | | | $ | 10.21 | | | $ | 9.98 | | | $ | 9.91 | | |
Total return | | | 0.84 | % | | | (6.55 | %)(c) | | | 4.70 | % | | | 0.80 | %(d) | | | (0.90 | %) | |
Ratios to average net assets(e) | |
Total gross expenses | | | 2.13 | %(f)(g) | | | 2.25 | %(f) | | | 2.39 | %(f) | | | 2.49 | %(f) | | | 4.45 | %(g) | |
Total net expenses(h) | | | 2.02 | %(f)(g) | | | 1.93 | %(f) | | | 2.02 | %(f) | | | 1.90 | %(f) | | | 1.73 | %(g) | |
Net investment loss | | | (1.56 | %)(g) | | | (1.24 | %) | | | (0.90 | %) | | | (0.87 | %) | | | (1.08 | %)(g) | |
Supplemental data | |
Net assets, end of period (in thousands) | | $ | 16 | | | $ | 13 | | | $ | 10 | | | $ | 5 | | | $ | 2 | | |
Portfolio turnover | | | 130 | % | | | 142 | % | | | 62 | % | | | 154 | % | | | 11 | % | |
Notes to Financial Highlights
(a) Based on operations from March 31, 2011 (commencement of operations) through the stated period end.
(b) Rounds to zero.
(c) The Fund received a payment from an affiliate. Had the Fund not received this payment, the total return would have been lower by 0.03%.
(d) The Fund received a payment from an affiliate. Had the Fund not received this payment, the total return would have been lower by 0.38%.
(e) In addition to the fees and expenses that the Fund bears directly, the Fund indirectly bears a pro rata share of the fees and expenses of any other funds in which it invests. Such indirect expenses are not included in the Fund's reported expense ratios.
(f) Ratios include dividends and interest on securities sold short. If dividends and interest on securities sold short had been excluded, expenses would have been lower by 0.28% for the six months ended November 30, 2014 and 0.17%, 0.29% and 0.17% for the years ended May 31, 2014, 2013 and 2012, respectively.
(g) Annualized.
(h) Total net expenses include the impact of certain fee waivers/expense reimbursements made by the Investment Manager and certain of its affiliates, if applicable.
The accompanying Notes to Financial Statements are an integral part of this statement.
Semiannual Report 2014
31
Columbia Absolute Return Enhanced Multi-Strategy Fund
Financial Highlights (continued)
| | | Six Months Ended
November 30, 2014 | |
Year Ended May 31, | |
Class R5 | | (Unaudited) | | 2014 | | 2013(a) | |
Per share data | |
Net asset value, beginning of period | | $ | 9.68 | | | $ | 10.37 | | | $ | 10.05 | | |
Income from investment operations: | |
Net investment loss | | | (0.05 | ) | | | (0.07 | ) | | | (0.01 | ) | |
Net realized and unrealized gain (loss) | | | 0.16 | | | | (0.56 | ) | | | 0.60 | | |
Increase from payment by affiliate | | | — | | | | 0.00 | (b) | | | — | | |
Total from investment operations | | | 0.11 | | | | (0.63 | ) | | | 0.59 | | |
Less distributions to shareholders: | |
Net investment income | | | — | | | | (0.06 | ) | | | (0.27 | ) | |
Total distributions to shareholders | | | — | | | | (0.06 | ) | | | (0.27 | ) | |
Net asset value, end of period | | $ | 9.79 | | | $ | 9.68 | | | $ | 10.37 | | |
Total return | | | 1.14 | % | | | (6.09 | %)(c) | | | 5.99 | % | |
Ratios to average net assets(d) | |
Total gross expenses | | | 1.58 | %(e)(f) | | | 1.43 | %(e) | | | 1.66 | %(e)(f) | |
Total net expenses(g) | | | 1.45 | %(e)(f) | | | 1.36 | %(e) | | | 1.35 | %(e)(f) | |
Net investment loss | | | (1.00 | %)(f) | | | (0.68 | %) | | | (0.25 | %)(f) | |
Supplemental data | |
Net assets, end of period (in thousands) | | $ | 2 | | | $ | 2 | | | $ | 3 | | |
Portfolio turnover | | | 130 | % | | | 142 | % | | | 62 | % | |
Notes to Financial Highlights
(a) Based on operations from November 8, 2012 (commencement of operations) through the stated period end.
(b) Rounds to zero.
(c) The Fund received a payment from an affiliate. Had the Fund not received this payment, the total return would have been lower by 0.03%.
(d) In addition to the fees and expenses that the Fund bears directly, the Fund indirectly bears a pro rata share of the fees and expenses of any other funds in which it invests. Such indirect expenses are not included in the Fund's reported expense ratios.
(e) Ratios include dividends and interest on securities sold short. If dividends and interest on securities sold short had been excluded, expenses would have been lower by 0.26% for the six months ended November 30, 2014 and 0.15% and 0.26% for the years ended May 31, 2014 and 2013, respectively.
(f) Annualized.
(g) Total net expenses include the impact of certain fee waivers/expense reimbursements made by the Investment Manager and certain of its affiliates, if applicable.
The accompanying Notes to Financial Statements are an integral part of this statement.
Semiannual Report 2014
32
Columbia Absolute Return Enhanced Multi-Strategy Fund
Financial Highlights (continued)
| | | Six Months Ended
November 30, 2014 | |
Year Ended May 31, | |
Class W | | (Unaudited) | | 2014 | | 2013 | | 2012 | | 2011(a) | |
Per share data | |
Net asset value, beginning of period | | $ | 9.59 | | | $ | 10.28 | | | $ | 10.01 | | | $ | 9.92 | | | $ | 10.00 | | |
Income from investment operations: | |
Net investment loss | | | (0.06 | ) | | | (0.10 | ) | | | (0.06 | ) | | | (0.06 | ) | | | (0.01 | ) | |
Net realized and unrealized gain (loss) | | | 0.14 | | | | (0.55 | ) | | | 0.57 | | | | 0.12 | | | | (0.07 | ) | |
Increase from payment by affiliate | | | — | | | | 0.00 | (b) | | | — | | | | 0.04 | | | | — | | |
Total from investment operations | | | 0.08 | | | | (0.65 | ) | | | 0.51 | | | | 0.10 | | | | (0.08 | ) | |
Less distributions to shareholders: | |
Net investment income | | | — | | | | (0.04 | ) | | | (0.24 | ) | | | — | | | | — | | |
Net realized gains | | | — | | | | — | | | | — | | | | (0.01 | ) | | | — | | |
Total distributions to shareholders | | | — | | | | (0.04 | ) | | | (0.24 | ) | | | (0.01 | ) | | | — | | |
Net asset value, end of period | | $ | 9.67 | | | $ | 9.59 | | | $ | 10.28 | | | $ | 10.01 | | | $ | 9.92 | | |
Total return | | | 0.83 | % | | | (6.32 | %)(c) | | | 5.13 | % | | | 1.00 | %(d) | | | (0.80 | %) | |
Ratios to average net assets(e) | |
Total gross expenses | | | 1.86 | %(f)(g) | | | 1.95 | %(f) | | | 2.24 | %(f) | | | 2.06 | %(f) | | | 4.17 | %(g) | |
Total net expenses(h) | | | 1.75 | %(f)(g) | | | 1.67 | %(f) | | | 1.79 | %(f) | | | 1.66 | %(f) | | | 1.48 | %(g) | |
Net investment loss | | | (1.28 | %)(g) | | | (1.01 | %) | | | (0.59 | %) | | | (0.66 | %) | | | (0.83 | %)(g) | |
Supplemental data | |
Net assets, end of period (in thousands) | | $ | 100 | | | $ | 184 | | | $ | 27 | | | $ | 9,334 | | | $ | 2 | | |
Portfolio turnover | | | 130 | % | | | 142 | % | | | 62 | % | | | 154 | % | | | 11 | % | |
Notes to Financial Highlights
(a) Based on operations from March 31, 2011 (commencement of operations) through the stated period end.
(b) Rounds to zero.
(c) The Fund received a payment from an affiliate. Had the Fund not received this payment, the total return would have been lower by 0.03%.
(d) The Fund received a payment from an affiliate. Had the Fund not received this payment, the total return would have been lower by 0.38%.
(e) In addition to the fees and expenses that the Fund bears directly, the Fund indirectly bears a pro rata share of the fees and expenses of any other funds in which it invests. Such indirect expenses are not included in the Fund's reported expense ratios.
(f) Ratios include dividends and interest on securities sold short. If dividends and interest on securities sold short had been excluded, expenses would have been lower by 0.24% for the six months ended November 30, 2014 and 0.16%, 0.31% and 0.18% for the years ended May 31, 2014, 2013 and 2012, respectively.
(g) Annualized
(h) Total net expenses include the impact of certain fee waivers/expense reimbursements made by the Investment Manager and certain of its affiliates, if applicable.
The accompanying Notes to Financial Statements are an integral part of this statement.
Semiannual Report 2014
33
Columbia Absolute Return Enhanced Multi-Strategy Fund
Financial Highlights (continued)
| | | Six Months Ended
November 30, 2014 | |
Year Ended May 31, | |
Class Z | | (Unaudited) | | 2014 | | 2013 | | 2012 | | 2011(a) | |
Per share data | |
Net asset value, beginning of period | | $ | 9.62 | | | $ | 10.30 | | | $ | 10.04 | | | $ | 9.92 | | | $ | 10.00 | | |
Income from investment operations: | |
Net investment loss | | | (0.05 | ) | | | (0.08 | ) | | | (0.04 | ) | | | (0.03 | ) | | | (0.01 | ) | |
Net realized and unrealized gain (loss) | | | 0.15 | | | | (0.55 | ) | | | 0.56 | | | | 0.12 | | | | (0.07 | ) | |
Increase from payment by affiliate | | | — | | | | 0.00 | (b) | | | — | | | | 0.04 | | | | — | | |
Total from investment operations | | | 0.10 | | | | (0.63 | ) | | | 0.52 | | | | 0.13 | | | | (0.08 | ) | |
Less distributions to shareholders: | |
Net investment income | | | — | | | | (0.05 | ) | | | (0.26 | ) | | | — | | | | — | | |
Net realized gains | | | — | | | | — | | | | — | | | | (0.01 | ) | | | — | | |
Total distributions to shareholders | | | — | | | | (0.05 | ) | | | (0.26 | ) | | | (0.01 | ) | | | — | | |
Net asset value, end of period | | $ | 9.72 | | | $ | 9.62 | | | $ | 10.30 | | | $ | 10.04 | | | $ | 9.92 | | |
Total return | | | 1.04 | % | | | (6.10 | %)(c) | | | 5.29 | % | | | 1.31 | %(d) | | | (0.80 | %) | |
Ratios to average net assets(e) | |
Total gross expenses | | | 1.63 | %(f)(g) | | | 1.70 | %(f) | | | 1.89 | %(f) | | | 1.87 | %(f) | | | 6.03 | %(g) | |
Total net expenses(h) | | | 1.51 | %(f)(g) | | | 1.43 | %(f) | | | 1.52 | %(f) | | | 1.42 | %(f) | | | 1.22 | %(g) | |
Net investment loss | | | (1.05 | %)(g) | | | (0.75 | %) | | | (0.38 | %) | | | (0.33 | %) | | | (0.45 | %)(g) | |
Supplemental data | |
Net assets, end of period (in thousands) | | $ | 1,793 | | | $ | 1,751 | | | $ | 3,591 | | | $ | 2,028 | | | $ | 717 | | |
Portfolio turnover | | | 130 | % | | | 142 | % | | | 62 | % | | | 154 | % | | | 11 | % | |
Notes to Financial Highlights
(a) Based on operations from March 31, 2011 (commencement of operations) through the stated period end.
(b) Rounds to zero.
(c) The Fund received a payment from an affiliate. Had the Fund not received this payment, the total return would have been lower by 0.03%.
(d) The Fund received a payment from an affiliate. Had the Fund not received this payment, the total return would have been lower by 0.38%.
(e) In addition to the fees and expenses that the Fund bears directly, the Fund indirectly bears a pro rata share of the fees and expenses of any other funds in which it invests. Such indirect expenses are not included in the Fund's reported expense ratios.
(f) Ratios include dividends and interest on securities sold short. If dividends and interest on securities sold short had been excluded, expenses would have been lower by 0.26% for the six months ended November 30, 2014 and 0.17%, 0.29% and 0.19% for the years ended May 31, 2014, 2013 and 2012, respectively.
(g) Annualized.
(h) Total net expenses include the impact of certain fee waivers/expense reimbursements made by the Investment Manager and certain of its affiliates, if applicable.
The accompanying Notes to Financial Statements are an integral part of this statement.
Semiannual Report 2014
34
Columbia Absolute Return Enhanced Multi-Strategy Fund
Notes to Financial Statements
November 30, 2014 (Unaudited)
Note 1. Organization
Columbia Absolute Return Enhanced Multi-Strategy Fund (the Fund), a series of Columbia Funds Series Trust II (the Trust), is a diversified fund. The Trust is registered under the Investment Company Act of 1940, as amended (the 1940 Act), as an open-end management investment company organized as a Massachusetts business trust.
Fund Shares
The Trust may issue an unlimited number of shares (without par value). The Fund offers Class A, Class B, Class C, Class I, Class R, Class R5, Class W and Class Z shares. Although all share classes generally have identical voting, dividend and liquidation rights, each share class votes separately when required by the Trust's organizational documents or by law. Different share classes pay different distribution amounts to the extent the expenses of such share classes differ, and distributions in liquidation will be proportional to the net asset value of each share class. Each share class has its own expense structure and sales charges.
Class A shares are subject to a maximum front-end sales charge of 5.75% based on the initial investment amount. Class A shares purchased without an initial sales charge in accounts aggregating $1 million to $50 million at the time of purchase are subject to a contingent deferred sales charge (CDSC) if the shares are sold within 18 months of purchase, charged as follows: 1.00% CDSC if redeemed within 12 months of purchase, and 0.50% CDSC if redeemed more than 12, but less than 18, months after purchase.
Class B shares may be subject to a maximum CDSC of 5.00% based upon the holding period after purchase. Class B shares will generally convert to Class A shares eight years after purchase. The Fund no longer accepts investments by new or existing investors in the Fund's Class B shares, except in connection with the reinvestment of any dividend and/or capital gain distributions in Class B shares of the Fund and exchanges by existing Class B shareholders of certain other funds within the Columbia Family of Funds.
Class C shares are subject to a 1.00% CDSC on shares redeemed within one year of purchase.
Class I shares are not subject to sales charges and are available only to the Columbia Family of Funds.
Class R shares are not subject to sales charges and are generally available only to certain retirement plans and other investors as described in the Fund's prospectus.
Class R5 shares are not subject to sales charges and are generally available only to investors purchasing through authorized investment professionals and omnibus retirement plans.
Class W shares are not subject to sales charges and are available only to investors purchasing through authorized investment programs managed by investment professionals, including discretionary managed account programs.
Class Z shares are not subject to sales charges and are available only to eligible investors, which are subject to different investment minimums as described in the Fund's prospectus.
Note 2. Summary of Significant Accounting Policies
Basis of Preparation
The Fund is an investment company that applies the accounting and reporting guidance in the Financial Accounting Standards Board (FASB) Accounting Standards Codification Topic 946, Financial Services — Investment Companies (ASC 946). The financial statements are prepared in accordance with U.S. generally accepted accounting principles (GAAP) which requires management to make certain estimates and assumptions that affect the reported amounts of assets and liabilities, the disclosure of contingent assets and liabilities at the date of the financial statements and the reported amounts of income and expenses during the reporting period. Actual results could differ from those estimates.
The following is a summary of significant accounting policies followed by the Fund in the preparation of its financial statements.
Security Valuation
All equity securities are valued at the close of business of the New York Stock Exchange (NYSE). Equity securities are valued at the last quoted sales price on the principal exchange or market on which they trade, except for securities traded on the NASDAQ Stock Market, which are valued at the NASDAQ official close price. Unlisted securities or listed securities for which there were no sales during the day are valued at the mean of the latest quoted bid and ask prices on such exchanges or markets.
Debt securities generally are valued by pricing services approved by the Board of Trustees (the Board) based upon market transactions for normal, institutional-size trading units of similar securities. The services may use various pricing techniques that take into account, as applicable, factors such as yield, quality, coupon rate, maturity, type of issue, trading characteristics and other data, as well as broker quotes. Debt securities for which quotations are readily available may also be valued based upon an over-the-counter or exchange bid quotation.
Semiannual Report 2014
35
Columbia Absolute Return Enhanced Multi-Strategy Fund
Notes to Financial Statements (continued)
November 30, 2014 (Unaudited)
Foreign equity securities are valued based on quotations from the principal market in which such securities are traded. If any foreign security prices are not readily available as a result of limited share activity, the securities are valued at the mean of the latest quoted bid and ask prices on such exchanges or markets. Foreign currency exchange rates are generally determined at 4:00 p.m. Eastern (U.S.) time. Many securities markets and exchanges outside the U.S. close prior to the close of the NYSE; therefore, the closing prices for securities in such markets or on such exchanges may not fully reflect events that occur after such close but before the close of the NYSE. In those situations, foreign securities will be fair valued pursuant to a policy adopted by the Board, including, if available, utilizing a third party pricing service to determine these fair values. The third party pricing service takes into account multiple factors, including, but not limited to, movements in the U.S. securities markets, certain depositary receipts, futures contracts and foreign exchange rates that have occurred subsequent to the close of the foreign exchange or market, to determine a good faith estimate that reasonably reflects the current market conditions as of the close of the NYSE. The fair value of a security is likely to be different from the quoted or published price, if available.
Investments in open-end investment companies, including money market funds, are valued at their net asset value.
Forward foreign currency exchange contracts are marked-to-market based upon foreign currency exchange rates provided by a pricing service.
Futures and options on futures contracts are valued based upon the settlement price established each day by the board of trade or exchange on which they are traded.
Investments for which market quotations are not readily available, or that have quotations which management believes are not reliable, are valued at fair value as determined in good faith under procedures established by and under the general supervision of the Board. If a security or class of securities (such as foreign securities) is valued at fair value, such value is likely to be different from the quoted or published price for the security.
The determination of fair value often requires significant judgment. To determine fair value, management may use assumptions including but not limited to future cash flows and estimated risk premiums. Multiple inputs from various sources may be used to determine fair value.
Foreign Currency Transactions and Translations
The values of all assets and liabilities denominated in foreign currencies are generally translated into U.S. dollars at exchange rates determined at the close of the NYSE. Net realized and unrealized gains (losses) on foreign currency
transactions and translations include gains (losses) arising from the fluctuation in exchange rates between trade and settlement dates on securities transactions, gains (losses) arising from the disposition of foreign currency and currency gains (losses) between the accrual and payment dates on dividends, interest income and foreign withholding taxes.
For financial statement purposes, the Fund does not distinguish that portion of gains (losses) on investments which is due to changes in foreign exchange rates from that which is due to changes in market prices of the investments. Such fluctuations are included with the net realized and unrealized gains (losses) on investments in the Statement of Operations.
Derivative Instruments
The Fund invests in certain derivative instruments, as detailed below, to meet its investment objectives. Derivatives are instruments whose values depend on, or are derived from, in whole or in part, the value of one or more other assets, such as securities, currencies, commodities or indices. Derivative instruments may be used to increase investment flexibility (including to maintain cash reserves while maintaining exposure to certain other assets), for risk management (hedging) purposes, to facilitate trading, to reduce transaction costs and to pursue higher investment returns. The Fund may also use derivative instruments to mitigate certain investment risks, such as foreign currency exchange rate risk, interest rate risk and credit risk. Derivatives may involve various risks, including the potential inability of the counterparty to fulfill its obligation under the terms of the contract, the potential for an illiquid secondary market (making it difficult for the Fund to sell, including at favorable prices) and the potential for market movements which may expose the Fund to gains or losses in excess of the amount shown in the Statement of Assets and Liabilities. The notional amounts of derivative instruments, if applicable, are not recorded in the financial statements.
A derivative instrument may suffer a marked-to-market loss if the value of the contract decreases due to an unfavorable change in the market rates or values of the underlying instrument. Losses can also occur if the counterparty does not perform under the contract. The Fund's risk of loss from counterparty credit risk on over-the-counter derivatives is generally limited to the aggregate unrealized gain netted against any collateral held by the Fund and the amount of any variation margin held by the counterparty. With exchange-traded or centrally cleared derivatives, there is reduced counterparty credit risk to the Fund since the exchange's clearinghouse, as counterparty to such instruments, guarantees against a possible default. The clearinghouse stands between the buyer and the seller of the contract; therefore, the counterparty credit risk is failure of the clearinghouse. However, credit risk still exists in exchange-traded or centrally
Semiannual Report 2014
36
Columbia Absolute Return Enhanced Multi-Strategy Fund
Notes to Financial Statements (continued)
November 30, 2014 (Unaudited)
cleared derivatives with respect to initial and variation margin that is held in a broker's customer account. While brokers are required to segregate customer margin from their own assets, in the event that a broker becomes insolvent or goes into bankruptcy and at that time there is a shortfall in the aggregate amount of margin held by the broker for all its clients, U.S. bankruptcy laws will typically allocate that shortfall on a pro-rata basis across all the broker's customers (including the Fund), potentially resulting in losses to the Fund.
In order to better define its contractual rights and to secure rights that will help the Fund mitigate its counterparty risk, the Fund may enter into an International Swaps and Derivatives Association, Inc. Master Agreement (ISDA Master Agreement) or similar agreement with its derivative contract counterparties. An ISDA Master Agreement is an agreement between the Fund and a counterparty that governs over-the-counter derivatives and forward foreign currency exchange contracts and typically contains, among other things, collateral posting terms and netting provisions in the event of a default and/or termination event. Under an ISDA Master Agreement, the Fund may, under certain circumstances, offset with the counterparty certain derivative instrument's payables and/or receivables with collateral held and/or posted and create one single net payment. The provisions of the ISDA Master Agreement typically permit a single net payment in the event of default (close-out netting) including the bankruptcy or insolvency of the counterparty. Note, however, that bankruptcy or insolvency laws of a particular jurisdiction may impose restrictions on or prohibitions against the right of offset in bankruptcy, insolvency or other events.
Collateral (margin) requirements differ by type of derivative. Margin requirements are established by the exchange or clearinghouse for exchange-traded and centrally cleared derivatives. Brokers can ask for margin in excess of the minimum in certain circumstances. Collateral terms are contract specific for over-the-counter derivatives. For over-the-counter derivatives traded under an ISDA Master Agreement, the collateral requirements are typically calculated by netting the marked-to-market amount for each transaction under such agreement and comparing that amount to the value of any variation margin currently pledged by the Fund and/or the counterparty. Generally, the amount of collateral due from or to a party has to exceed a minimum transfer amount threshold (e.g., $500,000) before a transfer has to be made. To the extent amounts due to the Fund from its counterparties are not fully collateralized, contractually or otherwise, the Fund bears the risk of loss from counterparty nonperformance. The Fund attempts to mitigate counterparty risk by only entering into agreements with counterparties that it believes have the financial resources to honor their obligations and by monitoring the financial stability of those counterparties.
Certain ISDA Master Agreements allow counterparties to over-the-counter derivatives to terminate derivative contracts prior to maturity in the event the Fund's net assets decline by a stated percentage over a specified time period or if the Fund fails to meet the terms of the ISDA Master Agreement, which would cause the Fund to accelerate payment of any net liability owed to the counterparty. The Fund also has termination rights if the counterparty fails to meet the terms of the ISDA Master Agreement. In addition to considering counterparty credit risk, the Fund would consider terminating the derivative contracts based on whether termination would result in a net liability owed from the counterparty.
For financial reporting purposes, the Fund does not offset derivative assets and derivative liabilities that are subject to netting arrangements in the Statement of Assets and Liabilities.
Forward Foreign Currency Exchange Contracts
Forward foreign currency exchange contracts are over-the-counter agreements between two parties to buy and sell a currency at a set price on a future date. The Fund utilized forward foreign currency exchange contracts primarily for the purpose of gaining market exposure to various foreign currencies. These instruments may be used for other purposes in future periods.
The values of forward foreign currency exchange contracts fluctuate daily with changes in foreign currency exchange rates. Changes in the value of these contracts are recorded as unrealized appreciation or depreciation until the contract is exercised or has expired. The Fund will realize a gain or loss when the forward foreign currency exchange contract is closed or expires.
The use of forward foreign currency exchange contracts does not eliminate fluctuations in the prices of the Fund's portfolio securities. The risks of forward foreign currency exchange contracts include movement in the values of the foreign currencies relative to the U.S. dollar (or other foreign currencies) and the possibility that counterparties will not complete their contractual obligations, which may be in excess of the amount reflected, if any, in the Statement of Assets and Liabilities.
Futures Contracts
Futures contracts are exchange traded and represent commitments for the future purchase or sale of an asset at a specified price on a specified date. The Fund bought and sold futures contracts to manage exposure to the securities market. These instruments may be used for other purposes in future periods. Upon entering into futures contracts the Fund bears risks that it may not achieve the anticipated benefits of the futures contracts and may realize a loss. Additional risks include counterparty credit risk, the possibility of an illiquid market,
Semiannual Report 2014
37
Columbia Absolute Return Enhanced Multi-Strategy Fund
Notes to Financial Statements (continued)
November 30, 2014 (Unaudited)
and that a change in the value of the contract or option may not correlate with changes in the value of the underlying asset.
Upon entering into a futures contract, the Fund pledges cash or securities with the broker in an amount sufficient to meet the initial margin requirement. The initial margin deposit must be maintained at an established level over the life of the contract. Cash deposited as initial margin is recorded in the Statement of Assets and Liabilities as margin deposits. Securities deposited as initial margin are designated in the
Portfolio of Investments. Subsequent payments (variation margin) are made or received by the Fund each day. The variation margin payments are equal to the daily change in the contract value and are recorded as variation margin receivable or payable and are offset in unrealized gains or losses. The Fund recognizes a realized gain or loss when the contract is closed or expires. Futures contracts involve, to varying degrees, risk of loss in excess of the variation margin disclosed in the Statement of Assets and Liabilities.
Offsetting of Derivative Assets and Derivative Liabilities
The following tables present the Fund's gross and net amount of assets and liabilities available for offset under netting arrangements as well as any related collateral received or pledged by the Fund as of November 30, 2014:
| | | | | | | | | Gross Amounts Not Offset in
the Statement of Assets and Liabilities | | | |
| | | Gross
Amounts of
Recognized
Assets ($) | | Gross Amounts
Offset in the
Statement of
Assets and
Liabilities ($) | | Net Amounts of
Assets
Presented in the
Statement of
Assets and
Liabilities ($) | | Financial
Instruments ($)(a) | | Cash
Collateral
Received ($) | | Securities
Collateral
Received ($) | | Net
Amount ($)(b) | |
Asset Derivatives: | |
Forward Foreign Currency
Exchange Contracts | | | 20,243,382 | | | | — | | | | 20,243,382 | | | | 14,309,105 | | | | — | | | | — | | | | 5,934,277 | | |
| | | | | | | | | Gross Amounts Not Offset in
the Statement of Assets and Liabilities | | | |
| | | Gross
Amounts of
Recognized
Liabilities ($) | | Gross Amounts
Offset in the
Statement of
Assets and
Liabilities ($) | | Net Amounts of
Liabilities
Presented in the
Statement of
Assets and
Liabilities ($) | | Financial
Instruments ($)(c) | | Cash
Collateral
Pledged ($) | | Securities
Collateral
Pledged ($) | | Net
Amount ($)(d) | |
Liability Derivatives: | |
Forward Foreign Currency
Exchange Contracts | | | 19,446,150 | | | | — | | | | 19,446,150 | | | | 14,309,105 | | | | — | | | | — | | | | 5,137,045 | | |
(a) Represents the amount of assets that could be offset by liabilities with the same counterparty under master netting or similar agreements that management elects not to offset on the Statement of Assets and Liabilities.
(b) Represents the net amount due from counterparties in the event of default.
(c) Represents the amount of liabilities that could be offset by assets with the same counterparty under master netting
or similar agreements that management elects not to offset on the Statement of Assets and Liabilities.
(d) Represents the net amount due to counterparties in the event of default.
Effects of Derivative Transactions in the Financial Statements
The following tables are intended to provide additional information about the effect of derivatives on the financial statements of the Fund, including: the fair value of derivatives by risk category and the location of those fair values in the
Statement of Assets and Liabilities; and the impact of derivative transactions over the period in the Statement of Operations, including realized gains or losses and unrealized gains or losses. The derivative schedules following the Portfolio of Investments present additional information regarding derivative instruments outstanding at the end of the period, if any.
Semiannual Report 2014
38
Columbia Absolute Return Enhanced Multi-Strategy Fund
Notes to Financial Statements (continued)
November 30, 2014 (Unaudited)
The following table is a summary of the fair value of derivative instruments (not considered to be hedging instruments for accounting disclosure purposes) at November 30, 2014:
Asset Derivatives | |
Risk Exposure
Category | | Statement of Assets and
Liabilities Location | | Fair Value ($) | |
Equity risk
| | Net assets — unrealized
appreciation on futures
contracts | | | 349,117
| * | |
Foreign exchange
risk
| | Unrealized appreciation on
forward foreign currency
exchange contracts | | | 20,243,382
| | |
Interest rate risk
| | Net assets — unrealized
appreciation on futures
contracts | | | 445,447
| * | |
Total | | | | | 21,037,946 | | |
Liability Derivatives | |
Risk Exposure
Category | | Statement of Assets and
Liabilities Location | | Fair Value ($) | |
Equity risk
| | Net assets — unrealized
depreciation on futures
contracts | | | 48,000
| * | |
Foreign exchange
risk
| | Unrealized depreciation on
forward foreign currency
exchange contracts | | | 19,446,150
| | |
Interest rate risk
| | Net assets — unrealized
depreciation on futures
contracts | | | 172,565
| * | |
Total | | | | | 19,666,715 | | |
*Includes cumulative appreciation (depreciation) as reported in the tables following the Portfolio of Investments. Only the current day's variation margin is reported in receivables or payables in the Statement of Assets and Liabilities.
The following table indicates the effect of derivative instruments (not considered to be hedging instruments for accounting disclosure purposes) in the Statement of Operations for the six months ended November 30, 2014:
Amount of Realized Gain (Loss) on Derivatives Recognized in Income | |
Risk Exposure
Category | | Forward Foreign
Currency Exchange
Contracts ($) | | Futures
Contracts ($) | | Total ($) | |
Equity risk | | | — | | | | (2,548,913 | ) | | | (2,548,913 | ) | |
Foreign exchange
risk | | | 633,642 | | | | — | | | | 633,642 | | |
Interest rate risk | | | — | | | | 981,551 | | | | 981,551 | | |
Total | | | 633,642 | | | | (1,567,362 | ) | | | (933,720 | ) | |
Change in Unrealized Appreciation (Depreciation) on Derivatives Recognized in Income | |
Risk Exposure
Category | | Forward Foreign
Currency Exchange
Contracts ($) | | Futures
Contracts ($) | | Total ($) | |
Equity risk | | | — | | | | 678,442 | | | | 678,442 | | |
Foreign exchange
risk | | | 1,141,932 | | | | — | | | | 1,141,932 | | |
Interest rate risk | | | — | | | | (256,134 | ) | | | (256,134 | ) | |
Total | | | 1,141,932 | | | | 422,308 | | | | 1,564,240 | | |
The following table is a summary of the average outstanding volume by derivative instrument for the six months ended November 30, 2014.
Derivative Instrument | | Average Notional
Amounts ($)* | | | |
Futures contracts — Long | | | 95,791,871 | | | | |
Futures contracts — Short | | | 103,106,523 | | | | |
Derivative Instrument | | Average Unrealized
Appreciation ($)* | | Average Unrealized
Depreciation ($)* | |
Forward foreign currency
exchange contracts | | | 12,254,100 | | | | (5,822,225 | ) | |
*Based on the ending quarterly outstanding amounts for the six months ended November 30, 2014.
Short Sales
The Fund may sell a security it does not own in anticipation of a decline in the fair value of the security. When the Fund sells a security short, it must borrow the security sold short and deliver it to the broker-dealer through which it made the short sale. The Fund is required to maintain a margin account with the broker and to pledge assets to the broker as collateral for the borrowed security. Securities pledged as collateral are designated in the Portfolio of Investments. The Fund can purchase the same security at the current market price and deliver it to the broker to close out the short sale. The Fund is obligated to pay the broker a fee for borrowing the security. The fee is included in "Dividends and interest on securities sold short" in the Statement of Operations and a short position is reported as a liability at fair value in the Statement of Assets and Liabilities. The Fund must also pay the broker for any dividends accrued (recognized on ex-date) on the borrowed security. This amount is recorded as an expense in the Statement of Operations. The Fund will record a gain if the security declines in value, and will realize a loss if the security appreciates. Such gain, limited to the price at which the Fund sold the security short, or such loss, potentially unlimited in size because the short position loses value as the market price of the security sold short increases, will be recognized upon the termination of a short sale.
Semiannual Report 2014
39
Columbia Absolute Return Enhanced Multi-Strategy Fund
Notes to Financial Statements (continued)
November 30, 2014 (Unaudited)
The following table presents the Fund's gross and net amount of liabilities available for offset under a netting arrangement for short sales as well as the related collateral pledged by the Fund as of November 30, 2014:
| | | | | | | | | Gross Amounts Not Offset in
the Statement of Assets and Liabilities | | | |
| | | Gross
Amounts of
Recognized
Liabilities ($) | | Gross Amounts
Offset in the
Statement of
Assets and
Liabilities ($) | | Net Amounts of
Liabilities
Presented in the
Statement of
Assets and
Liabilities ($) | | Financial
Instruments ($)(a) | | Cash
Collateral
Pledged ($) | | Securities
Collateral
Pledged ($) | | Net
Amount ($)(b) | |
Securities Borrowed | | | 26,595,123 | | | | — | | | | 26,595,123 | | | | — | | | | 23,907,663 | | | | 2,687,400 | | | | — | | |
(a) Represents the amount of liabilities that could be offset by assets with the same counterparty under master netting or similar agreements that management elects not to offset on the Statement of Assets and Liabilities.
(b) Represents the net amount due to counterparties in the event of default.
Security Transactions
Security transactions are accounted for on the trade date. Cost is determined and gains (losses) are based upon the specific identification method for both financial statement and federal income tax purposes.
Income Recognition
Corporate actions and dividend income are generally recorded net of any non-reclaimable tax withholdings, on the ex-dividend date or upon receipt of ex-dividend notification in the case of certain foreign securities.
Interest income is recorded on an accrual basis. Market premiums and discounts, including original issue discounts, are amortized and accreted, respectively, over the expected life of the security on all debt securities, unless otherwise noted.
The Fund may place a debt security on non-accrual status and reduce related interest income when it becomes probable that the interest will not be collected and the amount of uncollectible interest can be reasonably estimated. A defaulted debt security is removed from non-accrual status when the issuer resumes interest payments or when collectability of interest is reasonably assured.
The Fund may receive distributions from holdings in business development companies (BDCs), exchange-traded funds (ETFs), other regulated investment companies (RICs), and real estate investment trusts (REITs), which report information on the character of their distributions annually. These distributions are allocated to dividend income, capital gain and return of capital based on actual information reported. To the extent actual information has not yet been reported by the REITs, estimates for return of capital are made by the Fund's management. Return of capital is recorded as a reduction of the cost basis of securities held. If the Fund no longer owns the applicable securities, return of capital is recorded as a realized gain. Management's estimates are subsequently
adjusted when the actual character of the distributions is disclosed by the REITs, which could result in a proportionate change in return of capital to shareholders. No estimates are made for the BDCs, ETFs, and RICs.
Awards from class action litigation are recorded as a reduction of cost basis if the Fund still owns the applicable securities on the payment date. If the Fund no longer owns the applicable securities, the proceeds are recorded as realized gains.
Expenses
General expenses of the Trust are allocated to the Fund and other funds of the Trust based upon relative net assets or other expense allocation methodologies determined by the nature of the expense. Expenses directly attributable to the Fund are charged to the Fund. Expenses directly attributable to a specific class of shares are charged to that share class.
Determination of Class Net Asset Value
All income, expenses (other than class-specific expenses, which are charged to that share class, as shown in the Statement of Operations) and realized and unrealized gains (losses) are allocated to each class of the Fund on a daily basis, based on the relative net assets of each class, for purposes of determining the net asset value of each class.
Federal Income Tax Status
The Fund intends to qualify each year as a regulated investment company under Subchapter M of the Internal Revenue Code, as amended, and will distribute substantially all of its taxable income (including net short-term capital gains), if any, for its tax year, and as such will not be subject to federal income taxes. In addition, the Fund intends to distribute in each calendar year substantially all of its net investment income, capital gains and certain other amounts, if any, such that the Fund should not be subject to federal excise tax. Therefore, no federal income or excise tax provision is recorded.
Semiannual Report 2014
40
Columbia Absolute Return Enhanced Multi-Strategy Fund
Notes to Financial Statements (continued)
November 30, 2014 (Unaudited)
Foreign Taxes
The Fund may be subject to foreign taxes on income, gains on investments or currency repatriation, a portion of which may be recoverable. The Fund will accrue such taxes and recoveries, as applicable, based upon its current interpretation of tax rules and regulations that exist in the markets in which it invests.
Realized gains in certain countries may be subject to foreign taxes at the Fund level, based on statutory rates. The Fund accrues for such foreign taxes on realized and unrealized gains at the appropriate rate for each jurisdiction, as applicable. The amount, if any, is disclosed as a liability on the Statement of Assets and Liabilities.
Distributions to Shareholders
Distributions from net investment income, if any, are declared and paid annually. Net realized capital gains, if any, are distributed along with the income distribution. Income distributions and capital gain distributions are determined in accordance with federal income tax regulations, which may differ from GAAP.
Guarantees and Indemnifications
Under the Trust's organizational documents and, in some cases, by contract, its officers and trustees are indemnified against certain liabilities arising out of the performance of their duties to the Trust or its funds. In addition, certain of the Fund's contracts with its service providers contain general indemnification clauses. The Fund's maximum exposure under these arrangements is unknown since the amount of any future claims that may be made against the Fund cannot be determined, and the Fund has no historical basis for predicting the likelihood of any such claims.
Note 3. Fees and Compensation Paid to Affiliates
Investment Management Fees
Under an Investment Management Services Agreement, Columbia Management Investment Advisers, LLC (the Investment Manager), a wholly-owned subsidiary of Ameriprise Financial, Inc. (Ameriprise Financial), determines which securities will be purchased, held or sold. The investment management fee is an annual fee that is equal to a percentage of the Fund's average daily net assets that declines from 0.92% to 0.80% as the Fund's net assets increase. The annualized effective investment management fee rate for the six months ended November 30, 2014 was 0.92% of the Fund's average daily net assets.
Administration Fees
Under an Administrative Services Agreement, the Investment Manager also serves as the Fund Administrator. The Fund pays the Fund Administrator an annual fee for administration and accounting services equal to a percentage of the Fund's average daily net assets that declines from 0.08% to 0.05% as the Fund's net assets increase. The annualized effective administration fee rate for the six months ended November 30, 2014 was 0.08% of the Fund's average daily net assets.
Other Expenses
Other expenses are for, among other things, miscellaneous expenses of the Fund or the Board, including payments to a company providing limited administrative services to the Fund and the Board. That company's expenses include boardroom and office expense, employee compensation, employee health and retirement benefits, and certain other expenses. For the six months ended November 30, 2014, other expenses paid by the Fund to this company were $626.
Compensation of Board Members
Board members are compensated for their services to the Fund as disclosed in the Statement of Operations. Under a Deferred Compensation Plan (the Plan), the Board members who are not "interested persons" of the Fund, as defined under the 1940 Act, may elect to defer payment of up to 100% of their compensation. Deferred amounts are treated as though equivalent dollar amounts had been invested in shares of certain funds managed by the Investment Manager. The Fund's liability for these amounts is adjusted for market value changes and remains in the Fund until distributed in accordance with the Plan.
Transfer Agent Fees
Under a Transfer and Dividend Disbursing Agent Agreement, Columbia Management Investment Services Corp. (the Transfer Agent), an affiliate of the Investment Manager and a wholly-owned subsidiary of Ameriprise Financial, is responsible for providing transfer agency services to the Fund. The Transfer Agent has contracted with Boston Financial Data Services (BFDS) to serve as sub-transfer agent.
Effective November 1, 2014, the Transfer Agent receives a monthly transfer agency fee based on the number or the average value of accounts, depending on the type of account. Prior to November 1, 2014, the Transfer Agent received a monthly account-based service fee based on the number of open accounts. In addition, the Transfer Agent also receives sub-transfer agency fees based on a percentage of the average aggregate value of the Fund's shares maintained in omnibus accounts (other than omnibus accounts for which American
Semiannual Report 2014
41
Columbia Absolute Return Enhanced Multi-Strategy Fund
Notes to Financial Statements (continued)
November 30, 2014 (Unaudited)
Enterprise Investment Services Inc. is the broker of record or accounts where the beneficial shareholder is a customer of Ameriprise Financial Services, Inc., which receive a per account fee). The Transfer Agent pays the fees of BFDS for services as sub-transfer agent and is not entitled to reimbursement for such fees from the Fund (with the exception of out-of-pocket fees).
The Transfer Agent also receives compensation from the Fund for various shareholder services and reimbursements for certain out-of-pocket fees. Class I shares do not pay transfer agent fees. Total transfer agent fees for Class R5 shares are subject to an annual limitation of not more than 0.05% of the average daily net assets attributable to Class R5 shares.
For the six months ended November 30, 2014, the Fund's annualized effective transfer agent fee rates as a percentage of average daily net assets of each class were as follows:
Class A | | | 0.13 | % | |
Class B | | | 0.13 | | |
Class C | | | 0.13 | | |
Class R | | | 0.13 | | |
Class R5 | | | 0.05 | | |
Class W | | | 0.13 | | |
Class Z | | | 0.13 | | |
An annual minimum account balance fee of $20 may apply to certain accounts with a value below the applicable share class's initial minimum investment requirements to reduce the impact of small accounts on transfer agent fees. These minimum account balance fees are remitted to the Fund and recorded as part of expense reductions in the Statement of Operations. For the six months ended November 30, 2014, no minimum account balance fees were charged by the Fund.
Distribution Fees
The Fund has an agreement with Columbia Management Investment Distributors, Inc. (the Distributor), an affiliate of the Investment Manager and a wholly-owned subsidiary of Ameriprise Financial, for distribution and shareholder services. Under a Plan and Agreement of Distribution, the Fund pays a fee at an annual rate of up to 0.25% of the Fund's average daily net assets attributable to Class A and Class W shares, a fee at an annual rate of up to 0.50% of the Fund's average daily net assets attributable to Class R shares (of which up to 0.25% may be used for shareholder services) and a fee at an annual rate of up to 1.00% of the Fund's average daily net assets attributable to Class B and Class C shares. For Class B and Class C shares, of the 1.00% fee, up to 0.75% is reimbursed for distribution expenses.
The amount of distribution expenses incurred by the Distributor and not yet reimbursed (unreimbursed expense) was approximately $9,000 and $6,000 for Class B and Class C shares, respectively. This amount is based on the most recent information available as of September 30, 2014 and may be recovered from future payments under the distribution plan or CDSCs. To the extent the unreimbursed expense has been fully recovered, the distribution fee is reduced.
Sales Charges
Sales charges, including front-end charges and CDSCs, received by the Distributor for distributing Fund shares were $1,161 for Class A and $432 for Class C shares for the six months ended November 30, 2014.
Expenses Waived/Reimbursed by the Investment Manager and its Affiliates
The Investment Manager and certain of its affiliates have contractually agreed to waive fees and/or reimburse expenses (excluding certain fees and expenses described below) for the periods disclosed below, unless sooner terminated at the sole discretion of the Board, so that the Fund's net operating expenses, after giving effect to fees waived/expenses reimbursed and any balance credits and/or overdraft charges from the Fund's custodian, do not exceed the following annual rates as a percentage of the class' average daily net assets:
| | | October 1, 2014
through
September 30, 2015 | | Prior to
October 1, 2014 | |
Class A | | | 1.53 | % | | | 1.53 | % | |
Class B | | | 2.28 | | | | 2.28 | | |
Class C | | | 2.28 | | | | 2.28 | | |
Class I | | | 1.19 | | | | 1.20 | | |
Class R | | | 1.78 | | | | 1.78 | | |
Class R5 | | | 1.24 | | | | 1.25 | | |
Class W | | | 1.53 | | | | 1.53 | | |
Class Z | | | 1.28 | | | | 1.28 | | |
Under the agreement governing these fee waivers and/or expense reimbursement arrangements, the following fees and expenses are excluded from the waiver/reimbursement commitment, and therefore will be paid by the Fund, if applicable: taxes (including foreign transaction taxes), expenses associated with investments in affiliated and non-affiliated pooled investment vehicles (including mutual funds and exchange-traded funds), transaction costs and brokerage commissions, costs related to any securities lending program, dividend expenses associated with securities sold short, inverse floater program fees and expenses, transaction charges and interest on borrowed money, interest, extraordinary
Semiannual Report 2014
42
Columbia Absolute Return Enhanced Multi-Strategy Fund
Notes to Financial Statements (continued)
November 30, 2014 (Unaudited)
expenses and any other expenses the exclusion of which is specifically approved by the Board. This agreement may be modified or amended only with approval from all parties.
In addition, the Fund's expense ratio is subject to a voluntary expense reimbursement arrangement pursuant to which fees will be waived and/or expenses reimbursed (excluding certain fees and expenses immediately described above), so that the Fund's net operating expenses, after giving effect to fees waived/expenses reimbursed and any balance credits and/or overdraft charges from the Fund's custodian, do not exceed the annual rates of 1.52% for Class A, 2.27% for Class B, 2.27% for Class C, 1.18% for Class I, 1.77% for Class R, 1.23% for Class R5, 1.52% for Class W and 1.27% for Class Z. This arrangement may be revised or discontinued at any time.
Note 4. Federal Tax Information
The timing and character of income and capital gain distributions are determined in accordance with income tax regulations, which may differ from GAAP because of temporary or permanent book to tax differences.
At November 30, 2014, the cost of investments for federal income tax purposes was approximately $97,508,000 and the aggregate gross approximate unrealized appreciation and depreciation based on that cost was:
Unrealized appreciation | | $ | 3,004,000 | | |
Unrealized depreciation | | | (552,000 | ) | |
Net unrealized appreciation | | $ | 2,452,000 | | |
The following capital loss carryforwards, determined as of May 31, 2014, may be available to reduce taxable income arising from future net realized gains on investments, if any, to the extent permitted by the Internal Revenue Code:
Year of Expiration | | Amount ($) | |
No expiration — short-term | | | 3,007,019 | | |
No expiration — long-term | | | 2,431,537 | | |
Total | | | 5,438,556 | | |
Under current tax rules, regulated investment companies can elect to treat certain late-year ordinary losses incurred and post-October capital losses (capital losses realized after October 31) as arising on the first day of the following taxable year. The Fund has elected to treat late-year ordinary losses of $1,605,114 and post-October capital losses of $9,510,595 at May 31, 2014 as arising on June 1, 2014.
Management of the Fund has concluded that there are no significant uncertain tax positions in the Fund that would require recognition in the financial statements. However,
management's conclusion may be subject to review and adjustment at a later date based on factors including, but not limited to, new tax laws, regulations, and administrative interpretations (including relevant court decisions). Generally, the Fund's federal tax returns for the prior three fiscal years remain subject to examination by the Internal Revenue Service.
Note 5. Portfolio Information
The cost of purchases and proceeds from sales of securities, excluding short-term obligations and certain derivatives, if any, aggregated to $53,395,642 and $77,914,848, respectively, for the six months ended November 30, 2014.
The amount of purchase and sale activity impacts the portfolio turnover rate reported in the Financial Highlights.
Note 6. Affiliated Money Market Fund
The Fund significantly invests in Columbia Short-Term Cash Fund, an affiliated money market fund established for the exclusive use by the Fund and other affiliated funds. The income earned by the Fund from such investments is included as Dividends — affiliated issuers in the Statement of Operations. As an investing fund, the Fund indirectly bears its proportionate share of the expenses of Columbia Short-Term Cash Fund.
Note 7. Shareholder Concentration
At November 30, 2014, affiliated shareholders of record owned 96.8% of the outstanding shares of the Fund in one or more accounts. Subscription and redemption activity by concentrated accounts may have a significant effect on the operations of the Fund.
Note 8. Line of Credit
The Fund has entered into a revolving credit facility with a syndicate of banks led by JPMorgan Chase Bank N.A. (JPMorgan) whereby the Fund may borrow for the temporary funding of shareholder redemptions or for other temporary or emergency purposes. The credit facility agreement, as amended, which is a collective agreement between the Fund and certain other funds managed by the Investment Manager, severally and not jointly, permits collective borrowings up to $500 million. Interest is charged to each participating fund based on its borrowings at a rate equal to the higher of (i) the overnight federal funds rate plus 1.00% or (ii) the one-month LIBOR rate plus 1.00%. Each borrowing under the credit facility matures no later than 60 days after the date of borrowing. The Fund also pays a commitment fee equal to its pro rata share of the amount of the credit facility at a rate of 0.075% per annum. The commitment fee is included in other expenses in the Statement of Operations.
Semiannual Report 2014
43
Columbia Absolute Return Enhanced Multi-Strategy Fund
Notes to Financial Statements (continued)
November 30, 2014 (Unaudited)
Effective December 9, 2014, the Fund extended its revolving credit facility with JPMorgan. The credit facility agreement, as amended, permits collective borrowings up to $550 million under the same terms and interest rates as described above.
The Fund had no borrowings during the six months ended November 30, 2014.
Note 9. Significant Risks
Derivatives Risk
Losses involving derivative instruments may be substantial, because a relatively small price movement in the underlying security(ies) instrument, commodity, currency or index may result in a substantial loss for the Fund. In addition to the potential for increased losses, the use of derivative instruments may lead to increased volatility within the Fund. Derivatives will typically increase the Fund's exposure to principal risks to which it is otherwise exposed, and may expose the Fund to additional risks, including correlation risk, counterparty risk, hedging risk, leverage risk and liquidity risk.
Short Selling Risk
The Fund may make short sales, which involves selling a security the Fund does not own in anticipation that the security's price will decline. The Fund's potential losses could exceed those of other funds which hold only long security positions if the value of the securities held long decreases and the value of the securities sold short increases. The Fund's use of short sales in effect "leverages" the Fund, when the Fund uses the cash proceeds from the short sales to invest in additional long securities. Leveraging potentially exposes the Fund to greater risks due to unanticipated market movements, which may magnify losses and increase volatility of returns. There is no assurance that a leveraging strategy will be successful.
Note 10. Subsequent Events
Management has evaluated the events and transactions that have occurred through the date the financial statements were issued. Other than as noted below and in Note 8 above, there were no items requiring adjustment of the financial statements or additional disclosure.
On January 28, 2015 the Fund's Board of Trustees approved a Plan of Liquidation and Termination (the Plan) pursuant to which the Fund will be liquidated and terminated. Effective at the open of business on February 2, 2015, the Fund is no longer open to new investors. Under the terms of the Plan, it is anticipated that the Fund will be liquidated on or about March 6, 2015, at which time the Fund's shareholders will receive a liquidation distribution in an amount equal to the net asset value of their Fund shares. Shareholders of the Fund may also redeem their investment in the Fund or exchange their Fund shares for shares of another Columbia Fund at any time prior to the date of liquidation.
Note 11. Information Regarding Pending and Settled Legal Proceedings
In December 2005, without admitting or denying the allegations, American Express Financial Corporation (AEFC, which is now known as Ameriprise Financial, Inc. (Ameriprise Financial)) entered into settlement agreements with the Securities and Exchange Commission (SEC) and Minnesota Department of Commerce (MDOC) related to market timing activities. As a result, AEFC was censured and ordered to cease and desist from committing or causing any violations of certain provisions of the Investment Advisers Act of 1940, the Investment Company Act of 1940, and various Minnesota laws. AEFC agreed to pay disgorgement of $10 million and civil money penalties of $7 million. AEFC also agreed to retain an independent distribution consultant to assist in developing a plan for distribution of all disgorgement and civil penalties ordered by the SEC in accordance with various undertakings detailed at www.sec.gov/litigation/admin/ia-2451.pdf. Ameriprise Financial and its affiliates have cooperated with the SEC and the MDOC in these legal proceedings, and have made regular reports to the Funds' Boards of Trustees.
Ameriprise Financial and certain of its affiliates have historically been involved in a number of legal, arbitration and regulatory proceedings, including routine litigation, class actions, and governmental actions, concerning matters arising in connection with the conduct of their business activities. Ameriprise Financial believes that the Funds are not currently the subject of, and that neither Ameriprise Financial nor any of its affiliates are the subject of, any pending legal, arbitration or regulatory proceedings that are likely to have a material adverse effect on the Funds or the ability of Ameriprise Financial or its affiliates to perform under their contracts with the Funds. Ameriprise Financial is required to make quarterly (10-Q), annual (10-K) and, as necessary, 8-K filings with the Securities and Exchange Commission on legal and regulatory matters that relate to Ameriprise Financial and its affiliates. Copies of these filings may be obtained by accessing the SEC website at www.sec.gov.
There can be no assurance that these matters, or the adverse publicity associated with them, will not result in increased fund redemptions, reduced sale of fund shares or other adverse consequences to the Funds. Further, although we believe proceedings are not likely to have a material adverse effect on the Funds or the ability of Ameriprise Financial or its affiliates to perform under their contracts with the Funds, these proceedings are subject to uncertainties and, as such, we are unable to estimate the possible loss or range of loss that may result. An adverse outcome in one or more of these proceedings could result in adverse judgments, settlements, fines, penalties or other relief that could have a material adverse effect on the consolidated financial condition or results of operations of Ameriprise Financial.
Semiannual Report 2014
44
Columbia Absolute Return Enhanced Multi-Strategy Fund
Important Information About This Report
Each fund mails one shareholder report to each shareholder address. If you would like more than one report, please call shareholder services at 800.345.6611 and additional reports will be sent to you.
The policy of the Board is to vote the proxies of the companies in which each fund holds investments consistent with the procedures as stated in the Statement of Additional Information (SAI). You may obtain a copy of the SAI without charge by calling 800.345.6611; contacting your financial intermediary; visiting columbiamanagement.com; or searching the website of the Securities and Exchange Commission (SEC) at sec.gov. Information regarding how each fund voted proxies relating to portfolio securities is filed with the SEC by August 31 for the most recent 12-month period ending June 30 of that year, and is available without charge by visiting columbiamanagement.com; or searching the website of the SEC at sec.gov.
Each fund files a complete schedule of portfolio holdings with the SEC for the first and third quarters of each fiscal year on Form N-Q. Each fund's Form N-Q is available on the SEC's website at sec.gov and may be reviewed and copied at the SEC's Public Reference Room in Washington, D.C. Information on the operation of the Public Reference Room may be obtained by calling 800.SEC.0330. Each fund's complete schedule of portfolio holdings, as filed on Form N-Q, can also be obtained without charge, upon request, by calling 800.345.6611.
You may obtain the current net asset value (NAV) of Fund shares at no cost by calling 800.345.6611 or by sending an email to serviceinquiries@columbiamanagement.com.
Semiannual Report 2014
45

Columbia Absolute Return Enhanced Multi-Strategy Fund
P.O. Box 8081
Boston, MA 02266-8081
columbiamanagement.com
This information is for use with concurrent or prior delivery of a fund prospectus. Please read and consider the investment objectives, risks, charges and expenses for any fund carefully before investing. For a prospectus and, if available, a summary prospectus, which contains this and other important information about the Fund, go to columbiamanagement.com. The Fund is distributed by Columbia Management Investment Distributors, Inc., member FINRA, and managed by Columbia Management Investment Advisers, LLC.
© 2015 Columbia Management Investment Advisers, LLC. All rights reserved.
SAR106_05_E01_(01/15)
Semiannual Report
November 30, 2014

Columbia Absolute Return Multi-Strategy Fund
Not FDIC insured • No bank guarantee • May lose value
About Columbia Management
Backed by more than 100 years of experience, Columbia Management is one of the nation's largest asset managers. At the heart of our success — and, most importantly, that of our investors — are some of the most talented professionals in the industry, brought together by a unique way of working.
It starts with carefully selected, specialized investment teams. While each team brings a diverse and innovative range of skills, all are grounded by a common set of core beliefs. All possess a solid conviction in the power of proprietary, bottom-up research. All look not only at generating returns, but also at the likely consistency of those returns and the risks required to achieve them. And while our culture encourages teams to operate independently and question established thinking, a rigorous investment oversight process ensures that each team stays true to its clearly articulated investment process. At Columbia Management, reaching our performance goals matters, and the way we reach them matters just as much.
Columbia funds are distributed by Columbia Management Investment Distributors, Inc., member FINRA, and managed by Columbia Management Investment Advisers, LLC.
© 2015 Columbia Management Investment Advisers, LLC. All rights reserved.
Not part of the shareholder report
Note: Effective January 1, 2015, Christopher O. Petersen will serve as the President of the Columbia Funds, replacing J. Kevin Connaughton. Mr. Petersen has served as a Fund officer since 2007.
Dear Shareholders,
People invest for different reasons, though typically based on a desire for one or more outcomes, e.g., generating an appropriate income stream in retirement, navigating a changing interest rate environment, maximizing after-tax returns, growing assets to achieve financial goals, or easing the impact of volatile markets. Achieving these desired outcomes can be particularly challenging given the unpredictability of complex global markets. To continue to effectively deliver solutions that help clients achieve desired outcomes, an asset manager must have the resources and investment framework to meaningfully embody a global perspective.
With this in mind, I thought it important to highlight excerpts from a piece written by Jeffrey L. Knight, Global Head of Investment Solutions and Asset Allocation, in which he touches on some of these issues emphasizing the importance of maintaining a diversified portfolio with the flexibility to adapt to changing market conditions.
I encourage you to read the article in its entirety. To access the full article and for other insights on current market events and investment opportunities, please visit the Columbia Management blog at columbiamanagement.com/blog.
On behalf of the Funds, I want to acknowledge the contributions of J. Kevin Connaughton and to thank him for his years of trusted, dedicated service. He has worked tirelessly as an advocate for shareholders and a leader of the Columbia Funds. In taking on this new role, I look forward to continuing the work of Mr. Connaughton, helping build on the strong foundation of the Columbia Funds.
Thank you for your confidence. We look forward to continuing to serve your investment needs for many years to come.
Best regards,

Christopher O. Petersen
President, Columbia Funds
Excerpts from:
2015 Outlook: Same song, slightly different arrangement
By Jeffrey L. Knight, Global Head of Investment Solutions and Asset Allocation
Jeffrey L. Knight, CFA, is global head of investment solutions and asset allocation for Columbia Management Investment Advisers, LLC. Mr. Knight leads a team of six portfolio managers responsible for our broad suite of multi-asset strategies including capital allocation, risk allocation, absolute return and total return funds.
What's different in 2015?
As stationary as market conditions have felt lately, circumstances are always evolving. For 2015, while the essential elements of our outlook remain in place, we highlight two important changes in the market environment:
> The relative value of global equities vs. global bonds actually improved during 2014.
> Monetary policy around the globe has become desynchronized, with the U.S. Federal Reserve (the Fed) contemplating rate hikes, while the European Central Bank (ECB) and the Bank of Japan (BOJ) intensify their monetary stimulus programs.
In our view, while equities will most likely continue to dominate, the complex interactions of today's conditions elevate the role of dynamic risk management. We argue that investors will need a cross-asset surveillance methodology to detect tactical threats.
President's Message (continued)
Monetary policies diverge
The Fed has given strong signals that economic growth in the United States has reached self-sustaining momentum and no longer needs unconventional efforts to support the expansion. The withdrawal and suspension of large-scale asset purchases was only the first step in the evolution toward policy normalization. In 2015, we expect to see a change in forward guidance and, most likely, the first interest rate increase in years.
These actions stand in stark contrast with the direction of the monetary policies of other central banks as they double down on efforts to support growth and avoid deflation. The Bank of Japan has announced its intention to increase both qualitative and quantitative easing on an enormous scale, expanding purchases of Japanese government bonds (JGBs), exchange-traded funds and real estate investment trusts. They intend to coordinate this with government pension investment fund purchases by shifting into riskier assets through sales of JGBs.
With evidence of deterioration on both the economic and inflation front, the European Central Bank (ECB) also plans to take bolder actions. These include increased purchases of asset-backed securities and covered bonds in both the primary and secondary market, together with the long-term refinancing operations that will steer the ECB's balance sheet higher by €1 trillion.
The latest to jump on the bandwagon was the People's Bank of China (PBOC), which cut its benchmark interest rate for the first time in over two years to support private sector investment, as targeted liquidity injections have had minimal effect on sinking economic growth.
Investment strategy for 2015
We remain convinced that relative value favors stocks over bonds, even though stocks outperformed in 2014. Therefore, you will hear the same recommendation from us for 2015. Equities remain the most important asset class for generating returns.
Within equities, the currency-based advantage of U.S. stocks is offset somewhat by the valuation advantage from overseas equities, notably in Japan. Indeed, economic growth in Japan and Europe are essential ingredients for equities to continue to perform well. If Japanese and European stocks cannot produce gains, then the global economy will probably be stuck in a near recessionary funk.
Devising a strategy to manage risk and stabilize portfolio values in the event that equities do not perform well remains complicated. Bond yields are low enough that they are not likely to offer powerful diversification benefits. We affirm our recommendation for three additional sources of portfolio stability:
> Non-traditional diversifiers, such as liquid alternatives, alternative beta exposures and absolute return strategies
> Explicit downside hedges, such as put options (with emphasis on managing the related expense)
> Flexibility and a methodology for active risk reduction when appropriate (Our cross-asset methodologies should prove valuable in this regard.)
Our overall stance for investment strategy will likely remain in place until the valuation advantage for equities has been priced away, or until the healing process for the global economy reverses.
Please visit columbiamanagement.com/blog to read the entire article.
Investors should consider the investment objectives, risks, charges and expenses of a mutual fund carefully before investing. For a free prospectus and, if available, a summary prospectus, which contains this and other important information about a fund, visit columbiamanagement.com. The prospectus should be read carefully before investing.
The views expressed are as of December 2014, may change as market or other conditions change, and may differ from views expressed by other Columbia Management Investment Advisers, LLC (CMIA) associates or affiliates. Actual investments or investment decisions made by CMIA and its affiliates, whether for its own account or on behalf of clients, will not necessarily reflect the views expressed. This information is not intended to provide investment advice and does not account for individual investor circumstances. Investment decisions should always be made based on an investor's specific financial needs, objectives, goals, time horizon and risk tolerance. Asset classes described may not be suitable for all investors. Past performance does not guarantee future results, and no forecast should be considered a guarantee either. Since economic and market change frequently, there can be no assurance that the trends described here will continue or that the forecasts are accurate.
Diversification does not assure a profit or protect against loss.
Columbia Funds are distributed by Columbia Management Investment Distributors, Inc., member FINRA, and managed by Columbia Management Investment Advisers, LLC.
© 2015 Columbia Management Investment Advisers, LLC. All rights reserved
Columbia Absolute Return Multi-Strategy Fund
Performance Overview | | | 4 | | |
Portfolio Overview | | | 5 | | |
Understanding Your Fund's Expenses | | | 7 | | |
Portfolio of Investments | | | 8 | | |
Statement of Assets and Liabilities | | | 18 | | |
Statement of Operations | | | 20 | | |
Statement of Changes in Net Assets | | | 21 | | |
Financial Highlights | | | 23 | | |
Notes to Financial Statements | | | 31 | | |
Important Information About This Report | | | 41 | | |
Fund Investment Manager
Columbia Management Investment
Advisers, LLC
225 Franklin Street
Boston, MA 02110
Fund Distributor
Columbia Management Investment
Distributors, Inc.
225 Franklin Street
Boston, MA 02110
Fund Transfer Agent
Columbia Management Investment
Services Corp.
P.O. Box 8081
Boston, MA 02266-8081
For more information about any of the funds, please visit columbiamanagement.com or call 800.345.6611. Customer Service Representatives are available to answer your questions Monday through Friday from 8 a.m. to 7 p.m. Eastern time.
The views expressed in this report reflect the current views of the respective parties. These views are not guarantees of future performance and involve certain risks, uncertainties and assumptions that are difficult to predict, so actual outcomes and results may differ significantly from the views expressed. These views are subject to change at any time based upon economic, market or other conditions and the respective parties disclaim any responsibility to update such views. These views may not be relied on as investment advice and, because investment decisions for a Columbia Fund are based on numerous factors, may not be relied on as an indication of trading intent on behalf of any particular Columbia Fund. References to specific securities should not be construed as a recommendation or investment advice.
Columbia Absolute Return Multi-Strategy Fund
Performance Overview
(Unaudited)
Performance Summary
> Columbia Absolute Return Multi-Strategy Fund (the Fund) Class A shares returned -0.20% excluding sales charges for the six-month period that ended November 30, 2014.
> During the same time period, the Fund underperformed the Citigroup 3-Month U.S. Treasury Bill Index, which returned 0.01%, and the Barclays U.S. Aggregate Bond Index, a broad measure of the domestic fixed-income market, which returned 1.92%.
> On January 28, 2015 the Fund's Board of Trustees approved a Plan of Liquidation and Termination (the Plan) pursuant to which the Fund will be liquidated and terminated. Effective at the open of business on February 2, 2015, the Fund is no longer open to new investors. Under the terms of the Plan, it is anticipated that the Fund will be liquidated on or about March 6, 2015, at which time the Fund's shareholders will receive a liquidation distribution in an amount equal to the net asset value of their Fund shares. Shareholders of the Fund may also redeem their investment in the Fund or exchange their Fund shares for shares of another Columbia Fund at any time prior to the date of liquidation.
Average Annual Total Returns (%) (for period ended November 30, 2014)
| | | Inception | | 6 Months
cumulative | | 1 Year | | Life | |
Class A | | 03/31/11 | | | | | | | | | | | | | |
Excluding sales charges | | | | | | | -0.20 | | | | -2.81 | | | | -0.34 | | |
Including sales charges | | | | | | | -3.18 | | | | -5.71 | | | | -1.17 | | |
Class B | | 03/31/11 | | | | | | | | | | | | | |
Excluding sales charges | | | | | | | -0.62 | | | | -3.61 | | | | -1.10 | | |
Including sales charges | | | | | | | -5.59 | | | | -8.43 | | | | -1.92 | | |
Class C | | 03/31/11 | | | | | | | | | | | |
Excluding sales charges | | | | | | | -0.72 | | | | -3.71 | | | | -1.10 | | |
Including sales charges | | | | | | | -1.72 | | | | -4.67 | | | | -1.10 | | |
Class I | | 03/31/11 | | | -0.20 | | | | -2.69 | | | | -0.03 | | |
Class R | | 03/31/11 | | | -0.41 | | | | -3.25 | | | | -0.62 | | |
Class R5* | | 11/08/12 | | | -0.10 | | | | -2.59 | | | | -0.17 | | |
Class W | | 03/31/11 | | | -0.20 | | | | -2.13 | | | | -0.20 | | |
Class Z | | 03/31/11 | | | -0.10 | | | | -2.68 | | | | -0.13 | | |
Citigroup 3-Month U.S. Treasury Bill Index | | | | | | | 0.01 | | | | 0.04 | | | | 0.05 | | |
Barclays U.S. Aggregate Bond Index | | | | | | | 1.92 | | | | 5.27 | | | | 4.15 | | |
Returns for Class A are shown with and without the maximum initial sales charge of 3.00%. Returns for Class B are shown with and without the applicable contingent deferred sales charge (CDSC) of 5.00% in the first year, declining to 1.00% in the sixth year and eliminated thereafter. Returns for Class C are shown with and without the 1.00% CDSC for the first year only. If they had, returns would be lower. The Fund's other classes are not subject to sales charges and have limited eligibility. Please see the Fund's prospectus for details. Performance for different share classes will vary based on differences in sales charges and fees associated with each class. All results shown assume reinvestment of distributions during the period. Returns do not reflect the deduction of taxes that a shareholder may pay on Fund distributions or on the redemption of Fund shares. Performance results reflect the effect of any fee waivers or reimbursements of Fund expenses by Columbia Management Investment Advisers, LLC and/or any of its affiliates. Absent these fee waivers or expense reimbursement arrangements, performance results would have been lower.
The performance information shown represents past performance and is not a guarantee of future results. The investment return and principal value of your investment will fluctuate so that your shares, when redeemed, may be worth more or less than their original cost. Current performance may be lower or higher than the performance information shown. You may obtain performance information current to the most recent month-end by contacting your financial intermediary, visiting columbiamanagement.com or calling 800.345.6611.
*The returns shown for periods prior to the share class inception date (including returns for the Life of the Fund, if shown, which are since Fund inception) include the returns of the Fund's oldest share class. Since the Fund launched more than one share class at its inception, Class A shares were used. These returns are adjusted to reflect any higher class-related operating expenses of the newer share classes, as applicable. Please visit columbiamanagement.com/investment-products/mutual-funds/appended-performance for more information.
The Citigroup 3-Month U.S. Treasury Bill Index, an unmanaged index, is representative of the performance of three-month Treasury bills.
The Barclays U.S. Aggregate Bond Index is a broad-based benchmark that measures the investment grade, U.S. dollar-denominated, fixed-rate taxable bond market, including Treasuries, government-related and corporate securities, mortgage-backed securities (agency fixed-rate and hybrid adjustable-rate mortgage passthroughs), asset-backed securities, and commercial mortgage-backed securities.
Indices are not available for investment, are not professionally managed and do not reflect sales charges, fees, brokerage commissions, taxes or other expenses of investing. Securities in the Fund may not match those in an index.
Semiannual Report 2014
4
Columbia Absolute Return Multi-Strategy Fund
Portfolio Overview
(Unaudited)
Top Ten Holdings (%) — Long Positions
(at November 30, 2014) | |
Goldman Sachs Group, Inc. (The) | | | 3.5 | | |
Comcast Corp., Class A | | | 3.5 | | |
Cubist Pharmaceuticals, Inc. | | | 3.3 | | |
Alexandria Real Estate Equities, Inc. | | | 3.2 | | |
Bluebird Bio, Inc. | | | 3.2 | | |
Activision Blizzard, Inc. | | | 2.7 | | |
Rockwell Automation, Inc. | | | 2.7 | | |
Nike, Inc., Class B | | | 2.7 | | |
DISH Network Corp., Class A | | | 2.6 | | |
Electronic Arts, Inc. | | | 2.5 | | |
Percentages indicated are based upon total long investments (excluding Money Market Funds).
Top Ten Holdings (%) — Short Positions
(at November 30, 2014) | |
Coach, Inc. | | | (3.4 | ) | |
Dick's Sporting Goods, Inc. | | | (3.4 | ) | |
Regeneron Pharmaceuticals, Inc. | | | (2.8 | ) | |
Armstrong World Industries, Inc. | | | (2.8 | ) | |
First Republic Bank | | | (2.8 | ) | |
Xerox Corp. | | | (2.7 | ) | |
Clorox Co. (The) | | | (2.4 | ) | |
Expeditors International of Washington, Inc. | | | (2.4 | ) | |
Target Corp. | | | (2.4 | ) | |
SAP SE, ADR | | | (2.4 | ) | |
Percentages indicated are based upon total short investments.
For further detail about these holdings, please refer to the section entitled "Portfolio of Investments."
Fund holdings are as of the date given, are subject to change at any time, and are not recommendations to buy or sell any security.
Portfolio Management
Todd White
Jeffrey Knight, CFA
Kent Peterson, PhD
Semiannual Report 2014
5
Columbia Absolute Return Multi-Strategy Fund
Portfolio Overview (continued)
(Unaudited)
Portfolio Breakdown (%)
(at November 30, 2014) | |
| | | Long | | Short | | Net | |
Common Stocks | | | 55.7 | | | | (55.5 | ) | | | 0.2 | | |
Consumer Discretionary | | | 12.0 | | | | (11.9 | ) | | | 0.1 | | |
Consumer Staples | | | 3.2 | | | | (3.2 | ) | | | 0.0 | | |
Energy | | | 4.3 | | | | (4.1 | ) | | | 0.2 | | |
Financials | | | 7.9 | | | | (7.9 | ) | | | 0.0 | | |
Health Care | | | 8.9 | | | | (9.1 | ) | | | (0.2 | ) | |
Industrials | | | 6.0 | | | | (6.0 | ) | | | 0.0 | | |
Information Technology | | | 12.8 | | | | (12.7 | ) | | | 0.1 | | |
Materials | | | 0.6 | | | | (0.6 | ) | | | 0.0 | | |
Short-Term Investments Segregated in
Connection with Open Derivatives Contracts(a) | | | 99.8 | | | | — | | | | 99.8 | | |
Total | | | 155.5 | | | | (55.5 | ) | | | 100.0 | | |
Percentages indicated are based upon total investments. The Fund's portfolio composition is subject to change.
(a) Includes investments in Money Market Funds (amounting to $13.2 million) which have been segregated to cover obligations related to the Fund's investment in derivatives which provides exposure to multiple markets. For a description of the Fund's investments in derivatives, see Investments in Derivatives following the Portfolio of Investments, and Note 2 to the financial statements.
Semiannual Report 2014
6
Columbia Absolute Return Multi-Strategy Fund
Understanding Your Fund's Expenses
(Unaudited)
As an investor, you incur two types of costs. There are transaction costs, which generally include sales charges on purchases and may include redemption fees. There are also ongoing costs, which generally include management fees, distribution and/or service fees, and other fund expenses. The following information is intended to help you understand your ongoing costs (in dollars) of investing in the Fund and to help you compare these costs with the ongoing costs of investing in other mutual funds.
Analyzing Your Fund's Expenses
To illustrate these ongoing costs, we have provided examples and calculated the expenses paid by investors in each share class of the Fund during the period. The actual and hypothetical information in the table is based on an initial investment of $1,000 at the beginning of the period indicated and held for the entire period. Expense information is calculated two ways and each method provides you with different information. The amount listed in the "Actual" column is calculated using the Fund's actual operating expenses and total return for the period. You may use the Actual information, together with the amount invested, to estimate the expenses that you paid over the period. Simply divide your account value by $1,000 (for example, an $8,600 account value divided by $1,000 = 8.6), then multiply the results by the expenses paid during the period under the "Actual" column. The amount listed in the "Hypothetical" column assumes a 5% annual rate of return before expenses (which is not the Fund's actual return) and then applies the Fund's actual expense ratio for the period to the hypothetical return. You should not use the hypothetical account values and expenses to estimate either your actual account balance at the end of the period or the expenses you paid during the period. See "Compare With Other Funds" below for details on how to use the hypothetical data.
Compare With Other Funds
Since all mutual funds are required to include the same hypothetical calculations about expenses in shareholder reports, you can use this information to compare the ongoing cost of investing in the Fund with other funds. To do so, compare the hypothetical example with the 5% hypothetical examples that appear in the shareholder reports of other funds. As you compare hypothetical examples of other funds, it is important to note that hypothetical examples are meant to highlight the ongoing costs of investing in a fund only and do not reflect any transaction costs, such as sales charges, or redemption or exchange fees. Therefore, the hypothetical calculations are useful in comparing ongoing costs only, and will not help you determine the relative total costs of owning different funds. If transaction costs were included in these calculations, your costs would be higher.
June 1, 2014 – November 30, 2014
| | | Account Value at the Beginning
of the Period ($) | | Account Value at the End of the
Period ($) | | Expenses Paid During the
Period ($) | | Fund's Annualized
Expense Ratio (%) | |
| | | Actual | | Hypothetical | | Actual | | Hypothetical | | Actual | | Hypothetical | | Actual | |
Class A | | | 1,000.00 | | | | 1,000.00 | | | | 998.00 | | | | 1,016.21 | | | | 8.72 | | | | 8.80 | | | | 1.75 | | |
Class B | | | 1,000.00 | | | | 1,000.00 | | | | 993.80 | | | | 1,012.42 | | | | 12.48 | | | | 12.59 | | | | 2.51 | | |
Class C | | | 1,000.00 | | | | 1,000.00 | | | | 992.80 | | | | 1,012.32 | | | | 12.57 | | | | 12.69 | | | | 2.53 | | |
Class I | | | 1,000.00 | | | | 1,000.00 | | | | 998.00 | | | | 1,018.75 | | | | 6.18 | | | | 6.24 | | | | 1.24 | | |
Class R | | | 1,000.00 | | | | 1,000.00 | | | | 995.90 | | | | 1,014.56 | | | | 10.35 | | | | 10.45 | | | | 2.08 | | |
Class R5 | | | 1,000.00 | | | | 1,000.00 | | | | 999.00 | | | | 1,017.55 | | | | 7.38 | | | | 7.44 | | | | 1.48 | | |
Class W | | | 1,000.00 | | | | 1,000.00 | | | | 998.00 | | | | 1,016.11 | | | | 8.82 | | | | 8.90 | | | | 1.77 | | |
Class Z | | | 1,000.00 | | | | 1,000.00 | | | | 999.00 | | | | 1,017.10 | | | | 7.82 | | | | 7.90 | | | | 1.57 | | |
Expenses paid during the period are equal to the annualized expense ratio for each class as indicated above, multiplied by the average account value over the period and then multiplied by the number of days in the Fund's most recent fiscal half year and divided by 365.
Expenses do not include fees and expenses incurred indirectly by the Fund from its investment in underlying funds, including affiliated and non-affiliated pooled investment vehicles, such as mutual funds and exchange-traded funds.
Had Columbia Management Investment Advisers, LLC and/or certain of its affiliates not waived/reimbursed certain fees and expenses, account value at the end of the period would have been reduced.
Semiannual Report 2014
7
Columbia Absolute Return Multi-Strategy Fund
Portfolio of Investments
November 30, 2014 (Unaudited)
(Percentages represent value of investments compared to net assets)
Common Stocks 37.1%
Issuer | | Shares | | Value ($) | |
Consumer Discretionary 8.0% | |
Hotels, Restaurants & Leisure 0.6% | |
Hilton Worldwide Holdings, Inc.(a)(b) | | | 4,620 | | | | 121,136 | | |
Internet & Catalog Retail 0.6% | |
Priceline Group, Inc. (The)(a)(b) | | | 108 | | | | 125,301 | | |
Media 3.3% | |
Cinemark Holdings, Inc.(b) | | | 3,260 | | | | 118,371 | | |
Comcast Corp., Class A(b) | | | 4,490 | | | | 256,109 | | |
DISH Network Corp., Class A(a)(b) | | | 2,420 | | | | 192,172 | | |
Viacom, Inc., Class B(b) | | | 1,065 | | | | 80,546 | | |
Total | | | | | 647,198 | | |
Specialty Retail 0.8% | |
Cabela's, Inc.(a)(b) | | | 2,995 | | | | 162,449 | | |
Textiles, Apparel & Luxury Goods 2.7% | |
Nike, Inc., Class B(b) | | | 1,975 | | | | 196,098 | | |
PVH Corp.(b) | | | 1,225 | | | | 155,747 | | |
VF Corp.(b) | | | 2,455 | | | | 184,542 | | |
Total | | | | | 536,387 | | |
Total Consumer Discretionary | | | | | 1,592,471 | | |
Consumer Staples 2.1% | |
Beverages 0.9% | |
Dr. Pepper Snapple Group, Inc.(b) | | | 2,360 | | | | 174,640 | | |
Food Products 0.8% | |
Archer-Daniels-Midland Co. | | | 3,270 | | | | 172,264 | | |
Personal Products 0.4% | |
Avon Products, Inc.(b) | | | 7,435 | | | | 72,714 | | |
Total Consumer Staples | | | | | 419,618 | | |
Energy 2.9% | |
Energy Equipment & Services 0.7% | |
Halliburton Co.(b) | | | 3,430 | | | | 144,746 | | |
Oil, Gas & Consumable Fuels 2.2% | |
Anadarko Petroleum Corp. | | | 1,415 | | | | 111,997 | | |
Cimarex Energy Co.(b) | | | 1,060 | | | | 111,247 | | |
ConocoPhillips(b) | | | 1,450 | | | | 95,801 | | |
EOG Resources, Inc.(b) | | | 1,290 | | | | 111,869 | | |
Total | | | | | 430,914 | | |
Total Energy | | | | | 575,660 | | |
Common Stocks (continued)
Issuer | | Shares | | Value ($) | |
Financials 5.3% | |
Capital Markets 2.1% | |
Goldman Sachs Group, Inc. (The)(b) | | | 1,370 | | | | 258,122 | | |
Invesco Ltd.(b) | | | 3,950 | | | | 159,422 | | |
Total | | | | | 417,544 | | |
Consumer Finance 0.4% | |
American Express Co. | | | 875 | | | | 80,867 | | |
Insurance 0.4% | |
MetLife, Inc.(b) | | | 1,490 | | | | 82,859 | | |
Real Estate Investment Trusts (REITs) 1.6% | |
Alexandria Real Estate Equities, Inc. | | | 2,780 | | | | 238,858 | | |
Duke Realty Corp.(b) | | | 4,200 | | | | 81,648 | | |
Total | | | | | 320,506 | | |
Real Estate Management & Development 0.8% | |
St. Joe Co. (The)(a)(b) | | | 7,950 | | | | 147,790 | | |
Total Financials | | | | | 1,049,566 | | |
Health Care 5.9% | |
Biotechnology 4.8% | |
ARIAD Pharmaceuticals, Inc.(a) | | | 12,290 | | | | 87,382 | | |
Auspex Pharmaceuticals, Inc.(a)(b) | | | 4,735 | | | | 114,729 | | |
Bluebird Bio, Inc.(a)(b) | | | 5,665 | | | | 233,568 | | |
Clovis Oncology, Inc.(a)(b) | | | 2,975 | | | | 141,550 | | |
Cubist Pharmaceuticals, Inc.(a)(b) | | | 3,200 | | | | 242,592 | | |
Vertex Pharmaceuticals, Inc.(a)(b) | | | 1,265 | | | | 149,118 | | |
Total | | | | | 968,939 | | |
Health Care Equipment & Supplies 0.5% | |
HeartWare International, Inc.(a)(b) | | | 1,305 | | | | 95,957 | | |
Pharmaceuticals 0.6% | |
AstraZeneca PLC, ADR(b) | | | 1,605 | | | | 119,043 | | |
Total Health Care | | | | | 1,183,939 | | |
Industrials 4.0% | |
Airlines 1.8% | |
Alaska Air Group, Inc. | | | 2,960 | | | | 174,729 | | |
Delta Air Lines, Inc.(b) | | | 3,895 | | | | 181,779 | | |
Total | | | | | 356,508 | | |
Electrical Equipment 1.0% | |
Rockwell Automation, Inc.(b) | | | 1,735 | | | | 200,236 | | |
The accompanying Notes to Financial Statements are an integral part of this statement.
Semiannual Report 2014
8
Columbia Absolute Return Multi-Strategy Fund
Portfolio of Investments (continued)
November 30, 2014 (Unaudited)
Common Stocks (continued)
Issuer | | Shares | | Value ($) | |
Machinery 0.4% | |
IDEX Corp.(b) | | | 1,005 | | | | 77,194 | | |
Road & Rail 0.8% | |
Norfolk Southern Corp.(b) | | | 1,490 | | | | 166,344 | | |
Total Industrials | | | | | 800,282 | | |
Information Technology 8.5% | |
Internet Software & Services 1.1% | |
Google, Inc., Class C(a)(b) | | | 280 | | | | 151,712 | | |
HomeAway, Inc.(a)(b) | | | 2,475 | | | | 77,616 | | |
Total | | | | | 229,328 | | |
Semiconductors & Semiconductor Equipment 1.7% | |
Broadcom Corp., Class A(b) | | | 1,870 | | | | 80,653 | | |
TriQuint Semiconductor, Inc.(a)(b) | | | 3,475 | | | | 84,686 | | |
Xilinx, Inc.(b) | | | 3,665 | | | | 166,538 | | |
Total | | | | | 331,877 | | |
Software 5.3% | |
Activision Blizzard, Inc. | | | 9,355 | | | | 202,536 | | |
Autodesk, Inc.(a)(b) | | | 2,075 | | | | 128,650 | | |
Check Point Software Technologies Ltd.(a)(b) | | | 1,873 | | | | 144,802 | | |
Electronic Arts, Inc.(a)(b) | | | 4,225 | | | | 185,604 | | |
Fortinet, Inc.(a)(b) | | | 3,005 | | | | 82,818 | | |
salesforce.com, Inc.(a)(b) | | | 2,820 | | | | 168,833 | | |
Tableau Software, Inc., Class A(a)(b) | | | 925 | | | | 77,589 | | |
VMware, Inc., Class A(a)(b) | | | 760 | | | | 66,849 | | |
Total | | | | | 1,057,681 | | |
Technology Hardware, Storage & Peripherals 0.4% | |
EMC Corp.(b) | | | 2,636 | | | | 80,003 | | |
Total Information Technology | | | | | 1,698,889 | | |
Materials 0.4% | |
Chemicals 0.4% | |
Monsanto Co.(b) | | | 660 | | | | 79,141 | | |
Total Materials | | | | | 79,141 | | |
Total Common Stocks
(Cost: $6,676,372) | | | | | 7,399,566 | | |
Money Market Funds 66.4%
| | | Shares | | Value ($) | |
Columbia Short-Term Cash Fund,
0.104%(c)(d) | | | 13,231,873 | | | | 13,231,873 | | |
Total Money Market Funds
(Cost: $13,231,873) | | | | | 13,231,873 | | |
Total Investments
(Cost: $19,908,245) | | | | | 20,631,439 | | |
Investments Sold Short (37.0)%
Common Stocks (37.0)%
Issuer | | Shares | | Value ($) | |
Consumer Discretionary (7.9)% | |
Hotels, Restaurants & Leisure (1.4)% | |
Choice Hotels International, Inc. | | | (2,275 | ) | | | (126,058 | ) | |
Panera Bread Co., Class A(a) | | | (905 | ) | | | (151,497 | ) | |
Total | | | | | (277,555 | ) | |
Internet & Catalog Retail (0.4)% | |
Groupon, Inc.(a) | | | (10,285 | ) | | | (77,446 | ) | |
Media (1.2)% | |
Grupo Televisa SAB, ADR | | | (2,179 | ) | | | (81,385 | ) | |
Regal Entertainment Group, Class A | | | (7,420 | ) | | | (171,328 | ) | |
Total | | | | | (252,713 | ) | |
Multiline Retail (0.9)% | |
Target Corp. | | | (2,400 | ) | | | (177,600 | ) | |
Specialty Retail (2.7)% | |
Dick's Sporting Goods, Inc. | | | (4,980 | ) | | | (252,038 | ) | |
Staples, Inc. | | | (9,050 | ) | | | (127,243 | ) | |
Ulta Salon Cosmetics & Fragrance, Inc.(a) | | | (1,270 | ) | | | (160,642 | ) | |
Total | | | | | (539,923 | ) | |
Textiles, Apparel & Luxury Goods (1.3)% | |
Coach, Inc. | | | (6,835 | ) | | | (253,715 | ) | |
Total Consumer Discretionary | | | | | (1,578,952 | ) | |
Consumer Staples (2.1)% | |
Food & Staples Retailing (0.8)% | |
Sprouts Farmers Market, Inc.(a) | | | (5,280 | ) | | | (167,851 | ) | |
Household Products (1.3)% | |
Clorox Co. (The) | | | (1,750 | ) | | | (177,835 | ) | |
Colgate-Palmolive Co. | | | (1,130 | ) | | | (78,637 | ) | |
Total | | | | | (256,472 | ) | |
Total Consumer Staples | | | | | (424,323 | ) | |
The accompanying Notes to Financial Statements are an integral part of this statement.
Semiannual Report 2014
9
Columbia Absolute Return Multi-Strategy Fund
Portfolio of Investments (continued)
November 30, 2014 (Unaudited)
Investments Sold Short (continued)
Common Stocks (continued)
Issuer | | Shares | | Value ($) | |
Energy (2.7)% | |
Energy Equipment & Services (1.8)% | |
Rowan Companies PLC, Class A | | | (5,265 | ) | | | (114,619 | ) | |
SEACOR Holdings, Inc.(a) | | | (1,970 | ) | | | (140,146 | ) | |
Tidewater, Inc. | | | (3,705 | ) | | | (114,522 | ) | |
Total | | | | | (369,287 | ) | |
Oil, Gas & Consumable Fuels (0.9)% | |
Bill Barrett Corp.(a) | | | (6,480 | ) | | | (65,642 | ) | |
Pioneer Natural Resources Co. | | | (765 | ) | | | (109,571 | ) | |
Total | | | | | (175,213 | ) | |
Total Energy | | | | | (544,500 | ) | |
Financials (5.3)% | |
Banks (1.8)% | |
First Republic Bank | | | (4,005 | ) | | | (206,378 | ) | |
Westamerica Bancorporation | | | (3,215 | ) | | | (156,249 | ) | |
Total | | | | | (362,627 | ) | |
Capital Markets (0.4)% | |
SEI Investments Co. | | | (2,080 | ) | | | (82,430 | ) | |
Insurance (1.6)% | |
Progressive Corp. (The) | | | (5,860 | ) | | | (159,626 | ) | |
Travelers Companies, Inc. (The) | | | (780 | ) | | | (81,471 | ) | |
WR Berkley Corp. | | | (1,590 | ) | | | (83,062 | ) | |
Total | | | | | (324,159 | ) | |
Real Estate Investment Trusts (REITs) (1.5)% | |
American Homes 4 Rent, Class A | | | (6,845 | ) | | | (117,734 | ) | |
Healthcare Realty Trust, Inc. | | | (5,987 | ) | | | (158,117 | ) | |
Iron Mountain, Inc. | | | (311 | ) | | | (11,821 | ) | |
Total | | | | | (287,672 | ) | |
Total Financials | | | | | (1,056,888 | ) | |
Health Care (6.1)% | |
Biotechnology (4.1)% | |
Agios Pharmaceuticals, Inc.(a) | | | (1,495 | ) | | | (150,711 | ) | |
Alexion Pharmaceuticals, Inc.(a) | | | (400 | ) | | | (77,960 | ) | |
Ironwood Pharmaceuticals, Inc.(a) | | | (12,490 | ) | | | (172,861 | ) | |
Regeneron Pharmaceuticals, Inc.(a) | | | (500 | ) | | | (208,055 | ) | |
Synageva Biopharma Corp.(a) | | | (1,110 | ) | | | (90,132 | ) | |
United Therapeutics Corp.(a) | | | (840 | ) | | | (111,359 | ) | |
Total | | | | | (811,078 | ) | |
Investments Sold Short (continued)
Common Stocks (continued)
Issuer | | Shares | | Value ($) | |
Health Care Equipment & Supplies (0.8)% | |
Varian Medical Systems, Inc.(a) | | | (1,850 | ) | | | (163,744 | ) | |
Health Care Providers & Services (0.6)% | |
WellCare Health Plans, Inc.(a) | | | (1,630 | ) | | | (120,196 | ) | |
Pharmaceuticals (0.6)% | |
Eli Lilly & Co. | | | (1,695 | ) | | | (115,463 | ) | |
Total Health Care | | | | | (1,210,481 | ) | |
Industrials (4.0)% | |
Air Freight & Logistics (0.9)% | |
Expeditors International of Washington, Inc. | | | (3,795 | ) | | | (177,682 | ) | |
Building Products (1.1)% | |
Armstrong World Industries, Inc.(a) | | | (4,145 | ) | | | (207,665 | ) | |
Commercial Services & Supplies (0.4)% | |
Stericycle, Inc.(a) | | | (650 | ) | | | (83,798 | ) | |
Machinery (0.8)% | |
PACCAR, Inc. | | | (2,463 | ) | | | (165,070 | ) | |
Trading Companies & Distributors (0.8)% | |
Fastenal Co. | | | (3,430 | ) | | | (155,036 | ) | |
Total Industrials | | | | | (789,251 | ) | |
Information Technology (8.5)% | |
Electronic Equipment, Instruments & Components (1.5)% | |
Dolby Laboratories, Inc., Class A | | | (3,365 | ) | | | (149,339 | ) | |
Vishay Intertechnology, Inc. | | | (9,855 | ) | | | (136,689 | ) | |
Total | | | | | (286,028 | ) | |
Internet Software & Services (1.0)% | |
AOL, Inc.(a) | | | (1,790 | ) | | | (82,626 | ) | |
LinkedIn Corp., Class A(a) | | | (535 | ) | | | (121,055 | ) | |
Total | | | | | (203,681 | ) | |
IT Services (1.0)% | |
Xerox Corp. | | | (14,350 | ) | | | (200,326 | ) | |
Semiconductors & Semiconductor Equipment (1.6)% | |
Analog Devices, Inc. | | | (1,525 | ) | | | (83,326 | ) | |
Intersil Corp., Class A | | | (11,160 | ) | | | (146,308 | ) | |
Silicon Laboratories, Inc.(a) | | | (1,715 | ) | | | (77,775 | ) | |
Total | | | | | (307,409 | ) | |
The accompanying Notes to Financial Statements are an integral part of this statement.
Semiannual Report 2014
10
Columbia Absolute Return Multi-Strategy Fund
Portfolio of Investments (continued)
November 30, 2014 (Unaudited)
Investments Sold Short (continued)
Common Stocks (continued)
Issuer | | Shares | | Value ($) | |
Software (2.0)% | |
Concur Technologies, Inc.(a) | | | (1,165 | ) | | | (150,064 | ) | |
SAP SE, ADR | | | (2,508 | ) | | | (176,362 | ) | |
Zynga, Inc., Class A(a) | | | (29,680 | ) | | | (77,168 | ) | |
Total | | | | | (403,594 | ) | |
Technology Hardware, Storage & Peripherals (1.4)% | |
Diebold, Inc. | | | (4,175 | ) | | | (151,051 | ) | |
Lexmark International, Inc., Class A | | | (3,087 | ) | | | (132,309 | ) | |
Total | | | | | (283,360 | ) | |
Total Information Technology | | | | | (1,684,398 | ) | |
Investments Sold Short (continued)
Common Stocks (continued)
Issuer | | Shares | | Value ($) | |
Materials (0.4)% | |
Chemicals (0.4)% | |
Air Products & Chemicals, Inc. | | | (565 | ) | | | (81,264 | ) | |
Total Materials | | | | | (81,264 | ) | |
Total Common Stocks
(Proceeds: $7,093,039) | | | | | (7,370,057 | ) | |
Total Investments Sold Short
(Proceeds: $7,093,039) | | | | | (7,370,057 | ) | |
Total Investments, Net of Investments Sold Short | | | | | 13,261,382 | | |
Other Assets & Liabilities, Net | | | | | 6,666,176 | | |
Net Assets | | | | | 19,927,558 | | |
Investments in Derivatives
Forward Foreign Currency Exchange Contracts Open at November 30, 2014
Counterparty | | Exchange Date | | Currency to
be Delivered | | Currency to
be Received | | Unrealized
Appreciation ($) | | Unrealized
Depreciation ($) | |
Credit Suisse Securities (USA) L.L.C.
| | 12/12/2014
| | | 1,278,596
AUD | | | | 1,107,080
USD | | | | 19,910
| | | | —
| | |
Credit Suisse Securities (USA) L.L.C.
| | 12/12/2014
| | | 400,000
CAD | | | | 353,746
USD | | | | 4,028
| | | | —
| | |
Credit Suisse Securities (USA) L.L.C.
| | 12/12/2014
| | | 1,400,000
CHF | | | | 1,471,155
USD | | | | 22,035
| | | | —
| | |
Credit Suisse Securities (USA) L.L.C.
| | 12/12/2014
| | | 1,400,000
EUR | | | | 1,777,691
USD | | | | 36,767
| | | | —
| | |
Credit Suisse Securities (USA) L.L.C.
| | 12/12/2014
| | | 200,000
GBP | | | | 322,712
USD | | | | 10,330
| | | | —
| | |
Credit Suisse Securities (USA) L.L.C.
| | 12/12/2014
| | | 4,000,000
JPY | | | | 33,905
USD | | | | 204
| | | | —
| | |
Credit Suisse Securities (USA) L.L.C.
| | 12/12/2014
| | | 4,622,259
NOK | | | | 708,021
USD | | | | 49,391
| | | | —
| | |
Credit Suisse Securities (USA) L.L.C.
| | 12/12/2014
| | | 2,500,000
SEK | | | | 335,818
USD | | | | 534
| | | | —
| | |
Credit Suisse Securities (USA) L.L.C.
| | 12/12/2014
| | | 400,000
SGD | | | | 314,527
USD | | | | 7,842
| | | | —
| | |
Credit Suisse Securities (USA) L.L.C.
| | 12/12/2014
| | | 88,701
USD | | | | 100,000
AUD | | | | —
| | | | (3,673
| ) | |
Credit Suisse Securities (USA) L.L.C.
| | 12/12/2014
| | | 418,583
USD | | | | 400,000
CHF | | | | —
| | | | (4,549
| ) | |
Credit Suisse Securities (USA) L.L.C.
| | 12/12/2014
| | | 251,071
USD | | | | 200,000
EUR | | | | —
| | | | (2,367
| ) | |
Credit Suisse Securities (USA) L.L.C.
| | 12/12/2014
| | | 157,108
USD | | | | 100,000
GBP | | | | —
| | | | (917
| ) | |
The accompanying Notes to Financial Statements are an integral part of this statement.
Semiannual Report 2014
11
Columbia Absolute Return Multi-Strategy Fund
Portfolio of Investments (continued)
November 30, 2014 (Unaudited)
Forward Foreign Currency Exchange Contracts Open at November 30, 2014 (continued)
Counterparty | | Exchange Date | | Currency to
be Delivered | | Currency to
be Received | | Unrealized
Appreciation ($) | | Unrealized
Depreciation ($) | |
Credit Suisse Securities (USA) L.L.C.
| | 12/12/2014
| | | 268,261
USD | | | | 30,400,000
JPY | | | | —
| | | | (12,133
| ) | |
Credit Suisse Securities (USA) L.L.C.
| | 12/12/2014
| | | 193,088
USD | | | | 1,300,000
NOK | | | | —
| | | | (7,850
| ) | |
Credit Suisse Securities (USA) L.L.C.
| | 12/12/2014
| | | 529,975
USD | | | | 3,900,000
SEK | | | | —
| | | | (6,932
| ) | |
Credit Suisse Securities (USA) L.L.C.
| | 12/12/2014
| | | 306,370
USD | | | | 400,000
SGD | | | | 315
| | | | —
| | |
Credit Suisse Securities (USA) L.L.C.
| | 12/12/2014
| | | 76,799
USD | | | | 100,000
SGD | | | | —
| | | | (128
| ) | |
Deutsch Bank
| | 12/12/2014
| | | 523,636
USD | | | | 600,000
AUD | | | | —
| | | | (13,466
| ) | |
Deutsch Bank
| | 12/12/2014
| | | 126,687
USD | | | | 100,000
EUR | | | | —
| | | | (2,336
| ) | |
Deutsch Bank
| | 12/12/2014
| | | 160,675
USD | | | | 100,000
GBP | | | | —
| | | | (4,484
| ) | |
Deutsch Bank
| | 12/12/2014
| | | 76,422
USD | | | | 8,200,000
JPY | | | | —
| | | | (7,334
| ) | |
HSBC Securities (USA), Inc.
| | 12/12/2014
| | | 5,974,843
USD | | | | 7,600,000
SGD | | | | —
| | | | (147,828
| ) | |
State Street Bank & Trust Company
| | 12/12/2014
| | | 1,600,000
AUD | | | | 1,396,032
USD | | | | 35,579
| | | | —
| | |
State Street Bank & Trust Company
| | 12/12/2014
| | | 1,605,280
USD | | | | 1,800,000
CAD | | | | —
| | | | (31,546
| ) | |
State Street Bank & Trust Company
| | 12/12/2014
| | | 1,141,875
USD | | | | 900,000
EUR | | | | —
| | | | (22,710
| ) | |
State Street Bank & Trust Company
| | 12/12/2014
| | | 2,890,566
USD | | | | 1,800,000
GBP | | | | —
| | | | (79,122
| ) | |
UBS Securities
| | 12/12/2014
| | | 300,000
AUD | | | | 261,255
USD | | | | 6,170
| | | | —
| | |
UBS Securities
| | 12/12/2014
| | | 2,200,000
CAD | | | | 1,956,046
USD | | | | 32,592
| | | | —
| | |
UBS Securities
| | 12/12/2014
| | | 300,000
CHF | | | | 311,577
USD | | | | 1,051
| | | | —
| | |
UBS Securities
| | 12/12/2014
| | | 300,000
EUR | | | | 376,111
USD | | | | 3,056
| | | | —
| | |
UBS Securities
| | 12/12/2014
| | | 2,100,000
GBP | | | | 3,370,080
USD | | | | 90,061
| | | | —
| | |
UBS Securities
| | 12/12/2014
| | | 64,400,000
JPY | | | | 599,171
USD | | | | 56,584
| | | | —
| | |
UBS Securities
| | 12/12/2014
| | | 7,300,000
NOK | | | | 1,107,077
USD | | | | 66,894
| | | | —
| | |
UBS Securities
| | 12/12/2014
| | | 100,000
NZD | | | | 78,859
USD | | | | 496
| | | | —
| | |
UBS Securities
| | 12/12/2014
| | | 200,000
NZD | | | | 156,418
USD | | | | —
| | | | (309
| ) | |
UBS Securities
| | 12/12/2014
| | | 21,300,000
SEK | | | | 2,926,814
USD | | | | 70,194
| | | | —
| | |
The accompanying Notes to Financial Statements are an integral part of this statement.
Semiannual Report 2014
12
Columbia Absolute Return Multi-Strategy Fund
Portfolio of Investments (continued)
November 30, 2014 (Unaudited)
Forward Foreign Currency Exchange Contracts Open at November 30, 2014 (continued)
Counterparty | | Exchange Date | | Currency to
be Delivered | | Currency to
be Received | | Unrealized
Appreciation ($) | | Unrealized
Depreciation ($) | |
UBS Securities
| | 12/12/2014
| | | 7,900,000
SGD | | | | 6,210,230
USD | | | | 153,205
| | | | —
| | |
UBS Securities
| | 12/12/2014
| | | 1,550,897
USD | | | | 1,778,596
AUD | | | | —
| | | | (38,586
| ) | |
UBS Securities
| | 12/12/2014
| | | 266,763
USD | | | | 300,000
CAD | | | | —
| | | | (4,474
| ) | |
UBS Securities
| | 12/12/2014
| | | 1,155,984
USD | | | | 1,100,000
CHF | | | | —
| | | | (17,389
| ) | |
UBS Securities
| | 12/12/2014
| | | 127,870
USD | | | | 100,000
EUR | | | | —
| | | | (3,518
| ) | |
UBS Securities
| | 12/12/2014
| | | 1,750,326
USD | | | | 1,100,000
GBP | | | | —
| | | | (32,221
| ) | |
UBS Securities
| | 12/12/2014
| | | 165,376
USD | | | | 18,700,000
JPY | | | | —
| | | | (7,823
| ) | |
UBS Securities
| | 12/12/2014
| | | 922,213
USD | | | | 6,117,301
NOK | | | | —
| | | | (50,554
| ) | |
UBS Securities
| | 12/12/2014
| | | 466,759
USD | | | | 600,000
NZD | | | | 3,420
| | | | —
| | |
UBS Securities
| | 12/12/2014
| | | 157,612
USD | | | | 200,000
NZD | | | | —
| | | | (885
| ) | |
UBS Securities
| | 12/12/2014
| | | 221,955
USD | | | | 1,600,000
SEK | | | | —
| | | | (7,373
| ) | |
UBS Securities
| | 12/12/2014
| | | 698,084
USD | | | | 900,000
SGD | | | | —
| | | | (8,043
| ) | |
Credit Suisse Securities (USA) L.L.C.
| | 12/17/2014
| | | 702,000
EUR | | | | 874,790
USD | | | | 1,818
| | | | —
| | |
Credit Suisse Securities (USA) L.L.C.
| | 12/17/2014
| | | 3,000
EUR | | | | 3,728
USD | | | | —
| | | | (3
| ) | |
Credit Suisse Securities (USA) L.L.C.
| | 12/17/2014
| | | 349,853
USD | | | | 223,000
GBP | | | | —
| | | | (1,556
| ) | |
Credit Suisse Securities (USA) L.L.C.
| | 12/17/2014
| | | 528,043
USD | | | | 668,000
NZD | | | | —
| | | | (4,865
| ) | |
HSBC Securities (USA), Inc.
| | 12/17/2014
| | | 3,558,000
NOK | | | | 524,391
USD | | | | 17,501
| | | | —
| | |
HSBC Securities (USA), Inc.
| | 12/17/2014
| | | 883,841
USD | | | | 103,618,000
JPY | | | | —
| | | | (10,743
| ) | |
UBS Securities
| | 12/17/2014
| | | 339,000
CHF | | | | 351,605
USD | | | | 684
| | | | —
| | |
Total | | | | | | | | | 690,661 | | | | (535,717 | ) | |
The accompanying Notes to Financial Statements are an integral part of this statement.
Semiannual Report 2014
13
Columbia Absolute Return Multi-Strategy Fund
Portfolio of Investments (continued)
November 30, 2014 (Unaudited)
Futures Contracts Outstanding at November 30, 2014
At November 30, 2014, cash totaling $290,963 was pledged as collateral to cover initial margin requirements on open futures contracts.
Long Futures Contracts Outstanding
Contract Description | | Number of
Contracts | | Trading
Currency | | Notional
Market
Value ($) | | Expiration
Date | | Unrealized
Appreciation ($) | | Unrealized
Depreciation ($) | |
| 10YR MINI | | | 56 | | | JPY | | | | | 6,931,424 | | | 12/2014 | | | 14,148 | | | | — | | |
| 3MO EUROYEN (TFX) | | | 5 | | | JPY | | | | | 1,051,257 | | | 06/2015 | | | 162 | | | | — | | |
| 90 DAY STERLING | | | 6 | | | GBP | | | | | 1,163,651 | | | 06/2015 | | | 4,669 | | | | — | | |
AUST 10YR BOND | | | 9 | | | AUD | | | | | 959,265 | | | 12/2014 | | | 20,512 | | | | — | | |
BANK ACCEPT | | | 10 | | | CAD | | | | | 2,157,958 | | | 06/2015 | | | 188 | | | | — | | |
CAC40 10 EURO | | | 2 | | | EUR | | | | | 109,001 | | | 12/2014 | | | 3,183 | | | | — | | |
CAN 10YR BOND | | | 4 | | | CAD | | | | | 481,784 | | | 03/2015 | | | 6,169 | | | | — | | |
CBOE VIX | | | 4 | | | USD | | | | | 67,000 | | | 02/2015 | | | — | | | | (11 | ) | |
CBOE VIX | | | 12 | | | USD | | | | | 206,400 | | | 03/2015 | | | 1,303 | | | | — | | |
CBOE VIX | | | 7 | | | USD | | | | | 124,250 | | | 04/2015 | | | 581 | | | | — | | |
| EURO STOXX 50 | | | 3 | | | EUR | | | | | 121,013 | | | 12/2014 | | | 4,566 | | | | — | | |
| EURO-BUND | | | 3 | | | EUR | | | | | 570,184 | | | 12/2014 | | | 13,885 | | | | — | | |
FTSE 100 INDEX | | | 5 | | | GBP | | | | | 525,691 | | | 12/2014 | | | 7,910 | | | | — | | |
FTSE/MIB INDEX | | | 2 | | | EUR | | | | | 249,138 | | | 12/2014 | | | 12,559 | | | | — | | |
IBEX 35 INDEX | | | 1 | | | EUR | | | | | 133,799 | | | 12/2014 | | | 5,239 | | | | — | | |
LONG GILT | | | 8 | | | GBP | | | | | 1,468,780 | | | 03/2015 | | | 11,425 | | | | — | | |
MSCI SING IX ETS | | | 9 | | | SGD | | | | | 520,477 | | | 12/2014 | | | 2,044 | | | | — | | |
OMXS30 INDEX | | | 15 | | | SEK | | | | | 294,657 | | | 12/2014 | | | 6,985 | | | | — | | |
SPI 200 | | | 1 | | | AUD | | | | | 113,553 | | | 12/2014 | | | — | | | | (3,253 | ) | |
TOPIX INDEX | | | 1 | | | JPY | | | | | 118,814 | | | 12/2014 | | | 11,819 | | | | — | | |
US LONG BOND | | | 3 | | | USD | | | | | 427,875 | | | 03/2015 | | | 6,159 | | | | — | | |
Total | | | | | | | | | | | 133,506 | | | | (3,264 | ) | |
Short Futures Contracts Outstanding
Contract Description | | Number of
Contracts | | Trading
Currency | | Notional
Market
Value ($) | | Expiration
Date | | Unrealized
Appreciation ($) | | Unrealized
Depreciation ($) | |
| 3MO EURO EURIBOR | | | (1 | ) | | EUR | | | | | (310,629 | ) | | 06/2015 | | | — | | | | (64 | ) | |
3MO EURO SWISS FRANC | | | (15 | ) | | CHF | | | | | (3,885,252 | ) | | 06/2015 | | | — | | | | (995 | ) | |
| 3MO EUROYEN (TFX) | | | (8 | ) | | JPY | | | | | (1,682,012 | ) | | 06/2015 | | | — | | | | (217 | ) | |
CBOE VIX | | | (17 | ) | | USD | | | | | (252,450 | ) | | 12/2014 | | | 5,056 | | | | — | | |
CBOE VIX | | | (4 | ) | | USD | | | | | (63,800 | ) | | 01/2015 | | | — | | | | (810 | ) | |
| EURO$ 90 DAY | | | (19 | ) | | USD | | | | | (4,732,900 | ) | | 06/2015 | | | — | | | | (1,585 | ) | |
| EURO-BUND | | | (7 | ) | | EUR | | | | | (1,330,429 | ) | | 12/2014 | | | — | | | | (14,260 | ) | |
FTSE 100 INDEX | | | (1 | ) | | GBP | | | | | (105,138 | ) | | 12/2014 | | | — | | | | (4,297 | ) | |
The accompanying Notes to Financial Statements are an integral part of this statement.
Semiannual Report 2014
14
Columbia Absolute Return Multi-Strategy Fund
Portfolio of Investments (continued)
November 30, 2014 (Unaudited)
Futures Contracts Outstanding at November 30, 2014 (continued)
Short Futures Contracts Outstanding (continued)
Contract Description | | Number of
Contracts | | Trading
Currency | | Notional
Market
Value ($) | | Expiration
Date | | Unrealized
Appreciation ($) | | Unrealized
Depreciation ($) | |
SPI 200 | | | (1 | ) | | AUD | | | | | (113,553 | ) | | 12/2014 | | | 361 | | | | — | | |
TOPIX INDEX | | | (1 | ) | | JPY | | | | | (118,814 | ) | | 12/2014 | | | — | | | | (473 | ) | |
US LONG BOND | | | (2 | ) | | USD | | | | | (285,250 | ) | | 03/2015 | | | — | | | | (3,379 | ) | |
Total | | | | | | | | | | | 5,417 | | | | (26,080 | ) | |
Notes to Portfolio of Investments
(a) Non-income producing.
(b) This security, or a portion of this security, was pledged as collateral for securities sold short. At November 30, 2014, total securities pledged was $6,145,596.
(c) The rate shown is the seven-day current annualized yield at November 30, 2014.
(d) As defined in the Investment Company Act of 1940, an affiliated company is one in which the Fund owns 5% or more of the company's outstanding voting securities, or a company which is under common ownership or control with the Fund. Holdings and transactions in these affiliated companies during the period ended November 30, 2014, are as follows:
Issuer | | Beginning
Cost ($) | | Purchase
Cost ($) | | Proceeds
From Sales ($) | | Ending
Cost ($) | | Dividends —
Affiliated
Issuers ($) | | Value ($) | |
Columbia Short-Term Cash Fund | | | 58,915,448 | | | | 79,497,467 | | | | (125,181,042 | ) | | | 13,231,873 | | | | 18,430 | | | | 13,231,873 | | |
Abbreviation Legend
ADR American Depositary Receipt
Currency Legend
AUD Australian Dollar
CAD Canadian Dollar
CHF Swiss Franc
EUR Euro
GBP British Pound
JPY Japanese Yen
NOK Norwegian Krone
NZD New Zealand Dollar
SEK Swedish Krona
SGD Singapore Dollar
USD US Dollar
The accompanying Notes to Financial Statements are an integral part of this statement.
Semiannual Report 2014
15
Columbia Absolute Return Multi-Strategy Fund
Portfolio of Investments (continued)
November 30, 2014 (Unaudited)
Generally accepted accounting principles (GAAP) require disclosure regarding the inputs and valuation techniques used to measure fair value and any changes in valuation inputs or techniques. In addition, investments shall be disclosed by major category.
The Fund categorizes its fair value measurements according to a three-level hierarchy that maximizes the use of observable inputs and minimizes the use of unobservable inputs by prioritizing that the most observable input be used when available. Observable inputs are those that market participants would use in pricing an investment based on market data obtained from sources independent of the reporting entity. Unobservable inputs are those that reflect the Fund's assumptions about the information market participants would use in pricing an investment. An investment's level within the fair value hierarchy is based on the lowest level of any input that is deemed significant to the asset or liability's fair value measurement. The input levels are not necessarily an indication of the risk or liquidity associated with investments at that level. For example, certain U.S. government securities are generally high quality and liquid, however, they are reflected as Level 2 because the inputs used to determine fair value may not always be quoted prices in an active market.
Fair value inputs are summarized in the three broad levels listed below:
> Level 1 — Valuations based on quoted prices for investments in active markets that the Fund has the ability to access at the measurement date (including NAV for open-end mutual funds). Valuation adjustments are not applied to Level 1 investments.
> Level 2 — Valuations based on other significant observable inputs (including quoted prices for similar securities, interest rates, prepayment speeds, credit risks, etc.).
> Level 3 — Valuations based on significant unobservable inputs (including the Fund's own assumptions and judgment in determining the fair value of investments).
Inputs that are used in determining fair value of an investment may include price information, credit data, volatility statistics, and other factors. These inputs can be either observable or unobservable. The availability of observable inputs can vary between investments, and is affected by various factors such as the type of investment, and the volume and level of activity for that investment or similar investments in the marketplace. The inputs will be considered by the Investment Manager, along with any other relevant factors in the calculation of an investment's fair value. The Fund uses prices and inputs that are current as of the measurement date, which may include periods of market dislocations. During these periods, the availability of prices and inputs may be reduced for many investments. This condition could cause an investment to be reclassified between the various levels within the hierarchy.
Investments falling into the Level 3 category are primarily supported by quoted prices from brokers and dealers participating in the market for those investments. However, these may be classified as Level 3 investments due to lack of market transparency and corroboration to support these quoted prices. Additionally, valuation models may be used as the pricing source for any remaining investments classified as Level 3. These models may rely on one or more significant unobservable inputs and/or significant assumptions by the Investment Manager. Inputs used in valuations may include, but are not limited to, financial statement analysis, capital account balances, discount rates and estimated cash flows, and comparable company data.
Under the direction of the Fund's Board of Trustees (the Board), the Investment Manager's Valuation Committee (the Committee) is responsible for overseeing the valuation procedures approved by the Board. The Committee consists of voting and non-voting members from various groups within the Investment Manager's organization, including operations and accounting, trading and investments, compliance, risk management and legal.
The Committee meets at least monthly to review and approve valuation matters, which may include a description of specific valuation determinations, data regarding pricing information received from approved pricing vendors and brokers and the results of Board-approved valuation control policies and procedures (the Policies). The Policies address, among other things, instances when market quotations are or are not readily available, including recommendations of third party pricing vendors and a determination of appropriate pricing methodologies; events that require specific valuation determinations and assessment of fair value techniques; securities with a potential for stale pricing, including those that are illiquid, restricted, or in default; and the effectiveness of third party pricing vendors, including periodic reviews of vendors. The Committee meets more frequently, as needed, to discuss additional valuation matters, which may include the need to review back-testing results, review time-sensitive information or approve related valuation actions. The Committee reports to the Board, with members of the Committee meeting with the Board at each of its regularly scheduled meetings to discuss valuation matters and actions during the period, similar to those described earlier.
For investments categorized as Level 3, the Committee monitors information similar to that described above, which may include: (i) data specific to the issuer or comparable issuers, (ii) general market or specific sector news and (iii) quoted prices and specific or similar security transactions. The Committee considers this data and any changes from prior periods in order to assess the reasonableness of observable and unobservable inputs, any assumptions or internal models used to value those securities and changes in fair value. This data is also used to corroborate, when available, information received from approved pricing vendors and brokers. Various factors impact the frequency of monitoring this information (which may occur as often as daily). However, the Committee may determine that changes to inputs, assumptions and models are not required as a result of the monitoring procedures performed.
The accompanying Notes to Financial Statements are an integral part of this statement.
Semiannual Report 2014
16
Columbia Absolute Return Multi-Strategy Fund
Portfolio of Investments (continued)
November 30, 2014 (Unaudited)
Fair Value Measurements (continued)
The following table is a summary of the inputs used to value the Fund's investments at November 30, 2014:
Description | | Level 1
Quoted Prices in Active
Markets for Identical
Assets ($) | | Level 2
Other Significant
Observable Inputs ($) | | Level 3
Significant
Unobservable Inputs ($) | | Total ($) | |
Equity Securities | |
Common Stocks | |
Consumer Discretionary | | | 1,592,471 | | | | — | | | | — | | | | 1,592,471 | | |
Consumer Staples | | | 419,618 | | | | — | | | | — | | | | 419,618 | | |
Energy | | | 575,660 | | | | — | | | | — | | | | 575,660 | | |
Financials | | | 1,049,566 | | | | — | | | | — | | | | 1,049,566 | | |
Health Care | | | 1,183,939 | | | | — | | | | — | | | | 1,183,939 | | |
Industrials | | | 800,282 | | | | — | | | | — | | | | 800,282 | | |
Information Technology | | | 1,698,889 | | | | — | | | | — | | | | 1,698,889 | | |
Materials | | | 79,141 | | | | — | | | | — | | | | 79,141 | | |
Common Stocks — Investments
Sold Short | |
Consumer Discretionary | | | (1,578,952 | ) | | | — | | | | — | | | | (1,578,952 | ) | |
Consumer Staples | | | (424,323 | ) | | | — | | | | — | | | | (424,323 | ) | |
Energy | | | (544,500 | ) | | | — | | | | — | | | | (544,500 | ) | |
Financials | | | (1,056,888 | ) | | | — | | | | — | | | | (1,056,888 | ) | |
Health Care | | | (1,210,481 | ) | | | — | | | | — | | | | (1,210,481 | ) | |
Industrials | | | (789,251 | ) | | | — | | | | — | | | | (789,251 | ) | |
Information Technology | | | (1,684,398 | ) | | | — | | | | — | | | | (1,684,398 | ) | |
Materials | | | (81,264 | ) | | | — | | | | — | | | | (81,264 | ) | |
Total Equity Securities | | | 29,509 | | | | — | | | | — | | | | 29,509 | | |
Mutual Funds | |
Money Market Funds | | | 13,231,873 | | | | — | | | | — | | | | 13,231,873 | | |
Total Mutual Funds | | | 13,231,873 | | | | — | | | | — | | | | 13,231,873 | | |
Investments in Securities | | | 13,261,382 | | | | — | | | | — | | | | 13,261,382 | | |
Derivatives | |
Assets | |
Forward Foreign Currency
Exchange Contracts | | | — | | | | 690,661 | | | | — | | | | 690,661 | | |
Futures Contracts | | | 138,923 | | | | — | | | | — | | | | 138,923 | | |
Liabilities | |
Forward Foreign Currency
Exchange Contracts | | | — | | | | (535,717 | ) | | | — | | | | (535,717 | ) | |
Futures Contracts | | | (29,344 | ) | | | — | | | | — | | | | (29,344 | ) | |
Total | | | 13,370,961 | | | | 154,944 | | | | — | | | | 13,525,905 | | |
See the Portfolio of Investments for all investment classifications not indicated in the table.
There were no transfers of financial assets between levels during the period.
Derivative instruments are valued at unrealized appreciation (depreciation).
The accompanying Notes to Financial Statements are an integral part of this statement.
Semiannual Report 2014
17
Columbia Absolute Return Multi-Strategy Fund
Statement of Assets and Liabilities
November 30, 2014 (Unaudited)
Assets | |
Investments, at value | |
Unaffiliated issuers (identified cost $6,676,372) | | $ | 7,399,566 | | |
Affiliated issuers (identified cost $13,231,873) | | | 13,231,873 | | |
Total investments (identified cost $19,908,245) | | | 20,631,439 | | |
Cash | | | 714 | | |
Cash collateral held at broker | | | 6,295,400 | | |
Margin deposits | | | 290,963 | | |
Unrealized appreciation on forward foreign currency exchange contracts | | | 690,661 | | |
Receivable for: | |
Investments sold | | | 2,093 | | |
Capital shares sold | | | 200 | | |
Dividends | | | 9,181 | | |
Variation margin | | | 24,155 | | |
Expense reimbursement due from Investment Manager | | | 940 | | |
Prepaid expenses | | | 2,327 | | |
Total assets | | | 27,948,073 | | |
Liabilities | |
Securities sold short, at value (proceeds $7,093,039) | | | 7,370,057 | | |
Unrealized depreciation on forward foreign currency exchange contracts | | | 535,717 | | |
Payable for: | |
Investments purchased | | | 2,383 | | |
Capital shares purchased | | | 500 | | |
Dividends and interest on securities sold short | | | 10,993 | | |
Variation margin | | | 26,068 | | |
Investment management fees | | | 902 | | |
Distribution and/or service fees | | | 332 | | |
Transfer agent fees | | | 2,966 | | |
Administration fees | | | 88 | | |
Compensation of board members | | | 15,924 | | |
Other expenses | | | 54,585 | | |
Total liabilities | | | 8,020,515 | | |
Net assets applicable to outstanding capital stock | | $ | 19,927,558 | | |
Represented by | |
Paid-in capital | | $ | 21,780,863 | | |
Excess of distributions over net investment income | | | (404,882 | ) | |
Accumulated net realized loss | | | (2,153,286 | ) | |
Unrealized appreciation (depreciation) on: | |
Investments | | | 723,194 | | |
Foreign currency translations | | | (5,836 | ) | |
Forward foreign currency exchange contracts | | | 154,944 | | |
Futures contracts | | | 109,579 | | |
Securities sold short | | | (277,018 | ) | |
Total — representing net assets applicable to outstanding capital stock | | $ | 19,927,558 | | |
The accompanying Notes to Financial Statements are an integral part of this statement.
Semiannual Report 2014
18
Columbia Absolute Return Multi-Strategy Fund
Statement of Assets and Liabilities (continued)
November 30, 2014 (Unaudited)
Class A | |
Net assets | | $ | 14,776,296 | | |
Shares outstanding | | | 1,517,787 | | |
Net asset value per share | | $ | 9.74 | | |
Maximum offering price per share(a) | | $ | 10.04 | | |
Class B | |
Net assets | | $ | 40,672 | | |
Shares outstanding | | | 4,237 | | |
Net asset value per share | | $ | 9.60 | | |
Class C | |
Net assets | | $ | 2,269,190 | | |
Shares outstanding | | | 236,256 | | |
Net asset value per share | | $ | 9.60 | | |
Class I | |
Net assets | | $ | 1,811,924 | | |
Shares outstanding | | | 185,413 | | |
Net asset value per share | | $ | 9.77 | | |
Class R | |
Net assets | | $ | 2,421 | | |
Shares outstanding | | | 250 | | |
Net asset value per share | | $ | 9.68 | | |
Class R5 | |
Net assets | | $ | 2,459 | | |
Shares outstanding | | | 251 | | |
Net asset value per share | | $ | 9.80 | | |
Class W | |
Net assets | | $ | 63,927 | | |
Shares outstanding | | | 6,540 | | |
Net asset value per share(b) | | $ | 9.78 | | |
Class Z | |
Net assets | | $ | 960,669 | | |
Shares outstanding | | | 98,352 | | |
Net asset value per share | | $ | 9.77 | | |
(a) The maximum offering price per share is calculated by dividing the net asset value per share by 1.0 minus the maximum sales charge of 3.00%.
(b) Net asset value per share rounds to this amount due to fractional shares outstanding.
The accompanying Notes to Financial Statements are an integral part of this statement.
Semiannual Report 2014
19
Columbia Absolute Return Multi-Strategy Fund
Statement of Operations
Six Months Ended November 30, 2014 (Unaudited)
Net investment income | |
Income: | |
Dividends — unaffiliated issuers | | $ | 211,990 | | |
Dividends — affiliated issuers | | | 18,430 | | |
Foreign taxes withheld | | | (473 | ) | |
Total income | | | 229,947 | | |
Expenses: | |
Investment management fees | | | 261,417 | | |
Distribution and/or service fees | |
Class A | | | 25,867 | | |
Class B | | | 263 | | |
Class C | | | 12,747 | | |
Class R | | | 6 | | |
Class W | | | 90 | | |
Transfer agent fees | |
Class A | | | 12,469 | | |
Class B | | | 31 | | |
Class C | | | 1,505 | | |
Class R | | | 2 | | |
Class R5 | | | 1 | | |
Class W | | | 40 | | |
Class Z | | | 584 | | |
Administration fees | | | 25,504 | | |
Compensation of board members | | | 6,296 | | |
Custodian fees | | | 25,743 | | |
Printing and postage fees | | | 17,872 | | |
Registration fees | | | 45,531 | | |
Professional fees | | | 20,494 | | |
Dividends and interest on securities sold short | | | 96,213 | | |
Other | | | 12,691 | | |
Total expenses | | | 565,366 | | |
Fees waived or expenses reimbursed by Investment Manager and its affiliates | | | (98,350 | ) | |
Total net expenses | | | 467,016 | | |
Net investment loss | | | (237,069 | ) | |
Realized and unrealized gain (loss) — net | |
Net realized gain (loss) on: | |
Investments | | | 12,237,151 | | |
Foreign currency translations | | | (427,709 | ) | |
Forward foreign currency exchange contracts | | | 222,617 | | |
Futures contracts | | | (1,423,510 | ) | |
Securities sold short | | | (1,162,941 | ) | |
Net realized gain | | | 9,445,608 | | |
Net change in unrealized appreciation (depreciation) on: | |
Investments | | | (10,899,234 | ) | |
Foreign currency translations | | | (2,471 | ) | |
Forward foreign currency exchange contracts | | | 364,012 | | |
Futures contracts | | | 546,062 | | |
Securities sold short | | | 583,776 | | |
Net change in unrealized depreciation | | | (9,407,855 | ) | |
Net realized and unrealized gain | | | 37,753 | | |
Net decrease in net assets from operations | | $ | (199,316 | ) | |
The accompanying Notes to Financial Statements are an integral part of this statement.
Semiannual Report 2014
20
Columbia Absolute Return Multi-Strategy Fund
Statement of Changes in Net Assets
| | | Six Months Ended
November 30, 2014
(Unaudited) | | Year Ended
May 31,
2014 | |
Operations | |
Net investment loss | | $ | (237,069 | ) | | $ | (549,519 | ) | |
Net realized gain (loss) | | | 9,445,608 | | | | (1,570,874 | ) | |
Net change in unrealized depreciation | | | (9,407,855 | ) | | | (3,401,512 | ) | |
Net decrease in net assets resulting from operations | | | (199,316 | ) | | | (5,521,905 | ) | |
Distributions to shareholders | |
Net investment income | |
Class A | | | — | | | | (199,071 | ) | |
Class I | | | — | | | | (694,164 | ) | |
Class R | | | — | | | | (9 | ) | |
Class R5 | | | — | | | | (25 | ) | |
Class W | | | — | | | | (981 | ) | |
Class Z | | | — | | | | (8,603 | ) | |
Total distributions to shareholders | | | — | | | | (902,853 | ) | |
Decrease in net assets from capital stock activity | | | (81,657,149 | ) | | | (70,867,199 | ) | |
Total decrease in net assets | | | (81,856,465 | ) | | | (77,291,957 | ) | |
Net assets at beginning of period | | | 101,784,023 | | | | 179,075,980 | | |
Net assets at end of period | | $ | 19,927,558 | | | $ | 101,784,023 | | |
Excess of distributions over net investment income | | $ | (404,882 | ) | | $ | (167,813 | ) | |
The accompanying Notes to Financial Statements are an integral part of this statement.
Semiannual Report 2014
21
Columbia Absolute Return Multi-Strategy Fund
Statement of Changes in Net Assets (continued)
| | | Six Months Ended November 30, 2014
(Unaudited) | | Year Ended May 31, 2014 | |
| | | Shares | | Dollars ($) | | Shares | | Dollars ($) | |
Capital stock activity | |
Class A shares | |
Subscriptions(a) | | | 40,074 | | | | 390,623 | | | | 1,255,546 | | | | 12,657,788 | | |
Distributions reinvested | | | — | | | | — | | | | 19,886 | | | | 199,056 | | |
Redemptions | | | (1,213,353 | ) | | | (11,800,785 | ) | | | (1,611,177 | ) | | | (16,039,459 | ) | |
Net decrease | | | (1,173,279 | ) | | | (11,410,162 | ) | | | (335,745 | ) | | | (3,182,615 | ) | |
Class B shares | |
Redemptions(a) | | | (2,038 | ) | | | (19,380 | ) | | | (7,535 | ) | | | (74,480 | ) | |
Net decrease | | | (2,038 | ) | | | (19,380 | ) | | | (7,535 | ) | | | (74,480 | ) | |
Class C shares | |
Subscriptions | | | 8,615 | | | | 83,398 | | | | 97,631 | | | | 974,816 | | |
Redemptions | | | (53,110 | ) | | | (509,861 | ) | | | (156,146 | ) | | | (1,547,057 | ) | |
Net decrease | | | (44,495 | ) | | | (426,463 | ) | | | (58,515 | ) | | | (572,241 | ) | |
Class I shares | |
Subscriptions | | | 1,649 | | | | 16,111 | | | | 7,543,357 | | | | 75,781,349 | | |
Distributions reinvested | | | — | | | | — | | | | 69,275 | | | | 694,139 | | |
Redemptions | | | (7,157,033 | ) | | | (69,938,446 | ) | | | (12,001,431 | ) | | | (120,218,813 | ) | |
Net decrease | | | (7,155,384 | ) | | | (69,922,335 | ) | | | (4,388,799 | ) | | | (43,743,325 | ) | |
Class W shares | |
Subscriptions | | | — | | | | — | | | | 539,171 | | | | 5,449,012 | | |
Distributions reinvested | | | — | | | | — | | | | 97 | | | | 967 | | |
Redemptions | | | (1,458 | ) | | | (14,239 | ) | | | (2,926,610 | ) | | | (29,398,629 | ) | |
Net decrease | | | (1,458 | ) | | | (14,239 | ) | | | (2,387,342 | ) | | | (23,948,650 | ) | |
Class Z shares | |
Subscriptions | | | 97,245 | | | | 951,362 | | | | 357,825 | | | | 3,623,549 | | |
Distributions reinvested | | | — | | | | — | | | | 257 | | | | 2,578 | | |
Redemptions | | | (83,809 | ) | | | (815,932 | ) | | | (294,437 | ) | | | (2,972,015 | ) | |
Net increase | | | 13,436 | | | | 135,430 | | | | 63,645 | | | | 654,112 | | |
Total net decrease | | | (8,363,218 | ) | | | (81,657,149 | ) | | | (7,114,291 | ) | | | (70,867,199 | ) | |
(a) Includes conversions of Class B shares to Class A shares, if any.
The accompanying Notes to Financial Statements are an integral part of this statement.
Semiannual Report 2014
22
Columbia Absolute Return Multi-Strategy Fund
The following tables are intended to help you understand the Fund's financial performance. Certain information reflects financial results for a single share of a class held for the periods shown. Per share net investment income (loss) amounts are calculated based on average shares outstanding during the period. Total return assumes reinvestment of all dividends and distributions, if any. Total return does not reflect payment of sales charges, if any. Total return and portfolio turnover are not annualized for periods of less than one year. The portfolio turnover rate is calculated without regard to purchase and sales transactions of short-term instruments and certain derivatives, if any. If such transactions were included, the Fund's portfolio turnover rate may be higher.
| | | Six Months Ended
November 30, 2014 | |
Year Ended May 31, | |
Class A | | (Unaudited) | | 2014 | | 2013 | | 2012 | | 2011(a) | |
Per share data | |
Net asset value, beginning of period | | $ | 9.76 | | | $ | 10.20 | | | $ | 9.96 | | | $ | 9.98 | | | $ | 10.00 | | |
Income from investment operations: | |
Net investment loss | | | (0.05 | ) | | | (0.06 | ) | | | (0.04 | ) | | | (0.03 | ) | | | (0.01 | ) | |
Net realized and unrealized gain (loss) | | | 0.03 | | | | (0.32 | ) | | | 0.36 | | | | 0.00 | (b) | | | (0.01 | )(c) | |
Increase from payment by affiliate | | | — | | | | 0.00 | (b) | | | — | | | | 0.01 | | | | — | | |
Total from investment operations | | | (0.02 | ) | | | (0.38 | ) | | | 0.32 | | | | (0.02 | ) | | | (0.02 | ) | |
Less distributions to shareholders: | |
Net investment income | | | — | | | | (0.06 | ) | | | (0.08 | ) | | | — | | | | — | | |
Net realized gains | | | — | | | | — | | | | — | | | | (0.00 | )(b) | | | — | | |
Total distributions to shareholders | | | — | | | | (0.06 | ) | | | (0.08 | ) | | | (0.00 | )(b) | | | — | | |
Net asset value, end of period | | $ | 9.74 | | | $ | 9.76 | | | $ | 10.20 | | | $ | 9.96 | | | $ | 9.98 | | |
Total return | | | (0.20 | %) | | | (3.76 | %)(d) | | | 3.19 | % | | | (0.17 | %)(e) | | | (0.20 | %) | |
Ratios to average net assets(f) | |
Total gross expenses | | | 2.03 | %(g)(h) | | | 1.81 | %(g) | | | 2.07 | %(g) | | | 1.99 | %(g) | | | 3.83 | %(g)(h) | |
Total net expenses(i) | | | 1.75 | %(g)(h) | | | 1.58 | %(g) | | | 1.68 | %(g) | | | 1.65 | %(g) | | | 1.57 | %(g)(h) | |
Net investment loss | | | (1.08 | %)(h) | | | (0.60 | %) | | | (0.45 | %) | | | (0.26 | %) | | | (0.67 | %)(h) | |
Supplemental data | |
Net assets, end of period (in thousands) | | $ | 14,776 | | | $ | 26,256 | | | $ | 30,863 | | | $ | 45,673 | | | $ | 11,301 | | |
Portfolio turnover | | | 68 | % | | | 88 | % | | | 61 | % | | | 132 | % | | | 16 | % | |
Notes to Financial Highlights
(a) Based on operations from March 31, 2011 (commencement of operations) through the stated period end.
(b) Rounds to zero.
(c) Calculation of the net gain (loss) per share (both realized and unrealized) does not correlate to the aggregate realized and unrealized gain (loss) presented in the Statement of Operations due to the timing of subscriptions and redemptions of Fund shares in relation to fluctuations in the market value of the portfolio.
(d) The Fund received a payment from an affiliate. Had the Fund not received this payment, the total return would have been lower by 0.04%.
(e) The Fund received a payment from an affiliate. Had the Fund not received this payment, the total return would have been lower by 0.13%.
(f) In addition to the fees and expenses that the Fund bears directly, the Fund indirectly bears a pro rata share of the fees and expenses of any other funds in which it invests. Such indirect expenses are not included in the Fund's reported expense ratios.
(g) Ratios include dividends and interest on securities sold short. If dividends and interest on securities sold short had been excluded, expenses would have been lower by 0.36% for the six months ended November 30, 2014 and 0.24%, 0.30%, 0.27% and 0.20% for the years ended May 31, 2014, 2013, 2012 and 2011, respectively.
(h) Annualized.
(i) Total net expenses include the impact of certain fee waivers/expense reimbursements made by the Investment Manager and certain of its affiliates, if applicable.
The accompanying Notes to Financial Statements are an integral part of this statement.
Semiannual Report 2014
23
Columbia Absolute Return Multi-Strategy Fund
Financial Highlights (continued)
| | | Six Months Ended
November 30, 2014 | |
Year Ended May 31, | |
Class B | | (Unaudited) | | 2014 | | 2013 | | 2012 | | 2011(a) | |
Per share data | |
Net asset value, beginning of period | | $ | 9.66 | | | $ | 10.11 | | | $ | 9.88 | | | $ | 9.97 | | | $ | 10.00 | | |
Income from investment operations: | |
Net investment loss | | | (0.09 | ) | | | (0.13 | ) | | | (0.12 | ) | | | (0.10 | ) | | | (0.02 | ) | |
Net realized and unrealized gain (loss) | | | 0.03 | | | | (0.32 | ) | | | 0.35 | | | | 0.00 | (b) | | | (0.01 | )(c) | |
Increase from payment by affiliate | | | — | | | | 0.00 | (b) | | | — | | | | 0.01 | | | | — | | |
Total from investment operations | | | (0.06 | ) | | | (0.45 | ) | | | 0.23 | | | | (0.09 | ) | | | (0.03 | ) | |
Less distributions to shareholders: | |
Net realized gains | | | — | | | | — | | | | — | | | | (0.00 | )(b) | | | — | | |
Total distributions to shareholders | | | — | | | | — | | | | — | | | | (0.00 | )(b) | | | — | | |
Net asset value, end of period | | $ | 9.60 | | | $ | 9.66 | | | $ | 10.11 | | | $ | 9.88 | | | $ | 9.97 | | |
Total return | | | (0.62 | %) | | | (4.45 | %)(d) | | | 2.33 | % | | | (0.88 | %)(e) | | | (0.30 | %) | |
Ratios to average net assets(f) | |
Total gross expenses | | | 2.79 | %(g)(h) | | | 2.57 | %(g) | | | 2.82 | %(g) | | | 2.75 | %(g) | | | 4.21 | %(g)(h) | |
Total net expenses(i) | | | 2.51 | %(g)(h) | | | 2.32 | %(g) | | | 2.43 | %(g) | | | 2.40 | %(g) | | | 2.32 | %(g)(h) | |
Net investment loss | | | (1.86 | %)(h) | | | (1.35 | %) | | | (1.20 | %) | | | (1.03 | %) | | | (1.41 | %)(h) | |
Supplemental data | |
Net assets, end of period (in thousands) | | $ | 41 | | | $ | 61 | | | $ | 140 | | | $ | 171 | | | $ | 62 | | |
Portfolio turnover | | | 68 | % | | | 88 | % | | | 61 | % | | | 132 | % | | | 16 | % | |
Notes to Financial Highlights
(a) Based on operations from March 31, 2011 (commencement of operations) through the stated period end.
(b) Rounds to zero.
(c) Calculation of the net gain (loss) per share (both realized and unrealized) does not correlate to the aggregate realized and unrealized gain (loss) presented in the Statement of Operations due to the timing of subscriptions and redemptions of Fund shares in relation to fluctuations in the market value of the portfolio.
(d) The Fund received a payment from an affiliate. Had the Fund not received this payment, the total return would have been lower by 0.04%.
(e) The Fund received a payment from an affiliate. Had the Fund not received this payment, the total return would have been lower by 0.13%.
(f) In addition to the fees and expenses that the Fund bears directly, the Fund indirectly bears a pro rata share of the fees and expenses of any other funds in which it invests. Such indirect expenses are not included in the Fund's reported expense ratios.
(g) Ratios include dividends and interest on securities sold short. If dividends and interest on securities sold short had been excluded, expenses would have been lower by 0.37% for the six months ended November 30, 2014 and 0.23%, 0.30%, 0.27% and 0.19% for the years ended May 31, 2014, 2013, 2012 and 2011, respectively.
(h) Annualized.
(i) Total net expenses include the impact of certain fee waivers/expense reimbursements made by the Investment Manager and certain of its affiliates, if applicable.
The accompanying Notes to Financial Statements are an integral part of this statement.
Semiannual Report 2014
24
Columbia Absolute Return Multi-Strategy Fund
Financial Highlights (continued)
| | | Six Months Ended
November 30, 2014 | |
Year Ended May 31, | |
Class C | | (Unaudited) | | 2014 | | 2013 | | 2012 | | 2011(a) | |
Per share data | |
Net asset value, beginning of period | | $ | 9.67 | | | $ | 10.12 | | | $ | 9.88 | | | $ | 9.98 | | | $ | 10.00 | | |
Income from investment operations: | |
Net investment loss | | | (0.09 | ) | | | (0.13 | ) | | | (0.12 | ) | | | (0.10 | ) | | | (0.02 | ) | |
Net realized and unrealized gain (loss) | | | 0.02 | | | | (0.32 | ) | | | 0.36 | | | | (0.01 | )(b) | | | (0.00 | )(b)(c) | |
Increase from payment by affiliate | | | — | | | | 0.00 | (c) | | | — | | | | 0.01 | | | | — | | |
Total from investment operations | | | (0.07 | ) | | | (0.45 | ) | | | 0.24 | | | | (0.10 | ) | | | (0.02 | ) | |
Less distributions to shareholders: | |
Net realized gains | | | — | | | | — | | | | — | | | | (0.00 | )(c) | | | — | | |
Total distributions to shareholders | | | — | | | | — | | | | — | | | | (0.00 | )(c) | | | — | | |
Net asset value, end of period | | $ | 9.60 | | | $ | 9.67 | | | $ | 10.12 | | | $ | 9.88 | | | $ | 9.98 | | |
Total return | | | (0.72 | %) | | | (4.45 | %)(d) | | | 2.43 | % | | | (0.98 | %)(e) | | | (0.20 | %) | |
Ratios to average net assets(f) | |
Total gross expenses | | | 2.80 | %(g)(h) | | | 2.56 | %(g) | | | 2.82 | %(g) | | | 2.74 | %(g) | | | 4.81 | %(g)(h) | |
Total net expenses(i) | | | 2.53 | %(g)(h) | | | 2.33 | %(g) | | | 2.43 | %(g) | | | 2.40 | %(g) | | | 2.35 | %(g)(h) | |
Net investment loss | | | (1.88 | %)(h) | | | (1.35 | %) | | | (1.20 | %) | | | (1.01 | %) | | | (1.41 | %)(h) | |
Supplemental data | |
Net assets, end of period (in thousands) | | $ | 2,269 | | | $ | 2,714 | | | $ | 3,433 | | | $ | 5,196 | | | $ | 1,350 | | |
Portfolio turnover | | | 68 | % | | | 88 | % | | | 61 | % | | | 132 | % | | | 16 | % | |
Notes to Financial Highlights
(a) Based on operations from March 31, 2011 (commencement of operations) through the stated period end.
(b) Calculation of the net gain (loss) per share (both realized and unrealized) does not correlate to the aggregate realized and unrealized gain (loss) presented in the Statement of Operations due to the timing of subscriptions and redemptions of Fund shares in relation to fluctuations in the market value of the portfolio.
(c) Rounds to zero.
(d) The Fund received a payment from an affiliate. Had the Fund not received this payment, the total return would have been lower by 0.04%.
(e) The Fund received a payment from an affiliate. Had the Fund not received this payment, the total return would have been lower by 0.13%.
(f) In addition to the fees and expenses that the Fund bears directly, the Fund indirectly bears a pro rata share of the fees and expenses of any other funds in which it invests. Such indirect expenses are not included in the Fund's reported expense ratios.
(g) Ratios include dividends and interest on securities sold short. If dividends and interest on securities sold short had been excluded, expenses would have been lower by 038% for the six months ended November 30, 2014 and 0.24%, 0.30%, 0.27% and 0.23% for the years ended May 31, 2014, 2013, 2012 and 2011, respectively.
(h) Annualized.
(i) Total net expenses include the impact of certain fee waivers/expense reimbursements made by the Investment Manager and certain of its affiliates, if applicable.
The accompanying Notes to Financial Statements are an integral part of this statement.
Semiannual Report 2014
25
Columbia Absolute Return Multi-Strategy Fund
Financial Highlights (continued)
| | | Six Months Ended
November 30, 2014 | |
Year Ended May 31, | |
Class I | | (Unaudited) | | 2014 | | 2013 | | 2012 | | 2011(a) | |
Per share data | |
Net asset value, beginning of period | | $ | 9.79 | | | $ | 10.23 | | | $ | 10.00 | | | $ | 9.99 | | | $ | 10.00 | | |
Income from investment operations: | |
Net investment income (loss) | | | (0.02 | ) | | | (0.02 | ) | | | (0.00 | )(b) | | | 0.00 | (b) | | | (0.01 | ) | |
Net realized and unrealized gain (loss) | | | 0.00 | (b) | | | (0.32 | ) | | | 0.35 | | | | 0.00 | (b) | | | (0.00 | )(b)(c) | |
Increase from payment by affiliate | | | — | | | | 0.00 | (b) | | | — | | | | 0.01 | | | | — | | |
Total from investment operations | | | (0.02 | ) | | | (0.34 | ) | | | 0.35 | | | | 0.01 | | | | (0.01 | ) | |
Less distributions to shareholders: | |
Net investment income | | | — | | | | (0.10 | ) | | | (0.12 | ) | | | — | | | | — | | |
Net realized gains | | | — | | | | — | | | | — | | | | (0.00 | )(b) | | | — | | |
Total distributions to shareholders | | | — | | | | (0.10 | ) | | | (0.12 | ) | | | (0.00 | )(b) | | | — | | |
Net asset value, end of period | | $ | 9.77 | | | $ | 9.79 | | | $ | 10.23 | | | $ | 10.00 | | | $ | 9.99 | | |
Total return | | | (0.20 | %) | | | (3.34 | %)(d) | | | 3.54 | % | | | 0.13 | %(e) | | | (0.10 | %) | |
Ratios to average net assets(f) | |
Total gross expenses | | | 1.50 | %(g)(h) | | | 1.32 | %(g) | | | 1.40 | %(g) | | | 1.38 | %(g) | | | 2.92 | %(g)(h) | |
Total net expenses(i) | | | 1.24 | %(g)(h) | | | 1.19 | %(g) | | | 1.26 | %(g) | | | 1.32 | %(g) | | | 1.22 | %(g)(h) | |
Net investment income (loss) | | | (0.48 | %)(h) | | | (0.23 | %) | | | (0.03 | %) | | | 0.01 | % | | | (0.37 | %)(h) | |
Supplemental data | |
Net assets, end of period (in thousands) | | $ | 1,812 | | | $ | 71,839 | | | $ | 120,036 | | | $ | 108,694 | | | $ | 59,115 | | |
Portfolio turnover | | | 68 | % | | | 88 | % | | | 61 | % | | | 132 | % | | | 16 | % | |
Notes to Financial Highlights
(a) Based on operations from March 31, 2011 (commencement of operations) through the stated period end.
(b) Rounds to zero.
(c) Calculation of the net gain (loss) per share (both realized and unrealized) does not correlate to the aggregate realized and unrealized gain (loss) presented in the Statement of Operations due to the timing of subscriptions and redemptions of Fund shares in relation to fluctuations in the market value of the portfolio.
(d) The Fund received a payment from an affiliate. Had the Fund not received this payment, the total return would have been lower by 0.04%.
(e) The Fund received a payment from an affiliate. Had the Fund not received this payment, the total return would have been lower by 0.13%.
(f) In addition to the fees and expenses that the Fund bears directly, the Fund indirectly bears a pro rata share of the fees and expenses of any other funds in which it invests. Such indirect expenses are not included in the Fund's reported expense ratios.
(g) Ratios include dividends and interest on securities sold short. If dividends and interest on securities sold short had been excluded, expenses would have been lower by 0.26% for the six months ended November 30, 2014 and 0.23%, 0.31%, 0.26% and 0.16% for the years ended May 31, 2014, 2013, 2012 and 2011, respectively.
(h) Annualized.
(i) Total net expenses include the impact of certain fee waivers/expense reimbursements made by the Investment Manager and certain of its affiliates, if applicable.
The accompanying Notes to Financial Statements are an integral part of this statement.
Semiannual Report 2014
26
Columbia Absolute Return Multi-Strategy Fund
Financial Highlights (continued)
| | | Six Months Ended
November 30, 2014 | |
Year Ended May 31, | |
Class R | | (Unaudited) | | 2014 | | 2013 | | 2012 | | 2011(a) | |
Per share data | |
Net asset value, beginning of period | | $ | 9.72 | | | $ | 10.16 | | | $ | 9.93 | | | $ | 9.98 | | | $ | 10.00 | | |
Income from investment operations: | |
Net investment loss | | | (0.07 | ) | | | (0.08 | ) | | | (0.07 | ) | | | (0.06 | ) | | | (0.02 | ) | |
Net realized and unrealized gain (loss) | | | 0.03 | | | | (0.32 | ) | | | 0.36 | | | | 0.00 | (b) | | | (0.00 | )(b)(c) | |
Increase from payment by affiliate | | | — | | | | 0.00 | (b) | | | — | | | | 0.01 | | | | — | | |
Total from investment operations | | | (0.04 | ) | | | (0.40 | ) | | | 0.29 | | | | (0.05 | ) | | | (0.02 | ) | |
Less distributions to shareholders: | |
Net investment income | | | — | | | | (0.04 | ) | | | (0.06 | ) | | | — | | | | — | | |
Net realized gains | | | — | | | | — | | | | — | | | | (0.00 | )(b) | | | — | | |
Total distributions to shareholders | | | — | | | | (0.04 | ) | | | (0.06 | ) | | | (0.00 | )(b) | | | — | | |
Net asset value, end of period | | $ | 9.68 | | | $ | 9.72 | | | $ | 10.16 | | | $ | 9.93 | | | $ | 9.98 | | |
Total return | | | (0.41 | %) | | | (3.99 | %)(d) | | | 2.93 | % | | | (0.47 | %)(e) | | | (0.20 | %) | |
Ratios to average net assets(f) | |
Total gross expenses | | | 2.30 | %(g)(h) | | | 2.05 | %(g) | | | 2.31 | %(g) | | | 2.28 | %(g) | | | 3.32 | %(g)(h) | |
Total net expenses(i) | | | 2.08 | %(g)(h) | | | 1.80 | %(g) | | | 1.91 | %(g) | | | 1.86 | %(g) | | | 1.75 | %(g)(h) | |
Net investment loss | | | (1.47 | %)(h) | | | (0.83 | %) | | | (0.67 | %) | | | (0.59 | %) | | | (0.98 | %)(h) | |
Supplemental data | |
Net assets, end of period (in thousands) | | $ | 2 | | | $ | 2 | | | $ | 3 | | | $ | 2 | | | $ | 2 | | |
Portfolio turnover | | | 68 | % | | | 88 | % | | | 61 | % | | | 132 | % | | | 16 | % | |
Notes to Financial Highlights
(a) Based on operations from March 31, 2011 (commencement of operations) through the stated period end.
(b) Rounds to zero.
(c) Calculation of the net gain (loss) per share (both realized and unrealized) does not correlate to the aggregate realized and unrealized gain (loss) presented in the Statement of Operations due to the timing of subscriptions and redemptions of Fund shares in relation to fluctuations in the market value of the portfolio.
(d) The Fund received a payment from an affiliate. Had the Fund not received this payment, the total return would have been lower by 0.04%.
(e) The Fund received a payment from an affiliate. Had the Fund not received this payment, the total return would have been lower by 0.13%.
(f) In addition to the fees and expenses that the Fund bears directly, the Fund indirectly bears a pro rata share of the fees and expenses of any other funds in which it invests. Such indirect expenses are not included in the Fund's reported expense ratios.
(g) Ratios include dividends and interest on securities sold short. If dividends and interest on securities sold short had been excluded, expenses would have been lower by 0.38% for the six months ended November 30, 2014 and 0.22%, 0.28%, 0.23% and 0.13% for the years ended May 31, 2014, 2013, 2012 and 2011, respectively.
(h) Annualized.
(i) Total net expenses include the impact of certain fee waivers/expense reimbursements made by the Investment Manager and certain of its affiliates, if applicable.
The accompanying Notes to Financial Statements are an integral part of this statement.
Semiannual Report 2014
27
Columbia Absolute Return Multi-Strategy Fund
Financial Highlights (continued)
| | | Six Months Ended
November 30, 2014 | |
Year Ended May 31, | |
Class R5 | | (Unaudited) | | 2014 | | 2013(a) | |
Per share data | |
Net asset value, beginning of period | | $ | 9.81 | | | $ | 10.26 | | | $ | 9.96 | | |
Income from investment operations: | |
Net investment loss | | | (0.04 | ) | | | (0.03 | ) | | | (0.01 | ) | |
Net realized and unrealized gain (loss) | | | 0.03 | | | | (0.32 | ) | | | 0.43 | | |
Increase from payment by affiliate | | | — | | | | 0.00 | (b) | | | — | | |
Total from investment operations | | | (0.01 | ) | | | (0.35 | ) | | | 0.42 | | |
Less distributions to shareholders: | |
Net investment income | | | — | | | | (0.10 | ) | | | (0.12 | ) | |
Total distributions to shareholders | | | — | | | | (0.10 | ) | | | (0.12 | ) | |
Net asset value, end of period | | $ | 9.80 | | | $ | 9.81 | | | $ | 10.26 | | |
Total return | | | (0.10 | %) | | | (3.44 | %)(c) | | | 4.25 | % | |
Ratios to average net assets(d) | |
Total gross expenses | | | 1.73 | %(e)(f) | | | 1.39 | %(e) | | | 1.42 | %(e)(f) | |
Total net expenses(g) | | | 1.48 | %(e)(f) | | | 1.23 | %(e) | | | 1.27 | %(e)(f) | |
Net investment loss | | | (0.87 | %)(f) | | | (0.26 | %) | | | (0.15 | %)(f) | |
Supplemental data | |
Net assets, end of period (in thousands) | | $ | 2 | | | $ | 2 | | | $ | 3 | | |
Portfolio turnover | | | 68 | % | | | 88 | % | | | 61 | % | |
Notes to Financial Highlights
(a) Based on operations from November 8, 2012 (commencement of operations) through the stated period end.
(b) Rounds to zero.
(c) The Fund received a payment from an affiliate. Had the Fund not received this payment, the total return would have been lower by 0.04%.
(d) In addition to the fees and expenses that the Fund bears directly, the Fund indirectly bears a pro rata share of the fees and expenses of any other funds in which it invests. Such indirect expenses are not included in the Fund's reported expense ratios.
(e) Ratios include dividends and interest on securities sold short. If dividends and interest on securities sold short had been excluded, expenses would have been lower by 0.38% for the six months ended November 30, 2014 and 0.22% and 0.29% for the years ended May 31, 2014 and 2013, respectively.
(f) Annualized.
(g) Total net expenses include the impact of certain fee waivers/expense reimbursements made by the Investment Manager and certain of its affiliates, if applicable.
The accompanying Notes to Financial Statements are an integral part of this statement.
Semiannual Report 2014
28
Columbia Absolute Return Multi-Strategy Fund
Financial Highlights (continued)
| | | Six Months Ended
November 30, 2014 | |
Year Ended May 31, | |
Class W | | (Unaudited) | | 2014 | | 2013 | | 2012 | | 2011(a) | |
Per share data | |
Net asset value, beginning of period | | $ | 9.80 | | | $ | 10.18 | | | $ | 9.96 | | | $ | 9.98 | | | $ | 10.00 | | |
Income from investment operations: | |
Net investment loss | | | (0.05 | ) | | | (0.07 | ) | | | (0.05 | ) | | | (0.03 | ) | | | (0.01 | ) | |
Net realized and unrealized gain (loss) | | | 0.03 | | | | (0.25 | ) | | | 0.36 | | | | 0.00 | (b) | | | (0.01 | )(c) | |
Increase from payment by affiliate | | | — | | | | 0.00 | (b) | | | — | | | | 0.01 | | | | — | | |
Total from investment operations | | | (0.02 | ) | | | (0.32 | ) | | | 0.31 | | | | (0.02 | ) | | | (0.02 | ) | |
Less distributions to shareholders: | |
Net investment income | | | — | | | | (0.06 | ) | | | (0.09 | ) | | | — | | | | — | | |
Net realized gains | | | — | | | | — | | | | — | | | | (0.00 | )(b) | | | — | | |
Total distributions to shareholders | | | — | | | | (0.06 | ) | | | (0.09 | ) | | | (0.00 | )(b) | | | — | | |
Net asset value, end of period | | $ | 9.78 | | | $ | 9.80 | | | $ | 10.18 | | | $ | 9.96 | | | $ | 9.98 | | |
Total return | | | (0.20 | %) | | | (3.18 | %)(d) | | | 3.13 | % | | | (0.17 | %)(e) | | | (0.20 | %) | |
Ratios to average net assets(f) | |
Total gross expenses | | | 2.05 | %(g)(h) | | | 1.80 | %(g) | | | 2.08 | %(g) | | | 1.98 | %(g) | | | 3.05 | %(g)(h) | |
Total net expenses(i) | | | 1.77 | %(g)(h) | | | 1.58 | %(g) | | | 1.69 | %(g) | | | 1.63 | %(g) | | | 1.50 | %(g)(h) | |
Net investment loss | | | (1.12 | %)(h) | | | (0.65 | %) | | | (0.47 | %) | | | (0.28 | %) | | | (0.73 | %)(h) | |
Supplemental data | |
Net assets, end of period (in thousands) | | $ | 64 | | | $ | 78 | | | $ | 24,382 | | | $ | 18,610 | | | $ | 2 | | |
Portfolio turnover | | | 68 | % | | | 88 | % | | | 61 | % | | | 132 | % | | | 16 | % | |
Notes to Financial Highlights
(a) Based on operations from March 31, 2011 (commencement of operations) through the stated period end.
(b) Rounds to zero.
(c) Calculation of the net gain (loss) per share (both realized and unrealized) does not correlate to the aggregate realized and unrealized gain (loss) presented in the Statement of Operations due to the timing of subscriptions and redemptions of Fund shares in relation to fluctuations in the market value of the portfolio.
(d) The Fund received a payment from an affiliate. Had the Fund not received this payment, the total return would have been lower by 0.04%.
(e) The Fund received a payment from an affiliate. Had the Fund not received this payment, the total return would have been lower by 0.13%.
(f) In addition to the fees and expenses that the Fund bears directly, the Fund indirectly bears a pro rata share of the fees and expenses of any other funds in which it invests. Such indirect expenses are not included in the Fund's reported expense ratios.
(g) Ratios include dividends and interest on securities sold short. If dividends and interest on securities sold short had been excluded, expenses would have been lower by 0.38% for the six months ended November 30, 2014 and 0.20%, 0.31%, 0.25% and 0.13% for the years ended May 31, 2014, 2013, 2012 and 2011, respectively.
(h) Annualized.
(i) Total net expenses include the impact of certain fee waivers/expense reimbursements made by the Investment Manager and certain of its affiliates, if applicable.
The accompanying Notes to Financial Statements are an integral part of this statement.
Semiannual Report 2014
29
Columbia Absolute Return Multi-Strategy Fund
Financial Highlights (continued)
| | | Six Months Ended
November 30, 2014 | |
Year Ended May 31, | |
Class Z | | (Unaudited) | | 2014 | | 2013 | | 2012 | | 2011(a) | |
Per share data | |
Net asset value, beginning of period | | $ | 9.78 | | | $ | 10.23 | | | $ | 9.99 | | | $ | 9.99 | | | $ | 10.00 | | |
Income from investment operations: | |
Net investment income (loss) | | | (0.05 | ) | | | (0.04 | ) | | | (0.02 | ) | | | (0.00 | )(b) | | | (0.01 | ) | |
Net realized and unrealized gain (loss) | | | 0.04 | | | | (0.33 | ) | | | 0.36 | | | | (0.01 | )(c) | | | (0.00 | )(b)(c) | |
Increase from payment by affiliate | | | — | | | | 0.00 | (b) | | | — | | | | 0.01 | | | | — | | |
Total from investment operations | | | (0.01 | ) | | | (0.37 | ) | | | 0.34 | | | | 0.00 | | | | (0.01 | ) | |
Less distributions to shareholders: | |
Net investment income | | | — | | | | (0.08 | ) | | | (0.10 | ) | | | — | | | | — | | |
Net realized gains | | | — | | | | — | | | | — | | | | (0.00 | )(b) | | | — | | |
Total distributions to shareholders | | | — | | | | (0.08 | ) | | | (0.10 | ) | | | (0.00 | )(b) | | | — | | |
Net asset value, end of period | | $ | 9.77 | | | $ | 9.78 | | | $ | 10.23 | | | $ | 9.99 | | | $ | 9.99 | | |
Total return | | | (0.10 | %) | | | (3.62 | %)(d) | | | 3.45 | % | | | 0.03 | %(e) | | | (0.10 | %) | |
Ratios to average net assets(f) | |
Total gross expenses | | | 1.84 | %(g)(h) | | | 1.55 | %(g) | | | 1.82 | %(g) | | | 1.71 | %(g) | | | 3.36 | %(g)(h) | |
Total net expenses(i) | | | 1.57 | %(g)(h) | | | 1.34 | %(g) | | | 1.45 | %(g) | | | 1.40 | %(g) | | | 1.30 | %(g)(h) | |
Net investment loss | | | (0.96 | %)(h) | | | (0.39 | %) | | | (0.16 | %) | | | (0.00 | %)(b) | | | (0.45 | %)(h) | |
Supplemental data | |
Net assets, end of period (in thousands) | | $ | 961 | | | $ | 831 | | | $ | 218 | | | $ | 1,049 | | | $ | 362 | | |
Portfolio turnover | | | 68 | % | | | 88 | % | | | 61 | % | | | 132 | % | | | 16 | % | |
Notes to Financial Highlights
(a) Based on operations from March 31, 2011 (commencement of operations) through the stated period end.
(b) Rounds to zero.
(c) Calculation of the net gain (loss) per share (both realized and unrealized) does not correlate to the aggregate realized and unrealized gain (loss) presented in the Statement of Operations due to the timing of subscriptions and redemptions of Fund shares in relation to fluctuations in the market value of the portfolio.
(d) The Fund received a payment from an affiliate. Had the Fund not received this payment, the total return would have been lower by 0.04%.
(e) The Fund received a payment from an affiliate. Had the Fund not received this payment, the total return would have been lower by 0.13%.
(f) In addition to the fees and expenses that the Fund bears directly, the Fund indirectly bears a pro rata share of the fees and expenses of any other funds in which it invests. Such indirect expenses are not included in the Fund's reported expense ratios.
(g) Ratios include dividends and interest on securities sold short. If dividends and interest on securities sold short had been excluded, expenses would have been lower by 0.42% for the six months ended November 30, 2014 and 0.22%, 0.32%, 0.27% and 0.17% for the years ended May 31, 2014, 2013, 2012 and 2011, respectively.
(h) Annualized.
(i) Total net expenses include the impact of certain fee waivers/expense reimbursements made by the Investment Manager and certain of its affiliates, if applicable.
The accompanying Notes to Financial Statements are an integral part of this statement.
Semiannual Report 2014
30
Columbia Absolute Return Multi-Strategy Fund
Notes to Financial Statements
November 30, 2014 (Unaudited)
Note 1. Organization
Columbia Absolute Return Multi-Strategy Fund (the Fund), a series of Columbia Funds Series Trust II (the Trust), is a diversified fund. The Trust is registered under the Investment Company Act of 1940, as amended (the 1940 Act), as an open-end management investment company organized as a Massachusetts business trust.
Fund Shares
The Trust may issue an unlimited number of shares (without par value). The Fund offers Class A, Class B, Class C, Class I, Class R, Class R5, Class W and Class Z shares. Although all share classes generally have identical voting, dividend and liquidation rights, each share class votes separately when required by the Trust's organizational documents or by law. Different share classes pay different distribution amounts to the extent the expenses of such share classes differ, and distributions in liquidation will be proportional to the net asset value of each share class. Each share class has its own expense structure and sales charges.
Class A shares are subject to a maximum front-end sales charge of 3.00% based on the initial investment amount. Class A shares purchased without an initial sales charge in accounts aggregating $1 million to $50 million at the time of purchase are subject to a contingent deferred sales charge (CDSC) if the shares are sold within 18 months of purchase, charged as follows: 1.00% CDSC if redeemed within 12 months of purchase, and 0.50% CDSC if redeemed more than 12, but less than 18, months after purchase.
Class B shares may be subject to a maximum CDSC of 5.00% based upon the holding period after purchase. Class B shares will generally convert to Class A shares eight years after purchase. The Fund no longer accepts investments by new or existing investors in the Fund's Class B shares, except in connection with the reinvestment of any dividend and/or capital gain distributions in Class B shares of the Fund and exchanges by existing Class B shareholders of certain other funds within the Columbia Family of Funds.
Class C shares are subject to a 1.00% CDSC on shares redeemed within one year of purchase.
Class I shares are not subject to sales charges and are available only to the Columbia Family of Funds.
Class R shares are not subject to sales charges and are generally available only to certain retirement plans and other investors as described in the Fund's prospectus.
Class R5 shares are not subject to sales charges and are generally available only to investors purchasing through authorized investment professionals and omnibus retirement plans.
Class W shares are not subject to sales charges and are available only to investors purchasing through authorized
investment programs managed by investment professionals, including discretionary managed account programs.
Class Z shares are not subject to sales charges and are available only to eligible investors, which are subject to different investment minimums as described in the Fund's prospectus.
Note 2. Summary of Significant Accounting Policies
Basis of Preparation
The Fund is an investment company that applies the accounting and reporting guidance in the Financial Accounting Standards Board (FASB) Accounting Standards Codification Topic 946, Financial Services — Investment Companies (ASC 946). The financial statements are prepared in accordance with U.S. generally accepted accounting principles (GAAP) which requires management to make certain estimates and assumptions that affect the reported amounts of assets and liabilities, the disclosure of contingent assets and liabilities at the date of the financial statements and the reported amounts of income and expenses during the reporting period. Actual results could differ from those estimates.
The following is a summary of significant accounting policies followed by the Fund in the preparation of its financial statements.
Security Valuation
All equity securities are valued at the close of business of the New York Stock Exchange (NYSE). Equity securities are valued at the last quoted sales price on the principal exchange or market on which they trade, except for securities traded on the NASDAQ Stock Market, which are valued at the NASDAQ official close price. Unlisted securities or listed securities for which there were no sales during the day are valued at the mean of the latest quoted bid and ask prices on such exchanges or markets.
Foreign equity securities are valued based on quotations from the principal market in which such securities are traded. If any foreign security prices are not readily available as a result of limited share activity, the securities are valued at the mean of the latest quoted bid and ask prices on such exchanges or markets. Foreign currency exchange rates are generally determined at 4:00 p.m. Eastern (U.S.) time. Many securities markets and exchanges outside the U.S. close prior to the close of the NYSE; therefore, the closing prices for securities in such markets or on such exchanges may not fully reflect events that occur after such close but before the close of the NYSE. In those situations, foreign securities will be fair valued pursuant to a policy adopted by the Board of Trustees (the Board), including, if available, utilizing a third party pricing service to determine these fair values. The third party
Semiannual Report 2014
31
Columbia Absolute Return Multi-Strategy Fund
Notes to Financial Statements (continued)
November 30, 2014 (Unaudited)
pricing service takes into account multiple factors, including, but not limited to, movements in the U.S. securities markets, certain depositary receipts, futures contracts and foreign exchange rates that have occurred subsequent to the close of the foreign exchange or market, to determine a good faith estimate that reasonably reflects the current market conditions as of the close of the NYSE. The fair value of a security is likely to be different from the quoted or published price, if available.
Investments in open-end investment companies, including money market funds, are valued at their net asset value.
Forward foreign currency exchange contracts are marked-to-market based upon foreign currency exchange rates provided by a pricing service.
Futures and options on futures contracts are valued based upon the settlement price established each day by the board of trade or exchange on which they are traded.
Investments for which market quotations are not readily available, or that have quotations which management believes are not reliable, are valued at fair value as determined in good faith under procedures established by and under the general supervision of the Board. If a security or class of securities (such as foreign securities) is valued at fair value, such value is likely to be different from the quoted or published price for the security.
The determination of fair value often requires significant judgment. To determine fair value, management may use assumptions including but not limited to future cash flows and estimated risk premiums. Multiple inputs from various sources may be used to determine fair value.
Foreign Currency Transactions and Translations
The values of all assets and liabilities denominated in foreign currencies are generally translated into U.S. dollars at exchange rates determined at the close of the NYSE. Net realized and unrealized gains (losses) on foreign currency transactions and translations include gains (losses) arising from the fluctuation in exchange rates between trade and settlement dates on securities transactions, gains (losses) arising from the disposition of foreign currency and currency gains (losses) between the accrual and payment dates on dividends, interest income and foreign withholding taxes.
For financial statement purposes, the Fund does not distinguish that portion of gains (losses) on investments which is due to changes in foreign exchange rates from that which is due to changes in market prices of the investments. Such fluctuations are included with the net realized and unrealized gains (losses) on investments in the Statement of Operations.
Derivative Instruments
The Fund invests in certain derivative instruments, as detailed below, to meet its investment objectives. Derivatives are instruments whose values depend on, or are derived from, in whole or in part, the value of one or more other assets, such as securities, currencies, commodities or indices. Derivative instruments may be used to increase investment flexibility (including to maintain cash reserves while maintaining exposure to certain other assets), for risk management (hedging) purposes, to facilitate trading, to reduce transaction costs and to pursue higher investment returns. The Fund may also use derivative instruments to mitigate certain investment risks, such as foreign currency exchange rate risk, interest rate risk and credit risk. Derivatives may involve various risks, including the potential inability of the counterparty to fulfill its obligation under the terms of the contract, the potential for an illiquid secondary market (making it difficult for the Fund to sell, including at favorable prices) and the potential for market movements which may expose the Fund to gains or losses in excess of the amount shown in the Statement of Assets and Liabilities. The notional amounts of derivative instruments, if applicable, are not recorded in the financial statements.
A derivative instrument may suffer a marked-to-market loss if the value of the contract decreases due to an unfavorable change in the market rates or values of the underlying instrument. Losses can also occur if the counterparty does not perform under the contract. The Fund's risk of loss from counterparty credit risk on over-the-counter derivatives is generally limited to the aggregate unrealized gain netted against any collateral held by the Fund and the amount of any variation margin held by the counterparty. With exchange-traded or centrally cleared derivatives, there is reduced counterparty credit risk to the Fund since the exchange's clearinghouse, as counterparty to such instruments, guarantees against a possible default. The clearinghouse stands between the buyer and the seller of the contract; therefore, the counterparty credit risk is failure of the clearinghouse. However, credit risk still exists in exchange-traded or centrally cleared derivatives with respect to initial and variation margin that is held in a broker's customer account. While brokers are required to segregate customer margin from their own assets, in the event that a broker becomes insolvent or goes into bankruptcy and at that time there is a shortfall in the aggregate amount of margin held by the broker for all its clients, U.S. bankruptcy laws will typically allocate that shortfall on a pro-rata basis across all the broker's customers (including the Fund), potentially resulting in losses to the Fund.
In order to better define its contractual rights and to secure rights that will help the Fund mitigate its counterparty risk, the
Semiannual Report 2014
32
Columbia Absolute Return Multi-Strategy Fund
Notes to Financial Statements (continued)
November 30, 2014 (Unaudited)
Fund may enter into an International Swaps and Derivatives Association, Inc. Master Agreement (ISDA Master Agreement) or similar agreement with its derivative contract counterparties. An ISDA Master Agreement is an agreement between the Fund and a counterparty that governs over-the-counter derivatives and forward foreign currency exchange contracts and typically contains, among other things, collateral posting terms and netting provisions in the event of a default and/or termination event. Under an ISDA Master Agreement, the Fund may, under certain circumstances, offset with the counterparty certain derivative instrument's payables and/or receivables with collateral held and/or posted and create one single net payment. The provisions of the ISDA Master Agreement typically permit a single net payment in the event of default (close-out netting) including the bankruptcy or insolvency of the counterparty. Note, however, that bankruptcy or insolvency laws of a particular jurisdiction may impose restrictions on or prohibitions against the right of offset in bankruptcy, insolvency or other events.
Collateral (margin) requirements differ by type of derivative. Margin requirements are established by the exchange or clearinghouse for exchange-traded and centrally cleared derivatives. Brokers can ask for margin in excess of the minimum in certain circumstances. Collateral terms are contract specific for over-the-counter derivatives. For over-the-counter derivatives traded under an ISDA Master Agreement, the collateral requirements are typically calculated by netting the marked-to-market amount for each transaction under such agreement and comparing that amount to the value of any variation margin currently pledged by the Fund and/or the counterparty. Generally, the amount of collateral due from or to a party has to exceed a minimum transfer amount threshold (e.g., $500,000) before a transfer has to be made. To the extent amounts due to the Fund from its counterparties are not fully collateralized, contractually or otherwise, the Fund bears the risk of loss from counterparty nonperformance. The Fund attempts to mitigate counterparty risk by only entering into agreements with counterparties that it believes have the financial resources to honor their obligations and by monitoring the financial stability of those counterparties.
Certain ISDA Master Agreements allow counterparties to over-the-counter derivatives to terminate derivative contracts prior to maturity in the event the Fund's net assets decline by a stated percentage over a specified time period or if the Fund fails to meet the terms of the ISDA Master Agreement, which would cause the Fund to accelerate payment of any net liability owed to the counterparty. The Fund also has termination rights if the counterparty fails to meet the terms of the ISDA Master Agreement. In addition to considering counterparty credit risk, the Fund would consider terminating
the derivative contracts based on whether termination would result in a net liability owed from the counterparty.
For financial reporting purposes, the Fund does not offset derivative assets and derivative liabilities that are subject to netting arrangements in the Statement of Assets and Liabilities.
Forward Foreign Currency Exchange Contracts
Forward foreign currency exchange contracts are over-the-counter agreements between two parties to buy and sell a currency at a set price on a future date. The Fund utilized forward foreign currency exchange contracts to gain market exposure to various currencies. These instruments may be used for other purposes in future periods.
The values of forward foreign currency exchange contracts fluctuate daily with changes in foreign currency exchange rates. Changes in the value of these contracts are recorded as unrealized appreciation or depreciation until the contract is exercised or has expired. The Fund will realize a gain or loss when the forward foreign currency exchange contract is closed or expires.
The use of forward foreign currency exchange contracts does not eliminate fluctuations in the prices of the Fund's portfolio securities. The risks of forward foreign currency exchange contracts include movement in the values of the foreign currencies relative to the U.S. dollar (or other foreign currencies) and the possibility that counterparties will not complete their contractual obligations, which may be in excess of the amount reflected, if any, in the Statement of Assets and Liabilities.
Futures Contracts
Futures contracts are exchange traded and represent commitments for the future purchase or sale of an asset at a specified price on a specified date. The Fund bought and sold futures contracts to manage exposure to the securities market and gain market exposures to interest rates, equity indices, foreign currencies and soveriegn debt. These instruments may be used for other purposes in future periods. Upon entering into futures contracts, the Fund bears risks that it may not achieve the anticipated benefits of the futures contracts and may realize a loss. Additional risks include counterparty credit risk, the possibility of an illiquid market, and that a change in the value of the contract or option may not correlate with changes in the value of the underlying asset.
Upon entering into a futures contract, the Fund pledges cash or securities with the broker in an amount sufficient to meet the initial margin requirement. The initial margin deposit must be maintained at an established level over the life of the contract. Cash deposited as initial margin is recorded in the Statement of Assets and Liabilities as margin deposits. Securities deposited as initial margin are designated in the
Semiannual Report 2014
33
Columbia Absolute Return Multi-Strategy Fund
Notes to Financial Statements (continued)
November 30, 2014 (Unaudited)
Portfolio of Investments. Subsequent payments (variation margin) are made or received by the Fund each day. The variation margin payments are equal to the daily change in the contract value and are recorded as variation margin receivable or payable and are offset in unrealized gains or losses. The
Fund recognizes a realized gain or loss when the contract is closed or expires. Futures contracts involve, to varying degrees, risk of loss in excess of the variation margin disclosed in the Statement of Assets and Liabilities.
Offsetting of Derivative Assets and Derivative Liabilities
The following tables present the Fund's gross and net amount of assets and liabilities available for offset under netting arrangements as well as any related collateral received or pledged by the Fund as of November 30, 2014:
| | | | | | | | | Gross Amounts Not Offset in
the Statement of Assets and Liabilities | |
| |
| | | Gross
Amounts of
Recognized
Assets ($) | | Gross Amounts
Offset in the
Statement of
Assets and
Liabilities ($) | | Net Amounts of
Assets
Presented in the
Statement of
Assets and
Liabilities ($) | | Financial
Instruments ($)(a) | | Cash
Collateral
Received ($) | | Securities
Collateral
Received ($) | | Net
Amount ($)(b) | |
Asset Derivatives: | |
Forward Foreign Currency
Exchange Contracts | | | 690,661 | | | | — | | | | 690,661 | | | | 269,228 | | | | — | | | | — | | | | 421,433 | | |
| | | | | | | | | Gross Amounts Not Offset in
the Statement of Assets and Liabilities | | | |
| | | Gross
Amounts of
Recognized
Liabilities ($) | | Gross Amounts
Offset in the
Statement of
Assets and
Liabilities ($) | | Net Amounts of
Liabilities
Presented in the
Statement of
Assets and
Liabilities ($) | | Financial
Instruments ($)(c) | | Cash
Collateral
Pledged ($) | | Securities
Collateral
Pledged ($) | | Net
Amount ($)(d) | |
Liability Derivatives: | |
Forward Foreign Currency
Exchange Contracts | | | 535,717 | | | | — | | | | 535,717 | | | | 269,228 | | | | — | | | | — | | | | 266,489 | | |
(a) Represents the amount of assets that could be offset by liabilities with the same counterparty under master netting or similar agreements that management elects not to offset on the Statement of Assets and Liabilities.
(b) Represents the net amount due from counterparties in the event of default.
(c) Represents the amount of liabilities that could be offset by assets with the same counterparty under master netting or similar agreements that management elects not to offset on the Statement of Assets and Liabilities.
(d) Represents the net amount due to counterparties in the event of default.
Effects of Derivative Transactions in the Financial Statements
The following tables are intended to provide additional information about the effect of derivatives on the financial statements of the Fund, including: the fair value of derivatives by risk category and the location of those fair values in the Statement of Assets and Liabilities; and the impact of
derivative transactions over the period in the Statement of Operations, including realized gains or losses and unrealized gains or losses. The derivative schedules following the Portfolio of Investments present additional information regarding derivative instruments outstanding at the end of the period, if any.
Semiannual Report 2014
34
Columbia Absolute Return Multi-Strategy Fund
Notes to Financial Statements (continued)
November 30, 2014 (Unaudited)
The following table is a summary of the fair value of derivative instruments (not considered to be hedging instruments for accounting disclosure purposes) at November 30, 2014:
Asset Derivatives | |
Risk Exposure
Category | | Statement of Assets and
Liabilities Location | | Fair Value ($) | |
Equity risk
| | Net assets — unrealized
appreciation on futures
contracts | | | 56,369
| * | |
Foreign exchange
risk
| | Unrealized appreciation on
forward foreign currency
exchange contracts | | | 690,661
| | |
Interest rate risk
| | Net assets — unrealized
appreciation on futures
contracts | | | 82,554 | * | |
Total | | | | | 829,584 | | |
Liability Derivatives | |
Risk Exposure
Category | | Statement of Assets and
Liabilities Location | | Fair Value ($) | |
Equity risk
| | Net assets — unrealized
depreciation on futures
contracts | | | 8,843
| * | |
Foreign exchange
risk
| | Unrealized depreciation on
forward foreign currency
exchange contracts | | | 535,717
| | |
Interest rate risk
| | Net assets — unrealized
depreciation on futures
contracts | | | 20,501
| * | |
Total | | | | | 565,061 | | |
*Includes cumulative appreciation (depreciation) as reported in the tables following the Portfolio of Investments. Only the current day's variation margin is reported in receivables or payables in the Statement of Assets and Liabilities.
The following table indicates the effect of derivative instruments (not considered to be hedging instruments for accounting disclosure purposes) in the Statement of Operations for the six months ended November 30, 2014:
Amount of Realized Gain (Loss) on Derivatives Recognized in Income | |
Risk Exposure
Category | | Forward Foreign
Currency Exchange
Contracts ($) | | Futures
Contracts ($) | | Total ($) | |
Equity risk | | | — | | | | (2,000,381 | ) | | | (2,000,381 | ) | |
Foreign exchange
risk | | | 222,617 | | | | — | | | | 222,617 | | |
Interest rate risk | | | — | | | | 576,871 | | | | 576,871 | | |
Total | | | 222,617 | | | | (1,423,510 | ) | | | (1,200,893 | ) | |
Change in Unrealized Appreciation (Depreciation) on
Derivatives Recognized in Income | |
Risk Exposure
Category | | Forward Foreign
Currency Exchange
Contracts ($) | | Futures
Contracts ($) | | Total ($) | |
Equity risk | | | — | | | | 784,719 | | | | 784,719 | | |
Foreign exchange
risk | | | 364,012 | | | | — | | | | 364,012 | | |
Interest rate risk | | | — | | | | (238,657 | ) | | | (238,657 | ) | |
Total | | | 364,012 | | | | 546,062 | | | | 910,074 | | |
The following table is a summary of the average outstanding volume by derivative instrument for the six months ended November 30 , 2014:
Derivative Instrument | | Average Notional
Amounts ($)* | |
Futures contracts — Long | | 30,536,383 | |
Futures contracts — Short | | 32,122,043 | |
Derivative Instrument | | Average
Unrealized
Appreciation ($)* | | Average
Unrealized
Depreciation ($)* | |
Forward foreign currency
exchange contracts | | | 1,661,023 | | | | (1,500,170 | ) | |
*Based on the ending quarterly outstanding amounts for the six months ended November 30, 2014.
Short Sales
The Fund may sell a security it does not own in anticipation of a decline in the fair value of the security. When the Fund sells a security short, it must borrow the security sold short and deliver it to the broker-dealer through which it made the short sale. The Fund is required to maintain a margin account with the broker and to pledge assets to the broker as collateral for the borrowed security. Securities pledged as collateral are designated in the Portfolio of Investments. The Fund can purchase the same security at the current market price and deliver it to the broker to close out the short sale. The Fund is obligated to pay the broker a fee for borrowing the security. The fee is included in "Dividends and interest on securities sold short" in the Statement of Operations and a short position is reported as a liability at fair value in the Statement of Assets and Liabilities. The Fund must also pay the broker for any dividends accrued (recognized on ex-date) on the borrowed security. This amount is recorded as an expense in the Statement of Operations. The Fund will record a gain if the security declines in value, and will realize a loss if the security appreciates. Such gain, limited to the price at which the Fund sold the security short, or such loss, potentially unlimited in size because the short position loses value as the market price of the security sold short increases, will be recognized upon the termination of a short sale.
Semiannual Report 2014
35
Columbia Absolute Return Multi-Strategy Fund
Notes to Financial Statements (continued)
November 30, 2014 (Unaudited)
The following table presents the Fund's gross and net amount of liabilities available for offset under a netting arrangement for short sales as well as the related collateral pledged by the Fund as of November 30, 2014:
| | | | | | | | | Gross Amounts Not Offset in
the Statement of Assets and Liabilities | | | |
| | | Gross
Amounts of
Recognized
Liabilities ($) | | Gross Amounts
Offset in the
Statement of
Assets and
Liabilities ($) | | Net Amounts of
Liabilities
Presented in the
Statement of
Assets and
Liabilities ($) | | Financial
Instruments ($)(a) | | Cash
Collateral
Pledged ($) | | Securities
Collateral
Pledged ($) | | Net
Amount ($)(b) | |
Liability Derivatives: | |
Securities Borrowed | | | 7,370,057 | | | | — | | | | 7,370,057 | | | | — | | | | 6,295,400 | | | | 1,074,657 | | | | — | | |
(a) Represents the amount of assets that could be offset by liabilities with the same counterparty under master netting or similar agreements that management elects not to offset on the Statement of Assets and Liabilities.
(b) Represents the net amount due from counterparties in the event of default.
Security Transactions
Security transactions are accounted for on the trade date. Cost is determined and gains (losses) are based upon the specific identification method for both financial statement and federal income tax purposes.
Income Recognition
Corporate actions and dividend income are generally recorded net of any non-reclaimable tax withholdings, on the ex-dividend date or upon receipt of ex-dividend notification in the case of certain foreign securities.
The Fund may receive distributions from holdings in business development companies (BDCs), exchange-traded funds (ETFs), other regulated investment companies (RICs), and real estate investment trusts (REITs), which report information on the character of their distributions annually. These distributions are allocated to dividend income, capital gain and return of capital based on actual information reported. To the extent actual information has not yet been reported by the REITs, estimates for return of capital are made by the Fund's management. Return of capital is recorded as a reduction of the cost basis of securities held. If the Fund no longer owns the applicable securities, return of capital is recorded as a realized gain. Management's estimates are subsequently adjusted when the actual character of the distributions is disclosed by the REITs, which could result in a proportionate change in return of capital to shareholders. No estimates are made for the BDCs, ETFs, and RICs.
Awards from class action litigation are recorded as a reduction of cost basis if the Fund still owns the applicable securities on the payment date. If the Fund no longer owns the applicable securities, the proceeds are recorded as realized gains.
Expenses
General expenses of the Trust are allocated to the Fund and other funds of the Trust based upon relative net assets or other expense allocation methodologies determined by the nature of the expense. Expenses directly attributable to the Fund are charged to the Fund. Expenses directly attributable to a specific class of shares are charged to that share class.
Determination of Class Net Asset Value
All income, expenses (other than class-specific expenses, which are charged to that share class, as shown in the Statement of Operations) and realized and unrealized gains (losses) are allocated to each class of the Fund on a daily basis, based on the relative net assets of each class, for purposes of determining the net asset value of each class.
Federal Income Tax Status
The Fund intends to qualify each year as a regulated investment company under Subchapter M of the Internal Revenue Code, as amended, and will distribute substantially all of its taxable income (including net short-term capital gains), if any, for its tax year, and as such will not be subject to federal income taxes. In addition, the Fund intends to distribute in each calendar year substantially all of its net investment income, capital gains and certain other amounts, if any, such that the Fund should not be subject to federal excise tax. Therefore, no federal income or excise tax provision is recorded.
Foreign Taxes
The Fund may be subject to foreign taxes on income, gains on investments or currency repatriation, a portion of which may be recoverable. The Fund will accrue such taxes and recoveries, as applicable, based upon its current interpretation of tax rules and regulations that exist in the markets in which it invests.
Semiannual Report 2014
36
Columbia Absolute Return Multi-Strategy Fund
Notes to Financial Statements (continued)
November 30, 2014 (Unaudited)
Realized gains in certain countries may be subject to foreign taxes at the Fund level, based on statutory rates. The Fund accrues for such foreign taxes on realized and unrealized gains at the appropriate rate for each jurisdiction, as applicable. The amount, if any, is disclosed as a liability on the Statement of Assets and Liabilities.
Distributions to Shareholders
Distributions from net investment income, if any, are declared and paid annually. Net realized capital gains, if any, are distributed along with the income distribution. Income distributions and capital gain distributions are determined in accordance with federal income tax regulations, which may differ from GAAP.
Guarantees and Indemnifications
Under the Trust's organizational documents and, in some cases, by contract, its officers and trustees are indemnified against certain liabilities arising out of the performance of their duties to the Trust or its funds. In addition, certain of the Fund's contracts with its service providers contain general indemnification clauses. The Fund's maximum exposure under these arrangements is unknown since the amount of any future claims that may be made against the Fund cannot be determined, and the Fund has no historical basis for predicting the likelihood of any such claims.
Note 3. Fees and Compensation Paid to Affiliates
Investment Management Fees
Under an Investment Management Services Agreement, Columbia Management Investment Advisers, LLC (the Investment Manager), a wholly-owned subsidiary of Ameriprise Financial, Inc. (Ameriprise Financial), determines which securities will be purchased, held or sold. The investment management fee is an annual fee that is equal to a percentage of the Fund's average daily net assets that declines from 0.82% to 0.70% as the Fund's net assets increase. The annualized effective investment management fee rate for the six months ended November 30, 2014 was 0.82% of the Fund's average daily net assets.
Administration Fees
Under an Administrative Services Agreement, the Investment Manager also serves as the Fund Administrator. The Fund pays the Fund Administrator an annual fee for administration and accounting services equal to a percentage of the Fund's average daily net assets that declines from 0.08% to 0.05% as the Fund's net assets increase. The annualized effective administration fee rate for the six months ended November 30, 2014 was 0.08% of the Fund's average daily net assets.
Other Expenses
Other expenses are for, among other things, miscellaneous expenses of the Fund or the Board, including payments to a company providing limited administrative services to the Fund and the Board. That company's expenses include boardroom and office expense, employee compensation, employee health and retirement benefits, and certain other expenses. For the six months ended November 30, 2014, other expenses paid by the Fund to this company were $602.
Compensation of Board Members
Board members are compensated for their services to the Fund as disclosed in the Statement of Operations. Under a Deferred Compensation Plan (the Plan), the Board members who are not "interested persons" of the Fund, as defined under the 1940 Act, may elect to defer payment of up to 100% of their compensation. Deferred amounts are treated as though equivalent dollar amounts had been invested in shares of certain funds managed by the Investment Manager. The Fund's liability for these amounts is adjusted for market value changes and remains in the Fund until distributed in accordance with the Plan.
Transfer Agent Fees
Under a Transfer and Dividend Disbursing Agent Agreement, Columbia Management Investment Services Corp. (the Transfer Agent), an affiliate of the Investment Manager and a wholly-owned subsidiary of Ameriprise Financial, is responsible for providing transfer agency services to the Fund. The Transfer Agent has contracted with Boston Financial Data Services (BFDS) to serve as sub-transfer agent.
Effective November 1, 2014, the Transfer Agent receives a monthly transfer agency fee based on the number or the average value of accounts, depending on the type of account. Prior to November 1, 2014, the Transfer Agent received a monthly account-based service fee based on the number of open accounts. In addition, the Transfer Agent also receives sub-transfer agency fees based on a percentage of the average aggregate value of the Fund's shares maintained in omnibus accounts (other than omnibus accounts for which American Enterprise Investment Services Inc. is the broker of record or accounts where the beneficial shareholder is a customer of Ameriprise Financial Services, Inc., which receive a per account fee). The Transfer Agent pays the fees of BFDS for services as sub-transfer agent and is not entitled to reimbursement for such fees from the Fund (with the exception of out-of-pocket fees).
The Transfer Agent also receives compensation from the Fund for various shareholder services and reimbursements for certain out-of-pocket fees. Class I shares do not pay transfer agent fees. Total transfer agent fees for Class R5 shares are
Semiannual Report 2014
37
Columbia Absolute Return Multi-Strategy Fund
Notes to Financial Statements (continued)
November 30, 2014 (Unaudited)
subject to an annual limitation of not more than 0.05% of the average daily net assets attributable to Class R5 shares.
For the six months ended November 30, 2014, the Fund's annualized effective transfer agent fee rates as a percentage of average daily net assets of each class were as follows:
Class A | | | 0.12 | % | |
Class B | | | 0.12 | | |
Class C | | | 0.12 | | |
Class R | | | 0.12 | | |
Class R5 | | | 0.05 | | |
Class W | | | 0.12 | | |
Class Z | | | 0.12 | | |
An annual minimum account balance fee of $20 may apply to certain accounts with a value below the applicable share class's initial minimum investment requirements to reduce the impact of small accounts on transfer agent fees. These minimum account balance fees are remitted to the Fund and recorded as part of expense reductions in the Statement of Operations. For the six months ended November 30, 2014, no minimum account balance fees were charged by the Fund.
Distribution Fees
The Fund has an agreement with Columbia Management Investment Distributors, Inc. (the Distributor), an affiliate of the Investment Manager and a wholly-owned subsidiary of Ameriprise Financial, for distribution and shareholder services. Under a Plan and Agreement of Distribution, the Fund pays a fee at an annual rate of up to 0.25% of the Fund's average daily net assets attributable to Class A and Class W shares, a fee at an annual rate of up to 0.50% of the Fund's average daily net assets attributable to Class R shares (of which up to 0.25% may be used for shareholder services) and a fee at an annual rate of up to 1.00% of the Fund's average daily net assets attributable to Class B and Class C shares. For Class B and Class C shares, of the 1.00% fee, up to 0.75% is reimbursed for distribution expenses.
The amount of distribution expenses incurred by the Distributor and not yet reimbursed (unreimbursed expense) was approximately $8,000 and $14,000 for Class B and Class C shares, respectively. These amounts are based on the most recent information available as of September 30, 2014, and may be recovered from future payments under the distribution plan or CDSCs. To the extent the unreimbursed expense has been fully recovered, the distribution fee is reduced.
Sales Charges
Sales charges, including front-end charges and CDSCs, received by the Distributor for distributing Fund shares were $395 for Class A shares for the six months ended November 30, 2014.
Expenses Waived/Reimbursed by the Investment Manager and its Affiliates
The Fund's expense ratio is subject to an expense reimbursement arrangement pursuant to which fees will be waived and/or expenses reimbursed (excluding certain fees and expenses described below), so that the Fund's net operating expenses, after giving effect to fees waived/expenses reimbursed and any balance credits and/or overdraft charges from the Fund's custodian, do not exceed the annual rates of:
| | | Voluntary
Expense Cap
Effective
October 1, 2014 | | Contractual
Expense Cap
Prior to
October 1, 2014 | |
Class A | | | 1.52 | % | | | 1.43 | % | |
Class B | | | 2.27 | | | | 2.18 | | |
Class C | | | 2.27 | | | | 2.18 | | |
Class I | | | 1.19 | | | | 0.98 | | |
Class R | | | 1.77 | | | | 1.68 | | |
Class R5 | | | 1.24 | | | | 1.03 | | |
Class W | | | 1.52 | | | | 1.43 | | |
Class Z | | | 1.27 | | | | 1.18 | | |
The voluntary expense cap arrangement may be revised or discontinued at any time. Under the arrangements, the following fees and expenses are excluded from the waiver/reimbursement commitment, and therefore will be paid by the Fund, if applicable: taxes (including foreign transaction taxes), expenses associated with investments in affiliated and non-affiliated pooled investment vehicles (including mutual funds and exchange-traded funds), transaction costs and brokerage commissions, costs related to any securities lending program, dividend expenses associated with securities sold short, inverse floater program fees and expenses, transaction charges and interest on borrowed money, interest and extraordinary expenses.
Note 4. Federal Tax Information
The timing and character of income and capital gain distributions are determined in accordance with income tax regulations, which may differ from GAAP because of temporary or permanent book to tax differences.
At November 30, 2014, the cost of investments for federal income tax purposes was approximately $19,908,000 and the
Semiannual Report 2014
38
Columbia Absolute Return Multi-Strategy Fund
Notes to Financial Statements (continued)
November 30, 2014 (Unaudited)
aggregate gross approximate unrealized appreciation and depreciation based on that cost was:
Unrealized appreciation | | $ | 943,000 | | |
Unrealized depreciation | | | (220,000 | ) | |
Net unrealized appreciation | | $ | 723,000 | | |
The following capital loss carryforwards, determined as of May 31, 2014, may be available to reduce taxable income arising from future net realized gains on investments, if any, to the extent permitted by the Internal Revenue Code:
Year of Expiration | | Amount ($) | |
No expiration — short-term | | | 5,772,154 | | |
Management of the Fund has concluded that there are no significant uncertain tax positions in the Fund that would require recognition in the financial statements. However, management's conclusion may be subject to review and adjustment at a later date based on factors including, but not limited to, new tax laws, regulations, and administrative interpretations (including relevant court decisions). Generally, the Fund's federal tax returns for the prior three fiscal years remain subject to examination by the Internal Revenue Service.
Note 5. Portfolio Information
The cost of purchases and proceeds from sales of securities, excluding short-term obligations and certain derivatives, if any, aggregated to $23,415,783 and $56,652,697, respectively, for the six months ended November 30, 2014. The amount of purchase and sale activity impacts the portfolio turnover rate reported in the Financial Highlights.
Note 6. Affiliated Money Market Fund
The Fund invests in Columbia Short-Term Cash Fund, an affiliated money market fund established for the exclusive use by the Fund and other affiliated funds. The income earned by the Fund from such investments is included as Dividends — affiliated issuers in the Statement of Operations. As an investing fund, the Fund indirectly bears its proportionate share of the expenses of Columbia Short-Term Cash Fund.
Note 7. Shareholder Concentration
At November 30, 2014, affiliated shareholders of record owned 87.4% of the outstanding shares of the Fund in one or more accounts. Subscription and redemption activity by concentrated accounts may have a significant effect on the operations of the Fund.
Note 8. Line of Credit
The Fund has entered into a revolving credit facility with a syndicate of banks led by JPMorgan Chase Bank N.A.
(JPMorgan) whereby the Fund may borrow for the temporary funding of shareholder redemptions or for other temporary or emergency purposes. The credit facility agreement, as amended, which is a collective agreement between the Fund and certain other funds managed by the Investment Manager, severally and not jointly, permits collective borrowings up to $500 million. Interest is charged to each participating fund based on its borrowings at a rate equal to the higher of (i) the overnight federal funds rate plus 1.00% or (ii) the one-month LIBOR rate plus 1.00%. Each borrowing under the credit facility matures no later than 60 days after the date of borrowing. The Fund also pays a commitment fee equal to its pro rata share of the amount of the credit facility at a rate of 0.075% per annum. The commitment fee is included in other expenses in the Statement of Operations.
Effective December 9, 2014, the Fund extended its revolving credit facility with JPMorgan. The credit facility agreement, as amended, permits collective borrowings up to $550 million under the same terms and interest rates as described above.
The Fund had no borrowings during the six months ended November 30, 2014.
Note 9. Significant Risks
Derivatives Risk
Losses involving derivative instruments may be substantial, because a relatively small price movement in the underlying security(ies) instrument, commodity, currency or index may result in a substantial loss for the Fund. In addition to the potential for increased losses, the use of derivative instruments may lead to increased volatility within the Fund. Derivatives will typically increase the Fund's exposure to principal risks to which it is otherwise exposed, and may expose the Fund to additional risks, including correlation risk, counterparty risk, hedging risk, leverage risk and liquidity risk.
Short Selling Risk
The Fund may make short sales, which involves selling a security the Fund does not own in anticipation that the security's price will decline. The Fund's potential losses could exceed those of other funds which hold only long security positions if the value of the securities held long decreases and the value of the securities sold short increases. The Fund's use of short sales in effect "leverages" the Fund, when the Fund uses the cash proceeds from the short sales to invest in additional long securities. Leveraging potentially exposes the Fund to greater risks due to unanticipated market movements, which may magnify losses and increase volatility of returns. There is no assurance that a leveraging strategy will be successful.
Semiannual Report 2014
39
Columbia Absolute Return Multi-Strategy Fund
Notes to Financial Statements (continued)
November 30, 2014 (Unaudited)
Note 10. Subsequent Events
Management has evaluated the events and transactions that have occurred through the date the financial statements were issued. Other than as noted below and in Note 8 above, there were no items requiring adjustment of the financial statements or additional disclosure.
On January 28, 2015 the Fund's Board of Trustees approved a Plan of Liquidation and Termination (the Plan) pursuant to which the Fund will be liquidated and terminated. Effective at the open of business on February 2, 2015, the Fund is no longer open to new investors. Under the terms of the Plan, it is anticipated that the Fund will be liquidated on or about March 6, 2015, at which time the Fund's shareholders will receive a liquidation distribution in an amount equal to the net asset value of their Fund shares. Shareholders of the Fund may also redeem their investment in the Fund or exchange their Fund shares for shares of another Columbia Fund at any time prior to the date of liquidation.
Note 11. Information Regarding Pending and Settled Legal Proceedings
In December 2005, without admitting or denying the allegations, American Express Financial Corporation (AEFC, which is now known as Ameriprise Financial, Inc. (Ameriprise Financial)) entered into settlement agreements with the Securities and Exchange Commission (SEC) and Minnesota Department of Commerce (MDOC) related to market timing activities. As a result, AEFC was censured and ordered to cease and desist from committing or causing any violations of certain provisions of the Investment Advisers Act of 1940, the Investment Company Act of 1940, and various Minnesota laws. AEFC agreed to pay disgorgement of $10 million and civil money penalties of $7 million. AEFC also agreed to retain an independent distribution consultant to assist in developing a plan for distribution of all disgorgement and civil penalties ordered by the SEC in accordance with various undertakings detailed at www.sec.gov/litigation/admin/ia-2451.pdf. Ameriprise Financial and its affiliates have cooperated with the SEC and the MDOC in these legal proceedings, and have made regular reports to the Funds' Boards of Trustees.
Ameriprise Financial and certain of its affiliates have historically been involved in a number of legal, arbitration and regulatory proceedings, including routine litigation, class actions, and governmental actions, concerning matters arising in connection with the conduct of their business activities. Ameriprise Financial believes that the Funds are not currently the subject of, and that neither Ameriprise Financial nor any of its affiliates are the subject of, any pending legal, arbitration or
regulatory proceedings that are likely to have a material adverse effect on the Funds or the ability of Ameriprise Financial or its affiliates to perform under their contracts with the Funds. Ameriprise Financial is required to make quarterly (10-Q), annual (10-K) and, as necessary, 8-K filings with the Securities and Exchange Commission on legal and regulatory matters that relate to Ameriprise Financial and its affiliates. Copies of these filings may be obtained by accessing the SEC website at www.sec.gov.
There can be no assurance that these matters, or the adverse publicity associated with them, will not result in increased fund redemptions, reduced sale of fund shares or other adverse consequences to the Funds. Further, although we believe proceedings are not likely to have a material adverse effect on the Funds or the ability of Ameriprise Financial or its affiliates to perform under their contracts with the Funds, these proceedings are subject to uncertainties and, as such, we are unable to estimate the possible loss or range of loss that may result. An adverse outcome in one or more of these proceedings could result in adverse judgments, settlements, fines, penalties or other relief that could have a material adverse effect on the consolidated financial condition or results of operations of Ameriprise Financial.
Semiannual Report 2014
40
Columbia Absolute Return Multi-Strategy Fund
Important Information About This Report
Each fund mails one shareholder report to each shareholder address. If you would like more than one report, please call shareholder services at 800.345.6611 and additional reports will be sent to you.
The policy of the Board is to vote the proxies of the companies in which each fund holds investments consistent with the procedures as stated in the Statement of Additional Information (SAI). You may obtain a copy of the SAI without charge by calling 800.345.6611; contacting your financial intermediary; visiting columbiamanagement.com; or searching the website of the Securities and Exchange Commission (SEC) at sec.gov. Information regarding how each fund voted proxies relating to portfolio securities is filed with the SEC by August 31 for the most recent 12-month period ending June 30 of that year, and is available without charge by visiting columbiamanagement.com; or searching the website of the SEC at sec.gov.
Each fund files a complete schedule of portfolio holdings with the SEC for the first and third quarters of each fiscal year on Form N-Q. Each fund's Form N-Q is available on the SEC's website at sec.gov and may be reviewed and copied at the SEC's Public Reference Room in Washington, D.C. Information on the operation of the Public Reference Room may be obtained by calling 800.SEC.0330. Each fund's complete schedule of portfolio holdings, as filed on Form N-Q, can also be obtained without charge, upon request, by calling 800.345.6611.
You may obtain the current net asset value (NAV) of Fund shares at no cost by calling 800.345.6611 or by sending an email to serviceinquiries@columbiamanagement.com.
Semiannual Report 2014
41

Columbia Absolute Return Multi-Strategy Fund
P.O. Box 8081
Boston, MA 02266-8081
columbiamanagement.com
This information is for use with concurrent or prior delivery of a fund prospectus. Please read and consider the investment objectives, risks, charges and expenses for any fund carefully before investing. For a prospectus and, if available, a summary prospectus, which contains this and other important information about the Fund, go to columbiamanagement.com. The Fund is distributed by Columbia Management Investment Distributors, Inc., member FINRA, and managed by Columbia Management Investment Advisers, LLC.
© 2015 Columbia Management Investment Advisers, LLC. All rights reserved.
SAR107_05_E01_(01/15)
| | |
Semiannual Report November 30, 2014 | |  |
| | |
Columbia Commodity Strategy Fund | | |


President’s Message
Note: Effective January 1, 2015, Christopher O. Petersen will serve as the President of the Columbia Funds, replacing J. Kevin Connaughton. Mr. Petersen has served as a Fund officer since 2007.
Dear Shareholders,
People invest for different reasons, though typically based on a desire for one or more outcomes, e.g., generating an appropriate income stream in retirement, navigating a changing interest rate environment, maximizing after-tax returns, growing assets to achieve financial goals, or easing the impact of volatile markets. Achieving these desired outcomes can be particularly challenging given the unpredictability of complex global markets. To continue to effectively deliver solutions that help clients achieve desired outcomes, an asset manager must have the resources and investment framework to meaningfully embody a global perspective.
With this in mind, I thought it important to highlight excerpts from a piece written by Jeffrey L. Knight, Global Head of Investment Solutions and Asset Allocation, in which he touches on some of these issues emphasizing the importance of maintaining a diversified portfolio with the flexibility to adapt to changing market conditions.
I encourage you to read the article in its entirety. To access the full article and for other insights on current market events and investment opportunities, please visit the Columbia Management blog at columbiamanagement.com/blog.
On behalf of the Funds, I want to acknowledge the contributions of J. Kevin Connaughton and to thank him for his years of trusted, dedicated service. He has worked tirelessly as an advocate for shareholders and a leader of the Columbia Funds. In taking on this new role, I look forward to continuing the work of Mr. Connaughton, helping build on the strong foundation of the Columbia Funds.
Thank you for your confidence. We look forward to continuing to serve your investment needs for many years to come.
Best regards,

Christopher O. Petersen
President, Columbia Funds
Excerpts from:
2015 Outlook: Same song, slightly different arrangement
By Jeffrey L. Knight, Global Head of Investment Solutions and Asset Allocation
Jeffrey L. Knight, CFA, is global head of investment solutions and asset allocation for Columbia Management Investment Advisers, LLC. Mr. Knight leads a team of six portfolio managers responsible for our broad suite of multi-asset strategies including capital allocation, risk allocation, absolute return and total return funds.
What’s different in 2015?
As stationary as market conditions have felt lately, circumstances are always evolving. For 2015, while the essential elements of our outlook remain in place, we highlight two important changes in the market environment:
| > | | The relative value of global equities vs. global bonds actually improved during 2014. |
| > | | Monetary policy around the globe has become desynchronized, with the U.S. Federal Reserve (the Fed) contemplating rate hikes, while the European Central Bank (ECB) and the Bank of Japan (BOJ) intensify their monetary stimulus programs. |
In our view, while equities will most likely continue to dominate, the complex interactions of today’s conditions elevate the role of dynamic risk management. We argue that investors will need a cross-asset surveillance methodology to detect tactical threats.
Semiannual Report 2014
President’s Message (continued)
Monetary policies diverge
The Fed has given strong signals that economic growth in the United States has reached self-sustaining momentum and no longer needs unconventional efforts to support the expansion. The withdrawal and suspension of large-scale asset purchases was only the first step in the evolution toward policy normalization. In 2015, we expect to see a change in forward guidance and, most likely, the first interest rate increase in years.
These actions stand in stark contrast with the direction of the monetary policies of other central banks as they double down on efforts to support growth and avoid deflation. The Bank of Japan has announced its intention to increase both qualitative and quantitative easing on an enormous scale, expanding purchases of Japanese government bonds (JGBs), exchange-traded funds and real estate investment trusts. They intend to coordinate this with government pension investment fund purchases by shifting into riskier assets through sales of JGBs.
With evidence of deterioration on both the economic and inflation front, the European Central Bank (ECB) also plans to take bolder actions. These include increased purchases of asset-backed securities and covered bonds in both the primary and secondary market, together with the long-term refinancing operations that will steer the ECB’s balance sheet higher by €1 trillion.
The latest to jump on the bandwagon was the People’s Bank of China (PBOC), which cut its benchmark interest rate for the first time in over two years to support private sector investment, as targeted liquidity injections have had minimal effect on sinking economic growth.
Investment strategy for 2015
We remain convinced that relative value favors stocks over bonds, even though stocks outperformed in 2014. Therefore, you will hear the same recommendation from us for 2015. Equities remain the most important asset class for generating returns.
Within equities, the currency-based advantage of U.S. stocks is offset somewhat by the valuation advantage from overseas equities, notably in Japan. Indeed, economic growth in Japan and Europe are essential ingredients for equities to continue to perform well. If Japanese and European stocks cannot produce gains, then the global economy will probably be stuck in a near recessionary funk.
Devising a strategy to manage risk and stabilize portfolio values in the event that equities do not perform well remains complicated. Bond yields are low enough that they are not likely to offer powerful diversification benefits. We affirm our recommendation for three additional sources of portfolio stability:
| > | | Non-traditional diversifiers, such as liquid alternatives, alternative beta exposures and absolute return strategies |
| > | | Explicit downside hedges, such as put options (with emphasis on managing the related expense) |
| > | | Flexibility and a methodology for active risk reduction when appropriate (Our cross-asset methodologies should prove valuable in this regard.) |
Our overall stance for investment strategy will likely remain in place until the valuation advantage for equities has been priced away, or until the healing process for the global economy reverses.
Please visit columbiamanagement.com/blog to read the entire article.
Investors should consider the investment objectives, risks, charges and expenses of a mutual fund carefully before investing. For a free prospectus and, if available, a summary prospectus, which contains this and other important information about a fund, visit columbiamanagement.com. The prospectus should be read carefully before investing.
The views expressed are as of December 2014, may change as market or other conditions change, and may differ from views expressed by other Columbia Management Investment Advisers, LLC (CMIA) associates or affiliates. Actual investments or investment decisions made by CMIA and its affiliates, whether for its own account or on behalf of clients, will not necessarily reflect the views expressed. This information is not intended to provide investment advice and does not account for individual investor circumstances. Investment decisions should always be made based on an investor’s specific financial needs, objectives, goals, time horizon and risk tolerance. Asset classes described may not be suitable for all investors. Past performance does not guarantee future results, and no forecast should be considered a guarantee either. Since economic and market change frequently, there can be no assurance that the trends described here will continue or that the forecasts are accurate.
Diversification does not assure a profit or protect against loss.
Columbia Funds are distributed by Columbia Management Investment Distributors, Inc., member FINRA, and managed by Columbia Management Investment Advisers, LLC.
© 2015 Columbia Management Investment Advisers, LLC. All rights reserved
Semiannual Report 2014
| | |
| |
| | Columbia Commodity Strategy Fund |
Table of Contents
Fund Investment Manager
Columbia Management Investment
Advisers, LLC
225 Franklin Street
Boston, MA 02110
Fund Distributor
Columbia Management Investment
Distributors, Inc.
225 Franklin Street
Boston, MA 02110
Fund Transfer Agent
Columbia Management Investment
Services Corp.
P.O. Box 8081
Boston, MA 02266-8081
For more information about any of the funds, please visit columbiamanagement.com or call 800.345.6611. Customer Service Representatives are available to answer your questions Monday through Friday from 8 a.m. to 7 p.m. Eastern time.
The views expressed in this report reflect the current views of the respective parties. These views are not guarantees of future performance and involve certain risks, uncertainties and assumptions that are difficult to predict, so actual outcomes and results may differ significantly from the views expressed. These views are subject to change at any time based upon economic, market or other conditions and the respective parties disclaim any responsibility to update such views. These views may not be relied on as investment advice and, because investment decisions for a Columbia Fund are based on numerous factors, may not be relied on as an indication of trading intent on behalf of any particular Columbia Fund. References to specific securities should not be construed as a recommendation or investment advice.
Semiannual Report 2014
| | |
| |
| | Columbia Commodity Strategy Fund |
Performance Overview
(Unaudited)
Performance Summary
| > | | Columbia Commodity Strategy Fund (the Fund) Class A shares returned -16.92% excluding sales charges for the six-month period that ended November 30, 2014. |
| > | | The Fund underperformed its benchmark, the Bloomberg Commodity Index Total Return, which returned -15.60% for the same time period. |
| | | | | | | | | | | | | | |
Average Annual Total Returns (%) (for period ended November 30, 2014) | |
| | | Inception | | 6 Months
cumulative | | | 1 Year | | | Life | |
Class A* | | 06/18/12 | | | | | | | | | | | | |
Excluding sales charges | | | | | -16.92 | | | | -13.38 | | | | -9.66 | |
Including sales charges | | | | | -21.67 | | | | -18.35 | | | | -11.25 | |
Class C* | | 06/18/12 | | | | | | | | | | | | |
Excluding sales charges | | | | | -17.40 | | | | -14.04 | | | | -10.38 | |
Including sales charges | | | | | -18.22 | | | | -14.90 | | | | -10.38 | |
Class I | | 07/28/11 | | | -16.84 | | | | -13.03 | | | | -9.32 | |
Class R* | | 06/18/12 | | | -17.12 | | | | -13.57 | | | | -9.91 | |
Class R4* | | 03/19/13 | | | -16.76 | | | | -13.15 | | | | -9.57 | |
Class R5* | | 01/08/14 | | | -16.94 | | | | -13.15 | | | | -9.62 | |
Class W | | 07/28/11 | | | -17.04 | | | | -13.40 | | | | -9.70 | |
Class Y* | | 10/01/14 | | | -16.96 | | | | -13.31 | | | | -9.68 | |
Class Z* | | 06/18/12 | | | -16.94 | | | | -13.21 | | | | -9.51 | |
Bloomberg Commodity Index Total Return | | | | | -15.60 | | | | -9.04 | | | | -10.52 | |
Returns for Class A are shown with and without the maximum initial sales charge of 5.75%. Returns for Class C are shown with and without the 1.00% contingent deferred sales charge for the first year only. The Fund’s other classes are not subject to sales charges and have limited eligibility. Please see the Fund’s prospectus for details. Performance for different share classes will vary based on differences in sales charges and fees associated with each class. All results shown assume reinvestment of distributions during the period. Returns do not reflect the deduction of taxes that a shareholder may pay on Fund distributions or on the redemption of Fund shares. Performance results reflect the effect of any fee waivers or reimbursements of Fund expenses by Columbia Management Investment Advisers, LLC and/or any of its affiliates. Absent these fee waivers or expense reimbursement arrangements, performance results would have been lower.
The performance information shown represents past performance and is not a guarantee of future results. The investment return and principal value of your investment will fluctuate so that your shares, when redeemed, may be worth more or less than their original cost. Current performance may be lower or higher than the performance information shown. You may obtain performance information current to the most recent month-end by contacting your financial intermediary, visiting columbiamanagement.com or calling 800.345.6611.
| * | The returns shown for periods prior to the share class inception date (including returns for the Life of the Fund, if shown, which are since Fund inception) include the returns of the Fund’s oldest share class. Since the Fund launched more than one share class at its inception, Class W shares were used. These returns are adjusted to reflect any higher class-related operating expenses of the newer share classes, as applicable. Please visit columbiamanagement.com/investment-products/mutual-funds/appended-performance for more information. |
The Bloomberg Commodity Index Total Return is a total return index based on the Bloomberg Commodity Index, which is a broadly diversified index composed of futures contracts on physical commodities that allows investors to track commodity futures through a single, simple measure.
Indices are not available for investment, are not professionally managed and do not reflect sales charges, fees, brokerage commissions, taxes or other expenses of investing. Securities in the Fund may not match those in an index.
| | |
| |
| Columbia Commodity Strategy Fund | | |
Portfolio Overview
(Unaudited)
Portfolio Management
Threadneedle International Limited
David Donora
Nicolas Robin
| | | | |
Commodities Market Exposure (%)
(at November 30, 2014) | |
Commodities Futures Contracts(a) | | | | |
Agriculture | | | 37.1 | |
Energy | | | 32.0 | |
Industrial Metals | | | 19.5 | |
Precious Metals | | | 11.4 | |
Total Notional Market Value of Commodities Futures Contracts | | | 100.0 | |
| (a) | Reflects notional market value of commodities futures contracts. The notional exposure of a financial instrument is the nominal or face amount that is used to calculate payments made on that instrument and/or changes in value for the instrument. The notional exposure is a hypothetical underlying quantity upon which payment obligations are computed. Notional exposures provide a gauge for how the Fund may behave given changes in individual markets. Notional amounts for each commodities futures contract are shown in the Consolidated Portfolio of Investments. The notional amount of all outstanding commodities futures contracts is $15,794,922. For a description of the Fund’s investments in derivatives, see Investments in Derivatives following the Consolidated Portfolio of Investments and Note 2 to the Notes to Consolidated Financial Statements. |
| | | | |
Portfolio Holdings (%)
(at November 30, 2014)(a) | |
Money Market Funds | | | 139.7 | |
Other Assets & Liabilities | | | (39.7 | ) |
Total | | | 100.0 | |
| (a) | Percentage based upon net assets. At period end, the Fund held an investment in an affiliated money market fund, which has been segregated to cover obligations relating to the Fund’s investments in open futures contracts which provide exposure to the commodities market. For a description of the Fund’s investments in derivatives, see Investments in Derivatives following the Consolidated Portfolio of Investments and Note 2 to the Notes to Consolidated Financial Statements. |
| | |
| |
| | Columbia Commodity Strategy Fund |
Understanding Your Fund’s Expenses
(Unaudited)
As an investor, you incur two types of costs. There are transaction costs, which generally include sales charges on purchases and may include redemption fees. There are also ongoing costs, which generally include management fees, distribution and/or service fees, and other fund expenses. The following information is intended to help you understand your ongoing costs (in dollars) of investing in the Fund and to help you compare these costs with the ongoing costs of investing in other mutual funds.
Analyzing Your Fund’s Expenses
To illustrate these ongoing costs, we have provided examples and calculated the expenses paid by investors in each share class of the Fund during the period. The actual and hypothetical information in the table is based on an initial investment of $1,000 at the beginning of the period indicated and held for the entire period. Expense information is calculated two ways and each method provides you with different information. The amount listed in the “Actual” column is calculated using the Fund’s actual operating expenses and total return for the period. You may use the Actual information, together with the amount invested, to estimate the expenses that you paid over the period. Simply divide your account value by $1,000 (for example, an $8,600 account value divided by $1,000 = 8.6), then multiply the results by the expenses paid during the period under the “Actual” column. The amount listed in the “Hypothetical” column assumes a 5% annual rate of return before expenses (which is not the Fund’s actual return) and then applies the Fund’s actual expense ratio for the period to the hypothetical return. You should not use the hypothetical account values and expenses to estimate either your actual account balance at the end of the period or the expenses you paid during the period. See “Compare With Other Funds” below for details on how to use the hypothetical data.
Compare With Other Funds
Since all mutual funds are required to include the same hypothetical calculations about expenses in shareholder reports, you can use this information to compare the ongoing cost of investing in the Fund with other funds. To do so, compare the hypothetical example with the 5% hypothetical examples that appear in the shareholder reports of other funds. As you compare hypothetical examples of other funds, it is important to note that hypothetical examples are meant to highlight the ongoing costs of investing in a fund only and do not reflect any transaction costs, such as sales charges, or redemption or exchange fees. Therefore, the hypothetical calculations are useful in comparing ongoing costs only, and will not help you determine the relative total costs of owning different funds. If transaction costs were included in these calculations, your costs would be higher.
June 1, 2014 – November 30, 2014
| | | | | | | | | | | | | | | | | | | | | | | | | | | | |
| | | Account Value at the
Beginning of the
Period ($) | | | Account Value at the
End of the
Period ($) | | | Expenses Paid During
the Period ($) | | | Fund’s Annualized
Expense Ratio (%) | |
| | | | Actual | | | | Hypothetical | | | | Actual | | | | Hypothetical | | | | Actual | | | | Hypothetical | | | | Actual | |
Class A | | | 1,000.00 | | | | 1,000.00 | | | | 830.80 | | | | 1,019.05 | | | | 5.39 | | | | 5.94 | | | | 1.18 | |
Class C | | | 1,000.00 | | | | 1,000.00 | | | | 826.00 | | | | 1,015.31 | | | | 8.79 | | | | 9.70 | | | | 1.93 | |
Class I | | | 1,000.00 | | | | 1,000.00 | | | | 831.60 | | | | 1,020.84 | | | | 3.74 | | | | 4.13 | | | | 0.82 | |
Class R | | | 1,000.00 | | | | 1,000.00 | | | | 828.80 | | | | 1,017.80 | | | | 6.52 | | | | 7.19 | | | | 1.43 | |
Class R4 | | | 1,000.00 | | | | 1,000.00 | | | | 832.40 | | | | 1,020.29 | | | | 4.25 | | | | 4.68 | | | | 0.93 | |
Class R5 | | | 1,000.00 | | | | 1,000.00 | | | | 830.60 | | | | 1,020.59 | | | | 3.97 | | | | 4.38 | | | | 0.87 | |
Class W | | | 1,000.00 | | | | 1,000.00 | | | | 829.60 | | | | 1,019.05 | | | | 5.38 | | | | 5.94 | | | | 1.18 | |
Class Y | | | 1,000.00 | | | | 1,000.00 | | | | 937.70 | * | | | 1,020.84 | | | | 1.24 | * | | | 4.13 | | | | 0.82 | * |
Class Z | | | 1,000.00 | | | | 1,000.00 | | | | 830.60 | | | | 1,020.29 | | | | 4.24 | | | | 4.68 | | | | 0.93 | |
| * | Based on operations from October 1, 2014 (commencement of operations) through the stated period end. |
Expenses paid during the period are equal to the annualized expense ratio for each class as indicated above, multiplied by the average account value over the period and then multiplied by the number of days in the Fund’s most recent fiscal half year and divided by 365.
Expenses do not include fees and expenses incurred indirectly by the Fund from its investment in underlying funds, including affiliated and non-affiliated pooled investment vehicles, such as mutual funds and exchange-traded funds.
Had Columbia Management Investment Advisers, LLC and/or certain of its affiliates not waived/reimbursed certain fees and expenses, account value at the end of the period would have been reduced.
| | |
| |
| Columbia Commodity Strategy Fund | | |
Consolidated Portfolio of Investments
November 30, 2014 (Unaudited)
(Percentages represent value of investments compared to net assets)
| | | | | | | | |
| Money Market Funds 139.7% | |
| | | Shares | | | Value ($) | |
| | |
Columbia Short-Term Cash Fund, 0.104%(a)(b) | | | 22,100,219 | | | | 22,100,219 | |
| | | | | | | | | |
Total Money Market Funds | | | | | | | | |
(Cost: $22,100,219) | | | | | | | 22,100,219 | |
| | | | | | | | | |
Total Investments | | | | | | | | |
(Cost: $22,100,219) | | | | | | | 22,100,219 | |
| | | | | | | | | |
Other Assets & Liabilities, Net | | | | | | | (6,284,507 | ) |
| | | | | | | | | |
Net Assets | | | | | | | 15,815,712 | |
| | | | | | | | | |
Investments in Derivatives
Futures Contracts Outstanding at November 30, 2014
At November 30, 2014, cash totaling $1,359,363 was pledged as collateral to cover initial margin requirements on open futures contracts.
Long Futures Contracts Outstanding
| | | | | | | | | | | | | | | | | | | | | | | | |
| Contract Description | | Number of
Contracts | | | Trading
Currency | | | Notional Market
Value ($) | | | Expiration Date | | | Unrealized
Appreciation ($) | | | Unrealized
Depreciation ($) | |
BRENT CRUDE | | | 15 | | | | USD | | | | 1,058,700 | | | | 01/2015 | | | | — | | | | (22,236 | ) |
| | | | | | |
COFFEE ‘C’ | | | 4 | | | | USD | | | | 281,175 | | | | 03/2015 | | | | — | | | | (5,266 | ) |
| | | | | | |
COPPER | | | 6 | | | | USD | | | | 427,200 | | | | 05/2015 | | | | — | | | | (23,447 | ) |
| | | | | | |
CORN | | | 58 | | | | USD | | | | 1,127,375 | | | | 03/2015 | | | | 402 | | | | — | |
| | | | | | |
COTTON NO.2 | | | 6 | | | | USD | | | | 182,850 | | | | 05/2015 | | | | — | | | | (2,243 | ) |
| | | | | | |
GASOLINE RBOB | | | 15 | | | | USD | | | | 1,151,388 | | | | 12/2014 | | | | — | | | | (119,043 | ) |
| | | | | | |
GOLD 100 OZ | | | 12 | | | | USD | | | | 1,410,600 | | | | 02/2015 | | | | 16,122 | | | | — | |
| | | | | | |
HEATING OIL | | | 5 | | | | USD | | | | 445,473 | | | | 04/2015 | | | | — | | | | (46,054 | ) |
| | | | | | |
LEAN HOGS | | | 10 | | | | USD | | | | 352,900 | | | | 02/2015 | | | | — | | | | (4,380 | ) |
| | | | | | |
LIVE CATTLE | | | 12 | | | | USD | | | | 811,200 | | | | 04/2015 | | | | 15,869 | | | | — | |
| | | | | | |
LME LEAD | | | 15 | | | | USD | | | | 762,937 | | | | 05/2015 | | | | — | | | | (3,830 | ) |
| | | | | | |
LME NICKEL | | | 12 | | | | USD | | | | 1,170,504 | | | | 01/2015 | | | | — | | | | (495 | ) |
| | | | | | |
LME ZINC | | | 13 | | | | USD | | | | 721,906 | | | | 05/2015 | | | | — | | | | (15,792 | ) |
| | | | | | |
NATURAL GAS | | | 39 | | | | USD | | | | 1,594,320 | | | | 12/2014 | | | | 13,721 | | | | — | |
| | | | | | |
SILVER | | | 5 | | | | USD | | | | 388,900 | | | | 03/2015 | | | | — | | | | (3,129 | ) |
| | | | | | |
SOYBEAN | | | 14 | | | | USD | | | | 711,200 | | | | 01/2015 | | | | 41,555 | | | | — | |
| | | | | | |
SOYBEAN MEAL | | | 11 | | | | USD | | | | 402,930 | | | | 01/2015 | | | | 31,906 | | | | — | |
| | | | | | |
SOYBEAN OIL | | | 22 | | | | USD | | | | 430,188 | | | | 05/2015 | | | | — | | | | (5,928 | ) |
| | | | | | |
SUGAR #11 (WORLD) | | | 27 | | | | USD | | | | 471,442 | | | | 02/2015 | | | | — | | | | (21,886 | ) |
| | | | | | |
SUGAR #11 (WORLD) | | | 19 | | | | USD | | | | 339,629 | | | | 04/2015 | | | | — | | | | (11,374 | ) |
| | | | | | |
WHEAT KCBT | | | 17 | | | | USD | | | | 544,850 | | | | 05/2015 | | | | 44,006 | | | | — | |
| | | | | | |
WHEAT | | | 7 | | | | USD | | | | 204,575 | | | | 05/2015 | | | | 14,135 | | | | — | |
| | | | | | |
WTI CRUDE | | | 12 | | | | USD | | | | 802,680 | | | | 04/2015 | | | | — | | | | (111,907 | ) |
| | | | | | | | | | | | | | | | | | | | | | | | | |
Total | | | | | | | | | | | | | | | | | | | 177,716 | | | | (397,010 | ) |
| | | | | | | | | | | | | | | | | | | | | | | | | |
The accompanying Notes to Consolidated Financial Statements are an integral part of this statement.
| | |
| |
| | Columbia Commodity Strategy Fund |
Consolidated Portfolio of Investments (continued)
November 30, 2014 (Unaudited)
Notes to Consolidated Portfolio of Investments
| (a) | The rate shown is the seven-day current annualized yield at November 30, 2014. |
| (b) | As defined in the Investment Company Act of 1940, an affiliated company is one in which the Fund owns 5% or more of the company’s outstanding voting securities, or a company which is under common ownership or control with the Fund. Holdings and transactions in these affiliated companies during the period ended November 30, 2014, are as follows: |
| | | | | | | | | | | | | | | | | | | | | | | | |
| Issuer | | Beginning
Cost ($) | | | Purchase
Cost ($) | | | Proceeds
From Sales ($) | | | Ending
Cost ($) | | | Dividends —
Affiliated
Issuers ($) | | | Value ($) | |
Columbia Short-Term Cash Fund | | | 59,213,958 | | | | 20,278,462 | | | | (57,392,201 | ) | | | 22,100,219 | | | | 21,957 | | | | 22,100,219 | |
Currency Legend
Fair Value Measurements
Generally accepted accounting principles (GAAP) require disclosure regarding the inputs and valuation techniques used to measure fair value and any changes in valuation inputs or techniques. In addition, investments shall be disclosed by major category.
The Fund categorizes its fair value measurements according to a three-level hierarchy that maximizes the use of observable inputs and minimizes the use of unobservable inputs by prioritizing that the most observable input be used when available. Observable inputs are those that market participants would use in pricing an investment based on market data obtained from sources independent of the reporting entity. Unobservable inputs are those that reflect the Fund’s assumptions about the information market participants would use in pricing an investment. An investment’s level within the fair value hierarchy is based on the lowest level of any input that is deemed significant to the asset or liability’s fair value measurement. The input levels are not necessarily an indication of the risk or liquidity associated with investments at that level. For example, certain U.S. government securities are generally high quality and liquid, however, they are reflected as Level 2 because the inputs used to determine fair value may not always be quoted prices in an active market.
Fair value inputs are summarized in the three broad levels listed below:
| > | | Level 1 — Valuations based on quoted prices for investments in active markets that the Fund has the ability to access at the measurement date (including NAV for open-end mutual funds). Valuation adjustments are not applied to Level 1 investments. |
| > | | Level 2 — Valuations based on other significant observable inputs (including quoted prices for similar securities, interest rates, prepayment speeds, credit risks, etc.). |
| > | | Level 3 — Valuations based on significant unobservable inputs (including the Fund’s own assumptions and judgment in determining the fair value of investments). |
Inputs that are used in determining fair value of an investment may include price information, credit data, volatility statistics, and other factors. These inputs can be either observable or unobservable. The availability of observable inputs can vary between investments, and is affected by various factors such as the type of investment, and the volume and level of activity for that investment or similar investments in the marketplace. The inputs will be considered by the Investment Manager, along with any other relevant factors in the calculation of an investment’s fair value. The Fund uses prices and inputs that are current as of the measurement date, which may include periods of market dislocations. During these periods, the availability of prices and inputs may be reduced for many investments. This condition could cause an investment to be reclassified between the various levels within the hierarchy.
Investments falling into the Level 3 category are primarily supported by quoted prices from brokers and dealers participating in the market for those investments. However, these may be classified as Level 3 investments due to lack of market transparency and corroboration to support these quoted prices. Additionally, valuation models may be used as the pricing source for any remaining investments classified as Level 3. These models may rely on one or more significant unobservable inputs and/or significant assumptions by the Investment Manager. Inputs used in valuations may include, but are not limited to, financial statement analysis, capital account balances, discount rates and estimated cash flows, and comparable company data.
Under the direction of the Fund’s Board of Trustees (the Board), the Investment Manager’s Valuation Committee (the Committee) is responsible for overseeing the valuation procedures approved by the Board. The Committee consists of voting and non-voting members from various groups within the Investment Manager’s organization, including operations and accounting, trading and investments, compliance, risk management and legal.
The Committee meets at least monthly to review and approve valuation matters, which may include a description of specific valuation determinations, data regarding pricing information received from approved pricing vendors and brokers and the results of Board-approved valuation control policies and procedures (the Policies). The Policies address, among other things, instances when market quotations are or are not readily available, including recommendations of third party pricing vendors and a determination of appropriate pricing methodologies; events that require specific valuation determinations and assessment of fair value techniques; securities with a potential for stale pricing, including those that are illiquid, restricted, or in default; and the effectiveness of third party pricing vendors, including periodic reviews of vendors. The Committee meets more frequently, as needed, to discuss additional valuation matters, which may include the need to review back-testing results, review time-sensitive information or approve related valuation actions. The Committee reports to the Board, with members of the Committee meeting with the Board at each of its regularly scheduled meetings to discuss valuation matters and actions during the period, similar to those described earlier.
For investments categorized as Level 3, the Committee monitors information similar to that described above, which may include: (i) data specific to the issuer or comparable issuers, (ii) general market or specific sector news and (iii) quoted prices and specific or similar security transactions. The Committee considers this data and any changes from prior periods in order to assess the reasonableness of observable and unobservable inputs, any assumptions or internal models used to value those securities and changes in fair value. This data is also used to corroborate, when available,
The accompanying Notes to Consolidated Financial Statements are an integral part of this statement.
| | |
| |
| Columbia Commodity Strategy Fund | | |
Consolidated Portfolio of Investments (continued)
November 30, 2014 (Unaudited)
Fair Value Measurements (continued)
information received from approved pricing vendors and brokers. Various factors impact the frequency of monitoring this information (which may occur as often as daily). However, the Committee may determine that changes to inputs, assumptions and models are not required as a result of the monitoring procedures performed.
The following table is a summary of the inputs used to value the Fund’s investments at November 30, 2014:
| | | | | | | | | | | | | | | | |
| Description | | Level 1
Quoted Prices in Active
Markets for Identical
Assets ($) | | | Level 2
Other Significant
Observable Inputs ($) | | | Level 3
Significant
Unobservable Inputs ($) | | | Total ($) | |
Mutual Funds | | | | | | | | | | | | | | | | |
| | | | |
Money Market Funds | | | 22,100,219 | | | | — | | | | — | | | | 22,100,219 | |
| | | | | | | | | | | | | | | | | |
Total Mutual Funds | | | 22,100,219 | | | | — | | | | — | | | | 22,100,219 | |
| | | | | | | | | | | | | | | | | |
Derivatives | | | | | | | | | | | | | | | | |
| | | | |
Assets | | | | | | | | | | | | | | | | |
| | | | |
Futures Contracts | | | 177,716 | | | | — | | | | — | | | | 177,716 | |
| | | | |
Liabilities | | | | | | | | | | | | | | | | |
| | | | |
Futures Contracts | | | (397,010 | ) | | | — | | | | — | | | | (397,010 | ) |
| | | | | | | | | | | | | | | | | |
Total | | | 21,880,925 | | | | — | | | | — | | | | 21,880,925 | |
| | | | | | | | | | | | | | | | | |
See the Consolidated Portfolio of Investments for all investment classifications not indicated in the table.
There were no transfers of financial assets between levels during the period.
Derivative instruments are valued at unrealized appreciation (depreciation).
The accompanying Notes to Consolidated Financial Statements are an integral part of this statement.
| | |
| |
| | Columbia Commodity Strategy Fund |
Consolidated Statement of Assets and Liabilities
November 30, 2014 (Unaudited)
| | | | |
Assets | | | | |
| |
Investments, at value | | | | |
| |
Affiliated issuers (identified cost $22,100,219) | | | $22,100,219 | |
| |
Margin deposits | | | 1,359,363 | |
| |
Receivable for: | | | | |
| |
Capital shares sold | | | 5,441 | |
| |
Dividends | | | 1,719 | |
| |
Variation margin | | | 54,748 | |
| |
Expense reimbursement due from Investment Manager | | | 792 | |
| |
Prepaid expenses | | | 2,265 | |
| |
Other assets | | | 19,873 | |
| |
Total assets | | | 23,544,420 | |
| |
| |
Liabilities | | | | |
| |
Payable for: | | | | |
| |
Capital shares purchased | | | 6,894,884 | |
| |
Variation margin | | | 789,048 | |
| |
Investment management fees | | | 712 | |
| |
Distribution and/or service fees | | | 57 | |
| |
Transfer agent fees | | | 323 | |
| |
Administration fees | | | 104 | |
| |
Compensation of board members | | | 11,747 | |
| |
Other expenses | | | 31,833 | |
| |
Total liabilities | | | 7,728,708 | |
| |
Net assets applicable to outstanding capital stock | | | $15,815,712 | |
| |
| |
Represented by | | | | |
| |
Paid-in capital | | | $32,334,627 | |
| |
Undistributed net investment income | | | 773,757 | |
| |
Accumulated net realized loss | | | (17,073,378 | ) |
| |
Unrealized appreciation (depreciation) on: | | | | |
| |
Futures contracts | | | (219,294 | ) |
| |
Total — representing net assets applicable to outstanding capital stock | | | $15,815,712 | |
| |
The accompanying Notes to Consolidated Financial Statements are an integral part of this statement.
| | |
| |
| Columbia Commodity Strategy Fund | | |
Consolidated Statement of Assets and Liabilities (continued)
November 30, 2014 (Unaudited)
| | | | |
| |
Class A | | | | |
| |
Net assets | | | $2,941,783 | |
| |
Shares outstanding | | | 413,409 | |
| |
Net asset value per share | | | $7.12 | |
| |
Maximum offering price per share(a) | | | $7.55 | |
| |
Class C | | | | |
| |
Net assets | | | $154,467 | |
| |
Shares outstanding | | | 22,121 | |
| |
Net asset value per share | | | $6.98 | |
| |
Class I | | | | |
| |
Net assets | | | $11,261,832 | |
| |
Shares outstanding | | | 1,562,824 | |
| |
Net asset value per share | | | $7.21 | |
| |
Class R | | | | |
| |
Net assets | | | $119,625 | |
| |
Shares outstanding | | | 16,915 | |
| |
Net asset value per share | | | $7.07 | |
| |
Class R4 | | | | |
| |
Net assets | | | $127,170 | |
| |
Shares outstanding | | | 17,672 | |
| |
Net asset value per share | | | $7.20 | |
| |
Class R5 | | | | |
| |
Net assets | | | $589,689 | |
| |
Shares outstanding | | | 81,749 | |
| |
Net asset value per share | | | $7.21 | |
| |
Class W | | | | |
| |
Net assets | | | $2,112 | |
| |
Shares outstanding | | | 297 | |
| |
Net asset value per share | | | $7.11 | |
| |
Class Y | | | | |
| |
Net assets | | | $2,345 | |
| |
Shares outstanding | | | 325 | |
| |
Net asset value per share | | | $7.22 | |
| |
Class Z | | | | |
| |
Net assets | | | $616,689 | |
| |
Shares outstanding | | | 86,117 | |
| |
Net asset value per share | | | $7.16 | |
| |
| (a) | The maximum offering price per share is calculated by dividing the net asset value per share by 1.0 minus the maximum sales charge of 5.75%. |
The accompanying Notes to Consolidated Financial Statements are an integral part of this statement.
| | |
| 10 | | Semiannual Report 2014 |
| | |
| |
| | Columbia Commodity Strategy Fund |
Consolidated Statement of Operations
Six Months Ended November 30, 2014 (Unaudited)
| | | | |
Net investment income | | | | |
| |
Income: | | | | |
| |
Dividends — affiliated issuers | | | $21,957 | |
| |
Total income | | | 21,957 | |
| |
| |
Expenses: | | | | |
| |
Investment management fees | | | 133,020 | |
| |
Distribution and/or service fees | | | | |
| |
Class A | | | 4,250 | |
| |
Class C | | | 964 | |
| |
Class R | | | 329 | |
| |
Class W | | | 3 | |
| |
Transfer agent fees | | | | |
| |
Class A | | | 1,823 | |
| |
Class C | | | 103 | |
| |
Class R | | | 71 | |
| |
Class R4 | | | 25 | |
| |
Class R5 | | | 172 | |
| |
Class W | | | 2 | |
| |
Class Z | | | 366 | |
| |
Administration fees | | | 19,348 | |
| |
Compensation of board members | | | 5,709 | |
| |
Custodian fees | | | 2,127 | |
| |
Printing and postage fees | | | 9,651 | |
| |
Registration fees | | | 45,799 | |
| |
Professional fees | | | 18,745 | |
| |
Other | | | 6,925 | |
| |
Total expenses | | | 249,432 | |
| |
Fees waived or expenses reimbursed by Investment Manager and its affiliates | | | (43,003 | ) |
| |
Total net expenses | | | 206,429 | |
| |
Net investment loss | | | (184,472 | ) |
| |
| |
Realized and unrealized gain (loss) — net | | | | |
| |
Net realized gain (loss) on: | | | | |
| |
Futures contracts | | | (8,112,818 | ) |
| |
Net realized loss | | | (8,112,818 | ) |
| |
Net change in unrealized appreciation (depreciation) on: | | | | |
| |
Futures contracts | | | 562,040 | |
| |
Net change in unrealized appreciation | | | 562,040 | |
| |
Net realized and unrealized loss | | | (7,550,778 | ) |
| |
Net decrease in net assets from operations | | | $(7,735,250 | ) |
| |
The accompanying Notes to Consolidated Financial Statements are an integral part of this statement.
| | | | |
| Semiannual Report 2014 | | | 11 | |
| | |
| |
| Columbia Commodity Strategy Fund | | |
Consolidated Statement of Changes in Net Assets
| | | | | | | | |
| | | Six Months Ended
November 30, 2014
(Unaudited) | | | Year Ended
May 31, 2014 | |
Operations | | | | | | | | |
| | |
Net investment loss | | | $(184,472 | ) | | | $(423,887 | ) |
| | |
Net realized loss | | | (8,112,818 | ) | | | (1,133,669 | ) |
| | |
Net change in unrealized appreciation | | | 562,040 | | | | 879,725 | |
| |
Net decrease in net assets resulting from operations | | | (7,735,250 | ) | | | (677,831 | ) |
| |
Decrease in net assets from capital stock activity | | | (45,219,147 | ) | | | (18,442,621 | ) |
| |
Total decrease in net assets | | | (52,954,397 | ) | | | (19,120,452 | ) |
| | |
Net assets at beginning of period | | | 68,770,109 | | | | 87,890,561 | |
| |
Net assets at end of period | | | $15,815,712 | | | | $68,770,109 | |
| |
Undistributed net investment income | | | $773,757 | | | | $958,229 | |
| |
The accompanying Notes to Consolidated Financial Statements are an integral part of this statement.
| | |
| 12 | | Semiannual Report 2014 |
| | |
| |
| | Columbia Commodity Strategy Fund |
Consolidated Statement of Changes in Net Assets (continued)
| | | | | | | | | | | | | | | | |
| | | Six Months Ended
November 30, 2014(a)
(Unaudited) | | | Year Ended
May 31, 2014(b) | |
| | | Shares | | | Dollars ($) | | | Shares | | | Dollars ($) | |
Capital stock activity | | | | | | | | | | | | | | | | |
| | | | |
Class A shares | | | | | | | | | | | | | | | | |
| | | | |
Subscriptions | | | 88,132 | | | | 710,691 | | | | 277,762 | | | | 2,334,335 | |
| | | | |
Redemptions | | | (68,505 | ) | | | (522,231 | ) | | | (327,357 | ) | | | (2,709,417 | ) |
| |
Net increase (decrease) | | | 19,627 | | | | 188,460 | | | | (49,595 | ) | | | (375,082 | ) |
| |
Class C shares | | | | | | | | | | | | | | | | |
| | | | |
Subscriptions | | | 2,617 | | | | 21,718 | | | | 14,060 | | | | 117,330 | |
| | | | |
Redemptions | | | (7,297 | ) | | | (58,346 | ) | | | (4,405 | ) | | | (37,012 | ) |
| |
Net increase (decrease) | | | (4,680 | ) | | | (36,628 | ) | | | 9,655 | | | | 80,318 | |
| |
Class I shares | | | | | | | | | | | | | | | | |
| | | | |
Subscriptions | | | 126,575 | | | | 984,746 | | | | 3,896,772 | | | | 33,827,293 | |
| | | | |
Redemptions | | | (5,904,607 | ) | | | (46,610,366 | ) | | | (6,313,351 | ) | | | (53,291,565 | ) |
| |
Net decrease | | | (5,778,032 | ) | | | (45,625,620 | ) | | | (2,416,579 | ) | | | (19,464,272 | ) |
| |
Class R shares | | | | | | | | | | | | | | | | |
| | | | |
Subscriptions | | | 1,122 | | | | 9,075 | | | | 3,935 | | | | 32,803 | |
| | | | |
Redemptions | | | (179 | ) | | | (1,344 | ) | | | (2,094 | ) | | | (17,566 | ) |
| |
Net increase | | | 943 | | | | 7,731 | | | | 1,841 | | | | 15,237 | |
| |
Class R4 shares | | | | | | | | | | | | | | | | |
| | | | |
Subscriptions | | | 17,375 | | | | 135,283 | | | | 7,163 | | | | 60,200 | |
| | | | |
Redemptions | | | — | | | | — | | | | (7,140 | ) | | | (62,407 | ) |
| |
Net increase | | | 17,375 | | | | 135,283 | | | | 23 | | | | (2,207 | ) |
| |
Class R5 shares | | | | | | | | | | | | | | | | |
| | | | |
Subscriptions | | | 57,449 | | | | 452,350 | | | | 70,012 | | | | 607,029 | |
| | | | |
Redemptions | | | (45,712 | ) | | | (342,035 | ) | | | — | | | | — | |
| |
Net increase | | | 11,737 | | | | 110,315 | | | | 70,012 | | | | 607,029 | |
| |
Class W shares | | | | | | | | | | | | | | | | |
| | | | |
Subscriptions | | | — | | | | — | | | | 47 | | | | 400 | |
| |
Net increase | | | — | | | | — | | | | 47 | | | | 400 | |
| |
Class Y shares | | | | | | | | | | | | | | | | |
| | | | |
Subscriptions | | | 325 | | | | 2,500 | | | | — | | | | — | |
| |
Net increase | | | 325 | | | | 2,500 | | | | — | | | | — | |
| |
Class Z shares | | | | | | | | | | | | | | | | |
| | | | |
Subscriptions | | | 2,667 | | | | 20,302 | | | | 83,886 | | | | 701,929 | |
| | | | |
Redemptions | | | (2,665 | ) | | | (21,490 | ) | | | (704 | ) | | | (5,973 | ) |
| |
Net increase (decrease) | | | 2 | | | | (1,188 | ) | | | 83,182 | | | | 695,956 | |
| |
Total net decrease | | | (5,732,703 | ) | | | (45,219,147 | ) | | | (2,301,414 | ) | | | (18,442,621 | ) |
| |
| (a) | Class Y shares are based on operations from October 1, 2014 (commencement of operations) through the stated period end. |
| (b) | Class R5 shares are based on operations from January 8, 2014 (commencement of operations) through the stated period end. |
The accompanying Notes to Consolidated Financial Statements are an integral part of this statement.
| | | | |
| Semiannual Report 2014 | | | 13 | |
| | |
| |
| Columbia Commodity Strategy Fund | | |
Consolidated Financial Highlights
The following tables are intended to help you understand the Fund’s financial performance. Certain information reflects financial results for a single share of a class held for the periods shown. Per share net investment income (loss) amounts are calculated based on average shares outstanding during the period. Total return assumes reinvestment of all dividends and distributions, if any. Total return does not reflect payment of sales charges, if any. Total return and portfolio turnover are not annualized for periods of less than one year. The portfolio turnover rate is calculated without regard to purchase and sales transactions of short-term instruments and certain derivatives, if any. If such transactions were included, the Fund’s portfolio turnover rate may be higher.
| | | | | | | | | | | | |
| |
| Six Months Ended
November 30, 2014 |
| | | Year Ended May 31, | |
Class A | | | (Unaudited) | | | | 2014 | | | | 2013(a) | |
Per share data | | | | | | | | | | | | |
Net asset value, beginning of period | | | $8.57 | | | | $8.52 | | | | $8.50 | |
| | | | | | | | | | | | | |
Income from investment operations: | | | | | | | | | | | | |
| | | |
Net investment loss | | | (0.04 | ) | | | (0.09 | ) | | | (0.08 | ) |
| | | | | | | | | | | | | |
Net realized and unrealized gain (loss) | | | (1.41 | ) | | | 0.14 | (b) | | | 0.10 | (b) |
| | | | | | | | | | | | | |
Total from investment operations | | | (1.45 | ) | | | 0.05 | | | | 0.02 | |
| | | | | | | | | | | | | |
Net asset value, end of period | | | $7.12 | | | | $8.57 | | | | $8.52 | |
| | | | | | | | | | | | | |
Total return | | | (16.92 | %) | | | 0.59 | % | | | 0.24 | % |
| | | | | | | | | | | | | |
Ratios to average net assets(c) | | | | | | | | | | | | |
| | | |
Total gross expenses | | | 1.42 | %(d) | | | 1.34 | % | | | 1.25 | %(d) |
| | | | | | | | | | | | | |
Total net expenses(e) | | | 1.18 | %(d) | | | 1.16 | % | | | 1.14 | %(d) |
| | | | | | | | | | | | | |
Net investment loss | | | (1.09 | %)(d) | | | (1.07 | %) | | | (1.02 | %)(d) |
| | | | | | | | | | | | | |
Supplemental data | | | | | | | | | | | | |
| | | |
Net assets, end of period (in thousands) | | | $2,942 | | | | $3,376 | | | | $3,780 | |
| | | | | | | | | | | | | |
Portfolio turnover | | | 0 | % | | | 0 | % | | | 0 | % |
| | | | | | | | | | | | | |
Notes to Consolidated Financial Highlights
| (a) | Based on operations from June 18, 2012 (commencement of operations) through the stated period end. |
| (b) | Calculation of the net gain (loss) per share (both realized and unrealized) does not correlate to the aggregate realized and unrealized gain (loss) presented in the Consolidated Statement of Operations due to the timing of subscriptions and redemptions of Fund shares in relation to fluctuations in the market value of the portfolio. |
| (c) | In addition to the fees and expenses that the Fund bears directly, the Fund indirectly bears a pro rata share of the fees and expenses of any other funds in which it invests. Such indirect expenses are not included in the Fund’s reported expense ratios. |
| (e) | Total net expenses include the impact of certain fee waivers/expense reimbursements made by the Investment Manager and certain of its affiliates, if applicable. |
The accompanying Notes to Consolidated Financial Statements are an integral part of this statement.
| | |
| 14 | | Semiannual Report 2014 |
| | |
| |
| | Columbia Commodity Strategy Fund |
Consolidated Financial Highlights (continued)
| | | | | | | | | | | | |
| |
| Six Months Ended
November 30, 2014 |
| | | Year Ended May 31, | |
Class C | | | (Unaudited) | | | | 2014 | | | | 2013(a) | |
Per share data | | | | | | | | | | | | |
Net asset value, beginning of period | | | $8.45 | | | | $8.46 | | | | $8.50 | |
| | | | | | | | | | | | | |
Income from investment operations: | | | | | | | | | | | | |
| | | |
Net investment loss | | | (0.07 | ) | | | (0.15 | ) | | | (0.15 | ) |
| | | | | | | | | | | | | |
Net realized and unrealized gain (loss) | | | (1.40 | ) | | | 0.14 | (b) | | | 0.11 | (b) |
| | | | | | | | | | | | | |
Total from investment operations | | | (1.47 | ) | | | (0.01 | ) | | | (0.04 | ) |
| | | | | | | | | | | | | |
Net asset value, end of period | | | $6.98 | | | | $8.45 | | | | $8.46 | |
| | | | | | | | | | | | | |
Total return | | | (17.40 | %) | | | (0.12 | %) | | | (0.47 | %) |
| | | | | | | | | | | | | |
Ratios to average net assets(c) | | | | | | | | | | | | |
| | | |
Total gross expenses | | | 2.15 | %(d) | | | 2.10 | % | | | 2.01 | %(d) |
| | | | | | | | | | | | | |
Total net expenses(e) | | | 1.93 | %(d) | | | 1.91 | % | | | 1.90 | %(d) |
| | | | | | | | | | | | | |
Net investment loss | | | (1.84 | %)(d) | | | (1.82 | %) | | | (1.77 | %)(d) |
| | | | | | | | | | | | | |
Supplemental data | | | | | | | | | | | | |
| | | |
Net assets, end of period (in thousands) | | | $154 | | | | $226 | | | | $145 | |
| | | | | | | | | | | | | |
Portfolio turnover | | | 0 | % | | | 0 | % | | | 0 | % |
| | | | | | | | | | | | | |
Notes to Consolidated Financial Highlights
| (a) | Based on operations from June 18, 2012 (commencement of operations) through the stated period end. |
| (b) | Calculation of the net gain (loss) per share (both realized and unrealized) does not correlate to the aggregate realized and unrealized gain (loss) presented in the Consolidated Statement of Operations due to the timing of subscriptions and redemptions of Fund shares in relation to fluctuations in the market value of the portfolio. |
| (c) | In addition to the fees and expenses that the Fund bears directly, the Fund indirectly bears a pro rata share of the fees and expenses of any other funds in which it invests. Such indirect expenses are not included in the Fund’s reported expense ratios. |
| (e) | Total net expenses include the impact of certain fee waivers/expense reimbursements made by the Investment Manager and certain of its affiliates, if applicable. |
The accompanying Notes to Consolidated Financial Statements are an integral part of this statement.
| | | | |
| Semiannual Report 2014 | | | 15 | |
| | |
| |
| Columbia Commodity Strategy Fund | | |
Consolidated Financial Highlights (continued)
| | | | | | | | | | | | | | | | |
| |
| Six Months Ended
November 30, 2014 |
| | | Year Ended May 31, | |
Class I | | | (Unaudited) | | | | 2014 | | | | 2013 | | | | 2012(a) | |
Per share data | | | | | | | | | | | | | | | | |
Net asset value, beginning of period | | | $8.67 | | | | $8.59 | | | | $8.50 | | | | $10.00 | |
| | | | | | | | | | | | | | | | | |
Income from investment operations: | | | | | | | | | | | | | | | | |
| | | | |
Net investment loss | | | (0.03 | ) | | | (0.06 | ) | | | (0.05 | ) | | | (0.04 | ) |
| | | | | | | | | | | | | | | | | |
Net realized and unrealized gain (loss) | | | (1.43 | ) | | | 0.14 | (b) | | | 0.14 | (b) | | | (1.46 | ) |
| | | | | | | | | | | | | | | | | |
Total from investment operations | | | (1.46 | ) | | | 0.08 | | | | 0.09 | | | | (1.50 | ) |
| | | | | | | | | | | | | | | | | |
Net asset value, end of period | | | $7.21 | | | | $8.67 | | | | $8.59 | | | | $8.50 | |
| | | | | | | | | | | | | | | | | |
Total return | | | (16.84 | %) | | | 0.93 | % | | | 1.06 | % | | | (15.00 | %) |
| | | | | | | | | | | | | | | | | |
Ratios to average net assets(c) | | | | | | | | | | | | | | | | |
| | | | |
Total gross expenses | | | 0.99 | %(d) | | | 0.95 | % | | | 0.95 | % | | | 1.62 | %(d) |
| | | | | | | | | | | | | | | | | |
Total net expenses(e) | | | 0.82 | %(d) | | | 0.77 | % | | | 0.70 | % | | | 0.70 | %(d) |
| | | | | | | | | | | | | | | | | |
Net investment loss | | | (0.73 | %)(d) | | | (0.68 | %) | | | (0.57 | %) | | | (0.56 | %)(d) |
| | | | | | | | | | | | | | | | | |
Supplemental data | | | | | | | | | | | | | | | | |
| | | | |
Net assets, end of period (in thousands) | | | $11,262 | | | | $63,676 | | | | $83,816 | | | | $24,576 | |
| | | | | | | | | | | | | | | | | |
Portfolio turnover | | | 0 | % | | | 0 | % | | | 0 | % | | | 0 | % |
| | | | | | | | | | | | | | | | | |
Notes to Consolidated Financial Highlights
| (a) | Based on operations from July 28, 2011 (commencement of operations) through the stated period end. |
| (b) | Calculation of the net gain (loss) per share (both realized and unrealized) does not correlate to the aggregate realized and unrealized gain (loss) presented in the Consolidated Statement of Operations due to the timing of subscriptions and redemptions of Fund shares in relation to fluctuations in the market value of the portfolio. |
| (c) | In addition to the fees and expenses that the Fund bears directly, the Fund indirectly bears a pro rata share of the fees and expenses of any other funds in which it invests. Such indirect expenses are not included in the Fund’s reported expense ratios. |
| (e) | Total net expenses include the impact of certain fee waivers/expense reimbursements made by the Investment Manager and certain of its affiliates, if applicable. |
The accompanying Notes to Consolidated Financial Statements are an integral part of this statement.
| | |
| 16 | | Semiannual Report 2014 |
| | |
| |
| | Columbia Commodity Strategy Fund |
Consolidated Financial Highlights (continued)
| | | | | | | | | | | | |
| |
| Six Months Ended
November 30, 2014 |
| | | Year Ended May 31, | |
Class R | | | (Unaudited) | | | | 2014 | | | | 2013(a) | |
Per share data | | | | | | | | | | | | |
Net asset value, beginning of period | | | $8.53 | | | | $8.50 | | | | $8.50 | |
| | | | | | | | | | | | | |
Income from investment operations: | | | | | | | | | | | | |
| | | |
Net investment loss | | | (0.05 | ) | | | (0.11 | ) | | | (0.11 | ) |
| | | | | | | | | | | | | |
Net realized and unrealized gain (loss) | | | (1.41 | ) | | | 0.14 | (b) | | | 0.11 | (b) |
| | | | | | | | | | | | | |
Total from investment operations | | | (1.46 | ) | | | 0.03 | | | | — | |
| | | | | | | | | | | | | |
Net asset value, end of period | | | $7.07 | | | | $8.53 | | | | $8.50 | |
| | | | | | | | | | | | | |
Total return | | | (17.12 | %) | | | 0.35 | % | | | (0.00 | %) |
| | | | | | | | | | | | | |
Ratios to average net assets(c) | | | | | | | | | | | | |
| | | |
Total gross expenses | | | 1.67 | %(d) | | | 1.60 | % | | | 1.52 | %(d) |
| | | | | | | | | | | | | |
Total net expenses(e) | | | 1.43 | %(d) | | | 1.42 | % | | | 1.38 | %(d) |
| | | | | | | | | | | | | |
Net investment loss | | | (1.34 | %)(d) | | | (1.33 | %) | | | (1.25 | %)(d) |
| | | | | | | | | | | | | |
Supplemental data | | | | | | | | | | | | |
| | | |
Net assets, end of period (in thousands) | | | $120 | | | | $136 | | | | $120 | |
| | | | | | | | | | | | | |
Portfolio turnover | | | 0 | % | | | 0 | % | | | 0 | % |
| | | | | | | | | | | | | |
Notes to Consolidated Financial Highlights
| (a) | Based on operations from June 18, 2012 (commencement of operations) through the stated period end. |
| (b) | Calculation of the net gain (loss) per share (both realized and unrealized) does not correlate to the aggregate realized and unrealized gain (loss) presented in the Consolidated Statement of Operations due to the timing of subscriptions and redemptions of Fund shares in relation to fluctuations in the market value of the portfolio. |
| (c) | In addition to the fees and expenses that the Fund bears directly, the Fund indirectly bears a pro rata share of the fees and expenses of any other funds in which it invests. Such indirect expenses are not included in the Fund’s reported expense ratios. |
| (e) | Total net expenses include the impact of certain fee waivers/expense reimbursements made by the Investment Manager and certain of its affiliates, if applicable. |
The accompanying Notes to Consolidated Financial Statements are an integral part of this statement.
��
| | | | |
| Semiannual Report 2014 | | | 17 | |
| | |
| |
| Columbia Commodity Strategy Fund | | |
Consolidated Financial Highlights (continued)
| | | | | | | | | | | | |
| |
| Six Months Ended
November 30, 2014 |
| | | Year Ended May 31, | |
Class R4 | | | (Unaudited) | | | | 2014 | | | | 2013(a) | |
Per share data | | | | | | | | | | | | |
Net asset value, beginning of period | | | $8.65 | | | | $8.59 | | | | $9.14 | |
| | | | | | | | | | | | | |
Income from investment operations: | | | | | | | | | | | | |
| | | |
Net investment loss | | | (0.03 | ) | | | (0.07 | ) | | | (0.01 | ) |
| | | | | | | | | | | | | |
Net realized and unrealized gain (loss) | | | (1.42 | ) | | | 0.13 | (b) | | | (0.54 | ) |
| | | | | | | | | | | | | |
Total from investment operations | | | (1.45 | ) | | | 0.06 | | | | (0.55 | ) |
| | | | | | | | | | | | | |
Net asset value, end of period | | | $7.20 | | | | $8.65 | | | | $8.59 | |
| | | | | | | | | | | | | |
Total return | | | (16.76 | %) | | | 0.70 | % | | | (6.02 | %) |
| | | | | | | | | | | | | |
Ratios to average net assets(c) | | | | | | | | | | | | |
| | | |
Total gross expenses | | | 1.11 | %(d) | | | 1.10 | % | | | 0.92 | %(d) |
| | | | | | | | | | | | | |
Total net expenses(e) | | | 0.93 | %(d) | | | 0.95 | % | | | 0.90 | %(d) |
| | | | | | | | | | | | | |
Net investment loss | | | (0.84 | %)(d) | | | (0.86 | %) | | | (0.78 | %)(d) |
| | | | | | | | | | | | | |
Supplemental data | | | | | | | | | | | | |
| | | |
Net assets, end of period (in thousands) | | | $127 | | | | $3 | | | | $2 | |
| | | | | | | | | | | | | |
Portfolio turnover | | | 0 | % | | | 0 | % | | | 0 | % |
| | | | | | | | | | | | | |
Notes to Consolidated Financial Highlights
| (a) | Based on operations from March 19, 2013 (commencement of operations) through the stated period end. |
| (b) | Calculation of the net gain (loss) per share (both realized and unrealized) does not correlate to the aggregate realized and unrealized gain (loss) presented in the Consolidated Statement of Operations due to the timing of subscriptions and redemptions of Fund shares in relation to fluctuations in the market value of the portfolio. |
| (c) | In addition to the fees and expenses that the Fund bears directly, the Fund indirectly bears a pro rata share of the fees and expenses of any other funds in which it invests. Such indirect expenses are not included in the Fund’s reported expense ratios. |
| (e) | Total net expenses include the impact of certain fee waivers/expense reimbursements made by the Investment Manager and certain of its affiliates, if applicable. |
The accompanying Notes to Consolidated Financial Statements are an integral part of this statement.
| | |
| 18 | | Semiannual Report 2014 |
| | |
| |
| | Columbia Commodity Strategy Fund |
Consolidated Financial Highlights (continued)
| | | | | | | | |
Class R5 | |
| Six Months Ended
November 30, 2014
(Unaudited) |
| |
| Year Ended
May 31,
2014(a) |
|
Per share data | | | | | | | | |
Net asset value, beginning of period | | | $8.68 | | | | $8.16 | |
| | | | | | | | | |
Income from investment operations: | | | | | | | | |
| | |
Net investment loss | | | (0.03 | ) | | | (0.03 | ) |
| | | | | | | | | |
Net realized and unrealized gain (loss) | | | (1.44 | ) | | | 0.55 | (b) |
| | | | | | | | | |
Total from investment operations | | | (1.47 | ) | | | 0.52 | |
| | | | | | | | | |
Net asset value, end of period | | | $7.21 | | | | $8.68 | |
| | | | | | | | | |
Total return | | | (16.94 | %) | | | 6.37 | % |
| | | | | | | | | |
Ratios to average net assets(c) | | | | | | | | |
| | |
Total gross expenses | | | 1.13 | %(d) | | | 1.16 | %(d) |
| | | | | | | | | |
Total net expenses(e) | | | 0.87 | %(d) | | | 0.87 | %(d) |
| | | | | | | | | |
Net investment loss | | | (0.78 | %)(d) | | | (0.77 | %)(d) |
| | | | | | | | | |
Supplemental data | | | | | | | | |
| | |
Net assets, end of period (in thousands) | | | $590 | | | | $608 | |
| | | | | | | | | |
Portfolio turnover | | | 0 | % | | | 0 | % |
| | | | | | | | | |
Notes to Consolidated Financial Highlights
| (a) | Based on operations from January 8, 2014 (commencement of operations) through the stated period end. |
| (b) | Calculation of the net gain (loss) per share (both realized and unrealized) does not correlate to the aggregate realized and unrealized gain (loss) presented in the Consolidated Statement of Operations due to the timing of subscriptions and redemptions of Fund shares in relation to fluctuations in the market value of the portfolio. |
| (c) | In addition to the fees and expenses that the Fund bears directly, the Fund indirectly bears a pro rata share of the fees and expenses of any other funds in which it invests. Such indirect expenses are not included in the Fund’s reported expense ratios. |
| (e) | Total net expenses include the impact of certain fee waivers/expense reimbursements made by the Investment Manager and certain of its affiliates, if applicable. |
The accompanying Notes to Consolidated Financial Statements are an integral part of this statement.
| | | | |
| Semiannual Report 2014 | | | 19 | |
| | |
| |
| Columbia Commodity Strategy Fund | | |
Consolidated Financial Highlights (continued)
| | | | | | | | | | | | | | | | |
| |
| Six Months Ended
November 30, 2014 |
| | | Year Ended May 31, | |
Class W | | | (Unaudited) | | | | 2014 | | | | 2013 | | | | 2012(a) | |
Per share data | | | | | | | | | | | | | | | | |
Net asset value, beginning of period | | | $8.57 | | | | $8.53 | | | | $8.47 | | | | $10.00 | |
| | | | | | | | | | | | | | | | | |
Income from investment operations: | | | | | | | | | | | | | | | | |
| | | | |
Net investment loss | | | (0.04 | ) | | | (0.09 | ) | | | (0.09 | ) | | | (0.08 | ) |
| | | | | | | | | | | | | | | | | |
Net realized and unrealized gain (loss) | | | (1.42 | ) | | | 0.13 | (b) | | | 0.15 | (b) | | | (1.45 | ) |
| | | | | | | | | | | | | | | | | |
Total from investment operations | | | (1.46 | ) | | | 0.04 | | | | 0.06 | | | | (1.53 | ) |
| | | | | | | | | | | | | | | | | |
Net asset value, end of period | | | $7.11 | | | | $8.57 | | | | $8.53 | | | | $8.47 | |
| | | | | | | | | | | | | | | | | |
Total return | | | (17.04 | %) | | | 0.47 | % | | | 0.71 | % | | | (15.30 | %) |
| | | | | | | | | | | | | | | | | |
Ratios to average net assets(c) | | | | | | | | | | | | | | | | |
| | | | |
Total gross expenses | | | 1.36 | %(d) | | | 1.32 | % | | | 1.51 | % | | | 2.76 | %(d) |
| | | | | | | | | | | | | | | | | |
Total net expenses(e) | | | 1.18 | %(d) | | | 1.16 | % | | | 1.15 | % | | | 1.15 | %(d) |
| | | | | | | | | | | | | | | | | |
Net investment loss | | | (1.08 | %)(d) | | | (1.10 | %) | | | (0.98 | %) | | | (0.99 | %)(d) |
| | | | | | | | | | | | | | | | | |
Supplemental data | | | | | | | | | | | | | | | | |
| | | | |
Net assets, end of period (in thousands) | | | $2 | | | | $3 | | | | $2 | | | | $2 | |
| | | | | | | | | | | | | | | | | |
Portfolio turnover | | | 0 | % | | | 0 | % | | | 0 | % | | | 0 | % |
| | | | | | | | | | | | | | | | | |
Notes to Consolidated Financial Highlights
| (a) | Based on operations from July 28, 2011 (commencement of operations) through the stated period end. |
| (b) | Calculation of the net gain (loss) per share (both realized and unrealized) does not correlate to the aggregate realized and unrealized gain (loss) presented in the Consolidated Statement of Operations due to the timing of subscriptions and redemptions of Fund shares in relation to fluctuations in the market value of the portfolio. |
| (c) | In addition to the fees and expenses that the Fund bears directly, the Fund indirectly bears a pro rata share of the fees and expenses of any other funds in which it invests. Such indirect expenses are not included in the Fund’s reported expense ratios. |
| (e) | Total net expenses include the impact of certain fee waivers/expense reimbursements made by the Investment Manager and certain of its affiliates, if applicable. |
The accompanying Notes to Consolidated Financial Statements are an integral part of this statement.
| | |
| 20 | | Semiannual Report 2014 |
| | |
| |
| | Columbia Commodity Strategy Fund |
Consolidated Financial Highlights (continued)
| | | | |
Class Y | |
| Six Months Ended
November 30, 2014(a)
(Unaudited) |
|
Per share data | | | | |
Net asset value, beginning of period | | | $7.70 | |
| | | | | |
Income from investment operations: | | | | |
| |
Net investment loss | | | (0.01 | ) |
| | | | | |
Net realized and unrealized loss | | | (0.47 | ) |
| | | | | |
Total from investment operations | | | (0.48 | ) |
| | | | | |
Net asset value, end of period | | | $7.22 | |
| | | | | |
Total return | | | (6.23 | %) |
| | | | | |
Ratios to average net assets(b) | | | | |
| |
Total gross expenses | | | 1.29 | %(c) |
| | | | | |
Total net expenses(d) | | | 0.82 | %(c) |
| | | | | |
Net investment loss | | | (0.64 | %)(c) |
| | | | | |
Supplemental data | | | | |
| |
Net assets, end of period (in thousands) | | | $2 | |
| | | | | |
Portfolio turnover | | | 0 | % |
| | | | | |
Notes to Consolidated Financial Highlights
| (a) | Based on operations from October 1, 2014 (commencement of operations) through the stated period end. |
| (b) | In addition to the fees and expenses that the Fund bears directly, the Fund indirectly bears a pro rata share of the fees and expenses of any other funds in which it invests. Such indirect expenses are not included in the Fund’s reported expense ratios. |
| (d) | Total net expenses include the impact of certain fee waivers/expense reimbursements made by the Investment Manager and certain of its affiliates, if applicable. |
The accompanying Notes to Consolidated Financial Statements are an integral part of this statement.
| | | | |
| Semiannual Report 2014 | | | 21 | |
| | |
| |
| Columbia Commodity Strategy Fund | | |
Consolidated Financial Highlights (continued)
| | | | | | | | | | | | |
| |
| Six Months Ended
November 30, 2014 |
| | | Year Ended May 31, | |
Class Z | | | (Unaudited) | | | | 2014 | | | | 2013(a) | |
Per share data | | | | | | | | | | | | |
Net asset value, beginning of period | | | $8.62 | | | | $8.54 | | | | $8.50 | |
| | | | | | | | | | | | | |
Income from investment operations: | | | | | | | | | | | | |
| | | |
Net investment loss | | | (0.03 | ) | | | (0.07 | ) | | | (0.06 | ) |
| | | | | | | | | | | | | |
Net realized and unrealized gain (loss) | | | (1.43 | ) | | | 0.15 | (b) | | | 0.10 | (b) |
| | | | | | | | | | | | | |
Total from investment operations | | | (1.46 | ) | | | 0.08 | | | | 0.04 | |
| | | | | | | | | | | | | |
Net asset value, end of period | | | $7.16 | | | | $8.62 | | | | $8.54 | |
| | | | | | | | | | | | | |
Total return | | | (16.94 | %) | | | 0.94 | % | | | 0.47 | % |
| | | | | | | | | | | | | |
Ratios to average net assets(c) | | | | | | | | | | | | |
| | | |
Total gross expenses | | | 1.16 | %(d) | | | 1.12 | % | | | 1.05 | %(d) |
| | | | | | | | | | | | | |
Total net expenses(e) | | | 0.93 | %(d) | | | 0.92 | % | | | 0.90 | %(d) |
| | | | | | | | | | | | | |
Net investment loss | | | (0.84 | %)(d) | | | (0.83 | %) | | | (0.77 | %)(d) |
| | | | | | | | | | | | | |
Supplemental data | | | | | | | | | | | | |
| | | |
Net assets, end of period (in thousands) | | | $617 | | | | $742 | | | | $25 | |
| | | | | | | | | | | | | |
Portfolio turnover | | | 0 | % | | | 0 | % | | | 0 | % |
| | | | | | | | | | | | | |
Notes to Consolidated Financial Highlights
| (a) | Based on operations from June 18, 2012 (commencement of operations) through the stated period end. |
| (b) | Calculation of the net gain (loss) per share (both realized and unrealized) does not correlate to the aggregate realized and unrealized gain (loss) presented in the Consolidated Statement of Operations due to the timing of subscriptions and redemptions of Fund shares in relation to fluctuations in the market value of the portfolio. |
| (c) | In addition to the fees and expenses that the Fund bears directly, the Fund indirectly bears a pro rata share of the fees and expenses of any other funds in which it invests. Such indirect expenses are not included in the Fund’s reported expense ratios. |
| (e) | Total net expenses include the impact of certain fee waivers/expense reimbursements made by the Investment Manager and certain of its affiliates, if applicable. |
The accompanying Notes to Consolidated Financial Statements are an integral part of this statement.
| | |
| 22 | | Semiannual Report 2014 |
| | |
| |
| | Columbia Commodity Strategy Fund |
Notes to Consolidated Financial Statements
November 30, 2014 (Unaudited)
Note 1. Organization
Columbia Commodity Strategy Fund (the Fund), a series of Columbia Funds Series Trust II (the Trust), is a diversified fund. The Trust is registered under the Investment Company Act of 1940, as amended (the 1940 Act), as an open-end management investment company organized as a Massachusetts business trust.
Basis for Consolidation
CCSF Offshore Fund, Ltd. (the Subsidiary) is a Cayman Islands exempted company and wholly-owned subsidiary of the Fund. The Subsidiary operates as an investment vehicle to provide the Fund with exposure to the commodities markets consistent with the Fund’s investment objective and policies as stated in its current prospectus and statement of additional information. In accordance with the Memorandum and Articles of Association of the Subsidiary (the Articles), the Fund owns the sole issued share of the Subsidiary and retains all rights associated with such share, including the right to receive notice of, attend and vote at general meetings of the Subsidiary, rights in a winding-up or repayment of capital and the right to participate in the profits or assets of the Subsidiary. At November 30, 2014, the net assets of the Subsidiary were $2,618,141 or 16.6% of the Fund’s consolidated net assets. All intercompany transactions and balances have been eliminated in the consolidation process.
The consolidated financial statements (financial statements) present the portfolio holdings, financial position and results of operations of the Fund and the Subsidiary on a consolidated basis.
Fund Shares
The Trust may issue an unlimited number of shares (without par value). The Fund offers Class A, Class C, Class I, Class R, Class R4, Class R5, Class W, Class Y and Class Z shares. Although all share classes generally have identical voting, dividend and liquidation rights, each share class votes separately when required by the Trust’s organizational documents or by law. Different share classes pay different distribution amounts to the extent the expenses of such share classes differ, and distributions in liquidation will be proportional to the net asset value of each share class. Each share class has its own expense structure and sales charges.
Class A shares are subject to a maximum front-end sales charge of 5.75% based on the initial investment amount. Class A shares purchased without an initial sales charge in accounts aggregating $1 million to $50 million at the time of purchase are subject to a contingent deferred sales charge (CDSC) if the shares are sold within 18 months of purchase, charged as follows: 1.00% CDSC if redeemed within 12
months of purchase, and 0.50% CDSC if redeemed more than 12, but less than 18, months after purchase.
Class C shares are subject to a 1.00% CDSC on shares redeemed within one year of purchase.
Class I shares are not subject to sales charges and are available only to the Columbia Family of Funds.
Class R shares are not subject to sales charges and are generally available only to certain retirement plans and other investors as described in the Fund’s prospectus.
Class R4 shares are not subject to sales charges and are generally available only to omnibus retirement plans and certain investors as described in the Fund’s prospectus.
Class R5 shares are not subject to sales charges and are generally available only to investors purchasing through authorized investment professionals and omnibus retirement plans.
Class W shares are not subject to sales charges and are available only to investors purchasing through authorized investment programs managed by investment professionals, including discretionary managed account programs.
Class Y shares are not subject to sales charges and are generally available only to certain retirement plans as described in the Fund’s prospectus. Class Y shares commenced operations on October 1, 2014.
Class Z shares are not subject to sales charges and are available only to eligible investors, which are subject to different investment minimums as described in the Fund’s prospectus.
Note 2. Summary of Significant Accounting Policies
Basis of Preparation
The Fund is an investment company that applies the accounting and reporting guidance in the Financial Accounting Standards Board (FASB) Accounting Standards Codification Topic 946, Financial Services — Investment Companies (ASC 946). The financial statements are prepared in accordance with U.S. generally accepted accounting principles (GAAP) which requires management to make certain estimates and assumptions that affect the reported amounts of assets and liabilities, the disclosure of contingent assets and liabilities at the date of the financial statements and the reported amounts of income and expenses during the reporting period. Actual results could differ from those estimates.
| | | | |
| Semiannual Report 2014 | | | 23 | |
| | |
| |
| Columbia Commodity Strategy Fund | | |
Notes to Consolidated Financial Statements (continued)
November 30, 2014 (Unaudited)
The following is a summary of significant accounting policies followed by the Fund in the preparation of its financial statements.
Security Valuation
Investments in open-end investment companies, including money market funds, are valued at their net asset value.
Futures and options on futures contracts are valued based upon the settlement price established each day by the board of trade or exchange on which they are traded.
Investments for which market quotations are not readily available, or that have quotations which management believes are not reliable, are valued at fair value as determined in good faith under procedures established by and under the general supervision of the Board of Trustees (the Board). If a security or class of securities (such as foreign securities) is valued at fair value, such value is likely to be different from the quoted or published price for the security.
The determination of fair value often requires significant judgment. To determine fair value, management may use assumptions including but not limited to future cash flows and estimated risk premiums. Multiple inputs from various sources may be used to determine fair value.
Derivative Instruments
The Fund invests in certain derivative instruments, as detailed below, to meet its investment objectives. Derivatives are instruments whose values depend on, or are derived from, in whole or in part, the value of one or more other assets, such as securities, currencies, commodities or indices. Derivative instruments may be used to increase investment flexibility (including to maintain cash reserves while maintaining exposure to certain other assets), for risk management (hedging) purposes, to facilitate trading, to reduce transaction costs and to pursue higher investment returns. The Fund may also use derivative instruments to mitigate certain investment risks, such as foreign currency exchange rate risk, interest rate risk and credit risk. Derivatives may involve various risks, including the potential inability of the counterparty to fulfill its obligation under the terms of the contract, the potential for an illiquid secondary market (making it difficult for the Fund to sell, including at favorable prices) and the potential for market movements which may expose the Fund to gains or losses in excess of the amount shown in the Consolidated Statement of Assets and Liabilities. The notional amounts of derivative instruments, if applicable, are not recorded in the financial statements.
A derivative instrument may suffer a marked-to-market loss if the value of the contract decreases due to an unfavorable
change in the market rates or values of the underlying instrument. Losses can also occur if the counterparty does not perform under the contract. The Fund’s risk of loss from counterparty credit risk on over-the-counter derivatives is generally limited to the aggregate unrealized gain netted against any collateral held by the Fund and the amount of any variation margin held by the counterparty. With exchange-traded or centrally cleared derivatives, there is reduced counterparty credit risk to the Fund since the exchange’s clearinghouse, as counterparty to such instruments, guarantees against a possible default. The clearinghouse stands between the buyer and the seller of the contract; therefore, the counterparty credit risk is failure of the clearinghouse. However, credit risk still exists in exchange-traded or centrally cleared derivatives with respect to initial and variation margin that is held in a broker’s customer account. While brokers are required to segregate customer margin from their own assets, in the event that a broker becomes insolvent or goes into bankruptcy and at that time there is a shortfall in the aggregate amount of margin held by the broker for all its clients, U.S. bankruptcy laws will typically allocate that shortfall on a pro-rata basis across all the broker’s customers (including the Fund), potentially resulting in losses to the Fund.
In order to better define its contractual rights and to secure rights that will help the Fund mitigate its counterparty risk, the Fund may enter into an International Swaps and Derivatives Association, Inc. Master Agreement (ISDA Master Agreement) or similar agreement with its derivative contract counterparties. An ISDA Master Agreement is an agreement between the Fund and a counterparty that governs over-the-counter derivatives and forward foreign currency exchange contracts and typically contains, among other things, collateral posting terms and netting provisions in the event of a default and/or termination event. Under an ISDA Master Agreement, the Fund may, under certain circumstances, offset with the counterparty certain derivative instrument’s payables and/or receivables with collateral held and/or posted and create one single net payment. The provisions of the ISDA Master Agreement typically permit a single net payment in the event of default (close-out netting) including the bankruptcy or insolvency of the counterparty. Note, however, that bankruptcy or insolvency laws of a particular jurisdiction may impose restrictions on or prohibitions against the right of offset in bankruptcy, insolvency or other events.
Collateral (margin) requirements differ by type of derivative. Margin requirements are established by the exchange or clearinghouse for exchange-traded and centrally cleared derivatives. Brokers can ask for margin in excess of the minimum in certain circumstances. Collateral terms are
| | |
| 24 | | Semiannual Report 2014 |
| | |
| |
| | Columbia Commodity Strategy Fund |
Notes to Consolidated Financial Statements (continued)
November 30, 2014 (Unaudited)
contract specific for over-the-counter derivatives. For over-the-counter derivatives traded under an ISDA Master Agreement, the collateral requirements are typically calculated by netting the marked-to-market amount for each transaction under such agreement and comparing that amount to the value of any variation margin currently pledged by the Fund and/or the counterparty. Generally, the amount of collateral due from or to a party has to exceed a minimum transfer amount threshold (e.g., $500,000) before a transfer has to be made. To the extent amounts due to the Fund from its counterparties are not fully collateralized, contractually or otherwise, the Fund bears the risk of loss from counterparty nonperformance. The Fund attempts to mitigate counterparty risk by only entering into agreements with counterparties that it believes have the financial resources to honor their obligations and by monitoring the financial stability of those counterparties.
Certain ISDA Master Agreements allow counterparties to over-the-counter derivatives to terminate derivative contracts prior to maturity in the event the Fund’s net assets decline by a stated percentage over a specified time period or if the Fund fails to meet the terms of the ISDA Master Agreement, which would cause the Fund to accelerate payment of any net liability owed to the counterparty. The Fund also has termination rights if the counterparty fails to meet the terms of the ISDA Master Agreement. In addition to considering counterparty credit risk, the Fund would consider terminating the derivative contracts based on whether termination would result in a net liability owed from the counterparty.
For financial reporting purposes, the Fund does not offset derivative assets and derivative liabilities that are subject to netting arrangements in the Consolidated Statement of Assets and Liabilities.
Futures Contracts
Futures contracts are exchange traded and represent commitments for the future purchase or sale of an asset at a specified price on a specified date. The Fund bought and sold futures contracts to maintain appropriate commodity market exposure. These instruments may be used for other purposes in future periods. Upon entering into futures contracts, the Fund bears risks that it may not achieve the anticipated benefits of the futures contracts and may realize a loss. Additional risks include counterparty credit risk, the possibility of an illiquid market, and that a change in the value of the contract or option may not correlate with changes in the value of the underlying asset.
Upon entering into a futures contract, the Fund pledges cash or securities with the broker in an amount sufficient to meet the initial margin requirement. The initial margin deposit must be maintained at an established level over the life of the
contract. Cash deposited as initial margin is recorded in the Consolidated Statement of Assets and Liabilities as margin deposits. Securities deposited as initial margin are designated in the Consolidated Portfolio of Investments. Subsequent payments (variation margin) are made or received by the Fund each day. The variation margin payments are equal to the daily change in the contract value and are recorded as variation margin receivable or payable and are offset in unrealized gains or losses. The Fund recognizes a realized gain or loss when the contract is closed or expires. Futures contracts involve, to varying degrees, risk of loss in excess of the variation margin disclosed in the Consolidated Statement of Assets and Liabilities.
Effects of Derivative Transactions in the Financial Statements
The following tables are intended to provide additional information about the effect of derivatives on the financial statements of the Fund, including: the fair value of derivatives by risk category and the location of those fair values in the Consolidated Statement of Assets and Liabilities; and the impact of derivative transactions over the period in the Consolidated Statement of Operations, including realized gains or losses and unrealized gains or losses. The derivative schedules following the Consolidated Portfolio of Investments present additional information regarding derivative instruments outstanding at the end of the period, if any.
The following table is a summary of the fair value of derivative instruments (not considered to be hedging instruments for accounting disclosure purposes) at November 30, 2014:
| | | | | | |
| | | | | | | |
| | Asset Derivatives | |
Risk Exposure
Category | | Consolidated Statement of Assets and Liabilities Location | | | Fair Value ($) | |
Commodity-related investment risk | | Net assets — unrealized appreciation on futures contracts | | | 177,716 | * |
| |
| | Liability Derivatives | |
Risk Exposure
Category | | Consolidated Statement of Assets and Liabilities Location | | | Fair Value ($) | |
Commodity-related investment risk | | Net assets — unrealized depreciation on futures contracts | | | (397,010 | )* |
| * | Includes cumulative appreciation (depreciation) as reported in the tables following the Consolidated Portfolio of Investments. Only the current day’s variation margin is reported in receivables or payables in the Consolidated Statement of Assets and Liabilities. |
| | | | |
| Semiannual Report 2014 | | | 25 | |
| | |
| |
| Columbia Commodity Strategy Fund | | |
Notes to Consolidated Financial Statements (continued)
November 30, 2014 (Unaudited)
The following table indicates the effect of derivative instruments (not considered to be hedging instruments for accounting disclosure purposes) in the Consolidated Statement of Operations for the six months ended November 30, 2014:
| | | | |
Amount of Realized Gain (Loss) on Derivatives Recognized in
Income | |
| Risk Exposure Category | | Futures Contracts ($) | |
Commodity-related investment risk | | | (8,112,818 | ) |
Change in Unrealized Appreciation (Depreciation) on Derivatives
Recognized in Income | |
| Risk Exposure Category | | Futures Contracts ($) | |
Commodity-related investment risk | | | 562,040 | |
The following table is a summary of the average outstanding volume by derivative instrument for the six months ended November 30, 2014:
| | | | |
| Derivative Instrument | | Average Notional Amounts ($)* | |
Futures contracts — Long | | | 34,165,089 | |
| * | Based on the ending quarterly outstanding amounts for the six months ended November 30, 2014. |
Security Transactions
Security transactions are accounted for on the trade date. Cost is determined and gains (losses) are based upon the specific identification method for both financial statement and federal income tax purposes.
Income Recognition
Dividend income is recorded on the ex-dividend date.
Expenses
General expenses of the Trust are allocated to the Fund and other funds of the Trust based upon relative net assets or other expense allocation methodologies determined by the nature of the expense. Expenses directly attributable to the Fund are charged to the Fund. Expenses directly attributable to a specific class of shares are charged to that share class.
Determination of Class Net Asset Value
All income, expenses (other than class-specific expenses, which are charged to that share class, as shown in the Consolidated Statement of Operations) and realized and unrealized gains (losses) are allocated to each class of the Fund on a daily basis, based on the relative net assets of each class, for purposes of determining the net asset value of each class.
Federal Income Tax Status
The Fund intends to qualify each year as a regulated investment company under Subchapter M of the Internal
Revenue Code, as amended, and will distribute substantially all of its taxable income (including net short-term capital gains), if any, for its tax year, and as such will not be subject to federal income taxes. In addition, the Fund intends to distribute in each calendar year substantially all of its net investment income, capital gains and certain other amounts, if any, such that the Fund should not be subject to federal excise tax. Therefore, no federal income or excise tax provision is recorded.
Distributions to Shareholders
Distributions from net investment income, if any, are declared and paid annually. Net realized capital gains, if any, are distributed along with the income distribution. Income distributions and capital gain distributions are determined in accordance with federal income tax regulations, which may differ from GAAP.
Guarantees and Indemnifications
Under the Trust’s organizational documents and, in some cases, by contract, its officers and trustees are indemnified against certain liabilities arising out of the performance of their duties to the Trust or its funds. In addition, certain of the Fund’s contracts with its service providers contain general indemnification clauses. The Fund’s maximum exposure under these arrangements is unknown since the amount of any future claims that may be made against the Fund cannot be determined, and the Fund has no historical basis for predicting the likelihood of any such claims.
Note 3. Fees and Compensation Paid to Affiliates
Investment Management Fees
Columbia Management Investment Advisers, LLC (the Investment Manager), a wholly-owned subsidiary of Ameriprise Financial, Inc. (Ameriprise Financial), is responsible for the Subsidiary’s day-to-day business pursuant to an Investment Management Services Agreement between the Subsidary and the Investment Manager. Under the Investment Management Services Agreement, the Investment Manager is responsible for the ultimate oversight of investments made by the Fund. The Fund’s subadviser (see Subadvisory Agreement below) has the primary responsibility for the day-to-day portfolio management of the Fund. The investment management fee is an annual fee that is equal to a percentage of the Fund’s average daily net assets that declines from 0.55% to 0.44% as the Fund’s net assets increase. The annualized effective investment management fee rate for the six months ended November 30, 2014 was 0.55% of the Fund’s average daily net assets.
| | |
| 26 | | Semiannual Report 2014 |
| | |
| |
| | Columbia Commodity Strategy Fund |
Notes to Consolidated Financial Statements (continued)
November 30, 2014 (Unaudited)
Subadvisory Agreement
The Investment Manager has entered into a Subadvisory Agreement with Threadneedle International Limited (Threadneedle), an affiliate of the Investment Manager and wholly-owned subsidiary of Ameriprise Financial, to serve as the subadviser to the Fund. The Investment Manager compensates Threadneedle to manage the investment of the Fund’s assets.
Administration Fees
Under an Administrative Services Agreement, the Investment Manager also serves as the Fund Administrator. The Fund pays the Fund Administrator an annual fee for administration and accounting services equal to a percentage of the Fund’s average daily net assets that declines from 0.08% to 0.05% as the Fund’s net assets increase. The annualized effective administration fee rate for the six months ended November 30, 2014 was 0.08% of the Fund’s average daily net assets.
Other Expenses
Other expenses are for, among other things, miscellaneous expenses of the Fund or the Board, including payments to a company providing limited administrative services to the Fund and the Board. That company’s expenses include boardroom and office expense, employee compensation, employee health and retirement benefits, and certain other expenses. For the six months ended November 30, 2014, other expenses paid by the Fund to this company were $585.
Compensation of Board Members
Board members are compensated for their services to the Fund as disclosed in the Consolidated Statement of Operations. Under a Deferred Compensation Plan (the Plan), the Board members who are not “interested persons” of the Fund, as defined under the 1940 Act, may elect to defer payment of up to 100% of their compensation. Deferred amounts are treated as though equivalent dollar amounts had been invested in shares of certain funds managed by the Investment Manager. The Fund’s liability for these amounts is adjusted for market value changes and remains in the Fund until distributed in accordance with the Plan.
Transfer Agent Fees
Under a Transfer and Dividend Disbursing Agent Agreement, Columbia Management Investment Services Corp. (the Transfer Agent), an affiliate of the Investment Manager and a wholly-owned subsidiary of Ameriprise Financial, is responsible for providing transfer agency services to the Fund. The Transfer Agent has contracted with Boston Financial Data Services (BFDS) to serve as sub-transfer agent.
Effective November 1, 2014, the Transfer Agent receives a monthly transfer agency fee based on the number or the average value of accounts, depending on the type of account. Prior to November 1, 2014, the Transfer Agent received a monthly account-based service fee based on the number of open accounts. In addition, the Transfer Agent also receives sub-transfer agency fees based on a percentage of the average aggregate value of the Fund’s shares maintained in omnibus accounts (other than omnibus accounts for which American Enterprise Investment Services Inc. is the broker of record or accounts where the beneficial shareholder is a customer of Ameriprise Financial Services, Inc., which receive a per account fee). The Transfer Agent pays the fees of BFDS for services as sub-transfer agent and is not entitled to reimbursement for such fees from the Fund (with the exception of out-of-pocket fees).
The Transfer Agent also receives compensation from the Fund for various shareholder services and reimbursements for certain out-of-pocket fees. Total transfer agent fees for Class R5 shares are subject to an annual limitation of not more than 0.05% of the average daily net assets attributable to Class R5 shares. Class I and Class Y shares are not subject to transfer agent fees.
For the six months ended November 30, 2014, the Fund’s annualized effective transfer agent fee rates as a percentage of average daily net assets of each class were as follows:
| | | | |
Class A | | | 0.11 | % |
Class C | | | 0.11 | |
Class R | | | 0.11 | |
Class R4 | | | 0.11 | |
Class R5 | | | 0.05 | |
Class W | | | 0.11 | |
Class Z | | | 0.11 | |
An annual minimum account balance fee of $20 may apply to certain accounts with a value below the applicable share class’s initial minimum investment requirements to reduce the impact of small accounts on transfer agent fees. These minimum account balance fees are remitted to the Fund and recorded as part of expense reductions in the Consolidated Statement of Operations. For the six months ended November 30, 2014, no minimum account balance fees were charged by the Fund.
Distribution Fees
The Fund has an agreement with Columbia Management Investment Distributors, Inc. (the Distributor), an affiliate of the Investment Manager and a wholly-owned subsidiary of Ameriprise Financial, for distribution and shareholder
| | | | |
| Semiannual Report 2014 | | | 27 | |
| | |
| |
| Columbia Commodity Strategy Fund | | |
Notes to Consolidated Financial Statements (continued)
November 30, 2014 (Unaudited)
services. Under a Plan and Agreement of Distribution, the Fund pays a fee at an annual rate of up to 0.25% of the Fund’s average daily net assets attributable to Class A and Class W shares, a fee at an annual rate of up to 0.50% of the Fund’s average daily net assets attributable to Class R shares (of which up to 0.25% may be used for shareholder services) and a fee at an annual rate of up to 1.00% of the Fund’s average daily net assets attributable to Class C shares. For Class C shares, of the 1.00% fee, up to 0.75% is reimbursed for distribution expenses.
The amount of distribution expenses incurred by the Distributor and not yet reimbursed (unreimbursed expense) was approximately $1,000 for Class C shares. This amount is based on the most recent information available as of September 30, 2014, and may be recovered from future payments under the distribution plan or CDSCs. To the extent the unreimbursed expense has been fully recovered, the distribution fee is reduced.
Sales Charges
Sales charges, including front-end charges and CDSCs, received by the Distributor for distributing Fund shares were $2,387 for Class A shares for the six months ended November 30, 2014.
Expenses Waived/Reimbursed by the Investment Manager and its Affiliates
The Fund’s expense ratio is subject to an expense reimbursement arrangement pursuant to which fees will be waived and/or expenses reimbursed (excluding certain fees and expenses described below), so that the Fund’s net operating expenses, after giving effect to fees waived/expenses reimbursed and any balance credits and/or overdraft charges from the Fund’s custodian, do not exceed the annual rates of:
| | | | | | | | |
| | | Voluntary Expense Cap Effective October 1, 2014 | | | Contractual Expense Cap Prior to October 1, 2014 | |
Class A | | | 1.41 | % | | | 1.20 | % |
Class C | | | 2.16 | | | | 1.95 | |
Class I | | | 1.09 | | | | 0.82 | |
Class R | | | 1.66 | | | | 1.45 | |
Class R4 | | | 1.16 | | | | 0.95 | |
Class R5 | | | 1.14 | * | | | 0.87 | * |
Class W | | | 1.41 | | | | 1.20 | |
Class Y | | | 1.09 | ** | | | — | |
Class Z | | | 1.16 | | | | 0.95 | |
| * | Contractual expense cap is in effect through December 31, 2014. Voluntary expense cap of 1.14% will be effective January 1, 2015. |
| ** | Fee rate is effective beginning October 1, 2014 (the commencement of operations of Class Y shares). |
The voluntary expense cap arrangement may be revised or discontinued at any time. Under the arrangements, the following fees and expenses are excluded from the waiver/reimbursement commitment, and therefore will be paid by the Fund, if applicable: taxes (including foreign transaction taxes), expenses associated with investments in affiliated and non-affiliated pooled investment vehicles (including mutual funds and exchange-traded funds), transaction costs and brokerage commissions, costs related to any securities lending program, dividend expenses associated with securities sold short, inverse floater program fees and expenses, transaction charges and interest on borrowed money, interest and extraordinary expenses.
For the period January 8, 2014 (the commencement of operations of Class R5 shares) through December 31, 2014, unless sooner terminated at the sole discretion of the Fund’s Board, the Investment Manager and certain of its affiliates have contractually agreed to waive fees and/or reimburse expenses (excluding certain fees and expenses immediately described above, and any other expenses the exclusion of which is specifically approved by the Board), so that the Fund’s net operating expenses, after giving effect to fees waived/expenses reimbursed and any balance credits and/or overdraft charges from the Fund’s custodian, do not exceed the annual rate of 0.87% for Class R5 shares. This agreement may be modified or amended only with approval from all parties.
In addition, as a result of the contractual waiver in place for Class R5 shares, the Investment Manager has voluntarily agreed to waive fees and/or reimburse expenses for all other share classes (excluding certain fees and expenses immediately described above, and any other expenses, the exclusion of which is specifically approved by the Board). For the period October 1, 2014 through December 31, 2014, this additional waiver is at the annual rate of 0.27%.
Note 4. Federal Tax Information
The timing and character of income and capital gain distributions are determined in accordance with income tax regulations, which may differ from GAAP because of temporary or permanent book to tax differences.
At November 30, 2014, the cost of investments for federal income tax purposes was approximately $22,100,000 and the aggregate gross approximate unrealized appreciation and depreciation based on that cost was:
| | | | |
Unrealized appreciation | | | $— | |
Unrealized depreciation | | | — | |
Net unrealized appreciation/depreciation | | | $— | |
| | |
| 28 | | Semiannual Report 2014 |
| | |
| |
| | Columbia Commodity Strategy Fund |
Notes to Consolidated Financial Statements (continued)
November 30, 2014 (Unaudited)
Under current tax rules, regulated investment companies can elect to treat certain late-year ordinary losses incurred and post-October capital losses (capital losses realized after October 31) as arising on the first day of the following taxable year. The Fund has elected to treat late-year ordinary losses of $140,890 at May 31, 2014 as arising on June 1, 2014.
Management of the Fund has concluded that there are no significant uncertain tax positions in the Fund that would require recognition in the financial statements. However, management’s conclusion may be subject to review and adjustment at a later date based on factors including, but not limited to, new tax laws, regulations, and administrative interpretations (including relevant court decisions). Generally, the Fund’s federal tax returns for the prior three fiscal years remain subject to examination by the Internal Revenue Service.
Note 5. Portfolio Information
The cost of purchases and proceeds from sales of securities, excluding short-term obligations and certain derivatives, if any, aggregated to $0 and $0, respectively, for the six months ended November 30, 2014. The amount of purchase and sale activity impacts the portfolio turnover rate reported in the Consolidated Financial Highlights.
Note 6. Affiliated Money Market Fund
The Fund significantly invests in Columbia Short-Term Cash Fund, an affiliated money market fund established for the exclusive use by the Fund and other affiliated funds. The income earned by the Fund from such investments is included as Dividends — affiliated issuers in the Consolidated Statement of Operations. As an investing fund, the Fund indirectly bears its proportionate share of the expenses of Columbia Short-Term Cash Fund.
Note 7. Shareholder Concentration
At November 30, 2014, affiliated shareholders of record owned 91.3% of the outstanding shares of the Fund in one or more accounts. Subscription and redemption activity by concentrated accounts may have a significant effect on the operations of the Fund.
Note 8. Line of Credit
The Fund has entered into a revolving credit facility with a syndicate of banks led by JPMorgan Chase Bank N.A. (JPMorgan) whereby the Fund may borrow for the temporary funding of shareholder redemptions or for other temporary or emergency purposes. The credit facility agreement, as amended, which is a collective agreement between the Fund and certain other funds managed by the Investment Manager,
severally and not jointly, permits collective borrowings up to $500 million. Interest is charged to each participating fund based on its borrowings at a rate equal to the higher of (i) the overnight federal funds rate plus 1.00% or (ii) the one-month LIBOR rate plus 1.00%. Each borrowing under the credit facility matures no later than 60 days after the date of borrowing. The Fund also pays a commitment fee equal to its pro rata share of the amount of the credit facility at a rate of 0.075% per annum. The commitment fee is included in other expenses in the Consolidated Statement of Operations.
Effective December 9, 2014, the Fund extended its revolving credit facility with JPMorgan. The credit facility agreement, as amended, permits collective borrowings up to $550 million under the same terms and interest rates as described above.
The Fund had no borrowings during the six months ended November 30, 2014.
Note 9. Significant Risks
Commodity-Related Investment Risk
The value of commodities investments will generally be affected by overall market movements and factors specific to a particular industry or commodity, which may include demand for the commodity, weather, embargoes, tariffs, and economic health, political, international, regulatory and other developments. Economic and other events (whether real or perceived) can reduce the demand for commodities, which may, in turn, reduce market prices and cause the value of Fund shares to fall. The frequency and magnitude of such changes cannot be predicted. Exposure to commodities and commodities markets may subject the value of the Fund’s investments to greater volatility than other types of investments. Limited or no active trading market may exist for certain commodities investments, which may impair the ability to sell or to realize the full value of such investments in the event of the need to liquidate such investments. In addition, adverse market conditions may impair the liquidity of actively traded commodities investments. Certain types of commodities instruments (such as commodity-linked swaps and commodity-linked structured notes) are subject to the risk that the counterparty to the instrument may not perform or be unable to perform in accordance with the terms of the instrument. Foreign subsidiaries making commodity-related investments will not generally be subject to U.S. laws (including securities laws) and their protections. Further, they will be subject to the laws of a foreign jurisdiction, which can be adversely affected by developments in that jurisdiction.
Note 10. Subsequent Events
Management has evaluated the events and transactions that have occurred through the date the financial statements were
| | | | |
| Semiannual Report 2014 | | | 29 | |
| | |
| |
| Columbia Commodity Strategy Fund | | |
Notes to Consolidated Financial Statements (continued)
November 30, 2014 (Unaudited)
issued. Other than as noted in Notes 3 and 8 above, there were no items requiring adjustment of the financial statements or additional disclosure.
Note 11. Information Regarding Pending and Settled Legal Proceedings
In December 2005, without admitting or denying the allegations, American Express Financial Corporation (AEFC, which is now known as Ameriprise Financial, Inc. (Ameriprise Financial)) entered into settlement agreements with the Securities and Exchange Commission (SEC) and Minnesota Department of Commerce (MDOC) related to market timing activities. As a result, AEFC was censured and ordered to cease and desist from committing or causing any violations of certain provisions of the Investment Advisers Act of 1940, the Investment Company Act of 1940, and various Minnesota laws. AEFC agreed to pay disgorgement of $10 million and civil money penalties of $7 million. AEFC also agreed to retain an independent distribution consultant to assist in developing a plan for distribution of all disgorgement and civil penalties ordered by the SEC in accordance with various undertakings detailed at www.sec.gov/litigation/admin/ia-2451.pdf. Ameriprise Financial and its affiliates have cooperated with the SEC and the MDOC in these legal proceedings, and have made regular reports to the Funds’ Boards of Trustees.
Ameriprise Financial and certain of its affiliates have historically been involved in a number of legal, arbitration and regulatory proceedings, including routine litigation, class actions, and governmental actions, concerning matters arising in connection with the conduct of their business activities. Ameriprise Financial believes that the Funds are not currently the subject of, and that neither Ameriprise Financial nor any of its affiliates are the subject of, any pending legal, arbitration or regulatory proceedings that are likely to have a material adverse effect on the Funds or the ability of Ameriprise Financial or its affiliates to perform under their contracts with the Funds. Ameriprise Financial is required to make quarterly (10-Q), annual (10-K) and, as necessary, 8-K filings with the Securities and Exchange Commission on legal and regulatory matters that relate to Ameriprise Financial and its affiliates. Copies of these filings may be obtained by accessing the SEC website at www.sec.gov.
There can be no assurance that these matters, or the adverse publicity associated with them, will not result in increased fund redemptions, reduced sale of fund shares or other adverse consequences to the Funds. Further, although we believe proceedings are not likely to have a material adverse effect on the Funds or the ability of Ameriprise Financial or its affiliates to perform under their contracts with the Funds, these
proceedings are subject to uncertainties and, as such, we are unable to estimate the possible loss or range of loss that may result. An adverse outcome in one or more of these proceedings could result in adverse judgments, settlements, fines, penalties or other relief that could have a material adverse effect on the consolidated financial condition or results of operations of Ameriprise Financial.
| | |
| 30 | | Semiannual Report 2014 |
| | |
| |
| Columbia Commodity Strategy Fund | | |
Important Information About This Report
Each fund mails one shareholder report to each shareholder address. If you would like more than one report, please call shareholder services at 800.345.6611 and additional reports will be sent to you.
The policy of the Board is to vote the proxies of the companies in which each fund holds investments consistent with the procedures as stated in the Statement of Additional Information (SAI). You may obtain a copy of the SAI without charge by calling 800.345.6611; contacting your financial intermediary; visiting columbiamanagement.com; or searching the website of the Securities and Exchange Commission (SEC) at sec.gov. Information regarding how each fund voted proxies relating to portfolio securities is filed with the SEC by August 31 for the most recent 12-month period ending June 30 of that year, and is available without charge by visiting columbiamanagement.com; or searching the website of the SEC at sec.gov.
Each fund files a complete schedule of portfolio holdings with the SEC for the first and third quarters of each fiscal year on Form N-Q. Each fund’s Form N-Q is available on the SEC’s website at sec.gov and may be reviewed and copied at the SEC’s Public Reference Room in Washington, D.C. Information on the operation of the Public Reference Room may be obtained by calling 800.SEC.0330. Each fund’s complete schedule of portfolio holdings, as filed on Form N-Q, can also be obtained without charge, upon request, by calling 800.345.6611.
You may obtain the current net asset value (NAV) of Fund shares at no cost by calling 800.345.6611 or by sending an e-mail to serviceinquiries@columbiamanagement.com.
| | | | |
| Semiannual Report 2014 | | | 31 | |

Columbia Commodity Strategy Fund
P.O. Box 8081
Boston, MA 02266-8081
columbiamanagement.com
This information is for use with concurrent or prior delivery of a fund prospectus. Please read and consider the investment objectives, risks, charges and expenses for any fund carefully before investing. For a prospectus and, if available, a summary prospectus, which contains this and other important information about the Fund, go to columbiamanagement.com. The Fund is distributed by Columbia Management Investment Distributors, Inc., member FINRA, and managed by Columbia Management Investment Advisers, LLC.
© 2015 Columbia Management Investment Advisers, LLC. All rights reserved.
SAR129_05_E01_(01/15)
| | |
Semiannual Report November 30, 2014 | |  |
| | |
Columbia Flexible Capital Income Fund | | |


President’s Message
Note: Effective January 1, 2015, Christopher O. Petersen will serve as the President of the Columbia Funds, replacing J. Kevin Connaughton. Mr. Petersen has served as a Fund officer since 2007.
Dear Shareholders,
People invest for different reasons, though typically based on a desire for one or more outcomes, e.g., generating an appropriate income stream in retirement, navigating a changing interest rate environment, maximizing after-tax returns, growing assets to achieve financial goals, or easing the impact of volatile markets. Achieving these desired outcomes can be particularly challenging given the unpredictability of complex global markets. To continue to effectively deliver solutions that help clients achieve desired outcomes, an asset manager must have the resources and investment framework to meaningfully embody a global perspective.
With this in mind, I thought it important to highlight excerpts from a piece written by Jeffrey L. Knight, Global Head of Investment Solutions and Asset Allocation, in which he touches on some of these issues emphasizing the importance of maintaining a diversified portfolio with the flexibility to adapt to changing market conditions.
I encourage you to read the article in its entirety. To access the full article and for other insights on current market events and investment opportunities, please visit the Columbia Management blog at columbiamanagement.com/blog.
On behalf of the Funds, I want to acknowledge the contributions of J. Kevin Connaughton and to thank him for his years of trusted, dedicated service. He has worked tirelessly as an advocate for shareholders and a leader of the Columbia Funds. In taking on this new role, I look forward to continuing the work of Mr. Connaughton, helping build on the strong foundation of the Columbia Funds.
Thank you for your confidence. We look forward to continuing to serve your investment needs for many years to come.
Best regards,

Christopher O. Petersen
President, Columbia Funds
Excerpts from:
2015 Outlook: Same song, slightly different arrangement
By Jeffrey L. Knight, Global Head of Investment Solutions and Asset Allocation
Jeffrey L. Knight, CFA, is global head of investment solutions and asset allocation for Columbia Management Investment Advisers, LLC. Mr. Knight leads a team of six portfolio managers responsible for our broad suite of multi-asset strategies including capital allocation, risk allocation, absolute return and total return funds.
What’s different in 2015?
As stationary as market conditions have felt lately, circumstances are always evolving. For 2015, while the essential elements of our outlook remain in place, we highlight two important changes in the market environment:
| > | | The relative value of global equities vs. global bonds actually improved during 2014. |
| > | | Monetary policy around the globe has become desynchronized, with the U.S. Federal Reserve (the Fed) contemplating rate hikes, while the European Central Bank (ECB) and the Bank of Japan (BOJ) intensify their monetary stimulus programs. |
In our view, while equities will most likely continue to dominate, the complex interactions of today’s conditions elevate the role of dynamic risk management. We argue that investors will need a cross-asset surveillance methodology to detect tactical threats.
Semiannual Report 2014
President’s Message (continued)
Monetary policies diverge
The Fed has given strong signals that economic growth in the United States has reached self-sustaining momentum and no longer needs unconventional efforts to support the expansion. The withdrawal and suspension of large-scale asset purchases was only the first step in the evolution toward policy normalization. In 2015, we expect to see a change in forward guidance and, most likely, the first interest rate increase in years.
These actions stand in stark contrast with the direction of the monetary policies of other central banks as they double down on efforts to support growth and avoid deflation. The Bank of Japan has announced its intention to increase both qualitative and quantitative easing on an enormous scale, expanding purchases of Japanese government bonds (JGBs), exchange-traded funds and real estate investment trusts. They intend to coordinate this with government pension investment fund purchases by shifting into riskier assets through sales of JGBs.
With evidence of deterioration on both the economic and inflation front, the European Central Bank (ECB) also plans to take bolder actions. These include increased purchases of asset-backed securities and covered bonds in both the primary and secondary market, together with the long-term refinancing operations that will steer the ECB’s balance sheet higher by €1 trillion.
The latest to jump on the bandwagon was the People’s Bank of China (PBOC), which cut its benchmark interest rate for the first time in over two years to support private sector investment, as targeted liquidity injections have had minimal effect on sinking economic growth.
Investment strategy for 2015
We remain convinced that relative value favors stocks over bonds, even though stocks outperformed in 2014. Therefore, you will hear the same recommendation from us for 2015. Equities remain the most important asset class for generating returns.
Within equities, the currency-based advantage of U.S. stocks is offset somewhat by the valuation advantage from overseas equities, notably in Japan. Indeed, economic growth in Japan and Europe are essential ingredients for equities to continue to perform well. If Japanese and European stocks cannot produce gains, then the global economy will probably be stuck in a near recessionary funk.
Devising a strategy to manage risk and stabilize portfolio values in the event that equities do not perform well remains complicated. Bond yields are low enough that they are not likely to offer powerful diversification benefits. We affirm our recommendation for three additional sources of portfolio stability:
| > | | Non-traditional diversifiers, such as liquid alternatives, alternative beta exposures and absolute return strategies |
| > | | Explicit downside hedges, such as put options (with emphasis on managing the related expense) |
| > | | Flexibility and a methodology for active risk reduction when appropriate (Our cross-asset methodologies should prove valuable in this regard.) |
Our overall stance for investment strategy will likely remain in place until the valuation advantage for equities has been priced away, or until the healing process for the global economy reverses.
Please visit columbiamanagement.com/blog to read the entire article.
Investors should consider the investment objectives, risks, charges and expenses of a mutual fund carefully before investing. For a free prospectus and, if available, a summary prospectus, which contains this and other important information about a fund, visit columbiamanagement.com. The prospectus should be read carefully before investing.
The views expressed are as of December 2014, may change as market or other conditions change, and may differ from views expressed by other Columbia Management Investment Advisers, LLC (CMIA) associates or affiliates. Actual investments or investment decisions made by CMIA and its affiliates, whether for its own account or on behalf of clients, will not necessarily reflect the views expressed. This information is not intended to provide investment advice and does not account for individual investor circumstances. Investment decisions should always be made based on an investor’s specific financial needs, objectives, goals, time horizon and risk tolerance. Asset classes described may not be suitable for all investors. Past performance does not guarantee future results, and no forecast should be considered a guarantee either. Since economic and market change frequently, there can be no assurance that the trends described here will continue or that the forecasts are accurate.
Diversification does not assure a profit or protect against loss.
Columbia Funds are distributed by Columbia Management Investment Distributors, Inc., member FINRA, and managed by Columbia Management Investment Advisers, LLC.
© 2015 Columbia Management Investment Advisers, LLC. All rights reserved
Semiannual Report 2014
| | |
| |
| Columbia Flexible Capital Income Fund | | |
Table of Contents
Fund Investment Manager
Columbia Management Investment
Advisers, LLC
225 Franklin Street
Boston, MA 02110
Fund Distributor
Columbia Management Investment
Distributors, Inc.
225 Franklin Street
Boston, MA 02110
Fund Transfer Agent
Columbia Management Investment
Services Corp.
P.O. Box 8081
Boston, MA 02266-8081
For more information about any of the funds, please visit columbiamanagement.com or call 800.345.6611. Customer Service Representatives are available to answer your questions Monday through Friday from 8 a.m. to 7 p.m. Eastern time.
The views expressed in this report reflect the current views of the respective parties. These views are not guarantees of future performance and involve certain risks, uncertainties and assumptions that are difficult to predict, so actual outcomes and results may differ significantly from the views expressed. These views are subject to change at any time based upon economic, market or other conditions and the respective parties disclaim any responsibility to update such views. These views may not be relied on as investment advice and, because investment decisions for a Columbia Fund are based on numerous factors, may not be relied on as an indication of trading intent on behalf of any particular Columbia Fund. References to specific securities should not be construed as a recommendation or investment advice.
Semiannual Report 2014
| | |
| |
| | Columbia Flexible Capital Income Fund |
Performance Overview
(Unaudited)
Performance Summary
| > | | Columbia Flexible Capital Income Fund (the Fund) Class A shares returned 0.36% excluding sales charges for the six-month period ended November 30, 2014. |
| > | | During the same time period, the Fund underperformed its Blended Index, which returned 3.46%, as well as the Barclays U.S. Aggregate Bond Index, which returned 1.92%. |
| | | | | | | | | | | | | | |
Average Annual Total Returns (%) (for period ended November 30, 2014) | |
| | | Inception | | 6 Months
cumulative | | | 1 Year | | | Life | |
Class A | | 07/28/11 | | | | | | | | | | | | |
Excluding sales charges | | | | | 0.36 | | | | 6.84 | | | | 11.34 | |
Including sales charges | | | | | -5.42 | | | | 0.67 | | | | 9.38 | |
Class C | | 07/28/11 | | | | | | | | | | | | |
Excluding sales charges | | | | | -0.02 | | | | 6.07 | | | | 10.51 | |
Including sales charges | | | | | -1.00 | | | | 5.07 | | | | 10.51 | |
Class I | | 07/28/11 | | | 0.45 | | | | 7.26 | | | | 11.68 | |
Class R | | 07/28/11 | | | 0.23 | | | | 6.55 | | | | 11.02 | |
Class R4* | | 11/08/12 | | | 0.40 | | | | 7.14 | | | | 11.51 | |
Class R5* | | 11/08/12 | | | 0.50 | | | | 7.24 | | | | 11.54 | |
Class W | | 07/28/11 | | | 0.25 | | | | 6.78 | | | | 11.29 | |
Class Z | | 07/28/11 | | | 0.41 | | | | 7.11 | | | | 11.58 | |
Blended Index | | | | | 3.46 | | | | 11.05 | | | | 11.80 | |
Barclays U.S. Aggregate Bond Index | | | | | 1.92 | | | | 5.27 | | | | 3.55 | |
Returns for Class A are shown with and without the maximum initial sales charge of 5.75%. Returns for Class C are shown with and without the 1.00% contingent deferred sales charge for the first year only. The Fund’s other classes are not subject to sales charges and have limited eligibility. Please see the Fund���s prospectus for details. Performance for different share classes will vary based on differences in sales charges and fees associated with each class. All results shown assume reinvestment of distributions during the period. Returns do not reflect the deduction of taxes that a shareholder may pay on Fund distributions or on the redemption of Fund shares. Performance results reflect the effect of any fee waivers or reimbursements of Fund expenses by Columbia Management Investment Advisers, LLC and/or any of its affiliates. Absent these fee waivers or expense reimbursement arrangements, performance results would have been lower.
The performance information shown represents past performance and is not a guarantee of future results. The investment return and principal value of your investment will fluctuate so that your shares, when redeemed, may be worth more or less than their original cost. Current performance may be lower or higher than the performance information shown. You may obtain performance information current to the most recent month-end by contacting your financial intermediary, visiting columbiamanagement.com or calling 800.345.6611.
| * | The returns shown for periods prior to the share class inception date (including returns for the Life of the Fund, if shown, which are since Fund inception) include the returns of the Fund’s oldest share class. Since the Fund launched more than one share class at its inception, Class A shares were used. These returns are adjusted to reflect any higher class-related operating expenses of the newer share classes, as applicable. Please visit columbiamanagement.com/investment-products/mutual-funds/appended-performance for more information. |
The Blended Index, established by the Investment Manager, is comprised of one-third each of the Russell 1000 Value Index, the Barclays U.S. Corporate Investment Grade & High Yield Index and the Barclays U.S. Convertible Composite Index. The Russell 1000 Value Index, an unmanaged index, measures the performance of those stocks in the Russell 1000 Index with lower price-to-book ratios and lower forecasted growth values. The Barclays U.S. Corporate Investment Grade & High Yield Index is a broad-based benchmark that measures the performance of investment grade and non-investment grade, fixed-rate and taxable corporate bonds. It includes USD-denominated securities publicly issued by U.S. and non U.S. industrial, utility, and financial issuers that meet specified maturity, liquidity, and quality requirements. The Barclays U.S. Convertible Composite Index measures the performance of all four major classes of USD equity-linked securities including: convertible cash coupon bonds, zero-coupon bonds, preferred convertibles with fixed par amounts and mandatory equity-linked securities.
The Barclays U.S. Aggregate Bond Index is a broad-based benchmark that measures the investment grade, U.S. dollar denominated, fixed-rate taxable bond market, including Treasuries, government-related and corporate securities, mortgage-backed securities (agency fixed-rate and hybrid adjustable-rate mortgage passthroughs), asset-backed securities, and commercial mortgage-backed securities.
Indices are not available for investment, are not professionally managed and do not reflect sales charges, fees, brokerage commissions, taxes or other expenses of investing. Securities in the Fund may not match those in an index.
| | |
| |
| Columbia Flexible Capital Income Fund | | |
Portfolio Overview
(Unaudited)
| | | | |
Top Ten Holdings (%)
(at November 30, 2014) | |
Chesapeake Energy Corp., 5.750% | | | 1.5 | |
General Electric Co. | | | 1.5 | |
Verizon Communications, Inc. | | | 1.5 | |
Navistar International Corp.
4.750% 04/15/19 | | | 1.3 | |
AbbVie, Inc. | | | 1.1 | |
Cisco Systems, Inc. | | | 1.1 | |
Equinix, Inc.
5.750% 01/01/25 | | | 1.1 | |
Weyerhaeuser Co., 6.375% | | | 1.1 | |
MasTec, Inc.
4.875% 03/15/23 | | | 1.1 | |
Post Holdings, Inc.
6.750% 12/01/21 | | | 1.1 | |
Percentages indicated are based upon total investments (excluding Money Market Funds).
For further detail about these holdings, please refer to the section entitled “Portfolio of Investments.”
Fund holdings are as of the date given, are subject to change at any time, and are not recommendations to buy or sell any security.
| | | | |
Portfolio Breakdown (%)
(at November 30, 2014) | |
Common Stocks | | | 38.5 | |
Consumer Discretionary | | | 1.5 | |
Consumer Staples | | | 2.9 | |
Energy | | | 4.6 | |
Financials | | | 9.1 | |
Health Care | | | 3.0 | |
Industrials | | | 3.4 | |
Information Technology | | | 5.6 | |
Materials | | | 2.9 | |
Telecommunication Services | | | 2.4 | |
Utilities | | | 3.1 | |
Convertible Bonds | | | 16.8 | |
Convertible Preferred Stocks | | | 15.3 | |
Consumer Staples | | | 2.5 | |
Energy | | | 1.8 | |
Financials | | | 6.5 | |
Health Care | | | 0.5 | |
Industrials | | | 1.0 | |
Materials | | | 1.0 | |
Utilities | | | 2.0 | |
Corporate Bonds & Notes | | | 24.7 | |
Limited Partnerships | | | 0.5 | |
Money Market Funds | | | 3.8 | |
Preferred Debt | | | 0.4 | |
Total | | | 100.0 | |
Percentages indicated are based upon total investments. The Fund’s portfolio composition is subject to change.
Portfolio Management
David King, CFA
Yan Jin
| | |
| |
| | Columbia Flexible Capital Income Fund |
Understanding Your Fund’s Expenses
(Unaudited)
As an investor, you incur two types of costs. There are transaction costs, which generally include sales charges on purchases and may include redemption fees. There are also ongoing costs, which generally include management fees, distribution and/or service fees, and other fund expenses. The following information is intended to help you understand your ongoing costs (in dollars) of investing in the Fund and to help you compare these costs with the ongoing costs of investing in other mutual funds.
Analyzing Your Fund’s Expenses
To illustrate these ongoing costs, we have provided examples and calculated the expenses paid by investors in each share class of the Fund during the period. The actual and hypothetical information in the table is based on an initial investment of $1,000 at the beginning of the period indicated and held for the entire period. Expense information is calculated two ways and each method provides you with different information. The amount listed in the “Actual” column is calculated using the Fund’s actual operating expenses and total return for the period. You may use the Actual information, together with the amount invested, to estimate the expenses that you paid over the period. Simply divide your account value by $1,000 (for example, an $8,600 account value divided by $1,000 = 8.6), then multiply the results by the expenses paid during the period under the “Actual” column. The amount listed in the “Hypothetical” column assumes a 5% annual rate of return before expenses (which is not the Fund’s actual return) and then applies the Fund’s actual expense ratio for the period to the hypothetical return. You should not use the hypothetical account values and expenses to estimate either your actual account balance at the end of the period or the expenses you paid during the period. See “Compare With Other Funds” below for details on how to use the hypothetical data.
Compare With Other Funds
Since all mutual funds are required to include the same hypothetical calculations about expenses in shareholder reports, you can use this information to compare the ongoing cost of investing in the Fund with other funds. To do so, compare the hypothetical example with the 5% hypothetical examples that appear in the shareholder reports of other funds. As you compare hypothetical examples of other funds, it is important to note that hypothetical examples are meant to highlight the ongoing costs of investing in a fund only and do not reflect any transaction costs, such as sales charges, or redemption or exchange fees. Therefore, the hypothetical calculations are useful in comparing ongoing costs only, and will not help you determine the relative total costs of owning different funds. If transaction costs were included in these calculations, your costs would be higher.
June 1, 2014 – November 30, 2014
| | | | | | | | | | | | | | | | | | | | | | | | | | | | |
| | | Account Value at the Beginning of the Period ($) | | | Account Value at the End of the Period ($) | | | Expenses Paid During the Period ($) | | | Fund’s Annualized
Expense Ratio (%) | |
| | | | Actual | | | | Hypothetical | | | | Actual | | | | Hypothetical | | | | Actual | | | | Hypothetical | | | | Actual | |
Class A | | | 1,000.00 | | | | 1,000.00 | | | | 1,003.60 | | | | 1,019.75 | | | | 5.20 | | | | 5.24 | | | | 1.04 | |
Class C | | | 1,000.00 | | | | 1,000.00 | | | | 999.80 | | | | 1,016.01 | | | | 8.92 | | | | 9.00 | | | | 1.79 | |
Class I | | | 1,000.00 | | | | 1,000.00 | | | | 1,004.50 | | | | 1,021.64 | | | | 3.30 | | | | 3.33 | | | | 0.66 | |
Class R | | | 1,000.00 | | | | 1,000.00 | | | | 1,002.30 | | | | 1,018.55 | | | | 6.39 | | | | 6.44 | | | | 1.28 | |
Class R4 | | | 1,000.00 | | | | 1,000.00 | | | | 1,004.00 | | | | 1,020.99 | | | | 3.95 | | | | 3.98 | | | | 0.79 | |
Class R5 | | | 1,000.00 | | | | 1,000.00 | | | | 1,005.00 | | | | 1,021.39 | | | | 3.55 | | | | 3.58 | | | | 0.71 | |
Class W | | | 1,000.00 | | | | 1,000.00 | | | | 1,002.50 | | | | 1,019.60 | | | | 5.34 | | | | 5.39 | | | | 1.07 | |
Class Z | | | 1,000.00 | | | | 1,000.00 | | | | 1,004.10 | | | | 1,020.99 | | | | 3.95 | | | | 3.98 | | | | 0.79 | |
Expenses paid during the period are equal to the annualized expense ratio for each class as indicated above, multiplied by the average account value over the period and then multiplied by the number of days in the Fund’s most recent fiscal half year and divided by 365.
Expenses do not include fees and expenses incurred indirectly by the Fund from its investment in underlying funds, including affiliated and non-affiliated pooled investment vehicles, such as mutual funds and exchange-traded funds.
Had Columbia Management Investment Advisers, LLC and/or certain of its affiliates not waived/reimbursed certain fees and expenses, account value at the end of the period would have been reduced.
| | |
| |
| Columbia Flexible Capital Income Fund | | |
Portfolio of Investments
November 30, 2014 (Unaudited)
(Percentages represent value of investments compared to net assets)
| | | | | | | | |
| Common Stocks 38.4% | |
| Issuer | | Shares | | | Value ($) | |
Consumer Discretionary 1.5% | |
Automobiles 1.0% | |
| | |
General Motors Co. | | | 200,000 | | | | 6,686,000 | |
|
Media 0.5% | |
| | |
Cinemark Holdings, Inc. | | | 97,500 | | | | 3,540,225 | |
| | | | | | | | | |
Total Consumer Discretionary | | | | | | | 10,226,225 | |
|
| |
Consumer Staples 2.9% | |
Beverages 1.9% | |
| | |
Dr. Pepper Snapple Group, Inc. | | | 87,500 | | | | 6,475,000 | |
| | |
PepsiCo, Inc. | | | 65,000 | | | | 6,506,500 | |
| | | | | | | | | |
Total | | | | | | | 12,981,500 | |
|
Tobacco 1.0% | |
| | |
Philip Morris International, Inc. | | | 72,500 | | | | 6,302,425 | |
| | | | | | | | | |
Total Consumer Staples | | | | | | | 19,283,925 | |
|
| |
Energy 4.6% | |
Oil, Gas & Consumable Fuels 4.6% | |
| | |
BP PLC, ADR | | | 150,000 | | | | 5,898,000 | |
| | |
ConocoPhillips | | | 90,000 | | | | 5,946,300 | |
| | |
Kinder Morgan, Inc. | | | 162,500 | | | | 6,719,375 | |
| | |
Occidental Petroleum Corp. | | | 75,000 | | | | 5,982,750 | |
| | |
ONEOK, Inc. | | | 117,500 | | | | 6,363,800 | |
| | | | | | | | | |
Total | | | | | | | 30,910,225 | |
| | | | | | | | | |
Total Energy | | | | | | | 30,910,225 | |
|
| |
Financials 9.1% | |
Banks 3.8% | |
| | |
Bank of Montreal | | | 85,000 | | | | 6,263,650 | |
| | |
Cullen/Frost Bankers, Inc. | | | 85,000 | | | | 6,346,100 | |
| | |
JPMorgan Chase & Co. | | | 110,000 | | | | 6,617,600 | |
| | |
Wells Fargo & Co. | | | 120,000 | | | | 6,537,600 | |
| | | | | | | | | |
Total | | | | | | | 25,764,950 | |
|
Capital Markets 1.8% | |
| | |
Ares Capital Corp. | | | 370,000 | | | | 6,086,500 | |
| | |
T. Rowe Price Group, Inc. | | | 75,000 | | | | 6,260,250 | |
| | | | | | | | | |
Total | | | | | | | 12,346,750 | |
|
Insurance 1.0% | |
| | |
Aflac, Inc. | | | 110,000 | | | | 6,570,300 | |
|
Real Estate Investment Trusts (REITs) 2.5% | |
| | |
Colony Financial, Inc. | | | 137,500 | | | | 3,375,625 | |
| | |
National Health Investors, Inc. | | | 47,500 | | | | 3,148,300 | |
| | |
Outfront Media, Inc. | | | 125,000 | | | | 3,382,500 | |
| | |
Starwood Property Trust, Inc. | | | 275,000 | | | | 6,616,500 | |
| | | | | | | | | |
Total | | | | | | | 16,522,925 | |
| | | | | | | | | |
Total Financials | | | | | | | 61,204,925 | |
| | | | | | | | |
| Common Stocks (continued) | |
| Issuer | | Shares | | | Value ($) | |
Health Care 3.0% | |
Biotechnology 0.9% | |
| | |
Amgen, Inc. | | | 37,500 | | | | 6,199,125 | |
|
Pharmaceuticals 2.1% | |
| | |
AbbVie, Inc. | | | 105,000 | | | | 7,266,000 | |
| | |
Merck & Co., Inc. | | | 110,000 | | | | 6,644,000 | |
| | | | | | | | | |
Total | | | | | | | 13,910,000 | |
| | | | | | | | | |
Total Health Care | | | | | | | 20,109,125 | |
|
| |
Industrials 3.3% | |
Aerospace & Defense 0.9% | |
| | |
Raytheon Co. | | | 60,000 | | | | 6,402,000 | |
|
Industrial Conglomerates 1.4% | |
| | |
General Electric Co. | | | 360,000 | | | | 9,536,400 | |
|
Transportation Infrastructure 1.0% | |
| | |
Macquarie Infrastructure Co. LLC | | | 92,500 | | | | 6,502,750 | |
| | | | | | | | | |
Total Industrials | | | | | | | 22,441,150 | |
|
| |
Information Technology 5.6% | |
Communications Equipment 1.1% | |
| | |
Cisco Systems, Inc. | | | 260,000 | | | | 7,186,400 | |
|
IT Services 1.0% | |
| | |
Automatic Data Processing, Inc. | | | 77,500 | | | | 6,637,100 | |
|
Semiconductors & Semiconductor Equipment 2.5% | |
| | |
Intel Corp. | | | 185,000 | | | | 6,891,250 | |
| | |
Maxim Integrated Products, Inc. | | | 115,000 | | | | 3,400,550 | |
| | |
Xilinx, Inc. | | | 145,000 | | | | 6,588,800 | |
| | | | | | | | | |
Total | | | | | | | 16,880,600 | |
|
Technology Hardware, Storage & Peripherals 1.0% | |
| | |
Apple, Inc. | | | 57,500 | | | | 6,838,475 | |
| | | | | | | | | |
Total Information Technology | | | | | | | 37,542,575 | |
|
| |
Materials 2.9% | |
Chemicals 0.9% | |
| | |
Dow Chemical Co. (The) | | | 130,000 | | | | 6,327,100 | |
|
Metals & Mining 1.0% | |
| | |
Freeport-McMoRan, Inc. | | | 235,000 | | | | 6,309,750 | |
| | |
Jaguar Mining, Inc.(a) | | | 193,368 | | | | 98,079 | |
| | | | | | | | | |
Total | | | | | | | 6,407,829 | |
|
Paper & Forest Products 1.0% | |
| | |
International Paper Co. | | | 125,000 | | | | 6,727,500 | |
| | | | | | | | | |
Total Materials | | | | | | | 19,462,429 | |
|
| |
The accompanying Notes to Financial Statements are an integral part of this statement.
| | |
| |
| | Columbia Flexible Capital Income Fund |
Portfolio of Investments (continued)
November 30, 2014 (Unaudited)
| | | | | | | | |
| Common Stocks (continued) | |
| Issuer | | Shares | | | Value ($) | |
Telecommunication Services 2.4% | |
Diversified Telecommunication Services 2.4% | |
| | |
AT&T, Inc. | | | 185,000 | | | | 6,545,300 | |
| | |
Verizon Communications, Inc. | | | 185,000 | | | | 9,359,150 | |
| | | | | | | | | |
Total | | | | | | | 15,904,450 | |
| | | | | | | | | |
Total Telecommunication Services | | | | | | | 15,904,450 | |
|
| |
Utilities 3.1% | |
Electric Utilities 0.6% | |
| | |
NRG Yield, Inc. Class A | | | 80,000 | | | | 3,791,200 | |
|
Multi-Utilities 2.5% | |
| | |
Ameren Corp. | | | 155,000 | | | | 6,682,050 | |
| | |
Dominion Resources, Inc. | | | 92,500 | | | | 6,710,875 | |
| | |
PG&E Corp. | | | 68,000 | | | | 3,434,000 | |
| | | | | | | | | |
Total | | | | | | | 16,826,925 | |
| | | | | | | | | |
Total Utilities | | | | | | | 20,618,125 | |
| | | | | | | | | |
Total Common Stocks | | | | | | | | |
(Cost: $238,929,350) | | | | | | | 257,703,154 | |
|
| |
| Convertible Preferred Stocks 15.3% | |
Consumer Staples 2.5% | |
Food Products 2.5% | |
| | |
Bunge Ltd., 4.875% | | | 60,000 | | | | 6,722,100 | |
| | |
Post Holdings, Inc., 3.750%(b) | | | 37,500 | | | | 3,563,126 | |
| | |
Tyson Foods, Inc., 4.750% | | | 130,000 | | | | 6,808,100 | |
| | | | | | | | | |
Total | | | | | | | 17,093,326 | |
| | | | | | | | | |
Total Consumer Staples | | | | | | | 17,093,326 | |
|
| |
Energy 1.8% | |
Oil, Gas & Consumable Fuels 1.8% | |
| | |
Chesapeake Energy Corp., 5.750%(b) | | | 9,000 | | | | 9,556,875 | |
| | |
Penn Virginia Corp., 6.000%(b) | | | 45,000 | | | | 2,600,046 | |
| | | | | | | | | |
Total | | | | | | | 12,156,921 | |
| | | | | | | | | |
Total Energy | | | | | | | 12,156,921 | |
|
| |
Financials 6.5% | |
Banks 2.0% | |
| | |
Bank of America Corp., 7.250% | | | 5,500 | | | | 6,536,200 | |
| | |
Wells Fargo & Co., 7.500% | | | 5,500 | | | | 6,751,388 | |
| | | | | | | | | |
Total | | | | | | | 13,287,588 | |
|
Real Estate Investment Trusts (REITs) 4.5% | |
| | |
Alexandria Real Estate Equities, Inc., 7.000% | | | 249,000 | | | | 6,921,428 | |
| | |
Crown Castle International Corp., 4.500% | | | 60,000 | | | | 6,276,480 | |
| | | | | | | | |
| Convertible Preferred Stocks (continued) | |
| Issuer | | Shares | | | Value ($) | |
Health Care REIT, Inc., 6.500% | | | 100,000 | | | | 6,533,000 | |
| | |
Weyerhaeuser Co., 6.375% | | | 120,000 | | | | 7,044,000 | |
| | |
iStar Financial, Inc., 4.500% | | | 55,000 | | | | 3,351,150 | |
| | | | | | | | | |
Total | | | | | | | 30,126,058 | |
| | | | | | | | | |
Total Financials | | | | | | | 43,413,646 | |
|
| |
Health Care 0.5% | |
Health Care Equipment & Supplies 0.5% | |
| | |
Alere, Inc., 3.000% | | | 10,000 | | | | 3,300,000 | |
| | | | | | | | | |
Total Health Care | | | | | | | 3,300,000 | |
|
| |
Industrials 1.0% | |
Aerospace & Defense 1.0% | |
| | |
United Technologies Corp., 7.500% | | | 115,000 | | | | 6,901,150 | |
| | | | | | | | | |
Total Industrials | | | | | | | 6,901,150 | |
|
| |
Materials 1.0% | |
Metals & Mining 1.0% | |
| | |
Alcoa, Inc., 5.375% | | | 120,000 | | | | 6,396,000 | |
| | | | | | | | | |
Total Materials | | | | | | | 6,396,000 | |
| | |
| | | | | | | | |
Utilities 2.0% | |
Electric Utilities 1.0% | | | | | | | | |
| | |
NextEra Energy, Inc., 5.599% | | | 100,000 | | | | 6,787,950 | |
| | |
Multi-Utilities 1.0% | | | | | | | | |
| | |
CenterPoint Energy, Inc., 3.719%(c) | | | 100,000 | | | | 6,593,750 | |
| | | | | | | | | |
Total Utilities | | | | | | | 13,381,700 | |
| | | | | | | | | |
Total Convertible Preferred Stocks | |
(Cost: $98,183,766) | | | | | | | 102,642,743 | |
| | |
| | | | | | | | |
| | | | | | | | | | | | |
| Corporate Bonds & Notes 24.6% | |
| Issuer | | Coupon
Rate | | | Principal
Amount ($) | | | Value ($) | |
Aerospace & Defense 0.5% | |
ADS Tactical, Inc.
Senior Secured(b) | |
04/01/18 | | | 11.000% | | | | 3,198,000 | | | | 3,166,020 | |
| | | |
| | | | | | | | | | | | |
Banking 1.0% | |
Popular, Inc.
Senior Unsecured | |
07/01/19 | | | 7.000% | | | | 6,500,000 | | | | 6,532,500 | |
| | | |
| | | | | | | | | | | | |
Construction Machinery 1.0% | |
United Rentals North America, Inc. | |
11/15/24 | | | 5.750% | | | | 6,600,000 | | | | 6,847,500 | |
| | | |
| | | | | | | | | | | | |
The accompanying Notes to Financial Statements are an integral part of this statement.
| | |
| |
| Columbia Flexible Capital Income Fund | | |
Portfolio of Investments (continued)
November 30, 2014 (Unaudited)
| | | | | | | | | | | | |
| Corporate Bonds & Notes (continued) | |
| Issuer | | Coupon
Rate | | | Principal
Amount ($) | | | Value ($) | |
Consumer Cyclical Services 1.0% | |
ADT Corp. (The)
Senior Unsecured | |
04/15/19 | | | 4.125% | | | | 6,500,000 | | | | 6,474,813 | |
| | | |
| | | | | | | | | | | | |
Diversified Manufacturing 2.1% | |
Gardner Denver, Inc.
Senior Unsecured(b) | |
08/15/21 | | | 6.875% | | | | 7,000,000 | | | | 6,947,500 | |
|
Hamilton Sundstrand Corp.
Senior Unsecured(b) | |
12/15/20 | | | 7.750% | | | | 6,850,000 | | | | 6,918,500 | |
| | | | | | | | | | | | | |
Total | | | | | | | | | | | 13,866,000 | |
| | | |
| | | | | | | | | | | | |
Electric 1.4% | |
AES Corp. (The)
Senior Unsecured | |
07/01/21 | | | 7.375% | | | | 2,000,000 | | | | 2,290,000 | |
03/15/24 | | | 5.500% | | | | 3,832,000 | | | | 3,908,640 | |
|
DPL, Inc.
Senior Unsecured(b) | |
10/01/19 | | | 6.750% | | | | 3,000,000 | | | | 3,090,000 | |
| | | | | | | | | | | | | |
Total | | | | | | | | | | | 9,288,640 | |
| | | |
| | | | | | | | | | | | |
Food and Beverage 1.0% | |
Post Holdings, Inc.(b) | |
12/01/21 | | | 6.750% | | | | 7,143,000 | | | | 7,017,997 | |
| | | |
| | | | | | | | | | | | |
Health Care 1.1% | |
Omnicare, Inc.
Senior Unsecured | |
12/01/22 | | | 4.750% | | | | 6,713,000 | | | | 6,813,695 | |
12/01/24 | | | 5.000% | | | | 287,000 | | | | 292,740 | |
| | | | | | | | | | | | | |
Total | | | | | | | | | | | 7,106,435 | |
| | | |
| | | | | | | | | | | | |
Home Construction 1.0% | |
Taylor Morrison Communities, Inc./Monarch, Inc.(b) | |
04/15/21 | | | 5.250% | | | | 6,500,000 | | | | 6,532,500 | |
| | | |
| | | | | | | | | | | | |
Independent Energy 2.7% | |
Goodrich Petroleum Corp. | |
03/15/19 | | | 8.875% | | | | 7,500,000 | | | | 5,381,250 | |
|
Parsley Energy LLC/Finance Corp.
Senior Unsecured(b) | |
02/15/22 | | | 7.500% | | | | 6,513,000 | | | | 6,358,316 | |
|
Stone Energy Corp. | |
11/15/22 | | | 7.500% | | | | 7,100,000 | | | | 6,425,500 | |
| | | | | | | | | | | | | |
Total | | | | | | | | | | | 18,165,066 | |
| | | |
| | | | | | | | | | | | |
Leisure 1.0% | |
Live Nation Entertainment, Inc.(b) | |
06/15/22 | | | 5.375% | | | | 6,502,000 | | | | 6,518,255 | |
| | | | | | | | | | | | |
| Corporate Bonds & Notes (continued) | |
| Issuer | | Coupon
Rate | | | Principal
Amount ($) | | | Value ($) | |
Media and Entertainment 1.0% | |
AMC Networks, Inc. | |
12/15/22 | | | 4.750% | | | | 7,000,000 | | | | 6,912,500 | |
| | | |
| | | | | | | | | | | | |
Metals 1.0% | |
United States Steel Corp.
Senior Unsecured | |
04/01/21 | | | 6.875% | | | | 6,550,000 | | | | 6,951,188 | |
| | | |
| | | | | | | | | | | | |
Midstream 0.3% | |
Blue Racer Midstream LLC/Finance Corp.(b) | |
11/15/22 | | | 6.125% | | | | 1,928,000 | | | | 1,947,280 | |
| | | |
| | | | | | | | | | | | |
Other Industry 1.0% | |
MasTec, Inc. | |
03/15/23 | | | 4.875% | | | | 7,350,000 | | | | 7,037,625 | |
| | | |
| | | | | | | | | | | | |
Pharmaceuticals 0.6% | |
Salix Pharmaceuticals Ltd.(b) | |
01/15/21 | | | 6.000% | | | | 3,820,000 | | | | 3,896,400 | |
| | | |
| | | | | | | | | | | | |
Retailers 1.0% | |
Rite Aid Corp.
Senior Unsecured | |
02/15/27 | | | 7.700% | | | | 6,068,000 | | | | 6,705,140 | |
| | | |
| | | | | | | | | | | | |
Supermarkets 1.0% | |
Safeway, Inc.
Senior Unsecured | |
02/01/31 | | | 7.250% | | | | 6,988,000 | | | | 6,953,507 | |
| | | |
| | | | | | | | | | | | |
Technology 2.1% | |
Equinix, Inc.
Senior Unsecured | |
01/01/25 | | | 5.750% | | | | 7,000,000 | | | | 7,052,500 | |
|
Micron Technology, Inc.
Senior Unsecured(b) | |
02/01/25 | | | 5.500% | | | | 6,900,000 | | | | 6,934,500 | |
| | | | | | | | | | | | | |
Total | | | | | | | | | | | 13,987,000 | |
| | | |
| | | | | | | | | | | | |
Transportation Services 0.9% | |
XPO Logistics, Inc.
Senior Unsecured(b) | |
09/01/19 | | | 7.875% | | | | 5,892,000 | | | | 6,260,250 | |
| | | |
| | | | | | | | | | | | |
Wirelines 1.9% | |
Frontier Communications Corp.
Senior Unsecured | |
01/15/25 | | | 6.875% | | | | 6,500,000 | | | | 6,532,500 | |
The accompanying Notes to Financial Statements are an integral part of this statement.
| | |
| |
| | Columbia Flexible Capital Income Fund |
Portfolio of Investments (continued)
November 30, 2014 (Unaudited)
| | | | | | | | | | | | |
| Corporate Bonds & Notes (continued) | |
| Issuer | | Coupon
Rate | | | Principal
Amount ($) | | | Value ($) | |
Level 3 Escrow II, Inc.(b) | |
08/15/22 | | | 5.375% | | | | 6,400,000 | | | | 6,480,000 | |
| | | | | | | | | | | | | |
Total | | | | | | | | | | | 13,012,500 | |
| | | | | | | | | | | | | |
Total Corporate Bonds & Notes | |
(Cost: $168,403,015) | | | | 165,179,116 | |
| | | |
| | | | | | | | | | | | |
| Convertible Bonds 16.7% | |
Automotive 1.9% | |
Navistar International Corp.
Senior Subordinated Notes | |
10/15/18 | | | 4.500% | | | | 1,390,000 | | | | 1,361,331 | |
|
Navistar International Corp.(b)
Senior Subordinated Notes | |
04/15/19 | | | 4.750% | | | | 8,151,000 | | | | 8,130,623 | |
|
Wabash National Corp.
Senior Unsecured | |
05/01/18 | | | 3.375% | | | | 2,840,000 | | | | 3,266,142 | |
| | | | | | | | | | | | | |
Total | | | | | | | | | | | 12,758,096 | |
| | | |
| | | | | | | | | | | | |
Brokerage/Asset Managers/Exchanges 0.5% | |
Walter Investment Management Corp.
Senior Subordinated Notes | |
11/01/19 | | | 4.500% | | | | 4,410,000 | | | | 3,420,506 | |
| | | |
| | | | | | | | | | | | |
Finance Companies 0.5% | |
Air Lease Corp.
Senior Unsecured | |
12/01/18 | | | 3.875% | | | | 2,300,000 | | | | 3,368,063 | |
| | | |
| | | | | | | | | | | | |
Health Care 1.0% | |
Omnicare, Inc. | |
12/15/35 | | | 3.250% | | | | 3,100,000 | | | | 3,539,812 | |
|
Teleflex, Inc.
Senior Subordinated Notes | |
08/01/17 | | | 3.875% | | | | 1,600,000 | | | | 3,118,000 | |
| | | | | | | | | | | | | |
Total | | | | | | | | | | | 6,657,812 | |
| | | |
| | | | | | | | | | | | |
Independent Energy 0.5% | |
American Energy-Permian Basin LLC PIK(b) | |
05/01/22 | | | 8.000% | | | | 3,300,000 | | | | 3,159,750 | |
| | | |
| | | | | | | | | | | | |
Metals 0.4% | |
Alpha Natural Resources, Inc. | |
12/15/17 | | | 3.750% | | | | 4,800,000 | | | | 3,033,000 | |
| | | |
| | | | | | | | | | | | |
Oil Field Services 1.1% | |
Cobalt International Energy, Inc.
Senior Unsecured | |
12/01/19 | | | 2.625% | | | | 4,700,000 | | | | 3,335,120 | |
| | | | | | | | | | | | |
| Convertible Bonds (continued) | |
| Issuer | | Coupon
Rate | | | Principal
Amount ($) | | | Value ($) | |
Energy XXI Ltd.
Senior Unsecured(b) | |
12/15/18 | | | 3.000% | | | | 6,500,000 | | | | 4,225,000 | |
| | | | | | | | | | | | | |
Total | | | | | | | | | | | 7,560,120 | |
| | | |
| | | | | | | | | | | | |
Other Financial Institutions 1.0% | |
Forest City Enterprises, Inc.
Senior Unsecured | |
08/15/20 | | | 3.625% | | | | 6,197,000 | | | | 6,646,282 | |
| | | |
| | | | | | | | | | | | |
Other Industry 0.5% | |
General Cable Corp.
Subordinated Notes(c) | |
11/15/29 | | | 4.500% | | | | 4,500,000 | | | | 3,045,938 | |
| | | |
| | | | | | | | | | | | |
Other REIT 1.7% | |
Blackstone Mortgage Trust, Inc.
Senior Unsecured | |
12/01/18 | | | 5.250% | | | | 4,560,000 | | | | 4,809,158 | |
|
RWT Holdings, Inc.(b) | |
11/15/19 | | | 5.625% | | | | 3,400,000 | | | | 3,432,470 | |
|
Starwood Waypoint Residential Trust
Senior Unsecured(b) | |
10/15/17 | | | 4.500% | | | | 3,000,000 | | | | 3,101,220 | |
| | | | | | | | | | | | | |
Total | | | | | | | | | | | 11,342,848 | |
| | | |
| | | | | | | | | | | | |
Pharmaceuticals 1.2% | |
ARIAD Pharmaceuticals, Inc.
Senior Unsecured(b) | |
06/15/19 | | | 3.625% | | | | 3,150,000 | | | | 3,222,765 | |
|
Aegerion Pharmaceuticals, Inc.
Senior Unsecured(b) | |
08/15/19 | | | 2.000% | | | | 4,000,000 | | | | 3,231,000 | |
|
Dendreon Corp.
Senior Unsecured(d) | |
01/15/16 | | | 2.875% | | | | 2,400,000 | | | | 1,453,440 | |
| | | | | | | | | | | | | |
Total | | | | | | | | | | | 7,907,205 | |
| | | |
| | | | | | | | | | | | |
Property & Casualty 0.7% | |
MGIC Investment Corp.(b) | |
04/01/63 | | | 9.000% | | | | 3,950,000 | | | | 5,038,719 | |
| | | |
| | | | | | | | | | | | |
Refining 0.5% | |
Clean Energy Fuels Corp.
Senior Unsecured(b) | |
10/01/18 | | | 5.250% | | | | 4,250,000 | | | | 3,225,835 | |
| | | |
| | | | | | | | | | | | |
Retailers 0.5% | |
HeartWare International, Inc.
Senior Unsecured | |
12/15/17 | | | 3.500% | | | | 3,000,000 | | | | 3,146,250 | |
| | | |
| | | | | | | | | | | | |
The accompanying Notes to Financial Statements are an integral part of this statement.
| | |
| |
| Columbia Flexible Capital Income Fund | | |
Portfolio of Investments (continued)
November 30, 2014 (Unaudited)
| | | | | | | | | | | | |
| Convertible Bonds (continued) | |
| Issuer | | Coupon
Rate | | | Principal
Amount ($) | | | Value ($) | |
Technology 3.5% | |
Ciena Corp.
Senior Unsecured | |
12/15/20 | | | 4.000% | | | | 5,250,000 | | | | 6,109,687 | |
|
Cornerstone OnDemand, Inc.
Senior Unsecured | |
07/01/18 | | | 1.500% | | | | 3,500,000 | | | | 3,322,813 | |
|
Mentor Graphics Corp.
Subordinated Notes | |
04/01/31 | | | 4.000% | | | | 5,320,000 | | | | 6,400,625 | |
|
TiVo, Inc.
Senior Unsecured(b) | |
03/15/16 | | | 4.000% | | | | 2,550,000 | | | | 3,099,844 | |
|
j2 Global, Inc.
Senior Unsecured | |
06/15/29 | | | 3.250% | | | | 4,500,000 | | | | 4,694,062 | |
| | | | | | | | | | | | | |
Total | | | | | | | | | | | 23,627,031 | |
| | | |
| | | | | | | | | | | | |
Tobacco 0.9% | |
Vector Group Ltd.
Senior Unsecured | |
04/15/20 | | | 1.750% | | | | 4,000,000 | | | | 4,271,040 | |
|
Vector Group Ltd.(c)
Senior Unsecured | |
01/15/19 | | | 2.500% | | | | 1,450,000 | | | | 2,045,225 | |
| | | | | | | | | | | | | |
Total | | | | | | | | | | | 6,316,265 | |
| | | |
| | | | | | | | | | | | |
Transportation Services 0.3% | |
DryShips, Inc.
Senior Unsecured | |
12/01/14 | | | 5.000% | | | | 2,140,000 | | | | 2,140,000 | |
| | | | | | | | | | | | | |
Total Convertible Bonds | |
(Cost: $113,496,447) | | | | | | | | | | | 112,393,720 | |
| | | | | | | | | | | | |
| Preferred Debt 0.5% | |
| Issuer | | Coupon
Rate | | | Principal
Amount ($) | | | Value ($) | |
Banking 0.5% | |
Synovus Financial Corp.(c) | |
12/31/49 | | | 7.875% | | | | 105,000 | | | | 2,909,025 | |
| | | | | | | | | | | | | |
Total Preferred Debt | |
(Cost: $2,840,205) | | | | | | | | | | | 2,909,025 | |
| | | |
| | | | | | | | | | | | |
| Limited Partnerships 0.5% | |
| Issuer | | | | | Shares | | | Value | |
Energy 0.5% | |
Oil, Gas & Consumable Fuels 0.5% | |
| | |
Plains GP Holdings LP, Class A | | | | 132,000 | | | | 3,429,360 | |
| | | | | | | | | | | | | |
Total Energy | | | | | | | | 3,429,360 | |
| | | | | | | | | | | | | |
Total Limited Partnerships | | | | | | | | | |
(Cost: $3,300,000) | | | | | | | | 3,429,360 | |
| | | |
| | | | | | | | | | | | |
| Money Market Funds 3.7% | |
| | | | | | Shares | | | Value | |
JPMorgan Prime Money Market Fund, 0.010%(e) | | | | 25,169,205 | | | | 25,169,205 | |
| | | | | | | | | | | | | |
Total Money Market Funds | | | | | | | | | |
(Cost: $25,169,205) | | | | | | | | 25,169,205 | |
| | | | | | | | | | | | | |
Total Investments | | | | | | | | | |
(Cost: $650,321,988) | | | | | | | | 669,426,323 | |
| | | | | | | | | | | | | |
Other Assets & Liabilities, Net | | | | | | | | 2,307,624 | |
| | | | | | | | | | | | | |
Net Assets | | | | | | | | 671,733,947 | |
| | | | | | | | | | | | | |
Notes to Portfolio of Investments
| (b) | Security exempt from registration pursuant to Rule 144A under the Securities Act of 1933. This security may be resold in transactions exempt from registration, normally to qualified institutional buyers. At November 30, 2014, the value of these securities amounted to $127,654,791 or 19.00% of net assets. |
| (c) | Variable rate security. |
| (d) | Represents securities that have defaulted on payment of interest. The Fund has stopped accruing interest on these securities. At November 30, 2014, the value of these securities amounted to $1,453,440, which represents 0.22% of net assets. |
| (e) | The rate shown is the seven-day current annualized yield at November 30, 2014. |
Abbreviation Legend
| | |
| ADR | | American Depositary Receipt |
| PIK | | Payment-in-Kind |
Fair Value Measurements
Generally accepted accounting principles (GAAP) require disclosure regarding the inputs and valuation techniques used to measure fair value and any changes in valuation inputs or techniques. In addition, investments shall be disclosed by major category.
The Fund categorizes its fair value measurements according to a three-level hierarchy that maximizes the use of observable inputs and minimizes the use of unobservable inputs by prioritizing that the most observable input be used when available. Observable inputs are those that market
The accompanying Notes to Financial Statements are an integral part of this statement.
| | |
| |
| | Columbia Flexible Capital Income Fund |
Portfolio of Investments (continued)
November 30, 2014 (Unaudited)
Fair Value Measurements (continued)
participants would use in pricing an investment based on market data obtained from sources independent of the reporting entity. Unobservable inputs are those that reflect the Fund’s assumptions about the information market participants would use in pricing an investment. An investment’s level within the fair value hierarchy is based on the lowest level of any input that is deemed significant to the asset or liability’s fair value measurement. The input levels are not necessarily an indication of the risk or liquidity associated with investments at that level. For example, certain U.S. government securities are generally high quality and liquid, however, they are reflected as Level 2 because the inputs used to determine fair value may not always be quoted prices in an active market.
Fair value inputs are summarized in the three broad levels listed below:
| > | | Level 1 — Valuations based on quoted prices for investments in active markets that the Fund has the ability to access at the measurement date (including NAV for open-end mutual funds). Valuation adjustments are not applied to Level 1 investments. |
| > | | Level 2 — Valuations based on other significant observable inputs (including quoted prices for similar securities, interest rates, prepayment speeds, credit risks, etc.). |
| > | | Level 3 — Valuations based on significant unobservable inputs (including the Fund’s own assumptions and judgment in determining the fair value of investments). |
Inputs that are used in determining fair value of an investment may include price information, credit data, volatility statistics, and other factors. These inputs can be either observable or unobservable. The availability of observable inputs can vary between investments, and is affected by various factors such as the type of investment, and the volume and level of activity for that investment or similar investments in the marketplace. The inputs will be considered by the Investment Manager, along with any other relevant factors in the calculation of an investment’s fair value. The Fund uses prices and inputs that are current as of the measurement date, which may include periods of market dislocations. During these periods, the availability of prices and inputs may be reduced for many investments. This condition could cause an investment to be reclassified between the various levels within the hierarchy.
Foreign equity securities actively traded in markets where there is a significant delay in the local close relative to the New York Stock Exchange (NYSE) are classified as Level 2. The values of these securities may include an adjustment to reflect the impact of significant market movements following the close of local trading, as described in Note 2 to the financial statements — Security Valuation.
Investments falling into the Level 3 category are primarily supported by quoted prices from brokers and dealers participating in the market for those investments. However, these may be classified as Level 3 investments due to lack of market transparency and corroboration to support these quoted prices. Additionally, valuation models may be used as the pricing source for any remaining investments classified as Level 3. These models may rely on one or more significant unobservable inputs and/or significant assumptions by the Investment Manager. Inputs used in valuations may include, but are not limited to, financial statement analysis, capital account balances, discount rates and estimated cash flows, and comparable company data.
Under the direction of the Fund’s Board of Trustees (the Board), the Investment Manager’s Valuation Committee (the Committee) is responsible for overseeing the valuation procedures approved by the Board. The Committee consists of voting and non-voting members from various groups within the Investment Manager’s organization, including operations and accounting, trading and investments, compliance, risk management and legal.
The Committee meets at least monthly to review and approve valuation matters, which may include a description of specific valuation determinations, data regarding pricing information received from approved pricing vendors and brokers and the results of Board-approved valuation control policies and procedures (the Policies). The Policies address, among other things, instances when market quotations are or are not readily available, including recommendations of third party pricing vendors and a determination of appropriate pricing methodologies; events that require specific valuation determinations and assessment of fair value techniques; securities with a potential for stale pricing, including those that are illiquid, restricted, or in default; and the effectiveness of third party pricing vendors, including periodic reviews of vendors. The Committee meets more frequently, as needed, to discuss additional valuation matters, which may include the need to review back-testing results, review time-sensitive information or approve related valuation actions. The Committee reports to the Board, with members of the Committee meeting with the Board at each of its regularly scheduled meetings to discuss valuation matters and actions during the period, similar to those described earlier.
For investments categorized as Level 3, the Committee monitors information similar to that described above, which may include: (i) data specific to the issuer or comparable issuers, (ii) general market or specific sector news and (iii) quoted prices and specific or similar security transactions. The Committee considers this data and any changes from prior periods in order to assess the reasonableness of observable and unobservable inputs, any assumptions or internal models used to value those securities and changes in fair value. This data is also used to corroborate, when available, information received from approved pricing vendors and brokers. Various factors impact the frequency of monitoring this information (which may occur as often as daily). However, the Committee may determine that changes to inputs, assumptions and models are not required as a result of the monitoring procedures performed.
The accompanying Notes to Financial Statements are an integral part of this statement.
| | |
| 10 | | Semiannual Report 2014 |
| | |
| |
| Columbia Flexible Capital Income Fund | | |
Portfolio of Investments (continued)
November 30, 2014 (Unaudited)
Fair Value Measurements (continued)
The following table is a summary of the inputs used to value the Fund’s investments at November 30, 2014:
| | | | | | | | | | | | | | | | |
| Description | | Level 1 Quoted Prices in Active Markets for Identical Assets ($) | | | Level 2 Other Significant Observable Inputs ($) | | | Level 3 Significant Unobservable Inputs ($) | | | Total ($) | |
Equity Securities | | | | | | | | | | | | | | | | |
| | | | |
Common Stocks | | | | | | | | | | | | | | | | |
| | | | |
Consumer Discretionary | | | 10,226,225 | | | | — | | | | — | | | | 10,226,225 | |
| | | | |
Consumer Staples | | | 19,283,925 | | | | — | | | | — | | | | 19,283,925 | |
| | | | |
Energy | | | 30,910,225 | | | | — | | | | — | | | | 30,910,225 | |
| | | | |
Financials | | | 61,204,925 | | | | — | | | | — | | | | 61,204,925 | |
| | | | |
Health Care | | | 20,109,125 | | | | — | | | | — | | | | 20,109,125 | |
| | | | |
Industrials | | | 22,441,150 | | | | — | | | | — | | | | 22,441,150 | |
| | | | |
Information Technology | | | 37,542,575 | | | | — | | | | — | | | | 37,542,575 | |
| | | | |
Materials | | | 19,364,350 | | | | 98,079 | | | | — | | | | 19,462,429 | |
| | | | |
Telecommunication Services | | | 15,904,450 | | | | — | | | | — | | | | 15,904,450 | |
| | | | |
Utilities | | | 20,618,125 | | | | — | | | | — | | | | 20,618,125 | |
| | | | |
Convertible Preferred Stocks | | | | | | | | | | | | | | | | |
| | | | |
Consumer Staples | | | — | | | | 17,093,326 | | | | — | | | | 17,093,326 | |
| | | | |
Energy | | | — | | | | 12,156,921 | | | | — | | | | 12,156,921 | |
| | | | |
Financials | | | 26,864,588 | | | | 16,549,058 | | | | — | | | | 43,413,646 | |
| | | | |
Health Care | | | 3,300,000 | | | | — | | | | — | | | | 3,300,000 | |
| | | | |
Industrials | | | 6,901,150 | | | | — | | | | — | | | | 6,901,150 | |
| | | | |
Materials | | | 6,396,000 | | | | — | | | | — | | | | 6,396,000 | |
| | | | |
Utilities | | | — | | | | 13,381,700 | | | | — | | | | 13,381,700 | |
| | | | | | | | | | | | | | | | | |
Total Equity Securities | | | 301,066,813 | | | | 59,279,084 | | | | — | | | | 360,345,897 | |
| | | | | | | | | | | | | | | | | |
Bonds | | | | | | | | | | | | | | | | |
| | | | |
Corporate Bonds & Notes | | | — | | | | 165,179,116 | | | | — | | | | 165,179,116 | |
| | | | |
Convertible Bonds | | | — | | | | 112,393,720 | | | | — | | | | 112,393,720 | |
| | | | |
Preferred Debt | | | 2,909,025 | | | | — | | | | — | | | | 2,909,025 | |
| | | | | | | | | | | | | | | | | |
Total Bonds | | | 2,909,025 | | | | 277,572,836 | | | | — | | | | 280,481,861 | |
| | | | | | | | | | | | | | | | | |
Other | | | | | | | | | | | | | | | | |
| | | | |
Limited Partnerships | | | 3,429,360 | | | | — | | | | — | | | | 3,429,360 | |
| | | | | | | | | | | | | | | | | |
Total Other | | | 3,429,360 | | | | — | | | | — | | | | 3,429,360 | |
| | | | | | | | | | | | | | | | | |
Mutual Funds | | | | | | | | | | | | | | | | |
| | | | |
Money Market Funds | | | 25,169,205 | | | | — | | | | — | | | | 25,169,205 | |
| | | | | | | | | | | | | | | | | |
Total Mutual Funds | | | 25,169,205 | | | | — | | | | — | | | | 25,169,205 | |
| | | | | | | | | | | | | | | | | |
Total | | | 332,574,403 | | | | 336,851,920 | | | | — | | | | 669,426,323 | |
| | | | | | | | | | | | | | | | | |
See the Portfolio of Investments for all investment classifications not indicated in the table.
The Fund’s assets assigned to the Level 2 input category are generally valued using the market approach, in which a security’s value is determined through reference to prices and information from market transactions for similar or identical assets.
Financial assets were transferred from Level 1 to Level 2 as the market for these assets was deemed not to be active and fair values were consequently obtained using observable markets inputs rather than quoted prices for identical assets as of period end.
The following table shows transfers between Level 1 and Level 2 of the fair value hierarchy:
| | | | | | |
| Transfers In | | Transfers Out |
| Level 1 ($) | | Level 2 ($) | | Level 1 ($) | | Level 2 ($) |
| — | | 126,656 | | 126,656 | | — |
| | | | | | | |
Transfers between Level 1 and Level 2 are determined based on the fair value at the beginning of the period for security positions held throughout the period.
There were no transfers of financial assets between Levels 2 and 3 during the period.
The accompanying Notes to Financial Statements are an integral part of this statement.
| | | | |
| Semiannual Report 2014 | | | 11 | |
| | |
| |
| | Columbia Flexible Capital Income Fund |
Statement of Assets and Liabilities
November 30, 2014 (Unaudited)
| | | | |
Assets | |
| |
Investments, at value | | | | |
| |
(identified cost $650,321,988) | | | $669,426,323 | |
| |
Receivable for: | | | | |
| |
Capital shares sold | | | 2,630,876 | |
| |
Dividends | | | 1,264,813 | |
| |
Interest | | | 3,770,438 | |
| |
Prepaid expenses | | | 3,159 | |
| |
Other assets | | | 44,501 | |
| |
Total assets | | | 677,140,110 | |
| |
|
Liabilities | |
| |
Payable for: | | | | |
| |
Investments purchased | | | 4,863,280 | |
| |
Capital shares purchased | | | 407,980 | |
| |
Investment management fees | | | 21,641 | |
| |
Distribution and/or service fees | | | 11,899 | |
| |
Transfer agent fees | | | 53,055 | |
| |
Administration fees | | | 2,168 | |
| |
Compensation of board members | | | 13,146 | |
| |
Other expenses | | | 32,994 | |
| |
Total liabilities | | | 5,406,163 | |
| |
Net assets applicable to outstanding capital stock | | | $671,733,947 | |
| |
|
Represented by | |
| |
Paid-in capital | | | $649,751,591 | |
| |
Undistributed net investment income | | | 1,182,442 | |
| |
Accumulated net realized gain | | | 1,695,579 | |
| |
Unrealized appreciation (depreciation) on: | | | | |
| |
Investments | | | 19,104,335 | |
| |
Total — representing net assets applicable to outstanding capital stock | | | $671,733,947 | |
| |
The accompanying Notes to Financial Statements are an integral part of this statement.
| | |
| 12 | | Semiannual Report 2014 |
| | |
| |
| Columbia Flexible Capital Income Fund | | |
Statement of Assets and Liabilities (continued)
November 30, 2014 (Unaudited)
| | | | |
Class A | | | | |
| |
Net assets | | | $339,507,210 | |
| |
Shares outstanding | | | 27,339,127 | |
| |
Net asset value per share | | | $12.42 | |
| |
Maximum offering price per share(a) | | | $13.18 | |
| |
Class C | | | | |
| |
Net assets | | | $131,424,953 | |
| |
Shares outstanding | | | 10,641,872 | |
| |
Net asset value per share | | | $12.35 | |
| |
Class I | | | | |
| |
Net assets | | | $48,980,078 | |
| |
Shares outstanding | | | 3,939,862 | |
| |
Net asset value per share | | | $12.43 | |
| |
Class R | | | | |
| |
Net assets | | | $576,765 | |
| |
Shares outstanding | | | 46,482 | |
| |
Net asset value per share | | | $12.41 | |
| |
Class R4 | | | | |
| |
Net assets | | | $21,288,552 | |
| |
Shares outstanding | | | 1,702,992 | |
| |
Net asset value per share | | | $12.50 | |
| |
Class R5 | | | | |
| |
Net assets | | | $4,569,942 | |
| |
Shares outstanding | | | 365,396 | |
| |
Net asset value per share | | | $12.51 | |
| |
Class W | | | | |
| |
Net assets | | | $13,419 | |
| |
Shares outstanding | | | 1,080 | |
| |
Net asset value per share(b) | | | $12.42 | |
| |
Class Z | | | | |
| |
Net assets | | | $125,373,028 | |
| |
Shares outstanding | | | 10,095,155 | |
| |
Net asset value per share | | | $12.42 | |
| |
| (a) | The maximum offering price per share is calculated by dividing the net asset value per share by 1.0 minus the maximum sales charge of 5.75%. |
| (b) | Net asset value per share rounds to this amount due to fractional shares outstanding. |
The accompanying Notes to Financial Statements are an integral part of this statement.
| | | | |
| Semiannual Report 2014 | | | 13 | |
| | |
| |
| | Columbia Flexible Capital Income Fund |
Statement of Operations
Six Months Ended November 30, 2014 (Unaudited)
| | | | |
Net investment income | | | | |
| |
Income: | | | | |
| |
Dividends | | | $6,404,130 | |
| |
Interest | | | 4,056,572 | |
| |
Foreign taxes withheld | | | (26,184 | ) |
| |
Total income | | | 10,434,518 | |
| |
| |
Expenses: | | | | |
| |
Investment management fees | | | 1,476,745 | |
| |
Distribution and/or service fees | | | | |
| |
Class A | | | 309,196 | |
| |
Class C | | | 431,766 | |
| |
Class R | | | 1,350 | |
| |
Class W | | | 19 | |
| |
Transfer agent fees | | | | |
| |
Class A | | | 140,776 | |
| |
Class C | | | 49,401 | |
| |
Class R | | | 304 | |
| |
Class R4 | | | 9,148 | |
| |
Class R5 | | | 1,693 | |
| |
Class W | | | 9 | |
| |
Class Z | | | 42,893 | |
| |
Administration fees | | | 149,391 | |
| |
Compensation of board members | | | 7,389 | |
| |
Custodian fees | | | 3,934 | |
| |
Printing and postage fees | | | 24,724 | |
| |
Registration fees | | | 74,121 | |
| |
Professional fees | | | 20,513 | |
| |
Other | | | 6,316 | |
| |
Total expenses | | | 2,749,688 | |
| |
Fees waived or expenses reimbursed by Investment Manager and its affiliates | | | (80,230 | ) |
| |
Total net expenses | | | 2,669,458 | |
| |
Net investment income | | | 7,765,060 | |
| |
| |
Realized and unrealized gain (loss) — net | | | | |
| |
Net realized gain (loss) on: | | | | |
| |
Investments | | | (2,460,919 | ) |
| |
Foreign currency translations | | | (452 | ) |
| |
Net realized loss | | | (2,461,371 | ) |
| |
Net change in unrealized appreciation (depreciation) on: | | | | |
| |
Investments | | | (3,970,983 | ) |
| |
Foreign currency translations | | | (27 | ) |
| |
Net change in unrealized depreciation | | | (3,971,010 | ) |
| |
Net realized and unrealized loss | | | (6,432,381 | ) |
| |
Net increase in net assets resulting from operations | | | $1,332,679 | |
| |
The accompanying Notes to Financial Statements are an integral part of this statement.
| | |
| 14 | | Semiannual Report 2014 |
| | |
| |
| Columbia Flexible Capital Income Fund | | |
Statement of Changes in Net Assets
| | | | | | | | |
| | | Six Months Ended
November 30, 2014
(Unaudited) | | | Year Ended
May 31, 2014 | |
Operations | | | | | | | | |
| | |
Net investment income | | | $7,765,060 | | | | $7,180,422 | |
| | |
Net realized gain (loss) | | | (2,461,371 | ) | | | 6,119,884 | |
| | |
Net change in unrealized appreciation (depreciation) | | | (3,971,010 | ) | | | 12,137,775 | |
| |
Net increase in net assets resulting from operations | | | 1,332,679 | | | | 25,438,081 | |
| |
| | |
Distributions to shareholders | | | | | | | | |
| | |
Net investment income | | | | | | | | |
| | |
Class A | | | (3,921,382 | ) | | | (2,170,678 | ) |
| | |
Class C | | | (1,029,890 | ) | | | (325,952 | ) |
| | |
Class I | | | (1,525,372 | ) | | | (3,313,903 | ) |
| | |
Class R | | | (8,520 | ) | | | (1,317 | ) |
| | |
Class R4 | | | (262,587 | ) | | | (52,515 | ) |
| | |
Class R5 | | | (136,274 | ) | | | (346,286 | ) |
| | |
Class W | | | (267 | ) | | | (80,845 | ) |
| | |
Class Z | | | (1,163,930 | ) | | | (316,358 | ) |
| | |
Net realized gains | | | | | | | | |
| | |
Class A | | | — | | | | (2,124,151 | ) |
| | |
Class C | | | — | | | | (378,941 | ) |
| | |
Class I | | | — | | | | (2,378,637 | ) |
| | |
Class R | | | — | | | | (1,463 | ) |
| | |
Class R4 | | | — | | | | (24,993 | ) |
| | |
Class R5 | | | — | | | | (139,220 | ) |
| | |
Class W | | | — | | | | (789 | ) |
| | |
Class Z | | | — | | | | (247,008 | ) |
| |
Total distributions to shareholders | | | (8,048,222 | ) | | | (11,903,056 | ) |
| |
Increase in net assets from capital stock activity | | | 329,171,600 | | | | 207,953,611 | |
| |
Total increase in net assets | | | 322,456,057 | | | | 221,488,636 | |
| | |
Net assets at beginning of period | | | 349,277,890 | | | | 127,789,254 | |
| |
Net assets at end of period | | | $671,733,947 | | | | $349,277,890 | |
| |
Undistributed net investment income | | | $1,182,442 | | | | $1,465,604 | |
| |
The accompanying Notes to Financial Statements are an integral part of this statement.
| | | | |
| Semiannual Report 2014 | | | 15 | |
| | |
| |
| | Columbia Flexible Capital Income Fund |
Statement of Changes in Net Assets (continued)
| | | | | | | | | | | | | | | | |
| | | Six Months Ended
November 30, 2014 (Unaudited) | | | Year Ended
May 31, 2014 | |
| | | Shares | | | Dollars ($) | | | Shares | | | Dollars ($) | |
Capital stock activity | | | | | | | | | | | | | | | | |
| | | | |
Class A shares | | | | | | | | | | | | | | | | |
| | | | |
Subscriptions | | | 15,810,376 | | | | 196,951,822 | | | | 13,392,496 | | | | 163,153,678 | |
| | | | |
Distributions reinvested | | | 304,678 | | | | 3,827,202 | | | | 359,121 | | | | 4,278,898 | |
| | | | |
Redemptions | | | (2,186,558 | ) | | | (27,192,565 | ) | | | (1,638,128 | ) | | | (19,979,657 | ) |
| |
Net increase | | | 13,928,496 | | | | 173,586,459 | | | | 12,113,489 | | | | 147,452,919 | |
| |
Class C shares | | | | | | | | | | | | | | | | |
| | | | |
Subscriptions | | | 6,930,709 | | | | 85,866,888 | | | | 3,874,057 | | | | 47,139,610 | |
| | | | |
Distributions reinvested | | | 76,987 | | | | 962,884 | | | | 59,294 | | | | 703,896 | |
| | | | |
Redemptions | | | (337,080 | ) | | | (4,161,119 | ) | | | (123,682 | ) | | | (1,507,195 | ) |
| |
Net increase | | | 6,670,616 | | | | 82,668,653 | | | | 3,809,669 | | | | 46,336,311 | |
| |
Class I shares | | | | | | | | | | | | | | | | |
| | | | |
Subscriptions | | | 4,265 | | | | 53,603 | | | | 25,947 | | | | 315,506 | |
| | | | |
Distributions reinvested | | | 121,143 | | | | 1,525,322 | | | | 479,748 | | | | 5,692,354 | |
| | | | |
Redemptions | | | (3,143,438 | ) | | | (39,021,622 | ) | | | (579,640 | ) | | | (7,045,750 | ) |
| |
Net decrease | | | (3,018,030 | ) | | | (37,442,697 | ) | | | (73,945 | ) | | | (1,037,890 | ) |
| |
Class R shares | | | | | | | | | | | | | | | | |
| | | | |
Subscriptions | | | 3,591 | | | | 43,001 | | | | 48,136 | | | | 585,405 | |
| | | | |
Distributions reinvested | | | 674 | | | | 8,477 | | | | 217 | | | | 2,591 | |
| | | | |
Redemptions | | | — | | | | — | | | | (6,386 | ) | | | (77,827 | ) |
| |
Net increase | | | 4,265 | | | | 51,478 | | | | 41,967 | | | | 510,169 | |
| |
Class R4 shares | | | | | | | | | | | | | | | | |
| | | | |
Subscriptions | | | 1,183,175 | | | | 14,880,263 | | | | 690,127 | | | | 8,532,044 | |
| | | | |
Distributions reinvested | | | 20,793 | | | | 262,540 | | | | 6,439 | | | | 77,322 | |
| | | | |
Redemptions | | | (217,841 | ) | | | (2,715,075 | ) | | | (54,109 | ) | | | (659,167 | ) |
| |
Net increase | | | 986,127 | | | | 12,427,728 | | | | 642,457 | | | | 7,950,199 | |
| |
Class R5 shares | | | | | | | | | | | | | | | | |
| | | | |
Subscriptions | | | 470,195 | | | | 6,000,164 | | | | 169,022 | | | | 2,065,537 | |
| | | | |
Distributions reinvested | | | 10,775 | | | | 136,226 | | | | 40,929 | | | | 485,320 | |
| | | | |
Redemptions | | | (564,651 | ) | | | (7,015,374 | ) | | | (1,136,024 | ) | | | (13,864,518 | ) |
| |
Net decrease | | | (83,681 | ) | | | (878,984 | ) | | | (926,073 | ) | | | (11,313,661 | ) |
| |
Class W shares | | | | | | | | | | | | | | | | |
| | | | |
Subscriptions | | | — | | | | — | | | | 15,604 | | | | 187,086 | |
| | | | |
Distributions reinvested | | | 18 | | | | 222 | | | | 6,931 | | | | 81,439 | |
| | | | |
Redemptions | | | (195 | ) | | | (2,365 | ) | | | (428,143 | ) | | | (5,247,540 | ) |
| |
Net decrease | | | (177 | ) | | | (2,143 | ) | | | (405,608 | ) | | | (4,979,015 | ) |
| |
Class Z shares | | | | | | | | | | | | | | | | |
| | | | |
Subscriptions | | | 8,727,818 | | | | 108,834,061 | | | | 1,922,452 | | | | 23,555,721 | |
| | | | |
Distributions reinvested | | | 73,919 | | | | 926,126 | | | | 46,769 | | | | 556,688 | |
| | | | |
Redemptions | | | (897,834 | ) | | | (10,999,081 | ) | | | (88,217 | ) | | | (1,077,830 | ) |
| |
Net increase | | | 7,903,903 | | | | 98,761,106 | | | | 1,881,004 | | | | 23,034,579 | |
| |
Total net increase | | | 26,391,519 | | | | 329,171,600 | | | | 17,082,960 | | | | 207,953,611 | |
| |
The accompanying Notes to Financial Statements are an integral part of this statement.
| | |
| 16 | | Semiannual Report 2014 |
| | |
| |
| Columbia Flexible Capital Income Fund | | |
Financial Highlights
The following tables are intended to help you understand the Fund’s financial performance. Certain information reflects financial results for a single share of a class held for the periods shown. Per share net investment income (loss) amounts are calculated based on average shares outstanding during the period. Total return assumes reinvestment of all dividends and distributions, if any. Total return does not reflect payment of sales charges, if any. Total return and portfolio turnover are not annualized for periods of less than one year. The portfolio turnover rate is calculated without regard to purchase and sales transactions of short-term instruments and certain derivatives, if any. If such transactions were included, the Fund’s portfolio turnover rate may be higher.
| | | | | | | | | | | | | | | | |
| |
| Six Months Ended
November 30, 2014 |
| | | Year Ended May 31, | |
Class A | | | (Unaudited) | | | | 2014 | | | | 2013 | | | | 2012(a) | |
Per share data | | | | | | | | | | | | | | | | |
Net asset value, beginning of period | | | $12.59 | | | | $11.98 | | | | $10.32 | | | | $10.00 | |
| | | | | | | | | | | | | | | | | |
Income from investment operations: | | | | | | | | | | | | | | | | |
| | | | |
Net investment income | | | 0.19 | | | | 0.43 | | | | 0.45 | | | | 0.33 | |
| | | | | | | | | | | | | | | | | |
Net realized and unrealized gain (loss) | | | (0.14 | ) | | | 0.96 | | | | 1.69 | | | | 0.16 | (b) |
| | | | | | | | | | | | | | | | | |
Total from investment operations | | | 0.05 | | | | 1.39 | | | | 2.14 | | | | 0.49 | |
| | | | | | | | | | | | | | | | | |
Less distributions to shareholders: | | | | | | | | | | | | | | | | |
| | | | |
Net investment income | | | (0.22 | ) | | | (0.44 | ) | | | (0.43 | ) | | | (0.17 | ) |
| | | | | | | | | | | | | | | | | |
Net realized gains | | | — | | | | (0.34 | ) | | | (0.05 | ) | | | (0.00 | )(c) |
| | | | | | | | | | | | | | | | | |
Total distributions to shareholders | | | (0.22 | ) | | | (0.78 | ) | | | (0.48 | ) | | | (0.17 | ) |
| | | | | | | | | | | | | | | | | |
Net asset value, end of period | | | $12.42 | | | | $12.59 | | | | $11.98 | | | | $10.32 | |
| | | | | | | | | | | | | | | | | |
Total return | | | 0.36 | % | | | 12.17 | % | | | 21.18 | % | | | 4.97 | % |
| | | | | | | | | | | | | | | | | |
Ratios to average net assets(d) | | | | | | | | | | | | | | | | |
| | | | |
Total gross expenses | | | 1.07 | %(e) | | | 1.17 | % | | | 1.85 | % | | | 2.02 | %(e) |
| | | | | | | | | | | | | | | | | |
Total net expenses(f) | | | 1.04 | %(e) | | | 1.02 | % | | | 1.10 | % | | | 1.10 | %(e) |
| | | | | | | | | | | | | | | | | |
Net investment income | | | 3.13 | %(e) | | | 3.52 | % | | | 4.03 | % | | | 3.91 | %(e) |
| | | | | | | | | | | | | | | | | |
Supplemental data | | | | | | | | | | | | | | | | |
| | | | |
Net assets, end of period (in thousands) | | | $339,507 | | | | $168,897 | | | | $15,534 | | | | $5,029 | |
| | | | | | | | | | | | | | | | | |
Portfolio turnover | | | 31 | % | | | 48 | % | | | 63 | % | | | 36 | % |
| | | | | | | | | | | | | | | | | |
Notes to Financial Highlights
| (a) | Based on operations from July 28, 2011 (commencement of operations) through the stated period end. |
| (b) | Calculation of the net gain (loss) per share (both realized and unrealized) does not correlate to the aggregate realized and unrealized gain (loss) presented in the Statement of Operations due to the timing of subscriptions and redemptions of Fund shares in relation to fluctuations in the market value of the portfolio. |
| (d) | In addition to the fees and expenses that the Fund bears directly, the Fund indirectly bears a pro rata share of the fees and expenses of any other funds in which it invests. Such indirect expenses are not included in the Fund’s reported expense ratios. |
| (f) | Total net expenses include the impact of certain fee waivers/expense reimbursements made by the Investment Manager and certain of its affiliates, if applicable. |
The accompanying Notes to Financial Statements are an integral part of this statement.
| | | | |
| Semiannual Report 2014 | | | 17 | |
| | |
| |
| | Columbia Flexible Capital Income Fund |
Financial Highlights (continued)
| | | | | | | | | | | | | | | | |
| |
| Six Months Ended
November 30, 2014 |
| | | Year Ended May 31, | |
Class C | | | (Unaudited) | | | | 2014 | | | | 2013 | | | | 2012(a) | |
Per share data | | | | | | | | | | | | | | | | |
Net asset value, beginning of period | | | $12.52 | | | | $11.91 | | | | $10.28 | | | | $10.00 | |
| | | | | | | | | | | | | | | | | |
Income from investment operations: | | | | | | | | | | | | | | | | |
| | | | |
Net investment income | | | 0.15 | | | | 0.33 | | | | 0.37 | | | | 0.27 | |
| | | | | | | | | | | | | | | | | |
Net realized and unrealized gain (loss) | | | (0.15 | ) | | | 0.97 | | | | 1.67 | | | | 0.15 | (b) |
| | | | | | | | | | | | | | | | | |
Total from investment operations | | | — | | | | 1.30 | | | | 2.04 | | | | 0.42 | |
| | | | | | | | | | | | | | | | | |
Less distributions to shareholders: | | | | | | | | | | | | | | | | |
| | | | |
Net investment income | | | (0.17 | ) | | | (0.35 | ) | | | (0.36 | ) | | | (0.14 | ) |
| | | | | | | | | | | | | | | | | |
Net realized gains | | | — | | | | (0.34 | ) | | | (0.05 | ) | | | (0.00 | )(c) |
| | | | | | | | | | | | | | | | | |
Total distributions to shareholders | | | (0.17 | ) | | | (0.69 | ) | | | (0.41 | ) | | | (0.14 | ) |
| | | | | | | | | | | | | | | | | |
Net asset value, end of period | | | $12.35 | | | | $12.52 | | | | $11.91 | | | | $10.28 | |
| | | | | | | | | | | | | | | | | |
Total return | | | (0.02 | %) | | | 11.38 | % | | | 20.26 | % | | | 4.27 | % |
| | | | | | | | | | | | | | | | | |
Ratios to average net assets(d) | | | | | | | | | | | | | | | | |
| | | | |
Total gross expenses | | | 1.82 | %(e) | | | 1.92 | % | | | 2.63 | % | | | 2.73 | %(e) |
| | | | | | | | | | | | | | | | | |
Total net expenses(f) | | | 1.79 | %(e) | | | 1.78 | % | | | 1.85 | % | | | 1.85 | %(e) |
| | | | | | | | | | | | | | | | | |
Net investment income | | | 2.40 | %(e) | | | 2.79 | % | | | 3.26 | % | | | 3.18 | %(e) |
| | | | | | | | | | | | | | | | | |
Supplemental data | | | | | | | | | | | | | | | | |
| | | | |
Net assets, end of period (in thousands) | | | $131,425 | | | | $49,739 | | | | $1,925 | | | | $193 | |
| | | | | | | | | | | | | | | | | |
Portfolio turnover | | | 31 | % | | | 48 | % | | | 63 | % | | | 36 | % |
| | | | | | | | | | | | | | | | | |
Notes to Financial Highlights
| (a) | Based on operations from July 28, 2011 (commencement of operations) through the stated period end. |
| (b) | Calculation of the net gain (loss) per share (both realized and unrealized) does not correlate to the aggregate realized and unrealized gain (loss) presented in the Statement of Operations due to the timing of subscriptions and redemptions of Fund shares in relation to fluctuations in the market value of the portfolio. |
| (d) | In addition to the fees and expenses that the Fund bears directly, the Fund indirectly bears a pro rata share of the fees and expenses of any other funds in which it invests. Such indirect expenses are not included in the Fund’s reported expense ratios. |
| (f) | Total net expenses include the impact of certain fee waivers/expense reimbursements made by the Investment Manager and certain of its affiliates, if applicable. |
The accompanying Notes to Financial Statements are an integral part of this statement.
| | |
| 18 | | Semiannual Report 2014 |
| | |
| |
| Columbia Flexible Capital Income Fund | | |
Financial Highlights (continued)
| | | | | | | | | | | | | | | | |
| |
| Six Months Ended
November 30, 2014 |
| | | Year Ended May 31, | |
Class I | | | (Unaudited) | | | | 2014 | | | | 2013 | | | | 2012(a) | |
Per share data | | | | | | | | | | | | | | | | |
Net asset value, beginning of period | | | $12.61 | | | | $11.98 | | | | $10.32 | | | | $10.00 | |
| | | | | | | | | | | | | | | | | |
Income from investment operations: | | | | | | | | | | | | | | | | |
| | | | |
Net investment income | | | 0.21 | | | | 0.47 | | | | 0.48 | | | | 0.37 | |
| | | | | | | | | | | | | | | | | |
Net realized and unrealized gain (loss) | | | (0.15 | ) | | | 0.98 | | | | 1.69 | | | | 0.14 | (b) |
| | | | | | | | | | | | | | | | | |
Total from investment operations | | | 0.06 | | | | 1.45 | | | | 2.17 | | | | 0.51 | |
| | | | | | | | | | | | | | | | | |
Less distributions to shareholders: | | | | | | | | | | | | | | | | |
| | | | |
Net investment income | | | (0.24 | ) | | | (0.48 | ) | | | (0.46 | ) | | | (0.19 | ) |
| | | | | | | | | | | | | | | | | |
Net realized gains | | | — | | | | (0.34 | ) | | | (0.05 | ) | | | (0.00 | )(c) |
| | | | | | | | | | | | | | | | | |
Total distributions to shareholders | | | (0.24 | ) | | | (0.82 | ) | | | (0.51 | ) | | | (0.19 | ) |
| | | | | | | | | | | | | | | | | |
Net asset value, end of period | | | $12.43 | | | | $12.61 | | | | $11.98 | | | | $10.32 | |
| | | | | | | | | | | | | | | | | |
Total return | | | 0.45 | % | | | 12.69 | % | | | 21.55 | % | | | 5.14 | % |
| | | | | | | | | | | | | | | | | |
Ratios to average net assets(d) | | | | | | | | | | | | | | | | |
| | | | |
Total gross expenses | | | 0.70 | %(e) | | | 0.77 | % | | | 0.86 | % | | | 1.12 | %(e) |
| | | | | | | | | | | | | | | | | |
Total net expenses(f) | | | 0.66 | %(e) | | | 0.69 | % | | | 0.78 | % | | | 0.74 | %(e) |
| | | | | | | | | | | | | | | | | |
Net investment income | | | 3.37 | %(e) | | | 3.84 | % | | | 4.33 | % | | | 4.19 | %(e) |
| | | | | | | | | | | | | | | | | |
Supplemental data | | | | | | | | | | | | | | | | |
| | | | |
Net assets, end of period (in thousands) | | | $48,980 | | | | $87,713 | | | | $84,270 | | | | $81,861 | |
| | | | | | | | | | | | | | | | | |
Portfolio turnover | | | 31 | % | | | 48 | % | | | 63 | % | | | 36 | % |
| | | | | | | | | | | | | | | | | |
Notes to Financial Highlights
| (a) | Based on operations from July 28, 2011 (commencement of operations) through the stated period end. |
| (b) | Calculation of the net gain (loss) per share (both realized and unrealized) does not correlate to the aggregate realized and unrealized gain (loss) presented in the Statement of Operations due to the timing of subscriptions and redemptions of Fund shares in relation to fluctuations in the market value of the portfolio. |
| (d) | In addition to the fees and expenses that the Fund bears directly, the Fund indirectly bears a pro rata share of the fees and expenses of any other funds in which it invests. Such indirect expenses are not included in the Fund’s reported expense ratios. |
| (f) | Total net expenses include the impact of certain fee waivers/expense reimbursements made by the Investment Manager and certain of its affiliates, if applicable. |
The accompanying Notes to Financial Statements are an integral part of this statement.
| | | | |
| Semiannual Report 2014 | | | 19 | |
| | |
| |
| | Columbia Flexible Capital Income Fund |
Financial Highlights (continued)
| | | | | | | | | | | | | | | | |
| |
| Six Months Ended
November 30, 2014 |
| | | Year Ended May 31, | |
Class R | | | (Unaudited) | | | | 2014 | | | | 2013 | | | | 2012(a) | |
Per share data | | | | | | | | | | | | | | | | |
Net asset value, beginning of period | | | $12.58 | | | | $11.97 | | | | $10.31 | | | | $10.00 | |
| | | | | | | | | | | | | | | | | |
Income from investment operations: | | | | | | | | | | | | | | | | |
| | | | |
Net investment income | | | 0.17 | | | | 0.41 | | | | 0.42 | | | | 0.30 | |
| | | | | | | | | | | | | | | | | |
Net realized and unrealized gain (loss) | | | (0.14 | ) | | | 0.95 | | | | 1.69 | | | | 0.16 | (b) |
| | | | | | | | | | | | | | | | | |
Total from investment operations | | | 0.03 | | | | 1.36 | | | | 2.11 | | | | 0.46 | |
| | | | | | | | | | | | | | | | | |
Less distributions to shareholders: | | | | | | | | | | | | | | | | |
| | | | |
Net investment income | | | (0.20 | ) | | | (0.41 | ) | | | (0.40 | ) | | | (0.15 | ) |
| | | | | | | | | | | | | | | | | |
Net realized gains | | | — | | | | (0.34 | ) | | | (0.05 | ) | | | (0.00 | )(c) |
| | | | | | | | | | | | | | | | | |
Total distributions to shareholders | | | (0.20 | ) | | | (0.75 | ) | | | (0.45 | ) | | | (0.15 | ) |
| | | | | | | | | | | | | | | | | |
Net asset value, end of period | | | $12.41 | | | | $12.58 | | | | $11.97 | | | | $10.31 | |
| | | | | | | | | | | | | | | | | |
Total return | | | 0.23 | % | | | 11.87 | % | | | 20.87 | % | | | 4.64 | % |
| | | | | | | | | | | | | | | | | |
Ratios to average net assets(d) | | | | | | | | | | | | | | | | |
| | | | |
Total gross expenses | | | 1.31 | %(e) | | | 1.41 | % | | | 2.12 | % | | | 2.42 | %(e) |
| | | | | | | | | | | | | | | | | |
Total net expenses(f) | | | 1.28 | %(e) | | | 1.29 | % | | | 1.35 | % | | | 1.35 | %(e) |
| | | | | | | | | | | | | | | | | |
Net investment income | | | 2.81 | %(e) | | | 3.38 | % | | | 3.79 | % | | | 3.48 | %(e) |
| | | | | | | | | | | | | | | | | |
Supplemental data | | | | | | | | | | | | | | | | |
| | | | |
Net assets, end of period (in thousands) | | | $577 | | | | $531 | | | | $3 | | | | $3 | |
| | | | | | | | | | | | | | | | | |
Portfolio turnover | | | 31 | % | | | 48 | % | | | 63 | % | | | 36 | % |
| | | | | | | | | | | | | | | | | |
Notes to Financial Highlights
| (a) | Based on operations from July 28, 2011 (commencement of operations) through the stated period end. |
| (b) | Calculation of the net gain (loss) per share (both realized and unrealized) does not correlate to the aggregate realized and unrealized gain (loss) presented in the Statement of Operations due to the timing of subscriptions and redemptions of Fund shares in relation to fluctuations in the market value of the portfolio. |
| (d) | In addition to the fees and expenses that the Fund bears directly, the Fund indirectly bears a pro rata share of the fees and expenses of any other funds in which it invests. Such indirect expenses are not included in the Fund’s reported expense ratios. |
| (f) | Total net expenses include the impact of certain fee waivers/expense reimbursements made by the Investment Manager and certain of its affiliates, if applicable. |
The accompanying Notes to Financial Statements are an integral part of this statement.
| | |
| 20 | | Semiannual Report 2014 |
| | |
| |
| Columbia Flexible Capital Income Fund | | |
Financial Highlights (continued)
| | | | | | | | | | | | |
| |
| Six Months Ended
November 30, 2014 |
| | | Year Ended May 31, | |
Class R4 | | | (Unaudited) | | | | 2014 | | | | 2013(a) | |
Per share data | | | | | | | | | | | | |
Net asset value, beginning of period | | | $12.68 | | | | $12.05 | | | | $10.93 | |
| | | | | | | | | | | | | |
Income from investment operations: | | | | | | | | | | | | |
| | | |
Net investment income | | | 0.21 | | | | 0.47 | | | | 0.36 | |
| | | | | | | | | | | | | |
Net realized and unrealized gain (loss) | | | (0.16 | ) | | | 0.97 | | | | 1.08 | |
| | | | | | | | | | | | | |
Total from investment operations | | | 0.05 | | | | 1.44 | | | | 1.44 | |
| | | | | | | | | | | | | |
Less distributions to shareholders: | | | | | | | | | | | | |
| | | |
Net investment income | | | (0.23 | ) | | | (0.47 | ) | | | (0.27 | ) |
| | | | | | | | | | | | | |
Net realized gains | | | — | | | | (0.34 | ) | | | (0.05 | ) |
| | | | | | | | | | | | | |
Total distributions to shareholders | | | (0.23 | ) | | | (0.81 | ) | | | (0.32 | ) |
| | | | | | | | | | | | | |
Net asset value, end of period | | | $12.50 | | | | $12.68 | | | | $12.05 | |
| | | | | | | | | | | | | |
Total return | | | 0.40 | % | | | 12.55 | % | | | 13.40 | % |
| | | | | | | | | | | | | |
Ratios to average net assets(b) | | | | | | | | | | | | |
| | | |
Total gross expenses | | | 0.82 | %(c) | | | 0.92 | % | | | 1.59 | %(c) |
| | | | | | | | | | | | | |
Total net expenses(d) | | | 0.79 | %(c) | | | 0.77 | % | | | 0.85 | %(c) |
| | | | | | | | | | | | | |
Net investment income | | | 3.38 | %(c) | | | 3.83 | % | | | 4.28 | %(c) |
| | | | | | | | | | | | | |
Supplemental data | | | | | | | | | | | | |
| | | |
Net assets, end of period (in thousands) | | | $21,289 | | | | $9,087 | | | | $897 | |
| | | | | | | | | | | | | |
Portfolio turnover | | | 31 | % | | | 48 | % | | | 63 | % |
| | | | | | | | | | | | | |
Notes to Financial Highlights
| (a) | Based on operations from November 8, 2012 (commencement of operations) through the stated period end. |
| (b) | In addition to the fees and expenses that the Fund bears directly, the Fund indirectly bears a pro rata share of the fees and expenses of any other funds in which it invests. Such indirect expenses are not included in the Fund’s reported expense ratios. |
| (d) | Total net expenses include the impact of certain fee waivers/expense reimbursements made by the Investment Manager and certain of its affiliates, if applicable. |
The accompanying Notes to Financial Statements are an integral part of this statement.
| | | | |
| Semiannual Report 2014 | | | 21 | |
| | |
| |
| | Columbia Flexible Capital Income Fund |
Financial Highlights (continued)
| | | | | | | | | | | | |
| |
| Six Months Ended
November 30, 2014 |
| | | Year Ended May 31, | |
Class R5 | | | (Unaudited) | | | | 2014 | | | | 2013(a) | |
Per share data | | | | | | | | | | | | |
Net asset value, beginning of period | | | $12.68 | | | | $12.05 | | | | $10.93 | |
| | | | | | | | | | | | | |
Income from investment operations: | | | | | | | | | | | | |
| | | |
Net investment income | | | 0.21 | | | | 0.47 | | | | 0.37 | |
| | | | | | | | | | | | | |
Net realized and unrealized gain (loss) | | | (0.14 | ) | | | 0.97 | | | | 1.07 | |
| | | | | | | | | | | | | |
Total from investment operations | | | 0.07 | | | | 1.44 | | | | 1.44 | |
| | | | | | | | | | | | | |
Less distributions to shareholders: | | | | | | | | | | | | |
| | | |
Net investment income | | | (0.24 | ) | | | (0.47 | ) | | | (0.27 | ) |
| | | | | | | | | | | | | |
Net realized gains | | | — | | | | (0.34 | ) | | | (0.05 | ) |
| | | | | | | | | | | | | |
Total distributions to shareholders | | | (0.24 | ) | | | (0.81 | ) | | | (0.32 | ) |
| | | | | | | | | | | | | |
Net asset value, end of period | | | $12.51 | | | | $12.68 | | | | $12.05 | |
| | | | | | | | | | | | | |
Total return | | | 0.50 | % | | | 12.55 | % | | | 13.41 | % |
| | | | | | | | | | | | | |
Ratios to average net assets(b) | | | | | | | | | | | | |
| | | |
Total gross expenses | | | 0.75 | %(c) | | | 0.82 | % | | | 0.86 | %(c) |
| | | | | | | | | | | | | |
Total net expenses(d) | | | 0.71 | %(c) | | | 0.76 | % | | | 0.84 | %(c) |
| | | | | | | | | | | | | |
Net investment income | | | 3.34 | %(c) | | | 3.84 | % | | | 4.29 | %(c) |
| | | | | | | | | | | | | |
Supplemental data | | | | | | | | | | | | |
| | | |
Net assets, end of period (in thousands) | | | $4,570 | | | | $5,695 | | | | $16,569 | |
| | | | | | | | | | | | | |
Portfolio turnover | | | 31 | % | | | 48 | % | | | 63 | % |
| | | | | | | | | | | | | |
Notes to Financial Highlights
| (a) | Based on operations from November 8, 2012 (commencement of operations) through the stated period end. |
| (b) | In addition to the fees and expenses that the Fund bears directly, the Fund indirectly bears a pro rata share of the fees and expenses of any other funds in which it invests. Such indirect expenses are not included in the Fund’s reported expense ratios. |
| (d) | Total net expenses include the impact of certain fee waivers/expense reimbursements made by the Investment Manager and certain of its affiliates, if applicable. |
The accompanying Notes to Financial Statements are an integral part of this statement.
| | |
| 22 | | Semiannual Report 2014 |
| | |
| |
| Columbia Flexible Capital Income Fund | | |
Financial Highlights (continued)
| | | | | | | | | | | | | | | | |
| |
| Six Months Ended
November 30, 2014 |
| | | Year Ended May 31, | |
Class W | | | (Unaudited) | | | | 2014 | | | | 2013 | | | | 2012(a) | |
Per share data | | | | | | | | | | | | | | | | |
Net asset value, beginning of period | | | $12.60 | | | | $11.98 | | | | $10.32 | | | | $10.00 | |
| | | | | | | | | | | | | | | | | |
Income from investment operations: | | | | | | | | | | | | | | | | |
| | | | |
Net investment income | | | 0.19 | | | | 0.43 | | | | 0.44 | | | | 0.28 | |
| | | | | | | | | | | | | | | | | |
Net realized and unrealized gain (loss) | | | (0.16 | ) | | | 0.97 | | | | 1.69 | | | | 0.21 | (b) |
| | | | | | | | | | | | | | | | | |
Total from investment operations | | | 0.03 | | | | 1.40 | | | | 2.13 | | | | 0.49 | |
| | | | | | | | | | | | | | | | | |
Less distributions to shareholders: | | | | | | | | | | | | | | | | |
| | | | |
Net investment income | | | (0.21 | ) | | | (0.44 | ) | | | (0.42 | ) | | | (0.17 | ) |
| | | | | | | | | | | | | | | | | |
Net realized gains | | | — | | | | (0.34 | ) | | | (0.05 | ) | | | (0.00 | )(c) |
| | | | | | | | | | | | | | | | | |
Total distributions to shareholders | | | (0.21 | ) | | | (0.78 | ) | | | (0.47 | ) | | | (0.17 | ) |
| | | | | | | | | | | | | | | | | |
Net asset value, end of period | | | $12.42 | | | | $12.60 | | | | $11.98 | | | | $10.32 | |
| | | | | | | | | | | | | | | | | |
Total return | | | 0.25 | % | | | 12.22 | % | | | 21.13 | % | | | 4.92 | % |
| | | | | | | | | | | | | | | | | |
Ratios to average net assets(d) | | | | | | | | | | | | | | | | |
| | | | |
Total gross expenses | | | 1.07 | %(e) | | | 1.17 | % | | | 1.91 | % | | | 1.76 | %(e) |
| | | | | | | | | | | | | | | | | |
Total net expenses(f) | | | 1.07 | %(e) | | | 1.08 | % | | | 1.10 | % | | | 1.10 | %(e) |
| | | | | | | | | | | | | | | | | |
Net investment income | | | 3.00 | %(e) | | | 3.52 | % | | | 3.97 | % | | | 3.23 | %(e) |
| | | | | | | | | | | | | | | | | |
Supplemental data | | | | | | | | | | | | | | | | |
| | | | |
Net assets, end of period (in thousands) | | | $13 | | | | $16 | | | | $4,875 | | | | $7,979 | |
| | | | | | | | | | | | | | | | | |
Portfolio turnover | | | 31 | % | | | 48 | % | | | 63 | % | | | 36 | % |
| | | | | | | | | | | | | | | | | |
Notes to Financial Highlights
| (a) | Based on operations from July 28, 2011 (commencement of operations) through the stated period end. |
| (b) | Calculation of the net gain (loss) per share (both realized and unrealized) does not correlate to the aggregate realized and unrealized gain (loss) presented in the Statement of Operations due to the timing of subscriptions and redemptions of Fund shares in relation to fluctuations in the market value of the portfolio. |
| (d) | In addition to the fees and expenses that the Fund bears directly, the Fund indirectly bears a pro rata share of the fees and expenses of any other funds in which it invests. Such indirect expenses are not included in the Fund’s reported expense ratios. |
| (f) | Total net expenses include the impact of certain fee waivers/expense reimbursements made by the Investment Manager and certain of its affiliates, if applicable. |
The accompanying Notes to Financial Statements are an integral part of this statement.
| | | | |
| Semiannual Report 2014 | | | 23 | |
| | |
| |
| | Columbia Flexible Capital Income Fund |
Financial Highlights (continued)
| | | | | | | | | | | | | | | | |
| |
| Six Months Ended
November 30, 2014 |
| | | Year Ended May 31, | |
Class Z | | | (Unaudited) | | | | 2014 | | | | 2013 | | | | 2012(a) | |
Per share data | | | | | | | | | | | | | | | | |
Net asset value, beginning of period | | | $12.60 | | | | $11.98 | | | | $10.32 | | | | $10.00 | |
| | | | | | | | | | | | | | | | | |
Income from investment operations: | | | | | | | | | | | | | | | | |
| | | | |
Net investment income | | | 0.21 | | | | 0.46 | | | | 0.48 | | | | 0.36 | |
| | | | | | | | | | | | | | | | | |
Net realized and unrealized gain (loss) | | | (0.16 | ) | | | 0.97 | | | | 1.68 | | | | 0.14 | (b) |
| | | | | | | | | | | | | | | | | |
Total from investment operations | | | 0.05 | | | | 1.43 | | | | 2.16 | | | | 0.50 | |
| | | | | | | | | | | | | | | | | |
Less distributions to shareholders: | | | | | | | | | | | | | | | | |
| | | | |
Net investment income | | | (0.23 | ) | | | (0.47 | ) | | | (0.45 | ) | | | (0.18 | ) |
| | | | | | | | | | | | | | | | | |
Net realized gains | | | — | | | | (0.34 | ) | | | (0.05 | ) | | | (0.00 | )(c) |
| | | | | | | | | | | | | | | | | |
Total distributions to shareholders | | | (0.23 | ) | | | (0.81 | ) | | | (0.50 | ) | | | (0.18 | ) |
| | | | | | | | | | | | | | | | | |
Net asset value, end of period | | | $12.42 | | | | $12.60 | | | | $11.98 | | | | $10.32 | |
| | | | | | | | | | | | | | | | | |
Total return | | | 0.41 | % | | | 12.54 | % | | | 21.46 | % | | | 5.09 | % |
| | | | | | | | | | | | | | | | | |
Ratios to average net assets(d) | | | | | | | | | | | | | | | | |
| | | | |
Total gross expenses | | | 0.82 | %(e) | | | 0.92 | % | | | 1.61 | % | | | 1.82 | %(e) |
| | | | | | | | | | | | | | | | | |
Total net expenses(f) | | | 0.79 | %(e) | | | 0.75 | % | | | 0.85 | % | | | 0.85 | %(e) |
| | | | | | | | | | | | | | | | | |
Net investment income | | | 3.45 | %(e) | | | 3.82 | % | | | 4.30 | % | | | 4.16 | %(e) |
| | | | | | | | | | | | | | | | | |
Supplemental data | | | | | | | | | | | | | | | | |
| | | | |
Net assets, end of period (in thousands) | | | $125,373 | | | | $27,600 | | | | $3,716 | | | | $1,126 | |
| | | | | | | | | | | | | | | | | |
Portfolio turnover | | | 31 | % | | | 48 | % | | | 63 | % | | | 36 | % |
| | | | | | | | | | | | | | | | | |
Notes to Financial Highlights
| (a) | Based on operations from July 28, 2011 (commencement of operations) through the stated period end. |
| (b) | Calculation of the net gain (loss) per share (both realized and unrealized) does not correlate to the aggregate realized and unrealized gain (loss) presented in the Statement of Operations due to the timing of subscriptions and redemptions of Fund shares in relation to fluctuations in the market value of the portfolio. |
| (d) | In addition to the fees and expenses that the Fund bears directly, the Fund indirectly bears a pro rata share of the fees and expenses of any other funds in which it invests. Such indirect expenses are not included in the Fund’s reported expense ratios. |
| (f) | Total net expenses include the impact of certain fee waivers/expense reimbursements made by the Investment Manager and certain of its affiliates, if applicable. |
The accompanying Notes to Financial Statements are an integral part of this statement.
| | |
| 24 | | Semiannual Report 2014 |
| | |
| |
| Columbia Flexible Capital Income Fund | | |
Notes to Financial Statements
November 30, 2014 (Unaudited)
Note 1. Organization
Columbia Flexible Capital Income Fund (the Fund), a series of Columbia Funds Series Trust II (the Trust), is a diversified fund. The Trust is registered under the Investment Company Act of 1940, as amended (the 1940 Act), as an open-end management investment company organized as a Massachusetts business trust.
Fund Shares
The Trust may issue an unlimited number of shares (without par value). The Fund offers Class A, Class C, Class I, Class R, Class R4, Class R5, Class W and Class Z shares. Although all share classes generally have identical voting, dividend and liquidation rights, each share class votes separately when required by the Trust’s organizational documents or by law. Different share classes pay different distribution amounts to the extent the expenses of such share classes differ, and distributions in liquidation will be proportional to the net asset value of each share class. Each share class has its own expense structure and sales charges.
Class A shares are subject to a maximum front-end sales charge of 5.75% based on the initial investment amount. Class A shares purchased without an initial sales charge in accounts aggregating $1 million to $50 million at the time of purchase are subject to a contingent deferred sales charge (CDSC) if the shares are sold within 18 months of purchase, charged as follows: 1.00% CDSC if redeemed within 12 months of purchase, and 0.50% CDSC if redeemed more than 12, but less than 18, months after purchase.
Class C shares are subject to a 1.00% CDSC on shares redeemed within one year of purchase.
Class I shares are not subject to sales charges and are available only to the Columbia Family of Funds.
Class R shares are not subject to sales charges and are generally available only to certain retirement plans and other investors as described in the Fund’s prospectus.
Class R4 shares are not subject to sales charges and are generally available only to omnibus retirement plans and certain investors as described in the Fund’s prospectus.
Class R5 shares are not subject to sales charges and are generally available only to investors purchasing through authorized investment professionals and omnibus retirement plans.
Class W shares are not subject to sales charges and are available only to investors purchasing through authorized investment programs managed by investment professionals, including discretionary managed account programs.
Class Z shares are not subject to sales charges and are available only to eligible investors, which are subject to different investment minimums as described in the Fund’s prospectus.
Note 2. Summary of Significant Accounting Policies
Basis of Preparation
The Fund is an investment company that applies the accounting and reporting guidance in the Financial Accounting Standards Board (FASB) Accounting Standards Codification Topic 946, Financial Services — Investment Companies (ASC 946). The financial statements are prepared in accordance with U.S. generally accepted accounting principles (GAAP) which requires management to make certain estimates and assumptions that affect the reported amounts of assets and liabilities, the disclosure of contingent assets and liabilities at the date of the financial statements and the reported amounts of income and expenses during the reporting period. Actual results could differ from those estimates.
The following is a summary of significant accounting policies followed by the Fund in the preparation of its financial statements.
Security Valuation
All equity securities are valued at the close of business of the New York Stock Exchange (NYSE). Equity securities are valued at the last quoted sales price on the principal exchange or market on which they trade, except for securities traded on the NASDAQ Stock Market, which are valued at the NASDAQ official close price. Unlisted securities or listed securities for which there were no sales during the day are valued at the mean of the latest quoted bid and ask prices on such exchanges or markets.
Debt securities generally are valued by pricing services approved by the Board of Trustees (the Board) based upon market transactions for normal, institutional-size trading units of similar securities. The services may use various pricing techniques that take into account, as applicable, factors such as yield, quality, coupon rate, maturity, type of issue, trading characteristics and other data, as well as broker quotes. Debt securities for which quotations are readily available may also be valued based upon an over-the-counter or exchange bid quotation.
Foreign equity securities are valued based on quotations from the principal market in which such securities are traded. If any foreign security prices are not readily available as a result of limited share activity, the securities are valued at the mean of the latest quoted bid and ask prices on such exchanges or markets. Foreign currency exchange rates are generally determined at 4:00 p.m. Eastern (U.S.) time. Many securities
| | | | |
| Semiannual Report 2014 | | | 25 | |
| | |
| |
| | Columbia Flexible Capital Income Fund |
Notes to Financial Statements (continued)
November 30, 2014 (Unaudited)
markets and exchanges outside the U.S. close prior to the close of the NYSE; therefore, the closing prices for securities in such markets or on such exchanges may not fully reflect events that occur after such close but before the close of the NYSE. In those situations, foreign securities will be fair valued pursuant to a policy adopted by the Board, including, if available, utilizing a third party pricing service to determine these fair values. The third party pricing service takes into account multiple factors, including, but not limited to, movements in the U.S. securities markets, certain depositary receipts, futures contracts and foreign exchange rates that have occurred subsequent to the close of the foreign exchange or market, to determine a good faith estimate that reasonably reflects the current market conditions as of the close of the NYSE. The fair value of a security is likely to be different from the quoted or published price, if available.
Investments in open-end investment companies, including money market funds, are valued at their net asset value.
Investments for which market quotations are not readily available, or that have quotations which management believes are not reliable, are valued at fair value as determined in good faith under procedures established by and under the general supervision of the Board. If a security or class of securities (such as foreign securities) is valued at fair value, such value is likely to be different from the quoted or published price for the security.
The determination of fair value often requires significant judgment. To determine fair value, management may use assumptions including but not limited to future cash flows and estimated risk premiums. Multiple inputs from various sources may be used to determine fair value.
Foreign Currency Transactions and Translations
The values of all assets and liabilities denominated in foreign currencies are generally translated into U.S. dollars at exchange rates determined at the close of the NYSE. Net realized and unrealized gains (losses) on foreign currency transactions and translations include gains (losses) arising from the fluctuation in exchange rates between trade and settlement dates on securities transactions, gains (losses) arising from the disposition of foreign currency and currency gains (losses) between the accrual and payment dates on dividends, interest income and foreign withholding taxes.
For financial statement purposes, the Fund does not distinguish that portion of gains (losses) on investments which is due to changes in foreign exchange rates from that which is due to changes in market prices of the investments. Such fluctuations are included with the net realized and unrealized gains (losses) on investments in the Statement of Operations.
Security Transactions
Security transactions are accounted for on the trade date. Cost is determined and gains (losses) are based upon the specific identification method for both financial statement and federal income tax purposes.
Income Recognition
Corporate actions and dividend income are generally recorded net of any non-reclaimable tax withholdings, on the ex-dividend date or upon receipt of ex-dividend notification in the case of certain foreign securities.
Interest income is recorded on an accrual basis. Market premiums and discounts, including original issue discounts, are amortized and accreted, respectively, over the expected life of the security on all debt securities, unless otherwise noted.
The Fund may place a debt security on non-accrual status and reduce related interest income when it becomes probable that the interest will not be collected and the amount of uncollectible interest can be reasonably estimated. A defaulted debt security is removed from non-accrual status when the issuer resumes interest payments or when collectability of interest is reasonably assured.
The Fund may receive distributions from holdings in business development companies (BDCs), exchange-traded funds (ETFs), other regulated investment companies (RICs), and real estate investment trusts (REITs), which report information on the character of their distributions annually. These distributions are allocated to dividend income, capital gain and return of capital based on actual information reported. To the extent actual information has not yet been reported by the REITs, estimates for return of capital are made by the Fund’s management. Return of capital is recorded as a reduction of the cost basis of securities held. If the Fund no longer owns the applicable securities, return of capital is recorded as a realized gain. Management’s estimates are subsequently adjusted when the actual character of the distributions is disclosed by the REITs, which could result in a proportionate change in return of capital to shareholders. No estimates are made for the BDCs, ETFs, and RICs.
Awards from class action litigation are recorded as a reduction of cost basis if the Fund still owns the applicable securities on the payment date. If the Fund no longer owns the applicable securities, the proceeds are recorded as realized gains.
Expenses
General expenses of the Trust are allocated to the Fund and other funds of the Trust based upon relative net assets or other expense allocation methodologies determined by the nature of the expense. Expenses directly attributable to the Fund are
| | |
| 26 | | Semiannual Report 2014 |
| | |
| |
| Columbia Flexible Capital Income Fund | | |
Notes to Financial Statements (continued)
November 30, 2014 (Unaudited)
charged to the Fund. Expenses directly attributable to a specific class of shares are charged to that share class.
Determination of Class Net Asset Value
All income, expenses (other than class-specific expenses, which are charged to that share class, as shown in the Statement of Operations) and realized and unrealized gains (losses) are allocated to each class of the Fund on a daily basis, based on the relative net assets of each class, for purposes of determining the net asset value of each class.
Federal Income Tax Status
The Fund intends to qualify each year as a regulated investment company under Subchapter M of the Internal Revenue Code, as amended, and will distribute substantially all of its taxable income (including net short-term capital gains), if any, for its tax year, and as such will not be subject to federal income taxes. In addition, the Fund intends to distribute in each calendar year substantially all of its net investment income, capital gains and certain other amounts, if any, such that the Fund should not be subject to federal excise tax. Therefore, no federal income or excise tax provision is recorded.
Foreign Taxes
The Fund may be subject to foreign taxes on income, gains on investments or currency repatriation, a portion of which may be recoverable. The Fund will accrue such taxes and recoveries, as applicable, based upon its current interpretation of tax rules and regulations that exist in the markets in which it invests.
Realized gains in certain countries may be subject to foreign taxes at the Fund level, based on statutory rates. The Fund accrues for such foreign taxes on realized and unrealized gains at the appropriate rate for each jurisdiction, as applicable. The amount, if any, is disclosed as a liability on the Statement of Assets and Liabilities.
Distributions to Shareholders
Distributions from net investment income, if any, are declared and paid each calendar quarter. Net realized capital gains, if any, are distributed at least annually. Income distributions and capital gain distributions are determined in accordance with federal income tax regulations, which may differ from GAAP.
Guarantees and Indemnifications
Under the Trust’s organizational documents and, in some cases, by contract, its officers and trustees are indemnified against certain liabilities arising out of the performance of their duties to the Trust or its funds. In addition, certain of the Fund’s contracts with its service providers contain general indemnification clauses. The Fund’s maximum exposure under these arrangements is unknown since the amount of any
future claims that may be made against the Fund cannot be determined, and the Fund has no historical basis for predicting the likelihood of any such claims.
Note 3. Fees and Compensation Paid to Affiliates
Investment Management Fees
Under an Investment Management Services Agreement, Columbia Management Investment Advisers, LLC (the Investment Manager), a wholly-owned subsidiary of Ameriprise Financial, Inc. (Ameriprise Financial), determines which securities will be purchased, held or sold. The investment management fee is an annual fee that is equal to a percentage of the Fund’s average daily net assets that declines from 0.59% to 0.50% as the Fund’s net assets increase. The annualized effective investment management fee rate for the six months ended November 30, 2014 was 0.59% of the Fund’s average daily net assets.
Administration Fees
Under an Administrative Services Agreement, the Investment Manager also serves as the Fund Administrator. The Fund pays the Fund Administrator an annual fee for administration and accounting services equal to a percentage of the Fund’s average daily net assets that declines from 0.06% to 0.04% as the Fund’s net assets increase. The annualized effective administration fee rate for the six months ended November 30, 2014 was 0.06% of the Fund’s average daily net assets.
Other Expenses
Other expenses are for, among other things, miscellaneous expenses of the Fund or the Board, including payments to a company providing limited administrative services to the Fund and the Board. That company’s expenses include boardroom and office expense, employee compensation, employee health and retirement benefits, and certain other expenses. For the six months ended November 30, 2014, other expenses paid by the Fund to this company were $876.
Compensation of Board Members
Board members are compensated for their services to the Fund as disclosed in the Statement of Operations. Under a Deferred Compensation Plan (the Plan), the Board members who are not “interested persons” of the Fund, as defined under the 1940 Act, may elect to defer payment of up to 100% of their compensation. Deferred amounts are treated as though equivalent dollar amounts had been invested in shares of certain funds managed by the Investment Manager. The Fund’s liability for these amounts is adjusted for market value changes and remains in the Fund until distributed in accordance with the Plan.
| | | | |
| Semiannual Report 2014 | | | 27 | |
| | |
| |
| | Columbia Flexible Capital Income Fund |
Notes to Financial Statements (continued)
November 30, 2014 (Unaudited)
Transfer Agent Fees
Under a Transfer and Dividend Disbursing Agent Agreement, Columbia Management Investment Services Corp. (the Transfer Agent), an affiliate of the Investment Manager and a wholly-owned subsidiary of Ameriprise Financial, is responsible for providing transfer agency services to the Fund. The Transfer Agent has contracted with Boston Financial Data Services (BFDS) to serve as sub-transfer agent.
Effective November 1, 2014, the Transfer Agent receives a monthly transfer agency fee based on the number or the average value of accounts, depending on the type of account. Prior to November 1, 2014, the Transfer Agent received a monthly account-based service fee based on the number of open accounts. In addition, the Transfer Agent also receives sub-transfer agency fees based on a percentage of the average aggregate value of the Fund’s shares maintained in omnibus accounts (other than omnibus accounts for which American Enterprise Investment Services Inc. is the broker of record or accounts where the beneficial shareholder is a customer of Ameriprise Financial Services, Inc., which receive a per account fee). The Transfer Agent pays the fees of BFDS for services as sub-transfer agent and is not entitled to reimbursement for such fees from the Fund (with the exception of out-of-pocket fees).
The Transfer Agent also receives compensation from the Fund for various shareholder services and reimbursements for certain out-of-pocket fees. Class I shares do not pay transfer agent fees. Total transfer agent fees for Class R5 shares are subject to an annual limitation of not more than 0.05% of the average daily net assets attributable to Class R5 shares.
For the six months ended November 30, 2014, the Fund’s annualized effective transfer agent fee rates as a percentage of average daily net assets of each class were as follows:
| | | | |
Class A | | | 0.11 | % |
Class C | | | 0.11 | |
Class R | | | 0.11 | |
Class R4 | | | 0.11 | |
Class R5 | | | 0.05 | |
Class W | | | 0.11 | |
Class Z | | | 0.12 | |
An annual minimum account balance fee of $20 may apply to certain accounts with a value below the applicable share class’s initial minimum investment requirements to reduce the impact of small accounts on transfer agent fees. These minimum account balance fees are remitted to the Fund and recorded as part of expense reductions in the Statement of Operations. For the six months ended November 30, 2014, no minimum account balance fees were charged by the Fund.
Distribution Fees
The Fund has an agreement with Columbia Management Investment Distributors, Inc. (the Distributor), an affiliate of the Investment Manager and a wholly-owned subsidiary of Ameriprise Financial, for distribution and shareholder services. Under a Plan and Agreement of Distribution, the Fund pays a fee at an annual rate of up to 0.25% of the Fund’s average daily net assets attributable to Class A and Class W shares, a fee at an annual rate of up to 0.50% of the Fund’s average daily net assets attributable to Class R shares (of which up to 0.25% may be used for shareholder services) and a fee at an annual rate of up to 1.00% of the Fund’s average daily net assets attributable to Class C shares. For Class C shares, of the 1.00% fee, up to 0.75% is reimbursed for distribution expenses.
The amount of distribution expenses incurred by the Distributor and not yet reimbursed (unreimbursed expense) was approximately $495,000 for Class C shares. This amount is based on the most recent information available as of September 30, 2014, and may be recovered from future payments under the distribution plan or CDSCs. To the extent the unreimbursed expense has been fully recovered, the distribution fee is reduced.
Sales Charges
Sales charges, including front-end charges and CDSCs, received by the Distributor for distributing Fund shares were $1,452,044 for Class A and $9,742 for Class C shares for the six months ended November 30, 2014.
Expenses Waived/Reimbursed by the Investment Manager and its Affiliates
The Investment Manager and certain of its affiliates have contractually agreed to waive fees and/or reimburse expenses (excluding certain fees and expenses described below) for the periods disclosed below, unless sooner terminated at the sole discretion of the Board, so that the Fund’s net operating expenses, after giving effect to fees waived/expenses reimbursed and any balance credits and/or overdraft charges from the Fund’s custodian, do not exceed the following annual rates as a percentage of the class’ average daily net assets:
| | | | | | | | |
| | | | | | | | | |
| | | October 1, 2014 through September 30, 2015 | | | Prior to October 1, 2014 | |
Class A | | | 1.16 | % | | | 1.10 | % |
Class C | | | 1.91 | | | | 1.85 | |
Class I | | | 0.83 | | | | 0.65 | |
Class R | | | 1.41 | | | | 1.35 | |
Class R4 | | | 0.91 | | | | 0.85 | |
Class R5 | | | 0.88 | | | | 0.70 | |
Class W | | | 1.16 | | | | 1.10 | |
Class Z | | | 0.91 | | | | 0.85 | |
| | |
| 28 | | Semiannual Report 2014 |
| | |
| |
| Columbia Flexible Capital Income Fund | | |
Notes to Financial Statements (continued)
November 30, 2014 (Unaudited)
Under the agreement governing these fee waivers and/or expense reimbursement arrangements, the following fees and expenses are excluded from the waiver/reimbursement commitment, and therefore will be paid by the Fund, if applicable: taxes (including foreign transaction taxes), expenses associated with investments in affiliated and non-affiliated pooled investment vehicles (including mutual funds and exchange-traded funds), transaction costs and brokerage commissions, costs related to any securities lending program, dividend expenses associated with securities sold short, inverse floater program fees and expenses, transaction charges and interest on borrowed money, interest, extraordinary expenses and any other expenses the exclusion of which is specifically approved by the Board. This agreement may be modified or amended only with approval from all parties.
Note 4. Federal Tax Information
The timing and character of income and capital gain distributions are determined in accordance with income tax regulations, which may differ from GAAP because of temporary or permanent book to tax differences.
At November 30, 2014, the cost of investments for federal income tax purposes was approximately $650,322,000 and the aggregate gross approximate unrealized appreciation and depreciation based on that cost was:
| | | | |
Unrealized appreciation | | | $35,074,000 | |
Unrealized depreciation | | | (15,970,000 | ) |
Net unrealized appreciation | | | $19,104,000 | |
Management of the Fund has concluded that there are no significant uncertain tax positions in the Fund that would require recognition in the financial statements. However, management’s conclusion may be subject to review and adjustment at a later date based on factors including, but not limited to, new tax laws, regulations, and administrative interpretations (including relevant court decisions). Generally, the Fund’s federal tax returns for the prior three fiscal years remain subject to examination by the Internal Revenue Service.
Note 5. Portfolio Information
The cost of purchases and proceeds from sales of securities, excluding short-term obligations and certain derivatives, if any, aggregated to $471,540,939 and $150,974,783, respectively, for the six months ended November 30, 2014. The amount of purchase and sale activity impacts the portfolio turnover rate reported in the Financial Highlights.
Note 6. Shareholder Concentration
At November 30, 2014, affiliated shareholders of record owned 55.0% of the outstanding shares of the Fund in one or more accounts. Subscription and redemption activity by concentrated accounts may have a significant effect on the operations of the Fund.
Note 7. Line of Credit
The Fund has entered into a revolving credit facility with a syndicate of banks led by JPMorgan Chase Bank N.A. (JPMorgan) whereby the Fund may borrow for the temporary funding of shareholder redemptions or for other temporary or emergency purposes. The credit facility agreement, as amended, which is a collective agreement between the Fund and certain other funds managed by the Investment Manager, severally and not jointly, permits collective borrowings up to $500 million. Interest is charged to each participating fund based on its borrowings at a rate equal to the higher of (i) the overnight federal funds rate plus 1.00% or (ii) the one-month LIBOR rate plus 1.00%. Each borrowing under the credit facility matures no later than 60 days after the date of borrowing. The Fund also pays a commitment fee equal to its pro rata share of the amount of the credit facility at a rate of 0.075% per annum. The commitment fee is included in other expenses in the Statement of Operations.
Effective December 9, 2014, the Fund extended its revolving credit facility with JPMorgan. The credit facility agreement, as amended, permits collective borrowings up to $550 million under the same terms and interest rates as described above.
The Fund had no borrowings during the six months ended November 30, 2014.
Note 8. Significant Risks
Credit Risk
Credit risk is the risk that the value of debt securities in the Fund’s portfolio may decline because the issuer may default and fail to pay interest or repay principal when due. Rating agencies assign credit ratings to debt securities to indicate their credit risk. Lower rated or unrated debt securities held by the Fund may present increased credit risk as compared to higher-rated debt securities.
Interest Rate Risk
Interest rate risk is the risk of losses attributable to changes in interest rates. In general, if prevailing interest rates rise, the values of debt securities tend to fall, and if interest rates fall, the values of debt securities tend to rise. Actions by governments and central banking authorities can result in
| | | | |
| Semiannual Report 2014 | | | 29 | |
| | |
| |
| | Columbia Flexible Capital Income Fund |
Notes to Financial Statements (continued)
November 30, 2014 (Unaudited)
increases in interest rates. Increasing interest rates may negatively affect the value of debt securities held by the Fund, resulting in a negative impact on the Fund’s performance and net asset value per share. In general, the longer the maturity or duration of a debt security, the greater its sensitivity to changes in interest rates.
Liquidity Risk
Liquidity risk is the risk associated with a lack of marketability of investments which may make it difficult to sell the investment at a desirable time or price. Changing regulatory, market or other conditions or environments (for example, the interest rate or credit environments) may adversely affect the liquidity of the Fund’s investments. The Fund may have to accept a lower selling price for the holding, sell other investments, or forego another, more appealing investment opportunity. Generally, the less liquid the market at the time the Fund sells a portfolio investment, the greater the risk of loss or decline of value to the Fund. A less liquid market can lead to an increase in Fund redemptions, which may negatively impact Fund performance and net asset value per share, including, for example, if the Fund is forced to sell securities in a down market.
Note 9. Subsequent Events
Management has evaluated the events and transactions that have occurred through the date the financial statements were issued. Other than as noted in Note 7 above, there were no items requiring adjustment of the financial statements or additional disclosure.
Note 10. Information Regarding Pending and Settled Legal Proceedings
In December 2005, without admitting or denying the allegations, American Express Financial Corporation (AEFC, which is now known as Ameriprise Financial, Inc. (Ameriprise Financial)) entered into settlement agreements with the Securities and Exchange Commission (SEC) and Minnesota Department of Commerce (MDOC) related to market timing activities. As a result, AEFC was censured and ordered to cease and desist from committing or causing any violations of certain provisions of the Investment Advisers Act of 1940, the Investment Company Act of 1940, and various Minnesota laws. AEFC agreed to pay disgorgement of $10 million and civil money penalties of $7 million. AEFC also agreed to retain an independent distribution consultant to assist in developing a plan for distribution of all disgorgement and civil penalties ordered by the SEC in accordance with various undertakings detailed at www.sec.gov/litigation/admin/ia-2451.pdf. Ameriprise Financial and its affiliates
have cooperated with the SEC and the MDOC in these legal proceedings, and have made regular reports to the Funds’ Boards of Trustees.
Ameriprise Financial and certain of its affiliates have historically been involved in a number of legal, arbitration and regulatory proceedings, including routine litigation, class actions, and governmental actions, concerning matters arising in connection with the conduct of their business activities. Ameriprise Financial believes that the Funds are not currently the subject of, and that neither Ameriprise Financial nor any of its affiliates are the subject of, any pending legal, arbitration or regulatory proceedings that are likely to have a material adverse effect on the Funds or the ability of Ameriprise Financial or its affiliates to perform under their contracts with the Funds. Ameriprise Financial is required to make quarterly (10-Q), annual (10-K) and, as necessary, 8-K filings with the Securities and Exchange Commission on legal and regulatory matters that relate to Ameriprise Financial and its affiliates. Copies of these filings may be obtained by accessing the SEC website at www.sec.gov.
There can be no assurance that these matters, or the adverse publicity associated with them, will not result in increased fund redemptions, reduced sale of fund shares or other adverse consequences to the Funds. Further, although we believe proceedings are not likely to have a material adverse effect on the Funds or the ability of Ameriprise Financial or its affiliates to perform under their contracts with the Funds, these proceedings are subject to uncertainties and, as such, we are unable to estimate the possible loss or range of loss that may result. An adverse outcome in one or more of these proceedings could result in adverse judgments, settlements, fines, penalties or other relief that could have a material adverse effect on the consolidated financial condition or results of operations of Ameriprise Financial.
| | |
| 30 | | Semiannual Report 2014 |
| | |
| |
| Columbia Flexible Capital Income Fund | | |
Important Information About This Report
Each fund mails one shareholder report to each shareholder address. If you would like more than one report, please call shareholder services at 800.345.6611 and additional reports will be sent to you.
The policy of the Board is to vote the proxies of the companies in which each fund holds investments consistent with the procedures as stated in the Statement of Additional Information (SAI). You may obtain a copy of the SAI without charge by calling 800.345.6611; contacting your financial intermediary; visiting columbiamanagement.com; or searching the website of the Securities and Exchange Commission (SEC) at sec.gov. Information regarding how each fund voted proxies relating to portfolio securities is filed with the SEC by August 31 for the most recent 12-month period ending June 30 of that year, and is available without charge by visiting columbiamanagement.com; or searching the website of the SEC at sec.gov.
Each fund files a complete schedule of portfolio holdings with the SEC for the first and third quarters of each fiscal year on Form N-Q. Each fund’s Form N-Q is available on the SEC’s website at sec.gov and may be reviewed and copied at the SEC’s Public Reference Room in Washington, D.C. Information on the operation of the Public Reference Room may be obtained by calling 800.SEC.0330. Each fund’s complete schedule of portfolio holdings, as filed on Form N-Q, can also be obtained without charge, upon request, by calling 800.345.6611.
| | | | |
| Semiannual Report 2014 | | | 31 | |

Columbia Flexible Capital Income Fund
P.O. Box 8081
Boston, MA 02266-8081
columbiamanagement.com
This information is for use with concurrent or prior delivery of a fund prospectus. Please read and consider the investment objectives, risks, charges and expenses for any fund carefully before investing. For a prospectus and, if available, a summary prospectus, which contains this and other important information about the Fund, go to columbiamanagement.com. The Fund is distributed by Columbia Management Investment Distributors, Inc., member FINRA, and managed by Columbia Management Investment Advisers, LLC.
© 2015 Columbia Management Investment Advisers, LLC. All rights reserved.
SAR148_05_E01_(01/15)
| | |
Semiannual Report November 30, 2014 | |  |
| | |
Columbia Multi-Advisor Small Cap Value Fund | | |


President’s Message
Note: Effective January 1, 2015, Christopher O. Petersen will serve as the President of the Columbia Funds, replacing J. Kevin Connaughton. Mr. Petersen has served as a Fund officer since 2007.
Dear Shareholders,
People invest for different reasons, though typically based on a desire for one or more outcomes, e.g., generating an appropriate income stream in retirement, navigating a changing interest rate environment, maximizing after-tax returns, growing assets to achieve financial goals, or easing the impact of volatile markets. Achieving these desired outcomes can be particularly challenging given the unpredictability of complex global markets. To continue to effectively deliver solutions that help clients achieve desired outcomes, an asset manager must have the resources and investment framework to meaningfully embody a global perspective.
With this in mind, I thought it important to highlight excerpts from a piece written by Jeffrey L. Knight, Global Head of Investment Solutions and Asset Allocation, in which he touches on some of these issues emphasizing the importance of maintaining a diversified portfolio with the flexibility to adapt to changing market conditions.
I encourage you to read the article in its entirety. To access the full article and for other insights on current market events and investment opportunities, please visit the Columbia Management blog at columbiamanagement.com/blog.
On behalf of the Funds, I want to acknowledge the contributions of J. Kevin Connaughton and to thank him for his years of trusted, dedicated service. He has worked tirelessly as an advocate for shareholders and a leader of the Columbia Funds. In taking on this new role, I look forward to continuing the work of Mr. Connaughton, helping build on the strong foundation of the Columbia Funds.
Thank you for your confidence. We look forward to continuing to serve your investment needs for many years to come.
Best regards,

Christopher O. Petersen
President, Columbia Funds
Excerpts from:
2015 Outlook: Same song, slightly different arrangement
By Jeffrey L. Knight, Global Head of Investment Solutions and Asset Allocation
Jeffrey L. Knight, CFA, is global head of investment solutions and asset allocation for Columbia Management Investment Advisers, LLC. Mr. Knight leads a team of six portfolio managers responsible for our broad suite of multi-asset strategies including capital allocation, risk allocation, absolute return and total return funds.
What’s different in 2015?
As stationary as market conditions have felt lately, circumstances are always evolving. For 2015, while the essential elements of our outlook remain in place, we highlight two important changes in the market environment:
| > | | The relative value of global equities vs. global bonds actually improved during 2014. |
| > | | Monetary policy around the globe has become desynchronized, with the U.S. Federal Reserve (the Fed) contemplating rate hikes, while the European Central Bank (ECB) and the Bank of Japan (BOJ) intensify their monetary stimulus programs. |
In our view, while equities will most likely continue to dominate, the complex interactions of today’s conditions elevate the role of dynamic risk management. We argue that investors will need a cross-asset surveillance methodology to detect tactical threats.
Semiannual Report 2014
President’s Message (continued)
Monetary policies diverge
The Fed has given strong signals that economic growth in the United States has reached self-sustaining momentum and no longer needs unconventional efforts to support the expansion. The withdrawal and suspension of large-scale asset purchases was only the first step in the evolution toward policy normalization. In 2015, we expect to see a change in forward guidance and, most likely, the first interest rate increase in years.
These actions stand in stark contrast with the direction of the monetary policies of other central banks as they double down on efforts to support growth and avoid deflation. The Bank of Japan has announced its intention to increase both qualitative and quantitative easing on an enormous scale, expanding purchases of Japanese government bonds (JGBs), exchange-traded funds and real estate investment trusts. They intend to coordinate this with government pension investment fund purchases by shifting into riskier assets through sales of JGBs.
With evidence of deterioration on both the economic and inflation front, the European Central Bank (ECB) also plans to take bolder actions. These include increased purchases of asset-backed securities and covered bonds in both the primary and secondary market, together with the long-term refinancing operations that will steer the ECB’s balance sheet higher by €1 trillion.
The latest to jump on the bandwagon was the People’s Bank of China (PBOC), which cut its benchmark interest rate for the first time in over two years to support private sector investment, as targeted liquidity injections have had minimal effect on sinking economic growth.
Investment strategy for 2015
We remain convinced that relative value favors stocks over bonds, even though stocks outperformed in 2014. Therefore, you will hear the same recommendation from us for 2015. Equities remain the most important asset class for generating returns.
Within equities, the currency-based advantage of U.S. stocks is offset somewhat by the valuation advantage from overseas equities, notably in Japan. Indeed, economic growth in Japan and Europe are essential ingredients for equities to continue to perform well. If Japanese and European stocks cannot produce gains, then the global economy will probably be stuck in a near recessionary funk.
Devising a strategy to manage risk and stabilize portfolio values in the event that equities do not perform well remains complicated. Bond yields are low enough that they are not likely to offer powerful diversification benefits. We affirm our recommendation for three additional sources of portfolio stability:
| > | | Non-traditional diversifiers, such as liquid alternatives, alternative beta exposures and absolute return strategies |
| > | | Explicit downside hedges, such as put options (with emphasis on managing the related expense) |
| > | | Flexibility and a methodology for active risk reduction when appropriate (Our cross-asset methodologies should prove valuable in this regard.) |
Our overall stance for investment strategy will likely remain in place until the valuation advantage for equities has been priced away, or until the healing process for the global economy reverses.
Please visit columbiamanagement.com/blog to read the entire article.
Investors should consider the investment objectives, risks, charges and expenses of a mutual fund carefully before investing. For a free prospectus and, if available, a summary prospectus, which contains this and other important information about a fund, visit columbiamanagement.com. The prospectus should be read carefully before investing.
The views expressed are as of December 2014, may change as market or other conditions change, and may differ from views expressed by other Columbia Management Investment Advisers, LLC (CMIA) associates or affiliates. Actual investments or investment decisions made by CMIA and its affiliates, whether for its own account or on behalf of clients, will not necessarily reflect the views expressed. This information is not intended to provide investment advice and does not account for individual investor circumstances. Investment decisions should always be made based on an investor’s specific financial needs, objectives, goals, time horizon and risk tolerance. Asset classes described may not be suitable for all investors. Past performance does not guarantee future results, and no forecast should be considered a guarantee either. Since economic and market change frequently, there can be no assurance that the trends described here will continue or that the forecasts are accurate.
Diversification does not assure a profit or protect against loss.
Columbia Funds are distributed by Columbia Management Investment Distributors, Inc., member FINRA, and managed by Columbia Management Investment Advisers, LLC.
© 2015 Columbia Management Investment Advisers, LLC. All rights reserved
Semiannual Report 2014
| | |
| |
| | Columbia Multi-Advisor Small Cap Value Fund |
Table of Contents
Fund Investment Manager
Columbia Management Investment
Advisers, LLC
225 Franklin Street
Boston, MA 02110
Fund Distributor
Columbia Management Investment
Distributors, Inc.
225 Franklin Street
Boston, MA 02110
Fund Transfer Agent
Columbia Management Investment
Services Corp.
P.O. Box 8081
Boston, MA 02266-8081
For more information about any of the funds, please visit columbiamanagement.com or call 800.345.6611. Customer Service Representatives are available to answer your questions Monday through Friday from 8 a.m. to 7 p.m. Eastern time.
The views expressed in this report reflect the current views of the respective parties. These views are not guarantees of future performance and involve certain risks, uncertainties and assumptions that are difficult to predict, so actual outcomes and results may differ significantly from the views expressed. These views are subject to change at any time based upon economic, market or other conditions and the respective parties disclaim any responsibility to update such views. These views may not be relied on as investment advice and, because investment decisions for a Columbia Fund are based on numerous factors, may not be relied on as an indication of trading intent on behalf of any particular Columbia Fund. References to specific securities should not be construed as a recommendation or investment advice.
Semiannual Report 2014
| | |
| |
| Columbia Multi-Advisor Small Cap Value Fund | | |
Performance Overview
(Unaudited)
Performance Summary
| > | | Columbia Multi-Advisor Small Cap Value Fund (the Fund) Class A shares returned 1.46% excluding sales charges for the six-month period that ended November 30, 2014. |
| > | | The Fund underperformed its benchmark, the Russell 2000 Value Index, which returned 1.66% for the same time frame. |
| | | | | | | | | | | | | | | | | | |
Average Annual Total Returns (%) (for period ended November 30, 2014) | |
| | | Inception | | 6 Months
cumulative | | | 1 Year | | | 5 Years | | | 10 Years | |
Class A | | 06/18/01 | | | | | | | | | | | | | | | | |
Excluding sales charges | | | | | 1.46 | | | | 4.51 | | | | 15.11 | | | | 7.91 | |
Including sales charges | | | | | -4.37 | | | | -1.53 | | | | 13.75 | | | | 7.27 | |
Class B | | 06/18/01 | | | | | | | | | | | | | | | | |
Excluding sales charges | | | | | 1.04 | | | | 3.77 | | | | 14.20 | | | | 7.16 | |
Including sales charges | | | | | -3.96 | | | | -0.86 | | | | 13.96 | | | | 7.16 | |
Class C | | 06/18/01 | | | | | | | | | | | | | | | | |
Excluding sales charges | | | | | 1.19 | | | | 3.91 | | | | 14.24 | | | | 7.18 | |
Including sales charges | | | | | 0.19 | | | | 2.99 | | | | 14.24 | | | | 7.18 | |
Class I | | 03/04/04 | | | 1.63 | | | | 5.04 | | | | 15.57 | | | | 8.35 | |
Class K | | 06/18/01 | | | 1.54 | | | | 4.74 | | | | 15.27 | | | | 8.12 | |
Class R* | | 12/11/06 | | | 1.34 | | | | 4.27 | | | | 14.79 | | | | 7.58 | |
Class R4* | | 12/11/06 | | | 1.56 | | | | 4.86 | | | | 15.16 | | | | 7.94 | |
Class R5* | | 12/11/06 | | | 1.78 | | | | 5.09 | | | | 15.60 | | | | 8.25 | |
Class Z* | | 09/27/10 | | | 1.51 | | | | 4.83 | | | | 15.30 | | | | 8.00 | |
Russell 2000 Value Index | | | | | 1.66 | | | | 3.36 | | | | 15.31 | | | | 6.85 | |
Returns for Class A are shown with and without the maximum initial sales charge of 5.75%. Returns for Class B are shown with and without the applicable contingent deferred sales charge (CDSC) of 5.00% in the first year, declining to 1.00% in the sixth year and eliminated thereafter. Returns for Class C are shown with and without the 1.00% CDSC for the first year only. The Fund’s other classes are not subject to sales charges and have limited eligibility. Please see the Fund’s prospectus for details. Performance for different share classes will vary based on differences in sales charges and fees associated with each class. All results shown assume reinvestment of distributions during the period. Returns do not reflect the deduction of taxes that a shareholder may pay on Fund distributions or on the redemption of Fund shares. Performance results reflect the effect of any fee waivers or reimbursements of Fund expenses by Columbia Management Investment Advisers, LLC and/or any of its affiliates. Absent these fee waivers or expense reimbursement arrangements, performance results would have been lower.
The performance information shown represents past performance and is not a guarantee of future results. The investment return and principal value of your investment will fluctuate so that your shares, when redeemed, may be worth more or less than their original cost. Current performance may be lower or higher than the performance information shown. You may obtain performance information current to the most recent month-end by contacting your financial intermediary, visiting columbiamanagement.com or calling 800.345.6611.
| * | The returns shown for periods prior to the share class inception date (including returns for the Life of the Fund, if shown, which are since Fund inception) include the returns of the Fund’s oldest share class. Since the Fund launched more than one share class at its inception, Class A shares were used. These returns are adjusted to reflect any higher class-related operating expenses of the newer share classes, as applicable. Please visit columbiamanagement.com/investment-products/mutual-funds/appended-performance for more information. |
The Russell 2000 Value Index, an unmanaged index, tracks the performance of those Russell 2000 Index companies with lower price-to-book ratios and lower forecasted growth values.
Indices are not available for investment, are not professionally managed and do not reflect sales charges, fees, brokerage commissions, taxes or other expenses of investing. Securities in the Fund may not match those in an index.
| | |
| |
| | Columbia Multi-Advisor Small Cap Value Fund |
Portfolio Overview
(Unaudited)
Portfolio Management
Barrow, Hanley, Mewhinney & Strauss, LLC
James McClure, CFA
John Harloe, CFA
Donald Smith & Co., Inc.
Donald Smith
Richard Greenberg, CFA
Metropolitan West Capital Management, LLC
Samir Sikka
Segall Bryant & Hamill, LLC
Mark Dickherber, CFA, CPA
Shawn Nicholson
Morningstar Style Box™

The Morningstar Style Box™ is based on a fund’s portfolio holdings. For equity funds, the vertical axis shows the market capitalization of the stocks owned, and the horizontal axis shows investment style (value, blend, or growth). Information shown is based on the most recent data provided by Morningstar.
©2015 Morningstar, Inc. All rights reserved. The Morningstar information contained herein: (1) is proprietary to Morningstar and/or its content providers; (2) may not be copied or distributed; and (3) is not warranted to be accurate, complete or timely. Neither Morningstar nor its content providers are responsible for any damages or losses arising from any use of this information.
| | | | |
Top Ten Holdings (%) (at November 30, 2014) | |
Sanmina Corp. | | | 2.6 | |
AerCap Holdings NV | | | 2.2 | |
Platinum Underwriters Holdings Ltd. | | | 1.6 | |
Resolute Forest Products, Inc. | | | 1.4 | |
Dana Holding Corp. | | | 1.4 | |
Micron Technology, Inc. | | | 1.4 | |
American Axle & Manufacturing Holdings, Inc. | | | 1.1 | |
Whirlpool Corp. | | | 1.1 | |
KAR Auction Services, Inc. | | | 1.1 | |
Haemonetics Corp. | | | 1.1 | |
Percentages indicated are based upon total investments (excluding Money Market Funds).
For further detail about these holdings, please refer to the section entitled “Portfolio of Investments.”
Fund holdings are as of the date given, are subject to change at any time, and are not recommendations to buy or sell any security.
| | | | |
Portfolio Breakdown (%)
(at November 30, 2014) | |
Common Stocks | | | 90.7 | |
Consumer Discretionary | | | 13.0 | |
Consumer Staples | | | 2.9 | |
Energy | | | 4.0 | |
Financials | | | 18.0 | |
Health Care | | | 5.6 | |
Industrials | | | 20.0 | |
Information Technology | | | 19.3 | |
Materials | | | 6.8 | |
Utilities | | | 1.1 | |
Money Market Funds | | | 9.3 | |
Rights | | | 0.0 | (a) |
Industrials | | | 0.0 | (a) |
Total | | | 100.0 | |
Percentages indicated are based upon total investments. The Fund’s portfolio composition is subject to change.
| | |
| |
| Columbia Multi-Advisor Small Cap Value Fund | | |
Understanding Your Fund’s Expenses
(Unaudited)
As an investor, you incur two types of costs. There are transaction costs, which generally include sales charges on purchases and may include redemption fees. There are also ongoing costs, which generally include management fees, distribution and/or service fees, and other fund expenses. The following information is intended to help you understand your ongoing costs (in dollars) of investing in the Fund and to help you compare these costs with the ongoing costs of investing in other mutual funds.
Analyzing Your Fund’s Expenses
To illustrate these ongoing costs, we have provided examples and calculated the expenses paid by investors in each share class of the Fund during the period. The actual and hypothetical information in the table is based on an initial investment of $1,000 at the beginning of the period indicated and held for the entire period. Expense information is calculated two ways and each method provides you with different information. The amount listed in the “Actual” column is calculated using the Fund’s actual operating expenses and total return for the period. You may use the Actual information, together with the amount invested, to estimate the expenses that you paid over the period. Simply divide your account value by $1,000 (for example, an $8,600 account value divided by $1,000 = 8.6), then multiply the results by the expenses paid during the period under the “Actual” column. The amount listed in the “Hypothetical” column assumes a 5% annual rate of return before expenses (which is not the Fund’s actual return) and then applies the Fund’s actual expense ratio for the period to the hypothetical return. You should not use the hypothetical account values and expenses to estimate either your actual account balance at the end of the period or the expenses you paid during the period. See “Compare With Other Funds” below for details on how to use the hypothetical data.
Compare With Other Funds
Since all mutual funds are required to include the same hypothetical calculations about expenses in shareholder reports, you can use this information to compare the ongoing cost of investing in the Fund with other funds. To do so, compare the hypothetical example with the 5% hypothetical examples that appear in the shareholder reports of other funds. As you compare hypothetical examples of other funds, it is important to note that hypothetical examples are meant to highlight the ongoing costs of investing in a fund only and do not reflect any transaction costs, such as sales charges, or redemption or exchange fees. Therefore, the hypothetical calculations are useful in comparing ongoing costs only, and will not help you determine the relative total costs of owning different funds. If transaction costs were included in these calculations, your costs would be higher.
June 1, 2014 – November 30, 2014
| | | | | | | | | | | | | | | | | | | | | | | | | | | | |
| | | Account Value at the
Beginning of the
Period ($) | | | Account Value at the
End of the
Period ($) | | | Expenses Paid During
the Period ($) | | | Fund’s Annualized
Expense Ratio (%) | |
| | | | Actual | | | | Hypothetical | | | | Actual | | | | Hypothetical | | | | Actual | | | | Hypothetical | | | | Actual | |
Class A | | | 1,000.00 | | | | 1,000.00 | | | | 1,014.60 | | | | 1,018.00 | | | | 6.98 | | | | 6.99 | | | | 1.39 | |
Class B | | | 1,000.00 | | | | 1,000.00 | | | | 1,010.40 | | | | 1,014.26 | | | | 10.73 | | | | 10.75 | | | | 2.14 | |
Class C | | | 1,000.00 | | | | 1,000.00 | | | | 1,011.90 | | | | 1,014.26 | | | | 10.73 | | | | 10.75 | | | | 2.14 | |
Class I | | | 1,000.00 | | | | 1,000.00 | | | | 1,016.30 | | | | 1,020.19 | | | | 4.78 | | | | 4.78 | | | | 0.95 | |
Class K | | | 1,000.00 | | | | 1,000.00 | | | | 1,015.40 | | | | 1,018.70 | | | | 6.28 | | | | 6.29 | | | | 1.25 | |
Class R | | | 1,000.00 | | | | 1,000.00 | | | | 1,013.40 | | | | 1,016.75 | | | | 8.23 | | | | 8.25 | | | | 1.64 | |
Class R4 | | | 1,000.00 | | | | 1,000.00 | | | | 1,015.60 | | | | 1,019.25 | | | | 5.73 | | | | 5.74 | | | | 1.14 | |
Class R5 | | | 1,000.00 | | | | 1,000.00 | | | | 1,017.80 | | | | 1,019.95 | | | | 5.03 | | | | 5.04 | | | | 1.00 | |
Class Z | | | 1,000.00 | | | | 1,000.00 | | | | 1,015.10 | | | | 1,019.25 | | | | 5.73 | | | | 5.74 | | | | 1.14 | |
Expenses paid during the period are equal to the annualized expense ratio for each class as indicated above, multiplied by the average account value over the period and then multiplied by the number of days in the Fund’s most recent fiscal half year and divided by 365.
Expenses do not include fees and expenses incurred indirectly by the Fund from its investment in underlying funds, including affiliated and non-affiliated pooled investment vehicles, such as mutual funds and exchange-traded funds.
Had Columbia Management Investment Advisers, LLC and/or certain of its affiliates not waived/reimbursed certain fees and expenses, account value at the end of the period would have been reduced.
| | |
| |
| | Columbia Multi-Advisor Small Cap Value Fund |
Portfolio of Investments
November 30, 2014 (Unaudited)
(Percentages represent value of investments compared to net assets)
| | | | | | | | |
| Common Stocks 90.8% | |
| Issuer | | Shares | | | Value ($) | |
Consumer Discretionary 13.0% | |
Auto Components 2.3% | |
| | |
American Axle & Manufacturing Holdings, Inc.(a) | | | 177,839 | | | | 3,795,084 | |
| | |
Dana Holding Corp. | | | 217,619 | | | | 4,613,523 | |
| | | | | | | | | |
Total | | | | | | | 8,408,607 | |
|
Hotels, Restaurants & Leisure 1.6% | |
| | |
Interval Leisure Group, Inc. | | | 72,416 | | | | 1,574,324 | |
| | |
SeaWorld Entertainment, Inc. | | | 144,500 | | | | 2,411,705 | |
| | |
Six Flags Entertainment Corp. | | | 28,700 | | | | 1,166,655 | |
| | |
Wendy’s Co. (The) | | | 82,440 | | | | 718,876 | |
| | | | | | | | | |
Total | | | | | | | 5,871,560 | |
|
Household Durables 2.3% | |
| | |
Taylor Morrison Home Corp., Class A(a) | | | 65,500 | | | | 1,266,770 | |
| | |
Tempur Sealy International, Inc(a) | | | 58,370 | | | | 3,330,009 | |
| | |
Whirlpool Corp. | | | 20,149 | | | | 3,751,139 | |
| | | | | | | | | |
Total | | | | | | | 8,347,918 | |
|
Leisure Products 1.1% | |
| | |
Arctic Cat, Inc. | | | 22,030 | | | | 728,092 | |
| | |
Brunswick Corp. | | | 66,755 | | | | 3,316,388 | |
| | | | | | | | | |
Total | | | | | | | 4,044,480 | |
|
Media 0.2% | |
| | |
John Wiley & Sons, Inc., Class A | | | 15,428 | | | | 921,360 | |
|
Multiline Retail 0.3% | |
| | |
Big Lots, Inc. | | | 21,650 | | | | 1,099,820 | |
|
Specialty Retail 5.2% | |
| | |
Abercrombie & Fitch Co., Class A | | | 31,500 | | | | 908,775 | |
| | |
ANN, Inc.(a) | | | 22,710 | | | | 834,138 | |
| | |
Ascena Retail Group, Inc.(a) | | | 89,450 | | | | 1,197,735 | |
| | |
Cato Corp. (The), Class A | | | 24,640 | | | | 988,557 | |
| | |
Chico’s FAS, Inc. | | | 136,470 | | | | 2,165,779 | |
| | |
Children’s Place, Inc. (The) | | | 29,910 | | | | 1,676,755 | |
| | |
DSW, Inc., Class A | | | 58,550 | | | | 2,077,354 | |
| | |
Finish Line, Inc., Class A (The) | | | 16,180 | | | | 461,777 | |
| | |
Guess?, Inc. | | | 23,710 | | | | 537,506 | |
| | |
Kirkland’s, Inc.(a) | | | 41,580 | | | | 903,118 | |
| | |
Men’s Wearhouse, Inc. (The) | | | 55,086 | | | | 2,573,618 | |
| | |
Office Depot, Inc.(a) | | | 356,650 | | | | 2,364,589 | |
| | |
Vitamin Shoppe, Inc.(a) | | | 37,300 | | | | 1,785,178 | |
| | |
West Marine, Inc.(a) | | | 54,460 | | | | 595,248 | |
| | | | | | | | | |
Total | | | | | | | 19,070,127 | |
| | | | | | | | | |
Total Consumer Discretionary | | | | | | | 47,763,872 | |
| | | | | | | | |
| Common Stocks (continued) | |
| Issuer | | Shares | | | Value ($) | |
Consumer Staples 3.0% | |
Beverages 0.5% | |
| | |
Treasury Wine Estates Ltd., ADR | | | 441,500 | | | | 1,788,075 | |
|
Food & Staples Retailing 0.1% | |
| | |
Pantry, Inc. (The)(a) | | | 19,260 | | | | 511,353 | |
|
Food Products 2.3% | |
| | |
Chiquita Brands International, Inc.(a) | | | 126,210 | | | | 1,824,996 | |
| | |
Dean Foods Co. | | | 111,500 | | | | 1,901,075 | |
| | |
Flowers Foods, Inc. | | | 76,796 | | | | 1,497,522 | |
| | |
J&J Snack Foods Corp. | | | 10,100 | | | | 1,061,005 | |
| | |
Post Holdings, Inc.(a) | | | 50,500 | | | | 2,020,000 | |
| | | | | | | | | |
Total | | | | | | | 8,304,598 | |
|
Tobacco 0.1% | |
| | |
Alliance One International, Inc.(a) | | | 165,343 | | | | 299,271 | |
| | | | | | | | | |
Total Consumer Staples | | | | | | | 10,903,297 | |
|
| |
Energy 4.0% | |
Energy Equipment & Services 1.9% | |
| | |
Forum Energy Technologies, Inc.(a) | | | 55,400 | | | | 1,330,154 | |
| | |
Gulfmark Offshore, Inc., Class A | | | 15,019 | | | | 391,245 | |
| | |
Helix Energy Solutions Group, Inc.(a) | | | 57,100 | | | | 1,305,877 | |
| | |
McDermott International, Inc.(a) | | | 99,580 | | | | 353,509 | |
| | |
Paragon Offshore PLC | | | 325,700 | | | | 1,182,291 | |
| | |
Parker Drilling Co.(a) | | | 402,150 | | | | 1,427,633 | |
| | |
Tidewater, Inc. | | | 25,000 | | | | 772,750 | |
| | | | | | | | | |
Total | | | | | | | 6,763,459 | |
|
Oil, Gas & Consumable Fuels 2.1% | |
| | |
Advantage Oil & Gas Ltd.(a) | | | 304,421 | | | | 1,363,806 | |
| | |
Ardmore Shipping Corp. | | | 72,500 | | | | 740,225 | |
| | |
Energy XXI Ltd. | | | 97,700 | | | | 391,777 | |
| | |
LinnCo LLC | | | 29,534 | | | | 484,653 | |
| | |
Nordic American Tankers Ltd. | | | 73,000 | | | | 654,080 | |
| | |
Oasis Petroleum, Inc.(a) | | | 85,250 | | | | 1,566,895 | |
| | |
Petroquest Energy, Inc.(a) | | | 292,195 | | | | 1,086,965 | |
| | |
RSP Permian, Inc.(a) | | | 51,747 | | | | 1,126,015 | |
| | |
Sanchez Energy Corp.(a) | | | 36,070 | | | | 407,230 | |
| | | | | | | | | |
Total | | | | | | | 7,821,646 | |
| | | | | | | | | |
Total Energy | | | | | | | 14,585,105 | |
| | |
| | | | | | | | |
Financials 18.0% | |
Banks 8.5% | |
| | |
Ameris Bancorp | | | 61,100 | | | | 1,536,665 | |
| | |
BancFirst Corp. | | | 12,480 | | | | 798,845 | |
| | |
BankUnited, Inc. | | | 25,280 | | | | 763,456 | |
The accompanying Notes to Financial Statements are an integral part of this statement.
| | |
| |
| Columbia Multi-Advisor Small Cap Value Fund | | |
Portfolio of Investments (continued)
November 30, 2014 (Unaudited)
| | | | | | | | |
| Common Stocks (continued) | |
| Issuer | | Shares | | | Value ($) | |
Banner Corp. | | | 19,480 | | | | 802,381 | |
| | |
Cathay General Bancorp | | | 39,500 | | | | 1,002,510 | |
| | |
City National Corp. | | | 40,873 | | | | 3,154,987 | |
| | |
First Busey Corp. | | | 104,800 | | | | 686,440 | |
| | |
First Community Bancshares, Inc. | | | 46,140 | | | | 713,324 | |
| | |
First Horizon National Corp. | | | 115,300 | | | | 1,471,228 | |
| | |
First Niagara Financial Group, Inc. | | | 131,265 | | | | 1,072,435 | |
| | |
FirstMerit Corp. | | | 110,050 | | | | 1,968,794 | |
| | |
Hancock Holding Co. | | | 43,400 | | | | 1,419,614 | |
| | |
Hanmi Financial Corp. | | | 66,125 | | | | 1,329,112 | |
| | |
Investors Bancorp, Inc. | | | 101,400 | | | | 1,096,134 | |
| | |
Lakeland Financial Corp. | | | 28,820 | | | | 1,140,984 | |
| | |
Peoples Bancorp, Inc. | | | 34,990 | | | | 847,108 | |
| | |
Prosperity Bancshares, Inc. | | | 46,270 | | | | 2,599,449 | |
| | |
Simmons First National Corp., Class A | | | 29,580 | | | | 1,197,103 | |
| | |
Texas Capital Bancshares, Inc.(a) | | | 46,100 | | | | 2,541,493 | |
| | |
Umpqua Holdings Corp. | | | 162,310 | | | | 2,757,647 | |
| | |
WesBanco, Inc. | | | 13,099 | | | | 435,018 | |
| | |
Zions Bancorporation | | | 68,235 | | | | 1,914,674 | |
| | | | | | | | | |
Total | | | | | | | 31,249,401 | |
|
Consumer Finance 0.4% | |
| | |
Encore Capital Group, Inc.(a) | | | 31,750 | | | | 1,362,393 | |
|
Insurance 3.9% | |
| | |
American National Insurance Co. | | | 27,300 | | | | 3,133,494 | |
| | |
Horace Mann Educators Corp. | | | 101,700 | | | | 3,183,210 | |
| | |
Montpelier Re Holdings Ltd. | | | 80,358 | | | | 2,736,190 | |
| | |
Platinum Underwriters Holdings Ltd. | | | 71,025 | | | | 5,267,924 | |
| | | | | | | | | |
Total | | | | | | | 14,320,818 | |
|
Real Estate Investment Trusts (REITs) 3.0% | |
| | |
Capstead Mortgage Corp. | | | 41,150 | | | | 535,361 | |
| | |
Chimera Investment Corp. | | | 278,750 | | | | 942,175 | |
| | |
Equity Commonwealth | | | 43,200 | | | | 1,098,576 | |
| | |
Granite Real Estate Investment Trust | | | 90,205 | | | | 3,139,134 | |
| | |
Parkway Properties, Inc. | | | 73,704 | | | | 1,435,754 | |
| | |
PennyMac Mortgage Investment Trust | | | 74,700 | | | | 1,618,749 | |
| | |
Redwood Trust, Inc. | | | 87,200 | | | | 1,704,760 | |
| | |
Urstadt Biddle Properties, Inc., Class A | | | 29,550 | | | | 655,419 | |
| | | | | | | | | |
Total | | | | | | | 11,129,928 | |
|
Real Estate Management & Development 0.4% | |
| | |
Jones Lang LaSalle, Inc. | | | 11,450 | | | | 1,667,807 | |
|
Thrifts & Mortgage Finance 1.8% | |
| | |
Berkshire Hills Bancorp, Inc. | | | 10,634 | | | | 269,891 | |
| | |
Essent Group Ltd.(a) | | | 78,060 | | | | 1,967,112 | |
| | |
Ladder Capital Corp., Class A(a) | | | 75,500 | | | | 1,427,705 | |
| | | | | | | | |
| Common Stocks (continued) | |
| Issuer | | Shares | | | Value ($) | |
Ocwen Financial Corp.(a) | | | 84,650 | | | | 1,941,871 | |
| | |
TFS Financial Corp. | | | 59,460 | | | | 902,008 | |
| | | | | | | | | |
Total | | | | | | | 6,508,587 | |
| | | | | | | | | |
Total Financials | | | | | | | 66,238,934 | |
| | |
| | | | | | | | |
Health Care 5.6% | |
Biotechnology 0.2% | |
| | |
Emergent Biosolutions, Inc.(a) | | | 36,480 | | | | 906,893 | |
|
Health Care Equipment & Supplies 3.0% | |
| | |
Alere, Inc.(a) | | | 24,070 | | | | 960,152 | |
| | |
Haemonetics Corp.(a) | | | 99,523 | | | | 3,675,384 | |
| | |
Hill-Rom Holdings, Inc. | | | 15,320 | | | | 701,043 | |
| | |
Integra LifeSciences Holdings Corp.(a) | | | 31,200 | | | | 1,536,288 | |
| | |
OraSure Technologies, Inc.(a) | | | 90,970 | | | | 819,640 | |
| | |
Orthofix International NV(a) | | | 62,370 | | | | 1,741,371 | |
| | |
STERIS Corp. | | | 23,750 | | | | 1,514,063 | |
| | | | | | | | | |
Total | | | | | | | 10,947,941 | |
|
Health Care Providers & Services 1.7% | |
| | |
AMN Healthcare Services, Inc.(a) | | | 145,730 | | | | 2,494,897 | |
| | |
HealthSouth Corp. | | | 68,106 | | | | 2,801,200 | |
| | |
LHC Group, Inc.(a) | | | 46,690 | | | | 1,097,682 | |
| | | | | | | | | |
Total | | | | | | | 6,393,779 | |
|
Life Sciences Tools & Services 0.7% | |
| | |
Bio-Rad Laboratories, Inc., Class A(a) | | | 12,200 | | | | 1,449,238 | |
| | |
Charles River Laboratories International, Inc.(a) | | | 15,800 | | | | 1,023,050 | |
| | | | | | | | | |
Total | | | | | | | 2,472,288 | |
| | | | | | | | | |
Total Health Care | | | | | | | 20,720,901 | |
| | |
| | | | | | | | |
Industrials 20.0% | |
Aerospace & Defense 0.3% | |
| | |
Orbital Sciences Corp.(a) | | | 32,830 | | | | 893,633 | |
|
Air Freight & Logistics 0.7% | |
| | |
Forward Air Corp. | | | 53,100 | | | | 2,599,776 | |
|
Airlines 0.8% | |
| | |
Air France-KLM, ADR(a) | | | 286,770 | | | | 3,021,122 | |
|
Building Products 1.6% | |
| | |
Gibraltar Industries, Inc.(a) | | | 77,206 | | | | 1,107,906 | |
| | |
Simpson Manufacturing Co., Inc. | | | 48,985 | | | | 1,626,302 | |
| | |
Trex Co., Inc.(a) | | | 77,690 | | | | 3,273,857 | |
| | | | | | | | | |
Total | | | | | | | 6,008,065 | |
|
Commercial Services & Supplies 3.4% | |
| | |
Herman Miller, Inc. | | | 90,185 | | | | 2,740,722 | |
| | |
KAR Auction Services, Inc. | | | 107,000 | | | | 3,707,550 | |
The accompanying Notes to Financial Statements are an integral part of this statement.
| | |
| |
| | Columbia Multi-Advisor Small Cap Value Fund |
Portfolio of Investments (continued)
November 30, 2014 (Unaudited)
| | | | | | | | |
| Common Stocks (continued) | |
| Issuer | | Shares | | | Value ($) | |
Mobile Mini, Inc. | | | 75,210 | | | | 3,120,463 | |
| | |
Tetra Tech, Inc. | | | 52,297 | �� | | | 1,421,432 | |
| | |
United Stationers, Inc. | | | 39,400 | | | | 1,617,764 | |
| | | | | | | | | |
Total | | | | | | | 12,607,931 | |
|
Construction & Engineering 2.0% | |
| | |
Aegion Corp.(a) | | | 43,500 | | | | 828,675 | |
| | |
Comfort Systems U.S.A., Inc. | | | 96,519 | | | | 1,386,978 | |
| | |
EMCOR Group, Inc. | | | 46,002 | | | | 1,994,186 | |
| | |
Great Lakes Dredge & Dock Corp.(a) | | | 113,810 | | | | 862,680 | |
| | |
Pike Corp.(a) | | | 188,500 | | | | 2,254,460 | |
| | | | | | | | | |
Total | | | | | | | 7,326,979 | |
|
Electrical Equipment 1.3% | |
| | |
AZZ, Inc. | | | 58,440 | | | | 2,616,943 | |
| | |
Babcock & Wilcox Co. (The) | | | 57,893 | | | | 1,715,370 | |
| | |
EnerSys | | | 9,360 | | | | 568,433 | |
| | | | | | | | | |
Total | | | | | | | 4,900,746 | |
|
Industrial Conglomerates 0.6% | |
| | |
Carlisle Companies, Inc. | | | 22,250 | | | | 1,989,150 | |
| | |
Machinery 5.0% | | | | | | | | |
| | |
Actuant Corp., Class A | | | 20,250 | | | | 594,540 | |
| | |
Astec Industries, Inc. | | | 14,960 | | | | 587,479 | |
| | |
Barnes Group, Inc. | | | 56,400 | | | | 2,071,572 | |
| | |
CLARCOR, Inc. | | | 13,310 | | | | 876,996 | |
| | |
Dynamic Materials Corp. | | | 19,330 | | | | 310,053 | |
| | |
ESCO Technologies, Inc. | | | 79,080 | | | | 2,848,462 | |
| | |
Harsco Corp. | | | 50,500 | | | | 977,680 | |
| | |
Hillenbrand, Inc. | | | 22,060 | | | | 709,450 | |
| | |
IDEX Corp. | | | 12,000 | | | | 921,720 | |
| | |
ITT Corp. | | | 33,806 | | | | 1,399,568 | |
| | |
NN, Inc. | | | 13,800 | | | | 292,146 | |
| | |
Oshkosh Corp. | | | 53,345 | | | | 2,421,863 | |
| | |
Tecumseh Products Co.(a) | | | 10,948 | | | | 35,034 | |
| | |
Terex Corp. | | | 91,104 | | | | 2,614,685 | |
| | |
TriMas Corp.(a) | | | 37,210 | | | | 1,158,347 | |
| | |
Watts Water Technologies, Inc., Class A | | | 11,550 | | | | 698,313 | |
| | | | | | | | | |
Total | | | | | | | 18,517,908 | |
|
Professional Services 0.7% | |
| | |
Korn/Ferry International(a) | | | 31,800 | | | | 863,370 | |
| | |
Resources Connection, Inc. | | | 105,800 | | | | 1,604,986 | |
| | | | | | | | | |
Total | | | | | | | 2,468,356 | |
|
Road & Rail 0.7% | |
| | |
Heartland Express, Inc. | | | 52,410 | | | | 1,390,437 | |
| | |
Landstar System, Inc. | | | 12,690 | | | | 1,020,022 | |
| | | | | | | | | |
Total | | | | | | | 2,410,459 | |
| | | | | | | | |
| Common Stocks (continued) | |
| Issuer | | Shares | | | Value ($) | |
Trading Companies & Distributors 2.9% | |
| | |
AerCap Holdings NV(a) | | | 163,500 | | | | 7,244,685 | |
| | |
Applied Industrial Technologies, Inc. | | | 20,430 | | | | 957,963 | |
| | |
Beacon Roofing Supply, Inc.(a) | | | 42,400 | | | | 1,148,192 | |
| | |
Veritiv Corp.(a) | | | 27,500 | | | | 1,381,875 | |
| | | | | | | | | |
Total | | | | | | | 10,732,715 | |
| | | | | | | | | |
Total Industrials | | | | | | | 73,476,840 | |
| | |
| | | | | | | | |
Information Technology 19.3% | |
Communications Equipment 1.7% | |
| | |
Aviat Networks, Inc.(a) | | | 433,151 | | | | 654,058 | |
| | |
NETGEAR, Inc.(a) | | | 18,692 | | | | 648,986 | |
| | |
Oplink Communications, Inc. | | | 41,220 | | | | 996,288 | |
| | |
Polycom, Inc.(a) | | | 95,570 | | | | 1,258,657 | |
| | |
Riverbed Technology, Inc.(a) | | | 133,070 | | | | 2,751,222 | |
| | | | | | | | | |
Total | | | | | | | 6,309,211 | |
|
Electronic Equipment, Instruments & Components 7.4% | |
| | |
Celestica, Inc.(a) | | | 225,343 | | | | 2,424,691 | |
| | |
Electro Scientific Industries, Inc. | | | 198,160 | | | | 1,420,807 | |
| | |
FARO Technologies, Inc.(a) | | | 29,400 | | | | 1,614,942 | |
| | |
GSI Group, Inc.(a) | | | 941 | | | | 11,932 | |
| | |
II-VI, Inc.(a) | | | 165,355 | | | | 2,194,261 | |
| | |
Jabil Circuit, Inc. | | | 72,300 | | | | 1,500,225 | |
| | |
Littelfuse, Inc. | | | 20,140 | | | | 1,936,058 | |
| | |
Mercury Systems, Inc.(a) | | | 93,680 | | | | 1,210,345 | |
| | |
Park Electrochemical Corp. | | | 51,270 | | | | 1,261,242 | |
| | |
Plexus Corp.(a) | | | 45,600 | | | | 1,778,856 | |
| | |
Radisys Corp.(a) | | | 163,050 | | | | 391,320 | |
| | |
Sanmina Corp.(a) | | | 347,608 | | | | 8,551,157 | |
| | |
Vishay Intertechnology, Inc. | | | 215,262 | | | | 2,985,684 | |
| | | | | | | | | |
Total | | | | | | | 27,281,520 | |
|
IT Services 1.5% | |
| | |
CoreLogic, Inc.(a) | | | 60,500 | | | | 2,009,810 | |
| | |
EVERTEC, Inc. | | | 88,751 | | | | 1,956,072 | |
| | |
VeriFone Systems, Inc.(a) | | | 39,100 | | | | 1,394,306 | |
| | | | | | | | | |
Total | | | | | | | 5,360,188 | |
|
Semiconductors & Semiconductor Equipment 5.3% | |
| | |
Axcelis Technologies, Inc.(a) | | | 687,040 | | | | 1,477,136 | |
| | |
Brooks Automation, Inc. | | | 214,190 | | | | 2,508,165 | |
| | |
Diodes, Inc.(a) | | | 108,080 | | | | 2,873,847 | |
| | |
Fairchild Semiconductor International, Inc.(a) | | | 191,800 | | | | 3,093,734 | |
| | |
Micron Technology, Inc.(a) | | | 126,000 | | | | 4,529,700 | |
| | |
Photronics, Inc.(a) | | | 293,214 | | | | 2,644,790 | |
The accompanying Notes to Financial Statements are an integral part of this statement.
| | |
| |
| Columbia Multi-Advisor Small Cap Value Fund | | |
Portfolio of Investments (continued)
November 30, 2014 (Unaudited)
| | | | | | | | |
| Common Stocks (continued) | |
| Issuer | | Shares | | | Value ($) | |
Tessera Technologies, Inc. | | | 30,280 | | | | 1,034,971 | |
| | |
Xcerra Corp.(a) | | | 157,900 | | | | 1,264,779 | |
| | | | | | | | | |
Total | | | | | | | 19,427,122 | |
|
Software 2.2% | |
| | |
BroadSoft, Inc.(a) | | | 31,010 | | | | 836,340 | |
| | |
Fair Isaac Corp. | | | 16,850 | | | | 1,209,493 | |
| | |
Informatica Corp.(a) | | | 80,540 | | | | 2,930,045 | |
| | |
Mentor Graphics Corp. | | | 82,400 | | | | 1,830,104 | |
| | |
PTC, Inc.(a) | | | 10,923 | | | | 426,761 | |
| | |
TIBCO Software, Inc.(a) | | | 44,140 | | | | 1,060,684 | |
| | | | | | | | | |
Total | | | | | | | 8,293,427 | |
|
Technology Hardware, Storage & Peripherals 1.2% | |
| | |
Avid Technology, Inc.(a) | | | 128,000 | | | | 1,542,400 | |
| | |
Logitech International SA(a) | | | 55,370 | | | | 823,906 | |
| | |
QLogic Corp.(a) | | | 167,730 | | | | 1,935,604 | |
| | | | | | | | | |
Total | | | | | | | 4,301,910 | |
| | | | | | | | | |
Total Information Technology | | | | | | | 70,973,378 | |
| | |
| | | | | | | | |
Materials 6.8% | |
Chemicals 2.5% | |
| | |
Axiall Corp. | | | 22,580 | | | | 977,262 | |
| | |
Innospec, Inc. | | | 35,750 | | | | 1,532,245 | |
| | |
Minerals Technologies, Inc. | | | 24,070 | | | | 1,786,716 | |
| | |
PolyOne Corp. | | | 75,780 | | | | 2,826,594 | |
| | |
Scotts Miracle-Gro Co., Class A | | | 24,562 | | | | 1,499,019 | |
| | |
Sensient Technologies Corp. | | | 12,440 | | | | 733,338 | |
| | | | | | | | | |
Total | | | | | | | 9,355,174 | |
|
Containers & Packaging 1.2% | |
| | |
Berry Plastics Corp.(a) | | | 46,600 | | | | 1,348,604 | |
| | |
Myers Industries, Inc. | | | 84,080 | | | | 1,367,981 | |
| | |
Silgan Holdings, Inc. | | | 36,580 | | | | 1,845,827 | |
| | | | | | | | | |
Total | | | | | | | 4,562,412 | |
|
Metals & Mining 1.5% | |
| | |
Allegheny Technologies, Inc. | | | 18,970 | | | | 639,099 | |
| | |
AuRico Gold, Inc. | | | 952,829 | | | | 3,277,732 | |
| | |
Coeur Mining, Inc.(a) | | | 133,140 | | | | 547,206 | |
| | |
Pan American Silver Corp. | | | 97,900 | | | | 916,344 | |
| | | | | | | | | |
Total | | | | | | | 5,380,381 | |
| | | | | | | | |
| Common Stocks (continued) | |
| Issuer | | Shares | | | Value ($) | |
Paper & Forest Products 1.6% | |
| | |
PH Glatfelter Co. | | | 35,970 | | | | 910,760 | |
| | |
Resolute Forest Products, Inc.(a) | | | 287,998 | | | | 4,823,967 | |
| | | | | | | | | |
Total | | | | | | | 5,734,727 | |
| | | | | | | | | |
Total Materials | | | | | | | 25,032,694 | |
| | |
| | | | | | | | |
Utilities 1.1% | |
Electric Utilities 0.6% | |
| | |
Portland General Electric Co. | | | 16,520 | | | | 609,093 | |
| | |
Unitil Corp. | | | 12,400 | | | | 436,852 | |
| | |
Westar Energy, Inc. | | | 34,400 | | | | 1,344,696 | |
| | | | | | | | | |
Total | | | | | | | 2,390,641 | |
|
Gas Utilities 0.3% | |
| | |
Laclede Group, Inc. (The) | | | 10,580 | | | | 536,723 | |
| | |
New Jersey Resources Corp. | | | 11,670 | | | | 675,693 | |
| | | | | | | | | |
Total | | | | | | | 1,212,416 | |
|
Water Utilities 0.2% | |
| | |
American States Water Co. | | | 16,270 | | | | 567,660 | |
| | | | | | | | | |
Total Utilities | | | | | | | 4,170,717 | |
| | | | | | | | | |
Total Common Stocks | | | | | | | | |
(Cost: $264,816,612) | | | | | | | 333,865,738 | |
| | |
| | | | | | | | |
| Rights —% | |
Industrials —% | |
Airlines —% | |
| | |
American Airlines Escrow(a)(b)(c)(d) | | | 52,560 | | | | — | |
| | | | | | | | | |
Total Industrials | | | | | | | — | |
| | | | | | | | | |
Total Rights | | | | | | | | |
(Cost: $—) | | | | | | | — | |
| | |
| | | | | | | | |
| Money Market Funds 9.3% | | | | | | | | |
| | | Shares | | | Value ($) | |
| | |
Columbia Short-Term Cash Fund, 0.104%(e)(f) | | | 34,247,759 | | | | 34,247,759 | |
| | | | | | | | | |
Total Money Market Funds | | | | | | | | |
(Cost: $34,247,759) | | | | | | | 34,247,759 | |
| | | | | | | | | |
Total Investments | | | | | | | | |
(Cost: $299,064,371) | | | | | | | 368,113,497 | |
| | | | | | | | | |
Other Assets & Liabilities, Net | | | | | | | (203,549 | ) |
| | | | | | | | | |
Net Assets | | | | | | | 367,909,948 | |
| | | | | | | | | |
Notes to Portfolio of Investments
| (b) | Negligible market value. |
The accompanying Notes to Financial Statements are an integral part of this statement.
| | |
| |
| | Columbia Multi-Advisor Small Cap Value Fund |
Portfolio of Investments (continued)
November 30, 2014 (Unaudited)
Notes to Portfolio of Investments (continued)
| (c) | Identifies securities considered by the Investment Manager to be illiquid as to their marketability. The aggregate value of such securities at November 30, 2014 was $0. Information concerning such security holdings at November 30, 2014 is as follows: |
| | | | | | | | |
| Security Description | | Acquisition Dates | | | Cost ($) | |
American Airlines Escrow | | | 12/17/2013 | | | | — | |
| (d) | Represents fair value as determined in good faith under procedures approved by the Board of Trustees. At November 30, 2014, the value of these securities amounted to $0. |
| (e) | The rate shown is the seven-day current annualized yield at November 30, 2014. |
| (f) | As defined in the Investment Company Act of 1940, an affiliated company is one in which the Fund owns 5% or more of the company’s outstanding voting securities, or a company which is under common ownership or control with the Fund. Holdings and transactions in these affiliated companies during the period ended November 30, 2014, are as follows: |
| | | | | | | | | | | | | | | | | | | | | | | | |
| Issuer | | Beginning
Cost ($) | | | Purchase
Cost ($) | | | Proceeds
From Sales ($) | | | Ending
Cost ($) | | | Dividends —
Affiliated
Issuers ($) | | | Value ($) | |
Columbia Short-Term Cash Fund | | | 34,223,125 | | | | 116,780,342 | | | | (116,755,708 | ) | | | 34,247,759 | | | | 16,044 | | | | 34,247,759 | |
Abbreviation Legend
| | |
| ADR | | American Depositary Receipt |
Fair Value Measurements
Generally accepted accounting principles (GAAP) require disclosure regarding the inputs and valuation techniques used to measure fair value and any changes in valuation inputs or techniques. In addition, investments shall be disclosed by major category.
The Fund categorizes its fair value measurements according to a three-level hierarchy that maximizes the use of observable inputs and minimizes the use of unobservable inputs by prioritizing that the most observable input be used when available. Observable inputs are those that market participants would use in pricing an investment based on market data obtained from sources independent of the reporting entity. Unobservable inputs are those that reflect the Fund’s assumptions about the information market participants would use in pricing an investment. An investment’s level within the fair value hierarchy is based on the lowest level of any input that is deemed significant to the asset or liability’s fair value measurement. The input levels are not necessarily an indication of the risk or liquidity associated with investments at that level. For example, certain U.S. government securities are generally high quality and liquid, however, they are reflected as Level 2 because the inputs used to determine fair value may not always be quoted prices in an active market.
Fair value inputs are summarized in the three broad levels listed below:
| > | | Level 1 — Valuations based on quoted prices for investments in active markets that the Fund has the ability to access at the measurement date (including NAV for open-end mutual funds). Valuation adjustments are not applied to Level 1 investments. |
| > | | Level 2 — Valuations based on other significant observable inputs (including quoted prices for similar securities, interest rates, prepayment speeds, credit risks, etc.). |
| > | | Level 3 — Valuations based on significant unobservable inputs (including the Fund’s own assumptions and judgment in determining the fair value of investments). |
Inputs that are used in determining fair value of an investment may include price information, credit data, volatility statistics, and other factors. These inputs can be either observable or unobservable. The availability of observable inputs can vary between investments, and is affected by various factors such as the type of investment, and the volume and level of activity for that investment or similar investments in the marketplace. The inputs will be considered by the Investment Manager, along with any other relevant factors in the calculation of an investment’s fair value. The Fund uses prices and inputs that are current as of the measurement date, which may include periods of market dislocations. During these periods, the availability of prices and inputs may be reduced for many investments. This condition could cause an investment to be reclassified between the various levels within the hierarchy.
Investments falling into the Level 3 category are primarily supported by quoted prices from brokers and dealers participating in the market for those investments. However, these may be classified as Level 3 investments due to lack of market transparency and corroboration to support these quoted prices. Additionally, valuation models may be used as the pricing source for any remaining investments classified as Level 3. These models may rely on one or more significant unobservable inputs and/or significant assumptions by the Investment Manager. Inputs used in valuations may include, but are not limited to, financial statement analysis, capital account balances, discount rates and estimated cash flows, and comparable company data.
Under the direction of the Fund’s Board of Trustees (the Board), the Investment Manager’s Valuation Committee (the Committee) is responsible for overseeing the valuation procedures approved by the Board. The Committee consists of voting and non-voting members from various groups within the Investment Manager’s organization, including operations and accounting, trading and investments, compliance, risk management and legal.
The Committee meets at least monthly to review and approve valuation matters, which may include a description of specific valuation determinations, data regarding pricing information received from approved pricing vendors and brokers and the results of Board-approved valuation control policies and procedures (the Policies). The Policies address, among other things, instances when market quotations are or are not readily available, including recommendations of third party pricing vendors and a determination of appropriate pricing methodologies; events that require specific valuation determinations and assessment of fair value techniques; securities with a potential for stale pricing, including those that are illiquid, restricted, or in default; and the effectiveness of third party pricing vendors, including periodic reviews of vendors. The Committee meets
The accompanying Notes to Financial Statements are an integral part of this statement.
| | |
| 10 | | Semiannual Report 2014 |
| | |
| |
| Columbia Multi-Advisor Small Cap Value Fund | | |
Portfolio of Investments (continued)
November 30, 2014 (Unaudited)
Fair Value Measurements (continued)
more frequently, as needed, to discuss additional valuation matters, which may include the need to review back-testing results, review time-sensitive information or approve related valuation actions. The Committee reports to the Board, with members of the Committee meeting with the Board at each of its regularly scheduled meetings to discuss valuation matters and actions during the period, similar to those described earlier.
For investments categorized as Level 3, the Committee monitors information similar to that described above, which may include: (i) data specific to the issuer or comparable issuers, (ii) general market or specific sector news and (iii) quoted prices and specific or similar security transactions. The Committee considers this data and any changes from prior periods in order to assess the reasonableness of observable and unobservable inputs, any assumptions or internal models used to value those securities and changes in fair value. This data is also used to corroborate, when available, information received from approved pricing vendors and brokers. Various factors impact the frequency of monitoring this information (which may occur as often as daily). However, the Committee may determine that changes to inputs, assumptions and models are not required as a result of the monitoring procedures performed.
The following table is a summary of the inputs used to value the Fund’s investments at November 30, 2014:
| | | | | | | | | | | | | | | | |
| Description | | Level 1
Quoted Prices in Active
Markets for Identical
Assets ($) | | | Level 2
Other Significant
Observable Inputs ($) | | | Level 3
Significant
Unobservable Inputs ($) | | | Total ($) | |
Equity Securities | | | | | | | | | | | | | | | | |
| | | | |
Common Stocks | | | | | | | | | | | | | | | | |
| | | | |
Consumer Discretionary | | | 47,763,872 | | | | — | | | | — | | | | 47,763,872 | |
| | | | |
Consumer Staples | | | 10,903,297 | | | | — | | | | — | | | | 10,903,297 | |
| | | | |
Energy | | | 14,585,105 | | | | — | | | | — | | | | 14,585,105 | |
| | | | |
Financials | | | 66,238,934 | | | | — | | | | — | | | | 66,238,934 | |
| | | | |
Health Care | | | 20,720,901 | | | | — | | | | — | | | | 20,720,901 | |
| | | | |
Industrials | | | 73,476,840 | | | | — | | | | — | | | | 73,476,840 | |
| | | | |
Information Technology | | | 70,973,378 | | | | — | | | | — | | | | 70,973,378 | |
| | | | |
Materials | | | 25,032,694 | | | | — | | | | — | | | | 25,032,694 | |
| | | | |
Utilities | | | 4,170,717 | | | | — | | | | — | | | | 4,170,717 | |
| | | | |
Rights | | | | | | | | | | | | | | | | |
| | | | |
Industrials | | | — | | | | — | | | | 0 | (a) | | | 0 | (a) |
| | | | | | | | | | | | | | | | | |
Total Equity Securities | | | 333,865,738 | | | | — | | | | 0 | (a) | | | 333,865,738 | |
| | | | | | | | | | | | | | | | | |
Mutual Funds | | | | | | | | | | | | | | | | |
| | | | |
Money Market Funds | | | 34,247,759 | | | | — | | | | — | | | | 34,247,759 | |
| | | | | | | | | | | | | | | | | |
Total Mutual Funds | | | 34,247,759 | | | | — | | | | — | | | | 34,247,759 | |
| | | | | | | | | | | | | | | | | |
Total | | | 368,113,497 | | | | — | | | | 0 | (a) | | | 368,113,497 | |
| | | | | | | | | | | | | | | | | |
See the Portfolio of Investments for all investment classifications not indicated in the table.
There were no transfers of financial assets between levels during the period.
The Fund does not hold any significant investments with unobservable inputs which are categorized as Level 3.
The Fund’s assets assigned to the Level 3 category are valued utilizing the valuation technique deemed the most appropriate in the circumstances. Certain rights classified as Level 3 are valued using an income approach. To determine fair value for these securities, management considered estimates of future distributions from the company assets or potential actions related to the respective company’s restructuring. Significant increases (decreases) to any of these inputs would result in a significantly lower (higher) fair value measurement.
The accompanying Notes to Financial Statements are an integral part of this statement.
| | | | |
| Semiannual Report 2014 | | | 11 | |
| | |
| |
| | Columbia Multi-Advisor Small Cap Value Fund |
Statement of Assets and Liabilities
November 30, 2014 (Unaudited)
| | | | |
Assets | | | | |
| |
Investments, at value | | | | |
| |
Unaffiliated issuers (identified cost $264,816,612) | | | $333,865,738 | |
| |
Affiliated issuers (identified cost $34,247,759) | | | 34,247,759 | |
| |
Total investments (identified cost $299,064,371) | | | 368,113,497 | |
| |
Cash | | | 264 | |
| |
Receivable for: | | | | |
| |
Investments sold | | | 550,188 | |
| |
Capital shares sold | | | 86,129 | |
| |
Dividends | | | 307,009 | |
| |
Reclaims | | | 2,902 | |
| |
Expense reimbursement due from Investment Manager | | | 4,001 | |
| |
Prepaid expenses | | | 3,114 | |
| |
Other assets | | | 408 | |
| |
Total assets | | | 369,067,512 | |
| |
| |
Liabilities | | | | |
| |
Payable for: | | | | |
| |
Investments purchased | | | 852,026 | |
| |
Capital shares purchased | | | 149,748 | |
| |
Investment management fees | | | 19,706 | |
| |
Distribution and/or service fees | | | 5,081 | |
| |
Transfer agent fees | | | 44,587 | |
| |
Administration fees | | | 1,639 | |
| |
Plan administration fees | | | 358 | |
| |
Compensation of board members | | | 30,936 | |
| |
Other expenses | | | 53,483 | |
| |
Total liabilities | | | 1,157,564 | |
| |
Net assets applicable to outstanding capital stock | | | $367,909,948 | |
| |
| |
Represented by | | | | |
| |
Paid-in capital | | | $256,507,401 | |
| |
Excess of distributions over net investment income | | | (1,309,657 | ) |
| |
Accumulated net realized gain | | | 43,663,078 | |
| |
Unrealized appreciation (depreciation) on: | | | | |
| |
Investments | | | 69,049,126 | |
| |
Total — representing net assets applicable to outstanding capital stock | | | $367,909,948 | |
| |
The accompanying Notes to Financial Statements are an integral part of this statement.
| | |
| 12 | | Semiannual Report 2014 |
| | |
| |
| Columbia Multi-Advisor Small Cap Value Fund | | |
Statement of Assets and Liabilities (continued)
November 30, 2014 (Unaudited)
| | | | |
Class A | | | | |
| |
Net assets | | | $282,762,114 | |
| |
Shares outstanding | | | 36,902,964 | |
| |
Net asset value per share | | | $7.66 | |
| |
Maximum offering price per share(a) | | | $8.13 | |
| |
Class B | | | | |
| |
Net assets | | | $6,521,114 | |
| |
Shares outstanding | | | 960,087 | |
| |
Net asset value per share | | | $6.79 | |
| |
Class C | | | | |
| |
Net assets | | | $10,908,410 | |
| |
Shares outstanding | | | 1,600,445 | |
| |
Net asset value per share | | | $6.82 | |
| |
Class I | | | | |
| |
Net assets | | | $23,079,751 | |
| |
Shares outstanding | | | 2,840,639 | |
| |
Net asset value per share | | | $8.12 | |
| |
Class K | | | | |
| |
Net assets | | | $1,907,914 | |
| |
Shares outstanding | | | 241,849 | |
| |
Net asset value per share | | | $7.89 | |
| |
Class R | | | | |
| |
Net assets | | | $6,088,599 | |
| |
Shares outstanding | | | 805,146 | |
| |
Net asset value per share | | | $7.56 | |
| |
Class R4 | | | | |
| |
Net assets | | | $3,714,009 | |
| |
Shares outstanding | | | 476,723 | |
| |
Net asset value per share | | | $7.79 | |
| |
Class R5 | | | | |
| |
Net assets | | | $22,268,559 | |
| |
Shares outstanding | | | 2,781,792 | |
| |
Net asset value per share | | | $8.01 | |
| |
Class Z | | | | |
| |
Net assets | | | $10,659,478 | |
| |
Shares outstanding | | | 1,322,211 | |
| |
Net asset value per share | | | $8.06 | |
| |
| (a) | The maximum offering price per share is calculated by dividing the net asset value per share by 1.0 minus the maximum sales charge of 5.75%. |
The accompanying Notes to Financial Statements are an integral part of this statement.
| | | | |
| Semiannual Report 2014 | | | 13 | |
| | |
| |
| | Columbia Multi-Advisor Small Cap Value Fund |
Statement of Operations
Six Months Ended November 30, 2014 (Unaudited)
| | | | |
Net investment income | | | | |
| |
Income: | | | | |
| |
Dividends — unaffiliated issuers | | | $2,307,576 | |
| |
Dividends — affiliated issuers | | | 16,044 | |
| |
Foreign taxes withheld | | | (26,928 | ) |
| |
Total income | | | 2,296,692 | |
| |
| |
Expenses: | | | | |
| |
Investment management fees | | | 1,803,125 | |
| |
Distribution and/or service fees | | | | |
| |
Class A | | | 361,793 | |
| |
Class B | | | 36,883 | |
| |
Class C | | | 56,427 | |
| |
Class R | | | 15,566 | |
| |
Transfer agent fees | | | | |
| |
Class A | | | 344,229 | |
| |
Class B | | | 8,783 | |
| |
Class C | | | 13,423 | |
| |
Class K | | | 521 | |
| |
Class R | | | 7,408 | |
| |
Class R4 | | | 4,345 | |
| |
Class R5 | | | 5,422 | |
| |
Class Z | | | 12,135 | |
| |
Administration fees | | | 150,007 | |
| |
Plan administration fees | | | | |
| |
Class K | | | 2,605 | |
| |
Compensation of board members | | | 8,577 | |
| |
Custodian fees | | | 11,109 | |
| |
Printing and postage fees | | | 38,883 | |
| |
Registration fees | | | 52,717 | |
| |
Professional fees | | | 16,349 | |
| |
Other | | | 8,673 | |
| |
Total expenses | | | 2,958,980 | |
| |
Fees waived or expenses reimbursed by Investment Manager and its affiliates | | | (386,205 | ) |
| |
Total net expenses | | | 2,572,775 | |
| |
Net investment loss | | | (276,083 | ) |
| |
| |
Realized and unrealized gain (loss) — net | | | | |
| |
Net realized gain (loss) on: | | | | |
| |
Investments | | | 26,327,570 | |
| |
Net realized gain | | | 26,327,570 | |
| |
Net change in unrealized appreciation (depreciation) on: | | | | |
| |
Investments | | | (20,597,400 | ) |
| |
Net change in unrealized depreciation | | | (20,597,400 | ) |
| |
Net realized and unrealized gain | | | 5,730,170 | |
| |
Net increase in net assets resulting from operations | | | $5,454,087 | |
| |
The accompanying Notes to Financial Statements are an integral part of this statement.
| | |
| 14 | | Semiannual Report 2014 |
| | |
| |
| Columbia Multi-Advisor Small Cap Value Fund | | |
Statement of Changes in Net Assets
| | | | | | | | |
| | | Six Months Ended
November 30, 2014
(Unaudited) | | | Year Ended
May 31, 2014 | |
Operations | | | | | | | | |
| | |
Net investment loss | | | $(276,083 | ) | | | $(940,881 | ) |
| | |
Net realized gain | | | 26,327,570 | | | | 44,430,595 | |
| | |
Net change in unrealized appreciation (depreciation) | | | (20,597,400 | ) | | | 15,265,994 | |
| |
Net increase in net assets resulting from operations | | | 5,454,087 | | | | 58,755,708 | |
| |
| | |
Distributions to shareholders | | | | | | | | |
| | |
Net realized gains | | | | | | | | |
| | |
Class A | | | — | | | | (30,907,300 | ) |
| | |
Class B | | | — | | | | (1,075,783 | ) |
| | |
Class C | | | — | | | | (1,266,959 | ) |
| | |
Class I | | | — | | | | (2,255,774 | ) |
| | |
Class K | | | — | | | | (284,052 | ) |
| | |
Class R | | | — | | | | (604,267 | ) |
| | |
Class R4 | | | — | | | | (274,453 | ) |
| | |
Class R5 | | | — | | | | (2,101,852 | ) |
| | |
Class Z | | | — | | | | (963,734 | ) |
| |
Total distributions to shareholders | | | — | | | | (39,734,174 | ) |
| |
Increase (decrease) in net assets from capital stock activity | | | (19,957,315 | ) | | | 3,461,960 | |
| |
Total increase (decrease) in net assets | | | (14,503,228 | ) | | | 22,483,494 | |
| | |
Net assets at beginning of period | | | 382,413,176 | | | | 359,929,682 | |
| |
Net assets at end of period | | | $367,909,948 | | | | $382,413,176 | |
| |
Excess of distributions over net investment income | | | $(1,309,657 | ) | | | $(1,033,574 | ) |
| |
The accompanying Notes to Financial Statements are an integral part of this statement.
| | | | |
| Semiannual Report 2014 | | | 15 | |
| | |
| |
| | Columbia Multi-Advisor Small Cap Value Fund |
Statement of Changes in Net Assets (continued)
| | | | | | | | | | | | | | | | |
| | | Six Months Ended
November 30, 2014
(Unaudited) | | | Year Ended
May 31, 2014 | |
| | | Shares | | | Dollars ($) | | | Shares | | | Dollars ($) | |
Capital stock activity | | | | | | | | | | | | | | | | |
| | | | |
Class A shares | | | | | | | | | | | | | | | | |
| | | | |
Subscriptions(a) | | | 1,297,049 | | | | 9,852,760 | | | | 4,191,631 | | | | 31,636,338 | |
| | | | |
Distributions reinvested | | | — | | | | — | | | | 4,165,206 | | | | 30,447,655 | |
| | | | |
Redemptions | | | (3,534,506 | ) | | | (26,794,917 | ) | | | (7,787,539 | ) | | | (58,693,692 | ) |
| |
Net increase (decrease) | | | (2,237,457 | ) | | | (16,942,157 | ) | | | 569,298 | | | | 3,390,301 | |
| |
Class B shares | | | | | | | | | | | | | | | | |
| | | | |
Subscriptions | | | 2,065 | | | | 13,685 | | | | 27,077 | | | | 187,330 | |
| | | | |
Distributions reinvested | | | — | | | | — | | | | 162,835 | | | | 1,063,310 | |
| | | | |
Redemptions(a) | | | (258,090 | ) | | | (1,735,667 | ) | | | (913,869 | ) | | | (6,193,743 | ) |
| |
Net decrease | | | (256,025 | ) | | | (1,721,982 | ) | | | (723,957 | ) | | | (4,943,103 | ) |
| |
Class C shares | | | | | | | | | | | | | | | | |
| | | | |
Subscriptions | | | 56,612 | | | | 381,857 | | | | 266,835 | | | | 1,807,586 | |
| | | | |
Distributions reinvested | | | — | | | | — | | | | 181,787 | | | | 1,190,707 | |
| | | | |
Redemptions | | | (212,890 | ) | | | (1,441,427 | ) | | | (274,859 | ) | | | (1,862,089 | ) |
| |
Net increase (decrease) | | | (156,278 | ) | | | (1,059,570 | ) | | | 173,763 | | | | 1,136,204 | |
| |
Class I shares | | | | | | | | | | | | | | | | |
| | | | |
Subscriptions | | | 5,983 | | | | 47,336 | | | | 5,471 | | | | 42,549 | |
| | | | |
Distributions reinvested | | | — | | | | — | | | | 292,037 | | | | 2,254,522 | |
| | | | |
Redemptions | | | (66,827 | ) | | | (549,583 | ) | | | (353,506 | ) | | | (2,833,452 | ) |
| |
Net decrease | | | (60,844 | ) | | | (502,247 | ) | | | (55,998 | ) | | | (536,381 | ) |
| |
Class K shares | | | | | | | | | | | | | | | | |
| | | | |
Subscriptions | | | 74,112 | | | | 583,575 | | | | 57,002 | | | | 442,213 | |
| | | | |
Distributions reinvested | | | — | | | | — | | | | 37,553 | | | | 282,401 | |
| | | | |
Redemptions | | | (200,071 | ) | | | (1,585,527 | ) | | | (58,849 | ) | | | (461,052 | ) |
| |
Net increase (decrease) | | | (125,959 | ) | | | (1,001,952 | ) | | | 35,706 | | | | 263,562 | |
| |
Class R shares | | | | | | | | | | | | | | | | |
| | | | |
Subscriptions | | | 113,219 | | | | 850,368 | | | | 542,042 | | | | 4,019,234 | |
| | | | |
Distributions reinvested | | | — | | | | — | | | | 69,574 | | | | 503,018 | |
| | | | |
Redemptions | | | (165,271 | ) | | | (1,229,952 | ) | | | (892,478 | ) | | | (6,798,474 | ) |
| |
Net decrease | | | (52,052 | ) | | | (379,584 | ) | | | (280,862 | ) | | | (2,276,222 | ) |
| |
Class R4 shares | | | | | | | | | | | | | | | | |
| | | | |
Subscriptions | | | 67,667 | | | | 516,601 | | | | 322,297 | | | | 2,488,662 | |
| | | | |
Distributions reinvested | | | — | | | | — | | | | 36,912 | | | | 273,885 | |
| | | | |
Redemptions | | | (56,764 | ) | | | (436,086 | ) | | | (60,863 | ) | | | (465,096 | ) |
| |
Net increase | | | 10,903 | | | | 80,515 | | | | 298,346 | | | | 2,297,451 | |
| |
Class R5 shares | | | | | | | | | | | | | | | | |
| | | | |
Subscriptions | | | 348,908 | | | | 2,773,226 | | | | 517,615 | | | | 4,081,300 | |
| | | | |
Distributions reinvested | | | — | | | | — | | | | 276,121 | | | | 2,101,279 | |
| | | | |
Redemptions | | | (234,820 | ) | | | (1,856,506 | ) | | | (599,826 | ) | | | (4,670,447 | ) |
| |
Net increase | | | 114,088 | | | | 916,720 | | | | 193,910 | | | | 1,512,132 | |
| |
The accompanying Notes to Financial Statements are an integral part of this statement.
| | |
| 16 | | Semiannual Report 2014 |
| | |
| |
| Columbia Multi-Advisor Small Cap Value Fund | | |
Statement of Changes in Net Assets (continued)
| | | | | | | | | | | | | | | | |
| | | Six Months Ended
November 30, 2014
(Unaudited) | | | Year Ended
May 31, 2014 | |
| | | Shares | | | Dollars ($) | | | Shares | | | Dollars ($) | |
Capital stock activity (continued) | | | | | | | | | | | | | | | | |
| | | | |
Class Z shares | | | | | | | | | | | | | | | | |
| | | | |
Subscriptions | | | 166,155 | | | | 1,307,839 | | | | 498,723 | | | | 3,981,176 | |
| | | | |
Distributions reinvested | | | — | | | | — | | | | 122,138 | | | | 936,799 | |
| | | | |
Redemptions | | | (83,012 | ) | | | (654,897 | ) | | | (292,842 | ) | | | (2,299,959 | ) |
| |
Net increase | | | 83,143 | | | | 652,942 | | | | 328,019 | | | | 2,618,016 | |
| |
Total net increase (decrease) | | | (2,680,481 | ) | | | (19,957,315 | ) | | | 538,225 | | | | 3,461,960 | |
| |
| (a) | Includes conversions of Class B shares to Class A shares, if any. |
The accompanying Notes to Financial Statements are an integral part of this statement.
| | | | |
| Semiannual Report 2014 | | | 17 | |
| | |
| |
| | Columbia Multi-Advisor Small Cap Value Fund |
Financial Highlights
The following tables are intended to help you understand the Fund’s financial performance. Certain information reflects financial results for a single share of a class held for the periods shown. Per share net investment income (loss) amounts are calculated based on average shares outstanding during the period. Total return assumes reinvestment of all dividends and distributions, if any. Total return does not reflect payment of sales charges, if any. Total return and portfolio turnover are not annualized for periods of less than one year. The portfolio turnover rate is calculated without regard to purchase and sales transactions of short-term instruments and certain derivatives, if any. If such transactions were included, the Fund’s portfolio turnover rate may be higher.
| | | | | | | | | | | | | | | | | | | | | | | | |
| |
| Six Months Ended
November 30, 2014 |
| | | Year Ended May 31, | |
Class A | | | (Unaudited) | | | | 2014 | | | | 2013 | | | | 2012 | | | | 2011 | | | | 2010 | |
Per share data | | | | | | | | | | | | | | | | | | | | | | | | |
Net asset value, beginning of period | | | $7.55 | | | | $7.20 | | | | $5.42 | | | | $6.18 | | | | $4.91 | | | | $3.35 | |
| | | | | | | | | | | | | | | | | | | | | | | | | |
Income from investment operations: | | | | | | | | | | | | | | | | | | | | | | | | |
| | | | | | |
Net investment income (loss) | | | (0.01 | ) | | | (0.02 | ) | | | 0.00 | (a) | | | (0.01 | ) | | | (0.03 | ) | | | (0.02 | ) |
| | | | | | | | | | | | | | | | | | | | | | | | | |
Net realized and unrealized gain (loss) | | | 0.12 | | | | 1.19 | | | | 1.82 | | | | (0.75 | ) | | | 1.30 | | | | 1.58 | |
| | | | | | | | | | | | | | | | | | | | | | | | | |
Total from investment operations | | | 0.11 | | | | 1.17 | | | | 1.82 | | | | (0.76 | ) | | | 1.27 | | | | 1.56 | |
| | | | | | | | | | | | | | | | | | | | | | | | | |
Less distributions to shareholders: | | | | | | | | | | | | | | | | | | | | | | | | |
| | | | | | |
Net investment income | | | — | | | | — | | | | (0.01 | ) | | | — | | | | — | | | | — | |
| | | | | | | | | | | | | | | | | | | | | | | | | |
Net realized gains | | | — | | | | (0.82 | ) | | | (0.03 | ) | | | — | | | | — | | | | — | |
| | | | | | | | | | | | | | | | | | | | | | | | | |
Total distributions to shareholders | | | — | | | | (0.82 | ) | | | (0.04 | ) | | | — | | | | — | | | | — | |
| | | | | | | | | | | | | | | | | | | | | | | | | |
Proceeds from regulatory settlements | | | — | | | | — | | | | 0.00 | (a) | | | — | | | | — | | | | — | |
| | | | | | | | | | | | | | | | | | | | | | | | | |
Net asset value, end of period | | | $7.66 | | | | $7.55 | | | | $7.20 | | | | $5.42 | | | | $6.18 | | | | $4.91 | |
| | | | | | | | | | | | | | | | | | | | | | | | | |
Total return | | | 1.46 | % | | | 16.60 | % | | | 33.63 | %(b) | | | (12.30 | %) | | | 25.87 | % | | | 46.57 | % |
| | | | | | | | | | | | | | | | | | | | | | | | | |
Ratios to average net assets(c) | | | | | | | | | | | | | | | | | | | | | | | | |
| | | | | | |
Total gross expenses | | | 1.60 | %(d) | | | 1.63 | %(e) | | | 1.70 | % | | | 1.70 | % | | | 1.70 | % | | | 1.79 | % |
| | | | | | | | | | | | | | | | | | | | | | | | | |
Total net expenses(f) | | | 1.39 | %(d) | | | 1.40 | %(e)(g) | | | 1.42 | %(g) | | | 1.50 | %(g) | | | 1.53 | % | | | 1.52 | % |
| | | | | | | | | | | | | | | | | | | | | | | | | |
Net investment income (loss) | | | (0.17 | %)(d) | | | (0.26 | %) | | | 0.06 | % | | | (0.27 | %) | | | (0.56 | %) | | | (0.54 | %) |
| | | | | | | | | | | | | | | | | | | | | | | | | |
Supplemental data | | | | | | | | | | | | | | | | | | | | | | | | |
| | | | | | |
Net assets, end of period (in thousands) | | | $282,762 | | | | $295,555 | | | | $277,567 | | | | $244,913 | | | | $323,548 | | | | $277,384 | |
| | | | | | | | | | | | | | | | | | | | | | | | | |
Portfolio turnover | | | 40 | % | | | 74 | % | | | 68 | % | | | 66 | % | | | 54 | % | | | 80 | % |
| | | | | | | | | | | | | | | | | | | | | | | | | |
Notes to Financial Highlights
| (b) | The Fund received proceeds from regulatory settlements. Had the Fund not received these proceeds, the total return would have been lower by 0.04%. |
| (c) | In addition to the fees and expenses that the Fund bears directly, the Fund indirectly bears a pro rata share of the fees and expenses of any other funds in which it invests. Such indirect expenses are not included in the Fund’s reported expense ratios. |
| (e) | Ratios include line of credit interest expense which is less than 0.01%. |
| (f) | Total net expenses include the impact of certain fee waivers/expense reimbursements made by the Investment Manager and certain of its affiliates, if applicable. |
| (g) | The benefits derived from expense reductions had an impact of less than 0.01%. |
The accompanying Notes to Financial Statements are an integral part of this statement.
| | |
| 18 | | Semiannual Report 2014 |
| | |
| |
| Columbia Multi-Advisor Small Cap Value Fund | | |
Financial Highlights (continued)
| | | | | | | | | | | | | | | | | | | | | | | | |
| |
| Six Months Ended
November 30, 2014 |
| | | Year Ended May 31, | |
Class B | | | (Unaudited) | | | | 2014 | | | | 2013 | | | | 2012 | | | | 2011 | | | | 2010 | |
Per share data | | | | | | | | | | | | | | | | | | | | | | | | |
Net asset value, beginning of period | | | $6.72 | | | | $6.50 | | | | $4.93 | | | | $5.68 | | | | $4.54 | | | | $3.12 | |
| | | | | | | | | | | | | | | | | | | | | | | | | |
Income from investment operations: | | | | | | | | | | | | | | | | | | | | | | | | |
| | | | | | |
Net investment loss | | | (0.03 | ) | | | (0.07 | ) | | | (0.04 | ) | | | (0.05 | ) | | | (0.07 | ) | | | (0.05 | ) |
| | | | | | | | | | | | | | | | | | | | | | | | | |
Net realized and unrealized gain (loss) | | | 0.10 | | | | 1.08 | | | | 1.64 | | | | (0.70 | ) | | | 1.21 | | | | 1.47 | |
| | | | | | | | | | | | | | | | | | | | | | | | | |
Total from investment operations | | | 0.07 | | | | 1.01 | | | | 1.60 | | | | (0.75 | ) | | | 1.14 | | | | 1.42 | |
| | | | | | | | | | | | | | | | | | | | | | | | | |
Less distributions to shareholders: | | | | | | | | | | | | | | | | | | | | | | | | |
| | | | | | |
Net realized gains | | | — | | | | (0.79 | ) | | | (0.03 | ) | | | — | | | | — | | | | — | |
| | | | | | | | | | | | | | | | | | | | | | | | | |
Total distributions to shareholders | | | — | | | | (0.79 | ) | | | (0.03 | ) | | | — | | | | — | | | | — | |
| | | | | | | | | | | | | | | | | | | | | | | | | |
Proceeds from regulatory settlements | | | — | | | | — | | | | 0.00 | (a) | | | — | | | | — | | | | — | |
| | | | | | | | | | | | | | | | | | | | | | | | | |
Net asset value, end of period | | | $6.79 | | | | $6.72 | | | | $6.50 | | | | $4.93 | | | | $5.68 | | | | $4.54 | |
| | | | | | | | | | | | | | | | | | | | | | | | | |
Total return | | | 1.04 | % | | | 15.82 | % | | | 32.66 | %(b) | | | (13.20 | %) | | | 25.11 | % | | | 45.51 | % |
| | | | | | | | | | | | | | | | | | | | | | | | | |
Ratios to average net assets(c) | | | | | | | | | | | | | | | | | | | | | | | | |
| | | | | | |
Total gross expenses | | | 2.35 | %(d) | | | 2.38 | %(e) | | | 2.45 | % | | | 2.44 | % | | | 2.47 | % | | | 2.56 | % |
| | | | | | | | | | | | | | | | | | | | | | | | | |
Total net expenses(f) | | | 2.14 | %(d) | | | 2.15 | %(e)(g) | | | 2.17 | %(g) | | | 2.26 | %(g) | | | 2.30 | % | | | 2.30 | % |
| | | | | | | | | | | | | | | | | | | | | | | | | |
Net investment loss | | | (0.92 | %)(d) | | | (0.99 | %) | | | (0.70 | %) | | | (1.05 | %) | | | (1.34 | %) | | | (1.31 | %) |
| | | | | | | | | | | | | | | | | | | | | | | | | |
Supplemental data | | | | | | | | | | | | | | | | | | | | | | | | |
| | | | | | |
Net assets, end of period (in thousands) | | | $6,521 | | | | $8,171 | | | | $12,609 | | | | $17,066 | | | | $37,804 | | | | $62,404 | |
| | | | | | | | | | | | | | | | | | | | | | | | | |
Portfolio turnover | | | 40 | % | | | 74 | % | | | 68 | % | | | 66 | % | | | 54 | % | | | 80 | % |
| | | | | | | | | | | | | | | | | | | | | | | | | |
Notes to Financial Highlights
| (b) | The Fund received proceeds from regulatory settlements. Had the Fund not received these proceeds, the total return would have been lower by 0.04%. |
| (c) | In addition to the fees and expenses that the Fund bears directly, the Fund indirectly bears a pro rata share of the fees and expenses of any other funds in which it invests. Such indirect expenses are not included in the Fund’s reported expense ratios. |
| (e) | Ratios include line of credit interest expense which is less than 0.01%. |
| (f) | Total net expenses include the impact of certain fee waivers/expense reimbursements made by the Investment Manager and certain of its affiliates, if applicable. |
| (g) | The benefits derived from expense reductions had an impact of less than 0.01%. |
The accompanying Notes to Financial Statements are an integral part of this statement.
| | | | |
| Semiannual Report 2014 | | | 19 | |
| | |
| |
| | Columbia Multi-Advisor Small Cap Value Fund |
Financial Highlights (continued)
| | | | | | | | | | | | | | | | | | | | | | | | |
| |
| Six Months Ended
November 30, 2014 |
| | | Year Ended May 31, | |
Class C | | | (Unaudited) | | | | 2014 | | | | 2013 | | | | 2012 | | | | 2011 | | | | 2010 | |
Per share data | | | | | | | | | | | | | | | | | | | | | | | | |
Net asset value, beginning of period | | | $6.74 | | | | $6.52 | | | | $4.95 | | | | $5.69 | | | | $4.55 | | | | $3.12 | |
| | | | | | | | | | | | | | | | | | | | | | | | | |
Income from investment operations: | | | | | | | | | | | | | | | | | | | | | | | | |
| | | | | | |
Net investment loss | | | (0.03 | ) | | | (0.07 | ) | | | (0.04 | ) | | | (0.05 | ) | | | (0.07 | ) | | | (0.05 | ) |
| | | | | | | | | | | | | | | | | | | | | | | | | |
Net realized and unrealized gain (loss) | | | 0.11 | | | | 1.08 | | | | 1.64 | | | | (0.69 | ) | | | 1.21 | | | | 1.48 | |
| | | | | | | | | | | | | | | | | | | | | | | | | |
Total from investment operations | | | 0.08 | | | | 1.01 | | | | 1.60 | | | | (0.74 | ) | | | 1.14 | | | | 1.43 | |
| | | | | | | | | | | | | | | | | | | | | | | | | |
Less distributions to shareholders: | | | | | | | | | | | | | | | | | | | | | | | | |
| | | | | | |
Net realized gains | | | — | | | | (0.79 | ) | | | (0.03 | ) | | | — | | | | — | | | | — | |
| | | | | | | | | | | | | | | | | | | | | | | | | |
Total distributions to shareholders | | | — | | | | (0.79 | ) | | | (0.03 | ) | | | — | | | | — | | | | — | |
| | | | | | | | | | | | | | | | | | | | | | | | | |
Proceeds from regulatory settlements | | | — | | | | — | | | | 0.00 | (a) | | | — | | | | — | | | | — | |
| | | | | | | | | | | | | | | | | | | | | | | | | |
Net asset value, end of period | | | $6.82 | | | | $6.74 | | | | $6.52 | | | | $4.95 | | | | $5.69 | | | | $4.55 | |
| | | | | | | | | | | | | | | | | | | | | | | | | |
Total return | | | 1.19 | % | | | 15.77 | % | | | 32.52 | %(b) | | | (13.01 | %) | | | 25.05 | % | | | 45.83 | % |
| | | | | | | | | | | | | | | | | | | | | | | | | |
Ratios to average net assets(c) | | | | | | | | | | | | | | | | | | | | | | | | |
| | | | | | |
Total gross expenses | | | 2.35 | %(d) | | | 2.38 | %(e) | | | 2.45 | % | | | 2.44 | % | | | 2.44 | % | | | 2.55 | % |
| | | | | | | | | | | | | | | | | | | | | | | | | |
Total net expenses(f) | | | 2.14 | %(d) | | | 2.15 | %(e)(g) | | | 2.17 | %(g) | | | 2.26 | %(g) | | | 2.29 | % | | | 2.28 | % |
| | | | | | | | | | | | | | | | | | | | | | | | | |
Net investment loss | | | (0.91 | %)(d) | | | (1.01 | %) | | | (0.69 | %) | | | (1.02 | %) | | | (1.33 | %) | | | (1.29 | %) |
| | | | | | | | | | | | | | | | | | | | | | | | | |
Supplemental data | | | | | | | | | | | | | | | | | | | | | | | | |
| | | | | | |
Net assets, end of period (in thousands) | | | $10,908 | | | | $11,844 | | | | $10,320 | | | | $8,563 | | | | $10,055 | | | | $7,765 | |
| | | | | | | | | | | | | | | | | | | | | | | | | |
Portfolio turnover | | | 40 | % | | | 74 | % | | | 68 | % | | | 66 | % | | | 54 | % | | | 80 | % |
| | | | | | | | | | | | | | | | | | | | | | | | | |
Notes to Financial Highlights
| (b) | The Fund received proceeds from regulatory settlements. Had the Fund not received these proceeds, the total return would have been lower by 0.04%. |
| (c) | In addition to the fees and expenses that the Fund bears directly, the Fund indirectly bears a pro rata share of the fees and expenses of any other funds in which it invests. Such indirect expenses are not included in the Fund’s reported expense ratios. |
| (e) | Ratios include line of credit interest expense which is less than 0.01%. |
| (f) | Total net expenses include the impact of certain fee waivers/expense reimbursements made by the Investment Manager and certain of its affiliates, if applicable. |
| (g) | The benefits derived from expense reductions had an impact of less than 0.01%. |
The accompanying Notes to Financial Statements are an integral part of this statement.
| | |
| 20 | | Semiannual Report 2014 |
| | |
| |
| Columbia Multi-Advisor Small Cap Value Fund | | |
Financial Highlights (continued)
| | | | | | | | | | | | | | | | | | | | | | | | |
| |
| Six Months Ended
November 30, 2014 |
| | | Year Ended May 31, | |
Class I | | | (Unaudited) | | | | 2014 | | | | 2013 | | | | 2012 | | | | 2011 | | | | 2010 | |
Per share data | | | | | | | | | | | | | | | | | | | | | | | | |
Net asset value, beginning of period | | | $7.99 | | | | $7.56 | | | | $5.67 | | | | $6.45 | | | | $5.10 | | | | $3.46 | |
| | | | | | | | | | | | | | | | | | | | | | | | | |
Income from investment operations: | | | | | | | | | | | | | | | | | | | | | | | | |
| | | | | | |
Net investment income (loss) | | | 0.01 | | | | 0.02 | | | | 0.03 | | | | 0.01 | | | | (0.01 | ) | | | (0.00 | )(a) |
| | | | | | | | | | | | | | | | | | | | | | | | | |
Net realized and unrealized gain (loss) | | | 0.12 | | | | 1.25 | | | | 1.91 | | | | (0.79 | ) | | | 1.36 | | | | 1.64 | |
| | | | | | | | | | | | | | | | | | | | | | | | | |
Total from investment operations | | | 0.13 | | | | 1.27 | | | | 1.94 | | | | (0.78 | ) | | | 1.35 | | | | 1.64 | |
| | | | | | | | | | | | | | | | | | | | | | | | | |
Less distributions to shareholders: | | | | | | | | | | | | | | | | | | | | | | | | |
| | | | | | |
Net investment income | | | — | | | | — | | | | (0.02 | ) | | | — | | | | — | | | | — | |
| | | | | | | | | | | | | | | | | | | | | | | | | |
Net realized gains | | | — | | | | (0.84 | ) | | | (0.03 | ) | | | — | | | | — | | | | — | |
| | | | | | | | | | | | | | | | | | | | | | | | | |
Total distributions to shareholders | | | — | | | | (0.84 | ) | | | (0.05 | ) | | | — | | | | — | | | | — | |
| | | | | | | | | | | | | | | | | | | | | | | | | |
Proceeds from regulatory settlements | | | — | | | | — | | | | 0.00 | (a) | | | — | | | | — | | | | — | |
| | | | | | | | | | | | | | | | | | | | | | | | | |
Net asset value, end of period | | | $8.12 | | | | $7.99 | | | | $7.56 | | | | $5.67 | | | | $6.45 | | | | $5.10 | |
| | | | | | | | | | | | | | | | | | | | | | | | | |
Total return | | | 1.63 | % | | | 17.17 | % | | | 34.37 | %(b) | | | (12.09 | %) | | | 26.47 | % | | | 47.40 | % |
| | | | | | | | | | | | | | | | | | | | | | | | | |
Ratios to average net assets(c) | | | | | | | | | | | | | | | | | | | | | | | | |
| | | | | | |
Total gross expenses | | | 1.11 | %(d) | | | 1.12 | %(e) | | | 1.13 | % | | | 1.12 | % | | | 1.16 | % | | | 1.20 | % |
| | | | | | | | | | | | | | | | | | | | | | | | | |
Total net expenses(f) | | | 0.95 | %(d) | | | 0.95 | %(e) | | | 0.97 | % | | | 1.09 | % | | | 1.08 | % | | | 1.07 | % |
| | | | | | | | | | | | | | | | | | | | | | | | | |
Net investment income (loss) | | | 0.28 | %(d) | | | 0.20 | % | | | 0.50 | % | | | 0.09 | % | | | (0.12 | %) | | | (0.08 | %) |
| | | | | | | | | | | | | | | | | | | | | | | | | |
Supplemental data | | | | | | | | | | | | | | | | | | | | | | | | |
| | | | | | |
Net assets, end of period (in thousands) | | | $23,080 | | | | $23,181 | | | | $22,350 | | | | $19,114 | | | | $48,387 | | | | $43,815 | |
| | | | | | | | | | | | | | | | | | | | | | | | | |
Portfolio turnover | | | 40 | % | | | 74 | % | | | 68 | % | | | 66 | % | | | 54 | % | | | 80 | % |
| | | | | | | | | | | | | | | | | | | | | | | | | |
Notes to Financial Highlights
| (b) | The Fund received proceeds from regulatory settlements. Had the Fund not received these proceeds, the total return would have been lower by 0.04%. |
| (c) | In addition to the fees and expenses that the Fund bears directly, the Fund indirectly bears a pro rata share of the fees and expenses of any other funds in which it invests. Such indirect expenses are not included in the Fund’s reported expense ratios. |
| (e) | Ratios include line of credit interest expense which is less than 0.01%. |
| (f) | Total net expenses include the impact of certain fee waivers/expense reimbursements made by the Investment Manager and certain of its affiliates, if applicable. |
The accompanying Notes to Financial Statements are an integral part of this statement.
| | | | |
| Semiannual Report 2014 | | | 21 | |
| | |
| |
| | Columbia Multi-Advisor Small Cap Value Fund |
Financial Highlights (continued)
| | | | | | | | | | | | | | | | | | | | | | | | |
| |
| Six Months Ended
November 30, 2014 |
| | | Year Ended May 31, | |
Class K | | | (Unaudited) | | | | 2014 | | | | 2013 | | | | 2012 | | | | 2011 | | | | 2010 | |
Per share data | | | | | | | | | | | | | | | | | | | | | | | | |
Net asset value, beginning of period | | | $7.77 | | | | $7.38 | | | | $5.55 | | | | $6.33 | | | | $5.02 | | | | $3.41 | |
| | | | | | | | | | | | | | | | | | | | | | | | | |
Income from investment operations: | | | | | | | | | | | | | | | | | | | | | | | | |
| | | | | | |
Net investment income (loss) | | | (0.00 | )(a) | | | (0.01 | ) | | | 0.01 | | | | (0.01 | ) | | | (0.02 | ) | | | (0.02 | ) |
| | | | | | | | | | | | | | | | | | | | | | | | | |
Net realized and unrealized gain (loss) | | | 0.12 | | | | 1.23 | | | | 1.86 | | | | (0.77 | ) | | | 1.33 | | | | 1.63 | |
| | | | | | | | | | | | | | | | | | | | | | | | | |
Total from investment operations | | | 0.12 | | | | 1.22 | | | | 1.87 | | | | (0.78 | ) | | | 1.31 | | | | 1.61 | |
| | | | | | | | | | | | | | | | | | | | | | | | | |
Less distributions to shareholders: | | | | | | | | | | | | | | | | | | | | | | | | |
| | | | | | |
Net investment income | | | — | | | | — | | | | (0.01 | ) | | | — | | | | — | | | | — | |
| | | | | | | | | | | | | | | | | | | | | | | | | |
Net realized gains | | | — | | | | (0.83 | ) | | | (0.03 | ) | | | — | | | | — | | | | — | |
| | | | | | | | | | | | | | | | | | | | | | | | | |
Total distributions to shareholders | | | — | | | | (0.83 | ) | | | (0.04 | ) | | | — | | | | — | | | | — | |
| | | | | | | | | | | | | | | | | | | | | | | | | |
Proceeds from regulatory settlements | | | — | | | | — | | | | 0.00 | (a) | | | — | | | | — | | | | — | |
| | | | | | | | | | | | | | | | | | | | | | | | | |
Net asset value, end of period | | | $7.89 | | | | $7.77 | | | | $7.38 | | | | $5.55 | | | | $6.33 | | | | $5.02 | |
| | | | | | | | | | | | | | | | | | | | | | | | | |
Total return | | | 1.54 | % | | | 16.84 | % | | | 33.85 | %(b) | | | (12.32 | %) | | | 26.10 | % | | | 47.21 | % |
| | | | | | | | | | | | | | | | | | | | | | | | | |
Ratios to average net assets(c) | | | | | | | | | | | | | | | | | | | | | | | | |
| | | | | | |
Total gross expenses | | | 1.41 | %(d) | | | 1.42 | %(e) | | | 1.43 | % | | | 1.41 | % | | | 1.41 | % | | | 1.50 | % |
| | | | | | | | | | | | | | | | | | | | | | | | | |
Total net expenses(f) | | | 1.25 | %(d) | | | 1.25 | %(e) | | | 1.27 | % | | | 1.38 | % | | | 1.33 | % | | | 1.37 | % |
| | | | | | | | | | | | | | | | | | | | | | | | | |
Net investment income (loss) | | | (0.05 | %)(d) | | | (0.11 | %) | | | 0.21 | % | | | (0.15 | %) | | | (0.42 | %) | | | (0.37 | %) |
| | | | | | | | | | | | | | | | | | | | | | | | | |
Supplemental data | | | | | | | | | | | | | | | | | | | | | | | | |
| | | | | | |
Net assets, end of period (in thousands) | | | $1,908 | | | | $2,858 | | | | $2,450 | | | | $1,552 | | | | $2,250 | | | | $370 | |
| | | | | | | | | | | | | | | | | | | | | | | | | |
Portfolio turnover | | | 40 | % | | | 74 | % | | | 68 | % | | | 66 | % | | | 54 | % | | | 80 | % |
| | | | | | | | | | | | | | | | | | | | | | | | | |
Notes to Financial Highlights
| (b) | The Fund received proceeds from regulatory settlements. Had the Fund not received these proceeds, the total return would have been lower by 0.04%. |
| (c) | In addition to the fees and expenses that the Fund bears directly, the Fund indirectly bears a pro rata share of the fees and expenses of any other funds in which it invests. Such indirect expenses are not included in the Fund’s reported expense ratios. |
| (e) | Ratios include line of credit interest expense which is less than 0.01%. |
| (f) | Total net expenses include the impact of certain fee waivers/expense reimbursements made by the Investment Manager and certain of its affiliates, if applicable. |
The accompanying Notes to Financial Statements are an integral part of this statement.
| | |
| 22 | | Semiannual Report 2014 |
| | |
| |
| Columbia Multi-Advisor Small Cap Value Fund | | |
Financial Highlights (continued)
| | | | | | | | | | | | | | | | | | | | | | | | |
| |
| Six Months Ended
November 30, 2014 |
| | | Year Ended May 31, | |
Class R | | | (Unaudited) | | | | 2014 | | | | 2013 | | | | 2012 | | | | 2011 | | | | 2010 | |
Per share data | | | | | | | | | | | | | | | | | | | | | | | | |
Net asset value, beginning of period | | | $7.46 | | | | $7.13 | | | | $5.38 | | | | $6.15 | | | | $4.90 | | | | $3.35 | |
| | | | | | | | | | | | | | | | | | | | | | | | | |
Income from investment operations: | | | | | | | | | | | | | | | | | | | | | | | | |
| | | | | | |
Net investment loss | | | (0.02 | ) | | | (0.04 | ) | | | (0.01 | ) | | | (0.03 | ) | | | (0.05 | ) | | | (0.04 | ) |
| | | | | | | | | | | | | | | | | | | | | | | | | |
Net realized and unrealized gain (loss) | | | 0.12 | | | | 1.18 | | | | 1.79 | | | | (0.74 | ) | | | 1.30 | | | | 1.59 | |
| | | | | | | | | | | | | | | | | | | | | | | | | |
Total from investment operations | | | 0.10 | | | | 1.14 | | | | 1.78 | | | | (0.77 | ) | | | 1.25 | | | | 1.55 | |
| | | | | | | | | | | | | | | | | | | | | | | | | |
Less distributions to shareholders: | | | | | | | | | | | | | | | | | | | | | | | | |
| | | | | | |
Net realized gains | | | — | | | | (0.81 | ) | | | (0.03 | ) | | | — | | | | — | | | | — | |
| | | | | | | | | | | | | | | | | | | | | | | | | |
Total distributions to shareholders | | | — | | | | (0.81 | ) | | | (0.03 | ) | | | — | | | | — | | | | — | |
| | | | | | | | | | | | | | | | | | | | | | | | | |
Proceeds from regulatory settlements | | | — | | | | — | | | | 0.00 | (a) | | | — | | | | — | | | | — | |
| | | | | | | | | | | | | | | | | | | | | | | | | |
Net asset value, end of period | | | $7.56 | | | | $7.46 | | | | $7.13 | | | | $5.38 | | | | $6.15 | | | | $4.90 | |
| | | | | | | | | | | | | | | | | | | | | | | | | |
Total return | | | 1.34 | % | | | 16.31 | % | | | 33.27 | %(b) | | | (12.52 | %) | | | 25.51 | % | | | 46.27 | % |
| | | | | | | | | | | | | | | | | | | | | | | | | |
Ratios to average net assets(c) | | | | | | | | | | | | | | | | | | | | | | | | |
| | | | | | |
Total gross expenses | | | 1.85 | %(d) | | | 1.88 | %(e) | | | 1.95 | % | | | 1.96 | % | | | 1.89 | % | | | 2.00 | % |
| | | | | | | | | | | | | | | | | | | | | | | | | |
Total net expenses(f) | | | 1.64 | %(d) | | | 1.65 | %(e)(g) | | | 1.66 | %(g) | | | 1.76 | %(g) | | | 1.80 | % | | | 1.87 | % |
| | | | | | | | | | | | | | | | | | | | | | | | | |
Net investment loss | | | (0.42 | %)(d) | | | (0.53 | %) | | | (0.22 | %) | | | (0.50 | %) | | | (0.86 | %) | | | (0.89 | %) |
| | | | | | | | | | | | | | | | | | | | | | | | | |
Supplemental data | | | | | | | | | | | | | | | | | | | | | | | | |
| | | | | | |
Net assets, end of period (in thousands) | | | $6,089 | | | | $6,396 | | | | $8,110 | | | | $3,545 | | | | $1,951 | | | | $679 | |
| | | | | | | | | | | | | | | | | | | | | | | | | |
Portfolio turnover | | | 40 | % | | | 74 | % | | | 68 | % | | | 66 | % | | | 54 | % | | | 80 | % |
| | | | | | | | | | | | | | | | | | | | | | | | | |
Notes to Financial Highlights
| (b) | The Fund received proceeds from regulatory settlements. Had the Fund not received these proceeds, the total return would have been lower by 0.04%. |
| (c) | In addition to the fees and expenses that the Fund bears directly, the Fund indirectly bears a pro rata share of the fees and expenses of any other funds in which it invests. Such indirect expenses are not included in the Fund’s reported expense ratios. |
| (e) | Ratios include line of credit interest expense which is less than 0.01%. |
| (f) | Total net expenses include the impact of certain fee waivers/expense reimbursements made by the Investment Manager and certain of its affiliates, if applicable. |
| (g) | The benefits derived from expense reductions had an impact of less than 0.01%. |
The accompanying Notes to Financial Statements are an integral part of this statement.
| | | | |
| Semiannual Report 2014 | | | 23 | |
| | |
| |
| | Columbia Multi-Advisor Small Cap Value Fund |
Financial Highlights (continued)
| | | | | | | | | | | | | | | | | | | | | | | | |
| |
| Six Months Ended
November 30, 2014 |
| | | Year Ended May 31, | |
Class R4 | | | (Unaudited) | | | | 2014 | | | | 2013 | | | | 2012 | | | | 2011 | | | | 2010 | |
Per share data | | | | | | | | | | | | | | | | | | | | | | | | |
Net asset value, beginning of period | | | $7.67 | | | | $7.29 | | | | $5.48 | | | | $6.26 | | | | $4.98 | | | | $3.39 | |
| | | | | | | | | | | | | | | | | | | | | | | | | |
Income from investment operations: | | | | | | | | | | | | | | | | | | | | | | | | |
| | | | | | |
Net investment income (loss) | | | 0.00 | (a) | | | 0.00 | (a) | | | 0.01 | | | | (0.02 | ) | | | (0.04 | ) | | | (0.03 | ) |
| | | | | | | | | | | | | | | | | | | | | | | | | |
Net realized and unrealized gain (loss) | | | 0.12 | | | | 1.21 | | | | 1.83 | | | | (0.76 | ) | | | 1.32 | | | | 1.62 | |
| | | | | | | | | | | | | | | | | | | | | | | | | |
Total from investment operations | | | 0.12 | | | | 1.21 | | | | 1.84 | | | | (0.78 | ) | | | 1.28 | | | | 1.59 | |
| | | | | | | | | | | | | | | | | | | | | | | | | |
Less distributions to shareholders: | | | | | | | | | | | | | | | | | | | | | | | | |
| | | | | | |
Net realized gains | | | — | | | | (0.83 | ) | | | (0.03 | ) | | | — | | | | — | | | | — | |
| | | | | | | | | | | | | | | | | | | | | | | | | |
Total distributions to shareholders | | | — | | | | (0.83 | ) | | | (0.03 | ) | | | — | | | | — | | | | — | |
| | | | | | | | | | | | | | | | | | | | | | | | | |
Increase from payment by affiliate | | | — | | | | — | | | | 0.00 | (a) | | | — | | | | — | | | | — | |
| | | | | | | | | | | | | | | | | | | | | | | | | |
Net asset value, end of period | | | $7.79 | | | | $7.67 | | | | $7.29 | | | | $5.48 | | | | $6.26 | | | | $4.98 | |
| | | | | | | | | | | | | | | | | | | | | | | | | |
Total return | | | 1.56 | % | | | 16.98 | % | | | 33.76 | %(b) | | | (12.46 | %) | | | 25.70 | % | | | 46.90 | % |
| | | | | | | | | | | | | | | | | | | | | | | | | |
Ratios to average net assets(c) | | | | | | | | | | | | | | | | | | | | | | | | |
| | | | | | |
Total gross expenses | | | 1.35 | %(d) | | | 1.38 | %(e) | | | 1.55 | % | | | 1.65 | % | | | 1.67 | % | | | 1.76 | % |
| | | | | | | | | | | | | | | | | | | | | | | | | |
Total net expenses(f) | | | 1.14 | %(d) | | | 1.15 | %(e)(g) | | | 1.34 | % | | | 1.63 | % | | | 1.58 | % | | | 1.62 | % |
| | | | | | | | | | | | | | | | | | | | | | | | | |
Net investment income (loss) | | | 0.08 | %(d) | | | 0.00 | %(a) | | | 0.20 | % | | | (0.39 | %) | | | (0.62 | %) | | | (0.65 | %) |
| | | | | | | | | | | | | | | | | | | | | | | | | |
Supplemental data | | | | | | | | | | | | | | | | | | | | | | | | |
| | | | | | |
Net assets, end of period (in thousands) | | | $3,714 | | | | $3,572 | | | | $1,221 | | | | $2,585 | | | | $2,946 | | | | $440 | |
| | | | | | | | | | | | | | | | | | | | | | | | | |
Portfolio turnover | | | 40 | % | | | 74 | % | | | 68 | % | | | 66 | % | | | 54 | % | | | 80 | % |
| | | | | | | | | | | | | | | | | | | | | | | | | |
Notes to Financial Highlights
| (b) | The Fund received proceeds from regulatory settlements. Had the Fund not received these proceeds, the total return would have been lower by 0.04%. |
| (c) | In addition to the fees and expenses that the Fund bears directly, the Fund indirectly bears a pro rata share of the fees and expenses of any other funds in which it invests. Such indirect expenses are not included in the Fund’s reported expense ratios. |
| (e) | Ratios include line of credit interest expense which is less than 0.01%. |
| (f) | Total net expenses include the impact of certain fee waivers/expense reimbursements made by the Investment Manager and certain of its affiliates, if applicable. |
| (g) | The benefits derived from expense reductions had an impact of less than 0.01%. |
The accompanying Notes to Financial Statements are an integral part of this statement.
| | |
| 24 | | Semiannual Report 2014 |
| | |
| |
| Columbia Multi-Advisor Small Cap Value Fund | | |
Financial Highlights (continued)
| | | | | | | | | | | | | | | | | | | | | | | | |
| |
| Six Months Ended
November 30, 2014 |
| | | Year Ended May 31, | |
Class R5 | | | (Unaudited) | | | | 2014 | | | | 2013 | | | | 2012 | | | | 2011 | | | | 2010 | |
Per share data | | | | | | | | | | | | | | | | | | | | | | | | |
Net asset value, beginning of period | | | $7.87 | | | | $7.46 | | | | $5.60 | | | | $6.37 | | | | $5.04 | | | | $3.42 | |
| | | | | | | | | | | | | | | | | | | | | | | | | |
Income from investment operations: | | | | | | | | | | | | | | | | | | | | | | | | |
| | | | | | |
Net investment income (loss) | | | 0.01 | | | | 0.01 | | | | 0.03 | | | | 0.01 | | | | (0.01 | ) | | | (0.01 | ) |
| | | | | | | | | | | | | | | | | | | | | | | | | |
Net realized and unrealized gain (loss) | | | 0.13 | | | | 1.24 | | | | 1.88 | | | | (0.78 | ) | | | 1.34 | | | | 1.63 | |
| | | | | | | | | | | | | | | | | | | | | | | | | |
Total from investment operations | | | 0.14 | | | | 1.25 | | | | 1.91 | | | | (0.77 | ) | | | 1.33 | | | | 1.62 | |
| | | | | | | | | | | | | | | | | | | | | | | | | |
Less distributions to shareholders: | | | | | | | | | | | | | | | | | | | | | | | | |
| | | | | | |
Net investment income | | | — | | | | — | | | | (0.02 | ) | | | — | | | | — | | | | — | |
| | | | | | | | | | | | | | | | | | | | | | | | | |
Net realized gains | | | — | | | | (0.84 | ) | | | (0.03 | ) | | | — | | | | — | | | | — | |
| | | | | | | | | | | | | | | | | | | | | | | | | |
Total distributions to shareholders | | | — | | | | (0.84 | ) | | | (0.05 | ) | | | — | | | | — | | | | — | |
| | | | | | | | | | | | | | | | | | | | | | | | | |
Proceeds from regulatory settlements | | | — | | | | — | | | | 0.00 | (a) | | | — | | | | — | | | | — | |
| | | | | | | | | | | | | | | | | | | | | | | | | |
Net asset value, end of period | | | $8.01 | | | | $7.87 | | | | $7.46 | | | | $5.60 | | | | $6.37 | | | | $5.04 | |
| | | | | | | | | | | | | | | | | | | | | | | | | |
Total return | | | 1.78 | % | | | 17.09 | % | | | 34.23 | %(b) | | | (12.09 | %) | | | 26.39 | % | | | 47.37 | % |
| | | | | | | | | | | | | | | | | | | | | | | | | |
Ratios to average net assets(c) | | | | | | | | | | | | | | | | | | | | | | | | |
| | | | | | |
Total gross expenses | | | 1.17 | %(d) | | | 1.17 | %(e) | | | 1.18 | % | | | 1.15 | % | | | 1.20 | % | | | 1.25 | % |
| | | | | | | | | | | | | | | | | | | | | | | | | |
Total net expenses(f) | | | 1.00 | %(d) | | | 1.00 | %(e) | | | 1.02 | % | | | 1.12 | % | | | 1.11 | % | | | 1.12 | % |
| | | | | | | | | | | | | | | | | | | | | | | | | |
Net investment income (loss) | | | 0.23 | %(d) | | | 0.14 | % | | | 0.45 | % | | | 0.13 | % | | | (0.16 | %) | | | (0.14 | %) |
| | | | | | | | | | | | | | | | | | | | | | | | | |
Supplemental data | | | | | | | | | | | | | | | | | | | | | | | | |
| | | | | | |
Net assets, end of period (in thousands) | | | $22,269 | | | | $21,005 | | | | $18,454 | | | | $14,373 | | | | $17,344 | | | | $11,079 | |
| | | | | | | | | | | | | | | | | | | | | | | | | |
Portfolio turnover | | | 40 | % | | | 74 | % | | | 68 | % | | | 66 | % | | | 54 | % | | | 80 | % |
| | | | | | | | | | | | | | | | | | | | | | | | | |
Notes to Financial Highlights
| (b) | The Fund received proceeds from regulatory settlements. Had the Fund not received these proceeds, the total return would have been lower by 0.04%. |
| (c) | In addition to the fees and expenses that the Fund bears directly, the Fund indirectly bears a pro rata share of the fees and expenses of any other funds in which it invests. Such indirect expenses are not included in the Fund’s reported expense ratios. |
| (e) | Ratios include line of credit interest expense which is less than 0.01%. |
| (f) | Total net expenses include the impact of certain fee waivers/expense reimbursements made by the Investment Manager and certain of its affiliates, if applicable. |
The accompanying Notes to Financial Statements are an integral part of this statement.
| | | | |
| Semiannual Report 2014 | | | 25 | |
| | |
| |
| | Columbia Multi-Advisor Small Cap Value Fund |
Financial Highlights (continued)
| | | | | | | | | | | | | | | | | | | | |
| |
| Six Months Ended
November 30, 2014 |
| | | Year Ended May 31, | |
Class Z | | | (Unaudited) | | | | 2014 | | | | 2013 | | | | 2012 | | | | 2011(a) | |
Per share data | | | | | | | | | | | | | | | | | | | | |
Net asset value, beginning of period | | | $7.94 | | | | $7.52 | | | | $5.65 | | | | $6.43 | | | | $5.09 | |
| | | | | | | | | | | | | | | | | | | | | |
Income from investment operations: | | | | | | | | | | | | | | | | | | | | |
| | | | | |
Net investment income (loss) | | | 0.00 | (b) | | | (0.00 | )(b) | | | 0.02 | | | | (0.00 | )(b) | | | (0.01 | ) |
| | | | | | | | | | | | | | | | | | | | | |
Net realized and unrealized gain (loss) | | | 0.12 | | | | 1.25 | | | | 1.90 | | | | (0.78 | ) | | | 1.35 | |
| | | | | | | | | | | | | | | | | | | | | |
Total from investment operations | | | 0.12 | | | | 1.25 | | | | 1.92 | | | | (0.78 | ) | | | 1.34 | |
| | | | | | | | | | | | | | | | | | | | | |
Less distributions to shareholders: | | | | | | | | | | | | | | | | | | | | |
| | | | | |
Net investment income | | | — | | | | — | | | | (0.02 | ) | | | — | | | | — | |
| | | | | | | | | | | | | | | | | | | | | |
Net realized gains | | | — | | | | (0.83 | ) | | | (0.03 | ) | | | — | | | | — | |
| | | | | | | | | | | | | | | | | | | | | |
Total distributions to shareholders | | | — | | | | (0.83 | ) | | | (0.05 | ) | | | — | | | | — | |
| | | | | | | | | | | | | | | | | | | | | |
Proceeds from regulatory settlements | | | — | | | | — | | | | 0.00 | (b) | | | — | | | | — | |
| | | | | | | | | | | | | | | | | | | | | |
Net asset value, end of period | | | $8.06 | | | | $7.94 | | | | $7.52 | | | | $5.65 | | | | $6.43 | |
| | | | | | | | | | | | | | | | | | | | | |
Total return | | | 1.51 | % | | | 17.01 | % | | | 34.03 | %(c) | | | (12.13 | %) | | | 26.33 | % |
| | | | | | | | | | | | | | | | | | | | | |
Ratios to average net assets(d) | | | | | | | | | | | | | | | | | | | | |
| | | | | |
Total gross expenses | | | 1.35 | %(e) | | | 1.38 | %(f) | | | 1.45 | % | | | 1.44 | % | | | 1.32 | %(e) |
| | | | | | | | | | | | | | | | | | | | | |
Total net expenses(g) | | | 1.14 | %(e) | | | 1.15 | %(f)(h) | | | 1.16 | %(h) | | | 1.25 | %(h) | | | 1.20 | %(e) |
| | | | | | | | | | | | | | | | | | | | | |
Net investment income (loss) | | | 0.09 | %(e) | | | (0.01 | %) | | | 0.30 | % | | | (0.00 | %)(b) | | | (0.22 | %)(e) |
| | | | | | | | | | | | | | | | | | | | | |
Supplemental data | | | | | | | | | | | | | | | | | | | | |
| | | | | |
Net assets, end of period (in thousands) | | | $10,659 | | | | $9,832 | | | | $6,848 | | | | $3,960 | | | | $4,338 | |
| | | | | | | | | | | | | | | | | | | | | |
Portfolio turnover | | | 40 | % | | | 74 | % | | | 68 | % | | | 66 | % | | | 54 | % |
| | | | | | | | | | | | | | | | | | | | | |
Notes to Financial Highlights
| (a) | Based on operations from September 27, 2010 (commencement of operations) through the stated period end. |
| (c) | The Fund received proceeds from regulatory settlements. Had the Fund not received these proceeds, the total return would have been lower by 0.04%. |
| (d) | In addition to the fees and expenses that the Fund bears directly, the Fund indirectly bears a pro rata share of the fees and expenses of any other funds in which it invests. Such indirect expenses are not included in the Fund’s reported expense ratios. |
| (f) | Ratios include line of credit interest expense which is less than 0.01%. |
| (g) | Total net expenses include the impact of certain fee waivers/expense reimbursements made by the Investment Manager and certain of its affiliates, if applicable. |
| (h) | The benefits derived from expense reductions had an impact of less than 0.01%. |
The accompanying Notes to Financial Statements are an integral part of this statement.
| | |
| 26 | | Semiannual Report 2014 |
| | |
| |
| Columbia Multi-Advisor Small Cap Value Fund | | |
Notes to Financial Statements
November 30, 2014 (Unaudited)
Note 1. Organization
Columbia Multi-Advisor Small Cap Value Fund (the Fund), a series of Columbia Funds Series Trust II (the Trust), is a diversified fund. The Trust is registered under the Investment Company Act of 1940, as amended (the 1940 Act), as an open-end management investment company organized as a Massachusetts business trust.
Fund Shares
The Trust may issue an unlimited number of shares (without par value). The Fund offers Class A, Class B, Class C, Class I, Class K, Class R, Class R4, Class R5 and Class Z shares. Although all share classes generally have identical voting, dividend and liquidation rights, each share class votes separately when required by the Trust’s organizational documents or by law. Different share classes pay different distribution amounts to the extent the expenses of such share classes differ, and distributions in liquidation will be proportional to the net asset value of each share class. Each share class has its own expense structure and sales charges.
Class A shares are subject to a maximum front-end sales charge of 5.75% based on the initial investment amount. Class A shares purchased without an initial sales charge in accounts aggregating $1 million to $50 million at the time of purchase are subject to a contingent deferred sales charge (CDSC) if the shares are sold within 18 months of purchase, charged as follows: 1.00% CDSC if redeemed within 12 months of purchase, and 0.50% CDSC if redeemed more than 12, but less than 18, months after purchase.
Class B shares may be subject to a maximum CDSC of 5.00% based upon the holding period after purchase. Class B shares will generally convert to Class A shares eight years after purchase. The Fund no longer accepts investments by new or existing investors in the Fund’s Class B shares, except in connection with the reinvestment of any dividend and/or capital gain distributions in Class B shares of the Fund and exchanges by existing Class B shareholders of certain other funds within the Columbia Family of Funds.
Class C shares are subject to a 1.00% CDSC on shares redeemed within one year of purchase.
Class I shares are not subject to sales charges and are available only to the Columbia Family of Funds.
Class K shares are not subject to sales charges, however this share class is closed to new investors.
Class R shares are not subject to sales charges and are generally available only to certain retirement plans and other investors as described in the Fund’s prospectus.
Class R4 shares are not subject to sales charges and are generally available only to omnibus retirement plans and certain investors as described in the Fund’s prospectus.
Class R5 shares are not subject to sales charges and are generally available only to investors purchasing through authorized investment professionals and omnibus retirement plans.
Class Z shares are not subject to sales charges and are available only to eligible investors, which are subject to different investment minimums as described in the Fund’s prospectus.
Note 2. Summary of Significant Accounting Policies
Basis of Preparation
The Fund is an investment company that applies the accounting and reporting guidance in the Financial Accounting Standards Board (FASB) Accounting Standards Codification Topic 946, Financial Services — Investment Companies (ASC 946). The financial statements are prepared in accordance with U.S. generally accepted accounting principles (GAAP) which requires management to make certain estimates and assumptions that affect the reported amounts of assets and liabilities, the disclosure of contingent assets and liabilities at the date of the financial statements and the reported amounts of income and expenses during the reporting period. Actual results could differ from those estimates.
The following is a summary of significant accounting policies followed by the Fund in the preparation of its financial statements.
Security Valuation
All equity securities are valued at the close of business of the New York Stock Exchange (NYSE). Equity securities are valued at the last quoted sales price on the principal exchange or market on which they trade, except for securities traded on the NASDAQ Stock Market, which are valued at the NASDAQ official close price. Unlisted securities or listed securities for which there were no sales during the day are valued at the mean of the latest quoted bid and ask prices on such exchanges or markets.
Foreign equity securities are valued based on quotations from the principal market in which such securities are traded. If any foreign security prices are not readily available as a result of limited share activity, the securities are valued at the mean of the latest quoted bid and ask prices on such exchanges or markets. Foreign currency exchange rates are generally
| | | | |
| Semiannual Report 2014 | | | 27 | |
| | |
| |
| | Columbia Multi-Advisor Small Cap Value Fund |
Notes to Financial Statements (continued)
November 30, 2014 (Unaudited)
determined at 4:00 p.m. Eastern (U.S.) time. Many securities markets and exchanges outside the U.S. close prior to the close of the NYSE; therefore, the closing prices for securities in such markets or on such exchanges may not fully reflect events that occur after such close but before the close of the NYSE. In those situations, foreign securities will be fair valued pursuant to a policy adopted by the Board of Trustees (the Board), including, if available, utilizing a third party pricing service to determine these fair values. The third party pricing service takes into account multiple factors, including, but not limited to, movements in the U.S. securities markets, certain depositary receipts, futures contracts and foreign exchange rates that have occurred subsequent to the close of the foreign exchange or market, to determine a good faith estimate that reasonably reflects the current market conditions as of the close of the NYSE. The fair value of a security is likely to be different from the quoted or published price, if available.
Investments in open-end investment companies, including money market funds, are valued at their net asset value.
Investments for which market quotations are not readily available, or that have quotations which management believes are not reliable, are valued at fair value as determined in good faith under procedures established by and under the general supervision of the Board. If a security or class of securities (such as foreign securities) is valued at fair value, such value is likely to be different from the quoted or published price for the security.
The determination of fair value often requires significant judgment. To determine fair value, management may use assumptions including but not limited to future cash flows and estimated risk premiums. Multiple inputs from various sources may be used to determine fair value.
Security Transactions
Security transactions are accounted for on the trade date. Cost is determined and gains (losses) are based upon the specific identification method for both financial statement and federal income tax purposes.
Income Recognition
Corporate actions and dividend income are generally recorded net of any non-reclaimable tax withholdings, on the ex-dividend date or upon receipt of ex-dividend notification in the case of certain foreign securities.
The Fund may receive distributions from holdings in business development companies (BDCs), exchange-traded funds (ETFs), other regulated investment companies (RICs), and real estate investment trusts (REITs), which report
information on the character of their distributions annually. These distributions are allocated to dividend income, capital gain and return of capital based on actual information reported. To the extent actual information has not yet been reported by the REITs, estimates for return of capital are made by the Fund’s management. Return of capital is recorded as a reduction of the cost basis of securities held. If the Fund no longer owns the applicable securities, return of capital is recorded as a realized gain. Management’s estimates are subsequently adjusted when the actual character of the distributions is disclosed by the REITs, which could result in a proportionate change in return of capital to shareholders. No estimates are made for the BDCs, ETFs, and RICs.
Awards from class action litigation are recorded as a reduction of cost basis if the Fund still owns the applicable securities on the payment date. If the Fund no longer owns the applicable securities, the proceeds are recorded as realized gains.
Expenses
General expenses of the Trust are allocated to the Fund and other funds of the Trust based upon relative net assets or other expense allocation methodologies determined by the nature of the expense. Expenses directly attributable to the Fund are charged to the Fund. Expenses directly attributable to a specific class of shares are charged to that share class.
Determination of Class Net Asset Value
All income, expenses (other than class-specific expenses, which are charged to that share class, as shown in the Statement of Operations) and realized and unrealized gains (losses) are allocated to each class of the Fund on a daily basis, based on the relative net assets of each class, for purposes of determining the net asset value of each class.
Federal Income Tax Status
The Fund intends to qualify each year as a regulated investment company under Subchapter M of the Internal Revenue Code, as amended, and will distribute substantially all of its taxable income (including net short-term capital gains), if any, for its tax year, and as such will not be subject to federal income taxes. In addition, the Fund intends to distribute in each calendar year substantially all of its net investment income, capital gains and certain other amounts, if any, such that the Fund should not be subject to federal excise tax. Therefore, no federal income or excise tax provision is recorded.
Foreign Taxes
The Fund may be subject to foreign taxes on income, gains on investments or currency repatriation, a portion of which may be recoverable. The Fund will accrue such taxes and recoveries, as
| | |
| 28 | | Semiannual Report 2014 |
| | |
| |
| Columbia Multi-Advisor Small Cap Value Fund | | |
Notes to Financial Statements (continued)
November 30, 2014 (Unaudited)
applicable, based upon its current interpretation of tax rules and regulations that exist in the markets in which it invests.
Realized gains in certain countries may be subject to foreign taxes at the Fund level, based on statutory rates. The Fund accrues for such foreign taxes on realized and unrealized gains at the appropriate rate for each jurisdiction, as applicable. The amount, if any, is disclosed as a liability on the Statement of Assets and Liabilities.
Distributions to Shareholders
Distributions from net investment income, if any, are declared and paid annually. Net realized capital gains, if any, are distributed along with the income distribution. Income distributions and capital gain distributions are determined in accordance with federal income tax regulations, which may differ from GAAP.
Guarantees and Indemnifications
Under the Trust’s organizational documents and, in some cases, by contract, its officers and trustees are indemnified against certain liabilities arising out of the performance of their duties to the Trust or its funds. In addition, certain of the Fund’s contracts with its service providers contain general indemnification clauses. The Fund’s maximum exposure under these arrangements is unknown since the amount of any future claims that may be made against the Fund cannot be determined, and the Fund has no historical basis for predicting the likelihood of any such claims.
Note 3. Fees and Compensation Paid to Affiliates
Investment Management Fees
Under an Investment Management Services Agreement, Columbia Management Investment Advisers, LLC (the Investment Manager), a wholly-owned subsidiary of Ameriprise Financial, Inc. (Ameriprise Financial), is responsible for the ultimate oversight of investments made by the Fund. The Fund’s subadvisers (see Subadvisory Agreements below) have the primary responsibility for the day-to-day portfolio management of the Fund. The investment management fee is an annual fee that is equal to a percentage of the Fund’s average daily net assets that declines from 0.97% to 0.87% as the Fund’s net assets increase. The annualized effective investment management fee rate for the six months ended November 30, 2014 was 0.96% of the Fund’s average daily net assets.
Subadvisory Agreements
The Investment Manager has entered into Subadvisory Agreements with Barrow, Hanley, Mewhinney & Strauss,
LLC, Donald Smith & Co., Inc., Metropolitan West Capital Management, LLC and, effective August 20, 2014, Segall Bryant & Hamill, LLC to each serve as a subadviser to the Fund. New investments in the Fund, net of any redemptions, are allocated in accordance with the Investment Manager’s determination, subject to the oversight of the Fund’s Board. Each subadviser’s proportionate share of investments in the Fund will vary due to market fluctuations. The Investment Manager compensates each subadviser to manage the investment of the Fund’s assets. Prior to August 20, 2014, Turner Investments, L.P. also served as an investment subadviser to the Fund and was compensated by the Investment Manager through that date.
Administration Fees
Under an Administrative Services Agreement, the Investment Manager also serves as the Fund Administrator. The Fund pays the Fund Administrator an annual fee for administration and accounting services equal to a percentage of the Fund’s average daily net assets that declines from 0.08% to 0.05% as the Fund’s net assets increase. The annualized effective administration fee rate for the six months ended November 30, 2014 was 0.08% of the Fund’s average daily net assets.
Other Expenses
Other expenses are for, among other things, miscellaneous expenses of the Fund or the Board, including payments to a company providing limited administrative services to the Fund and the Board. That company’s expenses include boardroom and office expense, employee compensation, employee health and retirement benefits, and certain other expenses. For the six months ended November 30, 2014, other expenses paid by the Fund to this company were $818.
Compensation of Board Members
Board members are compensated for their services to the Fund as disclosed in the Statement of Operations. Under a Deferred Compensation Plan (the Plan), the Board members who are not “interested persons” of the Fund, as defined under the 1940 Act, may elect to defer payment of up to 100% of their compensation. Deferred amounts are treated as though equivalent dollar amounts had been invested in shares of certain funds managed by the Investment Manager. The Fund’s liability for these amounts is adjusted for market value changes and remains in the Fund until distributed in accordance with the Plan.
Transfer Agent Fees
Under a Transfer and Dividend Disbursing Agent Agreement, Columbia Management Investment Services Corp. (the Transfer Agent), an affiliate of the Investment Manager and a wholly-owned subsidiary of Ameriprise Financial, is responsible for
| | | | |
| Semiannual Report 2014 | | | 29 | |
| | |
| |
| | Columbia Multi-Advisor Small Cap Value Fund |
Notes to Financial Statements (continued)
November 30, 2014 (Unaudited)
providing transfer agency services to the Fund. The Transfer Agent has contracted with Boston Financial Data Services (BFDS) to serve as sub-transfer agent.
Effective November 1, 2014, the Transfer Agent receives a monthly transfer agency fee based on the number or the average value of accounts, depending on the type of account. Prior to November 1, 2014, the Transfer Agent received a monthly account-based service fee based on the number of open accounts. In addition, the Transfer Agent also receives sub-transfer agency fees based on a percentage of the average aggregate value of the Fund’s shares maintained in omnibus accounts (other than omnibus accounts for which American Enterprise Investment Services Inc. is the broker of record or accounts where the beneficial shareholder is a customer of Ameriprise Financial Services, Inc., which receive a per account fee). The Transfer Agent pays the fees of BFDS for services as sub-transfer agent and is not entitled to reimbursement for such fees from the Fund (with the exception of out-of-pocket fees).
The Transfer Agent also receives compensation from the Fund for various shareholder services and reimbursements for certain out-of-pocket fees. Class I shares do not pay transfer agent fees. Total transfer agent fees for Class K and Class R5 shares are subject to an annual limitation of not more than 0.05% of the average daily net assets attributable to each share class.
For the six months ended November 30, 2014, the Fund’s annualized effective transfer agent fee rates as a percentage of average daily net assets of each class were as follows:
| | | | |
Class A | | | 0.24 | % |
Class B | | | 0.24 | |
Class C | | | 0.24 | |
Class K | | | 0.05 | |
Class R | | | 0.24 | |
Class R4 | | | 0.24 | |
Class R5 | | | 0.05 | |
Class Z | | | 0.24 | |
An annual minimum account balance fee of $20 may apply to certain accounts with a value below the applicable share class’s initial minimum investment requirements to reduce the impact of small accounts on transfer agent fees. These minimum account balance fees are remitted to the Fund and recorded as part of expense reductions in the Statement of Operations. For the six months ended November 30, 2014, no minimum account balance fees were charged by the Fund.
Plan Administration Fees
Under a Plan Administration Services Agreement with the Transfer Agent, the Fund pays an annual fee at a rate of 0.25% of the Fund’s average daily net assets attributable to Class K shares for the provision of various administrative, recordkeeping, communication and educational services.
Distribution Fees
The Fund has an agreement with Columbia Management Investment Distributors, Inc. (the Distributor), an affiliate of the Investment Manager and a wholly-owned subsidiary of Ameriprise Financial, for distribution and shareholder services. Under a Plan and Agreement of Distribution, the Fund pays a fee at an annual rate of up to 0.25% of the Fund’s average daily net assets attributable to Class A shares, a fee at an annual rate of up to 0.50% of the Fund’s average daily net assets attributable to Class R shares (of which up to 0.25% may be used for shareholder services) and a fee at an annual rate of up to 1.00% of the Fund’s average daily net assets attributable to Class B and Class C shares. For Class B and Class C shares, of the 1.00% fee, up to 0.75% is reimbursed for distribution expenses.
The amount of distribution expenses incurred by the Distributor and not yet reimbursed (unreimbursed expense) was approximately $990,000 and $114,000 for Class B and Class C shares, respectively. These amounts are based on the most recent information available as of September 30, 2014, and may be recovered from future payments under the distribution plan or CDSCs. To the extent the unreimbursed expense has been fully recovered, the distribution fee is reduced.
Sales Charges
Sales charges, including front-end charges and CDSCs, received by the Distributor for distributing Fund shares were $58,453 for Class A, $724 for Class B and $159 for Class C shares for the six months ended November 30, 2014.
Expenses Waived/Reimbursed by the Investment Manager and its Affiliates
The Investment Manager and certain of its affiliates have contractually agreed to waive fees and/or reimburse expenses (excluding certain fees and expenses described below) for the periods disclosed below, unless sooner terminated at the sole discretion of the Board, so that the Fund’s net operating expenses, after giving effect to fees waived/expenses reimbursed and any balance credits and/or overdraft charges
| | |
| 30 | | Semiannual Report 2014 |
| | |
| |
| Columbia Multi-Advisor Small Cap Value Fund | | |
Notes to Financial Statements (continued)
November 30, 2014 (Unaudited)
from the Fund’s custodian, do not exceed the following annual rates as a percentage of the class’ average daily net assets:
| | | | | | | | |
| | | | | | | | | |
| | | October 1, 2014 through September 30, 2015 | | | Prior to October 1, 2014 | |
Class A | | | 1.50 | % | | | 1.40 | % |
Class B | | | 2.25 | | | | 2.15 | |
Class C | | | 2.25 | | | | 2.15 | |
Class I | | | 1.07 | | | | 0.95 | |
Class K | | | 1.37 | | | | 1.25 | |
Class R | | | 1.75 | | | | 1.65 | |
Class R4 | | | 1.25 | | | | 1.15 | |
Class R5 | | | 1.12 | | | | 1.00 | |
Class Z | | | 1.25 | | | | 1.15 | |
Under the agreement governing these fee waivers and/or expense reimbursement arrangements, the following fees and expenses are excluded from the waiver/reimbursement commitment, and therefore will be paid by the Fund, if applicable: taxes (including foreign transaction taxes), expenses associated with investments in affiliated and non-affiliated pooled investment vehicles (including mutual funds and exchange-traded funds), transaction costs and brokerage commissions, costs related to any securities lending program, dividend expenses associated with securities sold short, inverse floater program fees and expenses, transaction charges and interest on borrowed money, interest, extraordinary expenses and any other expenses the exclusion of which is specifically approved by the Board. This agreement may be modified or amended only with approval from all parties.
In addition, the Fund’s expense ratio is subject to a voluntary expense reimbursement arrangement pursuant to which fees will be waived and/or expenses reimbursed (excluding certain fees and expenses immediately described above), so that the Fund’s net operating expenses, after giving effect to fees waived/expenses reimbursed and any balance credits and/or overdraft charges from the Fund’s custodian, do not exceed the annual rates of 1.37% for Class A, 2.12% for Class B, 2.12% for Class C, 0.94% for Class I, 1.24% for Class K, 1.62% for Class R, 1.12% for Class R4, 0.99% for Class R5 and 1.12% for Class Z. This arrangement may be revised or discontinued at any time.
Note 4. Federal Tax Information
The timing and character of income and capital gain distributions are determined in accordance with income tax regulations, which may differ from GAAP because of temporary or permanent book to tax differences.
At November 30, 2014, the cost of investments for federal income tax purposes was approximately $299,064,000 and the aggregate gross approximate unrealized appreciation and depreciation based on that cost was:
| | | | |
Unrealized appreciation | | | $87,890,000 | |
Unrealized depreciation | | | (18,841,000 | ) |
Net unrealized appreciation | | | $69,049,000 | |
Management of the Fund has concluded that there are no significant uncertain tax positions in the Fund that would require recognition in the financial statements. However, management’s conclusion may be subject to review and adjustment at a later date based on factors including, but not limited to, new tax laws, regulations, and administrative interpretations (including relevant court decisions). Generally, the Fund’s federal tax returns for the prior three fiscal years remain subject to examination by the Internal Revenue Service.
Note 5. Portfolio Information
The cost of purchases and proceeds from sales of securities, excluding short-term obligations and certain derivatives, if any, aggregated to $136,095,807 and $156,388,436, respectively, for the six months ended November 30, 2014. The amount of purchase and sale activity impacts the portfolio turnover rate reported in the Financial Highlights.
Note 6. Affiliated Money Market Fund
The Fund invests in Columbia Short-Term Cash Fund, an affiliated money market fund established for the exclusive use by the Fund and other affiliated funds. The income earned by the Fund from such investments is included as Dividends — affiliated issuers in the Statement of Operations. As an investing fund, the Fund indirectly bears its proportionate share of the expenses of Columbia Short-Term Cash Fund.
Note 7. Shareholder Concentration
At November 30, 2014, affiliated shareholders of record owned 77.8% of the outstanding shares of the Fund in one or more accounts. Subscription and redemption activity by concentrated accounts may have a significant effect on the operations of the Fund.
Note 8. Line of Credit
The Fund has entered into a revolving credit facility with a syndicate of banks led by JPMorgan Chase Bank N.A. (JPMorgan) whereby the Fund may borrow for the temporary funding of shareholder redemptions or for other temporary or emergency purposes. The credit facility agreement, as amended, which is a collective agreement between the Fund
| | | | |
| Semiannual Report 2014 | | | 31 | |
| | |
| |
| | Columbia Multi-Advisor Small Cap Value Fund |
Notes to Financial Statements (continued)
November 30, 2014 (Unaudited)
and certain other funds managed by the Investment Manager, severally and not jointly, permits collective borrowings up to $500 million. Interest is charged to each participating fund based on its borrowings at a rate equal to the higher of (i) the overnight federal funds rate plus 1.00% or (ii) the one-month LIBOR rate plus 1.00%. Each borrowing under the credit facility matures no later than 60 days after the date of borrowing. The Fund also pays a commitment fee equal to its pro rata share of the amount of the credit facility at a rate of 0.075% per annum. The commitment fee is included in other expenses in the Statement of Operations.
Effective December 9, 2014, the Fund extended its revolving credit facility with JPMorgan. The credit facility agreement, as amended, permits collective borrowings up to $550 million under the same terms and interest rates as described above.
The Fund had no borrowings during the six months ended November 30, 2014.
Note 9. Significant Risks
Industrial Sector Risk
Sector risk occurs when a fund invests a significant portion of its assets in securities of companies conducting business in a related group of industries within an economic sector. Companies in the same economic sector may be similarly affected by economic, regulatory, political or market events or conditions, making a fund more vulnerable to unfavorable developments in that economic sector than funds that invest more broadly. The Fund may be more susceptible to the particular risks that may affect companies in the industrials sector than if it were invested in a wider variety of companies in unrelated sectors.
Note 10. Subsequent Events
Management has evaluated the events and transactions that have occurred through the date the financial statements were issued. Other than as noted in Note 8 above, there were no items requiring adjustment of the financial statements or additional disclosure.
Note 11. Information Regarding Pending and Settled Legal Proceedings
In December 2005, without admitting or denying the allegations, American Express Financial Corporation (AEFC, which is now known as Ameriprise Financial, Inc. (Ameriprise Financial)) entered into settlement agreements with the Securities and Exchange Commission (SEC) and Minnesota Department of Commerce (MDOC) related to market timing activities. As a result, AEFC was censured and ordered to cease and desist from committing or causing any
violations of certain provisions of the Investment Advisers Act of 1940, the Investment Company Act of 1940, and various Minnesota laws. AEFC agreed to pay disgorgement of $10 million and civil money penalties of $7 million. AEFC also agreed to retain an independent distribution consultant to assist in developing a plan for distribution of all disgorgement and civil penalties ordered by the SEC in accordance with various undertakings detailed at www.sec.gov/litigation/admin/ia-2451.pdf. Ameriprise Financial and its affiliates have cooperated with the SEC and the MDOC in these legal proceedings, and have made regular reports to the Funds’ Boards of Trustees.
Ameriprise Financial and certain of its affiliates have historically been involved in a number of legal, arbitration and regulatory proceedings, including routine litigation, class actions, and governmental actions, concerning matters arising in connection with the conduct of their business activities. Ameriprise Financial believes that the Funds are not currently the subject of, and that neither Ameriprise Financial nor any of its affiliates are the subject of, any pending legal, arbitration or regulatory proceedings that are likely to have a material adverse effect on the Funds or the ability of Ameriprise Financial or its affiliates to perform under their contracts with the Funds. Ameriprise Financial is required to make quarterly (10-Q), annual (10-K) and, as necessary, 8-K filings with the Securities and Exchange Commission on legal and regulatory matters that relate to Ameriprise Financial and its affiliates. Copies of these filings may be obtained by accessing the SEC website at www.sec.gov.
There can be no assurance that these matters, or the adverse publicity associated with them, will not result in increased fund redemptions, reduced sale of fund shares or other adverse consequences to the Funds. Further, although we believe proceedings are not likely to have a material adverse effect on the Funds or the ability of Ameriprise Financial or its affiliates to perform under their contracts with the Funds, these proceedings are subject to uncertainties and, as such, we are unable to estimate the possible loss or range of loss that may result. An adverse outcome in one or more of these proceedings could result in adverse judgments, settlements, fines, penalties or other relief that could have a material adverse effect on the consolidated financial condition or results of operations of Ameriprise Financial.
| | |
| 32 | | Semiannual Report 2014 |
| | |
| |
| Columbia Multi-Advisor Small Cap Value Fund | | |
Approval of Subadvisory Agreement
Columbia Management Investment Advisers, LLC (Columbia Management or the Investment Manager), a wholly-owned subsidiary of Ameriprise Financial, Inc. (Ameriprise Financial), serves as the investment manager to Columbia Multi-Advisor Small Cap Value Fund (the Fund). Under an investment management services agreement (the IMS Agreement), Columbia Management provides investment advice and other services to the Fund and other funds distributed by Columbia Management Investment Distributors, Inc. (collectively, the Funds). In addition, under the subadvisory agreements between Columbia Management and each of Barrow, Hanley, Mewhinney & Strauss, LLC (Barrow Hanley), Donald Smith & Co., Inc. (Donald Smith) and Metropolitan West Capital Management, LLC (MetWest Capital) (collectively, the Subadvisers), the Subadvisers perform portfolio management and related services for the Fund.
At the June 16-18, 2014 Board meeting, the Board, including all of the Independent Trustees, unanimously approved the proposal to (i) terminate the subadvisory agreement between Columbia Management and Turner Investments, L.P. (Turner); (ii) approve the proposed Subadvisory Agreement between Columbia Management and Segall, Bryant and Hamill, LLC (SBH); (iii) modify the Fund’s principal investment strategies to reflect SBH investment strategies; and (iv) approve SBH’s code of ethics and compliance program (collectively, the “Proposals”). Independent legal counsel to the Independent Trustees reminded the Board of the legal standards for consideration by directors/trustees of advisory and subadvisory agreements. The Board also recalled its most recent consideration and approval of advisory and subadvisory agreements for annual renewal purposes at the April 2014 meeting (the April Meeting) and, in that connection, independent legal counsel’s discussion of their responsibilities pursuant to Sections 15(c) and 36(b) of the 1940 Act, and the SEC-enumerated factors that should be considered in determining whether to approve a new subadvisory agreement, in this case, with SBH. The Board, its Contracts Committee and Investment Review Committee held meetings and discussions with Columbia Management and reviewed and considered various written materials and oral presentations in connection with SBH’s proposed services, including with respect to the quality of services, profitability and fees and expenses, investment strategy/style, performance and trading practices and the code of ethics and compliance program of SBH. Following an analysis and discussion of the factors identified below, the Board, including all of the Independent Trustees, approved the Proposals. Independent legal counsel also noted that the Board should take into account the Contracts Committee’s and Investment Review Committee’s reports respecting the termination of Turner and its replacement with SBH.
Nature, Extent and Quality of Services to be provided by SBH
The Board considered its analysis of the reports and presentations received by it and the Contracts Committee and Investment Review Committee, detailing the services proposed to be performed by SBH as subadviser for the Fund, as well as its history, reputation, expertise, resources and capabilities, and the qualifications of its personnel. The Board noted that Columbia Management serves as investment manager to the Fund pursuant to an IMS Agreement between Columbia Management and the Fund.
The Board observed that SBH’s compliance program had been reviewed by the Fund’s Chief Compliance Officer and was determined by Columbia Management’s Asset Management Compliance to be reasonably designed to prevent violations of the federal securities laws by the Fund. The Board also observed that information had been presented regarding the capabilities and financial condition of SBH and its ability to carry out its responsibilities under the proposed Subadvisory Agreement. The Board noted, in particular, that SBH’s investment approach was reviewed by the Investment Review Committee (which included a presentation to the Board by SBH). The Board also observed that the strategies to be utilized by SBH are led by a portfolio manager with 18 years of investment experience, supported by a team of five analysts. The Board also recalled the information provided by Columbia Management and the Committee reports regarding SBH personnel, its risk controls, philosophy, and investment process.
The Board also discussed the acceptability of the terms of the proposed Subadvisory Agreement, including that the relatively broad scope of services required to be performed by SBH was generally similar in scope to subadvisory agreements applicable to other subadvised funds.
The Board also considered, in this regard, the proposed termination of Turner and Columbia Management’s explanation that the termination was due to an effort to improve the Fund’s performance record and find a subadviser(s) that potentially provides a better complimentary fit to other sleeves of the Fund managed by other subadvisers. In that regard, the Board recalled the Investment Review Committee and Contracts Committee reports regarding the search process undertaken by Columbia Management to identify a prospective successor subadviser with an investment style consistent with Columbia Management’s desire to improve the Fund’s performance. The Board recalled Columbia Management’s presentation that SBH has experience managing registered mutual funds.
| | | | |
| Semiannual Report 2014 | | | 33 | |
| | |
| |
| | Columbia Multi-Advisor Small Cap Value Fund |
Approval of Subadvisory Agreement (continued)
The Board considered the proposal to change the Fund’s principal investment strategies to align with SBH’s investment management style. The Board recalled, in this regard, that SBH’s lower volatility style complements other subadvisers for the Fund. The Board observed that Turner’s performance for the Fund generally had not met expectations.
Investment Performance of SBH
The Board noted that a review of investment performance is a key factor in evaluating the nature, extent and quality of services provided under investment management agreements. The Board considered SBH’s investment performance, noting that it delivered strong performance results over the one-, three-, and five-year periods for its accounts managed using a strategy substantially similar to that proposed for the Fund.
Based on the foregoing, and based on other information received (both oral and written) and other considerations, the Board concluded that SBH was in a position to provide a high quality and level of service to the Fund.
Comparative Fees, Costs of Services Provided and Profitability
The Board reviewed the proposed level of subadvisory fees under the proposed Subadvisory Agreement, noting that the proposed subadvisory fees payable to SBH would be paid by Columbia Management and would not impact the fees paid by the Fund. The Board also reviewed data regarding fees charged by SBH to other clients, observing that the proposed subadvisory fees are generally in line with (i) fees charged by SBH to other clients; and (ii) subadvisory fees paid by Columbia Management to subadvisors of other Funds with comparable investment styles/strategies. The Board also considered the expected decrease in total profitability of Columbia Management and its affiliates in connection with the hiring of SBH and concluded that the profitability levels remained within the reasonable ranges of profitability levels reported at the Funds’ April Meeting.
Economies of Scale
The Board also considered the economies of scale that may be realized by Columbia Management and its affiliates as the Fund grows and took note of the extent to which shareholders might also benefit from such growth. The Board observed that fees to be paid under the proposed subadvisory agreement would not impact fees paid by the Fund (as subadvisory fees are paid by Columbia Management and not the Funds). The Board observed that the Fund’s IMS Agreement with Columbia Management continues to provide for sharing of economies of scale as investment management fees decline as assets increase at pre-established breakpoints. The Board further considered that the proposed subadvisory agreement with SBH provides for lower fees as assets increase at pre-established breakpoints. The Board observed that these fee rates and breakpoints are at levels that do not align with the breakpoints in the Fund’s management fees. The Board noted, in this regard, that Columbia Management’s investment management profitability declines as a result of the retention of SBH. The Board concluded that the Fund’s IMS Agreement continues to provide adequately for sharing of economies of scale.
Based on all of the foregoing, including all of the information received and presented, the Board, including all of the Independent Trustees, concluded that the proposed subadvisory fees to be paid and the Subadvisory Agreement were fair and reasonable in light of the extent and quality of services proposed to be provided. In reaching this conclusion, no single factor was determinative.
On June 16, 2014, the Board, including all of the Independent Trustees, approved the Subadvisory Agreement.
| | |
| 34 | | Semiannual Report 2014 |
| | |
| |
| Columbia Multi-Advisor Small Cap Value Fund | | |
Important Information About This Report
Each fund mails one shareholder report to each shareholder address. If you would like more than one report, please call shareholder services at 800.345.6611 and additional reports will be sent to you.
The policy of the Board is to vote the proxies of the companies in which each fund holds investments consistent with the procedures as stated in the Statement of Additional Information (SAI). You may obtain a copy of the SAI without charge by calling 800.345.6611; contacting your financial intermediary; visiting columbiamanagement.com; or searching the website of the Securities and Exchange Commission (SEC) at sec.gov. Information regarding how each fund voted proxies relating to portfolio securities is filed with the SEC by August 31 for the most recent 12-month period ending June 30 of that year, and is available without charge by visiting columbiamanagement.com; or searching the website of the SEC at sec.gov.
Each fund files a complete schedule of portfolio holdings with the SEC for the first and third quarters of each fiscal year on Form N-Q. Each fund’s Form N-Q is available on the SEC’s website at sec.gov and may be reviewed and copied at the SEC’s Public Reference Room in Washington, D.C. Information on the operation of the Public Reference Room may be obtained by calling 800.SEC.0330. Each fund’s complete schedule of portfolio holdings, as filed on Form N-Q, can also be obtained without charge, upon request, by calling 800.345.6611.
| | | | |
| Semiannual Report 2014 | | | 35 | |

Columbia Multi-Advisor Small Cap Value Fund
P.O. Box 8081
Boston, MA 02266-8081
columbiamanagement.com
This information is for use with concurrent or prior delivery of a fund prospectus. Please read and consider the investment objectives, risks, charges and expenses for any fund carefully before investing. For a prospectus and, if available, a summary prospectus, which contains this and other important information about the Fund, go to columbiamanagement.com. The Fund is distributed by Columbia Management Investment Distributors, Inc., member FINRA, and managed by Columbia Management Investment Advisers, LLC.
© 2015 Columbia Management Investment Advisers, LLC. All rights reserved.
SAR203_05_E01_(01/15)
| | |
Semiannual Report November 30, 2014 | |  |
| | |
Columbia Select Large-Cap Value Fund | | |

President’s Message
Note: Effective January 1, 2015, Christopher O. Petersen will serve as the President of the Columbia Funds, replacing J. Kevin Connaughton. Mr. Petersen has served as a Fund officer since 2007.
Dear Shareholders,
People invest for different reasons, though typically based on a desire for one or more outcomes, e.g., generating an appropriate income stream in retirement, navigating a changing interest rate environment, maximizing after-tax returns, growing assets to achieve financial goals, or easing the impact of volatile markets. Achieving these desired outcomes can be particularly challenging given the unpredictability of complex global markets. To continue to effectively deliver solutions that help clients achieve desired outcomes, an asset manager must have the resources and investment framework to meaningfully embody a global perspective.
With this in mind, I thought it important to highlight excerpts from a piece written by Jeffrey L. Knight, Global Head of Investment Solutions and Asset Allocation, in which he touches on some of these issues emphasizing the importance of maintaining a diversified portfolio with the flexibility to adapt to changing market conditions.
I encourage you to read the article in its entirety. To access the full article and for other insights on current market events and investment opportunities, please visit the Columbia Management blog at columbiamanagement.com/blog.
On behalf of the Funds, I want to acknowledge the contributions of J. Kevin Connaughton and to thank him for his years of trusted, dedicated service. He has worked tirelessly as an advocate for shareholders and a leader of the Columbia Funds. In taking on this new role, I look forward to continuing the work of Mr. Connaughton, helping build on the strong foundation of the Columbia Funds.
Thank you for your confidence. We look forward to continuing to serve your investment needs for many years to come.
Best regards,

Christopher O. Petersen
President, Columbia Funds
Excerpts from:
2015 Outlook: Same song, slightly different arrangement
By Jeffrey L. Knight, Global Head of Investment Solutions and Asset Allocation
Jeffrey L. Knight, CFA, is global head of investment solutions and asset allocation for Columbia Management Investment Advisers, LLC. Mr. Knight leads a team of six portfolio managers responsible for our broad suite of multi-asset strategies including capital allocation, risk allocation, absolute return and total return funds.
What’s different in 2015?
As stationary as market conditions have felt lately, circumstances are always evolving. For 2015, while the essential elements of our outlook remain in place, we highlight two important changes in the market environment:
| > | | The relative value of global equities vs. global bonds actually improved during 2014. |
| > | | Monetary policy around the globe has become desynchronized, with the U.S. Federal Reserve (the Fed) contemplating rate hikes, while the European Central Bank (ECB) and the Bank of Japan (BOJ) intensify their monetary stimulus programs. |
In our view, while equities will most likely continue to dominate, the complex interactions of today’s conditions elevate the role of dynamic risk management. We argue that investors will need a cross-asset surveillance methodology to detect tactical threats.
Semiannual Report 2014
President’s Message (continued)
Monetary policies diverge
The Fed has given strong signals that economic growth in the United States has reached self-sustaining momentum and no longer needs unconventional efforts to support the expansion. The withdrawal and suspension of large-scale asset purchases was only the first step in the evolution toward policy normalization. In 2015, we expect to see a change in forward guidance and, most likely, the first interest rate increase in years.
These actions stand in stark contrast with the direction of the monetary policies of other central banks as they double down on efforts to support growth and avoid deflation. The Bank of Japan has announced its intention to increase both qualitative and quantitative easing on an enormous scale, expanding purchases of Japanese government bonds (JGBs), exchange-traded funds and real estate investment trusts. They intend to coordinate this with government pension investment fund purchases by shifting into riskier assets through sales of JGBs.
With evidence of deterioration on both the economic and inflation front, the European Central Bank (ECB) also plans to take bolder actions. These include increased purchases of asset-backed securities and covered bonds in both the primary and secondary market, together with the long-term refinancing operations that will steer the ECB’s balance sheet higher by €1 trillion.
The latest to jump on the bandwagon was the People’s Bank of China (PBOC), which cut its benchmark interest rate for the first time in over two years to support private sector investment, as targeted liquidity injections have had minimal effect on sinking economic growth.
Investment strategy for 2015
We remain convinced that relative value favors stocks over bonds, even though stocks outperformed in 2014. Therefore, you will hear the same recommendation from us for 2015. Equities remain the most important asset class for generating returns.
Within equities, the currency-based advantage of U.S. stocks is offset somewhat by the valuation advantage from overseas equities, notably in Japan. Indeed, economic growth in Japan and Europe are essential ingredients for equities to continue to perform well. If Japanese and European stocks cannot produce gains, then the global economy will probably be stuck in a near recessionary funk.
Devising a strategy to manage risk and stabilize portfolio values in the event that equities do not perform well remains complicated. Bond yields are low enough that they are not likely to offer powerful diversification benefits. We affirm our recommendation for three additional sources of portfolio stability:
| > | | Non-traditional diversifiers, such as liquid alternatives, alternative beta exposures and absolute return strategies |
| > | | Explicit downside hedges, such as put options (with emphasis on managing the related expense) |
| > | | Flexibility and a methodology for active risk reduction when appropriate (Our cross-asset methodologies should prove valuable in this regard.) |
Our overall stance for investment strategy will likely remain in place until the valuation advantage for equities has been priced away, or until the healing process for the global economy reverses.
Please visit columbiamanagement.com/blog to read the entire article.
Investors should consider the investment objectives, risks, charges and expenses of a mutual fund carefully before investing. For a free prospectus and, if available, a summary prospectus, which contains this and other important information about a fund, visit columbiamanagement.com. The prospectus should be read carefully before investing.
The views expressed are as of December 2014, may change as market or other conditions change, and may differ from views expressed by other Columbia Management Investment Advisers, LLC (CMIA) associates or affiliates. Actual investments or investment decisions made by CMIA and its affiliates, whether for its own account or on behalf of clients, will not necessarily reflect the views expressed. This information is not intended to provide investment advice and does not account for individual investor circumstances. Investment decisions should always be made based on an investor’s specific financial needs, objectives, goals, time horizon and risk tolerance. Asset classes described may not be suitable for all investors. Past performance does not guarantee future results, and no forecast should be considered a guarantee either. Since economic and market change frequently, there can be no assurance that the trends described here will continue or that the forecasts are accurate.
Diversification does not assure a profit or protect against loss.
Columbia Funds are distributed by Columbia Management Investment Distributors, Inc., member FINRA, and managed by Columbia Management Investment Advisers, LLC.
© 2015 Columbia Management Investment Advisers, LLC. All rights reserved
Semiannual Report 2014
| | |
| |
| Columbia Select Large-Cap Value Fund | | |
Table of Contents
Fund Investment Manager
Columbia Management Investment
Advisers, LLC
225 Franklin Street
Boston, MA 02110
Fund Distributor
Columbia Management Investment
Distributors, Inc.
225 Franklin Street
Boston, MA 02110
Fund Transfer Agent
Columbia Management Investment
Services Corp.
P.O. Box 8081
Boston, MA 02266-8081
For more information about any of the funds, please visit columbiamanagement.com or call 800.345.6611. Customer Service Representatives are available to answer your questions Monday through Friday from 8 a.m. to 7 p.m. Eastern time.
The views expressed in this report reflect the current views of the respective parties. These views are not guarantees of future performance and involve certain risks, uncertainties and assumptions that are difficult to predict, so actual outcomes and results may differ significantly from the views expressed. These views are subject to change at any time based upon economic, market or other conditions and the respective parties disclaim any responsibility to update such views. These views may not be relied on as investment advice and, because investment decisions for a Columbia Fund are based on numerous factors, may not be relied on as an indication of trading intent on behalf of any particular Columbia Fund. References to specific securities should not be construed as a recommendation or investment advice.
Semiannual Report 2014
| | |
| |
| | Columbia Select Large-Cap Value Fund |
Performance Overview
(Unaudited)
Performance Summary
| > | | Columbia Select Large-Cap Value Fund (the Fund) Class A shares returned 5.01% excluding sales charges for the six-month period that ended November 30, 2014. |
| > | | During the same time period, the Fund underperformed its benchmark, the Russell 1000 Value Index, which returned 6.86%, and the broad-based S&P 500 Index, which returned 8.58%. |
| | | | | | | | | | | | | | | | | | |
Average Annual Total Returns (%) (for period ended November 30, 2014) | |
| | | Inception | | 6 Months
cumulative | | | 1 Year | | | 5 Years | | | 10 Years | |
Class A | | 04/25/97 | | | | | | | | | | | | | | | | |
Excluding sales charges | | | | | 5.01 | | | | 12.98 | | | | 16.41 | | | | 8.98 | |
Including sales charges | | | | | -1.02 | | | | 6.48 | | | | 15.03 | | | | 8.33 | |
Class B | | 04/25/97 | | | | | | | | | | | | | | | | |
Excluding sales charges | | | | | 4.61 | | | | 12.14 | | | | 15.54 | | | | 8.15 | |
Including sales charges | | | | | -0.39 | | | | 7.14 | | | | 15.32 | | | | 8.15 | |
Class C | | 05/27/99 | | | | | | | | | | | | | | | | |
Excluding sales charges | | | | | 4.61 | | | | 12.14 | | | | 15.55 | | | | 8.18 | |
Including sales charges | | | | | 3.61 | | | | 11.14 | | | | 15.55 | | | | 8.18 | |
Class I* | | 08/03/09 | | | 5.25 | | | | 13.47 | | | | 16.91 | | | | 9.22 | |
Class K* | | 08/03/09 | | | 5.05 | | | | 13.08 | | | | 16.57 | | | | 9.05 | |
Class R | | 04/30/03 | | | 4.89 | | | | 12.71 | | | | 16.12 | | | | 8.69 | |
Class R4* | | 11/08/12 | | | 5.15 | | | | 13.28 | | | | 16.54 | | | | 9.04 | |
Class R5 | | 11/30/01 | | | 5.20 | | | | 13.37 | | | | 16.86 | | | | 9.49 | |
Class W* | | 09/27/10 | | | 5.03 | | | | 13.05 | | | | 16.22 | | | | 8.39 | |
Class Y* | | 10/01/14 | | | 5.10 | | | | 13.09 | | | | 16.43 | | | | 8.99 | |
Class Z* | | 09/27/10 | | | 5.12 | | | | 13.27 | | | | 16.66 | | | | 9.10 | |
Russell 1000 Value Index | | | | | 6.86 | | | | 15.62 | | | | 15.69 | | | | 7.59 | |
S&P 500 Index | | | | | 8.58 | | | | 16.86 | | | | 15.96 | | | | 8.06 | |
Returns for Class A are shown with and without the maximum initial sales charge of 5.75%. Returns for Class B are shown with and without the applicable contingent deferred sales charge (CDSC) of 5.00% in the first year, declining to 1.00% in the sixth year and eliminated thereafter. Returns for Class C are shown with and without the 1.00% CDSC for the first year only. The Fund’s other classes are not subject to sales charges and have limited eligibility. Please see the Fund’s prospectus for details. Performance for different share classes will vary based on differences in sales charges and fees associated with each class. All results shown assume reinvestment of distributions during the period. Returns do not reflect the deduction of taxes that a shareholder may pay on Fund distributions or on the redemption of Fund shares. Performance results reflect the effect of any fee waivers or reimbursements of Fund expenses by Columbia Management Investment Advisers, LLC and/or any of its affiliates. Absent these fee waivers or expense reimbursement arrangements, performance results would have been lower.
The performance information shown represents past performance and is not a guarantee of future results. The investment return and principal value of your investment will fluctuate so that your shares, when redeemed, may be worth more or less than their original cost. Current performance may be lower or higher than the performance information shown. You may obtain performance information current to the most recent month-end by contacting your financial intermediary, visiting columbiamanagement.com or calling 800.345.6611.
| * | The returns shown for periods prior to the share class inception date (including returns for the Life of the Fund, if shown, which are since Fund inception) include the returns of the Fund’s oldest share class. Since the Fund launched more than one share class at its inception, Class A shares were used. These returns are adjusted to reflect any higher class-related operating expenses of the newer share classes, as applicable. Please visit columbiamanagement.com/investment-products/mutual-funds/appended-performance for more information. |
The Russell 1000 Value Index, an unmanaged index, measures the performance of those stocks in the Russell 1000 Index with lower price-to-book ratios and lower forecasted growth values.
The S&P 500 Index, an unmanaged index, measures the performance of 500 widely held, large-capitalization U.S. stocks and is frequently used as a general measure of market performance.
Indices are not available for investment, are not professionally managed and do not reflect sales charges, fees, brokerage commissions, taxes or other expenses of investing. Securities in the Fund may not match those in an index.
| | |
| |
| Columbia Select Large-Cap Value Fund | | |
Portfolio Overview
(Unaudited)
| | | | |
Top Ten Holdings (%)
(at November 30, 2014) | |
Verizon Communications, Inc. | | | 4.2 | |
Tyson Foods, Inc., Class A | | | 4.2 | |
Applied Materials, Inc. | | | 4.1 | |
Citigroup, Inc. | | | 3.9 | |
Bristol-Myers Squibb Co. | | | 3.7 | |
Altria Group, Inc. | | | 3.6 | |
Teradata Corp. | | | 3.5 | |
Morgan Stanley | | | 3.5 | |
Bank of America Corp. | | | 3.5 | |
JPMorgan Chase & Co. | | | 3.4 | |
Percentages indicated are based upon total investments (excluding Money Market Funds).
For further detail about these holdings, please refer to the section entitled “Portfolio of Investments.”
Fund holdings are as of the date given, are subject to change at any time, and are not recommendations to buy or sell any security.
| | | | |
Portfolio Breakdown (%)
(at November 30, 2014) | |
Common Stocks | | | 95.1 | |
Consumer Discretionary | | | 5.4 | |
Consumer Staples | | | 11.6 | |
Energy | | | 13.0 | |
Financials | | | 24.1 | |
Health Care | | | 8.2 | |
Industrials | | | 10.7 | |
Information Technology | | | 10.5 | |
Materials | | | 5.0 | |
Telecommunication Services | | | 4.0 | |
Utilities | | | 2.6 | |
Money Market Funds | | | 4.9 | |
Total | | | 100.0 | |
Percentages indicated are based upon total investments. The Fund’s portfolio composition is subject to change.
Portfolio Management
Richard Rosen
Kari Montanus
Morningstar Style Box™
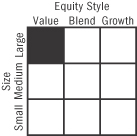
The Morningstar Style Box™ is based on a fund’s portfolio holdings. For equity funds, the vertical axis shows the market capitalization of the stocks owned, and the horizontal axis shows investment style (value, blend, or growth). Information shown is based on the most recent data provided by Morningstar.
© 2015 Morningstar, Inc. All rights reserved. The Morningstar information contained herein: (1) is proprietary to Morningstar and/or its content providers; (2) may not be copied or distributed; and (3) is not warranted to be accurate, complete or timely. Neither Morningstar nor its content providers are responsible for any damages or losses arising from any use of this information.
| | |
| |
| | Columbia Select Large-Cap Value Fund |
Understanding Your Fund’s Expenses
(Unaudited)
As an investor, you incur two types of costs. There are transaction costs, which generally include sales charges on purchases and may include redemption fees. There are also ongoing costs, which generally include management fees, distribution and/or service fees, and other fund expenses. The following information is intended to help you understand your ongoing costs (in dollars) of investing in the Fund and to help you compare these costs with the ongoing costs of investing in other mutual funds.
Analyzing Your Fund’s Expenses
To illustrate these ongoing costs, we have provided examples and calculated the expenses paid by investors in each share class of the Fund during the period. The actual and hypothetical information in the table is based on an initial investment of $1,000 at the beginning of the period indicated and held for the entire period. Expense information is calculated two ways and each method provides you with different information. The amount listed in the “Actual” column is calculated using the Fund’s actual operating expenses and total return for the period. You may use the Actual information, together with the amount invested, to estimate the expenses that you paid over the period. Simply divide your account value by $1,000 (for example, an $8,600 account value divided by $1,000 = 8.6), then multiply the results by the expenses paid during the period under the “Actual” column. The amount listed in the “Hypothetical” column assumes a 5% annual rate of return before expenses (which is not the Fund’s actual return) and then applies the Fund’s actual expense ratio for the period to the hypothetical return. You should not use the hypothetical account values and expenses to estimate either your actual account balance at the end of the period or the expenses you paid during the period. See “Compare With Other Funds” below for details on how to use the hypothetical data.
Compare With Other Funds
Since all mutual funds are required to include the same hypothetical calculations about expenses in shareholder reports, you can use this information to compare the ongoing cost of investing in the Fund with other funds. To do so, compare the hypothetical example with the 5% hypothetical examples that appear in the shareholder reports of other funds. As you compare hypothetical examples of other funds, it is important to note that hypothetical examples are meant to highlight the ongoing costs of investing in a fund only and do not reflect any transaction costs, such as sales charges, or redemption or exchange fees. Therefore, the hypothetical calculations are useful in comparing ongoing costs only, and will not help you determine the relative total costs of owning different funds. If transaction costs were included in these calculations, your costs would be higher.
June 1, 2014 – November 30, 2014
| | | | | | | | | | | | | | | | | | | | | | | | | | | | |
| | | Account Value at the
Beginning of the
Period ($) | | | Account Value at the
End of the
Period ($) | | | Expenses Paid During
the Period ($) | | | Fund’s Annualized
Expense Ratio (%) | |
| | | | Actual | | | | Hypothetical | | | | Actual | | | | Hypothetical | | | | Actual | | | | Hypothetical | | | | Actual | |
Class A | | | 1,000.00 | | | | 1,000.00 | | | | 1,050.10 | | | | 1,019.05 | | | | 6.03 | | | | 5.94 | | | | 1.18 | |
Class B | | | 1,000.00 | | | | 1,000.00 | | | | 1,046.10 | | | | 1,015.31 | | | | 9.85 | | | | 9.70 | | | | 1.93 | |
Class C | | | 1,000.00 | | | | 1,000.00 | | | | 1,046.10 | | | | 1,015.31 | | | | 9.85 | | | | 9.70 | | | | 1.93 | |
Class I | | | 1,000.00 | | | | 1,000.00 | | | | 1,052.50 | | | | 1,021.04 | | | | 3.99 | | | | 3.93 | | | | 0.78 | |
Class K | | | 1,000.00 | | | | 1,000.00 | | | | 1,050.50 | | | | 1,019.55 | | | | 5.52 | | | | 5.44 | | | | 1.08 | |
Class R | | | 1,000.00 | | | | 1,000.00 | | | | 1,048.90 | | | | 1,017.80 | | | | 7.30 | | | | 7.19 | | | | 1.43 | |
Class R4 | | | 1,000.00 | | | | 1,000.00 | | | | 1,051.50 | | | | 1,020.29 | | | | 4.76 | | | | 4.68 | | | | 0.93 | |
Class R5 | | | 1,000.00 | | | | 1,000.00 | | | | 1,052.00 | | | | 1,020.79 | | | | 4.25 | | | | 4.18 | | | | 0.83 | |
Class W | | | 1,000.00 | | | | 1,000.00 | | | | 1,050.30 | | | | 1,019.05 | | | | 6.03 | | | | 5.94 | | | | 1.18 | |
Class Y | | | 1,000.00 | | | | 1,000.00 | | | | 1,037.90 | * | | | 1,021.24 | | | | 1.18 | * | | | 3.73 | | | | 0.74 | * |
Class Z | | | 1,000.00 | | | | 1,000.00 | | | | 1,051.20 | | | | 1,020.29 | | | | 4.76 | | | | 4.68 | | | | 0.93 | |
| * | Based on operations from October 1, 2014 (commencement of operations) through the stated period end. |
Expenses paid during the period are equal to the annualized expense ratio for each class as indicated above, multiplied by the average account value over the period and then multiplied by the number of days in the Fund’s most recent fiscal half year and divided by 365.
Expenses do not include fees and expenses incurred indirectly by the Fund from its investment in underlying funds, including affiliated and non-affiliated pooled investment vehicles, such as mutual funds and exchange-traded funds.
Had Columbia Management Investment Advisers, LLC and/or certain of its affiliates not waived/reimbursed certain fees and expenses, account value at the end of the period would have been reduced.
| | |
| |
| Columbia Select Large-Cap Value Fund | | |
Portfolio of Investments
November 30, 2014 (Unaudited)
(Percentages represent value of investments compared to net assets)
| | | | | | | | |
| Common Stocks 94.8% | |
| Issuer | | Shares | | | Value ($) | |
| | | | | | | | |
Consumer Discretionary 5.4% | |
Multiline Retail 2.6% | |
| | |
Nordstrom, Inc. | | | 340,000 | | | | 25,962,400 | |
|
Specialty Retail 2.8% | |
| | |
Lowe’s Companies, Inc. | | | 450,000 | | | | 28,723,500 | |
| | | | | | | | | |
Total Consumer Discretionary | | | | | | | 54,685,900 | |
| | |
| | | | | | | | |
Consumer Staples 11.5% | |
Food & Staples Retailing 1.6% | |
| | |
Costco Wholesale Corp. | | | 115,000 | | | | 16,343,800 | |
|
Food Products 3.9% | |
| | |
Tyson Foods, Inc., Class A | | | 950,000 | | | | 40,223,000 | |
|
Tobacco 6.0% | |
| | |
Altria Group, Inc. | | | 687,241 | | | | 34,540,732 | |
| | |
Philip Morris International, Inc. | | | 300,000 | | | | 26,079,000 | |
| | | | | | | | | |
Total | | | | | | | 60,619,732 | |
| | | | | | | | | |
Total Consumer Staples | | | | | | | 117,186,532 | |
| | |
| | | | | | | | |
Energy 13.0% | |
Oil, Gas & Consumable Fuels 13.0% | |
| | |
Anadarko Petroleum Corp. | | | 300,000 | | | | 23,745,000 | |
| | |
Chevron Corp. | | | 140,000 | | | | 15,241,800 | |
| | |
ConocoPhillips | | | 275,000 | | | | 18,169,250 | |
| | |
Marathon Oil Corp. | | | 450,000 | | | | 13,014,000 | |
| | |
Marathon Petroleum Corp. | | | 250,000 | | | | 22,522,500 | |
| | |
Valero Energy Corp. | | | 435,475 | | | | 21,168,440 | |
| | |
Williams Companies, Inc. (The) | | | 350,000 | | | | 18,112,500 | |
| | | | | | | | | |
Total | | | | | | | 131,973,490 | |
| | | | | | | | | |
Total Energy | | | | | | | 131,973,490 | |
| | |
| | | | | | | | |
Financials 23.9% | |
Banks 13.3% | |
| | |
Bank of America Corp. | | | 1,960,000 | | | | 33,398,400 | |
| | |
Citigroup, Inc. | | | 700,000 | | | | 37,779,000 | |
| | |
JPMorgan Chase & Co. | | | 540,000 | | | | 32,486,400 | |
| | |
Wells Fargo & Co. | | | 580,000 | | | | 31,598,400 | |
| | | | | | | | | |
Total | | | | | | | 135,262,200 | |
|
Capital Markets 3.3% | |
| | |
Morgan Stanley | | | 960,000 | | | | 33,772,800 | |
|
Insurance 7.3% | |
| | |
MetLife, Inc. | | | 450,000 | | | | 25,024,500 | |
| | |
Prudential Financial, Inc. | | | 250,000 | | | | 21,245,000 | |
| | |
Unum Group | | | 825,000 | | | | 27,406,500 | |
| | | | | | | | | |
Total | | | | | | | 73,676,000 | |
| | | | | | | | | |
Total Financials | | | | | | | 242,711,000 | |
| | | | | | | | |
| Common Stocks (continued) | |
| Issuer | | Shares | | | Value ($) | |
| | | | | | | | |
Health Care 8.2% | |
Health Care Equipment & Supplies 1.4% | |
| | |
Baxter International, Inc. | | | 200,000 | | | | 14,600,000 | |
|
Health Care Providers & Services 3.3% | |
| | |
Express Scripts Holding Co.(a) | | | 88,819 | | | | 7,385,300 | |
| | |
Humana, Inc. | | | 185,000 | | | | 25,524,450 | |
| | | | | | | | | |
Total | | | | | | | 32,909,750 | |
|
Pharmaceuticals 3.5% | |
| | |
Bristol-Myers Squibb Co. | | | 600,000 | | | | 35,430,000 | |
| | | | | | | | | |
Total Health Care | | | | | | | 82,939,750 | |
| | |
| | | | | | | | |
Industrials 10.7% | |
Aerospace & Defense 6.2% | |
| | |
General Dynamics Corp. | | | 125,000 | | | | 18,170,000 | |
| | |
Honeywell International, Inc. | | | 225,000 | | | | 22,290,750 | |
| | |
United Technologies Corp. | | | 200,000 | | | | 22,016,000 | |
| | | | | | | | | |
Total | | | | | | | 62,476,750 | |
|
Road & Rail 4.5% | |
| | |
CSX Corp. | | | 650,000 | | | | 23,718,500 | |
| | |
Union Pacific Corp. | | | 190,000 | | | | 22,186,300 | |
| | | | | | | | | |
Total | | | | | | | 45,904,800 | |
| | | | | | | | | |
Total Industrials | | | | | | | 108,381,550 | |
| | |
| | | | | | | | |
Information Technology 10.5% | |
Communications Equipment 1.8% | |
| | |
Juniper Networks, Inc. | | | 805,000 | | | | 17,838,800 | |
|
Electronic Equipment, Instruments & Components 1.5% | |
| | |
Corning, Inc. | | | 703,937 | | | | 14,796,756 | |
|
IT Services 3.3% | |
| | |
Teradata Corp.(a) | | | 750,000 | | | | 33,855,000 | |
|
Semiconductors & Semiconductor Equipment 3.9% | |
| | |
Applied Materials, Inc. | | | 1,658,000 | | | | 39,874,900 | |
| | | | | | | | | |
Total Information Technology | | | | | | | 106,365,456 | |
| | |
| | | | | | | | |
Materials 5.0% | |
Chemicals 2.6% | |
| | |
EI du Pont de Nemours & Co. | | | 375,000 | | | | 26,775,000 | |
|
Metals & Mining 2.4% | |
| | |
Freeport-McMoRan, Inc. | | | 900,000 | | | | 24,165,000 | |
| | | | | | | | | |
Total Materials | | | | | | | 50,940,000 | |
| | |
| | | | | | | | |
Telecommunication Services 4.0% | |
Diversified Telecommunication Services 4.0% | |
| | |
Verizon Communications, Inc. | | | 800,000 | | | | 40,472,000 | |
| | | | | | | | | |
Total Telecommunication Services | | | | | | | 40,472,000 | |
The accompanying Notes to Financial Statements are an integral part of this statement.
| | |
| |
| | Columbia Select Large-Cap Value Fund |
Portfolio of Investments (continued)
November 30, 2014 (Unaudited)
| | | | | | | | |
| Common Stocks (continued) | |
| Issuer | | Shares | | | Value ($) | |
| | | | | | | | |
Utilities 2.6% | |
Independent Power and Renewable Electricity Producers 2.6% | |
| | |
AES Corp. (The) | | | 1,910,000 | | | | 26,491,700 | |
| | | | | | | | | |
Total Utilities | | | | | | | 26,491,700 | |
| | | | | | | | | |
Total Common Stocks | | | | | | | | |
(Cost: $627,521,094) | | | | | | | 962,147,378 | |
| | |
| | | | | | | | |
| | | | | | | | |
| Money Market Funds 4.9% | |
| | | Shares | | | Value ($) | |
| | | | | | | | |
| | |
Columbia Short-Term Cash Fund, 0.104%(b)(c) | | | 49,631,603 | | | | 49,631,603 | |
| | | | | | | | | |
Total Money Market Funds | | | | | | | | |
(Cost: $49,631,603) | | | | | | | 49,631,603 | |
| | | | | | | | | |
Total Investments | | | | | | | | |
(Cost: $677,152,697) | | | | | | | 1,011,778,981 | |
| | | | | | | | | |
Other Assets & Liabilities, Net | | | | 2,716,651 | |
| | | | | | | | | |
Net Assets | | | | | | | 1,014,495,632 | |
| | | | | | | | | |
Notes to Portfolio of Investments
| (b) | The rate shown is the seven-day current annualized yield at November 30, 2014. |
| (c) | As defined in the Investment Company Act of 1940, an affiliated company is one in which the Fund owns 5% or more of the company’s outstanding voting securities, or a company which is under common ownership or control with the Fund. Holdings and transactions in these affiliated companies during the period ended November 30, 2014, are as follows: |
| | | | | | | | | | | | | | | | | | | | | | | | |
| Issuer | | Beginning
Cost ($) | | | Purchase
Cost ($) | | | Proceeds From Sales ($) | | | Ending
Cost ($) | | | Dividends —
Affiliated
Issuers ($) | | | Value ($) | |
Columbia Short-Term Cash Fund | | | 32,859,842 | | | | 85,651,124 | | | | (68,879,363 | ) | | | 49,631,603 | | | | 10,556 | | | | 49,631,603 | |
Fair Value Measurements
Generally accepted accounting principles (GAAP) require disclosure regarding the inputs and valuation techniques used to measure fair value and any changes in valuation inputs or techniques. In addition, investments shall be disclosed by major category.
The Fund categorizes its fair value measurements according to a three-level hierarchy that maximizes the use of observable inputs and minimizes the use of unobservable inputs by prioritizing that the most observable input be used when available. Observable inputs are those that market participants would use in pricing an investment based on market data obtained from sources independent of the reporting entity. Unobservable inputs are those that reflect the Fund’s assumptions about the information market participants would use in pricing an investment. An investment’s level within the fair value hierarchy is based on the lowest level of any input that is deemed significant to the asset or liability’s fair value measurement. The input levels are not necessarily an indication of the risk or liquidity associated with investments at that level. For example, certain U.S. government securities are generally high quality and liquid, however, they are reflected as Level 2 because the inputs used to determine fair value may not always be quoted prices in an active market.
Fair value inputs are summarized in the three broad levels listed below:
| > | | Level 1 — Valuations based on quoted prices for investments in active markets that the Fund has the ability to access at the measurement date (including NAV for open-end mutual funds). Valuation adjustments are not applied to Level 1 investments. |
| > | | Level 2 — Valuations based on other significant observable inputs (including quoted prices for similar securities, interest rates, prepayment speeds, credit risks, etc.). |
| > | | Level 3 — Valuations based on significant unobservable inputs (including the Fund’s own assumptions and judgment in determining the fair value of investments). |
Inputs that are used in determining fair value of an investment may include price information, credit data, volatility statistics, and other factors. These inputs can be either observable or unobservable. The availability of observable inputs can vary between investments, and is affected by various factors such as the type of investment, and the volume and level of activity for that investment or similar investments in the marketplace. The inputs will be considered by the Investment Manager, along with any other relevant factors in the calculation of an investment’s fair value. The Fund uses prices and inputs that are current as of the measurement date, which may include periods of market dislocations. During these periods, the availability of prices and inputs may be reduced for many investments. This condition could cause an investment to be reclassified between the various levels within the hierarchy.
Investments falling into the Level 3 category are primarily supported by quoted prices from brokers and dealers participating in the market for those investments. However, these may be classified as Level 3 investments due to lack of market transparency and corroboration to support these quoted prices. Additionally, valuation models may be used as the pricing source for any remaining investments classified as Level 3. These models may rely on one or more significant unobservable inputs and/or significant assumptions by the Investment Manager. Inputs used in valuations may include, but are not limited to, financial statement analysis, capital account balances, discount rates and estimated cash flows, and comparable company data.
Under the direction of the Fund’s Board of Trustees (the Board), the Investment Manager’s Valuation Committee (the Committee) is responsible for overseeing the valuation procedures approved by the Board. The Committee consists of voting and non-voting members from various groups within the Investment Manager’s organization, including operations and accounting, trading and investments, compliance, risk management and legal.
The accompanying Notes to Financial Statements are an integral part of this statement.
| | |
| |
| Columbia Select Large-Cap Value Fund | | |
Portfolio of Investments (continued)
November 30, 2014 (Unaudited)
Fair Value Measurements (continued)
The Committee meets at least monthly to review and approve valuation matters, which may include a description of specific valuation determinations, data regarding pricing information received from approved pricing vendors and brokers and the results of Board-approved valuation control policies and procedures (the Policies). The Policies address, among other things, instances when market quotations are or are not readily available, including recommendations of third party pricing vendors and a determination of appropriate pricing methodologies; events that require specific valuation determinations and assessment of fair value techniques; securities with a potential for stale pricing, including those that are illiquid, restricted, or in default; and the effectiveness of third party pricing vendors, including periodic reviews of vendors. The Committee meets more frequently, as needed, to discuss additional valuation matters, which may include the need to review back-testing results, review time-sensitive information or approve related valuation actions. The Committee reports to the Board, with members of the Committee meeting with the Board at each of its regularly scheduled meetings to discuss valuation matters and actions during the period, similar to those described earlier.
For investments categorized as Level 3, the Committee monitors information similar to that described above, which may include: (i) data specific to the issuer or comparable issuers, (ii) general market or specific sector news and (iii) quoted prices and specific or similar security transactions. The Committee considers this data and any changes from prior periods in order to assess the reasonableness of observable and unobservable inputs, any assumptions or internal models used to value those securities and changes in fair value. This data is also used to corroborate, when available, information received from approved pricing vendors and brokers. Various factors impact the frequency of monitoring this information (which may occur as often as daily). However, the Committee may determine that changes to inputs, assumptions and models are not required as a result of the monitoring procedures performed.
The following table is a summary of the inputs used to value the Fund’s investments at November 30, 2014:
| | | | | | | | | | | | | | | | |
| Description | | Level 1 Quoted Prices in Active Markets for Identical Assets ($) | | | Level 2 Other Significant Observable Inputs ($) | | | Level 3 Significant Unobservable Inputs ($) | | | Total ($) | |
Equity Securities | | | | | | | | | | | | | | | | |
| | | | |
Common Stocks | | | | | | | | | | | | | | | | |
| | | | |
Consumer Discretionary | | | 54,685,900 | | | | — | | | | — | | | | 54,685,900 | |
| | | | |
Consumer Staples | | | 117,186,532 | | | | — | | | | — | | | | 117,186,532 | |
| | | | |
Energy | | | 131,973,490 | | | | — | | | | — | | | | 131,973,490 | |
| | | | |
Financials | | | 242,711,000 | | | | — | | | | — | | | | 242,711,000 | |
| | | | |
Health Care | | | 82,939,750 | | | | — | | | | — | | | | 82,939,750 | |
| | | | |
Industrials | | | 108,381,550 | | | | — | | | | — | | | | 108,381,550 | |
| | | | |
Information Technology | | | 106,365,456 | | | | — | | | | — | | | | 106,365,456 | |
| | | | |
Materials | | | 50,940,000 | | | | — | | | | — | | | | 50,940,000 | |
| | | | |
Telecommunication Services | | | 40,472,000 | | | | — | | | | — | | | | 40,472,000 | |
| | | | |
Utilities | | | 26,491,700 | | | | — | | | | — | | | | 26,491,700 | |
| | | | | | | | | | | | | | | | | |
Total Equity Securities | | | 962,147,378 | | | | — | | | | — | | | | 962,147,378 | |
| | | | | | | | | | | | | | | | | |
Mutual Funds | | | | | | | | | | | | | | | | |
| | | | |
Money Market Funds | | | 49,631,603 | | | | — | | | | — | | | | 49,631,603 | |
| | | | | | | | | | | | | | | | | |
Total Mutual Funds | | | 49,631,603 | | | | — | | | | — | | | | 49,631,603 | |
| | | | | | | | | | | | | | | | | |
Total | | | 1,011,778,981 | | | | — | | | | — | | | | 1,011,778,981 | |
| | | | | | | | | | | | | | | | | |
See the Portfolio of Investments for all investment classifications not indicated in the table.
There were no transfers of financial assets between levels during the period.
The accompanying Notes to Financial Statements are an integral part of this statement.
| | |
| |
| | Columbia Select Large-Cap Value Fund |
Statement of Assets and Liabilities
November 30, 2014 (Unaudited)
| | | | |
Assets | | | | |
| |
Investments, at value | | | | |
| |
Unaffiliated issuers (identified cost $627,521,094) | | | $962,147,378 | |
| |
Affiliated issuers (identified cost $49,631,603) | | | 49,631,603 | |
| |
Total investments (identified cost $677,152,697) | | | 1,011,778,981 | |
| |
Receivable for: | | | | |
| |
Capital shares sold | | | 2,292,051 | |
| |
Dividends | | | 2,320,115 | |
| |
Expense reimbursement due from Investment Manager | | | 2,095 | |
| |
Prepaid expenses | | | 4,557 | |
| |
Other assets | | | 14,700 | |
| |
Total assets | | | 1,016,412,499 | |
| |
| |
Liabilities | | | | |
| |
Payable for: | | | | |
| |
Capital shares purchased | | | 1,306,632 | |
| |
Investment management fees | | | 38,332 | |
| |
Distribution and/or service fees | | | 11,382 | |
| |
Transfer agent fees | | | 421,333 | |
| |
Administration fees | | | 3,221 | |
| |
Plan administration fees | | | 4 | |
| |
Compensation of board members | | | 26,977 | |
| |
Other expenses | | | 108,986 | |
| |
Total liabilities | | | 1,916,867 | |
| |
Net assets applicable to outstanding capital stock | | | $1,014,495,632 | |
| |
| |
Represented by | | | | |
| |
Paid-in capital | | | $656,996,561 | |
| |
Undistributed net investment income | | | 8,035,075 | |
| |
Accumulated net realized gain | | | 14,837,712 | |
| |
Unrealized appreciation (depreciation) on: | | | | |
| |
Investments | | | 334,626,284 | |
| |
Total — representing net assets applicable to outstanding capital stock | | | $1,014,495,632 | |
| |
The accompanying Notes to Financial Statements are an integral part of this statement.
| | |
| |
| Columbia Select Large-Cap Value Fund | | |
Statement of Assets and Liabilities (continued)
November 30, 2014 (Unaudited)
| | | | |
Class A | | | | |
| |
Net assets | | | $351,929,916 | |
| |
Shares outstanding | | | 15,109,763 | |
| |
Net asset value per share | | | $23.29 | |
| |
Maximum offering price per share(a) | | | $24.71 | |
| |
Class B | | | | |
| |
Net assets | | | $2,069,929 | |
| |
Shares outstanding | | | 95,952 | |
| |
Net asset value per share | | | $21.57 | |
| |
Class C | | | | |
| |
Net assets | | | $93,430,648 | |
| |
Shares outstanding | | | 4,333,428 | |
| |
Net asset value per share | | | $21.56 | |
| |
Class I | | | | |
| |
Net assets | | | $142,139,656 | |
| |
Shares outstanding | | | 5,913,307 | |
| |
Net asset value per share | | | $24.04 | |
| |
Class K | | | | |
| |
Net assets | | | $19,232 | |
| |
Shares outstanding | | | 804 | |
| |
Net asset value per share(b) | | | $23.93 | |
| |
Class R | | | | |
| |
Net assets | | | $22,180,249 | |
| |
Shares outstanding | | | 966,129 | |
| |
Net asset value per share | | | $22.96 | |
| |
Class R4 | | | | |
| |
Net assets | | | $11,964,645 | |
| |
Shares outstanding | | | 492,621 | |
| |
Net asset value per share | | | $24.29 | |
| |
Class R5 | | | | |
| |
Net assets | | | $3,498,663 | |
| |
Shares outstanding | | | 145,408 | |
| |
Net asset value per share | | | $24.06 | |
| |
Class W | | | | |
| |
Net assets | | | $41,897,330 | |
| |
Shares outstanding | | | 1,807,820 | |
| |
Net asset value per share | | | $23.18 | |
| |
Class Y | | | | |
| |
Net assets | | | $2,595 | |
| |
Shares outstanding | | | 107 | |
| |
Net asset value per share(b) | | | $24.36 | |
| |
Class Z | | | | |
| |
Net assets | | | $345,362,769 | |
| |
Shares outstanding | | | 14,369,188 | |
| |
Net asset value per share | | | $24.03 | |
| |
| (a) | The maximum offering price per share is calculated by dividing the net asset value per share by 1.0 minus the maximum sales charge of 5.75%. |
| (b) | Net asset value per share rounds to this amount due to fractional shares outstanding. |
The accompanying Notes to Financial Statements are an integral part of this statement.
| | |
| |
| | Columbia Select Large-Cap Value Fund |
Statement of Operations
Six Months Ended November 30, 2014 (Unaudited)
| | | | |
Net investment income | | | | |
| |
Income: | | | | |
| |
Dividends — unaffiliated issuers | | | $10,404,661 | |
| |
Dividends — affiliated issuers | | | 10,556 | |
| |
Total income | | | 10,415,217 | |
| |
| |
Expenses: | | | | |
| |
Investment management fees | | | 3,220,647 | |
| |
Distribution and/or service fees | | | | |
| |
Class A | | | 485,411 | |
| |
Class B | | | 11,269 | |
| |
Class C | | | 428,663 | |
| |
Class R | | | 53,338 | |
| |
Class W | | | 51,416 | |
| |
Transfer agent fees | | | | |
| |
Class A | | | 379,394 | |
| |
Class B | | | 2,201 | |
| |
Class C | | | 83,805 | |
| |
Class K | | | 5 | |
| |
Class R | | | 20,856 | |
| |
Class R4 | | | 8,917 | |
| |
Class R5 | | | 727 | |
| |
Class W | | | 40,187 | |
| |
Class Z | | | 238,317 | |
| |
Administration fees | | | 270,483 | |
| |
Plan administration fees | | | | |
| |
Class K | | | 23 | |
| |
Compensation of board members | | | 11,291 | |
| |
Custodian fees | | | 3,941 | |
| |
Printing and postage fees | | | 42,123 | |
| |
Registration fees | | | 71,119 | |
| |
Professional fees | | | 18,578 | |
| |
Other | | | 13,719 | |
| |
Total expenses | | | 5,456,430 | |
| |
Fees waived or expenses reimbursed by Investment Manager and its affiliates | | | (172,899 | ) |
| |
Expense reductions | | | (1,369 | ) |
| |
Total net expenses | | | 5,282,162 | |
| |
Net investment income | | | 5,133,055 | |
| |
| |
Realized and unrealized gain (loss) — net | | | | |
| |
Net realized gain (loss) on: | | | | |
| |
Investments | | | 7,300,195 | |
| |
Net realized gain | | | 7,300,195 | |
| |
Net change in unrealized appreciation (depreciation) on: | | | | |
| |
Investments | | | 33,935,766 | |
| |
Net change in unrealized appreciation | | | 33,935,766 | |
| |
Net realized and unrealized gain | | | 41,235,961 | |
| |
Net increase in net assets resulting from operations | | | $46,369,016 | |
| |
The accompanying Notes to Financial Statements are an integral part of this statement.
| | |
| 10 | | Semiannual Report 2014 |
| | |
| |
| Columbia Select Large-Cap Value Fund | | |
Statement of Changes in Net Assets
| | | | | | | | |
| | | Six Months Ended
November 30, 2014
(Unaudited) | | | Year Ended
May 31, 2014 | |
Operations | | | | | | | | |
| | |
Net investment income | | | $5,133,055 | | | | $6,719,368 | |
| | |
Net realized gain | | | 7,300,195 | | | | 14,881,962 | |
| | |
Net change in unrealized appreciation | | | 33,935,766 | | | | 108,599,545 | |
| |
Net increase in net assets resulting from operations | | | 46,369,016 | | | | 130,200,875 | |
| |
| | |
Distributions to shareholders | | | | | | | | |
| | |
Net investment income | | | | | | | | |
| | |
Class A | | | — | | | | (4,228,890 | ) |
| | |
Class B | | | — | | | | (13,299 | ) |
| | |
Class C | | | — | | | | (362,430 | ) |
| | |
Class I | | | — | | | | (2,153,731 | ) |
| | |
Class K | | | — | | | | (296 | ) |
| | |
Class R | | | — | | | | (173,233 | ) |
| | |
Class R4 | | | — | | | | (119,794 | ) |
| | |
Class R5 | | | — | | | | (63,501 | ) |
| | |
Class W | | | — | | | | (255,488 | ) |
| | |
Class Z | | | — | | | | (1,206,234 | ) |
| | |
Net realized gains | | | | | | | | |
| | |
Class A | | | — | | | | (6,957,529 | ) |
| | |
Class B | | | — | | | | (50,431 | ) |
| | |
Class C | | | — | | | | (1,374,410 | ) |
| | |
Class I | | | — | | | | (2,705,976 | ) |
| | |
Class K | | | — | | | | (449 | ) |
| | |
Class R | | | — | | | | (351,301 | ) |
| | |
Class R4 | | | — | | | | (164,191 | ) |
| | |
Class R5 | | | — | | | | (81,663 | ) |
| | |
Class W | | | — | | | | (421,576 | ) |
| | |
Class Z | | | — | | | | (1,669,498 | ) |
| |
Total distributions to shareholders | | | — | | | | (22,353,920 | ) |
| |
Increase in net assets from capital stock activity | | | 79,919,801 | | | | 216,123,749 | |
| |
Total increase in net assets | | | 126,288,817 | | | | 323,970,704 | |
| | |
Net assets at beginning of period | | | 888,206,815 | | | | 564,236,111 | |
| |
Net assets at end of period | | | $1,014,495,632 | | | | $888,206,815 | |
| |
Undistributed net investment income | | | $8,035,075 | | | | $2,902,020 | |
| |
The accompanying Notes to Financial Statements are an integral part of this statement.
| | | | |
| Semiannual Report 2014 | | | 11 | |
| | |
| |
| | Columbia Select Large-Cap Value Fund |
Statement of Changes in Net Assets (continued)
| | | | | | | | | | | | | | | | |
| | | Six Months Ended
November 30, 2014(a)
(Unaudited) | | | Year Ended
May 31, 2014 | |
| | | Shares | | | Dollars ($) | | | Shares | | | Dollars ($) | |
Capital stock activity | | | | | | | | | | | | | | | | |
| | | | |
Class A shares | | | | | | | | | | | | | | | | |
| | | | |
Subscriptions(b) | | | 3,288,588 | | | | 74,889,873 | | | | 7,661,307 | | | | 158,175,071 | |
| | | | |
Distributions reinvested | | | — | | | | — | | | | 482,784 | | | | 9,955,002 | |
| | | | |
Redemptions | | | (8,361,073 | ) | | | (192,236,907 | ) | | | (3,728,544 | ) | | | (75,643,954 | ) |
| |
Net increase (decrease) | | | (5,072,485 | ) | | | (117,347,034 | ) | | | 4,415,547 | | | | 92,486,119 | |
| |
Class B shares | | | | | | | | | | | | | | | | |
| | | | |
Subscriptions | | | 2,114 | | | | 44,554 | | | | 17,412 | | | | 334,378 | |
| | | | |
Distributions reinvested | | | — | | | | — | | | | 2,289 | | | | 44,010 | |
| | | | |
Redemptions(b) | | | (22,206 | ) | | | (467,545 | ) | | | (42,880 | ) | | | (812,980 | ) |
| |
Net decrease | | | (20,092 | ) | | | (422,991 | ) | | | (23,179 | ) | | | (434,592 | ) |
| |
Class C shares | | | | | | | | | | | | | | | | |
| | | | |
Subscriptions | | | 807,681 | | | | 17,030,287 | | | | 1,401,753 | | | | 27,004,236 | |
| | | | |
Distributions reinvested | | | — | | | | — | | | | 55,050 | | | | 1,058,052 | |
| | | | |
Redemptions | | | (325,360 | ) | | | (6,877,675 | ) | | | (620,948 | ) | | | (11,862,852 | ) |
| |
Net increase | | | 482,321 | | | | 10,152,612 | | | | 835,855 | | | | 16,199,436 | |
| |
Class I shares | | | | | | | | | | | | | | | | |
| | | | |
Subscriptions | | | 1,690 | | | | 38,444 | | | | 161,892 | | | | 3,372,851 | |
| | | | |
Distributions reinvested | | | — | | | | — | | | | 229,216 | | | | 4,859,388 | |
| | | | |
Redemptions | | | (511,184 | ) | | | (11,980,395 | ) | | | (860,028 | ) | | | (18,266,510 | ) |
| |
Net decrease | | | (509,494 | ) | | | (11,941,951 | ) | | | (468,920 | ) | | | (10,034,271 | ) |
| |
Class K shares | | | | | | | | | | | | | | | | |
| | | | |
Distributions reinvested | | | — | | | | — | | | | 22 | | | | 450 | |
| | | | |
Redemptions | | | — | | | | — | | | | (801 | ) | | | (17,595 | ) |
| |
Net increase (decrease) | | | — | | | | — | | | | (779 | ) | | | (17,145 | ) |
| |
Class R shares | | | | | | | | | | | | | | | | |
| | | | |
Subscriptions | | | 234,699 | | | | 5,263,318 | | | | 392,327 | | | | 8,018,613 | |
| | | | |
Distributions reinvested | | | — | | | | — | | | | 7,710 | | | | 157,051 | |
| | | | |
Redemptions | | | (174,705 | ) | | | (3,914,390 | ) | | | (314,700 | ) | | | (6,444,486 | ) |
| |
Net increase | | | 59,994 | | | | 1,348,928 | | | | 85,337 | | | | 1,731,178 | |
| |
Class R4 shares | | | | | | | | | | | | | | | | |
| | | | |
Subscriptions | | | 191,994 | | | | 4,620,548 | | | | 421,596 | | | | 8,892,317 | |
| | | | |
Distributions reinvested | | | — | | | | — | | | | 7,338 | | | | 157,410 | |
| | | | |
Redemptions | | | (55,947 | ) | | | (1,328,890 | ) | | | (146,511 | ) | | | (3,228,427 | ) |
| |
Net increase | | | 136,047 | | | | 3,291,658 | | | | 282,423 | | | | 5,821,300 | |
| |
Class R5 shares | | | | | | | | | | | | | | | | |
| | | | |
Subscriptions | | | 49,573 | | | | 1,157,989 | | | | 722,997 | | | | 14,085,538 | |
| | | | |
Distributions reinvested | | | — | | | | — | | | | 6,733 | | | | 142,952 | |
| | | | |
Redemptions | | | (1,670 | ) | | | (39,638 | ) | | | (836,747 | ) | | | (17,726,102 | ) |
| |
Net increase (decrease) | | | 47,903 | | | | 1,118,351 | | | | (107,017 | ) | | | (3,497,612 | ) |
| |
The accompanying Notes to Financial Statements are an integral part of this statement.
| | |
| 12 | | Semiannual Report 2014 |
| | |
| |
| Columbia Select Large-Cap Value Fund | | |
Statement of Changes in Net Assets (continued)
| | | | | | | | | | | | | | | | |
| | | Six Months Ended
November 30, 2014(a)
(Unaudited) | | | Year Ended
May 31, 2014 | |
| | | Shares | | | Dollars ($) | | | Shares | | | Dollars ($) | |
Capital stock activity (continued) | | | | | | | | | | | | | | | | |
| | | | |
Class W shares | | | | | | | | | | | | | | | | |
| | | | |
Subscriptions | | | 131,250 | | | | 2,967,198 | | | | 1,985,282 | | | | 41,701,037 | |
| | | | |
Distributions reinvested | | | — | | | | — | | | | 33,005 | | | | 676,938 | |
| | | | |
Redemptions | | | (157,398 | ) | | | (3,558,934 | ) | | | (191,906 | ) | | | (4,077,228 | ) |
| |
Net increase (decrease) | | | (26,148 | ) | | | (591,736 | ) | | | 1,826,381 | | | | 38,300,747 | |
| |
Class Y shares | | | | | | | | | | | | | | | | |
| | | | |
Subscriptions | | | 107 | | | | 2,500 | | | | — | | | | — | |
| |
Net increase | | | 107 | | | | 2,500 | | | | — | | | | — | |
| |
Class Z shares | | | | | | | | | | | | | | | | |
| | | | |
Subscriptions | | | 9,206,154 | | | | 218,156,191 | | | | 4,254,548 | | | | 90,619,341 | |
| | | | |
Distributions reinvested | | | — | | | | — | | | | 91,725 | | | | 1,946,411 | |
| | | | |
Redemptions | | | (1,016,645 | ) | | | (23,846,727 | ) | | | (800,984 | ) | | | (16,997,163 | ) |
| |
Net increase | | | 8,189,509 | | | | 194,309,464 | | | | 3,545,289 | | | | 75,568,589 | |
| |
Total net increase | | | 3,287,662 | | | | 79,919,801 | | | | 10,390,937 | | | | 216,123,749 | |
| |
| (a) | Class Y shares are based on operations from October 1, 2014 (commencement of operations) through the stated period end. |
| (b) | Includes conversions of Class B shares to Class A shares, if any. |
The accompanying Notes to Financial Statements are an integral part of this statement.
| | | | |
| Semiannual Report 2014 | | | 13 | |
| | |
| |
| | Columbia Select Large-Cap Value Fund |
Financial Highlights
The following tables are intended to help you understand the Fund’s financial performance. Certain information reflects financial results for a single share of a class held for the periods shown. Per share net investment income (loss) amounts are calculated based on average shares outstanding during the period. Total return assumes reinvestment of all dividends and distributions, if any. Total return does not reflect payment of sales charges, if any. Total return and portfolio turnover are not annualized for periods of less than one year. The portfolio turnover rate is calculated without regard to purchase and sales transactions of short-term instruments and certain derivatives, if any. If such transactions were included, the Fund’s portfolio turnover rate may be higher.
| | | | | | | | | | | | | | | | | | | | | | | | | | | | |
| |
| Six Months Ended
November 30, 2014 |
| | | Year Ended May 31, | | | | Year Ended December 31, | |
Class A | | | (Unaudited) | | | | 2014 | | | | 2013 | | | | 2012(a) | | | | 2011 | | | | 2010 | | | | 2009 | |
Per share data | | | | | | | | | | | | | | | | | | | | | | | | | | | | |
Net asset value, beginning of period | | | $22.18 | | | | $19.05 | | | | $14.31 | | | | $14.12 | | | | $14.70 | | | | $12.31 | | | | $9.77 | |
| | | | | | | | | | | | | | | | | | | | | | | | | | | | | |
Income from investment operations: | | | | | | | | | | | | | | | | | | | | | | | | | | | | |
| | | | | | | |
Net investment income | | | 0.12 | | | | 0.19 | | | | 0.19 | | | | 0.06 | | | | 0.12 | | | | 0.09 | | | | 0.10 | |
| | | | | | | | | | | | | | | | | | | | | | | | | | | | | |
Net realized and unrealized gain (loss) | | | 0.99 | | | | 3.61 | | | | 5.31 | | | | 0.13 | | | | (0.28 | ) | | | 2.39 | | | | 2.45 | |
| | | | | | | | | | | | | | | | | | | | | | | | | | | | | |
Total from investment operations | | | 1.11 | | | | 3.80 | | | | 5.50 | | | | 0.19 | | | | (0.16 | ) | | | 2.48 | | | | 2.55 | |
| | | | | | | | | | | | | | | | | | | | | | | | | | | | | |
Less distributions to shareholders: | | | | | | | | | | | | | | | | | | | | | | | | | | | | |
| | | | | | | |
Net investment income | | | — | | | | (0.26 | ) | | | (0.21 | ) | | | — | | | | (0.09 | ) | | | (0.04 | ) | | | (0.01 | ) |
| | | | | | | | | | | | | | | | | | | | | | | | | | | | | |
Net realized gains | | | — | | | | (0.41 | ) | | | (0.55 | ) | | | — | | | | (0.33 | ) | | | (0.05 | ) | | | (0.00 | )(b) |
| | | | | | | | | | | | | | | | | | | | | | | | | | | | | |
Total distributions to shareholders | | | — | | | | (0.67 | ) | | | (0.76 | ) | | | — | | | | (0.42 | ) | | | (0.09 | ) | | | (0.01 | ) |
| | | | | | | | | | | | | | | | | | | | | | | | | | | | | |
Net asset value, end of period | | | $23.29 | | | | $22.18 | | | | $19.05 | | | | $14.31 | | | | $14.12 | | | | $14.70 | | | | $12.31 | |
| | | | | | | | | | | | | | | | | | | | | | | | | | | | | |
Total return | | | 5.01 | % | | | 20.20 | % | | | 39.43 | % | | | 1.35 | % | | | (1.01 | %) | | | 20.21 | % | | | 26.07 | % |
| | | | | | | | | | | | | | | | | | | | | | | | | | | | | |
Ratios to average net assets(c) | | | | | | | | | | | | | | | | | | | | | | | | | | | | |
| | | | | | | |
Total gross expenses | | | 1.22 | %(d) | | | 1.25 | %(e) | | | 1.34 | % | | | 1.35 | %(d) | | | 1.28 | % | | | 1.37 | % | | | 1.61 | % |
| | | | | | | | | | | | | | | | | | | | | | | | | | | | | |
Total net expenses(f) | | | 1.18 | %(d)(g) | | | 1.18 | %(e)(g) | | | 1.24 | %(g) | | | 1.25 | %(d) | | | 1.26 | %(g) | | | 1.37 | % | | | 1.61 | % |
| | | | | | | | | | | | | | | | | | | | | | | | | | | | | |
Net investment income | | | 1.03 | %(d) | | | 0.92 | % | | | 1.17 | % | | | 0.89 | %(d) | | | 0.81 | % | | | 0.66 | % | | | 0.87 | % |
| | | | | | | | | | | | | | | | | | | | | | | | | | | | | |
Supplemental data | | | | | | | | | | | | | | | | | | | | | | | | | | | | |
| | | | | | | |
Net assets, end of period (in thousands) | | | $351,930 | | | | $447,665 | | | | $300,415 | | | | $232,859 | | | | $243,514 | | | | $271,885 | | | | $202,826 | |
| | | | | | | | | | | | | | | | | | | | | | | | | | | | | |
Portfolio turnover | | | 4 | % | | | 8 | % | | | 18 | % | | | 5 | % | | | 14 | % | | | 12 | % | | | 24 | % |
| | | | | | | | | | | | | | | | | | | | | | | | | | | | | |
Notes to Financial Highlights
| (a) | For the period from January 1, 2012 to May 31, 2012. During the period, the Fund’s fiscal year end was changed from December 31 to May 31. |
| (c) | In addition to the fees and expenses that the Fund bears directly, the Fund indirectly bears a pro rata share of the fees and expenses of any other funds in which it invests. Such indirect expenses are not included in the Fund’s reported expense ratios. |
| (e) | Ratios include line of credit interest expense which is less than 0.01%. |
| (f) | Total net expenses include the impact of certain fee waivers/expense reimbursements made by the Investment Manager and certain of its affiliates, if applicable. |
| (g) | The benefits derived from expense reductions had an impact of less than 0.01%. |
The accompanying Notes to Financial Statements are an integral part of this statement.
| | |
| 14 | | Semiannual Report 2014 |
| | |
| |
| Columbia Select Large-Cap Value Fund | | |
Financial Highlights (continued)
| | | | | | | | | | | | | | | | | | | | | | | | | | | | |
| |
| Six Months Ended
November 30, 2014 |
| | | Year Ended May 31, | | | | Year Ended December 31, | |
Class B | | | (Unaudited) | | | | 2014 | | | | 2013 | | | | 2012(a) | | | | 2011 | | | | 2010 | | | | 2009 | |
Per share data | | | | | | | | | | | | | | | | | | | | | | | | | | | | |
Net asset value, beginning of period | | | $20.62 | | | | $17.76 | | | | $13.36 | | | | $13.23 | | | | $13.81 | | | | $11.62 | | | | $9.29 | |
| | | | | | | | | | | | | | | | | | | | | | | | | | | | | |
Income from investment operations: | | | | | | | | | | | | | | | | | | | | | | | | | | | | |
| | | | | | | |
Net investment income (loss) | | | 0.03 | | | | 0.03 | | | | 0.06 | | | | 0.01 | | | | 0.00 | (b) | | | (0.01 | ) | | | (0.01 | ) |
| | | | | | | | | | | | | | | | | | | | | | | | | | | | | |
Net realized and unrealized gain (loss) | | | 0.92 | | | | 3.35 | | | | 4.96 | | | | 0.12 | | | | (0.25 | ) | | | 2.25 | | | | 2.34 | |
| | | | | | | | | | | | | | | | | | | | | | | | | | | | | |
Total from investment operations | | | 0.95 | | | | 3.38 | | | | 5.02 | | | | 0.13 | | | | (0.25 | ) | | | 2.24 | | | | 2.33 | |
| | | | | | | | | | | | | | | | | | | | | | | | | | | | | |
Less distributions to shareholders: | | | | | | | | | | | | | | | | | | | | | | | | | | | | |
| | | | | | | |
Net investment income | | | — | | | | (0.11 | ) | | | (0.07 | ) | | | — | | | | — | | | | — | | | | — | |
| | | | | | | | | | | | | | | | | | | | | | | | | | | | | |
Net realized gains | | | — | | | | (0.41 | ) | | | (0.55 | ) | | | — | | | | (0.33 | ) | | | (0.05 | ) | | | (0.00 | )(b) |
| | | | | | | | | | | | | | | | | | | | | | | | | | | | | |
Total distributions to shareholders | | | — | | | | (0.52 | ) | | | (0.62 | ) | | | — | | | | (0.33 | ) | | | (0.05 | ) | | | (0.00 | )(b) |
| | | | | | | | | | | | | | | | | | | | | | | | | | | | | |
Net asset value, end of period | | | $21.57 | | | | $20.62 | | | | $17.76 | | | | $13.36 | | | | $13.23 | | | | $13.81 | | | | $11.62 | |
| | | | | | | | | | | | | | | | | | | | | | | | | | | | | |
Total return | | | 4.61 | % | | | 19.27 | % | | | 38.42 | % | | | 0.98 | % | | | (1.72 | %) | | | 19.30 | % | | | 25.10 | % |
| | | | | | | | | | | | | | | | | | | | | | | | | | | | | |
Ratios to average net assets(c) | | | | | | | | | | | | | | | | | | | | | | | | | | | | |
| | | | | | | |
Total gross expenses | | | 1.97 | %(d) | | | 2.00 | %(e) | | | 2.09 | % | | | 2.10 | %(d) | | | 2.03 | % | | | 2.14 | % | | | 2.54 | % |
| | | | | | | | | | | | | | | | | | | | | | | | | | | | | |
Total net expenses(f) | | | 1.93 | %(d)(g) | | | 1.93 | %(e)(g) | | | 1.99 | %(g) | | | 2.00 | %(d) | | | 2.01 | %(g) | | | 2.14 | % | | | 2.54 | % |
| | | | | | | | | | | | | | | | | | | | | | | | | | | | | |
Net investment income (loss) | | | 0.27 | %(d) | | | 0.17 | % | | | 0.42 | % | | | 0.13 | %(d) | | | 0.02 | % | | | (0.10 | %) | | | (0.08 | %) |
| | | | | | | | | | | | | | | | | | | | | | | | | | | | | |
Supplemental data | | | | | | | | | | | | | | | | | | | | | | | | | | | | |
| | | | | | | |
Net assets, end of period (in thousands) | | | $2,070 | | | | $2,393 | | | | $2,472 | | | | $2,635 | | | | $3,083 | | | | $5,138 | | | | $5,890 | |
| | | | | | | | | | | | | | | | | | | | | | | | | | | | | |
Portfolio turnover | | | 4 | % | | | 8 | % | | | 18 | % | | | 5 | % | | | 14 | % | | | 12 | % | | | 24 | % |
| | | | | | | | | | | | | | | | | | | | | | | | | | | | | |
Notes to Financial Highlights
| (a) | For the period from January 1, 2012 to May 31, 2012. During the period, the Fund’s fiscal year end was changed from December 31 to May 31. |
| (c) | In addition to the fees and expenses that the Fund bears directly, the Fund indirectly bears a pro rata share of the fees and expenses of any other funds in which it invests. Such indirect expenses are not included in the Fund’s reported expense ratios. |
| (e) | Ratios include line of credit interest expense which is less than 0.01%. |
| (f) | Total net expenses include the impact of certain fee waivers/expense reimbursements made by the Investment Manager and certain of its affiliates, if applicable. |
| (g) | The benefits derived from expense reductions had an impact of less than 0.01%. |
The accompanying Notes to Financial Statements are an integral part of this statement.
| | | | |
| Semiannual Report 2014 | | | 15 | |
| | |
| |
| | Columbia Select Large-Cap Value Fund |
Financial Highlights (continued)
| | | | | | | | | | | | | | | | | | | | | | | | | | | | |
| |
| Six Months Ended
November 30, 2014 |
| | | Year Ended May 31, | | | | Year Ended December 31, | |
Class C | | | (Unaudited) | | | | 2014 | | | | 2013 | | | | 2012(a) | | | | 2011 | | | | 2010 | | | | 2009 | |
Per share data | | | | | | | | | | | | | | | | | | | | | | | | | | | | |
Net asset value, beginning of period | | | $20.61 | | | | $17.75 | | | | $13.37 | | | | $13.24 | | | | $13.83 | | | | $11.63 | | | | $9.30 | |
| | | | | | | | | | | | | | | | | | | | | | | | | | | | | |
Income from investment operations: | | | | | | | | | | | | | | | | | | | | | | | | | | | | |
| | | | | | | |
Net investment income (loss) | | | 0.03 | | | | 0.03 | | | | 0.06 | | | | 0.01 | | | | 0.01 | | | | (0.01 | ) | | | (0.01 | ) |
| | | | | | | | | | | | | | | | | | | | | | | | | | | | | |
Net realized and unrealized gain (loss) | | | 0.92 | | | | 3.35 | | | | 4.97 | | | | 0.12 | | | | (0.27 | ) | | | 2.26 | | | | 2.34 | |
| | | | | | | | | | | | | | | | | | | | | | | | | | | | | |
Total from investment operations | | | 0.95 | | | | 3.38 | | | | 5.03 | | | | 0.13 | | | | (0.26 | ) | | | 2.25 | | | | 2.33 | |
| | | | | | | | | | | | | | | | | | | | | | | | | | | | | |
Less distributions to shareholders: | | | | | | | | | | | | | | | | | | | | | | | | | | | | |
| | | | | | | |
Net investment income | | | — | | | | (0.11 | ) | | | (0.10 | ) | | | — | | | | — | | | | — | | | | — | |
| | | | | | | | | | | | | | | | | | | | | | | | | | | | | |
Net realized gains | | | — | | | | (0.41 | ) | | | (0.55 | ) | | | — | | | | (0.33 | ) | | | (0.05 | ) | | | (0.00 | )(b) |
| | | | | | | | | | | | | | | | | | | | | | | | | | | | | |
Total distributions to shareholders | | | — | | | | (0.52 | ) | | | (0.65 | ) | | | — | | | | (0.33 | ) | | | (0.05 | ) | | | (0.00 | )(b) |
| | | | | | | | | | | | | | | | | | | | | | | | | | | | | |
Net asset value, end of period | | | $21.56 | | | | $20.61 | | | | $17.75 | | | | $13.37 | | | | $13.24 | | | | $13.83 | | | | $11.63 | |
| | | | | | | | | | | | | | | | | | | | | | | | | | | | | |
Total return | | | 4.61 | % | | | 19.28 | % | | | 38.51 | % | | | 0.98 | % | | | (1.80 | %) | | | 19.37 | % | | | 25.07 | % |
| | | | | | | | | | | | | | | | | | | | | | | | | | | | | |
Ratios to average net assets(c) | | | | | | | | | | | | | | | | | | | | | | | | | | | | |
| | | | | | | |
Total gross expenses | | | 1.97 | %(d) | | | 2.00 | %(e) | | | 2.09 | % | | | 2.10 | %(d) | | | 2.03 | % | | | 2.13 | % | | | 2.51 | % |
| | | | | | | | | | | | | | | | | | | | | | | | | | | | | |
Total net expenses(f) | | | 1.93 | %(d)(g) | | | 1.93 | %(e)(g) | | | 1.99 | %(g) | | | 2.00 | %(d) | | | 2.01 | %(g) | | | 2.13 | % | | | 2.51 | % |
| | | | | | | | | | | | | | | | | | | | | | | | | | | | | |
Net investment income (loss) | | | 0.29 | %(d) | | | 0.17 | % | | | 0.42 | % | | | 0.15 | %(d) | | | 0.06 | % | | | (0.09 | %) | | | (0.05 | %) |
| | | | | | | | | | | | | | | | | | | | | | | | | | | | | |
Supplemental data | | | | | | | | | | | | | | | | | | | | | | | | | | | | |
| | | | | | | |
Net assets, end of period (in thousands) | | | $93,431 | | | | $79,365 | | | | $53,515 | | | | $43,840 | | | | $44,484 | | | | $48,210 | | | | $40,630 | |
| | | | | | | | | | | | | | | | | | | | | | | | | | | | | |
Portfolio turnover | | | 4 | % | | | 8 | % | | | 18 | % | | | 5 | % | | | 14 | % | | | 12 | % | | | 24 | % |
| | | | | | | | | | | | | | | | | | | | | | | | | | | | | |
Notes to Financial Highlights
| (a) | For the period from January 1, 2012 to May 31, 2012. During the period, the Fund’s fiscal year end was changed from December 31 to May 31. |
| (c) | In addition to the fees and expenses that the Fund bears directly, the Fund indirectly bears a pro rata share of the fees and expenses of any other funds in which it invests. Such indirect expenses are not included in the Fund’s reported expense ratios. |
| (e) | Ratios include line of credit interest expense which is less than 0.01%. |
| (f) | Total net expenses include the impact of certain fee waivers/expense reimbursements made by the Investment Manager and certain of its affiliates, if applicable. |
| (g) | The benefits derived from expense reductions had an impact of less than 0.01%. |
The accompanying Notes to Financial Statements are an integral part of this statement.
| | |
| 16 | | Semiannual Report 2014 |
| | |
| |
| Columbia Select Large-Cap Value Fund | | |
Financial Highlights (continued)
| | | | | | | | | | | | | | | | | | | | | | | | | | | | |
| |
| Six Months Ended
November 30, 2014 |
| | | Year Ended May 31, | | | | Year Ended December 31, | |
Class I | | | (Unaudited) | | | | 2014 | | | | 2013 | | | | 2012(a) | | | | 2011 | | | | 2010 | | | | 2009(b) | |
Per share data | | | | | | | | | | | | | | | | | | | | | | | | | | | | |
Net asset value, beginning of period | | | $22.84 | | | | $19.60 | | | | $14.69 | | | | $14.48 | | | | $15.07 | | | | $12.60 | | | | $11.64 | |
| | | | | | | | | | | | | | | | | | | | | | | | | | | | | |
Income from investment operations: | | | | | | | | | | | | | | | | | | | | | | | | | | | | |
| | | | | | | |
Net investment income | | | 0.17 | | | | 0.28 | | | | 0.27 | | | | 0.09 | | | | 0.19 | | | | 0.15 | | | | 0.08 | |
| | | | | | | | | | | | | | | | | | | | | | | | | | | | | |
Net realized and unrealized gain (loss) | | | 1.03 | | | | 3.71 | | | | 5.47 | | | | 0.12 | | | | (0.29 | ) | | | 2.47 | | | | 0.90 | |
| | | | | | | | | | | | | | | | | | | | | | | | | | | | | |
Total from investment operations | | | 1.20 | | | | 3.99 | | | | 5.74 | | | | 0.21 | | | | (0.10 | ) | | | 2.62 | | | | 0.98 | |
| | | | | | | | | | | | | | | | | | | | | | | | | | | | | |
Less distributions to shareholders: | | | | | | | | | | | | | | | | | | | | | | | | | | | | |
| | | | | | | |
Net investment income | | | — | | | | (0.34 | ) | | | (0.28 | ) | | | — | | | | (0.16 | ) | | | (0.10 | ) | | | (0.02 | ) |
| | | | | | | | | | | | | | | | | | | | | | | | | | | | | |
Net realized gains | | | — | | | | (0.41 | ) | | | (0.55 | ) | | | — | | | | (0.33 | ) | | | (0.05 | ) | | | (0.00 | )(c) |
| | | | | | | | | | | | | | | | | | | | | | | | | | | | | |
Total distributions to shareholders | | | — | | | | (0.75 | ) | | | (0.83 | ) | | | — | | | | (0.49 | ) | | | (0.15 | ) | | | (0.02 | ) |
| | | | | | | | | | | | | | | | | | | | | | | | | | | | | |
Net asset value, end of period | | | $24.04 | | �� | | $22.84 | | | | $19.60 | | | | $14.69 | | | | $14.48 | | | | $15.07 | | | | $12.60 | |
| | | | | | | | | | | | | | | | | | | | | | | | | | | | | |
Total return | | | 5.25 | % | | | 20.62 | % | | | 40.13 | % | | | 1.45 | % | | | (0.59 | %) | | | 20.80 | % | | | 8.41 | % |
| | | | | | | | | | | | | | | | | | | | | | | | | | | | | |
Ratios to average net assets(d) | | | | | | | | | | | | | | | | | | | | | | | | | | | | |
| | | | | | | |
Total gross expenses | | | 0.78 | %(e) | | | 0.80 | %(f) | | | 0.83 | % | | | 0.86 | %(e) | | | 0.84 | % | | | 0.92 | % | | | 0.89 | %(e) |
| | | | | | | | | | | | | | | | | | | | | | | | | | | | | |
Total net expenses(g) | | | 0.78 | %(e) | | | 0.78 | %(f) | | | 0.83 | % | | | 0.85 | %(e) | | | 0.84 | % | | | 0.92 | % | | | 0.89 | %(e) |
| | | | | | | | | | | | | | | | | | | | | | | | | | | | | |
Net investment income | | | 1.43 | %(e) | | | 1.32 | % | | | 1.58 | % | | | 1.29 | %(e) | | | 1.29 | % | | | 1.13 | % | | | 1.66 | %(e) |
| | | | | | | | | | | | | | | | | | | | | | | | | | | | | |
Supplemental data | | | | | | | | | | | | | | | | | | | | | | | | | | | | |
| | | | | | | |
Net assets, end of period (in thousands) | | | $142,140 | | | | $146,724 | | | | $135,066 | | | | $91,542 | | | | $107,682 | | | | $72,971 | | | | $23,870 | |
| | | | | | | | | | | | | | | | | | | | | | | | | | | | | |
Portfolio turnover | | | 4 | % | | | 8 | % | | | 18 | % | | | 5 | % | | | 14 | % | | | 12 | % | | | 24 | % |
| | | | | | | | | | | | | | | | | | | | | | | | | | | | | |
Notes to Financial Highlights
| (a) | For the period from January 1, 2012 to May 31, 2012. During the period, the Fund’s fiscal year end was changed from December 31 to May 31. |
| (b) | Based on operations from August 3, 2009 (commencement of operations) through the stated period end. |
| (d) | In addition to the fees and expenses that the Fund bears directly, the Fund indirectly bears a pro rata share of the fees and expenses of any other funds in which it invests. Such indirect expenses are not included in the Fund’s reported expense ratios. |
| (f) | Ratios include line of credit interest expense which is less than 0.01%. |
| (g) | Total net expenses include the impact of certain fee waivers/expense reimbursements made by the Investment Manager and certain of its affiliates, if applicable. |
The accompanying Notes to Financial Statements are an integral part of this statement.
| | | | |
| Semiannual Report 2014 | | | 17 | |
| | |
| |
| | Columbia Select Large-Cap Value Fund |
Financial Highlights (continued)
| | | | | | | | | | | | | | | | | | | | | | | | | | | | |
| |
| Six Months Ended
November 30, 2014 |
| | | Year Ended May 31, | | | | Year Ended December 31, | |
Class K | | | (Unaudited) | | | | 2014 | | | | 2013 | | | | 2012(a) | | | | 2011 | | | | 2010 | | | | 2009(b) | |
Per share data | | | | | | | | | | | | | | | | | | | | | | | | | | | | |
Net asset value, beginning of period | | | $22.78 | | | | $19.55 | | | | $14.66 | | | | $14.47 | | | | $15.06 | | | | $12.59 | | | | $11.64 | |
| | | | | | | | | | | | | | | | | | | | | | | | | | | | | |
Income from investment operations: | | | | | | | | | | | | | | | | | | | | | | | | | | | | |
| | | | | | | |
Net investment income | | | 0.13 | | | | 0.21 | | | | 0.22 | | | | 0.07 | | | | 0.14 | | | | 0.11 | | | | 0.07 | |
| | | | | | | | | | | | | | | | | | | | | | | | | | | | | |
Net realized and unrealized gain (loss) | | | 1.02 | | | | 3.71 | | | | 5.45 | | | | 0.12 | | | | (0.29 | ) | | | 2.47 | | | | 0.89 | |
| | | | | | | | | | | | | | | | | | | | | | | | | | | | | |
Total from investment operations | | | 1.15 | | | | 3.92 | | | | 5.67 | | | | 0.19 | | | | (0.15 | ) | | | 2.58 | | | | 0.96 | |
| | | | | | | | | | | | | | | | | | | | | | | | | | | | | |
Less distributions to shareholders: | | | | | | | | | | | | | | | | | | | | | | | | | | | | |
| | | | | | | |
Net investment income | | | — | | | | (0.28 | ) | | | (0.23 | ) | | | — | | | | (0.11 | ) | | | (0.06 | ) | | | (0.01 | ) |
| | | | | | | | | | | | | | | | | | | | | | | | | | | | | |
Net realized gains | | | — | | | | (0.41 | ) | | | (0.55 | ) | | | — | | | | (0.33 | ) | | | (0.05 | ) | | | (0.00 | )(c) |
| | | | | | | | | | | | | | | | | | | | | | | | | | | | | |
Total distributions to shareholders | | | — | | | | (0.69 | ) | | | (0.78 | ) | | | — | | | | (0.44 | ) | | | (0.11 | ) | | | (0.01 | ) |
| | | | | | | | | | | | | | | | | | | | | | | | | | | | | |
Net asset value, end of period | | | $23.93 | | | | $22.78 | | | | $19.55 | | | | $14.66 | | | | $14.47 | | | | $15.06 | | | | $12.59 | |
| | | | | | | | | | | | | | | | | | | | | | | | | | | | | |
Total return | | | 5.05 | % | | | 20.31 | % | | | 39.69 | % | | | 1.31 | % | | | (0.90 | %) | | | 20.50 | % | | | 8.29 | % |
| | | | | | | | | | | | | | | | | | | | | | | | | | | | | |
Ratios to average net assets(d) | | | | | | | | | | | | | | | | | | | | | | | | | | | | |
| | | | | | | |
Total gross expenses | | | 1.08 | %(e) | | | 1.09 | %(f) | | | 1.13 | % | | | 1.14 | %(e) | | | 1.14 | % | | | 1.21 | % | | | 1.21 | %(e) |
| | | | | | | | | | | | | | | | | | | | | | | | | | | | | |
Total net expenses(g) | | | 1.08 | %(e) | | | 1.07 | %(f) | | | 1.13 | % | | | 1.13 | %(e) | | | 1.14 | % | | | 1.21 | % | | | 1.21 | %(e) |
| | | | | | | | | | | | | | | | | | | | | | | | | | | | | |
Net investment income | | | 1.13 | %(e) | | | 1.02 | % | | | 1.28 | % | | | 1.02 | %(e) | | | 0.94 | % | | | 0.83 | % | | | 1.34 | %(e) |
| | | | | | | | | | | | | | | | | | | | | | | | | | | | | |
Supplemental data | | | | | | | | | | | | | | | | | | | | | | | | | | | | |
| | | | | | | |
Net assets, end of period (in thousands) | | | $19 | | | | $18 | | | | $31 | | | | $22 | | | | $22 | | | | $23 | | | | $5 | |
| | | | | | | | | | | | | | | | | | | | | | | | | | | | | |
Portfolio turnover | | | 4 | % | | | 8 | % | | | 18 | % | | | 5 | % | | | 14 | % | | | 12 | % | | | 24 | % |
| | | | | | | | | | | | | | | | | | | | | | | | | | | | | |
Notes to Financial Highlights
| (a) | For the period from January 1, 2012 to May 31, 2012. During the period, the Fund’s fiscal year end was changed from December 31 to May 31. |
| (b) | Based on operations from August 3, 2009 (commencement of operations) through the stated period end. |
| (d) | In addition to the fees and expenses that the Fund bears directly, the Fund indirectly bears a pro rata share of the fees and expenses of any other funds in which it invests. Such indirect expenses are not included in the Fund’s reported expense ratios. |
| (f) | Ratios include line of credit interest expense which is less than 0.01%. |
| (g) | Total net expenses include the impact of certain fee waivers/expense reimbursements made by the Investment Manager and certain of its affiliates, if applicable. |
The accompanying Notes to Financial Statements are an integral part of this statement.
| | |
| 18 | | Semiannual Report 2014 |
| | |
| |
| Columbia Select Large-Cap Value Fund | | |
Financial Highlights (continued)
| | | | | | | | | | | | | | | | | | | | | | | | | | | | |
| |
| Six Months Ended
November 30, 2014 |
| | | Year Ended May 31, | | | | Year Ended December 31, | |
Class R | | | (Unaudited) | | | | 2014 | | | | 2013 | | | | 2012(a) | | | | 2011 | | | | 2010 | | | | 2009 | |
Per share data | | | | | | | | | | | | | | | | | | | | | | | | | | | | |
Net asset value, beginning of period | | | $21.89 | | | | $18.81 | | | | $14.15 | | | | $13.98 | | | | $14.55 | | | | $12.19 | | | | $9.70 | |
| | | | | | | | | | | | | | | | | | | | | | | | | | | | | |
Income from investment operations: | | | | | | | | | | | | | | | | | | | | | | | | | | | | |
| | | | | | | |
Net investment income | | | 0.09 | | | | 0.14 | | | | 0.15 | | | | 0.04 | | | | 0.08 | | | | 0.05 | | | | 0.04 | |
| | | | | | | | | | | | | | | | | | | | | | | | | | | | | |
Net realized and unrealized gain (loss) | | | 0.98 | | | | 3.56 | | | | 5.24 | | | | 0.13 | | | | (0.27 | ) | | | 2.37 | | | | 2.45 | |
| | | | | | | | | | | | | | | | | | | | | | | | | | | | | |
Total from investment operations | | | 1.07 | | | | 3.70 | | | | 5.39 | | | | 0.17 | | | | (0.19 | ) | | | 2.42 | | | | 2.49 | |
| | | | | | | | | | | | | | | | | | | | | | | | | | | | | |
Less distributions to shareholders: | | | | | | | | | | | | | | | | | | | | | | | | | | | | |
| | | | | | | |
Net investment income | | | — | | | | (0.21 | ) | | | (0.18 | ) | | | — | | | | (0.05 | ) | | | (0.01 | ) | | | — | |
| | | | | | | | | | | | | | | | | | | | | | | | | | | | | |
Net realized gains | | | — | | | | (0.41 | ) | | | (0.55 | ) | | | — | | | | (0.33 | ) | | | (0.05 | ) | | | (0.00 | )(b) |
| | | | | | | | | | | | | | | | | | | | | | | | | | | | | |
Total distributions to shareholders | | | — | | | | (0.62 | ) | | | (0.73 | ) | | | — | | | | (0.38 | ) | | | (0.06 | ) | | | (0.00 | )(b) |
| | | | | | | | | | | | | | | | | | | | | | | | | | | | | |
Net asset value, end of period | | | $22.96 | | | | $21.89 | | | | $18.81 | | | | $14.15 | | | | $13.98 | | | | $14.55 | | | | $12.19 | |
| | | | | | | | | | | | | | | | | | | | | | | | | | | | | |
Total return | | | 4.89 | % | | | 19.91 | % | | | 39.09 | % | | | 1.22 | % | | | (1.23 | %) | | | 19.91 | % | | | 25.69 | % |
| | | | | | | | | | | | | | | | | | | | | | | | | | | | | |
Ratios to average net assets(c) | | | | | | | | | | | | | | | | | | | | | | | | | | | | |
| | | | | | | |
Total gross expenses | | | 1.47 | %(d) | | | 1.50 | %(e) | | | 1.59 | % | | | 1.60 | %(d) | | | 1.53 | % | | | 1.66 | % | | | 2.04 | % |
| | | | | | | | | | | | | | | | | | | | | | | | | | | | | |
Total net expenses(f) | | | 1.43 | %(d)(g) | | | 1.43 | %(e)(g) | | | 1.49 | %(g) | | | 1.50 | %(d) | | | 1.51 | %(g) | | | 1.66 | % | | | 2.04 | % |
| | | | | | | | | | | | | | | | | | | | | | | | | | | | | |
Net investment income | | | 0.79 | %(d) | | | 0.67 | % | | | 0.95 | % | | | 0.67 | %(d) | | | 0.55 | % | | | 0.38 | % | | | 0.41 | % |
| | | | | | | | | | | | | | | | | | | | | | | | | | | | | |
Supplemental data | | | | | | | | | | | | | | | | | | | | | | | | | | | | |
| | | | | | | |
Net assets, end of period (in thousands) | | | $22,180 | | | | $19,835 | | | | $15,443 | | | | $10,773 | | | | $9,720 | | | | $11,594 | | | | $8,288 | |
| | | | | | | | | | | | | | | | | | | | | | | | | | | | | |
Portfolio turnover | | | 4 | % | | | 8 | % | | | 18 | % | | | 5 | % | | | 14 | % | | | 12 | % | | | 24 | % |
| | | | | | | | | | | | | | | | | | | | | | | | | | | | | |
Notes to Financial Highlights
| (a) | For the period from January 1, 2012 to May 31, 2012. During the period, the Fund’s fiscal year end was changed from December 31 to May 31. |
| (c) | In addition to the fees and expenses that the Fund bears directly, the Fund indirectly bears a pro rata share of the fees and expenses of any other funds in which it invests. Such indirect expenses are not included in the Fund’s reported expense ratios. |
| (e) | Ratios include line of credit interest expense which is less than 0.01%. |
| (f) | Total net expenses include the impact of certain fee waivers/expense reimbursements made by the Investment Manager and certain of its affiliates, if applicable. |
| (g) | The benefits derived from expense reductions had an impact of less than 0.01%. |
The accompanying Notes to Financial Statements are an integral part of this statement.
| | | | |
| Semiannual Report 2014 | | | 19 | |
| | |
| |
| | Columbia Select Large-Cap Value Fund |
Financial Highlights (continued)
| | | | | | | | | | | | |
| |
| Six Months Ended
November 30, 2014 |
| | | Year Ended May 31, | |
Class R4 | | | (Unaudited) | | | | 2014 | | | | 2013(a) | |
Per share data | | | | | | | | | | | | |
Net asset value, beginning of period | | | $23.10 | | | | $19.81 | | | | $16.22 | |
| | | | | | | | | | | | | |
Income from investment operations: | | | | | | | | | | | | |
| | | |
Net investment income | | | 0.16 | | | | 0.25 | | | | 0.17 | |
| | | | | | | | | | | | | |
Net realized and unrealized gain | | | 1.03 | | | | 3.76 | | | | 4.24 | |
| | | | | | | | | | | | | |
Total from investment operations | | | 1.19 | | | | 4.01 | | | | 4.41 | |
| | | | | | | | | | | | | |
Less distributions to shareholders: | | | | | | | | | | | | |
| | | |
Net investment income | | | — | | | | (0.31 | ) | | | (0.27 | ) |
| | | | | | | | | | | | | |
Net realized gains | | | — | | | | (0.41 | ) | | | (0.55 | ) |
| | | | | | | | | | | | | |
Total distributions to shareholders | | | — | | | | (0.72 | ) | | | (0.82 | ) |
| | | | | | | | | | | | | |
Net asset value, end of period | | | $24.29 | | | | $23.10 | | | | $19.81 | |
| | | | | | | | | | | | | |
Total return | | | 5.15 | % | | | 20.51 | % | | | 28.18 | % |
| | | | | | | | | | | | | |
Ratios to average net assets(b) | | | | | | | | | | | | |
| | | |
Total gross expenses | | | 0.98 | %(c) | | | 1.00 | %(d) | | | 1.06 | %(c) |
| | | | | | | | | | | | | |
Total net expenses(e) | | | 0.93 | %(c)(f) | | | 0.93 | %(d)(f) | | | 0.95 | %(c) |
| | | | | | | | | | | | | |
Net investment income | | | 1.32 | %(c) | | | 1.15 | % | | | 1.62 | %(c) |
| | | | | | | | | | | | | |
Supplemental data | | | | | | | | | | | | |
| | | |
Net assets, end of period (in thousands) | | | $11,965 | | | | $8,237 | | | | $1,469 | |
| | | | | | | | | | | | | |
Portfolio turnover | | | 4 | % | | | 8 | % | | | 18 | % |
| | | | | | | | | | | | | |
Notes to Financial Highlights
| (a) | Based on operations from November 8, 2012 (commencement of operations) through the stated period end. |
| (b) | In addition to the fees and expenses that the Fund bears directly, the Fund indirectly bears a pro rata share of the fees and expenses of any other funds in which it invests. Such indirect expenses are not included in the Fund’s reported expense ratios. |
| (d) | Ratios include line of credit interest expense which is less than 0.01%. |
| (e) | Total net expenses include the impact of certain fee waivers/expense reimbursements made by the Investment Manager and certain of its affiliates, if applicable. |
| (f) | The benefits derived from expense reductions had an impact of less than 0.01%. |
The accompanying Notes to Financial Statements are an integral part of this statement.
| | |
| 20 | | Semiannual Report 2014 |
| | |
| |
| Columbia Select Large-Cap Value Fund | | |
Financial Highlights (continued)
| | | | | | | | | | | | | | | | | | | | | | | | | | | | |
| |
| Six Months Ended
November 30, 2014 |
| | | Year Ended May 31, | | | | Year Ended December 31, | |
Class R5 | | | (Unaudited) | | | | 2014 | | | | 2013 | | | | 2012(a) | | | | 2011 | | | | 2010 | | | | 2009 | |
Per share data | | | | | | | | | | | | | | | | | | | | | | | | | | | | |
Net asset value, beginning of period | | | $22.87 | | | | $19.62 | | | | $14.71 | | | | $14.50 | | | | $15.09 | | | | $12.62 | | | | $9.96 | |
| | | | | | | | | | | | | | | | | | | | | | | | | | | | | |
Income from investment operations: | | | | | | | | | | | | | | | | | | | | | | | | | | | | |
| | | | | | | |
Net investment income | | | 0.16 | | | | 0.25 | | | | 0.28 | | | | 0.09 | | | | 0.18 | | | | 0.15 | | | | 0.11 | |
| | | | | | | | | | | | | | | | | | | | | | | | | | | | | |
Net realized and unrealized gain (loss) | | | 1.03 | | | | 3.74 | | | | 5.44 | | | | 0.12 | | | | (0.28 | ) | | | 2.46 | | | | 2.55 | |
| | | | | | | | | | | | | | | | | | | | | | | | | | | | | |
Total from investment operations | | | 1.19 | | | | 3.99 | | | | 5.72 | | | | 0.21 | | | | (0.10 | ) | | | 2.61 | | | | 2.66 | |
| | | | | | | | | | | | | | | | | | | | | | | | | | | | | |
Less distributions to shareholders: | | | | | | | | | | | | | | | | | | | | | | | | | | | | |
| | | | | | | |
Net investment income | | | — | | | | (0.33 | ) | | | (0.26 | ) | | | — | | | | (0.16 | ) | | | (0.09 | ) | | | — | |
| | | | | | | | | | | | | | | | | | | | | | | | | | | | | |
Net realized gains | | | — | | | | (0.41 | ) | | | (0.55 | ) | | | — | | | | (0.33 | ) | | | (0.05 | ) | | | (0.00 | )(b) |
| | | | | | | | | | | | | | | | | | | | | | | | | | | | | |
Total distributions to shareholders | | | — | | | | (0.74 | ) | | | (0.81 | ) | | | — | | | | (0.49 | ) | | | (0.14 | ) | | | (0.00 | )(b) |
| | | | | | | | | | | | | | | | | | | | | | | | | | | | | |
Net asset value, end of period | | | $24.06 | | | | $22.87 | | | | $19.62 | | | | $14.71 | | | | $14.50 | | | | $15.09 | | | | $12.62 | |
| | | | | | | | | | | | | | | | | | | | | | | | | | | | | |
Total return | | | 5.20 | % | | | 20.61 | % | | | 39.96 | % | | | 1.45 | % | | | (0.62 | %) | | | 20.73 | % | | | 26.72 | % |
| | | | | | | | | | | | | | | | | | | | | | | | | | | | | |
Ratios to average net assets(c) | | | | | | | | | | | | | | | | | | | | | | | | | | | | |
| | | | | | | |
Total gross expenses | | | 0.83 | %(d) | | | 0.85 | %(e) | | | 0.87 | % | | | 0.89 | %(d) | | | 0.87 | % | | | 0.98 | % | | | 1.48 | % |
| | | | | | | | | | | | | | | | | | | | | | | | | | | | | |
Total net expenses(f) | | | 0.83 | %(d) | | | 0.81 | %(e) | | | 0.87 | % | | | 0.88 | %(d) | | | 0.87 | % | | | 0.98 | % | | | 1.48 | % |
| | | | | | | | | | | | | | | | | | | | | | | | | | | | | |
Net investment income | | | 1.41 | %(d) | | | 1.20 | % | | | 1.64 | % | | | 1.31 | %(d) | | | 1.21 | % | | | 1.09 | % | | | 1.10 | % |
| | | | | | | | | | | | | | | | | | | | | | | | | | | | | |
Supplemental data | | | | | | | | | | | | | | | | | | | | | | | | | | | | |
| | | | | | | |
Net assets, end of period (in thousands) | | | $3,499 | | | | $2,230 | | | | $4,014 | | | | $1,065 | | | | $1,731 | | | | $1,606 | | | | $718 | |
| | | | | | | | | | | | | | | | | | | | | | | | | | | | | |
Portfolio turnover | | | 4 | % | | | 8 | % | | | 18 | % | | | 5 | % | | | 14 | % | | | 12 | % | | | 24 | % |
| | | | | | | | | | | | | | | | | | | | | | | | | | | | | |
Notes to Financial Highlights
| (a) | For the period from January 1, 2012 to May 31, 2012. During the period, the Fund’s fiscal year end was changed from December 31 to May 31. |
| (c) | In addition to the fees and expenses that the Fund bears directly, the Fund indirectly bears a pro rata share of the fees and expenses of any other funds in which it invests. Such indirect expenses are not included in the Fund’s reported expense ratios. |
| (e) | Ratios include line of credit interest expense which is less than 0.01%. |
| (f) | Total net expenses include the impact of certain fee waivers/expense reimbursements made by the Investment Manager and certain of its affiliates, if applicable. |
The accompanying Notes to Financial Statements are an integral part of this statement.
| | | | |
| Semiannual Report 2014 | | | 21 | |
| | |
| |
| | Columbia Select Large-Cap Value Fund |
Financial Highlights (continued)
| | | | | | | | | | | | | | | | | | | | | | | | |
| |
| Six Months Ended
November 30, 2014 |
| | | Year Ended May 31, | | | | Year Ended December 31, | |
Class W | | | (Unaudited) | | | | 2014 | | | | 2013 | | | | 2012(a) | | | | 2011 | | | | 2010(b) | |
Per share data | | | | | | | | | | | | | | | | | | | | | | | | |
Net asset value, beginning of period | | | $22.07 | | | | $18.96 | | | | $14.24 | | | | $14.06 | | | | $14.66 | | | | $13.12 | |
| | | | | | | | | | | | | | | | | | | | | | | | | |
Income from investment operations: | | | | | | | | | | | | | | | | | | | | | | | | |
| | | | | | |
Net investment income (loss) | | | 0.12 | | | | 0.19 | | | | 0.19 | | | | 0.06 | | | | 0.14 | | | | (0.00 | )(c) |
| | | | | | | | | | | | | | | | | | | | | | | | | |
Net realized and unrealized gain (loss) | | | 0.99 | | | | 3.59 | | | | 5.28 | | | | 0.12 | | | | (0.29 | ) | | | 1.68 | |
| | | | | | | | | | | | | | | | | | | | | | | | | |
Total from investment operations | | | 1.11 | | | | 3.78 | | | | 5.47 | | | | 0.18 | | | | (0.15 | ) | | | 1.68 | |
| | | | | | | | | | | | | | | | | | | | | | | | | |
Less distributions to shareholders: | | | | | | | | | | | | | | | | | | | | | | | | |
| | | | | | |
Net investment income | | | — | | | | (0.26 | ) | | | (0.20 | ) | | | — | | | | (0.12 | ) | | | (0.09 | ) |
| | | | | | | | | | | | | | | | | | | | | | | | | |
Net realized gains | | | — | | | | (0.41 | ) | | | (0.55 | ) | | | — | | | | (0.33 | ) | | | (0.05 | ) |
| | | | | | | | | | | | | | | | | | | | | | | | | |
Total distributions to shareholders | | | — | | | | (0.67 | ) | | | (0.75 | ) | | | — | | | | (0.45 | ) | | | (0.14 | ) |
| | | | | | | | | | | | | | | | | | | | | | | | | |
Net asset value, end of period | | | $23.18 | | | | $22.07 | | | | $18.96 | | | | $14.24 | | | | $14.06 | | | | $14.66 | |
| | | | | | | | | | | | | | | | | | | | | | | | | |
Total return | | | 5.03 | % | | | 20.18 | % | | | 39.38 | % | | | 1.28 | % | | | (0.95 | %) | | | 12.80 | % |
| | | | | | | | | | | | | | | | | | | | | | | | | |
Ratios to average net assets(d) | | | | | | | | | | | | | | | | | | | | | | | | |
| | | | | | |
Total gross expenses | | | 1.22 | %(e) | | | 1.26 | %(f) | | | 1.35 | % | | | 1.35 | %(e) | | | 1.27 | % | | | 2.30 | %(e) |
| | | | | | | | | | | | | | | | | | | | | | | | | |
Total net expenses(g) | | | 1.18 | %(e)(h) | | | 1.18 | %(f)(h) | | | 1.25 | %(h) | | | 1.25 | %(e) | | | 1.25 | %(h) | | | 2.30 | %(e) |
| | | | | | | | | | | | | | | | | | | | | | | | | |
Net investment income (loss) | | | 1.03 | %(e) | | | 0.92 | % | | | 1.19 | % | | | 0.89 | %(e) | | | 0.97 | % | | | (0.11 | %)(e) |
| | | | | | | | | | | | | | | | | | | | | | | | | |
Supplemental data | | | | | | | | | | | | | | | | | | | | | | | | |
| | | | | | |
Net assets, end of period (in thousands) | | | $41,897 | | | | $40,475 | | | | $144 | | | | $30,250 | | | | $29,913 | | | | $11,833 | |
| | | | | | | | | | | | | | | | | | | | | | | | | |
Portfolio turnover | | | 4 | % | | | 8 | % | | | 18 | % | | | 5 | % | | | 14 | % | | | 12 | % |
| | | | | | | | | | | | | | | | | | | | | | | | | |
Notes to Financial Highlights
| (a) | For the period from January 1, 2012 to May 31, 2012. During the period, the Fund’s fiscal year end was changed from December 31 to May 31. |
| (b) | Based on operations from September 27, 2010 (commencement of operations) through the stated period end. |
| (d) | In addition to the fees and expenses that the Fund bears directly, the Fund indirectly bears a pro rata share of the fees and expenses of any other funds in which it invests. Such indirect expenses are not included in the Fund’s reported expense ratios. |
| (f) | Ratios include line of credit interest expense which is less than 0.01%. |
| (g) | Total net expenses include the impact of certain fee waivers/expense reimbursements made by the Investment Manager and certain of its affiliates, if applicable. |
| (h) | The benefits derived from expense reductions had an impact of less than 0.01%. |
The accompanying Notes to Financial Statements are an integral part of this statement.
| | |
| 22 | | Semiannual Report 2014 |
| | |
| |
| Columbia Select Large-Cap Value Fund | | |
Financial Highlights (continued)
| | | | |
Class Y | |
| Six Months Ended
November 30, 2014(a)
(Unaudited) |
|
Per share data | | | | |
Net asset value, beginning of period | | | $23.47 | |
| | | | | |
Income from investment operations: | | | | |
| |
Net investment income | | | 0.07 | |
| | | | | |
Net realized and unrealized gain | | | 0.82 | |
| | | | | |
Total from investment operations | | | 0.89 | |
| | | | | |
Net asset value, end of period | | | $24.36 | |
| | | | | |
Total return | | | 3.79 | % |
| | | | | |
Ratios to average net assets(b) | | | | |
| |
Total gross expenses | | | 0.74 | %(c) |
| | | | | |
Total net expenses(d) | | | 0.74 | %(c) |
| | | | | |
Net investment income | | | 1.87 | %(c) |
| | | | | |
Supplemental data | | | | |
| |
Net assets, end of period (in thousands) | | | $3 | |
| | | | | |
Portfolio turnover | | | 4 | % |
| | | | | |
Notes to Financial Highlights
| (a) | Based on operations from October 1, 2014 (commencement of operations) through the stated period end. |
| (b) | In addition to the fees and expenses that the Fund bears directly, the Fund indirectly bears a pro rata share of the fees and expenses of any other funds in which it invests. Such indirect expenses are not included in the Fund’s reported expense ratios. |
| (d) | Total net expenses include the impact of certain fee waivers/expense reimbursements made by the Investment Manager and certain of its affiliates, if applicable. |
The accompanying Notes to Financial Statements are an integral part of this statement.
| | | | |
| Semiannual Report 2014 | | | 23 | |
| | |
| |
| | Columbia Select Large-Cap Value Fund |
Financial Highlights (continued)
| | | | | | | | | | | | | | | | | | | | | | | | |
| |
| Six Months Ended
November 30, 2014 |
| | | Year Ended May 31, | | | | Year Ended December 31, | |
Class Z | | | (Unaudited) | | | | 2014 | | | | 2013 | | | | 2012(a) | | | | 2011 | | | | 2010(b) | |
Per share data | | | | | | | | | | | | | | | | | | | | | | | | |
Net asset value, beginning of period | | | $22.86 | | | | $19.61 | | | | $14.68 | | | | $14.48 | | | | $15.07 | | | | $13.48 | |
| | | | | | | | | | | | | | | | | | | | | | | | | |
Income from investment operations: | | | | | | | | | | | | | | | | | | | | | | | | |
| | | | | | |
Net investment income | | | 0.15 | | | | 0.25 | | | | 0.22 | | | | 0.07 | | | | 0.19 | | | | 0.03 | |
| | | | | | | | | | | | | | | | | | | | | | | | | |
Net realized and unrealized gain (loss) | | | 1.02 | | | | 3.71 | | | | 5.48 | | | | 0.13 | | | | (0.30 | ) | | | 1.70 | |
| | | | | | | | | | | | | | | | | | | | | | | | | |
Total from investment operations | | | 1.17 | | | | 3.96 | | | | 5.70 | | | | 0.20 | | | | (0.11 | ) | | | 1.73 | |
| | | | | | | | | | | | | | | | | | | | | | | | | |
Less distributions to shareholders: | | | | | | | | | | | | | | | | | | | | | | | | |
| | | | | | |
Net investment income | | | — | | | | (0.30 | ) | | | (0.22 | ) | | | — | | | | (0.15 | ) | | | (0.09 | ) |
| | | | | | | | | | | | | | | | | | | | | | | | | |
Net realized gains | | | — | | | | (0.41 | ) | | | (0.55 | ) | | | — | | | | (0.33 | ) | | | (0.05 | ) |
| | | | | | | | | | | | | | | | | | | | | | | | | |
Total distributions to shareholders | | | — | | | | (0.71 | ) | | | (0.77 | ) | | | — | | | | (0.48 | ) | | | (0.14 | ) |
| | | | | | | | | | | | | | | | | | | | | | | | | |
Net asset value, end of period | | | $24.03 | | | | $22.86 | | | | $19.61 | | | | $14.68 | | | | $14.48 | | | | $15.07 | |
| | | | | | | | | | | | | | | | | | | | | | | | | |
Total return | | | 5.12 | % | | | 20.50 | % | | | 39.84 | % | | | 1.38 | % | | | (0.68 | %) | | | 12.88 | % |
| | | | | | | | | | | | | | | | | | | | | | | | | |
Ratios to average net assets(c) | | | | | | | | | | | | | | | | | | | | | | | | |
| | | | | | |
Total gross expenses | | | 0.98 | %(d) | | | 1.00 | %(e) | | | 1.09 | % | | | 1.10 | %(d) | | | 1.02 | % | | | 1.11 | %(d) |
| | | | | | | | | | | | | | | | | | | | | | | | | |
Total net expenses(f) | | | 0.93 | %(d)(g) | | | 0.93 | %(e)(g) | | | 0.99 | %(g) | | | 1.00 | %(d) | | | 1.01 | %(g) | | | 1.11 | %(d) |
| | | | | | | | | | | | | | | | | | | | | | | | | |
Net investment income | | | 1.32 | %(d) | | | 1.17 | % | | | 1.33 | % | | | 1.12 | %(d) | | | 1.32 | % | | | 0.87 | %(d) |
| | | | | | | | | | | | | | | | | | | | | | | | | |
Supplemental data | | | | | | | | | | | | | | | | | | | | | | | | |
| | | | | | |
Net assets, end of period (in thousands) | | | $345,363 | | | | $141,264 | | | | $51,667 | | | | $55,909 | | | | $63,277 | | | | $8 | |
| | | | | | | | | | | | | | | | | | | | | | | | | |
Portfolio turnover | | | 4 | % | | | 8 | % | | | 18 | % | | | 5 | % | | | 14 | % | | | 12 | % |
| | | | | | | | | | | | | | | | | | | | | | | | | |
Notes to Financial Highlights
| (a) | For the period from January 1, 2012 to May 31, 2012. During the period, the Fund’s fiscal year end was changed from December 31 to May 31. |
| (b) | Based on operations from September 27, 2010 (commencement of operations) through the stated period end. |
| (c) | In addition to the fees and expenses that the Fund bears directly, the Fund indirectly bears a pro rata share of the fees and expenses of any other funds in which it invests. Such indirect expenses are not included in the Fund’s reported expense ratios. |
| (e) | Ratios include line of credit interest expense which is less than 0.01%. |
| (f) | Total net expenses include the impact of certain fee waivers/expense reimbursements made by the Investment Manager and certain of its affiliates, if applicable. |
| (g) | The benefits derived from expense reductions had an impact of less than 0.01%. |
The accompanying Notes to Financial Statements are an integral part of this statement.
| | |
| 24 | | Semiannual Report 2014 |
| | |
| |
| Columbia Select Large-Cap Value Fund | | |
Notes to Financial Statements
November 30, 2014 (Unaudited)
Note 1. Organization
Columbia Select Large-Cap Value Fund (the Fund), a series of Columbia Funds Series Trust II (the Trust), is a diversified fund. The Trust is registered under the Investment Company Act of 1940, as amended (the 1940 Act), as an open-end management investment company organized as a Massachusetts business trust.
Fund Shares
The Trust may issue an unlimited number of shares (without par value). The Fund offers Class A, Class B, Class C, Class I, Class K, Class R, Class R4, Class R5, Class W, Class Y and Class Z shares. Although all share classes generally have identical voting, dividend and liquidation rights, each share class votes separately when required by the Trust’s organizational documents or by law. Different share classes pay different distribution amounts to the extent the expenses of such share classes differ, and distributions in liquidation will be proportional to the net asset value of each share class. Each share class has its own expense structure and sales charges.
Class A shares are subject to a maximum front-end sales charge of 5.75% based on the initial investment amount. Class A shares purchased without an initial sales charge in accounts aggregating $1 million to $50 million at the time of purchase are subject to a contingent deferred sales charge (CDSC) if the shares are sold within 18 months of purchase, charged as follows: 1.00% CDSC if redeemed within 12 months of purchase, and 0.50% CDSC if redeemed more than 12, but less than 18, months after purchase.
Class B shares may be subject to a maximum CDSC of 5.00% based upon the holding period after purchase. Class B shares will generally convert to Class A shares eight years after purchase. The Fund no longer accepts investments by new or existing investors in the Fund’s Class B shares, except in connection with the reinvestment of any dividend and/or capital gain distributions in Class B shares of the Fund and exchanges by existing Class B shareholders of certain other funds within the Columbia Family of Funds.
Class C shares are subject to a 1.00% CDSC on shares redeemed within one year of purchase.
Class I shares are not subject to sales charges and are available only to the Columbia Family of Funds.
Class K shares are not subject to sales charges, however this share class is closed to new investors.
Class R shares are not subject to sales charges and are generally available only to certain retirement plans and other investors as described in the Fund’s prospectus.
Class R4 shares are not subject to sales charges and are generally available only to omnibus retirement plans and certain investors as described in the Fund’s prospectus.
Class R5 shares are not subject to sales charges and are generally available only to investors purchasing through authorized investment professionals and omnibus retirement plans.
Class W shares are not subject to sales charges and are available only to investors purchasing through authorized investment programs managed by investment professionals, including discretionary managed account programs.
Class Y shares are not subject to sales charges and are generally available only to certain retirement plans as described in the Fund’s prospectus. Class Y shares commenced operations on October 1, 2014.
Class Z shares are not subject to sales charges and are available only to eligible investors, which are subject to different investment minimums as described in the Fund’s prospectus.
Note 2. Summary of Significant Accounting Policies
Basis of Preparation
The Fund is an investment company that applies the accounting and reporting guidance in the Financial Accounting Standards Board (FASB) Accounting Standards Codification Topic 946, Financial Services — Investment Companies (ASC 946). The financial statements are prepared in accordance with U.S. generally accepted accounting principles (GAAP) which requires management to make certain estimates and assumptions that affect the reported amounts of assets and liabilities, the disclosure of contingent assets and liabilities at the date of the financial statements and the reported amounts of income and expenses during the reporting period. Actual results could differ from those estimates.
The following is a summary of significant accounting policies followed by the Fund in the preparation of its financial statements.
Security Valuation
All equity securities are valued at the close of business of the New York Stock Exchange (NYSE). Equity securities are valued at the last quoted sales price on the principal exchange or market on which they trade, except for securities traded on the NASDAQ Stock Market, which are valued at the NASDAQ official close price. Unlisted securities or listed securities for which there were no sales during the day are valued at the mean of the latest quoted bid and ask prices on such exchanges or markets.
| | | | |
| Semiannual Report 2014 | | | 25 | |
| | |
| |
| | Columbia Select Large-Cap Value Fund |
Notes to Financial Statements (continued)
November 30, 2014 (Unaudited)
Investments in open-end investment companies, including money market funds, are valued at their net asset value.
Investments for which market quotations are not readily available, or that have quotations which management believes are not reliable, are valued at fair value as determined in good faith under procedures established by and under the general supervision of the Board of Trustees (the Board). If a security or class of securities (such as foreign securities) is valued at fair value, such value is likely to be different from the quoted or published price for the security.
The determination of fair value often requires significant judgment. To determine fair value, management may use assumptions including but not limited to future cash flows and estimated risk premiums. Multiple inputs from various sources may be used to determine fair value.
Security Transactions
Security transactions are accounted for on the trade date. Cost is determined and gains (losses) are based upon the specific identification method for both financial statement and federal income tax purposes.
Income Recognition
Corporate actions and dividend income are recorded on the ex-dividend date.
Awards from class action litigation are recorded as a reduction of cost basis if the Fund still owns the applicable securities on the payment date. If the Fund no longer owns the applicable securities, the proceeds are recorded as realized gains.
Expenses
General expenses of the Trust are allocated to the Fund and other funds of the Trust based upon relative net assets or other expense allocation methodologies determined by the nature of the expense. Expenses directly attributable to the Fund are charged to the Fund. Expenses directly attributable to a specific class of shares are charged to that share class.
Determination of Class Net Asset Value
All income, expenses (other than class-specific expenses, which are charged to that share class, as shown in the Statement of Operations) and realized and unrealized gains (losses) are allocated to each class of the Fund on a daily basis, based on the relative net assets of each class, for purposes of determining the net asset value of each class.
Federal Income Tax Status
The Fund intends to qualify each year as a regulated investment company under Subchapter M of the Internal Revenue Code, as amended, and will distribute substantially
all of its taxable income (including net short-term capital gains), if any, for its tax year, and as such will not be subject to federal income taxes. In addition, the Fund intends to distribute in each calendar year substantially all of its net investment income, capital gains and certain other amounts, if any, such that the Fund should not be subject to federal excise tax. Therefore, no federal income or excise tax provision is recorded.
Distributions to Shareholders
Distributions from net investment income, if any, are declared and paid annually. Net realized capital gains, if any, are distributed along with the income distribution. Income distributions and capital gain distributions are determined in accordance with federal income tax regulations, which may differ from GAAP.
Guarantees and Indemnifications
Under the Trust’s organizational documents and, in some cases, by contract, its officers and trustees are indemnified against certain liabilities arising out of the performance of their duties to the Trust or its funds. In addition, certain of the Fund’s contracts with its service providers contain general indemnification clauses. The Fund’s maximum exposure under these arrangements is unknown since the amount of any future claims that may be made against the Fund cannot be determined, and the Fund has no historical basis for predicting the likelihood of any such claims.
Note 3. Fees and Compensation Paid to Affiliates
Investment Management Fees
Under an Investment Management Services Agreement, Columbia Management Investment Advisers, LLC (the Investment Manager), a wholly-owned subsidiary of Ameriprise Financial, Inc. (Ameriprise Financial), determines which securities will be purchased, held or sold. The investment management fee is an annual fee that is equal to a percentage of the Fund’s average daily net assets that declines from 0.71% to 0.54% as the Fund’s net assets increase. The annualized effective investment management fee rate for the six months ended November 30, 2014 was 0.69% of the Fund’s average daily net assets.
Administration Fees
Under an Administrative Services Agreement, the Investment Manager also serves as the Fund Administrator. The Fund pays the Fund Administrator an annual fee for administration and accounting services equal to a percentage of the Fund’s average daily net assets that declines from 0.06% to 0.03% as
| | |
| 26 | | Semiannual Report 2014 |
| | |
| |
| Columbia Select Large-Cap Value Fund | | |
Notes to Financial Statements (continued)
November 30, 2014 (Unaudited)
the Fund’s net assets increase. The annualized effective administration fee rate for the six months ended November 30, 2014 was 0.06% of the Fund’s average daily net assets.
Other Expenses
Other expenses are for, among other things, miscellaneous expenses of the Fund or the Board, including payments to a company providing limited administrative services to the Fund and the Board. That company’s expenses include boardroom and office expense, employee compensation, employee health and retirement benefits, and certain other expenses. For the six months ended November 30, 2014, other expenses paid by the Fund to this company were $1,207.
Compensation of Board Members
Board members are compensated for their services to the Fund as disclosed in the Statement of Operations. Under a Deferred Compensation Plan (the Plan), the Board members who are not “interested persons” of the Fund, as defined under the 1940 Act, may elect to defer payment of up to 100% of their compensation. Deferred amounts are treated as though equivalent dollar amounts had been invested in shares of certain funds managed by the Investment Manager. The Fund’s liability for these amounts is adjusted for market value changes and remains in the Fund until distributed in accordance with the Plan.
Transfer Agent Fees
Under a Transfer and Dividend Disbursing Agent Agreement, Columbia Management Investment Services Corp. (the Transfer Agent), an affiliate of the Investment Manager and a wholly-owned subsidiary of Ameriprise Financial, is responsible for providing transfer agency services to the Fund. The Transfer Agent has contracted with Boston Financial Data Services (BFDS) to serve as sub-transfer agent.
Effective November 1, 2014, the Transfer Agent receives a monthly transfer agency fee based on the number or the average value of accounts, depending on the type of account. Prior to November 1, 2014, the Transfer Agent received a monthly account-based service fee based on the number of open accounts. In addition, the Transfer Agent also receives sub-transfer agency fees based on a percentage of the average aggregate value of the Fund’s shares maintained in omnibus accounts (other than omnibus accounts for which American Enterprise Investment Services Inc. is the broker of record or accounts where the beneficial shareholder is a customer of Ameriprise Financial Services, Inc., which receive a per account fee). The Transfer Agent pays the fees of BFDS for services as sub-transfer agent and is not entitled to reimbursement for such fees from the Fund (with the exception of out-of-pocket fees).
The Transfer Agent also receives compensation from the Fund for various shareholder services and reimbursements for certain out-of-pocket fees. Total transfer agent fees for Class K and Class R5 shares are subject to an annual limitation of not more than 0.05% of the average daily net assets attributable to each share class. Class I and Class Y shares are not subject to transfer agent fees.
For the six months ended November 30, 2014, the Fund’s annualized effective transfer agent fee rates as a percentage of average daily net assets of each class were as follows:
| | | | |
Class A | | | 0.20 | % |
Class B | | | 0.20 | |
Class C | | | 0.20 | |
Class K | | | 0.05 | |
Class R | | | 0.20 | |
Class R4 | | | 0.20 | |
Class R5 | | | 0.05 | |
Class W | | | 0.20 | |
Class Z | | | 0.20 | |
The Fund and certain other associated investment companies, have severally, but not jointly, guaranteed the performance and observance of all the terms and conditions of a lease entered into by Seligman Data Corp. (SDC), the former transfer agent, including the payment of rent by SDC (the Guaranty). SDC was the legacy Seligman funds’ former transfer agent.
The lease and the Guaranty expire in January 2019. At November 30, 2014, the Fund’s total potential future obligation over the life of the Guaranty is $105,889. The liability remaining at November 30, 2014 for non-recurring charges associated with the lease amounted to $60,082 and is recorded as a part of the payable for other expenses in the Statement of Assets and Liabilities.
An annual minimum account balance fee of $20 may apply to certain accounts with a value below the applicable share class’s initial minimum investment requirements to reduce the impact of small accounts on transfer agent fees. These minimum account balance fees are remitted to the Fund and recorded as part of expense reductions in the Statement of Operations. For the six months ended November 30, 2014, these minimum account balance fees reduced total expenses of the Fund by $1,369.
Plan Administration Fees
Under a Plan Administration Services Agreement with the Transfer Agent, the Fund pays an annual fee at a rate of 0.25% of the Fund’s average daily net assets attributable to Class K
| | | | |
| Semiannual Report 2014 | | | 27 | |
| | |
| |
| | Columbia Select Large-Cap Value Fund |
Notes to Financial Statements (continued)
November 30, 2014 (Unaudited)
shares for the provision of various administrative, recordkeeping, communication and educational services.
Distribution Fees
The Fund has an agreement with Columbia Management Investment Distributors, Inc. (the Distributor), an affiliate of the Investment Manager and a wholly-owned subsidiary of Ameriprise Financial, for distribution and shareholder services. Under a Plan and Agreement of Distribution, the Fund pays a fee at an annual rate of up to 0.25% of the Fund’s average daily net assets attributable to Class A and Class W shares, a fee at an annual rate of up to 0.50% of the Fund’s average daily net assets attributable to Class R shares (of which up to 0.25% may be used for shareholder services) and a fee at an annual rate of up to 1.00% of the Fund’s average daily net assets attributable to Class B and Class C shares. For Class B and Class C shares, of the 1.00% fee, up to 0.75% is reimbursed for distribution expenses.
The amount of distribution expenses incurred by the Distributor and not yet reimbursed (unreimbursed expense) was approximately $35,000 and $2,866,000 for Class B and Class C shares, respectively. These amounts are based on the most recent information available as of September 30, 2014, and may be recovered from future payments under the distribution plan or CDSCs. To the extent the unreimbursed expense has been fully recovered, the distribution fee is reduced.
Sales Charges
Sales charges, including front-end charges and CDSCs, received by the Distributor for distributing Fund shares were $252,753 for Class A, $581 for Class B and $2,056 for Class C for the six months ended November 30, 2014.
Expenses Waived/Reimbursed by the Investment Manager and its Affiliates
The Fund’s expense ratio is subject to an expense reimbursement arrangement pursuant to which fees will be waived and/or expenses reimbursed (excluding certain fees and expenses described below), so that the Fund’s net operating expenses, after giving effect to fees waived/expenses reimbursed and any balance credits and/or overdraft charges from the Fund’s custodian, do not exceed the annual rates of:
| | | | | | | | |
| | | Voluntary
Expense Cap
Effective
October 1, 2014 | | | Contractual
Expense Cap
Prior to
October 1, 2014 | |
Class A | | | 1.18 | % | | | 1.18 | % |
Class B | | | 1.93 | | | | 1.93 | |
| | | | | | | | |
| | | Voluntary
Expense Cap
Effective
October 1, 2014 | | | Contractual
Expense Cap
Prior to
October 1, 2014 | |
Class C | | | 1.93 | % | | | 1.93 | % |
Class I | | | 0.79 | | | | 0.79 | |
Class K | | | 1.09 | | | | 1.09 | |
Class R | | | 1.43 | | | | 1.43 | |
Class R4 | | | 0.93 | | | | 0.93 | |
Class R5 | | | 0.84 | | | | 0.84 | |
Class W | | | 1.18 | | | | 1.18 | |
Class Y | | | 0.79 | * | | | — | |
Class Z | | | 0.93 | | | | 0.93 | |
| * | Fee rate is effective beginning October 1, 2014 (the commencement of operations of Class Y shares). |
The voluntary expense cap arrangement may be revised or discontinued at any time. Under the arrangements, the following fees and expenses are excluded from the waiver/reimbursement commitment, and therefore will be paid by the Fund, if applicable: taxes (including foreign transaction taxes), expenses associated with investments in affiliated and non-affiliated pooled investment vehicles (including mutual funds and exchange-traded funds), transaction costs and brokerage commissions, costs related to any securities lending program, dividend expenses associated with securities sold short, inverse floater program fees and expenses, transaction charges and interest on borrowed money, interest and extraordinary expenses.
Note 4. Federal Tax Information
The timing and character of income and capital gain distributions are determined in accordance with income tax regulations, which may differ from GAAP because of temporary or permanent book to tax differences.
At November 30, 2014, the cost of investments for federal income tax purposes was approximately $677,153,000 and the aggregate gross approximate unrealized appreciation and depreciation based on that cost was:
| | | | |
Unrealized appreciation | | | $342,305,000 | |
Unrealized depreciation | | | (7,679,000 | ) |
Net unrealized appreciation | | | $334,626,000 | |
Management of the Fund has concluded that there are no significant uncertain tax positions in the Fund that would require recognition in the financial statements. However, management’s conclusion may be subject to review and adjustment at a later date based on factors including, but not limited to, new tax laws, regulations, and administrative interpretations (including relevant court decisions). Generally,
| | |
| 28 | | Semiannual Report 2014 |
| | |
| |
| Columbia Select Large-Cap Value Fund | | |
Notes to Financial Statements (continued)
November 30, 2014 (Unaudited)
the Fund’s federal tax returns for the prior three fiscal years remain subject to examination by the Internal Revenue Service.
Note 5. Portfolio Information
The cost of purchases and proceeds from sales of securities, excluding short-term obligations and certain derivatives, if any, aggregated to $95,264,840 and $34,536,723, respectively, for the six months ended November 30, 2014. The amount of purchase and sale activity impacts the portfolio turnover rate reported in the Financial Highlights.
Note 6. Affiliated Money Market Fund
The Fund invests in Columbia Short-Term Cash Fund, an affiliated money market fund established for the exclusive use by the Fund and other affiliated funds. The income earned by the Fund from such investments is included as Dividends — affiliated issuers in the Statement of Operations. As an investing fund, the Fund indirectly bears its proportionate share of the expenses of Columbia Short-Term Cash Fund.
Note 7. Shareholder Concentration
At November 30, 2014, two unaffiliated shareholders of record owned 38.9% of the outstanding shares of the Fund in one or more accounts. The Fund has no knowledge about whether any portion of those shares was owned beneficially. Affiliated shareholders of record owned 27.2% of the outstanding shares of the Fund in one or more accounts. Subscription and redemption activity by concentrated accounts may have a significant effect on the operations of the Fund.
Note 8. Line of Credit
The Fund has entered into a revolving credit facility with a syndicate of banks led by JPMorgan Chase Bank N.A. (JPMorgan) whereby the Fund may borrow for the temporary funding of shareholder redemptions or for other temporary or emergency purposes. The credit facility agreement, as amended, which is a collective agreement between the Fund and certain other funds managed by the Investment Manager, severally and not jointly, permits collective borrowings up to $500 million. Interest is charged to each participating fund based on its borrowings at a rate equal to the higher of (i) the overnight federal funds rate plus 1.00% or (ii) the one-month LIBOR rate plus 1.00%. Each borrowing under the credit facility matures no later than 60 days after the date of borrowing. The Fund also pays a commitment fee equal to its pro rata share of the amount of the credit facility at a rate of 0.075% per annum. The commitment fee is included in other expenses in the Statement of Operations.
Effective December 9, 2014, the Fund extended its revolving credit facility with JPMorgan. The credit facility agreement, as amended, permits collective borrowings up to $550 million under the same terms and interest rates as described above.
The Fund had no borrowings during the six months ended November 30, 2014.
Note 9. Significant Risks
Financial Sector Risk
Sector risk occurs when a fund invests a significant portion of its assets in securities of companies conducting business in a related group of industries within an economic sector. Companies in the same economic sector may be similarly affected by economic, regulatory, political or market events or conditions, making a fund more vulnerable to unfavorable developments in that economic sector than funds that invest more broadly. The Fund may be more susceptible to the particular risks that may affect companies in the financial sector than if it were invested in a wider variety of companies in unrelated sectors.
Note 10. Subsequent Events
Management has evaluated the events and transactions that have occurred through the date the financial statements were issued. Other than as noted in Note 8 above, there were no items requiring adjustment of the financial statements or additional disclosure.
Note 11. Information Regarding Pending and Settled Legal Proceedings
In December 2005, without admitting or denying the allegations, American Express Financial Corporation (AEFC, which is now known as Ameriprise Financial, Inc. (Ameriprise Financial)) entered into settlement agreements with the Securities and Exchange Commission (SEC) and Minnesota Department of Commerce (MDOC) related to market timing activities. As a result, AEFC was censured and ordered to cease and desist from committing or causing any violations of certain provisions of the Investment Advisers Act of 1940, the Investment Company Act of 1940, and various Minnesota laws. AEFC agreed to pay disgorgement of $10 million and civil money penalties of $7 million. AEFC also agreed to retain an independent distribution consultant to assist in developing a plan for distribution of all disgorgement and civil penalties ordered by the SEC in accordance with various undertakings detailed at www.sec.gov/litigation/admin/ia-2451.pdf. Ameriprise Financial and its affiliates have cooperated with the SEC and the MDOC in these legal proceedings, and have made regular reports to the Funds’ Boards of Trustees.
| | | | |
| Semiannual Report 2014 | | | 29 | |
| | |
| |
| | Columbia Select Large-Cap Value Fund |
Notes to Financial Statements (continued)
November 30, 2014 (Unaudited)
Ameriprise Financial and certain of its affiliates have historically been involved in a number of legal, arbitration and regulatory proceedings, including routine litigation, class actions, and governmental actions, concerning matters arising in connection with the conduct of their business activities. Ameriprise Financial believes that the Funds are not currently the subject of, and that neither Ameriprise Financial nor any of its affiliates are the subject of, any pending legal, arbitration or regulatory proceedings that are likely to have a material adverse effect on the Funds or the ability of Ameriprise Financial or its affiliates to perform under their contracts with the Funds. Ameriprise Financial is required to make quarterly (10-Q), annual (10-K) and, as necessary, 8-K filings with the Securities and Exchange Commission on legal and regulatory matters that relate to Ameriprise Financial and its affiliates. Copies of these filings may be obtained by accessing the SEC website at www.sec.gov.
There can be no assurance that these matters, or the adverse publicity associated with them, will not result in increased fund redemptions, reduced sale of fund shares or other adverse consequences to the Funds. Further, although we believe proceedings are not likely to have a material adverse effect on the Funds or the ability of Ameriprise Financial or its affiliates to perform under their contracts with the Funds, these proceedings are subject to uncertainties and, as such, we are unable to estimate the possible loss or range of loss that may result. An adverse outcome in one or more of these proceedings could result in adverse judgments, settlements, fines, penalties or other relief that could have a material adverse effect on the consolidated financial condition or results of operations of Ameriprise Financial.
| | |
| 30 | | Semiannual Report 2014 |
| | |
| |
| Columbia Select Large-Cap Value Fund | | |
Important Information About This Report
Each fund mails one shareholder report to each shareholder address. If you would like more than one report, please call shareholder services at 800.345.6611 and additional reports will be sent to you.
The policy of the Board is to vote the proxies of the companies in which each fund holds investments consistent with the procedures as stated in the Statement of Additional Information (SAI). You may obtain a copy of the SAI without charge by calling 800.345.6611; contacting your financial intermediary; visiting columbiamanagement.com; or searching the website of the Securities and Exchange Commission (SEC) at sec.gov. Information regarding how each fund voted proxies relating to portfolio securities is filed with the SEC by August 31 for the most recent 12-month period ending June 30 of that year, and is available without charge by visiting columbiamanagement.com; or searching the website of the SEC at sec.gov.
Each fund files a complete schedule of portfolio holdings with the SEC for the first and third quarters of each fiscal year on Form N-Q. Each fund’s Form N-Q is available on the SEC’s website at sec.gov and may be reviewed and copied at the SEC’s Public Reference Room in Washington, D.C. Information on the operation of the Public Reference Room may be obtained by calling 800.SEC.0330. Each fund’s complete schedule of portfolio holdings, as filed on Form N-Q, can also be obtained without charge, upon request, by calling 800.345.6611.
| | | | |
| Semiannual Report 2014 | | | 31 | |

Columbia Select Large-Cap Value Fund
P.O. Box 8081
Boston, MA 02266-8081
columbiamanagement.com
This information is for use with concurrent or prior delivery of a fund prospectus. Please read and consider the investment objectives, risks, charges and expenses for any fund carefully before investing. For a prospectus and, if available, a summary prospectus, which contains this and other important information about the Fund, go to columbiamanagement.com. The Fund is distributed by Columbia Management Investment Distributors, Inc., member FINRA, and managed by Columbia Management Investment Advisers, LLC.
© 2015 Columbia Management Investment Advisers, LLC. All rights reserved.
SAR216_05_E01_(01/15)
| | |
Semiannual Report November 30, 2014 | |  |
| | |
Columbia Select Smaller-Cap Value Fund | | |


President’s Message
Note: Effective January 1, 2015, Christopher O. Petersen will serve as the President of the Columbia Funds, replacing J. Kevin Connaughton. Mr. Petersen has served as a Fund officer since 2007.
Dear Shareholders,
People invest for different reasons, though typically based on a desire for one or more outcomes, e.g., generating an appropriate income stream in retirement, navigating a changing interest rate environment, maximizing after-tax returns, growing assets to achieve financial goals, or easing the impact of volatile markets. Achieving these desired outcomes can be particularly challenging given the unpredictability of complex global markets. To continue to effectively deliver solutions that help clients achieve desired outcomes, an asset manager must have the resources and investment framework to meaningfully embody a global perspective.
With this in mind, I thought it important to highlight excerpts from a piece written by Jeffrey L. Knight, Global Head of Investment Solutions and Asset Allocation, in which he touches on some of these issues emphasizing the importance of maintaining a diversified portfolio with the flexibility to adapt to changing market conditions.
I encourage you to read the article in its entirety. To access the full article and for other insights on current market events and investment opportunities, please visit the Columbia Management blog at columbiamanagement.com/blog.
On behalf of the Funds, I want to acknowledge the contributions of J. Kevin Connaughton and to thank him for his years of trusted, dedicated service. He has worked tirelessly as an advocate for shareholders and a leader of the Columbia Funds. In taking on this new role, I look forward to continuing the work of Mr. Connaughton, helping build on the strong foundation of the Columbia Funds.
Thank you for your confidence. We look forward to continuing to serve your investment needs for many years to come.
Best regards,

Christopher O. Petersen
President, Columbia Funds
Excerpts from:
2015 Outlook: Same song, slightly different arrangement
By Jeffrey L. Knight, Global Head of Investment Solutions and Asset Allocation
Jeffrey L. Knight, CFA, is global head of investment solutions and asset allocation for Columbia Management Investment Advisers, LLC. Mr. Knight leads a team of six portfolio managers responsible for our broad suite of multi-asset strategies including capital allocation, risk allocation, absolute return and total return funds.
What’s different in 2015?
As stationary as market conditions have felt lately, circumstances are always evolving. For 2015, while the essential elements of our outlook remain in place, we highlight two important changes in the market environment:
| > | | The relative value of global equities vs. global bonds actually improved during 2014. |
| > | | Monetary policy around the globe has become desynchronized, with the U.S. Federal Reserve (the Fed) contemplating rate hikes, while the European Central Bank (ECB) and the Bank of Japan (BOJ) intensify their monetary stimulus programs. |
In our view, while equities will most likely continue to dominate, the complex interactions of today’s conditions elevate the role of dynamic risk management. We argue that investors will need a cross-asset surveillance methodology to detect tactical threats.
Semiannual Report 2014
President’s Message (continued)
Monetary policies diverge
The Fed has given strong signals that economic growth in the United States has reached self-sustaining momentum and no longer needs unconventional efforts to support the expansion. The withdrawal and suspension of large-scale asset purchases was only the first step in the evolution toward policy normalization. In 2015, we expect to see a change in forward guidance and, most likely, the first interest rate increase in years.
These actions stand in stark contrast with the direction of the monetary policies of other central banks as they double down on efforts to support growth and avoid deflation. The Bank of Japan has announced its intention to increase both qualitative and quantitative easing on an enormous scale, expanding purchases of Japanese government bonds (JGBs), exchange-traded funds and real estate investment trusts. They intend to coordinate this with government pension investment fund purchases by shifting into riskier assets through sales of JGBs.
With evidence of deterioration on both the economic and inflation front, the European Central Bank (ECB) also plans to take bolder actions. These include increased purchases of asset-backed securities and covered bonds in both the primary and secondary market, together with the long-term refinancing operations that will steer the ECB’s balance sheet higher by €1 trillion.
The latest to jump on the bandwagon was the People’s Bank of China (PBOC), which cut its benchmark interest rate for the first time in over two years to support private sector investment, as targeted liquidity injections have had minimal effect on sinking economic growth.
Investment strategy for 2015
We remain convinced that relative value favors stocks over bonds, even though stocks outperformed in 2014. Therefore, you will hear the same recommendation from us for 2015. Equities remain the most important asset class for generating returns.
Within equities, the currency-based advantage of U.S. stocks is offset somewhat by the valuation advantage from overseas equities, notably in Japan. Indeed, economic growth in Japan and Europe are essential ingredients for equities to continue to perform well. If Japanese and European stocks cannot produce gains, then the global economy will probably be stuck in a near recessionary funk.
Devising a strategy to manage risk and stabilize portfolio values in the event that equities do not perform well remains complicated. Bond yields are low enough that they are not likely to offer powerful diversification benefits. We affirm our recommendation for three additional sources of portfolio stability:
| > | | Non-traditional diversifiers, such as liquid alternatives, alternative beta exposures and absolute return strategies |
| > | | Explicit downside hedges, such as put options (with emphasis on managing the related expense) |
| > | | Flexibility and a methodology for active risk reduction when appropriate (Our cross-asset methodologies should prove valuable in this regard.) |
Our overall stance for investment strategy will likely remain in place until the valuation advantage for equities has been priced away, or until the healing process for the global economy reverses.
Please visit columbiamanagement.com/blog to read the entire article.
Investors should consider the investment objectives, risks, charges and expenses of a mutual fund carefully before investing. For a free prospectus and, if available, a summary prospectus, which contains this and other important information about a fund, visit columbiamanagement.com. The prospectus should be read carefully before investing.
The views expressed are as of December 2014, may change as market or other conditions change, and may differ from views expressed by other Columbia Management Investment Advisers, LLC (CMIA) associates or affiliates. Actual investments or investment decisions made by CMIA and its affiliates, whether for its own account or on behalf of clients, will not necessarily reflect the views expressed. This information is not intended to provide investment advice and does not account for individual investor circumstances. Investment decisions should always be made based on an investor’s specific financial needs, objectives, goals, time horizon and risk tolerance. Asset classes described may not be suitable for all investors. Past performance does not guarantee future results, and no forecast should be considered a guarantee either. Since economic and market change frequently, there can be no assurance that the trends described here will continue or that the forecasts are accurate.
Diversification does not assure a profit or protect against loss.
Columbia Funds are distributed by Columbia Management Investment Distributors, Inc., member FINRA, and managed by Columbia Management Investment Advisers, LLC.
© 2015 Columbia Management Investment Advisers, LLC. All rights reserved
Semiannual Report 2014
| | |
| |
| Columbia Select Smaller-Cap Value Fund | | |
Table of Contents
Fund Investment Manager
Columbia Management Investment
Advisers, LLC
225 Franklin Street
Boston, MA 02110
Fund Distributor
Columbia Management Investment
Distributors, Inc.
225 Franklin Street
Boston, MA 02110
Fund Transfer Agent
Columbia Management Investment
Services Corp.
P.O. Box 8081
Boston, MA 02266-8081
For more information about any of the funds, please visit columbiamanagement.com or call 800.345.6611. Customer Service Representatives are available to answer your questions Monday through Friday from 8 a.m. to 7 p.m. Eastern time.
The views expressed in this report reflect the current views of the respective parties. These views are not guarantees of future performance and involve certain risks, uncertainties and assumptions that are difficult to predict, so actual outcomes and results may differ significantly from the views expressed. These views are subject to change at any time based upon economic, market or other conditions and the respective parties disclaim any responsibility to update such views. These views may not be relied on as investment advice and, because investment decisions for a Columbia Fund are based on numerous factors, may not be relied on as an indication of trading intent on behalf of any particular Columbia Fund. References to specific securities should not be construed as a recommendation or investment advice.
Semiannual Report 2014
| | |
| |
| | Columbia Select Smaller-Cap Value Fund |
Performance Overview
(Unaudited)
Performance Summary
| > | | Columbia Select Smaller-Cap Value Fund (the Fund) Class A shares returned 2.23% excluding sales charges for the six-month period that ended November 30, 2014. |
| > | | The Fund outperformed its benchmark, the Russell 2000 Value Index, which returned 1.66% for the same six-month period. |
| | | | | | | | | | | | | | | | | | |
Average Annual Total Returns (%) (for period ended November 30, 2014) | |
| | | Inception | | 6 Months
cumulative | | | 1 Year | | | 5 Years | | | 10 Years | |
Class A | | 04/25/97 | | | | | | | | | | | | | | | | |
Excluding sales charges | | | | | 2.23 | | | | 5.42 | | | | 16.72 | | | | 7.80 | |
Including sales charges | | | | | -3.64 | | | | -0.63 | | | | 15.35 | | | | 7.16 | |
Class B | | 04/25/97 | | | | | | | | | | | | | | | | |
Excluding sales charges | | | | | 1.89 | | | | 4.70 | | | | 15.85 | | | | 6.99 | |
Including sales charges | | | | | -3.11 | | | | -0.14 | | | | 15.63 | | | | 6.99 | |
Class C | | 05/27/99 | | | | | | | | | | | | | | | | |
Excluding sales charges | | | | | 1.83 | | | | 4.64 | | | | 15.85 | | | | 6.99 | |
Including sales charges | | | | | 0.83 | | | | 3.67 | | | | 15.85 | | | | 6.99 | |
Class I* | | 08/03/09 | | | 2.50 | | | | 5.97 | | | | 17.28 | | | | 8.08 | |
Class K* | | 08/03/09 | | | 2.33 | | | | 5.61 | | | | 16.94 | | | | 7.90 | |
Class R | | 04/30/03 | | | 2.12 | | | | 5.22 | | | | 16.42 | | | | 7.50 | |
Class R4* | | 11/08/12 | | | 2.37 | | | | 5.73 | | | | 16.85 | | | | 7.86 | |
Class R5 | | 11/30/01 | | | 2.47 | | | | 5.90 | | | | 17.20 | | | | 8.34 | |
Class Y* | | 10/01/14 | | | 2.34 | | | | 5.54 | | | | 16.75 | | | | 7.81 | |
Class Z* | | 09/27/10 | | | 2.35 | | | | 5.70 | | | | 16.98 | | | | 7.91 | |
Russell 2000 Value Index | | | | | 1.66 | | | | 3.36 | | | | 15.31 | | | | 6.85 | |
Returns for Class A are shown with and without the maximum initial sales charge of 5.75%. Returns for Class B are shown with and without the applicable contingent deferred sales charge (CDSC) of 5.00% in the first year, declining to 1.00% in the sixth year and eliminated thereafter. Returns for Class C are shown with and without the 1.00% CDSC for the first year only. The Fund’s other classes are not subject to sales charges and have limited eligibility. Please see the Fund’s prospectus for details. Performance for different share classes will vary based on differences in sales charges and fees associated with each class. All results shown assume reinvestment of distributions during the period. Returns do not reflect the deduction of taxes that a shareholder may pay on Fund distributions or on the redemption of Fund shares. Performance results reflect the effect of any fee waivers or reimbursements of Fund expenses by Columbia Management Investment Advisers, LLC and/or any of its affiliates. Absent these fee waivers or expense reimbursement arrangements, performance results would have been lower.
The performance information shown represents past performance and is not a guarantee of future results. The investment return and principal value of your investment will fluctuate so that your shares, when redeemed, may be worth more or less than their original cost. Current performance may be lower or higher than the performance information shown. You may obtain performance information current to the most recent month-end by contacting your financial intermediary, visiting columbiamanagement.com or calling 800.345.6611.
| * | The returns shown for periods prior to the share class inception date (including returns for the Life of the Fund, if shown, which are since Fund inception) include the returns of the Fund’s oldest share class. Since the Fund launched more than one share class at its inception, Class A shares were used. These returns are adjusted to reflect any higher class-related operating expenses of the newer share classes, as applicable. Please visit columbiamanagement.com/investment-products/mutual-funds/appended-performance for more information. |
The Russell 2000 Value Index, an unmanaged index, measures the performance of those stocks in the Russell 2000 Index with lower price-to-book ratios and lower forecasted growth values.
Indices are not available for investment, are not professionally managed and do not reflect sales charges, fees, brokerage commissions, taxes or other expenses of investing. Securities in the Fund may not match those in an index.
| | |
| |
| Columbia Select Smaller-Cap Value Fund | | |
Portfolio Overview
(Unaudited)
| | | | |
Top Ten Holdings (%)
(at November 30, 2014) | |
Swift Transportation Co. | | | 4.3 | |
United Continental Holdings, Inc. | | | 4.1 | |
Endurance Specialty Holdings Ltd. | | | 3.4 | |
Impax Laboratories, Inc. | | | 3.4 | |
Hanesbrands, Inc. | | | 3.3 | |
Hanover Insurance Group, Inc. (The) | | | 3.2 | |
WellCare Health Plans, Inc. | | | 3.2 | |
Telephone & Data Systems, Inc. | | | 3.0 | |
Texas Roadhouse, Inc. | | | 3.0 | |
Minerals Technologies, Inc. | | | 2.6 | |
Percentages indicated are based upon total investments (excluding Money Market Funds).
For further detail about these holdings, please refer to the section entitled “Portfolio of Investments.”
Fund holdings are as of the date given, are subject to change at any time, and are not recommendations to buy or sell any security.
| | | | |
Portfolio Breakdown (%)
(at November 30, 2014) | |
Common Stocks | | | 99.6 | |
Consumer Discretionary | | | 18.9 | |
Consumer Staples | | | 4.9 | |
Energy | | | 5.4 | |
Financials | | | 14.0 | |
Health Care | | | 14.4 | |
Industrials | | | 19.2 | |
Information Technology | | | 14.2 | |
Materials | | | 4.2 | |
Telecommunication Services | | | 4.4 | |
Money Market Funds | | | 0.4 | |
Total | | | 100.0 | |
Percentages indicated are based upon total investments. The Fund’s portfolio composition is subject to change.
Portfolio Management
Richard Rosen
Kari Montanus
Morningstar Style Box™

The Morningstar Style Box™ is based on a fund’s portfolio holdings. For equity funds, the vertical axis shows the market capitalization of the stocks owned, and the horizontal axis shows investment style (value, blend, or growth). Information shown is based on the most recent data provided by Morningstar.
© 2015 Morningstar, Inc. All rights reserved. The Morningstar information contained herein: (1) is proprietary to Morningstar and/or its content providers; (2) may not be copied or distributed; and (3) is not warranted to be accurate, complete or timely. Neither Morningstar nor its content providers are responsible for any damages or losses arising from any use of this information.
| | |
| |
| | Columbia Select Smaller-Cap Value Fund |
Understanding Your Fund’s Expenses
(Unaudited)
As an investor, you incur two types of costs. There are transaction costs, which generally include sales charges on purchases and may include redemption fees. There are also ongoing costs, which generally include management fees, distribution and/or service fees, and other fund expenses. The following information is intended to help you understand your ongoing costs (in dollars) of investing in the Fund and to help you compare these costs with the ongoing costs of investing in other mutual funds.
Analyzing Your Fund’s Expenses
To illustrate these ongoing costs, we have provided examples and calculated the expenses paid by investors in each share class of the Fund during the period. The actual and hypothetical information in the table is based on an initial investment of $1,000 at the beginning of the period indicated and held for the entire period. Expense information is calculated two ways and each method provides you with different information. The amount listed in the “Actual” column is calculated using the Fund’s actual operating expenses and total return for the period. You may use the Actual information, together with the amount invested, to estimate the expenses that you paid over the period. Simply divide your account value by $1,000 (for example, an $8,600 account value divided by $1,000 = 8.6), then multiply the results by the expenses paid during the period under the “Actual” column. The amount listed in the “Hypothetical” column assumes a 5% annual rate of return before expenses (which is not the Fund’s actual return) and then applies the Fund’s actual expense ratio for the period to the hypothetical return. You should not use the hypothetical account values and expenses to estimate either your actual account balance at the end of the period or the expenses you paid during the period. See “Compare With Other Funds” below for details on how to use the hypothetical data.
Compare With Other Funds
Since all mutual funds are required to include the same hypothetical calculations about expenses in shareholder reports, you can use this information to compare the ongoing cost of investing in the Fund with other funds. To do so, compare the hypothetical example with the 5% hypothetical examples that appear in the shareholder reports of other funds. As you compare hypothetical examples of other funds, it is important to note that hypothetical examples are meant to highlight the ongoing costs of investing in a fund only and do not reflect any transaction costs, such as sales charges, or redemption or exchange fees. Therefore, the hypothetical calculations are useful in comparing ongoing costs only, and will not help you determine the relative total costs of owning different funds. If transaction costs were included in these calculations, your costs would be higher.
June 1, 2014 – November 30, 2014
| | | | | | | | | | | | | | | | | | | | | | | | | | | | |
| | | Account Value at the
Beginning of the
Period ($) | | | Account Value at the
End of the
Period ($) | | | Expenses Paid During
the Period ($) | | | Fund’s Annualized
Expense Ratio (%) | |
| | | | Actual | | | | Hypothetical | | | | Actual | | | | Hypothetical | | | | Actual | | | | Hypothetical | | | | Actual | |
Class A | | | 1,000.00 | | | | 1,000.00 | | | | 1,022.30 | | | | 1,018.00 | | | | 7.01 | | | | 6.99 | | | | 1.39 | |
Class B | | | 1,000.00 | | | | 1,000.00 | | | | 1,018.90 | | | | 1,014.26 | | | | 10.77 | | | | 10.75 | | | | 2.14 | |
Class C | | | 1,000.00 | | | | 1,000.00 | | | | 1,018.30 | | | | 1,014.26 | | | | 10.77 | | | | 10.75 | | | | 2.14 | |
Class I | | | 1,000.00 | | | | 1,000.00 | | | | 1,025.00 | | | | 1,020.29 | | | | 4.70 | | | | 4.68 | | | | 0.93 | |
Class K | | | 1,000.00 | | | | 1,000.00 | | | | 1,023.30 | | | | 1,018.80 | | | | 6.20 | | | | 6.19 | | | | 1.23 | |
Class R | | | 1,000.00 | | | | 1,000.00 | | | | 1,021.20 | | | | 1,016.75 | | | | 8.26 | | | | 8.25 | | | | 1.64 | |
Class R4 | | | 1,000.00 | | | | 1,000.00 | | | | 1,023.70 | | | | 1,019.25 | | | | 5.75 | | | | 5.74 | | | | 1.14 | |
Class R5 | | | 1,000.00 | | | | 1,000.00 | | | | 1,024.70 | | | | 1,020.04 | | | | 4.95 | | | | 4.94 | | | | 0.98 | |
Class Y | | | 1,000.00 | | | | 1,000.00 | | | | 1,064.50 | * | | | 1,020.54 | | | | 1.42 | * | | | 4.43 | | | | 0.88 | * |
Class Z | | | 1,000.00 | | | | 1,000.00 | | | | 1,023.50 | | | | 1,019.25 | | | | 5.75 | | | | 5.74 | | | | 1.14 | |
| * | Based on operations from October 1, 2014 (commencement of operations) through the stated period end. |
Expenses paid during the period are equal to the annualized expense ratio for each class as indicated above, multiplied by the average account value over the period and then multiplied by the number of days in the Fund’s most recent fiscal half year and divided by 365.
Expenses do not include fees and expenses incurred indirectly by the Fund from its investment in underlying funds, including affiliated and non-affiliated pooled investment vehicles, such as mutual funds and exchange-traded funds.
Had Columbia Management Investment Advisers, LLC and/or certain of its affiliates not waived/reimbursed certain fees and expenses, account value at the end of the period would have been reduced.
| | |
| |
| Columbia Select Smaller-Cap Value Fund | | |
Portfolio of Investments
November 30, 2014 (Unaudited)
(Percentages represent value of investments compared to net assets)
| | | | | | | | |
| Common Stocks 99.6% | |
| Issuer | | Shares | | | Value ($) | |
Consumer Discretionary 18.9% | |
Auto Components 3.1% | |
| | |
American Axle & Manufacturing Holdings, Inc.(a) | | | 531,000 | | | | 11,331,540 | |
| | |
Motorcar Parts of America, Inc.(a) | | | 89,928 | | | | 3,035,070 | |
| | | | | | | | | |
Total | | | | | | | 14,366,610 | |
|
Diversified Consumer Services 2.1% | |
| | |
Sotheby’s | | | 250,000 | | | | 10,102,500 | |
|
Hotels, Restaurants & Leisure 3.0% | |
| | |
Texas Roadhouse, Inc. | | | 425,000 | | | | 14,050,500 | |
|
Household Durables 5.6% | |
| | |
Beazer Homes USA, Inc.(a) | | | 538,145 | | | | 10,730,611 | |
| | |
Lennar Corp., Class A | | | 205,000 | | | | 9,684,200 | |
| | |
William Lyon Homes, Inc. Class A(a) | | | 300,000 | | | | 6,174,000 | |
| | | | | | | | | |
Total | | | | | | | 26,588,811 | |
|
Specialty Retail 1.8% | |
| | |
Vitamin Shoppe, Inc.(a) | | | 180,000 | | | | 8,614,800 | |
|
Textiles, Apparel & Luxury Goods 3.3% | |
| | |
Hanesbrands, Inc. | | | 135,000 | | | | 15,622,200 | |
| | | | | | | | | |
Total Consumer Discretionary | | | | | | | 89,345,421 | |
|
| |
Consumer Staples 4.9% | |
Food Products 3.1% | |
| | |
Dean Foods Co. | | | 307,500 | | | | 5,242,875 | |
| | |
WhiteWave Foods Co. (The), Class A(a) | | | 260,000 | | | | 9,523,800 | |
| | | | | | | | | |
Total | | | | | | | 14,766,675 | |
|
Personal Products 1.8% | |
| | |
Herbalife Ltd. | | | 195,000 | | | | 8,433,750 | |
| | | | | | | | | |
Total Consumer Staples | | | | | | | 23,200,425 | |
|
| |
Energy 5.4% | |
Energy Equipment & Services 4.5% | |
| | |
Exterran Holdings, Inc. | | | 200,000 | | | | 6,700,000 | |
| | |
Superior Energy Services, Inc. | | | 400,000 | | | | 7,724,000 | |
| | |
Tetra Technologies, Inc.(a) | | | 1,025,000 | | | | 6,508,750 | |
| | | | | | | | | |
Total | | | | | | | 20,932,750 | |
|
Oil, Gas & Consumable Fuels 0.9% | |
| | |
Oasis Petroleum, Inc.(a) | | | 235,000 | | | | 4,319,300 | |
| | | | | | | | | |
Total Energy | | | | | | | 25,252,050 | |
|
| |
Financials 14.0% | |
Insurance 10.8% | |
| | |
Endurance Specialty Holdings Ltd. | | | 275,000 | | | | 16,219,500 | |
| | |
Hanover Insurance Group, Inc. (The) | | | 210,000 | | | | 14,968,800 | |
| | |
Lincoln National Corp. | | | 200,000 | | | | 11,326,000 | |
| | | | | | | | |
| Common Stocks (continued) | |
| Issuer | | Shares | | | Value ($) | |
Meadowbrook Insurance Group, Inc. | | | 1,400,000 | | | | 8,526,000 | |
| | | | | | | | | |
Total | | | | | | | 51,040,300 | |
|
Real Estate Investment Trusts (REITs) 1.3% | |
| | |
Gaming and Leisure Properties, Inc. | | | 189,918 | | | | 6,058,384 | |
|
Thrifts & Mortgage Finance 1.9% | |
| | |
Ladder Capital Corp., Class A(a) | | | 485,100 | | | | 9,173,241 | |
| | | | | | | | | |
Total Financials | | | | | | | 66,271,925 | |
|
| |
Health Care 14.4% | |
Health Care Equipment & Supplies 2.6% | |
| | |
Analogic Corp. | | | 125,000 | | | | 9,105,000 | |
| | |
Sirona Dental Systems, Inc.(a) | | | 35,000 | | | | 3,023,650 | |
| | | | | | | | | |
Total | | | | | | | 12,128,650 | |
|
Health Care Providers & Services 5.2% | |
| | |
PharMerica Corp.(a) | | | 450,000 | | | | 9,814,500 | |
| | |
WellCare Health Plans, Inc.(a) | | | 202,500 | | | | 14,932,350 | |
| | | | | | | | | |
Total | | | | | | | 24,746,850 | |
|
Life Sciences Tools & Services 1.5% | |
| | |
Bruker Corp.(a) | | | 375,000 | | | | 7,192,500 | |
|
Pharmaceuticals 5.1% | |
| | |
Impax Laboratories, Inc.(a) | | | 500,492 | | | | 15,990,720 | |
| | |
Salix Pharmaceuticals Ltd.(a) | | | 80,000 | | | | 8,215,200 | |
| | | | | | | | | |
Total | | | | | | | 24,205,920 | |
| | | | | | | | | |
Total Health Care | | | | | | | 68,273,920 | |
|
| |
Industrials 19.2% | |
Aerospace & Defense 1.6% | |
| | |
Cubic Corp. | | | 150,000 | | | | 7,717,500 | |
|
Airlines 4.8% | |
| | |
United Continental Holdings, Inc.(a) | | | 316,500 | | | | 19,379,295 | |
| | |
Virgin America, Inc.(a) | | | 81,469 | | | | 3,069,752 | |
| | | | | | | | | |
Total | | | | | | | 22,449,047 | |
|
Building Products 1.6% | |
| | |
Armstrong World Industries, Inc.(a) | | | 150,000 | | | | 7,515,000 | |
|
Commercial Services & Supplies 2.3% | |
| | |
Waste Connections, Inc. | | | 225,000 | | | | 10,622,250 | |
|
Electrical Equipment 1.9% | |
| | |
EnerSys | | | 150,000 | | | | 9,109,500 | |
|
Machinery 2.8% | |
| | |
Mueller Industries, Inc. | | | 300,000 | | | | 9,843,000 | |
| | |
Wabash National Corp.(a) | | | 300,000 | | | | 3,237,000 | |
| | | | | | | | | |
Total | | | | | | | 13,080,000 | |
The accompanying Notes to Financial Statements are an integral part of this statement.
| | |
| |
| | Columbia Select Smaller-Cap Value Fund |
Portfolio of Investments (continued)
November 30, 2014 (Unaudited)
| | | | | | | | |
| Common Stocks (continued) | |
| Issuer | | Shares | | | Value ($) | |
Road & Rail 4.2% | |
| | |
Swift Transportation Co.(a) | | | 690,000 | | | | 20,058,300 | |
| | | | | | | | | |
Total Industrials | | | | | | | 90,551,597 | |
|
| |
Information Technology 14.2% | |
Communications Equipment 5.0% | |
| | |
Calix, Inc.(a) | | | 420,290 | | | | 4,455,074 | |
| | |
Extreme Networks, Inc.(a) | | | 2,408,763 | | | | 8,719,722 | |
| | |
JDS Uniphase Corp.(a) | | | 800,000 | | | | 10,672,000 | |
| | | | | | | | | |
Total | | | | | | | 23,846,796 | |
|
Electronic Equipment, Instruments & Components 2.6% | |
| | |
Belden, Inc. | | | 170,000 | | | | 12,415,100 | |
|
IT Services 3.4% | |
| | |
CACI International, Inc., Class A(a) | | | 120,441 | | | | 10,742,133 | |
| | |
EPAM Systems, Inc.(a) | | | 105,975 | | | | 5,407,904 | |
| | | | | | | | | |
Total | | | | | | | 16,150,037 | |
|
Software 3.2% | |
| | |
Allot Communications Ltd.(a) | | | 425,000 | | | | 4,016,250 | |
| | |
BroadSoft, Inc.(a) | | | 403,567 | | | | 10,884,202 | |
| | | | | | | | | |
Total | | | | | | | 14,900,452 | |
| | | | | | | | | |
Total Information Technology | | | | | | | 67,312,385 | |
|
| |
Materials 4.2% | |
Chemicals 2.6% | |
| | |
Minerals Technologies, Inc. | | | 167,500 | | | | 12,433,525 | |
| | | | | | | | |
| Common Stocks (continued) | |
| Issuer | | Shares | | | Value ($) | |
Containers & Packaging 1.6% | |
| | |
Owens-Illinois, Inc.(a) | | | 290,000 | | | | 7,435,600 | |
| | | | | | | | | |
Total Materials | | | | | | | 19,869,125 | |
|
| |
Telecommunication Services 4.4% | |
Diversified Telecommunication Services 1.4% | |
| | |
Globalstar, Inc. PIK(a) | | | 2,300,000 | | | | 6,486,000 | |
|
Wireless Telecommunication Services 3.0% | |
| | |
Telephone & Data Systems, Inc. | | | 550,000 | | | | 14,058,000 | |
| | | | | | | | | |
Total Telecommunication Services | | | | | | | 20,544,000 | |
| | | | | | | | | |
Total Common Stocks | | | | | | | | |
(Cost: $307,008,161) | | | | | | | 470,620,848 | |
|
| |
| Money Market Funds 0.4% | |
| | | Shares | | | Value ($) | |
| | |
Columbia Short-Term Cash Fund,
0.104%(b)(c) | | | 2,055,897 | | | | 2,055,897 | |
| | | | | | | | | |
Total Money Market Funds | | | | | | | | |
(Cost: $2,055,897) | | | | | | | 2,055,897 | |
| | | | | | | | | |
Total Investments | | | | | | | | |
(Cost: $309,064,058) | | | | | | | 472,676,745 | |
| | | | | | | | | |
Other Assets & Liabilities, Net | | | | | | | 208,701 | |
| | | | | | | | | |
Net Assets | | | | | | | 472,885,446 | |
| | | | | | | | | |
Notes to Portfolio of Investments
| (b) | The rate shown is the seven-day current annualized yield at November 30, 2014. |
| (c) | As defined in the Investment Company Act of 1940, an affiliated company is one in which the Fund owns 5% or more of the company’s outstanding voting securities, or a company which is under common ownership or control with the Fund. Holdings and transactions in these affiliated companies during the period ended November 30, 2014, are as follows: |
| | | | | | | | | | | | | | | | | | | | | | | | |
| Issuer | | Beginning
Cost ($) | | | Purchase
Cost ($) | | | Proceeds
From Sales ($) | | | Ending
Cost ($) | | | Dividends —
Affiliated
Issuers ($) | | | Value ($) | |
Columbia Short-Term Cash Fund | | | 2,344,688 | | | | 51,889,740 | | | | (52,178,531 | ) | | | 2,055,897 | | | | 2,157 | | | | 2,055,897 | |
Abbreviation Legend
Fair Value Measurements
Generally accepted accounting principles (GAAP) require disclosure regarding the inputs and valuation techniques used to measure fair value and any changes in valuation inputs or techniques. In addition, investments shall be disclosed by major category.
The Fund categorizes its fair value measurements according to a three-level hierarchy that maximizes the use of observable inputs and minimizes the use of unobservable inputs by prioritizing that the most observable input be used when available. Observable inputs are those that market participants would use in pricing an investment based on market data obtained from sources independent of the reporting entity. Unobservable inputs are those that reflect the Fund’s assumptions about the information market participants would use in pricing an investment. An investment’s level within the fair value hierarchy is based on the lowest level of any input that is deemed significant to the asset or liability’s fair value measurement. The input levels are not necessarily an indication of the risk or liquidity associated with investments at that level. For example, certain
The accompanying Notes to Financial Statements are an integral part of this statement.
| | |
| |
| Columbia Select Smaller-Cap Value Fund | | |
Portfolio of Investments (continued)
November 30, 2014 (Unaudited)
Fair Value Measurements (continued)
U.S. government securities are generally high quality and liquid, however, they are reflected as Level 2 because the inputs used to determine fair value may not always be quoted prices in an active market.
Fair value inputs are summarized in the three broad levels listed below:
| > | | Level 1 — Valuations based on quoted prices for investments in active markets that the Fund has the ability to access at the measurement date (including NAV for open-end mutual funds). Valuation adjustments are not applied to Level 1 investments. |
| > | | Level 2 — Valuations based on other significant observable inputs (including quoted prices for similar securities, interest rates, prepayment speeds, credit risks, etc.). |
| > | | Level 3 — Valuations based on significant unobservable inputs (including the Fund’s own assumptions and judgment in determining the fair value of investments). |
Inputs that are used in determining fair value of an investment may include price information, credit data, volatility statistics, and other factors. These inputs can be either observable or unobservable. The availability of observable inputs can vary between investments, and is affected by various factors such as the type of investment, and the volume and level of activity for that investment or similar investments in the marketplace. The inputs will be considered by the Investment Manager, along with any other relevant factors in the calculation of an investment’s fair value. The Fund uses prices and inputs that are current as of the measurement date, which may include periods of market dislocations. During these periods, the availability of prices and inputs may be reduced for many investments. This condition could cause an investment to be reclassified between the various levels within the hierarchy.
Investments falling into the Level 3 category are primarily supported by quoted prices from brokers and dealers participating in the market for those investments. However, these may be classified as Level 3 investments due to lack of market transparency and corroboration to support these quoted prices. Additionally, valuation models may be used as the pricing source for any remaining investments classified as Level 3. These models may rely on one or more significant unobservable inputs and/or significant assumptions by the Investment Manager. Inputs used in valuations may include, but are not limited to, financial statement analysis, capital account balances, discount rates and estimated cash flows, and comparable company data.
Under the direction of the Fund’s Board of Trustees (the Board), the Investment Manager’s Valuation Committee (the Committee) is responsible for overseeing the valuation procedures approved by the Board. The Committee consists of voting and non-voting members from various groups within the Investment Manager’s organization, including operations and accounting, trading and investments, compliance, risk management and legal.
The Committee meets at least monthly to review and approve valuation matters, which may include a description of specific valuation determinations, data regarding pricing information received from approved pricing vendors and brokers and the results of Board-approved valuation control policies and procedures (the Policies). The Policies address, among other things, instances when market quotations are or are not readily available, including recommendations of third party pricing vendors and a determination of appropriate pricing methodologies; events that require specific valuation determinations and assessment of fair value techniques; securities with a potential for stale pricing, including those that are illiquid, restricted, or in default; and the effectiveness of third party pricing vendors, including periodic reviews of vendors. The Committee meets more frequently, as needed, to discuss additional valuation matters, which may include the need to review back-testing results, review time-sensitive information or approve related valuation actions. The Committee reports to the Board, with members of the Committee meeting with the Board at each of its regularly scheduled meetings to discuss valuation matters and actions during the period, similar to those described earlier.
For investments categorized as Level 3, the Committee monitors information similar to that described above, which may include: (i) data specific to the issuer or comparable issuers, (ii) general market or specific sector news and (iii) quoted prices and specific or similar security transactions. The Committee considers this data and any changes from prior periods in order to assess the reasonableness of observable and unobservable inputs, any assumptions or internal models used to value those securities and changes in fair value. This data is also used to corroborate, when available, information received from approved pricing vendors and brokers. Various factors impact the frequency of monitoring this information (which may occur as often as daily). However, the Committee may determine that changes to inputs, assumptions and models are not required as a result of the monitoring procedures performed.
The accompanying Notes to Financial Statements are an integral part of this statement.
| | |
| |
| | Columbia Select Smaller-Cap Value Fund |
Portfolio of Investments (continued)
November 30, 2014 (Unaudited)
Fair Value Measurements (continued)
The following table is a summary of the inputs used to value the Fund’s investments at November 30, 2014:
| | | | | | | | | | | | | | | | |
| Description | | Level 1
Quoted Prices in Active
Markets for Identical
Assets ($) | | | Level 2
Other Significant
Observable Inputs ($) | | | Level 3
Significant
Unobservable Inputs ($) | | | Total ($) | |
Equity Securities | | | | | | | | | | | | | | | | |
| | | | |
Common Stocks | | | | | | | | | | | | | | | | |
| | | | |
Consumer Discretionary | | | 89,345,421 | | | | — | | | | — | | | | 89,345,421 | |
| | | | |
Consumer Staples | | | 23,200,425 | | | | — | | | | — | | | | 23,200,425 | |
| | | | |
Energy | | | 25,252,050 | | | | — | | | | — | | | | 25,252,050 | |
| | | | |
Financials | | | 66,271,925 | | | | — | | | | — | | | | 66,271,925 | |
| | | | |
Health Care | | | 68,273,920 | | | | — | | | | — | | | | 68,273,920 | |
| | | | |
Industrials | | | 90,551,597 | | | | — | | | | — | | | | 90,551,597 | |
| | | | |
Information Technology | | | 67,312,385 | | | | — | | | | — | | | | 67,312,385 | |
| | | | |
Materials | | | 19,869,125 | | | | — | | | | — | | | | 19,869,125 | |
| | | | |
Telecommunication Services | | | 20,544,000 | | | | — | | | | — | | | | 20,544,000 | |
| | | | | | | | | | | | | | | | | |
Total Equity Securities | | | 470,620,848 | | | | — | | | | — | | | | 470,620,848 | |
| | | | | | | | | | | | | | | | | |
Mutual Funds | | | | | | | | | | | | | | | | |
| | | | |
Money Market Funds | | | 2,055,897 | | | | — | | | | — | | | | 2,055,897 | |
| | | | | | | | | | | | | | | | | |
Total Mutual Funds | | | 2,055,897 | | | | — | | | | — | | | | 2,055,897 | |
| | | | | | | | | | | | | | | | | |
Total | | | 472,676,745 | | | | — | | | | — | | | | 472,676,745 | |
| | | | | | | | | | | | | | | | | |
See the Portfolio of Investments for all investment classifications not indicated in the table.
There were no transfers of financial assets between levels during the period.
The accompanying Notes to Financial Statements are an integral part of this statement.
| | |
| |
| Columbia Select Smaller-Cap Value Fund | | |
Statement of Assets and Liabilities
November 30, 2014 (Unaudited)
| | | | |
Assets | | | | |
| |
Investments, at value | | | | |
| |
Unaffiliated issuers (identified cost $307,008,161) | | | $470,620,848 | |
| |
Affiliated issuers (identified cost $2,055,897) | | | 2,055,897 | |
| |
Total investments (identified cost $309,064,058) | | | 472,676,745 | |
| |
Receivable for: | | | | |
| |
Investments sold | | | 1,676,681 | |
| |
Capital shares sold | | | 153,030 | |
| |
Dividends | | | 321,149 | |
| |
Prepaid expenses | | | 3,403 | |
| |
Other assets | | | 7,998 | |
| |
Total assets | | | 474,839,006 | |
| |
| |
Liabilities | | | | |
| |
Payable for: | | | | |
| |
Investments purchased | | | 1,505,921 | |
| |
Capital shares purchased | | | 218,660 | |
| |
Investment management fees | | | 20,658 | |
| |
Distribution and/or service fees | | | 8,108 | |
| |
Transfer agent fees | | | 61,838 | |
| |
Administration fees | | | 2,092 | |
| |
Plan administration fees | | | 1,295 | |
| |
Compensation of board members | | | 28,088 | |
| |
Other expenses | | | 106,900 | |
| |
Total liabilities | | | 1,953,560 | |
| |
Net assets applicable to outstanding capital stock | | | $472,885,446 | |
| |
| |
Represented by | | | | |
| |
Paid-in capital | | | $271,805,943 | |
| |
Excess of distributions over net investment income | | | (1,648,169 | ) |
| |
Accumulated net realized gain | | | 39,114,985 | |
| |
Unrealized appreciation (depreciation) on: | | | | |
| |
Investments | | | 163,612,687 | |
| |
Total — representing net assets applicable to outstanding capital stock | | | $472,885,446 | |
| |
The accompanying Notes to Financial Statements are an integral part of this statement.
| | |
| |
| | Columbia Select Smaller-Cap Value Fund |
Statement of Assets and Liabilities (continued)
November 30, 2014 (Unaudited)
| | | | |
| |
Class A | | | | |
| |
Net assets | | | $375,387,539 | |
| |
Shares outstanding | | | 17,060,761 | |
| |
Net asset value per share | | | $22.00 | |
| |
Maximum offering price per share(a) | | | $23.34 | |
| |
Class B | | | | |
| |
Net assets | | | $4,722,377 | |
| |
Shares outstanding | | | 257,978 | |
| |
Net asset value per share | | | $18.31 | |
| |
Class C | | | | |
| |
Net assets | | | $42,324,926 | |
| |
Shares outstanding | | | 2,308,720 | |
| |
Net asset value per share | | | $18.33 | |
| |
Class I | | | | |
| |
Net assets | | | $22,880,857 | |
| |
Shares outstanding | | | 947,207 | |
| |
Net asset value per share | | | $24.16 | |
| |
Class K | | | | |
| |
Net assets | | | $6,657,944 | |
| |
Shares outstanding | | | 280,421 | |
| |
Net asset value per share | | | $23.74 | |
| |
Class R | | | | |
| |
Net assets | | | $11,446,924 | |
| |
Shares outstanding | | | 539,770 | |
| |
Net asset value per share | | | $21.21 | |
| |
Class R4 | | | | |
| |
Net assets | | | $318,885 | |
| |
Shares outstanding | | | 13,184 | |
| |
Net asset value per share | | | $24.19 | |
| |
Class R5 | | | | |
| |
Net assets | | | $812,659 | |
| |
Shares outstanding | | | 33,763 | |
| |
Net asset value per share | | | $24.07 | |
| |
Class Y | | | | |
| |
Net assets | | | $2,661 | |
| |
Shares outstanding | | | 108 | |
| |
Net asset value per share(b) | | | $24.60 | |
| |
Class Z | | | | |
| |
Net assets | | | $8,330,674 | |
| |
Shares outstanding | | | 348,269 | |
| |
Net asset value per share | | | $23.92 | |
| |
| (a) | The maximum offering price per share is calculated by dividing the net asset value per share by 1.0 minus the maximum sales charge of 5.75%. |
| (b) | Net asset value per share rounds to this amount due to fractional shares outstanding. |
The accompanying Notes to Financial Statements are an integral part of this statement.
| | |
| 10 | | Semiannual Report 2014 |
| | |
| |
| Columbia Select Smaller-Cap Value Fund | | |
Statement of Operations
Six Months Ended November 30, 2014 (Unaudited)
| | | | |
Net investment income | | | | |
| |
Income: | | | | |
| |
Dividends — unaffiliated issuers | | | $1,799,213 | |
| |
Dividends — affiliated issuers | | | 2,157 | |
| |
Total income | | | 1,801,370 | |
| |
| |
Expenses: | | | | |
| |
Investment management fees | | | 1,876,620 | |
| |
Distribution and/or service fees | | | | |
| |
Class A | | | 473,154 | |
| |
Class B | | | 25,995 | |
| |
Class C | | | 212,347 | |
| |
Class R | | | 28,390 | |
| |
Transfer agent fees | | | | |
| |
Class A | | | 405,123 | |
| |
Class B | | | 5,568 | |
| |
Class C | | | 45,452 | |
| |
Class K | | | 1,666 | |
| |
Class R | | | 12,153 | |
| |
Class R4 | | | 178 | |
| |
Class R5 | | | 171 | |
| |
Class Z | | | 8,024 | |
| |
Administration fees | | | 190,036 | |
| |
Plan administration fees | | | | |
| |
Class K | | | 8,331 | |
| |
Compensation of board members | | | 9,114 | |
| |
Custodian fees | | | 4,632 | |
| |
Printing and postage fees | | | 41,722 | |
| |
Registration fees | | | 58,329 | |
| |
Professional fees | | | 17,460 | |
| |
Other | | | 11,092 | |
| |
Total expenses | | | 3,435,557 | |
| |
Fees waived or expenses reimbursed by Investment Manager and its affiliates | | | (8,809 | ) |
| |
Expense reductions | | | (1,454 | ) |
| |
Total net expenses | | | 3,425,294 | |
| |
Net investment loss | | | (1,623,924 | ) |
| |
| |
Realized and unrealized gain (loss) — net | | | | |
| |
Net realized gain (loss) on: | | | | |
| |
Investments | | | 44,629,568 | |
| |
Net realized gain | | | 44,629,568 | |
| |
Net change in unrealized appreciation (depreciation) on: | | | | |
| |
Investments | | | (32,615,989 | ) |
| |
Net change in unrealized depreciation | | | (32,615,989 | ) |
| |
Net realized and unrealized gain | | | 12,013,579 | |
| |
Net increase in net assets resulting from operations | | | $10,389,655 | |
| |
The accompanying Notes to Financial Statements are an integral part of this statement.
| | | | |
| Semiannual Report 2014 | | | 11 | |
| | |
| |
| | Columbia Select Smaller-Cap Value Fund |
Statement of Changes in Net Assets
| | | | | | | | |
| | | Six Months Ended
November 30, 2014
(Unaudited) | | | Year Ended
May 31, 2014 | |
Operations | | | | | | | | |
| | |
Net investment loss | | | $(1,623,924 | ) | | | $(916,921 | ) |
| | |
Net realized gain | | | 44,629,568 | | | | 56,256,277 | |
| | |
Net change in unrealized appreciation (depreciation) | | | (32,615,989 | ) | | | 36,931,455 | |
| |
Net increase in net assets resulting from operations | | | 10,389,655 | | | | 92,270,811 | |
| |
| | |
Distributions to shareholders | | | | | | | | |
| | |
Net realized gains | | | | | | | | |
| | |
Class A | | | — | | | | (25,054,165 | ) |
| | |
Class B | | | — | | | | (524,768 | ) |
| | |
Class C | | | — | | | | (3,330,568 | ) |
| | |
Class I | | | — | | | | (1,499,336 | ) |
| | |
Class K | | | — | | | | (391,313 | ) |
| | |
Class R | | | — | | | | (857,102 | ) |
| | |
Class R4 | | | — | | | | (67,140 | ) |
| | |
Class R5 | | | — | | | | (31,795 | ) |
| | |
Class Z | | | — | | | | (452,534 | ) |
| |
Total distributions to shareholders | | | — | | | | (32,208,721 | ) |
| |
Increase (decrease) in net assets from capital stock activity | | | (23,300,412 | ) | | | 7,218,123 | |
| |
Total increase (decrease) in net assets | | | (12,910,757 | ) | | | 67,280,213 | |
| | |
Net assets at beginning of period | | | 485,796,203 | | | | 418,515,990 | |
| |
Net assets at end of period | | | $472,885,446 | | | | $485,796,203 | |
| |
Excess of distributions over net investment income | | | $(1,648,169 | ) | | | $(24,245 | ) |
| |
The accompanying Notes to Financial Statements are an integral part of this statement.
| | |
| 12 | | Semiannual Report 2014 |
| | |
| |
| Columbia Select Smaller-Cap Value Fund | | |
Statement of Changes in Net Assets (continued)
| | | | | | | | | | | | | | | | |
| | | Six Months Ended
November 30, 2014(a)
(Unaudited) | | | Year Ended
May 31, 2014 | |
| | | Shares | | | Dollars ($) | | | Shares | | | Dollars ($) | |
Capital stock activity | | | | | | | | | | | | | | | | |
| | | | |
Class A shares | | | | | | | | | | | | | | | | |
| | | | |
Subscriptions(b) | | | 555,400 | | | | 11,965,757 | | | | 2,384,271 | | | | 48,910,003 | |
| | | | |
Distributions reinvested | | | — | | | | — | | | | 1,167,418 | | | | 24,177,227 | |
| | | | |
Redemptions | | | (1,491,499 | ) | | | (32,257,809 | ) | | | (2,856,638 | ) | | | (59,280,934 | ) |
| |
Net increase (decrease) | | | (936,099 | ) | | | (20,292,052 | ) | | | 695,051 | | | | 13,806,296 | |
| |
Class B shares | | | | | | | | | | | | | | | | |
| | | | |
Subscriptions | | | 1,747 | | | | 31,680 | | | | 11,283 | | | | 194,842 | |
| | | | |
Distributions reinvested | | | — | | | | — | | | | 29,848 | | | | 517,855 | |
| | | | |
Redemptions(b) | | | (65,475 | ) | | | (1,178,058 | ) | | | (240,486 | ) | | | (4,160,489 | ) |
| |
Net decrease | | | (63,728 | ) | | | (1,146,378 | ) | | | (199,355 | ) | | | (3,447,792 | ) |
| |
Class C shares | | | | | | | | | | | | | | | | |
| | | | |
Subscriptions | | | 98,498 | | | | 1,781,956 | | | | 344,444 | | | | 6,051,191 | |
| | | | |
Distributions reinvested | | | — | | | | — | | | | 149,709 | | | | 2,600,441 | |
| | | | |
Redemptions | | | (198,533 | ) | | | (3,593,820 | ) | | | (500,536 | ) | | | (8,737,655 | ) |
| |
Net decrease | | | (100,035 | ) | | | (1,811,864 | ) | | | (6,383 | ) | | | (86,023 | ) |
| |
Class I shares | | | | | | | | | | | | | | | | |
| | | | |
Subscriptions | | | 1,514 | | | | 35,373 | | | | 248,520 | | | | 5,569,611 | |
| | | | |
Distributions reinvested | | | — | | | | — | | | | 66,176 | | | | 1,497,554 | |
| | | | |
Redemptions | | | (22,725 | ) | | | (554,176 | ) | | | (625,565 | ) | | | (13,924,104 | ) |
| |
Net decrease | | | (21,211 | ) | | | (518,803 | ) | | | (310,869 | ) | | | (6,856,939 | ) |
| |
Class K shares | | | | | | | | | | | | | | | | |
| | | | |
Subscriptions | | | 19,105 | | | | 450,680 | | | | 74,142 | | | | 1,657,520 | |
| | | | |
Distributions reinvested | | | — | | | | — | | | | 17,475 | | | | 389,874 | |
| | | | |
Redemptions | | | (32,124 | ) | | | (752,717 | ) | | | (50,216 | ) | | | (1,120,815 | ) |
| |
Net increase (decrease) | | | (13,019 | ) | | | (302,037 | ) | | | 41,401 | | | | 926,579 | |
| |
Class R shares | | | | | | | | | | | | | | | | |
| | | | |
Subscriptions | | | 78,929 | | | | 1,651,027 | | | | 195,634 | | | | 3,950,600 | |
| | | | |
Distributions reinvested | | | — | | | | — | | | | 18,482 | | | | 369,633 | |
| | | | |
Redemptions | | | (113,739 | ) | | | (2,375,988 | ) | | | (224,883 | ) | | | (4,543,052 | ) |
| |
Net decrease | | | (34,810 | ) | | | (724,961 | ) | | | (10,767 | ) | | | (222,819 | ) |
| |
Class R4 shares | | | | | | | | | | | | | | | | |
| | | | |
Subscriptions | | | 9,276 | | | | 210,885 | | | | 51,700 | | | | 1,070,920 | |
| | | | |
Distributions reinvested | | | — | | | | — | | | | 2,914 | | | | 66,147 | |
| | | | |
Redemptions | | | (1,306 | ) | | | (30,437 | ) | | | (49,556 | ) | | | (1,136,250 | ) |
| |
Net increase | | | 7,970 | | | | 180,448 | | | | 5,058 | | | | 817 | |
| |
Class R5 shares | | | | | | | | | | | | | | | | |
| | | | |
Subscriptions | | | 7,837 | | | | 185,385 | | | | 9,869 | | | | 225,813 | |
| | | | |
Distributions reinvested | | | — | | | | — | | | | 1,177 | | | | 26,545 | |
| | | | |
Redemptions | | | (883 | ) | | | (19,919 | ) | | | (1,507 | ) | | | (34,737 | ) |
| |
Net increase | | | 6,954 | | | | 165,466 | | | | 9,539 | | | | 217,621 | |
| |
The accompanying Notes to Financial Statements are an integral part of this statement.
| | | | |
| Semiannual Report 2014 | | | 13 | |
| | |
| |
| | Columbia Select Smaller-Cap Value Fund |
Statement of Changes in Net Assets (continued)
| | | | | | | | | | | | | | | | |
| | | Six Months Ended
November 30, 2014(a)
(Unaudited) | | | Year Ended
May 31, 2014 | |
| | | Shares | | | Dollars ($) | | | Shares | | | Dollars ($) | |
Capital stock activity (continued) | | | | | | | | | | | | | | | | |
| | | | |
Class Y shares | | | | | | | | | | | | | | | | |
| | | | |
Subscriptions | | | 108 | | | | 2,500 | | | | — | | | | — | |
| |
Net increase | | | 108 | | | | 2,500 | | | | — | | | | — | |
| |
Class Z shares | | | | | | | | | | | | | | | | |
| | | | |
Subscriptions | | | 133,346 | | | | 3,140,720 | | | | 250,798 | | | | 5,617,890 | |
| | | | |
Distributions reinvested | | | — | | | | — | | | | 17,679 | | | | 397,074 | |
| | | | |
Redemptions | | | (85,474 | ) | | | (1,993,451 | ) | | | (139,018 | ) | | | (3,134,581 | ) |
| |
Net increase | | | 47,872 | | | | 1,147,269 | | | | 129,459 | | | | 2,880,383 | |
| |
Total net increase (decrease) | | | (1,105,998 | ) | | | (23,300,412 | ) | | | 353,134 | | | | 7,218,123 | |
| |
| (a) | Class Y shares are based on operations from October 1, 2014 (commencement of operations) through the stated period end. |
| (b) | Includes conversions of Class B shares to Class A shares, if any. |
The accompanying Notes to Financial Statements are an integral part of this statement.
| | |
| 14 | | Semiannual Report 2014 |
| | |
| |
| Columbia Select Smaller-Cap Value Fund | | |
Financial Highlights
The following tables are intended to help you understand the Fund’s financial performance. Certain information reflects financial results for a single share of a class held for the periods shown. Per share net investment income (loss) amounts are calculated based on average shares outstanding during the period. Total return assumes reinvestment of all dividends and distributions, if any. Total return does not reflect payment of sales charges, if any. Total return and portfolio turnover are not annualized for periods of less than one year. The portfolio turnover rate is calculated without regard to purchase and sales transactions of short-term instruments and certain derivatives, if any. If such transactions were included, the Fund’s portfolio turnover rate may be higher.
| | | | | | | | | | | | | | | | | | | | | | | | | | | | |
| |
| Six Months Ended
November 30, 2014 |
| | | Year Ended May 31, | | | | Year Ended December 31, | |
Class A | | | (Unaudited) | | | | 2014 | | | | 2013 | | | | 2012(a) | | | | 2011 | | | | 2010 | | | | 2009 | |
Per share data | | | | | | | | | | | | | | | | | | | | | | | | | | | | |
Net asset value, beginning of period | | | $21.52 | | | | $18.82 | | | | $14.31 | | | | $13.69 | | | | $15.97 | | | | $12.59 | | | | $9.23 | |
| | | | | | | | | | | | | | | | | | | | | | | | | | | | | |
Income from investment operations: | | | | | | | | | | | | | | | | | | | | | | | | | | | | |
| | | | | | | |
Net investment loss | | | (0.07 | ) | | | (0.03 | ) | | | (0.11 | ) | | | (0.06 | ) | | | (0.12 | ) | | | (0.11 | ) | | | (0.12 | ) |
| | | | | | | | | | | | | | | | | | | | | | | | | | | | | |
Net realized and unrealized gain (loss) | | | 0.55 | | | | 4.17 | | | | 5.06 | | | | 0.68 | | | | (1.40 | ) | | | 3.49 | | | | 3.48 | |
| | | | | | | | | | | | | | | | | | | | | | | | | | | | | |
Total from investment operations | | | 0.48 | | | | 4.14 | | | | 4.95 | | | | 0.62 | | | | (1.52 | ) | | | 3.38 | | | | 3.36 | |
| | | | | | | | | | | | | | | | | | | | | | | | | | | | | |
Less distributions to shareholders: | | | | | | | | | | | | | | | | | | | | | | | | | | | | |
| | | | | | | |
Net realized gains | | | — | | | | (1.44 | ) | | | (0.44 | ) | | | — | | | | (0.76 | ) | | | — | | | | — | |
| | | | | | | | | | | | | | | | | | | | | | | | | | | | | |
Total distributions to shareholders | | | — | | | | (1.44 | ) | | | (0.44 | ) | | | — | | | | (0.76 | ) | | | — | | | | — | |
| | | | | | | | | | | | | | | | | | | | | | | | | | | | | |
Proceeds from regulatory settlements | | | — | | | | — | | | | — | | | | — | | | | — | | | | 0.00 | (b) | | | 0.00 | (b) |
| | | | | | | | | | | | | | | | | | | | | | | | | | | | | |
Net asset value, end of period | | | $22.00 | | | | $21.52 | | | | $18.82 | | | | $14.31 | | | | $13.69 | | | | $15.97 | | | | $12.59 | |
| | | | | | | | | | | | | | | | | | | | | | | | | | | | | |
Total return | | | 2.23 | % | | | 22.30 | % | | | 35.23 | % | | | 4.53 | % | | | (9.42 | %) | | | 26.85 | %(c) | | | 36.40 | %(d) |
| | | | | | | | | | | | | | | | | | | | | | | | | | | | | |
Ratios to average net assets(e) | | | | | | | | | | | | | | | | | | | | | | | | | | | | |
| | | | | | | |
Total gross expenses | | | 1.39 | %(f) | | | 1.41 | % | | | 1.51 | % | | | 1.48 | %(f) | | | 1.48 | % | | | 1.66 | % | | | 2.00 | % |
| | | | | | | | | | | | | | | | | | | | | | | | | | | | | |
Total net expenses(g) | | | 1.39 | %(f)(h) | | | 1.40 | %(h) | | | 1.39 | %(h) | | | 1.41 | %(f) | | | 1.42 | %(h) | | | 1.33 | % | | | 1.69 | % |
| | | | | | | | | | | | | | | | | | | | | | | | | | | | | |
Net investment loss | | | (0.63 | %)(f) | | | (0.14 | %) | | | (0.67 | %) | | | (0.87 | %)(f) | | | (0.77 | %) | | | (0.84 | %) | | | (1.12 | %) |
| | | | | | | | | | | | | | | | | | | | | | | | | | | | | |
Supplemental data | | | | | | | | | | | | | | | | | | | | | | | | | | | | |
| | | | | | | |
Net assets, end of period (in thousands) | | | $375,388 | | | | $387,317 | | | | $325,677 | | | | $283,740 | | | | $295,973 | | | | $380,848 | | | | $221,181 | |
| | | | | | | | | | | | | | | | | | | | | | | | | | | | | |
Portfolio turnover | | | 13 | % | | | 22 | % | | | 9 | % | | | 3 | % | | | 18 | % | | | 5 | % | | | 7 | % |
| | | | | | | | | | | | | | | | | | | | | | | | | | | | | |
Notes to Financial Highlights
| (a) | For the period from January 1, 2012 to May 31, 2012. During the period, the Fund’s fiscal year end was changed from December 31 to May 31. |
| (c) | The Fund received proceeds from regulatory settlements. Had the Fund not received these proceeds, the total return would have been lower by 0.01%. |
| (d) | The Fund received proceeds from regulatory settlements. Had the Fund not received these proceeds, the total return would have been lower by 0.02%. |
| (e) | In addition to the fees and expenses that the Fund bears directly, the Fund indirectly bears a pro rata share of the fees and expenses of any other funds in which it invests. Such indirect expenses are not included in the Fund’s reported expense ratios. |
| (g) | Total net expenses include the impact of certain fee waivers/expense reimbursements made by the Investment Manager and certain of its affiliates, if applicable. |
| (h) | The benefits derived from expense reductions had an impact of less than 0.01%. |
The accompanying Notes to Financial Statements are an integral part of this statement.
| | | | |
| Semiannual Report 2014 | | | 15 | |
| | |
| |
| | Columbia Select Smaller-Cap Value Fund |
Financial Highlights (continued)
| | | | | | | | | | | | | | | | | | | | | | | | | | | | |
| |
| Six Months Ended
November 30, 2014 |
| | | Year Ended May 31, | | | | Year Ended December 31, | |
Class B | | | (Unaudited) | | | | 2014 | | | | 2013 | | | | 2012(a) | | | | 2011 | | | | 2010 | | | | 2009 | |
Per share data | | | | | | | | | | | | | | | | | | | | | | | | | | | | |
Net asset value, beginning of period | | | $17.97 | | | | $16.04 | | | | $12.34 | | | | $11.84 | | | | $14.04 | | | | $11.15 | | | | $8.23 | |
| | | | | | | | | | | | | | | | | | | | | | | | | | | | | |
Income from investment operations: | | | | | | | | | | | | | | | | | | | | | | | | | | | | |
| | | | | | | |
Net investment loss | | | (0.12 | ) | | | (0.16 | ) | | | (0.19 | ) | | | (0.09 | ) | | | (0.21 | ) | | | (0.19 | ) | | | (0.18 | ) |
| | | | | | | | | | | | | | | | | | | | | | | | | | | | | |
Net realized and unrealized gain (loss) | | | 0.46 | | | | 3.53 | | | | 4.33 | | | | 0.59 | | | | (1.23 | ) | | | 3.08 | | | | 3.10 | |
| | | | | | | | | | | | | | | | | | | | | | | | | | | | | |
Total from investment operations | | | 0.34 | | | | 3.37 | | | | 4.14 | | | | 0.50 | | | | (1.44 | ) | | | 2.89 | | | | 2.92 | |
| | | | | | | | | | | | | | | | | | | | | | | | | | | | | |
Less distributions to shareholders: | | | | | | | | | | | | | | | | | | | | | | | | | | | | |
| | | | | | | |
Net realized gains | | | — | | | | (1.44 | ) | | | (0.44 | ) | | | — | | | | (0.76 | ) | | | — | | | | — | |
| | | | | | | | | | | | | | | | | | | | | | | | | | | | | |
Total distributions to shareholders | | | — | | | | (1.44 | ) | | | (0.44 | ) | | | — | | | | (0.76 | ) | | | — | | | | — | |
| | | | | | | | | | | | | | | | | | | | | | | | | | | | | |
Proceeds from regulatory settlements | | | — | | | | — | | | | — | | | | — | | | | — | | | | 0.00 | (b) | | | 0.00 | (b) |
| | | | | | | | | | | | | | | | | | | | | | | | | | | | | |
Net asset value, end of period | | | $18.31 | | | | $17.97 | | | | $16.04 | | | | $12.34 | | | | $11.84 | | | | $14.04 | | | | $11.15 | |
| | | | | | | | | | | | | | | | | | | | | | | | | | | | | |
Total return | | | 1.89 | % | | | 21.33 | % | | | 34.28 | % | | | 4.22 | % | | | (10.15 | %) | | | 25.92 | %(c) | | | 35.48 | %(d) |
| | | | | | | | | | | | | | | | | | | | | | | | | | | | | |
Ratios to average net assets(e) | | | | | | | | | | | | | | | | | | | | | | | | | | | | |
| | | | | | | |
Total gross expenses | | | 2.14 | %(f) | | | 2.16 | % | | | 2.26 | % | | | 2.23 | %(f) | | | 2.23 | % | | | 2.43 | % | | | 2.77 | % |
| | | | | | | | | | | | | | | | | | | | | | | | | | | | | |
Total net expenses(g) | | | 2.14 | %(f)(h) | | | 2.15 | %(h) | | | 2.14 | %(h) | | | 2.16 | %(f) | | | 2.16 | %(h) | | | 2.10 | % | | | 2.46 | % |
| | | | | | | | | | | | | | | | | | | | | | | | | | | | | |
Net investment loss | | | (1.37 | %)(f) | | | (0.92 | %) | | | (1.41 | %) | | | (1.62 | %)(f) | | | (1.52 | %) | | | (1.62 | %) | | | (1.88 | %) |
| | | | | | | | | | | | | | | | | | | | | | | | | | | | | |
Supplemental data | | | | | | | | | | | | | | | | | | | | | | | | | | | | |
| | | | | | | |
Net assets, end of period (in thousands) | | | $4,722 | | | | $5,782 | | | | $8,356 | | | | $12,565 | | | | $13,501 | | | | $27,172 | | | | $26,500 | |
| | | | | | | | | | | | | | | | | | | | | | | | | | | | | |
Portfolio turnover | | | 13 | % | | | 22 | % | | | 9 | % | | | 3 | % | | | 18 | % | | | 5 | % | | | 7 | % |
| | | | | | | | | | | | | | | | | | | | | | | | | | | | | |
Notes to Financial Highlights
| (a) | For the period from January 1, 2012 to May 31, 2012. During the period, the Fund’s fiscal year end was changed from December 31 to May 31. |
| (c) | The Fund received proceeds from regulatory settlements. Had the Fund not received these proceeds, the total return would have been lower by 0.01%. |
| (d) | The Fund received proceeds from regulatory settlements. Had the Fund not received these proceeds, the total return would have been lower by 0.02%. |
| (e) | In addition to the fees and expenses that the Fund bears directly, the Fund indirectly bears a pro rata share of the fees and expenses of any other funds in which it invests. Such indirect expenses are not included in the Fund’s reported expense ratios. |
| (g) | Total net expenses include the impact of certain fee waivers/expense reimbursements made by the Investment Manager and certain of its affiliates, if applicable. |
| (h) | The benefits derived from expense reductions had an impact of less than 0.01%. |
The accompanying Notes to Financial Statements are an integral part of this statement.
| | |
| 16 | | Semiannual Report 2014 |
| | |
| |
| Columbia Select Smaller-Cap Value Fund | | |
Financial Highlights (continued)
| | | | | | | | | | | | | | | | | | | | | | | | | | | | |
| |
| Six Months Ended
November 30, 2014 |
| | | Year Ended May 31, | | | | Year Ended December 31, | |
Class C | | | (Unaudited) | | | | 2014 | | | | 2013 | | | | 2012(a) | | | | 2011 | | | | 2010 | | | | 2009 | |
Per share data | | | | | | | | | | | | | | | | | | | | | | | | | | | | |
Net asset value, beginning of period | | | $18.00 | | | | $16.06 | | | | $12.36 | | | | $11.86 | | | | $14.06 | | | | $11.17 | | | | $8.24 | |
| | | | | | | | | | | | | | | | | | | | | | | | | | | | | |
Income from investment operations: | | | | | | | | | | | | | | | | | | | | | | | | | | | | |
| | | | | | | |
Net investment loss | | | (0.12 | ) | | | (0.16 | ) | | | (0.19 | ) | | | (0.09 | ) | | | (0.21 | ) | | | (0.19 | ) | | | (0.19 | ) |
| | | | | | | | | | | | | | | | | | | | | | | | | | | | | |
Net realized and unrealized gain (loss) | | | 0.45 | | | | 3.54 | | | | 4.33 | | | | 0.59 | | | | (1.23 | ) | | | 3.08 | | | | 3.12 | |
| | | | | | | | | | | | | | | | | | | | | | | | | | | | | |
Total from investment operations | | | 0.33 | | | | 3.38 | | | | 4.14 | | | | 0.50 | | | | (1.44 | ) | | | 2.89 | | | | 2.93 | |
| | | | | | | | | | | | | | | | | | | | | | | | | | | | | |
Less distributions to shareholders: | | | | | | | | | | | | | | | | | | | | | | | | | | | | |
| | | | | | | |
Net realized gains | | | — | | | | (1.44 | ) | | | (0.44 | ) | | | — | | | | (0.76 | ) | | | — | | | | — | |
| | | | | | | | | | | | | | | | | | | | | | | | | | | | | |
Total distributions to shareholders | | | — | | | | (1.44 | ) | | | (0.44 | ) | | | — | | | | (0.76 | ) | | | — | | | | — | |
| | | | | | | | | | | | | | | | | | | | | | | | | | | | | |
Proceeds from regulatory settlements | | | — | | | | — | | | | — | | | | — | | | | — | | | | 0.00 | (b) | | | 0.00 | (b) |
| | | | | | | | | | | | | | | | | | | | | | | | | | | | | |
Net asset value, end of period | | | $18.33 | | | | $18.00 | | | | $16.06 | | | | $12.36 | | | | $11.86 | | | | $14.06 | | | | $11.17 | |
| | | | | | | | | | | | | | | | | | | | | | | | | | | | | |
Total return | | | 1.83 | % | | | 21.37 | % | | | 34.23 | % | | | 4.22 | % | | | (10.13 | %) | | | 25.87 | %(c) | | | 35.56 | %(d) |
| | | | | | | | | | | | | | | | | | | | | | | | | | | | | |
Ratios to average net assets(e) | | | | | | | | | | | | | | | | | | | | | | | | | | | | |
| | | | | | | |
Total gross expenses | | | 2.14 | %(f) | | | 2.16 | % | | | 2.26 | % | | | 2.23 | %(f) | | | 2.23 | % | | | 2.42 | % | | | 2.90 | % |
| | | | | | | | | | | | | | | | | | | | | | | | | | | | | |
Total net expenses(g) | | | 2.14 | %(f)(h) | | | 2.15 | %(h) | | | 2.14 | %(h) | | | 2.16 | %(f) | | | 2.17 | %(h) | | | 2.09 | % | | | 2.67 | % |
| | | | | | | | | | | | | | | | | | | | | | | | | | | | | |
Net investment loss | | | (1.38 | %)(f) | | | (0.91 | %) | | | (1.42 | %) | | | (1.63 | %)(f) | | | (1.52 | %) | | | (1.60 | %) | | | (2.10 | %) |
| | | | | | | | | | | | | | | | | | | | | | | | | | | | | |
Supplemental data | | | | | | | | | | | | | | | | | | | | | | | | | | | | |
| | | | | | | |
Net assets, end of period (in thousands) | | | $42,325 | | | | $43,354 | | | | $38,785 | | | | $33,327 | | | | $37,511 | | | | $51,712 | | | | $46,626 | |
| | | | | | | | | | | | | | | | | | | | | | | | | | | | | |
Portfolio turnover | | | 13 | % | | | 22 | % | | | 9 | % | | | 3 | % | | | 18 | % | | | 5 | % | | | 7 | % |
| | | | | | | | | | | | | | | | | | | | | | | | | | | | | |
Notes to Financial Highlights
| (a) | For the period from January 1, 2012 to May 31, 2012. During the period, the Fund’s fiscal year end was changed from December 31 to May 31. |
| (c) | The Fund received proceeds from regulatory settlements. Had the Fund not received these proceeds, the total return would have been lower by 0.01%. |
| (d) | The Fund received proceeds from regulatory settlements. Had the Fund not received these proceeds, the total return would have been lower by 0.02%. |
| (e) | In addition to the fees and expenses that the Fund bears directly, the Fund indirectly bears a pro rata share of the fees and expenses of any other funds in which it invests. Such indirect expenses are not included in the Fund’s reported expense ratios. |
| (g) | Total net expenses include the impact of certain fee waivers/expense reimbursements made by the Investment Manager and certain of its affiliates, if applicable. |
| (h) | The benefits derived from expense reductions had an impact of less than 0.01%. |
The accompanying Notes to Financial Statements are an integral part of this statement.
| | | | |
| Semiannual Report 2014 | | | 17 | |
| | |
| |
| | Columbia Select Smaller-Cap Value Fund |
Financial Highlights (continued)
| | | | | | | | | | | | | | | | | | | | | | | | | | | | |
| |
| Six Months Ended
November 30, 2014 |
| | | Year Ended May 31, | | | | Year Ended December 31, | |
Class I | | | (Unaudited) | | | | 2014 | | | | 2013 | | | | 2012(a) | | | | 2011 | | | | 2010 | | | | 2009(b) | |
Per share data | | | | | | | | | | | | | | | | | | | | | | | | | | | | |
Net asset value, beginning of period | | | $23.57 | | | | $20.41 | | | | $15.41 | | | | $14.71 | | | | $17.02 | | | | $13.35 | | | | $11.86 | |
| | | | | | | | | | | | | | | | | | | | | | | | | | | | | |
Income from investment operations: | | | | | | | | | | | | | | | | | | | | | | | | | | | | |
| | | | | | | |
Net investment income (loss) | | | (0.02 | ) | | | 0.07 | | | | (0.04 | ) | | | (0.03 | ) | | | (0.04 | ) | | | (0.05 | ) | | | (0.01 | ) |
| | | | | | | | | | | | | | | | | | | | | | | | | | | | | |
Net realized and unrealized gain (loss) | | | 0.61 | | | | 4.53 | | | | 5.48 | | | | 0.73 | | | | (1.51 | ) | | | 3.72 | | | | 1.50 | |
| | | | | | | | | | | | | | | | | | | | | | | | | | | | | |
Total from investment operations | | | 0.59 | | | | 4.60 | | | | 5.44 | | | | 0.70 | | | | (1.55 | ) | | | 3.67 | | | | 1.49 | |
| | | | | | | | | | | | | | | | | | | | | | | | | | | | | |
Less distributions to shareholders: | | | | | | | | | | | | | | | | | | | | | | | | | | | | |
| | | | | | | |
Net realized gains | | | — | | | | (1.44 | ) | | | (0.44 | ) | | | — | | | | (0.76 | ) | | | — | | | | — | |
| | | | | | | | | | | | | | | | | | | | | | | | | | | | | |
Total distributions to shareholders | | | — | | | | (1.44 | ) | | | (0.44 | ) | | | — | | | | (0.76 | ) | | | — | | | | — | |
| | | | | | | | | | | | | | | | | | | | | | | | | | | | | |
Proceeds from regulatory settlements | | | — | | | | — | | | | — | | | | — | | | | — | | | | 0.00 | (c) | | | — | |
| | | | | | | | | | | | | | | | | | | | | | | | | | | | | |
Net asset value, end of period | | | $24.16 | | | | $23.57 | | | | $20.41 | | | | $15.41 | | | | $14.71 | | | | $17.02 | | | | $13.35 | |
| | | | | | | | | | | | | | | | | | | | | | | | | | | | | |
Total return | | | 2.50 | % | | | 22.83 | % | | | 35.91 | % | | | 4.76 | % | | | (9.01 | %) | | | 27.49 | %(d) | | | 12.56 | % |
| | | | | | | | | | | | | | | | | | | | | | | | | | | | | |
Ratios to average net assets(e) | | | | | | | | | | | | | | | | | | | | | | | | | | | | |
| | | | | | | |
Total gross expenses | | | 0.93 | %(f) | | | 0.93 | % | | | 0.96 | % | | | 0.98 | %(f) | | | 0.94 | % | | | 1.09 | % | | | 1.14 | %(f) |
| | | | | | | | | | | | | | | | | | | | | | | | | | | | | |
Total net expenses(g) | | | 0.93 | %(f) | | | 0.93 | % | | | 0.93 | % | | | 0.94 | %(f) | | | 0.91 | % | | | 0.88 | % | | | 0.88 | %(f) |
| | | | | | | | | | | | | | | | | | | | | | | | | | | | | |
Net investment income (loss) | | | (0.17 | %)(f) | | | 0.32 | % | | | (0.21 | %) | | | (0.38 | %)(f) | | | (0.24 | %) | | | (0.38 | %) | | | (0.23 | %)(f) |
| | | | | | | | | | | | | | | | | | | | | | | | | | | | | |
Supplemental data | | | | | | | | | | | | | | | | | | | | | | | | | | | | |
| | | | | | | |
Net assets, end of period (in thousands) | | | $22,881 | | | | $22,829 | | | | $26,109 | | | | $20,764 | | | | $14,419 | | | | $10,145 | | | | $6,300 | |
| | | | | | | | | | | | | | | | | | | | | | | | | | | | | |
Portfolio turnover | | | 13 | % | | | 22 | % | | | 9 | % | | | 3 | % | | | 18 | % | | | 5 | % | | | 7 | % |
| | | | | | | | | | | | | | | | | | | | | | | | | | | | | |
Notes to Financial Highlights
| (a) | For the period from January 1, 2012 to May 31, 2012. During the period, the Fund’s fiscal year end was changed from December 31 to May 31. |
| (b) | Based on operations from August 3, 2009 (commencement of operations) through the stated period end. |
| (d) | The Fund received proceeds from regulatory settlements. Had the Fund not received these proceeds, the total return would have been lower by 0.01%. |
| (e) | In addition to the fees and expenses that the Fund bears directly, the Fund indirectly bears a pro rata share of the fees and expenses of any other funds in which it invests. Such indirect expenses are not included in the Fund’s reported expense ratios. |
| (g) | Total net expenses include the impact of certain fee waivers/expense reimbursements made by the Investment Manager and certain of its affiliates, if applicable. |
The accompanying Notes to Financial Statements are an integral part of this statement.
| | |
| 18 | | Semiannual Report 2014 |
| | |
| |
| Columbia Select Smaller-Cap Value Fund | | |
Financial Highlights (continued)
| | | | | | | | | | | | | | | | | | | | | | | | | | | | |
| |
| Six Months Ended
November 30, 2014 |
| | | Year Ended May 31, | | | | Year Ended December 31, | |
Class K | | | (Unaudited) | | | | 2014 | | | | 2013 | | | | 2012(a) | | | | 2011 | | | | 2010 | | | | 2009(b) | |
Per share data | | | | | | | | | | | | | | | | | | | | | | | | | | | | |
Net asset value, beginning of period | | | $23.20 | | | | $20.17 | | | | $15.28 | | | | $14.60 | | | | $16.94 | | | | $13.34 | | | | $11.86 | |
| | | | | | | | | | | | | | | | | | | | | | | | | | | | | |
Income from investment operations: | | | | | | | | | | | | | | | | | | | | | | | | | | | | |
| | | | | | | |
Net investment income (loss) | | | (0.05 | ) | | | 0.01 | | | | (0.09 | ) | | | (0.04 | ) | | | (0.09 | ) | | | (0.10 | ) | | | (0.03 | ) |
| | | | | | | | | | | | | | | | | | | | | | | | | | | | | |
Net realized and unrealized gain (loss) | | | 0.59 | | | | 4.46 | | | | 5.42 | | | | 0.72 | | | | (1.49 | ) | | | 3.70 | | | | 1.51 | |
| | | | | | | | | | | | | | | | | | | | | | | | | | | | | |
Total from investment operations | | | 0.54 | | | | 4.47 | | | | 5.33 | | | | 0.68 | | | | (1.58 | ) | | | 3.60 | | | | 1.48 | |
| | | | | | | | | | | | | | | | | | | | | | | | | | | | | |
Less distributions to shareholders: | | | | | | | | | | | | | | | | | | | | | | | | | | | | |
| | | | | | | |
Net realized gains | | | — | | | | (1.44 | ) | | | (0.44 | ) | | | — | | | | (0.76 | ) | | | — | | | | — | |
| | | | | | | | | | | | | | | | | | | | | | | | | | | | | |
Total distributions to shareholders | | | — | | | | (1.44 | ) | | | (0.44 | ) | | | — | | | | (0.76 | ) | | | — | | | | — | |
| | | | | | | | | | | | | | | | | | | | | | | | | | | | | |
Proceeds from regulatory settlements | | | — | | | | — | | | | — | | | | — | | | | — | | | | 0.00 | (c) | | | — | |
| | | | | | | | | | | | | | | | | | | | | | | | | | | | | |
Net asset value, end of period | | | $23.74 | | | | $23.20 | | | | $20.17 | | | | $15.28 | | | | $14.60 | | | | $16.94 | | | | $13.34 | |
| | | | | | | | | | | | | | | | | | | | | | | | | | | | | |
Total return | | | 2.33 | % | | | 22.45 | % | | | 35.49 | % | | | 4.66 | % | | | (9.23 | %) | | | 26.99 | %(d) | | | 12.48 | % |
| | | | | | | | | | | | | | | | | | | | | | | | | | | | | |
Ratios to average net assets(e) | | | | | | | | | | | | | | | | | | | | | | | | | | | | |
| | | | | | | |
Total gross expenses | | | 1.23 | %(f) | | | 1.23 | % | | | 1.26 | % | | | 1.23 | %(f) | | | 1.22 | % | | | 1.39 | % | | | 1.43 | %(f) |
| | | | | | | | | | | | | | | | | | | | | | | | | | | | | |
Total net expenses(g) | | | 1.23 | %(f) | | | 1.23 | % | | | 1.23 | % | | | 1.20 | %(f) | | | 1.18 | % | | | 1.18 | % | | | 1.18 | %(f) |
| | | | | | | | | | | | | | | | | | | | | | | | | | | | | |
Net investment income (loss) | | | (0.47 | %)(f) | | | 0.05 | % | | | (0.51 | %) | | | (0.65 | %)(f) | | | (0.53 | %) | | | (0.69 | %) | | | (0.58 | %)(f) |
| | | | | | | | | | | | | | | | | | | | | | | | | | | | | |
Supplemental data | | | | | | | | | | | | | | | | | | | | | | | | | | | | |
| | | | | | | |
Net assets, end of period (in thousands) | | | $6,658 | | | | $6,809 | | | | $5,083 | | | | $3,812 | | | | $3,642 | | | | $3,601 | | | | $42 | |
| | | | | | | | | | | | | | | | | | | | | | | | | | | | | |
Portfolio turnover | | | 13 | % | | | 22 | % | | | 9 | % | | | 3 | % | | | 18 | % | | | 5 | % | | | 7 | % |
| | | | | | | | | | | | | | | | | | | | | | | | | | | | | |
Notes to Financial Highlights
| (a) | For the period from January 1, 2012 to May 31, 2012. During the period, the Fund’s fiscal year end was changed from December 31 to May 31. |
| (b) | Based on operations from August 3, 2009 (commencement of operations) through the stated period end. |
| (d) | The Fund received proceeds from regulatory settlements. Had the Fund not received these proceeds, the total return would have been lower by 0.01%. |
| (e) | In addition to the fees and expenses that the Fund bears directly, the Fund indirectly bears a pro rata share of the fees and expenses of any other funds in which it invests. Such indirect expenses are not included in the Fund’s reported expense ratios. |
| (g) | Total net expenses include the impact of certain fee waivers/expense reimbursements made by the Investment Manager and certain of its affiliates, if applicable. |
The accompanying Notes to Financial Statements are an integral part of this statement.
| | | | |
| Semiannual Report 2014 | | | 19 | |
| | |
| |
| | Columbia Select Smaller-Cap Value Fund |
Financial Highlights (continued)
| | | | | | | | | | | | | | | | | | | | | | | | | | | | |
| |
| Six Months Ended
November 30, 2014 |
| | | Year Ended May 31, | | | | Year Ended December 31, | |
Class R | | | (Unaudited) | | | | 2014 | | | | 2013 | | | | 2012(a) | | | | 2011 | | | | 2010 | | | | 2009 | |
Per share data | | | | | | | | | | | | | | | | | | | | | | | | | | | | |
Net asset value, beginning of period | | | $20.77 | | | | $18.25 | | | | $13.92 | | | | $13.33 | | | | $15.62 | | | | $12.35 | | | | $9.08 | |
| | | | | | | | | | | | | | | | | | | | | | | | | | | | | |
Income from investment operations: | | | | | | | | | | | | | | | | | | | | | | | | | | | | |
| | | | | | | |
Net investment loss | | | (0.09 | ) | | | (0.08 | ) | | | (0.14 | ) | | | (0.07 | ) | | | (0.16 | ) | | | (0.16 | ) | | | (0.16 | ) |
| | | | | | | | | | | | | | | | | | | | | | | | | | | | | |
Net realized and unrealized gain (loss) | | | 0.53 | | | | 4.04 | | | | 4.91 | | | | 0.66 | | | | (1.37 | ) | | | 3.43 | | | | 3.43 | |
| | | | | | | | | | | | | | | | | | | | | | | | | | | | | |
Total from investment operations | | | 0.44 | | | | 3.96 | | | | 4.77 | | | | 0.59 | | | | (1.53 | ) | | | 3.27 | | | | 3.27 | |
| | | | | | | | | | | | | | | | | | | | | | | | | | | | | |
Less distributions to shareholders: | | | | | | | | | | | | | | | | | | | | | | | | | | | | |
| | | | | | | |
Net realized gains | | | — | | | | (1.44 | ) | | | (0.44 | ) | | | — | | | | (0.76 | ) | | | — | | | | — | |
| | | | | | | | | | | | | | | | | | | | | | | | | | | | | |
Total distributions to shareholders | | | — | | | | (1.44 | ) | | | (0.44 | ) | | | — | | | | (0.76 | ) | | | — | | | | — | |
| | | | | | | | | | | | | | | | | | | | | | | | | | | | | |
Proceeds from regulatory settlements | | | — | | | | — | | | | — | | | | — | | | | — | | | | 0.00 | (b) | | | 0.00 | (b) |
| | | | | | | | | | | | | | | | | | | | | | | | | | | | | |
Net asset value, end of period | | | $21.21 | | | | $20.77 | | | | $18.25 | | | | $13.92 | | | | $13.33 | | | | $15.62 | | | | $12.35 | |
| | | | | | | | | | | | | | | | | | | | | | | | | | | | | |
Total return | | | 2.12 | % | | | 22.01 | % | | | 34.92 | % | | | 4.43 | % | | | (9.69 | %) | | | 26.48 | %(c) | | | 36.01 | %(d) |
| | | | | | | | | | | | | | | | | | | | | | | | | | | | | |
Ratios to average net assets(e) | | | | | | | | | | | | | | | | | | | | | | | | | | | | |
| | | | | | | |
Total gross expenses | | | 1.64 | %(f) | | | 1.66 | % | | | 1.76 | % | | | 1.73 | %(f) | | | 1.73 | % | | | 1.87 | % | | | 2.31 | % |
| | | | | | | | | | | | | | | | | | | | | | | | | | | | | |
Total net expenses(g) | | | 1.64 | %(f)(h) | | | 1.65 | %(h) | | | 1.64 | %(h) | | | 1.67 | %(f) | | | 1.67 | %(h) | | | 1.66 | % | | | 2.19 | % |
| | | | | | | | | | | | | | | | | | | | | | | | | | | | | |
Net investment loss | | | (0.87 | %)(f) | | | (0.40 | %) | | | (0.92 | %) | | | (1.14 | %)(f) | | | (1.02 | %) | | | (1.16 | %) | | | (1.62 | %) |
| | | | | | | | | | | | | | | | | | | | | | | | | | | | | |
Supplemental data | | | | | | | | | | | | | | | | | | | | | | | | | | | | |
| | | | | | | |
Net assets, end of period (in thousands) | | | $11,447 | | | | $11,933 | | | | $10,684 | | | | $9,248 | | | | $11,156 | | | | $15,733 | | | | $10,778 | |
| | | | | | | | | | | | | | | | | | | | | | | | | | | | | |
Portfolio turnover | | | 13 | % | | | 22 | % | | | 9 | % | | | 3 | % | | | 18 | % | | | 5 | % | | | 7 | % |
| | | | | | | | | | | | | | | | | | | | | | | | | | | | | |
Notes to Financial Highlights
| (a) | For the period from January 1, 2012 to May 31, 2012. During the period, the Fund’s fiscal year end was changed from December 31 to May 31. |
| (c) | The Fund received proceeds from regulatory settlements. Had the Fund not received these proceeds, the total return would have been lower by 0.01%. |
| (d) | The Fund received proceeds from regulatory settlements. Had the Fund not received these proceeds, the total return would have been lower by 0.02%. |
| (e) | In addition to the fees and expenses that the Fund bears directly, the Fund indirectly bears a pro rata share of the fees and expenses of any other funds in which it invests. Such indirect expenses are not included in the Fund’s reported expense ratios. |
| (g) | Total net expenses include the impact of certain fee waivers/expense reimbursements made by the Investment Manager and certain of its affiliates, if applicable. |
| (h) | The benefits derived from expense reductions had an impact of less than 0.01%. |
The accompanying Notes to Financial Statements are an integral part of this statement.
| | |
| 20 | | Semiannual Report 2014 |
| | |
| |
| Columbia Select Smaller-Cap Value Fund | | |
Financial Highlights (continued)
| | | | | | | | | | | | |
| |
| Six Months Ended
November 30, 2014 |
| | | Year Ended May 31, | |
Class R4 | | | (Unaudited) | | | | 2014 | | | | 2013(a) | |
Per share data | | | | | | | | | | | | |
Net asset value, beginning of period | | | $23.63 | | | | $20.49 | | | | $15.99 | |
| | | | | | | | | | | | | |
Income from investment operations: | | | | | | | | | | | | |
| | | |
Net investment income (loss) | | | (0.04 | ) | | | 0.02 | | | | (0.04 | ) |
| | | | | | | | | | | | | |
Net realized and unrealized gain | | | 0.60 | | | | 4.56 | | | | 4.98 | |
| | | | | | | | | | | | | |
Total from investment operations | | | 0.56 | | | | 4.58 | | | | 4.94 | |
| | | | | | | | | | | | | |
Less distributions to shareholders: | | | | | | | | | | | | |
| | | |
Net realized gains | | | — | | | | (1.44 | ) | | | (0.44 | ) |
| | | | | | | | | | | | | |
Total distributions to shareholders | | | — | | | | (1.44 | ) | | | (0.44 | ) |
| | | | | | | | | | | | | |
Net asset value, end of period | | | $24.19 | | | | $23.63 | | | | $20.49 | |
| | | | | | | | | | | | | |
Total return | | | 2.37 | % | | | 22.64 | % | | | 31.47 | % |
| | | | | | | | | | | | | |
Ratios to average net assets(b) | | | | | | | | | | | | |
| | | |
Total gross expenses | | | 1.15 | %(c) | | | 1.16 | % | | | 1.27 | %(c) |
| | | | | | | | | | | | | |
Total net expenses(d) | | | 1.14 | %(c)(e) | | | 1.15 | %(e) | | | 1.14 | %(c) |
| | | | | | | | | | | | | |
Net investment income (loss) | | | (0.37 | %)(c) | | | 0.07 | % | | | (0.37 | %)(c) |
| | | | | | | | | | | | | |
Supplemental data | | | | | | | | | | | | |
| | | |
Net assets, end of period (in thousands) | | | $319 | | | | $123 | | | | $3 | |
| | | | | | | | | | | | | |
Portfolio turnover | | | 13 | % | | | 22 | % | | | 9 | % |
| | | | | | | | | | | | | |
Notes to Financial Highlights
| (a) | Based on operations from November 8, 2012 (commencement of operations) through the stated period end. |
| (b) | In addition to the fees and expenses that the Fund bears directly, the Fund indirectly bears a pro rata share of the fees and expenses of any other funds in which it invests. Such indirect expenses are not included in the Fund’s reported expense ratios. |
| (d) | Total net expenses include the impact of certain fee waivers/expense reimbursements made by the Investment Manager and certain of its affiliates, if applicable. |
| (e) | The benefits derived from expense reductions had an impact of less than 0.01%. |
The accompanying Notes to Financial Statements are an integral part of this statement.
| | | | |
| Semiannual Report 2014 | | | 21 | |
| | |
| |
| | Columbia Select Smaller-Cap Value Fund |
Financial Highlights (continued)
| | | | | | | | | | | | | | | | | | | | | | | | | | | | |
| |
| Six Months Ended
November 30, 2014 |
| | | Year Ended May 31, | | | | Year Ended December 31, | |
Class R5 | | | (Unaudited) | | | | 2014 | | | | 2013 | | | | 2012(a) | | | | 2011 | | | | 2010 | | | | 2009 | |
Per share data | | | | | | | | | | | | | | | | | | | | | | | | | | | | |
Net asset value, beginning of period | | | $23.49 | | | | $20.35 | | | | $15.40 | | | | $14.70 | | | | $17.01 | | | | $13.35 | | | | $9.72 | |
| | | | | | | | | | | | | | | | | | | | | | | | | | | | | |
Income from investment operations: | | | | | | | | | | | | | | | | | | | | | | | | | | | | |
| | | | | | | |
Net investment income (loss) | | | (0.03 | ) | | | 0.07 | | | | (0.05 | ) | | | (0.03 | ) | | | (0.05 | ) | | | (0.06 | ) | | | (0.09 | ) |
| | | | | | | | | | | | | | | | | | | | | | | | | | | | | |
Net realized and unrealized gain (loss) | | | 0.61 | | | | 4.51 | | | | 5.44 | | | | 0.73 | | | | (1.50 | ) | | | 3.72 | | | | 3.72 | |
| | | | | | | | | | | | | | | | | | | | | | | | | | | | | |
Total from investment operations | | | 0.58 | | | | 4.58 | | | | 5.39 | | | | 0.70 | | | | (1.55 | ) | | | 3.66 | | | | 3.63 | |
| | | | | | | | | | | | | | | | | | | | | | | | | | | | | |
Less distributions to shareholders: | | | | | | | | | | | | | | | | | | | | | | | | | | | | |
| | | | | | | |
Net realized gains | | | — | | | | (1.44 | ) | | | (0.44 | ) | | | — | | | | (0.76 | ) | | | — | | | | — | |
| | | | | | | | | | | | | | | | | | | | | | | | | | | | | |
Total distributions to shareholders | | | — | | | | (1.44 | ) | | | (0.44 | ) | | | — | | | | (0.76 | ) | | | — | | | | — | |
| | | | | | | | | | | | | | | | | | | | | | | | | | | | | |
Proceeds from regulatory settlements | | | — | | | | — | | | | — | | | | — | | | | — | | | | 0.00 | (b) | | | 0.00 | (b) |
| | | | | | | | | | | | | | | | | | | | | | | | | | | | | |
Net asset value, end of period | | | $24.07 | | | | $23.49 | | | | $20.35 | | | | $15.40 | | | | $14.70 | | | | $17.01 | | | | $13.35 | |
| | | | | | | | | | | | | | | | | | | | | | | | | | | | | |
Total return | | | 2.47 | % | | | 22.80 | % | | | 35.60 | % | | | 4.76 | % | | | (9.02 | %) | | | 27.42 | %(c) | | | 37.35 | %(d) |
| | | | | | | | | | | | | | | | | | | | | | | | | | | | | |
Ratios to average net assets(e) | | | | | | | | | | | | | | | | | | | | | | | | | | | | |
| | | | | | | |
Total gross expenses | | | 0.98 | %(f) | | | 0.98 | % | | | 0.98 | % | | | 0.98 | %(f) | | | 0.97 | % | | | 1.14 | % | | | 1.51 | % |
| | | | | | | | | | | | | | | | | | | | | | | | | | | | | |
Total net expenses(g) | | | 0.98 | %(f) | | | 0.98 | % | | | 0.98 | % | | | 0.95 | %(f) | | | 0.93 | % | | | 0.93 | % | | | 1.46 | % |
| | | | | | | | | | | | | | | | | | | | | | | | | | | | | |
Net investment income (loss) | | | (0.23 | %)(f) | | | 0.32 | % | | | (0.31 | %) | | | (0.41 | %)(f) | | | (0.28 | %) | | | (0.44 | %) | | | (0.88 | %) |
| | | | | | | | | | | | | | | | | | | | | | | | | | | | | |
Supplemental data | | | | | | | | | | | | | | | | | | | | | | | | | | | | |
| | | | | | | |
Net assets, end of period (in thousands) | | | $813 | | | | $630 | | | | $352 | | | | $2,145 | | | | $2,046 | | | | $2,289 | | | | $1,808 | |
| | | | | | | | | | | | | | | | | | | | | | | | | | | | | |
Portfolio turnover | | | 13 | % | | | 22 | % | | | 9 | % | | | 3 | % | | | 18 | % | | | 5 | % | | | 7 | % |
| | | | | | | | | | | | | | | | | | | | | | | | | | | | | |
Notes to Financial Highlights
| (a) | For the period from January 1, 2012 to May 31, 2012. During the period, the Fund’s fiscal year end was changed from December 31 to May 31. |
| (c) | The Fund received proceeds from regulatory settlements. Had the Fund not received these proceeds, the total return would have been lower by 0.01%. |
| (d) | The Fund received proceeds from regulatory settlements. Had the Fund not received these proceeds, the total return would have been lower by 0.02%. |
| (e) | In addition to the fees and expenses that the Fund bears directly, the Fund indirectly bears a pro rata share of the fees and expenses of any other funds in which it invests. Such indirect expenses are not included in the Fund’s reported expense ratios. |
| (g) | Total net expenses include the impact of certain fee waivers/expense reimbursements made by the Investment Manager and certain of its affiliates, if applicable. |
The accompanying Notes to Financial Statements are an integral part of this statement.
| | |
| 22 | | Semiannual Report 2014 |
| | |
| |
| Columbia Select Smaller-Cap Value Fund | | |
Financial Highlights (continued)
| | | | |
Class Y | |
| Six Months Ended
November 30, 2014(a)
(Unaudited) |
|
Per share data | | | | |
Net asset value, beginning of period | | | $23.11 | |
| | | | | |
Income from investment operations: | | | | |
| |
Net investment loss | | | (0.01 | ) |
| | | | | |
Net realized and unrealized gain | | | 1.50 | |
| | | | | |
Total from investment operations | | | 1.49 | |
| | | | | |
Net asset value, end of period | | | $24.60 | |
| | | | | |
Total return | | | 6.45 | % |
| | | | | |
Ratios to average net assets(b) | | | | |
| |
Total gross expenses | | | 0.88 | %(c) |
| | | | | |
Total net expenses(d) | | | 0.88 | %(c) |
| | | | | |
Net investment income | | | (0.24 | %)(c) |
| | | | | |
Supplemental data | | | | |
| |
Net assets, end of period (in thousands) | | | $3 | |
| | | | | |
Portfolio turnover | | | 13 | % |
| | | | | |
Notes to Financial Highlights
| (a) | Based on operations from October 1, 2014 (commencement of operations) through the stated period end. |
| (b) | In addition to the fees and expenses that the Fund bears directly, the Fund indirectly bears a pro rata share of the fees and expenses of any other funds in which it invests. Such indirect expenses are not included in the Fund’s reported expense ratios. |
| (d) | Total net expenses include the impact of certain fee waivers/expense reimbursements made by the Investment Manager and certain of its affiliates, if applicable. |
The accompanying Notes to Financial Statements are an integral part of this statement.
| | | | |
| Semiannual Report 2014 | | | 23 | |
| | |
| |
| | Columbia Select Smaller-Cap Value Fund |
Financial Highlights (continued)
| | | | | | | | | | | | | | | | | | | | | | | | |
| |
| Six Months Ended
November 30, 2014 |
| | | Year Ended May 31, | | | | Year Ended December 31, | |
Class Z | | | (Unaudited) | | | | 2014 | | | | 2013 | | | | 2012(a) | | | | 2011 | | | | 2010(b) | |
Per share data | | | | | | | | | | | | | | | | | | | | | | | | |
Net asset value, beginning of period | | | $23.37 | | | | $20.28 | | | | $15.35 | | | | $14.67 | | | | $17.01 | | | | $14.61 | |
| | | | | | | | | | | | | | | | | | | | | | | | | |
Income from investment operations: | | | | | | | | | | | | | | | | | | | | | | | | |
| | | | | | |
Net investment income (loss) | | | (0.04 | ) | | | 0.05 | | | | (0.07 | ) | | | (0.04 | ) | | | (0.08 | ) | | | (0.01 | ) |
| | | | | | | | | | | | | | | | | | | | | | | | | |
Net realized and unrealized gain (loss) | | | 0.59 | | | | 4.48 | | | | 5.44 | | | | 0.72 | | | | (1.50 | ) | | | 2.41 | |
| | | | | | | | | | | | | | | | | | | | | | | | | |
Total from investment operations | | | 0.55 | | | | 4.53 | | | | 5.37 | | | | 0.68 | | | | (1.58 | ) | | | 2.40 | |
| | | | | | | | | | | | | | | | | | | | | | | | | |
Less distributions to shareholders: | | | | | | | | | | | | | | | | | | | | | | | | |
| | | | | | |
Net realized gains | | | — | | | | (1.44 | ) | | | (0.44 | ) | | | — | | | | (0.76 | ) | | | — | |
| | | | | | | | | | | | | | | | | | | | | | | | | |
Total distributions to shareholders | | | — | | | | (1.44 | ) | | | (0.44 | ) | | | — | | | | (0.76 | ) | | | — | |
| | | | | | | | | | | | | | | | | | | | | | | | | |
Net asset value, end of period | | | $23.92 | | | | $23.37 | | | | $20.28 | | | | $15.35 | | | | $14.67 | | | | $17.01 | |
| | | | | | | | | | | | | | | | | | | | | | | | | |
Total return | | | 2.35 | % | | | 22.63 | % | | | 35.59 | % | | | 4.63 | % | | | (9.19 | %) | | | 16.43 | % |
| | | | | | | | | | | | | | | | | | | | | | | | | |
Ratios to average net assets(c) | | | | | | | | | | | | | | | | | | | | | | | | |
| | | | | | |
Total gross expenses | | | 1.15 | %(d) | | | 1.16 | % | | | 1.26 | % | | | 1.23 | %(d) | | | 1.20 | % | | | 1.55 | %(d) |
| | | | | | | | | | | | | | | | | | | | | | | | | |
Total net expenses(e) | | | 1.14 | %(d)(f) | | | 1.15 | %(f) | | | 1.14 | %(f) | | | 1.16 | %(d) | | | 1.19 | %(f) | | | 1.02 | %(d) |
| | | | | | | | | | | | | | | | | | | | | | | | | |
Net investment income (loss) | | | (0.37 | %)(d) | | | 0.22 | % | | | (0.42 | %) | | | (0.62 | %)(d) | | | (0.50 | %) | | | (0.34 | %)(d) |
| | | | | | | | | | | | | | | | | | | | | | | | | |
Supplemental data | | | | | | | | | | | | | | | | | | | | | | | | |
| | | | | | |
Net assets, end of period (in thousands) | | | $8,331 | | | | $7,019 | | | | $3,467 | | | | $2,417 | | | | $1,892 | | | | $133 | |
| | | | | | | | | | | | | | | | | | | | | | | | | |
Portfolio turnover | | | 13 | % | | | 22 | % | | | 9 | % | | | 3 | % | | | 18 | % | | | 5 | % |
| | | | | | | | | | | | | | | | | | | | | | | | | |
Notes to Financial Highlights
| (a) | For the period from January 1, 2012 to May 31, 2012. During the period, the Fund’s fiscal year end was changed from December 31 to May 31. |
| (b) | Based on operations from September 27, 2010 (commencement of operations) through the stated period end. |
| (c) | In addition to the fees and expenses that the Fund bears directly, the Fund indirectly bears a pro rata share of the fees and expenses of any other funds in which it invests. Such indirect expenses are not included in the Fund’s reported expense ratios. |
| (e) | Total net expenses include the impact of certain fee waivers/expense reimbursements made by the Investment Manager and certain of its affiliates, if applicable. |
| (f) | The benefits derived from expense reductions had an impact of less than 0.01%. |
The accompanying Notes to Financial Statements are an integral part of this statement.
| | |
| 24 | | Semiannual Report 2014 |
| | |
| |
| Columbia Select Smaller-Cap Value Fund | | |
Notes to Financial Statements
November 30, 2014 (Unaudited)
Note 1. Organization
Columbia Select Smaller-Cap Value Fund (the Fund), a series of Columbia Funds Series Trust II (the Trust), is a diversified fund. The Trust is registered under the Investment Company Act of 1940, as amended (the 1940 Act), as an open-end management investment company organized as a Massachusetts business trust.
Fund Shares
The Trust may issue an unlimited number of shares (without par value). The Fund offers Class A, Class B, Class C, Class I, Class K, Class R, Class R4, Class R5, Class Y and Class Z shares. Although all share classes generally have identical voting, dividend and liquidation rights, each share class votes separately when required by the Trust’s organizational documents or by law. Different share classes pay different distribution amounts to the extent the expenses of such share classes differ, and distributions in liquidation will be proportional to the net asset value of each share class. Each share class has its own expense structure and sales charges.
Class A shares are subject to a maximum front-end sales charge of 5.75% based on the initial investment amount. Class A shares purchased without an initial sales charge in accounts aggregating $1 million to $50 million at the time of purchase are subject to a contingent deferred sales charge (CDSC) if the shares are sold within 18 months of purchase, charged as follows: 1.00% CDSC if redeemed within 12 months of purchase, and 0.50% CDSC if redeemed more than 12, but less than 18, months after purchase.
Class B shares may be subject to a maximum CDSC of 5.00% based upon the holding period after purchase. Class B shares will generally convert to Class A shares eight years after purchase. The Fund no longer accepts investments by new or existing investors in the Fund’s Class B shares, except in connection with the reinvestment of any dividend and/or capital gain distributions in Class B shares of the Fund and exchanges by existing Class B shareholders of certain other funds within the Columbia Family of Funds.
Class C shares are subject to a 1.00% CDSC on shares redeemed within one year of purchase.
Class I shares are not subject to sales charges and are available only to the Columbia Family of Funds.
Class K shares are not subject to sales charges, however this share class is closed to new investors.
Class R shares are not subject to sales charges and are generally available only to certain retirement plans and other investors as described in the Fund’s prospectus.
Class R4 shares are not subject to sales charges and are generally available only to omnibus retirement plans and certain investors as described in the Fund’s prospectus.
Class R5 shares are not subject to sales charges and are generally available only to investors purchasing through authorized investment professionals and omnibus retirement plans.
Class Y shares are not subject to sales charges and are generally available only to certain retirement plans as described in the Fund’s prospectus. Class Y shares commenced operations on October 1, 2014.
Class Z shares are not subject to sales charges and are available only to eligible investors, which are subject to different investment minimums as described in the Fund’s prospectus.
Note 2. Summary of Significant Accounting Policies
Basis of Preparation
The Fund is an investment company that applies the accounting and reporting guidance in the Financial Accounting Standards Board (FASB) Accounting Standards Codification Topic 946, Financial Services — Investment Companies (ASC 946). The financial statements are prepared in accordance with U.S. generally accepted accounting principles (GAAP) which requires management to make certain estimates and assumptions that affect the reported amounts of assets and liabilities, the disclosure of contingent assets and liabilities at the date of the financial statements and the reported amounts of income and expenses during the reporting period. Actual results could differ from those estimates.
The following is a summary of significant accounting policies followed by the Fund in the preparation of its financial statements.
Security Valuation
All equity securities are valued at the close of business of the New York Stock Exchange (NYSE). Equity securities are valued at the last quoted sales price on the principal exchange or market on which they trade, except for securities traded on the NASDAQ Stock Market, which are valued at the NASDAQ official close price. Unlisted securities or listed securities for which there were no sales during the day are valued at the mean of the latest quoted bid and ask prices on such exchanges or markets.
Foreign equity securities are valued based on quotations from the principal market in which such securities are traded. If any foreign security prices are not readily available as a result of
| | | | |
| Semiannual Report 2014 | | | 25 | |
| | |
| |
| | Columbia Select Smaller-Cap Value Fund |
Notes to Financial Statements (continued)
November 30, 2014 (Unaudited)
limited share activity, the securities are valued at the mean of the latest quoted bid and ask prices on such exchanges or markets. Foreign currency exchange rates are generally determined at 4:00 p.m. Eastern (U.S.) time. Many securities markets and exchanges outside the U.S. close prior to the close of the NYSE; therefore, the closing prices for securities in such markets or on such exchanges may not fully reflect events that occur after such close but before the close of the NYSE. In those situations, foreign securities will be fair valued pursuant to a policy adopted by the Board of Trustees (the Board) , including, if available, utilizing a third party pricing service to determine these fair values. The third party pricing service takes into account multiple factors, including, but not limited to, movements in the U.S. securities markets, certain depositary receipts, futures contracts and foreign exchange rates that have occurred subsequent to the close of the foreign exchange or market, to determine a good faith estimate that reasonably reflects the current market conditions as of the close of the NYSE. The fair value of a security is likely to be different from the quoted or published price, if available.
Investments in open-end investment companies, including money market funds, are valued at their net asset value.
Investments for which market quotations are not readily available, or that have quotations which management believes are not reliable, are valued at fair value as determined in good faith under procedures established by and under the general supervision of the Board. If a security or class of securities (such as foreign securities) is valued at fair value, such value is likely to be different from the quoted or published price for the security.
The determination of fair value often requires significant judgment. To determine fair value, management may use assumptions including but not limited to future cash flows and estimated risk premiums. Multiple inputs from various sources may be used to determine fair value.
Security Transactions
Security transactions are accounted for on the trade date. Cost is determined and gains (losses) are based upon the specific identification method for both financial statement and federal income tax purposes.
Income Recognition
Corporate actions and dividend income are generally recorded net of any non-reclaimable tax withholdings, on the ex-dividend date or upon receipt of ex-dividend notification in the case of certain foreign securities.
The Fund may receive distributions from holdings in business development companies (BDCs), exchange-traded funds
(ETFs), other regulated investment companies (RICs), and real estate investment trusts (REITs), which report information on the character of their distributions annually. These distributions are allocated to dividend income, capital gain and return of capital based on actual information reported. To the extent actual information has not yet been reported by the REITs, estimates for return of capital are made by the Fund’s management. Return of capital is recorded as a reduction of the cost basis of securities held. If the Fund no longer owns the applicable securities, return of capital is recorded as a realized gain. Management’s estimates are subsequently adjusted when the actual character of the distributions is disclosed by the REITs, which could result in a proportionate change in return of capital to shareholders. No estimates are made for the BDCs, ETFs, and RICs.
Awards from class action litigation are recorded as a reduction of cost basis if the Fund still owns the applicable securities on the payment date. If the Fund no longer owns the applicable securities, the proceeds are recorded as realized gains.
The value of additional securities received as an income payment is recorded as income and increases the cost basis of such securities.
Expenses
General expenses of the Trust are allocated to the Fund and other funds of the Trust based upon relative net assets or other expense allocation methodologies determined by the nature of the expense. Expenses directly attributable to the Fund are charged to the Fund. Expenses directly attributable to a specific class of shares are charged to that share class.
Determination of Class Net Asset Value
All income, expenses (other than class-specific expenses, which are charged to that share class, as shown in the Statement of Operations) and realized and unrealized gains (losses) are allocated to each class of the Fund on a daily basis, based on the relative net assets of each class, for purposes of determining the net asset value of each class.
Federal Income Tax Status
The Fund intends to qualify each year as a regulated investment company under Subchapter M of the Internal Revenue Code, as amended, and will distribute substantially all of its taxable income (including net short-term capital gains), if any, for its tax year, and as such will not be subject to federal income taxes. In addition, the Fund intends to distribute in each calendar year substantially all of its net investment income, capital gains and certain other amounts, if any, such that the Fund should not be subject to federal excise tax. Therefore, no federal income or excise tax provision is recorded.
| | |
| 26 | | Semiannual Report 2014 |
| | |
| |
| Columbia Select Smaller-Cap Value Fund | | |
Notes to Financial Statements (continued)
November 30, 2014 (Unaudited)
Distributions to Shareholders
Distributions from net investment income, if any, are declared and paid annually. Net realized capital gains, if any, are distributed along with the income distribution. Income distributions and capital gain distributions are determined in accordance with federal income tax regulations, which may differ from GAAP.
Guarantees and Indemnifications
Under the Trust’s organizational documents and, in some cases, by contract, its officers and trustees are indemnified against certain liabilities arising out of the performance of their duties to the Trust or its funds. In addition, certain of the Fund’s contracts with its service providers contain general indemnification clauses. The Fund’s maximum exposure under these arrangements is unknown since the amount of any future claims that may be made against the Fund cannot be determined, and the Fund has no historical basis for predicting the likelihood of any such claims.
Note 3. Fees and Compensation Paid to Affiliates
Investment Management Fees
Under an Investment Management Services Agreement, Columbia Management Investment Advisers, LLC (the Investment Manager), a wholly-owned subsidiary of Ameriprise Financial, Inc. (Ameriprise Financial), determines which securities will be purchased, held or sold. The investment management fee is an annual fee that is equal to a percentage of the Fund’s average daily net assets that declines from 0.79% to 0.70% as the Fund’s net assets increase. The annualized effective investment management fee rate for the six months ended November 30, 2014 was 0.79% of the Fund’s average daily net assets.
Administration Fees
Under an Administrative Services Agreement, the Investment Manager also serves as the Fund Administrator. The Fund pays the Fund Administrator an annual fee for administration and accounting services equal to a percentage of the Fund’s average daily net assets that declines from 0.08% to 0.05% as the Fund’s net assets increase. The annualized effective administration fee rate for the six months ended November 30, 2014 was 0.08% of the Fund’s average daily net assets.
Other Expenses
Other expenses are for, among other things, miscellaneous expenses of the Fund or the Board, including payments to a company providing limited administrative services to the Fund and the Board. That company’s expenses include boardroom
and office expense, employee compensation, employee health and retirement benefits, and certain other expenses. For the six months ended November 30, 2014, other expenses paid by the Fund to this company were $890.
Compensation of Board Members
Board members are compensated for their services to the Fund as disclosed in the Statement of Operations. Under a Deferred Compensation Plan (the Plan), the Board members who are not “interested persons” of the Fund, as defined under the 1940 Act, may elect to defer payment of up to 100% of their compensation. Deferred amounts are treated as though equivalent dollar amounts had been invested in shares of certain funds managed by the Investment Manager. The Fund’s liability for these amounts is adjusted for market value changes and remains in the Fund until distributed in accordance with the Plan.
Transfer Agent Fees
Under a Transfer and Dividend Disbursing Agent Agreement, Columbia Management Investment Services Corp. (the Transfer Agent), an affiliate of the Investment Manager and a wholly-owned subsidiary of Ameriprise Financial, is responsible for providing transfer agency services to the Fund. The Transfer Agent has contracted with Boston Financial Data Services (BFDS) to serve as sub-transfer agent.
Effective November 1, 2014, the Transfer Agent receives a monthly transfer agency fee based on the number or the average value of accounts, depending on the type of account. Prior to November 1, 2014, the Transfer Agent received a monthly account-based service fee based on the number of open accounts. In addition, the Transfer Agent also receives sub-transfer agency fees based on a percentage of the average aggregate value of the Fund’s shares maintained in omnibus accounts (other than omnibus accounts for which American Enterprise Investment Services Inc. is the broker of record or accounts where the beneficial shareholder is a customer of Ameriprise Financial Services, Inc., which receive a per account fee). The Transfer Agent pays the fees of BFDS for services as sub-transfer agent and is not entitled to reimbursement for such fees from the Fund (with the exception of out-of-pocket fees).
The Transfer Agent also receives compensation from the Fund for various shareholder services and reimbursements for certain out-of-pocket fees. Total transfer agent fees for Class K and Class R5 shares are subject to an annual limitation of not more than 0.05% of the average daily net assets attributable to each share class. Class I and Class Y shares are not subject to transfer agent fees.
| | | | |
| Semiannual Report 2014 | | | 27 | |
| | |
| |
| | Columbia Select Smaller-Cap Value Fund |
Notes to Financial Statements (continued)
November 30, 2014 (Unaudited)
For the six months ended November 30, 2014, the Fund’s annualized effective transfer agent fee rates as a percentage of average daily net assets of each class were as follows:
| | | | |
Class A | | | 0.21 | % |
Class B | | | 0.21 | |
Class C | | | 0.21 | |
Class K | | | 0.05 | |
Class R | | | 0.21 | |
Class R4 | | | 0.21 | |
Class R5 | | | 0.05 | |
Class Z | | | 0.21 | |
The Fund and certain other associated investment companies, have severally, but not jointly, guaranteed the performance and observance of all the terms and conditions of a lease entered into by Seligman Data Corp. (SDC), the former transfer agent, including the payment of rent by SDC (the Guaranty). SDC was the legacy Seligman funds’ former transfer agent. The lease and the Guaranty expire in January 2019. At November 30, 2014, the Fund’s total potential future obligation over the life of the Guaranty is $92,740. The liability remaining at November 30, 2014 for non-recurring charges associated with the lease amounted to $52,612 and is recorded as a part of the payable for other expenses in the Statement of Assets and Liabilities.
An annual minimum account balance fee of $20 may apply to certain accounts with a value below the applicable share class’s initial minimum investment requirements to reduce the impact of small accounts on transfer agent fees. These minimum account balance fees are remitted to the Fund and recorded as part of expense reductions in the Statement of Operations. For the six months ended November 30, 2014, these minimum account balance fees reduced total expenses of the Fund by $1,454.
Plan Administration Fees
Under a Plan Administration Services Agreement with the Transfer Agent, the Fund pays an annual fee at a rate of 0.25% of the Fund’s average daily net assets attributable to Class K shares for the provision of various administrative, recordkeeping, communication and educational services.
Distribution Fees
The Fund has an agreement with Columbia Management Investment Distributors, Inc. (the Distributor), an affiliate of the Investment Manager and a wholly-owned subsidiary of Ameriprise Financial, for distribution and shareholder services. Under a Plan and Agreement of Distribution, the Fund pays a fee at an annual rate of up to 0.25% of the Fund’s average daily net assets attributable to Class A shares, a fee at
an annual rate of up to 0.50% of the Fund’s average daily net assets attributable to Class R shares (of which up to 0.25% may be used for shareholder services) and a fee at an annual rate of up to 1.00% of the Fund’s average daily net assets attributable to Class B and Class C shares. For Class B and Class C shares, of the 1.00% fee, up to 0.75% is reimbursed for distribution expenses.
The amount of distribution expenses incurred by the Distributor and not yet reimbursed (unreimbursed expense) was approximately $637,000 and $2,516,000 for Class B and Class C shares, respectively. These amounts are based on the most recent information available as of September 30, 2014, and may be recovered from future payments under the distribution plan or CDSCs. To the extent the unreimbursed expense has been fully recovered, the distribution fee is reduced.
Sales Charges
Sales charges, including front-end charges and CDSCs, received by the Distributor for distributing Fund shares were $81,587 for Class A, $142 for Class B and $354 for Class C shares for the six months ended November 30, 2014.
Expenses Waived/Reimbursed by the Investment Manager and its Affiliates
The Fund’s expense ratio is subject to an expense reimbursement arrangement pursuant to which fees will be waived and/or expenses reimbursed (excluding certain fees and expenses described below), so that the Fund’s net operating expenses, after giving effect to fees waived/expenses reimbursed and any balance credits and/or overdraft charges from the Fund’s custodian, do not exceed the annual rates of:
| | | | | | | | |
| | | Voluntary Expense Cap Effective October 1, 2014 | | | Contractual Expense Cap Prior to October 1, 2014 | |
Class A | | | 1.38 | % | | | 1.40 | % |
Class B | | | 2.13 | | | | 2.15 | |
Class C | | | 2.13 | | | | 2.15 | |
Class I | | | 0.97 | | | | 0.96 | |
Class K | | | 1.27 | | | | 1.26 | |
Class R | | | 1.63 | | | | 1.65 | |
Class R4 | | | 1.13 | | | | 1.15 | |
Class R5 | | | 1.02 | | | | 1.01 | |
Class Y | | | 0.97 | * | | | — | |
Class Z | | | 1.13 | | | | 1.15 | |
| * | Fee rate is effective beginning October 1, 2014 (the commencement of operations of Class Y shares). |
| | |
| 28 | | Semiannual Report 2014 |
| | |
| |
| Columbia Select Smaller-Cap Value Fund | | |
Notes to Financial Statements (continued)
November 30, 2014 (Unaudited)
The voluntary expense cap arrangement may be revised or discontinued at any time. Under the arrangements, the following fees and expenses are excluded from the waiver/reimbursement commitment, and therefore will be paid by the Fund, if applicable: taxes (including foreign transaction taxes), expenses associated with investments in affiliated and non-affiliated pooled investment vehicles (including mutual funds and exchange-traded funds), transaction costs and brokerage commissions, costs related to any securities lending program, dividend expenses associated with securities sold short, inverse floater program fees and expenses, transaction charges and interest on borrowed money, interest and extraordinary expenses.
Note 4. Federal Tax Information
The timing and character of income and capital gain distributions are determined in accordance with income tax regulations, which may differ from GAAP because of temporary or permanent book to tax differences.
At November 30, 2014, the cost of investments for federal income tax purposes was approximately $309,064,000 and the aggregate gross approximate unrealized appreciation and depreciation based on that cost was:
| | | | |
Unrealized appreciation | | | $182,240,000 | |
Unrealized depreciation | | | (18,627,000 | ) |
Net unrealized appreciation | | | $163,613,000 | |
The following capital loss carryforwards, determined as of May 31, 2014, may be available to reduce taxable income arising from future net realized gains on investments, if any, to the extent permitted by the Internal Revenue Code:
| | | | |
| | | | | |
| Year of Expiration | | Amount ($) | |
2016 | | | 17,541,329 | |
2017 | | | 17,513,029 | |
Total | | | 35,054,358 | |
Management of the Fund has concluded that there are no significant uncertain tax positions in the Fund that would require recognition in the financial statements. However, management’s conclusion may be subject to review and adjustment at a later date based on factors including, but not limited to, new tax laws, regulations, and administrative interpretations (including relevant court decisions). Generally, the Fund’s federal tax returns for the prior three fiscal years remain subject to examination by the Internal Revenue Service.
Note 5. Portfolio Information
The cost of purchases and proceeds from sales of securities, excluding short-term obligations and certain derivatives, if
any, aggregated to $61,333,447 and $87,845,747, respectively, for the six months ended November 30, 2014. The amount of purchase and sale activity impacts the portfolio turnover rate reported in the Financial Highlights.
Note 6. Affiliated Money Market Fund
The Fund invests in Columbia Short-Term Cash Fund, an affiliated money market fund established for the exclusive use by the Fund and other affiliated funds. The income earned by the Fund from such investments is included as Dividends — affiliated issuers in the Statement of Operations. As an investing fund, the Fund indirectly bears its proportionate share of the expenses of Columbia Short-Term Cash Fund.
Note 7. Shareholder Concentration
At November 30, 2014, affiliated shareholders of record owned 64.2 % of the outstanding shares of the Fund in one or more accounts. Subscription and redemption activity by concentrated accounts may have a significant effect on the operations of the Fund.
Note 8. Line of Credit
The Fund has entered into a revolving credit facility with a syndicate of banks led by JPMorgan Chase Bank N.A. (JPMorgan) whereby the Fund may borrow for the temporary funding of shareholder redemptions or for other temporary or emergency purposes. The credit facility agreement, as amended, which is a collective agreement between the Fund and certain other funds managed by the Investment Manager, severally and not jointly, permits collective borrowings up to $500 million. Interest is charged to each participating fund based on its borrowings at a rate equal to the higher of (i) the overnight federal funds rate plus 1.00% or (ii) the one-month LIBOR rate plus 1.00%. Each borrowing under the credit facility matures no later than 60 days after the date of borrowing. The Fund also pays a commitment fee equal to its pro rata share of the amount of the credit facility at a rate of 0.075% per annum. The commitment fee is included in other expenses in the Statement of Operations.
Effective December 9, 2014, the Fund extended its revolving credit facility with JPMorgan. The credit facility agreement, as amended, permits collective borrowings up to $550 million under the same terms and interest rates as described above.
The Fund had no borrowings during the six months ended November 30, 2014.
Note 9. Subsequent Events
Management has evaluated the events and transactions that have occurred through the date the financial statements were issued. Other than as noted in Note 8 above, there were no
| | | | |
| Semiannual Report 2014 | | | 29 | |
| | |
| |
| | Columbia Select Smaller-Cap Value Fund |
Notes to Financial Statements (continued)
November 30, 2014 (Unaudited)
items requiring adjustment of the financial statements or additional disclosure.
Note 10. Information Regarding Pending and Settled Legal Proceedings
In December 2005, without admitting or denying the allegations, American Express Financial Corporation (AEFC, which is now known as Ameriprise Financial, Inc. (Ameriprise Financial)) entered into settlement agreements with the Securities and Exchange Commission (SEC) and Minnesota Department of Commerce (MDOC) related to market timing activities. As a result, AEFC was censured and ordered to cease and desist from committing or causing any violations of certain provisions of the Investment Advisers Act of 1940, the Investment Company Act of 1940, and various Minnesota laws. AEFC agreed to pay disgorgement of $10 million and civil money penalties of $7 million. AEFC also agreed to retain an independent distribution consultant to assist in developing a plan for distribution of all disgorgement and civil penalties ordered by the SEC in accordance with various undertakings detailed at www.sec.gov/litigation/admin/ia-2451.pdf. Ameriprise Financial and its affiliates have cooperated with the SEC and the MDOC in these legal proceedings, and have made regular reports to the Funds’ Boards of Trustees.
Ameriprise Financial and certain of its affiliates have historically been involved in a number of legal, arbitration and regulatory proceedings, including routine litigation, class actions, and governmental actions, concerning matters arising in connection with the conduct of their business activities. Ameriprise Financial believes that the Funds are not currently the subject of, and that neither Ameriprise Financial nor any of its affiliates are the subject of, any pending legal, arbitration or regulatory proceedings that are likely to have a material adverse effect on the Funds or the ability of Ameriprise Financial or its affiliates to perform under their contracts with the Funds. Ameriprise Financial is required to make quarterly (10-Q), annual (10-K) and, as necessary, 8-K filings with the Securities and Exchange Commission on legal and regulatory matters that relate to Ameriprise Financial and its affiliates. Copies of these filings may be obtained by accessing the SEC website at www.sec.gov.
There can be no assurance that these matters, or the adverse publicity associated with them, will not result in increased fund redemptions, reduced sale of fund shares or other adverse consequences to the Funds. Further, although we believe proceedings are not likely to have a material adverse effect on the Funds or the ability of Ameriprise Financial or its affiliates to perform under their contracts with the Funds, these proceedings are subject to uncertainties and, as such, we are
unable to estimate the possible loss or range of loss that may result. An adverse outcome in one or more of these proceedings could result in adverse judgments, settlements, fines, penalties or other relief that could have a material adverse effect on the consolidated financial condition or results of operations of Ameriprise Financial.
| | |
| 30 | | Semiannual Report 2014 |
| | |
| |
| Columbia Select Smaller-Cap Value Fund | | |
Important Information About This Report
Each fund mails one shareholder report to each shareholder address. If you would like more than one report, please call shareholder services at 800.345.6611 and additional reports will be sent to you.
The policy of the Board is to vote the proxies of the companies in which each fund holds investments consistent with the procedures as stated in the Statement of Additional Information (SAI). You may obtain a copy of the SAI without charge by calling 800.345.6611; contacting your financial intermediary; visiting columbiamanagement.com; or searching the website of the Securities and Exchange Commission (SEC) at sec.gov. Information regarding how each fund voted proxies relating to portfolio securities is filed with the SEC by August 31 for the most recent 12-month period ending June 30 of that year, and is available without charge by visiting columbiamanagement.com; or searching the website of the SEC at sec.gov.
Each fund files a complete schedule of portfolio holdings with the SEC for the first and third quarters of each fiscal year on Form N-Q. Each fund’s Form N-Q is available on the SEC’s website at sec.gov and may be reviewed and copied at the SEC’s Public Reference Room in Washington, D.C. Information on the operation of the Public Reference Room may be obtained by calling 800.SEC.0330. Each fund’s complete schedule of portfolio holdings, as filed on Form N-Q, can also be obtained without charge, upon request, by calling 800.345.6611.
| | | | |
| Semiannual Report 2014 | | | 31 | |

Columbia Select Smaller-Cap Value Fund
P.O. Box 8081
Boston, MA 02266-8081
columbiamanagement.com
This information is for use with concurrent or prior delivery of a fund prospectus. Please read and consider the investment objectives, risks, charges and expenses for any fund carefully before investing. For a prospectus and, if available, a summary prospectus, which contains this and other important information about the Fund, go to columbiamanagement.com. The Fund is distributed by Columbia Management Investment Distributors, Inc., member FINRA, and managed by Columbia Management Investment Advisers, LLC.
© 2015 Columbia Management Investment Advisers, LLC. All rights reserved.
SAR218_05_E01_(01/15)
| | |
Semiannual Report November 30, 2014 | |  |
| | |
Columbia Seligman Communications and Information Fund | | |


President’s Message
Note: Effective January 1, 2015, Christopher O. Petersen will serve as the President of the Columbia Funds, replacing J. Kevin Connaughton. Mr. Petersen has served as a Fund officer since 2007.
Dear Shareholders,
People invest for different reasons, though typically based on a desire for one or more outcomes, e.g., generating an appropriate income stream in retirement, navigating a changing interest rate environment, maximizing after-tax returns, growing assets to achieve financial goals, or easing the impact of volatile markets. Achieving these desired outcomes can be particularly challenging given the unpredictability of complex global markets. To continue to effectively deliver solutions that help clients achieve desired outcomes, an asset manager must have the resources and investment framework to meaningfully embody a global perspective.
With this in mind, I thought it important to highlight excerpts from a piece written by Jeffrey L. Knight, Global Head of Investment Solutions and Asset Allocation, in which he touches on some of these issues emphasizing the importance of maintaining a diversified portfolio with the flexibility to adapt to changing market conditions.
I encourage you to read the article in its entirety. To access the full article and for other insights on current market events and investment opportunities, please visit the Columbia Management blog at columbiamanagement.com/blog.
On behalf of the Funds, I want to acknowledge the contributions of J. Kevin Connaughton and to thank him for his years of trusted, dedicated service. He has worked tirelessly as an advocate for shareholders and a leader of the Columbia Funds. In taking on this new role, I look forward to continuing the work of Mr. Connaughton, helping build on the strong foundation of the Columbia Funds.
Thank you for your confidence. We look forward to continuing to serve your investment needs for many years to come.
Best regards,

Christopher O. Petersen
President, Columbia Funds
Excerpts from:
2015 Outlook: Same song, slightly different arrangement
By Jeffrey L. Knight, Global Head of Investment Solutions and Asset Allocation
Jeffrey L. Knight, CFA, is global head of investment solutions and asset allocation for Columbia Management Investment Advisers, LLC. Mr. Knight leads a team of six portfolio managers responsible for our broad suite of multi-asset strategies including capital allocation, risk allocation, absolute return and total return funds.
What’s different in 2015?
As stationary as market conditions have felt lately, circumstances are always evolving. For 2015, while the essential elements of our outlook remain in place, we highlight two important changes in the market environment:
| > | | The relative value of global equities vs. global bonds actually improved during 2014. |
| > | | Monetary policy around the globe has become desynchronized, with the U.S. Federal Reserve (the Fed) contemplating rate hikes, while the European Central Bank (ECB) and the Bank of Japan (BOJ) intensify their monetary stimulus programs. |
In our view, while equities will most likely continue to dominate, the complex interactions of today’s conditions elevate the role of dynamic risk management. We argue that investors will need a cross-asset surveillance methodology to detect tactical threats.
Semiannual Report 2014
President’s Message (continued)
Monetary policies diverge
The Fed has given strong signals that economic growth in the United States has reached self-sustaining momentum and no longer needs unconventional efforts to support the expansion. The withdrawal and suspension of large-scale asset purchases was only the first step in the evolution toward policy normalization. In 2015, we expect to see a change in forward guidance and, most likely, the first interest rate increase in years.
These actions stand in stark contrast with the direction of the monetary policies of other central banks as they double down on efforts to support growth and avoid deflation. The Bank of Japan has announced its intention to increase both qualitative and quantitative easing on an enormous scale, expanding purchases of Japanese government bonds (JGBs), exchange-traded funds and real estate investment trusts. They intend to coordinate this with government pension investment fund purchases by shifting into riskier assets through sales of JGBs.
With evidence of deterioration on both the economic and inflation front, the European Central Bank (ECB) also plans to take bolder actions. These include increased purchases of asset-backed securities and covered bonds in both the primary and secondary market, together with the long-term refinancing operations that will steer the ECB’s balance sheet higher by €1 trillion.
The latest to jump on the bandwagon was the People’s Bank of China (PBOC), which cut its benchmark interest rate for the first time in over two years to support private sector investment, as targeted liquidity injections have had minimal effect on sinking economic growth.
Investment strategy for 2015
We remain convinced that relative value favors stocks over bonds, even though stocks outperformed in 2014. Therefore, you will hear the same recommendation from us for 2015. Equities remain the most important asset class for generating returns.
Within equities, the currency-based advantage of U.S. stocks is offset somewhat by the valuation advantage from overseas equities, notably in Japan. Indeed, economic growth in Japan and Europe are essential ingredients for equities to continue to perform well. If Japanese and European stocks cannot produce gains, then the global economy will probably be stuck in a near recessionary funk.
Devising a strategy to manage risk and stabilize portfolio values in the event that equities do not perform well remains complicated. Bond yields are low enough that they are not likely to offer powerful diversification benefits. We affirm our recommendation for three additional sources of portfolio stability:
| > | | Non-traditional diversifiers, such as liquid alternatives, alternative beta exposures and absolute return strategies |
| > | | Explicit downside hedges, such as put options (with emphasis on managing the related expense) |
| > | | Flexibility and a methodology for active risk reduction when appropriate (Our cross-asset methodologies should prove valuable in this regard.) |
Our overall stance for investment strategy will likely remain in place until the valuation advantage for equities has been priced away, or until the healing process for the global economy reverses.
Please visit columbiamanagement.com/blog to read the entire article.
Investors should consider the investment objectives, risks, charges and expenses of a mutual fund carefully before investing. For a free prospectus and, if available, a summary prospectus, which contains this and other important information about a fund, visit columbiamanagement.com. The prospectus should be read carefully before investing.
The views expressed are as of December 2014, may change as market or other conditions change, and may differ from views expressed by other Columbia Management Investment Advisers, LLC (CMIA) associates or affiliates. Actual investments or investment decisions made by CMIA and its affiliates, whether for its own account or on behalf of clients, will not necessarily reflect the views expressed. This information is not intended to provide investment advice and does not account for individual investor circumstances. Investment decisions should always be made based on an investor’s specific financial needs, objectives, goals, time horizon and risk tolerance. Asset classes described may not be suitable for all investors. Past performance does not guarantee future results, and no forecast should be considered a guarantee either. Since economic and market change frequently, there can be no assurance that the trends described here will continue or that the forecasts are accurate.
Diversification does not assure a profit or protect against loss.
Columbia Funds are distributed by Columbia Management Investment Distributors, Inc., member FINRA, and managed by Columbia Management Investment Advisers, LLC.
© 2015 Columbia Management Investment Advisers, LLC. All rights reserved
Semiannual Report 2014
| | |
| |
| | Columbia Seligman Communications and Information Fund |
Table of Contents
Fund Investment Manager
Columbia Management Investment
Advisers, LLC
225 Franklin Street
Boston, MA 02110
Fund Distributor
Columbia Management Investment
Distributors, Inc.
225 Franklin Street
Boston, MA 02110
Fund Transfer Agent
Columbia Management Investment
Services Corp.
P.O. Box 8081
Boston, MA 02266-8081
For more information about any of the funds, please visit columbiamanagement.com or call 800.345.6611. Customer Service Representatives are available to answer your questions Monday through Friday from 8 a.m. to 7 p.m. Eastern time.
The views expressed in this report reflect the current views of the respective parties. These views are not guarantees of future performance and involve certain risks, uncertainties and assumptions that are difficult to predict, so actual outcomes and results may differ significantly from the views expressed. These views are subject to change at any time based upon economic, market or other conditions and the respective parties disclaim any responsibility to update such views. These views may not be relied on as investment advice and, because investment decisions for a Columbia Fund are based on numerous factors, may not be relied on as an indication of trading intent on behalf of any particular Columbia Fund. References to specific securities should not be construed as a recommendation or investment advice.
Semiannual Report 2014
| | |
| |
| Columbia Seligman Communications and Information Fund | | |
Performance Overview
(Unaudited)
Performance Summary
| > | | Columbia Seligman Communications and Information Fund (the Fund) Class A shares returned 14.13% excluding sales charges for the six-month period that ended November 30, 2014. |
| > | | The Fund outperformed its benchmark, the S&P North American Technology Sector Index, which returned 12.05% for the same time period. |
| | | | | | | | | | | | | | | | | | |
Average Annual Total Returns (%) (for period ended November 30, 2014) | |
| | | Inception | | 6 Months
cumulative | | | 1 Year | | | 5 Years | | | 10 Years | |
Class A | | 06/23/83 | | | | | | | | | | | | | | | | |
Excluding sales charges | | | | | 14.13 | | | | 30.51 | | | | 13.66 | | | | 11.15 | |
Including sales charges | | | | | 7.57 | | | | 23.02 | | | | 12.32 | | | | 10.49 | |
Class B | | 04/22/96 | | | | | | | | | | | | | | | | |
Excluding sales charges | | | | | 14.13 | | | | 30.52 | | | | 13.14 | | | | 10.47 | |
Including sales charges | | | | | 9.13 | | | | 25.52 | | | | 12.89 | | | | 10.47 | |
Class C | | 05/27/99 | | | | | | | | | | | | | | | | |
Excluding sales charges | | | | | 13.71 | | | | 29.56 | | | | 12.82 | | | | 10.32 | |
Including sales charges | | | | | 12.71 | | | | 28.56 | | | | 12.82 | | | | 10.32 | |
Class I* | | 08/03/09 | | | 14.36 | | | | 31.08 | | | | 14.15 | | | | 11.40 | |
Class K* | | 08/03/09 | | | 14.18 | | | | 30.67 | | | | 13.80 | | | | 11.22 | |
Class R | | 04/30/03 | | | 13.98 | | | | 30.21 | | | | 13.36 | | | | 10.86 | |
Class R4* | | 08/03/09 | | | 14.28 | | | | 30.85 | | | | 13.70 | | | | 11.08 | |
Class R5 | | 11/30/01 | | | 14.34 | | | | 31.00 | | | | 14.09 | | | | 11.61 | |
Class Z* | | 09/27/10 | | | 14.27 | | | | 30.85 | | | | 13.93 | | | | 11.28 | |
S&P North American Technology Sector Index | | | | | 12.05 | | | | 21.71 | | | | 16.43 | | | | 9.61 | |
Returns for Class A are shown with and without the maximum initial sales charge of 5.75%. Returns for Class B are shown with and without the applicable contingent deferred sales charge (CDSC) of 5.00% in the first year, declining to 1.00% in the sixth year and eliminated thereafter. Returns for Class C are shown with and without the 1.00% CDSC for the first year only. The Fund’s other classes are not subject to sales charges and have limited eligibility. Please see the Fund’s prospectus for details. Performance for different share classes will vary based on differences in sales charges and fees associated with each class. All results shown assume reinvestment of distributions during the period. Returns do not reflect the deduction of taxes that a shareholder may pay on Fund distributions or on the redemption of Fund shares. Performance results reflect the effect of any fee waivers or reimbursements of Fund expenses by Columbia Management Investment Advisers, LLC and/or any of its affiliates. Absent these fee waivers or expense reimbursement arrangements, performance results would have been lower.
The performance information shown represents past performance and is not a guarantee of future results. The investment return and principal value of your investment will fluctuate so that your shares, when redeemed, may be worth more or less than their original cost. Current performance may be lower or higher than the performance information shown. You may obtain performance information current to the most recent month-end by contacting your financial intermediary, visiting columbiamanagement.com or calling 800.345.6611.
| * | The returns shown for periods prior to the share class inception date (including returns for the Life of the Fund, if shown, which are since Fund inception) include the returns of the Fund’s oldest share class. These returns are adjusted to reflect any higher class-related operating expenses of the newer share classes, as applicable. Please visit columbiamanagement.com/investment-products/mutual-funds/appended-performance for more information. |
The S&P North American Technology Sector Index is an unmanaged modified capitalization-weighted index based on a universe of technology-related stocks.
Indices are not available for investment, are not professionally managed and do not reflect sales charges, fees, brokerage commissions, taxes or other expenses of investing. Securities in the Fund may not match those in an index.
| | |
| |
| | Columbia Seligman Communications and Information Fund |
Portfolio Overview
(Unaudited)
Portfolio Management
Paul Wick
Ajay Diwan
Shekhar Pramanick
Sanjay Devgan
Morningstar Style Box™
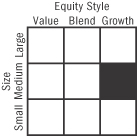
The Morningstar Style Box™ is based on a fund’s portfolio holdings. For equity funds, the vertical axis shows the market capitalization of the stocks owned, and the horizontal axis shows investment style (value, blend, or growth). Information shown is based on the most recent data provided by Morningstar.
© 2015 Morningstar, Inc. All rights reserved. The Morningstar information contained herein: (1) is proprietary to Morningstar and/or its content providers; (2) may not be copied or distributed; and (3) is not warranted to be accurate, complete or timely. Neither Morningstar nor its content providers are responsible for any damages or losses arising from any use of this information.
| | | | |
Top Ten Holdings (%)
(at November 30, 2014) | |
Lam Research Corp. | | | 9.4 | |
Synopsys, Inc. | | | 9.3 | |
Teradyne, Inc. | | | 6.1 | |
Apple, Inc. | | | 5.3 | |
Broadcom Corp., Class A | | | 4.8 | |
Synaptics, Inc. | | | 4.6 | |
Skyworks Solutions, Inc. | | | 4.3 | |
Marvell Technology Group Ltd. | | | 4.1 | |
Check Point Software Technologies Ltd. | | | 3.9 | |
NetApp, Inc. | | | 3.1 | |
Percentages indicated are based upon total investments (excluding Money Market Funds).
For further detail about these holdings, please refer to the section entitled “Portfolio of Investments.”
Fund holdings are as of the date given, are subject to change at any time, and are not recommendationsto buy or sell any security.
| | | | |
Portfolio Breakdown (%)
(at November 30, 2014) | |
Common Stocks | | | 96.4 | |
Consumer Discretionary | | | 2.9 | |
Financials | | | 0.0 | (a) |
Industrials | | | 0.4 | |
Information Technology | | | 93.1 | |
Convertible Preferred Stocks | | | 0.1 | |
Information Technology | | | 0.1 | |
Money Market Funds | | | 3.5 | |
Total | | | 100.0 | |
Percentages indicated are based upon total investments. The Fund’s portfolio composition is subject to change.
(a) Rounds to zero.
| | |
| |
| Columbia Seligman Communications and Information Fund | | |
Understanding Your Fund’s Expenses
(Unaudited)
As an investor, you incur two types of costs. There are transaction costs, which generally include sales charges on purchases and may include redemption fees. There are also ongoing costs, which generally include management fees, distribution and/or service fees, and other fund expenses. The following information is intended to help you understand your ongoing costs (in dollars) of investing in the Fund and to help you compare these costs with the ongoing costs of investing in other mutual funds.
Analyzing Your Fund’s Expenses
To illustrate these ongoing costs, we have provided examples and calculated the expenses paid by investors in each share class of the Fund during the period. The actual and hypothetical information in the table is based on an initial investment of $1,000 at the beginning of the period indicated and held for the entire period. Expense information is calculated two ways and each method provides you with different information. The amount listed in the “Actual” column is calculated using the Fund’s actual operating expenses and total return for the period. You may use the Actual information, together with the amount invested, to estimate the expenses that you paid over the period. Simply divide your account value by $1,000 (for example, an $8,600 account value divided by $1,000 = 8.6), then multiply the results by the expenses paid during the period under the “Actual” column. The amount listed in the “Hypothetical” column assumes a 5% annual rate of return before expenses (which is not the Fund’s actual return) and then applies the Fund’s actual expense ratio for the period to the hypothetical return. You should not use the hypothetical account values and expenses to estimate either your actual account balance at the end of the period or the expenses you paid during the period. See “Compare With Other Funds” below for details on how to use the hypothetical data.
Compare With Other Funds
Since all mutual funds are required to include the same hypothetical calculations about expenses in shareholder reports, you can use this information to compare the ongoing cost of investing in the Fund with other funds. To do so, compare the hypothetical example with the 5% hypothetical examples that appear in the shareholder reports of other funds. As you compare hypothetical examples of other funds, it is important to note that hypothetical examples are meant to highlight the ongoing costs of investing in a fund only and do not reflect any transaction costs, such as sales charges, or redemption or exchange fees. Therefore, the hypothetical calculations are useful in comparing ongoing costs only, and will not help you determine the relative total costs of owning different funds. If transaction costs were included in these calculations, your costs would be higher.
June 1, 2014 – November 30, 2014
| | | | | | | | | | | | | | | | | | | | | | | | | | | | |
| | | Account Value at the
Beginning of the
Period ($) | | | Account Value at the
End of the
Period ($) | | | Expenses Paid During
the Period ($) | | | Fund’s Annualized Expense Ratio (%) | |
| | | | Actual | | | | Hypothetical | | | | Actual | | | | Hypothetical | | | | Actual | | | | Hypothetical | | | | Actual | |
Class A | | | 1,000.00 | | | | 1,000.00 | | | | 1,141.30 | | | | 1,018.20 | | | | 7.21 | | | | 6.79 | | | | 1.35 | |
Class B | | | 1,000.00 | | | | 1,000.00 | | | | 1,141.30 | | | | 1,018.20 | | | | 7.21 | | | | 6.79 | | | | 1.35 | |
Class C | | | 1,000.00 | | | | 1,000.00 | | | | 1,137.10 | | | | 1,014.46 | | | | 11.19 | | | | 10.55 | | | | 2.10 | |
Class I | | | 1,000.00 | | | | 1,000.00 | | | | 1,143.60 | | | | 1,020.29 | | | | 4.97 | | | | 4.68 | | | | 0.93 | |
Class K | | | 1,000.00 | | | | 1,000.00 | | | | 1,141.80 | | | | 1,018.70 | | | | 6.67 | | | | 6.29 | | | | 1.25 | |
Class R | | | 1,000.00 | | | | 1,000.00 | | | | 1,139.80 | | | | 1,016.95 | | | | 8.54 | | | | 8.05 | | | | 1.60 | |
Class R4 | | | 1,000.00 | | | | 1,000.00 | | | | 1,142.80 | | | | 1,019.45 | | | | 5.88 | | | | 5.54 | | | | 1.10 | |
Class R5 | | | 1,000.00 | | | | 1,000.00 | | | | 1,143.40 | | | | 1,020.09 | | | | 5.18 | | | | 4.89 | | | | 0.97 | |
Class Z | | | 1,000.00 | | | | 1,000.00 | | | | 1,142.70 | | | | 1,019.45 | | | | 5.88 | | | | 5.54 | | | | 1.10 | |
Expenses paid during the period are equal to the annualized expense ratio for each class as indicated above, multiplied by the average account value over the period and then multiplied by the number of days in the Fund’s most recent fiscal half year and divided by 365.
Expenses do not include fees and expenses incurred indirectly by the Fund from its investment in underlying funds, including affiliated and non-affiliated pooled investment vehicles, such as mutual funds and exchange-traded funds.
| | |
| |
| | Columbia Seligman Communications and Information Fund |
Portfolio of Investments
November 30, 2014 (Unaudited)
(Percentages represent value of investments compared to net assets)
| | | | | | | | |
| Common Stocks 96.5% | |
| Issuer | | Shares | | | Value ($) | |
Consumer Discretionary 2.9% | |
Diversified Consumer Services 0.3% | |
| | |
LifeLock, Inc.(a) | | | 810,500 | | | | 13,381,355 | |
|
Internet & Catalog Retail 0.7% | |
| | |
Travelport Worldwide Ltd. | | | 1,453,054 | | | | 25,210,487 | |
|
Media 1.5% | |
| | |
DIRECTV(a) | | | 547,000 | | | | 47,977,370 | |
| | |
Twenty-First Century Fox, Inc., Class A | | | 206,300 | | | | 7,591,840 | |
| | | | | | | | | |
Total | | | | | | | 55,569,210 | |
|
Specialty Retail 0.4% | |
| | |
GameStop Corp., Class A | | | 445,400 | | | | 16,840,574 | |
| | | | | | | | | |
Total Consumer Discretionary | | | | | | | 111,001,626 | |
| | |
| | | | | | | | |
Financials —% | |
Diversified Financial Services —% | |
| | |
Hanei Corp.(b)(c)(d) | | | 49,382 | | | | — | |
| | | | | | | | | |
Total Financials | | | | | | | — | |
| | |
| | | | | | | | |
Industrials 0.4% | |
Commercial Services & Supplies 0.4% | |
| | |
Pitney Bowes, Inc. | | | 668,700 | | | | 16,463,394 | |
| | | | | | | | | |
Total Industrials | | | | | | | 16,463,394 | |
| | |
| | | | | | | | |
Information Technology 93.2% | |
Communications Equipment 2.7% | |
| | |
Aruba Networks, Inc.(a) | | | 444,800 | | | | 8,322,208 | |
| | |
Brocade Communications Systems, Inc. | | | 419,700 | | | | 4,746,807 | |
| | |
Cisco Systems, Inc. | | | 1,484,900 | | | | 41,042,636 | |
| | |
F5 Networks, Inc.(a) | | | 351,900 | | | | 45,461,961 | |
| | |
Flashpoint Technology, Inc.(b)(c)(d) | | | 246,914 | | | | — | |
| | |
Nortel Networks Corp.(a) | | | 819 | | | | 3 | |
| | |
Riverbed Technology, Inc.(a) | | | 187,300 | | | | 3,872,428 | |
| | | | | | | | | |
Total | | | | | | | 103,446,043 | |
|
Electronic Equipment, Instruments & Components 0.2% | |
| | |
CDW Corp. | | | 269,800 | | | | 9,464,584 | |
|
Internet Software & Services 5.9% | |
| | |
Cornerstone OnDemand, Inc.(a) | | | 317,200 | | | | 10,077,444 | |
| | |
Endurance International Group Holdings, Inc.(a) | | | 569,908 | | | | 9,471,871 | |
| | |
Google, Inc., Class A(a) | | | 176,100 | | | | 96,692,988 | |
| | |
Google, Inc., Class C(a) | | | 176,700 | | | | 95,741,361 | |
| | |
HomeAway, Inc.(a) | | | 455,200 | | | | 14,275,072 | |
| | | | | | | | | |
Total | | | | | | | 226,258,736 | |
| | | | | | | | |
| Common Stocks (continued) | |
| Issuer | | Shares | | | Value ($) | |
IT Services 4.0% | |
| | |
Computer Sciences Corp. | | | 434,300 | | | | 27,525,934 | |
| | |
Fidelity National Information Services, Inc. | | | 191,100 | | | | 11,693,409 | |
| | |
Sabre Corp. | | | 1,587,405 | | | | 29,747,970 | |
| | |
Vantiv, Inc., Class A(a) | | | 714,100 | | | | 24,093,734 | |
| | |
Visa, Inc., Class A | | | 230,400 | | | | 59,486,976 | |
| | | | | | | | | |
Total | | | | | | | 152,548,023 | |
|
Semiconductors & Semiconductor Equipment 45.2% | |
| | |
Advanced Energy Industries, Inc.(a) | | | 1,392,394 | | | | 28,446,610 | |
| | |
Advanced Micro Devices, Inc.(a) | | | 5,345,756 | | | | 14,914,659 | |
| | |
Avago Technologies Ltd. | | | 290,331 | | | | 27,116,915 | |
| | |
Broadcom Corp., Class A | | | 4,122,200 | | | | 177,790,486 | |
| | |
Lam Research Corp. | | | 4,181,628 | | | | 345,569,738 | |
| | |
Lattice Semiconductor Corp.(a)(e) | | | 7,411,677 | | | | 48,546,484 | |
| | |
Marvell Technology Group Ltd. | | | 10,603,597 | | | | 151,843,509 | |
| | |
Mattson Technology, Inc.(a)(e) | | | 4,297,127 | | | | 11,258,473 | |
| | |
Maxim Integrated Products, Inc. | | | 2,154,700 | | | | 63,714,479 | |
| | |
Microsemi Corp.(a) | | | 4,170,260 | | | | 113,431,072 | |
| | |
NXP Semiconductor NV(a) | | | 191,283 | | | | 14,883,730 | |
| | |
Skyworks Solutions, Inc. | | | 2,368,533 | | | | 159,804,922 | |
| | |
Spansion, Inc., Class A(a)(e) | | | 3,645,105 | | | | 85,186,104 | |
| | |
Synaptics, Inc.(a)(e) | | | 2,674,477 | | | | 168,465,306 | |
| | |
Taiwan Semiconductor Manufacturing Co., Ltd., ADR | | | 168,500 | | | | 3,954,695 | |
| | |
Teradyne, Inc.(e) | | | 11,378,318 | | | | 225,859,612 | |
| | |
TriQuint Semiconductor, Inc.(a) | | | 1,746,246 | | | | 42,556,015 | |
| | |
Xilinx, Inc. | | | 945,300 | | | | 42,954,432 | |
| | | | | | | | | |
Total | | | | | | | 1,726,297,241 | |
|
Software 24.5% | |
| | |
Activision Blizzard, Inc. | | | 1,363,523 | | | | 29,520,273 | |
| | |
AVG Technologies NV(a) | | | 472,800 | | | | 9,285,792 | |
| | |
Check Point Software Technologies Ltd.(a) | | | 1,882,520 | | | | 145,537,621 | |
| | |
Fortinet, Inc.(a) | | | 982,000 | | | | 27,063,920 | |
| | |
King Digital Entertainment PLC | | | 2,961,652 | | | | 45,165,193 | |
| | |
Microsoft Corp. | | | 1,532,500 | | | | 73,268,825 | |
| | |
Nuance Communications, Inc.(a) | | | 2,313,314 | | | | 35,000,441 | |
| | |
PTC, Inc.(a) | | | 507,478 | | | | 19,827,166 | |
| | |
Red Hat, Inc.(a) | | | 426,600 | | | | 26,513,190 | |
| | |
Rovi Corp.(a) | | | 715,100 | | | | 15,932,428 | |
| | |
Salesforce.com, Inc.(a) | | | 591,051 | | | | 35,386,223 | |
| | |
SolarWinds, Inc.(a) | | | 1,079,607 | | | | 56,053,195 | |
| | |
Synopsys, Inc.(a)(e) | | | 7,929,592 | | | | 344,064,997 | |
The accompanying Notes to Financial Statements are an integral part of this statement.
| | |
| |
| Columbia Seligman Communications and Information Fund | | |
Portfolio of Investments (continued)
November 30, 2014 (Unaudited)
| | | | | | | | |
| Common Stocks (continued) | |
| Issuer | | Shares | | | Value ($) | |
Verint Systems, Inc.(a) | | | 921,655 | | | | 55,474,414 | |
| | |
VMware, Inc., Class A(a) | | | 197,956 | | | | 17,412,210 | |
| | | | | | | | | |
Total | | | | | | | 935,505,888 | |
|
Technology Hardware, Storage & Peripherals 10.7% | |
| | |
Apple, Inc. | | | 1,642,400 | | | | 195,330,632 | |
| | |
Electronics for Imaging, Inc.(a) | | | 988,129 | | | | 43,922,334 | |
| | |
EMC Corp. | | | 617,400 | | | | 18,738,090 | |
| | |
Hewlett-Packard Co. | | | 887,300 | | | | 34,657,938 | |
| | |
NetApp, Inc. | | | 2,706,150 | | | | 115,146,683 | |
| | | | | | | | | |
Total | | | | | | | 407,795,677 | |
| | | | | | | | | |
Total Information Technology | | | | | | | 3,561,316,192 | |
| | | | | | | | | |
Total Common Stocks | | | | | | | | |
(Cost: $2,513,473,405) | | | | | | | 3,688,781,212 | |
| | |
| | | | | | | | |
| | | | | | | | |
| Convertible Preferred Stocks 0.1% | |
| Issuer | | Shares | | | Value ($) | |
Information Technology 0.1% | |
Technology Hardware, Storage & Peripherals 0.1% | |
| | |
Silver Peak Systems, Inc.(a)(b)(d) | | | 2,620,545 | | | | 2,541,928 | |
| | | | | | | | | |
Total Information Technology | | | | | | | 2,541,928 | |
| | | | | | | | | |
Total Convertible Preferred Stocks | | | | | |
(Cost: $10,041,773) | | | | | | | 2,541,928 | |
| | |
| | | | | | | | |
| Money Market Funds 3.5% | |
| | | Shares | | | Value ($) | |
| | |
Columbia Short-Term Cash Fund, 0.104%(e)(f) | | | 132,423,306 | | | | 132,423,306 | |
| | | | | | | | | |
Total Money Market Funds | | | | | | | | |
(Cost: $132,423,306) | | | | | | | 132,423,306 | |
| | | | | | | | | |
Total Investments | | | | | | | | |
(Cost: $2,655,938,484) | | | | | | | 3,823,746,446 | |
| | | | | | | | | |
Other Assets & Liabilities, Net | | | | | | | (4,489,719 | ) |
| | | | | | | | | |
Net Assets | | | | | | | 3,819,256,727 | |
| | | | | | | | | |
Notes to Portfolio of Investments
| (b) | Identifies securities considered by the Investment Manager to be illiquid as to their marketability. The aggregate value of such securities at November 30, 2014 was $2,541,928, which represents 0.07% of net assets. Information concerning such security holdings at November 30, 2014 is as follows: |
| | | | | | | | |
| Security Description | | Acquisition Dates | | | Cost ($) | |
Flashpoint Technology, Inc. | | | 09/10/1999 | | | | 1,000,844 | |
| | |
Hanei Corp. | | | 09/10/1999 | | | | — | |
| | |
Silver Peak Systems, Inc. | | | 01/14/2008 | | | | 10,041,774 | |
| (c) | Negligible market value. |
| (d) | Represents fair value as determined in good faith under procedures approved by the Board of Trustees. At November 30, 2014, the value of these securities amounted to $2,541,928, which represents 0.07% of net assets. |
| (e) | As defined in the Investment Company Act of 1940, an affiliated company is one in which the Fund owns 5% or more of the company’s outstanding voting securities, or a company which is under common ownership or control with the Fund. Holdings and transactions in these affiliated companies during the period ended November 30, 2014, are as follows: |
| | | | | | | | | | | | | | | | | | | | | | | | | | | | |
| Issuer | | Beginning
Cost ($) | | | Purchase
Cost ($) | | | Proceeds
From Sales ($) | | | Realized
Gain (Loss) ($) | | | Ending
Cost ($) | | | Dividends —
Affiliated
Issuers ($) | | | Value ($) | |
Columbia Short-Term Cash Fund | | | 6,035,079 | | | | 640,431,259 | | | | (514,043,032 | ) | | | — | | | | 132,423,306 | | | | 41,881 | | | | 132,423,306 | |
| | | | | | | |
Lattice Semiconductor Corp.* | | | 19,800,637 | | | | 27,190,361 | | | | — | | | | — | | | | 46,990,998 | | | | — | | | | 48,546,484 | |
| | | | | | | |
Mattson Technology, Inc.* | | | 4,171,931 | | | | 6,217,840 | | | | — | | | | — | | | | 10,389,771 | | | | — | | | | 11,258,473 | |
| | | | | | | |
Spansion, Inc., Class A | | | 68,991,664 | | | | 1,809,941 | | | | (26,083,810 | ) | | | 1,650,996 | | | | 46,368,791 | | | | — | | | | 85,186,104 | |
| | | | | | | |
Synaptics, Inc. | | | 125,627,871 | | | | 52,040,140 | | | | (63,600,581 | ) | | | 17,965,262 | | | | 132,032,692 | | | | — | | | | 168,465,306 | |
| | | | | | | |
Synopsys, Inc.* | | | 179,203,785 | | | | 30,930,268 | | | | (16,696,768 | ) | | | 908,012 | | | | 194,345,297 | | | | — | | | | 344,064,997 | |
| | | | | | | |
Teradyne, Inc. | | | 183,634,319 | | | | 16,455,257 | | | | (21,751,879 | ) | | | 1,863,766 | | | | 180,201,463 | | | | 673,768 | | | | 225,859,612 | |
| | | | | | | | | | | | | | | | | | | | | | | | | | | | | |
Total | | | 587,465,286 | | | | 775,075,066 | | | | (642,176,070 | ) | | | 22,388,036 | | | | 742,752,318 | | | | 715,649 | | | | 1,015,804,282 | |
| | | | | | | | | | | | | | | | | | | | | | | | | | | | | |
| | * | Issuer was not an affiliate for the entire period ended November 30, 2014. |
| (f) | The rate shown is the seven-day current annualized yield at November 30, 2014. |
Abbreviation Legend
| | |
| ADR | | American Depositary Receipt |
The accompanying Notes to Financial Statements are an integral part of this statement.
| | |
| |
| | Columbia Seligman Communications and Information Fund |
Portfolio of Investments (continued)
November 30, 2014 (Unaudited)
Fair Value Measurements
Generally accepted accounting principles (GAAP) require disclosure regarding the inputs and valuation techniques used to measure fair value and any changes in valuation inputs or techniques. In addition, investments shall be disclosed by major category.
The Fund categorizes its fair value measurements according to a three-level hierarchy that maximizes the use of observable inputs and minimizes the use of unobservable inputs by prioritizing that the most observable input be used when available. Observable inputs are those that market participants would use in pricing an investment based on market data obtained from sources independent of the reporting entity. Unobservable inputs are those that reflect the Fund’s assumptions about the information market participants would use in pricing an investment. An investment’s level within the fair value hierarchy is based on the lowest level of any input that is deemed significant to the asset or liability’s fair value measurement. The input levels are not necessarily an indication of the risk or liquidity associated with investments at that level. For example, certain U.S. government securities are generally high quality and liquid, however, they are reflected as Level 2 because the inputs used to determine fair value may not always be quoted prices in an active market.
Fair value inputs are summarized in the three broad levels listed below:
| > | | Level 1 — Valuations based on quoted prices for investments in active markets that the Fund has the ability to access at the measurement date (including NAV for open-end mutual funds). Valuation adjustments are not applied to Level 1 investments. |
| > | | Level 2 — Valuations based on other significant observable inputs (including quoted prices for similar securities, interest rates, prepayment speeds, credit risks, etc.). |
| > | | Level 3 — Valuations based on significant unobservable inputs (including the Fund’s own assumptions and judgment in determining the fair value of investments). |
Inputs that are used in determining fair value of an investment may include price information, credit data, volatility statistics, and other factors. These inputs can be either observable or unobservable. The availability of observable inputs can vary between investments, and is affected by various factors such as the type of investment, and the volume and level of activity for that investment or similar investments in the marketplace. The inputs will be considered by the Investment Manager, along with any other relevant factors in the calculation of an investment’s fair value. The Fund uses prices and inputs that are current as of the measurement date, which may include periods of market dislocations. During these periods, the availability of prices and inputs may be reduced for many investments. This condition could cause an investment to be reclassified between the various levels within the hierarchy.
Investments falling into the Level 3 category are primarily supported by quoted prices from brokers and dealers participating in the market for those investments. However, these may be classified as Level 3 investments due to lack of market transparency and corroboration to support these quoted prices. Additionally, valuation models may be used as the pricing source for any remaining investments classified as Level 3. These models may rely on one or more significant unobservable inputs and/or significant assumptions by the Investment Manager. Inputs used in valuations may include, but are not limited to, financial statement analysis, capital account balances, discount rates and estimated cash flows, and comparable company data.
Under the direction of the Fund’s Board of Trustees (the Board), the Investment Manager’s Valuation Committee (the Committee) is responsible for overseeing the valuation procedures approved by the Board. The Committee consists of voting and non-voting members from various groups within the Investment Manager’s organization, including operations and accounting, trading and investments, compliance, risk management and legal.
The Committee meets at least monthly to review and approve valuation matters, which may include a description of specific valuation determinations, data regarding pricing information received from approved pricing vendors and brokers and the results of Board-approved valuation control policies and procedures (the Policies). The Policies address, among other things, instances when market quotations are or are not readily available, including recommendations of third party pricing vendors and a determination of appropriate pricing methodologies; events that require specific valuation determinations and assessment of fair value techniques; securities with a potential for stale pricing, including those that are illiquid, restricted, or in default; and the effectiveness of third party pricing vendors, including periodic reviews of vendors. The Committee meets more frequently, as needed, to discuss additional valuation matters, which may include the need to review back-testing results, review time-sensitive information or approve related valuation actions. The Committee reports to the Board, with members of the Committee meeting with the Board at each of its regularly scheduled meetings to discuss valuation matters and actions during the period, similar to those described earlier.
For investments categorized as Level 3, the Committee monitors information similar to that described above, which may include: (i) data specific to the issuer or comparable issuers, (ii) general market or specific sector news and (iii) quoted prices and specific or similar security transactions. The Committee considers this data and any changes from prior periods in order to assess the reasonableness of observable and unobservable inputs, any assumptions or internal models used to value those securities and changes in fair value. This data is also used to corroborate, when available, information received from approved pricing vendors and brokers. Various factors impact the frequency of monitoring this information (which may occur as often as daily). However, the Committee may determine that changes to inputs, assumptions and models are not required as a result of the monitoring procedures performed.
The accompanying Notes to Financial Statements are an integral part of this statement.
| | |
| |
| Columbia Seligman Communications and Information Fund | | |
Portfolio of Investments (continued)
November 30, 2014 (Unaudited)
Fair Value Measurements (continued)
The following table is a summary of the inputs used to value the Fund’s investments at November 30, 2014:
| | | | | | | | | | | | | | | | |
| Description | | Level 1
Quoted Prices in Active
Markets for Identical
Assets ($) | | | Level 2
Other Significant
Observable Inputs ($) | | | Level 3
Significant
Unobservable Inputs ($) | | | Total ($) | |
Equity Securities | | | | | | | | | | | | | | | | |
| | | | |
Common Stocks | | | | | | | | | | | | | | | | |
| | | | |
Consumer Discretionary | | | 111,001,626 | | | | — | | | | — | | | | 111,001,626 | |
| | | | |
Financials | | | — | | | | — | | | | 0 | (a) | | | 0 | (a) |
| | | | |
Industrials | | | 16,463,394 | | | | — | | | | — | | | | 16,463,394 | |
| | | | |
Information Technology | | | 3,561,316,192 | | | | — | | | | 0 | (a) | | | 3,561,316,192 | |
| | | | |
Convertible Preferred Stocks | | | | | | | | | | | | | | | | |
| | | | |
Information Technology | | | — | | | | — | | | | 2,541,928 | | | | 2,541,928 | |
| | | | | | | | | | | | | | | | | |
Total Equity Securities | | | 3,688,781,212 | | | | — | | | | 2,541,928 | | | | 3,691,323,140 | |
| | | | | | | | | | | | | | | | | |
Mutual Funds | | | | | | | | | | | | | | | | |
| | | | |
Money Market Funds | | | 132,423,306 | | | | — | | | | — | | | | 132,423,306 | |
| | | | | | | | | | | | | | | | | |
Total Mutual Funds | | | 132,423,306 | | | | — | | | | — | | | | 132,423,306 | |
| | | | | | | | | | | | | | | | | |
Total | | | 3,821,204,518 | | | | — | | | | 2,541,928 | | | | 3,823,746,446 | |
| | | | | | | | | | | | | | | | | |
See the Portfolio of Investments for all investment classifications not indicated in the table.
There were no transfers of financial assets between levels during the period.
The Fund does not hold any significant investments with unobservable inputs which are categorized as Level 3.
The Fund’s assets assigned to the Level 3 category are valued utilizing the valuation technique deemed the most appropriate in the circumstances. Certain convertible preferred stocks classified as Level 3 are valued using a market approach. To determine fair value for these securities, management considered various factors which may have included, but were not limited to, the Fund’s pro-rata interest in the company’s capital balance, estimated earnings of the respective company, and the position of the security within the respective company’s capital structure. Significant increases (decreases) to any of these inputs would result in a significantly lower (higher) fair value measurement. Generally, a change in the fund’s pro-rata interest would result in a change to the company’s capital balance.
The accompanying Notes to Financial Statements are an integral part of this statement.
| | |
| |
| | Columbia Seligman Communications and Information Fund |
Statement of Assets and Liabilities
November 30, 2014 (Unaudited)
| | | | |
Assets | | | | |
| |
Investments, at value | | | | |
| |
Unaffiliated issuers (identified cost $1,913,186,166) | | | $2,807,942,164 | |
| |
Affiliated issuers (identified cost $742,752,318) | | | 1,015,804,282 | |
| |
Total investments (identified cost $2,655,938,484) | | | 3,823,746,446 | |
| |
Receivable for: | | | | |
| |
Investments sold | | | 45,210,027 | |
| |
Capital shares sold | | | 1,478,031 | |
| |
Dividends | | | 2,247,444 | |
| |
Prepaid expenses | | | 11,363 | |
| |
Other assets | | | 5,932 | |
| |
Total assets | | | 3,872,699,243 | |
| |
| |
Liabilities | | | | |
| |
Payable for: | | | | |
| |
Investments purchased | | | 45,093,546 | |
| |
Capital shares purchased | | | 5,698,893 | |
| |
Investment management fees | | | 178,006 | |
| |
Distribution and/or service fees | | | 79,002 | |
| |
Transfer agent fees | | | 986,519 | |
| |
Administration fees | | | 10,446 | |
| |
Plan administration fees | | | 7 | |
| |
Compensation of board members | | | 125,717 | |
| |
Other expenses | | | 1,270,380 | |
| |
Total liabilities | | | 53,442,516 | |
| |
Net assets applicable to outstanding capital stock | | | $3,819,256,727 | |
| |
| |
Represented by | | | | |
| |
Paid-in capital | | | $2,178,607,984 | |
| |
Excess of distributions over net investment income | | | (11,775,943 | ) |
| |
Accumulated net realized gain | | | 484,616,724 | |
| |
Unrealized appreciation (depreciation) on: | | | | |
| |
Investments �� unaffiliated issuers | | | 894,755,998 | |
| |
Investments — affiliated issuers | | | 273,051,964 | |
| |
Total — representing net assets applicable to outstanding capital stock | | | $3,819,256,727 | |
| |
The accompanying Notes to Financial Statements are an integral part of this statement.
| | |
| 10 | | Semiannual Report 2014 |
| | |
| |
| Columbia Seligman Communications and Information Fund | | |
Statement of Assets and Liabilities (continued)
November 30, 2014 (Unaudited)
| | | | |
Class A | | | | |
| |
Net assets | | | $2,685,158,517 | |
| |
Shares outstanding | | | 43,351,956 | |
| |
Net asset value per share | | | $61.94 | |
| |
Maximum offering price per share(a) | | | $65.72 | |
| |
Class B | | | | |
| |
Net assets | | | $25,099,939 | |
| |
Shares outstanding | | | 510,278 | |
| |
Net asset value per share | | | $49.19 | |
| |
Class C | | | | |
| |
Net assets | | | $736,441,877 | |
| |
Shares outstanding | | | 15,176,365 | |
| |
Net asset value per share | | | $48.53 | |
| |
Class I | | | | |
| |
Net assets | | | $3,578 | |
| |
Shares outstanding | | | 54 | |
| |
Net asset value per share(b) | | | $66.10 | |
| |
Class K | | | | |
| |
Net assets | | | $38,116 | |
| |
Shares outstanding | | | 587 | |
| |
Net asset value per share(b) | | | $64.97 | |
| |
Class R | | | | |
| |
Net assets | | | $49,864,199 | |
| |
Shares outstanding | | | 833,426 | |
| |
Net asset value per share | | | $59.83 | |
| |
Class R4 | | | | |
| |
Net assets | | | $14,082,235 | |
| |
Shares outstanding | | | 231,519 | |
| |
Net asset value per share | | | $60.83 | |
| |
Class R5 | | | | |
| |
Net assets | | | $26,285,440 | |
| |
Shares outstanding | | | 398,748 | |
| |
Net asset value per share | | | $65.92 | |
| |
Class Z | | | | |
| |
Net assets | | | $282,282,826 | |
| |
Shares outstanding | | | 4,298,330 | |
| |
Net asset value per share | | | $65.67 | |
| |
| (a) | The maximum offering price per share is calculated by dividing the net asset value per share by 1.0 minus the maximum sales charge of 5.75%. |
| (b) | Net asset value per share rounds to this amount due to fractional shares outstanding. |
The accompanying Notes to Financial Statements are an integral part of this statement.
| | | | |
| Semiannual Report 2014 | | | 11 | |
| | |
| |
| | Columbia Seligman Communications and Information Fund |
Statement of Operations
Six Months Ended November 30, 2014 (Unaudited)
| | | | |
Net investment income | | | | |
| |
Income: | | | | |
| |
Dividends — unaffiliated issuers | | | $13,386,028 | |
| |
Dividends — affiliated issuers | | | 715,649 | |
| |
Foreign taxes withheld | | | (9,056 | ) |
| |
Total income | | | 14,092,621 | |
| |
| |
Expenses: | | | | |
| |
Investment management fees | | | 15,326,498 | |
| |
Distribution and/or service fees | | | | |
| |
Class A | | | 3,203,852 | |
| |
Class B | | | 33,307 | |
| |
Class C | | | 3,491,560 | |
| |
Class R | | | 114,445 | |
| |
Transfer agent fees | | | | |
| |
Class A | | | 2,248,607 | |
| |
Class B | | | 23,338 | |
| |
Class C | | | 612,792 | |
| |
Class K | | | 20 | |
| |
Class R | | | 40,194 | |
| |
Class R4 | | | 11,773 | |
| |
Class R5 | | | 6,326 | |
| |
Class Z | | | 206,382 | |
| |
Administration fees | | | 908,331 | |
| |
Plan administration fees | | | | |
| |
Class K | | | 102 | |
| |
Compensation of board members | | | 32,021 | |
| |
Custodian fees | | | 18,156 | |
| |
Printing and postage fees | | | 151,268 | |
| |
Registration fees | | | 61,368 | |
| |
Professional fees | | | 31,926 | |
| |
Other | | | 105,983 | |
| |
Total expenses | | | 26,628,249 | |
| |
Expense reductions | | | (18,664 | ) |
| |
Total net expenses | | | 26,609,585 | |
| |
Net investment loss | | | (12,516,964 | ) |
| |
| |
Realized and unrealized gain (loss) — net | | | | |
| |
Net realized gain (loss) on: | | | | |
| |
Investments — unaffiliated issuers | | | 256,667,684 | |
| |
Investments — affiliated issuers | | | 22,388,036 | |
| |
Foreign currency translations | | | 27,058 | |
| |
Net realized gain | | | 279,082,778 | |
| |
Net change in unrealized appreciation (depreciation) on: | | | | |
| |
Investments — unaffiliated issuers | | | 175,588,046 | |
| |
Investments — affiliated issuers | | | 34,744,480 | |
| |
Foreign currency translations | | | (180 | ) |
| |
Net change in unrealized appreciation | | | 210,332,346 | |
| |
Net realized and unrealized gain | | | 489,415,124 | |
| |
Net increase in net assets resulting from operations | | | $476,898,160 | |
| |
The accompanying Notes to Financial Statements are an integral part of this statement.
| | |
| 12 | | Semiannual Report 2014 |
| | |
| |
| Columbia Seligman Communications and Information Fund | | |
Statement of Changes in Net Assets
| | | | | | | | |
| | | Six Months Ended
November 30, 2014
(Unaudited) | | | Year Ended
May 31, 2014 | |
Operations | | | | | | | | |
| | |
Net investment loss | | | $(12,516,964 | ) | | | $(22,694,055 | ) |
| | |
Net realized gain | | | 279,082,778 | | | | 383,972,944 | |
| | |
Net change in unrealized appreciation | | | 210,332,346 | | | | 312,445,077 | |
| |
Net increase in net assets resulting from operations | | | 476,898,160 | | | | 673,723,966 | |
| |
| | |
Distributions to shareholders | | | | | | | | |
| | |
Net realized gains | | | | | | | | |
| | |
Class A | | | — | | | | (37,998,585 | ) |
| | |
Class B | | | — | | | | (614,441 | ) |
| | |
Class C | | | — | | | | (12,800,540 | ) |
| | |
Class I | | | — | | | | (114 | ) |
| | |
Class K | | | — | | | | (14,308 | ) |
| | |
Class R | | | — | | | | (704,130 | ) |
| | |
Class R4 | | | — | | | | (35,744 | ) |
| | |
Class R5 | | | — | | | | (394,680 | ) |
| | |
Class Z | | | — | | | | (2,686,982 | ) |
| |
Total distributions to shareholders | | | — | | | | (55,249,524 | ) |
| |
Decrease in net assets from capital stock activity | | | (114,059,023 | ) | | | (484,846,719 | ) |
| |
Total increase in net assets | | | 362,839,137 | | | | 133,627,723 | |
| | |
Net assets at beginning of period | | | 3,456,417,590 | | | | 3,322,789,867 | |
| |
Net assets at end of period | | | $3,819,256,727 | | | | $3,456,417,590 | |
| |
Undistributed (excess of distributions over) net investment income | | | $(11,775,943 | ) | | | $741,021 | |
| |
The accompanying Notes to Financial Statements are an integral part of this statement.
| | | | |
| Semiannual Report 2014 | | | 13 | |
| | |
| |
| | Columbia Seligman Communications and Information Fund |
Statement of Changes in Net Assets (continued)
| | | | | | | | | | | | | | | | |
| | | Six Months Ended
November 30, 2014
(Unaudited) | | | Year Ended
May 31, 2014 | |
| | | Shares | | | Dollars ($) | | | Shares | | | Dollars ($) | |
Capital stock activity | | | | | | | | | | | | | | | | |
| | | | |
Class A shares | | | | | | | | | | | | | | | | |
| | | | |
Subscriptions(a) | | | 1,288,406 | | | | 74,578,285 | | | | 2,424,033 | | | | 118,883,324 | |
| | | | |
Distributions reinvested | | | — | | | | — | | | | 707,327 | | | | 34,036,587 | |
| | | | |
Redemptions | | | (3,742,244 | ) | | | (216,292,147 | ) | | | (10,882,777 | ) | | | (530,318,027 | ) |
| |
Net decrease | | | (2,453,838 | ) | | | (141,713,862 | ) | | | (7,751,417 | ) | | | (377,398,116 | ) |
| |
Class B shares | | | | | | | | | | | | | | | | |
| | | | |
Subscriptions | | | 913 | | | | 42,912 | | | | 6,463 | | | | 251,562 | |
| | | | |
Distributions reinvested | | | — | | | | — | | | | 12,602 | | | | 481,664 | |
| | | | |
Redemptions(a) | | | (140,055 | ) | | | (6,395,686 | ) | | | (397,660 | ) | | | (15,394,320 | ) |
| |
Net decrease | | | (139,142 | ) | | | (6,352,774 | ) | | | (378,595 | ) | | | (14,661,094 | ) |
| |
Class C shares | | | | | | | | | | | | | | | | |
| | | | |
Subscriptions | | | 266,664 | | | | 12,133,632 | | | | 483,260 | | | | 18,542,231 | |
| | | | |
Distributions reinvested | | | — | | | | — | | | | 274,971 | | | | 10,440,632 | |
| | | | |
Redemptions | | | (822,881 | ) | | | (37,321,514 | ) | | | (2,696,582 | ) | | | (103,851,503 | ) |
| |
Net decrease | | | (556,217 | ) | | | (25,187,882 | ) | | | (1,938,351 | ) | | | (74,868,640 | ) |
| |
Class I shares | | | | | | | | | | | | | | | | |
| | | | |
Redemptions | | | — | | | | — | | | | (91 | ) | | | (5,200 | ) |
| |
Net increase (decrease) | | | — | | | | — | | | | (91 | ) | | | (5,200 | ) |
| |
Class K shares | | | | | | | | | | | | | | | | |
| | | | |
Subscriptions | | | 1,048 | | | | 62,541 | | | | 1,231 | | | | 61,723 | |
| | | | |
Distributions reinvested | | | — | | | | — | | | | 281 | | | | 14,195 | |
| | | | |
Redemptions | | | (2,334 | ) | | | (139,473 | ) | | | (20,211 | ) | | | (1,083,337 | ) |
| |
Net decrease | | | (1,286 | ) | | | (76,932 | ) | | | (18,699 | ) | | | (1,007,419 | ) |
| |
Class R shares | | | | | | | | | | | | | | | | |
| | | | |
Subscriptions | | | 160,559 | | | | 8,993,211 | | | | 237,629 | | | | 11,197,953 | |
| | | | |
Distributions reinvested | | | — | | | | — | | | | 12,620 | | | | 588,086 | |
| | | | |
Redemptions | | | (141,384 | ) | | | (7,925,843 | ) | | | (374,515 | ) | | | (17,833,718 | ) |
| |
Net increase (decrease) | | | 19,175 | | | | 1,067,368 | | | | (124,266 | ) | | | (6,047,679 | ) |
| |
Class R4 shares | | | | | | | | | | | | | | | | |
| | | | |
Subscriptions | | | 33,791 | | | | 1,927,569 | | | | 322,083 | | | | 16,077,303 | |
| | | | |
Distributions reinvested | | | — | | | | — | | | | 756 | | | | 35,625 | |
| | | | |
Redemptions | | | (70,044 | ) | | | (3,883,377 | ) | | | (68,400 | ) | | | (3,257,450 | ) |
| |
Net increase (decrease) | | | (36,253 | ) | | | (1,955,808 | ) | | | 254,439 | | | | 12,855,478 | |
| |
Class R5 shares | | | | | | | | | | | | | | | | |
| | | | |
Subscriptions | | | 133,128 | | | | 8,242,597 | | | | 327,239 | | | | 16,536,623 | |
| | | | |
Distributions reinvested | | | — | | | | — | | | | 5,849 | | | | 298,547 | |
| | | | |
Redemptions | | | (162,462 | ) | | | (10,182,136 | ) | | | (269,702 | ) | | | (14,175,770 | ) |
| |
Net increase (decrease) | | | (29,334 | ) | | | (1,939,539 | ) | | | 63,386 | | | | 2,659,400 | |
| |
The accompanying Notes to Financial Statements are an integral part of this statement.
| | |
| 14 | | Semiannual Report 2014 |
| | |
| |
| Columbia Seligman Communications and Information Fund | | |
Statement of Changes in Net Assets (continued)
| | | | | | | | | | | | | | | | |
| | | Six Months Ended
November 30, 2014
(Unaudited) | | | Year Ended
May 31, 2014 | |
| | | Shares | | | Dollars ($) | | | Shares | | | Dollars ($) | |
Capital stock activity (continued) | | | | | | | | | | | | | | | | |
| | | | |
Class Z shares | | | | | | | | | | | | | | | | |
| | | | |
Subscriptions | | | 1,298,373 | | | | 79,807,449 | | | | 797,641 | | | | 41,097,680 | |
| | | | |
Distributions reinvested | | | — | | | | — | | | | 34,265 | | | | 1,744,426 | |
| | | | |
Redemptions | | | (290,424 | ) | | | (17,707,043 | ) | | | (1,348,259 | ) | | | (69,215,555 | ) |
| |
Net increase (decrease) | | | 1,007,949 | | | | 62,100,406 | | | | (516,353 | ) | | | (26,373,449 | ) |
| |
Total net decrease | | | (2,188,946 | ) | | | (114,059,023 | ) | | | (10,409,947 | ) | | | (484,846,719 | ) |
| |
| (a) | Includes conversions of Class B shares to Class A shares, if any. |
The accompanying Notes to Financial Statements are an integral part of this statement.
| | | | |
| Semiannual Report 2014 | | | 15 | |
| | |
| |
| | Columbia Seligman Communications and Information Fund |
Financial Highlights
The following tables are intended to help you understand the Fund’s financial performance. Certain information reflects financial results for a single share of a class held for the periods shown. Per share net investment income (loss) amounts are calculated based on average shares outstanding during the period. Total return assumes reinvestment of all dividends and distributions, if any. Total return does not reflect payment of sales charges, if any. Total return and portfolio turnover are not annualized for periods of less than one year. The portfolio turnover rate is calculated without regard to purchase and sales transactions of short-term instruments and certain derivatives, if any. If such transactions were included, the Fund’s portfolio turnover rate may be higher.
| | | | | | | | | | | | | | | | | | | | | | | | | | | | |
| |
| Six Months Ended
November 30, 2014 |
| | | Year Ended May 31, | | | | Year Ended December 31, | |
Class A | | | (Unaudited) | | | | 2014 | | | | 2013 | | | | 2012(a) | | | | 2011 | | | | 2010 | | | | 2009 | |
Per share data | | | | | | | | | | | | | | | | | | | | | | | | | | | | |
Net asset value, beginning of period | | | $54.27 | | | | $45.03 | | | | $42.89 | | | | $40.80 | | | | $44.71 | | | | $38.78 | | | | $24.25 | |
| | | | | | | | | | | | | | | | | | | | | | | | | | | | | |
Income from investment operations: | | | | | | | | | | | | | | | | | | | | | | | | | | | | |
| | | | | | | |
Net investment loss | | | (0.16 | ) | | | (0.27 | ) | | | (0.29 | ) | | | (0.14 | ) | | | (0.29 | ) | | | (0.29 | ) | | | (0.37 | ) |
| | | | | | | | | | | | | | | | | | | | | | | | | | | | | |
Net realized and unrealized gain (loss) | | | 7.83 | | | | 10.29 | | | | 5.15 | | | | 2.17 | | | | (1.88 | ) | | | 6.20 | | | | 14.81 | |
| | | | | | | | | | | | | | | | | | | | | | | | | | | | | |
Increase from payment by affiliate | | | — | | | | — | | | | — | | | | — | | | | 0.01 | | | | 0.01 | | | | — | |
| | | | | | | | | | | | | | | | | | | | | | | | | | | | | |
Total from investment operations | | | 7.67 | | | | 10.02 | | | | 4.86 | | | | 2.03 | | | | (2.16 | ) | | | 5.92 | | | | 14.44 | |
| | | | | | | | | | | | | | | | | | | | | | | | | | | | | |
Less distributions to shareholders: | | | | | | | | | | | | | | | | | | | | | | | | | | | | |
| | | | | | | |
Net realized gains | | | — | | | | (0.78 | ) | | | (2.72 | ) | | | — | | | | (1.75 | ) | | | — | | | | — | |
| | | | | | | | | | | | | | | | | | | | | | | | | | | | | |
Total distributions to shareholders | | | — | | | | (0.78 | ) | | | (2.72 | ) | | | — | | | | (1.75 | ) | | | — | | | | — | |
| | | | | | | | | | | | | | | | | | | | | | | | | | | | | |
Proceeds from regulatory settlements | | | — | | | | — | | | | — | | | | 0.06 | | | | — | | | | 0.01 | | | | 0.09 | |
| | | | | | | | | | | | | | | | | | | | | | | | | | | | | |
Net asset value, end of period | | | $61.94 | | | | $54.27 | | | | $45.03 | | | | $42.89 | | | | $40.80 | | | | $44.71 | | | | $38.78 | |
| | | | | | | | | | | | | | | | | | | | | | | | | | | | | |
Total return | | | 14.13 | % | | | 22.48 | % | | | 11.87 | % | | | 5.12 | %(b) | | | (4.86 | %)(c) | | | 15.29 | %(d)(e) | | | 59.92 | %(f) |
| | | | | | | | | | | | | | | | | | | | | | | | | | | | | |
Ratios to average net assets(g) | | | | | | | | | | | | | | | | | | | | | | | | | | | | |
| | | | | | | |
Total gross expenses | | | 1.35 | %(h) | | | 1.41 | %(i) | | | 1.37 | %(i) | | | 1.34 | %(h) | | | 1.35 | %(i) | | | 1.36 | % | | | 1.61 | % |
| | | | | | | | | | | | | | | | | | | | | | | | | | | | | |
Total net expenses(j) | | | 1.35 | %(h)(k) | | | 1.41 | %(i)(k) | | | 1.37 | %(i)(k) | | | 1.34 | %(h) | | | 1.35 | %(i)(k) | | | 1.36 | % | | | 1.61 | % |
| | | | | | | | | | | | | | | | | | | | | | | | | | | | | |
Net investment loss | | | (0.57 | %)(h) | | | (0.55 | %) | | | (0.66 | %) | | | (0.72 | %)(h) | | | (0.65 | %) | | | (0.72 | %) | | | (1.18 | %) |
| | | | | | | | | | | | | | | | | | | | | | | | | | | | | |
Supplemental data | | | | | | | | | | | | | | | | | | | | | | | | | | | | |
| | | | | | | |
Net assets, end of period (in thousands) | | | $2,685,159 | | | | $2,486,060 | | | | $2,411,838 | | | | $2,573,957 | | | | $2,536,229 | | | | $3,066,071 | | | | $2,788,834 | |
| | | | | | | | | | | | | | | | | | | | | | | | | | | | | |
Portfolio turnover | | | 31 | % | | | 48 | % | | | 61 | % | | | 38 | % | | | 66 | % | | | 105 | % | | | 150 | % |
| | | | | | | | | | | | | | | | | | | | | | | | | | | | | |
Notes to Financial Highlights
| (a) | For the period from January 1, 2012 to May 31, 2012. During the period, the Fund’s fiscal year end was changed from December 31 to May 31. |
| (b) | The Fund received proceeds from regulatory settlements. Had the Fund not received these proceeds, the total return would have been lower by 0.12%. |
| (c) | The Fund received a payment from an affiliate. Had the Fund not received this payment, the total return would have been lower by 0.01%. |
| (d) | The Fund received proceeds from regulatory settlements. Had the Fund not received these proceeds, the total return would have been lower by 0.02%. |
| (e) | The Fund received a payment from an affiliate. Had the Fund not received this payment, the total return would have been lower by 0.03%. |
| (f) | The Fund received proceeds from regulatory settlements. Had the Fund not received these proceeds, the total return would have been lower by 0.36%. |
| (g) | In addition to the fees and expenses that the Fund bears directly, the Fund indirectly bears a pro rata share of the fees and expenses of any other funds in which it invests. Such indirect expenses are not included in the Fund’s reported expense ratios. |
| (i) | Ratios include line of credit interest expense which is less than 0.01%. |
| (j) | Total net expenses include the impact of certain fee waivers/expense reimbursements made by the Investment Manager and certain of its affiliates, if applicable. |
| (k) | The benefits derived from expense reductions had an impact of less than 0.01%. |
The accompanying Notes to Financial Statements are an integral part of this statement.
| | |
| 16 | | Semiannual Report 2014 |
| | |
| |
| Columbia Seligman Communications and Information Fund | | |
Financial Highlights (continued)
| | | | | | | | | | | | | | | | | | | | | | | | | | | | |
| |
| Six Months Ended
November 30, 2014 |
| | | Year Ended May 31, | | | | Year Ended December 31, | |
Class B | | | (Unaudited) | | | | 2014 | | | | 2013 | | | | 2012(a) | | | | 2011 | | | | 2010 | | | | 2009 | |
Per share data | | | | | | | | | | | | | | | | | | | | | | | | | | | | |
Net asset value, beginning of period | | | $43.10 | | | | $35.91 | | | | $34.89 | | | | $33.29 | | | | $37.09 | | | | $32.42 | | | | $20.43 | |
| | | | | | | | | | | | | | | | | | | | | | | | | | | | | |
Income from investment operations: | | | | | | | | | | | | | | | | | | | | | | | | | | | | |
| | | | | | | |
Net investment loss | | | (0.13 | ) | | | (0.21 | ) | | | (0.39 | ) | | | (0.23 | ) | | | (0.52 | ) | | | (0.49 | ) | | | (0.51 | ) |
| | | | | | | | | | | | | | | | | | | | | | | | | | | | | |
Net realized and unrealized gain (loss) | | | 6.22 | | | | 8.18 | | | | 4.13 | | | | 1.78 | | | | (1.53 | ) | | | 5.14 | | | | 12.42 | |
| | | | | | | | | | | | | | | | | | | | | | | | | | | | | |
Increase from payment by affiliate | | | — | | | | — | | | | — | | | | — | | | | 0.00 | (b) | | | 0.01 | | | | — | |
| | | | | | | | | | | | | | | | | | | | | | | | | | | | | |
Total from investment operations | | | 6.09 | | | | 7.97 | | | | 3.74 | | | | 1.55 | | | | (2.05 | ) | | | 4.66 | | | | 11.91 | |
| | | | | | | | | | | | | | | | | | | | | | | | | | | | | |
Less distributions to shareholders: | | | | | | | | | | | | | | | | | | | | | | | | | | | | |
| | | | | | | |
Net realized gains | | | — | | | | (0.78 | ) | | | (2.72 | ) | | | — | | | | (1.75 | ) | | | — | | | | — | |
| | | | | | | | | | | | | | | | | | | | | | | | | | | | | |
Total distributions to shareholders | | | — | | | | (0.78 | ) | | | (2.72 | ) | | | — | | | | (1.75 | ) | | | — | | | | — | |
| | | | | | | | | | | | | | | | | | | | | | | | | | | | | |
Proceeds from regulatory settlements | | | — | | | | — | | | | — | | | | 0.05 | | | | — | | | | 0.01 | | | | 0.08 | |
| | | | | | | | | | | | | | | | | | | | | | | | | | | | | |
Net asset value, end of period | | | $49.19 | | | | $43.10 | | | | $35.91 | | | | $34.89 | | | | $33.29 | | | | $37.09 | | | | $32.42 | |
| | | | | | | | | | | | | | | | | | | | | | | | | | | | | |
Total return | | | 14.13 | % | | | 22.48 | % | | | 11.39 | % | | | 4.81 | %(c) | | | (5.57 | %)(d) | | | 14.40 | %(e)(f) | | | 58.69 | %(g) |
| | | | | | | | | | | | | | | | | | | | | | | | | | | | | |
Ratios to average net assets(h) | | | | | | | | | | | | | | | | | | | | | | | | | | | | |
| | | | | | | |
Total gross expenses | | | 1.35 | %(i) | | | 1.41 | %(j)(k) | | | 1.83 | %(j)(k) | | | 2.10 | %(i) | | | 2.10 | %(j) | | | 2.11 | % | | | 2.39 | % |
| | | | | | | | | | | | | | | | | | | | | | | | | | | | | |
Total net expenses(l) | | | 1.35 | %(i)(m) | | | 1.41 | %(j)(m) | | | 1.83 | %(j)(m) | | | 2.10 | %(i) | | | 2.10 | %(j)(m) | | | 2.11 | % | | | 2.39 | % |
| | | | | | | | | | | | | | | | | | | | | | | | | | | | | |
Net investment loss | | | (0.57 | %)(i) | | | (0.54 | %) | | | (1.13 | %) | | | (1.47 | %)(i) | | | (1.40 | %) | | | (1.48 | %) | | | (1.97 | %) |
| | | | | | | | | | | | | | | | | | | | | | | | | | | | | |
Supplemental data | | | | | | | | | | | | | | | | | | | | | | | | | | | | |
| | | | | | | |
Net assets, end of period (in thousands) | | | $25,100 | | | | $27,991 | | | | $36,917 | | | | $49,373 | | | | $54,282 | | | | $85,897 | | | | $106,646 | |
| | | | | | | | | | | | | | | | | | | | | | | | | | | | | |
Portfolio turnover | | | 31 | % | | | 48 | % | | | 61 | % | | | 38 | % | | | 66 | % | | | 105 | % | | | 150 | % |
| | | | | | | | | | | | | | | | | | | | | | | | | | | | | |
Notes to Financial Highlights
| (a) | For the period from January 1, 2012 to May 31, 2012. During the period, the Fund’s fiscal year end was changed from December 31 to May 31. |
| (c) | The Fund received proceeds from regulatory settlements. Had the Fund not received these proceeds, the total return would have been lower by 0.12%. |
| (d) | The Fund received a payment from an affiliate. Had the Fund not received this payment, the total return would have been lower by 0.01%. |
| (e) | The Fund received proceeds from regulatory settlements. Had the Fund not received these proceeds, the total return would have been lower by 0.02%. |
| (f) | The Fund received a payment from an affiliate. Had the Fund not received this payment, the total return would have been lower by 0.03%. |
| (g) | The Fund received proceeds from regulatory settlements. Had the Fund not received these proceeds, the total return would have been lower by 0.36%. |
| (h) | In addition to the fees and expenses that the Fund bears directly, the Fund indirectly bears a pro rata share of the fees and expenses of any other funds in which it invests. Such indirect expenses are not included in the Fund’s reported expense ratios. |
| (j) | Ratios include line of credit interest expense which is less than 0.01%. |
| (k) | Gross expense ratio has been revised to conform to current year presentation. |
| (l) | Total net expenses include the impact of certain fee waivers/expense reimbursements made by the Investment Manager and certain of its affiliates, if applicable. |
| (m) | The benefits derived from expense reductions had an impact of less than 0.01%. |
The accompanying Notes to Financial Statements are an integral part of this statement.
| | | | |
| Semiannual Report 2014 | | | 17 | |
| | |
| |
| | Columbia Seligman Communications and Information Fund |
Financial Highlights (continued)
| | | | | | | | | | | | | | | | | | | | | | | | | | | | |
| |
| Six Months Ended
November 30, 2014 |
| | | Year Ended May 31, | | | | Year Ended December 31, | |
Class C | | | (Unaudited) | | | | 2014 | | | | 2013 | | | | 2012(a) | | | | 2011 | | | | 2010 | | | | 2009 | |
Per share data | | | | | | | | | | | | | | | | | | | | | | | | | | | | |
Net asset value, beginning of period | | | $42.68 | | | | $35.83 | | | | $34.91 | | | | $33.32 | | | | $37.12 | | | | $32.44 | | | | $20.44 | |
| | | | | | | | | | | | | | | | | | | | | | | | | | | | | |
Income from investment operations: | | | | | | | | | | | | | | | | | | | | | | | | | | | | |
| | | | | | | |
Net investment loss | | | (0.30 | ) | | | (0.50 | ) | | | (0.49 | ) | | | (0.23 | ) | | | (0.51 | ) | | | (0.49 | ) | | | (0.51 | ) |
| | | | | | | | | | | | | | | | | | | | | | | | | | | | | |
Net realized and unrealized gain (loss) | | | 6.15 | | | | 8.13 | | | | 4.13 | | | | 1.77 | | | | (1.54 | ) | | | 5.15 | | | | 12.43 | |
| | | | | | | | | | | | | | | | | | | | | | | | | | | | | |
Increase from payment by affiliate | | | — | | | | — | | | | — | | | | — | | | | 0.00 | (b) | | | 0.01 | | | | — | |
| | | | | | | | | | | | | | | | | | | | | | | | | | | | | |
Total from investment operations | | | 5.85 | | | | 7.63 | | | | 3.64 | | | | 1.54 | | | | (2.05 | ) | | | 4.67 | | | | 11.92 | |
| | | | | | | | | | | | | | | | | | | | | | | | | | | | | |
Less distributions to shareholders: | | | | | | | | | | | | | | | | | | | | | | | | | | | | |
| | | | | | | |
Net realized gains | | | — | | | | (0.78 | ) | | | (2.72 | ) | | | — | | | | (1.75 | ) | | | — | | | | — | |
| | | | | | | | | | | | | | | | | | | | | | | | | | | | | |
Total distributions to shareholders | | | — | | | | (0.78 | ) | | | (2.72 | ) | | | — | | | | (1.75 | ) | | | — | | | | — | |
| | | | | | | | | | | | | | | | | | | | | | | | | | | | | |
Proceeds from regulatory settlements | | | — | | | | — | | | | — | | | | 0.05 | | | | — | | | | 0.01 | | | | 0.08 | |
| | | | | | | | | | | | | | | | | | | | | | | | | | | | | |
Net asset value, end of period | | | $48.53 | | | | $42.68 | | | | $35.83 | | | | $34.91 | | | | $33.32 | | | | $37.12 | | | | $32.44 | |
| | | | | | | | | | | | | | | | | | | | | | | | | | | | | |
Total return | | | 13.71 | % | | | 21.57 | % | | | 11.06 | % | | | 4.77 | %(c) | | | (5.56 | %)(d) | | | 14.43 | %(e)(f) | | | 58.71 | %(g) |
| | | | | | | | | | | | | | | | | | | | | | | | | | | | | |
Ratios to average net assets(h) | | | | | | | | | | | | | | | | | | | | | | | | | | | | |
| | | | | | | |
Total gross expenses | | | 2.10 | %(i) | | | 2.16 | %(j) | | | 2.12 | %(j) | | | 2.09 | %(i) | | | 2.10 | %(j) | | | 2.11 | % | | | 2.36 | % |
| | | | | | | | | | | | | | | | | | | | | | | | | | | | | |
Total net expenses(k) | | | 2.10 | %(i)(l) | | | 2.16 | %(j)(l) | | | 2.12 | %(j)(l) | | | 2.09 | %(i) | | | 2.10 | %(j)(l) | | | 2.11 | % | | | 2.36 | % |
| | | | | | | | | | | | | | | | | | | | | | | | | | | | | |
Net investment loss | | | (1.32 | %)(i) | | | (1.30 | %) | | | (1.41 | %) | | | (1.47 | %)(i) | | | (1.40 | %) | | | (1.48 | %) | | | (1.94 | %) |
| | | | | | | | | | | | | | | | | | | | | | | | | | | | | |
Supplemental data | | | | | | | | | | | | | | | | | | | | | | | | | | | | |
| | | | | | | |
Net assets, end of period (in thousands) | | | $736,442 | | | | $671,468 | | | | $633,180 | | | | $668,588 | | | | $670,843 | | | | $767,800 | | | | $694,889 | |
| | | | | | | | | | | | | | | | | | | | | | | | | | | | | |
Portfolio turnover | | | 31 | % | | | 48 | % | | | 61 | % | | | 38 | % | | | 66 | % | | | 105 | % | | | 150 | % |
| | | | | | | | | | | | | | | | | | | | | | | | | | | | | |
Notes to Financial Highlights
| (a) | For the period from January 1, 2012 to May 31, 2012. During the period, the Fund’s fiscal year end was changed from December 31 to May 31. |
| (c) | The Fund received proceeds from regulatory settlements. Had the Fund not received these proceeds, the total return would have been lower by 0.12%. |
| (d) | The Fund received a payment from an affiliate. Had the Fund not received this payment, the total return would have been lower by 0.01%. |
| (e) | The Fund received proceeds from regulatory settlements. Had the Fund not received these proceeds, the total return would have been lower by 0.02%. |
| (f) | The Fund received a payment from an affiliate. Had the Fund not received this payment, the total return would have been lower by 0.03%. |
| (g) | The Fund received proceeds from regulatory settlements. Had the Fund not received these proceeds, the total return would have been lower by 0.36%. |
| (h) | In addition to the fees and expenses that the Fund bears directly, the Fund indirectly bears a pro rata share of the fees and expenses of any other funds in which it invests. Such indirect expenses are not included in the Fund’s reported expense ratios. |
| (j) | Ratios include line of credit interest expense which is less than 0.01%. |
| (k) | Total net expenses include the impact of certain fee waivers/expense reimbursements made by the Investment Manager and certain of its affiliates, if applicable. |
| (l) | The benefits derived from expense reductions had an impact of less than 0.01%. |
The accompanying Notes to Financial Statements are an integral part of this statement.
| | |
| 18 | | Semiannual Report 2014 |
| | |
| |
| Columbia Seligman Communications and Information Fund | | |
Financial Highlights (continued)
| | | | | | | | | | | | | | | | | | | | | | | | | | | | |
| |
| Six Months Ended
November 30, 2014 |
| | | Year Ended May 31, | | | | Year Ended December 31, | |
Class I | | | (Unaudited) | | | | 2014 | | | | 2013 | | | | 2012(a) | | | | 2011 | | | | 2010 | | | | 2009(b) | |
Per share data | | | | | | | | | | | | | | | | | | | | | | | | | | | | |
Net asset value, beginning of period | | | $57.80 | | | | $47.70 | | | | $45.08 | | | | $42.82 | | | | $46.62 | | | | $40.29 | | | | $34.44 | |
| | | | | | | | | | | | | | | | | | | | | | | | | | | | | |
Income from investment operations: | | | | | | | | | | | | | | | | | | | | | | | | | | | | |
| | | | | | | |
Net investment loss | | | (0.04 | ) | | | (0.06 | ) | | | (0.11 | ) | | | (0.06 | ) | | | (0.20 | ) | | | (0.13 | ) | | | (0.08 | ) |
| | | | | | | | | | | | | | | | | | | | | | | | | | | | | |
Net realized and unrealized gain (loss) | | | 8.34 | | | | 10.94 | | | | 5.45 | | | | 2.26 | | | | (1.86 | ) | | | 6.44 | | | | 5.93 | |
| | | | | | | | | | | | | | | | | | | | | | | | | | | | | |
Increase from payment by affiliate | | | — | | | | — | | | | — | | | | — | | | | 0.01 | | | | 0.01 | | | | — | |
| | | | | | | | | | | | | | | | | | | | | | | | | | | | | |
Total from investment operations | | | 8.30 | | | | 10.88 | | | | 5.34 | | | | 2.20 | | | | (2.05 | ) | | | 6.32 | | | | 5.85 | |
| | | | | | | | | | | | | | | | | | | | | | | | | | | | | |
Less distributions to shareholders: | | | | | | | | | | | | | | | | | | | | | | | | | | | | |
| | | | | | | |
Net realized gains | | | — | | | | (0.78 | ) | | | (2.72 | ) | | | — | | | | (1.75 | ) | | | — | | | | — | |
| | | | | | | | | | | | | | | | | | | | | | | | | | | | | |
Total distributions to shareholders | | | — | | | | (0.78 | ) | | | (2.72 | ) | | | — | | | | (1.75 | ) | | | — | | | | — | |
| | | | | | | | | | | | | | | | | | | | | | | | | | | | | |
Proceeds from regulatory settlements | | | — | | | | — | | | | — | | | | 0.06 | | | | — | | | | 0.01 | | | | — | |
| | | | | | | | | | | | | | | | | | | | | | | | | | | | | |
Net asset value, end of period | | | $66.10 | | | | $57.80 | | | | $47.70 | | | | $45.08 | | | | $42.82 | | | | $46.62 | | | | $40.29 | |
| | | | | | | | | | | | | | | | | | | | | | | | | | | | | |
Total return | | | 14.36 | % | | | 23.03 | % | | | 12.37 | % | | | 5.28 | %(c) | | | (4.43 | %)(d) | | | 15.71 | %(e)(f) | | | 16.99 | % |
| | | | | | | | | | | | | | | | | | | | | | | | | | | | | |
Ratios to average net assets(g) | | | | | | | | | | | | | | | | | | | | | | | | | | | | |
| | | | | | | |
Total gross expenses | | | 0.93 | %(h) | | | 0.97 | %(i) | | | 0.94 | %(i) | | | 0.92 | %(h) | | | 0.90 | %(i) | | | 0.96 | % | | | 1.00 | %(h) |
| | | | | | | | | | | | | | | | | | | | | | | | | | | | | |
Total net expenses(j) | | | 0.93 | %(h) | | | 0.97 | %(i) | | | 0.94 | %(i) | | | 0.92 | %(h) | | | 0.90 | %(i) | | | 0.96 | % | | | 1.00 | %(h) |
| | | | | | | | | | | | | | | | | | | | | | | | | | | | | |
Net investment loss | | | (0.15 | %)(h) | | | (0.11 | %) | | | (0.23 | %) | | | (0.30 | %)(h) | | | (0.41 | %) | | | (0.31 | %) | | | (0.50 | %)(h) |
| | | | | | | | | | | | | | | | | | | | | | | | | | | | | |
Supplemental data | | | | | | | | | | | | | | | | | | | | | | | | | | | | |
| | | | | | | |
Net assets, end of period (in thousands) | | | $4 | | | | $3 | | | | $7 | | | | $7 | | | | $6 | | | | $55,590 | | | | $39,507 | |
| | | | | | | | | | | | | | | | | | | | | | | | | | | | | |
Portfolio turnover | | | 31 | % | | | 48 | % | | | 61 | % | | | 38 | % | | | 66 | % | | | 105 | % | | | 150 | % |
| | | | | | | | | | | | | | | | | | | | | | | | | | | | | |
Notes to Financial Highlights
| (a) | For the period from January 1, 2012 to May 31, 2012. During the period, the Fund’s fiscal year end was changed from December 31 to May 31. |
| (b) | Based on operations from August 3, 2009 (commencement of operations) through the stated period end. |
| (c) | The Fund received proceeds from regulatory settlements. Had the Fund not received these proceeds, the total return would have been lower by 0.12%. |
| (d) | The Fund received a payment from an affiliate. Had the Fund not received this payment, the total return would have been lower by 0.01%. |
| (e) | The Fund received proceeds from regulatory settlements. Had the Fund not received these proceeds, the total return would have been lower by 0.02%. |
| (f) | The Fund received a payment from an affiliate. Had the Fund not received this payment, the total return would have been lower by 0.03%. |
| (g) | In addition to the fees and expenses that the Fund bears directly, the Fund indirectly bears a pro rata share of the fees and expenses of any other funds in which it invests. Such indirect expenses are not included in the Fund’s reported expense ratios. |
| (i) | Ratios include line of credit interest expense which is less than 0.01%. |
| (j) | Total net expenses include the impact of certain fee waivers/expense reimbursements made by the Investment Manager and certain of its affiliates, if applicable. |
The accompanying Notes to Financial Statements are an integral part of this statement.
| | | | |
| Semiannual Report 2014 | | | 19 | |
| | |
| |
| | Columbia Seligman Communications and Information Fund |
Financial Highlights (continued)
| | | | | | | | | | | | | | | | | | | | | | | | | | | | |
| |
| Six Months Ended
November 30, 2014 |
| | | Year Ended May 31, | | | | Year Ended December 31, | |
Class K | | | (Unaudited) | | | | 2014 | | | | 2013 | | | | 2012(a) | | | | 2011 | | | | 2010 | | | | 2009(b) | |
Per share data | | | | | | | | | | | | | | | | | | | | | | | | | | | | |
Net asset value, beginning of period | | | $56.90 | | | | $47.12 | | | | $44.69 | | | | $42.50 | | | | $46.42 | | | | $40.24 | | | | $34.44 | |
| | | | | | | | | | | | | | | | | | | | | | | | | | | | | |
Income from investment operations: | | | | | | | | | | | | | | | | | | | | | | | | | | | | |
| | | | | | | |
Net investment loss | | | (0.17 | ) | | | (0.22 | ) | | | (0.24 | ) | | | (0.12 | ) | | | (0.25 | ) | | | (0.24 | ) | | | (0.12 | ) |
| | | | | | | | | | | | | | | | | | | | | | | | | | | | | |
Net realized and unrealized gain (loss) | | | 8.24 | | | | 10.78 | | | | 5.39 | | | | 2.25 | | | | (1.93 | ) | | | 6.40 | | | | 5.92 | |
| | | | | | | | | | | | | | | | | | | | | | | | | | | | | |
Increase from payment by affiliate | | | — | | | | — | | | | — | | | | — | | | | 0.01 | | | | 0.01 | | | | — | |
| | | | | | | | | | | | | | | | | | | | | | | | | | | | | |
Total from investment operations | | | 8.07 | | | | 10.56 | | | | 5.15 | | | | 2.13 | | | | (2.17 | ) | | | 6.17 | | | | 5.80 | |
| | | | | | | | | | | | | | | | | | | | | | | | | | | | | |
Less distributions to shareholders: | | | | | | | | | | | | | | | | | | | | | | | | | | | | |
| | | | | | | |
Net realized gains | | | — | | | | (0.78 | ) | | | (2.72 | ) | | | — | | | | (1.75 | ) | | | — | | | | — | |
| | | | | | | | | | | | | | | | | | | | | | | | | | | | | |
Total distributions to shareholders | | | — | | | | (0.78 | ) | | | (2.72 | ) | | | — | | | | (1.75 | ) | | | — | | | | — | |
| | | | | | | | | | | | | | | | | | | | | | | | | | | | | |
Proceeds from regulatory settlements | | | — | | | | — | | | | — | | | | 0.06 | | | | — | | | | 0.01 | | | | — | |
| | | | | | | | | | | | | | | | | | | | | | | | | | | | | |
Net asset value, end of period | | | $64.97 | | | | $56.90 | | | | $47.12 | | | | $44.69 | | | | $42.50 | | | | $46.42 | | | | $40.24 | |
| | | | | | | | | | | | | | | | | | | | | | | | | | | | | |
Total return | | | 14.18 | % | | | 22.63 | % | | | 12.04 | % | | | 5.15 | %(c) | | | (4.71 | %)(d) | | | 15.36 | %(e)(f) | | | 16.84 | % |
| | | | | | | | | | | | | | | | | | | | | | | | | | | | | |
Ratios to average net assets(g) | | | | | | | | | | | | | | | | | | | | | | | | | | | | |
| | | | | | | |
Total gross expenses | | | 1.25 | %(h) | | | 1.27 | %(i) | | | 1.24 | %(i) | | | 1.23 | %(h) | | | 1.23 | %(i) | | | 1.26 | % | | | 1.28 | %(h) |
| | | | | | | | | | | | | | | | | | | | | | | | | | | | | |
Total net expenses(j) | | | 1.25 | %(h) | | | 1.27 | %(i) | | | 1.24 | %(i) | | | 1.23 | %(h) | | | 1.23 | %(i) | | | 1.26 | % | | | 1.28 | %(h) |
| | | | | | | | | | | | | | | | | | | | | | | | | | | | | |
Net investment loss | | | (0.56 | %)(h) | | | (0.44 | %) | | | (0.53 | %) | | | (0.60 | %)(h) | | | (0.54 | %) | | | (0.58 | %) | | | (0.76 | %)(h) |
| | | | | | | | | | | | | | | | | | | | | | | | | | | | | |
Supplemental data | | | | | | | | | | | | | | | | | | | | | | | | | | | | |
| | | | | | | |
Net assets, end of period (in thousands) | | | $38 | | | | $107 | | | | $969 | | | | $1,172 | | | | $1,061 | | | | $507 | | | | $8 | |
| | | | | | | | | | | | | | | | | | | | | | | | | | | | | |
Portfolio turnover | | | 31 | % | | | 48 | % | | | 61 | % | | | 38 | % | | | 66 | % | | | 105 | % | | | 150 | % |
| | | | | | | | | | | | | | | | | | | | | | | | | | | | | |
Notes to Financial Highlights
| (a) | For the period from January 1, 2012 to May 31, 2012. During the period, the Fund’s fiscal year end was changed from December 31 to May 31. |
| (b) | Based on operations from August 3, 2009 (commencement of operations) through the stated period end. |
| (c) | The Fund received proceeds from regulatory settlements. Had the Fund not received these proceeds, the total return would have been lower by 0.12%. |
| (d) | The Fund received a payment from an affiliate. Had the Fund not received this payment, the total return would have been lower by 0.01%. |
| (e) | The Fund received proceeds from regulatory settlements. Had the Fund not received these proceeds, the total return would have been lower by 0.02%. |
| (f) | The Fund received a payment from an affiliate. Had the Fund not received this payment, the total return would have been lower by 0.03%. |
| (g) | In addition to the fees and expenses that the Fund bears directly, the Fund indirectly bears a pro rata share of the fees and expenses of any other funds in which it invests. Such indirect expenses are not included in the Fund’s reported expense ratios. |
| (i) | Ratios include line of credit interest expense which is less than 0.01%. |
| (j) | Total net expenses include the impact of certain fee waivers/expense reimbursements made by the Investment Manager and certain of its affiliates, if applicable. |
The accompanying Notes to Financial Statements are an integral part of this statement.
| | |
| 20 | | Semiannual Report 2014 |
| | |
| |
| Columbia Seligman Communications and Information Fund | | |
Financial Highlights (continued)
| | | | | | | | | | | | | | | | | | | | | | | | | | | | |
| |
| Six Months Ended
November 30, 2014 |
| | | Year Ended May 31, | | | | Year Ended December 31, | |
Class R | | | (Unaudited) | | | | 2014 | | | | 2013 | | | | 2012(a) | | | | 2011 | | | | 2010 | | | | 2009 | |
Per share data | | | | | | | | | | | | | | | | | | | | | | | | | | | | |
Net asset value, beginning of period | | | $52.49 | | | | $43.69 | | | | $41.78 | | | | $39.79 | | | | $43.75 | | | | $38.09 | | | | $23.89 | |
| | | | | | | | | | | | | | | | | | | | | | | | | | | | | |
Income from investment operations: | | | | | | | | | | | | | | | | | | | | | | | | | | | | |
| | | | | | | |
Net investment loss | | | (0.23 | ) | | | (0.38 | ) | | | (0.39 | ) | | | (0.18 | ) | | | (0.39 | ) | | | (0.41 | ) | | | (0.46 | ) |
| | | | | | | | | | | | | | | | | | | | | | | | | | | | | |
Net realized and unrealized gain (loss) | | | 7.57 | | | | 9.96 | | | | 5.02 | | | | 2.12 | | | | (1.83 | ) | | | 6.05 | | | | 14.57 | |
| | | | | | | | | | | | | | | | | | | | | | | | | | | | | |
Increase from payment by affiliate | | | — | | | | — | | | | — | | | | — | | | | 0.01 | | | | 0.01 | | | | — | |
| | | | | | | | | | | | | | | | | | | | | | | | | | | | | |
Total from investment operations | | | 7.34 | | | | 9.58 | | | | 4.63 | | | | 1.94 | | | | (2.21 | ) | | | 5.65 | | | | 14.11 | |
| | | | | | | | | | | | | | | | | | | | | | | | | | | | | |
Less distributions to shareholders: | | | | | | | | | | | | | | | | | | | | | | | | | | | | |
| | | | | | | |
Net realized gains | | | — | | | | (0.78 | ) | | | (2.72 | ) | | | — | | | | (1.75 | ) | | | — | | | | — | |
| | | | | | | | | | | | | | | | | | | | | | | | | | | | | |
Total distributions to shareholders | | | — | | | | (0.78 | ) | | | (2.72 | ) | | | — | | | | (1.75 | ) | | | — | | | | — | |
| | | | | | | | | | | | | | | | | | | | | | | | | | | | | |
Proceeds from regulatory settlements | | | — | | | | — | | | | — | | | | 0.05 | | | | — | | | | 0.01 | | | | 0.09 | |
| | | | | | | | | | | | | | | | | | | | | | | | | | | | | |
Net asset value, end of period | | | $59.83 | | | | $52.49 | | | | $43.69 | | | | $41.78 | | | | $39.79 | | | | $43.75 | | | | $38.09 | |
| | | | | | | | | | | | | | | | | | | | | | | | | | | | | |
Total return | | | 13.98 | % | | | 22.16 | % | | | 11.63 | % | | | 5.00 | %(b) | | | (5.08 | %)(c) | | | 14.86 | %(d)(e) | | | 59.44 | %(f) |
| | | | | | | | | | | | | | | | | | | | | | | | | | | | | |
Ratios to average net assets(g) | | | | | | | | | | | | | | | | | | | | | | | | | | | | |
| | | | | | | |
Total gross expenses | | | 1.60 | %(h) | | | 1.66 | %(i) | | | 1.62 | %(i) | | | 1.59 | %(h) | | | 1.60 | %(i) | | | 1.70 | % | | | 1.93 | % |
| | | | | | | | | | | | | | | | | | | | | | | | | | | | | |
Total net expenses(j) | | | 1.60 | %(h)(k) | | | 1.66 | %(i)(k) | | | 1.62 | %(i)(k) | | | 1.59 | %(h) | | | 1.60 | %(i)(k) | | | 1.70 | % | | | 1.93 | % |
| | | | | | | | | | | | | | | | | | | | | | | | | | | | | |
Net investment loss | | | (0.81 | %)(h) | | | (0.80 | %) | | | (0.92 | %) | | | (0.98 | %)(h) | | | (0.90 | %) | | | (1.06 | %) | | | (1.50 | %) |
| | | | | | | | | | | | | | | | | | | | | | | | | | | | | |
Supplemental data | | | | | | | | | | | | | | | | | | | | | | | | | | | | |
| | | | | | | |
Net assets, end of period (in thousands) | | | $49,864 | | | | $42,742 | | | | $41,000 | | | | $41,829 | | | | $43,815 | | | | $47,554 | | | | $37,012 | |
| | | | | | | | | | | | | | | | | | | | | | | | | | | | | |
Portfolio turnover | | | 31 | % | | | 48 | % | | | 61 | % | | | 38 | % | | | 66 | % | | | 105 | % | | | 150 | % |
| | | | | | | | | | | | | | | | | | | | | | | | | | | | | |
Notes to Financial Highlights
| (a) | For the period from January 1, 2012 to May 31, 2012. During the period, the Fund’s fiscal year end was changed from December 31 to May 31. |
| (b) | The Fund received proceeds from regulatory settlements. Had the Fund not received these proceeds, the total return would have been lower by 0.12%. |
| (c) | The Fund received a payment from an affiliate. Had the Fund not received this payment, the total return would have been lower by 0.01%. |
| (d) | The Fund received proceeds from regulatory settlements. Had the Fund not received these proceeds, the total return would have been lower by 0.02%. |
| (e) | The Fund received a payment from an affiliate. Had the Fund not received this payment, the total return would have been lower by 0.03%. |
| (f) | The Fund received proceeds from regulatory settlements. Had the Fund not received these proceeds, the total return would have been lower by 0.36%. |
| (g) | In addition to the fees and expenses that the Fund bears directly, the Fund indirectly bears a pro rata share of the fees and expenses of any other funds in which it invests. Such indirect expenses are not included in the Fund’s reported expense ratios. |
| (i) | Ratios include line of credit interest expense which is less than 0.01%. |
| (j) | Total net expenses include the impact of certain fee waivers/expense reimbursements made by the Investment Manager and certain of its affiliates, if applicable. |
| (k) | The benefits derived from expense reductions had an impact of less than 0.01%. |
The accompanying Notes to Financial Statements are an integral part of this statement.
| | | | |
| Semiannual Report 2014 | | | 21 | |
| | |
| |
| | Columbia Seligman Communications and Information Fund |
Financial Highlights (continued)
| | | | | | | | | | | | | | | | | | | | | | | | | | | | |
| |
| Six Months Ended
November 30, 2014 |
| | | Year Ended May 31, | | | | Year Ended December 31, | |
Class R4 | | | (Unaudited) | | | | 2014 | | | | 2013 | | | | 2012(a) | | | | 2011 | | | | 2010 | | | | 2009(b) | |
Per share data | | | | | | | | | | | | | | | | | | | | | | | | | | | | |
Net asset value, beginning of period | | | $53.23 | | | | $44.08 | | | | $42.00 | | | | $39.98 | | | | $43.89 | | | | $38.13 | | | | $32.67 | |
| | | | | | | | | | | | | | | | | | | | | | | | | | | | | |
Income from investment operations: | | | | | | | | | | | | | | | | | | | | | | | | | | | | |
| | | | | | | |
Net investment loss | | | (0.10 | ) | | | (0.17 | ) | | | (0.30 | ) | | | (0.16 | ) | | | (0.38 | ) | | | (0.35 | ) | | | (0.16 | ) |
| | | | | | | | | | | | | | | | | | | | | | | | | | | | | |
Net realized and unrealized gain (loss) | | | 7.70 | | | | 10.10 | | | | 5.10 | | | | 2.13 | | | | (1.79 | ) | | | 6.09 | | | | 5.62 | |
| | | | | | | | | | | | | | | | | | | | | | | | | | | | | |
Increase from payment by affiliate | | | — | | | | — | | | | — | | | | — | | | | 0.01 | | | | 0.01 | | | | — | |
| | | | | | | | | | | | | | | | | | | | | | | | | | | | | |
Total from investment operations | | | 7.60 | | | | 9.93 | | | | 4.80 | | | | 1.97 | | | | (2.16 | ) | | | 5.75 | | | | 5.46 | |
| | | | | | | | | | | | | | | | | | | | | | | | | | | | | |
Less distributions to shareholders: | | | | | | | | | | | | | | | | | | | | | | | | | | | | |
| | | | | | | |
Net realized gains | | | — | | | | (0.78 | ) | | | (2.72 | ) | | | — | | | | (1.75 | ) | | | — | | | | — | |
| | | | | | | | | | | | | | | | | | | | | | | | | | | | | |
Total distributions to shareholders | | | — | | | | (0.78 | ) | | | (2.72 | ) | | | — | | | | (1.75 | ) | | | — | | | | — | |
| | | | | | | | | | | | | | | | | | | | | | | | | | | | | |
Increase from payment by affiliate | | | — | | | | — | | | | — | | | | 0.05 | | | | — | | | | 0.01 | | | | — | |
| | | | | | | | | | | | | | | | | | | | | | | | | | | | | |
Net asset value, end of period | | | $60.83 | | | | $53.23 | | | | $44.08 | | | | $42.00 | | | | $39.98 | | | | $43.89 | | | | $38.13 | |
| | | | | | | | | | | | | | | | | | | | | | | | | | | | | |
Total return | | | 14.28 | % | | | 22.76 | % | | | 11.99 | % | | | 5.05 | %(c) | | | (4.95 | %)(d) | | | 15.11 | %(e)(f) | | | 16.71 | % |
| | | | | | | | | | | | | | | | | | | | | | | | | | | | | |
Ratios to average net assets(g) | | | | | | | | | | | | | | | | | | | | | | | | | | | | |
| | | | | | | |
Total gross expenses | | | 1.10 | %(h) | | | 1.16 | %(i) | | | 1.22 | %(i) | | | 1.48 | %(h) | | | 1.47 | %(i) | | | 1.51 | % | | | 1.54 | %(h) |
| | | | | | | | | | | | | | | | | | | | | | | | | | | | | |
Total net expenses(j) | | | 1.10 | %(h)(k) | | | 1.16 | %(i)(k) | | | 1.22 | %(i) | | | 1.48 | %(h) | | | 1.47 | %(i) | | | 1.51 | % | | | 1.54 | %(h) |
| | | | | | | | | | | | | | | | | | | | | | | | | | | | | |
Net investment loss | | | (0.34 | %)(h) | | | (0.35 | %) | | | (0.71 | %) | | | (0.85 | %)(h) | | | (0.85 | %) | | | (0.90 | %) | | | (1.08 | %)(h) |
| | | | | | | | | | | | | | | | | | | | | | | | | | | | | |
Supplemental data | | | | | | | | | | | | | | | | | | | | | | | | | | | | |
| | | | | | | |
Net assets, end of period (in thousands) | | | $14,082 | | | | $14,254 | | | | $588 | | | | $26 | | | | $23 | | | | $96 | | | | $16 | |
| | | | | | | | | | | | | | | | | | | | | | | | | | | | | |
Portfolio turnover | | | 31 | % | | | 48 | % | | | 61 | % | | | 38 | % | | | 66 | % | | | 105 | % | | | 150 | % |
| | | | | | | | | | | | | | | | | | | | | | | | | | | | | |
Notes to Financial Highlights
| (a) | For the period from January 1, 2012 to May 31, 2012. During the period, the Fund’s fiscal year end was changed from December 31 to May 31. |
| (b) | Based on operations from August 3, 2009 (commencement of operations) through the stated period end. |
| (c) | The Fund received proceeds from regulatory settlements. Had the Fund not received these proceeds, the total return would have been lower by 0.12%. |
| (d) | The Fund received a payment from an affiliate. Had the Fund not received this payment, the total return would have been lower by 0.01%. |
| (e) | The Fund received proceeds from regulatory settlements. Had the Fund not received these proceeds, the total return would have been lower by 0.02%. |
| (f) | The Fund received a payment from an affiliate. Had the Fund not received this payment, the total return would have been lower by 0.03%. |
| (g) | In addition to the fees and expenses that the Fund bears directly, the Fund indirectly bears a pro rata share of the fees and expenses of any other funds in which it invests. Such indirect expenses are not included in the Fund’s reported expense ratios. |
| (i) | Ratios include line of credit interest expense which is less than 0.01%. |
| (j) | Total net expenses include the impact of certain fee waivers/expense reimbursements made by the Investment Manager and certain of its affiliates, if applicable. |
| (k) | The benefits derived from expense reductions had an impact of less than 0.01%. |
The accompanying Notes to Financial Statements are an integral part of this statement.
| | |
| 22 | | Semiannual Report 2014 |
| | |
| |
| Columbia Seligman Communications and Information Fund | | |
Financial Highlights (continued)
| | | | | | | | | | | | | | | | | | | | | | | | | | | | |
| |
| Six Months Ended
November 30, 2014 |
| | | Year Ended May 31, | | | | Year Ended December 31, | |
Class R5 | | | (Unaudited) | | | | 2014 | | | | 2013 | | | | 2012(a) | | | | 2011 | | | | 2010 | | | | 2009 | |
Per share data | | | | | | | | | | | | | | | | | | | | | | | | | | | | |
Net asset value, beginning of period | | | $57.65 | | | | $47.61 | | | | $45.03 | | | | $42.77 | | | | $46.60 | | | | $40.28 | | | | $25.08 | |
| | | | | | | | | | | | | | | | | | | | | | | | | | | | | |
Income from investment operations: | | | | | | | | | | | | | | | | | | | | | | | | | | | | |
| | | | | | | |
Net investment loss | | | (0.06 | ) | | | (0.10 | ) | | | (0.13 | ) | | | (0.07 | ) | | | (0.12 | ) | | | (0.15 | ) | | | (0.27 | ) |
| | | | | | | | | | | | | | | | | | | | | | | | | | | | | |
Net realized and unrealized gain (loss) | | | 8.33 | | | | 10.92 | | | | 5.43 | | | | 2.27 | | | | (1.97 | ) | | | 6.45 | | | | 15.38 | |
| | | | | | | | | | | | | | | | | | | | | | | | | | | | | |
Increase from payment by affiliate | | | — | | | | — | | | | — | | | | — | | | | 0.01 | | | | 0.01 | | | | — | |
| | | | | | | | | | | | | | | | | | | | | | | | | | | | | |
Total from investment operations | | | 8.27 | | | | 10.82 | | | | 5.30 | | | | 2.20 | | | | (2.08 | ) | | | 6.31 | | | | 15.11 | |
| | | | | | | | | | | | | | | | | | | | | | | | | | | | | |
Less distributions to shareholders: | | | | | | | | | | | | | | | | | | | | | | | | | | | | |
| | | | | | | |
Net realized gains | | | — | | | | (0.78 | ) | | | (2.72 | ) | | | — | | | | (1.75 | ) | | | — | | | | — | |
| | | | | | | | | | | | | | | | | | | | | | | | | | | | | |
Total distributions to shareholders | | | — | | | | (0.78 | ) | | | (2.72 | ) | | | — | | | | (1.75 | ) | | | — | | | | — | |
| | | | | | | | | | | | | | | | | | | | | | | | | | | | | |
Proceeds from regulatory settlements | | | — | | | | — | | | | — | | | | 0.06 | | | | — | | | | 0.01 | | | | 0.09 | |
| | | | | | | | | | | | | | | | | | | | | | | | | | | | | |
Net asset value, end of period | | | $65.92 | | | | $57.65 | | | | $47.61 | | | | $45.03 | | | | $42.77 | | | | $46.60 | | | | $40.28 | |
| | | | | | | | | | | | | | | | | | | | | | | | | | | | | |
Total return | | | 14.34 | % | | | 22.94 | % | | | 12.29 | % | | | 5.28 | %(b) | | | (4.49 | %)(c) | | | 15.69 | %(d)(e) | | | 60.60 | %(f) |
| | | | | | | | | | | | | | | | | | | | | | | | | | | | | |
Ratios to average net assets(g) | | | | | | | | | | | | | | | | | | | | | | | | | | | | |
| | | | | | | |
Total gross expenses | | | 0.97 | %(h) | | | 1.03 | %(i) | | | 0.99 | %(i) | | | 0.98 | %(h) | | | 0.97 | %(i) | | | 1.00 | % | | | 1.27 | % |
| | | | | | | | | | | | | | | | | | | | | | | | | | | | | |
Total net expenses(j) | | | 0.97 | %(h) | | | 1.03 | %(i) | | | 0.99 | %(i) | | | 0.98 | %(h) | | | 0.97 | %(i) | | | 1.00 | % | | | 1.27 | % |
| | | | | | | | | | | | | | | | | | | | | | | | | | | | | |
Net investment loss | | | (0.19 | %)(h) | | | (0.19 | %) | | | (0.28 | %) | | | (0.35 | %)(h) | | | (0.27 | %) | | | (0.37 | %) | | | (0.87 | %) |
| | | | | | | | | | | | | | | | | | | | | | | | | | | | | |
Supplemental data | | | | | | | | | | | | | | | | | | | | | | | | | | | | |
| | | | | | | |
Net assets, end of period (in thousands) | | | $26,285 | | | | $24,681 | | | | $17,365 | | | | $18,085 | | | | $16,922 | | | | $18,414 | | | | $14,853 | |
| | | | | | | | | | | | | | | | | | | | | | | | | | | | | |
Portfolio turnover | | | 31 | % | | | 48 | % | | | 61 | % | | | 38 | % | | | 66 | % | | | 105 | % | | | 150 | % |
| | | | | | | | | | | | | | | | | | | | | | | | | | | | | |
Notes to Financial Highlights
| (a) | For the period from January 1, 2012 to May 31, 2012. During the period, the Fund’s fiscal year end was changed from December 31 to May 31. |
| (b) | The Fund received proceeds from regulatory settlements. Had the Fund not received these proceeds, the total return would have been lower by 0.12%. |
| (c) | The Fund received a payment from an affiliate. Had the Fund not received this payment, the total return would have been lower by 0.01%. |
| (d) | The Fund received proceeds from regulatory settlements. Had the Fund not received these proceeds, the total return would have been lower by 0.02%. |
| (e) | The Fund received a payment from an affiliate. Had the Fund not received this payment, the total return would have been lower by 0.03%. |
| (f) | The Fund received proceeds from regulatory settlements. Had the Fund not received these proceeds, the total return would have been lower by 0.36%. |
| (g) | In addition to the fees and expenses that the Fund bears directly, the Fund indirectly bears a pro rata share of the fees and expenses of any other funds in which it invests. Such indirect expenses are not included in the Fund’s reported expense ratios. |
| (i) | Ratios include line of credit interest expense which is less than 0.01%. |
| (j) | Total net expenses include the impact of certain fee waivers/expense reimbursements made by the Investment Manager and certain of its affiliates, if applicable. |
The accompanying Notes to Financial Statements are an integral part of this statement.
| | | | |
| Semiannual Report 2014 | | | 23 | |
| | |
| |
| | Columbia Seligman Communications and Information Fund |
Financial Highlights (continued)
| | | | | | | | | | | | | | | | | | | | | | | | |
| |
| Six Months Ended
November 30, 2014 |
| | | Year Ended May 31, | | | | Year Ended December 31, | |
Class Z | | | (Unaudited) | | | | 2014 | | | | 2013 | | | | 2012(a) | | | | 2011 | | | | 2010(b) | |
Per share data | | | | | | | | | | | | | | | | | | | | | | | | |
Net asset value, beginning of period | | | $57.47 | | | | $47.53 | | | | $45.01 | | | | $42.77 | | | | $46.62 | | | | $41.62 | |
| | | | | | | | | | | | | | | | | | | | | | | | | |
Income from investment operations: | | | | | | | | | | | | | | | | | | | | | | | | |
| | | | | | |
Net investment loss | | | (0.09 | ) | | | (0.15 | ) | | | (0.19 | ) | | | (0.09 | ) | | | (0.15 | ) | | | (0.06 | ) |
| | | | | | | | | | | | | | | | | | | | | | | | | |
Net realized and unrealized gain (loss) | | | 8.29 | | | | 10.87 | | | | 5.43 | | | | 2.27 | | | | (1.96 | ) | | | 5.05 | |
| | | | | | | | | | | | | | | | | | | | | | | | | |
Increase from payment by affiliate | | | — | | | | — | | | | — | | | | — | | | | 0.01 | | | | 0.01 | |
| | | | | | | | | | | | | | | | | | | | | | | | | |
Total from investment operations | | | 8.20 | | | | 10.72 | | | | 5.24 | | | | 2.18 | | | | (2.10 | ) | | | 5.00 | |
| | | | | | | | | | | | | | | | | | | | | | | | | |
Less distributions to shareholders: | | | | | | | | | | | | | | | | | | | | | | | | |
| | | | | | |
Net realized gains | | | — | | | | (0.78 | ) | | | (2.72 | ) | | | — | | | | (1.75 | ) | | | — | |
| | | | | | | | | | | | | | | | | | | | | | | | | |
Total distributions to shareholders | | | — | | | | (0.78 | ) | | | (2.72 | ) | | | — | | | | (1.75 | ) | | | — | |
| | | | | | | | | | | | | | | | | | | | | | | | | |
Proceeds from regulatory settlements | | | — | | | | — | | | | — | | | | 0.06 | | | | — | | | | — | |
| | | | | | | | | | | | | | | | | | | | | | | | | |
Net asset value, end of period | | | $65.67 | | | | $57.47 | | | | $47.53 | | | | $45.01 | | | | $42.77 | | | | $46.62 | |
| | | | | | | | | | | | | | | | | | | | | | | | | |
Total return | | | 14.27 | % | | | 22.77 | % | | | 12.16 | % | | | 5.24 | %(c) | | | (4.53 | %)(d) | | | 12.01 | %(e) |
| | | | | | | | | | | | | | | | | | | | | | | | | |
Ratios to average net assets(f) | | | | | | | | | | | | | | | | | | | | | | | | |
| | | | | | |
Total gross expenses | | | 1.10 | %(g) | | | 1.16 | %(h) | | | 1.12 | %(h) | | | 1.09 | %(g) | | | 1.09 | %(h) | | | 1.13 | %(g) |
| | | | | | | | | | | | | | | | | | | | | | | | | |
Total net expenses(i) | | | 1.10 | %(g)(j) | | | 1.16 | %(h)(j) | | | 1.12 | %(h)(j) | | | 1.09 | %(g) | | | 1.09 | %(h)(j) | | | 1.13 | %(g) |
| | | | | | | | | | | | | | | | | | | | | | | | | |
Net investment loss | | | (0.31 | %)(g) | | | (0.30 | %) | | | (0.41 | %) | | | (0.45 | %)(g) | | | (0.33 | %) | | | (0.50 | %)(g) |
| | | | | | | | | | | | | | | | | | | | | | | | | |
Supplemental data | | | | | | | | | | | | | | | | | | | | | | | | |
| | | | | | |
Net assets, end of period (in thousands) | | | $282,283 | | | | $189,112 | | | | $180,926 | | | | $235,749 | | | | $148,571 | | | | $679 | |
| | | | | | | | | | | | | | | | | | | | | | | | | |
Portfolio turnover | | | 31 | % | | | 48 | % | | | 61 | % | | | 38 | % | | | 66 | % | | | 105 | % |
| | | | | | | | | | | | | | | | | | | | | | | | | |
Notes to Financial Highlights
| (a) | For the period from January 1, 2012 to May 31, 2012. During the period, the Fund’s fiscal year end was changed from December 31 to May 31. |
| (b) | Based on operations from September 27, 2010 (commencement of operations) through the stated period end. |
| (c) | The Fund received proceeds from regulatory settlements. Had the Fund not received these proceeds, the total return would have been lower by 0.12%. |
| (d) | The Fund received a payment from an affiliate. Had the Fund not received this payment, the total return would have been lower by 0.01%. |
| (e) | The Fund received a payment from an affiliate. Had the Fund not received this payment, the total return would have been lower by 0.03%. |
| (f) | In addition to the fees and expenses that the Fund bears directly, the Fund indirectly bears a pro rata share of the fees and expenses of any other funds in which it invests. Such indirect expenses are not included in the Fund’s reported expense ratios. |
| (h) | Ratios include line of credit interest expense which is less than 0.01%. |
| (i) | Total net expenses include the impact of certain fee waivers/expense reimbursements made by the Investment Manager and certain of its affiliates, if applicable. |
| (j) | The benefits derived from expense reductions had an impact of less than 0.01%. |
The accompanying Notes to Financial Statements are an integral part of this statement.
| | |
| 24 | | Semiannual Report 2014 |
| | |
| |
| Columbia Seligman Communications and Information Fund | | |
Notes to Financial Statements
November 30, 2014 (Unaudited)
Note 1. Organization
Columbia Seligman Communications and Information Fund (the Fund), a series of Columbia Funds Series Trust II (the Trust), is a non-diversified fund. The Trust is registered under the Investment Company Act of 1940, as amended (the 1940 Act), as an open-end management investment company organized as a Massachusetts business trust.
Fund Shares
The Trust may issue an unlimited number of shares (without par value). The Fund offers Class A, Class B, Class C, Class I, Class K, Class R, Class R4, Class R5 and Class Z shares. Although all share classes generally have identical voting, dividend and liquidation rights, each share class votes separately when required by the Trust’s organizational documents or by law. Different share classes pay different distribution amounts to the extent the expenses of such share classes differ, and distributions in liquidation will be proportional to the net asset value of each share class. Each share class has its own expense structure and sales charges.
Class A shares are subject to a maximum front-end sales charge of 5.75% based on the initial investment amount. Class A shares purchased without an initial sales charge in accounts aggregating $1 million to $50 million at the time of purchase are subject to a contingent deferred sales charge (CDSC) if the shares are sold within 18 months of purchase, charged as follows: 1.00% CDSC if redeemed within 12 months of purchase, and 0.50% CDSC if redeemed more than 12, but less than 18, months after purchase.
Class B shares may be subject to a maximum CDSC of 5.00% based upon the holding period after purchase. Class B shares will generally convert to Class A shares eight years after purchase. The Fund no longer accepts investments by new or existing investors in the Fund’s Class B shares, except in connection with the reinvestment of any dividend and/or capital gain distributions in Class B shares of the Fund and exchanges by existing Class B shareholders of certain other funds within the Columbia Family of Funds.
Class C shares are subject to a 1.00% CDSC on shares redeemed within one year of purchase.
Class I shares are not subject to sales charges and are available only to the Columbia Family of Funds.
Class K shares are not subject to sales charges, however this share class is closed to new investors.
Class R shares are not subject to sales charges and are generally available only to certain retirement plans and other investors as described in the Fund’s prospectus.
Class R4 shares are not subject to sales charges and are generally available only to omnibus retirement plans and certain investors as described in the Fund’s prospectus.
Class R5 shares are not subject to sales charges and are generally available only to investors purchasing through authorized investment professionals and omnibus retirement plans.
Class Z shares are not subject to sales charges and are available only to eligible investors, which are subject to different investment minimums as described in the Fund’s prospectus.
Note 2. Summary of Significant Accounting Policies
Basis of Preparation
The Fund is an investment company that applies the accounting and reporting guidance in the Financial Accounting Standards Board (FASB) Accounting Standards Codification Topic 946, Financial Services — Investment Companies (ASC 946). The financial statements are prepared in accordance with U.S. generally accepted accounting principles (GAAP) which requires management to make certain estimates and assumptions that affect the reported amounts of assets and liabilities, the disclosure of contingent assets and liabilities at the date of the financial statements and the reported amounts of income and expenses during the reporting period. Actual results could differ from those estimates.
The following is a summary of significant accounting policies followed by the Fund in the preparation of its financial statements.
Security Valuation
All equity securities are valued at the close of business of the New York Stock Exchange (NYSE). Equity securities are valued at the last quoted sales price on the principal exchange or market on which they trade, except for securities traded on the NASDAQ Stock Market, which are valued at the NASDAQ official close price. Unlisted securities or listed securities for which there were no sales during the day are valued at the mean of the latest quoted bid and ask prices on such exchanges or markets.
Foreign equity securities are valued based on quotations from the principal market in which such securities are traded. If any foreign security prices are not readily available as a result of limited share activity, the securities are valued at the mean of the latest quoted bid and ask prices on such exchanges or markets. Foreign currency exchange rates are generally determined at 4:00 p.m. Eastern (U.S.) time. Many securities
| | | | |
| Semiannual Report 2014 | | | 25 | |
| | |
| |
| | Columbia Seligman Communications and Information Fund |
Notes to Financial Statements (continued)
November 30, 2014 (Unaudited)
markets and exchanges outside the U.S. close prior to the close of the NYSE; therefore, the closing prices for securities in such markets or on such exchanges may not fully reflect events that occur after such close but before the close of the NYSE. In those situations, foreign securities will be fair valued pursuant to a policy adopted by the Board of Trustees (the Board), including, if available, utilizing a third party pricing service to determine these fair values. The third party pricing service takes into account multiple factors, including, but not limited to, movements in the U.S. securities markets, certain depositary receipts, futures contracts and foreign exchange rates that have occurred subsequent to the close of the foreign exchange or market, to determine a good faith estimate that reasonably reflects the current market conditions as of the close of the NYSE. The fair value of a security is likely to be different from the quoted or published price, if available.
Investments in open-end investment companies, including money market funds, are valued at their net asset value.
Investments for which market quotations are not readily available, or that have quotations which management believes are not reliable, are valued at fair value as determined in good faith under procedures established by and under the general supervision of the Board. If a security or class of securities (such as foreign securities) is valued at fair value, such value is likely to be different from the quoted or published price for the security.
The determination of fair value often requires significant judgment. To determine fair value, management may use assumptions including but not limited to future cash flows and estimated risk premiums. Multiple inputs from various sources may be used to determine fair value.
Foreign Currency Transactions and Translations
The values of all assets and liabilities denominated in foreign currencies are generally translated into U.S. dollars at exchange rates determined at the close of the NYSE. Net realized and unrealized gains (losses) on foreign currency transactions and translations include gains (losses) arising from the fluctuation in exchange rates between trade and settlement dates on securities transactions, gains (losses) arising from the disposition of foreign currency and currency gains (losses) between the accrual and payment dates on dividends, interest income and foreign withholding taxes.
For financial statement purposes, the Fund does not distinguish that portion of gains (losses) on investments which is due to changes in foreign exchange rates from that which is due to changes in market prices of the investments. Such fluctuations are included with the net realized and unrealized gains (losses) on investments in the Statement of Operations.
Security Transactions
Security transactions are accounted for on the trade date. Cost is determined and gains (losses) are based upon the specific identification method for both financial statement and federal income tax purposes.
Income Recognition
Corporate actions and dividend income are generally recorded net of any non-reclaimable tax withholdings, on the ex-dividend date or upon receipt of ex-dividend notification in the case of certain foreign securities.
Awards from class action litigation are recorded as a reduction of cost basis if the Fund still owns the applicable securities on the payment date. If the Fund no longer owns the applicable securities, the proceeds are recorded as realized gains.
Expenses
General expenses of the Trust are allocated to the Fund and other funds of the Trust based upon relative net assets or other expense allocation methodologies determined by the nature of the expense. Expenses directly attributable to the Fund are charged to the Fund. Expenses directly attributable to a specific class of shares are charged to that share class.
Determination of Class Net Asset Value
All income, expenses (other than class-specific expenses, which are charged to that share class, as shown in the Statement of Operations) and realized and unrealized gains (losses) are allocated to each class of the Fund on a daily basis, based on the relative net assets of each class, for purposes of determining the net asset value of each class.
Federal Income Tax Status
The Fund intends to qualify each year as a regulated investment company under Subchapter M of the Internal Revenue Code, as amended, and will distribute substantially all of its taxable income (including net short-term capital gains), if any, for its tax year, and as such will not be subject to federal income taxes. In addition, the Fund intends to distribute in each calendar year substantially all of its net investment income, capital gains and certain other amounts, if any, such that the Fund should not be subject to federal excise tax. Therefore, no federal income or excise tax provision is recorded.
Foreign Taxes
The Fund may be subject to foreign taxes on income, gains on investments or currency repatriation, a portion of which may be recoverable. The Fund will accrue such taxes and recoveries, as applicable, based upon its current interpretation of tax rules and regulations that exist in the markets in which it invests.
| | |
| 26 | | Semiannual Report 2014 |
| | |
| |
| Columbia Seligman Communications and Information Fund | | |
Notes to Financial Statements (continued)
November 30, 2014 (Unaudited)
Realized gains in certain countries may be subject to foreign taxes at the Fund level, based on statutory rates. The Fund accrues for such foreign taxes on realized and unrealized gains at the appropriate rate for each jurisdiction, as applicable. The amount, if any, is disclosed as a liability on the Statement of Assets and Liabilities.
Distributions to Shareholders
Distributions from net investment income, if any, are declared and paid annually. Net realized capital gains, if any, are distributed along with the income distribution. Income distributions and capital gain distributions are determined in accordance with federal income tax regulations, which may differ from GAAP.
Guarantees and Indemnifications
Under the Trust’s organizational documents and, in some cases, by contract, its officers and trustees are indemnified against certain liabilities arising out of the performance of their duties to the Trust or its funds. In addition, certain of the Fund’s contracts with its service providers contain general indemnification clauses. The Fund’s maximum exposure under these arrangements is unknown since the amount of any future claims that may be made against the Fund cannot be determined, and the Fund has no historical basis for predicting the likelihood of any such claims.
Note 3. Fees and Compensation Paid to Affiliates
Investment Management Fees
Under an Investment Management Services Agreement, Columbia Management Investment Advisers, LLC (the Investment Manager), a wholly-owned subsidiary of Ameriprise Financial, Inc. (Ameriprise Financial), determines which securities will be purchased, held or sold. The investment management fee is an annual fee that is equal to a percentage of the Fund’s average daily net assets that declines from 0.855% to 0.725% as the Fund’s net assets increase. The annualized effective investment management fee rate for the six months ended November 30, 2014 was 0.850% of the Fund’s average daily net assets.
Administration Fees
Under an Administrative Services Agreement, the Investment Manager also serves as the Fund Administrator. The Fund pays the Fund Administrator an annual fee for administration and accounting services equal to a percentage of the Fund’s average daily net assets that declines from 0.06% to 0.03% as the Fund’s net assets increase. The annualized effective administration fee rate for the six months ended November 30, 2014 was 0.05% of the Fund’s average daily net assets.
Other Expenses
Other expenses are for, among other things, miscellaneous expenses of the Fund or the Board, including payments to a company providing limited administrative services to the Fund and the Board. That company’s expenses include boardroom and office expense, employee compensation, employee health and retirement benefits, and certain other expenses. For the six months ended November 30, 2014, other expenses paid by the Fund to this company were $3,101.
Compensation of Board Members
Board members are compensated for their services to the Fund as disclosed in the Statement of Operations. Under a Deferred Compensation Plan (the Plan), the Board members who are not “interested persons” of the Fund, as defined under the 1940 Act, may elect to defer payment of up to 100% of their compensation. Deferred amounts are treated as though equivalent dollar amounts had been invested in shares of certain funds managed by the Investment Manager. The Fund’s liability for these amounts is adjusted for market value changes and remains in the Fund until distributed in accordance with the Plan.
Transfer Agent Fees
Under a Transfer and Dividend Disbursing Agent Agreement, Columbia Management Investment Services Corp. (the Transfer Agent), an affiliate of the Investment Manager and a wholly-owned subsidiary of Ameriprise Financial, is responsible for providing transfer agency services to the Fund. The Transfer Agent has contracted with Boston Financial Data Services (BFDS) to serve as sub-transfer agent.
Effective November 1, 2014, the Transfer Agent receives a monthly transfer agency fee based on the number or the average value of accounts, depending on the type of account. Prior to November 1, 2014, the Transfer Agent received a monthly account-based service fee based on the number of open accounts. In addition, the Transfer Agent also receives sub-transfer agency fees based on a percentage of the average aggregate value of the Fund’s shares maintained in omnibus accounts (other than omnibus accounts for which American Enterprise Investment Services Inc. is the broker of record or accounts where the beneficial shareholder is a customer of Ameriprise Financial Services, Inc., which receive a per account fee). The Transfer Agent pays the fees of BFDS for services as sub-transfer agent and is not entitled to reimbursement for such fees from the Fund (with the exception of out-of-pocket fees).
The Transfer Agent also receives compensation from the Fund for various shareholder services and reimbursements for certain out-of-pocket fees. Class I shares do not pay transfer
| | | | |
| Semiannual Report 2014 | | | 27 | |
| | |
| |
| | Columbia Seligman Communications and Information Fund |
Notes to Financial Statements (continued)
November 30, 2014 (Unaudited)
agent fees. Total transfer agent fees for Class K and Class R5 shares are subject to an annual limitation of not more than 0.05% of the average daily net assets attributable to each share class.
For the six months ended November 30, 2014, the Fund’s annualized effective transfer agent fee rates as a percentage of average daily net assets of each class were as follows:
| | | | |
Class A | | | 0.18 | % |
Class B | | | 0.18 | |
Class C | | | 0.18 | |
Class K | | | 0.05 | |
Class R | | | 0.18 | |
Class R4 | | | 0.18 | |
Class R5 | | | 0.05 | |
Class Z | | | 0.18 | |
The Fund and certain other associated investment companies, have severally, but not jointly, guaranteed the performance and observance of all the terms and conditions of a lease entered into by Seligman Data Corp. (SDC), the former transfer agent, including the payment of rent by SDC (the Guaranty). SDC was the legacy Seligman funds’ former transfer agent.
The lease and the Guaranty expire in January 2019. At November 30, 2014, the Fund’s total potential future obligation over the life of the Guaranty is $2,002,689. The liability remaining at November 30, 2014 for non-recurring charges associated with the lease amounted to $1,136,262 and is recorded as a part of the payable for other expenses in the Statement of Assets and Liabilities.
An annual minimum account balance fee of $20 may apply to certain accounts with a value below the applicable share class’s initial minimum investment requirements to reduce the impact of small accounts on transfer agent fees. These minimum account balance fees are remitted to the Fund and recorded as part of expense reductions in the Statement of Operations. For the six months ended November 30, 2014, these minimum account balance fees reduced total expenses of the Fund by $18,664.
Plan Administration Fees
Under a Plan Administration Services Agreement with the Transfer Agent, the Fund pays an annual fee at a rate of 0.25% of the Fund’s average daily net assets attributable to Class K shares for the provision of various administrative, recordkeeping, communication and educational services.
Distribution Fees
The Fund has an agreement with Columbia Management Investment Distributors, Inc. (the Distributor), an affiliate of
the Investment Manager and a wholly-owned subsidiary of Ameriprise Financial, for distribution and shareholder services. Under a Plan and Agreement of Distribution, the Fund pays a fee at an annual rate of up to 0.25% of the Fund’s average daily net assets attributable to Class A shares, a fee at an annual rate of up to 0.50% of the Fund’s average daily net assets attributable to Class R shares (of which up to 0.25% may be used for shareholder services) and a fee at an annual rate of up to 1.00% of the Fund’s average daily net assets attributable to Class B and Class C shares. For Class B and Class C shares, of the 1.00% fee, up to 0.75% is reimbursed for distribution expenses.
Based on the most recent information available as of September 30, 2014, there were no unreimbursed distribution expenses for Class B shares and approximately $18,457,000 for Class C shares. To the extent distribution expenses incurred by the Distributor have been fully recovered, the distribution fee is not charged to the share class. The Fund did not pay any distribution fees for Class B shares during the period.
Sales Charges
Sales charges, including front-end charges and CDSCs, received by the Distributor for distributing Fund shares were $457,504 for Class A, $6,386 for Class B, $4,244 for Class C shares for the six months ended November 30, 2014.
Expenses Waived/Reimbursed by the Investment Manager and its Affiliates
The Fund’s expense ratio is subject to an expense reimbursement arrangement pursuant to which fees will be waived and/or expenses reimbursed (excluding certain fees and expenses described below), so that the Fund’s net operating expenses, after giving effect to fees waived/expenses reimbursed and any balance credits and/or overdraft charges from the Fund’s custodian, do not exceed the annual rates of:
| | | | | | | | |
| | | Voluntary Expense Cap Effective October 1, 2014 | | | Contractual Expense Cap Prior to October 1, 2014 | |
Class A | | | 1.45 | % | | | 1.45 | % |
Class B | | | 2.20 | | | | 2.20 | |
Class C | | | 2.20 | | | | 2.20 | |
Class I | | | 1.07 | | | | 1.07 | |
Class K | | | 1.37 | | | | 1.37 | |
Class R | | | 1.70 | | | | 1.70 | |
Class R4 | | | 1.20 | | | | 1.20 | |
Class R5 | | | 1.12 | | | | 1.12 | |
Class Z | | | 1.20 | | | | 1.20 | |
| | |
| 28 | | Semiannual Report 2014 |
| | |
| |
| Columbia Seligman Communications and Information Fund | | |
Notes to Financial Statements (continued)
November 30, 2014 (Unaudited)
The voluntary expense cap arrangement may be revised or discontinued at any time. Under the arrangements, the following fees and expenses are excluded from the waiver/reimbursement commitment, and therefore will be paid by the Fund, if applicable: taxes (including foreign transaction taxes), expenses associated with investments in affiliated and non-affiliated pooled investment vehicles (including mutual funds and exchange-traded funds), transaction costs and brokerage commissions, costs related to any securities lending program, dividend expenses associated with securities sold short, inverse floater program fees and expenses, transaction charges and interest on borrowed money, interest and extraordinary expenses.
Note 4. Federal Tax Information
The timing and character of income and capital gain distributions are determined in accordance with income tax regulations, which may differ from GAAP because of temporary or permanent book to tax differences.
At November 30, 2014, the cost of investments for federal income tax purposes was approximately $2,655,938,000 and the aggregate gross approximate unrealized appreciation and depreciation based on that cost was:
| | | | |
Unrealized appreciation | | | $1,190,304,000 | |
Unrealized depreciation | | | (22,496,000 | ) |
Net unrealized appreciation | | | $1,167,808,000 | |
Management of the Fund has concluded that there are no significant uncertain tax positions in the Fund that would require recognition in the financial statements. However, management’s conclusion may be subject to review and adjustment at a later date based on factors including, but not limited to, new tax laws, regulations, and administrative interpretations (including relevant court decisions). Generally, the Fund’s federal tax returns for the prior three fiscal years remain subject to examination by the Internal Revenue Service.
Note 5. Portfolio Information
The cost of purchases and proceeds from sales of securities, excluding short-term obligations and certain derivatives, if any, aggregated to $1,116,794,624 and $1,359,499,049, respectively, for the six months ended November 30, 2014. The amount of purchase and sale activity impacts the portfolio turnover rate reported in the Financial Highlights.
Note 6. Affiliated Money Market Fund
The Fund invests in Columbia Short-Term Cash Fund, an affiliated money market fund established for the exclusive use by the Fund and other affiliated funds. The income earned by
the Fund from such investments is included as Dividends — affiliated issuers in the Statement of Operations. As an investing fund, the Fund indirectly bears its proportionate share of the expenses of Columbia Short-Term Cash Fund.
Note 7. Shareholder Concentration
At November 30, 2014, one unaffiliated shareholder of record owned 12.0% of the outstanding shares of the Fund in one or more accounts. The Fund has no knowledge about whether any portion of those shares was owned beneficially. Subscription and redemption activity by concentrated accounts may have a significant effect on the operations of the Fund.
Note 8. Line of Credit
The Fund has entered into a revolving credit facility with a syndicate of banks led by JPMorgan Chase Bank N.A. (JPMorgan) whereby the Fund may borrow for the temporary funding of shareholder redemptions or for other temporary or emergency purposes. The credit facility agreement, as amended, which is a collective agreement between the Fund and certain other funds managed by the Investment Manager, severally and not jointly, permits collective borrowings up to $500 million. Interest is charged to each participating fund based on its borrowings at a rate equal to the higher of (i) the overnight federal funds rate plus 1.00% or (ii) the one-month LIBOR rate plus 1.00%. Each borrowing under the credit facility matures no later than 60 days after the date of borrowing. The Fund also pays a commitment fee equal to its pro rata share of the amount of the credit facility at a rate of 0.075% per annum. The commitment fee is included in other expenses in the Statement of Operations.
Effective December 9, 2014, the Fund extended its revolving credit facility with JPMorgan. The credit facility agreement, as amended, permits collective borrowings up to $550 million under the same terms and interest rates as described above.
The Fund had no borrowings during the six months ended November 30, 2014.
Note 9. Significant Risks
Non-Diversification Risk
A non-diversified fund is permitted to invest a greater percentage of its total assets in fewer issuers than a diversified fund. The Fund may, therefore, have a greater risk of loss from a few issuers than a similar fund that invests more broadly.
Technology and Technology-related Investment Risk
Sector risk occurs when a fund invests a significant portion of its assets in securities of companies conducting business in a
| | | | |
| Semiannual Report 2014 | | | 29 | |
| | |
| |
| | Columbia Seligman Communications and Information Fund |
Notes to Financial Statements (continued)
November 30, 2014 (Unaudited)
related group of industries within an economic sector. Companies in the same economic sector may be similarly affected by economic, regulatory, political or market events or conditions, making a fund more vulnerable to unfavorable developments in that economic sector than funds that invest more broadly. The Fund may be more susceptible to the particular risks that may affect companies in the technology and technology-related sectors than if it were invested in a wider variety of companies in unrelated sectors.
Note 10. Subsequent Events
Management has evaluated the events and transactions that have occurred through the date the financial statements were issued. Other than as noted in Note 8 above, there were no items requiring adjustment of the financial statements or additional disclosure.
Note 11. Information Regarding Pending and Settled Legal Proceedings
In December 2005, without admitting or denying the allegations, American Express Financial Corporation (AEFC, which is now known as Ameriprise Financial, Inc. (Ameriprise Financial)) entered into settlement agreements with the Securities and Exchange Commission (SEC) and Minnesota Department of Commerce (MDOC) related to market timing activities. As a result, AEFC was censured and ordered to cease and desist from committing or causing any violations of certain provisions of the Investment Advisers Act of 1940, the Investment Company Act of 1940, and various Minnesota laws. AEFC agreed to pay disgorgement of $10 million and civil money penalties of $7 million. AEFC also agreed to retain an independent distribution consultant to assist in developing a plan for distribution of all disgorgement and civil penalties ordered by the SEC in accordance with various undertakings detailed at www.sec.gov/litigation/admin/ia-2451.pdf. Ameriprise Financial and its affiliates have cooperated with the SEC and the MDOC in these legal proceedings, and have made regular reports to the Funds’ Boards of Trustees.
Ameriprise Financial and certain of its affiliates have historically been involved in a number of legal, arbitration and regulatory proceedings, including routine litigation, class actions, and governmental actions, concerning matters arising in connection with the conduct of their business activities. Ameriprise Financial believes that the Funds are not currently the subject of, and that neither Ameriprise Financial nor any of its affiliates are the subject of, any pending legal, arbitration or regulatory proceedings that are likely to have a material adverse effect on the Funds or the ability of Ameriprise Financial or its affiliates to perform under their
contracts with the Funds. Ameriprise Financial is required to make quarterly (10-Q), annual (10-K) and, as necessary, 8-K filings with the Securities and Exchange Commission on legal and regulatory matters that relate to Ameriprise Financial and its affiliates. Copies of these filings may be obtained by accessing the SEC website at www.sec.gov.
There can be no assurance that these matters, or the adverse publicity associated with them, will not result in increased fund redemptions, reduced sale of fund shares or other adverse consequences to the Funds. Further, although we believe proceedings are not likely to have a material adverse effect on the Funds or the ability of Ameriprise Financial or its affiliates to perform under their contracts with the Funds, these proceedings are subject to uncertainties and, as such, we are unable to estimate the possible loss or range of loss that may result. An adverse outcome in one or more of these proceedings could result in adverse judgments, settlements, fines, penalties or other relief that could have a material adverse effect on the consolidated financial condition or results of operations of Ameriprise Financial.
| | |
| 30 | | Semiannual Report 2014 |
| | |
| |
| Columbia Seligman Communications and Information Fund | | |
Important Information About This Report
Each fund mails one shareholder report to each shareholder address. If you would like more than one report, please call shareholder services at 800.345.6611 and additional reports will be sent to you.
The policy of the Board is to vote the proxies of the companies in which each fund holds investments consistent with the procedures as stated in the Statement of Additional Information (SAI). You may obtain a copy of the SAI without charge by calling 800.345.6611; contacting your financial intermediary; visiting columbiamanagement.com; or searching the website of the Securities and Exchange Commission (SEC) at sec.gov. Information regarding how each fund voted proxies relating to portfolio securities is filed with the SEC by August 31 for the most recent 12-month period ending June 30 of that year, and is available without charge by visiting columbiamanagement.com; or searching the website of the SEC at sec.gov.
Each fund files a complete schedule of portfolio holdings with the SEC for the first and third quarters of each fiscal year on Form N-Q. Each fund’s Form N-Q is available on the SEC’s website at sec.gov and may be reviewed and copied at the SEC’s Public Reference Room in Washington, D.C. Information on the operation of the Public Reference Room may be obtained by calling 800.SEC.0330. Each fund’s complete schedule of portfolio holdings, as filed on Form N-Q, can also be obtained without charge, upon request, by calling 800.345.6611.
| | | | |
| Semiannual Report 2014 | | | 31 | |

Columbia Seligman Communications and Information Fund
P.O. Box 8081
Boston, MA 02266-8081
columbiamanagement.com
This information is for use with concurrent or prior delivery of a fund prospectus. Please read and consider the investment objectives, risks, charges and expenses for any fund carefully before investing. For a prospectus and, if available, a summary prospectus, which contains this and other important information about the Fund, go to columbiamanagement.com. The Fund is distributed by Columbia Management Investment Distributors, Inc., member FINRA, and managed by Columbia Management Investment Advisers, LLC.
© 2015 Columbia Management Investment Advisers, LLC. All rights reserved.
SAR219_05_E01_(01/15)
Item 2. Code of Ethics.
Not applicable for semiannual reports.
Item 3. Audit Committee Financial Expert.
Not applicable for semiannual reports.
Item 4. Principal Accountant Fees and Services.
Not applicable for semiannual reports.
Item 5. Audit Committee of Listed Registrants.
Not applicable.
Item 6. Investments
(a) The registrant’s “Schedule I — Investments in securities of unaffiliated issuers” (as set forth in 17 CFR 210.12-12) is included in Item 1 of this Form N-CSR.
(b) Not applicable.
Item 7. Disclosure of Proxy Voting Policies and Procedures for Closed-End Management Investment Companies.
Not applicable.
Item 8. Portfolio Managers of Closed-End Management Investment Companies.
Not applicable.
Item 9. Purchases of Equity Securities by Closed-End Management Investment Company and Affiliated Purchasers.
Not applicable.
Item 10. Submission of Matters to a Vote of Security Holders.
There were no material changes to the procedures by which shareholders may recommend nominees to the registrant’s board of directors.
Item 11. Controls and Procedures.
(a) The registrant’s principal executive officer and principal financial officers, based on their evaluation of the registrant’s disclosure controls and procedures as of a
date within 90 days of the filing of this report, have concluded that such controls and procedures are adequately designed to ensure that material information required to be disclosed by the registrant in Form N-CSR is accumulated and communicated to the registrant’s management, including the principal executive officer and principal financial officer, or persons performing similar functions, as appropriate to allow timely decisions regarding required disclosure.
(b) There was no change in the registrant’s internal control over financial reporting that occurred during the registrant’s second fiscal quarter of the period covered by this report that has materially affected, or is reasonably likely to materially affect, the registrant’s internal control over financial reporting.
Item 12. Exhibits.
(a)(1) Code of ethics required to be disclosed under Item 2 of Form N-CSR: Not applicable for semiannual reports.
(a)(2) Certifications pursuant to Rule 30a-2(a) under the Investment Company Act of 1940 (17 CFR 270.30a-2(a)) attached hereto as Exhibit 99.CERT.
(a)(3) Not applicable.
(b) Certification pursuant to Rule 30a-2(b) under the Investment Company Act of 1940 (17 CFR 270.30a-2(b)) attached hereto as Exhibit 99.906CERT.
SIGNATURES
Pursuant to the requirements of the Securities Exchange Act of 1934 and the Investment Company Act of 1940, the registrant has duly caused this report to be signed on its behalf by the undersigned, thereunto duly authorized.
(registrant) | Columbia Funds Series Trust II | |
| |
| |
By (Signature and Title) | /s/ Christopher O. Petersen | |
| Christopher O. Petersen, President and Principal Executive Officer | |
| | |
| | |
Date | January 21, 2015 | |
| | | | |
Pursuant to the requirements of the Securities Exchange Act of 1934 and the Investment Company Act of 1940, this report has been signed below by the following persons on behalf of the registrant and in the capacities and on the dates indicated.
By (Signature and Title) | /s/ Christopher O. Petersen | |
| Christopher O. Petersen, President and Principal Executive Officer | |
| |
| |
Date | January 21, 2015 | |
| |
| |
By (Signature and Title) | /s/ Michael G. Clarke | |
| Michael G. Clarke, Treasurer and Chief Financial Officer | |
| |
| |
Date | January 21, 2015 | |
| | | |