UNITED STATES
SECURITIES AND EXCHANGE COMMISSION
Washington, D.C. 20549
FORM N-CSR
CERTIFIED SHAREHOLDER REPORT OF REGISTERED
MANAGEMENT INVESTMENT COMPANIES
Investment Company Act file number 811-21852
Columbia Funds Series Trust II
(Exact name of registrant as specified in charter)
50606 Ameriprise Financial Center
Minneapolis, MN 55474
(Address of principal executive offices) (Zip code)
Ryan Larrenaga
c/o Columbia Management Investment Advisers, LLC
225 Franklin Street
Boston, MA 02110
(Name and address of agent for service)
Registrant’s telephone number, including area code: (800) 345-6611
Date of fiscal year end: October 31
Date of reporting period: April 30, 2015
Form N-CSR is to be used by management investment companies to file reports with the Commission not later than 10 days after the transmission to stockholders of any report that is required to be transmitted to stockholders under Rule 30e-1 under the Investment Company Act of 1940 (17 CFR 270.30e-1). The Commission may use the information provided on Form N-CSR in its regulatory, disclosure review, inspection, and policymaking roles.
A registrant is required to disclose the information specified by Form N-CSR, and the Commission will make this information public. A registrant is not required to respond to the collection of information contained in Form N-CSR unless the Form displays a currently valid Office of Management and Budget (“OMB”) control number. Please direct comments concerning the accuracy of the information collection burden estimate and any suggestions for reducing the burden to Secretary, Securities and Exchange Commission, 450 Fifth Street, NW, Washington, DC 20549-0609. The OMB has reviewed this collection of information under the clearance requirements of 44 U.S.C. § 3507.
| Item 1. | Reports to Stockholders. |

SEMIANNUAL REPORT
April 30, 2015

COLUMBIA ABSOLUTE RETURN CURRENCY AND INCOME FUND


ABOUT COLUMBIA THREADNEEDLE INVESTMENTS
Columbia Threadneedle Investments is a leading global asset management group that provides a broad range of actively managed investment strategies and solutions for individual, institutional and corporate clients around the world.
With more than 2,000 people, including over 450 investment professionals based in North America, Europe and Asia, we manage $506 billion* of assets across developed and emerging market equities, fixed income, asset allocation solutions and alternatives. We are the 12th largest manager of long-term mutual fund assets in the U.S.** and the 5th largest manager of retail funds in the U.K.***
Our priority is the investment success of our clients. We aim to deliver the investment outcomes they expect through an investment approach that is team-based, performance-driven and risk-aware. Our culture is dynamic and interactive. By sharing our insights across asset classes and geographies, we generate richer perspectives on global, regional and local investment landscapes. The ability to exchange and debate investment ideas in a collaborative environment enriches our teams’ investment processes. More importantly, it results in better informed investment decisions for our clients.
Columbia funds are distributed by Columbia Management Investment Distributors, Inc., member FINRA, and managed by Columbia Management Investment Advisers, LLC.
Columbia Threadneedle Investments (Columbia Threadneedle) is the global brand name of the Columbia and Threadneedle group of companies.
| * | | In U.S. dollars as of March 31, 2015. Source: Ameriprise Q1 Earnings Release. Includes all assets managed by entities in the Columbia and Threadneedle groups of companies. |
Contact us for more current data.
| ** | | Source: ICI as of March 31, 2015 for Columbia Management Investment Advisers, LLC. |
| *** | | Source: Investment Association as of March 2015 for Threadneedle Asset Management Limited. |
© 2015 Columbia Management Investment Advisers, LLC. All rights reserved.
Not part of the shareholder report
Get the market insight you need from our investment experts
Connect with Columbia Threadneedle Investments
Investor insight
Find economic and market commentary, investment videos, white papers,
mutual fund commentary and more at columbiathreadneedle.com/us.
| | | | |
 | | Columbia Threadneedle Investor Newsletter (e-newsletter) Read our award-winning* shareholder
newsletter. Our quarterly newsletter
is available online and provides timely
and relevant content about economic
trends, fund news, service enhancements and
changes. Sign up to receive the newsletter
electronically at columbiathreadneedle.com/
us/newsletter. | |  |
| | |
 | | Investment videos Get analysis of current events and trends that may affect your investments.
Visit our online video library to watch and discover what our thought leaders
are saying about the financial markets and economy. |
| | |
| | Social media We offer you multiple ways to access our market commentary and
investment insights. |
| | n | | Perspectives blog at columbiathreadneedle.com/us |
Read timely posts by our investment team, including our chief investment officer, chief economist and portfolio managers.
| | n | | twitter.com/CTinvest_US |
Follow us on Twitter for quick, up-to-the-minute comments on market news and more.
View our commentaries on the economy, markets and current investment opportunities.
| | n | | linkedin.com/company/columbia-threadneedle-investments-us |
Connect with us on LinkedIn for updates from our thought leaders.
| * | Columbia Threadneedle Investor Newsletter was awarded top honors in the Mutual Fund Education Alliance STAR Awards competition for excellence in mutual fund marketing and communications in 2011, 2012 and 2013. Materials in the competition were evaluated on educational value, message comprehension, effective design and objectives. |
Not part of the shareholder report
Stay informed
Become a subscriber to receive the latest investment publications and mutual fund commentaries
Subscribe to Columbia Threadneedle Investments
Email subscription center
Subscribe to the latest information from Columbia Threadneedle. Visit our email subscription center at columbiathreadneedle.com/us/subscribe to register for economic and market commentary, product and service updates, white papers and more.
| n | | Columbia Threadneedle Investor Newsletter |
Quarterly newsletter featuring the latest macro- and micro-economic trends, investment themes, products, service changes and other items of interest to our investors
| n | | Investment Strategy Outlook |
Quarterly publication featuring the Columbia Threadneedle Asset Allocation Team’s perspective on global economic investment conditions and markets
Quarterly publication featuring more than 40 charts and graphs that highlight the current state of the economy and the markets; includes straightforward insight on current investment opportunities
Frequent articles that delve deep into a variety of investment topics
Quarterly portfolio manager commentary and fund fact sheets available for Columbia funds. (Not all funds have a commentary.)
Register your information online at columbiathreadneedle.com/us/subscribe and select the publications you would like to receive. Update your subscriptions at any time by accessing the email subscription center.

PRESIDENT’S MESSAGE

Dear Shareholder,
In a world that is changing faster than ever before, investors want asset managers who offer a global perspective while generating strong and sustainable returns. To that end, Columbia Management, in conjunction with its U.K.-based affiliate, Threadneedle Investments, has rebranded to Columbia Threadneedle Investments. The new global brand represents the combined capabilities, resources and reach of the global group, offering investors access to the best of both firms.
With a presence in 18 countries and more than 450 investment professionals*, our collective perspective and world view as Columbia Threadneedle Investments gives us deeper insight into what might affect the real-life financial outcomes clients are seeking. Putting our views into a global context enables us to build richer perspectives and create the right solutions, and provides us with enhanced capabilities to deliver consistent investment performance, which may ultimately lead to better investor outcomes.
As a result of the rebrand, you will begin to see our new logo and colors reflected in printed materials, such as this shareholder report, as well as on our new website — columbiathreadneedle.com/us. We encourage you to visit us online and view a new video on the “About Us” tab that speaks to the strength of the firm.
While we are introducing a new brand, in many ways, the investment company you know well has not changed. The following remain in effect:
| n | | Fund and strategy names |
| n | | Established investment teams, philosophies and processes |
| n | | Account services, features, servicing phone numbers and mailing addresses |
| n | | Columbia Management Investment Distributors as distributor and Columbia Management Investment Advisers as investment adviser |
We recognize that the money we manage represents the hard work and savings of people like you, and that everyone has different ambitions and different definitions of success. Investors have varying goals — funding their children’s education, enjoying their retirement, putting money aside for unexpected events, and more. Whatever your ambitions, we believe our wide range of investment products and solutions can help give you confidence that you will reach your goals.
The world is constantly changing, but our priority remains the same: to help you secure your finances, meet your goals and achieve success. Thank you for your continued investment with us. Our service representatives are available at 800.345.6611 to help with any questions.
Sincerely,

Christopher O. Petersen
President, Columbia Funds
Investors should consider the investment objectives, risks, charges and expenses of a mutual fund carefully before investing. For a free prospectus and summary prospectus, which contains this and other important information about a fund, visit columbiathreadneedle.com/us. The prospectus should be read carefully before investing.
* Source: Ameriprise as of December 1, 2014
Columbia Funds are distributed by Columbia Management Investment Distributors, Inc., member FINRA, and managed by Columbia Management Investment Advisers, LLC.
© 2015 Columbia Management Investment Advisers, LLC. All rights reserved.
Semiannual Report 2015
| | |
| |
| | COLUMBIA ABSOLUTE RETURN CURRENCY AND INCOME FUND |
TABLE OF CONTENTS
Fund Investment Manager
Columbia Management Investment
Advisers, LLC
225 Franklin Street
Boston, MA 02110
Fund Distributor
Columbia Management Investment
Distributors, Inc.
225 Franklin Street
Boston, MA 02110
Fund Transfer Agent
Columbia Management Investment
Services Corp.
P.O. Box 8081
Boston, MA 02266-8081
For more information about any of the funds, please visit columbiathreadneedle.com/us or call 800.345.6611. Customer Service Representatives are available to answer your questions Monday through Friday from 8 a.m. to 7 p.m. Eastern time.
The views expressed in this report reflect the current views of the respective parties. These views are not guarantees of future performance and involve certain risks, uncertainties and assumptions that are difficult to predict, so actual outcomes and results may differ significantly from the views expressed. These views are subject to change at any time based upon economic, market or other conditions and the respective parties disclaim any responsibility to update such views. These views may not be relied on as investment advice and, because investment decisions for a Columbia fund are based on numerous factors, may not be relied on as an indication of trading intent on behalf of any particular Columbia fund. References to specific securities should not be construed as a recommendation or investment advice.
Semiannual Report 2015
| | |
| |
| COLUMBIA ABSOLUTE RETURN CURRENCY AND INCOME FUND | | |
PERFORMANCE OVERVIEW
(Unaudited)
Performance Summary
| n | | Columbia Absolute Return Currency and Income Fund (the Fund) Class A shares returned 19.92% excluding sales charges for the six-month period that ended April 30, 2015. |
| n | | The Fund outperformed its benchmark, the Citi Three-Month U.S. Treasury Bill Index, which returned 0.01% for the same time period. |
| | | | | | | | | | | | | | | | | | |
Average Annual Total Returns (%) (for period ended April 30, 2015) | |
| | | Inception | | 6 Months
Cumulative | | | 1 Year | | | 5 Years | | | Life | |
Class A | | 06/15/06 | | | | | | | | | | | | | | | | |
Excluding sales charges | | | | | 19.92 | | | | 22.20 | | | | 3.35 | | | | 3.31 | |
Including sales charges | | | | | 16.30 | | | | 18.56 | | | | 2.73 | | | | 2.96 | |
Class B | | 06/15/06 | | | | | | | | | | | | | | | | |
Excluding sales charges | | | | | 19.59 | | | | 21.30 | | | | 2.58 | | | | 2.57 | |
Including sales charges | | | | | 14.59 | | | | 16.30 | | | | 2.21 | | | | 2.57 | |
Class C | | 06/15/06 | | | | | | | | | | | | | | | | |
Excluding sales charges | | | | | 19.48 | | | | 21.33 | | | | 2.58 | | | | 2.57 | |
Including sales charges | | | | | 18.48 | | | | 20.33 | | | | 2.58 | | | | 2.57 | |
Class I | | 06/15/06 | | | 20.26 | | | | 22.74 | | | | 3.85 | | | | 3.78 | |
Class R4* | | 03/19/13 | | | 20.26 | | | | 22.62 | | | | 3.50 | | | | 3.39 | |
Class R5* | | 06/25/14 | | | 20.16 | | | | 22.53 | | | | 3.41 | | | | 3.34 | |
Class W* | | 12/01/06 | | | 20.00 | | | | 22.29 | | | | 3.30 | | | | 3.27 | |
Class Y* | | 02/28/13 | | | 20.18 | | | | 22.66 | | | | 3.54 | | | | 3.42 | |
Class Z* | | 09/27/10 | | | 20.14 | | | | 22.62 | | | | 3.70 | | | | 3.48 | |
Citi Three-Month U.S. Treasury Bill Index** | | | | | 0.01 | | | | 0.03 | | | | 0.07 | | | | 1.07 | |
Returns for Class A are shown with and without the maximum initial sales charge of 3.00% Returns for Class B are shown with and without the applicable contingent deferred sales charge (CDSC) of 5.00% in the first year, declining to 1.00% in the sixth year and eliminated thereafter. Returns for Class C are shown with and without the 1.00% CDSC for the first year only. The Fund’s other classes are not subject to sales charges and have limited eligibility. Please see the Fund’s prospectus for details. Performance for different share classes will vary based on differences in sales charges and fees associated with each class. All results shown assume reinvestment of distributions during the period. Returns do not reflect the deduction of taxes that a shareholder may pay on Fund distributions or on the redemption of Fund shares. Performance results reflect the effect of any fee waivers or reimbursements of Fund expenses by Columbia Management Investment Advisers, LLC and/or any of its affiliates. Absent these fee waivers or expense reimbursement arrangements, performance results would have been lower.
The performance information shown represents past performance and is not a guarantee of future results. The investment return and principal value of your investment will fluctuate so that your shares, when redeemed, may be worth more or less than their original cost. Current performance may be lower or higher than the performance information shown. You may obtain performance information current to the most recent month-end by contacting your financial intermediary, visiting columbiathreadneedle.com/us or calling 800.345.6611.
| * | The returns shown for periods prior to the share class inception date (including returns for the Life of the Fund, if shown, which are since Fund inception) include the returns of the Fund’s oldest share class. Since the Fund launched more than one share class at its inception, Class A shares were used. These returns are adjusted to reflect any higher class-related operating expenses of the newer share classes, as applicable. Please visit columbiathreadneedle.com/us/investment-products/mutual-funds/appended-performance for more information. |
The Citi Three-Month U.S. Treasury Bill Index, an unmanaged index, is representative of the performance of three-month Treasury bills.
Indices are not available for investment, are not professionally managed and do not reflect sales charges, fees, brokerage commissions, taxes or other expenses of investing. Securities in the Fund may not match those in an index.
| | |
| |
| | COLUMBIA ABSOLUTE RETURN CURRENCY AND INCOME FUND |
PORTFOLIO OVERVIEW
(Unaudited)
Portfolio Management
Nicholas Pifer, CFA
| | | | |
Portfolio Breakdown (%)
(at April 30, 2015) | |
Asset-Backed Securities — Non-Agency | | | 1.5 | |
Short-Term Investments Segregated in Connection with Open Derivatives Contracts(a) | | | 98.5 | |
Total | | | 100.0 | |
Percentages indicated are based upon total investments. The Fund’s portfolio composition is subject to change.
| (a) | Includes investments in Money Market Funds (amounting to $52.9 million) which have been segregated to cover obligations related to the Fund’s investment in derivatives which provides exposure to multiple markets. For a description of the Fund’s investments in derivatives, see Investments in Derivatives following the Portfolio of Investments, and Note 2 to the financial statements. |
| | | | |
Quality Breakdown (%)
(at April 30, 2015) | |
AAA rating | | | 100.0 | |
Total | | | 100.0 | |
Percentages indicated are based upon total fixed income investments (excluding Money Market Funds).
Bond ratings apply to the underlying holdings of the Fund and not the Fund itself and are divided into categories ranging from highest to lowest credit quality, determined by using the middle rating of Moody’s, S&P and Fitch, after dropping the highest and lowest available ratings. When ratings are available from only two rating agencies, the lower rating is used. When a rating is available from only one rating agency, that rating is used. When a bond is not rated by any rating agency, it is designated as “Not rated”. Credit quality ratings assigned by a rating agency are subjective opinions, not statements of fact, and are subject to change, including daily. The ratings assigned by credit rating agencies are but one of the considerations that the Investment Manager and/or Fund’s subadviser incorporates into its credit analysis process, along with such other issuer-specific factors as cash flows, capital structure and leverage ratios, ability to de-leverage (repay) through free cash flow, quality of management, market positioning and access to capital, as well as such security-specific factors as the terms of the security (e.g., interest rate, and time to maturity) and the amount and type of any collateral.
| | |
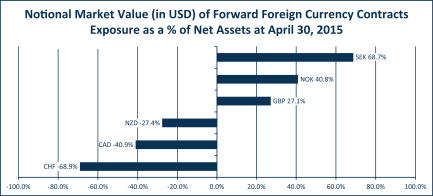
| CAD | | Canadian Dollar |
| CHF | | Swiss Franc |
| GBP | | British Pound |
| NOK | | Norwegian Krone |
| NZD | | New Zealand Dollar |
| SEK | | Swedish Krona |
| | |
| |
| COLUMBIA ABSOLUTE RETURN CURRENCY AND INCOME FUND | | |
UNDERSTANDING YOUR FUND’S EXPENSES
(Unaudited)
As an investor, you incur two types of costs. There are transaction costs, which generally include sales charges on purchases and may include redemption fees. There are also ongoing costs, which generally include management fees, distribution and/or service fees, and other fund expenses. The following information is intended to help you understand your ongoing costs (in dollars) of investing in the Fund and to help you compare these costs with the ongoing costs of investing in other mutual funds.
Analyzing Your Fund’s Expenses
To illustrate these ongoing costs, we have provided examples and calculated the expenses paid by investors in each share class of the Fund during the period. The actual and hypothetical information in the table is based on an initial investment of $1,000 at the beginning of the period indicated and held for the entire period. Expense information is calculated two ways and each method provides you with different information. The amount listed in the “Actual” column is calculated using the Fund’s actual operating expenses and total return for the period. You may use the Actual information, together with the amount invested, to estimate the expenses that you paid over the period. Simply divide your account value by $1,000 (for example, an $8,600 account value divided by $1,000 = 8.6), then multiply the results by the expenses paid during the period under the “Actual” column. The amount listed in the “Hypothetical” column assumes a 5% annual rate of return before expenses (which is not the Fund’s actual return) and then applies the Fund’s actual expense ratio for the period to the hypothetical return. You should not use the hypothetical account values and expenses to estimate either your actual account balance at the end of the period or the expenses you paid during the period. See “Compare With Other Funds” below for details on how to use the hypothetical data.
Compare With Other Funds
Since all mutual funds are required to include the same hypothetical calculations about expenses in shareholder reports, you can use this information to compare the ongoing cost of investing in the Fund with other funds. To do so, compare the hypothetical example with the 5% hypothetical examples that appear in the shareholder reports of other funds. As you compare hypothetical examples of other funds, it is important to note that hypothetical examples are meant to highlight the ongoing costs of investing in a fund only and do not reflect any transaction costs, such as sales charges, or redemption or exchange fees. Therefore, the hypothetical calculations are useful in comparing ongoing costs only, and will not help you determine the relative total costs of owning different funds. If transaction costs were included in these calculations, your costs would be higher.
November 1, 2014 – April 30, 2015
| | | | | | | | | | | | | | | | | | | | | | | | | | | | |
| | | Account Value at the
Beginning of the
Period ($) | | | Account Value at the
End of the
Period ($) | | | Expenses Paid During
the Period ($) | | | Fund’s Annualized
Expense Ratio (%) | |
| | | | Actual | | | | Hypothetical | | | | Actual | | | | Hypothetical | | | | Actual | | | | Hypothetical | | | | Actual | |
Class A | | | 1,000.00 | | | | 1,000.00 | | | | 1,199.20 | | | | 1,016.51 | | | | 9.11 | | | | 8.35 | | | | 1.67 | |
Class B | | | 1,000.00 | | | | 1,000.00 | | | | 1,195.90 | | | | 1,012.79 | | | | 13.18 | | | | 12.08 | | | | 2.42 | |
Class C | | | 1,000.00 | | | | 1,000.00 | | | | 1,194.80 | | | | 1,012.79 | | | | 13.17 | | | | 12.08 | | | | 2.42 | |
Class I | | | 1,000.00 | | | | 1,000.00 | | | | 1,202.60 | | | | 1,018.40 | | | | 7.05 | | | | 6.46 | | | | 1.29 | |
Class R4 | | | 1,000.00 | | | | 1,000.00 | | | | 1,202.60 | | | | 1,017.70 | | | | 7.81 | | | | 7.15 | | | | 1.43 | |
Class R5 | | | 1,000.00 | | | | 1,000.00 | | | | 1,201.60 | | | | 1,018.15 | | | | 7.31 | | | | 6.71 | | | | 1.34 | |
Class W | | | 1,000.00 | | | | 1,000.00 | | | | 1,200.00 | | | | 1,016.51 | | | | 9.11 | | | | 8.35 | | | | 1.67 | |
Class Y | | | 1,000.00 | | | | 1,000.00 | | | | 1,201.80 | | | | 1,018.40 | | | | 7.04 | | | | 6.46 | | | | 1.29 | |
Class Z | | | 1,000.00 | | | | 1,000.00 | | | | 1,201.40 | | | | 1,017.75 | | | | 7.75 | | | | 7.10 | | | | 1.42 | |
Expenses paid during the period are equal to the annualized expense ratio for each class as indicated above, multiplied by the average account value over the period and then multiplied by the number of days in the Fund’s most recent fiscal half year and divided by 365.
Expenses do not include fees and expenses incurred indirectly by the Fund from its investment in underlying funds, including affiliated and non-affiliated pooled investment vehicles, such as mutual funds and exchange-traded funds.
Had Columbia Management Investment Advisers, LLC and/or certain of its affiliates not waived/reimbursed certain fees and expenses, account value at the end of the period would have been reduced.
| | |
| |
| | COLUMBIA ABSOLUTE RETURN CURRENCY AND INCOME FUND |
PORTFOLIO OF INVESTMENTS
April 30, 2015 (Unaudited)
(Percentages represent value of investments compared to net assets)
| | | | | | | | | | | | |
| Asset-Backed Securities — Non-Agency 1.5% | |
| Issuer | | Coupon
Rate | | | Principal
Amount ($) | | | Value ($) | |
Northstar Education Finance, Inc.
Series 2007-1 Class A2(a) | |
01/29/46 | | | 1.029% | | | | 750,000 | | | | 743,936 | |
|
SLM Student Loan Trust
Series 2007-2 Class A2(a) | |
07/25/17 | | | 0.277% | | | | 58,959 | | | | 58,907 | |
| | | | | | | | | | | | | |
Total Asset-Backed Securities — Non-Agency (Cost: $805,783) | | | | 802,843 | |
| | | | | | | | | | |
| Money Market Funds 95.7% | | | | | |
| | | | | Shares | | | Value ($) | |
Columbia Short-Term Cash Fund,
0.111%(b)(c) | | | | | 52,903,260 | | | | 52,903,260 | |
| | | | | | | | | | | |
Total Money Market Funds
(Cost: $52,903,260) | | | | | | | | | 52,903,260 | |
| | | | | | | | | | | |
Total Investments
(Cost: $53,709,043) | | | | | | | | | 53,706,103 | |
| | | | | | | | | | | |
Other Assets & Liabilities, Net | | | | | | | 1,571,303 | |
| | | | | | | | | | | |
Net Assets | | | | | | | | | 55,277,406 | |
| | | | | | | | | | | |
Investments in Derivatives
Forward Foreign Currency Exchange Contracts Open at April 30, 2015
| | | | | | | | | | | | | | | | | | | | | | | | | | | | |
| Counterparty | | Exchange
Date | | | Currency to
be Delivered | | | Currency to
be Received | | | Unrealized
Appreciation ($) | | | Unrealized
Depreciation ($) | |
| | | | | | | |
Barclays Bank PLC | | | 05/20/2015 | | | | 3,316,663 | | | | USD | | | | 26,064,000 | | | | NOK | | | | 143,188 | | | | — | |
| | | | | | | |
Barclays Bank PLC | | | 05/20/2015 | | | | 19,236,368 | | | | USD | | | | 151,169,000 | | | | NOK | | | | 830,477 | | | | — | |
| | | | | | | |
Deutsche Bank | | | 05/20/2015 | | | | 5,347,000 | | | | CHF | | | | 5,603,177 | | | | USD | | | | — | | | | (131,385 | ) |
| | | | | | | |
Deutsche Bank | | | 05/20/2015 | | | | 28,109,000 | | | | CHF | | | | 29,455,715 | | | | USD | | | | — | | | | (690,687 | ) |
| | | | | | | |
Deutsche Bank | | | 05/20/2015 | | | | 2,904,000 | | | | CHF | | | | 3,036,577 | | | | USD | | | | — | | | | (77,911 | ) |
| | | | | | | |
HSBC Securities (USA), Inc. | | | 05/20/2015 | | | | 2,201,341 | | | | USD | | | | 1,477,000 | | | | GBP | | | | 65,586 | | | | — | |
| | | | | | | |
HSBC Securities (USA), Inc. | | | 05/20/2015 | | | | 11,756,386 | | | | USD | | | | 7,888,000 | | | | GBP | | | | 350,264 | | | | — | |
| | | | | | | |
HSBC Securities (USA), Inc. | | | 05/20/2015 | | | | 1,024,294 | | | | USD | | | | 677,000 | | | | GBP | | | | 14,778 | | | | — | |
| | | | | | | |
HSBC Securities (USA), Inc. | | | 05/20/2015 | | | | 3,423,841 | | | | USD | | | | 29,633,000 | | | | SEK | | | | 133,251 | | | | — | |
| | | | | | | |
HSBC Securities (USA), Inc. | | | 05/20/2015 | | | | 2,158,265 | | | | USD | | | | 18,622,000 | | | | SEK | | | | 77,085 | | | | — | |
| | | | | | | |
HSBC Securities (USA), Inc. | | | 05/20/2015 | | | | 17,651,850 | | | | USD | | | | 152,775,000 | | | | SEK | | | | 686,983 | | | | — | |
| | | | | | | |
HSBC Securities (USA), Inc. | | | 05/20/2015 | | | | 14,731,072 | | | | USD | | | | 127,103,000 | | | | SEK | | | | 526,141 | | | | — | |
| | | | | | | |
State Street Bank & Trust Company | | | 05/20/2015 | | | | 4,075,000 | | | | CAD | | | | 3,326,837 | | | | USD | | | | — | | | | (49,940 | ) |
| | | | | | | |
State Street Bank & Trust Company | | | 05/20/2015 | | | | 21,585,000 | | | | CAD | | | | 17,622,034 | | | | USD | | | | — | | | | (264,527 | ) |
| | | | | | | |
State Street Bank & Trust Company | | | 05/20/2015 | | | | 2,048,000 | | | | CAD | | | | 1,684,296 | | | | USD | | | | — | | | | (12,793 | ) |
| | | | | | | |
UBS Securities | | | 05/20/2015 | | | | 2,939,000 | | | | NZD | | | | 2,230,495 | | | | USD | | | | — | | | | (9,091 | ) |
| | | | | | | |
UBS Securities | | | 05/20/2015 | | | | 17,046,000 | | | | NZD | | | | 12,936,721 | | | | USD | | | | — | | | | (52,727 | ) |
| | | | | | | | | | | | | | | | | | | | | | | | | | | | | |
Total | | | | | | | | | | | | | | | | | | | | | | | 2,827,753 | | | | (1,289,061 | ) |
| | | | | | | | | | | | | | | | | | | | | | | | | | | | | |
Notes to Portfolio of Investments
| (a) | Variable rate security. |
| (b) | The rate shown is the seven-day current annualized yield at April 30, 2015. |
| (c) | As defined in the Investment Company Act of 1940, an affiliated company is one in which the Fund owns 5% or more of the company’s outstanding voting securities, or a company which is under common ownership or control with the Fund. Holdings and transactions in these affiliated companies during the period ended April 30, 2015, are as follows: |
| | | | | | | | | | | | | | | | | | | | | | | | |
| Issuer | | Beginning
Cost ($) | | | Purchase
Cost ($) | | | Proceeds
From Sales ($) | | | Ending
Cost ($) | | | Dividends —
Affiliated
Issuers ($) | | | Value ($) | |
Columbia Short-Term Cash Fund | | | 50,067,724 | | | | 34,876,768 | | | | (32,041,232 | ) | | | 52,903,260 | | | | 27,332 | | | | 52,903,260 | |
The accompanying Notes to Financial Statements are an integral part of this statement.
| | |
| |
| COLUMBIA ABSOLUTE RETURN CURRENCY AND INCOME FUND | | |
PORTFOLIO OF INVESTMENTS (continued)
April 30, 2015 (Unaudited)
Currency Legend
| | |
| CAD | | Canadian Dollar |
| CHF | | Swiss Franc |
| GBP | | British Pound |
| NOK | | Norwegian Krone |
| NZD | | New Zealand Dollar |
| SEK | | Swedish Krona |
| USD | | US Dollar |
Fair Value Measurements
Generally accepted accounting principles (GAAP) require disclosure regarding the inputs and valuation techniques used to measure fair value and any changes in valuation inputs or techniques. In addition, investments shall be disclosed by major category.
The Fund categorizes its fair value measurements according to a three-level hierarchy that maximizes the use of observable inputs and minimizes the use of unobservable inputs by prioritizing that the most observable input be used when available. Observable inputs are those that market participants would use in pricing an investment based on market data obtained from sources independent of the reporting entity. Unobservable inputs are those that reflect the Fund’s assumptions about the information market participants would use in pricing an investment. An investment’s level within the fair value hierarchy is based on the lowest level of any input that is deemed significant to the asset or liability’s fair value measurement. The input levels are not necessarily an indication of the risk or liquidity associated with investments at that level. For example, certain U.S. government securities are generally high quality and liquid, however, they are reflected as Level 2 because the inputs used to determine fair value may not always be quoted prices in an active market.
Fair value inputs are summarized in the three broad levels listed below:
| n | | Level 1 — Valuations based on quoted prices for investments in active markets that the Fund has the ability to access at the measurement date (including NAV for open-end mutual funds). Valuation adjustments are not applied to Level 1 investments. |
| n | | Level 2 — Valuations based on other significant observable inputs (including quoted prices for similar securities, interest rates, prepayment speeds, credit risks, etc.). |
| n | | Level 3 — Valuations based on significant unobservable inputs (including the Fund’s own assumptions and judgment in determining the fair value of investments). |
Inputs that are used in determining fair value of an investment may include price information, credit data, volatility statistics, and other factors. These inputs can be either observable or unobservable. The availability of observable inputs can vary between investments, and is affected by various factors such as the type of investment, and the volume and level of activity for that investment or similar investments in the marketplace. The inputs will be considered by the Investment Manager, along with any other relevant factors in the calculation of an investment’s fair value. The Fund uses prices and inputs that are current as of the measurement date, which may include periods of market dislocations. During these periods, the availability of prices and inputs may be reduced for many investments. This condition could cause an investment to be reclassified between the various levels within the hierarchy.
Investments falling into the Level 3 category are primarily supported by quoted prices from brokers and dealers participating in the market for those investments. However, these may be classified as Level 3 investments due to lack of market transparency and corroboration to support these quoted prices. Additionally, valuation models may be used as the pricing source for any remaining investments classified as Level 3. These models may rely on one or more significant unobservable inputs and/or significant assumptions by the Investment Manager. Inputs used in valuations may include, but are not limited to, financial statement analysis, capital account balances, discount rates and estimated cash flows, and comparable company data.
Under the direction of the Fund’s Board of Trustees (the Board), the Investment Manager’s Valuation Committee (the Committee) is responsible for overseeing the valuation procedures approved by the Board. The Committee consists of voting and non-voting members from various groups within the Investment Manager’s organization, including operations and accounting, trading and investments, compliance, risk management and legal.
The Committee meets at least monthly to review and approve valuation matters, which may include a description of specific valuation determinations, data regarding pricing information received from approved pricing vendors and brokers and the results of Board-approved valuation control policies and procedures (the Policies). The Policies address, among other things, instances when market quotations are or are not readily available, including recommendations of third party pricing vendors and a determination of appropriate pricing methodologies; events that require specific valuation determinations and assessment of fair value techniques; securities with a potential for stale pricing, including those that are illiquid, restricted, or in default; and the effectiveness of third party pricing vendors, including periodic reviews of vendors. The Committee meets more frequently, as needed, to discuss additional valuation matters, which may include the need to review back-testing results, review time-sensitive information or approve related valuation actions. The Committee reports to the Board, with members of the Committee meeting with the Board at each of its regularly scheduled meetings to discuss valuation matters and actions during the period, similar to those described earlier.
For investments categorized as Level 3, the Committee monitors information similar to that described above, which may include: (i) data specific to the issuer or comparable issuers, (ii) general market or specific sector news and (iii) quoted prices and specific or similar security transactions. The Committee considers this data and any changes from prior periods in order to assess the reasonableness of observable and unobservable inputs, any assumptions or internal models used to value those securities and changes in fair value. This data is also used to corroborate, when available, information received from approved pricing vendors and brokers. Various factors impact the frequency of monitoring this information (which may occur as often as daily). However, the Committee may determine that changes to inputs, assumptions and models are not required as a result of the monitoring procedures performed.
The accompanying Notes to Financial Statements are an integral part of this statement.
| | |
| |
| | COLUMBIA ABSOLUTE RETURN CURRENCY AND INCOME FUND |
PORTFOLIO OF INVESTMENTS (continued)
April 30, 2015 (Unaudited)
Fair Value Measurements (continued)
The following table is a summary of the inputs used to value the Fund’s investments at April 30, 2015:
| | | | | | | | | | | | | | | | |
| Description | | Level 1
Quoted Prices in Active
Markets for Identical
Assets ($) | | | Level 2
Other Significant
Observable Inputs ($) | | | Level 3
Significant
Unobservable Inputs ($) | | | Total ($) | |
Bonds | | | | | | | | | | | | | | | | |
| | | | |
Asset-Backed Securities — Non-Agency | | | — | | | | 802,843 | | | | — | | | | 802,843 | |
| | | | | | | | | | | | | | | | | |
Total Bonds | | | — | | | | 802,843 | | | | — | | | | 802,843 | |
| | | | | | | | | | | | | | | | | |
Mutual Funds | | | | | | | | | | | | | | | | |
| | | | |
Money Market Funds | | | 52,903,260 | | | | — | | | | — | | | | 52,903,260 | |
| | | | | | | | | | | | | | | | | |
Total Mutual Funds | | | 52,903,260 | | | | — | | | | — | | | | 52,903,260 | |
| | | | | | | | | | | | | | | | | |
Investments in Securities | | | 52,903,260 | | | | 802,843 | | | | — | | | | 53,706,103 | |
Derivatives | | | | | | | | | | | | | | | | |
| | | | |
Assets | | | | | | | | | | | | | | | | |
| | | | |
Forward Foreign Currency Exchange Contracts | | | — | | | | 2,827,753 | | | | — | | | | 2,827,753 | |
| | | | |
Liabilities | | | | | | | | | | | | | | | | |
| | | | |
Forward Foreign Currency Exchange Contracts | | | — | | | | (1,289,061 | ) | | | — | | | | (1,289,061 | ) |
| | | | | | | | | | | | | | | | | |
Total | | | 52,903,260 | | | | 2,341,535 | | | | — | | | | 55,244,795 | |
| | | | | | | | | | | | | | | | | |
See the Portfolio of Investments for all investment classifications not indicated in the table.
The Fund’s assets assigned to the Level 2 input category are generally valued using the market approach, in which a security’s value is determined through reference to prices and information from market transactions for similar or identical assets.
There were no transfers of financial assets between levels during the period.
Derivative instruments are valued at unrealized appreciation (depreciation).
The accompanying Notes to Financial Statements are an integral part of this statement.
| | |
| |
| COLUMBIA ABSOLUTE RETURN CURRENCY AND INCOME FUND | | |
STATEMENT OF ASSETS AND LIABILITIES
April 30, 2015 (Unaudited)
| | | | |
| |
Assets | | | | |
| |
Investments, at value | | | | |
| |
Unaffiliated issuers (identified cost $805,783) | | | $802,843 | |
| |
Affiliated issuers (identified cost $52,903,260) | | | 52,903,260 | |
| |
Total investments (identified cost $53,709,043) | | | 53,706,103 | |
| |
Unrealized appreciation on forward foreign currency exchange contracts | | | 2,827,753 | |
| |
Receivable for: | | | | |
| |
Investments sold | | | 114,929 | |
| |
Capital shares sold | | | 73,489 | |
| |
Dividends | | | 4,976 | |
| |
Interest | | | 1,941 | |
| |
Expense reimbursement due from Investment Manager | | | 14 | |
| |
Prepaid expenses | | | 609 | |
| |
Other assets | | | 35,283 | |
| |
Total assets | | | 56,765,097 | |
| |
| |
Liabilities | | | | |
| |
Unrealized depreciation on forward foreign currency exchange contracts | | | 1,289,061 | |
| |
Payable for: | | | | |
| |
Investments purchased | | | 90,359 | |
| |
Capital shares purchased | | | 54,948 | |
| |
Investment management fees | | | 1,357 | |
| |
Distribution and/or service fees | | | 158 | |
| |
Transfer agent fees | | | 2,744 | |
| |
Administration fees | | | 122 | |
| |
Compensation of board members | | | 22,638 | |
| |
Other expenses | | | 26,304 | |
| |
Total liabilities | | | 1,487,691 | |
| |
Net assets applicable to outstanding capital stock | | | $55,277,406 | |
| |
| |
Represented by | | | | |
| |
Paid-in capital | | | $48,480,025 | |
| |
Excess of distributions over net investment income | | | (852,494 | ) |
| |
Accumulated net realized gain | | | 6,114,123 | |
| |
Unrealized appreciation (depreciation) on: | | | | |
| |
Investments | | | (2,940 | ) |
| |
Forward foreign currency exchange contracts | | | 1,538,692 | |
| |
Total — representing net assets applicable to outstanding capital stock | | | $55,277,406 | |
| |
The accompanying Notes to Financial Statements are an integral part of this statement.
| | |
| |
| | COLUMBIA ABSOLUTE RETURN CURRENCY AND INCOME FUND |
STATEMENT OF ASSETS AND LIABILITIES (continued)
April 30, 2015 (Unaudited)
| | | | |
| |
Class A | | | | |
| |
Net assets | | | $14,949,314 | |
| |
Shares outstanding | | | 1,292,652 | |
| |
Net asset value per share | | | $11.56 | |
| |
Maximum offering price per share(a) | | | $11.92 | |
| |
Class B | | | | |
| |
Net assets | | | $46,660 | |
| |
Shares outstanding | | | 4,245 | |
| |
Net asset value per share | | | $10.99 | |
| |
Class C | | | | |
| |
Net assets | | | $1,947,782 | |
| |
Shares outstanding | | | 177,354 | |
| |
Net asset value per share | | | $10.98 | |
| |
Class I | | | | |
| |
Net assets | | | $29,627,057 | |
| |
Shares outstanding | | | 2,484,410 | |
| |
Net asset value per share | | | $11.93 | |
| |
Class R4 | | | | |
| |
Net assets | | | $144,523 | |
| |
Shares outstanding | | | 12,178 | |
| |
Net asset value per share | | | $11.87 | |
| |
Class R5 | | | | |
| |
Net assets | | | $12,193 | |
| |
Shares outstanding | | | 1,022 | |
| |
Net asset value per share(b) | | | $11.92 | |
| |
Class W | | | | |
| |
Net assets | | | $88,368 | |
| |
Shares outstanding | | | 7,671 | |
| |
Net asset value per share | | | $11.52 | |
| |
Class Y | | | | |
| |
Net assets | | | $12,262 | |
| |
Shares outstanding | | | 1,030 | |
| |
Net asset value per share(b) | | | $11.91 | |
| |
Class Z | | | | |
| |
Net assets | | | $8,449,247 | |
| |
Shares outstanding | | | 712,028 | |
| |
Net asset value per share | | | $11.87 | |
| |
| (a) | The maximum offering price per share is calculated by dividing the net asset value per share by 1.0 minus the maximum sales charge of 3.00%. |
| (b) | Net asset value per share rounds to this amount due to fractional shares outstanding. |
The accompanying Notes to Financial Statements are an integral part of this statement.
| | |
| 10 | | Semiannual Report 2015 |
| | |
| |
| COLUMBIA ABSOLUTE RETURN CURRENCY AND INCOME FUND | | |
STATEMENT OF OPERATIONS
Six Months Ended April 30, 2015 (Unaudited)
| | | | |
| |
Income: | | | | |
| |
Dividends — affiliated issuers | | | $27,332 | |
| |
Interest | | | 19,861 | |
| |
Total income | | | 47,193 | |
| |
| |
Expenses: | | | | |
| |
Investment management fees | | | 223,110 | |
| |
Distribution and/or service fees | | | | |
| |
Class A | | | 15,916 | |
| |
Class B | | | 231 | |
| |
Class C | | | 8,509 | |
| |
Class W | | | 108 | |
| |
Transfer agent fees | | | | |
| |
Class A | | | 10,354 | |
| |
Class B | | | 38 | |
| |
Class C | | | 1,380 | |
| |
Class R4 | | | 49 | |
| |
Class R5 | | | 3 | |
| |
Class W | | | 70 | |
| |
Class Z | | | 4,978 | |
| |
Administration fees | | | 20,055 | |
| |
Compensation of board members | | | 5,937 | |
| |
Custodian fees | | | 2,741 | |
| |
Printing and postage fees | | | 11,207 | |
| |
Registration fees | | | 49,325 | |
| |
Professional fees | | | 17,426 | |
| |
Other | | | 5,105 | |
| |
Total expenses | | | 376,542 | |
| |
Fees waived or expenses reimbursed by Investment Manager and its affiliates | | | (15,606 | ) |
| |
Total net expenses | | | 360,936 | |
| |
Net investment loss | | | (313,743 | ) |
| |
| |
Realized and unrealized gain (loss) — net | | | | |
| |
Net realized gain (loss) on: | | | | |
| |
Investments | | | 164 | |
| |
Foreign currency translations | | | (762 | ) |
| |
Forward foreign currency exchange contracts | | | 7,598,608 | |
| |
Net realized gain | | | 7,598,010 | |
| |
Net change in unrealized appreciation (depreciation) on: | | | | |
| |
Investments | | | (2,553 | ) |
| |
Forward foreign currency exchange contracts | | | 2,033,098 | |
| |
Net change in unrealized appreciation | | | 2,030,545 | |
| |
Net realized and unrealized gain | | | 9,628,555 | |
| |
Net increase in net assets resulting from operations | | | $9,314,812 | |
| |
The accompanying Notes to Financial Statements are an integral part of this statement.
| | | | |
| Semiannual Report 2015 | | | 11 | |
| | |
| |
| | COLUMBIA ABSOLUTE RETURN CURRENCY AND INCOME FUND |
STATEMENT OF CHANGES IN NET ASSETS
| | | | | | | | |
| | | Six Months Ended
April 30, 2015
(Unaudited) | | | Year Ended
October 31, 2014 | |
Operations | | | | | | | | |
| | |
Net investment loss | | | $(313,743 | ) | | | $(682,300 | ) |
| | |
Net realized gain (loss) | | | 7,598,010 | | | | (171,489 | ) |
| | |
Net change in unrealized appreciation (depreciation) | | | 2,030,545 | | | | (879,692 | ) |
| |
Net increase (decrease) in net assets resulting from operations | | | 9,314,812 | | | | (1,733,481 | ) |
| |
Decrease in net assets from capital stock activity | | | (4,432,896 | ) | | | (40,525,346 | ) |
| |
Total increase (decrease) in net assets | | | 4,881,916 | | | | (42,258,827 | ) |
| | |
Net assets at beginning of period | | | 50,395,490 | | | | 92,654,317 | |
| |
Net assets at end of period | | | $55,277,406 | | | | $50,395,490 | |
| |
Excess of distributions over net investment income | | | $(852,494 | ) | | | $(538,751 | ) |
| |
The accompanying Notes to Financial Statements are an integral part of this statement.
| | |
| 12 | | Semiannual Report 2015 |
| | |
| |
| COLUMBIA ABSOLUTE RETURN CURRENCY AND INCOME FUND | | |
STATEMENT OF CHANGES IN NET ASSETS (continued)
| | | | | | | | | | | | | | | | |
| | | Six Months Ended
April 30, 2015 (Unaudited) | | | Year Ended
October 31, 2014(a) | |
| | | Shares | | | Dollars ($) | | | Shares | | | Dollars ($) | |
Capital stock activity | | | | | | | | | | | | | | | | |
| | | | |
Class A shares | | | | | | | | | | | | | | | | |
| | | | |
Subscriptions(b) | | | 239,029 | | | | 2,633,013 | | | | 133,905 | | | | 1,270,682 | |
| | | | |
Redemptions | | | (198,575 | ) | | | (2,053,336 | ) | | | (937,918 | ) | | | (8,850,560 | ) |
| |
Net increase (decrease) | | | 40,454 | | | | 579,677 | | | | (804,013 | ) | | | (7,579,878 | ) |
| |
Class B shares | | | | | | | | | | | | | | | | |
| | | | |
Subscriptions | | | 360 | | | | 3,900 | | | | — | | | | — | |
| | | | |
Redemptions(b) | | | (1,737 | ) | | | (18,005 | ) | | | (14,515 | ) | | | (130,393 | ) |
| |
Net decrease | | | (1,377 | ) | | | (14,105 | ) | | | (14,515 | ) | | | (130,393 | ) |
| |
Class C shares | | | | | | | | | | | | | | | | |
| | | | |
Subscriptions | | | 107,439 | | | | 1,030,775 | | | | 26,784 | | | | 243,613 | |
| | | | |
Redemptions | | | (66,834 | ) | | | (693,213 | ) | | | (143,534 | ) | | | (1,285,590 | ) |
| |
Net increase (decrease) | | | 40,605 | | | | 337,562 | | | | (116,750 | ) | | | (1,041,977 | ) |
| |
Class I shares | | | | | | | | | | | | | | | | |
| | | | |
Subscriptions | | | 6,971 | | | | 73,864 | | | | 240,969 | | | | 2,353,549 | |
| | | | |
Redemptions | | | (494,851 | ) | | | (5,588,619 | ) | | | (3,794,421 | ) | | | (36,870,728 | ) |
| |
Net decrease | | | (487,880 | ) | | | (5,514,755 | ) | | | (3,553,452 | ) | | | (34,517,179 | ) |
| |
Class R4 shares | | | | | | | | | | | | | | | | |
| | | | |
Subscriptions | | | 11,758 | | | | 133,500 | | | | 788 | | | | 7,700 | |
| | | | |
Redemptions | | | (611 | ) | | | (6,951 | ) | | | — | | | | — | |
| |
Net increase | | | 11,147 | | | | 126,549 | | | | 788 | | | | 7,700 | |
| |
Class R5 shares | | | | | | | | | | | | | | | | |
| | | | |
Subscriptions | | | — | | | | — | | | | 1,022 | | | | 10,000 | |
| |
Net increase | | | — | | | | — | | | | 1,022 | | | | 10,000 | |
| |
Class W shares | | | | | | | | | | | | | | | | |
| | | | |
Subscriptions | | | — | | | | — | | | | 568 | | | | 5,400 | |
| | | | |
Redemptions | | | (1,254 | ) | | | (13,317 | ) | | | (4,302 | ) | | | (40,366 | ) |
| |
Net decrease | | | (1,254 | ) | | | (13,317 | ) | | | (3,734 | ) | | | (34,966 | ) |
| |
Class Y shares | | | | | | | | | | | | | | | | |
| | | | |
Subscriptions | | | — | | | | — | | | | 786 | | | | 7,696 | |
| |
Net increase | | | — | | | | — | | | | 786 | | | | 7,696 | |
| |
Class Z shares | | | | | | | | | | | | | | | | |
| | | | |
Subscriptions | | | 504,352 | | | | 5,802,475 | | | | 563,707 | | | | 5,511,319 | |
| | | | |
Redemptions | | | (543,637 | ) | | | (5,736,982 | ) | | | (281,598 | ) | | | (2,757,668 | ) |
| |
Net increase (decrease) | | | (39,285 | ) | | | 65,493 | | | | 282,109 | | | | 2,753,651 | |
| |
Total net decrease | | | (437,590 | ) | | | (4,432,896 | ) | | | (4,207,759 | ) | | | (40,525,346 | ) |
| |
| (a) | Class R5 shares are based on operations from June 25, 2014 (commencement of operations) through the stated period end. |
| (b) | Includes conversions of Class B shares to Class A shares, if any. |
The accompanying Notes to Financial Statements are an integral part of this statement.
| | | | |
| Semiannual Report 2015 | | | 13 | |
| | |
| |
| | COLUMBIA ABSOLUTE RETURN CURRENCY AND INCOME FUND |
FINANCIAL HIGHLIGHTS
The following tables are intended to help you understand the Fund’s financial performance. Certain information reflects financial results for a single share of a class held for the periods shown. Per share net investment income (loss) amounts are calculated based on average shares outstanding during the period. Total return assumes reinvestment of all dividends and distributions, if any. Total return does not reflect payment of sales charges, if any. Total return and portfolio turnover are not annualized for periods of less than one year. The portfolio turnover rate is calculated without regard to purchase and sales transactions of short-term instruments and certain derivatives, if any. If such transactions were included, the Fund’s portfolio turnover rate may be higher.
| | | | | | | | | | | | | | | | | | | | | | | | |
| |
| Six Months Ended
April 30, 2015 |
| | | Year Ended October 31, | |
Class A | | | (Unaudited) | | | | 2014 | | | | 2013 | | | | 2012 | | | | 2011 | | | | 2010 | |
Per share data | | | | | | | | | | | | | | | | | | | | | | | | |
Net asset value, beginning of period | | | $9.64 | | | | $9.75 | | | | $10.21 | | | | $9.95 | | | | $10.00 | | | | $9.93 | |
| | | | | | | | | | | | | | | | | | | | | | | | | |
Income from investment operations: | | | | | | | | | | | | | | | | | | | | | | | | |
| | | | | | |
Net investment loss | | | (0.08 | ) | | | (0.14 | ) | | | (0.13 | ) | | | (0.12 | ) | | | (0.15 | ) | | | (0.12 | ) |
| | | | | | | | | | | | | | | | | | | | | | | | | |
Net realized and unrealized gain (loss) | | | 2.00 | | | | 0.03 | (a) | | | (0.09 | ) | | | 0.38 | | | | 0.10 | | | | 0.19 | |
| | | | | | | | | | | | | | | | | | | | | | | | | |
Total from investment operations | | | 1.92 | | | | (0.11 | ) | | | (0.22 | ) | | | 0.26 | | | | (0.05 | ) | | | 0.07 | |
| | | | | | | | | | | | | | | | | | | | | | | | | |
Less distributions to shareholders: | | | | | | | | | | | | | | | | | | | | | | | | |
| | | | | | |
Net realized gains | | | — | | | | — | | | | (0.24 | ) | | | — | | | | — | | | | — | |
| | | | | | | | | | | | | | | | | | | | | | | | | |
Total distributions to shareholders | | | — | | | | — | | | | (0.24 | ) | | | — | | | | — | | | | — | |
| | | | | | | | | | | | | | | | | | | | | | | | | |
Net asset value, end of period | | | $11.56 | | | | $9.64 | | | | $9.75 | | | | $10.21 | | | | $9.95 | | | | $10.00 | |
| | | | | | | | | | | | | | | | | | | | | | | | | |
Total return | | | 19.92 | % | | | (1.13 | %) | | | (2.28 | %) | | | 2.61 | % | | | (0.50 | %) | | | 0.71 | % |
| | | | | | | | | | | | | | | | | | | | | | | | | |
Ratios to average net assets(b) | | | | | | | | | | | | | | | | | | | | | | | | |
| | | | | | |
Total gross expenses | | | 1.75 | %(c) | | | 1.77 | % | | | 1.68 | % | | | 1.65 | % | | | 1.73 | % | | | 1.47 | % |
| | | | | | | | | | | | | | | | | | | | | | | | | |
Total net expenses(d) | | | 1.67 | %(c) | | | 1.66 | % | | | 1.48 | % | | | 1.42 | % | | | 1.73 | % | | | 1.47 | % |
| | | | | | | | | | | | | | | | | | | | | | | | | |
Net investment loss | | | (1.47 | %)(c) | | | (1.50 | %) | | | (1.29 | %) | | | (1.18 | %) | | | (1.48 | %) | | | (1.19 | %) |
| | | | | | | | | | | | | | | | | | | | | | | | | |
Supplemental data | | | | | | | | | | | | | | | | | | | | | | | | |
| | | | | | |
Net assets, end of period (in thousands) | | | $14,949 | | | | $12,068 | | | | $20,050 | | | | $30,758 | | | | $40,755 | | | | $62,209 | |
| | | | | | | | | | | | | | | | | | | | | | | | | |
Portfolio turnover | | | 0 | % | | | 0 | % | | | 0 | % | | | 0 | % | | | 0 | % | | | 0 | % |
| | | | | | | | | | | | | | | | | | | | | | | | | |
Notes to Financial Highlights
| (a) | Calculation of the net gain (loss) per share (both realized and unrealized) does not correlate to the aggregate realized and unrealized gain (loss) presented in the Statement of Operations due to the timing of subscriptions and redemptions of Fund shares in relation to fluctuations in the market value of the portfolio. |
| (b) | In addition to the fees and expenses that the Fund bears directly, the Fund indirectly bears a pro rata share of the fees and expenses of any other funds in which it invests. Such indirect expenses are not included in the Fund’s reported expense ratios. |
| (d) | Total net expenses include the impact of certain fee waivers/expense reimbursements made by the Investment Manager and certain of its affiliates, if applicable. |
The accompanying Notes to Financial Statements are an integral part of this statement.
| | |
| 14 | | Semiannual Report 2015 |
| | |
| |
| COLUMBIA ABSOLUTE RETURN CURRENCY AND INCOME FUND | | |
FINANCIAL HIGHLIGHTS (continued)
| | | | | | | | | | | | | | | | | | | | | | | | |
| |
| Six Months Ended
April 30, 2015
|
| | | Year Ended October 31, | |
Class B | | | (Unaudited) | | | | 2014 | | | | 2013 | | | | 2012 | | | | 2011 | | | | 2010 | |
Per share data | | | | | | | | | | | | | | | | | | | | | | | | |
Net asset value, beginning of period | | | $9.19 | | | | $9.37 | | | | $9.90 | | | | $9.72 | | | | $9.85 | | | | $9.85 | |
| | | | | | | | | | | | | | | | | | | | | | | | | |
Income from investment operations: | | | | | | | | | | | | | | | | | | | | | | | | |
| | | | | | |
Net investment loss | | | (0.11 | ) | | | (0.20 | ) | | | (0.20 | ) | | | (0.19 | ) | | | (0.22 | ) | | | (0.19 | ) |
| | | | | | | | | | | | | | | | | | | | | | | | | |
Net realized and unrealized gain (loss) | | | 1.91 | | | | 0.02 | (a) | | | (0.09 | ) | | | 0.37 | | | | 0.09 | | | | 0.19 | |
| | |
Total from investment operations | | | 1.80 | | | | (0.18 | ) | | | (0.29 | ) | | | 0.18 | | | | (0.13 | ) | | | — | |
| | | | | | | | | | | | | | | | | | | | | | | | | |
Less distributions to shareholders: | | | | | | | | | | | | | | | | | | | | | | | | |
| | | | | | |
Net realized gains | | | — | | | | — | | | | (0.24 | ) | | | — | | | | — | | | | — | |
| | | | | | | | | | | | | | | | | | | | | | | | | |
Total distributions to shareholders | | | — | | | | — | | | | (0.24 | ) | | | — | | | | — | | | | — | |
| | | | | | | | | | | | | | | | | | | | | | | | | |
Net asset value, end of period | | | $10.99 | | | | $9.19 | | | | $9.37 | | | | $9.90 | | | | $9.72 | | | | $9.85 | |
| | | | | | | | | | | | | | | | | | | | | | | | | |
Total return | | | 19.59 | % | | | (1.92 | %) | | | (3.08 | %) | | | 1.85 | % | | | (1.32 | %) | | | 0.00 | %(b) |
| | | | | | | | | | | | | | | | | | | | | | | | | |
Ratios to average net assets(c) | | | | | | | | | | | | | | | | | | | | | | | | |
| | | | | | |
Total gross expenses | | | 2.50 | %(d) | | | 2.51 | % | | | 2.46 | % | | | 2.39 | % | | | 2.47 | % | | | 2.23 | % |
| | | | | | | | | | | | | | | | | | | | | | | | | |
Total net expenses(e) | | | 2.42 | %(d) | | | 2.41 | % | | | 2.23 | % | | | 2.17 | % | | | 2.47 | % | | | 2.23 | % |
| | | | | | | | | | | | | | | | | | | | | | | | | |
Net investment loss | | | (2.23 | %)(d) | | | (2.25 | %) | | | (2.04 | %) | | | (1.93 | %) | | | (2.21 | %) | | | (1.95 | %) |
| | | | | | | | | | | | | | | | | | | | | | | | | |
Supplemental data | | | | | | | | | | | | | | | | | | | | | | | | |
| | | | | | |
Net assets, end of period (in thousands) | | | $47 | | | | $52 | | | | $189 | | | | $456 | | | | $698 | | | | $1,006 | |
| | | | | | | | | | | | | | | | | | | | | | | | | |
Portfolio turnover | | | 0 | % | | | 0 | % | | | 0 | % | | | 0 | % | | | 0 | % | | | 0 | % |
| | | | | | | | | | | | | | | | | | | | | | | | | |
Notes to Financial Highlights
| (a) | Calculation of the net gain (loss) per share (both realized and unrealized) does not correlate to the aggregate realized and unrealized gain (loss) presented in the Statement of Operations due to the timing of subscriptions and redemptions of Fund shares in relation to fluctuations in the market value of the portfolio. |
| (c) | In addition to the fees and expenses that the Fund bears directly, the Fund indirectly bears a pro rata share of the fees and expenses of any other funds in which it invests. Such indirect expenses are not included in the Fund’s reported expense ratios. |
| (e) | Total net expenses include the impact of certain fee waivers/expense reimbursements made by the Investment Manager and certain of its affiliates, if applicable. |
The accompanying Notes to Financial Statements are an integral part of this statement.
| | | | |
| Semiannual Report 2015 | | | 15 | |
| | |
| |
| | COLUMBIA ABSOLUTE RETURN CURRENCY AND INCOME FUND |
FINANCIAL HIGHLIGHTS (continued)
| | | | | | | | | | | | | | | | | | | | | | | | |
| |
| Six Months Ended
April 30, 2015 |
| | | Year Ended October 31, | |
Class C | | | (Unaudited) | | | | 2014 | | | | 2013 | | | | 2012 | | | | 2011 | | | | 2010 | |
Per share data | | | | | | | | | | | | | | | | | | | | | | | | |
Net asset value, beginning of period | | | $9.19 | | | | $9.36 | | | | $9.89 | | | | $9.71 | | | | $9.83 | | | | $9.84 | |
| | | | | | | | | | | | | | | | | | | | | | | | | |
Income from investment operations: | | | | | | | | | | | | | | | | | | | | | | | | |
| | | | | | |
Net investment loss | | | (0.11 | ) | | | (0.20 | ) | | | (0.20 | ) | | | (0.19 | ) | | | (0.22 | ) | | | (0.19 | ) |
| | | | | | | | | | | | | | | | | | | | | | | | | |
Net realized and unrealized gain (loss) | | | 1.90 | | | | 0.03 | (a) | | | (0.09 | ) | | | 0.37 | | | | 0.10 | | | | 0.18 | |
| | |
Total from investment operations | | | 1.79 | | | | (0.17 | ) | | | (0.29 | ) | | | 0.18 | | | | (0.12 | ) | | | (0.01 | ) |
| | | | | | | | | | | | | | | | | | | | | | | | | |
Less distributions to shareholders: | | | | | | | | | | | | | | | | | | | | | | | | |
| | | | | | |
Net realized gains | | | — | | | | — | | | | (0.24 | ) | | | — | | | | — | | | | — | |
| | | | | | | | | | | | | | | | | | | | | | | | | |
Total distributions to shareholders | | | — | | | | — | | | | (0.24 | ) | | | — | | | | — | | | | — | |
| | | | | | | | | | | | | | | | | | | | | | | | | |
Net asset value, end of period | | | $10.98 | | | | $9.19 | | | | $9.36 | | | | $9.89 | | | | $9.71 | | | | $9.83 | |
| | | | | | | | | | | | | | | | | | | | | | | | | |
Total return | | | 19.48 | % | | | (1.82 | %) | | | (3.08 | %) | | | 1.85 | % | | | (1.22 | %) | | | (0.10 | %) |
| | | | | | | | | | | | | | | | | | | | | | | | | |
Ratios to average net assets(b) | | | | | | | | | | | | | | | | | | | | | | | | |
| | | | | | |
Total gross expenses | | | 2.50 | %(c) | | | 2.52 | % | | | 2.42 | % | | | 2.39 | % | | | 2.48 | % | | | 2.22 | % |
| | | | | | | | | | | | | | | | | | | | | | | | | |
Total net expenses(d) | | | 2.42 | %(c) | | | 2.41 | % | | | 2.23 | % | | | 2.16 | % | | | 2.48 | % | | | 2.22 | % |
| | | | | | | | | | | | | | | | | | | | | | | | | |
Net investment loss | | | (2.22 | %)(c) | | | (2.25 | %) | | | (2.05 | %) | | | (1.92 | %) | | | (2.23 | %) | | | (1.94 | %) |
| | | | | | | | | | | | | | | | | | | | | | | | | |
Supplemental data | | | | | | | | | | | | | | | | | | | | | | | | |
| | | | | | |
Net assets, end of period (in thousands) | | | $1,948 | | | | $1,256 | | | | $2,374 | | | | $2,887 | | | | $3,333 | | | | $4,703 | |
| | | | | | | | | | | | | | | | | | | | | | | | | |
Portfolio turnover | | | 0 | % | | | 0 | % | | | 0 | % | | | 0 | % | | | 0 | % | | | 0 | % |
| | | | | | | | | | | | | | | | | | | | | | | | | |
Notes to Financial Highlights
| (a) | Calculation of the net gain (loss) per share (both realized and unrealized) does not correlate to the aggregate realized and unrealized gain (loss) presented in the Statement of Operations due to the timing of subscriptions and redemptions of Fund shares in relation to fluctuations in the market value of the portfolio. |
| (b) | In addition to the fees and expenses that the Fund bears directly, the Fund indirectly bears a pro rata share of the fees and expenses of any other funds in which it invests. Such indirect expenses are not included in the Fund’s reported expense ratios. |
| (d) | Total net expenses include the impact of certain fee waivers/expense reimbursements made by the Investment Manager and certain of its affiliates, if applicable. |
The accompanying Notes to Financial Statements are an integral part of this statement.
| | |
| 16 | | Semiannual Report 2015 |
| | |
| |
| COLUMBIA ABSOLUTE RETURN CURRENCY AND INCOME FUND | | |
FINANCIAL HIGHLIGHTS (continued)
| | | | | | | | | | | | | | | | | | | | | | | | |
| |
| Six Months Ended
April 30, 2015 |
| | | Year Ended October 31, | |
Class I | | | (Unaudited) | | | | 2014 | | | | 2013 | | | | 2012 | | | | 2011 | | | | 2010 | |
Per share data | | | | | | | | | | | | | | | | | | | | | | | | |
Net asset value, beginning of period | | | $9.92 | | | | $10.00 | | | | $10.42 | | | | $10.11 | | | | $10.09 | | | | $9.98 | |
| | | | | | | | | | | | | | | | | | | | | | | | | |
Income from investment operations: | | | | | | | | | | | | | | | | | | | | | | | | |
| | | | | | |
Net investment loss | | | (0.06 | ) | | | (0.11 | ) | | | (0.09 | ) | | | (0.07 | ) | | | (0.08 | ) | | | (0.08 | ) |
| | | | | | | | | | | | | | | | | | | | | | | | | |
Net realized and unrealized gain (loss) | | | 2.07 | | | | 0.03 | (a) | | | (0.09 | ) | | | 0.38 | | | | 0.10 | | | | 0.19 | |
| | | | | | | | | | | | | | | | | | | | | | | | | |
Total from investment operations | | | 2.01 | | | | (0.08 | ) | | | (0.18 | ) | | | 0.31 | | | | 0.02 | | | | 0.11 | |
| | | | | | | | | | | | | | | | | | | | | | | | | |
Less distributions to shareholders: | | | | | | | | | | | | | | | | | | | | | | | | |
| | | | | | |
Net realized gains | | | — | | | | — | | | | (0.24 | ) | | | — | | | | — | | | | — | |
| | | | | | | | | | | | | | | | | | | | | | | | | |
Total distributions to shareholders | | | — | | | | — | | | | (0.24 | ) | | | — | | | | — | | | | — | |
| | | | | | | | | | | | | | | | | | | | | | | | | |
Net asset value, end of period | | | $11.93 | | | | $9.92 | | | | $10.00 | | | | $10.42 | | | | $10.11 | | | | $10.09 | |
| | | | | | | | | | | | | | | | | | | | | | | | | |
Total return | | | 20.26 | % | | | (0.80 | %) | | | (1.84 | %) | | | 3.07 | % | | | 0.20 | % | | | 1.10 | % |
| | | | | | | | | | | | | | | | | | | | | | | | | |
Ratios to average net assets(b) | | | | | | | | | | | | | | | | | | | | | | | | |
| | | | | | |
Total gross expenses | | | 1.34 | %(c) | | | 1.32 | % | | | 1.16 | % | | | 1.14 | % | | | 1.05 | % | | | 1.07 | % |
| | | | | | | | | | | | | | | | | | | | | | | | | |
Total net expenses(d) | | | 1.29 | %(c) | | | 1.26 | % | | | 1.08 | % | | | 0.91 | % | | | 1.05 | % | | | 1.07 | % |
| | | | | | | | | | | | | | | | | | | | | | | | | |
Net investment loss | | | (1.10 | %)(c) | | | (1.10 | %) | | | (0.90 | %) | | | (0.68 | %) | | | (0.84 | %) | | | (0.79 | %) |
| | | | | | | | | | | | | | | | | | | | | | | | | |
Supplemental data | | | | | | | | | | | | | | | | | | | | | | | | |
| | | | | | |
Net assets, end of period (in thousands) | | | $29,627 | | | | $29,482 | | | | $65,238 | | | | $47,585 | | | | $67,660 | | | | $38,718 | |
| | | | | | | | | | | | | | | | | | | | | | | | | |
Portfolio turnover | | | 0 | % | | | 0 | % | | | 0 | % | | | 0 | % | | | 0 | % | | | 0 | % |
| | | | | | | | | | | | | | | | | | | | | | | | | |
Notes to Financial Highlights
| (a) | Calculation of the net gain (loss) per share (both realized and unrealized) does not correlate to the aggregate realized and unrealized gain (loss) presented in the Statement of Operations due to the timing of subscriptions and redemptions of Fund shares in relation to fluctuations in the market value of the portfolio. |
| (b) | In addition to the fees and expenses that the Fund bears directly, the Fund indirectly bears a pro rata share of the fees and expenses of any other funds in which it invests. Such indirect expenses are not included in the Fund’s reported expense ratios. |
| (d) | Total net expenses include the impact of certain fee waivers/expense reimbursements made by the Investment Manager and certain of its affiliates, if applicable. |
The accompanying Notes to Financial Statements are an integral part of this statement.
| | | | |
| Semiannual Report 2015 | | | 17 | |
| | |
| |
| | COLUMBIA ABSOLUTE RETURN CURRENCY AND INCOME FUND |
FINANCIAL HIGHLIGHTS (continued)
| | | | | | | | | | | | |
| |
| Six Months Ended
April 30, 2015 |
| | | Year Ended October 31, | |
Class R4 | | | (Unaudited) | | | | 2014 | | | | 2013(a) | |
Per share data | | | | | | | | | | | | |
Net asset value, beginning of period | | | $9.87 | | | | $9.97 | | | | $10.28 | |
| | | | | | | | | | | | | |
Income from investment operations: | | | | | | | | | | | | |
| | | |
Net investment loss | | | (0.07 | ) | | | (0.12 | ) | | | (0.06 | ) |
| | | | | | | | | | | | | |
Net realized and unrealized gain (loss) | | | 2.07 | | | | 0.02 | (b) | | | (0.25 | ) |
| | | | | | | | | | | | | |
Total from investment operations | | | 2.00 | | | | (0.10 | ) | | | (0.31 | ) |
| | | | | | | | | | | | | |
Net asset value, end of period | | | $11.87 | | | | $9.87 | | | | $9.97 | |
| | | | | | | | | | | | | |
Total return | | | 20.26 | % | | | (1.00 | %) | | | (3.02 | %) |
| | | | | | | | | | | | | |
Ratios to average net assets(c) | | | | | | | | | | | | |
| | | |
Total gross expenses | | | 1.51 | %(d) | | | 1.54 | % | | | 1.19 | %(d) |
| | | | | | | | | | | | | |
Total net expenses(e) | | | 1.43 | %(d) | | | 1.41 | % | | | 1.19 | %(d) |
| | | | | | | | | | | | | |
Net investment loss | | | (1.20 | %)(d) | | | (1.25 | %) | | | (1.03 | %)(d) |
| | | | | | | | | | | | | |
Supplemental data | | | | | | | | | | | | |
| | | |
Net assets, end of period (in thousands) | | | $145 | | | | $10 | | | | $2 | |
| | | | | | | | | | | | | |
Portfolio turnover | | | 0 | % | | | 0 | % | | | 0 | % |
| | | | | | | | | | | | | |
Notes to Financial Highlights
| (a) | Based on operations from March 19, 2013 (commencement of operations) through the stated period end. |
| (b) | Calculation of the net gain (loss) per share (both realized and unrealized) does not correlate to the aggregate realized and unrealized gain (loss) presented in the Statement of Operations due to the timing of subscriptions and redemptions of Fund shares in relation to fluctuations in the market value of the portfolio. |
| (c) | In addition to the fees and expenses that the Fund bears directly, the Fund indirectly bears a pro rata share of the fees and expenses of any other funds in which it invests. Such indirect expenses are not included in the Fund’s reported expense ratios. |
| (e) | Total net expenses include the impact of certain fee waivers/expense reimbursements made by the Investment Manager and certain of its affiliates, if applicable. |
The accompanying Notes to Financial Statements are an integral part of this statement.
| | |
| 18 | | Semiannual Report 2015 |
| | |
| |
| COLUMBIA ABSOLUTE RETURN CURRENCY AND INCOME FUND | | |
FINANCIAL HIGHLIGHTS (continued)
| | | | | | | | |
| |
| Six Months Ended
April 30, 2015
|
| |
| Year Ended
October 31, |
|
Class R5 | | | (Unaudited) | | | | 2014(a) | |
Per share data | | | | | | | | |
Net asset value, beginning of period | | | $9.92 | | | | $9.78 | |
| | | | | | | | | |
Income from investment operations: | | | | | | | | |
| | |
Net investment loss | | | (0.06 | ) | | | (0.04 | ) |
| | | | | | | | | |
Net realized and unrealized gain | | | 2.06 | | | | 0.18 | (b) |
| | | | | | | | | |
Total from investment operations | | | 2.00 | | | | 0.14 | |
| | | | | | | | | |
Net asset value, end of period | | | $11.92 | | | | $9.92 | |
| | | | | | | | | |
Total return | | | 20.16 | % | | | 1.43 | % |
| | | | | | | | | |
Ratios to average net assets(c) | | | | | | | | |
| | |
Total gross expenses | | | 1.39 | %(d) | | | 1.46 | %(d) |
| | | | | | | | | |
Total net expenses(e) | | | 1.34 | %(d) | | | 1.33 | %(d) |
| | | | | | | | | |
Net investment loss | | | (1.15 | %)(d) | | | (1.08 | %)(d) |
| | | | | | | | | |
Supplemental data | | | | | | | | |
| | |
Net assets, end of period (in thousands) | | | $12 | | | | $10 | |
| | | | | | | | | |
Portfolio turnover | | | 0 | % | | | 0 | % |
| | | | | | | | | |
Notes to Financial Highlights
| (a) | Based on operations from June 25, 2014 (commencement of operations) through the stated period end. |
| (b) | Calculation of the net gain (loss) per share (both realized and unrealized) does not correlate to the aggregate realized and unrealized gain (loss) presented in the Statement of Operations due to the timing of subscriptions and redemptions of Fund shares in relation to fluctuations in the market value of the portfolio. |
| (c) | In addition to the fees and expenses that the Fund bears directly, the Fund indirectly bears a pro rata share of the fees and expenses of any other funds in which it invests. Such indirect expenses are not included in the Fund’s reported expense ratios. |
| (e) | Total net expenses include the impact of certain fee waivers/expense reimbursements made by the Investment Manager and certain of its affiliates, if applicable. |
The accompanying Notes to Financial Statements are an integral part of this statement.
| | | | |
| Semiannual Report 2015 | | | 19 | |
| | |
| |
| | COLUMBIA ABSOLUTE RETURN CURRENCY AND INCOME FUND |
FINANCIAL HIGHLIGHTS (continued)
| | | | | | | | | | | | | | | | | | | | | | | | |
| |
| Six Months Ended
April 30, 2015 |
| | | Year Ended October 31, | |
Class W | | | (Unaudited) | | | | 2014 | | | | 2013 | | | | 2012 | | | | 2011 | | | | 2010 | |
Per share data | | | | | | | | | | | | | | | | | | | | | | | | |
Net asset value, beginning of period | | | $9.60 | | | | $9.71 | | | | $10.19 | | | | $9.94 | | | | $9.99 | | | | $9.92 | |
| | | | | | | | | | | | | | | | | | | | | | | | | |
Income from investment operations: | | | | | | | | | | | | | | | | | | | | | | | | |
| | | | | | |
Net investment loss | | | (0.08 | ) | | | (0.14 | ) | | | (0.12 | ) | | | (0.14 | ) | | | (0.15 | ) | | | (0.12 | ) |
| | | | | | | | | | | | | | | | | | | | | | | | | |
Net realized and unrealized gain (loss) | | | 2.00 | | | | 0.03 | (a) | | | (0.12 | ) | | | 0.39 | | | | 0.10 | | | | 0.19 | |
| | | | | | | | | | | | | | | | | | | | | | | | | |
Total from investment operations | | | 1.92 | | | | (0.11 | ) | | | (0.24 | ) | | | 0.25 | | | | (0.05 | ) | | | 0.07 | |
| | | | | | | | | | | | | | | | | | | | | | | | | |
Less distributions to shareholders: | | | | | | | | | | | | | | | | | | | | | | | | |
| | | | | | |
Net realized gains | | | — | | | | — | | | | (0.24 | ) | | | — | | | | — | | | | — | |
| | | | | | | | | | | | | | | | | | | | | | | | | |
Total distributions to shareholders | | | — | | | | — | | | | (0.24 | ) | | | — | | | | — | | | | — | |
| | | | | | | | | | | | | | | | | | | | | | | | | |
Net asset value, end of period | | | $11.52 | | | | $9.60 | | | | $9.71 | | | | $10.19 | | | | $9.94 | | | | $9.99 | |
| | | | | | | | | | | | | | | | | | | | | | | | | |
Total return | | | 20.00 | % | | | (1.13 | %) | | | (2.49 | %) | | | 2.52 | % | | | (0.50 | %) | | | 0.71 | % |
| | | | | | | | | | | | | | | | | | | | | | | | | |
Ratios to average net assets(b) | | | | | | | | | | | | | | | | | | | | | | | | |
| | | | | | |
Total gross expenses | | | 1.75 | %(c) | | | 1.77 | % | | | 1.83 | % | | | 1.83 | % | | | 1.71 | % | | | 1.51 | % |
| | | | | | | | | | | | | | | | | | | | | | | | | |
Total net expenses(d) | | | 1.67 | %(c) | | | 1.66 | % | | | 1.33 | % | | | 1.62 | % | | | 1.71 | % | | | 1.51 | % |
| | | | | | | | | | | | | | | | | | | | | | | | | |
Net investment loss | | | (1.47 | %)(c) | | | (1.50 | %) | | | (1.13 | %) | | | (1.38 | %) | | | (1.46 | %) | | | (1.23 | %) |
| | | | | | | | | | | | | | | | | | | | | | | | | |
Supplemental data | | | | | | | | | | | | | | | | | | | | | | | | |
| | | | | | |
Net assets, end of period (in thousands) | | | $88 | | | | $86 | | | | $123 | | | | $10,922 | | | | $24,171 | | | | $63,369 | |
| | | | | | | | | | | | | | | | | | | | | | | | | |
Portfolio turnover | | | 0 | % | | | 0 | % | | | 0 | % | | | 0 | % | | | 0 | % | | | 0 | % |
| | | | | | | | | | | | | | | | | | | | | | | | | |
Notes to Financial Highlights
| (a) | Calculation of the net gain (loss) per share (both realized and unrealized) does not correlate to the aggregate realized and unrealized gain (loss) presented in the Statement of Operations due to the timing of subscriptions and redemptions of Fund shares in relation to fluctuations in the market value of the portfolio. |
| (b) | In addition to the fees and expenses that the Fund bears directly, the Fund indirectly bears a pro rata share of the fees and expenses of any other funds in which it invests. Such indirect expenses are not included in the Fund’s reported expense ratios. |
| (d) | Total net expenses include the impact of certain fee waivers/expense reimbursements made by the Investment Manager and certain of its affiliates, if applicable. |
The accompanying Notes to Financial Statements are an integral part of this statement.
| | |
| 20 | | Semiannual Report 2015 |
| | |
| |
| COLUMBIA ABSOLUTE RETURN CURRENCY AND INCOME FUND | | |
FINANCIAL HIGHLIGHTS (continued)
| | | | | | | | | | | | |
| |
| Six Months Ended
April 30, 2015 |
| | | Year Ended October 31, | |
Class Y | | | (Unaudited) | | | | 2014 | | | | 2013(a) | |
Per share data | | | | | | | | | | | | |
Net asset value, beginning of period | | | $9.91 | | | | $9.98 | | | | $10.25 | |
| | | | | | | | | | | | | |
Income from investment operations: | | | | | | | | | | | | |
| | | |
Net investment loss | | | (0.06 | ) | | | (0.11 | ) | | | (0.07 | ) |
| | | | | | | | | | | | | |
Net realized and unrealized gain (loss) | | | 2.06 | | | | 0.04 | (b) | | | (0.20 | ) |
| | | | | | | | | | | | | |
Total from investment operations | | | 2.00 | | | | (0.07 | ) | | | (0.27 | ) |
| | | | | | | | | | | | | |
Net asset value, end of period | | | $11.91 | | | | $9.91 | | | | $9.98 | |
| | | | | | | | | | | | | |
Total return | | | 20.18 | % | | | (0.70 | %) | | | (2.63 | %) |
| | | | | | | | | | | | | |
Ratios to average net assets(c) | | | | | | | | | | | | |
| | | |
Total gross expenses | | | 1.34 | %(d) | | | 1.36 | % | | | 1.20 | %(d) |
| | | | | | | | | | | | | |
Total net expenses(e) | | | 1.29 | %(d) | | | 1.28 | % | | | 1.20 | %(d) |
| | | | | | | | | | | | | |
Net investment loss | | | (1.10 | %)(d) | | | (1.11 | %) | | | (1.04 | %)(d) |
| | | | | | | | | | | | | |
Supplemental data | | | | | | | | | | | | |
| | | |
Net assets, end of period (in thousands) | | | $12 | | | | $10 | | | | $2 | |
| | | | | | | | | | | | | |
Portfolio turnover | | | 0 | % | | | 0 | % | | | 0 | % |
| | | | | | | | | | | | | |
Notes to Financial Highlights
| (a) | Based on operations from February 28, 2013 (commencement of operations) through the stated period end. |
| (b) | Calculation of the net gain (loss) per share (both realized and unrealized) does not correlate to the aggregate realized and unrealized gain (loss) presented in the Statement of Operations due to the timing of subscriptions and redemptions of Fund shares in relation to fluctuations in the market value of the portfolio. |
| (c) | In addition to the fees and expenses that the Fund bears directly, the Fund indirectly bears a pro rata share of the fees and expenses of any other funds in which it invests. Such indirect expenses are not included in the Fund’s reported expense ratios. |
| (e) | Total net expenses include the impact of certain fee waivers/expense reimbursements made by the Investment Manager and certain of its affiliates, if applicable. |
The accompanying Notes to Financial Statements are an integral part of this statement.
| | | | |
| Semiannual Report 2015 | | | 21 | |
| | |
| |
| | COLUMBIA ABSOLUTE RETURN CURRENCY AND INCOME FUND |
FINANCIAL HIGHLIGHTS (continued)
| | | | | | | | | | | | | | | | | | | | | | | | |
| |
| Six Months Ended
April 30, 2015
|
| | | Year Ended October 31, | |
Class Z | | | (Unaudited) | | | | 2014 | | | | 2013 | | | | 2012 | | | | 2011 | | | | 2010(a) | |
Per share data | | | | | | | | | | | | | | | | | | | | | | | | |
Net asset value, beginning of period | | | $9.88 | | | | $9.97 | | | | $10.41 | | | | $10.11 | | | | $10.09 | | | | $10.18 | |
| | | | | | | | | | | | | | | | | | | | | | | | | |
Income from investment operations: | | | | | | | | | | | | | | | | | | | | | | | | |
| | | | | | |
Net investment loss | | | (0.07 | ) | | | (0.12 | ) | | | (0.11 | ) | | | (0.09 | ) | | | (0.10 | ) | | | (0.01 | ) |
| | | | | | | | | | | | | | | | | | | | | | | | | |
Net realized and unrealized gain (loss) | | | 2.06 | | | | 0.03 | (b) | | | (0.09 | ) | | | 0.39 | | | | 0.12 | | | | (0.08 | ) |
| | | | | | | | | | | | | | | | | | | | | | | | | |
Total from investment operations | | | 1.99 | | | | (0.09 | ) | | | (0.20 | ) | | | 0.30 | | | | 0.02 | | | | (0.09 | ) |
| | | | | | | | | | | | | | | | | | | | | | | | | |
Less distributions to shareholders: | | | | | | | | | | | | | | | | | | | | | | | | |
| | | | | | |
Net realized gains | | | — | | | | — | | | | (0.24 | ) | | | — | | | | — | | | | — | |
| | | | | | | | | | | | | | | | | | | | | | | | | |
Total distributions to shareholders | | | — | | | | — | | | | (0.24 | ) | | | — | | | | — | | | | — | |
| | | | | | | | | | | | | | | | | | | | | | | | | |
Net asset value, end of period | | | $11.87 | | | | $9.88 | | | | $9.97 | | | | $10.41 | | | | $10.11 | | | | $10.09 | |
| | | | | | | | | | | | | | | | | | | | | | | | | |
Total return | | | 20.14 | % | | | (0.90 | %) | | | (2.04 | %) | | | 2.97 | % | | | 0.20 | % | | | (0.88 | %) |
| | | | | | | | | | | | | | | | | | | | | | | | | |
Ratios to average net assets(c) | | | | | | | | | | | | | | | | | | | | | | | | |
| | | | | | |
Total gross expenses | | | 1.49 | %(d) | | | 1.54 | % | | | 1.45 | % | | | 1.34 | % | | | 1.15 | % | | | 1.54 | %(d) |
| | | | | | | | | | | | | | | | | | | | | | | | | |
Total net expenses(e) | | | 1.42 | %(d) | | | 1.41 | % | | | 1.24 | % | | | 1.09 | % | | | 1.15 | % | | | 1.54 | %(d) |
| | | | | | | | | | | | | | | | | | | | | | | | | |
Net investment loss | | | (1.25 | %)(d) | | | (1.25 | %) | | | (1.05 | %) | | | (0.85 | %) | | | (0.95 | %) | | | (1.20 | %)(d) |
| | | | | | | | | | | | | | | | | | | | | | | | | |
Supplemental data | | | | | | | | | | | | | | | | | | | | | | | | |
| | | | | | |
Net assets, end of period (in thousands) | | | $8,449 | | | | $7,422 | | | | $4,677 | | | | $9,146 | | | | $6,079 | | | | $14 | |
| | | | | | | | | | | | | | | | | | | | | | | | | |
Portfolio turnover | | | 0 | % | | | 0 | % | | | 0 | % | | | 0 | % | | | 0 | % | | | 0 | % |
| | | | | | | | | | | | | | | | | | | | | | | | | |
Notes to Financial Highlights
| (a) | Based on operations from September 27, 2010 (commencement of operations) through the stated period end. |
| (b) | Calculation of the net gain (loss) per share (both realized and unrealized) does not correlate to the aggregate realized and unrealized gain (loss) presented in the Statement of Operations due to the timing of subscriptions and redemptions of Fund shares in relation to fluctuations in the market value of the portfolio. |
| (c) | In addition to the fees and expenses that the Fund bears directly, the Fund indirectly bears a pro rata share of the fees and expenses of any other funds in which it invests. Such indirect expenses are not included in the Fund’s reported expense ratios. |
| (e) | Total net expenses include the impact of certain fee waivers/expense reimbursements made by the Investment Manager and certain of its affiliates, if applicable. |
The accompanying Notes to Financial Statements are an integral part of this statement.
| | |
| 22 | | Semiannual Report 2015 |
| | |
| |
| COLUMBIA ABSOLUTE RETURN CURRENCY AND INCOME FUND | | |
NOTES TO FINANCIAL STATEMENTS
April 30, 2015 (Unaudited)
Note 1. Organization
Columbia Absolute Return Currency and Income Fund (the Fund), a series of Columbia Funds Series Trust II (the Trust), is a diversified fund. The Trust is registered under the Investment Company Act of 1940, as amended (the 1940 Act), as an open-end management investment company organized as a Massachusetts business trust.
Fund Shares
The Trust may issue an unlimited number of shares (without par value). The Fund offers Class A, Class B, Class C, Class I, Class R4, Class R5, Class W, Class Y and Class Z shares. Although all share classes generally have identical voting, dividend and liquidation rights, each share class votes separately when required by the Trust’s organizational documents or by law. Different share classes pay different distribution amounts to the extent the expenses of such share classes differ, and distributions in liquidation will be proportional to the net asset value of each share class. Each share class has its own expense structure and sales charges.
Class A shares are subject to a maximum front-end sales charge of 3.00% based on the initial investment amount. Class A shares purchased without an initial sales charge in accounts aggregating $1 million to $50 million at the time of purchase are subject to a contingent deferred sales charge (CDSC) if the shares are sold within 18 months after purchase, charged as follows: 1.00% CDSC if redeemed within 12 months after purchase, and 0.50% CDSC if redeemed more than 12, but less than 18, months after purchase.
Class B shares may be subject to a maximum CDSC of 5.00% based upon the holding period after purchase. Class B shares will generally convert to Class A shares eight years after purchase. The Fund no longer accepts investments by new or existing investors in the Fund’s Class B shares, except in connection with the reinvestment of any dividend and/or capital gain distributions in Class B shares of the Fund and exchanges by existing Class B shareholders of certain other funds within the Columbia Family of Funds.
Class C shares are subject to a 1.00% CDSC on shares redeemed within one year after purchase.
Class I shares are not subject to sales charges and are available only to the Columbia Family of Funds.
Class R4 shares are not subject to sales charges and are generally available only to omnibus retirement plans and certain investors as described in the Fund’s prospectus.
Class R5 shares are not subject to sales charges and are generally available only to investors purchasing through authorized investment professionals and omnibus retirement plans.
Class W shares are not subject to sales charges and are available only to investors purchasing through authorized investment programs managed by investment professionals, including discretionary managed account programs.
Class Y shares are not subject to sales charges and are generally available only to certain retirement plans as described in the Fund’s prospectus.
Class Z shares are not subject to sales charges and are available only to eligible investors, which are subject to different investment minimums as described in the Fund’s prospectus.
Note 2. Summary of Significant Accounting Policies
Basis of Preparation
The Fund is an investment company that applies the accounting and reporting guidance in the Financial Accounting Standards Board (FASB) Accounting Standards Codification Topic 946, Financial Services — Investment Companies (ASC 946). The financial statements are prepared in accordance with U.S. generally accepted accounting principles (GAAP), which requires management to make certain estimates and assumptions that affect the reported amounts of assets and liabilities, the disclosure of contingent assets and liabilities at the date of the financial statements and the reported amounts of income and expenses during the reporting period. Actual results could differ from those estimates.
The following is a summary of significant accounting policies followed by the Fund in the preparation of its financial statements.
Security Valuation
Debt securities generally are valued by pricing services approved by the Board of Trustees (the Board) based upon market transactions for normal, institutional-size trading units of similar securities. The services may use various pricing techniques that take into account, as applicable, factors such as yield, quality, coupon rate, maturity, type of issue, trading characteristics and other data, as well as broker quotes. Debt securities for which quotations are readily available may also be valued based upon an over-the-counter or exchange bid quotation.
| | | | |
| Semiannual Report 2015 | | | 23 | |
| | |
| |
| | COLUMBIA ABSOLUTE RETURN CURRENCY AND INCOME FUND |
NOTES TO FINANCIAL STATEMENTS (continued)
April 30, 2015 (Unaudited)
Asset and mortgage-backed securities are generally valued by pricing services, which utilize pricing models that incorporate the securities’ cash flow and loan performance data. These models also take into account available market data, including trades, market quotations, and benchmark yield curves for identical or similar securities. Factors used to identify similar securities may include, but are not limited to, issuer, collateral type, vintage, prepayment speeds, collateral performance, credit ratings, credit enhancement and expected life. Asset-backed securities for which quotations are readily available may also be valued based upon an over-the-counter or exchange bid quotation.
Investments in open-end investment companies, including money market funds, are valued at their net asset value.
Forward foreign currency exchange contracts are marked-to-market based upon foreign currency exchange rates provided by a pricing service.
Investments for which market quotations are not readily available, or that have quotations which management believes are not reliable, are valued at fair value as determined in good faith under procedures established by and under the general supervision of the Board. If a security or class of securities (such as foreign securities) is valued at fair value, such value is likely to be different from the quoted or published price for the security.
The determination of fair value often requires significant judgment. To determine fair value, management may use assumptions including but not limited to future cash flows and estimated risk premiums. Multiple inputs from various sources may be used to determine fair value.
Derivative Instruments
The Fund invests in certain derivative instruments, as detailed below, to meet its investment objectives. Derivatives are instruments whose values depend on, or are derived from, in whole or in part, the value of one or more other assets, such as securities, currencies, commodities or indices. Derivative instruments may be used to increase investment flexibility (including to maintain cash reserves while maintaining exposure to certain other assets), for risk management (hedging) purposes, to facilitate trading, to reduce transaction costs and to pursue higher investment returns. The Fund may also use derivative instruments to mitigate certain investment risks, such as foreign currency exchange rate risk, interest rate risk and credit risk. Derivatives may
involve various risks, including the potential inability of the counterparty to fulfill its obligation under the terms of the contract, the potential for an illiquid secondary market (making it difficult for the Fund to sell, including at favorable prices) and the potential for market movements which may expose the Fund to gains or losses in excess of the amount shown in the Statement of Assets and Liabilities. The notional amounts of derivative instruments, if applicable, are not recorded in the financial statements.
A derivative instrument may suffer a marked-to-market loss if the value of the contract decreases due to an unfavorable change in the market rates or values of the underlying instrument. Losses can also occur if the counterparty does not perform under the contract. The Fund’s risk of loss from counterparty credit risk on over-the-counter derivatives is generally limited to the aggregate unrealized gain netted against any collateral held by the Fund and the amount of any variation margin held by the counterparty. With exchange-traded or centrally cleared derivatives, there is reduced counterparty credit risk to the Fund since the exchange’s clearinghouse, as counterparty to such instruments, guarantees against a possible default. The clearinghouse stands between the buyer and the seller of the contract; therefore, the counterparty credit risk is failure of the clearinghouse. However, credit risk still exists in exchange-traded or centrally cleared derivatives with respect to initial and variation margin that is held in a broker’s customer account. While brokers are required to segregate customer margin from their own assets, in the event that a broker becomes insolvent or goes into bankruptcy and at that time there is a shortfall in the aggregate amount of margin held by the broker for all its clients, U.S. bankruptcy laws will typically allocate that shortfall on a pro-rata basis across all the broker’s customers (including the Fund), potentially resulting in losses to the Fund.
In order to better define its contractual rights and to secure rights that will help the Fund mitigate its counterparty risk, the Fund may enter into an International Swaps and Derivatives Association, Inc. Master Agreement (ISDA Master Agreement) or similar agreement with its derivative contract counterparties. An ISDA Master Agreement is an agreement between the Fund and a counterparty that governs over-the-counter derivatives and forward foreign currency exchange contracts and typically contains, among other things, collateral posting terms and netting provisions in the event of a default and/or termination event. Under an
| | |
| 24 | | Semiannual Report 2015 |
| | |
| |
| COLUMBIA ABSOLUTE RETURN CURRENCY AND INCOME FUND | | |
NOTES TO FINANCIAL STATEMENTS (continued)
April 30, 2015 (Unaudited)
ISDA Master Agreement, the Fund may, under certain circumstances, offset with the counterparty certain derivative instrument’s payables and/or receivables with collateral held and/or posted and create one single net payment. The provisions of the ISDA Master Agreement typically permit a single net payment in the event of default (close-out netting) including the bankruptcy or insolvency of the counterparty. Note, however, that bankruptcy or insolvency laws of a particular jurisdiction may impose restrictions on or prohibitions against the right of offset in bankruptcy, insolvency or other events.
Collateral (margin) requirements differ by type of derivative. Margin requirements are established by the exchange or clearinghouse for exchange-traded and centrally cleared derivatives. Brokers can ask for margin in excess of the minimum in certain circumstances. Collateral terms are contract specific for over-the-counter derivatives. For over-the-counter derivatives traded under an ISDA Master Agreement, the collateral requirements are typically calculated by netting the marked-to-market amount for each transaction under such agreement and comparing that amount to the value of any variation margin currently pledged by the Fund and/or the counterparty. Generally, the amount of collateral due from or to a party has to exceed a minimum transfer amount threshold (e.g., $500,000) before a transfer has to be made. To the extent amounts due to the Fund from its counterparties are not fully collateralized, contractually or otherwise, the Fund bears the risk of loss from counterparty nonperformance. The Fund attempts to mitigate counterparty risk by only entering into agreements with counterparties that it believes have the financial resources to honor their obligations and by monitoring the financial stability of those counterparties.
Certain ISDA Master Agreements allow counterparties to over-the-counter derivatives to terminate derivative contracts prior to maturity in the event the Fund’s net assets decline by a stated percentage over a specified time period or if the Fund fails to meet the terms of the ISDA Master Agreement, which would cause the Fund to
accelerate payment of any net liability owed to the counterparty. The Fund also has termination rights if the counterparty fails to meet the terms of the ISDA Master Agreement. In addition to considering counterparty credit risk, the Fund would consider terminating the derivative contracts based on whether termination would result in a net liability owed from the counterparty.
For financial reporting purposes, the Fund does not offset derivative assets and derivative liabilities that are subject to netting arrangements in the Statement of Assets and Liabilities.
Forward Foreign Currency Exchange Contracts
Forward foreign currency exchange contracts are over-the-counter agreements between two parties to buy and sell a currency at a set price on a future date. The Fund utilized forward foreign currency exchange contracts to shift investment exposure from one currency to another and to generate total return through long and short currency positions versus the U.S. dollar. These instruments may be used for other purposes in future periods.
The values of forward foreign currency exchange contracts fluctuate daily with changes in foreign currency exchange rates. Changes in the value of these contracts are recorded as unrealized appreciation or depreciation until the contract is exercised or has expired. The Fund will realize a gain or loss when the forward foreign currency exchange contract is closed or expires.
The use of forward foreign currency exchange contracts does not eliminate fluctuations in the prices of the Fund’s portfolio securities. The risks of forward foreign currency exchange contracts include movement in the values of the foreign currencies relative to the U.S. dollar (or other foreign currencies) and the possibility that counterparties will not complete their contractual obligations, which may be in excess of the amount reflected, if any, in the Statement of Assets and Liabilities.
| | | | |
| Semiannual Report 2015 | | | 25 | |
| | |
| |
| | COLUMBIA ABSOLUTE RETURN CURRENCY AND INCOME FUND |
NOTES TO FINANCIAL STATEMENTS (continued)
April 30, 2015 (Unaudited)
Offsetting of Derivative Assets and Derivative Liabilities
The following tables present the Fund’s gross and net amount of assets and liabilities available for offset under netting arrangements as well as any related collateral received or pledged by the Fund as of April 30, 2015:
| | | | | | | | | | | | | | | | | | | | | | | | | | | | |
| | | Gross Amounts
of Recognized Assets ($) | | | Gross Amounts Offset in the Statement of
Assets and
Liabilities ($) | | | Net Amounts of
Assets Presented
in the Statement
of Assets and
Liabilities ($) | | | Gross Amounts Not Offset in
the Statement of Assets and Liabilities | | | Net
Amount ($)(b) | |
| | | | | Financial Instruments ($)(a) | | | Cash
Collateral Received ($) | | | Securities Collateral
Received ($) | | |
Asset Derivatives: | | | | | | | | | | | | | | | | | | | | | | | | | | | | |
Forward Foreign Currency Exchange Contracts | | | 2,827,753 | | | | — | | | | 2,827,753 | | | | — | | | | — | | | | — | | | | 2,827,753 | |
| | | | | |
| | | Gross Amounts
of Recognized Liabilities ($) | | | Gross Amounts Offset in the Statement of Assets and
Liabilities ($) | | | Net Amounts of
Liabilities Presented
in the Statement of
Assets and
Liabilities ($) | | | Gross Amounts Not Offset in
the Statement of Assets and Liabilities | | | Net
Amount ($)(d) | |
| | | | | Financial
Instruments ($)(c) | | | Cash
Collateral
Pledged ($) | | | Securities
Collateral
Pledged ($) | | |
Liability Derivatives: | | | | | | | | | | | | | | | | | | | | | | | | | | | | |
Forward Foreign Currency Exchange Contracts | | | 1,289,061 | | | | — | | | | 1,289,061 | | | | — | | | | — | | | | — | | | | 1,289,061 | |
| (a) | Represents the amount of assets that could be offset by liabilities with the same counterparty under master netting or similar agreements that management elects not to offset on the Statement of Assets and Liabilities. |
| (b) | Represents the net amount due from counterparties in the event of default. |
| (c) | Represents the amount of liabilities that could be offset by assets with the same counterparty under master netting or similar agreements that management elects not to offset on the Statement of Assets and Liabilities. |
| (d) | Represents the net amount due to counterparties in the event of default. |
Effects of Derivative Transactions in the Financial Statements
The following tables are intended to provide additional information about the effect of derivatives on the financial statements of the Fund, including: the fair value of derivatives by risk category and the location of those fair values in the Statement of Assets and Liabilities; and the impact of derivative transactions over the period in the Statement of Operations, including realized gains or losses and unrealized gains or losses. The derivative schedules following the Portfolio of Investments present additional information regarding derivative instruments outstanding at the end of the period, if any.
The following table is a summary of the fair value of derivative instruments (not considered to be hedging instruments for accounting disclosure purposes) at April 30, 2015:
| | | | | | |
| | | Asset Derivatives | |
Risk Exposure
Category | | Statement of Assets and Liabilities Location | | | Fair Value ($) | |
Foreign exchange risk | | Unrealized appreciation on forward foreign currency exchange contracts | | | 2,827,753 | |
| | | | | | |
| | | Liability Derivatives | |
Risk Exposure
Category | | Statement of Assets and Liabilities Location | | | Fair Value ($) | |
Foreign exchange risk | | Unrealized depreciation on forward foreign currency exchange contracts | | | 1,289,061 | |
The following table indicates the effect of derivative instruments (not considered to be hedging instruments for accounting disclosure purposes) in the Statement of Operations for the six months ended April 30, 2015:
| | | | |
Amount of Realized Gain (Loss) on Derivatives Recognized in
Income | |
| Risk Exposure Category | | Forward Foreign
Currency Exchange
Contracts ($) | |
Foreign exchange risk | | | 7,598,608 | |
Change in Unrealized Appreciation (Depreciation) on Derivatives
Recognized in Income | |
| Risk Exposure Category | | Forward Foreign
Currency Exchange
Contracts ($) | |
Foreign exchange risk | | | 2,033,098 | |
| | |
| 26 | | Semiannual Report 2015 |
| | |
| |
| COLUMBIA ABSOLUTE RETURN CURRENCY AND INCOME FUND | | |
NOTES TO FINANCIAL STATEMENTS (continued)
April 30, 2015 (Unaudited)
The following table is a summary of the average outstanding volume by derivative instrument for the six months ended April 30, 2015:
| | | | | | | | |
| Derivative Instrument | | Average Unrealized
Appreciation ($)* | | | Average Unrealized
Depreciation ($)* | |
Forward foreign currency exchange contracts | | | 2,277,525 | | | | (982,386 | ) |
| |
| * | Based on the ending quarterly outstanding amounts for the six months ended April 30, 2015. |
Security Transactions
Security transactions are accounted for on the trade date. Cost is determined and gains (losses) are based upon the specific identification method for both financial statement and federal income tax purposes.
Income Recognition
Interest income is recorded on an accrual basis. Market premiums and discounts, including original issue discounts, are amortized and accreted, respectively, over the expected life of the security on all debt securities, unless otherwise noted.
The Fund may place a debt security on non-accrual status and reduce related interest income when it becomes probable that the interest will not be collected and the amount of uncollectible interest can be reasonably estimated. A defaulted debt security is removed from non-accrual status when the issuer resumes interest payments or when collectability of interest is reasonably assured.
Dividend income is recorded on the ex-dividend date.
Expenses
General expenses of the Trust are allocated to the Fund and other funds of the Trust based upon relative net assets or other expense allocation methodologies determined by the nature of the expense. Expenses directly attributable to the Fund are charged to the Fund. Expenses directly attributable to a specific class of shares are charged to that share class.
Determination of Class Net Asset Value
All income, expenses (other than class-specific expenses, which are charged to that share class, as shown in the Statement of Operations) and realized and unrealized gains (losses) are allocated to each class of the Fund on a daily basis, based on the relative net assets of each class, for purposes of determining the net asset value of each class.
Federal Income Tax Status
The Fund intends to qualify each year as a regulated investment company under Subchapter M of the Internal Revenue Code, as amended, and will distribute substantially all of its taxable income (including net short-term capital gains), if any, for its tax year, and as such will not be subject to federal income taxes. In addition, the Fund intends to distribute in each calendar year substantially all of its net investment income, capital gains and certain other amounts, if any, such that the Fund should not be subject to federal excise tax. Therefore, no federal income or excise tax provision is recorded.
Distributions to Shareholders
Distributions from net investment income, if any, are declared and paid monthly. Net realized capital gains, if any, are distributed at least annually. Income distributions and capital gain distributions are determined in accordance with federal income tax regulations, which may differ from GAAP.
Guarantees and Indemnifications
Under the Trust’s organizational documents and, in some cases, by contract, its officers and trustees are indemnified against certain liabilities arising out of the performance of their duties to the Trust or its funds. In addition, certain of the Fund’s contracts with its service providers contain general indemnification clauses. The Fund’s maximum exposure under these arrangements is unknown since the amount of any future claims that may be made against the Fund cannot be determined, and the Fund has no historical basis for predicting the likelihood of any such claims.
Note 3. Fees and Compensation Paid to Affiliates
Investment Management Fees
Under an Investment Management Services Agreement, Columbia Management Investment Advisers, LLC (the Investment Manager), a wholly-owned subsidiary of Ameriprise Financial, Inc. (Ameriprise Financial), determines which securities will be purchased, held or sold. The investment management fee is an annual fee that is equal to a percentage of the Fund’s average daily net assets that declines from 0.89% to 0.70% as the Fund’s net assets increase. The annualized effective investment management fee rate for the six months ended April 30, 2015 was 0.89% of the Fund’s average daily net assets.
| | | | |
| Semiannual Report 2015 | | | 27 | |
| | |
| |
| | COLUMBIA ABSOLUTE RETURN CURRENCY AND INCOME FUND |
NOTES TO FINANCIAL STATEMENTS (continued)
April 30, 2015 (Unaudited)
Administration Fees
Under an Administrative Services Agreement, the Investment Manager also serves as the Fund Administrator. The Fund pays the Fund Administrator an annual fee for administration and accounting services equal to a percentage of the Fund’s average daily net assets that declines from 0.08% to 0.05% as the Fund’s net assets increase. The annualized effective administration fee rate for the six months ended April 30, 2015 was 0.08% of the Fund’s average daily net assets.
Other Expenses
Other expenses are for, among other things, miscellaneous expenses of the Fund or the Board, including payments to a company providing limited administrative services to the Fund and the Board. That company’s expenses include boardroom and office expense, employee compensation, employee health and retirement benefits, and certain other expenses. For the six months ended April 30, 2015, other expenses paid by the Fund to this company were $663.
Compensation of Board Members
Board members are compensated for their services to the Fund as disclosed in the Statement of Operations. Under a Deferred Compensation Plan (the Plan), the Board members who are not “interested persons” of the Fund, as defined under the 1940 Act, may elect to defer payment of up to 100% of their compensation. Deferred amounts are treated as though equivalent dollar amounts had been invested in shares of certain funds managed by the Investment Manager. The Fund’s liability for these amounts is adjusted for market value changes and remains in the Fund until distributed in accordance with the Plan.
Transfer Agent Fees
Under a Transfer and Dividend Disbursing Agent Agreement, Columbia Management Investment Services Corp. (the Transfer Agent), an affiliate of the Investment Manager and a wholly-owned subsidiary of Ameriprise Financial, is responsible for providing transfer agency services to the Fund. The Transfer Agent has contracted with Boston Financial Data Services (BFDS) to serve as sub-transfer agent.
The Transfer Agent receives a monthly transfer agency fee based on the number or the average value of accounts, depending on the type of account. In addition, the Transfer Agent also receives sub-transfer agency fees based on a percentage of the average aggregate value of
the Fund’s shares maintained in omnibus accounts (other than omnibus accounts for which American Enterprise Investment Services Inc. is the broker of record or accounts where the beneficial shareholder is a customer of Ameriprise Financial Services, Inc., for which the Transfer Agent receives a per account fee). The Transfer Agent pays the fees of BFDS for services as sub-transfer agent and is not entitled to reimbursement for such fees from the Fund (with the exception of out-of-pocket fees).
The Transfer Agent also receives compensation from the Fund for various shareholder services and reimbursements for certain out-of-pocket fees. Total transfer agent fees for Class R5 shares are subject to an annual limitation of not more than 0.05% of the average daily net assets attributable to Class R5 shares. Class I and Class Y shares do not pay transfer agency fees.
For the six months ended April 30, 2015, the Fund’s annualized effective transfer agent fee rates as a percentage of average daily net assets of each class were as follows:
| | | | |
| | | | | |
Class A | | | 0.16 | % |
Class B | | | 0.16 | |
Class C | | | 0.16 | |
Class R4 | | | 0.16 | |
Class R5 | | | 0.05 | |
Class W | | | 0.16 | |
Class Z | | | 0.16 | |
An annual minimum account balance fee of $20 may apply to certain accounts with a value below the applicable share class’s initial minimum investment requirements to reduce the impact of small accounts on transfer agent fees. These minimum account balance fees are remitted to the Fund and recorded as part of expense reductions in the Statement of Operations. For the six months ended April 30, 2015, no minimum account balance fees were charged by the Fund.
Distribution Fees
The Fund has an agreement with Columbia Management Investment Distributors, Inc. (the Distributor), an affiliate of the Investment Manager and a wholly-owned subsidiary of Ameriprise Financial, for distribution and shareholder services. Under a Plan and Agreement of Distribution, the Fund pays a fee at an annual rate of up to 0.25% of the Fund’s average daily net assets attributable to Class A and Class W shares and a fee at an annual rate of up to 1.00% of the Fund’s average daily
| | |
| 28 | | Semiannual Report 2015 |
| | |
| |
| COLUMBIA ABSOLUTE RETURN CURRENCY AND INCOME FUND | | |
NOTES TO FINANCIAL STATEMENTS (continued)
April 30, 2015 (Unaudited)
net assets attributable to Class B and Class C shares. For Class B and Class C shares, of the 1.00% fee, up to 0.75% is reimbursed for distribution expenses.
The amount of distribution expenses incurred by the Distributor and not yet reimbursed (unreimbursed expense) was approximately $28,000 and $16,000 for Class B and Class C shares, respectively. These amounts are based on the most recent information available as of March 31, 2015, and may be recovered from future payments under the distribution plan or CDSCs. To the extent the unreimbursed expense has been fully recovered, the distribution fee is reduced.
Sales Charges
Sales charges, including front-end charges and CDSCs, received by the Distributor for distributing Fund shares were $9,280 for Class A shares for the six months ended April 30, 2015.
Expenses Waived/Reimbursed by the Investment Manager and its Affiliates
The Fund’s expense ratio is subject to an expense reimbursement arrangement pursuant to which fees will be waived and/or expenses reimbursed (excluding certain fees and expenses described below), so that the Fund’s net operating expenses, after giving effect to fees waived/expenses reimbursed and any balance credits and/or overdraft charges from the Fund’s custodian, do not exceed the annual rates of:
| | | | | | | | |
| | | Voluntary
Expense Cap
Effective
March 1, 2015 | | | Contractual
Expense Cap
Prior to
March 1, 2015 | |
Class A | | | 1.68 | % | | | 1.66 | % |
Class B | | | 2.43 | | | | 2.41 | |
Class C | | | 2.43 | | | | 2.41 | |
Class I | | | 1.30 | | | | 1.28 | |
Class R4 | | | 1.43 | | | | 1.41 | |
Class R5 | | | 1.35 | | | | 1.33 | |
Class W | | | 1.68 | | | | 1.66 | |
Class Y | | | 1.30 | | | | 1.28 | |
Class Z | | | 1.43 | | | | 1.41 | |
The voluntary expense cap arrangement may be revised or discontinued at any time. Under the arrangements, the following fees and expenses are excluded from the waiver/reimbursement commitment, and therefore will be paid by the Fund, if applicable: taxes (including foreign transaction taxes), expenses associated with investments in affiliated and non-affiliated pooled
investment vehicles (including mutual funds and exchange-traded funds), transaction costs and brokerage commissions, costs related to any securities lending program, dividend expenses associated with securities sold short, inverse floater program fees and expenses, transaction charges and interest on borrowed money, interest and extraordinary expenses. Any fees waived and/or expenses reimbursed under the expense reimbursement arrangements described above are not recoverable by the Investment Manager or its affiliates in future periods.
Note 4. Federal Tax Information
The timing and character of income and capital gain distributions are determined in accordance with income tax regulations, which may differ from GAAP because of temporary or permanent book to tax differences.
At April 30, 2015, the cost of investments for federal income tax purposes was approximately $53,709,043 and the aggregate gross approximate unrealized appreciation and depreciation based on that cost was:
| | | | |
Unrealized appreciation | | | $76 | |
Unrealized depreciation | | | (3,016 | ) |
Net unrealized depreciation | | | $(2,940 | ) |
The following capital loss carryforwards, determined as of October 31, 2014, may be available to reduce taxable income arising from future net realized gains on investments, if any, to the extent permitted by the Internal Revenue Code:
| | | | |
| Year of Expiration | | Amount ($) | |
No expiration — short-term | | | 785,233 | |
No expiration — long-term | | | 1,193,060 | |
Total | | | 1,978,293 | |
Under current tax rules, regulated investment companies can elect to treat certain late-year ordinary losses incurred and post-October capital losses (capital losses realized after October 31) as arising on the first day of the following taxable year. The Fund has elected to treat late-year ordinary losses of $518,457 as arising on November 1, 2014.
Management of the Fund has concluded that there are no significant uncertain tax positions in the Fund that would require recognition in the financial statements. However, management’s conclusion may be subject to review and adjustment at a later date based on factors including, but not limited to, new tax laws, regulations, and administrative interpretations (including relevant
| | | | |
| Semiannual Report 2015 | | | 29 | |
| | |
| |
| | COLUMBIA ABSOLUTE RETURN CURRENCY AND INCOME FUND |
NOTES TO FINANCIAL STATEMENTS (continued)
April 30, 2015 (Unaudited)
court decisions). Generally, the Fund’s federal tax returns for the prior three fiscal years remain subject to examination by the Internal Revenue Service.
Note 5. Portfolio Information
The cost of purchases and proceeds from sales of securities, excluding short-term investments and derivatives, if any, aggregated to $0 and $74,884, respectively, for the six months ended April 30, 2015. The amount of purchase and sale activity impacts the portfolio turnover rate reported in the Financial Highlights.
Note 6. Affiliated Money Market Fund
The Fund significantly invests in Columbia Short-Term Cash Fund, an affiliated money market fund established for the exclusive use by the Fund and other affiliated funds. The income earned by the Fund from such investments is included as Dividends — affiliated issuers in the Statement of Operations. As an investing fund, the Fund indirectly bears its proportionate share of the expenses of Columbia Short-Term Cash Fund.
Note 7. Shareholder Concentration
At April 30, 2015, affiliated shareholders of record owned 78.0% of the outstanding shares of the Fund in one or more accounts. Subscription and redemption activity by concentrated accounts may have a significant effect on the operations of the Fund.
Note 8. Line of Credit
The Fund has entered into a revolving credit facility with a syndicate of banks led by JPMorgan Chase Bank, N.A. whereby the Fund may borrow for the temporary funding of shareholder redemptions or for other temporary or emergency purposes. Pursuant to a December 9, 2014 amendment, the credit facility agreement, which is a collective agreement between the Fund and certain other funds managed by the Investment Manager, severally and not jointly, permits collective borrowings up to $550 million. Interest is charged to each participating fund based on its borrowings at a rate equal to the higher of (i) the overnight federal funds rate plus 1.00% or (ii) the one-month LIBOR rate plus 1.00%. Each borrowing under the credit facility matures no later than 60 days after the date of borrowing. The Fund also pays a commitment fee equal to its pro rata share of the amount of the credit facility at a rate of 0.075% per annum. The commitment fee is included in other expenses in the Statement of Operations. Prior to the December 9, 2014 amendment, the credit facility agreement permitted borrowings up to
$500 million under the same terms and interest rates as described above.
The Fund had no borrowings during the six months ended April 30, 2015.
Note 9. Significant Risks
Counterparty Risk
Counterparty risk is the risk that a counterparty to a financial instrument entered into by the Fund or held by a special purpose or structured vehicle becomes bankrupt or otherwise fails to perform its obligations due to financial difficulties. The Fund may experience significant delays in obtaining any recovery in a bankruptcy or other reorganization proceeding. The Fund may obtain only limited recovery or may obtain no recovery in such circumstances.
Derivatives Risk
Losses involving derivative instruments may be substantial, because a relatively small price movement in the underlying security(ies) instrument, commodity, currency or index may result in a substantial loss for the Fund. In addition to the potential for increased losses, the use of derivative instruments may lead to increased volatility within the Fund. Derivatives will typically increase the Fund’s exposure to principal risks to which it is otherwise exposed, and may expose the Fund to additional risks, including correlation risk, counterparty risk, hedging risk, leverage risk and liquidity risk.
Credit Risk
Credit risk is the risk that the value of debt securities in the Fund’s portfolio may decline because the issuer may default and fail to pay interest or repay principal when due. Rating agencies assign credit ratings to debt securities to indicate their credit risk. Lower rated or unrated debt securities held by the Fund may present increased credit risk as compared to higher-rated debt securities.
Interest Rate Risk
Interest rate risk is the risk of losses attributable to changes in interest rates. In general, if prevailing interest rates rise, the values of debt securities tend to fall, and if interest rates fall, the values of debt securities tend to rise. Actions by governments and central banking authorities can result in increases in interest rates. Increasing interest rates may negatively affect the value of debt securities held by the Fund, resulting in a negative impact on the Fund’s performance and net
| | |
| 30 | | Semiannual Report 2015 |
| | |
| |
| COLUMBIA ABSOLUTE RETURN CURRENCY AND INCOME FUND | | |
NOTES TO FINANCIAL STATEMENTS (continued)
April 30, 2015 (Unaudited)
asset value per share. In general, the longer the maturity or duration of a debt security, the greater its sensitivity to changes in interest rates.
Liquidity Risk
Liquidity risk is the risk associated with a lack of marketability of investments which may make it difficult to sell the investment at a desirable time or price. Changing regulatory, market or other conditions or environments (for example, the interest rate or credit environments) may adversely affect the liquidity of the Fund’s investments. The Fund may have to accept a lower selling price for the holding, sell other investments, or forego another, more appealing investment opportunity. Generally, the less liquid the market at the time the Fund sells a portfolio investment, the greater the risk of loss or decline of value to the Fund. A less liquid market can lead to an increase in Fund redemptions, which may negatively impact Fund performance and net asset value per share, including, for example, if the Fund is forced to sell securities in a down market.
Foreign Currency Risk
The Fund’s exposure to foreign currencies subjects the Fund to constantly changing exchange rates and the risk that those currencies will decline in value relative to the U.S. dollar, or, in the case of short positions, that the U.S. dollar will decline in value relative to the currency being sold forward. Currency rates in foreign countries may fluctuate significantly over short periods of time for a number of reasons, including changes in interest rates and economic or political developments in U.S. or abroad. As a result, the Fund’s exposure to foreign currencies may reduce the returns of the Fund. Trading of foreign currencies also includes the risk of clearing and settling trades which, if prices are volatile, may be difficult.
Geographic Concentration Risk
The Fund may be particularly susceptible to economic, political, regulatory or other events or conditions affecting issuers and countries within the specific geographic regions in which the Fund invests. Currency devaluation could occur in countries that have not yet experienced currency devaluation to date, or could continue to occur in countries that have already experienced such devaluations. As a result, the Fund may be more volatile than a more geographically diversified fund.
Money Market Fund Investment Risk
An investment in a money market fund is not a bank deposit and is not insured or guaranteed by any bank, the FDIC or any other government agency. Although money market funds seek to preserve the value of investments at $1.00 per share, it is possible for the Fund to lose money by investing in money market funds. In addition to the fees and expenses that the Fund directly bears, the Fund indirectly bears the fees and expenses of any money market funds in which it invests, including affiliated money market funds. The Fund will also be exposed to the investment risks of the money market fund. To the extent the Fund invests in instruments such as derivatives, the Fund may hold investments, which may be significant, in money market fund shares to cover its obligations resulting from its investments in derivatives.
Note 10. Subsequent Events
Management has evaluated the events and transactions that have occurred through the date the financial statements were issued and noted no items requiring adjustment of the financial statements or additional disclosure.
Note 11. Information Regarding Pending and Settled Legal Proceedings
In December 2005, without admitting or denying the allegations, American Express Financial Corporation (AEFC, which is now known as Ameriprise Financial, Inc. (Ameriprise Financial)) entered into settlement agreements with the Securities and Exchange Commission (SEC) and Minnesota Department of Commerce (MDOC) related to market timing activities. As a result, AEFC was censured and ordered to cease and desist from committing or causing any violations of certain provisions of the Investment Advisers Act of 1940, the Investment Company Act of 1940, and various Minnesota laws. AEFC agreed to pay disgorgement of $10 million and civil money penalties of $7 million. AEFC also agreed to retain an independent distribution consultant to assist in developing a plan for distribution of all disgorgement and civil penalties ordered by the SEC in accordance with various undertakings detailed at www.sec.gov/litigation/admin/ia-2451.pdf. Ameriprise Financial and its affiliates have cooperated with the SEC and the MDOC in these legal proceedings, and have made regular reports to the Funds’ Boards of Trustees.
| | | | |
| Semiannual Report 2015 | | | 31 | |
| | |
| |
| | COLUMBIA ABSOLUTE RETURN CURRENCY AND INCOME FUND |
NOTES TO FINANCIAL STATEMENTS (continued)
April 30, 2015 (Unaudited)
Ameriprise Financial and certain of its affiliates have historically been involved in a number of legal, arbitration and regulatory proceedings, including routine litigation, class actions, and governmental actions, concerning matters arising in connection with the conduct of their business activities. Ameriprise Financial believes that the Funds are not currently the subject of, and that neither Ameriprise Financial nor any of its affiliates are the subject of, any pending legal, arbitration or regulatory proceedings that are likely to have a material adverse effect on the Funds or the ability of Ameriprise Financial or its affiliates to perform under their contracts with the Funds. Ameriprise Financial is required to make quarterly (10-Q), annual (10-K) and, as necessary, 8-K filings with the Securities and Exchange Commission on legal and regulatory matters that relate to Ameriprise Financial and its affiliates. Copies of these filings may be obtained by accessing the SEC website at www.sec.gov.
There can be no assurance that these matters, or the adverse publicity associated with them, will not result in increased fund redemptions, reduced sale of fund shares or other adverse consequences to the Funds. Further, although we believe proceedings are not likely to have a material adverse effect on the Funds or the ability of Ameriprise Financial or its affiliates to perform under their contracts with the Funds, these proceedings are subject to uncertainties and, as such, we are unable to estimate the possible loss or range of loss that may result. An adverse outcome in one or more of these proceedings could result in adverse judgments, settlements, fines, penalties or other relief that could have a material adverse effect on the consolidated financial condition or results of operations of Ameriprise Financial.
| | |
| 32 | | Semiannual Report 2015 |
| | |
| |
| COLUMBIA ABSOLUTE RETURN CURRENCY AND INCOME FUND | | |
APPROVAL OF INVESTMENT MANAGEMENT SERVICES AGREEMENT
Columbia Management Investment Advisers, LLC (Columbia Management or the Investment Manager), a wholly-owned subsidiary of Ameriprise Financial, Inc. (Ameriprise Financial), serves as the investment manager to Columbia Absolute Return Currency and Income Fund (the Fund). Under an investment management services agreement (the IMS Agreement), Columbia Management provides investment advice and other services to the Fund and other funds distributed by Columbia Management Investment Distributors, Inc. (collectively, the Funds).
The Fund’s Board of Trustees (the Board), including the independent Board members (the Independent Trustees), considered the renewal of the IMS Agreement for a two-month period (Short-Term Period) in order to align the IMS Agreement with the review cycle of other funds in the Columbia family of funds. Columbia Management prepared detailed reports for the Board and its Contracts Committee in January, March and April 2015, including reports based on analyses of data provided by an independent organization (Lipper) and a comprehensive response to each item of information requested by independent legal counsel to the Independent Trustees (Independent Legal Counsel) in a letter to the Investment Manager, to assist the Board in making this determination. In addition, throughout the year, the Board (or its committees) regularly meets with portfolio management teams and senior management personnel, and reviews information prepared by Columbia Management addressing the services Columbia Management provides and Fund performance. The Board also accords appropriate weight to the work, deliberations and conclusions of the Contracts Committee, the Investment Review Committee and the Compliance Committee in determining whether to continue the IMS Agreement.
The Board, at its April 13-15, 2015 in-person Board meeting (the April Meeting), considered the renewal of the IMS Agreement for the Short-Term Period. At the April Meeting, Independent Legal Counsel reviewed with the Independent Trustees various factors relevant to the Board’s consideration of advisory agreements and the Board’s legal responsibilities related to such consideration. Following an analysis and discussion of the factors identified below, the Board, including all of the Independent Trustees, approved the renewal of the IMS Agreement for the Short-Term Period.
Nature, Extent and Quality of Services Provided by Columbia Management
The Independent Trustees analyzed various reports and presentations they had received detailing the services performed by Columbia Management, as well as its expertise, resources and capabilities. The Independent Trustees specifically considered many developments during the past year concerning the services provided by Columbia Management. The Independent Trustees noted the information they received concerning Columbia Management’s ability to retain its key portfolio management personnel. In evaluating the quality of services provided under the IMS Agreement and the Fund’s Administrative Services Agreement, the Independent Trustees also took into account the organization and strength of the Fund’s and its service providers’ compliance programs. In addition, the Board also reviewed the financial condition of Columbia Management (and its affiliates) and each entity’s ability to carry out its responsibilities under the IMS Agreement and the Fund’s other services agreements with affiliates of Ameriprise Financial, observing the financial strength of Ameriprise Financial, with its solid balance sheet. The Board also discussed the acceptability of the terms of the IMS Agreement for the Short-Term Period.
Based on the foregoing, and based on other information received (both oral and written, including the information on investment performance referenced below) and other considerations, the Board concluded that the services being performed by Columbia Management and its affiliates were acceptable for the Short-Term Period.
Investment Performance
For purposes of evaluating the nature, extent and quality of services provided under the IMS Agreement, the Board carefully reviewed the investment performance of the Fund. In this regard, the Board considered detailed reports providing the results of analyses performed by an independent organization showing, for various periods, the performance of the Fund, the performance of a benchmark index, the percentage ranking of the Fund among its comparison group and the net assets of the Fund. The Board observed that for purposes of approving the IMS Agreement for the Short-Term Period, the Fund’s performance was acceptable.
| | | | |
| Semiannual Report 2015 | | | 33 | |
| | |
| |
| | COLUMBIA ABSOLUTE RETURN CURRENCY AND INCOME FUND |
APPROVAL OF INVESTMENT MANAGEMENT SERVICES AGREEMENT (continued)
Comparative Fees, Costs of Services Provided and the Profits Realized By Columbia Management and its Affiliates from their Relationships with the Fund
The Board reviewed comparative fees and the costs of services provided under the IMS Agreement. The Board members considered detailed comparative information set forth in an annual report on fees and expenses, including, among other things, data (based on analyses conducted by an independent organization) showing a comparison of the Fund’s expenses with median expenses paid by funds in its comparative peer universe, as well as data showing the Fund’s contribution to Columbia Management’s profitability.
The Board accorded particular weight to the notion that the level of fees should reflect a rational pricing model applied consistently across the various product lines in the Fund family, while assuring that the overall fees for each Fund (with few defined exceptions) are generally in line with the “pricing philosophy” currently in effect (i.e., that the total expense ratio of the Fund is no higher than the median expense ratio of funds in the same comparison universe of the Fund).
The Board also considered the expected profitability of Columbia Management and its affiliates in connection with Columbia Management providing investment management services to the Fund. In this regard, the Board referred to a detailed profitability report, discussing the profitability to Columbia Management and Ameriprise Financial from managing, operating and distributing the Funds. For purposes of approving the IMS Agreement for the Short-Term Period, the Board concluded that the investment management service fees were fair and reasonable, observing that the profitability levels also seemed reasonable.
Economies of Scale to be Realized
The Board also considered the economies of scale that might be realized by Columbia Management as the Fund grows and took note of the extent to which Fund shareholders might also benefit from such growth. In this regard, the Independent Trustees took into account that IMS fees decline as Fund assets exceed various breakpoints.
Based on the foregoing, the Board, including all of the Independent Trustees, concluded that, for purposes of its consideration of the renewal of the IMS Agreement for the Short-Term Period, the investment management service fees were fair and reasonable in light of the extent and quality of services provided. In reaching this conclusion, no single factor was determinative. The Board noted its understanding that it would undertake the full consideration of renewal of the IMS Agreement for the full annual period at its June 2015 meetings. On April 15, 2015, the Board, including all of the Independent Trustees, approved the renewal of the IMS Agreement for the Short-Term Period.
| | |
| 34 | | Semiannual Report 2015 |
| | |
| |
| COLUMBIA ABSOLUTE RETURN CURRENCY AND INCOME FUND | | |
IMPORTANT INFORMATION ABOUT THIS REPORT
Each fund mails one shareholder report to each shareholder address. If you would like more than one report, please call shareholder services at 800.345.6611 and additional reports will be sent to you.
The policy of the Board is to vote the proxies of the companies in which each fund holds investments consistent with the procedures as stated in the Statement of Additional Information (SAI). You may obtain a copy of the SAI without charge by calling 800.345.6611; contacting your financial intermediary; visiting columbiathreadneedle.com/us; or searching the website of the Securities and Exchange Commission (SEC) at sec.gov. Information regarding how each fund voted proxies relating to portfolio securities is filed with the SEC by August 31st for the most recent 12-month period ending June 30th of that year, and is available without charge by visiting columbiathreadneedle.com/us, or searching the website of the SEC at sec.gov.
Each fund files a complete schedule of portfolio holdings with the SEC for the first and third quarters of each fiscal year on Form N-Q. Each fund’s Form N-Q is available on the SEC’s website at sec.gov and may be reviewed and copied at the SEC’s Public Reference Room in Washington, D.C. Information on the operation of the Public Reference Room may be obtained by calling 800.SEC.0330. Each fund’s complete schedule of portfolio holdings, as filed on Form N-Q, can also be obtained without charge, upon request, by calling 800.345.6611.
| | | | |
| Semiannual Report 2015 | | | 35 | |
Columbia Absolute Return Currency and Income Fund
P.O. Box 8081
Boston, MA 02266-8081
This information is for use with concurrent or prior delivery of a fund prospectus. Please read and consider the investment objectives, risks, charges and expenses for any fund carefully before investing. For a prospectus and summary prospectus, which contains this and other important information about the Fund, go to columbiathreadneedle.com/us. The Fund is distributed by Columbia Management Investment Distributors, Inc., member FINRA, and managed by Columbia Management Investment Advisers, LLC.
Columbia Threadneedle Investments (Columbia Threadneedle) is the global brand name of the Columbia and Threadneedle group of companies. All rights reserved. Columbia Management Investment Distributors, Inc., 225 Franklin Street, Boston, MA 02110-2804
© 2015 Columbia Management Investment Advisers, LLC.
columbiathreadneedle.com/us
SAR104_10_E01_(06/15)

SEMIANNUAL REPORT
April 30, 2015

COLUMBIA EMERGING MARKETS BOND FUND


ABOUT COLUMBIA THREADNEEDLE INVESTMENTS
Columbia Threadneedle Investments is a leading global asset management group that provides a broad range of actively managed investment strategies and solutions for individual, institutional and corporate clients around the world.
With more than 2,000 people, including over 450 investment professionals based in North America, Europe and Asia, we manage $506 billion* of assets across developed and emerging market equities, fixed income, asset allocation solutions and alternatives. We are the 12th largest manager of long-term mutual fund assets in the U.S.** and the 5th largest manager of retail funds in the U.K.***
Our priority is the investment success of our clients. We aim to deliver the investment outcomes they expect through an investment approach that is team-based, performance-driven and risk-aware. Our culture is dynamic and interactive. By sharing our insights across asset classes and geographies, we generate richer perspectives on global, regional and local investment landscapes. The ability to exchange and debate investment ideas in a collaborative environment enriches our teams’ investment processes. More importantly, it results in better informed investment decisions for our clients.
Columbia funds are distributed by Columbia Management Investment Distributors, Inc., member FINRA, and managed by Columbia Management Investment Advisers, LLC.
Columbia Threadneedle Investments (Columbia Threadneedle) is the global brand name of the Columbia and Threadneedle group of companies.
| * | | In U.S. dollars as of March 31, 2015. Source: Ameriprise Q1 Earnings Release. Includes all assets managed by entities in the Columbia and Threadneedle groups of companies. |
Contact us for more current data.
| ** | | Source: ICI as of March 31, 2015 for Columbia Management Investment Advisers, LLC. |
| *** | | Source: Investment Association as of March 2015 for Threadneedle Asset Management Limited. |
© 2015 Columbia Management Investment Advisers, LLC. All rights reserved.
Not part of the shareholder report
Get the market insight you need from our investment experts
Connect with Columbia Threadneedle Investments
Investor insight
Find economic and market commentary, investment videos, white papers,
mutual fund commentary and more at columbiathreadneedle.com/us.
| | | | |
 | | Columbia Threadneedle Investor Newsletter (e-newsletter) Read our award-winning* shareholder
newsletter. Our quarterly newsletter
is available online and provides timely
and relevant content about economic
trends, fund news, service enhancements and
changes. Sign up to receive the newsletter
electronically at columbiathreadneedle.com/
us/newsletter. | |  |
| | |
 | | Investment videos Get analysis of current events and trends that may affect your investments.
Visit our online video library to watch and discover what our thought leaders
are saying about the financial markets and economy. |
| | |
| | Social media We offer you multiple ways to access our market commentary and
investment insights. |
| | n | | Perspectives blog at columbiathreadneedle.com/us |
Read timely posts by our investment team, including our chief investment officer, chief economist and portfolio managers.
| | n | | twitter.com/CTinvest_US |
Follow us on Twitter for quick, up-to-the-minute comments on market news and more.
View our commentaries on the economy, markets and current investment opportunities.
| | n | | linkedin.com/company/columbia-threadneedle-investments-us |
Connect with us on LinkedIn for updates from our thought leaders.
| * | Columbia Threadneedle Investor Newsletter was awarded top honors in the Mutual Fund Education Alliance STAR Awards competition for excellence in mutual fund marketing and communications in 2011, 2012 and 2013. Materials in the competition were evaluated on educational value, message comprehension, effective design and objectives. |
Not part of the shareholder report
PRESIDENT’S MESSAGE

Dear Shareholder,
In a world that is changing faster than ever before, investors want asset managers who offer a global perspective while generating strong and sustainable returns. To that end, Columbia Management, in conjunction with its U.K.-based affiliate, Threadneedle Investments, has rebranded to Columbia Threadneedle Investments. The new global brand represents the combined capabilities, resources and reach of the global group, offering investors access to the best of both firms.
With a presence in 18 countries and more than 450 investment professionals*, our collective perspective and world view as Columbia Threadneedle Investments gives us deeper insight into what might affect the real-life financial outcomes clients are seeking. Putting our views into a global context enables us to build richer perspectives and create the right solutions, and provides us with enhanced capabilities to deliver consistent investment performance, which may ultimately lead to better investor outcomes.
As a result of the rebrand, you will begin to see our new logo and colors reflected in printed materials, such as this shareholder report, as well as on our new website — columbiathreadneedle.com/us. We encourage you to visit us online and view a new video on the “About Us” tab that speaks to the strength of the firm.
While we are introducing a new brand, in many ways, the investment company you know well has not changed. The following remain in effect:
| n | | Fund and strategy names |
| n | | Established investment teams, philosophies and processes |
| n | | Account services, features, servicing phone numbers and mailing addresses |
| n | | Columbia Management Investment Distributors as distributor and Columbia Management Investment Advisers as investment adviser |
We recognize that the money we manage represents the hard work and savings of people like you, and that everyone has different ambitions and different definitions of success. Investors have varying goals — funding their children’s education, enjoying their retirement, putting money aside for unexpected events, and more. Whatever your ambitions, we believe our wide range of investment products and solutions can help give you confidence that you will reach your goals.
The world is constantly changing, but our priority remains the same: to help you secure your finances, meet your goals and achieve success. Thank you for your continued investment with us. Our service representatives are available at 800.345.6611 to help with any questions.
Sincerely,

Christopher O. Petersen
President, Columbia Funds
Investors should consider the investment objectives, risks, charges and expenses of a mutual fund carefully before investing. For a free prospectus and summary prospectus, which contains this and other important information about a fund, visit columbiathreadneedle.com/us. The prospectus should be read carefully before investing.
* Source: Ameriprise as of December 1, 2014
Columbia Funds are distributed by Columbia Management Investment Distributors, Inc., member FINRA, and managed by Columbia Management Investment Advisers, LLC.
© 2015 Columbia Management Investment Advisers, LLC. All rights reserved.
Semiannual Report 2015
| | |
| |
| COLUMBIA EMERGING MARKETS BOND FUND | | |
TABLE OF CONTENTS
Fund Investment Manager
Columbia Management Investment
Advisers, LLC
225 Franklin Street
Boston, MA 02110
Fund Distributor
Columbia Management Investment
Distributors, Inc.
225 Franklin Street
Boston, MA 02110
Fund Transfer Agent
Columbia Management Investment
Services Corp.
P.O. Box 8081
Boston, MA 02266-8081
For more information about any of the funds, please visit columbiathreadneedle.com/us or call 800.345.6611. Customer Service Representatives are available to answer your questions Monday through Friday from 8 a.m. to 7 p.m. Eastern time.
The views expressed in this report reflect the current views of the respective parties. These views are not guarantees of future performance and involve certain risks, uncertainties and assumptions that are difficult to predict, so actual outcomes and results may differ significantly from the views expressed. These views are subject to change at any time based upon economic, market or other conditions and the respective parties disclaim any responsibility to update such views. These views may not be relied on as investment advice and, because investment decisions for a Columbia fund are based on numerous factors, may not be relied on as an indication of trading intent on behalf of any particular Columbia fund. References to specific securities should not be construed as a recommendation or investment advice.
Semiannual Report 2015
| | |
| |
| | COLUMBIA EMERGING MARKETS BOND FUND |
PERFORMANCE OVERVIEW
(Unaudited)
Performance Summary
| n | | Columbia Emerging Markets Bond Fund (the Fund) Class A shares returned -0.90% excluding sales charges for the six-month period that ended April 30, 2015. |
| n | | The Fund underperformed its benchmark, the JPMorgan Emerging Markets Bond Index-Global, which returned 0.70% for the same period. |
| | | | | | | | | | | | | | | | | | |
Average Annual Total Returns (%) (for period ended April 30, 2015) | | | | | |
| | | Inception | | 6 Months
Cumulative | | | 1 Year | | | 5 Years | | | Life | |
Class A | | 02/16/06 | | | | | | | | | | | | | | | | |
Excluding sales charges | | | | | -0.90 | | | | 1.19 | | | | 6.19 | | | | 7.12 | |
Including sales charges | | | | | -5.63 | | | | -3.58 | | | | 5.16 | | | | 6.55 | |
Class B | | 02/16/06 | | | | | | | | | | | | | | | | |
Excluding sales charges | | | | | -1.27 | | | | 0.53 | | | | 5.38 | | | | 6.31 | |
Including sales charges | | | | | -6.12 | | | | -4.35 | | | | 5.06 | | | | 6.31 | |
Class C | | 02/16/06 | | | | | | | | | | | | | | | | |
Excluding sales charges | | | | | -1.28 | | | | 0.53 | | | | 5.40 | | | | 6.32 | |
Including sales charges | | | | | -2.25 | | | | -0.45 | | | | 5.40 | | | | 6.32 | |
Class I | | 02/16/06 | | | -0.65 | | | | 1.80 | | | | 6.71 | | | | 7.59 | |
Class K | | 02/16/06 | | | -0.71 | | | | 1.50 | | | | 6.38 | | | | 7.34 | |
Class R* | | 11/16/11 | | | -1.03 | | | | 0.94 | | | | 5.98 | | | | 6.93 | |
Class R4* | | 03/19/13 | | | -0.69 | | | | 1.53 | | | | 6.32 | | | | 7.19 | |
Class R5* | | 11/08/12 | | | -0.67 | | | | 1.66 | | | | 6.42 | | | | 7.24 | |
Class W* | | 12/01/06 | | | -0.90 | | | | 1.29 | | | | 6.18 | | | | 7.10 | |
Class Y* | | 11/08/12 | | | -0.65 | | | | 1.81 | | | | 6.47 | | | | 7.27 | |
Class Z* | | 09/27/10 | | | -0.69 | | | | 1.54 | | | | 6.49 | | | | 7.28 | |
J.P. Morgan Emerging Markets Bond Index-Global | | | | | 0.70 | | | | 4.50 | | | | 7.08 | | | | 7.38 | |
Returns for Class A are shown with and without the maximum initial sales charge of 4.75% Returns for Class B are shown with and without the applicable contingent deferred sales charge (CDSC) of 5.00% in the first year, declining to 1.00% in the sixth year and eliminated thereafter. Returns for Class C are shown with and without the 1.00% CDSC for the first year only. The Fund’s other classes are not subject to sales charges and have limited eligibility. Please see the Fund’s prospectus for details. Performance for different share classes will vary based on differences in sales charges and fees associated with each class. All results shown assume reinvestment of distributions during the period. Returns do not reflect the deduction of taxes that a shareholder may pay on Fund distributions or on the redemption of Fund shares. Performance results reflect the effect of any fee waivers or reimbursements of Fund expenses by Columbia Management Investment Advisers, LLC and/or any of its affiliates. Absent these fee waivers or expense reimbursement arrangements, performance results would have been lower.
The performance information shown represents past performance and is not a guarantee of future results. The investment return and principal value of your investment will fluctuate so that your shares, when redeemed, may be worth more or less than their original cost. Current performance may be lower or higher than the performance information shown. You may obtain performance information current to the most recent month-end by contacting your financial intermediary, visiting columbiathreadneedle.com/us or calling 800.345.6611.
| * | The returns shown for periods prior to the share class inception date (including returns for the Life of the Fund, if shown, which are since Fund inception) include the returns of the Fund’s oldest share class. Since the Fund launched more than one share class at its inception, Class A shares were used. These returns are adjusted to reflect any higher class-related operating expenses of the newer share classes, as applicable. Please visit columbiathreadneedle.com/us/investment-products/mutual-funds/appended-performance for more information. |
The JPMorgan Emerging Markets Bond Index (EMBI) — Global is based on U.S. dollar-denominated debt instruments issued by emerging market sovereign and quasi-sovereign entities, such as Brady bonds, Eurobonds and loans, and reflects reinvestment of all distributions and changes in market prices.
Indices are not available for investment, are not professionally managed and do not reflect sales charges, fees, brokerage commissions, taxes or other expenses of investing. Securities in the Fund may not match those in an index.
| | |
| |
| COLUMBIA EMERGING MARKETS BOND FUND | | |
PORTFOLIO OVERVIEW
(Unaudited)
| | | | |
Country Breakdown (%) (at April 30, 2015) | |
Argentina | | | 1.7 | |
Brazil | | | 5.2 | |
Chile | | | 1.4 | |
Colombia | | | 4.3 | |
Costa Rica | | | 1.1 | |
Croatia | | | 0.6 | |
Dominican Republic | | | 6.0 | |
Ecuador | | | 0.6 | |
El Salvador | | | 1.1 | |
Gabon | | | 0.7 | |
Georgia | | | 1.3 | |
Ghana | | | 1.0 | |
Guatemala | | | 1.3 | |
Hungary | | | 4.0 | |
Indonesia | | | 12.5 | |
Ireland | | | 0.3 | |
Ivory Coast | | | 1.4 | |
Kazakhstan | | | 3.6 | |
Mexico | | | 10.9 | |
Morocco | | | 0.2 | |
Netherlands | | | 0.1 | |
Pakistan | | | 0.7 | |
Panama | | | 0.7 | |
Paraguay | | | 0.6 | |
Peru | | | 1.6 | |
Philippines | | | 1.4 | |
Republic of Namibia | | | 1.0 | |
Republic of the Congo | | | 0.3 | |
Romania | | | 0.5 | |
Russian Federation | | | 7.3 | |
Senegal | | | 0.5 | |
Serbia | | | 0.4 | |
South Africa | | | 0.6 | |
Spain | | | 0.5 | |
Trinidad and Tobago | | | 2.0 | |
Tunisia | | | 0.7 | |
Turkey | | | 8.0 | |
Ukraine | | | 0.8 | |
United Kingdom | | | 0.3 | |
United States(a) | | | 4.9 | |
Uruguay | | | 1.9 | |
Venezuela | | | 5.0 | |
Zambia | | | 1.0 | |
Total | | | 100.0 | |
Country Breakdown is based primarily on issuer’s place of organization/incorporation. Percentages indicated are based upon total investments. The Fund’s portfolio composition is subject to change.
| (a) | Includes investments in Money Market Funds. |
Portfolio Management
James Carlen, CFA
Henry Stipp, Ph.D.
| | |
| |
| | COLUMBIA EMERGING MARKETS BOND FUND |
PORTFOLIO OVERVIEW (continued)
(Unaudited)
| | | | |
Quality Breakdown (%) (at April 30, 2015) | |
A rating | | | 4.6 | |
BBB rating | | | 44.7 | |
BB rating | | | 26.0 | |
B rating | | | 16.5 | |
CCC rating | | | 8.2 | |
CC rating | | | 0.0 | (a) |
Total | | | 100.0 | |
Percentages indicated are based upon total fixed income investments (excluding Money Market Funds).
Bond ratings apply to the underlying holdings of the Fund and not the Fund itself and are divided into categories ranging from highest to lowest credit quality, determined by using the middle rating of Moody’s, S&P and Fitch, after dropping the highest and lowest available ratings. When ratings are available from only two rating agencies, the lower rating is used. When a rating is available from only one rating agency, that rating is used. When a bond is not rated by any rating agency, it is designated as “Not rated��. Credit quality ratings assigned by a rating agency are subjective opinions, not statements of fact, and are subject to change, including daily. The ratings assigned by credit rating agencies are but one of the considerations that the Investment Manager and/or Fund’s subadviser incorporates into its credit analysis process, along with such other country-specific factors as the direction and stance of fiscal policy, balance of payment trends and commodity prices, the level and structure of public debt as well as political stability and commitment to strong macroeconomic policies.
| | |
| |
| COLUMBIA EMERGING MARKETS BOND FUND | | |
UNDERSTANDING YOUR FUND’S EXPENSES
(Unaudited)
As an investor, you incur two types of costs. There are transaction costs, which generally include sales charges on purchases and may include redemption fees. There are also ongoing costs, which generally include management fees, distribution and/or service fees, and other fund expenses. The following information is intended to help you understand your ongoing costs (in dollars) of investing in the Fund and to help you compare these costs with the ongoing costs of investing in other mutual funds.
Analyzing Your Fund’s Expenses
To illustrate these ongoing costs, we have provided examples and calculated the expenses paid by investors in each share class of the Fund during the period. The actual and hypothetical information in the table is based on an initial investment of $1,000 at the beginning of the period indicated and held for the entire period. Expense information is calculated two ways and each method provides you with different information. The amount listed in the “Actual” column is calculated using the Fund’s actual operating expenses and total return for the period. You may use the Actual information, together with the amount invested, to estimate the expenses that you paid over the period. Simply divide your account value by $1,000 (for example, an $8,600 account value divided by $1,000 = 8.6), then multiply the results by the expenses paid during the period under the “Actual” column. The amount listed in the “Hypothetical” column assumes a 5% annual rate of return before expenses (which is not the Fund’s actual return) and then applies the Fund’s actual expense ratio for the period to the hypothetical return. You should not use the hypothetical account values and expenses to estimate either your actual account balance at the end of the period or the expenses you paid during the period. See “Compare With Other Funds” below for details on how to use the hypothetical data.
Compare With Other Funds
Since all mutual funds are required to include the same hypothetical calculations about expenses in shareholder reports, you can use this information to compare the ongoing cost of investing in the Fund with other funds. To do so, compare the hypothetical example with the 5% hypothetical examples that appear in the shareholder reports of other funds. As you compare hypothetical examples of other funds, it is important to note that hypothetical examples are meant to highlight the ongoing costs of investing in a fund only and do not reflect any transaction costs, such as sales charges, or redemption or exchange fees. Therefore, the hypothetical calculations are useful in comparing ongoing costs only, and will not help you determine the relative total costs of owning different funds. If transaction costs were included in these calculations, your costs would be higher.
November 1, 2014 – April 30, 2015
| | | | | | | | | | | | | | | | | | | | | | | | | | | | |
| | | Account Value at the
Beginning of the
Period ($) | | | Account Value at the
End of the
Period ($) | | | Expenses Paid During
the Period ($) | | | Fund’s Annualized
Expense Ratio (%) | |
| | | | Actual | | | | Hypothetical | | | | Actual | | | | Hypothetical | | | | Actual | | | | Hypothetical | | | | Actual | |
Class A | | | 1,000.00 | | | | 1,000.00 | | | | 991.90 | | | | 1,018.99 | | | | 5.78 | | | | 5.86 | | | | 1.17 | |
Class B | | | 1,000.00 | | | | 1,000.00 | | | | 987.30 | | | | 1,015.27 | | | | 9.46 | | | | 9.59 | | | | 1.92 | |
Class C | | | 1,000.00 | | | | 1,000.00 | | | | 987.20 | | | | 1,015.27 | | | | 9.46 | | | | 9.59 | | | | 1.92 | |
Class I | | | 1,000.00 | | | | 1,000.00 | | | | 993.50 | | | | 1,021.47 | | | | 3.31 | | | | 3.36 | | | | 0.67 | |
Class K | | | 1,000.00 | | | | 1,000.00 | | | | 992.90 | | | | 1,019.98 | | | | 4.79 | | | | 4.86 | | | | 0.97 | |
Class R | | | 1,000.00 | | | | 1,000.00 | | | | 989.70 | | | | 1,017.75 | | | | 7.01 | | | | 7.10 | | | | 1.42 | |
Class R4 | | | 1,000.00 | | | | 1,000.00 | | | | 993.10 | | | | 1,020.28 | | | | 4.50 | | | | 4.56 | | | | 0.91 | |
Class R5 | | | 1,000.00 | | | | 1,000.00 | | | | 993.30 | | | | 1,021.22 | | | | 3.56 | | | | 3.61 | | | | 0.72 | |
Class W | | | 1,000.00 | | | | 1,000.00 | | | | 991.00 | | | | 1,018.99 | | | | 5.78 | | | | 5.86 | | | | 1.17 | |
Class Y | | | 1,000.00 | | | | 1,000.00 | | | | 993.50 | | | | 1,021.47 | | | | 3.31 | | | | 3.36 | | | | 0.67 | |
Class Z | | | 1,000.00 | | | | 1,000.00 | | | | 993.10 | | | | 1,020.23 | | | | 4.55 | | | | 4.61 | | | | 0.92 | |
Expenses paid during the period are equal to the annualized expense ratio for each class as indicated above, multiplied by the average account value over the period and then multiplied by the number of days in the Fund’s most recent fiscal half year and divided by 365.
Expenses do not include fees and expenses incurred indirectly by the Fund from its investment in underlying funds, including affiliated and non-affiliated pooled investment vehicles, such as mutual funds and exchange-traded funds.
| | |
| |
| | COLUMBIA EMERGING MARKETS BOND FUND |
PORTFOLIO OF INVESTMENTS
April 30, 2015 (Unaudited)
(Percentages represent value of investments compared to net assets)
| | | | | | | | | | | | |
| Corporate Bonds & Notes(a) 14.1% | |
| Issuer | | Coupon
Rate | | | Principal
Amount ($) | | | Value ($) | |
BRAZIL 0.8% | |
Companhia de Eletricidade do Estad | |
04/27/16 | | | 11.750% | | | | BRL6,000,000 | | | | 1,901,791 | |
|
Cosan Luxembourg SA(b) | |
03/14/18 | | | 9.500% | | | BRL | 6,000,000 | | | | 1,683,015 | |
03/14/23 | | | 5.000% | | | | 1,309,000 | | | | 1,194,462 | |
| | | | | | | | | | | | | |
Total | | | | | | | | | | | 4,779,268 | |
| | | |
| | | | | | | | | | | | |
CHILE 1.4% | |
Cencosud SA(b) | |
02/12/45 | | | 6.625% | | | | 4,950,000 | | | | 4,913,900 | |
|
Inversiones CMPC SA(b) | |
09/15/24 | | | 4.750% | | | | 3,000,000 | | | | 3,142,086 | |
| | | | | | | | | | | | | |
Total | | | | | | | | | | | 8,055,986 | |
| | | |
| | | | | | | | | | | | |
GUATEMALA 1.3% | |
Agromercantil Senior Trust(b) | |
04/10/19 | | | 6.250% | | | | 1,323,000 | | | | 1,356,075 | |
|
Comcel Trust(b) | |
02/06/24 | | | 6.875% | | | | 3,300,000 | | | | 3,539,250 | |
|
Industrial Senior Trust(b) | |
11/01/22 | | | 5.500% | | | | 2,877,000 | | | | 2,835,284 | |
| | | | | | | | | | | | | |
Total | | | | | | | | | | | 7,730,609 | |
| | | |
| | | | | | | | | | | | |
KAZAKHSTAN 0.8% | |
Zhaikmunai LLP | | | | | | | | | | | | |
11/13/19 | | | 7.125% | | | | 2,546,000 | | | | 2,399,605 | |
|
Zhaikmunai LLP(b) | |
11/13/19 | | | 7.125% | | | | 2,285,000 | | | | 2,153,613 | |
| | | | | | | | | | | | | |
Total | | | | | | | | | | | 4,553,218 | |
| | | |
| | | | | | | | | | | | |
MEXICO 4.1% | |
America Movil SAB de CV | |
12/05/22 | | | 6.450% | | | MXN | 30,000,000 | | | | 1,896,754 | |
|
BBVA Bancomer SA(b)(c) | |
11/12/29 | | | 5.350% | | | | 4,000,000 | | | | 3,919,980 | |
| | |
Cemex SAB de CV | | | | | | | | | |
01/15/21 | | | 7.250% | | | | 6,532,000 | | | | 7,070,890 | |
|
Concesionaria Mexiquense SA de CV
(linked to Mexican Unidad de Inversion Index)(b) | |
12/15/35 | | | 5.950% | | | MXN | 42,522,872 | | | | 2,728,925 | |
|
Elementia SAB de CV(b) | |
01/15/25 | | | 5.500% | | | | 2,500,000 | | | | 2,487,500 | |
|
Grupo Televisa SAB | |
05/14/43 | | | 7.250% | | | MXN | 59,800,000 | | | | 3,383,689 | |
|
Mexichem SAB de CV(b) | |
09/19/42 | | | 6.750% | | | | 1,000,000 | | | | 1,092,500 | |
09/17/44 | | | 5.875% | | | | 1,900,000 | | | | 1,871,500 | |
| | | | | | | | | | | | | |
Total | | | | | | | | | | | 24,451,738 | |
| | | | | | | | | | | | |
| Corporate Bonds & Notes(a) (continued) | |
| Issuer | | Coupon
Rate | | | Principal
Amount ($) | | | Value ($) | |
PANAMA 0.6% | |
Panama Canal Railway Co. | |
11/01/26 | | | 7.000% | | | | 3,553,230 | | | | 3,517,698 | |
| | | |
| | | | | | | | | | | | |
PERU 1.2% | |
Banco de Credito del Peru(b)(c) | |
10/15/22 | | | 7.170% | | | PEN | 6,000,000 | | | | 1,913,446 | |
|
Corp. Azucarera del Peru SA(b) | |
08/02/22 | | | 6.375% | | | | 3,218,000 | | | | 2,912,290 | |
|
Union Andina de Cementos SAA(b) | |
10/30/21 | | | 5.875% | | | | 2,100,000 | | | | 2,136,750 | |
| | | | | | | | | | | | | |
Total | | | | | | | | | | | 6,962,486 | |
| | | |
| | | | | | | | | | | | |
RUSSIAN FEDERATION 1.3% | |
Metalloinvest Finance Ltd.(b) | |
07/21/16 | | | 6.500% | | | | 2,000,000 | | | | 1,990,000 | |
|
Sibur Securities Ltd.(b) | |
01/31/18 | | | 3.914% | | | | 6,450,000 | | | | 5,840,926 | |
| | | | | | | | | | | | | |
Total | | | | | | | | | | | 7,830,926 | |
| | | |
| | | | | | | | | | | | |
SPAIN 0.5% | |
ACI Airport SudAmerica SA(b)(d) | |
11/29/32 | | | 6.875% | | | | 3,000,000 | | | | 2,915,040 | |
| | | |
| | | | | | | | | | | | |
TURKEY 0.4% | |
Akbank TAS(b) | |
03/31/25 | | | 5.125% | | | | 2,150,000 | | | | 2,097,903 | |
| | | |
| | | | | | | | | | | | |
UKRAINE 0.8% | |
MHP SA(b) | |
04/02/20 | | | 8.250% | | | | 5,721,000 | | | | 4,662,615 | |
| | | |
| | | | | | | | | | | | |
UNITED KINGDOM 0.3% | |
Tullow Oil PLC(b) | |
04/15/22 | | | 6.250% | | | | 1,693,000 | | | | 1,549,095 | |
| | | |
| | | | | | | | | | | | |
UNITED STATES 0.6% | |
Kosmos Energy Ltd.(b) | |
08/01/21 | | | 7.875% | | | | 2,160,000 | | | | 2,065,716 | |
08/01/21 | | | 7.875% | | | | 1,776,000 | | | | 1,722,720 | |
| | | | | | | | | | | | | |
Total | | | | | | | | | | | 3,788,436 | |
| | | | | | | | | | | | | |
Total Corporate Bonds & Notes
| | | | | |
(Cost: $90,153,618) | | | | 82,895,018 | |
| | | |
| | | | | | | | | | | | |
| Inflation-Indexed Bonds(a) 2.5% | |
BRAZIL 1.2% | |
Brazil Notas do Tesouro Nacional | |
08/15/22 | | | 6.000% | | | BRL | 1,375,932 | | | | 4,532,079 | |
05/15/35 | | | 6.000% | | | BRL | 834,049 | | | | 2,780,996 | |
| | | | | | | | | | | | | |
Total | | | | | | | | | | | 7,313,075 | |
The accompanying Notes to Financial Statements are an integral part of this statement.
| | |
| |
| COLUMBIA EMERGING MARKETS BOND FUND | | |
PORTFOLIO OF INVESTMENTS (continued)
April 30, 2015 (Unaudited)
| | | | | | | | | | | | |
| Inflation-Indexed Bonds(a) (continued) | |
| Issuer | | Coupon
Rate | | | Principal
Amount ($) | | | Value ($) | |
URUGUAY 1.3% | |
Uruguay Government International Bond | |
04/05/27 | | | 4.250% | | | UYU | 120,084,069 | | | | 4,517,897 | |
12/15/28 | | | 4.375% | | | UYU | 78,803,215 | | | | 2,993,896 | |
| | | | | | | | | | | | | |
Total | | | | | | | | | | | 7,511,793 | |
| | | | | | | | | | | | | |
Total Inflation-Indexed Bonds | | | | | |
(Cost: $19,962,543) | | | | 14,824,868 | |
| | | |
| | | | | | | | | | | | |
| Foreign Government Obligations(a)(e) 78.5% | |
ARGENTINA 1.7% | |
Argentina Boden Bonds | |
10/03/15 | | | 7.000% | | | | 1,900,000 | | | | 1,865,800 | |
|
Argentina Bonar Bonds | |
04/17/17 | | | 7.000% | | | | 4,490,495 | | | | 4,301,894 | |
|
Provincia de Cordoba(b) | |
08/17/17 | | | 12.375% | | | | 1,874,000 | | | | 1,948,960 | |
|
YPF SA(b) | |
07/28/25 | | | 8.500% | | | | 1,800,000 | | | | 1,827,000 | |
| | | | | | | | | | | | | |
Total | | | | | | | | | | | 9,943,654 | |
| | | |
| | | | | | | | | | | | |
BRAZIL 3.1% | |
Brazil Notas do Tesouro Nacional | |
01/01/17 | | | 10.000% | | | BRL | 6,651,000 | | | | 2,171,628 | |
|
Brazilian Government International Bond | |
01/07/25 | | | 4.250% | | | | 5,600,000 | | | | 5,522,188 | |
01/07/41 | | | 5.625% | | | | 3,100,000 | | | | 3,187,203 | |
|
Centrais Eletricas Brasileiras SA(b) | |
10/27/21 | | | 5.750% | | | | 4,520,000 | | | | 4,203,600 | |
|
Petrobras Global Finance BV | |
03/15/19 | | | 7.875% | | | | 1,699,000 | | | | 1,844,281 | |
01/27/21 | | | 5.375% | | | | 1,582,000 | | | | 1,516,743 | |
| | | | | | | | | | | | | |
Total | | | | | | | | | | | 18,445,643 | |
| | | |
| | | | | | | | | | | | |
COLOMBIA 4.3% | |
Bogota Distrito Capital(b) | |
07/26/28 | | | 9.750% | | | COP | 1,377,000,000 | | | | 695,385 | |
|
Colombia Government International Bond | |
01/18/41 | | | 6.125% | | | | 6,328,000 | | | | 7,430,521 | |
|
Ecopetrol SA | |
01/16/25 | | | 4.125% | | | | 1,900,000 | | | | 1,828,180 | |
05/28/45 | | | 5.875% | | | | 2,800,000 | | | | 2,684,500 | |
|
Emgesa SA ESP | |
01/25/21 | | | 8.750% | | | COP | 5,204,000,000 | | | | 2,337,780 | |
|
Empresas Publicas de Medellin ESP(b) | |
02/01/21 | | | 8.375% | | | COP | 18,990,000,000 | | | | 8,441,860 | |
09/10/24 | | | 7.625% | | | COP | 3,939,000,000 | | | | 1,645,219 | |
| | | | | | | | | | | | | |
Total | | | | | | | | | | | 25,063,445 | |
| | | |
| | | | | | | | | | | | |
| | | | | | | | | | | | |
| Foreign Government Obligations(a)(e) (continued) | |
| Issuer | | Coupon
Rate | | | Principal
Amount ($) | | | Value ($) | |
COSTA RICA 1.1% | |
Costa Rica Government International Bond(b) | |
03/12/45 | | | 7.158% | | | | 6,250,000 | | | | 6,484,375 | |
| | | |
| | | | | | | | | | | | |
CROATIA 0.6% | |
Croatia Government International Bond(b) | |
01/26/24 | | | 6.000% | | | | 3,417,000 | | | | 3,738,881 | |
| | | |
| | | | | | | | | | | | |
DOMINICAN REPUBLIC 5.9% | |
Banco de Reservas de La Republica Dominicana(b) | |
02/01/23 | | | 7.000% | | | | 6,488,000 | | | | 6,482,842 | |
|
Dominican Republic International Bond | |
02/10/23 | | | 14.500% | | | DOP | 39,000,000 | | | | 1,033,994 | |
|
Dominican Republic International Bond(b) | |
07/05/19 | | | 15.000% | | | DOP | 139,000,000 | | | | 3,579,347 | |
01/08/21 | | | 14.000% | | | DOP | 226,239,000 | | | | 5,758,756 | |
04/20/27 | | | 8.625% | | | | 7,020,000 | | | | 8,406,450 | |
04/30/44 | | | 7.450% | | | | 6,000,000 | | | | 6,750,000 | |
01/27/45 | | | 6.850% | | | | 2,800,000 | | | | 2,926,000 | |
| | | | | | | | | | | | | |
Total | | | | | | | | | | | 34,937,389 | |
| | | |
| | | | | | | | | | | | |
ECUADOR 0.6% | |
Ecuador Government International Bond(b) | |
03/24/20 | | | 10.500% | | | | 3,000,000 | | | | 3,251,550 | |
| | | |
| | | | | | | | | | | | |
EL SALVADOR 1.1% | |
El Salvador Government International Bond | |
01/18/27 | | | 6.375% | | | | 500,000 | | | | 508,750 | |
|
El Salvador Government International Bond(b) | |
01/18/27 | | | 6.375% | | | | 2,800,000 | | | | 2,849,000 | |
04/10/32 | | | 8.250% | | | | 959,000 | | | | 1,102,850 | |
06/15/35 | | | 7.650% | | | | 1,736,000 | | | | 1,827,140 | |
| | | | | | | | | | | | | |
Total | | | | | | | | | | | 6,287,740 | |
| | | |
| | | | | | | | | | | | |
GABON 0.7% | |
Gabonese Republic | |
12/12/24 | | | 6.375% | | | | 4,279,527 | | | | 4,320,183 | |
| | | |
| | | | | | | | | | | | |
GEORGIA 1.2% | |
Georgian Railway JSC(b) | |
07/11/22 | | | 7.750% | | | | 6,633,000 | | | | 7,321,174 | |
| | | |
| | | | | | | | | | | | |
GHANA 1.0% | |
Republic of Ghana(b) | |
08/07/23 | | | 7.875% | | | | 3,150,000 | | | | 3,040,317 | |
01/18/26 | | | 8.125% | | | | 2,850,000 | | | | 2,757,603 | |
| | | | | | | | | | | | | |
Total | | | | | | | | | | | 5,797,920 | |
| | | |
| | | | | | | | | | | | |
HUNGARY 4.0% | |
Hungary Government International Bond | |
03/29/21 | | | 6.375% | | | | 1,302,000 | | | | 1,517,885 | |
11/22/23 | | | 5.750% | | | | 1,238,000 | | | | 1,422,771 | |
The accompanying Notes to Financial Statements are an integral part of this statement.
| | |
| |
| | COLUMBIA EMERGING MARKETS BOND FUND |
PORTFOLIO OF INVESTMENTS (continued)
April 30, 2015 (Unaudited)
| | | | | | | | | | | | |
| Foreign Government Obligations(a)(e) (continued) | |
| Issuer | | Coupon
Rate | | | Principal
Amount ($) | | | Value ($) | |
03/25/24 | | | 5.375% | | | | 4,406,000 | | | | 4,956,750 | |
03/29/41 | | | 7.625% | | | | 7,440,000 | | | | 10,695,000 | |
|
MFB Magyar Fejlesztesi Bank Zrt.(b) | |
10/21/20 | | | 6.250% | | | | 649,000 | | | | 734,343 | |
|
Magyar Export-Import Bank Zrt.(b) | |
02/12/18 | | | 5.500% | | | | 3,686,000 | | | | 3,937,533 | |
| | | | | | | | | | | | | |
Total | | | | | | | | | | | 23,264,282 | |
| | | |
| | | | | | | | | | | | |
INDONESIA 12.4% | |
Indonesia Government International Bond(b) | |
05/05/21 | | | 4.875% | | | | 794,000 | | | | 864,595 | |
04/25/22 | | | 3.750% | | | | 3,967,000 | | | | 4,041,381 | |
01/15/24 | | | 5.875% | | | | 4,200,000 | | | | 4,824,750 | |
01/17/38 | | | 7.750% | | | | 3,548,000 | | | | 4,838,585 | |
01/17/42 | | | 5.250% | | | | 1,000,000 | | | | 1,037,500 | |
01/15/45 | | | 5.125% | | | | 1,900,000 | | | | 1,952,250 | |
|
Indonesia Treasury Bond | |
04/15/19 | | | 7.875% | | | IDR | 32,000,000,000 | | | | 2,490,878 | |
09/15/19 | | | 11.500% | | | IDR | 50,400,000,000 | | | | 4,436,366 | |
11/15/20 | | | 11.000% | | | IDR | 9,000,000,000 | | | | 797,416 | |
06/15/21 | | | 12.800% | | | IDR | 6,800,000,000 | | | | 654,164 | |
07/15/22 | | | 10.250% | | | IDR | 13,210,000,000 | | | | 1,157,160 | |
05/15/27 | | | 7.000% | | | IDR | 85,060,000,000 | | | | 6,125,632 | |
03/15/29 | | | 9.000% | | | IDR | 53,989,000,000 | | | | 4,550,278 | |
|
Majapahit Holding BV(b) | |
08/07/19 | | | 8.000% | | | | 3,452,000 | | | | 4,043,328 | |
01/20/20 | | | 7.750% | | | | 1,657,000 | | | | 1,938,161 | |
|
PT Pertamina Persero | |
05/20/23 | | | 4.300% | | | | 500,000 | | | | 496,250 | |
|
PT Pertamina Persero(b) | |
05/23/21 | | | 5.250% | | | | 2,000,000 | | | | 2,131,460 | |
05/03/22 | | | 4.875% | | | | 1,000,000 | | | | 1,035,150 | |
05/20/23 | | | 4.300% | | | | 3,000,000 | | | | 2,977,500 | |
05/27/41 | | | 6.500% | | | | 1,000,000 | | | | 1,073,750 | |
05/03/42 | | | 6.000% | | | | 3,000,000 | | | | 3,011,250 | |
|
PT Perusahaan Listrik Negara(b) | |
11/22/21 | | | 5.500% | | | | 16,103,000 | | | | 17,574,653 | |
|
Pertamina Persero PT(b) | |
05/30/44 | | | 6.450% | | | | 755,000 | | | | 805,963 | |
| | | | | | | | | | | | | |
Total | | | | | | | | | | | 72,858,420 | |
| | | |
| | | | | | | | | | | | |
IRELAND 0.3% | |
Vnesheconombank Via VEB Finance PLC(b) | |
11/21/23 | | | 5.942% | | | | 2,300,000 | | | | 2,035,500 | |
| | | |
| | | | | | | | | | | | |
IVORY COAST 1.4% | |
Ivory Coast Government International Bond | |
07/23/24 | | | 5.375% | | | | 1,354,000 | | | | 1,295,548 | |
|
Ivory Coast Government International Bond(b) | |
07/23/24 | | | 5.375% | | | | 500,000 | | | | 472,500 | |
03/03/28 | | | 6.375% | | | | 4,377,000 | | | | 4,387,942 | |
|
Ivory Coast Government International Bond(c) | |
12/31/32 | | | 5.750% | | | | 2,100,000 | | | | 2,007,600 | |
| | | | | | | | | | | | | |
Total | | | | | | | | | | | 8,163,590 | |
| | | | | | | | | | | | |
| Foreign Government Obligations(a)(e) (continued) | |
| Issuer | | Coupon
Rate | | | Principal
Amount ($) | | | Value ($) | |
KAZAKHSTAN 2.8% | |
KazMunayGas National Co. JSC(b) | |
07/02/18 | | | 9.125% | | | | 3,293,000 | | | | 3,716,974 | |
04/30/43 | | | 5.750% | | | | 9,900,000 | | | | 8,823,375 | |
11/07/44 | | | 6.000% | | | | 4,450,000 | | | | 4,049,500 | |
| | | | | | | | | | | | | |
Total | | | | | | | | | | | 16,589,849 | |
| | | |
| | | | | | | | | | | | |
MEXICO 6.7% | |
Mexican Bonos | |
06/11/20 | | | 8.000% | | | MXN | 37,530,000 | | | | 2,734,489 | |
06/10/21 | | | 6.500% | | | MXN | 37,100,000 | | | | 2,525,380 | |
06/09/22 | | | 6.500% | | | MXN | 68,799,200 | | | | 4,690,725 | |
06/03/27 | | | 7.500% | | | MXN | 34,949,100 | | | | 2,533,199 | |
|
Mexico Government International Bond | |
01/23/46 | | | 4.600% | | | | 3,100,000 | | | | 3,088,375 | |
|
Petroleos Mexicanos | |
11/24/21 | | | 7.650% | | | MXN | 79,300,000 | | | | 5,310,040 | |
09/12/24 | | | 7.190% | | | MXN | 3,440,000 | | | | 217,494 | |
11/12/26 | | | 7.470% | | | MXN | 50,100,000 | | | | 3,238,442 | |
06/02/41 | | | 6.500% | | | | 5,453,000 | | | | 6,018,749 | |
01/23/45 | | | 6.375% | | | | 6,300,000 | | | | 6,980,369 | |
|
Petroleos Mexicanos(b) | |
01/23/26 | | | 4.500% | | | | 2,150,000 | | | | 2,187,584 | |
| | | | | | | | | | | | | |
Total | | | | | | | | | | | 39,524,846 | |
| | | |
| | | | | | | | | | | | |
MOROCCO 0.2% | |
Morocco Government International Bond(b) | |
12/11/22 | | | 4.250% | | | | 1,214,000 | | | | 1,244,350 | |
| | | |
| | | | | | | | | | | | |
NETHERLANDS 0.1% | |
Petrobras Global Finance BV | |
03/17/24 | | | 6.250% | | | | 481,000 | | | | 477,922 | |
| | | |
| | | | | | | | | | | | |
PAKISTAN 0.7% | |
Pakistan Government International Bond | |
04/15/24 | | | 8.250% | | | | 800,000 | | | | 872,000 | |
|
Pakistan Government International Bond(b) | |
12/03/19 | | | 6.750% | | | | 3,200,000 | | | | 3,312,000 | |
| | | | | | | | | | | | | |
Total | | | | | | | | | | | 4,184,000 | |
| | | |
| | | | | | | | | | | | |
PANAMA 0.1% | |
Ena Norte Trust(b) | |
04/25/23 | | | 4.950% | | | | 731,515 | | | | 758,033 | |
| | | |
| | | | | | | | | | | | |
PARAGUAY 0.6% | |
Republic of Paraguay(b) | |
08/11/44 | | | 6.100% | | | | 3,245,000 | | | | 3,528,937 | |
| | | |
| | | | | | | | | | | | |
PERU 0.4% | |
Peruvian Government International Bond | |
08/12/26 | | | 8.200% | | | PEN | 6,792,000 | | | | 2,534,516 | |
The accompanying Notes to Financial Statements are an integral part of this statement.
| | |
| |
| COLUMBIA EMERGING MARKETS BOND FUND | | |
PORTFOLIO OF INVESTMENTS (continued)
April 30, 2015 (Unaudited)
| | | | | | | | | | | | |
| Foreign Government Obligations(a)(e) (continued) | |
| Issuer | | Coupon
Rate | | | Principal
Amount ($) | | | Value ($) | |
PHILIPPINES 1.4% | |
Philippine Government International Bond | |
01/15/21 | | | 4.950% | | | PHP | 107,000,000 | | | | 2,555,721 | |
03/30/26 | | | 5.500% | | | | 1,500,000 | | | | 1,841,250 | |
|
Power Sector Assets & Liabilities Management Corp.(b) | |
12/02/24 | | | 7.390% | | | | 2,877,000 | | | | 3,869,565 | |
| | | | | | | | | | | | | |
Total | | | | | | | | | | | 8,266,536 | |
| | | |
| | | | | | | | | | | | |
REPUBLIC OF NAMIBIA 1.0% | |
Namibia International Bonds(b) | |
11/03/21 | | | 5.500% | | | | 5,200,000 | | | | 5,725,824 | |
| | | |
| | | | | | | | | | | | |
REPUBLIC OF THE CONGO 0.3% | |
Republic of Congo(c) | |
06/30/29 | | | 3.500% | | | | 1,974,366 | | | | 1,787,117 | |
| | | |
| | | | | | | | | | | | |
ROMANIA 0.5% | |
Romanian Government International Bond(b) | |
02/07/22 | | | 6.750% | | | | 2,392,000 | | | | 2,867,410 | |
| | | |
| | | | | | | | | | | | |
RUSSIAN FEDERATION 5.9% | |
Gazprom Neft OAO Via GPN Capital SA(b) | |
09/19/22 | | | 4.375% | | | | 8,379,000 | | | | 7,038,360 | |
|
Gazprom OAO Via Gaz Capital SA(b) | |
01/23/21 | | | 5.999% | | | | 1,000,000 | | | | 992,500 | |
03/07/22 | | | 6.510% | | | | 8,505,000 | | | | 8,530,243 | |
08/16/37 | | | 7.288% | | | | 2,829,000 | | | | 2,875,678 | |
|
Russian Agricultural Bank OJSC Via RSHB Capital SA(b) | |
12/27/17 | | | 5.298% | | | | 2,336,000 | | | | 2,230,880 | |
|
Russian Foreign Bond — Eurobond(b) | |
04/29/20 | | | 5.000% | | | | 1,800,000 | | | | 1,840,500 | |
04/04/22 | | | 4.500% | | | | 6,600,000 | | | | 6,417,312 | |
04/04/42 | | | 5.625% | | | | 3,400,000 | | | | 3,255,500 | |
|
Sberbank of Russia Via SB Capital SA(b) | |
10/29/22 | | | 5.125% | | | | 2,201,000 | | | | 1,826,830 | |
| | | | | | | | | | | | | |
Total | | | | | | | | | | | 35,007,803 | |
| | | |
| | | | | | | | | | | | |
SENEGAL 0.5% | |
Senegal Government International Bond(b) | |
07/30/24 | | | 6.250% | | | | 3,196,000 | | | | 3,144,065 | |
| | | |
| | | | | | | | | | | | |
SERBIA 0.4% | |
Republic of Serbia(b) | |
12/03/18 | | | 5.875% | | | | 2,125,000 | | | | 2,244,531 | |
| | | |
| | | | | | | | | | | | |
SOUTH AFRICA 0.6% | |
South Africa Government International Bond | |
01/17/24 | | | 4.665% | | | | 1,200,000 | | | | 1,258,248 | |
|
Transnet SOC Ltd.(b) | |
07/26/22 | | | 4.000% | | | | 2,200,000 | | | | 2,117,500 | |
| | | | | | | | | | | | | |
Total | | | | | | | | | | | 3,375,748 | |
| | | | | | | | | | | | |
| Foreign Government Obligations(a)(e) (continued) | |
| Issuer | | Coupon
Rate | | | Principal
Amount ($) | | | Value ($) | |
TRINIDAD AND TOBAGO 2.0% | |
Petroleum Co. of Trinidad & Tobago Ltd.(b) | |
08/14/19 | | | 9.750% | | | | 9,864,000 | | | | 11,817,072 | |
| | | |
| | | | | | | | | | | | |
TUNISIA 0.7% | |
Banque Centrale de Tunisie SA(b) | |
01/30/25 | | | 5.750% | | | | 3,700,000 | | | | 3,829,500 | |
| | | |
| | | | | | | | | | | | |
TURKEY 7.6% | |
Export Credit Bank of Turkey(b) | |
04/24/19 | | | 5.875% | | | | 7,017,000 | | | | 7,443,002 | |
09/23/21 | | | 5.000% | | | | 4,250,000 | | | | 4,250,000 | |
|
Turkey Government Bond | |
07/24/24 | | | 9.000% | | | TRY | 11,798,000 | | | | 4,392,356 | |
|
Turkey Government International Bond | |
03/30/21 | | | 5.625% | | | | 663,000 | | | | 723,267 | |
09/26/22 | | | 6.250% | | | | 1,560,000 | | | | 1,762,800 | |
03/23/23 | | | 3.250% | | | | 2,000,000 | | | | 1,885,000 | |
02/05/25 | | | 7.375% | | | | 4,868,000 | | | | 5,981,555 | |
04/14/26 | | | 4.250% | | | | 3,400,000 | | | | 3,304,936 | |
03/17/36 | | | 6.875% | | | | 5,544,000 | | | | 6,748,711 | |
05/30/40 | | | 6.750% | | | | 2,973,000 | | | | 3,596,438 | |
02/17/45 | | | 6.625% | | | | 3,750,000 | | | | 4,537,500 | |
| | | | | | | | | | | | | |
Total | | | | | | | | | | | 44,625,565 | |
| | | |
| | | | | | | | | | | | |
UKRAINE —% | |
Ukraine Government International Bond(b) | |
02/23/21 | | | 7.950% | | | | 355,000 | | | | 162,413 | |
| | | |
| | | | | | | | | | | | |
URUGUAY 0.6% | |
Uruguay Government International Bond | |
03/21/36 | | | 7.625% | | | | 1,710,404 | | | | 2,386,013 | |
11/20/45 | | | 4.125% | | | | 1,396,949 | | | | 1,281,701 | |
| | | | | | | | | | | | | |
Total | | | | | | | | | | | 3,667,714 | |
| | | |
| | | | | | | | | | | | |
VENEZUELA 5.0% | |
Petroleos de Venezuela SA | |
04/12/17 | | | 5.250% | | | | 23,922,000 | | | | 13,991,978 | |
11/17/21 | | | 9.000% | | | | 6,782,647 | | | | 3,305,862 | |
05/16/24 | | | 6.000% | | | | 12,785,871 | | | | 5,402,030 | |
|
Venezuela Government International Bond | |
10/13/19 | | | 7.750% | | | | 3,083,000 | | | | 1,425,888 | |
05/07/23 | | | 9.000% | | | | 11,400,500 | | | | 5,187,227 | |
| | | | | | | | | | | | | |
Total | | | | | | | | | | | 29,312,985 | |
| | | |
| | | | | | | | | | | | |
ZAMBIA 1.0% | |
Zambia Government International Bond(b) | |
04/14/24 | | | 8.500% | | | | 5,446,000 | | | | 5,898,672 | |
| | | | | | | | | | | | | |
Total Foreign Government Obligations | | | | | |
(Cost: $475,546,291) | | | | 462,489,154 | |
The accompanying Notes to Financial Statements are an integral part of this statement.
| | |
| |
| | COLUMBIA EMERGING MARKETS BOND FUND |
PORTFOLIO OF INVESTMENTS (continued)
April 30, 2015 (Unaudited)
| | | | | | | | | | |
| Money Market Funds 4.2% | |
| | | | | Shares | | | Value ($) | |
Columbia Short-Term Cash Fund, 0.111%(f)(g) | | | | | 24,802,677 | | | | 24,802,677 | |
| | | | | | | | | | | |
Total Money Market Funds | | | | | | | | | | |
(Cost: $24,802,677) | | | | | | | | | 24,802,677 | |
| | | | | | | | | | | |
Total Investments | | | | | | | | | | |
(Cost: $610,465,129) | | | | | | | | | 585,011,717 | |
| | | | | | | | | | | |
Other Assets & Liabilities, Net | | | | | | | | | 4,287,543 | |
| | | | | | | | | | | |
Net Assets | | | | | | | | | 589,299,260 | |
| | | | | | | | | | | |
Investments in Derivatives
Forward Foreign Currency Exchange Contracts Open at April 30, 2015
| | | | | | | | | | | | | | | | | | | | |
| Counterparty | | Exchange
Date | | | Currency to
be Delivered | | | Currency to
be Received | | | Unrealized
Appreciation ($) | | | Unrealized
Depreciation ($) | |
| | | | | |
Citicorp Investment Bank | | | 05/13/2015 | | | | 15,000,000,000 COP | | | | 5,966,587 USD | | | | — | | | | (324,833 | ) |
| | | | | |
Citicorp Investment Bank | | | 05/13/2015 | | | | 17,000,000,000 COP | | | | 6,732,007 USD | | | | — | | | | (398,269 | ) |
| | | | | |
J.P. Morgan Securities, Inc. | | | 05/15/2015 | | | | 8,846,000 SGD | | | | 6,504,785 USD | | | | — | | | | (178,950 | ) |
| | | | | |
J.P. Morgan Securities, Inc. | | | 05/15/2015 | | | | 11,265,000 SGD | | | | 8,305,685 USD | | | | — | | | | (205,764 | ) |
| | | | | |
Standard Chartered Bank | | | 05/22/2015 | | | | 14,397,000 PEN | | | | 4,576,287 USD | | | | — | | | | (9,119 | ) |
| | | | | |
UBS Securities | | | 06/05/2015 | | | | 28,000,000 EUR | | | | 30,446,500 USD | | | | — | | | | (1,006,762 | ) |
| | | | | | | | | | | | | | | | | | | | | |
Total | | | | | | | | | | | | | | | — | | | | (2,123,697 | ) |
| | | | | | | | | | | | | | | | | | | | | |
Futures Contracts Outstanding at April 30, 2015
At April 30, 2015, cash totaling $393,300 was pledged as collateral to cover initial margin requirements on open futures contracts.
Short Futures Contracts Outstanding
| | | | | | | | | | | | | | | | | | | | | | | | |
| Contract Description | | Number of
Contracts | | | Trading
Currency | | | Notional Market
Value ($) | | | Expiration Date | | | Unrealized
Appreciation ($) | | | Unrealized
Depreciation ($) | |
US 10YR NOTE (CBT) | | | (114 | ) | | | USD | | | | (14,634,750 | ) | | | 06/2015 | | | | — | | | | (132,000 | ) |
US ULTRA BOND (CBT) | | | (63 | ) | | | USD | | | | (10,363,500 | ) | | | 06/2015 | | | | 119,609 | | | | — | |
| | | | | | | | | | | | | | | | | | | | | | | | | |
Total | | | | | | | | | | | (24,998,250 | ) | | | | | | | 119,609 | | | | (132,000 | ) |
| | | | | | | | | | | | | | | | | | | | | | | | | |
Notes to Portfolio of Investments
| (a) | Principal amounts are denominated in United States Dollars unless otherwise noted. |
| (b) | Security exempt from registration pursuant to Rule 144A under the Securities Act of 1933. This security may be resold in transactions exempt from registration, normally to qualified institutional buyers. At April 30, 2015, the value of these securities amounted to $327,479,104 or 55.57% of net assets. |
| (c) | Variable rate security. |
| (d) | Security, or a portion thereof, has been purchased on a when-issued or delayed delivery basis. |
| (e) | Principal and interest may not be guaranteed by the government. |
| (f) | The rate shown is the seven-day current annualized yield at April 30, 2015. |
| (g) | As defined in the Investment Company Act of 1940, an affiliated company is one in which the Fund owns 5% or more of the company’s outstanding voting securities, or a company which is under common ownership or control with the Fund. Holdings and transactions in these affiliated companies during the period ended April 30, 2015, are as follows: |
| | | | | | | | | | | | | | | | | | | | | | | | |
| Issuer | | Beginning
Cost ($) | | | Purchase
Cost ($) | | | Proceeds
From Sales ($) | | | Ending
Cost ($) | | | Dividends —
Affiliated
Issuers ($) | | | Value ($) | |
Columbia Short-Term Cash Fund | | | 26,239,617 | | | | 129,367,335 | | | | (130,804,275 | ) | | | 24,802,677 | | | | 10,774 | | | | 24,802,677 | |
The accompanying Notes to Financial Statements are an integral part of this statement.
| | |
| 10 | | Semiannual Report 2015 |
| | |
| |
| COLUMBIA EMERGING MARKETS BOND FUND | | |
PORTFOLIO OF INVESTMENTS (continued)
April 30, 2015 (Unaudited)
Notes to Portfolio of Investments (continued)
Currency Legend
| | |
| BRL | | Brazilian Real |
| COP | | Colombian Peso |
| DOP | | Dominican Republic Peso |
| EUR | | Euro |
| IDR | | Indonesian Rupiah |
| MXN | | Mexican Peso |
| PEN | | Peru Nuevos Soles |
| PHP | | Philippine Peso |
| SGD | | Singapore Dollar |
| TRY | | Turkish Lira |
| USD | | US Dollar |
| UYU | | Uruguay Pesos |
Fair Value Measurements
Generally accepted accounting principles (GAAP) require disclosure regarding the inputs and valuation techniques used to measure fair value and any changes in valuation inputs or techniques. In addition, investments shall be disclosed by major category.
The Fund categorizes its fair value measurements according to a three-level hierarchy that maximizes the use of observable inputs and minimizes the use of unobservable inputs by prioritizing that the most observable input be used when available. Observable inputs are those that market participants would use in pricing an investment based on market data obtained from sources independent of the reporting entity. Unobservable inputs are those that reflect the Fund’s assumptions about the information market participants would use in pricing an investment. An investment’s level within the fair value hierarchy is based on the lowest level of any input that is deemed significant to the asset or liability’s fair value measurement. The input levels are not necessarily an indication of the risk or liquidity associated with investments at that level. For example, certain U.S. government securities are generally high quality and liquid, however, they are reflected as Level 2 because the inputs used to determine fair value may not always be quoted prices in an active market.
Fair value inputs are summarized in the three broad levels listed below:
| n | | Level 1 — Valuations based on quoted prices for investments in active markets that the Fund has the ability to access at the measurement date (including NAV for open-end mutual funds). Valuation adjustments are not applied to Level 1 investments. |
| n | | Level 2 — Valuations based on other significant observable inputs (including quoted prices for similar securities, interest rates, prepayment speeds, credit risks, etc.). |
| n | | Level 3 — Valuations based on significant unobservable inputs (including the Fund’s own assumptions and judgment in determining the fair value of investments). |
Inputs that are used in determining fair value of an investment may include price information, credit data, volatility statistics, and other factors. These inputs can be either observable or unobservable. The availability of observable inputs can vary between investments, and is affected by various factors such as the type of investment, and the volume and level of activity for that investment or similar investments in the marketplace. The inputs will be considered by the Investment Manager, along with any other relevant factors in the calculation of an investment’s fair value. The Fund uses prices and inputs that are current as of the measurement date, which may include periods of market dislocations. During these periods, the availability of prices and inputs may be reduced for many investments. This condition could cause an investment to be reclassified between the various levels within the hierarchy.
Investments falling into the Level 3 category are primarily supported by quoted prices from brokers and dealers participating in the market for those investments. However, these may be classified as Level 3 investments due to lack of market transparency and corroboration to support these quoted prices. Additionally, valuation models may be used as the pricing source for any remaining investments classified as Level 3. These models may rely on one or more significant unobservable inputs and/or significant assumptions by the Investment Manager. Inputs used in valuations may include, but are not limited to, financial statement analysis, capital account balances, discount rates and estimated cash flows, and comparable company data.
Under the direction of the Fund’s Board of Trustees (the Board), the Investment Manager’s Valuation Committee (the Committee) is responsible for overseeing the valuation procedures approved by the Board. The Committee consists of voting and non-voting members from various groups within the Investment Manager’s organization, including operations and accounting, trading and investments, compliance, risk management and legal.
The Committee meets at least monthly to review and approve valuation matters, which may include a description of specific valuation determinations, data regarding pricing information received from approved pricing vendors and brokers and the results of Board-approved valuation control policies and procedures (the Policies). The Policies address, among other things, instances when market quotations are or are not readily available, including recommendations of third party pricing vendors and a determination of appropriate pricing methodologies; events that require specific valuation determinations and assessment of fair value techniques; securities with a potential for stale pricing, including those that are illiquid, restricted, or in default; and the effectiveness of third party pricing vendors, including periodic reviews of vendors. The Committee meets more frequently, as needed, to discuss additional valuation matters, which may include the need to review back-testing results, review time-sensitive information or approve related valuation actions. The Committee reports to the Board, with members of the Committee meeting with the Board at each of its regularly scheduled meetings to discuss valuation matters and actions during the period, similar to those described
earlier.
For investments categorized as Level 3, the Committee monitors information similar to that described above, which may include:(i) data specific to the issuer or comparable issuers, (ii) general market or specific sector news and (iii) quoted prices and specific or similar security transactions. The Committee considers this data and any changes from prior periods in order to assess the reasonableness of observable and unobservable inputs,
The accompanying Notes to Financial Statements are an integral part of this statement.
| | | | |
| Semiannual Report 2015 | | | 11 | |
| | |
| |
| | COLUMBIA EMERGING MARKETS BOND FUND |
PORTFOLIO OF INVESTMENTS (continued)
April 30, 2015 (Unaudited)
Fair Value Measurements (continued)
any assumptions or internal models used to value those securities and changes in fair value. This data is also used to corroborate, when available, information received from approved pricing vendors and brokers. Various factors impact the frequency of monitoring this information (which may occur as often as daily). However, the Committee may determine that changes to inputs, assumptions and models are not required as a result of the monitoring procedures performed.
The following table is a summary of the inputs used to value the Fund’s investments at April 30, 2015:
| | | | | | | | | | | | | | | | |
| Description | | Level 1 Quoted Prices in Active
Markets for Identical
Assets ($) | | | Level 2 Other Significant
Observable Inputs ($) | | | Level 3 Significant
Unobservable Inputs ($) | | | Total ($) | |
Bonds | | | | | | | | | | | | | | | | |
| | | | |
Corporate Bonds & Notes | | | | | | | | | | | | | | | | |
| | | | |
Banking | | | — | | | | 10,209,242 | | | | 1,913,446 | | | | 12,122,688 | |
| | | | |
All Other Industries | | | — | | | | 70,772,330 | | | | — | | | | 70,772,330 | |
| | | | |
Inflation-Indexed Bonds | | | — | | | | 14,824,868 | | | | — | | | | 14,824,868 | |
| | | | |
Foreign Government Obligations | | | — | | | | 453,151,051 | | | | 9,338,103 | | | | 462,489,154 | |
| | | | | | | | | | | | | | | | | |
Total Bonds | | | — | | | | 548,957,491 | | | | 11,251,549 | | | | 560,209,040 | |
| | | | | | | | | | | | | | | | | |
Mutual Funds | | | | | | | | | | | | | | | | |
| | | | |
Money Market Funds | | | 24,802,677 | | | | — | | | | — | | | | 24,802,677 | |
| | | | | | | | | | | | | | | | | |
Total Mutual Funds | | | 24,802,677 | | | | — | | | | — | | | | 24,802,677 | |
| | | | | | | | | | | | | | | | | |
Investments in Securities | | | 24,802,677 | | | | 548,957,491 | | | | 11,251,549 | | | | 585,011,717 | |
| | | | |
Derivatives | | | | | | | | | | | | | | | | |
| | | | |
Assets | | | | | | | | | | | | | | | | |
| | | | |
Futures Contracts | | | 119,609 | | | | — | | | | — | | | | 119,609 | |
| | | | |
Liabilities | | | | | | | | | | | | | | | | |
| | | | |
Forward Foreign Currency Exchange Contracts | | | — | | | | (2,123,697 | ) | | | — | | | | (2,123,697 | ) |
| | | | |
Futures Contracts | | | (132,000 | ) | | | — | | | | — | | | | (132,000 | ) |
| | | | | | | | | | | | | | | | | |
Total | | | 24,790,286 | | | | 546,833,794 | | | | 11,251,549 | | | | 582,875,629 | |
| | | | | | | | | | | | | | | | | |
See the Portfolio of Investments for all investment classifications not indicated in the table.
The Fund’s assets assigned to the Level 2 input category are generally valued using the market approach, in which a security’s value is determined through reference to prices and information from market transactions for similar or identical assets.
There were no transfers of financial assets between Levels 1 and 2 during the period.
Derivative instruments are valued at unrealized appreciation (depreciation).
The following table is a reconciliation of Level 3 assets for which significant observable and/or unobservable inputs were used to determine fair value:
| | | | | | | | | | | | |
| | | Corporate Bonds &
Notes ($) | | | Foreign Government Obligations ($) | | | Total ($) | |
Balance as of October 31, 2014 | | | 5,206,294 | | | | 14,618,661 | | | | 19,824,955 | |
| | | |
Increase (decrease) in accrued discounts/premiums | | | 366 | | | | (38,517 | ) | | | (38,151 | ) |
| | | |
Realized gain (loss) | | | — | | | | 103,761 | | | | 103,761 | |
| | | |
Change in unrealized appreciation (depreciation)(a) | | | (180,659 | ) | | | (64,290 | ) | | | (244,949 | ) |
| | | |
Sales | | | — | | | | (2,895,333 | ) | | | (2,895,333 | ) |
| | | |
Purchases | | | — | | | | — | | | | — | |
| | | |
Transfers into Level 3 | | | — | | | | — | | | | — | |
| | | |
Transfers out of Level 3 | | | (3,112,555 | ) | | | (2,386,179 | ) | | | (5,498,734 | ) |
| | | | | | | | | | | | | |
Balance as of April 30, 2015 | | | 1,913,446 | | | | 9,338,103 | | | | 11,251,549 | |
| | | | | | | | | | | | | |
The accompanying Notes to Financial Statements are an integral part of this statement.
| | |
| 12 | | Semiannual Report 2015 |
| | |
| |
| COLUMBIA EMERGING MARKETS BOND FUND | | |
PORTFOLIO OF INVESTMENTS (continued)
April 30, 2015 (Unaudited)
Fair Value Measurements (continued)
| | (a) | Change in unrealized appreciation (depreciation) relating to securities held at April 30, 2015 was $(165,353), which is comprised of Corporate Bonds & Notes of $(180,659) and Foreign Government Obligations of $15,306. |
The Fund’s assets assigned to the Level 3 category are valued utilizing the valuation technique deemed the most appropriate in the circumstances. Certain corporate bonds and foreign government obligations classified as Level 3 securities are valued using the market approach and utilize single market quotations from broker dealers which may have included, but were not limited to, observable transactions for identical or similar assets in the market and the distressed nature of the security. The appropriateness of fair values for these securities is monitored on an ongoing basis which may include results of back testing, manual price reviews and other control procedures. Significant increases (decreases) to any of these inputs would result in a significantly lower (higher) valuation measurement.
Financial assets were transferred from Level 3 to Level 2 as observable market inputs were utilized and management determined that there was sufficient, reliable and observable market data to value these assets as of period end.
Transfers in and/or out of Level 3 are determined based on the fair value at the beginning of the period for security positions held throughout the period.
The accompanying Notes to Financial Statements are an integral part of this statement.
| | | | |
| Semiannual Report 2015 | | | 13 | |
| | |
| |
| | COLUMBIA EMERGING MARKETS BOND FUND |
STATEMENT OF ASSETS AND LIABILITIES
April 30, 2015 (Unaudited)
| | | | |
Assets | | | | |
| |
Investments, at value | | | | |
| |
Unaffiliated issuers (identified cost $585,662,452) | | | $560,209,040 | |
| |
Affiliated issuers (identified cost $24,802,677) | | | 24,802,677 | |
| |
Total investments (identified cost $610,465,129) | | | 585,011,717 | |
| |
Foreign currency (identified cost $466,882) | | | 439,361 | |
| |
Margin deposits | | | 393,300 | |
| |
Receivable for: | | | | |
| |
Investments sold | | | 4,003,977 | |
| |
Capital shares sold | | | 193,381 | |
| |
Dividends | | | 1,977 | |
| |
Interest | | | 8,815,555 | |
| |
Reclaims | | | 132,738 | |
| |
Variation margin | | | 31,782 | |
| |
Prepaid expenses | | | 1,142 | |
| |
Other assets | | | 33,116 | |
| |
Total assets | | | 599,058,046 | |
| |
| |
Liabilities | | | | |
| |
Disbursements in excess of cash | | | 25,428 | |
| |
Unrealized depreciation on forward foreign currency exchange contracts | | | 2,123,697 | |
| |
Payable for: | | | | |
| |
Investments purchased | | | 3,796,261 | |
| |
Investments purchased on a delayed delivery basis | | | 2,915,040 | |
| |
Capital shares purchased | | | 678,800 | |
| |
Investment management fees | | | 8,581 | |
| |
Distribution and/or service fees | | | 2,505 | |
| |
Transfer agent fees | | | 99,204 | |
| |
Administration fees | | | 1,122 | |
| |
Compensation of board members | | | 37,405 | |
| |
Other expenses | | | 70,743 | |
| |
Total liabilities | | | 9,758,786 | |
| |
Net assets applicable to outstanding capital stock | | | $589,299,260 | |
| |
| |
Represented by | | | | |
| |
Paid-in capital | | | $621,790,749 | |
| |
Undistributed net investment income | | | 5,224,292 | |
| |
Accumulated net realized loss | | | (10,069,980 | ) |
| |
Unrealized appreciation (depreciation) on: | | | | |
| |
Investments | | | (25,453,412 | ) |
| |
Foreign currency translations | | | (56,301 | ) |
| |
Forward foreign currency exchange contracts | | | (2,123,697 | ) |
| |
Futures contracts | | | (12,391 | ) |
| |
Total — representing net assets applicable to outstanding capital stock | | | $589,299,260 | |
| |
The accompanying Notes to Financial Statements are an integral part of this statement.
| | |
| 14 | | Semiannual Report 2015 |
| | |
| |
| COLUMBIA EMERGING MARKETS BOND FUND | | |
STATEMENT OF ASSETS AND LIABILITIES (continued)
April 30, 2015 (Unaudited)
| | | | |
Class A | | | | |
| |
Net assets | | | $172,388,369 | |
| |
Shares outstanding | | | 15,621,974 | |
| |
Net asset value per share | | | $11.03 | |
| |
Maximum offering price per share(a) | | | $11.58 | |
| |
Class B | | | | |
| |
Net assets | | | $879,199 | |
| |
Shares outstanding | | | 79,707 | |
| |
Net asset value per share | | | $11.03 | |
| |
Class C | | | | |
| |
Net assets | | | $40,989,112 | |
| |
Shares outstanding | | | 3,732,295 | |
| |
Net asset value per share | | | $10.98 | |
| |
Class I | | | | |
| |
Net assets | | | $247,575,474 | |
| |
Shares outstanding | | | 22,430,656 | |
| |
Net asset value per share | | | $11.04 | |
| |
Class K | | | | |
| |
Net assets | | | $21,533 | |
| |
Shares outstanding | | | 1,953 | |
| |
Net asset value per share | | | $11.03 | |
| |
Class R | | | | |
| |
Net assets | | | $11,993,730 | |
| |
Shares outstanding | | | 1,087,000 | |
| |
Net asset value per share | | | $11.03 | |
| |
Class R4 | | | | |
| |
Net assets | | | $4,797,184 | |
| |
Shares outstanding | | | 434,305 | |
| |
Net asset value per share | | | $11.05 | |
| |
Class R5 | | | | |
| |
Net assets | | | $7,458,869 | |
| |
Shares outstanding | | | 676,082 | |
| |
Net asset value per share | | | $11.03 | |
| |
Class W | | | | |
| |
Net assets | | | $378,048 | |
| |
Shares outstanding | | | 34,307 | |
| |
Net asset value per share | | | $11.02 | |
| |
Class Y | | | | |
| |
Net assets | | | $2,028,615 | |
| |
Shares outstanding | | | 183,764 | |
| |
Net asset value per share | | | $11.04 | |
| |
Class Z | | | | |
| |
Net assets | | | $100,789,127 | |
| |
Shares outstanding | | | 9,131,851 | |
| |
Net asset value per share | | | $11.04 | |
| |
| (a) | The maximum offering price per share is calculated by dividing the net asset value per share by 1.0 minus the maximum sales charge of 4.75%. |
The accompanying Notes to Financial Statements are an integral part of this statement.
| | | | |
| Semiannual Report 2015 | | | 15 | |
| | |
| |
| | COLUMBIA EMERGING MARKETS BOND FUND |
STATEMENT OF OPERATIONS
Six Months Ended April 30, 2015 (Unaudited)
| | | | |
Net investment income | | | | |
Income: | | | | |
Dividends — affiliated issuers | | | $10,774 | |
Interest | | | 21,215,718 | |
Foreign taxes withheld | | | (346,339 | ) |
| |
Total income | | | 20,880,153 | |
| |
Expenses: | | | | |
Investment management fees | | | 1,620,999 | |
Distribution and/or service fees | | | | |
Class A | | | 214,115 | |
Class B | | | 4,755 | |
Class C | | | 225,943 | |
Class R | | | 27,065 | |
Class W | | | 14,218 | |
Transfer agent fees | | | | |
Class A | | | 210,905 | |
Class B | | | 1,173 | |
Class C | | | 55,804 | |
Class K | | | 6 | |
Class R | | | 13,191 | |
Class R4 | | | 3,134 | |
Class R5 | | | 2,275 | |
Class W | | | 15,337 | |
Class Z | | | 123,530 | |
Administration fees | | | 211,557 | |
Plan administration fees | | | | |
Class K | | | 30 | |
Compensation of board members | | | 10,571 | |
Custodian fees | | | 30,765 | |
Printing and postage fees | | | 51,102 | |
Registration fees | | | 74,633 | |
Professional fees | | | 21,399 | |
Other | | | 34,092 | |
| |
Total expenses | | | 2,966,599 | |
| |
Net investment income | | | 17,913,554 | |
| |
| |
Realized and unrealized gain (loss) — net | | | | |
Net realized gain (loss) on: | | | | |
Investments | | | (14,183,828 | ) |
Foreign currency translations | | | (461,764 | ) |
Forward foreign currency exchange contracts | | | 7,282,670 | |
Futures contracts | | | (3,027,864 | ) |
| |
Net realized loss | | | (10,390,786 | ) |
Net change in unrealized appreciation (depreciation) on: | | | | |
Investments | | | (15,042,157 | ) |
Foreign currency translations | | | 40,052 | |
Forward foreign currency exchange contracts | | | (1,977,567 | ) |
Futures contracts | | | 873,534 | |
| |
Net change in unrealized depreciation | | | (16,106,138 | ) |
| |
Net realized and unrealized loss | | | (26,496,924 | ) |
| |
Net decrease in net assets from operations | | | $(8,583,370 | ) |
| |
The accompanying Notes to Financial Statements are an integral part of this statement.
| | |
| 16 | | Semiannual Report 2015 |
| | |
| |
| COLUMBIA EMERGING MARKETS BOND FUND | | |
STATEMENT OF CHANGES IN NET ASSETS
| | | | | | | | |
| | | Six Months Ended
April 30, 2015
(Unaudited) | | | Year Ended
October 31, 2014 | |
Operations | | | | | | | | |
| | |
Net investment income | | | $17,913,554 | | | | $41,771,998 | |
| | |
Net realized loss | | | (10,390,786 | ) | | | (7,675,552 | ) |
| | |
Net change in unrealized depreciation | | | (16,106,138 | ) | | | (4,597,381 | ) |
| |
Net increase (decrease) in net assets resulting from operations | | | (8,583,370 | ) | | | 29,499,065 | |
| |
| | |
Distributions to shareholders | | | | | | | | |
| | |
Net investment income | | | | | | | | |
| | |
Class A | | | (3,511,972 | ) | | | (8,885,435 | ) |
| | |
Class B | | | (15,821 | ) | | | (56,998 | ) |
| | |
Class C | | | (763,051 | ) | | | (1,983,673 | ) |
| | |
Class I | | | (5,928,426 | ) | | | (14,549,570 | ) |
| | |
Class K | | | (521 | ) | | | (1,654 | ) |
| | |
Class R | | | (207,348 | ) | | | (265,843 | ) |
| | |
Class R4 | | | (59,621 | ) | | | (80,689 | ) |
| | |
Class R5 | | | (212,473 | ) | | | (718,491 | ) |
| | |
Class W | | | (295,432 | ) | | | (2,662,924 | ) |
| | |
Class Y | | | (41,790 | ) | | | (273,974 | ) |
| | |
Class Z | | | (2,187,054 | ) | | | (5,117,320 | ) |
| | |
Net realized gains | | | | | | | | |
| | |
Class A | | | (152,243 | ) | | | (2,757,704 | ) |
| | |
Class B | | | (841 | ) | | | (24,022 | ) |
| | |
Class C | | | (41,414 | ) | | | (718,679 | ) |
| | |
Class I | | | (220,145 | ) | | | (3,825,672 | ) |
| | |
Class K | | | (20 | ) | | | (464 | ) |
| | |
Class R | | | (9,181 | ) | | | (58,040 | ) |
| | |
Class R4 | | | (1,727 | ) | | | (14,613 | ) |
| | |
Class R5 | | | (7,406 | ) | | | (106,460 | ) |
| | |
Class W | | | (25,818 | ) | | | (816,706 | ) |
| | |
Class Y | | | (1,641 | ) | | | (119,010 | ) |
| | |
Class Z | | | (89,492 | ) | | | (1,464,362 | ) |
| |
Total distributions to shareholders | | | (13,773,437 | ) | | | (44,502,303 | ) |
| |
Decrease in net assets from capital stock activity | | | (84,975,607 | ) | | | (81,418,355 | ) |
| |
Total decrease in net assets | | | (107,332,414 | ) | | | (96,421,593 | ) |
| | |
Net assets at beginning of period | | | 696,631,674 | | | | 793,053,267 | |
| |
Net assets at end of period | | | $589,299,260 | | | | $696,631,674 | |
| |
Undistributed net investment income | | | $5,224,292 | | | | $534,247 | |
| |
The accompanying Notes to Financial Statements are an integral part of this statement.
| | | | |
| Semiannual Report 2015 | | | 17 | |
| | |
| |
| | COLUMBIA EMERGING MARKETS BOND FUND |
STATEMENT OF CHANGES IN NET ASSETS (continued)
| | | | | | | | | | | | | | | | |
| | | Six Months Ended
April 30, 2015 (Unaudited) | | | Year Ended
October 31, 2014 | |
| | | Shares | | | Dollars ($) | | | Shares | | | Dollars ($) | |
Capital stock activity | | | | | | | | | | | | | | | | |
| | | | |
Class A shares | | | | | | | | | | | | | | | | |
| | | | |
Subscriptions(a) | | | 2,474,212 | | | | 26,984,485 | | | | 7,953,919 | | | | 90,510,930 | |
| | | | |
Distributions reinvested | | | 322,381 | | | | 3,470,169 | | | | 976,547 | | | | 10,928,869 | |
| | | | |
Redemptions | | | (3,789,165 | ) | | | (41,056,471 | ) | | | (12,653,428 | ) | | | (142,857,258 | ) |
| |
Net decrease | | | (992,572 | ) | | | (10,601,817 | ) | | | (3,722,962 | ) | | | (41,417,459 | ) |
| |
Class B shares | | | | | | | | | | | | | | | | |
| | | | |
Subscriptions | | | 1,955 | | | | 21,441 | | | | 3,703 | | | | 41,966 | |
| | | | |
Distributions reinvested | | | 1,459 | | | | 15,684 | | | | 6,881 | | | | 76,718 | |
| | | | |
Redemptions(a) | | | (18,929 | ) | | | (204,503 | ) | | | (93,475 | ) | | | (1,053,133 | ) |
| |
Net decrease | | | (15,515 | ) | | | (167,378 | ) | | | (82,891 | ) | | | (934,449 | ) |
| |
Class C shares | | | | | | | | | | | | | | | | |
| | | | |
Subscriptions | | | 254,326 | | | | 2,734,479 | | | | 1,303,858 | | | | 14,675,434 | |
| | | | |
Distributions reinvested | | | 65,814 | | | | 704,182 | | | | 212,194 | | | | 2,359,677 | |
| | | | |
Redemptions | | | (1,278,084 | ) | | | (13,759,272 | ) | | | (1,872,377 | ) | | | (21,015,050 | ) |
| |
Net decrease | | | (957,944 | ) | | | (10,320,611 | ) | | | (356,325 | ) | | | (3,979,939 | ) |
| |
Class I shares | | | | | | | | | | | | | | | | |
| | | | |
Subscriptions | | | 429,815 | | | | 4,698,406 | | | | 2,658,847 | | | | 29,770,254 | |
| | | | |
Distributions reinvested | | | 570,137 | | | | 6,148,335 | | | | 1,640,448 | | | | 18,374,569 | |
| | | | |
Redemptions | | | (4,235,134 | ) | | | (46,663,589 | ) | | | (2,958,838 | ) | | | (34,134,866 | ) |
| |
Net increase (decrease) | | | (3,235,182 | ) | | | (35,816,848 | ) | | | 1,340,457 | | | | 14,009,957 | |
| |
Class K shares | | | | | | | | | | | | | | | | |
| | | | |
Subscriptions | | | — | | | | — | | | | 79 | | | | 900 | |
| | | | |
Distributions reinvested | | | 30 | | | | 321 | | | | 132 | | | | 1,476 | |
| | | | |
Redemptions | | | (1,345 | ) | | | (14,773 | ) | | | (95 | ) | | | (1,067 | ) |
| |
Net increase (decrease) | | | (1,315 | ) | | | (14,452 | ) | | | 116 | | | | 1,309 | |
| |
Class R shares | | | | | | | | | | | | | | | | |
| | | | |
Subscriptions | | | 311,459 | | | | 3,375,792 | | | | 710,740 | | | | 8,025,976 | |
| | | | |
Distributions reinvested | | | 15,488 | | | | 166,707 | | | | 16,901 | | | | 190,126 | |
| | | | |
Redemptions | | | (138,035 | ) | | | (1,488,566 | ) | | | (149,869 | ) | | | (1,687,429 | ) |
| |
Net increase | | | 188,912 | | | | 2,053,933 | | | | 577,772 | | | | 6,528,673 | |
| |
Class R4 shares | | | | | | | | | | | | | | | | |
| | | | |
Subscriptions | | | 290,190 | | | | 3,150,694 | | | | 174,853 | | | | 1,966,508 | |
| | | | |
Distributions reinvested | | | 5,653 | | | | 61,131 | | | | 8,460 | | | | 95,008 | |
| | | | |
Redemptions | | | (35,920 | ) | | | (385,861 | ) | | | (99,911 | ) | | | (1,140,132 | ) |
| |
Net increase | | | 259,923 | | | | 2,825,964 | | | | 83,402 | | | | 921,384 | |
| |
Class R5 shares | | | | | | | | | | | | | | | | |
| | | | |
Subscriptions | | | 583,050 | | | | 6,263,311 | | | | 2,962,781 | | | | 33,740,533 | |
| | | | |
Distributions reinvested | | | 20,246 | | | | 218,018 | | | | 73,032 | | | | 824,635 | |
| | | | |
Redemptions | | | (712,300 | ) | | | (7,669,190 | ) | | | (3,270,212 | ) | | | (37,510,652 | ) |
| |
Net decrease | | | (109,004 | ) | | | (1,187,861 | ) | | | (234,399 | ) | | | (2,945,484 | ) |
| |
The accompanying Notes to Financial Statements are an integral part of this statement.
| | |
| 18 | | Semiannual Report 2015 |
| | |
| |
| COLUMBIA EMERGING MARKETS BOND FUND | | |
STATEMENT OF CHANGES IN NET ASSETS (continued)
| | | | | | | | | | | | | | | | |
| | | Six Months Ended
April 30, 2015 (Unaudited) | | | Year Ended
October 31, 2014 | |
| | | Shares | | | Dollars ($) | | | Shares | | | Dollars ($) | |
Capital stock activity (continued) | | | | | | | | | | | | | | | | |
| | | | |
Class W shares | | | | | | | | | | | | | | | | |
| | | | |
Subscriptions | | | 45,156 | | | | 493,316 | | | | 998,645 | | | | 11,252,255 | |
| | | | |
Distributions reinvested | | | 30,082 | | | | 321,043 | | | | 311,383 | | | | 3,479,229 | |
| | | | |
Redemptions | | | (2,814,038 | ) | | | (29,802,645 | ) | | | (4,152,387 | ) | | | (47,066,278 | ) |
| |
Net decrease | | | (2,738,800 | ) | | | (28,988,286 | ) | | | (2,842,359 | ) | | | (32,334,794 | ) |
| |
Class Y shares | | | | | | | | | | | | | | | | |
| | | | |
Subscriptions | | | 72,130 | | | | 786,444 | | | | 35,680 | | | | 409,400 | |
| | | | |
Distributions reinvested | | | 4,038 | | | | 43,431 | | | | 35,465 | | | | 392,895 | |
| | | | |
Redemptions | | | (14,069 | ) | | | (152,464 | ) | | | (750,506 | ) | | | (8,327,428 | ) |
| |
Net increase (decrease) | | | 62,099 | | | | 677,411 | | | | (679,361 | ) | | | (7,525,133 | ) |
| |
Class Z shares | | | | | | | | | | | | | | | | |
| | | | |
Subscriptions | | | 1,783,545 | | | | 19,376,524 | | | | 5,513,407 | | | | 62,770,029 | |
| | | | |
Distributions reinvested | | | 186,466 | | | | 2,008,367 | | | | 510,023 | | | | 5,712,404 | |
| | | | |
Redemptions | | | (2,291,320 | ) | | | (24,820,553 | ) | | | (7,288,378 | ) | | | (82,224,853 | ) |
| |
Net decrease | | | (321,309 | ) | | | (3,435,662 | ) | | | (1,264,948 | ) | | | (13,742,420 | ) |
| |
Total net decrease | | | (7,860,707 | ) | | | (84,975,607 | ) | | | (7,181,498 | ) | | | (81,418,355 | ) |
| |
| (a) | Includes conversions of Class B shares to Class A shares, if any. |
The accompanying Notes to Financial Statements are an integral part of this statement.
| | | | |
| Semiannual Report 2015 | | | 19 | |
| | |
| |
| | COLUMBIA EMERGING MARKETS BOND FUND |
FINANCIAL HIGHLIGHTS
The following tables are intended to help you understand the Fund’s financial performance. Certain information reflects financial results for a single share of a class held for the periods shown. Per share net investment income (loss) amounts are calculated based on average shares outstanding during the period. Total return assumes reinvestment of all dividends and distributions, if any. Total return does not reflect payment of sales charges, if any. Total return and portfolio turnover are not annualized for periods of less than one year. The portfolio turnover rate is calculated without regard to purchase and sales transactions of short-term instruments and certain derivatives, if any. If such transactions were included, the Fund’s portfolio turnover rate may be higher.
| | | | | | | | | | | | | | | | | | | | | | | | |
| |
| Six Months Ended
April 30, 2015 |
| | | Year Ended October 31, | |
Class A | | | (Unaudited) | | | | 2014 | | | | 2013 | | | | 2012 | | | | 2011 | | | | 2010 | |
Per share data | | | | | | | | | | | | | | | | | | | | | | | | |
Net asset value, beginning of period | | | $11.37 | | | | $11.59 | | | | $12.51 | | | | $11.33 | | | | $11.69 | | | | $10.35 | |
| | | | | | | | | | | | | | | | | | | | | | | | | |
Income from investment operations: | | | | | | | | | | | | | | | | | | | | | | | | |
| | | | | | |
Net investment income | | | 0.30 | | | | 0.60 | | | | 0.61 | | | | 0.65 | | | | 0.68 | | | | 0.76 | |
| | | | | | | | | | | | | | | | | | | | | | | | | |
Net realized and unrealized gain (loss) | | | (0.41 | ) | | | (0.18 | ) | | | (0.86 | ) | | | 1.16 | | | | (0.29 | ) | | | 1.32 | |
| | | | | | | | | | | | | | | | | | | | | | | | | |
Total from investment operations | | | (0.11 | ) | | | 0.42 | | | | (0.25 | ) | | | 1.81 | | | | 0.39 | | | | 2.08 | |
| | | | | | | | | | | | | | | | | | | | | | | | | |
Less distributions to shareholders: | | | | | | | | | | | | | | | | | | | | | | | | |
| | | | | | |
Net investment income | | | (0.22 | ) | | | (0.49 | ) | | | (0.59 | ) | | | (0.63 | ) | | | (0.75 | ) | | | (0.74 | ) |
| | | | | | | | | | | | | | | | | | | | | | | | | |
Net realized gains | | | (0.01 | ) | | | (0.15 | ) | | | (0.08 | ) | | | — | | | | — | | | | — | |
| | | | | | | | | | | | | | | | | | | | | | | | | |
Total distributions to shareholders | | | (0.23 | ) | | | (0.64 | ) | | | (0.67 | ) | | | (0.63 | ) | | | (0.75 | ) | | | (0.74 | ) |
| | | | | | | | | | | | | | | | | | | | | | | | | |
Net asset value, end of period | | | $11.03 | | | | $11.37 | | | | $11.59 | | | | $12.51 | | | | $11.33 | | | | $11.69 | |
| | | | | | | | | | | | | | | | | | | | | | | | | |
Total return | | | (0.90 | %) | | | 3.84 | % | | | (2.12 | %) | | | 16.51 | % | | | 3.58 | % | | | 20.75 | % |
| | | | | | | | | | | | | | | | | | | | | | | | | |
Ratios to average net assets(a) | | | | | | | | | | | | | | | | | | | | | | | | |
| | | | | | |
Total gross expenses | | | 1.17 | %(b) | | | 1.16 | % | | | 1.13 | % | | | 1.16 | % | | | 1.35 | % | | | 1.37 | % |
| | | | | | | | | | | | | | | | | | | | | | | | | |
Total net expenses(c) | | | 1.17 | %(b) | | | 1.16 | %(d) | | | 1.13 | %(d) | | | 1.16 | % | | | 1.28 | %(d) | | | 1.31 | % |
| | | | | | | | | | | | | | | | | | | | | | | | | |
Net investment income | | | 5.65 | %(b) | | | 5.29 | % | | | 5.00 | % | | | 5.54 | % | | | 5.91 | % | | | 6.93 | % |
| | | | | | | | | | | | | | | | | | | | | | | | | |
Supplemental data | | | | | | | | | | | | | | | | | | | | | | | | |
| | | | | | |
Net assets, end of period (in thousands) | | | $172,388 | | | | $188,935 | | | | $235,667 | | | | $284,818 | | | | $162,047 | | | | $76,725 | |
| | | | | | | | | | | | | | | | | | | | | | | | | |
Portfolio turnover | | | 20 | % | | | 42 | % | | | 26 | % | | | 21 | % | | | 24 | % | | | 38 | % |
| | | | | | | | | | | | | | | | | | | | | | | | | |
Notes to Financial Highlights
| (a) | In addition to the fees and expenses that the Fund bears directly, the Fund indirectly bears a pro rata share of the fees and expenses of any other funds in which it invests. Such indirect expenses are not included in the Fund’s reported expense ratios. |
| (c) | Total net expenses include the impact of certain fee waivers/expense reimbursements made by the Investment Manager and certain of its affiliates, if applicable. |
| (d) | The benefits derived from expense reductions had an impact of less than 0.01%. |
The accompanying Notes to Financial Statements are an integral part of this statement.
| | |
| 20 | | Semiannual Report 2015 |
| | |
| |
| COLUMBIA EMERGING MARKETS BOND FUND | | |
FINANCIAL HIGHLIGHTS (continued)
| | | | | | | | | | | | | | | | | | | | | | | | |
| |
| Six Months Ended
April 30, 2015 |
| | | Year Ended October 31, | |
Class B | | | (Unaudited) | | | | 2014 | | | | 2013 | | | | 2012 | | | | 2011 | | | | 2010 | |
Per share data | | | | | | | | | | | | | | | | | | | | | | | | |
Net asset value, beginning of period | | | $11.37 | | | | $11.59 | | | | $12.51 | | | | $11.32 | | | | $11.67 | | | | $10.34 | |
| | | | | | | | | | | | | | | | | | | | | | | | | |
Income from investment operations: | | | | | | | | | | | | | | | | | | | | | | | | |
| | | | | | |
Net investment income | | | 0.26 | | | | 0.51 | | | | 0.52 | | | | 0.57 | | | | 0.60 | | | | 0.67 | |
| | | | | | | | | | | | | | | | | | | | | | | | | |
Net realized and unrealized gain (loss) | | | (0.41 | ) | | | (0.18 | ) | | | (0.86 | ) | | | 1.16 | | | | (0.30 | ) | | | 1.31 | |
| | | | | | | | | | | | | | | | | | | | | | | | | |
Total from investment operations | | | (0.15 | ) | | | 0.33 | | | | (0.34 | ) | | | 1.73 | | | | 0.30 | | | | 1.98 | |
| | | | | | | | | | | | | | | | | | | | | | | | | |
Less distributions to shareholders: | | | | | | | | | | | | | | | | | | | | | | | | |
| | | | | | |
Net investment income | | | (0.18 | ) | | | (0.40 | ) | | | (0.50 | ) | | | (0.54 | ) | | | (0.65 | ) | | | (0.65 | ) |
| | | | | | | | | | | | | | | | | | | | | | | | | |
Net realized gains | | | (0.01 | ) | | | (0.15 | ) | | | (0.08 | ) | | | — | | | | — | | | | — | |
| | | | | | | | | | | | | | | | | | | | | | | | | |
Total distributions to shareholders | | | (0.19 | ) | | | (0.55 | ) | | | (0.58 | ) | | | (0.54 | ) | | | (0.65 | ) | | | (0.65 | ) |
| | | | | | | | | | | | | | | | | | | | | | | | | |
Net asset value, end of period | | | $11.03 | | | | $11.37 | | | | $11.59 | | | | $12.51 | | | | $11.32 | | | | $11.67 | |
| | | | | | | | | | | | | | | | | | | | | | | | | |
Total return | | | (1.27 | %) | | | 3.07 | % | | | (2.85 | %) | | | 15.73 | % | | | 2.77 | % | | | 19.76 | % |
| | | | | | | | | | | | | | | | | | | | | | | | | |
Ratios to average net assets(a) | | | | | | | | | | | | | | | | | | | | | | | | |
| | | | | | |
Total gross expenses | | | 1.92 | %(b) | | | 1.91 | % | | | 1.88 | % | | | 1.90 | % | | | 2.22 | % | | | 2.13 | % |
| | | | | | | | | | | | | | | | | | | | | | | | | |
Total net expenses(c) | | | 1.92 | %(b) | | | 1.91 | %(d) | | | 1.88 | %(d) | | | 1.90 | % | | | 2.04 | %(d) | | | 2.08 | % |
| | | | | | | | | | | | | | | | | | | | | | | | | |
Net investment income | | | 4.90 | %(b) | | | 4.55 | % | | | 4.25 | % | | | 4.87 | % | | | 5.27 | % | | | 6.20 | % |
| | | | | | | | | | | | | | | | | | | | | | | | | |
Supplemental data | | | | | | | | | | | | | | | | | | | | | | | | |
| | | | | | |
Net assets, end of period (in thousands) | | | $879 | | | | $1,083 | | | | $2,064 | | | | $2,908 | | | | $2,846 | | | | $3,569 | |
| | | | | | | | | | | | | | | | | | | | | | | | | |
Portfolio turnover | | | 20 | % | | | 42 | % | | | 26 | % | | | 21 | % | | | 24 | % | | | 38 | % |
| | | | | | | | | | | | | | | | | | | | | | | | | |
Notes to Financial Highlights
| (a) | In addition to the fees and expenses that the Fund bears directly, the Fund indirectly bears a pro rata share of the fees and expenses of any other funds in which it invests. Such indirect expenses are not included in the Fund’s reported expense ratios. |
| (c) | Total net expenses include the impact of certain fee waivers/expense reimbursements made by the Investment Manager and certain of its affiliates, if applicable. |
| (d) | The benefits derived from expense reductions had an impact of less than 0.01%. |
The accompanying Notes to Financial Statements are an integral part of this statement.
| | | | |
| Semiannual Report 2015 | | | 21 | |
| | |
| |
| | COLUMBIA EMERGING MARKETS BOND FUND |
FINANCIAL HIGHLIGHTS (continued)
| | | | | | | | | | | | | | | | | | | | | | | | |
| |
| Six Months Ended
April 30, 2015 |
| | | Year Ended October 31, | |
Class C | | | (Unaudited) | | | | 2014 | | | | 2013 | | | | 2012 | | | | 2011 | | | | 2010 | |
Per share data | | | | | | | | | | | | | | | | | | | | | | | | |
Net asset value, beginning of period | | | $11.32 | | | | $11.54 | | | | $12.46 | | | | $11.30 | | | | $11.65 | | | | $10.32 | |
| | | | | | | | | | | | | | | | | | | | | | | | | |
Income from investment operations: | | | | | | | | | | | | | | | | | | | | | | | | |
| | | | | | |
Net investment income | | | 0.26 | | | | 0.51 | | | | 0.52 | | | | 0.56 | | | | 0.58 | | | | 0.67 | |
| | | | | | | | | | | | | | | | | | | | | | | | | |
Net realized and unrealized gain (loss) | | | (0.41 | ) | | | (0.18 | ) | | | (0.86 | ) | | | 1.15 | | | | (0.26 | ) | | | 1.32 | |
| | | | | | | | | | | | | | | | | | | | | | | | | |
Total from investment operations | | | (0.15 | ) | | | 0.33 | | | | (0.34 | ) | | | 1.71 | | | | 0.32 | | | | 1.99 | |
| | | | | | | | | | | | | | | | | | | | | | | | | |
Less distributions to shareholders: | | | | | | | | | | | | | | | | | | | | | | | | |
| | | | | | |
Net investment income | | | (0.18 | ) | | | (0.40 | ) | | | (0.50 | ) | | | (0.55 | ) | | | (0.67 | ) | | | (0.66 | ) |
| | | | | | | | | | | | | | | | | | | | | | | | | |
Net realized gains | | | (0.01 | ) | | | (0.15 | ) | | | (0.08 | ) | | | — | | | | — | | | | — | |
| | | | | | | | | | | | | | | | | | | | | | | | | |
Total distributions to shareholders | | | (0.19 | ) | | | (0.55 | ) | | | (0.58 | ) | | | (0.55 | ) | | | (0.67 | ) | | | (0.66 | ) |
| | | | | | | | | | | | | | | | | | | | | | | | | |
Net asset value, end of period | | | $10.98 | | | | $11.32 | | | | $11.54 | | | | $12.46 | | | | $11.30 | | | | $11.65 | |
| | | | | | | | | | | | | | | | | | | | | | | | | |
Total return | | | (1.28 | %) | | | 3.08 | % | | | (2.85 | %) | | | 15.55 | % | | | 2.96 | % | | | 19.87 | % |
| | | | | | | | | | | | | | | | | | | | | | | | | |
Ratios to average net assets(a) | | | | | | | | | | | | | | | | | | | | | | | | |
| | | | | | |
Total gross expenses | | | 1.92 | %(b) | | | 1.91 | % | | | 1.88 | % | | | 1.91 | % | | | 2.03 | % | | | 2.14 | % |
| | | | | | | | | | | | | | | | | | | | | | | | | |
Total net expenses(c) | | | 1.92 | %(b) | | | 1.91 | %(d) | | | 1.88 | %(d) | | | 1.91 | % | | | 2.02 | %(d) | | | 2.06 | % |
| | | | | | | | | | | | | | | | | | | | | | | | | |
Net investment income | | | 4.89 | %(b) | | | 4.55 | % | | | 4.28 | % | | | 4.78 | % | | | 5.11 | % | | | 6.14 | % |
| | | | | | | | | | | | | | | | | | | | | | | | | |
Supplemental data | | | | | | | | | | | | | | | | | | | | | | | | |
| | | | | | |
Net assets, end of period (in thousands) | | | $40,989 | | | | $53,086 | | | | $58,219 | | | | $45,979 | | | | $19,877 | | | | $3,622 | |
| | | | | | | | | | | | | | | | | | | | | | | | | |
Portfolio turnover | | | 20 | % | | | 42 | % | | | 26 | % | | | 21 | % | | | 24 | % | | | 38 | % |
| | | | | | | | | | | | | | | | | | | | | | | | | |
Notes to Financial Highlights
| (a) | In addition to the fees and expenses that the Fund bears directly, the Fund indirectly bears a pro rata share of the fees and expenses of any other funds in which it invests. Such indirect expenses are not included in the Fund’s reported expense ratios. |
| (c) | Total net expenses include the impact of certain fee waivers/expense reimbursements made by the Investment Manager and certain of its affiliates, if applicable. |
| (d) | The benefits derived from expense reductions had an impact of less than 0.01%. |
The accompanying Notes to Financial Statements are an integral part of this statement.
| | |
| 22 | | Semiannual Report 2015 |
| | |
| |
| COLUMBIA EMERGING MARKETS BOND FUND | | |
FINANCIAL HIGHLIGHTS (continued)
| | | | | | | | | | | | | | | | | | | | | | | | |
| |
| Six Months Ended
April 30, 2015 |
| | | Year Ended October 31, | |
Class I | | | (Unaudited) | | | | 2014 | | | | 2013 | | | | 2012 | | | | 2011 | | | | 2010 | |
Per share data | | | | | | | | | | | | | | | | | | | | | | | | |
Net asset value, beginning of period | | | $11.38 | | | | $11.59 | | | | $12.51 | | | | $11.34 | | | | $11.69 | | | | $10.35 | |
| | | | | | | | | | | | | | | | | | | | | | | | | |
Income from investment operations: | | | | | | | | | | | | | | | | | | | | | | | | |
| | | | | | |
Net investment income | | | 0.33 | | | | 0.66 | | | | 0.67 | | | | 0.72 | | | | 0.73 | | | | 0.77 | |
| | | | | | | | | | | | | | | | | | | | | | | | | |
Net realized and unrealized gain (loss) | | | (0.41 | ) | | | (0.17 | ) | | | (0.86 | ) | | | 1.14 | | | | (0.27 | ) | | | 1.35 | |
| | | | | | | | | | | | | | | | | | | | | | | | | |
Total from investment operations | | | (0.08 | ) | | | 0.49 | | | | (0.19 | ) | | | 1.86 | | | | 0.46 | | | | 2.12 | |
| | | | | | | | | | | | | | | | | | | | | | | | | |
Less distributions to shareholders: | | | | | | | | | | | | | | | | | | | | | | | | |
| | | | | | |
Net investment income | | | (0.25 | ) | | | (0.55 | ) | | | (0.65 | ) | | | (0.69 | ) | | | (0.81 | ) | | | (0.78 | ) |
| | | | | | | | | | | | | | | | | | | | | | | | | |
Net realized gains | | | (0.01 | ) | | | (0.15 | ) | | | (0.08 | ) | | | — | | | | — | | | | — | |
| | | | | | | | | | | | | | | | | | | | | | | | | |
Total distributions to shareholders | | | (0.26 | ) | | | (0.70 | ) | | | (0.73 | ) | | | (0.69 | ) | | | (0.81 | ) | | | (0.78 | ) |
| | | | | | | | | | | | | | | | | | | | | | | | | |
Net asset value, end of period | | | $11.04 | | | | $11.38 | | | | $11.59 | | | | $12.51 | | | | $11.34 | | | | $11.69 | |
| | | | | | | | | | | | | | | | | | | | | | | | | |
Total return | | | (0.65 | %) | | | 4.45 | % | | | (1.67 | %) | | | 16.96 | % | | | 4.18 | % | | | 21.19 | % |
| | | | | | | | | | | | | | | | | | | | | | | | | |
Ratios to average net assets(a) | | | | | | | | | | | | | | | | | | | | | | | | |
| | | | | | |
Total gross expenses | | | 0.67 | %(b) | | | 0.66 | % | | | 0.65 | % | | | 0.68 | % | | | 0.83 | % | | | 0.92 | % |
| | | | | | | | | | | | | | | | | | | | | | | | | |
Total net expenses(c) | | | 0.67 | %(b) | | | 0.66 | % | | | 0.65 | % | | | 0.68 | % | | | 0.83 | % | | | 0.92 | % |
| | | | | | | | | | | | | | | | | | | | | | | | | |
Net investment income | | | 6.15 | %(b) | | | 5.81 | % | | | 5.56 | % | | | 6.11 | % | | | 6.43 | % | | | 7.13 | % |
| | | | | | | | | | | | | | | | | | | | | | | | | |
Supplemental data | | | | | | | | | | | | | | | | | | | | | | | | |
| | | | | | |
Net assets, end of period (in thousands) | | | $247,575 | | | | $291,971 | | | | $281,985 | | | | $163,508 | | | | $146,569 | | | | $78,154 | |
| | | | | | | | | | | | | | | | | | | | | | | | | |
Portfolio turnover | | | 20 | % | | | 42 | % | | | 26 | % | | | 21 | % | | | 24 | % | | | 38 | % |
| | | | | | | | | | | | | | | | | | | | | | | | | |
Notes to Financial Highlights
| (a) | In addition to the fees and expenses that the Fund bears directly, the Fund indirectly bears a pro rata share of the fees and expenses of any other funds in which it invests. Such indirect expenses are not included in the Fund’s reported expense ratios. |
| (c) | Total net expenses include the impact of certain fee waivers/expense reimbursements made by the Investment Manager and certain of its affiliates, if applicable. |
The accompanying Notes to Financial Statements are an integral part of this statement.
| | | | |
| Semiannual Report 2015 | | | 23 | |
| | |
| |
| | COLUMBIA EMERGING MARKETS BOND FUND |
FINANCIAL HIGHLIGHTS (continued)
| | | | | | | | | | | | | | | | | | | | | | | | |
| |
| Six Months Ended
April 30, 2015 |
| | | Year Ended October 31, | |
Class K | | | (Unaudited) | | | | 2014 | | | | 2013 | | | | 2012 | | | | 2011 | | | | 2010 | |
Per share data | | | | | | | | | | | | | | | | | | | | | | | | |
Net asset value, beginning of period | | | $11.36 | | | | $11.58 | | | | $12.50 | | | | $11.31 | | | | $11.68 | | | | $10.35 | |
| | | | | | | | | | | | | | | | | | | | | | | | | |
Income from investment operations: | | | | | | | | | | | | | | | | | | | | | | | | |
| | | | | | |
Net investment income | | | 0.32 | | | | 0.62 | | | | 0.63 | | | | 0.68 | | | | 0.71 | | | | 0.72 | |
| | | | | | | | | | | | | | | | | | | | | | | | | |
Net realized and unrealized gain (loss) | | | (0.41 | ) | | | (0.18 | ) | | | (0.86 | ) | | | 1.16 | | | | (0.31 | ) | | | 1.35 | |
| | | | | | | | | | | | | | | | | | | | | | | | | |
Total from investment operations | | | (0.09 | ) | | | 0.44 | | | | (0.23 | ) | | | 1.84 | | | | 0.40 | | | | 2.07 | |
| | | | | | | | | | | | | | | | | | | | | | | | | |
Less distributions to shareholders: | | | | | | | | | | | | | | | | | | | | | | | | |
| | | | | | |
Net investment income | | | (0.23 | ) | | | (0.51 | ) | | | (0.61 | ) | | | (0.65 | ) | | | (0.77 | ) | | | (0.74 | ) |
| | | | | | | | | | | | | | | | | | | | | | | | | |
Net realized gains | | | (0.01 | ) | | | (0.15 | ) | | | (0.08 | ) | | | — | | | | — | | | | — | |
| | | | | | | | | | | | | | | | | | | | | | | | | |
Total distributions to shareholders | | | (0.24 | ) | | | (0.66 | ) | | | (0.69 | ) | | | (0.65 | ) | | | (0.77 | ) | | | (0.74 | ) |
| | | | | | | | | | | | | | | | | | | | | | | | | |
Net asset value, end of period | | | $11.03 | | | | $11.36 | | | | $11.58 | | | | $12.50 | | | | $11.31 | | | | $11.68 | |
| | | | | | | | | | | | | | | | | | | | | | | | | |
Total return | | | (0.71 | %) | | | 4.05 | % | | | (1.97 | %) | | | 16.87 | % | | | 3.65 | % | | | 20.75 | % |
| | | | | | | | | | | | | | | | | | | | | | | | | |
Ratios to average net assets(a) | | | | | | | | | | | | | | | | | | | | | | | | |
| | | | | | |
Total gross expenses | | | 0.97 | %(b) | | | 0.96 | % | | | 0.95 | % | | | 0.98 | % | | | 1.17 | % | | | 1.27 | % |
| | | | | | | | | | | | | | | | | | | | | | | | | |
Total net expenses(c) | | | 0.97 | %(b) | | | 0.96 | % | | | 0.95 | % | | | 0.98 | % | | | 1.13 | % | | | 1.22 | % |
| | | | | | | | | | | | | | | | | | | | | | | | | |
Net investment income | | | 5.83 | %(b) | | | 5.50 | % | | | 5.16 | % | | | 5.78 | % | | | 6.18 | % | | | 6.52 | % |
| | | | | | | | | | | | | | | | | | | | | | | | | |
Supplemental data | | | | | | | | | | | | | | | | | | | | | | | | |
| | | | | | |
Net assets, end of period (in thousands) | | | $22 | | | | $37 | | | | $36 | | | | $72 | | | | $62 | | | | $124 | |
| | | | | | | | | | | | | | | | | | | | | | | | | |
Portfolio turnover | | | 20 | % | | | 42 | % | | | 26 | % | | | 21 | % | | | 24 | % | | | 38 | % |
| | | | | | | | | | | | | | | | | | | | | | | | | |
Notes to Financial Highlights
| (a) | In addition to the fees and expenses that the Fund bears directly, the Fund indirectly bears a pro rata share of the fees and expenses of any other funds in which it invests. Such indirect expenses are not included in the Fund’s reported expense ratios. |
| (c) | Total net expenses include the impact of certain fee waivers/expense reimbursements made by the Investment Manager and certain of its affiliates, if applicable. |
The accompanying Notes to Financial Statements are an integral part of this statement.
| | |
| 24 | | Semiannual Report 2015 |
| | |
| |
| COLUMBIA EMERGING MARKETS BOND FUND | | |
FINANCIAL HIGHLIGHTS (continued)
| | | | | | | | | | | | | | | | |
| |
| Six Months Ended
April 30, 2015 |
| | | Year Ended October 31, | |
Class R | | | (Unaudited) | | | | 2014 | | | | 2013 | | | | 2012(a) | |
Per share data | | | | | | | | | | | | | | | | |
Net asset value, beginning of period | | | $11.37 | | | | $11.59 | | | | $12.50 | | | | $11.30 | |
| | | | | | | | | | | | | | | | | |
Income from investment operations: | | | | | | | | | | | | | | | | |
| | | | |
Net investment income | | | 0.29 | | | | 0.57 | | | | 0.58 | | | | 0.58 | |
| | | | | | | | | | | | | | | | | |
Net realized and unrealized gain (loss) | | | (0.41 | ) | | | (0.18 | ) | | | (0.85 | ) | | | 1.23 | |
| | | | | | | | | | | | | | | | | |
Total from investment operations | | | (0.12 | ) | | | 0.39 | | | | (0.27 | ) | | | 1.81 | |
| | | | | | | | | | | | | | | | | |
Less distributions to shareholders: | | | | | | | | | | | | | | | | |
| | | | |
Net investment income | | | (0.21 | ) | | | (0.46 | ) | | | (0.56 | ) | | | (0.61 | ) |
| | | | | | | | | | | | | | | | | |
Net realized gains | | | (0.01 | ) | | | (0.15 | ) | | | (0.08 | ) | | | — | |
| | | | | | | | | | | | | | | | | |
Total distributions to shareholders | | | (0.22 | ) | | | (0.61 | ) | | | (0.64 | ) | | | (0.61 | ) |
| | | | | | | | | | | | | | | | | |
Net asset value, end of period | | | $11.03 | | | | $11.37 | | | | $11.59 | | | | $12.50 | |
| | | | | | | | | | | | | | | | | |
Total return | | | (1.03 | %) | | | 3.57 | % | | | (2.29 | %) | | | 16.57 | % |
| | | | | | | | | | | | | | | | | |
Ratios to average net assets(b) | | | | | | | | | | | | | | | | |
| | | | |
Total gross expenses | | | 1.42 | %(c) | | | 1.41 | % | | | 1.39 | % | | | 1.42 | %(c) |
| | | | | | | | | | | | | | | | | |
Total net expenses(d) | | | 1.42 | %(c) | | | 1.41 | %(e) | | | 1.39 | %(e) | | | 1.42 | %(c) |
| | | | | | | | | | | | | | | | | |
Net investment income | | | 5.42 | %(c) | | | 5.07 | % | | | 4.79 | % | | | 5.15 | %(c) |
| | | | | | | | | | | | | | | | | |
Supplemental data | | | | | | | | | | | | | | | | |
| | | | |
Net assets, end of period (in thousands) | | | $11,994 | | | | $10,212 | | | | $3,711 | | | | $2,877 | |
| | | | | | | | | | | | | | | | | |
Portfolio turnover | | | 20 | % | | | 42 | % | | | 26 | % | | | 21 | % |
| | | | | | | | | | | | | | | | | |
Notes to Financial Highlights
| (a) | Based on operations from November 16, 2011 (commencement of operations) through the stated period end. |
| (b) | In addition to the fees and expenses that the Fund bears directly, the Fund indirectly bears a pro rata share of the fees and expenses of any other funds in which it invests. Such indirect expenses are not included in the Fund’s reported expense ratios. |
| (d) | Total net expenses include the impact of certain fee waivers/expense reimbursements made by the Investment Manager and certain of its affiliates, if applicable. |
| (e) | The benefits derived from expense reductions had an impact of less than 0.01%. |
The accompanying Notes to Financial Statements are an integral part of this statement.
| | | | |
| Semiannual Report 2015 | | | 25 | |
| | |
| |
| | COLUMBIA EMERGING MARKETS BOND FUND |
FINANCIAL HIGHLIGHTS (continued)
| | | | | | | | | | | | |
| |
| Six Months Ended
April 30, 2015 |
| | | Year Ended October 31, | |
Class R4 | | | (Unaudited) | | | | 2014 | | | | 2013(a) | |
Per share data | | | | | | | | | | | | |
Net asset value, beginning of period | | | $11.38 | | | | $11.60 | | | | $12.57 | |
| | | | | | | | | | | | | |
Income from investment operations: | | | | | | | | | | | | |
| | | |
Net investment income | | | 0.32 | | | | 0.63 | | | | 0.41 | |
| | | | | | | | | | | | | |
Net realized and unrealized loss | | | (0.41 | ) | | | (0.18 | ) | | | (0.98 | ) |
| | | | | | | | | | | | | |
Total from investment operations | | | (0.09 | ) | | | 0.45 | | | | (0.57 | ) |
| | | | | | | | | | | | | |
Less distributions to shareholders: | | | | | | | | | | | | |
| | | |
Net investment income | | | (0.23 | ) | | | (0.52 | ) | | | (0.40 | ) |
| | | | | | | | | | | | | |
Net realized gains | | | (0.01 | ) | | | (0.15 | ) | | | — | |
| | | | | | | | | | | | | |
Total distributions to shareholders | | | (0.24 | ) | | | (0.67 | ) | | | (0.40 | ) |
| | | | | | | | | | | | | |
Net asset value, end of period | | | $11.05 | | | | $11.38 | | | | $11.60 | |
| | | | | | | | | | | | | |
Total return | | | (0.69 | %) | | | 4.09 | % | | | (4.57 | %) |
| | | | | | | | | | | | | |
Ratios to average net assets(b) | | | | | | | | | | | | |
| | | |
Total gross expenses | | | 0.91 | %(c) | | | 0.91 | % | | | 0.92 | %(c) |
| | | | | | | | | | | | | |
Total net expenses(d) | | | 0.91 | %(c) | | | 0.91 | %(e) | | | 0.92 | %(c)(e) |
| | | | | | | | | | | | | |
Net investment income | | | 5.98 | %(c) | | | 5.54 | % | | | 5.70 | %(c) |
| | | | | | | | | | | | | |
Supplemental data | | | | | | | | | | | | |
| | | |
Net assets, end of period (in thousands) | | | $4,797 | | | | $1,985 | | | | $1,055 | |
| | | | | | | | | | | | | |
Portfolio turnover | | | 20 | % | | | 42 | % | | | 26 | % |
| | | | | | | | | | | | | |
Notes to Financial Highlights
| (a) | Based on operations from March 19, 2013 (commencement of operations) through the stated period end. |
| (b) | In addition to the fees and expenses that the Fund bears directly, the Fund indirectly bears a pro rata share of the fees and expenses of any other funds in which it invests. Such indirect expenses are not included in the Fund’s reported expense ratios. |
| (d) | Total net expenses include the impact of certain fee waivers/expense reimbursements made by the Investment Manager and certain of its affiliates, if applicable. |
| (e) | The benefits derived from expense reductions had an impact of less than 0.01%. |
The accompanying Notes to Financial Statements are an integral part of this statement.
| | |
| 26 | | Semiannual Report 2015 |
| | |
| |
| COLUMBIA EMERGING MARKETS BOND FUND | | |
FINANCIAL HIGHLIGHTS (continued)
| | | | | | | | | | | | |
| |
| Six Months Ended
April 30, 2015 |
| | | Year Ended October 31, | |
Class R5 | | | (Unaudited) | | | | 2014 | | | | 2013(a) | |
Per share data | | | | | | | | | | | | |
Net asset value, beginning of period | | | $11.37 | | | | $11.59 | | | | $12.57 | |
| | | | | | | | | | | | | |
Income from investment operations: | | | | | | | | | | | | |
| | | |
Net investment income | | | 0.33 | | | | 0.65 | | | | 0.64 | |
| | | | | | | | | | | | | |
Net realized and unrealized loss | | | (0.42 | ) | | | (0.18 | ) | | | (0.90 | ) |
| | | | | | | | | | | | | |
Total from investment operations | | | (0.09 | ) | | | 0.47 | | | | (0.26 | ) |
| | | | | | | | | | | | | |
Less distributions to shareholders: | | | | | | | | | | | | |
| | | |
Net investment income | | | (0.24 | ) | | | (0.54 | ) | | | (0.64 | ) |
| | | | | | | | | | | | | |
Net realized gains | | | (0.01 | ) | | | (0.15 | ) | | | (0.08 | ) |
| | | | | | | | | | | | | |
Total distributions to shareholders | | | (0.25 | ) | | | (0.69 | ) | | | (0.72 | ) |
| | | | | | | | | | | | | |
Net asset value, end of period | | | $11.03 | | | | $11.37 | | | | $11.59 | |
| | | | | | | | | | | | | |
Total return | | | (0.67 | %) | | | 4.31 | % | | | (2.19 | %) |
| | | | | | | | | | | | | |
Ratios to average net assets(b) | | | | | | | | | | | | |
| | | |
Total gross expenses | | | 0.72 | %(c) | | | 0.70 | % | | | 0.71 | %(c) |
| | | | | | | | | | | | | |
Total net expenses(d) | | | 0.72 | %(c) | | | 0.70 | % | | | 0.71 | %(c) |
| | | | | | | | | | | | | |
Net investment income | | | 6.09 | %(c) | | | 5.67 | % | | | 5.54 | %(c) |
| | | | | | | | | | | | | |
Supplemental data | | | | | | | | | | | | |
| | | |
Net assets, end of period (in thousands) | | | $7,459 | | | | $8,928 | | | | $11,814 | |
| | | | | | | | | | | | | |
Portfolio turnover | | | 20 | % | | | 42 | % | | | 26 | % |
| | | | | | | | | | | | | |
Notes to Financial Highlights
| (a) | Based on operations from November 8, 2012 (commencement of operations) through the stated period end. |
| (b) | In addition to the fees and expenses that the Fund bears directly, the Fund indirectly bears a pro rata share of the fees and expenses of any other funds in which it invests. Such indirect expenses are not included in the Fund’s reported expense ratios. |
| (d) | Total net expenses include the impact of certain fee waivers/expense reimbursements made by the Investment Manager and certain of its affiliates, if applicable. |
The accompanying Notes to Financial Statements are an integral part of this statement.
| | | | |
| Semiannual Report 2015 | | | 27 | |
| | |
| |
| | COLUMBIA EMERGING MARKETS BOND FUND |
FINANCIAL HIGHLIGHTS (continued)
| | | | | | | | | | | | | | | | | | | | | | | | |
| |
| Six Months Ended
April 30, 2015 |
| | | Year Ended October 31, | |
Class W | | | (Unaudited) | | | | 2014 | | | | 2013 | | | | 2012 | | | | 2011 | | | | 2010 | |
Per share data | | | | | | | | | | | | | | | | | | | | | | | | |
Net asset value, beginning of period | | | $11.36 | | | | $11.57 | | | | $12.49 | | | | $11.31 | | | | $11.68 | | | | $10.34 | |
| | | | | | | | | | | | | | | | | | | | | | | | | |
Income from investment operations: | | | | | | | | | | | | | | | | | | | | | | | | |
| | | | | | |
Net investment income | | | 0.31 | | | | 0.60 | | | | 0.61 | | | | 0.66 | | | | 0.68 | | | | 0.75 | |
| | | | | | | | | | | | | | | | | | | | | | | | | |
Net realized and unrealized gain (loss) | | | (0.42 | ) | | | (0.17 | ) | | | (0.86 | ) | | | 1.15 | | | | (0.30 | ) | | | 1.32 | |
| | | | | | | | | | | | | | | | | | | | | | | | | |
Total from investment operations | | | (0.11 | ) | | | 0.43 | | | | (0.25 | ) | | | 1.81 | | | | 0.38 | | | | 2.07 | |
| | | | | | | | | | | | | | | | | | | | | | | | | |
Less distributions to shareholders: | | | | | | | | | | | | | | | | | | | | | | | | |
| | | | | | |
Net investment income | | | (0.22 | ) | | | (0.49 | ) | | | (0.59 | ) | | | (0.63 | ) | | | (0.75 | ) | | | (0.73 | ) |
| | | | | | | | | | | | | | | | | | | | | | | | | |
Net realized gains | | | (0.01 | ) | | | (0.15 | ) | | | (0.08 | ) | | | — | | | | — | | | | — | |
| | | | | | | | | | | | | | | | | | | | | | | | | |
Total distributions to shareholders | | | (0.23 | ) | | | (0.64 | ) | | | (0.67 | ) | | | (0.63 | ) | | | (0.75 | ) | | | (0.73 | ) |
| | | | | | | | | | | | | | | | | | | | | | | | | |
Net asset value, end of period | | | $11.02 | | | | $11.36 | | | | $11.57 | | | | $12.49 | | | | $11.31 | | | | $11.68 | |
| | | | | | | | | | | | | | | | | | | | | | | | | |
Total return | | | (0.90 | %) | | | 3.93 | % | | | (2.13 | %) | | | 16.53 | % | | | 3.47 | % | | | 20.68 | % |
| | | | | | | | | | | | | | | | | | | | | | | | | |
Ratios to average net assets(a) | | | | | | | | | | | | | | | | | | | | | | | | |
| | | | | | |
Total gross expenses | | | 1.17 | %(b) | | | 1.16 | % | | | 1.13 | % | | | 1.15 | % | | | 1.45 | % | | | 1.37 | % |
| | | | | | | | | | | | | | | | | | | | | | | | | |
Total net expenses(c) | | | 1.17 | %(b) | | | 1.16 | %(d) | | | 1.13 | %(d) | | | 1.15 | % | | | 1.30 | %(d) | | | 1.37 | % |
| | | | | | | | | | | | | | | | | | | | | | | | | |
Net investment income | | | 5.63 | %(b) | | | 5.26 | % | | | 5.02 | % | | | 5.63 | % | | | 5.96 | % | | | 6.93 | % |
| | | | | | | | | | | | | | | | | | | | | | | | | |
Supplemental data | | | | | | | | | | | | | | | | | | | | | | | | |
| | | | | | |
Net assets, end of period (in thousands) | | | $378 | | | | $31,493 | | | | $64,994 | | | | $63,707 | | | | $67,886 | | | | $74,067 | |
| | | | | | | | | | | | | | | | | | | | | | | | | |
Portfolio turnover | | | 20 | % | | | 42 | % | | | 26 | % | | | 21 | % | | | 24 | % | | | 38 | % |
| | | | | | | | | | | | | | | | | | | | | | | | | |
Notes to Financial Highlights
| (a) | In addition to the fees and expenses that the Fund bears directly, the Fund indirectly bears a pro rata share of the fees and expenses of any other funds in which it invests. Such indirect expenses are not included in the Fund’s reported expense ratios. |
| (c) | Total net expenses include the impact of certain fee waivers/expense reimbursements made by the Investment Manager and certain of its affiliates, if applicable. |
| (d) | The benefits derived from expense reductions had an impact of less than 0.01%. |
The accompanying Notes to Financial Statements are an integral part of this statement.
| | |
| 28 | | Semiannual Report 2015 |
| | |
| |
| COLUMBIA EMERGING MARKETS BOND FUND | | |
FINANCIAL HIGHLIGHTS (continued)
| | | | | | | | | | | | |
| |
| Six Months Ended
April 30, 2015 |
| | | Year Ended October 31, | |
Class Y | | | (Unaudited) | | | | 2014 | | | | 2013(a) | |
Per share data | | | | | | | | | | | | |
Net asset value, beginning of period | | | $11.38 | | | | $11.59 | | | | $12.57 | |
| | | | | | | | | | | | | |
Income from investment operations: | | | | | | | | | | | | |
| | | |
Net investment income | | | 0.33 | | | | 0.65 | | | | 0.65 | |
| | | | | | | | | | | | | |
Net realized and unrealized loss | | | (0.41 | ) | | | (0.16 | ) | | | (0.90 | ) |
| | | | | | | | | | | | | |
Total from investment operations | | | (0.08 | ) | | | 0.49 | | | | (0.25 | ) |
| | | | | | | | | | | | | |
Less distributions to shareholders: | | | | | | | | | | | | |
| | | |
Net investment income | | | (0.25 | ) | | | (0.55 | ) | | | (0.65 | ) |
| | | | | | | | | | | | | |
Net realized gains | | | (0.01 | ) | | | (0.15 | ) | | | (0.08 | ) |
| | | | | | | | | | | | | |
Total distributions to shareholders | | | (0.26 | ) | | | (0.70 | ) | | | (0.73 | ) |
| | | | | | | | | | | | | |
Net asset value, end of period | | | $11.04 | | | | $11.38 | | | | $11.59 | |
| | | | | | | | | | | | | |
Total return | | | (0.65 | %) | | | 4.46 | % | | | (2.14 | %) |
| | | | | | | | | | | | | |
Ratios to average net assets(b) | | | | | | | | | | | | |
| | | |
Total gross expenses | | | 0.67 | %(c) | | | 0.65 | % | | | 0.65 | %(c) |
| | | | | | | | | | | | | |
Total net expenses(d) | | | 0.67 | %(c) | | | 0.65 | % | | | 0.65 | %(c) |
| | | | | | | | | | | | | |
Net investment income | | | 6.16 | %(c) | | | 5.83 | % | | | 5.66 | %(c) |
| | | | | | | | | | | | | |
Supplemental data | | | | | | | | | | | | |
| | | |
Net assets, end of period (in thousands) | | | $2,029 | | | | $1,384 | | | | $9,286 | |
| | | | | | | | | | | | | |
Portfolio turnover | | | 20 | % | | | 42 | % | | | 26 | % |
| | | | | | | | | | | | | |
Notes to Financial Highlights
| (a) | Based on operations from November 8, 2012 (commencement of operations) through the stated period end. |
| (b) | In addition to the fees and expenses that the Fund bears directly, the Fund indirectly bears a pro rata share of the fees and expenses of any other funds in which it invests. Such indirect expenses are not included in the Fund’s reported expense ratios. |
| (d) | Total net expenses include the impact of certain fee waivers/expense reimbursements made by the Investment Manager and certain of its affiliates, if applicable. |
The accompanying Notes to Financial Statements are an integral part of this statement.
| | | | |
| Semiannual Report 2015 | | | 29 | |
| | |
| |
| | COLUMBIA EMERGING MARKETS BOND FUND |
FINANCIAL HIGHLIGHTS (continued)
| | | | | | | | | | | | | | | | | | | | | | | | |
| |
| Six Months Ended
April 30, 2015 |
| | | Year Ended October 31, | |
Class Z | | | (Unaudited) | | | | 2014 | | | | 2013 | | | | 2012 | | | | 2011 | | | | 2010(a) | |
Per share data | | | | | | | | | | | | | | | | | | | | | | | | |
Net asset value, beginning of period | | | $11.37 | | | | $11.59 | | | | $12.51 | | | | $11.35 | | | | $11.69 | | | | $11.47 | |
| | | | | | | | | | | | | | | | | | | | | | | | | |
Income from investment operations: | | | | | | | | | | | | | | | | | | | | | | | | |
| | | | | | |
Net investment income | | | 0.32 | | | | 0.63 | | | | 0.64 | | | | 0.68 | | | | 0.68 | | | | 0.07 | |
| | | | | | | | | | | | | | | | | | | | | | | | | |
Net realized and unrealized gain (loss) | | | (0.41 | ) | | | (0.18 | ) | | | (0.86 | ) | | | 1.14 | | | | (0.22 | ) | | | 0.24 | |
| | | | | | | | | | | | | | | | | | | | | | | | | |
Total from investment operations | | | (0.09 | ) | | | 0.45 | | | | (0.22 | ) | | | 1.82 | | | | 0.46 | | | | 0.31 | |
| | | | | | | | | | | | | | | | | | | | | | | | | |
Less distributions to shareholders: | | | | | | | | | | | | | | | | | | | | | | | | |
| | | | | | |
Net investment income | | | (0.23 | ) | | | (0.52 | ) | | | (0.62 | ) | | | (0.66 | ) | | | (0.80 | ) | | | (0.09 | ) |
| | | | | | | | | | | | | | | | | | | | | | | | | |
Net realized gains | | | (0.01 | ) | | | (0.15 | ) | | | (0.08 | ) | | | — | | | | — | | | | — | |
| | | | | | | | | | | | | | | | | | | | | | | | | |
Total distributions to shareholders | | | (0.24 | ) | | | (0.67 | ) | | | (0.70 | ) | | | (0.66 | ) | | | (0.80 | ) | | | (0.09 | ) |
| | | | | | | | | | | | | | | | | | | | | | | | | |
Net asset value, end of period | | | $11.04 | | | | $11.37 | | | | $11.59 | | | | $12.51 | | | | $11.35 | | | | $11.69 | |
| | | | | | | | | | | | | | | | | | | | | | | | | |
Total return | | | (0.69 | %) | | | 4.10 | % | | | (1.87 | %) | | | 16.64 | % | | | 4.16 | % | | | 2.68 | % |
| | | | | | | | | | | | | | | | | | | | | | | | | |
Ratios to average net assets(b) | | | | | | | | | | | | | | | | | | | | | | | | |
| | | | | | |
Total gross expenses | | | 0.92 | %(c) | | | 0.91 | % | | | 0.88 | % | | | 0.91 | % | | | 0.84 | % | | | 1.32 | %(c) |
| | | | | | | | | | | | | | | | | | | | | | | | | |
Total net expenses(d) | | | 0.92 | %(c) | | | 0.91 | %(e) | | | 0.88 | %(e) | | | 0.91 | % | | | 0.84 | %(e) | | | 0.97 | %(c) |
| | | | | | | | | | | | | | | | | | | | | | | | | |
Net investment income | | | 5.91 | %(c) | | | 5.55 | % | | | 5.23 | % | | | 5.72 | % | | | 6.03 | % | | | 7.36 | %(c) |
| | | | | | | | | | | | | | | | | | | | | | | | | |
Supplemental data | | | | | | | | | | | | | | | | | | | | | | | | |
| | | | | | |
Net assets, end of period (in thousands) | | | $100,789 | | | | $107,518 | | | | $124,223 | | | | $144,687 | | | | $35,902 | | | | $123 | |
| | | | | | | | | | | | | | | | | | | | | | | | | |
Portfolio turnover | | | 20 | % | | | 42 | % | | | 26 | % | | | 21 | % | | | 24 | % | | | 38 | % |
| | | | | | | | | | | | | | | | | | | | | | | | | |
Notes to Financial Highlights
| (a) | Based on operations from September 27, 2010 (commencement of operations) through the stated period end. |
| (b) | In addition to the fees and expenses that the Fund bears directly, the Fund indirectly bears a pro rata share of the fees and expenses of any other funds in which it invests. Such indirect expenses are not included in the Fund’s reported expense ratios. |
| (d) | Total net expenses include the impact of certain fee waivers/expense reimbursements made by the Investment Manager and certain of its affiliates, if applicable. |
| (e) | The benefits derived from expense reductions had an impact of less than 0.01%. |
The accompanying Notes to Financial Statements are an integral part of this statement.
| | |
| 30 | | Semiannual Report 2015 |
| | |
| |
| COLUMBIA EMERGING MARKETS BOND FUND | | |
NOTES TO FINANCIAL STATEMENTS
April 30, 2015 (Unaudited)
Note 1. Organization
Columbia Emerging Markets Bond Fund (the Fund), a series of Columbia Funds Series Trust II (the Trust), is a non-diversified fund. The Trust is registered under the Investment Company Act of 1940, as amended (the 1940 Act), as an open-end management investment company organized as a Massachusetts business trust.
Fund Shares
The Trust may issue an unlimited number of shares (without par value). The Fund offers Class A, Class B, Class C, Class I, Class K, Class R, Class R4, Class R5, Class W, Class Y and Class Z shares. Although all share classes generally have identical voting, dividend and liquidation rights, each share class votes separately when required by the Trust’s organizational documents or by law. Different share classes pay different distribution amounts to the extent the expenses of such share classes differ, and distributions in liquidation will be proportional to the net asset value of each share class. Each share class has its own expense structure and sales charges.
Class A shares are subject to a maximum front-end sales charge of 4.75% based on the initial investment amount. Class A shares purchased without an initial sales charge in accounts aggregating $1 million to $50 million at the time of purchase are subject to a contingent deferred sales charge (CDSC) if the shares are sold within 18 months after purchase, charged as follows: 1.00% CDSC if redeemed within 12 months after purchase, and 0.50% CDSC if redeemed more than 12, but less than 18, months after purchase.
Class B shares may be subject to a maximum CDSC of 5.00% based upon the holding period after purchase. Class B shares will generally convert to Class A shares eight years after purchase. The Fund no longer accepts investments by new or existing investors in the Fund’s Class B shares, except in connection with the reinvestment of any dividend and/or capital gain distributions in Class B shares of the Fund and exchanges by existing Class B shareholders of certain other funds within the Columbia Family of Funds.
Class C shares are subject to a 1.00% CDSC on shares redeemed within one year after purchase.
Class I shares are not subject to sales charges and are available only to the Columbia Family of Funds.
Class K shares are not subject to sales charges, however this share class is closed to new investors.
Class R shares are not subject to sales charges and are generally available only to certain retirement plans and other investors as described in the Fund’s prospectus.
Class R4 shares are not subject to sales charges and are generally available only to omnibus retirement plans and certain investors as described in the Fund’s prospectus.
Class R5 shares are not subject to sales charges and are generally available only to investors purchasing through authorized investment professionals and omnibus retirement plans.
Class W shares are not subject to sales charges and are available only to investors purchasing through authorized investment programs managed by investment professionals, including discretionary managed account programs.
Class Y shares are not subject to sales charges and are generally available only to certain retirement plans as described in the Fund’s prospectus.
Class Z shares are not subject to sales charges and are available only to eligible investors, which are subject to different investment minimums as described in the Fund’s prospectus.
Note 2. Summary of Significant Accounting Policies
Basis of Preparation
The Fund is an investment company that applies the accounting and reporting guidance in the Financial Accounting Standards Board (FASB) Accounting Standards Codification Topic 946, Financial Services — Investment Companies (ASC 946). The financial statements are prepared in accordance with U.S. generally accepted accounting principles (GAAP), which requires management to make certain estimates and assumptions that affect the reported amounts of assets and liabilities, the disclosure of contingent assets and liabilities at the date of the financial statements and the reported amounts of income and expenses during the reporting period. Actual results could differ from those estimates.
The following is a summary of significant accounting policies followed by the Fund in the preparation of its financial statements.
Security Valuation
Debt securities generally are valued by pricing services approved by the Board of Trustees (the Board) based
| | | | |
| Semiannual Report 2015 | | | 31 | |
| | |
| |
| | COLUMBIA EMERGING MARKETS BOND FUND |
NOTES TO FINANCIAL STATEMENTS (continued)
April 30, 2015 (Unaudited)
upon market transactions for normal, institutional-size trading units of similar securities. The services may use various pricing techniques that take into account, as applicable, factors such as yield, quality, coupon rate, maturity, type of issue, trading characteristics and other data, as well as broker quotes. Debt securities for which quotations are readily available may also be valued based upon an over-the-counter or exchange bid quotation.
Investments in open-end investment companies, including money market funds, are valued at their net asset value.
Forward foreign currency exchange contracts are marked-to-market based upon foreign currency exchange rates provided by a pricing service.
Futures and options on futures contracts are valued based upon the settlement price established each day by the board of trade or exchange on which they are traded.
Investments for which market quotations are not readily available, or that have quotations which management believes are not reliable, are valued at fair value as determined in good faith under procedures established by and under the general supervision of the Board. If a security or class of securities (such as foreign securities) is valued at fair value, such value is likely to be different from the quoted or published price for the security.
The determination of fair value often requires significant judgment. To determine fair value, management may use assumptions including but not limited to future cash flows and estimated risk premiums. Multiple inputs from various sources may be used to determine fair value.
Foreign Currency Transactions and Translations
The values of all assets and liabilities denominated in foreign currencies are generally translated into U.S. dollars at exchange rates determined at the close of the New York Stock Exchange (NYSE). Net realized and unrealized gains (losses) on foreign currency transactions and translations include gains (losses) arising from the fluctuation in exchange rates between trade and settlement dates on securities transactions, gains (losses) arising from the disposition of foreign currency and currency gains (losses) between the accrual and payment dates on dividends, interest income and foreign withholding taxes.
For financial statement purposes, the Fund does not distinguish that portion of gains (losses) on investments which is due to changes in foreign exchange rates from that which is due to changes in market prices of the
investments. Such fluctuations are included with the net realized and unrealized gains (losses) on investments in the Statement of Operations.
Derivative Instruments
The Fund invests in certain derivative instruments, as detailed below, to meet its investment objectives. Derivatives are instruments whose values depend on, or are derived from, in whole or in part, the value of one or more other assets, such as securities, currencies, commodities or indices. Derivative instruments may be used to increase investment flexibility (including to maintain cash reserves while maintaining exposure to certain other assets), for risk management (hedging) purposes, to facilitate trading, to reduce transaction costs and to pursue higher investment returns. The Fund may also use derivative instruments to mitigate certain investment risks, such as foreign currency exchange rate risk, interest rate risk and credit risk. Derivatives may involve various risks, including the potential inability of the counterparty to fulfill its obligation under the terms of the contract, the potential for an illiquid secondary market (making it difficult for the Fund to sell, including at favorable prices) and the potential for market movements which may expose the Fund to gains or losses in excess of the amount shown in the Statement of Assets and Liabilities. The notional amounts of derivative instruments, if applicable, are not recorded in the financial statements.
A derivative instrument may suffer a marked-to-market loss if the value of the contract decreases due to an unfavorable change in the market rates or values of the underlying instrument. Losses can also occur if the counterparty does not perform under the contract. The Fund’s risk of loss from counterparty credit risk on over-the-counter derivatives is generally limited to the aggregate unrealized gain netted against any collateral held by the Fund and the amount of any variation margin held by the counterparty. With exchange-traded or centrally cleared derivatives, there is reduced counterparty credit risk to the Fund since the exchange’s clearinghouse, as counterparty to such instruments, guarantees against a possible default. The clearinghouse stands between the buyer and the seller of the contract; therefore, the counterparty credit risk is failure of the clearinghouse. However, credit risk still exists in exchange-traded or centrally cleared derivatives with respect to initial and variation margin that is held in a broker’s customer account. While brokers are required to segregate customer margin from their own assets, in the event that a broker becomes insolvent or goes into
| | |
| 32 | | Semiannual Report 2015 |
| | |
| |
| COLUMBIA EMERGING MARKETS BOND FUND | | |
NOTES TO FINANCIAL STATEMENTS (continued)
April 30, 2015 (Unaudited)
bankruptcy and at that time there is a shortfall in the aggregate amount of margin held by the broker for all its clients, U.S. bankruptcy laws will typically allocate that shortfall on a pro-rata basis across all the broker’s customers (including the Fund), potentially resulting in losses to the Fund.
In order to better define its contractual rights and to secure rights that will help the Fund mitigate its counterparty risk, the Fund may enter into an International Swaps and Derivatives Association, Inc. Master Agreement (ISDA Master Agreement) or similar agreement with its derivative contract counterparties. An ISDA Master Agreement is an agreement between the Fund and a counterparty that governs over-the-counter derivatives and forward foreign currency exchange contracts and typically contains, among other things, collateral posting terms and netting provisions in the event of a default and/or termination event. Under an ISDA Master Agreement, the Fund may, under certain circumstances, offset with the counterparty certain derivative instrument’s payables and/or receivables with collateral held and/or posted and create one single net payment. The provisions of the ISDA Master Agreement typically permit a single net payment in the event of default (close-out netting) including the bankruptcy or insolvency of the counterparty. Note, however, that bankruptcy or insolvency laws of a particular jurisdiction may impose restrictions on or prohibitions against the right of offset in bankruptcy, insolvency or other events.
Collateral (margin) requirements differ by type of derivative. Margin requirements are established by the exchange or clearinghouse for exchange-traded and centrally cleared derivatives. Brokers can ask for margin in excess of the minimum in certain circumstances. Collateral terms are contract specific for over-the-counter derivatives. For over-the-counter derivatives traded under an ISDA Master Agreement, the collateral requirements are typically calculated by netting the marked-to-market amount for each transaction under such agreement and comparing that amount to the value of any variation margin currently pledged by the Fund and/or the counterparty. Generally, the amount of collateral due from or to a party has to exceed a minimum transfer amount threshold (e.g., $500,000) before a transfer has to be made. To the extent amounts due to the Fund from its counterparties are not fully collateralized, contractually or otherwise, the Fund bears the risk of loss from counterparty nonperformance. The Fund attempts to mitigate counterparty risk by only entering into agreements with counterparties that it believes have the
financial resources to honor their obligations and by monitoring the financial stability of those counterparties.
Certain ISDA Master Agreements allow counterparties to over-the-counter derivatives to terminate derivative contracts prior to maturity in the event the Fund’s net assets decline by a stated percentage over a specified time period or if the Fund fails to meet the terms of the ISDA Master Agreement, which would cause the Fund to accelerate payment of any net liability owed to the counterparty. The Fund also has termination rights if the counterparty fails to meet the terms of the ISDA Master Agreement. In addition to considering counterparty credit risk, the Fund would consider terminating the derivative contracts based on whether termination would result in a net liability owed from the counterparty.
For financial reporting purposes, the Fund does not offset derivative assets and derivative liabilities that are subject to netting arrangements in the Statement of Assets and Liabilities.
Forward Foreign Currency Exchange Contracts
Forward foreign currency exchange contracts are over-the-counter agreements between two parties to buy and sell a currency at a set price on a future date. The Fund utilized forward foreign currency exchange contracts to hedge the currency exposure associated with some or all of the Fund’s securities and to shift investment exposure from one currency to another. These instruments may be used for other purposes in future periods.
The values of forward foreign currency exchange contracts fluctuate daily with changes in foreign currency exchange rates. Changes in the value of these contracts are recorded as unrealized appreciation or depreciation until the contract is exercised or has expired. The Fund will realize a gain or loss when the forward foreign currency exchange contract is closed or expires.
The use of forward foreign currency exchange contracts does not eliminate fluctuations in the prices of the Fund’s portfolio securities. The risks of forward foreign currency exchange contracts include movement in the values of the foreign currencies relative to the U.S. dollar (or other foreign currencies) and the possibility that counterparties will not complete their contractual obligations, which may be in excess of the amount reflected, if any, in the Statement of Assets and Liabilities.
Futures Contracts
Futures contracts are exchange traded and represent commitments for the future purchase or sale of an asset
| | | | |
| Semiannual Report 2015 | | | 33 | |
| | |
| |
| | COLUMBIA EMERGING MARKETS BOND FUND |
NOTES TO FINANCIAL STATEMENTS (continued)
April 30, 2015 (Unaudited)
at a specified price on a specified date. The Fund bought and sold futures contracts to manage the duration and yield curve exposure of the Fund versus the benchmark. These instruments may be used for other purposes in future periods. Upon entering into futures contracts, the Fund bears risks that it may not achieve the anticipated benefits of the futures contracts and may realize a loss. Additional risks include counterparty credit risk, the possibility of an illiquid market, and that a change in the value of the contract or option may not correlate with changes in the value of the underlying asset.
Upon entering into a futures contract, the Fund pledges cash or securities with the broker in an amount sufficient to meet the initial margin requirement. The initial margin
deposit must be maintained at an established level over the life of the contract. Cash deposited as initial margin is recorded in the Statement of Assets and Liabilities as margin deposits. Securities deposited as initial margin are designated in the Portfolio of Investments. Subsequent payments (variation margin) are made or received by the Fund each day. The variation margin payments are equal to the daily change in the contract value and are recorded as variation margin receivable or payable and are offset in unrealized gains or losses. The Fund recognizes a realized gain or loss when the contract is closed or expires. Futures contracts involve, to varying degrees, risk of loss in excess of the variation margin disclosed in the Statement of Assets and Liabilities.
Offsetting of Derivative Assets and Derivative Liabilities
The following tables present the Fund’s gross and net amount of assets and liabilities available for offset under netting arrangements as well as any related collateral received or pledged by the Fund as of April 30, 2015:
| | | | | | | | | | | | | | | | | | | | | | | | | | | | |
| | | Gross Amounts
of Recognized
Liabilities ($) | | | Gross Amounts
Offset in the
Statement of
Assets and
Liabilities ($) | | | Net Amounts of
Liabilities Presented
in the Statement
of Assets and
Liabilities ($) | | | Gross Amounts Not Offset in
the Statement of Assets and Liabilities | | | Net
Amount ($)(b) | |
| | | | | Financial Instruments ($)(a) | | | Cash
Collateral Pledged ($) | | | Securities Collateral
Pledged ($) | | |
Liability Derivatives: | | | | | | | | | | | | | | | | | | | | | | | | | | | | |
Forward Foreign Currency Exchange Contracts | | | 2,123,697 | | | | — | | | | 2,123,697 | | | | — | | | | — | | | | — | | | | 2,123,697 | |
| (a) | Represents the amount of liabilities that could be offset by assets with the same counterparty under master netting or similar agreements that management elects not to offset on the Statement of Assets and Liabilities. |
| (b) | Represents the net amount due to counterparties in the event of default. |
Effects of Derivative Transactions in the Financial Statements
The following tables are intended to provide additional information about the effect of derivatives on the financial statements of the Fund, including: the fair value of derivatives by risk category and the location of those fair values in the Statement of Assets and Liabilities; and the impact of derivative transactions over the period in the Statement of Operations, including realized gains or losses and unrealized gains or losses. The derivative schedules following the Portfolio of Investments present additional information regarding derivative instruments outstanding at the end of the period, if any.
The following table is a summary of the fair value of derivative instruments (not considered to be hedging instruments for accounting disclosure purposes) at April 30, 2015:
| | | | | | |
| | | Asset Derivatives | |
Risk Exposure
Category | | Statement of Assets and Liabilities Location | | | Fair Value ($) | |
Interest rate risk | | Net assets — unrealized appreciation on futures contracts | | | 119,609 | * |
| |
| | Liability Derivatives | |
Risk Exposure
Category | | Statement of Assets and Liabilities Location | | | Fair Value ($) | |
Foreign exchange risk | | Unrealized depreciation on forward foreign currency exchange contracts | | | 2,123,697 | |
Interest rate risk | | Net assets — unrealized depreciation on futures contracts | | | 132,000 | * |
Total | | | | | 2,255,697 | |
| * | Includes cumulative appreciation (depreciation) as reported in the tables following the Portfolio of Investments. Only the current day’s variation margin is reported in receivables or payables in the Statement of Assets and Liabilities. |
| | |
| 34 | | Semiannual Report 2015 |
| | |
| |
| COLUMBIA EMERGING MARKETS BOND FUND | | |
NOTES TO FINANCIAL STATEMENTS (continued)
April 30, 2015 (Unaudited)
The following table indicates the effect of derivative instruments (not considered to be hedging instruments for accounting disclosure purposes) in the Statement of Operations for the six months ended April 30, 2015:
| | | | | | | | | | | | |
Amount of Realized Gain (Loss) on Derivatives Recognized in
Income | |
Risk Exposure
Category | | Forward Foreign
Currency Exchange
Contracts ($) | | | Futures
Contracts ($) | | | Total ($) | |
Foreign exchange risk | | | 7,282,670 | | | | — | | | | 7,282,670 | |
Interest rate risk | | | — | | | | (3,027,864 | ) | | | (3,027,864 | ) |
Total | | | 7,282,670 | | | | (3,027,864 | ) | | | 4,254,806 | |
Change in Unrealized Appreciation (Depreciation) on Derivatives
Recognized in Income | |
Risk Exposure
Category | | Forward Foreign
Currency Exchange
Contracts ($) | | | Futures
Contracts ($) | | | Total ($) | |
Foreign exchange risk | | | (1,977,567 | ) | | | — | | | | (1,977,567 | ) |
Interest rate risk | | | — | | | | 873,534 | | | | 873,534 | |
Total | | | (1,977,567 | ) | | | 873,534 | | | | (1,104,033 | ) |
The following table is a summary of the average outstanding volume by derivative instrument for the six months ended April 30, 2015:
| | | | |
| Derivative Instrument | | Average Notional Amounts ($)* | |
Futures contracts — Long | | | 19,475,672 | |
Futures contracts — Short | | | 65,692,125 | |
| | | | | | | | |
| Derivative Instrument | | Average Unrealized
Appreciation ($)* | | | Average Unrealized
Depreciation ($)* | |
Forward foreign currency exchange contracts | | | 1,059,999 | | | | (1,062,938 | ) |
| * | Based on the ending quarterly outstanding amounts for the six months ended April 30, 2015. |
Delayed Delivery Securities
The Fund may trade securities on other than normal settlement terms, including securities purchased or sold on a “when-issued” basis. This may increase risk to the Fund since the other party to the transaction may fail to deliver which could cause the Fund to subsequently invest at less advantageous prices. The Fund designates cash or liquid securities in an amount equal to the delayed delivery commitment.
Treasury Inflation Protected Securities
The Fund may invest in treasury inflation protected securities (TIPS). The principal amount of TIPS is adjusted periodically and is increased for inflation or decreased for deflation based on a monthly published
index. These adjustments are recorded as interest income in the Statement of Operations. Coupon payments are based on the adjusted principal at the time the interest is paid.
Security Transactions
Security transactions are accounted for on the trade date. Cost is determined and gains (losses) are based upon the specific identification method for both financial statement and federal income tax purposes.
Income Recognition
Interest income is recorded on an accrual basis. Market premiums and discounts, including original issue discounts, are amortized and accreted, respectively, over the expected life of the security on all debt securities, unless otherwise noted.
The Fund may place a debt security on non-accrual status and reduce related interest income when it becomes probable that the interest will not be collected and the amount of uncollectible interest can be reasonably estimated. A defaulted debt security is removed from non-accrual status when the issuer resumes interest payments or when collectability of interest is reasonably assured.
Dividend income is recorded on the ex-dividend date.
Expenses
General expenses of the Trust are allocated to the Fund and other funds of the Trust based upon relative net assets or other expense allocation methodologies determined by the nature of the expense. Expenses directly attributable to the Fund are charged to the Fund. Expenses directly attributable to a specific class of shares are charged to that share class.
Determination of Class Net Asset Value
All income, expenses (other than class-specific expenses, which are charged to that share class, as shown in the Statement of Operations) and realized and unrealized gains (losses) are allocated to each class of the Fund on a daily basis, based on the relative net assets of each class, for purposes of determining the net asset value of each class.
Federal Income Tax Status
The Fund intends to qualify each year as a regulated investment company under Subchapter M of the Internal Revenue Code, as amended, and will distribute substantially all of its taxable income (including net
| | | | |
| Semiannual Report 2015 | | | 35 | |
| | |
| |
| | COLUMBIA EMERGING MARKETS BOND FUND |
NOTES TO FINANCIAL STATEMENTS (continued)
April 30, 2015 (Unaudited)
short-term capital gains), if any, for its tax year, and as such will not be subject to federal income taxes. In addition, the Fund intends to distribute in each calendar year substantially all of its net investment income, capital gains and certain other amounts, if any, such that the Fund should not be subject to federal excise tax. Therefore, no federal income or excise tax provision is recorded.
Foreign Taxes
The Fund may be subject to foreign taxes on income, gains on investments or currency repatriation, a portion of which may be recoverable. The Fund will accrue such taxes and recoveries, as applicable, based upon its current interpretation of tax rules and regulations that exist in the markets in which it invests.
Realized gains in certain countries may be subject to foreign taxes at the Fund level, based on statutory rates. The Fund accrues for such foreign taxes on realized and unrealized gains at the appropriate rate for each jurisdiction, as applicable. The amount, if any, is disclosed as a liability on the Statement of Assets and Liabilities.
Distributions to Shareholders
Distributions from net investment income, if any, are declared and paid monthly. Net realized capital gains, if any, are distributed at least annually. Income distributions and capital gain distributions are determined in accordance with federal income tax regulations, which may differ from GAAP.
Guarantees and Indemnifications
Under the Trust’s organizational documents and, in some cases, by contract, its officers and trustees are indemnified against certain liabilities arising out of the performance of their duties to the Trust or its funds. In addition, certain of the Fund’s contracts with its service providers contain general indemnification clauses. The Fund’s maximum exposure under these arrangements is unknown since the amount of any future claims that may be made against the Fund cannot be determined, and the Fund has no historical basis for predicting the likelihood of any such claims.
Note 3. Fees and Compensation Paid to Affiliates
Investment Management Fees
Under an Investment Management Services Agreement, Columbia Management Investment Advisers, LLC (the
Investment Manager), a wholly-owned subsidiary of Ameriprise Financial, Inc. (Ameriprise Financial), determines which securities will be purchased, held or sold. The investment management fee is an annual fee that is equal to a percentage of the Fund’s average daily net assets that declines from 0.530% to 0.353% as the Fund’s net assets increase. The annualized effective investment management fee rate for the six months ended April 30, 2015 was 0.529% of the Fund’s average daily net assets.
The Investment Manager has entered into a personnel-sharing arrangement with its affiliate, Threadneedle Investments (Threadneedle). Threadneedle, like the Investment Manager, is a wholly-owned subsidiary of Ameriprise Financial and is an SEC-registered investment adviser. Pursuant to this arrangement, certain employees of Threadneedle serve as “associated persons” of the Investment Manager and, in this capacity, subject to the oversight and supervision of the Investment Manager and consistent with the investment objectives, policies and limitations set forth in the Fund’s prospectus and Statement of Additional Information (SAI), may provide research and related services, and discretionary investment management services (including acting as portfolio managers) to the Fund on behalf of the Investment Manager.
Administration Fees
Under an Administrative Services Agreement, the Investment Manager also serves as the Fund Administrator. The Fund pays the Fund Administrator an annual fee for administration and accounting services equal to a percentage of the Fund’s average daily net assets that declines from 0.07% to 0.04% as the Fund’s net assets increase. The annualized effective administration fee rate for the six months ended April 30, 2015 was 0.07% of the Fund’s average daily net assets.
Other Expenses
Other expenses are for, among other things, miscellaneous expenses of the Fund or the Board, including payments to a company providing limited administrative services to the Fund and the Board. That company’s expenses include boardroom and office expense, employee compensation, employee health and retirement benefits, and certain other expenses. For the six months ended April 30, 2015, other expenses paid by the Fund to this company were $1,136.
| | |
| 36 | | Semiannual Report 2015 |
| | |
| |
| COLUMBIA EMERGING MARKETS BOND FUND | | |
NOTES TO FINANCIAL STATEMENTS (continued)
April 30, 2015 (Unaudited)
Compensation of Board Members
Board members are compensated for their services to the Fund as disclosed in the Statement of Operations. Under a Deferred Compensation Plan (the Plan), the Board members who are not “interested persons” of the Fund, as defined under the 1940 Act, may elect to defer payment of up to 100% of their compensation. Deferred amounts are treated as though equivalent dollar amounts had been invested in shares of certain funds managed by the Investment Manager. The Fund’s liability for these amounts is adjusted for market value changes and remains in the Fund until distributed in accordance with the Plan.
Transfer Agent Fees
Under a Transfer and Dividend Disbursing Agent Agreement, Columbia Management Investment Services Corp. (the Transfer Agent), an affiliate of the Investment Manager and a wholly-owned subsidiary of Ameriprise Financial, is responsible for providing transfer agency services to the Fund. The Transfer Agent has contracted with Boston Financial Data Services (BFDS) to serve as sub-transfer agent.
The Transfer Agent receives a monthly transfer agency fee based on the number or the average value of accounts, depending on the type of account. In addition, the Transfer Agent also receives sub-transfer agency fees based on a percentage of the average aggregate value of the Fund’s shares maintained in omnibus accounts (other than omnibus accounts for which American Enterprise Investment Services Inc. is the broker of record or accounts where the beneficial shareholder is a customer of Ameriprise Financial Services, Inc., for which the Transfer Agent receives a per account fee). The Transfer Agent pays the fees of BFDS for services as sub-transfer agent and is not entitled to reimbursement for such fees from the Fund (with the exception of out-of-pocket fees).
The Transfer Agent also receives compensation from the Fund for various shareholder services and reimbursements for certain out-of-pocket fees. Total transfer agent fees for Class K and Class R5 shares are subject to an annual limitation of not more than 0.05% of the average daily net assets attributable to each share class. Class I and Class Y shares do not pay transfer agency fees.
For the six months ended April 30, 2015, the Fund’s annualized effective transfer agent fee rates as a
percentage of average daily net assets of each class were as follows:
| | | | |
Class A | | | 0.25 | % |
Class B | | | 0.25 | |
Class C | | | 0.25 | |
Class K | | | 0.05 | |
Class R | | | 0.24 | |
Class R4 | | | 0.23 | |
Class R5 | | | 0.05 | |
Class W | | | 0.27 | |
Class Z | | | 0.25 | |
An annual minimum account balance fee of $20 may apply to certain accounts with a value below the applicable share class’s initial minimum investment requirements to reduce the impact of small accounts on transfer agent fees. These minimum account balance fees are remitted to the Fund and recorded as part of expense reductions in the Statement of Operations. For the six months ended April 30, 2015, no minimum account balance fees were charged by the Fund.
Plan Administration Fees
Under a Plan Administration Services Agreement with the Transfer Agent, the Fund pays an annual fee at a rate of 0.25% of the Fund’s average daily net assets attributable to Class K shares for the provision of various administrative, recordkeeping, communication and educational services.
Distribution Fees
The Fund has an agreement with Columbia Management Investment Distributors, Inc. (the Distributor), an affiliate of the Investment Manager and a wholly-owned subsidiary of Ameriprise Financial, for distribution and shareholder services. Under a Plan and Agreement of Distribution, the Fund pays a fee at an annual rate of up to 0.25% of the Fund’s average daily net assets attributable to Class A and Class W shares, a fee at an annual rate of up to 0.50% of the Fund’s average daily net assets attributable to Class R shares (of which up to 0.25% may be used for shareholder services) and a fee at an annual rate of up to 1.00% of the Fund’s average daily net assets attributable to Class B and Class C shares. For Class B and Class C shares, of the 1.00% fee, up to 0.75% is reimbursed for distribution expenses.
The amount of distribution expenses incurred by the Distributor and not yet reimbursed (unreimbursed expense) was approximately $124,000 and $287,000
| | | | |
| Semiannual Report 2015 | | | 37 | |
| | |
| |
| | COLUMBIA EMERGING MARKETS BOND FUND |
NOTES TO FINANCIAL STATEMENTS (continued)
April 30, 2015 (Unaudited)
for Class B and Class C shares, respectively. These amounts are based on the most recent information available as of March 31, 2015, and may be recovered from future payments under the distribution plan or CDSCs. To the extent the unreimbursed expense has been fully recovered, the distribution fee is reduced.
Sales Charges
Sales charges, including front-end charges and CDSCs, received by the Distributor for distributing Fund shares were $84,856 for Class A, $42 for Class B, and $6,857 for Class C shares for the six months ended April 30, 2015.
Expenses Waived/Reimbursed by the Investment Manager and its Affiliates
The Fund’s expense ratio is subject to an expense reimbursement arrangement pursuant to which fees will be waived and/or expenses reimbursed (excluding certain fees and expenses described below), so that the Fund’s net operating expenses, after giving effect to fees waived/expenses reimbursed and any balance credits and/or overdraft charges from the Fund’s custodian, do not exceed the annual rates of:
| | | | | | | | |
| | | Voluntary Expense Cap Effective March 1, 2015 | | | Contractual Expense Cap Prior to March 1, 2015 | |
Class A | | | 1.21 | % | | | 1.24 | % |
Class B | | | 1.96 | | | | 1.99 | |
Class C | | | 1.96 | | | | 1.99 | |
Class I | | | 0.76 | | | | 0.80 | |
Class K | | | 1.06 | | | | 1.10 | |
Class R | | | 1.46 | | | | 1.49 | |
Class R4 | | | 0.96 | | | | 0.99 | |
Class R5 | | | 0.81 | | | | 0.85 | |
Class W | | | 1.21 | | | | 1.24 | |
Class Y | | | 0.76 | | | | 0.80 | |
Class Z | | | 0.96 | | | | 0.99 | |
The voluntary expense cap arrangement may be revised or discontinued at any time. Under the arrangements, the following fees and expenses are excluded from the waiver/reimbursement commitment, and therefore will be paid by the Fund, if applicable: taxes (including foreign transaction taxes), expenses associated with investments in affiliated and non-affiliated pooled investment vehicles (including mutual funds and exchange-traded funds), transaction costs and brokerage commissions, costs related to any securities lending
program, dividend expenses associated with securities sold short, inverse floater program fees and expenses, transaction charges and interest on borrowed money, interest and extraordinary expenses. Any fees waived and/or expenses reimbursed under the expense reimbursement arrangements described above are not recoverable by the Investment Manager or its affiliates in future periods.
Note 4. Federal Tax Information
The timing and character of income and capital gain distributions are determined in accordance with income tax regulations, which may differ from GAAP because of temporary or permanent book to tax differences.
At April 30, 2015, the cost of investments for federal income tax purposes was approximately $610,465,000 and the aggregate gross approximate unrealized appreciation and depreciation based on that cost was:
| | | | |
Unrealized appreciation | | | $21,244,000 | |
Unrealized depreciation | | | (46,697,000 | ) |
Net unrealized depreciation | | | $(25,453,000 | ) |
Management of the Fund has concluded that there are no significant uncertain tax positions in the Fund that would require recognition in the financial statements. However, management’s conclusion may be subject to review and adjustment at a later date based on factors including, but not limited to, new tax laws, regulations, and administrative interpretations (including relevant court decisions). Generally, the Fund’s federal tax returns for the prior three fiscal years remain subject to examination by the Internal Revenue Service.
Note 5. Portfolio Information
The cost of purchases and proceeds from sales of securities, excluding short-term investments and derivatives, if any, aggregated to $118,452,990 and $192,781,203, respectively, for the six months ended April 30, 2015. The amount of purchase and sale activity impacts the portfolio turnover rate reported in the Financial Highlights.
Note 6. Affiliated Money Market Fund
The Fund invests in Columbia Short-Term Cash Fund, an affiliated money market fund established for the exclusive use by the Fund and other affiliated funds. The income earned by the Fund from such investments is included as Dividends — affiliated issuers in the Statement of Operations. As an investing fund, the Fund
| | |
| 38 | | Semiannual Report 2015 |
| | |
| |
| COLUMBIA EMERGING MARKETS BOND FUND | | |
NOTES TO FINANCIAL STATEMENTS (continued)
April 30, 2015 (Unaudited)
indirectly bears its proportionate share of the expenses of Columbia Short-Term Cash Fund.
Note 7. Shareholder Concentration
At April 30, 2015, affiliated shareholders of record owned 61.1% of the outstanding shares of the Fund in one or more accounts. Subscription and redemption activity by concentrated accounts may have a significant effect on the operations of the Fund.
Note 8. Line of Credit
The Fund has entered into a revolving credit facility with a syndicate of banks led by JPMorgan Chase Bank, N.A. whereby the Fund may borrow for the temporary funding of shareholder redemptions or for other temporary or emergency purposes. Pursuant to a December 9, 2014 amendment, the credit facility agreement, which is a collective agreement between the Fund and certain other funds managed by the Investment Manager, severally and not jointly, permits collective borrowings up to $550 million. Interest is charged to each participating fund based on its borrowings at a rate equal to the higher of (i) the overnight federal funds rate plus 1.00% or (ii) the one-month LIBOR rate plus 1.00%. Each borrowing under the credit facility matures no later than 60 days after the date of borrowing. The Fund also pays a commitment fee equal to its pro rata share of the amount of the credit facility at a rate of 0.075% per annum. The commitment fee is included in other expenses in the Statement of Operations. Prior to the December 9, 2014 amendment, the credit facility agreement permitted borrowings up to $500 million under the same terms and interest rates as described above.
The Fund had no borrowings during the six months ended April 30, 2015.
Note 9. Significant Risks
Credit Risk
Credit risk is the risk that the value of debt securities in the Fund’s portfolio may decline because the issuer may default and fail to pay interest or repay principal when due. Rating agencies assign credit ratings to debt securities to indicate their credit risk. Lower rated or unrated debt securities held by the Fund may present increased credit risk as compared to higher-rated debt securities.
Interest Rate Risk
Interest rate risk is the risk of losses attributable to changes in interest rates. In general, if prevailing interest
rates rise, the values of debt securities tend to fall, and if interest rates fall, the values of debt securities tend to rise. Actions by governments and central banking authorities can result in increases in interest rates. Increasing interest rates may negatively affect the value of debt securities held by the Fund, resulting in a negative impact on the Fund’s performance and net asset value per share. In general, the longer the maturity or duration of a debt security, the greater its sensitivity to changes in interest rates.
Liquidity Risk
Liquidity risk is the risk associated with a lack of marketability of investments which may make it difficult to sell the investment at a desirable time or price. Changing regulatory, market or other conditions or environments (for example, the interest rate or credit environments) may adversely affect the liquidity of the Fund’s investments. The Fund may have to accept a lower selling price for the holding, sell other investments, or forego another, more appealing investment opportunity. Generally, the less liquid the market at the time the Fund sells a portfolio investment, the greater the risk of loss or decline of value to the Fund. A less liquid market can lead to an increase in Fund redemptions, which may negatively impact Fund performance and net asset value per share, including, for example, if the Fund is forced to sell securities in a down market.
Foreign Securities and Emerging Market Countries Risk
Investing in foreign securities may include certain risks and considerations not typically associated with investing in U.S. securities, such as fluctuating currency values and changing local and regional economic, political and social conditions, which may result in greater market volatility. In addition, certain foreign securities may not be as liquid as U.S. securities. Investing in emerging markets may accentuate these risks. These countries are also more likely to experience high levels of inflation, deflation or currency devaluation which could hurt their economies and securities markets. To the extent that the Fund concentrates its investment exposure to any one or a few specific countries, the Fund will be particularly susceptible to the various conditions, events or other factors impacting those countries and may, therefore, have a greater risk than that of a fund which is more geographically diversified.
| | | | |
| Semiannual Report 2015 | | | 39 | |
| | |
| |
| | COLUMBIA EMERGING MARKETS BOND FUND |
NOTES TO FINANCIAL STATEMENTS (continued)
April 30, 2015 (Unaudited)
Non-Diversification Risk
A non-diversified fund is permitted to invest a greater percentage of its total assets in fewer issuers than a diversified fund. The Fund may, therefore, have a greater risk of loss from a few issuers than a similar fund that invests more broadly.
High-Yield Securities Risk
Securities rated below investment grade (commonly called “high-yield” or “junk” bonds) and unrated securities of comparable quality expose the Fund to a greater risk of loss of principal and income than a fund that invests solely or primarily in investment grade securities. In addition, these investments have greater price fluctuations, are less liquid and are more likely to experience a default than higher-rated securities. High-yield securities are considered to be predominantly speculative with respect to the issuer’s capacity to pay interest and repay principal.
Note 10. Subsequent Events
Management has evaluated the events and transactions that have occurred through the date the financial statements were issued and noted no items requiring adjustment of the financial statements or additional disclosure.
Note 11. Information Regarding Pending and Settled Legal Proceedings
In December 2005, without admitting or denying the allegations, American Express Financial Corporation (AEFC, which is now known as Ameriprise Financial, Inc. (Ameriprise Financial)) entered into settlement agreements with the Securities and Exchange Commission (SEC) and Minnesota Department of Commerce (MDOC) related to market timing activities. As a result, AEFC was censured and ordered to cease and desist from committing or causing any violations of certain provisions of the Investment Advisers Act of 1940, the Investment Company Act of 1940, and various Minnesota laws. AEFC agreed to pay disgorgement of $10 million and civil money penalties of $7 million. AEFC also agreed to retain an independent distribution consultant to assist in developing a plan for distribution of all disgorgement and civil penalties ordered by the SEC in accordance with various undertakings detailed at www.sec.gov/litigation/admin/ia-2451.pdf. Ameriprise Financial and its affiliates have cooperated with the SEC and the MDOC in these legal proceedings, and have made regular reports to the Funds’ Boards of Trustees.
Ameriprise Financial and certain of its affiliates have historically been involved in a number of legal, arbitration and regulatory proceedings, including routine litigation, class actions, and governmental actions, concerning matters arising in connection with the conduct of their business activities. Ameriprise Financial believes that the Funds are not currently the subject of, and that neither Ameriprise Financial nor any of its affiliates are the subject of, any pending legal, arbitration or regulatory proceedings that are likely to have a material adverse effect on the Funds or the ability of Ameriprise Financial or its affiliates to perform under their contracts with the Funds. Ameriprise Financial is required to make quarterly (10-Q), annual (10-K) and, as necessary, 8-K filings with the Securities and Exchange Commission on legal and regulatory matters that relate to Ameriprise Financial and its affiliates. Copies of these filings may be obtained by accessing the SEC website at www.sec.gov.
There can be no assurance that these matters, or the adverse publicity associated with them, will not result in increased fund redemptions, reduced sale of fund shares or other adverse consequences to the Funds. Further, although we believe proceedings are not likely to have a material adverse effect on the Funds or the ability of Ameriprise Financial or its affiliates to perform under their contracts with the Funds, these proceedings are subject to uncertainties and, as such, we are unable to estimate the possible loss or range of loss that may result. An adverse outcome in one or more of these proceedings could result in adverse judgments, settlements, fines, penalties or other relief that could have a material adverse effect on the consolidated financial condition or results of operations of Ameriprise Financial.
| | |
| 40 | | Semiannual Report 2015 |
| | |
| |
| COLUMBIA EMERGING MARKETS BOND FUND | | |
APPROVAL OF INVESTMENT MANAGEMENT SERVICES AGREEMENT
Columbia Management Investment Advisers, LLC (Columbia Management or the Investment Manager), a wholly-owned subsidiary of Ameriprise Financial, Inc. (Ameriprise Financial), serves as the investment manager to Columbia Emerging Markets Bond Fund (the Fund). Under an investment management services agreement (the IMS Agreement), Columbia Management provides investment advice and other services to the Fund and other funds distributed by Columbia Management Investment Distributors, Inc. (collectively, the Funds).
The Fund’s Board of Trustees (the Board), including the independent Board members (the Independent Trustees), considered the renewal of the IMS Agreement for a two-month period (Short-Term Period) in order to align the IMS Agreement with the review cycle of other funds in the Columbia family of funds. Columbia Management prepared detailed reports for the Board and its Contracts Committee in January, March and April 2015, including reports based on analyses of data provided by an independent organization (Lipper) and a comprehensive response to each item of information requested by independent legal counsel to the Independent Trustees (Independent Legal Counsel) in a letter to the Investment Manager, to assist the Board in making this determination. In addition, throughout the year, the Board (or its committees) regularly meets with portfolio management teams and senior management personnel, and reviews information prepared by Columbia Management addressing the services Columbia Management provides and Fund performance. The Board also accords appropriate weight to the work, deliberations and conclusions of the Contracts Committee, the Investment Review Committee and the Compliance Committee in determining whether to continue the IMS Agreement.
The Board, at its April 13-15, 2015 in-person Board meeting (the April Meeting), considered the renewal of the IMS Agreement for the Short-Term Period. At the April Meeting, Independent Legal Counsel reviewed with the Independent Trustees various factors relevant to the Board’s consideration of advisory agreements and the Board’s legal responsibilities related to such consideration. Following an analysis and discussion of the factors identified below, the Board, including all of the Independent Trustees, approved the renewal of the IMS Agreement for the Short-Term Period.
Nature, Extent and Quality of Services Provided by Columbia Management
The Independent Trustees analyzed various reports and presentations they had received detailing the services performed by Columbia Management, as well as its expertise, resources and capabilities. The Independent Trustees specifically considered many developments during the past year concerning the services provided by Columbia Management. The Independent Trustees noted the information they received concerning Columbia Management’s ability to retain its key portfolio management personnel. In evaluating the quality of services provided under the IMS Agreement and the Fund’s Administrative Services Agreement, the Independent Trustees also took into account the organization and strength of the Fund’s and its service providers’ compliance programs. In addition, the Board also reviewed the financial condition of Columbia Management (and its affiliates) and each entity’s ability to carry out its responsibilities under the IMS Agreement and the Fund’s other services agreements with affiliates of Ameriprise Financial, observing the financial strength of Ameriprise Financial, with its solid balance sheet. The Board also discussed the acceptability of the terms of the IMS Agreement for the Short-Term Period.
Based on the foregoing, and based on other information received (both oral and written, including the information on investment performance referenced below) and other considerations, the Board concluded that the services being performed by Columbia Management and its affiliates were acceptable for the Short-Term Period.
Investment Performance
For purposes of evaluating the nature, extent and quality of services provided under the IMS Agreement, the Board carefully reviewed the investment performance of the Fund. In this regard, the Board considered detailed reports providing the results of analyses performed by an independent organization showing, for various periods, the performance of the Fund, the performance of a benchmark index, the percentage ranking of the Fund among its comparison group and the net assets of the Fund. The Board observed that for purposes of approving the IMS Agreement for the Short-Term Period, the Fund’s performance was acceptable.
| | | | |
| Semiannual Report 2015 | | | 41 | |
| | |
| |
| | COLUMBIA EMERGING MARKETS BOND FUND |
APPROVAL OF INVESTMENT MANAGEMENT SERVICES AGREEMENT (continued)
Comparative Fees, Costs of Services Provided and the Profits Realized By Columbia Management and its Affiliates from their Relationships with the Fund
The Board reviewed comparative fees and the costs of services provided under the IMS Agreement. The Board members considered detailed comparative information set forth in an annual report on fees and expenses, including, among other things, data (based on analyses conducted by an independent organization) showing a comparison of the Fund’s expenses with median expenses paid by funds in its comparative peer universe, as well as data showing the Fund’s contribution to Columbia Management’s profitability.
The Board accorded particular weight to the notion that the level of fees should reflect a rational pricing model applied consistently across the various product lines in the Fund family, while assuring that the overall fees for each Fund (with few defined exceptions) are generally in line with the “pricing philosophy” currently in effect (i.e., that the total expense ratio of the Fund is no higher than the median expense ratio of funds in the same comparison universe of the Fund).
The Board also considered the expected profitability of Columbia Management and its affiliates in connection with Columbia Management providing investment management services to the Fund. In this regard, the Board referred to a detailed profitability report, discussing the profitability to Columbia Management and Ameriprise Financial from managing, operating and distributing the Funds. For purposes of approving the IMS Agreement for the Short-Term Period, the Board concluded that the investment management service fees were fair and reasonable, observing that the profitability levels also seemed reasonable.
Economies of Scale to be Realized
The Board also considered the economies of scale that might be realized by Columbia Management as the Fund grows and took note of the extent to which Fund shareholders might also benefit from such growth. In this regard, the Independent Trustees took into account that IMS fees decline as Fund assets exceed various breakpoints.
Based on the foregoing, the Board, including all of the Independent Trustees, concluded that, for purposes of its consideration of the renewal of the IMS Agreement for the Short-Term Period, the investment management service fees were fair and reasonable in light of the extent and quality of services provided. In reaching this conclusion, no single factor was determinative. The Board noted its understanding that it would undertake the full consideration of renewal of the IMS Agreement for the full annual period at its June 2015 meetings. On April 15, 2015, the Board, including all of the Independent Trustees, approved the renewal of the IMS Agreement for the Short-Term Period.
| | |
| 42 | | Semiannual Report 2015 |
| | |
| |
| COLUMBIA EMERGING MARKETS BOND FUND | | |
IMPORTANT INFORMATION ABOUT THIS REPORT
Each fund mails one shareholder report to each shareholder address. If you would like more than one report, please call shareholder services at 800.345.6611 and additional reports will be sent to you.
The policy of the Board is to vote the proxies of the companies in which each fund holds investments consistent with the procedures as stated in the Statement of Additional Information (SAI). You may obtain a copy of the SAI without charge by calling 800.345.6611; contacting your financial intermediary; visiting columbiathreadneedle.com/us; or searching the website of the Securities and Exchange Commission (SEC) at sec.gov. Information regarding how each fund voted proxies relating to portfolio securities is filed with the SEC by August 31st for the most recent 12-month period ending June 30th of that year, and is available without charge by visiting columbiathreadneedle.com/us, or searching the website of the SEC at sec.gov.
Each fund files a complete schedule of portfolio holdings with the SEC for the first and third quarters of each fiscal year on Form N-Q. Each fund’s Form N-Q is available on the SEC’s website at sec.gov and may be reviewed and copied at the SEC’s Public Reference Room in Washington, D.C. Information on the operation of the Public Reference Room may be obtained by calling 800.SEC.0330. Each fund’s complete schedule of portfolio holdings, as filed on Form N-Q, can also be obtained without charge, upon request, by calling 800.345.6611.
| | | | |
| Semiannual Report 2015 | | | 43 | |
Columbia Emerging Markets Bond Fund
P.O. Box 8081
Boston, MA 02266-8081
This information is for use with concurrent or prior delivery of a fund prospectus. Please read and consider the investment objectives, risks, charges and expenses for any fund carefully before investing. For a prospectus and summary prospectus, which contains this and other important information about the Fund, go to columbiathreadneedle.com/us. The Fund is distributed by Columbia Management Investment Distributors, Inc., member FINRA, and managed by Columbia Management Investment Advisers, LLC.
Columbia Threadneedle Investments (Columbia Threadneedle) is the global brand name of the Columbia and Threadneedle group of companies. All rights reserved. Columbia Management Investment Distributors, Inc., 225 Franklin Street, Boston, MA 02110-2804
© 2015 Columbia Management Investment Advisers, LLC.
columbiathreadneedle.com/us
SAR141_10_E01_(06/15)

SEMIANNUAL REPORT
April 30, 2015

COLUMBIA EUROPEAN EQUITY FUND


ABOUT COLUMBIA THREADNEEDLE INVESTMENTS
Columbia Threadneedle Investments is a leading global asset management group that provides a broad range of actively managed investment strategies and solutions for individual, institutional and corporate clients around the world.
With more than 2,000 people, including over 450 investment professionals based in North America, Europe and Asia, we manage $506 billion* of assets across developed and emerging market equities, fixed income, asset allocation solutions and alternatives. We are the 12th largest manager of long-term mutual fund assets in the U.S.** and the 5th largest manager of retail funds in the U.K.***
Our priority is the investment success of our clients. We aim to deliver the investment outcomes they expect through an investment approach that is team-based, performance-driven and risk-aware. Our culture is dynamic and interactive. By sharing our insights across asset classes and geographies, we generate richer perspectives on global, regional and local investment landscapes. The ability to exchange and debate investment ideas in a collaborative environment enriches our teams’ investment processes. More importantly, it results in better informed investment decisions for our clients.
Columbia funds are distributed by Columbia Management Investment Distributors, Inc., member FINRA, and managed by Columbia Management Investment Advisers, LLC.
Columbia Threadneedle Investments (Columbia Threadneedle) is the global brand name of the Columbia and Threadneedle group of companies.
| * | | In U.S. dollars as of March 31, 2015. Source: Ameriprise Q1 Earnings Release. Includes all assets managed by entities in the Columbia and Threadneedle groups of companies. |
Contact us for more current data.
| ** | | Source: ICI as of March 31, 2015 for Columbia Management Investment Advisers, LLC. |
| *** | | Source: Investment Association as of March 2015 for Threadneedle Asset Management Limited. |
© 2015 Columbia Management Investment Advisers, LLC. All rights reserved.
Not part of the shareholder report
Get the market insight you need from our investment experts
Connect with Columbia Threadneedle Investments
Investor insight
Find economic and market commentary, investment videos, white papers,
mutual fund commentary and more at columbiathreadneedle.com/us.
| | | | |
 | | Columbia Threadneedle Investor Newsletter (e-newsletter) Read our award-winning* shareholder
newsletter. Our quarterly newsletter
is available online and provides timely
and relevant content about economic
trends, fund news, service enhancements and
changes. Sign up to receive the newsletter
electronically at columbiathreadneedle.com/
us/newsletter. | |  |
| | |
 | | Investment videos Get analysis of current events and trends that may affect your investments.
Visit our online video library to watch and discover what our thought leaders
are saying about the financial markets and economy. |
| | |
| | Social media We offer you multiple ways to access our market commentary and
investment insights. |
| | n | | Perspectives blog at columbiathreadneedle.com/us |
Read timely posts by our investment team, including our chief investment officer, chief economist and portfolio managers.
| | n | | twitter.com/CTinvest_US |
Follow us on Twitter for quick, up-to-the-minute comments on market news and more.
View our commentaries on the economy, markets and current investment opportunities.
| | n | | linkedin.com/company/columbia-threadneedle-investments-us |
Connect with us on LinkedIn for updates from our thought leaders.
| * | Columbia Threadneedle Investor Newsletter was awarded top honors in the Mutual Fund Education Alliance STAR Awards competition for excellence in mutual fund marketing and communications in 2011, 2012 and 2013. Materials in the competition were evaluated on educational value, message comprehension, effective design and objectives. |
Not part of the shareholder report
PRESIDENT’S MESSAGE

Dear Shareholder,
In a world that is changing faster than ever before, investors want asset managers who offer a global perspective while generating strong and sustainable returns. To that end, Columbia Management, in conjunction with its U.K.-based affiliate, Threadneedle Investments, has rebranded to Columbia Threadneedle Investments. The new global brand represents the combined capabilities, resources and reach of the global group, offering investors access to the best of both firms.
With a presence in 18 countries and more than 450 investment professionals*, our collective perspective and world view as Columbia Threadneedle Investments gives us deeper insight into what might affect the real-life financial outcomes clients are seeking. Putting our views into a global context enables us to build richer perspectives and create the right solutions, and provides us with enhanced capabilities to deliver consistent investment performance, which may ultimately lead to better investor outcomes.
As a result of the rebrand, you will begin to see our new logo and colors reflected in printed materials, such as this shareholder report, as well as on our new website — columbiathreadneedle.com/us. We encourage you to visit us online and view a new video on the “About Us” tab that speaks to the strength of the firm.
While we are introducing a new brand, in many ways, the investment company you know well has not changed. The following remain in effect:
| n | | Fund and strategy names |
| n | | Established investment teams, philosophies and processes |
| n | | Account services, features, servicing phone numbers and mailing addresses |
| n | | Columbia Management Investment Distributors as distributor and Columbia Management Investment Advisers as investment adviser |
We recognize that the money we manage represents the hard work and savings of people like you, and that everyone has different ambitions and different definitions of success. Investors have varying goals — funding their children’s education, enjoying their retirement, putting money aside for unexpected events, and more. Whatever your ambitions, we believe our wide range of investment products and solutions can help give you confidence that you will reach your goals.
The world is constantly changing, but our priority remains the same: to help you secure your finances, meet your goals and achieve success. Thank you for your continued investment with us. Our service representatives are available at 800.345.6611 to help with any questions.
Sincerely,

Christopher O. Petersen
President, Columbia Funds
Investors should consider the investment objectives, risks, charges and expenses of a mutual fund carefully before investing. For a free prospectus and summary prospectus, which contains this and other important information about a fund, visit columbiathreadneedle.com/us. The prospectus should be read carefully before investing.
* Source: Ameriprise as of December 1, 2014
Columbia Funds are distributed by Columbia Management Investment Distributors, Inc., member FINRA, and managed by Columbia Management Investment Advisers, LLC.
© 2015 Columbia Management Investment Advisers, LLC. All rights reserved.
Semiannual Report 2015
| | |
| |
| COLUMBIA EUROPEAN EQUITY FUND | | |
TABLE OF CONTENTS
Fund Investment Manager
Columbia Management Investment
Advisers, LLC
225 Franklin Street
Boston, MA 02110
Fund Distributor
Columbia Management Investment
Distributors, Inc.
225 Franklin Street
Boston, MA 02110
Fund Transfer Agent
Columbia Management Investment
Services Corp.
P.O. Box 8081
Boston, MA 02266-8081
For more information about any of the funds, please visit columbiathreadneedle.com/us or call 800.345.6611. Customer Service Representatives are available to answer your questions Monday through Friday from 8 a.m. to 7 p.m. Eastern time.
The views expressed in this report reflect the current views of the respective parties. These views are not guarantees of future performance and involve certain risks, uncertainties and assumptions that are difficult to predict, so actual outcomes and results may differ significantly from the views expressed. These views are subject to change at any time based upon economic, market or other conditions and the respective parties disclaim any responsibility to update such views. These views may not be relied on as investment advice and, because investment decisions for a Columbia fund are based on numerous factors, may not be relied on as an indication of trading intent on behalf of any particular Columbia fund. References to specific securities should not be construed as a recommendation or investment advice.
Semiannual Report 2015
| | |
| |
| | COLUMBIA EUROPEAN EQUITY FUND |
PERFORMANCE OVERVIEW
(Unaudited)
Performance Summary
| n | | Columbia European Equity Fund (the Fund) Class A shares returned 7.63% excluding sales charges for the six-month period that ended April 30, 2015. |
| n | | The Fund outperformed its benchmark, the MSCI Europe Index (Net), which returned 6.04% for the same six months. |
| | | | | | | | | | | | | | | | | | |
Average Annual Total Returns (%) (for period ended April 30, 2015) | |
| | | Inception | | 6 Months
Cumulative | | | 1 Year | | | 5 Years | | | 10 Years | |
Class A | | 06/26/00 | | | | | | | | | | | | | | | | |
Excluding sales charges | | | | | 7.63 | | | | -1.46 | | | | 10.44 | | | | 8.33 | |
Including sales charges | | | | | 1.44 | | | | -7.13 | | | | 9.15 | | | | 7.69 | |
Class B | | 06/26/00 | | | | | | | | | | | | | | | | |
Excluding sales charges | | | | | 7.28 | | | | -2.25 | | | | 9.62 | | | | 7.51 | |
Including sales charges | | | | | 2.28 | | | | -6.94 | | | | 9.34 | | | | 7.51 | |
Class C | | 06/26/00 | | | | | | | | | | | | | | | | |
Excluding sales charges | | | | | 7.24 | | | | -2.17 | | | | 9.64 | | | | 7.52 | |
Including sales charges | | | | | 6.24 | | | | -3.11 | | | | 9.64 | | | | 7.52 | |
Class I | | 07/15/04 | | | 7.97 | | | | -1.11 | | | | 11.11 | | | | 8.90 | |
Class K | | 06/26/00 | | | 7.82 | | | | -1.30 | | | | 10.66 | | | | 8.61 | |
Class R4* | | 01/08/14 | | | 7.94 | | | | -1.19 | | | | 10.53 | | | | 8.37 | |
Class R5* | | 01/08/14 | | | 7.90 | | | | -1.04 | | | | 10.56 | | | | 8.39 | |
Class W* | | 06/18/12 | | | 7.83 | | | | -1.30 | | | | 10.45 | | | | 8.33 | |
Class Z* | | 09/27/10 | | | 7.79 | | | | -1.19 | | | | 10.79 | | | | 8.50 | |
MSCI Europe Index (Net) | | | | | 6.04 | | | | -3.23 | | | | 7.88 | | | | 5.62 | |
Returns for Class A are shown with and without the maximum initial sales charge of 5.75%. Returns for Class B are shown with and without the applicable contingent deferred sales charge (CDSC) of 5.00% in the first year, declining to 1.00% in the sixth year and eliminated thereafter. Returns for Class C are shown with and without the 1.00% CDSC for the first year only. The Fund’s other classes are not subject to sales charges and have limited eligibility. Please see the Fund’s prospectus for details. Performance for different share classes will vary based on differences in sales charges and fees associated with each class. All results shown assume reinvestment of distributions during the period. Returns do not reflect the deduction of taxes that a shareholder may pay on Fund distributions or on the redemption of Fund shares. Performance results reflect the effect of any fee waivers or reimbursements of Fund expenses by Columbia Management Investment Advisers, LLC and/or any of its affiliates. Absent these fee waivers or expense reimbursement arrangements, performance results would have been lower.
The performance information shown represents past performance and is not a guarantee of future results. The investment return and principal value of your investment will fluctuate so that your shares, when redeemed, may be worth more or less than their original cost. Current performance may be lower or higher than the performance information shown. You may obtain performance information current to the most recent month-end by contacting your financial intermediary, visiting columbiathreadneedle.com/us or calling 800.345.6611.
| * | The returns shown for periods prior to the share class inception date (including returns for the Life of the Fund, if shown, which are since Fund inception) include the returns of the Fund’s oldest share class. Since the Fund launched more than one share class at its inception, Class A shares were used. These returns are adjusted to reflect any higher class-related operating expenses of the newer share classes, as applicable. Please visit columbiathreadneedle.com/us/investment-products/mutual-funds/appended-performance for more information. |
The MSCI Europe Index (Net) is a free float-adjusted market capitalization weighted index that is designed to measure the equity market performance of the developed markets in Europe.
Indices are not available for investment, are not professionally managed and do not reflect sales charges, fees, brokerage commissions, taxes (except the MSCI Europe Index (Net), which reflects reinvested dividends net of withholding taxes) or other expenses of investing. Securities in the Fund may not match those in an index.
| | |
| |
| COLUMBIA EUROPEAN EQUITY FUND | | |
PORTFOLIO OVERVIEW
(Unaudited)
| | | | |
Top Ten Holdings (%)
(at April 30, 2015) | |
Bayer AG, Registered Shares (Germany) | | | 3.7 | |
Novo Nordisk A/S, Class B (Denmark) | | | 3.4 | |
Roche Holding AG, Genusschein Shares (Switzerland) | | | 3.3 | |
ING Groep NV-CVA (Netherlands) | | | 3.1 | |
UBS AG (Switzerland) | | | 3.0 | |
Novartis AG, Registered Shares (Switzerland) | | | 2.9 | |
ASML Holding NV (Netherlands) | | | 2.5 | |
Prudential PLC (United Kingdom) | | | 2.5 | |
BT Group PLC (United Kingdom) | | | 2.3 | |
Unilever PLC (United Kingdom) | | | 2.2 | |
Percentages indicated are based upon total investments (excluding Money Market Funds).
For further detail about these holdings, please refer to the section entitled “Portfolio of Investments.”
Fund holdings are as of the date given, are subject to change at any time, and are not recommendations to buy or sell any security.
| | | | |
Portfolio Breakdown (%)
(at April 30, 2015) | |
Common Stocks | | | 98.9 | |
Consumer Discretionary | | | 18.8 | |
Consumer Staples | | | 8.8 | |
Energy | | | 3.0 | |
Financials | | | 21.4 | |
Health Care | | | 17.2 | |
Industrials | | | 14.7 | |
Information Technology | | | 5.0 | |
Materials | | | 7.0 | |
Telecommunication Services | | | 3.0 | |
Money Market Funds | | | 0.1 | |
Preferred Stocks | | | 1.0 | |
Consumer Discretionary | | | 1.0 | |
Total | | | 100.0 | |
Percentages indicated are based upon total investments. The Fund’s portfolio composition is subject to change.
Portfolio Management
Threadneedle International Limited
Daniel Ison
Ann Steele
Morningstar Style Box™

The Morningstar Style Box™ is based on a fund’s portfolio holdings. For equity funds, the vertical axis shows the market capitalization of the stocks owned, and the horizontal axis shows investment style (value, blend, or growth). Information shown is based on the most recent data provided by Morningstar.
© 2015 Morningstar, Inc. All rights reserved. The Morningstar information contained herein: (1) is proprietary to Morningstar and/or its content providers; (2) may not be copied or distributed; and (3) is not warranted to be accurate, complete or timely. Neither Morningstar nor its content providers are responsible for any damages or losses arising from any use of this information.
| | |
| |
| | COLUMBIA EUROPEAN EQUITY FUND |
PORTFOLIO OVERVIEW (continued)
(Unaudited)
| | | | |
Country Breakdown (%)
(at April 30, 2015) | |
Belgium | | | 3.7 | |
Denmark | | | 5.4 | |
Finland | | | 2.2 | |
France | | | 13.6 | |
Germany | | | 11.9 | |
Ireland | | | 2.8 | |
Italy | | | 1.4 | |
Netherlands | | | 8.4 | |
Norway | | | 1.2 | |
Spain | | | 4.6 | |
Sweden | | | 2.9 | |
Switzerland | | | 13.9 | |
United Kingdom | | | 27.9 | |
United States(a) | | | 0.1 | |
Total | | | 100.0 | |
Country Breakdown is based primarily on issuer’s place of organization/incorporation. Percentages indicated are based upon total investments. The Fund’s portfolio composition is subject to change.
| (a) | Includes investments in Money Market Funds. |
| | |
| |
| COLUMBIA EUROPEAN EQUITY FUND | | |
UNDERSTANDING YOUR FUND’S EXPENSES
(Unaudited)
As an investor, you incur two types of costs. There are transaction costs, which generally include sales charges on purchases and may include redemption fees. There are also ongoing costs, which generally include management fees, distribution and/or service fees, and other fund expenses. The following information is intended to help you understand your ongoing costs (in dollars) of investing in the Fund and to help you compare these costs with the ongoing costs of investing in other mutual funds.
Analyzing Your Fund’s Expenses
To illustrate these ongoing costs, we have provided examples and calculated the expenses paid by investors in each share class of the Fund during the period. The actual and hypothetical information in the table is based on an initial investment of $1,000 at the beginning of the period indicated and held for the entire period. Expense information is calculated two ways and each method provides you with different information. The amount listed in the “Actual” column is calculated using the Fund’s actual operating expenses and total return for the period. You may use the Actual information, together with the amount invested, to estimate the expenses that you paid over the period. Simply divide your account value by $1,000 (for example, an $8,600 account value divided by $1,000 = 8.6), then multiply the results by the expenses paid during the period under the “Actual” column. The amount listed in the “Hypothetical” column assumes a 5% annual rate of return before expenses (which is not the Fund’s actual return) and then applies the Fund’s actual expense ratio for the period to the hypothetical return. You should not use the hypothetical account values and expenses to estimate either your actual account balance at the end of the period or the expenses you paid during the period. See “Compare With Other Funds” below for details on how to use the hypothetical data.
Compare With Other Funds
Since all mutual funds are required to include the same hypothetical calculations about expenses in shareholder reports, you can use this information to compare the ongoing cost of investing in the Fund with other funds. To do so, compare the hypothetical example with the 5% hypothetical examples that appear in the shareholder reports of other funds. As you compare hypothetical examples of other funds, it is important to note that hypothetical examples are meant to highlight the ongoing costs of investing in a fund only and do not reflect any transaction costs, such as sales charges, or redemption or exchange fees. Therefore, the hypothetical calculations are useful in comparing ongoing costs only, and will not help you determine the relative total costs of owning different funds. If transaction costs were included in these calculations, your costs would be higher.
November 1, 2014 – April 30, 2015
| | | | | | | | | | | | | | | | | | | | | | | | | | | | |
| | | Account Value at the
Beginning of the
Period ($) | | | Account Value at the
End of the
Period ($) | | | Expenses Paid During
the Period ($) | | | Fund’s Annualized
Expense Ratio (%) | |
| | | | Actual | | | | Hypothetical | | | | Actual | | | | Hypothetical | | | | Actual | | | | Hypothetical | | | | Actual | |
Class A | | | 1,000.00 | | | | 1,000.00 | | | | 1,076.30 | | | | 1,017.95 | | | | 7.10 | | | | 6.90 | | | | 1.38 | |
Class B | | | 1,000.00 | | | | 1,000.00 | | | | 1,072.80 | | | | 1,014.23 | | | | 10.95 | | | | 10.64 | | | | 2.13 | |
Class C | | | 1,000.00 | | | | 1,000.00 | | | | 1,072.40 | | | | 1,014.23 | | | | 10.94 | | | | 10.64 | | | | 2.13 | |
Class I | | | 1,000.00 | | | | 1,000.00 | | | | 1,079.70 | | | | 1,020.18 | | | | 4.80 | | | | 4.66 | | | | 0.93 | |
Class K | | | 1,000.00 | | | | 1,000.00 | | | | 1,078.20 | | | | 1,018.79 | | | | 6.23 | | | | 6.06 | | | | 1.21 | |
Class R4 | | | 1,000.00 | | | | 1,000.00 | | | | 1,079.40 | | | | 1,019.14 | | | | 5.88 | | | | 5.71 | | | | 1.14 | |
Class R5 | | | 1,000.00 | | | | 1,000.00 | | | | 1,079.00 | | | | 1,019.84 | | | | 5.15 | | | | 5.01 | | | | 1.00 | |
Class W | | | 1,000.00 | | | | 1,000.00 | | | | 1,078.30 | | | | 1,017.95 | | | | 7.11 | | | | 6.90 | | | | 1.38 | |
Class Z | | | 1,000.00 | | | | 1,000.00 | | | | 1,077.90 | | | | 1,019.24 | | | | 5.77 | | | | 5.61 | | | | 1.12 | |
Expenses paid during the period are equal to the annualized expense ratio for each class as indicated above, multiplied by the average account value over the period and then multiplied by the number of days in the Fund’s most recent fiscal half year and divided by 365.
Expenses do not include fees and expenses incurred indirectly by the Fund from its investment in underlying funds, including affiliated and non-affiliated pooled investment vehicles, such as mutual funds and exchange-traded funds.
| | |
| |
| | COLUMBIA EUROPEAN EQUITY FUND |
PORTFOLIO OF INVESTMENTS
April 30, 2015 (Unaudited)
(Percentages represent value of investments compared to net assets)
| | | | | | | | |
| Common Stocks 98.3% | |
| Issuer | | Shares | | | Value ($) | |
BELGIUM 3.7% | |
| | |
Anheuser-Busch InBev NV | | | 76,486 | | | | 9,312,043 | |
| | |
KBC Groep NV(a) | | | 84,678 | | | | 5,571,244 | |
| | |
UCB SA | | | 63,465 | | | | 4,571,565 | |
| | | | | | | | | |
Total | | | | | | | 19,454,852 | |
|
| |
DENMARK 5.4% | |
| | |
Novo Nordisk A/S, Class B | | | 315,921 | | | | 17,992,628 | |
| | |
Pandora A/S | | | 102,388 | | | | 10,617,057 | |
| | | | | | | | | |
Total | | | | | | | 28,609,685 | |
|
| |
FINLAND 2.2% | |
| | |
KONE OYJ, Class B | | | 173,420 | | | | 7,460,811 | |
| | |
Nokia OYJ | | | 654,441 | | | | 4,415,797 | |
| | | | | | | | | |
Total | | | | | | | 11,876,608 | |
|
| |
FRANCE 13.5% | |
| | |
Airbus Group NV | | | 99,949 | | | | 6,926,679 | |
| | |
Bureau Veritas SA | | | 234,063 | | | | 5,511,618 | |
| | |
Essilor International SA | | | 42,068 | | | | 5,125,148 | |
| | |
Groupe Eurotunnel SE | | | 569,934 | | | | 9,137,499 | |
| | |
Iliad SA | | | 15,935 | | | | 3,763,711 | |
| | |
L’Oreal SA | | | 54,992 | | | | 10,494,721 | |
| | |
Legrand SA | | | 164,381 | | | | 9,504,964 | |
| | |
Publicis Groupe SA | | | 80,194 | | | | 6,725,916 | |
| | |
Schneider Electric SE | | | 90,029 | | | | 6,729,526 | |
| | |
Vivendi SA | | | 329,018 | | | | 8,248,055 | |
| | | | | | | | | |
Total | | | | | | | 72,167,837 | |
|
| |
GERMANY 10.8% | |
| | |
Bayer AG, Registered Shares | | | 137,064 | | | | 19,727,977 | |
| | |
Bayerische Motoren Werke AG | | | 43,566 | | | | 5,139,247 | |
| | |
Brenntag AG | | | 153,539 | | | | 9,212,443 | |
| | |
Continental AG | | | 39,781 | | | | 9,322,868 | |
| | |
Fresenius Medical Care AG & Co. KGaA | | | 56,959 | | | | 4,786,930 | |
| | |
ProSiebenSat.1 Media AG, Registered Shares | | | 103,424 | | | | 5,287,779 | |
| | |
TUI AG | | | 234,661 | | | | 4,374,293 | |
| | | | | | | | | |
Total | | | | | | | 57,851,537 | |
|
| |
IRELAND 2.8% | |
| | |
Bank of Ireland(a) | | | 11,402,723 | | | | 4,407,992 | |
| | |
CRH PLC | | | 370,431 | | | | 10,351,124 | |
| | | | | | | | | |
Total | | | | | | | 14,759,116 | |
| | | | | | | | |
| Common Stocks (continued) | |
| Issuer | | Shares | | | Value ($) | |
ITALY 1.4% | |
| | |
Intesa Sanpaolo SpA | | | 2,221,449 | | | | 7,462,964 | |
|
| |
NETHERLANDS 8.4% | |
| | |
Akzo Nobel NV | | | 84,723 | | | | 6,482,475 | |
| | |
ASML Holding NV | | | 125,525 | | | | 13,508,117 | |
| | |
ING Groep NV-CVA(a) | | | 1,069,765 | | | | 16,411,856 | |
| | |
Reed Elsevier NV | | | 337,054 | | | | 8,128,873 | |
| | | | | | | | | |
Total | | | | | | | 44,531,321 | |
|
| |
NORWAY 1.2% | |
| | |
DNB ASA | | | 363,930 | | | | 6,476,569 | |
|
| |
SPAIN 4.5% | |
| | |
Amadeus IT Holding SA, Class A | | | 182,690 | | | | 8,327,366 | |
| | |
Ferrovial SA | | | 370,463 | | | | 8,401,334 | |
| | |
Inditex SA | | | 232,274 | | | | 7,453,458 | |
| | | | | | | | | |
Total | | | | | | | 24,182,158 | |
|
| |
SWEDEN 2.8% | |
| | |
Nordea Bank AB | | | 582,116 | | | | 7,395,871 | |
| | |
Svenska Handelsbanken AB, Class A | | | 166,932 | | | | 7,705,409 | |
| | | | | | | | | |
Total | | | | | | | 15,101,280 | |
|
| |
SWITZERLAND 13.8% | |
| | |
Cie Financiere Richemont SA, Class A, Registered Shares | | | 85,391 | | | | 7,611,152 | |
| | |
Nestlé SA, Registered Shares | | | 130,138 | | | | 10,096,655 | |
| | |
Novartis AG, Registered Shares | | | 149,988 | | | | 15,309,604 | |
| | |
Roche Holding AG, Genusschein Shares | | | 60,395 | | | | 17,282,337 | |
| | |
Sika AG | | | 2,148 | | | | 7,372,681 | |
| | |
UBS AG | | | 804,379 | | | | 16,069,348 | |
| | | | | | | | | |
Total | | | | | | | 73,741,777 | |
|
| |
UNITED KINGDOM 27.8% | |
| | |
Ashtead Group PLC | | | 509,826 | | | | 8,742,283 | |
| | |
British American Tobacco PLC | | | 91,992 | | | | 5,054,374 | |
| | |
BT Group PLC | | | 1,731,371 | | | | 12,075,599 | |
| | |
Burberry Group PLC | | | 195,778 | | | | 5,219,246 | |
| | |
IMI PLC | | | 10,436 | | | | 199,981 | |
| | |
InterContinental Hotels Group PLC | | | 174,384 | | | | 7,457,620 | |
| | |
John Wood Group PLC | | | 493,880 | | | | 5,203,740 | |
| | |
Johnson Matthey PLC | | | 115,123 | | | | 5,886,103 | |
The accompanying Notes to Financial Statements are an integral part of this statement.
| | |
| |
| COLUMBIA EUROPEAN EQUITY FUND | | |
PORTFOLIO OF INVESTMENTS (continued)
April 30, 2015 (Unaudited)
| | | | | | | | |
| Common Stocks (continued) | |
| Issuer | | Shares | | | Value ($) | |
Legal & General Group PLC | | | 2,328,542 | | | | 9,256,135 | |
| | |
London Stock Exchange Group PLC | | | 233,908 | | | | 9,104,964 | |
| | |
Pearson PLC | | | 287,693 | | | | 5,813,954 | |
| | |
Persimmon PLC | | | 326,310 | | | | 8,472,422 | |
| | |
Prudential PLC | | | 523,809 | | | | 13,041,554 | |
| | |
Rio Tinto PLC | | | 157,701 | | | | 7,057,292 | |
| | |
Royal Dutch Shell PLC, Class A | | | 334,646 | | | | 10,551,475 | |
| | |
Schroders PLC | | | 84,817 | | | | 4,206,782 | |
| | |
Smith & Nephew PLC | | | 382,117 | | | | 6,503,406 | |
| | |
St. James’s Place PLC | | | 476,604 | | | | 6,501,215 | |
| | |
Unilever PLC | | | 264,894 | | | | 11,611,493 | |
| | |
Wolseley PLC | | | 104,863 | | | | 6,202,058 | |
| | | | | | | | | |
Total | | | | | | | 148,161,696 | |
| | | | | | | | | |
Total Common Stocks | | | | | | | | |
(Cost: $460,057,010) | | | | | | | 524,377,400 | |
| | | | | | | | |
| Preferred Stocks 1.0% | |
| Issuer | | Shares | | | Value ($) | |
Germany 1.0% | | | | | | | | |
| | |
Volkswagen AG | | | 20,938 | | | | 5,390,399 | |
| | | | | | | | | |
Total Preferred Stocks | | | | | | | | |
(Cost: $5,273,082) | | | | | | | 5,390,399 | |
| | |
| | | | | | | | |
| Money Market Funds 0.1% | |
| | | Shares | | | Value ($) | |
Columbia Short-Term Cash Fund, 0.111%(b)(c) | | | 707,526 | | | | 707,526 | |
| | | | | | | | | |
Total Money Market Funds | | | | | | | | |
(Cost: $707,526) | | | | | | | 707,526 | |
| | | | | | | | | |
Total Investments | | | | | | | | |
(Cost: $466,037,618) | | | | | | | 530,475,325 | |
| | | | | | | | | |
Other Assets & Liabilities, Net | | | | | | | 3,134,522 | |
| | | | | | | | | |
Net Assets | | | | | | | 533,609,847 | |
| | | | | | | | | |
Notes to Portfolio of Investments
| (b) | The rate shown is the seven-day current annualized yield at April 30, 2015. |
| (c) | As defined in the Investment Company Act of 1940, an affiliated company is one in which the Fund owns 5% or more of the company’s outstanding voting securities, or a company which is under common ownership or control with the Fund. Holdings and transactions in these affiliated companies during the period ended April 30, 2015, are as follows: |
| | | | | | | | | | | | | | | | | | | | | | | | |
| Issuer | | Beginning
Cost ($) | | | Purchase
Cost ($) | | | Proceeds
From Sales ($) | | | Ending
Cost ($) | | | Dividends —
Affiliated
Issuers ($) | | | Value ($) | |
Columbia Short-Term Cash Fund | | | 26,229,310 | | | | 81,751,642 | | | | (107,273,426 | ) | | | 707,526 | | | | 1,554 | | | | 707,526 | |
Fair Value Measurements
Generally accepted accounting principles (GAAP) require disclosure regarding the inputs and valuation techniques used to measure fair value and any changes in valuation inputs or techniques. In addition, investments shall be disclosed by major category.
The Fund categorizes its fair value measurements according to a three-level hierarchy that maximizes the use of observable inputs and minimizes the use of unobservable inputs by prioritizing that the most observable input be used when available. Observable inputs are those that market participants would use in pricing an investment based on market data obtained from sources independent of the reporting entity. Unobservable inputs are those that reflect the Fund’s assumptions about the information market participants would use in pricing an investment. An investment’s level within the fair value hierarchy is based on the lowest level of any input that is deemed significant to the asset or liability’s fair value measurement. The input levels are not necessarily an indication of the risk or liquidity associated with investments at that level. For example, certain U.S. government securities are generally high quality and liquid, however, they are reflected as Level 2 because the inputs used to determine fair value may not always be quoted prices in an active market.
Fair value inputs are summarized in the three broad levels listed below:
| n | | Level 1 — Valuations based on quoted prices for investments in active markets that the Fund has the ability to access at the measurement date (including NAV for open-end mutual funds). Valuation adjustments are not applied to Level 1 investments. |
| n | | Level 2 — Valuations based on other significant observable inputs (including quoted prices for similar securities, interest rates, prepayment speeds, credit risks, etc.). |
| n | | Level 3 — Valuations based on significant unobservable inputs (including the Fund’s own assumptions and judgment in determining the fair value of investments). |
Inputs that are used in determining fair value of an investment may include price information, credit data, volatility statistics, and other factors. These inputs can be either observable or unobservable. The availability of observable inputs can vary between investments, and is affected by various factors such as the type of investment, and the volume and level of activity for that investment or similar investments in the marketplace. The inputs will be considered by the Investment Manager, along with any other relevant factors in the calculation of an investment’s fair value. The Fund uses prices and inputs that are current as of the measurement date, which may include periods of market dislocations. During these periods, the availability of prices and inputs may be reduced for many investments. This condition could cause an investment to be reclassified between the various levels within the hierarchy.
The accompanying Notes to Financial Statements are an integral part of this statement.
| | |
| |
| | COLUMBIA EUROPEAN EQUITY FUND |
PORTFOLIO OF INVESTMENTS (continued)
April 30, 2015 (Unaudited)
Fair Value Measurements (continued)
Foreign equity securities actively traded in markets where there is a significant delay in the local close relative to the New York Stock Exchange (NYSE) are classified as Level 2. The values of these securities may include an adjustment to reflect the impact of significant market movements following the close of local trading, as described in Note 2 to the financial statements — Security Valuation.
Investments falling into the Level 3 category are primarily supported by quoted prices from brokers and dealers participating in the market for those investments. However, these may be classified as Level 3 investments due to lack of market transparency and corroboration to support these quoted prices. Additionally, valuation models may be used as the pricing source for any remaining investments classified as Level 3. These models may rely on one or more significant unobservable inputs and/or significant assumptions by the Investment Manager. Inputs used in valuations may include, but are not limited to, financial statement analysis, capital account balances, discount rates and estimated cash flows, and comparable company data.
Under the direction of the Fund’s Board of Trustees (the Board), the Investment Manager’s Valuation Committee (the Committee) is responsible for overseeing the valuation procedures approved by the Board. The Committee consists of voting and non-voting members from various groups within the Investment Manager’s organization, including operations and accounting, trading and investments, compliance, risk management and legal.
The Committee meets at least monthly to review and approve valuation matters, which may include a description of specific valuation determinations, data regarding pricing information received from approved pricing vendors and brokers and the results of Board-approved valuation control policies and procedures (the Policies). The Policies address, among other things, instances when market quotations are or are not readily available, including recommendations of third party pricing vendors and a determination of appropriate pricing methodologies; events that require specific valuation determinations and assessment of fair value techniques; securities with a potential for stale pricing, including those that are illiquid, restricted, or in default; and the effectiveness of third party pricing vendors, including periodic reviews of vendors. The Committee meets more frequently, as needed, to discuss additional valuation matters, which may include the need to review back-testing results, review time-sensitive information or approve related valuation actions. The Committee reports to the Board, with members of the Committee meeting with the Board at each of its regularly scheduled meetings to discuss valuation matters and actions during the period, similar to those described earlier.
For investments categorized as Level 3, the Committee monitors information similar to that described above, which may include: (i) data specific to the issuer or comparable issuers, (ii) general market or specific sector news and (iii) quoted prices and specific or similar security transactions. The Committee considers this data and any changes from prior periods in order to assess the reasonableness of observable and unobservable inputs, any assumptions or internal models used to value those securities and changes in fair value. This data is also used to corroborate, when available, information received from approved pricing vendors and brokers. Various factors impact the frequency of monitoring this information (which may occur as often as daily). However, the Committee may determine that changes to inputs, assumptions and models are not required as a result of the monitoring procedures performed.
The following table is a summary of the inputs used to value the Fund’s investments at April 30, 2015:
| | | | | | | | | | | | | | | | |
| Description | | Level 1
Quoted Prices in Active
Markets for Identical
Assets ($) | | | Level 2
Other Significant
Observable Inputs ($) | | | Level 3
Significant
Unobservable Inputs ($) | | | Total ($) | |
Equity Securities | | | | | | | | | | | | | | | | |
| | | | |
Common Stocks | | | | | | | | | | | | | | | | |
| | | | |
Consumer Discretionary | | | — | | | | 99,871,939 | | | | — | | | | 99,871,939 | |
| | | | |
Consumer Staples | | | — | | | | 46,569,286 | | | | — | | | | 46,569,286 | |
| | | | |
Energy | | | — | | | | 15,755,215 | | | | — | | | | 15,755,215 | |
| | | | |
Financials | | | — | | | | 113,611,903 | | | | — | | | | 113,611,903 | |
| | | | |
Health Care | | | — | | | | 91,299,594 | | | | — | | | | 91,299,594 | |
| | | | |
Industrials | | | — | | | | 78,029,196 | | | | — | | | | 78,029,196 | |
| | | | |
Information Technology | | | — | | | | 26,251,281 | | | | — | | | | 26,251,281 | |
| | | | |
Materials | | | — | | | | 37,149,675 | | | | — | | | | 37,149,675 | |
| | | | |
Telecommunication Services | | | — | | | | 15,839,311 | | | | — | | | | 15,839,311 | |
| | | | |
Preferred Stocks | | | | | | | | | | | | | | | | |
| | | | |
Consumer Discretionary | | | — | | | | 5,390,399 | | | | — | | | | 5,390,399 | |
| | | | | | | | | | | | | | | | | |
Total Equity Securities | | | — | | | | 529,767,799 | | | | — | | | | 529,767,799 | |
| | | | | | | | | | | | | | | | | |
Mutual Funds | | | | | | | | | | | | | | | | |
| | | | |
Money Market Funds | | | 707,526 | | | | — | | | | — | | | | 707,526 | |
| | | | | | | | | | | | | | | | | |
Total Mutual Funds | | | 707,526 | | | | — | | | | — | | | | 707,526 | |
| | | | | | | | | | | | | | | | | |
Total | | | 707,526 | | | | 529,767,799 | | | | — | | | | 530,475,325 | |
| | | | | | | | | | | | | | | | | |
See the Portfolio of Investments for all investment classifications not indicated in the table.
The accompanying Notes to Financial Statements are an integral part of this statement.
| | |
| |
| COLUMBIA EUROPEAN EQUITY FUND | | |
PORTFOLIO OF INVESTMENTS (continued)
April 30, 2015 (Unaudited)
Fair Value Measurements (continued)
The Fund’s assets assigned to the Level 2 input category are generally valued using the market approach, in which a security’s value is determined through reference to prices and information from market transactions for similar or identical assets. These assets include certain foreign securities for which a third party statistical pricing service may be employed for purposes of fair market valuation. The model utilized by such third party statistical pricing service takes into account a security’s correlation to available market data including, but not limited to, intraday index, ADR, and ETF movements.
There were no transfers of financial assets between levels during the period.
The accompanying Notes to Financial Statements are an integral part of this statement.
| | |
| |
| | COLUMBIA EUROPEAN EQUITY FUND |
STATEMENT OF ASSETS AND LIABILITIES
April 30, 2015 (Unaudited)
| | | | |
Assets | | | | |
| |
Investments, at value | | | | |
| |
Unaffiliated issuers (identified cost $465,330,092) | | | $529,767,799 | |
| |
Affiliated issuers (identified cost $707,526) | | | 707,526 | |
| |
Total investments (identified cost $466,037,618) | | | 530,475,325 | |
| |
Foreign currency (identified cost $49,002) | | | 49,002 | |
| |
Receivable for: | | | | |
| |
Investments sold | | | 366,576 | |
| |
Capital shares sold | | | 1,003,032 | |
| |
Dividends | | | 2,061,471 | |
| |
Reclaims | | | 1,216,830 | |
| |
Prepaid expenses | | | 1,066 | |
| |
Other assets | | | 16,781 | |
| |
Total assets | | | 535,190,083 | |
| |
| |
Liabilities | | | | |
| |
Payable for: | | | | |
| |
Capital shares purchased | | | 1,440,908 | |
| |
Investment management fees | | | 11,475 | |
| |
Distribution and/or service fees | | | 1,956 | |
| |
Transfer agent fees | | | 56,943 | |
| |
Administration fees | | | 1,165 | |
| |
Compensation of board members | | | 26,137 | |
| |
Other expenses | | | 41,652 | |
| |
Total liabilities | | | 1,580,236 | |
| |
Net assets applicable to outstanding capital stock | | | $533,609,847 | |
| |
| |
Represented by | | | | |
| |
Paid-in capital | | | $463,199,968 | |
| |
Undistributed net investment income | | | 3,442,043 | |
| |
Accumulated net realized gain | | | 2,557,513 | |
| |
Unrealized appreciation (depreciation) on: | | | | |
| |
Investments | | | 64,437,707 | |
| |
Foreign currency translations | | | (27,384 | ) |
| |
Total — representing net assets applicable to outstanding capital stock | | | $533,609,847 | |
| |
The accompanying Notes to Financial Statements are an integral part of this statement.
| | |
| 10 | | Semiannual Report 2015 |
| | |
| |
| COLUMBIA EUROPEAN EQUITY FUND | | |
STATEMENT OF ASSETS AND LIABILITIES (continued)
April 30, 2015 (Unaudited)
| | | | |
Class A | | | | |
| |
Net assets | | | $174,604,986 | |
| |
Shares outstanding | | | 24,139,061 | |
| |
Net asset value per share | | | $7.23 | |
| |
Maximum offering price per share(a) | | | $7.67 | |
| |
Class B | | | | |
| |
Net assets | | | $1,395,190 | |
| |
Shares outstanding | | | 194,274 | |
| |
Net asset value per share | | | $7.18 | |
| |
Class C | | | | |
| |
Net assets | | | $26,850,235 | |
| |
Shares outstanding | | | 3,802,666 | |
| |
Net asset value per share | | | $7.06 | |
| |
Class I | | | | |
| |
Net assets | | | $253,559,812 | |
| |
Shares outstanding | | | 34,964,074 | |
| |
Net asset value per share | | | $7.25 | |
| |
Class K | | | | |
| |
Net assets | | | $3,762 | |
| |
Shares outstanding | | | 522 | |
| |
Net asset value per share | | | $7.21 | |
| |
Class R4 | | | | |
| |
Net assets | | | $5,269,378 | |
| |
Shares outstanding | | | 731,207 | |
| |
Net asset value per share | | | $7.21 | |
| |
Class R5 | | | | |
| |
Net assets | | | $156,907 | |
| |
Shares outstanding | | | 21,635 | |
| |
Net asset value per share | | | $7.25 | |
| |
Class W | | | | |
| |
Net assets | | | $2,346 | |
| |
Shares outstanding | | | 326 | |
| |
Net asset value per share(b) | | | $7.21 | |
| |
Class Z | | | | |
| |
Net assets | | | $71,767,231 | |
| |
Shares outstanding | | | 9,959,066 | |
| |
Net asset value per share | | | $7.21 | |
| |
| (a) | The maximum offering price per share is calculated by dividing the net asset value per share by 1.0 minus the maximum sales charge of 5.75%. |
| (b) | Net asset value per share rounds to this amount due to fractional shares outstanding. |
The accompanying Notes to Financial Statements are an integral part of this statement.
| | | | |
| Semiannual Report 2015 | | | 11 | |
| | |
| |
| | COLUMBIA EUROPEAN EQUITY FUND |
STATEMENT OF OPERATIONS
Six Months Ended April 30, 2015 (Unaudited)
| | | | |
Net investment income | | | | |
| |
Income: | | | | |
| |
Dividends — unaffiliated issuers | | | $7,718,440 | |
| |
Dividends — affiliated issuers | | | 1,554 | |
| |
Foreign taxes withheld | | | (942,045 | ) |
| |
Total income | | | 6,777,949 | |
| |
| |
Expenses: | | | | |
| |
Investment management fees | | | 2,154,764 | |
| |
Distribution and/or service fees | | | | |
| |
Class A | | | 194,241 | |
| |
Class B | | | 6,987 | |
| |
Class C | | | 124,006 | |
| |
Class W | | | 3 | |
| |
Transfer agent fees | | | | |
| |
Class A | | | 153,554 | |
| |
Class B | | | 1,380 | |
| |
Class C | | | 24,496 | |
| |
Class K | | | 3 | |
| |
Class R4 | | | 2,624 | |
| |
Class R5 | | | 17 | |
| |
Class W | | | 2 | |
| |
Class Z | | | 103,470 | |
| |
Administration fees | | | 218,576 | |
| |
Plan administration fees | | | | |
| |
Class K | | | 13 | |
| |
Compensation of board members | | | 9,396 | |
| |
Custodian fees | | | 38,889 | |
| |
Printing and postage fees | | | 23,851 | |
| |
Registration fees | | | 67,077 | |
| |
Professional fees | | | 31,131 | |
| |
Line of credit interest expense | | | 1,247 | |
| |
Other | | | 8,124 | |
| |
Total expenses | | | 3,163,851 | |
| |
Net investment income | | | 3,614,098 | |
| |
| |
Realized and unrealized gain (loss) — net | | | | |
| |
Net realized gain (loss) on: | | | | |
| |
Investments | | | 9,167,057 | |
| |
Foreign currency translations | | | (193,060 | ) |
| |
Net realized gain | | | 8,973,997 | |
| |
Net change in unrealized appreciation (depreciation) on: | | | | |
| |
Investments | | | 28,809,186 | |
| |
Foreign currency translations | | | 22,110 | |
| |
Net change in unrealized appreciation | | | 28,831,296 | |
| |
Net realized and unrealized gain | | | 37,805,293 | |
| |
Net increase in net assets resulting from operations | | | $41,419,391 | |
| |
The accompanying Notes to Financial Statements are an integral part of this statement.
| | |
| 12 | | Semiannual Report 2015 |
| | |
| |
| COLUMBIA EUROPEAN EQUITY FUND | | |
STATEMENT OF CHANGES IN NET ASSETS
| | | | | | | | |
| | | Six Months Ended
April 30, 2015
(Unaudited) | | | Year Ended
October 31, 2014 | |
Operations | | | | | | | | |
| | |
Net investment income | | | $3,614,098 | | | | $11,002,786 | |
| | |
Net realized gain | | | 8,973,997 | | | | 28,974,368 | |
| | |
Net change in unrealized appreciation (depreciation) | | | 28,831,296 | | | | (58,354,253 | ) |
| |
Net increase (decrease) in net assets resulting from operations | | | 41,419,391 | | | | (18,377,099 | ) |
| |
| | |
Distributions to shareholders | | | | | | | | |
| | |
Net investment income | | | | | | | | |
| | |
Class A | | | (2,600,430 | ) | | | (914,336 | ) |
| | |
Class B | | | (13,264 | ) | | | (2,962 | ) |
| | |
Class C | | | (244,671 | ) | | | (35,650 | ) |
| | |
Class I | | | (5,805,350 | ) | | | (2,848,859 | ) |
| | |
Class K | | | (212 | ) | | | (123 | ) |
| | |
Class R4 | | | (58,744 | ) | | | — | |
| | |
Class R5 | | | (1,176 | ) | | | — | |
| | |
Class W | | | (40 | ) | | | (26 | ) |
| | |
Class Z | | | (2,295,832 | ) | | | (1,004,051 | ) |
| | |
Net realized gains | | | | | | | | |
| | |
Class A | | | (4,532,653 | ) | | | (4,599,973 | ) |
| | |
Class B | | | (42,360 | ) | | | (62,148 | ) |
| | |
Class C | | | (790,300 | ) | | | (664,654 | ) |
| | |
Class I | | | (7,928,441 | ) | | | (9,618,553 | ) |
| | |
Class K | | | (339 | ) | | | (522 | ) |
| | |
Class R4 | | | (88,770 | ) | | | — | |
| | |
Class R5 | | | (1,654 | ) | | | — | |
| | |
Class W | | | (69 | ) | | | (136 | ) |
| | |
Class Z | | | (3,469,337 | ) | | | (4,041,339 | ) |
| |
Total distributions to shareholders | | | (27,873,642 | ) | | | (23,793,332 | ) |
| |
Increase (decrease) in net assets from capital stock activity | | | (57,086,440 | ) | | | 132,655,875 | |
| |
Total increase (decrease) in net assets | | | (43,540,691 | ) | | | 90,485,444 | |
| | |
Net assets at beginning of period | | | 577,150,538 | | | | 486,665,094 | |
| |
Net assets at end of period | | | $533,609,847 | | | | $577,150,538 | |
| |
Undistributed net investment income | | | $3,442,043 | | | | $10,847,664 | |
| |
The accompanying Notes to Financial Statements are an integral part of this statement.
| | | | |
| Semiannual Report 2015 | | | 13 | |
| | |
| |
| | COLUMBIA EUROPEAN EQUITY FUND |
STATEMENT OF CHANGES IN NET ASSETS (continued)
| | | | | | | | | | | | | | | | |
| | | Six Months Ended
April 30, 2015 (Unaudited) | | | Year Ended
October 31, 2014(a) | |
| | | Shares | | | Dollars ($) | | | Shares | | | Dollars ($) | |
Capital stock activity | | | | | | | | | | | | | | | | |
| | | | |
Class A shares | | | | | | | | | | | | | | | | |
| | | | |
Subscriptions(b) | | | 4,664,459 | | | | 32,848,252 | | | | 15,607,418 | | | | 118,365,491 | |
| | | | |
Distributions reinvested | | | 1,036,066 | | | | 7,014,164 | | | | 728,683 | | | | 5,377,680 | |
| | | | |
Redemptions | | | (4,787,130 | ) | | | (33,403,009 | ) | | | (6,478,273 | ) | | | (47,333,225 | ) |
| |
Net increase | | | 913,395 | | | | 6,459,407 | | | | 9,857,828 | | | | 76,409,946 | |
| |
| | | | |
Class B shares | | | | | | | | | | | | | | | | |
| | | | |
Subscriptions | | | 33,569 | | | | 234,033 | | | | 126,778 | | | | 957,549 | |
| | | | |
Distributions reinvested | | | 8,253 | | | | 55,623 | | | | 8,594 | | | | 63,168 | |
| | | | |
Redemptions(b) | | | (67,684 | ) | | | (467,864 | ) | | | (123,861 | ) | | | (915,084 | ) |
| |
Net increase (decrease) | | | (25,862 | ) | | | (178,208 | ) | | | 11,511 | | | | 105,633 | |
| |
Class C shares | | | | | | | | | | | | | | | | |
| | | | |
Subscriptions | | | 700,065 | | | | 4,828,584 | | | | 2,982,555 | | | | 22,128,570 | |
| | | | |
Distributions reinvested | | | 139,556 | | | | 925,254 | | | | 81,627 | | | | 590,161 | |
| | | | |
Redemptions | | | (867,172 | ) | | | (5,819,012 | ) | | | (1,042,180 | ) | | | (7,291,284 | ) |
| |
Net increase (decrease) | | | (27,551 | ) | | | (65,174 | ) | | | 2,022,002 | | | | 15,427,447 | |
| |
Class I shares | | | | | | | | | | | | | | | | |
| | | | |
Subscriptions | | | 89,899 | | | | 607,615 | | | | 8,127,361 | | | | 60,387,068 | |
| | | | |
Distributions reinvested | | | 2,025,614 | | | | 13,733,661 | | | | 1,686,999 | | | | 12,466,922 | |
| | | | |
Redemptions | | | (5,234,880 | ) | | | (37,287,996 | ) | | | (6,515,570 | ) | | | (49,769,113 | ) |
| |
Net increase (decrease) | | | (3,119,367 | ) | | | (22,946,720 | ) | | | 3,298,790 | | | | 23,084,877 | |
| |
Class K shares | | | | | | | | | | | | | | | | |
| | | | |
Subscriptions | | | 340 | | | | 2,351 | | | | 113 | | | | 849 | |
| | | | |
Distributions reinvested | | | 65 | | | | 436 | | | | 59 | | | | 434 | |
| | | | |
Redemptions | | | (1,628 | ) | | | (11,553 | ) | | | (270 | ) | | | (2,100 | ) |
| |
Net decrease | | | (1,223 | ) | | | (8,766 | ) | | | (98 | ) | | | (817 | ) |
| |
Class R4 shares | | | | | | | | | | | | | | | | |
| | | | |
Subscriptions | | | 733,142 | | | | 5,248,785 | | | | 7,495 | | | | 57,593 | |
| | | | |
Distributions reinvested | | | 21,869 | | | | 147,398 | | | | — | | | | — | |
| | | | |
Redemptions | | | (31,299 | ) | | | (213,952 | ) | | | — | | | | — | |
| |
Net increase | | | 723,712 | | | | 5,182,231 | | | | 7,495 | | | | 57,593 | |
| |
Class R5 shares | | | | | | | | | | | | | | | | |
| | | | |
Subscriptions | | | 15,207 | | | | 107,445 | | | | 7,086 | | | | 54,580 | |
| | | | |
Distributions reinvested | | | 400 | | | | 2,711 | | | | — | | | | — | |
| | | | |
Redemptions | | | (1,058 | ) | | | (7,447 | ) | | | — | | | | (1 | ) |
| |
Net increase | | | 14,549 | | | | 102,709 | | | | 7,086 | | | | 54,579 | |
| |
Class W shares | | | | | | | | | | | | | | | | |
| | | | |
Redemptions | | | — | | | | — | | | | (154 | ) | | | (1,200 | ) |
| |
Net (decrease) | | | — | | | | — | | | | (154 | ) | | | (1,200 | ) |
| |
The accompanying Notes to Financial Statements are an integral part of this statement.
| | |
| 14 | | Semiannual Report 2015 |
| | |
| |
| COLUMBIA EUROPEAN EQUITY FUND | | |
STATEMENT OF CHANGES IN NET ASSETS (continued)
| | | | | | | | | | | | | | | | |
| | | Six Months Ended
April 30, 2015 (Unaudited) | | | Year Ended
October 31, 2014(a) | |
| | | Shares | | | Dollars ($) | | | Shares | | | Dollars ($) | |
Capital stock activity (continued) | | | | | | | | | | | | | | | | |
| | | | |
Class Z shares | | | | | | | | | | | | | | | | |
| | | | |
Subscriptions | | | 1,544,796 | | | | 10,547,022 | | | | 8,916,412 | | | | 66,694,072 | |
| | | | |
Distributions reinvested | | | 809,337 | | | | 5,454,932 | | | | 638,196 | | | | 4,690,740 | |
| | | | |
Redemptions | | | (8,847,199 | ) | | | (61,633,873 | ) | | | (7,314,999 | ) | | | (53,866,995 | ) |
| |
Net increase (decrease) | | | (6,493,066 | ) | | | (45,631,919 | ) | | | 2,239,609 | | | | 17,517,817 | |
| |
Total net increase (decrease) | | | (8,015,413 | ) | | | (57,086,440 | ) | | | 17,444,069 | | | | 132,655,875 | |
| |
| (a) | Class R4 and Class R5 shares are based on operations from January 8, 2014 (commencement of operations) through the stated period end. |
| (b) | Includes conversions of Class B shares to Class A shares, if any. |
The accompanying Notes to Financial Statements are an integral part of this statement.
| | | | |
| Semiannual Report 2015 | | | 15 | |
| | |
| |
| | COLUMBIA EUROPEAN EQUITY FUND |
FINANCIAL HIGHLIGHTS
The following tables are intended to help you understand the Fund’s financial performance. Certain information reflects financial results for a single share of a class held for the periods shown. Per share net investment income (loss) amounts are calculated based on average shares outstanding during the period. Total return assumes reinvestment of all dividends and distributions, if any. Total return does not reflect payment of sales charges, if any. Total return and portfolio turnover are not annualized for periods of less than one year. The portfolio turnover rate is calculated without regard to purchase and sales transactions of short-term instruments and certain derivatives, if any. If such transactions were included, the Fund’s portfolio turnover rate may be higher.
| | | | | | | | | | | | | | | | | | | | | | | | |
| |
| Six Months Ended
April 30, 2015 |
| | | Year Ended October 31, | |
Class A | | | (Unaudited) | | | | 2014 | | | | 2013 | | | | 2012 | | | | 2011 | | | | 2010 | |
Per share data | | | | | | | | | | | | | | | | | | | | | | | | |
Net asset value, beginning of period | | | $7.05 | | | | $7.55 | | | | $5.94 | | | | $5.47 | | | | $5.80 | | | | $4.86 | |
| | | | | | | | | | | | | | | | | | | | | | | | | |
Income from investment operations: | | | | | | | | | | | | | | | | | | | | | | | | |
| | | | | | |
Net investment income | | | 0.04 | | | | 0.13 | | | | 0.07 | | | | 0.08 | | | | 0.05 | | | | 0.03 | |
| | | | | | | | | | | | | | | | | | | | | | | | | |
Net realized and unrealized gain (loss) | | | 0.47 | | | | (0.29 | ) | | | 1.66 | | | | 0.40 | | | | (0.35 | ) | | | 0.98 | |
| | | | | | | | | | | | | | | | | | | | | | | | | |
Total from investment operations | | | 0.51 | | | | (0.16 | ) | | | 1.73 | | | | 0.48 | | | | (0.30 | ) | | | 1.01 | |
| | | | | | | | | | | | | | | | | | | | | | | | | |
Less distributions to shareholders: | | | | | | | | | | | | | | | | | | | | | | | | |
| | | | | | |
Net investment income | | | (0.12 | ) | | | (0.06 | ) | | | (0.09 | ) | | | (0.01 | ) | | | (0.03 | ) | | | (0.07 | ) |
| | | | | | | | | | | | | | | | | | | | | | | | | |
Net realized gains | | | (0.21 | ) | | | (0.28 | ) | | | (0.03 | ) | | | — | | | | — | | | | — | |
| | | | | | | | | | | | | | | | | | | | | | | | | |
Total distributions to shareholders | | | (0.33 | ) | | | (0.34 | ) | | | (0.12 | ) | | | (0.01 | ) | | | (0.03 | ) | | | (0.07 | ) |
| | | | | | | | | | | | | | | | | | | | | | | | | |
Net asset value, end of period | | | $7.23 | | | | $7.05 | | | | $7.55 | | | | $5.94 | | | | $5.47 | | | | $5.80 | |
| | | | | | | | | | | | | | | | | | | | | | | | | |
Total return | | | 7.63 | % | | | (2.33 | %) | | | 29.57 | % | | | 8.88 | % | | | (5.25 | %) | | | 21.14 | % |
| | | | | | | | | | | | | | | | | | | | | | | | | |
Ratios to average net assets(a) | | | | | | | | | | | | | | | | | | | | | | | | |
| | | | | | |
Total gross expenses | | | 1.38 | %(b)(c) | | | 1.37 | % | | | 1.42 | % | | | 1.54 | %(c) | | | 1.55 | % | | | 1.67 | % |
| | | | | | | | | | | | | | | | | | | | | | | | | |
Total net expenses(d) | | | 1.38 | %(b)(c) | | | 1.37 | % | | | 1.42 | %(e) | | | 1.52 | %(c)(e) | | | 1.51 | %(e) | | | 1.41 | % |
| | | | | | | | | | | | | | | | | | | | | | | | | |
Net investment income | | | 1.23 | %(b) | | | 1.74 | % | | | 1.03 | % | | | 1.42 | % | | | 0.84 | % | | | 0.63 | % |
| | | | | | | | | | | | | | | | | | | | | | | | | |
Supplemental data | | | | | | | | | | | | | | | | | | | | | | | | |
| | | | | | |
Net assets, end of period (in thousands) | | | $174,605 | | | | $163,706 | | | | $100,943 | | | | $52,850 | | | | $60,295 | | | | $69,831 | |
| | | | | | | | | | | | | | | | | | | | | | | | | |
Portfolio turnover | | | 25 | % | | | 64 | % | | | 73 | % | | | 126 | % | | | 121 | % | | | 115 | % |
| | | | | | | | | | | | | | | | | | | | | | | | | |
Notes to Financial Highlights
| (a) | In addition to the fees and expenses that the Fund bears directly, the Fund indirectly bears a pro rata share of the fees and expenses of any other funds in which it invests. Such indirect expenses are not included in the Fund’s reported expense ratios. |
| (c) | Ratios include line of credit interest expense which is less than 0.01%. |
| (d) | Total net expenses include the impact of certain fee waivers/expense reimbursements made by the Investment Manager and certain of its affiliates, if applicable. |
| (e) | The benefits derived from expense reductions had an impact of less than 0.01%. |
The accompanying Notes to Financial Statements are an integral part of this statement.
| | |
| 16 | | Semiannual Report 2015 |
| | |
| |
| COLUMBIA EUROPEAN EQUITY FUND | | |
FINANCIAL HIGHLIGHTS (continued)
| | | | | | | | | | | | | | | | | | | | | | | | |
| |
| Six Months Ended
April 30, 2015 |
| | | Year Ended October 31, | |
Class B | | | (Unaudited) | | | | 2014 | | | | 2013 | | | | 2012 | | | | 2011 | | | | 2010 | |
Per share data | | | | | | | | | | | | | | | | | | | | | | | | |
Net asset value, beginning of period | | | $6.97 | | | | $7.48 | | | | $5.87 | | | | $5.44 | | | | $5.78 | | | | $4.83 | |
| | | | | | | | | | | | | | | | | | | | | | | | | |
Income from investment operations: | | | | | | | | | | | | | | | | | | | | | | | | |
| | | | | | |
Net investment income (loss) | | | 0.01 | | | | 0.07 | | | | 0.03 | | | | 0.04 | | | | 0.01 | | | | (0.00 | )(a) |
| | | | | | | | | | | | | | | | | | | | | | | | | |
Net realized and unrealized gain (loss) | | | 0.48 | | | | (0.28 | ) | | | 1.64 | | | | 0.39 | | | | (0.35 | ) | | | 0.97 | |
| | | | | | | | | | | | | | | | | | | | | | | | | |
Total from investment operations | | | 0.49 | | | | (0.21 | ) | | | 1.67 | | | | 0.43 | | | | (0.34 | ) | | | 0.97 | |
| | | | | | | | | | | | | | | | | | | | | | | | | |
Less distributions to shareholders: | | | | | | | | | | | | | | | | | | | | | | | | |
| | | | | | |
Net investment income | | | (0.07 | ) | | | (0.02 | ) | | | (0.03 | ) | | | — | | | | — | | | | (0.02 | ) |
| | | | | | | | | | | | | | | | | | | | | | | | | |
Net realized gains | | | (0.21 | ) | | | (0.28 | ) | | | (0.03 | ) | | | — | | | | — | | | | — | |
| | | | | | | | | | | | | | | | | | | | | | | | | |
Total distributions to shareholders | | | (0.28 | ) | | | (0.30 | ) | | | (0.06 | ) | | | — | | | | — | | | | (0.02 | ) |
| | | | | | | | | | | | | | | | | | | | | | | | | |
Net asset value, end of period | | | $7.18 | | | | $6.97 | | | | $7.48 | | | | $5.87 | | | | $5.44 | | | | $5.78 | |
| | | | | | | | | | | | | | | | | | | | | | | | | |
Total return | | | 7.28 | % | | | (3.06 | %) | | | 28.59 | % | | | 7.90 | % | | | (5.88 | %) | | | 20.10 | % |
| | | | | | | | | | | | | | | | | | | | | | | | | |
Ratios to average net assets(b) | | | | | | | | | | | | | | | | | | | | | | | | |
| | | | | | |
Total gross expenses | | | 2.13 | %(c)(d) | | | 2.11 | % | | | 2.18 | % | | | 2.28 | %(d) | | | 2.30 | % | | | 2.41 | % |
| | | | | | | | | | | | | | | | | | | | | | | | | |
Total net expenses(e) | | | 2.13 | %(c)(d) | | | 2.11 | % | | | 2.18 | %(f) | | | 2.27 | %(d)(f) | | | 2.26 | %(f) | | | 2.16 | % |
| | | | | | | | | | | | | | | | | | | | | | | | | |
Net investment income (loss) | | | 0.38 | %(c) | | | 0.97 | % | | | 0.42 | % | | | 0.78 | % | | | 0.15 | % | | | (0.06 | %) |
| | | | | | | | | | | | | | | | | | | | | | | | | |
Supplemental data | | | | | | | | | | | | | | | | | | | | | | | | |
| | | | | | |
Net assets, end of period (in thousands) | | | $1,395 | | | | $1,535 | | | | $1,561 | | | | $1,492 | | | | $2,382 | | | | $4,051 | |
| | | | | | | | | | | | | | | | | | | | | | | | | |
Portfolio turnover | | | 25 | % | | | 64 | % | | | 73 | % | | | 126 | % | | | 121 | % | | | 115 | % |
| | | | | | | | | | | | | | | | | | | | | | | | | |
Notes to Financial Highlights
| (b) | In addition to the fees and expenses that the Fund bears directly, the Fund indirectly bears a pro rata share of the fees and expenses of any other funds in which it invests. Such indirect expenses are not included in the Fund’s reported expense ratios. |
| (d) | Ratios include line of credit interest expense which is less than 0.01%. |
| (e) | Total net expenses include the impact of certain fee waivers/expense reimbursements made by the Investment Manager and certain of its affiliates, if applicable. |
| (f) | The benefits derived from expense reductions had an impact of less than 0.01%. |
The accompanying Notes to Financial Statements are an integral part of this statement.
| | | | |
| Semiannual Report 2015 | | | 17 | |
| | |
| |
| | COLUMBIA EUROPEAN EQUITY FUND |
FINANCIAL HIGHLIGHTS (continued)
| | | | | | | | | | | | | | | | | | | | | | | | |
| |
| Six Months Ended
April 30, 2015 |
| | | Year Ended October 31, | |
Class C | | | (Unaudited) | | | | 2014 | | | | 2013 | | | | 2012 | | | | 2011 | | | | 2010 | |
Per share data | | | | | | | | | | | | | | | | | | | | | | | | |
Net asset value, beginning of period | | | $6.86 | | | | $7.37 | | | | $5.82 | | | | $5.39 | | | | $5.72 | | | | $4.81 | |
| | | | | | | | | | | | | | | | | | | | | | | | | |
Income from investment operations: | | | | | | | | | | | | | | | | | | | | | | | | |
| | | | | | |
Net investment income (loss) | | | 0.01 | | | | 0.07 | | | | (0.00 | )(a) | | | 0.04 | | | | 0.01 | | | | (0.01 | ) |
| | | | | | | | | | | | | | | | | | | | | | | | | |
Net realized and unrealized gain (loss) | | | 0.47 | | | | (0.28 | ) | | | 1.64 | | | | 0.39 | | | | (0.34 | ) | | | 0.96 | |
| | | | | | | | | | | | | | | | | | | | | | | | | |
Total from investment operations | | | 0.48 | | | | (0.21 | ) | | | 1.64 | | | | 0.43 | | | | (0.33 | ) | | | 0.95 | |
| | | | | | | | | | | | | | | | | | | | | | | | | |
Less distributions to shareholders: | | | | | | | | | | | | | | | | | | | | | | | | |
| | | | | | |
Net investment income | | | (0.07 | ) | | | (0.02 | ) | | | (0.06 | ) | | | — | | | | — | | | | (0.04 | ) |
| | | | | | | | | | | | | | | | | | | | | | | | | |
Net realized gains | | | (0.21 | ) | | | (0.28 | ) | | | (0.03 | ) | | | — | | | | — | | | | — | |
| | | | | | | | | | | | | | | | | | | | | | | | | |
Total distributions to shareholders | | | (0.28 | ) | | | (0.30 | ) | | | (0.09 | ) | | | — | | | | — | | | | (0.04 | ) |
| | | | | | | | | | | | | | | | | | | | | | | | | |
Net asset value, end of period | | | $7.06 | | | | $6.86 | | | | $7.37 | | | | $5.82 | | | | $5.39 | | | | $5.72 | |
| | | | | | | | | | | | | | | | | | | | | | | | | |
Total return | | | 7.24 | % | | | (3.08 | %) | | | 28.58 | % | | | 7.98 | % | | | (5.77 | %) | | | 19.96 | % |
| | | | | | | | | | | | | | | | | | | | | | | | | |
Ratios to average net assets(b) | | | | | | | | | | | | | | | | | | | | | | | | |
| | | | | | |
Total gross expenses | | | 2.13 | %(c)(d) | | | 2.12 | % | | | 2.15 | % | | | 2.31 | %(d) | | | 2.29 | % | | | 2.43 | % |
| | | | | | | | | | | | | | | | | | | | | | | | | |
Total net expenses(e) | | | 2.13 | %(c)(d) | | | 2.12 | % | | | 2.15 | %(f) | | | 2.27 | %(d)(f) | | | 2.26 | %(f) | | | 2.17 | % |
| | | | | | | | | | | | | | | | | | | | | | | | | |
Net investment income (loss) | | | 0.41 | %(c) | | | 1.00 | % | | | (0.05 | %) | | | 0.72 | % | | | 0.11 | % | | | (0.10 | %) |
| | | | | | | | | | | | | | | | | | | | | | | | | |
Supplemental data | | | | | | | | | | | | | | | | | | | | | | | | |
| | | | | | |
Net assets, end of period (in thousands) | | | $26,850 | | | | $26,264 | | | | $13,322 | | | | $2,106 | | | | $1,274 | | | | $1,406 | |
| | | | | | | | | | | | | | | | | | | | | | | | | |
Portfolio turnover | | | 25 | % | | | 64 | % | | | 73 | % | | | 126 | % | | | 121 | % | | | 115 | % |
| | | | | | | | | | | | | | | | | | | | | | | | | |
Notes to Financial Highlights
| (b) | In addition to the fees and expenses that the Fund bears directly, the Fund indirectly bears a pro rata share of the fees and expenses of any other funds in which it invests. Such indirect expenses are not included in the Fund’s reported expense ratios. |
| (d) | Ratios include line of credit interest expense which is less than 0.01%. |
| (e) | Total net expenses include the impact of certain fee waivers/expense reimbursements made by the Investment Manager and certain of its affiliates, if applicable. |
| (f) | The benefits derived from expense reductions had an impact of less than 0.01%. |
The accompanying Notes to Financial Statements are an integral part of this statement.
| | |
| 18 | | Semiannual Report 2015 |
| | |
| |
| COLUMBIA EUROPEAN EQUITY FUND | | |
FINANCIAL HIGHLIGHTS (continued)
| | | | | | | | | | | | | | | | | | | | | | | | |
| |
| Six Months Ended
April 30, 2015 |
| | | Year Ended October 31, | |
Class I | | | (Unaudited) | | | | 2014 | | | | 2013 | | | | 2012 | | | | 2011 | | | | 2010 | |
Per share data | | | | | | | | | | | | | | | | | | | | | | | | |
Net asset value, beginning of period | | | $7.08 | | | | $7.58 | | | | $5.96 | | | | $5.50 | | | | $5.80 | | | | $4.86 | |
| | | | | | | | | | | | | | | | | | | | | | | | | |
Income from investment operations: | | | | | | | | | | | | | | | | | | | | | | | | |
| | | | | | |
Net investment income | | | 0.05 | | | | 0.15 | | | | 0.11 | | | | 0.10 | | | | 0.11 | | | | 0.05 | |
| | | | | | | | | | | | | | | | | | | | | | | | | |
Net realized and unrealized gain (loss) | | | 0.49 | | | | (0.28 | ) | | | 1.66 | | | | 0.41 | | | | (0.36 | ) | | | 0.98 | |
| | | | | | | | | | | | | | | | | | | | | | | | | |
Total from investment operations | | | 0.54 | | | | (0.13 | ) | | | 1.77 | | | | 0.51 | | | | (0.25 | ) | | | 1.03 | |
| | | | | | | | | | | | | | | | | | | | | | | | | |
Less distributions to shareholders: | | | | | | | | | | | | | | | | | | | | | | | | |
| | | | | | |
Net investment income | | | (0.16 | ) | | | (0.09 | ) | | | (0.12 | ) | | | (0.05 | ) | | | (0.05 | ) | | | (0.09 | ) |
| | | | | | | | | | | | | | | | | | | | | | | | | |
Net realized gains | | | (0.21 | ) | | | (0.28 | ) | | | (0.03 | ) | | | — | | | | — | | | | — | |
| | | | | | | | | | | | | | | | | | | | | | | | | |
Total distributions to shareholders | | | (0.37 | ) | | | (0.37 | ) | | | (0.15 | ) | | | (0.05 | ) | | | (0.05 | ) | | | (0.09 | ) |
| | | | | | | | | | | | | | | | | | | | | | | | | |
Net asset value, end of period | | | $7.25 | | | | $7.08 | | | | $7.58 | | | | $5.96 | | | | $5.50 | | | | $5.80 | |
| | | | | | | | | | | | | | | | | | | | | | | | | |
Total return | | | 7.97 | % | | | (1.96 | %) | | | 30.29 | % | | | 9.36 | % | | | (4.36 | %) | | | 21.61 | % |
| | | | | | | | | | | | | | | | | | | | | | | | | |
Ratios to average net assets(a) | | | | | | | | | | | | | | | | | | | | | | | | |
| | | | | | |
Total gross expenses | | | 0.93 | %(b)(c) | | | 0.92 | % | | | 0.93 | % | | | 0.97 | %(c) | | | 1.00 | % | | | 1.14 | % |
| | | | | | | | | | | | | | | | | | | | | | | | | |
Total net expenses(d) | | | 0.93 | %(b)(c) | | | 0.92 | % | | | 0.93 | % | | | 0.97 | %(c) | | | 1.00 | % | | | 0.96 | % |
| | | | | | | | | | | | | | | | | | | | | | | | | |
Net investment income | | | 1.57 | %(b) | | | 2.04 | % | | | 1.65 | % | | | 1.86 | % | | | 1.83 | % | | | 1.07 | % |
| | | | | | | | | | | | | | | | | | | | | | | | | |
Supplemental data | | | | | | | | | | | | | | | | | | | | | | | | |
| | | | | | |
Net assets, end of period (in thousands) | | | $253,560 | | | | $269,774 | | | | $263,736 | | | | $236,735 | | | | $319,236 | | | | $8 | |
| | | | | | | | | | | | | | | | | | | | | | | | | |
Portfolio turnover | | | 25 | % | | | 64 | % | | | 73 | % | | | 126 | % | | | 121 | % | | | 115 | % |
| | | | | | | | | | | | | | | | | | | | | | | | | |
Notes to Financial Highlights
| (a) | In addition to the fees and expenses that the Fund bears directly, the Fund indirectly bears a pro rata share of the fees and expenses of any other funds in which it invests. Such indirect expenses are not included in the Fund’s reported expense ratios. |
| (c) | Ratios include line of credit interest expense which is less than 0.01%. |
| (d) | Total net expenses include the impact of certain fee waivers/expense reimbursements made by the Investment Manager and certain of its affiliates, if applicable. |
The accompanying Notes to Financial Statements are an integral part of this statement.
| | | | |
| Semiannual Report 2015 | | | 19 | |
| | |
| |
| | COLUMBIA EUROPEAN EQUITY FUND |
FINANCIAL HIGHLIGHTS (continued)
| | | | | | | | | | | | | | | | | | | | | | | | |
| |
| Six Months Ended
April 30, 2015 |
| | | Year Ended October 31, | |
Class K | | | (Unaudited) | | | | 2014 | | | | 2013 | | | | 2012 | | | | 2011 | | | | 2010 | |
Per share data | | | | | | | | | | | | | | | | | | | | | | | | |
Net asset value, beginning of period | | | $7.03 | | | | $7.54 | | | | $5.93 | | | | $5.47 | | | | $5.79 | | | | $4.86 | |
| | | | | | | | | | | | | | | | | | | | | | | | | |
Income from investment operations: | | | | | | | | | | | | | | | | | | | | | | | | |
| | | | | | |
Net investment income | | | 0.04 | | | | 0.13 | | | | 0.08 | | | | 0.08 | | | | 0.06 | | | | 0.04 | |
| | | | | | | | | | | | | | | | | | | | | | | | | |
Net realized and unrealized gain (loss) | | | 0.49 | | | | (0.29 | ) | | | 1.67 | | | | 0.41 | | | | (0.34 | ) | | | 0.97 | |
| | | | | | | | | | | | | | | | | | | | | | | | | |
Total from investment operations | | | 0.53 | | | | (0.16 | ) | | | 1.75 | | | | 0.49 | | | | (0.28 | ) | | | 1.01 | |
| | | | | | | | | | | | | | | | | | | | | | | | | |
Less distributions to shareholders: | | | | | | | | | | | | | | | | | | | | | | | | |
| | | | | | |
Net investment income | | | (0.14 | ) | | | (0.07 | ) | | | (0.11 | ) | | | (0.03 | ) | | | (0.04 | ) | | | (0.08 | ) |
| | | | | | | | | | | | | | | | | | | | | | | | | |
Net realized gains | | | (0.21 | ) | | | (0.28 | ) | | | (0.03 | ) | | | — | | | | — | | | | — | |
| | | | | | | | | | | | | | | | | | | | | | | | | |
Total distributions to shareholders | | | (0.35 | ) | | | (0.35 | ) | | | (0.14 | ) | | | (0.03 | ) | | | (0.04 | ) | | | (0.08 | ) |
| | | | | | | | | | | | | | | | | | | | | | | | | |
Net asset value, end of period | | | $7.21 | | | | $7.03 | | | | $7.54 | | | | $5.93 | | | | $5.47 | | | | $5.79 | |
| | | | | | | | | | | | | | | | | | | | | | | | | |
Total return | | | 7.82 | % | | | (2.33 | %) | | | 29.93 | % | | | 9.08 | % | | | (4.93 | %) | | | 21.08 | % |
| | | | | | | | | | | | | | | | | | | | | | | | | |
Ratios to average net assets(a) | | | | | | | | | | | | | | | | | | | | | | | | |
| | | | | | |
Total gross expenses | | | 1.21 | %(b)(c) | | | 1.22 | % | | | 1.23 | % | | | 1.27 | %(c) | | | 1.32 | % | | | 1.49 | % |
| | | | | | | | | | | | | | | | | | | | | | | | | |
Total net expenses(d) | | | 1.21 | %(b)(c) | | | 1.22 | % | | | 1.23 | % | | | 1.27 | %(c) | | | 1.26 | % | | | 1.27 | % |
| | | | | | | | | | | | | | | | | | | | | | | | | |
Net investment income | | | 1.17 | %(b) | | | 1.74 | % | | | 1.21 | % | | | 1.43 | % | | | 1.08 | % | | | 0.79 | % |
| | | | | | | | | | | | | | | | | | | | | | | | | |
Supplemental data | | | | | | | | | | | | | | | | | | | | | | | | |
| | | | | | |
Net assets, end of period (in thousands) | | | $4 | | | | $12 | | | | $14 | | | | $17 | | | | $27 | | | | $25 | |
| | | | | | | | | | | | | | | | | | | | | | | | | |
Portfolio turnover | | | 25 | % | | | 64 | % | | | 73 | % | | | 126 | % | | | 121 | % | | | 115 | % |
| | | | | | | | | | | | | | | | | | | | | | | | | |
Notes to Financial Highlights
| (a) | In addition to the fees and expenses that the Fund bears directly, the Fund indirectly bears a pro rata share of the fees and expenses of any other funds in which it invests. Such indirect expenses are not included in the Fund’s reported expense ratios. |
| (c) | Ratios include line of credit interest expense which is less than 0.01%. |
| (d) | Total net expenses include the impact of certain fee waivers/expense reimbursements made by the Investment Manager and certain of its affiliates, if applicable. |
The accompanying Notes to Financial Statements are an integral part of this statement.
| | |
| 20 | | Semiannual Report 2015 |
| | |
| |
| COLUMBIA EUROPEAN EQUITY FUND | | |
FINANCIAL HIGHLIGHTS (continued)
| | | | | | | | |
Class R4 | |
| Six Months Ended
April 30, 2015
(Unaudited) |
| |
| Year Ended
October 31, 2014(a) |
|
Per share data | | | | | | | | |
Net asset value, beginning of period | | | $7.03 | | | | $7.59 | |
| | | | | | | | | |
Income from investment operations: | | | | | | | | |
| | |
Net investment income | | | 0.07 | | | | 0.10 | |
| | | | | | | | | |
Net realized and unrealized gain (loss) | | | 0.46 | | | | (0.66 | ) |
| | | | | | | | | |
Total from investment operations | | | 0.53 | | | | (0.56 | ) |
| | | | | | | | | |
Less distributions to shareholders: | | | | | | | | |
| | |
Net investment income | | | (0.14 | ) | | | — | |
| | | | | | | | | |
Net realized gains | | | (0.21 | ) | | | — | |
| | | | | | | | | |
Total distributions to shareholders | | | (0.35 | ) | | | — | |
| | | | | | | | | |
Net asset value, end of period | | | $7.21 | | | | $7.03 | |
| | | | | | | | | |
Total return | | | 7.94 | % | | | (7.38 | %) |
| | | | | | | | | |
Ratios to average net assets(b) | | | | | | | | |
| | |
Total gross expenses | | | 1.14 | %(c)(d) | | | 1.12 | %(c) |
| | | | | | | | | |
Total net expenses(e) | | | 1.14 | %(c)(d) | | | 1.12 | %(c) |
| | | | | | | | | |
Net investment income | | | 2.04 | %(c) | | | 1.69 | %(c) |
| | | | | | | | | |
Supplemental data | | | | | | | | |
| | |
Net assets, end of period (in thousands) | | | $5,269 | | | | $53 | |
| | | | | | | | | |
Portfolio turnover | | | 25 | % | | | 64 | % |
| | | | | | | | | |
Notes to Financial Highlights
| (a) | Based on operations from January 8, 2014 (commencement of operations) through the stated period end. |
| (b) | In addition to the fees and expenses that the Fund bears directly, the Fund indirectly bears a pro rata share of the fees and expenses of any other funds in which it invests. Such indirect expenses are not included in the Fund’s reported expense ratios. |
| (d) | Ratios include line of credit interest expense which is less than 0.01%. |
| (e) | Total net expenses include the impact of certain fee waivers/expense reimbursements made by the Investment Manager and certain of its affiliates, if applicable. |
The accompanying Notes to Financial Statements are an integral part of this statement.
| | | | |
| Semiannual Report 2015 | | | 21 | |
| | |
| |
| | COLUMBIA EUROPEAN EQUITY FUND |
FINANCIAL HIGHLIGHTS (continued)
| | | | | | | | |
Class R5 | |
| Six Months Ended
April 30, 2015
(Unaudited) |
| |
| Year Ended
October 31, 2014(a) |
|
Per share data | | | | | | | | |
Net asset value, beginning of period | | | $7.08 | | | | $7.63 | |
| | | | | | | | | |
Income from investment operations: | | | | | | | | |
| | |
Net investment income | | | 0.08 | | | | 0.09 | |
| | | | | | | | | |
Net realized and unrealized gain (loss) | | | 0.45 | | | | (0.64 | ) |
| | | | | | | | | |
Total from investment operations | | | 0.53 | | | | (0.55 | ) |
| | | | | | | | | |
Less distributions to shareholders: | | | | | | | | |
| | |
Net investment income | | | (0.15 | ) | | | — | |
| | | | | | | | | |
Net realized gains | | | (0.21 | ) | | | — | |
| | | | | | | | | |
Total distributions to shareholders | | | (0.36 | ) | | | — | |
| | | | | | | | | |
Net asset value, end of period | | | $7.25 | | | | $7.08 | |
| | | | | | | | | |
Total return | | | 7.90 | % | | | (7.21 | %) |
| | | | | | | | | |
Ratios to average net assets(b) | | | | | | | | |
| | |
Total gross expenses | | | 1.00 | %(c)(d) | | | 0.98 | %(c) |
| | | | | | | | | |
Total net expenses(e) | | | 1.00 | %(c)(d) | | | 0.98 | %(c) |
| | | | | | | | | |
Net investment income | | | 2.21 | %(c) | | | 1.51 | %(c) |
| | | | | | | | | |
Supplemental data | | | | | | | | |
| | |
Net assets, end of period (in thousands) | | | $157 | | | | $50 | |
| | | | | | | | | |
Portfolio turnover | | | 25 | % | | | 64 | % |
| | | | | | | | | |
Notes to Financial Highlights
| (a) | Based on operations from January 8, 2014 (commencement of operations) through the stated period end. |
| (b) | In addition to the fees and expenses that the Fund bears directly, the Fund indirectly bears a pro rata share of the fees and expenses of any other funds in which it invests. Such indirect expenses are not included in the Fund’s reported expense ratios. |
| (d) | Ratios include line of credit interest expense which is less than 0.01%. |
| (e) | Total net expenses include the impact of certain fee waivers/expense reimbursements made by the Investment Manager and certain of its affiliates, if applicable. |
The accompanying Notes to Financial Statements are an integral part of this statement.
| | |
| 22 | | Semiannual Report 2015 |
| | |
| |
| COLUMBIA EUROPEAN EQUITY FUND | | |
FINANCIAL HIGHLIGHTS (continued)
| | | | | | | | | | | | | | | | |
| |
| Six Months Ended
April 30, 2015 |
| | | Year Ended October 31, | |
Class W | | | (Unaudited) | | | | 2014 | | | | 2013 | | | | 2012(a) | |
Per share data | | | | | | | | | | | | | | | | |
Net asset value, beginning of period | | | $7.02 | | | | $7.52 | | | | $5.94 | | | | $5.21 | |
| | | | | | | | | | | | | | | | | |
Income from investment operations: | | | | | | | | | | | | | | | | |
| | | | |
Net investment income | | | 0.04 | | | | 0.12 | | | | 0.07 | | | | 0.00 | (b) |
| | | | | | | | | | | | | | | | | |
Net realized and unrealized gain (loss) | | | 0.49 | | | | (0.28 | ) | | | 1.65 | | | | 0.73 | |
| | | | | | | | | | | | | | | | | |
Total from investment operations | | | 0.53 | | | | (0.16 | ) | | | 1.72 | | | | 0.73 | |
| | | | | | | | | | | | | | | | | |
Less distributions to shareholders: | | | | | | | | | | | | | | | | |
| | | | |
Net investment income | | | (0.13 | ) | | | (0.06 | ) | | | (0.11 | ) | | | — | |
| | | | | | | | | | | | | | | | | |
Net realized gains | | | (0.21 | ) | | | (0.28 | ) | | | (0.03 | ) | | | — | |
| | | | | | | | | | | | | | | | | |
Total distributions to shareholders | | | (0.34 | ) | | | (0.34 | ) | | | (0.14 | ) | | | — | |
| | | | | | | | | | | | | | | | | |
Net asset value, end of period | | | $7.21 | | | | $7.02 | | | | $7.52 | | | | $5.94 | |
| | | | | | | | | | | | | | | | | |
Total return | | | 7.83 | % | | | (2.37 | %) | | | 29.42 | % | | | 14.01 | % |
| | | | | | | | | | | | | | | | | |
Ratios to average net assets(c) | | | | | | | | | | | | | | | | |
| | | | |
Total gross expenses | | | 1.38 | %(d)(e) | | | 1.35 | % | | | 1.46 | % | | | 1.64 | %(d) |
| | | | | | | | | | | | | | | | | |
Total net expenses(f) | | | 1.38 | %(d)(e) | | | 1.35 | % | | | 1.46 | %(g) | | | 1.52 | %(d) |
| | | | | | | | | | | | | | | | | |
Net investment income | | | 1.18 | %(d) | | | 1.62 | % | | | 1.09 | % | | | 0.11 | %(d) |
| | | | | | | | | | | | | | | | | |
Supplemental data | | | | | | | | | | | | | | | | |
| | | | |
Net assets, end of period (in thousands) | | | $2 | | | | $2 | | | | $4 | | | | $3 | |
| | | | | | | | | | | | | | | | | |
Portfolio turnover | | | 25 | % | | | 64 | % | | | 73 | % | | | 126 | % |
| | | | | | | | | | | | | | | | | |
Notes to Financial Highlights
| (a) | Based on operations from June 18, 2012 (commencement of operations) through the stated period end. |
| (c) | In addition to the fees and expenses that the Fund bears directly, the Fund indirectly bears a pro rata share of the fees and expenses of any other funds in which it invests. Such indirect expenses are not included in the Fund’s reported expense ratios. |
| (e) | Ratios include line of credit interest expense which is less than 0.01%. |
| (f) | Total net expenses include the impact of certain fee waivers/expense reimbursements made by the Investment Manager and certain of its affiliates, if applicable. |
| (g) | The benefits derived from expense reductions had an impact of less than 0.01%. |
The accompanying Notes to Financial Statements are an integral part of this statement.
| | | | |
| Semiannual Report 2015 | | | 23 | |
| | |
| |
| | COLUMBIA EUROPEAN EQUITY FUND |
FINANCIAL HIGHLIGHTS (continued)
| | | | | | | | | | | | | | | | | | | | | | | | |
| |
| Six Months Ended
April 30, 2015 |
| | | Year Ended October 31, | |
Class Z | | | (Unaudited) | | | | 2014 | | | | 2013 | | | | 2012 | | | | 2011 | | | | 2010(a) | |
Per share data | | | | | | | | | | | | | | | | | | | | | | | | |
Net asset value, beginning of period | | | $7.04 | | | | $7.53 | | | | $5.94 | | | | $5.49 | | | | $5.80 | | | | $5.52 | |
| | | | | | | | | | | | | | | | | | | | | | | | | |
Income from investment operations: | | | | | | | | | | | | | | | | | | | | | | | | |
| | | | | | |
Net investment income | | | 0.04 | | | | 0.14 | | | | 0.09 | | | | 0.02 | | | | 0.10 | | | | 0.00 | (b) |
| | | | | | | | | | | | | | | | | | | | | | | | | |
Net realized and unrealized gain (loss) | | | 0.48 | | | | (0.28 | ) | | | 1.65 | | | | 0.47 | | | | (0.36 | ) | | | 0.28 | |
| | | | | | | | | | | | | | | | | | | | | | | | | |
Total from investment operations | | | 0.52 | | | | (0.14 | ) | | | 1.74 | | | | 0.49 | | | | (0.26 | ) | | | 0.28 | |
| | | | | | | | | | | | | | | | | | | | | | | | | |
Less distributions to shareholders: | | | | | | | | | | | | | | | | | | | | | | | | |
| | | | | | |
Net investment income | | | (0.14 | ) | | | (0.07 | ) | | | (0.12 | ) | | | (0.04 | ) | | | (0.05 | ) | | | — | |
| | | | | | | | | | | | | | | | | | | | | | | | | |
Net realized gains | | | (0.21 | ) | | | (0.28 | ) | | | (0.03 | ) | | | — | | | | — | | | | — | |
| | | | | | | | | | | | | | | | | | | | | | | | | |
Total distributions to shareholders | | | (0.35 | ) | | | (0.35 | ) | | | (0.15 | ) | | | (0.04 | ) | | | (0.05 | ) | | | — | |
| | | | | | | | | | | | | | | | | | | | | | | | | |
Net asset value, end of period | | | $7.21 | | | | $7.04 | | | | $7.53 | | | | $5.94 | | | | $5.49 | | | | $5.80 | |
| | | | | | | | | | | | | | | | | | | | | | | | | |
Total return | | | 7.79 | % | | | (2.01 | %) | | | 29.83 | % | | | 9.09 | % | | | (4.57 | %) | | | 5.07 | % |
| | | | | | | | | | | | | | | | | | | | | | | | | |
Ratios to average net assets(c) | | | | | | | | | | | | | | | | | | | | | | | | |
| | | | | | |
Total gross expenses | | | 1.12 | %(d)(e) | | | 1.12 | % | | | 1.17 | % | | | 1.49 | %(e) | | | 1.24 | % | | | 1.96 | %(d) |
| | | | | | | | | | | | | | | | | | | | | | | | | |
Total net expenses(f) | | | 1.12 | %(d)(e) | | | 1.12 | % | | | 1.17 | %(g) | | | 1.27 | %(e)(g) | | | 1.24 | %(g) | | | 1.27 | %(d) |
| | | | | | | | | | | | | | | | | | | | | | | | | |
Net investment income | | | 1.02 | %(d) | | | 1.92 | % | | | 1.34 | % | | | 0.34 | % | | | 1.72 | % | | | 0.12 | %(d) |
| | | | | | | | | | | | | | | | | | | | | | | | | |
Supplemental data | | | | | | | | | | | | | | | | | | | | | | | | |
| | | | | | |
Net assets, end of period (in thousands) | | | $71,767 | | | | $115,755 | | | | $107,086 | | | | $60,380 | | | | $70 | | | | $3 | |
| | | | | | | | | | | | | | | | | | | | | | | | | |
Portfolio turnover | | | 25 | % | | | 64 | % | | | 73 | % | | | 126 | % | | | 121 | % | | | 115 | % |
| | | | | | | | | | | | | | | | | | | | | | | | | |
Notes to Financial Highlights
| (a) | Based on operations from September 27, 2010 (commencement of operations) through the stated period end. |
| (c) | In addition to the fees and expenses that the Fund bears directly, the Fund indirectly bears a pro rata share of the fees and expenses of any other funds in which it invests. Such indirect expenses are not included in the Fund’s reported expense ratios. |
| (e) | Ratios include line of credit interest expense which is less than 0.01%. |
| (f) | Total net expenses include the impact of certain fee waivers/expense reimbursements made by the Investment Manager and certain of its affiliates, if applicable. |
| (g) | The benefits derived from expense reductions had an impact of less than 0.01%. |
The accompanying Notes to Financial Statements are an integral part of this statement.
| | |
| 24 | | Semiannual Report 2015 |
| | |
| |
| COLUMBIA EUROPEAN EQUITY FUND | | |
NOTES TO FINANCIAL STATEMENTS
April 30, 2015 (Unaudited)
Note 1. Organization
Columbia European Equity Fund (the Fund), a series of Columbia Funds Series Trust II (the Trust), is a diversified fund. The Trust is registered under the Investment Company Act of 1940, as amended (the 1940 Act), as an open-end management investment company organized as a Massachusetts business trust.
Fund Shares
The Trust may issue an unlimited number of shares (without par value). The Fund offers Class A, Class B, Class C, Class I, Class K, Class R4, Class R5, Class W and Class Z shares. Although all share classes generally have identical voting, dividend and liquidation rights, each share class votes separately when required by the Trust’s organizational documents or by law. Different share classes pay different distribution amounts to the extent the expenses of such share classes differ, and distributions in liquidation will be proportional to the net asset value of each share class. Each share class has its own expense structure and sales charges.
Class A shares are subject to a maximum front-end sales charge of 5.75% based on the initial investment amount. Class A shares purchased without an initial sales charge in accounts aggregating $1 million to $50 million at the time of purchase are subject to a contingent deferred sales charge (CDSC) if the shares are sold within 18 months after purchase, charged as follows: 1.00% CDSC if redeemed within 12 months after purchase, and 0.50% CDSC if redeemed more than 12, but less than 18, months after purchase.
Class B shares may be subject to a maximum CDSC of 5.00% based upon the holding period after purchase. Class B shares will generally convert to Class A shares eight years after purchase. The Fund no longer accepts investments by new or existing investors in the Fund’s Class B shares, except in connection with the reinvestment of any dividend and/or capital gain distributions in Class B shares of the Fund and exchanges by existing Class B shareholders of certain other funds within the Columbia Family of Funds.
Class C shares are subject to a 1.00% CDSC on shares redeemed within one year after purchase.
Class I shares are not subject to sales charges and are available only to the Columbia Family of Funds.
Class K shares are not subject to sales charges, however this share class is closed to new investors.
Class R4 shares are not subject to sales charges and are generally available only to omnibus retirement plans and certain investors as described in the Fund’s prospectus.
Class R5 shares are not subject to sales charges and are generally available only to investors purchasing through authorized investment professionals and omnibus retirement plans.
Class W shares are not subject to sales charges and are available only to investors purchasing through authorized investment programs managed by investment professionals, including discretionary managed account programs.
Class Z shares are not subject to sales charges and are available only to eligible investors, which are subject to different investment minimums as described in the Fund’s prospectus.
Note 2. Summary of Significant Accounting Policies
Basis of Preparation
The Fund is an investment company that applies the accounting and reporting guidance in the Financial Accounting Standards Board (FASB) Accounting Standards Codification Topic 946, Financial Services —Investment Companies (ASC 946). The financial statements are prepared in accordance with U.S. generally accepted accounting principles (GAAP), which requires management to make certain estimates and assumptions that affect the reported amounts of assets and liabilities, the disclosure of contingent assets and liabilities at the date of the financial statements and the reported amounts of income and expenses during the reporting period. Actual results could differ from those estimates.
The following is a summary of significant accounting policies followed by the Fund in the preparation of its financial statements.
Security Valuation
All equity securities are valued at the close of business of the New York Stock Exchange (NYSE). Equity securities are valued at the last quoted sales price on the principal exchange or market on which they trade, except for securities traded on the NASDAQ Stock Market, which are valued at the NASDAQ official close price. Unlisted securities or listed securities for which there were no sales during the day are valued at the mean of the latest quoted bid and ask prices on such exchanges or markets.
| | | | |
| Semiannual Report 2015 | | | 25 | |
| | |
| |
| | COLUMBIA EUROPEAN EQUITY FUND |
NOTES TO FINANCIAL STATEMENTS (continued)
April 30, 2015 (Unaudited)
Foreign equity securities are valued based on quotations from the principal market in which such securities are traded. If any foreign security prices are not readily available as a result of limited share activity, the securities are valued at the mean of the latest quoted bid and ask prices on such exchanges or markets. Foreign currency exchange rates are generally determined at 4:00 p.m. Eastern (U.S.) time. Many securities markets and exchanges outside the U.S. close prior to the close of the NYSE; therefore, the closing prices for securities in such markets or on such exchanges may not fully reflect events that occur after such close but before the close of the NYSE. In those situations, foreign securities will be fair valued pursuant to a policy adopted by the Board of Trustees (the Board), including, if available, utilizing a third party pricing service to determine these fair values. The third party pricing service takes into account multiple factors, including, but not limited to, movements in the U.S. securities markets, certain depositary receipts, futures contracts and foreign exchange rates that have occurred subsequent to the close of the foreign exchange or market, to determine a good faith estimate that reasonably reflects the current market conditions as of the close of the NYSE. The fair value of a security is likely to be different from the quoted or published price, if available.
Investments in open-end investment companies, including money market funds, are valued at their net asset value.
Investments for which market quotations are not readily available, or that have quotations which management believes are not reliable, are valued at fair value as determined in good faith under procedures established by and under the general supervision of the Board. If a security or class of securities (such as foreign securities) is valued at fair value, such value is likely to be different from the quoted or published price for the security.
The determination of fair value often requires significant judgment. To determine fair value, management may use assumptions including but not limited to future cash flows and estimated risk premiums. Multiple inputs from various sources may be used to determine fair value.
Foreign Currency Transactions and Translations
The values of all assets and liabilities denominated in foreign currencies are generally translated into U.S. dollars at exchange rates determined at the close of the NYSE. Net realized and unrealized gains (losses) on foreign currency transactions and translations include gains (losses) arising from the fluctuation in exchange
rates between trade and settlement dates on securities transactions, gains (losses) arising from the disposition of foreign currency and currency gains (losses) between the accrual and payment dates on dividends, interest income and foreign withholding taxes.
For financial statement purposes, the Fund does not distinguish that portion of gains (losses) on investments which is due to changes in foreign exchange rates from that which is due to changes in market prices of the investments. Such fluctuations are included with the net realized and unrealized gains (losses) on investments in the Statement of Operations.
Security Transactions
Security transactions are accounted for on the trade date. Cost is determined and gains (losses) are based upon the specific identification method for both financial statement and federal income tax purposes.
Income Recognition
Corporate actions and dividend income are generally recorded net of any non-reclaimable tax withholdings, on the ex-dividend date or upon receipt of ex-dividend notification in the case of certain foreign securities.
Awards from class action litigation are recorded as a reduction of cost basis if the Fund still owns the applicable securities on the payment date. If the Fund no longer owns the applicable securities, the proceeds are recorded as realized gains.
Expenses
General expenses of the Trust are allocated to the Fund and other funds of the Trust based upon relative net assets or other expense allocation methodologies determined by the nature of the expense. Expenses directly attributable to the Fund are charged to the Fund. Expenses directly attributable to a specific class of shares are charged to that share class.
Determination of Class Net Asset Value
All income, expenses (other than class-specific expenses, which are charged to that share class, as shown in the Statement of Operations) and realized and unrealized gains (losses) are allocated to each class of the Fund on a daily basis, based on the relative net assets of each class, for purposes of determining the net asset value of each class.
| | |
| 26 | | Semiannual Report 2015 |
| | |
| |
| COLUMBIA EUROPEAN EQUITY FUND | | |
NOTES TO FINANCIAL STATEMENTS (continued)
April 30, 2015 (Unaudited)
Federal Income Tax Status
The Fund intends to qualify each year as a regulated investment company under Subchapter M of the Internal Revenue Code, as amended, and will distribute substantially all of its taxable income (including net short-term capital gains), if any, for its tax year, and as such will not be subject to federal income taxes. In addition, the Fund intends to distribute in each calendar year substantially all of its net investment income, capital gains and certain other amounts, if any, such that the Fund should not be subject to federal excise tax. Therefore, no federal income or excise tax provision is recorded.
Foreign Taxes
The Fund may be subject to foreign taxes on income, gains on investments or currency repatriation, a portion of which may be recoverable. The Fund will accrue such taxes and recoveries, as applicable, based upon its current interpretation of tax rules and regulations that exist in the markets in which it invests.
Realized gains in certain countries may be subject to foreign taxes at the Fund level, based on statutory rates. The Fund accrues for such foreign taxes on realized and unrealized gains at the appropriate rate for each jurisdiction, as applicable. The amount, if any, is disclosed as a liability on the Statement of Assets and Liabilities.
Distributions to Shareholders
Distributions from net investment income, if any, are declared and paid annually. Net realized capital gains, if any, are distributed along with the income distribution. Income distributions and capital gain distributions are determined in accordance with federal income tax regulations, which may differ from GAAP.
Guarantees and Indemnifications
Under the Trust’s organizational documents and, in some cases, by contract, its officers and trustees are indemnified against certain liabilities arising out of the performance of their duties to the Trust or its funds. In addition, certain of the Fund’s contracts with its service providers contain general indemnification clauses. The Fund’s maximum exposure under these arrangements is unknown since the amount of any future claims that may be made against the Fund cannot be determined, and the Fund has no historical basis for predicting the likelihood of any such claims.
Note 3. Fees and Compensation Paid to Affiliates
Investment Management Fees
Under an Investment Management Services Agreement, Columbia Management Investment Advisers, LLC (the Investment Manager), a wholly-owned subsidiary of Ameriprise Financial, Inc. (Ameriprise Financial), is responsible for the ultimate oversight of investments made by the Fund. The Fund’s subadviser (see Subadvisory Agreement below) has the primary responsibility for the day-to-day portfolio management of the Fund. The investment management fee is an annual fee that is equal to a percentage of the Fund’s average daily net assets that declines from 0.80% to 0.57% as the Fund’s net assets increase. The annualized effective investment management fee rate for the six months ended April 30, 2015 was 0.78% of the Fund’s average daily net assets.
Subadvisory Agreement
The Investment Manager has entered into a Subadvisory Agreement with Threadneedle International Limited (Threadneedle), an affiliate of the Investment Manager and wholly-owned subsidiary of Ameriprise Financial, to serve as the subadviser to the Fund. The Investment Manager compensates Threadneedle to manage the investment of the Fund’s assets.
Administration Fees
Under an Administrative Services Agreement, the Investment Manager also serves as the Fund Administrator. The Fund pays the Fund Administrator an annual fee for administration and accounting services equal to a percentage of the Fund’s average daily net assets that declines from 0.08% to 0.05% as the Fund’s net assets increase. The annualized effective administration fee rate for the six months ended April 30, 2015 was 0.08% of the Fund’s average daily net assets.
Other Expenses
Other expenses are for, among other things, miscellaneous expenses of the Fund or the Board, including payments to a company providing limited administrative services to the Fund and the Board. That company’s expenses include boardroom and office expense, employee compensation, employee health and retirement benefits, and certain other expenses. For the six months ended April 30, 2015, other expenses paid by the Fund to this company were $1,073.
| | | | |
| Semiannual Report 2015 | | | 27 | |
| | |
| |
| | COLUMBIA EUROPEAN EQUITY FUND |
NOTES TO FINANCIAL STATEMENTS (continued)
April 30, 2015 (Unaudited)
Compensation of Board Members
Board members are compensated for their services to the Fund as disclosed in the Statement of Operations. Under a Deferred Compensation Plan (the Plan), the Board members who are not “interested persons” of the Fund, as defined under the 1940 Act, may elect to defer payment of up to 100% of their compensation. Deferred amounts are treated as though equivalent dollar amounts had been invested in shares of certain funds managed by the Investment Manager. The Fund’s liability for these amounts is adjusted for market value changes and remains in the Fund until distributed in accordance with the Plan.
Transfer Agent Fees
Under a Transfer and Dividend Disbursing Agent Agreement, Columbia Management Investment Services Corp. (the Transfer Agent), an affiliate of the Investment Manager and a wholly-owned subsidiary of Ameriprise Financial, is responsible for providing transfer agency services to the Fund. The Transfer Agent has contracted with Boston Financial Data Services (BFDS) to serve as sub-transfer agent.
The Transfer Agent receives a monthly transfer agency fee based on the number or the average value of accounts, depending on the type of account. In addition, the Transfer Agent also receives sub-transfer agency fees based on a percentage of the average aggregate value of the Fund’s shares maintained in omnibus accounts (other than omnibus accounts for which American Enterprise Investment Services Inc. is the broker of record or accounts where the beneficial shareholder is a customer of Ameriprise Financial Services, Inc., for which the Transfer Agent receives a per account fee). The Transfer Agent pays the fees of BFDS for services as sub-transfer agent and is not entitled to reimbursement for such fees from the Fund (with the exception of out-of-pocket fees).
The Transfer Agent also receives compensation from the Fund for various shareholder services and reimbursements for certain out-of-pocket fees. Class I shares do not pay transfer agency fees. Total transfer agent fees for Class K and Class R5 shares are subject to an annual limitation of not more than 0.05% of the average daily net assets attributable to each share class.
For the six months ended April 30, 2015, the Fund’s annualized effective transfer agent fee rates as a
percentage of average daily net assets of each class were as follows:
| | | | |
Class A | | | 0.20 | % |
Class B | | | 0.20 | |
Class C | | | 0.20 | |
Class K | | | 0.05 | |
Class R4 | | | 0.20 | |
Class R5 | | | 0.05 | |
Class W | | | 0.20 | |
Class Z | | | 0.20 | |
An annual minimum account balance fee of $20 may apply to certain accounts with a value below the applicable share class’s initial minimum investment requirements to reduce the impact of small accounts on transfer agent fees. These minimum account balance fees are remitted to the Fund and recorded as part of expense reductions in the Statement of Operations. For the six months ended April 30, 2015, no minimum account balance fees were charged by the Fund.
Plan Administration Fees
Under a Plan Administration Services Agreement with the Transfer Agent, the Fund pays an annual fee at a rate of 0.25% of the Fund’s average daily net assets attributable to Class K shares for the provision of various administrative, recordkeeping, communication and educational services.
Distribution Fees
The Fund has an agreement with Columbia Management Investment Distributors, Inc. (the Distributor), an affiliate of the Investment Manager and a wholly-owned subsidiary of Ameriprise Financial, for distribution and shareholder services. Under a Plan and Agreement of Distribution, the Fund pays a fee at an annual rate of up to 0.25% of the Fund’s average daily net assets attributable to Class A and Class W shares, and a fee at an annual rate of up to 1.00% of the Fund’s average daily net assets attributable to Class B and Class C shares. For Class B and Class C shares, of the 1.00% fee, up to 0.75% is reimbursed for distribution expenses.
The amount of distribution expenses incurred by the Distributor and not yet reimbursed (unreimbursed expense) was approximately $226,000 and $147,000 for Class B and Class C shares, respectively. These amounts are based on the most recent information available as of March 31, 2015, and may be recovered from future payments under the distribution plan or
| | |
| 28 | | Semiannual Report 2015 |
| | |
| |
| COLUMBIA EUROPEAN EQUITY FUND | | |
NOTES TO FINANCIAL STATEMENTS (continued)
April 30, 2015 (Unaudited)
CDSCs. To the extent the unreimbursed expense has been fully recovered, the distribution fee is reduced.
Sales Charges
Sales charges, including front-end charges and CDSCs, received by the Distributor for distributing Fund shares were $388,974 for Class A, $264 for Class B and $1,690 for Class C shares for the six months ended April 30, 2015.
Expenses Waived/Reimbursed by the Investment Manager and its Affiliates
The Fund’s expense ratio is subject to an expense reimbursement arrangement pursuant to which fees will be waived and/or expenses reimbursed (excluding certain fees and expenses described below), so that the Fund’s net operating expenses, after giving effect to fees waived/expenses reimbursed and any balance credits and/or overdraft charges from the Fund’s custodian, do not exceed the annual rates of:
| | | | | | | | |
| | | Voluntary Expense Cap Effective March 1, 2015 | | | Contractual Expense Cap Prior to March 1, 2015 | |
Class A | | | 1.50 | % | | | 1.49 | % |
Class B | | | 2.25 | | | | 2.24 | |
Class C | | | 2.25 | | | | 2.24 | |
Class I | | | 1.11 | | | | 1.09 | |
Class K | | | 1.41 | | | | 1.39 | |
Class R4 | | | 1.25 | | | | 1.24 | |
Class R5 | | | 1.16 | | | | 1.14 | |
Class W | | | 1.50 | | | | 1.49 | |
Class Z | | | 1.25 | | | | 1.24 | |
The voluntary expense cap arrangement may be revised or discontinued at any time. Under the arrangements, the following fees and expenses are excluded from the waiver/reimbursement commitment, and therefore will be paid by the Fund, if applicable: taxes (including foreign transaction taxes), expenses associated with investments in affiliated and non-affiliated pooled investment vehicles (including mutual funds and exchange-traded funds), transaction costs and brokerage commissions, costs related to any securities lending program, dividend expenses associated with securities sold short, inverse floater program fees and expenses, transaction charges and interest on borrowed money, interest and extraordinary expenses. Any fees waived and/or expenses reimbursed under the expense reimbursement arrangements described above are not
recoverable by the Investment Manager or its affiliates in future periods.
Note 4. Federal Tax Information
The timing and character of income and capital gain distributions are determined in accordance with income tax regulations, which may differ from GAAP because of temporary or permanent book to tax differences.
At April 30, 2015, the cost of investments for federal income tax purposes was approximately $466,038,000 and the aggregate gross approximate unrealized appreciation and depreciation based on that cost was:
| | | | |
Unrealized appreciation | | | $72,314,000 | |
Unrealized depreciation | | | (7,876,000 | ) |
Net unrealized appreciation | | | $64,438,000 | |
The following capital loss carryforwards, determined as of October 31, 2014, may be available to reduce taxable income arising from future net realized gains on investments, if any, to the extent permitted by the Internal Revenue Code:
| | | | |
| Year of Expiration | | Amount ($) | |
2017 | | | 4,368,227 | |
Management of the Fund has concluded that there are no significant uncertain tax positions in the Fund that would require recognition in the financial statements. However, management’s conclusion may be subject to review and adjustment at a later date based on factors including, but not limited to, new tax laws, regulations, and administrative interpretations (including relevant court decisions). Generally, the Fund’s federal tax returns for the prior three fiscal years remain subject to examination by the Internal Revenue Service.
Note 5. Portfolio Information
The cost of purchases and proceeds from sales of securities, excluding short-term investments and derivatives, if any, aggregated to $136,871,189 and $215,522,782, respectively, for the six months ended April 30, 2015. The amount of purchase and sale activity impacts the portfolio turnover rate reported in the Financial Highlights.
Note 6. Affiliated Money Market Fund
The Fund invests in Columbia Short-Term Cash Fund, an affiliated money market fund established for the exclusive use by the Fund and other affiliated funds. The income earned by the Fund from such investments is
| | | | |
| Semiannual Report 2015 | | | 29 | |
| | |
| |
| | COLUMBIA EUROPEAN EQUITY FUND |
NOTES TO FINANCIAL STATEMENTS (continued)
April 30, 2015 (Unaudited)
included as Dividends — affiliated issuers in the Statement of Operations. As an investing fund, the Fund indirectly bears its proportionate share of the expenses of Columbia Short-Term Cash Fund.
Note 7. Shareholder Concentration
At April 30, 2015, affiliated shareholders of record owned 76.6% of the outstanding shares of the Fund in one or more accounts. Subscription and redemption activity by concentrated accounts may have a significant effect on the operations of the Fund.
Note 8. Line of Credit
The Fund has entered into a revolving credit facility with a syndicate of banks led by JPMorgan Chase Bank, N.A. whereby the Fund may borrow for the temporary funding of shareholder redemptions or for other temporary or emergency purposes. Pursuant to a December 9, 2014 amendment, the credit facility agreement, which is a collective agreement between the Fund and certain other funds managed by the Investment Manager, severally and not jointly, permits collective borrowings up to $550 million. Interest is charged to each participating fund based on its borrowings at a rate equal to the higher of (i) the overnight federal funds rate plus 1.00% or (ii) the one-month LIBOR rate plus 1.00%. Each borrowing under the credit facility matures no later than 60 days after the date of borrowing. The Fund also pays a commitment fee equal to its pro rata share of the amount of the credit facility at a rate of 0.075% per annum. The commitment fee is included in other expenses in the Statement of Operations. Prior to the December 9, 2014 amendment, the credit facility agreement permitted borrowings up to $500 million under the same terms and interest rates as described above.
For the six months ended April 30, 2015, the average daily loan balance outstanding on days when borrowing existed was $9,550,000 at a weighted average interest rate of 1.18%. Interest expense incurred by the Fund is recorded as line of credit interest expense in the Statement of Operations.
Note 9. Significant Risks
Foreign Securities and Emerging Market Countries Risk
Investing in foreign securities may include certain risks and considerations not typically associated with investing in U.S. securities, such as fluctuating currency values and changing local and regional economic, political and
social conditions, which may result in greater market volatility. In addition, certain foreign securities may not be as liquid as U.S. securities. Investing in emerging markets may accentuate these risks. These countries are also more likely to experience high levels of inflation, deflation or currency devaluation which could hurt their economies and securities markets. To the extent that the Fund concentrates its investment exposure to any one or a few specific countries, the Fund will be particularly susceptible to the various conditions, events or other factors impacting those countries and may, therefore, have a greater risk than that of a fund which is more geographically diversified.
Financial Sector Risk
Sector risk occurs when a fund invests a significant portion of its assets in securities of companies conducting business in a related group of industries within an economic sector. Companies in the same economic sector may be similarly affected by economic, regulatory, political or market events or conditions, making a fund more vulnerable to unfavorable developments in that economic sector than funds that invest more broadly. The Fund may be more susceptible to the particular risks that may affect companies in the financial sector than if it were invested in a wider variety of companies in unrelated sectors.
Geographic Concentration Risk
Because the Fund concentrates its investments in Europe, the Fund may be particularly susceptible to economic, political, regulatory or other events or conditions affecting issuers and countries in Europe. Currency devaluations could occur in countries that have not yet experienced currency devaluation to date, or could continue to occur in countries that have already experienced such devaluations. In addition, the private and public sectors’ debt problems of a single EU country can pose significant economic risks to the EU as a whole. As a result, the Fund may be more volatile than a more geographically diversified fund. If securities of issuers in Europe fall out of favor, it may cause the Fund to underperform other funds that do not concentrate in this region of the world.
Note 10. Subsequent Events
Management has evaluated the events and transactions that have occurred through the date the financial statements were issued and noted no items requiring adjustment of the financial statements or additional disclosure.
| | |
| 30 | | Semiannual Report 2015 |
| | |
| |
| COLUMBIA EUROPEAN EQUITY FUND | | |
NOTES TO FINANCIAL STATEMENTS (continued)
April 30, 2015 (Unaudited)
Note 11. Information Regarding Pending and Settled Legal Proceedings
In December 2005, without admitting or denying the allegations, American Express Financial Corporation (AEFC, which is now known as Ameriprise Financial, Inc. (Ameriprise Financial)) entered into settlement agreements with the Securities and Exchange Commission (SEC) and Minnesota Department of Commerce (MDOC) related to market timing activities. As a result, AEFC was censured and ordered to cease and desist from committing or causing any violations of certain provisions of the Investment Advisers Act of 1940, the Investment Company Act of 1940, and various Minnesota laws. AEFC agreed to pay disgorgement of $10 million and civil money penalties of $7 million. AEFC also agreed to retain an independent distribution consultant to assist in developing a plan for distribution of all disgorgement and civil penalties ordered by the SEC in accordance with various undertakings detailed at www.sec.gov/litigation/admin/ia-2451.pdf. Ameriprise Financial and its affiliates have cooperated with the SEC and the MDOC in these legal proceedings, and have made regular reports to the Funds’ Boards of Trustees.
Ameriprise Financial and certain of its affiliates have historically been involved in a number of legal, arbitration and regulatory proceedings, including routine litigation, class actions, and governmental actions, concerning matters arising in connection with the conduct of their business activities. Ameriprise Financial believes that the Funds are not currently the subject of, and that neither Ameriprise Financial nor any of its affiliates are the subject of, any pending legal, arbitration or regulatory proceedings that are likely to have a material adverse effect on the Funds or the ability of Ameriprise Financial or its affiliates to perform under their contracts with the Funds. Ameriprise Financial is required to make quarterly (10-Q), annual (10-K) and, as necessary, 8-K filings with the Securities and Exchange Commission on legal and regulatory matters that relate to Ameriprise Financial and its affiliates. Copies of these filings may be obtained by accessing the SEC website at www.sec.gov.
There can be no assurance that these matters, or the adverse publicity associated with them, will not result in increased fund redemptions, reduced sale of fund shares or other adverse consequences to the Funds. Further, although we believe proceedings are not likely to have a material adverse effect on the Funds or the ability of Ameriprise Financial or its affiliates to perform under their contracts with the Funds, these proceedings are
subject to uncertainties and, as such, we are unable to estimate the possible loss or range of loss that may result. An adverse outcome in one or more of these proceedings could result in adverse judgments, settlements, fines, penalties or other relief that could have a material adverse effect on the consolidated financial condition or results of operations of Ameriprise Financial.
| | | | |
| Semiannual Report 2015 | | | 31 | |
| | |
| |
| | COLUMBIA EUROPEAN EQUITY FUND |
APPROVAL OF INVESTMENT MANAGEMENT SERVICES AND
SUBADVISORY AGREEMENTS
Columbia Management Investment Advisers, LLC (Columbia Management or the Investment Manager), a wholly-owned subsidiary of Ameriprise Financial, Inc. (Ameriprise Financial), serves as the investment manager to Columbia European Equity Fund (the Fund). Under an investment management services agreement (the IMS Agreement), Columbia Management provides investment advice and other services to the Fund and other funds distributed by Columbia Management Investment Distributors, Inc. (collectively, the Funds). In addition, under a Subadvisory Agreement (the Subadvisory Agreement) between Columbia Management and Threadneedle International Limited (the Subadviser), an affiliate of Columbia Management, the Subadviser has provided portfolio management and related services for the Fund.
The Fund’s Board of Trustees (the Board), including the independent Board members (the Independent Trustees), considered the renewal of the IMS Agreement and the Subadvisory Agreement (together, the Advisory Agreements) for a two-month period (Short-Term Period) in order to align the Advisory Agreements with the review cycle of other funds in the Columbia family of funds. Columbia Management prepared detailed reports for the Board and its Contracts Committee in January, March and April 2015, including reports based on analyses of data provided by an independent organization (Lipper) and a comprehensive response to each item of information requested by independent legal counsel to the Independent Trustees (Independent Legal Counsel) in a letter to the Investment Manager, to assist the Board in making this determination. In addition, throughout the year, the Board (or its committees) regularly meets with portfolio management teams and senior management personnel, and reviews information prepared by Columbia Management addressing the services Columbia Management provides and Fund performance. The Board also accords appropriate weight to the work, deliberations and conclusions of the Contracts Committee, the Investment Review Committee and the Compliance Committee in determining whether to continue the Advisory Agreements.
The Board, at its April 13-15, 2015 in-person Board meeting (the April Meeting), considered the renewal of the Advisory Agreements for the Short-Term Period. At the April Meeting, Independent Legal Counsel reviewed with the Independent Trustees various factors relevant to the Board’s consideration of advisory and subadvisory agreements and the Board’s legal responsibilities related to such consideration. Following an analysis and discussion of the factors identified below, the Board, including all of the Independent Trustees, approved the renewal of each of the Advisory Agreements for the Short-Term Period.
Nature, Extent and Quality of Services Provided by Columbia Management and the Subadviser
The Board analyzed various reports and presentations it had received detailing the services performed by Columbia Management and the Subadviser, as well as their history, reputation, expertise, resources and relative capabilities, and the qualifications of their personnel.
With respect to Columbia Management, the Board specifically considered many developments during the past year concerning the services provided by Columbia Management. The Board took into account the information it received and reviewed concerning Columbia Management’s ongoing oversight and monitoring of the subadvisers, observing the broad scope of services provided by Columbia Management to each subadvised Fund, including, among other noted services, investment, risk and compliance oversight. The Board also took into account the Subadviser oversight structure and the Columbia Management team dedicated thereto as well as the contemplated enhancements to the team and its resources. The Board also noted the information it received concerning Columbia Management’s ability to retain its key portfolio management personnel.
In connection with the Board’s evaluation of the overall package of services provided by Columbia Management, the Board also considered the quality of administrative services provided to the Fund by Columbia Management. In evaluating the quality of services provided under the IMS Agreement and the Fund’s Administrative Services Agreement, the Board also took into account the organization and strength of the Fund’s and its service providers’ compliance programs. The Board also reviewed the financial condition of Columbia Management and its affiliates and their ability to carry out their responsibilities under the IMS Agreement and the Fund’s other service agreements with affiliates of Ameriprise Financial, observing the financial strength of Ameriprise Financial, with its solid balance sheet. In addition, the Board discussed the acceptability of the terms of the IMS Agreement for the Short-Term Period.
| | |
| 32 | | Semiannual Report 2015 |
| | |
| |
| COLUMBIA EUROPEAN EQUITY FUND | | |
APPROVAL OF INVESTMENT MANAGEMENT SERVICES AND
SUBADVISORY AGREEMENTS (continued)
Based on the foregoing, and based on other information received (both oral and written, including the information on investment performance referenced below) and other considerations, the Board concluded that the services being performed by Columbia Management and its affiliates were acceptable for the Short-Term Period.
With respect to the Subadviser, the Board observed that it had previously approved the Subadviser’s code of ethics and compliance program, that the Chief Compliance Officer of the Fund continues to monitor the code and the program, and that no material concerns have been reported. The Board also considered the Subadviser’s organizational strength and resources, portfolio management team depth and capabilities and investment process. The Board also considered the Subadviser’s capability and wherewithal to carry out its responsibilities under the Subadvisory Agreement for the Short-Term Period. In addition, the Board discussed the acceptability of the terms of the Subadvisory Agreement for the Short-Term Period. The Board noted that the terms of the Subadvisory Agreement are generally consistent with the terms of other subadviser agreements for subadvisers who manage other funds managed by the Investment Manager. Based on the foregoing, and based on other information received (both oral and written) and other considerations, including, in particular, the performance of the Fund (discussed below), as well as the Investment Manager’s recommendation that the Board approve renewal of the Subadvisory Agreement with the Subadviser the Board concluded that the services being performed under the Subadvisory Agreement were acceptable for purposes of renewal for the Short-Term Period.
Investment Performance
For purposes of evaluating the nature, extent and quality of services provided under the Advisory Agreements, the Board carefully reviewed the investment performance of the Fund. In this regard, the Board considered detailed reports providing the results of analyses performed by an independent organization showing, for various periods, the performance of the Fund, the performance of a benchmark index, the percentage ranking of the Fund among its comparison group and the net assets of the Fund. Additionally, the Board reviewed the performance of the Subadviser and Columbia Management’s process for monitoring the Subadviser. The Board considered, in particular, management’s rationale for recommending the continued retention of the Subadviser. The Board observed that for purposes of approving the Advisory Agreements for the Short-Term Period, the Fund’s performance was acceptable.
Comparative Fees, Costs of Services Provided and the Profits Realized By Columbia Management, its Affiliates and the Subadvisers from their Relationships with the Fund
The Board reviewed comparative fees and the costs of services provided under each of the Advisory Agreements. The Board members considered detailed comparative information set forth in an annual report on fees and expenses, including, among other things, data (based on analyses conducted by an independent organization) showing a comparison of the Fund’s expenses with median expenses paid by funds in its comparative peer universe, as well as data showing the Fund’s contribution to Columbia Management’s profitability.
The Board accorded particular weight to the notion that the level of fees should reflect a rational pricing model applied consistently across the various product lines in the Fund family, while assuring that the overall fees for each Fund (with few defined exceptions) are generally in line with the “pricing philosophy” currently in effect (i.e., that the total expense ratio of the Fund is no higher than the median expense ratio of funds in the same comparison universe of the Fund).
Additionally, the Board reviewed the level of subadvisory fees paid to the Subadviser, noting that the fees are paid by the Investment Manager and do not impact the fees paid by the Fund. The Board observed that the subadvisory fee level for the Subadviser was generally comparable to those charged by other subadvisers to similar funds managed by the Investment Manager. The Board also reviewed fee rates charged by the Subadviser to other client accounts.
The Board also considered the expected profitability of Columbia Management and its affiliates in connection with Columbia Management providing investment management services to the Fund. In this regard, the Board referred to a detailed profitability report, discussing the profitability to Columbia Management and Ameriprise Financial from managing, operating and distributing the Funds. The Board noted that the fees paid by the Funds should permit the Investment Manager to offer competitive compensation to its personnel, make necessary investments in its business and earn an appropriate profit. For purposes of approving the Advisory Agreements for the Short-Term Period, the Board concluded that the investment management service and subadvisory fees were fair and reasonable, observing that the profitability levels also seemed reasonable.
| | | | |
| Semiannual Report 2015 | | | 33 | |
| | |
| |
| | COLUMBIA EUROPEAN EQUITY FUND |
APPROVAL OF INVESTMENT MANAGEMENT SERVICES AND
SUBADVISORY AGREEMENTS (continued)
Economies of Scale to be Realized
The Board also considered the economies of scale that might be realized by Columbia Management as the Fund grows and took note of the extent to which Fund shareholders might also benefit from such growth. In this regard, the Board took into account that IMS fees decline as Fund assets exceed various breakpoints.
Based on the foregoing, the Board, including all of the Independent Trustees, concluded that, for purposes of its consideration of the renewal of the Advisory Agreements for the Short-Term Period, fees payable under the Advisory Agreements were fair and reasonable in light of the extent and quality of services provided. In reaching this conclusion, no single factor was determinative. The Board noted its understanding that it would undertake the full consideration of renewal of the Advisory Agreements for the full annual period at its June 2015 meetings. On April 15, 2015, the Board, including all of the Independent Trustees, approved the renewal of the Advisory Agreements for the Short-Term Period.
| | |
| 34 | | Semiannual Report 2015 |
| | |
| |
| COLUMBIA EUROPEAN EQUITY FUND | | |
IMPORTANT INFORMATION ABOUT THIS REPORT
Each fund mails one shareholder report to each shareholder address. If you would like more than one report, please call shareholder services at 800.345.6611 and additional reports will be sent to you.
The policy of the Board is to vote the proxies of the companies in which each fund holds investments consistent with the procedures as stated in the Statement of Additional Information (SAI). You may obtain a copy of the SAI without charge by calling 800.345.6611; contacting your financial intermediary; visiting columbiathreadneedle.com/us; or searching the website of the Securities and Exchange Commission (SEC) at sec.gov. Information regarding how each fund voted proxies relating to portfolio securities is filed with the SEC by August 31st for the most recent 12-month period ending June 30th of that year, and is available without charge by visiting columbiathreadneedle.com/us, or searching the website of the SEC at sec.gov.
Each fund files a complete schedule of portfolio holdings with the SEC for the first and third quarters of each fiscal year on Form N-Q. Each fund’s Form N-Q is available on the SEC’s website at sec.gov and may be reviewed and copied at the SEC’s Public Reference Room in Washington, D.C. Information on the operation of the Public Reference Room may be obtained by calling 800.SEC.0330. Each fund’s complete schedule of portfolio holdings, as filed on Form N-Q, can also be obtained without charge, upon request, by calling 800.345.6611.
| | | | |
| Semiannual Report 2015 | | | 35 | |
Columbia European Equity Fund
P.O. Box 8081
Boston, MA 02266-8081
This information is for use with concurrent or prior delivery of a fund prospectus. Please read and consider the investment objectives, risks, charges and expenses for any fund carefully before investing. For a prospectus and summary prospectus, which contains this and other important information about the Fund, go to columbiathreadneedle.com/us. The Fund is distributed by Columbia Management Investment Distributors, Inc., member FINRA, and managed by Columbia Management Investment Advisers, LLC.
Columbia Threadneedle Investments (Columbia Threadneedle) is the global brand name of the Columbia and Threadneedle group of companies. All rights reserved. Columbia Management Investment Distributors, Inc., 225 Franklin Street, Boston, MA 02110-2804
© 2015 Columbia Management Investment Advisers, LLC.
columbiathreadneedle.com/us
SAR147_10_E01_(06/15)

SEMIANNUAL REPORT
April 30, 2015

COLUMBIA SELECT GLOBAL EQUITY FUND
(formerly Columbia Global Equity Fund)

PRESIDENT’S MESSAGE

Dear Shareholder,
In a world that is changing faster than ever before, investors want asset managers who offer a global perspective while generating strong and sustainable returns. To that end, Columbia Management, in conjunction with its U.K.-based affiliate, Threadneedle Investments, has rebranded to Columbia Threadneedle Investments. The new global brand represents the combined capabilities, resources and reach of the global group, offering investors access to the best of both firms.
With a presence in 18 countries and more than 450 investment professionals*, our collective perspective and world view as Columbia Threadneedle Investments gives us deeper insight into what might affect the real-life financial outcomes clients are seeking. Putting our views into a global context enables us to build richer perspectives and create the right solutions, and provides us with enhanced capabilities to deliver consistent investment performance, which may ultimately lead to better investor outcomes.
As a result of the rebrand, you will begin to see our new logo and colors reflected in printed materials, such as this shareholder report, as well as on our new website — columbiathreadneedle.com/us. We encourage you to visit us online and view a new video on the “About Us” tab that speaks to the strength of the firm.
While we are introducing a new brand, in many ways, the investment company you know well has not changed. The following remain in effect:
| n | | Fund and strategy names |
| n | | Established investment teams, philosophies and processes |
| n | | Account services, features, servicing phone numbers and mailing addresses |
| n | | Columbia Management Investment Distributors as distributor and Columbia Management Investment Advisers as investment adviser |
We recognize that the money we manage represents the hard work and savings of people like you, and that everyone has different ambitions and different definitions of success. Investors have varying goals — funding their children’s education, enjoying their retirement, putting money aside for unexpected events, and more. Whatever your ambitions, we believe our wide range of investment products and solutions can help give you confidence that you will reach your goals.
The world is constantly changing, but our priority remains the same: to help you secure your finances, meet your goals and achieve success. Thank you for your continued investment with us. Our service representatives are available at 800.345.6611 to help with any questions.
Sincerely,

Christopher O. Petersen
President, Columbia Funds
Investors should consider the investment objectives, risks, charges and expenses of a mutual fund carefully before investing. For a free prospectus and summary prospectus, which contains this and other important information about a fund, visit columbiathreadneedle.com/us. The prospectus should be read carefully before investing.
* Source: Ameriprise as of December 1, 2014
Columbia Funds are distributed by Columbia Management Investment Distributors, Inc., member FINRA, and managed by Columbia Management Investment Advisers, LLC.
© 2015 Columbia Management Investment Advisers, LLC. All rights reserved.
Semiannual Report 2015
| | |
| |
| COLUMBIA SELECT GLOBAL EQUITY FUND | | |
TABLE OF CONTENTS
Fund Investment Manager
Columbia Management Investment
Advisers, LLC
225 Franklin Street
Boston, MA 02110
Fund Distributor
Columbia Management Investment
Distributors, Inc.
225 Franklin Street
Boston, MA 02110
Fund Transfer Agent
Columbia Management Investment
Services Corp.
P.O. Box 8081
Boston, MA 02266-8081
For more information about any of the funds, please visit columbiathreadneedle.com/us or call 800.345.6611. Customer Service Representatives are available to answer your questions Monday through Friday from 8 a.m. to 7 p.m. Eastern time.
The views expressed in this report reflect the current views of the respective parties. These views are not guarantees of future performance and involve certain risks, uncertainties and assumptions that are difficult to predict, so actual outcomes and results may differ significantly from the views expressed. These views are subject to change at any time based upon economic, market or other conditions and the respective parties disclaim any responsibility to update such views. These views may not be relied on as investment advice and, because investment decisions for a Columbia fund are based on numerous factors, may not be relied on as an indication of trading intent on behalf of any particular Columbia fund. References to specific securities should not be construed as a recommendation or investment advice.
Semiannual Report 2015
| | |
| |
| | COLUMBIA SELECT GLOBAL EQUITY FUND |
PERFORMANCE OVERVIEW
(Unaudited)
Performance Summary
| n | | Columbia Select Global Equity Fund (the Fund) Class A shares returned 1.79% excluding sales charges for the six-month period that ended April 30, 2015. |
| n | | The Fund underperformed its benchmark, the MSCI ACWI (Net), which returned 4.97% for the same six months. |
| n | | Effective January 15, 2015, the Fund’s principal investment strategy was revised to employ a more focused investing style, which will result in a more concentrated portfolio of 30-50 stocks. The Fund was renamed to reflect its new investment strategy. |
| | | | | | | | | | | | | | | | | | |
Average Annual Total Returns (%) (for period ended April 30, 2015) | |
| | | Inception | | 6 Months
Cumulative | | | 1 Year | | | 5 Years | | | 10 Years | |
Class A | | 05/29/90 | | | | | | | | | | | | | | | | |
Excluding sales charges | | | | | 1.79 | | | | 4.34 | | | | 8.73 | | | | 6.74 | |
Including sales charges | | | | | -4.08 | | | | -1.63 | | | | 7.45 | | | | 6.12 | |
Class B | | 03/20/95 | | | | | | | | | | | | | | | | |
Excluding sales charges | | | | | 1.43 | | | | 3.72 | | | | 7.92 | | | | 5.93 | |
Including sales charges | | | | | -3.57 | | | | -1.28 | | | | 7.62 | | | | 5.93 | |
Class C | | 06/26/00 | | | | | | | | | | | | | | | | |
Excluding sales charges | | | | | 1.45 | | | | 3.66 | | | | 7.94 | | | | 5.93 | |
Including sales charges | | | | | 0.45 | | | | 2.66 | | | | 7.94 | | | | 5.93 | |
Class I* | | 08/01/08 | | | 2.04 | | | | 4.90 | | | | 9.26 | | | | 7.10 | |
Class K | | 03/20/95 | | | 1.87 | | | | 4.61 | | | | 8.95 | | | | 6.92 | |
Class R* | | 12/11/06 | | | 1.63 | | | | 4.18 | | | | 8.48 | | | | 6.56 | |
Class R5* | | 12/11/06 | | | 2.02 | | | | 4.88 | | | | 9.23 | | | | 7.14 | |
Class W* | | 12/01/06 | | | 1.76 | | | | 4.41 | | | | 8.75 | | | | 6.75 | |
Class Z* | | 09/27/10 | | | 1.91 | | | | 4.67 | | | | 8.97 | | | | 6.86 | |
MSCI ACWI (Net) | | | | | 4.97 | | | | 7.46 | | | | 9.58 | | | | 6.98 | |
Returns for Class A are shown with and without the maximum initial sales charge of 5.75%. Returns for Class B are shown with and without the applicable contingent deferred sales charge (CDSC) of 5.00% in the first year, declining to 1.00% in the sixth year and eliminated thereafter. The Fund’s other classes are not subject to sales charges and have limited eligibility. Please see the Fund’s prospectus for details. Performance for different share classes will vary based on differences in sales charges and fees associated with each class. All results shown assume reinvestment of distributions during the period. Returns do not reflect the deduction of taxes that a shareholder may pay on Fund distributions or on the redemption of Fund shares. Performance results reflect the effect of any fee waivers or reimbursements of Fund expenses by Columbia Management Investment Advisers, LLC and/or any of its affiliates. Absent these fee waivers or expense reimbursement arrangements, performance results would have been lower.
The performance information shown represents past performance and is not a guarantee of future results. The investment return and principal value of your investment will fluctuate so that your shares, when redeemed, may be worth more or less than their original cost. Current performance may be lower or higher than the performance information shown. You may obtain performance information current to the most recent month-end by contacting your financial intermediary, visiting columbiathreadneedle.com/us or calling 800.345.6611.
| * | The returns shown for periods prior to the share class inception date (including returns for the Life of the Fund, if shown, which are since Fund inception) include the returns of the Fund’s oldest share class. These returns are adjusted to reflect any higher class-related operating expenses of the newer share classes, as applicable. Please visit columbiathreadneedle.com/us/investment-products/mutual-funds/appended-performance for more information. |
The MSCI ACWI (Net) is a free float-adjusted market capitalization weighted index that is designed to measure the equity market performance of developed and emerging markets. The index consists of 45 country indices comprising 24 developed and 21 emerging market country indices.
Indices are not available for investment, are not professionally managed and do not reflect sales charges, fees, brokerage commissions, taxes (except the MSCI ACWI (Net), which reflects reinvested dividends net of withholding taxes) or other expenses of investing. Securities in the Fund may not match those in an index.
| | |
| |
| COLUMBIA SELECT GLOBAL EQUITY FUND | | |
PORTFOLIO OVERVIEW
(Unaudited)
| | | | |
Top Ten Holdings (%)
(at April 30, 2015) | |
MasterCard, Inc., Class A (United States) | | | 5.2 | |
AIA Group Ltd. (Hong Kong) | | | 5.0 | |
Walt Disney Co. (The) (United States) | | | 4.2 | |
Thermo Fisher Scientific, Inc. (United States) | | | 4.0 | |
CSL Ltd. (Australia) | | | 3.8 | |
Sirona Dental Systems, Inc. (United States) | | | 3.2 | |
American Express Co. (United States) | | | 3.1 | |
Union Pacific Corp. (United States) | | | 2.8 | |
Novo Nordisk A/S, Class B (Denmark) | | | 2.7 | |
Nike, Inc., Class B (United States) | | | 2.6 | |
Percentages indicated are based upon total investments (excluding Money Market Funds).
For further detail about these holdings, please refer to the section entitled “Portfolio of Investments.”
Fund holdings are as of the date given, are subject to change at any time, and are not recommendations to buy or sell any security.
| | | | |
Portfolio Breakdown (%)
(at April 30, 2015) | |
Common Stocks | | | 98.9 | |
Consumer Discretionary | | | 17.1 | |
Consumer Staples | | | 15.8 | |
Financials | | | 17.6 | |
Health Care | | | 24.5 | |
Industrials | | | 6.8 | |
Information Technology | | | 12.0 | |
Materials | | | 5.1 | |
Money Market Funds | | | 1.1 | |
Total | | | 100.0 | |
Percentages indicated are based upon total investments. The Fund’s portfolio composition is subject to change.
Portfolio Management
Threadneedle International Limited
Daniel Dudding, CFA*
Pauline Grange
| * | Effective, January 15, 2015, Mr. Dudding was named a Portfolio Manager of the Fund. Neil Robson no longer serves as a Portfolio Manager of the Fund. |
Morningstar Style Box™
The Morningstar Style Box™ is based on a fund’s portfolio holdings. For equity funds, the vertical axis shows the market capitalization of the stocks owned, and the horizontal axis shows investment style (value, blend, or growth). Information shown is based on the most recent data provided by Morningstar.
© 2015 Morningstar, Inc. All rights reserved. The Morningstar information contained herein: (1) is proprietary to Morningstar and/or its content providers; (2) may not be copied or distributed; and (3) is not warranted to be accurate, complete or timely. Neither Morningstar nor its content providers are responsible for any damages or losses arising from any use of this information.
| | |
| |
| | COLUMBIA SELECT GLOBAL EQUITY FUND |
PORTFOLIO OVERVIEW (continued)
(Unaudited)
| | | | |
Country Breakdown (%)
(at April 30, 2015) | |
Australia | | | 3.8 | |
Belgium | | | 2.0 | |
China | | | 1.0 | |
Denmark | | | 2.6 | |
France | | | 2.0 | |
Germany | | | 5.8 | |
Hong Kong | | | 4.9 | |
India | | | 2.0 | |
Indonesia | | | 1.8 | |
Ireland | | | 1.9 | |
Japan | | | 2.0 | |
Singapore | | | 1.9 | |
South Africa | | | 2.0 | |
Sweden | | | 1.9 | |
United Kingdom | | | 7.0 | |
United States(a) | | | 57.4 | |
Total | | | 100.0 | |
Country Breakdown is based primarily on issuer’s place of organization/incorporation. The Fund may use this and/or other criteria, for purposes of its investment policies, in determining whether an issuer is domestic (U.S.) or foreign. Percentages indicated are based upon total investments. The Fund’s portfolio composition is subject to change.
| (a) | Includes investments in Money Market Funds. |
| | |
| |
| COLUMBIA SELECT GLOBAL EQUITY FUND | | |
UNDERSTANDING YOUR FUND’S EXPENSES
(Unaudited)
As an investor, you incur two types of costs. There are transaction costs, which generally include sales charges on purchases and may include redemption fees. There are also ongoing costs, which generally include management fees, distribution and/or service fees, and other fund expenses. The following information is intended to help you understand your ongoing costs (in dollars) of investing in the Fund and to help you compare these costs with the ongoing costs of investing in other mutual funds.
Analyzing Your Fund’s Expenses
To illustrate these ongoing costs, we have provided examples and calculated the expenses paid by investors in each share class of the Fund during the period. The actual and hypothetical information in the table is based on an initial investment of $1,000 at the beginning of the period indicated and held for the entire period. Expense information is calculated two ways and each method provides you with different information. The amount listed in the “Actual” column is calculated using the Fund’s actual operating expenses and total return for the period. You may use the Actual information, together with the amount invested, to estimate the expenses that you paid over the period. Simply divide your account value by $1,000 (for example, an $8,600 account value divided by $1,000 = 8.6), then multiply the results by the expenses paid during the period under the “Actual” column. The amount listed in the “Hypothetical” column assumes a 5% annual rate of return before expenses (which is not the Fund’s actual return) and then applies the Fund’s actual expense ratio for the period to the hypothetical return. You should not use the hypothetical account values and expenses to estimate either your actual account balance at the end of the period or the expenses you paid during the period. See “Compare With Other Funds” below for details on how to use the hypothetical data.
Compare With Other Funds
Since all mutual funds are required to include the same hypothetical calculations about expenses in shareholder reports, you can use this information to compare the ongoing cost of investing in the Fund with other funds. To do so, compare the hypothetical example with the 5% hypothetical examples that appear in the shareholder reports of other funds. As you compare hypothetical examples of other funds, it is important to note that hypothetical examples are meant to highlight the ongoing costs of investing in a fund only and do not reflect any transaction costs, such as sales charges, or redemption or exchange fees. Therefore, the hypothetical calculations are useful in comparing ongoing costs only, and will not help you determine the relative total costs of owning different funds. If transaction costs were included in these calculations, your costs would be higher.
November 1, 2014 – April 30, 2015
| | | | | | | | | | | | | | | | | | | | | | | | | | | | |
| | | Account Value at the
Beginning of the
Period ($) | | | Account Value at the
End of the
Period ($) | | | Expenses Paid During
the Period ($) | | | Fund’s Annualized
Expense Ratio (%) | |
| | | | Actual | | | | Hypothetical | | | | Actual | | | | Hypothetical | | | | Actual | | | | Hypothetical | | | | Actual | |
Class A | | | 1,000.00 | | | | 1,000.00 | | | | 1,017.90 | | | | 1,017.70 | | | | 7.15 | | | | 7.15 | | | | 1.43 | |
Class B | | | 1,000.00 | | | | 1,000.00 | | | | 1,014.30 | | | | 1,013.98 | | | | 10.89 | | | | 10.89 | | | | 2.18 | |
Class C | | | 1,000.00 | | | | 1,000.00 | | | | 1,014.50 | | | | 1,013.98 | | | | 10.89 | | | | 10.89 | | | | 2.18 | |
Class I | | | 1,000.00 | | | | 1,000.00 | | | | 1,020.40 | | | | 1,019.79 | | | | 5.06 | | | | 5.06 | | | | 1.01 | |
Class K | | | 1,000.00 | | | | 1,000.00 | | | | 1,018.70 | | | | 1,018.55 | | | | 6.31 | | | | 6.31 | | | | 1.26 | |
Class R | | | 1,000.00 | | | | 1,000.00 | | | | 1,016.30 | | | | 1,016.46 | | | | 8.40 | | | | 8.40 | | | | 1.68 | |
Class R5 | | | 1,000.00 | | | | 1,000.00 | | | | 1,020.20 | | | | 1,019.74 | | | | 5.11 | | | | 5.11 | | | | 1.02 | |
Class W | | | 1,000.00 | | | | 1,000.00 | | | | 1,017.60 | | | | 1,017.70 | | | | 7.15 | | | | 7.15 | | | | 1.43 | |
Class Z | | | 1,000.00 | | | | 1,000.00 | | | | 1,019.10 | | | | 1,018.94 | | | | 5.91 | | | | 5.91 | | | | 1.18 | |
Expenses paid during the period are equal to the annualized expense ratio for each class as indicated above, multiplied by the average account value over the period and then multiplied by the number of days in the Fund’s most recent fiscal half year and divided by 365.
Expenses do not include fees and expenses incurred indirectly by the Fund from its investment in underlying funds, including affiliated and non-affiliated pooled investment vehicles, such as mutual funds and exchange-traded funds.
| | |
| |
| | COLUMBIA SELECT GLOBAL EQUITY FUND |
PORTFOLIO OF INVESTMENTS
April 30, 2015 (Unaudited)
(Percentages represent value of investments compared to net assets)
| | | | | | | | |
| Common Stocks 98.8% | |
| Issuer | | Shares | | | Value ($) | |
AUSTRALIA 3.8% | |
CSL Ltd. | | | 196,386 | | | | 14,077,601 | |
|
| |
BELGIUM 2.0% | |
Anheuser-Busch InBev NV | | | 59,844 | | | | 7,285,908 | |
|
| |
CHINA 1.0% | |
Baidu, Inc., ADR(a) | | | 17,643 | | | | 3,533,540 | |
|
| |
DENMARK 2.6% | |
Novo Nordisk A/S, Class B | | | 171,763 | | | | 9,782,407 | |
|
| |
FRANCE 2.0% | |
L’Oreal SA | | | 39,290 | | | | 7,498,138 | |
|
| |
GERMANY 5.8% | |
Bayer AG, Registered Shares | | | 48,964 | | | | 7,047,516 | |
| | |
Brenntag AG | | | 120,907 | | | | 7,254,501 | |
| | |
Continental AG | | | 30,903 | | | | 7,242,266 | |
| | |
Total | | | | | | | 21,544,283 | |
|
| |
HONG KONG 4.9% | |
AIA Group Ltd. | | | 2,736,400 | | | | 18,198,374 | |
|
| |
INDIA 2.0% | |
HDFC Bank Ltd., ADR | | | 129,984 | | | | 7,388,291 | |
|
| |
INDONESIA 1.8% | |
PT Bank Rakyat Indonesia Persero Tbk | | | 7,350,300 | | | | 6,562,348 | |
|
| |
IRELAND 1.9% | |
Medtronic PLC | | | 96,222 | | | | 7,163,728 | |
|
| |
JAPAN 2.0% | |
Keyence Corp. | | | 13,700 | | | | 7,313,733 | |
|
| |
SINGAPORE 1.9% | |
DBS Group Holdings Ltd. | | | 453,000 | | | | 7,198,342 | |
|
| |
SOUTH AFRICA 2.0% | |
Naspers Ltd., Class N | | | 46,364 | | | | 7,292,082 | |
|
| |
SWEDEN 1.9% | |
Svenska Handelsbanken AB, Class A | | | 150,885 | | | | 6,964,696 | |
|
| |
UNITED KINGDOM 7.0% | |
Diageo PLC | | | 264,736 | | | | 7,349,698 | |
| | |
Reckitt Benckiser Group PLC | | | 83,923 | | | | 7,469,518 | |
| | |
Rolls-Royce Holdings PLC | | | 249,871 | | | | 3,983,669 | |
| | | | | | | | |
| Common Stocks (continued) | |
| Issuer | | Shares | | | Value ($) | |
Rolls-Royce Holdings PLC(a)(b) | | | 35,231,811 | | | | 54,081 | |
| | |
Unilever PLC | | | 166,391 | | | | 7,293,664 | |
| | |
Total | | | | | | | 26,150,630 | |
|
| |
UNITED STATES 56.2% | |
American Express Co. | | | 146,742 | | | | 11,365,168 | |
| | |
Apple, Inc. | | | 58,854 | | | | 7,365,578 | |
| | |
Celgene Corp.(a) | | | 41,710 | | | | 4,507,183 | |
| | |
Colgate-Palmolive Co. | | | 107,771 | | | | 7,250,833 | |
| | |
Comcast Corp., Class A | | | 156,628 | | | | 9,046,833 | |
| | |
Estee Lauder Companies, Inc. (The), Class A | | | 89,871 | | | | 7,305,614 | |
| | |
Express Scripts Holding Co.(a) | | | 87,888 | | | | 7,593,523 | |
| | |
Gilead Sciences, Inc.(a) | | | 36,788 | | | | 3,697,562 | |
| | |
Google, Inc., Class A(a) | | | 13,261 | | | | 7,277,239 | |
| | |
Graco, Inc. | | | 50,606 | | | | 3,624,402 | |
| | |
MasterCard, Inc., Class A | | | 212,753 | | | | 19,192,448 | |
| | |
Mead Johnson Nutrition Co. | | | 74,965 | | | | 7,190,643 | |
| | |
Mettler-Toledo International, Inc.(a) | | | 22,674 | | | | 7,187,885 | |
| | |
Monsanto Co. | | | 23,101 | | | | 2,632,590 | |
| | |
Nike, Inc., Class B | | | 96,161 | | | | 9,504,553 | |
| | |
PPG Industries, Inc. | | | 38,231 | | | | 8,470,460 | |
| | |
Praxair, Inc. | | | 62,394 | | | | 7,607,700 | |
| | |
Priceline Group, Inc. (The)(a) | | | 6,156 | | | | 7,619,958 | |
| | |
Sirona Dental Systems, Inc.(a) | | | 125,553 | | | | 11,645,041 | |
| | |
Thermo Fisher Scientific, Inc. | | | 116,142 | | | | 14,596,727 | |
| | |
TJX Companies, Inc. (The) | | | 111,341 | | | | 7,185,948 | |
| | |
Union Pacific Corp. | | | 97,452 | | | | 10,352,326 | |
| | |
Vertex Pharmaceuticals, Inc.(a) | | | 29,046 | | | | 3,580,791 | |
| | |
Walt Disney Co. (The) | | | 143,117 | | | | 15,559,680 | |
| | |
Wells Fargo & Co. | | | 138,265 | | | | 7,618,401 | |
| | |
Total | | | | | | | 208,979,086 | |
| | | | | | | | | |
Total Common Stocks
(Cost: $341,285,300) | | | | | | | 366,933,187 | |
| | |
| | | | | | | | |
| Money Market Funds 1.1% | | | | | | | | |
| | | Shares | | | Value ($) | |
| | |
Columbia Short-Term Cash Fund, 0.111%(c)(d) | | | 4,205,711 | | | | 4,205,711 | |
| | | | | | | | | |
Total Money Market Funds | |
(Cost: $4,205,711) | | | | 4,205,711 | |
| | | | | | | | | |
Total Investments | | | | | | | | |
(Cost: $345,491,011) | | | | 371,138,898 | |
| | | | | | | | | |
Other Assets & Liabilities, Net | | | | 431,680 | |
| | | | | | | | | |
Net Assets | | | | | | | 371,570,578 | |
| | | | | | | | | |
The accompanying Notes to Financial Statements are an integral part of this statement.
| | |
| |
| COLUMBIA SELECT GLOBAL EQUITY FUND | | |
PORTFOLIO OF INVESTMENTS (continued)
April 30, 2015 (Unaudited)
Notes to Portfolio of Investments
| (b) | Represents fair value as determined in good faith under procedures approved by the Board of Trustees. At April 30, 2015, the value of these securities amounted to $54,081, which represents 0.01% of net assets. |
| (c) | The rate shown is the seven-day current annualized yield at April 30, 2015. |
| (d) | As defined in the Investment Company Act of 1940, an affiliated company is one in which the Fund owns 5% or more of the company’s outstanding voting securities, or a company which is under common ownership or control with the Fund. Holdings and transactions in these affiliated companies during the period ended April 30, 2015, are as follows: |
| | | | | | | | | | | | | | | | | | | | | | | | |
| Issuer | | Beginning
Cost ($) | | | Purchase
Cost ($) | | | Proceeds
From Sales ($) | | | Ending
Cost ($) | | | Dividends —
Affiliated
Issuers ($) | | | Value ($) | |
Columbia Short-Term Cash Fund | | | 15,322,940 | | | | 89,898,946 | | | | (101,016,175 | ) | | | 4,205,711 | | | | 3,555 | | | | 4,205,711 | |
Abbreviation Legend
| | |
| ADR | | American Depositary Receipt |
Fair Value Measurements
Generally accepted accounting principles (GAAP) require disclosure regarding the inputs and valuation techniques used to measure fair value and any changes in valuation inputs or techniques. In addition, investments shall be disclosed by major category.
The Fund categorizes its fair value measurements according to a three-level hierarchy that maximizes the use of observable inputs and minimizes the use of unobservable inputs by prioritizing that the most observable input be used when available. Observable inputs are those that market participants would use in pricing an investment based on market data obtained from sources independent of the reporting entity. Unobservable inputs are those that reflect the Fund’s assumptions about the information market participants would use in pricing an investment. An investment’s level within the fair value hierarchy is based on the lowest level of any input that is deemed significant to the asset or liability’s fair value measurement. The input levels are not necessarily an indication of the risk or liquidity associated with investments at that level. For example, certain U.S. government securities are generally high quality and liquid, however, they are reflected as Level 2 because the inputs used to determine fair value may not always be quoted prices in an active market.
Fair value inputs are summarized in the three broad levels listed below:
| n | | Level 1 — Valuations based on quoted prices for investments in active markets that the Fund has the ability to access at the measurement date (including NAV for open-end mutual funds). Valuation adjustments are not applied to Level 1 investments. |
| n | | Level 2 — Valuations based on other significant observable inputs (including quoted prices for similar securities, interest rates, prepayment speeds, credit risks, etc.). |
| n | | Level 3 — Valuations based on significant unobservable inputs (including the Fund’s own assumptions and judgment in determining the fair value of investments). |
Inputs that are used in determining fair value of an investment may include price information, credit data, volatility statistics, and other factors. These inputs can be either observable or unobservable. The availability of observable inputs can vary between investments, and is affected by various factors such as the type of investment, and the volume and level of activity for that investment or similar investments in the marketplace. The inputs will be considered by the Investment Manager, along with any other relevant factors in the calculation of an investment’s fair value. The Fund uses prices and inputs that are current as of the measurement date, which may include periods of market dislocations. During these periods, the availability of prices and inputs may be reduced for many investments. This condition could cause an investment to be reclassified between the various levels within the hierarchy.
Foreign equity securities actively traded in markets where there is a significant delay in the local close relative to the New York Stock Exchange (NYSE) are classified as Level 2. The values of these securities may include an adjustment to reflect the impact of significant market movements following the close of local trading, as described in Note 2 to the financial statements — Security Valuation.
Investments falling into the Level 3 category are primarily supported by quoted prices from brokers and dealers participating in the market for those investments. However, these may be classified as Level 3 investments due to lack of market transparency and corroboration to support these quoted prices. Additionally, valuation models may be used as the pricing source for any remaining investments classified as Level 3. These models may rely on one or more significant unobservable inputs and/or significant assumptions by the Investment Manager. Inputs used in valuations may include, but are not limited to, financial statement analysis, capital account balances, discount rates and estimated cash flows, and comparable company data.
Under the direction of the Fund’s Board of Trustees (the Board), the Investment Manager’s Valuation Committee (the Committee) is responsible for overseeing the valuation procedures approved by the Board. The Committee consists of voting and non-voting members from various groups within the Investment Manager’s organization, including operations and accounting, trading and investments, compliance, risk management and legal.
The Committee meets at least monthly to review and approve valuation matters, which may include a description of specific valuation determinations, data regarding pricing information received from approved pricing vendors and brokers and the results of Board-approved valuation control policies and procedures (the Policies). The Policies address, among other things, instances when market quotations are or are not readily available, including recommendations of third party pricing vendors and a determination of appropriate pricing methodologies; events that require specific valuation determinations and assessment of fair value techniques; securities with a potential for stale pricing, including those that are illiquid, restricted, or in default; and the effectiveness of third party pricing vendors, including periodic reviews of vendors. The Committee meets more frequently, as needed, to discuss additional valuation matters, which may include the need to review back-testing results, review time-sensitive
The accompanying Notes to Financial Statements are an integral part of this statement.
| | |
| |
| | COLUMBIA SELECT GLOBAL EQUITY FUND |
PORTFOLIO OF INVESTMENTS (continued)
April 30, 2015 (Unaudited)
Fair Value Measurements (continued)
information or approve related valuation actions. The Committee reports to the Board, with members of the Committee meeting with the Board at each of its regularly scheduled meetings to discuss valuation matters and actions during the period, similar to those described earlier.
For investments categorized as Level 3, the Committee monitors information similar to that described above, which may include: (i) data specific to the issuer or comparable issuers, (ii) general market or specific sector news and (iii) quoted prices and specific or similar security transactions. The Committee considers this data and any changes from prior periods in order to assess the reasonableness of observable and unobservable inputs, any assumptions or internal models used to value those securities and changes in fair value. This data is also used to corroborate, when available, information received from approved pricing vendors and brokers. Various factors impact the frequency of monitoring this information (which may occur as often as daily). However, the Committee may determine that changes to inputs, assumptions and models are not required as a result of the monitoring procedures performed.
The following table is a summary of the inputs used to value the Fund’s investments at April 30, 2015:
| | | | | | | | | | | | | | | | |
| Description | | Level 1
Quoted Prices in Active
Markets for Identical
Assets ($) | | | Level 2
Other Significant
Observable Inputs ($) | | | Level 3
Significant
Unobservable Inputs ($) | | | Total ($) | |
Equity Securities | | | | | | | | | | | | | | | | |
| | | | |
Common Stocks | | | | | | | | | | | | | | | | |
| | | | |
Consumer Discretionary | | | 48,916,973 | | | | 14,534,349 | | | | — | | | | 63,451,322 | |
| | | | |
Consumer Staples | | | 21,747,089 | | | | 36,896,926 | | | | — | | | | 58,644,015 | |
| | | | |
Financials | | | 26,371,860 | | | | 38,923,760 | | | | — | | | | 65,295,620 | |
| | | | |
Health Care | | | 59,972,439 | | | | 30,907,524 | | | | — | | | | 90,879,963 | |
| | | | |
Industrials | | | 13,976,728 | | | | 11,238,170 | | | | 54,081 | | | | 25,268,979 | |
| | | | |
Information Technology | | | 37,368,805 | | | | 7,313,733 | | | | — | | | | 44,682,538 | |
| | | | |
Materials | | | 18,710,750 | | | | — | | | | — | | | | 18,710,750 | |
| | | | | | | | | | | | | | | | | |
Total Equity Securities | | | 227,064,644 | | | | 139,814,462 | | | | 54,081 | | | | 366,933,187 | |
| | | | | | | | | | | | | | | | | |
Mutual Funds | | | | | | | | | | | | | | | | |
| | | | |
Money Market Funds | | | 4,205,711 | | | | — | | | | — | | | | 4,205,711 | |
| | | | | | | | | | | | | | | | | |
Total Mutual Funds | | | 4,205,711 | | | | — | | | | — | | | | 4,205,711 | |
| | | | | | | | | | | | | | | | | |
Total | | | 231,270,355 | | | | 139,814,462 | | | | 54,081 | | | | 371,138,898 | |
| | | | | | | | | | | | | | | | | |
See the Portfolio of Investments for all investment classifications not indicated in the table.
The Fund’s assets assigned to the Level 2 input category are generally valued using the market approach, in which a security’s value is determined through reference to prices and information from market transactions for similar or identical assets. These assets include certain foreign securities for which a third party statistical pricing service may be employed for purposes of fair market valuation. The model utilized by such third party statistical pricing service takes into account a security’s correlation to available market data including, but not limited to, intraday index, ADR, and ETF movements.
There were no transfers of financial assets between levels during the period.
The Fund does not hold any significant investments (greater than one percent of net assets) categorized as Level 3.
The Fund’s assets assigned to the Level 3 category are valued utilizing the valuation technique deemed the most appropriate in the circumstances. Certain common stocks classified as Level 3 are valued using an income approach. To determine fair value for these securities, management considered estimates of future distributions from the company. Significant increases (decreases) to any of these inputs would result in a significantly lower (higher) fair value measurement.
The accompanying Notes to Financial Statements are an integral part of this statement.
| | |
| |
| COLUMBIA SELECT GLOBAL EQUITY FUND | | |
STATEMENT OF ASSETS AND LIABILITIES
April 30, 2015 (Unaudited)
| | | | |
Assets | |
| |
Investments, at value | | | | |
| |
Unaffiliated issuers (identified cost $341,285,300) | | | $366,933,187 | |
| |
Affiliated issuers (identified cost $4,205,711) | | | 4,205,711 | |
| |
Total investments (identified cost $345,491,011) | | | 371,138,898 | |
| |
Foreign currency (identified cost $141,471) | | | 138,382 | |
| |
Receivable for: | | | | |
| |
Capital shares sold | | | 67,157 | |
| |
Dividends | | | 405,932 | |
| |
Reclaims | | | 267,105 | |
| |
Prepaid expenses | | | 868 | |
| |
Trustees’ deferred compensation plan | | | 24,040 | |
| |
Other assets | | | 27,994 | |
| |
Total assets | | | 372,070,376 | |
| |
| |
Liabilities | | | | |
| |
Payable for: | | | | |
| |
Capital shares purchased | | | 277,570 | |
| |
Investment management fees | | | 8,127 | |
| |
Distribution and/or service fees | | | 2,929 | |
| |
Transfer agent fees | | | 37,450 | |
| |
Administration fees | | | 821 | |
| |
Plan administration fees | | | 45 | |
| |
Compensation of board members | | | 103,186 | |
| |
Other expenses | | | 45,630 | |
| |
Trustees’ deferred compensation plan | | | 24,040 | |
| |
Total liabilities | | | 499,798 | |
| |
Net assets applicable to outstanding capital stock | | | $371,570,578 | |
| |
| |
Represented by | | | | |
| |
Paid-in capital | | | $381,826,351 | |
| |
Excess of distributions over net investment income | | | (491,095 | ) |
| |
Accumulated net realized loss | | | (35,398,526 | ) |
| |
Unrealized appreciation (depreciation) on: | | | | |
| |
Investments | | | 25,647,887 | |
| |
Foreign currency translations | | | (14,039 | ) |
| |
Total — representing net assets applicable to outstanding capital stock | | | $371,570,578 | |
| |
The accompanying Notes to Financial Statements are an integral part of this statement.
| | |
| |
| | COLUMBIA SELECT GLOBAL EQUITY FUND |
STATEMENT OF ASSETS AND LIABILITIES (continued)
April 30, 2015 (Unaudited)
| | | | |
Class A | | | | |
| |
Net assets | | | $341,584,442 | |
| |
Shares outstanding | | | 34,323,167 | |
| |
Net asset value per share | | | $9.95 | |
| |
Maximum offering price per share(a) | | | $10.56 | |
| |
Class B | | | | |
| |
Net assets | | | $4,485,579 | |
| |
Shares outstanding | | | 488,332 | |
| |
Net asset value per share | | | $9.19 | |
| |
Class C | | | | |
| |
Net assets | | | $16,050,861 | |
| |
Shares outstanding | | | 1,769,330 | |
| |
Net asset value per share | | | $9.07 | |
| |
Class I | | | | |
| |
Net assets | | | $2,560 | |
| |
Shares outstanding | | | 255 | |
| |
Net asset value per share(b) | | | $10.03 | |
| |
Class K | | | | |
| |
Net assets | | | $6,528,767 | |
| |
Shares outstanding | | | 650,203 | |
| |
Net asset value per share | | | $10.04 | |
| |
Class R | | | | |
| |
Net assets | | | $141,407 | |
| |
Shares outstanding | | | 14,142 | |
| |
Net asset value per share | | | $10.00 | |
| |
Class R5 | | | | |
| |
Net assets | | | $148,039 | |
| |
Shares outstanding | | | 14,763 | |
| |
Net asset value per share | | | $10.03 | |
| |
Class W | | | | |
| |
Net assets | | | $2,573 | |
| |
Shares outstanding | | | 257 | |
| |
Net asset value per share | | | $10.01 | |
| |
Class Z | | | | |
| |
Net assets | | | $2,626,350 | |
| |
Shares outstanding | | | 262,257 | |
| |
Net asset value per share | | | $10.01 | |
| |
| (a) | The maximum offering price per share is calculated by dividing the net asset value per share by 1.0 minus the maximum sales charge of 5.75%. |
| (b) | Net asset value per share rounds to this amount due to fractional shares outstanding. |
The accompanying Notes to Financial Statements are an integral part of this statement.
| | |
| 10 | | Semiannual Report 2015 |
| | |
| |
| COLUMBIA SELECT GLOBAL EQUITY FUND | | |
STATEMENT OF OPERATIONS
Six Months Ended April 30, 2015 (Unaudited)
| | | | |
Net investment income | | | | |
| |
Income: | | | | |
| |
Dividends — unaffiliated issuers | | | $2,591,153 | |
| |
Dividends — affiliated issuers | | | 3,555 | |
| |
Interest | | | 547 | |
| |
Foreign taxes withheld | | | (165,932 | ) |
| |
Total income | | | 2,429,323 | |
| |
| |
Expenses: | | | | |
| |
Investment management fees | | | 1,483,355 | |
| |
Distribution and/or service fees | | | | |
| |
Class A | | | 429,746 | |
| |
Class B | | | 25,695 | |
| |
Class C | | | 80,768 | |
| |
Class R | | | 326 | |
| |
Class W | | | 3 | |
| |
Transfer agent fees | | | | |
| |
Class A | | | 379,861 | |
| |
Class B | | | 5,677 | |
| |
Class C | | | 17,847 | |
| |
Class K | | | 1,647 | |
| |
Class R | | | 144 | |
| |
Class R5 | | | 25 | |
| |
Class W | | | 3 | |
| |
Class Z | | | 3,193 | |
| |
Administration fees | | | 149,921 | |
| |
Plan administration fees | | | | |
| |
Class K | | | 8,234 | |
| |
Compensation of board members | | | 12,263 | |
| |
Custodian fees | | | 15,976 | |
| |
Printing and postage fees | | | 50,682 | |
| |
Registration fees | | | 52,587 | |
| |
Professional fees | | | 19,421 | |
| |
Other | | | 7,550 | |
| |
Total expenses | | | 2,744,924 | |
| |
Net investment loss | | | (315,601 | ) |
| |
| |
Realized and unrealized gain (loss) — net | | | | |
| |
Net realized gain (loss) on: | | | | |
| |
Investments | | | 27,332,947 | |
| |
Foreign currency translations | | | (510,011 | ) |
| |
Net realized gain | | | 26,822,936 | |
| |
Net change in unrealized appreciation (depreciation) on: | | | | |
| |
Investments | | | (19,989,786 | ) |
| |
Foreign currency translations | | | 16,121 | |
| |
Net change in unrealized depreciation | | | (19,973,665 | ) |
| |
Net realized and unrealized gain | | | 6,849,271 | |
| |
Net increase in net assets resulting from operations | | | $6,533,670 | |
| |
The accompanying Notes to Financial Statements are an integral part of this statement.
| | | | |
| Semiannual Report 2015 | | | 11 | |
| | |
| |
| | COLUMBIA SELECT GLOBAL EQUITY FUND |
STATEMENT OF CHANGES IN NET ASSETS
| | | | | | | | |
| | | Six Months Ended
April 30, 2015
(Unaudited) | | | Year Ended
October 31, 2014 | |
Operations | | | | | | | | |
| | |
Net investment income (loss) | | | $(315,601 | ) | | | $1,378,552 | |
| | |
Net realized gain | | | 26,822,936 | | | | 60,843,113 | |
| | |
Net change in unrealized depreciation | | | (19,973,665 | ) | | | (34,123,575 | ) |
| |
Net increase in net assets resulting from operations | | | 6,533,670 | | | | 28,098,090 | |
| |
| | |
Distributions to shareholders | | | | | | | | |
| | |
Net investment income | | | | | | | | |
| | |
Class A | | | (885,283 | ) | | | (1,302,262 | ) |
| | |
Class I | | | (18 | ) | | | (28 | ) |
| | |
Class K | | | (30,153 | ) | | | (36,839 | ) |
| | |
Class R | | | (10 | ) | | | (195 | ) |
| | |
Class R5 | | | (17 | ) | | | (26 | ) |
| | |
Class W | | | (6 | ) | | | (12 | ) |
| | |
Class Z | | | (15,980 | ) | | | (15,775 | ) |
| |
Total distributions to shareholders | | | (931,467 | ) | | | (1,355,137 | ) |
| |
Decrease in net assets from capital stock activity | | | (21,999,850 | ) | | | (34,863,041 | ) |
| |
Total decrease in net assets | | | (16,397,647 | ) | | | (8,120,088 | ) |
| | |
Net assets at beginning of period | | | 387,968,225 | | | | 396,088,313 | |
| |
Net assets at end of period | | | $371,570,578 | | | | $387,968,225 | |
| |
Undistributed (excess of distributions over) net investment income | | | $(491,095 | ) | | | $755,973 | |
| |
The accompanying Notes to Financial Statements are an integral part of this statement.
| | |
| 12 | | Semiannual Report 2015 |
| | |
| |
| COLUMBIA SELECT GLOBAL EQUITY FUND | | |
STATEMENT OF CHANGES IN NET ASSETS (continued)
| | | | | | | | | | | | | | | | |
| | | Six Months Ended
April 30, 2015 (Unaudited) | | | Year Ended
October 31, 2014 | |
| | | Shares | | | Dollars ($) | | | Shares | | | Dollars ($) | |
Capital stock activity | | | | | | | | | | | | | | | | |
| | | | |
Class A shares | | | | | | | | | | | | | | | | |
| | | | |
Subscriptions(a) | | | 682,354 | | | | 6,698,328 | | | | 1,840,813 | | | | 17,640,728 | |
| | | | |
Distributions reinvested | | | 87,904 | | | | 859,700 | | | | 134,135 | | | | 1,263,552 | |
| | | | |
Redemptions | | | (2,683,907 | ) | | | (26,348,731 | ) | | | (5,019,366 | ) | | | (48,206,545 | ) |
| |
Net decrease | | | (1,913,649 | ) | | | (18,790,703 | ) | | | (3,044,418 | ) | | | (29,302,265 | ) |
| |
Class B shares | | | | | | | | | | | | | | | | |
| | | | |
Subscriptions | | | 3,957 | | | | 35,793 | | | | 21,481 | | | | 191,106 | |
| | | | |
Redemptions(a) | | | (168,700 | ) | | | (1,523,209 | ) | | | (459,881 | ) | | | (4,075,625 | ) |
| |
Net decrease | | | (164,743 | ) | | | (1,487,416 | ) | | | (438,400 | ) | | | (3,884,519 | ) |
| |
Class C shares | | | | | | | | | | | | | | | | |
| | | | |
Subscriptions | | | 92,718 | | | | 828,836 | | | | 261,781 | | | | 2,308,381 | |
| | | | |
Redemptions | | | (188,336 | ) | | | (1,686,890 | ) | | | (451,001 | ) | | | (4,009,013 | ) |
| |
Net decrease | | | (95,618 | ) | | | (858,054 | ) | | | (189,220 | ) | | | (1,700,632 | ) |
| |
Class I shares | | | | | | | | | | | | | | | | |
| | | | |
Redemptions | | | — | | | | — | | | | (113 | ) | | | (1,099 | ) |
| |
Net increase (decrease) | | | — | | | | — | | | | (113 | ) | | | (1,099 | ) |
| |
Class K shares | | | | | | | | | | | | | | | | |
| | | | |
Subscriptions | | | 58,459 | | | | 573,262 | | | | 100,249 | | | | 962,016 | |
| | | | |
Distributions reinvested | | | 3,057 | | | | 30,141 | | | | 3,876 | | | | 36,819 | |
| | | | |
Redemptions | | | (89,309 | ) | | | (878,870 | ) | | | (139,394 | ) | | | (1,367,736 | ) |
| |
Net decrease | | | (27,793 | ) | | | (275,467 | ) | | | (35,269 | ) | | | (368,901 | ) |
| |
Class R shares | | | | | | | | | | | | | | | | |
| | | | |
Subscriptions | | | 1,684 | | | | 16,489 | | | | 3,330 | | | | 32,157 | |
| | | | |
Distributions reinvested | | | 1 | | | | 5 | | | | 13 | | | | 127 | |
| | | | |
Redemptions | | | (93 | ) | | | (914 | ) | | | (6,266 | ) | | | (60,739 | ) |
| |
Net increase (decrease) | | | 1,592 | | | | 15,580 | | | | (2,923 | ) | | | (28,455 | ) |
| |
Class R5 shares | | | | | | | | | | | | | | | | |
| | | | |
Subscriptions | | | 15,764 | | | | 154,845 | | | | 359 | | | | 3,462 | |
| | | | |
Redemptions | | | (1,256 | ) | | | (12,596 | ) | | | (472 | ) | | | (4,476 | ) |
| |
Net increase (decrease) | | | 14,508 | | | | 142,249 | | | | (113 | ) | | | (1,014 | ) |
| |
Class W shares | | | | | | | | | | | | | | | | |
| | | | |
Redemptions | | | — | | | | — | | | | (113 | ) | | | (1,100 | ) |
| |
Net increase (decrease) | | | — | | | | — | | | | (113 | ) | | | (1,100 | ) |
| |
Class Z shares | | | | | | | | | | | | | | | | |
| | | | |
Subscriptions | | | 31,802 | | | | 317,659 | | | | 153,030 | | | | 1,507,480 | |
| | | | |
Distributions reinvested | | | 1,390 | | | | 13,666 | | | | 1,239 | | | | 11,732 | |
| | | | |
Redemptions | | | (111,233 | ) | | | (1,077,364 | ) | | | (113,010 | ) | | | (1,094,268 | ) |
| |
Net increase (decrease) | | | (78,041 | ) | | | (746,039 | ) | | | 41,259 | | | | 424,944 | |
| |
Total net decrease | | | (2,263,744 | ) | | | (21,999,850 | ) | | | (3,669,310 | ) | | | (34,863,041 | ) |
| |
| (a) | Includes conversions of Class B shares to Class A shares, if any. |
The accompanying Notes to Financial Statements are an integral part of this statement.
| | | | |
| Semiannual Report 2015 | | | 13 | |
| | |
| |
| | COLUMBIA SELECT GLOBAL EQUITY FUND |
FINANCIAL HIGHLIGHTS
The following tables are intended to help you understand the Fund’s financial performance. Certain information reflects financial results for a single share of a class held for the periods shown. Per share net investment income (loss) amounts are calculated based on average shares outstanding during the period. Total return assumes reinvestment of all dividends and distributions, if any. Total return does not reflect payment of sales charges, if any. Total return and portfolio turnover are not annualized for periods of less than one year. The portfolio turnover rate is calculated without regard to purchase and sales transactions of short-term instruments and certain derivatives, if any. If such transactions were included, the Fund’s portfolio turnover rate may be higher.
| | | | | | | | | | | | | | | | | | | | | | | | |
| |
| Six Months Ended
April 30, 2015 |
| | | Year Ended October 31, | |
Class A | | | (Unaudited) | | | | 2014 | | | | 2013 | | | | 2012 | | | | 2011 | | | | 2010 | |
Per share data | | | | | | | | | | | | | | | | | | | | | | | | |
Net asset value, beginning of period | | | $9.80 | | | | $9.17 | | | | $7.39 | | | | $6.95 | | | | $7.07 | | | | $6.13 | |
| | | | | | | | | | | | | | | | | | | | | | | | | |
Income from investment operations: | | | | | | | | | | | | | | | | | | | | | | | | |
| | | | | | |
Net investment income (loss) | | | (0.01 | ) | | | 0.04 | | | | 0.04 | | | | 0.05 | | | | 0.01 | | | | 0.00 | (a) |
| | | | | | | | | | | | | | | | | | | | | | | | | |
Net realized and unrealized gain (loss) | | | 0.18 | | | | 0.62 | | | | 1.83 | | | | 0.40 | | | | (0.11 | ) | | | 0.96 | |
| | | | | | | | | | | | | | | | | | | | | | | | | |
Total from investment operations | | | 0.17 | | | | 0.66 | | | | 1.87 | | | | 0.45 | | | | (0.10 | ) | | | 0.96 | |
| | | | | | | | | | | | | | | | | | | | | | | | | |
Less distributions to shareholders: | | | | | | | | | | | | | | | | | | | | | | | | |
| | | | | | |
Net investment income | | | (0.02 | ) | | | (0.03 | ) | | | (0.09 | ) | | | (0.02 | ) | | | (0.02 | ) | | | (0.03 | ) |
| | | | | | | | | | | | | | | | | | | | | | | | | |
Total distributions to shareholders | | | (0.02 | ) | | | (0.03 | ) | | | (0.09 | ) | | | (0.02 | ) | | | (0.02 | ) | | | (0.03 | ) |
| | | | | | | | | | | | | | | | | | | | | | | | | |
Proceeds from regulatory settlements | | | — | | | | — | | | | — | | | | 0.01 | | | | — | | | | 0.01 | |
| | | | | | | | | | | | | | | | | | | | | | | | | |
Net asset value, end of period | | | $9.95 | | | | $9.80 | | | | $9.17 | | | | $7.39 | | | | $6.95 | | | | $7.07 | |
| | | | | | | | | | | | | | | | | | | | | | | | | |
Total return | | | 1.79 | % | | | 7.25 | % | | | 25.62 | % | | | 6.62 | %(b) | | | (1.40 | %) | | | 15.78 | %(c) |
| | | | | | | | | | | | | | | | | | | | | | | | | |
Ratios to average net assets(d) | | | | | | | | | | | | | | | | | | | | | | | | |
| | | | | | |
Total gross expenses | | | 1.43 | %(e) | | | 1.45 | % | | | 1.51 | % | | | 1.51 | % | | | 1.46 | % | | | 1.45 | % |
| | | | | | | | | | | | | | | | | | | | | | | | | |
Total net expenses(f) | | | 1.43 | %(e) | | | 1.45 | %(g) | | | 1.45 | %(g) | | | 1.36 | %(g) | | | 1.36 | %(g) | | | 1.45 | % |
| | | | | | | | | | | | | | | | | | | | | | | | | |
Net investment income (loss) | | | (0.13 | %)(e) | | | 0.39 | % | | | 0.48 | % | | | 0.75 | % | | | 0.18 | % | | | 0.03 | % |
| | | | | | | | | | | | | | | | | | | | | | | | | |
Supplemental data | | | | | | | | | | | | | | | | | | | | | | | | |
| | | | | | |
Net assets, end of period (in thousands) | | | $341,584 | | | | $355,168 | | | | $360,041 | | | | $333,196 | | | | $387,709 | | | | $375,169 | |
| | | | | | | | | | | | | | | | | | | | | | | | | |
Portfolio turnover | | | 89 | % | | | 63 | % | | | 46 | % | | | 50 | % | | | 44 | % | | | 54 | % |
| | | | | | | | | | | | | | | | | | | | | | | | | |
Notes to Financial Highlights
| (b) | The Fund received proceeds from regulatory settlements. Had the Fund not received these proceeds, the total return would have been lower by 0.11%. |
| (c) | The Fund received proceeds from regulatory settlements. Had the Fund not received these proceeds, the total return would have been lower by 0.09%. |
| (d) | In addition to the fees and expenses that the Fund bears directly, the Fund indirectly bears a pro rata share of the fees and expenses of any other funds in which it invests. Such indirect expenses are not included in the Fund’s reported expense ratios. |
| (f) | Total net expenses include the impact of certain fee waivers/expense reimbursements made by the Investment Manager and certain of its affiliates, if applicable. |
| (g) | The benefits derived from expense reductions had an impact of less than 0.01%. |
The accompanying Notes to Financial Statements are an integral part of this statement.
| | |
| 14 | | Semiannual Report 2015 |
| | |
| |
| COLUMBIA SELECT GLOBAL EQUITY FUND | | |
FINANCIAL HIGHLIGHTS (continued)
| | | | | | | | | | | | | | | | | | | | | | | | |
| |
| Six Months Ended
April 30, 2015 |
| | | Year Ended October 31, | |
Class B | | | (Unaudited) | | | | 2014 | | | | 2013 | | | | 2012 | | | | 2011 | | | | 2010 | |
Per share data | | | | | | | | | | | | | | | | | | | | | | | | |
Net asset value, beginning of period | | | $9.06 | | | | $8.50 | | | | $6.85 | | | | $6.47 | | | | $6.63 | | | | $5.77 | |
| | | | | | | | | | | | | | | | | | | | | | | | | |
Income from investment operations: | | | | | | | | | | | | | | | | | | | | | | | | |
| | | | | | |
Net investment income (loss) | | | (0.04 | ) | | | (0.03 | ) | | | (0.02 | ) | | | 0.00 | (a) | | | (0.04 | ) | | | (0.04 | ) |
| | | | | | | | | | | | | | | | | | | | | | | | | |
Net realized and unrealized gain (loss) | | | 0.17 | | | | 0.59 | | | | 1.70 | | | | 0.37 | | | | (0.11 | ) | | | 0.90 | |
| | | | | | | | | | | | | | | | | | | | | | | | | |
Total from investment operations | | | 0.13 | | | | 0.56 | | | | 1.68 | | | | 0.37 | | | | (0.15 | ) | | | 0.86 | |
| | | | | | | | | | | | | | | | | | | | | | | | | |
Less distributions to shareholders: | | | | | | | | | | | | | | | | | | | | | | | | |
| | | | | | |
Net investment income | | | — | | | | — | | | | (0.03 | ) | | | — | | | | (0.01 | ) | | | (0.01 | ) |
| | | | | | | | | | | | | | | | | | | | | | | | | |
Total distributions to shareholders | | | — | | | | — | | | | (0.03 | ) | | | — | | | | (0.01 | ) | | | (0.01 | ) |
| | | | | | | | | | | | | | | | | | | | | | | | | |
Proceeds from regulatory settlements | | | — | | | | — | | | | — | | | | 0.01 | | | | — | | | | 0.01 | |
| | | | | | | | | | | | | | | | | | | | | | | | | |
Net asset value, end of period | | | $9.19 | | | | $9.06 | | | | $8.50 | | | | $6.85 | | | | $6.47 | | | | $6.63 | |
| | | | | | | | | | | | | | | | | | | | | | | | | |
Total return | | | 1.43 | % | | | 6.59 | % | | | 24.52 | % | | | 5.87 | %(b) | | | (2.26 | %) | | | 15.03 | %(c) |
| | | | | | | | | | | | | | | | | | | | | | | | | |
Ratios to average net assets(d) | | | | | | | | | | | | | | | | | | | | | | | | |
| | | | | | |
Total gross expenses | | | 2.18 | %(e) | | | 2.20 | % | | | 2.27 | % | | | 2.26 | % | | | 2.22 | % | | | 2.21 | % |
| | | | | | | | | | | | | | | | | | | | | | | | | |
Total net expenses(f) | | | 2.18 | %(e) | | | 2.20 | %(g) | | | 2.20 | %(g) | | | 2.11 | %(g) | | | 2.12 | %(g) | | | 2.21 | % |
| | | | | | | | | | | | | | | | | | | | | | | | | |
Net investment income (loss) | | | (0.90 | %)(e) | | | (0.35 | %) | | | (0.24 | %) | | | 0.02 | % | | | (0.56 | %) | | | (0.69 | %) |
| | | | | | | | | | | | | | | | | | | | | | | | | |
Supplemental data | | | | | | | | | | | | | | | | | | | | | | | | |
| | | | | | |
Net assets, end of period (in thousands) | | | $4,486 | | | | $5,915 | | | | $9,282 | | | | $10,979 | | | | $17,347 | | | | $23,894 | |
| | | | | | | | | | | | | | | | | | | | | | | | | |
Portfolio turnover | | | 89 | % | | | 63 | % | | | 46 | % | | | 50 | % | | | 44 | % | | | 54 | % |
| | | | | | | | | | | | | | | | | | | | | | | | | |
Notes to Financial Highlights
| (b) | The Fund received proceeds from regulatory settlements. Had the Fund not received these proceeds, the total return would have been lower by 0.11%. |
| (c) | The Fund received proceeds from regulatory settlements. Had the Fund not received these proceeds, the total return would have been lower by 0.09%. |
| (d) | In addition to the fees and expenses that the Fund bears directly, the Fund indirectly bears a pro rata share of the fees and expenses of any other funds in which it invests. Such indirect expenses are not included in the Fund’s reported expense ratios. |
| (f) | Total net expenses include the impact of certain fee waivers/expense reimbursements made by the Investment Manager and certain of its affiliates, if applicable. |
| (g) | The benefits derived from expense reductions had an impact of less than 0.01%. |
The accompanying Notes to Financial Statements are an integral part of this statement.
| | | | |
| Semiannual Report 2015 | | | 15 | |
| | |
| |
| | COLUMBIA SELECT GLOBAL EQUITY FUND |
FINANCIAL HIGHLIGHTS (continued)
| | | | | | | | | | | | | | | | | | | | | | | | |
| |
| Six Months Ended
April 30, 2015 |
| | | Year Ended October 31, | |
Class C | | | (Unaudited) | | | | 2014 | | | | 2013 | | | | 2012 | | | | 2011 | | | | 2010 | |
Per share data | | | | | | | | | | | | | | | | | | | | | | | | |
Net asset value, beginning of period | | | $8.94 | | | | $8.40 | | | | $6.78 | | | | $6.40 | | | | $6.55 | | | | $5.71 | |
| | | | | | | | | | | | | | | | | | | | | | | | | |
Income from investment operations: | | | | | | | | | | | | | | | | | | | | | | | | |
| | | | | | |
Net investment income (loss) | | | (0.04 | ) | | | (0.03 | ) | | | (0.02 | ) | | | (0.00 | )(a) | | | (0.04 | ) | | | (0.04 | ) |
| | | | | | | | | | | | | | | | | | | | | | | | | |
Net realized and unrealized gain (loss) | | | 0.17 | | | | 0.57 | | | | 1.68 | | | | 0.37 | | | | (0.10 | ) | | | 0.88 | |
| | | | | | | | | | | | | | | | | | | | | | | | | |
Total from investment operations | | | 0.13 | | | | 0.54 | | | | 1.66 | | | | 0.37 | | | | (0.14 | ) | | | 0.84 | |
| | | | | | | | | | | | | | | | | | | | | | | | | |
Less distributions to shareholders: | | | | | | | | | | | | | | | | | | | | | | | | |
| | | | | | |
Net investment income | | | — | | | | — | | | | (0.04 | ) | | | — | | | | (0.01 | ) | | | (0.01 | ) |
| | | | | | | | | | | | | | | | | | | | | | | | | |
Total distributions to shareholders | | | — | | | | — | | | | (0.04 | ) | | | — | | | | (0.01 | ) | | | (0.01 | ) |
| | | | | | | | | | | | | | | | | | | | | | | | | |
Proceeds from regulatory settlements | | | — | | | | — | | | | — | | | | 0.01 | | | | — | | | | 0.01 | |
| | | | | | | | | | | | | | | | | | | | | | | | | |
Net asset value, end of period | | | $9.07 | | | | $8.94 | | | | $8.40 | | | | $6.78 | | | | $6.40 | | | | $6.55 | |
| | | | | | | | | | | | | | | | | | | | | | | | | |
Total return | | | 1.45 | % | | | 6.43 | % | | | 24.52 | % | | | 5.94 | %(b) | | | (2.14 | %) | | | 14.86 | %(c) |
| | | | | | | | | | | | | | | | | | | | | | | | | |
Ratios to average net assets(d) | | | | | | | | | | | | | | | | | | | | | | | | |
| | | | | | |
Total gross expenses | | | 2.18 | %(e) | | | 2.20 | % | | | 2.26 | % | | | 2.25 | % | | | 2.22 | % | | | 2.21 | % |
| | | | | | | | | | | | | | | | | | | | | | | | | |
Total net expenses(f) | | | 2.18 | %(e) | | | 2.20 | %(g) | | | 2.20 | %(g) | | | 2.11 | %(g) | | | 2.11 | %(g) | | | 2.21 | % |
| | | | | | | | | | | | | | | | | | | | | | | | | |
Net investment income (loss) | | | (0.88 | %)(e) | | | (0.36 | %) | | | (0.26 | %) | | | (0.00 | )(a) | | | (0.62 | %) | | | (0.72 | %) |
| | | | | | | | | | | | | | | | | | | | | | | | | |
Supplemental data | | | | | | | | | | | | | | | | | | | | | | | | |
| | | | | | |
Net assets, end of period (in thousands) | | | $16,051 | | | | $16,682 | | | | $17,250 | | | | $17,516 | | | | $21,560 | | | | $10,147 | |
| | | | | | | | | | | | | | | | | | | | | | | | | |
Portfolio turnover | | | 89 | % | | | 63 | % | | | 46 | % | | | 50 | % | | | 44 | % | | | 54 | % |
| | | | | | | | | | | | | | | | | | | | | | | | | |
Notes to Financial Highlights
| (b) | The Fund received proceeds from regulatory settlements. Had the Fund not received these proceeds, the total return would have been lower by 0.11%. |
| (c) | The Fund received proceeds from regulatory settlements. Had the Fund not received these proceeds, the total return would have been lower by 0.09%. |
| (d) | In addition to the fees and expenses that the Fund bears directly, the Fund indirectly bears a pro rata share of the fees and expenses of any other funds in which it invests. Such indirect expenses are not included in the Fund’s reported expense ratios. |
| (f) | Total net expenses include the impact of certain fee waivers/expense reimbursements made by the Investment Manager and certain of its affiliates, if applicable. |
| (g) | The benefits derived from expense reductions had an impact of less than 0.01%. |
The accompanying Notes to Financial Statements are an integral part of this statement.
| | |
| 16 | | Semiannual Report 2015 |
| | |
| |
| COLUMBIA SELECT GLOBAL EQUITY FUND | | |
FINANCIAL HIGHLIGHTS (continued)
| | | | | | | | | | | | | | | | | | | | | | | | |
| |
| Six Months Ended
April 30, 2015 |
| | | Year Ended October 31, | |
Class I | | | (Unaudited) | | | | 2014 | | | | 2013 | | | | 2012 | | | | 2011 | | | | 2010 | |
Per share data | | | | | | | | | | | | | | | | | | | | | | | | |
Net asset value, beginning of period | | | $9.90 | | | | $9.26 | | | | $7.46 | | | | $7.01 | | | | $7.11 | | | | $6.16 | |
| | | | | | | | | | | | | | | | | | | | | | | | | |
Income from investment operations: | | | | | | | | | | | | | | | | | | | | | | | | |
| | | | | | |
Net investment income | | | 0.01 | | | | 0.09 | | | | 0.08 | | | | 0.09 | | | | 0.01 | | | | 0.04 | |
| | | | | | | | | | | | | | | | | | | | | | | | | |
Net realized and unrealized gain (loss) | | | 0.19 | | | | 0.63 | | | | 1.85 | | | | 0.40 | | | | (0.08 | ) | | | 0.95 | |
| | | | | | | | | | | | | | | | | | | | | | | | | |
Total from investment operations | | | 0.20 | | | | 0.72 | | | | 1.93 | | | | 0.49 | | | | (0.07 | ) | | | 0.99 | |
| | | | | | | | | | | | | | | | | | | | | | | | | |
Less distributions to shareholders: | | | | | | | | | | | | | | | | | | | | | | | | |
| | | | | | |
Net investment income | | | (0.07 | ) | | | (0.08 | ) | | | (0.13 | ) | | | (0.05 | ) | | | (0.03 | ) | | | (0.05 | ) |
| | | | | | | | | | | | | | | | | | | | | | | | | |
Total distributions to shareholders | | | (0.07 | ) | | | (0.08 | ) | | | (0.13 | ) | | | (0.05 | ) | | | (0.03 | ) | | | (0.05 | ) |
| | | | | | | | | | | | | | | | | | | | | | | | | |
Proceeds from regulatory settlements | | | — | | | | — | | | | — | | | | 0.01 | | | | — | | | | 0.01 | |
| | | | | | | | | | | | | | | | | | | | | | | | | |
Net asset value, end of period | | | $10.03 | | | | $9.90 | | | | $9.26 | | | | $7.46 | | | | $7.01 | | | | $7.11 | |
| | | | | | | | | | | | | | | | | | | | | | | | | |
Total return | | | 2.04 | % | | | 7.77 | % | | | 26.25 | % | | | 7.15 | %(a) | | | (0.98 | %) | | | 16.32 | %(b) |
| | | | | | | | | | | | | | | | | | | | | | | | | |
Ratios to average net assets(c) | | | | | | | | | | | | | | | | | | | | | | | | |
| | | | | | |
Total gross expenses | | | 1.01 | %(d) | | | 0.98 | % | | | 0.98 | % | | | 1.02 | % | | | 0.93 | % | | | 0.91 | % |
| | | | | | | | | | | | | | | | | | | | | | | | | |
Total net expenses(e) | | | 1.01 | %(d) | | | 0.98 | % | | | 0.95 | % | | | 0.91 | % | | | 0.92 | % | | | 0.91 | % |
| | | | | | | | | | | | | | | | | | | | | | | | | |
Net investment income | | | 0.29 | %(d) | | | 0.90 | % | | | 0.97 | % | | | 1.20 | % | | | 0.15 | % | | | 0.55 | % |
| | | | | | | | | | | | | | | | | | | | | | | | | |
Supplemental data | | | | | | | | | | | | | | | | | | | | | | | | |
| | | | | | |
Net assets, end of period (in thousands) | | | $3 | | | | $3 | | | | $3 | | | | $3 | | | | $3 | | | | $31,015 | |
| | | | | | | | | | | | | | | | | | | | | | | | | |
Portfolio turnover | | | 89 | % | | | 63 | % | | | 46 | % | | | 50 | % | | | 44 | % | | | 54 | % |
| | | | | | | | | | | | | | | | | | | | | | | | | |
Notes to Financial Highlights
| (a) | The Fund received proceeds from regulatory settlements. Had the Fund not received these proceeds, the total return would have been lower by 0.11%. |
| (b) | The Fund received proceeds from regulatory settlements. Had the Fund not received these proceeds, the total return would have been lower by 0.09%. |
| (c) | In addition to the fees and expenses that the Fund bears directly, the Fund indirectly bears a pro rata share of the fees and expenses of any other funds in which it invests. Such indirect expenses are not included in the Fund’s reported expense ratios. |
| (e) | Total net expenses include the impact of certain fee waivers/expense reimbursements made by the Investment Manager and certain of its affiliates, if applicable. |
The accompanying Notes to Financial Statements are an integral part of this statement.
| | | | |
| Semiannual Report 2015 | | | 17 | |
| | |
| |
| | COLUMBIA SELECT GLOBAL EQUITY FUND |
FINANCIAL HIGHLIGHTS (continued)
| | | | | | | | | | | | | | | | | | | | | | | | |
| |
| Six Months Ended
April 30, 2015 |
| | | Year Ended October 31, | |
Class K | | | (Unaudited) | | | | 2014 | | | | 2013 | | | | 2012 | | | | 2011 | | | | 2010 | |
Per share data | | | | | | | | | | | | | | | | | | | | | | | | |
Net asset value, beginning of period | | | $9.90 | | | | $9.26 | | | | $7.46 | | | | $7.01 | | | | $7.13 | | | | $6.18 | |
| | | | | | | | | | | | | | | | | | | | | | | | | |
Income from investment operations: | | | | | | | | | | | | | | | | | | | | | | | | |
| | | | | | |
Net investment income | | | 0.00 | (a) | | | 0.06 | | | | 0.06 | | | | 0.07 | | | | 0.02 | | | | 0.02 | |
| | | | | | | | | | | | | | | | | | | | | | | | | |
Net realized and unrealized gain (loss) | | | 0.18 | | | | 0.63 | | | | 1.85 | | | | 0.40 | | | | (0.11 | ) | | | 0.96 | |
| | | | | | | | | | | | | | | | | | | | | | | | | |
Total from investment operations | | | 0.18 | | | | 0.69 | | | | 1.91 | | | | 0.47 | | | | (0.09 | ) | | | 0.98 | |
| | | | | | | | | | | | | | | | | | | | | | | | | |
Less distributions to shareholders: | | | | | | | | | | | | | | | | | | | | | | | | |
| | | | | | |
Net investment income | | | (0.04 | ) | | | (0.05 | ) | | | (0.11 | ) | | | (0.03 | ) | | | (0.03 | ) | | | (0.04 | ) |
| | | | | | | | | | | | | | | | | | | | | | | | | |
Total distributions to shareholders | | | (0.04 | ) | | | (0.05 | ) | | | (0.11 | ) | | | (0.03 | ) | | | (0.03 | ) | | | (0.04 | ) |
| | | | | | | | | | | | | | | | | | | | | | | | | |
Proceeds from regulatory settlements | | | — | | | | — | | | | — | | | | 0.01 | | | | — | | | | 0.01 | |
| | | | | | | | | | | | | | | | | | | | | | | | | |
Net asset value, end of period | | | $10.04 | | | | $9.90 | | | | $9.26 | | | | $7.46 | | | | $7.01 | | | | $7.13 | |
| | | | | | | | | | | | | | | | | | | | | | | | | |
Total return | | | 1.87 | % | | | 7.49 | % | | | 25.87 | % | | | 6.87 | %(b) | | | (1.33 | %) | | | 16.03 | %(c) |
| | | | | | | | | | | | | | | | | | | | | | | | | |
Ratios to average net assets(d) | | | | | | | | | | | | | | | | | | | | | | | | |
| | | | | | |
Total gross expenses | | | 1.26 | %(e) | | | 1.25 | % | | | 1.26 | % | | | 1.28 | % | | | 1.24 | % | | | 1.21 | % |
| | | | | | | | | | | | | | | | | | | | | | | | | |
Total net expenses(f) | | | 1.26 | %(e) | | | 1.25 | % | | | 1.24 | % | | | 1.21 | % | | | 1.17 | % | | | 1.21 | % |
| | | | | | | | | | | | | | | | | | | | | | | | | |
Net investment income | | | 0.04 | %(e) | | | 0.60 | % | | | 0.67 | % | | | 0.90 | % | | | 0.32 | % | | | 0.27 | % |
| | | | | | | | | | | | | | | | | | | | | | | | | |
Supplemental data | | | | | | | | | | | | | | | | | | | | | | | | |
| | | | | | |
Net assets, end of period (in thousands) | | | $6,529 | | | | $6,712 | | | | $6,601 | | | | $5,032 | | | | $4,627 | | | | $7,016 | |
| | | | | | | | | | | | | | | | | | | | | | | | | |
Portfolio turnover | | | 89 | % | | | 63 | % | | | 46 | % | | | 50 | % | | | 44 | % | | | 54 | % |
| | | | | | | | | | | | | | | | | | | | | | | | | |
Notes to Financial Highlights
| (b) | The Fund received proceeds from regulatory settlements. Had the Fund not received these proceeds, the total return would have been lower by 0.11%. |
| (c) | The Fund received proceeds from regulatory settlements. Had the Fund not received these proceeds, the total return would have been lower by 0.09%. |
| (d) | In addition to the fees and expenses that the Fund bears directly, the Fund indirectly bears a pro rata share of the fees and expenses of any other funds in which it invests. Such indirect expenses are not included in the Fund’s reported expense ratios. |
| (f) | Total net expenses include the impact of certain fee waivers/expense reimbursements made by the Investment Manager and certain of its affiliates, if applicable. |
The accompanying Notes to Financial Statements are an integral part of this statement.
| | |
| 18 | | Semiannual Report 2015 |
| | |
| |
| COLUMBIA SELECT GLOBAL EQUITY FUND | | |
FINANCIAL HIGHLIGHTS (continued)
| | | | | | | | | | | | | | | | | | | | | | | | |
| |
| Six Months Ended
April 30, 2015 |
| | | Year Ended October 31, | |
Class R | | | (Unaudited) | | | | 2014 | | | | 2013 | | | | 2012 | | | | 2011 | | | | 2010 | |
Per share data | | | | | | | | | | | | | | | | | | | | | | | | |
Net asset value, beginning of period | | | $9.84 | | | | $9.20 | | | | $7.44 | | | | $7.00 | | | | $7.14 | | | | $6.14 | |
| | | | | | | | | | | | | | | | | | | | | | | | | |
Income from investment operations: | | | | | | | | | | | | | | | | | | | | | | | | |
| | | | | | |
Net investment income (loss) | | | (0.18 | ) | | | 0.01 | | | | 0.02 | | | | 0.03 | | | | (0.00 | )(a) | | | (0.02 | ) |
| | | | | | | | | | | | | | | | | | | | | | | | | |
Net realized and unrealized gain (loss) | | | 0.34 | | | | 0.64 | | | | 1.84 | | | | 0.41 | | | | (0.12 | ) | | | 1.01 | |
| | | | | | | | | | | | | | | | | | | | | | | | | |
Total from investment operations | | | 0.16 | | | | 0.65 | | | | 1.86 | | | | 0.44 | | | | (0.12 | ) | | | 0.99 | |
| | | | | | | | | | | | | | | | | | | | | | | | | |
Less distributions to shareholders: | | | | | | | | | | | | | | | | | | | | | | | | |
| | | | | | |
Net investment income | | | (0.00 | )(a) | | | (0.01 | ) | | | (0.10 | ) | | | (0.01 | ) | | | (0.02 | ) | | | — | |
| | | | | | | | | | | | | | | | | | | | | | | | | |
Total distributions to shareholders | | | (0.00 | )(a) | | | (0.01 | ) | | | (0.10 | ) | | | (0.01 | ) | | | (0.02 | ) | | | — | |
| | | | | | | | | | | | | | | | | | | | | | | | | |
Proceeds from regulatory settlements | | | — | | | | — | | | | — | | | | 0.01 | | | | — | | | | 0.01 | |
| | | | | | | | | | | | | | | | | | | | | | | | | |
Net asset value, end of period | | | $10.00 | | | | $9.84 | | | | $9.20 | | | | $7.44 | | | | $7.00 | | | | $7.14 | |
| | | | | | | | | | | | | | | | | | | | | | | | | |
Total return | | | 1.63 | % | | | 7.10 | % | | | 25.19 | % | | | 6.37 | %(b) | | | (1.70 | %) | | | 16.29 | %(c) |
| | | | | | | | | | | | | | | | | | | | | | | | | |
Ratios to average net assets(d) | | | | | | | | | | | | | | | | | | | | | | | | |
| | | | | | |
Total gross expenses | | | 1.68 | %(e) | | | 1.70 | % | | | 1.77 | % | | | 1.76 | % | | | 1.72 | % | | | 1.71 | % |
| | | | | | | | | | | | | | | | | | | | | | | | | |
Total net expenses(f) | | | 1.68 | %(e) | | | 1.70 | %(g) | | | 1.70 | %(g) | | | 1.61 | %(g) | | | 1.61 | %(g) | | | 1.71 | % |
| | | | | | | | | | | | | | | | | | | | | | | | | |
Net investment income (loss) | | | (0.36 | %)(e) | | | 0.12 | % | | | 0.20 | % | | | 0.48 | % | | | (0.01 | %) | | | (0.24 | %) |
| | | | | | | | | | | | | | | | | | | | | | | | | |
Supplemental data | | | | | | | | | | | | | | | | | | | | | | | | |
| | | | | | |
Net assets, end of period (in thousands) | | | $141 | | | | $123 | | | | $142 | | | | $63 | | | | $70 | | | | $41 | |
| | | | | | | | | | | | | | | | | | | | | | | | | |
Portfolio turnover | | | 89 | % | | | 63 | % | | | 46 | % | | | 50 | % | | | 44 | % | | | 54 | % |
| | | | | | | | | | | | | | | | | | | | | | | | | |
Notes to Financial Highlights
| (b) | The Fund received proceeds from regulatory settlements. Had the Fund not received these proceeds, the total return would have been lower by 0.11%. |
| (c) | The Fund received proceeds from regulatory settlements. Had the Fund not received these proceeds, the total return would have been lower by 0.09%. |
| (d) | In addition to the fees and expenses that the Fund bears directly, the Fund indirectly bears a pro rata share of the fees and expenses of any other funds in which it invests. Such indirect expenses are not included in the Fund’s reported expense ratios. |
| (f) | Total net expenses include the impact of certain fee waivers/expense reimbursements made by the Investment Manager and certain of its affiliates, if applicable. |
| (g) | The benefits derived from expense reductions had an impact of less than 0.01%. |
The accompanying Notes to Financial Statements are an integral part of this statement.
| | | | |
| Semiannual Report 2015 | | | 19 | |
| | |
| |
| | COLUMBIA SELECT GLOBAL EQUITY FUND |
FINANCIAL HIGHLIGHTS (continued)
| | | | | | | | | | | | | | | | | | | | | | | | |
| |
| Six Months Ended
April 30, 2015 |
| | | Year Ended October 31, | |
Class R5 | | | (Unaudited) | | | | 2014 | | | | 2013 | | | | 2012 | | | | 2011 | | | | 2010 | |
Per share data | | | | | | | | | | | | | | | | | | | | | | | | |
Net asset value, beginning of period | | | $9.90 | | | | $9.25 | | | | $7.46 | | | | $7.01 | | | | $7.12 | | | | $6.16 | |
| | | | | | | | | | | | | | | | | | | | | | | | | |
Income from investment operations: | | | | | | | | | | | | | | | | | | | | | | | | |
| | | | | | |
Net investment income | | | 0.02 | | | | 0.09 | | | | 0.08 | | | | 0.08 | | | | 0.02 | | | | 0.03 | |
| | | | | | | | | | | | | | | | | | | | | | | | | |
Net realized and unrealized gain (loss) | | | 0.18 | | | | 0.63 | | | | 1.84 | | | | 0.41 | | | | (0.10 | ) | | | 0.97 | |
| | | | | | | | | �� | | | | | | | | | | | | | | | | |
Total from investment operations | | | 0.20 | | | | 0.72 | | | | 1.92 | | | | 0.49 | | | | (0.08 | ) | | | 1.00 | |
| | | | | | | | | | | | | | | | | | | | | | | | | |
Less distributions to shareholders: | | | | | | | | | | | | | | | | | | | | | | | | |
| | | | | | |
Net investment income | | | (0.07 | ) | | | (0.07 | ) | | | (0.13 | ) | | | (0.05 | ) | | | (0.03 | ) | | | (0.05 | ) |
| | | | | | | | | | | | | | | | | | | | | | | | | |
Total distributions to shareholders | | | (0.07 | ) | | | (0.07 | ) | | | (0.13 | ) | | | (0.05 | ) | | | (0.03 | ) | | | (0.05 | ) |
| | | | | | | | | | | | | | | | | | | | | | | | | |
Proceeds from regulatory settlements | | | — | | | | — | | | | — | | | | 0.01 | | | | — | | | | 0.01 | |
| | | | | | | | | | | | | | | | | | | | | | | | | |
Net asset value, end of period | | | $10.03 | | | | $9.90 | | | | $9.25 | | | | $7.46 | | | | $7.01 | | | | $7.12 | |
| | | | | | | | | | | | | | | | | | | | | | | | | |
Total return | | | 2.02 | % | | | 7.83 | % | | | 26.06 | % | | | 7.15 | %(a) | | | (1.13 | %) | | | 16.44 | %(b) |
| | | | | | | | | | | | | | | | | | | | | | | | | |
Ratios to average net assets(c) | | | | | | | | | | | | | | | | | | | | | | | | |
| | | | | | |
Total gross expenses | | | 1.02 | %(d) | | | 1.00 | % | | | 1.03 | % | | | 1.07 | % | | | 0.94 | % | | | 0.96 | % |
| | | | | | | | | | | | | | | | | | | | | | | | | |
Total net expenses(e) | | | 1.02 | %(d) | | | 1.00 | % | | | 1.00 | % | | | 0.96 | % | | | 0.92 | % | | | 0.96 | % |
| | | | | | | | | | | | | | | | | | | | | | | | | |
Net investment income | | | 0.36 | %(d) | | | 0.96 | % | | | 0.92 | % | | | 1.15 | % | | | 0.32 | % | | | 0.50 | % |
| | | | | | | | | | | | | | | | | | | | | | | | | |
Supplemental data | | | | | | | | | | | | | | | | | | | | | | | | |
| | | | | | |
Net assets, end of period (in thousands) | | | $148 | | | | $3 | | | | $3 | | | | $3 | | | | $3 | | | | $19 | |
| | | | | | | | | | | | | | | | | | | | | | | | | |
Portfolio turnover | | | 89 | % | | | 63 | % | | | 46 | % | | | 50 | % | | | 44 | % | | | 54 | % |
| | | | | | | | | | | | | | | | | | | | | | | | | |
Notes to Financial Highlights
| (a) | The Fund received proceeds from regulatory settlements. Had the Fund not received these proceeds, the total return would have been lower by 0.11%. |
| (b) | The Fund received proceeds from regulatory settlements. Had the Fund not received these proceeds, the total return would have been lower by 0.09%. |
| (c) | In addition to the fees and expenses that the Fund bears directly, the Fund indirectly bears a pro rata share of the fees and expenses of any other funds in which it invests. Such indirect expenses are not included in the Fund’s reported expense ratios. |
| (e) | Total net expenses include the impact of certain fee waivers/expense reimbursements made by the Investment Manager and certain of its affiliates, if applicable. |
The accompanying Notes to Financial Statements are an integral part of this statement.
| | |
| 20 | | Semiannual Report 2015 |
| | |
| |
| COLUMBIA SELECT GLOBAL EQUITY FUND | | |
FINANCIAL HIGHLIGHTS (continued)
| | | | | | | | | | | | | | | | | | | | | | | | |
| |
| Six Months Ended
April 30, 2015 |
| | | Year Ended October 31, | |
Class W | | | (Unaudited) | | | | 2014 | | | | 2013 | | | | 2012 | | | | 2011 | | | | 2010 | |
Per share data | | | | | | | | | | | | | | | | | | | | | | | | |
Net asset value, beginning of period | | | $9.86 | | | | $9.22 | | | | $7.44 | | | | $6.97 | | | | $7.10 | | | | $6.16 | |
| | | | | | | | | | | | | | | | | | | | | | | | | |
Income from investment operations: | | | | | | | | | | | | | | | | | | | | | | | | |
| | | | | | |
Net investment income (loss) | | | (0.01 | ) | | | 0.04 | | | | 0.04 | | | | 0.05 | | | | 0.02 | | | | 0.01 | |
| | | | | | | | | | | | | | | | | | | | | | | | | |
Net realized and unrealized gain (loss) | | | 0.18 | | | | 0.63 | | | | 1.84 | | | | 0.41 | | | | (0.13 | ) | | | 0.95 | |
| | | | | | | | | | | | | | | | | | | | | | | | | |
Total from investment operations | | | 0.17 | | | | 0.67 | | | | 1.88 | | | | 0.46 | | | | (0.11 | ) | | | 0.96 | |
| | | | | | | | | | | | | | | | | | | | | | | | | |
Less distributions to shareholders: | | | | | | | | | | | | | | | | | | | | | | | | |
| | | | | | |
Net investment income | | | (0.02 | ) | | | (0.03 | ) | | | (0.10 | ) | | | (0.00 | )(a) | | | (0.02 | ) | | | (0.03 | ) |
| | | | | | | | | | | | | | | | | | | | | | | | | |
Total distributions to shareholders | | | (0.02 | ) | | | (0.03 | ) | | | (0.10 | ) | | | (0.00 | )(a) | | | (0.02 | ) | | | (0.03 | ) |
| | | | | | | | | | | | | | | | | | | | | | | | | |
Proceeds from regulatory settlements | | | — | | | | — | | | | — | | | | 0.01 | | | | — | | | | 0.01 | |
| | | | | | | | | | | | | | | | | | | | | | | | | |
Net asset value, end of period | | | $10.01 | | | | $9.86 | | | | $9.22 | | | | $7.44 | | | | $6.97 | | | | $7.10 | |
| | | | | | | | | | | | | | | | | | | | | | | | | |
Total return | | | 1.76 | % | | | 7.32 | % | | | 25.51 | % | | | 6.76 | %(b) | | | (1.52 | %) | | | 15.80 | %(c) |
| | | | | | | | | | | | | | | | | | | | | | | | | |
Ratios to average net assets(d) | | | | | | | | | | | | | | | | | | | | | | | | |
| | | | | | |
Total gross expenses | | | 1.43 | %(e) | | | 1.49 | % | | | 1.54 | % | | | 1.59 | % | | | 1.48 | % | | | 1.38 | % |
| | | | | | | | | | | | | | | | | | | | | | | | | |
Total net expenses(f) | | | 1.43 | %(e) | | | 1.47 | %(g) | | | 1.45 | %(g) | | | 1.36 | %(g) | | | 1.37 | %(g) | | | 1.38 | % |
| | | | | | | | | | | | | | | | | | | | | | | | | |
Net investment income (loss) | | | (0.13 | %)(e) | | | 0.41 | % | | | 0.47 | % | | | 0.75 | % | | | 0.21 | % | | | 0.08 | % |
| | | | | | | | | | | | | | | | | | | | | | | | | |
Supplemental data | | | | | | | | | | | | | | | | | | | | | | | | |
| | | | | | |
Net assets, end of period (in thousands) | | | $3 | | | | $3 | | | | $3 | | | | $3 | | | | $3 | | | | $5 | |
| | | | | | | | | | | | | | | | | | | | | | | | | |
Portfolio turnover | | | 89 | % | | | 63 | % | | | 46 | % | | | 50 | % | | | 44 | % | | | 54 | % |
| | | | | | | | | | | | | | | | | | | | | | | | | |
Notes to Financial Highlights
| (b) | The Fund received proceeds from regulatory settlements. Had the Fund not received these proceeds, the total return would have been lower by 0.11%. |
| (c) | The Fund received proceeds from regulatory settlements. Had the Fund not received these proceeds, the total return would have been lower by 0.09%. |
| (d) | In addition to the fees and expenses that the Fund bears directly, the Fund indirectly bears a pro rata share of the fees and expenses of any other funds in which it invests. Such indirect expenses are not included in the Fund’s reported expense ratios. |
| (f) | Total net expenses include the impact of certain fee waivers/expense reimbursements made by the Investment Manager and certain of its affiliates, if applicable. |
| (g) | The benefits derived from expense reductions had an impact of less than 0.01%. |
The accompanying Notes to Financial Statements are an integral part of this statement.
| | | | |
| Semiannual Report 2015 | | | 21 | |
| | |
| |
| | COLUMBIA SELECT GLOBAL EQUITY FUND |
FINANCIAL HIGHLIGHTS (continued)
| | | | | | | | | | | | | | | | | | | | | | | | |
| |
| Six Months Ended
April 30, 2015 |
| | | Year Ended October 31, | |
Class Z | | | (Unaudited) | | | | 2014 | | | | 2013 | | | | 2012 | | | | 2011 | | | | 2010(a) | |
Per share data | | | | | | | | | | | | | | | | | | | | | | | | |
Net asset value, beginning of period | | | $9.87 | | | | $9.23 | | | | $7.45 | | | | $7.00 | | | | $7.12 | | | | $6.85 | |
| | | | | | | | | | | | | | | | | | | | | | | | | |
Income from investment operations: | | | | | | | | | | | | | | | | | | | | | | | | |
| | | | | | |
Net investment income (loss) | | | 0.01 | | | | 0.06 | | | | 0.06 | | | | 0.07 | | | | 0.02 | | | | (0.01 | ) |
| | | | | | | | | | | | | | | | | | | | | | | | | |
Net realized and unrealized gain (loss) | | | 0.18 | | | | 0.63 | | | | 1.84 | | | | 0.41 | | | | (0.11 | ) | | | 0.28 | |
| | | | | | | | | | | | | | | | | | | | | | | | | |
Total from investment operations | | | 0.19 | | | | 0.69 | | | | 1.90 | | | | 0.48 | | | | (0.09 | ) | | | 0.27 | |
| | | | | | | | | | | | | | | | | | | | | | | | | |
Less distributions to shareholders: | | | | | | | | | | | | | | | | | | | | | | | | |
| | | | | | |
Net investment income | | | (0.05 | ) | | | (0.05 | ) | | | (0.12 | ) | | | (0.04 | ) | | | (0.03 | ) | | | — | |
| | | | | | | | | | | | | | | | | | | | | | | | | |
Total distributions to shareholders | | | (0.05 | ) | | | (0.05 | ) | | | (0.12 | ) | | | (0.04 | ) | | | (0.03 | ) | | | — | |
| | | | | | | | | | | | | | | | | | | | | | | | | |
Proceeds from regulatory settlements | | | — | | | | — | | | | — | | | | 0.01 | | | | — | | | | — | |
| | | | | | | | | | | | | | | | | | | | | | | | | |
Net asset value, end of period | | | $10.01 | | | | $9.87 | | | | $9.23 | | | | $7.45 | | | | $7.00 | | | | $7.12 | |
| | | | | | | | | | | | | | | | | | | | | | | | | |
Total return | | | 1.91 | % | | | 7.55 | % | | | 25.74 | % | | | 7.03 | %(b) | | | (1.29 | %) | | | 3.94 | % |
| | | | | | | | | | | | | | | | | | | | | | | | | |
Ratios to average net assets(c) | | | | | | | | | | | | | | | | | | | | | | | | |
| | | | | | |
Total gross expenses | | | 1.18 | %(d) | | | 1.21 | % | | | 1.26 | % | | | 1.25 | % | | | 1.23 | % | | | 1.37 | %(d) |
| | | | | | | | | | | | | | | | | | | | | | | | | |
Total net expenses(e) | | | 1.18 | %(d) | | | 1.21 | %(f) | | | 1.20 | %(f) | | | 1.11 | %(f) | | | 1.11 | %(g) | | | 1.37 | %(d) |
| | | | | | | | | | | | | | | | | | | | | | | | | |
Net investment income (loss) | | | 0.10 | %(d) | | | 0.62 | % | | | 0.72 | % | | | 1.00 | % | | | 0.24 | % | | | (1.52 | %)(d) |
| | | | | | | | | | | | | | | | | | | | | | | | | |
Supplemental data | | | | | | | | | | | | | | | | | | | | | | | | |
| | | | | | |
Net assets, end of period (in thousands) | | | $2,626 | | | | $3,360 | | | | $2,760 | | | | $2,387 | | | | $3,004 | | | | $3 | |
| | | | | | | | | | | | | | | | | | | | | | | | | |
Portfolio turnover | | | 89 | % | | | 63 | % | | | 46 | % | | | 50 | % | | | 44 | % | | | 54 | % |
| | | | | | | | | | | | | | | | | | | | | | | | | |
Notes to Financial Highlights
| (a) | Based on operations from September 27, 2010 (commencement of operations) through the stated period end. |
| (b) | The Fund received proceeds from regulatory settlements. Had the Fund not received these proceeds, the total return would have been lower by 0.11%. |
| (c) | In addition to the fees and expenses that the Fund bears directly, the Fund indirectly bears a pro rata share of the fees and expenses of any other funds in which it invests. Such indirect expenses are not included in the Fund’s reported expense ratios. |
| (e) | Total net expenses include the impact of certain fee waivers/expense reimbursements made by the Investment Manager and certain of its affiliates, if applicable. |
| (f) | The benefits derived from expense reductions had an impact of less than 0.01%. |
| (g) | The benefits derived from expense reductions had an impact of 0.01%. |
The accompanying Notes to Financial Statements are an integral part of this statement.
| | |
| 22 | | Semiannual Report 2015 |
| | |
| |
| COLUMBIA SELECT GLOBAL EQUITY FUND | | |
NOTES TO FINANCIAL STATEMENTS
April 30, 2015 (Unaudited)
Note 1. Organization
Columbia Select Global Equity Fund (formerly known as Columbia Global Equity Fund) (the Fund), a series of Columbia Funds Series Trust II (the Trust), is a diversified fund. The Trust is registered under the Investment Company Act of 1940, as amended (the 1940 Act), as an open-end management investment company organized as a Massachusetts business trust. Effective January 15, 2015, Columbia Global Equity Fund was renamed Columbia Select Global Equity Fund.
Fund Shares
The Trust may issue an unlimited number of shares (without par value). The Fund offers Class A, Class B, Class C, Class I, Class K, Class R, Class R5, Class W and Class Z shares. Although all share classes generally have identical voting, dividend and liquidation rights, each share class votes separately when required by the Trust’s organizational documents or by law. Different share classes pay different distribution amounts to the extent the expenses of such share classes differ, and distributions in liquidation will be proportional to the net asset value of each share class. Each share class has its own expense structure and sales charges.
Class A shares are subject to a maximum front-end sales charge of 5.75% based on the initial investment amount. Class A shares purchased without an initial sales charge in accounts aggregating $1 million to $50 million at the time of purchase are subject to a contingent deferred sales charge (CDSC) if the shares are sold within 18 months after purchase, charged as follows: 1.00% CDSC if redeemed within 12 months after purchase, and 0.50% CDSC if redeemed more than 12, but less than 18, months after purchase.
Class B shares may be subject to a maximum CDSC of 5.00% based upon the holding period after purchase. Class B shares will generally convert to Class A shares eight years after purchase. The Fund no longer accepts investments by new or existing investors in the Fund’s Class B shares, except in connection with the reinvestment of any dividend and/or capital gain distributions in Class B shares of the Fund and exchanges by existing Class B shareholders of certain other funds within the Columbia Family of Funds.
Class C shares are subject to a 1.00% CDSC on shares redeemed within one year after purchase.
Class I shares are not subject to sales charges and are available only to the Columbia Family of Funds.
Class K shares are not subject to sales charges, however this share class is closed to new investors.
Class R shares are not subject to sales charges and are generally available only to certain retirement plans and other investors as described in the Fund’s prospectus.
Class R5 shares are not subject to sales charges and are generally available only to investors purchasing through authorized investment professionals and omnibus retirement plans.
Class W shares are not subject to sales charges and are available only to investors purchasing through authorized investment programs managed by investment professionals, including discretionary managed account programs.
Class Z shares are not subject to sales charges and are available only to eligible investors, which are subject to different investment minimums as described in the Fund’s prospectus.
Note 2. Summary of Significant Accounting Policies
Basis of Preparation
The Fund is an investment company that applies the accounting and reporting guidance in the Financial Accounting Standards Board (FASB) Accounting Standards Codification Topic 946, Financial Services — Investment Companies (ASC 946). The financial statements are prepared in accordance with U.S. generally accepted accounting principles (GAAP), which requires management to make certain estimates and assumptions that affect the reported amounts of assets and liabilities, the disclosure of contingent assets and liabilities at the date of the financial statements and the reported amounts of income and expenses during the reporting period. Actual results could differ from those estimates.
The following is a summary of significant accounting policies followed by the Fund in the preparation of its financial statements.
Security Valuation
All equity securities are valued at the close of business of the New York Stock Exchange (NYSE). Equity securities are valued at the last quoted sales price on the principal exchange or market on which they trade, except for securities traded on the NASDAQ Stock Market, which are valued at the NASDAQ official close price. Unlisted securities or listed securities for which there were no
| | | | |
| Semiannual Report 2015 | | | 23 | |
| | |
| |
| | COLUMBIA SELECT GLOBAL EQUITY FUND |
NOTES TO FINANCIAL STATEMENTS (continued)
April 30, 2015 (Unaudited)
sales during the day are valued at the mean of the latest quoted bid and ask prices on such exchanges or markets.
Foreign equity securities are valued based on quotations from the principal market in which such securities are traded. If any foreign security prices are not readily available as a result of limited share activity, the securities are valued at the mean of the latest quoted bid and ask prices on such exchanges or markets. Foreign currency exchange rates are generally determined at 4:00 p.m. Eastern (U.S.) time. Many securities markets and exchanges outside the U.S. close prior to the close of the NYSE; therefore, the closing prices for securities in such markets or on such exchanges may not fully reflect events that occur after such close but before the close of the NYSE. In those situations, foreign securities will be fair valued pursuant to a policy adopted by the Board of Trustees (the Board), including, if available, utilizing a third party pricing service to determine these fair values. The third party pricing service takes into account multiple factors, including, but not limited to, movements in the U.S. securities markets, certain depositary receipts, futures contracts and foreign exchange rates that have occurred subsequent to the close of the foreign exchange or market, to determine a good faith estimate that reasonably reflects the current market conditions as of the close of the NYSE. The fair value of a security is likely to be different from the quoted or published price, if available.
Investments in open-end investment companies, including money market funds, are valued at their net asset value.
Investments for which market quotations are not readily available, or that have quotations which management believes are not reliable, are valued at fair value as determined in good faith under procedures established by and under the general supervision of the Board. If a security or class of securities (such as foreign securities) is valued at fair value, such value is likely to be different from the quoted or published price for the security.
The determination of fair value often requires significant judgment. To determine fair value, management may use assumptions including but not limited to future cash flows and estimated risk premiums. Multiple inputs from various sources may be used to determine fair value.
Foreign Currency Transactions and Translations
The values of all assets and liabilities denominated in foreign currencies are generally translated into U.S. dollars at exchange rates determined at the close of the
NYSE. Net realized and unrealized gains (losses) on foreign currency transactions and translations include gains (losses) arising from the fluctuation in exchange rates between trade and settlement dates on securities transactions, gains (losses) arising from the disposition of foreign currency and currency gains (losses) between the accrual and payment dates on dividends, interest income and foreign withholding taxes.
For financial statement purposes, the Fund does not distinguish that portion of gains (losses) on investments which is due to changes in foreign exchange rates from that which is due to changes in market prices of the investments. Such fluctuations are included with the net realized and unrealized gains (losses) on investments in the Statement of Operations.
Security Transactions
Security transactions are accounted for on the trade date. Cost is determined and gains (losses) are based upon the specific identification method for both financial statement and federal income tax purposes.
Income Recognition
Corporate actions and dividend income are generally recorded net of any non-reclaimable tax withholdings, on the ex-dividend date or upon receipt of ex-dividend notification in the case of certain foreign securities.
Awards from class action litigation are recorded as a reduction of cost basis if the Fund still owns the applicable securities on the payment date. If the Fund no longer owns the applicable securities, the proceeds are recorded as realized gains.
Expenses
General expenses of the Trust are allocated to the Fund and other funds of the Trust based upon relative net assets or other expense allocation methodologies determined by the nature of the expense. Expenses directly attributable to the Fund are charged to the Fund. Expenses directly attributable to a specific class of shares are charged to that share class.
Determination of Class Net Asset Value
All income, expenses (other than class-specific expenses, which are charged to that share class, as shown in the Statement of Operations) and realized and unrealized gains (losses) are allocated to each class of the Fund on a daily basis, based on the relative net assets of each class, for purposes of determining the net asset value of each class.
| | |
| 24 | | Semiannual Report 2015 |
| | |
| |
| COLUMBIA SELECT GLOBAL EQUITY FUND | | |
NOTES TO FINANCIAL STATEMENTS (continued)
April 30, 2015 (Unaudited)
Federal Income Tax Status
The Fund intends to qualify each year as a regulated investment company under Subchapter M of the Internal Revenue Code, as amended, and will distribute substantially all of its taxable income (including net short-term capital gains), if any, for its tax year, and as such will not be subject to federal income taxes. In addition, the Fund intends to distribute in each calendar year substantially all of its net investment income, capital gains and certain other amounts, if any, such that the Fund should not be subject to federal excise tax. Therefore, no federal income or excise tax provision is recorded.
Foreign Taxes
The Fund may be subject to foreign taxes on income, gains on investments or currency repatriation, a portion of which may be recoverable. The Fund will accrue such taxes and recoveries, as applicable, based upon its current interpretation of tax rules and regulations that exist in the markets in which it invests.
Realized gains in certain countries may be subject to foreign taxes at the Fund level, based on statutory rates. The Fund accrues for such foreign taxes on realized and unrealized gains at the appropriate rate for each jurisdiction, as applicable. The amount, if any, is disclosed as a liability on the Statement of Assets and Liabilities.
Distributions to Shareholders
Distributions from net investment income, if any, are declared and paid annually. Net realized capital gains, if any, are distributed along with the income distribution. Income distributions and capital gain distributions are determined in accordance with federal income tax regulations, which may differ from GAAP.
Guarantees and Indemnifications
Under the Trust’s organizational documents and, in some cases, by contract, its officers and trustees are indemnified against certain liabilities arising out of the performance of their duties to the Trust or its funds. In addition, certain of the Fund’s contracts with its service providers contain general indemnification clauses. The Fund’s maximum exposure under these arrangements is unknown since the amount of any future claims that may be made against the Fund cannot be determined, and the Fund has no historical basis for predicting the likelihood of any such claims.
Note 3. Fees and Compensation Paid to Affiliates
Investment Management Fees
Under an Investment Management Services Agreement, Columbia Management Investment Advisers, LLC (the Investment Manager), a wholly-owned subsidiary of Ameriprise Financial, Inc. (Ameriprise Financial), is responsible for the ultimate oversight of investments made by the Fund. The Fund’s subadviser (see Subadvisory Agreement below) has the primary responsibility for the day-to-day portfolio management of the Fund. The investment management fee is an annual fee that is equal to a percentage of the Fund’s average daily net assets that declines from 0.80% to 0.57% as the Fund’s net assets increase. The annualized effective investment management fee rate for the six months ended April 30, 2015 was 0.79% of the Fund’s average daily net assets.
Subadvisory Agreement
The Investment Manager has entered into a Subadvisory Agreement with Threadneedle International Limited (Threadneedle), an affiliate of the Investment Manager and wholly-owned subsidiary of Ameriprise Financial, to serve as the subadviser to the Fund. The Investment Manager compensates Threadneedle to manage the investment of the Fund’s assets.
Administration Fees
Under an Administrative Services Agreement, the Investment Manager also serves as the Fund Administrator. The Fund pays the Fund Administrator an annual fee for administration and accounting services equal to a percentage of the Fund’s average daily net assets that declines from 0.08% to 0.05% as the Fund’s net assets increase. The annualized effective administration fee rate for the six months ended April 30, 2015 was 0.08% of the Fund’s average daily net assets.
Other Expenses
Other expenses are for, among other things, miscellaneous expenses of the Fund or the Board, including payments to a company providing limited administrative services to the Fund and the Board. That company’s expenses include boardroom and office expense, employee compensation, employee health and retirement benefits, and certain other expenses. For the six months ended April 30, 2015, other expenses paid by the Fund to this company were $926.
| | | | |
| Semiannual Report 2015 | | | 25 | |
| | |
| |
| | COLUMBIA SELECT GLOBAL EQUITY FUND |
NOTES TO FINANCIAL STATEMENTS (continued)
April 30, 2015 (Unaudited)
Compensation of Board Members
Board members are compensated for their services to the Fund as disclosed in the Statement of Operations. Under a Deferred Compensation Plan (the Plan), the Board members who are not “interested persons” of the Fund, as defined under the 1940 Act, may elect to defer payment of up to 100% of their compensation. Deferred amounts are treated as though equivalent dollar amounts had been invested in shares of certain funds managed by the Investment Manager. The Fund’s liability for these amounts is adjusted for market value changes and remains in the Fund until distributed in accordance with the Plan.
Transfer Agent Fees
Under a Transfer and Dividend Disbursing Agent Agreement, Columbia Management Investment Services Corp. (the Transfer Agent), an affiliate of the Investment Manager and a wholly-owned subsidiary of Ameriprise Financial, is responsible for providing transfer agency services to the Fund. The Transfer Agent has contracted with Boston Financial Data Services (BFDS) to serve as sub-transfer agent.
The Transfer Agent receives a monthly transfer agency fee based on the number or the average value of accounts, depending on the type of account. In addition, the Transfer Agent also receives sub-transfer agency fees based on a percentage of the average aggregate value of the Fund’s shares maintained in omnibus accounts (other than omnibus accounts for which American Enterprise Investment Services Inc. is the broker of record or accounts where the beneficial shareholder is a customer of Ameriprise Financial Services, Inc., for which the Transfer Agent receives a per account fee). The Transfer Agent pays the fees of BFDS for services as sub-transfer agent and is not entitled to reimbursement for such fees from the Fund (with the exception of out-of-pocket fees).
The Transfer Agent also receives compensation from the Fund for various shareholder services and reimbursements for certain out-of-pocket fees. Class I shares do not pay transfer agency fees. Total transfer agent fees for Class K and Class R5 shares are subject to an annual limitation of not more than 0.05% of the average daily net assets attributable to each share class.
For the six months ended April 30, 2015, the Fund’s annualized effective transfer agent fee rates as a
percentage of average daily net assets of each class were as follows:
| | | | |
Class A | | | 0.22 | % |
Class B | | | 0.22 | |
Class C | | | 0.22 | |
Class K | | | 0.05 | |
Class R | | | 0.22 | |
Class R5 | | | 0.05 | |
Class W | | | 0.22 | |
Class Z | | | 0.22 | |
The Fund and certain other associated investment companies have severally, but not jointly, guaranteed the performance and observance of all the terms and conditions of a lease entered into by Seligman Data Corp. (SDC), the former transfer agent, including the payment of rent by SDC (the Guaranty). SDC was the legacy Seligman funds’ former transfer agent.
The lease and the Guaranty expire in January 2019. At April 30, 2015, the Fund’s total potential future obligation over the life of the Guaranty is $11,221. The liability remaining at April 30, 2015 for non-recurring charges associated with the lease amounted to 6,599 and is recorded as a part of the payable for other expenses in the Statement of Assets and Liabilities.
An annual minimum account balance fee of $20 may apply to certain accounts with a value below the applicable share class’s initial minimum investment requirements to reduce the impact of small accounts on transfer agent fees. These minimum account balance fees are remitted to the Fund and recorded as part of expense reductions in the Statement of Operations. For the six months ended April 30, 2015, no minimum account balance fees were charged by the Fund.
Plan Administration Fees
Under a Plan Administration Services Agreement with the Transfer Agent, the Fund pays an annual fee at a rate of 0.25% of the Fund’s average daily net assets attributable to Class K shares for the provision of various administrative, recordkeeping, communication and educational services.
Distribution Fees
The Fund has an agreement with Columbia Management Investment Distributors, Inc. (the Distributor), an affiliate of the Investment Manager and a wholly-owned subsidiary of Ameriprise Financial, for distribution and shareholder services. Under a Plan and Agreement of
| | |
| 26 | | Semiannual Report 2015 |
| | |
| |
| COLUMBIA SELECT GLOBAL EQUITY FUND | | |
NOTES TO FINANCIAL STATEMENTS (continued)
April 30, 2015 (Unaudited)
Distribution, the Fund pays a fee at an annual rate of up to 0.25% of the Fund’s average daily net assets attributable to Class A and Class W shares, a fee at an annual rate of up to 0.50% of the Fund’s average daily net assets attributable to Class R shares (of which up to 0.25% may be used for shareholder services) and a fee at an annual rate of up to 1.00% of the Fund’s average daily net assets attributable to Class B and Class C shares. For Class B and Class C shares, of the 1.00% fee, up to 0.75% is reimbursed for distribution expenses.
The amount of distribution expenses incurred by the Distributor and not yet reimbursed (unreimbursed expense) was approximately $732,000 and $1,326,000 for Class B and Class C shares, respectively. These amounts are based on the most recent information available as of March 31, 2015, and may be recovered from future payments under the distribution plan or CDSCs. To the extent the unreimbursed expense has been fully recovered, the distribution fee is reduced.
Sales Charges
Sales charges, including front-end charges and CDSCs, received by the Distributor for distributing Fund shares were $72,725 for Class A, $550 for Class B and $478 for Class C shares for the six months ended April 30, 2015.
Expenses Waived/Reimbursed by the Investment Manager and its Affiliates
The Fund’s expense ratio is subject to an expense reimbursement arrangement pursuant to which fees will be waived and/or expenses reimbursed (excluding certain fees and expenses described below), so that the Fund’s net operating expenses, after giving effect to fees waived/expenses reimbursed and any balance credits and/or overdraft charges from the Fund’s custodian, do not exceed the annual rates of:
| | | | | | | | |
| | | Voluntary
Expense Cap
Effective
March 1, 2015 | | | Contractual
Expense Cap
Prior to
March 1, 2015 | |
Class A | | | 1.49 | % | | | 1.50 | % |
Class B | | | 2.24 | | | | 2.25 | |
Class C | | | 2.24 | | | | 2.25 | |
Class I | | | 1.08 | | | | 1.05 | |
Class K | | | 1.38 | | | | 1.35 | |
Class R | | | 1.74 | | | | 1.75 | |
Class R5 | | | 1.13 | | | | 1.10 | |
Class W | | | 1.49 | | | | 1.50 | |
Class Z | | | 1.24 | | | | 1.25 | |
The voluntary expense cap arrangement may be revised or discontinued at any time. Under the arrangements, the following fees and expenses are excluded from the waiver/reimbursement commitment, and therefore will be paid by the Fund, if applicable: taxes (including foreign transaction taxes), expenses associated with investments in affiliated and non-affiliated pooled investment vehicles (including mutual funds and exchange-traded funds), transaction costs and brokerage commissions, costs related to any securities lending program, dividend expenses associated with securities sold short, inverse floater program fees and expenses, transaction charges and interest on borrowed money, interest and extraordinary expenses. Any fees waived and/or expenses reimbursed under the expense reimbursement arrangements described above are not recoverable by the Investment Manager or its affiliates in future periods.
Note 4. Federal Tax Information
The timing and character of income and capital gain distributions are determined in accordance with income tax regulations, which may differ from GAAP because of temporary or permanent book to tax differences.
At April 30, 2015, the cost of investments for federal income tax purposes was approximately $345,491,000 and the aggregate gross approximate unrealized appreciation and depreciation based on that cost was:
| | | | |
Unrealized appreciation | | | $30,139,000 | |
Unrealized depreciation | | | (4,491,000 | ) |
Net unrealized appreciation | | | $25,648,000 | |
The following capital loss carryforwards, determined as of October 31, 2014, may be available to reduce taxable income arising from future net realized gains on investments, if any, to the extent permitted by the Internal Revenue Code:
| | | | |
| Year of Expiration | | Amount ($) | |
2016 | | | 1,476,532 | |
2017 | | | 53,446,454 | |
2019 | | | 7,043,255 | |
Total | | | 61,966,241 | |
Management of the Fund has concluded that there are no significant uncertain tax positions in the Fund that would require recognition in the financial statements. However, management’s conclusion may be subject to review and adjustment at a later date based on factors including, but not limited to, new tax laws, regulations,
| | | | |
| Semiannual Report 2015 | | | 27 | |
| | |
| |
| | COLUMBIA SELECT GLOBAL EQUITY FUND |
NOTES TO FINANCIAL STATEMENTS (continued)
April 30, 2015 (Unaudited)
and administrative interpretations (including relevant court decisions). Generally, the Fund’s federal tax returns for the prior three fiscal years remain subject to examination by the Internal Revenue Service.
Note 5. Portfolio Information
The cost of purchases and proceeds from sales of securities, excluding short-term investments and derivatives, if any, aggregated to $329,577,948 and $345,742,418, respectively, for the six months ended April 30, 2015. The amount of purchase and sale activity impacts the portfolio turnover rate reported in the Financial Highlights.
Note 6. Affiliated Money Market Fund
The Fund invests in Columbia Short-Term Cash Fund, an affiliated money market fund established for the exclusive use by the Fund and other affiliated funds. The income earned by the Fund from such investments is included as Dividends — affiliated issuers in the Statement of Operations. As an investing fund, the Fund indirectly bears its proportionate share of the expenses of Columbia Short-Term Cash Fund.
Note 7. Shareholder Concentration
At April 30, 2015, affiliated shareholders of record owned 76.9% of the outstanding shares of the Fund in one or more accounts. Subscription and redemption activity by concentrated accounts may have a significant effect on the operations of the Fund.
Note 8. Line of Credit
The Fund has entered into a revolving credit facility with a syndicate of banks led by JPMorgan Chase Bank, N.A. whereby the Fund may borrow for the temporary funding of shareholder redemptions or for other temporary or emergency purposes. Pursuant to a December 9, 2014 amendment, the credit facility agreement, which is a collective agreement between the Fund and certain other funds managed by the Investment Manager, severally and not jointly, permits collective borrowings up to $550 million. Interest is charged to each participating fund based on its borrowings at a rate equal to the higher of (i) the overnight federal funds rate plus 1.00% or (ii) the one-month LIBOR rate plus 1.00%. Each borrowing under the credit facility matures no later than 60 days after the date of borrowing. The Fund also pays a commitment fee equal to its pro rata share of the amount of the credit facility at a rate of 0.075% per annum. The commitment fee is included in other expenses in the Statement of Operations. Prior to the
December 9, 2014 amendment, the credit facility agreement permitted borrowings up to $500 million under the same terms and interest rates as described above.
The Fund had no borrowings during the six months ended April 30, 2015.
Note 9. Significant Risks
Health Care Sector Risk
Sector risk occurs when a fund invests a significant portion of its assets in securities of companies conducting business in a related group of industries within an economic sector. Companies in the same economic sector may be similarly affected by economic, regulatory, political or market events or conditions, making a fund more vulnerable to unfavorable developments in that economic sector than funds that invest more broadly. The Fund may be more susceptible to the particular risks that may affect companies in the health care sector than if it were invested in a wider variety of companies in unrelated sectors.
Foreign Securities and Emerging Market Countries Risk
Investing in foreign securities may include certain risks and considerations not typically associated with investing in U.S. securities, such as fluctuating currency values and changing local and regional economic, political and social conditions, which may result in greater market volatility. In addition, certain foreign securities may not be as liquid as U.S. securities. Investing in emerging markets may accentuate these risks. These countries are also more likely to experience high levels of inflation, deflation or currency devaluation which could hurt their economies and securities markets. To the extent that the Fund concentrates its investment exposure to any one or a few specific countries, the Fund will be particularly susceptible to the various conditions, events or other factors impacting those countries and may, therefore, have a greater risk than that of a fund which is more geographically diversified.
Note 10. Subsequent Events
Management has evaluated the events and transactions that have occurred through the date the financial statements were issued and noted no items requiring adjustment of the financial statements or additional disclosure.
| | |
| 28 | | Semiannual Report 2015 |
| | |
| |
| COLUMBIA SELECT GLOBAL EQUITY FUND | | |
NOTES TO FINANCIAL STATEMENTS (continued)
April 30, 2015 (Unaudited)
Note 11. Information Regarding Pending and Settled Legal Proceedings
In December 2005, without admitting or denying the allegations, American Express Financial Corporation (AEFC, which is now known as Ameriprise Financial, Inc. (Ameriprise Financial)) entered into settlement agreements with the Securities and Exchange Commission (SEC) and Minnesota Department of Commerce (MDOC) related to market timing activities. As a result, AEFC was censured and ordered to cease and desist from committing or causing any violations of certain provisions of the Investment Advisers Act of 1940, the Investment Company Act of 1940, and various Minnesota laws. AEFC agreed to pay disgorgement of $10 million and civil money penalties of $7 million. AEFC also agreed to retain an independent distribution consultant to assist in developing a plan for distribution of all disgorgement and civil penalties ordered by the SEC in accordance with various undertakings detailed at www.sec.gov/litigation/admin/ia-2451.pdf. Ameriprise Financial and its affiliates have cooperated with the SEC and the MDOC in these legal proceedings, and have made regular reports to the Funds’ Boards of Trustees.
Ameriprise Financial and certain of its affiliates have historically been involved in a number of legal, arbitration and regulatory proceedings, including routine litigation, class actions, and governmental actions, concerning matters arising in connection with the conduct of their business activities. Ameriprise Financial believes that the Funds are not currently the subject of, and that neither Ameriprise Financial nor any of its affiliates are the subject of, any pending legal, arbitration or regulatory proceedings that are likely to have a material adverse effect on the Funds or the ability of Ameriprise Financial or its affiliates to perform under their contracts with the Funds. Ameriprise Financial is required to make quarterly (10-Q), annual (10-K) and, as necessary, 8-K filings with the Securities and Exchange Commission on legal and regulatory matters that relate to Ameriprise Financial and its affiliates. Copies of these filings may be obtained by accessing the SEC website at www.sec.gov.
There can be no assurance that these matters, or the adverse publicity associated with them, will not result in increased fund redemptions, reduced sale of fund shares or other adverse consequences to the Funds. Further, although we believe proceedings are not likely to have a material adverse effect on the Funds or the ability of Ameriprise Financial or its affiliates to perform under their contracts with the Funds, these proceedings are
subject to uncertainties and, as such, we are unable to estimate the possible loss or range of loss that may result. An adverse outcome in one or more of these proceedings could result in adverse judgments, settlements, fines, penalties or other relief that could have a material adverse effect on the consolidated financial condition or results of operations of Ameriprise Financial.
| | | | |
| Semiannual Report 2015 | | | 29 | |
| | |
| |
| | COLUMBIA SELECT GLOBAL EQUITY FUND |
APPROVAL OF INVESTMENT MANAGEMENT SERVICES AND SUBADVISORY AGREEMENTS
Columbia Management Investment Advisers, LLC (Columbia Management or the Investment Manager), a wholly-owned subsidiary of Ameriprise Financial, Inc. (Ameriprise Financial), serves as the investment manager to Columbia Select Global Equity Fund (the Fund). Under an investment management services agreement (the IMS Agreement), Columbia Management provides investment advice and other services to the Fund and other funds distributed by Columbia Management Investment Distributors, Inc. (collectively, the Funds). In addition, under a Subadvisory Agreement (the Subadvisory Agreement) between Columbia Management and Threadneedle International Limited (the Subadviser), affiliate of Columbia Management, the Subadviser has provided portfolio management and related services for the Fund.
The Fund’s Board of Trustees (the Board), including the independent Board members (the Independent Trustees), considered the renewal of the IMS Agreement and the Subadvisory Agreement (together, the Advisory Agreements) for a two-month period (Short-Term Period) in order to align the Advisory Agreements with the review cycle of other funds in the Columbia family of funds. Columbia Management prepared detailed reports for the Board and its Contracts Committee in January, March and April 2015, including reports based on analyses of data provided by an independent organization (Lipper) and a comprehensive response to each item of information requested by independent legal counsel to the Independent Trustees (Independent Legal Counsel) in a letter to the Investment Manager, to assist the Board in making this determination. In addition, throughout the year, the Board (or its committees) regularly meets with portfolio management teams and senior management personnel, and reviews information prepared by Columbia Management addressing the services Columbia Management provides and Fund performance. The Board also accords appropriate weight to the work, deliberations and conclusions of the Contracts Committee, the Investment Review Committee and the Compliance Committee in determining whether to continue the Advisory Agreements.
The Board, at its April 13-15, 2015 in-person Board meeting (the April Meeting), considered the renewal of the Advisory Agreements for the Short-Term Period. At the April Meeting, Independent Legal Counsel reviewed with the Independent Trustees various factors relevant to the Board’s consideration of advisory and subadvisory agreements and the Board’s legal responsibilities related to such consideration. Following an analysis and discussion of the factors identified below, the Board, including all of the Independent Trustees, approved the renewal of each of the Advisory Agreements for the Short-Term Period.
Nature, Extent and Quality of Services Provided by Columbia Management and the Subadviser
The Board analyzed various reports and presentations it had received detailing the services performed by Columbia Management and the Subadviser, as well as their history, reputation, expertise, resources and relative capabilities, and the qualifications of their personnel.
With respect to Columbia Management, the Board specifically considered many developments during the past year concerning the services provided by Columbia Management. The Board took into account the information it received and reviewed concerning Columbia Management’s ongoing oversight and monitoring of the subadvisers, observing the broad scope of services provided by Columbia Management to each subadvised Fund, including, among other noted services, investment, risk and compliance oversight. The Board also took into account the Subadviser oversight structure and the Columbia Management team dedicated thereto as well as the contemplated enhancements to the team and its resources. The Board also noted the information it received concerning Columbia Management’s ability to retain its key portfolio management personnel.
In connection with the Board’s evaluation of the overall package of services provided by Columbia Management, the Board also considered the quality of administrative services provided to the Fund by Columbia Management. In evaluating the quality of services provided under the IMS Agreement and the Fund’s Administrative Services Agreement, the Board also took into account the organization and strength of the Fund’s and its service providers’ compliance programs. The Board also reviewed the financial condition of Columbia Management and its affiliates and their ability to carry out their responsibilities under the IMS Agreement and the Fund’s other service agreements with affiliates of Ameriprise Financial, observing the financial strength of Ameriprise Financial, with its solid balance sheet. In addition, the Board discussed the acceptability of the terms of the IMS Agreement for the Short-Term Period.
Based on the foregoing, and based on other information received (both oral and written, including the information on investment performance referenced below) and other considerations, the Board concluded that the services being performed by Columbia Management and its affiliates were acceptable for the Short-Term Period.
| | |
| 30 | | Semiannual Report 2015 |
| | |
| |
| COLUMBIA SELECT GLOBAL EQUITY FUND | | |
APPROVAL OF INVESTMENT MANAGEMENT SERVICES AND SUBADVISORY AGREEMENTS (continued)
With respect to the Subadviser, the Board observed that it had previously approved the Subadviser’s code of ethics and compliance program, that the Chief Compliance Officer of the Fund continues to monitor the code and the program, and that no material concerns have been reported. The Board also considered the Subadviser’s organizational strength and resources, portfolio management team depth and capabilities and investment process. The Board also considered the Subadviser’s capability and wherewithal to carry out its responsibilities under the Subadvisory Agreement for the Short-Term Period. In addition, the Board discussed the acceptability of the terms of the Subadvisory Agreement for the Short-Term Period. The Board noted that the terms of the Subadvisory Agreement are generally consistent with the terms of other subadviser agreements for subadvisers who manage other funds managed by the Investment Manager. Based on the foregoing, and based on other information received (both oral and written) and other considerations, including, in particular, the performance of the Fund (discussed below), as well as the Investment Manager’s recommendation that the Board approve renewal of the Subadvisory Agreement with the Subadviser the Board concluded that the services being performed under the Subadvisory Agreement were acceptable for purposes of renewal for the Short-Term Period.
Investment Performance
For purposes of evaluating the nature, extent and quality of services provided under the Advisory Agreements, the Board carefully reviewed the investment performance of the Fund. In this regard, the Board considered detailed reports providing the results of analyses performed by an independent organization showing, for various periods, the performance of the Fund, the performance of a benchmark index, the percentage ranking of the Fund among its comparison group and the net assets of the Fund. Additionally, the Board reviewed the performance of the Subadviser and Columbia Management’s process for monitoring the Subadviser. The Board considered, in particular, management’s rationale for recommending the continued retention of the Subadviser. The Board observed that for purposes of approving the Advisory Agreements for the Short-Term Period, the Fund’s performance was acceptable.
Comparative Fees, Costs of Services Provided and the Profits Realized by Columbia Management, its Affiliates and the Subadviser from their Relationships with the Fund
The Board reviewed comparative fees and the costs of services provided under each of the Advisory Agreements. The Board members considered detailed comparative information set forth in an annual report on fees and expenses, including, among other things, data (based on analyses conducted by an independent organization) showing a comparison of the Fund’s expenses with median expenses paid by funds in its comparative peer universe, as well as data showing the Fund’s contribution to Columbia Management’s profitability.
The Board accorded particular weight to the notion that the level of fees should reflect a rational pricing model applied consistently across the various product lines in the Fund family, while assuring that the overall fees for each Fund (with few defined exceptions) are generally in line with the “pricing philosophy” currently in effect (i.e., that the total expense ratio of the Fund is no higher than the median expense ratio of funds in the same comparison universe of the Fund).
Additionally, the Board reviewed the level of subadvisory fees paid to the Subadviser, noting that the fees are paid by the Investment Manager and do not impact the fees paid by the Fund. The Board observed that the subadvisory fee level for the Subadviser was generally comparable to those charged by other subadvisers to similar funds managed by the Investment Manager. The Board also reviewed fee rates charged by the Subadviser to other client accounts.
The Board also considered the expected profitability of Columbia Management and its affiliates in connection with Columbia Management providing investment management services to the Fund. In this regard, the Board referred to a detailed profitability report, discussing the profitability to Columbia Management and Ameriprise Financial from managing, operating and distributing the Funds. The Board noted that the fees paid by the Funds should permit the Investment Manager to offer competitive compensation to its personnel, make necessary investments in its business and earn an appropriate profit. For purposes of approving the Advisory Agreements for the Short-Term Period, the Board concluded that the investment management service and subadvisory fees were fair and reasonable, observing that the profitability levels also seemed reasonable.
| | | | |
| Semiannual Report 2015 | | | 31 | |
| | |
| |
| | COLUMBIA SELECT GLOBAL EQUITY FUND |
APPROVAL OF INVESTMENT MANAGEMENT SERVICES AND SUBADVISORY AGREEMENTS (continued)
Economies of Scale to be Realized
The Board also considered the economies of scale that might be realized by Columbia Management as the Fund grows and took note of the extent to which Fund shareholders might also benefit from such growth. In this regard, the Board took into account that IMS fees decline as Fund assets exceed various breakpoints.
Based on the foregoing, the Board, including all of the Independent Trustees, concluded that, for purposes of its consideration of the renewal of the Advisory Agreements for the Short-Term Period, fees payable under the Advisory Agreements were fair and reasonable in light of the extent and quality of services provided. In reaching this conclusion, no single factor was determinative. The Board noted its understanding that it would undertake the full consideration of renewal of the Advisory Agreements for the full annual period at its June 2015 meetings. On April 15, 2015, the Board, including all of the Independent Trustees, approved the renewal of the Advisory Agreements for the Short-Term Period.
| | |
| 32 | | Semiannual Report 2015 |
| | |
| |
| COLUMBIA SELECT GLOBAL EQUITY FUND | | |
IMPORTANT INFORMATION ABOUT THIS REPORT
Each fund mails one shareholder report to each shareholder address. If you would like more than one report, please call shareholder services at 800.345.6611 and additional reports will be sent to you.
The policy of the Board is to vote the proxies of the companies in which each fund holds investments consistent with the procedures as stated in the Statement of Additional Information (SAI). You may obtain a copy of the SAI without charge by calling 800.345.6611; contacting your financial intermediary; visiting columbiathreadneedle.com/us; or searching the website of the Securities and Exchange Commission (SEC) at sec.gov. Information regarding how each fund voted proxies relating to portfolio securities is filed with the SEC by August 31st for the most recent 12-month period ending June 30th of that year, and is available without charge by visiting columbiathreadneedle.com/us, or searching the website of the SEC at sec.gov.
Each fund files a complete schedule of portfolio holdings with the SEC for the first and third quarters of each fiscal year on Form N-Q. Each fund’s Form N-Q is available on the SEC’s website at sec.gov and may be reviewed and copied at the SEC’s Public Reference Room in Washington, D.C. Information on the operation of the Public Reference Room may be obtained by calling 800.SEC.0330. Each fund’s complete schedule of portfolio holdings, as filed on Form N-Q, can also be obtained without charge, upon request, by calling 800.345.6611.
| | | | |
| Semiannual Report 2015 | | | 33 | |
Columbia Select Global Equity Fund
P.O. Box 8081
Boston, MA 02266-8081
This information is for use with concurrent or prior delivery of a fund prospectus. Please read and consider the investment objectives, risks, charges and expenses for any fund carefully before investing. For a prospectus and summary prospectus, which contains this and other important information about the Fund, go to columbiathreadneedle.com/us. The Fund is distributed by Columbia Management Investment Distributors, Inc., member FINRA, and managed by Columbia Management Investment Advisers, LLC.
Columbia Threadneedle Investments (Columbia Threadneedle) is the global brand name of the Columbia and Threadneedle group of companies. All rights reserved. Columbia Management Investment Distributors, Inc., 225 Franklin Street, Boston, MA 02110-2804
© 2015 Columbia Management Investment Advisers, LLC.
columbiathreadneedle.com/us
SAR155_10_E01_(06/15)

SEMIANNUAL REPORT
April 30, 2015

COLUMBIA ASIA PACIFIC EX-JAPAN FUND


ABOUT COLUMBIA THREADNEEDLE INVESTMENTS
Columbia Threadneedle Investments is a leading global asset management group that provides a broad range of actively managed investment strategies and solutions for individual, institutional and corporate clients around the world.
With more than 2,000 people, including over 450 investment professionals based in North America, Europe and Asia, we manage $506 billion* of assets across developed and emerging market equities, fixed income, asset allocation solutions and alternatives. We are the 12th largest manager of long-term mutual fund assets in the U.S.** and the 5th largest manager of retail funds in the U.K.***
Our priority is the investment success of our clients. We aim to deliver the investment outcomes they expect through an investment approach that is team-based, performance-driven and risk-aware. Our culture is dynamic and interactive. By sharing our insights across asset classes and geographies, we generate richer perspectives on global, regional and local investment landscapes. The ability to exchange and debate investment ideas in a collaborative environment enriches our teams’ investment processes. More importantly, it results in better informed investment decisions for our clients.
Columbia funds are distributed by Columbia Management Investment Distributors, Inc., member FINRA, and managed by Columbia Management Investment Advisers, LLC.
Columbia Threadneedle Investments (Columbia Threadneedle) is the global brand name of the Columbia and Threadneedle group of companies.
| * | | In U.S. dollars as of March 31, 2015. Source: Ameriprise Q1 Earnings Release. Includes all assets managed by entities in the Columbia and Threadneedle groups of companies. |
Contact us for more current data.
| ** | | Source: ICI as of March 31, 2015 for Columbia Management Investment Advisers, LLC. |
| *** | | Source: Investment Association as of March 2015 for Threadneedle Asset Management Limited. |
© 2015 Columbia Management Investment Advisers, LLC. All rights reserved.
Not part of the shareholder report
PRESIDENT’S MESSAGE

Dear Shareholder,
In a world that is changing faster than ever before, investors want asset managers who offer a global perspective while generating strong and sustainable returns. To that end, Columbia Management, in conjunction with its U.K.-based affiliate, Threadneedle Investments, has rebranded to Columbia Threadneedle Investments. The new global brand represents the combined capabilities, resources and reach of the global group, offering investors access to the best of both firms.
With a presence in 18 countries and more than 450 investment professionals*, our collective perspective and world view as Columbia Threadneedle Investments gives us deeper insight into what might affect the real-life financial outcomes clients are seeking. Putting our views into a global context enables us to build richer perspectives and create the right solutions, and provides us with enhanced capabilities to deliver consistent investment performance, which may ultimately lead to better investor outcomes.
As a result of the rebrand, you will begin to see our new logo and colors reflected in printed materials, such as this shareholder report, as well as on our new website — columbiathreadneedle.com/us. We encourage you to visit us online and view a new video on the “About Us” tab that speaks to the strength of the firm.
While we are introducing a new brand, in many ways, the investment company you know well has not changed. The following remain in effect:
| n | | Fund and strategy names |
| n | | Established investment teams, philosophies and processes |
| n | | Account services, features, servicing phone numbers and mailing addresses |
| n | | Columbia Management Investment Distributors as distributor and Columbia Management Investment Advisers as investment adviser |
We recognize that the money we manage represents the hard work and savings of people like you, and that everyone has different ambitions and different definitions of success. Investors have varying goals — funding their children’s education, enjoying their retirement, putting money aside for unexpected events, and more. Whatever your ambitions, we believe our wide range of investment products and solutions can help give you confidence that you will reach your goals.
The world is constantly changing, but our priority remains the same: to help you secure your finances, meet your goals and achieve success. Thank you for your continued investment with us. Our service representatives are available at 800.345.6611 to help with any questions.
Sincerely,

Christopher O. Petersen
President, Columbia Funds
Investors should consider the investment objectives, risks, charges and expenses of a mutual fund carefully before investing. For a free prospectus and summary prospectus, which contains this and other important information about a fund, visit columbiathreadneedle.com/us. The prospectus should be read carefully before investing.
* Source: Ameriprise as of December 1, 2014
Columbia Funds are distributed by Columbia Management Investment Distributors, Inc., member FINRA, and managed by Columbia Management Investment Advisers, LLC.
© 2015 Columbia Management Investment Advisers, LLC. All rights reserved.
Semiannual Report 2015
| | |
| |
| | COLUMBIA ASIA PACIFIC EX-JAPAN FUND |
TABLE OF CONTENTS
Fund Investment Manager
Columbia Management Investment
Advisers, LLC
225 Franklin Street
Boston, MA 02110
Fund Distributor
Columbia Management Investment
Distributors, Inc.
225 Franklin Street
Boston, MA 02110
Fund Transfer Agent
Columbia Management Investment
Services Corp.
P.O. Box 8081
Boston, MA 02266-8081
For more information about any of the funds, please visit columbiathreadneedle.com/us or call 800.345.6611. Customer Service Representatives are available to answer your questions Monday through Friday from 8 a.m. to 7 p.m. Eastern time.
The views expressed in this report reflect the current views of the respective parties. These views are not guarantees of future performance and involve certain risks, uncertainties and assumptions that are difficult to predict, so actual outcomes and results may differ significantly from the views expressed. These views are subject to change at any time based upon economic, market or other conditions and the respective parties disclaim any responsibility to update such views. These views may not be relied on as investment advice and, because investment decisions for a Columbia fund are based on numerous factors, may not be relied on as an indication of trading intent on behalf of any particular Columbia fund. References to specific securities should not be construed as a recommendation or investment advice.
Semiannual Report 2015
| | |
| |
| COLUMBIA ASIA PACIFIC EX-JAPAN FUND | | |
PERFORMANCE OVERVIEW
(Unaudited)
Performance Summary
| n | | Columbia Asia Pacific ex-Japan Fund (the Fund) Class A shares returned 6.94% excluding sales charges for the six-month period that ended April 30, 2015. |
| n | | The Fund outperformed its benchmark, the MSCI All Country (AC) Asia Pacific ex-Japan Index (Net), which returned 6.79% for the same six months. |
| | | | | | | | | | | | | | | | | | |
Average Annual Total Returns (%) (for period ended April 30, 2015) | |
| | | Inception | | 6 Months
Cumulative | | | 1 Year | | | 5 Years | | | Life | |
Class A* | | 09/27/10 | | | | | | | | | | | | | | | | |
Excluding sales charges | | | | | 6.94 | | | | 13.32 | | | | 6.68 | | | | 9.75 | |
Including sales charges | | | | | 0.79 | | | | 6.80 | | | | 5.42 | | | | 8.63 | |
Class C* | | 09/27/10 | | | | | | | | | | | | | | | | |
Excluding sales charges | | | | | 6.55 | | | | 12.50 | | | | 5.84 | | | | 8.89 | |
Including sales charges | | | | | 5.55 | | | | 11.50 | | | | 5.84 | | | | 8.89 | |
Class I* | | 09/27/10 | | | 7.30 | | | | 13.99 | | | | 7.13 | | | | 10.20 | |
Class R* | | 09/27/10 | | | 6.85 | | | | 13.02 | | | | 6.35 | | | | 9.42 | |
Class R5 | | 07/15/09 | | | 7.19 | | | | 13.78 | | | | 7.07 | | | | 10.15 | |
Class Z* | | 09/27/10 | | | 7.11 | | | | 13.64 | | | | 6.90 | | | | 9.98 | |
MSCI AC Asia Pacific ex-Japan Index (Net) | | | | | 6.79 | | | | 11.39 | | | | 6.75 | | | | 11.23 | |
Returns for Class A are shown with and without the maximum initial sales charge of 5.75%. Returns for Class C are shown with and without the 1.00% contingent deferred sales charge for the first year only. The Fund’s other classes are not subject to sales charges and have limited eligibility. Please see the Fund’s prospectus for details. Performance for different share classes will vary based on differences in sales charges and fees associated with each class. All results shown assume reinvestment of distributions during the period. Returns do not reflect the deduction of taxes that a shareholder may pay on Fund distributions or on the redemption of Fund shares. Performance results reflect the effect of any fee waivers or reimbursements of Fund expenses by Columbia Management Investment Advisers, LLC and/or any of its affiliates. Absent these fee waivers or expense reimbursement arrangements, performance results would have been lower.
The performance information shown represents past performance and is not a guarantee of future results. The investment return and principal value of your investment will fluctuate so that your shares, when redeemed, may be worth more or less than their original cost. Current performance may be lower or higher than the performance information shown. You may obtain performance information current to the most recent month-end by contacting your financial intermediary, visiting columbiathreadneedle.com/us or calling 800.345.6611.
| * | The returns shown for periods prior to the share class inception date (including returns for the Life of the Fund, if shown, which are since Fund inception) include the returns of the Fund’s oldest share class. These returns are adjusted to reflect any higher class-related operating expenses of the newer share classes, as applicable. Please visit columbiathreadneedle.com/us/investment-products/mutual-funds/appended-performance for more information. |
The MSCI AC Asia Pacific ex-Japan Index (Net) is a free float-adjusted market capitalization weighted index that is designed to measure the equity market performance of Asia, excluding Japan.
Indices are not available for investment, are not professionally managed and do not reflect sales charges, fees, brokerage commissions, taxes (except the MSCI AC Asia Pacific ex-Japan Index (Net), which reflects reinvested dividends net of withholding taxes) or other expenses of investing. Securities in the Fund may not match those in an index.
| | |
| |
| | COLUMBIA ASIA PACIFIC EX-JAPAN FUND |
PORTFOLIO OVERVIEW
(Unaudited)
Portfolio Management
Threadneedle International Limited
Vanessa Donegan
George Gosden
Morningstar Style Box™
The Morningstar Style Box™ is based on a fund’s portfolio holdings. For equity funds, the vertical axis shows the market capitalization of the stocks owned, and the horizontal axis shows investment style (value, blend, or growth). Information shown is based on the most recent data provided by Morningstar.
© 2015 Morningstar, Inc. All rights reserved. The Morningstar information contained herein: (1) is proprietary to Morningstar and/or its content providers; (2) may not be copied or distributed; and (3) is not warranted to be accurate, complete or timely. Neither Morningstar nor its content providers are responsible for any damages or losses arising from any use of this information.
| | | | |
Top Ten Holdings (%)
(at April 30, 2015) | |
Tencent Holdings Ltd. (China) | | | 3.4 | |
Samsung Electronics Co., Ltd. (South Korea) | | | 3.3 | |
AIA Group Ltd. (Hong Kong) | | | 3.1 | |
China Mobile Ltd. (China) | | | 2.9 | |
Westpac Banking Corp. (Australia) | | | 2.5 | |
Ping An Insurance Group Co. of China Ltd., Class H (China) | | | 2.2 | |
Taiwan Semiconductor Manufacturing Co., Ltd., ADR (Taiwan) | | | 2.1 | |
Taiwan Semiconductor Manufacturing Co., Ltd. (Taiwan) | | | 2.0 | |
China Construction Bank Corp., Class H (China) | | | 1.8 | |
CK Hutchison Holdings Ltd. (Hong Kong) | | | 1.7 | |
Percentages indicated are based upon total investments (excluding Money Market Funds and short term cash equivalents).
For further detail about these holdings, please refer to the section entitled “Portfolio of Investments.”
Fund holdings are as of the date given, are subject to change at any time, and are not recommendations to buy or sell any security.
| | | | |
Portfolio Breakdown (%)
(at April 30, 2015) | |
Common Stocks | | | 98.4 | |
Consumer Discretionary | | | 8.0 | |
Consumer Staples | | | 3.5 | |
Energy | | | 3.1 | |
Financials | | | 37.4 | |
Health Care | | | 4.5 | |
Industrials | | | 6.4 | |
Information Technology | | | 21.4 | |
Materials | | | 5.6 | |
Telecommunication Services | | | 6.3 | |
Utilities | | | 2.2 | |
Money Market Funds | | | 1.6 | |
Total | | | 100.0 | |
Percentages indicated are based upon total investments. The Fund’s portfolio composition is subject to change.
| | |
| |
| COLUMBIA ASIA PACIFIC EX-JAPAN FUND | | |
PORTFOLIO OVERVIEW (continued)
(Unaudited)
| | | | |
Country Breakdown (%)
(at April 30, 2015) | |
Australia | | | 18.9 | |
China | | | 26.4 | |
Hong Kong | | | 10.7 | |
India | | | 7.1 | |
Indonesia | | | 3.2 | |
Luxembourg | | | 0.3 | |
Malaysia | | | 1.3 | |
Philippines | | | 2.6 | |
Singapore | | | 2.6 | |
South Korea | | | 11.1 | |
Taiwan | | | 12.2 | |
Thailand | | | 2.0 | |
United States(a) | | | 1.6 | |
Total | | | 100.0 | |
Country Breakdown is based primarily on issuer’s place of organization/incorporation. Percentages indicated are based upon total investments. The Fund’s portfolio composition is subject to change.
| (a) | Includes investments in Money Market Funds. |
| | |
| |
| | COLUMBIA ASIA PACIFIC EX-JAPAN FUND |
UNDERSTANDING YOUR FUND’S EXPENSES
(Unaudited)
As an investor, you incur two types of costs. There are transaction costs, which generally include sales charges on purchases and may include redemption fees. There are also ongoing costs, which generally include management fees, distribution and/or service fees, and other fund expenses. The following information is intended to help you understand your ongoing costs (in dollars) of investing in the Fund and to help you compare these costs with the ongoing costs of investing in other mutual funds.
Analyzing Your Fund’s Expenses
To illustrate these ongoing costs, we have provided examples and calculated the expenses paid by investors in each share class of the Fund during the period. The actual and hypothetical information in the table is based on an initial investment of $1,000 at the beginning of the period indicated and held for the entire period. Expense information is calculated two ways and each method provides you with different information. The amount listed in the “Actual” column is calculated using the Fund’s actual operating expenses and total return for the period. You may use the Actual information, together with the amount invested, to estimate the expenses that you paid over the period. Simply divide your account value by $1,000 (for example, an $8,600 account value divided by $1,000 = 8.6), then multiply the results by the expenses paid during the period under the “Actual” column. The amount listed in the “Hypothetical” column assumes a 5% annual rate of return before expenses (which is not the Fund’s actual return) and then applies the Fund’s actual expense ratio for the period to the hypothetical return. You should not use the hypothetical account values and expenses to estimate either your actual account balance at the end of the period or the expenses you paid during the period. See “Compare With Other Funds” below for details on how to use the hypothetical data.
Compare With Other Funds
Since all mutual funds are required to include the same hypothetical calculations about expenses in shareholder reports, you can use this information to compare the ongoing cost of investing in the Fund with other funds. To do so, compare the hypothetical example with the 5% hypothetical examples that appear in the shareholder reports of other funds. As you compare hypothetical examples of other funds, it is important to note that hypothetical examples are meant to highlight the ongoing costs of investing in a fund only and do not reflect any transaction costs, such as sales charges, or redemption or exchange fees. Therefore, the hypothetical calculations are useful in comparing ongoing costs only, and will not help you determine the relative total costs of owning different funds. If transaction costs were included in these calculations, your costs would be higher.
November 1, 2014 – April 30, 2015
| | | | | | | | | | | | | | | | | | | | | | | | | | | | |
| | | Account Value at the
Beginning of the
Period ($) | | | Account Value at the
End of the
Period ($) | | | Expenses Paid During
the Period ($) | | | Fund’s Annualized
Expense Ratio (%) | |
| | | | Actual | | | | Hypothetical | | | | Actual | | | | Hypothetical | | | | Actual | | | | Hypothetical | | | | Actual | |
Class A | | | 1,000.00 | | | | 1,000.00 | | | | 1,069.40 | | | | 1,018.15 | | | | 6.88 | | | | 6.71 | | | | 1.34 | |
Class C | | | 1,000.00 | | | | 1,000.00 | | | | 1,065.50 | | | | 1,014.33 | | | | 10.81 | | | | 10.54 | | | | 2.11 | |
Class I | | | 1,000.00 | | | | 1,000.00 | | | | 1,073.00 | | | | 1,020.78 | | | | 4.16 | | | | 4.06 | | | | 0.81 | |
Class R | | | 1,000.00 | | | | 1,000.00 | | | | 1,068.50 | | | | 1,016.81 | | | | 8.26 | | | | 8.05 | | | | 1.61 | |
Class R5 | | | 1,000.00 | | | | 1,000.00 | | | | 1,071.90 | | | | 1,020.23 | | | | 4.73 | | | | 4.61 | | | | 0.92 | |
Class Z | | | 1,000.00 | | | | 1,000.00 | | | | 1,071.10 | | | | 1,019.34 | | | | 5.65 | | | | 5.51 | | | | 1.10 | |
Expenses paid during the period are equal to the annualized expense ratio for each class as indicated above, multiplied by the average account value over the period and then multiplied by the number of days in the Fund’s most recent fiscal half year and divided by 365.
Expenses do not include fees and expenses incurred indirectly by the Fund from its investment in underlying funds, including affiliated and non-affiliated pooled investment vehicles, such as mutual funds and exchange-traded funds.
| | |
| |
| COLUMBIA ASIA PACIFIC EX-JAPAN FUND | | |
PORTFOLIO OF INVESTMENTS
April 30, 2015 (Unaudited)
(Percentages represent value of investments compared to net assets)
| | | | | | | | |
| Common Stocks 97.6% | |
| Issuer | | Shares | | | Value ($) | |
AUSTRALIA 18.8% | |
Amcor Ltd. | | | 1,647,609 | | | | 17,540,604 | |
| | |
Ansell Ltd. | | | 392,343 | | | | 8,074,489 | |
| | |
Australia and New Zealand Banking Group Ltd. | | | 905,653 | | | | 24,233,344 | |
| | |
BHP Billiton Ltd. | | | 834,043 | | | | 21,298,440 | |
| | |
Commonwealth Bank of Australia | | | 371,224 | | | | 25,984,557 | |
| | |
CSL Ltd. | | | 285,914 | | | | 20,495,266 | |
| | |
Healthscope Ltd. | | | 5,735,243 | | | | 12,853,053 | |
| | |
James Hardie Industries PLC | | | 932,474 | | | | 10,710,034 | |
| | |
Lend Lease Group | | | 1,211,178 | | | | 15,303,571 | |
| | |
Macquarie Group Ltd. | | | 17,006 | | | | 1,042,000 | |
| | |
Macquarie Group Ltd. | | | 313,655 | | | | 19,218,428 | |
| | |
National Australia Bank Ltd. | | | 178,339 | | | | 5,163,874 | |
| | |
QBE Insurance Group Ltd. | | | 1,455,889 | | | | 15,702,855 | |
| | |
Rio Tinto Ltd. | | | 348,335 | | | | 15,702,005 | |
| | |
Spotless Group Holdings Ltd. | | | 7,250,999 | | | | 13,029,544 | |
| | |
Suncorp Group Ltd. | | | 914,106 | | | | 9,453,111 | |
| | |
Telstra Corp., Ltd. | | | 2,584,432 | | | | 12,704,306 | |
| | |
Westpac Banking Corp. | | | 1,339,764 | | | | 38,492,324 | |
| | |
Woodside Petroleum Ltd. | | | 272,089 | | | | 7,503,458 | |
| | |
Woolworths Ltd. | | | 176,837 | | | | 4,105,738 | |
| | | | | | | | | |
Total | | | | | | | 298,611,001 | |
| | |
| | | | | | | | |
CHINA 26.1% | |
Alibaba Group Holding Ltd., ADR(a) | | | 53,858 | | | | 4,378,117 | |
| | |
Baidu, Inc., ADR(a) | | | 66,138 | | | | 13,246,119 | |
| | |
Bank of China Ltd., Class H | | | 31,667,000 | | | | 21,698,339 | |
| | |
Bitauto Holdings Ltd., ADR(a) | | | 40,130 | | | | 2,386,932 | |
| | |
China Construction Bank Corp., Class H | | | 28,317,380 | | | | 27,488,664 | |
| | |
China Gas Holdings Ltd. | | | 3,948,000 | | | | 6,975,509 | |
| | |
China Mengniu Dairy Co., Ltd. | | | 1,388,000 | | | | 7,029,050 | |
| | |
China Mobile Ltd. | | | 3,102,000 | | | | 44,306,753 | |
| | |
China Overseas Land & Investment Ltd. | | | 5,482,000 | | | | 22,834,627 | |
| | |
China Petroleum & Chemical Corp., Class H | | | 15,014,000 | | | | 14,169,709 | |
| | |
China Unicom Hong Kong Ltd. | | | 4,156,000 | | | | 7,805,507 | |
| | |
Chongqing Changan Automobile Co., Ltd., Class B | | | 1,279,430 | | | | 4,197,997 | |
| | |
CNOOC Ltd. | | | 6,317,000 | | | | 10,771,826 | |
| | |
CSPC Pharmaceutical Group Ltd. | | | 1,626,000 | | | | 1,690,920 | |
| | |
Great Wall Motor Co., Ltd., Class H | | | 1,526,500 | | | | 11,582,442 | |
| | |
Guangdong Investment Ltd. | | | 6,360,000 | | | | 9,483,805 | |
| | |
Haier Electronics Group Co., Ltd. | | | 2,690,000 | | | | 7,738,131 | |
| | | | | | | | |
| Common Stocks (continued) | |
| Issuer | | Shares | | | Value ($) | |
Haitong Securities Co., Ltd., Class H | | | 4,556,400 | | | | 14,881,638 | |
| | |
Industrial & Commercial Bank of China Ltd., Class H | | | 26,608,000 | | | | 23,081,399 | |
| | |
Lenovo Group Ltd. | | | 7,098,000 | | | | 12,205,508 | |
| | |
Luye Pharma Group Ltd.(a) | | | 1,985,000 | | | | 2,544,975 | |
| | |
PetroChina Co., Ltd., Class H | | | 6,674,000 | | | | 8,607,886 | |
| | |
Ping An Insurance Group Co. of China Ltd., Class H | | | 2,409,000 | | | | 34,451,694 | |
| | |
Sihuan Pharmaceutical Holdings Group Ltd.(b)(c) | | | 3,563,000 | | | | 1,926,182 | |
| | |
Sinotrans Ltd., Class H | | | 14,460,000 | | | | 11,066,449 | |
| | |
Sunny Optical Technology Group Co., Ltd. | | | 2,657,000 | | | | 5,912,645 | |
| | |
Tencent Holdings Ltd. | | | 2,568,300 | | | | 53,006,837 | |
| | |
Vipshop Holdings Ltd., ADS(a) | | | 419,003 | | | | 11,853,595 | |
| | |
Zhuzhou CSR Times Electric Co., Ltd., Class H | | | 2,130,500 | | | | 18,115,843 | |
| | | | | | | | | |
Total | | | | | | | 415,439,098 | |
| | |
| | | | | | | | |
HONG KONG 10.6% | |
AIA Group Ltd. | | | 7,307,600 | | | | 48,599,050 | |
| | |
BOC Hong Kong Holdings Ltd. | | | 3,312,000 | | | | 12,846,316 | |
| | |
CK Hutchison Holdings Ltd. | | | 1,231,000 | | | | 26,703,078 | |
| | |
Hong Kong Exchanges and Clearing Ltd. | | | 695,400 | | | | 26,508,832 | |
| | |
Hutchison Whampoa Ltd. | | | 1,733,000 | | | | 25,534,781 | |
| | |
Li & Fung Ltd. | | | 6,572,000 | | | | 6,693,377 | |
| | |
Orient Overseas International Ltd. | | | 618,000 | | | | 3,792,965 | |
| | |
Samsonite International SA | | | 3,448,200 | | | | 12,576,166 | |
| | |
Sands China Ltd. | | | 1,263,600 | | | | 5,150,927 | |
| | | | | | | | | |
Total | | | | | | | 168,405,492 | |
| | |
| | | | | | | | |
INDIA 7.1% | |
Dabur India Ltd. | | | 1,903,307 | | | | 7,536,163 | |
| | |
HDFC Bank Ltd. | | | 1,059,033 | | | | 16,496,075 | |
| | |
ICICI Bank Ltd. | | | 2,382,527 | | | | 12,447,144 | |
| | |
ICICI Bank Ltd., ADR | | | 362,160 | | | | 3,958,409 | |
| | |
Infosys Ltd., ADR | | | 363,176 | | | | 11,251,192 | |
| | |
ITC Ltd. | | | 1,051,702 | | | | 5,337,576 | |
| | |
Larsen & Toubro Ltd. | | | 391,182 | | | | 10,019,405 | |
| | |
Maruti Suzuki India Ltd. | | | 162,245 | | | | 9,508,178 | |
| | |
Motherson Sumi Systems Ltd. | | | 1,241,675 | | | | 9,828,314 | |
| | |
Oil & Natural Gas Corp., Ltd. | | | 1,589,842 | | | | 7,593,990 | |
| | |
Sun Pharmaceutical Industries Ltd. | | | 965,987 | | | | 14,257,657 | |
| | |
Tata Consultancy Services Ltd. | | | 105,377 | | | | 4,087,496 | |
| | | | | | | | | |
Total | | | | | | | 112,321,599 | |
The accompanying Notes to Financial Statements are an integral part of this statement.
| | |
| |
| | COLUMBIA ASIA PACIFIC EX-JAPAN FUND |
PORTFOLIO OF INVESTMENTS (continued)
April 30, 2015 (Unaudited)
| | | | | | | | |
| Common Stocks (continued) | |
| Issuer | | Shares | | | Value ($) | |
INDONESIA 3.1% | |
PT Bank Mandiri Persero Tbk | | | 13,110,816 | | | | 10,784,187 | |
| | |
PT Bank Rakyat Indonesia Persero Tbk | | | 17,876,600 | | | | 15,960,229 | |
| | |
PT Matahari Department Store Tbk | | | 7,400,500 | | | | 9,953,003 | |
| | |
PT Mitra Keluarga Karyasehat Tbk(a) | | | 1,450,700 | | | | 2,730,729 | |
| | |
PT Surya Citra Media Tbk | | | 20,953,962 | | | | 4,671,876 | |
| | |
PT Telekomunikasi Tbk | | | 29,191,200 | | | | 5,870,972 | |
| | | | | | | | | |
Total | | | | | | | 49,970,996 | |
| | |
| | | | | | | | |
LUXEMBOURG 0.3% | |
L’Occitane International SA | | | 1,712,000 | | | | 5,047,281 | |
| | |
| | | | | | | | |
MALAYSIA 1.3% | |
IHH Healthcare Bhd | | | 3,805,000 | | | | 6,324,751 | |
| | |
IJM Corp., BHD | | | 4,346,000 | | | | 8,949,234 | |
| | |
Telekom Malaysia Bhd | | | 2,418,800 | | | | 5,022,557 | |
| | | | | | | | | |
Total | | | | | | | 20,296,542 | |
| | |
| | | | | | | | |
PHILIPPINES 2.6% | |
Ayala Corp. | | | 465,202 | | | | 8,134,663 | |
| | |
GT Capital Holdings, Inc. | | | 324,835 | | | | 9,152,535 | |
| | |
Metropolitan Bank & Trust Co. | | | 5,656,294 | | | | 11,791,119 | |
| | |
Universal Robina Corp. | | | 2,518,140 | | | | 12,279,950 | |
| | | | | | | | | |
Total | | | | | | | 41,358,267 | |
| | |
| | | | | | | | |
SINGAPORE 2.6% | |
DBS Group Holdings Ltd. | | | 1,634,200 | | | | 25,968,058 | |
| | |
Oversea-Chinese Banking Corp., Ltd. | | | 1,901,715 | | | | 15,314,273 | |
| | | | | | | | | |
Total | | | | | | | 41,282,331 | |
| | |
| | | | | | | | |
SOUTH KOREA 11.0% | |
Halla Climate Control Corp. | | | 60,106 | | | | 2,255,030 | |
| | |
Hana Financial Group, Inc. | | | 224,303 | | | | 6,602,556 | |
| | |
Hyundai Development Co. | | | 191,505 | | | | 10,193,818 | |
| | |
Hyundai Motor Co. | | | 89,351 | | | | 14,022,844 | |
| | |
Korea Electric Power Corp. | | | 403,804 | | | | 17,558,988 | |
| | |
LG Chem Ltd. | | | 25,620 | | | | 6,471,826 | |
| | |
LG Display Co., Ltd. | | | 223,087 | | | | 6,177,972 | |
| | |
NAVER Corp. | | | 6,726 | | | | 4,067,066 | |
| | |
POSCO | | | 30,474 | | | | 7,178,565 | |
| | |
Samsung Electronics Co., Ltd. | | | 39,035 | | | | 51,208,216 | |
| | |
Samsung Life Insurance Co., Ltd. | | | 66,474 | | | | 6,501,977 | |
| | |
SK Hynix, Inc. | | | 574,739 | | | | 24,590,259 | |
| | |
SK Telecom Co., Ltd. | | | 42,276 | | | | 11,328,825 | |
| | |
Wonik IPS Co., Ltd.(a) | | | 646,763 | | | | 7,238,149 | |
| | | | | | | | | |
Total | | | | | | | 175,396,091 | |
| | | | | | | | |
| Common Stocks (continued) | |
| Issuer | | Shares | | | Value ($) | |
TAIWAN 12.1% | |
Advanced Semiconductor Engineering, Inc. | | | 11,511,000 | | | | 16,324,034 | |
| | |
Catcher Technology Co., Ltd. | | | 786,000 | | | | 9,197,651 | |
| | |
CTBC Financial Holding Co., Ltd. | | | 9,120,908 | | | | 7,099,473 | |
| | |
E.Sun Financial Holding Co., Ltd. | | | 19,584,714 | | | | 13,410,289 | |
| | |
Far EasTone Telecommunications Co., Ltd. | | | 4,880,000 | | | | 11,635,157 | |
| | |
Hon Hai Precision Industry Co., Ltd. | | | 3,303,320 | | | | 9,898,226 | |
| | |
Largan Precision Co., Ltd. | | | 120,000 | | | | 12,024,728 | |
| | |
Makalot Industrial Co., Ltd. | | | 1,410,181 | | | | 11,027,336 | |
| | |
MediaTek, Inc. | | | 1,251,000 | | | | 16,080,591 | |
| | |
Pegatron Corp. | | | 4,124,000 | | | | 12,217,154 | |
| | |
President Chain Store Corp. | | | 1,445,000 | | | | 10,693,249 | |
| | |
Taiwan Semiconductor Manufacturing Co., Ltd. | | | 6,336,000 | | | | 30,503,231 | |
| | |
Taiwan Semiconductor Manufacturing Co., Ltd., ADR | | | 1,307,035 | | | | 31,943,935 | |
| | | | | | | | | |
Total | | | | | | | 192,055,054 | |
| | |
| | | | | | | | |
THAILAND 2.0% | |
Kasikornbank PCL, Foreign Registered Shares | | | 142,900 | | | | 907,219 | |
| | |
Kasikornbank PCL, Foreign Registered Shares, NVDR | | | 1,360,048 | | | | 8,629,891 | |
| | |
Siam Cement PCL, NVDR | | | 573,200 | | | | 9,326,312 | |
| | |
Supalai Public Co., Ltd. | | | 8,118,200 | | | | 4,904,297 | |
| | |
Thai Union Frozen Products PCL, Foreign Registered Shares | | | 12,884,500 | | | | 7,972,790 | |
| | | | | | | | | |
Total | | | | | | | 31,740,509 | |
| | | | | | | | | |
Total Common Stocks | | | | | | | | |
(Cost: $1,331,155,360) | | | | | | | 1,551,924,261 | |
| | |
| | | | | | | | |
| Money Market Funds 1.6% | |
| | | Shares | | | Value ($) | |
| | |
Columbia Short-Term Cash Fund, 0.111%(d)(e) | | | 25,373,652 | | | | 25,373,652 | |
| | | | | | | | | |
Total Money Market Funds | | | | | | | | |
(Cost: $25,373,652) | | | | | | | 25,373,652 | |
| | | | | | | | | |
Total Investments | | | | | | | | |
(Cost: $1,356,529,012) | | | | | | | 1,577,297,913 | |
| | | | | | | | | |
Other Assets & Liabilities, Net | | | | | | | 12,548,785 | |
| | | | | | | | | |
Net Assets | | | | | | | 1,589,846,698 | |
| | | | | | | | | |
The accompanying Notes to Financial Statements are an integral part of this statement.
| | |
| |
| COLUMBIA ASIA PACIFIC EX-JAPAN FUND | | |
PORTFOLIO OF INVESTMENTS (continued)
April 30, 2015 (Unaudited)
Notes to Portfolio of Investments
| (b) | Represents fair value as determined in good faith under procedures approved by the Board of Trustees. At April 30, 2015, the value of these securities amounted to $1,926,182, which represents 0.12% of net assets. |
| (c) | Identifies securities considered by the Investment Manager to be illiquid as to their marketability. The aggregate value of such securities at April 30, 2015 was $1,926,182, which represents 0.12% of net assets. Information concerning such security holdings at April 30, 2015 is as follows: |
| | | | | | | | |
| Security Description | | Acquisition Dates | | | Cost ($) | |
Sihuan Pharmaceutical Holdings Group Ltd. | | | 03/17/2014 - 03/06/2015 | | | | 97,386 | |
| (d) | The rate shown is the seven-day current annualized yield at April 30, 2015. |
| (e) | As defined in the Investment Company Act of 1940, an affiliated company is one in which the Fund owns 5% or more of the company’s outstanding voting securities, or a company which is under common ownership or control with the Fund. Holdings and transactions in these affiliated companies during the period ended April 30, 2015, are as follows: |
| | | | | | | | | | | | | | | | | | | | | | | | |
| Issuer | | Beginning
Cost ($) | | | Purchase
Cost ($) | | | Proceeds
From Sales ($) | | | Ending
Cost ($) | | | Dividends —
Affiliated
Issuers ($) | | | Value ($) | |
Columbia Short-Term Cash Fund | | | 23,713,013 | | | | 380,654,231 | | | | (378,993,592 | ) | | | 25,373,652 | | | | 18,205 | | | | 25,373,652 | |
Abbreviation Legend
| | |
| ADR | | American Depositary Receipt |
| ADS | | American Depositary Share |
| NVDR | | Non-voting Depository Receipt |
Fair Value Measurements
Generally accepted accounting principles (GAAP) require disclosure regarding the inputs and valuation techniques used to measure fair value and any changes in valuation inputs or techniques. In addition, investments shall be disclosed by major category.
The Fund categorizes its fair value measurements according to a three-level hierarchy that maximizes the use of observable inputs and minimizes the use of unobservable inputs by prioritizing that the most observable input be used when available. Observable inputs are those that market participants would use in pricing an investment based on market data obtained from sources independent of the reporting entity. Unobservable inputs are those that reflect the Fund’s assumptions about the information market participants would use in pricing an investment. An investment’s level within the fair value hierarchy is based on the lowest level of any input that is deemed significant to the asset or liability’s fair value measurement. The input levels are not necessarily an indication of the risk or liquidity associated with investments at that level. For example, certain U.S. government securities are generally high quality and liquid, however, they are reflected as Level 2 because the inputs used to determine fair value may not always be quoted prices in an active market.
Fair value inputs are summarized in the three broad levels listed below:
| n | | Level 1 — Valuations based on quoted prices for investments in active markets that the Fund has the ability to access at the measurement date (including NAV for open-end mutual funds). Valuation adjustments are not applied to Level 1 investments. |
| n | | Level 2 — Valuations based on other significant observable inputs (including quoted prices for similar securities, interest rates, prepayment speeds, credit risks, etc.). |
| n | | Level 3 — Valuations based on significant unobservable inputs (including the Fund’s own assumptions and judgment in determining the fair value of investments). |
Inputs that are used in determining fair value of an investment may include price information, credit data, volatility statistics, and other factors. These inputs can be either observable or unobservable. The availability of observable inputs can vary between investments, and is affected by various factors such as the type of investment, and the volume and level of activity for that investment or similar investments in the marketplace. The inputs will be considered by the Investment Manager, along with any other relevant factors in the calculation of an investment’s fair value. The Fund uses prices and inputs that are current as of the measurement date, which may include periods of market dislocations. During these periods, the availability of prices and inputs may be reduced for many investments. This condition could cause an investment to be reclassified between the various levels within the hierarchy.
Foreign equity securities actively traded in markets where there is a significant delay in the local close relative to the New York Stock Exchange (NYSE) are classified as Level 2. The values of these securities may include an adjustment to reflect the impact of significant market movements following the close of local trading, as described in Note 2 to the financial statements — Security Valuation.
Investments falling into the Level 3 category are primarily supported by quoted prices from brokers and dealers participating in the market for those investments. However, these may be classified as Level 3 investments due to lack of market transparency and corroboration to support these quoted prices. Additionally, valuation models may be used as the pricing source for any remaining investments classified as Level 3. These models may rely on one or more significant unobservable inputs and/or significant assumptions by the Investment Manager. Inputs used in valuations may include, but are not limited to, financial statement analysis, capital account balances, discount rates and estimated cash flows, and comparable company data.
The accompanying Notes to Financial Statements are an integral part of this statement.
| | |
| |
| | COLUMBIA ASIA PACIFIC EX-JAPAN FUND |
PORTFOLIO OF INVESTMENTS (continued)
April 30, 2015 (Unaudited)
Fair Value Measurements (continued)
Under the direction of the Fund’s Board of Trustees (the Board), the Investment Manager’s Valuation Committee (the Committee) is responsible for overseeing the valuation procedures approved by the Board. The Committee consists of voting and non-voting members from various groups within the Investment Manager’s organization, including operations and accounting, trading and investments, compliance, risk management and legal.
The Committee meets at least monthly to review and approve valuation matters, which may include a description of specific valuation determinations, data regarding pricing information received from approved pricing vendors and brokers and the results of Board-approved valuation control policies and procedures (the Policies). The Policies address, among other things, instances when market quotations are or are not readily available, including recommendations of third party pricing vendors and a determination of appropriate pricing methodologies; events that require specific valuation determinations and assessment of fair value techniques; securities with a potential for stale pricing, including those that are illiquid, restricted, or in default; and the effectiveness of third party pricing vendors, including periodic reviews of vendors. The Committee meets more frequently, as needed, to discuss additional valuation matters, which may include the need to review back-testing results, review time-sensitive information or approve related valuation actions. The Committee reports to the Board, with members of the Committee meeting with the Board at each of its regularly scheduled meetings to discuss valuation matters and actions during the period, similar to those described earlier.
For investments categorized as Level 3, the Committee monitors information similar to that described above, which may include: (i) data specific to the issuer or comparable issuers, (ii) general market or specific sector news and (iii) quoted prices and specific or similar security transactions. The Committee considers this data and any changes from prior periods in order to assess the reasonableness of observable and unobservable inputs, any assumptions or internal models used to value those securities and changes in fair value. This data is also used to corroborate, when available, information received from approved pricing vendors and brokers. Various factors impact the frequency of monitoring this information (which may occur as often as daily). However, the Committee may determine that changes to inputs, assumptions and models are not required as a result of the monitoring procedures performed.
The following table is a summary of the inputs used to value the Fund’s investments at April 30, 2015:
| | | | | | | | | | | | | | | | |
| Description | | Level 1
Quoted Prices in Active
Markets for Identical
Assets ($) | | | Level 2
Other Significant
Observable Inputs ($) | | | Level 3
Significant
Unobservable Inputs ($) | | | Total ($) | |
Equity Securities | | | | | | | | | | | | | | | | |
| | | | |
Common Stocks | | | | | | | | | | | | | | | | |
| | | | |
Consumer Discretionary | | | 11,853,595 | | | | 114,252,902 | | | | — | | | | 126,106,497 | |
| | | | |
Consumer Staples | | | — | | | | 54,954,516 | | | | — | | | | 54,954,516 | |
| | | | |
Energy | | | — | | | | 48,646,869 | | | | — | | | | 48,646,869 | |
| | | | |
Financials | | | 3,958,409 | | | | 587,791,685 | | | | — | | | | 591,750,094 | |
| | | | |
Health Care | | | — | | | | 68,971,840 | | | | 1,926,182 | | | | 70,898,022 | |
| | | | |
Industrials | | | — | | | | 100,702,039 | | | | — | | | | 100,702,039 | |
| | | | |
Information Technology | | | 63,206,296 | | | | 274,739,763 | | | | — | | | | 337,946,059 | |
| | | | |
Materials | | | — | | | | 88,227,786 | | | | — | | | | 88,227,786 | |
| | | | |
Telecommunication Services | | | — | | | | 98,674,077 | | | | — | | | | 98,674,077 | |
| | | | |
Utilities | | | — | | | | 34,018,302 | | | | — | | | | 34,018,302 | |
| | | | | | | | | | | | | | | | | |
Total Equity Securities | | | 79,018,300 | | | | 1,470,979,779 | | | | 1,926,182 | | | | 1,551,924,261 | |
| | | | | | | | | | | | | | | | | |
Mutual Funds | | | | | | | | | | | | | | | | |
| | | | |
Money Market Funds | | | 25,373,652 | | | | — | | | | — | | | | 25,373,652 | |
| | | | | | | | | | | | | | | | | |
Total Mutual Funds | | | 25,373,652 | | | | — | | | | — | | | | 25,373,652 | |
| | | | | | | | | | | | | | | | | |
Total | | | 104,391,952 | | | | 1,470,979,779 | | | | 1,926,182 | | | | 1,577,297,913 | |
| | | | | | | | | | | | | | | | | |
See the Portfolio of Investments for all investment classifications not indicated in the table.
The Fund’s assets assigned to the Level 2 input category are generally valued using the market approach, in which a security’s value is determined through reference to prices and information from market transactions for similar or identical assets. These assets include certain foreign securities for which a third party statistical pricing service may be employed for purposes of fair market valuation. The model utilized by such third party statistical pricing service takes into account a security’s correlation to available market data including, but not limited to, intraday index, ADR, and ETF movements.
There were no transfers of financial assets between Levels 1 and 2 during the period.
The Fund does not hold any significant investments (greater than one percent of net assets) categorized as Level 3.
The Fund’s assets assigned to the Level 3 category are valued utilizing the valuation technique deemed the most appropriate in the circumstances. Certain common stock classified as Level 3 securities are valued using the market approach. To determine fair value for these securities, management considered various factors which may have included, but were not limited to, the halt price of the security, discount rates observed in the market for similar assets as well as the movement in certain foreign or domestic market indices. Significant increases (decreases) to any of
The accompanying Notes to Financial Statements are an integral part of this statement.
| | |
| 10 | | Semiannual Report 2015 |
| | |
| |
| COLUMBIA ASIA PACIFIC EX-JAPAN FUND | | |
PORTFOLIO OF INVESTMENTS (continued)
April 30, 2015 (Unaudited)
Fair Value Measurements (continued)
these inputs would result in a significantly lower (higher) fair value measurement. Generally, a change in observable yields on comparable securities would result in a directionally similar change to discount rates.
Financial assets were transferred from Level 2 to Level 3 due to unavailable market quotes. As a result, as of period end, management determined to fair value the securities under procedures established by and under the general supervision of the Board of Trustees.
Financial assets were transferred from Level 3 to Level 2 as observable market inputs were utilized and management determined that there was sufficient, reliable and observable market data to value these assets as of period end.
| | | | | | |
| Transfers In | | Transfers Out |
| Level 2 ($) | | Level 3 ($) | | Level 2 ($) | | Level 3 ($) |
5,250,117 | | 2,719,693 | | 2,719,693 | | 5,250,117 |
Transfers in and/or out of Level 3 are determined based on the fair value at the beginning of the period for security positions held throughout the period.
The accompanying Notes to Financial Statements are an integral part of this statement.
| | | | |
| Semiannual Report 2015 | | | 11 | |
| | |
| |
| | COLUMBIA ASIA PACIFIC EX-JAPAN FUND |
STATEMENT OF ASSETS AND LIABILITIES
April 30, 2015 (Unaudited)
| | | | |
Assets | |
| |
Investments, at value | | | | |
| |
Unaffiliated issuers (identified cost $1,331,155,360) | | | $1,551,924,261 | |
| |
Affiliated issuers (identified cost $25,373,652) | | | 25,373,652 | |
| |
Total investments (identified cost $1,356,529,012) | | | 1,577,297,913 | |
| |
Foreign currency (identified cost $6,702,830) | | | 6,728,897 | |
| |
Receivable for: | | | | |
| |
Investments sold | | | 8,953,014 | |
| |
Capital shares sold | | | 3,459,494 | |
| |
Dividends | | | 1,047,034 | |
| |
Reclaims | | | 27,673 | |
| |
Prepaid expenses | | | 1,069 | |
| |
Other assets | | | 24,461 | |
| |
Total assets | | | 1,597,539,555 | |
| |
|
Liabilities | |
| |
Payable for: | | | | |
| |
Investments purchased | | | 6,000,020 | |
| |
Capital shares purchased | | | 1,052,595 | |
| |
Foreign capital gains taxes deferred | | | 69,163 | |
| |
Investment management fees | | | 32,409 | |
| |
Distribution and/or service fees | | | 23 | |
| |
Transfer agent fees | | | 447,328 | |
| |
Administration fees | | | 3,290 | |
| |
Compensation of board members | | | 29,310 | |
| |
Other expenses | | | 58,719 | |
| |
Total liabilities | | | 7,692,857 | |
| |
Net assets applicable to outstanding capital stock | | | $1,589,846,698 | |
| |
|
Represented by | |
| |
Paid-in capital | | | $1,393,129,186 | |
| |
Undistributed net investment income | | | 2,086,187 | |
| |
Accumulated net realized loss | | | (26,096,708 | ) |
| |
Unrealized appreciation (depreciation) on: | | | | |
| |
Investments | | | 220,768,901 | |
| |
Foreign currency translations | | | 28,295 | |
| |
Foreign capital gains tax | | | (69,163 | ) |
| |
Total — representing net assets applicable to outstanding capital stock | | | $1,589,846,698 | |
| |
The accompanying Notes to Financial Statements are an integral part of this statement.
| | |
| 12 | | Semiannual Report 2015 |
| | |
| |
| COLUMBIA ASIA PACIFIC EX-JAPAN FUND | | |
STATEMENT OF ASSETS AND LIABILITIES (continued)
April 30, 2015 (Unaudited)
| | | | |
Class A | | | | |
| |
Net assets | | | $946,101 | |
| |
Shares outstanding | | | 61,261 | |
| |
Net asset value per share | | | $15.44 | |
| |
Maximum offering price per share(a) | | | $16.38 | |
| |
Class C | | | | |
| |
Net assets | | | $352,585 | |
| |
Shares outstanding | | | 23,074 | |
| |
Net asset value per share | | | $15.28 | |
| |
Class I | | | | |
| |
Net assets | | | $2,908 | |
| |
Shares outstanding | | | 188 | |
| |
Net asset value per share(b) | | | $15.50 | |
| |
Class R | | | | |
| |
Net assets | | | $345,791 | |
| |
Shares outstanding | | | 22,543 | |
| |
Net asset value per share | | | $15.34 | |
| |
Class R5 | | | | |
| |
Net assets | | | $1,587,403,167 | |
| |
Shares outstanding | | | 102,389,687 | |
| |
Net asset value per share | | | $15.50 | |
| |
Class Z | | | | |
| |
Net assets | | | $796,146 | |
| |
Shares outstanding | | | 51,469 | |
| |
Net asset value per share | | | $15.47 | |
| |
| (a) | The maximum offering price per share is calculated by dividing the net asset value per share by 1.0 minus the maximum sales charge of 5.75%. |
| (b) | Net asset value per share rounds to this amount due to fractional shares outstanding. |
The accompanying Notes to Financial Statements are an integral part of this statement.
| | | | |
| Semiannual Report 2015 | | | 13 | |
| | |
| |
| | COLUMBIA ASIA PACIFIC EX-JAPAN FUND |
STATEMENT OF OPERATIONS
Six Months Ended April 30, 2015 (Unaudited)
| | | | |
Net investment income | | | | |
| |
Income: | | | | |
| |
Dividends — unaffiliated issuers | | | $10,153,521 | |
| |
Dividends — affiliated issuers | | | 18,205 | |
| |
Interest | | | 2 | |
| |
Foreign taxes withheld | | | (605,115 | ) |
| |
Total income | | | 9,566,613 | |
| |
| |
Expenses: | | | | |
| |
Investment management fees | | | 4,262,196 | |
| |
Distribution and/or service fees | | | | |
| |
Class A | | | 1,317 | |
| |
Class C | | | 1,577 | |
| |
Class R | | | 805 | |
| |
Transfer agent fees | | | | |
| |
Class A | | | 1,197 | |
| |
Class C | | | 376 | |
| |
Class R | | | 386 | |
| |
Class R5 | | | 282,434 | |
| |
Class Z | | | 597 | |
| |
Administration fees | | | 432,096 | |
| |
Compensation of board members | | | 10,640 | |
| |
Custodian fees | | | 125,177 | |
| |
Printing and postage fees | | | 8,753 | |
| |
Registration fees | | | 35,476 | |
| |
Professional fees | | | 19,967 | |
| |
Other | | | 15,684 | |
| |
Total expenses | | | 5,198,678 | |
| |
Net investment income | | | 4,367,935 | |
| |
| |
Realized and unrealized gain (loss) — net | | | | |
| |
Net realized gain (loss) on: | | | | |
| |
Investments | | | 8,354,344 | |
| |
Foreign currency translations | | | (587,793 | ) |
| |
| |
Net realized gain | | | 7,766,551 | |
| |
Net change in unrealized appreciation (depreciation) on: | | | | |
| |
Investments | | | 91,612,647 | |
| |
Foreign currency translations | | | 31,227 | |
| |
Foreign capital gains tax | | | 424,718 | |
| |
Net change in unrealized appreciation | | | 92,068,592 | |
| |
Net realized and unrealized gain | | | 99,835,143 | |
| |
Net increase in net assets resulting from operations | | | $104,203,078 | |
| |
The accompanying Notes to Financial Statements are an integral part of this statement.
| | |
| 14 | | Semiannual Report 2015 |
| | |
| |
| COLUMBIA ASIA PACIFIC EX-JAPAN FUND | | |
STATEMENT OF CHANGES IN NET ASSETS
| | | | | | | | |
| | | Six Months Ended
April 30, 2015
(Unaudited) | | | Year Ended
October 31, 2014 | |
Operations | | | | | | | | |
| | |
Net investment income | | | $4,367,935 | | | | $11,533,859 | |
| | |
Net realized gain | | | 7,766,551 | | | | 8,821,526 | |
| | |
Net change in unrealized appreciation | | | 92,068,592 | | | | 31,797,699 | |
| |
Net increase in net assets resulting from operations | | | 104,203,078 | | | | 52,153,084 | |
| |
| | |
Distributions to shareholders | | | | | | | | |
| | |
Net investment income | | | | | | | | |
| | |
Class A | | | (5,410 | ) | | | (5,071 | ) |
| | |
Class C | | | (599 | ) | | | (384 | ) |
| | |
Class I | | | (39 | ) | | | (34 | ) |
| | |
Class R | | | (2,093 | ) | | | (2,373 | ) |
| | |
Class R5 | | | (11,863,536 | ) | | | (8,510,619 | ) |
| | |
Class Z | | | (3,600 | ) | | | (3,205 | ) |
| |
Total distributions to shareholders | | | (11,875,277 | ) | | | (8,521,686 | ) |
| |
Increase in net assets from capital stock activity | | | 596,869,452 | | | | 219,505,386 | |
| |
Total increase in net assets | | | 689,197,253 | | | | 263,136,784 | |
| | |
Net assets at beginning of period | | | 900,649,445 | | | | 637,512,661 | |
| |
Net assets at end of period | | | $1,589,846,698 | | | | $900,649,445 | |
| |
Undistributed net investment income | | | $2,086,187 | | | | $9,593,529 | |
| |
The accompanying Notes to Financial Statements are an integral part of this statement.
| | | | |
| Semiannual Report 2015 | | | 15 | |
| | |
| |
| | COLUMBIA ASIA PACIFIC EX-JAPAN FUND |
STATEMENT OF CHANGES IN NET ASSETS (continued)
| | | | | | | | | | | | | | | | |
| | | Six Months Ended
April 30, 2015 (Unaudited) | | | Year Ended
October 31, 2014 | |
| | | Shares | | | Dollars ($) | | | Shares | | | Dollars ($) | |
Capital stock activity | | | | | | | | | | | | | | | | |
| | | | |
Class A shares | | | | | | | | | | | | | | | | |
| | | | |
Subscriptions | | | 71,581 | | | | 1,017,041 | | | | 137,687 | | | | 1,984,196 | |
| | | | |
Distributions reinvested | | | 392 | | | | 5,410 | | | | 382 | | | | 5,047 | |
| | | | |
Redemptions | | | (47,604 | ) | | | (714,181 | ) | | | (146,177 | ) | | | (2,142,438 | ) |
| |
Net increase (decrease) | | | 24,369 | | | | 308,270 | | | | (8,108 | ) | | | (153,195 | ) |
| |
Class C shares | | | | | | | | | | | | | | | | |
| | | | |
Subscriptions | | | 1,500 | | | | 21,994 | | | | 6,114 | | | | 86,663 | |
| | | | |
Distributions reinvested | | | 44 | | | | 599 | | | | 29 | | | | 380 | |
| | | | |
Redemptions | | | (141 | ) | | | (2,010 | ) | | | (773 | ) | | | (10,386 | ) |
| |
Net increase | | | 1,403 | | | | 20,583 | | | | 5,370 | | | | 76,657 | |
| |
Class R shares | | | | | | | | | | | | | | | | |
| | | | |
Subscriptions | | | 1,407 | | | | 20,372 | | | | 7,395 | | | | 104,375 | |
| | | | |
Distributions reinvested | | | 151 | | | | 2,075 | | | | 179 | | | | 2,356 | |
| | | | |
Redemptions | | | (3,333 | ) | | | (46,476 | ) | | | (8,285 | ) | | | (111,459 | ) |
| |
Net decrease | | | (1,775 | ) | | | (24,029 | ) | | | (711 | ) | | | (4,728 | ) |
| |
Class R5 shares | | | | | | | | | | | | | | | | |
| | | | |
Subscriptions | | | 46,191,838 | | | | 671,190,994 | | | | 31,732,684 | | | | 441,114,659 | |
| | | | |
Distributions reinvested | | | 31,751 | | | | 438,795 | | | | 29,761 | | | | 394,333 | |
| | | | |
Redemptions | | | (5,159,610 | ) | | | (75,473,313 | ) | | | (16,516,562 | ) | | | (221,956,792 | ) |
| |
Net increase | | | 41,063,979 | | | | 596,156,476 | | | | 15,245,883 | | | | 219,552,200 | |
| |
Class Z shares | | | | | | | | | | | | | | | | |
| | | | |
Subscriptions | | | 37,367 | | | | 537,783 | | | | 12,684 | | | | 186,675 | |
| | | | |
Distributions reinvested | | | 259 | | | | 3,568 | | | | 240 | | | | 3,176 | |
| | | | |
Redemptions | | | (9,168 | ) | | | (133,199 | ) | | | (10,527 | ) | | | (155,399 | ) |
| |
Net increase | | | 28,458 | | | | 408,152 | | | | 2,397 | | | | 34,452 | |
| |
Total net increase | | | 41,116,434 | | | | 596,869,452 | | | | 15,244,831 | | | | 219,505,386 | |
| |
The accompanying Notes to Financial Statements are an integral part of this statement.
| | |
| 16 | | Semiannual Report 2015 |
| | |
| |
| COLUMBIA ASIA PACIFIC EX-JAPAN FUND | | |
FINANCIAL HIGHLIGHTS
The following tables are intended to help you understand the Fund’s financial performance. Certain information reflects financial results for a single share of a class held for the periods shown. Per share net investment income (loss) amounts are calculated based on average shares outstanding during the period. Total return assumes reinvestment of all dividends and distributions, if any. Total return does not reflect payment of sales charges, if any. Total return and portfolio turnover are not annualized for periods of less than one year. The portfolio turnover rate is calculated without regard to purchase and sales transactions of short-term instruments and certain derivatives, if any. If such transactions were included, the Fund’s portfolio turnover rate may be higher.
| | | | | | | | | | | | | | | | | | | | | | | | |
| |
| Six Months Ended
April 30, 2015 |
| | | Year Ended October 31, | |
Class A | | | (Unaudited) | | | | 2014 | | | | 2013 | | | | 2012 | | | | 2011 | | | | 2010(a) | |
Per share data | | | | | | | | | | | | | | | | | | | | | | | | |
Net asset value, beginning of period | | | $14.58 | | | | $13.73 | | | | $12.35 | | | | $12.49 | | | | $13.79 | | | | $13.32 | |
| | | | | | | | | | | | | | | | | | | | | | | | | |
Income from investment operations: | | | | | | | | | | | | | | | | | | | | | | | | |
| | | | | | |
Net investment income (loss) | | | 0.02 | | | | 0.27 | | | | 0.08 | | | | 0.15 | | | | 0.15 | | | | (0.01 | ) |
| | | | | | | | | | | | | | | | | | | | | | | | | |
Net realized and unrealized gain (loss) | | | 0.98 | | | | 0.70 | | | | 1.54 | | | | 0.41 | | | | (1.36 | ) | | | 0.48 | |
| | | | | | | | | | | | | | | | | | | | | | | | | |
Total from investment operations | | | 1.00 | | | | 0.97 | | | | 1.62 | | | | 0.56 | | | | (1.21 | ) | | | 0.47 | |
| | | | | | | | | | | | | | | | | | | | | | | | | |
Less distributions to shareholders: | | | | | | | | | | | | | | | | | | | | | | | | |
| | | | | | |
Net investment income | | | (0.14 | ) | | | (0.12 | ) | | | (0.24 | ) | | | (0.14 | ) | | | (0.07 | ) | | | — | |
| | | | | | | | | | | | | | | | | | | | | | | | | |
Net realized gains | | | — | | | | — | | | | — | | | | (0.56 | ) | | | (0.02 | ) | | | — | |
| | | | | | | | | | | | | | | | | | | | | | | | | |
Total distributions to shareholders | | | (0.14 | ) | | | (0.12 | ) | | | (0.24 | ) | | | (0.70 | ) | | | (0.09 | ) | | | — | |
| | | | | | | | | | | | | | | | | | | | | | | | | |
Net asset value, end of period | | | $15.44 | | | | $14.58 | | | | $13.73 | | | | $12.35 | | | | $12.49 | | | | $13.79 | |
| | | | | | | | | | | | | | | | | | | | | | | | | |
Total return | | | 6.94 | % | | | 7.18 | % | | | 13.26 | % | | | 5.23 | % | | | (8.82 | %) | | | 3.53 | % |
| | | | | | | | | | | | | | | | | | | | | | | | | |
Ratios to average net assets(b) | | | | | | | | | | | | | | | | | | | | | | | | |
| | | | | | |
Total gross expenses | | | 1.34 | %(c) | | | 1.34 | %(d) | | | 1.37 | %(d) | | | 1.42 | %(d) | | | 1.45 | %(d) | | | 1.50 | %(c) |
| | | | | | | | | | | | | | | | | | | | | | | | | |
Total net expenses(e) | | | 1.34 | %(c) | | | 1.34 | %(d) | | | 1.37 | %(d) | | | 1.42 | %(d) | | | 1.45 | %(d)(f) | | | 1.50 | %(c) |
| | | | | | | | | | | | | | | | | | | | | | | | | |
Net investment income (loss) | | | 0.28 | %(c) | | | 1.88 | % | | | 0.60 | % | | | 1.25 | % | | | 1.12 | % | | | (0.95 | %)(c) |
| | | | | | | | | | | | | | | | | | | | | | | | | |
Supplemental data | | | | | | | | | | | | | | | | | | | | | | | | |
| | | | | | |
Net assets, end of period (in thousands) | | | $946 | | | | $538 | | | | $618 | | | | $452 | | | | $642 | | | | $78 | |
| | | | | | | | | | | | | | | | | | | | | | | | | |
Portfolio turnover | | | 10 | % | | | 39 | % | | | 34 | % | | | 50 | % | | | 63 | % | | | 21 | % |
| | | | | | | | | | | | | | | | | | | | | | | | | |
Notes to Financial Highlights
| (a) | Based on operations from September 27, 2010 (commencement of operations) through the stated period end. |
| (b) | In addition to the fees and expenses that the Fund bears directly, the Fund indirectly bears a pro rata share of the fees and expenses of any other funds in which it invests. Such indirect expenses are not included in the Fund’s reported expense ratios. |
| (d) | Ratios include line of credit interest expense which is less than 0.01%. |
| (e) | Total net expenses include the impact of certain fee waivers/expense reimbursements made by the Investment Manager and certain of its affiliates, if applicable. |
| (f) | The benefits derived from expense reductions had an impact of less than 0.01%. |
The accompanying Notes to Financial Statements are an integral part of this statement.
| | | | |
| Semiannual Report 2015 | | | 17 | |
| | |
| |
| | COLUMBIA ASIA PACIFIC EX-JAPAN FUND |
FINANCIAL HIGHLIGHTS (continued)
| | | | | | | | | | | | | | | | | | | | | | | | |
| |
| Six Months Ended
April 30, 2015 |
| | | Year Ended October 31, | |
Class C | | | (Unaudited) | | | | 2014 | | | | 2013 | | | | 2012 | | | | 2011 | | | | 2010(a) | |
Per share data | | | | | | | | | | | | | | | | | | | | | | | | |
Net asset value, beginning of period | | | $14.37 | | | | $13.52 | | | | $12.20 | | | | $12.38 | | | | $13.78 | | | | $13.32 | |
| | | | | | | | | | | | | | | | | | | | | | | | | |
Income from investment operations: | | | | | | | | | | | | | | | | | | | | | | | | |
| | | | | | |
Net investment income (loss) | | | (0.04 | ) | | | 0.09 | | | | 0.04 | | | | 0.03 | | | | 0.06 | | | | (0.02 | ) |
| | | | | | | | | | | | | | | | | | | | | | | | | |
Net realized and unrealized gain (loss) | | | 0.98 | | | | 0.78 | | | | 1.46 | | | | 0.42 | | | | (1.38 | ) | | | 0.48 | |
| | | | | | | | | | | | | | | | | | | | | | | | | |
Total from investment operations | | | 0.94 | | | | 0.87 | | | | 1.50 | | | | 0.45 | | | | (1.32 | ) | | | 0.46 | |
| | | | | | | | | | | | | | | | | | | | | | | | | |
Less distributions to shareholders: | | | | | | | | | | | | | | | | | | | | | | | | |
| | | | | | |
Net investment income | | | (0.03 | ) | | | (0.02 | ) | | | (0.18 | ) | | | (0.07 | ) | | | (0.06 | ) | | | — | |
| | | | | | | | | | | | | | | | | | | | | | | | | |
Net realized gains | | | — | | | | — | | | | — | | | | (0.56 | ) | | | (0.02 | ) | | | — | |
| | | | | | | | | | | | | | | | | | | | | | | | | |
Total distributions to shareholders | | | (0.03 | ) | | | (0.02 | ) | | | (0.18 | ) | | | (0.63 | ) | | | (0.08 | ) | | | — | |
| | | | | | | | | | | | | | | | | | | | | | | | | |
Net asset value, end of period | | | $15.28 | | | | $14.37 | | | | $13.52 | | | | $12.20 | | | | $12.38 | | | | $13.78 | |
| | | | | | | | | | | | | | | | | | | | | | | | | |
Total return | | | 6.55 | % | | | 6.48 | % | | | 12.33 | % | | | 4.33 | % | | | (9.62 | %) | | | 3.45 | % |
| | | | | | | | | | | | | | | | | | | | | | | | | |
Ratios to average net assets(b) | | | | | | | | | | | | | | | | | | | | | | | | |
| | | | | | |
Total gross expenses | | | 2.11 | %(c) | | | 2.11 | %(d) | | | 2.13 | %(d) | | | 2.16 | %(d) | | | 2.19 | %(d) | | | 2.22 | %(c) |
| | | | | | | | | | | | | | | | | | | | | | | | | |
Total net expenses(e) | | | 2.11 | %(c) | | | 2.11 | %(d) | | | 2.13 | %(d) | | | 2.16 | %(d) | | | 2.19 | %(d)(f) | | | 2.22 | %(c) |
| | | | | | | | | | | | | | | | | | | | | | | | | |
Net investment income (loss) | | | (0.50 | %)(c) | | | 0.67 | % | | | 0.31 | % | | | 0.25 | % | | | 0.44 | % | | | (1.93 | %)(c) |
| | | | | | | | | | | | | | | | | | | | | | | | | |
Supplemental data | | | | | | | | | | | | | | | | | | | | | | | | |
| | | | | | |
Net assets, end of period (in thousands) | | | $353 | | | | $311 | | | | $220 | | | | $70 | | | | $45 | | | | $3 | |
| | | | | | | | | | | | | | | | | | | | | | | | | |
Portfolio turnover | | | 10 | % | | | 39 | % | | | 34 | % | | | 50 | % | | | 63 | % | | | 21 | % |
| | | | | | | | | | | | | | | | | | | | | | | | | |
Notes to Financial Highlights
| (a) | Based on operations from September 27, 2010 (commencement of operations) through the stated period end. |
| (b) | In addition to the fees and expenses that the Fund bears directly, the Fund indirectly bears a pro rata share of the fees and expenses of any other funds in which it invests. Such indirect expenses are not included in the Fund’s reported expense ratios. |
| (d) | Ratios include line of credit interest expense which is less than 0.01%. |
| (e) | Total net expenses include the impact of certain fee waivers/expense reimbursements made by the Investment Manager and certain of its affiliates, if applicable. |
| (f) | The benefits derived from expense reductions had an impact of less than 0.01%. |
The accompanying Notes to Financial Statements are an integral part of this statement.
| | |
| 18 | | Semiannual Report 2015 |
| | |
| |
| COLUMBIA ASIA PACIFIC EX-JAPAN FUND | | |
FINANCIAL HIGHLIGHTS (continued)
| | | | | | | | | | | | | | | | | | | | | | | | |
| |
| Six Months Ended
April 30, 2015 |
| | | Year Ended October 31, | |
Class I | | | (Unaudited) | | | | 2014 | | | | 2013 | | | | 2012 | | | | 2011 | | | | 2010(a) | |
Per share data | | | | | | | | | | | | | | | | | | | | | | | | |
Net asset value, beginning of period | | | $14.66 | | | | $13.80 | | | | $12.38 | | | | $12.54 | | | | $13.79 | | | | $13.32 | |
| | | | | | | | | | | | | | | | | | | | | | | | | |
Income from investment operations: | | | | | | | | | | | | | | | | | | | | | | | | |
| | | | | | |
Net investment income (loss) | | | 0.06 | | | | 0.26 | | | | 0.19 | | | | 0.20 | | | | 0.18 | | | | (0.01 | ) |
| | | | | | | | | | | | | | | | | | | | | | | | | |
Net realized and unrealized gain (loss) | | | 0.99 | | | | 0.78 | | | | 1.49 | | | | 0.38 | | | | (1.33 | ) | | | 0.48 | |
| | | | | | | | | | | | | | | | | | | | | | | | | |
Total from investment operations | | | 1.05 | | | | 1.04 | | | | 1.68 | | | | 0.58 | | | | (1.15 | ) | | | 0.47 | |
| | | | | | | | | | | | | | | | | | | | | | | | | |
Less distributions to shareholders: | | | | | | | | | | | | | | | | | | | | | | | | |
| | | | | | |
Net investment income | | | (0.21 | ) | | | (0.18 | ) | | | (0.26 | ) | | | (0.18 | ) | | | (0.08 | ) | | | — | |
| | | | | | | | | | | | | | | | | | | | | | | | | |
Net realized gains | | | — | | | | — | | | | — | | | | (0.56 | ) | | | (0.02 | ) | | | — | |
| | | | | | | | | | | | | | | | | | | | | | | | | |
Total distributions to shareholders | | | (0.21 | ) | | | (0.18 | ) | | | (0.26 | ) | | | (0.74 | ) | | | (0.10 | ) | | | — | |
| | | | | | | | | | | | | | | | | | | | | | | | | |
Net asset value, end of period | | | $15.50 | | | | $14.66 | | | | $13.80 | | | | $12.38 | | | | $12.54 | | | | $13.79 | |
| | | | | | | | | | | | | | | | | | | | | | | | | |
Total return | | | 7.30 | % | | | 7.69 | % | | | 13.73 | % | | | 5.48 | % | | | (8.40 | %) | | | 3.53 | % |
| | | | | | | | | | | | | | | | | | | | | | | | | |
Ratios to average net assets(b) | | | | | | | | | | | | | | | | | | | | | | | | |
| | | | | | |
Total gross expenses | | | 0.81 | %(c) | | | 0.87 | %(d) | | | 0.94 | %(d) | | | 0.97 | %(d) | | | 0.99 | %(d) | | | 1.08 | %(c) |
| | | | | | | | | | | | | | | | | | | | | | | | | |
Total net expenses(e) | | | 0.81 | %(c) | | | 0.87 | %(d) | | | 0.94 | %(d) | | | 0.97 | %(d) | | | 0.99 | %(d) | | | 1.08 | %(c) |
| | | | | | | | | | | | | | | | | | | | | | | | | |
Net investment income (loss) | | | 0.78 | %(c) | | | 1.89 | % | | | 1.49 | % | | | 1.70 | % | | | 1.31 | % | | | (0.78 | %)(c) |
| | | | | | | | | | | | | | | | | | | | | | | | | |
Supplemental data | | | | | | | | | | | | | | | | | | | | | | | | |
| | | | | | |
Net assets, end of period (in thousands) | | | $3 | | | | $3 | | | | $3 | | | | $2 | | | | $2 | | | | $3 | |
| | | | | | | | | | | | | | | | | | | | | | | | | |
Portfolio turnover | | | 10 | % | | | 39 | % | | | 34 | % | | | 50 | % | | | 63 | % | | | 21 | % |
| | | | | | | | | | | | | | | | | | | | | | | | | |
Notes to Financial Highlights
| (a) | Based on operations from September 27, 2010 (commencement of operations) through the stated period end. |
| (b) | In addition to the fees and expenses that the Fund bears directly, the Fund indirectly bears a pro rata share of the fees and expenses of any other funds in which it invests. Such indirect expenses are not included in the Fund’s reported expense ratios. |
| (d) | Ratios include line of credit interest expense which is less than 0.01%. |
| (e) | Total net expenses include the impact of certain fee waivers/expense reimbursements made by the Investment Manager and certain of its affiliates, if applicable. |
The accompanying Notes to Financial Statements are an integral part of this statement.
| | | | |
| Semiannual Report 2015 | | | 19 | |
| | |
| |
| | COLUMBIA ASIA PACIFIC EX-JAPAN FUND |
FINANCIAL HIGHLIGHTS (continued)
| | | | | | | | | | | | | | | | | | | | | | | | |
| |
| Six Months Ended
April 30, 2015 |
| | | Year Ended October 31, | |
Class R | | | (Unaudited) | | | | 2014 | | | | 2013 | | | | 2012 | | | | 2011 | | | | 2010(a) | |
Per share data | | | | | | | | | | | | | | | | | | | | | | | | |
Net asset value, beginning of period | | | $14.46 | | | | $13.62 | | | | $12.27 | | | | $12.46 | | | | $13.79 | | | | $13.32 | |
| | | | | | | | | | | | | | | | | | | | | | | | | |
Income from investment operations: | | | | | | | | | | | | | | | | | | | | | | | | |
| | | | | | |
Net investment income (loss) | | | (0.00 | )(b) | | | 0.15 | | | | 0.13 | | | | 0.13 | | | | 0.16 | | | | (0.02 | ) |
| | | | | | | | | | | | | | | | | | | | | | | | | |
Net realized and unrealized gain (loss) | | | 0.98 | | | | 0.78 | | | | 1.44 | | | | 0.37 | | | | (1.41 | ) | | | 0.49 | |
| | | | | | | | | | | | | | | | | | | | | | | | | |
Total from investment operations | | | 0.98 | | | | 0.93 | | | | 1.57 | | | | 0.50 | | | | (1.25 | ) | | | 0.47 | |
| | | | | | | | | | | | | | | | | | | | | | | | | |
Less distributions to shareholders: | | | | | | | | | | | | | | | | | | | | | | | | |
| | | | | | |
Net investment income | | | (0.10 | ) | | | (0.09 | ) | | | (0.22 | ) | | | (0.13 | ) | | | (0.06 | ) | | | — | |
| | | | | | | | | | | | | | | | | | | | | | | | | |
Net realized gains | | | — | | | | — | | | | — | | | | (0.56 | ) | | | (0.02 | ) | | | — | |
| | | | | | | | | | | | | | | | | | | | | | | | | |
Total distributions to shareholders | | | (0.10 | ) | | | (0.09 | ) | | | (0.22 | ) | | | (0.69 | ) | | | (0.08 | ) | | | — | |
| | | | | | | | | | | | | | | | | | | | | | | | | |
Net asset value, end of period | | | $15.34 | | | | $14.46 | | | | $13.62 | | | | $12.27 | | | | $12.46 | | | | $13.79 | |
| | | | | | | | | | | | | | | | | | | | | | | | | |
Total return | | | 6.85 | % | | | 6.89 | % | | | 12.92 | % | | | 4.78 | % | | | (9.15 | %) | | | 3.53 | % |
| | | | | | | | | | | | | | | | | | | | | | | | | |
Ratios to average net assets(c) | | | | | | | | | | | | | | | | | | | | | | | | |
| | | | | | |
Total gross expenses | | | 1.61 | %(d) | | | 1.61 | %(e) | | | 1.63 | %(e) | | | 1.63 | %(e) | | | 1.70 | %(e) | | | 1.73 | %(d) |
| | | | | | | | | | | | | | | | | | | | | | | | | |
Total net expenses(f) | | | 1.61 | %(d) | | | 1.61 | %(e) | | | 1.63 | %(e) | | | 1.63 | %(e) | | | 1.68 | %(e)(g) | | | 1.73 | %(d) |
| | | | | | | | | | | | | | | | | | | | | | | | | |
Net investment income (loss) | | | (0.01 | %)(d) | | | 1.05 | % | | | 1.01 | % | | | 1.08 | % | | | 1.26 | % | | | (1.43 | %)(d) |
| | | | | | | | | | | | | | | | | | | | | | | | | |
Supplemental data | | | | | | | | | | | | | | | | | | | | | | | | |
| | | | | | |
Net assets, end of period (in thousands) | | | $346 | | | | $352 | | | | $341 | | | | $175 | | | | $32 | | | | $3 | |
| | | | | | | | | | | | | | | | | | | | | | | | | |
Portfolio turnover | | | 10 | % | | | 39 | % | | | 34 | % | | | 50 | % | | | 63 | % | | | 21 | % |
| | | | | | | | | | | | | | | | | | | | | | | | | |
Notes to Financial Highlights
| (a) | Based on operations from September 27, 2010 (commencement of operations) through the stated period end. |
| (c) | In addition to the fees and expenses that the Fund bears directly, the Fund indirectly bears a pro rata share of the fees and expenses of any other funds in which it invests. Such indirect expenses are not included in the Fund’s reported expense ratios. |
| (e) | Ratios include line of credit interest expense which is less than 0.01%. |
| (f) | Total net expenses include the impact of certain fee waivers/expense reimbursements made by the Investment Manager and certain of its affiliates, if applicable. |
| (g) | The benefits derived from expense reductions had an impact of less than 0.01%. |
The accompanying Notes to Financial Statements are an integral part of this statement.
| | |
| 20 | | Semiannual Report 2015 |
| | |
| |
| COLUMBIA ASIA PACIFIC EX-JAPAN FUND | | |
FINANCIAL HIGHLIGHTS (continued)
| | | | | | | | | | | | | | | | | | | | | | | | |
| |
| Six Months Ended
April 30, 2015 |
| | | Year Ended October 31, | |
Class R5 | | | (Unaudited) | | | | 2014 | | | | 2013 | | | | 2012 | | | | 2011 | | | | 2010 | |
Per share data | | | | | | | | | | | | | | | | | | | | | | | | |
Net asset value, beginning of period | | | $14.66 | | | | $13.80 | | | | $12.38 | | | | $12.54 | | | | $13.79 | | | | $11.42 | |
| | | | | | | | | | | | | | | | | | | | | | | | | |
Income from investment operations: | | | | | | | | | | | | | | | | | | | | | | | | |
| | | | | | |
Net investment income | | | 0.06 | | | | 0.24 | | | | 0.20 | | | | 0.21 | | | | 0.18 | | | | 0.13 | |
| | | | | | | | | | | | | | | | | | | | | | | | | |
Net realized and unrealized gain (loss) | | | 0.97 | | | | 0.79 | | | | 1.48 | | | | 0.37 | | | | (1.33 | ) | | | 2.27 | |
| | | | | | | | | | | | | | | | | | | | | | | | | |
Total from investment operations | | | 1.03 | | | | 1.03 | | | | 1.68 | | | | 0.58 | | | | (1.15 | ) | | | 2.40 | |
| | | | | | | | | | | | | | | | | | | | | | | | | |
Less distributions to shareholders: | | | | | | | | | | | | | | | | | | | | | | | | |
| | | | | | |
Net investment income | | | (0.19 | ) | | | (0.17 | ) | | | (0.26 | ) | | | (0.18 | ) | | | (0.08 | ) | | | (0.02 | ) |
| | | | | | | | | | | | | | | | | | | | | | | | | |
Net realized gains | | | — | | | | — | | | | — | | | | (0.56 | ) | | | (0.02 | ) | | | (0.01 | ) |
| | | | | | | | | | | | | | | | | | | | | | | | | |
Total distributions to shareholders | | | (0.19 | ) | | | (0.17 | ) | | | (0.26 | ) | | | (0.74 | ) | | | (0.10 | ) | | | (0.03 | ) |
| | | | | | | | | | | | | | | | | | | | | | | | | |
Net asset value, end of period | | | $15.50 | | | | $14.66 | | | | $13.80 | | | | $12.38 | | | | $12.54 | | | | $13.79 | |
| | | | | | | | | | | | | | | | | | | | | | | | | |
Total return | | | 7.19 | % | | | 7.63 | % | | | 13.66 | % | | | 5.44 | % | | | (8.42 | %) | | | 21.06 | % |
| | | | | | | | | | | | | | | | | | | | | | | | | |
Ratios to average net assets(a) | | | | | | | | | | | | | | | | | | | | | | | | |
| | | | | | |
Total gross expenses | | | 0.92 | %(b) | | | 0.97 | %(c) | | | 0.98 | %(c) | | | 1.01 | %(c) | | | 0.98 | %(c) | | | 1.09 | % |
| | | | | | | | | | | | | | | | | | | | | | | | | |
Total net expenses(d) | | | 0.92 | %(b) | | | 0.97 | %(c) | | | 0.98 | %(c) | | | 1.01 | %(c) | | | 0.98 | %(c) | | | 1.09 | % |
| | | | | | | | | | | | | | | | | | | | | | | | | |
Net investment income | | | 0.77 | %(b) | | | 1.73 | % | | | 1.51 | % | | | 1.76 | % | | | 1.31 | % | | | 1.09 | % |
| | | | | | | | | | | | | | | | | | | | | | | | | |
Supplemental data | | | | | | | | | | | | | | | | | | | | | | | | |
| | | | | | |
Net assets, end of period (in thousands) | | | $1,587,403 | | | | $899,110 | | | | $636,047 | | | | $389,978 | | | | $504,370 | | | | $512,721 | |
| | | | | | | | | | | | | | | | | | | | | | | | | |
Portfolio turnover | | | 10 | % | | | 39 | % | | | 34 | % | | | 50 | % | | | 63 | % | | | 21 | % |
| | | | | | | | | | | | | | | | | | | | | | | | | |
Notes to Financial Highlights
| (a) | In addition to the fees and expenses that the Fund bears directly, the Fund indirectly bears a pro rata share of the fees and expenses of any other funds in which it invests. Such indirect expenses are not included in the Fund’s reported expense ratios. |
| (c) | Ratios include line of credit interest expense which is less than 0.01%. |
| (d) | Total net expenses include the impact of certain fee waivers/expense reimbursements made by the Investment Manager and certain of its affiliates, if applicable. |
The accompanying Notes to Financial Statements are an integral part of this statement.
| | | | |
| Semiannual Report 2015 | | | 21 | |
| | |
| |
| | COLUMBIA ASIA PACIFIC EX-JAPAN FUND |
FINANCIAL HIGHLIGHTS (continued)
| | | | | | | | | | | | | | | | | | | | | | | | |
| |
| Six Months Ended
April 30, 2015 |
| | | Year Ended October 31, | |
Class Z | | | (Unaudited) | | | | 2014 | | | | 2013 | | | | 2012 | | | | 2011 | | | | 2010(a) | |
Per share data | | | | | | | | | | | | | | | | | | | | | | | | |
Net asset value, beginning of period | | | $14.62 | | | | $13.76 | | | | $12.36 | | | | $12.51 | | | | $13.79 | | | | $13.32 | |
| | | | | | | | | | | | | | | | | | | | | | | | | |
Income from investment operations: | | | | | | | | | | | | | | | | | | | | | | | | |
| | | | | | |
Net investment income (loss) | | | 0.06 | | | | 0.24 | | | | 0.17 | | | | 0.17 | | | | 0.19 | | | | (0.01 | ) |
| | | | | | | | | | | | | | | | | | | | | | | | | |
Net realized and unrealized gain (loss) | | | 0.96 | | | | 0.78 | | | | 1.48 | | | | 0.40 | | | | (1.37 | ) | | | 0.48 | |
| | | | | | | | | | | | | | | | | | | | | | | | | |
Total from investment operations | | | 1.02 | | | | 1.02 | | | | 1.65 | | | | 0.57 | | | | (1.18 | ) | | | 0.47 | |
| | | | | | | | | | | | | | | | | | | | | | | | | |
Less distributions to shareholders: | | | | | | | | | | | | | | | | | | | | | | | | |
| | | | | | |
Net investment income | | | (0.17 | ) | | | (0.16 | ) | | | (0.25 | ) | | | (0.16 | ) | | | (0.08 | ) | | | — | |
| | | | | | | | | | | | | | | | | | | | | | | | | |
Net realized gains | | | — | | | | — | | | | — | | | | (0.56 | ) | | | (0.02 | ) | | | — | |
| | | | | | | | | | | | | | | | | | | | | | | | | |
Total distributions to shareholders | | | (0.17 | ) | | | (0.16 | ) | | | (0.25 | ) | | | (0.72 | ) | | | (0.10 | ) | | | — | |
| | | | | | | | | | | | | | | | | | | | | | | | | |
Net asset value, end of period | | | $15.47 | | | | $14.62 | | | | $13.76 | | | | $12.36 | | | | $12.51 | | | | $13.79 | |
| | | | | | | | | | | | | | | | | | | | | | | | | |
Total return | | | 7.11 | % | | | 7.50 | % | | | 13.45 | % | | | 5.33 | % | | | (8.63 | %) | | | 3.53 | % |
| | | | | | | | | | | | | | | | | | | | | | | | | |
Ratios to average net assets(b) | | | | | | | | | | | | | | | | | | | | | | | | |
| | | | | | |
Total gross expenses | | | 1.10 | %(c) | | | 1.11 | %(d) | | | 1.13 | %(d) | | | 1.15 | %(d) | | | 1.24 | %(d) | | | 1.23 | %(c) |
| | | | | | | | | | | | | | | | | | | | | | | | | |
Total net expenses(e) | | | 1.10 | %(c) | | | 1.11 | %(d) | | | 1.13 | %(d) | | | 1.15 | %(d) | | | 1.24 | %(d)(f) | | | 1.23 | %(c) |
| | | | | | | | | | | | | | | | | | | | | | | | | |
Net investment income (loss) | | | 0.77 | %(c) | | | 1.71 | % | | | 1.32 | % | | | 1.41 | % | | | 1.35 | % | | | (0.93 | %)(c) |
| | | | | | | | | | | | | | | | | | | | | | | | | |
Supplemental data | | | | | | | | | | | | | | | | | | | | | | | | |
| | | | | | |
Net assets, end of period (in thousands) | | | $796 | | | | $336 | | | | $284 | | | | $243 | | | | $97 | | | | $3 | |
| | | | | | | | | | | | | | | | | | | | | | | | | |
Portfolio turnover | | | 10 | % | | | 39 | % | | | 34 | % | | | 50 | % | | | 63 | % | | | 21 | % |
| | | | | | | | | | | | | | | | | | | | | | | | | |
Notes to Financial Highlights
| (a) | Based on operations from September 27, 2010 (commencement of operations) through the stated period end. |
| (b) | In addition to the fees and expenses that the Fund bears directly, the Fund indirectly bears a pro rata share of the fees and expenses of any other funds in which it invests. Such indirect expenses are not included in the Fund’s reported expense ratios. |
| (d) | Ratios include line of credit interest expense which is less than 0.01%. |
| (e) | Total net expenses include the impact of certain fee waivers/expense reimbursements made by the Investment Manager and certain of its affiliates, if applicable. |
| (f) | The benefits derived from expense reductions had an impact of less than 0.01%. |
The accompanying Notes to Financial Statements are an integral part of this statement.
| | |
| 22 | | Semiannual Report 2015 |
| | |
| |
| COLUMBIA ASIA PACIFIC EX-JAPAN FUND | | |
NOTES TO FINANCIAL STATEMENTS
April 30, 2015 (Unaudited)
Note 1. Organization
Columbia Asia Pacific ex-Japan Fund (the Fund), a series of Columbia Funds Series Trust II (the Trust), is a diversified fund. The Trust is registered under the Investment Company Act of 1940, as amended (the 1940 Act), as an open-end management investment company organized as a Massachusetts business trust.
Fund Shares
The Trust may issue an unlimited number of shares (without par value). The Fund offers Class A, Class C, Class I, Class R, Class R5 and Class Z shares. Although all share classes generally have identical voting, dividend and liquidation rights, each share class votes separately when required by the Trust’s organizational documents or by law. Different share classes pay different distribution amounts to the extent the expenses of such share classes differ, and distributions in liquidation will be proportional to the net asset value of each share class. Each share class has its own expense structure and sales charges.
Class A shares are subject to a maximum front-end sales charge of 5.75% based on the initial investment amount. Class A shares purchased without an initial sales charge in accounts aggregating $1 million to $50 million at the time of purchase are subject to a contingent deferred sales charge (CDSC) if the shares are sold within 18 months after purchase, charged as follows: 1.00% CDSC if redeemed within 12 months after purchase, and 0.50% CDSC if redeemed more than 12, but less than 18, months after purchase.
Class C shares are subject to a 1.00% CDSC on shares redeemed within one year after purchase.
Class I shares are not subject to sales charges and are available only to the Columbia Family of Funds.
Class R shares are not subject to sales charges and are generally available only to certain retirement plans and other investors as described in the Fund’s prospectus.
Class R5 shares are not subject to sales charges and are generally available only to investors purchasing through authorized investment professionals and omnibus retirement plans.
Class Z shares are not subject to sales charges and are available only to eligible investors, which are subject to different investment minimums as described in the Fund’s prospectus.
Note 2. Summary of Significant Accounting Policies
Basis of Preparation
The Fund is an investment company that applies the accounting and reporting guidance in the Financial Accounting Standards Board (FASB) Accounting Standards Codification Topic 946, Financial Services — Investment Companies (ASC 946). The financial statements are prepared in accordance with U.S. generally accepted accounting principles (GAAP), which requires management to make certain estimates and assumptions that affect the reported amounts of assets and liabilities, the disclosure of contingent assets and liabilities at the date of the financial statements and the reported amounts of income and expenses during the reporting period. Actual results could differ from those estimates.
The following is a summary of significant accounting policies followed by the Fund in the preparation of its financial statements.
Security Valuation
All equity securities are valued at the close of business of the New York Stock Exchange (NYSE). Equity securities are valued at the last quoted sales price on the principal exchange or market on which they trade, except for securities traded on the NASDAQ Stock Market, which are valued at the NASDAQ official close price. Unlisted securities or listed securities for which there were no sales during the day are valued at the mean of the latest quoted bid and ask prices on such exchanges or markets.
Foreign equity securities are valued based on quotations from the principal market in which such securities are traded. If any foreign security prices are not readily available as a result of limited share activity, the securities are valued at the mean of the latest quoted bid and ask prices on such exchanges or markets. Foreign currency exchange rates are generally determined at 4:00 p.m. Eastern (U.S.) time. Many securities markets and exchanges outside the U.S. close prior to the close of the NYSE; therefore, the closing prices for securities in such markets or on such exchanges may not fully reflect events that occur after such close but before the close of the NYSE. In those situations, foreign securities will be fair valued pursuant to a policy adopted by the Board of Trustees (the Board), including, if available, utilizing a third party pricing service to determine these fair values. The third party pricing
| | | | |
| Semiannual Report 2015 | | | 23 | |
| | |
| |
| | COLUMBIA ASIA PACIFIC EX-JAPAN FUND |
NOTES TO FINANCIAL STATEMENTS (continued)
April 30, 2015 (Unaudited)
service takes into account multiple factors, including, but not limited to, movements in the U.S. securities markets, certain depositary receipts, futures contracts and foreign exchange rates that have occurred subsequent to the close of the foreign exchange or market, to determine a good faith estimate that reasonably reflects the current market conditions as of the close of the NYSE. The fair value of a security is likely to be different from the quoted or published price, if available.
Investments in open-end investment companies, including money market funds, are valued at their net asset value.
Investments for which market quotations are not readily available, or that have quotations which management believes are not reliable, are valued at fair value as determined in good faith under procedures established by and under the general supervision of the Board. If a security or class of securities (such as foreign securities) is valued at fair value, such value is likely to be different from the quoted or published price for the security.
The determination of fair value often requires significant judgment. To determine fair value, management may use assumptions including but not limited to future cash flows and estimated risk premiums. Multiple inputs from various sources may be used to determine fair value.
Foreign Currency Transactions and Translations
The values of all assets and liabilities denominated in foreign currencies are generally translated into U.S. dollars at exchange rates determined at the close of the NYSE. Net realized and unrealized gains (losses) on foreign currency transactions and translations include gains (losses) arising from the fluctuation in exchange rates between trade and settlement dates on securities transactions, gains (losses) arising from the disposition of foreign currency and currency gains (losses) between the accrual and payment dates on dividends, interest income and foreign withholding taxes.
For financial statement purposes, the Fund does not distinguish that portion of gains (losses) on investments which is due to changes in foreign exchange rates from that which is due to changes in market prices of the investments. Such fluctuations are included with the net realized and unrealized gains (losses) on investments in the Statement of Operations.
Security Transactions
Security transactions are accounted for on the trade date. Cost is determined and gains (losses) are based upon the specific identification method for both financial statement and federal income tax purposes.
Income Recognition
Corporate actions and dividend income are generally recorded net of any non-reclaimable tax withholdings, on the ex-dividend date or upon receipt of ex-dividend notification in the case of certain foreign securities.
Awards from class action litigation are recorded as a reduction of cost basis if the Fund still owns the applicable securities on the payment date. If the Fund no longer owns the applicable securities, the proceeds are recorded as realized gains.
Expenses
General expenses of the Trust are allocated to the Fund and other funds of the Trust based upon relative net assets or other expense allocation methodologies determined by the nature of the expense. Expenses directly attributable to the Fund are charged to the Fund. Expenses directly attributable to a specific class of shares are charged to that share class.
Determination of Class Net Asset Value
All income, expenses (other than class-specific expenses, which are charged to that share class, as shown in the Statement of Operations) and realized and unrealized gains (losses) are allocated to each class of the Fund on a daily basis, based on the relative net assets of each class, for purposes of determining the net asset value of each class.
Federal Income Tax Status
The Fund intends to qualify each year as a regulated investment company under Subchapter M of the Internal Revenue Code, as amended, and will distribute substantially all of its taxable income (including net short-term capital gains), if any, for its tax year, and as such will not be subject to federal income taxes. In addition, the Fund intends to distribute in each calendar year substantially all of its net investment income, capital gains and certain other amounts, if any, such that the Fund should not be subject to federal excise tax. Therefore, no federal income or excise tax provision is recorded.
Foreign Taxes
The Fund may be subject to foreign taxes on income, gains on investments or currency repatriation, a portion of which may be recoverable. The Fund will accrue such taxes and recoveries, as applicable, based upon its current interpretation of tax rules and regulations that exist in the markets in which it invests.
| | |
| 24 | | Semiannual Report 2015 |
| | |
| |
| COLUMBIA ASIA PACIFIC EX-JAPAN FUND | | |
NOTES TO FINANCIAL STATEMENTS (continued)
April 30, 2015 (Unaudited)
Realized gains in certain countries may be subject to foreign taxes at the Fund level, based on statutory rates. The Fund accrues for such foreign taxes on realized and unrealized gains at the appropriate rate for each jurisdiction, as applicable. The amount, if any, is disclosed as a liability on the Statement of Assets and Liabilities.
Distributions to Shareholders
Distributions from net investment income, if any, are declared and paid annually. Net realized capital gains, if any, are distributed along with the income distribution. Income distributions and capital gain distributions are determined in accordance with federal income tax regulations, which may differ from GAAP.
Guarantees and Indemnifications
Under the Trust’s organizational documents and, in some cases, by contract, its officers and trustees are indemnified against certain liabilities arising out of the performance of their duties to the Trust or its funds. In addition, certain of the Fund’s contracts with its service providers contain general indemnification clauses. The Fund’s maximum exposure under these arrangements is unknown since the amount of any future claims that may be made against the Fund cannot be determined, and the Fund has no historical basis for predicting the likelihood of any such claims.
Note 3. Fees and Compensation Paid to Affiliates
Investment Management Fees
Under an Investment Management Services Agreement, Columbia Management Investment Advisers, LLC (the Investment Manager), a wholly-owned subsidiary of Ameriprise Financial, Inc. (Ameriprise Financial), is responsible for the ultimate oversight of investments made by the Fund. The Fund’s subadviser (see Subadvisory Agreement below) has the primary responsibility for the day-to-day portfolio management of the Fund. The investment management fee is an annual fee that is equal to a percentage of the Fund’s average daily net assets that declines from 0.80% to 0.57% as the Fund’s net assets increase. The annualized effective investment management fee rate for the six months ended April 30, 2015 was 0.75% of the Fund��s average daily net assets.
Subadvisory Agreement
The Investment Manager has entered into a Subadvisory Agreement with Threadneedle International Limited
(Threadneedle), an affiliate of the Investment Manager and wholly-owned subsidiary of Ameriprise Financial, to serve as the subadviser to the Fund. The Investment Manager compensates Threadneedle to manage the investment of the Fund’s assets.
Administration Fees
Under an Administrative Services Agreement, the Investment Manager also serves as the Fund Administrator. The Fund pays the Fund Administrator an annual fee for administration and accounting services equal to a percentage of the Fund’s average daily net assets that declines from 0.08% to 0.05% as the Fund’s net assets increase. The annualized effective administration fee rate for the six months ended April 30, 2015 was 0.08% of the Fund’s average daily net assets.
Other Expenses
Other expenses are for, among other things, miscellaneous expenses of the Fund or the Board, including payments to a company providing limited administrative services to the Fund and the Board. That company’s expenses include boardroom and office expense, employee compensation, employee health and retirement benefits, and certain other expenses. For the six months ended April 30, 2015, other expenses paid by the Fund to this company were $1,415.
Compensation of Board Members
Board members are compensated for their services to the Fund as disclosed in the Statement of Operations. Under a Deferred Compensation Plan (the Plan), the Board members who are not “interested persons” of the Fund, as defined under the 1940 Act, may elect to defer payment of up to 100% of their compensation. Deferred amounts are treated as though equivalent dollar amounts had been invested in shares of certain funds managed by the Investment Manager. The Fund’s liability for these amounts is adjusted for market value changes and remains in the Fund until distributed in accordance with the Plan.
Transfer Agent Fees
Under a Transfer and Dividend Disbursing Agent Agreement, Columbia Management Investment Services Corp. (the Transfer Agent), an affiliate of the Investment Manager and a wholly-owned subsidiary of Ameriprise Financial, is responsible for providing transfer agency services to the Fund. The Transfer Agent has contracted with Boston Financial Data Services (BFDS) to serve as sub-transfer agent.
| | | | |
| Semiannual Report 2015 | | | 25 | |
| | |
| |
| | COLUMBIA ASIA PACIFIC EX-JAPAN FUND |
NOTES TO FINANCIAL STATEMENTS (continued)
April 30, 2015 (Unaudited)
The Transfer Agent receives a monthly transfer agency fee based on the number or the average value of accounts, depending on the type of account. In addition, the Transfer Agent also receives sub-transfer agency fees based on a percentage of the average aggregate value of the Fund’s shares maintained in omnibus accounts (other than omnibus accounts for which American Enterprise Investment Services Inc. is the broker of record or accounts where the beneficial shareholder is a customer of Ameriprise Financial Services, Inc., for which the Transfer Agent receives a per account fee). The Transfer Agent pays the fees of BFDS for services as sub-transfer agent and is not entitled to reimbursement for such fees from the Fund (with the exception of out-of-pocket fees).
The Transfer Agent also receives compensation from the Fund for various shareholder services and reimbursements for certain out-of-pocket fees. Class I shares do not pay transfer agency fees. Total transfer agent fees for Class R5 shares are subject to an annual limitation of not more than 0.05% of the average daily net assets attributable to Class R5 shares.
For the six months ended April 30, 2015, the Fund’s annualized effective transfer agent fee rates as a percentage of average daily net assets of each class were as follows:
| | | | |
| | | | | |
Class A | | | 0.23 | % |
Class C | | | 0.24 | |
Class R | | | 0.24 | |
Class R5 | | | 0.05 | |
Class Z | | | 0.24 | |
An annual minimum account balance fee of $20 may apply to certain accounts with a value below the applicable share class’s initial minimum investment requirements to reduce the impact of small accounts on transfer agent fees. These minimum account balance fees are remitted to the Fund and recorded as part of expense reductions in the Statement of Operations. For the six months ended April 30, 2015, no minimum account balance fees were charged by the Fund.
Distribution Fees
The Fund has an agreement with Columbia Management Investment Distributors, Inc. (the Distributor), an affiliate of the Investment Manager and a wholly-owned subsidiary of Ameriprise Financial, for distribution and shareholder services. Under a Plan and Agreement of Distribution, the Fund pays a fee at an annual rate of up
to 0.25% of the Fund’s average daily net assets attributable to Class A shares, a fee at an annual rate of up to 0.50% of the Fund’s average daily net assets attributable to Class R shares (of which up to 0.25% may be used for shareholder services) and a fee at an annual rate of up to 1.00% of the Fund’s average daily net assets attributable to Class C shares. For Class C shares, of the 1.00% fee, up to 0.75% is reimbursed for distribution expenses.
The amount of distribution expenses incurred by the Distributor and not yet reimbursed (unreimbursed expense) was approximately $2,000 for Class C shares. These amounts are based on the most recent information available as of March 31, 2015, and may be recovered from future payments under the distribution plan or CDSCs. To the extent the unreimbursed expense has been fully recovered, the distribution fee is reduced.
Sales Charges
Sales charges, including front-end charges and CDSCs, received by the Distributor for distributing Fund shares were $4,525 for Class A shares for the six months ended April 30, 2015.
Expenses Waived/Reimbursed by the Investment Manager and its Affiliates
The Fund’s expense ratio is subject to an expense reimbursement arrangement pursuant to which fees will be waived and/or expenses reimbursed (excluding certain fees and expenses described below), so that the Fund’s net operating expenses, after giving effect to fees waived/expenses reimbursed and any balance credits and/or overdraft charges from the Fund’s custodian, do not exceed the annual rates of:
| | | | | | | | |
| | | Voluntary Expense Cap Effective March 1, 2015 | | | Contractual Expense Cap Prior to March 1, 2015 | |
Class A | | | 1.69 | % | | | 1.73 | % |
Class C | | | 2.44 | | | | 2.48 | |
Class I | | | 1.27 | | | | 1.36 | |
Class R | | | 1.94 | | | | 1.98 | |
Class R5 | | | 1.32 | | | | 1.41 | |
Class Z | | | 1.44 | | | | 1.48 | |
The voluntary expense cap arrangement may be revised or discontinued at any time. Under the arrangements, the following fees and expenses are excluded from the waiver/reimbursement commitment, and therefore will be paid by the Fund, if applicable: taxes (including foreign
| | |
| 26 | | Semiannual Report 2015 |
| | |
| |
| COLUMBIA ASIA PACIFIC EX-JAPAN FUND | | |
NOTES TO FINANCIAL STATEMENTS (continued)
April 30, 2015 (Unaudited)
transaction taxes), expenses associated with investments in affiliated and non-affiliated pooled investment vehicles (including mutual funds and exchange-traded funds), transaction costs and brokerage commissions, costs related to any securities lending program, dividend expenses associated with securities sold short, inverse floater program fees and expenses, transaction charges and interest on borrowed money, interest and extraordinary expenses. Any fees waived and/or expenses reimbursed under the expense reimbursement arrangements described above are not recoverable by the Investment Manager or its affiliates in future periods.
Note 4. Federal Tax Information
The timing and character of income and capital gain distributions are determined in accordance with income tax regulations, which may differ from GAAP because of temporary or permanent book to tax differences.
At April 30, 2015, the cost of investments for federal income tax purposes was approximately $1,356,529,000 and the aggregate gross approximate unrealized appreciation and depreciation based on that cost was:
| | | | |
Unrealized appreciation | | | $250,557,000 | |
Unrealized depreciation | | | (29,788,000 | ) |
Net unrealized appreciation | | | $220,769,000 | |
The following capital loss carryforwards, determined as of October 31, 2014, may be available to reduce taxable income arising from future net realized gains on investments, if any, to the extent permitted by the Internal Revenue Code:
| | | | |
| Year of Expiration | | Amount ($) | |
No expiration — short-term | | | 25,807,474 | |
No expiration — long-term | | | 6,650,003 | |
Total | | | 32,457,477 | |
Management of the Fund has concluded that there are no significant uncertain tax positions in the Fund that would require recognition in the financial statements. However, management’s conclusion may be subject to review and adjustment at a later date based on factors including, but not limited to, new tax laws, regulations, and administrative interpretations (including relevant court decisions). Generally, the Fund’s federal tax returns for the prior three fiscal years remain subject to examination by the Internal Revenue Service.
Note 5. Portfolio Information
The cost of purchases and proceeds from sales of securities, excluding short-term investments and derivatives, if any, aggregated to $687,875,105 and $109,518,003, respectively, for the six months ended April 30, 2015. The amount of purchase and sale activity impacts the portfolio turnover rate reported in the Financial Highlights.
Note 6. Affiliated Money Market Fund
The Fund invests in Columbia Short-Term Cash Fund, an affiliated money market fund established for the exclusive use by the Fund and other affiliated funds. The income earned by the Fund from such investments is included as Dividends — affiliated issuers in the Statement of Operations. As an investing fund, the Fund indirectly bears its proportionate share of the expenses of Columbia Short-Term Cash Fund.
Note 7. Shareholder Concentration
At April 30, 2015, two unaffiliated shareholders of record owned 99.0% of the outstanding shares of the Fund in one or more accounts. The Fund has no knowledge about whether any portion of those shares was owned beneficially. Subscription and redemption activity by concentrated accounts may have a significant effect on the operations of the Fund.
Note 8. Line of Credit
The Fund has entered into a revolving credit facility with a syndicate of banks led by JPMorgan Chase Bank, N.A. whereby the Fund may borrow for the temporary funding of shareholder redemptions or for other temporary or emergency purposes. Pursuant to a December 9, 2014 amendment, the credit facility agreement, which is a collective agreement between the Fund and certain other funds managed by the Investment Manager, severally and not jointly, permits collective borrowings up to $550 million. Interest is charged to each participating fund based on its borrowings at a rate equal to the higher of (i) the overnight federal funds rate plus 1.00% or (ii) the one-month LIBOR rate plus 1.00%. Each borrowing under the credit facility matures no later than 60 days after the date of borrowing. The Fund also pays a commitment fee equal to its pro rata share of the amount of the credit facility at a rate of 0.075% per annum. The commitment fee is included in other expenses in the Statement of Operations. Prior to the December 9, 2014 amendment, the credit facility agreement permitted borrowings up to $500 million under the same terms and interest rates as described above.
| | | | |
| Semiannual Report 2015 | | | 27 | |
| | |
| |
| | COLUMBIA ASIA PACIFIC EX-JAPAN FUND |
NOTES TO FINANCIAL STATEMENTS (continued)
April 30, 2015 (Unaudited)
The Fund had no borrowings during the six months ended April 30, 2015.
Note 9. Significant Risks
Asia Pacific Region Risk
Because the Fund concentrates its investments in the Asia Pacific region, the Fund may be particularly susceptible to economic, political or regulatory events affecting companies and countries within the Asia Pacific region. Many of the countries in the Asia Pacific region are developing both politically and economically, and may have relatively unstable governments and economies based on a limited number of commodities or industries. Securities markets in the Asia Pacific region are smaller and have a lower trading volume than those in the United States, which may result in the securities of some companies in the Asia Pacific region being less liquid than similar U.S. or other foreign securities. Some currencies in the Asia Pacific region are more volatile than the U.S. dollar and some countries in the Asia Pacific region have restricted the flow of money in and out of the country. If securities of companies in the Asia Pacific region fall out of favor, it may cause the Fund to underperform those funds that do not concentrate in this particular region of the world.
Information Technology Sector Risk
Sector risk occurs when a fund invests a significant portion of its assets in securities of companies conducting business in a related group of industries within an economic sector. Companies in the same economic sector may be similarly affected by economic, regulatory, political or market events or conditions, making a fund more vulnerable to unfavorable developments in that economic sector than funds that invest more broadly. The Fund may be more susceptible to the particular risks that may affect companies in the information technology sector than if it were invested in a wider variety of companies in unrelated sectors.
Financial Sector Risk
Sector risk occurs when a fund invests a significant portion of its assets in securities of companies conducting business in a related group of industries within an economic sector. Companies in the same economic sector may be similarly affected by economic, regulatory, political or market events or conditions, making a fund more vulnerable to unfavorable developments in that economic sector than funds that invest more broadly. The Fund may be more susceptible
to the particular risks that may affect companies in the financial sector than if it were invested in a wider variety of companies in unrelated sectors.
Foreign Securities and Emerging Market Countries Risk
Investing in foreign securities may include certain risks and considerations not typically associated with investing in U.S. securities, such as fluctuating currency values and changing local and regional economic, political and social conditions, which may result in greater market volatility. In addition, certain foreign securities may not be as liquid as U.S. securities. Investing in emerging markets may accentuate these risks. These countries are also more likely to experience high levels of inflation, deflation or currency devaluation which could hurt their economies and securities markets. To the extent that the Fund concentrates its investment exposure to any one or a few specific countries, the Fund will be particularly susceptible to the various conditions, events or other factors impacting those countries and may, therefore, have a greater risk than that of a fund which is more geographically diversified.
Note 10. Subsequent Events
Management has evaluated the events and transactions that have occurred through the date the financial statements were issued and noted no items requiring adjustment of the financial statements or additional disclosure.
Note 11. Information Regarding Pending and Settled Legal Proceedings
In December 2005, without admitting or denying the allegations, American Express Financial Corporation (AEFC, which is now known as Ameriprise Financial, Inc. (Ameriprise Financial)) entered into settlement agreements with the Securities and Exchange Commission (SEC) and Minnesota Department of Commerce (MDOC) related to market timing activities. As a result, AEFC was censured and ordered to cease and desist from committing or causing any violations of certain provisions of the Investment Advisers Act of 1940, the Investment Company Act of 1940, and various Minnesota laws. AEFC agreed to pay disgorgement of $10 million and civil money penalties of $7 million. AEFC also agreed to retain an independent distribution consultant to assist in developing a plan for distribution of all disgorgement and civil penalties ordered by the SEC in accordance with various undertakings detailed at
| | |
| 28 | | Semiannual Report 2015 |
| | |
| |
| COLUMBIA ASIA PACIFIC EX-JAPAN FUND | | |
NOTES TO FINANCIAL STATEMENTS (continued)
April 30, 2015 (Unaudited)
www.sec.gov/litigation/admin/ia-2451.pdf. Ameriprise Financial and its affiliates have cooperated with the SEC and the MDOC in these legal proceedings, and have made regular reports to the Funds’ Boards of Trustees.
Ameriprise Financial and certain of its affiliates have historically been involved in a number of legal, arbitration and regulatory proceedings, including routine litigation, class actions, and governmental actions, concerning matters arising in connection with the conduct of their business activities. Ameriprise Financial believes that the Funds are not currently the subject of, and that neither Ameriprise Financial nor any of its affiliates are the subject of, any pending legal, arbitration or regulatory proceedings that are likely to have a material adverse effect on the Funds or the ability of Ameriprise Financial or its affiliates to perform under their contracts with the Funds. Ameriprise Financial is required to make quarterly (10-Q), annual (10-K) and, as necessary, 8-K filings with the Securities and Exchange Commission on legal and regulatory matters that relate to Ameriprise Financial and its affiliates. Copies of these filings may be obtained by accessing the SEC website at www.sec.gov.
There can be no assurance that these matters, or the adverse publicity associated with them, will not result in increased fund redemptions, reduced sale of fund shares or other adverse consequences to the Funds. Further, although we believe proceedings are not likely to have a material adverse effect on the Funds or the ability of Ameriprise Financial or its affiliates to perform under their contracts with the Funds, these proceedings are subject to uncertainties and, as such, we are unable to estimate the possible loss or range of loss that may result. An adverse outcome in one or more of these proceedings could result in adverse judgments, settlements, fines, penalties or other relief that could have a material adverse effect on the consolidated financial condition or results of operations of Ameriprise Financial.
| | | | |
| Semiannual Report 2015 | | | 29 | |
| | |
| |
| | COLUMBIA ASIA PACIFIC EX-JAPAN FUND |
APPROVAL OF INVESTMENT MANAGEMENT SERVICES AND SUBADVISORY AGREEMENTS
Columbia Management Investment Advisers, LLC (Columbia Management or the Investment Manager), a wholly-owned subsidiary of Ameriprise Financial, Inc. (Ameriprise Financial), serves as the investment manager to Columbia Asia Pacific ex-Japan Fund (the Fund). Under an investment management services agreement (the IMS Agreement), Columbia Management provides investment advice and other services to the Fund and other funds distributed by Columbia Management Investment Distributors, Inc. (collectively, the Funds). In addition, under a Subadvisory Agreement (the Subadvisory Agreement) between Columbia Management and Threadneedle International Limited (the Subadviser), an affiliate of Columbia Management, the Subadviser has provided portfolio management and related services for the Fund.
The Fund’s Board of Trustees (the Board), including the independent Board members (the Independent Trustees), considered the renewal of the IMS Agreement and the Subadvisory Agreement (together, the Advisory Agreements) for a two-month period (Short-Term Period) in order to align the Advisory Agreements with the review cycle of other funds in the Columbia family of funds. Columbia Management prepared detailed reports for the Board and its Contracts Committee in January, March and April 2015, including reports based on analyses of data provided by an independent organization (Lipper) and a comprehensive response to each item of information requested by independent legal counsel to the Independent Trustees (Independent Legal Counsel) in a letter to the Investment Manager, to assist the Board in making this determination. In addition, throughout the year, the Board (or its committees) regularly meets with portfolio management teams and senior management personnel, and reviews information prepared by Columbia Management addressing the services Columbia Management provides and Fund performance. The Board also accords appropriate weight to the work, deliberations and conclusions of the Contracts Committee, the Investment Review Committee and the Compliance Committee in determining whether to continue the Advisory Agreements.
The Board, at its April 13-15, 2015 in-person Board meeting (the April Meeting), considered the renewal of the Advisory Agreements for the Short-Term Period. At the April Meeting, Independent Legal Counsel reviewed with the Independent Trustees various factors relevant to the Board’s consideration of advisory and subadvisory agreements and the Board’s legal responsibilities related to such consideration. Following an analysis and discussion of the factors identified below, the Board, including all of the Independent Trustees, approved the renewal of each of the Advisory Agreements for the Short-Term Period.
Nature, Extent and Quality of Services Provided by Columbia Management and the Subadviser
The Board analyzed various reports and presentations it had received detailing the services performed by Columbia Management and the Subadviser, as well as their history, reputation, expertise, resources and relative capabilities, and the qualifications of their personnel.
With respect to Columbia Management, the Board specifically considered many developments during the past year concerning the services provided by Columbia Management. The Board took into account the information it received and reviewed concerning Columbia Management’s ongoing oversight and monitoring of the subadvisers, observing the broad scope of services provided by Columbia Management to each subadvised Fund, including, among other noted services, investment, risk and compliance oversight. The Board also took into account the Subadviser oversight structure and the Columbia Management team dedicated thereto as well as the contemplated enhancements to the team and its resources. The Board also noted the information it received concerning Columbia Management’s ability to retain its key portfolio management personnel.
In connection with the Board’s evaluation of the overall package of services provided by Columbia Management, the Board also considered the quality of administrative services provided to the Fund by Columbia Management. In evaluating the quality of services provided under the IMS Agreement and the Fund’s Administrative Services Agreement, the Board also took into account the organization and strength of the Fund’s and its service providers’ compliance programs. The Board also reviewed the financial condition of Columbia Management and its affiliates and their ability to carry out their responsibilities under the IMS Agreement and the Fund’s other service agreements with affiliates of Ameriprise Financial, observing the financial strength of Ameriprise Financial, with its solid balance sheet. In addition, the Board discussed the acceptability of the terms of the IMS Agreement for the Short-Term Period.
Based on the foregoing, and based on other information received (both oral and written, including the information on investment performance referenced below) and other considerations, the Board concluded that the services being performed by Columbia Management and its affiliates were acceptable for the Short-Term Period.
| | |
| 30 | | Semiannual Report 2015 |
| | |
| |
| | COLUMBIA ASIA PACIFIC EX-JAPAN FUND |
APPROVAL OF INVESTMENT MANAGEMENT SERVICES AND SUBADVISORY AGREEMENTS (continued)
With respect to the Subadviser[s], the Board observed that it had previously approved the Subadviser’s code of ethics and compliance program, that the Chief Compliance Officer of the Fund continues to monitor the code and the program, and that no material concerns have been reported. The Board also considered the Subadviser’s organizational strength and resources, portfolio management team depth and capabilities and investment process. The Board also considered the Subadviser’s capability and wherewithal to carry out its responsibilities under the Subadvisory Agreement for the Short-Term Period. In addition, the Board discussed the acceptability of the terms of the Subadvisory Agreement for the Short-Term Period. The Board noted that the terms of the Subadvisory Agreement are generally consistent with the terms of other subadviser agreements for subadvisers who manage other funds managed by the Investment Manager. Based on the foregoing, and based on other information received (both oral and written) and other considerations, including, in particular, the performance of the Fund (discussed below), as well as the Investment Manager’s recommendation that the Board approve renewal of the Subadvisory Agreement with the Subadviser the Board concluded that the services being performed under the Subadvisory Agreement were acceptable for purposes of renewal for the Short-Term Period.
Investment Performance
For purposes of evaluating the nature, extent and quality of services provided under the Advisory Agreements, the Board carefully reviewed the investment performance of the Fund. In this regard, the Board considered detailed reports providing the results of analyses performed by an independent organization showing, for various periods, the performance of the Fund, the performance of a benchmark index, the percentage ranking of the Fund among its comparison group and the net assets of the Fund. Additionally, the Board reviewed the performance of the Subadviser and Columbia Management’s process for monitoring the Subadviser. The Board considered, in particular, management’s rationale for recommending the continued retention of the Subadviser. The Board observed that for purposes of approving the Advisory Agreements for the Short-Term Period, the Fund’s performance was acceptable.
Comparative Fees, Costs of Services Provided and the Profits Realized by Columbia Management, its Affiliates and the Subadviser from their Relationships with the Fund
The Board reviewed comparative fees and the costs of services provided under each of the Advisory Agreements. The Board members considered detailed comparative information set forth in an annual report on fees and expenses, including, among other things, data (based on analyses conducted by an independent organization) showing a comparison of the Fund’s expenses with median expenses paid by funds in its comparative peer universe, as well as data showing the Fund’s contribution to Columbia Management’s profitability.
The Board accorded particular weight to the notion that the level of fees should reflect a rational pricing model applied consistently across the various product lines in the Fund family, while assuring that the overall fees for each Fund (with few defined exceptions) are generally in line with the “pricing philosophy” currently in effect (i.e., that the total expense ratio of the Fund is no higher than the median expense ratio of funds in the same comparison universe of the Fund).
Additionally, the Board reviewed the level of subadvisory fees paid to the Subadviser, noting that the fees are paid by the Investment Manager and do not impact the fees paid by the Fund. The Board observed that the subadvisory fee level for the Subadviser was generally comparable to those charged by other subadvisers to similar funds managed by the Investment Manager. The Board also reviewed fee rates charged by the Subadviser to other client accounts.
The Board also considered the expected profitability of Columbia Management and its affiliates in connection with Columbia Management providing investment management services to the Fund. In this regard, the Board referred to a detailed profitability report, discussing the profitability to Columbia Management and Ameriprise Financial from managing, operating and distributing the Funds. The Board noted that the fees paid by the Funds should permit the Investment Manager to offer competitive compensation to its personnel, make necessary investments in its business and earn an appropriate profit. For purposes of approving the Advisory Agreements for the Short-Term Period, the Board concluded that the investment management service and subadvisory fees were fair and reasonable, observing that the profitability levels also seemed reasonable.
| | | | |
| Semiannual Report 2015 | | | 31 | |
| | |
| |
| | COLUMBIA ASIA PACIFIC EX-JAPAN FUND |
APPROVAL OF INVESTMENT MANAGEMENT SERVICES AND SUBADVISORY AGREEMENTS (continued)
Economies of Scale to be Realized
The Board also considered the economies of scale that might be realized by Columbia Management as the Fund grows and took note of the extent to which Fund shareholders might also benefit from such growth. In this regard, the Board took into account that IMS fees decline as Fund assets exceed various breakpoints.
Based on the foregoing, the Board, including all of the Independent Trustees, concluded that, for purposes of its consideration of the renewal of the Advisory Agreements for the Short-Term Period, fees payable under the Advisory Agreements were fair and reasonable in light of the extent and quality of services provided. In reaching this conclusion, no single factor was determinative. The Board noted its understanding that it would undertake the full consideration of renewal of the Advisory Agreements for the full annual period at its June 2015 meetings. On April 15, 2015, the Board, including all of the Independent Trustees, approved the renewal of the Advisory Agreements for the Short-Term Period.
| | |
| 32 | | Semiannual Report 2015 |
| | |
| |
| COLUMBIA ASIA PACIFIC EX-JAPAN FUND | | |
IMPORTANT INFORMATION ABOUT THIS REPORT
Each fund mails one shareholder report to each shareholder address. If you would like more than one report, please call shareholder services at 800.345.6611 and additional reports will be sent to you.
The policy of the Board is to vote the proxies of the companies in which each fund holds investments consistent with the procedures as stated in the Statement of Additional Information (SAI). You may obtain a copy of the SAI without charge by calling 800.345.6611; contacting your financial intermediary; visiting columbiathreadneedle.com/us; or searching the website of the Securities and Exchange Commission (SEC) at sec.gov. Information regarding how each fund voted proxies relating to portfolio securities is filed with the SEC by August 31st for the most recent 12-month period ending June 30th of that year, and is available without charge by visiting columbiathreadneedle.com/us, or searching the website of the SEC at sec.gov.
Each fund files a complete schedule of portfolio holdings with the SEC for the first and third quarters of each fiscal year on Form N-Q. Each fund’s Form N-Q is available on the SEC’s website at sec.gov and may be reviewed and copied at the SEC’s Public Reference Room in Washington, D.C. Information on the operation of the Public Reference Room may be obtained by calling 800.SEC.0330. Each fund’s complete schedule of portfolio holdings, as filed on Form N-Q, can also be obtained without charge, upon request, by calling 800.345.6611.
| | | | |
| Semiannual Report 2015 | | | 33 | |
Columbia Asia Pacific ex-Japan Fund
P.O. Box 8081
Boston, MA 02266-8081
This information is for use with concurrent or prior delivery of a fund prospectus. Please read and consider the investment objectives, risks, charges and expenses for any fund carefully before investing. For a prospectus and summary prospectus, which contains this and other important information about the Fund, go to columbiathreadneedle.com/us. The Fund is distributed by Columbia Management Investment Distributors, Inc., member FINRA, and managed by Columbia Management Investment Advisers, LLC.
Columbia Threadneedle Investments (Columbia Threadneedle) is the global brand name of the Columbia and Threadneedle group of companies. All rights reserved. Columbia Management Investment Distributors, Inc., 225 Franklin Street, Boston, MA 02110-2804
© 2015 Columbia Management Investment Advisers, LLC.
columbiathreadneedle.com/us
SAR119_10_E01_(06/15)

SEMIANNUAL REPORT
April 30, 2015

COLUMBIA GLOBAL BOND FUND

PRESIDENT’S MESSAGE

Dear Shareholder,
In a world that is changing faster than ever before, investors want asset managers who offer a global perspective while generating strong and sustainable returns. To that end, Columbia Management, in conjunction with its U.K.-based affiliate, Threadneedle Investments, has rebranded to Columbia Threadneedle Investments. The new global brand represents the combined capabilities, resources and reach of the global group, offering investors access to the best of both firms.
With a presence in 18 countries and more than 450 investment professionals*, our collective perspective and world view as Columbia Threadneedle Investments gives us deeper insight into what might affect the real-life financial outcomes clients are seeking. Putting our views into a global context enables us to build richer perspectives and create the right solutions, and provides us with enhanced capabilities to deliver consistent investment performance, which may ultimately lead to better investor outcomes.
As a result of the rebrand, you will begin to see our new logo and colors reflected in printed materials, such as this shareholder report, as well as on our new website — columbiathreadneedle.com/us. We encourage you to visit us online and view a new video on the “About Us” tab that speaks to the strength of the firm.
While we are introducing a new brand, in many ways, the investment company you know well has not changed. The following remain in effect:
| n | | Fund and strategy names |
| n | | Established investment teams, philosophies and processes |
| n | | Account services, features, servicing phone numbers and mailing addresses |
| n | | Columbia Management Investment Distributors as distributor and Columbia Management Investment Advisers as investment adviser |
We recognize that the money we manage represents the hard work and savings of people like you, and that everyone has different ambitions and different definitions of success. Investors have varying goals — funding their children’s education, enjoying their retirement, putting money aside for unexpected events, and more. Whatever your ambitions, we believe our wide range of investment products and solutions can help give you confidence that you will reach your goals.
The world is constantly changing, but our priority remains the same: to help you secure your finances, meet your goals and achieve success. Thank you for your continued investment with us. Our service representatives are available at 800.345.6611 to help with any questions.
Sincerely,

Christopher O. Petersen
President, Columbia Funds
Investors should consider the investment objectives, risks, charges and expenses of a mutual fund carefully before investing. For a free prospectus and summary prospectus, which contains this and other important information about a fund, visit columbiathreadneedle.com/us. The prospectus should be read carefully before investing.
* Source: Ameriprise as of December 1, 2014
Columbia Funds are distributed by Columbia Management Investment Distributors, Inc., member FINRA, and managed by Columbia Management Investment Advisers, LLC.
© 2015 Columbia Management Investment Advisers, LLC. All rights reserved.
Semiannual Report 2015
| | |
| |
| COLUMBIA GLOBAL BOND FUND | | |
TABLE OF CONTENTS
Fund Investment Manager
Columbia Management Investment
Advisers, LLC
225 Franklin Street
Boston, MA 02110
Fund Distributor
Columbia Management Investment
Distributors, Inc.
225 Franklin Street
Boston, MA 02110
Fund Transfer Agent
Columbia Management Investment
Services Corp.
P.O. Box 8081
Boston, MA 02266-8081
For more information about any of the funds, please visit columbiathreadneedle.com/us or call 800.345.6611. Customer Service Representatives are available to answer your questions Monday through Friday from 8 a.m. to 7 p.m. Eastern time.
The views expressed in this report reflect the current views of the respective parties. These views are not guarantees of future performance and involve certain risks, uncertainties and assumptions that are difficult to predict, so actual outcomes and results may differ significantly from the views expressed. These views are subject to change at any time based upon economic, market or other conditions and the respective parties disclaim any responsibility to update such views. These views may not be relied on as investment advice and, because investment decisions for a Columbia fund are based on numerous factors, may not be relied on as an indication of trading intent on behalf of any particular Columbia fund. References to specific securities should not be construed as a recommendation or investment advice.
Semiannual Report 2015
| | |
| |
| | COLUMBIA GLOBAL BOND FUND |
PERFORMANCE OVERVIEW
(Unaudited)
Performance Summary
| n | | Columbia Global Bond Fund (the Fund) Class A shares returned -0.68% excluding sales charges for the six-month period that ended April 30, 2015. |
| n | | The Fund outperformed its benchmark, the Barclays Global Aggregate Index, which returned -1.92% for the six months. |
| | | | | | | | | | | | | | | | | | |
Average Annual Total Returns (%) (for period ended April 30, 2015) | |
| | | Inception | | 6 Months
cumulative | | | 1 Year | | | 5 Years | | | 10 Years | |
Class A | | 03/20/89 | | | | | | | | | | | | | | | | |
Excluding sales charges | | | | | -0.68 | | | | -1.77 | | | | 2.08 | | | | 3.12 | |
Including sales charges | | | | | -5.33 | | | | -6.46 | | | | 1.09 | | | | 2.61 | |
Class B | | 03/20/95 | | | | | | | | | | | | | | | | |
Excluding sales charges | | | | | -0.88 | | | | -2.42 | | | | 1.35 | | | | 2.35 | |
Including sales charges | | | | | -5.71 | | | | -7.18 | | | | 1.01 | | | | 2.35 | |
Class C | | 06/26/00 | | | | | | | | | | | | | | | | |
Excluding sales charges | | | | | -0.89 | | | | -2.46 | | | | 1.35 | | | | 2.35 | |
Including sales charges | | | | | -1.86 | | | | -3.41 | | | | 1.35 | | | | 2.35 | |
Class I | | 03/04/04 | | | -0.53 | | | | -1.47 | | | | 2.51 | | | | 3.54 | |
Class K | | 03/20/95 | | | -0.52 | | | | -1.61 | | | | 2.24 | | | | 3.32 | |
Class R* | | 03/15/10 | | | -0.63 | | | | -1.88 | | | | 1.84 | | | | 2.82 | |
Class W* | | 12/01/06 | | | -0.68 | | | | -1.77 | | | | 2.04 | | | | 3.10 | |
Class Y* | | 11/08/12 | | | -0.38 | | | | -1.32 | | | | 2.32 | | | | 3.24 | |
Class Z* | | 09/27/10 | | | -0.42 | | | | -1.51 | | | | 2.36 | | | | 3.26 | |
Barclays Global Aggregate Index | | | | | -1.92 | | | | -3.73 | | | | 2.52 | | | | 3.59 | |
Returns for Class A are shown with and without the maximum initial sales charge of 4.75%. Returns for Class B are shown with and without the applicable contingent deferred sales charge (CDSC) of 5.00% in the first year, declining to 1.00% in the sixth year and eliminated thereafter. Returns for Class C are shown with and without the 1.00% CDSC for the first year only. The Fund’s other classes are not subject to sales charges and have limited eligibility. Please see the Fund’s prospectus for details. Performance for different share classes will vary based on differences in sales charges and fees associated with each class. All results shown assume reinvestment of distributions during the period. Returns do not reflect the deduction of taxes that a shareholder may pay on Fund distributions or on the redemption of Fund shares. Performance results reflect the effect of any fee waivers or reimbursements of Fund expenses by Columbia Management Investment Advisers, LLC and/or any of its affiliates. Absent these fee waivers or expense reimbursement arrangements, performance results would have been lower.
The performance information shown represents past performance and is not a guarantee of future results. The investment return and principal value of your investment will fluctuate so that your shares, when redeemed, may be worth more or less than their original cost. Current performance may be lower or higher than the performance information shown. You may obtain performance information current to the most recent month-end by contacting your financial intermediary, visiting columbiathreadneedle.com/us or calling 800.345.6611.
| * | The returns shown for periods prior to the share class inception date (including returns for the Life of the Fund, if shown, which are since Fund inception) include the returns of the Fund’s oldest share class. These returns are adjusted to reflect any higher class-related operating expenses of the newer share classes, as applicable. Please visit columbiathreadneedle.com/us/investment-products/mutual-funds/appended-performance for more information. |
The Barclays Global Aggregate Index is a broad-based benchmark that measures the global investment grade fixed-rate debt markets.
Indices are not available for investment, are not professionally managed and do not reflect sales charges, fees, brokerage commissions, taxes or other expenses of investing. Securities in the Fund may not match those in an index.
| | |
| |
| COLUMBIA GLOBAL BOND FUND | | |
PORTFOLIO OVERVIEW
(Unaudited)
| | | | |
Country Breakdown (%)
(at April 30, 2015) | |
Argentina | | | 0.2 | |
Australia | | | 4.7 | |
Belgium | | | 0.0 | (a) |
Bermuda | | | 0.7 | |
Brazil | | | 5.6 | |
Canada | | | 0.5 | |
Caymen Islands | | | 0.9 | |
Chile | | | 0.3 | |
Colombia | | | 2.0 | |
Dominican Republic | | | 0.8 | |
El Salvador | | | 0.2 | |
France | | | 0.1 | |
Georgia | | | 0.3 | |
Ghana | | | 0.3 | |
Guatemala | | | 0.4 | |
Hungary | | | 0.7 | |
Indonesia | | | 4.1 | |
Ireland | | | 0.1 | |
Italy | | | 2.7 | |
Kazakhstan | | | 0.2 | |
Lithuania | | | 0.5 | |
Luxembourg | | | 0.2 | |
Malaysia | | | 2.7 | |
Mexico | | | 5.7 | |
Netherlands | | | 0.4 | |
New Zealand | | | 3.2 | |
Panama | | | 0.1 | |
Paraguay | | | 0.1 | |
Peru | | | 0.9 | |
Philippines | | | 0.3 | |
Romania | | | 2.9 | |
Russian Federation | | | 1.4 | |
Serbia | | | 0.2 | |
Spain | | | 2.8 | |
Thailand | | | 0.8 | |
Trinidad and Tobago | | | 0.5 | |
Turkey | | | 2.0 | |
Ukraine | | | 0.2 | |
United Kingdom | | | 3.8 | |
United States(b) | | | 45.4 | |
Venezuela | | | 0.7 | |
Virgin Islands | | | 0.0 | (a) |
Zambia | | | 0.4 | |
Total | | | 100.0 | |
Percentages indicated are based upon total investments. The Fund’s portfolio composition is subject to change.
| (b) | Includes investments in Money Market Funds. |
Portfolio Management
Jim Cielinski
Matthew Cobon
Gene Tannuzzo, CFA
Effective May 1, 2015, Zach Pandl no longer serves as a Portfolio Manager of the Fund.
| | |
| |
| | COLUMBIA GLOBAL BOND FUND |
PORTFOLIO OVERVIEW (continued)
(Unaudited)
| | | | |
Quality Breakdown (%) (at April 30, 2015) | |
AAA rating | | | 12.4 | |
AA rating | | | 8.0 | |
A rating | | | 13.3 | |
BBB rating | | | 43.9 | |
BB rating | | | 9.1 | |
B rating | | | 6.5 | |
CCC rating | | | 1.7 | |
Not rated | | | 5.1 | |
Total | | | 100.0 | |
Percentages indicated are based upon total fixed income investments (excluding Money Market Funds).
Bond ratings apply to the underlying holdings of the Fund and not the Fund itself and are divided into categories ranging from highest to lowest credit quality, determined by using the middle rating of Moody’s, S&P and Fitch, after dropping the highest and lowest available ratings. When ratings are available from only two rating agencies, the lower rating is used. When a rating is available from only one rating agency, that rating is used. When a bond is not rated by any rating agency, it is designated as “Not rated.” Credit quality ratings assigned by a rating agency are subjective opinions, not statements of fact, and are subject to change, including daily. The ratings assigned by credit rating agencies are but one of the considerations that the Investment Manager and/or Fund’s subadviser incorporates into its credit analysis process, along with such other country-specific factors as the direction and stance of fiscal policy, balance of payment trends and commodity prices, the level and structure of public debt as well as political stability and commitment to strong macroeconomic policies.
| | |
| |
| COLUMBIA GLOBAL BOND FUND | | |
UNDERSTANDING YOUR FUND’S EXPENSES
(Unaudited)
As an investor, you incur two types of costs. There are transaction costs, which generally include sales charges on purchases and may include redemption fees. There are also ongoing costs, which generally include management fees, distribution and/or service fees, and other fund expenses. The following information is intended to help you understand your ongoing costs (in dollars) of investing in the Fund and to help you compare these costs with the ongoing costs of investing in other mutual funds.
Analyzing Your Fund’s Expenses
To illustrate these ongoing costs, we have provided examples and calculated the expenses paid by investors in each share class of the Fund during the period. The actual and hypothetical information in the table is based on an initial investment of $1,000 at the beginning of the period indicated and held for the entire period. Expense information is calculated two ways and each method provides you with different information. The amount listed in the “Actual” column is calculated using the Fund’s actual operating expenses and total return for the period. You may use the Actual information, together with the amount invested, to estimate the expenses that you paid over the period. Simply divide your account value by $1,000 (for example, an $8,600 account value divided by $1,000 = 8.6), then multiply the results by the expenses paid during the period under the “Actual” column. The amount listed in the “Hypothetical” column assumes a 5% annual rate of return before expenses (which is not the Fund’s actual return) and then applies the Fund’s actual expense ratio for the period to the hypothetical return. You should not use the hypothetical account values and expenses to estimate either your actual account balance at the end of the period or the expenses you paid during the period. See “Compare With Other Funds” below for details on how to use the hypothetical data.
Compare With Other Funds
Since all mutual funds are required to include the same hypothetical calculations about expenses in shareholder reports, you can use this information to compare the ongoing cost of investing in the Fund with other funds. To do so, compare the hypothetical example with the 5% hypothetical examples that appear in the shareholder reports of other funds. As you compare hypothetical examples of other funds, it is important to note that hypothetical examples are meant to highlight the ongoing costs of investing in a fund only and do not reflect any transaction costs, such as sales charges, or redemption or exchange fees. Therefore, the hypothetical calculations are useful in comparing ongoing costs only, and will not help you determine the relative total costs of owning different funds. If transaction costs were included in these calculations, your costs would be higher.
November 1, 2014 – April 30, 2015
| | | | | | | | | | | | | | | | | | | | | | | | | | | | |
| | | Account Value at the
Beginning of the
Period ($) | | | Account Value at the
End of the
Period ($) | | | Expenses Paid During
the Period ($) | | | Fund’s Annualized
Expense Ratio (%) | |
| | | | Actual | | | | Hypothetical | | | | Actual | | | | Hypothetical | | | | Actual | | | | Hypothetical | | | | Actual | |
Class A | | | 1,000.00 | | | | 1,000.00 | | | | 993.20 | | | | 1,019.39 | | | | 5.39 | | | | 5.46 | | | | 1.09 | |
Class B | | | 1,000.00 | | | | 1,000.00 | | | | 991.20 | | | | 1,015.67 | | | | 9.08 | | | | 9.20 | | | | 1.84 | |
Class C | | | 1,000.00 | | | | 1,000.00 | | | | 991.10 | | | | 1,015.67 | | | | 9.08 | | | | 9.20 | | | | 1.84 | |
Class I | | | 1,000.00 | | | | 1,000.00 | | | | 994.70 | | | | 1,021.57 | | | | 3.21 | | | | 3.26 | | | | 0.65 | |
Class K | | | 1,000.00 | | | | 1,000.00 | | | | 994.80 | | | | 1,020.08 | | | | 4.70 | | | | 4.76 | | | | 0.95 | |
Class R | | | 1,000.00 | | | | 1,000.00 | | | | 993.70 | | | | 1,018.15 | | | | 6.62 | | | | 6.71 | | | | 1.34 | |
Class W | | | 1,000.00 | | | | 1,000.00 | | | | 993.20 | | | | 1,019.39 | | | | 5.39 | | | | 5.46 | | | | 1.09 | |
Class Y | | | 1,000.00 | | | | 1,000.00 | | | | 996.20 | | | | 1,021.57 | | | | 3.22 | | | | 3.26 | | | | 0.65 | |
Class Z | | | 1,000.00 | | | | 1,000.00 | | | | 995.80 | | | | 1,020.63 | | | | 4.16 | | | | 4.21 | | | | 0.84 | |
Expenses paid during the period are equal to the annualized expense ratio for each class as indicated above, multiplied by the average account value over the period and then multiplied by the number of days in the Fund’s most recent fiscal half year and divided by 365.
Expenses do not include fees and expenses incurred indirectly by the Fund from its investment in underlying funds, including affiliated and non-affiliated pooled investment vehicles, such as mutual funds and exchange-traded funds.
Had Columbia Management Investment Advisers, LLC and/or certain of its affiliates not waived/reimbursed certain fees and expenses, account value at the end of the period would have been reduced.
| | |
| |
| | COLUMBIA GLOBAL BOND FUND |
PORTFOLIO OF INVESTMENTS
April 30, 2015 (Unaudited)
(Percentages represent value of investments compared to net assets)
| | | | | | | | | | | | |
| Corporate Bonds & Notes 28.3% | |
| Issuer | | Coupon
Rate | | | Principal
Amount ($) | | | Value ($) | |
AUSTRALIA 0.6% | |
FMG Resources August 2006 Proprietary Ltd.(a) | |
03/01/22 | | | 9.750% | | | | 17,000 | | | | 17,521 | |
|
Woodside Finance Ltd.(a) | |
05/10/21 | | | 4.600% | | | | 605,000 | | | | 654,003 | |
| | | | | | | | | | | | | |
Total | | | | | | | | | | | 671,524 | |
| | | |
| | | | | | | | | | | | |
BELGIUM —% | |
Calcipar SA | |
05/01/18 | | | 6.875% | | | | 37,000 | | | | 38,272 | |
| | | |
| | | | | | | | | | | | |
CANADA 0.5% | |
BC ULC/New Red Finance Inc.(a) | |
04/01/22 | | | 6.000% | | | | 39,000 | | | | 40,267 | |
|
Bombardier, Inc.(a) | |
03/15/20 | | | 7.750% | | | | 8,000 | | | | 8,459 | |
03/15/25 | | | 7.500% | | | | 20,000 | | | | 19,825 | |
|
Catamaran Corp. | |
03/15/21 | | | 4.750% | | | | 10,000 | | | | 10,950 | |
|
Cogeco Cable, Inc.(a) | |
05/01/20 | | | 4.875% | | | | 22,000 | | | | 22,577 | |
|
Concordia Healthcare Corp.(a) | |
04/15/23 | | | 7.000% | | | | 15,000 | | | | 15,225 | |
|
MDC Partners, Inc.(a) | |
04/01/20 | | | 6.750% | | | | 54,000 | | | | 54,810 | |
|
NOVA Chemicals Corp.(a) | |
05/01/25 | | | 5.000% | | | | 19,000 | | | | 20,021 | |
|
Thomson Reuters Corp. | |
05/23/43 | | | 4.500% | | | | 65,000 | | | | 63,472 | |
|
TransCanada PipeLines Ltd. | |
10/16/23 | | | 3.750% | | | | 110,000 | | | | 115,014 | |
|
Valeant Pharmaceuticals International, Inc.(a) | |
08/15/18 | | | 6.750% | | | | 14,000 | | | | 14,823 | |
07/15/21 | | | 7.500% | | | | 20,000 | | | | 21,700 | |
12/01/21 | | | 5.625% | | | | 7,000 | | | | 7,193 | |
07/15/22 | | | 7.250% | | | | 19,000 | | | | 20,259 | |
03/01/23 | | | 5.500% | | | | 14,000 | | | | 14,175 | |
05/15/23 | | | 5.875% | | | | 71,000 | | | | 72,864 | |
04/15/25 | | | 6.125% | | | | 52,000 | | | | 53,657 | |
|
Videotron Ltd.(a) | |
06/15/24 | | | 5.375% | | | | 39,000 | | | | 40,414 | |
| | | | | | | | | | | | | |
Total | | | | | | | | | | | 615,705 | |
| | | |
| | | | | | | | | | | | |
CHILE 0.3% | |
ENTEL Chile SA(a) | |
08/01/26 | | | 4.750% | | | | 300,000 | | | | 314,487 | |
| | | |
| | | | | | | | | | | | |
FRANCE 0.1% | |
Numericable-SFR(a) | |
05/15/22 | | | 6.000% | | | | 50,000 | | | | 51,219 | |
| | | |
| | | | | | | | | | | | |
| | | | | | | | | | | | |
| Corporate Bonds & Notes (continued) | |
| Issuer | | Coupon
Rate | | | Principal
Amount ($) | | | Value ($) | |
IRELAND 0.1% | |
AerCap Ireland Capital Ltd./Global Aviation Trust(a) | |
05/15/21 | | | 4.500% | | | | 89,000 | | | | 93,673 | |
|
Ardagh Packaging Finance PLC/Holdings USA, Inc.(a) | |
01/31/21 | | | 6.750% | | | | 16,000 | | | | 16,600 | |
|
Grifols Worldwide Operations Ltd.(a) | |
04/01/22 | | | 5.250% | | | | 22,000 | | | | 22,495 | |
| | | | | | | | | | | | | |
Total | | | | | | | | | | | 132,768 | |
| | | |
| | | | | | | | | | | | |
ITALY 0.1% | |
Telecom Italia Capital SA | |
06/18/19 | | | 7.175% | | | | 14,000 | | | | 16,100 | |
|
Telecom Italia SpA(a) | |
05/30/24 | | | 5.303% | | | | 22,000 | | | | 23,181 | |
|
Wind Acquisition Finance SA(a) | |
04/30/20 | | | 6.500% | | | | 25,000 | | | | 26,563 | |
07/15/20 | | | 4.750% | | | | 23,000 | | | | 23,000 | |
| | | | | | | | | | | | | |
Total | | | | | | | | | | | 88,844 | |
| | | |
| | | | | | | | | | | | |
LUXEMBOURG 0.2% | |
Altice SA(a) | | | | | | | | | | | | |
05/15/22 | | | 7.750% | | | | 12,000 | | | | 12,120 | |
02/15/25 | | | 7.625% | | | | 46,000 | | | | 46,690 | |
|
ArcelorMittal | |
02/25/22 | | | 7.000% | | | | 4,000 | | | | 4,358 | |
|
INEOS Group Holdings SA(a) | |
08/15/18 | | | 6.125% | | | | 3,000 | | | | 3,053 | |
02/15/19 | | | 5.875% | | | | 34,000 | | | | 34,425 | |
|
Intelsat Jackson Holdings SA | |
10/15/20 | | | 7.250% | | | | 83,000 | | | | 85,583 | |
| | | | | | | | | | | | | |
Total | | | | | | | | | | | 186,229 | |
| | | |
| | | | | | | | | | | | |
MEXICO 0.5% | |
Cemex SAB de CV | |
01/15/21 | | | 7.250% | | | | 300,000 | | | | 324,750 | |
|
Grupo Bimbo SAB de CV(a) | |
06/27/44 | | | 4.875% | | | | 285,000 | | | | 278,422 | |
| | | | | | | | | | | | | |
Total | | | | | | | | | | | 603,172 | |
| | | |
| | | | | | | | | | | | |
NETHERLANDS 0.4% | |
Heineken NV(a) | |
04/01/22 | | | 3.400% | | | | 325,000 | | | | 336,213 | |
|
LYB International Finance BV | |
03/15/44 | | | 4.875% | | | | 40,000 | | | | 42,270 | |
|
NXP BV/Funding LLC(a) | |
02/15/21 | | | 5.750% | | | | 39,000 | | | | 41,437 | |
|
Schaeffler Finance BV(a) | |
05/15/21 | | | 4.750% | | | | 9,000 | | | | 9,203 | |
|
Schaeffler Holding Finance BV PIK(a) | |
08/15/18 | | | 6.875% | | | | 24,000 | | | | 25,020 | |
The accompanying Notes to Financial Statements are an integral part of this statement.
| | |
| |
| COLUMBIA GLOBAL BOND FUND | | |
PORTFOLIO OF INVESTMENTS (continued)
April 30, 2015 (Unaudited)
| | | | | | | | | | | | |
| Corporate Bonds & Notes (continued) | |
| Issuer | | Coupon
Rate | | | Principal
Amount ($) | | | Value ($) | |
Sensata Technologies BV(a) | |
10/01/25 | | | 5.000% | | | | 36,000 | | | | 37,170 | |
| | | | | | | | | | | | | |
Total | | | | | | | | | | | 491,313 | |
| | | |
| | | | | | | | | | | | |
RUSSIAN FEDERATION 0.2% | |
Sibur Securities Ltd.(a) | |
01/31/18 | | | 3.914% | | | | 300,000 | | | | 271,671 | |
| | | |
| | | | | | | | | | | | |
UKRAINE 0.2% | |
MHP SA(a) | |
04/02/20 | | | 8.250% | | | | 250,000 | | | | 203,750 | |
| | | |
| | | | | | | | | | | | |
UNITED KINGDOM 0.7% | |
Jaguar Land Rover Automotive PLC(a) | |
02/01/23 | | | 5.625% | | | | 43,000 | | | | 45,580 | |
|
Royal Bank of Scotland Group PLC | |
05/28/24 | | | 5.125% | | | | 44,000 | | | | 45,445 | |
|
Sky PLC(a) | |
11/26/22 | | | 3.125% | | | | 670,000 | | | | 663,272 | |
|
Virgin Media Finance PLC(a) | |
01/15/25 | | | 5.750% | | | | 47,000 | | | | 47,764 | |
| | | | | | | | | | | | | |
Total | | | | | | | | | | | 802,061 | |
| | | |
| | | | | | | | | | | | |
UNITED STATES 24.4% | |
ADT Corp. (The) | |
03/15/20 | | | 5.250% | | | | 6,000 | | | | 6,330 | |
07/15/22 | | | 3.500% | | | | 28,000 | | | | 26,390 | |
|
AES Corp. (The) | |
07/01/21 | | | 7.375% | | | | 56,000 | | | | 62,317 | |
|
AMC Entertainment, Inc. | |
02/15/22 | | | 5.875% | | | | 16,000 | | | | 16,600 | |
|
AMC Networks, Inc. | |
07/15/21 | | | 7.750% | | | | 18,000 | | | | 19,620 | |
12/15/22 | | | 4.750% | | | | 47,000 | | | | 47,881 | |
|
APX Group, Inc. | |
12/01/19 | | | 6.375% | | | | 61,000 | | | | 60,847 | |
|
AT&T, Inc. | |
06/15/45 | | | 4.350% | | | | 770,000 | | | | 711,547 | |
|
Acadia Healthcare Co., Inc. | |
07/01/22 | | | 5.125% | | | | 15,000 | | | | 14,963 | |
|
Acadia Healthcare Co., Inc.(a) | |
02/15/23 | | | 5.625% | | | | 4,000 | | | | 4,090 | |
|
Activision Blizzard, Inc.(a) | |
09/15/21 | | | 5.625% | | | | 70,000 | | | | 74,812 | |
|
Actuant Corp. | |
06/15/22 | | | 5.625% | | | | 36,000 | | | | 37,260 | |
|
Air Medical Merger Sub Corp.(a) | |
05/15/23 | | | 6.375% | | | | 17,000 | | | | 16,511 | |
|
Aircastle Ltd. | |
03/15/21 | | | 5.125% | | | | 24,000 | | | | 25,169 | |
02/15/22 | | | 5.500% | | | | 5,000 | | | | 5,338 | |
| | | | | | | | | | | | |
| Corporate Bonds & Notes (continued) | |
| Issuer | | Coupon
Rate | | | Principal
Amount ($) | | | Value ($) | |
Alcoa, Inc. | |
10/01/24 | | | 5.125% | | | | 25,000 | | | | 26,948 | |
|
Allegion US Holding Co., Inc. | |
10/01/21 | | | 5.750% | | | | 27,000 | | | | 28,417 | |
|
Alliance Data Systems Corp.(a) | |
12/01/17 | | | 5.250% | | | | 25,000 | | | | 26,000 | |
04/01/20 | | | 6.375% | | | | 34,000 | | | | 35,402 | |
08/01/22 | | | 5.375% | | | | 31,000 | | | | 31,310 | |
|
Ally Financial, Inc. | |
03/15/20 | | | 8.000% | | | | 38,000 | | | | 45,030 | |
09/15/20 | | | 7.500% | | | | 89,000 | | | | 104,255 | |
02/13/22 | | | 4.125% | | | | 43,000 | | | | 42,140 | |
09/30/24 | | | 5.125% | | | | 12,000 | | | | 12,450 | |
03/30/25 | | | 4.625% | | | | 17,000 | | | | 16,947 | |
|
American Axle & Manufacturing, Inc. | |
02/15/19 | | | 5.125% | | | | 12,000 | | | | 12,360 | |
11/15/19 | | | 7.750% | | | | 8,000 | | | | 9,080 | |
03/15/21 | | | 6.250% | | | | 23,000 | | | | 24,208 | |
|
American Builders & Contractors Supply Co., Inc.(a) | |
04/15/21 | | | 5.625% | | | | 44,000 | | | | 45,320 | |
|
Amsted Industries, Inc.(a) | |
03/15/22 | | | 5.000% | | | | 15,000 | | | | 15,469 | |
09/15/24 | | | 5.375% | | | | 31,000 | | | | 31,620 | |
|
Amsurg Corp. | |
11/30/20 | | | 5.625% | | | | 15,000 | | | | 15,356 | |
07/15/22 | | | 5.625% | | | | 10,000 | | | | 10,152 | |
|
Ancestry.com, Inc. | |
12/15/20 | | | 11.000% | | | | 25,000 | | | | 28,437 | |
|
Angus Chemical Co.(a) | |
02/15/23 | | | 8.750% | | | | 20,000 | | | | 19,925 | |
|
Antero Resources Corp. | |
12/01/22 | | | 5.125% | | | | 33,000 | | | | 32,835 | |
|
Antero Resources Corp.(a) | |
06/01/23 | | | 5.625% | | | | 47,000 | | | | 47,999 | |
|
Aramark Services, Inc. | |
03/15/20 | | | 5.750% | | | | 49,000 | | | | 51,082 | |
|
ArcelorMittal | |
03/01/21 | | | 6.250% | | | | 39,000 | | | | 40,784 | |
|
Asbury Automotive Group, Inc. | |
12/15/24 | | | 6.000% | | | | 14,000 | | | | 14,595 | |
|
Ashtead Capital, Inc.(a) | |
07/15/22 | | | 6.500% | | | | 16,000 | | | | 17,200 | |
|
Audatex North America, Inc.(a) | |
06/15/21 | | | 6.000% | | | | 20,000 | | | | 20,656 | |
11/01/23 | | | 6.125% | | | | 10,000 | | | | 10,425 | |
|
Aviation Capital Group Corp.(a) | |
04/06/21 | | | 6.750% | | | | 2,000 | | | | 2,323 | |
|
Avis Budget Car Rental LLC/Finance, Inc. | |
04/01/23 | | | 5.500% | | | | 28,000 | | | | 28,551 | |
|
Avis Budget Car Rental LLC/Finance, Inc.(a) | |
03/15/25 | | | 5.250% | | | | 28,000 | | | | 27,720 | |
|
Axalta Coating Systems Dutch Holding B BV/U.S. Holdings, Inc.(a) | |
05/01/21 | | | 7.375% | | | | 19,000 | | | | 20,663 | |
The accompanying Notes to Financial Statements are an integral part of this statement.
| | |
| |
| | COLUMBIA GLOBAL BOND FUND |
PORTFOLIO OF INVESTMENTS (continued)
April 30, 2015 (Unaudited)
| | | | | | | | | | | | |
| Corporate Bonds & Notes (continued) | |
| Issuer | | Coupon
Rate | | | Principal
Amount ($) | | | Value ($) | |
B&G Foods, Inc. | |
06/01/21 | | | 4.625% | | | | 33,000 | | | | 33,082 | |
|
Bank of America Corp. | |
07/24/23 | | | 4.100% | | | | 320,000 | | | | 336,616 | |
|
Berkshire Hathaway Finance Corp. | |
05/15/42 | | | 4.400% | | | | 500,000 | | | | 537,105 | |
|
Berry Plastics Corp. | |
05/15/22 | | | 5.500% | | | | 10,000 | | | | 10,363 | |
|
Blue Racer Midstream LLC/Finance Corp.(a) | |
11/15/22 | | | 6.125% | | | | 32,000 | | | | 33,280 | |
|
CB Richard Ellis Services, Inc. | |
03/15/25 | | | 5.250% | | | | 47,000 | | | | 50,877 | |
|
CCO Holdings LLC/Capital Corp. | |
03/15/21 | | | 5.250% | | | | 20,000 | | | | 20,200 | |
01/31/22 | | | 6.625% | | | | 36,000 | | | | 38,340 | |
09/30/22 | | | 5.250% | | | | 1,000 | | | | 999 | |
|
CCO Holdings LLC/Capital Corp.(a) | |
05/01/23 | | | 5.125% | | | | 2,000 | | | | 1,980 | |
05/01/25 | | | 5.375% | | | | 10,000 | | | | 9,825 | |
05/01/27 | | | 5.875% | | | | 46,000 | | | | 45,310 | |
|
CHS/Community Health Systems, Inc. | |
08/01/21 | | | 5.125% | | | | 6,000 | | | | 6,210 | |
02/01/22 | | | 6.875% | | | | 71,000 | | | | 75,349 | |
|
CIT Group, Inc. | |
05/15/20 | | | 5.375% | | | | 75,000 | | | | 79,406 | |
|
CIT Group, Inc.(a) | |
04/01/18 | | | 6.625% | | | | 70,000 | | | | 75,425 | |
|
CMS Energy Corp. | |
03/31/43 | | | 4.700% | | | | 335,000 | | | | 367,849 | |
|
CSC Holdings LLC | |
11/15/21 | | | 6.750% | | | | 69,000 | | | | 78,315 | |
|
Calpine Corp.(a) | |
01/15/22 | | | 6.000% | | | | 74,000 | | | | 78,810 | |
|
Capsugel SA PIK(a) | |
05/15/19 | | | 7.000% | | | | 5,000 | | | | 5,100 | |
|
Carrizo Oil & Gas, Inc. | |
04/15/23 | | | 6.250% | | | | 38,000 | | | | 38,570 | |
|
Case New Holland Industrial, Inc. | |
12/01/17 | | | 7.875% | | | | 53,000 | | | | 58,432 | |
|
Cedar Fair LP/Canada’s Wonderland Co./Magnum Management Corp. | |
03/15/21 | | | 5.250% | | | | 15,000 | | | | 15,563 | |
|
Cedar Fair LP/Canada’s Wonderland Co./Magnum Management Corp.(a) | |
06/01/24 | | | 5.375% | | | | 7,000 | | | | 7,228 | |
|
Celanese U.S. Holdings LLC | |
06/15/21 | | | 5.875% | | | | 27,000 | | | | 29,632 | |
|
Centene Corp. | |
05/15/22 | | | 4.750% | | | | 27,000 | | | | 28,417 | |
|
CenterPoint Energy Houston Electric LLC | |
04/01/44 | | | 4.500% | | | | 150,000 | | | | 167,842 | |
| | | | | | | | | | | | |
| Corporate Bonds & Notes (continued) | |
| Issuer | | Coupon
Rate | | | Principal
Amount ($) | | | Value ($) | |
CenturyLink, Inc. | |
03/15/22 | | | 5.800% | | | | 12,000 | | | | 12,450 | |
12/01/23 | | | 6.750% | | | | 51,000 | | | | 55,170 | |
|
CenturyLink, Inc.(a) | |
04/01/25 | | | 5.625% | | | | 20,000 | | | | 19,975 | |
|
Cequel Communications Holdings I LLC/Capital Corp.(a) | |
09/15/20 | | | 6.375% | | | | 49,000 | | | | 51,634 | |
|
Chesapeake Energy Corp. | |
08/15/20 | | | 6.625% | | | | 126,000 | | | | 129,780 | |
03/15/23 | | | 5.750% | | | | 7,000 | | | | 6,843 | |
|
Cimarex Energy Co. | |
06/01/24 | | | 4.375% | | | | 6,000 | | | | 6,075 | |
|
Cinemark USA, Inc. | |
12/15/22 | | | 5.125% | | | | 12,000 | | | | 12,404 | |
|
Clean Harbors, Inc. | |
08/01/20 | | | 5.250% | | | | 44,000 | | | | 45,320 | |
|
Clear Channel Worldwide Holdings, Inc. | |
11/15/22 | | | 6.500% | | | | 82,000 | | | | 86,715 | |
|
Colorado Interstate Gas Co. LLC | |
11/15/15 | | | 6.800% | | | | 1,000,000 | | | | 1,030,493 | |
|
Compass Minerals International, Inc.(a) | |
07/15/24 | | | 4.875% | | | | 30,000 | | | | 30,300 | |
|
Comstock Resources, Inc.(a) | |
03/15/20 | | | 10.000% | | | | 24,000 | | | | 23,520 | |
|
ConAgra Foods, Inc. | |
09/15/22 | | | 3.250% | | | | 630,000 | | | | 622,424 | |
|
Concho Resources, Inc. | |
04/01/23 | | | 5.500% | | | | 73,000 | | | | 74,004 | |
|
Constellation Brands, Inc. | |
11/15/19 | | | 3.875% | | | | 7,000 | | | | 7,245 | |
05/01/21 | | | 3.750% | | | | 9,000 | | | | 9,180 | |
05/01/23 | | | 4.250% | | | | 10,000 | | | | 10,288 | |
11/15/24 | | | 4.750% | | | | 7,000 | | | | 7,420 | |
|
Continental Resources, Inc. | |
09/15/22 | | | 5.000% | | | | 139,000 | | | | 141,085 | |
|
Crestwood Midstream Partners LP/Finance Corp. | |
12/15/20 | | | 6.000% | | | | 3,000 | | | | 3,075 | |
|
Crestwood Midstream Partners LP/Finance Corp.(a) | |
04/01/23 | | | 6.250% | | | | 27,000 | | | | 28,215 | |
|
Crown Castle International Corp. | |
01/15/23 | | | 5.250% | | | | 54,000 | | | | 57,002 | |
|
CrownRock LP/Finance, Inc.(a) | |
02/15/23 | | | 7.750% | | | | 22,000 | | | | 23,320 | |
|
CyrusOne LP/Finance Corp. | |
11/15/22 | | | 6.375% | | | | 37,000 | | | | 38,989 | |
|
D.R. Horton, Inc. | |
03/01/19 | | | 3.750% | | | | 19,000 | | | | 19,238 | |
|
DISH DBS Corp. | |
06/01/21 | | | 6.750% | | | | 52,000 | | | | 55,059 | |
07/15/22 | | | 5.875% | | | | 27,000 | | | | 27,202 | |
03/15/23 | | | 5.000% | | | | 21,000 | | | | 19,898 | |
The accompanying Notes to Financial Statements are an integral part of this statement.
| | |
| |
| COLUMBIA GLOBAL BOND FUND | | |
PORTFOLIO OF INVESTMENTS (continued)
April 30, 2015 (Unaudited)
| | | | | | | | | | | | |
| Corporate Bonds & Notes (continued) | |
| Issuer | | Coupon
Rate | | | Principal
Amount ($) | | | Value ($) | |
DR Horton, Inc. | |
02/15/20 | | | 4.000% | | | | 5,000 | | | | 5,075 | |
|
DaVita HealthCare Partners, Inc. | |
08/15/22 | | | 5.750% | | | | 51,000 | | | | 54,187 | |
05/01/25 | | | 5.000% | | | | 26,000 | | | | 25,951 | |
|
Darling Ingredients, Inc. | |
01/15/22 | | | 5.375% | | | | 20,000 | | | | 20,350 | |
|
Diamond Foods, Inc.(a) | |
03/15/19 | | | 7.000% | | | | 21,000 | | | | 21,735 | |
|
Diamondback Energy, Inc. | |
10/01/21 | | | 7.625% | | | | 7,000 | | | | 7,578 | |
|
DigitalGlobe, Inc.(a) | |
02/01/21 | | | 5.250% | | | | 14,000 | | | | 14,105 | |
|
Dominion Resources, Inc. | |
09/15/42 | | | 4.050% | | | | 170,000 | | | | 166,392 | |
|
Dow Chemical Co. (The) | |
10/01/44 | | | 4.625% | | | | 50,000 | | | | 50,916 | |
|
Duke Energy Corp. | |
08/15/22 | | | 3.050% | | | | 155,000 | | | | 158,193 | |
|
E*TRADE Financial Corp. | |
11/15/22 | | | 5.375% | | | | 25,000 | | | | 26,562 | |
09/15/23 | | | 4.625% | | | | 20,000 | | | | 20,425 | |
|
EP Energy LLC/Everest Acquisition Finance, Inc. | |
05/01/20 | | | 9.375% | | | | 37,000 | | | | 39,590 | |
09/01/22 | | | 7.750% | | | | 6,000 | | | | 6,300 | |
|
ERAC U.S.A. Finance LLC(a) | |
03/15/42 | | | 5.625% | | | | 309,000 | | | | 356,977 | |
02/15/45 | | | 4.500% | | | | 175,000 | | | | 172,707 | |
|
Eco Services Operations LLC/Finance Corp.(a) | |
11/01/22 | | | 8.500% | | | | 10,000 | | | | 10,200 | |
|
Endo Finance LLC/Finco, Inc.(a) | |
02/01/25 | | | 6.000% | | | | 32,000 | | | | 32,820 | |
|
Entegris, Inc.(a) | |
04/01/22 | | | 6.000% | | | | 21,000 | | | | 21,945 | |
|
Enterprise Products Operating LLC | |
03/15/23 | | | 3.350% | | | | 335,000 | | | | 337,111 | |
02/15/45 | | | 5.100% | | | | 250,000 | | | | 267,014 | |
|
Equinix, Inc. | |
01/01/22 | | | 5.375% | | | | 32,000 | | | | 33,200 | |
|
ExamWorks Group, Inc. | |
04/15/23 | | | 5.625% | | | | 11,000 | | | | 11,358 | |
|
FCA US LLC/CG Co-Issuer, Inc. | |
06/15/21 | | | 8.250% | | | | 45,000 | | | | 49,669 | |
|
FTI Consulting, Inc. | |
11/15/22 | | | 6.000% | | | | 11,000 | | | | 11,715 | |
|
Family Tree Escrow LLC(a) | |
03/01/20 | | | 5.250% | | | | 6,000 | | | | 6,285 | |
03/01/23 | | | 5.750% | | | | 28,000 | | | | 29,400 | |
|
First Data Corp. | |
01/15/21 | | | 12.625% | | | | 33,000 | | | | 38,956 | |
|
First Data Corp.(a) | |
06/15/19 | | | 7.375% | | | | 68,000 | | | | 70,805 | |
| | | | | | | | | | | | |
| Corporate Bonds & Notes (continued) | |
| Issuer | | Coupon
Rate | | | Principal
Amount ($) | | | Value ($) | |
Five Corners Funding Trust(a) | |
11/15/23 | | | 4.419% | | | | 195,000 | | | | 208,646 | |
|
Florida East Coast Holdings Corp.(a) | |
05/01/19 | | | 6.750% | | | | 16,000 | | | | 15,920 | |
|
Fresenius Medical Care U.S. Finance II, Inc.(a) | |
07/31/19 | | | 5.625% | | | | 14,000 | | | | 15,295 | |
01/31/22 | | | 5.875% | | | | 11,000 | | | | 12,045 | |
10/15/24 | | | 4.750% | | | | 14,000 | | | | 14,630 | |
|
Fresenius Medical Care U.S. Finance, Inc.(a) | |
09/15/18 | | | 6.500% | | | | 9,000 | | | | 10,080 | |
|
Frontier Communications Corp. | |
07/01/21 | | | 9.250% | | | | 10,000 | | | | 11,363 | |
09/15/21 | | | 6.250% | | | | 3,000 | | | | 2,978 | |
04/15/22 | | | 8.750% | | | | 15,000 | | | | 16,425 | |
01/15/23 | | | 7.125% | | | | 18,000 | | | | 18,090 | |
01/15/25 | | | 6.875% | | | | 48,000 | | | | 46,488 | |
|
GLP Capital LP/Financing II, Inc. | |
11/01/20 | | | 4.875% | | | | 17,000 | | | | 17,298 | |
11/01/23 | | | 5.375% | | | | 23,000 | | | | 23,920 | |
|
Gannett Co., Inc. | |
10/15/23 | | | 6.375% | | | | 4,000 | | | | 4,330 | |
|
Gannett Co., Inc.(a) | |
09/15/21 | | | 4.875% | | | | 10,000 | | | | 10,275 | |
09/15/24 | | | 5.500% | | | | 11,000 | | | | 11,440 | |
|
Gates Global LLC/Co.(a) | |
07/15/22 | | | 6.000% | | | | 37,000 | | | | 34,502 | |
|
General Motors Co. | |
10/02/23 | | | 4.875% | | | | 71,000 | | | | 76,894 | |
|
General Motors Financial Co., Inc. | |
09/25/21 | | | 4.375% | | | | 7,000 | | | | 7,437 | |
01/15/25 | | | 4.000% | | | | 9,000 | | | | 9,056 | |
|
Gibraltar Industries, Inc. | |
02/01/21 | | | 6.250% | | | | 9,000 | | | | 9,135 | |
|
Graphic Packaging International, Inc. | |
04/15/21 | | | 4.750% | | | | 29,000 | | | | 30,160 | |
|
Group 1 Automotive, Inc.(a) | |
06/01/22 | | | 5.000% | | | | 8,000 | | | | 8,040 | |
|
H&E Equipment Services, Inc. | |
09/01/22 | | | 7.000% | | | | 24,000 | | | | 25,140 | |
|
HCA Holdings, Inc. | |
02/15/21 | | | 6.250% | | | | 33,000 | | | | 36,036 | |
|
HCA, Inc. | |
05/01/23 | | | 5.875% | | | | 102,000 | | | | 110,287 | |
02/01/25 | | | 5.375% | | | | 13,000 | | | | 13,650 | |
04/15/25 | | | 5.250% | | | | 33,000 | | | | 35,764 | |
|
HD Supply, Inc. | |
07/15/20 | | | 7.500% | | | | 24,000 | | | | 25,740 | |
|
HD Supply, Inc.(a) | |
12/15/21 | | | 5.250% | | | | 18,000 | | | | 18,675 | |
|
HUB International Ltd.(a) | |
10/01/21 | | | 7.875% | | | | 53,000 | | | | 54,590 | |
|
Halcon Resources Corp. | |
05/15/21 | | | 8.875% | | | | 21,000 | | | | 16,401 | |
The accompanying Notes to Financial Statements are an integral part of this statement.
| | |
| |
| | COLUMBIA GLOBAL BOND FUND |
PORTFOLIO OF INVESTMENTS (continued)
April 30, 2015 (Unaudited)
| | | | | | | | | | | | |
| Corporate Bonds & Notes (continued) | |
| Issuer | | Coupon
Rate | | | Principal
Amount ($) | | | Value ($) | |
Halcon Resources Corp.(a)(b) | |
02/01/20 | | | 8.625% | | | | 21,000 | | | | 21,853 | |
|
Hilcorp Energy I LP/Finance Co.(a) | |
12/01/24 | | | 5.000% | | | | 14,000 | | | | 13,580 | |
|
Hilton Worldwide Finance LLC/Corp. | |
10/15/21 | | | 5.625% | | | | 51,000 | | | | 53,805 | |
|
Huntington Ingalls Industries, Inc.(a) | |
12/15/21 | | | 5.000% | | | | 11,000 | | | | 11,371 | |
|
Huntsman International LLC | |
11/15/20 | | | 4.875% | | | | 44,000 | | | | 44,440 | |
|
IHS, Inc.(a) | |
11/01/22 | | | 5.000% | | | | 15,000 | | | | 15,000 | |
|
IMS Health, Inc.(a) | |
11/01/20 | | | 6.000% | | | | 33,000 | | | | 34,320 | |
|
Icahn Enterprises LP/Finance Corp. | |
08/01/20 | | | 6.000% | | | | 11,000 | | | | 11,566 | |
02/01/22 | | | 5.875% | | | | 29,000 | | | | 29,976 | |
|
Indiana Michigan Power Co. | |
03/15/23 | | | 3.200% | | | | 1,070,000 | | | | 1,092,822 | |
|
International Game Technology PLC(a) | |
02/15/22 | | | 6.250% | | | | 56,000 | | | | 55,300 | |
|
International Lease Finance Corp. | |
04/15/18 | | | 3.875% | | | | 6,000 | | | | 6,135 | |
12/15/20 | | | 8.250% | | | | 72,000 | | | | 88,200 | |
|
Interval Acquisition Corp.(a) | |
04/15/23 | | | 5.625% | | | | 20,000 | | | | 20,250 | |
|
Ipalco Enterprises, Inc. | |
05/01/18 | | | 5.000% | | | | 60,000 | | | | 63,900 | |
|
JM Huber Corp.(a) | |
11/01/19 | | | 9.875% | | | | 80,000 | | | | 86,300 | |
|
Jaguar Holding Co. II/Merger Sub, Inc.(a) | |
12/01/19 | | | 9.500% | | | | 16,000 | | | | 17,200 | |
|
Kinder Morgan Energy Partners LP | |
09/01/22 | | | 3.950% | | | | 1,050,000 | | | | 1,065,161 | |
02/15/23 | | | 3.450% | | | | 90,000 | | | | 87,326 | |
|
L Brands, Inc. | |
04/01/21 | | | 6.625% | | | | 49,000 | | | | 56,105 | |
|
L-3 Communications Corp. | |
02/15/21 | | | 4.950% | | | | 435,000 | | | | 474,145 | |
|
Lamar Media Corp. | |
02/01/22 | | | 5.875% | | | | 18,000 | | | | 19,035 | |
01/15/24 | | | 5.375% | | | | 15,000 | | | | 15,659 | |
|
Laredo Petroleum, Inc. | |
01/15/22 | | | 5.625% | | | | 23,000 | | | | 23,144 | |
05/01/22 | | | 7.375% | | | | 67,000 | | | | 71,690 | |
03/15/23 | | | 6.250% | | | | 14,000 | | | | 14,490 | |
|
Level 3 Communications, Inc. | |
12/01/22 | | | 5.750% | | | | 21,000 | | | | 21,538 | |
|
Level 3 Financing, Inc. | |
01/15/21 | | | 6.125% | | | | 13,000 | | | | 13,764 | |
08/15/22 | | | 5.375% | | | | 75,000 | | | | 76,594 | |
| | | | | | | | | | | | |
| Corporate Bonds & Notes (continued) | |
| Issuer | | Coupon
Rate | | | Principal
Amount ($) | | | Value ($) | |
Level 3 Financing, Inc.(a) | |
02/01/23 | | | 5.625% | | | | 19,000 | | | | 19,475 | |
05/01/25 | | | 5.375% | | | | 28,000 | | | | 28,000 | |
|
Liberty Mutual Group, Inc.(a) | |
05/01/22 | | | 4.950% | | | | 355,000 | | | | 390,691 | |
06/15/23 | | | 4.250% | | | | 500,000 | | | | 529,315 | |
|
LifePoint Hospitals, Inc. | |
12/01/21 | | | 5.500% | | | | 34,000 | | | | 35,737 | |
|
Loews Corp. | |
05/15/23 | | | 2.625% | | | | 280,000 | | | | 274,011 | |
|
MGM Resorts International | |
10/01/20 | | | 6.750% | | | | 12,000 | | | | 12,915 | |
12/15/21 | | | 6.625% | | | | 50,000 | | | | 53,500 | |
03/15/23 | | | 6.000% | | | | 7,000 | | | | 7,249 | |
|
MSCI, Inc.(a) | |
11/15/24 | | | 5.250% | | | | 29,000 | | | | 30,160 | |
|
Mallinckrodt International Finance SA/CB LLC(a) | |
04/15/25 | | | 5.500% | | | | 9,000 | | | | 9,180 | |
|
MarkWest Energy Partners LP/Finance Corp. | |
06/15/22 | | | 6.250% | | | | 73,000 | | | | 77,380 | |
02/15/23 | | | 5.500% | | | | 39,000 | | | | 40,657 | |
07/15/23 | | | 4.500% | | | | 9,000 | | | | 9,023 | |
12/01/24 | | | 4.875% | | | | 80,000 | | | | 82,752 | |
|
Masco Corp. | |
04/01/25 | | | 4.450% | | | | 26,000 | | | | 26,845 | |
|
Matador Resources Co.(a) | |
04/15/23 | | | 6.875% | | | | 7,000 | | | | 7,193 | |
|
Meritage Homes Corp. | |
03/01/18 | | | 4.500% | | | | 12,000 | | | | 12,225 | |
04/15/20 | | | 7.150% | | | | 3,000 | | | | 3,255 | |
04/01/22 | | | 7.000% | | | | 36,000 | | | | 38,520 | |
|
NBCUniversal Media LLC | |
01/15/43 | | | 4.450% | | | | 410,000 | | | | 428,681 | |
|
NCR Corp. | |
12/15/21 | | | 5.875% | | | | 6,000 | | | | 6,150 | |
12/15/23 | | | 6.375% | | | | 7,000 | | | | 7,368 | |
|
NRG Energy, Inc. | |
07/15/22 | | | 6.250% | | | | 35,000 | | | | 36,312 | |
|
NRG Yield Operating LLC(a) | |
08/15/24 | | | 5.375% | | | | 25,000 | | | | 25,937 | |
|
Navient Corp. | |
01/15/19 | | | 5.500% | | | | 7,000 | | | | 7,116 | |
10/26/20 | | | 5.000% | | | | 3,000 | | | | 2,925 | |
01/25/22 | | | 7.250% | | | | 24,000 | | | | 25,440 | |
03/25/24 | | | 6.125% | | | | 24,000 | | | | 23,310 | |
10/25/24 | | | 5.875% | | | | 41,000 | | | | 38,745 | |
|
Netflix, Inc.(a) | |
02/15/22 | | | 5.500% | | | | 18,000 | | | | 18,945 | |
02/15/25 | | | 5.875% | | | | 25,000 | | | | 26,625 | |
|
Newfield Exploration Co. | |
01/01/26 | | | 5.375% | | | | 15,000 | | | | 15,600 | |
|
Nielsen Finance Co. SARL (The)(a) | |
10/01/21 | | | 5.500% | | | | 24,000 | | | | 24,720 | |
The accompanying Notes to Financial Statements are an integral part of this statement.
| | |
| 10 | | Semiannual Report 2015 |
| | |
| |
| COLUMBIA GLOBAL BOND FUND | | |
PORTFOLIO OF INVESTMENTS (continued)
April 30, 2015 (Unaudited)
| | | | | | | | | | | | |
| Corporate Bonds & Notes (continued) | |
| Issuer | | Coupon
Rate | | | Principal
Amount ($) | | | Value ($) | |
Nielsen Finance LLC/Co. | |
10/01/20 | | | 4.500% | | | | 59,000 | | | | 60,032 | |
|
Nielsen Finance LLC/Co.(a) | |
04/15/22 | | | 5.000% | | | | 13,000 | | | | 13,072 | |
|
Nortek, Inc. | |
04/15/21 | | | 8.500% | | | | 32,000 | | | | 34,560 | |
|
Northwest Pipeline LLC | |
04/15/17 | | | 5.950% | | | | 460,000 | | | | 497,087 | |
|
Nuance Communications, Inc.(a) | |
08/15/20 | | | 5.375% | | | | 14,000 | | | | 14,175 | |
|
Oasis Petroleum, Inc. | |
03/15/22 | | | 6.875% | | | | 49,000 | | | | 49,857 | |
01/15/23 | | | 6.875% | | | | 56,000 | | | | 56,840 | |
|
Omnicare, Inc. | |
12/01/22 | | | 4.750% | | | | 16,000 | | | | 17,480 | |
12/01/24 | | | 5.000% | | | | 6,000 | | | | 6,540 | |
|
OneMain Financial Holdings, Inc.(a) | |
12/15/19 | | | 6.750% | | | | 28,000 | | | | 29,400 | |
12/15/21 | | | 7.250% | | | | 2,000 | | | | 2,117 | |
|
Outfront Media Capital LLC/Corp. | |
02/15/22 | | | 5.250% | | | | 4,000 | | | | 4,160 | |
02/15/24 | | | 5.625% | | | | 15,000 | | | | 15,769 | |
03/15/25 | | | 5.875% | | | | 37,000 | | | | 39,312 | |
|
PPL Capital Funding, Inc. | |
06/01/23 | | | 3.400% | | | | 885,000 | | | | 907,919 | |
|
PQ Corp.(a) | |
11/01/18 | | | 8.750% | | | | 64,000 | | | | 66,483 | |
|
Parsley Energy LLC/Finance Corp.(a) | |
02/15/22 | | | 7.500% | | | | 50,000 | | | | 52,250 | |
|
Peabody Energy Corp. | |
11/15/18 | | | 6.000% | | | | 14,000 | | | | 11,034 | |
|
Penn National Gaming, Inc. | |
11/01/21 | | | 5.875% | | | | 11,000 | | | | 10,973 | |
|
Penske Automotive Group, Inc. | |
10/01/22 | | | 5.750% | | | | 22,000 | | | | 23,100 | |
12/01/24 | | | 5.375% | | | | 21,000 | | | | 21,840 | |
|
PetSmart, Inc.(a) | |
03/15/23 | | | 7.125% | | | | 24,000 | | | | 25,200 | |
|
Physio-Control International, Inc.(a) | |
01/15/19 | | | 9.875% | | | | 30,000 | | | | 32,025 | |
|
Pinnacle Entertainment, Inc. | |
08/01/21 | | | 6.375% | | | | 19,000 | | | | 20,188 | |
|
Pinnacle Foods Finance LLC/Corp. | |
05/01/21 | | | 4.875% | | | | 39,000 | | | | 39,390 | |
|
Post Holdings, Inc. | |
02/15/22 | | | 7.375% | | | | 4,000 | | | | 4,150 | |
|
Post Holdings, Inc.(a) | |
12/15/22 | | | 6.000% | | | | 20,000 | | | | 19,500 | |
| | | |
Progress Energy, Inc. | | | | | | | | | | | | |
04/01/22 | | | 3.150% | | | | 1,325,000 | | | | 1,357,404 | |
|
Provident Funding Associates LP/Finance Corp.(a) | |
06/15/21 | | | 6.750% | | | | 49,000 | | | | 46,672 | |
| | | | | | | | | | | | |
| Corporate Bonds & Notes (continued) | |
| Issuer | | Coupon
Rate | | | Principal
Amount ($) | | | Value ($) | |
Qualitytech LP/Finance Corp. | |
08/01/22 | | | 5.875% | | | | 15,000 | | | | 15,375 | |
|
RHP Hotel Properties LP/Finance Corp.(a) | |
04/15/23 | | | 5.000% | | | | 6,000 | | | | 6,120 | |
|
RSI Home Products, Inc.(a) | |
03/15/23 | | | 6.500% | | | | 15,000 | | | | 15,600 | |
|
RSP Permian, Inc.(a) | |
10/01/22 | | | 6.625% | | | | 10,000 | | | | 10,380 | |
|
Radio One, Inc.(a) | |
04/15/22 | | | 7.375% | | | | 20,000 | | | | 20,200 | |
|
Range Resources Corp. | |
03/15/23 | | | 5.000% | | | | 38,000 | | | | 38,570 | |
|
Regency Energy Partners LP/Finance Corp. | |
07/15/21 | | | 6.500% | | | | 24,000 | | | | 25,440 | |
03/01/22 | | | 5.875% | | | | 38,000 | | | | 42,465 | |
10/01/22 | | | 5.000% | | | | 7,000 | | | | 7,508 | |
04/15/23 | | | 5.500% | | | | 17,000 | | | | 17,978 | |
|
Reynolds Group Issuer, Inc./LLC | |
08/15/19 | | | 7.875% | | | | 83,000 | | | | 87,357 | |
|
Rite Aid Corp.(a) | |
04/01/23 | | | 6.125% | | | | 57,000 | | | | 59,066 | |
|
Riverbed Technology, Inc.(a) | |
03/01/23 | | | 8.875% | | | | 11,000 | | | | 11,124 | |
|
SBA Communications Corp.(a) | |
07/15/22 | | | 4.875% | | | | 31,000 | | | | 30,651 | |
|
SBA Telecommunications, Inc. | |
07/15/20 | | | 5.750% | | | | 25,000 | | | | 26,187 | |
|
SM Energy Co. | |
01/15/24 | | | 5.000% | | | | 2,000 | | | | 1,965 | |
|
SM Energy Co.(a) | |
11/15/22 | | | 6.125% | | | | 19,000 | | | | 19,950 | |
|
STHI Holding Corp.(a) | |
03/15/18 | | | 8.000% | | | | 51,000 | | | | 53,154 | |
|
Sally Holdings LLC/Capital, Inc. | |
11/15/19 | | | 6.875% | | | | 26,000 | | | | 27,495 | |
|
Scientific Games International, Inc.(a) | |
01/01/22 | | | 7.000% | | | | 46,000 | | | | 47,955 | |
12/01/22 | | | 10.000% | | | | 51,000 | | | | 47,302 | |
|
Sealed Air Corp.(a) | |
09/15/21 | | | 8.375% | | | | 21,000 | | | | 23,678 | |
|
Sempra Energy | |
12/01/23 | | | 4.050% | | | | 180,000 | | | | 192,109 | |
|
Serta Simmons Holdings LLC(a) | |
10/01/20 | | | 8.125% | | | | 19,000 | | | | 20,140 | |
|
Service Corp. International | |
01/15/22 | | | 5.375% | | | | 19,000 | | | | 20,140 | |
|
Sirius XM Radio, Inc.(a) | |
04/15/25 | | | 5.375% | | | | 25,000 | | | | 25,125 | |
|
Southern Natural Gas Co. LLC(a) | |
04/01/17 | | | 5.900% | | | | 2,131,000 | | | | 2,286,081 | |
|
Spectrum Brands, Inc. | |
11/15/20 | | | 6.375% | | | | 45,000 | | | | 47,610 | |
11/15/22 | | | 6.625% | | | | 32,000 | | | | 34,240 | |
The accompanying Notes to Financial Statements are an integral part of this statement.
| | | | |
| Semiannual Report 2015 | | | 11 | |
| | |
| |
| | COLUMBIA GLOBAL BOND FUND |
PORTFOLIO OF INVESTMENTS (continued)
April 30, 2015 (Unaudited)
| | | | | | | | | | | | |
| Corporate Bonds & Notes (continued) | |
| Issuer | | Coupon
Rate | | | Principal
Amount ($) | | | Value ($) | |
Springleaf Finance Corp. | |
12/15/17 | | | 6.900% | | | | 60,000 | | | | 63,900 | |
06/01/20 | | | 6.000% | | | | 4,000 | | | | 4,090 | |
|
Springs Industries, Inc. | |
06/01/21 | | | 6.250% | | | | 44,000 | | | | 43,670 | |
|
Sprint Communications, Inc.(a) | |
11/15/18 | | | 9.000% | | | | 37,000 | | | | 42,226 | |
03/01/20 | | | 7.000% | | | | 37,000 | | | | 40,931 | |
|
Sprint Corp. | |
09/15/21 | | | 7.250% | | | | 5,000 | | | | 5,019 | |
06/15/24 | | | 7.125% | | | | 34,000 | | | | 32,682 | |
02/15/25 | | | 7.625% | | | | 32,000 | | | | 31,469 | |
|
Standard Pacific Corp. | |
12/15/21 | | | 6.250% | | | | 14,000 | | | | 14,910 | |
11/15/24 | | | 5.875% | | | | 8,000 | | | | 8,300 | |
|
Surgical Care Affiliates, Inc.(a) | |
04/01/23 | | | 6.000% | | | | 12,000 | | | | 12,270 | |
|
Synovus Financial Corp. | |
02/15/19 | | | 7.875% | | | | 54,000 | | | | 60,817 | |
|
T-Mobile USA, Inc. | |
04/28/20 | | | 6.542% | | | | 9,000 | | | | 9,495 | |
04/28/21 | | | 6.633% | | | | 26,000 | | | | 27,430 | |
01/15/22 | | | 6.125% | | | | 11,000 | | | | 11,344 | |
04/28/22 | | | 6.731% | | | | 10,000 | | | | 10,538 | |
03/01/23 | | | 6.000% | | | | 38,000 | | | | 38,724 | |
04/01/23 | | | 6.625% | | | | 4,000 | | | | 4,153 | |
04/28/23 | | | 6.836% | | | | 9,000 | | | | 9,518 | |
01/15/24 | | | 6.500% | | | | 11,000 | | | | 11,481 | |
03/01/25 | | | 6.375% | | | | 19,000 | | | | 19,513 | |
|
TRI Pointe Holdings, Inc.(a) | |
06/15/19 | | | 4.375% | | | | 7,000 | | | | 6,895 | |
|
Targa Resources Partners LP/Finance Corp. | |
05/01/23 | | | 5.250% | | | | 2,000 | | | | 2,040 | |
11/15/23 | | | 4.250% | | | | 25,000 | | | | 24,375 | |
|
Targa Resources Partners LP/Finance Corp.(a) | |
01/15/18 | | | 5.000% | | | | 36,000 | | | | 37,350 | |
11/15/19 | | | 4.125% | | | | 13,000 | | | | 13,033 | |
|
Taylor Morrison Communities, Inc./Monarch, Inc. | |
04/15/20 | | | 7.750% | | | | 44,000 | | | | 46,558 | |
|
Taylor Morrison Communities, Inc./Monarch, Inc.(a) | |
04/15/23 | | | 5.875% | | | | 22,000 | | | | 22,440 | |
|
Teleflex, Inc. | |
06/15/24 | | | 5.250% | | | | 2,000 | | | | 2,020 | |
|
Tempur Sealy International, Inc. | |
12/15/20 | | | 6.875% | | | | 26,000 | | | | 27,690 | |
|
Tenet Healthcare Corp. | |
06/01/20 | | | 4.750% | | | | 31,000 | | | | 31,542 | |
10/01/20 | | | 6.000% | | | | 37,000 | | | | 39,497 | |
|
Tenet Healthcare Corp.(a) | |
03/01/19 | | | 5.500% | | | | 55,000 | | | | 55,344 | |
|
TerraForm Power Operating LLC(a) | |
02/01/23 | | | 5.875% | | | | 20,000 | | | | 20,850 | |
|
Tesoro Logistics LP/Finance Corp.(a) | |
10/15/19 | | | 5.500% | | | | 7,000 | | | | 7,403 | |
10/15/22 | | | 6.250% | | | | 22,000 | | | | 23,348 | |
| | | | | | | | | | | | |
| Corporate Bonds & Notes (continued) | |
| Issuer | | Coupon
Rate | | | Principal
Amount ($) | | | Value ($) | |
Time Warner Cable, Inc. | |
09/15/42 | | | 4.500% | | | | 385,000 | | | | 327,434 | |
|
TransDigm, Inc. | |
10/15/20 | | | 5.500% | | | | 31,000 | | | | 30,457 | |
|
Transcontinental Gas Pipe Line Co. LLC | |
04/15/16 | | | 6.400% | | | | 2,255,000 | | | | 2,364,293 | |
|
USG Corp.(a) | |
11/01/21 | | | 5.875% | | | | 9,000 | | | | 9,653 | |
03/01/25 | | | 5.500% | | | | 4,000 | | | | 4,200 | |
|
United Rentals North America, Inc. | |
05/15/20 | | | 7.375% | | | | 41,000 | | | | 44,210 | |
04/15/22 | | | 7.625% | | | | 21,000 | | | | 23,153 | |
06/15/23 | | | 6.125% | | | | 4,000 | | | | 4,193 | |
|
Universal Health Services, Inc.(a) | |
08/01/22 | | | 4.750% | | | | 39,000 | | | | 40,950 | |
|
Univision Communications, Inc.(a) | |
09/15/22 | | | 6.750% | | | | 26,000 | | | | 27,919 | |
05/15/23 | | | 5.125% | | | | 38,000 | | | | 38,427 | |
02/15/25 | | | 5.125% | | | | 87,000 | | | | 87,652 | |
|
Vail Resorts, Inc. | |
05/01/19 | | | 6.500% | | | | 42,000 | | | | 43,365 | |
|
Valeant Pharmaceuticals International, Inc.(a) | |
10/15/20 | | | 6.375% | | | | 35,000 | | | | 36,881 | |
|
VeriSign, Inc. | |
05/01/23 | | | 4.625% | | | | 14,000 | | | | 13,993 | |
|
VeriSign, Inc.(a) | |
04/01/25 | | | 5.250% | | | | 24,000 | | | | 24,809 | |
|
Verizon Communications, Inc. | |
11/01/42 | | | 3.850% | | | | 825,000 | | | | 735,271 | |
|
Virgin Media Secured Finance PLC(a) | |
04/15/21 | | | 5.375% | | | | 14,400 | | | | 15,030 | |
|
WR Grace & Co.(a) | |
10/01/21 | | | 5.125% | | | | 14,000 | | | | 14,595 | |
|
WhiteWave Foods Co. (The) | |
10/01/22 | | | 5.375% | | | | 26,000 | | | | 27,950 | |
|
Whiting Petroleum Corp. | |
03/15/21 | | | 5.750% | | | | 41,000 | | | | 41,590 | |
|
Whiting Petroleum Corp.(a) | |
04/01/23 | | | 6.250% | | | | 31,000 | | | | 32,046 | |
|
Windstream Corp. | |
10/15/20 | | | 7.750% | | | | 8,000 | | | | 8,220 | |
|
Yum! Brands, Inc. | |
11/01/23 | | | 3.875% | | | | 270,000 | | | | 278,845 | |
|
ZF North America Capital, Inc.(a) | |
04/29/25 | | | 4.750% | | | | 55,000 | | | | 55,137 | |
|
Zayo Group LLC/Capital, Inc.(a) | |
04/01/23 | | | 6.000% | | | | 74,000 | | | | 74,370 | |
|
Zebra Technologies Corp.(a) | |
10/15/22 | | | 7.250% | | | | 33,000 | | | | 35,640 | |
|
iHeartCommunications, Inc. | |
09/15/22 | | | 9.000% | | | | 51,000 | | | | 48,705 | |
The accompanying Notes to Financial Statements are an integral part of this statement.
| | |
| 12 | | Semiannual Report 2015 |
| | |
| |
| COLUMBIA GLOBAL BOND FUND | | |
PORTFOLIO OF INVESTMENTS (continued)
April 30, 2015 (Unaudited)
| | | | | | | | | | | | |
| Corporate Bonds & Notes (continued) | |
| Issuer | | Coupon
Rate | | | Principal
Amount ($) | | | Value ($) | |
iHeartCommunications, Inc.(a) | |
03/15/23 | | | 10.625% | | | | 25,000 | | | | 25,375 | |
|
iStar Financial, Inc. | |
07/01/19 | | | 5.000% | | | | 21,000 | | | | 20,921 | |
| | | | | | | | | | | | | |
Total | | | | | | | | | | | 28,046,302 | |
| | | |
| | | | | | | | | | | | |
VIRGIN ISLANDS —% | |
Platform Specialty Products Corp.(a) | |
02/01/22 | | | 6.500% | | | | 47,000 | | | | 49,115 | |
| | | | | | | | | | | | | |
Total Corporate Bonds & Notes | | | | | |
(Cost: $31,614,789) | | | | | | | | | | | 32,566,432 | |
| | | |
| | | | | | | | | | | | |
| Residential Mortgage-Backed Securities — Agency 0.5% | |
UNITED STATES 0.5% | |
Federal Home Loan Mortgage Corp.(c) | |
09/01/2017 - 08/01/2033 | | | 6.500% | | | | 113,678 | | | | 128,134 | |
|
Federal National Mortgage Association(c) | |
04/01/17 | | | 6.500% | | | | 28,758 | | | | 29,688 | |
05/01/32 - 11/01/32 | | | 7.500% | | | | 202,457 | | | | 238,022 | |
|
Federal National Mortgage Association(c)(d) | |
04/01/33 | | | 6.000% | | | | 140,137 | | | | 161,483 | |
| | | | | | | | | | | | | |
Total | | | | | | | | | | | 557,327 | |
| | | | | | | | | | | | | |
Total Residential Mortgage-Backed Securities — Agency | |
(Cost: $501,610) | | | | | | | | 557,327 | |
| | | |
| | | | | | | | | | | | |
| Residential Mortgage-Backed Securities — Non-Agency 0.5% | |
UNITED STATES 0.5% | |
Citigroup Mortgage Loan Trust, Inc.
CMO Series 2013-2 Class 1A3(a)(c)(e) | |
11/25/37 | | | 2.612% | | | | 619,221 | | | | 608,352 | |
| | | | | | | | | | | | | |
Total Residential Mortgage-Backed Securities — Non-Agency | |
(Cost: $629,464) | | | | | | | | 608,352 | |
| | | |
| | | | | | | | | | | | |
| Commercial Mortgage-Backed Securities — Agency 3.5% | |
UNITED STATES 3.5% | |
Government National Mortgage Association(c)
Series 2013-13 Class AC | |
04/16/46 | | | 1.700% | | | | 2,007,706 | | | | 1,935,742 | |
Series 2013-33 Class AC | |
05/16/46 | | | 1.744% | | | | 2,160,470 | | | | 2,105,760 | |
| | | | | | | | | | | | | |
Total | | | | | | | | | | | 4,041,502 | |
| | | | | | | | | | | | | |
Total Commercial Mortgage-Backed Securities — Agency | |
(Cost: $4,136,026) | | | | | | | | 4,041,502 | |
| | | |
| | | | | | | | | | | | |
| | | | | | | | | | | | |
| Commercial Mortgage-Backed Securities — Non-Agency 4.7% | |
| Issuer | | Coupon
Rate | | | Principal
Amount ($) | | | Value ($) | |
UNITED STATES 4.7% | |
American Homes 4 Rent
Series 2015-SFR1 Class A(a)(c) | |
04/17/52 | | | 3.467% | | | | 1,000,000 | | | | 1,017,942 | |
|
Banc of America Merrill Lynch Re-Remic Trust
Series 2014-FRR7 Class A(a)(c)(e) | |
10/26/44 | | | 2.431% | | | | 700,000 | | | | 689,474 | |
|
Extended Stay America Trust
Series 2013-ESH5 Class A25(a)(c) | |
12/05/31 | | | 1.830% | | | | 1,000,000 | | | | 996,666 | |
|
General Electric Capital Assurance Co.
Series 2003-1 Class A4(a)(c)(e) | |
05/12/35 | | | 5.254% | | | | 11,704 | | | | 11,762 | |
|
JPMorgan Chase Commercial Mortgage Securities Trust(c)
Series 2006-LDP9 Class AM | |
05/15/47 | | | 5.372% | | | | 550,000 | | | | 570,182 | |
|
JPMorgan Chase Commercial Mortgage Securities Trust(c)(e)
Series 2005-LDP3 Class ASB | |
08/15/42 | | | 4.893% | | | | 37,290 | | | | 37,353 | |
|
ORES NPL LLC(a)(c)
Series 2013-LV2 Class A | |
09/25/25 | | | 3.081% | | | | 1,154,929 | | | | 1,155,287 | |
Series 2014-LV3 Class A | |
03/27/24 | | | 3.000% | | | | 486,178 | | | | 486,178 | |
|
VFC LLC
Series 2015-3 Class A(a)(c) | |
12/20/31 | | | 2.750% | | | | 469,231 | | | | 468,000 | |
| | | | | | | | | | | | | |
Total | | | | | | | | | | | 5,432,844 | |
| | | | | | | | | | | | | |
Total Commercial Mortgage-Backed Securities — Non-Agency | |
(Cost: $5,417,712) | | | | | | | | | | | 5,432,844 | |
| | | |
| | | | | | | | | | | | |
| Asset-Backed Securities — Non-Agency 5.5% | |
BERMUDA 0.7% | |
Cronos Containers Program I Ltd.
Series 2013-1A Class A(a) | |
04/18/28 | | | 3.080% | | | | 800,000 | | | | 801,066 | |
| | | |
| | | | | | | | | | | | |
CAYMAN ISLANDS 0.8% | |
Octagon Investment Partners XXI Ltd.
Series 2014-1A Class A1B(a)(e) | |
11/14/26 | | | 1.572% | | | | 975,000 | | | | 973,878 | |
| | | |
| | | | | | | | | | | | |
UNITED STATES 4.0% | |
CLI Funding V LLC
Series 2013-1A(a) | |
03/18/28 | | | 2.830% | | | | 475,000 | | | | 473,958 | |
|
Centre Point Funding LLC
Series 2012-2A Class 1(a) | |
08/20/21 | | | 2.610% | | | | 430,229 | | | | 430,692 | |
The accompanying Notes to Financial Statements are an integral part of this statement.
| | | | |
| Semiannual Report 2015 | | | 13 | |
| | |
| |
| | COLUMBIA GLOBAL BOND FUND |
PORTFOLIO OF INVESTMENTS (continued)
April 30, 2015 (Unaudited)
| | | | | | | | | | | | |
| Asset-Backed Securities — Non-Agency (continued) | |
| Issuer | | Coupon
Rate | | | Principal
Amount ($) | | | Value ($) | |
Exeter Automobile Receivables Trust
Series 2015-1A Class A(a) | |
06/17/19 | | | 1.600% | | | | 570,138 | | | | 569,496 | |
|
New York Mortgage Trust Residential LLC(a)(e)
Series 2013-RP1A Class A | |
07/25/18 | | | 4.250% | | | | 378,842 | | | | 385,558 | |
Series 2013-RP2A Class A | |
09/25/18 | | | 4.600% | | | | 337,978 | | | | 343,156 | |
|
Oak Hill Advisors Residential Loan Trust
Series 2015-NPL1 Class A1(a)(e) | |
01/25/55 | | | 3.475% | | | | 247,287 | | | | 247,436 | |
|
SBA Tower Trust(a) | |
04/16/18 | | | 2.240% | | | | 900,000 | | | | 895,296 | |
|
SpringCastle America Funding LLC
Series 2014-AA Class A(a) | |
05/25/23 | | | 2.700% | | | | 359,547 | | | | 361,365 | |
|
TAL Advantage V LLC
Series 2013-1A Class A(a) | |
02/22/38 | | | 2.830% | | | | 411,250 | | | | 410,813 | |
|
Westgate Resorts LLC
Series 2013-1A Class B(a) | |
08/20/25 | | | 3.750% | | | | 457,531 | | | | 460,282 | |
| | | | | | | | | | | | | |
Total | | | | | | | | | | | 4,578,052 | |
| | | | | | | | | | | | | |
Total Asset-Backed Securities — Non-Agency | |
(Cost: $6,357,003) | | | | | | | | | | | 6,352,996 | |
| | | |
| | | | | | | | | | | | |
| Inflation-Indexed Bonds(f) 2.2% | |
ITALY 2.2% | |
Italy Buoni Poliennali Del Tesoro | |
09/15/19 | | | 2.350% | | | EUR | 1,585,923 | | | | 2,000,386 | |
09/15/41 | | | 2.550% | | | EUR | 354,248 | | | | 537,443 | |
| | | | | | | | | | | | | |
Total | | | | | | | | | | | 2,537,829 | |
| | | | | | | | | | | | | |
Total Inflation-Indexed Bonds | |
(Cost: $2,494,123) | | | | | | | | | | | 2,537,829 | |
| | | |
| | | | | | | | | | | | |
| U.S. Treasury Obligations 0.8% | |
UNITED STATES 0.8% | |
U.S. Treasury | |
04/30/17 | | | 0.500% | | | | 100,100 | | | | 99,943 | |
|
U.S. Treasury(d) | |
02/15/25 | | | 2.000% | | | | 815,900 | | | | 812,586 | |
| | | | | | | | | | | | | |
Total | | | | | | | | | | | 912,529 | |
| | | | | | | | | | | | | |
Total U.S. Treasury Obligations | | | | | |
(Cost: $924,434) | | | | | | | | 912,529 | |
| | | |
| | | | | | | | | | | | |
| Foreign Government Obligations(f)(g) 46.2% | |
ARGENTINA 0.2% | |
Argentina Bonar Bonds | |
04/17/17 | | | 7.000% | | | | 194,000 | | | | 185,852 | |
| | | | | | | | | | | | |
| Foreign Government Obligations(f)(g) (continued) | |
| Issuer | | Coupon
Rate | | | Principal
Amount ($) | | | Value ($) | |
AUSTRALIA 4.0% | |
Australia Government Bond | |
10/21/19 | | | 2.750% | | | AUD | 3,800,000 | | | | 3,096,593 | |
04/21/37 | | | 3.750% | | | AUD | 1,780,000 | | | | 1,541,012 | |
| | | | | | | | | | | | | |
Total | | | | | | | | | | | 4,637,605 | |
| | | |
| | | | | | | | | | | | |
BRAZIL 5.5% | |
Brazil Notas do Tesouro Nacional
Series F | |
01/01/25 | | | 10.000% | | | BRL | 12,000,000 | | | | 3,529,572 | |
|
Brazil Notas do Tesouro Nacional | |
01/01/17 | | | 10.000% | | | BRL | 6,558,000 | | | | 2,141,263 | |
|
Brazilian Government International Bond | |
01/07/41 | | | 5.625% | | | | 270,000 | | | | 277,595 | |
|
Petrobras Global Finance BV | |
01/27/21 | | | 5.375% | | | | 420,000 | | | | 402,675 | |
| | | | | | | | | | | | | |
Total | | | | | | | | | | | 6,351,105 | |
| | | |
| | | | | | | | | | | | |
COLOMBIA 1.9% | |
Colombia Government International Bond | |
01/18/41 | | | 6.125% | | | | 235,000 | | | | 275,944 | |
|
Corporación Andina de Fomento | |
06/15/22 | | | 4.375% | | | | 232,000 | | | | 254,646 | |
|
Empresas Publicas de Medellin ESP(a) | |
09/10/24 | | | 7.625% | | | COP | 3,995,000,000 | | | | 1,668,609 | |
| | | | | | | | | | | | | |
Total | | | | | | | | | | | 2,199,199 | |
| | | |
| | | | | | | | | | | | |
DOMINICAN REPUBLIC 0.7% | |
Dominican Republic International Bond(a) | |
04/20/27 | | | 8.625% | | | | 700,000 | | | | 838,250 | |
| | | |
| | | | | | | | | | | | |
EL SALVADOR 0.2% | |
El Salvador Government International Bond(a) | |
01/18/27 | | | 6.375% | | | | 250,000 | | | | 254,375 | |
| | | |
| | | | | | | | | | | | |
GEORGIA 0.3% | |
Georgian Railway JSC(a) | |
07/11/22 | | | 7.750% | | | | 300,000 | | | | 331,125 | |
| | | |
| | | | | | | | | | | | |
GHANA 0.3% | |
Republic of Ghana(a) | |
01/18/26 | | | 8.125% | | | | 400,000 | | | | 387,032 | |
| | | |
| | | | | | | | | | | | |
GUATEMALA 0.4% | |
Guatemala Government Bond(a) | |
06/06/22 | | | 5.750% | | | | 400,000 | | | | 440,000 | |
| | | |
| | | | | | | | | | | | |
HUNGARY 0.7% | |
Hungary Government International Bond | |
03/25/24 | | | 5.375% | | | | 100,000 | | | | 112,500 | |
03/29/41 | | | 7.625% | | | | 450,000 | | | | 646,875 | |
| | | | | | | | | | | | | |
Total | | | | | | | | | | | 759,375 | |
The accompanying Notes to Financial Statements are an integral part of this statement.
| | |
| 14 | | Semiannual Report 2015 |
| | |
| |
| COLUMBIA GLOBAL BOND FUND | | |
PORTFOLIO OF INVESTMENTS (continued)
April 30, 2015 (Unaudited)
| | | | | | | | | | | | |
| Foreign Government Obligations(f)(g) (continued) | |
| Issuer | | Coupon
Rate | | | Principal
Amount ($) | | | Value ($) | |
INDONESIA 4.0% | |
Indonesia Government International Bond(a) | |
01/17/18 | | | 6.875% | | | | 500,000 | | | | 564,055 | |
10/12/35 | | | 8.500% | | | | 190,000 | | | | 274,550 | |
01/17/38 | | | 7.750% | | | | 140,000 | | | | 190,925 | |
|
Indonesia Treasury Bond | |
05/15/16 | | | 10.750% | | | IDR | 3,620,000,000 | | | | 288,483 | |
11/15/20 | | | 11.000% | | | IDR | 10,840,000,000 | | | | 960,443 | |
07/15/22 | | | 10.250% | | | IDR | 8,394,000,000 | | | | 735,291 | |
03/15/29 | | | 9.000% | | | IDR | 10,920,000,000 | | | | 920,355 | |
|
PT Pertamina Persero | |
05/20/23 | | | 4.300% | | | | 700,000 | | | | 694,750 | |
| | | | | | | | | | | | | |
Total | | | | | | | | | | | 4,628,852 | |
| | | |
| | | | | | | | | | | | |
ITALY 0.4% | |
Italy Buoni Poliennali Del Tesoro | |
11/01/26 | | | 7.250% | | | EUR | 283 | | | | 503 | |
|
Italy Buoni Poliennali Del Tesoro(a) | |
09/01/44 | | | 4.750% | | | EUR | 280,000 | | | | 464,127 | |
| | | | | | | | | | | | | |
Total | | | | | | | | | | | 464,630 | |
| | | |
| | | | | | | | | | | | |
KAZAKHSTAN 0.3% | |
KazMunayGas National Co. JSC(a) | |
07/02/18 | | | 9.125% | | | | 250,000 | | | | 282,187 | |
| | | |
| | | | | | | | | | | | |
LITHUANIA 0.5% | |
Lithuania Government International Bond | |
02/07/18 | | | 4.850% | | | EUR | 470,000 | | | | 596,129 | |
| | | |
| | | | | | | | | | | | |
MALAYSIA 2.6% | |
Malaysia Government Bond | |
03/31/20 | | | 3.492% | | | MYR | 6,920,000 | | | | 1,928,959 | |
|
Petronas Capital Ltd.(a) | |
08/12/19 | | | 5.250% | | | | 970,000 | | | | 1,085,188 | |
| | | | | | | | | | | | | |
Total | | | | | | | | | | | 3,014,147 | |
| | | |
| | | | | | | | | | | | |
MEXICO 5.1% | |
Mexican Bonos | |
12/07/23 | | | 8.000% | | | MXN | 7,000,000 | | | | 520,411 | |
05/31/29 | | | 8.500% | | | MXN | 5,200,000 | | | | 409,608 | |
11/23/34 | | | 7.750% | | | MXN | 53,700,000 | | | | 4,040,073 | |
|
Mexico Government International Bond | |
09/27/34 | | | 6.750% | | | | 270,000 | | | | 357,750 | |
|
Petroleos Mexicanos | |
01/24/22 | | | 4.875% | | | | 500,000 | | | | 528,750 | |
| | | | | | | | | | | | | |
Total | | | | | | | | | | | 5,856,592 | |
| | | |
| | | | | | | | | | | | |
NEW ZEALAND 3.2% | |
New Zealand Government Bond | |
04/15/23 | | | 5.500% | | | NZD | 4,122,000 | | | | 3,622,312 | |
| | | |
| | | | | | | | | | | | |
| | | | | | | | | | | | |
| Foreign Government Obligations(f)(g) (continued) | |
| Issuer | | Coupon
Rate | | | Principal
Amount ($) | | | Value ($) | |
PANAMA 0.1% | |
Ena Norte Trust(a) | |
04/25/23 | | | 4.950% | | | | 133,326 | | | | 138,159 | |
| | | |
| | | | | | | | | | | | |
PARAGUAY 0.1% | |
Republic of Paraguay(a) | |
08/11/44 | | | 6.100% | | | | 150,000 | | | | 163,125 | |
| | | |
| | | | | | | | | | | | |
PERU 0.9% | |
Corporacion Financiera de Desarrollo SA(a)(e) | |
07/15/29 | | | 5.250% | | | | 300,000 | | | | 314,250 | |
|
Peruvian Government International Bond | |
08/12/26 | | | 8.200% | | | PEN | 2,030,000 | | | | 757,519 | |
| | | | | | | | | | | | | |
Total | | | | | | | | | | | 1,071,769 | |
| | | |
| | | | | | | | | | | | |
PHILIPPINES 0.3% | |
Power Sector Assets & Liabilities Management Corp.(a) | |
05/27/19 | | | 7.250% | | | | 290,000 | | | | 345,825 | |
| | | |
| | | | | | | | | | | | |
ROMANIA 2.8% | |
Romania Government Bond | |
02/24/25 | | | 4.750% | | | RON | 11,200,000 | | | | 3,164,583 | |
|
Romanian Government International Bond(a) | |
01/22/24 | | | 4.875% | | | | 100,000 | | | | 109,500 | |
| | | | | | | | | | | | | |
Total | | | | | | | | | | | 3,274,083 | |
| | | |
| | | | | | | | | | | | |
RUSSIAN FEDERATION 1.2% | |
AK Transneft OJSC Via TransCapitalInvest Ltd.(a) | |
08/07/18 | | | 8.700% | | | | 100,000 | | | | 108,415 | |
|
Gazprom OAO Via Gaz Capital SA(a) | |
11/22/16 | | | 6.212% | | | | 100,000 | | | | 102,375 | |
03/07/22 | | | 6.510% | | | | 550,000 | | | | 551,632 | |
08/16/37 | | | 7.288% | | | | 230,000 | | | | 233,795 | |
|
Russian Foreign Bond — Eurobond(e) | |
03/31/30 | | | 7.500% | | | | 312,500 | | | | 365,541 | |
| | | | | | | | | | | | | |
Total | | | | | | | | | | | 1,361,758 | |
| | | |
| | | | | | | | | | | | |
SERBIA 0.2% | |
Republic of Serbia(a) | |
12/03/18 | | | 5.875% | | | | 200,000 | | | | 211,250 | |
| | | |
| | | | | | | | | | | | |
SPAIN 2.8% | |
Spain Government Bond | |
01/31/22 | | | 5.850% | | | EUR | 920,000 | | | | 1,357,153 | |
|
Spain Government Bond(a) | |
10/31/44 | | | 5.150% | | | EUR | 1,060,000 | | | | 1,857,447 | |
| | | | | | | | | | | | | |
Total | | | | | | | | | | | 3,214,600 | |
| | | |
| | | | | | | | | | | | |
THAILAND 0.8% | |
Thailand Government Bond | |
03/13/18 | | | 5.125% | | | THB | 26,490,000 | | | | 878,421 | |
The accompanying Notes to Financial Statements are an integral part of this statement.
| | | | |
| Semiannual Report 2015 | | | 15 | |
| | |
| |
| | COLUMBIA GLOBAL BOND FUND |
PORTFOLIO OF INVESTMENTS (continued)
April 30, 2015 (Unaudited)
| | | | | | | | | | | | |
| Foreign Government Obligations(f)(g) (continued) | |
| Issuer | | Coupon
Rate | | | Principal
Amount ($) | | | Value ($) | |
TRINIDAD AND TOBAGO 0.5% | |
Petroleum Co. of Trinidad & Tobago Ltd.(a) | |
08/14/19 | | | 9.750% | | | | 450,000 | | | | 539,100 | |
| | | |
| | | | | | | | | | | | |
TURKEY 2.0% | |
Export Credit Bank of Turkey(a) | |
09/23/21 | | | 5.000% | | | | 600,000 | | | | 600,000 | |
|
Turkey Government International Bond | |
02/16/17 | | | 5.500% | | | EUR | 480,000 | | | | 581,142 | |
03/17/36 | | | 6.875% | | | | 940,000 | | | | 1,144,262 | |
| | | | | | | | | | | | | |
Total | | | | | | | | | | | 2,325,404 | |
| | | |
| | | | | | | | | | | | |
UNITED KINGDOM 3.1% | |
United Kingdom Gilt | | | | | | | | | | | | |
03/07/25 | | | 5.000% | | | GBP | 1,800,000 | | | | 3,553,485 | |
| | | |
| | | | | | | | | | | | |
VENEZUELA 0.7% | |
Petroleos de Venezuela SA | |
04/12/17 | | | 5.250% | | | | 590,000 | | | | 345,091 | |
|
Venezuela Government International Bond | |
02/26/16 | | | 5.750% | | | | 20,000 | | | | 17,000 | |
05/07/23 | | | 9.000% | | | | 931,000 | | | | 423,605 | |
| | | | | | | | | | | | | |
Total | | | | | | | | | | | 785,696 | |
| | | |
| | | | | | | | | | | | |
ZAMBIA 0.4% | |
Zambia Government International Bond(a) | |
04/14/24 | | | 8.500% | | | | 400,000 | | | | 433,248 | |
| | | | | | | | | | | | | |
Total Foreign Government Obligations | | | | | |
(Cost: $55,859,503) | | | | | | | | 53,144,690 | |
| | | |
| | | | | | | | | | | | |
| Senior Loans 0.1% | |
| Borrower | | Weighted
Average
Coupon
| | | Principal
Amount ($) | | | Value ($) | |
CANADA —% | |
Four Seasons Holdings, Inc.
2nd Lien Term Loan(e)(h) | |
12/27/20 | | | 6.250% | | | | 6,000 | | | | 6,037 | |
| | | |
| | | | | | | | | | | | |
UNITED STATES 0.1% | |
Applied Systems, Inc.
1st Lien Term Loan(e)(h) | |
01/25/21 | | | 4.265% | | | | 1,919 | | | | 1,923 | |
|
Axalta Coating Systems Dutch Holding B BV
Tranche B Term Loan(e)(h) | |
02/01/20 | | | 3.750% | | | | 8,451 | | | | 8,468 | |
|
CHS/Community Health Systems, Inc.
Tranche D Term Loan(e)(h) | |
01/27/21 | | | 4.250% | | | | 6,913 | | | | 6,954 | |
| | | | | | | | | | | | |
| Senior Loans (continued) | |
| Borrower | | Weighted
Average
Coupon
| | | Principal
Amount ($) | | | Value ($) | |
Rite Aid Corp.
Tranche 1 2nd Lien Term Loan(e)(h) | |
08/21/20 | | | 5.750% | | | | 34,000 | | | | 34,383 | |
|
Riverbed Technology, Inc.
Term Loan(b)(e)(h) | |
04/24/22 | | | 6.000% | | | | 53,441 | | | | 54,002 | |
|
U.S. Renal Care, Inc.
Tranche B2 1st Lien Term Loan(e)(h) | |
07/03/19 | | | 4.250% | | | | 7,880 | | | | 7,916 | |
| | | | | | | | | | | | | |
Total | | | | | | | | | | | 113,646 | |
| | | | | | | | | | | | | |
Total Senior Loans | | | | | |
(Cost: $119,339) | | | | | | | | 119,683 | |
| | | |
| | | | | | | | | | | | |
| Money Market Funds 6.3% | |
| | | | | | Shares | | | Value ($) | |
Columbia Short-Term Cash Fund, 0.111%(i)(j) | | | | 7,303,059 | | | | 7,303,059 | |
| | | | | | | | | | | | | |
Total Money Market Funds | | | | | |
(Cost: $7,303,059) | | | | 7,303,059 | |
| | | | | | | | | | | | | |
Total Investments | | | | | | | | | | | | |
(Cost: $115,357,062) | | | | | | | | 113,577,243 | |
| | | | | | | | | | | | | |
Other Assets & Liabilities, Net | | | | | | | | 1,580,408 | |
| | | | | | | | | | | | | |
Net Assets | | | | | | | | | | | 115,157,651 | |
| | | | | | | | | | | | | |
The accompanying Notes to Financial Statements are an integral part of this statement.
| | |
| 16 | | Semiannual Report 2015 |
| | |
| |
| COLUMBIA GLOBAL BOND FUND | | |
PORTFOLIO OF INVESTMENTS (continued)
April 30, 2015 (Unaudited)
Investments in Derivatives
Forward Foreign Currency Exchange Contracts Open at April 30, 2015
| | | | | | | | | | | | | | | | | | | | |
| Counterparty | | Exchange
Date | | | Currency to
be Delivered | | | Currency to
be Received | | | Unrealized
Appreciation ($) | | | Unrealized
(Depreciation) ($) | |
| | | | | |
Barclays Bank PLC | | | 5/29/2015 | | | | 5,767,349 USD | | | | 685,818,000 JPY | | | | — | | | | (22,135 | ) |
| | | | | |
Citigroup Global Markets Inc. | | | 5/22/2015 | | | | 5,063,000 AUD | | | | 3,829,704 USD | | | | — | | | | (172,800 | ) |
| | | | | |
Citigroup Global Markets Inc. | | | 5/22/2015 | | | | 4,100,000,000 COP | | | | 1,597,755 USD | | | | — | | | | (120,309 | ) |
| | | | | |
Citigroup Global Markets Inc. | | | 5/22/2015 | | | | 39,690,000,000 IDR | | | | 3,005,225 USD | | | | — | | | | (40,904 | ) |
| | | | | |
Citigroup Global Markets Inc. | | | 5/22/2015 | | | | 311,677 USD | | | | 2,200,000 DKK | | | | 19,428 | | | | — | |
| | | | | |
Citigroup Global Markets Inc. | | | 5/29/2015 | | | | 8,164,000 AUD | | | | 6,368,614 USD | | | | — | | | | (82,782 | ) |
| | | | | |
Citigroup Global Markets Inc. | | | 5/29/2015 | | | | 30,378,000 NZD | | | | 22,967,894 USD | | | | — | | | | (159,886 | ) |
| | | | | |
Deutsche Bank | | | 5/22/2015 | | | | 12,678,000 RON | | | | 3,041,232 USD | | | | — | | | | (176,355 | ) |
| | | | | |
Deutsche Bank | | | 5/22/2015 | | | | 29,250,000 THB | | | | 895,618 USD | | | | 8,846 | | | | — | |
| | | | | |
Deutsche Bank | | | 5/22/2015 | | | | 279,906 USD | | | | 1,062,000 PLN | | | | 14,920 | | | | — | |
| | | | | |
Deutsche Bank | | | 5/29/2015 | | | | 3,739,000 GBP | | | | 5,742,244 USD | | | | 3,938 | | | | — | |
| | | | | |
Deutsche Bank | | | 5/29/2015 | | | | 3,734,000 GBP | | | | 5,740,316 USD | | | | 9,683 | | | | — | |
| | | | | |
Deutsche Bank | | | 5/29/2015 | | | | 1,502,000 GBP | | | | 2,300,553 USD | | | | — | | | | (4,591 | ) |
| | | | | |
Deutsche Bank | | | 5/29/2015 | | | | 19,649,000 SEK | | | | 2,341,154 USD | | | | — | | | | (17,901 | ) |
| | | | | |
Deutsche Morgan Grenfell | | | 5/29/2015 | | | | 2,304,598 USD | | | | 19,649,000 SEK | | | | 54,457 | | | | — | |
| | | | | |
Goldman, Sachs & Co. | | | 5/22/2015 | | | | 53,500,000 MXN | | | | 3,474,703 USD | | | | — | | | | (7,864 | ) |
| | | | | |
Goldman, Sachs & Co. | | | 5/22/2015 | | | | 15,761,000 MXN | | | | 1,024,343 USD | | | | — | | | | (1,614 | ) |
| | | | | |
Goldman, Sachs & Co. | | | 5/22/2015 | | | | 224,588 USD | | | | 1,980,000 SEK | | | | 13,097 | | | | — | |
| | | | | |
Goldman, Sachs & Co. | | | 5/22/2015 | | | | 290,448 USD | | | | 3,548,000 ZAR | | | | 6,889 | | | | — | |
| | | | | |
Goldman, Sachs & Co. | | | 5/29/2015 | | | | 5,626,000 EUR | | | | 6,162,045 USD | | | | — | | | | (157,219 | ) |
| | | | | |
Goldman, Sachs & Co. | | | 5/29/2015 | | | | 5,254,000 EUR | | | | 5,769,365 USD | | | | — | | | | (132,060 | ) |
| | | | | |
Goldman, Sachs & Co. | | | 5/29/2015 | | | | 10,617,000 EUR | | | | 11,844,113 USD | | | | — | | | | (81,175 | ) |
| | | | | |
Goldman, Sachs & Co. | | | 5/29/2015 | | | | 2,568,000 EUR | | | | 2,870,305 USD | | | | — | | | | (14,139 | ) |
| | | | | |
Goldman, Sachs & Co. | | | 5/29/2015 | | | | 3,093,000 GBP | | | | 4,727,468 USD | | | | — | | | | (19,411 | ) |
| | | | | |
Goldman, Sachs & Co. | | | 5/29/2015 | | | | 4,727,905 USD | | | | 4,324,000 EUR | | | | 128,921 | | | | — | |
| | | | | |
Goldman, Sachs & Co. | | | 5/29/2015 | | | | 10,544,269 USD | | | | 9,701,000 EUR | | | | 352,138 | | | | — | |
| | | | | |
Goldman, Sachs & Co. | | | 5/29/2015 | | | | 19,573,830 USD | | | | 17,775,000 EUR | | | | 391,496 | | | | — | |
| | | | | |
Goldman, Sachs & Co. | | | 5/29/2015 | | | | 4,678,750 USD | | | | 3,093,000 GBP | | | | 68,129 | | | | — | |
| | | | | |
HSBC Securities (USA), Inc. | | | 5/22/2015 | | | | 75,000,000 JPY | | | | 631,225 USD | | | | 2,979 | | | | — | |
| | | | | |
HSBC Securities (USA), Inc. | | | 5/22/2015 | | | | 13,901,831 USD | | | | 1,668,545,000 JPY | | | | 74,938 | | | | — | |
| | | | | |
HSBC Securities (USA), Inc. | | | 5/29/2015 | | | | 3,455,574 USD | | | | 2,130,880,000 CLP | | | | 19,446 | | | | — | |
| | | | | |
J.P. Morgan Securities, Inc. | | | 5/22/2015 | | | | 16,934,000 BRL | | | | 5,369,055 USD | | | | — | | | | (214,706 | ) |
| | | | | |
J.P. Morgan Securities, Inc. | | | 5/22/2015 | | | | 900,000 BRL | | | | 291,168 USD | | | | — | | | | (5,595 | ) |
| | | | | |
J.P. Morgan Securities, Inc. | | | 5/22/2015 | | | | 6,000,000 MYR | | | | 1,610,738 USD | | | | — | | | | (69,143 | ) |
| | | | | |
J.P. Morgan Securities, Inc. | | | 5/22/2015 | | | | 3,912,150 USD | | | | 3,666,000 EUR | | | | 205,208 | | | | — | |
| | | | | |
J.P. Morgan Securities, Inc. | | | 5/22/2015 | | | | 7,476,730 USD | | | | 7,074,000 EUR | | | | 468,221 | | | | — | |
| | | | | |
Standard Chartered Bank | | | 5/22/2015 | | | | 2,655,000 PEN | | | | 843,929 USD | | | | — | | | | (1,682 | ) |
| | | | | |
Standard Chartered Bank | | | 5/22/2015 | | | | 149,616 USD | | | | 102,000 GBP | | | | 6,934 | | | | — | |
| | | | | |
Standard Chartered Bank | | | 5/29/2015 | | | | 18,430,000 CNY | | | | 3,000,651 USD | | | | 2,049 | | | | — | |
| | | | | |
Standard Chartered Bank | | | 5/29/2015 | | | | 177,767,000 MXN | | | | 11,594,281 USD | | | | 30,139 | | | | — | |
| | | | | |
Standard Chartered Bank | | | 5/29/2015 | | | | 22,923,797 USD | | | | 353,501,000 MXN | | | | 75,446 | | | | — | |
The accompanying Notes to Financial Statements are an integral part of this statement.
| | | | |
| Semiannual Report 2015 | | | 17 | |
| | |
| |
| | COLUMBIA GLOBAL BOND FUND |
PORTFOLIO OF INVESTMENTS (continued)
April 30, 2015 (Unaudited)
Forward Foreign Currency Exchange Contracts Open at April 30, 2015 (continued)
| | | | | | | | | | | | | | | | | | | | |
| Counterparty | | Exchange
Date | | | Currency to
be Delivered | | | Currency to
be Received | | | Unrealized
Appreciation ($) | | | Unrealized
(Depreciation) ($) | |
| | | | | |
State Street Bank & Trust Company | | | 5/22/2015 | | | | 968,199 USD | | | | 1,220,000 CAD | | | | 42,735 | | | | — | |
| | | | | |
UBS Securities | | | 5/22/2015 | | | | 4,811,000 NZD | | | | 3,569,642 USD | | | | — | | | | (95,714 | ) |
| | | | | | | | | | | | | | | | | | | | | |
Total | | | | | | | | | | | | | | | 2,000,037 | | | | (1,597,985 | ) |
| | | | | | | | | | | | | | | | | | | | | |
Futures Contracts Outstanding at April 30, 2015
At April 30, 2015, securities totaling $974,069 were pledged as collateral to cover initial margin requirements on open futures contracts.
Long Futures Contracts Outstanding
| | | | | | | | | | | | | | | | | | | | | | | | |
| Contract Description | | Number of
Contracts | | | Trading
Currency | | | Notional Market
Value ($) | | | Expiration Date | | | Unrealized
Appreciation ($) | | | Unrealized
Depreciation ($) | |
AUST 10Y BOND FUT | | | 35 | | | | AUD | | | | 3,580,141 | | | | 06/2015 | | | | — | | | | (48,136 | ) |
AUST 3YR BOND FUT | | | 118 | | | | AUD | | | | 10,440,556 | | | | 06/2015 | | | | — | | | | (61,332 | ) |
Euro-BTP Future | | | 56 | | | | EUR | | | | 8,701,278 | | | | 06/2015 | | | | — | | | | (114,552 | ) |
LONG GILT | | | 101 | | | | GBP | | | | 18,312,729 | | | | 06/2015 | | | | — | | | | (32,109 | ) |
US 2YR NOTE (CBT) | | | 7 | | | | USD | | | | 1,534,859 | | | | 06/2015 | | | | 6,340 | | | | — | |
| | | | | | | | | | | | | | | | | | | | | | | | | |
Total | | | | | | | | | | | 42,569,563 | | | | | | | | 6,340 | | | | (256,129 | ) |
| | | | | | | | | | | | | | | | | | | | | | | | | |
Short Futures Contracts Outstanding
| | | | | | | | | | | | | | | | | | | | | | | | |
| Contract Description | | Number of
Contracts | | | Trading
Currency | | | Notional Market
Value ($) | | | Expiration Date | | | Unrealized
Appreciation ($) | | | Unrealized
Depreciation ($) | |
EURO-BUND FUTURE | | | (86 | ) | | | EUR | | | | (15,131,750 | ) | | | 06/2015 | | | | 125,428 | | | | — | |
US 10YR NOTE(CBT) | | | (58 | ) | | | USD | | | | (7,445,750 | ) | | | 06/2015 | | | | — | | | | (3,465 | ) |
US 5YR NOTE (CBT) | | | (100 | ) | | | USD | | | | (12,013,281 | ) | | | 06/2015 | | | | — | | | | (24,332 | ) |
US ULTRA BOND(CBT) | | | (19 | ) | | | USD | | | | (3,125,500 | ) | | | 06/2015 | | | | 36,072 | | | | — | |
| | | | | | | | | | | | | | | | | | | | | | | | | |
Total | | | | | | | | | | | (37,716,281 | ) | | | | | | | 161,500 | | | | (27,797 | ) |
| | | | | | | | | | | | | | | | | | | | | | | | | |
Credit Default Swap Contracts Outstanding at April 30, 2015
At April 30, 2015, cash totaling $521,708 were pledged as collateral to cover open centrally cleared credit default swap contracts.
Sell Protection
| | | | | | | | | | | | | | | | | | | | | | | | | | | | | | | | |
| Counterparty | | Reference
Entity | | Expiration
Date | | Receive
Fixed
Rate (%) | | | Implied
Credit
Spread (%)* | | | Notional
Amount ($) | | | Market
Value ($) | | | Periodic
Payments
Receivable
(Payable) ($) | | | Unrealized
Appreciation
($) | | | Unrealized
Depreciation
($) | |
Morgan Stanley** | | CDX North America High Yield 24-V1 | | 6/20/2020 | | | 5.000 | | | | 3.400 | | | | 4,115,000 | | | | 15,240 | | | | 24,004 | | | | 39,244 | | | | — | |
| | * | Implied credit spreads, represented in absolute terms, utilized in determining the market value of credit default swap agreements on corporate or sovereign issues as of period end serve as an indicator of the current status of the payment/performance risk and represent the likelihood or risk of default for the credit derivative. The implied credit spread of a particular referenced entity reflects the cost of buying/selling protection and may include upfront payments required to be made to enter into the agreement. Wider credit spreads represent a deterioration of the referenced entity’s credit soundness and a greater likelihood or risk of default or other credit event occurring as defined under the terms of the agreement. |
| | ** | Centrally cleared swap contract |
The accompanying Notes to Financial Statements are an integral part of this statement.
| | |
| 18 | | Semiannual Report 2015 |
| | |
| |
| COLUMBIA GLOBAL BOND FUND | | |
PORTFOLIO OF INVESTMENTS (continued)
April 30, 2015 (Unaudited)
Interest Rate Swap Contracts Outstanding at April 30, 2015
At April 30, 2015, cash totaling $827,309 were pledged as collateral to cover open centrally cleared interest rate swap contracts.
| | | | | | | | | | | | | | | | | | | | | | | | | | | | | | | | |
| Counterparty | | Floating Rate
Index | | Fund
Pay/Receive
Floating
Rate | | Fixed
Rate (%) | | | Expiration
Date | | | Notional
Currency | | | Notional
Amount | | | Unamortized
Premium
(Paid)
Received ($) | | | Unrealized
Appreciation
($) | | | Unrealized
Depreciation
($) | |
| | | | | | | | | |
JPMorgan | | 28-Day MXN TIIE-Banxico | | Receive | | | 5.519 | | | | 3/5/2020 | | | | MXN | | | | 127,000,000 | | | | — | | | | — | | | | (87,271 | ) |
| | | | | | | | | |
JPMorgan | | 6-Month PLN-WIBOR | | Receive | | | 1.918 | | | | 3/23/2020 | | | | PLN | | | | 24,000,000 | | | | — | | | | 64,095 | | | | — | |
| | | | | | | | | |
Morgan Stanley* | | 3-Month USD LIBOR-BBA | | Receive | | | 1.959 | | | | 1/28/2025 | | | | USD | | | | 24,000,000 | | | | (223 | ) | | | 205,473 | | | | — | |
| | | | | | | | | |
Morgan Stanley* | | 3-Month USD LIBOR-BBA | | Receive | | | 2.134 | | | | 2/13/2025 | | | | USD | | | | 3,250,000 | | | | (25 | ) | | | — | | | | (19,154 | ) |
| | | | | | | | | |
Morgan Stanley* | | 6-Month JPY LIBOR-BBA | | Pay | | | 1.323 | | | | 4/14/2045 | | | | JPY | | | | 54,000,000 | | | | (8 | ) | | | — | | | | (3,784 | ) |
| | | | | | | | | | | | | | | | | | | | | | | | | | | | | | | | | |
Total | | | | | | | | | | | | | | | | | | | | | | | | | | | 269,568 | | | | (110,209 | ) |
| | | | | | | | | | | | | | | | | | | | | | | | | | | | | | | | | |
| | * | Centrally cleared swap contract |
Notes to Portfolio of Investments
| (a) | Security exempt from registration pursuant to Rule 144A under the Securities Act of 1933. This security may be resold in transactions exempt from registration, normally to qualified institutional buyers. At April 30, 2015, the value of these securities amounted to $35,249,210 or 30.61% of net assets. |
| (b) | Security, or a portion thereof, has been purchased on a when-issued or delayed delivery basis. |
| (c) | The maturity dates shown represent the original maturity of the underlying obligation. Actual maturity may vary based upon prepayment activity on these obligations. Unless otherwise noted, the coupon rates presented are fixed rates. |
| (d) | This security, or a portion of this security, has been pledged as collateral in connection with open futures contracts. These values are denoted within the Investments in Derivatives section of the Portfolio of Investments. |
| (e) | Variable rate security. |
| (f) | Principal amounts are denominated in United States Dollars unless otherwise noted. |
| (g) | Principal and interest may not be guaranteed by the government. |
| (h) | Senior loans have rates of interest that float periodically based primarily on the London Interbank Offered Rate (“LIBOR”) and other short-term rates. The interest rate shown reflects the weighted average coupon as of April 30, 2015. The interest rate shown for senior loans purchased on a when-issued or delayed delivery basis, if any, reflects an estimated average coupon. Remaining maturities of senior loans may be less than the stated maturities shown as a result of contractual or optional prepayments by the borrower. Such prepayments cannot be predicted. |
| (i) | The rate shown is the seven-day current annualized yield at April 30, 2015. |
| (j) | As defined in the Investment Company Act of 1940, an affiliated company is one in which the Fund owns 5% or more of the company’s outstanding voting securities, or a company which is under common ownership or control with the Fund. Holdings and transactions in these affiliated companies during the period ended April 30, 2015, are as follows: |
| | | | | | | | | | | | | | | | | | | | | | | | |
| Issuer | | Beginning
Cost ($) | | | Purchase
Cost ($) | | | Proceeds
From Sales ($) | | | Ending
Cost ($) | | | Dividends —
Affiliated
Issuers ($) | | | Value ($) | |
Columbia Short-Term Cash Fund | | | 11,082,966 | | | | 41,614,788 | | | | (45,394,695 | ) | | | 7,303,059 | | | | 4,385 | | | | 7,303,059 | |
Abbreviation Legend
| | |
| CMO | | Collateralized Mortgage Obligation |
| PIK | | Payment-in-Kind |
|
| Currency Legend |
| AUD | | Australian Dollar |
| BRL | | Brazilian Real |
| CLP | | Chilean Peso |
| CNY | | Chinese Yuan |
| COP | | Colombian Peso |
| EUR | | Euro |
The accompanying Notes to Financial Statements are an integral part of this statement.
| | | | |
| Semiannual Report 2015 | | | 19 | |
| | |
| |
| | COLUMBIA GLOBAL BOND FUND |
PORTFOLIO OF INVESTMENTS (continued)
April 30, 2015 (Unaudited)
Currency Legend (continued)
| | |
| GBP | | British Pound |
| IDR | | Indonesian Rupiah |
| JPY | | Japanese Yen |
| MXN | | Mexican Peso |
| MYR | | Malaysia Ringgits |
| NZD | | New Zealand Dollar |
| PEN | | Peru Nuevos Soles |
| PLN | | Polish Zloty |
| RON | | Romania, New Lei |
| SEK | | Swedish Krona |
| THB | | Thailand Baht |
| USD | | US Dollar |
| ZAR | | South African Rand |
Fair Value Measurements
Generally accepted accounting principles (GAAP) require disclosure regarding the inputs and valuation techniques used to measure fair value and any changes in valuation inputs or techniques. In addition, investments shall be disclosed by major category.
The Fund categorizes its fair value measurements according to a three-level hierarchy that maximizes the use of observable inputs and minimizes the use of unobservable inputs by prioritizing that the most observable input be used when available. Observable inputs are those that market participants would use in pricing an investment based on market data obtained from sources independent of the reporting entity. Unobservable inputs are those that reflect the Fund’s assumptions about the information market participants would use in pricing an investment. An investment’s level within the fair value hierarchy is based on the lowest level of any input that is deemed significant to the asset or liability’s fair value measurement. The input levels are not necessarily an indication of the risk or liquidity associated with investments at that level. For example, certain U.S. government securities are generally high quality and liquid, however, they are reflected as Level 2 because the inputs used to determine fair value may not always be quoted prices in an active market.
Fair value inputs are summarized in the three broad levels listed below:
| n | | Level 1 — Valuations based on quoted prices for investments in active markets that the Fund has the ability to access at the measurement date (including NAV for open-end mutual funds). Valuation adjustments are not applied to Level 1 investments. |
| n | | Level 2 — Valuations based on other significant observable inputs (including quoted prices for similar securities, interest rates, prepayment speeds, credit risks, etc.). |
| n | | Level 3 — Valuations based on significant unobservable inputs (including the Fund’s own assumptions and judgment in determining the fair value of investments). |
Inputs that are used in determining fair value of an investment may include price information, credit data, volatility statistics, and other factors. These inputs can be either observable or unobservable. The availability of observable inputs can vary between investments, and is affected by various factors such as the type of investment, and the volume and level of activity for that investment or similar investments in the marketplace. The inputs will be considered by the Investment Manager, along with any other relevant factors in the calculation of an investment’s fair value. The Fund uses prices and inputs that are current as of the measurement date, which may include periods of market dislocations. During these periods, the availability of prices and inputs may be reduced for many investments. This condition could cause an investment to be reclassified between the various levels within the hierarchy.
Investments falling into the Level 3 category are primarily supported by quoted prices from brokers and dealers participating in the market for those investments. However, these may be classified as Level 3 investments due to lack of market transparency and corroboration to support these quoted prices. Additionally, valuation models may be used as the pricing source for any remaining investments classified as Level 3. These models may rely on one or more significant unobservable inputs and/or significant assumptions by the Investment Manager. Inputs used in valuations may include, but are not limited to, financial statement analysis, capital account balances, discount rates and estimated cash flows, and comparable company data.
Under the direction of the Fund’s Board of Trustees (the Board), the Investment Manager’s Valuation Committee (the Committee) is responsible for overseeing the valuation procedures approved by the Board. The Committee consists of voting and non-voting members from various groups within the Investment Manager’s organization, including operations and accounting, trading and investments, compliance, risk management and legal.
The Committee meets at least monthly to review and approve valuation matters, which may include a description of specific valuation determinations, data regarding pricing information received from approved pricing vendors and brokers and the results of Board-approved valuation control policies and procedures (the Policies). The Policies address, among other things, instances when market quotations are or are not readily available, including recommendations of third party pricing vendors and a determination of appropriate pricing methodologies; events that require specific valuation determinations and assessment of fair value techniques; securities with a potential for stale pricing, including those that are illiquid, restricted, or in default; and the effectiveness of third party pricing vendors, including periodic reviews of vendors. The Committee meets more frequently, as needed, to discuss additional valuation matters, which may include the need to review back-testing results, review time-sensitive information or approve related valuation actions. The Committee reports to the Board, with members of the Committee meeting with the Board at each of its regularly scheduled meetings to discuss valuation matters and actions during the period, similar to those described earlier.
For investments categorized as Level 3, the Committee monitors information similar to that described above, which may include: (i) data specific to the issuer or comparable issuers, (ii) general market or specific sector news and (iii) quoted prices and specific or similar security transactions. The Committee considers this data and any changes from prior periods in order to assess the reasonableness of observable and unobservable inputs, any assumptions or internal models used to value those securities and changes in fair value. This data is also used to corroborate, when available,
The accompanying Notes to Financial Statements are an integral part of this statement.
| | |
| 20 | | Semiannual Report 2015 |
| | |
| |
| COLUMBIA GLOBAL BOND FUND | | |
PORTFOLIO OF INVESTMENTS (continued)
April 30, 2015 (Unaudited)
Fair Value Measurements (continued)
information received from approved pricing vendors and brokers. Various factors impact the frequency of monitoring this information (which may occur as often as daily). However, the Committee may determine that changes to inputs, assumptions and models are not required as a result of the monitoring procedures performed.
The following table is a summary of the inputs used to value the Fund’s investments at April 30, 2015:
| | | | | | | | | | | | | | | | |
| Description | | Level 1
Quoted Prices in Active
Markets for Identical
Assets ($) | | | Level 2
Other Significant
Observable Inputs ($) | | | Level 3
Significant
Unobservable Inputs ($) | | | Total ($) | |
Bonds | | | | | | | | | | | | | | | | |
| | | | |
Corporate Bonds & Notes | | | — | | | | 32,566,432 | | | | — | | | | 32,566,432 | |
| | | | |
Residential Mortgage-Backed Securities — Agency | | | — | | | | 557,327 | | | | — | | | | 557,327 | |
| | | | |
Residential Mortgage-Backed Securities — Non-Agency | | | — | | | | 608,352 | | | | — | | | | 608,352 | |
| | | | |
Commercial Mortgage-Backed Securities — Agency | | | — | | | | 4,041,502 | | | | — | | | | 4,041,502 | |
| | | | |
Commercial Mortgage-Backed Securities — Non-Agency | | | — | | | | 4,277,557 | | | | 1,155,287 | | | | 5,432,844 | |
| | | | |
Asset-Backed Securities — Non-Agency | | | — | | | | 6,352,996 | | | | — | | | | 6,352,996 | |
| | | | |
Inflation-Indexed Bonds | | | — | | | | 2,537,829 | | | | — | | | | 2,537,829 | |
| | | | |
U.S. Treasury Obligations | | | 912,529 | | | | — | | | | — | | | | 912,529 | |
| | | | |
Foreign Government Obligations | | | — | | | | 53,144,690 | | | | — | | | | 53,144,690 | |
| | | | | | | | | | | | | | | | | |
Total Bonds | | | 912,529 | | | | 104,086,685 | | | | 1,155,287 | | | | 106,154,501 | |
| | | | | | | | | | | | | | | | | |
Other | | | | | | | | | | | | | | | | |
| | | | |
Senior Loans | | | | | | | | | | | | | | | | |
| | | | |
Lodging | | | — | | | | — | | | | 6,037 | | | | 6,037 | |
| | | | |
All Other Industries | | | — | | | | 113,646 | | | | — | | | | 113,646 | |
| | | | | | | | | | | | | | | | | |
Total Other | | | — | | | | 113,646 | | | | 6,037 | | | | 119,683 | |
| | | | | | | | | | | | | | | | | |
Mutual Funds | | | | | | | | | | | | | | | | |
| | | | |
Money Market Funds | | | 7,303,059 | | | | — | | | | — | | | | 7,303,059 | |
| | | | | | | | | | | | | | | | | |
Total Mutual Funds | | | 7,303,059 | | | | — | | | | — | | | | 7,303,059 | |
| | | | | | | | | | | | | | | | | |
Investments in Securities | | | 8,215,588 | | | | 104,200,331 | | | | 1,161,324 | | | | 113,577,243 | |
| | | | |
Derivatives | | | | | | | | | | | | | | | | |
| | | | |
Assets | | | | | | | | | | | | | | | | |
| | | | |
Forward Foreign Currency Exchange Contracts | | | — | | | | 2,000,037 | | | | — | | | | 2,000,037 | |
| | | | |
Futures Contracts | | | 167,840 | | | | — | | | | — | | | | 167,840 | |
| | | | |
Swap Contracts | | | — | | | | 308,812 | | | | — | | | | 308,812 | |
| | | | |
Liabilities | | | | | | | | | | | | | | | | |
| | | | |
Forward Foreign Currency Exchange Contracts | | | — | | | | (1,597,985 | ) | | | — | | | | (1,597,985 | ) |
| | | | |
Futures Contracts | | | (283,926 | ) | | | — | | | | — | | | | (283,926 | ) |
| | | | |
Swap Contracts | | | — | | | | (110,209 | ) | | | — | | | | (110,209 | ) |
| | | | | | | | | | | | | | | | | |
Total | | | 8,099,502 | | | | 104,800,986 | | | | 1,161,324 | | | | 114,061,812 | |
| | | | | | | | | | | | | | | | | |
See the Portfolio of Investments for all investment classifications not indicated in the table.
The Fund’s assets assigned to the Level 2 input category are generally valued using the market approach, in which a security’s value is determined through reference to prices and information from market transactions for similar or identical assets.
There were no transfers of financial assets between Levels 1 and 2 during the period.
The accompanying Notes to Financial Statements are an integral part of this statement.
| | | | |
| Semiannual Report 2015 | | | 21 | |
| | |
| |
| | COLUMBIA GLOBAL BOND FUND |
PORTFOLIO OF INVESTMENTS (continued)
April 30, 2015 (Unaudited)
Fair Value Measurements (continued)
Derivative instruments are valued at unrealized appreciation (depreciation).
The following table is a reconciliation of Level 3 assets for which significant observable and/or unobservable inputs were used to determine fair value:
| | | | | | | | | | | | |
| | | Asset-Backed
Securities —
Non-Agency ($) | | | Senior Loans ($) | | | Total ($) | |
Balance as of October 31, 2014 | | | 2,348,520 | | | | 6,015 | | | | 2,354,535 | |
| | | |
Increase (decrease) in accrued discounts/premiums | | | (10 | ) | | | — | | | | (10 | ) |
| | | |
Realized gain (loss) | | | 1,366 | | | | — | | | | 1,366 | |
| | | |
Change in unrealized appreciation (depreciation)(a) | | | (154 | ) | | | 22 | | | | (132 | ) |
| | | |
Sales | | | (1,097,466 | ) | | | — | | | | (1,097,466 | ) |
| | | |
Purchases | | | 1,148,956 | | | | — | | | | 1,148,956 | |
| | | |
Transfers into Level 3 | | | 752,485 | | | | — | | | | 752,485 | |
| | | |
Transfers out of Level 3 | | | (1,998,410 | ) | | | — | | | | (1,998,410 | ) |
| | | | | | | | | | | | | |
Balance as of April 30, 2015 | | | 1,155,287 | | | | 6,037 | | | | 1,161,324 | |
| | | | | | | | | | | | | |
| | (a) | Change in unrealized appreciation (depreciation) relating to securities held at April 30, 2015 was $32, which is comprised of Asset-Backed Securities — Non-Agency of $10 and Senior Loans of $22. |
The Fund’s assets assigned to the Level 3 category are valued utilizing the valuation technique deemed the most appropriate in the circumstances. Certain commercial mortgage backed securities and senior loans classified as Level 3 securities are valued using the market approach and utilize single market quotations from broker dealers which may have included, but were not limited to, observable transactions for identical or similar assets in the market and the distressed nature of the security. The appropriateness of fair values for these securities is monitored on an ongoing basis which may include results of back testing, manual price reviews and other control procedures. Significant increases (decreases) to any of these inputs would result in a significant lower (higher) fair value measurement.
Financial assets were transferred from Level 3 to Level 2 as observable market inputs were utilized and management determined that there was sufficient, reliable and observable market data to value these assets as of period end.
Financial Assets were transferred from Level 2 to Level 3 due to utilizing a single market quotation from a broker dealer. As a result, as of period end, management determined to value the security(s) under consistently applied procedures established by and under the general supervision of the Board of Trustees.
Transfers in and/or out of Level 3 are determined based on the fair value at the beginning of the period for security positions held throughout the period.
The accompanying Notes to Financial Statements are an integral part of this statement.
| | |
| 22 | | Semiannual Report 2015 |
| | |
| |
| COLUMBIA GLOBAL BOND FUND | | |
STATEMENT OF ASSETS AND LIABILITIES
April 30, 2015 (Unaudited)
| | | | |
Assets | |
| |
Investments, at value | | | | |
| |
Unaffiliated issuers (identified cost $108,054,003) | | | $106,274,184 | |
| |
Affiliated issuers (identified cost $7,303,059) | | | 7,303,059 | |
| |
Total investments (identified cost $115,357,062) | | | 113,577,243 | |
| |
Cash | | | 163 | |
| |
Foreign currency (identified cost $155,304) | | | 154,278 | |
| |
Margin deposits | | | 1,349,017 | |
| |
Unrealized appreciation on forward foreign currency exchange contracts | | | 2,000,037 | |
| |
Unrealized appreciation on swap contracts | | | 64,095 | |
| |
Premiums paid on outstanding swap contracts | | | 256 | |
| |
Receivable for: | | | | |
| |
Investments sold | | | 69,860 | |
| |
Dividends | | | 662 | |
| |
Interest | | | 999,628 | |
| |
Reclaims | | | 46,805 | |
| |
Variation margin | | | 94,338 | |
| |
Expense reimbursement due from Investment Manager | | | 1,021 | |
| |
Prepaid expenses | | | 673 | |
| |
Other assets | | | 19,734 | |
| |
Total assets | | | 118,377,810 | |
| |
| |
Liabilities | | | | |
| |
Unrealized depreciation on forward foreign currency exchange contracts | | | 1,597,985 | |
| |
Unrealized depreciation on swap contracts | | | 87,271 | |
| |
Payable for: | | | | |
| |
Investments purchased | | | 1,095,279 | |
| |
Investments purchased on a delayed delivery basis | | | 75,136 | |
| |
Capital shares purchased | | | 219,347 | |
| |
Variation margin | | | 59,600 | |
| |
Investment management fees | | | 1,797 | |
| |
Distribution and/or service fees | | | 865 | |
| |
Transfer agent fees | | | 14,635 | |
| |
Administration fees | | | 252 | |
| |
Compensation of board members | | | 34,484 | |
| |
Other expenses | | | 33,508 | |
| |
Total liabilities | | | 3,220,159 | |
| |
Net assets applicable to outstanding capital stock | | | $115,157,651 | |
| |
| |
Represented by | | | | |
| |
Paid-in capital | | | $120,235,891 | |
| |
Excess of distributions over net investment income | | | (363,422 | ) |
| |
Accumulated net realized loss | | | (3,411,272 | ) |
| |
Unrealized appreciation (depreciation) on: | | | | |
| |
Investments | | | (1,779,819 | ) |
| |
Foreign currency translations | | | (8,296 | ) |
| |
Forward foreign currency exchange contracts | | | 402,052 | |
| |
Futures contracts | | | (116,086 | ) |
| |
Swap contracts | | | 198,603 | |
| |
Total — representing net assets applicable to outstanding capital stock | | | $115,157,651 | |
| |
The accompanying Notes to Financial Statements are an integral part of this statement.
| | | | |
| Semiannual Report 2015 | | | 23 | |
| | |
| |
| | COLUMBIA GLOBAL BOND FUND |
STATEMENT OF ASSETS AND LIABILITIES (continued)
April 30, 2015 (Unaudited)
| | | | |
Class A | | | | |
| |
Net assets | | | $106,776,575 | |
| |
Shares outstanding | | | 17,577,386 | |
| |
Net asset value per share | | | $6.07 | |
| |
Maximum offering price per share(a) | | | $6.37 | |
| |
Class B | | | | |
| |
Net assets | | | $1,185,338 | |
| |
Shares outstanding | | | 194,147 | |
| |
Net asset value per share | | | $6.11 | |
| |
Class C | | | | |
| |
Net assets | | | $3,716,816 | |
| |
Shares outstanding | | | 616,687 | |
| |
Net asset value per share | | | $6.03 | |
| |
Class I | | | | |
| |
Net assets | | | $9,903 | |
| |
Shares outstanding | | | 1,638 | |
| |
Net asset value per share(b) | | | $6.04 | |
| |
Class K | | | | |
| |
Net assets | | | $71,395 | |
| |
Shares outstanding | | | 11,742 | |
| |
Net asset value per share | | | $6.08 | |
| |
Class R | | | | |
| |
Net assets | | | $43,656 | |
| |
Shares outstanding | | | 7,208 | |
| |
Net asset value per share | | | $6.06 | |
| |
Class W | | | | |
| |
Net assets | | | $73,236 | |
| |
Shares outstanding | | | 12,059 | |
| |
Net asset value per share | | | $6.07 | |
| |
Class Y | | | | |
| |
Net assets | | | $9,705 | |
| |
Shares outstanding | | | 1,607 | |
| |
Net asset value per share | | | $6.04 | |
| |
Class Z | | | | |
| |
Net assets | | | $3,271,027 | |
| |
Shares outstanding | | | 538,002 | |
| |
Net asset value per share | | | $6.08 | |
| |
| (a) | The maximum offering price per share is calculated by dividing the net asset value per share by 1.0 minus the maximum sales charge of 4.75%. |
| (b) | Net asset value per share rounds to this amount due to fractional shares outstanding. |
The accompanying Notes to Financial Statements are an integral part of this statement.
| | |
| 24 | | Semiannual Report 2015 |
| | |
| |
| COLUMBIA GLOBAL BOND FUND | | |
STATEMENT OF OPERATIONS
Six Months Ended April 30, 2015 (Unaudited)
| | | | |
Net investment income | | | | |
Income: | | | | |
Dividends — affiliated issuers | | | $4,385 | |
Interest | | | 2,489,823 | |
Foreign taxes withheld | | | (28,306 | ) |
| |
Total income | | | 2,465,902 | |
| |
Expenses: | | | | |
Investment management fees | | | 344,264 | |
Distribution and/or service fees | | | | |
Class A | | | 139,843 | |
Class B | | | 7,057 | |
Class C | | | 19,623 | |
Class R | | | 86 | |
Class W | | | 99 | |
Transfer agent fees | | | | |
Class A | | | 134,084 | |
Class B | | | 1,690 | |
Class C | | | 4,702 | |
Class K | | | 25 | |
Class R | | | 41 | |
Class W | | | 95 | |
Class Z | | | 4,020 | |
Administration fees | | | 48,318 | |
Plan administration fees | | | | |
Class K | | | 126 | |
Compensation of board members | | | 6,885 | |
Custodian fees | | | 13,506 | |
Printing and postage fees | | | 30,435 | |
Registration fees | | | 49,059 | |
Professional fees | | | 18,058 | |
Other | | | 14,746 | |
| |
Total expenses | | | 836,762 | |
Fees waived or expenses reimbursed by Investment Manager and its affiliates | | | (164,665 | ) |
| |
Total net expenses | | | 672,097 | |
| |
Net investment income | | | 1,793,805 | |
| |
| |
Realized and unrealized gain (loss) — net | | | | |
Net realized gain (loss) on: | | | | |
Investments | | | 6,399 | |
Foreign currency translations | | | (44,594 | ) |
Forward foreign currency exchange contracts | | | (554,118 | ) |
Futures contracts | | | (1,734,907 | ) |
Swap contracts | | | 419,102 | |
| |
Net realized loss | | | (1,908,118 | ) |
Net change in unrealized appreciation (depreciation) on: | | | | |
Investments | | | (2,131,215 | ) |
Foreign currency translations | | | 7,508 | |
Forward foreign currency exchange contracts | | | 886,852 | |
Futures contracts | | | 352,713 | |
Swap contracts | | | (11,921 | ) |
| |
Net change in unrealized depreciation | | | (896,063 | ) |
| |
Net realized and unrealized loss | | | (2,804,181 | ) |
| |
Net decrease in net assets from operations | | | $(1,010,376 | ) |
| |
The accompanying Notes to Financial Statements are an integral part of this statement.
| | | | |
| Semiannual Report 2015 | | | 25 | |
| | |
| |
| | COLUMBIA GLOBAL BOND FUND |
STATEMENT OF CHANGES IN NET ASSETS
| | | | | | | | |
| | | Six Months Ended
April 30, 2015
(Unaudited) | | | Year Ended
October 31, 2014 | |
Operations | | | | | | | | |
| | |
Net investment income | | | $1,793,805 | | | | $3,937,786 | |
| | |
Net realized gain (loss) | | | (1,908,118 | ) | | | 1,053,690 | |
| | |
Net change in unrealized depreciation | | | (896,063 | ) | | | (5,015,540 | ) |
| |
Net decrease in net assets resulting from operations | | | (1,010,376 | ) | | | (24,064 | ) |
| |
| | |
Distributions to shareholders | | | | | | | | |
| | |
Net investment income | | | | | | | | |
| | |
Class A | | | (777,310 | ) | | | (290,032 | ) |
| | |
Class B | | | — | | | | (111 | ) |
| | |
Class C | | | — | | | | (277 | ) |
| | |
Class I | | | (114 | ) | | | (28 | ) |
| | |
Class K | | | (967 | ) | | | (350 | ) |
| | |
Class R | | | (132 | ) | | | (6 | ) |
| | |
Class W | | | (558 | ) | | | (225 | ) |
| | |
Class Y | | | (111 | ) | | | (7 | ) |
| | |
Class Z | | | (31,676 | ) | | | (8,294 | ) |
| | |
Net realized gains | | | | | | | | |
| | |
Class A | | | (2,836,317 | ) | | | (2,308,265 | ) |
| | |
Class B | | | (36,781 | ) | | | (38,525 | ) |
| | |
Class C | | | (99,904 | ) | | | (96,384 | ) |
| | |
Class I | | | (248 | ) | | | (141 | ) |
| | |
Class K | | | (2,872 | ) | | | (2,325 | ) |
| | |
Class R | | | (792 | ) | | | (70 | ) |
| | |
Class W | | | (2,036 | ) | | | (1,788 | ) |
| | |
Class Y | | | (243 | ) | | | (34 | ) |
| | |
Class Z | | | (83,694 | ) | | | (49,692 | ) |
| |
Total distributions to shareholders | | | (3,873,755 | ) | | | (2,796,554 | ) |
| |
Decrease in net assets from capital stock activity | | | (11,634,185 | ) | | | (36,743,068 | ) |
| |
Total decrease in net assets | | | (16,518,316 | ) | | | (39,563,686 | ) |
| | |
Net assets at beginning of period | | | 131,675,967 | | | | 171,239,653 | |
| |
Net assets at end of period | | | $115,157,651 | | | | $131,675,967 | |
| |
Excess of distributions over net investment income | | | $(363,422 | ) | | | $(1,346,359 | ) |
| |
The accompanying Notes to Financial Statements are an integral part of this statement.
| | |
| 26 | | Semiannual Report 2015 |
| | |
| |
| COLUMBIA GLOBAL BOND FUND | | |
STATEMENT OF CHANGES IN NET ASSETS (continued)
| | | | | | | | | | | | | | | | |
| | | Six Months Ended
April 30, 2015 (Unaudited) | | | Year Ended
October 31, 2014 | |
| | | Shares | | | Dollars ($) | | | Shares | | | Dollars ($) | |
Capital stock activity | | | | | | | | | | | | | | | | |
| | | | |
Class A shares | | | | | | | | | | | | | | | | |
| | | | |
Subscriptions(a) | | | 483,791 | | | | 2,925,572 | | | | 1,425,853 | | | | 8,990,144 | |
| | | | |
Distributions reinvested | | | 587,774 | | | | 3,491,378 | | | | 406,784 | | | | 2,509,855 | |
| | | | |
Redemptions | | | (2,823,759 | ) | | | (17,082,952 | ) | | | (7,208,248 | ) | | | (45,438,284 | ) |
| |
Net decrease | | | (1,752,194 | ) | | | (10,666,002 | ) | | | (5,375,611 | ) | | | (33,938,285 | ) |
| |
Class B shares | | | | | | | | | | | | | | | | |
| | | | |
Subscriptions | | | 535 | | | | 3,329 | | | | 3,844 | | | | 24,247 | |
| | | | |
Distributions reinvested | | | 5,956 | | | | 35,614 | | | | 6,012 | | | | 37,397 | |
| | | | |
Redemptions(a) | | | (72,851 | ) | | | (442,410 | ) | | | (195,122 | ) | | | (1,237,281 | ) |
| |
Net decrease | | | (66,360 | ) | | | (403,467 | ) | | | (185,266 | ) | | | (1,175,637 | ) |
| |
Class C shares | | | | | | | | | | | | | | | | |
| | | | |
Subscriptions | | | 42,424 | | | | 256,718 | | | | 135,205 | | | | 847,664 | |
| | | | |
Distributions reinvested | | | 15,815 | | | | 93,464 | | | | 15,015 | | | | 92,190 | |
| | | | |
Redemptions | | | (133,492 | ) | | | (805,045 | ) | | | (450,280 | ) | | | (2,806,248 | ) |
| |
Net decrease | | | (75,253 | ) | | | (454,863 | ) | | | (300,060 | ) | | | (1,866,394 | ) |
| |
Class I shares | | | | | | | | | | | | | | | | |
| | | | |
Subscriptions | | | — | | | | — | | | | 191 | | | | 1,200 | |
| |
Net increase | | | — | | | | — | | | | 191 | | | | 1,200 | |
| |
Class K shares | | | | | | | | | | | | | | | | |
| | | | |
Subscriptions | | | 527 | | | | 3,168 | | | | 4,169 | | | | 26,731 | |
| | | | |
Distributions reinvested | | | 646 | | | | 3,839 | | | | 433 | | | | 2,675 | |
| | | | |
Redemptions | | | (8,607 | ) | | | (51,794 | ) | | | (9,197 | ) | | | (56,871 | ) |
| |
Net decrease | | | (7,434 | ) | | | (44,787 | ) | | | (4,595 | ) | | | (27,465 | ) |
| |
Class R shares | | | | | | | | | | | | | | | | |
| | | | |
Subscriptions | | | 1,937 | | | | 11,562 | | | | 4,524 | | | | 28,610 | |
| | | | |
Distributions reinvested | | | 108 | | | | 641 | | | | — | | | | — | |
| | | | |
Redemptions | | | — | | | | — | | | | (77 | ) | | | (493 | ) |
| |
Net increase | | | 2,045 | | | | 12,203 | | | | 4,447 | | | | 28,117 | |
| |
Class W shares | | | | | | | | | | | | | | | | |
| | | | |
Subscriptions | | | — | | | | — | | | | 872 | | | | 5,500 | |
| | | | |
Distributions reinvested | | | 385 | | | | 2,284 | | | | 313 | | | | 1,932 | |
| | | | |
Redemptions | | | (2,604 | ) | | | (15,695 | ) | | | (6,276 | ) | | | (39,385 | ) |
| |
Net decrease | | | (2,219 | ) | | | (13,411 | ) | | | (5,091 | ) | | | (31,953 | ) |
| |
Class Y shares | | | | | | | | | | | | | | | | |
| | | | |
Subscriptions | | | — | | | | — | | | | 1,260 | | | | 7,900 | |
| |
Net increase | | | — | | | | — | | | | 1,260 | | | | 7,900 | |
| |
Class Z shares | | | | | | | | | | | | | | | | |
| | | | |
Subscriptions | | | 33,178 | | | | 201,485 | | | | 156,776 | | | | 994,569 | |
| | | | |
Distributions reinvested | | | 16,313 | | | | 96,897 | | | | 9,179 | | | | 56,637 | |
| | | | |
Redemptions | | | (59,942 | ) | | | (362,240 | ) | | | (126,246 | ) | | | (791,757 | ) |
| |
Net increase (decrease) | | | (10,451 | ) | | | (63,858 | ) | | | 39,709 | | | | 259,449 | |
| |
Total net decrease | | | (1,911,866 | ) | | | (11,634,185 | ) | | | (5,825,016 | ) | | | (36,743,068 | ) |
| |
| (a) | Includes conversions of Class B shares to Class A shares, if any. |
The accompanying Notes to Financial Statements are an integral part of this statement.
| | | | |
| Semiannual Report 2015 | | | 27 | |
| | |
| |
| | COLUMBIA GLOBAL BOND FUND |
FINANCIAL HIGHLIGHTS
The following tables are intended to help you understand the Fund’s financial performance. Certain information reflects financial results for a single share of a class held for the periods shown. Per share net investment income (loss) amounts are calculated based on average shares outstanding during the period. Total return assumes reinvestment of all dividends and distributions, if any. Total return does not reflect payment of sales charges, if any. Total return and portfolio turnover are not annualized for periods of less than one year. The portfolio turnover rate is calculated without regard to purchase and sales transactions of short-term instruments and certain derivatives, if any. If such transactions were included, the Fund’s portfolio turnover rate may be higher.
| | | | | | | | | | | | | | | | | | | | | | | | |
| |
| Six Months Ended
April 30, 2015 |
| | | Year Ended October 31, | |
Class A | | | (Unaudited) | | | | 2014 | | | | 2013 | | | | 2012 | | | | 2011 | | | | 2010 | |
Per share data | | | | | | | | | | | | | | | | | | | | | | | | |
Net asset value, beginning of period | | | $6.31 | | | | $6.41 | | | | $7.22 | | | | $7.35 | | | | $7.47 | | | | $7.10 | |
| | | | | | | | | | | | | | | | | | | | | | | | | |
Income from investment operations: | | | | | | | | | | | | | | | | | | | | | | | | |
| | | | | | |
Net investment income | | | 0.09 | | | | 0.17 | | | | 0.16 | | | | 0.18 | | | | 0.22 | | | | 0.23 | |
| | | | | | | | | | | | | | | | | | | | | | | | | |
Net realized and unrealized gain (loss) | | | (0.14 | ) | | | (0.16 | ) | | | (0.49 | ) | | | 0.17 | | | | (0.05 | ) | | | 0.31 | |
| | | | | | | | | | | | | | | | | | | | | | | | | |
Total from investment operations | | | (0.05 | ) | | | 0.01 | | | | (0.33 | ) | | | 0.35 | | | | 0.17 | | | | 0.54 | |
| | | | | | | | | | | | | | | | | | | | | | | | | |
Less distributions to shareholders: | | | | | | | | | | | | | | | | | | | | | | | | |
| | | | | | |
Net investment income | | | (0.04 | ) | | | (0.01 | ) | | | (0.46 | ) | | | (0.45 | ) | | | (0.29 | ) | | | (0.17 | ) |
| | | | | | | | | | | | | | | | | | | | | | | | | |
Net realized gains | | | (0.15 | ) | | | (0.10 | ) | | | (0.02 | ) | | | (0.03 | ) | | | — | | | | — | |
| | | | | | | | | | | | | | | | | | | | | | | | | |
Total distributions to shareholders | | | (0.19 | ) | | | (0.11 | ) | | | (0.48 | ) | | | (0.48 | ) | | | (0.29 | ) | | | (0.17 | ) |
| | | | | | | | | | | | | | | | | | | | | | | | | |
Net asset value, end of period | | | $6.07 | | | | $6.31 | | | | $6.41 | | | | $7.22 | | | | $7.35 | | | | $7.47 | |
| | | | | | | | | | | | | | | | | | | | | | | | | |
Total return | | | (0.68 | %) | | | 0.19 | % | | | (4.89 | %) | | | 5.20 | % | | | 2.46 | % | | | 7.70 | % |
| | | | | | | | | | | | | | | | | | | | | | | | | |
Ratios to average net assets(a) | | | | | | | | | | | | | | | | | | | | | | | | |
| | | | | | |
Total gross expenses | | | 1.36 | %(b) | | | 1.36 | % | | | 1.33 | % | | | 1.33 | % | | | 1.35 | % | | | 1.34 | % |
| | | | | | | | | | | | | | | | | | | | | | | | | |
Total net expenses(c) | | | 1.09 | %(b) | | | 1.08 | %(d) | | | 1.10 | %(d) | | | 1.15 | %(d) | | | 1.21 | %(d) | | | 1.25 | % |
| | | | | | | | | | | | | | | | | | | | | | | | | |
Net investment income | | | 3.00 | %(b) | | | 2.69 | % | | | 2.37 | % | | | 2.51 | % | | | 2.95 | % | | | 3.31 | % |
| | | | | | | | | | | | | | | | | | | | | | | | | |
Supplemental data | | | | | | | | | | | | | | | | | | | | | | | | |
| | | | | | |
Net assets, end of period (in thousands) | | | $106,777 | | | | $121,977 | | | | $158,471 | | | | $209,873 | | | | $223,462 | | | | $246,929 | |
| | | | | | | | | | | | | | | | | | | | | | | | | |
Portfolio turnover | | | 35 | % | | | 62 | % | | | 47 | % | | | 34 | % | | | 57 | % | | | 62 | % |
| | | | | | | | | | | | | | | | | | | | | | | | | |
Notes to Financial Highlights
| (a) | In addition to the fees and expenses that the Fund bears directly, the Fund indirectly bears a pro rata share of the fees and expenses of any other funds in which it invests. Such indirect expenses are not included in the Fund’s reported expense ratios. |
| (c) | Total net expenses include the impact of certain fee waivers/expense reimbursements made by the Investment Manager and certain of its affiliates, if applicable. |
| (d) | The benefits derived from expense reductions had an impact of less than 0.01%. |
The accompanying Notes to Financial Statements are an integral part of this statement.
| | |
| 28 | | Semiannual Report 2015 |
| | |
| |
| COLUMBIA GLOBAL BOND FUND | | |
FINANCIAL HIGHLIGHTS (continued)
| | | | | | | | | | | | | | | | | | | | | | | | |
| |
| Six Months Ended
April 30, 2015 |
| | | Year Ended October 31, | |
Class B | | | (Unaudited) | | | | 2014 | | | | 2013 | | | | 2012 | | | | 2011 | | | | 2010 | |
Per share data | | | | | | | | | | | | | | | | | | | | | | | | |
Net asset value, beginning of period | | | $6.32 | | | | $6.46 | | | | $7.28 | | | | $7.41 | | | | $7.52 | | | | $7.14 | |
| | | | | | | | | | | | | | | | | | | | | | | | | |
Income from investment operations: | | | | | | | | | | | | | | | | | | | | | | | | |
| | | | | | |
Net investment income | | | 0.07 | | | | 0.12 | | | | 0.11 | | | | 0.13 | | | | 0.16 | | | | 0.18 | |
| | | | | | | | | | | | | | | | | | | | | | | | | |
Net realized and unrealized gain (loss) | | | (0.13 | ) | | | (0.16 | ) | | | (0.49 | ) | | | 0.18 | | | | (0.04 | ) | | | 0.31 | |
| | | | | | | | | | | | | | | | | | | | | | | | | |
Total from investment operations | | | (0.06 | ) | | | (0.04 | ) | | | (0.38 | ) | | | 0.31 | | | | 0.12 | | | | 0.49 | |
| | | | | | | | | | | | | | | | | | | | | | | | | |
Less distributions to shareholders: | | | | | | | | | | | | | | | | | | | | | | | | |
| | | | | | |
Net investment income | | | — | | | | (0.00 | )(a) | | | (0.42 | ) | | | (0.41 | ) | | | (0.23 | ) | | | (0.11 | ) |
| | | | | | | | | | | | | | | | | | | | | | | | | |
Net realized gains | | | (0.15 | ) | | | (0.10 | ) | | | (0.02 | ) | | | (0.03 | ) | | | — | | | | — | |
| | | | | | | | | | | | | | | | | | | | | | | | | |
Total distributions to shareholders | | | (0.15 | ) | | | (0.10 | ) | | | (0.44 | ) | | | (0.44 | ) | | | (0.23 | ) | | | (0.11 | ) |
| | | | | | | | | | | | | | | | | | | | | | | | | |
Net asset value, end of period | | | $6.11 | | | | $6.32 | | | | $6.46 | | | | $7.28 | | | | $7.41 | | | | $7.52 | |
| | | | | | | | | | | | | | | | | | | | | | | | | |
Total return | | | (0.88 | %) | | | (0.63 | %) | | | (5.62 | %) | | | 4.50 | % | | | 1.72 | % | | | 6.89 | % |
| | | | | | | | | | | | | | | | | | | | | | | | | |
Ratios to average net assets(b) | | | | | | | | | | | | | | | | | | | | | | | | |
| | | | | | |
Total gross expenses | | | 2.11 | %(c) | | | 2.11 | % | | | 2.09 | % | | | 2.10 | % | | | 2.12 | % | | | 2.10 | % |
| | | | | | | | | | | | | | | | | | | | | | | | | |
Total net expenses(d) | | | 1.84 | %(c) | | | 1.83 | %(e) | | | 1.85 | %(e) | | | 1.90 | %(e) | | | 1.96 | %(e) | | | 2.02 | % |
| | | | | | | | | | | | | | | | | | | | | | | | | |
Net investment income | | | 2.27 | %(c) | | | 1.94 | % | | | 1.60 | % | | | 1.79 | % | | | 2.22 | % | | | 2.58 | % |
| | | | | | | | | | | | | | | | | | | | | | | | | |
Supplemental data | | | | | | | | | | | | | | | | | | | | | | | | |
| | | | | | |
Net assets, end of period (in thousands) | | | $1,185 | | | | $1,647 | | | | $2,881 | | | | $5,819 | | | | $9,836 | | | | $18,513 | |
| | | | | | | | | | | | | | | | | | | | | | | | | |
Portfolio turnover | | | 35 | % | | | 62 | % | | | 47 | % | | | 34 | % | | | 57 | % | | | 62 | % |
| | | | | | | | | | | | | | | | | | | | | | | | | |
Notes to Financial Highlights
| (b) | In addition to the fees and expenses that the Fund bears directly, the Fund indirectly bears a pro rata share of the fees and expenses of any other funds in which it invests. Such indirect expenses are not included in the Fund’s reported expense ratios. |
| (d) | Total net expenses include the impact of certain fee waivers/expense reimbursements made by the Investment Manager and certain of its affiliates, if applicable. |
| (e) | The benefits derived from expense reductions had an impact of less than 0.01%. |
The accompanying Notes to Financial Statements are an integral part of this statement.
| | | | |
| Semiannual Report 2015 | | | 29 | |
| | |
| |
| | COLUMBIA GLOBAL BOND FUND |
FINANCIAL HIGHLIGHTS (continued)
| | | | | | | | | | | | | | | | | | | | | | | | |
| |
| Six Months Ended
April 30, 2015 |
| | | Year Ended October 31, | |
Class C | | | (Unaudited) | | | | 2014 | | | | 2013 | | | | 2012 | | | | 2011 | | | | 2010 | |
Per share data | | | | | | | | | | | | | | | | | | | | | | | | |
Net asset value, beginning of period | | | $6.24 | | | | $6.38 | | | | $7.19 | | | | $7.33 | | | | $7.45 | | | | $7.08 | |
| | | | | | | | | | | | | | | | | | | | | | | | | |
Income from investment operations: | | | | | | | | | | | | | | | | | | | | | | | | |
| | | | | | |
Net investment income | | | 0.07 | | | | 0.12 | | | | 0.11 | | | | 0.12 | | | | 0.16 | | | | 0.18 | |
| | | | | | | | | | | | | | | | | | | | | | | | | |
Net realized and unrealized gain (loss) | | | (0.13 | ) | | | (0.16 | ) | | | (0.48 | ) | | | 0.18 | | | | (0.04 | ) | | | 0.31 | |
| | | | | | | | | | | | | | | | | | | | | | | | | |
Total from investment operations | | | (0.06 | ) | | | (0.04 | ) | | | (0.37 | ) | | | 0.30 | | | | 0.12 | | | | 0.49 | |
| | | | | | | | | | | | | | | | | | | | | | | | | |
Less distributions to shareholders: | | | | | | | | | | | | | | | | | | | | | | | | |
| | | | | | |
Net investment income | | | — | | | | (0.00 | )(a) | | | (0.42 | ) | | | (0.41 | ) | | | (0.24 | ) | | | (0.12 | ) |
| | | | | | | | | | | | | | | | | | | | | | | | | |
Net realized gains | | | (0.15 | ) | | | (0.10 | ) | | | (0.02 | ) | | | (0.03 | ) | | | — | | | | — | |
| | | | | | | | | | | | | | | | | | | | | | | | | |
Total distributions to shareholders | | | (0.15 | ) | | | (0.10 | ) | | | (0.44 | ) | | | (0.44 | ) | | | (0.24 | ) | | | (0.12 | ) |
| | | | | | | | | | | | | | | | | | | | | | | | | |
Net asset value, end of period | | | $6.03 | | | | $6.24 | | | | $6.38 | | | | $7.19 | | | | $7.33 | | | | $7.45 | |
| | | | | | | | | | | | | | | | | | | | | | | | | |
Total return | | | (0.89 | %) | | | (0.64 | %) | | | (5.53 | %) | | | 4.42 | % | | | 1.70 | % | | | 6.95 | % |
| | | | | | | | | | | | | | | | | | | | | | | | | |
Ratios to average net assets(b) | | | | | | | | | | | | | | | | | | | | | | | | |
| | | | | | |
Total gross expenses | | | 2.11 | %(c) | | | 2.11 | % | | | 2.08 | % | | | 2.09 | % | | | 2.10 | % | | | 2.10 | % |
| | | | | | | | | | | | | | | | | | | | | | | | | |
Total net expenses(d) | | | 1.84 | %(c) | | | 1.83 | %(e) | | | 1.85 | %(e) | | | 1.90 | %(e) | | | 1.95 | %(e) | | | 2.01 | % |
| | | | | | | | | | | | | | | | | | | | | | | | | |
Net investment income | | | 2.25 | %(c) | | | 1.94 | % | | | 1.62 | % | | | 1.73 | % | | | 2.21 | % | | | 2.58 | % |
| | | | | | | | | | | | | | | | | | | | | | | | | |
Supplemental data | | | | | | | | | | | | | | | | | | | | | | | | |
| | | | | | |
Net assets, end of period (in thousands) | | | $3,717 | | | | $4,319 | | | | $6,331 | | | | $8,481 | | | | $5,926 | | | | $6,162 | |
| | | | | | | | | | | | | | | | | | | | | | | | | |
Portfolio turnover | | | 35 | % | | | 62 | % | | | 47 | % | | | 34 | % | | | 57 | % | | | 62 | % |
| | | | | | | | | | | | | | | | | | | | | | | | | |
Notes to Financial Highlights
| (b) | In addition to the fees and expenses that the Fund bears directly, the Fund indirectly bears a pro rata share of the fees and expenses of any other funds in which it invests. Such indirect expenses are not included in the Fund’s reported expense ratios. |
| (d) | Total net expenses include the impact of certain fee waivers/expense reimbursements made by the Investment Manager and certain of its affiliates, if applicable. |
| (e) | The benefits derived from expense reductions had an impact of less than 0.01%. |
The accompanying Notes to Financial Statements are an integral part of this statement.
| | |
| 30 | | Semiannual Report 2015 |
| | |
| |
| COLUMBIA GLOBAL BOND FUND | | |
FINANCIAL HIGHLIGHTS (continued)
| | | | | | | | | | | | | | | | | | | | | | | | |
| |
| Six Months Ended
April 30, 2015 |
| | | Year Ended October 31, | |
Class I | | | (Unaudited) | | | | 2014 | | | | 2013 | | | | 2012 | | | | 2011 | | | | 2010 | |
Per share data | | | | | | | | | | | | | | | | | | | | | | | | |
Net asset value, beginning of period | | | $6.30 | | | | $6.38 | | | | $7.19 | | | | $7.36 | | | | $7.48 | | | | $7.11 | |
| | | | | | | | | | | | | | | | | | | | | | | | | |
Income from investment operations: | | | | | | | | | | | | | | | | | | | | | | | | |
| | | | | | |
Net investment income | | | 0.10 | | | | 0.20 | | | | 0.19 | | | | 0.21 | | | | 0.25 | | | | 0.26 | |
| | | | | | | | | | | | | | | | | | | | | | | | | |
Net realized and unrealized gain (loss) | | | (0.14 | ) | | | (0.16 | ) | | | (0.49 | ) | | | 0.17 | | | | (0.05 | ) | | | 0.31 | |
| | | | | | | | | | | | | | | | | | | | | | | | | |
Total from investment operations | | | (0.04 | ) | | | 0.04 | | | | (0.30 | ) | | | 0.38 | | | | 0.20 | | | | 0.57 | |
| | | | | | | | | | | | | | | | | | | | | | | | | |
Less distributions to shareholders: | | | | | | | | | | | | | | | | | | | | | | | | |
| | | | | | |
Net investment income | | | (0.07 | ) | | | (0.02 | ) | | | (0.49 | ) | | | (0.52 | ) | | | (0.32 | ) | | | (0.20 | ) |
| | | | | | | | | | | | | | | | | | | | | | | | | |
Net realized gains | | | (0.15 | ) | | | (0.10 | ) | | | (0.02 | ) | | | (0.03 | ) | | | — | | | | — | |
| | | | | | | | | | | | | | | | | | | | | | | | | |
Total distributions to shareholders | | | (0.22 | ) | | | (0.12 | ) | | | (0.51 | ) | | | (0.55 | ) | | | (0.32 | ) | | | (0.20 | ) |
| | | | | | | | | | | | | | | | | | | | | | | | | |
Net asset value, end of period | | | $6.04 | | | | $6.30 | | | | $6.38 | | | | $7.19 | | | | $7.36 | | | | $7.48 | |
| | | | | | | | | | | | | | | | | | | | | | | | | |
Total return | | | (0.53 | %) | | | 0.63 | % | | | (4.47 | %) | | | 5.63 | % | | | 2.94 | % | | | 8.16 | % |
| | | | | | | | | | | | | | | | | | | | | | | | | |
Ratios to average net assets(a) | | | | | | | | | | | | | | | | | | | | | | | | |
| | | | | | |
Total gross expenses | | | 0.86 | %(b) | | | 0.83 | % | | | 0.77 | % | | | 0.77 | % | | | 0.82 | % | | | 0.86 | % |
| | | | | | | | | | | | | | | | | | | | | | | | | |
Total net expenses(c) | | | 0.65 | %(b) | | | 0.63 | % | | | 0.64 | % | | | 0.71 | % | | | 0.76 | % | | | 0.82 | % |
| | | | | | | | | | | | | | | | | | | | | | | | | |
Net investment income | | | 3.41 | %(b) | | | 3.14 | % | | | 2.82 | % | | | 3.02 | % | | | 3.40 | % | | | 3.70 | % |
| | | | | | | | | | | | | | | | | | | | | | | | | |
Supplemental data | | | | | | | | | | | | | | | | | | | | | | | | |
| | | | | | |
Net assets, end of period (in thousands) | | | $10 | | | | $10 | | | | $9 | | | | $10 | | | | $3,369 | | | | $195,613 | |
| | | | | | | | | | | | | | | | | | | | | | | | | |
Portfolio turnover | | | 35 | % | | | 62 | % | | | 47 | % | | | 34 | % | | | 57 | % | | | 62 | % |
| | | | | | | | | | | | | | | | | | | | | | | | | |
Notes to Financial Highlights
| (a) | In addition to the fees and expenses that the Fund bears directly, the Fund indirectly bears a pro rata share of the fees and expenses of any other funds in which it invests. Such indirect expenses are not included in the Fund’s reported expense ratios. |
| (c) | Total net expenses include the impact of certain fee waivers/expense reimbursements made by the Investment Manager and certain of its affiliates, if applicable. |
The accompanying Notes to Financial Statements are an integral part of this statement.
| | | | |
| Semiannual Report 2015 | | | 31 | |
| | |
| |
| | COLUMBIA GLOBAL BOND FUND |
FINANCIAL HIGHLIGHTS (continued)
| | | | | | | | | | | | | | | | | | | | | | | | |
| |
| Six Months Ended
April 30, 2015 |
| | | Year Ended October 31, | |
Class K | | | (Unaudited) | | | | 2014 | | | | 2013 | | | | 2012 | | | | 2011 | | | | 2010 | |
Per share data | | | | | | | | | | | | | | | | | | | | | | | | |
Net asset value, beginning of period | | | $6.32 | | | | $6.42 | | | | $7.23 | | | | $7.36 | | | | $7.48 | | | | $7.11 | |
| | | | | | | | | | | | | | | | | | | | | | | | | |
Income from investment operations: | | | | | | | | | | | | | | | | | | | | | | | | |
| | | | | | |
Net investment income | | | 0.10 | | | | 0.18 | | | | 0.17 | | | | 0.19 | | | | 0.23 | | | | 0.24 | |
| | | | | | | | | | | | | | | | | | | | | | | | | |
Net realized and unrealized gain (loss) | | | (0.14 | ) | | | (0.17 | ) | | | (0.49 | ) | | | 0.18 | | | | (0.05 | ) | | | 0.31 | |
| | | | | | | | | | | | | | | | | | | | | | | | | |
Total from investment operations | | | (0.04 | ) | | | 0.01 | | | | (0.32 | ) | | | 0.37 | | | | 0.18 | | | | 0.55 | |
| | | | | | | | | | | | | | | | | | | | | | | | | |
Less distributions to shareholders: | | | | | | | | | | | | | | | | | | | | | | | | |
| | | | | | |
Net investment income | | | (0.05 | ) | | | (0.01 | ) | | | (0.47 | ) | | | (0.47 | ) | | | (0.30 | ) | | | (0.18 | ) |
| | | | | | | | | | | | | | | | | | | | | | | | | |
Net realized gains | | | (0.15 | ) | | | (0.10 | ) | | | (0.02 | ) | | | (0.03 | ) | | | — | | | | — | |
| | | | | | | | | | | | | | | | | | | | | | | | | |
Total distributions to shareholders | | | (0.20 | ) | | | (0.11 | ) | | | (0.49 | ) | | | (0.50 | ) | | | (0.30 | ) | | | (0.18 | ) |
| | | | | | | | | | | | | | | | | | | | | | | | | |
Net asset value, end of period | | | $6.08 | | | | $6.32 | | | | $6.42 | | | | $7.23 | | | | $7.36 | | | | $7.48 | |
| | | | | | | | | | | | | | | | | | | | | | | | | |
Total return | | | (0.52 | %) | | | 0.23 | % | | | (4.73 | %) | | | 5.39 | % | | | 2.60 | % | | | 7.85 | % |
| | | | | | | | | | | | | | | | | | | | | | | | | |
Ratios to average net assets(a) | | | | | | | | | | | | | | | | | | | | | | | | |
| | | | | | |
Total gross expenses | | | 1.16 | %(b) | | | 1.13 | % | | | 1.08 | % | | | 1.08 | % | | | 1.12 | % | | | 1.18 | % |
| | | | | | | | | | | | | | | | | | | | | | | | | |
Total net expenses(c) | | | 0.95 | %(b) | | | 0.93 | % | | | 0.95 | % | | | 1.00 | % | | | 1.06 | % | | | 1.12 | % |
| | | | | | | | | | | | | | | | | | | | | | | | | |
Net investment income | | | 3.18 | %(b) | | | 2.85 | % | | | 2.48 | % | | | 2.65 | % | | | 3.10 | % | | | 3.35 | % |
| | | | | | | | | | | | | | | | | | | | | | | | | |
Supplemental data | | | | | | | | | | | | | | | | | | | | | | | | |
| | | | | | |
Net assets, end of period (in thousands) | | | $71 | | | | $121 | | | | $153 | | | | $410 | | | | $291 | | | | $407 | |
| | | | | | | | | | | | | | | | | | | | | | | | | |
Portfolio turnover | | | 35 | % | | | 62 | % | | | 47 | % | | | 34 | % | | | 57 | % | | | 62 | % |
| | | | | | | | | | | | | | | | | | | | | | | | | |
Notes to Financial Highlights
| (a) | In addition to the fees and expenses that the Fund bears directly, the Fund indirectly bears a pro rata share of the fees and expenses of any other funds in which it invests. Such indirect expenses are not included in the Fund’s reported expense ratios. |
| (c) | Total net expenses include the impact of certain fee waivers/expense reimbursements made by the Investment Manager and certain of its affiliates, if applicable. |
The accompanying Notes to Financial Statements are an integral part of this statement.
| | |
| 32 | | Semiannual Report 2015 |
| | |
| |
| COLUMBIA GLOBAL BOND FUND | | |
FINANCIAL HIGHLIGHTS (continued)
| | | | | | | | | | | | | | | | | | | | | | | | |
| |
| Six Months Ended
April 30, 2015 |
| | | Year Ended October 31, | |
Class R | | | (Unaudited) | | | | 2014 | | | | 2013 | | | | 2012 | | | | 2011 | | | | 2010(a) | |
Per share data | | | | | | | | | | | | | | | | | | | | | | | | |
Net asset value, beginning of period | | | $6.28 | | | | $6.40 | | | | $7.20 | | | | $7.34 | | | | $7.46 | | | | $6.98 | |
| | | | | | | | | | | | | | | | | | | | | | | | | |
Income from investment operations: | | | | | | | | | | | | | | | | | | | | | | | | |
| | | | | | |
Net investment income | | | 0.08 | | | | 0.16 | | | | 0.14 | | | | 0.16 | | | | 0.20 | | | | 0.16 | |
| | | | | | | | | | | | | | | | | | | | | | | | | |
Net realized and unrealized gain (loss) | | | (0.12 | ) | | | (0.17 | ) | | | (0.47 | ) | | | 0.17 | | | | (0.05 | ) | | | 0.40 | |
| | | | | | | | | | | | | | | | | | | | | | | | | |
Total from investment operations | | | (0.04 | ) | | | (0.01 | ) | | | (0.33 | ) | | | 0.33 | | | | 0.15 | | | | 0.56 | |
| | | | | | | | | | | | | | | | | | | | | | | | | |
Less distributions to shareholders: | | | | | | | | | | | | | | | | | | | | | | | | |
| | | | | | |
Net investment income | | | (0.03 | ) | | | (0.01 | ) | | | (0.45 | ) | | | (0.44 | ) | | | (0.27 | ) | | | (0.08 | ) |
| | | | | | | | | | | | | | | | | | | | | | | | | |
Net realized gains | | | (0.15 | ) | | | (0.10 | ) | | | (0.02 | ) | | | (0.03 | ) | | | — | | | | — | |
| | | | | | | | | | | | | | | | | | | | | | | | | |
Total distributions to shareholders | | | (0.18 | ) | | | (0.11 | ) | | | (0.47 | ) | | | (0.47 | ) | | | (0.27 | ) | | | (0.08 | ) |
| | | | | | | | | | | | | | | | | | | | | | | | | |
Net asset value, end of period | | | $6.06 | | | | $6.28 | | | | $6.40 | | | | $7.20 | | | | $7.34 | | | | $7.46 | |
| | | | | | | | | | | | | | | | | | | | | | | | | |
Total return | | | (0.63 | %) | | | (0.19 | %) | | | (4.98 | %) | | | 4.83 | % | | | 2.21 | % | | | 8.15 | % |
| | | | | | | | | | | | | | | | | | | | | | | | | |
Ratios to average net assets(b) | | | | | | | | | | | | | | | | | | | | | | | | |
| | | | | | |
Total gross expenses | | | 1.62 | %(c) | | | 1.62 | % | | | 1.58 | % | | | 1.60 | % | | | 1.59 | % | | | 1.66 | %(c) |
| | | | | | | | | | | | | | | | | | | | | | | | | |
Total net expenses(d) | | | 1.34 | %(c) | | | 1.34 | %(e) | | | 1.34 | %(e) | | | 1.40 | %(e) | | | 1.46 | %(e) | | | 1.59 | %(c) |
| | | | | | | | | | | | | | | | | | | | | | | | | |
Net investment income | | | 2.72 | %(c) | | | 2.46 | % | | | 2.16 | % | | | 2.26 | % | | | 2.69 | % | | | 3.58 | %(c) |
| | | | | | | | | | | | | | | | | | | | | | | | | |
Supplemental data | | | | | | | | | | | | | | | | | | | | | | | | |
| | | | | | |
Net assets, end of period (in thousands) | | | $44 | | | | $32 | | | | $5 | | | | $5 | | | | $5 | | | | $5 | |
| | | | | | | | | | | | | | | | | | | | | | | | | |
Portfolio turnover | | | 35 | % | | | 62 | % | | | 47 | % | | | 34 | % | | | 57 | % | | | 62 | % |
| | | | | | | | | | | | | | | | | | | | | | | | | |
Notes to Financial Highlights
| (a) | Based on operations from March 15, 2010 (commencement of operations) through the stated period end. |
| (b) | In addition to the fees and expenses that the Fund bears directly, the Fund indirectly bears a pro rata share of the fees and expenses of any other funds in which it invests. Such indirect expenses are not included in the Fund’s reported expense ratios. |
| (d) | Total net expenses include the impact of certain fee waivers/expense reimbursements made by the Investment Manager and certain of its affiliates, if applicable. |
| (e) | The benefits derived from expense reductions had an impact of less than 0.01%. |
The accompanying Notes to Financial Statements are an integral part of this statement.
| | | | |
| Semiannual Report 2015 | | | 33 | |
| | |
| |
| | COLUMBIA GLOBAL BOND FUND |
FINANCIAL HIGHLIGHTS (continued)
| | | | | | | | | | | | | | | | | | | | | | | | |
| |
| Six Months Ended
April 30, 2015 |
| | | Year Ended October 31, | |
Class W | | | (Unaudited) | | | | 2014 | | | | 2013 | | | | 2012 | | | | 2011 | | | | 2010 | |
Per share data | | | | | | | | | | | | | | | | | | | | | | | | |
Net asset value, beginning of period | | | $6.31 | | | | $6.41 | | | | $7.22 | | | | $7.35 | | | | $7.46 | | | | $7.09 | |
| | | | | | | | | | | | | | | | | | | | | | | | | |
Income from investment operations: | | | | | | | | | | | | | | | | | | | | | | | | |
| | | | | | |
Net investment income | | | 0.09 | | | | 0.17 | | | | 0.17 | | | | 0.18 | | | | 0.22 | | | | 0.22 | |
| | | | | | | | | | | | | | | | | | | | | | | | | |
Net realized and unrealized gain (loss) | | | (0.14 | ) | | | (0.16 | ) | | | (0.51 | ) | | | 0.17 | | | | (0.04 | ) | | | 0.31 | |
| | | | | | | | | | | | | | | | | | | | | | | | | |
Total from investment operations | | | (0.05 | ) | | | 0.01 | | | | (0.34 | ) | | | 0.35 | | | | 0.18 | | | | 0.53 | |
| | | | | | | | | | | | | | | | | | | | | | | | | |
Less distributions to shareholders: | | | | | | | | | | | | | | | | | | | | | | | | |
| | | | | | |
Net investment income | | | (0.04 | ) | | | (0.01 | ) | | | (0.45 | ) | | | (0.45 | ) | | | (0.29 | ) | | | (0.16 | ) |
| | | | | | | | | | | | | | | | | | | | | | | | | |
Net realized gains | | | (0.15 | ) | | | (0.10 | ) | | | (0.02 | ) | | | (0.03 | ) | | | — | | | | — | |
| | | | | | | | | | | | | | | | | | | | | | | | | |
Total distributions to shareholders | | | (0.19 | ) | | | (0.11 | ) | | | (0.47 | ) | | | (0.48 | ) | | | (0.29 | ) | | | (0.16 | ) |
| | | | | | | | | | | | | | | | | | | | | | | | | |
Net asset value, end of period | | | $6.07 | | | | $6.31 | | | | $6.41 | | | | $7.22 | | | | $7.35 | | | | $7.46 | |
| | | | | | | | | | | | | | | | | | | | | | | | | |
Total return | | | (0.68 | %) | | | 0.19 | % | | | (5.04 | %) | | | 5.18 | % | | | 2.59 | % | | | 7.66 | % |
| | | | | | | | | | | | | | | | | | | | | | | | | |
Ratios to average net assets(a) | | | | | | | | | | | | | | | | | | | | | | | | |
| | | | | | |
Total gross expenses | | | 1.36 | %(b) | | | 1.36 | % | | | 1.36 | % | | | 1.34 | % | | | 1.36 | % | | | 1.31 | % |
| | | | | | | | | | | | | | | | | | | | | | | | | |
Total net expenses(c) | | | 1.09 | %(b) | | | 1.08 | %(d) | | | 1.13 | %(d) | | | 1.16 | %(d) | | | 1.21 | %(d) | | | 1.27 | % |
| | | | | | | | | | | | | | | | | | | | | | | | | |
Net investment income | | | 3.02 | %(b) | | | 2.69 | % | | | 2.38 | % | | | 2.56 | % | | | 2.95 | % | | | 3.15 | % |
| | | | | | | | | | | | | | | | | | | | | | | | | |
Supplemental data | | | | | | | | | | | | | | | | | | | | | | | | |
| | | | | | |
Net assets, end of period (in thousands) | | | $73 | | | | $90 | | | | $124 | | | | $31,187 | | | | $52,531 | | | | $69,842 | |
| | | | | | | | | | | | | | | | | | | | | | | | | |
Portfolio turnover | | | 35 | % | | | 62 | % | | | 47 | % | | | 34 | % | | | 57 | % | | | 62 | % |
| | | | | | | | | | | | | | | | | | | | | | | | | |
Notes to Financial Highlights
| (a) | In addition to the fees and expenses that the Fund bears directly, the Fund indirectly bears a pro rata share of the fees and expenses of any other funds in which it invests. Such indirect expenses are not included in the Fund’s reported expense ratios. |
| (c) | Total net expenses include the impact of certain fee waivers/expense reimbursements made by the Investment Manager and certain of its affiliates, if applicable. |
| (d) | The benefits derived from expense reductions had an impact of less than 0.01%. |
The accompanying Notes to Financial Statements are an integral part of this statement.
| | |
| 34 | | Semiannual Report 2015 |
| | |
| |
| COLUMBIA GLOBAL BOND FUND | | |
FINANCIAL HIGHLIGHTS (continued)
| | | | | | | | | | | | |
| |
| Six Months Ended
April 30, 2015 |
| | | Year Ended October 31, | |
Class Y | | | (Unaudited) | | | | 2014 | | | | 2013(a) | |
Per share data | | | | | | | | | | | | |
Net asset value, beginning of period | | | $6.29 | | | | $6.37 | | | | $7.20 | |
| | | | | | | | | | | | | |
Income from investment operations: | | | | | | | | | | | | |
| | | |
Net investment income | | | 0.10 | | | | 0.20 | | | | 0.18 | |
| | | | | | | | | | | | | |
Net realized and unrealized loss | | | (0.13 | ) | | | (0.16 | ) | | | (0.50 | ) |
| | | | | | | | | | | | | |
Total from investment operations | | | (0.03 | ) | | | 0.04 | | | | (0.32 | ) |
| | | | | | | | | | | | | |
Less distributions to shareholders: | | | | | | | | | | | | |
| | | |
Net investment income | | | (0.07 | ) | | | (0.02 | ) | | | (0.49 | ) |
| | | | | | | | | | | | | |
Net realized gains | | | (0.15 | ) | | | (0.10 | ) | | | (0.02 | ) |
| | | | | | | | | | | | | |
Total distributions to shareholders | | | (0.22 | ) | | | (0.12 | ) | | | (0.51 | ) |
| | | | | | | | | | | | | |
Net asset value, end of period | | | $6.04 | | | | $6.29 | | | | $6.37 | |
| | | | | | | | | | | | | |
Total return | | | (0.38 | %) | | | 0.63 | % | | | (4.75 | %) |
| | | | | | | | | | | | | |
Ratios to average net assets(b) | | | | | | | | | | | | |
| | | |
Total gross expenses | | | 0.87 | %(c) | | | 0.83 | % | | | 0.79 | %(c) |
| | | | | | | | | | | | | |
Total net expenses(d) | | | 0.65 | %(c) | | | 0.64 | % | | | 0.64 | %(c) |
| | | | | | | | | | | | | |
Net investment income | | | 3.41 | %(c) | | | 3.15 | % | | | 2.86 | %(c) |
| | | | | | | | | | | | | |
Supplemental data | | | | | | | | | | | | |
| | | |
Net assets, end of period (in thousands) | | | $10 | | | | $10 | | | | $2 | |
| | | | | | | | | | | | | |
Portfolio turnover | | | 35 | % | | | 62 | % | | | 47 | % |
| | | | | | | | | | | | | |
Notes to Financial Highlights
| (a) | Based on operations from November 8, 2012 (commencement of operations) through the stated period end. |
| (b) | In addition to the fees and expenses that the Fund bears directly, the Fund indirectly bears a pro rata share of the fees and expenses of any other funds in which it invests. Such indirect expenses are not included in the Fund’s reported expense ratios. |
| (d) | Total net expenses include the impact of certain fee waivers/expense reimbursements made by the Investment Manager and certain of its affiliates, if applicable. |
The accompanying Notes to Financial Statements are an integral part of this statement.
| | | | |
| Semiannual Report 2015 | | | 35 | |
| | |
| |
| | COLUMBIA GLOBAL BOND FUND |
FINANCIAL HIGHLIGHTS (continued)
| | | | | | | | | | | | | | | | | | | | | | | | |
| |
| Six Months Ended
April 30, 2015 |
| | | Year Ended October 31, | |
Class Z | | | (Unaudited) | | | | 2014 | | | | 2013 | | | | 2012 | | | | 2011 | | | | 2010(a) | |
Per share data | | | | | | | | | | | | | | | | | | | | | | | | |
Net asset value, beginning of period | | | $6.32 | | | | $6.42 | | | | $7.22 | | | | $7.36 | | | | $7.48 | | | | $7.33 | |
| | | | | | | | | | | | | | | | | | | | | | | | | |
Income from investment operations: | | | | | | | | | | | | | | | | | | | | | | | | |
| | | | | | |
Net investment income | | | 0.10 | | | | 0.19 | | | | 0.17 | | | | 0.19 | | | | 0.23 | | | | 0.01 | |
| | | | | | | | | | | | | | | | | | | | | | | | | |
Net realized and unrealized gain (loss) | | | (0.13 | ) | | | (0.18 | ) | | | (0.47 | ) | | | 0.17 | | | | (0.03 | ) | | | 0.14 | |
| | | | | | | | | | | | | | | | | | | | | | | | | |
Total from investment operations | | | (0.03 | ) | | | 0.01 | | | | (0.30 | ) | | | 0.36 | | | | 0.20 | | | | 0.15 | |
| | | | | | | | | | | | | | | | | | | | | | | | | |
Less distributions to shareholders: | | | | | | | | | | | | | | | | | | | | | | | | |
| | | | | | |
Net investment income | | | (0.06 | ) | | | (0.01 | ) | | | (0.48 | ) | | | (0.47 | ) | | | (0.32 | ) | | | — | |
| | | | | | | | | | | | | | | | | | | | | | | | | |
Net realized gains | | | (0.15 | ) | | | (0.10 | ) | | | (0.02 | ) | | | (0.03 | ) | | | — | | | | — | |
| | | | | | | | | | | | | | | | | | | | | | | | | |
Total distributions to shareholders | | | (0.21 | ) | | | (0.11 | ) | | | (0.50 | ) | | | (0.50 | ) | | | (0.32 | ) | | | — | |
| | | | | | | | | | | | | | | | | | | | | | | | | |
Net asset value, end of period | | | $6.08 | | | | $6.32 | | | | $6.42 | | | | $7.22 | | | | $7.36 | | | | $7.48 | |
| | | | | | | | | | | | | | | | | | | | | | | | | |
Total return | | | (0.42 | %) | | | 0.26 | % | | | (4.50 | %) | | | 5.34 | % | | | 2.83 | % | | | 2.05 | % |
| | | | | | | | | | | | | | | | | | | | | | | | | |
Ratios to average net assets(b) | | | | | | | | | | | | | | | | | | | | | | | | |
| | | | | | |
Total gross expenses | | | 1.11 | %(c) | | | 1.11 | % | | | 1.08 | % | | | 1.08 | % | | | 0.96 | % | | | 1.13 | %(c) |
| | | | | | | | | | | | | | | | | | | | | | | | | |
Total net expenses(d) | | | 0.84 | %(c) | | | 0.83 | %(e) | | | 0.84 | %(e) | | | 0.89 | %(e) | | | 0.94 | %(e) | | | 0.95 | %(c) |
| | | | | | | | | | | | | | | | | | | | | | | | | |
Net investment income | | | 3.23 | %(c) | | | 2.94 | % | | | 2.65 | % | | | 2.70 | % | | | 3.19 | % | | | 2.31 | %(c) |
| | | | | | | | | | | | | | | | | | | | | | | | | |
Supplemental data | | | | | | | | | | | | | | | | | | | | | | | | |
| | | | | | |
Net assets, end of period (in thousands) | | | $3,271 | | | | $3,469 | | | | $3,264 | | | | $2,123 | | | | $768 | | | | $8 | |
| | | | | | | | | | | | | | | | | | | | | | | | | |
Portfolio turnover | | | 35 | % | | | 62 | % | | | 47 | % | | | 34 | % | | | 57 | % | | | 62 | % |
| | | | | | | | | | | | | | | | | | | | | | | | | |
Notes to Financial Highlights
| (a) | Based on operations from September 27, 2010 (commencement of operations) through the stated period end. |
| (b) | In addition to the fees and expenses that the Fund bears directly, the Fund indirectly bears a pro rata share of the fees and expenses of any other funds in which it invests. Such indirect expenses are not included in the Fund’s reported expense ratios. |
| (d) | Total net expenses include the impact of certain fee waivers/expense reimbursements made by the Investment Manager and certain of its affiliates, if applicable. |
| (e) | The benefits derived from expense reductions had an impact of less than 0.01%. |
The accompanying Notes to Financial Statements are an integral part of this statement.
| | |
| 36 | | Semiannual Report 2015 |
| | |
| |
| COLUMBIA GLOBAL BOND FUND | | |
NOTES TO FINANCIAL STATEMENTS
April 30, 2015 (Unaudited)
Note 1. Organization
Columbia Global Bond Fund (the Fund), a series of Columbia Funds Series Trust II (the Trust), is a non-diversified fund. The Trust is registered under the Investment Company Act of 1940, as amended (the 1940 Act), as an open-end management investment company organized as a Massachusetts business trust.
Fund Shares
The Trust may issue an unlimited number of shares (without par value). The Fund offers Class A, Class B, Class C, Class I, Class K, Class R, Class W, Class Y and Class Z shares. Although all share classes generally have identical voting, dividend and liquidation rights, each share class votes separately when required by the Trust’s organizational documents or by law. Different share classes pay different distribution amounts to the extent the expenses of such share classes differ, and distributions in liquidation will be proportional to the net asset value of each share class. Each share class has its own expense structure and sales charges.
Class A shares are subject to a maximum front-end sales charge of 4.75% based on the initial investment amount. Class A shares purchased without an initial sales charge in accounts aggregating $1 million to $50 million at the time of purchase are subject to a contingent deferred sales charge (CDSC) if the shares are sold within 18 months after purchase, charged as follows: 1.00% CDSC if redeemed within 12 months after purchase, and 0.50% CDSC if redeemed more than 12, but less than 18, months after purchase.
Class B shares may be subject to a maximum CDSC of 5.00% based upon the holding period after purchase. Class B shares will generally convert to Class A shares eight years after purchase. The Fund no longer accepts investments by new or existing investors in the Fund’s Class B shares, except in connection with the reinvestment of any dividend and/or capital gain distributions in Class B shares of the Fund and exchanges by existing Class B shareholders of certain other funds within the Columbia Family of Funds.
Class C shares are subject to a 1.00% CDSC on shares redeemed within one year after purchase.
Class I shares are not subject to sales charges and are available only to the Columbia Family of Funds.
Class K shares are not subject to sales charges, however this share class is closed to new investors.
Class R shares are not subject to sales charges and are generally available only to certain retirement plans and other investors as described in the Fund’s prospectus.
Class W shares are not subject to sales charges and are available only to investors purchasing through authorized investment programs managed by investment professionals, including discretionary managed account programs.
Class Y shares are not subject to sales charges and are generally available only to certain retirement plans as described in the Fund’s prospectus.
Class Z shares are not subject to sales charges and are available only to eligible investors, which are subject to different investment minimums as described in the Fund’s prospectus.
Note 2. Summary of Significant Accounting Policies
Basis of Preparation
The Fund is an investment company that applies the accounting and reporting guidance in the Financial Accounting Standards Board (FASB) Accounting Standards Codification Topic 946, Financial Services — Investment Companies (ASC 946). The financial statements are prepared in accordance with U.S. generally accepted accounting principles (GAAP), which requires management to make certain estimates and assumptions that affect the reported amounts of assets and liabilities, the disclosure of contingent assets and liabilities at the date of the financial statements and the reported amounts of income and expenses during the reporting period. Actual results could differ from those estimates.
The following is a summary of significant accounting policies followed by the Fund in the preparation of its financial statements.
Security Valuation
Debt securities generally are valued by pricing services approved by the Board of Trustees (the Board) based upon market transactions for normal, institutional-size trading units of similar securities. The services may use various pricing techniques that take into account, as applicable, factors such as yield, quality, coupon rate, maturity, type of issue, trading characteristics and other data, as well as broker quotes. Debt securities for which quotations are readily available may also be valued based upon an over-the-counter or exchange bid quotation.
| | | | |
| Semiannual Report 2015 | | | 37 | |
| | |
| |
| | COLUMBIA GLOBAL BOND FUND |
NOTES TO FINANCIAL STATEMENTS (continued)
April 30, 2015 (Unaudited)
Asset and mortgage-backed securities are generally valued by pricing services, which utilize pricing models that incorporate the securities’ cash flow and loan performance data. These models also take into account available market data, including trades, market quotations, and benchmark yield curves for identical or similar securities. Factors used to identify similar securities may include, but are not limited to, issuer, collateral type, vintage, prepayment speeds, collateral performance, credit ratings, credit enhancement and expected life. Asset-backed securities for which quotations are readily available may also be valued based upon an over-the-counter or exchange bid quotation.
Senior loan securities for which reliable market quotations are readily available are generally valued by pricing services at the average of the bids received.
Investments in open-end investment companies, including money market funds, are valued at their net asset value.
Forward foreign currency exchange contracts are marked-to-market based upon foreign currency exchange rates provided by a pricing service.
Futures and options on futures contracts are valued based upon the settlement price established each day by the board of trade or exchange on which they are traded.
Swap transactions are valued through an independent pricing service or broker, or if neither is available, through an internal model based upon observable inputs.
Investments for which market quotations are not readily available, or that have quotations which management believes are not reliable, are valued at fair value as determined in good faith under procedures established by and under the general supervision of the Board. If a security or class of securities (such as foreign securities) is valued at fair value, such value is likely to be different from the quoted or published price for the security.
The determination of fair value often requires significant judgment. To determine fair value, management may use assumptions including but not limited to future cash flows and estimated risk premiums. Multiple inputs from various sources may be used to determine fair value.
Foreign Currency Transactions and Translations
The values of all assets and liabilities denominated in foreign currencies are generally translated into U.S. dollars at exchange rates determined at the close of the New York Stock Exchange (NYSE). Net realized and
unrealized gains (losses) on foreign currency transactions and translations include gains (losses) arising from the fluctuation in exchange rates between trade and settlement dates on securities transactions, gains (losses) arising from the disposition of foreign currency and currency gains (losses) between the accrual and payment dates on dividends, interest income and foreign withholding taxes.
For financial statement purposes, the Fund does not distinguish that portion of gains (losses) on investments which is due to changes in foreign exchange rates from that which is due to changes in market prices of the investments. Such fluctuations are included with the net realized and unrealized gains (losses) on investments in the Statement of Operations.
Derivative Instruments
The Fund invests in certain derivative instruments, as detailed below, to meet its investment objectives. Derivatives are instruments whose values depend on, or are derived from, in whole or in part, the value of one or more other assets, such as securities, currencies, commodities or indices. Derivative instruments may be used to increase investment flexibility (including to maintain cash reserves while maintaining exposure to certain other assets), for risk management (hedging) purposes, to facilitate trading, to reduce transaction costs and to pursue higher investment returns. The Fund may also use derivative instruments to mitigate certain investment risks, such as foreign currency exchange rate risk, interest rate risk and credit risk. Derivatives may involve various risks, including the potential inability of the counterparty to fulfill its obligation under the terms of the contract, the potential for an illiquid secondary market (making it difficult for the Fund to sell, including at favorable prices) and the potential for market movements which may expose the Fund to gains or losses in excess of the amount shown in the Statement of Assets and Liabilities. The notional amounts of derivative instruments, if applicable, are not recorded in the financial statements.
A derivative instrument may suffer a marked-to-market loss if the value of the contract decreases due to an unfavorable change in the market rates or values of the underlying instrument. Losses can also occur if the counterparty does not perform under the contract. The Fund’s risk of loss from counterparty credit risk on over-the-counter derivatives is generally limited to the aggregate unrealized gain netted against any collateral held by the Fund and the amount of any variation margin held by the counterparty. With exchange-traded or centrally cleared derivatives, there is reduced
| | |
| 38 | | Semiannual Report 2015 |
| | |
| |
| COLUMBIA GLOBAL BOND FUND | | |
NOTES TO FINANCIAL STATEMENTS (continued)
April 30, 2015 (Unaudited)
counterparty credit risk to the Fund since the exchange’s clearinghouse, as counterparty to such instruments, guarantees against a possible default. The clearinghouse stands between the buyer and the seller of the contract; therefore, the counterparty credit risk is failure of the clearinghouse. However, credit risk still exists in exchange-traded or centrally cleared derivatives with respect to initial and variation margin that is held in a broker’s customer account. While brokers are required to segregate customer margin from their own assets, in the event that a broker becomes insolvent or goes into bankruptcy and at that time there is a shortfall in the aggregate amount of margin held by the broker for all its clients, U.S. bankruptcy laws will typically allocate that shortfall on a pro-rata basis across all the broker’s customers (including the Fund), potentially resulting in losses to the Fund.
In order to better define its contractual rights and to secure rights that will help the Fund mitigate its counterparty risk, the Fund may enter into an International Swaps and Derivatives Association, Inc. Master Agreement (ISDA Master Agreement) or similar agreement with its derivative contract counterparties. An ISDA Master Agreement is an agreement between the Fund and a counterparty that governs over-the-counter derivatives and forward foreign currency exchange contracts and typically contains, among other things, collateral posting terms and netting provisions in the event of a default and/or termination event. Under an ISDA Master Agreement, the Fund may, under certain circumstances, offset with the counterparty certain derivative instrument’s payables and/or receivables with collateral held and/or posted and create one single net payment. The provisions of the ISDA Master Agreement typically permit a single net payment in the event of default (close-out netting) including the bankruptcy or insolvency of the counterparty. Note, however, that bankruptcy or insolvency laws of a particular jurisdiction may impose restrictions on or prohibitions against the right of offset in bankruptcy, insolvency or other events.
Collateral (margin) requirements differ by type of derivative. Margin requirements are established by the exchange or clearinghouse for exchange-traded and centrally cleared derivatives. Brokers can ask for margin in excess of the minimum in certain circumstances. Collateral terms are contract specific for over-the-counter derivatives. For over-the-counter derivatives traded under an ISDA Master Agreement, the collateral requirements are typically calculated by netting the marked-to-market amount for each transaction under such agreement and
comparing that amount to the value of any variation margin currently pledged by the Fund and/or the counterparty. Generally, the amount of collateral due from or to a party has to exceed a minimum transfer amount threshold (e.g., $500,000) before a transfer has to be made. To the extent amounts due to the Fund from its counterparties are not fully collateralized, contractually or otherwise, the Fund bears the risk of loss from counterparty nonperformance. The Fund attempts to mitigate counterparty risk by only entering into agreements with counterparties that it believes have the financial resources to honor their obligations and by monitoring the financial stability of those counterparties.
Certain ISDA Master Agreements allow counterparties to over-the-counter derivatives to terminate derivative contracts prior to maturity in the event the Fund’s net assets decline by a stated percentage over a specified time period or if the Fund fails to meet the terms of the ISDA Master Agreement, which would cause the Fund to accelerate payment of any net liability owed to the counterparty. The Fund also has termination rights if the counterparty fails to meet the terms of the ISDA Master Agreement. In addition to considering counterparty credit risk, the Fund would consider terminating the derivative contracts based on whether termination would result in a net liability owed from the counterparty.
For financial reporting purposes, the Fund does not offset derivative assets and derivative liabilities that are subject to netting arrangements in the Statement of Assets and Liabilities.
Forward Foreign Currency Exchange Contracts
Forward foreign currency exchange contracts are over-the-counter agreements between two parties to buy and sell a currency at a set price on a future date. The Fund utilized forward foreign currency exchange contracts to hedge the currency exposure associated with some or all of the Fund’s securities and to generate total return through long and short currency positions versus the U.S. dollar. These instruments may be used for other purposes in future periods.
The values of forward foreign currency exchange contracts fluctuate daily with changes in foreign currency exchange rates. Changes in the value of these contracts are recorded as unrealized appreciation or depreciation until the contract is exercised or has expired. The Fund will realize a gain or loss when the forward foreign currency exchange contract is closed or expires.
The use of forward foreign currency exchange contracts does not eliminate fluctuations in the prices of the
| | | | |
| Semiannual Report 2015 | | | 39 | |
| | |
| |
| | COLUMBIA GLOBAL BOND FUND |
NOTES TO FINANCIAL STATEMENTS (continued)
April 30, 2015 (Unaudited)
Fund’s portfolio securities. The risks of forward foreign currency exchange contracts include movement in the values of the foreign currencies relative to the U.S. dollar (or other foreign currencies) and the possibility that counterparties will not complete their contractual obligations, which may be in excess of the amount reflected, if any, in the Statement of Assets and Liabilities.
Futures Contracts
Futures contracts are exchange traded and represent commitments for the future purchase or sale of an asset at a specified price on a specified date. The Fund bought and sold futures contracts to manage the duration and yield curve exposure of the Fund versus the benchmark. These instruments may be used for other purposes in future periods. Upon entering into futures contracts, the Fund bears risks that it may not achieve the anticipated benefits of the futures contracts and may realize a loss. Additional risks include counterparty credit risk, the possibility of an illiquid market, and that a change in the value of the contract or option may not correlate with changes in the value of the underlying asset.
Upon entering into a futures contract, the Fund pledges cash or securities with the broker in an amount sufficient to meet the initial margin requirement. The initial margin deposit must be maintained at an established level over the life of the contract. Cash deposited as initial margin is recorded in the Statement of Assets and Liabilities as margin deposits. Securities deposited as initial margin are designated in the Portfolio of Investments. Subsequent payments (variation margin) are made or received by the Fund each day. The variation margin payments are equal to the daily change in the contract value and are recorded as variation margin receivable or payable and are offset in unrealized gains or losses. The Fund recognizes a realized gain or loss when the contract is closed or expires. Futures contracts involve, to varying degrees, risk of loss in excess of the variation margin disclosed in the Statement of Assets and Liabilities.
Swap Contracts
Swap contracts are privately negotiated in the over-the-counter market and may be entered into as a bilateral contract or centrally cleared (centrally cleared swap contract). In a centrally cleared swap contract, immediately following execution of the swap contract with a broker, the swap contract is novated to a central counterparty (the CCP) and the CCP becomes the Fund’s counterparty to the centrally cleared swap contract. The Fund is required to deposit initial margin with the broker
in the form of cash or securities in an amount that varies depending on the size and risk profile of the particular swap contract. Securities deposited as initial margin are designated in the Portfolio of Investments and cash deposited is recorded in the Statement of Assets and Liabilities as margin deposits. Unlike a bilateral swap contract, for centrally cleared swap contracts, the Fund has minimal credit exposure to the counterparty because the CCP stands between the Fund and the counterparty. Swap contracts are marked-to-market daily and changes in value are recorded as unrealized appreciation (depreciation). The daily change in valuation of centrally cleared swap contracts, if any, is recorded as a receivable or payable for variation margin in the Statement of Assets and Liabilities.
Credit Default Swap Contracts
The Fund entered into credit default swap contracts to increase or decrease its credit exposure to an index. These instruments may be used for other purposes in future periods. Credit default swap contracts are agreements in which one party pays fixed periodic payments to a counterparty in consideration for a guarantee from the counterparty to make a specific payment should a specified credit event(s) take place. Although specified credit events are contract specific, credit events are generally defined as bankruptcy, failure to pay, restructuring, obligation acceleration, obligation default, or repudiation/moratorium.
As the purchaser of a credit default swap contract, the Fund purchases protection by paying a periodic interest rate on the notional amount to the counterparty. The interest amount is accrued daily as a component of unrealized appreciation (depreciation) and is recorded as a realized loss upon payment. If a credit event as specified in the contract occurs, the Fund may have the option either to deliver the reference obligation to the seller in exchange for a cash payment of its par amount, or to receive a net cash settlement equal to the par amount less an agreed-upon value of the reference obligation as of the date of the credit event. The difference between the value of the obligation or cash delivered and the notional amount received will be recorded as a realized gain (loss).
As the seller of a credit default swap contract, the Fund sells protection to a buyer and will generally receive a periodic interest rate on the notional amount. The interest amount is accrued daily as a component of unrealized appreciation (depreciation) and is recorded as a realized gain upon receipt of the payment. If a credit event as specified in the contract with the counterparty
| | |
| 40 | | Semiannual Report 2015 |
| | |
| |
| COLUMBIA GLOBAL BOND FUND | | |
NOTES TO FINANCIAL STATEMENTS (continued)
April 30, 2015 (Unaudited)
occurs, the Fund may either be required to accept the reference obligation from the buyer in exchange for a cash payment of its notional amount, or to pay the buyer a net cash settlement equal to the notional amount less an agreed-upon value of the reference obligation (recovery value) as of the date of the credit event. The difference between the value of the obligation or cash received and the notional amount paid will be recorded as a realized gain (loss). The maximum potential amount of undiscounted future payments the Fund could be required to make as the seller of protection under a credit default swap contract is equal to the notional amount of the reference obligation. These potential amounts may be partially offset by any recovery values of the respective reference obligations or premiums received upon entering into the agreement. The notional amounts and market values of all credit default swap contracts in which the Fund is the seller of protection, if any, are disclosed in the Credit Default Swap Contracts Outstanding schedule following the Portfolio of Investments.
As a protection seller, the Fund bears the risk of loss from the credit events specified in the contract with the counterparty. For credit default swap contracts on credit indices, quoted market prices and resulting market values serve as an indicator of the current status of the payment/performance risk. Increasing market values, in absolute terms when compared to the notional amount of the swap, represent a deterioration of the reference entity’s credit soundness and a greater likelihood or risk of default or other credit event occurring as defined under the terms of the contract.
Any premium paid or received by the Fund upon entering into a credit default swap contract is recorded as an asset or liability, respectively, and amortized daily as a component of realized gain (loss) in the Statement of Operations. Credit default swap contracts are valued daily, and the change in value is recorded as unrealized appreciation (depreciation) until the termination of the swap, at which time a realized gain (loss) is recorded.
Credit default swap contracts can involve greater risks than if a fund had invested in the reference obligation directly since, in addition to general market risks, credit default swaps are subject to counterparty credit risk, leverage risk, hedging risk, correlation risk and liquidity risk. The Fund will enter into credit default swap transactions only with counterparties that meet certain standards of creditworthiness as determined by the Investment Manager.
Interest Rate Swap Contracts
The Fund entered into interest rate swap transactions to manage the duration and yield curve exposure of the Fund versus the benchmark. These instruments may be used for other purposes in future periods. Interest rate swaps are agreements between two parties that involve the exchange of one type of interest rate for another type of interest rate cash flow on specified dates in the future, based on a predetermined, specified notional amount. Certain interest rate swaps are considered forward-starting, whereby the accrual for the exchange of cash flows does not begin until a specified date in the future (the effective date). The net cash flow for a standard interest rate swap transaction is generally the difference between a floating market interest rate versus a fixed interest rate.
Interest rate swaps are valued daily and unrealized appreciation (depreciation) is recorded. Certain interest rate swaps may accrue periodic interest on a daily basis as a component of unrealized appreciation (depreciation); the Fund will realize a gain or loss upon the payment or receipt of accrued interest. The Fund will realize a gain or a loss when the interest rate swap is terminated.
Risks of entering into interest rate swaps include a lack of correlation between the swaps and the portfolio of bonds the swaps are designed to hedge or replicate. A lack of correlation may cause the interest rate swaps to experience adverse changes in value relative to expectations. In addition, interest rate swaps are subject to the risk of default of a counterparty, and the risk of adverse movements in market interest rates relative to the interest rate swap positions taken. The Fund’s maximum risk of loss from counterparty credit risk is the discounted net value of the cash flows to be received from/paid to the counterparty over the contract’s remaining life to the extent that such amount is positive, plus the cost of entering into a similar transaction with another counterparty.
The Fund attempts to mitigate counterparty credit risk by entering into interest rate swap transactions only with counterparties that meet prescribed levels of creditworthiness, as determined by the Investment Manager. The Fund and any counterparty are required to maintain an agreement that requires the Fund and that counterparty to monitor (on a daily basis) the net market value of all derivative transactions entered into pursuant to the agreement between the Fund and such counterparty. If the net market value of such derivatives transactions between the Fund and that counterparty
| | | | |
| Semiannual Report 2015 | | | 41 | |
| | |
| |
| | COLUMBIA GLOBAL BOND FUND |
NOTES TO FINANCIAL STATEMENTS (continued)
April 30, 2015 (Unaudited)
exceeds a certain threshold (as defined in the agreement), the Fund or the counterparty is required to post cash and/or securities as collateral. Market values of derivatives transactions presented in the financial
statements are not netted with the market values of other derivatives transactions or with any collateral amounts posted by the Fund or any counterparty.
Offsetting of Derivative Assets and Derivative Liabilities
The following tables present the Fund’s gross and net amount of assets and liabilities available for offset under netting arrangements as well as any related collateral received or pledged by the Fund as of April 30, 2015:
| | | | | | | | | | | | | | | | | | | | | | | | | | | | |
| | | Gross Amounts
of Recognized
Assets ($) | | | Gross Amounts
Offset in the
Statement of
Assets and
Liabilities ($) | | | Net Amounts of
Assets Presented
in the Statement
of Assets and
Liabilities ($) | | | Gross Amounts Not Offset in
the Statement of Assets and Liabilities | | | Net
Amount ($)(b) | |
| | | | | Financial
Instruments ($)(a) | | | Cash Collateral
Received ($) | | | Securities
Collateral
Received ($) | | |
Asset Derivatives: | | | | | | | | | | | | | | | | | | | | | | | | | | | | |
Forward Foreign Currency Exchange Contracts | | | 2,000,037 | | | | — | | | | 2,000,037 | | | | 1,597,985 | | | | — | | | | — | | | | 402,052 | |
Over-the-Counter Swap Contracts(c) | | | 64,095 | | | | — | | | | 64,095 | | | | 64,095 | | | | — | | | | — | | | | — | |
Centrally Cleared Swap Contracts(d) | | | 30,920 | | | | — | | | | 30,920 | | | | 8,346 | | | | — | | | | — | | | | 22,574 | |
Total Asset Derivatives | | | 2,095,052 | | | | — | | | | 2,095,052 | | | | 1,670,426 | | | | — | | | | — | | | | 424,626 | |
| | | | | |
| | | Gross Amounts
of Recognized
Liabilities ($) | | | Gross Amounts
Offset in the
Statement of
Assets and
Liabilities ($) | | | Net Amounts of
Liabilities Presented
in the Statement
of Assets and
Liabilities ($) | | | Gross Amounts Not Offset in
the Statement of Assets and Liabilities | | | Net
Amount ($)(f) | |
| | | | | Financial
Instruments ($)(e) | | | Cash
Collateral
Pledged ($) | | | Securities
Collateral
Pledged ($) | | |
Liability Derivatives: | | | | | | | | | | | | | | | | | | | | | | | | | | | | |
Forward Foreign Currency Exchange Contracts | | | 1,597,985 | | | | — | | | | 1,597,985 | | | | 1,597,985 | | | | — | | | | — | | | | — | |
Over-the-Counter Swap Contracts(c) | | | 87,271 | | | | — | | | | 87,271 | | | | 64,095 | | | | — | | | | — | | | | 23,176 | |
Centrally Cleared Swap Contracts(g) | | | 8,346 | | | | — | | | | 8,346 | | | | 8,346 | | | | — | | | | — | | | | — | |
Total Liability Derivatives | | | 1,693,602 | | | | — | | | | 1,693,602 | | | | 1,670,426 | | | | — | | | | — | | | | 23,176 | |
| (a) | Represents the amount of assets that could be offset by liabilities with the same counterparty under master netting or similar agreements that management elects not to offset on the Statement of Assets and Liabilities. |
| (b) | Represents the net amount due from counterparties in the event of default. |
| (c) | Over-the-Counter Swap Contracts are presented at market value plus periodic payments receivable (payable), which is comprised of unrealized appreciation, unrealized depreciation, premiums paid and premiums received. |
| (d) | Centrally cleared swaps are included within receivable for variation margin on the Statement of Assets and Liabilities. |
| (e) | Represents the amount of liabilities that could be offset by assets with the same counterparty under master netting or similar agreements that management elects not to offset on the Statement of Assets and Liabilities. |
| (f) | Represents the net amount due to counterparties in the event of default. |
| (g) | Centrally cleared swaps are included within payable for variation margin on the Statement of Assets and Liabilities. |
Effects of Derivative Transactions in the Financial Statements
The following tables are intended to provide additional information about the effect of derivatives on the financial statements of the Fund, including: the fair value of derivatives by risk category and the location of those fair
values in the Statement of Assets and Liabilities; and the impact of derivative transactions over the period in the Statement of Operations, including realized gains or losses and unrealized gains or losses. The derivative schedules following the Portfolio of Investments present additional information regarding derivative instruments outstanding at the end of the period, if any.
| | |
| 42 | | Semiannual Report 2015 |
| | |
| |
| COLUMBIA GLOBAL BOND FUND | | |
NOTES TO FINANCIAL STATEMENTS (continued)
April 30, 2015 (Unaudited)
The following table is a summary of the fair value of derivative instruments (not considered to be hedging instruments for accounting disclosure purposes) at April 30, 2015:
| | | | | | |
| | | | | | | |
| | Asset Derivatives | |
Risk Exposure
Category | | Statement of Assets and Liabilities Location | | | Fair Value ($) | |
Credit risk | | Net assets — unrealized appreciation on swap contracts | | | 39,244 | * |
Foreign exchange risk | | Unrealized appreciation on forward foreign currency exchange contracts | | | 2,000,037 | |
Interest rate risk | | Net assets — unrealized appreciation on futures contracts | | | 167,840 | * |
Interest rate risk | | Net assets — unrealized appreciation on swap contracts | | | 269,568 | * |
Interest rate risk | | Premiums paid on outstanding swap contracts | | | 256 | |
Total | | | | | 2,476,945 | |
| |
| | Liability Derivatives | |
Risk Exposure
Category | | Statement of Assets and Liabilities Location | | | Fair Value ($) | |
Foreign exchange risk | | Unrealized depreciation on forward foreign currency exchange contracts | | | 1,597,985 | |
Interest rate risk | | Net assets — unrealized depreciation on futures contracts | | | 283,926 | * |
Interest rate risk | | Net assets — unrealized depreciation on swap contracts | | | 110,209 | * |
Total | | | | | 1,992,120 | |
| * | Includes cumulative appreciation (depreciation) as reported in the tables following the Portfolio of Investments. Only the current day’s variation margin is reported in receivables or payables in the Statement of Assets and Liabilities. |
The following table indicates the effect of derivative instruments (not considered to be hedging instruments for accounting disclosure purposes) in the Statement of Operations for the six months ended April 30, 2015:
| | | | | | | | | | | | | | | | |
| | | | | | | | | | | | | | | | | |
| Amount of Realized Gain (Loss) on Derivatives Recognized in Income | |
Risk Exposure
Category | | Forward
Foreign
Currency
Exchange
Contracts
($) | | | Futures
Contracts
($) | | | Swap
Contracts
($) | | | Total
($) | |
Credit risk | | | — | | | | — | | | | 409,479 | | | | 409,479 | |
| | | | | | | | | | | | | | | | | |
Foreign exchange risk | | | (554,118 | ) | | | — | | | | — | | | | (554,118 | ) |
| | | | | | | | | | | | | | | | | |
Interest rate risk | | | — | | | | (1,734,907 | ) | | | 9,623 | | | | (1,725,284 | ) |
| | | | | | | | | | | | | | | | | |
Total | | | (554,118 | ) | | | (1,734,907 | ) | | | 419,102 | | | | (1,869,923 | ) |
| | | | | | | | | | | | | | | | | |
Change in Unrealized Appreciation (Depreciation) on Derivatives Recognized in
Income | |
Risk Exposure
Category | | Forward
Foreign
Currency
Exchange
Contracts
($) | | | Futures
Contracts
($) | | | Swap
Contracts
($) | | | Total
($) | |
Credit risk | | | — | | | | — | | | | (171,280 | ) | | | (171,280 | ) |
| | | | | | | | | | | | | | | | | |
Foreign exchange risk | | | 886,852 | | | | — | | | | — | | | | 886,852 | |
| | | | | | | | | | | | | | | | | |
Interest rate risk | | | — | | | | 352,713 | | | | 159,359 | | | | 512,072 | |
| | | | | | | | | | | | | | | | | |
Total | | | 886,852 | | | | 352,713 | | | | (11,921 | ) | | | 1,227,644 | |
| | | | | | | | | | | | | | | | | |
The following table is a summary of the average outstanding volume by derivative instrument for the six months ended April 30, 2015:
| | | | | | |
| Derivative Instrument | | | | Average
Notional
Amounts ($)* | |
Futures contracts — Long | | | | | 30,302,276 | |
Futures contracts — Short | | | | | 26,832,617 | |
Credit default swap contracts — sell protection | | | | | 7,965,000 | |
| | | | | | | | |
| Derivative Instrument | | Average
Unrealized
Appreciation ($)* | | | Average
Unrealized
Depreciation ($)* | |
Forward foreign currency exchange contracts | | | 2,501,660 | | | | (2,168,931 | ) |
Interest rate swap contracts | | | 134,784 | | | | (225,055 | ) |
| * | Based on the ending quarterly outstanding amounts for the six months ended April 30, 2015. |
Investments in Senior Loans
The Fund may invest in senior loan assignments. When the Fund purchases an assignment of a senior loan, the Fund typically has direct rights against the borrower; provided, however, that the Fund’s rights may be more limited than the lender from which it acquired the assignment and the Fund may be able to enforce its rights only through an administrative agent. Although certain senior loan assignments are secured by collateral, the Fund could experience delays or limitations in realizing such collateral or have its interest
| | | | |
| Semiannual Report 2015 | | | 43 | |
| | |
| |
| | COLUMBIA GLOBAL BOND FUND |
NOTES TO FINANCIAL STATEMENTS (continued)
April 30, 2015 (Unaudited)
subordinated to other indebtedness of the obligor. In the event that the administrator or collateral agent of a loan becomes insolvent, enters into receivership or bankruptcy, the Fund may incur costs and delays in realizing payment or may suffer a loss of principal and/or interest. The risk of loss is greater for unsecured or subordinated loans. In addition, senior loan assignments are vulnerable to market, economic or other conditions or events that may reduce the demand for senior loan assignments and certain senior loan assignments which were liquid, when purchased, may become illiquid.
The Fund may enter into senior loan assignments where all or a portion of the loan may be unfunded. The Fund is obligated to fund these commitments at the borrower’s discretion. These commitments are generally traded and priced in the same manner as other senior loan securities and are disclosed as unfunded senior loan commitments in the Fund’s Portfolio of Investments. The Fund designates cash or liquid securities to cover these commitments.
Delayed Delivery Securities
The Fund may trade securities on other than normal settlement terms, including securities purchased or sold on a “when-issued” basis. This may increase risk to the Fund since the other party to the transaction may fail to deliver which could cause the Fund to subsequently invest at less advantageous prices. The Fund designates cash or liquid securities in an amount equal to the delayed delivery commitment.
Treasury Inflation Protected Securities
The Fund may invest in treasury inflation protected securities (TIPS). The principal amount of TIPS is adjusted periodically and is increased for inflation or decreased for deflation based on a monthly published index. These adjustments are recorded as interest income in the Statement of Operations. Coupon payments are based on the adjusted principal at the time the interest is paid.
Security Transactions
Security transactions are accounted for on the trade date. Cost is determined and gains (losses) are based upon the specific identification method for both financial statement and federal income tax purposes.
Trade date for senior loans purchased in the primary market is the date on which the loan is allocated. Trade date for senior loans purchased in the secondary market is the date on which the transaction is entered into.
Income Recognition
Interest income is recorded on an accrual basis. Market premiums and discounts, including original issue discounts, are amortized and accreted, respectively, over the expected life of the security on all debt securities, unless otherwise noted. The Fund classifies gains and losses realized on prepayments received on mortgage-backed securities as adjustments to interest income.
The Fund may place a debt security on non-accrual status and reduce related interest income when it becomes probable that the interest will not be collected and the amount of uncollectible interest can be reasonably estimated. A defaulted debt security is removed from non-accrual status when the issuer resumes interest payments or when collectability of interest is reasonably assured.
Dividend income is recorded on the ex-dividend date.
The value of additional securities received as an income payment is recorded as income and increases the cost basis of such securities.
The Fund may receive other income from senior loans, including amendment fees, consent fees and commitment fees. These fees are recorded as income when received by the Fund. These amounts are included in Interest Income in the Statement of Operations.
Expenses
General expenses of the Trust are allocated to the Fund and other funds of the Trust based upon relative net assets or other expense allocation methodologies determined by the nature of the expense. Expenses directly attributable to the Fund are charged to the Fund. Expenses directly attributable to a specific class of shares are charged to that share class.
Determination of Class Net Asset Value
All income, expenses (other than class-specific expenses, which are charged to that share class, as shown in the Statement of Operations) and realized and unrealized gains (losses) are allocated to each class of the Fund on a daily basis, based on the relative net assets of each class, for purposes of determining the net asset value of each class.
Federal Income Tax Status
The Fund intends to qualify each year as a regulated investment company under Subchapter M of the Internal Revenue Code, as amended, and will distribute substantially all of its taxable income (including net
| | |
| 44 | | Semiannual Report 2015 |
| | |
| |
| COLUMBIA GLOBAL BOND FUND | | |
NOTES TO FINANCIAL STATEMENTS (continued)
April 30, 2015 (Unaudited)
short-term capital gains), if any, for its tax year, and as such will not be subject to federal income taxes. In addition, the Fund intends to distribute in each calendar year substantially all of its net investment income, capital gains and certain other amounts, if any, such that the Fund should not be subject to federal excise tax. Therefore, no federal income or excise tax provision is recorded.
Foreign Taxes
The Fund may be subject to foreign taxes on income, gains on investments or currency repatriation, a portion of which may be recoverable. The Fund will accrue such taxes and recoveries, as applicable, based upon its current interpretation of tax rules and regulations that exist in the markets in which it invests.
Realized gains in certain countries may be subject to foreign taxes at the Fund level, based on statutory rates. The Fund accrues for such foreign taxes on realized and unrealized gains at the appropriate rate for each jurisdiction, as applicable. The amount, if any, is disclosed as a liability on the Statement of Assets and Liabilities.
Distributions to Shareholders
Distributions from net investment income, if any, are declared and paid each calendar quarter. Net realized capital gains, if any, are distributed at least annually. Income distributions and capital gain distributions are determined in accordance with federal income tax regulations, which may differ from GAAP.
Guarantees and Indemnifications
Under the Trust’s organizational documents and, in some cases, by contract, its officers and trustees are indemnified against certain liabilities arising out of the performance of their duties to the Trust or its funds. In addition, certain of the Fund’s contracts with its service providers contain general indemnification clauses. The Fund’s maximum exposure under these arrangements is unknown since the amount of any future claims that may be made against the Fund cannot be determined, and the Fund has no historical basis for predicting the likelihood of any such claims.
Note 3. Fees and Compensation Paid to Affiliates
Investment Management Fees
Under an Investment Management Services Agreement, Columbia Management Investment Advisers, LLC (the
Investment Manager), a wholly-owned subsidiary of Ameriprise Financial, Inc. (Ameriprise Financial), determines which securities will be purchased, held or sold. The investment management fee is an annual fee that is equal to a percentage of the Fund’s average daily net assets that declines from 0.57% to 0.47% as the Fund’s net assets increase. The annualized effective investment management fee rate for the six months ended April 30, 2015 was 0.57% of the Fund’s average daily net assets.
The Investment Manager has entered into a personnel-sharing arrangement with its affiliate, Threadneedle Investments (Threadneedle). Threadneedle, like the Investment Manager, is a wholly-owned subsidiary of Ameriprise Financial and is an SEC-registered investment adviser. Pursuant to this arrangement, certain employees of Threadneedle serve as “associated persons” of the Investment Manager and, in this capacity, subject to the oversight and supervision of the Investment Manager and consistent with the investment objectives, policies and limitations set forth in the Fund’s prospectus and Statement of Additional Information (SAI), may provide research and related services, and discretionary investment management services (including acting as portfolio managers) to the Fund on behalf of the Investment Manager.
Administration Fees
Under an Administrative Services Agreement, the Investment Manager also serves as the Fund Administrator. The Fund pays the Fund Administrator an annual fee for administration and accounting services equal to a percentage of the Fund’s average daily net assets that declines from 0.08% to 0.05% as the Fund’s net assets increase. The annualized effective administration fee rate for the six months ended April 30, 2015 was 0.08% of the Fund’s average daily net assets.
Other Expenses
Other expenses are for, among other things, miscellaneous expenses of the Fund or the Board, including payments to a company providing limited administrative services to the Fund and the Board. That company’s expenses include boardroom and office expense, employee compensation, employee health and retirement benefits, and certain other expenses. For the six months ended April 30, 2015, other expenses paid by the Fund to this company were $724.
| | | | |
| Semiannual Report 2015 | | | 45 | |
| | |
| |
| | COLUMBIA GLOBAL BOND FUND |
NOTES TO FINANCIAL STATEMENTS (continued)
April 30, 2015 (Unaudited)
Compensation of Board Members
Board members are compensated for their services to the Fund as disclosed in the Statement of Operations. Under a Deferred Compensation Plan (the Plan), the Board members who are not “interested persons” of the Fund, as defined under the 1940 Act, may elect to defer payment of up to 100% of their compensation. Deferred amounts are treated as though equivalent dollar amounts had been invested in shares of certain funds managed by the Investment Manager. The Fund’s liability for these amounts is adjusted for market value changes and remains in the Fund until distributed in accordance with the Plan.
Transfer Agent Fees
Under a Transfer and Dividend Disbursing Agent Agreement, Columbia Management Investment Services Corp. (the Transfer Agent), an affiliate of the Investment Manager and a wholly-owned subsidiary of Ameriprise Financial, is responsible for providing transfer agency services to the Fund. The Transfer Agent has contracted with Boston Financial Data Services (BFDS) to serve as sub-transfer agent.
The Transfer Agent receives a monthly transfer agency fee based on the number or the average value of accounts, depending on the type of account. In addition, the Transfer Agent also receives sub-transfer agency fees based on a percentage of the average aggregate value of the Fund’s shares maintained in omnibus accounts (other than omnibus accounts for which American Enterprise Investment Services Inc. is the broker of record or accounts where the beneficial shareholder is a customer of Ameriprise Financial Services, Inc., for which the Transfer Agent receives a per account fee). The Transfer Agent pays the fees of BFDS for services as sub-transfer agent and is not entitled to reimbursement for such fees from the Fund (with the exception of out-of-pocket fees).
The Transfer Agent also receives compensation from the Fund for various shareholder services and reimbursements for certain out-of-pocket fees. Total transfer agent fees for Class K shares are subject to an annual limitation of not more than 0.05% of the average daily net assets attributable to Class K shares. Class I and Class Y shares do not pay transfer agency fees.
For the six months ended April 30, 2015, the Fund’s annualized effective transfer agent fee rates as a percentage of average daily net assets of each class were as follows:
| | | | |
| | | | | |
Class A | | | 0.24 | % |
Class B | | | 0.24 | |
Class C | | | 0.24 | |
Class K | | | 0.05 | |
Class R | | | 0.24 | |
Class W | | | 0.24 | |
Class Z | | | 0.24 | |
An annual minimum account balance fee of $20 may apply to certain accounts with a value below the applicable share class’s initial minimum investment requirements to reduce the impact of small accounts on transfer agent fees. These minimum account balance fees are remitted to the Fund and recorded as part of expense reductions in the Statement of Operations. For the six months ended April 30, 2015, no minimum account balance fees were charged by the Fund.
Plan Administration Fees
Under a Plan Administration Services Agreement with the Transfer Agent, the Fund pays an annual fee at a rate of 0.25% of the Fund’s average daily net assets attributable to Class K shares for the provision of various administrative, recordkeeping, communication and educational services.
Distribution Fees
The Fund has an agreement with Columbia Management Investment Distributors, Inc. (the Distributor), an affiliate of the Investment Manager and a wholly-owned subsidiary of Ameriprise Financial, for distribution and shareholder services. Under a Plan and Agreement of Distribution, the Fund pays a fee at an annual rate of up to 0.25% of the Fund’s average daily net assets attributable to Class A and Class W shares, a fee at an annual rate of up to 0.50% of the Fund’s average daily net assets attributable to Class R shares (of which up to 0.25% may be used for shareholder services) and a fee at an annual rate of up to 1.00% of the Fund’s average daily net assets attributable to Class B and Class C shares. For Class B and Class C shares, of the 1.00% fee, up to 0.75% is reimbursed for distribution expenses.
The amount of distribution expenses incurred by the Distributor and not yet reimbursed (unreimbursed expense) was approximately $558,000 and $56,000 for
| | |
| 46 | | Semiannual Report 2015 |
| | |
| |
| COLUMBIA GLOBAL BOND FUND | | |
NOTES TO FINANCIAL STATEMENTS (continued)
April 30, 2015 (Unaudited)
Class B and Class C shares, respectively. These amounts are based on the most recent information available as of March 31, 2015, and may be recovered from future payments under the distribution plan or CDSCs. To the extent the unreimbursed expense has been fully recovered, the distribution fee is reduced.
Sales Charges
Sales charges, including front-end charges and CDSCs, received by the Distributor for distributing Fund shares were $12,618 for Class A, $45 for Class B and $175 for Class C shares for the six months ended April 30, 2015.
Expenses Waived/Reimbursed by the Investment Manager and its Affiliates
The Investment Manager and certain of its affiliates have contractually agreed to waive fees and/or reimburse expenses (excluding certain fees and expenses described below) for the periods disclosed below, unless sooner terminated at the sole discretion of the Board, so that the Fund’s net operating expenses, after giving effect to fees waived/expenses reimbursed and any balance credits and/or overdraft charges from the Fund’s custodian, do not exceed the following annual rates as a percentage of the class’ average daily net assets:
| | | | | | | | |
| | | March 1, 2015 through February 29, 2016 | | | Prior to March 1, 2015 | |
Class A | | | 1.16 | % | | | 1.09 | % |
Class B | | | 1.91 | | | | 1.84 | |
Class C | | | 1.91 | | | | 1.84 | |
Class I | | | 0.75 | | | | 0.64 | |
Class K | | | 1.05 | | | | 0.94 | |
Class R | | | 1.41 | | | | 1.34 | |
Class W | | | 1.16 | | | | 1.09 | |
Class Y | | | 0.75 | | | | 0.64 | |
Class Z | | | 0.91 | | | | 0.84 | |
Under the agreement governing these fee waivers and/or expense reimbursement arrangements, the following fees and expenses are excluded from the waiver/reimbursement commitment, and therefore will be paid by the Fund, if applicable: taxes (including foreign transaction taxes), expenses associated with investments in affiliated and non-affiliated pooled investment vehicles (including mutual funds and exchange-traded funds), transaction costs and brokerage commissions, costs related to any securities lending program, dividend expenses associated with securities sold short, inverse floater program fees and expenses,
transaction charges and interest on borrowed money, interest, extraordinary expenses and any other expenses the exclusion of which is specifically approved by the Board. This agreement may be modified or amended only with approval from all parties.
In addition, the Fund’s expense ratio is subject to a voluntary expense reimbursement arrangement pursuant to which fees will be waived and/or expenses reimbursed (excluding certain fees and expenses described above), so that the Fund’s net operating expenses, after giving effect to fees waived/expenses reimbursed and any balance credits and/or overdraft charges from the Fund’s custodian, do not exceed the annual rates of 1.08% for Class A, 1.83% for Class B, 1.83% for Class C, 0.67% for Class I, 0.97% for Class K, 1.33% for Class R, 1.08% for Class W, 0.67% for Class Y and 0.83% for Class Z. This arrangement may be revised or discontinued at any time.
Any fees waived and or expenses reimbursed under the expense reimbursement arrangements described above are not recoverable by the Investment Manager or its affiliates in future periods.
Note 4. Federal Tax Information
The timing and character of income and capital gain distributions are determined in accordance with income tax regulations, which may differ from GAAP because of temporary or permanent book to tax differences.
At April 30, 2015, the cost of investments for federal income tax purposes was approximately $115,357,000 and the aggregate gross approximate unrealized appreciation and depreciation based on that cost was:
| | | | |
Unrealized appreciation | | | $2,519,000 | |
Unrealized depreciation | | | (4,299,000 | ) |
Net unrealized depreciation | | | $(1,780,000 | ) |
Management of the Fund has concluded that there are no significant uncertain tax positions in the Fund that would require recognition in the financial statements. However, management’s conclusion may be subject to review and adjustment at a later date based on factors including, but not limited to, new tax laws, regulations, and administrative interpretations (including relevant court decisions). Generally, the Fund’s federal tax returns for the prior three fiscal years remain subject to examination by the Internal Revenue Service.
Note 5. Portfolio Information
The cost of purchases and proceeds from sales of securities, excluding short-term investments and
| | | | |
| Semiannual Report 2015 | | | 47 | |
| | |
| |
| | COLUMBIA GLOBAL BOND FUND |
NOTES TO FINANCIAL STATEMENTS (continued)
April 30, 2015 (Unaudited)
derivatives, if any, aggregated to $39,248,614 and $49,902,821, respectively, for the six months ended April 30, 2015, of which $6,546,125 of sales were U.S. government securities. The amount of purchase and sale activity impacts the portfolio turnover rate reported in the Financial Highlights.
Note 6. Affiliated Money Market Fund
The Fund invests in Columbia Short-Term Cash Fund, an affiliated money market fund established for the exclusive use by the Fund and other affiliated funds. The income earned by the Fund from such investments is included as Dividends — affiliated issuers in the Statement of Operations. As an investing fund, the Fund indirectly bears its proportionate share of the expenses of Columbia Short-Term Cash Fund.
Note 7. Shareholder Concentration
At April 30, 2015, affiliated shareholders of record owned 88.3% of the outstanding shares of the Fund in one or more accounts. Subscription and redemption activity by concentrated accounts may have a significant effect on the operations of the Fund.
Note 8. Line of Credit
The Fund has entered into a revolving credit facility with a syndicate of banks led by JPMorgan Chase Bank, N.A. whereby the Fund may borrow for the temporary funding of shareholder redemptions or for other temporary or emergency purposes. Pursuant to a December 9, 2014 amendment, the credit facility agreement, which is a collective agreement between the Fund and certain other funds managed by the Investment Manager, severally and not jointly, permits collective borrowings up to $550 million. Interest is charged to each participating fund based on its borrowings at a rate equal to the higher of (i) the overnight federal funds rate plus 1.00% or (ii) the one-month LIBOR rate plus 1.00%. Each borrowing under the credit facility matures no later than 60 days after the date of borrowing. The Fund also pays a commitment fee equal to its pro rata share of the amount of the credit facility at a rate of 0.075% per annum. The commitment fee is included in other expenses in the Statement of Operations. Prior to the December 9, 2014 amendment, the credit facility agreement permitted borrowings up to $500 million under the same terms and interest rates as described above.
The Fund had no borrowings during the six months ended April 30, 2015.
Note 9. Significant Risks
Derivatives Risk
Losses involving derivative instruments may be substantial, because a relatively small price movement in the underlying security(ies) instrument, commodity, currency or index may result in a substantial loss for the Fund. In addition to the potential for increased losses, the use of derivative instruments may lead to increased volatility within the Fund. Derivatives will typically increase the Fund’s exposure to principal risks to which it is otherwise exposed, and may expose the Fund to additional risks, including correlation risk, counterparty risk, hedging risk, leverage risk and liquidity risk.
Credit Risk
Credit risk is the risk that the value of debt securities in the Fund’s portfolio may decline because the issuer may default and fail to pay interest or repay principal when due. Rating agencies assign credit ratings to debt securities to indicate their credit risk. Lower rated or unrated debt securities held by the Fund may present increased credit risk as compared to higher-rated debt securities.
Interest Rate Risk
Interest rate risk is the risk of losses attributable to changes in interest rates. In general, if prevailing interest rates rise, the values of debt securities tend to fall, and if interest rates fall, the values of debt securities tend to rise. Actions by governments and central banking authorities can result in increases in interest rates. Increasing interest rates may negatively affect the value of debt securities held by the Fund, resulting in a negative impact on the Fund’s performance and net asset value per share. In general, the longer the maturity or duration of a debt security, the greater its sensitivity to changes in interest rates.
Liquidity Risk
Liquidity risk is the risk associated with a lack of marketability of investments which may make it difficult to sell the investment at a desirable time or price. Changing regulatory, market or other conditions or environments (for example, the interest rate or credit environments) may adversely affect the liquidity of the Fund’s investments. The Fund may have to accept a lower selling price for the holding, sell other investments, or forego another, more appealing investment opportunity. Generally, the less liquid the market at the time the Fund sells a portfolio investment, the greater
| | |
| 48 | | Semiannual Report 2015 |
| | |
| |
| COLUMBIA GLOBAL BOND FUND | | |
NOTES TO FINANCIAL STATEMENTS (continued)
April 30, 2015 (Unaudited)
the risk of loss or decline of value to the Fund. A less liquid market can lead to an increase in Fund redemptions, which may negatively impact Fund performance and net asset value per share, including, for example, if the Fund is forced to sell securities in a down market.
Foreign Securities and Emerging Market Countries Risk
Investing in foreign securities may include certain risks and considerations not typically associated with investing in U.S. securities, such as fluctuating currency values and changing local and regional economic, political and social conditions, which may result in greater market volatility. In addition, certain foreign securities may not be as liquid as U.S. securities. Investing in emerging markets may accentuate these risks. These countries are also more likely to experience high levels of inflation, deflation or currency devaluation which could hurt their economies and securities markets. To the extent that the Fund concentrates its investment exposure to any one or a few specific countries, the Fund will be particularly susceptible to the various conditions, events or other factors impacting those countries and may, therefore, have a greater risk than that of a fund which is more geographically diversified.
Geographic Concentration Risk
The Fund may be particularly susceptible to economic, political, regulatory or other events or conditions affecting issuers and countries within the specific geographic regions in which the Fund invests. Currency devaluation could occur in countries that have not yet experienced currency devaluation to date, or could continue to occur in countries that have already experienced such devaluations. As a result, the Fund may be more volatile than a more geographically diversified fund.
High-Yield Securities Risk
Securities rated below investment grade (commonly called “high-yield” or “junk” bonds) and unrated securities of comparable quality expose the Fund to a greater risk of loss of principal and income than a fund that invests solely or primarily in investment grade securities. In addition, these investments have greater price fluctuations, are less liquid and are more likely to experience a default than higher-rated securities. High-yield securities are considered to be predominantly speculative with respect to the issuer’s capacity to pay interest and repay principal.
Non-Diversification Risk
A non-diversified fund is permitted to invest a greater percentage of its total assets in fewer issuers than a diversified fund. The Fund may, therefore, have a greater risk of loss from a few issuers than a similar fund that invests more broadly.
Note 10. Subsequent Events
Management has evaluated the events and transactions that have occurred through the date the financial statements were issued and noted no items requiring adjustment of the financial statements or additional disclosure.
Note 11. Information Regarding Pending and Settled Legal Proceedings
In December 2005, without admitting or denying the allegations, American Express Financial Corporation (AEFC, which is now known as Ameriprise Financial, Inc. (Ameriprise Financial)) entered into settlement agreements with the Securities and Exchange Commission (SEC) and Minnesota Department of Commerce (MDOC) related to market timing activities. As a result, AEFC was censured and ordered to cease and desist from committing or causing any violations of certain provisions of the Investment Advisers Act of 1940, the Investment Company Act of 1940, and various Minnesota laws. AEFC agreed to pay disgorgement of $10 million and civil money penalties of $7 million. AEFC also agreed to retain an independent distribution consultant to assist in developing a plan for distribution of all disgorgement and civil penalties ordered by the SEC in accordance with various undertakings detailed at www.sec.gov/litigation/admin/ia-2451.pdf. Ameriprise Financial and its affiliates have cooperated with the SEC and the MDOC in these legal proceedings, and have made regular reports to the Funds’ Boards of Trustees.
Ameriprise Financial and certain of its affiliates have historically been involved in a number of legal, arbitration and regulatory proceedings, including routine litigation, class actions, and governmental actions, concerning matters arising in connection with the conduct of their business activities. Ameriprise Financial believes that the Funds are not currently the subject of, and that neither Ameriprise Financial nor any of its affiliates are the subject of, any pending legal, arbitration or regulatory proceedings that are likely to have a material adverse effect on the Funds or the ability of Ameriprise Financial or its affiliates to perform under their contracts with the
| | | | |
| Semiannual Report 2015 | | | 49 | |
| | |
| |
| | COLUMBIA GLOBAL BOND FUND |
NOTES TO FINANCIAL STATEMENTS (continued)
April 30, 2015 (Unaudited)
Funds. Ameriprise Financial is required to make quarterly (10-Q), annual (10-K) and, as necessary, 8-K filings with the Securities and Exchange Commission on legal and regulatory matters that relate to Ameriprise Financial and its affiliates. Copies of these filings may be obtained by accessing the SEC website at www.sec.gov.
There can be no assurance that these matters, or the adverse publicity associated with them, will not result in increased fund redemptions, reduced sale of fund shares or other adverse consequences to the Funds. Further, although we believe proceedings are not likely to have a material adverse effect on the Funds or the ability of Ameriprise Financial or its affiliates to perform under their contracts with the Funds, these proceedings are subject to uncertainties and, as such, we are unable to estimate the possible loss or range of loss that may result. An adverse outcome in one or more of these proceedings could result in adverse judgments, settlements, fines, penalties or other relief that could have a material adverse effect on the consolidated financial condition or results of operations of Ameriprise Financial.
| | |
| 50 | | Semiannual Report 2015 |
| | |
| |
| COLUMBIA GLOBAL BOND FUND | | |
APPROVAL OF INVESTMENT MANAGEMENT SERVICES AGREEMENT
Columbia Management Investment Advisers, LLC (Columbia Management or the Investment Manager), a wholly-owned subsidiary of Ameriprise Financial, Inc. (Ameriprise Financial), serves as the investment manager to Columbia Global Bond Fund (the Fund). Under an investment management services agreement (the IMS Agreement), Columbia Management provides investment advice and other services to the Fund and other funds distributed by Columbia Management Investment Distributors, Inc. (collectively, the Funds).
The Fund’s Board of Trustees (the Board), including the independent Board members (the Independent Trustees), considered the renewal of the IMS Agreement for a two-month period (Short-Term Period) in order to align the IMS Agreement with the review cycle of other funds in the Columbia family of funds. Columbia Management prepared detailed reports for the Board and its Contracts Committee in January, March and April 2015, including reports based on analyses of data provided by an independent organization (Lipper) and a comprehensive response to each item of information requested by independent legal counsel to the Independent Trustees (Independent Legal Counsel) in a letter to the Investment Manager, to assist the Board in making this determination. In addition, throughout the year, the Board (or its committees) regularly meets with portfolio management teams and senior management personnel, and reviews information prepared by Columbia Management addressing the services Columbia Management provides and Fund performance. The Board also accords appropriate weight to the work, deliberations and conclusions of the Contracts Committee, the Investment Review Committee and the Compliance Committee in determining whether to continue the IMS Agreement.
The Board, at its April 13-15, 2015 in-person Board meeting (the April Meeting), considered the renewal of the IMS Agreement for the Short-Term Period. At the April Meeting, Independent Legal Counsel reviewed with the Independent Trustees various factors relevant to the Board’s consideration of advisory agreements and the Board’s legal responsibilities related to such consideration. Following an analysis and discussion of the factors identified below, the Board, including all of the Independent Trustees, approved the renewal of the IMS Agreement for the Short-Term Period.
Nature, Extent and Quality of Services Provided by Columbia Management
The Independent Trustees analyzed various reports and presentations they had received detailing the services performed by Columbia Management, as well as its expertise, resources and capabilities. The Independent Trustees specifically considered many developments during the past year concerning the services provided by Columbia Management. The Independent Trustees noted the information they received concerning Columbia Management’s ability to retain its key portfolio management personnel. In evaluating the quality of services provided under the IMS Agreement and the Fund’s Administrative Services Agreement, the Independent Trustees also took into account the organization and strength of the Fund’s and its service providers’ compliance programs. In addition, the Board also reviewed the financial condition of Columbia Management (and its affiliates) and each entity’s ability to carry out its responsibilities under the IMS Agreement and the Fund’s other services agreements with affiliates of Ameriprise Financial, observing the financial strength of Ameriprise Financial, with its solid balance sheet. The Board also discussed the acceptability of the terms of the IMS Agreement for the Short-Term Period.
Based on the foregoing, and based on other information received (both oral and written, including the information on investment performance referenced below) and other considerations, the Board concluded that the services being performed by Columbia Management and its affiliates were acceptable for the Short-Term Period.
Investment Performance
For purposes of evaluating the nature, extent and quality of services provided under the IMS Agreement, the Board carefully reviewed the investment performance of the Fund. In this regard, the Board considered detailed reports providing the results of analyses performed by an independent organization showing, for various periods, the performance of the Fund, the performance of a benchmark index, the percentage ranking of the Fund among its comparison group and the net assets of the Fund. The Board observed that for purposes of approving the IMS Agreement for the Short-Term Period, the Fund’s performance was acceptable.
| | | | |
| Semiannual Report 2015 | | | 51 | |
| | |
| |
| | COLUMBIA GLOBAL BOND FUND |
APPROVAL OF INVESTMENT MANAGEMENT SERVICES AGREEMENT (continued)
Comparative Fees, Costs of Services Provided and the Profits Realized by Columbia Management and its Affiliates from their Relationships with the Fund
The Board reviewed comparative fees and the costs of services provided under the IMS Agreement. The Board members considered detailed comparative information set forth in an annual report on fees and expenses, including, among other things, data (based on analyses conducted by an independent organization) showing a comparison of the Fund’s expenses with median expenses paid by funds in its comparative peer universe, as well as data showing the Fund’s contribution to Columbia Management’s profitability.
The Board accorded particular weight to the notion that the level of fees should reflect a rational pricing model applied consistently across the various product lines in the Fund family, while assuring that the overall fees for each Fund (with few defined exceptions) are generally in line with the “pricing philosophy” currently in effect (i.e., that the total expense ratio of the Fund is no higher than the median expense ratio of funds in the same comparison universe of the Fund).
The Board also considered the expected profitability of Columbia Management and its affiliates in connection with Columbia Management providing investment management services to the Fund. In this regard, the Board referred to a detailed profitability report, discussing the profitability to Columbia Management and Ameriprise Financial from managing, operating and distributing the Funds. For purposes of approving the IMS Agreement for the Short-Term Period, the Board concluded that the investment management service fees were fair and reasonable, observing that the profitability levels also seemed reasonable.
Economies of Scale to be Realized
The Board also considered the economies of scale that might be realized by Columbia Management as the Fund grows and took note of the extent to which Fund shareholders might also benefit from such growth. In this regard, the Independent Trustees took into account that IMS fees decline as Fund assets exceed various breakpoints.
Based on the foregoing, the Board, including all of the Independent Trustees, concluded that, for purposes of its consideration of the renewal of the IMS Agreement for the Short-Term Period, the investment management service fees were fair and reasonable in light of the extent and quality of services provided. In reaching this conclusion, no single factor was determinative. The Board noted its understanding that it would undertake the full consideration of renewal of the IMS Agreement for the full annual period at its June 2015 meetings. On April 15, 2015, the Board, including all of the Independent Trustees, approved the renewal of the IMS Agreement for the Short-Term Period.
| | |
| 52 | | Semiannual Report 2015 |
| | |
| |
| COLUMBIA GLOBAL BOND FUND | | |
IMPORTANT INFORMATION ABOUT THIS REPORT
Each fund mails one shareholder report to each shareholder address. If you would like more than one report, please call shareholder services at 800.345.6611 and additional reports will be sent to you.
The policy of the Board is to vote the proxies of the companies in which each fund holds investments consistent with the procedures as stated in the Statement of Additional Information (SAI). You may obtain a copy of the SAI without charge by calling 800.345.6611; contacting your financial intermediary; visiting columbiathreadneedle.com/us; or searching the website of the Securities and Exchange Commission (SEC) at sec.gov. Information regarding how each fund voted proxies relating to portfolio securities is filed with the SEC by August 31st for the most recent 12-month period ending June 30th of that year, and is available without charge by visiting columbiathreadneedle.com/us, or searching the website of the SEC at sec.gov.
Each fund files a complete schedule of portfolio holdings with the SEC for the first and third quarters of each fiscal year on Form N-Q. Each fund’s Form N-Q is available on the SEC’s website at sec.gov and may be reviewed and copied at the SEC’s Public Reference Room in Washington, D.C. Information on the operation of the Public Reference Room may be obtained by calling 800.SEC.0330. Each fund’s complete schedule of portfolio holdings, as filed on Form N-Q, can also be obtained without charge, upon request, by calling 800.345.6611.
| | | | |
| Semiannual Report 2015 | | | 53 | |
Columbia Global Bond Fund
P.O. Box 8081
Boston, MA 02266-8081
This information is for use with concurrent or prior delivery of a fund prospectus. Please read and consider the investment objectives, risks, charges and expenses for any fund carefully before investing. For a prospectus and summary prospectus, which contains this and other important information about the Fund, go to columbiathreadneedle.com/us. The Fund is distributed by Columbia Management Investment Distributors, Inc., member FINRA, and managed by Columbia Management Investment Advisers, LLC.
Columbia Threadneedle Investments (Columbia Threadneedle) is the global brand name of the Columbia and Threadneedle group of companies. All rights reserved. Columbia Management Investment Distributors, Inc., 225 Franklin Street, Boston, MA 02110-2804
© 2015 Columbia Management Investment Advisers, LLC.
columbiathreadneedle.com/us
SAR153_10_E01_(06/15)

SEMIANNUAL REPORT
April 30, 2015

COLUMBIA SELIGMAN GLOBAL TECHNOLOGY FUND


ABOUT COLUMBIA THREADNEEDLE INVESTMENTS
Columbia Threadneedle Investments is a leading global asset management group that provides a broad range of actively managed investment strategies and solutions for individual, institutional and corporate clients around the world.
With more than 2,000 people, including over 450 investment professionals based in North America, Europe and Asia, we manage $506 billion* of assets across developed and emerging market equities, fixed income, asset allocation solutions and alternatives. We are the 12th largest manager of long-term mutual fund assets in the U.S.** and the 5th largest manager of retail funds in the U.K.***
Our priority is the investment success of our clients. We aim to deliver the investment outcomes they expect through an investment approach that is team-based, performance-driven and risk-aware. Our culture is dynamic and interactive. By sharing our insights across asset classes and geographies, we generate richer perspectives on global, regional and local investment landscapes. The ability to exchange and debate investment ideas in a collaborative environment enriches our teams’ investment processes. More importantly, it results in better informed investment decisions for our clients.
Columbia funds are distributed by Columbia Management Investment Distributors, Inc., member FINRA, and managed by Columbia Management Investment Advisers, LLC.
Columbia Threadneedle Investments (Columbia Threadneedle) is the global brand name of the Columbia and Threadneedle group of companies.
| * | | In U.S. dollars as of March 31, 2015. Source: Ameriprise Q1 Earnings Release. Includes all assets managed by entities in the Columbia and Threadneedle groups of companies. |
Contact us for more current data.
| ** | | Source: ICI as of March 31, 2015 for Columbia Management Investment Advisers, LLC. |
| *** | | Source: Investment Association as of March 2015 for Threadneedle Asset Management Limited. |
© 2015 Columbia Management Investment Advisers, LLC. All rights reserved.
Not part of the shareholder report
PRESIDENT’S MESSAGE

Dear Shareholder,
In a world that is changing faster than ever before, investors want asset managers who offer a global perspective while generating strong and sustainable returns. To that end, Columbia Management, in conjunction with its U.K.-based affiliate, Threadneedle Investments, has rebranded to Columbia Threadneedle Investments. The new global brand represents the combined capabilities, resources and reach of the global group, offering investors access to the best of both firms.
With a presence in 18 countries and more than 450 investment professionals*, our collective perspective and world view as Columbia Threadneedle Investments gives us deeper insight into what might affect the real-life financial outcomes clients are seeking. Putting our views into a global context enables us to build richer perspectives and create the right solutions, and provides us with enhanced capabilities to deliver consistent investment performance, which may ultimately lead to better investor outcomes.
As a result of the rebrand, you will begin to see our new logo and colors reflected in printed materials, such as this shareholder report, as well as on our new website — columbiathreadneedle.com/us. We encourage you to visit us online and view a new video on the “About Us” tab that speaks to the strength of the firm.
While we are introducing a new brand, in many ways, the investment company you know well has not changed. The following remain in effect:
| n | | Fund and strategy names |
| n | | Established investment teams, philosophies and processes |
| n | | Account services, features, servicing phone numbers and mailing addresses |
| n | | Columbia Management Investment Distributors as distributor and Columbia Management Investment Advisers as investment adviser |
We recognize that the money we manage represents the hard work and savings of people like you, and that everyone has different ambitions and different definitions of success. Investors have varying goals — funding their children’s education, enjoying their retirement, putting money aside for unexpected events, and more. Whatever your ambitions, we believe our wide range of investment products and solutions can help give you confidence that you will reach your goals.
The world is constantly changing, but our priority remains the same: to help you secure your finances, meet your goals and achieve success. Thank you for your continued investment with us. Our service representatives are available at 800.345.6611 to help with any questions.
Sincerely,

Christopher O. Petersen
President, Columbia Funds
Investors should consider the investment objectives, risks, charges and expenses of a mutual fund carefully before investing. For a free prospectus and summary prospectus, which contains this and other important information about a fund, visit columbiathreadneedle.com/us. The prospectus should be read carefully before investing.
* Source: Ameriprise as of December 1, 2014
Columbia Funds are distributed by Columbia Management Investment Distributors, Inc., member FINRA, and managed by Columbia Management Investment Advisers, LLC.
© 2015 Columbia Management Investment Advisers, LLC. All rights reserved.
Semiannual Report 2015
| | |
| |
| | COLUMBIA SELIGMAN GLOBAL TECHNOLOGY FUND |
TABLE OF CONTENTS
Fund Investment Manager
Columbia Management Investment
Advisers, LLC
225 Franklin Street
Boston, MA 02110
Fund Distributor
Columbia Management Investment
Distributors, Inc.
225 Franklin Street
Boston, MA 02110
Fund Transfer Agent
Columbia Management Investment
Services Corp.
P.O. Box 8081
Boston, MA 02266-8081
For more information about any of the funds, please visit columbiathreadneedle.com/us or call 800.345.6611. Customer Service Representatives are available to answer your questions Monday through Friday from 8 a.m. to 7 p.m. Eastern time.
The views expressed in this report reflect the current views of the respective parties. These views are not guarantees of future performance and involve certain risks, uncertainties and assumptions that are difficult to predict, so actual outcomes and results may differ significantly from the views expressed. These views are subject to change at any time based upon economic, market or other conditions and the respective parties disclaim any responsibility to update such views. These views may not be relied on as investment advice and, because investment decisions for a Columbia fund are based on numerous factors, may not be relied on as an indication of trading intent on behalf of any particular Columbia fund. References to specific securities should not be construed as a recommendation or investment advice.
Semiannual Report 2015
| | |
| |
| COLUMBIA SELIGMAN GLOBAL TECHNOLOGY FUND | | |
PERFORMANCE OVERVIEW
(Unaudited)
Performance Summary
| n | | Columbia Seligman Global Technology Fund (the Fund) Class A shares returned 12.41% excluding sales charges for the six-month period that ended April 30, 2015. |
| n | | The Fund outperformed its benchmark, the MSCI World IT Index (Net), which returned 7.17% for the same time period. |
| | | | | | | | | | | | | | | | | | |
Average Annual Total Returns (%) (for period ended April 30, 2015) | |
| | | Inception | | 6 Months
Cumulative | | | 1 Year | | | 5 Years | | | 10 Years | |
Class A | | 05/23/94 | | | | | | | | | | | | | | | | |
Excluding sales charges | | | | | 12.41 | | | | 27.08 | | | | 12.63 | | | | 12.03 | |
Including sales charges | | | | | 5.95 | | | | 19.76 | | | | 11.30 | | | | 11.37 | |
Class B | | 04/22/96 | | | | | | | | | | | | | | | | |
Excluding sales charges | | | | | 11.98 | | | | 26.19 | | | | 11.78 | | | | 11.19 | |
Including sales charges | | | | | 7.08 | | | | 21.19 | | | | 11.52 | | | | 11.19 | |
Class C | | 05/27/99 | | | | | | | | | | | | | | | | |
Excluding sales charges | | | | | 11.99 | | | | 26.14 | | | | 11.78 | | | | 11.19 | |
Including sales charges | | | | | 11.01 | | | | 25.14 | | | | 11.78 | | | | 11.19 | |
Class I* | | 08/03/09 | | | 12.67 | | | | 27.67 | | | | 13.15 | | | | 12.33 | |
Class K* | | 08/03/09 | | | 12.50 | | | | 27.27 | | | | 12.85 | | | | 12.15 | |
Class R | | 04/30/03 | | | 12.26 | | | | 26.77 | | | | 12.34 | | | | 11.73 | |
Class R4* | | 11/08/12 | | | 12.55 | | | | 27.39 | | | | 12.77 | | | | 12.10 | |
Class R5* | | 08/03/09 | | | 12.63 | | | | 27.65 | | | | 13.08 | | | | 12.29 | |
Class Z* | | 09/27/10 | | | 12.55 | | | | 27.39 | | | | 12.91 | | | | 12.16 | |
MSCI World IT Index (Net) | | | | | 7.17 | | | | 19.02 | | | | 12.44 | | | | 9.07 | |
Returns for Class A are shown with and without the maximum initial sales charge of 5.75%. Returns for Class B are shown with and without the applicable contingent deferred sales charge (CDSC) of 5.00% in the first year, declining to 1.00% in the sixth year and eliminated thereafter. Returns for Class C are shown with and without the 1.00% CDSC for the first year only. The Fund’s other classes are not subject to sales charges and have limited eligibility. Please see the Fund’s prospectus for details. Performance for different share classes will vary based on differences in sales charges and fees associated with each class. All results shown assume reinvestment of distributions during the period. Returns do not reflect the deduction of taxes that a shareholder may pay on Fund distributions or on the redemption of Fund shares. Performance results reflect the effect of any fee waivers or reimbursements of Fund expenses by Columbia Management Investment Advisers, LLC and/or any of its affiliates. Absent these fee waivers or expense reimbursement arrangements, performance results would have been lower.
The performance information shown represents past performance and is not a guarantee of future results. The investment return and principal value of your investment will fluctuate so that your shares, when redeemed, may be worth more or less than their original cost. Current performance may be lower or higher than the performance information shown. You may obtain performance information current to the most recent month-end by contacting your financial intermediary, visiting columbiathreadneedle.com/us or calling 800.345.6611.
| * | The returns shown for periods prior to the share class inception date (including returns for the Life of the Fund, if shown, which are since Fund inception) include the returns of the Fund’s oldest share class. These returns are adjusted to reflect any higher class-related operating expenses of the newer share classes, as applicable. Please visit columbiathreadneedle.com/us/investment-products/mutual-funds/appended-performance for more information. |
The MSCI World IT Index (Net) is a free float-adjusted market capitalization index designed to measure information technology stock performance in the global developed equity market.
Indices are not available for investment, are not professionally managed and do not reflect sales charges, fees, brokerage commissions, taxes (except the MSCI World IT Index (Net), which reflects reinvested dividends net of withholding taxes) or other expenses of investing. Securities in the Fund may not match those in an index.
| | |
| |
| | COLUMBIA SELIGMAN GLOBAL TECHNOLOGY FUND |
PORTFOLIO OVERVIEW
(Unaudited)
Portfolio Management
Paul Wick
Ajay Diwan
Sanjay Devgan
Rahul Narang
Shekhar Pramanick
Morningstar Style Box™
The Morningstar Style Box™ is based on a fund’s portfolio holdings. For equity funds, the vertical axis shows the market capitalization of the stocks owned, and the horizontal axis shows investment style (value, blend, or growth). Information shown is based on the most recent data provided by Morningstar.
© 2015 Morningstar, Inc. All rights reserved. The Morningstar information contained herein: (1) is proprietary to Morningstar and/or its content providers; (2) may not be copied or distributed; and (3) is not warranted to be accurate, complete or timely. Neither Morningstar nor its content providers are responsible for any damages or losses arising from any use of this information.
| | | | |
Top Ten Holdings (%)
(at April 30, 2015) | |
Lam Research Corp. (United States) | | | 8.3 | |
Synopsys, Inc. (United States) | | | 8.3 | |
Synaptics, Inc. (United States) | | | 6.3 | |
Apple, Inc. (United States) | | | 5.9 | |
Broadcom Corp., Class A (United States) | | | 5.9 | |
Teradyne, Inc. (United States) | | | 3.8 | |
Check Point Software Technologies Ltd. (Israel) | | | 3.1 | |
Maxim Integrated Products, Inc. (United States) | | | 3.1 | |
Microsemi Corp. (United States) | | | 3.0 | |
Marvell Technology Group Ltd. (United States) | | | 2.9 | |
Percentages indicated are based upon total investments (excluding Money Market Funds).
For further detail about these holdings, please refer to the section entitled “Portfolio of Investments.”
Fund holdings are as of the date given, are subject to change at any time, and are not recommendations to buy or sell any security.
| | | | |
Country Breakdown (%)
(at April 30, 2015) | |
Canada | | | 1.0 | |
China | | | 0.3 | |
Ireland | | | 2.1 | |
Israel | | | 3.3 | |
Japan | | | 0.3 | |
Netherlands | | | 3.3 | |
Singapore | | | 2.0 | |
Taiwan | | | 0.9 | |
United States(a) | | | 86.8 | |
Total | | | 100.0 | |
Country Breakdown is based primarily on issuer’s place of organization/incorporation. The Fund may use this and/or other criteria, for purposes of its investment policies, in determining whether an issuer is domestic (U.S.) or foreign. Percentages indicated are based upon total investments. The Fund’s portfolio composition is subject to change.
| (a) | Includes investments in Money Market Funds. |
| | |
| |
| COLUMBIA SELIGMAN GLOBAL TECHNOLOGY FUND | | |
PORTFOLIO OVERVIEW (continued)
(Unaudited)
| | | | |
Summary of Investments in Securities by Industry (%)
(at April 30, 2015) | |
Communications Equipment | | | 2.8 | |
Diversified Consumer Services | | | 0.7 | |
Electrical Equipment | | | 0.3 | |
Health Care Technology | | | 0.1 | |
Internet & Catalog Retail | | | 1.2 | |
Internet Software & Services | | | 3.8 | |
IT Services | | | 3.7 | |
Machinery | | | 0.3 | |
Media | | | 1.2 | |
Semiconductors & Semiconductor Equipment | | | 47.3 | |
Software | | | 26.1 | |
Specialty Retail | | | 0.3 | |
Technology Hardware, Storage & Peripherals | | | 7.8 | |
Money Market Funds | | | 4.2 | |
Total | | | 99.8 | |
Percentages indicated are based upon net assets. The Fund’s portfolio composition is subject to change.
| | |
| |
| | COLUMBIA SELIGMAN GLOBAL TECHNOLOGY FUND |
UNDERSTANDING YOUR FUND’S EXPENSES
(Unaudited)
As an investor, you incur two types of costs. There are transaction costs, which generally include sales charges on purchases and may include redemption fees. There are also ongoing costs, which generally include management fees, distribution and/or service fees, and other fund expenses. The following information is intended to help you understand your ongoing costs (in dollars) of investing in the Fund and to help you compare these costs with the ongoing costs of investing in other mutual funds.
Analyzing Your Fund’s Expenses
To illustrate these ongoing costs, we have provided examples and calculated the expenses paid by investors in each share class of the Fund during the period. The actual and hypothetical information in the table is based on an initial investment of $1,000 at the beginning of the period indicated and held for the entire period. Expense information is calculated two ways and each method provides you with different information. The amount listed in the “Actual” column is calculated using the Fund’s actual operating expenses and total return for the period. You may use the Actual information, together with the amount invested, to estimate the expenses that you paid over the period. Simply divide your account value by $1,000 (for example, an $8,600 account value divided by $1,000 = 8.6), then multiply the results by the expenses paid during the period under the “Actual” column. The amount listed in the “Hypothetical” column assumes a 5% annual rate of return before expenses (which is not the Fund’s actual return) and then applies the Fund’s actual expense ratio for the period to the hypothetical return. You should not use the hypothetical account values and expenses to estimate either your actual account balance at the end of the period or the expenses you paid during the period. See “Compare With Other Funds” below for details on how to use the hypothetical data.
Compare With Other Funds
Since all mutual funds are required to include the same hypothetical calculations about expenses in shareholder reports, you can use this information to compare the ongoing cost of investing in the Fund with other funds. To do so, compare the hypothetical example with the 5% hypothetical examples that appear in the shareholder reports of other funds. As you compare hypothetical examples of other funds, it is important to note that hypothetical examples are meant to highlight the ongoing costs of investing in a fund only and do not reflect any transaction costs, such as sales charges, or redemption or exchange fees. Therefore, the hypothetical calculations are useful in comparing ongoing costs only, and will not help you determine the relative total costs of owning different funds. If transaction costs were included in these calculations, your costs would be higher.
November 1, 2014 – April 30, 2015
| | | | | | | | | | | | | | | | | | | | | | | | | | | | |
| | | Account Value at the
Beginning of the
Period ($) | | | Account Value at the
End of the
Period ($) | | | Expenses Paid During
the Period ($) | | | Fund’s Annualized
Expense Ratio (%) | |
| | | | Actual | | | | Hypothetical | | | | Actual | | | | Hypothetical | | | | Actual | | | | Hypothetical | | | | Actual | |
Class A | | | 1,000.00 | | | | 1,000.00 | | | | 1,124.10 | | | | 1,017.70 | | | | 7.53 | | | | 7.15 | | | | 1.43 | |
Class B | | | 1,000.00 | | | | 1,000.00 | | | | 1,119.80 | | | | 1,013.98 | | | | 11.46 | | | | 10.89 | | | | 2.18 | |
Class C | | | 1,000.00 | | | | 1,000.00 | | | | 1,119.90 | | | | 1,013.98 | | | | 11.46 | | | | 10.89 | | | | 2.18 | |
Class I | | | 1,000.00 | | | | 1,000.00 | | | | 1,126.70 | | | | 1,019.89 | | | | 5.22 | | | | 4.96 | | | | 0.99 | |
Class K | | | 1,000.00 | | | | 1,000.00 | | | | 1,125.00 | | | | 1,018.50 | | | | 6.69 | | | | 6.36 | | | | 1.27 | |
Class R | | | 1,000.00 | | | | 1,000.00 | | | | 1,122.60 | | | | 1,016.46 | | | | 8.84 | | | | 8.40 | | | | 1.68 | |
Class R4 | | | 1,000.00 | | | | 1,000.00 | | | | 1,125.50 | | | | 1,018.94 | | | | 6.22 | | | | 5.91 | | | | 1.18 | |
Class R5 | | | 1,000.00 | | | | 1,000.00 | | | | 1,126.30 | | | | 1,019.74 | | | | 5.38 | | | | 5.11 | | | | 1.02 | |
Class Z | | | 1,000.00 | | | | 1,000.00 | | | | 1,125.50 | | | | 1,018.94 | | | | 6.22 | | | | 5.91 | | | | 1.18 | |
Expenses paid during the period are equal to the annualized expense ratio for each class as indicated above, multiplied by the average account value over the period and then multiplied by the number of days in the Fund’s most recent fiscal half year and divided by 365.
Expenses do not include fees and expenses incurred indirectly by the Fund from its investment in underlying funds, including affiliated and non-affiliated pooled investment vehicles, such as mutual funds and exchange-traded funds.
| | |
| |
| COLUMBIA SELIGMAN GLOBAL TECHNOLOGY FUND | | |
PORTFOLIO OF INVESTMENTS
April 30, 2015 (Unaudited)
(Percentages represent value of investments compared to net assets)
| | | | | | | | |
| Common Stocks 95.6% | | | | | | | | |
| Issuer | | Shares | | | Value ($) | |
CANADA 1.0% | | | | | | | | |
Kinaxis, Inc.(a) | | | 250,977 | | | | 5,764,254 | |
| | |
| | | | | | | | |
CHINA 0.3% | | | | | | | | |
JD.com, Inc. ADR(a) | | | 42,500 | | | | 1,426,300 | |
| | |
| | | | | | | | |
IRELAND 2.1% | | | | | | | | |
King Digital Entertainment PLC | | | 760,112 | | | | 12,055,376 | |
| | |
| | | | | | | | |
ISRAEL 3.3% | | | | | | | | |
Check Point Software Technologies Ltd.(a) | | | 203,160 | | | | 16,959,797 | |
| | |
Kornit Digital Ltd.(a) | | | 106,722 | | | | 1,590,158 | |
| | | | | | | | | |
Total | | | | | | | 18,549,955 | |
| | |
| | | | | | | | |
JAPAN 0.3% | | | | | | | | |
Mabuchi Motor Co., Ltd. | | | 28,100 | | | | 1,682,567 | |
| | |
| | | | | | | | |
NETHERLANDS 3.3% | | | | | | | | |
AVG Technologies NV(a) | | | 343,383 | | | | 8,213,721 | |
| | |
Mobileye NV(a) | | | 240,088 | | | | 10,770,348 | |
| | | | | | | | | |
Total | | | | | | | 18,984,069 | |
| | |
| | | | | | | | |
SINGAPORE 2.0% | | | | | | | | |
Avago Technologies Ltd. | | | 96,809 | | | | 11,315,036 | |
| | |
| | | | | | | | |
TAIWAN 0.9% | | | | | | | | |
Himax Technologies, Inc., ADR | | | 313,100 | | | | 1,916,172 | |
| | |
Taiwan Semiconductor Manufacturing Co., Ltd., ADR | | | 141,088 | | | | 3,448,191 | |
| | | | | | | | | |
Total | | | | | | | 5,364,363 | |
| | |
| | | | | | | | |
UNITED STATES 82.4% | | | | | | | | |
Activision Blizzard, Inc. | | | 265,621 | | | | 6,060,143 | |
| | |
Advanced Energy Industries, Inc.(a) | | | 514,053 | | | | 12,573,736 | |
| | |
Apple, Inc. | | | 259,085 | | | | 32,424,488 | |
| | |
Arista Networks, Inc.(a) | | | 78,400 | | | | 5,018,384 | |
| | |
Audience, Inc.(a) | | | 527,925 | | | | 2,512,923 | |
| | |
Broadcom Corp., Class A | | | 729,700 | | | | 32,256,389 | |
| | |
Cavium, Inc.(a) | | | 70,400 | | | | 4,561,216 | |
| | |
Cisco Systems, Inc. | | | 125,000 | | | | 3,603,750 | |
| | |
Computer Sciences Corp. | | | 50,900 | | | | 3,280,505 | |
| | |
Cornerstone OnDemand, Inc.(a) | | | 43,700 | | | | 1,251,131 | |
| | |
Cypress Semiconductor Corp. | | | 631,205 | | | | 8,407,651 | |
| | |
DIRECTV(a) | | | 74,200 | | | | 6,730,311 | |
| | |
Electronics for Imaging, Inc.(a) | | | 136,455 | | | | 5,694,267 | |
| | |
Euronet Worldwide, Inc.(a) | | | 24,800 | | | | 1,450,304 | |
| | | | | | | | |
| Common Stocks (continued) | |
| Issuer | | Shares | | | Value ($) | |
F5 Networks, Inc.(a) | | | 61,700 | | | | 7,528,634 | |
| | |
Fortinet, Inc.(a) | | | 41,000 | | | | 1,547,340 | |
| | |
GameStop Corp., Class A | | | 38,400 | | | | 1,479,936 | |
| | |
Godaddy, Inc., Class A(a) | | | 21,013 | | | | 526,796 | |
| | |
Google, Inc., Class A(a) | | | 15,700 | | | | 8,615,689 | |
| | |
Google, Inc., Class C(a) | | | 15,743 | | | | 8,459,400 | |
| | |
Hewlett-Packard Co. | | | 138,300 | | | | 4,559,751 | |
| | |
HomeAway, Inc.(a) | | | 53,100 | | | | 1,484,145 | |
| | |
Lam Research Corp. | | | 598,937 | | | | 45,267,658 | |
| | |
Lattice Semiconductor Corp.(a) | | | 1,090,187 | | | | 6,464,809 | |
| | |
LifeLock, Inc.(a) | | | 270,900 | | | | 3,957,849 | |
| | |
Marvell Technology Group Ltd. | | | 1,124,038 | | | | 15,747,772 | |
| | |
Mattson Technology, Inc.(a) | | | 1,321,361 | | | | 4,505,841 | |
| | |
Maxim Integrated Products, Inc. | | | 510,300 | | | | 16,753,149 | |
| | |
Micron Technology, Inc.(a) | | | 144,600 | | | | 4,067,598 | |
| | |
Microsemi Corp.(a) | | | 495,851 | | | | 16,541,589 | |
| | |
Nuance Communications, Inc.(a) | | | 238,757 | | | | 3,660,145 | |
| | |
PTC, Inc.(a) | | | 28,673 | | | | 1,099,323 | |
| | |
Q2 Holdings, Inc.(a) | | | 55,466 | | | | 1,128,733 | |
| | |
QLogic Corp.(a) | | | 117,100 | | | | 1,721,370 | |
| | |
Qorvo, Inc.(a) | | | 206,819 | | | | 13,631,440 | |
| | |
Red Hat, Inc.(a) | | | 41,800 | | | | 3,145,868 | |
| | |
Rovi Corp.(a) | | | 361,700 | | | | 6,695,067 | |
| | |
Sabre Corp. | | | 210,428 | | | | 5,237,553 | |
| | |
salesforce.com, Inc.(a) | | | 58,333 | | | | 4,247,809 | |
| | |
Skyworks Solutions, Inc. | | | 163,381 | | | | 15,071,897 | |
| | |
SolarWinds, Inc.(a) | | | 172,300 | | | | 8,404,794 | |
| | |
Synaptics, Inc.(a) | | | 403,496 | | | | 34,184,181 | |
| | |
Synopsys, Inc.(a) | | | 964,602 | | | | 45,220,542 | |
| | |
Teradyne, Inc. | | | 1,147,560 | | | | 20,942,970 | |
| | |
Travelport Worldwide Ltd. | | | 358,057 | | | | 5,668,042 | |
| | |
Vantiv, Inc., Class A(a) | | | 62,600 | | | | 2,447,660 | |
| | |
Veeva Systems Inc., Class A(a) | | | 22,100 | | | | 586,755 | |
| | |
Verint Systems, Inc.(a) | | | 124,618 | | | | 7,655,284 | |
| | |
Visa, Inc., Class A | | | 130,000 | | | | 8,586,500 | |
| | |
VMware, Inc., Class A(a) | | | 86,585 | | | | 7,628,139 | |
| | | | | | | | | |
Total | | | | | | | 470,297,226 | |
| | | | | | | | | |
Total Common Stocks | | | | | | | | |
(Cost: $399,091,117) | | | | | | | 545,439,146 | |
| | |
| | | | | | | | |
The accompanying Notes to Financial Statements are an integral part of this statement.
| | |
| |
| | COLUMBIA SELIGMAN GLOBAL TECHNOLOGY FUND |
PORTFOLIO OF INVESTMENTS (continued)
April 30, 2015 (Unaudited)
| | | | | | | | |
| Money Market Funds 4.2% | | | | | | | | |
| | | Shares | | | Value ($) | |
Columbia Short-Term Cash Fund, 0.111%(b)(c) | | | 23,914,966 | | | | 23,914,966 | |
| | | | | | | | | |
Total Money Market Funds | | | | | | | | |
(Cost: $23,914,966) | | | | | | | 23,914,966 | |
| | | | | | | | | |
Total Investments | | | | | | | | |
(Cost: $423,006,083) | | | | | | | 569,354,112 | |
| | | | | | | | | |
Other Assets & Liabilities, Net | | | | | | | 1,262,427 | |
| | | | | | | | | |
Net Assets | | | | | | | 570,616,539 | |
| | | | | | | | | |
Notes to Portfolio of Investments
| (b) | The rate shown is the seven-day current annualized yield at April 30, 2015. |
| (c) | As defined in the Investment Company Act of 1940, an affiliated company is one in which the Fund owns 5% or more of the company’s outstanding voting securities, or a company which is under common ownership or control with the Fund. Holdings and transactions in these affiliated companies during the period ended April 30, 2015, are as follows: |
| | | | | | | | | | | | | | | | | | | | | | | | |
| Issuer | | Beginning
Cost ($) | | | Purchase
Cost ($) | | | Proceeds
From Sales ($) | | | Ending
Cost ($) | | | Dividends —
Affiliated
Issuers ($) | | | Value ($) | |
Columbia Short-Term Cash Fund | | | 9,314,310 | | | | 90,679,320 | | | | (76,078,664 | ) | | | 23,914,966 | | | | 5,739 | | | | 23,914,966 | |
Abbreviation Legend
| | |
| ADR | | American Depositary Receipt |
Fair Value Measurements
Generally accepted accounting principles (GAAP) require disclosure regarding the inputs and valuation techniques used to measure fair value and any changes in valuation inputs or techniques. In addition, investments shall be disclosed by major category.
The Fund categorizes its fair value measurements according to a three-level hierarchy that maximizes the use of observable inputs and minimizes the use of unobservable inputs by prioritizing that the most observable input be used when available. Observable inputs are those that market participants would use in pricing an investment based on market data obtained from sources independent of the reporting entity. Unobservable inputs are those that reflect the Fund’s assumptions about the information market participants would use in pricing an investment. An investment’s level within the fair value hierarchy is based on the lowest level of any input that is deemed significant to the asset or liability’s fair value measurement. The input levels are not necessarily an indication of the risk or liquidity associated with investments at that level. For example, certain U.S. government securities are generally high quality and liquid, however, they are reflected as Level 2 because the inputs used to determine fair value may not always be quoted prices in an active market.
Fair value inputs are summarized in the three broad levels listed below:
| n | | Level 1 — Valuations based on quoted prices for investments in active markets that the Fund has the ability to access at the measurement date (including NAV for open-end mutual funds). Valuation adjustments are not applied to Level 1 investments. |
| n | | Level 2 — Valuations based on other significant observable inputs (including quoted prices for similar securities, interest rates, prepayment speeds, credit risks, etc.). |
| n | | Level 3 — Valuations based on significant unobservable inputs (including the Fund’s own assumptions and judgment in determining the fair value of investments). |
Inputs that are used in determining fair value of an investment may include price information, credit data, volatility statistics, and other factors. These inputs can be either observable or unobservable. The availability of observable inputs can vary between investments, and is affected by various factors such as the type of investment, and the volume and level of activity for that investment or similar investments in the marketplace. The inputs will be considered by the Investment Manager, along with any other relevant factors in the calculation of an investment’s fair value. The Fund uses prices and inputs that are current as of the measurement date, which may include periods of market dislocations. During these periods, the availability of prices and inputs may be reduced for many investments. This condition could cause an investment to be reclassified between the various levels within the hierarchy.
Foreign equity securities actively traded in markets where there is a significant delay in the local close relative to the New York Stock Exchange (NYSE) are classified as Level 2. The values of these securities may include an adjustment to reflect the impact of significant market movements following the close of local trading, as described in Note 2 to the financial statements — Security Valuation.
Investments falling into the Level 3 category are primarily supported by quoted prices from brokers and dealers participating in the market for those investments. However, these may be classified as Level 3 investments due to lack of market transparency and corroboration to support these quoted prices. Additionally, valuation models may be used as the pricing source for any remaining investments classified as Level 3. These models
The accompanying Notes to Financial Statements are an integral part of this statement.
| | |
| |
| COLUMBIA SELIGMAN GLOBAL TECHNOLOGY FUND | | |
PORTFOLIO OF INVESTMENTS (continued)
April 30, 2015 (Unaudited)
Fair Value Measurements (continued)
may rely on one or more significant unobservable inputs and/or significant assumptions by the Investment Manager. Inputs used in valuations may include, but are not limited to, financial statement analysis, capital account balances, discount rates and estimated cash flows, and comparable company data.
Under the direction of the Fund’s Board of Trustees (the Board), the Investment Manager’s Valuation Committee (the Committee) is responsible for overseeing the valuation procedures approved by the Board. The Committee consists of voting and non-voting members from various groups within the Investment Manager’s organization, including operations and accounting, trading and investments, compliance, risk management and legal.
The Committee meets at least monthly to review and approve valuation matters, which may include a description of specific valuation determinations, data regarding pricing information received from approved pricing vendors and brokers and the results of Board-approved valuation control policies and procedures (the Policies). The Policies address, among other things, instances when market quotations are or are not readily available, including recommendations of third party pricing vendors and a determination of appropriate pricing methodologies; events that require specific valuation determinations and assessment of fair value techniques; securities with a potential for stale pricing, including those that are illiquid, restricted, or in default; and the effectiveness of third party pricing vendors, including periodic reviews of vendors. The Committee meets more frequently, as needed, to discuss additional valuation matters, which may include the need to review back-testing results, review time-sensitive information or approve related valuation actions. The Committee reports to the Board, with members of the Committee meeting with the Board at each of its regularly scheduled meetings to discuss valuation matters and actions during the period, similar to those described earlier.
For investments categorized as Level 3, the Committee monitors information similar to that described above, which may include: (i) data specific to the issuer or comparable issuers, (ii) general market or specific sector news and (iii) quoted prices and specific or similar security transactions. The Committee considers this data and any changes from prior periods in order to assess the reasonableness of observable and unobservable inputs, any assumptions or internal models used to value those securities and changes in fair value. This data is also used to corroborate, when available, information received from approved pricing vendors and brokers. Various factors impact the frequency of monitoring this information (which may occur as often as daily). However, the Committee may determine that changes to inputs, assumptions and models are not required as a result of the monitoring procedures performed.
The following table is a summary of the inputs used to value the Fund’s investments at April 30, 2015:
| | | | | | | | | | | | | | | | |
| Description | | Level 1 Quoted Prices in Active Markets for Identical Assets ($) | | | Level 2 Other Significant Observable Inputs ($) | | | Level 3 Significant
Unobservable Inputs ($) | | | Total ($) | |
Equity Securities | | | | | | | | | | | | | | | | |
| | | | |
Common Stocks | | | | | | | | | | | | | | | | |
| | | | |
Consumer Discretionary | | | 19,262,438 | | | | — | | | | — | | | | 19,262,438 | |
| | | | |
Health Care | | | 586,755 | | | | — | | | | — | | | | 586,755 | |
| | | | |
Industrials | | | 1,590,158 | | | | 1,682,567 | | | | — | | | | 3,272,725 | |
| | | | |
Information Technology | | | 522,317,228 | | | | — | | | | — | | | | 522,317,228 | |
| | | | | | | | | | | | | | | | | |
Total Equity Securities | | | 543,756,579 | | | | 1,682,567 | | | | — | | | | 545,439,146 | |
| | | | | | | | | | | | | | | | | |
Mutual Funds | | | | | | | | | | | | | | | | |
| | | | |
Money Market Funds | | | 23,914,966 | | | | — | | | | — | | | | 23,914,966 | |
| | | | | | | | | | | | | | | | | |
Total Mutual Funds | | | 23,914,966 | | | | — | | | | — | | | | 23,914,966 | |
| | | | | | | | | | | | | | | | | |
Total | | | 567,671,545 | | | | 1,682,567 | | | | — | | | | 569,354,112 | |
| | | | | | | | | | | | | | | | | |
See the Portfolio of Investments for all investment classifications not indicated in the table.
The Fund’s assets assigned to the Level 2 input category are generally valued using the market approach, in which a security’s value is determined through reference to prices and information from market transactions for similar or identical assets. These assets include certain foreign securities for which a third party statistical pricing service may be employed for purposes of fair market valuation. The model utilized by such third party statistical pricing service takes into account a security’s correlation to available market data including, but not limited to, intraday index, ADR, and ETF movements.
There were no transfers of financial assets between levels during the period.
The accompanying Notes to Financial Statements are an integral part of this statement.
| | |
| |
| | COLUMBIA SELIGMAN GLOBAL TECHNOLOGY FUND |
STATEMENT OF ASSETS AND LIABILITIES
April 30, 2015 (Unaudited)
| | | | |
Assets | | | | |
| |
Investments, at value | | | | |
| |
Unaffiliated issuers (identified cost $399,091,117) | | | $545,439,146 | |
| |
Affiliated issuers (identified cost $23,914,966) | | | 23,914,966 | |
| |
Total investments (identified cost $423,006,083) | | | 569,354,112 | |
| |
Cash | | | 43,834 | |
| |
Receivable for: | | | | |
| |
Investments sold | | | 4,774,793 | |
| |
Capital shares sold | | | 354,312 | |
| |
Dividends | | | 62,073 | |
| |
Reclaims | | | 3,408 | |
| |
Prepaid expenses | | | 928 | |
| |
Other assets | | | 31,191 | |
| |
Total assets | | | 574,624,651 | |
| |
| |
Liabilities | | | | |
| |
Payable for: | | | | |
| |
Investments purchased | | | 3,350,090 | |
| |
Capital shares purchased | | | 373,455 | |
| |
Investment management fees | | | 13,547 | |
| |
Distribution and/or service fees | | | 5,664 | |
| |
Transfer agent fees | | | 98,779 | |
| |
Administration fees | | | 940 | |
| |
Plan administration fees | | | 1 | |
| |
Compensation of board members | | | 29,612 | |
| |
Other expenses | | | 136,024 | |
| |
Total liabilities | | | 4,008,112 | |
| |
Net assets applicable to outstanding capital stock | | | $570,616,539 | |
| |
| |
Represented by | | | | |
| |
Paid-in capital | | | $391,596,282 | |
| |
Excess of distributions over net investment income | | | (1,726,336 | ) |
| |
Accumulated net realized gain | | | 34,398,234 | |
| |
Unrealized appreciation (depreciation) on: | | | | |
| |
Investments | | | 146,348,029 | |
| |
Foreign currency translations | | | 330 | |
| |
Total — representing net assets applicable to outstanding capital stock | | | $570,616,539 | |
| |
The accompanying Notes to Financial Statements are an integral part of this statement.
| | |
| 10 | | Semiannual Report 2015 |
| | |
| |
| COLUMBIA SELIGMAN GLOBAL TECHNOLOGY FUND | | |
STATEMENT OF ASSETS AND LIABILITIES (continued)
April 30, 2015 (Unaudited)
| | | | |
Class A | | | | |
| |
Net assets | | | $432,949,974 | |
| |
Shares outstanding | | | 14,349,872 | |
| |
Net asset value per share | | | $30.17 | |
| |
Maximum offering price per share(a) | | | $32.01 | |
| |
Class B | | | | |
| |
Net assets | | | $4,042,361 | |
| |
Shares outstanding | | | 164,009 | |
| |
Net asset value per share | | | $24.65 | |
| |
Class C | | | | |
| |
Net assets | | | $87,248,744 | |
| |
Shares outstanding | | | 3,541,234 | |
| |
Net asset value per share | | | $24.64 | |
| |
Class I | | | | |
| |
Net assets | | | $3,813 | |
| |
Shares outstanding | | | 124 | |
| |
Net asset value per share(b) | | | $30.84 | |
| |
Class K | | | | |
| |
Net assets | | | $211,883 | |
| |
Shares outstanding | | | 6,957 | |
| |
Net asset value per share(b) | | | $30.45 | |
| |
Class R | | | | |
| |
Net assets | | | $8,989,023 | |
| |
Shares outstanding | | | 306,745 | |
| |
Net asset value per share | | | $29.30 | |
| |
Class R4 | | | | |
| |
Net assets | | | $243,758 | |
| |
Shares outstanding | | | 7,872 | |
| |
Net asset value per share | | | $30.97 | |
| |
Class R5 | | | | |
| |
Net assets | | | $216,575 | |
| |
Shares outstanding | | | 7,050 | |
| |
Net asset value per share | | | $30.72 | |
| |
Class Z | | | | |
| |
Net assets | | | $36,710,408 | |
| |
Shares outstanding | | | 1,199,926 | |
| |
Net asset value per share | | | $30.59 | |
| |
| (a) | The maximum offering price per share is calculated by dividing the net asset value per share by 1.0 minus the maximum sales charge of 5.75%. |
| (b) | Net asset value per share rounds to this amount due to fractional shares outstanding. |
The accompanying Notes to Financial Statements are an integral part of this statement.
| | | | |
| Semiannual Report 2015 | | | 11 | |
| | |
| |
| | COLUMBIA SELIGMAN GLOBAL TECHNOLOGY FUND |
STATEMENT OF OPERATIONS
Six Months Ended April 30, 2015 (Unaudited)
| | | | |
Net investment income | | | | |
| |
Income: | | | | |
| |
Dividends — unaffiliated issuers | | | $2,473,522 | |
| |
Dividends — affiliated issuers | | | 5,739 | |
| |
Total income | | | 2,479,261 | |
| |
| |
Expenses: | | | | |
| |
Investment management fees | | | 2,323,453 | |
| |
Distribution and/or service fees | | | | |
| |
Class A | | | 512,010 | |
| |
Class B | | | 22,517 | |
| |
Class C | | | 420,507 | |
| |
Class R | | | 21,238 | |
| |
Transfer agent fees | | | | |
| |
Class A | | | 428,104 | |
| |
Class B | | | 4,714 | |
| |
Class C | | | 87,910 | |
| |
Class K | | | 51 | |
| |
Class R | | | 8,875 | |
| |
Class R4 | | | 300 | |
| |
Class R5 | | | 36 | |
| |
Class Z | | | 37,788 | |
| |
Administration fees | | | 161,856 | |
| |
Plan administration fees | | | | |
| |
Class K | | | 253 | |
| |
Compensation of board members | | | 9,121 | |
| |
Custodian fees | | | 8,979 | |
| |
Printing and postage fees | | | 43,850 | |
| |
Registration fees | | | 53,357 | |
| |
Professional fees | | | 19,772 | |
| |
Other | | | 14,850 | |
| |
Total expenses | | | 4,179,541 | |
| |
Net investment loss | | | (1,700,280 | ) |
| |
| |
Realized and unrealized gain (loss) — net | | | | |
| |
Net realized gain (loss) on: | | | | |
| |
Investments | | | 35,891,069 | |
| |
Foreign currency translations | | | (26,911 | ) |
| |
Net realized gain | | | 35,864,158 | |
| |
Net change in unrealized appreciation (depreciation) on: | | | | |
| |
Investments | | | 28,179,219 | |
| |
Foreign currency translations | | | 336 | |
| |
Net change in unrealized appreciation | | | 28,179,555 | |
| |
Net realized and unrealized gain | | | 64,043,713 | |
| |
Net increase in net assets resulting from operations | | | $62,343,433 | |
| |
The accompanying Notes to Financial Statements are an integral part of this statement.
| | |
| 12 | | Semiannual Report 2015 |
| | |
| |
| COLUMBIA SELIGMAN GLOBAL TECHNOLOGY FUND | | |
STATEMENT OF CHANGES IN NET ASSETS
| | | | | | | | |
| | | Six Months Ended
April 30, 2015
(Unaudited) | | | Year Ended
October 31, 2014 | |
Operations | | | | | | | | |
| | |
Net investment loss | | | $(1,700,280 | ) | | | $(3,869,140 | ) |
| | |
Net realized gain | | | 35,864,158 | | | | 70,526,829 | |
| | |
Net change in unrealized appreciation | | | 28,179,555 | | | | 38,516,743 | |
| |
Net increase in net assets resulting from operations | | | 62,343,433 | | | | 105,174,432 | |
| |
| | |
Distributions to shareholders | | | | | | | | |
| | |
Net realized gains | | | | | | | | |
| | |
Class A | | | (44,430,647 | ) | | | (7,886,387 | ) |
| | |
Class B | | | (590,350 | ) | | | (162,300 | ) |
| | |
Class C | | | (10,492,719 | ) | | | (1,937,073 | ) |
| | |
Class I | | | (452 | ) | | | (322 | ) |
| | |
Class K | | | (22,097 | ) | | | (3,999 | ) |
| | |
Class R | | | (902,568 | ) | | | (176,715 | ) |
| | |
Class R4 | | | (28,723 | ) | | | (1,491 | ) |
| | |
Class R5 | | | (6,693 | ) | | | (1,944 | ) |
| | |
Class Z | | | (3,953,877 | ) | | | (375,160 | ) |
| |
Total distributions to shareholders | | | (60,428,126 | ) | | | (10,545,391 | ) |
| |
Increase (decrease) in net assets from capital stock activity | | | 64,848,730 | | | | (32,040,061 | ) |
| |
Total increase in net assets | | | 66,764,037 | | | | 62,588,980 | |
| | |
Net assets at beginning of period | | | 503,852,502 | | | | 441,263,522 | |
| |
Net assets at end of period | | | $570,616,539 | | | | $503,852,502 | |
| |
Excess of distributions over net investment income | | | $(1,726,336 | ) | | | $(26,056 | ) |
| |
The accompanying Notes to Financial Statements are an integral part of this statement.
| | | | |
| Semiannual Report 2015 | | | 13 | |
| | |
| |
| | COLUMBIA SELIGMAN GLOBAL TECHNOLOGY FUND |
STATEMENT OF CHANGES IN NET ASSETS (continued)
| | | | | | | | | | | | | | | | |
| | | Six Months Ended
April 30, 2015 (Unaudited) | | | Year Ended
October 31, 2014 | |
| | | Shares | | | Dollars ($) | | | Shares | | | Dollars ($) | |
Capital stock activity | | | | | �� | | | | | | | | | | | |
| | | | |
Class A shares | | | | | | | | | | | | | | | | |
| | | | |
Subscriptions(a) | | | 1,202,980 | | | | 35,845,395 | | | | 890,632 | | | | 24,519,346 | |
| | | | |
Distributions reinvested | | | 1,419,148 | | | | 40,616,003 | | | | 291,228 | | | | 7,254,492 | |
| | | | |
Redemptions | | | (856,664 | ) | | | (25,584,894 | ) | | | (2,518,069 | ) | | | (68,780,821 | ) |
| |
Net increase (decrease) | | | 1,765,464 | | | | 50,876,504 | | | | (1,336,209 | ) | | | (37,006,983 | ) |
| |
Class B shares | | | | | | | | | | | | | | | | |
| | | | |
Subscriptions | | | 6,338 | | | | 157,461 | | | | 4,417 | | | | 100,408 | |
| | | | |
Distributions reinvested | | | 24,510 | | | | 574,517 | | | | 7,477 | | | | 156,267 | |
| | | | |
Redemptions(a) | | | (55,122 | ) | | | (1,358,780 | ) | | | (114,946 | ) | | | (2,610,395 | ) |
| |
Net decrease | | | (24,274 | ) | | | (626,802 | ) | | | (103,052 | ) | | | (2,353,720 | ) |
| |
Class C shares | | | | | | | | | | | | | | | | |
| | | | |
Subscriptions | | | 220,037 | | | | 5,362,059 | | | | 130,742 | | | | 2,982,625 | |
| | | | |
Distributions reinvested | | | 371,025 | | | | 8,693,115 | | | | 75,467 | | | | 1,576,497 | |
| | | | |
Redemptions | | | (206,164 | ) | | | (5,047,450 | ) | | | (383,603 | ) | | | (8,680,147 | ) |
| |
Net increase (decrease) | | | 384,898 | | | | 9,007,724 | | | | (177,394 | ) | | | (4,121,025 | ) |
| |
Class I shares | | | | | | | | | | | | | | | | |
| | | | |
Redemptions | | | — | | | | — | | | | (420 | ) | | | (11,802 | ) |
| |
Net decrease | | | — | | | | — | | | | (420 | ) | | | (11,802 | ) |
| |
Class K shares | | | | | | | | | | | | | | | | |
| | | | |
Subscriptions | | | 37 | | | | 1,141 | | | | 107 | | | | 3,038 | |
| | | | |
Distributions reinvested | | | 753 | | | | 21,734 | | | | 155 | | | | 3,888 | |
| | | | |
Redemptions | | | — | | | | — | | | | (849 | ) | | | (23,447 | ) |
| |
Net increase (decrease) | | | 790 | | | | 22,875 | | | | (587 | ) | | | (16,521 | ) |
| |
Class R shares | | | | | | | | | | | | | | | | |
| | | | |
Subscriptions | | | 77,993 | | | | 2,266,536 | | | | 98,548 | | | | 2,627,261 | |
| | | | |
Distributions reinvested | | | 28,339 | | | | 788,395 | | | | 6,067 | | | | 147,429 | |
| | | | |
Redemptions | | | (59,476 | ) | | | (1,760,982 | ) | | | (148,292 | ) | | | (3,952,438 | ) |
| |
Net increase (decrease) | | | 46,856 | | | | 1,293,949 | | | | (43,677 | ) | | | (1,177,748 | ) |
| |
Class R4 shares | | | | | | | | | | | | | | | | |
| | | | |
Subscriptions | | | 4,292 | | | | 131,663 | | | | 7,343 | | | | 209,570 | |
| | | | |
Distributions reinvested | | | 967 | | | | 28,379 | | | | 56 | | | | 1,418 | |
| | | | |
Redemptions | | | (4,872 | ) | | | (151,912 | ) | | | (594 | ) | | | (16,195 | ) |
| |
Net increase | | | 387 | | | | 8,130 | | | | 6,805 | | | | 194,793 | |
| |
Class R5 shares | | | | | | | | | | | | | | | | |
| | | | |
Subscriptions | | | 5,840 | | | | 171,618 | | | | 1,204 | | | | 30,899 | |
| | | | |
Distributions reinvested | | | 216 | | | | 6,291 | | | | 69 | | | | 1,754 | |
| | | | |
Redemptions | | | (833 | ) | | | (25,554 | ) | | | (1,779 | ) | | | (49,068 | ) |
| |
Net increase (decrease) | | | 5,223 | | | | 152,355 | | | | (506 | ) | | | (16,415 | ) |
| |
Class Z shares | | | | | | | | | | | | | | | | |
| | | | |
Subscriptions | | | 350,177 | | | | 10,603,704 | | | | 543,421 | | | | 16,192,902 | |
| | | | |
Distributions reinvested | | | 85,454 | | | | 2,477,312 | | | | 5,437 | | | | 136,894 | |
| | | | |
Redemptions | | | (291,933 | ) | | | (8,967,021 | ) | | | (140,277 | ) | | | (3,860,436 | ) |
| |
Net increase | | | 143,698 | | | | 4,113,995 | | | | 408,581 | | | | 12,469,360 | |
| |
Total net increase (decrease) | | | 2,323,042 | | | | 64,848,730 | | | | (1,246,459 | ) | | | (32,040,061 | ) |
| |
| (a) | Includes conversions of Class B shares to Class A shares, if any. |
The accompanying Notes to Financial Statements are an integral part of this statement.
| | |
| 14 | | Semiannual Report 2015 |
| | |
| |
| COLUMBIA SELIGMAN GLOBAL TECHNOLOGY FUND | | |
FINANCIAL HIGHLIGHTS
The following tables are intended to help you understand the Fund’s financial performance. Certain information reflects financial results for a single share of a class held for the periods shown. Per share net investment income (loss) amounts are calculated based on average shares outstanding during the period. Total return assumes reinvestment of all dividends and distributions, if any. Total return does not reflect payment of sales charges, if any. Total return and portfolio turnover are not annualized for periods of less than one year. The portfolio turnover rate is calculated without regard to purchase and sales transactions of short-term instruments and certain derivatives, if any. If such transactions were included, the Fund’s portfolio turnover rate may be higher.
| | | | | | | | | | | | | | | | | | | | | | | | |
| |
| Six Months Ended
April 30, 2015 |
| | | Year Ended October 31, | |
Class A | | | (Unaudited) | | | | 2014 | | | | 2013 | | | | 2012 | | | | 2011 | | | | 2010 | |
Per share data | | | | | | | | | | | | | | | | | | | | | | | | |
Net asset value, beginning of period | | | $30.15 | | | | $24.60 | | | | $20.07 | | | | $20.16 | | | | $20.24 | | | | $16.50 | |
| | | | | | | | | | | | | | | | | | | | | | | | | |
Income from investment operations: | | | | | | | | | | | | | | | | | | | | | | | | |
| | | | | | |
Net investment loss | | | (0.08 | ) | | | (0.19 | ) | | | (0.16 | ) | | | (0.15 | ) | | | (0.15 | ) | | | (0.16 | ) |
| | | | | | | | | | | | | | | | | | | | | | | | | |
Net realized and unrealized gain | | | 3.63 | | | | 6.33 | | | | 4.69 | | | | 0.04 | | | | 0.21 | | | | 3.87 | |
| | | | | | | | | | | | | | | | | | | | | | | | | |
Total from investment operations | | | 3.55 | | | | 6.14 | | | | 4.53 | | | | (0.11 | ) | | | 0.06 | | | | 3.71 | |
| | | | | | | | | | | | | | | | | | | | | | | | | |
Less distributions to shareholders: | | | | | | | | | | | | | | | | | | | | | | | | |
| | | | | | |
Net investment income | | | — | | | | — | | | | — | | | | — | | | | (0.14 | ) | | | — | |
| | | | | | | | | | | | | | | | | | | | | | | | | |
Net realized gains | | | (3.53 | ) | | | (0.59 | ) | | | — | | | | — | | | | — | | | | — | |
| | | | | | | | | | | | | | | | | | | | | | | | | |
Total distributions to shareholders | | | (3.53 | ) | | | (0.59 | ) | | | — | | | | — | | | | (0.14 | ) | | | — | |
| | | | | | | | | | | | | | | | | | | | | | | | | |
Proceeds from regulatory settlements | | | — | | | | — | | | | — | | | | 0.02 | | | | — | | | | 0.03 | |
| | | | | | | | | | | | | | | | | | | | | | | | | |
Net asset value, end of period | | | $30.17 | | | | $30.15 | | | | $24.60 | | | | $20.07 | | | | $20.16 | | | | $20.24 | |
| | | | | | | | | | | | | | | | | | | | | | | | | |
Total return | | | 12.41 | % | | | 25.47 | % | | | 22.57 | % | | | (0.45 | %)(a) | | | 0.26 | % | | | 22.67 | %(b) |
| | | | | | | | | | | | | | | | | | | | | | | | | |
Ratios to average net assets(c) | | | | | | | | | | | | | | | | | | | | | | | | |
| | | | | | |
Total gross expenses | | | 1.43 | %(d) | | | 1.46 | % | | | 1.55 | % | | | 1.50 | % | | | 1.49 | % | | | 1.67 | % |
| | | | | | | | | | | | | | | | | | | | | | | | | |
Total net expenses(e) | | | 1.43 | %(d) | | | 1.46 | %(f) | | | 1.50 | %(f) | | | 1.40 | %(f) | | | 1.49 | %(f) | | | 1.57 | % |
| | | | | | | | | | | | | | | | | | | | | | | | | |
Net investment loss | | | (0.52 | %)(d) | | | (0.70 | %) | | | (0.70 | %) | | | (0.70 | %) | | | (0.70 | %) | | | (0.89 | %) |
| | | | | | | | | | | | | | | | | | | | | | | | | |
Supplemental data | | | | | | | | | | | | | | | | | | | | | | | | |
| | | | | | |
Net assets, end of period (in thousands) | | | $432,950 | | | | $379,433 | | | | $342,423 | | | | $311,523 | | | | $364,366 | | | | $418,600 | |
| | | | | | | | | | | | | | | | | | | | | | | | | |
Portfolio turnover | | | 33 | % | | | 89 | % | | | 81 | % | | | 88 | % | | | 95 | % | | | 111 | % |
| | | | | | | | | | | | | | | | | | | | | | | | | |
Notes to Financial Highlights
| (a) | The Fund received proceeds from regulatory settlements. Had the Fund not received these proceeds, the total return would have been lower by 0.11%. |
| (b) | The Fund received proceeds from regulatory settlements. Had the Fund not received these proceeds, the total return would have been lower by 0.16%. |
| (c) | In addition to the fees and expenses that the Fund bears directly, the Fund indirectly bears a pro rata share of the fees and expenses of any other funds in which it invests. Such indirect expenses are not included in the Fund’s reported expense ratios. |
| (e) | Total net expenses include the impact of certain fee waivers/expense reimbursements made by the Investment Manager and certain of its affiliates, if applicable. |
| (f) | The benefits derived from expense reductions had an impact of less than 0.01%. |
The accompanying Notes to Financial Statements are an integral part of this statement.
| | | | |
| Semiannual Report 2015 | | | 15 | |
| | |
| |
| | COLUMBIA SELIGMAN GLOBAL TECHNOLOGY FUND |
FINANCIAL HIGHLIGHTS (continued)
| | | | | | | | | | | | | | | | | | | | | | | | |
| |
| Six Months Ended
April 30, 2015 |
| | | Year Ended October 31, | |
Class B | | | (Unaudited) | | | | 2014 | | | | 2013 | | | | 2012 | | | | 2011 | | | | 2010 | |
Per share data | | | | | | | | | | | | | | | | | | | | | | | | |
Net asset value, beginning of period | | | $25.14 | | | | $20.75 | | | | $17.06 | | | | $17.27 | | | | $17.35 | | | | $14.25 | |
| | | | | | | | | | | | | | | | | | | | | | | | | |
Income from investment operations: | | | | | | | | | | | | | | | | | | | | | | | | |
| | | | | | |
Net investment loss | | | (0.15 | ) | | | (0.33 | ) | | | (0.27 | ) | | | (0.27 | ) | | | (0.26 | ) | | | (0.26 | ) |
| | | | | | | | | | | | | | | | | | | | | | | | | |
Net realized and unrealized gain | | | 2.99 | | | | 5.31 | | | | 3.96 | | | | 0.04 | | | | 0.18 | | | | 3.33 | |
| | | | | | | | | | | | | | | | | | | | | | | | | |
Total from investment operations | | | 2.84 | | | | 4.98 | | | | 3.69 | | | | (0.23 | ) | | | (0.08 | ) | | | 3.07 | |
| | | | | | | | | | | | | | | | | | | | | | | | | |
Less distributions to shareholders: | | | | | | | | | | | | | | | | | | | | | | | | |
| | | | | | |
Net realized gains | | | (3.33 | ) | | | (0.59 | ) | | | — | | | | — | | | | — | | | | — | |
| | | | | | | | | | | | | | | | | | | | | | | | | |
Total distributions to shareholders | | | (3.33 | ) | | | (0.59 | ) | | | — | | | | — | | | | — | | | | — | |
| | | | | | | | | | | | | | | | | | | | | | | | | |
Proceeds from regulatory settlements | | | — | | | | — | | | | — | | | | 0.02 | | | | — | | | | 0.03 | |
| | | | | | | | | | | | | | | | | | | | | | | | | |
Net asset value, end of period | | | $24.65 | | | | $25.14 | | | | $20.75 | | | | $17.06 | | | | $17.27 | | | | $17.35 | |
| | | | | | | | | | | | | | | | | | | | | | | | | |
Total return | | | 11.98 | % | | | 24.58 | % | | | 21.63 | % | | | (1.22 | %)(a) | | | (0.46 | %) | | | 21.75 | %(b) |
| | | | | | | | | | | | | | | | | | | | | | | | | |
Ratios to average net assets(c) | | | | | | | | | | | | | | | | | | | | | | | | |
| | | | | | |
Total gross expenses | | | 2.18 | %(d) | | | 2.21 | % | | | 2.30 | % | | | 2.26 | % | | | 2.25 | % | | | 2.44 | % |
| | | | | | | | | | | | | | | | | | | | | | | | | |
Total net expenses(e) | | | 2.18 | %(d) | | | 2.21 | %(f) | | | 2.25 | %(f) | | | 2.17 | %(f) | | | 2.25 | %(f) | | | 2.34 | % |
| | | | | | | | | | | | | | | | | | | | | | | | | |
Net investment loss | | | (1.26 | %)(d) | | | (1.45 | %) | | | (1.43 | %) | | | (1.47 | %) | | | (1.47 | %) | | | (1.66 | %) |
| | | | | | | | | | | | | | | | | | | | | | | | | |
Supplemental data | | | | | | | | | | | | | | | | | | | | | | | | |
| | | | | | |
Net assets, end of period (in thousands) | | | $4,042 | | | | $4,732 | | | | $6,045 | | | | $7,858 | | | | $12,499 | | | | $19,558 | |
| | | | | | | | | | | | | | | | | | | | | | | | | |
Portfolio turnover | | | 33 | % | | | 89 | % | | | 81 | % | | | 88 | % | | | 95 | % | | | 111 | % |
| | | | | | | | | | | | | | | | | | | | | | | | | |
Notes to Financial Highlights
| (a) | The Fund received proceeds from regulatory settlements. Had the Fund not received these proceeds, the total return would have been lower by 0.11%. |
| (b) | The Fund received proceeds from regulatory settlements. Had the Fund not received these proceeds, the total return would have been lower by 0.18%. |
| (c) | In addition to the fees and expenses that the Fund bears directly, the Fund indirectly bears a pro rata share of the fees and expenses of any other funds in which it invests. Such indirect expenses are not included in the Fund’s reported expense ratios. |
| (e) | Total net expenses include the impact of certain fee waivers/expense reimbursements made by the Investment Manager and certain of its affiliates, if applicable. |
| (f) | The benefits derived from expense reductions had an impact of less than 0.01%. |
The accompanying Notes to Financial Statements are an integral part of this statement.
| | |
| 16 | | Semiannual Report 2015 |
| | |
| |
| COLUMBIA SELIGMAN GLOBAL TECHNOLOGY FUND | | |
FINANCIAL HIGHLIGHTS (continued)
| | | | | | | | | | | | | | | | | | | | | | | | |
| |
| Six Months Ended
April 30, 2015 |
| | | Year Ended October 31, | |
Class C | | | (Unaudited) | | | | 2014 | | | | 2013 | | | | 2012 | | | | 2011 | | | | 2010 | |
Per share data | | | | | | | | | | | | | | | | | | | | | | | | |
Net asset value, beginning of period | | | $25.13 | | | | $20.74 | | | | $17.06 | | | | $17.26 | | | | $17.37 | | | | $14.25 | |
| | | | | | | | | | | | | | | | | | | | | | | | | |
Income from investment operations: | | | | | | | | | | | | | | | | | | | | | | | | |
| | | | | | |
Net investment loss | | | (0.15 | ) | | | (0.33 | ) | | | (0.28 | ) | | | (0.26 | ) | | | (0.26 | ) | | | (0.26 | ) |
| | | | | | | | | | | | | | | | | | | | | | | | | |
Net realized and unrealized gain | | | 2.99 | | | | 5.31 | | | | 3.96 | | | | 0.04 | | | | 0.17 | | | | 3.35 | |
| | | | | | | | | | | | | | | | | | | | | | | | | |
Total from investment operations | | | 2.84 | | | | 4.98 | | | | 3.68 | | | | (0.22 | ) | | | (0.09 | ) | | | 3.09 | |
| | | | | | | | | | | | | | | | | | | | | | | | | |
Less distributions to shareholders: | | | | | | | | | | | | | | | | | | | | | | | | |
| | | | | | |
Net investment income | | | — | | | | — | | | | — | | | | — | | | | (0.02 | ) | | | — | |
| | | | | | | | | | | | | | | | | | | | | | | | | |
Net realized gains | | | (3.33 | ) | | | (0.59 | ) | | | — | | | | — | | | | — | | | | — | |
| | | | | | | | | | | | | | | | | | | | | | | | | |
Total distributions to shareholders | | | (3.33 | ) | | | (0.59 | ) | | | — | | | | — | | | | (0.02 | ) | | | — | |
| | | | | | | | | | | | | | | | | | | | | | | | | |
Proceeds from regulatory settlements | | | — | | | | — | | | | — | | | | 0.02 | | | | — | | | | 0.03 | |
| | | | | | | | | | | | | | | | | | | | | | | | | |
Net asset value, end of period | | | $24.64 | | | | $25.13 | | | | $20.74 | | | | $17.06 | | | | $17.26 | | | | $17.37 | |
| | | | | | | | | | | | | | | | | | | | | | | | | |
Total return | | | 11.99 | % | | | 24.59 | % | | | 21.57 | % | | | (1.16 | %)(a) | | | (0.51 | %) | | | 21.89 | %(b) |
| | | | | | | | | | | | | | | | | | | | | | | | | |
Ratios to average net assets(c) | | | | | | | | | | | | | | | | | | | | | | | | |
| | | | | | |
Total gross expenses | | | 2.18 | %(d) | | | 2.21 | % | | | 2.30 | % | | | 2.25 | % | | | 2.25 | % | | | 2.43 | % |
| | | | | | | | | | | | | | | | | | | | | | | | | |
Total net expenses(e) | | | 2.18 | %(d) | | | 2.21 | %(f) | | | 2.25 | %(f) | | | 2.15 | %(f) | | | 2.25 | %(f) | | | 2.33 | % |
| | | | | | | | | | | | | | | | | | | | | | | | | |
Net investment loss | | | (1.27 | %)(d) | | | (1.45 | %) | | | (1.45 | %) | | | (1.45 | %) | | | (1.45 | %) | | | (1.65 | %) |
| | | | | | | | | | | | | | | | | | | | | | | | | |
Supplemental data | | | | | | | | | | | | | | | | | | | | | | | | |
| | | | | | |
Net assets, end of period (in thousands) | | | $87,249 | | | | $79,309 | | | | $69,151 | | | | $64,360 | | | | $72,162 | | | | $80,128 | |
| | | | | | | | | | | | | | | | | | | | | | | | | |
Portfolio turnover | | | 33 | % | | | 89 | % | | | 81 | % | | | 88 | % | | | 95 | % | | | 111 | % |
| | | | | | | | | | | | | | | | | | | | | | | | | |
Notes to Financial Highlights
| (a) | The Fund received proceeds from regulatory settlements. Had the Fund not received these proceeds, the total return would have been lower by 0.11%. |
| (b) | The Fund received proceeds from regulatory settlements. Had the Fund not received these proceeds, the total return would have been lower by 0.18%. |
| (c) | In addition to the fees and expenses that the Fund bears directly, the Fund indirectly bears a pro rata share of the fees and expenses of any other funds in which it invests. Such indirect expenses are not included in the Fund’s reported expense ratios. |
| (e) | Total net expenses include the impact of certain fee waivers/expense reimbursements made by the Investment Manager and certain of its affiliates, if applicable. |
| (f) | The benefits derived from expense reductions had an impact of less than 0.01%. |
The accompanying Notes to Financial Statements are an integral part of this statement.
| | | | |
| Semiannual Report 2015 | | | 17 | |
| | |
| |
| | COLUMBIA SELIGMAN GLOBAL TECHNOLOGY FUND |
FINANCIAL HIGHLIGHTS (continued)
| | | | | | | | | | | | | | | | | | | | | | | | |
| |
| Six Months Ended
April 30, 2015 |
| | | Year Ended October 31, | |
Class I | | | (Unaudited) | | | | 2014 | | | | 2013 | | | | 2012 | | | | 2011 | | | | 2010 | |
Per share data | | | | | | | | | | | | | | | | | | | | | | | | |
Net asset value, beginning of period | | | $30.80 | | | | $25.00 | | | | $20.30 | | | | $20.31 | | | | $20.37 | | | | $16.52 | |
| | | | | | | | | | | | | | | | | | | | | | | | | |
Income from investment operations: | | | | | | | | | | | | | | | | | | | | | | | | |
| | | | | | |
Net investment loss | | | (0.01 | ) | | | (0.06 | ) | | | (0.05 | ) | | | (0.06 | ) | | | (0.06 | ) | | | (0.08 | ) |
| | | | | | | | | | | | | | | | | | | | | | | | | |
Net realized and unrealized gain | | | 3.71 | | | | 6.45 | | | | 4.75 | | | | 0.03 | | | | 0.22 | | | | 3.90 | |
| | | | | | | | | | | | | | | | | | | | | | | | | |
Total from investment operations | | | 3.70 | | | | 6.39 | | | | 4.70 | | | | (0.03 | ) | | | 0.16 | | | | 3.82 | |
| | | | | | | | | | | | | | | | | | | | | | | | | |
Less distributions to shareholders: | | | | | | | | | | | | | | | | | | | | | | | | |
| | | | | | |
Net investment income | | | — | | | | — | | | | — | | | | — | | | | (0.22 | ) | | | — | |
| | | | | | | | | | | | | | | | | | | | | | | | | |
Net realized gains | | | (3.66 | ) | | | (0.59 | ) | | | — | | | | — | | | | — | | | | — | |
| | | | | | | | | | | | | | | | | | | | | | | | | |
Total distributions to shareholders | | | (3.66 | ) | | | (0.59 | ) | | | — | | | | — | | | | (0.22 | ) | | | — | |
| | | | | | | | | | | | | | | | | | | | | | | | | |
Proceeds from regulatory settlements | | | — | | | | — | | | | — | | | | 0.02 | | | | — | | | | 0.03 | |
| | | | | | | | | | | | | | | | | | | | | | | | | |
Net asset value, end of period | | | $30.84 | | | | $30.80 | | | | $25.00 | | | | $20.30 | | | | $20.31 | | | | $20.37 | |
| | | | | | | | | | | | | | | | | | | | | | | | | |
Total return | | | 12.67 | % | | | 26.07 | % | | | 23.15 | % | | | (0.05 | %)(a) | | | 0.77 | % | | | 23.31 | %(b) |
| | | | | | | | | | | | | | | | | | | | | | | | | |
Ratios to average net assets(c) | | | | | | | | | | | | | | | | | | | | | | | | |
| | | | | | |
Total gross expenses | | | 0.99 | %(d) | | | 0.99 | % | | | 1.04 | % | | | 1.00 | % | | | 1.09 | % | | | 1.17 | % |
| | | | | | | | | | | | | | | | | | | | | | | | | |
Total net expenses(e) | | | 0.99 | %(d) | | | 0.99 | % | | | 1.03 | % | | | 0.97 | % | | | 1.09 | % | | | 1.12 | % |
| | | | | | | | | | | | | | | | | | | | | | | | | |
Net investment loss | | | (0.08 | %)(d) | | | (0.21 | %) | | | (0.23 | %) | | | (0.26 | %) | | | (0.28 | %) | | | (0.45 | %) |
| | | | | | | | | | | | | | | | | | | | | | | | | |
Supplemental data | | | | | | | | | | | | | | | | | | | | | | | | |
| | | | | | |
Net assets, end of period (in thousands) | | | $4 | | | | $4 | | | | $14 | | | | $11 | | | | $11 | | | | $28,563 | |
| | | | | | | | | | | | | | | | | | | | | | | | | |
Portfolio turnover | | | 33 | % | | | 89 | % | | | 81 | % | | | 88 | % | | | 95 | % | | | 111 | % |
| | | | | | | | | | | | | | | | | | | | | | | | | |
Notes to Financial Highlights
| (a) | The Fund received proceeds from regulatory settlements. Had the Fund not received these proceeds, the total return would have been lower by 0.11%. |
| (b) | The Fund received proceeds from regulatory settlements. Had the Fund not received these proceeds, the total return would have been lower by 0.16%. |
| (c) | In addition to the fees and expenses that the Fund bears directly, the Fund indirectly bears a pro rata share of the fees and expenses of any other funds in which it invests. Such indirect expenses are not included in the Fund’s reported expense ratios. |
| (e) | Total net expenses include the impact of certain fee waivers/expense reimbursements made by the Investment Manager and certain of its affiliates, if applicable. |
The accompanying Notes to Financial Statements are an integral part of this statement.
| | |
| 18 | | Semiannual Report 2015 |
| | |
| |
| COLUMBIA SELIGMAN GLOBAL TECHNOLOGY FUND | | |
FINANCIAL HIGHLIGHTS (continued)
| | | | | | | | | | | | | | | | | | | | | | | | |
| |
| Six Months Ended
April 30, 2015 |
| | | Year Ended October 31, | |
Class K | | | (Unaudited) | | | | 2014 | | | | 2013 | | | | 2012 | | | | 2011 | | | | 2010 | |
Per share data | | | | | | | | | | | | | | | | | | | | | | | | |
Net asset value, beginning of period | | | $30.42 | | | | $24.77 | | | | $20.18 | | | | $20.22 | | | | $20.29 | | | | $16.51 | |
| | | | | | | | | | | | | | | | | | | | | | | | | |
Income from investment operations: | | | | | | | | | | | | | | | | | | | | | | | | |
| | | | | | |
Net investment loss | | | (0.05 | ) | | | (0.15 | ) | | | (0.12 | ) | | | (0.10 | ) | | | (0.10 | ) | | | (0.14 | ) |
| | | | | | | | | | | | | | | | | | | | | | | | | |
Net realized and unrealized gain | | | 3.66 | | | | 6.39 | | | | 4.71 | | | | 0.04 | | | | 0.20 | | | | 3.89 | |
| | | | | | | | | | | | | | | | | | | | | | | | | |
Total from investment operations | | | 3.61 | | | | 6.24 | | | | 4.59 | | | | (0.06 | ) | | | 0.10 | | | | 3.75 | |
| | | | | | | | | | | | | | | | | | | | | | | | | |
Less distributions to shareholders: | | | | | | | | | | | | | | | | | | | | | | | | |
| | | | | | |
Net investment income | | | — | | | | — | | | | — | | | | — | | | | (0.17 | ) | | | — | |
| | | | | | | | | | | | | | | | | | | | | | | | | |
Net realized gains | | | (3.58 | ) | | | (0.59 | ) | | | — | | | | — | | | | — | | | | — | |
| | | | | | | | | | | | | | | | | | | | | | | | | |
Total distributions to shareholders | | | (3.58 | ) | | | (0.59 | ) | | | — | | | | — | | | | (0.17 | ) | | | — | |
| | | | | | | | | | | | | | | | | | | | | | | | | |
Proceeds from regulatory settlements | | | — | | | | — | | | | — | | | | 0.02 | | | | — | | | | 0.03 | |
| | | | | | | | | | | | | | | | | | | | | | | | | |
Net asset value, end of period | | | $30.45 | | | | $30.42 | | | | $24.77 | | | | $20.18 | | | | $20.22 | | | | $20.29 | |
| | | | | | | | | | | | | | | | | | | | | | | | | |
Total return | | | 12.50 | % | | | 25.70 | % | | | 22.75 | % | | | (0.20 | %)(a) | | | 0.48 | % | | | 22.89 | %(b) |
| | | | | | | | | | | | | | | | | | | | | | | | | |
Ratios to average net assets(c) | | | | | | | | | | | | | | | | | | | | | | | | |
| | | | | | |
Total gross expenses | | | 1.27 | %(d) | | | 1.29 | % | | | 1.34 | % | | | 1.30 | % | | | 1.29 | % | | | 1.48 | % |
| | | | | | | | | | | | | | | | | | | | | | | | | |
Total net expenses(e) | | | 1.27 | %(d) | | | 1.29 | % | | | 1.32 | % | | | 1.16 | % | | | 1.29 | % | | | 1.42 | % |
| | | | | | | | | | | | | | | | | | | | | | | | | |
Net investment loss | | | (0.36 | %)(d) | | | (0.52 | %) | | | (0.52 | %) | | | (0.45 | %) | | | (0.50 | %) | | | (0.75 | %) |
| | | | | | | | | | | | | | | | | | | | | | | | | |
Supplemental data | | | | | | | | | | | | | | | | | | | | | | | | |
| | | | | | |
Net assets, end of period (in thousands) | | | $212 | | | | $188 | | | | $167 | | | | $231 | | | | $432 | | | | $534 | |
| | | | | | | | | | | | | | | | | | | | | | | | | |
Portfolio turnover | | | 33 | % | | | 89 | % | | | 81 | % | | | 88 | % | | | 95 | % | | | 111 | % |
| | | | | | | | | | | | | | | | | | | | | | | | | |
Notes to Financial Highlights
| (a) | The Fund received proceeds from regulatory settlements. Had the Fund not received these proceeds, the total return would have been lower by 0.11%. |
| (b) | The Fund received proceeds from regulatory settlements. Had the Fund not received these proceeds, the total return would have been lower by 0.16%. |
| (c) | In addition to the fees and expenses that the Fund bears directly, the Fund indirectly bears a pro rata share of the fees and expenses of any other funds in which it invests. Such indirect expenses are not included in the Fund’s reported expense ratios. |
| (e) | Total net expenses include the impact of certain fee waivers/expense reimbursements made by the Investment Manager and certain of its affiliates, if applicable. |
The accompanying Notes to Financial Statements are an integral part of this statement.
| | | | |
| Semiannual Report 2015 | | | 19 | |
| | |
| |
| | COLUMBIA SELIGMAN GLOBAL TECHNOLOGY FUND |
FINANCIAL HIGHLIGHTS (continued)
| | | | | | | | | | | | | | | | | | | | | | | | |
| |
| Six Months Ended
April 30, 2015 |
| | | Year Ended October 31, | |
Class R | | | (Unaudited) | | | | 2014 | | | | 2013 | | | | 2012 | | | | 2011 | | | | 2010 | |
Per share data | | | | | | | | | | | | | | | | | | | | | | | | |
Net asset value, beginning of period | | | $29.35 | | | | $24.02 | | | | $19.65 | | | | $19.78 | | | | $19.88 | | | | $16.25 | |
| | | | | | | | | | | | | | | | | | | | | | | | | |
Income from investment operations: | | | | | | | | | | | | | | | | | | | | | | | | |
| | | | | | |
Net investment loss | | | (0.11 | ) | | | (0.25 | ) | | | (0.21 | ) | | | (0.19 | ) | | | (0.19 | ) | | | (0.22 | ) |
| | | | | | | | | | | | | | | | | | | | | | | | | |
Net realized and unrealized gain | | | 3.52 | | | | 6.17 | | | | 4.58 | | | | 0.04 | | | | 0.19 | | | | 3.82 | |
| | | | | | | | | | | | | | | | | | | | | | | | | |
Total from investment operations | | | 3.41 | | | | 5.92 | | | | 4.37 | | | | (0.15 | ) | | | — | | | | 3.60 | |
| | | | | | | | | | | | | | | | | | | | | | | | | |
Less distributions to shareholders: | | | | | | | | | | | | | | | | | | | | | | | | |
| | | | | | |
Net investment income | | | — | | | | — | | | | — | | | | — | | | | (0.10 | ) | | | — | |
| | | | | | | | | | | | | | | | | | | | | | | | | |
Net realized gains | | | (3.46 | ) | | | (0.59 | ) | | | — | | | | — | | | | — | | | | — | |
| | | | | | | | | | | | | | | | | | | | | | | | | |
Total distributions to shareholders | | | (3.46 | ) | | | (0.59 | ) | | | — | | | | — | | | | (0.10 | ) | | | — | |
| | | | | | | | | | | | | | | | | | | | | | | | | |
Proceeds from regulatory settlements | | | — | | | | — | | | | — | | | | 0.02 | | | | — | | | | 0.03 | |
| | | | | | | | | | | | | | | | | | | | | | | | | |
Net asset value, end of period | | | $29.30 | | | | $29.35 | | | | $24.02 | | | | $19.65 | | | | $19.78 | | | | $19.88 | |
| | | | | | | | | | | | | | | | | | | | | | | | | |
Total return | | | 12.26 | % | | | 25.16 | % | | | 22.24 | % | | | (0.66 | %)(a) | | | (0.04 | %) | | | 22.34 | %(b) |
| | | | | | | | | | | | | | | | | | | | | | | | | |
Ratios to average net assets(c) | | | | | | | | | | | | | | | | | | | | | | | | |
| | | | | | |
Total gross expenses | | | 1.68 | %(d) | | | 1.71 | % | | | 1.80 | % | | | 1.75 | % | | | 1.74 | % | | | 1.95 | % |
| | | | | | | | | | | | | | | | | | | | | | | | | |
Total net expenses(e) | | | 1.68 | %(d) | | | 1.71 | %(f) | | | 1.75 | %(f) | | | 1.65 | %(f) | | | 1.74 | %(f) | | | 1.90 | % |
| | | | | | | | | | | | | | | | | | | | | | | | | |
Net investment loss | | | (0.78 | %)(d) | | | (0.95 | %) | | | (0.94 | %) | | | (0.94 | %) | | | (0.95 | %) | | | (1.22 | %) |
| | | | | | | | | | | | | | | | | | | | | | | | | |
Supplemental data | | | | | | | | | | | | | | | | | | | | | | | | |
| | | | | | |
Net assets, end of period (in thousands) | | | $8,989 | | | | $7,628 | | | | $7,291 | | | | $8,124 | | | | $9,787 | | | | $9,158 | |
| | | | | | | | | | | | | | | | | | | | | | | | | |
Portfolio turnover | | | 33 | % | | | 89 | % | | | 81 | % | | | 88 | % | | | 95 | % | | | 111 | % |
| | | | | | | | | | | | | | | | | | | | | | | | | |
Notes to Financial Highlights
| (a) | The Fund received proceeds from regulatory settlements. Had the Fund not received these proceeds, the total return would have been lower by 0.11%. |
| (b) | The Fund received proceeds from regulatory settlements. Had the Fund not received these proceeds, the total return would have been lower by 0.16%. |
| (c) | In addition to the fees and expenses that the Fund bears directly, the Fund indirectly bears a pro rata share of the fees and expenses of any other funds in which it invests. Such indirect expenses are not included in the Fund’s reported expense ratios. |
| (e) | Total net expenses include the impact of certain fee waivers/expense reimbursements made by the Investment Manager and certain of its affiliates, if applicable. |
| (f) | The benefits derived from expense reductions had an impact of less than 0.01%. |
The accompanying Notes to Financial Statements are an integral part of this statement.
| | |
| 20 | | Semiannual Report 2015 |
| | |
| |
| COLUMBIA SELIGMAN GLOBAL TECHNOLOGY FUND | | |
FINANCIAL HIGHLIGHTS (continued)
| | | | | | | | | | | | |
| |
| Six Months Ended
April 30, 2015 |
| | | Year Ended October 31, | |
Class R4 | | | (Unaudited) | | | | 2014 | | | | 2013(a) | |
Per share data | | | | | | | | | | | | |
Net asset value, beginning of period | | | $30.89 | | | | $25.12 | | | | $20.20 | |
| | | | | | | | | | | | | |
Income from investment operations: | | | | | | | | | | | | |
| | | |
Net investment loss | | | (0.03 | ) | | | (0.13 | ) | | | (0.12 | ) |
| | | | | | | | | | | | | |
Net realized and unrealized gain | | | 3.71 | | | | 6.49 | | | | 5.04 | |
| | | | | | | | | | | | | |
Total from investment operations | | | 3.68 | | | | 6.36 | | | | 4.92 | |
| | | | | | | | | | | | | |
Less distributions to shareholders: | | | | | | | | | | | | |
| | | |
Net realized gains | | | (3.60 | ) | | | (0.59 | ) | | | — | |
| | | | | | | | | | | | | |
Total distributions to shareholders | | | (3.60 | ) | | | (0.59 | ) | | | — | |
| | | | | | | | | | | | | |
Net asset value, end of period | | | $30.97 | | | | $30.89 | | | | $25.12 | |
| | | | | | | | | | | | | |
Total return | | | 12.55 | % | | | 25.82 | % | | | 24.36 | % |
| | | | | | | | | | | | | |
Ratios to average net assets(b) | | | | | | | | | | | | |
| | | |
Total gross expenses | | | 1.18 | %(c) | | | 1.21 | % | | | 1.33 | %(c) |
| | | | | | | | | | | | | |
Total net expenses(d) | | | 1.18 | %(c) | | | 1.21 | %(e) | | | 1.29 | %(c)(e) |
| | | | | | | | | | | | | |
Net investment loss | | | (0.22 | %)(c) | | | (0.47 | %) | | | (0.53 | %)(c) |
| | | | | | | | | | | | | |
Supplemental data | | | | | | | | | | | | |
| | | |
Net assets, end of period (in thousands) | | | $244 | | | | $231 | | | | $17 | |
| | | | | | | | | | | | | |
Portfolio turnover | | | 33 | % | | | 89 | % | | | 81 | % |
| | | | | | | | | | | | | |
Notes to Financial Highlights
| (a) | Based on operations from November 8, 2012 (commencement of operations) through the stated period end. |
| (b) | In addition to the fees and expenses that the Fund bears directly, the Fund indirectly bears a pro rata share of the fees and expenses of any other funds in which it invests. Such indirect expenses are not included in the Fund’s reported expense ratios. |
| (d) | Total net expenses include the impact of certain fee waivers/expense reimbursements made by the Investment Manager and certain of its affiliates, if applicable. |
| (e) | The benefits derived from expense reductions had an impact of less than 0.01%. |
The accompanying Notes to Financial Statements are an integral part of this statement.
| | | | |
| Semiannual Report 2015 | | | 21 | |
| | |
| |
| | COLUMBIA SELIGMAN GLOBAL TECHNOLOGY FUND |
FINANCIAL HIGHLIGHTS (continued)
| | | | | | | | | | | | | | | | | | | | | | | | |
| |
| Six Months Ended
April 30, 2015 |
| | | Year Ended October 31, | |
Class R5 | | | (Unaudited) | | | | 2014 | | | | 2013 | | | | 2012 | | | | 2011 | | | | 2010 | |
Per share data | | | | | | | | | | | | | | | | | | | | | | | | |
Net asset value, beginning of period | | | $30.69 | | | | $24.92 | | | | $20.25 | | | | $20.27 | | | | $20.35 | | | | $16.52 | |
| | | | | | | | | | | | | | | | | | | | | | | | | |
Income from investment operations: | | | | | | | | | | | | | | | | | | | | | | | | |
| | | | | | |
Net investment loss | | | (0.00 | )(a) | | | (0.08 | ) | | | (0.04 | ) | | | (0.05 | ) | | | (0.05 | ) | | | (0.42 | ) |
| | | | | | | | | | | | | | | | | | | | | | | | | |
Net realized and unrealized gain | | | 3.67 | | | | 6.44 | | | | 4.71 | | | | 0.01 | | | | 0.19 | | | | 4.22 | |
| | | | | | | | | | | | | | | | | | | | | | | | | |
Total from investment operations | | | 3.67 | | | | 6.36 | | | | 4.67 | | | | (0.04 | ) | | | 0.14 | | | | 3.80 | |
| | | | | | | | | | | | | | | | | | | | | | | | | |
Less distributions to shareholders: | | | | | | | | | | | | | | | | | | | | | | | | |
| | | | | | |
Net investment income | | | — | | | | — | | | | — | | | | — | | | | (0.22 | ) | | | — | |
| | | | | | | | | | | | | | | | | | | | | | | | | |
Net realized gains | | | (3.64 | ) | | | (0.59 | ) | | | — | | | | — | | | | — | | | | — | |
| | | | | | | | | | | | | | | | | | | | | | | | | |
Total distributions to shareholders | | | (3.64 | ) | | | (0.59 | ) | | | — | | | | — | | | | (0.22 | ) | | | — | |
| | | | | | | | | | | | | | | | | | | | | | | | | |
Proceeds from regulatory settlements | | | — | | | | — | | | | — | | | | 0.02 | | | | — | | | | 0.03 | |
| | | | | | | | | | | | | | | | | | | | | | | | | |
Net asset value, end of period | | | $30.72 | | | | $30.69 | | | | $24.92 | | | | $20.25 | | | | $20.27 | | | | $20.35 | |
| | | | | | | | | | | | | | | | | | | | | | | | | |
Total return | | | 12.63 | % | | | 26.03 | % | | | 23.06 | % | | | (0.10 | %)(b) | | | 0.66 | % | | | 23.18 | %(c) |
| | | | | | | | | | | | | | | | | | | | | | | | | |
Ratios to average net assets(d) | | | | | | | | | | | | | | | | | | | | | | | | |
| | | | | | |
Total gross expenses | | | 1.02 | %(e) | | | 1.04 | % | | | 1.08 | % | | | 1.06 | % | | | 1.03 | % | | | 1.28 | % |
| | | | | | | | | | | | | | | | | | | | | | | | | |
Total net expenses(f) | | | 1.02 | %(e) | | | 1.04 | % | | | 1.06 | % | | | 0.99 | % | | | 1.03 | % | | | 1.13 | % |
| | | | | | | | | | | | | | | | | | | | | | | | | |
Net investment loss | | | (0.01 | %)(e) | | | (0.28 | %) | | | (0.16 | %) | | | (0.23 | %) | | | (0.21 | %) | | | (2.23 | %) |
| | | | | | | | | | | | | | | | | | | | | | | | | |
Supplemental data | | | | | | | | | | | | | | | | | | | | | | | | |
| | | | | | |
Net assets, end of period (in thousands) | | | $217 | | | | $56 | | | | $58 | | | | $165 | | | | $33 | | | | $25,932 | |
| | | | | | | | | | | | | | | | | | | | | | | | | |
Portfolio turnover | | | 33 | % | | | 89 | % | | | 81 | % | | | 88 | % | | | 95 | % | | | 111 | % |
| | | | | | | | | | | | | | | | | | | | | | | | | |
Notes to Financial Highlights
| (b) | The Fund received proceeds from regulatory settlements. Had the Fund not received these proceeds, the total return would have been lower by 0.11%. |
| (c) | The Fund received proceeds from regulatory settlements. Had the Fund not received these proceeds, the total return would have been lower by 0.16%. |
| (d) | In addition to the fees and expenses that the Fund bears directly, the Fund indirectly bears a pro rata share of the fees and expenses of any other funds in which it invests. Such indirect expenses are not included in the Fund’s reported expense ratios. |
| (f) | Total net expenses include the impact of certain fee waivers/expense reimbursements made by the Investment Manager and certain of its affiliates, if applicable. |
The accompanying Notes to Financial Statements are an integral part of this statement.
| | |
| 22 | | Semiannual Report 2015 |
| | |
| |
| COLUMBIA SELIGMAN GLOBAL TECHNOLOGY FUND | | |
FINANCIAL HIGHLIGHTS (continued)
| | | | | | | | | | | | | | | | | | | | | | | | |
| |
| Six Months Ended
April 30, 2015 |
| | | Year Ended October 31, | |
Class Z | | | (Unaudited) | | | | 2014 | | | | 2013 | | | | 2012 | | | | 2011 | | | | 2010(a) | |
Per share data | | | | | | | | | | | | | | | | | | | | | | | | |
Net asset value, beginning of period | | | $30.55 | | | | $24.85 | | | | $20.23 | | | | $20.26 | | | | $20.36 | | | | $19.28 | |
| | | | | | | | | | | | | | | | | | | | | | | | | |
Income from investment operations: | | | | | | | | | | | | | | | | | | | | | | | | |
| | | | | | |
Net investment loss | | | (0.04 | ) | | | (0.13 | ) | | | (0.10 | ) | | | (0.09 | ) | | | (0.06 | ) | | | (0.03 | ) |
| | | | | | | | | | | | | | | | | | | | | | | | | |
Net realized and unrealized gain | | | 3.67 | | | | 6.42 | | | | 4.72 | | | | 0.04 | | | | 0.18 | | | | 1.11 | |
| | | | | | | | | | | | | | | | | | | | | | | | | |
Total from investment operations | | | 3.63 | | | | 6.29 | | | | 4.62 | | | | (0.05 | ) | | | 0.12 | | | | 1.08 | |
| | | | | | | | | | | | | | | | | | | | | | | | | |
Less distributions to shareholders: | | | | | | | | | | | | | | | | | | | | | | | | |
| | | | | | |
Net investment income | | | — | | | | — | | | | — | | | | — | | | | (0.22 | ) | | | — | |
| | | | | | | | | | | | | | | | | | | | | | | | | |
Net realized gains | | | (3.59 | ) | | | (0.59 | ) | | | — | | | | — | | | | — | | | | — | |
| | | | | | | | | | | | | | | | | | | | | | | | | |
Total distributions to shareholders | | | (3.59 | ) | | | (0.59 | ) | | | — | | | | — | | | | (0.22 | ) | | | — | |
| | | | | | | | | | | | | | | | | | | | | | | | | |
Proceeds from regulatory settlements | | | — | | | | — | | | | — | | | | 0.02 | | | | — | | | | — | |
| | | | | | | | | | | | | | | | | | | | | | | | | |
Net asset value, end of period | | | $30.59 | | | | $30.55 | | | | $24.85 | | | | $20.23 | | | | $20.26 | | | | $20.36 | |
| | | | | | | | | | | | | | | | | | | | | | | | | |
Total return | | | 12.55 | % | | | 25.82 | % | | | 22.84 | % | | | (0.15 | %)(b) | | | 0.55 | % | | | 5.60 | % |
| | | | | | | | | | | | | | | | | | | | | | | | | |
Ratios to average net assets(c) | | | | | | | | | | | | | | | | | | | | | | | | |
| | | | | | |
Total gross expenses | | | 1.18 | %(d) | | | 1.22 | % | | | 1.30 | % | | | 1.23 | % | | | 1.14 | % | | | 1.31 | %(d) |
| | | | | | | | | | | | | | | | | | | | | | | | | |
Total net expenses(e) | | | 1.18 | %(d) | | | 1.22 | %(f) | | | 1.24 | %(f) | | | 1.13 | %(f) | | | 1.14 | %(f) | | | 1.28 | %(d) |
| | | | | | | | | | | | | | | | | | | | | | | | | |
Net investment loss | | | (0.24 | %)(d) | | | (0.47 | %) | | | (0.42 | %) | | | (0.42 | %) | | | (0.30 | %) | | | (1.57 | %)(d) |
| | | | | | | | | | | | | | | | | | | | | | | | | |
Supplemental data | | | | | | | | | | | | | | | | | | | | | | | | |
| | | | | | |
Net assets, end of period (in thousands) | | | $36,710 | | | | $32,271 | | | | $16,097 | | | | $22,115 | | | | $20,020 | | | | $3 | |
| | | | | | | | | | | | | | | | | | | | | | | | | |
Portfolio turnover | | | 33 | % | | | 89 | % | | | 81 | % | | | 88 | % | | | 95 | % | | | 111 | % |
| | | | | | | | | | | | | | | | | | | | | | | | | |
Notes to Financial Highlights
| (a) | Based on operations from September 27, 2010 (commencement of operations) through the stated period end. |
| (b) | The Fund received proceeds from regulatory settlements. Had the Fund not received these proceeds, the total return would have been lower by 0.11%. |
| (c) | In addition to the fees and expenses that the Fund bears directly, the Fund indirectly bears a pro rata share of the fees and expenses of any other funds in which it invests. Such indirect expenses are not included in the Fund’s reported expense ratios. |
| (e) | Total net expenses include the impact of certain fee waivers/expense reimbursements made by the Investment Manager and certain of its affiliates, if applicable. |
| (f) | The benefits derived from expense reductions had an impact of less than 0.01%. |
The accompanying Notes to Financial Statements are an integral part of this statement.
| | | | |
| Semiannual Report 2015 | | | 23 | |
| | |
| |
| | COLUMBIA SELIGMAN GLOBAL TECHNOLOGY FUND |
NOTES TO FINANCIAL STATEMENTS
April 30, 2015 (Unaudited)
Note 1. Organization
Columbia Seligman Global Technology Fund (the Fund), a series of Columbia Funds Series Trust II (the Trust), is a non-diversified fund. The Trust is registered under the Investment Company Act of 1940, as amended (the 1940 Act), as an open-end management investment company organized as a Massachusetts business trust.
Fund Shares
The Trust may issue an unlimited number of shares (without par value). The Fund offers Class A, Class B, Class C, Class I, Class K, Class R, Class R4, Class R5 and Class Z shares. Although all share classes generally have identical voting, dividend and liquidation rights, each share class votes separately when required by the Trust’s organizational documents or by law. Different share classes pay different distribution amounts to the extent the expenses of such share classes differ, and distributions in liquidation will be proportional to the net asset value of each share class. Each share class has its own expense structure and sales charges.
Class A shares are subject to a maximum front-end sales charge of 5.75% based on the initial investment amount. Class A shares purchased without an initial sales charge in accounts aggregating $1 million to $50 million at the time of purchase are subject to a contingent deferred sales charge (CDSC) if the shares are sold within 18 months after purchase, charged as follows: 1.00% CDSC if redeemed within 12 months after purchase, and 0.50% CDSC if redeemed more than 12, but less than 18, months after purchase.
Class B shares may be subject to a maximum CDSC of 5.00% based upon the holding period after purchase. Class B shares will generally convert to Class A shares eight years after purchase. The Fund no longer accepts investments by new or existing investors in the Fund’s Class B shares, except in connection with the reinvestment of any dividend and/or capital gain distributions in Class B shares of the Fund and exchanges by existing Class B shareholders of certain other funds within the Columbia Family of Funds.
Class C shares are subject to a 1.00% CDSC on shares redeemed within one year after purchase.
Class I shares are not subject to sales charges and are available only to the Columbia Family of Funds.
Class K shares are not subject to sales charges, however this share class is closed to new investors.
Class R shares are not subject to sales charges and are generally available only to certain retirement plans and other investors as described in the Fund’s prospectus.
Class R4 shares are not subject to sales charges and are generally available only to omnibus retirement plans and certain investors as described in the Fund’s prospectus.
Class R5 shares are not subject to sales charges and are generally available only to investors purchasing through authorized investment professionals and omnibus retirement plans.
Class Z shares are not subject to sales charges and are available only to eligible investors, which are subject to different investment minimums as described in the Fund’s prospectus.
Note 2. Summary of Significant Accounting Policies
Basis of Preparation
The Fund is an investment company that applies the accounting and reporting guidance in the Financial Accounting Standards Board (FASB) Accounting Standards Codification Topic 946, Financial Services — Investment Companies (ASC 946). The financial statements are prepared in accordance with U.S. generally accepted accounting principles (GAAP), which requires management to make certain estimates and assumptions that affect the reported amounts of assets and liabilities, the disclosure of contingent assets and liabilities at the date of the financial statements and the reported amounts of income and expenses during the reporting period. Actual results could differ from those estimates.
The following is a summary of significant accounting policies followed by the Fund in the preparation of its financial statements.
Security Valuation
All equity securities are valued at the close of business of the New York Stock Exchange (NYSE). Equity securities are valued at the last quoted sales price on the principal exchange or market on which they trade, except for securities traded on the NASDAQ Stock Market, which are valued at the NASDAQ official close price. Unlisted securities or listed securities for which there were no sales during the day are valued at the mean of the latest quoted bid and ask prices on such exchanges or markets.
| | |
| 24 | | Semiannual Report 2015 |
| | |
| |
| COLUMBIA SELIGMAN GLOBAL TECHNOLOGY FUND | | |
NOTES TO FINANCIAL STATEMENTS (continued)
April 30, 2015 (Unaudited)
Foreign equity securities are valued based on quotations from the principal market in which such securities are traded. If any foreign security prices are not readily available as a result of limited share activity, the securities are valued at the mean of the latest quoted bid and ask prices on such exchanges or markets. Foreign currency exchange rates are generally determined at 4:00 p.m. Eastern (U.S.) time. Many securities markets and exchanges outside the U.S. close prior to the close of the NYSE; therefore, the closing prices for securities in such markets or on such exchanges may not fully reflect events that occur after such close but before the close of the NYSE. In those situations, foreign securities will be fair valued pursuant to a policy adopted by the Board of Trustees (the Board), including, if available, utilizing a third party pricing service to determine these fair values. The third party pricing service takes into account multiple factors, including, but not limited to, movements in the U.S. securities markets, certain depositary receipts, futures contracts and foreign exchange rates that have occurred subsequent to the close of the foreign exchange or market, to determine a good faith estimate that reasonably reflects the current market conditions as of the close of the NYSE. The fair value of a security is likely to be different from the quoted or published price, if available.
Investments in open-end investment companies, including money market funds, are valued at their net asset value.
Investments for which market quotations are not readily available, or that have quotations which management believes are not reliable, are valued at fair value as determined in good faith under procedures established by and under the general supervision of the Board. If a security or class of securities (such as foreign securities) is valued at fair value, such value is likely to be different from the quoted or published price for the security.
The determination of fair value often requires significant judgment. To determine fair value, management may use assumptions including but not limited to future cash flows and estimated risk premiums. Multiple inputs from various sources may be used to determine fair value.
Foreign Currency Transactions and Translations
The values of all assets and liabilities denominated in foreign currencies are generally translated into U.S. dollars at exchange rates determined at the close of the NYSE. Net realized and unrealized gains (losses) on foreign currency transactions and translations include gains (losses) arising from the fluctuation in exchange
rates between trade and settlement dates on securities transactions, gains (losses) arising from the disposition of foreign currency and currency gains (losses) between the accrual and payment dates on dividends, interest income and foreign withholding taxes.
For financial statement purposes, the Fund does not distinguish that portion of gains (losses) on investments which is due to changes in foreign exchange rates from that which is due to changes in market prices of the investments. Such fluctuations are included with the net realized and unrealized gains (losses) on investments in the Statement of Operations.
Security Transactions
Security transactions are accounted for on the trade date. Cost is determined and gains (losses) are based upon the specific identification method for both financial statement and federal income tax purposes.
Income Recognition
Corporate actions and dividend income are generally recorded net of any non-reclaimable tax withholdings, on the ex-dividend date or upon receipt of ex-dividend notification in the case of certain foreign securities.
Awards from class action litigation are recorded as a reduction of cost basis if the Fund still owns the applicable securities on the payment date. If the Fund no longer owns the applicable securities, the proceeds are recorded as realized gains.
Expenses
General expenses of the Trust are allocated to the Fund and other funds of the Trust based upon relative net assets or other expense allocation methodologies determined by the nature of the expense. Expenses directly attributable to the Fund are charged to the Fund. Expenses directly attributable to a specific class of shares are charged to that share class.
Determination of Class Net Asset Value
All income, expenses (other than class-specific expenses, which are charged to that share class, as shown in the Statement of Operations) and realized and unrealized gains (losses) are allocated to each class of the Fund on a daily basis, based on the relative net assets of each class, for purposes of determining the net asset value of each class.
Federal Income Tax Status
The Fund intends to qualify each year as a regulated investment company under Subchapter M of the Internal
| | | | |
| Semiannual Report 2015 | | | 25 | |
| | |
| |
| | COLUMBIA SELIGMAN GLOBAL TECHNOLOGY FUND |
NOTES TO FINANCIAL STATEMENTS (continued)
April 30, 2015 (Unaudited)
Revenue Code, as amended, and will distribute substantially all of its taxable income (including net short-term capital gains), if any, for its tax year, and as such will not be subject to federal income taxes. In addition, the Fund intends to distribute in each calendar year substantially all of its net investment income, capital gains and certain other amounts, if any, such that the Fund should not be subject to federal excise tax. Therefore, no federal income or excise tax provision is recorded.
Distributions to Shareholders
Distributions from net investment income, if any, are declared and paid annually. Net realized capital gains, if any, are distributed along with the income distribution. Income distributions and capital gain distributions are determined in accordance with federal income tax regulations, which may differ from GAAP.
Guarantees and Indemnifications
Under the Trust’s organizational documents and, in some cases, by contract, its officers and trustees are indemnified against certain liabilities arising out of the performance of their duties to the Trust or its funds. In addition, certain of the Fund’s contracts with its service providers contain general indemnification clauses. The Fund’s maximum exposure under these arrangements is unknown since the amount of any future claims that may be made against the Fund cannot be determined, and the Fund has no historical basis for predicting the likelihood of any such claims.
Note 3. Fees and Compensation Paid to Affiliates
Investment Management Fees
Under an Investment Management Services Agreement, Columbia Management Investment Advisers, LLC (the Investment Manager), a wholly-owned subsidiary of Ameriprise Financial, Inc. (Ameriprise Financial), determines which securities will be purchased, held or sold. The investment management fee is an annual fee that is equal to a percentage of the Fund’s average daily net assets that declines from 0.855% to 0.725% as the Fund’s net assets increase. The annualized effective investment management fee rate for the six months ended April 30, 2015 was 0.855% of the Fund’s average daily net assets.
Administration Fees
Under an Administrative Services Agreement, the Investment Manager also serves as the Fund
Administrator. The Fund pays the Fund Administrator an annual fee for administration and accounting services equal to a percentage of the Fund’s average daily net assets that declines from 0.06% to 0.03% as the Fund’s net assets increase. The annualized effective administration fee rate for the six months ended April 30, 2015 was 0.06% of the Fund’s average daily net assets.
Other Expenses
Other expenses are for, among other things, miscellaneous expenses of the Fund or the Board, including payments to a company providing limited administrative services to the Fund and the Board. That company’s expenses include boardroom and office expense, employee compensation, employee health and retirement benefits, and certain other expenses. For the six months ended April 30, 2015, other expenses paid by the Fund to this company were $1,048.
Compensation of Board Members
Board members are compensated for their services to the Fund as disclosed in the Statement of Operations. Under a Deferred Compensation Plan (the Plan), the Board members who are not “interested persons” of the Fund, as defined under the 1940 Act, may elect to defer payment of up to 100% of their compensation. Deferred amounts are treated as though equivalent dollar amounts had been invested in shares of certain funds managed by the Investment Manager. The Fund’s liability for these amounts is adjusted for market value changes and remains in the Fund until distributed in accordance with the Plan.
Transfer Agent Fees
Under a Transfer and Dividend Disbursing Agent Agreement, Columbia Management Investment Services Corp. (the Transfer Agent), an affiliate of the Investment Manager and a wholly-owned subsidiary of Ameriprise Financial, is responsible for providing transfer agency services to the Fund. The Transfer Agent has contracted with Boston Financial Data Services (BFDS) to serve as sub-transfer agent.
The Transfer Agent receives a monthly transfer agency fee based on the number or the average value of accounts, depending on the type of account. In addition, the Transfer Agent also receives sub-transfer agency fees based on a percentage of the average aggregate value of the Fund’s shares maintained in omnibus accounts (other than omnibus accounts for which American Enterprise Investment Services Inc. is the broker of record or accounts where the beneficial shareholder is a
| | |
| 26 | | Semiannual Report 2015 |
| | |
| |
| COLUMBIA SELIGMAN GLOBAL TECHNOLOGY FUND | | |
NOTES TO FINANCIAL STATEMENTS (continued)
April 30, 2015 (Unaudited)
customer of Ameriprise Financial Services, Inc., for which the Transfer Agent receives a per account fee). The Transfer Agent pays the fees of BFDS for services as sub-transfer agent and is not entitled to reimbursement for such fees from the Fund (with the exception of out-of-pocket fees).
The Transfer Agent also receives compensation from the Fund for various shareholder services and reimbursements for certain out-of-pocket fees. Class I shares do not pay transfer agency fees. Total transfer agent fees for Class K and Class R5 shares are subject to an annual limitation of not more than 0.05% of the average daily net assets attributable to each share class.
For the six months ended April 30, 2015, the Fund’s annualized effective transfer agent fee rates as a percentage of average daily net assets of each class were as follows:
| | | | |
Class A | | | 0.21 | % |
Class B | | | 0.21 | |
Class C | | | 0.21 | |
Class K | | | 0.05 | |
Class R | | | 0.21 | |
Class R4 | | | 0.21 | |
Class R5 | | | 0.05 | |
Class Z | | | 0.21 | |
The Fund and certain other associated investment companies have severally, but not jointly, guaranteed the performance and observance of all the terms and conditions of a lease entered into by Seligman Data Corp. (SDC), the former transfer agent, including the payment of rent by SDC (the Guaranty). SDC was the legacy Seligman funds’ former transfer agent.
The lease and the Guaranty expire in January 2019. At April 30, 2015, the Fund’s total potential future obligation over the life of the Guaranty is $160,626. The liability remaining at April 30, 2015 for non-recurring charges associated with the lease amounted to $94,250 and is recorded as a part of the payable for other expenses in the Statement of Assets and Liabilities.
An annual minimum account balance fee of $20 may apply to certain accounts with a value below the applicable share class’s initial minimum investment requirements to reduce the impact of small accounts on transfer agent fees. These minimum account balance fees are remitted to the Fund and recorded as part of expense reductions in the Statement of Operations. For
the six months ended April 30, 2015, no minimum account balance fees were charged by the Fund.
Plan Administration Fees
Under a Plan Administration Services Agreement with the Transfer Agent, the Fund pays an annual fee at a rate of 0.25% of the Fund’s average daily net assets attributable to Class K shares for the provision of various administrative, recordkeeping, communication and educational services.
Distribution Fees
The Fund has an agreement with Columbia Management Investment Distributors, Inc. (the Distributor), an affiliate of the Investment Manager and a wholly-owned subsidiary of Ameriprise Financial, for distribution and shareholder services. Under a Plan and Agreement of Distribution, the Fund pays a fee at an annual rate of up to 0.25% of the Fund’s average daily net assets attributable to Class A shares, a fee at an annual rate of up to 0.50% of the Fund’s average daily net assets attributable to Class R shares (of which up to 0.25% may be used for shareholder services) and a fee at an annual rate of up to 1.00% of the Fund’s average daily net assets attributable to Class B and Class C shares. For Class B and Class C shares, of the 1.00% fee, up to 0.75% is reimbursed for distribution expenses.
The amount of distribution expenses incurred by the Distributor and not yet reimbursed (unreimbursed expense) was approximately $150,000 and $4,292,000 for Class B and Class C shares, respectively. These amounts are based on the most recent information available as of March 31, 2015, and may be recovered from future payments under the distribution plan or CDSCs. To the extent the unreimbursed expense has been fully recovered, the distribution fee is reduced.
Sales Charges
Sales charges, including front-end charges and CDSCs, received by the Distributor for distributing Fund shares were $159,467 for Class A, $1,101 for Class B and $392 for Class C shares for the six months ended April 30, 2015.
Expenses Waived/Reimbursed by the Investment Manager and its Affiliates
The Fund’s expense ratio is subject to an expense reimbursement arrangement pursuant to which fees will be waived and/or expenses reimbursed (excluding certain fees and expenses described below), so that the
| | | | |
| Semiannual Report 2015 | | | 27 | |
| | |
| |
| | COLUMBIA SELIGMAN GLOBAL TECHNOLOGY FUND |
NOTES TO FINANCIAL STATEMENTS (continued)
April 30, 2015 (Unaudited)
Fund’s net operating expenses, after giving effect to fees waived/expenses reimbursed and any balance credits and/or overdraft charges from the Fund’s custodian, do not exceed the annual rates of:
| | | | | | | | |
| | | Voluntary Expense Cap Effective March 1, 2015 | | | Contractual Expense Cap Prior to March 1, 2015 | |
Class A | | | 1.51 | % | | | 1.53 | % |
Class B | | | 2.26 | | | | 2.28 | |
Class C | | | 2.26 | | | | 2.28 | |
Class I | | | 1.10 | | | | 1.10 | |
Class K | | | 1.40 | | | | 1.40 | |
Class R | | | 1.76 | | | | 1.78 | |
Class R4 | | | 1.26 | | | | 1.28 | |
Class R5 | | | 1.15 | | | | 1.15 | |
Class Z | | | 1.26 | | | | 1.28 | |
The voluntary expense cap arrangement may be revised or discontinued at any time. Under the arrangements, the following fees and expenses are excluded from the waiver/reimbursement commitment, and therefore will be paid by the Fund, if applicable: taxes (including foreign transaction taxes), expenses associated with investments in affiliated and non-affiliated pooled investment vehicles (including mutual funds and exchange-traded funds), transaction costs and brokerage commissions, costs related to any securities lending program, dividend expenses associated with securities sold short, inverse floater program fees and expenses, transaction charges and interest on borrowed money, interest and extraordinary expenses. Any fees waived and/or expenses reimbursed under the expense reimbursement arrangements described above are not recoverable by the Investment Manager or its affiliates in future periods.
Note 4. Federal Tax Information
The timing and character of income and capital gain distributions are determined in accordance with income tax regulations, which may differ from GAAP because of temporary or permanent book to tax differences.
At April 30, 2015, the cost of investments for federal income tax purposes was approximately $423,006,000 and the aggregate gross approximate unrealized appreciation and depreciation based on that cost was:
| | | | |
Unrealized appreciation | | | $155,091,000 | |
Unrealized depreciation | | | (8,743,000 | ) |
Net unrealized appreciation | | | $146,348,000 | |
Management of the Fund has concluded that there are no significant uncertain tax positions in the Fund that would require recognition in the financial statements. However, management’s conclusion may be subject to review and adjustment at a later date based on factors including, but not limited to, new tax laws, regulations, and administrative interpretations (including relevant court decisions). Generally, the Fund’s federal tax returns for the prior three fiscal years remain subject to examination by the Internal Revenue Service.
Note 5. Portfolio Information
The cost of purchases and proceeds from sales of securities, excluding short-term investments and derivatives, if any, aggregated to $175,928,375 and $188,592,097, respectively, for the six months ended April 30, 2015. The amount of purchase and sale activity impacts the portfolio turnover rate reported in the Financial Highlights.
Note 6. Affiliated Money Market Fund
The Fund invests in Columbia Short-Term Cash Fund, an affiliated money market fund established for the exclusive use by the Fund and other affiliated funds. The income earned by the Fund from such investments is included as Dividends — affiliated issuers in the Statement of Operations. As an investing fund, the Fund indirectly bears its proportionate share of the expenses of Columbia Short-Term Cash Fund.
Note 7. Shareholder Concentration
At April 30, 2015, affiliated shareholders of record owned 32.7% of the outstanding shares of the Fund in one or more accounts. Subscription and redemption activity by concentrated accounts may have a significant effect on the operations of the Fund.
Note 8. Line of Credit
The Fund has entered into a revolving credit facility with a syndicate of banks led by JPMorgan Chase Bank, N.A. whereby the Fund may borrow for the temporary funding of shareholder redemptions or for other temporary or emergency purposes. Pursuant to a December 9, 2014 amendment, the credit facility agreement, which is a collective agreement between the Fund and certain other funds managed by the Investment Manager, severally and not jointly, permits collective borrowings up to $550 million. Interest is charged to each participating fund based on its borrowings at a rate equal to the higher of (i) the overnight federal funds rate plus 1.00% or (ii) the one-month LIBOR rate plus 1.00%. Each borrowing under
| | |
| 28 | | Semiannual Report 2015 |
| | |
| |
| COLUMBIA SELIGMAN GLOBAL TECHNOLOGY FUND | | |
NOTES TO FINANCIAL STATEMENTS (continued)
April 30, 2015 (Unaudited)
the credit facility matures no later than 60 days after the date of borrowing. The Fund also pays a commitment fee equal to its pro rata share of the amount of the credit facility at a rate of 0.075% per annum. The commitment fee is included in other expenses in the Statement of Operations. Prior to the December 9, 2014 amendment, the credit facility agreement permitted borrowings up to $500 million under the same terms and interest rates as described above.
The Fund had no borrowings during the six months ended April 30, 2015.
Note 9. Significant Risks
Foreign Securities and Emerging Market Countries Risk
Investing in foreign securities may include certain risks and considerations not typically associated with investing in U.S. securities, such as fluctuating currency values and changing local and regional economic, political and social conditions, which may result in greater market volatility. In addition, certain foreign securities may not be as liquid as U.S. securities. Investing in emerging markets may accentuate these risks. These countries are also more likely to experience high levels of inflation, deflation or currency devaluation which could hurt their economies and securities markets. To the extent that the Fund concentrates its investment exposure to any one or a few specific countries, the Fund will be particularly susceptible to the various conditions, events or other factors impacting those countries and may, therefore, have a greater risk than that of a fund which is more geographically diversified.
Non-Diversification Risk
A non-diversified fund is permitted to invest a greater percentage of its total assets in fewer issuers than a diversified fund. The Fund may, therefore, have a greater risk of loss from a few issuers than a similar fund that invests more broadly.
Technology and Technology-related Investment Risk
Sector risk occurs when a fund invests a significant portion of its assets in securities of companies conducting business in a related group of industries within an economic sector. Companies in the same economic sector may be similarly affected by economic, regulatory, political or market events or conditions, making a fund more vulnerable to unfavorable developments in that economic sector than funds that
invest more broadly. The Fund may be more susceptible to the particular risks that may affect companies in the technology and technology-related sectors than if it were invested in a wider variety of companies in unrelated sectors.
Note 10. Subsequent Events
Management has evaluated the events and transactions that have occurred through the date the financial statements were issued and noted no items requiring adjustment of the financial statements or additional disclosure.
Note 11. Information Regarding Pending and Settled Legal Proceedings
In December 2005, without admitting or denying the allegations, American Express Financial Corporation (AEFC, which is now known as Ameriprise Financial, Inc. (Ameriprise Financial)) entered into settlement agreements with the Securities and Exchange Commission (SEC) and Minnesota Department of Commerce (MDOC) related to market timing activities. As a result, AEFC was censured and ordered to cease and desist from committing or causing any violations of certain provisions of the Investment Advisers Act of 1940, the Investment Company Act of 1940, and various Minnesota laws. AEFC agreed to pay disgorgement of $10 million and civil money penalties of $7 million. AEFC also agreed to retain an independent distribution consultant to assist in developing a plan for distribution of all disgorgement and civil penalties ordered by the SEC in accordance with various undertakings detailed at www.sec.gov/litigation/admin/ia-2451.pdf. Ameriprise Financial and its affiliates have cooperated with the SEC and the MDOC in these legal proceedings, and have made regular reports to the Funds’ Boards of Trustees.
Ameriprise Financial and certain of its affiliates have historically been involved in a number of legal, arbitration and regulatory proceedings, including routine litigation, class actions, and governmental actions, concerning matters arising in connection with the conduct of their business activities. Ameriprise Financial believes that the Funds are not currently the subject of, and that neither Ameriprise Financial nor any of its affiliates are the subject of, any pending legal, arbitration or regulatory proceedings that are likely to have a material adverse effect on the Funds or the ability of Ameriprise Financial or its affiliates to perform under their contracts with the Funds. Ameriprise Financial is required to make quarterly (10-Q), annual (10-K) and, as necessary, 8-K filings with
| | | | |
| Semiannual Report 2015 | | | 29 | |
| | |
| |
| | COLUMBIA SELIGMAN GLOBAL TECHNOLOGY FUND |
NOTES TO FINANCIAL STATEMENTS (continued)
April 30, 2015 (Unaudited)
the Securities and Exchange Commission on legal and regulatory matters that relate to Ameriprise Financial and its affiliates. Copies of these filings may be obtained by accessing the SEC website at www.sec.gov.
There can be no assurance that these matters, or the adverse publicity associated with them, will not result in increased fund redemptions, reduced sale of fund shares or other adverse consequences to the Funds. Further, although we believe proceedings are not likely to have a material adverse effect on the Funds or the ability of Ameriprise Financial or its affiliates to perform under their contracts with the Funds, these proceedings are subject to uncertainties and, as such, we are unable to estimate the possible loss or range of loss that may result. An adverse outcome in one or more of these proceedings could result in adverse judgments, settlements, fines, penalties or other relief that could have a material adverse effect on the consolidated financial condition or results of operations of Ameriprise Financial.
| | |
| 30 | | Semiannual Report 2015 |
| | |
| |
| COLUMBIA SELIGMAN GLOBAL TECHNOLOGY FUND | | |
APPROVAL OF INVESTMENT MANAGEMENT SERVICES AGREEMENT
Columbia Management Investment Advisers, LLC (Columbia Management or the Investment Manager), a wholly-owned subsidiary of Ameriprise Financial, Inc. (Ameriprise Financial), serves as the investment manager to Columbia Seligman Global Technology Fund (the Fund). Under an investment management services agreement (the IMS Agreement), Columbia Management provides investment advice and other services to the Fund and other funds distributed by Columbia Management Investment Distributors, Inc. (collectively, the Funds).
The Fund’s Board of Trustees (the Board), including the independent Board members (the Independent Trustees), considered the renewal of the IMS Agreement for a two-month period (Short-Term Period) in order to align the IMS Agreement with the review cycle of other funds in the Columbia family of funds. Columbia Management prepared detailed reports for the Board and its Contracts Committee in January, March and April 2015, including reports based on analyses of data provided by an independent organization (Lipper) and a comprehensive response to each item of information requested by independent legal counsel to the Independent Trustees (Independent Legal Counsel) in a letter to the Investment Manager, to assist the Board in making this determination. In addition, throughout the year, the Board (or its committees) regularly meets with portfolio management teams and senior management personnel, and reviews information prepared by Columbia Management addressing the services Columbia Management provides and Fund performance. The Board also accords appropriate weight to the work, deliberations and conclusions of the Contracts Committee, the Investment Review Committee and the Compliance Committee in determining whether to continue the IMS Agreement.
The Board, at its April 13-15, 2015 in-person Board meeting (the April Meeting), considered the renewal of the IMS Agreement for the Short-Term Period. At the April Meeting, Independent Legal Counsel reviewed with the Independent Trustees various factors relevant to the Board’s consideration of advisory agreements and the Board’s legal responsibilities related to such consideration. Following an analysis and discussion of the factors identified below, the Board, including all of the Independent Trustees, approved the renewal of the IMS Agreement for the Short-Term Period.
Nature, Extent and Quality of Services Provided by Columbia Management
The Independent Trustees analyzed various reports and presentations they had received detailing the services performed by Columbia Management, as well as its expertise, resources and capabilities. The Independent Trustees specifically considered many developments during the past year concerning the services provided by Columbia Management. The Independent Trustees noted the information they received concerning Columbia Management’s ability to retain its key portfolio management personnel. In evaluating the quality of services provided under the IMS Agreement and the Fund’s Administrative Services Agreement, the Independent Trustees also took into account the organization and strength of the Fund’s and its service providers’ compliance programs. In addition, the Board also reviewed the financial condition of Columbia Management (and its affiliates) and each entity’s ability to carry out its responsibilities under the IMS Agreement and the Fund’s other services agreements with affiliates of Ameriprise Financial, observing the financial strength of Ameriprise Financial, with its solid balance sheet. The Board also discussed the acceptability of the terms of the IMS Agreement for the Short-Term Period.
Based on the foregoing, and based on other information received (both oral and written, including the information on investment performance referenced below) and other considerations, the Board concluded that the services being performed by Columbia Management and its affiliates were acceptable for the Short-Term Period.
Investment Performance
For purposes of evaluating the nature, extent and quality of services provided under the IMS Agreement, the Board carefully reviewed the investment performance of the Fund. In this regard, the Board considered detailed reports providing the results of analyses performed by an independent organization showing, for various periods, the performance of the Fund, the performance of a benchmark index, the percentage ranking of the Fund among its comparison group and the net assets of the Fund. The Board observed that for purposes of approving the IMS Agreement for the Short-Term Period, the Fund’s performance was acceptable.
Comparative Fees, Costs of Services Provided and the Profits Realized by Columbia Management and its Affiliates from their Relationships with the Fund
The Board reviewed comparative fees and the costs of services provided under the IMS Agreement. The Board members considered detailed comparative information set forth in an annual report on fees and expenses, including,
| | | | |
| Semiannual Report 2015 | | | 31 | |
| | |
| |
| | COLUMBIA SELIGMAN GLOBAL TECHNOLOGY FUND |
APPROVAL OF INVESTMENT MANAGEMENT SERVICES AGREEMENT (continued)
among other things, data (based on analyses conducted by an independent organization) showing a comparison of the Fund’s expenses with median expenses paid by funds in its comparative peer universe, as well as data showing the Fund’s contribution to Columbia Management’s profitability.
The Board accorded particular weight to the notion that the level of fees should reflect a rational pricing model applied consistently across the various product lines in the Fund family, while assuring that the overall fees for each Fund (with few defined exceptions) are generally in line with the “pricing philosophy” currently in effect (i.e., that the total expense ratio of the Fund is no higher than the median expense ratio of funds in the same comparison universe of the Fund).
The Board also considered the expected profitability of Columbia Management and its affiliates in connection with Columbia Management providing investment management services to the Fund. In this regard, the Board referred to a detailed profitability report, discussing the profitability to Columbia Management and Ameriprise Financial from managing, operating and distributing the Funds. For purposes of approving the IMS Agreement for the Short-Term Period, the Board concluded that the investment management service fees were fair and reasonable, observing that the profitability levels also seemed reasonable.
Economies of Scale to be Realized
The Board also considered the economies of scale that might be realized by Columbia Management as the Fund grows and took note of the extent to which Fund shareholders might also benefit from such growth. In this regard, the Independent Trustees took into account that IMS fees decline as Fund assets exceed various breakpoints.
Based on the foregoing, the Board, including all of the Independent Trustees, concluded that, for purposes of its consideration of the renewal of the IMS Agreement for the Short-Term Period, the investment management service fees were fair and reasonable in light of the extent and quality of services provided. In reaching this conclusion, no single factor was determinative. The Board noted its understanding that it would undertake the full consideration of renewal of the IMS Agreement for the full annual period at its June 2015 meetings. On April 15, 2015, the Board, including all of the Independent Trustees, approved the renewal of the IMS Agreement for the Short-Term Period.
| | |
| 32 | | Semiannual Report 2015 |
| | |
| |
| COLUMBIA SELIGMAN GLOBAL TECHNOLOGY FUND | | |
IMPORTANT INFORMATION ABOUT THIS REPORT
Each fund mails one shareholder report to each shareholder address. If you would like more than one report, please call shareholder services at 800.345.6611 and additional reports will be sent to you.
The policy of the Board is to vote the proxies of the companies in which each fund holds investments consistent with the procedures as stated in the Statement of Additional Information (SAI). You may obtain a copy of the SAI without charge by calling 800.345.6611; contacting your financial intermediary; visiting columbiathreadneedle.com/us; or searching the website of the Securities and Exchange Commission (SEC) at sec.gov. Information regarding how each fund voted proxies relating to portfolio securities is filed with the SEC by August 31st for the most recent 12-month period ending June 30th of that year, and is available without charge by visiting columbiathreadneedle.com/us, or searching the website of the SEC at sec.gov.
Each fund files a complete schedule of portfolio holdings with the SEC for the first and third quarters of each fiscal year on Form N-Q. Each fund’s Form N-Q is available on the SEC’s website at sec.gov and may be reviewed and copied at the SEC’s Public Reference Room in Washington, D.C. Information on the operation of the Public Reference Room may be obtained by calling 800.SEC.0330. Each fund’s complete schedule of portfolio holdings, as filed on Form N-Q, can also be obtained without charge, upon request, by calling 800.345.6611.
| | | | |
| Semiannual Report 2015 | | | 33 | |
Columbia Seligman Global Technology Fund
P.O. Box 8081
Boston, MA 02266-8081
This information is for use with concurrent or prior delivery of a fund prospectus. Please read and consider the investment objectives, risks, charges and expenses for any fund carefully before investing. For a prospectus and summary prospectus, which contains this and other important information about the Fund, go to columbiathreadneedle.com/us. The Fund is distributed by Columbia Management Investment Distributors, Inc., member FINRA, and managed by Columbia Management Investment Advisers, LLC.
Columbia Threadneedle Investments (Columbia Threadneedle) is the global brand name of the Columbia and Threadneedle group of companies. All rights reserved. Columbia Management Investment Distributors, Inc., 225 Franklin Street, Boston, MA 02110-2804
© 2015 Columbia Management Investment Advisers, LLC.
columbiathreadneedle.com/us
SAR220_10_E01_(06/15)
Not applicable for semiannual reports.
| Item 3. | Audit Committee Financial Expert. |
Not applicable for semiannual reports.
| Item 4. | Principal Accountant Fees and Services. |
Not applicable for semiannual reports.
| Item 5. | Audit Committee of Listed Registrants. |
Not applicable.
| | (a) | The registrant’s “Schedule I – Investments in securities of unaffiliated issuers” (as set forth in 17 CFR 210.12-12) is included in Item 1 of this Form N-CSR. |
Item 7. Disclosure of Proxy Voting Policies and Procedures for Closed-End Management Investment Companies.
Not applicable.
| Item 8. | Portfolio Managers of Closed-End Management Investment Companies. |
Not applicable.
Item 9. Purchases of Equity Securities by Closed-End Management Investment Company and Affiliated Purchasers.
Not applicable.
| Item 10. | Submission of Matters to a Vote of Security Holders. |
There were no material changes to the procedures by which shareholders may recommend nominees to the registrant’s board of directors.
| Item 11. | Controls and Procedures. |
| | (a) | The registrant’s principal executive officer and principal financial officers, based on their evaluation of the registrant’s disclosure controls and procedures as of a date within 90 days of the filing of this report, have concluded that such controls and procedures are adequately designed to ensure that material information required to be disclosed by the registrant in Form N-CSR is accumulated and communicated to the registrant’s management, including the principal executive officer and principal financial officer, or persons performing similar functions, as appropriate to allow timely decisions regarding required disclosure. |
| | (b) | There was no change in the registrant’s internal control over financial reporting that occurred during the registrant’s second fiscal quarter of the period covered by this report that has materially affected, or is reasonably likely to materially affect, the registrant’s internal control over financial reporting. |
(a)(1) Code of ethics required to be disclosed under Item 2 of Form N-CSR: Not applicable for semiannual reports.
(a)(2) Certifications pursuant to Rule 30a-2(a) under the Investment Company Act of 1940 (17 CFR 270.30a-2(a)) attached hereto as Exhibit 99.CERT.
(a)(3) Not applicable.
(b) Certification pursuant to Rule 30a-2(b) under the Investment Company Act of 1940 (17 CFR 270.30a-2(b)) attached hereto as Exhibit 99.906CERT.
SIGNATURES
Pursuant to the requirements of the Securities Exchange Act of 1934 and the Investment Company Act of 1940, the registrant has duly caused this report to be signed on its behalf by the undersigned, thereunto duly authorized.
| | | | |
| (registrant) | | Columbia Funds Series Trust II | | |
| | | | |
| | |
| By (Signature and Title) | | /s/ Christopher O. Petersen | | |
Christopher O. Petersen, President and Principal Executive Officer | | |
Pursuant to the requirements of the Securities Exchange Act of 1934 and the Investment Company Act of 1940, this report has been signed below by the following persons on behalf of the registrant and in the capacities and on the dates indicated.
| | | | |
| By (Signature and Title) | | /s/ Christopher O. Petersen | | |
Christopher O. Petersen, President and Principal Executive Officer | | |
| | | | |
| | |
| By (Signature and Title) | | /s/ Michael G. Clarke | | |
Michael G. Clarke, Treasurer and Chief Financial Officer | | |