UNITED STATES
SECURITIES AND EXCHANGE COMMISSION
Washington, D.C. 20549
FORM N-CSR
CERTIFIED SHAREHOLDER REPORT OF REGISTERED
MANAGEMENT INVESTMENT COMPANIES
Investment Company Act file number 811-21852
Columbia Funds Series Trust II
(Exact name of registrant as specified in charter)
50606 Ameriprise Financial Center
Minneapolis, MN 55474
(Address of principal executive offices) (Zip code)
Ryan Larrenaga
c/o Columbia Management Investment Advisers, LLC
225 Franklin Street
Boston, MA 02110
(Name and address of agent for service)
Registrant’s telephone number, including area code: (800) 345-6611
Date of fiscal year end: February 28
Date of reporting period: August 31, 2015
Form N-CSR is to be used by management investment companies to file reports with the Commission not later than 10 days after the transmission to stockholders of any report that is required to be transmitted to stockholders under Rule 30e-1 under the Investment Company Act of 1940 (17 CFR 270.30e-1). The Commission may use the information provided on Form N-CSR in its regulatory, disclosure review, inspection, and policymaking roles.
A registrant is required to disclose the information specified by Form N-CSR, and the Commission will make this information public. A registrant is not required to respond to the collection of information contained in Form N-CSR unless the Form displays a currently valid Office of Management and Budget (“OMB”) control number. Please direct comments concerning the accuracy of the information collection burden estimate and any suggestions for reducing the burden to Secretary, Securities and Exchange Commission, 450 Fifth Street, NW, Washington, DC 20549-0609. The OMB has reviewed this collection of information under the clearance requirements of 44 U.S.C. § 3507.
Item 1. Reports to Stockholders.

SEMIANNUAL REPORT
August 31, 2015

COLUMBIA GLOBAL EQUITY VALUE FUND


ABOUT COLUMBIA THREADNEEDLE INVESTMENTS
Columbia Threadneedle Investments is a leading global asset management group that provides a broad range of actively managed investment strategies and solutions for individual, institutional and corporate clients around the world.
With more than 2,000 people, including over 450 investment professionals based in North America, Europe and Asia, we manage $503 billion* of assets across developed and emerging market equities, fixed income, asset allocation solutions and alternatives. We are the 13th largest manager of long-term mutual fund assets in the U.S.** and the 4th largest manager of retail funds in the U.K.***
Our priority is the investment success of our clients. We aim to deliver the investment outcomes they expect through an investment approach that is team-based, performance-driven and risk-aware. Our culture is dynamic and interactive. By sharing our insights across asset classes and geographies, we generate richer perspectives on global, regional and local investment landscapes. The ability to exchange and debate investment ideas in a collaborative environment enriches our teams’ investment processes. More importantly, it results in better informed investment decisions for our clients.
Columbia funds are distributed by Columbia Management Investment Distributors, Inc., member FINRA, and managed by Columbia Management Investment Advisers, LLC.
Columbia Threadneedle Investments (Columbia Threadneedle) is the global brand name of the Columbia and Threadneedle group of companies.
| * | | In U.S. dollars as of June 30, 2015. Source: Ameriprise Q2 Earnings Release. Includes all assets managed by entities in the Columbia and Threadneedle groups of companies. |
Contact us for more current data.
| ** | | Source: ICI as of June 30, 2015 for Columbia Management Investment Advisers, LLC. |
| *** | | Source: Investment Association as of June 2015 for Threadneedle Asset Management Limited. |
© 2015 Columbia Management Investment Advisers, LLC. All rights reserved.
Not part of the shareholder report
Get the market insight you need
from our investment experts
Connect with Columbia Threadneedle Investments
Investor insight
Find economic and market commentary, investment videos, white papers,
mutual fund commentary and more at columbiathreadneedle.com/us.
| | | | |
 | | Columbia Threadneedle Investor Newsletter (e-newsletter) Read our award-winning* shareholder
newsletter. Our quarterly newsletter
is available online and provides timely
and relevant content about economic
trends, fund news, service enhancements and
changes. Sign up to receive the newsletter
electronically at columbiathreadneedle.com/
us/newsletter. | |  |
| | |
 | | Investment videos Get analysis of current events and trends that may affect your investments.
Visit our online video library to watch and discover what our thought leaders
are saying about the financial markets and economy. |
| | |
| | Social media We offer you multiple ways to access our market commentary and
investment insights. |
| | n | | Perspectives blog at columbiathreadneedle.com/us |
Read timely posts by our investment team, including our chief investment officer, chief economist and portfolio managers.
| | n | | twitter.com/CTinvest_US |
Follow us on Twitter for quick, up-to-the-minute comments on market news and more.
View our commentaries on the economy, markets and current investment opportunities.
| | n | | linkedin.com/company/columbia-threadneedle-investments-us |
Connect with us on LinkedIn for updates from our thought leaders.
| * | Columbia Threadneedle Investor Newsletter was awarded top honors in the Mutual Fund Education Alliance STAR Awards competition for excellence in mutual fund marketing and communications in 2011, 2012 and 2013. Materials in the competition were evaluated on educational value, message comprehension, effective design and objectives. |
Not part of the shareholder report
PRESIDENT’S MESSAGE

Dear Shareholder,
Today’s investors are typically focused on outcomes, like living a certain retirement lifestyle, paying for college education or building a legacy. But in today’s complex global investment landscape, even simple goals are not easily achieved.
At Columbia Threadneedle Investments, we aspire to help satisfy five core needs of today’s investors:
| | n | | Generate an appropriate stream of income in retirement |
Traditional approaches to generating income may not provide the diversification benefits they once did, and they may actually introduce unwanted risk in today’s market. To seek to improve your potential to live comfortably long term, we endeavor to pursue investments that explore less traveled paths to income.
| n | | Navigate a changing interest rate environment |
Today’s uncertain market environment includes the prospect of a rise in interest rates. Blending traditional investments with non-traditional or alternative products may help protect your wealth during periods of volatility. We can attempt to help strengthen your portfolio with agile products designed to take on the market’s ups and downs.
| n | | Maximize after-tax returns |
In an environment where what you keep may be more important than what you earn, municipal bonds can help mitigate high tax burdens while providing potentially attractive yields. Our state and federal tax-exempt products are aimed at helping investors manage risk, minimize the fluctuation of capital and grow wealth on a more tax-efficient basis.
| n | | Grow assets to achieve financial goals |
We believe that finding and protecting growth comes from a disciplined security selection process designed to create excess return. Our goal is to provide investment solutions built to help you face today’s market challenges and grow your assets at each crossroad of your journey.
| n | | Ease the impact of volatile markets |
Despite a bull market run that has benefited many investors over the past several years, it’s important to remember the lessons of 2008 and the value that a well-diversified portfolio may provide through times of market volatility. We are here to help you hold onto the savings you have worked tirelessly to amass, and to provide you the best opportunity to maintain your standard of living regardless of market conditions.
Find out today how we can help you confidently invest to realize your dreams. Please visit us at blog.columbiathreadneedleus.com/our-best-ideas to learn more about our unique investment solutions.
The world is constantly changing, but our priority remains the same: to help you secure your finances, meet your goals and achieve success. Thank you for your continued investment with us.
Sincerely,

Christopher O. Petersen
President, Columbia Funds
Investors should consider the investment objectives, risks, charges and expenses of a mutual fund carefully before investing. For a free prospectus and summary prospectus, which contains this and other important information about a fund, visit columbiathreadneedle.com/us. The prospectus should be read carefully before investing.
Columbia Funds are distributed by Columbia Management Investment Distributors, Inc., member FINRA, and managed by Columbia Management Investment Advisers, LLC.
© 2015 Columbia Management Investment Advisers, LLC. All rights reserved.
| | |
| |
| COLUMBIA GLOBAL EQUITY VALUE FUND | | |
TABLE OF CONTENTS
Fund Investment Manager
Columbia Management Investment
Advisers, LLC
225 Franklin Street
Boston, MA 02110
Fund Distributor
Columbia Management Investment
Distributors, Inc.
225 Franklin Street
Boston, MA 02110
Fund Transfer Agent
Columbia Management Investment
Services Corp.
P.O. Box 8081
Boston, MA 02266-8081
For more information about any of the funds, please visit columbiathreadneedle.com/us or call 800.345.6611. Customer Service Representatives are available to answer your questions Monday through Friday from 8 a.m. to 7 p.m. Eastern time.
The views expressed in this report reflect the current views of the respective parties. These views are not guarantees of future performance and involve certain risks, uncertainties and assumptions that are difficult to predict, so actual outcomes and results may differ significantly from the views expressed. These views are subject to change at any time based upon economic, market or other conditions and the respective parties disclaim any responsibility to update such views. These views may not be relied on as investment advice and, because investment decisions for a Columbia fund are based on numerous factors, may not be relied on as an indication of trading intent on behalf of any particular Columbia fund. References to specific securities should not be construed as a recommendation or investment advice.
Semiannual Report 2015
| | |
| |
| | COLUMBIA GLOBAL EQUITY VALUE FUND |
PERFORMANCE OVERVIEW
(Unaudited)
Performance Summary
| n | | Columbia Global Equity Value Fund (the Fund) Class A shares returned -8.21% excluding sales charges for the six-month period that ended August 31, 2015. |
| n | | During the same time period, the Fund underperformed its benchmark, the MSCI World Value Index (Net), which returned -7.68%, as well as its supplemental benchmark, the MSCI World Index (Net), which returned -6.14%. |
| | | | | | | | | | | | | | | | | | |
Average Annual Total Returns (%) (for period ended August 31, 2015) | |
| | | Inception | | 6 Months
Cumulative | | | 1 Year | | | 5 Years | | | 10 Years | |
Class A | | 03/20/95 | | | | | | | | | | | | | | | | |
Excluding sales charges | | | | | -8.21 | | | | -7.59 | | | | 12.00 | | | | 5.55 | |
Including sales charges | | | | | -13.47 | | | | -12.88 | | | | 10.68 | | | | 4.93 | |
Class B | | 05/14/84 | | | | | | | | | | | | | | | | |
Excluding sales charges | | | | | -8.57 | | | | -8.32 | | | | 11.17 | | | | 4.74 | |
Including sales charges | | | | | -13.06 | | | | -12.53 | | | | 10.91 | | | | 4.74 | |
Class C | | 06/26/00 | | | | | | | | | | | | | | | | |
Excluding sales charges | | | | | -8.57 | | | | -8.30 | | | | 11.17 | | | | 4.75 | |
Including sales charges | | | | | -9.46 | | | | -9.14 | | | | 11.17 | | | | 4.75 | |
Class I | | 03/04/04 | | | -8.04 | | | | -7.18 | | | | 12.48 | | | | 6.00 | |
Class K | | 03/20/95 | | | -8.19 | | | | -7.51 | | | | 12.16 | | | | 5.71 | |
Class R* | | 12/11/06 | | | -8.41 | | | | -7.92 | | | | 11.72 | | | | 5.29 | |
Class R4* | | 12/11/06 | | | -8.14 | | | | -7.41 | | | | 12.20 | | | | 5.61 | |
Class R5* | | 12/11/06 | | | -8.11 | | | | -7.31 | | | | 12.43 | | | | 5.89 | |
Class W* | | 12/01/06 | | | -8.22 | | | | -7.61 | | | | 11.95 | | | | 5.51 | |
Class Y* | | 02/28/13 | | | -8.03 | | | | -7.26 | | | | 12.24 | | | | 5.66 | |
Class Z* | | 09/27/10 | | | -8.16 | | | | -7.42 | | | | 12.29 | | | | 5.68 | |
MSCI World Value Index (Net) | | | | | -7.68 | | | | -8.48 | �� | | | 9.53 | | | | 4.32 | |
MSCI World Index (Net) | | | | | -6.14 | | | | -4.13 | | | | 11.07 | | | | 5.40 | |
Returns for Class A are shown with and without the maximum initial sales charge of 5.75%. Returns for Class B are shown with and without the applicable contingent deferred sales charge (CDSC) of 5.00% in the first year, declining to 1.00% in the sixth year and eliminated thereafter. Returns for Class C are shown with and without the 1.00% CDSC for the first year only. The Fund’s other classes are not subject to sales charges and have limited eligibility. Please see the Fund’s prospectus for details. Performance for different share classes will vary based on differences in sales charges and fees associated with each class. All results shown assume reinvestment of distributions during the period. Returns do not reflect the deduction of taxes that a shareholder may pay on Fund distributions or on the redemption of Fund shares. Performance results reflect the effect of any fee waivers or reimbursements of Fund expenses by Columbia Management Investment Advisers, LLC and/or any of its affiliates. Absent these fee waivers or expense reimbursement arrangements, performance results would have been lower.
The performance information shown represents past performance and is not a guarantee of future results. The investment return and principal value of your investment will fluctuate so that your shares, when redeemed, may be worth more or less than their original cost. Current performance may be lower or higher than the performance information shown. You may obtain performance information current to the most recent month-end by contacting your financial intermediary, visiting columbiathreadneedle.com/us or calling 800.345.6611.
| * | The returns shown for periods prior to the share class inception date (including returns for the Life of the Fund, if shown, which are since Fund inception) include the returns of the Fund’s oldest share class. Since the oldest share class of the Fund, Class B, are no longer available, Class A shares of the Fund were used. These returns are adjusted to reflect any higher class-related operating expenses of the newer share classes, as applicable. Please visit columbiathreadneedle.com/us/investment-products/mutual-funds/appended-performance for more information. |
The MSCI World Value Index (Net) captures large and mid-cap securities exhibiting overall value style characteristics across 23 Developed Markets countries. The value investment style characteristics for index construction are defined using three variables: book value to price, 12-month forward earnings to price and dividend yield. With 819 constituents, the index targets 50% coverage of the free float-adjusted market capitalization of the MSCI World Index.
The MSCI World Index (Net) is a free float-adjusted market capitalization weighted index that is designed to measure the equity market performance of developed markets.
Indices are not available for investment, are not professionally managed and do not reflect sales charges, fees, brokerage commissions, taxes (except the MSCI World Value Index (Net) and the MSCI World Index (Net), which reflect reinvested dividends net of withholding taxes) or other expenses of investing. Securities in the Fund may not match those in an index.
| | |
| |
| COLUMBIA GLOBAL EQUITY VALUE FUND | | |
PORTFOLIO OVERVIEW
(Unaudited)
| | | | |
Top Ten Holdings (%)
(at August 31, 2015) | |
Bank of America Corp. (United States) | | | 2.9 | |
JPMorgan Chase & Co. (United States) | | | 2.8 | |
Dow Chemical Co. (The) (United States) | | | 2.0 | |
Cisco Systems, Inc. (United States) | | | 1.9 | |
Occidental Petroleum Corp. (United States) | | | 1.7 | |
Citigroup, Inc. (United States) | | | 1.7 | |
Johnson & Johnson (United States) | | | 1.7 | |
AT&T, Inc. (United States) | | | 1.6 | |
Philip Morris International, Inc. (United States) | | | 1.6 | |
General Electric Co. (United States) | | | 1.5 | |
Percentages indicated are based upon total investments (excluding Money Market Funds).
For further detail about these holdings, please refer to the section entitled “Portfolio of Investments.”
Fund holdings are as of the date given, are subject to change at any time, and are not recommendations to buy or sell any security.
| | | | |
Country Breakdown (%)
(at August 31, 2015) | |
Australia | | | 1.4 | |
Belgium | | | 0.6 | |
Canada | | | 4.9 | |
France | | | 5.9 | |
Germany | | | 2.6 | |
Ireland | | | 2.3 | |
Japan | | | 4.3 | |
Liberia | | | 0.6 | |
Netherlands | | | 0.5 | |
Spain | | | 1.1 | |
Sweden | | | 1.1 | |
Switzerland | | | 2.7 | |
United Kingdom | | | 8.2 | |
United States(a) | | | 63.8 | |
Total | | | 100.0 | |
Country Breakdown is based primarily on issuer’s place of organization/incorporation. The Fund may use this and/or other criteria, for purposes of its investment policies, in determining whether an issuer is domestic (U.S.) or foreign. Percentages indicated are based upon total investments. The Fund’s portfolio composition is subject to change.
| (a) | Includes investments in Money Market Funds. |
| | | | |
Equity Sector Breakdown (%)
(at August 31, 2015) | |
Consumer Discretionary | | | 9.1 | |
Consumer Staples | | | 8.3 | |
Energy | | | 11.8 | |
Financials | | | 25.9 | |
Health Care | | | 13.3 | |
Industrials | | | 12.5 | |
Information Technology | | | 6.6 | |
Materials | | | 4.7 | |
Telecommunication Services | | | 3.9 | |
Utilities | | | 3.9 | |
Total | | | 100.0 | |
Percentages indicated are based upon total equity investments. The Fund’s portfolio composition is subject to change.
Portfolio Management
Steve Schroll
Paul Stocking
Dean Ramos, CFA
Morningstar Style Box™
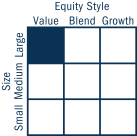
The Morningstar Style Box™ is based on a fund’s portfolio holdings. For equity funds, the vertical axis shows the market capitalization of the stocks owned, and the horizontal axis shows investment style (value, blend, or growth). Information shown is based on the most recent data provided by Morningstar.
©2015 Morningstar, Inc. All rights reserved. The Morningstar information contained herein: (1) is proprietary to Morningstar and/or its content providers; (2) may not be copied or distributed; and (3) is not warranted to be accurate, complete or timely. Neither Morningstar nor its content providers are responsible for any damages or losses arising from any use of this information.
| | |
| |
| | COLUMBIA GLOBAL EQUITY VALUE FUND |
UNDERSTANDING YOUR FUND’S EXPENSES
(Unaudited)
As an investor, you incur two types of costs. There are transaction costs, which generally include sales charges on purchases and may include redemption fees. There are also ongoing costs, which generally include management fees, distribution and/or service fees, and other fund expenses. The following information is intended to help you understand your ongoing costs (in dollars) of investing in the Fund and to help you compare these costs with the ongoing costs of investing in other mutual funds.
Analyzing Your Fund’s Expenses
To illustrate these ongoing costs, we have provided examples and calculated the expenses paid by investors in each share class of the Fund during the period. The actual and hypothetical information in the table is based on an initial investment of $1,000 at the beginning of the period indicated and held for the entire period. Expense information is calculated two ways and each method provides you with different information. The amount listed in the “Actual” column is calculated using the Fund’s actual operating expenses and total return for the period. You may use the Actual information, together with the amount invested, to estimate the expenses that you paid over the period. Simply divide your account value by $1,000 (for example, an $8,600 account value divided by $1,000 = 8.6), then multiply the results by the expenses paid during the period under the “Actual” column. The amount listed in the “Hypothetical” column assumes a 5% annual rate of return before expenses (which is not the Fund’s actual return) and then applies the Fund’s actual expense ratio for the period to the hypothetical return. You should not use the hypothetical account values and expenses to estimate either your actual account balance at the end of the period or the expenses you paid during the period. See “Compare With Other Funds” below for details on how to use the hypothetical data.
Compare With Other Funds
Since all mutual funds are required to include the same hypothetical calculations about expenses in shareholder reports, you can use this information to compare the ongoing cost of investing in the Fund with other funds. To do so, compare the hypothetical example with the 5% hypothetical examples that appear in the shareholder reports of other funds. As you compare hypothetical examples of other funds, it is important to note that hypothetical examples are meant to highlight the ongoing costs of investing in a fund only and do not reflect any transaction costs, such as sales charges, or redemption or exchange fees. Therefore, the hypothetical calculations are useful in comparing ongoing costs only, and will not help you determine the relative total costs of owning different funds. If transaction costs were included in these calculations, your costs would be higher.
March 1, 2015 – August 31, 2015
| | | | | | | | | | | | | | | | | | | | | | | | | | | | |
| | | Account Value at the
Beginning of the
Period ($) | | | Account Value at the
End of the
Period ($) | | | Expenses Paid During
the Period ($) | | | Fund’s Annualized
Expense Ratio (%) | |
| | | | Actual | | | | Hypothetical | | | | Actual | | | | Hypothetical | | | | Actual | | | | Hypothetical | | | | Actual | |
Class A | | | 1,000.00 | | | | 1,000.00 | | | | 917.90 | | | | 1,019.31 | | | | 5.72 | | | | 6.02 | | | | 1.18 | |
Class B | | | 1,000.00 | | | | 1,000.00 | | | | 914.30 | | | | 1,015.52 | | | | 9.34 | | | | 9.83 | | | | 1.93 | |
Class C | | | 1,000.00 | | | | 1,000.00 | | | | 914.30 | | | | 1,015.52 | | | | 9.34 | | | | 9.83 | | | | 1.93 | |
Class I | | | 1,000.00 | | | | 1,000.00 | | | | 919.60 | | | | 1,021.43 | | | | 3.69 | | | | 3.88 | | | | 0.76 | |
Class K | | | 1,000.00 | | | | 1,000.00 | | | | 918.10 | | | | 1,020.02 | | | | 5.04 | | | | 5.31 | | | | 1.04 | |
Class R | | | 1,000.00 | | | | 1,000.00 | | | | 915.90 | | | | 1,018.05 | | | | 6.92 | | | | 7.29 | | | | 1.43 | |
Class R4 | | | 1,000.00 | | | | 1,000.00 | | | | 918.60 | | | | 1,020.57 | | | | 4.51 | | | | 4.75 | | | | 0.93 | |
Class R5 | | | 1,000.00 | | | | 1,000.00 | | | | 918.90 | | | | 1,021.23 | | | | 3.88 | | | | 4.09 | | | | 0.80 | |
Class W | | | 1,000.00 | | | | 1,000.00 | | | | 917.80 | | | | 1,019.41 | | | | 5.62 | | | | 5.92 | | | | 1.16 | |
Class Y | | | 1,000.00 | | | | 1,000.00 | | | | 919.70 | | | | 1,021.58 | | | | 3.54 | | | | 3.73 | | | | 0.73 | |
Class Z | | | 1,000.00 | | | | 1,000.00 | | | | 918.40 | | | | 1,020.57 | | | | 4.51 | | | | 4.75 | | | | 0.93 | |
Expenses paid during the period are equal to the annualized expense ratio for each class as indicated above, multiplied by the average account value over the period and then multiplied by the number of days in the Fund’s most recent fiscal half year and divided by 366.
Expenses do not include fees and expenses incurred indirectly by the Fund from its investment in underlying funds, including affiliated and non-affiliated pooled investment vehicles, such as mutual funds and exchange-traded funds.
| | |
| |
| COLUMBIA GLOBAL EQUITY VALUE FUND | | |
PORTFOLIO OF INVESTMENTS
August 31, 2015 (Unaudited)
(Percentages represent value of investments compared to net assets)
| | | | | | | | |
| Common Stocks 97.6% | |
| Issuer | | Shares | | | Value ($) | |
AUSTRALIA 1.4% | |
Australia and New Zealand Banking Group Ltd. | | | 308,840 | | | | 6,142,495 | |
| | |
National Australia Bank Ltd. | | | 294,009 | | | | 6,519,211 | |
| | | | | | | | | |
Total | | | | | | | 12,661,706 | |
| | |
| | | | | | | | |
BELGIUM 0.6% | |
Anheuser-Busch InBev SA/NV | | | 48,892 | | | | 5,347,064 | |
| | |
| | | | | | | | |
CANADA 5.0% | |
Bank of Montreal | | | 52,341 | | | | 2,824,727 | |
| | |
Bank of Montreal | | | 40,368 | | | | 2,177,046 | |
| | |
Enbridge, Inc. | | | 222,630 | | | | 9,179,035 | |
| | |
EnCana Corp. | | | 463,700 | | | | 3,449,928 | |
| | |
First Quantum Minerals Ltd. | | | 401,759 | | | | 2,094,912 | |
| | |
Rogers Communications, Inc., Class B | | | 142,481 | | | | 4,863,805 | |
| | |
Royal Bank of Canada | | | 91,505 | | | | 5,101,077 | |
| | |
Suncor Energy, Inc. | | | 404,874 | | | | 11,433,642 | |
| | |
Toronto-Dominion Bank (The) | | | 76,043 | | | | 3,033,397 | |
| | |
Toronto-Dominion Bank (The) | | | 57,358 | | | | 2,282,848 | |
| | | | | | | | | |
Total | | | | | | | 46,440,417 | |
| | |
| | | | | | | | |
FRANCE 5.9% | |
Cie Generale des Etablissements Michelin | | | 77,957 | | | | 7,548,605 | |
| | |
Engie | | | 268,759 | | | | 4,820,885 | |
| | |
Lagardere SCA | | | 167,336 | | | | 4,553,573 | |
| | |
Orange SA | | | 377,468 | | | | 5,968,185 | |
| | |
Rexel SA | | | 438,989 | | | | 6,736,466 | |
| | |
Sanofi | | | 92,300 | | | | 9,132,164 | |
| | |
Schneider Electric SE | | | 73,021 | | | | 4,615,712 | |
| | |
Total SA, ADR | | | 151,900 | | | | 7,048,160 | |
| | |
VINCI SA | | | 72,238 | | | | 4,653,764 | |
| | | | | | | | | |
Total | | | | | | | 55,077,514 | |
| | |
| | | | | | | | |
GERMANY 2.6% | |
Commerzbank AG(a) | | | 383,148 | | | | 4,296,058 | |
| | |
Deutsche Bank AG, Registered Shares | | | 159,847 | | | | 4,713,010 | |
| | |
E.ON SE | | | 375,328 | | | | 4,255,969 | |
| | |
SAP SE | | | 92,558 | | | | 6,230,802 | |
| | |
Siemens AG, Registered Shares | | | 49,152 | | | | 4,879,095 | |
| | | | | | | | | |
Total | | | | | | | 24,374,934 | |
| | |
| | | | | | | | |
| | | | | | | | |
| Common Stocks (continued) | |
| Issuer | | Shares | | | Value ($) | |
IRELAND 2.3% | |
Allergan PLC(a) | | | 31,802 | | | | 9,659,539 | |
| | |
Medtronic PLC | | | 167,778 | | | | 12,128,672 | |
| | | | | | | | | |
Total | | | | | | | 21,788,211 | |
| | |
| | | | | | | | |
JAPAN 4.4% | |
Honda Motor Co., Ltd. | | | 232,600 | | | | 7,316,222 | |
| | |
Japan Tobacco, Inc. | | | 138,900 | | | | 4,936,422 | |
| | |
Komatsu Ltd. | | | 241,600 | | | | 4,000,911 | |
| | |
Mitsubishi Estate Co., Ltd. | | | 192,000 | | | | 4,130,081 | |
| | |
Mitsui & Co., Ltd. | | | 460,100 | | | | 5,983,024 | |
| | |
Mizuho Financial Group, Inc. | | | 2,761,900 | | | | 5,656,286 | |
| | |
Nippon Telegraph & Telephone Corp. | | | 106,000 | | | | 4,043,069 | |
| | |
Sumitomo Mitsui Financial Group, Inc. | | | 112,500 | | | | 4,591,852 | |
| | | | | | | | | |
Total | | | | | | | 40,657,867 | |
| | |
| | | | | | | | |
LIBERIA 0.6% | |
Royal Caribbean Cruises Ltd. | | | 67,028 | | | | 5,909,188 | |
| | |
| | | | | | | | |
NETHERLANDS 0.5% | |
LyondellBasell Industries NV, Class A | | | 56,676 | | | | 4,838,997 | |
| | |
| | | | | | | | |
SPAIN 1.1% | |
Banco Santander SA | | | 772,489 | | | | 4,732,995 | |
| | |
Red Electrica Corp. SA | | | 65,706 | | | | 5,252,670 | |
| | | | | | | | | |
Total | | | | | | | 9,985,665 | |
| | |
| | | | | | | | |
SWEDEN 1.1% | |
Skanska AB, Class B | | | 272,793 | | | | 5,348,882 | |
| | |
Svenska Cellulosa AB, Class B | | | 168,930 | | | | 4,816,880 | |
| | | | | | | | | |
Total | | | | | | | 10,165,762 | |
| | |
| | | | | | | | |
SWITZERLAND 2.8% | |
Novartis AG, ADR | | | 79,671 | | | | 7,745,615 | |
| | |
Roche Holding AG, Genusschein Shares | | | 27,800 | | | | 7,592,407 | |
| | |
TE Connectivity Ltd. | | | 93,722 | | | | 5,556,777 | |
| | |
Tyco International PLC | | | 132,745 | | | | 4,817,316 | |
| | | | | | | | | |
Total | | | | | | | 25,712,115 | |
| | |
| | | | | | | | |
UNITED KINGDOM 8.2% | |
AstraZeneca PLC | | | 150,717 | | | | 9,403,102 | |
| | |
BAE Systems PLC, ADR | | | 222,717 | | | | 6,138,080 | |
| | |
BP PLC, ADR | | | 272,179 | | | | 9,128,884 | |
| | |
Britvic PLC | | | 453,600 | | | | 4,634,342 | |
The accompanying Notes to Financial Statements are an integral part of this statement.
| | |
| |
| | COLUMBIA GLOBAL EQUITY VALUE FUND |
PORTFOLIO OF INVESTMENTS (continued)
August 31, 2015 (Unaudited)
| | | | | | | | |
| Common Stocks (continued) | |
| Issuer | | Shares | | | Value ($) | |
BT Group PLC | | | 888,942 | | | | 5,930,299 | |
| | |
HSBC Holdings PLC | | | 1,260,693 | | | | 9,964,104 | |
| | |
Pearson PLC | | | 347,277 | | | | 6,020,590 | |
| | |
Rio Tinto PLC | | | 148,141 | | | | 5,408,724 | |
| | |
Rio Tinto PLC, ADR | | | 45,000 | | | | 1,652,400 | |
| | |
Royal Dutch Shell PLC, Class A | | | 343,566 | | | | 8,950,679 | |
| | |
SABMiller PLC | | | 98,721 | | | | 4,592,212 | |
| | |
Standard Chartered PLC | | | 426,800 | | | | 4,972,424 | |
| | | | | | | | | |
Total | | | | | | | 76,795,840 | |
| | |
| | | | | | | | |
UNITED STATES 61.1% | |
AbbVie, Inc. | | | 76,400 | | | | 4,768,124 | |
| | |
American International Group, Inc. | | | 158,925 | | | | 9,589,535 | |
| | |
AT&T, Inc. | | | 450,600 | | | | 14,959,920 | |
| | |
Bank of America Corp. | | | 1,632,866 | | | | 26,681,030 | |
| | |
Bank of New York Mellon Corp. (The) | | | 295,900 | | | | 11,776,820 | |
| | |
Best Buy Co., Inc. | | | 67,022 | | | | 2,462,388 | |
| | |
BlackRock, Inc. | | | 17,240 | | | | 5,214,583 | |
| | |
Boeing Co. (The) | | | 67,041 | | | | 8,760,918 | |
| | |
Bristol-Myers Squibb Co. | | | 120,777 | | | | 7,182,608 | |
| | |
Capital One Financial Corp. | | | 126,409 | | | | 9,828,300 | |
| | |
Cisco Systems, Inc. | | | 678,785 | | | | 17,566,956 | |
| | |
Citigroup, Inc. | | | 288,655 | | | | 15,437,269 | |
| | |
Comcast Corp., Class A | | | 105,260 | | | | 5,929,296 | |
| | |
CVS Health Corp. | | | 114,782 | | | | 11,753,677 | |
| | |
Delta Air Lines, Inc. | | | 113,270 | | | | 4,958,961 | |
| | |
Devon Energy Corp. | | | 162,396 | | | | 6,927,813 | |
| | |
Discover Financial Services | | | 152,461 | | | | 8,191,730 | |
| | |
Dollar General Corp. | | | 68,200 | | | | 5,080,218 | |
| | |
Dow Chemical Co. (The) | | | 417,961 | | | | 18,289,973 | |
| | |
Eastman Chemical Co. | | | 64,370 | | | | 4,664,250 | |
| | |
EOG Resources, Inc. | | | 74,112 | | | | 5,803,711 | |
| | |
Exelon Corp. | | | 361,538 | | | | 11,120,909 | |
| | |
Exxon Mobil Corp. | | | 59,308 | | | | 4,462,334 | |
| | |
General Electric Co. | | | 569,561 | | | | 14,136,504 | |
| | |
General Mills, Inc. | | | 128,846 | | | | 7,313,299 | |
| | |
Gilead Sciences, Inc. | | | 118,728 | | | | 12,474,751 | |
| | |
Goldman Sachs Group, Inc. (The) | | | 72,919 | | | | 13,752,523 | |
| | |
Harley-Davidson, Inc. | | | 97,800 | | | | 5,481,690 | |
| | |
Home Depot, Inc. (The) | | | 49,572 | | | | 5,773,155 | |
| | |
Host Hotels & Resorts, Inc. | | | 251,500 | | | | 4,459,095 | |
| | |
Intel Corp. | | | 342,556 | | | | 9,776,548 | |
| | |
Johnson & Johnson | | | 164,107 | | | | 15,422,776 | |
| | | | | | | | |
| Common Stocks (continued) | |
| Issuer | | Shares | | | Value ($) | |
JPMorgan Chase & Co. | | | 394,645 | | | | 25,296,744 | |
| | |
McDonald’s Corp. | | | 47,981 | | | | 4,559,155 | |
| | |
Merck & Co., Inc. | | | 101,419 | | | | 5,461,413 | |
| | |
MetLife, Inc. | | | 146,897 | | | | 7,359,540 | |
| | |
Microsoft Corp. | | | 228,358 | | | | 9,938,140 | |
| | |
Molson Coors Brewing Co., Class B | | | 58,728 | | | | 3,998,790 | |
| | |
Morgan Stanley | | | 182,196 | | | | 6,276,652 | |
| | |
NextEra Energy, Inc. | | | 60,326 | | | | 5,936,682 | |
| | |
Nielsen Holdings PLC | | | 178,454 | | | | 8,071,474 | |
| | |
Norwegian Cruise Line Holdings Ltd.(a) | | | 132,059 | | | | 7,606,598 | |
| | |
Nucor Corp. | | | 144,300 | | | | 6,246,747 | |
| | |
Occidental Petroleum Corp. | | | 212,605 | | | | 15,522,291 | |
| | |
PACCAR, Inc. | | | 77,687 | | | | 4,581,202 | |
| | |
Pfizer, Inc. | | | 288,652 | | | | 9,300,367 | |
| | |
Philip Morris International, Inc. | | | 181,400 | | | | 14,475,720 | |
| | |
Phillips 66 | | | 150,097 | | | | 11,868,170 | |
| | |
Pioneer Natural Resources Co. | | | 55,065 | | | | 6,776,299 | |
| | |
PNC Financial Services Group, Inc. (The) | | | 53,670 | | | | 4,890,410 | |
| | |
Procter & Gamble Co. (The) | | | 128,410 | | | | 9,074,735 | |
| | |
PVH Corp. | | | 60,698 | | | | 7,221,848 | |
| | |
RR Donnelley & Sons Co. | | | 324,800 | | | | 5,099,360 | |
| | |
Ryder System, Inc. | | | 85,417 | | | | 7,001,631 | |
| | |
Schlumberger Ltd. | | | 90,802 | | | | 7,025,351 | |
| | |
Seagate Technology PLC | | | 98,907 | | | | 5,083,820 | |
| | |
Sempra Energy | | | 48,943 | | | | 4,642,244 | |
| | |
United Continental Holdings, Inc.(a) | | | 161,933 | | | | 9,225,323 | |
| | |
United Rentals, Inc.(a) | | | 69,628 | | | | 4,827,309 | |
| | |
UnitedHealth Group, Inc. | | | 98,981 | | | | 11,452,102 | |
| | |
Visteon Corp.(a) | | | 78,925 | | | | 7,865,666 | |
| | |
Wal-Mart Stores, Inc. | | | 68,499 | | | | 4,433,940 | |
| | |
Wells Fargo & Co. | | | 209,028 | | | | 11,147,463 | |
| | |
Western Digital Corp. | | | 78,803 | | | | 6,458,694 | |
| | | | | | | | | |
Total | | | | 568,727,544 | |
| | | | | | | | | |
Total Common Stocks
(Cost: $889,978,222) | | | | 908,482,824 | |
| | |
| | | | | | | | |
| Limited Partnerships 0.5% | |
UNITED STATES 0.5% | |
KKR & Co. LP | | | 268,665 | | | | 5,128,815 | |
| | | | | | | | | |
Total Limited Partnerships
(Cost: $5,781,341) | | | | | | | 5,128,815 | |
The accompanying Notes to Financial Statements are an integral part of this statement.
| | |
| |
| COLUMBIA GLOBAL EQUITY VALUE FUND | | |
PORTFOLIO OF INVESTMENTS (continued)
August 31, 2015 (Unaudited)
| | | | | | | | |
| Money Market Funds 2.7% | |
| | | Shares | | | Value ($) | |
Columbia Short-Term Cash Fund, 0.150%(b)(c) | | | 25,322,451 | | | | 25,322,451 | |
| | | | | | | | | |
Total Money Market Funds | | | | | | | | |
(Cost: $25,322,451) | | | | | | | 25,322,451 | |
| | | | | | | | | |
Total Investments | | | | | | | | |
(Cost: $921,082,014) | | | | | | | 938,934,090 | |
| | | | | | | | | |
Other Assets & Liabilities, Net | | | | | | | (7,712,217 | ) |
| | | | | | | | | |
Net Assets | | | | | | | 931,221,873 | |
| | | | | | | | | |
Notes to Portfolio of Investments
| (a) | Non-income producing investment. |
| (b) | The rate shown is the seven-day current annualized yield at August 31, 2015. |
| (c) | As defined in the Investment Company Act of 1940, an affiliated company is one in which the Fund owns 5% or more of the company’s outstanding voting securities, or a company which is under common ownership or control with the Fund. Holdings and transactions in these affiliated companies during the period ended August 31, 2015 are as follows: |
| | | | | | | | | | | | | | | | | | | | | | | | |
| Issuer | | Beginning
Cost ($) | | | Purchase
Cost ($) | | | Proceeds
From Sales ($) | | | Ending
Cost ($) | | | Dividends —
Affiliated
Issuers ($) | | | Value ($) | |
Columbia Short-Term Cash Fund | | | 24,764,704 | | | | 214,086,556 | | | | (213,528,809 | ) | | | 25,322,451 | | | | 8,666 | | | | 25,322,451 | |
Abbreviation Legend
| | |
| ADR | | American Depositary Receipt |
Fair Value Measurements
The Fund categorizes its fair value measurements according to a three-level hierarchy that maximizes the use of observable inputs and minimizes the use of unobservable inputs by prioritizing that the most observable input be used when available. Observable inputs are those that market participants would use in pricing an investment based on market data obtained from sources independent of the reporting entity. Unobservable inputs are those that reflect the Fund’s assumptions about the information market participants would use in pricing an investment. An investment’s level within the fair value hierarchy is based on the lowest level of any input that is deemed significant to the asset’s or liability’s fair value measurement. The input levels are not necessarily an indication of the risk or liquidity associated with investments at that level. For example, certain U.S. government securities are generally high quality and liquid, however, they are reflected as Level 2 because the inputs used to determine fair value may not always be quoted prices in an active market.
Fair value inputs are summarized in the three broad levels listed below:
| n | | Level 1 — Valuations based on quoted prices for investments in active markets that the Fund has the ability to access at the measurement date (including NAV for open-end mutual funds). Valuation adjustments are not applied to Level 1 investments. |
| n | | Level 2 — Valuations based on other significant observable inputs (including quoted prices for similar securities, interest rates, prepayment speeds, credit risks, etc.). |
| n | | Level 3 — Valuations based on significant unobservable inputs (including the Fund’s own assumptions and judgment in determining the fair value of investments). |
Inputs that are used in determining fair value of an investment may include price information, credit data, volatility statistics, and other factors. These inputs can be either observable or unobservable. The availability of observable inputs can vary between investments, and is affected by various factors such as the type of investment, and the volume and level of activity for that investment or similar investments in the marketplace. The inputs will be considered by the Investment Manager, along with any other relevant factors in the calculation of an investment’s fair value. The Fund uses prices and inputs that are current as of the measurement date, which may include periods of market dislocations. During these periods, the availability of prices and inputs may be reduced for many investments. This condition could cause an investment to be reclassified between the various levels within the hierarchy.
Foreign equity securities actively traded in markets where there is a significant delay in the local close relative to the New York Stock Exchange (NYSE) are classified as Level 2. The values of these securities may include an adjustment to reflect the impact of significant market movements following the close of local trading, as described in Note 2 to the financial statements — Security Valuation.
Investments falling into the Level 3 category are primarily supported by quoted prices from brokers and dealers participating in the market for those investments. However, these may be classified as Level 3 investments due to lack of market transparency and corroboration to support these quoted prices. Additionally, valuation models may be used as the pricing source for any remaining investments classified as Level 3. These models may rely on one or more significant unobservable inputs and/or significant assumptions by the Investment Manager. Inputs used in valuations may include, but are not limited to, financial statement analysis, capital account balances, discount rates and estimated cash flows, and comparable company data.
The accompanying Notes to Financial Statements are an integral part of this statement.
| | |
| |
| | COLUMBIA GLOBAL EQUITY VALUE FUND |
PORTFOLIO OF INVESTMENTS (continued)
August 31, 2015 (Unaudited)
Fair Value Measurements (continued)
Under the direction of the Fund’s Board of Trustees (the Board), the Investment Manager’s Valuation Committee (the Committee) is responsible for overseeing the valuation procedures approved by the Board. The Committee consists of voting and non-voting members from various groups within the Investment Manager’s organization, including operations and accounting, trading and investments, compliance, risk management and legal.
The Committee meets at least monthly to review and approve valuation matters, which may include a description of specific valuation determinations, data regarding pricing information received from approved pricing vendors and brokers and the results of Board-approved valuation control policies and procedures (the Policies). The Policies address, among other things, instances when market quotations are or are not readily available, including recommendations of third party pricing vendors and a determination of appropriate pricing methodologies; events that require specific valuation determinations and assessment of fair value techniques; securities with a potential for stale pricing, including those that are illiquid, restricted, or in default; and the effectiveness of third party pricing vendors, including periodic reviews of vendors. The Committee meets more frequently, as needed, to discuss additional valuation matters, which may include the need to review back-testing results, review time-sensitive information or approve related valuation actions. The Committee reports to the Board, with members of the Committee meeting with the Board at each of its regularly scheduled meetings to discuss valuation matters and actions during the period, similar to those described earlier.
For investments categorized as Level 3, the Committee monitors information similar to that described above, which may include: (i) data specific to the issuer or comparable issuers, (ii) general market or specific sector news and (iii) quoted prices and specific or similar security transactions. The Committee considers this data and any changes from prior periods in order to assess the reasonableness of observable and unobservable inputs, any assumptions or internal models used to value those securities and changes in fair value. This data is also used to corroborate, when available, information received from approved pricing vendors and brokers. Various factors impact the frequency of monitoring this information (which may occur as often as daily). However, the Committee may determine that changes to inputs, assumptions and models are not required as a result of the monitoring procedures performed.
The following table is a summary of the inputs used to value the Fund’s investments at August 31, 2015:
| | | | | | | | | | | | | | | | |
| | | Level 1 Quoted Prices in Active
Markets for Identical
Assets ($) | | | Level 2 Other Significant
Observable Inputs ($) | | | Level 3 Significant
Unobservable Inputs ($) | | | Total ($) | |
Investments | | | | | | | | | | | | | | | | |
| | | | |
Common Stocks | | | | | | | | | | | | | | | | |
| | | | |
Australia | | | — | | | | 12,661,706 | | | | — | | | | 12,661,706 | |
| | | | |
Belgium | | | — | | | | 5,347,064 | | | | — | | | | 5,347,064 | |
| | | | |
Canada | | | 46,440,417 | | | | — | | | | — | | | | 46,440,417 | |
| | | | |
France | | | 7,048,160 | | | | 48,029,354 | | | | — | | | | 55,077,514 | |
| | | | |
Germany | | | — | | | | 24,374,934 | | | | — | | | | 24,374,934 | |
| | | | |
Ireland | | | 21,788,211 | | | | — | | | | — | | | | 21,788,211 | |
| | | | |
Japan | | | — | | | | 40,657,867 | | | | — | | | | 40,657,867 | |
| | | | |
Liberia | | | 5,909,188 | | | | — | | | | — | | | | 5,909,188 | |
| | | | |
Netherlands | | | 4,838,997 | | | | — | | | | — | | | | 4,838,997 | |
| | | | |
Spain | | | — | | | | 9,985,665 | | | | — | | | | 9,985,665 | |
| | | | |
Sweden | | | — | | | | 10,165,762 | | | | — | | | | 10,165,762 | |
| | | | |
Switzerland | | | 18,119,708 | | | | 7,592,407 | | | | — | | | | 25,712,115 | |
| | | | |
United Kingdom | | | 16,919,364 | | | | 59,876,476 | | | | — | | | | 76,795,840 | |
| | | | |
United States | | | 568,727,544 | | | | — | | | | — | | | | 568,727,544 | |
| | | | | | | | | | | | | | | | | |
Total Common Stocks | | | 689,791,589 | | | | 218,691,235 | | | | — | | | | 908,482,824 | |
| | | | | | | | | | | | | | | | | |
Limited Partnerships | | | | | | | | | | | | | | | | |
| | | | |
United States | | | 5,128,815 | | | | — | | | | — | | | | 5,128,815 | |
| | | | |
Money Market Funds | | | — | | | | 25,322,451 | | | | — | | | | 25,322,451 | |
| | | | | | | | | | | | | | | | | |
Total Investments | | | 694,920,404 | | | | 244,013,686 | | | | — | | | | 938,934,090 | |
| | | | | | | | | | | | | | | | | |
See the Portfolio of Investments for all investment classifications not indicated in the table.
The Fund’s assets assigned to the Level 2 input category are generally valued using the market approach, in which a security’s value is determined through reference to prices and information from market transactions for similar or identical assets. These assets include certain foreign securities for which a third party statistical pricing service may be employed for purposes of fair market valuation. The model utilized by such third party statistical pricing service takes into account a security’s correlation to available market data including, but not limited to, intraday index, ADR, and exchange-traded fund movements.
The accompanying Notes to Financial Statements are an integral part of this statement.
| | |
| |
| COLUMBIA GLOBAL EQUITY VALUE FUND | | |
PORTFOLIO OF INVESTMENTS (continued)
August 31, 2015 (Unaudited)
Fair Value Measurements (continued)
Financial assets were transferred from Level 1 to Level 2 as the market for these assets is not considered publicly available. Fund per share market values were obtained using observable market inputs.
The following table shows transfers between Level 1 and Level 2 of the fair value hierarchy:
| | | | | | |
| Transfers In | | Transfers Out |
| Level 1 ($) | | Level 2 ($) | | Level 1 ($) | | Level 2 ($) |
| — | | 24,764,704 | | 24,764,704 | | — |
| | | | | | | |
Transfers between Level 1 and Level 2 are determined based on the fair value at the beginning of the period for security positions held throughout the period.
There were no transfers of financial assets between Levels 2 and 3 during the period.
The accompanying Notes to Financial Statements are an integral part of this statement.
| | |
| |
| | COLUMBIA GLOBAL EQUITY VALUE FUND |
STATEMENT OF ASSETS AND LIABILITIES
August 31, 2015 (Unaudited)
| | | | |
| |
Assets | | | | |
| |
Investments, at value | | | | |
| |
Unaffiliated issuers (identified cost $895,759,563) | | | $913,611,639 | |
| |
Affiliated issuers (identified cost $25,322,451) | | | 25,322,451 | |
| |
Total investments (identified cost $921,082,014) | | | 938,934,090 | |
| |
Receivable for: | | | | |
| |
Investments sold | | | 9,485,480 | |
| |
Capital shares sold | | | 619,305 | |
| |
Dividends | | | 2,455,568 | |
| |
Foreign tax reclaims | | | 217,047 | |
| |
Prepaid expenses | | | 6,603 | |
| |
Other assets | | | 15,019 | |
| |
Total assets | | | 951,733,112 | |
| |
| |
Liabilities | | | | |
| |
Payable for: | | | | |
| |
Investments purchased | | | 19,412,293 | |
| |
Capital shares purchased | | | 620,539 | |
| |
Investment management fees | | | 53,619 | |
| |
Distribution and/or service fees | | | 18,641 | |
| |
Transfer agent fees | | | 122,441 | |
| |
Plan administration fees | | | 956 | |
| |
Compensation of board members | | | 207,515 | |
| |
Other expenses | | | 75,235 | |
| |
Total liabilities | | | 20,511,239 | |
| |
Net assets applicable to outstanding capital stock | | | $931,221,873 | |
| |
| |
Represented by | | | | |
| |
Paid-in capital | | | $916,647,447 | |
| |
Undistributed net investment income | | | 6,590,619 | |
| |
Accumulated net realized loss | | | (9,857,813 | ) |
| |
Unrealized appreciation (depreciation) on: | | | | |
| |
Investments | | | 17,852,076 | |
| |
Foreign currency translations | | | (10,456 | ) |
| |
Total — representing net assets applicable to outstanding capital stock | | | $931,221,873 | |
| |
The accompanying Notes to Financial Statements are an integral part of this statement.
| | |
| 10 | | Semiannual Report 2015 |
| | |
| |
| COLUMBIA GLOBAL EQUITY VALUE FUND | | |
STATEMENT OF ASSETS AND LIABILITIES (continued)
August 31, 2015 (Unaudited)
| | | | |
Class A | | | | |
| |
Net assets | | | $776,546,478 | |
| |
Shares outstanding | | | 66,624,009 | |
| |
Net asset value per share | | | $11.66 | |
| |
Maximum offering price per share(a) | | | $12.37 | |
| |
Class B | | | | |
| |
Net assets | | | $6,066,933 | |
| |
Shares outstanding | | | 517,246 | |
| |
Net asset value per share | | | $11.73 | |
| |
Class C | | | | |
| |
Net assets | | | $24,844,662 | |
| |
Shares outstanding | | | 2,155,369 | |
| |
Net asset value per share | | | $11.53 | |
| |
Class I | | | | |
| |
Net assets | | | $21,123,402 | |
| |
Shares outstanding | | | 1,861,746 | |
| |
Net asset value per share | | | $11.35 | |
| |
Class K | | | | |
| |
Net assets | | | $4,202,066 | |
| |
Shares outstanding | | | 359,145 | |
| |
Net asset value per share | | | $11.70 | |
| |
Class R | | | | |
| |
Net assets | | | $980,631 | |
| |
Shares outstanding | | | 84,299 | |
| |
Net asset value per share | | | $11.63 | |
| |
Class R4 | | | | |
| |
Net assets | | | $211,814 | |
| |
Shares outstanding | | | 18,104 | |
| |
Net asset value per share | | | $11.70 | |
| |
Class R5 | | | | |
| |
Net assets | | | $153,206 | |
| |
Shares outstanding | | | 13,151 | |
| |
Net asset value per share | | | $11.65 | |
| |
Class W | | | | |
| |
Net assets | | | $12,515 | |
| |
Shares outstanding | | | 1,066 | |
| |
Net asset value per share | | | $11.74 | |
| |
Class Y | | | | |
| |
Net assets | | | $2,213 | |
| |
Shares outstanding | | | 194 | |
| |
Net asset value per share(b) | | | $11.39 | |
| |
Class Z | | | | |
| |
Net assets | | | $97,077,953 | |
| |
Shares outstanding | | | 8,318,821 | |
| |
Net asset value per share | | | $11.67 | |
| |
| (a) | The maximum offering price per share is calculated by dividing the net asset value per share by 1.0 minus the maximum sales charge of 5.75%. |
| (b) | Net asset value per share rounds to this amount due to fractional shares outstanding. |
The accompanying Notes to Financial Statements are an integral part of this statement.
| | | | |
| Semiannual Report 2015 | | | 11 | |
| | |
| |
| | COLUMBIA GLOBAL EQUITY VALUE FUND |
STATEMENT OF OPERATIONS
Six Months Ended August 31, 2015 (Unaudited)
| | | | |
Net investment income | | | | |
| |
Income: | | | | |
| |
Dividends — unaffiliated issuers | | | $15,594,140 | |
| |
Dividends — affiliated issuers | | | 8,666 | |
| |
Interest | | | 950 | |
| |
Foreign taxes withheld | | | (908,546 | ) |
| |
Total income | | | 14,695,210 | |
| |
| |
Expenses: | | | | |
| |
Investment management fees | | | 3,572,420 | |
| |
Distribution and/or service fees | | | | |
| |
Class A | | | 1,090,855 | |
| |
Class B | | | 40,212 | |
| |
Class C | | | 141,659 | |
| |
Class R | | | 2,826 | |
| |
Class W | | | 17 | |
| |
Transfer agent fees | | | | |
| |
Class A | | | 816,359 | |
| |
Class B | | | 7,529 | |
| |
Class C | | | 26,504 | |
| |
Class K | | | 1,156 | |
| |
Class R | | | 1,058 | |
| |
Class R4 | | | 193 | |
| |
Class R5 | | | 20 | |
| |
Class W | | | 13 | |
| |
Class Z | | | 101,723 | |
| |
Plan administration fees | | | | |
| |
Class K | | | 5,798 | |
| |
Compensation of board members | | | 19,071 | |
| |
Custodian fees | | | 21,219 | |
| |
Printing and postage fees | | | 76,044 | |
| |
Registration fees | | | 63,226 | |
| |
Professional fees | | | 18,840 | |
| |
Other | | | 23,639 | |
| |
Total expenses | | | 6,030,381 | |
| |
Expense reductions | | | (9,829 | ) |
| |
Total net expenses | | | 6,020,552 | |
| |
Net investment income | | | 8,674,658 | |
| |
| |
Realized and unrealized gain (loss) — net | | | | |
| |
Net realized gain (loss) on: | | | | |
| |
Investments | | | 42,511,990 | |
| |
Foreign currency translations | | | (117,428 | ) |
| |
Net realized gain | | | 42,394,562 | |
| |
Net change in unrealized appreciation (depreciation) on: | | | | |
| |
Investments | | | (135,880,004 | ) |
| |
Foreign currency translations | | | 22 | |
| |
Net change in unrealized depreciation | | | (135,879,982 | ) |
| |
Net realized and unrealized loss | | | (93,485,420 | ) |
| |
Net decrease in net assets from operations | | | $(84,810,762 | ) |
| |
The accompanying Notes to Financial Statements are an integral part of this statement.
| | |
| 12 | | Semiannual Report 2015 |
| | |
| |
| COLUMBIA GLOBAL EQUITY VALUE FUND | | |
STATEMENT OF CHANGES IN NET ASSETS
| | | | | | | | |
| | | Six Months Ended
August 31, 2015
(Unaudited) | | | Year Ended
February 28, 2015 | |
Operations | | | | | | | | |
| | |
Net investment income | | | $8,674,658 | | | | $17,687,672 | |
| | |
Net realized gain | | | 42,394,562 | | | | 132,248,447 | |
| | |
Net change in unrealized depreciation | | | (135,879,982 | ) | | | (56,698,409 | ) |
| |
Net increase (decrease) in net assets resulting from operations | | | (84,810,762 | ) | | | 93,237,710 | |
| |
| | |
Distributions to shareholders | | | | | | | | |
| | |
Net investment income | | | | | | | | |
| | |
Class A | | | (7,884,700 | ) | | | (10,515,311 | ) |
| | |
Class B | | | (42,096 | ) | | | (50,837 | ) |
| | |
Class C | | | (152,560 | ) | | | (126,401 | ) |
| | |
Class I | | | (31 | ) | | | (100 | ) |
| | |
Class K | | | (44,956 | ) | | | (56,781 | ) |
| | |
Class R | | | (8,803 | ) | | | (9,411 | ) |
| | |
Class R4 | | | (2,093 | ) | | | (3,396 | ) |
| | |
Class R5 | | | (275 | ) | | | (311 | ) |
| | |
Class W | | | (124 | ) | | | (171 | ) |
| | |
Class Y | | | (28 | ) | | | (57 | ) |
| | |
Class Z | | | (1,115,633 | ) | | | (1,591,936 | ) |
| | |
Net realized gains | | | | | | | | |
| | |
Class A | | | (12,146,430 | ) | | | (118,742,393 | ) |
| | |
Class B | | | (107,245 | ) | | | (1,605,844 | ) |
| | |
Class C | | | (398,293 | ) | | | (4,031,194 | ) |
| | |
Class I | | | (39 | ) | | | (385 | ) |
| | |
Class K | | | (64,533 | ) | | | (585,805 | ) |
| | |
Class R | | | (15,845 | ) | | | (132,355 | ) |
| | |
Class R4 | | | (2,888 | ) | | | (37,665 | ) |
| | |
Class R5 | | | (353 | ) | | | (2,605 | ) |
| | |
Class W | | | (191 | ) | | | (1,739 | ) |
| | |
Class Y | | | (35 | ) | | | (352 | ) |
| | |
Class Z | | | (1,511,027 | ) | | | (14,793,726 | ) |
| |
Total distributions to shareholders | | | (23,498,178 | ) | | | (152,288,775 | ) |
| |
Increase (decrease) in net assets from capital stock activity | | | (12,897,000 | ) | | | 17,304,236 | |
| |
Proceeds from regulatory settlements (Note 6) | | | 537,100 | | | | — | |
| |
Total decrease in net assets | | | (120,668,840 | ) | | | (41,746,829 | ) |
| | |
Net assets at beginning of period | | | 1,051,890,713 | | | | 1,093,637,542 | |
| |
Net assets at end of period | | | $931,221,873 | | | | $1,051,890,713 | |
| |
Undistributed net investment income | | | $6,590,619 | | | | $7,167,260 | |
| |
The accompanying Notes to Financial Statements are an integral part of this statement.
| | | | |
| Semiannual Report 2015 | | | 13 | |
| | |
| |
| | COLUMBIA GLOBAL EQUITY VALUE FUND |
STATEMENT OF CHANGES IN NET ASSETS (continued)
| | | | | | | | | | | | | | | | |
| | | Six Months Ended August 31, 2015 (Unaudited) | | | Year Ended February 28, 2015 | |
| | | Shares | | | Dollars ($) | | | Shares | | | Dollars ($) | |
Capital stock activity | | | | | | | | | | | | | | | | |
| | | | |
Class A shares | | | | | | | | | | | | | | | | |
| | | | |
Subscriptions(a) | | | 745,115 | | | | 9,518,008 | | | | 2,162,270 | | | | 28,822,554 | |
| | | | |
Distributions reinvested | | | 1,435,387 | | | | 18,377,718 | | | | 9,008,313 | | | | 118,312,799 | |
| | | | |
Redemptions | | | (4,386,919 | ) | | | (55,719,088 | ) | | | (9,492,669 | ) | | | (127,372,345 | ) |
| |
Net increase (decrease) | | | (2,206,417 | ) | | | (27,823,362 | ) | | | 1,677,914 | | | | 19,763,008 | |
| |
Class B shares | | | | | | | | | | | | | | | | |
| | | | |
Subscriptions | | | 2,906 | | | | 36,709 | | | | 11,217 | | | | 149,829 | |
| | | | |
Distributions reinvested | | | 10,927 | | | | 140,977 | | | | 117,607 | | | | 1,560,184 | |
| | | | |
Redemptions(a) | | | (238,714 | ) | | | (3,084,534 | ) | | | (527,719 | ) | | | (7,094,757 | ) |
| |
Net decrease | | | (224,881 | ) | | | (2,906,848 | ) | | | (398,895 | ) | | | (5,384,744 | ) |
| |
Class C shares | | | | | | | | | | | | | | | | |
| | | | |
Subscriptions | | | 40,376 | | | | 512,607 | | | | 148,168 | | | | 1,955,003 | |
| | | | |
Distributions reinvested | | | 37,240 | | | | 472,246 | | | | 273,332 | | | | 3,552,530 | |
| | | | |
Redemptions | | | (200,518 | ) | | | (2,526,922 | ) | | | (433,969 | ) | | | (5,735,689 | ) |
| |
Net decrease | | | (122,902 | ) | | | (1,542,069 | ) | | | (12,469 | ) | | | (228,156 | ) |
| |
Class I shares | | | | | | | | | | | | | | | | |
| | | | |
Subscriptions | | | 1,949,232 | | | | 23,746,000 | | | | — | | | | — | |
| | | | |
Redemptions | | | (87,699 | ) | | | (1,032,572 | ) | | | (949 | ) | | | (12,998 | ) |
| |
Net increase (decrease) | | | 1,861,533 | | | | 22,713,428 | | | | (949 | ) | | | (12,998 | ) |
| |
Class K shares | | | | | | | | | | | | | | | | |
| | | | |
Subscriptions | | | 20,895 | | | | 263,921 | | | | 69,933 | | | | 937,580 | |
| | | | |
Distributions reinvested | | | 8,520 | | | | 109,430 | | | | 48,698 | | | | 642,175 | |
| | | | |
Redemptions | | | (31,151 | ) | | | (394,762 | ) | | | (84,324 | ) | | | (1,153,614 | ) |
| |
Net increase (decrease) | | | (1,736 | ) | | | (21,411 | ) | | | 34,307 | | | | 426,141 | |
| |
Class R shares | | | | | | | | | | | | | | | | |
| | | | |
Subscriptions | | | 4,479 | | | | 56,868 | | | | 23,427 | | | | 312,999 | |
| | | | |
Distributions reinvested | | | 1,816 | | | | 23,219 | | | | 10,290 | | | | 134,424 | |
| | | | |
Redemptions | | | (7,922 | ) | | | (92,984 | ) | | | (19,886 | ) | | | (265,968 | ) |
| |
Net increase (decrease) | | | (1,627 | ) | | | (12,897 | ) | | | 13,831 | | | | 181,455 | |
| |
Class R4 shares | | | | | | | | | | | | | | | | |
| | | | |
Subscriptions | | | 2,196 | | | | 25,252 | | | | 22,485 | | | | 308,823 | |
| | | | |
Distributions reinvested | | | 384 | | | | 4,930 | | | | 3,099 | | | | 40,652 | |
| | | | |
Redemptions | | | (67 | ) | | | (851 | ) | | | (17,576 | ) | | | (233,714 | ) |
| |
Net increase | | | 2,513 | | | | 29,331 | | | | 8,008 | | | | 115,761 | |
| |
Class R5 shares | | | | | | | | | | | | | | | | |
| | | | |
Subscriptions | | | 13,135 | | | | 167,630 | | | | 619 | | | | 8,467 | |
| | | | |
Distributions reinvested | | | 44 | | | | 565 | | | | 192 | | | | 2,492 | |
| | | | |
Redemptions | | | (1,965 | ) | | | (24,864 | ) | | | (479 | ) | | | (6,701 | ) |
| |
Net increase | | | 11,214 | | | | 143,331 | | | | 332 | | | | 4,258 | |
| |
Class W shares | | | | | | | | | | | | | | | | |
| | | | |
Distributions reinvested | | | 20 | | | | 258 | | | | 115 | | | | 1,519 | |
| | | | |
Redemptions | | | — | | | | — | | | | (463 | ) | | | (6,528 | ) |
| |
Net increase (decrease) | | | 20 | | | | 258 | | | | (348 | ) | | | (5,009 | ) |
| |
The accompanying Notes to Financial Statements are an integral part of this statement.
| | |
| 14 | | Semiannual Report 2015 |
| | |
| |
| COLUMBIA GLOBAL EQUITY VALUE FUND | | |
STATEMENT OF CHANGES IN NET ASSETS (continued)
| | | | | | | | | | | | | | | | |
| | | Six Months Ended August 31, 2015 (Unaudited) | | | Year Ended February 28, 2015 | |
| | | Shares | | | Dollars ($) | | | Shares | | | Dollars ($) | |
Capital stock activity (continued) | | | | | | | | | | | | | | | | |
| | | | |
Class Y shares | | | | | | | | | | | | | | | | |
| | | | |
Redemptions | | | — | | | | — | | | | (262 | ) | | | (3,600 | ) |
| |
Net decrease | | | — | | | | — | | | | (262 | ) | | | (3,600 | ) |
| |
Class Z shares | | | | | | | | | | | | | | | | |
| | | | |
Subscriptions | | | 169,237 | | | | 2,169,533 | | | | 504,582 | | | | 6,768,003 | |
| | | | |
Distributions reinvested | | | 158,264 | | | | 2,027,982 | | | | 937,766 | | | | 12,317,753 | |
| | | | |
Redemptions | | | (602,582 | ) | | | (7,674,276 | ) | | | (1,232,471 | ) | | | (16,637,636 | ) |
| |
Net increase (decrease) | | | (275,081 | ) | | | (3,476,761 | ) | | | 209,877 | | | | 2,448,120 | |
| |
Total net increase (decrease) | | | (957,364 | ) | | | (12,897,000 | ) | | | 1,531,346 | | | | 17,304,236 | |
| |
| (a) | Includes conversions of Class B shares to Class A shares, if any. |
The accompanying Notes to Financial Statements are an integral part of this statement.
| | | | |
| Semiannual Report 2015 | | | 15 | |
| | |
| |
| | COLUMBIA GLOBAL EQUITY VALUE FUND |
FINANCIAL HIGHLIGHTS
The following tables are intended to help you understand the Fund’s financial performance. Certain information reflects financial results for a single share of a class held for the periods shown. Per share net investment income (loss) amounts are calculated based on average shares outstanding during the period. Total return assumes reinvestment of all dividends and distributions, if any. Total return does not reflect payment of sales charges, if any. Total return and portfolio turnover are not annualized for periods of less than one year. The portfolio turnover rate is calculated without regard to purchase and sales transactions of short-term instruments and certain derivatives, if any. If such transactions were included, the Fund’s portfolio turnover rate may be higher.
| | | | | | | | | | | | | | | | | | | | | | | | | | | | |
| |
| Six Months Ended
August 31, 2015 |
| | | Year Ended February 28, | | |
| Year Ended
February 29, |
| | | Year Ended March 31, | |
Class A | | | (Unaudited) | | | | 2015 | | | | 2014 | | | | 2013 | | | | 2012(a) | | | | 2011 | | | | 2010 | |
Per share data | | | | | | | | | | | | | | | | | | | | | | | | | | | | |
Net asset value, beginning of period | | | $13.00 | | | | $13.78 | | | | $11.82 | | | | $10.72 | | | | $11.02 | | | | $9.63 | | | | $6.54 | |
| | | | | | | | | | | | | | | | | | | | | | | | | | | | | |
Income from investment operations: | | | | | | | | | | | | | | | | | | | | | | | | | | | | |
| | | | | | | |
Net investment income | | | 0.11 | (g) | | | 0.22 | | | | 0.14 | | | | 0.15 | | | | 0.11 | | | | 0.10 | | | | 0.12 | |
| | | | | | | | | | | | | | | | | | | | | | | | | | | | | |
Net realized and unrealized gain (loss) | | | (1.16 | ) | | | 0.97 | | | | 2.45 | | | | 1.11 | | | | (0.33 | ) | | | 1.40 | | | | 3.10 | |
| | | | | | | | | | | | | | | | | | | | | | | | | | | | | |
Total from investment operations | | | (1.05 | ) | | | 1.19 | | | | 2.59 | | | | 1.26 | | | | (0.22 | ) | | | 1.50 | | | | 3.22 | |
| | | | | | | | | | | | | | | | | | | | | | | | | | | | | |
Less distributions to shareholders: | | | | | | | | | | | | | | | | | | | | | | | | | | | | |
| | | | | | | |
Net investment income | | | (0.12 | ) | | | (0.16 | ) | | | (0.14 | ) | | | (0.16 | ) | | | (0.08 | ) | | | (0.11 | ) | | | (0.13 | ) |
| | | | | | | | | | | | | | | | | | | | | | | | | | | | | |
Net realized gains | | | (0.18 | ) | | | (1.81 | ) | | | (0.49 | ) | | | — | | | | — | | | | — | | | | — | |
| | | | | | | | | | | | | | | | | | | | | | | | | | | | | |
Total distributions to shareholders | | | (0.30 | ) | | | (1.97 | ) | | | (0.63 | ) | | | (0.16 | ) | | | (0.08 | ) | | | (0.11 | ) | | | (0.13 | ) |
| | | | | | | | | | | | | | | | | | | | | | | | | | | | | |
Proceeds from regulatory settlements | | | 0.01 | | | | — | | | | — | | | | — | | | | — | | | | — | | | | — | |
| | | | | | | | | | | | | | | | | | | | | | | | | | | | | |
Net asset value, end of period | | | $11.66 | | | | $13.00 | | | | $13.78 | | | | $11.82 | | | | $10.72 | | | | $11.02 | | | | $9.63 | |
| | | | | | | | | | | | | | | | | | | | | | | | | | | | | |
Total return | | | (8.21 | %)(b) | | | 9.06 | % | | | 22.21 | % | | | 11.94 | % | | | (1.87 | %) | | | 15.67 | % | | | 49.52 | % |
| | | | | | | | | | | | | | | | | | | | | | | | | | | | | |
Ratios to average net assets(c) | | | | | | | | | | | | | | | | | | | | | | | | | | | | |
| | | | | | | |
Total gross expenses | | | 1.18 | %(d) | | | 1.17 | % | | | 1.19 | % | | | 1.26 | % | | | 1.22 | %(d) | | | 1.11 | % | | | 1.09 | % |
| | | | | | | | | | | | | | | | | | | | | | | | | | | | | |
Total net expenses(e) | | | 1.18 | %(d)(f) | | | 1.17 | %(f) | | | 1.18 | %(f) | | | 1.16 | %(f) | | | 1.12 | %(d)(f) | | | 1.11 | % | | | 1.09 | % |
| | | | | | | | | | | | | | | | | | | | | | | | | | | | | |
Net investment income | | | 1.69 | %(d) | | | 1.66 | % | | | 1.06 | % | | | 1.41 | % | | | 1.18 | %(d) | | | 1.07 | % | | | 1.39 | % |
| | | | | | | | | | | | | | | | | | | | | | | | | | | | | |
Supplemental data | | | | | | | | | | | | | | | | | | | | | | | | | | | | |
| | | | | | | |
Net assets, end of period (in thousands) | | | $776,546 | | | | $894,934 | | | | $925,249 | | | | $587,324 | | | | $595,255 | | | | $729,078 | | | | $681,073 | |
| | | | | | | | | | | | | | | | | | | | | | | | | | | | | |
Portfolio turnover | | | 44 | % | | | 61 | % | | | 61 | % | | | 49 | % | | | 21 | % | | | 37 | % | | | 30 | % |
| | | | | | | | | | | | | | | | | | | | | | | | | | | | | |
Notes to Financial Highlights
| (a) | For the period from April 1, 2011 to February 29, 2012. During the period, the Fund’s fiscal year end was changed from March 31 to February 29. |
| (b) | The Fund received proceeds from regulatory settlements. Had the Fund not received these proceeds, the total return would have been lower by 0.05%. |
| (c) | In addition to the fees and expenses that the Fund bears directly, the Fund indirectly bears a pro rata share of the fees and expenses of any other funds in which it invests. Such indirect expenses are not included in the Fund’s reported expense ratios. |
| (e) | Total net expenses include the impact of certain fee waivers/expense reimbursements made by the Investment Manager and certain of its affiliates, if applicable. |
| (f) | The benefits derived from expense reductions had an impact of less than 0.01%. |
| (g) | Net investment income per share includes special dividends. The effect of these dividends amounted to $0.08 per share. |
The accompanying Notes to Financial Statements are an integral part of this statement.
| | |
| 16 | | Semiannual Report 2015 |
| | |
| |
| COLUMBIA GLOBAL EQUITY VALUE FUND | | |
FINANCIAL HIGHLIGHTS (continued)
| | | | | | | | | | | | | | | | | | | | | | | | | | | | |
| |
| Six Months Ended
August 31, 2015 |
| | | Year Ended February 28, | | |
| Year Ended
February 29, |
| | | Year Ended March 31, | |
Class B | | | (Unaudited) | | | | 2015 | | | | 2014 | | | | 2013 | | | | 2012(a) | | | | 2011 | | | | 2010 | |
Per share data | | | | | | | | | | | | | | | | | | | | | | | | | | | | |
Net asset value, beginning of period | | | $13.08 | | | | $13.85 | | | | $11.89 | | | | $10.77 | | | | $11.08 | | | | $9.67 | | | | $6.57 | |
| | | | | | | | | | | | | | | | | | | | | | | | | | | | | |
Income from investment operations: | | | | | | | | | | | | | | | | | | | | | | | | | | | | |
| | | | | | | |
Net investment income | | | 0.05 | (g) | | | 0.11 | | | | 0.04 | | | | 0.07 | | | | 0.04 | | | | 0.03 | | | | 0.06 | |
| | | | | | | | | | | | | | | | | | | | | | | | | | | | | |
Net realized and unrealized gain (loss) | | | (1.16 | ) | | | 0.99 | | | | 2.45 | | | | 1.13 | | | | (0.33 | ) | | | 1.40 | | | | 3.10 | |
| | | | | | | | | | | | | | | | | | | | | | | | | | | | | |
Total from investment operations | | | (1.11 | ) | | | 1.10 | | | | 2.49 | | | | 1.20 | | | | (0.29 | ) | | | 1.43 | | | | 3.16 | |
| | | | | | | | | | | | | | | | | | | | | | | | | | | | | |
Less distributions to shareholders: | | | | | | | | | | | | | | | | | | | | | | | | | | | | |
| | | | | | | |
Net investment income | | | (0.07 | ) | | | (0.06 | ) | | | (0.04 | ) | | | (0.08 | ) | | | (0.02 | ) | | | (0.02 | ) | | | (0.06 | ) |
| | | | | | | | | | | | | | | | | | | | | | | | | | | | | |
Net realized gains | | | (0.18 | ) | | | (1.81 | ) | | | (0.49 | ) | | | — | | | | — | | | | — | | | | — | |
| | | | | | | | | | | | | | | | | | | | | | | | | | | | | |
Total distributions to shareholders | | | (0.25 | ) | | | (1.87 | ) | | | (0.53 | ) | | | (0.08 | ) | | | (0.02 | ) | | | (0.02 | ) | | | (0.06 | ) |
| | | | | | | | | | | | | | | | | | | | | | | | | | | | | |
Proceeds from regulatory settlements | | | 0.01 | | | | — | | | | — | | | | — | | | | — | | | | — | | | | — | |
| | | | | | | | | | | | | | | | | | | | | | | | | | | | | |
Net asset value, end of period | | | $11.73 | | | | $13.08 | | | | $13.85 | | | | $11.89 | | | | $10.77 | | | | $11.08 | | | | $9.67 | |
| | | | | | | | | | | | | | | | | | | | | | | | | | | | | |
Total return | | | (8.57 | %)(b) | | | 8.27 | % | | | 21.16 | % | | | 11.18 | % | | | (2.58 | %) | | | 14.84 | % | | | 48.26 | % |
| | | | | | | | | | | | | | | | | | | | | | | | | | | | | |
Ratios to average net assets(c) | | | | | | | | | | | | | | | | | | | | | | | | | | | | |
| | | | | | | |
Total gross expenses | | | 1.93 | %(d) | | | 1.91 | % | | | 1.94 | % | | | 2.00 | % | | | 1.96 | %(d) | | | 1.86 | % | | | 1.85 | % |
| | | | | | | | | | | | | | | | | | | | | | | | | | | | | |
Total net expenses(e) | | | 1.93 | %(d)(f) | | | 1.91 | %(f) | | | 1.93 | %(f) | | | 1.91 | %(f) | | | 1.88 | %(d)(f) | | | 1.86 | % | | | 1.85 | % |
| | | | | | | | | | | | | | | | | | | | | | | | | | | | | |
Net investment income | | | 0.75 | %(d) | | | 0.79 | % | | | 0.32 | % | | | 0.63 | % | | | 0.41 | %(d) | | | 0.30 | % | | | 0.68 | % |
| | | | | | | | | | | | | | | | | | | | | | | | | | | | | |
Supplemental data | | | | | | | | | | | | | | | | | | | | | | | | | | | | |
| | | | | | | |
Net assets, end of period (in thousands) | | | $6,067 | | | | $9,711 | | | | $15,807 | | | | $12,730 | | | | $19,003 | | | | $32,311 | | | | $50,132 | |
| | | | | | | | | | | | | | | | | | | | | | | | | | | | | |
Portfolio turnover | | | 44 | % | | | 61 | % | | | 61 | % | | | 49 | % | | | 21 | % | | | 37 | % | | | 30 | % |
| | | | | | | | | | | | | | | | | | | | | | | | | | | | | |
Notes to Financial Highlights
| (a) | For the period from April 1, 2011 to February 29, 2012. During the period, the Fund’s fiscal year end was changed from March 31 to February 29. |
| (b) | The Fund received proceeds from regulatory settlements. Had the Fund not received these proceeds, the total return would have been lower by 0.05%. |
| (c) | In addition to the fees and expenses that the Fund bears directly, the Fund indirectly bears a pro rata share of the fees and expenses of any other funds in which it invests. Such indirect expenses are not included in the Fund’s reported expense ratios. |
| (e) | Total net expenses include the impact of certain fee waivers/expense reimbursements made by the Investment Manager and certain of its affiliates, if applicable. |
| (f) | The benefits derived from expense reductions had an impact of less than 0.01%. |
| (g) | Net investment income per share includes special dividends. The effect of these dividends amounted to $0.08 per share. |
The accompanying Notes to Financial Statements are an integral part of this statement.
| | | | |
| Semiannual Report 2015 | | | 17 | |
| | |
| |
| | COLUMBIA GLOBAL EQUITY VALUE FUND |
FINANCIAL HIGHLIGHTS (continued)
| | | | | | | | | | | | | | | | | | | | | | | | | | | | |
| |
| Six Months Ended
August 31, 2015 |
| | | Year Ended February 28, | | |
| Year Ended
February 29, |
| | | Year Ended March 31, | |
Class C | | | (Unaudited) | | | | 2015 | | | | 2014 | | | | 2013 | | | | 2012(a) | | | | 2011 | | | | 2010 | |
Per share data | | | | | | | | | | | | | | | | | | | | | | | | | | | | |
Net asset value, beginning of period | | | $12.86 | | | | $13.65 | | | | $11.72 | | | | $10.62 | | | | $10.93 | | | | $9.55 | | | | $6.49 | |
| | | | | | | | | | | | | | | | | | | | | | | | | | | | | |
Income from investment operations: | | | | | | | | | | | | | | | | | | | | | | | | | | | | |
| | | | | | | |
Net investment income | | | 0.06 | (g) | | | 0.12 | | | | 0.05 | | | | 0.07 | | | | 0.04 | | | | 0.03 | | | | 0.05 | |
| | | | | | | | | | | | | | | | | | | | | | | | | | | | | |
Net realized and unrealized gain (loss) | | | (1.15 | ) | | | 0.96 | | | | 2.41 | | | | 1.11 | | | | (0.32 | ) | | | 1.38 | | | | 3.08 | |
| | | | | | | | | | | | | | | | | | | | | | | | | | | | | |
Total from investment operations | | | (1.09 | ) | | | 1.08 | | | | 2.46 | | | | 1.18 | | | | (0.28 | ) | | | 1.41 | | | | 3.13 | |
| | | | | | | | | | | | | | | | | | | | | | | | | | | | | |
Less distributions to shareholders: | | | | | | | | | | | | | | | | | | | | | | | | | | | | |
| | | | | | | |
Net investment income | | | (0.07 | ) | | | (0.06 | ) | | | (0.04 | ) | | | (0.08 | ) | | | (0.03 | ) | | | (0.03 | ) | | | (0.07 | ) |
| | | | | | | | | | | | | | | | | | | | | | | | | | | | | |
Net realized gains | | | (0.18 | ) | | | (1.81 | ) | | | (0.49 | ) | | | — | | | | — | | | | — | | | | — | |
| | | | | | | | | | | | | | | | | | | | | | | | | | | | | |
Total distributions to shareholders | | | (0.25 | ) | | | (1.87 | ) | | | (0.53 | ) | | | (0.08 | ) | | | (0.03 | ) | | | (0.03 | ) | | | (0.07 | ) |
| | | | | | | | | | | | | | | | | | | | | | | | | | | | | |
Proceeds from regulatory settlements | | | 0.01 | | | | — | | | | — | | | | — | | | | — | | | | — | | | | — | |
| | | | | | | | | | | | | | | | | | | | | | | | | | | | | |
Net asset value, end of period | | | $11.53 | | | | $12.86 | | | | $13.65 | | | | $11.72 | | | | $10.62 | | | | $10.93 | | | | $9.55 | |
| | | | | | | | | | | | | | | | | | | | | | | | | | | | | |
Total return | | | (8.57 | %)(b) | | | 8.25 | % | | | 21.23 | % | | | 11.20 | % | | | (2.56 | %) | | | 14.82 | % | | | 48.35 | % |
| | | | | | | | | | | | | | | | | | | | | | | | | | | | | |
Ratios to average net assets(c) | | | | | | | | | | | | | | | | | | | | | | | | | | | | |
| | | | | | | |
Total gross expenses | | | 1.93 | %(d) | | | 1.92 | % | | | 1.93 | % | | | 2.01 | % | | | 1.97 | %(d) | | | 1.86 | % | | | 1.85 | % |
| | | | | | | | | | | | | | | | | | | | | | | | | | | | | |
Total net expenses(e) | | | 1.93 | %(d)(f) | | | 1.92 | %(f) | | | 1.93 | %(f) | | | 1.91 | %(f) | | | 1.88 | %(d)(f) | | | 1.86 | % | | | 1.85 | % |
| | | | | | | | | | | | | | | | | | | | | | | | | | | | | |
Net investment income | | | 0.91 | %(d) | | | 0.90 | % | | | 0.39 | % | | | 0.66 | % | | | 0.44 | %(d) | | | 0.32 | % | | | 0.62 | % |
| | | | | | | | | | | | | | | | | | | | | | | | | | | | | |
Supplemental data | | | | | | | | | | | | | | | | | | | | | | | | | | | | |
| | | | | | | |
Net assets, end of period (in thousands) | | | $24,845 | | | | $29,304 | | | | $31,265 | | | | $4,147 | | | | $4,203 | | | | $4,977 | | | | $4,895 | |
| | | | | | | | | | | | | | | | | | | | | | | | | | | | | |
Portfolio turnover | | | 44 | % | | | 61 | % | | | 61 | % | | | 49 | % | | | 21 | % | | | 37 | % | | | 30 | % |
| | | | | | | | | | | | | | | | | | | | | | | | | | | | | |
Notes to Financial Highlights
| (a) | For the period from April 1, 2011 to February 29, 2012. During the period, the Fund’s fiscal year end was changed from March 31 to February 29. |
| (b) | The Fund received proceeds from regulatory settlements. Had the Fund not received these proceeds, the total return would have been lower by 0.05%. |
| (c) | In addition to the fees and expenses that the Fund bears directly, the Fund indirectly bears a pro rata share of the fees and expenses of any other funds in which it invests. Such indirect expenses are not included in the Fund’s reported expense ratios. |
| (e) | Total net expenses include the impact of certain fee waivers/expense reimbursements made by the Investment Manager and certain of its affiliates, if applicable. |
| (f) | The benefits derived from expense reductions had an impact of less than 0.01%. |
| (g) | Net investment income per share includes special dividends. The effect of these dividends amounted to $0.08 per share. |
The accompanying Notes to Financial Statements are an integral part of this statement.
| | |
| 18 | | Semiannual Report 2015 |
| | |
| |
| COLUMBIA GLOBAL EQUITY VALUE FUND | | |
FINANCIAL HIGHLIGHTS (continued)
| | | | | | | | | | | | | | | | | | | | | | | | | | | | |
| |
| Six Months Ended
August 31, 2015 |
| | | Year Ended February 28, | | |
| Year Ended
February 29, |
| | | Year Ended March 31, | |
Class I | | | (Unaudited) | | | | 2015 | | | | 2014 | | | | 2013 | | | | 2012(a) | | | | 2011 | | | | 2010 | |
Per share data | | | | | | | | | | | | | | | | | | | | | | | | | | | | |
Net asset value, beginning of period | | | $12.67 | | | | $13.47 | | | | $11.59 | | | | $10.51 | | | | $11.03 | | | | $9.64 | | | | $6.55 | |
| | | | | | | | | | | | | | | | | | | | | | | | | | | | | |
Income from investment operations: | | | | | | | | | | | | | | | | | | | | | | | | | | | | |
| | | | | | | |
Net investment income | | | 0.10 | | | | 0.26 | | | | 0.20 | | | | 0.19 | | | | 0.14 | | | | 0.14 | | | | 0.14 | |
| | | | | | | | | | | | | | | | | | | | | | | | | | | | | |
Net realized and unrealized gain (loss) | | | (1.10 | ) | | | 0.97 | | | | 2.38 | | | | 1.10 | | | | (0.36 | ) | | | 1.40 | | | | 3.12 | |
| | | | | | | | | | | | | | | | | | | | | | | | | | | | | |
Total from investment operations | | | (1.00 | ) | | | 1.23 | | | | 2.58 | | | | 1.29 | | | | (0.22 | ) | | | 1.54 | | | | 3.26 | |
| | | | | | | | | | | | | | | | | | | | | | | | | | | | | |
Less distributions to shareholders: | | | | | | | | | | | | | | | | | | | | | | | | | | | | |
| | | | | | | |
Net investment income | | | (0.15 | ) | | | (0.22 | ) | | | (0.21 | ) | | | (0.21 | ) | | | (0.30 | ) | | | (0.15 | ) | | | (0.17 | ) |
| | | | | | | | | | | | | | | | | | | | | | | | | | | | | |
Net realized gains | | | (0.18 | ) | | | (1.81 | ) | | | (0.49 | ) | | | — | | | | — | | | | — | | | | — | |
| | | | | | | | | | | | | | | | | | | | | | | | | | | | | |
Total distributions to shareholders | | | (0.33 | ) | | | (2.03 | ) | | | (0.70 | ) | | | (0.21 | ) | | | (0.30 | ) | | | (0.15 | ) | | | (0.17 | ) |
| | | | | | | | | | | | | | | | | | | | | | | | | | | | | |
Proceeds from regulatory settlements | | | 0.01 | | | | — | | | | — | | | | — | | | | — | | | | — | | | | — | |
| | | | | | | | | | | | | | | | | | | | | | | | | | | | | |
Net asset value, end of period | | | $11.35 | | | | $12.67 | | | | $13.47 | | | | $11.59 | | | | $10.51 | | | | $11.03 | | | | $9.64 | |
| | | | | | | | | | | | | | | | | | | | | | | | | | | | | |
Total return | | | (8.04 | %)(b) | | | 9.66 | % | | | 22.63 | % | | | 12.46 | % | | | (1.59 | %) | | | 16.18 | % | | | 50.13 | % |
| | | | | | | | | | | | | | | | | | | | | | | | | | | | | |
Ratios to average net assets(c) | | | | | | | | | | | | | | | | | | | | | | | | | | | | |
| | | | | | | |
Total gross expenses | | | 0.76 | %(d) | | | 0.69 | % | | | 0.69 | % | | | 0.78 | % | | | 0.74 | %(d) | | | 0.63 | % | | | 0.66 | % |
| | | | | | | | | | | | | | | | | | | | | | | | | | | | | |
Total net expenses(e) | | | 0.76 | %(d) | | | 0.69 | % | | | 0.69 | % | | | 0.75 | % | | | 0.69 | %(d) | | | 0.63 | % | | | 0.66 | % |
| | | | | | | | | | | | | | | | | | | | | | | | | | | | | |
Net investment income | | | 1.80 | %(d) | | | 1.92 | % | | | 1.57 | % | | | 1.83 | % | | | 1.52 | %(d) | | | 1.50 | % | | | 1.50 | % |
| | | | | | | | | | | | | | | | | | | | | | | | | | | | | |
Supplemental data | | | | | | | | | | | | | | | | | | | | | | | | | | | | |
| | | | | | | |
Net assets, end of period (in thousands) | | | $21,123 | | | | $3 | | | | $16 | | | | $10 | | | | $9 | | | | $10 | | | | $18,363 | |
| | | | | | | | | | | | | | | | | | | | | | | | | | | | | |
Portfolio turnover | | | 44 | % | | | 61 | % | | | 61 | % | | | 49 | % | | | 21 | % | | | 37 | % | | | 30 | % |
| | | | | | | | | | | | | | | | | | | | | | | | | | | | | |
Notes to Financial Highlights
| (a) | For the period from April 1, 2011 to February 29, 2012. During the period, the Fund’s fiscal year end was changed from March 31 to February 29. |
| (b) | The Fund received proceeds from regulatory settlements. Had the Fund not received these proceeds, the total return would have been lower by 0.05%. |
| (c) | In addition to the fees and expenses that the Fund bears directly, the Fund indirectly bears a pro rata share of the fees and expenses of any other funds in which it invests. Such indirect expenses are not included in the Fund’s reported expense ratios. |
| (e) | Total net expenses include the impact of certain fee waivers/expense reimbursements made by the Investment Manager and certain of its affiliates, if applicable. |
The accompanying Notes to Financial Statements are an integral part of this statement.
| | | | |
| Semiannual Report 2015 | | | 19 | |
| | |
| |
| | COLUMBIA GLOBAL EQUITY VALUE FUND |
FINANCIAL HIGHLIGHTS (continued)
| | | | | | | | | | | | | | | | | | | | | | | | | | | | |
| |
| Six Months Ended
August 31, 2015 |
| | | Year Ended February 28, | | |
| Year Ended
February 29, |
| | | Year Ended March 31, | |
Class K | | | (Unaudited) | | | | 2015 | | | | 2014 | | | | 2013 | | | | 2012(a) | | | | 2011 | | | | 2010 | |
Per share data | | | | | | | | | | | | | | | | | | | | | | | | | | | | |
Net asset value, beginning of period | | | $13.05 | | | | $13.82 | | | | $11.86 | | | | $10.75 | | | | $11.05 | | | | $9.65 | | | | $6.56 | |
| | | | | | | | | | | | | | | | | | | | | | | | | | | | | |
Income from investment operations: | | | | | | | | | | | | | | | | | | | | | | | | | | | | |
| | | | | | | |
Net investment income | | | 0.12 | (f) | | | 0.24 | | | | 0.16 | | | | 0.17 | | | | 0.11 | | | | 0.12 | | | | 0.13 | |
| | | | | | | | | | | | | | | | | | | | | | | | | | | | | |
Net realized and unrealized gain (loss) | | | (1.17 | ) | | | 0.98 | | | | 2.45 | | | | 1.12 | | | | (0.32 | ) | | | 1.40 | | | | 3.10 | |
| | | | | | | | | | | | | | | | | | | | | | | | | | | | | |
Total from investment operations | | | (1.05 | ) | | | 1.22 | | | | 2.61 | | | | 1.29 | | | | (0.21 | ) | | | 1.52 | | | | 3.23 | |
| | | | | | | | | | | | | | | | | | | | | | | | | | | | | |
Less distributions to shareholders: | | | | | | | | | | | | | | | | | | | | | | | | | | | | |
| | | | | | | |
Net investment income | | | (0.13 | ) | | | (0.18 | ) | | | (0.16 | ) | | | (0.18 | ) | | | (0.09 | ) | | | (0.12 | ) | | | (0.14 | ) |
| | | | | | | | | | | | | | | | | | | | | | | | | | | | | |
Net realized gains | | | (0.18 | ) | | | (1.81 | ) | | | (0.49 | ) | | | — | | | | — | | | | — | | | | — | |
| | | | | | | | | | | | | | | | | | | | | | | | | | | | | |
Total distributions to shareholders | | | (0.31 | ) | | | (1.99 | ) | | | (0.65 | ) | | | (0.18 | ) | | | (0.09 | ) | | | (0.12 | ) | | | (0.14 | ) |
| | | | | | | | | | | | | | | | | | | | | | | | | | | | | |
Proceeds from regulatory settlements | | | 0.01 | | | | — | | | | — | | | | — | | | | — | | | | — | | | | — | |
| | | | | | | | | | | | | | | | | | | | | | | | | | | | | |
Net asset value, end of period | | | $11.70 | | | | $13.05 | | | | $13.82 | | | | $11.86 | | | | $10.75 | | | | $11.05 | | | | $9.65 | |
| | | | | | | | | | | | | | | | | | | | | | | | | | | | | |
Total return | | | (8.19 | %)(b) | | | 9.25 | % | | | 22.31 | % | | | 12.13 | % | | | (1.81 | %) | | | 15.94 | % | | | 49.64 | % |
| | | | | | | | | | | | | | | | | | | | | | | | | | | | | |
Ratios to average net assets(c) | | | | | | | | | | | | | | | | | | | | | | | | | | | | |
| | | | | | | |
Total gross expenses | | | 1.04 | %(d) | | | 1.03 | % | | | 1.04 | % | | | 1.08 | % | | | 1.03 | %(d) | | | 0.92 | % | | | 0.92 | % |
| | | | | | | | | | | | | | | | | | | | | | | | | | | | | |
Total net expenses(e) | | | 1.04 | %(d) | | | 1.03 | % | | | 1.04 | % | | | 1.05 | % | | | 0.97 | %(d) | | | 0.92 | % | | | 0.92 | % |
| | | | | | | | | | | | | | | | | | | | | | | | | | | | | |
Net investment income | | | 1.87 | %(d) | | | 1.81 | % | | | 1.22 | % | | | 1.55 | % | | | 1.14 | %(d) | | | 1.26 | % | | | 1.53 | % |
| | | | | | | | | | | | | | | | | | | | | | | | | | | | | |
Supplemental data | | | | | | | | | | | | | | | | | | | | | | | | | | | | |
| | | | | | | |
Net assets, end of period (in thousands) | | | $4,202 | | | | $4,710 | | | | $4,514 | | | | $3,394 | | | | $2,762 | | | | $13,828 | | | | $10,093 | |
| | | | | | | | | | | | | | | | | | | | | | | | | | | | | |
Portfolio turnover | | | 44 | % | | | 61 | % | | | 61 | % | | | 49 | % | | | 21 | % | | | 37 | % | | | 30 | % |
| | | | | | | | | | | | | | | | | | | | | | | | | | | | | |
Notes to Financial Highlights
| (a) | For the period from April 1, 2011 to February 29, 2012. During the period, the Fund’s fiscal year end was changed from March 31 to February 29. |
| (b) | The Fund received proceeds from regulatory settlements. Had the Fund not received these proceeds, the total return would have been lower by 0.05%. |
| (c) | In addition to the fees and expenses that the Fund bears directly, the Fund indirectly bears a pro rata share of the fees and expenses of any other funds in which it invests. Such indirect expenses are not included in the Fund’s reported expense ratios. |
| (e) | Total net expenses include the impact of certain fee waivers/expense reimbursements made by the Investment Manager and certain of its affiliates, if applicable. |
| (f) | Net investment income per share includes special dividends. The effect of these dividends amounted to $0.08 per share. |
The accompanying Notes to Financial Statements are an integral part of this statement.
| | |
| 20 | | Semiannual Report 2015 |
| | |
| |
| COLUMBIA GLOBAL EQUITY VALUE FUND | | |
FINANCIAL HIGHLIGHTS (continued)
| | | | | | | | | | | | | | | | | | | | | | | | | | | | |
| |
| Six Months Ended
August 31, 2015 |
| | | Year Ended February 28, | | |
| Year Ended
February 29, |
| | | Year Ended March 31, | |
Class R | | | (Unaudited) | | | | 2015 | | | | 2014 | | | | 2013 | | | | 2012(a) | | | | 2011 | | | | 2010 | |
Per share data | | | | | | | | | | | | | | | | | | | | | | | | | | | | |
Net asset value, beginning of period | | | $12.98 | | | | $13.76 | | | | $11.82 | | | | $10.72 | | | | $11.02 | | | | $9.63 | | | | $6.54 | |
| | | | | | | | | | | | | | | | | | | | | | | | | | | | | |
Income from investment operations: | | | | | | | | | | | | | | | | | | | | | | | | | | | | |
| | | | | | | |
Net investment income | | | 0.09 | (g) | | | 0.19 | | | | 0.12 | | | | 0.13 | | | | 0.09 | | | | 0.08 | | | | 0.08 | |
| | | | | | | | | | | | | | | | | | | | | | | | | | | | | |
Net realized and unrealized gain (loss) | | | (1.17 | ) | | | 0.97 | | | | 2.43 | | | | 1.11 | | | | (0.33 | ) | | | 1.39 | | | | 3.12 | |
| | | | | | | | | | | | | | | | | | | | | | | | | | | | | |
Total from investment operations | | | (1.08 | ) | | | 1.16 | | | | 2.55 | | | | 1.24 | | | | (0.24 | ) | | | 1.47 | | | | 3.20 | |
| | | | | | | | | | | | | | | | | | | | | | | | | | | | | |
Less distributions to shareholders: | | | | | | | | | | | | | | | | | | | | | | | | | | | | |
| | | | | | | |
Net investment income | | | (0.10 | ) | | | (0.13 | ) | | | (0.12 | ) | | | (0.14 | ) | | | (0.06 | ) | | | (0.08 | ) | | | (0.11 | ) |
| | | | | | | | | | | | | | | | | | | | | | | | | | | | | |
Net realized gains | | | (0.18 | ) | | | (1.81 | ) | | | (0.49 | ) | | | — | | | | — | | | | — | | | | — | |
| | | | | | | | | | | | | | | | | | | | | | | | | | | | | |
Total distributions to shareholders | | | (0.28 | ) | | | (1.94 | ) | | | (0.61 | ) | | | (0.14 | ) | | | (0.06 | ) | | | (0.08 | ) | | | (0.11 | ) |
| | | | | | | | | | | | | | | | | | | | | | | | | | | | | |
Proceeds from regulatory settlements | | | 0.01 | | | | — | | | | — | | | | — | | | | — | | | | — | | | | — | |
| | | | | | | | | | | | | | | | | | | | | | | | | | | | | |
Net asset value, end of period | | | $11.63 | | | | $12.98 | | | | $13.76 | | | | $11.82 | | | | $10.72 | | | | $11.02 | | | | $9.63 | |
| | | | | | | | | | | | | | | | | | | | | | | | | | | | | |
Total return | | | (8.41 | %)(b) | | | 8.80 | % | | | 21.88 | % | | | 11.68 | % | | | (2.08 | %) | | | 15.35 | % | | | 49.13 | % |
| | | | | | | | | | | | | | | | | | | | | | | | | | | | | |
Ratios to average net assets(c) | | | | | | | | | | | | | | | | | | | | | | | | | | | | |
| | | | | | | |
Total gross expenses | | | 1.43 | %(d) | | | 1.42 | % | | | 1.43 | % | | | 1.51 | % | | | 1.47 | %(d) | | | 1.39 | % | | | 1.45 | % |
| | | | | | | | | | | | | | | | | | | | | | | | | | | | | |
Total net expenses(e) | | | 1.43 | %(d)(f) | | | 1.42 | %(f) | | | 1.43 | %(f) | | | 1.41 | % | | | 1.38 | %(d) | | | 1.39 | % | | | 1.45 | % |
| | | | | | | | | | | | | | | | | | | | | | | | | | | | | |
Net investment income | | | 1.48 | %(d) | | | 1.46 | % | | | 0.87 | % | | | 1.18 | % | | | 0.95 | %(d) | | | 0.78 | % | | | 0.88 | % |
| | | | | | | | | | | | | | | | | | | | | | | | | | | | | |
Supplemental data | | | | | | | | | | | | | | | | | | | | | | | | | | | | |
| | | | | | | |
Net assets, end of period (in thousands) | | | $981 | | | | $1,115 | | | | $992 | | | | $38 | | | | $29 | | | | $34 | | | | $30 | |
| | | | | | | | | | | | | | | | | | | | | | | | | | | | | |
Portfolio turnover | | | 44 | % | | | 61 | % | | | 61 | % | | | 49 | % | | | 21 | % | | | 37 | % | | | 30 | % |
| | | | | | | | | | | | | | | | | | | | | | | | | | | | | |
Notes to Financial Highlights
| (a) | For the period from April 1, 2011 to February 29, 2012. During the period, the Fund’s fiscal year end was changed from March 31 to February 29. |
| (b) | The Fund received proceeds from regulatory settlements. Had the Fund not received these proceeds, the total return would have been lower by 0.05%. |
| (c) | In addition to the fees and expenses that the Fund bears directly, the Fund indirectly bears a pro rata share of the fees and expenses of any other funds in which it invests. Such indirect expenses are not included in the Fund’s reported expense ratios. |
| (e) | Total net expenses include the impact of certain fee waivers/expense reimbursements made by the Investment Manager and certain of its affiliates, if applicable. |
| (f) | The benefits derived from expense reductions had an impact of less than 0.01%. |
| (g) | Net investment income per share includes special dividends. The effect of these dividends amounted to $0.08 per share. |
The accompanying Notes to Financial Statements are an integral part of this statement.
| | | | |
| Semiannual Report 2015 | | | 21 | |
| | |
| |
| | COLUMBIA GLOBAL EQUITY VALUE FUND |
FINANCIAL HIGHLIGHTS (continued)
| | | | | | | | | | | | | | | | | | | | | | | | | | | | |
| |
| Six Months Ended
August 31, 2015 |
| | | Year Ended February 28, | | |
| Year Ended
February 29, |
| | | Year Ended March 31, | |
Class R4 | | | (Unaudited) | | | | 2015 | | | | 2014 | | | | 2013 | | | | 2012(a) | | | | 2011 | | | | 2010 | |
Per share data | | | | | | | | | | | | | | | | | | | | | | | | | | | | |
Net asset value, beginning of period | | | $13.05 | | | | $13.82 | | | | $11.86 | | | | $10.74 | | | | $11.07 | | | | $9.64 | | | | $6.55 | |
| | | | | | | | | | | | | | | | | | | | | | | | | | | | | |
Income from investment operations: | | | | | | | | | | | | | | | | | | | | | | | | | | | | |
| | | | | | | |
Net investment income | | | 0.11 | (g) | | | 0.26 | | | | 0.19 | | | | 0.15 | | | | 0.13 | | | | 0.10 | | | | 0.11 | |
| | | | | | | | | | | | | | | | | | | | | | | | | | | | | |
Net realized and unrealized gain (loss) | | | (1.16 | ) | | | 0.97 | | | | 2.43 | | | | 1.13 | | | | (0.34 | ) | | | 1.40 | | | | 3.10 | |
| | | | | | | | | | | | | | | | | | | | | | | | | | | | | |
Total from investment operations | | | (1.05 | ) | | | 1.23 | | | | 2.62 | | | | 1.28 | | | | (0.21 | ) | | | 1.50 | | | | 3.21 | |
| | | | | | | | | | | | | | | | | | | | | | | | | | | | | |
Less distributions to shareholders: | | | | | | | | | | | | | | | | | | | | | | | | | | | | |
| | | | | | | |
Net investment income | | | (0.13 | ) | | | (0.19 | ) | | | (0.17 | ) | | | (0.16 | ) | | | (0.12 | ) | | | (0.07 | ) | | | (0.12 | ) |
| | | | | | | | | | | | | | | | | | | | | | | | | | | | | |
Net realized gains | | | (0.18 | ) | | | (1.81 | ) | | | (0.49 | ) | | | — | | | | — | | | | — | | | | — | |
| | | | | | | | | | | | | | | | | | | | | | | | | | | | | |
Total distributions to shareholders | | | (0.31 | ) | | | (2.00 | ) | | | (0.66 | ) | | | (0.16 | ) | | | (0.12 | ) | | | (0.07 | ) | | | (0.12 | ) |
| | | | | | | | | | | | | | | | | | | | | | | | | | | | | |
Proceeds from regulatory settlements | | | 0.01 | | | | — | | | | — | | | | — | | | | — | | | | — | | | | — | |
| | | | | | | | | | | | | | | | | | | | | | | | | | | | | |
Net asset value, end of period | | | $11.70 | | | | $13.05 | | | | $13.82 | | | | $11.86 | | | | $10.74 | | | | $11.07 | | | | $9.64 | |
| | | | | | | | | | | | | | | | | | | | | | | | | | | | | |
Total return | | | (8.14 | %)(b) | | | 9.38 | % | | | 22.45 | % | | | 12.03 | % | | | (1.77 | %) | | | 15.67 | % | | | 49.35 | % |
| | | | | | | | | | | | | | | | | | | | | | | | | | | | | |
Ratios to average net assets(c) | | | | | | | | | | | | | | | | | | | | | | | | | | | | |
| | | | | | | |
Total gross expenses | | | 0.93 | %(d) | | | 0.92 | % | | | 0.94 | % | | | 1.21 | % | | | 1.29 | %(d) | | | 1.18 | % | | | 1.17 | % |
| | | | | | | | | | | | | | | | | | | | | | | | | | | | | |
Total net expenses(e) | | | 0.93 | %(d)(f) | | | 0.92 | %(f) | | | 0.93 | %(f) | | | 1.15 | % | | | 0.92 | %(d) | | | 1.18 | % | | | 1.17 | % |
| | | | | | | | | | | | | | | | | | | | | | | | | | | | | |
Net investment income | | | 1.67 | %(d) | | | 1.93 | % | | | 1.42 | % | | | 1.43 | % | | | 1.40 | %(d) | | | 1.07 | % | | | 1.32 | % |
| | | | | | | | | | | | | | | | | | | | | | | | | | | | | |
Supplemental data | | | | | | | | | | | | | | | | | | | | | | | | | | | | |
| | | | | | | |
Net assets, end of period (in thousands) | | | $212 | | | | $203 | | | | $105 | | | | $8 | | | | $8 | | | | $8 | | | | $183 | |
| | | | | | | | | | | | | | | | | | | | | | | | | | | | | |
Portfolio turnover | | | 44 | % | | | 61 | % | | | 61 | % | | | 49 | % | | | 21 | % | | | 37 | % | | | 30 | % |
| | | | | | | | | | | | | | | | | | | | | | | | | | | | | |
Notes to Financial Highlights
| (a) | For the period from April 1, 2011 to February 29, 2012. During the period, the Fund’s fiscal year end was changed from March 31 to February 29. |
| (b) | The Fund received proceeds from regulatory settlements. Had the Fund not received these proceeds, the total return would have been lower by 0.05%. |
| (c) | In addition to the fees and expenses that the Fund bears directly, the Fund indirectly bears a pro rata share of the fees and expenses of any other funds in which it invests. Such indirect expenses are not included in the Fund’s reported expense ratios. |
| (e) | Total net expenses include the impact of certain fee waivers/expense reimbursements made by the Investment Manager and certain of its affiliates, if applicable. |
| (f) | The benefits derived from expense reductions had an impact of less than 0.01%. |
| (g) | Net investment income per share includes special dividends. The effect of these dividends amounted to $0.08 per share. |
The accompanying Notes to Financial Statements are an integral part of this statement.
| | |
| 22 | | Semiannual Report 2015 |
| | |
| |
| COLUMBIA GLOBAL EQUITY VALUE FUND | | |
FINANCIAL HIGHLIGHTS (continued)
| | | | | | | | | | | | | | | | | | | | | | | | | | | | |
| |
| Six Months Ended
August 31, 2015 |
| | | Year Ended February 28, | | |
| Year Ended
February 29, |
| | | Year Ended March 31, | |
Class R5 | | | (Unaudited) | | | | 2015 | | | | 2014 | | | | 2013 | | | | 2012(a) | | | | 2011 | | | | 2010 | |
Per share data | | | | | | | | | | | | | | | | | | | | | | | | | | | | |
Net asset value, beginning of period | | | $13.00 | | | | $13.78 | | | | $11.83 | | | | $10.73 | | | | $11.03 | | | | $9.63 | | | | $6.54 | |
| | | | | | | | | | | | | | | | | | | | | | | | | | | | | |
Income from investment operations: | | | | | | | | | | | | | | | | | | | | | | | | | | | | |
| | | | | | | |
Net investment income | | | 0.13 | (f) | | | 0.30 | | | | 0.17 | | | | 0.19 | | | | 0.15 | | | | 0.14 | | | | 0.15 | |
| | | | | | | | | | | | | | | | | | | | | | | | | | | | | |
Net realized and unrealized gain (loss) | | | (1.17 | ) | | | 0.94 | | | | 2.46 | | | | 1.11 | | | | (0.33 | ) | | | 1.41 | | | | 3.10 | |
| | | | | | | | | | | | | | | | | | | | | | | | | | | | | |
Total from investment operations | | | (1.04 | ) | | | 1.24 | | | | 2.63 | | | | 1.30 | | | | (0.18 | ) | | | 1.55 | | | | 3.25 | |
| | | | | | | | | | | | | | | | | | | | | | | | | | | | | |
Less distributions to shareholders: | | | | | | | | | | | | | | | | | | | | | | | | | | | | |
| | | | | | | |
Net investment income | | | (0.14 | ) | | | (0.21 | ) | | | (0.19 | ) | | | (0.20 | ) | | | (0.12 | ) | | | (0.15 | ) | | | (0.16 | ) |
| | | | | | | | | | | | | | | | | | | | | | | | | | | | | |
Net realized gains | | | (0.18 | ) | | | (1.81 | ) | | | (0.49 | ) | | | — | | | | — | | | | — | | | | — | |
| | | | | | | | | | | | | | | | | | | | | | | | | | | | | |
Total distributions to shareholders | | | (0.32 | ) | | | (2.02 | ) | | | (0.68 | ) | | | (0.20 | ) | | | (0.12 | ) | | | (0.15 | ) | �� | | (0.16 | ) |
| | | | | | | | | | | | | | | | | | | | | | | | | | | | | |
Proceeds from regulatory settlements | | | 0.01 | | | | — | | | | — | | | | — | | | | — | | | | — | | | | — | |
| | | | | | | | | | | | | | | | | | | | | | | | | | | | | |
Net asset value, end of period | | | $11.65 | | | | $13.00 | | | | $13.78 | | | | $11.83 | | | | $10.73 | | | | $11.03 | | | | $9.63 | |
| | | | | | | | | | | | | | | | | | | | | | | | | | | | | |
Total return | | | (8.11 | %)(b) | | | 9.48 | % | | | 22.59 | % | | | 12.34 | % | | | (1.53 | %) | | | 16.26 | % | | | 50.15 | % |
| | | | | | | | | | | | | | | | | | | | | | | | | | | | | |
Ratios to average net assets(c) | | | | | | | | | | | | | | | | | | | | | | | | | | | | |
| | | | | | | |
Total gross expenses | | | 0.80 | %(d) | | | 0.79 | % | | | 0.78 | % | | | 0.83 | % | | | 0.79 | %(d) | | | 0.67 | % | | | 0.67 | % |
| | | | | | | | | | | | | | | | | | | | | | | | | | | | | |
Total net expenses(e) | | | 0.80 | %(d) | | | 0.79 | % | | | 0.78 | % | | | 0.80 | % | | | 0.73 | %(d) | | | 0.67 | % | | | 0.67 | % |
| | | | | | | | | | | | | | | | | | | | | | | | | | | | | |
Net investment income | | | 2.07 | %(d) | | | 2.23 | % | | | 1.32 | % | | | 1.78 | % | | | 1.59 | %(d) | | | 1.49 | % | | | 1.72 | % |
| | | | | | | | | | | | | | | | | | | | | | | | | | | | | |
Supplemental data | | | | | | | | | | | | | | | | | | | | | | | | | | | | |
| | | | | | | |
Net assets, end of period (in thousands) | | | $153 | | | | $25 | | | | $22 | | | | $1,149 | | | | $1,043 | | | | $1,066 | | | | $7 | |
| | | | | | | | | | | | | | | | | | | | | | | | | | | | | |
Portfolio turnover | | | 44 | % | | | 61 | % | | | 61 | % | | | 49 | % | | | 21 | % | | | 37 | % | | | 30 | % |
| | | | | | | | | | | | | | | | | | | | | | | | | | | | | |
Notes to Financial Highlights
| (a) | For the period from April 1, 2011 to February 29, 2012. During the period, the Fund’s fiscal year end was changed from March 31 to February 29. |
| (b) | The Fund received proceeds from regulatory settlements. Had the Fund not received these proceeds, the total return would have been lower by 0.05%. |
| (c) | In addition to the fees and expenses that the Fund bears directly, the Fund indirectly bears a pro rata share of the fees and expenses of any other funds in which it invests. Such indirect expenses are not included in the Fund’s reported expense ratios. |
| (e) | Total net expenses include the impact of certain fee waivers/expense reimbursements made by the Investment Manager and certain of its affiliates, if applicable. |
| (f) | Net investment income per share includes special dividends. The effect of these dividends amounted to $0.04 per share. |
The accompanying Notes to Financial Statements are an integral part of this statement.
| | | | |
| Semiannual Report 2015 | | | 23 | |
| | |
| |
| | COLUMBIA GLOBAL EQUITY VALUE FUND |
FINANCIAL HIGHLIGHTS (continued)
| | | | | | | | | | | | | | | | | | | | | | | | | | | | |
| |
| Six Months Ended
August 31, 2015 |
| | | Year Ended February 28, | | |
| Year Ended
February 29, |
| | | Year Ended March 31, | |
Class W | | | (Unaudited) | | | | 2015 | | | | 2014 | | | | 2013 | | | | 2012(a) | | | | 2011 | | | | 2010 | |
Per share data | | | | | | | | | | | | | | | | | | | | | | | | | | | | |
Net asset value, beginning of period | | | $13.09 | | | | $13.86 | | | | $11.89 | | | | $10.76 | | | | $11.03 | | | | $9.63 | | | | $6.54 | |
| | | | | | | | | | | | | | | | | | | | | | | | | | | | | |
Income from investment operations: | | | | | | | | | | | | | | | | | | | | | | | | | | | | |
| | | | | | | |
Net investment income | | | 0.11 | (g) | | | 0.22 | | | | 0.14 | | | | 0.15 | | | | 0.09 | | | | 0.11 | | | | 0.12 | |
| | | | | | | | | | | | | | | | | | | | | | | | | | | | | |
Net realized and unrealized gain (loss) | | | (1.17 | ) | | | 0.98 | | | | 2.46 | | | | 1.12 | | | | (0.33 | ) | | | 1.40 | | | | 3.10 | |
| | | | | | | | | | | | | | | | | | | | | | | | | | | | | |
Total from investment operations | | | (1.06 | ) | | | 1.20 | | | | 2.60 | | | | 1.27 | | | | (0.24 | ) | | | 1.51 | | | | 3.22 | |
| | | | | | | | | | | | | | | | | | | | | | | | | | | | | |
Less distributions to shareholders: | | | | | | | | | | | | | | | | | | | | | | | | | | | | |
| | | | | | | |
Net investment income | | | (0.12 | ) | | | (0.16 | ) | | | (0.14 | ) | | | (0.14 | ) | | | (0.03 | ) | | | (0.11 | ) | | | (0.13 | ) |
| | | | | | | | | | | | | | | | | | | | | | | | | | | | | |
Net realized gains | | | (0.18 | ) | | | (1.81 | ) | | | (0.49 | ) | | | — | | | | — | | | | — | | | | — | |
| | | | | | | | | | | | | | | | | | | | | | | | | | | | | |
Total distributions to shareholders | | | (0.30 | ) | | | (1.97 | ) | | | (0.63 | ) | | | (0.14 | ) | | | (0.03 | ) | | | (0.11 | ) | | | (0.13 | ) |
| | | | | | | | | | | | | | | | | | | | | | | | | | | | | |
Proceeds from regulatory settlements | | | 0.01 | | | | — | | | | — | | | | — | | | | — | | | | — | | | | — | |
| | | | | | | | | | | | | | | | | | | | | | | | | | | | | |
Net asset value, end of period | | | $11.74 | | | | $13.09 | | | | $13.86 | | | | $11.89 | | | | $10.76 | | | | $11.03 | | | | $9.63 | |
| | | | | | | | | | | | | | | | | | | | | | | | | | | | | |
Total return | | | (8.22 | %)(b) | | | 9.08 | % | | | 22.16 | % | | | 11.92 | % | | | (2.19 | %) | | | 15.82 | % | | | 49.56 | % |
| | | | | | | | | | | | | | | | | | | | | | | | | | | | | |
Ratios to average net assets(c) | | | | | | | | | | | | | | | | | | | | | | | | | | | | |
| | | | | | | |
Total gross expenses | | | 1.16 | %(d) | | | 1.16 | % | | | 1.19 | % | | | 1.26 | % | | | 1.13 | %(d) | | | 1.14 | % | | | 1.03 | % |
| | | | | | | | | | | | | | | | | | | | | | | | | | | | | |
Total net expenses(e) | | | 1.16 | %(d)(f) | | | 1.16 | %(f) | | | 1.18 | %(f) | | | 1.16 | % | | | 1.10 | %(d)(f) | | | 1.14 | % | | | 1.03 | % |
| | | | | | | | | | | | | | | | | | | | | | | | | | | | | |
Net investment income | | | 1.73 | %(d) | | | 1.65 | % | | | 1.08 | % | | | 1.38 | % | | | 0.89 | %(d) | | | 1.04 | % | | | 1.45 | % |
| | | | | | | | | | | | | | | | | | | | | | | | | | | | | |
Supplemental data | | | | | | | | | | | | | | | | | | | | | | | | | | | | |
| | | | | | | |
Net assets, end of period (in thousands) | | | $13 | | | | $14 | | | | $19 | | | | $13 | | | | $25 | | | | $20,400 | | | | $4 | |
| | | | | | | | | | | | | | | | | | | | | | | | | | | | | |
Portfolio turnover | | | 44 | % | | | 61 | % | | | 61 | % | | | 49 | % | | | 21 | % | | | 37 | % | | | 30 | % |
| | | | | | | | | | | | | | | | | | | | | | | | | | | | | |
Notes to Financial Highlights
| (a) | For the period from April 1, 2011 to February 29, 2012. During the period, the Fund’s fiscal year end was changed from March 31 to February 29. |
| (b) | The Fund received proceeds from regulatory settlements. Had the Fund not received these proceeds, the total return would have been lower by 0.05%. |
| (c) | In addition to the fees and expenses that the Fund bears directly, the Fund indirectly bears a pro rata share of the fees and expenses of any other funds in which it invests. Such indirect expenses are not included in the Fund’s reported expense ratios. |
| (e) | Total net expenses include the impact of certain fee waivers/expense reimbursements made by the Investment Manager and certain of its affiliates, if applicable. |
| (f) | The benefits derived from expense reductions had an impact of less than 0.01%. |
| (g) | Net investment income per share includes special dividends. The effect of these dividends amounted to $0.08 per share. |
The accompanying Notes to Financial Statements are an integral part of this statement.
| | |
| 24 | | Semiannual Report 2015 |
| | |
| |
| COLUMBIA GLOBAL EQUITY VALUE FUND | | |
FINANCIAL HIGHLIGHTS (continued)
| | | | | | | | | | | | |
| |
| Six Months Ended
August 31, 2015 |
| | | Year Ended February 28, | |
Class Y | | | (Unaudited) | | | | 2015 | | | | 2014(a) | |
Per share data | | | | | | | | | | | | |
Net asset value, beginning of period | | | $12.71 | | | | $13.52 | | | | $11.61 | |
| | | | | | | | | | | | | |
Income from investment operations: | | | | | | | | | | | | |
| | | |
Net investment income | | | 0.14 | (f) | | | 0.27 | | | | 0.19 | |
| | | | | | | | | | | | | |
Net realized and unrealized gain (loss) | | | (1.14 | ) | | | 0.95 | | | | 2.41 | |
| | | | | | | | | | | | | |
Total from investment operations | | | (1.00 | ) | | | 1.22 | | | | 2.60 | |
| | | | | | | | | | | | | |
Less distributions to shareholders: | | | | | | | | | | | | |
| | | |
Net investment income | | | (0.15 | ) | | | (0.22 | ) | | | (0.20 | ) |
| | | | | | | | | | | | | |
Net realized gains | | | (0.18 | ) | | | (1.81 | ) | | | (0.49 | ) |
| | | | | | | | | | | | | |
Total distributions to shareholders | | | (0.33 | ) | | | (2.03 | ) | | | (0.69 | ) |
| | | | | | | | | | | | | |
Proceeds from regulatory settlements | | | 0.01 | | | | — | | | | — | |
| | | | | | | | | | | | | |
Net asset value, end of period | | | $11.39 | | | | $12.71 | | | | $13.52 | |
| | | | | | | | | | | | | |
Total return | | | (8.03 | %)(b) | | | 9.50 | % | | | 22.76 | % |
| | | | | | | | | | | | | |
Ratios to average net assets(c) | | | | | | | | | | | | |
| | | |
Total gross expenses | | | 0.73 | %(d) | | | 0.72 | % | | | 0.72 | % |
| | | | | | | | | | | | | |
Total net expenses(e) | | | 0.73 | %(d) | | | 0.72 | % | | | 0.72 | % |
| | | | | | | | | | | | | |
Net investment income | | | 2.16 | %(d) | | | 2.01 | % | | | 1.46 | % |
| | | | | | | | | | | | | |
Supplemental data | | | | | | | | | | | | |
| | | |
Net assets, end of period (in thousands) | | | $2 | | | | $2 | | | | $6 | |
| | | | | | | | | | | | | |
Portfolio turnover | | | 44 | % | | | 61 | % | | | 61 | % |
| | | | | | | | | | | | | |
Notes to Financial Highlights
| (a) | Based on operations from February 28, 2013 (commencement of operations) through the stated period end. |
| (b) | The Fund received proceeds from regulatory settlements. Had the Fund not received these proceeds, the total return would have been lower by 0.05%. |
| (c) | In addition to the fees and expenses that the Fund bears directly, the Fund indirectly bears a pro rata share of the fees and expenses of any other funds in which it invests. Such indirect expenses are not included in the Fund’s reported expense ratios. |
| (e) | Total net expenses include the impact of certain fee waivers/expense reimbursements made by the Investment Manager and certain of its affiliates, if applicable. |
| (f) | Net investment income per share includes special dividends. The effect of these dividends amounted to $0.08 per share. |
The accompanying Notes to Financial Statements are an integral part of this statement.
| | | | |
| Semiannual Report 2015 | | | 25 | |
| | |
| |
| | COLUMBIA GLOBAL EQUITY VALUE FUND |
FINANCIAL HIGHLIGHTS (continued)
| | | | | | | | | | | | | | | | | | | | | | | | |
| |
| Six Months Ended
August 31, 2015 |
| | | Year Ended February 28, | | |
| Year Ended
February 29, |
| |
| Year Ended
March 31, |
|
Class Z | | | (Unaudited) | | | | 2015 | | | | 2014 | | | | 2013 | | | | 2012(a) | | | | 2011(b) | |
Per share data | | | | | | | | | | | | | | | | | | | | | | | | |
Net asset value, beginning of period | | | $13.02 | | | | $13.79 | | | | $11.84 | | | | $10.73 | | | | $11.03 | | | | $9.32 | |
| | | | | | | | | | | | | | | | | | | | | | | | | |
Income from investment operations: | | | | | | | | | | | | | | | | | | | | | | | | |
| | | | | | |
Net investment income | | | 0.12 | (h) | | | 0.26 | | | | 0.19 | | | | 0.18 | | | | 0.15 | | | | 0.06 | |
| | | | | | | | | | | | | | | | | | | | | | | | | |
Net realized and unrealized gain (loss) | | | (1.17 | ) | | | 0.97 | | | | 2.42 | | | | 1.12 | | | | (0.34 | ) | | | 1.72 | |
| | | | | | | | | | | | | | | | | | | | | | | | | |
Total from investment operations | | | (1.05 | ) | | | 1.23 | | | | 2.61 | | | | 1.30 | | | | (0.19 | ) | | | 1.78 | |
| | | | | | | | | | | | | | | | | | | | | | | | | |
Less distributions to shareholders: | | | | | | | | | | | | | | | | | | | | | | | | |
| | | | | | |
Net investment income | | | (0.13 | ) | | | (0.19 | ) | | | (0.17 | ) | | | (0.19 | ) | | | (0.11 | ) | | | (0.07 | ) |
| | | | | | | | | | | | | | | | | | | | | | | | | |
Net realized gains | | | (0.18 | ) | | | (1.81 | ) | | | (0.49 | ) | | | — | | | | — | | | | — | |
| | | | | | | | | | | | | | | | | | | | | | | | | |
Total distributions to shareholders | | | (0.31 | ) | | | (2.00 | ) | | | (0.66 | ) | | | (0.19 | ) | | | (0.11 | ) | | | (0.07 | ) |
| | | | | | | | | | | | | | | | | | | | | | | | | |
Proceeds from regulatory settlements | | | 0.01 | | | | — | | | | — | | | | — | | | | — | | | | — | |
| | | | | | | | | | | | | | | | | | | | | | | | | |
Net asset value, end of period | | | $11.67 | | | | $13.02 | | | | $13.79 | | | | $11.84 | | | | $10.73 | | | | $11.03 | |
| | | | | | | | | | | | | | | | | | | | | | | | | |
Total return | | | (8.16 | %)(c) | | | 9.41 | % | | | 22.40 | % | | | 12.32 | % | | | (1.62 | %) | | | 19.16 | % |
| | | | | | | | | | | | | | | | | | | | | | | | | |
Ratios to average net assets(d) | | | | | | | | | | | | | | | | | | | | | | | | |
| | | | | | |
Total gross expenses | | | 0.93 | %(e) | | | 0.92 | % | | | 0.93 | % | | | 1.01 | % | | | 0.96 | %(e) | | | 0.87 | %(e) |
| | | | | | | | | | | | | | | | | | | | | | | | | |
Total net expenses(f) | | | 0.93 | %(e)(g) | | | 0.92 | %(g) | | | 0.93 | %(g) | | | 0.91 | %(g) | | | 0.86 | %(e)(g) | | | 0.87 | %(e) |
| | | | | | | | | | | | | | | | | | | | | | | | | |
Net investment income | | | 1.93 | %(e) | | | 1.91 | % | | | 1.41 | % | | | 1.68 | % | | | 1.67 | %(e) | | | 1.35 | %(e) |
| | | | | | | | | | | | | | | | | | | | | | | | | |
Supplemental data | | | | | | | | | | | | | | | | | | | | | | | | |
| | | | | | |
Net assets, end of period (in thousands) | | | $97,078 | | | | $111,869 | | | | $115,642 | | | | $785 | | | | $552 | | | | $3 | |
| | | | | | | | | | | | | | | | | | | | | | | | | |
Portfolio turnover | | | 44 | % | | | 61 | % | | | 61 | % | | | 49 | % | | | 21 | % | | | 37 | % |
| | | | | | | | | | | | | | | | | | | | | | | | | |
Notes to Financial Highlights
| (a) | For the period from April 1, 2011 to February 29, 2012. During the period, the Fund’s fiscal year end was changed from March 31 to February 29. |
| (b) | Based on operations from September 27, 2010 (commencement of operations) through the stated period end. |
| (c) | The Fund received proceeds from regulatory settlements. Had the Fund not received these proceeds, the total return would have been lower by 0.05%. |
| (d) | In addition to the fees and expenses that the Fund bears directly, the Fund indirectly bears a pro rata share of the fees and expenses of any other funds in which it invests. Such indirect expenses are not included in the Fund’s reported expense ratios. |
| (f) | Total net expenses include the impact of certain fee waivers/expense reimbursements made by the Investment Manager and certain of its affiliates, if applicable. |
| (g) | The benefits derived from expense reductions had an impact of less than 0.01%. |
| (h) | Net investment income per share includes special dividends. The effect of these dividends amounted to $0.08 per share. |
The accompanying Notes to Financial Statements are an integral part of this statement.
| | |
| 26 | | Semiannual Report 2015 |
| | |
| |
| COLUMBIA GLOBAL EQUITY VALUE FUND | | |
NOTES TO FINANCIAL STATEMENTS
August 31, 2015 (Unaudited)
Note 1. Organization
Columbia Global Equity Value Fund (the Fund), a series of Columbia Funds Series Trust II (the Trust), is a diversified fund. The Trust is registered under the Investment Company Act of 1940, as amended (the 1940 Act), as an open-end management investment company organized as a Massachusetts business trust.
Fund Shares
The Trust may issue an unlimited number of shares (without par value). The Fund offers Class A, Class B, Class C, Class I, Class K, Class R, Class R4, Class R5, Class W, Class Y and Class Z shares. Although all share classes generally have identical voting, dividend and liquidation rights, each share class votes separately when required by the Trust’s organizational documents or by law. Different share classes pay different distribution amounts to the extent the expenses of such share classes differ, and distributions in liquidation will be proportional to the net asset value of each share class. Each share class has its own expense and sales charge structure.
Class A shares are subject to a maximum front-end sales charge of 5.75% based on the initial investment amount. Class A shares purchased without an initial sales charge in accounts aggregating $1 million to $50 million at the time of purchase are subject to a contingent deferred sales charge (CDSC) if the shares are sold within 18 months after purchase, charged as follows: 1.00% CDSC if redeemed within 12 months after purchase, and 0.50% CDSC if redeemed more than 12, but less than 18, months after purchase.
Class B shares may be subject to a maximum CDSC of 5.00% based upon the holding period after purchase. Class B shares will generally convert to Class A shares eight years after purchase. The Fund no longer accepts investments by new or existing investors in the Fund’s Class B shares, except in connection with the reinvestment of any dividend and/or capital gain distributions in Class B shares of the Fund and exchanges by existing Class B shareholders of certain other funds within the Columbia Family of Funds.
Class C shares are subject to a 1.00% CDSC on shares redeemed within one year after purchase.
Class I shares are not subject to sales charges and are available only to the Columbia Family of Funds.
Class K shares are not subject to sales charges, however this share class is closed to new investors.
Class R shares are not subject to sales charges and are generally available only to certain retirement plans and other investors as described in the Fund’s prospectus.
Class R4 shares are not subject to sales charges and are generally available only to omnibus retirement plans and certain investors as described in the Fund’s prospectus.
Class R5 shares are not subject to sales charges and are generally available only to investors purchasing through authorized investment professionals and omnibus retirement plans.
Class W shares are not subject to sales charges and are available only to investors purchasing through authorized investment programs managed by investment professionals, including discretionary managed account programs.
Class Y shares are not subject to sales charges and are generally available only to certain retirement plans as described in the Fund’s prospectus.
Class Z shares are not subject to sales charges and are available only to eligible investors, which are subject to different investment minimums as described in the Fund’s prospectus.
Note 2. Summary of Significant Accounting Policies
Basis of Preparation
The Fund is an investment company that applies the accounting and reporting guidance in the Financial Accounting Standards Board (FASB) Accounting Standards Codification Topic 946, Financial Services —Investment Companies (ASC 946). The financial statements are prepared in accordance with U.S. generally accepted accounting principles (GAAP), which requires management to make certain estimates and assumptions that affect the reported amounts of assets and liabilities, the disclosure of contingent assets and liabilities at the date of the financial statements and the reported amounts of income and expenses during the reporting period. Actual results could differ from those estimates.
The following is a summary of significant accounting policies followed by the Fund in the preparation of its financial statements.
Security Valuation
All equity securities are valued at the close of business of the New York Stock Exchange (NYSE). Equity securities
| | | | |
| Semiannual Report 2015 | | | 27 | |
| | |
| |
| | COLUMBIA GLOBAL EQUITY VALUE FUND |
NOTES TO FINANCIAL STATEMENTS (continued)
August 31, 2015 (Unaudited)
are valued at the last quoted sales price on the principal exchange or market on which they trade, except for securities traded on the NASDAQ Stock Market, which are valued at the NASDAQ official close price. Unlisted securities or listed securities for which there were no sales during the day are valued at the mean of the latest quoted bid and ask prices on such exchanges or markets.
Foreign equity securities are valued based on the closing price on the foreign exchange in which such securities are primarily traded. If any foreign equity security closing prices are not readily available, the securities are valued at the mean of the latest quoted bid and ask prices on such exchanges or markets. Foreign currency exchange rates are generally determined at 4:00 p.m. Eastern (U.S.) time. Many securities markets and exchanges outside the U.S. close prior to the close of the NYSE; therefore, the closing prices for securities in such markets or on such exchanges may not fully reflect events that occur after such close but before the close of the NYSE. In those situations, foreign securities will be fair valued pursuant to a policy adopted by the Board of Trustees (the Board), including, if available, utilizing a third party pricing service to determine these fair values. The third party pricing service takes into account multiple factors, including, but not limited to, movements in the U.S. securities markets, certain depositary receipts, futures contracts and foreign exchange rates that have occurred subsequent to the close of the foreign exchange or market, to determine a good faith estimate that reasonably reflects the current market conditions as of the close of the NYSE. The fair value of a security is likely to be different from the quoted or published price, if available.
Investments in open-end investment companies, including money market funds, are valued at their latest net asset value.
Investments for which market quotations are not readily available, or that have quotations which management believes are not reflective of market value or reliable, are valued at fair value as determined in good faith under procedures approved by and under the general supervision of the Board. If a security or class of securities (such as foreign securities) is valued at fair value, such value is likely to be different from the quoted or published price for the security.
The determination of fair value often requires significant judgment. To determine fair value, management may use assumptions including but not limited to future cash
flows and estimated risk premiums. Multiple inputs from various sources may be used to determine fair value.
GAAP requires disclosure regarding the inputs and valuation techniques used to measure fair value and any changes in valuation inputs or techniques. In addition, investments shall be disclosed by major category. This information is disclosed following the Fund’s Portfolio of Investments.
Foreign Currency Transactions and Translations
The values of all assets and liabilities denominated in foreign currencies are generally translated into U.S. dollars at exchange rates determined at the close of the NYSE. Net realized and unrealized gains (losses) on foreign currency transactions and translations include gains (losses) arising from the fluctuation in exchange rates between trade and settlement dates on securities transactions, gains (losses) arising from the disposition of foreign currency and currency gains (losses) between the accrual and payment dates on dividends, interest income and foreign withholding taxes.
For financial statement purposes, the Fund does not distinguish that portion of gains (losses) on investments which is due to changes in foreign exchange rates from that which is due to changes in market prices of the investments. Such fluctuations are included with the net realized and unrealized gains (losses) on investments in the Statement of Operations.
Security Transactions
Security transactions are accounted for on the trade date. Cost is determined and gains (losses) are based upon the specific identification method for both financial statement and federal income tax purposes.
Income Recognition
Corporate actions and dividend income are generally recorded net of any non-reclaimable tax withholdings, on the ex-dividend date or upon receipt of ex-dividend notification in the case of certain foreign securities.
The Fund may receive distributions from holdings in equity securities, business development companies (BDCs), exchange-traded funds, other regulated investment companies (RICs), and real estate investment trusts (REITs), which report information on the tax character of their distributions annually. These distributions are allocated to dividend income, capital gain and return of capital based on actual information reported. Return of capital is recorded as a reduction of the cost basis of securities held. If the Fund no longer
| | |
| 28 | | Semiannual Report 2015 |
| | |
| |
| COLUMBIA GLOBAL EQUITY VALUE FUND | | |
NOTES TO FINANCIAL STATEMENTS (continued)
August 31, 2015 (Unaudited)
owns the applicable securities, return of capital is recorded as a realized gain. With respect to REITs, to the extent actual information has not yet been reported, estimates for return of capital are made by the Fund’s management. Management’s estimates are subsequently adjusted when the actual character of the distributions is disclosed by the REITs, which could result in a proportionate change in return of capital to shareholders.
Awards from class action litigation are recorded as a reduction of cost basis if the Fund still owns the applicable securities on the payment date. If the Fund no longer owns the applicable securities, the proceeds are recorded as realized gains.
Expenses
General expenses of the Trust are allocated to the Fund and other funds of the Trust based upon relative net assets or other expense allocation methodologies determined by the nature of the expense. Expenses directly attributable to the Fund are charged to the Fund. Expenses directly attributable to a specific class of shares are charged to that share class.
Determination of Class Net Asset Value
All income, expenses (other than class-specific expenses, which are charged to that share class, as shown in the Statement of Operations) and realized and unrealized gains (losses) are allocated to each class of the Fund on a daily basis, based on the relative net assets of each class, for purposes of determining the net asset value of each class.
Federal Income Tax Status
The Fund intends to qualify each year as a regulated investment company under Subchapter M of the Internal Revenue Code, as amended, and will distribute substantially all of its taxable income (including net short-term capital gains), if any, for its tax year, and as such will not be subject to federal income taxes. In addition, the Fund intends to distribute in each calendar year substantially all of its net investment income, capital gains and certain other amounts, if any, such that the Fund should not be subject to federal excise tax. Therefore, no federal income or excise tax provision is recorded.
Foreign Taxes
The Fund may be subject to foreign taxes on income, gains on investments or currency repatriation, a portion of which may be recoverable. The Fund will accrue such
taxes and recoveries, as applicable, based upon its current interpretation of tax rules and regulations that exist in the markets in which it invests.
Realized gains in certain countries may be subject to foreign taxes at the Fund level, based on statutory rates. The Fund accrues for such foreign taxes on realized and unrealized gains at the appropriate rate for each jurisdiction, as applicable. The amount, if any, is disclosed as a liability on the Statement of Assets and Liabilities.
Distributions to Shareholders
Distributions from net investment income, if any, are declared and paid each calendar quarter. Net realized capital gains, if any, are distributed at least annually. Income distributions and capital gain distributions are determined in accordance with federal income tax regulations, which may differ from GAAP.
Guarantees and Indemnifications
Under the Trust’s organizational documents and, in some cases, by contract, its officers and trustees are indemnified against certain liabilities arising out of the performance of their duties to the Trust or its funds. In addition, certain of the Fund’s contracts with its service providers contain general indemnification clauses. The Fund’s maximum exposure under these arrangements is unknown since the amount of any future claims that may be made against the Fund cannot be determined, and the Fund has no historical basis for predicting the likelihood of any such claims.
Recent Accounting Pronouncement
Fair Value Measurement (Topic 820), Disclosure for Investments in Certain Entities That Calculate Net Asset Value per Share (or Its Equivalent)
In May 2015, the Financial Accounting Standards Board (FASB) issued Accounting Standards Update (ASU) No. 2015-07, Fair Value Measurement (Topic 820), Disclosure for Investments in Certain Entities That Calculate Net Asset Value per Share (or Its Equivalent). ASU No. 2015-07 changes the disclosure requirements for investments for which fair value is measured using the net asset value per share practical expedient. The disclosure requirements are effective for annual periods beginning after December 15, 2015 and interim periods within those fiscal years. At this time, management is evaluating the implications of this guidance and the impact it will have on the financial statement amounts and footnote disclosures, if any.
| | | | |
| Semiannual Report 2015 | | | 29 | |
| | |
| |
| | COLUMBIA GLOBAL EQUITY VALUE FUND |
NOTES TO FINANCIAL STATEMENTS (continued)
August 31, 2015 (Unaudited)
Note 3. Fees and Other Transactions with Affiliates
Management Fees
Effective July 1, 2015, the Fund entered into a Management Agreement with Columbia Management Investment Advisers, LLC (the Investment Manager), a wholly-owned subsidiary of Ameriprise Financial, Inc. (Ameriprise Financial). Under the Management Agreement, the Investment Manager provides the Fund with investment research and advice, as well as administrative and accounting services. The management services fee is an annual fee that is equal to a percentage of the Fund’s average daily net assets that declines from 0.72% to 0.52% as the Fund’s net assets increase. The annualized effective management services fee rate for the six months ended August 31, 2015 was 0.70% of the Fund’s average daily net assets.
Prior to July 1, 2015, the Fund paid the Investment Manager an annual fee for advisory services under an Investment Management Services Agreement and a separate annual fee for administrative and accounting services under an Administrative Services Agreement. For the period from March 1, 2015 through June 30, 2015, the investment advisory services fee paid to the Investment Manager was $2,205,910, and the administrative services fee paid to the Investment Manager was $198,822.
Other Expenses
Other expenses are for, among other things, miscellaneous expenses of the Fund or the Board, including payments to Board Services Corp., a company providing limited administrative services to the Fund and the Board. That company’s expenses include boardroom and office expense, employee compensation, employee health and retirement benefits, and certain other expenses. For the six months ended August 31, 2015, other expenses paid by the Fund to this company were $1,317.
Compensation of Board Members
Board members, who are not officers or employees of the Investment Manager or Ameriprise Financial, are compensated for their services to the Fund as disclosed in the Statement of Operations. Under a Deferred Compensation Plan (the Plan), these Board members may elect to defer payment of up to 100% of their compensation. Deferred amounts are treated as though equivalent dollar amounts had been invested in shares of certain funds managed by the Investment Manager. The Fund’s liability for these amounts is adjusted for market value changes and remains in the Fund until distributed
in accordance with the Plan. All amounts payable under the Plan constitute a general unsecured obligation of the Fund.
Transfer Agency Fees
Under a Transfer and Dividend Disbursing Agent Agreement, Columbia Management Investment Services Corp. (the Transfer Agent), an affiliate of the Investment Manager and a wholly-owned subsidiary of Ameriprise Financial, is responsible for providing transfer agency services to the Fund. The Transfer Agent has contracted with Boston Financial Data Services (BFDS) to serve as sub-transfer agent.
The Transfer Agent receives a monthly transfer agency fee based on the number or the average value of accounts, depending on the type of account. In addition, the Transfer Agent also receives sub-transfer agency fees based on a percentage of the average aggregate value of the Fund’s shares maintained in omnibus accounts (other than omnibus accounts for which American Enterprise Investment Services Inc. is the broker of record or accounts where the beneficial shareholder is a customer of Ameriprise Financial Services, Inc., which receive a per account fee). The Transfer Agent pays the fees of BFDS for services as sub-transfer agent and is not entitled to reimbursement for such fees from the Fund (with the exception of out-of-pocket fees).
The Transfer Agent also receives compensation from the Fund for various shareholder services and reimbursements for certain out-of-pocket fees. Total transfer agent fees for Class K and Class R5 shares are subject to an annual limitation of not more than 0.05% of the average daily net assets attributable to each share class. Class I and Class Y shares do not pay transfer agency fees.
For the six months ended August 31, 2015, the Fund’s annualized effective transfer agency fee rates as a percentage of average daily net assets of each class were as follows:
| | | | |
Class A | | | 0.19 | % |
Class B | | | 0.19 | |
Class C | | | 0.19 | |
Class K | | | 0.05 | |
Class R | | | 0.19 | |
Class R4 | | | 0.19 | |
Class R5 | | | 0.05 | |
Class W | | | 0.19 | |
Class Z | | | 0.19 | |
| | |
| 30 | | Semiannual Report 2015 |
| | |
| |
| COLUMBIA GLOBAL EQUITY VALUE FUND | | |
NOTES TO FINANCIAL STATEMENTS (continued)
August 31, 2015 (Unaudited)
An annual minimum account balance fee of $20 may apply to certain accounts with a value below the applicable share class’s initial minimum investment requirements to reduce the impact of small accounts on transfer agency fees. These minimum account balance fees are remitted to the Fund and recorded as part of expense reductions in the Statement of Operations. For the six months ended August 31, 2015, these minimum account balance fees reduced total expenses of the Fund by $9,829.
Plan Administration Fees
Under a Plan Administration Services Agreement with the Transfer Agent, the Fund pays an annual fee at a rate of 0.25% of the Fund’s average daily net assets attributable to Class K shares for the provision of various administrative, recordkeeping, communication and educational services.
Distribution and Service Fees
The Fund has an agreement with Columbia Management Investment Distributors, Inc. (the Distributor), an affiliate of the Investment Manager and a wholly-owned subsidiary of Ameriprise Financial, for distribution and shareholder services. Under a Plan and Agreement of Distribution, the Fund pays a fee at an annual rate of up to 0.25% of the Fund’s average daily net assets attributable to Class A and Class W shares, a fee at an annual rate of up to 0.50% of the Fund’s average daily net assets attributable to Class R shares (of which up to 0.25% may be used for shareholder services) and a fee at an annual rate of up to 1.00% of the Fund’s average daily net assets attributable to Class B and Class C shares. For Class B and Class C shares, of the 1.00% fee, up to 0.75% is reimbursed for distribution expenses.
The amount of distribution and shareholder services expenses incurred by the Distributor and not yet reimbursed (unreimbursed expense) was approximately $1,532,000 and $35,000 for Class B and Class C shares, respectively. These amounts are based on the most recent information available as of June 30, 2015, and may be recovered from future payments under the distribution plan or CDSCs. To the extent the unreimbursed expense has been fully recovered, the distribution and/or shareholder services fee is reduced.
Sales Charges
Sales charges, including front-end charges and CDSCs, received by the Distributor for distributing Fund shares were $103,781 for Class A, $426 for Class B and $219 for Class C shares for the six months ended August 31, 2015.
Expenses Waived/Reimbursed by the Investment Manager and its Affiliates
The Investment Manager and certain of its affiliates have contractually agreed to waive fees and/or reimburse expenses (excluding certain fees and expenses described below), so that the Fund’s net operating expenses, after giving effect to fees waived/expenses reimbursed and any balance credits and/or overdraft charges from the Fund’s custodian, do not exceed the annual rates of:
| | | | | | | | |
| | | Contractual Expense Cap July 1, 2015 Through June 30, 2016 | | | Voluntary Expense Cap Prior to July 1, 2015 | |
Class A | | | 1.19 | % | | | 1.18 | % |
Class B | | | 1.94 | | | | 1.93 | |
Class C | | | 1.94 | | | | 1.93 | |
Class I | | | 0.80 | | | | 0.80 | |
Class K | | | 1.10 | | | | 1.10 | |
Class R | | | 1.44 | | | | 1.43 | |
Class R4 | | | 0.94 | | | | 0.93 | |
Class R5 | | | 0.85 | | | | 0.85 | |
Class W | | | 1.19 | | | | 1.18 | |
Class Y | | | 0.80 | | | | 0.80 | |
Class Z | | | 0.94 | | | | 0.93 | |
The contractual agreement may be modified or amended only with approval from all parties. Under the arrangements, the following fees and expenses are excluded from the waiver/reimbursement commitment, and therefore will be paid by the Fund, if applicable: taxes (including foreign transaction taxes), expenses associated with investments in affiliated and non-affiliated pooled investment vehicles (including mutual funds and exchange-traded funds), transaction costs and brokerage commissions, costs related to any securities lending program, dividend and interest expenses associated with securities sold short, inverse floater program fees and expenses, transaction charges and interest on borrowed money, interest, extraordinary expenses and other expenses the exclusion of which is specifically approved by the Board. Any fees waived and/or expenses reimbursed under the expense reimbursement arrangements described above are not recoverable by the Investment Manager or its affiliates in future periods.
| | | | |
| Semiannual Report 2015 | | | 31 | |
| | |
| |
| | COLUMBIA GLOBAL EQUITY VALUE FUND |
NOTES TO FINANCIAL STATEMENTS (continued)
August 31, 2015 (Unaudited)
Note 4. Federal Tax Information
The timing and character of income and capital gain distributions are determined in accordance with income tax regulations, which may differ from GAAP because of temporary or permanent book to tax differences.
At August 31, 2015, the cost of investments for federal income tax purposes was approximately $921,082,000 and the aggregate gross approximate unrealized appreciation and depreciation based on that cost was:
| | | | |
Unrealized appreciation | | | $92,367,000 | |
Unrealized depreciation | | | (74,515,000 | ) |
Net unrealized appreciation | | | $17,852,000 | |
The following capital loss carryforwards, determined as of February 28, 2015, may be available to reduce taxable income arising from future net realized gains on investments, if any, to the extent permitted by the Internal Revenue Code:
| | | | |
| Year of Expiration | | Amount ($) | |
2017 | | | 50,228,924 | |
Management of the Fund has concluded that there are no significant uncertain tax positions in the Fund that would require recognition in the financial statements. However, management’s conclusion may be subject to review and adjustment at a later date based on factors including, but not limited to, new tax laws, regulations, and administrative interpretations (including relevant court decisions). Generally, the Fund’s federal tax returns for the prior three fiscal years remain subject to examination by the Internal Revenue Service.
Note 5. Portfolio Information
The cost of purchases and proceeds from sales of securities, excluding short-term investments and derivatives, if any, aggregated to $438,934,018 and $457,228,604, respectively, for the six months ended August 31, 2015. The amount of purchase and sale activity impacts the portfolio turnover rate reported in the Financial Highlights.
Note 6. Regulatory Settlements
During the six months ended August 31, 2015, the Fund recorded a receivable of $537,100 as a result of a regulatory settlement proceeding brought by the Securities and Exchange Commission against an unaffiliated third party relating to market timing and/or late trading of mutual funds. This amount represented the Fund’s portion of the proceeds from the settlement (neither the Fund nor the
Investment Manager were a party to the proceeding). The payments have been included in Proceeds from regulatory settlements in the Statement of Changes in Net Assets.
Note 7. Affiliated Money Market Fund
The Fund invests in Columbia Short-Term Cash Fund, an affiliated money market fund established for the exclusive use by the Fund and other affiliated funds. The income earned by the Fund from such investments is included as Dividends — affiliated issuers in the Statement of Operations. As an investing fund, the Fund indirectly bears its proportionate share of the expenses of Columbia Short-Term Cash Fund.
Note 8. Line of Credit
The Fund has entered into a revolving credit facility with a syndicate of banks led by JPMorgan Chase Bank, N.A. whereby the Fund may borrow for the temporary funding of shareholder redemptions or for other temporary or emergency purposes. The credit facility agreement, which is a collective agreement between the Fund and certain other funds managed by the Investment Manager, severally and not jointly, permits collective borrowings up to $550 million. Interest is charged to each participating fund based on its borrowings at a rate equal to the higher of (i) the overnight federal funds rate plus 1.00% or (ii) the one-month LIBOR rate plus 1.00%. Each borrowing under the credit facility matures no later than 60 days after the date of borrowing. The Fund also pays a commitment fee equal to its pro rata share of the amount of the credit facility at a rate of 0.075% per annum. The commitment fee is included in other expenses in the Statement of Operations.
The Fund had no borrowings during the six months ended August 31, 2015.
Note 9. Significant Risks
Financial Sector Risk
The Fund may be more susceptible to the particular risks that may affect companies in the financial services sector than if it were invested in a wider variety of companies in unrelated sectors. Companies in the financial services sector are subject to certain risks, including the risk of regulatory change, decreased liquidity in credit markets and unstable interest rates. Such companies may have concentrated portfolios, such as a high level of loans to real estate developers, which makes them vulnerable to economic conditions that affect that industry. Performance of such companies may be affected by competitive pressures and exposure to
| | |
| 32 | | Semiannual Report 2015 |
| | |
| |
| COLUMBIA GLOBAL EQUITY VALUE FUND | | |
NOTES TO FINANCIAL STATEMENTS (continued)
August 31, 2015 (Unaudited)
investments or agreements that, under certain circumstances, may lead to losses (e.g., subprime loans). Companies in the financial services sector are subject to extensive governmental regulation that may limit the amount and types of loans and other financial commitments they can make, and interest rates and fees that they may charge. In addition, profitability of such companies is largely dependent upon the availability and the cost of capital.
Foreign Securities and Emerging Market Countries Risk
Investing in foreign securities may include certain risks and considerations not typically associated with investing in U.S. securities, such as fluctuating currency values and changing local and regional economic, political and social conditions, which may result in greater market volatility. In addition, certain foreign securities may not be as liquid as U.S. securities. Investing in emerging markets may accentuate these risks. These countries are also more likely to experience high levels of inflation, deflation or currency devaluation which could hurt their economies and securities markets. To the extent that the Fund concentrates its investment exposure to any one or a few specific countries, the Fund will be particularly susceptible to the various conditions, events or other factors impacting those countries and may, therefore, have a greater risk than that of a fund which is more geographically diversified.
Shareholder Concentration Risk
At August 31, 2015, affiliated shareholders of record owned 46.4% of the outstanding shares of the Fund in one or more accounts. Subscription and redemption activity by concentrated accounts may have a significant effect on the operations of the Fund. In the case of a large redemption, the Fund may be forced to sell investments at inopportune times, including its liquid or more liquid positions, resulting in Fund losses and the Fund holding a higher percentage of less liquid or illiquid securities. Large redemptions could result in decreased economies of scale and increased operating expenses for non-redeeming Fund shareholders.
Note 10. Subsequent Events
Management has evaluated the events and transactions that have occurred through the date the financial statements were issued and noted no items requiring adjustment of the financial statements or additional disclosure.
Note 11. Information Regarding Pending and Settled Legal Proceedings
In December 2005, without admitting or denying the allegations, American Express Financial Corporation (AEFC, which is now known as Ameriprise Financial, Inc. (Ameriprise Financial)) entered into settlement agreements with the Securities and Exchange Commission (SEC) and Minnesota Department of Commerce (MDOC) related to market timing activities. As a result, AEFC was censured and ordered to cease and desist from committing or causing any violations of certain provisions of the Investment Advisers Act of 1940, the Investment Company Act of 1940, and various Minnesota laws. AEFC agreed to pay disgorgement of $10 million and civil money penalties of $7 million. AEFC also agreed to retain an independent distribution consultant to assist in developing a plan for distribution of all disgorgement and civil penalties ordered by the SEC in accordance with various undertakings detailed at http://www.sec.gov/litigation/admin/ia-2451.pdf. Ameriprise Financial and its affiliates have cooperated with the SEC and the MDOC in these legal proceedings, and have made regular reports to the Funds’ Boards of Trustees.
Ameriprise Financial and certain of its affiliates have historically been involved in a number of legal, arbitration and regulatory proceedings, including routine litigation, class actions, and governmental actions, concerning matters arising in connection with the conduct of their business activities. Ameriprise Financial believes that the Funds are not currently the subject of, and that neither Ameriprise Financial nor any of its affiliates are the subject of, any pending legal, arbitration or regulatory proceedings that are likely to have a material adverse effect on the Funds or the ability of Ameriprise Financial or its affiliates to perform under their contracts with the Funds. Ameriprise Financial is required to make quarterly (10-Q), annual (10-K) and, as necessary, 8-K filings with the SEC on legal and regulatory matters that relate to Ameriprise Financial and its affiliates. Copies of these filings may be obtained by accessing the SEC website at www.sec.gov.
There can be no assurance that these matters, or the adverse publicity associated with them, will not result in increased fund redemptions, reduced sale of fund shares or other adverse consequences to the Funds. Further, although we believe proceedings are not likely to have a material adverse effect on the Funds or the ability of Ameriprise Financial or its affiliates to perform under
| | | | |
| Semiannual Report 2015 | | | 33 | |
| | |
| |
| | COLUMBIA GLOBAL EQUITY VALUE FUND |
NOTES TO FINANCIAL STATEMENTS (continued)
August 31, 2015 (Unaudited)
their contracts with the Funds, these proceedings are subject to uncertainties and, as such, we are unable to estimate the possible loss or range of loss that may result. An adverse outcome in one or more of these proceedings could result in adverse judgments, settlements, fines, penalties or other relief that could have a material adverse effect on the consolidated financial condition or results of operations of Ameriprise Financial.
| | |
| 34 | | Semiannual Report 2015 |
| | |
| |
| COLUMBIA GLOBAL EQUITY VALUE FUND | | |
INTERIM APPROVAL OF INVESTMENT MANAGEMENT SERVICES AGREEMENT
Columbia Management Investment Advisers, LLC (Columbia Management or the Investment Manager), a wholly-owned subsidiary of Ameriprise Financial, Inc. (Ameriprise Financial), serves as the investment manager to Columbia Global Equity Value Fund (the Fund). Under an investment management services agreement (the IMS Agreement), Columbia Management provides investment advice and other services to the Fund and other funds distributed by Columbia Management Investment Distributors, Inc. (collectively, the Funds).
The Fund’s Board of Trustees (the Board), including the independent Board members (the Independent Trustees), considered the renewal of the IMS Agreement for a two-month period (Short-Term Period) in order to align the IMS Agreement with the review cycle of other funds in the Columbia family of funds. Columbia Management prepared detailed reports for the Board and its Contracts Committee in January, March and April 2015, including reports based on analyses of data provided by an independent organization (Lipper) and a comprehensive response to each item of information requested by independent legal counsel to the Independent Trustees (Independent Legal Counsel) in a letter to the Investment Manager, to assist the Board in making this determination. In addition, throughout the year, the Board (or its committees) regularly meets with portfolio management teams and senior management personnel, and reviews information prepared by Columbia Management addressing the services Columbia Management provides and Fund performance. The Board also accords appropriate weight to the work, deliberations and conclusions of the Contracts Committee, the Investment Review Committee and the Compliance Committee in determining whether to continue the IMS Agreement.
The Board, at its April 13-15, 2015 in-person Board meeting (the April Meeting), considered the renewal of the IMS Agreement for the Short-Term Period. At the April Meeting, Independent Legal Counsel reviewed with the Independent Trustees various factors relevant to the Board’s consideration of advisory agreements and the Board’s legal responsibilities related to such consideration. Following an analysis and discussion of the factors identified below, the Board, including all of the Independent Trustees, approved the renewal of the IMS Agreement for the Short-Term Period.
Nature, Extent and Quality of Services Provided by Columbia Management
The Independent Trustees analyzed various reports and presentations they had received detailing the services performed by Columbia Management, as well as its expertise, resources and capabilities. The Independent Trustees specifically considered many developments during the past year concerning the services provided by Columbia Management. The Independent Trustees noted the information they received concerning Columbia Management’s ability to retain its key portfolio management personnel. In evaluating the quality of services provided under the IMS Agreement and the Fund’s Administrative Services Agreement, the Independent Trustees also took into account the organization and strength of the Fund’s and its service providers’ compliance programs. In addition, the Board also reviewed the financial condition of Columbia Management (and its affiliates) and each entity’s ability to carry out its responsibilities under the IMS Agreement and the Fund’s other services agreements with affiliates of Ameriprise Financial, observing the financial strength of Ameriprise Financial, with its solid balance sheet. The Board also discussed the acceptability of the terms of the IMS Agreement for the Short-Term Period.
Based on the foregoing, and based on other information received (both oral and written, including the information on investment performance referenced below) and other considerations, the Board concluded that the services being performed by Columbia Management and its affiliates were acceptable for the Short-Term Period.
Investment Performance
For purposes of evaluating the nature, extent and quality of services provided under the IMS Agreement, the Board carefully reviewed the investment performance of the Fund. In this regard, the Board considered detailed reports providing the results of analyses performed by an independent organization showing, for various periods, the performance of the Fund, the performance of a benchmark index, the percentage ranking of the Fund among its comparison group and the net assets of the Fund. The Board observed that for purposes of approving the IMS Agreement for the Short-Term Period, the Fund’s performance was acceptable.
| | | | |
| Semiannual Report 2015 | | | 35 | |
| | |
| |
| | COLUMBIA GLOBAL EQUITY VALUE FUND |
INTERIM APPROVAL OF INVESTMENT MANAGEMENT SERVICES AGREEMENT (continued)
Comparative Fees, Costs of Services Provided and the Profits Realized By Columbia Management and its Affiliates from their Relationships with the Fund
The Board reviewed comparative fees and the costs of services provided under the IMS Agreement. The Board members considered detailed comparative information set forth in an annual report on fees and expenses, including, among other things, data (based on analyses conducted by an independent organization) showing a comparison of the Fund’s expenses with median expenses paid by funds in its comparative peer universe, as well as data showing the Fund’s contribution to Columbia Management’s profitability.
The Board accorded particular weight to the notion that the level of fees should reflect a rational pricing model applied consistently across the various product lines in the Fund family, while assuring that the overall fees for each Fund (with certain defined exceptions) are generally in line with the “pricing philosophy” currently in effect (i.e., that the total expense ratio of the Fund is generally no higher than the median expense ratio of funds in the same comparison universe of the Fund).
The Board also considered the expected profitability of Columbia Management and its affiliates in connection with Columbia Management providing investment management services to the Fund. In this regard, the Board referred to a detailed profitability report, discussing the profitability to Columbia Management and Ameriprise Financial from managing, operating and distributing the Funds. For purposes of approving the IMS Agreement for the Short-Term Period, the Board concluded that the investment management service fees were fair and reasonable, observing that the profitability levels also seemed reasonable.
Economies of Scale to be Realized
The Board also considered the economies of scale that might be realized by Columbia Management as the Fund grows and took note of the extent to which Fund shareholders might also benefit from such growth. In this regard, the Independent Trustees took into account that IMS fees decline as Fund assets exceed various breakpoints.
Based on the foregoing, the Board, including all of the Independent Trustees, concluded that, for purposes of its consideration of the renewal of the IMS Agreement for the Short-Term Period, the investment management service fees were fair and reasonable in light of the extent and quality of services provided. In reaching this conclusion, no single factor was determinative. The Board noted its understanding that it would undertake the full consideration of renewal of the IMS Agreement for the full annual period at its June 2015 meetings. On April 15, 2015, the Board, including all of the Independent Trustees, approved the renewal of the IMS Agreement for the Short-Term Period.
| | |
| 36 | | Semiannual Report 2015 |
| | |
| |
| COLUMBIA GLOBAL EQUITY VALUE FUND | | |
APPROVAL OF INVESTMENT MANAGEMENT SERVICES AGREEMENT
Columbia Management Investment Advisers, LLC (Columbia Management or the Investment Manager, and together with its global affiliates, Columbia Threadneedle), a wholly-owned subsidiary of Ameriprise Financial, Inc. (Ameriprise Financial), serves as the investment manager to Columbia Global Equity Value Fund (the Fund). Under an investment management services agreement (the IMS Agreement), Columbia Management provides investment advice and other services to the Fund and other funds distributed by Columbia Management Investment Distributors, Inc. (collectively, the Funds).
On an annual basis, the Fund’s Board of Trustees (the Board), including the independent Board members (the Independent Trustees), considers renewal of the IMS Agreement. Columbia Management prepared detailed reports for the Board and its Contracts Committee in January, March, April and June 2015, including reports based on analyses of data provided by an independent organization (Lipper) and a comprehensive response to items of information requested by independent legal counsel to the Independent Trustees (Independent Legal Counsel) in a letter to the Investment Manager, to assist the Board in making this determination. All of the materials presented in January, March, April and June were first supplied in draft form to designated representatives of the Independent Trustees, i.e., Independent Legal Counsel, Fund Counsel, the Chair of the Board and the Chair of the Contracts Committee, and the final materials were revised to reflect discussion and subsequent requests made by the Board representatives. In addition, throughout the year, the Board (or its committees) regularly meets with portfolio management teams and senior management personnel and reviews information prepared by Columbia Management addressing the services Columbia Management provides and Fund performance. The Board also accords appropriate weight to the work, deliberations and conclusions of the Contracts Committee, the Investment Review Committee and the Compliance Committee in determining whether to continue the IMS Agreement.
The Board, at its June 15-17, 2015 in-person Board meeting (the June Meeting), considered the renewal of the IMS Agreement for an additional one-year term. At the June Meeting, Independent Legal Counsel reviewed with the Independent Trustees various factors relevant to the Board’s consideration of advisory agreements and the Board’s legal responsibilities related to such consideration. Following an analysis and discussion of the factors identified below, the Board, including all of the Independent Trustees, approved the renewal of the IMS Agreement.
Nature, Extent and Quality of Services Provided by Columbia Management
The Independent Trustees analyzed various reports and presentations they had received detailing the services performed by Columbia Management, as well as its organization, expertise, resources and capabilities.
The Independent Trustees specifically considered many developments during the past year concerning the services provided by Columbia Management, including, in particular, the restructured leadership in the Chief Investment Officer’s organization, the strengthening of the investment research department, the solidifying of the Global Asset Management initiative and the restructured investment risk management organization. The Board also noted the broad scope of services provided by Columbia Management to each Fund, including, among other services, investment, risk and compliance oversight. The Board also took into account the information it received concerning Columbia Management’s ability to attract and retain key portfolio management personnel.
In connection with the Board’s evaluation of the overall package of services provided by Columbia Management, the Board also considered the quality of administrative services provided to the Fund by Columbia Management, recalling the information it received highlighting achievements in 2014 in the performance of administrative services. In evaluating the quality of services provided under the IMS Agreement and the Fund’s Administrative Services Agreement, the Independent Trustees also took into account the organization and strength of the Fund’s and its service providers’ compliance programs. In addition, the Board reviewed the financial condition of Columbia Management and its affiliates and each entity’s ability to carry out its responsibilities under the IMS Agreement and the Fund’s other service agreements with affiliates of Ameriprise Financial, observing the financial strength of Ameriprise Financial, with its solid balance sheet. The Board also discussed the acceptability of the terms of the IMS Agreement (including the relatively broad scope of services required to be performed by Columbia Management). The Board took into account the proposed combination of the forms of IMS Agreements and Administrative Services Agreements into a single form of agreement with the combined form reflecting no proposed change in services or fees. Given no material change, the Trustees agreed to the combined form, to be effective upon each Fund’s next annual update. The Board concluded that the services being performed under the IMS Agreement and the Administrative Services Agreement were of a reasonably high quality.
| | | | |
| Semiannual Report 2015 | | | 37 | |
| | |
| |
| | COLUMBIA GLOBAL EQUITY VALUE FUND |
APPROVAL OF INVESTMENT MANAGEMENT SERVICES AGREEMENT (continued)
Investment Performance
For purposes of evaluating the nature, extent and quality of services provided under the IMS Agreement, the Board carefully reviewed the investment performance of the Fund. In this regard, the Board considered detailed reports providing the results of analyses performed by an independent organization showing, for various periods, the performance of the Fund, the performance of a benchmark index, the percentage ranking of the Fund among its comparison group and the net assets of the Fund. The Board observed that the Fund’s investment performance met expectations.
Comparative Fees, Costs of Services Provided and the Profits Realized By Columbia Management and its Affiliates from their Relationships with the Fund
The Board reviewed comparative fees and the costs of services provided under the IMS Agreement. The Board members considered detailed comparative information set forth in an annual report on fees and expenses, including, among other things, data (based on analyses conducted by an independent organization) showing a comparison of the Fund’s expenses with median expenses paid by funds in its comparative peer universe, as well as data showing the Fund’s contribution to Columbia Management’s profitability.
The Board considered the reports of its independent fee consultant, JDL, which assisted in its analysis of the Funds’ performance and expenses, and JDL’s conclusion that the effective investment management fee rate for the Fund remains within a reasonable range. The Board accorded particular weight to the notion that the level of fees should reflect a rational pricing model applied consistently across the various product lines in the Fund family, while assuring that the overall fees for each Fund (with certain defined exceptions) are generally in line with the “pricing philosophy” currently in effect (i.e., that the total expense ratio of the Fund is generally no higher than the median expense ratio of funds in the same comparison universe of the Fund). The Board took into account that the Fund’s total expense ratio (after considering proposed expense caps/waivers) was slightly below the peer universe’s median expense ratio shown in the reports. Based on its review, the Board concluded that the Fund’s management fee was fair and reasonable in light of the extent and quality of services that the Fund receives.
The Board also considered the expected profitability of Columbia Management and its affiliates in connection with Columbia Management providing investment management services to the Fund. In this regard, the Independent Trustees referred to their detailed analysis of the Profitability Report, discussing the profitability to Columbia Management and Ameriprise from managing, operating and distributing the Funds. The Board took into account JDL’s conclusion that 2014 Columbia Management profitability was reasonable. It also considered that Columbia Management generated 2014 profitability that only moderately exceeded 2013 levels. It was further observed that, based on information presented, 2014 overall profitability is in line with profitability levels of industry competitors. It also took into account the indirect economic benefits flowing to Columbia Management or its affiliates in connection with managing or distributing the Funds, such as the enhanced ability to offer various other financial products to Ameriprise Financial customers, soft dollar benefits and overall reputational advantages. The Board noted that the fees paid by the Funds should permit the Investment Manager to offer competitive compensation to its personnel, make necessary investments in its business and earn an appropriate profit. The Board concluded that profitability levels were reasonable.
Economies of Scale to be Realized
The Board also considered the economies of scale that might be realized by Columbia Management as the Fund grows and took note of the extent to which Fund shareholders might also benefit from such growth. In this regard, the Board took into account that IMS fees decline as Fund assets exceed various breakpoints, all of which have not been surpassed.
Based on the foregoing, the Board, including all of the Independent Trustees, concluded that the investment management services fees were fair and reasonable in light of the extent and quality of services provided. In reaching this conclusion, no single factor was determinative. On June 17, 2015, the Board, including all of the Independent Trustees, approved the renewal of the IMS Agreement.
| | |
| 38 | | Semiannual Report 2015 |
| | |
| |
| COLUMBIA GLOBAL EQUITY VALUE FUND | | |
IMPORTANT INFORMATION ABOUT THIS REPORT
Each fund mails one shareholder report to each shareholder address. If you would like more than one report, please call shareholder services at 800.345.6611 and additional reports will be sent to you.
The policy of the Board is to vote the proxies of the companies in which each fund holds investments consistent with the procedures as stated in the Statement of Additional Information (SAI). You may obtain a copy of the SAI without charge by calling 800.345.6611; contacting your financial intermediary; visiting columbiathreadneedle.com/us; or searching the website of the Securities and Exchange Commission (SEC) at sec.gov. Information regarding how each fund voted proxies relating to portfolio securities is filed with the SEC by August 31st for the most recent 12-month period ending June 30th of that year, and is available without charge by visiting columbiathreadneedle.com/us, or searching the website of the SEC at sec.gov.
Each fund files a complete schedule of portfolio holdings with the SEC for the first and third quarters of each fiscal year on Form N-Q. Each fund’s Form N-Q is available on the SEC’s website at sec.gov and may be reviewed and copied at the SEC’s Public Reference Room in Washington, D.C. Information on the operation of the Public Reference Room may be obtained by calling 800.SEC.0330. Each fund’s complete schedule of portfolio holdings, as filed on Form N-Q, can also be obtained without charge, upon request, by calling 800.345.6611.
| | | | |
| Semiannual Report 2015 | | | 39 | |
Columbia Global Equity Value Fund
P.O. Box 8081
Boston, MA 02266-8081
This information is for use with concurrent or prior delivery of a fund prospectus. Please read and consider the investment objectives, risks, charges and expenses for any fund carefully before investing. For a prospectus and summary prospectus, which contains this and other important information about the Fund, go to columbiathreadneedle.com/us. The Fund is distributed by Columbia Management Investment Distributors, Inc., member FINRA, and managed by Columbia Management Investment Advisers, LLC.
Columbia Threadneedle Investments (Columbia Threadneedle) is the global brand name of the Columbia and Threadneedle group of companies. All rights reserved. Columbia Management Investment Distributors, Inc., 225 Franklin Street, Boston, MA 02110-2804
© 2015 Columbia Management Investment Advisers, LLC.
columbiathreadneedle.com/us
SAR145_02_E01_(10/15)
Item 2. Code of Ethics.
Not applicable for semiannual reports.
Item 3. Audit Committee Financial Expert.
Not applicable for semiannual reports.
Item 4. Principal Accountant Fees and Services.
Not applicable for semiannual reports.
Item 5. Audit Committee of Listed Registrants.
Not applicable.
Item 6. Investments
| | (a) | The registrant’s “Schedule I – Investments in securities of unaffiliated issuers” (as set forth in 17 CFR 210.12-12) is included in Item 1 of this Form N-CSR. |
Item 7. Disclosure of Proxy Voting Policies and Procedures for Closed-End Management Investment Companies.
Not applicable.
Item 8. Portfolio Managers of Closed-End Management Investment Companies.
Not applicable.
Item 9. Purchases of Equity Securities by Closed-End Management Investment Company and Affiliated Purchasers.
Not applicable.
Item 10. Submission of Matters to a Vote of Security Holders.
There were no material changes to the procedures by which shareholders may recommend nominees to the registrant’s board of directors.
Item 11. Controls and Procedures.
| | (a) | The registrant’s principal executive officer and principal financial officers, based on their evaluation of the registrant’s disclosure controls and procedures as of a date within 90 days of the filing of this report, have concluded that such controls and procedures are adequately designed to ensure that material information required to be disclosed by the registrant in Form N-CSR is accumulated and communicated to the registrant’s management, including the principal executive officer and principal financial officer, or persons performing similar functions, as appropriate to allow timely decisions regarding required disclosure. |
| | (b) | There was no change in the registrant’s internal control over financial reporting that occurred during the registrant’s second fiscal quarter of the period covered by this report that has materially affected, or is reasonably likely to materially affect, the registrant’s internal control over financial reporting. |
Item 12. Exhibits.
(a)(1) Code of ethics required to be disclosed under Item 2 of Form N-CSR: Not applicable for semiannual reports.
(a)(2) Certifications pursuant to Rule 30a-2(a) under the Investment Company Act of 1940 (17 CFR 270.30a-2(a)) attached hereto as Exhibit 99.CERT.
(a)(3) Not applicable.
(b) Certification pursuant to Rule 30a-2(b) under the Investment Company Act of 1940 (17 CFR 270.30a-2(b)) attached hereto as Exhibit 99.906CERT.
SIGNATURES
Pursuant to the requirements of the Securities Exchange Act of 1934 and the Investment Company Act of 1940, the registrant has duly caused this report to be signed on its behalf by the undersigned, thereunto duly authorized.
| | |
| (registrant) | | Columbia Funds Series Trust II |
| | |
| By (Signature and Title) | | /s/ Christopher O. Petersen |
| | Christopher O. Petersen, President and Principal Executive Officer |
Pursuant to the requirements of the Securities Exchange Act of 1934 and the Investment Company Act of 1940, this report has been signed below by the following persons on behalf of the registrant and in the capacities and on the dates indicated.
| | |
| By (Signature and Title) | | /s/ Christopher O. Petersen |
| | Christopher O. Petersen, President and Principal Executive Officer |
| | |
| By (Signature and Title) | | /s/ Michael G. Clarke |
| | Michael G. Clarke, Treasurer and Chief Financial Officer |